Table of Contents
UNITED STATES
SECURITIES AND EXCHANGE COMMISSION
Washington, D.C. 20549
FORM N-CSR
CERTIFIED SHAREHOLDER REPORT OF REGISTERED MANAGEMENT
INVESTMENT COMPANIES
Investment Company Act file number 811-07989
Metropolitan West Funds
(Exact name of registrant as specified in charter)
865 South Figueroa Street, Suite 1800
Los Angeles, CA 90017
(Address of principal executive offices) (Zip code)
David B. Lippman
Metropolitan West Funds
865 South Figueroa Street, Suite 1800
Los Angeles, CA 90017
(Name and address of agent for service)
Registrant’s telephone number, including area code: (213) 244-0000
Date of fiscal year end: March 31
Date of reporting period: March 31, 2022
Form N-CSR is to be used by management investment companies to file reports with the Commission not later than 10 days after the transmission to stockholders of any report that is required to be transmitted to stockholders under Rule 30e-1 under the Investment Company Act of 1940 (17 CFR 270.30e-1). The Commission may use the information provided on Form N-CSR in its regulatory, disclosure review, inspection, and policymaking roles.
A registrant is required to disclose the information specified by Form N-CSR, and the Commission will make this information public. A registrant is not required to respond to the collection of information contained in Form N-CSR unless the Form displays a currently valid Office of Management and Budget (“OMB”) control number. Please direct comments concerning the accuracy of the information collection burden estimate and any suggestions for reducing the burden to Secretary, Securities and Exchange Commission, 450 Fifth Street, NW, Washington, DC 20549-0609. The OMB has reviewed this collection of information under the clearance requirements of 44 U.S.C. § 3507.
Table of Contents
Item 1. Reports to Stockholders.
| (a) | The Report to Shareholders is attached herewith. |
Table of Contents

| MARCH 31 | ||
| 2022 | ||
| ANNUAL REPORT | ||
| METWEST FUNDS |
||
|
AlphaTrak 500 Fund
Corporate Bond Fund
ESG Securitized Fund
Flexible Income Fund
Floating Rate Income Fund
High Yield Bond Fund
Intermediate Bond Fund
Investment Grade Credit Fund
Low Duration Bond Fund
Opportunistic High Income Credit Fund
Strategic Income Fund
Total Return Bond Fund
Ultra Short Bond Fund
Unconstrained Bond Fund
|
||
Paper copies of the Funds’ annual and semi-annual shareholder reports will no longer be sent by mail, unless you specifically request paper copies of the reports. Instead, the reports will be made available on the Funds’ website (www.tcw.com), and you will be notified by mail each time a report is posted and provided with a website link to access the report.
You may elect to receive all future reports in paper free of charge. You can call 1-800-241-4671, if you invest directly with the Funds, or contact your financial intermediary, if you invest though a financial intermediary, to inform the Funds or the financial intermediary that you wish to continue receiving paper copies of your shareholder reports. Your election to receive reports in paper will apply to all funds held directly with TCW or through your financial intermediary.
Table of Contents
[THIS PAGE INTENTIONALLY LEFT BLANK]
Table of Contents
| Metropolitan West Funds | ||
| Table of Contents | March 31, 2022 |
| 1 | ||||
| 15 | ||||
| 23 | ||||
| 26 | ||||
| 29 | ||||
| 29 | ||||
| 40 | ||||
| 51 | ||||
| 54 | ||||
| 77 | ||||
| 92 | ||||
| 101 | ||||
| 117 | ||||
| 128 | ||||
| 146 | ||||
| 152 | ||||
| 165 | ||||
| 214 | ||||
| 225 | ||||
| 257 | ||||
| 263 | ||||
| 269 | ||||
| 277 | ||||
| 310 | ||||
| 368 | ||||
| 370 | ||||
| 372 | ||||
| 373 | ||||
| 378 | ||||
Table of Contents
Dear Fellow Shareholder,
Thank you for your continued investment in the Metropolitan West Funds. We are pleased to provide the following Annual Report for the Funds for the period ended March 31, 2022. As interest rates reset higher in the past year, particularly so far in 2022, asset growth in the complex stalled on weaker market pricing, ending the reporting year at $86 billion. In addition, as is typical in these periods, an investor rethink on fixed income tends to spur reallocations away from interest rate risk and the asset class, further muting our recent growth profile. These challenges notwithstanding, the higher rates do imply an improved return outlook going forward and the attendant volatility brings opportunity for our teams to apply their hallmark discipline to find value for client assets across the Fund complex.
The March 31, 2022 Annual Report covers the following Metropolitan West Funds:
| Metropolitan West AlphaTrak 500 Fund | M-Class (MWATX) | |
| Metropolitan West Corporate Bond Fund | M-Class (MWCSX), I-Class (MWCBX) | |
| Metropolitan West ESG Securitized Fund | M-Class (MWERX), I-Class (MWESX) | |
| Metropolitan West Flexible Income Fund | M-Class (MWFSX), I-Class (MWFEX) | |
| Metropolitan West Floating Rate Income Fund | M-Class (MWFRX), I-Class (MWFLX), | |
| Plan-Class (MWFPX) | ||
| Metropolitan West High Yield Bond Fund | M-Class (MWHYX), I-Class (MWHIX) | |
| Metropolitan West Intermediate Bond Fund | M-Class (MWIMX), I-Class (MWIIX) | |
| Metropolitan West Investment Grade Credit Fund | M-Class (MWISX), I-Class (MWIGX) | |
| Metropolitan West Low Duration Bond Fund | M-Class (MWLDX), I-Class (MWLIX), | |
| Administrative-Class (MWLNX) | ||
| Metropolitan West Opportunistic High Income Credit Fund | M-Class (MWORX), I-Class (MWOPX) | |
| Metropolitan West Strategic Income Fund | M-Class (MWSTX), I-Class (MWSIX) | |
| Metropolitan West Total Return Bond Fund | M-Class (MWTRX), I-Class (MWTIX), | |
| I-2-Class (MWTTX), | ||
| Administrative-Class (MWTNX), | ||
| Plan-Class (MWTSX) | ||
| Metropolitan West Ultra Short Bond Fund | M-Class (MWUSX), I-Class (MWUIX) | |
| Metropolitan West Unconstrained Bond Fund | M-Class (MWCRX), I-Class (MWCIX), | |
| Plan-Class (MWCPX) |
Economic Review and Market Environment
A little more than two years removed from the onset of COVID-19, the arrival of which led to unprecedented commercial lockdowns and massive economic stimulus, a certain reckoning has begun to play out. While the first quarter of 2021 provided a temporary preview (which was reversed by the summer) of the consequences of the sustained monetary and fiscal largesse invoked to forestall a deep recession or worse, the start of 2022 (and indeed a few months prior) has delivered a seemingly more “permanent” higher interest rate regime. This is largely because of, one, demonstrated inflation, and two, expectations for considerable Fed tightening in the months ahead. Indicative of the inflation (and the geopolitical upset owing to Russia’s invasion of Ukraine), commodity prices climbed 25% in the first quarter of 2022 as ongoing supply issues and easy money conditions were exacerbated by the war. The contrast with the pandemic depths could not be starker: the spot price of U.S. oil, having plunged to below zero in April 2020, traded briefly above $130 in early March. Against this backdrop, headline consumer price index (CPI) for February showed a 7.9% year-over-year inflation rate, and expectations are for still-elevated prints in the coming months, with the Fed revising its 2022 core personal consumption expenditure (PCE) inflation forecast sharply up to 4.1% from 2.7% prior. The Fed also made it clear it will use the primary tool at hand – higher rates – to curb inflation, initiating this hiking cycle with a 25 basis point (bps) increase to the Funds rate in March 2022. The market is currently pricing in eleven expected 25 bps hikes between now and mid-2023, and given front-loaded expectations for the hikes, the Treasury yield curve re-pricing was considerable for shorter maturities. The 2-Year Treasury yield surged to 2.34%, nearly 220 bps over year-ago levels while the 10-Year, up 60 bps, also closed the period at 2.34%. In contrast, longer yields fluctuated, but ended the period nearly unchanged with the 30-Year up a modest 4 bps to 2.45%. As such, multiple parts of the curve inverted, signaling that markets are skeptical of future growth even if the Fed is successful at moderating inflation with its efforts.
Notwithstanding a decidedly volatile start to 2022, equity returns were broadly positive over the course of the annual period, with the S&P 500 Index gaining 15.6%. Against a backdrop of sharply higher Treasury yields, fixed income markets delivered largely negative total returns, with the Bloomberg U.S. Aggregate Bond Index down 4.2% during the trailing twelve-month period, approximately 66 bps behind duration-matched Treasuries. Agency mortgage-backed securities (MBS), in particular, were challenged in this environment of rate volatility, with further headwinds coming from concerns over the Fed pullback, with the sector delivering a 4.9% decline that was over 150 bps behind comparable Treasuries. Corporate credit also fell over 4%, and trailed duration-matched Treasuries by nearly 90 bps. Electric utilities, communications, and healthcare were the worst
1 / Annual Report March 2022
Table of Contents
performing credit sectors, while energy and airlines benefitted from a stark uptick in commodity prices and a rebound in travel. High yield credit fared slightly better than investment grade, with a negative total return of just 0.7%, and was one of the few sectors to deliver positive excess returns, besting Treasuries by nearly 290 bps on a duration-adjusted basis. The lower-quality cohort of CCC-rated issues starkly outperformed, with a positive return of 0.8% while BB-rated issues were down 1.5% and B-rated issues were roughly flat. Among the other securitized sectors, commercial MBS (CMBS) was down approximately 4.5% but flat on a duration-adjusted basis, largely due to the outperformance of non-agency collateral. Finally, asset-backed securities (ABS) were down 3.1% and trailed duration-matched Treasuries by roughly 16 bps, weighed down by autos.
The Economy and Market Ahead
Looking forward, risk factors have become more apparent in both number and magnitude - cost inflation, rising interest rates, policy missteps, geopolitical uncertainty, capital markets volatility, and supply chain disruptions are just a few. And these are only the “known” unknowns. The dangerous confluence of factors has meaningfully increased the odds of recession in the next 12-18 months. Further, we are likely to see stagflationary conditions (slowing growth and high inflation) for at least some period of time, though probably not as long or as painful as the episode experienced in the late 70s or early 80s. Thus, we believe the next 12-24 months could be a challenging period for markets and for fixed income investors especially, while at the same time, recognize that those challenges bring potential significant opportunity. Our value investment philosophy forces our gaze towards these areas of price volatility, as these emerging opportunity sets represent fertile ground for new idea generation. As we saw in the first quarter of 2022, sharp spread level corrections can quickly increase the compensation for the downside risks.
Data sources for the discussion above include Bloomberg, JPMorgan and Merrill Lynch.
Fund Performance Commentary
The performance data presented below represents past performance and is no guarantee of future results. Total returns include reinvestment of dividends and distributions. Current performance may be lower or higher than the performance data presented. Performance data current to the most recent month end is available on the Funds’ website at TCW.com. Investment returns and principal value will fluctuate with market conditions. The value of an investment in a Fund, when redeemed, may be worth more or less than its original purchase cost.
Metropolitan West AlphaTrak 500 Fund
(MWATX)
For the one-year period ending March 31, 2022, the MetWest AlphaTrak 500 Fund (“Fund”) gained 13.35% (net of fees), trailing the S&P 500 Index (“Index”) by approximately 230 bps. As a reminder, the Fund holds S&P 500 Index futures which allows the portfolio to replicate the return of the benchmark, while the underlying fixed income portfolio seeks to generate excess return. The Fund’s use of futures contracts, which are derivatives, was effective in generating Index returns for the Fund, less the implied financing rate of those futures. The Fund’s duration position, which was reduced earlier in the year and gradually extended in the second half of the year, has remained at a relatively low level overall, weighing on performance in the rising rate environment, particularly as the front end of the curve led the move (the 2-Year yield was up over 200 bps while the 10-Year was up roughly 60 bps). The allocation to corporate credit produced an additional drag as the sector grappled with supply chain issues and volatility throughout the year, trailing Treasuries by 88 bps on a duration-adjusted basis. Despite the challenges faced in the space, positive absolute contribution came from airlines and autos, diversified manufacturing credits, oil field services, independent energy, and office and retail real estate investment trusts (REITs). Additionally, the modest allocation to high yield corporates was a tailwind as the sector outperformed investment grade credit and duration-matched Treasuries. Within securitized, floating rate ABS holdings like collateralized loan obligations (CLOs) and government-guaranteed FFELP student loans contributed to performance, as did the Fund’s position in non-agency MBS as the sector posted over 2% total return for the period, supported by rising home prices, strong consumer demand, and declining loan-to-value ratios. CMBS positioning favors non-agency backed collateral, which added on the margin as the sector outperformed Treasuries by 14 bps on a duration-adjusted basis. Agency MBS holdings, challenged throughout the year by interest rate volatility and the Fed shifting away from accommodative policy, focused on lower coupon issues which detracted from performance, though the preference for TBAs (To be announced) offset some of the drag as they provided a higher running yield than specified pools.
Duration positioning was extended throughout the period as rates moved higher, though remained modest at 0.88 years. With long-term rates at current levels seemingly close to fair value, the team will be slow to add meaningful duration given the potential for a large, but likely temporary, move in rates materially higher, though potential tactical adjustments will be made in a disciplined manner. Among corporate credit, after months of de-risking given historically tight valuations, the team was able to take advantage of pricing dislocations late in the period to layer back in exposure. In particular, hefty new issue concessions created opportunities to add defensive, high-quality bonds at levels that we view as compensatory for the risk underwritten. Additions included banking, communications, and consumer non-cyclicals, the latter two already areas of interest given their relatively defensive nature. Meanwhile, high yield and emerging market debt remain small positions, but were upsized marginally during
Annual Report March 2022 / 2
Table of Contents
the period given attractive entry points. Within securitized, the strategy continues to prefer current coupon agency MBS TBAs due to better yield carry versus specified pools as the stock effect of the Fed’s purchases as well as sponsorship from money center banks remains supportive. Among non-agency MBS, legacy issues are preferred given the ongoing fundamental improvement in borrower profiles, with the added benefit of having largely floating rate coupons, and the strategy will continue sourcing exposure at favorable valuations, but may also look to add exposure in select newer-vintage non-agency MBS if opportunities arise. In CMBS, the emphasis is on non-agency CMBS holdings, including commercial real estate (CRE) CLOs and super senior single asset, single borrower (SASB) deals, but the strategy will continue to monitor the sector for opportunities down the capital structure. A similar strategy applies to CLOs, with current exposure focused in AAA-rated issues and an eye toward possible additions of well-collateralized AA-rated issues offering good yields alongside solid liquidity, while other ABS exposure includes government-guaranteed FFELP student loans and a very small position in automobiles.
| Performance Through March 31, 2022 | ||||||||||||||||
| 6 Months (Cumulative) |
1 Year (Annualized) |
3 Year (Annualized) |
5 Year (Annualized) |
10 Year (Annualized) |
Since Inception (Annualized) | |||||||||||
| MWATX (Inception: June 29, 1998) | 4.15% | 13.35% | 18.22% | 15.37% | 15.42% | 8.19% | ||||||||||
| S&P 500 Index | 5.92% | 15.65% | 18.91% | 15.98% | 14.63% | 7.98% | ||||||||||
Metropolitan West Corporate Bond Fund
M-Class (MWCSX), I-Class (MWCBX)
For the one-year period ending March 31, 2022, the MetWest Corporate Bond Fund – I Class (“Fund”) fell 4.44% (net of fees), trailing the Bloomberg U.S. Corporate Index (“Index”) by 24 bps. The Fund’s duration position was trimmed early in the period to nearly a half-year short versus the benchmark, but was extended in a disciplined fashion alongside the rise in rates over the subsequent months to end the period approximately 0.1 year short. This underweight position rewarded returns as rates rose; however, the overweight to the front-end of the yield curve during the second half of the period resulted in a drag on performance as the yield curve flattened. From a sector allocation perspective, the broad underweight to corporate credit was a benefit overall as yield premiums increased over the period. Issue selection among financials was further additive given the overweight to finance companies and REITs as these were among the top performing corporate credit sectors for the period. Additionally, the underweight to banking rewarded relative performance as bank spreads widened. Meanwhile, issue selection among industrial credit was a drag, particularly the underweight to top performing energy credits, and the overweight to communications and non-cyclicals which trailed Treasuries by 155 and 135 bps, respectively. Finally, the small allocation to securitized products had little impact on relative performance – residential MBS allocations were modestly negative as agency MBS experienced significant volatility due to rising rates and tighter monetary policy during the second half of the period, while ABS and senior CMBS added modestly.
Duration positioning was extended in the last quarter of the period as rates moved higher, though the strategy remained somewhat underweight the Index. With long-term rates at current levels seemingly close to fair value, the team will be cautious in adding duration given the potential for a large, but likely temporary, move in rates materially higher, though all adjustments will be made in a disciplined manner. On the credit side, after months of de-risking given historically tight valuations, the team was able to take advantage of pricing dislocations late in the period to layer back in some exposure to bring the overall sector allocation to roughly neutral versus the benchmark. In particular, hefty new issue concessions created opportunities to add defensive, high quality bonds at levels that we view as compensatory for the risk underwritten. Additions were focused in banking, with smaller adds in brokers, technology, and transportations. Though the position was upsized, banking remains one of the largest underweights in the Fund. This is somewhat offset by an overweight to finance companies, REITs and certain insurance credits with attractive long-term fundamentals. Overall Fund positioning remains focused on sectors that offer more stability in times of volatility (such as consumer non-cyclicals and communications) and on idiosyncratic opportunities where wider spreads offer more compelling value. Emerging market debt remains a small position, as potentially raising rates and risks of slowing global growth make relative value unattractive in most cases. Within the off-Index allocation to securitized products, the focus remains on high-quality, more defensive CMBS and ABS holdings generally at the top of the capital structure (though there is some potential to move down the capital structure as opportunities arise).
| Performance Through March 31, 2022 | ||||||||||||||||||||||||
| 6 Months (Cumulative) |
1 Year (Annualized) |
3 Year (Annualized) |
5 Year (Annualized) |
10 Year (Annualized) |
Since (Annualized) |
|||||||||||||||||||
| MWCSX (Inception: June 29, 2018) | -7.72% | -4.67% | 3.83% | — | — | 5.12% | ||||||||||||||||||
| Bloomberg U.S. Corporate Index | -7.48% | -4.20% | 3.02% | — | — | 4.00% | ||||||||||||||||||
| MWCBX (Inception: June 29, 2018) | -7.61% | -4.44% | 4.09% | — | — | 5.38% | ||||||||||||||||||
| Bloomberg U.S. Corporate Index | -7.48% | -4.20% | 3.02% | — | — | 4.00% | ||||||||||||||||||
3 / Annual Report March 2022
Table of Contents
Metropolitan West ESG Securitized Fund
M-Class (MWERX), I-Class (MWESX)
For the period since inception on September 30, 2021, through March 31, 2022, the MetWest ESG Securitized Fund – I Class (“Fund”) fell 5.87% (net of fees) amid rising rates, trailing the Bloomberg U.S. Mortgage-Backed Securities (MBS) Index (“Index”) by 54 bps. Duration positioning was extended alongside the rise in rates, but remained shorter than the benchmark overall, which significantly benefitted relative returns for the period. However, the extension was focused in the front-end of the curve (primarily the 2-Year), which resulted in a small headwind to performance versus the benchmark as shorter yields led the march higher. The Fund’s underweight to agency MBS also added to relative performance as the sector experienced significant volatility due to rising rates and tighter monetary policy during the second half of the period. Meanwhile, the CMBS position was a significant drag as holdings were focused on highly-rated non-agency backed bonds, which were weighed down by underperformance late in the period as this cohort of the market was weighed down by investors fulfilling liquidity needs.
This environment will broadly continue to inform duration and curve positioning in the Fund, along with relative value considerations across securitized sectors. That said, the ESG emphasis of the Fund requires a priority on securitized assets that have positive ESG attributes. This drives an emphasis on a targeted subset of the agency MBS universe where social characteristics, such as affordability, are prioritized along with relative value considerations. Additionally, there is a large allocation to unlabeled green opportunities in the non-agency CMBS sector, specifically single asset, single borrower (SASB) senior A – AAA rated issues, though tactical opportunities down the capital structure are also attractive. Various ABS holdings, particularly solar ABS and data centers present compelling unlabeled green opportunities. In the ESG-labeled securities market, while agency MBS and CMBS (multifamily) offer opportunities for green, social, and sustainable bonds, relative value is constrained, with most opportunities in subordinate and interest-only investments. We expect the ESG-labeled market to increase over time, as issuers structure bonds to meet the rising demand for these assets. Along with expanded ESG labeled issuance, we anticipate more securitized sectors will evolve into social and/or environmental lending and issuance criteria. In the meantime, the Fund will continue to emphasize unlabeled opportunities in securitized credit and agency MBS with socially responsible characteristics, while looking for labeled opportunities that meet our return and ESG objectives. Finally, duration positioning was slightly extended throughout the period as rates moved higher, though the strategy remains underweight the Index.
| Performance Through March 31, 2022 | ||||||||||||||||||||||||
| 6 Months (Cumulative) |
1 Year (Annualized) |
3 Year (Annualized) |
5 Year (Annualized) |
10 Year (Annualized) |
Since Inception1 |
|||||||||||||||||||
| MWERX (Inception: October 1, 2021) | -5.60% | — | — | — | — | -5.60% | ||||||||||||||||||
| Bloomberg U.S. Mortgage-Backed Securities (MBS) Index | -5.33% | — | — | — | — | -5.33% | ||||||||||||||||||
| MWESX (Inception: October 1, 2021) | -5.87% | — | — | — | — | -5.87% | ||||||||||||||||||
| Bloomberg U.S. Mortgage-Backed Securities (MBS) Index | -5.33% | — | — | — | — | -5.33% | ||||||||||||||||||
| 1 Non-annualized. Cumulative return for the Fund during the period of October 1, 2021 through March 31, 2022. |
| |||||||||||||||||||||||
Metropolitan West Flexible Income Fund M-Class
(MWFSX), I-Class (MWFEX)
For the one-year period ending March 31, 2022, the MetWest Flexible Income Fund – I Class (“Fund”) fell 2.05% (net of fees), but outperformed the Bloomberg U.S. Aggregate Bond Index (“Index”) by 210 bps. Duration positioning was extended alongside the rise in rates, but remained shorter than the benchmark overall, which significantly benefitted relative returns for the period. However, the extension was focused in the front-end of the curve (primarily the 5-year space) increasing the relative overweight in that space, which resulted in a headwind to performance versus the benchmark as shorter yields led the march higher. From a sector perspective, the relative underweight to corporate credit was additive to returns as risk premiums increased, with a further contribution from the overweight to high yield corporate debt which outpaced Treasuries by nearly 290 bps year-over-year. While this underweight to investment grade credit, informed by historically tight spreads, minimal dispersion and fundamental vulnerabilities was maintained going into the year, the move wider in yield spreads provided opportunities to add exposure. Among securitized, the underweight to agency MBS rewarded relative returns as the sector experienced significant volatility due to rising rates and tighter monetary policy during the second half of the period. The out-of-Index allocation to legacy non-agency MBS (up over 2.3% for the year, notwithstanding some price volatility in early 2022) further boosted returns as the sector benefitted from a solid housing backdrop and rising prices throughout the year. Finally, smaller additional gains came from issue selection among CMBS and ABS.
Annual Report March 2022 / 4
Table of Contents
Duration positioning was slightly extended throughout the period as rates moved higher, though the strategy remains underweight the Index. With long-term rates at current levels seemingly close to fair value, the team will be slow to add meaningful duration given the potential for a large, but likely temporary, move in rates materially higher, though tactical adjustments may be made in a disciplined manner. On the credit side, after months of de-risking given historically tight valuations, the team was able to take advantage of pricing dislocations late in the period to layer back in exposure at attractive levels. In particular, hefty new issue concessions created opportunities to add defensive, high-quality bonds at levels that we view as compensatory for the risk underwritten. Additions included banking, brokers, insurance, capital goods, and consumer non-cyclicals, the last already an area of interest given its relatively defensive nature. Meanwhile, high yield and emerging market debt remain small positions, but were upsized marginally during the period given attractive entry points. Within securitized, the strategy continues to prefer current coupon agency MBS TBAs due to better yield carry versus specified pools as the stock effect of the Fed’s purchases as well as sponsorship from money center banks both remain supportive. Among non-agency MBS, legacy issues are preferred given the ongoing fundamental improvement in borrower profiles, with the added benefit of having largely floating rate coupons, and the strategy will continue sourcing exposure at favorable valuations, but may also look to add exposure in select newer-vintage non-agency MBS if opportunities arise. In CMBS, the emphasis is on non-agency holdings, including conduits and single asset, single borrower (SASB) deals, but the strategy will continue to monitor the sector for opportunities down the capital structure. A similar strategy applies to CLOs, with additions of well-collateralized AA-rated issues offering good yields alongside solid liquidity, while other ABS exposure includes automobile, government-guaranteed FFELP student loans and other esoteric collateral types.
| Performance Through March 31, 2022 | ||||||||||||||||||||||||
| 6 Months (Cumulative) |
1 Year (Annualized) |
3 Year (Annualized) |
5 Year (Annualized) |
10 Year (Annualized) |
Since Inception (Annualized) |
|||||||||||||||||||
| MWFSX (Inception: November 30, 2018) | -4.62% | -2.30% | 5.96% | — | — | 8.49% | ||||||||||||||||||
| Bloomberg U.S. Aggregate Bond Index | -5.92% | -4.15% | 1.69% | — | — | 2.97% | ||||||||||||||||||
| MWFEX (Inception: November 30, 2018) | -4.50% | -2.05% | 6.14% | — | — | 8.64% | ||||||||||||||||||
| Bloomberg U.S. Aggregate Bond Index | -5.92% | -4.15% | 1.69% | — | — | 2.97% | ||||||||||||||||||
Metropolitan West Floating Rate Income Fund
M-Class (MWFRX), I-Class (MWFLX), Plan-Class (MWFPX)
Macro volatility stemming from tighter monetary policy and the Russia/Ukraine crisis was overshadowed by skyrocketing inflation and the rise in rates that resulted in a bid for loans owing to their floating-rate structure. Consequently, performance by the MetWest Floating Rate Income Fund – I Class (“Fund”) was positive for the one-year period ending March 31, 2022, though its gain of 1.61% (net of fees) represents a 164-basis point deficit versus the S&P/LSTA Leveraged Loan Index (“Index”). The effects of COVID-induced financial stimulus and accommodative monetary policy prompted industries with more market exposure to generally outperform. In this environment, the Fund’s underweight to sectors such as technology, cyclicals, and transportation was a small negative. Weighing further on returns was issue selection in these sectors that held a bias for higher quality vis-à-vis those held in the Index, given the outperformance of lower-rated issues during this timeframe. Adding to the underperformance were selections among communications and financials like brokerage and insurance, as those designated in the Fund performed behind those held within the Index. However, delivering a boost to returns were the Fund’s selection in non-cyclical loans, which outpaced those in the Index. Finally, from a quality perspective as alluded to above, lower-rated loans exceeded their better-rated counterparts in terms of returns, with the Fund’s emphasis on premium quality, therefore, a driver of underperformance.
After months of de-risking given historically tight valuations, the team was able to take advantage of pricing dislocations during the first quarter of 2022 to layer back in exposure at attractive levels. In particular, hefty new issue concessions created opportunities to add defensive, high-quality names at levels that we view as compensatory for the risk underwritten. Additions included banking, insurance, communications, and consumer non-cyclicals, the latter two already areas of interest given their relatively defensive nature. As such, allocations continue to emphasize high-conviction names and defensive industries such as communications, non-cyclicals (especially healthcare), senior secured gaming, and select packaging, while cautious of those with more market risk like cyclicals, energy, basic industry, transportation, and technology. Financials remain an underweight overall; within financials, however, the exposure to banking is an overweight. With strong balance sheets, banking remains compelling, particularly given expectations for a steeper curve. In utilities, the small allocation consists of an overweight to utility servicers and an underweight to electric. Finally, on a quality basis, current valuation in lower-rated loans is lofty with overly optimistic assumptions, informing an emphasis on higher quality, though the strategy remains opportunistic and will look to take advantage of bouts of volatility and increase the exposure to lower-rated cohorts should attractive entry points present themselves.
5 / Annual Report March 2022
Table of Contents
| Performance Through March 31, 2022 | ||||||||||||||||||||||||
| 6 Months (Cumulative) |
1 Year (Annualized) |
3 Year (Annualized) |
5 Year (Annualized) |
10 Year (Annualized) |
Since Inception (Annualized) |
|||||||||||||||||||
| MWFRX (Inception: June 28, 2013) | -0.27% | 1.50% | 3.16% | 3.16% | — | 3.39% | ||||||||||||||||||
| S&P/LSTA Leveraged Loan Index | 0.64% | 3.25% | 4.22% | 4.00% | — | 3.98% | ||||||||||||||||||
| MWFLX (Inception: June 28, 2013) | -0.28% | 1.61% | 3.34% | 3.35% | — | 3.59% | ||||||||||||||||||
| S&P/LSTA Leveraged Loan Index | 0.64% | 3.25% | 4.22% | 4.00% | — | 3.98% | ||||||||||||||||||
| MWFPX (Inception: January 29, 2021) | -0.22% | 1.76% | — | — | — | 1.78% | ||||||||||||||||||
| S&P/LSTA Leveraged Loan Index | 0.64% | 3.25% | — | — | — | 3.31% | ||||||||||||||||||
Metropolitan West High Yield Bond Fund
M-Class (MWHYX), I-Class (MWHIX)
The MetWest High Yield Bond Fund – I Class (“Fund”) fell 1.15% (net of fees) for the one-year period ended March 31, 2022, trailing the Bloomberg U.S. Corporate High Yield Index 2% Issuer Cap (“Index”) by 49 bps. The biggest drag on performance came from the Fund’s industrial positioning, notably an underweight to top performing energy sub-sectors such as independent E&P (Exploration and Production) and oil field services, which generated over 12% and 19% of positive excess returns, respectively. A further drag came from an overweight to communications and consumer non-cyclicals, both of which were the worst performers within the broader high yield universe (weighed down by wireless and pharmaceuticals in particular). An overall underweight to lower-quality credits was an additional headwind, as CCC-rated issues handily outpaced the higher-rated cohorts with a 0.8% positive total return. However, strong issue selection was able to offset some of these drags, with the Fund’s holdings in the energy, transportation, and electric utility sectors outpacing those held in the Index. Finally, as rates moved sharply higher over the course of the year, the duration position was extended though remained relatively short versus the benchmark, rewarding performance.
Volatility in early 2022 has presented opportunities to add in exposure, as the high yield market became broadly actionable at wider spread levels, though spread levels have subsequently tightened in. Looking forward, upcoming earnings releases will be critical for dissecting how companies respond to rising input costs and the impact on profitability. We expect there to be further divergence in issuer performance, which should create additional opportunities to add to corporate bond exposures in the months and quarters ahead. Meanwhile, the team continues to be very deliberate in its additions, with an overall emphasis on what are viewed as more resilient, defensive areas of the market such as non-cyclical, recession-resistant sectors (i.e., communications and consumer non-cyclicals) while energy, retail and technology credits represent relative underweights. Given expectations for episodic market volatility, prospective performance gains are likely to be less attributable to market beta and more the result of credit-specific alpha, informing the continued focus on security selection and fundamental credit underwriting to minimize principal loss. Finally, the Fund’s positioning closed March approximately 0.2 years shorter than the benchmark, and with long-term rates at current levels seemingly close to fair value, the team will be cautious in adding duration given the potential for a large, but likely temporary, move in rates materially higher, though all adjustments will be made in a disciplined manner.
| Performance Through March 31, 2022 | ||||||||||||||||
| 6 Months (Cumulative) |
1 Year (Annualized) |
3 Year (Annualized) |
5 Year (Annualized) |
10 Year (Annualized) |
Since Inception (Annualized) | |||||||||||
| MWHYX (Inception: September 30, 2002) | -4.48% | -1.30% | 5.23% | 4.85% | 4.80% | 7.63% | ||||||||||
| Bloomberg U.S. Corporate High Yield Index 2% Issuer Cap | -4.16% | -0.66% | 4.55% | 4.67% | 5.74% | 8.17% | ||||||||||
| MWHIX (Inception: March 31, 2003) | -4.37% | -1.15% | 5.50% | 5.09% | 5.05% | 7.13% | ||||||||||
| Bloomberg U.S. Corporate High Yield Index 2% Issuer Cap | -4.16% | -0.66% | 4.55% | 4.67% | 5.74% | 7.63% | ||||||||||
Metropolitan West Intermediate Bond Fund
M-Class (MWIMX), I-Class (MWIIX)
For the one-year period ending March 31, 2022, the MetWest Intermediate Bond Fund – I Class (“Fund”) fell 4.33%, trailing the Bloomberg Intermediate U.S. Government/Credit Index (“Index”) by 23 bps. The Fund’s duration position was extended in a disciplined fashion alongside this rise in rates but remained shorter than the Index overall, which benefitted relative returns. However, the extension during the year was focused primarily in the front-end of the curve, which resulted in a small headwind to performance versus the Index as shorter yields led the march higher. An underweight to corporate credit benefitted returns during
Annual Report March 2022 / 6
Table of Contents
the period as yield premiums rose throughout the year, while the preference for defensive subsectors including communications and non-cyclicals further helped relative returns as they were among the top performers within corporate credit. Additional contributions came from favorable issue selection within industrials, namely diversified manufacturing, airline and automobile credits, while modest off-Index exposure to high yield corporates provided a tailwind as the sector outperformed Treasuries by nearly 290 bps on a duration-adjusted basis. The Fund’s allocation to securitized products, however, weighed on returns as the broad sector grappled with interest rate volatility. Agency MBS holdings emphasized lower coupon issues which performed poorly during the period, though some of the drag was offset by the preference for TBAs (To be announced) as they offered a higher running yield compared to specified pools. Similarly, the ABS sector experienced a rise in yield premiums in sympathy with the broader markets, though government-guaranteed FFELP student loan and floating rate collateralized loan obligations (CLOs) held in the Fund performed well versus Index ABS holdings. Lastly, non-agency MBS holdings backed by both prime and subprime collateral benefitted returns as the broad sector returned 2.3% amidst a strong housing backdrop with increased demand, rising home prices and declining loan-to-value ratios.
Duration positioning was extended throughout the period as rates moved higher, though the strategy remained somewhat underweight the Index. With long-term rates at current levels seemingly close to fair value, the team will be cautious in adding duration given the potential for a large, but likely temporary, move in rates materially higher, though all adjustments will be made in a disciplined manner. On the credit side, after months of de-risking given historically tight valuations, the team was able to take advantage of pricing dislocations late in the period to layer back in exposure to bring the overall sector allocation to neutral versus the benchmark. In particular, hefty new issue concessions created opportunities to add defensive, longer tenor, high-quality bonds at levels that we view as compensatory for the risk underwritten. Additions included banking, insurance, communications, and consumer non-cyclicals, the latter two already areas of interest given their relatively defensive nature. Meanwhile, high yield and emerging market debt remain a small position. Within securitized, the strategy continues to prefer current coupon agency MBS TBAs due to better yield carry versus specified pools as the stock effect of the Fed’s purchases as well as sponsorship from money center banks remains supportive. Among non-agency MBS, legacy issues are preferred given the ongoing fundamental improvement in borrower profiles, with the added benefit of having largely floating rate coupons, and the strategy will continue sourcing exposure at favorable valuations, but may also look to add exposure in select newer-vintage non-agency MBS if opportunities arise. In CMBS, the emphasis is on non-agency CMBS holdings, including super senior single asset, single borrower (SASB) deals, but the strategy will continue to monitor the sector for opportunities down the capital structure. A similar strategy applies to CLOs, with additions of well-collateralized AA-rated issues offering good yields alongside solid liquidity, while other ABS exposure includes government-guaranteed FFELP student loans.
| Performance Through March 31, 2022 | ||||||||||||||||||||||||
| 6 Months (Cumulative) |
1 Year (Annualized) |
3 Year (Annualized) |
5 Year (Annualized) |
10 Year (Annualized) |
Since (Annualized) |
|||||||||||||||||||
| MWIMX (Inception: June 30, 2003) | -5.36% | -4.63% | -1.65% | 1.85% | 2.15% | 3.75% | ||||||||||||||||||
| Bloomberg Intermediate U.S. Government/Credit Index | -5.05% | -4.10% | 1.50% | 1.81% | 1.84% | 3.03% | ||||||||||||||||||
| MWIIX (Inception: June 28, 2002) | -5.17% | -4.33% | 1.91% | 2.08% | 2.38% | 4.55% | ||||||||||||||||||
| Bloomberg Intermediate U.S. Government/Credit Index | -5.05% | -4.10% | 1.50% | 1.81% | 1.84% | 3.41% | ||||||||||||||||||
Metropolitan West Investment Grade Credit Fund
M-Class (MWISX), I-Class (MWIGX)
For the one-year period ending March 31, 2022, the MetWest Investment Grade Credit Fund – I Class (“Fund”) lost 5.22% (net of fees), trailing the Bloomberg U.S. Intermediate Credit Index (“Index”) by 117 bps. The Fund’s duration position was trimmed early in the period to nearly a half-year short versus the benchmark, but was extended in a disciplined fashion alongside the rise in rates over the subsequent months to end the period approximately 0.1 year short. This underweight position rewarded returns as rates rose; however, the overweight to the front-end of the yield curve during the second half of the period resulted in a drag on performance as the yield curve flattened. From a sector allocation perspective, the increased allocation to corporate credit, bringing the position to a relative overweight versus the benchmark, resulted in a drag on performance as yield premiums increased over the period. Offsetting some of this drag was an overweight among financials, particularly the overweight to REITs as this was one of the top performing corporate credit sectors for the period, while the underweight to banking was also additive as bank spreads widened. Issue selection among industrials, however, was a drag, particularly the underweight to top performing energy credits, and the overweight to communications and non-cyclicals, which trailed Treasuries by 155 and 135 bps, respectively. Meanwhile, the small allocation to securitized products (not held in the benchmark) had a negative impact on relative performance – residential MBS allocations weighed on returns as agency MBS experienced significant volatility due to rising rates and tighter monetary policy during the second half of the period, while ABS and senior CMBS detracted modestly. Among non-corporate credit, the small off-Index position in municipal debt also weighed on performance as the sector lagged Treasuries and the broader corporate market on a duration-adjusted basis.
7 / Annual Report March 2022
Table of Contents
Duration positioning was extended in the last quarter of the period as rates moved higher, though the strategy remained somewhat underweight the Index. With long-term rates at current levels seemingly close to fair value, the team will be cautious in adding duration given the potential for a large, but likely temporary, move in rates materially higher, though all adjustments will be made in a disciplined manner. On the credit side, after months of de-risking given historically tight valuations, the team was able to take advantage of pricing dislocations late in the period to layer back in some exposure to bring the overall sector allocation to roughly neutral versus the benchmark. In particular, hefty new issue concessions created opportunities to add defensive, high-quality bonds at levels that we view as compensatory for the risk underwritten. Additions were focused in REITs and electric utilities, with smaller adds in transportation. Meanwhile, banking remains one of the largest underweights in the Fund. This is somewhat offset by an overweight to REITs and certain insurance credits with attractive long-term fundamentals. Overall Fund positioning remains focused on sectors that offer more stability in times of volatility (such as consumer non-cyclicals and communications) and on idiosyncratic opportunities where wider spreads offer more compelling value. Emerging market debt remains a small position (underweight versus the benchmark), as potentially raising rates and risks of slowing global growth make relative value unattractive in most cases. Within the off-Index allocation to securitized products, the focus remains on high-quality, more defensive CMBS and ABS holdings generally at the top of the capital structure (though there is some potential to move down the capital structure as opportunities arise).
| Performance Through March 31, 2022 | ||||||||||||||||||||||||
| 6 Months (Cumulative) |
1 Year (Annualized) |
3 Year (Annualized) |
5 Year (Annualized) |
10 Year (Annualized) |
Since Inception (Annualized) |
|||||||||||||||||||
| MWISX (Inception: June 29, 2018) | -6.87% | -5.42% | 2.29% | — | — | 4.19% | ||||||||||||||||||
| Bloomberg U.S. Intermediate Credit Index | -5.59% | -4.05% | 2.09% | — | — | 3.02% | ||||||||||||||||||
| MWIGX (Inception: June 29, 2018) | -6.77% | -5.22% | 2.50% | — | — | 4.41% | ||||||||||||||||||
| Bloomberg U.S. Intermediate Credit Index | -5.59% | -4.05% | 2.09% | — | — | 3.02% | ||||||||||||||||||
Metropolitan West Low Duration Bond Fund
M-Class (MWLDX), I-Class (MWLIX), Administrative-Class (MWLNX)
The MetWest Low Duration Bond Fund – I Class (“Fund”) fell 2.34% (net of fees) for the one-year period ending March 31, 2022, outpacing the ICE BofA 1-3 Year U.S. Treasury Index (“Index”) by 50 bps. On the heels of COVID-induced financial stimulus and accommodative monetary policy, inflation concerns were prevalent throughout 2021 and have increased considerably in the first quarter of 2022, with Russia’s invasion of Ukraine creating further volatility and price pressures. As such, markets re-priced considerably with rates rising across the maturity spectrum led by front-end of the curve, with the 2-Year up over 200 basis points (bps) and the 10-Year up nearly 60 bps since March of last year. The Fund’s duration position, which was reduced earlier in the year and gradually extended in the second half of the year, has remained short the Index for a majority of the period, benefiting performance in the rising rate environment. An additional boost to performance came from the underweight to the front-end of the curve. The allocation to corporate credit, meanwhile produced a muted return with positive absolute contribution coming from midstream, autos, and diversified manufacturing. Additionally, the modest allocation to high yield corporates was a tailwind as the sector outperformed investment grade credit and duration-matched Treasuries. Within securitized, floating rate ABS holdings like collateralized loan obligations (CLOs) and government-guaranteed FFELP student loans contributed to performance, as did the Fund’s position in non-agency MBS as the sector posted over 2% total return for the period, supported by rising home prices, strong consumer demand, and declining loan-to-value ratios in the underlying collateral. Challenged by rate volatility and Fed tapering, agency MBS weighed on returns, though this drag was offset somewhat by the Fund’s preference for TBAs (To be announced) given their higher running yield versus pools.
Duration positioning was extended as rates moved higher, with the strategy now modestly overweight the Index. With long-term rates at current levels seemingly close to fair value, the team will be slow to add meaningful duration given the potential for a large, but likely temporary, move in rates materially higher, though tactical adjustments may be made in a disciplined manner. On the credit side, after months of de-risking given historically tight valuations, the team was able to take advantage of pricing dislocations during the first quarter of 2022 to layer back in exposure at attractive levels. In particular, hefty new issue concessions created opportunities to add defensive, high-quality bonds at levels that we view as compensatory for the risk underwritten. Additions included banking, insurance, communications, and consumer non-cyclicals, the latter two already areas of interest given their relatively defensive nature. Meanwhile, high yield and emerging market debt remain small positions, but were upsized marginally during the end of the period given attractive entry points. Within securitized, the strategy continues to prefer current coupon agency MBS TBAs due to better yield carry versus specified pools as the stock effect of the Fed’s purchases as well as sponsorship from money center banks both remain supportive. Among non-agency MBS, legacy issues are preferred given the ongoing fundamental improvement in borrower profiles, with the added benefit of having largely floating rate coupons, and the strategy will continue sourcing exposure at favorable valuations, but may also look to add exposure in select newer-vintage non-agency MBS if opportunities arise. In CMBS, the emphasis is on non-agency CMBS holdings, including conduits and super
Annual Report March 2022 / 8
Table of Contents
senior single asset, single borrower (SASB) deals, but the strategy will continue to monitor the sector for opportunities down the capital structure. A similar strategy applies to CLOs, with additions of well-collateralized AA-rated issues offering good yields alongside solid liquidity, while other ABS exposure includes government-guaranteed FFELP student loans.
| Performance Through March 31, 2022 | ||||||||||||||||||||||||
| 6 Months (Cumulative) |
1 Year (Annualized) |
3 Year (Annualized) |
5 Year (Annualized) |
10 Year (Annualized) |
Since Inception (Annualized) |
|||||||||||||||||||
| MWLDX (Inception: March 31, 1997) | -3.14% | -2.65% | 1.03% | 1.29% | 1.62% | 3.30% | ||||||||||||||||||
| ICE BofA 1-3 Year U.S. Treasury Index | -2.86% | -2.84% | 0.88% | 1.08% | 0.86% | 2.91% | ||||||||||||||||||
| MWLIX (Inception: March 31, 2000) | -3.04% | -2.34% | 1.27% | 1.53% | 1.84% | 3.00% | ||||||||||||||||||
| ICE BofA 1-3 Year U.S. Treasury Index | -2.86% | -2.84% | 0.88% | 1.08% | 0.86% | 2.52% | ||||||||||||||||||
| MWLNX (Inception: September 22, 2009) | -3.16% | -2.74% | 0.96% | 1.19% | 1.49% | 2.65% | ||||||||||||||||||
| ICE BofA 1-3 Year U.S. Treasury Index | -2.86% | -2.84% | 0.88% | 1.08% | 0.86% | 1.00% | ||||||||||||||||||
Metropolitan West Opportunistic High Income Credit Fund
M-Class (MWORX), I-Class (MWOPX)
Since its inception of August 2, 2021, the MetWest Opportunistic High Income Credit Fund – I Class (“Fund”) has fallen 2.04% (net fees), though this was approximately 127 bps ahead of the Bloomberg U.S. Corporate High Yield Index 2% Issuer Cap (“Index”). The negative total return profile was largely a function of the sharp uptick in rates, with 2-Year and 5-Year Treasury yields up over 216 and 180 bps during the period, respectively, weighing on fixed income overall. The duration position remained short the Index for a majority of the period, though was extended as rates rose, to ultimately end the period modestly long relative to the benchmark. Regarding the sector allocations, while the Fund has a broad selection set including equities, bank loans, corporate and securitized credit, positioning remains largely concentrated in the corporate credit space. Within that exposure, an underweight to energy and consumer cyclicals detracted from returns, with an additional drag coming from issue selection among consumer cyclicals and communications. However, the Fund’s holdings in capital goods, energy, and transportation outpaced those held in the Index, offsetting the aforementioned drag. Meanwhile, an allocation to legacy non-agency residential mortgage-backed securities was beneficial, as the sector was supported by rising home prices, strong consumer demand, and declining loan-to-value ratios in the underlying collateral, followed by addition contributions from commercial mortgage-backed securities, particularly those backed by non-agency collateral.
Strategically, the Fund will continue to position for good value opportunities with a higher yield profile and the search for idiosyncratic securities and themes will guide the approach. Within corporate credit, the team was able to take advantage of pricing dislocations during the first quarter of 2022 to layer in exposure. In particular, hefty new issue concessions created opportunities to add defensive, high-quality bonds at levels that we view as compensatory for the risk underwritten. Additions included banking, communications, and consumer non-cyclicals, the latter two already areas of interest given their relatively defensive nature. Meanwhile, high yield and emerging market debt remain small positions, but were upsized marginally given attractive entry points. Presently, just under 10% of the holdings are allocated to residential and commercial MBS, with approximately 15% and 8% of Fund NAV (net asset value) allocated to equities and bank loans, respectively. Going forward, expectations are that these exposures can vary substantially as value perspectives shift in the market and present yield opportunities at attractive risk-adjusted yields.
| Performance Through March 31, 2022 | ||||||||||||||||||||||||
| 6 Months (Cumulative) |
1 Year (Annualized) |
3 Year (Annualized) |
5 Year (Annualized) |
10 Year (Annualized) |
Since Inception1 |
|||||||||||||||||||
| MWORX (Inception: August 2, 2021) | -4.59% | — | — | — | — | -2.09% | ||||||||||||||||||
| Bloomberg U.S. Corporate High Yield Index 2% Issuer Cap | -4.16% | — | — | — | — | -3.31% | ||||||||||||||||||
| MWOPX (Inception: August 2, 2021) | -4.16% | — | — | — | — | -2.04% | ||||||||||||||||||
| Bloomberg U.S. Corporate High Yield Index 2% Issuer Cap | -4.16% | — | — | — | — | -3.31% | ||||||||||||||||||
| 1 Non-annualized. Cumulative return for the Fund during the period of August 2, 2021 through March 31, 2022. |
| |||||||||||||||||||||||
Metropolitan West Strategic Income Fund
M-Class (MWSTX), I-Class (MWSIX)
The MetWest Strategic Income Fund – I Class (“Fund”) fell 2.76% (net of fees), 466 bps behind the ICE BofA U.S. 3-Month Treasury Bill Index Plus 200 bps (“Index”). The largest headwind to returns came from the duration positioning, which was extended from 1.4 years to 2.4 years alongside the rise in rates (the 2-Year Treasury yield was up over 220 bps, while the 10-Year
9 / Annual Report March 2022
Table of Contents
bellwether yield moved 60 bps higher). A further drag came from the allocation to securitized products, namely CMBS, while ABS also weighed on returns. Among residential MBS holdings, non-agency MBS issues held in the Fund experienced some price weakness later in the period despite a solid housing backdrop, while agency MBS was a drag from a sector perspective given headwinds of rate volatility and concerns over Fed pullback. Within the corporate credit exposure, investment grade credit detracted from returns, as the overall sector trailed duration-matched Treasuries by nearly 90 bps. In particular, an emphasis on consumer non-cyclicals and communications was a drag. These headwinds were somewhat offset by positive contributions coming from the smaller position in high yield credit, as the asset class was one of the few to deliver positive excess returns over Treasuries during the period.
Duration positioning ended the period at a modest 2.4 years and with long-term rates at current levels now seemingly close to fair value, the team will be slow to add meaningful duration given the potential for a large, but likely temporary, move in rates materially higher, though potential tactical adjustments will be made in a disciplined manner. On the credit side of things, after months of de-risking given historically tight valuations, the team was able to take advantage of pricing dislocations late in the period to layer back in a considerable amount of exposure. In particular, hefty new issue concessions created opportunities to add defensive, longer-tenor, high-quality bonds at levels that we view as compensatory for the risk underwritten. Additions included banking, insurance, communications, and consumer non-cyclicals, the latter two already areas of interest given their relatively defensive nature. Meanwhile, high yield and emerging market debt remain small positions, but were upsized marginally later in the period given attractive entry points. Within securitized, the strategy continues to prefer legacy non-agency MBS, which remains attractive from a collateral perspective while having the added benefit of having largely floating rate coupons if rates continue to rise. In CMBS, though current holdings continue to focus on top-of the-capital structure exposures in single asset, single borrower (SASB) AAA-rated issues, opportunities are beginning to present in AA- and A-rated collateral with good loan-to-value (LTV) ratios, i.e., protection, and good spread compensation. A similar strategy applies to CLO debt tranches, with possible additions on well-collateralized AA-rated issues offering good yields.
| Performance Through March 31, 2022 | ||||||||||||||||||||||||
| 6 Months (Cumulative) |
1 Year (Annualized) |
3 Year (Annualized) |
5 Year (Annualized) |
10 Year (Annualized) |
Since Inception (Annualized) |
|||||||||||||||||||
| MWSTX (Inception: June 30, 2003) | -4.42% | -2.99% | 2.11% | 2.42% | 3.16% | 3.80% | ||||||||||||||||||
| ICE BofA U.S. 3-Month Treasury Bill Index Plus 200 bps | 0.88% | 1.90% | 2.76% | 3.10% | 2.62% | 3.26% | ||||||||||||||||||
| MWSIX (Inception: March 31, 2004) | -4.30% | -2.76% | 2.29% | 2.64% | 3.41% | 3.34% | ||||||||||||||||||
| ICE BofA U.S. 3-Month Treasury Bill Index Plus 200 bps | 0.88% | 1.90% | 2.76% | 3.10% | 2.62% | 3.27% | ||||||||||||||||||
Metropolitan West Total Return Bond Fund
M-Class (MWTRX), I-Class (MWTIX), I-2-Class (MWTTX), Administrative-Class (MWTNX), Plan-Class (MWTSX)
For the year ending March 31, 2022, the MetWest Total Return Bond Fund – I Class (“Fund”) fell 4.58% (net of fees), trailing the Bloomberg U.S. Aggregate Bond Index (“Index”) by 43 bps. The Fund’s duration position was trimmed early in the period to nearly approximately a half-year short versus the benchmark, but was extended in a disciplined fashion alongside the rise in rates over the subsequent months to end the period approximately 0.1 year short. This underweight position rewarded returns as rates rose; however, the increase in duration was primarily focused in the shorter end of the curve, which underperformed as the curve flattened, resulting in a drag on performance. An underweight to lagging corporate credit was additive to returns throughout the period, though issue selection within the sector was a modest drag as names held in the Fund slightly lagged those held in the benchmark. Among securitized, the overall impact was largely flat - an overweight to ABS and CMBS resulted in a small drag, with issue selection having little additional impact, while the contributions from residential MBS issue selection were offset by an overweight to the sector as it widened. More specifically, the relative overweight to agency MBS weighed on relative returns as the sector experienced significant volatility due to rising rates and tighter monetary policy during the second half of the period. While some of this was mitigated by a focus within agency MBS on TBAs (which benefit from a higher running yield than pools), the emphasis on lower coupon issues was still a drag. Meanwhile, returns benefitted from the allocation to legacy non-agency MBS (up over 2.3% for the year, notwithstanding some price volatility in early 2022) which benefitted from a solid housing backdrop and rising prices throughout the year.
Duration positioning remained somewhat underweight the Index, and with long-term rates at current levels seemingly close to fair value, the team will be cautious in adding duration given the potential for a large, but likely temporary, move in rates materially higher, though all adjustments will be made in a disciplined manner. On the credit side, after months of de-risking given historically tight valuations, the team was able to take advantage of pricing dislocations late in the period to layer back in exposure to bring the overall sector allocation to roughly neutral versus the benchmark. In particular, hefty new issue concessions created opportunities to add defensive, longer-tenor, high-quality bonds at levels that we view as compensatory for the risk
Annual Report March 2022 / 10
Table of Contents
underwritten. Additions included banking, insurance, communications, and consumer non-cyclicals, the latter two already areas of interest given their relatively defensive nature. Meanwhile, high yield and emerging market debt remain a small position, but were upsized marginally during the period given attractive entry points. Within securitized, the strategy continues to prefer current coupon agency MBS TBAs due to better yield carry versus specified pools as the stock effect of the Fed’s purchases as well as sponsorship from money center banks remains supportive. Among non-agency MBS, legacy issues are preferred given the ongoing fundamental improvement in borrower profiles, with the added benefit of having largely floating rate coupons, and the strategy will continue sourcing exposure at favorable valuations, but may also look to add exposure in select newer-vintage non-agency MBS if opportunities arise. In CMBS, the emphasis is on non-agency CMBS holdings, including CRE CLOs and super senior single asset, single borrower (SASB) deals, but the strategy will continue to monitor the sector for opportunities down the capital structure. A similar strategy applies to CLOs, with additions of well-collateralized AA-rated issues offering good yields alongside solid liquidity, while other ABS exposure includes government-guaranteed FFELP student loans.
| Performance Through March 31, 2022 | ||||||||||||||||||||||
| 6 Months (Cumulative) |
1 Year (Annualized) |
3 Year (Annualized) |
5 Year (Annualized) |
10 Year (Annualized) |
Since Inception (Annualized) | |||||||||||||||||
| MWTRX (Inception: March 31, 1997) | -6.47% | -4.69% | 2.05% | 2.31% | 2.88% | 5.56% | ||||||||||||||||
| Bloomberg U.S. Aggregate Bond Index | -5.92% | -4.15% | 1.69% | 2.14% | 2.24% | 4.71% | ||||||||||||||||
| MWTIX (Inception: March 31, 2000) | -6.38% | -4.58% | 2.24% | 2.51% | 3.10% | 5.37% | ||||||||||||||||
| Bloomberg U.S. Aggregate Bond Index | -5.92% | -4.15% | 1.69% | 2.14% | 2.24% | 4.44% | ||||||||||||||||
| MWTTX (Inception: March 6, 2020) | -6.43% | -4.65% | — | — | — | -1.99% | ||||||||||||||||
| Bloomberg U.S. Aggregate Bond Index | -5.92% | -4.15% | — | — | — | -1.97% | ||||||||||||||||
| MWTNX (Inception: December 18, 2009) | -6.53% | -4.89% | 1.90% | 2.17% | 2.74% | 3.69% | ||||||||||||||||
| Bloomberg U.S. Aggregate Bond Index | -5.92% | -4.15% | 1.69% | 2.14% | 2.24% | 2.92% | ||||||||||||||||
| MWTSX (Inception: August 1, 2011) | -6.33% | -4.50% | 2.34% | 2.60% | 3.17% | 3.33% | ||||||||||||||||
| Bloomberg U.S. Aggregate Bond Index | -5.92% | -4.15% | 1.69% | 2.14% | 2.24% | 2.44% | ||||||||||||||||
Metropolitan West Ultra Short Bond Fund
M-Class (MWUSX), I-Class (MWUIX)
The MetWest Ultra Short Bond Fund – I Class (“Fund”) fell 1.21% (net of fees) for the one-year period ending March 31, 2022, lagging the ICE BofA 1-Year U.S. Treasury Index (“Index”) by 27 bps. On the heels of COVID-induced financial stimulus and accommodative monetary policy, inflation concerns were prevalent throughout 2021 and have increased considerably in the first quarter of 2022, with Russia’s invasion of Ukraine creating further volatility and price pressures. As such, markets re-priced considerably with rates rising across the maturity spectrum led by front-end of the curve, with the 2-Year up over 200 basis points (bps) and the 10-Year up nearly 60 bps since March of last year. The Fund’s duration position, which was reduced earlier in the year and gradually extended in the second half of the year, has remained short the Index for a majority of the period, benefiting performance in the rising rate environment. However, an overweight to the front-end detracted. The allocation to corporate credit, meanwhile, produced a drag as the sector grappled with supply chain issues and volatility throughout the year, trailing Treasuries by 8 bps on a duration-adjusted basis. Despite the challenges faced in the space, positive contribution came from issue selection, notably in airlines and autos, diversified manufacturing, and food & beverage. Within securitized, the Fund’s position in non-agency MBS was beneficial as the sector posted over 2% total return for the period, supported by rising home prices, strong consumer demand, and declining loan-to-value ratios in the underlying collateral. CMBS positioning favors non-agency backed collateral, which further benefited returns as the sector outperformed Treasuries by 14 bps on a duration-adjusted basis. Challenged by rate volatility and Fed tapering, agency MBS held back returns, though this drag was offset by the Fund’s preference for TBAs (To be announced) given their higher running yield versus pools.
A shorter-than-Index duration positioning was extended throughout the year as rates moved higher, ending at 0.1 years long versus the Index. With long-term rates at current levels seemingly close to fair value, the team will be slow to add meaningful duration given the potential for a large, but likely temporary, move in rates materially higher, though potential tactical adjustments will be made in a disciplined manner. Among corporate credit, after months of de-risking given historically tight valuations, the team was able to take advantage of pricing dislocations during the first quarter of 2022 to layer back in exposure. In particular, hefty new issue concessions created opportunities to add defensive, high-quality bonds at levels that we view as compensatory for the risk underwritten. Additions included banking, communications, and consumer non-cyclicals, the latter two already areas of interest given their relatively defensive nature. Meanwhile, high yield and emerging market debt remain small positions, but were upsized marginally given attractive entry points. Within securitized, the strategy continues to prefer current coupon agency MBS TBAs due to better yield carry versus specified pools as the stock effect of the Fed’s purchases as well as sponsorship from money center banks remains supportive. Among non-agency MBS, legacy issues are preferred given the ongoing fundamental improvement in
11 / Annual Report March 2022
Table of Contents
borrower profiles, with the added benefit of having largely floating rate coupons, and the strategy will continue sourcing exposure at favorable valuations, but may also look to add exposure in select newer-vintage non-agency MBS if opportunities arise. In CMBS, the emphasis is on non-agency CMBS holdings, including CRE CLOs and super senior single asset, single borrower (SASB) deals, but the strategy will continue to monitor the sector for opportunities down the capital structure. A similar strategy applies to CLOs, with current exposure focused in AAA-rated issues and an eye toward possible additions of well-collateralized AA-rated issues offering good yields alongside solid liquidity, while other ABS exposure includes government-guaranteed FFELP student loans and a very small position in automobiles.
| Performance Through March 31, 2022 | ||||||||||||||||||||||
| 6 Months (Cumulative) |
1 Year (Annualized) |
3 Year (Annualized) |
5 Year (Annualized) |
10 Year (Annualized) |
Since Inception (Annualized) | |||||||||||||||||
| MWUSX (Inception: June 30, 2003) | -1.39% | -1.14% | 0.57% | 0.95% | 1.14% | 1.66% | ||||||||||||||||
| ICE BofA 1-Year U.S. Treasury Index | -0.98% | -0.94% | 1.00% | 1.22% | 0.78% | 1.52% | ||||||||||||||||
| MWUIX (Inception: July 31, 2004) | -1.54% | -1.21% | 0.66% | 1.11% | 1.28% | 1.52% | ||||||||||||||||
| ICE BofA 1-Year U.S. Treasury Index | -0.98% | -0.94% | 1.00% | 1.22% | 0.78% | 1.56% | ||||||||||||||||
Metropolitan West Unconstrained Bond Fund
M-Class (MWCRX), I-Class (MWCIX), Plan-Class (MWCPX)
The MetWest Unconstrained Bond Fund – I Class (“Fund”) fell 2.88% (net of fees) during the one-year period ending March 31, 2022, trailing the ICE BofA U.S. Dollar 3-Month Deposit Offered Rate Average Index (“Index”) by 307 bps. The largest headwind to returns came from the duration positioning, which was adjusted in a range of 1.8 to 2.4 years amid rate volatility, given that the Treasury curve moved considerably higher (the 2-Year Treasury yield was up over 220 bps, while the 10-Year bellwether yield moved just 60 bps higher). Meanwhile, the allocation to spread sectors were additive, led by corporate credit. In particular, names within midstream energy, finance companies, and airlines benefitted performance. The smaller position in high yield credit also boosted returns, as the asset class was one of the few to deliver positive excess returns over Treasuries during the period (+287 bps) and the Fund upsized the exposure there on weakness in early 2022. Within the securitized products allocation, contributions were led by the Fund’s CMBS holdings, most notably non-agency backed bonds, which outperformed comparable duration-matched Treasuries by 14 bps during the period. Further benefit came from the ABS position, which remains focused on government-guaranteed FFELP student loans and high-quality CLOs. Among residential MBS, non-agency MBS issues held in the Fund experienced some price weakness later in the period, but were modestly additive to returns. Finally, agency MBS was a drag from a sector perspective given headwinds of rate volatility and concerns over Fed pullback, though this was offset by an emphasis on TBAs, which continued to benefit from a higher running yield than pools.
Duration positioning ended the period at a modest 2.0 years and with long-term rates at current levels now seemingly close to fair value, the team will be slow to add meaningful duration given the potential for a large, but likely temporary, move in rates materially higher, though potential tactical adjustments will be made in a disciplined manner. On the credit side of things, after months of de-risking given historically tight valuations, the team was able to take advantage of pricing dislocations late in the period to layer back in exposure. In particular, hefty new issue concessions created opportunities to add defensive, longer-tenor, high-quality bonds at levels that we view as compensatory for the risk underwritten. Additions included banking, insurance, communications, and consumer non-cyclicals, the latter two already areas of interest given their relatively defensive nature. Meanwhile, high yield and emerging market debt remain small positions, but were upsized marginally during the period given attractive entry points. Within securitized, the strategy continues to prefer current coupon agency MBS TBAs due to better yield carry versus specified pools as the stock effect of the Fed’s purchases as well as sponsorship from money center banks remains supportive. Among non-agency MBS, legacy issues are preferred given the ongoing fundamental improvement in borrower profiles, with the added benefit of having largely floating rate coupons, and the strategy will continue sourcing exposure at favorable valuations, but may also look to add exposure in select newer-vintage non-agency MBS if opportunities arise. In CMBS, the emphasis is on non-agency CMBS holdings, including CRE CLOs and super senior single asset, single borrower (SASB) deals, but the strategy will continue to monitor the sector for opportunities down the capital structure. A similar strategy applies to CLOs, with additions of well-collateralized AA-rated issues offering good yields alongside solid liquidity, while other ABS exposure includes government-guaranteed FFELP student loans.
Annual Report March 2022 / 12
Table of Contents
| Performance Through March 31, 2022 | ||||||||||||||||||||||
| 6 Months (Cumulative) |
1 Year (Annualized) |
3 Year (Annualized) |
5 Year (Annualized) |
10 Year (Annualized) |
Since Inception (Annualized) | |||||||||||||||||
| MWCRX (Inception: October 1, 2011) | -4.43% | -3.15% | 1.63% | 2.08% | 2.95% | 4.24% | ||||||||||||||||
| ICE BofA U.S. Dollar 3-Month Deposit Offered Rate Average Index | 0.10% | 0.19% | 0.97% | 1.35% | 0.88% | 0.86% | ||||||||||||||||
| MWCIX (Inception: October 1, 2011) | -4.31% | -2.88% | 1.92% | 2.37% | 3.22% | 4.52% | ||||||||||||||||
| ICE BofA U.S. Dollar 3-Month Deposit Offered Rate Average Index | 0.10% | 0.19% | 0.97% | 1.35% | 0.88% | 0.86% | ||||||||||||||||
| MWCPX (Inception: March 6, 2020) | -4.28% | -2.83% | — | — | — | 0.41% | ||||||||||||||||
| ICE BofA U.S. Dollar 3-Month Deposit Offered Rate Average Index | 0.10% | 0.19% | — | — | — | 0.38% | ||||||||||||||||
A Disciplined Value Philosophy
While the start to the year – one of the most difficult stretches in bond market history – also signals the possibility of turbulence in the months and quarters to come, we continue, as ever, to look at challenges as opportunity. Navigating the bumpy environment also reminds us that performance can defy reason for some periods, as well. However, with appropriate risk control, discipline and alertness to buy attractive bonds at cheap and hopefully compelling prices, the stage can be set for significant longer-term outperformance. Portfolios are currently well positioned to capitalize on these opportunities, while also maintaining substantial liquidity for flexibility in all market conditions.
Thank you again for your investment in the Metropolitan West Funds. We look forward to continuing to assist you in the fulfillment of your financial goals.
Sincerely,
David B. Lippman
President and Principal Executive Officer of the Trust
Metropolitan West Funds
Portfolio composition is subject to change. The current and future portfolio holdings of the Funds are subject to investment risk.
Bond Funds have similar interest rate, issue, and credit risks as those risks associated with the underlying bonds in their portfolio, all of which could reduce a Fund’s value. As interest rates rise, the value of a Bond Fund can decline and an investor can lose principal. Additional risks to the Funds include derivatives risk, foreign securities risk, asset-backed securities investment risk, and prepayment risk. The High Yield Bond Fund purchases more speculative bonds, which are subject to greater risks than higher rated bonds, including leverage risk. The Strategic Income Fund engages in sophisticated investment strategies, and is subject to short sales and leverage risks. The AlphaTrak 500 trades futures and derivative contracts. These Funds may not be suitable for all investors.
Derivatives risk refers to the risk that changes in the value of a derivative may not correlate perfectly with the underlying asset. Foreign securities risk refers to the risk that the value of a Fund’s investments in foreign securities may decline based on changes to currency values, or political and economic environments in the countries where the Fund invests. Asset-backed securities investment risk refers to the risk that the impairment of the value of the collateral underlying the security in which a Fund invests, such as the non-payment of loans, will result in a reduction in the value of the security. Prepayment risk refers to the possibility that falling interest rates may cause the underlying loans to pay off at a faster than expected rate. This tends to reduce returns since the funds prepaid will have to be reinvested at the then lower prevailing rates. Short sale risk refers to the limited ability of a Fund to sell a debt or equity security short (without owning it) and to borrow the same security from a broker or other institution to complete the sale. If the value of the short sale increases, a Fund would lose money because it will need to replace the borrowed security by purchasing it at a higher price. Leverage risk refers to the limited ability of a Fund to borrow from broker-dealers or other institutions to leverage a transaction, provided that the borrowing is fully-collateralized. The Fund’s assets may change in value while the borrowing is outstanding, which could create interest expenses that can exceed the income from the assets retained.
13 / Annual Report March 2022
Table of Contents
The views and forecasts expressed here are as of May 2022, are subject to change without notice and may not come to pass. Investment strategies may not achieve the desired results due to implementation lag, other timing factors, portfolio management decision making, economic or market conditions or other unanticipated factors.
This report must be preceded or accompanied by a prospectus.
Annual Report March 2022 / 14
Table of Contents
Illustration of an Assumed Investment of $10,000
The graphs below illustrate the assumed investment of $10,000 for each of the Metropolitan West Funds. The performance data quoted represents past performance and does not guarantee future results. Current performance may be lower or higher than the performance data quoted. Performance data current to the most recent month-end may be obtained at www.tcw.com. Returns are due in part to market conditions which may not be repeated in the future. The investment return and principal value of an investment will fluctuate so that shares, when redeemed, may be worth more or less than their original cost.
The performance tables and graphs do not reflect the deduction of taxes that a shareholder would pay on fund distributions or redemption of fund shares. Unlike an index, the Fund’s total returns are reduced by transaction costs, taxes, management fees and other expenses.
Metropolitan West AlphaTrak 500 Fund
Total Return Performance
The graph below compares the increase in value of a $10,000 investment in the Metropolitan West AlphaTrak 500 Fund with the performance of the S&P 500 Index. The one year and average annual 10 year total returns for the Metropolitan West AlphaTrak 500 Fund were 13.35% and 15.42%, respectively. The graph assumes that distributions were reinvested.
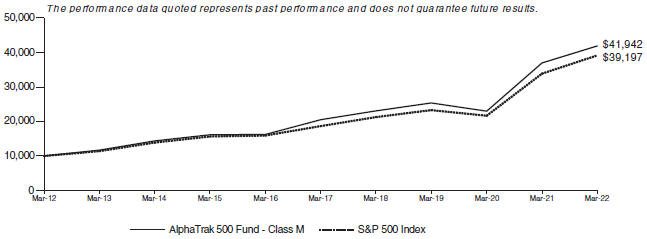
Metropolitan West Corporate Bond Fund – Class M
Total Return Performance
The graph below compares the increase in value of a $10,000 investment in the Metropolitan West Corporate Bond Fund Class M with the performance of the Bloomberg U.S. Corporate Index. The one year and average annual since inception total returns for the Metropolitan West Corporate Bond Fund Class M were -4.67% and 5.12%, respectively. The inception date for Class M was June 29, 2018. The graph assumes that distributions were reinvested.
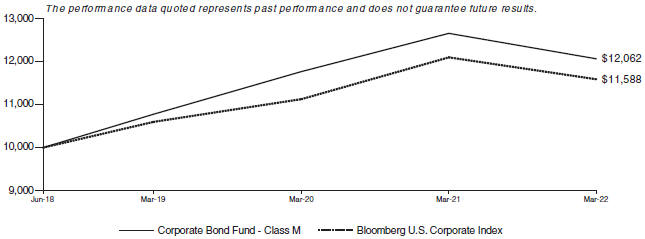
The inception date for the Metropolitan West Corporate Bond Fund Class I was June 29, 2018. The one year and average annual since inception total returns for the Metropolitan West Corporate Bond Fund Class I were -4.44% and 5.38%, respectively. At the end of the same period, a $10,000 investment in the Metropolitan West Corporate Bond Fund Class I shares would have been valued at $12,175.
15 / Annual Report March 2022
Table of Contents
Metropolitan West ESG Securitized Fund – Class M
Total Return Performance
The graph below compares the increase in value of a $10,000 investment in the Metropolitan West ESG Securitized Fund Class M with the performance of the Bloomberg U.S. Mortgage-Backed Securities (MBS) Index. The since inception total return for the Metropolitan West ESG Securitized Fund Class M was -5.60%. The inception date for Class M was October 1, 2021. The graph assumes that distributions were reinvested.
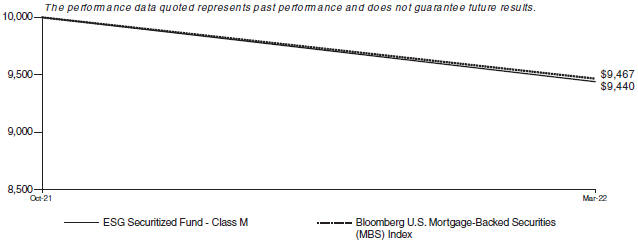
The inception date for the Metropolitan West ESG Securitized Fund Class I was October 1, 2021. The since inception total return for the Metropolitan West ESG Securitized Fund Class I was -5.87%. At the end of the same period, a $10,000 investment in the Metropolitan West ESG Securitized Fund Class I shares would have been valued at $9,414.
Metropolitan West Flexible Income Fund – Class M
Total Return Performance
The graph below compares the increase in value of a $10,000 investment in the Metropolitan West Flexible Income Fund Class M with the performance of the Bloomberg U.S. Aggregate Bond Index. The one year and average annual since inception total returns for the Metropolitan West Flexible Income Fund Class M were -2.30% and 8.49%, respectively. The inception date for Class M was November 30, 2018. The graph assumes that distributions were reinvested.
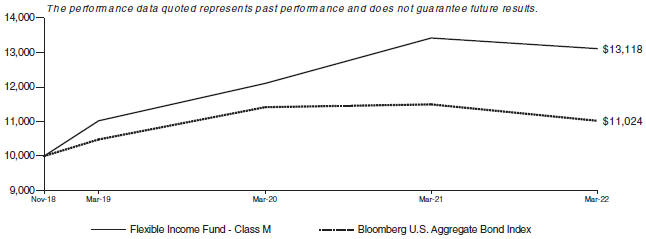
The inception date for the Metropolitan West Flexible Income Fund Class I was November 30, 2018. The one year and average annual since inception total returns for the Metropolitan West Flexible Income Fund Class I were -2.05% and 8.64%, respectively. At the end of the same period, a $10,000 investment in the Metropolitan West Flexible Income Fund Class I shares would have been valued at $13,181.
Annual Report March 2022 / 16
Table of Contents
Metropolitan West Floating Rate Income Fund – Class M
Total Return Performance
The graph below compares the increase in value of a $10,000 investment in the Metropolitan West Floating Rate Income Fund Class M with the performance of the S&P/LSTA Leveraged Loan Index. The one year and average annual since inception total returns for the Metropolitan West Floating Rate Income Fund Class M were 1.50% and 3.39%, respectively. The inception date for Class M was June 28, 2013. The graph assumes that distributions were reinvested.
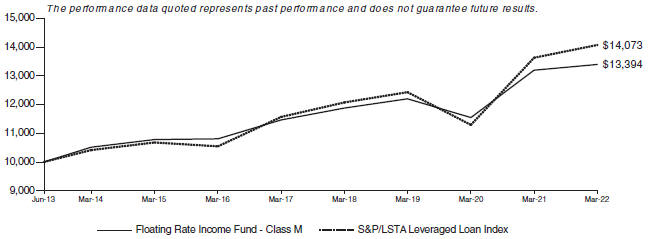
The inception date for the Metropolitan West Floating Rate Income Fund Class I was June 28, 2013. The one year and average annual since inception total returns for the Metropolitan West Floating Rate Income Fund Class I were 1.61% and 3.59%, respectively. At the end of the same period, a $10,000 investment in the Metropolitan West Floating Rate Income Fund Class I shares would have been valued at $13,615.
The inception date for the Metropolitan West Floating Rate Income Fund Plan Class was January 29, 2021. The one year and average annual since inception total returns for the Metropolitan West Floating Rate Income Fund Plan Class were 1.76% and 1.78%, respectively. At the end of the same period, a $10,000 investment in the Metropolitan West Floating Rate Income Fund Plan Class shares would have been valued at $10,208.
Metropolitan West High Yield Bond Fund – Class M
Total Return Performance
The graph below compares the increase in value of a $10,000 investment in the Metropolitan West High Yield Bond Fund Class M with the performance of the Bloomberg U.S. Corporate High Yield Index 2% Issuer Cap. The one year and average annual 10 year total returns for the Metropolitan West High Yield Bond Fund Class M were -1.30% and 4.80%, respectively. The graph assumes that distributions were reinvested.
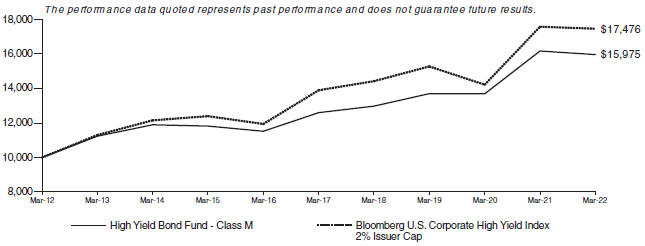
For the Metropolitan West High Yield Bond Fund Class I, the one year and average annual 10 year total returns were -1.15% and 5.05%, respectively. At the end of the same period, a $10,000 investment in the Metropolitan West High Yield Bond Fund Class I shares would have been valued at $16,362.
17 / Annual Report March 2022
Table of Contents
Metropolitan West Intermediate Bond Fund – Class M
Total Return Performance
The graph below compares the increase in value of a $10,000 investment in the Metropolitan West Intermediate Bond Fund Class M with the performance of the Bloomberg Intermediate U.S. Government/Credit Index. The one year and average annual 10 year total returns for the Metropolitan West Intermediate Bond Fund Class M were -4.63% and 2.15%, respectively. The graph assumes that distributions were reinvested.
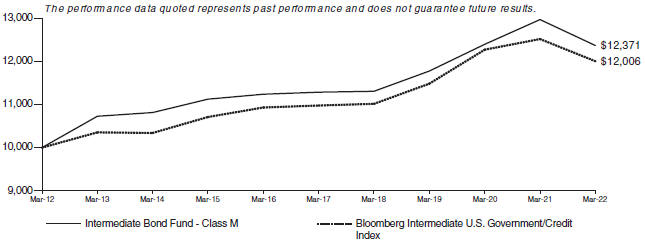
For the Metropolitan West Intermediate Bond Fund Class I, the one year and average annual 10 year total returns were -4.33% and 2.38%, respectively. At the end of the same period, a $10,000 investment in the Metropolitan West Intermediate Bond Fund Class I shares would have been valued at $12,653.
Metropolitan West Investment Grade Credit Fund – Class M
Total Return Performance
The graph below compares the increase in value of a $10,000 investment in the Metropolitan West Investment Grade Credit Fund Class M with the performance of the Bloomberg U.S. Intermediate Credit Index. The one year and average annual since inception total returns for the Metropolitan West Investment Grade Credit Fund Class M were -5.42% and 4.19%, respectively. The inception date for Class M was June 29, 2018. The graph assumes that distributions were reinvested.
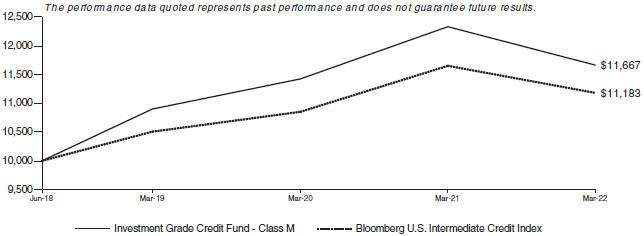
The inception date for the Metropolitan West Investment Grade Credit Fund Class I was June 29, 2018. The one year and average annual since inception total returns for the Metropolitan West Investment Grade Credit Fund Class I were -5.22% and 4.41%, respectively. At the end of the same period, a $10,000 investment in the Metropolitan West Investment Grade Credit Fund Class I shares would have been valued at $11,759.
Annual Report March 2022 / 18
Table of Contents
Metropolitan West Low Duration Bond Fund – Class M
Total Return Performance
The graph below compares the increase in value of a $10,000 investment in the Metropolitan West Low Duration Bond Fund Class M with the performance of the ICE BofA 1-3 Year U.S. Treasury Index. The one year and average annual 10 year total returns for the Metropolitan West Low Duration Bond Fund Class M were -2.65% and 1.62%, respectively. The graph assumes that distributions were reinvested.
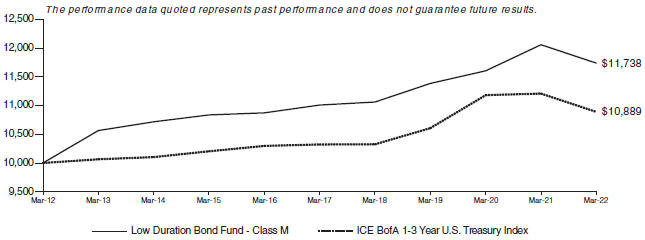
For the Metropolitan West Low Duration Bond Fund Class I, the one year and average annual 10 year total returns were -2.34% and 1.84%, respectively. At the end of the same period, a $10,000 investment in the Metropolitan West Low Duration Bond Fund Class I shares would have been valued at $11,999.
For the Metropolitan West Low Duration Bond Fund Administrative Class, the one year and average annual 10 year total returns were -2.74% and 1.49%, respectively. At the end of the same period, a $10,000 investment in the Metropolitan West Low Duration Bond Fund Administrative Class shares would have been valued at $11,597.
Metropolitan West Opportunistic High Income Credit Fund – Class M
Total Return Performance
The graph below compares the increase in value of a $10,000 investment in the Metropolitan Opportunistic High Income Credit Fund Class M with the performance of the Bloomberg U.S. Corporate High Yield Index 2% Issuer Cap. The since inception total return for the Metropolitan Opportunistic High Income Credit Fund Class M was -2.09%. The inception date for Class M was August 2, 2021. The graph assumes that distributions were reinvested.
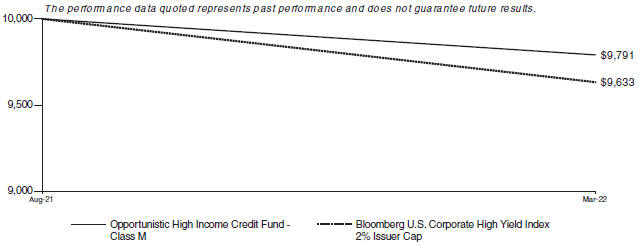
The inception date for the Metropolitan Opportunistic High Income Credit Fund Class I was August 2, 2021. The since inception total return for the Metropolitan Opportunistic High Income Credit Fund Class I was -2.04%. At the end of the same period, a $10,000 investment in the Metropolitan Opportunistic High Income Credit Fund Class I shares would have been valued at $9,796.
19 / Annual Report March 2022
Table of Contents
Metropolitan West Strategic Income Fund – Class M
Total Return Performance
The graph below compares the increase in value of a $10,000 investment in the Metropolitan West Strategic Income Fund Class M with the performance of the ICE BofA U.S. 3-Month Treasury Bill Index Plus 200 bps. The one year and average annual 10 year total returns for the Metropolitan West Strategic Income Fund Class M were -2.99% and 3.16%, respectively. The graph assumes that distributions were reinvested.
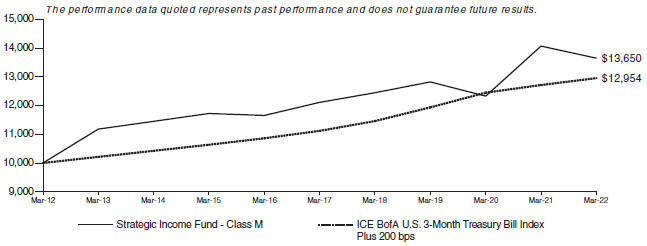
For the Metropolitan West Strategic Income Fund Class I, the one year and average annual 10 year total returns were -2.76% and 3.41%, respectively. At the end of the same period, a $10,000 investment in the Metropolitan West Strategic Income Fund Class I shares would have been valued at $13,979.
Metropolitan West Total Return Bond Fund – Class M
Total Return Performance
The graph below compares the increase in value of a $10,000 investment in the Metropolitan West Total Return Bond Fund Class M with the performance of the Bloomberg U.S. Aggregate Bond Index. The one year and average annual 10 year total returns for the Metropolitan West Total Return Bond Fund Class M were -4.69% and 2.88%, respectively. The graph assumes that distributions were reinvested.
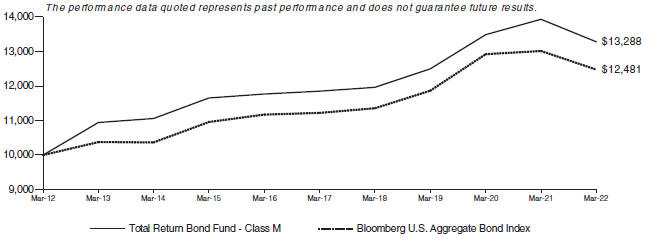
For the Metropolitan West Total Return Bond Fund Class I, the one year and average annual 10 year total returns were -4.58% and 3.10%, respectively. At the end of the same period, a $10,000 investment in the Metropolitan West Total Return Bond Fund Class I shares would have been valued at $13,575.
The inception date for the Metropolitan West Total Return Bond Fund Class I-2 was March 6, 2020. The one year and average annual since inception total returns for the Metropolitan West Total Return Bond Fund Class I-2 were -4.65% and -1.99%, respectively. At the end of the same period, a $10,000 investment in the Metropolitan West Total Return Bond Fund Class I-2 shares would have been valued at $9,594.
Annual Report March 2022 / 20
Table of Contents
For the Metropolitan West Total Return Bond Fund Administrative Class, the one year and average annual 10 year total returns were -4.89% and 2.74%, respectively. At the end of the same period, a $10,000 investment in the Metropolitan West Total Return Bond Fund Administrative Class shares would have been valued at $13,102.
For the Metropolitan West Total Return Bond Fund Plan Class, the one year and average annual 10 year total returns were -4.50% and 3.17%, respectively. At the end of the same period, a $10,000 investment in the Metropolitan West Total Return Bond Fund Plan Class shares would have been valued at $13,660.
Metropolitan West Ultra Short Bond Fund – Class M
Total Return Performance
The graph below compares the increase in value of a $10,000 investment in the Metropolitan West Ultra Short Bond Fund Class M with the performance of the ICE BofA 1-Year U.S. Treasury Index. The one year and average annual 10 year total returns for the Metropolitan West Ultra Short Bond Fund Class M were -1.14% and 1.14%, respectively. The graph assumes that distributions were reinvested.
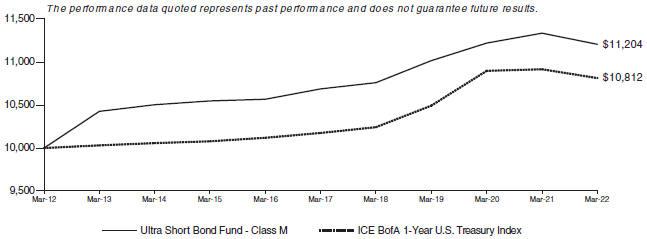
For the Metropolitan West Ultra Short Bond Fund Class I, the one year and average annual 10 year total returns were -1.21% and 1.28%, respectively. At the end of the same period, a $10,000 investment in the Metropolitan West Ultra Short Bond Fund Class I shares would have been valued at $11,358.
21 / Annual Report March 2022
Table of Contents
Metropolitan West Unconstrained Bond Fund – Class M
Total Return Performance
The graph below compares the increase in value of a $10,000 investment in the Metropolitan West Unconstrained Bond Fund Class M with the performance of the ICE BofA U.S. Dollar 3-Month Deposit Offered Rate Average Index. The one year and average annual 10 year total returns for the Metropolitan West Unconstrained Bond Fund Class M were -3.15% and 2.95%, respectively. The graph assumes that distributions were reinvested.
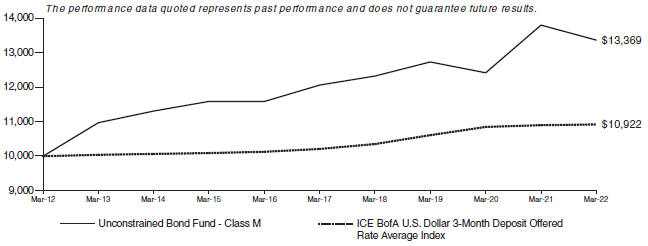
For the Metropolitan West Unconstrained Bond Fund Class I, the one year and average annual 10 year total returns were -2.88% and 3.22%, respectively. At the end of the same period, a $10,000 investment in the Metropolitan West Unconstrained Bond Fund Class I shares would have been valued at $13,731.
The inception date for the Metropolitan West Unconstrained Bond Fund Plan Class was March 6, 2020. The one year and average annual since inception total return for the Metropolitan West Unconstrained Bond Fund Plan Class were -2.83% and 0.41%, respectively. At the end of the same period, a $10,000 investment in the Metropolitan West Unconstrained Bond Fund Plan Class shares would have been valued at $10,084.
Annual Report March 2022 / 22
Table of Contents
Disclosure of Fund Expenses (Unaudited)
For the Six Months Ended March 31, 2022
We believe it is important for you to understand the impact of fees regarding your investment. All mutual funds have operating expenses. As a shareholder of a mutual fund, you incur ongoing costs, which include costs for portfolio management, administrative services, and shareholder reports (like this one), among others. Operating expenses, which are deducted from a fund’s gross income, directly reduce the investment return of the fund. A fund’s expenses are expressed as a percentage of its average net assets. This figure is known as the expense ratio. The following examples are intended to help you understand the ongoing fees (in dollars) of investing in your Fund and to compare these costs with those of other mutual funds. The examples are based on an investment of $1,000 made at the beginning of the period shown and held for the entire period.
This table illustrates your Fund’s costs in two ways:
Actual Fund Return: This section helps you to estimate the actual expenses, after any applicable fee waivers, that you paid over the period. The “Ending Account Value” shown is derived from the Fund’s actual return for the past six-month period, the “Expense Ratio” column shows the period’s annualized expense ratio, and the “Expenses Paid During Period” column shows the dollar amount that would have been paid by an investor who started with $1,000 in the Fund at the beginning of the period.
You may use the information here, together with your account value, to estimate the expenses that you paid over the period. To do so, simply divide your account value by $1,000 (for example, an $8,600 account value divided by $1,000= 8.6), then multiply the result by the number given for your Fund in the first line under the heading entitled “Expenses Paid During Period.”
Hypothetical 5% Return: This section is intended to help you compare your Fund’s costs with those of other mutual funds. It assumes that the Fund had an annual return of 5% before expenses, but that the expense ratio is unchanged. In this case, because the return used is not the Fund’s actual return, the results do not apply to your investment. This example is useful in making comparisons to other mutual funds because the Securities and Exchange Commission (SEC) requires all mutual funds to calculate expenses based on an assumed 5% annual return. You can assess your Fund’s costs by comparing this hypothetical example with the hypothetical examples that appear in shareholder reports of other funds.
Please note that the expenses shown in the table are meant to highlight and help you compare your ongoing costs only and do not reflect any transactional costs such as sales charges (loads), redemption fees, or exchange fees. The Metropolitan West Funds do not charge any sales loads or exchange fees, but these may be present in other funds to which you compare this data. Therefore, the hypothetical portions of the table are useful in comparing ongoing costs only, and will not help you determine the relative total costs of owning different funds.
| Beginning Account Value 10/01/21 |
Ending Account Value 03/31/22 |
Expense Ratio1 |
Expenses Paid During Period2 | |||||
| ALPHATRAK 500 FUND | ||||||||
| Actual Fund Return |
$1,000.00 | $1,041.50 | 0.76% | $3.87 | ||||
| Hypothetical 5% Return |
$1,000.00 | $1,021.14 | 0.76% | $3.83 | ||||
| CORPORATE BOND FUND | ||||||||
| Actual Fund Return |
||||||||
| Class M |
$1,000.00 | $ 922.80 | 0.75% | $3.60 | ||||
| Class I |
$1,000.00 | $ 923.90 | 0.50% | $2.40 | ||||
| Hypothetical 5% Return |
||||||||
| Class M |
$1,000.00 | $1,021.19 | 0.75% | $3.78 | ||||
| Class I |
$1,000.00 | $1,022.44 | 0.50% | $2.52 | ||||
| ESG SECURITIZED FUND | ||||||||
| Actual Fund Return |
||||||||
| Class M |
$1,000.00 | $ 944.00 | 0.79% | $3.83 | ||||
| Class I |
$1,000.00 | $ 941.30 | 0.49% | $2.37 | ||||
| Hypothetical 5% Return |
||||||||
| Class M |
$1,000.00 | $1,020.99 | 0.79% | $3.98 | ||||
| Class I |
$1,000.00 | $1,022.49 | 0.49% | $2.47 | ||||
| 1 | Annualized, based on the Fund’s most recent fiscal half-year expenses. |
| 2 | Expenses are equal to the Fund’s annualized expense ratio multiplied by the average account value over the period, multiplied by 182 days then divided by 365 (to reflect the one-half year period shown). |
23 / Annual Report March 2022
Table of Contents
|
Beginning Account Value 10/01/21 |
Ending Account Value 03/31/22 |
Expense Ratio1 |
Expenses Paid During Period2 |
|||||||||||||
| FLEXIBLE INCOME FUND | ||||||||||||||||
| Actual Fund Return |
||||||||||||||||
| Class M |
$1,000.00 | $ 953.80 | 0.80% | $3.90 | ||||||||||||
| Class I |
$1,000.00 | $ 955.00 | 0.55% | $2.68 | ||||||||||||
| Hypothetical 5% Return |
||||||||||||||||
| Class M |
$1,000.00 | $1,020.94 | 0.80% | $4.03 | ||||||||||||
| Class I |
$1,000.00 | $1,022.19 | 0.55% | $2.77 | ||||||||||||
| FLOATING RATE INCOME FUND | ||||||||||||||||
| Actual Fund Return |
||||||||||||||||
| Class M |
$1,000.00 | $ 997.30 | 0.90% | $4.48 | ||||||||||||
| Class I |
$1,000.00 | $ 997.20 | 0.70% | $3.49 | ||||||||||||
| Plan Class |
$1,000.00 | $ 997.80 | 0.60% | $2.99 | ||||||||||||
| Hypothetical 5% Return |
||||||||||||||||
| Class M |
$1,000.00 | $1,020.44 | 0.90% | $4.53 | ||||||||||||
| Class I |
$1,000.00 | $1,021.44 | 0.70% | $3.53 | ||||||||||||
| Plan Class |
$1,000.00 | $1,021.94 | 0.60% | $3.02 | ||||||||||||
| HIGH YIELD BOND FUND | ||||||||||||||||
| Actual Fund Return |
||||||||||||||||
| Class M |
$1,000.00 | $ 955.20 | 0.85% | $4.14 | ||||||||||||
| Class I |
$1,000.00 | $ 956.30 | 0.60% | $2.93 | ||||||||||||
| Hypothetical 5% Return |
||||||||||||||||
| Class M |
$1,000.00 | $1,020.69 | 0.85% | $4.28 | ||||||||||||
| Class I |
$1,000.00 | $1,021.94 | 0.60% | $3.02 | ||||||||||||
| INTERMEDIATE BOND FUND | ||||||||||||||||
| Actual Fund Return |
||||||||||||||||
| Class M |
$1,000.00 | $ 946.40 | 0.70% | $3.40 | ||||||||||||
| Class I |
$1,000.00 | $ 948.30 | 0.47% | $2.28 | ||||||||||||
| Hypothetical 5% Return |
||||||||||||||||
| Class M |
$1,000.00 | $1,021.44 | 0.70% | $3.53 | ||||||||||||
| Class I |
$1,000.00 | $1,022.59 | 0.47% | $2.37 | ||||||||||||
| INVESTMENT GRADE CREDIT FUND | ||||||||||||||||
| Actual Fund Return |
||||||||||||||||
| Class M |
$1,000.00 | $ 931.30 | 0.70% | $3.37 | ||||||||||||
| Class I |
$1,000.00 | $ 932.30 | 0.49% | $2.36 | ||||||||||||
| Hypothetical 5% Return |
||||||||||||||||
| Class M |
$1,000.00 | $1,021.44 | 0.70% | $3.53 | ||||||||||||
| Class I |
$1,000.00 | $1,022.49 | 0.49% | $2.47 | ||||||||||||
| LOW DURATION BOND FUND | ||||||||||||||||
| Actual Fund Return |
||||||||||||||||
| Class M |
$1,000.00 | $ 968.60 | 0.62% | $3.04 | ||||||||||||
| Class I |
$1,000.00 | $ 969.60 | 0.41% | $2.01 | ||||||||||||
| Administrative Class |
$1,000.00 | $ 968.40 | 0.72% | $3.53 | ||||||||||||
| Hypothetical 5% Return |
||||||||||||||||
| Class M |
$1,000.00 | $1,021.84 | 0.62% | $3.13 | ||||||||||||
| Class I |
$1,000.00 | $1,022.89 | 0.41% | $2.07 | ||||||||||||
| Administrative Class |
$1,000.00 | $1,021.34 | 0.72% | $3.63 | ||||||||||||
| 1 | Annualized, based on the Fund’s most recent fiscal half-year expenses. |
| 2 | Expenses are equal to the Fund’s annualized expense ratio multiplied by the average account value over the period, multiplied by 182 days then divided by 365 (to reflect the one-half year period shown). |
Annual Report March 2022 / 24
Table of Contents
|
Beginning Account Value 10/01/21 |
Ending Account Value 03/31/22 |
Expense Ratio1 |
Expenses Paid During Period2 |
|||||||||||||
| OPPORTUNISTIC HIGH INCOME CREDIT FUND | ||||||||||||||||
| Actual Fund Return |
||||||||||||||||
| Class M |
$1,000.00 | $ 954.10 | 0.85% | $4.14 | ||||||||||||
| Class I |
$1,000.00 | $ 956.00 | 0.60% | $2.93 | ||||||||||||
| Hypothetical 5% Return |
||||||||||||||||
| Class M |
$1,000.00 | $1,020.69 | 0.85% | $4.28 | ||||||||||||
| Class I |
$1,000.00 | $1,021.94 | 0.60% | $3.02 | ||||||||||||
| STRATEGIC INCOME FUND | ||||||||||||||||
| Actual Fund Return |
||||||||||||||||
| Class M |
$1,000.00 | $ 955.80 | 1.04% | $5.07 | ||||||||||||
| Class I |
$1,000.00 | $ 957.00 | 0.80% | $3.90 | ||||||||||||
| Hypothetical 5% Return |
||||||||||||||||
| Class M |
$1,000.00 | $1,019.75 | 1.04% | $5.24 | ||||||||||||
| Class I |
$1,000.00 | $1,020.94 | 0.80% | $4.03 | ||||||||||||
| TOTAL RETURN BOND FUND | ||||||||||||||||
| Actual Fund Return |
||||||||||||||||
| Class M |
$1,000.00 | $ 935.30 | 0.64% | $3.09 | ||||||||||||
| Class I |
$1,000.00 | $ 936.20 | 0.44% | $2.12 | ||||||||||||
| Class I-2 |
$1,000.00 | $ 935.70 | 0.53% | $2.56 | ||||||||||||
| Administrative Class |
$1,000.00 | $ 934.70 | 0.77% | $3.71 | ||||||||||||
| Plan Class |
$1,000.00 | $ 936.70 | 0.36% | $1.74 | ||||||||||||
| Hypothetical 5% Return |
||||||||||||||||
| Class M |
$1,000.00 | $1,021.74 | 0.64% | $3.23 | ||||||||||||
| Class I |
$1,000.00 | $1,022.74 | 0.44% | $2.22 | ||||||||||||
| Class I-2 |
$1,000.00 | $1,022.29 | 0.53% | $2.67 | ||||||||||||
| Administrative Class |
$1,000.00 | $1,021.09 | 0.77% | $3.88 | ||||||||||||
| Plan Class |
$1,000.00 | $1,023.14 | 0.36% | $1.82 | ||||||||||||
| ULTRA SHORT BOND FUND | ||||||||||||||||
| Actual Fund Return |
||||||||||||||||
| Class M |
$1,000.00 | $ 986.10 | 0.50% | $2.48 | ||||||||||||
| Class I |
$1,000.00 | $ 984.60 | 0.34% | $1.68 | ||||||||||||
| Hypothetical 5% Return |
||||||||||||||||
| Class M |
$1,000.00 | $1,022.44 | 0.50% | $2.52 | ||||||||||||
| Class I |
$1,000.00 | $1,023.24 | 0.34% | $1.72 | ||||||||||||
| UNCONSTRAINED BOND FUND | ||||||||||||||||
| Actual Fund Return |
||||||||||||||||
| Class M |
$1,000.00 | $ 955.70 | 1.02% | $4.97 | ||||||||||||
| Class I |
$1,000.00 | $ 956.90 | 0.75% | $3.66 | ||||||||||||
| Plan Class |
$1,000.00 | $ 957.20 | 0.68% | $3.32 | ||||||||||||
| Hypothetical 5% Return |
||||||||||||||||
| Class M |
$1,000.00 | $1,019.85 | 1.02% | $5.14 | ||||||||||||
| Class I |
$1,000.00 | $1,021.19 | 0.75% | $3.78 | ||||||||||||
| Plan Class |
$1,000.00 | $1,021.54 | 0.68% | $3.43 | ||||||||||||
| 1 | Annualized, based on the Fund’s most recent fiscal half-year expenses. |
| 2 | Expenses are equal to the Fund’s annualized expense ratio multiplied by the average account value over the period, multiplied by 182 days then divided by 365 (to reflect the one-half year period shown). |
25 / Annual Report March 2022
Table of Contents
Summary of Portfolio Holdings
March 31, 2022
These tables are provided to give you a quick reference to the composition of each Fund. The “Sector Diversification” table is a percentage of net assets. We hope that this information enhances your understanding of the different kinds of investments in the Funds.
| ALPHATRAK 500 FUND | ||||
| Sector Diversification | ||||
| Corporate Bonds |
28.38% | |||
| Mutual Funds |
18.11% | |||
| Asset-Backed Securities |
10.85% | |||
| Non-Agency Commercial Mortgage-Backed |
9.06% | |||
| Money Market Funds |
8.12% | |||
| Non-Agency Mortgage-Backed |
6.14% | |||
| U.S. Treasury Bills |
4.70% | |||
| U.S. Agency Mortgage-Backed |
3.97% | |||
| U.S. Agency Discount Notes |
2.64% | |||
| U.S. Agency Commercial Mortgage-Backed |
2.54% | |||
| Municipal Bonds |
2.00% | |||
| U.S. Treasury Securities |
0.32% | |||
| Common Stock |
0.05% | |||
| Rights |
0.00% | |||
| Other* |
3.12% | |||
| Total |
100.00% | |||
| CORPORATE BOND FUND | ||||
| Sector Diversification | ||||
| Corporate Bonds |
89.39% | |||
| U.S. Treasury Securities |
2.93% | |||
| Municipal Bonds |
2.90% | |||
| Money Market Funds |
2.83% | |||
| Asset-Backed Securities |
0.32% | |||
| Non-Agency Commercial Mortgage-Backed |
0.26% | |||
| U.S. Agency Commercial Mortgage-Backed |
0.20% | |||
| U.S. Agency Mortgage-Backed |
0.11% | |||
| Written Swaptions |
(0.08)% | |||
| Other* |
1.14% | |||
| Total |
100.00% | |||
| ESG SECURITIZED FUND | ||||
| Sector Diversification | ||||
| U.S. Agency Mortgage-Backed |
45.48% | |||
| Non-Agency Commercial Mortgage-Backed |
38.11% | |||
| U.S. Treasury Securities |
18.59% | |||
| Asset-Backed Securities |
6.50% | |||
| Money Market Funds |
2.13% | |||
| U.S. Agency Commercial Mortgage-Backed |
1.70% | |||
| U.S. Agency Discount Notes |
0.91% | |||
| Other* |
(13.42)% | |||
| Total |
100.00% | |||
| FLEXIBLE INCOME FUND | ||||
| Sector Diversification | ||||
| Corporate Bonds |
35.21% | |||
| Non-Agency Mortgage-Backed |
19.70% | |||
| U.S. Agency Mortgage-Backed |
14.72% | |||
| Non-Agency Commercial Mortgage-Backed |
9.81% | |||
| Asset-Backed Securities |
7.21% | |||
| Bank Loans |
6.87% | |||
| Money Market Funds |
6.15% | |||
| U.S. Treasury Bills |
4.76% | |||
| Foreign Government Obligations |
2.32% | |||
| U.S. Agency Commercial Mortgage-Backed |
2.01% | |||
| U.S. Treasury Securities |
1.19% | |||
| Municipal Bonds |
0.65% | |||
| Common Stock |
0.32% | |||
| Warrant |
0.01% | |||
| Rights |
0.00% | |||
| Written Options |
(0.04)% | |||
| Other* |
(10.89)% | |||
| Total |
100.00% | |||
| FLOATING RATE INCOME FUND | ||||
| Sector Diversification | ||||
| Bank Loans |
88.53% | |||
| Corporate Bonds |
6.16% | |||
| U.S. Treasury Bills |
4.76% | |||
| Money Market Funds |
2.19% | |||
| Common Stock |
0.06% | |||
| Warrant |
0.01% | |||
| Rights |
0.00% | |||
| Other* |
(1.71)% | |||
| Total |
100.00% | |||
| HIGH YIELD BOND FUND | ||||
| Sector Diversification | ||||
| Corporate Bonds |
81.55% | |||
| Bank Loans |
11.69% | |||
| Money Market Funds |
4.33% | |||
| Common Stock |
1.09% | |||
| Warrant |
0.01% | |||
| Rights |
0.00% | |||
| Other* |
1.33% | |||
| Total |
100.00% | |||
Annual Report March 2022 / 26
Table of Contents
| INTERMEDIATE BOND FUND | ||||
| Sector Diversification | ||||
| U.S. Treasury Securities |
45.65% | |||
| Corporate Bonds |
32.95% | |||
| U.S. Agency Mortgage-Backed |
8.72% | |||
| Asset-Backed Securities |
6.83% | |||
| Non-Agency Mortgage-Backed |
5.03% | |||
| Money Market Funds |
4.29% | |||
| Non-Agency Commercial Mortgage-Backed |
2.01% | |||
| Bank Loans |
1.45% | |||
| Municipal Bonds |
0.79% | |||
| Foreign Government Obligations |
0.15% | |||
| Common Stock |
0.06% | |||
| Purchased Options |
0.01% | |||
| U.S. Agency Commercial Mortgage-Backed |
0.01% | |||
| Rights |
0.00% | |||
| Written Options |
(0.27)% | |||
| Other* |
(7.68)% | |||
| Total |
100.00% | |||
| INVESTMENT GRADE CREDIT FUND | ||||
| Sector Diversification | ||||
| Corporate Bonds |
66.31% | |||
| U.S. Agency Mortgage-Backed |
10.48% | |||
| Non-Agency Commercial Mortgage-Backed |
7.07% | |||
| Non-Agency Mortgage-Backed |
6.75% | |||
| Municipal Bonds |
5.47% | |||
| Asset-Backed Securities |
5.43% | |||
| Money Market Funds |
2.83% | |||
| U.S. Treasury Securities |
2.37% | |||
| U.S. Agency Commercial Mortgage-Backed |
0.80% | |||
| Written Options |
(0.08)% | |||
| Written Swaptions |
(0.09)% | |||
| Other* |
(7.34)% | |||
| Total |
100.00% | |||
| LOW DURATION BOND FUND | ||||
| Sector Diversification | ||||
| Corporate Bonds |
31.51% | |||
| U.S. Treasury Securities |
25.02% | |||
| U.S. Agency Mortgage-Backed |
16.03% | |||
| Non-Agency Mortgage-Backed |
12.71% | |||
| Non-Agency Commercial Mortgage-Backed |
8.43% | |||
| Asset-Backed Securities |
8.33% | |||
| U.S. Agency Commercial Mortgage-Backed |
4.15% | |||
| Money Market Funds |
3.99% | |||
| U.S. Treasury Bills |
2.80% | |||
| Bank Loans |
2.71% | |||
| Municipal Bonds |
0.92% | |||
| Purchased Options |
0.01% | |||
| Common Stock |
0.00% | |||
| Purchased Swaptions |
0.00% | |||
| Written Swaptions |
0.00% | |||
| Written Options |
(0.28)% | |||
| Other* |
(16.33)% | |||
| Total |
100.00% | |||
| OPPORTUNISTIC HIGH INCOME CREDIT FUND | ||||
| Sector Diversification | ||||
| Corporate Bonds |
63.50% | |||
| Common Stock |
12.48% | |||
| Bank Loans |
7.94% | |||
| Non-Agency Mortgage-Backed |
4.66% | |||
| Non-Agency Commercial Mortgage-Backed |
4.01% | |||
| Money Market Funds |
3.20% | |||
| Master Limited Partnerships |
2.63% | |||
| U.S. Agency Commercial Mortgage-Backed |
1.17% | |||
| Other* |
0.41% | |||
| Total |
100.00% | |||
| STRATEGIC INCOME FUND | ||||
| Sector Diversification | ||||
| Corporate Bonds |
36.73% | |||
| Non-Agency Mortgage-Backed |
22.55% | |||
| Asset-Backed Securities |
17.57% | |||
| Non-Agency Commercial Mortgage-Backed |
10.64% | |||
| U.S. Agency Mortgage-Backed |
9.29% | |||
| U.S. Agency Commercial Mortgage-Backed |
5.20% | |||
| Money Market Funds |
2.96% | |||
| Municipal Bonds |
0.49% | |||
| Common Stock |
0.34% | |||
| Foreign Government Obligations |
0.10% | |||
| Rights |
0.00% | |||
| Written Options |
(0.06)% | |||
| Written Swaptions |
(0.08)% | |||
| Other* |
(5.73)% | |||
| Total |
100.00% | |||
| TOTAL RETURN BOND FUND | ||||
| Sector Diversification | ||||
| U.S. Agency Mortgage-Backed |
32.31% | |||
| U.S. Treasury Securities |
32.05% | |||
| Corporate Bonds |
28.89% | |||
| Non-Agency Mortgage-Backed |
7.36% | |||
| U.S. Agency Discount Notes |
6.14% | |||
| U.S. Treasury Bills |
4.67% | |||
| Asset-Backed Securities |
4.34% | |||
| Money Market Funds |
2.38% | |||
| Bank Loans |
2.01% | |||
| Non-Agency Commercial Mortgage-Backed |
2.01% | |||
| Foreign Government Obligations |
1.17% | |||
| Municipal Bonds |
0.67% | |||
| Common Stock |
0.09% | |||
| Purchased Options |
0.01% | |||
| Rights |
0.00% | |||
| U.S. Agency Commercial Mortgage-Backed |
0.00% | |||
| Written Swaptions |
(0.08)% | |||
| Written Options |
(0.29)% | |||
| Other* |
(23.73)% | |||
| Total |
100.00% | |||
27 / Annual Report March 2022
Table of Contents
| ULTRA SHORT BOND FUND | ||||
| Sector Diversification | ||||
| U.S. Treasury Securities |
27.47% | |||
| Corporate Bonds |
26.04% | |||
| U.S. Agency Mortgage-Backed |
17.02% | |||
| U.S. Treasury Bills |
9.59% | |||
| Non-Agency Mortgage-Backed |
8.39% | |||
| Non-Agency Commercial Mortgage-Backed |
7.39% | |||
| Asset-Backed Securities |
7.20% | |||
| Money Market Funds |
4.60% | |||
| U.S. Agency Discount Notes |
3.61% | |||
| U.S. Agency Commercial Mortgage-Backed |
2.71% | |||
| Municipal Bonds |
0.86% | |||
| Purchased Options |
0.01% | |||
| Written Options |
(0.32)% | |||
| Other* |
(14.57)% | |||
| Total |
100.00% | |||
| UNCONSTRAINED BOND FUND | ||||
| Sector Diversification | ||||
| Corporate Bonds |
30.77% | |||
| Non-Agency Mortgage-Backed |
25.75% | |||
| Asset-Backed Securities |
14.13% | |||
| U.S. Agency Mortgage-Backed |
12.05% | |||
| Non-Agency Commercial Mortgage-Backed |
7.15% | |||
| U.S. Treasury Bills |
5.04% | |||
| Money Market Funds |
4.78% | |||
| Bank Loans |
3.99% | |||
| Foreign Government Obligations |
3.16% | |||
| U.S. Treasury Securities |
1.42% | |||
| U.S. Agency Commercial Mortgage-Backed |
1.15% | |||
| U.S. Agency Discount Notes |
0.50% | |||
| Municipal Bonds |
0.48% | |||
| Common Stock |
0.30% | |||
| Purchased Options |
0.01% | |||
| Rights |
0.00% | |||
| Written Swaptions |
(0.08)% | |||
| Written Options |
(0.27)% | |||
| Other* |
(10.33)% | |||
| Total |
100.00% | |||
| * | Includes cash and equivalents, futures, foreign currency exchange contracts, swaps, pending trades, fund share transactions, interest and dividends receivable and accrued expenses payable. |
In addition to the annual and semi-annual reports, the Funds file a complete schedule of portfolio holdings with the SEC for the first and third quarters of each fiscal year on Form NPORT-P. Such filings occur no later than 60 days after the end of the Funds’ first and third quarters and are available on the SEC’s website at www.sec.gov.
Annual Report March 2022 / 28
Table of Contents
Schedule of Portfolio Investments
March 31, 2022
| Issues |
Maturity Date |
Principal Amount |
Value | |||||||||
| BONDS – 63.26% |
|
|||||||||||
| ASSET-BACKED SECURITIES — 10.85%** |
|
|||||||||||
| ACAM Ltd., |
|
|||||||||||
| Series 2019-FL1, Class A |
|
|||||||||||
| (Cayman Islands) |
|
|||||||||||
| (SOFR30A plus 1.51%) |
|
|||||||||||
| 1.56% |
11/17/341,2,3 | $ | 115,192 | $ | 113,741 | |||||||
| Access Group, Inc., |
|
|||||||||||
| Series 2015-1, Class A |
|
|||||||||||
| (LIBOR USD 1-Month plus 0.70%) |
|
|||||||||||
| 1.16% |
07/25/561,2 | 11,390 | 11,216 | |||||||||
| Aimco CLO 11 Ltd., |
|
|||||||||||
| Series 2020-11A, Class AR |
|
|||||||||||
| (Cayman Islands) |
|
|||||||||||
| (LIBOR USD 3-Month plus 1.13%) |
|
|||||||||||
| 1.37% |
10/17/341,2,3 | 100,000 | 99,045 | |||||||||
| Barings CLO Ltd., |
|
|||||||||||
| Series 2013-IA, Class AR |
|
|||||||||||
| (Cayman Islands) |
|
|||||||||||
| (LIBOR USD 3-Month plus 0.80%) |
|
|||||||||||
| 1.05% |
01/20/281,2,3 | 57,285 | 56,979 | |||||||||
| Barings CLO Ltd., |
|
|||||||||||
| Series 2018-3A, Class A1 |
|
|||||||||||
| (Cayman Islands) |
|
|||||||||||
| (LIBOR USD 3-Month plus 0.95%) |
|
|||||||||||
| 1.20% |
07/20/291,2,3 | 66,293 | 65,925 | |||||||||
| Bayview Commercial Asset Trust, |
|
|||||||||||
| Series 2004-3, Class A1 |
|
|||||||||||
| (LIBOR USD 1-Month plus 0.56%) |
|
|||||||||||
| 1.01% |
01/25/351,2 | 7,454 | 7,411 | |||||||||
| Brazos Higher Education Authority, Inc., |
|
|||||||||||
| Series 2010-1, Class A2 |
|
|||||||||||
| (LIBOR USD 3-Month plus 1.20%) |
|
|||||||||||
| 1.70% |
02/25/352 | 215,000 | 216,334 | |||||||||
| Brazos Higher Education Authority, Inc., |
|
|||||||||||
| Series 2011-1, Class A2 |
|
|||||||||||
| (LIBOR USD 3-Month plus 0.80%) |
|
|||||||||||
| 1.30% |
02/25/302 | 141,802 | 141,858 | |||||||||
| BSPRT Issuer Ltd., |
|
|||||||||||
| Series 2019-FL5, Class A |
|
|||||||||||
| (Cayman Islands) |
|
|||||||||||
| (LIBOR USD 1-Month plus 1.15%) |
|
|||||||||||
| 1.55% |
05/15/291,2,3 | 217,783 | 217,249 | |||||||||
| Cedar Funding XII CLO Ltd., |
|
|||||||||||
| Series 2020-12A, Class A1R |
|
|||||||||||
| (Cayman Islands) |
|
|||||||||||
| (LIBOR USD 3-Month plus 1.13%) |
|
|||||||||||
| 1.39% |
10/25/341,2,3 | 100,000 | 99,096 | |||||||||
| CLNC Ltd., |
|
|||||||||||
| Series 2019-FL1, Class A |
|
|||||||||||
| (Cayman Islands) |
|
|||||||||||
| (SOFR30A plus 1.36%) |
|
|||||||||||
| 1.41% |
08/20/351,2,3 | 221,498 | 219,734 | |||||||||
| Dryden XXVI Senior Loan Fund, |
|
|||||||||||
| Series 2013-26A, Class AR |
|
|||||||||||
| (Cayman Islands) |
|
|||||||||||
| (LIBOR USD 3-Month plus 0.90%) |
|
|||||||||||
| 1.14% |
04/15/291,2,3 | 47,947 | 47,680 | |||||||||
| Issues |
Maturity Date |
Principal Amount |
Value | |||||||||
| ASSET-BACKED SECURITIES (continued) |
|
|||||||||||
| Eaton Vance CLO Ltd., |
|
|||||||||||
| Series 2020-1A, Class AR |
|
|||||||||||
| (Cayman Islands) |
|
|||||||||||
| (LIBOR USD 3-Month plus 1.17%) |
|
|||||||||||
| 1.41% |
10/15/341,2,3 | $ | 150,000 | $ | 148,447 | |||||||
| Educational Funding of the South, Inc., |
|
|||||||||||
| Series 2011-1, Class A2 |
|
|||||||||||
| (LIBOR USD 3-Month plus 0.65%) |
|
|||||||||||
| 0.91% |
04/25/352 | 1,800 | 1,794 | |||||||||
| Educational Funding of the South, Inc., |
|
|||||||||||
| Series 2012-1, Class A |
|
|||||||||||
| (LIBOR USD 1-Month plus 1.05%) |
|
|||||||||||
| 1.51% |
03/25/362 | 20,674 | 20,636 | |||||||||
| Ford Credit Floorplan Master Owner Trust A, |
|
|||||||||||
| Series 2019-3, Class A1 |
|
|||||||||||
| 2.23% |
09/15/24 | 250,000 | 250,728 | |||||||||
| GoldenTree Loan Management U.S. CLO 8 Ltd., |
|
|||||||||||
| Series 2020-8A, Class AR |
|
|||||||||||
| (Cayman Islands) |
|
|||||||||||
| (LIBOR USD 3-Month plus 1.15%) |
|
|||||||||||
| 1.40% |
10/20/341,2,3 | 140,000 | 138,480 | |||||||||
| GPMT Ltd., |
|
|||||||||||
| Series 2019-FL2, Class A |
|
|||||||||||
| (Cayman Islands) |
|
|||||||||||
| (LIBOR USD 1-Month plus 1.30%) |
|
|||||||||||
| 1.75% |
02/22/361,2,3 | 50,841 | 50,226 | |||||||||
| Higher Education Funding I, |
|
|||||||||||
| Series 2014-1, Class A |
|
|||||||||||
| (LIBOR USD 3-Month plus 1.05%) |
|
|||||||||||
| 1.55% |
05/25/341,2 | 73,743 | 73,828 | |||||||||
| Invitation Homes Trust, |
|
|||||||||||
| Series 2018-SFR2, Class B |
|
|||||||||||
| (LIBOR USD 1-Month plus 1.08%) |
|
|||||||||||
| 1.48% |
06/17/371,2 | 99,984 | 99,286 | |||||||||
| LCM 29 Ltd., |
|
|||||||||||
| Series 29A, Class XR |
|
|||||||||||
| (Cayman Islands) |
|
|||||||||||
| (LIBOR USD 3-Month plus 0.80%) |
|
|||||||||||
| 1.04% |
04/15/311,2,3 | 102,273 | 101,621 | |||||||||
| LoanCore Issuer Ltd., |
|
|||||||||||
| Series 2018-CRE1, Class AS |
|
|||||||||||
| (Cayman Islands) |
|
|||||||||||
| (LIBOR USD 1-Month plus 1.50%) |
|
|||||||||||
| 1.90% |
05/15/281,2,3 | 215,000 | 214,189 | |||||||||
| LoanCore Issuer Ltd., |
|
|||||||||||
| Series 2019-CRE2, Class A |
|
|||||||||||
| (Cayman Islands) |
|
|||||||||||
| (LIBOR USD 1-Month plus 1.13%) |
|
|||||||||||
| 1.53% |
05/15/361,2,3 | 88,730 | 88,148 | |||||||||
| MF1 Ltd., |
|
|||||||||||
| Series 2020-FL4, Class A |
|
|||||||||||
| (CME Term SOFR 1-Month plus 1.81%) |
|
|||||||||||
| 2.14% |
11/15/351,2 | 220,000 | 218,132 | |||||||||
| Navient Student Loan Trust, |
|
|||||||||||
| Series 2014-1, Class A3 |
|
|||||||||||
| (LIBOR USD 1-Month plus 0.51%) |
|
|||||||||||
| 0.97% |
06/25/312 | 84,744 | 83,149 | |||||||||
| See accompanying Notes to Financial Statements. |
| 29 / Annual Report March 2022 |
Table of Contents
AlphaTrak 500 Fund
Schedule of Portfolio Investments
March 31, 2022
| Issues |
Maturity Date |
Principal Amount |
Value | |||||||||||||
| ASSET-BACKED SECURITIES (continued) |
|
|||||||||||||||
| Navient Student Loan Trust, |
|
|||||||||||||||
| Series 2017-2A, Class A |
|
|||||||||||||||
| (LIBOR USD 1-Month plus 1.05%) |
|
|||||||||||||||
| 1.51% |
12/27/661,2 | $ | 66,641 | $ | 66,863 | |||||||||||
| Navient Student Loan Trust, |
|
|||||||||||||||
| Series 2017-4A, Class A2 |
|
|||||||||||||||
| (LIBOR USD 1-Month plus 0.50%) |
|
|||||||||||||||
| 0.96% |
09/27/661,2 | 37,729 | 37,757 | |||||||||||||
| Nelnet Student Loan Trust, |
|
|||||||||||||||
| Series 2014-3A, Class A |
|
|||||||||||||||
| (LIBOR USD 1-Month plus 0.58%) |
|
|||||||||||||||
| 1.04% |
06/25/411,2 | 12,900 | 12,720 | |||||||||||||
| North Carolina State Education Authority, |
|
|||||||||||||||
| Series A3, Class A3 |
|
|||||||||||||||
| (LIBOR USD 3-Month plus 0.90%) |
|
|||||||||||||||
| 1.16% |
10/25/412 | 8,322 | 8,321 | |||||||||||||
| NYACK Park CLO Ltd., |
|
|||||||||||||||
| Series 2021-1A, Class X |
|
|||||||||||||||
| (Cayman Islands) |
|
|||||||||||||||
| (LIBOR USD 3-Month plus 0.65%) |
|
|||||||||||||||
| 0.77% |
10/20/341,2,3 | 120,000 | 118,888 | |||||||||||||
| OCP CLO Ltd., |
|
|||||||||||||||
| Series 2017-14A, Class A1A |
|
|||||||||||||||
| (Cayman Islands) |
|
|||||||||||||||
| (LIBOR USD 3-Month plus 1.15%) |
|
|||||||||||||||
| 1.63% |
11/20/301,2,3 | 85,000 | 84,621 | |||||||||||||
| OHA Credit Funding 7 Ltd., |
|
|||||||||||||||
| Series 2020-7A, Class AR |
|
|||||||||||||||
| (Cayman Islands) |
|
|||||||||||||||
| (CME Term SOFR 3-Month plus 1.30%) |
|
|||||||||||||||
| 2.15% |
02/24/371,2,3 | 115,000 | 114,520 | |||||||||||||
| Palmer Square CLO Ltd., |
|
|||||||||||||||
| Series 2014-1A, Class A1R2 |
|
|||||||||||||||
| (Cayman Islands) |
|
|||||||||||||||
| (LIBOR USD 3-Month plus 1.13%) |
|
|||||||||||||||
| 1.37% |
01/17/311,2,3 | 85,000 | 84,597 | |||||||||||||
| PHEAA Student Loan Trust, |
|
|||||||||||||||
| Series 2016-1A, Class A |
|
|||||||||||||||
| (LIBOR USD 1-Month plus 1.15%) |
|
|||||||||||||||
| 1.61% |
09/25/651,2 | 54,645 | 54,771 | |||||||||||||
| Progress Residential Trust, |
|
|||||||||||||||
| Series 2019-SFR3, Class A |
|
|||||||||||||||
| 2.27% |
09/17/361 | 119,163 | 115,686 | |||||||||||||
| Progress Residential Trust, |
|
|||||||||||||||
| Series 2019-SFR4, Class A |
|
|||||||||||||||
| 2.69% |
10/17/361 | 100,000 | 98,410 | |||||||||||||
| Rockford Tower CLO Ltd., |
|
|||||||||||||||
| Series 2017-3A, Class A |
|
|||||||||||||||
| (Cayman Islands) |
|
|||||||||||||||
| (LIBOR USD 3-Month plus 1.19%) |
|
|||||||||||||||
| 1.44% |
10/20/30 | 1,2,3 | 130,000 | 129,376 | ||||||||||||
| SLM Student Loan Trust, |
|
|||||||||||||||
| Series 2003-10A, Class A3 |
|
|||||||||||||||
| (LIBOR USD 3-Month plus 0.47%) |
|
|||||||||||||||
| 1.30% |
12/15/271,2 | 2,240 | 2,239 | |||||||||||||
| Issues | Maturity Date |
Principal Amount |
Value | |||||||||
| ASSET-BACKED SECURITIES (continued) |
|
|||||||||||
| SLM Student Loan Trust, |
|
|||||||||||
| Series 2003-11, Class A6 |
|
|||||||||||
| (LIBOR USD 3-Month plus 0.55%) |
|
|||||||||||
| 1.38% |
12/15/251,2 | $ | 14,016 | $ | 13,993 | |||||||
| SLM Student Loan Trust, |
|
|||||||||||
| Series 2004-1, Class A4 |
|
|||||||||||
| (LIBOR USD 3-Month plus 0.26%) |
|
|||||||||||
| 0.52% |
10/27/252 | 21,057 | 21,019 | |||||||||
| SLM Student Loan Trust, |
|
|||||||||||
| Series 2005-4, Class A3 |
|
|||||||||||
| (LIBOR USD 3-Month plus 0.12%) |
|
|||||||||||
| 0.38% |
01/25/272 | 36,829 | 36,674 | |||||||||
| SLM Student Loan Trust, |
|
|||||||||||
| Series 2005-5, Class A4 |
|
|||||||||||
| (LIBOR USD 3-Month plus 0.14%) |
|
|||||||||||
| 0.40% |
10/25/282 | 80,314 | 80,019 | |||||||||
| SLM Student Loan Trust, |
|
|||||||||||
| Series 2005-7, Class A4 |
|
|||||||||||
| (LIBOR USD 3-Month plus 0.15%) |
|
|||||||||||
| 0.41% |
10/25/292 | 206,578 | 205,356 | |||||||||
| SLM Student Loan Trust, |
|
|||||||||||
| Series 2008-5, Class A4 |
|
|||||||||||
| (LIBOR USD 3-Month plus 1.70%) |
|
|||||||||||
| 1.96% |
07/25/232 | 97,673 | 98,009 | |||||||||
| SLM Student Loan Trust, |
|
|||||||||||
| Series 2008-6, Class A4 |
|
|||||||||||
| (LIBOR USD 3-Month plus 1.10%) |
|
|||||||||||
| 1.36% |
07/25/232 | 139,643 | 137,986 | |||||||||
| SLM Student Loan Trust, |
|
|||||||||||
| Series 2008-9, Class A |
|
|||||||||||
| (LIBOR USD 3-Month plus 1.50%) |
|
|||||||||||
| 1.76% |
04/25/232 | 36,755 | 36,756 | |||||||||
| SLM Student Loan Trust, |
|
|||||||||||
| Series 2012-1, Class A3 |
|
|||||||||||
| (LIBOR USD 1-Month plus 0.95%) |
|
|||||||||||
| 1.41% |
09/25/282 | 142,311 | 139,951 | |||||||||
| SLM Student Loan Trust, |
|
|||||||||||
| Series 2012-2, Class A |
|
|||||||||||
| (LIBOR USD 1-Month plus 0.70%) |
|
|||||||||||
| 1.16% |
01/25/292 | 82,061 | 79,794 | |||||||||
| SLM Student Loan Trust, |
|
|||||||||||
| Series 2013-4, Class A |
|
|||||||||||
| (LIBOR USD 1-Month plus 0.55%) |
|
|||||||||||
| 1.01% |
06/25/432 | 5,617 | 5,527 | |||||||||
| Sofi Professional Loan Program, LLC, |
|
|||||||||||
| Series 2019-A, Class A2FX |
|
|||||||||||
| 3.69% |
06/15/481 | 201,808 | 202,818 | |||||||||
| Toyota Auto Receivables Owner Trust, |
|
|||||||||||
| Series 2018-B, Class A4 |
|
|||||||||||
| 3.11% |
11/15/23 | 120,667 | 121,003 | |||||||||
|
|
|
|||||||||||
| Total Asset-Backed Securities |
|
|||||||||||
| (Cost $4,927,786) |
|
4,892,606 | ||||||||||
|
|
|
|||||||||||
| CORPORATES — 28.38%* |
|
|||||||||||
| Banking — 8.50% |
|
|||||||||||
| Bank of America Corp. |
|
|||||||||||
| 3.00% |
12/20/234 | 91,000 | 91,264 | |||||||||
| See accompanying Notes to Financial Statements. |
| Annual Report March 2022 / 30 |
Table of Contents
AlphaTrak 500 Fund
Schedule of Portfolio Investments
March 31, 2022
| Issues |
Maturity Date |
Principal Amount |
Value | |||||||||
| CORPORATES (continued) |
|
|||||||||||
| Banking (continued) |
|
|||||||||||
| Bank of America Corp. |
|
|||||||||||
| (MTN) |
|
|||||||||||
| 3.46% |
03/15/254 | $ | 550,000 | $ | 553,601 | |||||||
| Credit Suisse Group AG |
|
|||||||||||
| (Switzerland) |
|
|||||||||||
| 2.59% |
09/11/251,3,4 | 220,000 | 212,320 | |||||||||
| Discover Bank |
|
|||||||||||
| (BKNT) |
|
|||||||||||
| 4.20% |
08/08/23 | 125,000 | 127,183 | |||||||||
| DNB Bank ASA |
|
|||||||||||
| (Norway) |
|
|||||||||||
| 0.86% |
09/30/251,3,4 | 200,000 | 189,561 | |||||||||
| HSBC Holdings PLC |
|
|||||||||||
| (United Kingdom) |
|
|||||||||||
| 3.00% |
03/10/263,4 | 315,000 | 308,979 | |||||||||
| ING Groep NV |
|
|||||||||||
| (Netherlands) |
|
|||||||||||
| 3.87% |
03/28/263,4 | 200,000 | 201,075 | |||||||||
| JPMorgan Chase & Co. |
|
|||||||||||
| 0.77% |
08/09/254 | 110,000 | 104,397 | |||||||||
| 0.97% |
06/23/254 | 50,000 | 47,769 | |||||||||
| 3.21% |
04/01/234 | 200,000 | 200,104 | |||||||||
| 4.02% |
12/05/244 | 290,000 | 294,766 | |||||||||
| Lloyds Banking Group PLC |
|
|||||||||||
| (United Kingdom) |
|
|||||||||||
| 2.91% |
11/07/233,4 | 200,000 | 200,341 | |||||||||
| 3.87% |
07/09/253,4 | 60,000 | 60,667 | |||||||||
| Macquarie Group Ltd. |
|
|||||||||||
| (Australia) |
|
|||||||||||
| 1.20% |
10/14/251,3,4 | 90,000 | 85,140 | |||||||||
| 1.34% |
01/12/271,3,4 | 70,000 | 63,863 | |||||||||
| 3.19% |
11/28/231,3,4 | 90,000 | 90,172 | |||||||||
| NatWest Group PLC |
|
|||||||||||
| (United Kingdom) |
|
|||||||||||
| 4.27% |
03/22/253,4 | 105,000 | 106,278 | |||||||||
| 4.52% |
06/25/243,4 | 75,000 | 76,154 | |||||||||
| Santander UK Group Holdings PLC |
|
|||||||||||
| (United Kingdom) |
|
|||||||||||
| 1.53% |
08/21/263,4 | 200,000 | 184,066 | |||||||||
| 3.37% |
01/05/243,4 | 155,000 | 155,531 | |||||||||
| 4.80% |
11/15/243,4 | 75,000 | 76,740 | |||||||||
| UBS AG |
|
|||||||||||
| (Switzerland) |
|
|||||||||||
| 0.70% |
08/09/241,3 | 200,000 | 189,664 | |||||||||
| Wells Fargo & Co. |
|
|||||||||||
| 2.19% |
04/30/264 | 220,000 | 212,369 | |||||||||
|
|
|
| ||||||||||
| 3,832,004 | ||||||||||||
|
|
|
| ||||||||||
| Communications — 2.36% |
|
|||||||||||
| AT&T, Inc. |
|
|||||||||||
| (LIBOR USD 3-Month plus 1.18%) |
|
|||||||||||
| 1.98% |
06/12/242 | 175,000 | 177,597 | |||||||||
| Charter Communications Operating LLC/Charter |
|
|||||||||||
| Communications Operating Capital |
|
|||||||||||
| (LIBOR USD 3-Month plus 1.65%) |
|
|||||||||||
| 1.97% |
02/01/242 | 125,000 | 127,470 | |||||||||
| Issues |
Maturity Date |
Principal Amount |
Value | |||||||||
| CORPORATES (continued) |
|
|||||||||||
| Communications (continued) |
|
|||||||||||
| CSC Holdings LLC |
|
|||||||||||
| 4.13% |
12/01/301 | $ | 75,000 | $ | 66,136 | |||||||
| Intelsat Jackson Holdings SA |
|
|||||||||||
| (Luxembourg) |
|
|||||||||||
| 6.50% |
03/15/301,3 | 131,000 | 131,004 | |||||||||
| Intelsat Jackson Holdings SA, |
|
|||||||||||
| Class B |
|
|||||||||||
| 8.50% |
10/15/241,3,5,6,7,8 | 20,000 | — | |||||||||
| Intelsat Jackson Holdings SA, |
|
|||||||||||
| Class B |
|
|||||||||||
| (Luxembourg) |
|
|||||||||||
| 9.75% |
07/15/251,3,5,6,7,8 | 61,000 | — | |||||||||
| Qwest Corp. |
|
|||||||||||
| 7.25% |
09/15/25 | 100,000 | 109,250 | |||||||||
| Sprint Spectrum Co. LLC/Sprint Spectrum Co. II LLC/Sprint Spectrum Co. III LLC |
|
|||||||||||
| 4.74% |
03/20/251 | 165,000 | 168,536 | |||||||||
| 5.15% |
03/20/281 | 50,000 | 52,698 | |||||||||
| T-Mobile USA, Inc. |
|
|||||||||||
| 2.25% |
02/15/26 | 113,000 | 106,604 | |||||||||
| 2.63% |
04/15/26 | 124,000 | 118,693 | |||||||||
| Virgin Media Secured Finance PLC |
|
|||||||||||
| (United Kingdom) |
|
|||||||||||
| 5.50% |
05/15/291,3 | 5,000 | 4,971 | |||||||||
|
|
|
| ||||||||||
| 1,062,959 | ||||||||||||
|
|
|
| ||||||||||
| Consumer Discretionary — 2.23% |
|
|||||||||||
| Bacardi Ltd. |
|
|||||||||||
| (Bermuda) |
|
|||||||||||
| 4.45% |
05/15/251,3 | 100,000 | 102,449 | |||||||||
| Constellation Brands, Inc. |
|
|||||||||||
| 3.20% |
02/15/23 | 110,000 | 110,751 | |||||||||
| GSK Consumer Healthcare Capital UK PLC |
|
|||||||||||
| (United Kingdom) |
|
|||||||||||
| 3.13% |
03/24/251,3 | 250,000 | 249,381 | |||||||||
| Hyatt Hotels Corp. |
|
|||||||||||
| 1.30% |
10/01/23 | 140,000 | 136,529 | |||||||||
| Imperial Brands Finance PLC |
|
|||||||||||
| (United Kingdom) |
|
|||||||||||
| 3.75% |
07/21/221,3 | 195,000 | 195,643 | |||||||||
| Magallanes, Inc. |
|
|||||||||||
| 3.43% |
03/15/241 | 210,000 | 211,161 | |||||||||
|
|
|
| ||||||||||
| 1,005,914 | ||||||||||||
|
|
|
| ||||||||||
| Electric — 1.66% |
|
|||||||||||
| Alliant Energy Finance LLC |
|
|||||||||||
| 3.75% |
06/15/231 | 140,000 | 141,636 | |||||||||
| American Electric Power Co., Inc. |
|
|||||||||||
| 2.03% |
03/15/24 | 120,000 | 118,036 | |||||||||
| Dominion Energy, Inc., |
|
|||||||||||
| Series B |
|
|||||||||||
| 2.75% |
09/15/22 | 150,000 | 150,342 | |||||||||
| El Paso Electric Co. |
|
|||||||||||
| 3.30% |
12/15/22 | 50,000 | 50,267 | |||||||||
| FirstEnergy Transmission LLC |
|
|||||||||||
| 2.87% |
09/15/281 | 128,000 | 118,989 | |||||||||
| See accompanying Notes to Financial Statements. |
| 31 / Annual Report March 2022 |
Table of Contents
AlphaTrak 500 Fund
Schedule of Portfolio Investments
March 31, 2022
| Issues |
Maturity Date |
Principal Amount |
Value | |||||||||
| CORPORATES (continued) |
|
|||||||||||
| Electric (continued) |
|
|||||||||||
| NextEra Energy Capital Holdings, Inc. |
|
|||||||||||
| 2.94% |
03/21/24 | $ | 170,000 | $ | 170,090 | |||||||
|
|
|
| ||||||||||
| 749,360 | ||||||||||||
|
|
|
| ||||||||||
| Energy — 1.03% |
|
|||||||||||
| Antero Resources Corp. |
|
|||||||||||
| 8.38% |
07/15/261 | 9,000 | 9,959 | |||||||||
| Energy Transfer LP |
|
|||||||||||
| 4.25% |
04/01/24 | 150,000 | 153,009 | |||||||||
| 5.50% |
06/01/27 | 12,000 | 12,910 | |||||||||
| Occidental Petroleum Corp. |
|
|||||||||||
| 0.00% |
10/10/369 | 25,000 | 13,460 | |||||||||
| Plains All American Pipeline LP/PAA Finance Corp. |
|
|||||||||||
| 4.65% |
10/15/25 | 125,000 | 128,060 | |||||||||
| Southern Co. Gas Capital Corp. |
|
|||||||||||
| 3.88% |
11/15/25 | 100,000 | 101,894 | |||||||||
| Sunoco LP/Sunoco Finance Corp. |
|
|||||||||||
| 4.50% |
04/30/301 | 14,000 | 12,919 | |||||||||
| Transocean Phoenix 2 Ltd. |
|
|||||||||||
| (Cayman Islands) |
|
|||||||||||
| 7.75% |
10/15/241,3 | 10,500 | 10,592 | |||||||||
| Transocean Pontus Ltd. |
|
|||||||||||
| (Cayman Islands) |
|
|||||||||||
| 6.13% |
08/01/251,3 | 3,690 | 3,673 | |||||||||
| Transocean Poseidon Ltd. |
|
|||||||||||
| (Cayman Islands) |
|
|||||||||||
| 6.88% |
02/01/271,3 | 16,875 | 16,733 | |||||||||
| Transocean Proteus Ltd. |
|
|||||||||||
| (Cayman Islands) |
|
|||||||||||
| 6.25% |
12/01/241,3 | 2,000 | 1,988 | |||||||||
|
|
|
| ||||||||||
| 465,197 | ||||||||||||
|
|
|
| ||||||||||
| Finance — 4.65% |
|
|||||||||||
| AerCap Ireland Capital DAC/AerCap Global Aviation Trust |
|
|||||||||||
| (Ireland) |
|
|||||||||||
| 3.15% |
02/15/243 | 150,000 | 147,715 | |||||||||
| Air Lease Corp. |
|
|||||||||||
| 2.25% |
01/15/23 | 75,000 | 75,059 | |||||||||
| American Express Co. |
|
|||||||||||
| 2.25% |
03/04/25 | 110,000 | 108,041 | |||||||||
| Avolon Holdings Funding Ltd. |
|
|||||||||||
| (Cayman Islands) |
|
|||||||||||
| 2.53% |
11/18/271,3 | 5,000 | 4,426 | |||||||||
| Capital One Financial Corp. |
|
|||||||||||
| 1.34% |
12/06/244 | 120,000 | 116,480 | |||||||||
| Citigroup, Inc. |
|
|||||||||||
| 2.88% |
07/24/234 | 225,000 | 225,367 | |||||||||
| 3.35% |
04/24/254 | 290,000 | 290,842 | |||||||||
| (LIBOR USD 3-Month plus 0.95%) |
|
|||||||||||
| 1.21% |
07/24/232 | 30,000 | 30,053 | |||||||||
| Goldman Sachs Group, Inc. (The) |
|
|||||||||||
| 1.22% |
12/06/23 | 90,000 | 87,906 | |||||||||
| 3.27% |
09/29/254 | 40,000 | 39,980 | |||||||||
| Issues |
Maturity Date |
Principal Amount |
Value | |||||||||
| CORPORATES (continued) |
|
|||||||||||
| Finance (continued) |
|
|||||||||||
| Goldman Sachs Group, Inc. (The) |
|
|||||||||||
| (MTN) |
|
|||||||||||
| (LIBOR USD 3-Month plus 1.60%) |
|
|||||||||||
| 2.11% |
11/29/232 | $ | 75,000 | $ | 75,996 | |||||||
| Morgan Stanley |
|
|||||||||||
| (MTN) |
|
|||||||||||
| 0.53% |
01/25/244 | 150,000 | 147,594 | |||||||||
| 2.72% |
07/22/254 | 400,000 | 395,873 | |||||||||
| Nationwide Building Society |
|
|||||||||||
| (United Kingdom) |
|
|||||||||||
| 3.62% |
04/26/231,3,4 | 90,000 | 90,019 | |||||||||
| 3.77% |
03/08/241,3,4 | 75,000 | 75,444 | |||||||||
| 4.36% |
08/01/241,3,4 | 75,000 | 76,178 | |||||||||
| Park Aerospace Holdings Ltd. |
|
|||||||||||
| (Cayman Islands) |
|
|||||||||||
| 4.50% |
03/15/231,3 | 110,000 | 110,835 | |||||||||
|
|
|
| ||||||||||
| 2,097,808 | ||||||||||||
|
|
|
| ||||||||||
| Food — 0.14% |
|
|||||||||||
| Post Holdings, Inc. |
|
|||||||||||
| 4.63% |
04/15/301 | 68,000 | 61,343 | |||||||||
|
|
|
| ||||||||||
| Gaming — 0.10% |
|
|||||||||||
| CDI Escrow Issuer, Inc. |
|
|||||||||||
| 5.75% |
04/01/301 | 45,000 | 45,513 | |||||||||
|
|
|
| ||||||||||
| Health Care — 2.92% |
|
|||||||||||
| AbbVie, Inc. |
|
|||||||||||
| 3.75% |
11/14/23 | 125,000 | 127,456 | |||||||||
| Bayer U.S. Finance II LLC |
|
|||||||||||
| 2.20% |
07/15/221 | 150,000 | 150,000 | |||||||||
| Dignity Health |
|
|||||||||||
| 3.13% |
11/01/22 | 50,000 | 50,382 | |||||||||
| Embecta Corp. |
|
|||||||||||
| 5.00% |
02/15/301 | 45,000 | 42,526 | |||||||||
| Endo DAC/Endo Finance LLC/Endo Finco, Inc. |
|
|||||||||||
| (Ireland) |
|
|||||||||||
| 6.00% |
06/30/281,3 | 61,000 | 35,572 | |||||||||
| Fresenius U.S. Finance II, Inc. |
|
|||||||||||
| 4.50% |
01/15/231 | 75,000 | 75,975 | |||||||||
| HCA, Inc. |
|
|||||||||||
| 5.00% |
03/15/24 | 75,000 | 77,758 | |||||||||
| 5.25% |
06/15/26 | 185,000 | 195,444 | |||||||||
| Humana, Inc. |
|
|||||||||||
| 0.65% |
08/03/23 | 85,000 | 82,953 | |||||||||
| 3.85% |
10/01/24 | 130,000 | 132,174 | |||||||||
| Mozart Debt Merger Sub, Inc. |
|
|||||||||||
| 3.88% |
04/01/291 | 32,000 | 29,631 | |||||||||
| Royalty Pharma PLC |
|
|||||||||||
| (United Kingdom) |
|
|||||||||||
| 0.75% |
09/02/233 | 85,000 | 82,579 | |||||||||
| Thermo Fisher Scientific, Inc. |
|
|||||||||||
| 1.22% |
10/18/24 | 140,000 | 134,681 | |||||||||
| Viatris, Inc. |
|
|||||||||||
| 1.13% |
06/22/22 | 100,000 | 99,995 | |||||||||
|
|
|
| ||||||||||
| 1,317,126 | ||||||||||||
|
|
|
| ||||||||||
| See accompanying Notes to Financial Statements. |
| Annual Report March 2022 / 32 |
Table of Contents
AlphaTrak 500 Fund
Schedule of Portfolio Investments
March 31, 2022
| Issues |
Maturity Date |
Principal Amount |
Value | |||||||||
| CORPORATES (continued) |
|
|||||||||||
| Industrials — 0.82% |
|
|||||||||||
| Artera Services LLC |
|
|||||||||||
| 9.03% |
12/04/251 | $ | 9,000 | $ | 9,003 | |||||||
| Berry Global, Inc. |
|
|||||||||||
| 0.95% |
02/15/24 | 110,000 | 105,334 | |||||||||
| General Electric Co. |
|
|||||||||||
| (MTN) |
|
|||||||||||
| (LIBOR USD 3-Month plus 0.38%) |
|
|||||||||||
| 0.70% |
05/05/262 | 29,000 | 28,553 | |||||||||
| (LIBOR USD 3-Month plus 0.48%) |
|
|||||||||||
| 0.99% |
08/15/362 | 75,000 | 64,605 | |||||||||
| Mauser Packaging Solutions Holding Co. |
|
|||||||||||
| 5.50% |
04/15/241 | 5,000 | 4,987 | |||||||||
| Sealed Air Corp. |
|
|||||||||||
| 4.00% |
12/01/271 | 5,000 | 4,900 | |||||||||
| Sydney Airport Finance Co. Pty Ltd. |
|
|||||||||||
| (Australia) |
|
|||||||||||
| 3.90% |
03/22/231,3 | 150,000 | 151,787 | |||||||||
|
|
|
| ||||||||||
| 369,169 | ||||||||||||
|
|
|
| ||||||||||
| Information Technology — 0.49% |
|
|||||||||||
| NXP BV/NXP Funding LLC |
|
|||||||||||
| (Netherlands) |
|
|||||||||||
| 4.63% |
06/01/231,3 | 10,000 | 10,150 | |||||||||
| Skyworks Solutions, Inc. |
|
|||||||||||
| 0.90% |
06/01/23 | 110,000 | 107,602 | |||||||||
| VMware, Inc. |
|
|||||||||||
| 1.00% |
08/15/24 | 110,000 | 104,888 | |||||||||
|
|
|
| ||||||||||
| 222,640 | ||||||||||||
|
|
|
| ||||||||||
| Insurance — 0.63% |
|
|||||||||||
| Athene Global Funding |
|
|||||||||||
| (SOFR Rate plus 0.70%) |
|
|||||||||||
| 0.91% |
05/24/241,2 | 85,000 | 83,945 | |||||||||
| Nationwide Mutual Insurance Co. |
|
|||||||||||
| 3.12% |
12/15/241,4 | 90,000 | 90,062 | |||||||||
| Trinity Acquisition PLC |
|
|||||||||||
| (United Kingdom) |
|
|||||||||||
| 4.63% |
08/15/233 | 110,000 | 112,564 | |||||||||
|
|
|
| ||||||||||
| 286,571 | ||||||||||||
|
|
|
| ||||||||||
| Materials — 0.26% |
|
|||||||||||
| Georgia-Pacific LLC |
|
|||||||||||
| 3.60% |
03/01/251 | 115,000 | 116,230 | |||||||||
|
|
|
| ||||||||||
| Real Estate Investment Trust (REIT) — 1.52% |
|
|||||||||||
| American Campus Communities Operating Partnership LP |
|
|||||||||||
| 3.75% |
04/15/23 | 115,000 | 116,019 | |||||||||
| Camden Property Trust |
|
|||||||||||
| 2.95% |
12/15/22 | 55,000 | 55,240 | |||||||||
| CyrusOne LP/CyrusOne Finance Corp. |
|
|||||||||||
| 2.90% |
11/15/24 | 140,000 | 140,384 | |||||||||
| GLP Capital LP/GLP Financing II, Inc. |
|
|||||||||||
| 3.35% |
09/01/24 | 25,000 | 24,985 | |||||||||
| 5.38% |
11/01/23 | 190,000 | 195,106 | |||||||||
| Healthpeak Properties, Inc. |
|
|||||||||||
| 4.00% |
06/01/25 | 60,000 | 61,056 | |||||||||
| Issues |
Maturity Date |
Principal Amount |
Value | |||||||||
| CORPORATES (continued) |
|
|||||||||||
| Real Estate Investment Trust (REIT) (continued) |
| |||||||||||
| MGM Growth Properties Operating Partnership LP/MGP Finance Co.-Issuer, Inc. |
|
|||||||||||
| 4.50% |
01/15/28 | $ | 6,000 | $ | 6,067 | |||||||
| Post Apartment Homes LP |
|
|||||||||||
| 3.38% |
12/01/22 | 37,000 | 37,177 | |||||||||
| SL Green Operating Partnership LP |
|
|||||||||||
| 3.25% |
10/15/22 | 50,000 | 50,019 | |||||||||
|
|
|
| ||||||||||
| 686,053 | ||||||||||||
|
|
|
| ||||||||||
| Retail — 0.40% |
|
|||||||||||
| 1011778 BC ULC/New Red Finance, Inc. |
|
|||||||||||
| (Canada) |
|
|||||||||||
| 4.00% |
10/15/301,3 | 45,000 | 40,709 | |||||||||
| Dollar Tree, Inc. |
|
|||||||||||
| 4.00% |
05/15/25 | 85,000 | 87,044 | |||||||||
| Fertitta Entertainment, LLC/Fertitta Entertainment Finance Co., Inc. |
|
|||||||||||
| 4.63% |
01/15/291 | 34,000 | 32,226 | |||||||||
| Michaels Cos., Inc. (The) |
|
|||||||||||
| 5.25% |
05/01/281 | 20,000 | 18,388 | |||||||||
|
|
|
| ||||||||||
| 178,367 | ||||||||||||
|
|
|
| ||||||||||
| Services — 0.30% |
|
|||||||||||
| Global Payments, Inc. |
|
|||||||||||
| 1.50% |
11/15/24 | 120,000 | 114,754 | |||||||||
| Waste Pro USA, Inc. |
|
|||||||||||
| 5.50% |
02/15/261 | 23,000 | 21,762 | |||||||||
|
|
|
| ||||||||||
| 136,516 | ||||||||||||
|
|
|
| ||||||||||
| Transportation — 0.37% |
|
|||||||||||
| Canadian Pacific Railway Co. |
|
|||||||||||
| (Canada) |
|
|||||||||||
| 1.35% |
12/02/243 | 100,000 | 96,088 | |||||||||
| Continental Airlines Pass-Through Trust, |
|
|||||||||||
| Series 2007-1, Class A |
|
|||||||||||
| 5.98% |
04/19/22 | 30,041 | 30,085 | |||||||||
| Northwest Airlines Pass-Through Trust, |
|
|||||||||||
| Series 2001-1, Class A-1 |
|
|||||||||||
| 7.04% |
04/01/22 | 3,402 | 3,419 | |||||||||
| U.S. Airways Pass-Through Trust, |
|
|||||||||||
| Series 2012-1, Class A |
|
|||||||||||
| 5.90% |
10/01/24 | 35,071 | 36,584 | |||||||||
|
|
|
| ||||||||||
| 166,176 | ||||||||||||
|
|
|
| ||||||||||
| Total Corporates |
|
|||||||||||
| (Cost $13,128,857) |
|
12,798,946 | ||||||||||
|
|
|
| ||||||||||
| MORTGAGE-BACKED — 21.71%** |
|
|||||||||||
| Non-Agency Commercial Mortgage-Backed — 9.06% |
| |||||||||||
| 1345 Avenue of the Americas & Park Avenue Plaza Trust, |
|
|||||||||||
| Series 2005-1, Class A3 |
|
|||||||||||
| 5.28% |
08/10/351 | 33,729 | 34,297 | |||||||||
| BANK, |
|
|||||||||||
| Series 2018-BN14, Class A2 |
|
|||||||||||
| 4.13% |
09/15/60 | 71,098 | 72,089 | |||||||||
| See accompanying Notes to Financial Statements. |
| 33 / Annual Report March 2022 |
Table of Contents
AlphaTrak 500 Fund
Schedule of Portfolio Investments
March 31, 2022
| Issues |
Maturity Date |
Principal Amount |
Value | |||||||||||
| MORTGAGE-BACKED (continued) |
|
|||||||||||||
| Non-Agency Commercial Mortgage-Backed (continued) |
| |||||||||||||
| Barclays Commercial Mortgage Securities Trust, |
|
|||||||||||||
| Series 2018-BXH, Class A |
|
|||||||||||||
| (LIBOR USD 1-Month plus 1.00%) |
|
|||||||||||||
| 1.40% |
10/15/371,2 | $ | 119,346 | $ | 118,133 | |||||||||
| Beast Mortgage Trust, |
|
|||||||||||||
| Series 2021-SSCP, Class A |
|
|||||||||||||
| (LIBOR USD 1-Month plus 0.75%) |
|
|||||||||||||
| 1.15% |
04/15/361,2 | 250,000 | 243,825 | |||||||||||
| Benchmark Mortgage Trust, |
|
|||||||||||||
| Series 2018-B6, Class A2 |
|
|||||||||||||
| 4.20% |
10/10/51 | 194,833 | 195,967 | |||||||||||
| BFLD Trust, |
|
|||||||||||||
| Series 2020-EYP, Class A |
|
|||||||||||||
| (LIBOR USD 1-Month plus 1.15%) |
|
|||||||||||||
| 1.55% |
10/15/351,2 | 125,000 | 123,944 | |||||||||||
| BX Commercial Mortgage Trust, |
|
|||||||||||||
| Series 2020-FOX, Class A |
|
|||||||||||||
| (LIBOR USD 1-Month plus 1.00%) |
|
|||||||||||||
| 1.40% |
11/15/321,2 | 170,811 | 169,750 | |||||||||||
| BXMT Ltd., |
|
|||||||||||||
| Series 2020-FL2, Class A |
|
|||||||||||||
| (Cayman Islands) |
|
|||||||||||||
| (SOFR30A plus 1.01%) |
|
|||||||||||||
| 1.06% |
02/15/381,2,3 | 120,000 | 119,409 | |||||||||||
| BXMT Ltd., |
|
|||||||||||||
| Series 2020-FL3, Class A |
|
|||||||||||||
| (Cayman Islands) |
|
|||||||||||||
| (SOFR30A plus 1.51%) |
|
|||||||||||||
| 1.56% |
11/15/371,2,3 | 410,000 | 407,562 | |||||||||||
| CD Mortgage Trust, |
|
|||||||||||||
| Series 2017-CD4, Class A2 |
|
|||||||||||||
| 3.03% |
05/10/50 | 143,000 | 142,924 | |||||||||||
| Citigroup Commercial Mortgage Trust, |
|
|||||||||||||
| Series 2012-GC8, Class AAB |
|
|||||||||||||
| 2.61% |
09/10/45 | 2,749 | 2,749 | |||||||||||
| Citigroup Commercial Mortgage Trust, |
|
|||||||||||||
| Series 2013-GC11, Class AAB |
|
|||||||||||||
| 2.69% |
04/10/46 | 20,418 | 20,478 | |||||||||||
| Citigroup Commercial Mortgage Trust, |
|
|||||||||||||
| Series 2015-GC29, Class AAB |
|
|||||||||||||
| 2.98% |
04/10/48 | 51,596 | 51,800 | |||||||||||
| Citigroup Commercial Mortgage Trust, |
|
|||||||||||||
| Series 2015-P1, Class AAB |
|
|||||||||||||
| 3.47% |
09/15/48 | 37,926 | 38,118 | |||||||||||
| Commercial Mortgage Trust, |
|
|||||||||||||
| Series 2012-CR3, Class ASB |
|
|||||||||||||
| 2.37% |
10/15/45 | 2,267 | 2,268 | |||||||||||
| Commercial Mortgage Trust, |
|
|||||||||||||
| Series 2012-CR4, Class XA (IO) |
|
|||||||||||||
| 1.68% |
10/15/454 | 322,566 | 1,148 | |||||||||||
| Commercial Mortgage Trust, |
|
|||||||||||||
| Series 2013-CR11, Class ASB |
|
|||||||||||||
| 3.66% |
08/10/50 | 6,355 | 6,420 | |||||||||||
| Commercial Mortgage Trust, |
|
|||||||||||||
| Series 2013-CR7, Class XA (IO) |
|
|||||||||||||
| 1.17% |
03/10/464 | 1,156,598 | 9,058 | |||||||||||
| Issues |
Maturity Date |
Principal Amount |
Value | |||||||||
| MORTGAGE-BACKED (continued) |
|
|||||||||||
| Non-Agency Commercial Mortgage-Backed (continued) |
| |||||||||||
| Commercial Mortgage Trust, |
|
|||||||||||
| Series 2013-LC6, Class XB (IO) |
|
|||||||||||
| 0.36% |
01/10/461,4 | $ | 1,750,000 | $ | 4,265 | |||||||
| Commercial Mortgage Trust, |
|
|||||||||||
| Series 2015-LC23, Class A2 |
|
|||||||||||
| 3.22% |
10/10/48 | 120,200 | 119,888 | |||||||||
| Commercial Mortgage Trust, |
|
|||||||||||
| Series 2015-PC1, Class A4 |
|
|||||||||||
| 3.62% |
07/10/50 | 138,567 | 138,866 | |||||||||
| Credit Suisse Mortgage Capital Certificates, |
|
|||||||||||
| Series 2019-ICE4, Class A |
|
|||||||||||
| (LIBOR USD 1-Month plus 0.98%) |
|
|||||||||||
| 1.38% |
05/15/361,2 | 245,000 | 243,408 | |||||||||
| GS Mortgage Securities Trust, |
|
|||||||||||
| Series 2010-C1, Class X (IO) |
|
|||||||||||
| 0.56% |
08/10/431,4 | 1,561,864 | 11,724 | |||||||||
| GS Mortgage Securities Trust, |
|
|||||||||||
| Series 2011-GC3, Class X (IO) |
|
|||||||||||
| 0.00% |
03/10/441,4 | 410,063 | 4 | |||||||||
| GS Mortgage Securities Trust, |
|
|||||||||||
| Series 2012-ALOH, Class A |
|
|||||||||||
| 3.55% |
04/10/341 | 235,000 | 234,897 | |||||||||
| JPMBB Commercial Mortgage Securities Trust, |
|
|||||||||||
| Series 2013-C17, Class XA (IO) |
|
|||||||||||
| 0.72% |
01/15/474 | 1,579,203 | 15,953 | |||||||||
| JPMBB Commercial Mortgage Securities Trust, |
|
|||||||||||
| Series 2014-C19, Class A3 |
|
|||||||||||
| 3.67% |
04/15/47 | 73,149 | 71,492 | |||||||||
| JPMBB Commercial Mortgage Securities Trust, |
|
|||||||||||
| Series 2014-C24, Class A3 |
|
|||||||||||
| 3.10% |
11/15/47 | 270,000 | 268,314 | |||||||||
| JPMorgan Chase Commercial Mortgage Securities Trust, |
|
|||||||||||
| Series 2013-C13, Class XA (IO) |
|
|||||||||||
| 0.09% |
01/15/464 | 8,310,633 | 8,995 | |||||||||
| JPMorgan Chase Commercial Mortgage Securities Trust, |
|
|||||||||||
| Series 2013-LC11, Class XA (IO) |
|
|||||||||||
| 1.23% |
04/15/464 | 3,121,834 | 27,731 | |||||||||
| JPMorgan Chase Commercial Mortgage Securities Trust, |
|
|||||||||||
| Series 2015-JP1, Class XA (IO) |
|
|||||||||||
| 0.89% |
01/15/494,5,8 | 669,451 | 19,553 | |||||||||
| LB-UBS Commercial Mortgage Trust, |
|
|||||||||||
| Series 2006-C6, Class XCL (IO) |
|
|||||||||||
| 0.43% |
09/15/391,4 | 303,520 | 37 | |||||||||
| Morgan Stanley Bank of America Merrill Lynch Trust, |
|
|||||||||||
| Series 2013-C13, Class ASB |
|
|||||||||||
| 3.56% |
11/15/46 | 7,077 | 7,138 | |||||||||
| Morgan Stanley Bank of America Merrill Lynch Trust, |
|
|||||||||||
| Series 2014-C14, Class XA (IO) |
|
|||||||||||
| 0.96% |
02/15/474 | 1,175,869 | 15,291 | |||||||||
| Morgan Stanley Bank of America Merrill Lynch Trust, |
|
|||||||||||
| Series 2015-C26, Class ASB |
|
|||||||||||
| 3.32% |
10/15/48 | 56,434 | 56,899 | |||||||||
| One New York Plaza Trust, |
|
|||||||||||
| Series 2020-1NYP, Class A |
|
|||||||||||
| (LIBOR USD 1-Month plus 0.95%) |
|
|||||||||||
| 1.35% |
01/15/361,2 | 94,000 | 92,575 | |||||||||
| See accompanying Notes to Financial Statements. |
| Annual Report March 2022 / 34 |
Table of Contents
AlphaTrak 500 Fund
Schedule of Portfolio Investments
March 31, 2022
| Issues | Maturity Date |
Principal Amount |
Value | |||||||||||
| MORTGAGE-BACKED (continued) |
|
|||||||||||||
| Non-Agency Commercial Mortgage-Backed (continued) |
|
|||||||||||||
| PFP Ltd., |
|
|||||||||||||
| Series 2019-6, Class A |
|
|||||||||||||
| (Cayman Islands) |
|
|||||||||||||
| (LIBOR USD 1-Month plus 1.05%) |
|
|||||||||||||
| 1.48% |
04/14/37 | 1,2,3 | $ | 103,107 | $ | 102,371 | ||||||||
| SREIT Trust, |
|
|||||||||||||
| Series 2021-MFP, Class A |
|
|||||||||||||
| (LIBOR USD 1-Month plus 0.73%) |
|
|||||||||||||
| 1.13% |
11/15/38 | 1,2 | 250,000 | 245,207 | ||||||||||
| TMSQ Mortgage Trust, |
|
|||||||||||||
| Series 2014-1500, Class XA (IO) |
|
|||||||||||||
| 0.15% |
10/10/36 | 1,4 | 14,000,000 | 57,198 | ||||||||||
| UBS-Barclays Commercial Mortgage Trust, |
|
|||||||||||||
| Series 2012-C3, Class XB (IO) |
|
|||||||||||||
| 0.21% |
08/10/49 | 1,4,5,8 | 3,000,000 | 3,295 | ||||||||||
| Wells Fargo Commercial Mortgage Trust, |
|
|||||||||||||
| Series 2014-LC16, Class A4 |
|
|||||||||||||
| 3.55% |
08/15/50 | 143,179 | 141,676 | |||||||||||
| Wells Fargo Commercial Mortgage Trust, |
|
|||||||||||||
| Series 2016-NXS6, Class A2 |
|
|||||||||||||
| 2.40% |
11/15/49 | 30,832 | 30,845 | |||||||||||
| Wells Fargo Commercial Mortgage Trust, |
|
|||||||||||||
| Series 2017-C38, Class A2 |
|
|||||||||||||
| 3.04% |
07/15/50 | 43,558 | 43,551 | |||||||||||
| Wells Fargo Commercial Mortgage Trust, |
|
|||||||||||||
| Series 2017-SMP, Class A |
|
|||||||||||||
| (LIBOR USD 1-Month plus 0.88%) |
|
|||||||||||||
| 1.27% |
12/15/34 | 1,2 | 200,000 | 197,431 | ||||||||||
| WF-RBS Commercial Mortgage Trust, |
|
|||||||||||||
| Series 2014-C20, Class A4 |
|
|||||||||||||
| 3.72% |
05/15/47 | 124,288 | 124,146 | |||||||||||
| WF-RBS Commercial Mortgage Trust, |
|
|||||||||||||
| Series 2014-C21, Class ASB |
|
|||||||||||||
| 3.39% |
08/15/47 | 24,768 | 24,985 | |||||||||||
| WF-RBS Commercial Mortgage Trust, |
|
|||||||||||||
| Series 2014-LC14, Class ASB |
|
|||||||||||||
| 3.52% |
03/15/47 | 17,713 | 17,876 | |||||||||||
|
|
|
| ||||||||||||
| 4,085,550 | ||||||||||||||
|
|
|
| ||||||||||||
| Non-Agency Mortgage-Backed — 6.14% |
|
|||||||||||||
| Alternative Loan Trust, |
|
|||||||||||||
| Series 2005-J4, Class M2 |
|
|||||||||||||
| (LIBOR USD 1-Month plus 0.96%) |
|
|||||||||||||
| 1.42% |
07/25/35 | 2 | 21,930 | 21,919 | ||||||||||
| Alternative Loan Trust, |
|
|||||||||||||
| Series 2007-22, Class 2A16 |
|
|||||||||||||
| 6.50% |
09/25/37 | 200,553 | 107,309 | |||||||||||
| Asset-Backed Funding Certificates, |
|
|||||||||||||
| Series 2004-OPT4, Class M1 |
|
|||||||||||||
| (LIBOR USD 1-Month plus 0.90%) |
|
|||||||||||||
| 1.36% |
02/25/34 | 2 | 100,716 | 100,564 | ||||||||||
| Asset-Backed Funding Certificates, |
|
|||||||||||||
| Series 2006-OPT1, Class A2 |
|
|||||||||||||
| (LIBOR USD 1-Month plus 0.28%) |
|
|||||||||||||
| 0.74% |
09/25/36 | 2 | 3,565 | 3,554 | ||||||||||
| Issues | Maturity Date |
Principal Amount |
Value | |||||||||||||
| MORTGAGE-BACKED (continued) |
|
|||||||||||||||
| Non-Agency Mortgage-Backed (continued) |
|
|||||||||||||||
| Banc of America Funding Trust, |
|
|||||||||||||||
| Series 2014-R7, Class 1A1 |
|
|||||||||||||||
| (LIBOR USD 1-Month plus 0.15%) |
|
|||||||||||||||
| 0.61% |
|
05/26/36 | 1,2 | $ | 27,218 | $ | 26,940 | |||||||||
| Banc of America Funding Trust, |
|
|||||||||||||||
| Series 2015-R7, Class 1A1 |
|
|||||||||||||||
| (Federal Reserve US 12-Month Cumulative Average plus 0.92%) |
|
|||||||||||||||
| 1.02% |
|
09/26/46 | 1,2 | 53,664 | 53,709 | |||||||||||
| Centex Home Equity Loan Trust, |
|
|||||||||||||||
| Series 2005-B, Class M2 |
|
|||||||||||||||
| (LIBOR USD 1-Month plus 0.65%) |
|
|||||||||||||||
| 1.10% |
|
03/25/35 | 2 | 153,756 | 153,784 | |||||||||||
| Centex Home Equity Loan Trust, |
|
|||||||||||||||
| Series 2005-D, Class M4 |
|
|||||||||||||||
| (LIBOR USD 1-Month plus 0.92%) |
|
|||||||||||||||
| 1.37% |
|
10/25/35 | 2 | 137,063 | 137,032 | |||||||||||
| CIM Trust, |
|
|||||||||||||||
| Series 2019-R1, Class A |
|
|||||||||||||||
| 3.25% |
|
10/25/58 | 1,4 | 104,188 | 97,555 | |||||||||||
| CIM Trust, |
|
|||||||||||||||
| Series 2021-R3, Class A1A |
|
|||||||||||||||
| 1.95% |
|
06/25/57 | 1,4 | 142,818 | 138,546 | |||||||||||
| Citigroup Mortgage Loan Trust, Inc., |
|
|||||||||||||||
| Series 2005-HE4, Class M2 |
|
|||||||||||||||
| (LIBOR USD 1-Month plus 0.68%) |
|
|||||||||||||||
| 1.13% |
|
10/25/35 | 2 | 203,620 | 201,877 | |||||||||||
| Countrywide Asset-Backed Certificates Trust, |
|
|||||||||||||||
| Series 2007-13, Class 2A1 |
|
|||||||||||||||
| (LIBOR USD 1-Month plus 0.90%) |
|
|||||||||||||||
| 1.36% |
|
10/25/47 | 2 | 69,566 | 68,332 | |||||||||||
| Countrywide Home Loan Mortgage Pass-Through Trust, |
|
|||||||||||||||
| Series 2005-9, Class 1A1 |
|
|||||||||||||||
| (LIBOR USD 1-Month plus 0.60%) |
|
|||||||||||||||
| 1.06% |
|
05/25/35 | 2 | 46,050 | 39,519 | |||||||||||
| Credit-Based Asset Servicing and Securitization LLC, |
|
|||||||||||||||
| Series 2003-CB1, Class AF (STEP-reset date 05/25/22) |
|
|||||||||||||||
| 3.95% |
|
01/25/33 | 6,874 | 6,589 | ||||||||||||
| DSLA Mortgage Loan Trust, |
|
|||||||||||||||
| Series 2004-AR3, Class 2A2A |
|
|||||||||||||||
| (LIBOR USD 1-Month plus 0.74%) |
|
|||||||||||||||
| 1.19% |
|
07/19/44 | 2 | 2,330 | 2,235 | |||||||||||
| First Franklin Mortgage Loan Trust, |
|
|||||||||||||||
| Series 2006-FF4, Class A3 |
|
|||||||||||||||
| (LIBOR USD 1-Month plus 0.56%) |
|
|||||||||||||||
| 1.02% |
|
03/25/36 | 2 | 40,841 | 40,044 | |||||||||||
| GMACM Mortgage Corp. Loan Trust, |
|
|||||||||||||||
| Series 2006-AR1, Class 1A1 |
|
|||||||||||||||
| 2.89% |
|
04/19/36 | 4 | 66,151 | 55,805 | |||||||||||
| HarborView Mortgage Loan Trust, |
|
|||||||||||||||
| Series 2005-4, Class 2A |
|
|||||||||||||||
| 2.41% |
|
07/19/35 | 4 | 1,033 | 901 | |||||||||||
| HarborView Mortgage Loan Trust, |
|
|||||||||||||||
| Series 2005-9, Class 2A1A |
|
|||||||||||||||
| (LIBOR USD 1-Month plus 0.68%) |
|
|||||||||||||||
| 1.13% |
06/20/35 | 2 | 116,226 | 113,269 | ||||||||||||
| See accompanying Notes to Financial Statements. |
| 35 / Annual Report March 2022 |
Table of Contents
AlphaTrak 500 Fund
Schedule of Portfolio Investments
March 31, 2022
| Issues |
Maturity Date |
Principal Amount |
Value | |||||||||||
| MORTGAGE-BACKED (continued) |
|
|||||||||||||
| Non-Agency Mortgage-Backed (continued) |
|
|||||||||||||
| HSI Asset Securitization Corp. Trust, |
|
|||||||||||||
| Series 2007-WF1, Class 1A1 |
|
|||||||||||||
| (LIBOR USD 1-Month plus 0.16%) |
|
|||||||||||||
| 0.62% |
05/25/37 | 2 | $ | 73,493 | $ | 73,063 | ||||||||
| IndyMac Index Mortgage Loan Trust, |
|
|||||||||||||
| Series 2004-AR5, Class 2A1A |
|
|||||||||||||
| (LIBOR USD 1-Month plus 0.86%) |
|
|||||||||||||
| 1.32% |
08/25/34 | 2 | 7,097 | 6,711 | ||||||||||
| IndyMac Index Mortgage Loan Trust, |
|
|||||||||||||
| Series 2006-AR4, Class A1A |
|
|||||||||||||
| (LIBOR USD 1-Month plus 0.42%) |
|
|||||||||||||
| 0.88% |
05/25/46 | 2 | 82,049 | 79,306 | ||||||||||
| IndyMac Index Mortgage Loan Trust, |
|
|||||||||||||
| Series 2007-AR1, Class 2A1 |
|
|||||||||||||
| 2.88% |
06/25/37 | 4 | 62,631 | 46,784 | ||||||||||
| JPMorgan Mortgage Acquisition Trust, |
|
|||||||||||||
| Series 2005-WMC1, Class M3 |
|
|||||||||||||
| (LIBOR USD 1-Month plus 0.71%) |
|
|||||||||||||
| 1.16% |
09/25/35 | 2 | 199,594 | 199,402 | ||||||||||
| Long Beach Mortgage Loan Trust, |
|
|||||||||||||
| Series 2004-4, Class 1A1 |
|
|||||||||||||
| (LIBOR USD 1-Month plus 0.56%) |
|
|||||||||||||
| 1.02% |
10/25/34 | 2 | 100,360 | 97,111 | ||||||||||
| Morgan Stanley ABS Capital I, Inc. Trust, |
|
|||||||||||||
| Series 2007-HE7, Class A2B |
|
|||||||||||||
| (LIBOR USD 1-Month plus 1.00%) |
|
|||||||||||||
| 1.46% |
07/25/37 | 2 | 102,764 | 102,203 | ||||||||||
| Option One Mortgage Loan Trust 2005-4 Asset-Backed Certificates, |
|
|||||||||||||
| Series 2005-4, Class M2 |
|
|||||||||||||
| (LIBOR USD 1-Month plus 0.69%) |
|
|||||||||||||
| 1.15% |
11/25/35 | 2 | 96,749 | 95,708 | ||||||||||
| Option One Mortgage Loan Trust, |
|
|||||||||||||
| Series 2006-1, Class 1A1 |
|
|||||||||||||
| (LIBOR USD 1-Month plus 0.44%) |
|
|||||||||||||
| 0.90% |
01/25/36 | 2 | 17,279 | 17,272 | ||||||||||
| Park Place Securities, Inc., Asset-Backed Pass-Through Certificates, |
|
|||||||||||||
| Series 2005-WCW3, Class M1 |
|
|||||||||||||
| (LIBOR USD 1-Month plus 0.72%) |
|
|||||||||||||
| 1.18% |
08/25/35 | 2 | 25,900 | 25,947 | ||||||||||
| Residential Asset Mortgage Products Trust, |
|
|||||||||||||
| Series 2004-SL1, Class A2 |
|
|||||||||||||
| 8.50% |
11/25/31 | 4,097 | 1 | |||||||||||
| Residential Asset Mortgage Products Trust, |
|
|||||||||||||
| Series 2006-NC3, Class M1 |
|
|||||||||||||
| (LIBOR USD 1-Month plus 0.34%) |
|
|||||||||||||
| 0.97% |
03/25/36 | 2 | 100,000 | 99,626 | ||||||||||
| Residential Asset Securities Corp., |
|
|||||||||||||
| Series 2005-AHL2, Class M1 |
|
|||||||||||||
| (LIBOR USD 1-Month plus 0.63%) |
|
|||||||||||||
| 1.09% |
10/25/35 | 2 | 61,434 | 61,342 | ||||||||||
| Structured Asset Mortgage Investments II Trust, |
|
|||||||||||||
| Series 2006-AR1, Class 3A1 |
|
|||||||||||||
| (LIBOR USD 1-Month plus 0.46%) |
|
|||||||||||||
| 0.92% |
02/25/36 | 2 | 66,863 | 63,849 | ||||||||||
| Issues |
Maturity Date |
Principal Amount |
Value | |||||||||||
| MORTGAGE-BACKED (continued) |
|
|||||||||||||
| Non-Agency Mortgage-Backed (continued) |
|
|||||||||||||
| Terwin NIMs Trust, |
|
|||||||||||||
| Series 2004-13AL, Class 2PX (IO) |
|
|||||||||||||
| 0.34% |
08/25/34 | 1,5,8 | $ | 1,650,376 | $ | 20,102 | ||||||||
| VOLT XCIX, LLC, |
|
|||||||||||||
| Series 2021-NPL8, Class A1 (STEP-reset date 04/25/22) |
|
|||||||||||||
| 2.12% |
04/25/51 | 1 | 213,021 | 204,414 | ||||||||||
| WaMu Mortgage Pass-Through Certificates, |
|
|||||||||||||
| Series 2002-AR6, Class A |
|
|||||||||||||
| (Federal Reserve US 12-Month Cumulative Average plus 1.40%) |
|
|||||||||||||
| 1.54% |
06/25/42 | 2 | 1,224 | 1,197 | ||||||||||
| WaMu Mortgage Pass-Through Certificates, |
|
|||||||||||||
| Series 2005-AR8, Class 2AB2 |
|
|||||||||||||
| (LIBOR USD 1-Month plus 0.84%) |
|
|||||||||||||
| 1.30% |
07/25/45 | 2 | 100,395 | 100,359 | ||||||||||
| Wells Fargo Home Equity Asset-Backed Securities Trust, |
|
|||||||||||||
| Series 2005-4, Class M3 |
|
|||||||||||||
| (LIBOR USD 1-Month plus 0.75%) |
|
|||||||||||||
| 1.21% |
12/25/35 | 2 | 100,000 | 99,784 | ||||||||||
| Wells Fargo Mortgage-Backed Securities Trust, |
|
|||||||||||||
| Series 2003-I, Class A1 |
|
|||||||||||||
| 2.38% |
09/25/33 | 4 | 7,328 | 7,117 | ||||||||||
|
|
|
| ||||||||||||
| 2,770,781 | ||||||||||||||
|
|
|
| ||||||||||||
| U.S. Agency Commercial Mortgage-Backed — 2.54% |
| |||||||||||||
| Fannie Mae-Aces, |
|
|||||||||||||
| Series 2015-M4, Class X2 (IO) |
|
|||||||||||||
| 2.84% |
07/25/22 | 4 | 441,395 | 29 | ||||||||||
| Freddie Mac Multifamily Structured Pass-Through Certificates, |
|
|||||||||||||
| Series K031, Class X1 (IO) |
|
|||||||||||||
| 0.18% |
04/25/23 | 4 | 20,321,284 | 35,666 | ||||||||||
| Freddie Mac Multifamily Structured Pass-Through Certificates, |
|
|||||||||||||
| Series K033, Class X1 (IO) |
|
|||||||||||||
| 0.29% |
07/25/23 | 4 | 3,988,139 | 12,995 | ||||||||||
| Freddie Mac Multifamily Structured Pass-Through Certificates, |
|
|||||||||||||
| Series K036, Class X1 (IO) |
|
|||||||||||||
| 0.70% |
10/25/23 | 4 | 5,150,553 | 46,649 | ||||||||||
| Freddie Mac Multifamily Structured Pass-Through Certificates, |
|
|||||||||||||
| Series K044, Class X1 (IO) |
|
|||||||||||||
| 0.71% |
01/25/25 | 4 | 1,382,506 | 21,563 | ||||||||||
| Freddie Mac Multifamily Structured Pass-Through Certificates, |
|
|||||||||||||
| Series K732, Class X3 (IO) |
|
|||||||||||||
| 2.17% |
05/25/46 | 4 | 250,000 | 16,065 | ||||||||||
| Freddie Mac Multifamily Structured Pass-Through Certificates, |
|
|||||||||||||
| Series KC01, Class X1 (IO) |
|
|||||||||||||
| 0.42% |
12/25/22 | 4 | 3,791,699 | 15,507 | ||||||||||
| Freddie Mac Multifamily Structured Pass-Through Certificates, |
|
|||||||||||||
| Series KC05, Class X1 (IO) |
|
|||||||||||||
| 1.20% |
06/25/27 | 4 | 993,511 | 38,518 | ||||||||||
| See accompanying Notes to Financial Statements. |
| Annual Report March 2022 / 36 |
Table of Contents
AlphaTrak 500 Fund
Schedule of Portfolio Investments
March 31, 2022
| Issues |
Maturity Date |
Principal Amount |
Value | |||||||||||
| MORTGAGE-BACKED (continued) |
|
|||||||||||||
| U.S. Agency Commercial Mortgage-Backed (continued) |
| |||||||||||||
| Freddie Mac Multifamily Structured Pass-Through Certificates, |
|
|||||||||||||
| Series KF88, Class AL |
|
|||||||||||||
| (LIBOR USD 1-Month plus 0.33%) |
|
|||||||||||||
| 0.57% |
09/25/30 | 2 | $ | 177,890 | $ | 177,688 | ||||||||
| Freddie Mac Multifamily Structured Pass-Through |
|
|||||||||||||
| Certificates, |
|
|||||||||||||
| Series KJ30, Class A1 |
|
|||||||||||||
| 0.53% |
01/25/25 | 404,088 | 391,298 | |||||||||||
| Freddie Mac Multifamily Structured Pass-Through |
|
|||||||||||||
| Certificates, |
|
|||||||||||||
| Series KJ31, Class A1 |
|
|||||||||||||
| 0.57% |
05/25/26 | 148,192 | 142,664 | |||||||||||
| Freddie Mac Multifamily Structured Pass-Through |
|
|||||||||||||
| Certificates, |
|
|||||||||||||
| Series KJ32, Class A1 |
|
|||||||||||||
| 0.52% |
06/25/25 | 189,474 | 182,308 | |||||||||||
| Freddie Mac Multifamily Structured Pass-Through |
|
|||||||||||||
| Certificates, |
|
|||||||||||||
| Series KS07, Class X (IO) |
|
|||||||||||||
| 0.64% |
09/25/25 | 4 | 2,925,499 | 63,504 | ||||||||||
| Ginnie Mae, |
|
|||||||||||||
| Series 2010-140, Class IO (IO) |
|
|||||||||||||
| 0.00% |
10/16/43 | 4,5 | — | — | ||||||||||
|
|
|
| ||||||||||||
| 1,144,454 | ||||||||||||||
|
|
|
| ||||||||||||
| U.S. Agency Mortgage-Backed — 3.97% |
|
|||||||||||||
| Fannie Mae Pool 802665 |
|
|||||||||||||
| (LIBOR USD 6-Month plus 1.74%) |
|
|||||||||||||
| 1.86% |
12/01/34 | 2 | 608 | 609 | ||||||||||
| Fannie Mae Pool AL0851 |
|
|||||||||||||
| 6.00% |
10/01/40 | 2,054 | 2,280 | |||||||||||
| Fannie Mae REMICS, |
|
|||||||||||||
| Series 1997-91, Class SL (IO) |
|
|||||||||||||
| (-2.00 X LIBOR USD 1-Month plus 16.00%, 7.50% Cap) |
|
|||||||||||||
| 7.50% |
11/25/23 | 2 | 4,592 | 145 | ||||||||||
| Fannie Mae REMICS, |
|
|||||||||||||
| Series 2002-21, Class FB |
|
|||||||||||||
| (LIBOR USD 1-Month plus 0.90%) |
|
|||||||||||||
| 1.36% |
04/25/32 | 2 | 27,873 | 28,207 | ||||||||||
| Fannie Mae REMICS, |
|
|||||||||||||
| Series 2002-53, Class FY |
|
|||||||||||||
| (LIBOR USD 1-Month plus 0.50%) |
|
|||||||||||||
| 0.96% |
08/25/32 | 2 | 80,268 | 80,652 | ||||||||||
| Fannie Mae REMICS, |
|
|||||||||||||
| Series 2003-11, Class FA |
|
|||||||||||||
| (LIBOR USD 1-Month plus 1.00%) |
|
|||||||||||||
| 1.46% |
09/25/32 | 2 | 4,142 | 4,145 | ||||||||||
| Fannie Mae REMICS, |
|
|||||||||||||
| Series 2003-81, Class FE |
|
|||||||||||||
| (LIBOR USD 1-Month plus 0.50%) |
|
|||||||||||||
| 0.96% |
09/25/33 | 2 | 29,349 | 29,474 | ||||||||||
| Fannie Mae REMICS, |
|
|||||||||||||
| Series 2006-48, Class FL |
|
|||||||||||||
| (LIBOR USD 1-Month plus 0.40%) |
|
|||||||||||||
| 0.86% |
06/25/36 | 2 | 38,047 | 38,149 | ||||||||||
| Issues |
Maturity Date |
Principal Amount |
Value | |||||||||||
| MORTGAGE-BACKED (continued) |
|
|||||||||||||
| U.S. Agency Mortgage-Backed (continued) |
|
|||||||||||||
| Fannie Mae REMICS, |
|
|||||||||||||
| Series 2006-8, Class NF |
|
|||||||||||||
| (LIBOR USD 1-Month plus 0.37%) |
|
|||||||||||||
| 0.83% |
03/25/36 | 2 | $ | 34,682 | $ | 34,740 | ||||||||
| Fannie Mae REMICS, |
|
|||||||||||||
| Series 2008-12, Class FA |
|
|||||||||||||
| (LIBOR USD 1-Month plus 0.67%) |
|
|||||||||||||
| 1.13% |
03/25/38 | 2 | 108,753 | 110,424 | ||||||||||
| Fannie Mae REMICS, |
|
|||||||||||||
| Series 2010-109, Class PF |
|
|||||||||||||
| (LIBOR USD 1-Month plus 0.40%) |
|
|||||||||||||
| 0.86% |
10/25/40 | 2 | 3,492 | 3,509 | ||||||||||
| Fannie Mae REMICS, |
|
|||||||||||||
| Series 2010-74, Class AF |
|
|||||||||||||
| (LIBOR USD 1-Month plus 0.54%) |
|
|||||||||||||
| 1.00% |
07/25/37 | 2 | 33,067 | 33,363 | ||||||||||
| Freddie Mac REMICS, |
|
|||||||||||||
| Series 2684, Class F |
|
|||||||||||||
| (LIBOR USD 1-Month plus 0.90%) |
|
|||||||||||||
| 1.30% |
01/15/33 | 2 | 3,719 | 3,790 | ||||||||||
| Freddie Mac REMICS, |
|
|||||||||||||
| Series 3231, Class FB |
|
|||||||||||||
| (LIBOR USD 1-Month plus 0.35%) |
|
|||||||||||||
| 0.75% |
10/15/36 | 2 | 63,155 | 63,207 | ||||||||||
| Freddie Mac Strips, |
|
|||||||||||||
| Series 263, Class F5 |
|
|||||||||||||
| (LIBOR USD 1-Month plus 0.50%) |
|
|||||||||||||
| 0.90% |
06/15/42 | 2 | 9,142 | 9,154 | ||||||||||
| UMBS (TBA) |
|
|||||||||||||
| 2.50% |
05/01/52 | 675,000 | 642,710 | |||||||||||
| 3.00% |
05/01/52 | 725,000 | 707,781 | |||||||||||
|
|
|
| ||||||||||||
| 1,792,339 | ||||||||||||||
|
|
|
| ||||||||||||
| Total Mortgage-Backed |
|
|||||||||||||
| (Cost $10,449,086) |
|
9,793,124 | ||||||||||||
|
|
|
| ||||||||||||
| MUNICIPAL BONDS — 2.00%* |
|
|||||||||||||
| California — 0.45% |
|
|||||||||||||
| State of California General Obligation, Series B |
|
|||||||||||||
| 2.50% |
10/01/22 | 200,000 | 201,314 | |||||||||||
|
|
|
| ||||||||||||
| Colorado — 0.29% |
|
|||||||||||||
| City & County of Denver Airport System Revenue Bonds, |
|
|||||||||||||
| Series C |
|
|||||||||||||
| 0.88% |
11/15/23 | 135,000 | 131,473 | |||||||||||
|
|
|
| ||||||||||||
| Florida — 0.20% |
|
|||||||||||||
| County of Miami-Dade Aviation Revenue Bonds, Airport and |
|
|||||||||||||
| Marina Improvements, Series D |
|
|||||||||||||
| 2.32% |
10/01/22 | 90,000 | 90,399 | |||||||||||
|
|
|
| ||||||||||||
| Maryland — 0.23% |
|
|||||||||||||
| City of Baltimore General Obligation, School Improvements, |
|
|||||||||||||
| Series C |
|
|||||||||||||
| 5.00% |
10/15/25 | 100,000 | 104,445 | |||||||||||
|
|
|
| ||||||||||||
| See accompanying Notes to Financial Statements. |
| 37 / Annual Report March 2022 |
Table of Contents
AlphaTrak 500 Fund
Schedule of Portfolio Investments
March 31, 2022
| Issues |
Maturity Date |
Principal Amount |
Value | |||||||||||
| MUNICIPAL BONDS (continued) |
|
|||||||||||||
| New York — 0.83% |
|
|||||||||||||
| City of New York General Obligation, Series D |
| |||||||||||||
| 0.43% |
08/01/22 | $ | 230,000 | $ | 229,637 | |||||||||
| New York City Transitional Finance Authority Future Tax |
| |||||||||||||
| Secured Revenue Bonds, Public Improvements, Series A2 |
| |||||||||||||
| 2.15% |
05/01/25 | 150,000 | 147,096 | |||||||||||
|
|
|
| ||||||||||||
| 376,733 | ||||||||||||||
|
|
|
| ||||||||||||
| Total Municipal Bonds (Cost $923,098) |
|
904,364 | ||||||||||||
|
|
|
| ||||||||||||
| U.S. TREASURY SECURITIES — 0.32% |
|
|||||||||||||
| U.S. Treasury Notes — 0.32% |
|
|||||||||||||
| U.S. Treasury Notes |
|
|||||||||||||
| 0.88% |
01/31/24 | 70,000 | 68,227 | |||||||||||
| 1.50% |
02/29/24 | 50,000 | 49,277 | |||||||||||
| 1.75% |
03/15/25 | 27,000 | 26,442 | |||||||||||
|
|
|
| ||||||||||||
| Total U.S. Treasury Securities (Cost $146,069) |
|
143,946 | ||||||||||||
|
|
|
| ||||||||||||
| Total Bonds — 63.26% (Cost $29,574,896) |
|
28,532,986 | ||||||||||||
|
|
|
| ||||||||||||
| Issues | Shares | Value | ||||||||||||
| COMMON STOCK — 0.05% |
|
|||||||||||||
| Communications — 0.05% |
|
|||||||||||||
| Intelsat Emergence SA3,5,6,8 |
|
|||||||||||||
| (Luxembourg) |
|
772 | 23,160 | |||||||||||
|
|
|
| ||||||||||||
| Total Common Stock |
|
|||||||||||||
| (Cost $25,862) |
|
|||||||||||||
| RIGHTS — 0.00% |
|
|||||||||||||
| Communications — 0.00% |
|
|||||||||||||
| Intelsat Jackson Holdings SA, Series A3,5,6,8 |
| |||||||||||||
| (Luxembourg) |
|
80 | — | |||||||||||
| Intelsat Jackson Holdings SA, Series B3,5,6,8 |
| |||||||||||||
| (Luxembourg) |
|
80 | — | |||||||||||
|
|
|
| ||||||||||||
| — | ||||||||||||||
|
|
|
| ||||||||||||
| Total Rights (Cost $–) |
|
— | ||||||||||||
|
|
|
| ||||||||||||
| Issues | Shares | Value | ||||||||||||
| MUTUAL FUNDS — 18.11% |
|
|||||||||||||
| Mutual Funds — 18.11% |
|
|||||||||||||
| iShares Core S&P 500 ETF |
|
3,845 | 1,744,438 | |||||||||||
| SPDR S&P 500 ETF Trust10 |
|
14,226 | 6,425,031 | |||||||||||
|
|
|
| ||||||||||||
| Total Mutual Funds |
|
|||||||||||||
| (Cost $7,404,356) |
|
8,169,469 | ||||||||||||
|
|
|
| ||||||||||||
| Issues |
Maturity Date |
Principal Amount/Shares |
Value | |||||||||||
| SHORT-TERM INVESTMENTS — 15.46% |
|
|||||||||||||
| Money Market Funds — 8.12% |
|
|||||||||||||
| Dreyfus Government Cash Management Fund |
| |||||||||||||
|
0.19%11 |
|
1,773,000 | $ | 1,773,000 | ||||||||||
| Fidelity Investments Money Market Funds - Government Portfolio |
| |||||||||||||
|
0.12%11 |
|
20,904 | 20,904 | |||||||||||
| Morgan Stanley Institutional Liquidity Funds - Government Portfolio |
| |||||||||||||
|
0.23%11 |
|
1,867,000 | 1,867,000 | |||||||||||
|
|
|
| ||||||||||||
| 3,660,904 | ||||||||||||||
|
|
|
| ||||||||||||
| U.S. Agency Discount Notes — 2.64% |
|
|||||||||||||
| Federal Home Loan Bank |
|
|||||||||||||
|
1.04%12 |
06/14/24 | $ | 500,000 | 484,047 | ||||||||||
|
1.20%12 |
12/23/24 | 495,000 | 477,808 | |||||||||||
| 3.22% |
09/04/24 | 235,000 | 230,922 | |||||||||||
|
|
|
| ||||||||||||
| 1,192,777 | ||||||||||||||
|
|
|
| ||||||||||||
| U.S. Treasury Bills — 4.70% |
|
|||||||||||||
| U.S. Treasury Bills |
|
|||||||||||||
|
0.13%12 |
06/09/22 | 125,000 | 124,910 | |||||||||||
|
0.61%12 |
08/25/22 | 2,000,000 | 1,992,944 | |||||||||||
|
|
|
| ||||||||||||
| 2,117,854 | ||||||||||||||
|
|
|
| ||||||||||||
| Total Short-Term Investments |
|
|||||||||||||
| (Cost $7,010,967) |
|
6,971,535 | ||||||||||||
|
|
|
| ||||||||||||
| Total Investments - 96.88% |
|
|||||||||||||
| (Cost $44,016,081) |
|
43,697,150 | ||||||||||||
|
|
|
| ||||||||||||
| Cash and Other Assets, Less Liabilities - 3.12% |
|
1,405,318 | ||||||||||||
|
|
|
| ||||||||||||
| Net Assets - 100.00% |
|
$ | 45,102,468 | |||||||||||
|
|
|
| ||||||||||||
| 1 | Securities exempt from registration under Rule 144A of the Securities Act of 1933, as amended. The securities may be resold in transactions exempt from registration, normally to qualified institutional buyers. |
| 2 | Floating rate security. The rate disclosed was in effect at March 31, 2022. |
| 3 | Foreign denominated security issued by foreign domiciled entity. |
| 4 | Variable rate security. Interest rate disclosed is as of the most recent information available. Certain variable rate securities are not based on a published reference rate and spread but are determined by the issuer or agent and are based on current market conditions. |
| 5 | Security is valued using significant unobservable inputs and is classified as Level 3 in the fair value hierarchy. |
| 6 | Non-income producing security. |
| 7 | Security is currently in default with regard to scheduled interest or principal payments. |
| 8 | Illiquid security as determined under procedures approved by the Board of Trustees. The aggregate value of illiquid securities is $66,110, which is 0.15% of total net assets. |
| 9 | Zero coupon bond. The rate shown is the effective yield as of March 31, 2022. |
| See accompanying Notes to Financial Statements. |
| Annual Report March 2022 / 38 |
Table of Contents
AlphaTrak 500 Fund
Schedule of Portfolio Investments
March 31, 2022
| 10 | SPDR S&P 500 ETF Trust (the “S&P 500 ETF”) is a unit investment trust created under the laws of the State of New York and registered under the Investment Company Act of 1940, as amended. The S&P 500 ETF was created to provide investors with the opportunity to purchase a security representing a proportionate undivided interest in a portfolio of securities consisting of substantially all of the component common stocks, in substantially the same weighting, which comprise the Standard & Poor’s 500 Index (the “S&P 500 Index”). Each unit of fractional undivided interest in the S&P 500 ETF is referred to as a “Unit”. The S&P 500 ETF seeks to provide investment results that, before expenses, correspond generally to the price and yield performance of the S&P 500 Index. You can access the financial statements of this ETF by going to its homepage at https://us.spdrs.com/en/etf/spdr-sp-500-etf-SPY. |
| 11 | Represents the current yield as of March 31, 2022. |
| 12 | Represents annualized yield at date of purchase. |
| * | Securities with a call or reset feature will have an effective maturity date sooner than the stated maturity. |
| ** | Securities backed by mortgage or consumer loans where payment is periodically made will have an effective maturity date sooner than the stated maturity date. |
Note: For Fund compliance purposes, the Fund’s industry classifications refer to any one or more of the industry sub-classifications used by one or more widely recognized market indexes or ratings group indexes, and/or as defined by Fund management. This definition may not apply for purposes of this report, which may combine industry sub-classifications for more meaningful presentation for investors.
(BKNT): Bank Note
(CLO): Collateralized Loan Obligation
(ETF): Exchange-Traded Fund
(IO): Interest Only
(LIBOR): London InterBank Offer Rate
(MTN): Medium-Term Note
(S&P): Standard & Poor’s
(SOFR): Secured Overnight Financing Rate
(SPDR): Standard & Poor’s Depositary Receipts
(STEP): Step Coupon Bond
(TBA): To-Be-Announced
(USD): U.S. Dollar
| Description | Number of Contracts |
Expiration Date | Notional Amount | Value | Unrealized Appreciation |
|||||||||||||||
| FUTURES CONTRACTS: LONG POSITIONS | ||||||||||||||||||||
| S&P 500 E-mini Index |
159 | 06/17/22 | $ | 35,995,612 | $ | 2,224,884 | $ | 2,224,884 | ||||||||||||
|
|
|
|
|
|
|
|||||||||||||||
| See accompanying Notes to Financial Statements. |
39 / Annual Report March 2022
Table of Contents
Schedule of Portfolio Investments
March 31, 2022
| Issues |
Maturity Date |
Principal Amount |
Value | |||||||||
| BONDS – 96.11% |
|
|||||||||||
| ASSET-BACKED SECURITIES — 0.32%** |
|
|||||||||||
| Skyline Aircraft Finance LLC, |
|
|||||||||||
| Series 2021-1, Class A |
|
|||||||||||
| 3.23% |
05/10/371,2 | $ | 42,316 | $ | 39,936 | |||||||
|
|
|
| ||||||||||
| Total Asset-Backed Securities (Cost $42,316) |
|
|||||||||||
| CORPORATES — 89.39%* |
|
|||||||||||
| Banking — 12.79% |
|
|||||||||||
| Bank of America Corp. |
|
|||||||||||
| 1.73% |
07/22/273 | 200,000 | 185,981 | |||||||||
| 2.97% |
02/04/333 | 20,000 | 18,774 | |||||||||
| 3.00% |
12/20/233 | 35,000 | 35,102 | |||||||||
| Bank of America Corp. |
|
|||||||||||
| (MTN) |
|
|||||||||||
| 2.09% |
06/14/293 | 110,000 | 100,631 | |||||||||
| 3.97% |
03/05/293 | 20,000 | 20,324 | |||||||||
| 4.08% |
03/20/513 | 20,000 | 20,648 | |||||||||
| 4.27% |
07/23/293 | 15,000 | 15,544 | |||||||||
| Credit Suisse Group AG |
|
|||||||||||
| (Switzerland) |
|
|||||||||||
| 1.31% |
02/02/273,4,5 | 30,000 | 26,829 | |||||||||
| 2.19% |
06/05/263,4,5 | 25,000 | 23,523 | |||||||||
| 2.59% |
09/11/253,4,5 | 5,000 | 4,826 | |||||||||
| 3.09% |
05/14/323,4,5 | 20,000 | 18,018 | |||||||||
| Discover Bank |
|
|||||||||||
| (BKNT) |
|
|||||||||||
| 3.45% |
07/27/26 | 25,000 | 24,891 | |||||||||
| 4.20% |
08/08/23 | 10,000 | 10,175 | |||||||||
| DNB Bank ASA |
|
|||||||||||
| (Norway) |
|
|||||||||||
| 1.13% |
09/16/263,4,5 | 50,000 | 45,953 | |||||||||
| Fifth Third Bancorp |
|
|||||||||||
| 2.55% |
05/05/27 | 40,000 | 38,713 | |||||||||
| HSBC Holdings PLC |
|
|||||||||||
| (United Kingdom) |
|
|||||||||||
| 2.21% |
08/17/293,5 | 120,000 | 108,148 | |||||||||
| JPMorgan Chase & Co. |
|
|||||||||||
| 1.58% |
04/22/273 | 70,000 | 65,250 | |||||||||
| 2.07% |
06/01/293 | 15,000 | 13,775 | |||||||||
| 3.11% |
04/22/513 | 70,000 | 62,282 | |||||||||
| 4.01% |
04/23/293 | 20,000 | 20,411 | |||||||||
| 4.02% |
12/05/243 | 55,000 | 55,904 | |||||||||
| 4.20% |
07/23/293 | 25,000 | 25,884 | |||||||||
| 4.49% |
03/24/313 | 35,000 | 37,200 | |||||||||
| Lloyds Banking Group PLC |
|
|||||||||||
| (United Kingdom) |
|
|||||||||||
| 1.63% |
05/11/273,5 | 10,000 | 9,180 | |||||||||
| 3.87% |
07/09/253,5 | 65,000 | 65,722 | |||||||||
| Macquarie Group Ltd. |
|
|||||||||||
| (Australia) |
|
|||||||||||
| 1.34% |
01/12/273,4,5 | 20,000 | 18,247 | |||||||||
| 1.63% |
09/23/273,4,5 | 30,000 | 27,072 | |||||||||
| 4.44% |
06/21/333,4,5 | 15,000 | 15,188 | |||||||||
| NatWest Group PLC |
|
|||||||||||
| (United Kingdom) |
|
|||||||||||
| 4.27% |
03/22/253,5 | 50,000 | 50,608 | |||||||||
| Issues |
Maturity Date |
Principal Amount |
Value | |||||||||
| CORPORATES (continued) |
|
|||||||||||
| Banking (continued) |
|
|||||||||||
| Santander UK Group Holdings PLC |
|
|||||||||||
| (United Kingdom) |
|
|||||||||||
| 1.09% |
03/15/253,5 | $ | 80,000 | $ | 76,103 | |||||||
| Truist Financial Corp. |
|
|||||||||||
| (MTN) |
|
|||||||||||
| 1.89% |
06/07/293 | 30,000 | 27,305 | |||||||||
| Wells Fargo & Co. |
|
|||||||||||
| (MTN) |
|
|||||||||||
| 2.39% |
06/02/283 | 275,000 | 260,354 | |||||||||
| 3.35% |
03/02/333 | 15,000 | 14,594 | |||||||||
| 3.53% |
03/24/283 | 20,000 | 19,979 | |||||||||
| 3.58% |
05/22/283 | 25,000 | 24,991 | |||||||||
| 5.01% |
04/04/513 | 15,000 | 17,881 | |||||||||
|
|
|
| ||||||||||
| 1,606,010 | ||||||||||||
|
|
|
| ||||||||||
| Communications — 11.00% |
|
|||||||||||
| AT&T, Inc. |
|
|||||||||||
| 2.55% |
12/01/33 | 50,000 | 44,522 | |||||||||
| 3.80% |
12/01/57 | 188,000 | 167,546 | |||||||||
| Charter Communications Operating LLC/Charter Communications Operating Capital |
|
|||||||||||
| 2.30% |
02/01/32 | 50,000 | 42,782 | |||||||||
| 3.75% |
02/15/28 | 45,000 | 44,522 | |||||||||
| 5.38% |
05/01/47 | 52,000 | 53,335 | |||||||||
| 5.75% |
04/01/48 | 20,000 | 21,274 | |||||||||
| Charter Communications Operating, LLC/Charter |
|
|||||||||||
| Communications Operating Capital |
|
|||||||||||
| 5.25% |
04/01/53 | 5,000 | 5,047 | |||||||||
| Comcast Corp. |
|
|||||||||||
| 1.50% |
02/15/31 | 60,000 | 52,344 | |||||||||
| 2.94% |
11/01/564 | 23,000 | 19,187 | |||||||||
| 3.97% |
11/01/47 | 35,000 | 35,455 | |||||||||
| 4.00% |
11/01/49 | 15,000 | 15,355 | |||||||||
| Cox Communications, Inc. |
|
|||||||||||
| 2.60% |
06/15/314 | 40,000 | 36,207 | |||||||||
| 3.15% |
08/15/244 | 18,000 | 18,042 | |||||||||
| Discovery Communications LLC |
|
|||||||||||
| 3.63% |
05/15/30 | 45,000 | 43,777 | |||||||||
| Fox Corp. |
|
|||||||||||
| 3.50% |
04/08/30 | 25,000 | 24,800 | |||||||||
| Level 3 Financing, Inc. |
|
|||||||||||
| 3.40% |
03/01/274 | 10,000 | 9,442 | |||||||||
| 3.88% |
11/15/294 | 24,000 | 22,130 | |||||||||
| Paramount Global |
|
|||||||||||
| 4.20% |
05/19/32 | 20,000 | 20,041 | |||||||||
| 4.60% |
01/15/45 | 14,000 | 13,875 | |||||||||
| Qwest Corp. |
|
|||||||||||
| 7.25% |
09/15/25 | 20,000 | 21,850 | |||||||||
| SES GLOBAL Americas Holdings GP |
|
|||||||||||
| 5.30% |
03/25/444 | 35,000 | 34,051 | |||||||||
| Sprint Spectrum Co. LLC/Sprint Spectrum Co. II LLC/Sprint Spectrum Co. III LLC |
|
|||||||||||
| 4.74% |
03/20/254 | 75,000 | 76,607 | |||||||||
| 5.15% |
03/20/284 | 15,000 | 15,809 | |||||||||
See accompanying Notes to Financial Statements.
| Annual Report March 2022 / 40 |
Table of Contents
Corporate Bond Fund
Schedule of Portfolio Investments
March 31, 2022
| Issues |
Maturity Date |
Principal Amount |
Value | |||||||||
| CORPORATES (continued) |
|
|||||||||||
| Communications (continued) |
|
|||||||||||
| Tencent Holdings Ltd. |
|
|||||||||||
| (Cayman Islands) |
|
|||||||||||
| 3.98% |
04/11/294,5 | $ | 40,000 | $ | 39,991 | |||||||
| Time Warner Cable LLC |
|
|||||||||||
| 5.50% |
09/01/41 | 33,000 | 34,342 | |||||||||
| T-Mobile USA, Inc. |
|
|||||||||||
| 2.55% |
02/15/31 | 103,000 | 93,563 | |||||||||
| 3.50% |
04/15/25 | 15,000 | 15,143 | |||||||||
| 3.75% |
04/15/27 | 25,000 | 25,191 | |||||||||
| 4.50% |
04/15/50 | 22,000 | 22,335 | |||||||||
| Verizon Communications, Inc. |
|
|||||||||||
| 2.36% |
03/15/324 | 120,000 | 108,557 | |||||||||
| 2.55% |
03/21/31 | 37,000 | 34,400 | |||||||||
| 4.50% |
08/10/33 | 55,000 | 59,157 | |||||||||
| Vodafone Group PLC |
|
|||||||||||
| (United Kingdom) |
|
|||||||||||
| 4.13% |
05/30/255 | 21,000 | 21,629 | |||||||||
| 4.25% |
09/17/505 | 41,000 | 40,905 | |||||||||
| Walt Disney Co. (The) |
|
|||||||||||
| 3.60% |
01/13/51 | 38,000 | 37,760 | |||||||||
| 6.20% |
12/15/34 | 8,000 | 10,091 | |||||||||
|
|
|
| ||||||||||
| 1,381,064 | ||||||||||||
|
|
|
| ||||||||||
| Consumer Discretionary — 3.93% |
|
|||||||||||
| Altria Group, Inc. |
|
|||||||||||
| 3.70% |
02/04/51 | 5,000 | 4,079 | |||||||||
| 3.88% |
09/16/46 | 11,000 | 9,310 | |||||||||
| 5.95% |
02/14/49 | 15,000 | 16,346 | |||||||||
| Anheuser-Busch Cos. LLC/Anheuser-Busch InBev Worldwide, Inc. |
|
|||||||||||
| 4.70% |
02/01/36 | 30,000 | 32,650 | |||||||||
| 4.90% |
02/01/46 | 38,000 | 42,322 | |||||||||
| Anheuser-Busch InBev Worldwide, Inc. |
|
|||||||||||
| 4.60% |
04/15/48 | 77,000 | 82,911 | |||||||||
| Bacardi Ltd. |
|
|||||||||||
| (Bermuda) |
|
|||||||||||
| 4.70% |
05/15/284,5 | 20,000 | 20,833 | |||||||||
| BAT Capital Corp. |
|
|||||||||||
| 4.39% |
08/15/37 | 45,000 | 41,946 | |||||||||
| 4.54% |
08/15/47 | 50,000 | 44,752 | |||||||||
| Constellation Brands, Inc. |
|
|||||||||||
| 3.75% |
05/01/50 | 35,000 | 32,529 | |||||||||
| Hyatt Hotels Corp. |
|
|||||||||||
| 1.80% |
10/01/24 | 45,000 | 43,285 | |||||||||
| Imperial Brands Finance PLC |
|
|||||||||||
| (United Kingdom) |
|
|||||||||||
| 4.25% |
07/21/254,5 | 35,000 | 35,304 | |||||||||
| Magallanes, Inc. |
|
|||||||||||
| 4.28% |
03/15/324 | 15,000 | 15,094 | |||||||||
| 5.14% |
03/15/524 | 65,000 | 66,585 | |||||||||
| Reynolds American, Inc. |
|
|||||||||||
| 5.85% |
08/15/45 | 5,000 | 5,118 | |||||||||
|
|
|
| ||||||||||
| 493,064 | ||||||||||||
|
|
|
| ||||||||||
| Issues |
Maturity Date |
Principal Amount |
Value | |||||||||
| CORPORATES (continued) |
|
|||||||||||
| Electric — 7.98% |
|
|||||||||||
| AEP Transmission Co. LLC, |
|
|||||||||||
| Series M |
|
|||||||||||
| 3.65% |
04/01/50 | $ | 10,000 | $ | 9,687 | |||||||
| AEP Transmission Co. LLC, |
|
|||||||||||
| Series N |
|
|||||||||||
| 2.75% |
08/15/51 | 50,000 | 41,531 | |||||||||
| Alabama Power Co. |
|
|||||||||||
| 5.50% |
03/15/41 | 9,000 | 10,616 | |||||||||
| Alliant Energy Finance LLC |
|
|||||||||||
| 1.40% |
03/15/264 | 45,000 | 40,999 | |||||||||
| Appalachian Power Co. |
|
|||||||||||
| 4.45% |
06/01/45 | 10,000 | 10,268 | |||||||||
| Appalachian Power Co., |
|
|||||||||||
| Series X |
|
|||||||||||
| 3.30% |
06/01/27 | 30,000 | 30,212 | |||||||||
| Baltimore Gas and Electric Co. |
|
|||||||||||
| 2.90% |
06/15/50 | 43,000 | 37,461 | |||||||||
| Black Hills Corp. |
|
|||||||||||
| 4.35% |
05/01/33 | 35,000 | 35,723 | |||||||||
| CenterPoint Energy Houston Electric, LLC, |
|
|||||||||||
| Series AG |
|
|||||||||||
| 3.00% |
03/01/32 | 40,000 | 39,154 | |||||||||
| Consolidated Edison Co. of New York, Inc. |
|
|||||||||||
| 3.20% |
12/01/51 | 43,000 | 38,163 | |||||||||
| Consolidated Edison Co. of New York, Inc., |
|
|||||||||||
| Series 2017 |
|
|||||||||||
| 3.88% |
06/15/47 | 10,000 | 9,752 | |||||||||
| Duke Energy Carolinas LLC |
|
|||||||||||
| 3.75% |
06/01/45 | 70,000 | 68,825 | |||||||||
| 3.88% |
03/15/46 | 15,000 | 15,329 | |||||||||
| 4.00% |
09/30/42 | 10,000 | 10,285 | |||||||||
| Evergy Missouri West, Inc. |
|
|||||||||||
| 3.75% |
03/15/324 | 20,000 | 20,170 | |||||||||
| Evergy, Inc. |
|
|||||||||||
| 2.45% |
09/15/24 | 5,000 | 4,910 | |||||||||
| FirstEnergy Transmission LLC |
|
|||||||||||
| 5.45% |
07/15/444 | 55,000 | 60,234 | |||||||||
| Florida Power & Light Co. |
|
|||||||||||
| 4.13% |
02/01/42 | 115,000 | 121,888 | |||||||||
| Interstate Power and Light Co. |
|
|||||||||||
| 2.30% |
06/01/30 | 20,000 | 18,267 | |||||||||
| ITC Holdings Corp. |
|
|||||||||||
| 4.05% |
07/01/23 | 10,000 | 10,103 | |||||||||
| Metropolitan Edison Co. |
|
|||||||||||
| 4.00% |
04/15/254 | 39,000 | 39,222 | |||||||||
| 4.30% |
01/15/294 | 15,000 | 15,617 | |||||||||
| MidAmerican Energy Co. |
|
|||||||||||
| 4.25% |
05/01/46 | 10,000 | 10,805 | |||||||||
| Narragansett Electric Co. (The) |
|
|||||||||||
| 3.40% |
04/09/304 | 10,000 | 9,843 | |||||||||
| Northern States Power Co. |
|
|||||||||||
| 4.13% |
05/15/44 | 10,000 | 10,495 | |||||||||
| PacifiCorp. |
|
|||||||||||
| 4.13% |
01/15/49 | 60,000 | 62,911 | |||||||||
| Public Service Co. of New Mexico |
|
|||||||||||
| 3.85% |
08/01/25 | 45,000 | 45,806 | |||||||||
See accompanying Notes to Financial Statements.
| 41 / Annual Report March 2022 |
Table of Contents
Corporate Bond Fund
Schedule of Portfolio Investments
March 31, 2022
| Issues |
Maturity Date |
Principal Amount |
Value | |||||||||
| CORPORATES (continued) |
|
|||||||||||
| Electric (continued) |
|
|||||||||||
| Southern Co. (The) |
|
|||||||||||
| 3.25% |
07/01/26 | $ | 6,000 | $ | 6,008 | |||||||
| Tucson Electric Power Co. |
|
|||||||||||
| 3.85% |
03/15/23 | 60,000 | 60,910 | |||||||||
| Virginia Electric & Power Co., |
|
|||||||||||
| Series B |
|
|||||||||||
| 3.80% |
09/15/47 | 20,000 | 19,995 | |||||||||
| Virginia Electric and Power Co. |
|
|||||||||||
| 2.45% |
12/15/50 | 27,000 | 21,760 | |||||||||
| Vistra Operations Co., LLC |
|
|||||||||||
| 3.55% |
07/15/244 | 6,000 | 5,958 | |||||||||
| Xcel Energy, Inc. |
|
|||||||||||
| 4.80% |
09/15/41 | 55,000 | 59,501 | |||||||||
|
|
|
| ||||||||||
| 1,002,408 | ||||||||||||
|
|
|
| ||||||||||
| Energy — 5.95% |
|
|||||||||||
| Boston Gas Co. |
|
|||||||||||
| 3.76% |
03/16/324 | 10,000 | 10,012 | |||||||||
| BP Capital Markets America, Inc. |
|
|||||||||||
| 3.63% |
04/06/30 | 45,000 | 45,878 | |||||||||
| Diamondback Energy, Inc. |
|
|||||||||||
| 4.25% |
03/15/52 | 15,000 | 14,842 | |||||||||
| Energy Transfer LP |
|
|||||||||||
| 4.20% |
04/15/27 | 27,000 | 27,536 | |||||||||
| 4.95% |
06/15/28 | 25,000 | 26,292 | |||||||||
| 5.00% |
05/15/50 | 55,000 | 55,817 | |||||||||
| 5.40% |
10/01/47 | 6,000 | 6,281 | |||||||||
| 6.13% |
12/15/45 | 12,000 | 13,294 | |||||||||
| EQM Midstream Partners LP |
|
|||||||||||
| 6.50% |
07/15/48 | 8,000 | 7,880 | |||||||||
| Exxon Mobil Corp. |
|
|||||||||||
| 3.45% |
04/15/51 | 24,000 | 23,386 | |||||||||
| 4.33% |
03/19/50 | 7,000 | 7,840 | |||||||||
| KeySpan Gas East Corp. |
|
|||||||||||
| 5.82% |
04/01/414 | 15,000 | 17,394 | |||||||||
| Kinder Morgan Energy Partners LP |
|
|||||||||||
| 5.80% |
03/15/35 | 15,000 | 17,141 | |||||||||
| Kinder Morgan Energy Partners LP |
|
|||||||||||
| (MTN) |
|
|||||||||||
| 6.95% |
01/15/38 | 15,000 | 18,816 | |||||||||
| Kinder Morgan, Inc. |
|
|||||||||||
| (GMTN) |
|
|||||||||||
| 7.80% |
08/01/31 | 15,000 | 19,229 | |||||||||
| Lundin Energy Finance BV |
|
|||||||||||
| (Netherlands) |
|
|||||||||||
| 3.10% |
07/15/314,5 | 30,000 | 27,833 | |||||||||
| NGPL Pipe Co. LLC |
|
|||||||||||
| 3.25% |
07/15/314 | 20,000 | 18,589 | |||||||||
| 4.88% |
08/15/274 | 10,000 | 10,426 | |||||||||
| Petroleos Mexicanos |
|
|||||||||||
| (Mexico) |
|
|||||||||||
| 7.69% |
01/23/505 | 40,000 | 35,008 | |||||||||
| Phillips 66 Partners LP |
|
|||||||||||
| 4.90% |
10/01/46 | 10,000 | 11,018 | |||||||||
| Plains All American Pipeline LP/PAA Finance Corp. |
|
|||||||||||
| 3.55% |
12/15/29 | 31,000 | 30,014 | |||||||||
| Issues |
Maturity Date |
Principal Amount |
Value | |||||||||
| CORPORATES (continued) |
|
|||||||||||
| Energy (continued) |
|
|||||||||||
| 3.80% |
09/15/30 | $ | 15,000 | $ | 14,737 | |||||||
| 4.50% |
12/15/26 | 13,000 | 13,352 | |||||||||
| Rockies Express Pipeline LLC |
|
|||||||||||
| 3.60% |
05/15/254 | 30,000 | 29,534 | |||||||||
| 6.88% |
04/15/404 | 17,000 | 16,872 | |||||||||
| Ruby Pipeline LLC |
|
|||||||||||
| 8.00% |
04/01/221,2,4 | 5,758 | 5,355 | |||||||||
| Sabine Pass Liquefaction LLC |
|
|||||||||||
| 4.20% |
03/15/28 | 3,000 | 3,089 | |||||||||
| Shell International Finance BV |
|
|||||||||||
| (Netherlands) |
|
|||||||||||
| 2.88% |
11/26/415 | 10,000 | 9,005 | |||||||||
| 3.13% |
11/07/495 | 20,000 | 18,388 | |||||||||
| 4.00% |
05/10/465 | 11,000 | 11,476 | |||||||||
| 4.38% |
05/11/455 | 10,000 | 10,808 | |||||||||
| Southern Co. Gas Capital Corp. |
|
|||||||||||
| 2.45% |
10/01/23 | 13,000 | 12,957 | |||||||||
| 4.40% |
06/01/43 | 10,000 | 10,034 | |||||||||
| 5.88% |
03/15/41 | 30,000 | 35,513 | |||||||||
| Southern Natural Gas Co. LLC |
|
|||||||||||
| 4.80% |
03/15/474 | 15,000 | 15,934 | |||||||||
| TC PipeLines LP |
|
|||||||||||
| 4.38% |
03/13/25 | 30,000 | 30,729 | |||||||||
| Texas Eastern Transmission LP |
|
|||||||||||
| 2.80% |
10/15/224 | 40,000 | 40,141 | |||||||||
| TransCanada PipeLines Ltd. |
|
|||||||||||
| (Canada) |
|
|||||||||||
| 5.00% |
10/16/435 | 15,000 | 16,547 | |||||||||
| Williams Cos., Inc. (The) |
|
|||||||||||
| 3.90% |
01/15/25 | 8,000 | 8,120 | |||||||||
|
|
|
| ||||||||||
| 747,117 | ||||||||||||
|
|
|
| ||||||||||
| Finance — 10.46% |
|
|||||||||||
| AerCap Ireland Capital DAC/AerCap Global Aviation Trust |
|
|||||||||||
| (Ireland) |
|
|||||||||||
| 2.45% |
10/29/265 | 28,000 | 25,898 | |||||||||
| 3.00% |
10/29/285 | 15,000 | 13,831 | |||||||||
| 3.88% |
01/23/285 | 4,000 | 3,896 | |||||||||
| Air Lease Corp. |
|
|||||||||||
| 3.63% |
12/01/27 | 19,000 | 18,142 | |||||||||
| 4.25% |
09/15/24 | 20,000 | 20,256 | |||||||||
| American Express Co. |
|
|||||||||||
| 2.55% |
03/04/27 | 20,000 | 19,448 | |||||||||
| Avolon Holdings Funding Ltd. |
|
|||||||||||
| (Cayman Islands) |
|
|||||||||||
| 2.53% |
11/18/274,5 | 3,000 | 2,655 | |||||||||
| 2.88% |
02/15/254,5 | 25,000 | 24,204 | |||||||||
| Capital One Financial Corp. |
|
|||||||||||
| 1.34% |
12/06/243 | 35,000 | 33,974 | |||||||||
| 3.27% |
03/01/303 | 10,000 | 9,679 | |||||||||
| Cboe Global Markets, Inc. |
|
|||||||||||
| 3.00% |
03/16/32 | 20,000 | 19,363 | |||||||||
| Charles Schwab Corp. (The) |
|
|||||||||||
| 2.90% |
03/03/32 | 20,000 | 19,261 | |||||||||
| Citigroup, Inc. |
|
|||||||||||
| 2.57% |
06/03/313 | 100,000 | 91,791 | |||||||||
See accompanying Notes to Financial Statements.
| Annual Report March 2022 / 42 |
Table of Contents
Corporate Bond Fund
Schedule of Portfolio Investments
March 31, 2022
| Issues |
Maturity Date |
Principal Amount |
Value | |||||||||
| CORPORATES (continued) |
|
|||||||||||
| Finance (continued) |
|
|||||||||||
| 2.88% |
07/24/233 | $ | 50,000 | $ | 50,081 | |||||||
| 3.06% |
01/25/333 | 25,000 | 23,410 | |||||||||
| 3.52% |
10/27/283 | 30,000 | 29,760 | |||||||||
| 3.67% |
07/24/283 | 25,000 | 25,085 | |||||||||
| 3.79% |
03/17/333 | 30,000 | 29,837 | |||||||||
| Citigroup, Inc., |
|
|||||||||||
| Series VAR |
|
|||||||||||
| 3.07% |
02/24/283 | 25,000 | 24,412 | |||||||||
| CME Group, Inc. |
|
|||||||||||
| 2.65% |
03/15/32 | 20,000 | 19,147 | |||||||||
| Ford Motor Credit Co. LLC |
|
|||||||||||
| 4.25% |
09/20/22 | 19,000 | 19,139 | |||||||||
| Goldman Sachs Group, Inc. (The) |
|
|||||||||||
| 1.43% |
03/09/273 | 15,000 | 13,847 | |||||||||
| 1.54% |
09/10/273 | 20,000 | 18,339 | |||||||||
| 1.95% |
10/21/273 | 20,000 | 18,601 | |||||||||
| 2.38% |
07/21/323 | 10,000 | 8,892 | |||||||||
| 2.60% |
02/07/30 | 100,000 | 92,871 | |||||||||
| 2.91% |
07/24/233 | 35,000 | 35,052 | |||||||||
| 3.10% |
02/24/333 | 25,000 | 23,591 | |||||||||
| 3.27% |
09/29/253 | 30,000 | 29,985 | |||||||||
| 3.50% |
11/16/26 | 5,000 | 5,025 | |||||||||
| Intercontinental Exchange, Inc. |
|
|||||||||||
| 1.85% |
09/15/32 | 50,000 | 43,354 | |||||||||
| JPMorgan Chase & Co. |
|
|||||||||||
| 2.95% |
02/24/283 | 20,000 | 19,525 | |||||||||
| LSEGA Financing PLC |
|
|||||||||||
| (United Kingdom) |
|
|||||||||||
| 2.00% |
04/06/284,5 | 40,000 | 36,485 | |||||||||
| Morgan Stanley |
|
|||||||||||
| 0.99% |
12/10/263 | 70,000 | 64,418 | |||||||||
| 2.94% |
01/21/333 | 50,000 | 46,877 | |||||||||
| Morgan Stanley |
|
|||||||||||
| (GMTN) |
|
|||||||||||
| 1.51% |
07/20/273 | 85,000 | 78,409 | |||||||||
| 3.70% |
10/23/24 | 5,000 | 5,091 | |||||||||
| 3.77% |
01/24/293 | 25,000 | 25,226 | |||||||||
| Morgan Stanley |
|
|||||||||||
| (MTN) |
|
|||||||||||
| 1.16% |
10/21/253 | 15,000 | 14,262 | |||||||||
| Morgan Stanley, |
|
|||||||||||
| Series F |
|
|||||||||||
| 3.88% |
04/29/24 | 20,000 | 20,411 | |||||||||
| Nationwide Building Society |
|
|||||||||||
| (United Kingdom) |
|
|||||||||||
| 3.62% |
04/26/233,4,5 | 10,000 | 10,002 | |||||||||
| 3.77% |
03/08/243,4,5 | 65,000 | 65,385 | |||||||||
| 4.36% |
08/01/243,4,5 | 15,000 | 15,236 | |||||||||
| Park Aerospace Holdings Ltd. |
|
|||||||||||
| (Cayman Islands) |
|
|||||||||||
| 5.50% |
02/15/244,5 | 2,000 | 2,049 | |||||||||
| Pipeline Funding Co. LLC |
|
|||||||||||
| 7.50% |
01/15/304 | 26,349 | 30,891 | |||||||||
| Raymond James Financial, Inc. |
|
|||||||||||
| 3.75% |
04/01/51 | 40,000 | 39,282 | |||||||||
| Issues |
Maturity Date |
Principal Amount |
Value | |||||||||
| CORPORATES (continued) |
|
|||||||||||
| Finance (continued) |
|
|||||||||||
| 4.65% |
04/01/30 | $ | 25,000 | $ | 26,548 | |||||||
|
|
|
| ||||||||||
| 1,312,923 | ||||||||||||
|
|
|
| ||||||||||
| Food — 0.97% |
|
|||||||||||
| Kraft Heinz Foods Co. |
|
|||||||||||
| 3.75% |
04/01/30 | 5,000 | 5,012 | |||||||||
| 4.63% |
10/01/39 | 10,000 | 10,137 | |||||||||
| 5.00% |
07/15/35 | 10,000 | 10,735 | |||||||||
| Mondelez International, Inc. |
|
|||||||||||
| 3.00% |
03/17/32 | 35,000 | 33,811 | |||||||||
| Pilgrim’s Pride Corp. |
|
|||||||||||
| 3.50% |
03/01/324 | 35,000 | 30,632 | |||||||||
| Smithfield Foods, Inc. |
|
|||||||||||
| 2.63% |
09/13/314 | 30,000 | 26,325 | |||||||||
| 5.20% |
04/01/294 | 5,000 | 5,252 | |||||||||
|
|
|
| ||||||||||
| 121,904 | ||||||||||||
|
|
|
| ||||||||||
| Health Care — 11.30% |
|
|||||||||||
| AbbVie, Inc. |
|
|||||||||||
| 4.05% |
11/21/39 | 20,000 | 20,645 | |||||||||
| 4.40% |
11/06/42 | 45,000 | 47,822 | |||||||||
| 4.50% |
05/14/35 | 13,000 | 13,983 | |||||||||
| 4.55% |
03/15/35 | 20,000 | 21,518 | |||||||||
| Amgen, Inc. |
|
|||||||||||
| 3.15% |
02/21/40 | 45,000 | 41,108 | |||||||||
| 3.35% |
02/22/32 | 25,000 | 24,803 | |||||||||
| 4.40% |
05/01/45 | 15,000 | 15,817 | |||||||||
| Anthem, Inc. |
|
|||||||||||
| 3.60% |
03/15/51 | 10,000 | 9,657 | |||||||||
| 3.70% |
09/15/49 | 15,000 | 14,651 | |||||||||
| Ascension Health, |
|
|||||||||||
| Series B |
|
|||||||||||
| 2.53% |
11/15/29 | 10,000 | 9,637 | |||||||||
| Barnabas Health, Inc., |
|
|||||||||||
| Series 2012 |
|
|||||||||||
| 4.00% |
07/01/28 | 5,000 | 5,107 | |||||||||
| Baxter International, Inc. |
|
|||||||||||
| 3.95% |
04/01/30 | 10,000 | 10,329 | |||||||||
| Bayer U.S. Finance II LLC |
|
|||||||||||
| 3.88% |
12/15/234 | 5,000 | 5,054 | |||||||||
| 4.38% |
12/15/284 | 25,000 | 25,592 | |||||||||
| 4.88% |
06/25/484 | 30,000 | 32,374 | |||||||||
| Becton Dickinson and Co. |
|
|||||||||||
| 3.79% |
05/20/50 | 30,000 | 29,175 | |||||||||
| 4.67% |
06/06/47 | 5,000 | 5,467 | |||||||||
| Centene Corp. |
|
|||||||||||
| 3.00% |
10/15/30 | 21,000 | 19,320 | |||||||||
| Children’s Hospital Medical Center |
|
|||||||||||
| 2.82% |
11/15/50 | 20,000 | 17,190 | |||||||||
| Cigna Corp. |
|
|||||||||||
| 3.40% |
03/15/51 | 5,000 | 4,525 | |||||||||
| 3.88% |
10/15/47 | 33,000 | 32,288 | |||||||||
| 4.38% |
10/15/28 | 25,000 | 26,337 | |||||||||
| City of Hope, |
|
|||||||||||
| Series 2013 |
|
|||||||||||
| 5.62% |
11/15/43 | 15,000 | 18,318 | |||||||||
See accompanying Notes to Financial Statements.
| 43 / Annual Report March 2022 |
Table of Contents
Corporate Bond Fund
Schedule of Portfolio Investments
March 31, 2022
| Issues |
Maturity Date |
Principal Amount |
Value | |||||||||
| CORPORATES (continued) |
|
|||||||||||
| Health Care (continued) |
|
|||||||||||
| City of Hope, |
|
|||||||||||
| Series 2018 |
|
|||||||||||
| 4.38% |
08/15/48 | $ | 10,000 | $ | 10,865 | |||||||
| CommonSpirit Health |
|
|||||||||||
| 2.78% |
10/01/30 | 35,000 | 32,475 | |||||||||
| 3.91% |
10/01/50 | 10,000 | 9,572 | |||||||||
| CVS Health Corp. |
|
|||||||||||
| 5.05% |
03/25/48 | 68,000 | 77,126 | |||||||||
| Danaher Corp. |
|
|||||||||||
| 2.80% |
12/10/51 | 30,000 | 25,553 | |||||||||
| DENTSPLY SIRONA, Inc. |
|
|||||||||||
| 3.25% |
06/01/30 | 45,000 | 43,429 | |||||||||
| Elanco Animal Health, Inc. |
|
|||||||||||
| 6.40% |
08/28/28 | 5,000 | 5,388 | |||||||||
| Hackensack Meridian Health, Inc., |
|
|||||||||||
| Series 2020 |
|
|||||||||||
| 2.88% |
09/01/50 | 30,000 | 25,636 | |||||||||
| HCA, Inc. |
|
|||||||||||
| 2.38% |
07/15/31 | 5,000 | 4,472 | |||||||||
| 3.63% |
03/15/324 | 5,000 | 4,903 | |||||||||
| 5.00% |
03/15/24 | 29,000 | 30,066 | |||||||||
| 5.25% |
06/15/49 | 50,000 | 54,974 | |||||||||
| Humana, Inc. |
|
|||||||||||
| 3.95% |
03/15/27 | 25,000 | 25,434 | |||||||||
| Illumina, Inc. |
|
|||||||||||
| 2.55% |
03/23/31 | 35,000 | 31,837 | |||||||||
| Johnson & Johnson |
|
|||||||||||
| 4.50% |
09/01/40 | 35,000 | 39,576 | |||||||||
| Kaiser Foundation Hospitals |
|
|||||||||||
| 3.15% |
05/01/27 | 10,000 | 9,990 | |||||||||
| Mass General Brigham, Inc., |
|
|||||||||||
| Series 2020 |
|
|||||||||||
| 3.34% |
07/01/60 | 10,000 | 9,110 | |||||||||
| Mayo Clinic, |
|
|||||||||||
| Series 2013 |
|
|||||||||||
| 4.00% |
11/15/47 | 25,000 | 26,222 | |||||||||
| Memorial Sloan-Kettering Cancer Center |
|
|||||||||||
| 4.13% |
07/01/52 | 5,000 | 5,336 | |||||||||
| Merck & Co., Inc. |
|
|||||||||||
| 2.15% |
12/10/31 | 50,000 | 46,351 | |||||||||
| NYU Langone Hospitals, |
|
|||||||||||
| Series 2020 |
|
|||||||||||
| 3.38% |
07/01/55 | 15,000 | 13,443 | |||||||||
| OhioHealth Corp., |
|
|||||||||||
| Series 2020 |
|
|||||||||||
| 3.04% |
11/15/50 | 15,000 | 13,334 | |||||||||
| PerkinElmer, Inc. |
|
|||||||||||
| 2.25% |
09/15/31 | 20,000 | 17,732 | |||||||||
| 2.55% |
03/15/31 | 35,000 | 32,094 | |||||||||
| Pfizer, Inc. |
|
|||||||||||
| 4.10% |
09/15/38 | 10,000 | 10,838 | |||||||||
| Providence St. Joseph Health Obligated Group, |
|
|||||||||||
| Series H |
|
|||||||||||
| 2.75% |
10/01/26 | 10,000 | 9,908 | |||||||||
| Regeneron Pharmaceuticals, Inc. |
|
|||||||||||
| 1.75% |
09/15/30 | 70,000 | 60,719 | |||||||||
| Issues |
Maturity Date |
Principal Amount |
Value | |||||||||
| CORPORATES (continued) |
|
|||||||||||
| Health Care (continued) |
|
|||||||||||
| Royalty Pharma PLC |
|
|||||||||||
| (United Kingdom) |
|
|||||||||||
| 1.75% |
09/02/275 | $ | 45,000 | $ | 40,941 | |||||||
| Sharp HealthCare, |
|
|||||||||||
| Series 20B |
|
|||||||||||
| 2.68% |
08/01/50 | 50,000 | 41,845 | |||||||||
| Smith & Nephew PLC |
|
|||||||||||
| (United Kingdom) |
|
|||||||||||
| 2.03% |
10/14/305 | 30,000 | 26,121 | |||||||||
| STERIS Irish FinCo UnLtd Co. |
|
|||||||||||
| (Ireland) |
|
|||||||||||
| 2.70% |
03/15/315 | 30,000 | 27,497 | |||||||||
| UnitedHealth Group, Inc. |
|
|||||||||||
| 3.25% |
05/15/51 | 50,000 | 47,321 | |||||||||
| 3.70% |
08/15/49 | 10,000 | 10,190 | |||||||||
| 4.25% |
04/15/47 | 15,000 | 16,320 | |||||||||
| Universal Health Services, Inc. |
|
|||||||||||
| 1.65% |
09/01/264 | 40,000 | 36,714 | |||||||||
| Viatris, Inc. |
|
|||||||||||
| 1.13% |
06/22/22 | 15,000 | 14,999 | |||||||||
| West Virginia United Health System Obligated Group, |
|
|||||||||||
| Series 2020 |
|
|||||||||||
| 3.13% |
06/01/50 | 35,000 | 29,647 | |||||||||
|
|
|
| ||||||||||
| 1,418,695 | ||||||||||||
|
|
|
| ||||||||||
| Industrials — 2.96% |
|
|||||||||||
| Amcor Flexibles North America, Inc. |
|
|||||||||||
| 2.63% |
06/19/30 | 5,000 | 4,622 | |||||||||
| BAE Systems Holdings, Inc. |
|
|||||||||||
| 3.85% |
12/15/254 | 20,000 | 20,092 | |||||||||
| BAE Systems PLC |
|
|||||||||||
| (United Kingdom) |
|
|||||||||||
| 3.40% |
04/15/304,5 | 30,000 | 29,602 | |||||||||
| Berry Global, Inc. |
|
|||||||||||
| 0.95% |
02/15/24 | 15,000 | 14,364 | |||||||||
| 1.57% |
01/15/26 | 28,000 | 26,147 | |||||||||
| Boeing Co. (The) |
|
|||||||||||
| 1.43% |
02/04/24 | 35,000 | 33,878 | |||||||||
| 5.93% |
05/01/60 | 12,000 | 13,923 | |||||||||
| CCL Industries, Inc. |
|
|||||||||||
| (Canada) |
|
|||||||||||
| 3.05% |
06/01/304,5 | 25,000 | 23,508 | |||||||||
| General Electric Co. |
|
|||||||||||
| (MTN) |
|
|||||||||||
| (LIBOR USD 3-Month plus 0.38%) |
|
|||||||||||
| 0.70% |
05/05/266 | 10,000 | 9,846 | |||||||||
| L3Harris Technologies, Inc. |
|
|||||||||||
| 3.85% |
06/15/23 | 40,000 | 40,516 | |||||||||
| Northrop Grumman Corp. |
|
|||||||||||
| 5.15% |
05/01/40 | 28,000 | 32,689 | |||||||||
| Sealed Air Corp. |
|
|||||||||||
| 1.57% |
10/15/264 | 20,000 | 18,263 | |||||||||
| Sonoco Products Co. |
|
|||||||||||
| 3.13% |
05/01/30 | 10,000 | 9,627 | |||||||||
See accompanying Notes to Financial Statements.
| Annual Report March 2022 / 44 |
Table of Contents
Corporate Bond Fund
Schedule of Portfolio Investments
March 31, 2022
| Issues |
Maturity Date |
Principal Amount |
Value | |||||||||
| CORPORATES (continued) |
|
|||||||||||
| Industrials (continued) |
|
|||||||||||
| Sydney Airport Finance Co. Pty Ltd. |
|
|||||||||||
| (Australia) |
|
|||||||||||
| 3.63% |
04/28/264,5 | $ | 5,000 | $ | 5,023 | |||||||
| 3.90% |
03/22/234,5 | 50,000 | 50,595 | |||||||||
| Trane Technologies Luxembourg Finance SA |
|
|||||||||||
| (Luxembourg) |
|
|||||||||||
| 3.55% |
11/01/245 | 5,000 | 5,055 | |||||||||
| WRKCo, Inc. |
|
|||||||||||
| 3.00% |
09/15/24 | 30,000 | 29,748 | |||||||||
| 3.00% |
06/15/33 | 5,000 | 4,673 | |||||||||
|
|
|
| ||||||||||
| 372,171 | ||||||||||||
|
|
|
| ||||||||||
| Information Technology — 4.81% |
|
|||||||||||
| Amazon.com, Inc. |
|
|||||||||||
| 2.50% |
06/03/50 | 67,000 | 56,210 | |||||||||
| 3.10% |
05/12/51 | 7,000 | 6,591 | |||||||||
| Analog Devices, Inc. |
|
|||||||||||
| 2.95% |
10/01/51 | 35,000 | 31,652 | |||||||||
| Apple, Inc. |
|
|||||||||||
| 2.38% |
02/08/41 | 25,000 | 21,734 | |||||||||
| 2.65% |
02/08/51 | 31,000 | 26,865 | |||||||||
| 2.70% |
08/05/51 | 70,000 | 60,961 | |||||||||
| Broadcom, Inc. |
|
|||||||||||
| 2.60% |
02/15/334 | 30,000 | 26,134 | |||||||||
| 3.14% |
11/15/354 | 25,000 | 22,067 | |||||||||
| 3.42% |
04/15/334 | 15,000 | 14,006 | |||||||||
| 3.63% |
10/15/24 | 15,000 | 15,210 | |||||||||
| CDW LLC/CDW Finance Corp. |
|
|||||||||||
| 3.28% |
12/01/28 | 25,000 | 23,606 | |||||||||
| Fiserv, Inc. |
|
|||||||||||
| 2.65% |
06/01/30 | 15,000 | 13,866 | |||||||||
| Intel Corp. |
|
|||||||||||
| 3.05% |
08/12/51 | 20,000 | 17,811 | |||||||||
| 3.25% |
11/15/49 | 15,000 | 13,898 | |||||||||
| Micron Technology, Inc. |
|
|||||||||||
| 2.70% |
04/15/32 | 25,000 | 22,711 | |||||||||
| Netflix, Inc. |
|
|||||||||||
| 3.63% |
06/15/254 | 30,000 | 30,197 | |||||||||
| NVIDIA Corp. |
|
|||||||||||
| 3.50% |
04/01/50 | 20,000 | 20,276 | |||||||||
| NXP BV/NXP Funding LLC |
|
|||||||||||
| (Netherlands) |
|
|||||||||||
| 4.63% |
06/01/234,5 | 10,000 | 10,150 | |||||||||
| Oracle Corp. |
|
|||||||||||
| 3.60% |
04/01/50 | 82,000 | 68,211 | |||||||||
| 3.95% |
03/25/51 | 25,000 | 21,900 | |||||||||
| salesforce.com, Inc. |
|
|||||||||||
| 2.90% |
07/15/51 | 30,000 | 26,841 | |||||||||
| Skyworks Solutions, Inc. |
|
|||||||||||
| 0.90% |
06/01/23 | 25,000 | 24,455 | |||||||||
| VMware, Inc. |
|
|||||||||||
| 1.00% |
08/15/24 | 30,000 | 28,606 | |||||||||
|
|
|
| ||||||||||
| 603,958 | ||||||||||||
|
|
|
| ||||||||||
| Issues |
Maturity Date |
Principal Amount |
Value | |||||||||
| CORPORATES (continued) |
|
|||||||||||
| Insurance — 5.89% |
|
|||||||||||
| Allstate Corp. (The) |
|
|||||||||||
| 3.85% |
08/10/49 | $ | 20,000 | $ | 20,386 | |||||||
| Aon Corp. |
|
|||||||||||
| 2.80% |
05/15/30 | 25,000 | 23,815 | |||||||||
| 3.75% |
05/02/29 | 5,000 | 5,118 | |||||||||
| Aon Corp./Aon Global Holdings PLC |
|
|||||||||||
| 2.05% |
08/23/31 | 10,000 | 8,843 | |||||||||
| Arthur J Gallagher & Co. |
|
|||||||||||
| 3.05% |
03/09/52 | 20,000 | 16,446 | |||||||||
| Athene Global Funding |
|
|||||||||||
| 1.61% |
06/29/264 | 15,000 | 13,679 | |||||||||
| 1.99% |
08/19/284 | 10,000 | 8,790 | |||||||||
| (SOFR Rate plus 0.70%) |
|
|||||||||||
| 0.91% |
05/24/244,6 | 30,000 | 29,628 | |||||||||
| Berkshire Hathaway Finance Corp. |
|
|||||||||||
| 2.85% |
10/15/50 | 35,000 | 30,436 | |||||||||
| 2.88% |
03/15/32 | 10,000 | 9,705 | |||||||||
| 4.20% |
08/15/48 | 20,000 | 21,547 | |||||||||
| Brown & Brown, Inc. |
|
|||||||||||
| 4.20% |
03/17/32 | 40,000 | 40,673 | |||||||||
| Equitable Financial Life Global Funding |
|
|||||||||||
| 1.80% |
03/08/284 | 20,000 | 18,004 | |||||||||
| Farmers Exchange Capital II |
|
|||||||||||
| 6.15% |
11/01/533,4 | 10,000 | 11,840 | |||||||||
| Farmers Insurance Exchange |
|
|||||||||||
| 4.75% |
11/01/573,4 | 55,000 | 57,780 | |||||||||
| Guardian Life Insurance Co. of America (The) |
|
|||||||||||
| 3.70% |
01/22/704 | 45,000 | 41,058 | |||||||||
| Marsh & McLennan Cos., Inc. |
|
|||||||||||
| 2.25% |
11/15/30 | 10,000 | 9,141 | |||||||||
| Massachusetts Mutual Life Insurance Co. |
|
|||||||||||
| 3.38% |
04/15/504 | 37,000 | 33,384 | |||||||||
| MMI Capital Trust I, |
|
|||||||||||
| Series B |
|
|||||||||||
| 7.63% |
12/15/27 | 25,000 | 29,351 | |||||||||
| Nationwide Mutual Insurance Co. |
|
|||||||||||
| 3.12% |
12/15/243,4 | 45,000 | 45,031 | |||||||||
| New York Life Insurance Co. |
|
|||||||||||
| 3.75% |
05/15/504 | 65,000 | 63,293 | |||||||||
| Northwestern Mutual Life Insurance Co. (The) |
|
|||||||||||
| 3.45% |
03/30/514 | 39,000 | 35,620 | |||||||||
| Principal Life Global Funding II |
|
|||||||||||
| 0.75% |
04/12/244 | 25,000 | 23,922 | |||||||||
| Teachers Insurance & Annuity Association of America |
|
|||||||||||
| 3.30% |
05/15/504 | 15,000 | 13,339 | |||||||||
| 4.38% |
09/15/543,4 | 65,000 | 64,786 | |||||||||
| Travelers Cos., Inc. (The) |
|
|||||||||||
| 4.05% |
03/07/48 | 10,000 | 10,523 | |||||||||
| Trinity Acquisition PLC |
|
|||||||||||
| (United Kingdom) |
|
|||||||||||
| 4.40% |
03/15/265 | 20,000 | 20,658 | |||||||||
| Willis North America, Inc. |
|
|||||||||||
| 2.95% |
09/15/29 | 35,000 | 32,911 | |||||||||
|
|
|
| ||||||||||
| 739,707 | ||||||||||||
|
|
|
| ||||||||||
See accompanying Notes to Financial Statements.
| 45 / Annual Report March 2022 |
Table of Contents
Corporate Bond Fund
Schedule of Portfolio Investments
March 31, 2022
| Issues |
Maturity Date |
Principal Amount |
Value | |||||||||
| CORPORATES (continued) |
|
|||||||||||
| Materials — 0.60% |
|
|||||||||||
| Georgia-Pacific LLC |
|
|||||||||||
| 2.30% |
04/30/304 | $ | 10,000 | $ | 9,296 | |||||||
| 3.60% |
03/01/254 | 20,000 | 20,214 | |||||||||
| International Flavors & Fragrances, Inc. |
|
|||||||||||
| 1.23% |
10/01/254 | 5,000 | 4,635 | |||||||||
| 2.30% |
11/01/304 | 15,000 | 13,414 | |||||||||
| 5.00% |
09/26/48 | 25,000 | 27,527 | |||||||||
|
|
|
| ||||||||||
| 75,086 | ||||||||||||
|
|
|
| ||||||||||
| Real Estate Investment Trust (REIT) — 6.40% |
|
|||||||||||
| Alexandria Real Estate Equities, Inc. |
|
|||||||||||
| 4.50% |
07/30/29 | 11,000 | 11,713 | |||||||||
| American Assets Trust LP |
|
|||||||||||
| 3.38% |
02/01/31 | 30,000 | 28,231 | |||||||||
| American Campus Communities Operating Partnership LP |
|
|||||||||||
| 2.25% |
01/15/29 | 15,000 | 13,695 | |||||||||
| 3.30% |
07/15/26 | 10,000 | 9,959 | |||||||||
| 3.63% |
11/15/27 | 35,000 | 34,852 | |||||||||
| 3.75% |
04/15/23 | 25,000 | 25,221 | |||||||||
| American Homes 4 Rent LP |
|
|||||||||||
| 2.38% |
07/15/31 | 15,000 | 13,280 | |||||||||
| Boston Properties LP |
|
|||||||||||
| 2.55% |
04/01/32 | 10,000 | 9,027 | |||||||||
| 3.25% |
01/30/31 | 5,000 | 4,850 | |||||||||
| 3.40% |
06/21/29 | 5,000 | 4,962 | |||||||||
| Crown Castle International Corp. |
|
|||||||||||
| 3.30% |
07/01/30 | 50,000 | 47,887 | |||||||||
| CubeSmart LP |
|
|||||||||||
| 2.25% |
12/15/28 | 20,000 | 18,233 | |||||||||
| 4.38% |
02/15/29 | 5,000 | 5,239 | |||||||||
| CyrusOne LP/CyrusOne Finance Corp. |
|
|||||||||||
| 2.90% |
11/15/24 | 5,000 | 5,014 | |||||||||
| 3.45% |
11/15/29 | 55,000 | 57,755 | |||||||||
| Equinix, Inc. |
|
|||||||||||
| 3.90% |
04/15/32 | 30,000 | 29,842 | |||||||||
| Essex Portfolio LP |
|
|||||||||||
| 2.65% |
03/15/32 | 5,000 | 4,576 | |||||||||
| Extra Space Storage LP |
|
|||||||||||
| 3.90% |
04/01/29 | 25,000 | 25,097 | |||||||||
| GLP Capital LP/GLP Financing II, Inc. |
|
|||||||||||
| 3.35% |
09/01/24 | 5,000 | 4,997 | |||||||||
| 4.00% |
01/15/30 | 65,000 | 63,563 | |||||||||
| Healthcare Realty Trust, Inc. |
|
|||||||||||
| 3.63% |
01/15/28 | 30,000 | 29,777 | |||||||||
| Healthcare Trust of America Holdings LP |
|
|||||||||||
| 2.00% |
03/15/31 | 15,000 | 13,002 | |||||||||
| Healthpeak Properties, Inc. |
|
|||||||||||
| 4.00% |
06/01/25 | 35,000 | 35,616 | |||||||||
| Hudson Pacific Properties LP |
|
|||||||||||
| 3.95% |
11/01/27 | 50,000 | 50,299 | |||||||||
| Invitation Homes Operating Partnership LP |
|
|||||||||||
| 2.30% |
11/15/28 | 30,000 | 27,285 | |||||||||
| Kilroy Realty LP |
|
|||||||||||
| 2.50% |
11/15/32 | 15,000 | 13,056 | |||||||||
| 3.45% |
12/15/24 | 10,000 | 10,032 | |||||||||
| Issues |
Maturity Date |
Principal Amount |
Value | |||||||||
| CORPORATES (continued) |
|
|||||||||||
| Real Estate Investment Trust (REIT) (continued) |
|
|||||||||||
| Life Storage LP |
|
|||||||||||
| 2.20% |
10/15/30 | $ | 40,000 | $ | 35,407 | |||||||
| LXP Industrial Trust |
|
|||||||||||
| 2.38% |
10/01/31 | 5,000 | 4,445 | |||||||||
| 2.70% |
09/15/30 | 45,000 | 41,597 | |||||||||
| MGM Growth Properties Operating Partnership LP/MGP Finance Co.-Issuer, Inc. |
|
|||||||||||
| 4.63% |
06/15/254 | 28,000 | 28,355 | |||||||||
| Mid-America Apartments LP |
|
|||||||||||
| 1.70% |
02/15/31 | 10,000 | 8,657 | |||||||||
| Piedmont Operating Partnership LP |
|
|||||||||||
| 2.75% |
04/01/32 | 15,000 | 13,346 | |||||||||
| SL Green Operating Partnership LP |
|
|||||||||||
| 3.25% |
10/15/22 | 45,000 | 45,017 | |||||||||
| UDR, Inc. |
|
|||||||||||
| (MTN) |
|
|||||||||||
| 4.40% |
01/26/29 | 5,000 | 5,262 | |||||||||
| Ventas Realty LP |
|
|||||||||||
| 4.13% |
01/15/26 | 10,000 | 10,240 | |||||||||
| Weyerhaeuser Co. |
|
|||||||||||
| 3.38% |
03/09/33 | 15,000 | 14,631 | |||||||||
|
|
|
| ||||||||||
| 804,017 | ||||||||||||
|
|
|
| ||||||||||
| Retail — 0.88% |
|
|||||||||||
| 7-Eleven, Inc. |
|
|||||||||||
| 0.80% |
02/10/244 | 35,000 | 33,644 | |||||||||
| Alimentation Couche-Tard, Inc. |
|
|||||||||||
| (Canada) |
|
|||||||||||
| 3.80% |
01/25/504,5 | 45,000 | 41,974 | |||||||||
| McDonald’s Corp. |
|
|||||||||||
| (MTN) |
|
|||||||||||
| 4.20% |
04/01/50 | 15,000 | 15,725 | |||||||||
| Starbucks Corp. |
|
|||||||||||
| 3.00% |
02/14/32 | 20,000 | 19,131 | |||||||||
|
|
|
| ||||||||||
| 110,474 | ||||||||||||
|
|
|
| ||||||||||
| Services — 1.42% |
|
|||||||||||
| Global Payments, Inc. |
|
|||||||||||
| 1.50% |
11/15/24 | 35,000 | 33,470 | |||||||||
| Moody’s Corp. |
|
|||||||||||
| 2.75% |
08/19/41 | 20,000 | 17,232 | |||||||||
| 3.75% |
02/25/52 | 15,000 | 14,820 | |||||||||
| Northwestern University |
|
|||||||||||
| 3.69% |
12/01/38 | 10,000 | 10,710 | |||||||||
| RELX Capital, Inc. |
|
|||||||||||
| 4.00% |
03/18/29 | 35,000 | 35,939 | |||||||||
| S&P Global, Inc. |
|
|||||||||||
| 4.75% |
08/01/284 | 15,000 | 16,128 | |||||||||
| University of Southern California |
|
|||||||||||
| 2.81% |
10/01/50 | 10,000 | 8,841 | |||||||||
| Waste Connections, Inc. |
|
|||||||||||
| (Canada) |
|
|||||||||||
| 2.60% |
02/01/305 | 5,000 | 4,710 | |||||||||
| 3.05% |
04/01/505 | 20,000 | 17,370 | |||||||||
| 3.20% |
06/01/325 | 15,000 | 14,624 | |||||||||
See accompanying Notes to Financial Statements.
| Annual Report March 2022 / 46 |
Table of Contents
Corporate Bond Fund
Schedule of Portfolio Investments
March 31, 2022
| Issues | Maturity Date |
Principal Amount |
Value | |||||||||
| CORPORATES (continued) |
|
|||||||||||
| Services (continued) |
|
|||||||||||
| William Marsh Rice University |
|
|||||||||||
| 2.60% |
05/15/50 | $ | 5,000 | $ | 4,278 | |||||||
|
|
|
| ||||||||||
| 178,122 | ||||||||||||
|
|
|
| ||||||||||
| Transportation — 1.97% |
|
|||||||||||
| Burlington Northern Santa Fe LLC |
|
|||||||||||
| 3.30% |
09/15/51 | 20,000 | 19,094 | |||||||||
| 4.40% |
03/15/42 | 18,000 | 19,636 | |||||||||
| Canadian Pacific Railway Co. |
|
|||||||||||
| (Canada) |
|
|||||||||||
| 2.45% |
12/02/315 | 35,000 | 32,491 | |||||||||
| Delta Air Lines Pass-Through Trust, |
|
|||||||||||
| Series 2020-1, Class AA |
|
|||||||||||
| 2.00% |
06/10/28 | 22,758 | 20,889 | |||||||||
| JetBlue Airways Pass-Through Trust, |
|
|||||||||||
| Series 2019-1, Class AA |
|
|||||||||||
| 2.75% |
05/15/32 | 13,720 | 12,677 | |||||||||
| JetBlue Airways Pass-Through Trust, |
|
|||||||||||
| Series 2020-1, Class A |
|
|||||||||||
| 4.00% |
11/15/32 | 28,037 | 27,906 | |||||||||
| Norfolk Southern Corp. |
|
|||||||||||
| 3.00% |
03/15/32 | 15,000 | 14,640 | |||||||||
| U.S. Airways Pass-Through Trust, |
|
|||||||||||
| Series 2011-1, Class A |
|
|||||||||||
| 7.13% |
10/22/23 | 20,595 | 21,131 | |||||||||
| U.S. Airways Pass-Through Trust, |
|
|||||||||||
| Series 2012-1, Class A |
|
|||||||||||
| 5.90% |
10/01/24 | 13,664 | 14,253 | |||||||||
| Union Pacific Corp. |
|
|||||||||||
| 2.80% |
02/14/32 | 15,000 | 14,434 | |||||||||
| 2.95% |
03/10/52 | 20,000 | 17,777 | |||||||||
| 3.84% |
03/20/60 | 25,000 | 25,222 | |||||||||
| United Airlines Pass-Through Trust, |
|
|||||||||||
| Series 2016-2, Class AA |
|
|||||||||||
| 2.88% |
10/07/28 | 7,886 | 7,439 | |||||||||
|
|
|
| ||||||||||
| 247,589 | ||||||||||||
|
|
|
| ||||||||||
| Water — 0.08% |
|
|||||||||||
| American Water Capital Corp. |
|
|||||||||||
| 3.45% |
05/01/50 | 11,000 | 10,382 | |||||||||
|
|
|
| ||||||||||
| Total Corporates |
|
|||||||||||
| (Cost $12,182,778) |
|
11,224,691 | ||||||||||
|
|
|
| ||||||||||
| MORTGAGE-BACKED — 0.57%** |
|
|||||||||||
| Non-Agency Commercial Mortgage-Backed — 0.26% |
|
|||||||||||
| Commercial Mortgage Trust, |
|
|||||||||||
| Series 2013-CR7, Class XA (IO) |
|
|||||||||||
| 1.17% |
03/10/463 | 302,141 | 2,366 | |||||||||
| Commercial Mortgage Trust, |
|
|||||||||||
| Series 2014-UBS5, Class XA (IO) |
|
|||||||||||
| 0.85% |
09/10/471,2,3 | 597,896 | 9,750 | |||||||||
| Commercial Mortgage Trust, |
|
|||||||||||
| Series 2014-UBS6, Class XA (IO) |
|
|||||||||||
| 0.86% |
12/10/473 | 433,667 | 8,158 | |||||||||
| Issues |
Maturity Date |
Principal Amount |
Value | |||||||||
| MORTGAGE-BACKED (continued) |
|
|||||||||||
| Non-Agency Commercial Mortgage-Backed (continued) |
|
|||||||||||
| GS Mortgage Securities Trust, |
|
|||||||||||
| Series 2010-C1, Class X (IO) |
|
|||||||||||
| 0.56% |
08/10/433,4 | $ | 1,281,307 | $ | 9,618 | |||||||
| GS Mortgage Securities Trust, |
|
|||||||||||
| Series 2011-GC3, Class X (IO) |
|
|||||||||||
| 0.00% |
03/10/443,4 | 102,516 | 1 | |||||||||
| Morgan Stanley Bank of America Merrill Lynch Trust, |
|
|||||||||||
| Series 2012-C5, Class XA (IO) |
|
|||||||||||
| 1.31% |
08/15/453,4 | 122,258 | 80 | |||||||||
| Morgan Stanley Bank of America Merrill Lynch Trust, |
|
|||||||||||
| Series 2012-C6, Class XA (IO) |
|
|||||||||||
| 1.57% |
11/15/451,2,3,4 | 130,009 | 129 | |||||||||
| UBS-Barclays Commercial Mortgage Trust, |
|
|||||||||||
| Series 2012-C3, Class XB (IO) |
|
|||||||||||
| 0.21% |
08/10/491,2,3,4 | 2,200,000 | 2,416 | |||||||||
| WF-RBS Commercial Mortgage Trust, |
|
|||||||||||
| Series 2012-C7, Class XA (IO) |
|
|||||||||||
| 1.20% |
06/15/453,4 | 294,702 | 91 | |||||||||
|
|
|
| ||||||||||
| 32,609 | ||||||||||||
|
|
|
| ||||||||||
| U.S. Agency Commercial Mortgage-Backed — 0.20% |
|
|||||||||||
| Fannie Mae-Aces, |
|
|||||||||||
| Series 2015-M4, Class X2 (IO) |
|
|||||||||||
| 2.84% |
07/25/223 | 20,052 | 1 | |||||||||
| Ginnie Mae, |
|
|||||||||||
| Series 2009-111, Class IO (IO) |
|
|||||||||||
| 0.19% |
09/16/513 | 518,385 | 22,959 | |||||||||
| Ginnie Mae, |
|
|||||||||||
| Series 2012-144, Class IO (IO) |
|
|||||||||||
| 0.33% |
01/16/533 | 162,023 | 1,718 | |||||||||
|
|
|
| ||||||||||
| 24,678 | ||||||||||||
|
|
|
| ||||||||||
| U.S. Agency Mortgage-Backed — 0.11% |
|
|||||||||||
| Fannie Mae REMICS, |
|
|||||||||||
| Series 2011-116, Class SA (IO) |
|
|||||||||||
| (-1.00 X LIBOR USD 1-Month plus 6.00%, 6.00% Cap) |
|
|||||||||||
| 5.54% |
11/25/416 | 31,332 | 3,295 | |||||||||
| Fannie Mae REMICS, |
|
|||||||||||
| Series 2012-128, Class UA |
|
|||||||||||
| 2.50% |
06/25/42 | 10,835 | 10,514 | |||||||||
|
|
|
| ||||||||||
| 13,809 | ||||||||||||
|
|
|
| ||||||||||
| Total Mortgage-Backed |
|
|||||||||||
| (Cost $227,078) |
|
71,096 | ||||||||||
|
|
|
| ||||||||||
| MUNICIPAL BONDS — 2.90%* |
|
|||||||||||
| California — 1.18% |
|
|||||||||||
| California State University Revenue Bonds, University & College Improvements, Series B |
|
|||||||||||
| 2.37% |
11/01/35 | 35,000 | 29,920 | |||||||||
| City of San Francisco Public Utilities Commission Water Revenue Bonds, Series E |
|
|||||||||||
| 2.83% |
11/01/41 | 25,000 | 22,498 | |||||||||
| Los Angeles Department of Airports Revenue Bonds, Port, Airport and Marina Improvements, Series A |
|
|||||||||||
| 3.89% |
05/15/38 | 15,000 | 14,819 | |||||||||
See accompanying Notes to Financial Statements.
| 47 / Annual Report March 2022 |
Table of Contents
Corporate Bond Fund
Schedule of Portfolio Investments
March 31, 2022
| Issues |
Maturity Date |
Principal Amount |
Value | |||||||||
| MUNICIPAL BONDS (continued) |
|
|||||||||||
| California (continued) |
|
|||||||||||
| Los Angeles Department of Water & Power Water System Revenue Bonds, Water Utility Improvements, Series SY |
|
|||||||||||
| 6.01% |
07/01/39 | $ | 5,000 | $ | 6,242 | |||||||
| Los Angeles Unified School District General Obligation Bonds, School Improvements, Series KR |
|
|||||||||||
| 5.75% |
07/01/34 | 30,000 | 35,575 | |||||||||
| 5.76% |
07/01/29 | 10,000 | 11,369 | |||||||||
| Los Angeles Unified School District General Obligation Bonds, School Improvements, Series RY |
|
|||||||||||
| 6.76% |
07/01/34 | 5,000 | 6,354 | |||||||||
| Regents of the University of California Medical Center Pooled Revenue Bonds, Health, Hospital and Nursing Home Improvements, Series N |
|
|||||||||||
| 3.26% |
05/15/60 | 5,000 | 4,479 | |||||||||
| Santa Clara Valley Transportation Authority Revenue Bonds, Transit Improvements |
|
|||||||||||
| 5.88% |
04/01/32 | 10,000 | 11,332 | |||||||||
| University of California, Taxable, College & University, Revenue Bonds, University & College Improvements, Series AJ |
|
|||||||||||
| 4.60% |
05/15/31 | 5,000 | 5,358 | |||||||||
|
|
|
| ||||||||||
| 147,946 | ||||||||||||
|
|
|
| ||||||||||
| Florida — 0.12% |
|
|||||||||||
| County of Miami-Dade Aviation Revenue Bonds, Airport and Marina Improvements, Series D |
|
|||||||||||
| 3.50% |
10/01/31 | 15,000 | 15,046 | |||||||||
|
|
|
| ||||||||||
| Massachusetts — 0.15% |
|
|||||||||||
| Massachusetts School Building Authority Revenue Bonds, Series A |
|
|||||||||||
| 2.50% |
02/15/37 | 10,000 | 8,760 | |||||||||
| Massachusetts School Building Authority Revenue Bonds, Series B |
|
|||||||||||
| 2.97% |
10/15/32 | 10,000 | 9,970 | |||||||||
|
|
|
| ||||||||||
| 18,730 | ||||||||||||
|
|
|
| ||||||||||
| Michigan — 0.12% |
|
|||||||||||
| University of Michigan Revenue Bonds, Taxable, Revenue Bonds, University & College Improvements, Series A |
|
|||||||||||
| 3.50% |
04/01/52 | 15,000 | 15,281 | |||||||||
| New York — 1.22% |
|
|||||||||||
| City of New York General Obligation Bonds, Series D |
|
|||||||||||
| 1.92% |
08/01/31 | 25,000 | 21,959 | |||||||||
| Metropolitan Transportation Authority Revenue Bonds, Transit Improvements, Series C2 |
|
|||||||||||
| 5.18% |
11/15/49 | 5,000 | 5,718 | |||||||||
| New York City Transitional Finance Authority Future Tax Secured Revenue Bonds, Public Improvements |
|
|||||||||||
| 3.73% |
08/01/29 | 5,000 | 5,074 | |||||||||
| New York City Transitional Finance Authority Future Tax Secured Revenue Bonds, Public Improvements, Series E |
|
|||||||||||
| 1.97% |
02/01/33 | 20,000 | 16,830 | |||||||||
| Issues |
Maturity Date |
Principal Amount |
Value | |||||||||
| MUNICIPAL BONDS (continued) |
|
|||||||||||
| New York (continued) |
|
|||||||||||
| New York City Transitional Finance Authority Future Tax Secured Revenue Bonds, Taxable Bonds, Public Improvements |
|
|||||||||||
| 3.96% |
08/01/32 | $ | 30,000 | $ | 30,535 | |||||||
| New York State Dormitory Authority Revenue Bonds, Series C |
|
|||||||||||
| 1.95% |
03/15/29 | 50,000 | 45,742 | |||||||||
| New York State Urban Development Corp. Revenue Bonds, Transit Improvements, Series B |
|
|||||||||||
| 2.54% |
03/15/34 | 10,000 | 8,978 | |||||||||
| 2.59% |
03/15/35 | 20,000 | 17,827 | |||||||||
|
|
|
| ||||||||||
| 152,663 | ||||||||||||
|
|
|
| ||||||||||
| Ohio — 0.11% |
|
|||||||||||
| Ohio, Taxable Revenue Bonds, Advanced Refunding, Cleveland Clinic |
|
|||||||||||
| 2.89% |
01/01/32 | 15,000 | 14,341 | |||||||||
|
|
|
| ||||||||||
| Total Municipal Bonds |
|
|||||||||||
| (Cost $399,969) |
|
364,007 | ||||||||||
|
|
|
| ||||||||||
| U.S. TREASURY SECURITIES — 2.93% |
|
|||||||||||
| U.S. Treasury Bonds — 0.63% |
|
|||||||||||
| U.S. Treasury Bonds |
|
|||||||||||
| 2.00% |
11/15/41 | 27,000 | 24,476 | |||||||||
| 2.25% |
02/15/52 | 35,000 | 33,578 | |||||||||
| U.S. Treasury Bonds - Treasury Inflation Indexed Bonds |
|
|||||||||||
| 0.13% |
02/15/527 | 21,209 | 22,025 | |||||||||
|
|
|
| ||||||||||
| 80,079 | ||||||||||||
|
|
|
| ||||||||||
| U.S. Treasury Notes — 2.30% |
|
|||||||||||
| U.S. Treasury Notes |
|
|||||||||||
| 1.50% |
02/29/24 | 37,000 | 36,465 | |||||||||
| 1.75% |
03/15/25 | 71,000 | 69,533 | |||||||||
| 1.88% |
02/28/27 | 100,000 | 97,360 | |||||||||
| 1.88% |
02/15/32 | 72,000 | 69,159 | |||||||||
| 2.50% |
03/31/27 | 16,000 | 16,038 | |||||||||
|
|
|
| ||||||||||
| 288,555 | ||||||||||||
|
|
|
| ||||||||||
| Total U.S. Treasury Securities |
|
|||||||||||
| (Cost $371,619) |
|
368,634 | ||||||||||
|
|
|
| ||||||||||
| Total Bonds — 96.11% |
|
|||||||||||
| (Cost $13,223,760) |
|
12,068,364 | ||||||||||
|
|
|
| ||||||||||
| Issues | Maturity Date |
Principal Amount/Shares |
Value | |||||||||
| SHORT-TERM INVESTMENTS — 2.83% |
|
|||||||||||
| Money Market Funds — 2.83% |
|
|||||||||||
| Dreyfus Government Cash Management Fund |
|
|||||||||||
| 0.19%8 |
186,000 | 186,000 | ||||||||||
| Fidelity Investments Money Market Funds - Government Portfolio |
|
|||||||||||
| 0.12%8 |
20,236 | 20,236 | ||||||||||
See accompanying Notes to Financial Statements.
| Annual Report March 2022 / 48 |
Table of Contents
Corporate Bond Fund
Schedule of Portfolio Investments
March 31, 2022
| Issues | Maturity Date |
Principal Amount/Shares |
Value | |||||||||
| SHORT-TERM INVESTMENTS (continued) |
|
|||||||||||
| Money Market Funds (continued) |
|
|||||||||||
| Morgan Stanley Institutional Liquidity Funds - Government Portfolio |
|
|||||||||||
| 0.23%8 |
149,000 | $ | 149,000 | |||||||||
|
|
|
| ||||||||||
| Total Short-Term Investments |
|
|||||||||||
| (Cost $355,236) |
|
355,236 | ||||||||||
|
|
|
| ||||||||||
| Total Investments Before Written Swaptions - 98.94% |
|
|||||||||||
| (Cost $13,578,996) |
|
12,423,600 | ||||||||||
|
|
|
| ||||||||||
| Written Swaptions - (0.08)% |
|
|||||||||||
| (Cost $(1,848)) |
|
(10,206) | ||||||||||
|
|
|
| ||||||||||
| Cash and Other Assets, Less Liabilities - 1.14% |
|
143,444 | ||||||||||
|
|
|
| ||||||||||
| Net Assets - 100.00% |
|
$ | 12,556,838 | |||||||||
|
|
|
| ||||||||||
| 1 | Security is valued using significant unobservable inputs and is classified as Level 3 in the fair value hierarchy. |
| 2 | Illiquid security as determined under procedures approved by the Board of Trustees. The aggregate value of illiquid securities is $57,586, which is 0.46% of total net assets. |
| 3 | Variable rate security. Interest rate disclosed is as of the most recent information available. Certain variable rate securities are not based on a published reference rate and spread but are determined by the issuer or agent and are based on current market conditions. |
| 4 | Securities exempt from registration under Rule 144A of the Securities Act of 1933, as amended. The securities may be resold in transactions exempt from registration, normally to qualified institutional buyers. |
| 5 | Foreign denominated security issued by foreign domiciled entity. |
| 6 | Floating rate security. The rate disclosed was in effect at March 31, 2022. |
| 7 | Inflation protected security. Principal amount reflects original security face amount. |
| 8 | Represents the current yield as of March 31, 2022. |
| * | Securities with a call or reset feature will have an effective maturity date sooner than the stated maturity. |
| ** | Securities backed by mortgage or consumer loans where payment is periodically made will have an effective maturity date sooner than the stated maturity date. |
Note: For Fund compliance purposes, the Fund’s industry classifications refer to any one or more of the industry sub-classifications used by one or more widely recognized market indexes or ratings group indexes, and/or as defined by Fund management. This definition may not apply for purposes of this report, which may combine industry sub-classifications for more meaningful presentation for investors.
(BKNT): Bank Note
(CAD): Canadian Dollar
(GMTN): Global Medium-Term Note
(IO): Interest Only
(LIBOR): London InterBank Offer Rate
(MTN): Medium-Term Note
(S&P): Standard & Poor’s
(SOFR): Secured Overnight Financing Rate
(USD): U.S. Dollar
| Currency to be Purchased |
Currency to be Sold |
Counterparty | Settlement Date |
Unrealized Appreciation (Depreciation) |
||||||||
| FOREIGN CURRENCY EXCHANGE CONTRACT |
||||||||||||
| CAD 275,000 |
USD 215,610 | Citigroup Global Markets, Inc. | 04/08/22 | $ | 4,548 | |||||||
|
|
|
|||||||||||
| USD 214,422 |
CAD 275,000 | Citigroup Global Markets, Inc. | 04/08/22 | (5,737) | ||||||||
|
|
|
|||||||||||
| NET UNREALIZED DEPRECIATION |
$ | (1,189) | ||||||||||
|
|
|
|||||||||||
See accompanying Notes to Financial Statements.
| 49 / Annual Report March 2022 |
Table of Contents
Corporate Bond Fund
Schedule of Portfolio Investments
March 31, 2022
| Description | Number of Contracts |
Expiration Date | Notional Amount | Value | Unrealized Appreciation (Depreciation) |
|||||||||||||||
| FUTURES CONTRACTS: LONG POSITIONS | ||||||||||||||||||||
| U.S. Treasury Two-Year Note |
6 | 06/30/22 | $ | 1,271,531 | $ | (2,449) | $ | (2,449) | ||||||||||||
| U.S. Treasury Five-Year Note |
4 | 06/30/22 | 458,750 | 2,304 | 2,304 | |||||||||||||||
|
|
|
|
|
|
|
|||||||||||||||
| 1,730,281 | (145) | (145) | ||||||||||||||||||
|
|
|
|
|
|
|
|||||||||||||||
| FUTURES CONTRACTS: SHORT POSITIONS | ||||||||||||||||||||
| U.S. Treasury Ten-Year Ultra Bond |
5 | 06/21/22 | (677,344) | 16,372 | 16,372 | |||||||||||||||
| U.S. Treasury Ultra Bond |
1 | 06/21/22 | (177,125) | (3,689) | (3,689) | |||||||||||||||
|
|
|
|
|
|
|
|||||||||||||||
| (854,469) | 12,683 | 12,683 | ||||||||||||||||||
|
|
|
|
|
|
|
|||||||||||||||
| TOTAL FUTURES CONTRACTS |
$ | 875,812 | $ | 12,538 | $ | 12,538 | ||||||||||||||
|
|
|
|
|
|
|
|||||||||||||||
| Received by the Fund |
Paid by the Fund | |||||||||||||||||||||||||||||||||||||
| Description | Counterparty | Purchase Date |
Maturity Date |
Rate | Frequency | Rate | Frequency | Notional Amount (000’s) |
Value | Premiums (Received) |
Unrealized (Depreciation) |
|||||||||||||||||||||||||||
| WRITTEN PUT SWAPTIONS | ||||||||||||||||||||||||||||||||||||||
| Option to enter into a 2-year Interest Rate Swap | Citigroup Global Markets, Inc. |
03/09/22 | 06/08/22 | 1.95 | % | Semi- annually |
3-month USD LIBOR | Quarterly | $ | 660 | $ | (10,206) | $ | (1,848) | $ | (8,358) | ||||||||||||||||||||||
|
|
|
|
|
|
|
|
|
|||||||||||||||||||||||||||||||
| Received by the Fund | Paid by the Fund | |||||||||||||||||||||||||||||||||
| Description | Maturity Date |
Rate | Frequency | Rate | Frequency | Notional Amount (000’s) |
Value | Premiums Paid |
Unrealized Appreciation (Depreciation) |
|||||||||||||||||||||||||
| SWAPS: INTEREST RATE |
|
|||||||||||||||||||||||||||||||||
| Interest Rate Swap1 | 09/28/53 | |
3-month USD LIBOR |
|
Quarterly | 1.87% | Semi-annually | $ | 95 | $ | 7,552 | $ | — | $ | 7,552 | |||||||||||||||||||
| Interest Rate Swap1 | 12/07/53 | |
3-month USD LIBOR |
|
Quarterly | 1.74% | Semi-annually | 35 | 3,612 | — | 3,612 | |||||||||||||||||||||||
| Interest Rate Swap1 | 09/28/25 | 1.39% | |
Semi- annually |
|
3-month USD LIBOR |
|
Quarterly | 1,130 | (30,788) | — | (30,788) | ||||||||||||||||||||||
| Interest Rate Swap1 | 12/07/25 | 1.69% | |
Semi- annually |
|
3-month USD LIBOR |
|
Quarterly | 420 | (8,453) | — | (8,453) | ||||||||||||||||||||||
|
|
|
|
|
|
|
|
|
|||||||||||||||||||||||||||
| TOTAL SWAPS CONTRACTS | $ | 1,680 | $ | (28,077) | $ | — | $ | (28,077) | ||||||||||||||||||||||||||
|
|
|
|
|
|
|
|
|
|||||||||||||||||||||||||||
| 1 | Centrally cleared. |
See accompanying Notes to Financial Statements.
| Annual Report March 2022 / 50 |
Table of Contents
Schedule of Portfolio Investments
March 31, 2022
| Issues |
Maturity Date |
Principal Amount |
Value | |||||||||
| BONDS – 110.38% |
|
|||||||||||
| ASSET-BACKED SECURITIES — 6.50%** |
|
|||||||||||
| Aligned Data Centers Issuer LLC, |
|
|||||||||||
| Series 2021-1A, Class A2 |
|
|||||||||||
| 1.94% |
08/15/461 | $ | 150,000 | $ | 138,121 | |||||||
| Flexential Issuer, |
|
|||||||||||
| Series 2021-1A, Class A2 |
|
|||||||||||
| 3.25% |
11/27/511 | 150,000 | 141,585 | |||||||||
| GoodLeap Sustainable Home Solutions Trust, |
|
|||||||||||
| Series 2022-1GS, Class A |
|
|||||||||||
| 2.70% |
01/20/491 | 68,509 | 65,185 | |||||||||
| Loanpal Solar Loan Ltd., |
|
|||||||||||
| Series 2021-1GS, Class A |
|
|||||||||||
| 2.29% |
01/20/481 | 183,824 | 168,208 | |||||||||
| Sunnova Helios VII Issuer LLC, |
|
|||||||||||
| Series 2021-C, Class A |
|
|||||||||||
| 2.03% |
10/20/481 | 194,450 | 179,908 | |||||||||
|
|
|
| ||||||||||
| Total Asset-Backed Securities |
|
|||||||||||
| (Cost $741,543) |
|
693,007 | ||||||||||
|
|
|
| ||||||||||
| MORTGAGE-BACKED — 85.29%** |
|
|||||||||||
| Non-Agency Commercial Mortgage-Backed — 38.11% |
|
|||||||||||
| 1211 Avenue of the Americas Trust, |
|
|||||||||||
| Series 2015-1211, Class A1A1 |
|
|||||||||||
| 3.90% |
08/10/351 | 150,000 | 150,934 | |||||||||
| BX Commercial Mortgage Trust, |
|
|||||||||||
| Series 2022-AHP, Class AS |
|
|||||||||||
| (CME Term SOFR 1-Month plus 1.49%) |
|
|||||||||||
| 1.79% |
01/17/391,2 | 155,000 | 153,445 | |||||||||
| CALI Mortgage Trust, |
|
|||||||||||
| Series 2019-101C, Class A |
|
|||||||||||
| 3.96% |
03/10/391 | 125,000 | 127,085 | |||||||||
| CAMB Commercial Mortgage Trust, |
|
|||||||||||
| Series 2021-CX2, Class B |
|
|||||||||||
| 2.77% |
11/10/461,3 | 150,000 | 135,520 | |||||||||
| Commercial Mortgage Trust, |
|
|||||||||||
| Series 2019-521F, Class A |
|
|||||||||||
| (LIBOR USD 1-Month plus 0.90%) |
|
|||||||||||
| 1.30% |
06/15/341,2 | 150,000 | 149,074 | |||||||||
| Commercial Mortgage Trust, |
|
|||||||||||
| Series 2020-CX, Class A |
|
|||||||||||
| 2.17% |
11/10/461 | 176,000 | 157,564 | |||||||||
| Commercial Mortgage Trust, |
|
|||||||||||
| Series 2022-HC, Class A |
|
|||||||||||
| 2.82% |
01/10/391 | 150,000 | 144,130 | |||||||||
| DC Office Trust, |
|
|||||||||||
| Series 2019-MTC, Class A |
|
|||||||||||
| 2.97% |
09/15/451 | 170,000 | 161,086 | |||||||||
| DOLP Trust, |
|
|||||||||||
| Series 2021-NYC, Class A |
|
|||||||||||
| 2.96% |
05/10/411 | 150,000 | 141,582 | |||||||||
| DROP Mortgage Trust, |
|
|||||||||||
| Series 2021-FILE, Class A |
|
|||||||||||
| (LIBOR USD 1-Month plus 1.15%) |
|
|||||||||||
| 1.55% |
04/15/261,2 | 150,000 | 148,638 | |||||||||
| Issues |
Maturity Date |
Principal Amount |
Value | |||||||||
| MORTGAGE-BACKED (continued) |
|
|||||||||||
| Non-Agency Commercial Mortgage-Backed (continued) |
|
|||||||||||
| Frost CMBS DAC, |
|
|||||||||||
| Series 2021-1A, Class GBB |
|
|||||||||||
| (Ireland) |
|
|||||||||||
| (SONIA plus 1.65%) |
|
|||||||||||
| 1.84% |
11/22/261,2,4 | $ | 250,000 | $ | 319,990 | |||||||
| Grace Trust, |
|
|||||||||||
| Series 2020-GRCE, Class B |
|
|||||||||||
| 2.60% |
12/10/401 | 150,000 | 135,405 | |||||||||
| Hudson Yards Mortgage Trust, |
|
|||||||||||
| Series 2019-30HY, Class A |
|
|||||||||||
| 3.23% |
07/10/391 | 150,000 | 145,978 | |||||||||
| Hudson Yards Mortgage Trust, |
|
|||||||||||
| Series 2019-55HY, Class A |
|
|||||||||||
| 2.94% |
12/10/411,3 | 150,000 | 143,519 | |||||||||
| JPMorgan Chase Commercial Mortgage Securities Trust, |
|
|||||||||||
| Series 2019-OSB, Class A |
|
|||||||||||
| 3.40% |
06/05/391 | 150,000 | 148,352 | |||||||||
| KNDL Mortgage Trust, |
|
|||||||||||
| Series 2019-KNSQ, Class A |
|
|||||||||||
| (LIBOR USD 1-Month plus 0.80%) |
|
|||||||||||
| 1.20% |
05/15/361,2 | 130,000 | 129,044 | |||||||||
| KREST Commercial Mortgage Securities Trust, |
|
|||||||||||
| Series 2021-CHIP, Class C |
|
|||||||||||
| 2.93% |
11/05/441,3 | 125,000 | 110,208 | |||||||||
| Manhattan West Mortgage Trust, |
|
|||||||||||
| Series 2020-1MW, Class A |
|
|||||||||||
| 2.13% |
09/10/391 | 160,000 | 148,283 | |||||||||
| MFT Mortgage Trust, |
|
|||||||||||
| Series 2020-B6, Class B |
|
|||||||||||
| 3.28% |
08/10/401,3 | 150,000 | 126,873 | |||||||||
| Morgan Stanley Capital I Trust, |
|
|||||||||||
| Series 2020-CNP, Class A |
|
|||||||||||
| 2.43% |
04/05/421,3 | 150,000 | 136,261 | |||||||||
| Natixis Commercial Mortgage Securities Trust, |
|
|||||||||||
| Series 2019-10K, Class A |
|
|||||||||||
| 3.62% |
05/15/391 | 150,000 | 147,952 | |||||||||
| NYO Commercial Mortgage Trust, |
|
|||||||||||
| Series 2021-1290, Class A |
|
|||||||||||
| (LIBOR USD 1-Month plus 1.10%) |
|
|||||||||||
| 1.49% |
11/15/381,2 | 100,000 | 99,185 | |||||||||
| One Bryant Park Trust, |
|
|||||||||||
| Series 2019-OBP, Class A |
|
|||||||||||
| 2.52% |
09/15/541 | 150,000 | 139,165 | |||||||||
| One New York Plaza Trust, |
|
|||||||||||
| Series 2020-1NYP, Class AJ |
|
|||||||||||
| (LIBOR USD 1-Month plus 1.25%) |
|
|||||||||||
| 1.65% |
01/15/361,2 | 150,000 | 147,897 | |||||||||
| SFO Commercial Mortgage Trust, |
|
|||||||||||
| Series 2021-555, Class C |
|
|||||||||||
| (LIBOR USD 1-Month plus 1.80%) |
|
|||||||||||
| 2.20% |
05/15/381,2 | 130,000 | 127,079 | |||||||||
| Shops at Crystals Trust, |
|
|||||||||||
| Series 2016-CSTL, Class A |
|
|||||||||||
| 3.13% |
07/05/361 | 150,000 | 142,467 | |||||||||
See accompanying Notes to Financial Statements.
| 51 / Annual Report March 2022 |
Table of Contents
ESG Securitized Fund
Schedule of Portfolio Investments
March 31, 2022
| Issues |
Maturity Date |
Principal Amount |
Value | |||||||||
| MORTGAGE-BACKED (continued) |
|
|||||||||||
| Non-Agency Commercial Mortgage-Backed (continued) |
|
|||||||||||
| SLG Office Trust, |
|
|||||||||||
| Series 2021-OVA, Class A |
|
|||||||||||
| 2.59% |
07/15/411 | $ | 100,000 | $ | 93,295 | |||||||
| STWD Mortgage Trust, |
|
|||||||||||
| Series 2021-LIH, Class A |
|
|||||||||||
| (LIBOR USD 1-Month plus 0.86%) |
|
|||||||||||
| 1.26% |
11/15/361,2 | 160,000 | 157,055 | |||||||||
|
|
|
| ||||||||||
| 4,067,066 | ||||||||||||
|
|
|
| ||||||||||
| U.S. Agency Commercial Mortgage-Backed — 1.70% |
|
|||||||||||
| Fannie Mae-Aces, |
|
|||||||||||
| Series 2019-M9, Class A1 |
|
|||||||||||
| 2.61% |
06/25/29 | 49,846 | 49,342 | |||||||||
| Freddie Mac Multifamily ML Certificates, |
|
|||||||||||
| Series 2021-ML12, Class XUS (IO) |
|
|||||||||||
| 1.22% |
07/25/413 | 1,096,855 | 132,007 | |||||||||
|
|
|
| ||||||||||
| 181,349 | ||||||||||||
|
|
|
| ||||||||||
| U.S. Agency Mortgage-Backed — 45.48% |
|
|||||||||||
| Fannie Mae Pool AL9266 |
|
|||||||||||
| 3.00% |
10/01/46 | 149,077 | 148,096 | |||||||||
| Fannie Mae Pool BO2256 |
|
|||||||||||
| 3.00% |
10/01/49 | 339,305 | 333,867 | |||||||||
| Fannie Mae Pool CA5496 |
|
|||||||||||
| 3.00% |
04/01/50 | 428,666 | 424,201 | |||||||||
| Fannie Mae Pool FM2870 |
|
|||||||||||
| 3.00% |
03/01/50 | 267,634 | 264,260 | |||||||||
| Fannie Mae Pool FM3687 |
|
|||||||||||
| 2.50% |
06/01/50 | 379,809 | 364,926 | |||||||||
| Fannie Mae Pool MA4414 |
|
|||||||||||
| 2.50% |
09/01/51 | 213,291 | 203,945 | |||||||||
| Fannie Mae REMICS, |
|
|||||||||||
| Series 2011-117, Class PF |
|
|||||||||||
| (LIBOR USD 1-Month plus 0.35%) |
|
|||||||||||
| 0.81% |
07/25/392 | 15,803 | 15,804 | |||||||||
| Fannie Mae REMICS, |
|
|||||||||||
| Series 2019-25, Class PA |
|
|||||||||||
| 3.00% |
05/25/48 | 271,833 | 272,666 | |||||||||
| Freddie Mac Gold Pool G67707 |
|
|||||||||||
| 3.50% |
01/01/48 | 236,927 | 241,061 | |||||||||
| Freddie Mac Gold Pool G67708 |
|
|||||||||||
| 3.50% |
03/01/48 | 46,388 | 46,913 | |||||||||
| Freddie Mac Pool QA7550 |
|
|||||||||||
| 3.00% |
03/01/50 | 77,370 | 76,153 | |||||||||
| Freddie Mac Pool QA8518 |
|
|||||||||||
| 3.00% |
04/01/50 | 94,459 | 92,944 | |||||||||
| Freddie Mac Pool RA3282 |
|
|||||||||||
| 3.00% |
08/01/50 | 422,774 | 417,049 | |||||||||
| Freddie Mac Pool RA5552 |
|
|||||||||||
| 3.00% |
07/01/51 | 259,461 | 254,549 | |||||||||
| Freddie Mac Pool RA5855 |
|
|||||||||||
| 2.50% |
09/01/51 | 216,266 | 206,790 | |||||||||
| Freddie Mac Pool SD7511 |
|
|||||||||||
| 3.50% |
01/01/50 | 42,746 | 43,167 | |||||||||
| Issues |
Maturity Date |
Principal Amount |
Value | |||||||||
| MORTGAGE-BACKED (continued) |
|
|||||||||||
| U.S. Agency Mortgage-Backed (continued) |
|
|||||||||||
| Freddie Mac REMICS, |
|
|||||||||||
| Series 3067, Class FA |
|
|||||||||||
| (LIBOR USD 1-Month plus 0.35%) |
|
|||||||||||
| 0.75% |
11/15/352 | $ | 76,606 | $ | 76,564 | |||||||
| Freddie Mac REMICS, |
|
|||||||||||
| Series 3071, Class TF |
|
|||||||||||
| (LIBOR USD 1-Month plus 0.30%) |
|
|||||||||||
| 0.70% |
04/15/352 | 23,795 | 23,811 | |||||||||
| Freddie Mac REMICS, |
|
|||||||||||
| Series 3210, Class F |
|
|||||||||||
| (LIBOR USD 1-Month plus 0.40%) |
|
|||||||||||
| 0.80% |
05/15/362 | 7,155 | 7,166 | |||||||||
| Freddie Mac REMICS, |
|
|||||||||||
| Series 4139, Class DA |
|
|||||||||||
| 1.25% |
12/15/27 | 33,932 | 32,741 | |||||||||
| Ginnie Mae (TBA) |
|
|||||||||||
| 2.00% |
04/20/52 | 150,000 | 142,684 | |||||||||
| 2.50% |
04/20/52 | 150,000 | 145,419 | |||||||||
| UMBS (TBA) |
|
|||||||||||
| 2.00% |
04/01/37 | 50,000 | 48,557 | |||||||||
| 2.00% |
04/01/52 | 75,000 | 69,580 | |||||||||
| 2.00% |
05/01/52 | 375,000 | 347,481 | |||||||||
| 2.50% |
04/01/37 | 75,000 | 74,119 | |||||||||
| 2.50% |
05/01/52 | 400,000 | 380,865 | |||||||||
| 3.00% |
04/01/52 | 25,000 | 24,457 | |||||||||
| 3.00% |
05/01/52 | 75,000 | 73,219 | |||||||||
|
|
|
| ||||||||||
| 4,853,054 | ||||||||||||
|
|
|
| ||||||||||
| Total Mortgage-Backed |
|
|||||||||||
| (Cost $9,606,571) |
|
9,101,469 | ||||||||||
|
|
|
| ||||||||||
| U.S. TREASURY SECURITIES — 18.59% |
|
|||||||||||
| U.S. Treasury Bonds — 2.65% |
|
|||||||||||
| U.S. Treasury Bonds |
|
|||||||||||
| 1.88% |
11/15/51 | 127,000 | 111,443 | |||||||||
| 2.00% |
11/15/41 | 34,000 | 30,821 | |||||||||
| 2.25% |
02/15/52 | 147,000 | 141,028 | |||||||||
|
|
|
| ||||||||||
| 283,292 | ||||||||||||
|
|
|
| ||||||||||
| U.S. Treasury Notes — 15.94% |
|
|||||||||||
| U.S. Treasury Notes |
|
|||||||||||
| 0.88% |
01/31/24 | 38,000 | 37,037 | |||||||||
| 1.50% |
02/29/24 | 203,000 | 200,066 | |||||||||
| 1.75% |
03/15/25 | 378,000 | 370,191 | |||||||||
| 1.88% |
02/28/27 | 223,000 | 217,112 | |||||||||
| 1.88% |
02/15/32 | 711,000 | 682,949 | |||||||||
| 2.25% |
03/31/24 | 61,000 | 60,919 | |||||||||
| 2.50% |
03/31/27 | 132,000 | 132,314 | |||||||||
|
|
|
| ||||||||||
| 1,700,588 | ||||||||||||
|
|
|
| ||||||||||
| Total U.S. Treasury Securities |
|
|||||||||||
| (Cost $2,017,575) |
|
1,983,880 | ||||||||||
|
|
|
| ||||||||||
| Total Bonds — 110.38% |
|
|||||||||||
| (Cost $12,365,689) |
|
11,778,356 | ||||||||||
|
|
|
| ||||||||||
See accompanying Notes to Financial Statements.
| Annual Report March 2022 / 52 |
Table of Contents
ESG Securitized Fund
Schedule of Portfolio Investments
March 31, 2022
| Issues |
|
Maturity Date |
Principal Amount/ |
Value | ||||||||||
| SHORT-TERM INVESTMENTS — 3.04% |
|
|||||||||||||
| Money Market Funds — 2.13% |
|
|||||||||||||
| Fidelity Investments Money Market Funds - Government Portfolio |
|
|||||||||||||
| 0.12%5 |
|
227,640 | $ | 227,640 | ||||||||||
|
|
|
| ||||||||||||
| U.S. Agency Discount Notes — 0.91% |
|
|||||||||||||
| Federal Home Loan Bank |
|
|||||||||||||
| 1.04%6 |
06/14/24 | $ | 100,000 | 96,810 | ||||||||||
|
|
|
| ||||||||||||
| Total Short-Term Investments |
|
|||||||||||||
| (Cost $327,640) |
|
324,450 | ||||||||||||
|
|
|
| ||||||||||||
| Total Investments - 113.42% |
|
|||||||||||||
| (Cost $12,693,329) |
|
12,102,806 | ||||||||||||
|
|
|
| ||||||||||||
| Liabilities in Excess of Other Assets - (13.42)% |
|
(1,431,641 | ) | |||||||||||
|
|
|
| ||||||||||||
| Net Assets - 100.00% |
|
$ | 10,671,165 | |||||||||||
|
|
|
| ||||||||||||
| 1 | Securities exempt from registration under Rule 144A of the Securities Act of 1933, as amended. The securities may be resold in transactions exempt from registration, normally to qualified institutional buyers. |
| 2 | Floating rate security. The rate disclosed was in effect at March 31, 2022. |
| 3 | Variable rate security. Interest rate disclosed is as of the most recent information available. Certain variable rate securities are not based on a published reference rate and spread but are determined by the issuer or agent and are based on current market conditions. |
| 4 | Foreign denominated security issued by foreign domiciled entity. |
| 5 | Represents the current yield as of March 31, 2022. |
| 6 | Represents annualized yield at date of purchase. |
| ** | Securities backed by mortgage or consumer loans where payment is periodically made will have an effective maturity date sooner than the stated maturity date. |
Note: For Fund compliance purposes, the Fund’s industry classifications refer to any one or more of the industry sub-classifications used by one or more widely recognized market indexes or ratings group indexes, and/or as defined by Fund management. This definition may not apply for purposes of this report, which may combine industry sub-classifications for more meaningful presentation for investors.
(GBP): British Pound
(IO): Interest Only
(LIBOR): London InterBank Offer Rate
(SOFR): Secured Overnight Financing Rate
(SONIA): Sterling Overnight Index Average
(TBA): To-Be-Announced
(USD): U.S. Dollar
| Currency to be Purchased |
Currency to be Sold |
Counterparty | Settlement Date |
Unrealized Appreciation (Depreciation) |
||||||||
| FOREIGN CURRENCY EXCHANGE CONTRACT |
||||||||||||
| GBP 255,000 |
USD 334,340 | Bank of America N.A. | 04/08/22 | $ | 1,388 | |||||||
| USD 342,186 |
GBP 255,000 | Bank of America N.A. | 04/08/22 | 6,457 | ||||||||
|
|
|
|||||||||||
| 7,845 | ||||||||||||
|
|
|
|||||||||||
| USD 323,422 |
GBP 247,000 | Bank of America N.A. | 07/08/22 | (1,715) | ||||||||
|
|
|
|||||||||||
| NET UNREALIZED APPRECIATION |
$ | 6,130 | ||||||||||
|
|
|
|||||||||||
| Description | Number of Contracts |
Expiration Date | Notional Amount | Value | Unrealized Appreciation (Depreciation) |
|||||||||||
| FUTURES CONTRACTS: LONG POSITIONS | ||||||||||||||||
| U.S. Treasury Two-Year Note | 7 | 06/30/22 | $ | 1,483,453 | $ | (15,590) | $ | (15,590) | ||||||||
| FUTURES CONTRACTS: SHORT POSITIONS | ||||||||||||||||
| U.S. Treasury Five-Year Note | 7 | 06/30/22 | (802,813) | 24,447 | 24,447 | |||||||||||
| U.S. Treasury Ten-Year Ultra Bond | 4 | 06/21/22 | (541,875) | 17,522 | 17,522 | |||||||||||
|
|
|
|
|
|
|
|||||||||||
| (1,344,688) | 41,969 | 41,969 | ||||||||||||||
|
|
|
|
|
|
|
|||||||||||
| TOTAL FUTURES CONTRACTS |
$ | 138,765 | $ | 26,379 | $ | 26,379 | ||||||||||
|
|
|
|
|
|
|
|||||||||||
See accompanying Notes to Financial Statements.
| 53 / Annual Report March 2022 |
Table of Contents
Schedule of Portfolio Investments
March 31, 2022
| Issues |
Maturity Date |
Principal Amount |
Value | |||||||||
| BONDS – 99.69% |
|
|||||||||||
| ASSET-BACKED SECURITIES — 7.21%** |
|
|||||||||||
| Aimco CLO 11 Ltd., |
|
|||||||||||
| Series 2020-11A, Class AR |
|
|||||||||||
| (Cayman Islands) |
|
|||||||||||
| (LIBOR USD 3-Month plus 1.13%) |
|
|||||||||||
| 1.37% |
10/17/341,2,3 | $ | 185,000 | $ | 183,233 | |||||||
| Aimco CLO 14 Ltd., |
|
|||||||||||
| Series 2021-14A, Class SUB |
|
|||||||||||
| (Cayman Islands) |
|
|||||||||||
| 0.00% |
04/20/341,3,4 | 700,000 | 607,071 | |||||||||
| AMMC CLO 19 Ltd., |
|
|||||||||||
| Series 2016-19A, Class AR |
|
|||||||||||
| (Cayman Islands) |
|
|||||||||||
| (LIBOR USD 3-Month plus 1.14%) |
|
|||||||||||
| 1.38% |
10/16/281,2,3 | 6,478 | 6,465 | |||||||||
| AMSR Trust, |
|
|||||||||||
| Series 2020-SFR1, Class I |
|
|||||||||||
| 8.19% |
04/17/371 | 450,000 | 453,419 | |||||||||
| BlueMountain CLO Ltd., |
|
|||||||||||
| Series 2018-3A, Class B |
|
|||||||||||
| (Cayman Islands) |
|
|||||||||||
| (LIBOR USD 3-Month plus 1.77%) |
|
|||||||||||
| 2.03% |
10/25/301,2,3 | 250,000 | 248,350 | |||||||||
| BMO SBA COOF Trust, |
|
|||||||||||
| Series 2019-1, Class A (IO) |
|
|||||||||||
| 1.98% |
10/25/451,4 | 3,885,529 | 213,838 | |||||||||
| Carvana Auto Receivables Trust, |
|
|||||||||||
| Series 2020-P1, Class R |
|
|||||||||||
| 0.00% |
09/08/271 | 1,300 | 319,741 | |||||||||
| Carvana Auto Receivables Trust, |
|
|||||||||||
| Series 2021-N3, Class R |
|
|||||||||||
| 0.00% |
06/12/281 | 1,500 | 553,771 | |||||||||
| CIFC Funding Ltd., |
|
|||||||||||
| Series 2018-1A, Class SUB |
|
|||||||||||
| (Cayman Islands) |
|
|||||||||||
| 0.00% |
04/18/311,3,4 | 575,000 | 385,689 | |||||||||
| CIFC Funding Ltd., |
|
|||||||||||
| Series 2022-2A, Class INCB |
|
|||||||||||
| (Cayman Islands) |
|
|||||||||||
| 0.00% |
04/19/35†,1,3,4 | 475,000 | 410,126 | |||||||||
| CoreVest American Finance Trust, |
|
|||||||||||
| Series 2019-3, Class XA (IO) |
|
|||||||||||
| 2.04% |
10/15/521,4 | 687,393 | 37,889 | |||||||||
| CoreVest American Finance Trust, |
|
|||||||||||
| Series 2021-1, Class XB (IO) |
|
|||||||||||
| 1.56% |
04/15/531,4 | 4,459,000 | 366,685 | |||||||||
| Dryden 72 CLO Ltd., |
|
|||||||||||
| Series 2019-72A, Class BR |
|
|||||||||||
| (Cayman Islands) |
|
|||||||||||
| (LIBOR USD 3-Month plus 1.65%) |
|
|||||||||||
| 2.16% |
05/15/321,2,3 | 925,000 | 919,477 | |||||||||
| Dryden XXVI Senior Loan Fund, |
|
|||||||||||
| Series 2013-26A, Class AR |
|
|||||||||||
| (Cayman Islands) |
|
|||||||||||
| (LIBOR USD 3-Month plus 0.90%) |
|
|||||||||||
| 1.14% |
04/15/291,2,3 | 61,372 | 61,030 | |||||||||
| Issues |
Maturity Date |
Principal Amount |
Value | |||||||||
| ASSET-BACKED SECURITIES (continued) |
|
|||||||||||
| Dryden XXVIII Senior Loan Fund, |
|
|||||||||||
| Series 2013-28A, Class A1LR |
|
|||||||||||
| (Cayman Islands) |
|
|||||||||||
| (LIBOR USD 3-Month plus 1.20%) |
|
|||||||||||
| 1.71% |
08/15/301,2,3 | $ | 10,000 | $ | 9,969 | |||||||
| Elmwood CLO VI Ltd., |
|
|||||||||||
| Series 2020-3A, Class BR |
|
|||||||||||
| (Cayman Islands) |
|
|||||||||||
| (LIBOR USD 3-Month plus 1.65%) |
|
|||||||||||
| 1.90% |
10/20/341,2,3 | 440,000 | 436,528 | |||||||||
| Gilbert Park CLO Ltd., |
|
|||||||||||
| Series 2017-1A, Class A |
|
|||||||||||
| (Cayman Islands) |
|
|||||||||||
| (LIBOR USD 3-Month plus 1.19%) |
|
|||||||||||
| 1.43% |
10/15/301,2,3 | 335,000 | 333,111 | |||||||||
| GoldenTree Loan Management U.S. CLO 8 Ltd., |
|
|||||||||||
| Series 2020-8A, Class AR |
|
|||||||||||
| (Cayman Islands) |
|
|||||||||||
| (LIBOR USD 3-Month plus 1.15%) |
|
|||||||||||
| 1.40% |
10/20/341,2,3 | 250,000 | 247,285 | |||||||||
| Greenwood Park CLO Ltd., |
|
|||||||||||
| Series 2018-1A, Class SUB |
|
|||||||||||
| (Cayman Islands) |
|
|||||||||||
| 0.00% |
04/15/311,3,4 | 675,000 | 463,431 | |||||||||
| Invesco CLO Ltd., |
|
|||||||||||
| Series 2021-1A, Class SUB |
|
|||||||||||
| (Cayman Islands) |
|
|||||||||||
| 0.00% |
04/15/341,3,4 | 650,000 | 511,508 | |||||||||
| J.G. Wentworth XXX LLC, |
|
|||||||||||
| Series 2013-3A, Class A |
|
|||||||||||
| 4.08% |
01/17/731 | 44,066 | 45,709 | |||||||||
| J.G. Wentworth XXXII LLC, |
|
|||||||||||
| Series 2014-2A, Class A |
|
|||||||||||
| 3.61% |
01/17/731 | 45,509 | 46,154 | |||||||||
| JPMorgan Chase Bank Auto Credit Linked Notes, |
|
|||||||||||
| Series 2021-1, Class R |
|
|||||||||||
| 28.35% |
09/25/281 | 532,802 | 639,241 | |||||||||
| Navient Student Loan Trust, |
|
|||||||||||
| Series 2018-4A, Class B |
|
|||||||||||
| (LIBOR USD 1-Month plus 1.30%) |
|
|||||||||||
| 1.76% |
06/27/671,2 | 850,000 | 814,009 | |||||||||
| Nelnet Student Loan Trust, |
|
|||||||||||
| Series 2015-3A, Class A3 |
|
|||||||||||
| (LIBOR USD 1-Month plus 0.90%) |
|
|||||||||||
| 1.36% |
06/25/541,2 | 630,000 | 627,914 | |||||||||
| Neuberger Berman Loan Advisers CLO 40 Ltd., |
|
|||||||||||
| Series 2021-40A, Class SUB |
|
|||||||||||
| (Cayman Islands) |
|
|||||||||||
| 0.00% |
04/16/331,3,4 | 275,000 | 227,570 | |||||||||
| OCP CLO Ltd., |
|
|||||||||||
| Series 2017-14A, Class A1A |
|
|||||||||||
| (Cayman Islands) |
|
|||||||||||
| (LIBOR USD 3-Month plus 1.15%) |
|
|||||||||||
| 1.63% |
11/20/301,2,3 | 325,000 | 323,551 | |||||||||
See accompanying Notes to Financial Statements.
| Annual Report March 2022 / 54 |
Table of Contents
Flexible Income Fund
Schedule of Portfolio Investments
March 31, 2022
| Issues |
Maturity Date |
Principal Amount |
Value | |||||||||
| ASSET-BACKED SECURITIES (continued) |
|
|||||||||||
| Palmer Square CLO Ltd., |
|
|||||||||||
| Series 2014-1A, Class A1R2 |
|
|||||||||||
| (Cayman Islands) |
|
|||||||||||
| (LIBOR USD 3-Month plus 1.13%) |
|
|||||||||||
| 1.37% |
01/17/311,2,3 | $ | 725,000 | $ | 721,563 | |||||||
| Palmer Square CLO Ltd., |
|
|||||||||||
| Series 2021-1A, Class SUB |
|
|||||||||||
| (Cayman Islands) |
|
|||||||||||
| 0.00% |
04/20/341,3,4 | 625,000 | 520,656 | |||||||||
| Palmer Square Loan Funding Ltd., |
|
|||||||||||
| Series 2019-4A, Class A1 |
|
|||||||||||
| (Cayman Islands) |
|
|||||||||||
| (LIBOR USD 3-Month plus 0.90%) |
|
|||||||||||
| 1.16% |
10/24/271,2,3 | 12,975 | 12,923 | |||||||||
| Palmer Square Loan Funding Ltd., |
|
|||||||||||
| Series 2020-2A, Class A2 |
|
|||||||||||
| (Cayman Islands) |
|
|||||||||||
| (LIBOR USD 3-Month plus 1.55%) |
|
|||||||||||
| 1.80% |
04/20/281,2,3 | 10,000 | 9,998 | |||||||||
| PHEAA Student Loan Trust, |
|
|||||||||||
| Series 2014-3A, Class A |
|
|||||||||||
| (LIBOR USD 1-Month plus 0.59%) |
|
|||||||||||
| 1.05% |
08/25/401,2 | 35,667 | 35,005 | |||||||||
| Progress Residential Trust, |
|
|||||||||||
| Series 2019-SFR2, Class A |
|
|||||||||||
| 3.15% |
05/17/361 | 330,332 | 326,927 | |||||||||
| Progress Residential, |
|
|||||||||||
| Series 2021-SFR1, Class H |
|
|||||||||||
| 5.00% |
04/17/381 | 750,000 | 678,476 | |||||||||
| Rockford Tower CLO Ltd., |
|
|||||||||||
| Series 2017-2A, Class AR |
|
|||||||||||
| (Cayman Islands) |
|
|||||||||||
| (LIBOR USD 3-Month plus 1.02%) |
|
|||||||||||
| 1.26% |
10/15/291,2,3 | 54,811 | 54,603 | |||||||||
| Rockford Tower CLO Ltd., |
|
|||||||||||
| Series 2017-3A, Class A |
|
|||||||||||
| (Cayman Islands) |
|
|||||||||||
| (LIBOR USD 3-Month plus 1.19%) |
|
|||||||||||
| 1.44% |
10/20/301,2,3 | 475,000 | 472,720 | |||||||||
| Skyline Aircraft Finance LLC, |
|
|||||||||||
| Series 2021-1, Class A |
|
|||||||||||
| 3.23% |
05/10/375,6 | 517,199 | 488,107 | |||||||||
| SLM Student Loan Trust, |
|
|||||||||||
| Series 2004-1, Class B |
|
|||||||||||
| (LIBOR USD 3-Month plus 0.50%) |
|
|||||||||||
| 0.76% |
07/25/392 | 183,449 | 175,482 | |||||||||
| SLM Student Loan Trust, |
|
|||||||||||
| Series 2007-2, Class B |
|
|||||||||||
| (LIBOR USD 3-Month plus 0.17%) |
|
|||||||||||
| 0.43% |
07/25/252 | 115,000 | 106,654 | |||||||||
| SLM Student Loan Trust, |
|
|||||||||||
| Series 2008-5, Class A4 |
|
|||||||||||
| (LIBOR USD 3-Month plus 1.70%) |
|
|||||||||||
| 1.96% |
07/25/232 | 88,991 | 89,297 | |||||||||
| Issues |
Maturity Date |
Principal Amount |
Value | |||||||||
| ASSET-BACKED SECURITIES (continued) |
|
|||||||||||
| SLM Student Loan Trust, |
|
|||||||||||
| Series 2008-7, Class A4 |
|
|||||||||||
| (LIBOR USD 3-Month plus 0.90%) |
|
|||||||||||
| 1.16% |
07/25/232 | $ | 16,214 | $ | 16,059 | |||||||
| SLM Student Loan Trust, |
|
|||||||||||
| Series 2008-7, Class B |
|
|||||||||||
| (LIBOR USD 3-Month plus 1.85%) |
|
|||||||||||
| 2.11% |
07/26/832 | 10,000 | 9,950 | |||||||||
| Stratus CLO Ltd., |
|
|||||||||||
| Series 2021-3A, Class SUB |
|
|||||||||||
| (Cayman Islands) |
|
|||||||||||
| 0.00% |
12/29/291,3,4 | 975,000 | 935,924 | |||||||||
| Textainer Marine Containers VII Ltd., |
|
|||||||||||
| Series 2021-1A, Class B |
|
|||||||||||
| (Bermuda) |
|
|||||||||||
| 2.52% |
02/20/461,3 | 700,812 | 649,916 | |||||||||
| VCC Trust, |
|
|||||||||||
| Series 2020-MC1, Class A |
|
|||||||||||
| 4.50% |
06/25/451,4 | 71,593 | 71,593 | |||||||||
| Voya CLO Ltd., |
|
|||||||||||
| Series 2018-4A, Class BR |
|
|||||||||||
| (Cayman Islands) |
|
|||||||||||
| (LIBOR USD 3-Month plus 1.65%) |
|
|||||||||||
| 1.89% |
01/15/321,2,3 | 250,000 | 247,477 | |||||||||
|
|
|
| ||||||||||
| Total Asset-Backed Securities (Cost $15,832,663) |
|
15,116,094 | ||||||||||
|
|
|
| ||||||||||
| BANK LOANS — 6.87%* |
|
|||||||||||
| Communications — 0.44% |
|
|||||||||||
| CenturyLink, Inc., |
|
|||||||||||
| Term Loan B, 1st Lien |
|
|||||||||||
| (LIBOR plus 2.25%) |
|
|||||||||||
| 2.71% |
03/15/272 | 123,422 | 120,327 | |||||||||
| CSC Holdings LLC, |
|
|||||||||||
| Term Loan B5, 1st Lien |
|
|||||||||||
| (LIBOR plus 2.50%) |
|
|||||||||||
| 2.90% |
04/15/272 | 49,370 | 48,605 | |||||||||
| DIRECTV Financing LLC, |
|
|||||||||||
| Term Loan, 1st Lien |
|
|||||||||||
| (LIBOR plus 5.00%) |
|
|||||||||||
| 5.75% |
08/02/272 | 334,250 | 334,315 | |||||||||
| Frontier Communications Holdings LLC, |
|
|||||||||||
| Term Loan B, 1st Lien |
|
|||||||||||
| (LIBOR plus 3.75%) |
|
|||||||||||
| 4.81% |
05/01/282 | 123,750 | 122,100 | |||||||||
| GTT Communications BV, |
|
|||||||||||
| Term Loan B, 1st Lien |
|
|||||||||||
| (EURIBOR plus 3.25%) |
|
|||||||||||
| 3.25% |
05/31/252 | 75,654 | 70,024 | |||||||||
| National CineMedia LLC, |
|
|||||||||||
| Term Loan B, 1st Lien |
|
|||||||||||
| (LIBOR plus 8.00%) |
|
|||||||||||
| 9.00% |
12/20/242 | 247,500 | 233,888 | |||||||||
|
|
|
| ||||||||||
| 929,259 | ||||||||||||
|
|
|
| ||||||||||
See accompanying Notes to Financial Statements.
| 55 / Annual Report March 2022 |
Table of Contents
Flexible Income Fund
Schedule of Portfolio Investments
March 31, 2022
| Issues |
Maturity Date |
Principal Amount |
Value | |||||||||
| BANK LOANS (continued) |
|
|||||||||||
| Consumer Discretionary — 0.48% |
|
|||||||||||
| ADMI Corp., |
|
|||||||||||
| Term Loan B2, 1st Lien |
|
|||||||||||
| (LIBOR plus 3.38%) |
|
|||||||||||
| 3.88% |
12/23/272 | $ | 148,500 | $ | 146,192 | |||||||
| Naked Juice, LLC, |
|
|||||||||||
| Term Loan |
|
|||||||||||
| (SOFR plus 3.25%) |
|
|||||||||||
| 4.00% |
01/24/292 | 250,000 | 246,429 | |||||||||
| Peraton Corp., |
|
|||||||||||
| Term Loan B, 1st Lien |
|
|||||||||||
| (LIBOR plus 3.75%) |
|
|||||||||||
| 4.50% |
02/01/282 | 267,331 | 265,994 | |||||||||
| Sunshine Luxembourg VII SARL, |
|
|||||||||||
| Term Loan B, 1st Lien |
|
|||||||||||
| (LIBOR plus 3.75%) |
|
|||||||||||
| 4.76% |
10/01/262 | 247,500 | 246,224 | |||||||||
| Waystar technologies, Inc., |
|
|||||||||||
| Term Loan B, 1st Lien |
|
|||||||||||
| (LIBOR plus 4.00%) |
|
|||||||||||
| 4.46% |
10/22/262 | 98,492 | 98,369 | |||||||||
|
|
|
| ||||||||||
| 1,003,208 | ||||||||||||
|
|
|
| ||||||||||
| Electric — 0.66% |
|
|||||||||||
| Astoria Energy LLC, |
|
|||||||||||
| Term Loan B, 1st Lien |
|
|||||||||||
| (LIBOR plus 3.50%) |
|
|||||||||||
| 4.50% |
12/10/272 | 266,660 | 263,618 | |||||||||
| Calpine Corp., |
|
|||||||||||
| Term Loan B9, 1st Lien |
|
|||||||||||
| (LIBOR plus 2.00%) |
|
|||||||||||
| 2.46% |
04/05/262 | 246,827 | 243,793 | |||||||||
| Endure Digital, Inc., |
|
|||||||||||
| Term Loan B, 1st Lien |
|
|||||||||||
| (LIBOR plus 3.50%) |
|
|||||||||||
| 4.25% |
02/10/282 | 397,000 | 386,579 | |||||||||
| Vistra Operations Co., LLC, |
|
|||||||||||
| Term Loan B3, 1st Lien |
|
|||||||||||
| (LIBOR plus 1.75%) |
|
|||||||||||
| 2.19% |
12/31/252 | 95,978 | 95,138 | |||||||||
| 2.21% |
12/31/252 | 397,098 | 393,624 | |||||||||
|
|
|
| ||||||||||
| 1,382,752 | ||||||||||||
|
|
|
| ||||||||||
| Entertainment — 0.49% |
|
|||||||||||
| Cineworld Finance U.S., Inc., |
|
|||||||||||
| Term Loan B, 1st Lien |
|
|||||||||||
| (LIBOR plus 2.50%) |
|
|||||||||||
| 4.00% |
02/28/252 | 123,003 | 95,255 | |||||||||
| Crown Finance U.S., Inc., |
|
|||||||||||
| Term Loan B1, 1st Lien |
|
|||||||||||
| (LIBOR plus 7.00%) |
|
|||||||||||
| 7.00% |
05/23/242 | 783,473 | 927,440 | |||||||||
|
|
|
| ||||||||||
| 1,022,695 | ||||||||||||
|
|
|
| ||||||||||
| Issues |
Maturity Date |
Principal Amount |
Value | |||||||||
| BANK LOANS (continued) |
|
|||||||||||
| Finance — 0.26% |
|
|||||||||||
| DCG Acquisition Corp., |
|
|||||||||||
| Term Loan, 1st Lien |
|
|||||||||||
| (LIBOR plus 4.50%) |
|
|||||||||||
| 4.96% |
09/30/262 | $ | 271,561 | $ | 267,657 | |||||||
| Schweitzer-Mauduit International, Inc., |
|
|||||||||||
| Term Loan, 1st Lien |
|
|||||||||||
| (LIBOR plus 3.75%) |
|
|||||||||||
| 4.50% |
04/20/282 | 272,938 | 269,982 | |||||||||
|
|
|
| ||||||||||
| 537,639 | ||||||||||||
|
|
|
| ||||||||||
| Food — 0.04% |
|
|||||||||||
| Houston Foods, Inc., |
|
|||||||||||
| Term Loan B, 1st Lien |
|
|||||||||||
| (LIBOR plus 3.75%) |
|
|||||||||||
| 6.21% |
07/20/252 | 98,510 | 93,092 | |||||||||
|
|
|
| ||||||||||
| Gaming — 0.18% |
|
|||||||||||
| Churchill Downs, Inc., |
|
|||||||||||
| Term Loan B, 1st Lien |
|
|||||||||||
| (LIBOR plus 2.00%) |
|
|||||||||||
| 2.46% |
12/27/242 | 394,845 | 390,589 | |||||||||
|
|
|
| ||||||||||
| Health Care — 0.84% |
|
|||||||||||
| Avantor Funding, Inc., |
|
|||||||||||
| Term Loan B5, 1st Lien |
|
|||||||||||
| (LIBOR plus 2.25%) |
|
|||||||||||
| 2.75% |
11/08/272 | 99,003 | 98,384 | |||||||||
| Avolon TLB Borrower 1 U.S. LLC, |
|
|||||||||||
| Term Loan B3, 1st Lien |
|
|||||||||||
| (LIBOR plus 1.75%) |
|
|||||||||||
| 2.50% |
01/15/252 | 275,000 | 271,151 | |||||||||
| Buckeye Partners LP, |
|
|||||||||||
| Term Loan, 1st Lien |
|
|||||||||||
| (LIBOR plus 2.25%) |
|
|||||||||||
| 2.71% |
11/01/262 | 246,875 | 245,410 | |||||||||
| Certara Holdco, Inc., |
|
|||||||||||
| Term Loan B |
|
|||||||||||
| (LIBOR plus 3.50%) |
|
|||||||||||
| 3.96% |
08/15/262 | 272,938 | 269,526 | |||||||||
| Genesee & Wyoming, Inc., |
|
|||||||||||
| Term Loan, 1st Lien |
|
|||||||||||
| (LIBOR plus 2.00%) |
|
|||||||||||
| 3.01% |
12/30/262 | 271,537 | 268,949 | |||||||||
| Horizon Therapeutics USA, Inc., |
|
|||||||||||
| Term Loan B, 1st Lien |
|
|||||||||||
| (LIBOR plus 1.75%) |
|
|||||||||||
| 2.25% |
03/15/282 | 272,250 | 269,954 | |||||||||
| ICON Luxembourg SARL, |
|
|||||||||||
| Term Loan B, 1st Lien |
|
|||||||||||
| (LIBOR plus 2.25%) |
|
|||||||||||
| 3.31% |
07/03/282 | 191,077 | 190,420 | |||||||||
| Indigo Merger Sub, Inc., |
|
|||||||||||
| Term Loan B, 1st Lien |
|
|||||||||||
| (LIBOR plus 2.25%) |
|
|||||||||||
| 3.31% |
07/03/282 | 47,607 | 47,443 | |||||||||
See accompanying Notes to Financial Statements.
| Annual Report March 2022 / 56 |
Table of Contents
Flexible Income Fund
Schedule of Portfolio Investments
March 31, 2022
| Issues |
Maturity Date |
Principal Amount |
Value | |||||||||
| BANK LOANS (continued) |
|
|||||||||||
| Health Care (continued) |
|
|||||||||||
| Pathway Vet Alliance LLC, |
|
|||||||||||
| Term Loan, 1st Lien |
|
|||||||||||
| (LIBOR plus 3.75%) |
|
|||||||||||
| 4.21% |
03/31/272 | $ | 98,502 | $ | 97,702 | |||||||
|
|
|
| ||||||||||
| 1,758,939 | ||||||||||||
|
|
|
| ||||||||||
| Industrials — 0.42% |
|
|||||||||||
| Berry Global, Inc., |
|
|||||||||||
| Term Loan Z, 1st Lien |
|
|||||||||||
| (LIBOR plus 1.75%) |
|
|||||||||||
| 2.07% |
07/01/262 | 357,442 | 353,029 | |||||||||
| Charter Next generation, Inc., |
|
|||||||||||
| Term Loan, 1st Lien |
|
|||||||||||
| (LIBOR plus 3.75%) |
|
|||||||||||
| 4.50% |
12/01/272 | 74,250 | 73,937 | |||||||||
| Michaels Cos., Inc. (The), |
|
|||||||||||
| Term Loan, 1st Lien |
|
|||||||||||
| (LIBOR plus 4.25%) |
|
|||||||||||
| 5.26% |
04/15/282 | 168,725 | 158,695 | |||||||||
| Proampac PG Borrower LLC, |
|
|||||||||||
| Term Loan B, 1st Lien |
|
|||||||||||
| (LIBOR plus 3.75%) |
|
|||||||||||
| 4.50% |
11/03/252 | 198,005 | 194,094 | |||||||||
| Zep, Inc., |
|
|||||||||||
| Term Loan B, 1st Lien |
|
|||||||||||
| (LIBOR plus 4.00%) |
|
|||||||||||
| 5.00% |
08/12/242 | 98,235 | 94,305 | |||||||||
|
|
|
| ||||||||||
| 874,060 | ||||||||||||
|
|
|
| ||||||||||
| Information Technology — 1.79% |
|
|||||||||||
| AppLovin Corp., |
|
|||||||||||
| Term Loan B, 1st Lien |
|
|||||||||||
| (LIBOR plus 3.25%) |
|
|||||||||||
| 3.25% |
08/15/252 | 271,492 | 270,496 | |||||||||
| AthenaHealth Group, Inc., |
|
|||||||||||
| Term Loan B, 1st Lien |
|
|||||||||||
| (SOFR plus 3.50%) |
|
|||||||||||
| 4.00% |
02/15/292,7 | 855,072 | 847,590 | |||||||||
| CT Technologies Intermediate Holdings, Inc., |
|
|||||||||||
| Term Loan, 1st Lien |
|
|||||||||||
| (LIBOR plus 4.25%) |
|
|||||||||||
| 5.00% |
12/16/252 | 74,250 | 73,819 | |||||||||
| EagleView Technology Co., |
|
|||||||||||
| Term Loan B, 1st Lien |
|
|||||||||||
| (LIBOR plus 3.50%) |
|
|||||||||||
| 4.51% |
08/14/252 | 271,492 | 264,819 | |||||||||
| Gainwell Acquisition Corp., |
|
|||||||||||
| Term Loan B, 1st Lien |
|
|||||||||||
| (LIBOR plus 4.00%) |
|
|||||||||||
| 5.01% |
10/01/272 | 247,494 | 247,494 | |||||||||
| IQVIA, Inc., |
|
|||||||||||
| Term Loan B3, 1st Lien |
|
|||||||||||
| (LIBOR plus 1.75%) |
|
|||||||||||
| 2.76% |
06/11/252 | 369,469 | 367,899 | |||||||||
| Issues |
Maturity Date |
Principal Amount |
Value | |||||||||
| BANK LOANS (continued) |
| |||||||||||
| Information Technology (continued) |
| |||||||||||
| Nouryon USA LLC, |
| |||||||||||
| Term Loan B, 1st Lien |
| |||||||||||
| (LIBOR plus 3.00%) |
| |||||||||||
| 4.01% |
10/01/252 | $ | 311,239 | $ | 307,219 | |||||||
| Precision Medicine Group LLC, |
| |||||||||||
| Term Loan B, 1st Lien |
| |||||||||||
| (LIBOR plus 3.00%) |
| |||||||||||
| 4.01% |
11/18/272,8 | 349,423 | 343,745 | |||||||||
| RealPage, Inc., |
| |||||||||||
| Term Loan B, 1st Lien |
| |||||||||||
| (LIBOR plus 3.25%) |
| |||||||||||
| 3.75% |
04/24/282 | 273,625 | 270,889 | |||||||||
| Scientific Games International, Inc., |
| |||||||||||
| Term Loan B5, 1st Lien |
| |||||||||||
| (LIBOR plus 2.75%) |
| |||||||||||
| 3.21% |
08/14/242 | 487,829 | 486,612 | |||||||||
| Spin Holdco, Inc., |
| |||||||||||
| Term Loan B, 1st Lien |
| |||||||||||
| (LIBOR plus 4.00%) |
| |||||||||||
| 4.75% |
03/04/282 | 272,250 | 270,642 | |||||||||
|
|
|
| ||||||||||
| 3,751,224 | ||||||||||||
|
|
|
| ||||||||||
| Insurance — 0.12% |
| |||||||||||
| Acrisure LLC, |
| |||||||||||
| Term Loan B, 1st Lien |
| |||||||||||
| (LIBOR plus 3.50%) |
| |||||||||||
| 3.96% |
02/15/272 | 249,364 | 246,351 | |||||||||
|
|
|
| ||||||||||
| Real Estate Investment Trust (REIT) — 0.23% |
| |||||||||||
| Aveanna Healthcare LLC, |
| |||||||||||
| Term Loan B, 1st Lien |
| |||||||||||
| (LIBOR plus 3.75%) |
| |||||||||||
| 4.25% |
07/17/282,9 | 250,252 | 244,090 | |||||||||
| Rent-A-Center, Inc., |
| |||||||||||
| Term Loan B, 1st Lien |
| |||||||||||
| (LIBOR plus 3.25%) |
| |||||||||||
| 3.81% |
02/17/282 | 247,500 | 243,130 | |||||||||
|
|
|
| ||||||||||
| 487,220 | ||||||||||||
|
|
|
| ||||||||||
| Retail — 0.49% |
| |||||||||||
| AmWINS Group, Inc., |
| |||||||||||
| Term Loan B, 1st Lien |
| |||||||||||
| (LIBOR plus 2.25%) |
| |||||||||||
| 3.00% |
02/19/282 | 172,813 | 170,221 | |||||||||
| Sinclair Television Group, Inc., |
| |||||||||||
| Term Loan B2B, 1st Lien |
| |||||||||||
| (LIBOR plus 2.50%) |
| |||||||||||
| 2.96% |
09/30/262 | 394,937 | 383,910 | |||||||||
| U.S. Anesthesia Partners, Inc., |
| |||||||||||
| Term Loan B, 1st Lien |
| |||||||||||
| (LIBOR plus 4.25%) |
| |||||||||||
| 4.75% |
09/22/282 | 472,625 | 470,175 | |||||||||
|
|
|
| ||||||||||
| 1,024,306 | ||||||||||||
|
|
|
| ||||||||||
See accompanying Notes to Financial Statements.
| 57 / Annual Report March 2022 |
Table of Contents
Flexible Income Fund
Schedule of Portfolio Investments
March 31, 2022
| Issues |
Maturity Date |
Principal Amount |
Value | |||||||||
| BANK LOANS (continued) |
|
|||||||||||
| Services — 0.30% |
|
|||||||||||
| SS&C Technologies, Inc., |
|
|||||||||||
| Term Loan B5, 1st Lien |
|
|||||||||||
| (LIBOR plus 1.75%) |
|
|||||||||||
| 2.21% |
04/16/252 | $ | 389,965 | $ | 384,468 | |||||||
| Trans Union LLC, |
|
|||||||||||
| Term Loan B6 |
|
|||||||||||
| (LIBOR plus 2.25%) |
|
|||||||||||
| 2.75% |
12/01/282 | 249,282 | 247,828 | |||||||||
|
|
|
| ||||||||||
| 632,296 | ||||||||||||
|
|
|
| ||||||||||
| Transportation — 0.13% |
|
|||||||||||
| Kenan Advantage Group, Inc. (The), |
|
|||||||||||
| Term Loan, 2nd Lien |
|
|||||||||||
| (LIBOR plus 7.25%) |
|
|||||||||||
| 8.00% |
09/01/272 | 275,000 | 266,750 | |||||||||
|
|
|
| ||||||||||
| Total Bank Loans |
|
|||||||||||
| (Cost $14,357,185) |
|
14,400,380 | ||||||||||
|
|
|
| ||||||||||
| CORPORATES — 35.21%* |
|
|||||||||||
| Banking — 5.71% |
|
|||||||||||
| ABN AMRO Bank NV |
|
|||||||||||
| (Netherlands) |
|
|||||||||||
| 2.47% |
12/13/291,3,4 | 270,000 | 247,152 | |||||||||
| Bank of America Corp. |
|
|||||||||||
| 2.30% |
07/21/324 | 485,000 | 431,992 | |||||||||
| 2.57% |
10/20/324 | 130,000 | 118,480 | |||||||||
| 2.69% |
04/22/324 | 55,000 | 50,571 | |||||||||
| 3.00% |
12/20/234 | 170,000 | 170,494 | |||||||||
| Bank of America Corp. |
|
|||||||||||
| (MTN) |
|
|||||||||||
| 2.02% |
02/13/264 | 375,000 | 361,276 | |||||||||
| 2.09% |
06/14/294 | 310,000 | 283,597 | |||||||||
| 3.82% |
01/20/284 | 125,000 | 126,698 | |||||||||
| Bank of America Corp., |
|
|||||||||||
| Series N |
|
|||||||||||
| 1.66% |
03/11/274 | 865,000 | 808,599 | |||||||||
| Bank of America Corp., |
|
|||||||||||
| Series RR |
|
|||||||||||
| 4.38%4,10 |
100,000 | 94,227 | ||||||||||
| Comerica, Inc. |
|
|||||||||||
| 5.63%4,10 |
15,000 | 15,600 | ||||||||||
| Credit Suisse Group AG |
|
|||||||||||
| (Switzerland) |
|
|||||||||||
| 1.31% |
02/02/271,3,4 | 325,000 | 290,647 | |||||||||
| 2.19% |
06/05/261,3,4 | 195,000 | 183,482 | |||||||||
| 2.59% |
09/11/251,3,4 | 215,000 | 207,495 | |||||||||
| 3.09% |
05/14/321,3,4 | 260,000 | 234,234 | |||||||||
| 3.75% |
03/26/253 | 80,000 | 79,762 | |||||||||
| Discover Bank |
|
|||||||||||
| 2.45% |
09/12/24 | 230,000 | 226,164 | |||||||||
| DNB Bank ASA |
|
|||||||||||
| (Norway) |
|
|||||||||||
| 0.86% |
09/30/251,3,4 | 220,000 | 208,517 | |||||||||
| Issues |
Maturity Date |
Principal Amount |
Value | |||||||||
| CORPORATES (continued) |
|
|||||||||||
| Banking (continued) |
|
|||||||||||
| HSBC Holdings PLC |
|
|||||||||||
| (United Kingdom) |
|
|||||||||||
| 1.59% |
05/24/273,4 | $ | 525,000 | $ | 479,854 | |||||||
| 2.01% |
09/22/283,4 | 200,000 | 181,636 | |||||||||
| 2.63% |
11/07/253,4 | 150,000 | 146,426 | |||||||||
| 2.87% |
11/22/323,4 | 500,000 | 455,645 | |||||||||
| 4.29% |
09/12/263,4 | 130,000 | 131,699 | |||||||||
| JPMorgan Chase & Co. |
|
|||||||||||
| 0.97% |
06/23/254 | 280,000 | 267,508 | |||||||||
| 1.58% |
04/22/274 | 580,000 | 540,640 | |||||||||
| 2.01% |
03/13/264 | 25,000 | 24,132 | |||||||||
| 2.08% |
04/22/264 | 165,000 | 159,151 | |||||||||
| 2.58% |
04/22/324 | 640,000 | 587,252 | |||||||||
| Lloyds Banking Group PLC |
|
|||||||||||
| (United Kingdom) |
|
|||||||||||
| 1.63% |
05/11/273,4 | 205,000 | 188,187 | |||||||||
| 2.91% |
11/07/233,4 | 185,000 | 185,315 | |||||||||
| 3.75% |
03/18/283,4 | 390,000 | 388,772 | |||||||||
| 3.87% |
07/09/253,4 | 30,000 | 30,334 | |||||||||
| Macquarie Group Ltd. |
|
|||||||||||
| (Australia) |
|
|||||||||||
| 2.87% |
01/14/331,3,4 | 375,000 | 333,598 | |||||||||
| 3.19% |
11/28/231,3,4 | 135,000 | 135,257 | |||||||||
| 4.44% |
06/21/331,3,4 | 135,000 | 136,697 | |||||||||
| NatWest Group PLC |
|
|||||||||||
| (United Kingdom) |
|
|||||||||||
| 4.27% |
03/22/253,4 | 500,000 | 506,085 | |||||||||
| Santander UK Group Holdings PLC |
|
|||||||||||
| (United Kingdom) |
|
|||||||||||
| 1.09% |
03/15/253,4 | 325,000 | 309,169 | |||||||||
| 1.67% |
06/14/273,4 | 325,000 | 296,093 | |||||||||
| 3.37% |
01/05/243,4 | 35,000 | 35,120 | |||||||||
| 4.80% |
11/15/243,4 | 245,000 | 250,684 | |||||||||
| U.S. Bancorp |
|
|||||||||||
| 3.70%4,10 |
105,000 | 95,270 | ||||||||||
| Wells Fargo & Co. |
|
|||||||||||
| (MTN) |
|
|||||||||||
| 2.39% |
06/02/284 | 745,000 | 705,321 | |||||||||
| 3.35% |
03/02/334 | 770,000 | 749,132 | |||||||||
| 3.53% |
03/24/284 | 525,000 | 524,453 | |||||||||
|
|
|
| ||||||||||
| 11,982,417 | ||||||||||||
|
|
|
| ||||||||||
| Communications — 4.05% |
|
|||||||||||
| AT&T, Inc. |
|
|||||||||||
| 2.55% |
12/01/33 | 897,000 | 798,718 | |||||||||
| 4.75% |
05/15/46 | 125,000 | 136,271 | |||||||||
| CCO Holdings, LLC/CCO Holdings Capital Corp. |
|
|||||||||||
| 4.25% |
01/15/341 | 195,000 | 169,650 | |||||||||
| Charter Communications Operating LLC/Charter |
|
|||||||||||
| Communications Operating Capital |
|
|||||||||||
| 4.80% |
03/01/50 | 250,000 | 238,807 | |||||||||
| 5.38% |
05/01/47 | 141,000 | 144,619 | |||||||||
| Charter Communications Operating, LLC/Charter |
|
|||||||||||
| Communications Operating Capital |
|
|||||||||||
| 5.25% |
04/01/53 | 520,000 | 524,928 | |||||||||
See accompanying Notes to Financial Statements.
| Annual Report March 2022 / 58 |
Table of Contents
Flexible Income Fund
Schedule of Portfolio Investments
March 31, 2022
| Issues |
Maturity Date |
Principal Amount |
Value | |||||||||
| CORPORATES (continued) |
|
|||||||||||
| Communications (continued) |
|
|||||||||||
| CommScope, Inc. |
|
|||||||||||
| 4.75% |
09/01/291 | $ | 300,000 | $ | 278,250 | |||||||
| CSC Holdings LLC |
|
|||||||||||
| 4.13% |
12/01/301 | 775,000 | 683,410 | |||||||||
| Diamond Sports Group LLC/Diamond Sports Finance Co. |
|
|||||||||||
| 6.63% |
08/15/271 | 740,000 | 154,253 | |||||||||
| Diamond Sports Group, LLC/Diamond Sports Finance Co. |
|
|||||||||||
| 5.38% |
08/15/261 | 751,000 | 294,768 | |||||||||
| DIRECTV Financing LLC/DIRECTV Financing Co. Obligor, Inc. |
|
|||||||||||
| 5.88% |
08/15/271 | 169,000 | 166,756 | |||||||||
| DISH Network Corp. |
|
|||||||||||
| 3.38% |
08/15/26 | 837,000 | 754,974 | |||||||||
| Gray Escrow II, Inc. |
|
|||||||||||
| 5.38% |
11/15/311 | 267,000 | 255,533 | |||||||||
| Intelsat Jackson Holdings SA |
|
|||||||||||
| (Luxembourg) |
|
|||||||||||
| 6.50% |
03/15/301,3 | 335,000 | 335,011 | |||||||||
| Intelsat Jackson Holdings SA, |
|
|||||||||||
| Class B |
|
|||||||||||
| 8.50% |
10/15/241,3,5,6,11,12 | 270,000 | — | |||||||||
| Intelsat Jackson Holdings SA, |
|
|||||||||||
| Class B |
|
|||||||||||
| (Luxembourg) |
|
|||||||||||
| 5.50% |
08/01/233,5,6,11,12 | 535,000 | — | |||||||||
| 9.75% |
07/15/251,3,5,6,11,12 | 360,000 | — | |||||||||
| Level 3 Financing, Inc. |
|
|||||||||||
| 3.63% |
01/15/291 | 40,000 | 35,038 | |||||||||
| 3.88% |
11/15/291 | 530,000 | 488,716 | |||||||||
| Lumen Technologies, Inc. |
|
|||||||||||
| 5.38% |
06/15/291 | 675,000 | 602,073 | |||||||||
| National CineMedia LLC |
|
|||||||||||
| 5.88% |
04/15/281 | 757,000 | 662,670 | |||||||||
| Sprint Spectrum Co. LLC/Sprint Spectrum Co. II LLC/Sprint Spectrum Co. III LLC |
|
|||||||||||
| 4.74% |
03/20/251 | 393,750 | 402,188 | |||||||||
| 5.15% |
03/20/281 | 495,000 | 521,705 | |||||||||
| Tencent Holdings Ltd. |
|
|||||||||||
| (Cayman Islands) |
|
|||||||||||
| 2.88% |
04/22/311,3 | 200,000 | 182,881 | |||||||||
| Time Warner Cable LLC |
|
|||||||||||
| 5.50% |
09/01/41 | 80,000 | 83,253 | |||||||||
| Vodafone Group PLC |
|
|||||||||||
| (United Kingdom) |
|
|||||||||||
| 4.25% |
09/17/503 | 60,000 | 59,861 | |||||||||
| 5.25% |
05/30/483 | 300,000 | 337,033 | |||||||||
| Zayo Group Holdings, Inc. |
|
|||||||||||
| 4.00% |
03/01/271 | 185,000 | 170,574 | |||||||||
|
|
|
| ||||||||||
| 8,481,940 | ||||||||||||
|
|
|
| ||||||||||
| Consumer Discretionary — 1.36% |
|
|||||||||||
| Anheuser-Busch Cos. LLC/Anheuser-Busch InBev |
|
|||||||||||
| Worldwide, Inc. |
|
|||||||||||
| 4.90% |
02/01/46 | 115,000 | 128,081 | |||||||||
| Issues |
Maturity Date |
Principal Amount |
Value | |||||||||
| CORPORATES (continued) |
|
|||||||||||
| Consumer Discretionary (continued) |
|
|||||||||||
| Bacardi Ltd. |
|
|||||||||||
| (Bermuda) |
|
|||||||||||
| 4.45% |
05/15/251,3 | $ | 165,000 | $ | 169,040 | |||||||
| BAT Capital Corp. |
|
|||||||||||
| 3.56% |
08/15/27 | 165,000 | 160,624 | |||||||||
| 4.39% |
08/15/37 | 150,000 | 139,819 | |||||||||
| 5.65% |
03/16/52 | 430,000 | 437,187 | |||||||||
| Imperial Brands Finance PLC |
|
|||||||||||
| (United Kingdom) |
|
|||||||||||
| 4.25% |
07/21/251,3 | 160,000 | 161,389 | |||||||||
| Magallanes, Inc. |
|
|||||||||||
| 4.28% |
03/15/321 | 190,000 | 191,189 | |||||||||
| 5.05% |
03/15/421 | 375,000 | 382,774 | |||||||||
| 5.14% |
03/15/521 | 240,000 | 245,851 | |||||||||
| Reynolds American, Inc. |
|
|||||||||||
| 4.45% |
06/12/25 | 95,000 | 97,100 | |||||||||
| 5.70% |
08/15/35 | 100,000 | 105,442 | |||||||||
| 5.85% |
08/15/45 | 95,000 | 97,231 | |||||||||
| Spectrum Brands, Inc. |
|
|||||||||||
| 5.50% |
07/15/301 | 550,000 | 528,770 | |||||||||
|
|
|
| ||||||||||
| 2,844,497 | ||||||||||||
|
|
|
| ||||||||||
| Electric — 1.02% |
|
|||||||||||
| Alliant Energy Finance LLC |
|
|||||||||||
| 1.40% |
03/15/261 | 245,000 | 223,215 | |||||||||
| Alliant Energy Finance, LLC |
|
|||||||||||
| 3.60% |
03/01/321 | 155,000 | 151,359 | |||||||||
| American Electric Power Co., Inc. |
|
|||||||||||
| 2.03% |
03/15/24 | 455,000 | 447,554 | |||||||||
| Comision Federal de Electricidad |
|
|||||||||||
| (Mexico) |
|
|||||||||||
| 4.69% |
05/15/291,3 | 200,000 | 198,063 | |||||||||
| Duke Energy Carolinas LLC |
|
|||||||||||
| 4.00% |
09/30/42 | 250,000 | 257,120 | |||||||||
| Eversource Energy, |
|
|||||||||||
| Series O |
|
|||||||||||
| 4.25% |
04/01/29 | 8,000 | 8,342 | |||||||||
| FirstEnergy Transmission LLC |
|
|||||||||||
| 2.87% |
09/15/281 | 418,000 | 388,574 | |||||||||
| Pennsylvania Electric Co. |
|
|||||||||||
| 4.15% |
04/15/251 | 280,000 | 284,614 | |||||||||
| Public Service Co. of New Mexico |
|
|||||||||||
| 3.85% |
08/01/25 | 40,000 | 40,716 | |||||||||
| Tucson Electric Power Co. |
|
|||||||||||
| 3.85% |
03/15/23 | 140,000 | 142,124 | |||||||||
|
|
|
| ||||||||||
| 2,141,681 | ||||||||||||
|
|
|
| ||||||||||
| Energy — 3.14% |
|
|||||||||||
| Archrock Partners LP/Archrock Partners Finance Corp. |
|
|||||||||||
| 6.25% |
04/01/281 | 211,000 | 208,626 | |||||||||
| Ecopetrol SA |
|
|||||||||||
| (Colombia) |
|
|||||||||||
| 6.88% |
04/29/303 | 200,000 | 210,720 | |||||||||
| Energy Transfer LP |
|
|||||||||||
| 4.75% |
01/15/26 | 10,000 | 10,385 | |||||||||
| 4.90% |
03/15/35 | 20,000 | 20,165 | |||||||||
See accompanying Notes to Financial Statements.
| 59 / Annual Report March 2022 |
Table of Contents
Flexible Income Fund
Schedule of Portfolio Investments
March 31, 2022
| Issues |
Maturity Date |
Principal Amount |
Value | |||||||||
| CORPORATES (continued) |
|
|||||||||||
| Energy (continued) |
|
|||||||||||
| 4.95% |
06/15/28 | $ | 100,000 | $ | 105,169 | |||||||
| Energy Transfer LP, |
|
|||||||||||
| Series B |
|
|||||||||||
| 6.63%4,10 |
733,000 | 658,784 | ||||||||||
| Exxon Mobil Corp. |
|
|||||||||||
| 4.23% |
03/19/40 | 70,000 | 75,545 | |||||||||
| Galaxy Pipeline Assets Bidco Ltd. |
|
|||||||||||
| (United Kingdom) |
|
|||||||||||
| 2.16% |
03/31/341,3 | 384,344 | 354,861 | |||||||||
| Global Partners LP/GLP Finance Corp. |
|
|||||||||||
| 6.88% |
01/15/29 | 430,000 | 425,433 | |||||||||
| Hess Corp. |
|
|||||||||||
| 5.60% |
02/15/41 | 20,000 | 22,526 | |||||||||
| KazMunayGas National Co. JSC |
|
|||||||||||
| (Kazakhstan) |
|
|||||||||||
| 3.50% |
04/14/331,3 | 200,000 | 167,500 | |||||||||
| NGL Energy Operating LLC/NGL Energy Finance Corp. |
|
|||||||||||
| 7.50% |
02/01/261 | 294,000 | 289,332 | |||||||||
| NGPL Pipe Co. LLC |
|
|||||||||||
| 4.88% |
08/15/271 | 40,000 | 41,704 | |||||||||
| Occidental Petroleum Corp. |
|
|||||||||||
| 0.00% |
10/10/3613 | 644,000 | 346,730 | |||||||||
| Petroleos Mexicanos |
|
|||||||||||
| (Mexico) |
|
|||||||||||
| 6.63% |
06/15/353 | 5,000 | 4,497 | |||||||||
| 6.75% |
09/21/473 | 15,000 | 12,221 | |||||||||
| 6.95% |
01/28/603 | 5,000 | 4,062 | |||||||||
| 7.69% |
01/23/503 | 145,000 | 126,904 | |||||||||
| Petronas Capital Ltd. |
|
|||||||||||
| (Malaysia) |
|
|||||||||||
| 3.50% |
04/21/301,3 | 200,000 | 204,320 | |||||||||
| Rockies Express Pipeline LLC |
|
|||||||||||
| 4.80% |
05/15/301 | 234,000 | 224,055 | |||||||||
| 4.95% |
07/15/291 | 215,000 | 208,961 | |||||||||
| Ruby Pipeline LLC |
|
|||||||||||
| 8.00% |
04/01/221,5,6 | 535,455 | 497,973 | |||||||||
| Southern Natural Gas Co. LLC |
|
|||||||||||
| 4.80% |
03/15/471 | 65,000 | 69,045 | |||||||||
| Texas Eastern Transmission LP |
|
|||||||||||
| 2.80% |
10/15/221 | 170,000 | 170,601 | |||||||||
| TransMontaigne Partners LP/TLP Finance Corp. |
|
|||||||||||
| 6.13% |
02/15/26 | 325,000 | 320,125 | |||||||||
| Transocean Phoenix 2 Ltd. |
|
|||||||||||
| (Cayman Islands) |
|
|||||||||||
| 7.75% |
10/15/241,3 | 77,500 | 78,175 | |||||||||
| Transocean Poseidon Ltd. |
|
|||||||||||
| (Cayman Islands) |
|
|||||||||||
| 6.88% |
02/01/271,3 | 32,813 | 32,537 | |||||||||
| Transocean Proteus Ltd. |
|
|||||||||||
| (Cayman Islands) |
|
|||||||||||
| 6.25% |
12/01/241,3 | 355,000 | 352,819 | |||||||||
| USA Compression Partners LP/USA Compression Finance Corp. |
|
|||||||||||
| 6.88% |
09/01/27 | 407,000 | 409,192 | |||||||||
| Venture Global Calcasieu Pass LLC |
|
|||||||||||
| 4.13% |
08/15/311 | 875,000 | 860,271 | |||||||||
| Issues |
Maturity Date |
Principal Amount |
Value | |||||||||
| CORPORATES (continued) |
|
|||||||||||
| Energy (continued) |
|
|||||||||||
| Williams Cos., Inc. (The) |
|
|||||||||||
| 4.30% |
03/04/24 | $ | 60,000 | $ | 61,305 | |||||||
|
|
|
| ||||||||||
| 6,574,543 | ||||||||||||
|
|
|
| ||||||||||
| Entertainment — 0.29% |
|
|||||||||||
| Cinemark USA, Inc. |
|
|||||||||||
| 5.25% |
07/15/281 | 385,000 | 360,745 | |||||||||
| WMG Acquisition Corp. |
|
|||||||||||
| 3.75% |
12/01/291 | 269,000 | 252,801 | |||||||||
|
|
|
| ||||||||||
| 613,546 | ||||||||||||
|
|
|
| ||||||||||
| Finance — 4.70% |
|
|||||||||||
| AerCap Ireland Capital DAC/AerCap Global Aviation Trust |
|
|||||||||||
| (Ireland) |
|
|||||||||||
| 2.45% |
10/29/263 | 123,000 | 113,765 | |||||||||
| 3.30% |
01/30/323 | 410,000 | 370,933 | |||||||||
| 3.88% |
01/23/283 | 5,000 | 4,870 | |||||||||
| 4.45% |
10/01/253 | 110,000 | 110,517 | |||||||||
| Air Lease Corp. |
|
|||||||||||
| 2.25% |
01/15/23 | 25,000 | 25,020 | |||||||||
| Air Lease Corp. |
|
|||||||||||
| (MTN) |
|
|||||||||||
| 2.88% |
01/15/26 | 380,000 | 367,256 | |||||||||
| American Express Co. |
|
|||||||||||
| 2.55% |
03/04/27 | 190,000 | 184,751 | |||||||||
| Avolon Holdings Funding Ltd. |
|
|||||||||||
| (Cayman Islands) |
|
|||||||||||
| 2.53% |
11/18/271,3 | 123,000 | 108,871 | |||||||||
| Capital One Financial Corp. |
|
|||||||||||
| 1.34% |
12/06/244 | 360,000 | 349,440 | |||||||||
| Cboe Global Markets, Inc. |
|
|||||||||||
| 3.00% |
03/16/32 | 190,000 | 183,943 | |||||||||
| Charles Schwab Corp. (The) |
|
|||||||||||
| 2.90% |
03/03/32 | 285,000 | 274,473 | |||||||||
| 5.00%4,10 |
200,000 | 199,760 | ||||||||||
| Citigroup, Inc. |
|
|||||||||||
| 2.56% |
05/01/324 | 90,000 | 81,338 | |||||||||
| 2.57% |
06/03/314 | 75,000 | 68,843 | |||||||||
| 3.06% |
01/25/334 | 480,000 | 449,465 | |||||||||
| 3.52% |
10/27/284 | 435,000 | 431,517 | |||||||||
| 3.79% |
03/17/334 | 245,000 | 243,667 | |||||||||
| Citigroup, Inc., |
|
|||||||||||
| Series VAR |
|
|||||||||||
| 3.07% |
02/24/284 | 95,000 | 92,766 | |||||||||
| CME Group, Inc. |
|
|||||||||||
| 2.65% |
03/15/32 | 190,000 | 181,900 | |||||||||
| Discover Financial Services |
|
|||||||||||
| 3.95% |
11/06/24 | 105,000 | 106,760 | |||||||||
| Ford Motor Credit Co. LLC |
|
|||||||||||
| 4.25% |
09/20/22 | 85,000 | 85,623 | |||||||||
| Goldman Sachs Group, Inc. (The) |
|
|||||||||||
| 0.93% |
10/21/244 | 130,000 | 126,081 | |||||||||
| 1.22% |
12/06/23 | 455,000 | 444,411 | |||||||||
| 1.43% |
03/09/274 | 575,000 | 530,799 | |||||||||
| 1.95% |
10/21/274 | 230,000 | 213,907 | |||||||||
| 2.38% |
07/21/324 | 170,000 | 151,164 | |||||||||
See accompanying Notes to Financial Statements.
| Annual Report March 2022 / 60 |
Table of Contents
Flexible Income Fund
Schedule of Portfolio Investments
March 31, 2022
| Issues |
Maturity Date |
Principal Amount |
Value | |||||||||
| CORPORATES (continued) |
|
|||||||||||
| Finance (continued) |
|
|||||||||||
| 3.10% |
02/24/334 | $ | 500,000 | $ | 471,826 | |||||||
| 3.20% |
02/23/23 | 100,000 | 100,930 | |||||||||
| 3.27% |
09/29/254 | 165,000 | 164,918 | |||||||||
| Goldman Sachs Group, Inc. (The), |
|
|||||||||||
| Series VAR |
|
|||||||||||
| 1.09% |
12/09/264 | 5,000 | 4,587 | |||||||||
| Intercontinental Exchange, Inc. |
|
|||||||||||
| 1.85% |
09/15/32 | 195,000 | 169,082 | |||||||||
| Jane Street Group/JSG Finance, Inc. |
|
|||||||||||
| 4.50% |
11/15/291 | 435,000 | 412,699 | |||||||||
| JPMorgan Chase & Co. |
|
|||||||||||
| 1.05% |
11/19/264 | 270,000 | 249,578 | |||||||||
| 2.55% |
11/08/324 | 90,000 | 82,218 | |||||||||
| 2.95% |
02/24/284 | 120,000 | 117,147 | |||||||||
| JPMorgan Chase & Co., |
|
|||||||||||
| Series KK |
|
|||||||||||
| 3.65%4,10 |
115,000 | 107,813 | ||||||||||
| Morgan Stanley |
|
|||||||||||
| 0.99% |
12/10/264 | 145,000 | 133,438 | |||||||||
| 1.59% |
05/04/274 | 120,000 | 111,588 | |||||||||
| 2.94% |
01/21/334 | 305,000 | 285,948 | |||||||||
| Morgan Stanley |
|
|||||||||||
| (GMTN) |
|
|||||||||||
| 2.24% |
07/21/324 | 20,000 | 17,741 | |||||||||
| Morgan Stanley |
|
|||||||||||
| (MTN) |
|
|||||||||||
| 1.16% |
10/21/254 | 495,000 | 470,657 | |||||||||
| 1.93% |
04/28/324 | 445,000 | 385,599 | |||||||||
| Nationwide Building Society |
|
|||||||||||
| (United Kingdom) |
|
|||||||||||
| 2.97% |
02/16/281,3,4 | 200,000 | 190,733 | |||||||||
| 3.77% |
03/08/241,3,4 | 380,000 | 382,249 | |||||||||
| 4.36% |
08/01/241,3,4 | 130,000 | 132,042 | |||||||||
| Park Aerospace Holdings Ltd. |
|
|||||||||||
| (Cayman Islands) |
|
|||||||||||
| 4.50% |
03/15/231,3 | 30,000 | 30,228 | |||||||||
| 5.50% |
02/15/241,3 | 2,000 | 2,048 | |||||||||
| Pipeline Funding Co. LLC |
|
|||||||||||
| 7.50% |
01/15/301 | 153,703 | 180,198 | |||||||||
| Raymond James Financial, Inc. |
|
|||||||||||
| 4.65% |
04/01/30 | 145,000 | 153,981 | |||||||||
|
|
|
| ||||||||||
| 9,859,088 | ||||||||||||
|
|
|
| ||||||||||
| Food — 1.53% |
|
|||||||||||
| Chobani LLC/Chobani Finance Corp, Inc. |
|
|||||||||||
| 4.63% |
11/15/281 | 500,000 | 462,183 | |||||||||
| JBS USA LUX SA/JBS USA Food Co./JBS USA Finance, Inc. |
|
|||||||||||
| (Canada) |
|
|||||||||||
| 3.75% |
12/01/311,3 | 385,000 | 356,042 | |||||||||
| 5.50% |
01/15/301,3 | 376,000 | 385,182 | |||||||||
| Kraft Heinz Foods Co. |
|
|||||||||||
| 3.00% |
06/01/26 | 185,000 | 182,321 | |||||||||
| 4.88% |
10/01/49 | 70,000 | 73,873 | |||||||||
| 5.20% |
07/15/45 | 150,000 | 162,562 | |||||||||
| Issues |
Maturity Date |
Principal Amount |
Value | |||||||||
| CORPORATES (continued) |
|
|||||||||||
| Food (continued) |
|
|||||||||||
| Lamb Weston Holdings, Inc. |
|
|||||||||||
| 4.13% |
01/31/301 | $ | 550,000 | $ | 515,212 | |||||||
| Pilgrim’s Pride Corp. |
|
|||||||||||
| 4.25% |
04/15/311 | 180,000 | 166,844 | |||||||||
| 5.88% |
09/30/271 | 184,000 | 186,155 | |||||||||
| Post Holdings, Inc. |
|
|||||||||||
| 4.50% |
09/15/311 | 525,000 | 465,741 | |||||||||
| 4.63% |
04/15/301 | 265,000 | 239,056 | |||||||||
| Smithfield Foods, Inc. |
|
|||||||||||
| 5.20% |
04/01/291 | 5,000 | 5,252 | |||||||||
|
|
|
| ||||||||||
| 3,200,423 | ||||||||||||
|
|
|
| ||||||||||
| Gaming — 0.39% |
|
|||||||||||
| Caesars Entertainment, Inc. |
|
|||||||||||
| 4.63% |
10/15/291 | 550,000 | 516,291 | |||||||||
| CDI Escrow Issuer, Inc. |
|
|||||||||||
| 5.75% |
04/01/301 | 300,000 | 303,423 | |||||||||
|
|
|
| ||||||||||
| 819,714 | ||||||||||||
|
|
|
| ||||||||||
| Health Care — 3.67% |
|
|||||||||||
| 180 Medical, Inc. |
|
|||||||||||
| 3.88% |
10/15/291 | 168,000 | 159,180 | |||||||||
| AbbVie, Inc. |
|
|||||||||||
| 3.85% |
06/15/24 | 10,000 | 10,203 | |||||||||
| 4.50% |
05/14/35 | 324,000 | 348,513 | |||||||||
| Amgen, Inc. |
|
|||||||||||
| 3.15% |
02/21/40 | 100,000 | 91,351 | |||||||||
| 3.35% |
02/22/32 | 95,000 | 94,253 | |||||||||
| Baxter International, Inc. |
|
|||||||||||
| 0.87% |
12/01/231 | 260,000 | 251,796 | |||||||||
| Bayer U.S. Finance II LLC |
|
|||||||||||
| 4.25% |
12/15/251 | 255,000 | 259,581 | |||||||||
| 4.38% |
12/15/281 | 210,000 | 214,972 | |||||||||
| 4.40% |
07/15/441 | 245,000 | 237,430 | |||||||||
| 4.88% |
06/25/481 | 80,000 | 86,331 | |||||||||
| Becton Dickinson and Co. |
|
|||||||||||
| 3.73% |
12/15/24 | 3,000 | 3,051 | |||||||||
| Centene Corp. |
|
|||||||||||
| 2.45% |
07/15/28 | 349,000 | 319,170 | |||||||||
| 3.00% |
10/15/30 | 323,000 | 297,163 | |||||||||
| CommonSpirit Health |
|
|||||||||||
| 2.78% |
10/01/30 | 35,000 | 32,475 | |||||||||
| 4.35% |
11/01/42 | 100,000 | 101,214 | |||||||||
| CVS Health Corp. |
|
|||||||||||
| 5.05% |
03/25/48 | 270,000 | 306,236 | |||||||||
| Embecta Corp. |
|
|||||||||||
| 6.75% |
02/15/301 | 525,000 | 527,267 | |||||||||
| Encompass Health Corp. |
|
|||||||||||
| 4.63% |
04/01/31 | 550,000 | 516,772 | |||||||||
| Endo DAC/Endo Finance LLC/Endo Finco, Inc. |
|
|||||||||||
| (Ireland) |
|
|||||||||||
| 6.00% |
06/30/281,3 | 860,000 | 501,509 | |||||||||
| Endo Luxembourg Finance Co. I Sarl/Endo U.S., Inc. |
|
|||||||||||
| (Luxembourg) |
|
|||||||||||
| 6.13% |
04/01/291,3 | 175,000 | 159,913 | |||||||||
See accompanying Notes to Financial Statements.
| 61 / Annual Report March 2022 |
Table of Contents
Flexible Income Fund
Schedule of Portfolio Investments
March 31, 2022
| Issues |
Maturity Date |
Principal Amount |
Value | |||||||||
| CORPORATES (continued) |
|
|||||||||||
| Health Care (continued) |
|
|||||||||||
| HCA, Inc. |
|
|||||||||||
| 3.63% |
03/15/321 | $ | 550,000 | $ | 539,294 | |||||||
| 4.13% |
06/15/29 | 80,000 | 81,533 | |||||||||
| 5.00% |
03/15/24 | 10,000 | 10,368 | |||||||||
| 5.25% |
06/15/49 | 185,000 | 203,404 | |||||||||
| 5.63% |
09/01/28 | 275,000 | 297,687 | |||||||||
| ModivCare Escrow Issuer, Inc. |
|
|||||||||||
| 5.00% |
10/01/291 | 625,000 | 583,171 | |||||||||
| Molina Healthcare, Inc. |
|
|||||||||||
| 3.88% |
11/15/301 | 763,000 | 737,962 | |||||||||
| 4.38% |
06/15/281 | 74,000 | 73,259 | |||||||||
| NYU Langone Hospitals, |
|
|||||||||||
| Series 2020 |
|
|||||||||||
| 3.38% |
07/01/55 | 295,000 | 264,369 | |||||||||
| Prime Healthcare Services, Inc. |
|
|||||||||||
| 7.25% |
11/01/251 | 258,000 | 265,095 | |||||||||
| Royalty Pharma PLC |
|
|||||||||||
| (United Kingdom) |
|
|||||||||||
| 1.75% |
09/02/273 | 125,000 | 113,724 | |||||||||
|
|
|
| ||||||||||
| 7,688,246 | ||||||||||||
|
|
|
| ||||||||||
| Industrials — 1.89% |
|
|||||||||||
| Ardagh Packaging Finance PLC/Ardagh Holdings USA, Inc. |
|
|||||||||||
| (Canada) |
|
|||||||||||
| 5.25% |
08/15/271,3 | 825,000 | 766,054 | |||||||||
| Artera Services LLC |
|
|||||||||||
| 9.03% |
12/04/251 | 669,000 | 669,253 | |||||||||
| BAE Systems Holdings, Inc. |
|
|||||||||||
| 3.85% |
12/15/251 | 250,000 | 251,154 | |||||||||
| Berry Global, Inc. |
|
|||||||||||
| 1.65% |
01/15/27 | 40,000 | 36,500 | |||||||||
| Boeing Co. (The) |
|
|||||||||||
| 1.43% |
02/04/24 | 340,000 | 329,099 | |||||||||
| Clydesdale Acquisition Holdings, Inc. |
|
|||||||||||
| 6.63% |
04/15/291 | 300,000 | 303,375 | |||||||||
| Energizer Holdings, Inc. |
|
|||||||||||
| 4.38% |
03/31/291 | 475,000 | 416,979 | |||||||||
| General Electric Co. |
|
|||||||||||
| (MTN) |
|
|||||||||||
| (LIBOR USD 3-Month plus 0.38%) |
|
|||||||||||
| 0.70% |
05/05/262 | 57,000 | 56,121 | |||||||||
| (LIBOR USD 3-Month plus 0.48%) |
|
|||||||||||
| 0.99% |
08/15/362 | 52,000 | 44,793 | |||||||||
| General Electric Co., |
|
|||||||||||
| Series A (MTN) |
|
|||||||||||
| 6.75% |
03/15/32 | 17,000 | 21,461 | |||||||||
| OT Merger Corp. |
|
|||||||||||
| 7.88% |
10/15/291 | 625,000 | 550,404 | |||||||||
| Trivium Packaging Finance BV |
|
|||||||||||
| (Netherlands) |
|
|||||||||||
| 5.50% |
08/15/261,3 | 509,000 | 507,575 | |||||||||
|
|
|
| ||||||||||
| 3,952,768 | ||||||||||||
|
|
|
| ||||||||||
| Information Technology — 0.48% |
|
|||||||||||
| Broadcom, Inc. |
|
|||||||||||
| 3.42% |
04/15/331 | 190,000 | 177,410 | |||||||||
| Issues |
Maturity Date |
Principal Amount |
Value | |||||||||
| CORPORATES (continued) |
|
|||||||||||
| Information Technology (continued) |
|
|||||||||||
| Fiserv, Inc. |
|
|||||||||||
| 2.65% |
06/01/30 | $ | 10,000 | $ | 9,244 | |||||||
| Intel Corp. |
|
|||||||||||
| 3.05% |
08/12/51 | 29,000 | 25,827 | |||||||||
| Netflix, Inc. |
|
|||||||||||
| 5.88% |
02/15/25 | 310,000 | 331,153 | |||||||||
| Oracle Corp. |
|
|||||||||||
| 2.88% |
03/25/31 | 65,000 | 59,351 | |||||||||
| 3.80% |
11/15/37 | 90,000 | 81,034 | |||||||||
| 3.95% |
03/25/51 | 320,000 | 280,315 | |||||||||
| 4.00% |
11/15/47 | 40,000 | 35,481 | |||||||||
|
|
|
| ||||||||||
| 999,815 | ||||||||||||
|
|
|
| ||||||||||
| Insurance — 1.15% |
|
|||||||||||
| Acrisure LLC/Acrisure Finance, Inc. |
|
|||||||||||
| 4.25% |
02/15/291 | 175,000 | 159,215 | |||||||||
| AmWINS Group, Inc. |
|
|||||||||||
| 4.88% |
06/30/291 | 179,000 | 171,146 | |||||||||
| Aon Corp./Aon Global Holdings PLC |
|
|||||||||||
| 3.90% |
02/28/52 | 280,000 | 277,530 | |||||||||
| Athene Global Funding |
|
|||||||||||
| 1.99% |
08/19/281 | 370,000 | 325,215 | |||||||||
| 2.72% |
01/07/291 | 95,000 | 87,430 | |||||||||
| 3.21% |
03/08/271 | 130,000 | 125,299 | |||||||||
| Berkshire Hathaway Finance Corp. |
|
|||||||||||
| 2.50% |
01/15/51 | 115,000 | 92,939 | |||||||||
| 3.85% |
03/15/52 | 85,000 | 86,978 | |||||||||
| Brown & Brown, Inc. |
|
|||||||||||
| 4.95% |
03/17/52 | 160,000 | 171,002 | |||||||||
| Farmers Exchange Capital II |
|
|||||||||||
| 6.15% |
11/01/531,4 | 150,000 | 177,601 | |||||||||
| Farmers Exchange Capital III |
|
|||||||||||
| 5.45% |
10/15/541,4 | 85,000 | 95,961 | |||||||||
| Farmers Insurance Exchange |
|
|||||||||||
| 4.75% |
11/01/571,4 | 135,000 | 141,824 | |||||||||
| Metropolitan Life Global Funding I |
|
|||||||||||
| 2.95% |
04/09/301 | 15,000 | 14,559 | |||||||||
| Nationwide Mutual Insurance Co. |
|
|||||||||||
| 3.12% |
12/15/241,4 | 375,000 | 375,259 | |||||||||
| Teachers Insurance & Annuity Association of America |
|
|||||||||||
| 4.27% |
05/15/471 | 40,000 | 42,371 | |||||||||
| 4.38% |
09/15/541,4 | 65,000 | 64,786 | |||||||||
|
|
|
| ||||||||||
| 2,409,115 | ||||||||||||
|
|
|
| ||||||||||
| Materials — 1.15% |
|
|||||||||||
| ASP Unifrax Holdings, Inc. |
|
|||||||||||
| 5.25% |
09/30/281 | 265,000 | 246,511 | |||||||||
| Axalta Coating Systems, LLC |
|
|||||||||||
| 3.38% |
02/15/291 | 865,000 | 761,320 | |||||||||
| EverArc Escrow SARL |
|
|||||||||||
| (Luxembourg) |
|
|||||||||||
| 5.00% |
10/30/291,3 | 450,000 | 412,031 | |||||||||
| Herens Holdco SARL |
|
|||||||||||
| (Luxembourg) |
|
|||||||||||
| 4.75% |
05/15/281,3 | 450,000 | 405,050 | |||||||||
See accompanying Notes to Financial Statements.
| Annual Report March 2022 / 62 |
Table of Contents
Flexible Income Fund
Schedule of Portfolio Investments
March 31, 2022
| Issues |
Maturity Date |
Principal Amount |
Value | |||||||||||
| CORPORATES (continued) |
|
|||||||||||||
| Materials (continued) |
|
|||||||||||||
| Indonesia Asahan Aluminium Persero PT, |
|
|||||||||||||
| Series REGS |
|
|||||||||||||
| (Indonesia) |
|
|||||||||||||
| 5.45% |
05/15/303 | $ | 200,000 | $ | 209,225 | |||||||||
| 6.53% |
11/15/283 | 200,000 | 222,491 | |||||||||||
| International Flavors & Fragrances, Inc. |
|
|||||||||||||
| 2.30% |
11/01/301 | 170,000 | 152,022 | |||||||||||
|
|
|
| ||||||||||||
| 2,408,650 | ||||||||||||||
|
|
|
| ||||||||||||
| Real Estate Investment Trust (REIT) — 1.97% |
|
|||||||||||||
| American Assets Trust LP |
|
|||||||||||||
| 3.38% |
02/01/31 | 500,000 | 470,522 | |||||||||||
| American Campus Communities Operating Partnership LP |
|
|||||||||||||
| 2.25% |
01/15/29 | 45,000 | 41,085 | |||||||||||
| 3.30% |
07/15/26 | 55,000 | 54,775 | |||||||||||
| 3.63% |
11/15/27 | 190,000 | 189,194 | |||||||||||
| 3.75% |
04/15/23 | 60,000 | 60,532 | |||||||||||
| Boston Properties LP |
|
|||||||||||||
| 2.75% |
10/01/26 | 10,000 | 9,744 | |||||||||||
| China Aoyuan Group Ltd. |
|
|||||||||||||
| (Cayman Islands) |
|
|||||||||||||
| 6.35% |
02/08/243,5,6,11,12 | 200,000 | 34,000 | |||||||||||
| CyrusOne LP/CyrusOne Finance Corp. |
|
|||||||||||||
| 2.90% |
11/15/24 | 5,000 | 5,014 | |||||||||||
| 3.45% |
11/15/29 | 660,000 | 693,064 | |||||||||||
| GLP Capital LP/GLP Financing II, Inc. |
|
|||||||||||||
| 4.00% |
01/15/30 | 130,000 | 127,127 | |||||||||||
| 5.38% |
11/01/23 | 10,000 | 10,269 | |||||||||||
| 5.38% |
04/15/26 | 375,000 | 392,262 | |||||||||||
| 5.75% |
06/01/28 | 10,000 | 10,779 | |||||||||||
| Healthcare Realty Trust, Inc. |
|
|||||||||||||
| 3.63% |
01/15/28 | 150,000 | 148,883 | |||||||||||
| Healthcare Trust of America Holdings LP |
|
|||||||||||||
| 2.00% |
03/15/31 | 140,000 | 121,348 | |||||||||||
| Healthpeak Properties, Inc. |
|
|||||||||||||
| 3.40% |
02/01/25 | 2,000 | 2,009 | |||||||||||
| Hudson Pacific Properties LP |
|
|||||||||||||
| 3.95% |
11/01/27 | 255,000 | 256,524 | |||||||||||
| Invitation Homes Operating Partnership LP |
|
|||||||||||||
| 2.30% |
11/15/28 | 50,000 | 45,474 | |||||||||||
| 4.15% |
04/15/32 | 165,000 | 168,713 | |||||||||||
| Iron Mountain Information Management Services, Inc. |
|
|||||||||||||
| 5.00% |
07/15/321 | 275,000 | 258,789 | |||||||||||
| Iron Mountain, Inc. |
|
|||||||||||||
| 4.50% |
02/15/311 | 200,000 | 185,460 | |||||||||||
| Kilroy Realty LP |
|
|||||||||||||
| 2.50% |
11/15/32 | 50,000 | 43,521 | |||||||||||
| LXP Industrial Trust |
|
|||||||||||||
| 2.70% |
09/15/30 | 160,000 | 147,901 | |||||||||||
| SL Green Operating Partnership LP |
|
|||||||||||||
| 3.25% |
10/15/22 | 420,000 | 420,156 | |||||||||||
| Sunac China Holdings Ltd. |
|
|||||||||||||
| (Cayman Islands) |
|
|||||||||||||
| 6.50% |
01/10/253,6 | 210,000 | 53,400 | |||||||||||
| Issues |
Maturity Date |
Principal Amount |
Value | |||||||||
| CORPORATES (continued) |
|
|||||||||||
| Real Estate Investment Trust (REIT) (continued) |
|
|||||||||||
| Weyerhaeuser Co. |
|
|||||||||||
| 3.38% |
03/09/33 | $ | 195,000 | $ | 190,209 | |||||||
|
|
|
| ||||||||||
| 4,140,754 | ||||||||||||
|
|
|
| ||||||||||
| Retail — 1.34% |
|
|||||||||||
| 1011778 BC ULC/New Red Finance, Inc. |
|
|||||||||||
| (Canada) |
|
|||||||||||
| 4.00% |
10/15/301,3 | 800,000 | 723,712 | |||||||||
| Asbury Automotive Group, Inc. |
|
|||||||||||
| 5.00% |
02/15/321 | 275,000 | 256,177 | |||||||||
| Bloomin’ Brands, Inc./OSI Restaurant Partners LLC |
|
|||||||||||
| 5.13% |
04/15/291 | 343,000 | 324,392 | |||||||||
| Fertitta Entertainment, LLC/Fertitta Entertainment Finance Co., Inc. |
|
|||||||||||
| 6.75% |
01/15/301 | 450,000 | 415,125 | |||||||||
| FirstCash, Inc. |
|
|||||||||||
| 5.63% |
01/01/301 | 475,000 | 457,013 | |||||||||
| Michaels Cos., Inc. (The) |
|
|||||||||||
| 7.88% |
05/01/291 | 745,000 | 638,834 | |||||||||
|
|
|
| ||||||||||
| 2,815,253 | ||||||||||||
|
|
|
| ||||||||||
| Services — 1.31% |
|
|||||||||||
| Adtalem Global Education, Inc. |
|
|||||||||||
| 5.50% |
03/01/281 | 434,000 | 420,403 | |||||||||
| HealthEquity, Inc. |
|
|||||||||||
| 4.50% |
10/01/291 | 450,000 | 429,096 | |||||||||
| Hertz Corp. (The) |
|
|||||||||||
| 5.00% |
12/01/291 | 750,000 | 683,812 | |||||||||
| Rent-A-Center, Inc. |
|
|||||||||||
| 6.38% |
02/15/291 | 300,000 | 275,532 | |||||||||
| Waste Pro USA, Inc. |
|
|||||||||||
| 5.50% |
02/15/261 | 1,000,000 | 946,185 | |||||||||
|
|
|
| ||||||||||
| 2,755,028 | ||||||||||||
|
|
|
| ||||||||||
| Transportation — 0.06% |
|
|||||||||||
| Delta Air Lines Pass-Through Trust, |
|
|||||||||||
| Series 2020-1, Class AA |
|
|||||||||||
| 2.00% |
06/10/28 | 22,758 | 20,889 | |||||||||
| JetBlue Airways Pass-Through Trust, |
|
|||||||||||
| Series 2019-1, Class AA |
|
|||||||||||
| 2.75% |
05/15/32 | 27,440 | 25,354 | |||||||||
| JetBlue Airways Pass-Through Trust, |
|
|||||||||||
| Series 2020-1, Class A |
|
|||||||||||
| 4.00% |
11/15/32 | 70,092 | 69,766 | |||||||||
| U.S. Airways Pass-Through Trust, |
|
|||||||||||
| Series 2012-1, Class A |
|
|||||||||||
| 5.90% |
10/01/24 | 13,664 | 14,253 | |||||||||
|
|
|
| ||||||||||
| 130,262 | ||||||||||||
|
|
|
| ||||||||||
| Total Corporates |
|
|||||||||||
| (Cost $77,750,367) |
|
73,817,740 | ||||||||||
|
|
|
| ||||||||||
| FOREIGN GOVERNMENT OBLIGATIONS — 2.32% |
|
|||||||||||
| Foreign Government Obligations — 2.32% |
|
|||||||||||
| Airport Authority |
|
|||||||||||
| (Hong Kong) |
|
|||||||||||
| 3.25% |
01/12/521,3 | 200,000 | 181,510 | |||||||||
See accompanying Notes to Financial Statements.
| 63 / Annual Report March 2022 |
Table of Contents
Flexible Income Fund
Schedule of Portfolio Investments
March 31, 2022
| Issues |
Maturity Date |
Principal Amount |
Value | |||||||||
| FOREIGN GOVERNMENT OBLIGATIONS (continued) |
|
|||||||||||
| Foreign Government Obligations (continued) |
|
|||||||||||
| Brazilian Government International Bond |
|
|||||||||||
| (Brazil) |
|
|||||||||||
| 2.88% |
06/06/253 | $ | 200,000 | $ | 196,600 | |||||||
| 3.88% |
06/12/303 | 200,000 | 184,730 | |||||||||
| Chile Government International Bond |
|
|||||||||||
| (Chile) |
|
|||||||||||
| 2.55% |
01/27/323 | 200,000 | 188,680 | |||||||||
| Colombia Government International Bond |
|
|||||||||||
| (Colombia) |
|
|||||||||||
| 3.00% |
01/30/303 | 200,000 | 172,185 | |||||||||
| Dominican Republic International Bond, |
|
|||||||||||
| Series REGS |
|
|||||||||||
| (Dominican Republic) |
|
|||||||||||
| 4.88% |
09/23/323 | 150,000 | 136,591 | |||||||||
| Egypt Government International Bond |
|
|||||||||||
| (Egypt) |
|
|||||||||||
| 7.60% |
03/01/291,3 | 200,000 | 190,500 | |||||||||
| Guatemala Government Bond |
|
|||||||||||
| Series REGS |
|
|||||||||||
| (Guam) |
|
|||||||||||
| 4.90% |
06/01/303 | 200,000 | 204,872 | |||||||||
| Hungary Government International Bond |
|
|||||||||||
| (Hungary) |
|
|||||||||||
| 2.13% |
09/22/311,3 | 200,000 | 181,568 | |||||||||
| Mexico Government International Bond |
|
|||||||||||
| (Mexico) |
|
|||||||||||
| 2.66% |
05/24/313 | 212,000 | 193,302 | |||||||||
| 3.75% |
01/11/283 | 200,000 | 204,460 | |||||||||
| Oman Government International Bond, |
|
|||||||||||
| Series REGS |
|
|||||||||||
| (Oman) |
|
|||||||||||
| 5.63% |
01/17/283 | 250,000 | 258,775 | |||||||||
| Panama Government International Bond |
|
|||||||||||
| (Panama) |
|
|||||||||||
| 3.16% |
01/23/303 | 200,000 | 196,094 | |||||||||
| 3.88% |
03/17/283 | 200,000 | 205,000 | |||||||||
| Paraguay Government International Bond |
|
|||||||||||
| (Paraguay) |
|
|||||||||||
| 4.95% |
04/28/311,3 | 200,000 | 211,440 | |||||||||
| Peruvian Government International Bond |
|
|||||||||||
| (Peru) |
|
|||||||||||
| 2.84% |
06/20/303 | 250,000 | 240,675 | |||||||||
| Philippine Government International Bond |
|
|||||||||||
| (Philippines) |
|
|||||||||||
| 1.65% |
06/10/313 | 200,000 | 179,000 | |||||||||
| Qatar Government International Bond, |
|
|||||||||||
| Series REGS |
|
|||||||||||
| (Qatar) |
|
|||||||||||
| 3.75% |
04/16/303 | 200,000 | 211,660 | |||||||||
| 4.50% |
04/23/283 | 200,000 | 218,080 | |||||||||
| Republic of South Africa Government International Bond |
|
|||||||||||
| (South Africa) |
|
|||||||||||
| 4.85% |
09/30/293 | 200,000 | 196,140 | |||||||||
| Issues |
Maturity Date |
Principal Amount |
Value | |||||||||
| FOREIGN GOVERNMENT OBLIGATIONS (continued) |
|
|||||||||||
| Foreign Government Obligations (continued) |
|
|||||||||||
| Romanian Government International Bond, |
|
|||||||||||
| Series REGS |
|
|||||||||||
| (Romania) |
|
|||||||||||
| 3.00% |
02/14/313 | $ | 100,000 | $ | 92,709 | |||||||
| Saudi Government International Bond, |
|
|||||||||||
| Series REGS (EMTN) |
|
|||||||||||
| (Saudi Arabia) |
|
|||||||||||
| 3.25% |
10/26/263 | 400,000 | 410,000 | |||||||||
| Turkey Government International Bond |
|
|||||||||||
| (Turkey) |
|
|||||||||||
| 3.25% |
03/23/233 | 200,000 | 197,447 | |||||||||
| Uruguay Government International Bond |
|
|||||||||||
| (Uruguay) |
|
|||||||||||
| 4.38% |
01/23/313 | 200,000 | 217,880 | |||||||||
|
|
|
| ||||||||||
| Total Foreign Government Obligations |
|
|||||||||||
| (Cost $5,208,043) |
|
4,869,898 | ||||||||||
|
|
|
| ||||||||||
| MORTGAGE-BACKED — 46.24%** |
|
|||||||||||
| Non-Agency Commercial Mortgage-Backed — 9.81% |
|
|||||||||||
| Banc of America Commercial Mortgage Trust, |
|
|||||||||||
| Series 2015-UBS7, Class XA (IO) |
|
|||||||||||
| 0.79% |
09/15/484 | 7,034,449 | 165,259 | |||||||||
| Banc of America Commercial Mortgage Trust, |
|
|||||||||||
| Series 2015-UBS7, Class XE (IO) |
|
|||||||||||
| 1.25% |
09/15/481,4 | 500,000 | 16,310 | |||||||||
| Barclays Commercial Mortgage Securities Mortgage Trust, |
|
|||||||||||
| Series 2017-C1, Class XA (IO) |
|
|||||||||||
| 1.44% |
02/15/504 | 132,046 | 7,261 | |||||||||
| BB-UBS Trust, |
|
|||||||||||
| Series 2012-SHOW, Class XA (IO) |
|
|||||||||||
| 0.60% |
11/05/361,4 | 3,109,000 | 46,211 | |||||||||
| BB-UBS Trust, |
|
|||||||||||
| Series 2012-SHOW, Class XB (IO) |
|
|||||||||||
| 0.14% |
11/05/361,4 | 1,395,000 | 6,377 | |||||||||
| Benchmark Mortgage Trust, |
|
|||||||||||
| Series 2020-B18, Class AGNF |
|
|||||||||||
| 4.14% |
07/15/531 | 449,000 | 404,423 | |||||||||
| BX Commercial Mortgage Trust, |
|
|||||||||||
| Series 2020-FOX, Class G |
|
|||||||||||
| (LIBOR USD 1-Month plus 4.75%) |
|
|||||||||||
| 5.15% |
11/15/321,2 | 613,591 | 608,145 | |||||||||
| CD Mortgage Trust, |
|
|||||||||||
| Series 2016-CD1, Class XA (IO) |
|
|||||||||||
| 1.38% |
08/10/494 | 9,240,256 | 421,489 | |||||||||
| Century Plaza Towers, |
|
|||||||||||
| Series 2019-CPT, Class F |
|
|||||||||||
| 3.00% |
11/13/391,4 | 450,000 | 389,188 | |||||||||
| Citigroup Commercial Mortgage Trust, |
|
|||||||||||
| Series 2013-GC15, Class XA (IO) |
|
|||||||||||
| 0.82% |
09/10/464 | 3,981,328 | 35,660 | |||||||||
| Citigroup Commercial Mortgage Trust, |
|
|||||||||||
| Series 2014-GC19, Class XA (IO) |
|
|||||||||||
| 1.12% |
03/10/474 | 962,979 | 15,899 | |||||||||
| Citigroup Commercial Mortgage Trust, |
|
|||||||||||
| Series 2014-GC25, Class XA (IO) |
|
|||||||||||
| 0.96% |
10/10/474 | 9,671,947 | 188,190 | |||||||||
See accompanying Notes to Financial Statements.
| Annual Report March 2022 / 64 |
Table of Contents
Flexible Income Fund
Schedule of Portfolio Investments
March 31, 2022
| Issues |
Maturity Date |
Principal Amount |
Value | |||||||||
| MORTGAGE-BACKED (continued) |
|
|||||||||||
| Non-Agency Commercial Mortgage-Backed (continued) |
|
|||||||||||
| Citigroup Commercial Mortgage Trust, |
|
|||||||||||
| Series 2015-GC27, Class XA (IO) |
|
|||||||||||
| 1.33% |
02/10/484 | $ | 1,697,201 | $ | 50,459 | |||||||
| Citigroup Commercial Mortgage Trust, |
|
|||||||||||
| Series 2016-GC36, Class XA (IO) |
|
|||||||||||
| 1.22% |
02/10/494 | 5,617,993 | 206,895 | |||||||||
| Citigroup Commercial Mortgage Trust, |
|
|||||||||||
| Series 2017-B1, Class XF (IO) |
|
|||||||||||
| 0.87% |
08/15/501,4 | 11,628,000 | 415,917 | |||||||||
| Commercial Mortgage Lease-Backed Certificates-1, |
|
|||||||||||
| Series 2001-CMLB, Class X (IO) |
|
|||||||||||
| 0.80% |
06/20/311,4 | 3,482,842 | 38,161 | |||||||||
| Commercial Mortgage Trust, |
|
|||||||||||
| Series 2012-CR1, Class XA (IO) |
|
|||||||||||
| 1.66% |
05/15/454 | 29,304 | — | |||||||||
| Commercial Mortgage Trust, |
|
|||||||||||
| Series 2012-CR2, Class XA (IO) |
|
|||||||||||
| 1.60% |
08/15/454 | 641,464 | 257 | |||||||||
| Commercial Mortgage Trust, |
|
|||||||||||
| Series 2012-CR3, Class XA (IO) |
|
|||||||||||
| 1.82% |
10/15/454 | 617,594 | 1,710 | |||||||||
| Commercial Mortgage Trust, |
|
|||||||||||
| Series 2012-CR4, Class XA (IO) |
|
|||||||||||
| 1.68% |
10/15/454 | 790,552 | 2,814 | |||||||||
| Commercial Mortgage Trust, |
|
|||||||||||
| Series 2012-LC4, Class XB (IO) |
|
|||||||||||
| 0.50% |
12/10/441,4 | 1,609,402 | 16 | |||||||||
| Commercial Mortgage Trust, |
|
|||||||||||
| Series 2013-CR7, Class XA (IO) |
|
|||||||||||
| 1.17% |
03/10/464 | 4,998,117 | 39,145 | |||||||||
| Commercial Mortgage Trust, |
|
|||||||||||
| Series 2013-CR9, Class XA (IO) |
|
|||||||||||
| 0.05% |
07/10/454 | 14,145,229 | 3,798 | |||||||||
| Commercial Mortgage Trust, |
|
|||||||||||
| Series 2014-CR14, Class XA (IO) |
|
|||||||||||
| 0.54% |
02/10/474 | 3,412,077 | 28,637 | |||||||||
| Commercial Mortgage Trust, |
|
|||||||||||
| Series 2014-CR19, Class XA (IO) |
|
|||||||||||
| 0.95% |
08/10/474 | 939,277 | 16,779 | |||||||||
| Commercial Mortgage Trust, |
|
|||||||||||
| Series 2014-CR19, Class XC (IO) |
|
|||||||||||
| 0.78% |
08/10/471,4 | 1,200,000 | 18,514 | |||||||||
| Commercial Mortgage Trust, |
|
|||||||||||
| Series 2014-LC15, Class XA (IO) |
|
|||||||||||
| 1.06% |
04/10/474 | 3,404,757 | 54,311 | |||||||||
| Commercial Mortgage Trust, |
|
|||||||||||
| Series 2014-UBS3, Class XA (IO) |
|
|||||||||||
| 1.06% |
06/10/474 | 3,158,635 | 56,254 | |||||||||
| Commercial Mortgage Trust, |
|
|||||||||||
| Series 2014-UBS5, Class XA (IO) |
|
|||||||||||
| 0.85% |
09/10/474,5,6 | 30,795,150 | 502,172 | |||||||||
| Commercial Mortgage Trust, |
|
|||||||||||
| Series 2014-UBS6, Class XA (IO) |
|
|||||||||||
| 0.86% |
12/10/474 | 12,288,055 | 231,159 | |||||||||
| Issues |
Maturity Date |
Principal Amount |
Value | |||||||||
| MORTGAGE-BACKED (continued) |
|
|||||||||||
| Non-Agency Commercial Mortgage-Backed (continued) |
|
|||||||||||
| Commercial Mortgage Trust, |
|
|||||||||||
| Series 2015-CR22, Class XA (IO) |
|
|||||||||||
| 0.86% |
03/10/484 | $ | 10,312,940 | $ | 211,293 | |||||||
| Commercial Mortgage Trust, |
|
|||||||||||
| Series 2015-CR25, Class XA (IO) |
|
|||||||||||
| 0.82% |
08/10/484 | 8,304,638 | 191,983 | |||||||||
| Commercial Mortgage Trust, |
|
|||||||||||
| Series 2015-LC21, Class XE (IO) |
|
|||||||||||
| 1.08% |
07/10/481,4 | 10,015,000 | 319,978 | |||||||||
| Commercial Mortgage Trust, |
|
|||||||||||
| Series 2016-CR28, Class XA (IO) |
|
|||||||||||
| 0.71% |
02/10/494 | 14,657,872 | 291,353 | |||||||||
| CSAIL Commercial Mortgage Trust, |
|
|||||||||||
| Series 2015-C2, Class XA (IO) |
|
|||||||||||
| 0.74% |
06/15/574 | 17,715,046 | 314,159 | |||||||||
| CSAIL Commercial Mortgage Trust, |
|
|||||||||||
| Series 2019-C16, Class XA (IO) |
|
|||||||||||
| 1.56% |
06/15/524 | 566,577 | 49,168 | |||||||||
| CSMC Trust, |
|
|||||||||||
| Series 2016-NXSR, Class XA (IO) |
|
|||||||||||
| 0.71% |
12/15/494 | 441,141 | 11,968 | |||||||||
| CSMC, |
|
|||||||||||
| Series 2019-RIO, Class A |
|
|||||||||||
| (LIBOR USD 1-Month plus 3.02%) |
|
|||||||||||
| 4.02% |
12/15/221,2 | 425,000 | 424,420 | |||||||||
| CSMC, |
|
|||||||||||
| Series 2020-522F, Class A |
|
|||||||||||
| (LIBOR USD 1-Month plus 3.74%) |
|
|||||||||||
| 4.14% |
09/16/251,2 | 400,000 | 399,167 | |||||||||
| DBJPM 16-C1 Mortgage Trust, |
|
|||||||||||
| Series 2016-C1, Class XA (IO) |
|
|||||||||||
| 1.38% |
05/10/494 | 8,905,631 | 381,566 | |||||||||
| DBUBS Mortgage Trust, |
|
|||||||||||
| Series 2011-LC1A, Class XB (IO) |
|
|||||||||||
| 0.74% |
11/10/461,4 | 25,163 | 14 | |||||||||
| European Loan Conduit No. 36 DAC, |
|
|||||||||||
| Series 36A, Class E |
|
|||||||||||
| (Ireland) |
|
|||||||||||
| (-1.00 X 3 month Euribor plus 3.35%, 8.35% Cap) |
|
|||||||||||
| 3.35% |
02/17/301,2,3 | 699,166 | 767,523 | |||||||||
| GS Mortgage Securities Corp. II, |
|
|||||||||||
| Series 2013-GC10, Class XA (IO) |
|
|||||||||||
| 1.47% |
02/10/464 | 16,750,307 | 134,992 | |||||||||
| GS Mortgage Securities Trust, |
|
|||||||||||
| Series 2010-C1, Class X (IO) |
|
|||||||||||
| 0.56% |
08/10/431,4 | 5,391,611 | 40,473 | |||||||||
| GS Mortgage Securities Trust, |
|
|||||||||||
| Series 2011-GC3, Class X (IO) |
|
|||||||||||
| 0.00% |
03/10/441,4 | 174,277 | 2 | |||||||||
| GS Mortgage Securities Trust, |
|
|||||||||||
| Series 2011-GC5, Class XA (IO) |
|
|||||||||||
| 0.00% |
08/10/441,4 | 751,322 | 8 | |||||||||
| GS Mortgage Securities Trust, |
|
|||||||||||
| Series 2012-GCJ9, Class XA (IO) |
|
|||||||||||
| 1.91% |
11/10/454 | 652,616 | 3,886 | |||||||||
See accompanying Notes to Financial Statements.
| 65 / Annual Report March 2022 |
Table of Contents
Flexible Income Fund
Schedule of Portfolio Investments
March 31, 2022
| Issues |
Maturity Date |
Principal Amount |
Value | |||||||||
| MORTGAGE-BACKED (continued) |
|
|||||||||||
| Non-Agency Commercial Mortgage-Backed (continued) |
|
|||||||||||
| GS Mortgage Securities Trust, |
|
|||||||||||
| Series 2014-GC18, Class XA (IO) |
|
|||||||||||
| 1.07% |
01/10/474 | $ | 26,601,174 | $ | 392,657 | |||||||
| GS Mortgage Securities Trust, |
|
|||||||||||
| Series 2015-GC32, Class XA (IO) |
|
|||||||||||
| 0.73% |
07/10/484 | 34,525,198 | 697,930 | |||||||||
| GS Mortgage Securities Trust, |
|
|||||||||||
| Series 2015-GC34, Class XA (IO) |
|
|||||||||||
| 1.22% |
10/10/484 | 5,538,196 | 192,283 | |||||||||
| GS Mortgage Securities Trust, |
|
|||||||||||
| Series 2015-GS1, Class XA (IO) |
|
|||||||||||
| 0.76% |
11/10/484 | 9,377,060 | 227,702 | |||||||||
| GS Mortgage Securities Trust, |
|
|||||||||||
| Series 2016-GS2, Class XA (IO) |
|
|||||||||||
| 1.74% |
05/10/494 | 255,985 | 14,496 | |||||||||
| GS Mortgage Securities Trust, |
|
|||||||||||
| Series 2016-GS3, Class XA (IO) |
|
|||||||||||
| 1.20% |
10/10/494 | 2,497,963 | 106,831 | |||||||||
| GS Mortgage Securities Trust, |
|
|||||||||||
| Series 2016-GS4, Class XA (IO) |
|
|||||||||||
| 0.57% |
11/10/494 | 15,068,470 | 320,693 | |||||||||
| GSCG Trust, |
|
|||||||||||
| Series 2019-600C, Class G |
|
|||||||||||
| 3.99% |
09/06/341,4 | 285,000 | 257,676 | |||||||||
| Hilton USA Trust, |
|
|||||||||||
| Series 2016-SFP, Class E |
|
|||||||||||
| 5.52% |
11/05/351 | 400,000 | 395,811 | |||||||||
| JPMBB Commercial Mortgage Securities Trust, |
|
|||||||||||
| Series 2014-C19, Class XA (IO) |
|
|||||||||||
| 0.65% |
04/15/474 | 12,438,421 | 114,269 | |||||||||
| JPMBB Commercial Mortgage Securities Trust, |
|
|||||||||||
| Series 2015-C30, Class XA (IO) |
|
|||||||||||
| 0.49% |
07/15/484 | 21,103,964 | 292,936 | |||||||||
| JPMBB Commercial Mortgage Securities Trust, |
|
|||||||||||
| Series 2015-C30, Class XNR (IO) |
|
|||||||||||
| 0.25% |
07/15/481,4 | 44,664,247 | 253,487 | |||||||||
| JPMBB Commercial Mortgage Securities Trust, |
|
|||||||||||
| Series 2015-C31, Class XA (IO) |
|
|||||||||||
| 0.82% |
08/15/484 | 7,240,856 | 169,545 | |||||||||
| JPMCC Commercial Mortgage Securities Trust, |
|
|||||||||||
| Series 2017-JP5, Class XA (IO) |
|
|||||||||||
| 0.94% |
03/15/504 | 4,491,714 | 134,181 | |||||||||
| JPMDB Commercial Mortgage Securities Trust, |
|
|||||||||||
| Series 2016-C2, Class XA (IO) |
|
|||||||||||
| 1.55% |
06/15/494 | 275,227 | 11,808 | |||||||||
| JPMorgan Chase Commercial Mortgage Securities Trust, |
|
|||||||||||
| Series 2012-C6, Class XA (IO) |
|
|||||||||||
| 1.43% |
05/15/454 | 184,793 | 7 | |||||||||
| JPMorgan Chase Commercial Mortgage Securities Trust, |
|
|||||||||||
| Series 2012-C8, Class XA (IO) |
|
|||||||||||
| 1.71% |
10/15/454 | 415,750 | 683 | |||||||||
| JPMorgan Chase Commercial Mortgage Securities Trust, |
|
|||||||||||
| Series 2012-CBX, Class XA (IO) |
|
|||||||||||
| 0.78% |
06/15/454 | 163,516 | 4 | |||||||||
| Issues |
Maturity Date |
Principal Amount |
Value | |||||||||
| MORTGAGE-BACKED (continued) |
|
|||||||||||
| Non-Agency Commercial Mortgage-Backed (continued) |
|
|||||||||||
| JPMorgan Chase Commercial Mortgage Securities Trust, |
|
|||||||||||
| Series 2012-CBX, Class XB (IO) |
|
|||||||||||
| 0.27% |
06/15/451,4 | $ | 125,332,727 | $ | 187,059 | |||||||
| JPMorgan Chase Commercial Mortgage Securities Trust, |
|
|||||||||||
| Series 2012-LC9, Class XA (IO) |
|
|||||||||||
| 1.39% |
12/15/474 | 1,411,266 | 8,003 | |||||||||
| JPMorgan Chase Commercial Mortgage Securities Trust, |
|
|||||||||||
| Series 2013-C10, Class XA (IO) |
|
|||||||||||
| 0.93% |
12/15/474 | 1,168,955 | 5,596 | |||||||||
| JPMorgan Chase Commercial Mortgage Securities Trust, |
|
|||||||||||
| Series 2013-LC11, Class XA (IO) |
|
|||||||||||
| 1.23% |
04/15/464 | 2,617,358 | 23,249 | |||||||||
| JPMorgan Chase Commercial Mortgage Securities Trust, |
|
|||||||||||
| Series 2019-COR4, Class A3 |
|
|||||||||||
| 3.76% |
03/10/52 | 500,000 | 506,486 | |||||||||
| JPMorgan Chase Commercial Mortgage Securities Trust, |
|
|||||||||||
| Series 2020-ACE, Class XA (IO) |
|
|||||||||||
| 0.34% |
01/10/371,4 | 2,000,000 | 19,046 | |||||||||
| JPMorgan Chase Commercial Mortgage Securities Trust, |
|
|||||||||||
| Series 2020-LOOP, Class XB (IO) |
|
|||||||||||
| 0.25% |
12/05/381,4 | 2,010,000 | 22,253 | |||||||||
| JPMorgan Chase Commercial Mortgage Securities Trust, |
|
|||||||||||
| Series 2020-NNN, Class XAFX (IO) |
|
|||||||||||
| 1.88% |
01/16/371,4 | 450,000 | 18,845 | |||||||||
| JPMorgan Chase Commercial Mortgage Securities Trust, |
|
|||||||||||
| Series 2020-NNN, Class XBFX (IO) |
|
|||||||||||
| 0.57% |
01/16/371,4 | 1,450,000 | 19,145 | |||||||||
| Last Mile Logistics Pan Euro Finance DAC, |
|
|||||||||||
| Series 1A, Class F |
|
|||||||||||
| (Ireland) |
|
|||||||||||
| (-1.00 X 3 month Euribor plus 3.65%) |
|
|||||||||||
| 3.65% |
08/17/331,2,3 | 497,769 | 530,651 | |||||||||
| LB-UBS Commercial Mortgage Trust, |
|
|||||||||||
| Series 2006-C7, Class XW (IO) |
|
|||||||||||
| 0.05% |
11/15/381,4 | 638,651 | 2,142 | |||||||||
| Med Trust, |
|
|||||||||||
| Series 2021-MDLN, Class G |
|
|||||||||||
| (LIBOR USD 1-Month plus 5.25%) |
|
|||||||||||
| 5.65% |
11/15/381,2 | 420,000 | 412,656 | |||||||||
| ML-CFC Commercial Mortgage Trust, |
|
|||||||||||
| Series 2007-6, Class X (IO) |
|
|||||||||||
| 0.06% |
03/12/511,4 | 13,810,469 | 59,085 | |||||||||
| Morgan Stanley Bank of America Merrill Lynch Trust, |
|
|||||||||||
| Series 2012-C5, Class XA (IO) |
|
|||||||||||
| 1.31% |
08/15/451,4 | 317,553 | 208 | |||||||||
| Morgan Stanley Bank of America Merrill Lynch Trust, |
|
|||||||||||
| Series 2012-C5, Class XC (IO) |
|
|||||||||||
| 0.05% |
08/15/451,4 | 34,760,450 | 16,951 | |||||||||
| Morgan Stanley Bank of America Merrill Lynch Trust, |
|
|||||||||||
| Series 2012-CKSV, Class XA (IO) |
|
|||||||||||
| 1.02% |
10/15/301,4 | 1,097,042 | 561 | |||||||||
| Morgan Stanley Bank of America Merrill Lynch Trust, |
|
|||||||||||
| Series 2013-C12, Class XC (IO) |
|
|||||||||||
| 1.05% |
10/15/461,4 | 19,087,479 | 304,876 | |||||||||
See accompanying Notes to Financial Statements.
| Annual Report March 2022 / 66 |
Table of Contents
Flexible Income Fund
Schedule of Portfolio Investments
March 31, 2022
| Issues |
Maturity Date |
Principal Amount |
Value | |||||||||
| MORTGAGE-BACKED (continued) |
|
|||||||||||
| Non-Agency Commercial Mortgage-Backed (continued) |
|
|||||||||||
| Morgan Stanley Bank of America Merrill Lynch Trust, |
|
|||||||||||
| Series 2013-C13, Class XA (IO) |
|
|||||||||||
| 0.94% |
11/15/464 | $ | 2,442,825 | $ | 26,460 | |||||||
| Morgan Stanley Bank of America Merrill Lynch Trust, |
|
|||||||||||
| Series 2014-C18, Class XA (IO) |
|
|||||||||||
| 0.63% |
10/15/474 | 95,008 | 1,048 | |||||||||
| Morgan Stanley Bank of America Merrill Lynch Trust, |
|
|||||||||||
| Series 2015-C21, Class XA (IO) |
|
|||||||||||
| 0.86% |
03/15/484 | 3,356,616 | 66,222 | |||||||||
| Morgan Stanley Bank of America Merrill Lynch Trust, |
|
|||||||||||
| Series 2015-C22, Class XA (IO) |
|
|||||||||||
| 1.02% |
04/15/484 | 1,107,221 | 24,725 | |||||||||
| Morgan Stanley Bank of America Merrill Lynch Trust, |
|
|||||||||||
| Series 2015-C24, Class XA (IO) |
|
|||||||||||
| 0.72% |
05/15/484 | 7,463,709 | 147,028 | |||||||||
| Morgan Stanley Capital I Trust, |
|
|||||||||||
| Series 2011-C2, Class XB (IO) |
|
|||||||||||
| 0.43% |
06/15/441,4 | 11,481,882 | 45,032 | |||||||||
| Morgan Stanley Capital I Trust, |
|
|||||||||||
| Series 2017-CLS, Class F |
|
|||||||||||
| (LIBOR USD 1-Month plus 2.60%) |
|
|||||||||||
| 3.00% |
11/15/341,2 | 206,000 | 203,958 | |||||||||
| MRCD Mortgage Trust, |
|
|||||||||||
| Series 2019-PRKC, Class A |
|
|||||||||||
| 4.25% |
12/15/361,4 | 500,000 | 433,613 | |||||||||
| Natixis Commercial Mortgage Securities Trust, |
|
|||||||||||
| Series 2018-ALXA, Class E |
|
|||||||||||
| 4.32% |
01/15/431,4 | 70,000 | 64,117 | |||||||||
| Natixis Commercial Mortgage Securities Trust, |
|
|||||||||||
| Series 2019-FAME, Class D |
|
|||||||||||
| 4.40% |
08/15/361,4 | 665,000 | 610,407 | |||||||||
| Natixis Commercial Mortgage Securities Trust, |
|
|||||||||||
| Series 2019-FAME, Class E |
|
|||||||||||
| 4.40% |
08/15/361,4 | 395,000 | 340,512 | |||||||||
| Natixis Commercial Mortgage Securities Trust, |
|
|||||||||||
| Series 2020-2PAC, Class MSK1 |
|
|||||||||||
| 3.25% |
12/15/361,4 | 172,000 | 160,912 | |||||||||
| SFAVE Commercial Mortgage Securities Trust, |
|
|||||||||||
| Series 2015-5AVE, Class A2A |
|
|||||||||||
| 3.66% |
01/05/431,4 | 400,000 | 381,834 | |||||||||
| SFAVE Commercial Mortgage Securities Trust, |
|
|||||||||||
| Series 2015-5AVE, Class A2B |
|
|||||||||||
| 4.14% |
01/05/431,4 | 460,000 | 440,733 | |||||||||
| SFAVE Commercial Mortgage Securities Trust, |
|
|||||||||||
| Series 2015-5AVE, Class C |
|
|||||||||||
| 4.39% |
01/05/431,4 | 925,000 | 737,338 | |||||||||
| Taurus UK DAC, |
|
|||||||||||
| Series 2021-UK1A, Class D |
|
|||||||||||
| (Ireland) |
|
|||||||||||
| (SONIA plus 2.60%) |
|
|||||||||||
| 2.76% |
05/17/311,2,3 | 471,537 | 616,765 | |||||||||
| UBS Commercial Mortgage Trust, |
|
|||||||||||
| Series 2017-C4, Class XA (IO) |
|
|||||||||||
| 1.01% |
10/15/504 | 9,316,281 | 389,596 | |||||||||
| Issues |
Maturity Date |
Principal Amount |
Value | |||||||||
| MORTGAGE-BACKED (continued) |
|
|||||||||||
| Non-Agency Commercial Mortgage-Backed (continued) |
|
|||||||||||
| UBS-Barclays Commercial Mortgage Trust, |
|
|||||||||||
| Series 2012-C4, Class XA (IO) |
|
|||||||||||
| 1.57% |
12/10/451,4 | $ | 725,040 | $ | 2,548 | |||||||
| Wells Fargo Commercial Mortgage Trust, |
|
|||||||||||
| Series 2012-LC5, Class XA (IO) |
|
|||||||||||
| 1.70% |
10/15/451,4 | 785,401 | 2,474 | |||||||||
| Wells Fargo Commercial Mortgage Trust, |
|
|||||||||||
| Series 2014-LC16, Class XA (IO) |
|
|||||||||||
| 1.10% |
08/15/504 | 16,966,452 | 306,753 | |||||||||
| Wells Fargo Commercial Mortgage Trust, |
|
|||||||||||
| Series 2014-LC18, Class XA (IO) |
|
|||||||||||
| 1.03% |
12/15/474 | 1,542,627 | 32,224 | |||||||||
| Wells Fargo Commercial Mortgage Trust, |
|
|||||||||||
| Series 2015-C27, Class XA (IO) |
|
|||||||||||
| 0.86% |
02/15/484 | 18,191,259 | 370,943 | |||||||||
| Wells Fargo Commercial Mortgage Trust, |
|
|||||||||||
| Series 2015-C31, Class XA (IO) |
|
|||||||||||
| 0.97% |
11/15/484 | 17,909,289 | 506,949 | |||||||||
| Wells Fargo Commercial Mortgage Trust, |
|
|||||||||||
| Series 2015-LC20, Class XF (IO) |
|
|||||||||||
| 1.74% |
04/15/501,4 | 415,000 | 16,252 | |||||||||
| Wells Fargo Commercial Mortgage Trust, |
|
|||||||||||
| Series 2015-NXS3, Class XA (IO) |
|
|||||||||||
| 0.90% |
09/15/574 | 9,555,854 | 245,697 | |||||||||
| Wells Fargo Commercial Mortgage Trust, |
|
|||||||||||
| Series 2016-C34, Class XA (IO) |
|
|||||||||||
| 2.09% |
06/15/494 | 6,847,400 | 393,028 | |||||||||
| Wells Fargo Commercial Mortgage Trust, |
|
|||||||||||
| Series 2021-SAVE, Class XCP (IO) |
|
|||||||||||
| 10.12% |
02/15/401,4 | 5,587,000 | 112,886 | |||||||||
| WF-RBS Commercial Mortgage Trust, |
|
|||||||||||
| Series 2012-C10, Class XA (IO) |
|
|||||||||||
| 1.48% |
12/15/451,4 | 1,069,730 | 6,130 | |||||||||
| WF-RBS Commercial Mortgage Trust, |
|
|||||||||||
| Series 2012-C10, Class XB (IO) |
|
|||||||||||
| 0.45% |
12/15/451,4 | 56,000,000 | 170,055 | |||||||||
| WF-RBS Commercial Mortgage Trust, |
|
|||||||||||
| Series 2012-C7, Class XB (IO) |
|
|||||||||||
| 0.09% |
06/15/451,4 | 29,387,219 | 1,741 | |||||||||
| WF-RBS Commercial Mortgage Trust, |
|
|||||||||||
| Series 2012-C8, Class XA (IO) |
|
|||||||||||
| 1.69% |
08/15/451,4 | 364,076 | 18 | |||||||||
| WF-RBS Commercial Mortgage Trust, |
|
|||||||||||
| Series 2014-C20, Class XA (IO) |
|
|||||||||||
| 0.91% |
05/15/474 | 10,518,604 | 157,685 | |||||||||
| WF-RBS Commercial Mortgage Trust, |
|
|||||||||||
| Series 2014-C22, Class XA (IO) |
|
|||||||||||
| 0.79% |
09/15/574 | 1,920,472 | 29,063 | |||||||||
| WF-RBS Commercial Mortgage Trust, |
|
|||||||||||
| Series 2014-C24, Class XA (IO) |
|
|||||||||||
| 0.85% |
11/15/474 | 6,174,848 | 109,667 | |||||||||
| WF-RBS Commercial Mortgage Trust, |
|
|||||||||||
| Series 2014-LC14, Class XA (IO) |
|
|||||||||||
| 1.25% |
03/15/474 | 10,622,321 | 187,005 | |||||||||
|
|
|
| ||||||||||
| 20,574,592 | ||||||||||||
|
|
|
| ||||||||||
See accompanying Notes to Financial Statements.
| 67 / Annual Report March 2022 |
Table of Contents
Flexible Income Fund
Schedule of Portfolio Investments
March 31, 2022
| Issues |
Maturity Date |
Principal Amount |
Value | |||||||||||
| MORTGAGE-BACKED (continued) |
|
|||||||||||||
| Non-Agency Mortgage-Backed — 19.70% |
|
|||||||||||||
| Alternative Loan Trust, |
|
|||||||||||||
| Series 2005-46CB, Class A3 |
|
|||||||||||||
| 5.50% |
10/25/35 | $ | 297,684 | $ | 263,482 | |||||||||
| Alternative Loan Trust, |
|
|||||||||||||
| Series 2005-46CB, Class A4 |
|
|||||||||||||
| 5.25% |
10/25/35 | 224,941 | 188,294 | |||||||||||
| Alternative Loan Trust, |
|
|||||||||||||
| Series 2005-46CB, Class A7 |
|
|||||||||||||
| 5.50% |
10/25/35 | 634,544 | 561,638 | |||||||||||
| Alternative Loan Trust, |
|
|||||||||||||
| Series 2005-55CB, Class 1A1 |
|
|||||||||||||
| 5.50% |
11/25/35 | 210,399 | 173,353 | |||||||||||
| Alternative Loan Trust, |
|
|||||||||||||
| Series 2005-64CB, Class 2A1 |
|
|||||||||||||
| 6.00% |
11/25/35 | 3,082,645 | 796,754 | |||||||||||
| Alternative Loan Trust, |
|
|||||||||||||
| Series 2005-65CB, Class 2A4 |
|
|||||||||||||
| 5.50% |
12/25/35 | 365,225 | 304,757 | |||||||||||
| Alternative Loan Trust, |
|
|||||||||||||
| Series 2005-67CB, Class A1 |
|
|||||||||||||
| 5.50% |
01/25/36 | 77,925 | 67,830 | |||||||||||
| Alternative Loan Trust, |
|
|||||||||||||
| Series 2005-74T1, Class A5 |
|
|||||||||||||
| 6.00% |
01/25/36 | 520,138 | 392,330 | |||||||||||
| Alternative Loan Trust, |
|
|||||||||||||
| Series 2005-7CB, Class 2A2 (IO) |
|
|||||||||||||
| (-1.00 X LIBOR USD 1-Month plus 5.05%, 5.05% Cap) |
|
|||||||||||||
| 4.59% |
03/01/382,5,6 | 1,619,455 | 132,367 | |||||||||||
| Alternative Loan Trust, |
|
|||||||||||||
| Series 2005-86CB, Class A1 |
|
|||||||||||||
| 5.50% |
02/25/36 | 599,975 | 456,569 | |||||||||||
| Alternative Loan Trust, |
|
|||||||||||||
| Series 2005-86CB, Class A8 |
|
|||||||||||||
| 5.50% |
02/25/36 | 274,275 | 208,718 | |||||||||||
| Alternative Loan Trust, |
|
|||||||||||||
| Series 2006-19CB, Class A15 |
|
|||||||||||||
| 6.00% |
08/25/36 | 131,915 | 98,540 | |||||||||||
| Alternative Loan Trust, |
|
|||||||||||||
| Series 2006-32CB, Class A18 |
|
|||||||||||||
| 6.00% |
11/25/36 | 150,877 | 112,329 | |||||||||||
| Alternative Loan Trust, |
|
|||||||||||||
| Series 2006-34, Class A5 |
|
|||||||||||||
| 6.25% |
11/25/46 | 1,297,025 | 826,702 | |||||||||||
| Alternative Loan Trust, |
|
|||||||||||||
| Series 2006-J1, Class 1A11 |
|
|||||||||||||
| 5.50% |
02/25/36 | 225,581 | 194,883 | |||||||||||
| Alternative Loan Trust, |
|
|||||||||||||
| Series 2007-13, Class A1 |
|
|||||||||||||
| 6.00% |
06/25/47 | 293,826 | 201,153 | |||||||||||
| Alternative Loan Trust, |
|
|||||||||||||
| Series 2007-15CB, Class A6 |
|
|||||||||||||
| 5.75% |
07/25/37 | 618,265 | 474,687 | |||||||||||
| Alternative Loan Trust, |
|
|||||||||||||
| Series 2007-16CB, Class 1A7 |
|
|||||||||||||
| 6.00% |
08/25/37 | 8,269 | 7,699 | |||||||||||
| Issues |
Maturity Date |
Principal Amount |
Value | |||||||||
| MORTGAGE-BACKED (continued) |
|
|||||||||||
| Non-Agency Mortgage-Backed (continued) |
|
|||||||||||
| Alternative Loan Trust, |
|
|||||||||||
| Series 2007-18CB, Class 2A25 |
|
|||||||||||
| 6.00% |
08/25/37 | $ | 348,279 | $ | 252,623 | |||||||
| Alternative Loan Trust, |
|
|||||||||||
| Series 2007-22, Class 2A16 |
|
|||||||||||
| 6.50% |
09/25/37 | 250,692 | 134,137 | |||||||||
| Alternative Loan Trust, |
|
|||||||||||
| Series 2007-5CB, Class 1A3 |
|
|||||||||||
| 6.00% |
04/25/37 | 195,031 | 138,940 | |||||||||
| Alternative Loan Trust, |
|
|||||||||||
| Series 2007-5CB, Class 1A4 |
|
|||||||||||
| 6.00% |
04/25/37 | 575,410 | 409,929 | |||||||||
| American Home Mortgage Assets Trust, |
|
|||||||||||
| Series 2006-6, Class XP (IO) (PO) |
|
|||||||||||
| 2.34% |
12/25/464,5,6 | 633,671 | 30,355 | |||||||||
| American Home Mortgage Assets Trust, |
|
|||||||||||
| Series 2007-5, Class XP (IO) (PO) |
|
|||||||||||
| 2.71% |
06/25/474,5,6 | 1,050,022 | 63,846 | |||||||||
| American Home Mortgage Investment Trust, |
|
|||||||||||
| Series 2006-1, Class 11A1 |
|
|||||||||||
| (LIBOR USD 1-Month plus 0.28%) |
|
|||||||||||
| 0.74% |
03/25/462 | 14,405 | 13,718 | |||||||||
| Banc of America Funding Trust, |
|
|||||||||||
| Series 2006-3, Class 5A3 |
|
|||||||||||
| 5.50% |
03/25/36 | 6,943 | 6,661 | |||||||||
| Banc of America Funding Trust, |
|
|||||||||||
| Series 2014-R7, Class 1A1 |
|
|||||||||||
| (LIBOR USD 1-Month plus 0.15%) |
|
|||||||||||
| 0.61% |
05/26/361,2 | 12,372 | 12,245 | |||||||||
| Banc of America Funding Trust, |
|
|||||||||||
| Series 2015-R4, Class 5A1 |
|
|||||||||||
| (LIBOR USD 1-Month plus 0.15%) |
|
|||||||||||
| 0.34% |
10/25/361,2 | 10,997 | 10,819 | |||||||||
| Bear Stearns ALT-A Trust, |
|
|||||||||||
| Series 2005-7, Class 22A1 |
|
|||||||||||
| 2.87% |
09/25/354 | 155,643 | 114,959 | |||||||||
| Bear Stearns ARM Trust, |
|
|||||||||||
| Series 2004-3, Class 2A |
|
|||||||||||
| 2.73% |
07/25/344 | 8,297 | 8,248 | |||||||||
| Bear Stearns ARM Trust, |
|
|||||||||||
| Series 2005-10, Class A3 |
|
|||||||||||
| 2.68% |
10/25/354 | 159,645 | 154,756 | |||||||||
| Bombardier Capital Mortgage Securitization Corp., |
|
|||||||||||
| Series 1999-B, Class A2 |
|
|||||||||||
| 6.98% |
12/15/294 | 997,492 | 184,012 | |||||||||
| Bombardier Capital Mortgage Securitization Corp., |
|
|||||||||||
| Series 2000-A, Class A3 |
|
|||||||||||
| 7.83% |
06/15/304 | 1,658,345 | 338,914 | |||||||||
| Bombardier Capital Mortgage Securitization Corp., |
|
|||||||||||
| Series 2000-A, Class A4 |
|
|||||||||||
| 8.29% |
06/15/304 | 142,144 | 30,756 | |||||||||
| ChaseFlex Trust, |
|
|||||||||||
| Series 2007-1, Class 1A1 |
|
|||||||||||
| 6.50% |
02/25/37 | 350,071 | 158,076 | |||||||||
See accompanying Notes to Financial Statements.
| Annual Report March 2022 / 68 |
Table of Contents
Flexible Income Fund
Schedule of Portfolio Investments
March 31, 2022
| Issues |
Maturity Date |
Principal Amount |
Value | |||||||||
| MORTGAGE-BACKED (continued) |
|
|||||||||||
| Non-Agency Mortgage-Backed (continued) |
|
|||||||||||
| CIM Trust, |
|
|||||||||||
| Series 2021-R5, Class A1B |
|
|||||||||||
| 2.00% |
08/25/611,4 | $ | 681,000 | $ | 570,269 | |||||||
| CIT Mortgage Loan Trust, |
|
|||||||||||
| Series 2007-1, Class 1M2 |
|
|||||||||||
| (LIBOR USD 1-Month plus 1.75%) |
|
|||||||||||
| 2.21% |
10/25/371,2 | 600,000 | 584,046 | |||||||||
| Citigroup Mortgage Loan Trust, |
|
|||||||||||
| Series 2006-WF1, Class A2C (STEP-reset date 05/25/22) |
|
|||||||||||
| 4.77% |
03/25/36 | 32,359 | 18,613 | |||||||||
| Citigroup Mortgage Loan Trust, |
|
|||||||||||
| Series 2009-10, Class 2A2 |
|
|||||||||||
| 7.00% |
12/25/351,4 | 578,135 | 508,846 | |||||||||
| CitiMortgage Alternative Loan Trust, |
|
|||||||||||
| Series 2006-A1, Class 1A5 |
|
|||||||||||
| 5.50% |
04/25/36 | 319,263 | 305,999 | |||||||||
| CitiMortgage Alternative Loan Trust, |
|
|||||||||||
| Series 2007-A1, Class 1A1 |
|
|||||||||||
| 6.00% |
01/25/37 | 125,364 | 121,752 | |||||||||
| CitiMortgage Alternative Loan Trust, |
|
|||||||||||
| Series 2007-A1, Class 1A5 |
|
|||||||||||
| 6.00% |
01/25/37 | 239,297 | 232,404 | |||||||||
| CitiMortgage Alternative Loan Trust, |
|
|||||||||||
| Series 2007-A2, Class 1A13 |
|
|||||||||||
| 5.75% |
02/25/37 | 270,219 | 262,260 | |||||||||
| CitiMortgage Alternative Loan Trust, |
|
|||||||||||
| Series 2007-A3, Class 1A7 |
|
|||||||||||
| 5.75% |
03/25/37 | 237,507 | 227,122 | |||||||||
| Conseco Finance Securitizations Corp., |
|
|||||||||||
| Series 2000-1, Class A5 |
|
|||||||||||
| 8.06% |
09/01/294 | 3,422,743 | 989,619 | |||||||||
| Conseco Finance Securitizations Corp., |
|
|||||||||||
| Series 2000-4, Class A5 |
|
|||||||||||
| 7.97% |
05/01/32 | 1,992,158 | 514,835 | |||||||||
| Countrywide Home Loan Mortgage Pass-Through Trust, |
|
|||||||||||
| Series 2007-14, Class A3 |
|
|||||||||||
| 6.25% |
09/25/37 | 23,963 | 16,869 | |||||||||
| Countrywide Home Loan Mortgage Pass-Through Trust, |
|
|||||||||||
| Series 2007-20, Class A1 |
|
|||||||||||
| 6.50% |
01/25/38 | 212,791 | 129,493 | |||||||||
| Countrywide Home Loan Mortgage Pass-Through Trust, |
|
|||||||||||
| Series 2007-7, Class A9 |
|
|||||||||||
| 5.50% |
06/25/37 | 645,749 | 390,323 | |||||||||
| Credit-Based Asset Servicing and Securitization LLC, |
|
|||||||||||
| Series 2006-CB7, Class A4 |
|
|||||||||||
| (LIBOR USD 1-Month plus 0.16%) |
|
|||||||||||
| 0.78% |
10/25/362 | 40,900 | 33,148 | |||||||||
| Credit-Based Asset Servicing and Securitization LLC, |
|
|||||||||||
| Series 2006-MH1, Class B1 (STEP-reset date 05/25/22) |
|
|||||||||||
| 6.25% |
10/25/361 | 61,000 | 63,066 | |||||||||
| Credit-Based Asset Servicing and Securitization LLC, |
|
|||||||||||
| Series 2007-CB1, Class AF3 (STEP-reset date 05/25/22) |
|
|||||||||||
| 3.16% |
01/25/37 | 1,047,983 | 391,575 | |||||||||
| Credit-Based Asset Servicing and Securitization LLC, |
|
|||||||||||
| Series 2007-CB1, Class AF6 (STEP-reset date 05/25/22) |
|
|||||||||||
| 3.16% |
01/25/37 | 1,850,132 | 691,745 | |||||||||
| Issues |
Maturity Date |
Principal Amount |
Value | |||||||||
| MORTGAGE-BACKED (continued) |
|
|||||||||||
| Non-Agency Mortgage-Backed (continued) |
|
|||||||||||
| Credit-Based Asset Servicing and Securitization LLC, |
|
|||||||||||
| Mortgage Loan Trust, |
|
|||||||||||
| Series 2007-CB2, Class A2B (STEP-reset date 05/25/22) |
|
|||||||||||
| 3.61% |
02/25/37 | $ | 1,034,916 | $ | 774,287 | |||||||
| CSMC Mortgage-Backed Trust, |
|
|||||||||||
| Series 2006-6, Class 1A8 |
|
|||||||||||
| 6.00% |
07/25/36 | 404,790 | 276,199 | |||||||||
| CSMC Mortgage-Backed Trust, |
|
|||||||||||
| Series 2006-7, Class 10A6 |
|
|||||||||||
| 6.50% |
08/25/36 | 1,211,644 | 848,220 | |||||||||
| CSMC Mortgage-Backed Trust, |
|
|||||||||||
| Series 2006-7, Class 8A11 |
|
|||||||||||
| 6.50% |
08/25/36 | 440,270 | 270,805 | |||||||||
| CSMC Mortgage-Backed Trust, |
|
|||||||||||
| Series 2007-5, Class 1A9 |
|
|||||||||||
| 7.00% |
08/25/374 | 177,247 | 121,930 | |||||||||
| CSMC Trust, |
|
|||||||||||
| Series 2020-RPL5, Class A1 |
|
|||||||||||
| 3.02% |
08/25/601,4 | 239,409 | 239,198 | |||||||||
| CSMC, |
|
|||||||||||
| Series 2014-8R, Class 3A2 |
|
|||||||||||
| 3.99% |
02/27/361,4 | 1,015,469 | 940,210 | |||||||||
| Deutsche ALT-B Securities, Inc., Mortgage Loan Trust, |
|
|||||||||||
| Series 2006-AB2, Class A2 |
|
|||||||||||
| 4.93% |
06/25/364 | 203,276 | 194,741 | |||||||||
| Deutsche Mortgage & Asset Receiving Corp., |
|
|||||||||||
| Series 2014-RS1, Class 1A2 |
|
|||||||||||
| 6.50% |
07/27/371,4 | 398,921 | 354,644 | |||||||||
| First Franklin Mortgage Loan Trust, |
|
|||||||||||
| Series 2006-FF13, Class A2C |
|
|||||||||||
| (LIBOR USD 1-Month plus 0.32%) |
|
|||||||||||
| 0.78% |
10/25/362 | 414,697 | 316,129 | |||||||||
| First Franklin Mortgage Loan Trust, |
|
|||||||||||
| Series 2007-FF2, Class A2D |
|
|||||||||||
| (LIBOR USD 1-Month plus 0.22%) |
|
|||||||||||
| 0.68% |
03/25/372 | 750,613 | 433,740 | |||||||||
| First Horizon Alternative Mortgage Securities Trust, |
|
|||||||||||
| Series 2006-FA6, Class 2A3 |
|
|||||||||||
| 6.25% |
11/25/36 | 758,975 | 343,411 | |||||||||
| First Horizon Alternative Mortgage Securities Trust, |
|
|||||||||||
| Series 2007-FA1, Class A4 |
|
|||||||||||
| 6.25% |
03/25/37 | 636,868 | 370,091 | |||||||||
| First Horizon Alternative Mortgage Securities Trust, |
|
|||||||||||
| Series 2007-FA2, Class 1A4 |
|
|||||||||||
| 5.75% |
04/25/37 | 749,725 | 374,121 | |||||||||
| Fremont Home Loan Trust, |
|
|||||||||||
| Series 2005-E, Class 2A4 |
|
|||||||||||
| (LIBOR USD 1-Month plus 0.66%) |
|
|||||||||||
| 1.12% |
01/25/362 | 24,367 | 24,032 | |||||||||
| GreenPoint Mortgage Funding Trust, |
|
|||||||||||
| Series 2005-AR3, Class 1A1 |
|
|||||||||||
| (LIBOR USD 1-Month plus 0.48%) |
|
|||||||||||
| 0.94% |
08/25/452 | 5,075 | 4,689 | |||||||||
| GSAA Home Equity Trust, |
|
|||||||||||
| Series 2007-5, Class 1F3B |
|
|||||||||||
| 6.00% |
05/25/374 | 4,300,000 | 467,768 | |||||||||
See accompanying Notes to Financial Statements.
| 69 / Annual Report March 2022 |
Table of Contents
Flexible Income Fund
Schedule of Portfolio Investments
March 31, 2022
| Issues |
Maturity Date |
Principal Amount |
Value | |||||||||
| MORTGAGE-BACKED (continued) |
|
|||||||||||
| Non-Agency Mortgage-Backed (continued) |
|
|||||||||||
| GSAA Home Equity Trust, |
|
|||||||||||
| Series 2007-5, Class 1F5B (STEP-reset date 05/25/22) |
|
|||||||||||
| 6.44% |
05/25/37 | $ | 1,987,261 | $ | 235,474 | |||||||
| GSAA Home Equity Trust, |
|
|||||||||||
| Series 2007-5, Class 2A2A |
|
|||||||||||
| (LIBOR USD 1-Month plus 0.46%) |
|
|||||||||||
| 0.92% |
04/25/472 | 890,055 | 520,445 | |||||||||
| GSAA Trust, |
|
|||||||||||
| Series 2007-3, Class 2A1B |
|
|||||||||||
| (LIBOR USD 1-Month plus 0.20%) |
|
|||||||||||
| 0.66% |
03/25/472 | 166,316 | 19,006 | |||||||||
| GSMSC Resecuritization Trust, |
|
|||||||||||
| Series 2015-5R, Class 1C |
|
|||||||||||
| (LIBOR USD 1-Month plus 0.14%) |
|
|||||||||||
| 0.33% |
04/26/371,2 | 376,969 | 373,838 | |||||||||
| GSR Mortgage Loan Trust, |
|
|||||||||||
| Series 2005-AR6, Class 2A1 |
|
|||||||||||
| 2.91% |
09/25/354 | 4,657 | 4,711 | |||||||||
| HarborView Mortgage Loan Trust, |
|
|||||||||||
| Series 2005-9, Class 2A1A |
|
|||||||||||
| (LIBOR USD 1-Month plus 0.68%) |
|
|||||||||||
| 1.13% |
06/20/352 | 17,145 | 16,709 | |||||||||
| HarborView Mortgage Loan Trust, |
|
|||||||||||
| Series 2005-9, Class 2X (IO) |
|
|||||||||||
| 2.07% |
06/20/351,4,5,6 | 1,257,310 | 25,739 | |||||||||
| HarborView Mortgage Loan Trust, |
|
|||||||||||
| Series 2006-5, Class X2 (IO) |
|
|||||||||||
| 2.66% |
07/19/464,5,6 | 2,930,027 | 157,313 | |||||||||
| HSI Asset Loan Obligation Trust, |
|
|||||||||||
| Series 2007-WF1, Class A5 (STEP-reset date 05/25/22) |
|
|||||||||||
| 4.71% |
12/25/36 | 265,523 | 114,180 | |||||||||
| IndyMac Index Mortgage Loan Trust, |
|
|||||||||||
| Series 2006-AR3, Class 2A1A |
|
|||||||||||
| 2.92% |
03/25/364 | 89,400 | 70,167 | |||||||||
| IndyMac Index Mortgage Loan Trust, |
|
|||||||||||
| Series 2007-F2, Class 1A4 |
|
|||||||||||
| 6.00% |
07/25/37 | 799,054 | 709,055 | |||||||||
| JPMorgan Alternative Loan Trust, |
|
|||||||||||
| Series 2006-S1, Class 3A4 |
|
|||||||||||
| 6.18% |
03/25/364 | 904,592 | 864,810 | |||||||||
| JPMorgan Mortgage Acquisition Trust, |
|
|||||||||||
| Series 2006-CH2, Class AF3 (STEP-reset date 05/25/22) |
|
|||||||||||
| 5.46% |
09/25/29 | 537,848 | 386,938 | |||||||||
| JPMorgan Mortgage Acquisition Trust, |
|
|||||||||||
| Series 2006-CW2, Class AF4 (STEP-reset date 05/25/22) |
|
|||||||||||
| 6.08% |
08/25/36 | 582,177 | 436,965 | |||||||||
| JPMorgan Mortgage Acquisition Trust, |
|
|||||||||||
| Series 2006-CW2, Class AF5 (STEP-reset date 05/25/22) |
|
|||||||||||
| 6.34% |
08/25/36 | 293,494 | 219,429 | |||||||||
| JPMorgan Mortgage Acquisition Trust, |
|
|||||||||||
| Series 2006-WF1, Class A5 (STEP-reset date 05/25/22) |
|
|||||||||||
| 6.91% |
07/25/36 | 1,814,828 | 660,181 | |||||||||
| JPMorgan Mortgage Acquisition Trust, |
|
|||||||||||
| Series 2007-CH1, Class AF6 (STEP-reset date 05/25/22) |
|
|||||||||||
| 4.65% |
11/25/36 | 7,134 | 7,223 | |||||||||
| Issues |
Maturity Date |
Principal Amount |
Value | |||||||||
| MORTGAGE-BACKED (continued) |
|
|||||||||||
| Non-Agency Mortgage-Backed (continued) |
|
|||||||||||
| JPMorgan Mortgage Acquisition Trust, |
|
|||||||||||
| Series 2007-CH2, Class AF2 (STEP-reset date 05/25/22) |
|
|||||||||||
| 4.45% |
01/25/37 | $ | 438,198 | $ | 270,413 | |||||||
| JPMorgan Mortgage Acquisition Trust, |
|
|||||||||||
| Series 2007-CH2, Class AF3 (STEP-reset date 05/25/22) |
|
|||||||||||
| 4.45% |
10/25/30 | 672,749 | 446,903 | |||||||||
| JPMorgan Mortgage Trust, |
|
|||||||||||
| Series 2007-S1, Class 2A11 |
|
|||||||||||
| 6.00% |
03/25/37 | 373,026 | 215,459 | |||||||||
| Lehman ABS Manufactured Housing Contract Trust, |
|
|||||||||||
| Series 2001-B, Class M1 |
|
|||||||||||
| 6.63% |
04/15/404 | 967,186 | 982,021 | |||||||||
| Lehman Mortgage Trust, |
|
|||||||||||
| Series 2006-1, Class 1A5 |
|
|||||||||||
| 5.50% |
02/25/36 | 148,088 | 105,149 | |||||||||
| Lehman Mortgage Trust, |
|
|||||||||||
| Series 2006-7, Class 2A5 (IO) |
|
|||||||||||
| (-1.00 X LIBOR USD 1-Month plus 6.55%, 6.55% Cap) |
|
|||||||||||
| 6.09% |
11/25/362,5,6 | 189,206 | 35,387 | |||||||||
| Lehman Mortgage Trust, |
|
|||||||||||
| Series 2007-5, Class 10A2 (IO) |
|
|||||||||||
| (-1.00 X LIBOR USD 1-Month plus 6.34%, 6.34% Cap) |
|
|||||||||||
| 5.88% |
06/25/372,5,6 | 248,724 | 52,205 | |||||||||
| Lehman Mortgage Trust, |
|
|||||||||||
| Series 2007-5, Class 7A3 |
|
|||||||||||
| 7.50% |
10/25/36 | 553,042 | 326,850 | |||||||||
| Lehman XS Trust, |
|
|||||||||||
| Series 2005-1, Class 3A4 (STEP-reset date 05/25/22) |
|
|||||||||||
| 5.37% |
07/25/35 | 54,311 | 54,311 | |||||||||
| Lehman XS Trust, |
|
|||||||||||
| Series 2006-17, Class 1A3 |
|
|||||||||||
| (LIBOR USD 1-Month plus 0.50%) |
|
|||||||||||
| 0.96% |
08/25/462 | 234,650 | 223,701 | |||||||||
| Lehman XS Trust, |
|
|||||||||||
| Series 2006-17, Class 1AIO (IO) |
|
|||||||||||
| 0.60% |
08/25/465,6 | 9,021,034 | 195,194 | |||||||||
| MASTR Alternative Loan Trust, |
|
|||||||||||
| Series 2005-2, Class 4A3 |
|
|||||||||||
| (LIBOR USD 1-Month plus 0.40%) |
|
|||||||||||
| 0.86% |
03/25/352 | 16,440 | 16,493 | |||||||||
| MASTR Alternative Loan Trust, |
|
|||||||||||
| Series 2005-2, Class 4A4 (IO) |
|
|||||||||||
| (-1.00 X LIBOR USD 1-Month plus 5.10%, 5.10% Cap) |
|
|||||||||||
| 4.64% |
03/25/352,5,6 | 330,521 | 14,092 | |||||||||
| MASTR Asset-Backed Securities Trust, |
|
|||||||||||
| Series 2006-NC2, Class A3 |
|
|||||||||||
| (LIBOR USD 1-Month plus 0.22%) |
|
|||||||||||
| 0.68% |
08/25/362 | 763,681 | 366,482 | |||||||||
| Merrill Lynch Alternative Note Asset Trust, |
|
|||||||||||
| Series 2007-A1, Class A3 |
|
|||||||||||
| (LIBOR USD 1-Month plus 0.32%) |
|
|||||||||||
| 0.78% |
01/25/372 | 688,547 | 266,605 | |||||||||
| Merrill Lynch Alternative Note Asset Trust, |
|
|||||||||||
| Series 2007-OAR2, Class A3 |
|
|||||||||||
| (LIBOR USD 1-Month plus 0.52%) |
|
|||||||||||
| 0.98% |
04/25/372 | 1,961,965 | 224,191 | |||||||||
See accompanying Notes to Financial Statements.
| Annual Report March 2022 / 70 |
Table of Contents
Flexible Income Fund
Schedule of Portfolio Investments
March 31, 2022
| Issues |
Maturity Date |
Principal Amount |
Value | |||||||||
| MORTGAGE-BACKED (continued) |
|
|||||||||||
| Non-Agency Mortgage-Backed (continued) |
|
|||||||||||
| Merrill Lynch First Franklin Mortgage Loan Trust, |
|
|||||||||||
| Series 2007-3, Class A2B |
|
|||||||||||
| (LIBOR USD 1-Month plus 0.13%) |
|
|||||||||||
| 0.59% |
06/25/372 | $ | 565,410 | $ | 520,632 | |||||||
| Merrill Lynch Mortgage Investors Trust, |
|
|||||||||||
| Series 2004-B, Class A1 |
|
|||||||||||
| (LIBOR USD 1-Month plus 0.50%) |
|
|||||||||||
| 0.96% |
05/25/292 | 11,734 | 11,445 | |||||||||
| Merrill Lynch Mortgage Investors Trust, |
|
|||||||||||
| Series 2006-HE6, Class A2B |
|
|||||||||||
| (LIBOR USD 1-Month plus 0.30%) |
|
|||||||||||
| 0.76% |
11/25/372 | 856,246 | 377,309 | |||||||||
| Mid-State Capital Corp. Trust, |
|
|||||||||||
| Series 2005-1, Class A |
|
|||||||||||
| 5.75% |
01/15/40 | 6,357 | 6,416 | |||||||||
| Mid-State Capital Corp. Trust, |
|
|||||||||||
| Series 2006-1, Class A |
|
|||||||||||
| 5.79% |
10/15/401 | 42,560 | 43,039 | |||||||||
| Mid-State Trust XI, |
|
|||||||||||
| Series 11, Class A1 |
|
|||||||||||
| 4.86% |
07/15/38 | 2,922 | 2,943 | |||||||||
| Morgan Stanley Mortgage Loan Trust, |
|
|||||||||||
| Series 2007-13, Class 6A1 |
|
|||||||||||
| 6.00% |
10/25/37 | 176,227 | 124,762 | |||||||||
| Nationstar Home Equity Loan Trust, |
|
|||||||||||
| Series 2007-C, Class 2AV4 |
|
|||||||||||
| (LIBOR USD 1-Month plus 0.25%) |
|
|||||||||||
| 0.71% |
06/25/372 | 24,412 | 23,901 | |||||||||
| Oakwood Mortgage Investors, Inc., |
|
|||||||||||
| Series 1999-C, Class A2 |
|
|||||||||||
| 7.48% |
08/15/27 | 435,517 | 398,734 | |||||||||
| Oakwood Mortgage Investors, Inc., |
|
|||||||||||
| Series 2002-A, Class A2 |
|
|||||||||||
| 5.01% |
03/15/204 | 7,140 | 7,134 | |||||||||
| Park Place Securities, Inc., Asset-Backed Pass-Through Certificates, |
|
|||||||||||
| Series 2005-WCH1, Class M4 |
|
|||||||||||
| (LIBOR USD 1-Month plus 1.25%) |
|
|||||||||||
| 1.70% |
01/25/362 | 11,121 | 11,192 | |||||||||
| Residential Accredit Loans Trust, |
|
|||||||||||
| Series 2005-QS14, Class 3A3 |
|
|||||||||||
| 6.00% |
09/25/35 | 155,517 | 146,311 | |||||||||
| Residential Accredit Loans Trust, |
|
|||||||||||
| Series 2005-QS16, Class A7 |
|
|||||||||||
| 5.50% |
11/25/35 | 503,910 | 469,213 | |||||||||
| Residential Accredit Loans Trust, |
|
|||||||||||
| Series 2006-QS15, Class A3 |
|
|||||||||||
| 6.50% |
10/25/36 | 1,001,503 | 941,415 | |||||||||
| Residential Accredit Loans Trust, |
|
|||||||||||
| Series 2006-QS4, Class A2 |
|
|||||||||||
| 6.00% |
04/25/36 | 338,778 | 319,834 | |||||||||
| Residential Accredit Loans Trust, |
|
|||||||||||
| Series 2006-QS4, Class A4 |
|
|||||||||||
| 6.00% |
04/25/36 | 419,672 | 398,711 | |||||||||
| Issues |
Maturity Date |
Principal Amount |
Value | |||||||||
| MORTGAGE-BACKED (continued) |
|
|||||||||||
| Non-Agency Mortgage-Backed (continued) |
|
|||||||||||
| Residential Accredit Loans Trust, |
|
|||||||||||
| Series 2006-QS6, Class 1A15 |
|
|||||||||||
| 6.00% |
06/25/36 | $ | 168,965 | $ | 160,980 | |||||||
| Residential Accredit Loans Trust, |
|
|||||||||||
| Series 2006-QS6, Class 1A2 |
|
|||||||||||
| 6.00% |
06/25/36 | 542,922 | 517,263 | |||||||||
| Residential Accredit Loans Trust, |
|
|||||||||||
| Series 2007-QH9, Class X (IO) (PO) |
|
|||||||||||
| 0.69% |
11/25/374,5,6 | 12,405,888 | 357,603 | |||||||||
| Residential Accredit Loans Trust, |
|
|||||||||||
| Series 2007-QO2, Class A1 |
|
|||||||||||
| (LIBOR USD 1-Month plus 0.15%) |
|
|||||||||||
| 0.61% |
02/25/472 | 537,892 | 239,789 | |||||||||
| Residential Accredit Loans Trust, |
|
|||||||||||
| Series 2007-QS1, Class 1A4 |
|
|||||||||||
| 6.00% |
01/25/37 | 542,394 | 506,868 | |||||||||
| Residential Accredit Loans Trust, |
|
|||||||||||
| Series 2007-QS3, Class A1 |
|
|||||||||||
| 6.50% |
02/25/37 | 519,900 | 487,808 | |||||||||
| Residential Accredit Loans Trust, |
|
|||||||||||
| Series 2007-QS7, Class 1A1 |
|
|||||||||||
| 6.00% |
05/25/37 | 56,054 | 53,292 | |||||||||
| Residential Asset Mortgage Products Trust, |
|
|||||||||||
| Series 2006-EFC2, Class A4 |
|
|||||||||||
| (LIBOR USD 1-Month plus 0.22%) |
|
|||||||||||
| 0.68% |
12/25/362 | 52,090 | 51,554 | |||||||||
| Residential Asset Securitization Trust, |
|
|||||||||||
| Series 2003-A15, Class 1A3 (IO) |
|
|||||||||||
| (-1.00 X LIBOR USD 1-Month plus 7.55%, 7.55% Cap) |
|
|||||||||||
| 7.09% |
02/25/342,5,6 | 503,028 | 45,928 | |||||||||
| Residential Asset Securitization Trust, |
|
|||||||||||
| Series 2005-A14, Class A5 |
|
|||||||||||
| 5.50% |
12/25/35 | 86,669 | 56,663 | |||||||||
| Residential Asset Securitization Trust, |
|
|||||||||||
| Series 2005-A8CB, Class A9 |
|
|||||||||||
| 5.38% |
07/25/35 | 268,441 | 201,566 | |||||||||
| Residential Asset Securitization Trust, |
|
|||||||||||
| Series 2006-A12, Class A1 |
|
|||||||||||
| 6.25% |
11/25/36 | 501,364 | 259,316 | |||||||||
| Residential Asset Securitization Trust, |
|
|||||||||||
| Series 2006-A15, Class A2 |
|
|||||||||||
| 6.25% |
01/25/37 | 515,666 | 256,984 | |||||||||
| Residential Asset Securitization Trust, |
|
|||||||||||
| Series 2006-A16, Class 1A3 |
|
|||||||||||
| 6.00% |
02/25/37 | 340,604 | 203,413 | |||||||||
| Residential Asset Securitization Trust, |
|
|||||||||||
| Series 2006-A5CB, Class A4 |
|
|||||||||||
| 6.00% |
06/25/36 | 210,600 | 112,358 | |||||||||
| Residential Asset Securitization Trust, |
|
|||||||||||
| Series 2007-A1, Class A1 |
|
|||||||||||
| 6.00% |
03/25/37 | 326,672 | 150,230 | |||||||||
| Residential Asset Securitization Trust, |
|
|||||||||||
| Series 2007-A3, Class 1A4 |
|
|||||||||||
| 5.75% |
04/25/37 | 55,364 | 36,191 | |||||||||
See accompanying Notes to Financial Statements.
| 71 / Annual Report March 2022 |
Table of Contents
Flexible Income Fund
Schedule of Portfolio Investments
March 31, 2022
| Issues |
Maturity Date |
Principal Amount |
Value | |||||||||
| MORTGAGE-BACKED (continued) |
|
|||||||||||
| Non-Agency Mortgage-Backed (continued) |
|
|||||||||||
| Residential Asset Securitization Trust, |
|
|||||||||||
| Series 2007-A6, Class 1A3 |
|
|||||||||||
| 6.00% |
06/25/37 | $ | 151,609 | $ | 112,173 | |||||||
| Residential Funding Mortgage Securities Trust, |
|
|||||||||||
| Series 2006-S10, Class 1A1 |
|
|||||||||||
| 6.00% |
10/25/36 | 778,264 | 740,560 | |||||||||
| Residential Funding Mortgage Securities Trust, |
|
|||||||||||
| Series 2006-S3, Class A7 |
|
|||||||||||
| 5.50% |
03/25/36 | 555,708 | 508,590 | |||||||||
| Residential Funding Mortgage Securities Trust, |
|
|||||||||||
| Series 2006-S6, Class A10 |
|
|||||||||||
| 6.00% |
07/25/36 | 265,793 | 251,538 | |||||||||
| Residential Funding Mortgage Securities Trust, |
|
|||||||||||
| Series 2006-S6, Class A14 |
|
|||||||||||
| 6.00% |
07/25/36 | 85,226 | 81,003 | |||||||||
| Residential Funding Mortgage Securities Trust, |
|
|||||||||||
| Series 2007-S8, Class 1A1 |
|
|||||||||||
| 6.00% |
09/25/37 | 167,445 | 139,617 | |||||||||
| Securitized Asset-Backed Receivables LLC Trust, |
|
|||||||||||
| Series 2006-CB1, Class AF4 (STEP-reset date 05/25/22) |
|
|||||||||||
| 2.91% |
01/25/36 | 112,456 | 103,778 | |||||||||
| Securitized Asset-Backed Receivables LLC Trust, |
|
|||||||||||
| Series 2007-NC1, Class A2B |
|
|||||||||||
| (LIBOR USD 1-Month plus 0.15%) |
|
|||||||||||
| 0.61% |
12/25/362 | 958,836 | 637,413 | |||||||||
| Soundview Home Loan Trust, |
|
|||||||||||
| Series 2007-OPT2, Class 2A4 |
|
|||||||||||
| (LIBOR USD 1-Month plus 0.25%) |
|
|||||||||||
| 0.71% |
07/25/372 | 313,143 | 273,854 | |||||||||
| Soundview Home Loan Trust, |
|
|||||||||||
| Series 2007-OPT4, Class 1A1 |
|
|||||||||||
| (LIBOR USD 1-Month plus 1.00%) |
|
|||||||||||
| 1.46% |
09/25/372 | 429,250 | 352,405 | |||||||||
| Structured Adjustable Rate Mortgage Loan Trust, |
|
|||||||||||
| Series 2004-1, Class 4A1 |
|
|||||||||||
| 2.46% |
02/25/344 | 1,451 | 1,438 | |||||||||
| Structured Asset Mortgage Investments II Trust, |
|
|||||||||||
| Series 2006-AR2, Class A1 |
|
|||||||||||
| (LIBOR USD 1-Month plus 0.46%) |
|
|||||||||||
| 0.92% |
02/25/362 | 20,603 | 18,475 | |||||||||
| VOLT XCVI LLC, |
|
|||||||||||
| Series 2021-NPL5, Class A2 (STEP-reset date 04/25/22) |
|
|||||||||||
| 4.83% |
03/27/511 | 800,000 | 769,677 | |||||||||
| WaMu Mortgage Pass-Through Certificates, |
|
|||||||||||
| Series 2006-2, Class 1A6 |
|
|||||||||||
| 6.00% |
03/25/36 | 27,280 | 27,149 | |||||||||
| WaMu Mortgage Pass-Through Certificates, |
|
|||||||||||
| Series 2006-AR3, Class X3 (IO) |
|
|||||||||||
| 1.15% |
05/25/465,6 | 7,965,658 | 336,335 | |||||||||
| Wells Fargo Alternative Loan Trust, |
|
|||||||||||
| Series 2007-PA2, Class 1A1 |
|
|||||||||||
| 6.00% |
06/25/37 | 228,248 | 205,070 | |||||||||
| Wells Fargo Alternative Loan Trust, |
|
|||||||||||
| Series 2007-PA5, Class 1A1 |
|
|||||||||||
| 6.25% |
11/25/37 | 407,867 | 385,041 | |||||||||
| Issues |
Maturity Date |
Principal Amount |
Value | |||||||||
| MORTGAGE-BACKED (continued) |
|
|||||||||||
| Non-Agency Mortgage-Backed (continued) |
|
|||||||||||
| Wells Fargo Mortgage-Backed Securities Trust, |
|
|||||||||||
| Series 2006-AR14, Class 2A3 |
|
|||||||||||
| 2.60% |
10/25/364 | $ | 41,926 | $ | 40,209 | |||||||
| Wells Fargo Mortgage-Backed Securities Trust, |
|
|||||||||||
| Series 2006-AR4, Class 2A1 |
|
|||||||||||
| 2.88% |
04/25/364 | 8,944 | 8,068 | |||||||||
| Wells Fargo Mortgage-Backed Securities Trust, |
|
|||||||||||
| Series 2007-7, Class A1 |
|
|||||||||||
| 6.00% |
06/25/37 | 270,741 | 255,440 | |||||||||
|
|
|
| ||||||||||
| 41,297,547 | ||||||||||||
|
|
|
| ||||||||||
| U.S. Agency Commercial Mortgage-Backed — 2.01% |
|
|||||||||||
| Fannie Mae-Aces, |
|
|||||||||||
| Series 2016-M11, Class X2 (IO) |
|
|||||||||||
| 2.94% |
07/25/394 | 448,561 | 11,791 | |||||||||
| Fannie Mae-Aces, |
|
|||||||||||
| Series 2016-M2, Class X3 (IO) |
|
|||||||||||
| 2.12% |
04/25/364 | 141,640 | 1,424 | |||||||||
| Fannie Mae-Aces, |
|
|||||||||||
| Series 2016-M4, Class X2 (IO) |
|
|||||||||||
| 2.65% |
01/25/394 | 908,808 | 25,681 | |||||||||
| Freddie Mac Multifamily Structured Pass-Through Certificates, |
|
|||||||||||
| Series K022, Class X3 (IO) |
|
|||||||||||
| 1.81% |
08/25/404 | 900,000 | 5,210 | |||||||||
| Freddie Mac Multifamily Structured Pass-Through Certificates, |
|
|||||||||||
| Series K028, Class X3 (IO) |
|
|||||||||||
| 1.66% |
06/25/414 | 12,639,000 | 192,134 | |||||||||
| Freddie Mac Multifamily Structured Pass-Through Certificates, |
|
|||||||||||
| Series K031, Class X3 (IO) |
|
|||||||||||
| 1.66% |
07/25/414 | 1,170,000 | 19,296 | |||||||||
| Freddie Mac Multifamily Structured Pass-Through Certificates, |
|
|||||||||||
| Series K037, Class X3 (IO) |
|
|||||||||||
| 2.21% |
01/25/424 | 390,000 | 14,746 | |||||||||
| Freddie Mac Multifamily Structured Pass-Through Certificates, |
|
|||||||||||
| Series K043, Class X1 (IO) |
|
|||||||||||
| 0.52% |
12/25/244 | 23,484,376 | 299,057 | |||||||||
| Freddie Mac Multifamily Structured Pass-Through Certificates, |
|
|||||||||||
| Series K044, Class X3 (IO) |
|
|||||||||||
| 1.48% |
01/25/434 | 4,900,000 | 205,928 | |||||||||
| Freddie Mac Multifamily Structured Pass-Through Certificates, |
|
|||||||||||
| Series K045, Class X1 (IO) |
|
|||||||||||
| 0.43% |
11/25/254 | 31,754,058 | 326,826 | |||||||||
| Freddie Mac Multifamily Structured Pass-Through Certificates, |
|
|||||||||||
| Series K049, Class X1 (IO) |
|
|||||||||||
| 0.58% |
07/25/254 | 12,682,719 | 206,145 | |||||||||
See accompanying Notes to Financial Statements.
| Annual Report March 2022 / 72 |
Table of Contents
Flexible Income Fund
Schedule of Portfolio Investments
March 31, 2022
| Issues |
Maturity Date |
Principal Amount |
Value | |||||||||
| MORTGAGE-BACKED (continued) |
|
|||||||||||
| U.S. Agency Commercial Mortgage-Backed (continued) |
|
|||||||||||
| Freddie Mac Multifamily Structured Pass-Through Certificates, |
|
|||||||||||
| Series K049, Class X3 (IO) |
|
|||||||||||
| 1.55% |
10/25/434 | $ | 2,925,000 | $ | 130,291 | |||||||
| Freddie Mac Multifamily Structured Pass-Through Certificates, |
|
|||||||||||
| Series K050, Class X1 (IO) |
|
|||||||||||
| 0.31% |
08/25/254 | 22,003,380 | 209,265 | |||||||||
| Freddie Mac Multifamily Structured Pass-Through Certificates, |
|
|||||||||||
| Series K056, Class X3 (IO) |
|
|||||||||||
| 2.11% |
06/25/444 | 6,243,936 | 483,786 | |||||||||
| Freddie Mac Multifamily Structured Pass-Through Certificates, |
|
|||||||||||
| Series K062, Class X3 (IO) |
|
|||||||||||
| 2.08% |
01/25/454 | 3,000,000 | 264,232 | |||||||||
| Freddie Mac Multifamily Structured Pass-Through Certificates, |
|
|||||||||||
| Series K732, Class X3 (IO) |
|
|||||||||||
| 2.17% |
05/25/464 | 4,850,000 | 311,662 | |||||||||
| Freddie Mac Multifamily Structured Pass-Through Certificates, |
|
|||||||||||
| Series K735, Class X3 (IO) |
|
|||||||||||
| 2.15% |
05/25/474 | 3,160,000 | 243,170 | |||||||||
| Freddie Mac Multifamily Structured Pass-Through Certificates, |
|
|||||||||||
| Series K736, Class X3 (IO) |
|
|||||||||||
| 2.01% |
09/25/474 | 2,495,000 | 192,671 | |||||||||
| Freddie Mac Multifamily Structured Pass-Through Certificates, |
|
|||||||||||
| Series KC05, Class X1 (IO) |
|
|||||||||||
| 1.20% |
06/25/274 | 695,458 | 26,963 | |||||||||
| Freddie Mac Multifamily Structured Pass-Through Certificates, |
|
|||||||||||
| Series KLU1, Class X3 (IO) |
|
|||||||||||
| 3.97% |
01/25/314 | 338,631 | 45,634 | |||||||||
| Freddie Mac Multifamily Structured Pass-Through Certificates, |
|
|||||||||||
| Series Q013, Class XPT1 (IO) |
|
|||||||||||
| 1.66% |
05/25/25 | 4,984,750 | 144,107 | |||||||||
| Freddie Mac Multifamily Structured Pass-Through Certificates, |
|
|||||||||||
| Series Q013, Class XPT2 (IO) |
|
|||||||||||
| 1.81% |
05/25/27 | 4,050,127 | 133,521 | |||||||||
| FREMF Mortgage Trust, |
|
|||||||||||
| Series 2012-K20, Class X2A (IO) |
|
|||||||||||
| 0.20% |
05/25/451 | 425,445 | 2 | |||||||||
| Ginnie Mae, |
|
|||||||||||
| Series 2009-111, Class IO (IO) |
|
|||||||||||
| 0.19% |
09/16/514 | 921,574 | 40,816 | |||||||||
| Ginnie Mae, |
|
|||||||||||
| Series 2010-159, Class D |
|
|||||||||||
| 4.30% |
09/16/444 | 254,729 | 254,403 | |||||||||
| Ginnie Mae, |
|
|||||||||||
| Series 2011-119, Class IO (IO) |
|
|||||||||||
| 0.23% |
08/16/514 | 1,174,449 | 3,052 | |||||||||
| Issues |
Maturity Date |
Principal Amount |
Value | |||||||||
| MORTGAGE-BACKED (continued) |
|
|||||||||||
| U.S. Agency Commercial Mortgage-Backed (continued) |
|
|||||||||||
| Ginnie Mae, |
|
|||||||||||
| Series 2011-86, Class C |
|
|||||||||||
| 3.63% |
09/16/514 | $ | 244,852 | $ | 242,354 | |||||||
| Ginnie Mae, |
|
|||||||||||
| Series 2012-123, Class IO (IO) |
|
|||||||||||
| 0.64% |
12/16/514 | 1,642,646 | 24,434 | |||||||||
| Ginnie Mae, |
|
|||||||||||
| Series 2012-135, Class IO (IO) |
|
|||||||||||
| 0.52% |
01/16/534 | 342,748 | 5,838 | |||||||||
| Ginnie Mae, |
|
|||||||||||
| Series 2013-33, Class IO (IO) |
|
|||||||||||
| 0.37% |
04/16/544 | 425,133 | 2,537 | |||||||||
| Ginnie Mae, |
|
|||||||||||
| Series 2014-126, Class IO (IO) |
|
|||||||||||
| 0.72% |
02/16/554 | 5,716,889 | 150,496 | |||||||||
|
|
|
| ||||||||||
| 4,217,472 | ||||||||||||
|
|
|
| ||||||||||
| U.S. Agency Mortgage-Backed — 14.72% |
|
|||||||||||
| Fannie Mae Pool 462209 |
|
|||||||||||
| (US Treasury Yield Curve Rate T Note Constant Maturity |
|
|||||||||||
| 1-Year plus 2.18%) |
|
|||||||||||
| 2.84% |
04/01/362 | 53,767 | 53,619 | |||||||||
| Fannie Mae REMICS, |
|
|||||||||||
| Series 2005-56, Class SP |
|
|||||||||||
| (-6.00 X LIBOR USD 1-Month plus 42.30%, 6.00% Cap) |
|
|||||||||||
| 6.00% |
08/25/332 | 4,919 | 4,997 | |||||||||
| Fannie Mae REMICS, |
|
|||||||||||
| Series 2011-116, Class SA (IO) |
|
|||||||||||
| (-1.00 X LIBOR USD 1-Month plus 6.00%, 6.00% Cap) |
|
|||||||||||
| 5.54% |
11/25/412 | 93,996 | 9,885 | |||||||||
| Fannie Mae REMICS, |
|
|||||||||||
| Series 2012-139, Class AI (IO) |
|
|||||||||||
| 3.00% |
12/25/27 | 229,171 | 12,755 | |||||||||
| Freddie Mac Strips, |
|
|||||||||||
| Series 240, Class IO (IO) |
|
|||||||||||
| 5.50% |
07/15/36 | 281,615 | 52,849 | |||||||||
| Ginnie Mae, |
|
|||||||||||
| Series 2003-110, Class S (IO) |
|
|||||||||||
| (-1.00 X LIBOR USD 1-Month plus 6.60%, 6.60% Cap) |
|
|||||||||||
| 6.15% |
10/20/332 | 337,467 | 46,674 | |||||||||
| Ginnie Mae, |
|
|||||||||||
| Series 2018-124, Class NW |
|
|||||||||||
| 3.50% |
09/20/48 | 33,503 | 33,916 | |||||||||
| Ginnie Mae, |
|
|||||||||||
| Series 2018-154, Class BP |
|
|||||||||||
| 3.50% |
11/20/48 | 3,651 | 3,690 | |||||||||
| UMBS (TBA) |
|
|||||||||||
| 2.00% |
04/01/52 | 2,025,000 | 1,878,672 | |||||||||
| 2.00% |
05/01/52 | 7,950,000 | 7,366,607 | |||||||||
| 2.50% |
05/01/52 | 11,450,000 | 10,902,265 | |||||||||
| 3.00% |
05/01/52 | 10,750,000 | 10,494,688 | |||||||||
|
|
|
| ||||||||||
| 30,860,617 | ||||||||||||
|
|
|
| ||||||||||
| Total Mortgage-Backed |
|
|||||||||||
| (Cost $112,669,649) |
|
96,950,228 | ||||||||||
|
|
|
| ||||||||||
See accompanying Notes to Financial Statements.
| 73 / Annual Report March 2022 |
Table of Contents
Flexible Income Fund
Schedule of Portfolio Investments
March 31, 2022
| Issues |
Maturity Date |
Principal Amount |
Value | |||||||||
| MUNICIPAL BONDS — 0.65%* |
|
|||||||||||
| California — 0.16% |
|
|||||||||||
| Los Angeles Department of Airports Revenue Bonds, Port, Airport and Marina Improvements, Series A |
|
|||||||||||
| 3.89% |
05/15/38 | $ | 100,000 | $ | 98,792 | |||||||
| Los Angeles Unified School District General Obligation Bonds, School Improvements, Series KR |
|
|||||||||||
| 5.75% |
07/01/34 | 205,000 | 243,091 | |||||||||
|
|
|
| ||||||||||
| 341,883 | ||||||||||||
|
|
|
| ||||||||||
| Florida — 0.06% |
|
|||||||||||
| County of Miami-Dade Aviation Revenue Bonds, Airport and Marina Improvements, Series B |
|
|||||||||||
| 2.61% |
10/01/32 | 100,000 | 92,462 | |||||||||
| County of Miami-Dade Aviation Revenue Bonds, Airport and Marina Improvements, Series D |
|
|||||||||||
| 3.45% |
10/01/30 | 30,000 | 30,038 | |||||||||
|
|
|
| ||||||||||
| 122,500 | ||||||||||||
|
|
|
| ||||||||||
| New York — 0.39% |
|
|||||||||||
| City of New York General Obligation Bonds, Public Improvements, Series F |
|
|||||||||||
| 3.62% |
04/01/31 | 155,000 | 156,388 | |||||||||
| New York City Transitional Finance Authority Future Tax Secured Revenue Bonds, Public Improvements |
|
|||||||||||
| 5.51% |
08/01/37 | 175,000 | 209,377 | |||||||||
| New York City Transitional Finance Authority Future Tax Secured Revenue Bonds, Public Improvements, Subseries B3 |
|
|||||||||||
| 1.85% |
08/01/32 | 75,000 | 63,173 | |||||||||
| New York State Dormitory Authority Revenue Bonds, School Improvements, Series F |
|
|||||||||||
| 3.11% |
02/15/39 | 150,000 | 141,537 | |||||||||
| New York State Urban Development Corp. Revenue Bonds, Economic Improvements, Series F |
|
|||||||||||
| 2.00% |
03/15/33 | 100,000 | 85,582 | |||||||||
| New York State Urban Development Corp. Revenue Bonds, Transit Improvements, Series B |
|
|||||||||||
| 2.54% |
03/15/34 | 175,000 | 157,112 | |||||||||
|
|
|
| ||||||||||
| 813,169 | ||||||||||||
|
|
|
| ||||||||||
| Ohio — 0.04% |
|
|||||||||||
| Ohio, Taxable Revenue Bonds, Advanced Refunding, |
|
|||||||||||
| Cleveland Clinic |
|
|||||||||||
| 2.89% |
01/01/32 | 100,000 | 95,605 | |||||||||
|
|
|
| ||||||||||
| Total Municipal Bonds |
|
|||||||||||
| (Cost $1,500,334) |
|
1,373,157 | ||||||||||
|
|
|
| ||||||||||
| U.S. TREASURY SECURITIES — 1.19% |
|
|||||||||||
| U.S. Treasury Notes — 1.19% |
|
|||||||||||
| U.S. Treasury Notes |
|
|||||||||||
| 1.50% |
02/29/24 | 1,904,000 | 1,876,481 | |||||||||
| Issues |
Maturity Date |
Principal Amount |
Value | |||||||||||
| U.S. TREASURY SECURITIES (continued) |
|
|||||||||||||
| U.S. Treasury Notes (continued) |
|
|||||||||||||
| 1.75% |
03/15/25 | $ | 630,000 | $ | 616,986 | |||||||||
|
|
|
| ||||||||||||
| Total U.S. Treasury Securities |
|
|||||||||||||
| (Cost $2,513,069) |
|
2,493,467 | ||||||||||||
|
|
|
| ||||||||||||
| Total Bonds — 99.69% |
|
|||||||||||||
| (Cost $229,831,310) |
|
209,020,964 | ||||||||||||
|
|
|
| ||||||||||||
| Issues | Shares | Value | ||||||||||||
| COMMON STOCK — 0.32% |
|
|||||||||||||
| Communications — 0.16% |
|
|||||||||||||
| Intelsat Emergence SA3,5,6,11 |
|
|||||||||||||
| (Luxembourg) |
|
11,030 | 330,900 | |||||||||||
|
|
|
| ||||||||||||
| Financials — 0.16% |
|
|||||||||||||
| AGNC Investment Corp. |
|
25,500 | 334,050 | |||||||||||
|
|
|
| ||||||||||||
| Total Common Stock |
|
|||||||||||||
| (Cost $701,674) |
|
664,950 | ||||||||||||
|
|
|
| ||||||||||||
| RIGHTS — 0.00% |
|
|||||||||||||
| Communications — 0.00% |
|
|||||||||||||
| Intelsat Jackson Holdings SA, Series A3,5,6,11 |
|
|||||||||||||
| (Luxembourg) |
|
1,154 | — | |||||||||||
| Intelsat Jackson Holdings SA, Series B3,5,6,11 |
|
|||||||||||||
| (Luxembourg) |
|
1,154 | — | |||||||||||
|
|
|
| ||||||||||||
| — | ||||||||||||||
|
|
|
| ||||||||||||
| Total Rights |
|
|||||||||||||
| (Cost $–) |
|
— | ||||||||||||
|
|
|
| ||||||||||||
| WARRANT — 0.01% |
|
|||||||||||||
| Entertainment — 0.01% |
|
|||||||||||||
| Cineworld Group PLC3,11 |
|
|||||||||||||
| (United Kingdom) |
|
152,713 | 33,176 | |||||||||||
|
|
|
| ||||||||||||
| Total Warrant |
|
|||||||||||||
| (Cost $–) |
|
|||||||||||||
| Issues | Maturity Date |
Principal Amount/Shares |
Value | |||||||||||
| SHORT-TERM INVESTMENTS — 10.91% |
|
|||||||||||||
| Money Market Funds — 6.15% |
|
|||||||||||||
| Dreyfus Government Cash Management Fund |
|
|||||||||||||
| 0.19%14 |
|
5,790,000 | 5,790,000 | |||||||||||
| Fidelity Investments Money Market Funds - Government Portfolio |
|
|||||||||||||
| 0.12%14 |
|
19,658 | 19,658 | |||||||||||
| Morgan Stanley Institutional Liquidity Funds - Government Portfolio |
|
|||||||||||||
| 0.23%14 |
|
7,092,000 | 7,092,000 | |||||||||||
|
|
|
| ||||||||||||
| 12,901,658 | ||||||||||||||
|
|
|
| ||||||||||||
See accompanying Notes to Financial Statements.
| Annual Report March 2022 / 74 |
Table of Contents
Flexible Income Fund
Schedule of Portfolio Investments
March 31, 2022
| Issues | Maturity Date |
Principal Amount/Shares |
Value | |||||||
| SHORT-TERM INVESTMENTS (continued) |
|
|||||||||
| U.S. Treasury Bills — 4.76% |
|
|||||||||
| U.S. Treasury Bills |
|
|||||||||
| 0.61%15 |
08/25/22 | $ | 10,000,000 | $ | 9,964,717 | |||||
|
|
|
| ||||||||
| Total Short-Term Investments |
|
|||||||||
| (Cost $22,877,122) |
|
22,866,375 | ||||||||
|
|
|
| ||||||||
| Total Investments Before Written Options - 110.93% |
|
|||||||||
| (Cost $253,410,106) |
|
232,585,465 | ||||||||
|
|
|
| ||||||||
| Written Options - (0.04)% |
|
|||||||||
| (Cost $(74,002)) |
|
(81,875 | ) | |||||||
|
|
|
| ||||||||
| Net unrealized appreciation on unfunded commitments - 0.00% |
|
12 | ||||||||
| Liabilities in Excess of Other Assets - (10.89)% |
|
(22,845,101 | ) | |||||||
|
|
|
| ||||||||
| Net Assets - 100.00% |
|
$ | 209,658,501 | |||||||
|
|
|
| ||||||||
| 1 | Securities exempt from registration under Rule 144A of the Securities Act of 1933, as amended. The securities may be resold in transactions exempt from registration, normally to qualified institutional buyers. |
| 2 | Floating rate security. The rate disclosed was in effect at March 31, 2022. |
| 3 | Foreign denominated security issued by foreign domiciled entity. |
| 4 | Variable rate security. Interest rate disclosed is as of the most recent information available. Certain variable rate securities are not based on a published reference rate and spread but are determined by the issuer or agent and are based on current market conditions. |
| 5 | Security is valued using significant unobservable inputs and is classified as Level 3 in the fair value hierarchy. |
| 6 | Illiquid security as determined under procedures approved by the Board of Trustees. The aggregate value of illiquid securities is $3,352,916, which is 1.60% of total net assets. |
| 7 | Excluded from the investment total above is an unfunded delayed draw term loan commitment in an amount not to exceed $143,659, at an interest rate of 0.00% and a maturity of February 15, 2029. The investment is accruing an unused commitment fee of 0.63% per annum. |
| 8 | Excluded from the investment total above is an unfunded delayed draw term loan commitment in an amount not to exceed $45,404, at an interest rate of 3.75% and a maturity of November 18, 2027. The investment is accruing an unused commitment fee of 1.13% per annum. |
| 9 | Excluded from the investment total above is an unfunded delayed draw term loan commitment in an amount not to exceed $57,050, at an interest rate of 1.88% and a maturity of July 17, 2028. The investment is not accruing an unused commitment fee. |
| 10 | Perpetual security with no stated maturity date. |
| 11 | Non-income producing security. |
| 12 | Security is currently in default with regard to scheduled interest or principal payments. |
| 13 | Zero coupon bond. The rate shown is the effective yield as of March 31, 2022. |
| 14 | Represents the current yield as of March 31, 2022. |
| 15 | Represents annualized yield at date of purchase. |
| † | Fair valued security. The aggregate value of fair valued securities is $410,126, which is 0.20% of total net assets. Fair valued securities were not valued utilizing an independent quote but were valued pursuant to guidelines established by the Board of Trustees. See Notes to Financial Statements. |
| * | Securities with a call or reset feature will have an effective maturity date sooner than the stated maturity. |
| ** | Securities backed by mortgage or consumer loans where payment is periodically made will have an effective maturity date sooner than the stated maturity date. |
Note: For Fund compliance purposes, the Fund’s industry classifications refer to any one or more of the industry sub-classifications used by one or more widely recognized market indexes or ratings group indexes, and/or as defined by Fund management. This definition may not apply for purposes of this report, which may combine industry sub-classifications for more meaningful presentation for investors.
(CAD): Canadian Dollar
(CLO): Collateralized Loan Obligation
(EMTN): Euro Medium-Term Note
(EUR): Euro
(EURIBOR): Euro InterBank Offer Rate
(GBP): British Pound
(GMTN): Global Medium-Term Note
(IO): Interest Only
(LIBOR): London InterBank Offer Rate
(MTN): Medium-Term Note
(PO): Principal Only
(SOFR): Secured Overnight Financing Rate
(SONIA): Sterling Overnight Index Average
(STEP): Step Coupon Bond
(TBA): To-Be-Announced
(USD): U.S. Dollar
See accompanying Notes to Financial Statements.
| 75 / Annual Report March 2022 |
Table of Contents
Flexible Income Fund
Schedule of Portfolio Investments
March 31, 2022
| Currency to be Purchased |
Currency to be Sold |
Counterparty | Settlement Date |
Unrealized Appreciation (Depreciation) |
||||||||
| FOREIGN CURRENCY EXCHANGE CONTRACT |
||||||||||||
| CAD 3,248,000 |
USD 2,546,552 | Citigroup Global Markets, Inc. | 04/08/22 | $ | 53,719 | |||||||
| EUR 1,253,000 |
USD 1,378,049 | Goldman Sachs International | 04/08/22 | 16,431 | ||||||||
| GBP 483,000 |
USD 633,499 | Goldman Sachs International | 04/08/22 | 2,411 | ||||||||
| USD 643,658 |
EUR 568,000 | Goldman Sachs International | 04/08/22 | 11,523 | ||||||||
| USD 648,007 |
GBP 483,000 | Goldman Sachs International | 04/08/22 | 12,097 | ||||||||
|
|
|
|||||||||||
| 96,181 | ||||||||||||
|
|
|
|||||||||||
| USD 2,532,514 |
CAD 3,248,000 | Citigroup Global Markets, Inc. | 04/08/22 | (67,757) | ||||||||
| USD 744,915 |
EUR 685,000 | Citigroup Global Markets, Inc. | 04/08/22 | (17,430) | ||||||||
| USD 1,383,425 |
EUR 1,253,000 | Goldman Sachs International | 07/08/22 | (16,541) | ||||||||
| USD 610,262 |
GBP 466,000 | Goldman Sachs International | 07/08/22 | (3,154) | ||||||||
|
|
|
|||||||||||
| (104,882) | ||||||||||||
|
|
|
|||||||||||
| NET UNREALIZED DEPRECIATION |
$ | (8,701) | ||||||||||
|
|
|
|||||||||||
| Description | Number of Contracts |
Expiration Date | Notional Amount | Value | Unrealized Appreciation (Depreciation) |
|||||||||||
| FUTURES CONTRACTS: LONG POSITIONS | ||||||||||||||||
| U.S. Treasury Five-Year Note | 562 | 06/30/22 | $ | 64,454,375 | $ | (1,482,559) | $ | (1,482,559) | ||||||||
| FUTURES CONTRACTS: SHORT POSITIONS | ||||||||||||||||
| U.S. Treasury Ten-Year Ultra Bond |
227 | 06/21/22 | (30,751,406) | 984,315 | 984,315 | |||||||||||
| U.S. Treasury Ultra Bond |
51 | 06/21/22 | (9,033,375) | 289,968 | 289,968 | |||||||||||
|
|
|
|
|
|
|
|||||||||||
| (39,784,781) | 1,274,283 | 1,274,283 | ||||||||||||||
|
|
|
|
|
|
|
|||||||||||
| TOTAL FUTURES CONTRACTS |
$ | 24,669,594 | $ | (208,276) | $ | (208,276) | ||||||||||
|
|
|
|
|
|
|
|||||||||||
| Description | Number of contracts |
Exercise Price |
Expiration Date |
Notional Amount | Value | |||||||||||||
| WRITTEN CALL OPTIONS EXCHANGE TRADED |
||||||||||||||||||
| IMM Eurodollar 2-Year MIDCV Future Options |
50 | $97.88 | 12/16/22 | $ | (3,040,469) | $ | (23,437) | |||||||||||
|
|
|
|
|
|||||||||||||||
| WRITTEN PUT OPTIONS EXCHANGE TRADED |
||||||||||||||||||
| IMM Eurodollar 2-Year MIDCV Future Options |
50 | $97.38 | 12/16/22 | $ |
(3,040,469) |
|
$ | (58,438) | ||||||||||
|
|
|
|
|
|||||||||||||||
See accompanying Notes to Financial Statements.
| Annual Report March 2022 / 76 |
Table of Contents
Schedule of Portfolio Investments
March 31, 2022
| Issues |
Maturity Date |
Principal Amount |
Value | |||||||||
| BONDS – 94.69% |
| |||||||||||
| BANK LOANS — 88.53%* |
| |||||||||||
| Automotive — 0.89% |
| |||||||||||
| Clarios Global LP, |
| |||||||||||
| Term Loan B, 1st Lien |
| |||||||||||
| (LIBOR plus 3.25%) |
| |||||||||||
| 3.71% |
04/30/261 | $ | 2,211,302 | $ | 2,186,978 | |||||||
| Oeconnection LLC, |
| |||||||||||
| Term Loan B, 1st Lien |
| |||||||||||
| (LIBOR plus 4.00%) |
| |||||||||||
| 4.46% |
09/25/261 | 1,808,495 | 1,782,868 | |||||||||
| 4.47% |
09/25/261 | 417,522 | 411,606 | |||||||||
|
|
|
| ||||||||||
| 4,381,452 | ||||||||||||
|
|
|
| ||||||||||
| Communications — 10.07% |
| |||||||||||
| A-L Parent LLC, |
| |||||||||||
| Term Loan, 1st Lien |
| |||||||||||
| (LIBOR plus 3.25%) |
| |||||||||||
| 4.25% |
12/01/231 | 487,147 | 465,096 | |||||||||
| Altice Financing SA, |
| |||||||||||
| Term Loan B, 1st Lien |
| |||||||||||
| (LIBOR plus 2.75%) |
| |||||||||||
| 2.99% |
01/31/261 | 957,500 | 925,314 | |||||||||
| Altice France SA, |
| |||||||||||
| Term Loan B11, 1st Lien |
| |||||||||||
| (LIBOR plus 2.75%) |
| |||||||||||
| 3.05% |
07/31/251 | 989,610 | 968,170 | |||||||||
| Altice SA, |
| |||||||||||
| Term Loan B13, 1st Lien (France) |
| |||||||||||
| (LIBOR plus 4.00%) |
| |||||||||||
| 4.51% |
08/14/261,2 | 483,750 | 475,488 | |||||||||
| Banijay Group U.S. Holding, Inc., |
| |||||||||||
| Term Loan B, 1st Lien |
| |||||||||||
| (LIBOR plus 3.75%) |
| |||||||||||
| 3.99% |
03/01/251 | 1,735,570 | 1,722,553 | |||||||||
| CCI Buyer, Inc., |
| |||||||||||
| Term Loan B, 1st Lien |
| |||||||||||
| (SOFR plus 4.00%) |
| |||||||||||
| 4.75% |
12/17/271 | 1,485,000 | 1,467,677 | |||||||||
| CenturyLink, Inc., |
| |||||||||||
| Term Loan B, 1st Lien |
| |||||||||||
| (LIBOR plus 2.25%) |
| |||||||||||
| 2.71% |
03/15/271 | 2,447,393 | 2,386,025 | |||||||||
| Charter Communications Operating LLC, |
| |||||||||||
| Term Loan B2, 1st Lien |
| |||||||||||
| (LIBOR plus 1.75%) |
| |||||||||||
| 2.21% |
02/01/271 | 1,325,781 | 1,316,487 | |||||||||
| Consolidated Communications, Inc., |
| |||||||||||
| Term Loan B1, 1st Lien |
| |||||||||||
| (LIBOR plus 3.50%) |
| |||||||||||
| 4.25% |
10/02/271 | 2,000,000 | 1,886,070 | |||||||||
| Coralus Co-Borrower LLC, |
| |||||||||||
| Term Loan B5, 1st Lien |
| |||||||||||
| (LIBOR plus 2.25%) |
| |||||||||||
| 2.65% |
01/31/281 | 2,250,000 | 2,206,057 | |||||||||
| Issues |
Maturity Date |
Principal Amount |
Value | |||||||||
| BANK LOANS (continued) |
| |||||||||||
| Communications (continued) |
| |||||||||||
| Crown Subsea Communications Holding, Inc., |
| |||||||||||
| Term Loan, 1st Lien |
| |||||||||||
| (LIBOR plus 4.75%) |
| |||||||||||
| 5.50% |
04/27/271 | $ | 801,370 | $ | 800,032 | |||||||
| CSC Holdings LLC, |
| |||||||||||
| Term Loan B, 1st Lien |
| |||||||||||
| (LIBOR plus 2.25%) |
| |||||||||||
| 2.65% |
01/15/261 | 970,000 | 957,875 | |||||||||
| Term Loan B5, 1st Lien |
| |||||||||||
| (LIBOR plus 2.50%) |
| |||||||||||
| 2.90% |
04/15/271 | 984,925 | 969,658 | |||||||||
| Dawn Acquisition LLC, |
| |||||||||||
| Term Loan B, 1st Lien |
| |||||||||||
| (LIBOR plus 3.75%) |
| |||||||||||
| 3.97% |
12/31/251 | 1,468,570 | 1,249,709 | |||||||||
| Diamond Sports Group, LLC, |
| |||||||||||
| Term Loan, 2nd Lien |
| |||||||||||
| (SOFR plus 3.25%) |
| |||||||||||
| 3.54% |
08/24/261 | 1,484,857 | 514,600 | |||||||||
| DIRECTV Financing LLC, |
| |||||||||||
| Term Loan, 1st Lien |
| |||||||||||
| (LIBOR plus 5.00%) |
| |||||||||||
| 5.75% |
08/02/271 | 1,910,000 | 1,910,372 | |||||||||
| EW Scripps Co., |
| |||||||||||
| Term Loan B, 1st Lien |
| |||||||||||
| (LIBOR plus 3.00%) |
| |||||||||||
| 3.75% |
01/07/281 | 415,625 | 413,611 | |||||||||
| Frontier Communications Holdings LLC, |
| |||||||||||
| Term Loan B, 1st Lien |
| |||||||||||
| (LIBOR plus 3.75%) |
| |||||||||||
| 4.81% |
05/01/281 | 1,237,500 | 1,220,998 | |||||||||
| Global Tel*Link Corp., |
| |||||||||||
| Term Loan, 1st Lien |
| |||||||||||
| (LIBOR plus 4.25%) |
| |||||||||||
| 4.71% |
11/29/251 | 982,765 | 936,875 | |||||||||
| Gray Television, Inc., |
| |||||||||||
| Term Loan D, 1st Lien |
| |||||||||||
| (LIBOR plus 3.00%) |
| |||||||||||
| 3.23% |
12/01/281 | 1,496,250 | 1,490,504 | |||||||||
| GTT Communications BV, |
| |||||||||||
| Term Loan B, 1st Lien |
| |||||||||||
| (EURIBOR plus 3.25%) |
| |||||||||||
| 3.25% |
05/31/251 | 706,100 | 653,560 | |||||||||
| GTT Communications, Inc., |
| |||||||||||
| Term Loan B, 1st Lien |
| |||||||||||
| (PRIME plus 3.75%) |
| |||||||||||
| 7.25% |
05/30/251 | 475,870 | 391,791 | |||||||||
| Intelsat Jackson Holdings SA, |
| |||||||||||
| Term Loan (Luxembourg) |
| |||||||||||
| (SOFR plus 4.42%) |
| |||||||||||
| 4.92% |
02/01/291,2 | 4,987,500 | 4,914,633 | |||||||||
| Level 3 Parent LLC, |
| |||||||||||
| Term Loan B, 1st Lien |
| |||||||||||
| (LIBOR plus 1.75%) |
| |||||||||||
| 2.21% |
03/01/271 | 2,337,328 | 2,296,974 | |||||||||
See accompanying Notes to Financial Statements.
| 77 / Annual Report March 2022 |
Table of Contents
Floating Rate Income Fund
Schedule of Portfolio Investments
March 31, 2022
| Issues | Maturity Date |
Principal Amount |
Value | |||||||||
| BANK LOANS (continued) |
| |||||||||||
| Communications (continued) |
| |||||||||||
| MacDonald Dettwiler & Associates Ltd., |
| |||||||||||
| Term Loan B, 1st Lien |
| |||||||||||
| (LIBOR plus 2.75%) |
| |||||||||||
| 3.21% |
10/04/241 | $ | 736,668 | $ | 726,734 | |||||||
| Metronet Systems Holdings LLC, |
| |||||||||||
| Term Loan B |
| |||||||||||
| (LIBOR plus 3.75%) |
| |||||||||||
| 4.50% |
06/02/281 | 1,986,281 | 1,969,517 | |||||||||
| MH Sub I LLC, |
| |||||||||||
| Term Loan, 1st Lien |
| |||||||||||
| (LIBOR plus 3.75%) |
| |||||||||||
| 4.75% |
09/13/241 | 2,324,775 | 2,303,189 | |||||||||
| National CineMedia LLC, |
| |||||||||||
| Term Loan B, 1st Lien |
| |||||||||||
| (LIBOR plus 4.00%) |
| |||||||||||
| 5.00% |
06/20/251 | 1,243,332 | 1,126,770 | |||||||||
| (LIBOR plus 8.00%) |
| |||||||||||
| 9.00% |
12/20/241 | 579,821 | 547,930 | |||||||||
| NEP Group, Inc., |
| |||||||||||
| Term Loan B, 1st Lien |
| |||||||||||
| (PRIME plus 3.00%) |
| |||||||||||
| 6.50% |
10/20/251 | 249,375 | 247,400 | |||||||||
| NEP/NCP Holdco, Inc., |
| |||||||||||
| Term Loan B, 1st Lien |
| |||||||||||
| (LIBOR plus 3.25%) |
| |||||||||||
| 3.70% |
10/20/251 | 1,482,770 | 1,459,417 | |||||||||
| Term Loan, 2nd Lien |
| |||||||||||
| (LIBOR plus 7.00%) |
| |||||||||||
| 7.46% |
10/19/261 | 440,000 | 426,910 | |||||||||
| New Insight Holdings, Inc., |
| |||||||||||
| Term Loan, 1st Lien |
| |||||||||||
| (LIBOR plus 5.50%) |
| |||||||||||
| 6.50% |
12/20/241 | 478,750 | 471,518 | |||||||||
| Sinclair Television Group, Inc., |
| |||||||||||
| Term Loan B3, 1st Lien |
| |||||||||||
| (LIBOR plus 3.00%) |
| |||||||||||
| 3.46% |
04/01/281 | 1,612,703 | 1,577,433 | |||||||||
| Terrier Media Buyer, Inc., |
| |||||||||||
| Term Loan B, 1st Lien |
| |||||||||||
| (LIBOR plus 3.50%) |
| |||||||||||
| 3.96% |
12/17/261 | 2,018,994 | 1,990,909 | |||||||||
| Univision Communications, Inc., |
| |||||||||||
| Term Loan B, 1st Lien |
| |||||||||||
| (LIBOR plus 3.25%) |
| |||||||||||
| 4.00% |
05/06/281 | 1,000,000 | 991,665 | |||||||||
| UPC Financing Partnership, |
| |||||||||||
| Term Loan, 1st Lien |
| |||||||||||
| (LIBOR plus 2.25%) |
| |||||||||||
| 2.65% |
04/30/281 | 250,000 | 244,866 | |||||||||
| Virgin Media Bristol LLC, |
| |||||||||||
| Term Loan N, 1st Lien |
| |||||||||||
| (LIBOR plus 2.50%) |
| |||||||||||
| 2.90% |
01/31/281 | 1,000,000 | 989,375 | |||||||||
| Issues | Maturity Date |
Principal Amount |
Value | |||||||||
| BANK LOANS (continued) |
| |||||||||||
| Communications (continued) |
| |||||||||||
| Zayo Group Holdings, Inc., |
| |||||||||||
| Term Loan, 1st Lien |
| |||||||||||
| (LIBOR plus 3.00%) |
| |||||||||||
| 3.46% |
03/09/271 | $ | 2,004,276 | $ | 1,953,338 | |||||||
|
|
|
| ||||||||||
| 49,567,100 | ||||||||||||
|
|
|
| ||||||||||
| Consumer Discretionary — 5.11% |
| |||||||||||
| ADMI Corp., |
| |||||||||||
| Term Loan B2, 1st Lien |
| |||||||||||
| (LIBOR plus 3.38%) |
| |||||||||||
| 3.88% |
12/23/271 | 1,237,500 | 1,218,263 | |||||||||
| AI Aqua Merger Sub, Inc., |
| |||||||||||
| Term Loan B, 1st Lien |
| |||||||||||
| (SOFR plus 4.00%) |
| |||||||||||
| 4.00% |
07/31/281,3 | 814,815 | 807,433 | |||||||||
| Arterra Wines Canada, Inc., |
| |||||||||||
| Term Loan, 1st Lien |
| |||||||||||
| (LIBOR plus 3.50%) |
| |||||||||||
| 4.51% |
11/24/271 | 691,250 | 685,720 | |||||||||
| Birkenstock U.S. BidCo, Inc., |
| |||||||||||
| Term Loan B, 1st Lien |
| |||||||||||
| (LIBOR plus 3.25%) |
| |||||||||||
| 3.75% |
04/28/281 | 744,375 | 737,862 | |||||||||
| City Brewing Co. LLC, |
| |||||||||||
| Term Loan B, 1st Lien |
| |||||||||||
| (LIBOR plus 3.50%) |
| |||||||||||
| 4.25% |
04/05/281 | 996,247 | 916,547 | |||||||||
| Culligan International, Inc., |
| |||||||||||
| Term Loan B, 1st Lien |
| |||||||||||
| (SOFR plus 3.75%) |
| |||||||||||
| 4.25% |
07/31/281 | 1,150,000 | 1,140,840 | |||||||||
| Landry’s, |
| |||||||||||
| Term Loan, 1st Lien |
| |||||||||||
| (LIBOR plus 12.00%) |
| |||||||||||
| 13.00% |
10/04/231 | 53,605 | 57,358 | |||||||||
| Naked Juice, LLC, |
| |||||||||||
| Term Loan |
| |||||||||||
| (SOFR plus 3.25%) |
| |||||||||||
| 4.00% |
01/24/291 | 3,000,000 | 2,957,145 | |||||||||
| (SOFR plus 6.00%) |
| |||||||||||
| 6.75% |
01/24/301 | 2,100,000 | 2,100,000 | |||||||||
| New Trojan Parent, Inc., |
| |||||||||||
| Term Loan, 1st Lien |
| |||||||||||
| (LIBOR plus 3.25%) |
| |||||||||||
| 3.75% |
01/06/281 | 1,488,750 | 1,445,948 | |||||||||
| Peraton Corp., |
| |||||||||||
| Term Loan B, 1st Lien |
| |||||||||||
| (LIBOR plus 3.75%) |
| |||||||||||
| 4.50% |
02/01/281 | 2,430,281 | 2,418,130 | |||||||||
| Prometric Holdings, Inc., |
| |||||||||||
| Term Loan B, 1st Lien |
| |||||||||||
| (LIBOR plus 3.00%) |
| |||||||||||
| 4.00% |
01/29/251 | 962,707 | 947,304 | |||||||||
See accompanying Notes to Financial Statements.
| Annual Report March 2022 / 78 |
Table of Contents
Floating Rate Income Fund
Schedule of Portfolio Investments
March 31, 2022
| Issues |
Maturity Date |
Principal Amount |
Value | |||||||||
| BANK LOANS (continued) |
| |||||||||||
| Consumer Discretionary (continued) |
| |||||||||||
| Refresco, |
| |||||||||||
| Term Loan B3, 1st Lien |
| |||||||||||
| (LIBOR plus 2.75%) |
| |||||||||||
| 3.22% |
03/28/251 | $ | 1,920,600 | $ | 1,908,596 | |||||||
| Sunshine Luxembourg VII SARL, |
| |||||||||||
| Term Loan B, 1st Lien |
| |||||||||||
| (LIBOR plus 3.75%) |
| |||||||||||
| 4.76% |
10/01/261 | 2,227,500 | 2,216,017 | |||||||||
| Tecta America Corp., |
| |||||||||||
| Term Loan, 1st Lien |
| |||||||||||
| (LIBOR plus 4.25%) |
| |||||||||||
| 5.00% |
04/10/281 | 992,500 | 985,056 | |||||||||
| Triton Water Holdings, Inc., |
| |||||||||||
| Term Loan B, 1st Lien |
| |||||||||||
| (LIBOR plus 3.50%) |
| |||||||||||
| 4.51% |
03/31/281 | 1,488,751 | 1,454,986 | |||||||||
| Waystar technologies, Inc., |
| |||||||||||
| Term Loan B, 1st Lien |
| |||||||||||
| (LIBOR plus 4.00%) |
| |||||||||||
| 4.46% |
10/22/261 | 1,962,469 | 1,960,015 | |||||||||
| Weber-Stephen Products LLC, |
| |||||||||||
| Term Loan B, 1st Lien |
| |||||||||||
| (LIBOR plus 3.25%) |
| |||||||||||
| 4.00% |
10/30/271 | 1,217,130 | 1,182,442 | |||||||||
|
|
|
| ||||||||||
| 25,139,662 | ||||||||||||
|
|
|
| ||||||||||
| Consumer Products — 0.68% |
| |||||||||||
| Hoffmaster Group, Inc., |
| |||||||||||
| Term Loan, 1st Lien |
| |||||||||||
| (LIBOR plus 4.00%) |
| |||||||||||
| 5.01% |
11/21/231 | 1,457,621 | 1,396,284 | |||||||||
| Lakeshore Intermediate, LLC, |
| |||||||||||
| Term Loan B, 1st Lien |
| |||||||||||
| (LIBOR plus 3.50%) |
| |||||||||||
| 4.00% |
09/29/281 | 1,995,000 | 1,963,409 | |||||||||
|
|
|
| ||||||||||
| 3,359,693 | ||||||||||||
|
|
|
| ||||||||||
| Electric — 1.33% |
| |||||||||||
| Astoria Energy LLC, |
| |||||||||||
| Term Loan B, 1st Lien |
| |||||||||||
| (LIBOR plus 3.50%) |
| |||||||||||
| 4.50% |
12/10/271 | 1,454,507 | 1,437,919 | |||||||||
| CommScope, Inc., |
| |||||||||||
| Term Loan B, 1st Lien |
| |||||||||||
| (LIBOR plus 3.25%) |
| |||||||||||
| 3.71% |
04/06/261 | 1,954,988 | 1,906,924 | |||||||||
| Endure Digital, Inc., |
| |||||||||||
| Term Loan B, 1st Lien |
| |||||||||||
| (LIBOR plus 3.50%) |
| |||||||||||
| 4.25% |
02/10/281 | 1,985,000 | 1,932,894 | |||||||||
| Linden LLC, |
| |||||||||||
| Term Loan B, 1st Lien |
| |||||||||||
| (LIBOR plus 3.50%) |
| |||||||||||
| 4.51% |
10/01/271 | 1,286,884 | 1,256,520 | |||||||||
|
|
|
| ||||||||||
| 6,534,257 | ||||||||||||
|
|
|
| ||||||||||
| Issues | Maturity Date |
Principal Amount |
Value | |||||||||
| BANK LOANS (continued) |
| |||||||||||
| Energy — 1.45% |
| |||||||||||
| Apro LLC, |
| |||||||||||
| Term Loan B, 1st Lien |
| |||||||||||
| (LIBOR plus 3.75%) |
| |||||||||||
| 4.50% |
11/14/261 | $ | 1,332,839 | $ | 1,327,841 | |||||||
| Calpine Corp., |
| |||||||||||
| Term Loan B10, 1st Lien |
| |||||||||||
| (LIBOR plus 2.00%) |
| |||||||||||
| 2.46% |
08/12/261 | 188,894 | 186,565 | |||||||||
| EPIC Y-Grade Services L.P, |
| |||||||||||
| Term Loan B, 1st Lien |
| |||||||||||
| (LIBOR plus 6.00%) |
| |||||||||||
| 7.00% |
06/30/271 | 249,975 | 211,437 | |||||||||
| Lucid Energy Group II Borrower LLC, |
| |||||||||||
| Term Loan, 1st Lien |
| |||||||||||
| (LIBOR plus 4.25%) |
| |||||||||||
| 5.00% |
11/24/281 | 997,500 | 990,542 | |||||||||
| Parkway Generation LLC, |
| |||||||||||
| Term Loan B, 1st Lien |
| |||||||||||
| (LIBOR plus 4.75%) |
| |||||||||||
| 5.50% |
02/16/291 | 1,798,246 | 1,764,529 | |||||||||
| Term Loan C, 1st Lien |
| |||||||||||
| (LIBOR plus 4.75%) |
| |||||||||||
| 5.50% |
02/16/291 | 251,754 | 246,719 | |||||||||
| TransMontaigne Operating Co. LP, |
| |||||||||||
| Term Loan B, 1st Lien |
| |||||||||||
| (LIBOR plus 3.50%) |
| |||||||||||
| 4.00% |
11/17/281 | 1,498,125 | 1,490,949 | |||||||||
| Traverse Midstream Partners LLC, |
| |||||||||||
| Term Loan B, 1st Lien |
| |||||||||||
| (SOFR plus 4.25%) |
| |||||||||||
| 5.25% |
09/27/241 | 908,450 | 906,179 | |||||||||
|
|
|
| ||||||||||
| 7,124,761 | ||||||||||||
|
|
|
| ||||||||||
| Entertainment — 1.39% |
| |||||||||||
| Cineworld Finance U.S., Inc., |
| |||||||||||
| Term Loan B, 1st Lien |
| |||||||||||
| (LIBOR plus 2.50%) |
| |||||||||||
| 4.00% |
02/28/251 | 2,128,377 | 1,648,247 | |||||||||
| Crown Finance U.S., Inc., |
| |||||||||||
| Term Loan B1, 1st Lien |
| |||||||||||
| (LIBOR plus 7.00%) |
| |||||||||||
| 7.00% |
05/23/241 | 1,177,818 | 1,394,248 | |||||||||
| NAI Entertainment Holdings LLC, |
| |||||||||||
| Term Loan B, 1st Lien |
| |||||||||||
| (LIBOR plus 2.50%) |
| |||||||||||
| 3.50% |
05/08/251 | 1,391,572 | 1,367,220 | |||||||||
| SMG US Midco 2, Inc., |
| |||||||||||
| Term Loan, 1st Lien |
| |||||||||||
| (LIBOR plus 2.50%) |
| |||||||||||
| 2.80% |
01/23/251 | 712,027 | 687,106 | |||||||||
| 2.97% |
01/23/251 | 282,890 | 272,989 | |||||||||
| WildBrain Ltd., |
| |||||||||||
| Term Loan B, 1st Lien |
| |||||||||||
| (LIBOR plus 4.25%) |
| |||||||||||
| 5.00% |
03/24/281 | 1,485,000 | 1,476,187 | |||||||||
|
|
|
| ||||||||||
| 6,845,997 | ||||||||||||
|
|
|
| ||||||||||
See accompanying Notes to Financial Statements.
| 79 / Annual Report March 2022 |
Table of Contents
Floating Rate Income Fund
Schedule of Portfolio Investments
March 31, 2022
| Issues | Maturity Date |
Principal Amount |
Value | |||||||||
| BANK LOANS (continued) |
| |||||||||||
| Finance — 3.52% |
| |||||||||||
| Auris Lux III SA, |
| |||||||||||
| Term Loan B, 1st Lien (Luxembourg) |
| |||||||||||
| (LIBOR plus 3.75%) |
| |||||||||||
| 4.21% |
02/27/261,2 | $ | 1,212,505 | $ | 1,184,090 | |||||||
| Camelot Finance SA, |
| |||||||||||
| Term Loan B, 1st Lien |
| |||||||||||
| (LIBOR plus 3.00%) |
| |||||||||||
| 3.46% |
10/30/261 | 977,500 | 968,747 | |||||||||
| Cushman & Wakefield, |
| |||||||||||
| Term Loan B, 1st Lien |
| |||||||||||
| (LIBOR plus 2.75%) |
| |||||||||||
| 3.21% |
08/21/251 | 1,497,776 | 1,480,611 | |||||||||
| DCG Acquisition Corp., |
| |||||||||||
| Term Loan, 1st Lien |
| |||||||||||
| (LIBOR plus 4.50%) |
| |||||||||||
| 4.96% |
09/30/261 | 2,451,876 | 2,416,630 | |||||||||
| First Eagle Holdings, Inc., |
| |||||||||||
| Term Loan B, 1st Lien |
| |||||||||||
| (LIBOR plus 2.50%) |
| |||||||||||
| 3.51% |
02/01/271 | 1,427,619 | 1,405,312 | |||||||||
| Hertz Corp. (The), |
| |||||||||||
| Term Loan B, 1st Lien |
| |||||||||||
| (LIBOR plus 3.25%) |
| |||||||||||
| 3.75% |
06/30/281 | 417,557 | 415,091 | |||||||||
| Term Loan C, 1st Lien |
| |||||||||||
| (LIBOR plus 3.25%) |
| |||||||||||
| 3.75% |
06/30/281 | 79,288 | 78,820 | |||||||||
| Jane Street Group LLC, |
| |||||||||||
| Term Loan B, 1st Lien |
| |||||||||||
| (LIBOR plus 2.75%) |
| |||||||||||
| 3.21% |
01/26/281 | 1,728,125 | 1,708,329 | |||||||||
| Mozart Borrower, LP, |
| |||||||||||
| Term Loan B |
| |||||||||||
| (LIBOR plus 3.25%) |
| |||||||||||
| 3.75% |
10/23/281 | 2,300,000 | 2,279,726 | |||||||||
| Schweitzer-Mauduit International, Inc., |
| |||||||||||
| Term Loan, 1st Lien |
| |||||||||||
| (LIBOR plus 3.75%) |
| |||||||||||
| 4.50% |
04/20/281 | 1,985,000 | 1,963,502 | |||||||||
| Tegra118 Wealth Solutions, Inc., |
| |||||||||||
| Term Loan B, 1st Lien |
| |||||||||||
| (LIBOR plus 4.00%) |
| |||||||||||
| 4.49% |
02/18/271 | 1,000,000 | 995,835 | |||||||||
| Telenet Financing USD LLC, |
| |||||||||||
| Term Loan AR, 1st Lien |
| |||||||||||
| (LIBOR plus 2.00%) |
| |||||||||||
| 2.40% |
04/28/281 | 1,500,000 | 1,468,928 | |||||||||
| Trident TPI Holdings, Inc., |
| |||||||||||
| Delayed-Draw Term Loan, 1st Lien |
| |||||||||||
| (LIBOR plus 4.00%) |
| |||||||||||
| 4.50% |
09/15/281,4 | 77,693 | 76,851 | |||||||||
| Term Loan B3, 1st Lien |
| |||||||||||
| (LIBOR plus 4.00%) |
| |||||||||||
| 4.50% |
09/15/281 | 871,398 | 861,960 | |||||||||
|
|
|
| ||||||||||
| 17,304,432 | ||||||||||||
|
|
|
| ||||||||||
| Issues | Maturity Date |
Principal Amount |
Value | |||||||||
| BANK LOANS (continued) |
| |||||||||||
| Food — 4.43% |
| |||||||||||
| 8th Avenue Food & Provisions, Inc., |
| |||||||||||
| Term Loan B, 1st Lien |
| |||||||||||
| (LIBOR plus 4.75%) |
| |||||||||||
| 5.50% |
10/01/251 | $ | 497,500 | $ | 448,994 | |||||||
| CH Gunther PPC Parent LLC, |
| |||||||||||
| Term Loan B, 1st Lien |
| |||||||||||
| (LIBOR plus 3.00%) |
| |||||||||||
| 3.50% |
12/08/281 | 1,000,000 | 978,750 | |||||||||
| Chobani LLC, |
| |||||||||||
| Term Loan B, 1st Lien |
| |||||||||||
| (LIBOR plus 3.50%) |
| |||||||||||
| 4.50% |
10/25/271 | 1,477,500 | 1,456,726 | |||||||||
| Dessert Holdings, Inc., |
| |||||||||||
| Term Loan, 1st Lien |
| |||||||||||
| (LIBOR plus 4.00%) |
| |||||||||||
| 5.01% |
06/09/281,5 | 2,175,789 | 2,138,399 | |||||||||
| Flora Food Group, |
| |||||||||||
| Term Loan B, 1st Lien |
| |||||||||||
| (LIBOR plus 3.00%) |
| |||||||||||
| 3.35% |
07/02/251 | 1,949,679 | 1,786,745 | |||||||||
| Hostess Brands LLC, |
| |||||||||||
| Term Loan, 1st Lien |
| |||||||||||
| (LIBOR plus 2.25%) |
| |||||||||||
| 3.00% |
08/03/251 | 2,403,654 | 2,376,829 | |||||||||
| Houston Foods, Inc., |
| |||||||||||
| Term Loan B, 1st Lien |
| |||||||||||
| (LIBOR plus 3.75%) |
| |||||||||||
| 6.21% |
07/20/251 | 2,236,924 | 2,113,893 | |||||||||
| Matterhorn Merger Sub LLC, |
| |||||||||||
| Term Loan, 1st Lien |
| |||||||||||
| (LIBOR plus 4.00%) |
| |||||||||||
| 4.46% |
05/23/251 | 1,477,517 | 1,434,115 | |||||||||
| Shearer’s Foods LLC, |
| |||||||||||
| Term Loan B, 1st Lien |
| |||||||||||
| (LIBOR plus 3.50%) |
| |||||||||||
| 4.25% |
09/23/271 | 2,034,376 | 1,979,834 | |||||||||
| Snacking Investments Bidco, |
| |||||||||||
| Term Loan B, 1st Lien |
| |||||||||||
| (LIBOR plus 4.00%) |
| |||||||||||
| 5.00% |
12/18/261 | 1,238,092 | 1,224,163 | |||||||||
| Sovos Brands Intermediate, Inc., |
| |||||||||||
| Term Loan B, 1st Lien |
| |||||||||||
| (LIBOR plus 3.75%) |
| |||||||||||
| 4.50% |
06/08/281 | 1,036,207 | 1,027,881 | |||||||||
| TKC Holdings, Inc., |
| |||||||||||
| Term Loan, 1st Lien |
| |||||||||||
| (LIBOR plus 5.50%) |
| |||||||||||
| 6.50% |
05/15/281 | 986,786 | 974,944 | |||||||||
| U.S. Foods, Inc., |
| |||||||||||
| Term Loan, 1st Lien |
| |||||||||||
| (LIBOR plus 2.00%) |
| |||||||||||
| 2.51% |
09/14/261 | 1,950,000 | 1,915,212 | |||||||||
See accompanying Notes to Financial Statements.
| Annual Report March 2022 / 80 |
Table of Contents
Floating Rate Income Fund
Schedule of Portfolio Investments
March 31, 2022
| Issues | Maturity Date |
Principal Amount |
Value | |||||||||
| BANK LOANS (continued) |
| |||||||||||
| Food (continued) |
| |||||||||||
| Utz Quality Foods LLC, |
| |||||||||||
| Term Loan B, 1st Lien |
| |||||||||||
| (LIBOR plus 3.00%) |
| |||||||||||
| 3.46% |
01/20/281 | $ | 1,973,765 | $ | 1,949,409 | |||||||
|
|
|
| ||||||||||
| 21,805,894 | ||||||||||||
|
|
|
| ||||||||||
| Gaming — 2.39% |
| |||||||||||
| Bally’s Corp., |
| |||||||||||
| Term Loan B, 1st Lien |
| |||||||||||
| (LIBOR plus 3.25%) |
| |||||||||||
| 3.75% |
10/02/281 | 498,750 | 496,685 | |||||||||
| Caesars Resort Collection LLC, |
| |||||||||||
| Term Loan, 1st Lien |
| |||||||||||
| (LIBOR plus 2.75%) |
| |||||||||||
| 3.21% |
12/23/241 | 1,436,250 | 1,430,663 | |||||||||
| Golden Entertainment, Inc., |
| |||||||||||
| Term Loan B, 1st Lien |
| |||||||||||
| (LIBOR plus 3.00%) |
| |||||||||||
| 3.75% |
10/21/241 | 1,171,875 | 1,161,621 | |||||||||
| Golden Nugget, LLC, |
| |||||||||||
| Term Loan B, 1st Lien |
| |||||||||||
| (SOFR plus 4.00%) |
| |||||||||||
| 4.50% |
01/27/291 | 4,000,000 | 3,985,260 | |||||||||
| GVC Holdings Gibraltar Ltd., |
| |||||||||||
| Term Loan B4, 1st Lien |
| |||||||||||
| (LIBOR plus 2.25%) |
| |||||||||||
| 3.74% |
03/29/271 | 1,736,875 | 1,722,763 | |||||||||
| J&J Ventures Gaming LLC, |
| |||||||||||
| Term Loan, 1st Lien |
| |||||||||||
| (LIBOR plus 4.00%) |
| |||||||||||
| 4.75% |
04/26/281 | 995,000 | 989,403 | |||||||||
| Scientific Games Holdings LP, |
| |||||||||||
| Term Loan B, 1st Lien |
| |||||||||||
| (SOFR plus 3.50%) |
| |||||||||||
| 3.50% |
02/04/291 | 2,004,000 | 1,988,610 | |||||||||
|
|
|
| ||||||||||
| 11,775,005 | ||||||||||||
|
|
|
| ||||||||||
| Health Care — 11.79% |
| |||||||||||
| ADMI Corp., |
| |||||||||||
| Term Loan B, 1st Lien |
| |||||||||||
| (LIBOR plus 2.75%) |
| |||||||||||
| 3.21% |
04/30/251 | 962,638 | 946,393 | |||||||||
| Bella Holding Co. LLC, |
| |||||||||||
| Term Loan, 1st Lien |
| |||||||||||
| (LIBOR plus 3.75%) |
| |||||||||||
| 4.50% |
05/10/281 | 995,000 | 988,781 | |||||||||
| Cano Health, LLC, |
| |||||||||||
| Term Loan, 1st Lien |
| |||||||||||
| (SOFR plus 4.00%) |
| |||||||||||
| 4.51% |
11/23/271 | 2,012,852 | 1,986,232 | |||||||||
| Carestream Dental, Inc., |
| |||||||||||
| Term Loan, 1st Lien |
| |||||||||||
| (LIBOR plus 4.50%) |
| |||||||||||
| 5.00% |
09/01/241 | 2,992,500 | 2,977,538 | |||||||||
| Issues | Maturity Date |
Principal Amount |
Value | |||||||||
| BANK LOANS (continued) |
| |||||||||||
| Health Care (continued) |
| |||||||||||
| CCS-CMGC Holdings, Inc., |
| |||||||||||
| Term Loan, 1st Lien |
| |||||||||||
| (LIBOR plus 5.50%) |
| |||||||||||
| 5.96% |
10/01/251 | $ | 483,750 | $ | 474,984 | |||||||
| Certara Holdco, Inc., |
| |||||||||||
| Term Loan B |
| |||||||||||
| (LIBOR plus 3.50%) |
| |||||||||||
| 3.96% |
08/15/261 | 1,985,000 | 1,960,188 | |||||||||
| Change Healthcare Holdings LLC, |
| |||||||||||
| Term Loan B, 1st Lien |
| |||||||||||
| (LIBOR plus 2.50%) |
| |||||||||||
| 3.50% |
03/01/241 | 598,627 | 596,158 | |||||||||
| Curia Global, Inc., |
| |||||||||||
| Term Loan B, 1st Lien |
| |||||||||||
| (LIBOR plus 3.75%) |
| |||||||||||
| 4.50% |
08/30/261 | 2,180,699 | 2,165,315 | |||||||||
| Da Vinci Purchaser Corp., |
| |||||||||||
| Term Loan B, 1st Lien |
| |||||||||||
| (LIBOR plus 4.00%) |
| |||||||||||
| 5.01% |
01/08/271 | 2,211,856 | 2,207,245 | |||||||||
| Elanco Animal Health, Inc., |
| |||||||||||
| Term Loan B, 1st Lien |
| |||||||||||
| (LIBOR plus 1.75%) |
| |||||||||||
| 1.98% |
08/01/271 | 1,247,744 | 1,230,101 | |||||||||
| Endo Luxembourg Finance Co., |
| |||||||||||
| Term Loan B, 1st Lien |
| |||||||||||
| (LIBOR plus 5.00%) |
| |||||||||||
| 5.75% |
03/27/281 | 2,052,600 | 1,928,377 | |||||||||
| eResearchTechnology, Inc., |
| |||||||||||
| Term Loan B, 1st Lien |
| |||||||||||
| (LIBOR plus 4.50%) |
| |||||||||||
| 5.50% |
02/04/271 | 1,760,758 | 1,756,911 | |||||||||
| Femur Buyer, Inc., |
| |||||||||||
| Term Loan, 1st Lien |
| |||||||||||
| (LIBOR plus 4.50%) |
| |||||||||||
| 5.51% |
03/05/261 | 624,606 | 565,268 | |||||||||
| Grifols Worldwide Operations USA, Inc., |
| |||||||||||
| Term Loan B, 1st Lien |
| |||||||||||
| (LIBOR plus 2.00%) |
| |||||||||||
| 2.46% |
11/15/271 | 925,556 | 911,325 | |||||||||
| Heartland Dental LLC, |
| |||||||||||
| Term Loan B, 1st Lien |
| |||||||||||
| (LIBOR plus 4.00%) |
| |||||||||||
| 4.45% |
04/30/251 | 993,744 | 986,822 | |||||||||
| Term Loan, 1st Lien |
| |||||||||||
| (LIBOR plus 3.50%) |
| |||||||||||
| 3.96% |
04/30/251 | 1,480,814 | 1,466,006 | |||||||||
| Horizon Therapeutics USA, Inc., |
| |||||||||||
| Term Loan B, 1st Lien |
| |||||||||||
| (LIBOR plus 1.75%) |
| |||||||||||
| 2.25% |
03/15/281 | 1,485,000 | 1,472,474 | |||||||||
| Jazz Financing Lux SARL, |
| |||||||||||
| Term Loan B, 1st Lien |
| |||||||||||
| (LIBOR plus 3.50%) |
| |||||||||||
| 4.00% |
05/05/281 | 1,985,000 | 1,980,167 | |||||||||
See accompanying Notes to Financial Statements.
| 81 / Annual Report March 2022 |
Table of Contents
Floating Rate Income Fund
Schedule of Portfolio Investments
March 31, 2022
| Issues | Maturity Date |
Principal Amount |
Value | |||||||||
| BANK LOANS (continued) |
| |||||||||||
| Health Care (continued) |
| |||||||||||
| LSCS Holdings, Inc., |
| |||||||||||
| Term Loan, 1st Lien |
| |||||||||||
| (LIBOR plus 4.50%) |
| |||||||||||
| 5.00% |
12/16/281 | $ | 2,443,875 | $ | 2,422,503 | |||||||
| Medplast Holdings, Inc., |
| |||||||||||
| Term Loan, 1st Lien |
| |||||||||||
| (LIBOR plus 3.75%) |
| |||||||||||
| 4.21% |
07/02/251 | 965,000 | 910,029 | |||||||||
| National Seating & Mobility, |
| |||||||||||
| Term Loan, 1st Lien |
| |||||||||||
| (LIBOR plus 5.25%) |
| |||||||||||
| 5.71% |
11/16/261 | 1,967,372 | 1,952,617 | |||||||||
| NMN Holdings III Corp., |
| |||||||||||
| Delayed-Draw Term Loan, 1st Lien |
| |||||||||||
| (LIBOR plus 3.75%) |
| |||||||||||
| 4.21% |
11/13/251 | 257,549 | 251,110 | |||||||||
| Term Loan, 1st Lien |
| |||||||||||
| (LIBOR plus 3.75%) |
| |||||||||||
| 4.21% |
11/13/251 | 1,200,328 | 1,170,320 | |||||||||
| Option Care Health, Inc., |
| |||||||||||
| Term Loan B, 1st Lien |
| |||||||||||
| (LIBOR plus 3.75%) |
| |||||||||||
| 3.25% |
10/27/281 | 1,995,000 | 1,980,875 | |||||||||
| Organon & Co., |
| |||||||||||
| Term Loan B, 1st Lien |
| |||||||||||
| (LIBOR plus 3.00%) |
| |||||||||||
| 3.56% |
06/02/281 | 962,958 | 959,347 | |||||||||
| Pacific Dental Services, Inc., |
| |||||||||||
| Term Loan B, 1st Lien |
| |||||||||||
| (LIBOR plus 3.25%) |
| |||||||||||
| 4.00% |
05/05/281 | 992,500 | 983,195 | |||||||||
| Pathway Vet Alliance LLC, |
| |||||||||||
| Term Loan, 1st Lien |
| |||||||||||
| (LIBOR plus 3.75%) |
| |||||||||||
| 4.21% |
03/31/271 | 2,458,196 | 2,438,235 | |||||||||
| PetVet Care Centers LLC, |
| |||||||||||
| Term Loan B3, 1st Lien |
| |||||||||||
| (LIBOR plus 3.50%) |
| |||||||||||
| 4.25% |
02/14/251 | 2,475,891 | 2,467,387 | |||||||||
| Phoenix Guarantor, Inc., |
| |||||||||||
| Term Loan B, 1st Lien |
| |||||||||||
| (LIBOR plus 3.50%) |
| |||||||||||
| 3.95% |
03/05/261 | 1,978,763 | 1,960,736 | |||||||||
| Phoenix Newco, Inc., |
| |||||||||||
| Term Loan, 1st Lien |
| |||||||||||
| (LIBOR plus 3.50%) |
| |||||||||||
| 4.00% |
11/15/281 | 2,500,000 | 2,484,825 | |||||||||
| Pluto Acquisition I, Inc., |
| |||||||||||
| Term Loan B, 1st Lien |
| |||||||||||
| (LIBOR plus 4.00%) |
| |||||||||||
| 4.21% |
06/22/261 | 1,494,981 | 1,476,294 | |||||||||
| Pregis TopCo LLC, |
| |||||||||||
| Term Loan, 1st Lien |
| |||||||||||
| (LIBOR plus 4.00%) |
| |||||||||||
| 4.46% |
07/31/261 | 999,356 | 980,493 | |||||||||
| Issues | Maturity Date |
Principal Amount |
Value | |||||||||
| BANK LOANS (continued) |
| |||||||||||
| Health Care (continued) |
| |||||||||||
| Premise Health Holding Corp., |
| |||||||||||
| Term Loan, 1st Lien |
| |||||||||||
| (LIBOR plus 3.50%) |
| |||||||||||
| 4.51% |
07/10/251 | $ | 2,115,939 | $ | 2,100,069 | |||||||
| Resonetics LLC, |
| |||||||||||
| Term Loan, 1st Lien |
| |||||||||||
| (LIBOR plus 4.00%) |
| |||||||||||
| 4.75% |
04/28/281 | 1,742,497 | 1,728,339 | |||||||||
| Sharp Midco LLC, |
| |||||||||||
| Term Loan B, 1st Lien |
| |||||||||||
| (LIBOR plus 4.00%) |
| |||||||||||
| 5.01% |
12/29/281 | 1,750,000 | 1,743,438 | |||||||||
| Surgery Center Holdings, Inc., |
| |||||||||||
| Term Loan, 1st Lien |
| |||||||||||
| (LIBOR plus 3.75%) |
| |||||||||||
| 4.50% |
08/31/261 | 1,196,569 | 1,189,247 | |||||||||
| Tecomet, Inc., |
| |||||||||||
| Term Loan B, 1st Lien |
| |||||||||||
| (LIBOR plus 3.50%) |
| |||||||||||
| 4.50% |
05/01/241 | 194,392 | 182,728 | |||||||||
| U.S. Renal Care, Inc., |
| |||||||||||
| Term Loan B, 1st Lien |
| |||||||||||
| (LIBOR plus 5.00%) |
| |||||||||||
| 5.25% |
06/26/261 | 772,507 | 712,638 | |||||||||
| (LIBOR plus 5.50%) |
| |||||||||||
| 6.50% |
06/26/261 | 995,000 | 922,240 | |||||||||
| Valeant Pharmaceuticals International, Inc., |
| |||||||||||
| Term Loan B, 1st Lien |
| |||||||||||
| (LIBOR plus 2.75%) |
| |||||||||||
| 3.21% |
11/27/251 | 398,779 | 395,788 | |||||||||
|
|
|
| ||||||||||
| 58,012,738 | ||||||||||||
|
|
|
| ||||||||||
| Industrials — 11.30% |
| |||||||||||
| Alliance Laundry Systems, LLC, |
| |||||||||||
| Term Loan B, 1st Lien |
| |||||||||||
| (LIBOR plus 3.50%) |
| |||||||||||
| 4.25% |
10/08/271 | 1,496,171 | 1,483,087 | |||||||||
| Anchor Packaging LLC, |
| |||||||||||
| Term Loan, 1st Lien |
| |||||||||||
| (LIBOR plus 4.00%) |
| |||||||||||
| 4.46% |
07/18/261 | 1,969,620 | 1,937,614 | |||||||||
| Arterrsa Services |
LLC, | |||||||||||
| Term Loan, 1st Lien |
| |||||||||||
| (LIBOR plus 3.50%) |
| |||||||||||
| 4.51% |
03/06/251 | 1,488,750 | 1,399,797 | |||||||||
| ASP Blade Holdings, Inc., |
| |||||||||||
| Term Loan B, 1st Lien |
| |||||||||||
| (LIBOR plus 4.00%) |
| |||||||||||
| 4.50% |
10/13/281 | 1,247,059 | 1,233,185 | |||||||||
| BCPE Empire Holdings, Inc., |
| |||||||||||
| Term Loan, 1st Lien |
| |||||||||||
| (LIBOR plus 4.00%) |
| |||||||||||
| 4.50% |
06/11/261 | 498,380 | 493,084 | |||||||||
See accompanying Notes to Financial Statements.
| Annual Report March 2022 / 82 |
Table of Contents
Floating Rate Income Fund
Schedule of Portfolio Investments
March 31, 2022
| Issues | Maturity Date |
Principal Amount |
Value | |||||||||
| BANK LOANS (continued) |
| |||||||||||
| Industrials (continued) |
| |||||||||||
| Berry Global, Inc., |
| |||||||||||
| Term Loan Z, 1st Lien |
| |||||||||||
| (LIBOR plus 1.75%) |
| |||||||||||
| 2.07% |
07/01/261 | $ | 2,070,521 | $ | 2,044,961 | |||||||
| Charter Next generation, Inc., |
| |||||||||||
| Term Loan, 1st Lien |
| |||||||||||
| (LIBOR plus 3.75%) |
| |||||||||||
| 4.50% |
12/01/271 | 1,736,842 | 1,729,513 | |||||||||
| Clydesdale Acquisition Holdings, Inc., |
| |||||||||||
| Term Loan, 1st Lien |
| |||||||||||
| (SOFR plus 4.25%) |
| |||||||||||
| 4.25% |
03/30/291,6 | 1,500,000 | 1,477,500 | |||||||||
| Conserve Merger Sub, Inc., |
| |||||||||||
| Term Loan, 1st Lien (France) |
| |||||||||||
| (LIBOR plus 3.50%) |
| |||||||||||
| 3.73% |
08/08/251,2 | 1,930,000 | 1,884,162 | |||||||||
| Convergint Technologies, |
| |||||||||||
| Term Loan, 1st Lien |
| |||||||||||
| (LIBOR plus 3.50%) |
| |||||||||||
| 4.25% |
03/31/281 | 496,266 | 491,986 | |||||||||
| Deliver Buyer, Inc., |
| |||||||||||
| Term Loan B, 1st Lien |
| |||||||||||
| (LIBOR plus 5.00%) |
| |||||||||||
| 6.01% |
05/01/241 | 1,068,889 | 1,068,889 | |||||||||
| Dermatology Intermediate Holdings, Inc., |
| |||||||||||
| Term Loan, 1st Lien |
| |||||||||||
| (SOFR plus 4.25%) |
| |||||||||||
| 4.75% |
04/01/291,7 | 1,516,535 | 1,501,370 | |||||||||
| Eagle 4 Ltd., |
| |||||||||||
| Term Loan B, 1st Lien |
| |||||||||||
| (LIBOR plus 3.50%) |
| |||||||||||
| 3.96% |
07/12/281 | 498,723 | 492,489 | |||||||||
| Energizer Holdings, Inc., |
| |||||||||||
| Term Loan, 1st Lien |
| |||||||||||
| (LIBOR plus 2.25%) |
| |||||||||||
| 2.75% |
12/22/271 | 1,490,000 | 1,467,650 | |||||||||
| Engineered Machinery Holdings, Inc., |
| |||||||||||
| Term Loan, 1st Lien |
| |||||||||||
| (LIBOR plus 3.75%) |
| |||||||||||
| 4.76% |
05/19/281 | 489,947 | 484,163 | |||||||||
| II-VI, Inc., |
| |||||||||||
| Term Loan B, 1st Lien |
| |||||||||||
| (LIBOR plus 2.75%) |
| |||||||||||
| 2.75% |
12/08/281 | 1,000,000 | 995,000 | |||||||||
| Ingram Micro, Inc., |
| |||||||||||
| Term Loan B, 1st Lien |
| |||||||||||
| (LIBOR plus 3.50%) |
| |||||||||||
| 4.51% |
06/30/281 | 992,500 | 985,552 | |||||||||
| Iridium Satellite LLC, |
| |||||||||||
| Term Loan B2, 1st Lien |
| |||||||||||
| (LIBOR plus 2.50%) |
| |||||||||||
| 3.25% |
11/04/261 | 1,237,822 | 1,229,602 | |||||||||
| KAMC Holdings, Inc., |
| |||||||||||
| Term Loan, 1st Lien |
| |||||||||||
| (LIBOR plus 4.00%) |
| |||||||||||
| 4.51% |
08/14/261,6,8 | 731,250 | 622,780 | |||||||||
| Issues | Maturity Date |
Principal Amount |
Value | |||||||||
| BANK LOANS (continued) |
| |||||||||||
| Industrials (continued) |
| |||||||||||
| Liqui-Box Corp., |
| |||||||||||
| Term Loan B, 1st Lien |
| |||||||||||
| (LIBOR plus 4.50%) |
| |||||||||||
| 5.50% |
02/26/271 | $ | 982,500 | $ | 929,936 | |||||||
| MAR Bidco SARL, |
| |||||||||||
| Term Loan B, 1st Lien |
| |||||||||||
| (LIBOR plus 4.25%) |
| |||||||||||
| 5.26% |
07/07/281 | 1,741,250 | 1,721,661 | |||||||||
| Michaels Cos., Inc. (The), |
| |||||||||||
| Term Loan, 1st Lien |
| |||||||||||
| (LIBOR plus 4.25%) |
| |||||||||||
| 5.26% |
04/15/281 | 992,500 | 933,501 | |||||||||
| Osmose Utilities Services, Inc., |
| |||||||||||
| Term Loan, 1st Lien |
| |||||||||||
| (LIBOR plus 3.25%) |
| |||||||||||
| 3.75% |
06/23/281 | 1,496,241 | 1,480,343 | |||||||||
| Patriot Container Corp., |
| |||||||||||
| Term Loan, 1st Lien |
| |||||||||||
| (LIBOR plus 3.75%) |
| |||||||||||
| 4.75% |
03/20/251 | 1,465,649 | 1,410,687 | |||||||||
| Peacock Merger Corp., |
| |||||||||||
| Term Loan, 1st Lien |
| |||||||||||
| (LIBOR plus 4.25%) |
| |||||||||||
| 5.26% |
12/29/281 | 1,496,250 | 1,470,066 | |||||||||
| Plaze, Inc., |
| |||||||||||
| Term Loan B, 1st Lien |
| |||||||||||
| (LIBOR plus 3.50%) |
| |||||||||||
| 4.51% |
08/03/261 | 1,764,806 | 1,707,450 | |||||||||
| (LIBOR plus 3.75%) |
| |||||||||||
| 4.76% |
08/03/261 | 493,750 | 477,703 | |||||||||
| Proampac PG Borrower LLC, |
| |||||||||||
| Term Loan B, 1st Lien |
| |||||||||||
| (LIBOR plus 3.75%) |
| |||||||||||
| 4.50% |
11/03/251 | 2,920,574 | 2,862,892 | |||||||||
| Protective Industrial Products, Inc., |
| |||||||||||
| Term Loan, 1st Lien |
| |||||||||||
| (LIBOR plus 4.00%) |
| |||||||||||
| 4.75% |
12/29/271 | 1,779,654 | 1,757,409 | |||||||||
| Refficiency Holdings LLC, |
| |||||||||||
| Delayed-Draw Term Loan |
| |||||||||||
| (LIBOR plus 3.75%) |
| |||||||||||
| 4.50% |
12/16/271,9 | 8,767 | 8,683 | |||||||||
| Term Loan, 1st Lien |
| |||||||||||
| (LIBOR plus 3.75%) |
| |||||||||||
| 4.50% |
12/16/271 | 1,663,511 | 1,647,567 | |||||||||
| Ring Container Technologies Group, LLC, |
| |||||||||||
| Term Loan B, 1st Lien |
| |||||||||||
| (LIBOR plus 3.75%) |
| |||||||||||
| 4.21% |
08/12/281 | 2,500 | 2,469 | |||||||||
| 4.27% |
08/12/281 | 995,000 | 982,567 | |||||||||
| Spectrum Holdings III Corp., |
| |||||||||||
| Term Loan, 1st Lien |
| |||||||||||
| (LIBOR plus 3.25%) |
| |||||||||||
| 4.26% |
01/31/251 | 1,401,624 | 1,352,189 | |||||||||
See accompanying Notes to Financial Statements.
| 83 / Annual Report March 2022 |
Table of Contents
Floating Rate Income Fund
Schedule of Portfolio Investments
March 31, 2022
| Issues | Maturity Date |
Principal Amount |
Value | |||||||||
| BANK LOANS (continued) |
| |||||||||||
| Industrials (continued) |
| |||||||||||
| SPX FLOW, Inc., |
| |||||||||||
| Term Loan B, 1st Lien |
| |||||||||||
| (SOFR plus 4.50%) |
| |||||||||||
| 5.00% |
03/16/291 | $ | 500,000 | $ | 487,707 | |||||||
| Titan Acquisition, Ltd., |
| |||||||||||
| Term Loan, 1st Lien |
| |||||||||||
| (LIBOR plus 3.00%) |
| |||||||||||
| 3.35% |
03/28/251 | 987,251 | 968,039 | |||||||||
| Transcendia Holdings, Inc., |
| |||||||||||
| Term Loan B, 1st Lien |
| |||||||||||
| (LIBOR plus 3.50%) |
| |||||||||||
| 4.50% |
05/30/241 | 2,422,918 | 2,166,234 | |||||||||
| TransDigm, Inc., |
| |||||||||||
| Term Loan E, 1st Lien |
| |||||||||||
| (LIBOR plus 2.25%) |
| |||||||||||
| 2.71% |
05/30/251 | 487,525 | 479,603 | |||||||||
| TricorBraun Holdings, Inc., |
| |||||||||||
| Term Loan, 1st Lien |
| |||||||||||
| (LIBOR plus 3.25%) |
| |||||||||||
| 3.75% |
03/03/281 | 1,987,945 | 1,943,763 | |||||||||
| USIC Holdings, Inc., |
| |||||||||||
| Term Loan, 1st Lien |
| |||||||||||
| (LIBOR plus 3.50%) |
| |||||||||||
| 4.25% |
05/12/281 | 1,492,500 | 1,480,105 | |||||||||
| Vantage Elevator Solutions, |
| |||||||||||
| Term Loan, 1st Lien |
| |||||||||||
| (LIBOR plus 3.75%) |
| |||||||||||
| 4.25% |
11/17/281 | 2,500,000 | 2,469,062 | |||||||||
| Wrench Group LLC, |
| |||||||||||
| Term Loan, 1st Lien |
| |||||||||||
| (LIBOR plus 4.00%) |
| |||||||||||
| 5.01% |
04/30/261 | 2,238,491 | 2,224,501 | |||||||||
| Zep, Inc., |
| |||||||||||
| Term Loan B, 1st Lien |
| |||||||||||
| (LIBOR plus 4.00%) |
| |||||||||||
| 5.00% |
08/12/241 | 1,705,351 | 1,637,137 | |||||||||
|
|
|
| ||||||||||
| 55,623,658 | ||||||||||||
|
|
|
| ||||||||||
| Information Technology — 14.20% |
| |||||||||||
| AppLovin Corp., |
| |||||||||||
| Term Loan B, 1st Lien |
| |||||||||||
| (LIBOR plus 3.00%) |
| |||||||||||
| 3.50% |
10/25/281 | 498,750 | 495,498 | |||||||||
| (LIBOR plus 3.25%) |
| |||||||||||
| 3.25% |
08/15/251 | 740,434 | 737,716 | |||||||||
| AQAAcquisition Holding, Inc., |
| |||||||||||
| Term Loan, 1st Lien |
| |||||||||||
| (LIBOR plus 4.25%) |
| |||||||||||
| 5.26% |
03/03/281 | 1,488,750 | 1,484,098 | |||||||||
| AthenaHealth Group, Inc., |
| |||||||||||
| Term Loan B, 1st Lien |
| |||||||||||
| (SOFR plus 3.50%) |
| |||||||||||
| 4.00% |
02/15/291,10 | 1,710,145 | 1,695,181 | |||||||||
| Issues | Maturity Date |
Principal Amount |
Value | |||||||||
| BANK LOANS (continued) |
| |||||||||||
| Information Technology (continued) |
| |||||||||||
| Azalea Topco, Inc., |
| |||||||||||
| Term Loan B, 1st Lien |
| |||||||||||
| (SOFR plus 3.75%) |
| |||||||||||
| 3.75% |
07/24/261 | $ | 500,000 | $ | 495,938 | |||||||
| Bifm CA Buyer, Inc., |
| |||||||||||
| Term Loan, 1st Lien |
| |||||||||||
| (LIBOR plus 3.50%) |
| |||||||||||
| 3.96% |
06/01/261 | 990,339 | 976,721 | |||||||||
| Caesars Resort Collection LLC, |
| |||||||||||
| Term Loan, 1st Lien |
| |||||||||||
| (LIBOR plus 3.50%) |
| |||||||||||
| 3.96% |
07/21/251 | 985,000 | 983,030 | |||||||||
| Castle U.S. Holding Corp., |
| |||||||||||
| Term Loan B, 1st Lien |
| |||||||||||
| (LIBOR plus 3.75%) |
| |||||||||||
| 4.21% |
01/29/271 | 983,333 | 952,914 | |||||||||
| CHG Healthcare Services, Inc., |
| |||||||||||
| Term Loan, 1st Lien |
| |||||||||||
| (LIBOR plus 3.50%) |
| |||||||||||
| 4.51% |
09/29/281 | 1,875 | 1,861 | |||||||||
| 5.00% |
09/29/281 | 744,375 | 738,792 | |||||||||
| CT Technologies Intermediate Holdings, Inc., |
| |||||||||||
| Term Loan, 1st Lien |
| |||||||||||
| (LIBOR plus 4.25%) |
| |||||||||||
| 5.00% |
12/16/251 | 1,268,441 | 1,261,077 | |||||||||
| DCert Buyer, Inc., |
| |||||||||||
| Term Loan, 1st Lien |
| |||||||||||
| (LIBOR plus 4.00%) |
| |||||||||||
| 4.46% |
10/16/261 | 1,721,178 | 1,711,255 | |||||||||
| E2open LLC, |
| |||||||||||
| Term Loan B, 1st Lien |
| |||||||||||
| (LIBOR plus 3.50%) |
| |||||||||||
| 4.00% |
02/04/281 | 1,985,011 | 1,965,160 | |||||||||
| EagleView Technology Co., |
| |||||||||||
| Term Loan B, 1st Lien |
| |||||||||||
| (LIBOR plus 3.50%) |
| |||||||||||
| 4.51% |
08/14/251 | 2,701,302 | 2,634,904 | |||||||||
| Electron Bidco, Inc., |
| |||||||||||
| Term Loan, 1st Lien |
| |||||||||||
| (LIBOR plus 3.25%) |
| |||||||||||
| 3.75% |
11/01/281 | 1,000,000 | 990,470 | |||||||||
| Emerald Topco, Inc., |
| |||||||||||
| Term Loan B, 1st Lien |
| |||||||||||
| (LIBOR plus 3.50%) |
| |||||||||||
| 3.80% |
07/24/261 | 1,472,367 | 1,456,032 | |||||||||
| Ensemble RCM LLC, |
| |||||||||||
| Term Loan, 1st Lien |
| |||||||||||
| (LIBOR plus 3.75%) |
| |||||||||||
| 4.05% |
08/03/261 | 983,621 | 979,829 | |||||||||
| EQT Box Merger Sub, Inc., |
| |||||||||||
| Term Loan, 1st Lien |
| |||||||||||
| (SOFR plus 3.50%) |
| |||||||||||
| 4.00% |
04/17/281 | 249,375 | 246,571 | |||||||||
See accompanying Notes to Financial Statements.
| Annual Report March 2022 / 84 |
Table of Contents
Floating Rate Income Fund
Schedule of Portfolio Investments
March 31, 2022
| Issues | Maturity Date |
Principal Amount |
Value | |||||||||
| BANK LOANS (continued) |
| |||||||||||
| Information Technology (continued) |
| |||||||||||
| Gainwell Acquisition Corp., |
| |||||||||||
| Term Loan B, 1st Lien |
| |||||||||||
| (LIBOR plus 4.00%) |
| |||||||||||
| 5.01% |
10/01/271 | $ | 1,484,962 | $ | 1,484,962 | |||||||
| Helios Software Holdings, Inc., |
| |||||||||||
| Term Loan B, 1st Lien |
| |||||||||||
| (LIBOR plus 3.75%) |
| |||||||||||
| 5.25% |
03/11/281 | 1,657,143 | 1,644,723 | |||||||||
| Imperva, Inc., |
| |||||||||||
| Term Loan, 1st Lien |
| |||||||||||
| (LIBOR plus 4.00%) |
| |||||||||||
| 5.00% |
01/12/261 | 1,754,193 | 1,735,993 | |||||||||
| ION Analytics, |
| |||||||||||
| Term Loan, 1st Lien |
| |||||||||||
| (LIBOR plus 4.00%) |
| |||||||||||
| 4.50% |
02/16/281 | 677,083 | 672,533 | |||||||||
| Logmein, Inc., |
| |||||||||||
| Term Loan B, 1st Lien |
| |||||||||||
| (LIBOR plus 4.75%) |
| |||||||||||
| 5.22% |
08/31/271 | 2,478,725 | 2,439,610 | |||||||||
| Magenta Buyer LLC, |
| |||||||||||
| Term Loan, 1st Lien |
| |||||||||||
| (LIBOR plus 5.00%) |
| |||||||||||
| 5.75% |
07/27/281 | 1,995,000 | 1,983,030 | |||||||||
| Magenta Buyer, LLC, |
| |||||||||||
| Term Loan, 2nd Lien |
| |||||||||||
| (LIBOR plus 8.25%) |
| |||||||||||
| 9.00% |
07/27/291 | 446,493 | 443,702 | |||||||||
| Maximus, Inc., |
| |||||||||||
| Term Loan B |
| |||||||||||
| (LIBOR plus 2.00%) |
| |||||||||||
| 2.50% |
05/28/281 | 1,488,750 | 1,482,244 | |||||||||
| MeridianLink, Inc., |
| |||||||||||
| Term Loan B, 1st Lien |
| |||||||||||
| (LIBOR plus 3.00%) |
| |||||||||||
| 4.01% |
11/10/281 | 2,000,000 | 1,965,010 | |||||||||
| Monotype Imaging Holdings, Inc., |
| |||||||||||
| Term Loan B, 1st Lien |
| |||||||||||
| (LIBOR plus 5.00%) |
| |||||||||||
| 6.01% |
10/09/261 | 1,492,500 | 1,493,440 | |||||||||
| Northwest Fiber LLC, |
| |||||||||||
| Term Loan B, 1st Lien |
| |||||||||||
| (LIBOR plus 3.75%) |
| |||||||||||
| 4.14% |
04/30/271 | 1,792,165 | 1,763,410 | |||||||||
| Nouryon USA LLC, |
| |||||||||||
| Term Loan B, 1st Lien |
| |||||||||||
| (LIBOR plus 3.00%) |
| |||||||||||
| 4.01% |
10/01/251 | 1,245,818 | 1,229,728 | |||||||||
| Pactiv Evergreen Group Holdings, Inc., |
| |||||||||||
| Term Loan B, 1st Lien |
| |||||||||||
| (LIBOR plus 3.50%) |
| |||||||||||
| 4.00% |
09/25/281 | 1,741,250 | 1,699,895 | |||||||||
| Panther Purchaser LP, |
| |||||||||||
| Term Loan, 1st Lien |
| |||||||||||
| (LIBOR plus 4.50%) |
| |||||||||||
| 5.00% |
01/07/281 | 1,488,750 | 1,481,932 | |||||||||
| Issues | Maturity Date |
Principal Amount |
Value | |||||||||
| BANK LOANS (continued) |
| |||||||||||
| Information Technology (continued) |
| |||||||||||
| Playtika Holding Corp., |
| |||||||||||
| Term Loan B, 1st Lien |
| |||||||||||
| (LIBOR plus 2.75%) |
| |||||||||||
| 3.21% |
03/13/281 | $ | 997,481 | $ | 984,559 | |||||||
| Precision Medicine Group LLC, |
| |||||||||||
| Term Loan B, 1st Lien |
| |||||||||||
| (LIBOR plus 3.00%) |
| |||||||||||
| 4.01% |
11/18/271,11 | 2,620,673 | 2,578,087 | |||||||||
| Pretium Packaging Holdings, Inc., |
| |||||||||||
| Term Loan, 1st Lien |
| |||||||||||
| (LIBOR plus 4.00%) |
| |||||||||||
| 4.50% |
10/02/281 | 1,246,875 | 1,213,920 | |||||||||
| Project Alpha Intermediate Holding, Inc., |
| |||||||||||
| Term Loan B, 1st Lien |
| |||||||||||
| (LIBOR plus 4.00%) |
| |||||||||||
| 4.30% |
04/26/241 | 1,940,437 | 1,931,143 | |||||||||
| Project Boost Purchaser, LLC, |
| |||||||||||
| Term Loan B, 1st Lien |
| |||||||||||
| (LIBOR plus 3.50%) |
| |||||||||||
| 3.96% |
06/01/261 | 1,496,164 | 1,483,072 | |||||||||
| Proofpoint, Inc., |
| |||||||||||
| Term Loan B, 1st Lien |
| |||||||||||
| (LIBOR plus 3.25%) |
| |||||||||||
| 3.76% |
08/31/281 | 997,500 | 988,009 | |||||||||
| RealPage, Inc., |
| |||||||||||
| Term Loan B, 1st Lien |
| |||||||||||
| (LIBOR plus 3.25%) |
| |||||||||||
| 3.75% |
04/24/281 | 1,991,247 | 1,971,334 | |||||||||
| Renaissance Learning, Inc., |
| |||||||||||
| Term Loan, 1st Lien |
| |||||||||||
| (SOFR plus 4.50%) |
| |||||||||||
| 4.50% |
03/16/271 | 500,000 | 498,750 | |||||||||
| Sitel Worldwide Corp., |
| |||||||||||
| Term Loan B, 1st Lien |
| |||||||||||
| (LIBOR plus 3.75%) |
| |||||||||||
| 4.21% |
08/28/281 | 1,492,500 | 1,482,553 | |||||||||
| Skillsoft Finance II, Inc., |
| |||||||||||
| Term Loan B, 1st Lien |
| |||||||||||
| (LIBOR plus 4.75%) |
| |||||||||||
| 5.50% |
07/14/281 | 1,246,875 | 1,236,277 | |||||||||
| Sophia LP, |
| |||||||||||
| Term Loan B, 1st Lien |
| |||||||||||
| (LIBOR plus 3.25%) |
| |||||||||||
| 4.26% |
10/07/271 | 2,226,325 | 2,208,704 | |||||||||
| Spin Holdco, Inc., |
| |||||||||||
| Term Loan B, 1st Lien |
| |||||||||||
| (LIBOR plus 4.00%) |
| |||||||||||
| 4.75% |
03/04/281 | 1,980,000 | 1,968,308 | |||||||||
| Sunshine Software Merger Sub, Inc., |
| |||||||||||
| Term Loan B, 1st Lien |
| |||||||||||
| (LIBOR plus 3.75%) |
| |||||||||||
| 4.25% |
10/16/281 | 2,000,000 | 1,983,750 | |||||||||
| Surf Holdings LLC, |
| |||||||||||
| Term Loan B, 1st Lien |
| |||||||||||
| (LIBOR plus 3.50%) |
| |||||||||||
| 4.11% |
03/05/271 | 2,017,843 | 2,001,136 | |||||||||
See accompanying Notes to Financial Statements.
| 85 / Annual Report March 2022 |
Table of Contents
Floating Rate Income Fund
Schedule of Portfolio Investments
March 31, 2022
| Issues | Maturity Date |
Principal Amount |
Value | |||||||||
| BANK LOANS (continued) |
| |||||||||||
| Information Technology (continued) |
| |||||||||||
| TierPoint LLC, |
| |||||||||||
| Term Loan B, 1st Lien |
| |||||||||||
| (LIBOR plus 3.75%) |
| |||||||||||
| 4.50% |
05/05/261 | $ | 967,149 | $ | 959,596 | |||||||
| Veeam Software, |
| |||||||||||
| Term Loan B, 1st Lien |
| |||||||||||
| (LIBOR plus 3.00%) |
| |||||||||||
| 3.46% |
02/28/271 | 1,735,497 | 1,723,930 | |||||||||
| VT Topco, Inc., |
| |||||||||||
| Term Loan, 1st Lien |
| |||||||||||
| (LIBOR plus 3.25%) |
| |||||||||||
| 4.26% |
08/01/251 | 1,704,082 | 1,679,586 | |||||||||
| Zelis Payments Buyer, Inc., |
| |||||||||||
| Term Loan B, 1st Lien |
| |||||||||||
| (LIBOR plus 3.50%) |
| |||||||||||
| 3.73% |
09/30/261 | 735,056 | 728,919 | |||||||||
| Zotec Partners LLC, |
| |||||||||||
| Term Loan B, 1st Lien |
| |||||||||||
| (LIBOR plus 3.75%) |
| |||||||||||
| 4.75% |
02/14/241 | 937,125 | 932,439 | |||||||||
|
|
|
| ||||||||||
| 69,881,331 | ||||||||||||
|
|
|
| ||||||||||
| Insurance — 1.34% |
| |||||||||||
| Acrisure LLC, |
| |||||||||||
| Term Loan B, 1st Lien |
| |||||||||||
| (LIBOR plus 3.50%) |
| |||||||||||
| 3.96% |
02/15/271 | 2,967,216 | 2,931,372 | |||||||||
| Asurion LLC, |
| |||||||||||
| Term Loan B8, 1st Lien |
| |||||||||||
| (LIBOR plus 3.25%) |
| |||||||||||
| 3.71% |
12/23/261 | 492,513 | 482,559 | |||||||||
| Term Loan B9, 1st Lien |
| |||||||||||
| (LIBOR plus 3.25%) |
| |||||||||||
| 3.71% |
07/31/271 | 1,243,111 | 1,219,803 | |||||||||
| Asurion, LLC, |
| |||||||||||
| Term Loan B4, 1st Lien |
| |||||||||||
| (LIBOR plus 5.25%) |
| |||||||||||
| 5.71% |
01/20/291 | 1,000,000 | 979,065 | |||||||||
| Howden Group Holdings Ltd., |
| |||||||||||
| Term Loan B, 1st Lien |
| |||||||||||
| (LIBOR plus 3.25%) |
| |||||||||||
| 4.00% |
11/12/271 | 989,962 | 980,270 | |||||||||
|
|
|
| ||||||||||
| 6,593,069 | ||||||||||||
|
|
|
| ||||||||||
| Materials — 3.68% |
| |||||||||||
| American Rock Salt Co. LLC, |
| |||||||||||
| Term Loan B, 1st Lien |
| |||||||||||
| (LIBOR plus 4.00%) |
| |||||||||||
| 4.75% |
06/09/281 | 992,500 | 984,436 | |||||||||
| Archroma Finance SARL, |
| |||||||||||
| Term Loan B2, 1st Lien (Switzerland) |
| |||||||||||
| (LIBOR plus 4.25%) |
| |||||||||||
| 4.51% |
08/12/241,2 | 716,250 | 710,878 | |||||||||
| Issues | Maturity Date |
Principal Amount |
Value | |||||||||
| BANK LOANS (continued) |
| |||||||||||
| Materials (continued) |
| |||||||||||
| Cyanco Intermediate Corp., |
| |||||||||||
| Term Loan, 1st Lien |
| |||||||||||
| (LIBOR plus 3.50%) |
| |||||||||||
| 3.96% |
03/16/251 | $ | 416,884 | $ | 409,589 | |||||||
| Geon Performance Solutions, LLC, |
| |||||||||||
| Term Loan B, 1st Lien |
| |||||||||||
| (LIBOR plus 4.75%) |
| |||||||||||
| 5.50% |
08/18/281 | 1,194,000 | 1,194,006 | |||||||||
| Herens U.S. Holdco Corp., |
| |||||||||||
| Term Loan B, 1st Lien |
| |||||||||||
| (LIBOR plus 4.00%) |
| |||||||||||
| 4.00% |
07/03/281 | 997,500 | 975,056 | |||||||||
| 5.01% |
07/03/281 | 1,836,148 | 1,794,835 | |||||||||
| ICP Group, |
| |||||||||||
| Term Loan, 1st Lien |
| |||||||||||
| (LIBOR plus 3.75%) |
| |||||||||||
| 4.76% |
12/29/271 | 1,485,000 | 1,447,875 | |||||||||
| INEOS U.S. Finance LLC, |
| |||||||||||
| Term Loan B, 1st Lien |
| |||||||||||
| (LIBOR plus 2.50%) |
| |||||||||||
| 3.00% |
11/08/281 | 500,000 | 490,938 | |||||||||
| INEOS U.S. Quattro LLC, |
| |||||||||||
| Term Loan B, 1st Lien |
| |||||||||||
| (LIBOR plus 2.75%) |
| |||||||||||
| 3.25% |
01/29/261 | 1,240,625 | 1,220,930 | |||||||||
| LSF11 A5 HoldCo LLC, |
| |||||||||||
| Term Loan, 1st Lien |
| |||||||||||
| (LIBOR plus 3.50%) |
| |||||||||||
| 4.00% |
10/15/281 | 1,500,000 | 1,481,438 | |||||||||
| Lummus Technology Holdings V LLC, |
| |||||||||||
| Term Loan B, 1st Lien |
| |||||||||||
| (LIBOR plus 3.50%) |
| |||||||||||
| 3.96% |
06/30/271 | 1,884,523 | 1,825,641 | |||||||||
| Plaskolite PPC Intermediate II LLC, |
| |||||||||||
| Term Loan, 1st Lien |
| |||||||||||
| (LIBOR plus 4.00%) |
| |||||||||||
| 4.75% |
12/15/251 | 1,983,741 | 1,908,854 | |||||||||
| Polar U.S. Borrower LLC, |
| |||||||||||
| Term Loan, 1st Lien |
| |||||||||||
| (LIBOR plus 4.75%) |
| |||||||||||
| 4.99% |
10/15/251 | 544,322 | 529,353 | |||||||||
| Potters Borrower LP, |
| |||||||||||
| Term Loan, 1st Lien |
| |||||||||||
| (LIBOR plus 4.00%) |
| |||||||||||
| 5.01% |
12/14/271 | 2,483,715 | 2,479,580 | |||||||||
| Tronox Finance LLC, |
| |||||||||||
| Term Loan B, 1st Lien |
| |||||||||||
| (LIBOR plus 2.25%) |
| |||||||||||
| 2.71% |
03/10/281 | 116,923 | 115,462 | |||||||||
| 3.26% |
03/10/281 | 576,923 | 569,715 | |||||||||
|
|
|
| ||||||||||
| 18,138,586 | ||||||||||||
|
|
|
| ||||||||||
See accompanying Notes to Financial Statements.
| Annual Report March 2022 / 86 |
Table of Contents
Floating Rate Income Fund
Schedule of Portfolio Investments
March 31, 2022
| Issues |
Maturity Date |
Principal Amount |
Value | |||||||||
| BANK LOANS (continued) |
| |||||||||||
| Real Estate Investment Trust (REIT) — 0.87% |
| |||||||||||
| Aveanna Healthcare LLC, |
| |||||||||||
| Term Loan B, 1st Lien |
| |||||||||||
| (LIBOR plus 3.75%) |
| |||||||||||
| 4.25% |
07/17/281,12 | $ | 1,614,528 | $ | 1,574,771 | |||||||
| Avison Young Canada, Inc., |
| |||||||||||
| Term Loan, 1st Lien |
| |||||||||||
| (LIBOR plus 5.75%) |
| |||||||||||
| 6.05% |
01/31/261 | 498,319 | 496,451 | |||||||||
| 6.21% |
01/31/261 | 993,969 | 990,241 | |||||||||
| Rent-A-Center, Inc., |
| |||||||||||
| Term Loan B, 1st Lien |
| |||||||||||
| (LIBOR plus 3.25%) |
| |||||||||||
| 3.81% |
02/17/281 | 1,239,370 | 1,217,489 | |||||||||
|
|
|
| ||||||||||
| 4,278,952 | ||||||||||||
|
|
|
| ||||||||||
| Retail — 3.94% |
| |||||||||||
| American Airlines, Inc., |
| |||||||||||
| Term Loan, 1st Lien |
| |||||||||||
| (LIBOR plus 4.75%) |
| |||||||||||
| 5.50% |
04/20/281 | 1,500,000 | 1,522,500 | |||||||||
| AmWINS Group, Inc., |
| |||||||||||
| Term Loan B, 1st Lien |
| |||||||||||
| (LIBOR plus 2.25%) |
| |||||||||||
| 3.00% |
02/19/281 | 2,225,615 | 2,192,231 | |||||||||
| BC ULC, |
| |||||||||||
| Term Loan B, 1st Lien (Canada) |
| |||||||||||
| (LIBOR plus 1.75%) |
| |||||||||||
| 2.21% |
11/19/261,2 | 2,113,226 | 2,071,617 | |||||||||
| BCPE Empire Holdings, Inc., |
| |||||||||||
| Term Loan, 1st Lien |
| |||||||||||
| (LIBOR plus 4.00%) |
| |||||||||||
| 4.46% |
06/11/261 | 1,219,517 | 1,204,785 | |||||||||
| BW Gas & Convenience Holdings LLC, |
| |||||||||||
| Term Loan B, 1st Lien |
| |||||||||||
| (LIBOR plus 3.50%) |
| |||||||||||
| 4.00% |
03/31/281 | 1,240,625 | 1,223,567 | |||||||||
| Curium Bidco SARL, |
| |||||||||||
| Term Loan B, 1st Lien |
| |||||||||||
| (LIBOR plus 4.00%) |
| |||||||||||
| 5.01% |
07/09/261 | 984,849 | 983,002 | |||||||||
| (LIBOR plus 4.25%) |
| |||||||||||
| 5.00% |
12/02/271 | 987,500 | 980,099 | |||||||||
| Harbor Freight Tools USA, Inc., |
| |||||||||||
| Term Loan B, 1st Lien |
| |||||||||||
| (LIBOR plus 2.75%) |
| |||||||||||
| 3.25% |
10/19/271 | 496,231 | 486,773 | |||||||||
| LSF9 Atlantis Holdings, LLC, |
| |||||||||||
| Term Loan B, 1st Lien |
| |||||||||||
| (SOFR plus 7.25%) |
| |||||||||||
| 8.00% |
03/29/291 | 400,000 | 394,250 | |||||||||
| Pacific Bells LLC, |
| |||||||||||
| Term Loan B, 1st Lien |
| |||||||||||
| (LIBOR plus 4.50%) |
| |||||||||||
| 5.00% |
11/10/281,13 | 493,608 | 489,906 | |||||||||
| Issues |
Maturity Date |
Principal Amount |
Value | |||||||||
| BANK LOANS (continued) |
| |||||||||||
| Retail (continued) |
| |||||||||||
| SRS Distribution, Inc., |
| |||||||||||
| Term Loan B |
| |||||||||||
| (LIBOR plus 3.50%) |
| |||||||||||
| 4.00% |
06/02/281 | $ | 1,875 | $ | 1,855 | |||||||
| 4.02% |
06/02/281 | 744,375 | 736,313 | |||||||||
| Term Loan B, 1st Lien |
| |||||||||||
| (SOFR plus 3.50%) |
| |||||||||||
| 4.00% |
06/02/281 | 750,000 | 742,031 | |||||||||
| Tacala Investment Corp., |
| |||||||||||
| Term Loan B, 1st Lien |
| |||||||||||
| (LIBOR plus 3.50%) |
| |||||||||||
| 4.25% |
02/05/271 | 1,180,578 | 1,166,706 | |||||||||
| Term Loan B, 2nd Lien |
| |||||||||||
| (LIBOR plus 7.50%) |
| |||||||||||
| 8.25% |
02/04/281 | 735,000 | 726,731 | |||||||||
| U.S. Anesthesia Partners, Inc., |
| |||||||||||
| Term Loan B, 1st Lien |
| |||||||||||
| (LIBOR plus 4.25%) |
| |||||||||||
| 4.75% |
09/22/281 | 1,492,500 | 1,484,761 | |||||||||
| Whatabrands LLC, |
| |||||||||||
| Term Loan B, 1st Lien |
| |||||||||||
| (LIBOR plus 3.25%) |
| |||||||||||
| 3.75% |
08/03/281 | 1,995,000 | 1,973,604 | |||||||||
| Woof Holdings, Inc., |
| |||||||||||
| Term Loan B, 1st Lien |
| |||||||||||
| (LIBOR plus 3.75%) |
| |||||||||||
| 4.68% |
12/21/271 | 997,481 | 991,247 | |||||||||
|
|
|
| ||||||||||
| 19,371,978 | ||||||||||||
|
|
|
| ||||||||||
| Services — 8.17% |
| |||||||||||
| Adtalem Global Education, Inc., |
| |||||||||||
| Term Loan B, 1st Lien |
| |||||||||||
| (LIBOR plus 4.50%) |
| |||||||||||
| 5.25% |
08/12/281 | 773,538 | 771,968 | |||||||||
| Allied Universal Holdco LLC, |
| |||||||||||
| Term Loan B, 1st Lien |
| |||||||||||
| (LIBOR plus 3.75%) |
| |||||||||||
| 4.25% |
05/12/281 | 1,990,000 | 1,962,100 | |||||||||
| Alterra Mountain Co., |
| |||||||||||
| Term Loan B, 1st Lien |
| |||||||||||
| (LIBOR plus 3.50%) |
| |||||||||||
| 4.00% |
08/17/281 | 1,990,000 | 1,977,563 | |||||||||
| Amentum Government Services Holdings, LLC, |
| |||||||||||
| Term Loan B, 1st Lien |
| |||||||||||
| (SOFR plus 4.00%) |
| |||||||||||
| 4.78% |
02/15/291 | 1,456,311 | 1,447,208 | |||||||||
| (SOFR plus 4.50%) |
| |||||||||||
| 4.50% |
02/15/291 | 1,293,689 | 1,285,604 | |||||||||
| Aramark Services, Inc., |
| |||||||||||
| Term Loan, 1st Lien |
| |||||||||||
| (LIBOR plus 1.75%) |
| |||||||||||
| 2.21% |
03/11/251 | 1,865,325 | 1,834,547 | |||||||||
| ArchKey Holdings, Inc., |
| |||||||||||
| Term Loan, 1st Lien |
| |||||||||||
| (LIBOR plus 5.25%) |
| |||||||||||
| 6.00% |
06/29/281 | 497,500 | 493,769 | |||||||||
See accompanying Notes to Financial Statements.
| 87 / Annual Report March 2022 |
Table of Contents
Floating Rate Income Fund
Schedule of Portfolio Investments
March 31, 2022
| Issues |
Maturity Date |
Principal Amount |
Value | |||||||||
| BANK LOANS (continued) |
| |||||||||||
| Services (continued) |
| |||||||||||
| Arcis Golf LLC, |
| |||||||||||
| Term Loan B, 1st Lien |
| |||||||||||
| (LIBOR plus 4.25%) |
| |||||||||||
| 4.75% |
11/24/281 | $ | 997,500 | $ | 997,500 | |||||||
| CCRR Parent, Inc., |
| |||||||||||
| Term Loan B, 1st Lien |
| |||||||||||
| (LIBOR plus 3.75%) |
| |||||||||||
| 4.76% |
03/06/281 | 2,317,108 | 2,309,867 | |||||||||
| Confluent Medical Technologies, Inc., |
| |||||||||||
| Term Loan B, 1st Lien |
| |||||||||||
| (SOFR plus 3.75%) |
| |||||||||||
| 4.25% |
02/16/291 | 1,250,000 | 1,234,375 | |||||||||
| CoreLogic, Inc., |
| |||||||||||
| Term Loan B, 1st Lien |
| |||||||||||
| (LIBOR plus 3.50%) |
| |||||||||||
| 4.00% |
06/02/281 | 2,238,750 | 2,217,773 | |||||||||
| Covanta Holding Corp., |
| |||||||||||
| Term Loan B, 1st Lien |
| |||||||||||
| (LIBOR plus 2.50%) |
| |||||||||||
| 3.00% |
11/30/281 | 930,314 | 927,406 | |||||||||
| Term Loan C, 1st Lien |
| |||||||||||
| (LIBOR plus 2.50%) |
| |||||||||||
| 3.00% |
11/30/281 | 69,686 | 69,469 | |||||||||
| Dodge Data & Analytics, LLC, |
| |||||||||||
| Term Loan, 1st Lien |
| |||||||||||
| (SOFR plus 4.75%) |
| |||||||||||
| 5.55% |
02/23/291 | 1,000,000 | 982,500 | |||||||||
| Hornblower Sub LLC, |
| |||||||||||
| Term Loan B, 1st Lien |
| |||||||||||
| (LIBOR plus 4.50%) |
| |||||||||||
| 5.50% |
04/27/251 | 1,495,735 | 1,344,666 | |||||||||
| Lakeland Holdings LLC, |
| |||||||||||
| Term Loan, 1st Lien |
| |||||||||||
| (LIBOR plus 13.25%) |
| |||||||||||
| 13.25% |
09/25/271,6,8 | 557,605 | 395,900 | |||||||||
| Lakeland Tours LLC, |
| |||||||||||
| Term Loan, 1st Lien |
| |||||||||||
| (LIBOR plus 7.50%) |
| |||||||||||
| 8.75% |
09/25/251,6,8 | 490,454 | 444,437 | |||||||||
| Mavenir Systems, Inc., |
| |||||||||||
| Term Loan B, 1st Lien |
| |||||||||||
| (LIBOR plus 4.75%) |
| |||||||||||
| 5.25% |
08/18/281 | 650,000 | 647,969 | |||||||||
| Med Parentco LP, |
| |||||||||||
| Term Loan, 1st Lien |
| |||||||||||
| (LIBOR plus 4.25%) |
| |||||||||||
| 4.71% |
08/31/261 | 1,465,934 | 1,453,107 | |||||||||
| NAB Holdings, LLC, |
| |||||||||||
| Term Loan B |
| |||||||||||
| (SOFR plus 3.00%) |
| |||||||||||
| 3.80% |
11/23/281 | 1,496,250 | 1,479,649 | |||||||||
| Olympus Water US Holding Corp., |
| |||||||||||
| Term Loan B, 1st Lien |
| |||||||||||
| (LIBOR plus 3.75%) |
| |||||||||||
| 4.81% |
11/09/281 | 1,496,250 | 1,460,250 | |||||||||
| Issues |
Maturity Date |
Principal Amount |
Value | |||||||||
| BANK LOANS (continued) |
| |||||||||||
| Services (continued) |
| |||||||||||
| PowerTeam Services LLC, |
| |||||||||||
| Term Loan, 1st Lien |
| |||||||||||
| (LIBOR plus 3.25%) |
| |||||||||||
| 4.26% |
03/06/251 | $ | 148,104 | $ | 138,514 | |||||||
| Term Loan, 2nd Lien |
| |||||||||||
| (LIBOR plus 7.25%) |
| |||||||||||
| 8.26% |
03/06/261,6,8 | 880,000 | 840,400 | |||||||||
| Pre-Paid Legal Services, Inc., |
| |||||||||||
| Term Loan, 1st Lien |
| |||||||||||
| (LIBOR plus 3.75%) |
| |||||||||||
| 4.25% |
12/15/281 | 2,500,000 | 2,473,175 | |||||||||
| Safe Fleet Holdings, LLC, |
| |||||||||||
| Term Loan, 1st Lien |
| |||||||||||
| (SOFR plus 3.75%) |
| |||||||||||
| 4.27% |
02/23/291 | 1,000,000 | 989,165 | |||||||||
| SS&C Technologies, Inc., |
| |||||||||||
| Term Loan B5, 1st Lien |
| |||||||||||
| (LIBOR plus 1.75%) |
| |||||||||||
| 2.21% |
04/16/251 | 2,411 | 2,377 | |||||||||
| Technimark Holdings LLC, |
| |||||||||||
| Term Loan, 1st Lien |
| |||||||||||
| (LIBOR plus 3.75%) |
| |||||||||||
| 4.25% |
07/07/281 | 2,977,500 | 2,920,421 | |||||||||
| Trans Union LLC, |
| |||||||||||
| Term Loan B6 |
| |||||||||||
| (LIBOR plus 2.25%) |
| |||||||||||
| 2.75% |
12/01/281 | 434,234 | 431,700 | |||||||||
| TruGreen LP, |
| |||||||||||
| Term Loan B, 1st Lien |
| |||||||||||
| (LIBOR plus 4.00%) |
| |||||||||||
| 4.75% |
11/02/271 | 997,475 | 992,906 | |||||||||
| University Support Services, LLC, |
| |||||||||||
| Term Loan B, 1st Lien |
| |||||||||||
| (LIBOR plus 3.25%) |
| |||||||||||
| 3.75% |
02/10/291 | 1,843,148 | 1,823,334 | |||||||||
| Vaco Holdings, LLC, |
| |||||||||||
| Term Loan B |
| |||||||||||
| (SOFR plus 5.00%) |
| |||||||||||
| 5.75% |
01/19/291 | 1,995,000 | 1,986,272 | |||||||||
| Verscend Holding Corp., |
| |||||||||||
| Term Loan B, 1st Lien |
| |||||||||||
| (LIBOR plus 4.00%) |
| |||||||||||
| 4.46% |
08/27/251 | 992,500 | 991,259 | |||||||||
| WW International, Inc., |
| |||||||||||
| Term Loan B, 1st Lien |
| |||||||||||
| (LIBOR plus 3.50%) |
| |||||||||||
| 3.96% |
04/13/281 | 945,000 | 865,464 | |||||||||
|
|
|
| ||||||||||
| 40,192,614 | ||||||||||||
|
|
|
| ||||||||||
| Transportation — 1.98% |
| |||||||||||
| American Airlines, Inc., |
| |||||||||||
| Term Loan B, 1st Lien |
| |||||||||||
| (LIBOR plus 1.75%) |
| |||||||||||
| 2.20% |
01/29/271 | 268,356 | 251,919 | |||||||||
See accompanying Notes to Financial Statements.
| Annual Report March 2022 / 88 |
Table of Contents
Floating Rate Income Fund
Schedule of Portfolio Investments
March 31, 2022
| Issues |
Maturity Date |
Principal Amount |
Value | |||||||||
| BANK LOANS (continued) |
|
|||||||||||
| Transportation (continued) |
|
|||||||||||
| Kenan Advantage Group, Inc. (The), |
|
|||||||||||
| Term Loan, 2nd Lien |
|
|||||||||||
| (LIBOR plus 7.25%) |
|
|||||||||||
| 8.00% |
09/01/271 | $ | 2,350,000 | $ | 2,279,500 | |||||||
| Kestrel Bidco, Inc., |
|
|||||||||||
| Term Loan, 1st Lien |
|
|||||||||||
| (LIBOR plus 3.00%) |
|
|||||||||||
| 4.00% |
12/11/261 | 1,483,661 | 1,433,899 | |||||||||
| Ozark Holdings, Inc., |
|
|||||||||||
| Term Loan B, 1st Lien |
|
|||||||||||
| (LIBOR plus 3.75%) |
|
|||||||||||
| 4.25% |
12/16/271 | 1,984,576 | 1,968,759 | |||||||||
| United Air, |
|
|||||||||||
| Term Loan B, 1st Lien |
|
|||||||||||
| (LIBOR plus 5.25%) |
|
|||||||||||
| 6.25% |
06/21/271 | 2,000,000 | 2,081,940 | |||||||||
| United Airlines, Inc., |
|
|||||||||||
| Term Loan B, 1st Lien |
|
|||||||||||
| (LIBOR plus 3.75%) |
|
|||||||||||
| 4.50% |
04/21/281 | 1,732,500 | 1,715,054 | |||||||||
|
|
|
| ||||||||||
| 9,731,071 | ||||||||||||
|
|
|
| ||||||||||
| Total Bank Loans |
|
|||||||||||
| (Cost $439,957,756) |
|
435,662,250 | ||||||||||
|
|
|
| ||||||||||
| CORPORATES — 6.16%* |
|
|||||||||||
| Banking — 0.61% |
|
|||||||||||
| Bank of America Corp. |
|
|||||||||||
| (MTN) |
|
|||||||||||
| (LIBOR USD 3-Month plus 0.65%) |
|
|||||||||||
| 1.17% |
12/01/261 | 2,600,000 | 2,504,511 | |||||||||
| HSBC Holdings PLC |
|
|||||||||||
| (United Kingdom) |
|
|||||||||||
| (LIBOR USD 3-Month plus 1.00%) |
|
|||||||||||
| 1.49% |
05/18/241,2 | 500,000 | 500,954 | |||||||||
|
|
|
| ||||||||||
| 3,005,465 | ||||||||||||
|
|
|
| ||||||||||
| Communications — 0.44% |
|
|||||||||||
| Diamond Sports Group, LLC/Diamond Sports Finance Co. |
|
|||||||||||
| 5.38% |
08/15/2614 | 4,353,000 | 1,708,553 | |||||||||
| Intelsat Jackson Holdings SA, |
|
|||||||||||
| Class B |
|
|||||||||||
| 8.50% |
10/15/242,6,8,14,15,16 | 1,000,000 | — | |||||||||
| National CineMedia LLC |
|
|||||||||||
| 5.88% |
04/15/2814 | 500,000 | 437,695 | |||||||||
|
|
|
| ||||||||||
| 2,146,248 | ||||||||||||
|
|
|
| ||||||||||
| Consumer Discretionary — 0.32% |
|
|||||||||||
| Magallanes, Inc. |
|
|||||||||||
| 3.43% |
03/15/2414 | 1,570,000 | 1,578,681 | |||||||||
|
|
|
| ||||||||||
| Energy — 0.40% |
|
|||||||||||
| NGL Energy Operating LLC/NGL Energy Finance Corp. |
|
|||||||||||
| 7.50% |
02/01/2614 | 1,500,000 | 1,476,181 | |||||||||
| Issues |
Maturity Date |
Principal Amount |
Value | |||||||||
| CORPORATES (continued) |
|
|||||||||||
| Energy (continued) |
|
|||||||||||
| USA Compression Partners LP/USA Compression Finance Corp. |
|
|||||||||||
| 6.88% |
09/01/27 | $ | 500,000 | $ | 502,692 | |||||||
|
|
|
| ||||||||||
| 1,978,873 | ||||||||||||
|
|
|
| ||||||||||
| Finance — 0.66% |
|
|||||||||||
| Citigroup, Inc. |
|
|||||||||||
| (LIBOR USD 3-Month plus 0.55%) |
|
|||||||||||
| 1.05% |
08/25/361 | 1,800,000 | 1,526,665 | |||||||||
| Goldman Sachs Group, Inc. (The) |
|
|||||||||||
| 3.27% |
09/29/2517 | 980,000 | 979,513 | |||||||||
| Park Aerospace Holdings Ltd. |
|
|||||||||||
| (Cayman Islands) |
|
|||||||||||
| 4.50% |
03/15/232,14 | 750,000 | 755,696 | |||||||||
|
|
|
| ||||||||||
| 3,261,874 | ||||||||||||
|
|
|
| ||||||||||
| Food — 0.42% |
|
|||||||||||
| Pilgrim’s Pride Corp. |
|
|||||||||||
| 3.50% |
03/01/3214 | 2,350,000 | 2,056,720 | |||||||||
|
|
|
| ||||||||||
| Health Care — 1.55% |
|
|||||||||||
| 180 Medical, Inc. |
|
|||||||||||
| 3.88% |
10/15/2914 | 1,000,000 | 947,500 | |||||||||
| Centene Corp. |
|
|||||||||||
| 3.00% |
10/15/30 | 1,400,000 | 1,288,014 | |||||||||
| Cigna Corp. |
|
|||||||||||
| (LIBOR USD 3-Month plus 0.89%) |
|
|||||||||||
| 1.13% |
07/15/231 | 2,700,000 | 2,720,161 | |||||||||
| Endo DAC/Endo Finance LLC/Endo Finco, Inc. |
|
|||||||||||
| (Ireland) |
|
|||||||||||
| 6.00% |
06/30/282,14 | 650,000 | 379,048 | |||||||||
| Molina Healthcare, Inc. |
|
|||||||||||
| 3.88% |
11/15/3014 | 500,000 | 483,592 | |||||||||
| Prime Healthcare Services, Inc. |
|
|||||||||||
| 7.25% |
11/01/2514 | 1,250,000 | 1,284,375 | |||||||||
| Tenet Healthcare Corp. |
|
|||||||||||
| 4.63% |
09/01/2414 | 500,000 | 504,039 | |||||||||
|
|
|
| ||||||||||
| 7,606,729 | ||||||||||||
|
|
|
| ||||||||||
| Industrials — 0.92% |
|
|||||||||||
| Artera Services LLC |
|
|||||||||||
| 9.03% |
12/04/2514 | 880,000 | 880,333 | |||||||||
| General Electric Co. |
|
|||||||||||
| (MTN) |
|
|||||||||||
| (LIBOR USD 3-Month plus 0.48%) |
|
|||||||||||
| 0.99% |
08/15/361 | 850,000 | 732,191 | |||||||||
| OT Merger Corp. |
|
|||||||||||
| 7.88% |
10/15/2914 | 1,000,000 | 880,647 | |||||||||
| Sealed Air Corp. |
|
|||||||||||
| 5.25% |
04/01/2314 | 1,500,000 | 1,520,625 | |||||||||
| Titan Acquisition Ltd./Titan Co-Borrower LLC |
|
|||||||||||
| (Canada) |
|
|||||||||||
| 7.75% |
04/15/262,14 | 250,000 | 249,100 | |||||||||
| Trident TPI Holdings, Inc. |
|
|||||||||||
| 9.25% |
08/01/2414 | 250,000 | 251,955 | |||||||||
|
|
|
| ||||||||||
| 4,514,851 | ||||||||||||
|
|
|
| ||||||||||
See accompanying Notes to Financial Statements.
| 89 / Annual Report March 2022 |
Table of Contents
Floating Rate Income Fund
Schedule of Portfolio Investments
March 31, 2022
| Issues | Maturity Date |
Principal Amount |
Value | |||||||||||
| CORPORATES (continued) |
|
|||||||||||||
| Insurance — 0.40% |
|
|||||||||||||
| Teachers Insurance & Annuity Association of |
|
|||||||||||||
| America |
|
|||||||||||||
| 4.38% |
09/15/54 | 14,17 | $ | 2,000,000 | $ | 1,993,402 | ||||||||
|
|
|
| ||||||||||||
| Materials — 0.09% |
|
|||||||||||||
| EverArc Escrow SARL |
|
|||||||||||||
| (Luxembourg) |
|
|||||||||||||
| 5.00% |
10/30/29 | 2,14 | 500,000 | 457,813 | ||||||||||
|
|
|
| ||||||||||||
| Retail — 0.35% |
|
|||||||||||||
| Michaels Cos., Inc. (The) |
|
|||||||||||||
| 7.88% |
05/01/29 | 14 | 2,000,000 | 1,714,990 | ||||||||||
|
|
|
| ||||||||||||
| Total Corporates |
|
|||||||||||||
| (Cost $32,975,749) |
|
30,315,646 | ||||||||||||
|
|
|
| ||||||||||||
| Total Bonds — 94.69% |
|
|||||||||||||
| (Cost $472,933,505) |
|
465,977,896 | ||||||||||||
|
|
|
| ||||||||||||
|
|
|
|||||||||||||
| Issues | Shares | Value | ||||||||||||
| COMMON STOCK — 0.06% |
|
|||||||||||||
| Communications — 0.06% |
|
|||||||||||||
| Intelsat Emergence SA2,6,8,15 |
|
|||||||||||||
| (Luxembourg) |
|
9,662 | 289,860 | |||||||||||
|
|
|
| ||||||||||||
| Total Common Stock |
|
|||||||||||||
| (Cost $323,677) |
|
|||||||||||||
| RIGHTS — 0.00% |
|
|||||||||||||
| Communications — 0.00% |
|
|||||||||||||
| Intelsat Jackson Holdings SA, Series A2,6,8,15 |
|
|||||||||||||
| (Luxembourg) |
|
1,011 | — | |||||||||||
| Intelsat Jackson Holdings SA, Series B2,6,8,15 |
|
|||||||||||||
| (Luxembourg) |
|
1,011 | — | |||||||||||
|
|
|
| ||||||||||||
| — | ||||||||||||||
|
|
|
| ||||||||||||
| Total Rights |
|
|||||||||||||
| (Cost $–) |
|
— | ||||||||||||
|
|
|
| ||||||||||||
| WARRANT — 0.01% |
|
|||||||||||||
| Entertainment — 0.01% |
|
|||||||||||||
| Cineworld Group PLC2,15 |
|
|||||||||||||
| (United Kingdom) |
|
229,579 | 49,875 | |||||||||||
|
|
|
| ||||||||||||
| Total Warrant |
|
|||||||||||||
| (Cost $–) |
|
|||||||||||||
|
|
|
|||||||||||||
| Issues | Maturity Date |
Principal Amount/Shares |
Value | |||||||||||
| SHORT-TERM INVESTMENTS — 6.95% |
|
|||||||||||||
| Money Market Funds — 2.19% |
|
|||||||||||||
| Dreyfus Government Cash Management Fund |
|
|||||||||||||
| 0.19%18 |
|
4,920,000 | 4,920,000 | |||||||||||
| Fidelity Investments Money Market Funds - Government Portfolio |
|
|||||||||||||
| 0.12%18 |
|
155,915 | 155,915 | |||||||||||
| Issues | Maturity Date |
Principal Amount/Shares |
Value | |||||||||||
| SHORT-TERM INVESTMENTS (continued) |
| |||||||||||||
| Money Market Funds (continued) |
| |||||||||||||
| Morgan Stanley Institutional Liquidity Funds - Government Portfolio |
|
|||||||||||||
|
0.23%18 |
|
5,721,000 | $ | 5,721,000 | ||||||||||
|
|
|
| ||||||||||||
| 10,796,915 | ||||||||||||||
|
|
|
| ||||||||||||
| U.S. Treasury Bills — 4.76% |
| |||||||||||||
| U.S. Treasury Bills |
| |||||||||||||
|
0.18%19 |
06/23/22 | $ | 3,445,000 | 3,441,307 | ||||||||||
|
0.37%19 |
07/28/22 | 20,000,000 | 19,950,833 | |||||||||||
|
|
|
| ||||||||||||
| 23,392,140 | ||||||||||||||
|
|
|
| ||||||||||||
| Total Short-Term Investments |
| |||||||||||||
| (Cost $34,216,585) |
|
34,189,055 | ||||||||||||
|
|
|
| ||||||||||||
| Total Investments - 101.71% |
| |||||||||||||
| (Cost $507,473,767) |
|
500,506,686 | ||||||||||||
|
|
|
| ||||||||||||
| Net unrealized depreciation on unfunded commitments - (0.01)% |
|
(28,828 | ) | |||||||||||
| Liabilities in Excess of Other Assets - (1.70)% |
|
(8,368,829 | ) | |||||||||||
|
|
|
| ||||||||||||
| Net Assets - 100.00% |
|
$ | 492,109,029 | |||||||||||
|
|
|
| ||||||||||||
| 1 | Floating rate security. The rate disclosed was in effect at March 31, 2022. |
| 2 | Foreign denominated security issued by foreign domiciled entity. |
| 3 | Excluded from the investment total above is an unfunded delayed draw term loan commitment in an amount not to exceed $183,507, at an interest rate of 4.00% and a maturity of July 31, 2028. The investment is not accruing an unused commitment fee. |
| 4 | Excluded from the investment total above is an unfunded delayed draw term loan commitment in an amount not to exceed $45,711, at an interest rate of 4.00% and a maturity of September 15, 2028. The investment is not accruing an unused commitment fee. |
| 5 | Excluded from the investment total above is an unfunded delayed draw term loan commitment in an amount not to exceed $310,363, at an interest rate of 4.00% and a maturity of June 09, 2028. The investment is not accruing an unused commitment fee. |
| 6 | Security is valued using significant unobservable inputs and is classified as Level 3 in the fair value hierarchy. |
| 7 | Excluded from the investment total above is an unfunded delayed draw term loan commitment in an amount not to exceed $280,630, at an interest rate of 0.50% and a maturity of April 01, 2029. The investment is not accruing an unused commitment fee. |
| 8 | Illiquid security as determined under procedures approved by the Board of Trustees. The aggregate value of illiquid securities is $2,593,377, which is 0.53% of total net assets. |
| 9 | Excluded from the investment total above is an unfunded delayed draw term loan commitment in an amount not to exceed $312,128, at an interest rate of 3.75% and a maturity of December 16, 2027. The investment is not accruing an unused commitment fee. |
| 10 | Excluded from the investment total above is an unfunded delayed draw term loan commitment in an amount not to exceed $287,319, at an interest rate of 0.00% and a maturity of February 15, 2029. The investment is accruing an unused commitment fee of 0.63% per annum. |
| 11 | Excluded from the investment total above is an unfunded delayed draw term loan commitment in an amount not to exceed $340,529, at an interest rate of 3.75% and a maturity of November 18, 2027. The investment is accruing an unused commitment fee of 1.13% per annum. |
| 12 | Excluded from the investment total above is an unfunded delayed draw term loan commitment in an amount not to exceed $368,066, at an interest rate of 1.88% and a maturity of July 17, 2028. The investment is not accruing an unused commitment fee. |
See accompanying Notes to Financial Statements.
| Annual Report March 2022 / 90 |
Table of Contents
Floating Rate Income Fund
Schedule of Portfolio Investments
March 31, 2022
| 13 | Excluded from the investment total above is an unfunded delayed draw term loan commitment in an amount not to exceed $5,116, at an interest rate of 4.50% and a maturity of November 10, 2028. The investment is accruing an unused commitment fee of 1.00% per annum. |
| 14 | Securities exempt from registration under Rule 144A of the Securities Act of 1933, as amended. The securities may be resold in transactions exempt from registration, normally to qualified institutional buyers. |
| 15 | Non-income producing security. |
| 16 | Security is currently in default with regard to scheduled interest or principal payments. |
| 17 | Variable rate security. Interest rate disclosed is as of the most recent information available. Certain variable rate securities are not based on a published reference rate and spread but are determined by the issuer or agent and are based on current market conditions. |
| 18 | Represents the current yield as of March 31, 2022. |
| 19 | Represents annualized yield at date of purchase. |
| * | Securities with a call or reset feature will have an effective maturity date sooner than the stated maturity. |
Note: For Fund compliance purposes, the Fund’s industry classifications refer to any one or more of the industry sub-classifications used by one or more widely recognized market indexes or ratings group indexes, and/or as defined by Fund management. This definition may not apply for purposes of this report, which may combine industry sub-classifications for more meaningful presentation for investors.
(EUR): Euro
(EURIBOR): Euro InterBank Offer Rate
(LIBOR): London InterBank Offer Rate
(MTN): Medium-Term Note
(SOFR): Secured Overnight Financing Rate
(USD): U.S. Dollar
| Currency to be Purchased |
Currency to be Sold |
Counterparty | Settlement Date |
Unrealized Appreciation (Depreciation) |
||||||||
| FOREIGN CURRENCY EXCHANGE CONTRACT |
||||||||||||
| EUR 646,000 |
USD 711,480 | Goldman Sachs International | 04/08/22 | $ | 7,462 | |||||||
| USD 732,098 |
EUR 646,000 | Goldman Sachs International | 04/08/22 | 13,157 | ||||||||
|
|
|
|||||||||||
| 20,619 | ||||||||||||
|
|
|
|||||||||||
| USD 659,142 |
EUR 597,000 | Goldman Sachs International | 07/08/22 | (7,881) | ||||||||
|
|
|
|||||||||||
| NET UNREALIZED APPRECIATION |
$ | 12,738 | ||||||||||
|
|
|
|||||||||||
See accompanying Notes to Financial Statements.
| 91 / Annual Report March 2022 |
Table of Contents
Schedule of Portfolio Investments
March 31, 2022
| Issues | Maturity Date |
Principal Amount |
Value | |||||||||
| BONDS – 93.24% |
| |||||||||||
| BANK LOANS — 11.69%* |
| |||||||||||
| Communications — 2.45% |
| |||||||||||
| CenturyLink, Inc., |
| |||||||||||
| Term Loan B, 1st Lien |
| |||||||||||
| (LIBOR plus 2.25%) |
| |||||||||||
| 2.71% |
03/15/271 | $ | 909,075 | $ | 886,280 | |||||||
| CSC Holdings LLC, |
| |||||||||||
| Term Loan B, 1st Lien |
| |||||||||||
| (LIBOR plus 2.25%) |
| |||||||||||
| 2.65% |
07/17/251 | 5,120,835 | 5,050,449 | |||||||||
| Diamond Sports Group, LLC, |
| |||||||||||
| Term Loan, 2nd Lien |
| |||||||||||
| (SOFR plus 3.25%) |
| |||||||||||
| 3.54% |
08/24/261 | 5,498,790 | 1,905,688 | |||||||||
| DIRECTV Financing LLC, |
| |||||||||||
| Term Loan, 1st Lien |
| |||||||||||
| (LIBOR plus 5.00%) |
| |||||||||||
| 5.75% |
08/02/271 | 706,700 | 706,838 | |||||||||
| Frontier Communications Holdings LLC, |
| |||||||||||
| Term Loan B, 1st Lien |
| |||||||||||
| (LIBOR plus 3.75%) |
| |||||||||||
| 4.81% |
05/01/281 | 3,762,000 | 3,711,834 | |||||||||
| GTT Communications BV, |
| |||||||||||
| Term Loan B, 1st Lien |
| |||||||||||
| (EURIBOR plus 3.25%) |
| |||||||||||
| 3.25% |
05/31/251 | 1,235,675 | 1,143,730 | |||||||||
| GTT Communications, Inc., |
| |||||||||||
| Term Loan B, 1st Lien |
| |||||||||||
| (PRIME plus 3.75%) |
| |||||||||||
| 7.25% |
05/30/251 | 1,082,463 | 891,208 | |||||||||
| MacDonald Dettwiler & Associates Ltd., |
| |||||||||||
| Term Loan B, 1st Lien |
| |||||||||||
| (LIBOR plus 2.75%) |
| |||||||||||
| 3.21% |
10/04/241 | 1,890,818 | 1,865,320 | |||||||||
| National CineMedia LLC, |
| |||||||||||
| Term Loan B, 1st Lien |
| |||||||||||
| (LIBOR plus 4.00%) |
| |||||||||||
| 5.00% |
06/20/251 | 762,996 | 691,466 | |||||||||
| NEP/NCP Holdco, Inc., |
| |||||||||||
| Term Loan, 2nd Lien |
| |||||||||||
| (LIBOR plus 7.00%) |
| |||||||||||
| 7.46% |
10/19/261 | 875,000 | 848,969 | |||||||||
|
|
|
| ||||||||||
| 17,701,782 | ||||||||||||
|
|
|
| ||||||||||
| Consumer Discretionary — 1.26% |
| |||||||||||
| ADMI Corp., |
| |||||||||||
| Term Loan B2, 1st Lien |
| |||||||||||
| (LIBOR plus 3.38%) |
| |||||||||||
| 3.88% |
12/23/271 | 1,905,750 | 1,876,125 | |||||||||
| Landry’s, |
| |||||||||||
| Term Loan, 1st Lien |
| |||||||||||
| (LIBOR plus 12.00%) |
| |||||||||||
| 13.00% |
10/04/231 | 56,625 | 60,589 | |||||||||
| Naked Juice, LLC, |
| |||||||||||
| Term Loan |
| |||||||||||
| (SOFR plus 6.00%) |
| |||||||||||
| 6.75% |
01/24/301 | 1,741,000 | 1,741,000 | |||||||||
| Issues | Maturity Date |
Principal Amount |
Value | |||||||||
| BANK LOANS (continued) |
| |||||||||||
| Consumer Discretionary (continued) |
|
|||||||||||
| Peraton Corp., |
| |||||||||||
| Term Loan B, 1st Lien |
| |||||||||||
| (LIBOR plus 3.75%) |
| |||||||||||
| 4.50% |
02/01/281 | $ | 3,742,633 | $ | 3,723,920 | |||||||
| Triton Water Holdings, Inc., |
| |||||||||||
| Term Loan B, 1st Lien |
| |||||||||||
| (LIBOR plus 3.50%) |
| |||||||||||
| 4.51% |
03/31/281 | 1,712,063 | 1,673,234 | |||||||||
|
|
|
| ||||||||||
| 9,074,868 | ||||||||||||
|
|
|
| ||||||||||
| Entertainment — 0.79% |
| |||||||||||
| Cineworld Finance U.S., Inc., |
| |||||||||||
| Term Loan B, 1st Lien |
| |||||||||||
| (LIBOR plus 2.50%) |
| |||||||||||
| 4.00% |
02/28/251 | 5,143,500 | 3,983,204 | |||||||||
| Crown Finance U.S., Inc., |
| |||||||||||
| Term Loan B1, 1st Lien |
| |||||||||||
| (LIBOR plus 7.00%) |
| |||||||||||
| 7.00% |
05/23/241 | 1,479,284 | 1,751,110 | |||||||||
|
|
|
| ||||||||||
| 5,734,314 | ||||||||||||
|
|
|
| ||||||||||
| Finance — 0.14% |
| |||||||||||
| Auris Lux III SA, |
| |||||||||||
| Term Loan B, 1st Lien (Luxembourg) |
| |||||||||||
| (LIBOR plus 3.75%) |
| |||||||||||
| 4.21% |
02/27/261,2 | 1,074,064 | 1,048,893 | |||||||||
|
|
|
| ||||||||||
| Food — 0.50% |
| |||||||||||
| Houston Foods, Inc., |
| |||||||||||
| Term Loan B, 1st Lien |
| |||||||||||
| (LIBOR plus 3.75%) |
| |||||||||||
| 6.21% |
07/20/251 | 3,808,029 | 3,598,587 | |||||||||
|
|
|
| ||||||||||
| Health Care — 1.47% |
| |||||||||||
| Elanco Animal Health, Inc., |
| |||||||||||
| Term Loan B, 1st Lien |
| |||||||||||
| (LIBOR plus 1.75%) |
| |||||||||||
| 1.98% |
08/01/271 | 3,641,143 | 3,589,657 | |||||||||
| Endo Luxembourg Finance Co., |
| |||||||||||
| Term Loan B, 1st Lien |
| |||||||||||
| (LIBOR plus 5.00%) |
| |||||||||||
| 5.75% |
03/27/281 | 557,495 | 523,756 | |||||||||
| eResearchTechnology, Inc., |
| |||||||||||
| Term Loan B, 1st Lien |
| |||||||||||
| (LIBOR plus 4.50%) |
| |||||||||||
| 5.50% |
02/04/271 | 859,070 | 857,193 | |||||||||
| ICON Luxembourg SARL, |
| |||||||||||
| Term Loan B, 1st Lien |
| |||||||||||
| (LIBOR plus 2.25%) |
| |||||||||||
| 3.31% |
07/03/281 | 1,327,542 | 1,322,982 | |||||||||
| Indigo Merger Sub, Inc., |
| |||||||||||
| Term Loan B, 1st Lien |
| |||||||||||
| (LIBOR plus 2.25%) |
| |||||||||||
| 3.31% |
07/03/281 | 330,758 | 329,622 | |||||||||
See accompanying Notes to Financial Statements.
| Annual Report March 2022 / 92 |
Table of Contents
High Yield Bond Fund
Schedule of Portfolio Investments
March 31, 2022
| Issues | Maturity Date |
Principal Amount |
Value | |||||||||
| BANK LOANS (continued) |
| |||||||||||
| Health Care (continued) |
|
|||||||||||
| Phoenix Newco, Inc., |
| |||||||||||
| Term Loan, 1st Lien |
| |||||||||||
| (LIBOR plus 3.50%) |
| |||||||||||
| 4.00% |
11/15/281 | $ | 4,000,000 | $ | 3,975,720 | |||||||
|
|
|
| ||||||||||
| 10,598,930 | ||||||||||||
|
|
|
| ||||||||||
| Industrials — 2.66% |
| |||||||||||
| Berry Global, Inc., |
| |||||||||||
| Term Loan Z, 1st Lien |
| |||||||||||
| (LIBOR plus 1.75%) |
| |||||||||||
| 2.07% |
07/01/261 | 2,976,676 | 2,939,929 | |||||||||
| Charter Next generation, Inc., |
| |||||||||||
| Term Loan, 1st Lien |
| |||||||||||
| (LIBOR plus 3.75%) |
| |||||||||||
| 4.50% |
12/01/271 | 2,593,800 | 2,582,854 | |||||||||
| Clydesdale Acquisition Holdings, Inc., |
| |||||||||||
| Term Loan, 1st Lien |
| |||||||||||
| (SOFR plus 4.25%) |
| |||||||||||
| 4.25% |
03/30/291,3 | 2,200,000 | 2,167,000 | |||||||||
| Liqui-Box Corp., |
| |||||||||||
| Term Loan B, 1st Lien |
| |||||||||||
| (LIBOR plus 4.50%) |
| |||||||||||
| 5.50% |
02/26/271 | 1,473,750 | 1,394,904 | |||||||||
| Plaze, Inc., |
| |||||||||||
| Term Loan B, 1st Lien |
| |||||||||||
| (LIBOR plus 3.75%) |
| |||||||||||
| 4.76% |
08/03/261 | 2,301,406 | 2,226,610 | |||||||||
| Proampac PG Borrower LLC, |
| |||||||||||
| Term Loan B, 1st Lien |
| |||||||||||
| (LIBOR plus 3.75%) |
| |||||||||||
| 4.50% |
11/03/251 | 2,593,866 | 2,542,637 | |||||||||
| SPX FLOW, Inc., |
| |||||||||||
| Term Loan B, 1st Lien |
| |||||||||||
| (SOFR plus 4.50%) |
| |||||||||||
| 5.00% |
03/16/291 | 492,500 | 480,392 | |||||||||
| Titan Acquisition, Ltd., |
| |||||||||||
| Term Loan, 1st Lien |
| |||||||||||
| (LIBOR plus 3.00%) |
| |||||||||||
| 3.35% |
03/28/251 | 913,588 | 895,809 | |||||||||
| Transcendia Holdings, Inc., |
| |||||||||||
| Term Loan B, 1st Lien |
| |||||||||||
| (LIBOR plus 3.50%) |
| |||||||||||
| 4.50% |
05/30/241 | 1,610,943 | 1,440,280 | |||||||||
| TransDigm, Inc., |
| |||||||||||
| Term Loan E, 1st Lien |
| |||||||||||
| (LIBOR plus 2.25%) |
| |||||||||||
| 2.71% |
05/30/251 | 918,850 | 903,919 | |||||||||
| Zep, Inc., |
| |||||||||||
| Term Loan B, 1st Lien |
| |||||||||||
| (LIBOR plus 4.00%) |
| |||||||||||
| 5.00% |
08/12/241 | 1,708,257 | 1,639,926 | |||||||||
|
|
|
| ||||||||||
| 19,214,260 | ||||||||||||
|
|
|
| ||||||||||
| Issues | Maturity Date |
Principal Amount |
Value | |||||||||
| BANK LOANS (continued) |
| |||||||||||
| Information Technology — 0.89% |
|
|||||||||||
| CT Technologies Intermediate Holdings, Inc., |
| |||||||||||
| Term Loan, 1st Lien |
| |||||||||||
| (LIBOR plus 4.25%) |
| |||||||||||
| 5.00% |
12/16/251 | $ | 1,039,500 | $ | 1,033,466 | |||||||
| RealPage, Inc., |
| |||||||||||
| Term Loan B, 1st Lien |
| |||||||||||
| (LIBOR plus 3.25%) |
| |||||||||||
| 3.75% |
04/24/281 | 1,044,750 | 1,034,302 | |||||||||
| Spin Holdco, Inc., |
| |||||||||||
| Term Loan B, 1st Lien |
| |||||||||||
| (LIBOR plus 4.00%) |
| |||||||||||
| 4.75% |
03/04/281 | 2,722,500 | 2,706,424 | |||||||||
| TierPoint LLC, |
| |||||||||||
| Term Loan B, 1st Lien |
| |||||||||||
| (LIBOR plus 3.75%) |
| |||||||||||
| 4.50% |
05/05/261 | 1,699,879 | 1,686,602 | |||||||||
|
|
|
| ||||||||||
| 6,460,794 | ||||||||||||
|
|
|
| ||||||||||
| Insurance — 0.27% |
| |||||||||||
| Acrisure LLC, |
| |||||||||||
| Term Loan B, 1st Lien |
| |||||||||||
| (LIBOR plus 3.50%) |
| |||||||||||
| 3.96% |
02/15/271 | 1,974,811 | 1,950,955 | |||||||||
|
|
|
| ||||||||||
| Real Estate Investment Trust (REIT) — 0.17% |
| |||||||||||
| Aveanna Healthcare LLC, |
| |||||||||||
| Term Loan B, 1st Lien |
| |||||||||||
| (LIBOR plus 3.75%) |
| |||||||||||
| 4.25% |
07/17/281,4 | 1,271,441 | 1,240,132 | |||||||||
|
|
|
| ||||||||||
| Retail — 0.23% |
| |||||||||||
| American Airlines, Inc., |
| |||||||||||
| Term Loan, 1st Lien |
| |||||||||||
| (LIBOR plus 4.75%) |
| |||||||||||
| 5.50% |
04/20/281 | 430,000 | 436,450 | |||||||||
| Tacala Investment Corp., |
| |||||||||||
| Term Loan B, 2nd Lien |
| |||||||||||
| (LIBOR plus 7.50%) |
| |||||||||||
| 8.25% |
02/04/281 | 1,249,500 | 1,235,443 | |||||||||
|
|
|
| ||||||||||
| 1,671,893 | ||||||||||||
|
|
|
| ||||||||||
| Services — 0.32% |
| |||||||||||
| PowerTeam Services LLC, |
| |||||||||||
| Term Loan, 2nd Lien |
| |||||||||||
| (LIBOR plus 7.25%) |
| |||||||||||
| 8.26% |
03/06/261,3,5 | 2,402,000 | 2,293,910 | |||||||||
|
|
|
| ||||||||||
| Transportation — 0.54% |
| |||||||||||
| Kenan Advantage Group, Inc. (The), |
| |||||||||||
| Term Loan, 2nd Lien |
| |||||||||||
| (LIBOR plus 7.25%) |
| |||||||||||
| 8.00% |
09/01/271 | 4,000,000 | 3,880,000 | |||||||||
|
|
|
| ||||||||||
| Total Bank Loans |
| |||||||||||
| (Cost $86,208,523) |
|
84,469,318 | ||||||||||
|
|
|
| ||||||||||
See accompanying Notes to Financial Statements.
| 93 / Annual Report March 2022 |
Table of Contents
High Yield Bond Fund
Schedule of Portfolio Investments
March 31, 2022
| Issues | Maturity Date |
Principal Amount |
Value | |||||||||
| CORPORATES — 81.55%* |
|
|||||||||||
| Automotive — 0.79% |
|
|||||||||||
| Ford Motor Credit Co. LLC |
|
|||||||||||
| 2.90% |
02/16/28 | $ | 6,347,000 | $ | 5,740,015 | |||||||
|
|
|
| ||||||||||
| Banking — 0.92% |
|
|||||||||||
| Bank of America Corp., |
|
|||||||||||
| Series RR |
|
|||||||||||
| 4.38%6,7 |
2,040,000 | 1,922,232 | ||||||||||
| Bank of New York Mellon Corp. (The), |
|
|||||||||||
| Series I |
|
|||||||||||
| 3.75%6,7 |
2,515,000 | 2,313,800 | ||||||||||
| U.S. Bancorp |
|
|||||||||||
|
3.70%6,7 |
2,695,000 | 2,445,270 | ||||||||||
|
|
|
| ||||||||||
| 6,681,302 | ||||||||||||
|
|
|
| ||||||||||
| Communications — 19.55% |
|
|||||||||||
| Altice France SA |
|
|||||||||||
| (France) |
|
|||||||||||
| 5.13% |
01/15/292,8 | 1,628,000 | 1,463,491 | |||||||||
| 5.50% |
10/15/292,8 | 5,934,000 | 5,336,611 | |||||||||
| AT&T, Inc. |
|
|||||||||||
| 3.55% |
09/15/55 | 3,879,000 | 3,411,342 | |||||||||
| 4.50% |
05/15/35 | 4,043,000 | 4,258,979 | |||||||||
| Cable One, Inc. |
|
|||||||||||
| 4.00% |
11/15/308 | 5,301,000 | 4,903,425 | |||||||||
| CCO Holdings LLC/CCO Holdings Capital Corp. |
|
|||||||||||
| 4.25% |
02/01/318 | 644,000 | 587,690 | |||||||||
| CCO Holdings, LLC/CCO Holdings Capital Corp. |
|
|||||||||||
| 4.25% |
01/15/348 | 2,905,000 | 2,527,350 | |||||||||
| 4.50% |
06/01/338 | 500,000 | 449,170 | |||||||||
| 4.75% |
02/01/328 | 4,533,000 | 4,228,744 | |||||||||
| Charter Communications Operating, LLC/Charter |
|
|||||||||||
| Communications Operating Capital |
|
|||||||||||
| 5.25% |
04/01/53 | 1,200,000 | 1,211,373 | |||||||||
| CommScope, Inc. |
|
|||||||||||
| 4.75% |
09/01/298 | 7,200,000 | 6,678,000 | |||||||||
| CSC Holdings LLC |
|
|||||||||||
| 3.38% |
02/15/318 | 4,600,000 | 3,881,834 | |||||||||
| 4.13% |
12/01/308 | 3,100,000 | 2,733,641 | |||||||||
| 4.50% |
11/15/318 | 8,900,000 | 7,984,492 | |||||||||
| 6.50% |
02/01/298 | 2,141,000 | 2,162,132 | |||||||||
| Diamond Sports Group LLC/Diamond Sports Finance Co. |
|
|||||||||||
| 6.63% |
08/15/278 | 5,004,000 | 1,043,084 | |||||||||
| Diamond Sports Group, LLC/Diamond Sports Finance Co. |
|
|||||||||||
| 5.38% |
08/15/268 | 6,975,000 | 2,737,687 | |||||||||
| DIRECTV Financing LLC/DIRECTV Financing Co. Obligor, Inc. |
|
|||||||||||
| 5.88% |
08/15/278 | 3,859,000 | 3,807,770 | |||||||||
| DISH DBS Corp. |
|
|||||||||||
| 5.25% |
12/01/268 | 3,396,000 | 3,241,057 | |||||||||
| 7.38% |
07/01/28 | 2,552,000 | 2,424,784 | |||||||||
| DISH Network Corp. |
|
|||||||||||
| 3.38% |
08/15/26 | 5,120,000 | 4,618,240 | |||||||||
| Gray Escrow II, Inc. |
|
|||||||||||
| 5.38% |
11/15/318 | 4,546,000 | 4,350,763 | |||||||||
| Issues | Maturity Date |
Principal Amount |
Value | |||||||||||
| CORPORATES (continued) |
|
|||||||||||||
| Communications (continued) |
|
|||||||||||||
| Intelsat Jackson Holdings SA |
|
|||||||||||||
| (Luxembourg) |
|
|||||||||||||
| 6.50% |
03/15/302,8 | $ | 5,643,000 | $ | 5,643,193 | |||||||||
| Intelsat Jackson Holdings SA, Class B |
|
|||||||||||||
| 8.50% |
10/15/242,3,5,8,9,10 | 2,853,000 | — | |||||||||||
| Intelsat Jackson Holdings SA, Class B |
|
|||||||||||||
| (Luxembourg) |
|
|||||||||||||
| 5.50% |
08/01/232,3,5,9,10 | 6,350,000 | — | |||||||||||
| 9.75% |
07/15/252,3,5,8,9,10 | 4,051,000 | — | |||||||||||
| Level 3 Financing, Inc. |
|
|||||||||||||
| 3.63% |
01/15/298 | 4,850,000 | 4,248,365 | |||||||||||
| 3.75% |
07/15/298 | 8,380,000 | 7,437,166 | |||||||||||
| 3.88% |
11/15/298 | 3,000,000 | 2,766,315 | |||||||||||
| Lumen Technologies, Inc. |
|
|||||||||||||
| 4.00% |
02/15/278 | 1,956,000 | 1,825,134 | |||||||||||
| 5.38% |
06/15/298 | 6,808,000 | 6,072,463 | |||||||||||
| National CineMedia LLC |
|
|||||||||||||
| 5.75% |
08/15/26 | 4,896,000 | 3,531,240 | |||||||||||
| 5.88% |
04/15/288 | 3,986,000 | 3,489,305 | |||||||||||
| Outfront Media Capital LLC/Outfront Media Capital Corp. |
|
|||||||||||||
| 4.63% |
03/15/308 | 445,000 | 421,081 | |||||||||||
| Scripps Escrow II, Inc. |
|
|||||||||||||
| 5.38% |
01/15/318 | 3,358,000 | 3,223,680 | |||||||||||
| SES GLOBAL Americas Holdings GP |
|
|||||||||||||
| 5.30% |
03/25/448 | 2,516,000 | 2,447,781 | |||||||||||
| Sinclair Television Group, Inc. |
|
|||||||||||||
| 4.13% |
12/01/308 | 6,970,000 | 6,227,695 | |||||||||||
| Sirius XM Radio, Inc. |
|
|||||||||||||
| 3.88% |
09/01/318 | 5,091,000 | 4,641,337 | |||||||||||
| 5.50% |
07/01/298 | 362,000 | 367,572 | |||||||||||
| Sprint Corp. |
|
|||||||||||||
| 7.88% |
09/15/23 | 100,000 | 106,374 | |||||||||||
| T-Mobile USA, Inc. |
|
|||||||||||||
| 2.63% |
02/15/29 | 777,000 | 711,134 | |||||||||||
| Vmed O2 UK Financing I PLC |
|
|||||||||||||
| (United Kingdom) |
|
|||||||||||||
| 4.75% |
07/15/312,8 | 3,613,000 | 3,410,654 | |||||||||||
| VZ Secured Financing BV |
|
|||||||||||||
| (Netherlands) |
|
|||||||||||||
| 5.00% |
01/15/322,8 | 4,184,000 | 3,919,637 | |||||||||||
| Zayo Group Holdings, Inc. |
|
|||||||||||||
| 4.00% |
03/01/278 | 7,333,000 | 6,761,173 | |||||||||||
|
|
|
| ||||||||||||
| 141,292,958 | ||||||||||||||
|
|
|
| ||||||||||||
| Consumer Discretionary — 2.68% |
|
|||||||||||||
| BAT Capital Corp. |
|
|||||||||||||
| 5.28% |
04/02/50 | 1,763,000 | 1,750,444 | |||||||||||
| Everi Holdings, Inc. |
|
|||||||||||||
| 5.00% |
07/15/298 | 2,029,000 | 1,927,793 | |||||||||||
| Magallanes, Inc. |
|
|||||||||||||
| 5.14% |
03/15/528 | 7,500,000 | 7,682,844 | |||||||||||
| Primo Water Holdings, Inc. |
|
|||||||||||||
| 4.38% |
04/30/29 | 8 | 2,942,000 | 2,666,614 | ||||||||||
See accompanying Notes to Financial Statements.
| Annual Report March 2022 / 94 |
Table of Contents
High Yield Bond Fund
Schedule of Portfolio Investments
March 31, 2022
| Issues | Maturity Date |
Principal Amount |
Value | |||||||||
| CORPORATES (continued) |
|
|||||||||||
| Consumer Discretionary (continued) |
|
|||||||||||
| Spectrum Brands, Inc. |
|
|||||||||||
| 5.50% |
07/15/308 | $ | 1,634,000 | $ | 1,570,928 | |||||||
| Triton Water Holdings, Inc. |
|
|||||||||||
| 6.25% |
04/01/298 | 4,366,000 | 3,776,590 | |||||||||
|
|
|
| ||||||||||
| 19,375,213 | ||||||||||||
|
|
|
| ||||||||||
| Electric — 0.57% |
|
|||||||||||
| FirstEnergy Corp., |
|
|||||||||||
| Series B |
|
|||||||||||
| 2.25% |
09/01/30 | 225,000 | 199,775 | |||||||||
| FirstEnergy Corp., |
|
|||||||||||
| Series C |
|
|||||||||||
| 5.35% |
07/15/47 | 148,000 | 155,594 | |||||||||
| Jersey Central Power & Light Co. |
|
|||||||||||
| 2.75% |
03/01/328 | 800,000 | 745,976 | |||||||||
| Pike Corp. |
|
|||||||||||
| 5.50% |
09/01/288 | 3,157,000 | 2,980,934 | |||||||||
|
|
|
| ||||||||||
| 4,082,279 | ||||||||||||
|
|
|
| ||||||||||
| Energy — 8.60% |
|
|||||||||||
| Archrock Partners LP/Archrock Partners Finance Corp. |
|
|||||||||||
| 6.25% |
04/01/288 | 5,267,000 | 5,207,746 | |||||||||
| Energy Transfer LP |
|
|||||||||||
| 5.00% |
05/15/50 | 840,000 | 852,468 | |||||||||
| 5.35% |
05/15/45 | 820,000 | 847,951 | |||||||||
| 5.40% |
10/01/47 | 500,000 | 523,380 | |||||||||
| Energy Transfer LP, |
|
|||||||||||
| Series B |
|
|||||||||||
| 6.63%6,7 |
6,154,000 | 5,530,907 | ||||||||||
| Global Partners LP/GLP Finance Corp. |
|
|||||||||||
| 6.88% |
01/15/29 | 4,247,000 | 4,201,897 | |||||||||
| Hess Corp. |
|
|||||||||||
| 5.60% |
02/15/41 | 1,047,000 | 1,179,226 | |||||||||
| NGL Energy Operating LLC/NGL Energy Finance Corp. |
|
|||||||||||
| 7.50% |
02/01/268 | 5,270,000 | 5,186,315 | |||||||||
| Occidental Petroleum Corp. |
|
|||||||||||
| 0.00% |
10/10/3611 | 19,685,000 | 10,598,404 | |||||||||
| 4.40% |
04/15/46 | 1,000,000 | 951,550 | |||||||||
| 4.40% |
08/15/49 | 4,300,000 | 4,061,885 | |||||||||
| Petroleos Mexicanos |
|
|||||||||||
| (Mexico) |
|
|||||||||||
| 6.75% |
09/21/472 | 524,000 | 426,913 | |||||||||
| 7.69% |
01/23/502 | 425,000 | 371,960 | |||||||||
| Rockies Express Pipeline LLC |
|
|||||||||||
| 4.80% |
05/15/308 | 650,000 | 622,375 | |||||||||
| 6.88% |
04/15/408 | 2,984,000 | 2,961,620 | |||||||||
| Ruby Pipeline LLC |
|
|||||||||||
| 8.00% |
04/01/223,5,8 | 4,309,545 | 4,007,877 | |||||||||
| SM Energy Co. |
|
|||||||||||
| 6.50% |
07/15/28 | 1,907,000 | 1,970,421 | |||||||||
| TransMontaigne Partners LP/TLP Finance Corp. |
|
|||||||||||
| 6.13% |
02/15/26 | 2,389,000 | 2,353,165 | |||||||||
| Transocean Sentry Ltd. |
|
|||||||||||
| (Cayman Islands) |
|
|||||||||||
| 5.38% |
05/15/232,8 | 1,521,348 | 1,483,314 | |||||||||
| Issues | Maturity Date |
Principal Amount |
Value | |||||||||
| CORPORATES (continued) |
|
|||||||||||
| Energy (continued) |
|
|||||||||||
| USA Compression Partners LP/USA Compression Finance Corp. |
|
|||||||||||
| 6.88% |
04/01/26 | $ | 1,289,000 | $ | 1,302,767 | |||||||
| 6.88% |
09/01/27 | 1,385,000 | 1,392,458 | |||||||||
| Valaris Ltd., |
|
|||||||||||
| Series 1145, PIK |
|
|||||||||||
| (Bermuda) |
|
|||||||||||
| 8.25% |
04/30/282,12 | 111,000 | 115,153 | |||||||||
| Venture Global Calcasieu Pass LLC |
|
|||||||||||
| 4.13% |
08/15/318 | 6,089,000 | 5,986,506 | |||||||||
|
|
|
| ||||||||||
| 62,136,258 | ||||||||||||
|
|
|
| ||||||||||
| Entertainment — 0.71% |
|
|||||||||||
| Cinemark USA, Inc. |
|
|||||||||||
| 5.25% |
07/15/288 | 2,980,000 | 2,792,260 | |||||||||
| WMG Acquisition Corp. |
|
|||||||||||
| 3.75% |
12/01/298 | 2,502,000 | 2,351,330 | |||||||||
|
|
|
| ||||||||||
| 5,143,590 | ||||||||||||
|
|
|
| ||||||||||
| Finance — 1.66% |
|
|||||||||||
| American Express Co., |
|
|||||||||||
| Series D |
|
|||||||||||
| 3.55%6,7 |
2,150,000 | 1,953,745 | ||||||||||
| Avolon Holdings Funding Ltd. |
|
|||||||||||
| (Cayman Islands) |
|
|||||||||||
| 2.53% |
11/18/272,8 | 2,083,000 | 1,843,725 | |||||||||
| Charles Schwab Corp. (The) |
|
|||||||||||
| 5.00%6,7 |
2,430,000 | 2,427,084 | ||||||||||
| Citigroup, Inc. |
|
|||||||||||
| 3.79% |
03/17/337 | 1,950,000 | 1,939,387 | |||||||||
| Jane Street Group/JSG Finance, Inc. |
|
|||||||||||
| 4.50% |
11/15/298 | 3,244,000 | 3,077,692 | |||||||||
| JPMorgan Chase & Co., |
|
|||||||||||
| Series KK |
|
|||||||||||
|
3.65%6,7 |
805,000 | 754,687 | ||||||||||
|
|
|
| ||||||||||
| 11,996,320 | ||||||||||||
|
|
|
| ||||||||||
| Food — 6.93% |
|
|||||||||||
| Chobani LLC/Chobani Finance Corp, Inc. |
|
|||||||||||
| 4.63% |
11/15/288 | 2,330,000 | 2,153,770 | |||||||||
| JBS USA LUX SA/JBS USA Food Co./JBS USA Finance, Inc. |
|
|||||||||||
| (Canada) |
|
|||||||||||
| 3.75% |
12/01/312,8 | 4,491,000 | 4,153,205 | |||||||||
| 4.38% |
02/02/522,8 | 8,350,000 | 7,280,252 | |||||||||
| 5.50% |
01/15/302,8 | 5,250,000 | 5,378,205 | |||||||||
| Kraft Heinz Foods Co. |
|
|||||||||||
| 4.25% |
03/01/31 | 850,000 | 877,708 | |||||||||
| 4.38% |
06/01/46 | 1,643,000 | 1,630,791 | |||||||||
| 5.00% |
06/04/42 | 700,000 | 748,545 | |||||||||
| 5.20% |
07/15/45 | 6,650,000 | 7,206,937 | |||||||||
| Lamb Weston Holdings, Inc. |
|
|||||||||||
| 4.13% |
01/31/308 | 1,150,000 | 1,077,263 | |||||||||
| Nathan’s Famous, Inc. |
|
|||||||||||
| 6.63% |
11/01/258 | 512,000 | 517,120 | |||||||||
See accompanying Notes to Financial Statements.
| 95 / Annual Report March 2022 |
Table of Contents
High Yield Bond Fund
Schedule of Portfolio Investments
March 31, 2022
| Issues | Maturity Date |
Principal Amount |
Value | |||||||||
| CORPORATES (continued) |
| |||||||||||
| Food (continued) |
|
|||||||||||
| Pilgrim’s Pride Corp. |
| |||||||||||
| 3.50% |
03/01/328 | $ | 8,331,000 | $ | 7,291,292 | |||||||
| Post Holdings, Inc. |
| |||||||||||
| 4.50% |
09/15/318 | 5,941,000 | 5,270,409 | |||||||||
| 4.63% |
04/15/308 | 3,350,000 | 3,022,035 | |||||||||
| 5.50% |
12/15/298 | 1,565,000 | 1,508,237 | |||||||||
| Simmons Foods, Inc./Simmons Prepared Foods, Inc./ |
|
|||||||||||
| Simmons Pet Food, Inc./Simmons Feed |
| |||||||||||
| 4.63% |
03/01/298 | 2,077,000 | 1,949,926 | |||||||||
|
|
|
| ||||||||||
| 50,065,695 | ||||||||||||
|
|
|
| ||||||||||
| Gaming — 1.32% |
| |||||||||||
| Boyd Gaming Corp. |
| |||||||||||
| 4.75% |
06/15/318 | 1,619,000 | 1,561,280 | |||||||||
| Caesars Entertainment, Inc. |
| |||||||||||
| 4.63% |
10/15/298 | 3,037,000 | 2,850,863 | |||||||||
| CDI Escrow Issuer, Inc. |
| |||||||||||
| 5.75% |
04/01/308 | 3,600,000 | 3,641,076 | |||||||||
| Penn National Gaming, Inc. |
| |||||||||||
| 4.13% |
07/01/298 | 1,665,000 | 1,494,337 | |||||||||
|
|
|
| ||||||||||
| 9,547,556 | ||||||||||||
|
|
|
| ||||||||||
| Health Care — 11.75% |
| |||||||||||
| 180 Medical, Inc. |
| |||||||||||
| 3.88% |
10/15/298 | 3,775,000 | 3,576,812 | |||||||||
| Bausch Health Cos., Inc. |
| |||||||||||
| (Canada) |
| |||||||||||
| 5.25% |
02/15/312,8 | 4,996,000 | 3,895,381 | |||||||||
| Cano Health LLC |
| |||||||||||
| 6.25% |
10/01/288 | 2,192,000 | 2,108,496 | |||||||||
| Centene Corp. |
| |||||||||||
| 2.45% |
07/15/28 | 7,675,000 | 7,019,001 | |||||||||
| 3.00% |
10/15/30 | 140,000 | 128,802 | |||||||||
| Embecta Corp. |
| |||||||||||
| 6.75% |
02/15/308 | 4,500,000 | 4,519,430 | |||||||||
| Encompass Health Corp. |
| |||||||||||
| 4.63% |
04/01/31 | 4,106,000 | 3,857,941 | |||||||||
| Endo DAC/Endo Finance LLC/Endo Finco, Inc. |
| |||||||||||
| (Ireland) |
| |||||||||||
| 6.00% |
06/30/282,8 | 11,836,000 | 6,902,163 | |||||||||
| 9.50% |
07/31/272,8 | 542,000 | 477,316 | |||||||||
| Grifols Escrow Issuer SA |
| |||||||||||
| (Spain) |
| |||||||||||
| 4.75% |
10/15/282,8 | 4,140,000 | 3,925,320 | |||||||||
| HCA, Inc. |
| |||||||||||
| 4.63% |
03/15/528 | 4,000,000 | 4,055,531 | |||||||||
| 5.63% |
09/01/28 | 1,088,000 | 1,177,760 | |||||||||
| 5.88% |
02/01/29 | 5,249,000 | 5,773,900 | |||||||||
| 7.69% |
06/15/25 | 1,650,000 | 1,823,250 | |||||||||
| HCA, Inc. |
| |||||||||||
| (MTN) |
| |||||||||||
| 7.58% |
09/15/25 | 1,650,000 | 1,829,811 | |||||||||
| ModivCare Escrow Issuer, Inc. |
| |||||||||||
| 5.00% |
10/01/298 | 5,639,000 | 5,261,602 | |||||||||
| Molina Healthcare, Inc. |
| |||||||||||
| 3.88% |
11/15/308 | 7,845,000 | 7,587,565 | |||||||||
| Issues | Maturity Date |
Principal Amount |
Value | |||||||||
| CORPORATES (continued) |
| |||||||||||
| Health Care (continued) |
|
|||||||||||
| 3.88% |
05/15/328 | $ | 3,213,000 | $ | 3,062,343 | |||||||
| 4.38% |
06/15/288 | 6,079,000 | 6,018,171 | |||||||||
| Mozart Debt Merger Sub, Inc. |
| |||||||||||
| 3.88% |
04/01/298 | 1,670,000 | 1,546,357 | |||||||||
| Option Care Health, Inc. |
| |||||||||||
| 4.38% |
10/31/298 | 1,637,000 | 1,543,403 | |||||||||
| Owens & Minor, Inc. |
| |||||||||||
| 6.63% |
04/01/308 | 2,056,000 | 2,116,469 | |||||||||
| Par Pharmaceutical, Inc. |
| |||||||||||
| 7.50% |
04/01/278 | 244,000 | 228,477 | |||||||||
| Prime Healthcare Services, Inc. |
| |||||||||||
| 7.25% |
11/01/258 | 3,833,000 | 3,938,407 | |||||||||
| Teleflex, Inc. |
| |||||||||||
| 4.25% |
06/01/288 | 2,609,000 | 2,545,432 | |||||||||
|
|
|
| ||||||||||
| 84,919,140 | ||||||||||||
|
|
|
| ||||||||||
| Industrials — 4.67% |
| |||||||||||
| Ardagh Packaging Finance PLC/Ardagh Holdings USA, Inc. |
|
|||||||||||
| (Canada) | ||||||||||||
| 5.25% |
08/15/272,8 | 7,861,000 | 7,296,743 | |||||||||
| Artera Services LLC |
| |||||||||||
| 9.03% |
12/04/258 | 3,484,000 | 3,485,318 | |||||||||
| Ball Corp. |
| |||||||||||
| 3.13% |
09/15/31 | 3,091,000 | 2,761,692 | |||||||||
| Clydesdale Acquisition Holdings, Inc. |
| |||||||||||
| 6.63% |
04/15/298 | 2,000,000 | 2,022,500 | |||||||||
| Energizer Holdings, Inc. |
| |||||||||||
| 4.38% |
03/31/298 | 4,150,000 | 3,643,078 | |||||||||
| General Electric Co. |
| |||||||||||
| (MTN) | ||||||||||||
| (LIBOR USD 3-Month plus 0.48%) |
| |||||||||||
| 0.99% |
08/15/361 | 1,300,000 | 1,119,822 | |||||||||
| Graham Packaging Co., Inc. |
| |||||||||||
| 7.13% |
08/15/288 | 3,286,000 | 3,000,072 | |||||||||
| OT Merger Corp. |
| |||||||||||
| 7.88% |
10/15/298 | 5,907,000 | 5,201,981 | |||||||||
| Ritchie Bros Holdings, Inc. |
| |||||||||||
| 4.75% |
12/15/318 | 1,412,000 | 1,378,183 | |||||||||
| TransDigm, Inc. |
| |||||||||||
| 4.63% |
01/15/29 | 1,645,000 | 1,540,539 | |||||||||
| Trivium Packaging Finance BV |
| |||||||||||
| (Netherlands) | ||||||||||||
| 8.50% |
08/15/272,8 | 2,295,000 | 2,306,475 | |||||||||
|
|
|
| ||||||||||
| 33,756,403 | ||||||||||||
|
|
|
| ||||||||||
| Information Technology — 1.48% |
| |||||||||||
| Booz Allen Hamilton, Inc. |
| |||||||||||
| 4.00% |
07/01/298 | 2,816,000 | 2,752,556 | |||||||||
| Clarivate Science Holdings Corp. |
| |||||||||||
| 3.88% |
07/01/288 | 500,000 | 476,500 | |||||||||
| MSCI, Inc. |
| |||||||||||
| 3.63% |
09/01/308 | 2,020,000 | 1,897,790 | |||||||||
| NCR Corp. |
| |||||||||||
| 5.13% |
04/15/298 | 2,403,000 | 2,313,727 | |||||||||
| 5.25% |
10/01/308 | 1,588,000 | 1,508,092 | |||||||||
See accompanying Notes to Financial Statements.
| Annual Report March 2022 / 96 |
Table of Contents
High Yield Bond Fund
Schedule of Portfolio Investments
March 31, 2022
| Issues | Maturity Date |
Principal Amount |
Value | |||||||||
| CORPORATES (continued) |
|
|||||||||||
| Information Technology (continued) |
|
|||||||||||
| Science Applications International Corp. |
|
|||||||||||
| 4.88% |
04/01/288 | $ | 1,795,000 | $ | 1,780,458 | |||||||
|
|
|
| ||||||||||
| 10,729,123 | ||||||||||||
|
|
|
| ||||||||||
| Insurance — 2.27% |
|
|||||||||||
| Acrisure LLC/Acrisure Finance, Inc. |
|
|||||||||||
| 4.25% |
02/15/298 | 4,246,000 | 3,863,024 | |||||||||
| 6.00% |
08/01/298 | 2,619,000 | 2,426,765 | |||||||||
| Alliant Holdings Intermediate, LLC/Alliant Holdings Co.-Issuer |
|
|||||||||||
| 5.88% |
11/01/298 | 1,810,000 | 1,748,912 | |||||||||
| AmWINS Group, Inc. |
|
|||||||||||
| 4.88% |
06/30/298 | 3,261,000 | 3,117,926 | |||||||||
| AssuredPartners, Inc. |
|
|||||||||||
| 5.63% |
01/15/298 | 1,630,000 | 1,503,390 | |||||||||
| Berkshire Hathaway Finance Corp. |
|
|||||||||||
| 3.85% |
03/15/52 | 1,950,000 | 1,995,385 | |||||||||
| HUB International Ltd. |
|
|||||||||||
| 5.63% |
12/01/298 | 1,810,000 | 1,765,737 | |||||||||
|
|
|
| ||||||||||
| 16,421,139 | ||||||||||||
|
|
|
| ||||||||||
| Materials — 4.59% |
|
|||||||||||
| Allegheny Technologies, Inc. |
|
|||||||||||
| 5.13% |
10/01/31 | 1,968,000 | 1,852,380 | |||||||||
| ASP Unifrax Holdings, Inc. |
|
|||||||||||
| 5.25% |
09/30/288 | 6,050,000 | 5,627,892 | |||||||||
| 7.50% |
09/30/298 | 3,409,000 | 3,039,197 | |||||||||
| Axalta Coating Systems, LLC |
|
|||||||||||
| 3.38% |
02/15/298 | 4,340,000 | 3,819,803 | |||||||||
| Carpenter Technology Corp. |
|
|||||||||||
| 7.63% |
03/15/30 | 2,914,000 | 2,983,604 | |||||||||
| Clearwater Paper Corp. |
|
|||||||||||
| 4.75% |
08/15/288 | 2,671,000 | 2,482,834 | |||||||||
| EverArc Escrow SARL |
|
|||||||||||
| (Luxembourg) |
|
|||||||||||
| 5.00% |
10/30/292,8 | 6,251,000 | 5,723,572 | |||||||||
| Herens Holdco SARL |
|
|||||||||||
| (Luxembourg) |
|
|||||||||||
| 4.75% |
05/15/282,8 | 3,474,000 | 3,126,989 | |||||||||
| SCIL IV LLC/SCIL USA Holdings LLC |
|
|||||||||||
| 5.38% |
11/01/268 | 1,189,000 | 1,095,472 | |||||||||
| Valvoline, Inc. |
|
|||||||||||
| 3.63% |
06/15/318 | 2,449,000 | 2,120,075 | |||||||||
| WR Grace Holdings, LLC |
|
|||||||||||
| 5.63% |
08/15/298 | 1,360,000 | 1,275,136 | |||||||||
|
|
|
| ||||||||||
| 33,146,954 | ||||||||||||
|
|
|
| ||||||||||
| Real Estate Investment Trust (REIT) — 2.19% |
| |||||||||||
| American Assets Trust LP |
|
|||||||||||
| 3.38% |
02/01/31 | 4,056,000 | 3,816,872 | |||||||||
| CyrusOne LP/CyrusOne Finance Corp. |
|
|||||||||||
| 1.45% |
01/22/27 | 1,750,000 | 2,017,007 | |||||||||
| 2.15% |
11/01/30 | 2,178,000 | 2,176,007 | |||||||||
| GLP Capital LP/GLP Financing II, Inc. |
|
|||||||||||
| 5.75% |
06/01/28 | 1,650,000 | 1,778,524 | |||||||||
| Iron Mountain Information Management Services, Inc. |
|
|||||||||||
| 5.00% |
07/15/328 | 1,926,000 | 1,812,462 | |||||||||
| Issues | Maturity Date |
Principal Amount |
Value | |||||||||
| CORPORATES (continued) |
|
|||||||||||
| Real Estate Investment Trust (REIT) (continued) |
|
|||||||||||
| Iron Mountain, Inc. |
|
|||||||||||
| 4.50% |
02/15/318 | $ | 1,257,000 | $ | 1,165,616 | |||||||
| MGM Growth Properties Operating Partnership LP/MGP |
|
|||||||||||
| Finance Co.-Issuer, Inc. |
|
|||||||||||
| 4.63% |
06/15/258 | 2,990,000 | 3,027,901 | |||||||||
|
|
|
| ||||||||||
| 15,794,389 | ||||||||||||
|
|
|
| ||||||||||
| Retail — 3.85% |
|
|||||||||||
| 1011778 BC ULC/New Red Finance, Inc. |
|
|||||||||||
| (Canada) |
|
|||||||||||
| 4.00% |
10/15/302,8 | 3,000,000 | 2,713,920 | |||||||||
| Asbury Automotive Group, Inc. |
|
|||||||||||
| 5.00% |
02/15/328 | 2,843,000 | 2,648,399 | |||||||||
| Fertitta Entertainment, LLC/Fertitta Entertainment Finance Co., Inc. |
|
|||||||||||
| 6.75% |
01/15/308 | 7,419,000 | 6,844,028 | |||||||||
| FirstCash, Inc. |
|
|||||||||||
| 4.63% |
09/01/288 | 1,250,000 | 1,165,000 | |||||||||
| 5.63% |
01/01/308 | 4,168,000 | 4,010,171 | |||||||||
| Michaels Cos., Inc. (The) |
|
|||||||||||
| 7.88% |
05/01/298 | 7,031,000 | 6,029,047 | |||||||||
| Sonic Automotive, Inc. |
|
|||||||||||
| 4.88% |
11/15/318 | 4,973,000 | 4,437,938 | |||||||||
|
|
|
| ||||||||||
| 27,848,503 | ||||||||||||
|
|
|
| ||||||||||
| Services — 5.73% |
|
|||||||||||
| Adtalem Global Education, Inc. |
|
|||||||||||
| 5.50% |
03/01/288 | 3,471,000 | 3,362,253 | |||||||||
| Allied Universal Holdco LLC/Allied Universal Finance Corp./ Atlas Luxco 4 SARL |
|
|||||||||||
| (Canada) |
|
|||||||||||
| 4.63% |
06/01/282,8 | 2,908,000 | 2,734,234 | |||||||||
| Carriage Services, Inc. |
|
|||||||||||
| 4.25% |
05/15/298 | 2,100,000 | 1,962,564 | |||||||||
| Gartner, Inc. |
|
|||||||||||
| 3.63% |
06/15/298 | 2,071,000 | 1,963,020 | |||||||||
| GFL Environmental, Inc. |
|
|||||||||||
| (Canada) |
|
|||||||||||
| 4.00% |
08/01/282,8 | 3,600,000 | 3,298,500 | |||||||||
| 4.38% |
08/15/292,8 | 2,795,000 | 2,587,038 | |||||||||
| HealthEquity, Inc. |
|
|||||||||||
| 4.50% |
10/01/298 | 2,518,000 | 2,401,031 | |||||||||
| Hertz Corp. (The) |
|
|||||||||||
| 4.63% |
12/01/268 | 976,000 | 913,995 | |||||||||
| 5.00% |
12/01/298 | 1,864,000 | 1,699,502 | |||||||||
| Prime Security Services Borrower LLC/Prime Finance, Inc. |
|
|||||||||||
| 3.38% |
08/31/278 | 5,503,000 | 5,053,147 | |||||||||
| Rent-A-Center, Inc. |
|
|||||||||||
| 6.38% |
02/15/298 | 5,651,000 | 5,190,104 | |||||||||
| WASH Multifamily Acquisition, Inc. |
|
|||||||||||
| 5.75% |
04/15/268 | 1,594,000 | 1,603,813 | |||||||||
| Waste Pro USA, Inc. |
|
|||||||||||
| 5.50% |
02/15/268 | 7,080,000 | 6,698,990 | |||||||||
| WW International, Inc. |
|
|||||||||||
| 4.50% |
04/15/298 | 2,410,000 | 1,960,161 | |||||||||
|
|
|
| ||||||||||
| 41,428,352 | ||||||||||||
|
|
|
| ||||||||||
See accompanying Notes to Financial Statements.
| 97 / Annual Report March 2022 |
Table of Contents
High Yield Bond Fund
Schedule of Portfolio Investments
March 31, 2022
| Issues | Maturity Date |
Principal Amount |
Value | |||||||||
| CORPORATES (continued) |
| |||||||||||
| Transportation — 1.29% |
| |||||||||||
| American Airlines, Inc./AAdvantage Loyalty IP Ltd. (Canada) |
|
|||||||||||
| 5.75% |
04/20/292,8 | $ | 2,658,000 | $ | 2,658,000 | |||||||
| Continental Airlines Pass-Through Trust, |
| |||||||||||
| Series 2007-1, Class B |
| |||||||||||
| 6.90% |
04/19/22 | 100,147 | 100,149 | |||||||||
| Delta Air Lines, Inc./SkyMiles IP Ltd. |
| |||||||||||
| (Canada) |
| |||||||||||
| 4.75% |
10/20/282,8 | 1,880,000 | 1,897,679 | |||||||||
| Mileage Plus Holdings LLC/Mileage Plus Intellectual Property Assets Ltd. |
|
|||||||||||
| 6.50% |
06/20/278 | 2,211,000 | 2,304,613 | |||||||||
| U.S. Airways Pass-Through Trust, |
| |||||||||||
| Series 2010-1, Class A |
| |||||||||||
| 6.25% |
04/22/23 | 805,321 | 810,159 | |||||||||
| U.S. Airways Pass-Through Trust, |
| |||||||||||
| Series 2012-1, Class A |
| |||||||||||
| 5.90% |
10/01/24 | 1,457,507 | 1,520,360 | |||||||||
|
|
|
| ||||||||||
| 9,290,960 | ||||||||||||
|
|
|
| ||||||||||
| Total Corporates |
| |||||||||||
| (Cost $616,595,583) |
|
589,396,149 | ||||||||||
|
|
|
| ||||||||||
| Total Bonds — 93.24% |
| |||||||||||
| (Cost $702,804,106) |
|
673,865,467 | ||||||||||
|
|
|
| ||||||||||
| Issues | Shares | Value | ||||||||||
| COMMON STOCK — 1.09% |
| |||||||||||
| Communications — 0.52% |
| |||||||||||
| Intelsat Emergence SA2,3,5,9 |
| |||||||||||
| (Luxembourg) | 125,435 | 3,763,050 | ||||||||||
|
|
|
| ||||||||||
| Electric — 0.00% |
| |||||||||||
| Homer City Holdings LLC†,3,5,9,10,13 | 502,908 | — | ||||||||||
|
|
|
| ||||||||||
| Energy — 0.11% |
| |||||||||||
| Valaris Ltd.9 | 15,493 | 805,171 | ||||||||||
|
|
|
| ||||||||||
| Transportation — 0.46% |
| |||||||||||
| Hertz Global Holdings, Inc.9 | 150,000 | 3,322,500 | ||||||||||
|
|
|
| ||||||||||
| Total Common Stock |
| |||||||||||
| (Cost $33,622,933) |
|
7,890,721 | ||||||||||
|
|
|
| ||||||||||
| RIGHTS — 0.00% |
| |||||||||||
| Communications — 0.00% |
| |||||||||||
| Intelsat Jackson Holdings SA, Series |
| |||||||||||
| A2,3,5,9 |
| |||||||||||
| (Luxembourg) | 13,135 | — | ||||||||||
| Intelsat Jackson Holdings SA, Series |
| |||||||||||
| B2,3,5,9 |
| |||||||||||
| (Luxembourg) | 13,135 | — | ||||||||||
|
|
|
| ||||||||||
| — | ||||||||||||
|
|
|
| ||||||||||
| Total Rights |
| |||||||||||
| (Cost $–) |
|
— | ||||||||||
|
|
|
| ||||||||||
| Issues | Shares | Value | ||||||||||
| WARRANT — 0.01% |
| |||||||||||
| Communications — 0.00% |
| |||||||||||
| Intelsat Jackson Holdings SA,2,3,5,9 |
| |||||||||||
| (Luxembourg) | 16 | $ | 51 | |||||||||
|
|
|
| ||||||||||
| Entertainment — 0.01% |
| |||||||||||
| Cineworld Group PLC2,9 |
| |||||||||||
| (United Kingdom) | 288,340 | 62,641 | ||||||||||
|
|
|
| ||||||||||
| Total Warrant |
| |||||||||||
| (Cost $60) |
|
62,692 | ||||||||||
|
|
|
| ||||||||||
|
|
| |||||||||||
| Issues | Maturity Date |
Principal Amount/Shares |
Value | |||||||||
| SHORT-TERM INVESTMENTS — 4.33% |
| |||||||||||
| Money Market Funds — 4.33% |
| |||||||||||
| Dreyfus Government Cash Management Fund |
| |||||||||||
| 0.19%14 |
9,176,000 | 9,176,000 | ||||||||||
| Fidelity Investments Money Market Funds - Government Portfolio |
|
|||||||||||
| 0.12%14 |
49,239 | 49,239 | ||||||||||
| Morgan Stanley Institutional Liquidity Funds - Government Portfolio |
|
|||||||||||
| 0.23%14 |
22,067,000 | 22,067,000 | ||||||||||
|
|
|
| ||||||||||
| Total Short-Term Investments |
| |||||||||||
| (Cost $31,292,239) |
|
31,292,239 | ||||||||||
|
|
|
| ||||||||||
| Total Investments - 98.67% |
| |||||||||||
| (Cost $767,719,338) |
|
713,111,119 | ||||||||||
|
|
|
| ||||||||||
| Net unrealized depreciation on unfunded commitments - 0.00% |
|
(5,832 | ) | |||||||||
| Cash and Other Assets, Less Liabilities - 1.33% |
|
9,603,925 | ||||||||||
|
|
|
| ||||||||||
| Net Assets - 100.00% |
|
$ | 722,709,212 | |||||||||
|
|
|
| ||||||||||
| 1 | Floating rate security. The rate disclosed was in effect at March 31, 2022. |
| 2 | Foreign denominated security issued by foreign domiciled entity. |
| 3 | Security is valued using significant unobservable inputs and is classified as Level 3 in the fair value hierarchy. |
| 4 | Excluded from the investment total above is an unfunded delayed draw term loan commitment in an amount not to exceed $289,852, at an interest rate of 1.88% and a maturity of July 17, 2028. The investment is not accruing an unused commitment fee. |
| 5 | Illiquid security as determined under procedures approved by the Board of Trustees. The aggregate value of illiquid securities is $10,064,888, which is 1.39% of total net assets. |
| 6 | Perpetual security with no stated maturity date. |
| 7 | Variable rate security. Interest rate disclosed is as of the most recent information available. Certain variable rate securities are not based on a published reference rate and spread but are determined by the issuer or agent and are based on current market conditions. |
| 8 | Securities exempt from registration under Rule 144A of the Securities Act of 1933, as amended. The securities may be resold in transactions exempt from registration, normally to qualified institutional buyers. |
| 9 | Non-income producing security. |
| 10 | Security is currently in default with regard to scheduled interest or principal payments. |
| 11 | Zero coupon bond. The rate shown is the effective yield as of March 31, 2022. |
| 12 | Payment-in-kind (“PIK”) security. Income may be paid in additional securities or cash at the discretion of the issuer - 8.25% cash or 12.00% payment-in-kind interest. |
| 13 | Affiliated investment. |
| 14 | Represents the current yield as of March 31, 2022. |
See accompanying Notes to Financial Statements.
| Annual Report March 2022 / 98 |
Table of Contents
High Yield Bond Fund
Schedule of Portfolio Investments
March 31, 2022
| † | Fair valued security. The aggregate value of fair valued securities is $0, which is 0.00% of total net assets. Fair valued securities were not valued utilizing an independent quote but were valued pursuant to guidelines established by the Board of Trustees. See Notes to Financial Statements. |
| * | Securities with a call or reset feature will have an effective maturity date sooner than the stated maturity. |
Note: For Fund compliance purposes, the Fund’s industry classifications refer to any one or more of the industry sub-classifications used by one or more widely recognized market indexes or ratings group indexes, and/or as defined by Fund management. This definition may not apply for purposes of this report, which may combine industry sub-classifications for more meaningful presentation for investors.
(EUR): Euro
(EURIBOR): Euro InterBank Offer Rate
(LIBOR): London InterBank Offer Rate
(MTN): Medium-Term Note
(PIK): Payment In Kind
(SOFR): Secured Overnight Financing Rate
(USD): U.S. Dollar
| Currency to be Purchased |
Currency to be Sold | Counterparty | Settlement Date |
Unrealized Appreciation (Depreciation) |
||||||
| FOREIGN CURRENCY EXCHANGE CONTRACT |
||||||||||
|
EUR 2,940,000 |
USD 3,236,181 | Goldman Sachs International | 04/08/22 | $ | 35,784 | |||||
|
USD 3,331,608 |
EUR 2,940,000 | Goldman Sachs International | 04/08/22 | 59,643 | ||||||
|
|
|
|||||||||
| 95,427 | ||||||||||
|
|
|
|||||||||
|
USD 3,138,928 |
EUR 2,843,000 | Goldman Sachs International | 07/08/22 | (37,530) | ||||||
|
|
|
|||||||||
| NET UNREALIZED APPRECIATION |
$ | 57,897 | ||||||||
|
|
|
|||||||||
| Description | Number of Contracts |
Expiration Date | Notional Amount | Value | Unrealized Appreciation |
|||||||||||||||
| FUTURES CONTRACTS: SHORT POSITIONS |
|
|||||||||||||||||||
| U.S. Treasury Ten-Year Ultra Bond |
167 | 06/21/22 | $ | (22,623,281) | $ | 794,318 | $ | 794,318 | ||||||||||||
| U.S. Treasury Ultra Bond |
144 | 06/21/22 | (25,506,000) | 813,344 | 813,344 | |||||||||||||||
| U.S. Treasury Five-Year Note |
55 | 06/30/22 | (6,307,813) | 103,874 | 103,874 | |||||||||||||||
|
|
|
|
|
|
|
|||||||||||||||
| TOTAL FUTURES CONTRACTS |
$ | (54,437,094) | $ | 1,711,536 | $ | 1,711,536 | ||||||||||||||
|
|
|
|
|
|
|
|||||||||||||||
| Reference Obligation/Index | Financing Rate Paid by the Fund |
Payment Frequency |
Implied Credit Spread at 03/31/221 |
Counterparty | Expiration Date |
Notional Amount (000’s)2 |
Value3 | Premiums Paid |
Unrealized Appreciation |
|||||||||||||||||||
| SWAPS: CREDIT DEFAULT (SALES) - SINGLE ISSUES OTC4 |
||||||||||||||||||||||||||||
| 1011778 BC ULC/New Red |
|
Credit Suisse | ||||||||||||||||||||||||||
| Finance, Inc., 4.00%, due |
|
First Boston | ||||||||||||||||||||||||||
| 10/15/305 |
5.00% | 3 Months | 120 | International | 06/20/23 | $ | 1,985 | $ | 94,040 | $ | 79,698 | $ | 14,342 | |||||||||||||||
| Berry Global, Inc., 5.63%, due |
|
Credit Suisse First Boston | ||||||||||||||||||||||||||
| 07/15/27 |
5.00% | 3 Months | 175 | International | 12/20/23 | 3,995 | 222,693 | 211,335 | 11,358 | |||||||||||||||||||
|
|
|
|
|
|
|
|||||||||||||||||||||||
| TOTAL |
$ | 316,733 | $ | 291,033 | $ | 25,700 | ||||||||||||||||||||||
|
|
|
|
|
|
|
|||||||||||||||||||||||
| 1 | An implied credit spread is the spread in yield between a U.S. Treasury security and the referenced obligation or underlying investment that are identical in all respects except for the quality rating. Implied credit spreads, represented in absolute terms, utilized in determining the value of credit default swaps on corporate issues as of year end serve as an indicator of the current status of the payment performance risk and represent the likelihood of risk of default for the credit derivative. The implied credit spread of a particular referenced entity reflects the cost of buying/selling protection and may include upfront payments required to be made to enter the agreement. Wider credit spreads, in comparison to narrower credit spreads, represent a deterioration of the referenced entity’s credit soundness and a greater likelihood of risk of default or other credit event occurring as defined under the terms of the agreement. |
| 2 | The maximum potential amount for the Fund could be required to pay as a seller of credit protection or receive as a buyer of credit protection if a credit event occurs as defined under the terms of that particular swap agreement. |
| 3 | The quoted market prices are resulting values for credit default swap agreements on credit indices serve as an indicator of the current status of the payment/performance risk and represent the likelihood of an expected liability (or profit) for the credit derivative had the notional amount of the swap agreement been closed/sold as of year end. Increasing values (buy protection) or decreasing values (sell protection), when compared to the notional amount of the swap, represent a deterioration of the referenced entity’s credit soundness and a greater likelihood of risk of default or other credit event occurring as defined under the terms of the agreement. |
See accompanying Notes to Financial Statements.
| 99 / Annual Report March 2022 |
Table of Contents
High Yield Bond Fund
Schedule of Portfolio Investments
March 31, 2022
| 4 | If the Fund is a seller of protection and credit event occurs, as defined under the terms of that particular swap agreement, the Fund will either (i) pay to the buyer of protection the amount equal to the notional amount of the swap and take delivery of the referenced obligation or underlying investments comprising the referenced index or (ii) pay a net settlement amount in the form of cash or investments equal to the notional amount of the swap less the recovery value of the referenced obligation or underlying investments comprising the referenced index. |
| 5 | Security is valued using significant unobservable inputs and is classified as Level 3 in the fair value hierarchy. |
See accompanying Notes to Financial Statements.
| Annual Report March 2022 / 100 |
Table of Contents
Schedule of Portfolio Investments
March 31, 2022
| Issues | Maturity Date |
Principal Amount |
Value | |||||||||
| BONDS – 103.59% |
| |||||||||||
| ASSET-BACKED SECURITIES — 6.83%** |
| |||||||||||
| Academic Loan Funding Trust, |
| |||||||||||
| Series 2012-1A, Class A2 |
| |||||||||||
| (LIBOR USD 1-Month plus 1.10%) |
| |||||||||||
| 1.56% |
12/27/441,2 | $ | 535,209 | $ | 531,889 | |||||||
| AIG CLO Ltd., |
| |||||||||||
| Series 2019-2A, Class BR |
| |||||||||||
| (Cayman Islands) |
| |||||||||||
| (LIBOR USD 3-Month plus 1.60%) |
| |||||||||||
| 1.86% |
10/25/331,2,3 | 2,200,000 | 2,173,050 | |||||||||
| AMMC CLO 19 Ltd., |
| |||||||||||
| Series 2016-19A, Class AR |
| |||||||||||
| (Cayman Islands) |
| |||||||||||
| (LIBOR USD 3-Month plus 1.14%) |
| |||||||||||
| 1.38% |
10/16/281,2,3 | 397,289 | 396,546 | |||||||||
| Barings CLO Ltd., |
| |||||||||||
| Series 2013-IA, Class AR |
| |||||||||||
| (Cayman Islands) |
| |||||||||||
| (LIBOR USD 3-Month plus 0.80%) |
| |||||||||||
| 1.05% |
01/20/281,2,3 | 1,004,400 | 999,036 | |||||||||
| Bayview Commercial Asset Trust, |
| |||||||||||
| Series 2004-3, Class A1 |
| |||||||||||
| (LIBOR USD 1-Month plus 0.56%) |
| |||||||||||
| 1.01% |
01/25/351,2 | 223,629 | 222,338 | |||||||||
| Brazos Higher Education Authority, Inc., |
| |||||||||||
| Series 2010-1, Class A2 |
| |||||||||||
| (LIBOR USD 3-Month plus 1.20%) |
| |||||||||||
| 1.70% |
02/25/352 | 650,000 | 654,032 | |||||||||
| Brazos Higher Education Authority, Inc., |
| |||||||||||
| Series 2011-1, Class A2 |
| |||||||||||
| (LIBOR USD 3-Month plus 0.80%) |
| |||||||||||
| 1.30% |
02/25/302 | 11,078 | 11,083 | |||||||||
| Brazos Higher Education Authority, Inc., |
| |||||||||||
| Series 2011-2, Class A3 |
| |||||||||||
| (LIBOR USD 3-Month plus 1.00%) |
| |||||||||||
| 1.26% |
10/27/362 | 1,030,000 | 1,023,583 | |||||||||
| Cedar Funding XII CLO Ltd., |
| |||||||||||
| Series 2020-12A, Class A1R |
| |||||||||||
| (Cayman Islands) |
| |||||||||||
| (LIBOR USD 3-Month plus 1.13%) |
| |||||||||||
| 1.39% |
10/25/341,2,3 | 2,000,000 | 1,981,914 | |||||||||
| CIT Education Loan Trust, |
| |||||||||||
| Series 2007-1, Class A |
| |||||||||||
| (LIBOR USD 3-Month plus 0.09%) |
| |||||||||||
| 1.06% |
03/25/421,2 | 198,765 | 190,478 | |||||||||
| CoreVest American Finance Trust, |
| |||||||||||
| Series 2019-1, Class XA (IO) |
| |||||||||||
| 2.16% |
03/15/521,4 | 3,566,330 | 149,192 | |||||||||
| Dryden XXVI Senior Loan Fund, |
| |||||||||||
| Series 2013-26A, Class AR |
| |||||||||||
| (Cayman Islands) |
| |||||||||||
| (LIBOR USD 3-Month plus 0.90%) |
| |||||||||||
| 1.14% |
04/15/291,2,3 | 1,711,707 | 1,702,173 | |||||||||
| Educational Funding of the South, Inc., |
| |||||||||||
| Series 2011-1, Class A2 |
| |||||||||||
| (LIBOR USD 3-Month plus 0.65%) |
| |||||||||||
| 0.91% |
04/25/352 | 153,942 | 153,382 | |||||||||
| Issues | Maturity Date |
Principal Amount |
Value | |||||||||
| ASSET-BACKED SECURITIES (continued) |
| |||||||||||
| Global SC Finance II SRL, |
| |||||||||||
| Series 2014-1A, Class A2 |
| |||||||||||
| (Barbados) |
| |||||||||||
| 3.09% |
07/17/291,3 | $ | 388,902 | $ | 383,213 | |||||||
| GPMT Ltd., |
| |||||||||||
| Series 2021-FL4, Class AS |
| |||||||||||
| (Cayman Islands) |
| |||||||||||
| (LIBOR USD 1-Month plus 1.70%) |
| |||||||||||
| 2.15% |
12/15/361,2,3 | 2,380,000 | 2,356,505 | |||||||||
| Higher Education Funding I, |
| |||||||||||
| Series 2014-1, Class A |
| |||||||||||
| (LIBOR USD 3-Month plus 1.05%) |
| |||||||||||
| 1.55% |
05/25/341,2 | 483,015 | 483,571 | |||||||||
| J.G. Wentworth XXX LLC, |
| |||||||||||
| Series 2013-3A, Class A |
| |||||||||||
| 4.08% |
01/17/731 | 369,052 | 382,813 | |||||||||
| J.G. Wentworth XXXII LLC, |
| |||||||||||
| Series 2014-2A, Class A |
| |||||||||||
| 3.61% |
01/17/731 | 697,807 | 707,696 | |||||||||
| LCM XVIII LP, |
| |||||||||||
| Series 19A, Class AR |
| |||||||||||
| (Cayman Islands) |
| |||||||||||
| (LIBOR USD 3-Month plus 1.24%) |
| |||||||||||
| 1.48% |
07/15/271,2,3 | 19,070 | 19,040 | |||||||||
| LCM XX LP, |
| |||||||||||
| Series 20A, Class AR |
| |||||||||||
| (Cayman Islands) |
| |||||||||||
| (LIBOR USD 3-Month plus 1.04%) |
| |||||||||||
| 1.29% |
10/20/271,2,3 | 733,094 | 730,337 | |||||||||
| Navient Student Loan Trust, |
| |||||||||||
| Series 2014-1, Class A3 |
| |||||||||||
| (LIBOR USD 1-Month plus 0.51%) |
| |||||||||||
| 0.97% |
06/25/312 | 564,957 | 554,325 | |||||||||
| Navient Student Loan Trust, |
| |||||||||||
| Series 2014-3, Class A |
| |||||||||||
| (LIBOR USD 1-Month plus 0.62%) |
| |||||||||||
| 1.08% |
03/25/832 | 1,503,282 | 1,478,257 | |||||||||
| Navient Student Loan Trust, |
| |||||||||||
| Series 2014-4, Class A |
| |||||||||||
| (LIBOR USD 1-Month plus 0.62%) |
| |||||||||||
| 1.08% |
03/25/832 | 1,343,644 | 1,321,298 | |||||||||
| Navient Student Loan Trust, |
| |||||||||||
| Series 2016-2A, Class A3 |
| |||||||||||
| (LIBOR USD 1-Month plus 1.50%) |
| |||||||||||
| 1.96% |
06/25/651,2 | 1,640,000 | 1,657,866 | |||||||||
| Nelnet Student Loan Trust, |
| |||||||||||
| Series 2014-4A, Class A2 |
| |||||||||||
| (LIBOR USD 1-Month plus 0.95%) |
| |||||||||||
| 1.41% |
11/25/481,2 | 1,370,000 | 1,364,975 | |||||||||
| Neuberger Berman CLO XX Ltd., |
| |||||||||||
| Series 2015-20A, Class ARR |
| |||||||||||
| (Cayman Islands) |
| |||||||||||
| (LIBOR USD 3-Month plus 1.16%) |
| |||||||||||
| 1.40% |
07/15/341,2,3 | 2,140,000 | 2,117,209 | |||||||||
See accompanying Notes to Financial Statements.
| 101 / Annual Report March 2022 |
Table of Contents
Intermediate Bond Fund
Schedule of Portfolio Investments
March 31, 2022
| Issues | Maturity Date |
Principal Amount |
Value | |||||||||
| ASSET-BACKED SECURITIES (continued) |
| |||||||||||
| OCP CLO Ltd., |
| |||||||||||
| Series 2020-19A, Class AR |
| |||||||||||
| (Cayman Islands) |
| |||||||||||
| (LIBOR USD 3-Month plus 1.15%) |
| |||||||||||
| 1.40% |
10/20/341,2,3 | $ | 1,850,000 | $ | 1,831,439 | |||||||
| Octagon Investment Partners 46 Ltd., |
| |||||||||||
| Series 2020-2A, Class AR |
| |||||||||||
| (Cayman Islands) |
| |||||||||||
| (LIBOR USD 3-Month plus 1.16%) |
| |||||||||||
| 1.40% |
07/15/361,2,3 | 2,000,000 | 1,983,350 | |||||||||
| Recette CLO Ltd., |
| |||||||||||
| Series 2015-1A, Class ARR |
| |||||||||||
| (Cayman Islands) |
| |||||||||||
| (LIBOR USD 3-Month plus 1.08%) |
| |||||||||||
| 1.33% |
04/20/341,2,3 | 1,875,000 | 1,850,625 | |||||||||
| Regata XII Funding Ltd., |
| |||||||||||
| Series 2019-1A, Class BR |
| |||||||||||
| (Cayman Islands) |
| |||||||||||
| (LIBOR USD 3-Month plus 1.60%) |
| |||||||||||
| 1.84% |
10/15/321,2,3 | 2,100,000 | 2,078,937 | |||||||||
| Rockford Tower CLO Ltd., |
| |||||||||||
| Series 2019-2A, Class AR |
| |||||||||||
| (Cayman Islands) |
| |||||||||||
| (LIBOR USD 3-Month plus 1.10%) |
| |||||||||||
| 1.58% |
08/20/321,2,3 | 2,000,000 | 1,983,596 | |||||||||
| Skyline Aircraft Finance LLC, |
| |||||||||||
| Series 2021-1, Class A |
| |||||||||||
| 3.23% |
05/10/375,6 | 2,162,834 | 2,041,174 | |||||||||
| SLC Student Loan Trust, |
| |||||||||||
| Series 2004-1, Class B |
| |||||||||||
| (LIBOR USD 3-Month plus 0.29%) |
| |||||||||||
| 0.80% |
08/15/312 | 107,526 | 100,063 | |||||||||
| SLC Student Loan Trust, |
| |||||||||||
| Series 2008-1, Class A4A |
| |||||||||||
| (LIBOR USD 3-Month plus 1.60%) |
| |||||||||||
| 2.43% |
12/15/322 | 221,967 | 224,785 | |||||||||
| SLM Student Loan Trust, |
| |||||||||||
| Series 2004-2, Class B |
| |||||||||||
| (LIBOR USD 3-Month plus 0.47%) |
| |||||||||||
| 0.73% |
07/25/392 | 141,280 | 135,184 | |||||||||
| SLM Student Loan Trust, |
| |||||||||||
| Series 2006-8, Class A6 |
| |||||||||||
| (LIBOR USD 3-Month plus 0.16%) |
| |||||||||||
| 0.42% |
01/25/412 | 961,295 | 921,242 | |||||||||
| SLM Student Loan Trust, |
| |||||||||||
| Series 2008-2, Class A3 |
| |||||||||||
| (LIBOR USD 3-Month plus 0.75%) |
| |||||||||||
| 1.01% |
04/25/232 | 3,247,124 | 3,192,275 | |||||||||
| SLM Student Loan Trust, |
| |||||||||||
| Series 2008-2, Class B |
| |||||||||||
| (LIBOR USD 3-Month plus 1.20%) |
| |||||||||||
| 1.46% |
01/25/832 | 185,000 | 176,020 | |||||||||
| SLM Student Loan Trust, |
| |||||||||||
| Series 2008-3, Class B |
| |||||||||||
| (LIBOR USD 3-Month plus 1.20%) |
| |||||||||||
| 1.46% |
04/26/832 | 185,000 | 170,362 | |||||||||
| Issues | Maturity Date |
Principal Amount |
Value | |||||||||
| ASSET-BACKED SECURITIES (continued) |
| |||||||||||
| SLM Student Loan Trust, |
| |||||||||||
| Series 2008-4, Class B |
| |||||||||||
| (LIBOR USD 3-Month plus 1.85%) |
| |||||||||||
| 2.11% |
04/25/732 | $ | 185,000 | $ | 184,101 | |||||||
| SLM Student Loan Trust, |
| |||||||||||
| Series 2008-5, Class B |
| |||||||||||
| (LIBOR USD 3-Month plus 1.85%) |
| |||||||||||
| 2.11% |
07/25/732 | 2,235,000 | 2,232,239 | |||||||||
| SLM Student Loan Trust, |
| |||||||||||
| Series 2008-6, Class A4 |
| |||||||||||
| (LIBOR USD 3-Month plus 1.10%) |
| |||||||||||
| 1.36% |
07/25/232 | 1,704,812 | 1,684,574 | |||||||||
| SLM Student Loan Trust, |
| |||||||||||
| Series 2008-6, Class B |
| |||||||||||
| (LIBOR USD 3-Month plus 1.85%) |
| |||||||||||
| 2.11% |
07/26/832 | 185,000 | 180,991 | |||||||||
| SLM Student Loan Trust, |
| |||||||||||
| Series 2008-7, Class B |
| |||||||||||
| (LIBOR USD 3-Month plus 1.85%) |
| |||||||||||
| 2.11% |
07/26/832 | 185,000 | 184,079 | |||||||||
| SLM Student Loan Trust, |
| |||||||||||
| Series 2008-8, Class B |
| |||||||||||
| (LIBOR USD 3-Month plus 2.25%) |
| |||||||||||
| 2.51% |
10/25/752 | 185,000 | 185,409 | |||||||||
| SLM Student Loan Trust, |
| |||||||||||
| Series 2008-9, Class A |
| |||||||||||
| (LIBOR USD 3-Month plus 1.50%) |
| |||||||||||
| 1.76% |
04/25/232 | 588,075 | 588,103 | |||||||||
| SLM Student Loan Trust, |
| |||||||||||
| Series 2008-9, Class B |
| |||||||||||
| (LIBOR USD 3-Month plus 2.25%) |
| |||||||||||
| 2.51% |
10/25/832 | 1,885,000 | 1,893,438 | |||||||||
| SLM Student Loan Trust, |
| |||||||||||
| Series 2009-3, Class A |
| |||||||||||
| (LIBOR USD 1-Month plus 0.75%) |
| |||||||||||
| 1.21% |
01/25/451,2 | 2,612,300 | 2,587,906 | |||||||||
| SLM Student Loan Trust, |
| |||||||||||
| Series 2011-2, Class A2 |
| |||||||||||
| (LIBOR USD 1-Month plus 1.20%) |
| |||||||||||
| 1.66% |
10/25/342 | 471,264 | 473,222 | |||||||||
| SLM Student Loan Trust, |
| |||||||||||
| Series 2012-7, Class A3 |
| |||||||||||
| (LIBOR USD 1-Month plus 0.65%) |
| |||||||||||
| 1.11% |
05/26/262 | 567,239 | 555,176 | |||||||||
| Structured Receivables Finance LLC, |
| |||||||||||
| Series 2010-A, Class B |
| |||||||||||
| 7.61% |
01/16/461 | 446,445 | 474,243 | |||||||||
| Student Loan Consolidation Center Student Loan Trust I, |
| |||||||||||
| Series 2002-2, Class B2 |
| |||||||||||
| (28 Day Auction Rate plus 0.00%) |
| |||||||||||
| 1.61% |
07/01/421,2 | 500,000 | 460,669 | |||||||||
| Treman Park CLO Ltd., |
| |||||||||||
| Series 2015-1A, Class ARR |
| |||||||||||
| (Cayman Islands) |
| |||||||||||
| (LIBOR USD 3-Month plus 1.07%) |
| |||||||||||
| 1.32% |
10/20/281,2,3 | 24,562 | 24,487 | |||||||||
See accompanying Notes to Financial Statements.
| Annual Report March 2022 / 102 |
Table of Contents
Intermediate Bond Fund
Schedule of Portfolio Investments
March 31, 2022
| Issues | Maturity Date |
Principal Amount |
Value | |||||||||
| ASSET-BACKED SECURITIES (continued) |
| |||||||||||
| Vantage Data Centers Issuer LLC, |
| |||||||||||
| Series 2018-2A, Class A2 |
| |||||||||||
| 4.20% |
11/16/431 | $ | 2,030,000 | $ | 2,043,069 | |||||||
|
|
|
| ||||||||||
| Total Asset-Backed Securities |
| |||||||||||
| (Cost $55,114,204) |
|
54,186,559 | ||||||||||
|
|
|
| ||||||||||
| BANK LOANS — 1.45%* |
| |||||||||||
| Automotive — 0.02% |
| |||||||||||
| Clarios Global LP, |
| |||||||||||
| Term Loan B, 1st Lien |
| |||||||||||
| (LIBOR plus 3.25%) |
| |||||||||||
| 3.71% |
04/30/262 | 169,042 | 167,182 | |||||||||
|
|
|
| ||||||||||
| Communications — 0.39% |
| |||||||||||
| CenturyLink, Inc., |
| |||||||||||
| Term Loan B, 1st Lien |
| |||||||||||
| (LIBOR plus 2.25%) |
| |||||||||||
| 2.71% |
03/15/272 | 566,551 | 552,345 | |||||||||
| Charter Communications Operating LLC, |
| |||||||||||
| Term Loan B2, 1st Lien |
| |||||||||||
| (LIBOR plus 1.75%) |
| |||||||||||
| 2.21% |
02/01/272 | 97,744 | 97,059 | |||||||||
| CSC Holdings LLC, |
| |||||||||||
| Term Loan B, 1st Lien |
| |||||||||||
| (LIBOR plus 2.25%) |
| |||||||||||
| 2.65% |
07/17/252 | 148,057 | 146,022 | |||||||||
| Term Loan B5, 1st Lien |
| |||||||||||
| (LIBOR plus 2.50%) |
| |||||||||||
| 2.90% |
04/15/272 | 98,741 | 97,210 | |||||||||
| Diamond Sports Group, LLC, |
| |||||||||||
| Term Loan, 1st Lien |
| |||||||||||
| (LIBOR plus 8.00%) |
| |||||||||||
| 9.00% |
05/25/262 | 116,686 | 118,688 | |||||||||
| DIRECTV Financing LLC, |
| |||||||||||
| Term Loan, 1st Lien |
| |||||||||||
| (LIBOR plus 5.00%) |
| |||||||||||
| 5.75% |
08/02/272 | 391,550 | 391,626 | |||||||||
| Level 3 Parent LLC, |
| |||||||||||
| Term Loan B, 1st Lien |
| |||||||||||
| (LIBOR plus 1.75%) |
| |||||||||||
| 2.21% |
03/01/272 | 1,275,000 | 1,252,987 | |||||||||
| Zayo Group Holdings, Inc., |
| |||||||||||
| Term Loan, 1st Lien |
| |||||||||||
| (LIBOR plus 3.00%) |
| |||||||||||
| 3.46% |
03/09/272 | 445,395 | 434,075 | |||||||||
|
|
|
| ||||||||||
| 3,090,012 | ||||||||||||
|
|
|
| ||||||||||
| Consumer Discretionary — 0.01% |
| |||||||||||
| Naked Juice, LLC, |
| |||||||||||
| Term Loan |
| |||||||||||
| (SOFR plus 3.25%) |
| |||||||||||
| 4.00% |
01/24/292 | 89,362 | 88,086 | |||||||||
|
|
|
| ||||||||||
| Electric — 0.02% |
| |||||||||||
| Vistra Operations Co., LLC, |
| |||||||||||
| Term Loan B3, 1st Lien |
| |||||||||||
| (LIBOR plus 1.75%) |
| |||||||||||
| 2.19% |
12/31/252 | 26,579 | 26,347 | |||||||||
| Issues | Maturity Date |
Principal Amount |
Value | |||||||||
| BANK LOANS (continued) |
| |||||||||||
| Electric (continued) |
| |||||||||||
| 2.21% |
12/31/252 | $ | 109,969 | $ | 109,007 | |||||||
|
|
|
| ||||||||||
| 135,354 | ||||||||||||
|
|
|
| ||||||||||
| Finance — 0.11% |
| |||||||||||
| Mozart Borrower, LP, |
| |||||||||||
| Term Loan B |
| |||||||||||
| (LIBOR plus 3.25%) |
| |||||||||||
| 3.75% |
10/23/282 | 100,000 | 99,118 | |||||||||
| Setanta Aircraft Leasing DAC, |
| |||||||||||
| Term Loan B, 1st Lien |
| |||||||||||
| (LIBOR plus 2.00%) |
| |||||||||||
| 3.01% |
11/05/282 | 800,000 | 789,336 | |||||||||
|
|
|
| ||||||||||
| 888,454 | ||||||||||||
|
|
|
| ||||||||||
| Food — 0.04% |
| |||||||||||
| Hostess Brands LLC, |
| |||||||||||
| Term Loan, 1st Lien |
| |||||||||||
| (LIBOR plus 2.25%) |
| |||||||||||
| 3.00% |
08/03/252 | 293,233 | 289,961 | |||||||||
|
|
|
| ||||||||||
| Gaming — 0.01% |
| |||||||||||
| Caesars Resort Collection LLC, |
| |||||||||||
| Term Loan, 1st Lien |
| |||||||||||
| (LIBOR plus 2.75%) |
| |||||||||||
| 3.21% |
12/23/242 | 1,061 | 1,057 | |||||||||
| Churchill Downs, Inc., |
| |||||||||||
| Term Loan B, 1st Lien |
| |||||||||||
| (LIBOR plus 2.00%) |
| |||||||||||
| 2.46% |
12/27/242 | 52,927 | 52,357 | |||||||||
|
|
|
| ||||||||||
| 53,414 | ||||||||||||
|
|
|
| ||||||||||
| Health Care — 0.44% |
| |||||||||||
| Avantor Funding, Inc., |
| |||||||||||
| Term Loan B5, 1st Lien |
| |||||||||||
| (LIBOR plus 2.25%) |
| |||||||||||
| 2.75% |
11/08/272 | 603,915 | 600,141 | |||||||||
| Avolon TLB Borrower 1 U.S. LLC, |
| |||||||||||
| Term Loan B3, 1st Lien |
| |||||||||||
| (LIBOR plus 1.75%) |
| |||||||||||
| 2.50% |
01/15/252 | 52,744 | 52,005 | |||||||||
| Change Healthcare Holdings LLC, |
| |||||||||||
| Term Loan B, 1st Lien |
| |||||||||||
| (LIBOR plus 2.50%) |
| |||||||||||
| 3.50% |
03/01/242 | 298,808 | 297,575 | |||||||||
| Elanco Animal Health, Inc., |
| |||||||||||
| Term Loan B, 1st Lien |
| |||||||||||
| (LIBOR plus 1.75%) |
| |||||||||||
| 1.98% |
08/01/272 | 897,299 | 884,611 | |||||||||
| Endo Luxembourg Finance Co., |
| |||||||||||
| Term Loan B, 1st Lien |
| |||||||||||
| (LIBOR plus 5.00%) |
| |||||||||||
| 5.75% |
03/27/282 | 856,581 | 804,740 | |||||||||
| Grifols Worldwide Operations USA, Inc., |
| |||||||||||
| Term Loan B, 1st Lien |
| |||||||||||
| (LIBOR plus 2.00%) |
| |||||||||||
| 2.46% |
11/15/272 | 92,556 | 91,133 | |||||||||
See accompanying Notes to Financial Statements.
| 103 / Annual Report March 2022 |
Table of Contents
Intermediate Bond Fund
Schedule of Portfolio Investments
March 31, 2022
| Issues | Maturity Date |
Principal Amount |
Value | |||||||||
| BANK LOANS (continued) |
| |||||||||||
| Health Care (continued) |
| |||||||||||
| Horizon Therapeutics USA, Inc., |
| |||||||||||
| Term Loan B, 1st Lien |
| |||||||||||
| (LIBOR plus 1.75%) |
| |||||||||||
| 2.25% |
03/15/282 | $ | 381,150 | $ | 377,935 | |||||||
| Jazz Financing Lux SARL, |
| |||||||||||
| Term Loan B, 1st Lien |
| |||||||||||
| (LIBOR plus 3.50%) |
| |||||||||||
| 4.00% |
05/05/282 | 397,000 | 396,033 | |||||||||
|
|
|
| ||||||||||
| 3,504,173 | ||||||||||||
|
|
|
| ||||||||||
| Industrials — 0.15% |
| |||||||||||
| Berry Global, Inc., |
| |||||||||||
| Term Loan Z, 1st Lien |
| |||||||||||
| (LIBOR plus 1.75%) |
| |||||||||||
| 2.07% |
07/01/262 | 909,899 | 898,666 | |||||||||
| TransDigm, Inc., |
| |||||||||||
| Term Loan E, 1st Lien |
| |||||||||||
| (LIBOR plus 2.25%) |
| |||||||||||
| 2.71% |
05/30/252 | 291,280 | 286,547 | |||||||||
|
|
|
| ||||||||||
| 1,185,213 | ||||||||||||
|
|
|
| ||||||||||
| Information Technology — 0.08% |
| |||||||||||
| Entegris, Inc., |
| |||||||||||
| Term Loan B, 1st Lien |
| |||||||||||
| (SOFR plus 3.00%) |
| |||||||||||
| 3.00% |
03/02/292 | 130,000 | 129,865 | |||||||||
| NortonLifeLock, Inc., |
| |||||||||||
| Term Loan B, 1st Lien |
| |||||||||||
| (SOFR plus 2.00%) |
| |||||||||||
| 2.00% |
01/28/292 | 530,000 | 524,149 | |||||||||
|
|
|
| ||||||||||
| 654,014 | ||||||||||||
|
|
|
| ||||||||||
| Insurance — 0.03% |
| |||||||||||
| Acrisure LLC, |
| |||||||||||
| Term Loan B, 1st Lien |
| |||||||||||
| (LIBOR plus 3.50%) |
| |||||||||||
| 3.96% |
02/15/272 | 249,364 | 246,352 | |||||||||
|
|
|
| ||||||||||
| Retail — 0.06% |
| |||||||||||
| Whatabrands LLC, |
| |||||||||||
| Term Loan B, 1st Lien |
| |||||||||||
| (LIBOR plus 3.25%) |
| |||||||||||
| 3.75% |
08/03/282 | 473,813 | 468,731 | |||||||||
|
|
|
| ||||||||||
| Services — 0.08% |
| |||||||||||
| GFL Environmental, Inc., |
| |||||||||||
| Term Loan B, 1st Lien |
| |||||||||||
| (LIBOR plus 3.00%) |
| |||||||||||
| 3.50% |
05/30/252 | 73,756 | 73,595 | |||||||||
| Trans Union LLC, |
| |||||||||||
| Term Loan B6 |
| |||||||||||
| (LIBOR plus 2.25%) |
| |||||||||||
| 2.75% |
12/01/282 | 607,927 | 604,380 | |||||||||
|
|
|
| ||||||||||
| 677,975 | ||||||||||||
|
|
|
| ||||||||||
| Issues | Maturity Date |
Principal Amount |
Value | |||||||||
| BANK LOANS (continued) |
| |||||||||||
| Transportation — 0.01% |
| |||||||||||
| American Airlines, Inc., |
| |||||||||||
| Term Loan B, 1st Lien |
| |||||||||||
| (LIBOR plus 1.75%) |
| |||||||||||
| 2.20% |
01/29/272 | $ | 51,722 | $ | 48,554 | |||||||
|
|
|
| ||||||||||
| Total Bank Loans |
| |||||||||||
| (Cost $11,408,600) |
|
11,497,475 | ||||||||||
|
|
|
| ||||||||||
| CORPORATES — 32.95%* |
| |||||||||||
| Automotive — 0.11% |
| |||||||||||
| General Motors Co. |
| |||||||||||
| 4.88% |
10/02/23 | 845,000 | 870,923 | |||||||||
|
|
|
| ||||||||||
| Banking — 6.66% |
| |||||||||||
| Bank of America Corp. |
| |||||||||||
| 2.30% |
07/21/324 | 1,420,000 | 1,264,802 | |||||||||
| 2.57% |
10/20/324 | 215,000 | 195,948 | |||||||||
| 2.69% |
04/22/324 | 250,000 | 229,867 | |||||||||
| 3.00% |
12/20/234 | 1,000,000 | 1,002,903 | |||||||||
| 3.37% |
01/23/264 | 605,000 | 605,050 | |||||||||
| Bank of America Corp. |
| |||||||||||
| (MTN) |
| |||||||||||
| 2.09% |
06/14/294 | 1,355,000 | 1,239,594 | |||||||||
| 3.09% |
10/01/254 | 152,000 | 151,581 | |||||||||
| 3.46% |
03/15/254 | 1,435,000 | 1,444,395 | |||||||||
| 3.56% |
04/23/274 | 2,605,000 | 2,614,802 | |||||||||
| 3.97% |
03/05/294 | 1,540,000 | 1,564,951 | |||||||||
| Credit Suisse Group AG |
| |||||||||||
| (Switzerland) |
| |||||||||||
| 1.31% |
02/02/271,3,4 | 1,520,000 | 1,359,333 | |||||||||
| 2.19% |
06/05/261,3,4 | 1,195,000 | 1,124,415 | |||||||||
| 2.59% |
09/11/251,3,4 | 370,000 | 357,084 | |||||||||
| 3.09% |
05/14/321,3,4 | 750,000 | 675,675 | |||||||||
| 3.75% |
03/26/253 | 210,000 | 209,376 | |||||||||
| 4.28% |
01/09/281,3 | 175,000 | 175,065 | |||||||||
| DNB Bank ASA |
| |||||||||||
| (Norway) |
| |||||||||||
| 0.86% |
09/30/251,3,4 | 2,485,000 | 2,355,298 | |||||||||
| HSBC Holdings PLC |
| |||||||||||
| (United Kingdom) |
| |||||||||||
| 1.59% |
05/24/273,4 | 1,730,000 | 1,581,235 | |||||||||
| 2.01% |
09/22/283,4 | 2,425,000 | 2,202,340 | |||||||||
| 2.21% |
08/17/293,4 | 1,195,000 | 1,076,972 | |||||||||
| 2.80% |
05/24/323,4 | 435,000 | 396,255 | |||||||||
| 2.87% |
11/22/323,4 | 285,000 | 259,718 | |||||||||
| ING Groep NV |
| |||||||||||
| (Netherlands) |
| |||||||||||
| 4.02% |
03/28/283,4 | 1,595,000 | 1,606,676 | |||||||||
| JPMorgan Chase & Co. |
| |||||||||||
| 0.77% |
08/09/254 | 850,000 | 806,705 | |||||||||
| 0.97% |
06/23/254 | 755,000 | 721,315 | |||||||||
| 1.58% |
04/22/274 | 420,000 | 391,498 | |||||||||
| 2.58% |
04/22/324 | 420,000 | 385,384 | |||||||||
| 3.22% |
03/01/254 | 2,820,000 | 2,831,279 | |||||||||
| 3.96% |
01/29/274 | 50,000 | 51,088 | |||||||||
See accompanying Notes to Financial Statements.
| Annual Report March 2022 / 104 |
Table of Contents
Intermediate Bond Fund
Schedule of Portfolio Investments
March 31, 2022
| Issues | Maturity Date |
Principal Amount |
Value | |||||||||
| CORPORATES (continued) |
| |||||||||||
| Banking (continued) |
| |||||||||||
| Lloyds Banking Group PLC |
| |||||||||||
| (United Kingdom) |
| |||||||||||
| 2.91% |
11/07/233,4 | $ | 875,000 | $ | 876,491 | |||||||
| 3.87% |
07/09/253,4 | 3,020,000 | 3,053,568 | |||||||||
| Macquarie Group Ltd. |
| |||||||||||
| (Australia) |
| |||||||||||
| 1.20% |
10/14/251,3,4 | 1,760,000 | 1,664,957 | |||||||||
| 1.34% |
01/12/271,3,4 | 1,160,000 | 1,058,309 | |||||||||
| 4.44% |
06/21/331,3,4 | 410,000 | 415,152 | |||||||||
| NatWest Group PLC |
| |||||||||||
| (United Kingdom) |
| |||||||||||
| 3.50% |
05/15/233,4 | 1,200,000 | 1,201,739 | |||||||||
| 4.27% |
03/22/253,4 | 385,000 | 389,685 | |||||||||
| 4.52% |
06/25/243,4 | 1,165,000 | 1,182,923 | |||||||||
| Santander UK Group Holdings PLC |
| |||||||||||
| (United Kingdom) |
| |||||||||||
| 1.09% |
03/15/253,4 | 1,575,000 | 1,498,281 | |||||||||
| 1.53% |
08/21/263,4 | 155,000 | 142,651 | |||||||||
| 1.67% |
06/14/273,4 | 435,000 | 396,310 | |||||||||
| 2.47% |
01/11/283,4 | 245,000 | 228,162 | |||||||||
| 4.80% |
11/15/243,4 | 1,730,000 | 1,770,134 | |||||||||
| Santander UK PLC |
| |||||||||||
| (United Kingdom) |
| |||||||||||
| 5.00% |
11/07/231,3 | 330,000 | 338,085 | |||||||||
| UBS Group AG |
| |||||||||||
| (Switzerland) |
| |||||||||||
| 3.49% |
05/23/231,3 | 1,000,000 | 1,001,501 | |||||||||
| Wells Fargo & Co. |
| |||||||||||
| 2.19% |
04/30/264 | 545,000 | 526,097 | |||||||||
| Wells Fargo & Co. |
| |||||||||||
| (MTN) |
| |||||||||||
| 2.39% |
06/02/284 | 4,585,000 | 4,340,805 | |||||||||
| 3.53% |
03/24/284 | 3,815,000 | 3,811,024 | |||||||||
|
|
|
| ||||||||||
| 52,776,478 | ||||||||||||
|
|
|
| ||||||||||
| Communications — 3.47% |
| |||||||||||
| AT&T, Inc. |
| |||||||||||
| 2.55% |
12/01/33 | 4,387,000 | 3,906,327 | |||||||||
| CCO Holdings, LLC/CCO Holdings Capital Corp. |
| |||||||||||
| 4.25% |
01/15/341 | 875,000 | 761,250 | |||||||||
| 4.50% |
05/01/32 | 750,000 | 686,949 | |||||||||
| Charter Communications Operating LLC/Charter |
| |||||||||||
| Communications Operating Capital |
| |||||||||||
| 2.30% |
02/01/32 | 825,000 | 705,908 | |||||||||
| Charter Communications Operating, LLC/Charter |
| |||||||||||
| Communications Operating Capital |
| |||||||||||
| 4.40% |
04/01/33 | 1,615,000 | 1,612,592 | |||||||||
| Cox Communications, Inc. |
| |||||||||||
| 2.60% |
06/15/311 | 705,000 | 638,150 | |||||||||
| CSC Holdings LLC |
| |||||||||||
| 4.13% |
12/01/301 | 900,000 | 793,638 | |||||||||
| 5.38% |
02/01/281 | 65,000 | 63,201 | |||||||||
| 6.50% |
02/01/291 | 43,000 | 43,424 | |||||||||
| Diamond Sports Group, LLC/Diamond Sports Finance Co. |
| |||||||||||
| 5.38% |
08/15/261 | 1,007,000 | 395,248 | |||||||||
| Issues | Maturity Date |
Principal Amount |
Value | |||||||||
| CORPORATES (continued) |
| |||||||||||
| Communications (continued) |
| |||||||||||
| Fox Corp. |
| |||||||||||
| 3.50% |
04/08/30 | $ | 1,500,000 | $ | 1,488,001 | |||||||
| Frontier Communications Holdings LLC |
| |||||||||||
| 5.00% |
05/01/281 | 400,000 | 385,376 | |||||||||
| Intelsat Jackson Holdings SA |
| |||||||||||
| (Luxembourg) |
| |||||||||||
| 6.50% |
03/15/301,3 | 2,108,000 | 2,108,072 | |||||||||
| Intelsat Jackson Holdings SA, |
| |||||||||||
| Class B |
| |||||||||||
| 8.50% |
10/15/241,3,5,6,7,8 | 1,003,000 | — | |||||||||
| Intelsat Jackson Holdings SA, |
| |||||||||||
| Class B |
| |||||||||||
| (Luxembourg) |
| |||||||||||
| 9.75% |
07/15/251,3,5,6,7,8 | 585,000 | — | |||||||||
| Level 3 Financing, Inc. |
| |||||||||||
| 3.88% |
11/15/291 | 1,210,000 | 1,115,747 | |||||||||
| Lumen Technologies, Inc. |
| |||||||||||
| 5.38% |
06/15/291 | 275,000 | 245,289 | |||||||||
| SES GLOBAL Americas Holdings GP |
| |||||||||||
| 5.30% |
03/25/441 | 750,000 | 729,664 | |||||||||
| SES SA |
| |||||||||||
| (Luxembourg) |
| |||||||||||
| 3.60% |
04/04/231,3 | 1,500,000 | 1,508,791 | |||||||||
| Sinclair Television Group, Inc. |
| |||||||||||
| 4.13% |
12/01/301 | 800,000 | 714,800 | |||||||||
| Sprint Corp. |
| |||||||||||
| 7.88% |
09/15/23 | 65,000 | 69,143 | |||||||||
| Sprint Spectrum Co. LLC/Sprint Spectrum Co. II LLC/Sprint |
|
|||||||||||
| Spectrum Co. III LLC |
| |||||||||||
| 4.74% |
03/20/251 | 881,250 | 900,136 | |||||||||
| 5.15% |
03/20/281 | 1,785,000 | 1,881,300 | |||||||||
| Tencent Holdings Ltd. |
| |||||||||||
| (Cayman Islands) |
| |||||||||||
| 2.88% |
04/22/311,3 | 1,210,000 | 1,106,429 | |||||||||
| T-Mobile USA, Inc. |
| |||||||||||
| 2.25% |
02/15/26 | 700,000 | 660,380 | |||||||||
| 2.55% |
02/15/31 | 740,000 | 672,202 | |||||||||
| 3.75% |
04/15/27 | 2,275,000 | 2,292,329 | |||||||||
| 3.88% |
04/15/30 | 800,000 | 804,210 | |||||||||
| Verizon Communications, Inc. |
| |||||||||||
| 2.36% |
03/15/321 | 765,000 | 692,055 | |||||||||
| Virgin Media Secured Finance PLC |
| |||||||||||
| (United Kingdom) |
| |||||||||||
| 5.50% |
05/15/291,3 | 65,000 | 64,617 | |||||||||
| Zayo Group Holdings, Inc. |
| |||||||||||
| 4.00% |
03/01/271 | 500,000 | 461,010 | |||||||||
|
|
|
| ||||||||||
| 27,506,238 | ||||||||||||
|
|
|
| ||||||||||
| Consumer Discretionary — 1.69% |
| |||||||||||
| Anheuser-Busch InBev Worldwide, Inc. |
| |||||||||||
| 4.38% |
04/15/38 | 725,000 | 763,611 | |||||||||
| Bacardi Ltd. |
| |||||||||||
| (Bermuda) |
| |||||||||||
| 4.45% |
05/15/251,3 | 1,045,000 | 1,070,587 | |||||||||
| BAT Capital Corp. |
| |||||||||||
| 2.73% |
03/25/31 | 555,000 | 490,022 | |||||||||
See accompanying Notes to Financial Statements.
| 105 / Annual Report March 2022 |
Table of Contents
Intermediate Bond Fund
Schedule of Portfolio Investments
March 31, 2022
| Issues | Maturity Date |
Principal Amount |
Value | |||||||||
| CORPORATES (continued) |
| |||||||||||
| Consumer Discretionary (continued) |
| |||||||||||
| 3.46% |
09/06/29 | $ | 770,000 | $ | 725,818 | |||||||
| 3.56% |
08/15/27 | 550,000 | 535,412 | |||||||||
| 4.39% |
08/15/37 | 830,000 | 773,666 | |||||||||
| Constellation Brands, Inc. |
| |||||||||||
| 4.65% |
11/15/28 | 1,000,000 | 1,056,747 | |||||||||
| Hyatt Hotels Corp. |
| |||||||||||
| 1.30% |
10/01/23 | 1,240,000 | 1,209,259 | |||||||||
| Imperial Brands Finance PLC |
| |||||||||||
| (United Kingdom) |
| |||||||||||
| 3.13% |
07/26/241,3 | 1,000,000 | 991,690 | |||||||||
| JDE Peet’s NV |
| |||||||||||
| (Netherlands) |
| |||||||||||
| 0.80% |
09/24/241,3 | 1,650,000 | 1,549,706 | |||||||||
| Magallanes, Inc. |
| |||||||||||
| 4.28% |
03/15/321 | 2,825,000 | 2,842,674 | |||||||||
| Reynolds American, Inc. |
| |||||||||||
| 4.45% |
06/12/25 | 365,000 | 373,071 | |||||||||
| 5.70% |
08/15/35 | 940,000 | 991,152 | |||||||||
|
|
|
| ||||||||||
| 13,373,415 | ||||||||||||
|
|
|
| ||||||||||
| Electric — 1.64% |
| |||||||||||
| Alliant Energy Finance, LLC |
| |||||||||||
| 3.60% |
03/01/321 | 1,625,000 | 1,586,825 | |||||||||
| Appalachian Power Co., |
| |||||||||||
| Series H |
| |||||||||||
| 5.95% |
05/15/33 | 350,000 | 408,569 | |||||||||
| Appalachian Power Co., |
| |||||||||||
| Series X |
| |||||||||||
| 3.30% |
06/01/27 | 410,000 | 412,897 | |||||||||
| CenterPoint Energy Houston Electric, LLC, |
| |||||||||||
| Series AG |
| |||||||||||
| 3.00% |
03/01/32 | 1,500,000 | 1,468,268 | |||||||||
| Duke Energy Corp. |
| |||||||||||
| 2.65% |
09/01/26 | 30,000 | 29,240 | |||||||||
| Duke Energy Progress, LLC |
| |||||||||||
| 3.40% |
04/01/32 | 780,000 | 784,790 | |||||||||
| Evergy Missouri West, Inc. |
| |||||||||||
| 3.75% |
03/15/321 | 1,615,000 | 1,628,739 | |||||||||
| Exelon Corp. |
| |||||||||||
| 2.75% |
03/15/271 | 2,120,000 | 2,065,974 | |||||||||
| FirstEnergy Transmission LLC |
| |||||||||||
| 2.87% |
09/15/281 | 853,000 | 792,952 | |||||||||
| Jersey Central Power & Light Co. |
| |||||||||||
| 4.70% |
04/01/241 | 995,000 | 1,017,779 | |||||||||
| Metropolitan Edison Co. |
| |||||||||||
| 4.00% |
04/15/251 | 770,000 | 774,377 | |||||||||
| Public Service Co. of New Mexico |
| |||||||||||
| 3.85% |
08/01/25 | 1,405,000 | 1,430,159 | |||||||||
| Tucson Electric Power Co. |
| |||||||||||
| 3.85% |
03/15/23 | 595,000 | 604,028 | |||||||||
|
|
|
| ||||||||||
| 13,004,597 | ||||||||||||
|
|
|
| ||||||||||
| Energy — 1.44% |
| |||||||||||
| Boston Gas Co. |
| |||||||||||
| 3.76% |
03/16/321 | 2,400,000 | 2,402,812 | |||||||||
| Issues | Maturity Date |
Principal Amount |
Value | |||||||||
| CORPORATES (continued) |
| |||||||||||
| Energy (continued) |
| |||||||||||
| Energy Transfer LP |
| |||||||||||
| 3.45% |
01/15/23 | $ | 105,000 | $ | 105,617 | |||||||
| 3.75% |
05/15/30 | 315,000 | 310,260 | |||||||||
| 4.75% |
01/15/26 | 130,000 | 135,004 | |||||||||
| 4.95% |
05/15/28 | 750,000 | 780,978 | |||||||||
| 4.95% |
06/15/28 | 1,000,000 | 1,051,693 | |||||||||
| 5.50% |
06/01/27 | 531,000 | 571,279 | |||||||||
| Occidental Petroleum Corp. |
| |||||||||||
| 0.00% |
10/10/369 | 444,000 | 239,050 | |||||||||
| Petroleos Mexicanos |
| |||||||||||
| (Mexico) |
| |||||||||||
| 2.00% |
12/20/223 | 300,000 | 300,080 | |||||||||
| 5.95% |
01/28/313 | 300,000 | 277,335 | |||||||||
| 6.63% |
06/15/353 | 1,780,000 | 1,601,110 | |||||||||
| Plains All American Pipeline LP/PAA Finance Corp. |
|
|||||||||||
| 3.80% |
09/15/30 | 525,000 | 515,806 | |||||||||
| Rockies Express Pipeline LLC |
| |||||||||||
| 4.80% |
05/15/301 | 400,000 | 383,000 | |||||||||
| 4.95% |
07/15/291 | 1,000,000 | 971,913 | |||||||||
| Ruby Pipeline LLC |
| |||||||||||
| 8.00% |
04/01/221,5,6 | 561,364 | 522,068 | |||||||||
| Sunoco LP/Sunoco Finance Corp. |
| |||||||||||
| 4.50% |
04/30/301 | 250,000 | 230,700 | |||||||||
| USA Compression Partners LP/USA Compression Finance |
|
|||||||||||
| Corp. |
| |||||||||||
| 6.88% |
04/01/26 | 60,000 | 60,641 | |||||||||
| 6.88% |
09/01/27 | 181,000 | 181,975 | |||||||||
| Venture Global Calcasieu Pass LLC |
| |||||||||||
| 3.88% |
08/15/291 | 825,000 | 803,402 | |||||||||
|
|
|
| ||||||||||
| 11,444,723 | ||||||||||||
|
|
|
| ||||||||||
| Finance — 6.23% |
| |||||||||||
| AerCap Ireland Capital DAC/AerCap Global Aviation Trust |
|
|||||||||||
| (Ireland) |
| |||||||||||
| 2.45% |
10/29/263 | 2,045,000 | 1,891,464 | |||||||||
| 3.30% |
01/30/323 | 85,000 | 76,901 | |||||||||
| Air Lease Corp. |
| |||||||||||
| 2.25% |
01/15/23 | 1,000,000 | 1,000,794 | |||||||||
| 3.25% |
03/01/25 | 820,000 | 804,580 | |||||||||
| 3.25% |
10/01/29 | 525,000 | 496,412 | |||||||||
| 3.63% |
12/01/27 | 355,000 | 338,974 | |||||||||
| American Express Co. |
| |||||||||||
| 2.55% |
03/04/27 | 815,000 | 792,484 | |||||||||
| Avolon Holdings Funding Ltd. |
| |||||||||||
| (Cayman Islands) |
| |||||||||||
| 2.53% |
11/18/271,3 | 773,000 | 684,205 | |||||||||
| 2.88% |
02/15/251,3 | 1,160,000 | 1,123,058 | |||||||||
| Capital One Financial Corp. |
| |||||||||||
| 1.34% |
12/06/244 | 2,090,000 | 2,028,694 | |||||||||
| Cboe Global Markets, Inc. |
| |||||||||||
| 3.00% |
03/16/32 | 820,000 | 793,860 | |||||||||
| Charles Schwab Corp. (The) |
| |||||||||||
| 2.45% |
03/03/27 | 815,000 | 791,682 | |||||||||
| Citigroup, Inc. |
| |||||||||||
| 2.52% |
11/03/324 | 1,145,000 | 1,029,804 | |||||||||
| 2.56% |
05/01/324 | 420,000 | 379,577 | |||||||||
See accompanying Notes to Financial Statements.
| Annual Report March 2022 / 106 |
Table of Contents
Intermediate Bond Fund
Schedule of Portfolio Investments
March 31, 2022
| Issues | Maturity Date |
Principal Amount |
Value | |||||||||||
| CORPORATES (continued) |
| |||||||||||||
| Finance (continued) |
| |||||||||||||
| 2.57% |
06/03/31 | 4 | $ | 285,000 | $ | 261,604 | ||||||||
| 3.06% |
01/25/33 | 4 | 2,455,000 | 2,298,828 | ||||||||||
| 4.41% |
03/31/31 | 4 | 985,000 | 1,024,439 | ||||||||||
| Citigroup, Inc., |
| |||||||||||||
| Series VAR |
| |||||||||||||
| 3.07% |
02/24/28 | 4 | 405,000 | 395,476 | ||||||||||
| CME Group, Inc. |
| |||||||||||||
| 2.65% |
03/15/32 | 815,000 | 780,257 | |||||||||||
| Durrah MSN 35603 |
| |||||||||||||
| (Cayman Islands) |
| |||||||||||||
| 1.68% |
01/22/25 | 3 | 1,714,698 | 1,700,267 | ||||||||||
| General Motors Financial Co., Inc. |
| |||||||||||||
| 3.15% |
06/30/22 | 495,000 | 496,679 | |||||||||||
| 3.45% |
04/10/22 | 120,000 | 120,038 | |||||||||||
| Goldman Sachs Group, Inc. (The) |
| |||||||||||||
| 0.93% |
10/21/24 | 4 | 840,000 | 814,674 | ||||||||||
| 1.22% |
12/06/23 | 2,090,000 | 2,041,362 | |||||||||||
| 1.43% |
03/09/27 | 4 | 2,555,000 | 2,358,596 | ||||||||||
| 2.38% |
07/21/32 | 4 | 1,020,000 | 906,983 | ||||||||||
| 2.65% |
10/21/32 | 4 | 3,160,000 | 2,863,772 | ||||||||||
| 2.91% |
07/24/23 | 4 | 725,000 | 726,083 | ||||||||||
| 3.75% |
02/25/26 | 20,000 | 20,335 | |||||||||||
| Intercontinental Exchange, Inc. |
| |||||||||||||
| 1.85% |
09/15/32 | 870,000 | 754,366 | |||||||||||
| JPMorgan Chase & Co. |
| |||||||||||||
| 1.05% |
11/19/26 | 4 | 1,235,000 | 1,141,590 | ||||||||||
| 1.56% |
12/10/25 | 4 | 555,000 | 531,361 | ||||||||||
| 2.55% |
11/08/32 | 4 | 425,000 | 388,250 | ||||||||||
| 2.74% |
10/15/30 | 4 | 3,055,000 | 2,890,262 | ||||||||||
| 2.95% |
02/24/28 | 4 | 425,000 | 414,894 | ||||||||||
| Morgan Stanley |
| |||||||||||||
| 1.59% |
05/04/27 | 4 | 1,210,000 | 1,125,175 | ||||||||||
| Morgan Stanley |
| |||||||||||||
| (MTN) |
| |||||||||||||
| 1.16% |
10/21/25 | 4 | 4,790,000 | 4,554,436 | ||||||||||
| 1.93% |
04/28/32 | 4 | 340,000 | 294,615 | ||||||||||
| Nationwide Building Society |
| |||||||||||||
| (United Kingdom) |
| |||||||||||||
| 2.97% |
02/16/28 | 1,3,4 | 100,000 | 95,367 | ||||||||||
| 3.62% |
04/26/23 | 1,3,4 | 390,000 | 390,083 | ||||||||||
| 3.77% |
03/08/24 | 1,3,4 | 1,265,000 | 1,272,488 | ||||||||||
| 4.36% |
08/01/24 | 1,3,4 | 1,085,000 | 1,102,042 | ||||||||||
| Park Aerospace Holdings Ltd. |
| |||||||||||||
| (Cayman Islands) |
| |||||||||||||
| 4.50% |
03/15/23 | 1,3 | 860,000 | 866,532 | ||||||||||
| 5.50% |
02/15/24 | 1,3 | 40,000 | 40,968 | ||||||||||
| Safina Ltd. |
| |||||||||||||
| (Cayman Islands) |
| |||||||||||||
| 2.00% |
12/30/23 | 3 | 2,211,544 | 2,214,379 | ||||||||||
| Sandalwood 2013 LLC |
| |||||||||||||
| 2.90% |
07/10/25 | 1,087,169 | 1,095,849 | |||||||||||
| TIAA FSB Holdings, Inc. |
| |||||||||||||
| 5.75% |
07/02/25 | 1,150,000 | 1,193,102 | |||||||||||
|
|
|
| ||||||||||||
| 49,407,641 | ||||||||||||||
|
|
|
| ||||||||||||
| Issues | Maturity Date |
Principal Amount |
Value | |||||||||
| CORPORATES (continued) |
|
|||||||||||
| Food — 0.55% |
|
|||||||||||
| JBS USA LUX SA/JBS USA Food Co./JBS USA Finance, |
|
|||||||||||
| Inc. |
|
|||||||||||
| (Canada) |
|
|||||||||||
| 3.00% |
02/02/291,3 | $ | 435,000 | $ | 404,097 | |||||||
| JBS USA LUX SA/JBS USA Food Co/JBS USA Finance, Inc. |
|
|||||||||||
| (Canada) |
|
|||||||||||
| 3.00% |
05/15/321,3 | 1,185,000 | 1,055,266 | |||||||||
| Kraft Heinz Foods Co. |
|
|||||||||||
| 5.00% |
07/15/35 | 933,000 | 1,001,603 | |||||||||
| 5.00% |
06/04/42 | 245,000 | 261,991 | |||||||||
| Mondelez International, Inc. |
|
|||||||||||
| 3.00% |
03/17/32 | 860,000 | 830,793 | |||||||||
| Pilgrim’s Pride Corp. |
|
|||||||||||
| 5.88% |
09/30/271 | 65,000 | 65,761 | |||||||||
| Post Holdings, Inc. |
|
|||||||||||
| 4.63% |
04/15/301 | 826,000 | 745,135 | |||||||||
|
|
|
| ||||||||||
| 4,364,646 | ||||||||||||
|
|
|
| ||||||||||
| Health Care — 4.05% |
|
|||||||||||
| AbbVie, Inc. |
|
|||||||||||
| 3.60% |
05/14/25 | 1,152,000 | 1,168,221 | |||||||||
| 3.85% |
06/15/24 | 1,342,000 | 1,369,245 | |||||||||
| Aetna, Inc. |
|
|||||||||||
| 2.80% |
06/15/23 | 50,000 | 50,225 | |||||||||
| 3.50% |
11/15/24 | 1,250,000 | 1,264,513 | |||||||||
| Alcon Finance Corp. |
|
|||||||||||
| 2.75% |
09/23/261 | 2,300,000 | 2,230,296 | |||||||||
| American Medical Systems Europe BV |
|
|||||||||||
| (Netherlands) |
|
|||||||||||
| 1.63% |
03/08/313 | 400,000 | 434,401 | |||||||||
| Amgen, Inc. |
|
|||||||||||
| 3.35% |
02/22/32 | 1,620,000 | 1,607,264 | |||||||||
| Bayer U.S. Finance II LLC |
|
|||||||||||
| 4.25% |
12/15/251 | 25,000 | 25,449 | |||||||||
| 4.38% |
12/15/281 | 2,900,000 | 2,968,661 | |||||||||
| 5.50% |
08/15/251 | 1,100,000 | 1,145,281 | |||||||||
| Bayer U.S. Finance LLC |
|
|||||||||||
| 3.38% |
10/08/241 | 1,020,000 | 1,019,950 | |||||||||
| Baylor Scott & White Holdings |
|
|||||||||||
| 2.65% |
11/15/26 | 1,530,000 | 1,520,180 | |||||||||
| Becton Dickinson and Co. |
|
|||||||||||
| 3.36% |
06/06/24 | 589,000 | 594,486 | |||||||||
| Centene Corp. |
|
|||||||||||
| 3.00% |
10/15/30 | 2,000,000 | 1,840,020 | |||||||||
| Cigna Corp. |
|
|||||||||||
| 4.13% |
11/15/25 | 545,000 | 562,186 | |||||||||
| CommonSpirit Health |
|
|||||||||||
| 2.78% |
10/01/30 | 1,650,000 | 1,530,984 | |||||||||
| CVS Health Corp. |
|
|||||||||||
| 3.25% |
08/15/29 | 2,890,000 | 2,856,664 | |||||||||
| DENTSPLY SIRONA, Inc. |
|
|||||||||||
| 3.25% |
06/01/30 | 1,000,000 | 965,088 | |||||||||
| Endo DAC/Endo Finance LLC/Endo Finco, Inc. |
|
|||||||||||
| (Ireland) |
|
|||||||||||
| 6.00% |
06/30/281,3 | 889,000 | 518,420 | |||||||||
See accompanying Notes to Financial Statements.
| 107 / Annual Report March 2022 |
Table of Contents
Intermediate Bond Fund
Schedule of Portfolio Investments
March 31, 2022
| Issues |
Maturity Date |
Principal Amount |
Value | |||||||||
| CORPORATES (continued) |
| |||||||||||
| Health Care (continued) |
| |||||||||||
| HCA, Inc. |
| |||||||||||
| 4.13% |
06/15/29 | $ | 1,145,000 | $ | 1,166,938 | |||||||
| 5.00% |
03/15/24 | 1,460,000 | 1,513,678 | |||||||||
| 5.25% |
04/15/25 | 206,000 | 217,036 | |||||||||
| 5.25% |
06/15/26 | 1,070,000 | 1,130,407 | |||||||||
| 7.05% |
12/01/27 | 80,000 | 90,445 | |||||||||
| Humana, Inc. |
| |||||||||||
| 3.85% |
10/01/24 | 860,000 | 874,383 | |||||||||
| 3.95% |
03/15/27 | 885,000 | 900,348 | |||||||||
| PerkinElmer, Inc. |
| |||||||||||
| 0.85% |
09/15/24 | 2,050,000 | 1,947,151 | |||||||||
| Royalty Pharma PLC |
| |||||||||||
| (United Kingdom) |
| |||||||||||
| 2.20% |
09/02/303 | 675,000 | 591,837 | |||||||||
|
|
|
| ||||||||||
| 32,103,757 | ||||||||||||
|
|
|
| ||||||||||
| Industrials — 1.13% |
| |||||||||||
| Amcor Finance USA, Inc. |
| |||||||||||
| 3.63% |
04/28/26 | 1,950,000 | 1,977,764 | |||||||||
| Artera Services LLC |
| |||||||||||
| 9.03% |
12/04/251 | 227,000 | 227,086 | |||||||||
| BAE Systems Holdings, Inc. |
| |||||||||||
| 3.80% |
10/07/241 | 630,000 | 634,670 | |||||||||
| Berry Global, Inc. |
| |||||||||||
| 1.65% |
01/15/27 | 95,000 | 86,687 | |||||||||
| 4.88% |
07/15/261 | 555,000 | 561,222 | |||||||||
| Boeing Co. (The) |
| |||||||||||
| 1.43% |
02/04/24 | 1,300,000 | 1,258,322 | |||||||||
| Crane Co. |
| |||||||||||
| 4.45% |
12/15/23 | 1,130,000 | 1,154,242 | |||||||||
| General Electric Co. |
| |||||||||||
| (MTN) |
| |||||||||||
| (LIBOR USD 3-Month plus 0.38%) |
| |||||||||||
| 0.70% |
05/05/262 | 1,028,000 | 1,012,144 | |||||||||
| (LIBOR USD 3-Month plus 0.48%) |
| |||||||||||
| 0.99% |
08/15/362 | 1,115,000 | 960,463 | |||||||||
| General Electric Co., |
| |||||||||||
| Series A (MTN) |
| |||||||||||
| 6.75% |
03/15/32 | 135,000 | 170,426 | |||||||||
| L3Harris Technologies, Inc. |
| |||||||||||
| 3.85% |
06/15/23 | 410,000 | 415,288 | |||||||||
| Mauser Packaging Solutions Holding Co. |
| |||||||||||
| 5.50% |
04/15/241 | 65,000 | 64,830 | |||||||||
| Sealed Air Corp. |
| |||||||||||
| 4.00% |
12/01/271 | 65,000 | 63,700 | |||||||||
| Sydney Airport Finance Co. Pty Ltd. |
| |||||||||||
| (Australia) |
| |||||||||||
| 3.38% |
04/30/251,3 | 410,000 | 408,036 | |||||||||
|
|
|
| ||||||||||
| 8,994,880 | ||||||||||||
|
|
|
| ||||||||||
| Information Technology — 0.63% |
| |||||||||||
| Apple, Inc. |
| |||||||||||
| 3.25% |
02/23/26 | 20,000 | 20,387 | |||||||||
| Broadcom, Inc. |
| |||||||||||
| 4.30% |
11/15/32 | 750,000 | 761,762 | |||||||||
| Issues |
Maturity Date |
Principal Amount |
Value | |||||||||
| CORPORATES (continued) |
| |||||||||||
| Information Technology (continued) |
| |||||||||||
| Change Healthcare Holdings LLC/Change Healthcare |
| |||||||||||
| Finance, Inc. |
| |||||||||||
| 5.75% |
03/01/251 | $ | 65,000 | $ | 65,081 | |||||||
| Netflix, Inc. |
| |||||||||||
| 5.88% |
02/15/25 | 1,475,000 | 1,575,650 | |||||||||
| Oracle Corp. |
| |||||||||||
| 2.88% |
03/25/31 | 1,955,000 | 1,785,108 | |||||||||
| VMware, Inc. |
| |||||||||||
| 1.00% |
08/15/24 | 815,000 | 777,127 | |||||||||
|
|
|
| ||||||||||
| 4,985,115 | ||||||||||||
|
|
|
| ||||||||||
| Insurance — 1.39% |
| |||||||||||
| Aon Corp./Aon Global Holdings PLC |
| |||||||||||
| 2.85% |
05/28/27 | 1,625,000 | 1,593,208 | |||||||||
| Athene Global Funding |
| |||||||||||
| 1.99% |
08/19/281 | 2,055,000 | 1,806,263 | |||||||||
| 3.21% |
03/08/271 | 530,000 | 510,834 | |||||||||
| Berkshire Hathaway Finance Corp. |
| |||||||||||
| 2.88% |
03/15/32 | 1,210,000 | 1,174,285 | |||||||||
| Brown & Brown, Inc. |
| |||||||||||
| 4.20% |
03/17/32 | 1,000,000 | 1,016,819 | |||||||||
| Equitable Financial Life Global Funding |
| |||||||||||
| 1.80% |
03/08/281 | 1,190,000 | 1,071,225 | |||||||||
| Metropolitan Life Global Funding I |
| |||||||||||
| 3.30% |
03/21/291 | 1,200,000 | 1,192,777 | |||||||||
| Nationwide Mutual Insurance Co. |
| |||||||||||
| 3.12% |
12/15/241,4 | 1,212,000 | 1,212,836 | |||||||||
| New York Life Global Funding |
| |||||||||||
| 3.00% |
01/10/281 | 50,000 | 49,295 | |||||||||
| Trinity Acquisition PLC |
| |||||||||||
| (United Kingdom) |
| |||||||||||
| 4.40% |
03/15/263 | 1,385,000 | 1,430,589 | |||||||||
|
|
|
| ||||||||||
| 11,058,131 | ||||||||||||
|
|
|
| ||||||||||
| Materials — 0.18% |
| |||||||||||
| International Flavors & Fragrances, Inc. |
| |||||||||||
| 1.23% |
10/01/251 | 950,000 | 880,688 | |||||||||
| 2.30% |
11/01/301 | 635,000 | 567,848 | |||||||||
|
|
|
| ||||||||||
| 1,448,536 | ||||||||||||
|
|
|
| ||||||||||
| Real Estate Investment Trust (REIT) — 2.39% |
| |||||||||||
| American Campus Communities Operating Partnership LP |
| |||||||||||
| 3.75% |
04/15/23 | 50,000 | 50,443 | |||||||||
| 4.13% |
07/01/24 | 1,250,000 | 1,273,519 | |||||||||
| CyrusOne LP/CyrusOne Finance Corp. |
| |||||||||||
| 2.90% |
11/15/24 | 1,450,000 | 1,453,980 | |||||||||
| 3.45% |
11/15/29 | 1,000,000 | 1,050,098 | |||||||||
| Extra Space Storage LP |
| |||||||||||
| 3.90% |
04/01/29 | 1,650,000 | 1,656,429 | |||||||||
| GLP Capital LP/GLP Financing II, Inc. |
| |||||||||||
| 3.35% |
09/01/24 | 1,140,000 | 1,139,316 | |||||||||
| 5.38% |
11/01/23 | 30,000 | 30,806 | |||||||||
| 5.38% |
04/15/26 | 2,323,000 | 2,429,936 | |||||||||
| 5.75% |
06/01/28 | 325,000 | 350,316 | |||||||||
| Healthcare Realty Trust, Inc. |
| |||||||||||
| 3.88% |
05/01/25 | 1,400,000 | 1,417,646 | |||||||||
See accompanying Notes to Financial Statements.
| Annual Report March 2022 / 108 |
Table of Contents
Intermediate Bond Fund
Schedule of Portfolio Investments
March 31, 2022
| Issues |
Maturity Date |
Principal Amount |
Value | |||||||||
| CORPORATES (continued) |
|
|||||||||||
| Real Estate Investment Trust (REIT) (continued) |
|
|||||||||||
| Healthcare Trust of America Holdings LP |
|
|||||||||||
| 3.50% |
08/01/26 | $ | 225,000 | $ | 225,051 | |||||||
| Healthpeak Properties, Inc. |
|
|||||||||||
| 4.00% |
06/01/25 | 750,000 | 763,199 | |||||||||
| Hudson Pacific Properties LP |
|
|||||||||||
| 4.65% |
04/01/29 | 1,065,000 | 1,118,047 | |||||||||
| Kilroy Realty LP |
|
|||||||||||
| 3.45% |
12/15/24 | 790,000 | 792,497 | |||||||||
| Life Storage LP |
|
|||||||||||
| 2.20% |
10/15/30 | 1,000,000 | 885,180 | |||||||||
| Piedmont Operating Partnership LP |
|
|||||||||||
| 3.40% |
06/01/23 | 1,210,000 | 1,211,929 | |||||||||
| SL Green Operating Partnership LP |
|
|||||||||||
| 3.25% |
10/15/22 | 1,350,000 | 1,350,502 | |||||||||
| Ventas Realty LP |
|
|||||||||||
| 3.25% |
10/15/26 | 940,000 | 932,028 | |||||||||
| Weyerhaeuser Co. |
|
|||||||||||
| 3.38% |
03/09/33 | 810,000 | 790,099 | |||||||||
|
|
|
| ||||||||||
| 18,921,021 | ||||||||||||
|
|
|
| ||||||||||
| Retail — 0.51% |
|
|||||||||||
| 7-Eleven, Inc. |
|
|||||||||||
| 0.80% |
02/10/241 | 1,565,000 | 1,504,385 | |||||||||
| Alimentation Couche-Tard, Inc. |
|
|||||||||||
| (Canada) |
|
|||||||||||
| 3.55% |
07/26/271,3 | 640,000 | 636,650 | |||||||||
| FirstCash, Inc. |
|
|||||||||||
| 5.63% |
01/01/301 | 415,000 | 399,285 | |||||||||
| Michaels Cos., Inc. (The) |
|
|||||||||||
| 5.25% |
05/01/281 | 405,000 | 372,349 | |||||||||
| Starbucks Corp. |
|
|||||||||||
| 3.00% |
02/14/32 | 1,220,000 | 1,166,979 | |||||||||
|
|
|
| ||||||||||
| 4,079,648 | ||||||||||||
|
|
|
| ||||||||||
| Services — 0.40% |
|
|||||||||||
| Global Payments, Inc. |
|
|||||||||||
| 1.50% |
11/15/24 | 1,255,000 | 1,200,134 | |||||||||
| Waste Connections, Inc. |
|
|||||||||||
| (Canada) |
|
|||||||||||
| 3.20% |
06/01/323 | 2,045,000 | 1,993,797 | |||||||||
|
|
|
| ||||||||||
| 3,193,931 | ||||||||||||
|
|
|
| ||||||||||
| Transportation — 0.48% |
|
|||||||||||
| Canadian Pacific Railway Co. |
|
|||||||||||
| (Canada) |
|
|||||||||||
| 1.35% |
12/02/243 | 1,675,000 | 1,609,484 | |||||||||
| Continental Airlines Pass-Through Trust, |
|
|||||||||||
| Series 2007-1, Class A |
|
|||||||||||
| 5.98% |
04/19/22 | 395,491 | 396,065 | |||||||||
| Northwest Airlines Pass-Through Trust, |
|
|||||||||||
| Series 2001-1, Class A-1 |
|
|||||||||||
| 7.04% |
04/01/22 | 33,525 | 33,693 | |||||||||
| U.S. Airways Pass-Through Trust, |
|
|||||||||||
| Series 2011-1, Class A |
|
|||||||||||
| 7.13% |
10/22/23 | 408,146 | 418,778 | |||||||||
| Issues |
Maturity Date |
Principal Amount |
Value | |||||||||
| CORPORATES (continued) |
|
|||||||||||
| Transportation (continued) |
|
|||||||||||
| U.S. Airways Pass-Through Trust, |
|
|||||||||||
| Series 2012-1, Class A |
|
|||||||||||
| 5.90% |
10/01/24 | $ | 284,669 | $ | 296,945 | |||||||
| U.S. Airways Pass-Through Trust, |
|
|||||||||||
| Series 2012-2, Class A |
|
|||||||||||
| 4.63% |
06/03/25 | 253,480 | 245,255 | |||||||||
| Union Pacific Corp. |
|
|||||||||||
| 2.80% |
02/14/32 | 815,000 | 784,264 | |||||||||
|
|
|
| ||||||||||
| 3,784,484 | ||||||||||||
|
|
|
| ||||||||||
| Total Corporates |
|
|||||||||||
| (Cost $270,838,382) |
|
261,318,164 | ||||||||||
|
|
|
| ||||||||||
| FOREIGN GOVERNMENT OBLIGATIONS — 0.15% |
|
|||||||||||
| Foreign Government Obligations — 0.15% |
|
|||||||||||
| Airport Authority |
|
|||||||||||
| (Hong Kong) |
|
|||||||||||
| 2.50% |
01/12/321,3 | 1,245,000 | 1,164,081 | |||||||||
|
|
|
| ||||||||||
| Total Foreign Government Obligations |
|
|||||||||||
| (Cost $1,244,036) |
|
|||||||||||
| MORTGAGE-BACKED — 15.77%** |
|
|||||||||||
| Non-Agency Commercial Mortgage-Backed — 2.01% |
|
|||||||||||
| Banc of America Merrill Lynch Commercial Mortgage Trust, |
|
|||||||||||
| Series 2018-PARK, Class A |
|
|||||||||||
| 4.09% |
08/10/381,4 | 1,095,000 | 1,126,867 | |||||||||
| BX Commercial Mortgage Trust, |
|
|||||||||||
| Series 2019-XL, Class A |
|
|||||||||||
| (LIBOR USD 1-Month plus 0.92%) |
|
|||||||||||
| 1.32% |
10/15/361,2 | 1,814,467 | 1,806,666 | |||||||||
| BX Trust, |
|
|||||||||||
| Series 2019-OC11, Class A |
|
|||||||||||
| 3.20% |
12/09/411 | 375,000 | 362,808 | |||||||||
| CALI Mortgage Trust, |
|
|||||||||||
| Series 2019-101C, Class A |
|
|||||||||||
| 3.96% |
03/10/391 | 805,000 | 818,430 | |||||||||
| Century Plaza Towers, |
|
|||||||||||
| Series 2019-CPT, Class A |
|
|||||||||||
| 2.87% |
11/13/391 | 715,000 | 676,175 | |||||||||
| Citigroup Commercial Mortgage Trust, |
|
|||||||||||
| Series 2016-GC36, Class A5 |
|
|||||||||||
| 3.62% |
02/10/49 | 3,250,000 | 3,266,050 | |||||||||
| Citigroup Commercial Mortgage Trust, |
|
|||||||||||
| Series 2016-GC37, Class A4 |
|
|||||||||||
| 3.31% |
04/10/49 | 1,000,000 | 994,483 | |||||||||
| Commercial Mortgage Trust, |
|
|||||||||||
| Series 2014-UBS2, Class XA (IO) |
|
|||||||||||
| 1.12% |
03/10/474 | 19,862,757 | 325,219 | |||||||||
| DC Office Trust, |
|
|||||||||||
| Series 2019-MTC, Class A |
|
|||||||||||
| 2.97% |
09/15/451 | 765,000 | 724,889 | |||||||||
| Hudson Yards Mortgage Trust, |
|
|||||||||||
| Series 2019-30HY, Class A |
|
|||||||||||
| 3.23% |
07/10/391 | 760,000 | 739,623 | |||||||||
See accompanying Notes to Financial Statements.
| 109 / Annual Report March 2022 |
Table of Contents
Intermediate Bond Fund
Schedule of Portfolio Investments
March 31, 2022
| Issues |
Maturity Date |
Principal Amount |
Value | |||||||||
| MORTGAGE-BACKED (continued) |
|
|||||||||||
| Non-Agency Commercial Mortgage-Backed (continued) |
|
|||||||||||
| Hudson Yards Mortgage Trust, |
|
|||||||||||
| Series 2019-55HY, Class A |
|
|||||||||||
| 2.94% |
12/10/411,4 | $ | 765,000 | $ | 731,945 | |||||||
| JPMBB Commercial Mortgage Securities Trust, |
|
|||||||||||
| Series 2015-C29, Class XA (IO) |
|
|||||||||||
| 0.60% |
05/15/484 | 22,841,142 | 340,870 | |||||||||
| JPMorgan Chase Commercial Mortgage Securities Trust, |
|
|||||||||||
| Series 2019-OSB, Class A |
|
|||||||||||
| 3.40% |
06/05/391 | 740,000 | 731,869 | |||||||||
| MKT Mortgage Trust, |
|
|||||||||||
| Series 2020-525M, Class A |
|
|||||||||||
| 2.69% |
02/12/401 | 945,000 | 882,391 | |||||||||
| One Bryant Park Trust, |
|
|||||||||||
| Series 2019-OBP, Class A |
|
|||||||||||
| 2.52% |
09/15/541 | 960,000 | 890,658 | |||||||||
| RBS Commercial Funding, Inc., Trust, |
|
|||||||||||
| Series 2013-GSP, Class A |
|
|||||||||||
| 3.83% |
01/15/321,4 | 560,000 | 561,277 | |||||||||
| SFAVE Commercial Mortgage Securities Trust, |
|
|||||||||||
| Series 2015-5AVE, Class A2B |
|
|||||||||||
| 4.14% |
01/05/431,4 | 45,000 | 43,115 | |||||||||
| Wells Fargo Commercial Mortgage Trust, |
|
|||||||||||
| Series 2015-C26, Class XA (IO) |
|
|||||||||||
| 1.20% |
02/15/484 | 32,671,514 | 912,339 | |||||||||
|
|
|
| ||||||||||
| 15,935,674 | ||||||||||||
|
|
|
| ||||||||||
| Non-Agency Mortgage-Backed — 5.03% |
|
|||||||||||
| ACE Securities Corp. Home Equity Loan Trust, |
|
|||||||||||
| Series 2005-HE2, Class M5 |
|
|||||||||||
| (LIBOR USD 1-Month plus 1.02%) |
|
|||||||||||
| 1.48% |
04/25/352 | 3,382,575 | 3,363,582 | |||||||||
| Amresco Residential Securities Corp. Mortgage Loan Trust, |
|
|||||||||||
| Series 1998-1, Class A5 (STEP-reset date 05/25/22) |
|
|||||||||||
| 7.53% |
10/25/27 | 6,013 | 6,120 | |||||||||
| Asset-Backed Securities Corp. Home Equity Loan Trust, |
|
|||||||||||
| Series 2004-HE9, Class M1 |
|
|||||||||||
| (LIBOR USD 1-Month plus 0.98%) |
|
|||||||||||
| 1.43% |
12/25/342 | 350,182 | 344,695 | |||||||||
| Banc of America Funding Trust, |
|
|||||||||||
| Series 2003-2, Class 1A1 |
|
|||||||||||
| 6.50% |
06/25/32 | 3,740 | 3,693 | |||||||||
| Bear Stearns ALT-A Trust, |
|
|||||||||||
| Series 2004-12, Class 1M1 |
|
|||||||||||
| (LIBOR USD 1-Month plus 0.93%) |
|
|||||||||||
| 1.39% |
01/25/352 | 2,312,027 | 2,292,357 | |||||||||
| Chevy Chase Mortgage Funding LLC, Mortgage-Backed |
|
|||||||||||
| Certificates, |
|
|||||||||||
| Series 2005-2A, Class A1 |
|
|||||||||||
| (LIBOR USD 1-Month plus 0.18%) |
|
|||||||||||
| 0.64% |
05/25/361,2 | 46,827 | 43,900 | |||||||||
| CIM Trust, |
|
|||||||||||
| Series 2021-R3, Class A1A |
|
|||||||||||
| 1.95% |
06/25/571,4 | 3,006,696 | 2,916,760 | |||||||||
| Citigroup Mortgage Loan Trust, Inc., |
|
|||||||||||
| Series 2004-HYB1, Class A41 |
|
|||||||||||
| 2.66% |
02/25/344 | 110 | 110 | |||||||||
| Issues |
Maturity Date |
Principal Amount |
Value | |||||||||
| MORTGAGE-BACKED (continued) |
|
|||||||||||
| Non-Agency Mortgage-Backed (continued) |
|
|||||||||||
| Citigroup Mortgage Loan Trust, Inc., |
|
|||||||||||
| Series 2006-WFH1, Class M5 |
|
|||||||||||
| (LIBOR USD 1-Month plus 0.78%) |
|
|||||||||||
| 1.24% |
01/25/362 | $ | 2,000,000 | $ | 1,970,053 | |||||||
| Countrywide Asset-Backed Certificates Trust, |
|
|||||||||||
| Series 2005-7, Class MV5 |
|
|||||||||||
| (LIBOR USD 1-Month plus 1.13%) |
|
|||||||||||
| 1.58% |
11/25/352 | 4,220,000 | 4,163,822 | |||||||||
| Countrywide Home Loan Mortgage Pass-Through Trust, |
|
|||||||||||
| Series 2004-14, Class 4A1 |
|
|||||||||||
| 2.45% |
08/25/344 | 55,107 | 55,106 | |||||||||
| Credit-Based Asset Servicing and Securitization LLC, |
|
|||||||||||
| Series 2003-CB3, Class AF1 (STEP-reset date 05/25/22) |
|
|||||||||||
| 3.38% |
12/25/32 | 526,240 | 510,737 | |||||||||
| Credit-Based Asset Servicing and Securitization LLC, |
|
|||||||||||
| Series 2006-CB2, Class AF4 (STEP-reset date 05/25/22) |
|
|||||||||||
| 3.00% |
12/25/36 | 370,274 | 328,907 | |||||||||
| Credit-Based Asset Servicing and Securitization LLC, |
|
|||||||||||
| Series 2007-CB5, Class A1 |
|
|||||||||||
| (LIBOR USD 1-Month plus 0.06%) |
|
|||||||||||
| 0.52% |
04/25/372 | 105,698 | 74,058 | |||||||||
| Credit-Based Asset Servicing and Securitization LLC, |
|
|||||||||||
| Series 2007-CB5, Class A3 |
|
|||||||||||
| (LIBOR USD 1-Month plus 0.25%) |
|
|||||||||||
| 0.71% |
04/25/372 | 1,255,968 | 885,976 | |||||||||
| First Horizon Alternative Mortgage Securities Trust, |
|
|||||||||||
| Series 2004-AA3, Class A1 |
|
|||||||||||
| 2.37% |
09/25/344 | 53,610 | 52,655 | |||||||||
| GSR Mortgage Loan Trust, |
|
|||||||||||
| Series 2004-9, Class 5A7 |
|
|||||||||||
| 2.29% |
08/25/344 | 14,569 | 14,638 | |||||||||
| HarborView Mortgage Loan Trust, |
|
|||||||||||
| Series 2007-7, Class 2A1A |
|
|||||||||||
| (LIBOR USD 1-Month plus 1.00%) |
|
|||||||||||
| 1.46% |
10/25/372 | 1,737,462 | 1,737,576 | |||||||||
| HomeBanc Mortgage Trust, |
|
|||||||||||
| Series 2005-4, Class A1 |
|
|||||||||||
| (LIBOR USD 1-Month plus 0.54%) |
|
|||||||||||
| 1.00% |
10/25/352 | 8,396 | 8,402 | |||||||||
| HSI Asset Securitization Corp. Trust, |
|
|||||||||||
| Series 2005-OPT1, Class M1 |
|
|||||||||||
| (LIBOR USD 1-Month plus 0.63%) |
|
|||||||||||
| 1.09% |
11/25/352 | 201,125 | 199,447 | |||||||||
| IndyMac Index Mortgage Loan Trust, |
|
|||||||||||
| Series 2004-AR7, Class A2 |
|
|||||||||||
| (LIBOR USD 1-Month plus 0.86%) |
|
|||||||||||
| 1.32% |
09/25/342 | 7,926 | 7,659 | |||||||||
| IndyMac Index Mortgage Loan Trust, |
|
|||||||||||
| Series 2004-AR8, Class 2A2A |
|
|||||||||||
| (LIBOR USD 1-Month plus 0.80%) |
|
|||||||||||
| 1.26% |
11/25/342 | 22,467 | 21,550 | |||||||||
| IndyMac Index Mortgage Loan Trust, |
|
|||||||||||
| Series 2007-AR11, Class 1A1 |
|
|||||||||||
| 2.79% |
06/25/374 | 526,326 | 488,597 | |||||||||
See accompanying Notes to Financial Statements.
| Annual Report March 2022 / 110 |
Table of Contents
Intermediate Bond Fund
Schedule of Portfolio Investments
March 31, 2022
| Issues |
Maturity Date |
Principal Amount |
Value | |||||||||
| MORTGAGE-BACKED (continued) |
|
|||||||||||
| Non-Agency Mortgage-Backed (continued) |
|
|||||||||||
| IndyMac Manufactured Housing Contract Pass-Through |
|
|||||||||||
| Certificates, |
|
|||||||||||
| Series 1997-1, Class A3 |
|
|||||||||||
| 6.61% |
02/25/28 | $ | 41,758 | $ | 41,893 | |||||||
| IndyMac Manufactured Housing Contract Pass-Through |
|
|||||||||||
| Certificates, |
|
|||||||||||
| Series 1997-1, Class A4 |
|
|||||||||||
| 6.75% |
02/25/28 | 11,116 | 11,160 | |||||||||
| IndyMac Manufactured Housing Contract Pass-Through |
|
|||||||||||
| Certificates, |
|
|||||||||||
| Series 1998-1, Class A4 |
|
|||||||||||
| 6.49% |
09/25/28 | 55,783 | 57,548 | |||||||||
| JPMorgan Mortgage Acquisition Trust, |
|
|||||||||||
| Series 2006-CH1, Class M2 |
|
|||||||||||
| (LIBOR USD 1-Month plus 0.29%) |
|
|||||||||||
| 0.75% |
07/25/362 | 1,918,250 | 1,911,433 | |||||||||
| JPMorgan Mortgage Trust, |
|
|||||||||||
| Series 2007-A3, Class 3A2 |
|
|||||||||||
| 3.11% |
05/25/374 | 115,839 | 110,522 | |||||||||
| MASTR Adjustable Rate Mortgages Trust, |
|
|||||||||||
| Series 2003-6, Class 4A2 |
|
|||||||||||
| 3.02% |
01/25/344 | 48,528 | 50,891 | |||||||||
| MASTR Adjustable Rate Mortgages Trust, |
|
|||||||||||
| Series 2007-HF2, Class A1 |
|
|||||||||||
| (LIBOR USD 1-Month plus 0.62%) |
|
|||||||||||
| 1.08% |
09/25/372 | 1,023,968 | 1,025,474 | |||||||||
| MASTR Seasoned Securitization Trust, |
|
|||||||||||
| Series 2004-1, Class 4A1 |
|
|||||||||||
| 2.41% |
10/25/324 | 4,781 | 4,918 | |||||||||
| MASTR Seasoned Securitization Trust, |
|
|||||||||||
| Series 2005-1, Class 4A1 |
|
|||||||||||
| 2.38% |
10/25/324 | 17,479 | 17,651 | |||||||||
| Merrill Lynch First Franklin Mortgage Loan Trust, |
|
|||||||||||
| Series 2007-3, Class A2C |
|
|||||||||||
| (LIBOR USD 1-Month plus 0.18%) |
|
|||||||||||
| 0.64% |
06/25/372 | 351,663 | 325,621 | |||||||||
| Merrill Lynch First Franklin Mortgage Loan Trust, |
|
|||||||||||
| Series 2007-3, Class A2D |
|
|||||||||||
| (LIBOR USD 1-Month plus 0.25%) |
|
|||||||||||
| 0.71% |
06/25/372 | 649,864 | 606,418 | |||||||||
| Mid-State Capital Corp. Trust, |
|
|||||||||||
| Series 2005-1, Class M2 |
|
|||||||||||
| 7.08% |
01/15/40 | 288,610 | 297,816 | |||||||||
| Mid-State Trust XI, |
|
|||||||||||
| Series 11, Class A1 |
|
|||||||||||
| 4.86% |
07/15/38 | 402,549 | 405,380 | |||||||||
| Morgan Stanley ABS Capital I Trust, |
|
|||||||||||
| Series 2004-NC7, Class M2 |
|
|||||||||||
| (LIBOR USD 1-Month plus 0.93%) |
|
|||||||||||
| 1.39% |
07/25/342 | 122,878 | 119,316 | |||||||||
| Morgan Stanley ABS Capital I, Inc., Trust, |
|
|||||||||||
| Series 2005-HE3, Class M5 |
|
|||||||||||
| (LIBOR USD 1-Month plus 1.04%) |
|
|||||||||||
| 1.49% |
07/25/352 | 4,450,842 | 4,411,406 | |||||||||
| Issues |
Maturity Date |
Principal Amount |
Value | |||||||||
| MORTGAGE-BACKED (continued) |
|
|||||||||||
| Non-Agency Mortgage-Backed (continued) |
|
|||||||||||
| Nationstar Home Equity Loan Trust, |
|
|||||||||||
| Series 2007-B, Class 1AV1 |
|
|||||||||||
| (LIBOR USD 1-Month plus 0.22%) |
|
|||||||||||
| 0.68% |
04/25/372 | $ | 2,253,352 | $ | 2,239,877 | |||||||
| New Century Home Equity Loan Trust, |
|
|||||||||||
| Series 2005-1, Class M1 |
|
|||||||||||
| (LIBOR USD 1-Month plus 0.68%) |
|
|||||||||||
| 1.13% |
03/25/352 | 2,322,859 | 2,322,793 | |||||||||
| New Century Home Equity Loan Trust, |
|
|||||||||||
| Series 2005-D, Class A1 |
|
|||||||||||
| (LIBOR USD 1-Month plus 0.44%) |
|
|||||||||||
| 0.90% |
02/25/362 | 944,119 | 944,907 | |||||||||
| New York Mortgage Trust, |
|
|||||||||||
| Series 2005-3, Class A1 |
|
|||||||||||
| (LIBOR USD 1-Month plus 0.48%) |
|
|||||||||||
| 0.94% |
02/25/362 | 499,033 | 500,831 | |||||||||
| Option One Mortgage Loan Trust, |
|
|||||||||||
| Series 2005-2, Class M1 |
|
|||||||||||
| (LIBOR USD 1-Month plus 0.66%) |
|
|||||||||||
| 1.12% |
05/25/352 | 52,606 | 52,525 | |||||||||
| RBSSP Resecuritization Trust, |
|
|||||||||||
| Series 2009-12, Class 17A2 |
|
|||||||||||
| 2.40% |
10/25/351,4 | 1,874,695 | 1,858,759 | |||||||||
| Residential Asset Mortgage Products Trust, |
|
|||||||||||
| Series 2003-SL1, Class A41 |
|
|||||||||||
| 8.00% |
04/25/31 | 16,175 | 15,788 | |||||||||
| Residential Asset Mortgage Products Trust, |
|
|||||||||||
| Series 2004-SL1, Class A7 |
|
|||||||||||
| 7.00% |
11/25/31 | 7,370 | 7,145 | |||||||||
| Residential Asset Securities Corp., |
|
|||||||||||
| Series 2005-AHL3, Class A3 |
|
|||||||||||
| (LIBOR USD 1-Month plus 0.34%) |
|
|||||||||||
| 1.14% |
11/25/352 | 11,804 | 11,794 | |||||||||
| Residential Asset Securitization Trust, |
|
|||||||||||
| Series 2004-IP2, Class 2A1 |
|
|||||||||||
| 2.84% |
12/25/344 | 11,993 | 11,634 | |||||||||
| Structured Adjustable Rate Mortgage Loan Trust, |
|
|||||||||||
| Series 2004-15, Class A |
|
|||||||||||
| 2.61% |
10/25/344 | 644,411 | 612,858 | |||||||||
| Structured Asset Mortgage Investments II Trust, |
|
|||||||||||
| Series 2005-AR1, Class A1 |
|
|||||||||||
| (LIBOR USD 1-Month plus 0.48%) |
|
|||||||||||
| 0.93% |
04/19/352 | 395,312 | 385,821 | |||||||||
| Structured Asset Mortgage Investments II Trust, |
|
|||||||||||
| Series 2005-AR8, Class A2 |
|
|||||||||||
| (Federal Reserve US 12-Month Cumulative Average plus |
|
|||||||||||
| 1.48%) |
|
|||||||||||
| 1.57% |
02/25/362 | 389,713 | 383,281 | |||||||||
| Structured Asset Mortgage Investments II Trust, |
|
|||||||||||
| Series 2006-AR3, Class 22A1 |
|
|||||||||||
| 2.48% |
05/25/364 | 1,814,662 | 1,139,889 | |||||||||
See accompanying Notes to Financial Statements.
| 111 / Annual Report March 2022 |
Table of Contents
Intermediate Bond Fund
Schedule of Portfolio Investments
March 31, 2022
| Issues |
Maturity Date |
Principal Amount |
Value | |||||||||
| MORTGAGE-BACKED (continued) |
|
|||||||||||
| Non-Agency Mortgage-Backed (continued) |
|
|||||||||||
| WaMu Mortgage Pass-Through Certificates, |
|
|||||||||||
| Series 2005-AR13, Class A1A3 |
|
|||||||||||
| (LIBOR USD 1-Month plus 1.56%) |
|
|||||||||||
| 2.02% |
10/25/452 | $ | 477,669 | $ | 486,612 | |||||||
|
|
|
| ||||||||||
| 39,862,361 | ||||||||||||
|
|
|
| ||||||||||
| U.S. Agency Commercial Mortgage-Backed — 0.01% |
|
|||||||||||
| Fannie Mae-Aces, |
|
|||||||||||
| Series 2015-M4, Class X2 (IO) |
|
|||||||||||
| 2.84% |
07/25/224 | 3,319,292 | 216 | |||||||||
| Freddie Mac Multifamily Structured Pass-Through |
|
|||||||||||
| Certificates, |
|
|||||||||||
| Series K021, Class A2 |
|
|||||||||||
| 2.40% |
06/25/22 | 80,602 | 80,619 | |||||||||
|
|
|
| ||||||||||
| 80,835 | ||||||||||||
|
|
|
| ||||||||||
| U.S. Agency Mortgage-Backed — 8.72% |
|
|||||||||||
| Fannie Mae Pool 253974 |
|
|||||||||||
| 7.00% |
08/01/31 | 1,060 | 1,124 | |||||||||
| Fannie Mae Pool 527247 |
|
|||||||||||
| 7.00% |
09/01/26 | 11 | 11 | |||||||||
| Fannie Mae Pool 545191 |
|
|||||||||||
| 7.00% |
09/01/31 | 489 | 525 | |||||||||
| Fannie Mae Pool 545646 |
|
|||||||||||
| 7.00% |
09/01/26 | 5 | 5 | |||||||||
| Fannie Mae Pool 549740 |
|
|||||||||||
| 6.50% |
10/01/27 | 2,506 | 2,691 | |||||||||
| Fannie Mae Pool 606108 |
|
|||||||||||
| 7.00% |
03/01/31 | 309 | 312 | |||||||||
| Fannie Mae Pool 630599 |
|
|||||||||||
| 7.00% |
05/01/32 | 2,631 | 2,838 | |||||||||
| Fannie Mae Pool 655928 |
|
|||||||||||
| 7.00% |
08/01/32 | 1,708 | 1,914 | |||||||||
| Fannie Mae Pool 735207 |
|
|||||||||||
| 7.00% |
04/01/34 | 798 | 873 | |||||||||
| Fannie Mae Pool 735686 |
|
|||||||||||
| 6.50% |
12/01/22 | 6 | 6 | |||||||||
| Fannie Mae Pool 735861 |
|
|||||||||||
| 6.50% |
09/01/33 | 43,022 | 45,764 | |||||||||
| Fannie Mae Pool 764388 |
|
|||||||||||
| (LIBOR USD 6-Month plus 1.38%) |
|
|||||||||||
| 1.76% |
03/01/342 | 7,015 | 7,042 | |||||||||
| Fannie Mae Pool 776708 |
|
|||||||||||
| 5.00% |
05/01/34 | 72,745 | 78,763 | |||||||||
| Fannie Mae Pool 844773 |
|
|||||||||||
| (LIBOR USD 12-Month plus 1.53%) |
|
|||||||||||
| 1.78% |
12/01/352 | 5,111 | 5,117 | |||||||||
| Fannie Mae Pool 889184 |
|
|||||||||||
| 5.50% |
09/01/36 | 57,196 | 62,676 | |||||||||
| Fannie Mae Pool 890221 |
|
|||||||||||
| 5.50% |
12/01/33 | 84,973 | 92,233 | |||||||||
| Fannie Mae Pool 939419 |
|
|||||||||||
| (LIBOR USD 12-Month plus 1.27%) |
|
|||||||||||
| 1.52% |
05/01/372 | 20,671 | 20,745 | |||||||||
| Fannie Mae Pool AL0209 |
|
|||||||||||
| 4.50% |
05/01/41 | 232,795 | 249,560 | |||||||||
| Issues |
Maturity Date |
Principal Amount |
Value | |||||||||
| MORTGAGE-BACKED (continued) |
|
|||||||||||
| U.S. Agency Mortgage-Backed (continued) |
|
|||||||||||
| Fannie Mae Pool AN2786 |
|
|||||||||||
| 2.76% |
09/01/36 | $ | 47,913 | $ | 46,202 | |||||||
| Fannie Mae Pool BL6060 |
|
|||||||||||
| 2.46% |
04/01/40 | 1,160,000 | 1,048,108 | |||||||||
| Fannie Mae Pool CA1710 |
|
|||||||||||
| 4.50% |
05/01/48 | 10,257 | 10,678 | |||||||||
| Fannie Mae Pool CA1711 |
|
|||||||||||
| 4.50% |
05/01/48 | 687,381 | 717,067 | |||||||||
| Fannie Mae Pool CA2208 |
|
|||||||||||
| 4.50% |
08/01/48 | 9,611 | 10,006 | |||||||||
| Fannie Mae Pool FM2318 |
|
|||||||||||
| 3.50% |
09/01/49 | 1,081,021 | 1,091,670 | |||||||||
| Fannie Mae Pool MA1527 |
|
|||||||||||
| 3.00% |
08/01/33 | 15,332 | 15,385 | |||||||||
| Fannie Mae Pool MA1561 |
|
|||||||||||
| 3.00% |
09/01/33 | 857,489 | 860,479 | |||||||||
| Fannie Mae Pool MA1608 |
|
|||||||||||
| 3.50% |
10/01/33 | 758,105 | 774,634 | |||||||||
| Fannie Mae Pool MA3427 |
|
|||||||||||
| 4.00% |
07/01/33 | 8,188 | 8,438 | |||||||||
| Fannie Mae Pool MA3537 |
|
|||||||||||
| 4.50% |
12/01/48 | 658,648 | 684,134 | |||||||||
| Fannie Mae Pool MA3811 |
|
|||||||||||
| 3.00% |
10/01/49 | 459,727 | 448,360 | |||||||||
| Fannie Mae Pool MA4152 |
|
|||||||||||
| 2.00% |
10/01/40 | 2,651,651 | 2,498,962 | |||||||||
| Fannie Mae Pool MA4333 |
|
|||||||||||
| 2.00% |
05/01/41 | 732,125 | 689,786 | |||||||||
| Fannie Mae REMICS, |
|
|||||||||||
| Series 1993-80, Class S |
|
|||||||||||
| (-1.22 X LIBOR USD 1-Month plus 10.88%, 10.88% Cap) |
|
|||||||||||
| 10.32% |
05/25/232 | 342 | 354 | |||||||||
| Fannie Mae REMICS, |
|
|||||||||||
| Series 2001-52, Class YZ |
|
|||||||||||
| 6.50% |
10/25/31 | 90,775 | 95,609 | |||||||||
| Fannie Mae REMICS, |
|
|||||||||||
| Series 2003-124, Class TS |
|
|||||||||||
| (-14.00 X LIBOR USD 1-Month plus 100.80%, 9.80% Cap) |
|
|||||||||||
| 9.80% |
01/25/342 | 2,610 | 2,675 | |||||||||
| Fannie Mae REMICS, |
|
|||||||||||
| Series 2007-64, Class FA |
|
|||||||||||
| (LIBOR USD 1-Month plus 0.47%) |
|
|||||||||||
| 0.93% |
07/25/372 | 40,307 | 40,519 | |||||||||
| Fannie Mae REMICS, |
|
|||||||||||
| Series 2008-50, Class SA (IO) |
|
|||||||||||
| (-1.00 X LIBOR USD 1-Month plus 6.05%, 6.05% Cap) |
|
|||||||||||
| 5.59% |
11/25/362 | 640,953 | 90,607 | |||||||||
| Fannie Mae REMICS, |
|
|||||||||||
| Series 2018-38, Class PA |
|
|||||||||||
| 3.50% |
06/25/47 | 4,666 | 4,719 | |||||||||
| Fannie Mae REMICS, |
|
|||||||||||
| Series 2018-43, Class CT |
|
|||||||||||
| 3.00% |
06/25/48 | 230,096 | 228,094 | |||||||||
| Fannie Mae REMICS, |
|
|||||||||||
| Series 2018-55, Class PA |
|
|||||||||||
| 3.50% |
01/25/47 | 38,592 | 39,032 | |||||||||
See accompanying Notes to Financial Statements.
| Annual Report March 2022 / 112 |
Table of Contents
Intermediate Bond Fund
Schedule of Portfolio Investments
March 31, 2022
| Issues | Maturity Date |
Principal Amount |
Value | |||||||||
| MORTGAGE-BACKED (continued) |
|
|||||||||||
| U.S. Agency Mortgage-Backed (continued) |
|
|||||||||||
| Fannie Mae REMICS, |
|
|||||||||||
| Series 2018-86, Class JA |
|
|||||||||||
| 4.00% |
05/25/47 | $ | 228,221 | $ | 229,752 | |||||||
| Fannie Mae Trust, |
|
|||||||||||
| Series 2003-W6, Class 5T (IO) |
|
|||||||||||
| (-1.00 X LIBOR USD 1-Month plus 8.15%, 0.55% Cap) |
|
|||||||||||
| 0.55% |
09/25/422 | 7,335,873 | 112,529 | |||||||||
| Freddie Mac Gold Pool A25162 |
|
|||||||||||
| 5.50% |
05/01/34 | 64,151 | 69,074 | |||||||||
| Freddie Mac Gold Pool A33262 |
|
|||||||||||
| 5.50% |
02/01/35 | 27,238 | 29,923 | |||||||||
| Freddie Mac Gold Pool A68781 |
|
|||||||||||
| 5.50% |
10/01/37 | 4,317 | 4,744 | |||||||||
| Freddie Mac Gold Pool C03813 |
|
|||||||||||
| 3.50% |
04/01/42 | 529,841 | 541,149 | |||||||||
| Freddie Mac Gold Pool G01548 |
|
|||||||||||
| 7.50% |
07/01/32 | 186,810 | 209,936 | |||||||||
| Freddie Mac Gold Pool G01644 |
|
|||||||||||
| 5.50% |
02/01/34 | 43,985 | 48,237 | |||||||||
| Freddie Mac Gold Pool G02366 |
|
|||||||||||
| 6.50% |
10/01/36 | 37,746 | 42,711 | |||||||||
| Freddie Mac Gold Pool G08844 |
|
|||||||||||
| 5.00% |
10/01/48 | 203,056 | 213,769 | |||||||||
| Freddie Mac Gold Pool G12909 |
|
|||||||||||
| 6.00% |
11/01/22 | 3,529 | 3,565 | |||||||||
| Freddie Mac Gold Pool G13032 |
|
|||||||||||
| 6.00% |
09/01/22 | 29 | 29 | |||||||||
| Freddie Mac Gold Pool G15897 |
|
|||||||||||
| 2.50% |
09/01/31 | 22,844 | 22,750 | |||||||||
| Freddie Mac Gold Pool G16085 |
|
|||||||||||
| 2.50% |
02/01/32 | 1,371,817 | 1,360,541 | |||||||||
| Freddie Mac Gold Pool G16524 |
|
|||||||||||
| 3.50% |
05/01/33 | 46,942 | 48,252 | |||||||||
| Freddie Mac Gold Pool G16756 |
|
|||||||||||
| 3.50% |
01/01/34 | 837,073 | 861,324 | |||||||||
| Freddie Mac Gold Pool G18581 |
|
|||||||||||
| 2.50% |
01/01/31 | 21,407 | 21,209 | |||||||||
| Freddie Mac Pool SD7503 |
|
|||||||||||
| 3.50% |
08/01/49 | 3,036,602 | 3,066,515 | |||||||||
| Freddie Mac REMICS, |
|
|||||||||||
| Series 1602, Class SN |
|
|||||||||||
| (-4.25 X PRIME plus 46.22%, 10.09% Cap) |
|
|||||||||||
| 10.09% |
10/15/232 | 2,552 | 2,608 | |||||||||
| Freddie Mac REMICS, |
|
|||||||||||
| Series 2174, Class PN |
|
|||||||||||
| 6.00% |
07/15/29 | 15,675 | 16,643 | |||||||||
| Freddie Mac REMICS, |
|
|||||||||||
| Series 3460, Class SA (IO) |
|
|||||||||||
| (-1.00 X LIBOR USD 1-Month plus 6.20%, 6.20% Cap) |
|
|||||||||||
| 5.80% |
06/15/382 | 629,508 | 90,840 | |||||||||
| Freddie Mac REMICS, |
|
|||||||||||
| Series 4030, Class HS (IO) |
|
|||||||||||
| (-1.00 X LIBOR USD 1-Month plus 6.61%, 6.61% Cap) |
|
|||||||||||
| 6.21% |
04/15/422 | 525,549 | 89,104 | |||||||||
| Ginnie Mae (TBA) |
|
|||||||||||
| 2.00% |
04/20/52 | 1,800,000 | 1,712,206 | |||||||||
| Issues | Maturity Date |
Principal Amount |
Value | |||||||||
| MORTGAGE-BACKED (continued) |
|
|||||||||||
| U.S. Agency Mortgage-Backed (continued) |
|
|||||||||||
| 2.50% |
04/20/52 | $ | 3,900,000 | $ | 3,780,895 | |||||||
| Ginnie Mae I Pool 782810 |
|
|||||||||||
| 4.50% |
11/15/39 | 459,295 | 489,172 | |||||||||
| Ginnie Mae II Pool 80968 |
|
|||||||||||
| (US Treasury Yield Curve Rate T Note Constant Maturity |
|
|||||||||||
| 1-Year plus 1.50%) |
|
|||||||||||
| 1.63% |
07/20/342 | 11,761 | 12,058 | |||||||||
| Ginnie Mae II Pool MA4454 |
|
|||||||||||
| 5.00% |
05/20/47 | 16,426 | 17,484 | |||||||||
| Ginnie Mae II Pool MA4511 |
|
|||||||||||
| 4.00% |
06/20/47 | 4,118 | 4,245 | |||||||||
| Ginnie Mae II Pool MA4588 |
|
|||||||||||
| 4.50% |
07/20/47 | 151,801 | 159,972 | |||||||||
| Ginnie Mae II Pool MA4589 |
|
|||||||||||
| 5.00% |
07/20/47 | 810,318 | 861,554 | |||||||||
| Ginnie Mae II Pool MA4838 |
|
|||||||||||
| 4.00% |
11/20/47 | 379,258 | 391,269 | |||||||||
| Ginnie Mae II Pool MA4901 |
|
|||||||||||
| 4.00% |
12/20/47 | 302,717 | 312,055 | |||||||||
| Ginnie Mae II Pool MA5399 |
|
|||||||||||
| 4.50% |
08/20/48 | 389,561 | 404,501 | |||||||||
| Ginnie Mae II Pool MA5530 |
|
|||||||||||
| 5.00% |
10/20/48 | 4,865 | 5,073 | |||||||||
| Ginnie Mae II Pool MA6030 |
|
|||||||||||
| 3.50% |
07/20/49 | 55,691 | 55,260 | |||||||||
| Ginnie Mae II Pool MA6080 |
|
|||||||||||
| 3.00% |
08/20/49 | 23,965 | 23,469 | |||||||||
| Ginnie Mae II Pool MA6209 |
|
|||||||||||
| 3.00% |
10/20/49 | 452,178 | 442,261 | |||||||||
| Ginnie Mae, |
|
|||||||||||
| Series 2004-8, Class SE |
|
|||||||||||
| (-2.00 X LIBOR USD 1-Month plus 14.30%, 14.30% Cap) |
|
|||||||||||
| 13.41% |
11/26/232 | 4,179 | 4,425 | |||||||||
| UMBS (TBA) |
|
|||||||||||
| 2.00% |
04/01/37 | 3,750,000 | 3,641,779 | |||||||||
| 2.00% |
04/01/52 | 350,000 | 324,709 | |||||||||
| 2.00% |
05/01/52 | 2,575,000 | 2,386,039 | |||||||||
| 2.50% |
04/01/37 | 4,875,000 | 4,817,704 | |||||||||
| 2.50% |
05/01/52 | 16,550,000 | 15,758,296 | |||||||||
| 3.00% |
04/01/52 | 3,775,000 | 3,693,012 | |||||||||
| 3.00% |
05/01/52 | 13,150,000 | 12,837,688 | |||||||||
|
|
|
| ||||||||||
| 69,198,047 | ||||||||||||
|
|
|
| ||||||||||
| Total Mortgage-Backed |
|
|||||||||||
| (Cost $128,689,990) |
|
125,076,917 | ||||||||||
|
|
|
| ||||||||||
| MUNICIPAL BONDS — 0.79%* |
|
|||||||||||
| California — 0.26% |
|
|||||||||||
| City of San Francisco Public Utilities Commission Water |
|
|||||||||||
| Revenue Bonds, Series G |
|
|||||||||||
| 2.19% |
11/01/32 | 795,000 | 711,374 | |||||||||
| Los Angeles Department of Water & Power Power System |
|
|||||||||||
| Revenue Bonds, Electric Light & Power Improvements, |
|
|||||||||||
| Series C |
|
|||||||||||
| 5.52% |
07/01/27 | 50,000 | 55,957 | |||||||||
See accompanying Notes to Financial Statements.
| 113 / Annual Report March 2022 |
Table of Contents
Intermediate Bond Fund
Schedule of Portfolio Investments
March 31, 2022
| Issues | Maturity Date |
Principal Amount |
Value | |||||||||||
| MUNICIPAL BONDS (continued) |
|
|||||||||||||
| California (continued) |
|
|||||||||||||
| Los Angeles Unified School District General Obligation |
|
|||||||||||||
| Bonds, School Improvements, Series KR |
|
|||||||||||||
| 5.75% |
07/01/34 | $ | 1,075,000 | $ | 1,274,749 | |||||||||
|
|
|
| ||||||||||||
| 2,042,080 | ||||||||||||||
|
|
|
| ||||||||||||
| Florida — 0.07% |
|
|||||||||||||
| County of Miami-Dade Aviation Revenue Bonds, Airport and |
|
|||||||||||||
| Marina Improvements, Series C |
|
|||||||||||||
| 4.06% |
10/01/31 | 280,000 | 290,481 | |||||||||||
| County of Miami-Dade Aviation Revenue Bonds, Airport and |
|
|||||||||||||
| Marina Improvements, Series D |
|
|||||||||||||
| 3.50% |
10/01/31 | 245,000 | 245,755 | |||||||||||
|
|
|
| ||||||||||||
| 536,236 | ||||||||||||||
|
|
|
| ||||||||||||
| New York — 0.46% |
|
|||||||||||||
| City of New York General Obligation, Public Improvements, |
|
|||||||||||||
| Series 2 |
|
|||||||||||||
| 1.70% |
03/01/29 | 250,000 | 225,041 | |||||||||||
| Metropolitan Transportation Authority Revenue Bonds, |
|
|||||||||||||
| Transit Improvements |
|
|||||||||||||
| 6.55% |
11/15/31 | 25,000 | 29,307 | |||||||||||
| New York City Transitional Finance Authority Future Tax |
|
|||||||||||||
| Secured Revenue Bonds, School Improvements, Series G-3 |
|
|||||||||||||
| 5.27% |
05/01/27 | 1,465,000 | 1,598,435 | |||||||||||
| New York State Dormitory Authority Revenue Bonds, Series C |
|
|||||||||||||
| 1.95% |
03/15/29 | 590,000 | 539,760 | |||||||||||
| New York State Dormitory Authority Revenue Bonds, Transit |
|
|||||||||||||
| Improvements, Series F |
|
|||||||||||||
| 3.03% |
02/15/33 | 1,245,000 | 1,175,263 | |||||||||||
| New York State Dormitory Authority Revenue Bonds, |
|
|||||||||||||
| University & College Improvements, Series D |
|
|||||||||||||
| 5.50% |
03/15/30 | 70,000 | 76,911 | |||||||||||
|
|
|
| ||||||||||||
| 3,644,717 | ||||||||||||||
|
|
|
| ||||||||||||
| Pennsylvania — 0.00% |
|
|||||||||||||
| Pennsylvania Economic Development Financing Authority |
|
|||||||||||||
| Revenue Bonds, University of Pittsburgh Medical Center, |
|
|||||||||||||
| Series B |
|
|||||||||||||
| 3.20% |
11/15/27 | 40,000 | 39,810 | |||||||||||
|
|
|
| ||||||||||||
| Total Municipal Bonds |
|
|||||||||||||
| (Cost $6,606,390) |
|
6,262,843 | ||||||||||||
|
|
|
| ||||||||||||
| U.S. TREASURY SECURITIES — 45.65% |
|
|||||||||||||
| U.S. Treasury Notes — 45.65% |
|
|||||||||||||
| U.S. Treasury Notes |
|
|||||||||||||
| 0.75% |
12/31/23 | 17,614,000 | 17,159,545 | |||||||||||
| 0.88% |
01/31/24 | 21,285,000 | 20,745,808 | |||||||||||
| 1.25% |
12/31/26 | 9,375,000 | 8,859,569 | |||||||||||
| 1.50% |
02/29/24 | 36,019,000 | 35,498,413 | |||||||||||
| 1.50% |
01/31/27 | 34,472,000 | 32,947,691 | |||||||||||
| 1.75% |
03/15/25 | 52,267,000 | 51,187,268 | |||||||||||
| 1.88% |
02/28/27 | 84,030,000 | 81,811,175 | |||||||||||
| 1.88% |
02/15/32 | 10,490,000 | 10,076,137 | |||||||||||
| 2.25% |
03/31/24 | 23,240,000 | 23,209,135 | |||||||||||
| Issues | Maturity Date |
Principal Amount |
Value | |||||||||
| U.S. TREASURY SECURITIES (continued) |
|
|||||||||||
| U.S. Treasury Notes (continued) |
|
|||||||||||
| 2.50% |
03/31/27 | $ | 80,290,000 | $ | 80,481,316 | |||||||
|
|
|
| ||||||||||
| Total U.S. Treasury Securities |
|
|||||||||||
| (Cost $366,633,080) |
|
361,976,057 | ||||||||||
|
|
|
| ||||||||||
| Total Bonds — 103.59% |
|
|||||||||||
| (Cost $840,534,682) |
|
821,482,096 | ||||||||||
|
|
|
| ||||||||||
| Issues | Shares | Value | ||||||||||
| COMMON STOCK — 0.06% |
|
|||||||||||
| Communications — 0.06% |
|
|||||||||||
| Intelsat Emergence SA3,5,6,7 |
|
|||||||||||
| (Luxembourg) | 15,249 | 457,470 | ||||||||||
|
|
|
| ||||||||||
| Electric — 0.00% |
|
|||||||||||
| Homer City Holdings LLC†,5,6,7,8 | 8,014 | — | ||||||||||
|
|
|
| ||||||||||
| Total Common Stock |
|
|||||||||||
| (Cost $968,241) |
|
457,470 | ||||||||||
|
|
|
| ||||||||||
| RIGHTS — 0.00% |
|
|||||||||||
| Communications — 0.00% |
|
|||||||||||
| Intelsat Jackson Holdings SA, Series A3,5,6,7 |
|
|||||||||||
| (Luxembourg) | 1,596 | — | ||||||||||
| Intelsat Jackson Holdings SA, Series B3,5,6,7 |
|
|||||||||||
| (Luxembourg) | 1,596 | — | ||||||||||
|
|
|
| ||||||||||
| — | ||||||||||||
|
|
|
| ||||||||||
| Total Rights |
|
|||||||||||
| (Cost $–) |
|
— | ||||||||||
|
|
|
| ||||||||||
| Purchased Options - 0.01% |
|
|||||||||||
| (Cost $331,590) |
|
93,306 | ||||||||||
|
|
|
| ||||||||||
| Issues | Maturity Date |
Principal Amount/Shares |
Value | |||||||||
| SHORT-TERM INVESTMENTS — 4.29% |
|
|||||||||||
| Money Market Funds — 4.29% |
|
|||||||||||
| Dreyfus Government Cash Management Fund |
|
|||||||||||
| 0.19%10 |
5,193,000 | 5,193,000 | ||||||||||
| Fidelity Investments Money Market Funds - Government |
|
|||||||||||
| Portfolio |
|
|||||||||||
| 0.12%10,11 |
4,752,208 | 4,752,208 | ||||||||||
See accompanying Notes to Financial Statements.
| Annual Report March 2022 / 114 |
Table of Contents
Intermediate Bond Fund
Schedule of Portfolio Investments
March 31, 2022
| Issues | Maturity Date |
Principal Amount/Shares |
Value | |||||||||||
| SHORT-TERM INVESTMENTS (continued) |
|
|||||||||||||
| Money Market Funds (continued) |
|
|||||||||||||
| Morgan Stanley Institutional Liquidity Funds - Government |
|
|||||||||||||
| Portfolio | ||||||||||||||
| 0.23%10 |
24,102,000 | $ | 24,102,000 | |||||||||||
|
|
|
| ||||||||||||
| Total Short-Term Investments |
|
|||||||||||||
| (Cost $34,047,208) |
|
34,047,208 | ||||||||||||
|
|
|
| ||||||||||||
| Total Investments Before Written Options - 107.95% |
|
|||||||||||||
| (Cost $875,881,721) |
|
856,080,080 | ||||||||||||
|
|
|
| ||||||||||||
| Written Options - (0.27)% |
| |||||||||||||
| (Cost $(1,391,267)) |
|
(2,179,744 | ) | |||||||||||
|
|
|
| ||||||||||||
| Liabilities in Excess of Other Assets - (7.68)% |
|
(60,883,157 | ) | |||||||||||
|
|
|
| ||||||||||||
| Net Assets - 100.00% |
|
$ | 793,017,179 | |||||||||||
|
|
|
| ||||||||||||
| 1 | Securities exempt from registration under Rule 144A of the Securities Act of 1933, as amended. The securities may be resold in transactions exempt from registration, normally to qualified institutional buyers. |
| 2 | Floating rate security. The rate disclosed was in effect at March 31, 2022. |
| 3 | Foreign denominated security issued by foreign domiciled entity. |
| 4 | Variable rate security. Interest rate disclosed is as of the most recent information available. Certain variable rate securities are not based on a published reference rate and spread but are determined by the issuer or agent and are based on current market conditions. |
| 5 | Security is valued using significant unobservable inputs and is classified as Level 3 in the fair value hierarchy. |
| 6 | Illiquid security as determined under procedures approved by the Board of Trustees. The aggregate value of illiquid securities is $3,020,712, which is 0.38% of total net assets. |
| 7 | Non-income producing security. |
| 8 | Security is currently in default with regard to scheduled interest or principal payments. |
| 9 | Zero coupon bond. The rate shown is the effective yield as of March 31, 2022. |
| 10 | Represents the current yield as of March 31, 2022. |
| 11 | Securities, or a portion thereof, pledged as collateral for swaps. The total market value of collateral pledged is $36. |
| † | Fair valued security. The aggregate value of fair valued securities is $0, which is 0.00% of total net assets. Fair valued securities were not valued utilizing an independent quote but were valued pursuant to guidelines established by the Board of Trustees. See Notes to Financial Statements. |
| * | Securities with a call or reset feature will have an effective maturity date sooner than the stated maturity. |
| ** | Securities backed by mortgage or consumer loans where payment is periodically made will have an effective maturity date sooner than the stated maturity date. |
Note: For Fund compliance purposes, the Fund’s industry classifications refer to any one or more of the industry sub-classifications used by one or more widely recognized market indexes or ratings group indexes, and/or as defined by Fund management. This definition may not apply for purposes of this report, which may combine industry sub-classifications for more meaningful presentation for investors.
(CAD): Canadian Dollar
(CLO): Collateralized Loan Obligation
(EUR): Euro
(IO): Interest Only
(LIBOR): London InterBank Offer Rate
(MTN): Medium-Term Note
(SOFR): Secured Overnight Financing Rate
(STEP): Step Coupon Bond
(TBA): To-Be-Announced
(USD): U.S. Dollar
| Currency to be Purchased |
Currency to be Sold |
Counterparty | Settlement Date |
Unrealized Appreciation (Depreciation) |
||||||||||||
| FOREIGN CURRENCY EXCHANGE CONTRACT |
|
|||||||||||||||
| CAD 15,326,000 |
USD 12,016,151 | Citigroup Global Markets, Inc. | 04/08/22 | $ | 253,479 | |||||||||||
| EUR 400,000 |
USD 439,897 | Goldman Sachs International | 04/08/22 | 5,268 | ||||||||||||
|
|
|
|||||||||||||||
| 258,747 | ||||||||||||||||
|
|
|
|||||||||||||||
| USD 11,949,911 |
CAD 15,326,000 | Citigroup Global Markets, Inc. | 04/08/22 | (319,719) | ||||||||||||
| USD 442,120 |
EUR 400,000 | Goldman Sachs International | 04/08/22 | (3,045) | ||||||||||||
| USD 427,283 |
EUR 387,000 | Goldman Sachs International | 07/08/22 | (5,109) | ||||||||||||
|
|
|
|||||||||||||||
| (327,873) | ||||||||||||||||
|
|
|
|||||||||||||||
| NET UNREALIZED DEPRECIATION | $ | (69,126) | ||||||||||||||
|
|
|
|||||||||||||||
| Description | Number of Contracts |
Expiration Date | Notional Amount | Value | Unrealized Appreciation (Depreciation) |
|||||||||||||||
| FUTURES CONTRACTS: LONG POSITIONS |
|
|||||||||||||||||||
| U.S. Treasury Two-Year Note |
483 | 06/30/22 | $ | 102,358,266 | $ | (1,007,235) | $ | (1,007,235) | ||||||||||||
| U.S. Treasury Five-Year Note |
83 | 06/30/22 | 9,519,063 | (273,809) | (273,809) | |||||||||||||||
|
|
|
|
|
|
|
|||||||||||||||
| 111,877,329 | (1,281,044) | (1,281,044) | ||||||||||||||||||
|
|
|
|
|
|
|
|||||||||||||||
| FUTURES CONTRACTS: SHORT POSITIONS |
|
|||||||||||||||||||
| U.S. Treasury Ten-Year Ultra Bond | 50 | 06/21/22 | (6,773,438) | 115,296 | 115,296 | |||||||||||||||
| U.S. Treasury Ultra Bond | 31 | 06/21/22 | (5,490,875) | 200,080 | 200,080 | |||||||||||||||
|
|
|
|
|
|
|
|||||||||||||||
| (12,264,313) | 315,376 | 315,376 | ||||||||||||||||||
|
|
|
|
|
|
|
|||||||||||||||
| TOTAL FUTURES CONTRACTS |
$ | 99,613,016 | $ | (965,668) | $ | (965,668) | ||||||||||||||
|
|
|
|
|
|
|
|||||||||||||||
See accompanying Notes to Financial Statements.
| 115 / Annual Report March 2022 |
Table of Contents
Intermediate Bond Fund
Schedule of Portfolio Investments
March 31, 2022
| Reference Obligation/Index | Financing Rate Paid by the Fund |
Payment Frequency |
Implied Credit Spread at 03/31/221 |
Counterparty | Expiration Date |
Notional Amount (000’s)2 |
Value3 | Premiums Paid |
Unrealized Appreciation |
|||||||||||||||||||||||||||
| SWAPS: CREDIT DEFAULT (SALES) - SINGLE ISSUES OTC4 |
|
|||||||||||||||||||||||||||||||||||
| 1011778 BC ULC/New Red |
|
Credit Suisse | ||||||||||||||||||||||||||||||||||
| Finance, Inc., 4.00%, due |
|
First Boston | ||||||||||||||||||||||||||||||||||
| 10/15/305 |
5.00 | % | 3 Months | 120 | International | 06/20/23 | $ | 2,070 | $ | 98,067 | $ | 83,368 | $ | 14,699 | ||||||||||||||||||||||
| Credit Suisse | ||||||||||||||||||||||||||||||||||||
| Berry Global, Inc., 5.63%, due |
|
First Boston | ||||||||||||||||||||||||||||||||||
| 07/15/27 |
5.00 | % | 3 Months | 175 | International | 12/20/23 | 1,155 | 64,383 | 61,099 | 3,284 | ||||||||||||||||||||||||||
|
|
|
|
|
|
|
|||||||||||||||||||||||||||||||
| TOTAL |
$ | 162,450 | $ | 144,467 | $ | 17,983 | ||||||||||||||||||||||||||||||
|
|
|
|
|
|
|
|||||||||||||||||||||||||||||||
| 1 | An implied credit spread is the spread in yield between a U.S. Treasury security and the referenced obligation or underlying investment that are identical in all respects except for the quality rating. Implied credit spreads, represented in absolute terms, utilized in determining the value of credit default swaps on corporate issues as of year end serve as an indicator of the current status of the payment performance risk and represent the likelihood of risk of default for the credit derivative. The implied credit spread of a particular referenced entity reflects the cost of buying/selling protection and may include upfront payments required to be made to enter the agreement. Wider credit spreads, in comparison to narrower credit spreads, represent a deterioration of the referenced entity’s credit soundness and a greater likelihood of risk of default or other credit event occurring as defined under the terms of the agreement. |
| 2 | The maximum potential amount for the Fund could be required to pay as a seller of credit protection or receive as a buyer of credit protection if a credit event occurs as defined under the terms of that particular swap agreement. |
| 3 | The quoted market prices are resulting values for credit default swap agreements on credit indices serve as an indicator of the current status of the payment/performance risk and represent the likelihood of an expected liability (or profit) for the credit derivative had the notional amount of the swap agreement been closed/sold as of year end. Increasing values (buy protection) or decreasing values (sell protection), when compared to the notional amount of the swap, represent a deterioration of the referenced entity’s credit soundness and a greater likelihood of risk of default or other credit event occurring as defined under the terms of the agreement. |
| 4 | If the Fund is a seller of protection and credit event occurs, as defined under the terms of that particular swap agreement, the Fund will either (i) pay to the buyer of protection the amount equal to the notional amount of the swap and take delivery of the referenced obligation or underlying investments comprising the referenced index or (ii) pay a net settlement amount in the form of cash or investments equal to the notional amount of the swap less the recovery value of the referenced obligation or underlying investments comprising the referenced index. |
| 5 | Security is valued using significant unobservable inputs and is classified as Level 3 in the fair value hierarchy. |
| Description | Number of contracts |
Exercise Price |
Expiration Date |
Notional Amount | Value | |||||||||||||||
| PURCHASED CALL OPTIONS EXCHANGE TRADED |
||||||||||||||||||||
| 90-Day Euro Dollar Futures |
165 | $98.00 | 12/19/22 | $ | 1,204,583 | $ | 74,250 | |||||||||||||
| IMM Eurodollar 1-Year MIDCV Future Options |
101 | 98.38 | 09/16/22 | 733,866 | 8,206 | |||||||||||||||
| IMM Eurodollar 1-Year MIDCV Future Options |
217 | 98.75 | 09/16/22 | 10,511,480 | 10,850 | |||||||||||||||
|
|
|
|
|
|||||||||||||||||
| TOTAL PURCHASED OPTIONS |
$ | 12,449,929 | $ | 93,306 | ||||||||||||||||
|
|
|
|
|
|||||||||||||||||
| Description | Number of contracts |
Exercise Price |
Expiration Date |
Notional Amount | Value | |||||||||||||||
| WRITTEN CALL OPTIONS EXCHANGE TRADED |
||||||||||||||||||||
| IMM Eurodollar 1-Year MIDCV Future Options |
495 | $99.00 | 09/16/22 | $ | (21,580,020) | $ | (18,562) | |||||||||||||
| 90-Day Euro Dollar Futures |
165 | 98.25 | 12/19/22 | (1,204,583) | (51,563) | |||||||||||||||
| IMM Eurodollar 2-Year MIDCV Future Options |
149 | 97.63 | 12/16/22 | (9,060,597) | (102,438) | |||||||||||||||
| IMM Eurodollar 2-Year MIDCV Future Options |
240 | 97.88 | 12/16/22 | (14,594,250) | (112,500) | |||||||||||||||
|
|
|
|
|
|||||||||||||||||
| (46,439,450) | (285,063) | |||||||||||||||||||
|
|
|
|
|
|||||||||||||||||
| WRITTEN PUT OPTIONS EXCHANGE TRADED | ||||||||||||||||||||
| 90-Day Euro Dollar Futures |
165 | $97.25 | 12/19/22 | $ | (1,204,582) | $ | (162,937) | |||||||||||||
| IMM Eurodollar 1-Year MIDCV Future Options |
594 | 97.63 | 09/16/22 | (2,877,336) | (1,277,100) | |||||||||||||||
| IMM Eurodollar 2-Year MIDCV Future Options |
389 | 97.38 | 12/16/22 | (23,654,847) | (454,644) | |||||||||||||||
|
|
|
|
|
|||||||||||||||||
| (27,736,765) | (1,894,681) | |||||||||||||||||||
|
|
|
|
|
|||||||||||||||||
| TOTAL WRITTEN OPTIONS |
$ | (74,176,215) | $ | (2,179,744) | ||||||||||||||||
|
|
|
|
|
|||||||||||||||||
See accompanying Notes to Financial Statements.
| Annual Report March 2022 / 116 |
Table of Contents
Schedule of Portfolio Investments
March 31, 2022
| Issues | Maturity Date |
Principal Amount |
Value | |||||||
| BONDS – 104.68% |
| |||||||||
| ASSET-BACKED SECURITIES — 5.43%** |
| |||||||||
| Aimco CLO, |
| |||||||||
| Series 2015-AA, Class BR2 |
| |||||||||
| (Cayman Islands) |
| |||||||||
| (LIBOR USD 3-Month plus 1.60%) |
| |||||||||
| 1.84% |
10/17/341,2,3 | $ | 70,000 | $ | 69,319 | |||||
| J.G. Wentworth XXX LLC, |
| |||||||||
| Series 2013-3A, Class A |
| |||||||||
| 4.08% |
01/17/731 | 33,049 | 34,282 | |||||||
| Madison Park Funding XXXIX Ltd., |
| |||||||||
| Series 2021-39A, Class B |
| |||||||||
| (Cayman Islands) |
| |||||||||
| (LIBOR USD 3-Month plus 1.65%) |
| |||||||||
| 1.78% |
10/22/341,2,3 | 70,000 | 69,173 | |||||||
| Octagon Investment Partners 46 Ltd., |
| |||||||||
| Series 2020-2A, Class AR |
| |||||||||
| (Cayman Islands) |
| |||||||||
| (LIBOR USD 3-Month plus 1.16%) |
| |||||||||
| 1.40% |
07/15/361,2,3 | 70,000 | 69,417 | |||||||
| Skyline Aircraft Finance LLC, |
| |||||||||
| Series 2021-1, Class A |
| |||||||||
| 3.23% |
05/10/374,5 | 37,615 | 35,499 | |||||||
| SLM Student Loan Trust, |
| |||||||||
| Series 2007-2, Class B |
| |||||||||
| (LIBOR USD 3-Month plus 0.17%) |
| |||||||||
| 0.43% |
07/25/252 | 70,000 | 64,920 | |||||||
| SLM Student Loan Trust, |
| |||||||||
| Series 2008-2, Class B |
| |||||||||
| (LIBOR USD 3-Month plus 1.20%) |
| |||||||||
| 1.46% |
01/25/832 | 20,000 | 19,029 | |||||||
| SLM Student Loan Trust, |
| |||||||||
| Series 2008-3, Class B |
| |||||||||
| (LIBOR USD 3-Month plus 1.20%) |
| |||||||||
| 1.46% |
04/26/832 | 20,000 | 18,418 | |||||||
| SLM Student Loan Trust, |
| |||||||||
| Series 2008-5, Class B |
| |||||||||
| (LIBOR USD 3-Month plus 1.85%) |
| |||||||||
| 2.11% |
07/25/732 | 35,000 | 34,957 | |||||||
| SLM Student Loan Trust, |
| |||||||||
| Series 2008-6, Class A4 |
| |||||||||
| (LIBOR USD 3-Month plus 1.10%) |
| |||||||||
| 1.36% |
07/25/232 | 29,092 | 28,747 | |||||||
| SLM Student Loan Trust, |
| |||||||||
| Series 2008-6, Class B |
| |||||||||
| (LIBOR USD 3-Month plus 1.85%) |
| |||||||||
| 2.11% |
07/26/832 | 20,000 | 19,567 | |||||||
| SLM Student Loan Trust, |
| |||||||||
| Series 2008-7, Class B |
| |||||||||
| (LIBOR USD 3-Month plus 1.85%) |
| |||||||||
| 2.11% |
07/26/832 | 20,000 | 19,900 | |||||||
| SLM Student Loan Trust, |
| |||||||||
| Series 2008-8, Class A4 |
| |||||||||
| (LIBOR USD 3-Month plus 1.50%) |
| |||||||||
| 1.76% |
04/25/232 | 18,210 | 18,258 | |||||||
| Issues | Maturity Date |
Principal Amount |
Value | |||||||
| ASSET-BACKED SECURITIES (continued) |
| |||||||||
| SLM Student Loan Trust, |
| |||||||||
| Series 2008-8, Class B |
| |||||||||
| (LIBOR USD 3-Month plus 2.25%) |
| |||||||||
| 2.51% |
10/25/752 | $ | 30,000 | $ | 30,066 | |||||
| SLM Student Loan Trust, |
| |||||||||
| Series 2008-9, Class A |
| |||||||||
| (LIBOR USD 3-Month plus 1.50%) |
| |||||||||
| 1.76% |
04/25/232 | 13,783 | 13,784 | |||||||
| SLM Student Loan Trust, |
| |||||||||
| Series 2008-9, Class B |
| |||||||||
| (LIBOR USD 3-Month plus 2.25%) |
| |||||||||
| 2.51% |
10/25/832 | 15,000 | 15,067 | |||||||
| Wachovia Student Loan Trust, |
| |||||||||
| Series 2006-1, Class A6 |
| |||||||||
| (LIBOR USD 3-Month plus 0.17%) |
| |||||||||
| 0.43% |
04/25/401,2 | 32,712 | 31,952 | |||||||
|
|
|
| ||||||||
| Total Asset-Backed Securities |
|
|||||||||
| (Cost $593,319) |
|
592,355 | ||||||||
|
|
|
| ||||||||
| CORPORATES — 66.31%* |
| |||||||||
| Banking — 10.33% |
| |||||||||
| Bank of America Corp. |
| |||||||||
| 1.73% |
07/22/276 | 100,000 | 92,990 | |||||||
| Bank of America Corp. |
| |||||||||
| (MTN) |
| |||||||||
| 2.09% |
06/14/296 | 175,000 | 160,095 | |||||||
| Credit Suisse Group AG |
| |||||||||
| (Switzerland) |
| |||||||||
| 1.31% |
02/02/271,3,6 | 45,000 | 40,243 | |||||||
| 3.09% |
05/14/321,3,6 | 10,000 | 9,009 | |||||||
| DNB Bank ASA |
| |||||||||
| (Norway) |
| |||||||||
| 1.13% |
09/16/261,3,6 | 25,000 | 22,977 | |||||||
| Fifth Third Bancorp |
| |||||||||
| 2.55% |
05/05/27 | 20,000 | 19,357 | |||||||
| HSBC Holdings PLC |
| |||||||||
| (United Kingdom) |
| |||||||||
| 2.21% |
08/17/293,6 | 105,000 | 94,629 | |||||||
| JPMorgan Chase & Co. |
| |||||||||
| 0.97% |
06/23/256 | 45,000 | 42,992 | |||||||
| 1.58% |
04/22/276 | 265,000 | 247,017 | |||||||
| Lloyds Banking Group PLC |
| |||||||||
| (United Kingdom) |
| |||||||||
| 3.87% |
07/09/253,6 | 55,000 | 55,611 | |||||||
| Macquarie Group Ltd. |
| |||||||||
| (Australia) |
| |||||||||
| 1.63% |
09/23/271,3,6 | 45,000 | 40,608 | |||||||
| 4.44% |
06/21/331,3,6 | 10,000 | 10,126 | |||||||
| NatWest Group PLC |
| |||||||||
| (United Kingdom) |
| |||||||||
| 4.27% |
03/22/253,6 | 35,000 | 35,426 | |||||||
| Santander UK PLC |
| |||||||||
| (United Kingdom) |
| |||||||||
| 5.00% |
11/07/231,3 | 45,000 | 46,103 | |||||||
See accompanying Notes to Financial Statements.
| 117 / Annual Report March 2022 |
Table of Contents
Investment Grade Credit Fund
Schedule of Portfolio Investments
March 31, 2022
| Issues | Maturity Date |
Principal Amount |
Value | |||||||
| CORPORATES (continued) |
| |||||||||
| Banking (continued) |
| |||||||||
| Wells Fargo & Co. |
| |||||||||
| (MTN) |
| |||||||||
| 2.39% |
06/02/286 | $ | 220,000 | $ | 208,283 | |||||
|
|
|
| ||||||||
| 1,125,466 | ||||||||||
|
|
|
| ||||||||
| Communications — 7.19% |
| |||||||||
| AT&T, Inc. |
| |||||||||
| 2.55% |
12/01/33 | 144,000 | 128,222 | |||||||
| 3.80% |
12/01/57 | 10,000 | 8,912 | |||||||
| Charter Communications Operating LLC/Charter |
| |||||||||
| Communications Operating Capital |
| |||||||||
| 2.30% |
02/01/32 | 100,000 | 85,564 | |||||||
| 3.75% |
02/15/28 | 42,000 | 41,554 | |||||||
| Comcast Corp. |
| |||||||||
| 1.95% |
01/15/31 | 30,000 | 27,105 | |||||||
| Discovery Communications LLC |
| |||||||||
| 3.63% |
05/15/30 | 35,000 | 34,049 | |||||||
| Level 3 Financing, Inc. |
| |||||||||
| 3.88% |
11/15/291 | 46,000 | 42,417 | |||||||
| Paramount Global |
| |||||||||
| 4.20% |
05/19/32 | 30,000 | 30,062 | |||||||
| SES SA |
| |||||||||
| (Luxembourg) |
| |||||||||
| 3.60% |
04/04/231,3 | 15,000 | 15,088 | |||||||
| Sprint Spectrum Co. LLC/Sprint Spectrum Co. II LLC/Sprint |
| |||||||||
| Spectrum Co. III LLC |
| |||||||||
| 4.74% |
03/20/251 | 56,250 | 57,455 | |||||||
| 5.15% |
03/20/281 | 60,000 | 63,237 | |||||||
| Tencent Holdings Ltd. |
| |||||||||
| (Cayman Islands) |
| |||||||||
| 3.98% |
04/11/291,3 | 40,000 | 39,991 | |||||||
| T-Mobile USA, Inc. |
| |||||||||
| 2.55% |
02/15/31 | 99,000 | 89,930 | |||||||
| Verizon Communications, Inc. |
| |||||||||
| 2.36% |
03/15/321 | 66,000 | 59,707 | |||||||
| Vodafone Group PLC |
| |||||||||
| (United Kingdom) |
| |||||||||
| 4.38% |
05/30/283 | 45,000 | 47,148 | |||||||
| Walt Disney Co. (The) |
| |||||||||
| 7.75% |
01/20/24 | 12,000 | 12,980 | |||||||
|
|
|
| ||||||||
| 783,421 | ||||||||||
|
|
|
| ||||||||
| Consumer Discretionary — 2.68% |
| |||||||||
| Anheuser-Busch InBev Worldwide, Inc. |
| |||||||||
| 3.50% |
06/01/30 | 40,000 | 40,618 | |||||||
| Bacardi Ltd. |
| |||||||||
| (Bermuda) |
| |||||||||
| 4.70% |
05/15/281,3 | 15,000 | 15,625 | |||||||
| Constellation Brands, Inc. |
| |||||||||
| 2.88% |
05/01/30 | 30,000 | 28,183 | |||||||
| Hyatt Hotels Corp. |
| |||||||||
| 1.80% |
10/01/24 | 35,000 | 33,666 | |||||||
| Imperial Brands Finance PLC |
| |||||||||
| (United Kingdom) |
| |||||||||
| 4.25% |
07/21/251,3 | 40,000 | 40,347 | |||||||
| Issues | Maturity Date |
Principal Amount |
Value | |||||||
| CORPORATES (continued) |
| |||||||||
| Consumer Discretionary (continued) |
| |||||||||
| Magallanes, Inc. |
| |||||||||
| 4.28% |
03/15/321 | $ | 65,000 | $ | 65,407 | |||||
| Reynolds American, Inc. |
| |||||||||
| 5.70% |
08/15/35 | 65,000 | 68,537 | |||||||
|
|
|
| ||||||||
| 292,383 | ||||||||||
|
|
|
| ||||||||
| Electric — 4.72% |
| |||||||||
| Alliant Energy Finance LLC |
| |||||||||
| 1.40% |
03/15/261 | 65,000 | 59,220 | |||||||
| Ameren Corp. |
| |||||||||
| 3.50% |
01/15/31 | 95,000 | 93,855 | |||||||
| Appalachian Power Co., |
| |||||||||
| Series X |
| |||||||||
| 3.30% |
06/01/27 | 20,000 | 20,141 | |||||||
| Berkshire Hathaway Energy Co. |
| |||||||||
| 1.65% |
05/15/31 | 25,000 | 21,802 | |||||||
| Black Hills Corp. |
| |||||||||
| 4.35% |
05/01/33 | 36,000 | 36,744 | |||||||
| Duke Energy Corp. |
| |||||||||
| 2.55% |
06/15/31 | 45,000 | 41,332 | |||||||
| Evergy Missouri West, Inc. |
| |||||||||
| 3.75% |
03/15/321 | 25,000 | 25,213 | |||||||
| Jersey Central Power & Light Co. |
| |||||||||
| 2.75% |
03/01/321 | 55,000 | 51,286 | |||||||
| Metropolitan Edison Co. |
| |||||||||
| 4.00% |
04/15/251 | 25,000 | 25,142 | |||||||
| Narragansett Electric Co. (The) |
| |||||||||
| 3.40% |
04/09/301 | 35,000 | 34,449 | |||||||
| Public Service Co. of New Mexico |
| |||||||||
| 3.85% |
08/01/25 | 40,000 | 40,716 | |||||||
| Public Service Electric and Gas Co. |
| |||||||||
| (MTN) |
| |||||||||
| 3.10% |
03/15/32 | 30,000 | 29,695 | |||||||
| Southwestern Electric Power Co., |
| |||||||||
| Series M |
| |||||||||
| 4.10% |
09/15/28 | 15,000 | 15,377 | |||||||
| Xcel Energy, Inc. |
| |||||||||
| 3.40% |
06/01/30 | 20,000 | 19,992 | |||||||
|
|
|
| ||||||||
| 514,964 | ||||||||||
|
|
|
| ||||||||
| Energy — 3.10% |
| |||||||||
| Energy Transfer LP |
| |||||||||
| 4.95% |
06/15/28 | 65,000 | 68,360 | |||||||
| Kinder Morgan, Inc. |
| |||||||||
| 5.30% |
12/01/34 | 30,000 | 32,944 | |||||||
| Lundin Energy Finance BV |
| |||||||||
| (Netherlands) |
| |||||||||
| 3.10% |
07/15/311,3 | 35,000 | 32,472 | |||||||
| Petroleos Mexicanos |
| |||||||||
| (Mexico) |
| |||||||||
| 5.95% |
01/28/313 | 30,000 | 27,734 | |||||||
| 6.70% |
02/16/323 | 13,000 | 12,382 | |||||||
| Phillips 66 Partners LP |
| |||||||||
| 3.15% |
12/15/29 | 25,000 | 24,105 | |||||||
| Piedmont Natural Gas Co., Inc. |
| |||||||||
| 2.50% |
03/15/31 | 10,000 | 9,161 | |||||||
See accompanying Notes to Financial Statements.
| Annual Report March 2022 / 118 |
Table of Contents
Investment Grade Credit Fund
Schedule of Portfolio Investments
March 31, 2022
| Issues | Maturity Date |
Principal Amount |
Value | |||||||
| CORPORATES (continued) |
| |||||||||
| Energy (continued) |
| |||||||||
| Plains All American Pipeline LP/PAA Finance Corp. |
| |||||||||
| 4.65% |
10/15/25 | $ | 30,000 | $ | 30,735 | |||||
| Rockies Express Pipeline LLC |
| |||||||||
| 3.60% |
05/15/251 | 20,000 | 19,689 | |||||||
| 4.95% |
07/15/291 | 10,000 | 9,719 | |||||||
| Ruby Pipeline LLC |
| |||||||||
| 8.00% |
04/01/221,4,5 | 14,394 | 13,386 | |||||||
| Southern Natural Gas Co. LLC |
| |||||||||
| 4.80% |
03/15/471 | 30,000 | 31,867 | |||||||
| Texas Eastern Transmission LP |
| |||||||||
| 2.80% |
10/15/221 | 10,000 | 10,036 | |||||||
| Williams Cos., Inc. (The) |
| |||||||||
| 4.30% |
03/04/24 | 15,000 | 15,326 | |||||||
|
|
|
| ||||||||
| 337,916 | ||||||||||
|
|
|
| ||||||||
| Finance — 6.83% |
| |||||||||
| AerCap Ireland Capital DAC/AerCap Global Aviation Trust |
|
|||||||||
| (Ireland) |
| |||||||||
| 3.00% |
10/29/283 | 30,000 | 27,663 | |||||||
| 3.88% |
01/23/283 | 16,000 | 15,583 | |||||||
| Air Lease Corp. |
| |||||||||
| 3.63% |
12/01/27 | 31,000 | 29,601 | |||||||
| Avolon Holdings Funding Ltd. |
| |||||||||
| (Cayman Islands) |
| |||||||||
| 2.53% |
11/18/271,3 | 21,000 | 18,588 | |||||||
| 2.88% |
02/15/251,3 | 10,000 | 9,681 | |||||||
| Cboe Global Markets, Inc. |
| |||||||||
| 3.00% |
03/16/32 | 15,000 | 14,522 | |||||||
| Citigroup, Inc. |
| |||||||||
| 3.06% |
01/25/336 | 115,000 | 107,684 | |||||||
| 3.79% |
03/17/336 | 10,000 | 9,946 | |||||||
| Ford Motor Credit Co. LLC |
| |||||||||
| 4.25% |
09/20/22 | 25,000 | 25,183 | |||||||
| (LIBOR USD 3-Month plus 1.08%) |
| |||||||||
| 1.38% |
08/03/222 | 35,000 | 34,886 | |||||||
| Goldman Sachs Group, Inc. (The) |
| |||||||||
| 1.54% |
09/10/276 | 140,000 | 128,375 | |||||||
| 2.65% |
10/21/326 | 10,000 | 9,062 | |||||||
| Intercontinental Exchange, Inc. |
| |||||||||
| 1.85% |
09/15/32 | 30,000 | 26,013 | |||||||
| Morgan Stanley |
| |||||||||
| (GMTN) |
| |||||||||
| 1.51% |
07/20/276 | 35,000 | 32,286 | |||||||
| Morgan Stanley |
| |||||||||
| (MTN) |
| |||||||||
| 1.93% |
04/28/326 | 165,000 | 142,975 | |||||||
| Nationwide Building Society |
| |||||||||
| (United Kingdom) |
| |||||||||
| 3.77% |
03/08/241,3,6 | 60,000 | 60,355 | |||||||
| Pipeline Funding Co. LLC |
| |||||||||
| 7.50% |
01/15/301 | 17,566 | 20,594 | |||||||
| Raymond James Financial, Inc. |
| |||||||||
| 4.65% |
04/01/30 | 30,000 | 31,858 | |||||||
|
|
|
| ||||||||
| 744,855 | ||||||||||
|
|
|
| ||||||||
| Issues | Maturity Date |
Principal Amount |
Value | |||||||
| CORPORATES (continued) |
| |||||||||
| Food — 1.97% |
| |||||||||
| JBS USA LUX SA/JBS USA Food Co./JBS USA Finance, Inc. |
|
|||||||||
| (Canada) |
| |||||||||
| 5.50% |
01/15/301,3 | $ | 45,000 | $ | 46,099 | |||||
| Kraft Heinz Foods Co. |
| |||||||||
| 5.00% |
07/15/35 | 28,000 | 30,059 | |||||||
| Mondelez International, Inc. |
| |||||||||
| 3.00% |
03/17/32 | 30,000 | 28,981 | |||||||
| Pilgrim’s Pride Corp. |
| |||||||||
| 3.50% |
03/01/321 | 60,000 | 52,512 | |||||||
| Smithfield Foods, Inc. |
| |||||||||
| 2.63% |
09/13/311 | 65,000 | 57,038 | |||||||
|
|
|
|||||||||
| 214,689 | ||||||||||
|
|
|
|||||||||
| Health Care — 8.11% |
| |||||||||
| AbbVie, Inc. |
| |||||||||
| 4.50% |
05/14/35 | 40,000 | 43,026 | |||||||
| Alcon Finance Corp. |
| |||||||||
| 2.75% |
09/23/261 | 30,000 | 29,091 | |||||||
| Amgen, Inc. |
| |||||||||
| 3.35% |
02/22/32 | 30,000 | 29,764 | |||||||
| Ascension Health, |
| |||||||||
| Series B |
| |||||||||
| 2.53% |
11/15/29 | 20,000 | 19,274 | |||||||
| Banner Health |
| |||||||||
| 2.34% |
01/01/30 | 10,000 | 9,307 | |||||||
| Barnabas Health, Inc., |
| |||||||||
| Series 2012 |
| |||||||||
| 4.00% |
07/01/28 | 15,000 | 15,321 | |||||||
| Baxter International, Inc. |
| |||||||||
| 3.95% |
04/01/30 | 10,000 | 10,329 | |||||||
| Bayer U.S. Finance II LLC |
| |||||||||
| 4.38% |
12/15/281 | 45,000 | 46,065 | |||||||
| Becton Dickinson and Co. |
| |||||||||
| 3.70% |
06/06/27 | 20,000 | 20,322 | |||||||
| Centene Corp. |
| |||||||||
| 3.00% |
10/15/30 | 50,000 | 46,000 | |||||||
| Cigna Corp. |
| |||||||||
| 2.40% |
03/15/30 | 45,000 | 41,640 | |||||||
| CommonSpirit Health |
| |||||||||
| 2.78% |
10/01/30 | 20,000 | 18,558 | |||||||
| 3.35% |
10/01/29 | 50,000 | 48,568 | |||||||
| CVS Health Corp. |
| |||||||||
| 3.25% |
08/15/29 | 45,000 | 44,481 | |||||||
| DENTSPLY SIRONA, Inc. |
| |||||||||
| 3.25% |
06/01/30 | 35,000 | 33,778 | |||||||
| Elanco Animal Health, Inc. |
| |||||||||
| 6.40% |
08/28/28 | 15,000 | 16,163 | |||||||
| Fresenius Medical Care U.S. Finance III, Inc. |
| |||||||||
| 1.88% |
12/01/261 | 20,000 | 18,583 | |||||||
| HCA, Inc. |
| |||||||||
| 3.63% |
03/15/321 | 10,000 | 9,805 | |||||||
| 4.13% |
06/15/29 | 95,000 | 96,820 | |||||||
| Humana, Inc. |
| |||||||||
| 2.15% |
02/03/32 | 5,000 | 4,392 | |||||||
| 3.70% |
03/23/29 | 10,000 | 10,035 | |||||||
See accompanying Notes to Financial Statements.
| 119 / Annual Report March 2022 |
Table of Contents
Investment Grade Credit Fund
Schedule of Portfolio Investments
March 31, 2022
| Issues | Maturity Date |
Principal Amount |
Value | |||||||
| CORPORATES (continued) |
| |||||||||
| Health Care (continued) |
| |||||||||
| Illumina, Inc. |
| |||||||||
| 2.55% |
03/23/31 | $ | 30,000 | $ | 27,289 | |||||
| Molina Healthcare, Inc. |
| |||||||||
| 3.88% |
11/15/301 | 30,000 | 29,016 | |||||||
| PerkinElmer, Inc. |
| |||||||||
| 2.25% |
09/15/31 | 35,000 | 31,031 | |||||||
| Providence St. Joseph Health Obligated Group, |
| |||||||||
| Series H |
| |||||||||
| 2.75% |
10/01/26 | 20,000 | 19,815 | |||||||
| Regeneron Pharmaceuticals, Inc. |
| |||||||||
| 1.75% |
09/15/30 | 25,000 | 21,686 | |||||||
| Royalty Pharma PLC |
| |||||||||
| (United Kingdom) |
| |||||||||
| 1.75% |
09/02/273 | 30,000 | 27,294 | |||||||
| Smith & Nephew PLC |
| |||||||||
| (United Kingdom) |
| |||||||||
| 2.03% |
10/14/303 | 30,000 | 26,121 | |||||||
| STERIS Irish FinCo UnLtd Co. |
| |||||||||
| (Ireland) |
| |||||||||
| 2.70% |
03/15/313 | 30,000 | 27,497 | |||||||
| UnitedHealth Group, Inc. |
| |||||||||
| 3.88% |
12/15/28 | 20,000 | 21,066 | |||||||
| Universal Health Services, Inc. |
| |||||||||
| 1.65% |
09/01/261 | 45,000 | 41,304 | |||||||
|
|
|
| ||||||||
| 883,441 | ||||||||||
|
|
|
| ||||||||
| Industrials — 2.52% |
| |||||||||
| Amcor Finance USA, Inc. |
| |||||||||
| 3.63% |
04/28/26 | 25,000 | 25,356 | |||||||
| BAE Systems Holdings, Inc. |
| |||||||||
| 3.80% |
10/07/241 | 15,000 | 15,111 | |||||||
| 3.85% |
12/15/251 | 10,000 | 10,046 | |||||||
| Berry Global, Inc. |
| |||||||||
| 1.57% |
01/15/26 | 20,000 | 18,677 | |||||||
| 1.65% |
01/15/27 | 20,000 | 18,250 | |||||||
| Boeing Co. (The) |
| |||||||||
| 4.88% |
05/01/25 | 25,000 | 25,826 | |||||||
| General Electric Co. |
| |||||||||
| (MTN) |
| |||||||||
| (LIBOR USD 3-Month plus 0.38%) |
| |||||||||
| 0.70% |
05/05/262 | 10,000 | 9,846 | |||||||
| Sealed Air Corp. |
| |||||||||
| 1.57% |
10/15/261 | 30,000 | 27,394 | |||||||
| Sonoco Products Co. |
| |||||||||
| 3.13% |
05/01/30 | 25,000 | 24,067 | |||||||
| Sydney Airport Finance Co. Pty Ltd. |
| |||||||||
| (Australia) |
| |||||||||
| 3.63% |
04/28/261,3 | 15,000 | 15,069 | |||||||
| 3.90% |
03/22/231,3 | 75,000 | 75,893 | |||||||
| WRKCo, Inc. |
| |||||||||
| 3.00% |
06/15/33 | 10,000 | 9,345 | |||||||
|
|
|
| ||||||||
| 274,880 | ||||||||||
|
|
|
| ||||||||
| Information Technology — 1.50% |
| |||||||||
| Broadcom, Inc. |
| |||||||||
| 3.42% |
04/15/331 | 35,000 | 32,681 | |||||||
| Issues | Maturity Date |
Principal Amount |
Value | |||||||
| CORPORATES (continued) |
| |||||||||
| Information Technology (continued) |
| |||||||||
| Fiserv, Inc. |
| |||||||||
| 2.65% |
06/01/30 | $ | 10,000 | $ | 9,244 | |||||
| Micron Technology, Inc. |
| |||||||||
| 2.70% |
04/15/32 | 15,000 | 13,627 | |||||||
| Netflix, Inc. |
| |||||||||
| 3.63% |
06/15/251 | 35,000 | 35,229 | |||||||
| Oracle Corp. |
| |||||||||
| 2.88% |
03/25/31 | 80,000 | 73,048 | |||||||
|
|
|
| ||||||||
| 163,829 | ||||||||||
|
|
|
| ||||||||
| Insurance — 4.28% |
| |||||||||
| Aon Corp. |
| |||||||||
| 2.80% |
05/15/30 | 25,000 | 23,815 | |||||||
| Aon Corp./Aon Global Holdings PLC |
| |||||||||
| 2.60% |
12/02/31 | 10,000 | 9,222 | |||||||
| Athene Global Funding |
| |||||||||
| 1.61% |
06/29/261 | 5,000 | 4,560 | |||||||
| (SOFR Rate plus 0.70%) |
| |||||||||
| 0.91% |
05/24/241,2 | 40,000 | 39,503 | |||||||
| Berkshire Hathaway Finance Corp. |
| |||||||||
| 2.88% |
03/15/32 | 15,000 | 14,557 | |||||||
| Brown & Brown, Inc. |
| |||||||||
| 4.20% |
03/17/32 | 30,000 | 30,505 | |||||||
| Equitable Financial Life Global Funding |
| |||||||||
| 1.80% |
03/08/281 | 25,000 | 22,505 | |||||||
| Farmers Exchange Capital |
| |||||||||
| 7.05% |
07/15/281 | 5,000 | 5,706 | |||||||
| Farmers Insurance Exchange |
| |||||||||
| 4.75% |
11/01/571,6 | 45,000 | 47,275 | |||||||
| Marsh & McLennan Cos., Inc. |
| |||||||||
| 2.25% |
11/15/30 | 20,000 | 18,282 | |||||||
| 2.38% |
12/15/31 | 10,000 | 9,174 | |||||||
| Metropolitan Life Global Funding I |
| |||||||||
| 2.95% |
04/09/301 | 15,000 | 14,559 | |||||||
| MMI Capital Trust I, |
| |||||||||
| Series B |
| |||||||||
| 7.63% |
12/15/27 | 50,000 | 58,701 | |||||||
| Nationwide Mutual Insurance Co. |
| |||||||||
| 3.12% |
12/15/241,6 | 50,000 | 50,034 | |||||||
| New York Life Insurance Co. |
| |||||||||
| 5.88% |
05/15/331 | 25,000 | 29,861 | |||||||
| Progressive Corp. (The) |
| |||||||||
| 3.00% |
03/15/32 | 10,000 | 9,741 | |||||||
| Teachers Insurance & Annuity Association of America |
| |||||||||
| 4.38% |
09/15/541,6 | 55,000 | 54,819 | |||||||
| Willis North America, Inc. |
| |||||||||
| 2.95% |
09/15/29 | 25,000 | 23,508 | |||||||
|
|
|
| ||||||||
| 466,327 | ||||||||||
|
|
|
| ||||||||
| Materials — 0.51% |
| |||||||||
| FMC Corp. |
| |||||||||
| 3.45% |
10/01/29 | 10,000 | 9,836 | |||||||
| Georgia-Pacific LLC |
| |||||||||
| 2.30% |
04/30/301 | 20,000 | 18,593 | |||||||
See accompanying Notes to Financial Statements.
| Annual Report March 2022 / 120 |
Table of Contents
Investment Grade Credit Fund
Schedule of Portfolio Investments
March 31, 2022
| Issues | Maturity Date |
Principal Amount |
Value | |||||||
| CORPORATES (continued) |
| |||||||||
| Materials (continued) |
| |||||||||
| International Flavors & Fragrances, Inc. |
| |||||||||
| 2.30% |
11/01/301 | $ | 30,000 | $ | 26,828 | |||||
|
|
|
| ||||||||
| 55,257 | ||||||||||
|
|
|
| ||||||||
| Real Estate Investment Trust (REIT) — 9.42% |
| |||||||||
| American Assets Trust LP |
| |||||||||
| 3.38% |
02/01/31 | 25,000 | 23,526 | |||||||
| American Campus Communities Operating Partnership LP |
|
|||||||||
| 2.25% |
01/15/29 | 80,000 | 73,040 | |||||||
| 3.30% |
07/15/26 | 15,000 | 14,939 | |||||||
| 3.63% |
11/15/27 | 5,000 | 4,979 | |||||||
| 3.75% |
04/15/23 | 20,000 | 20,177 | |||||||
| American Homes 4 Rent LP |
| |||||||||
| 2.38% |
07/15/31 | 30,000 | 26,561 | |||||||
| American Tower Corp. |
| |||||||||
| 2.90% |
01/15/30 | 15,000 | 13,994 | |||||||
| Boston Properties LP |
| |||||||||
| 3.25% |
01/30/31 | 15,000 | 14,549 | |||||||
| Crown Castle International Corp. |
| |||||||||
| 3.30% |
07/01/30 | 25,000 | 23,943 | |||||||
| CubeSmart LP |
| |||||||||
| 4.38% |
02/15/29 | 15,000 | 15,716 | |||||||
| CyrusOne LP/CyrusOne Finance Corp. |
| |||||||||
| 2.90% |
11/15/24 | 40,000 | 40,110 | |||||||
| 3.45% |
11/15/29 | 65,000 | 68,256 | |||||||
| Equinix, Inc. |
| |||||||||
| 3.90% |
04/15/32 | 25,000 | 24,869 | |||||||
| Essex Portfolio LP |
| |||||||||
| 2.65% |
03/15/32 | 10,000 | 9,152 | |||||||
| Extra Space Storage LP |
| |||||||||
| 3.90% |
04/01/29 | 25,000 | 25,097 | |||||||
| GLP Capital LP/GLP Financing II, Inc. |
| |||||||||
| 3.35% |
09/01/24 | 15,000 | 14,991 | |||||||
| 4.00% |
01/15/30 | 20,000 | 19,558 | |||||||
| 5.30% |
01/15/29 | 20,000 | 21,083 | |||||||
| Healthcare Realty Trust, Inc. |
| |||||||||
| 3.88% |
05/01/25 | 20,000 | 20,252 | |||||||
| Healthcare Trust of America Holdings LP |
| |||||||||
| 2.00% |
03/15/31 | 100,000 | 86,677 | |||||||
| 3.10% |
02/15/30 | 15,000 | 14,343 | |||||||
| Healthpeak Properties, Inc. |
| |||||||||
| 4.00% |
06/01/25 | 65,000 | 66,144 | |||||||
| Hudson Pacific Properties LP |
| |||||||||
| 3.95% |
11/01/27 | 75,000 | 75,448 | |||||||
| Invitation Homes Operating Partnership LP |
| |||||||||
| 2.30% |
11/15/28 | 45,000 | 40,927 | |||||||
| Kilroy Realty LP |
| |||||||||
| 2.50% |
11/15/32 | 25,000 | 21,761 | |||||||
| 3.05% |
02/15/30 | 5,000 | 4,685 | |||||||
| 4.38% |
10/01/25 | 15,000 | 15,416 | |||||||
| Life Storage LP |
| |||||||||
| 2.20% |
10/15/30 | 40,000 | 35,407 | |||||||
| LXP Industrial Trust |
| |||||||||
| 2.38% |
10/01/31 | 25,000 | 22,223 | |||||||
| 2.70% |
09/15/30 | 25,000 | 23,110 | |||||||
| Issues | Maturity Date |
Principal Amount |
Value | |||||||
| CORPORATES (continued) |
| |||||||||
| Real Estate Investment Trust (REIT) (continued) |
| |||||||||
| MGM Growth Properties Operating Partnership LP/MGP Finance Co.-Issuer, Inc. |
|
|||||||||
| 4.63% |
06/15/251 | $ | 50,000 | $ | 50,634 | |||||
| Mid-America Apartments LP |
| |||||||||
| 1.70% |
02/15/31 | 20,000 | 17,313 | |||||||
| Piedmont Operating Partnership LP |
| |||||||||
| 2.75% |
04/01/32 | 25,000 | 22,243 | |||||||
| SL Green Operating Partnership LP |
| |||||||||
| 3.25% |
10/15/22 | 35,000 | 35,013 | |||||||
| UDR, Inc. |
| |||||||||
| (MTN) |
| |||||||||
| 4.40% |
01/26/29 | 10,000 | 10,525 | |||||||
| Ventas Realty LP |
| |||||||||
| 4.13% |
01/15/26 | 10,000 | 10,240 | |||||||
|
|
|
| ||||||||
| 1,026,901 | ||||||||||
|
|
|
| ||||||||
| Retail — 0.39% |
| |||||||||
| Alimentation Couche-Tard, Inc. |
| |||||||||
| (Canada) |
| |||||||||
| 2.95% |
01/25/301,3 | 25,000 | 23,701 | |||||||
| Starbucks Corp. |
| |||||||||
| 2.55% |
11/15/30 | 20,000 | 18,630 | |||||||
|
|
|
| ||||||||
| 42,331 | ||||||||||
|
|
|
| ||||||||
| Services — 1.24% |
| |||||||||
| Global Payments, Inc. |
| |||||||||
| 1.50% |
11/15/24 | 10,000 | 9,563 | |||||||
| Northwestern University |
| |||||||||
| 3.69% |
12/01/38 | 20,000 | 21,420 | |||||||
| RELX Capital, Inc. |
| |||||||||
| 3.00% |
05/22/30 | 30,000 | 28,641 | |||||||
| Republic Services, Inc. |
| |||||||||
| 2.90% |
07/01/26 | 10,000 | 9,938 | |||||||
| S&P Global, Inc. |
| |||||||||
| 2.90% |
03/01/321 | 10,000 | 9,699 | |||||||
| 4.75% |
08/01/281 | 30,000 | 32,256 | |||||||
| Waste Connections, Inc. |
| |||||||||
| (Canada) |
| |||||||||
| 2.60% |
02/01/303 | 25,000 | 23,548 | |||||||
|
|
|
| ||||||||
| 135,065 | ||||||||||
|
|
|
| ||||||||
| Transportation — 1.52% |
| |||||||||
| Continental Airlines Pass-Through Trust, |
| |||||||||
| Series 2007-1, Class A |
| |||||||||
| 5.98% |
04/19/22 | 6,008 | 6,017 | |||||||
| Delta Air Lines Pass-Through Trust, |
| |||||||||
| Series 2020-1, Class AA |
| |||||||||
| 2.00% |
06/10/28 | 22,758 | 20,889 | |||||||
| JetBlue Airways Pass-Through Trust, |
| |||||||||
| Series 2019-1, Class AA |
| |||||||||
| 2.75% |
05/15/32 | 30,183 | 27,889 | |||||||
| Norfolk Southern Corp. |
| |||||||||
| 3.00% |
03/15/32 | 15,000 | 14,640 | |||||||
| U.S. Airways Pass-Through Trust, |
| |||||||||
| Series 2010-1, Class A |
| |||||||||
| 6.25% |
04/22/23 | 3,221 | 3,241 | |||||||
See accompanying Notes to Financial Statements.
| 121 / Annual Report March 2022 |
Table of Contents
Investment Grade Credit Fund
Schedule of Portfolio Investments
March 31, 2022
| Issues | Maturity Date |
Principal Amount |
Value | |||||||||
| CORPORATES (continued) |
| |||||||||||
| Transportation (continued) |
| |||||||||||
| U.S. Airways Pass-Through Trust, |
| |||||||||||
| Series 2011-1, Class A |
| |||||||||||
| 7.13% |
10/22/23 | $ | 16,850 | $ | 17,289 | |||||||
| U.S. Airways Pass-Through Trust, |
| |||||||||||
| Series 2012-1, Class A |
| |||||||||||
| 5.90% |
10/01/24 | 40,992 | 42,760 | |||||||||
| Union Pacific Corp. |
| |||||||||||
| 2.80% |
02/14/32 | 5,000 | 4,811 | |||||||||
| 2.89% |
04/06/36 | 30,000 | 28,065 | |||||||||
|
|
|
| ||||||||||
| 165,601 | ||||||||||||
|
|
|
| ||||||||||
| Total Corporates |
|
|||||||||||
| (Cost $7,735,055) |
|
7,227,326 | ||||||||||
|
|
|
| ||||||||||
| MORTGAGE-BACKED — 25.10%** |
| |||||||||||
| Non-Agency Commercial Mortgage-Backed — 7.07% |
| |||||||||||
| Citigroup Commercial Mortgage Trust, |
| |||||||||||
| Series 2013-GC11, Class XA (IO) |
| |||||||||||
| 1.35% |
04/10/466 | 3,376,752 | 33,066 | |||||||||
| Citigroup Commercial Mortgage Trust, |
| |||||||||||
| Series 2013-GC15, Class XA (IO) |
| |||||||||||
| 0.82% |
09/10/466 | 7,309,012 | 65,466 | |||||||||
| Citigroup Commercial Mortgage Trust, |
| |||||||||||
| Series 2014-GC25, Class XA (IO) |
| |||||||||||
| 0.96% |
10/10/476 | 572,256 | 11,135 | |||||||||
| Commercial Mortgage Trust, |
| |||||||||||
| Series 2013-CR7, Class XA (IO) |
| |||||||||||
| 1.17% |
03/10/466 | 486,773 | 3,812 | |||||||||
| Commercial Mortgage Trust, |
| |||||||||||
| Series 2013-CR9, Class XA (IO) |
| |||||||||||
| 0.05% |
07/10/456 | 13,811,968 | 3,709 | |||||||||
| Commercial Mortgage Trust, |
| |||||||||||
| Series 2013-LC6, Class XA (IO) |
| |||||||||||
| 1.26% |
01/10/466 | 2,058,633 | 8,795 | |||||||||
| Commercial Mortgage Trust, |
| |||||||||||
| Series 2014-CR19, Class XA (IO) |
| |||||||||||
| 0.95% |
08/10/476 | 593,728 | 10,606 | |||||||||
| Commercial Mortgage Trust, |
| |||||||||||
| Series 2014-UBS2, Class XA (IO) |
| |||||||||||
| 1.12% |
03/10/476 | 870,608 | 14,255 | |||||||||
| Commercial Mortgage Trust, |
| |||||||||||
| Series 2014-UBS3, Class XA (IO) |
| |||||||||||
| 1.06% |
06/10/476 | 1,787,201 | 31,829 | |||||||||
| Commercial Mortgage Trust, |
| |||||||||||
| Series 2014-UBS5, Class XA (IO) |
| |||||||||||
| 0.85% |
09/10/474,5,6 | 2,060,982 | 33,608 | |||||||||
| CSMC Trust, |
| |||||||||||
| Series 2016-NXSR, Class XA (IO) |
| |||||||||||
| 0.71% |
12/15/496 | 318,389 | 8,638 | |||||||||
| GS Mortgage Securities Corp. II, |
| |||||||||||
| Series 2013-GC10, Class XA (IO) |
| |||||||||||
| 1.47% |
02/10/466 | 3,073,346 | 24,768 | |||||||||
| GS Mortgage Securities Corp. Trust, |
| |||||||||||
| Series 2020-UPTN, Class XA (IO) |
| |||||||||||
| 0.35% |
02/10/371,6 | 375,000 | 3,510 | |||||||||
| Issues | Maturity Date |
Principal Amount |
Value | |||||||
| MORTGAGE-BACKED (continued) |
| |||||||||
| Non-Agency Commercial Mortgage-Backed (continued) |
| |||||||||
| GS Mortgage Securities Trust, |
| |||||||||
| Series 2010-C1, Class X (IO) |
| |||||||||
| 0.56% |
08/10/431,6 | $ | 2,479,150 | $ | 18,610 | |||||
| GS Mortgage Securities Trust, |
| |||||||||
| Series 2011-GC5, Class XA (IO) |
| |||||||||
| 0.00% |
08/10/441,6 | 272,824 | 3 | |||||||
| GS Mortgage Securities Trust, |
| |||||||||
| Series 2013-GC14, Class XA (IO) |
| |||||||||
| 0.54% |
08/10/466 | 4,480,226 | 26,610 | |||||||
| GS Mortgage Securities Trust, |
| |||||||||
| Series 2014-GC20, Class XA (IO) |
| |||||||||
| 1.06% |
04/10/476 | 2,404,750 | 37,622 | |||||||
| GS Mortgage Securities Trust, |
| |||||||||
| Series 2016-GS3, Class XA (IO) |
| |||||||||
| 1.20% |
10/10/496 | 209,631 | 8,965 | |||||||
| JPMBB Commercial Mortgage Securities Trust, |
| |||||||||
| Series 2014-C22, Class XA (IO) |
| |||||||||
| 0.82% |
09/15/476 | 1,906,476 | 29,571 | |||||||
| JPMBB Commercial Mortgage Securities Trust, |
| |||||||||
| Series 2014-C25, Class XA (IO) |
| |||||||||
| 0.82% |
11/15/476 | 1,477,975 | 26,536 | |||||||
| JPMBB Commercial Mortgage Securities Trust, |
| |||||||||
| Series 2015-C29, Class XA (IO) |
| |||||||||
| 0.60% |
05/15/486 | 493,542 | 7,365 | |||||||
| JPMorgan Chase Commercial Mortgage Securities Trust, |
| |||||||||
| Series 2010-C2, Class XB (IO) |
| |||||||||
| 1.52% |
11/15/431,6 | 602,323 | 1,425 | |||||||
| JPMorgan Chase Commercial Mortgage Securities Trust, |
| |||||||||
| Series 2012-LC9, Class XA (IO) |
| |||||||||
| 1.39% |
12/15/476 | 1,181,582 | 6,701 | |||||||
| Morgan Stanley Bank of America Merrill Lynch Trust, |
| |||||||||
| Series 2013-C8, Class XA (IO) |
| |||||||||
| 0.90% |
12/15/486 | 2,887,067 | 14,419 | |||||||
| Morgan Stanley Bank of America Merrill Lynch Trust, |
| |||||||||
| Series 2014-C19, Class XA (IO) |
| |||||||||
| 0.96% |
12/15/476 | 1,828,272 | 36,256 | |||||||
| Morgan Stanley Bank of America Merrill Lynch Trust, |
| |||||||||
| Series 2015-C22, Class XA (IO) |
| |||||||||
| 1.02% |
04/15/486 | 676,166 | 15,099 | |||||||
| Natixis Commercial Mortgage Securities Trust, |
| |||||||||
| Series 2020-2PAC, Class XB (IO) |
| |||||||||
| 0.81% |
12/15/381,6 | 570,000 | 12,769 | |||||||
| UBS-Barclays Commercial Mortgage Trust, |
| |||||||||
| Series 2012-C3, Class XB (IO) |
| |||||||||
| 0.21% |
08/10/491,4,5,6 | 3,700,000 | 4,064 | |||||||
| Wells Fargo Commercial Mortgage Trust, |
| |||||||||
| Series 2014-LC16, Class XA (IO) |
| |||||||||
| 1.10% |
08/15/506 | 326,278 | 5,899 | |||||||
| Wells Fargo Commercial Mortgage Trust, |
| |||||||||
| Series 2014-LC18, Class XA (IO) |
| |||||||||
| 1.03% |
12/15/476 | 4,961,859 | 103,647 | |||||||
| Wells Fargo Commercial Mortgage Trust, |
| |||||||||
| Series 2015-NXS2, Class XA (IO) |
| |||||||||
| 0.65% |
07/15/586 | 2,198,996 | 38,049 | |||||||
See accompanying Notes to Financial Statements.
| Annual Report March 2022 / 122 |
Table of Contents
Investment Grade Credit Fund
Schedule of Portfolio Investments
March 31, 2022
| Issues | Maturity Date |
Principal Amount |
Value | |||||||||
| MORTGAGE-BACKED (continued) |
|
|||||||||||
| Non-Agency Commercial Mortgage-Backed (continued) |
| |||||||||||
| WF-RBS Commercial Mortgage Trust, |
| |||||||||||
| Series 2012-C7, Class XA (IO) |
| |||||||||||
| 1.20% |
06/15/451,6 | $ | 2,191,406 | $ | 677 | |||||||
| WF-RBS Commercial Mortgage Trust, |
| |||||||||||
| Series 2014-C19, Class XA (IO) |
| |||||||||||
| 1.00% |
03/15/476 | 7,627,697 | 98,538 | |||||||||
| WF-RBS Commercial Mortgage Trust, |
| |||||||||||
| Series 2014-LC14, Class XA (IO) |
| |||||||||||
| 1.25% |
03/15/476 | 1,363,772 | 24,009 | |||||||||
|
|
|
| ||||||||||
| 770,031 | ||||||||||||
|
|
|
| ||||||||||
| Non-Agency Mortgage-Backed — 6.75% |
| |||||||||||
| American Home Mortgage Investment Trust, |
| |||||||||||
| Series 2004-4, Class 1A1 |
| |||||||||||
| (LIBOR USD 1-Month plus 0.68%) |
| |||||||||||
| 1.14% |
02/25/452 | 56,894 | 56,979 | |||||||||
| Ameriquest Mortgage Securities, Inc., Asset-Backed Pass- Through Certificates, |
|
|||||||||||
| Series 2005-R11, Class M3 |
| |||||||||||
| (LIBOR USD 1-Month plus 0.75%) |
| |||||||||||
| 1.21% |
01/25/362 | 100,000 | 99,978 | |||||||||
| Banc of America Funding Trust, |
| |||||||||||
| Series 2014-R7, Class 2A1 |
| |||||||||||
| (LIBOR USD 1-Month plus 0.14%) |
| |||||||||||
| 0.60% |
09/26/361,2 | 15,782 | 15,661 | |||||||||
| Bear Stearns ARM Trust, |
| |||||||||||
| Series 2004-1, Class 12A5 |
| |||||||||||
| 2.79% |
04/25/346 | 7,452 | 7,419 | |||||||||
| Bombardier Capital Mortgage Securitization Corp., |
| |||||||||||
| Series 2000-A, Class A2 |
| |||||||||||
| 7.58% |
06/15/306 | 19,426 | 3,841 | |||||||||
| Centex Home Equity Loan Trust, |
| |||||||||||
| Series 2005-D, Class M4 |
| |||||||||||
| (LIBOR USD 1-Month plus 0.92%) |
| |||||||||||
| 1.37% |
10/25/352 | 22,593 | 22,588 | |||||||||
| CIM Trust, |
| |||||||||||
| Series 2021-R4, Class A1A |
| |||||||||||
| 2.00% |
05/01/611,6 | 80,929 | 76,737 | |||||||||
| CIT Mortgage Loan Trust, |
| |||||||||||
| Series 2007-1, Class 1A |
| |||||||||||
| (LIBOR USD 1-Month plus 1.35%) |
| |||||||||||
| 1.81% |
10/25/371,2 | 4,794 | 4,801 | |||||||||
| Citigroup Mortgage Loan Trust, Inc., |
| |||||||||||
| Series 2005-OPT1, Class M1 |
| |||||||||||
| (LIBOR USD 1-Month plus 0.63%) |
| |||||||||||
| 1.09% |
02/25/352 | 41,532 | 40,250 | |||||||||
| Countrywide Asset-Backed Certificates Trust, |
| |||||||||||
| Series 2007-13, Class 2A1 |
| |||||||||||
| (LIBOR USD 1-Month plus 0.90%) |
| |||||||||||
| 1.36% |
10/25/472 | 21,556 | 21,173 | |||||||||
| GSR Mortgage Loan Trust, |
| |||||||||||
| Series 2005-AR6, Class 2A1 |
| |||||||||||
| 2.91% |
09/25/356 | 11,643 | 11,776 | |||||||||
| Issues | Maturity Date |
Principal Amount |
Value | |||||||||
| MORTGAGE-BACKED (continued) |
|
|||||||||||
| Non-Agency Mortgage-Backed (continued) |
|
|||||||||||
| HSI Asset Securitization Corp. Trust, |
| |||||||||||
| Series 2007-WF1, Class 1A1 |
| |||||||||||
| (LIBOR USD 1-Month plus 0.16%) |
| |||||||||||
| 0.62% |
05/25/372 | $ | 17,292 | $ | 17,191 | |||||||
| Impac CMB Trust, |
| |||||||||||
| Series 2004-6, Class 1A2 |
| |||||||||||
| (LIBOR USD 1-Month plus 0.78%) |
| |||||||||||
| 1.24% |
10/25/342 | 91,452 | 91,654 | |||||||||
| IndyMac Index Mortgage Loan Trust, |
| |||||||||||
| Series 2007-FLX3, Class A1 |
| |||||||||||
| (LIBOR USD 1-Month plus 0.24%) |
| |||||||||||
| 0.70% |
06/25/372 | 83,358 | 79,732 | |||||||||
| JPMorgan Mortgage Trust, |
| |||||||||||
| Series 2005-A3, Class 2A1 |
| |||||||||||
| 2.69% |
06/25/356 | 2,670 | 2,726 | |||||||||
| Long Beach Mortgage Loan Trust, |
| |||||||||||
| Series 2006-1, Class 1A |
| |||||||||||
| (LIBOR USD 1-Month plus 0.44%) |
| |||||||||||
| 0.90% |
02/25/362 | 5,027 | 4,958 | |||||||||
| Morgan Stanley Mortgage Loan Trust, |
| |||||||||||
| Series 2004-5AR, Class 3A1 |
| |||||||||||
| 2.25% |
07/25/346 | 13,328 | 13,645 | |||||||||
| Saxon Asset Securities Trust, |
| |||||||||||
| Series 2007-2, Class A2A |
| |||||||||||
| (LIBOR USD 1-Month plus 0.10%) |
| |||||||||||
| 0.56% |
05/25/472 | 69,529 | 56,134 | |||||||||
| Structured Asset Mortgage Investments II Trust, |
| |||||||||||
| Series 2004-AR1, Class 1A2 |
| |||||||||||
| (LIBOR USD 1-Month plus 0.70%) |
| |||||||||||
| 1.15% |
03/19/342 | 1,743 | 1,709 | |||||||||
| WaMu Mortgage Pass-Through Certificates, |
| |||||||||||
| Series 2005-AR1, Class A2A1 |
| |||||||||||
| (LIBOR USD 1-Month plus 0.68%) |
| |||||||||||
| 1.14% |
01/25/452 | 96,712 | 95,348 | |||||||||
| Wells Fargo Home Equity Trust Mortgage Pass-Through Certificates, |
|
|||||||||||
| Series 2004-1, Class 2A1 |
| |||||||||||
| (LIBOR USD 1-Month plus 0.60%) |
| |||||||||||
| 1.06% |
04/25/342 | 11,733 | 11,478 | |||||||||
|
|
|
| ||||||||||
| 735,778 | ||||||||||||
|
|
|
| ||||||||||
| U.S. Agency Commercial Mortgage-Backed — 0.80% |
| |||||||||||
| Fannie Mae-Aces, |
||||||||||||
| Series 2016-M11, Class X2 (IO) |
| |||||||||||
| 2.94% |
07/25/396 | 477,041 | 12,539 | |||||||||
| Fannie Mae-Aces, |
| |||||||||||
| Series 2016-M2, Class X3 (IO) |
| |||||||||||
| 2.12% |
04/25/366 | 94,426 | 950 | |||||||||
| Fannie Mae-Aces, |
||||||||||||
| Series 2016-M4, Class X2 (IO) |
| |||||||||||
| 2.65% |
01/25/396 | 515,424 | 14,565 | |||||||||
| Freddie Mac Multifamily Structured Pass-Through |
| |||||||||||
| Certificates, |
||||||||||||
| Series K020, Class X1 (IO) |
| |||||||||||
| 1.51% |
05/25/226 | 212,231 | — | |||||||||
See accompanying Notes to Financial Statements.
| 123 / Annual Report March 2022 |
Table of Contents
Investment Grade Credit Fund
Schedule of Portfolio Investments
March 31, 2022
| Issues | Maturity Date |
Principal Amount |
Value | |||||||||
| MORTGAGE-BACKED (continued) |
|
|||||||||||
| U.S. Agency Commercial Mortgage-Backed (continued) |
|
|||||||||||
| Freddie Mac Multifamily Structured Pass-Through |
| |||||||||||
| Certificates, |
| |||||||||||
| Series K025, Class X1 (IO) |
| |||||||||||
| 0.78% |
10/25/226 | $ | 1,625,574 | $ | 4,821 | |||||||
| Freddie Mac Multifamily Structured Pass-Through |
| |||||||||||
| Certificates, |
||||||||||||
| Series K049, Class X3 (IO) |
| |||||||||||
| 1.55% |
10/25/436 | 250,000 | 11,136 | |||||||||
| Freddie Mac Multifamily Structured Pass-Through |
| |||||||||||
| Certificates, |
| |||||||||||
| Series KC01, Class X1 (IO) |
| |||||||||||
| 0.42% |
12/25/226 | 2,284,499 | 9,343 | |||||||||
| Ginnie Mae, |
| |||||||||||
| Series 2012-112, Class IO (IO) |
| |||||||||||
| 0.13% |
02/16/536 | 2,993,198 | 12,415 | |||||||||
| Ginnie Mae, |
| |||||||||||
| Series 2013-1, Class IO (IO) |
| |||||||||||
| 0.58% |
02/16/546 | 519,301 | 7,459 | |||||||||
| Ginnie Mae, |
| |||||||||||
| Series 2013-125, Class IO (IO) |
| |||||||||||
| 0.20% |
10/16/546 | 922,748 | 14,115 | |||||||||
|
|
|
| ||||||||||
| 87,343 | ||||||||||||
|
|
|
| ||||||||||
| U.S. Agency Mortgage-Backed — 10.48% |
| |||||||||||
| Fannie Mae REMICS, |
| |||||||||||
| Series 2011-116, Class SA (IO) |
| |||||||||||
| (-1.00 X LIBOR USD 1-Month plus 6.00%, 6.00% Cap) |
|
|||||||||||
| 5.54% |
11/25/412 | 78,330 | 8,238 | |||||||||
| Fannie Mae REMICS, |
| |||||||||||
| Series 2012-128, Class UA |
| |||||||||||
| 2.50% |
06/25/42 | 28,514 | 27,668 | |||||||||
| Fannie Mae REMICS, |
| |||||||||||
| Series 2013-5, Class GF |
| |||||||||||
| (LIBOR USD 1-Month plus 1.10%) |
| |||||||||||
| 1.56% |
10/25/422 | 32,753 | 32,751 | |||||||||
| Freddie Mac REMICS, |
| |||||||||||
| Series 4064, Class TB |
| |||||||||||
| 3.50% |
06/15/42 | 103,000 | 103,321 | |||||||||
| Freddie Mac Strips, |
| |||||||||||
| Series 240, Class IO (IO) |
| |||||||||||
| 5.50% |
07/15/36 | 176,009 | 33,030 | |||||||||
| Ginnie Mae, |
| |||||||||||
| Series 2003-110, Class S (IO) |
| |||||||||||
| (-1.00 X LIBOR USD 1-Month plus 6.60%, 6.60% Cap) |
|
|||||||||||
| 6.15% |
10/20/332 | 216,943 | 30,005 | |||||||||
| Ginnie Mae, |
| |||||||||||
| Series 2018-124, Class NW |
| |||||||||||
| 3.50% |
09/20/48 | 27,919 | 28,263 | |||||||||
| Ginnie Mae, |
| |||||||||||
| Series 2018-154, Class BP |
| |||||||||||
| 3.50% |
11/20/48 | 3,165 | 3,198 | |||||||||
| Ginnie Mae, |
| |||||||||||
| Series 2019-15, Class GT |
| |||||||||||
| 3.50% |
02/20/49 | 25,321 | 25,515 | |||||||||
| UMBS (TBA) |
| |||||||||||
| 2.00% |
04/01/52 | 25,000 | 23,193 | |||||||||
| Issues | Maturity Date |
Principal Amount |
Value | |||||||||
| MORTGAGE-BACKED (continued) |
|
|||||||||||
| U.S. Agency Mortgage-Backed (continued) |
|
|||||||||||
| 2.00% |
05/01/52 | $ | 325,000 | $ | 301,151 | |||||||
| 2.50% |
05/01/52 | 450,000 | 428,473 | |||||||||
| 3.00% |
05/01/52 | 100,000 | 97,625 | |||||||||
|
|
|
| ||||||||||
| 1,142,431 | ||||||||||||
|
|
|
| ||||||||||
| Total Mortgage-Backed |
| |||||||||||
| (Cost $3,922,669) |
2,735,583 | |||||||||||
|
|
|
| ||||||||||
| MUNICIPAL BONDS — 5.47%* |
| |||||||||||
| California — 1.67% |
| |||||||||||
| Los Angeles Unified School District General Obligation Bonds, School Improvements, Series KR |
|
|||||||||||
| 5.75% |
07/01/34 | 25,000 | 29,645 | |||||||||
| 5.76% |
07/01/29 | 80,000 | 90,953 | |||||||||
| Los Angeles Unified School District General Obligation Bonds, School Improvements, Series RY |
|
|||||||||||
| 6.76% | 07/01/34 | 10,000 | 12,708 | |||||||||
| Regents of the University of California Medical Center Pooled Revenue Bonds, Health, Hospital and Nursing Home Improvements, Series N |
|
|||||||||||
| 3.01% |
05/15/50 | 10,000 | 8,770 | |||||||||
| Santa Clara Valley Transportation Authority Revenue Bonds, Transit Improvements |
|
|||||||||||
| 5.88% |
04/01/32 | 20,000 | 22,664 | |||||||||
| Santa Monica Community College District General Obligation Bonds |
|
|||||||||||
| 2.05% |
08/01/33 | 20,000 | 17,901 | |||||||||
|
|
|
| ||||||||||
| 182,641 | ||||||||||||
|
|
|
| ||||||||||
| Florida — 0.14% |
| |||||||||||
| County of Miami-Dade Aviation Revenue Bonds, Airport and Marina Improvements, Series D |
|
|||||||||||
| 3.50% |
10/01/31 | 15,000 | 15,046 | |||||||||
|
|
|
| ||||||||||
| Maryland — 0.12% |
| |||||||||||
| City of Baltimore Revenue Bonds, Series B |
| |||||||||||
| 2.13% |
07/01/33 | 15,000 | 13,349 | |||||||||
|
|
|
| ||||||||||
| Massachusetts — 0.26% |
| |||||||||||
| Massachusetts School Building Authority Revenue Bonds, Series A |
|
|||||||||||
| 2.50% |
02/15/37 | 15,000 | 13,141 | |||||||||
| Massachusetts School Building Authority Revenue Bonds, |
|
|||||||||||
| Series B |
| |||||||||||
| 2.97% |
10/15/32 | 15,000 | 14,955 | |||||||||
|
|
|
| ||||||||||
| 28,096 | ||||||||||||
|
|
|
| ||||||||||
| New York — 3.28% |
| |||||||||||
| City of New York General Obligation Bonds, Series D |
| |||||||||||
| 1.92% |
08/01/31 | 30,000 | 26,351 | |||||||||
| New York City Transitional Finance Authority Future Tax Secured Revenue Bonds, Public Improvements |
|
|||||||||||
| 3.73% |
08/01/29 | 5,000 | 5,074 | |||||||||
| New York City Transitional Finance Authority Future Tax Secured Revenue Bonds, Public Improvements, Series D |
|
|||||||||||
| 2.50% |
11/01/33 | 50,000 | 44,486 | |||||||||
See accompanying Notes to Financial Statements.
| Annual Report March 2022 / 124 |
Table of Contents
Investment Grade Credit Fund
Schedule of Portfolio Investments
March 31, 2022
| Issues | Maturity Date |
Principal Amount |
Value | |||||||||
| MUNICIPAL BONDS (continued) |
|
|||||||||||
| New York (continued) |
| |||||||||||
| New York City Transitional Finance Authority Future Tax Secured Revenue Bonds, Public Improvements, Series E |
|
|||||||||||
| 1.97% |
02/01/33 | $ | 100,000 | $ | 84,149 | |||||||
| New York State Dormitory Authority Revenue Bonds, School Improvements, Series F |
|
|||||||||||
| 2.96% |
02/15/32 | 25,000 | 23,729 | |||||||||
| New York State Dormitory Authority Revenue Bonds, Series C |
|
|||||||||||
| 1.95% |
03/15/29 | 75,000 | 68,614 | |||||||||
| New York State Dormitory Authority Revenue Bonds, University & College Improvements |
|
|||||||||||
| 5.29% |
03/15/33 | 50,000 | 55,810 | |||||||||
| New York State Urban Development Corp. Revenue Bonds, Economic Improvements, Series B |
|
|||||||||||
| 2.97% |
03/15/34 | 15,000 | 14,075 | |||||||||
| New York State Urban Development Corp. Revenue Bonds, Economic Improvements, Series F |
|
|||||||||||
| 2.00% |
03/15/33 | 15,000 | 12,837 | |||||||||
| New York State Urban Development Corp. Revenue Bonds, Transit Improvements, Series B |
|
|||||||||||
| 2.59% |
03/15/35 | 25,000 | 22,284 | |||||||||
|
|
|
| ||||||||||
| 357,409 | ||||||||||||
|
|
|
| ||||||||||
| Total Municipal Bonds |
| |||||||||||
| (Cost $664,911) |
|
596,541 | ||||||||||
|
|
|
| ||||||||||
| U.S. TREASURY SECURITIES — 2.37% |
| |||||||||||
| U.S. Treasury Notes — 2.37% |
| |||||||||||
| U.S. Treasury Notes |
| |||||||||||
| 1.75% |
03/15/25 | 45,000 | 44,070 | |||||||||
| 1.88% |
02/15/32 | 163,000 | 156,569 | |||||||||
| 2.50% |
03/31/27 | 57,000 | 57,136 | |||||||||
|
|
|
| ||||||||||
| Total U.S. Treasury Securities |
| |||||||||||
| (Cost $257,627) |
|
257,775 | ||||||||||
|
|
|
| ||||||||||
| Total Bonds — 104.68% |
| |||||||||||
| (Cost $13,173,581) |
|
11,409,580 | ||||||||||
|
|
|
| ||||||||||
| Issues | Maturity Date |
Principal Amount/Shares |
Value | |||||||||
| SHORT-TERM INVESTMENTS — 2.83% |
| |||||||||||
| Money Market Funds — 2.83% |
| |||||||||||
| Dreyfus Government Cash Management Fund |
| |||||||||||
| 0.19%7 |
138,000 | 138,000 | ||||||||||
| Issues | Maturity Date |
Principal Amount/Shares |
Value | |||||||
| SHORT-TERM INVESTMENTS (continued) |
| |||||||||
| Money Market Funds (continued) |
|
|||||||||
| Fidelity Investments Money Market Funds - Government Portfolio |
|
|||||||||
| 0.12%7 |
20,477 | $ | 20,477 | |||||||
| Morgan Stanley Institutional Liquidity Funds - Government Portfolio |
|
|||||||||
| 0.23%7 |
150,000 | 150,000 | ||||||||
|
|
|
| ||||||||
| Total Short-Term Investments |
| |||||||||
| (Cost $308,477) |
|
308,477 | ||||||||
|
|
|
| ||||||||
| Total Investments Before Written Options - 107.51% |
|
|||||||||
| (Cost $13,482,058) |
|
11,718,057 | ||||||||
|
|
|
| ||||||||
| Written Options - (0.17)% |
| |||||||||
| (Cost $(9,237)) |
|
(18,394 | ) | |||||||
|
|
|
| ||||||||
| Liabilities in Excess of Other Assets - (7.34)% |
|
(800,537 | ) | |||||||
|
|
|
| ||||||||
| Net Assets - 100.00% |
|
$ | 10,899,126 | |||||||
|
|
|
| ||||||||
| 1 | Securities exempt from registration under Rule 144A of the Securities Act of 1933, as amended. The securities may be resold in transactions exempt from registration, normally to qualified institutional buyers. |
| 2 | Floating rate security. The rate disclosed was in effect at March 31, 2022. |
| 3 | Foreign denominated security issued by foreign domiciled entity. |
| 4 | Security is valued using significant unobservable inputs and is classified as Level 3 in the fair value hierarchy. |
| 5 | Illiquid security as determined under procedures approved by the Board of Trustees. The aggregate value of illiquid securities is $86,557, which is 0.79% of total net assets. |
| 6 | Variable rate security. Interest rate disclosed is as of the most recent information available. Certain variable rate securities are not based on a published reference rate and spread but are determined by the issuer or agent and are based on current market conditions. |
| 7 | Represents the current yield as of March 31, 2022. |
| * | Securities with a call or reset feature will have an effective maturity date sooner than the stated maturity. |
| ** | Securities backed by mortgage or consumer loans where payment is periodically made will have an effective maturity date sooner than the stated maturity date. |
Note: For Fund compliance purposes, the Fund’s industry classifications refer to any one or more of the industry sub-classifications used by one or more widely recognized market indexes or ratings group indexes, and/or as defined by Fund management. This definition may not apply for purposes of this report, which may combine industry sub-classifications for more meaningful presentation for investors.
(CLO): Collateralized Loan Obligation
(GMTN): Global Medium-Term Note
(IO): Interest Only
(LIBOR): London InterBank Offer Rate
(MTN): Medium-Term Note
(S&P): Standard & Poor’s
(SOFR): Secured Overnight Financing Rate
(TBA): To-Be-Announced
(USD): U.S. Dollar
See accompanying Notes to Financial Statements.
| 125 / Annual Report March 2022 |
Table of Contents
Investment Grade Credit Fund
Schedule of Portfolio Investments
March 31, 2022
| Description | Number of Contracts |
Expiration Date | Notional Amount | Value | Unrealized Appreciation (Depreciation) |
|||||||||||||||
| FUTURES CONTRACTS: LONG POSITIONS |
||||||||||||||||||||
| U.S. Treasury Five-Year Note |
10 | 06/30/22 | $ | 1,146,875 | $ | (29,731) | $ (29,731) | |||||||||||||
| U.S. Treasury Two-Year Note |
8 | 06/30/22 | 1,695,375 | (20,758) | (20,758) | |||||||||||||||
|
|
|
|
|
|
|
|||||||||||||||
| 2,842,250 | (50,489) | (50,489) | ||||||||||||||||||
|
|
|
|
|
|
|
|||||||||||||||
| FUTURES CONTRACTS: SHORT POSITIONS |
||||||||||||||||||||
| U.S. Treasury Ten-Year Ultra Bond |
13 | 06/21/22 | (1,761,094) | 58,308 | 58,308 | |||||||||||||||
| U.S. Treasury Ultra Bond |
1 | 06/21/22 | (177,125) | 6,920 | 6,920 | |||||||||||||||
|
|
|
|
|
|
|
|||||||||||||||
| (1,938,219) | 65,228 | 65,228 | ||||||||||||||||||
|
|
|
|
|
|
|
|||||||||||||||
| TOTAL FUTURES CONTRACTS |
$ | 904,031 | $ | 14,739 | $ | 14,739 | ||||||||||||||
|
|
|
|
|
|
|
|||||||||||||||
| Description | Number of contracts |
Exercise Price |
Expiration Date |
Notional Amount | Value | |||||||||||||||
| WRITTEN CALL OPTIONS EXCHANGE TRADED |
||||||||||||||||||||
| IMM Eurodollar 2-Year MIDCV Future Options |
5 | $97.88 | 12/16/22 | $ | (304,047) | $ | (2,344) | |||||||||||||
|
|
|
|
|
|||||||||||||||||
| WRITTEN PUT OPTIONS EXCHANGE TRADED |
||||||||||||||||||||
| IMM Eurodollar 2-Year MIDCV Future Options |
5 | $97.38 | 12/16/22 | $ | (304,047) | $ | (5,844) | |||||||||||||
|
|
|
|
|
|||||||||||||||||
| Received by the Fund |
Paid by the Fund | |||||||||||||||||||||||||||||||||||||||||
| Description | Counterparty | Purchase Date |
Maturity Date |
Rate | Frequency | Rate | Frequency | Notional Amount (000’s) |
Value | Premiums (Received) |
Unrealized (Depreciation) |
|||||||||||||||||||||||||||||||
| WRITTEN PUT SWAPTIONS |
|
|||||||||||||||||||||||||||||||||||||||||
| Option to enter into a 2-year Interest Rate Swap | Citigroup Global Markets, Inc. |
03/09/22 | 06/08/22 | 1.95% | |
Semi- annually |
|
3-month USD LIBOR |
|
Quarterly | $ | 660 | $ | (10,206) | $ | (1,848) | $ | (8,358) | ||||||||||||||||||||||||
|
|
|
|
|
|
|
|
|
|||||||||||||||||||||||||||||||||||
| Received by the Fund | Paid by the Fund | |||||||||||||||||||||||||||||||
| Description | Maturity Date |
Rate | Frequency | Rate | Frequency | Notional Amount (000’s) |
Value | Premiums Paid |
Unrealized Appreciation (Depreciation) |
|||||||||||||||||||||||
| SWAPS: INTEREST RATE |
||||||||||||||||||||||||||||||||
| Interest Rate Swap1 |
07/24/53 | 3-month USD LIBOR |
Quarterly | 1.81% | Semi-annually | $ | 20 | $ | 1,903 | $ | — | $ | 1,903 | |||||||||||||||||||
| Interest Rate Swap1 |
07/24/53 | 3-month USD LIBOR |
Quarterly | 1.77% | Semi-annually | 40 | 4,097 | — | 4,097 | |||||||||||||||||||||||
| Interest Rate Swap1 |
07/24/53 | 3-month USD LIBOR |
Quarterly | 1.79% | Semi-annually | 25 | 2,496 | — | 2,496 | |||||||||||||||||||||||
| Interest Rate Swap1 |
09/28/53 | 3-month USD LIBOR |
Quarterly | 1.87% | Semi-annually | 85 | 6,757 | — | 6,757 | |||||||||||||||||||||||
| Interest Rate Swap1 |
07/24/25 | 1.07% | Semi-annually | |
3-month USD LIBOR |
|
Quarterly | 235 | (8,130 | ) | — | (8,130 | ) | |||||||||||||||||||
| Interest Rate Swap1 |
07/24/25 | 1.03% | Semi-annually | |
3-month USD LIBOR |
|
Quarterly | 470 | (16,674 | ) | — | (16,674 | ) | |||||||||||||||||||
| Interest Rate Swap1 |
07/24/25 | 1.03% | Semi-annually | |
3-month USD LIBOR |
|
Quarterly | 340 | (12,011 | ) | — | (12,011 | ) | |||||||||||||||||||
See accompanying Notes to Financial Statements.
| Annual Report March 2022 / 126 |
Table of Contents
Investment Grade Credit Fund
Schedule of Portfolio Investments
March 31, 2022
| Received by the Fund | Paid by the Fund | |||||||||||||||||||||||||||||||
| Description | Maturity Date |
Rate | Frequency | Rate | Frequency | Notional Amount (000’s) |
Value | Premiums Paid |
Unrealized Appreciation (Depreciation) |
|||||||||||||||||||||||
| Interest Rate Swap1 |
09/28/25 | 1.39% | Semi-annually | 3-month USD LIBOR | Quarterly | $ | 1,010 | $ | (27,519 | ) | $ | — | $ | (27,519 | ) | |||||||||||||||||
|
|
|
|
|
|
|
|
|
|||||||||||||||||||||||||
| TOTAL SWAPS CONTRACTS |
$ | 2,225 | $ | (49,081 | ) | $ | — | $ | (49,081 | ) | ||||||||||||||||||||||
|
|
|
|
|
|
|
|
|
|||||||||||||||||||||||||
| 1 | Centrally cleared. |
See accompanying Notes to Financial Statements.
| 127 / Annual Report March 2022 |
Table of Contents
Schedule of Portfolio Investments
March 31, 2022
| Issues | Maturity Date |
Principal Amount |
Value | |||||||
| BONDS – 109.81% |
| |||||||||
| ASSET-BACKED SECURITIES — 8.33%** |
| |||||||||
| Access Group, Inc., |
| |||||||||
| Series 2015-1, Class A |
| |||||||||
| (LIBOR USD 1-Month plus 0.70%) |
| |||||||||
| 1.16% |
07/25/561,2 | $ | 1,187,412 | $ | 1,169,254 | |||||
| ACRES Commercial Realty Ltd., |
| |||||||||
| Series 2021-FL1, Class A |
| |||||||||
| (Cayman Islands) |
| |||||||||
| (LIBOR USD 1-Month plus 1.20%) |
| |||||||||
| 1.64% |
06/15/361,2,3 | 3,630,000 | 3,604,545 | |||||||
| AMMC CLO 19 Ltd., |
| |||||||||
| Series 2016-19A, Class AR |
| |||||||||
| (Cayman Islands) |
| |||||||||
| (LIBOR USD 3-Month plus 1.14%) |
| |||||||||
| 1.38% |
10/16/281,2,3 | 950,038 | 948,262 | |||||||
| AMMC CLO XIII Ltd., |
| |||||||||
| Series 2013-13A, Class A1R2 |
| |||||||||
| (Cayman Islands) |
| |||||||||
| (LIBOR USD 3-Month plus 1.05%) |
| |||||||||
| 1.32% |
07/24/291,2,3 | 6,050,000 | 6,018,480 | |||||||
| Barings CLO Ltd., |
| |||||||||
| Series 2018-3A, Class A1 |
| |||||||||
| (Cayman Islands) |
| |||||||||
| (LIBOR USD 3-Month plus 0.95%) |
| |||||||||
| 1.20% |
07/20/291,2,3 | 3,023,738 | 3,006,956 | |||||||
| Bayview Commercial Asset Trust, |
| |||||||||
| Series 2005-1A, Class A1 |
| |||||||||
| (LIBOR USD 1-Month plus 0.45%) |
| |||||||||
| 0.91% |
04/25/351,2 | 123,485 | 120,199 | |||||||
| Brazos Higher Education Authority, Inc., |
| |||||||||
| Series 2011-1, Class A2 |
| |||||||||
| (LIBOR USD 3-Month plus 0.80%) |
| |||||||||
| 1.30% |
02/25/302 | 42,097 | 42,114 | |||||||
| Brazos Higher Education Authority, Inc., |
| |||||||||
| Series 2011-2, Class A3 |
| |||||||||
| (LIBOR USD 3-Month plus 1.00%) |
| |||||||||
| 1.26% |
10/27/362 | 5,075,000 | 5,043,380 | |||||||
| BSPRT Issuer Ltd., |
| |||||||||
| Series 2018-FL4, Class AS |
| |||||||||
| (Cayman Islands) |
| |||||||||
| (LIBOR USD 1-Month plus 1.30%) |
| |||||||||
| 1.70% |
09/15/351,2,3 | 4,077,718 | 4,030,290 | |||||||
| BSPRT Issuer Ltd., |
| |||||||||
| Series 2019-FL5, Class AS |
| |||||||||
| (Cayman Islands) |
| |||||||||
| (LIBOR USD 1-Month plus 1.48%) |
| |||||||||
| 1.88% |
05/15/291,2,3 | 6,500,000 | 6,430,639 | |||||||
| Canyon Capital CLO Ltd., |
| |||||||||
| Series 2021-1A, Class X |
| |||||||||
| (Cayman Islands) |
| |||||||||
| (LIBOR USD 3-Month plus 0.80%) |
| |||||||||
| 1.04% |
04/15/341,2,3 | 1,350,000 | 1,345,450 | |||||||
| Carvana Auto Receivables Trust, |
| |||||||||
| Series 2022-N1, Class N |
| |||||||||
| 4.60% |
12/11/281 | 4,000,000 | 4,003,729 | |||||||
| Issues | Maturity Date |
Principal Amount |
Value | |||||||
| ASSET-BACKED SECURITIES (continued) |
| |||||||||
| CF Hippolyta, LLC, |
| |||||||||
| Series 2020-1, Class A1 |
| |||||||||
| 1.69% |
07/15/601 | $ | 8,468,632 | $ | 7,947,884 | |||||
| Education Loan Asset-Backed Trust I, |
| |||||||||
| Series 2013-1, Class A2 |
| |||||||||
| (LIBOR USD 1-Month plus 0.80%) |
| |||||||||
| 1.26% |
04/26/321,2 | 6,092,103 | 6,050,948 | |||||||
| Goal Capital Funding Trust, |
| |||||||||
| Series 2006-1, Class B |
| |||||||||
| (LIBOR USD 3-Month plus 0.45%) |
| |||||||||
| 0.95% |
08/25/422 | 1,739,165 | 1,634,796 | |||||||
| Higher Education Funding I, |
| |||||||||
| Series 2014-1, Class A |
| |||||||||
| (LIBOR USD 3-Month plus 1.05%) |
| |||||||||
| 1.55% |
05/25/341,2 | 442,456 | 442,965 | |||||||
| Invitation Homes Trust, |
| |||||||||
| Series 2018-SFR2, Class B |
| |||||||||
| (LIBOR USD 1-Month plus 1.08%) |
| |||||||||
| 1.48% |
06/17/371,2 | 5,844,082 | 5,803,250 | |||||||
| J.G. Wentworth XXX LLC, |
| |||||||||
| Series 2013-3A, Class A |
| |||||||||
| 4.08% |
01/17/731 | 3,125,924 | 3,242,482 | |||||||
| LCM XXIV Ltd., |
| |||||||||
| Series 24A, Class AR |
| |||||||||
| (Cayman Islands) |
| |||||||||
| (LIBOR USD 3-Month plus 0.98%) |
| |||||||||
| 1.23% |
03/20/301,2,3 | 4,500,000 | 4,473,882 | |||||||
| LoanCore Issuer Ltd., |
| |||||||||
| Series 2018-CRE1, Class A |
| |||||||||
| (Cayman Islands) |
| |||||||||
| (LIBOR USD 1-Month plus 1.13%) |
| |||||||||
| 1.53% |
05/15/281,2,3 | 2,882,475 | 2,878,665 | |||||||
| Madison Park Funding XIX Ltd., |
| |||||||||
| Series 2015-19A, Class A1R2 |
| |||||||||
| (Cayman Islands) |
| |||||||||
| (LIBOR USD 3-Month plus 0.92%) |
| |||||||||
| 1.18% |
01/22/281,2,3 | 6,074,446 | 6,032,836 | |||||||
| Madison Park Funding XVII Ltd., |
| |||||||||
| Series 2015-17A, Class AR2 |
| |||||||||
| (Cayman Islands) |
| |||||||||
| (LIBOR USD 3-Month plus 1.00%) |
| |||||||||
| 1.26% |
07/21/301,2,3 | 9,550,000 | 9,490,312 | |||||||
| Magnetite VII Ltd., |
| |||||||||
| Series 2012-7A, Class A1R2 |
| |||||||||
| (Cayman Islands) |
| |||||||||
| (LIBOR USD 3-Month plus 0.80%) |
| |||||||||
| 1.04% |
01/15/281,2,3 | 5,310,991 | 5,275,992 | |||||||
| Navient Student Loan Trust, |
| |||||||||
| Series 2015-2, Class A3 |
| |||||||||
| (LIBOR USD 1-Month plus 0.57%) |
| |||||||||
| 1.03% |
11/26/402 | 4,157,298 | 4,096,432 | |||||||
| Navient Student Loan Trust, |
| |||||||||
| Series 2017-2A, Class A |
| |||||||||
| (LIBOR USD 1-Month plus 1.05%) |
| |||||||||
| 1.51% |
12/27/661,2 | 2,499,041 | 2,507,352 | |||||||
See accompanying Notes to Financial Statements.
| Annual Report March 2022 / 128 |
Table of Contents
Low Duration Bond Fund
Schedule of Portfolio Investments
March 31, 2022
| Issues | Maturity Date |
Principal Amount |
Value | |||||||
| ASSET-BACKED SECURITIES (continued) |
| |||||||||
| Nelnet Student Loan Trust, |
| |||||||||
| Series 2013-1A, Class A |
| |||||||||
| (LIBOR USD 1-Month plus 0.60%) |
| |||||||||
| 1.06% |
06/25/411,2 | $ | 1,848,539 | $ | 1,814,201 | |||||
| Nelnet Student Loan Trust, |
| |||||||||
| Series 2014-5A, Class A |
| |||||||||
| (LIBOR USD 1-Month plus 0.55%) |
| |||||||||
| 1.01% |
07/25/461,2 | 5,874,282 | 5,776,208 | |||||||
| NYACK Park CLO Ltd., |
| |||||||||
| Series 2021-1A, Class X |
| |||||||||
| (Cayman Islands) |
| |||||||||
| (LIBOR USD 3-Month plus 0.65%) |
| |||||||||
| 0.77% |
10/20/341,2,3 | 3,125,000 | 3,096,031 | |||||||
| Octagon Investment Partners XIV Ltd., |
| |||||||||
| Series 2012-1A, Class AARR |
| |||||||||
| (Cayman Islands) |
| |||||||||
| (LIBOR USD 3-Month plus 0.95%) |
| |||||||||
| 1.19% |
07/15/291,2,3 | 6,000,000 | 5,968,236 | |||||||
| OHA Credit Funding 2 Ltd., |
| |||||||||
| Series 2019-2A, Class XR |
| |||||||||
| (Cayman Islands) |
| |||||||||
| (LIBOR USD 3-Month plus 0.80%) |
| |||||||||
| 1.06% |
04/21/341,2,3 | 1,640,625 | 1,636,064 | |||||||
| Palmer Square CLO Ltd., |
| |||||||||
| Series 2018-1A, Class A1 |
| |||||||||
| (Cayman Islands) |
| |||||||||
| (LIBOR USD 3-Month plus 1.03%) |
| |||||||||
| 1.27% |
04/18/311,2,3 | 2,250,000 | 2,234,138 | |||||||
| Palmer Square Loan Funding Ltd., |
| |||||||||
| Series 2020-2A, Class A1 |
| |||||||||
| (Cayman Islands) |
| |||||||||
| (LIBOR USD 3-Month plus 1.00%) |
| |||||||||
| 1.25% |
04/20/281,2,3 | 2,285,486 | 2,278,149 | |||||||
| Palmer Square Loan Funding Ltd., |
| |||||||||
| Series 2021-2A, Class A1 |
| |||||||||
| (Cayman Islands) |
| |||||||||
| (LIBOR USD 3-Month plus 0.80%) |
| |||||||||
| 1.28% |
05/20/291,2,3 | 1,354,364 | 1,344,437 | |||||||
| PHEAA Student Loan Trust, |
| |||||||||
| Series 2016-1A, Class A |
| |||||||||
| (LIBOR USD 1-Month plus 1.15%) |
| |||||||||
| 1.61% |
09/25/651,2 | 5,828,783 | 5,842,288 | |||||||
| Progress Residential Trust, |
| |||||||||
| Series 2020-SFR3, Class F |
| |||||||||
| 2.80% |
10/17/271 | 6,980,000 | 6,337,636 | |||||||
| Recette CLO Ltd., |
| |||||||||
| Series 2015-1A, Class ARR |
| |||||||||
| (Cayman Islands) |
| |||||||||
| (LIBOR USD 3-Month plus 1.08%) |
| |||||||||
| 1.33% |
04/20/341,2,3 | 5,100,000 | 5,033,700 | |||||||
| Reese Park CLO Ltd., |
| |||||||||
| Series 2020-1A, Class XR |
| |||||||||
| (Cayman Islands) |
| |||||||||
| (LIBOR USD 3-Month plus 0.90%) |
| |||||||||
| 1.14% |
10/15/341,2,3 | 1,900,000 | 1,883,603 | |||||||
| Issues | Maturity Date |
Principal Amount |
Value | |||||||
| ASSET-BACKED SECURITIES (continued) |
| |||||||||
| Skyline Aircraft Finance LLC, |
| |||||||||
| Series 2021-1, Class A |
| |||||||||
| 3.23% |
05/10/374,5 | $ | 6,394,464 | $ | 6,034,776 | |||||
| SLC Student Loan Trust, |
| |||||||||
| Series 2007-1, Class A4 |
| |||||||||
| (LIBOR USD 3-Month plus 0.06%) |
| |||||||||
| 0.57% |
05/15/292 | 2,611,457 | 2,575,016 | |||||||
| SLM Student Loan Trust, |
| |||||||||
| Series 2003-10A, Class A3 |
| |||||||||
| (LIBOR USD 3-Month plus 0.47%) |
| |||||||||
| 1.30% |
12/15/271,2 | 270,838 | 270,784 | |||||||
| SLM Student Loan Trust, |
| |||||||||
| Series 2003-11, Class A6 |
| |||||||||
| (LIBOR USD 3-Month plus 0.55%) |
| |||||||||
| 1.38% |
12/15/251,2 | 890,047 | 888,568 | |||||||
| SLM Student Loan Trust, |
| |||||||||
| Series 2008-4, Class A4 |
| |||||||||
| (LIBOR USD 3-Month plus 1.65%) |
| |||||||||
| 1.91% |
07/25/222 | 3,516,294 | 3,529,101 | |||||||
| SLM Student Loan Trust, |
| |||||||||
| Series 2008-6, Class A4 |
| |||||||||
| (LIBOR USD 3-Month plus 1.10%) |
| |||||||||
| 1.36% |
07/25/232 | 2,426,302 | 2,397,499 | |||||||
| SLM Student Loan Trust, |
| |||||||||
| Series 2012-2, Class A |
| |||||||||
| (LIBOR USD 1-Month plus 0.70%) |
| |||||||||
| 1.16% |
01/25/292 | 2,111,697 | 2,053,375 | |||||||
| SLM Student Loan Trust, |
| |||||||||
| Series 2012-7, Class A3 |
| |||||||||
| (LIBOR USD 1-Month plus 0.65%) |
| |||||||||
| 1.11% |
05/26/262 | 8,281,691 | 8,105,567 | |||||||
| SLM Student Loan Trust, |
| |||||||||
| Series 2013-4, Class A |
| |||||||||
| (LIBOR USD 1-Month plus 0.55%) |
| |||||||||
| 1.01% |
06/25/432 | 2,429,304 | 2,390,460 | |||||||
| SLM Student Loan Trust, |
| |||||||||
| Series 2014-1, Class A3 |
| |||||||||
| (LIBOR USD 1-Month plus 0.60%) |
| |||||||||
| 1.06% |
02/26/292 | 3,907,713 | 3,778,130 | |||||||
| Student Loan Consolidation Center Student Loan Trust I, |
|
|||||||||
| Series 2002-2, Class B2 |
| |||||||||
| (28 Day Auction Rate plus 0.00%) |
| |||||||||
| 1.61% |
07/01/421,2 | 2,900,000 | 2,671,877 | |||||||
| Tricon American Homes Trust, |
| |||||||||
| Series 2017-SFR2, Class A |
| |||||||||
| 2.93% |
01/17/361 | 10,967,613 | 10,890,909 | |||||||
| Tricon American Homes Trust, |
| |||||||||
| Series 2017-SFR2, Class B |
| |||||||||
| 3.28% |
01/17/361 | 9,017,000 | 8,934,665 | |||||||
| TRTX Issuer Ltd., |
| |||||||||
| Series 2019-FL3, Class A |
| |||||||||
| (Cayman Islands) |
| |||||||||
| (SOFR30A plus 1.26%) |
| |||||||||
| 1.31% |
10/15/341,2,3 | 8,552,513 | 8,532,510 | |||||||
See accompanying Notes to Financial Statements.
| 129 / Annual Report March 2022 |
Table of Contents
Low Duration Bond Fund
Schedule of Portfolio Investments
March 31, 2022
| Issues | Maturity Date |
Principal Amount |
Value | |||||||
| ASSET-BACKED SECURITIES (continued) |
| |||||||||
| Voya CLO, |
| |||||||||
| Series 2017-2A, Class A1R |
| |||||||||
| (Cayman Islands) |
| |||||||||
| (LIBOR USD 3-Month plus 0.98%) |
| |||||||||
| 1.22% |
06/07/301,2,3 | $ | 5,850,000 | $ | 5,808,523 | |||||
|
|
|
| ||||||||
| Total Asset-Backed Securities (Cost $209,583,201) |
|
207,747,545 | ||||||||
|
|
|
| ||||||||
| BANK LOANS — 2.71%* |
| |||||||||
| Automotive — 0.02% |
| |||||||||
| Clarios Global LP, |
| |||||||||
| Term Loan B, 1st Lien |
| |||||||||
| (LIBOR plus 3.25%) |
| |||||||||
| 3.71% |
04/30/262 | 507,125 | 501,546 | |||||||
|
|
|
| ||||||||
| Communications — 0.58% |
| |||||||||
| CenturyLink, Inc., |
| |||||||||
| Term Loan B, 1st Lien |
| |||||||||
| (LIBOR plus 2.25%) |
| |||||||||
| 2.71% |
03/15/272 | 2,914,546 | 2,841,464 | |||||||
| Charter Communications Operating LLC, |
| |||||||||
| Term Loan B2, 1st Lien |
| |||||||||
| (LIBOR plus 1.75%) |
| |||||||||
| 2.21% |
02/01/272 | 244,361 | 242,648 | |||||||
| CSC Holdings LLC, |
| |||||||||
| Term Loan B, 1st Lien |
| |||||||||
| (LIBOR plus 2.25%) |
| |||||||||
| 2.65% |
07/17/252 | 444,171 | 438,066 | |||||||
| Term Loan B5, 1st Lien |
| |||||||||
| (LIBOR plus 2.50%) |
| |||||||||
| 2.90% |
04/15/272 | 246,851 | 243,025 | |||||||
| Diamond Sports Group, LLC, |
| |||||||||
| Term Loan, 1st Lien |
| |||||||||
| (LIBOR plus 8.00%) |
| |||||||||
| 9.00% |
05/25/262 | 209,299 | 212,889 | |||||||
| DIRECTV Financing LLC, |
| |||||||||
| Term Loan, 1st Lien |
| |||||||||
| (LIBOR plus 5.00%) |
| |||||||||
| 5.75% |
08/02/272 | 1,193,750 | 1,193,983 | |||||||
| Intelsat Jackson Holdings SA, |
| |||||||||
| Term Loan (Luxembourg) |
| |||||||||
| (SOFR plus 4.42%) |
| |||||||||
| 4.92% |
02/01/292,3 | 3,133,588 | 3,087,806 | |||||||
| Level 3 Parent LLC, |
| |||||||||
| Term Loan B, 1st Lien |
| |||||||||
| (LIBOR plus 1.75%) |
| |||||||||
| 2.21% |
03/01/272 | 3,950,000 | 3,881,803 | |||||||
| Zayo Group Holdings, Inc., |
| |||||||||
| Term Loan, 1st Lien |
| |||||||||
| (LIBOR plus 3.00%) |
| |||||||||
| 3.46% |
03/09/272 | 2,462,632 | 2,400,044 | |||||||
|
|
|
| ||||||||
| 14,541,728 | ||||||||||
|
|
|
| ||||||||
| Issues | Maturity Date |
Principal Amount |
Value | |||||||
| BANK LOANS (continued) |
| |||||||||
| Consumer Discretionary — 0.36% |
| |||||||||
| AI Aqua Merger Sub, Inc., |
| |||||||||
| Term Loan B, 1st Lien |
| |||||||||
| (SOFR plus 4.00%) |
| |||||||||
| 4.00% |
07/31/282,6 | $ | 1,629,630 | $ | 1,614,865 | |||||
| Four Seasons Hotels, Ltd., |
| |||||||||
| Term Loan B, 1st Lien |
| |||||||||
| (LIBOR plus 2.00%) |
| |||||||||
| 2.21% |
11/30/232 | 2,685,827 | 2,681,207 | |||||||
| Naked Juice, LLC, |
| |||||||||
| Term Loan |
| |||||||||
| (SOFR plus 3.25%) |
| |||||||||
| 4.00% |
01/24/292 | 3,250,000 | 3,203,574 | |||||||
| Sunshine Luxembourg VII SARL, |
| |||||||||
| Term Loan B, 1st Lien |
| |||||||||
| (LIBOR plus 3.75%) |
| |||||||||
| 4.76% |
10/01/262 | 1,567,085 | 1,559,007 | |||||||
|
|
|
| ||||||||
| 9,058,653 | ||||||||||
|
|
|
| ||||||||
| Electric — 0.01% |
| |||||||||
| Vistra Operations Co., LLC, |
| |||||||||
| Term Loan B3, 1st Lien |
| |||||||||
| (LIBOR plus 1.75%) |
| |||||||||
| 2.19% |
12/31/252 | 47,463 | 47,048 | |||||||
| 2.21% |
12/31/252 | 196,374 | 194,656 | |||||||
|
|
|
| ||||||||
| 241,704 | ||||||||||
|
|
|
| ||||||||
| Finance — 0.18% |
| |||||||||
| Jane Street Group LLC, |
| |||||||||
| Term Loan B, 1st Lien |
| |||||||||
| (LIBOR plus 2.75%) |
| |||||||||
| 3.21% |
01/26/282 | 746,222 | 737,674 | |||||||
| Mozart Borrower, LP, |
| |||||||||
| Term Loan B |
| |||||||||
| (LIBOR plus 3.25%) |
| |||||||||
| 3.75% |
10/23/282 | 2,525,000 | 2,502,742 | |||||||
| Setanta Aircraft Leasing DAC, |
| |||||||||
| Term Loan B, 1st Lien |
| |||||||||
| (LIBOR plus 2.00%) |
| |||||||||
| 3.01% |
11/05/282 | 1,315,000 | 1,297,471 | |||||||
|
|
|
| ||||||||
| 4,537,887 | ||||||||||
|
|
|
| ||||||||
| Food — 0.17% |
| |||||||||
| Chobani LLC, |
| |||||||||
| Term Loan B, 1st Lien |
| |||||||||
| (LIBOR plus 3.50%) |
| |||||||||
| 4.50% |
10/25/272 | 2,643,291 | 2,606,127 | |||||||
| Hostess Brands LLC, |
| |||||||||
| Term Loan, 1st Lien |
| |||||||||
| (LIBOR plus 2.25%) |
| |||||||||
| 3.00% |
08/03/252 | 1,686,894 | 1,668,068 | |||||||
|
|
|
| ||||||||
| 4,274,195 | ||||||||||
|
|
|
| ||||||||
| Gaming — 0.08% |
| |||||||||
| Caesars Resort Collection LLC, |
| |||||||||
| Term Loan, 1st Lien |
| |||||||||
| (LIBOR plus 2.75%) |
| |||||||||
| 3.21% |
12/23/242 | 3,231 | 3,218 | |||||||
See accompanying Notes to Financial Statements.
| Annual Report March 2022 / 130 |
Table of Contents
Low Duration Bond Fund
Schedule of Portfolio Investments
March 31, 2022
| Issues | Maturity Date |
Principal Amount |
Value | |||||||
| BANK LOANS (continued) |
| |||||||||
| Gaming (continued) |
| |||||||||
| Golden Nugget, LLC, |
| |||||||||
| Term Loan B, 1st Lien |
| |||||||||
| (SOFR plus 4.00%) |
| |||||||||
| 4.50% |
01/27/292 | $ | 1,950,000 | $ | 1,942,814 | |||||
|
|
|
| ||||||||
| 1,946,032 | ||||||||||
|
|
|
| ||||||||
| Health Care — 0.48% |
| |||||||||
| Avantor Funding, Inc., |
| |||||||||
| Term Loan B5, 1st Lien |
| |||||||||
| (LIBOR plus 2.25%) |
| |||||||||
| 2.75% |
11/08/272 | 1,584,040 | 1,574,140 | |||||||
| Change Healthcare Holdings LLC, |
| |||||||||
| Term Loan B, 1st Lien |
| |||||||||
| (LIBOR plus 2.50%) |
| |||||||||
| 3.50% |
03/01/242 | 870,019 | 866,430 | |||||||
| Elanco Animal Health, Inc., |
| |||||||||
| Term Loan B, 1st Lien |
| |||||||||
| (LIBOR plus 1.75%) |
| |||||||||
| 1.98% |
08/01/272 | 2,859,992 | 2,819,552 | |||||||
| Embecta Corp., |
| |||||||||
| Term Loan B |
| |||||||||
| (SOFR plus 3.00%) |
| |||||||||
| 3.65% |
01/27/292 | 2,478,261 | 2,449,278 | |||||||
| Endo Luxembourg Finance Co., |
| |||||||||
| Term Loan B, 1st Lien |
| |||||||||
| (LIBOR plus 5.00%) |
| |||||||||
| 5.75% |
03/27/282 | 1,585,995 | 1,490,010 | |||||||
| Grifols Worldwide Operations USA, Inc., |
| |||||||||
| Term Loan B, 1st Lien |
| |||||||||
| (LIBOR plus 2.00%) |
| |||||||||
| 2.46% |
11/15/272 | 231,389 | 227,831 | |||||||
| Jazz Financing Lux SARL, |
| |||||||||
| Term Loan B, 1st Lien |
| |||||||||
| (LIBOR plus 3.50%) |
| |||||||||
| 4.00% |
05/05/282 | 2,488,232 | 2,482,174 | |||||||
|
|
|
| ||||||||
| 11,909,415 | ||||||||||
|
|
|
| ||||||||
| Industrials — 0.13% |
| |||||||||
| Berry Global, Inc., |
| |||||||||
| Term Loan Z, 1st Lien |
| |||||||||
| (LIBOR plus 1.75%) |
| |||||||||
| 2.07% |
07/01/262 | 2,911,775 | 2,875,829 | |||||||
| TransDigm, Inc., |
| |||||||||
| Term Loan E, 1st Lien |
| |||||||||
| (LIBOR plus 2.25%) |
| |||||||||
| 2.71% |
05/30/252 | 391,000 | 384,646 | |||||||
|
|
|
| ||||||||
| 3,260,475 | ||||||||||
|
|
|
| ||||||||
| Information Technology — 0.36% |
| |||||||||
| AthenaHealth Group, Inc., |
| |||||||||
| Term Loan B, 1st Lien |
| |||||||||
| (SOFR plus 3.50%) |
| |||||||||
| 4.00% |
02/15/292,7 | 2,137,681 | 2,118,976 | |||||||
| Azalea Topco, Inc., |
| |||||||||
| Term Loan B, 1st Lien |
| |||||||||
| (SOFR plus 3.75%) |
| |||||||||
| 3.75% |
07/24/262 | 1,500,000 | 1,487,812 | |||||||
| Issues | Maturity Date |
Principal Amount |
Value | |||||||
| BANK LOANS (continued) |
| |||||||||
| Information Technology (continued) |
| |||||||||
| Entegris, Inc., |
| |||||||||
| Term Loan B, 1st Lien |
| |||||||||
| (SOFR plus 3.00%) |
| |||||||||
| 3.00% |
03/02/292 | $ | 410,000 | $ | 409,574 | |||||
| Gainwell Acquisition Corp., |
| |||||||||
| Term Loan B, 1st Lien |
| |||||||||
| (LIBOR plus 4.00%) |
| |||||||||
| 5.01% |
10/01/272 | 648,359 | 648,359 | |||||||
| IQVIA, Inc., |
| |||||||||
| Term Loan B1, 1st Lien |
| |||||||||
| (LIBOR plus 1.75%) |
| |||||||||
| 2.21% |
03/07/242 | 428,968 | 426,556 | |||||||
| NortonLifeLock, Inc., |
| |||||||||
| Term Loan B, 1st Lien |
| |||||||||
| (SOFR plus 2.00%) |
| |||||||||
| 2.00% |
01/28/292 | 3,000,000 | 2,966,880 | |||||||
| Scientific Games International, Inc., |
| |||||||||
| Term Loan B5, 1st Lien |
| |||||||||
| (LIBOR plus 2.75%) |
| |||||||||
| 3.21% |
08/14/242 | 997,403 | 994,914 | |||||||
|
|
|
| ||||||||
| 9,053,071 | ||||||||||
|
|
|
| ||||||||
| Insurance — 0.08% |
| |||||||||
| Acrisure LLC, |
| |||||||||
| Term Loan B, 1st Lien |
| |||||||||
| (LIBOR plus 3.50%) |
| |||||||||
| 3.96% |
02/15/272 | 1,969,975 | 1,946,177 | |||||||
|
|
|
| ||||||||
| Retail — 0.06% |
| |||||||||
| AmWINS Group, Inc., |
| |||||||||
| Term Loan B, 1st Lien |
| |||||||||
| (LIBOR plus 2.25%) |
| |||||||||
| 3.00% |
02/19/282 | 437,785 | 431,218 | |||||||
| Whatabrands LLC, |
| |||||||||
| Term Loan B, 1st Lien |
| |||||||||
| (LIBOR plus 3.25%) |
| |||||||||
| 3.75% |
08/03/282 | 997,500 | 986,802 | |||||||
|
|
|
| ||||||||
| 1,418,020 | ||||||||||
|
|
|
| ||||||||
| Services — 0.19% |
| |||||||||
| Amentum Government Services Holdings, LLC, |
| |||||||||
| Term Loan B, 1st Lien |
| |||||||||
| (SOFR plus 4.00%) |
| |||||||||
| 4.78% |
02/15/292 | 1,588,703 | 1,578,773 | |||||||
| (SOFR plus 4.50%) |
| |||||||||
| 4.50% |
02/15/292 | 1,411,297 | 1,402,477 | |||||||
| GFL Environmental, Inc., |
| |||||||||
| Term Loan B, 1st Lien |
| |||||||||
| (LIBOR plus 3.00%) |
| |||||||||
| 3.50% |
05/30/252 | 651,845 | 650,421 | |||||||
| Trans Union LLC, |
| |||||||||
| Term Loan B6 |
| |||||||||
| (LIBOR plus 2.25%) |
| |||||||||
| 2.75% |
12/01/282 | 1,246,412 | 1,239,139 | |||||||
|
|
|
| ||||||||
| 4,870,810 | ||||||||||
|
|
|
| ||||||||
See accompanying Notes to Financial Statements.
| 131 / Annual Report March 2022 |
Table of Contents
Low Duration Bond Fund
Schedule of Portfolio Investments
March 31, 2022
| Issues | Maturity Date |
Principal Amount |
Value | |||||||
| BANK LOANS (continued) |
| |||||||||
| Transportation — 0.01% |
| |||||||||
| American Airlines, Inc., |
| |||||||||
| Term Loan B, 1st Lien |
| |||||||||
| (LIBOR plus 1.75%) |
| |||||||||
| 2.20% |
01/29/272 | $ | 173,727 | $ | 163,086 | |||||
|
|
|
| ||||||||
| Total Bank Loans |
| |||||||||
| (Cost $67,443,595) |
|
67,722,799 | ||||||||
|
|
|
| ||||||||
| CORPORATES — 31.51%* |
| |||||||||
| Banking — 8.67% |
| |||||||||
| Bank of America Corp. |
| |||||||||
| 1.73% |
07/22/278 | 10,000,000 | 9,299,039 | |||||||
| 2.88% |
04/24/238 | 3,000,000 | 3,000,937 | |||||||
| Bank of America Corp. |
| |||||||||
| (MTN) |
| |||||||||
| 3.38% |
04/02/268 | 26,972,000 | 26,940,411 | |||||||
| 3.46% |
03/15/258 | 6,773,000 | 6,817,342 | |||||||
| Credit Suisse Group AG |
| |||||||||
| (Switzerland) |
| |||||||||
| 1.31% |
02/02/271,3,8 | 2,000,000 | 1,788,596 | |||||||
| 2.59% |
09/11/251,3,8 | 9,715,000 | 9,375,869 | |||||||
| 3.80% |
06/09/233 | 1,170,000 | 1,181,350 | |||||||
| 3.87% |
01/12/291,3,8 | 2,605,000 | 2,550,208 | |||||||
| DNB Bank ASA |
| |||||||||
| (Norway) |
| |||||||||
| 0.86% |
09/30/251,3,8 | 8,340,000 | 7,904,701 | |||||||
| HSBC Holdings PLC |
| |||||||||
| (United Kingdom) |
| |||||||||
| 3.00% |
03/10/263,8 | 23,710,000 | 23,256,774 | |||||||
| ING Groep NV |
| |||||||||
| (Netherlands) |
| |||||||||
| 3.87% |
03/28/263,8 | 645,000 | 648,467 | |||||||
| JPMorgan Chase & Co. |
| |||||||||
| 0.70% |
03/16/248 | 6,581,000 | 6,461,070 | |||||||
| 0.77% |
08/09/258 | 2,535,000 | 2,405,878 | |||||||
| 0.97% |
06/23/258 | 9,244,000 | 8,831,573 | |||||||
| 4.02% |
12/05/248 | 20,520,000 | 20,857,266 | |||||||
| Lloyds Banking Group PLC |
| |||||||||
| (United Kingdom) |
| |||||||||
| 3.51% |
03/18/263,8 | 3,370,000 | 3,354,557 | |||||||
| 3.87% |
07/09/253,8 | 5,501,000 | 5,562,145 | |||||||
| Macquarie Group Ltd. |
| |||||||||
| (Australia) |
| |||||||||
| 1.20% |
10/14/251,3,8 | 5,880,000 | 5,562,470 | |||||||
| 1.34% |
01/12/271,3,8 | 3,425,000 | 3,124,748 | |||||||
| 3.19% |
11/28/231,3,8 | 3,960,000 | 3,967,545 | |||||||
| NatWest Group PLC |
| |||||||||
| (United Kingdom) |
| |||||||||
| 3.50% |
05/15/233,8 | 11,639,000 | 11,655,871 | |||||||
| Santander UK Group Holdings PLC |
| |||||||||
| (United Kingdom) |
| |||||||||
| 3.37% |
01/05/243,8 | 320,000 | 321,097 | |||||||
| 4.80% |
11/15/243,8 | 13,000,000 | 13,301,588 | |||||||
| Santander UK PLC |
| |||||||||
| (United Kingdom) |
| |||||||||
| 5.00% |
11/07/231,3 | 1,000,000 | 1,024,500 | |||||||
| Issues | Maturity Date |
Principal Amount |
Value | |||||||||
| CORPORATES (continued) |
|
|||||||||||
| Banking (continued) |
| |||||||||||
| UBS AG |
| |||||||||||
| (Switzerland) |
| |||||||||||
| 0.70% |
08/09/241,3 | $ | 1,820,000 | $ | 1,725,940 | |||||||
| (SOFR Rate plus 0.45%) |
| |||||||||||
| 0.63% |
08/09/241,2,3 | 4,000,000 | 3,971,893 | |||||||||
| Wells Fargo & Co. |
| |||||||||||
| (MTN) |
||||||||||||
| 2.39% |
06/02/288 | 2,000,000 | 1,893,481 | |||||||||
| 3.53% |
03/24/288 | 29,700,000 | 29,669,049 | |||||||||
|
|
|
| ||||||||||
| 216,454,365 | ||||||||||||
|
|
|
| ||||||||||
| Communications — 1.98% |
| |||||||||||
| AT&T, Inc. |
| |||||||||||
| 2.30% |
06/01/27 | 1,600,000 | 1,527,360 | |||||||||
| 2.55% |
12/01/33 | 1,599,000 | 1,423,802 | |||||||||
| (LIBOR USD 3-Month plus 1.18%) |
| |||||||||||
| 1.98% |
06/12/242 | 475,000 | 482,050 | |||||||||
| Charter Communications Operating LLC/Charter |
| |||||||||||
| Communications Operating Capital |
| |||||||||||
| 4.50% |
02/01/24 | 1,720,000 | 1,760,386 | |||||||||
| Cox Communications, Inc. |
| |||||||||||
| 3.15% |
08/15/241 | 1,199,000 | 1,201,784 | |||||||||
| 7.63% |
06/15/25 | 900,000 | 1,009,792 | |||||||||
| Level 3 Financing, Inc. |
| |||||||||||
| 3.40% |
03/01/271 | 1,330,000 | 1,255,759 | |||||||||
| Qwest Corp. |
| |||||||||||
| 7.25% |
09/15/25 | 4,665,000 | 5,096,513 | |||||||||
| SES SA |
| |||||||||||
| (Luxembourg) |
| |||||||||||
| 3.60% |
04/04/231,3 | 4,820,000 | 4,848,248 | |||||||||
| Sprint Spectrum Co. LLC/Sprint Spectrum Co. II LLC/Sprint Spectrum Co. III LLC |
|
|||||||||||
| 4.74% |
03/20/251 | 9,837,000 | 10,047,816 | |||||||||
| 5.15% |
03/20/281 | 3,675,000 | 3,873,264 | |||||||||
| T-Mobile USA, Inc. |
| |||||||||||
| 2.25% |
02/15/26 | 3,091,000 | 2,916,049 | |||||||||
| 3.50% |
04/15/25 | 645,000 | 651,166 | |||||||||
| 3.75% |
04/15/27 | 6,325,000 | 6,373,179 | |||||||||
| 3.88% |
04/15/30 | 3,810,000 | 3,830,049 | |||||||||
| Vodafone Group PLC |
| |||||||||||
| (United Kingdom) |
| |||||||||||
| 4.13% |
05/30/253 | 3,000,000 | 3,089,895 | |||||||||
|
|
|
| ||||||||||
| 49,387,112 | ||||||||||||
|
|
|
| ||||||||||
| Consumer Discretionary — 2.44% |
| |||||||||||
| Bacardi Ltd. |
| |||||||||||
| (Bermuda) |
| |||||||||||
| 4.45% |
05/15/251,3 | 6,030,000 | 6,177,647 | |||||||||
| BAT Capital Corp. |
| |||||||||||
| 3.22% |
08/15/24 | 2,140,000 | 2,139,748 | |||||||||
| 3.56% |
08/15/27 | 9,265,000 | 9,019,256 | |||||||||
| Constellation Brands, Inc. |
| |||||||||||
| 3.20% |
02/15/23 | 5,000,000 | 5,034,128 | |||||||||
| GSK Consumer Healthcare Capital U.S., LLC |
| |||||||||||
| 3.38% |
03/24/271 | 9,350,000 | 9,360,396 | |||||||||
See accompanying Notes to Financial Statements.
| Annual Report March 2022 / 132 |
Table of Contents
Low Duration Bond Fund
Schedule of Portfolio Investments
March 31, 2022
| Issues | Maturity Date |
Principal Amount |
Value | |||||||
| CORPORATES (continued) |
| |||||||||
| Consumer Discretionary (continued) |
| |||||||||
| Hyatt Hotels Corp. |
| |||||||||
| 1.30% |
10/01/23 | $ | 4,655,000 | $ | 4,539,599 | |||||
| Imperial Brands Finance PLC |
| |||||||||
| (United Kingdom) |
| |||||||||
| 3.13% |
07/26/241,3 | 1,106,000 | 1,096,810 | |||||||
| 3.75% |
07/21/221,3 | 3,921,000 | 3,933,930 | |||||||
| 4.25% |
07/21/251,3 | 5,205,000 | 5,250,201 | |||||||
| Magallanes, Inc. |
| |||||||||
| 3.76% |
03/15/271 | 14,400,000 | 14,381,354 | |||||||
|
|
|
| ||||||||
| 60,933,069 | ||||||||||
|
|
|
| ||||||||
| Electric — 2.44% |
| |||||||||
| Alliant Energy Finance LLC |
| |||||||||
| 1.40% |
03/15/261 | 6,540,000 | 5,958,461 | |||||||
| American Electric Power Co., Inc. |
| |||||||||
| 2.03% |
03/15/24 | 6,880,000 | 6,767,404 | |||||||
| Black Hills Corp. |
| |||||||||
| 4.25% |
11/30/23 | 4,050,000 | 4,117,303 | |||||||
| Dominion Energy, Inc. |
| |||||||||
| 2.45% |
01/15/231 | 5,000,000 | 5,004,038 | |||||||
| Dominion Energy, Inc., |
| |||||||||
| Series A |
| |||||||||
| 3.30% |
03/15/25 | 4,600,000 | 4,638,596 | |||||||
| Evergy Metro, Inc. |
| |||||||||
| 3.65% |
08/15/25 | 1,613,000 | 1,639,303 | |||||||
| Eversource Energy |
| |||||||||
| 2.90% |
03/01/27 | 6,425,000 | 6,304,962 | |||||||
| Exelon Corp. |
| |||||||||
| 2.75% |
03/15/271 | 5,165,000 | 5,033,375 | |||||||
| Jersey Central Power & Light Co. |
| |||||||||
| 4.30% |
01/15/261 | 1,868,000 | 1,909,043 | |||||||
| 4.70% |
04/01/241 | 8,348,000 | 8,539,114 | |||||||
| NextEra Energy Capital Holdings, Inc. |
| |||||||||
| 2.94% |
03/21/24 | 10,020,000 | 10,025,287 | |||||||
| Pennsylvania Electric Co. |
| |||||||||
| 4.15% |
04/15/251 | 500,000 | 508,239 | |||||||
| Tucson Electric Power Co. |
| |||||||||
| 3.85% |
03/15/23 | 530,000 | 538,042 | |||||||
|
|
|
| ||||||||
| 60,983,167 | ||||||||||
|
|
|
| ||||||||
| Energy — 1.00% |
| |||||||||
| Energy Transfer LP |
| |||||||||
| 4.05% |
03/15/25 | 2,610,000 | 2,645,290 | |||||||
| 4.75% |
01/15/26 | 2,000,000 | 2,076,978 | |||||||
| 4.90% |
02/01/24 | 4,292,000 | 4,400,199 | |||||||
| 5.95% |
12/01/25 | 2,520,000 | 2,697,939 | |||||||
| Petroleos Mexicanos |
| |||||||||
| (Mexico) |
| |||||||||
| 6.70% |
02/16/323 | 6,259,000 | 5,961,697 | |||||||
| Plains All American Pipeline LP/PAA Finance Corp. |
| |||||||||
| 4.50% |
12/15/26 | 3,017,000 | 3,098,691 | |||||||
| Ruby Pipeline LLC |
| |||||||||
| 8.00% |
04/01/221,4,5 | 2,254,091 | 2,096,305 | |||||||
| Southern Co. Gas Capital Corp. |
| |||||||||
| 3.88% |
11/15/25 | 1,950,000 | 1,986,938 | |||||||
|
|
|
| ||||||||
| 24,964,037 | ||||||||||
|
|
|
| ||||||||
| Issues | Maturity Date |
Principal Amount |
Value | |||||||
| CORPORATES (continued) |
| |||||||||
| Finance — 5.04% |
| |||||||||
| AerCap Ireland Capital DAC/AerCap Global Aviation Trust |
|
|||||||||
| (Ireland) |
| |||||||||
| 2.45% |
10/29/263 | $ | 500,000 | $ | 462,461 | |||||
| 3.15% |
02/15/243 | 6,300,000 | 6,204,033 | |||||||
| 4.88% |
01/16/243 | 718,000 | 727,481 | |||||||
| Air Lease Corp. |
| |||||||||
| 2.20% |
01/15/27 | 4,835,000 | 4,475,635 | |||||||
| Air Lease Corp. |
| |||||||||
| (MTN) |
| |||||||||
| 0.70% |
02/15/24 | 1,250,000 | 1,194,670 | |||||||
| American Express Co. |
| |||||||||
| 2.25% |
03/04/25 | 6,440,000 | 6,325,336 | |||||||
| Avolon Holdings Funding Ltd. |
| |||||||||
| (Cayman Islands) |
| |||||||||
| 2.53% |
11/18/271,3 | 3,608,000 | 3,193,547 | |||||||
| Capital One Financial Corp. |
| |||||||||
| 2.64% |
03/03/268 | 5,150,000 | 5,048,185 | |||||||
| Citigroup, Inc. |
| |||||||||
| 0.98% |
05/01/258 | 6,270,000 | 5,985,336 | |||||||
| 3.11% |
04/08/268 | 8,025,000 | 7,970,197 | |||||||
| 3.35% |
04/24/258 | 17,240,000 | 17,290,070 | |||||||
| Daimler Finance North America LLC |
| |||||||||
| 1.75% |
03/10/231 | 2,470,000 | 2,458,189 | |||||||
| Discover Financial Services |
| |||||||||
| 5.20% |
04/27/22 | 2,558,000 | 2,564,745 | |||||||
| Ford Motor Credit Co. LLC |
| |||||||||
| (LIBOR USD 3-Month plus 1.08%) |
| |||||||||
| 1.38% |
08/03/222 | 2,700,000 | 2,691,225 | |||||||
| Goldman Sachs Group, Inc. (The) |
| |||||||||
| 2.91% |
07/24/238 | 6,814,000 | 6,824,180 | |||||||
| Morgan Stanley |
| |||||||||
| 2.48% |
01/21/288 | 5,000,000 | 4,770,149 | |||||||
| Morgan Stanley |
| |||||||||
| (GMTN) |
| |||||||||
| 0.79% |
01/22/258 | 7,760,000 | 7,454,209 | |||||||
| Morgan Stanley |
| |||||||||
| (MTN) |
| |||||||||
| 0.53% |
01/25/248 | 17,835,000 | 17,548,908 | |||||||
| 2.72% |
07/22/258 | 7,270,000 | 7,194,990 | |||||||
| Nationwide Building Society |
| |||||||||
| (United Kingdom) |
| |||||||||
| 3.62% |
04/26/231,3,8 | 8,205,000 | 8,206,750 | |||||||
| 3.77% |
03/08/241,3,8 | 6,730,000 | 6,769,835 | |||||||
| Park Aerospace Holdings Ltd. |
| |||||||||
| (Cayman Islands) |
| |||||||||
| 4.50% |
03/15/231,3 | 365,000 | 367,772 | |||||||
|
|
|
| ||||||||
| 125,727,903 | ||||||||||
|
|
|
| ||||||||
| Food — 0.51% |
| |||||||||
| JBS USA LUX SA/JBS USA Food Co./JBS USA Finance, Inc. |
|
|||||||||
| (Canada) |
| |||||||||
| 3.00% |
02/02/291,3 | 5,590,000 | 5,192,871 | |||||||
| Kraft Heinz Foods Co. |
| |||||||||
| 3.88% |
05/15/27 | 7,500,000 | 7,620,493 | |||||||
|
|
|
| ||||||||
| 12,813,364 | ||||||||||
|
|
|
| ||||||||
See accompanying Notes to Financial Statements.
| 133 / Annual Report March 2022 |
Table of Contents
Low Duration Bond Fund
Schedule of Portfolio Investments
March 31, 2022
| Issues | Maturity Date |
Principal Amount |
Value | |||||||
| CORPORATES (continued) |
| |||||||||
| Health Care — 3.65% |
| |||||||||
| AbbVie, Inc. |
| |||||||||
| 3.25% |
10/01/22 | $ | 1,500,000 | $ | 1,507,617 | |||||
| 3.85% |
06/15/24 | 2,500,000 | 2,550,754 | |||||||
| Aetna, Inc. |
| |||||||||
| 3.50% |
11/15/24 | 3,136,000 | 3,172,410 | |||||||
| Baxter International, Inc. |
| |||||||||
| 0.87% |
12/01/231 | 3,830,000 | 3,709,151 | |||||||
| Bayer U.S. Finance II LLC |
| |||||||||
| 2.20% |
07/15/221 | 1,455,000 | 1,454,999 | |||||||
| 2.85% |
04/15/251 | 4,665,000 | 4,559,478 | |||||||
| 4.25% |
12/15/251 | 1,000,000 | 1,017,967 | |||||||
| Bayer U.S. Finance LLC |
| |||||||||
| 3.38% |
10/08/241 | 5,540,000 | 5,539,728 | |||||||
| Becton Dickinson and Co. |
| |||||||||
| 3.73% |
12/15/24 | 3,000,000 | 3,051,225 | |||||||
| Boston Scientific Corp. |
| |||||||||
| 1.90% |
06/01/25 | 2,500,000 | 2,400,949 | |||||||
| Cigna Corp. |
| |||||||||
| 3.75% |
07/15/23 | 2,166,000 | 2,198,581 | |||||||
| CommonSpirit Health |
| |||||||||
| 2.76% |
10/01/24 | 5,400,000 | 5,358,057 | |||||||
| CVS Health Corp. |
| |||||||||
| 2.88% |
06/01/26 | 4,330,000 | 4,292,703 | |||||||
| Dignity Health |
| |||||||||
| 3.13% |
11/01/22 | 1,140,000 | 1,148,723 | |||||||
| Fresenius U.S. Finance II, Inc. |
| |||||||||
| 4.50% |
01/15/231 | 5,205,000 | 5,272,668 | |||||||
| HCA, Inc. |
| |||||||||
| 3.13% |
03/15/271 | 2,510,000 | 2,456,450 | |||||||
| 5.00% |
03/15/24 | 10,450,000 | 10,834,205 | |||||||
| 5.25% |
04/15/25 | 1,500,000 | 1,580,360 | |||||||
| HCA, Inc. |
| |||||||||
| (MTN) |
| |||||||||
| 7.58% |
09/15/25 | 1,100,000 | 1,219,874 | |||||||
| Humana, Inc. |
| |||||||||
| 0.65% |
08/03/23 | 7,130,000 | 6,958,290 | |||||||
| 3.15% |
12/01/22 | 2,000,000 | 2,012,976 | |||||||
| 3.85% |
10/01/24 | 3,990,000 | 4,056,731 | |||||||
| PerkinElmer, Inc. |
| |||||||||
| 0.85% |
09/15/24 | 6,880,000 | 6,534,829 | |||||||
| Royalty Pharma PLC |
| |||||||||
| (United Kingdom) |
| |||||||||
| 0.75% |
09/02/233 | 5,275,000 | 5,124,762 | |||||||
| Tenet Healthcare Corp. |
| |||||||||
| 4.63% |
09/01/241 | 3,000,000 | 3,024,231 | |||||||
|
|
|
| ||||||||
| 91,037,718 | ||||||||||
|
|
|
| ||||||||
| Industrials — 1.23% |
| |||||||||
| Artera Services LLC |
| |||||||||
| 9.03% |
12/04/251 | 2,500,000 | 2,500,945 | |||||||
| BAE Systems Holdings, Inc. |
| |||||||||
| 3.85% |
12/15/251 | 2,910,000 | 2,923,434 | |||||||
| Berry Global, Inc. |
| |||||||||
| 0.95% |
02/15/24 | 1,405,000 | 1,345,405 | |||||||
| 1.65% |
01/15/27 | 2,000,000 | 1,825,001 | |||||||
| 4.88% |
07/15/261 | 1,365,000 | 1,380,302 | |||||||
| Issues | Maturity Date |
Principal Amount |
Value | |||||||
| CORPORATES (continued) |
| |||||||||
| Industrials (continued) |
| |||||||||
| Boeing Co. (The) |
| |||||||||
| 1.17% |
02/04/23 | $ | 5,750,000 | $ | 5,686,003 | |||||
| General Electric Co. |
| |||||||||
| (MTN) |
| |||||||||
| (LIBOR USD 3-Month plus 0.38%) |
| |||||||||
| 0.70% |
05/05/262 | 7,235,000 | 7,123,403 | |||||||
| (LIBOR USD 3-Month plus 0.48%) |
| |||||||||
| 0.99% |
08/15/362 | 2,182,000 | 1,879,579 | |||||||
| Sydney Airport Finance Co. Pty Ltd. |
| |||||||||
| (Australia) |
| |||||||||
| 3.90% |
03/22/231,3 | 5,920,000 | 5,990,524 | |||||||
|
|
|
| ||||||||
| 30,654,596 | ||||||||||
|
|
|
| ||||||||
| Information Technology — 1.35% |
| |||||||||
| Netflix, Inc. |
| |||||||||
| 3.63% |
06/15/251 | 3,207,000 | 3,228,038 | |||||||
| 5.88% |
02/15/25 | 1,885,000 | 2,013,626 | |||||||
| NXP BV/NXP Funding LLC |
| |||||||||
| (Netherlands) |
| |||||||||
| 4.63% |
06/01/231,3 | 6,745,000 | 6,845,863 | |||||||
| Oracle Corp. |
| |||||||||
| 2.80% |
04/01/27 | 9,385,000 | 8,996,181 | |||||||
| Skyworks Solutions, Inc. |
| |||||||||
| 0.90% |
06/01/23 | 6,340,000 | 6,201,765 | |||||||
| VMware, Inc. |
| |||||||||
| 1.00% |
08/15/24 | 6,690,000 | 6,379,117 | |||||||
|
|
|
| ||||||||
| 33,664,590 | ||||||||||
|
|
|
| ||||||||
| Insurance — 1.32% |
| |||||||||
| Aon Corp./Aon Global Holdings PLC |
| |||||||||
| 2.85% |
05/28/27 | 3,160,000 | 3,098,177 | |||||||
| Athene Global Funding |
| |||||||||
| 2.51% |
03/08/241 | 2,935,000 | 2,891,937 | |||||||
| (SOFR Rate plus 0.70%) |
| |||||||||
| 0.91% |
05/24/241,2 | 5,005,000 | 4,942,875 | |||||||
| Equitable Financial Life Global Funding |
| |||||||||
| 0.80% |
08/12/241 | 3,655,000 | 3,465,352 | |||||||
| Farmers Insurance Exchange |
| |||||||||
| 8.63% |
05/01/241 | 5,000,000 | 5,467,860 | |||||||
| MMI Capital Trust I, |
| |||||||||
| Series B |
| |||||||||
| 7.63% |
12/15/27 | 2,000,000 | 2,348,046 | |||||||
| Nationwide Mutual Insurance Co. |
| |||||||||
| 3.12% |
12/15/241,8 | 5,550,000 | 5,553,827 | |||||||
| Teachers Insurance & Annuity Association of America |
| |||||||||
| 4.38% |
09/15/541,8 | 1,600,000 | 1,594,722 | |||||||
| Trinity Acquisition PLC |
| |||||||||
| (United Kingdom) |
| |||||||||
| 4.63% |
08/15/233 | 3,410,000 | 3,489,488 | |||||||
|
|
|
| ||||||||
| 32,852,284 | ||||||||||
|
|
|
| ||||||||
| Materials — 0.06% |
| |||||||||
| International Flavors & Fragrances, Inc. |
| |||||||||
| 0.70% |
09/15/221 | 1,490,000 | 1,483,217 | |||||||
|
|
|
| ||||||||
See accompanying Notes to Financial Statements.
| Annual Report March 2022 / 134 |
Table of Contents
Low Duration Bond Fund
Schedule of Portfolio Investments
March 31, 2022
| Issues | Maturity Date |
Principal Amount |
Value | |||||||||
| CORPORATES (continued) |
|
|||||||||||
| Real Estate Investment Trust (REIT) — 1.44% |
| |||||||||||
| American Campus Communities Operating Partnership LP |
|
|||||||||||
| 3.75% |
04/15/23 | $ | 7,374,000 | $ | 7,439,307 | |||||||
| CyrusOne LP/CyrusOne Finance Corp. |
| |||||||||||
| 2.90% |
11/15/24 | 6,440,000 | 6,457,678 | |||||||||
| Federal Realty Investment Trust |
| |||||||||||
| 7.48% |
08/15/26 | 1,850,000 | 2,088,527 | |||||||||
| GLP Capital LP/GLP Financing II, Inc. |
| |||||||||||
| 3.35% |
09/01/24 | 1,197,000 | 1,196,282 | |||||||||
| 5.38% |
11/01/23 | 7,868,000 | 8,079,449 | |||||||||
| Healthpeak Properties, Inc. |
| |||||||||||
| 4.00% |
06/01/25 | 3,455,000 | 3,515,804 | |||||||||
| Kilroy Realty LP |
| |||||||||||
| 3.45% |
12/15/24 | 5,863,000 | 5,881,531 | |||||||||
| MGM Growth Properties Operating Partnership LP/MGP Finance Co.-Issuer, Inc. |
|
|||||||||||
| 4.63% |
06/15/251 | 675,000 | 683,556 | |||||||||
| SL Green Operating Partnership LP |
| |||||||||||
| 3.25% |
10/15/22 | 645,000 | 645,240 | |||||||||
|
|
|
| ||||||||||
| 35,987,374 | ||||||||||||
|
|
|
| ||||||||||
| Retail — 0.09% |
| |||||||||||
| Alimentation Couche-Tard, Inc. |
| |||||||||||
| (Canada) |
| |||||||||||
| 3.55% |
07/26/271,3 | 2,175,000 | 2,163,614 | |||||||||
|
|
|
| ||||||||||
| Services — 0.15% |
| |||||||||||
| Global Payments, Inc. |
| |||||||||||
| 1.50% |
11/15/24 | 3,835,000 | 3,667,342 | |||||||||
|
|
|
| ||||||||||
| Transportation — 0.14% |
| |||||||||||
| Canadian Pacific Railway Co. |
| |||||||||||
| (Canada) |
| |||||||||||
| 1.35% |
12/02/243 | 2,315,000 | 2,224,451 | |||||||||
| Delta Air Lines Pass-Through Trust, |
| |||||||||||
| Series 2020-1, Class AA |
| |||||||||||
| 2.00% |
06/10/28 | 1,429,185 | 1,311,851 | |||||||||
| Northwest Airlines Pass-Through Trust, |
| |||||||||||
| Series 2001-1, Class A-1 |
| |||||||||||
| 7.04% |
04/01/22 | 53,084 | 53,349 | |||||||||
|
|
|
| ||||||||||
| 3,589,651 | ||||||||||||
|
|
|
| ||||||||||
| Total Corporates |
| |||||||||||
| (Cost $807,276,197) |
|
786,363,403 | ||||||||||
|
|
|
| ||||||||||
| MORTGAGE-BACKED — 41.32%** |
| |||||||||||
| Non-Agency Commercial Mortgage-Backed — 8.43% |
| |||||||||||
| BANK, |
| |||||||||||
| Series 2018-BN14, Class A2 |
| |||||||||||
| 4.13% |
09/15/60 | 5,414,830 | 5,490,260 | |||||||||
| BXMT Ltd., |
| |||||||||||
| Series 2020-FL2, Class A |
| |||||||||||
| (Cayman Islands) |
| |||||||||||
| (SOFR30A plus 1.01%) |
| |||||||||||
| 1.06% |
02/15/381,2,3 | 7,000,000 | 6,965,506 | |||||||||
| CFCRE Commercial Mortgage Trust, |
| |||||||||||
| Series 2016-C4, Class ASB |
| |||||||||||
| 3.09% |
05/10/58 | 2,782,649 | 2,788,337 | |||||||||
| Issues | Maturity Date |
Principal Amount |
Value | |||||||
| MORTGAGE-BACKED (continued) |
|
|||||||||
| Non-Agency Commercial Mortgage-Backed (continued) |
| |||||||||
| Citigroup Commercial Mortgage Trust, |
| |||||||||
| Series 2017-C4, Class A2 |
| |||||||||
| 3.19% |
10/12/50 | $ | 10,912,761 | $ | 10,942,422 | |||||
| Commercial Mortgage Trust, |
| |||||||||
| Series 2013-CR7, Class XA (IO) |
| |||||||||
| 1.17% |
03/10/468 | 23,583,249 | 184,702 | |||||||
| Commercial Mortgage Trust, |
| |||||||||
| Series 2014-CR15, Class ASB |
| |||||||||
| 3.60% |
02/10/47 | 2,339,958 | 2,360,734 | |||||||
| Commercial Mortgage Trust, |
| |||||||||
| Series 2014-CR20, Class A3 |
| |||||||||
| 3.33% |
11/10/47 | 6,389,770 | 6,360,549 | |||||||
| Commercial Mortgage Trust, |
| |||||||||
| Series 2015-PC1, Class A4 |
| |||||||||
| 3.62% |
07/10/50 | 7,840,576 | 7,857,498 | |||||||
| Commercial Mortgage Trust, |
| |||||||||
| Series 2016-DC2, Class ASB |
| |||||||||
| 3.55% |
02/10/49 | 197,207 | 199,137 | |||||||
| Credit Suisse Mortgage Capital Certificates, |
| |||||||||
| Series 2019-ICE4, Class A |
| |||||||||
| (LIBOR USD 1-Month plus 0.98%) |
| |||||||||
| 1.38% |
05/15/361,2 | 11,094,800 | 11,022,720 | |||||||
| Great Wolf Trust, |
| |||||||||
| Series 2019-WOLF, Class A |
| |||||||||
| (LIBOR USD 1-Month plus 1.03%) |
| |||||||||
| 1.43% |
12/15/361,2 | 8,884,000 | 8,775,719 | |||||||
| GS Mortgage Securities Corp. II, |
| |||||||||
| Series 2018-GS10, Class A1 |
| |||||||||
| 3.20% |
07/10/51 | 2,437,552 | 2,445,524 | |||||||
| GS Mortgage Securities Corp. Trust, |
| |||||||||
| Series 2019-70P, Class A |
| |||||||||
| (LIBOR USD 1-Month plus 1.00%) |
| |||||||||
| 1.40% |
10/15/361,2 | 10,000,000 | 9,896,542 | |||||||
| GS Mortgage Securities Trust, |
| |||||||||
| Series 2011-GC5, Class AS |
| |||||||||
| 5.16% |
08/10/441,8 | 3,637,805 | 3,646,830 | |||||||
| GS Mortgage Securities Trust, |
| |||||||||
| Series 2012-ALOH, Class A |
| |||||||||
| 3.55% |
04/10/341 | 20,500,000 | 20,491,033 | |||||||
| GS Mortgage Securities Trust, |
| |||||||||
| Series 2018-GS9, Class A2 |
| |||||||||
| 3.84% |
03/10/51 | 9,148,221 | 9,202,651 | |||||||
| Independence Plaza Trust, |
| |||||||||
| Series 2018-INDP, Class B |
| |||||||||
| 3.91% |
07/10/351 | 10,000,000 | 9,870,115 | |||||||
| Irvine Core Office Trust, |
| |||||||||
| Series 2013-IRV, Class A1 |
| |||||||||
| 2.07% |
05/15/481 | 3,533,330 | 3,536,628 | |||||||
| JPMorgan Chase Commercial Mortgage Securities Trust, |
|
|||||||||
| Series 2012-C8, Class ASB |
| |||||||||
| 2.38% |
10/15/45 | 99,037 | 99,001 | |||||||
| JPMorgan Chase Commercial Mortgage Securities Trust, |
|
|||||||||
| Series 2012-CBX, Class A4FX |
| |||||||||
| 3.48% |
06/15/451 | 1,084,909 | 1,084,834 | |||||||
See accompanying Notes to Financial Statements.
| 135 / Annual Report March 2022 |
Table of Contents
Low Duration Bond Fund
Schedule of Portfolio Investments
March 31, 2022
| Issues | Maturity Date |
Principal Amount |
Value | |||||||
| MORTGAGE-BACKED (continued) |
|
|||||||||
| Non-Agency Commercial Mortgage-Backed (continued) |
| |||||||||
| JPMorgan Chase Commercial Mortgage Securities Trust, |
|
|||||||||
| Series 2013-LC11, Class XA (IO) |
| |||||||||
| 1.23% |
04/15/468 | $ | 28,985,820 | $ | 257,474 | |||||
| JPMorgan Chase Commercial Mortgage Securities Trust, |
|
|||||||||
| Series 2014-C20, Class A4A2 |
| |||||||||
| 3.54% |
07/15/471 | 4,545,626 | 4,460,406 | |||||||
| LoanCore Issuer Ltd., |
| |||||||||
| Series 2019-CRE3, Class A |
| |||||||||
| (Cayman Islands) |
| |||||||||
| (LIBOR USD 1-Month plus 1.05%) |
| |||||||||
| 1.45% |
04/15/341,2,3 | 8,274,119 | 8,240,745 | |||||||
| Morgan Stanley Bank of America Merrill Lynch Trust, |
|
|||||||||
| Series 2013-C12, Class XA (IO) |
| |||||||||
| 0.57% |
10/15/468 | 46,029,832 | 281,268 | |||||||
| Morgan Stanley Bank of America Merrill Lynch Trust, |
|
|||||||||
| Series 2015-C21, Class XA (IO) |
| |||||||||
| 0.86% |
03/15/488 | 33,744,160 | 665,733 | |||||||
| New York City Housing Development Corp., |
| |||||||||
| Series A - 8SPR, Class A (STEP-reset date 05/15/22) |
| |||||||||
| 3.71% |
02/15/48 | 8,000,000 | 8,196,064 | |||||||
| One Lincoln Street Commercial Mortgage, |
| |||||||||
| Series 2004-C3, Class A1 |
| |||||||||
| 5.72% |
10/15/301,8 | 6,004,228 | 6,223,902 | |||||||
| One Market Plaza Trust, |
| |||||||||
| Series 2017-1MKT, Class A |
| |||||||||
| 3.61% |
02/10/321 | 8,500,000 | 8,470,051 | |||||||
| One Market Plaza Trust, |
| |||||||||
| Series 2017-1MKT, Class E |
| |||||||||
| 4.14% |
02/10/321 | 4,520,000 | 4,437,355 | |||||||
| One New York Plaza Trust, |
| |||||||||
| Series 2020-1NYP, Class A |
| |||||||||
| (LIBOR USD 1-Month plus 0.95%) |
| |||||||||
| 1.35% |
01/15/361,2 | 3,240,000 | 3,190,879 | |||||||
| UBS Commercial Mortgage Trust, |
| |||||||||
| Series 2018-C11, Class A2 |
| |||||||||
| 3.99% |
06/15/51 | 775,890 | 779,761 | |||||||
| UBS Commercial Mortgage Trust, |
| |||||||||
| Series 2018-C12, Class A2 |
| |||||||||
| 4.15% |
08/15/51 | 12,889,000 | 13,044,783 | |||||||
| Wells Fargo Commercial Mortgage Trust, |
| |||||||||
| Series 2014-LC16, Class A4 |
| |||||||||
| 3.55% |
08/15/50 | 12,980,214 | 12,843,896 | |||||||
| WF-RBS Commercial Mortgage Trust, |
| |||||||||
| Series 2012-C7, Class A2 |
| |||||||||
| 3.43% |
06/15/45 | 2,439,660 | 2,436,942 | |||||||
| WF-RBS Commercial Mortgage Trust, |
| |||||||||
| Series 2012-C9, Class AS |
| |||||||||
| 3.39% |
11/15/45 | 7,911,000 | 7,955,873 | |||||||
| WF-RBS Commercial Mortgage Trust, |
| |||||||||
| Series 2013-C18, Class A4 |
| |||||||||
| 3.90% |
12/15/46 | 5,666,501 | 5,675,448 | |||||||
|
|
|
| ||||||||
| 210,381,322 | ||||||||||
|
|
|
| ||||||||
| Issues | Maturity Date |
Principal Amount |
Value | |||||||
| MORTGAGE-BACKED (continued) |
|
|||||||||
| Non-Agency Mortgage-Backed — 12.71% |
|
|||||||||
| Accredited Mortgage Loan Trust, |
| |||||||||
| Series 2007-1, Class A4 |
| |||||||||
| (LIBOR USD 1-Month plus 0.22%) |
| |||||||||
| 0.68% |
02/25/372 | $ | 3,221,423 | $ | 3,226,939 | |||||
| ACE Securities Corp. Home Equity Loan Trust, |
| |||||||||
| Series 2006-OP1, Class A2D |
| |||||||||
| (LIBOR USD 1-Month plus 0.48%) |
| |||||||||
| 0.94% |
04/25/362 | 8,264,062 | 7,952,860 | |||||||
| Ameriquest Mortgage Securities, Inc., Asset-Backed Pass- Through Certificates, |
|
|||||||||
| Series 2005-R1, Class M3 |
| |||||||||
| (LIBOR USD 1-Month plus 0.80%) |
| |||||||||
| 1.25% |
03/25/352 | 2,289,945 | 2,289,945 | |||||||
| Ameriquest Mortgage Securities, Inc., Asset-Backed Pass- Through Certificates, |
|
|||||||||
| Series 2005-R9, Class M1 |
| |||||||||
| (LIBOR USD 1-Month plus 0.71%) |
| |||||||||
| 1.16% |
11/25/352 | 11,746,913 | 11,661,034 | |||||||
| Amresco Residential Securities Corp. Mortgage Loan Trust, |
|
|||||||||
| Series 1998-1, Class A5 (STEP-reset date 05/25/22) |
| |||||||||
| 7.53% |
10/25/27 | 2,498 | 2,542 | |||||||
| Argent Securities, Inc., Asset-Backed Pass-Through |
| |||||||||
| Certificates, |
| |||||||||
| Series 2005-W2, Class M1 |
| |||||||||
| (LIBOR USD 1-Month plus 0.74%) |
| |||||||||
| 1.19% |
10/25/352 | 7,915,250 | 7,859,893 | |||||||
| Asset-Backed Securities Corp. Home Equity Loan Trust, |
|
|||||||||
| Series 2006-HE3, Class A5 |
| |||||||||
| (LIBOR USD 1-Month plus 0.54%) |
| |||||||||
| 1.00% |
03/25/362 | 2,887,479 | 2,861,768 | |||||||
| Banc of America Alternative Loan Trust, |
| |||||||||
| Series 2003-8, Class 1CB1 |
| |||||||||
| 5.50% |
10/25/33 | 4,061,222 | 4,021,240 | |||||||
| Bear Stearns ALT-A Trust, |
| |||||||||
| Series 2004-10, Class M1 |
| |||||||||
| (LIBOR USD 1-Month plus 0.90%) |
| |||||||||
| 1.36% |
09/25/342 | 3,063,426 | 3,063,426 | |||||||
| Bear Stearns ALT-A Trust, |
| |||||||||
| Series 2005-2, Class 1M1 |
| |||||||||
| (LIBOR USD 1-Month plus 0.75%) |
| |||||||||
| 1.21% |
03/25/352 | 1,715,116 | 1,712,059 | |||||||
| Bear Stearns ARM Trust, |
| |||||||||
| Series 2004-3, Class 4A |
| |||||||||
| 2.71% |
07/25/348 | 313,651 | 306,214 | |||||||
| BNC Mortgage Loan Trust, |
| |||||||||
| Series 2007-1, Class A4 |
| |||||||||
| (LIBOR USD 1-Month plus 0.16%) |
| |||||||||
| 0.62% |
03/25/372 | 5,714,667 | 5,557,769 | |||||||
| Chase Funding Trust, |
| |||||||||
| Series 2002-2, Class 2A1 |
| |||||||||
| (LIBOR USD 1-Month plus 0.50%) |
| |||||||||
| 0.96% |
05/25/322 | 1,897,930 | 1,873,003 | |||||||
| Chase Mortgage Finance Trust, |
| |||||||||
| Series 2007-A1, Class 8A1 |
| |||||||||
| 2.40% |
02/25/378 | 3,392,488 | 3,475,738 | |||||||
See accompanying Notes to Financial Statements.
| Annual Report March 2022 / 136 |
Table of Contents
Low Duration Bond Fund
Schedule of Portfolio Investments
March 31, 2022
| Issues | Maturity Date |
Principal Amount |
Value | |||||||
| MORTGAGE-BACKED (continued) |
| |||||||||
| Non-Agency Mortgage-Backed (continued) |
|
|||||||||
| Chase Mortgage Finance Trust, |
| |||||||||
| Series 2007-A2, Class 2A3 |
| |||||||||
| 2.38% |
06/25/358 | $ | 597,548 | $ | 603,426 | |||||
| Chevy Chase Mortgage Funding LLC, Mortgage-Backed Certificates, |
|
|||||||||
| Series 2005-2A, Class A1 |
| |||||||||
| (LIBOR USD 1-Month plus 0.18%) |
| |||||||||
| 0.64% |
05/25/361,2 | 464,023 | 435,015 | |||||||
| CIM Trust, |
| |||||||||
| Series 2018-R6, Class A1 |
| |||||||||
| (LIBOR USD 1-Month plus 1.08%) |
| |||||||||
| 1.31% |
09/25/581,2 | 4,790,809 | 4,693,036 | |||||||
| CIM Trust, |
| |||||||||
| Series 2021-R3, Class A1A |
| |||||||||
| 1.95% |
06/25/571,8 | 9,313,241 | 9,034,664 | |||||||
| Citigroup Mortgage Loan Trust, Inc., |
| |||||||||
| Series 2004-HYB1, Class A41 |
| |||||||||
| 2.66% |
02/25/348 | 452 | 455 | |||||||
| Citigroup Mortgage Loan Trust, Inc., |
| |||||||||
| Series 2006-WFH2, Class M2 |
| |||||||||
| (LIBOR USD 1-Month plus 0.42%) |
| |||||||||
| 0.88% |
08/25/362 | 10,113,000 | 9,969,925 | |||||||
| Countrywide Asset-Backed Certificates Trust, |
|
|||||||||
| Series 2005-AB2, Class M1 |
| |||||||||
| (LIBOR USD 1-Month plus 0.71%) |
| |||||||||
| 1.16% |
09/25/352 | 9,002,216 | 8,824,117 | |||||||
| Countrywide Asset-Backed Certificates Trust, |
|
|||||||||
| Series 2006-14, Class 2A3 |
| |||||||||
| (LIBOR USD 1-Month plus 0.24%) |
| |||||||||
| 0.70% |
02/25/372 | 3,073,701 | 2,980,760 | |||||||
| Countrywide Asset-Backed Certificates Trust, |
|
|||||||||
| Series 2006-4, Class M1 |
| |||||||||
| (LIBOR USD 1-Month plus 0.53%) |
| |||||||||
| 0.98% |
07/25/362 | 5,746,924 | 5,683,623 | |||||||
| Countrywide Asset-Backed Certificates Trust, |
|
|||||||||
| Series 2007-8, Class 1A1 |
| |||||||||
| (LIBOR USD 1-Month plus 0.19%) |
| |||||||||
| 0.65% |
11/25/372 | 8,935,224 | 8,663,105 | |||||||
| Countrywide Home Loan Mortgage Pass-Through Trust, |
|
|||||||||
| Series 2004-14, Class 4A1 |
| |||||||||
| 2.45% |
08/25/348 | 7,547 | 7,547 | |||||||
| Credit Suisse First Boston Mortgage Securities Corp., |
|
|||||||||
| Series 2004-AR1, Class 5A1 |
| |||||||||
| 2.35% |
02/25/348 | 492,036 | 507,982 | |||||||
| Credit-Based Asset Servicing and Securitization LLC, |
|
|||||||||
| Series 2007-CB4, Class A1A |
| |||||||||
| (LIBOR USD 1-Month plus 0.09%) |
| |||||||||
| 0.55% |
04/25/372 | 1,701,367 | 1,626,369 | |||||||
| Credit-Based Asset Servicing and Securitization LLC, |
|
|||||||||
| Series 2007-CB5, Class A1 |
| |||||||||
| (LIBOR USD 1-Month plus 0.06%) |
| |||||||||
| 0.52% |
04/25/372 | 2,119,522 | 1,485,053 | |||||||
| DSLA Mortgage Loan Trust, |
| |||||||||
| Series 2005-AR2, Class 2A1A |
| |||||||||
| (LIBOR USD 1-Month plus 0.42%) |
| |||||||||
| 0.87% |
03/19/452 | 361,576 | 351,548 | |||||||
| Issues | Maturity Date |
Principal Amount |
Value | |||||||
| MORTGAGE-BACKED (continued) |
| |||||||||
| Non-Agency Mortgage-Backed (continued) |
| |||||||||
| Encore Credit Receivables Trust, |
| |||||||||
| Series 2005-3, Class M4 |
| |||||||||
| (LIBOR USD 1-Month plus 0.90%) |
| |||||||||
| 1.36% |
10/25/352 | $ | 7,017,000 | $ | 7,024,603 | |||||
| First Franklin Mortgage Loan Trust, |
| |||||||||
| Series 2004-FF5, Class A3C |
| |||||||||
| (LIBOR USD 1-Month plus 1.00%) |
| |||||||||
| 1.46% |
08/25/342 | 482,694 | 481,343 | |||||||
| First Franklin Mortgage Loan Trust, |
| |||||||||
| Series 2005-FF8, Class M2 |
| |||||||||
| (LIBOR USD 1-Month plus 0.78%) |
| |||||||||
| 1.24% |
09/25/352 | 3,126,638 | 3,124,195 | |||||||
| First Franklin Mortgage Loan Trust, |
| |||||||||
| Series 2006-FF5, Class 2A5 (PO) |
| |||||||||
| 0.00% |
04/25/369 | 2,865,060 | 2,850,603 | |||||||
| First Horizon Alternative Mortgage Securities Trust, |
| |||||||||
| Series 2004-AA3, Class A1 |
| |||||||||
| 2.37% |
09/25/348 | 1,978 | 1,943 | |||||||
| GMACM Home Equity Loan Trust, |
| |||||||||
| Series 2000-HE2, Class A1 |
| |||||||||
| (LIBOR USD 1-Month plus 0.44%) |
| |||||||||
| 0.54% |
06/25/302 | 68,033 | 65,689 | |||||||
| GSAMP Trust, |
| |||||||||
| Series 2005-HE4, Class M3 |
| |||||||||
| (LIBOR USD 1-Month plus 0.78%) |
| |||||||||
| 1.24% |
07/25/452 | 1,944,183 | 1,936,644 | |||||||
| GSAMP Trust, |
| |||||||||
| Series 2006-HE2, Class M1 |
| |||||||||
| (LIBOR USD 1-Month plus 0.48%) |
| |||||||||
| 0.94% |
03/25/462 | 5,966,155 | 5,904,734 | |||||||
| GSAMP Trust, |
| |||||||||
| Series 2006-NC1, Class A3 |
| |||||||||
| (LIBOR USD 1-Month plus 0.58%) |
| |||||||||
| 1.04% |
02/25/362 | 1,525,714 | 1,524,410 | |||||||
| GSR Mortgage Loan Trust, |
| |||||||||
| Series 2005-AR7, Class 2A1 |
| |||||||||
| 2.80% |
11/25/358 | 136,696 | 134,035 | |||||||
| Impac CMB Trust, |
| |||||||||
| Series 2005-5, Class A1 |
| |||||||||
| (LIBOR USD 1-Month plus 0.32%) |
| |||||||||
| 1.10% |
08/25/352 | 1,130,077 | 1,095,974 | |||||||
| IndyMac Index Mortgage Loan Trust, |
| |||||||||
| Series 2004-AR12, Class A1 |
| |||||||||
| (LIBOR USD 1-Month plus 0.78%) |
| |||||||||
| 1.24% |
12/25/342 | 182,772 | 152,939 | |||||||
| IndyMac Index Mortgage Loan Trust, |
| |||||||||
| Series 2004-AR8, Class 2A2A |
| |||||||||
| (LIBOR USD 1-Month plus 0.80%) |
| |||||||||
| 1.26% |
11/25/342 | 501,293 | 480,825 | |||||||
| IndyMac Manufactured Housing Contract Pass-Through Certificates, |
|
|||||||||
| Series 1998-1, Class A4 |
| |||||||||
| 6.49% |
09/25/28 | 254,117 | 262,159 | |||||||
See accompanying Notes to Financial Statements.
| 137 / Annual Report March 2022 |
Table of Contents
Low Duration Bond Fund
Schedule of Portfolio Investments
March 31, 2022
| Issues | Maturity Date |
Principal Amount |
Value | |||||||
| MORTGAGE-BACKED (continued) |
| |||||||||
| Non-Agency Mortgage-Backed (continued) |
| |||||||||
| JPMorgan Mortgage Acquisition Trust, |
| |||||||||
| Series 2005-FRE1, Class M1 |
| |||||||||
| (LIBOR USD 1-Month plus 0.62%) |
| |||||||||
| 1.07% |
10/25/352 | $ | 6,169,279 | $ | 6,184,789 | |||||
| JPMorgan Mortgage Acquisition Trust, |
| |||||||||
| Series 2006-NC1, Class M1 |
| |||||||||
| (LIBOR USD 1-Month plus 0.48%) |
| |||||||||
| 0.94% |
04/25/362 | 5,985,653 | 5,937,045 | |||||||
| JPMorgan Mortgage Acquisition Trust, |
| |||||||||
| Series 2007-CH4, Class M1 |
| |||||||||
| (LIBOR USD 1-Month plus 0.23%) |
| |||||||||
| 0.69% |
05/25/372 | 14,750,000 | 14,315,790 | |||||||
| JPMorgan Mortgage Acquisition Trust, |
| |||||||||
| Series 2007-CH5, Class A1 |
| |||||||||
| (LIBOR USD 1-Month plus 0.16%) |
| |||||||||
| 0.62% |
06/25/372 | 15,229,718 | 15,156,773 | |||||||
| JPMorgan Mortgage Acquisition Trust, |
| |||||||||
| Series 2007-HE1, Class AV4 |
| |||||||||
| (LIBOR USD 1-Month plus 0.28%) |
| |||||||||
| 0.74% |
03/25/472 | 50,000 | 48,425 | |||||||
| JPMorgan Mortgage Trust, |
| |||||||||
| Series 2007-A1, Class 1A1 |
| |||||||||
| 2.60% |
07/25/358 | 389,115 | 397,381 | |||||||
| JPMorgan Mortgage Trust, |
| |||||||||
| Series 2007-A1, Class 5A2 |
| |||||||||
| 2.39% |
07/25/358 | 103,167 | 104,261 | |||||||
| Lehman ABS Manufactured Housing Contract Trust, |
| |||||||||
| Series 2001-B, Class AIOC (IO) |
| |||||||||
| 0.55% |
04/15/404,5,8 | 64,518,561 | 891,424 | |||||||
| Long Beach Mortgage Loan Trust, |
| |||||||||
| Series 2005-WL3, Class M1 |
| |||||||||
| (LIBOR USD 1-Month plus 0.65%) |
| |||||||||
| 1.10% |
11/25/352 | 2,272,187 | 2,238,625 | |||||||
| MASTR Adjustable Rate Mortgages Trust, |
| |||||||||
| Series 2003-6, Class 4A2 |
| |||||||||
| 3.02% |
01/25/348 | 4,262 | 4,470 | |||||||
| MASTR Adjustable Rate Mortgages Trust, |
| |||||||||
| Series 2004-13, Class 3A1 |
| |||||||||
| 2.76% |
11/21/348 | 422,169 | 421,443 | |||||||
| MASTR Adjustable Rate Mortgages Trust, |
| |||||||||
| Series 2004-3, Class 3A3 |
| |||||||||
| 2.53% |
04/25/348 | 64,778 | 64,813 | |||||||
| MASTR Alternative Loan Trust, |
| |||||||||
| Series 2003-1, Class 1A1 |
| |||||||||
| 6.25% |
12/25/32 | 1,087,300 | 1,097,885 | |||||||
| MASTR Alternative Loan Trust, |
| |||||||||
| Series 2003-5, Class 4A1 |
| |||||||||
| 5.50% |
07/25/33 | 1,839,978 | 1,860,909 | |||||||
| MASTR Alternative Loan Trust, |
| |||||||||
| Series 2003-9, Class 4A1 |
| |||||||||
| 5.25% |
11/25/33 | 2,163,971 | 2,158,919 | |||||||
| MASTR Alternative Loan Trust, |
| |||||||||
| Series 2004-7, Class 1A1 |
| |||||||||
| 5.50% |
07/25/34 | 1,982,325 | 2,004,965 | |||||||
| Issues | Maturity Date |
Principal Amount |
Value | |||||||
| MORTGAGE-BACKED (continued) |
| |||||||||
| Non-Agency Mortgage-Backed (continued) |
| |||||||||
| MASTR Asset-Backed Securities Trust, |
| |||||||||
| Series 2006-HE1, Class M1 |
| |||||||||
| (LIBOR USD 1-Month plus 0.56%) |
| |||||||||
| 1.01% |
01/25/362 | $ | 6,430,639 | $ | 6,346,028 | |||||
| MASTR Seasoned Securitization Trust, |
| |||||||||
| Series 2004-1, Class 4A1 |
| |||||||||
| 2.41% |
10/25/328 | 94,701 | 97,408 | |||||||
| Merrill Lynch First Franklin Mortgage Loan Trust, |
| |||||||||
| Series 2007-3, Class A2C |
| |||||||||
| (LIBOR USD 1-Month plus 0.18%) |
| |||||||||
| 0.64% |
06/25/372 | 8,256,398 | 7,644,981 | |||||||
| Merrill Lynch Mortgage Investors Trust, |
| |||||||||
| Series 2004-A4, Class A1 |
| |||||||||
| 2.66% |
08/25/348 | 591,537 | 575,309 | |||||||
| Merrill Lynch Mortgage Investors Trust, |
| |||||||||
| Series 2006-F1, Class 1A2 |
| |||||||||
| 6.00% |
04/25/36 | 899,835 | 568,699 | |||||||
| Mid-State Capital Corp. Trust, |
| |||||||||
| Series 2006-1, Class A |
| |||||||||
| 5.79% |
10/15/401 | 3,186,280 | 3,222,114 | |||||||
| Mid-State Trust, |
| |||||||||
| Series 10W, Class A2 |
| |||||||||
| 5.82% |
02/15/36 | 365,532 | 367,323 | |||||||
| Morgan Stanley ABS Capital I Trust, |
| |||||||||
| Series 2004-NC7, Class M2 |
| |||||||||
| (LIBOR USD 1-Month plus 0.93%) |
| |||||||||
| 1.39% |
07/25/342 | 798,709 | 775,555 | |||||||
| Morgan Stanley ABS Capital I, Inc., Trust, |
| |||||||||
| Series 2005-HE2, Class M1 |
| |||||||||
| (LIBOR USD 1-Month plus 0.60%) |
| |||||||||
| 1.06% |
01/25/352 | 652,478 | 651,942 | |||||||
| MortgageIT Trust, |
| |||||||||
| Series 2005-3, Class A1 |
| |||||||||
| (LIBOR USD 1-Month plus 0.60%) |
| |||||||||
| 1.06% |
08/25/352 | 130,780 | 128,936 | |||||||
| MortgageIT Trust, |
| |||||||||
| Series 2005-4, Class A1 |
| |||||||||
| (LIBOR USD 1-Month plus 0.56%) |
| |||||||||
| 1.02% |
10/25/352 | 3,252,665 | 3,223,341 | |||||||
| Nationstar Home Equity Loan Trust, |
| |||||||||
| Series 2007-B, Class 1AV1 |
| |||||||||
| (LIBOR USD 1-Month plus 0.22%) |
| |||||||||
| 0.68% |
04/25/372 | 6,513,991 | 6,475,036 | |||||||
| New Century Home Equity Loan Trust, |
| |||||||||
| Series 2005-3, Class M4 |
| |||||||||
| (LIBOR USD 1-Month plus 0.64%) |
| |||||||||
| 1.42% |
07/25/352 | 2,427,021 | 2,428,571 | |||||||
| New Century Home Equity Loan Trust, |
| |||||||||
| Series 2005-D, Class A1 |
| |||||||||
| (LIBOR USD 1-Month plus 0.44%) |
| |||||||||
| 0.90% |
02/25/362 | 2,388,465 | 2,390,458 | |||||||
| New Century Home Equity Loan Trust, |
| |||||||||
| Series 2005-D, Class M1 |
| |||||||||
| (LIBOR USD 1-Month plus 0.68%) |
| |||||||||
| 1.13% |
02/25/362 | 5,000,000 | 4,931,495 | |||||||
See accompanying Notes to Financial Statements.
| Annual Report March 2022 / 138 |
Table of Contents
Low Duration Bond Fund
Schedule of Portfolio Investments
March 31, 2022
| Issues | Maturity Date |
Principal Amount |
Value | |||||||
| MORTGAGE-BACKED (continued) |
| |||||||||
| Non-Agency Mortgage-Backed (continued) |
| |||||||||
| NLT Trust, |
| |||||||||
| Series 2021-INV2, Class A1 |
| |||||||||
| 1.16% |
08/25/561,8 | $ | 7,262,644 | $ | 6,814,034 | |||||
| Opteum Mortgage Acceptance Corp. Asset-Backed Pass- Through Certificates, |
|
|||||||||
| Series 2005-5, Class 1APT |
| |||||||||
| (LIBOR USD 1-Month plus 0.56%) |
| |||||||||
| 1.02% |
12/25/352 | 3,490,952 | 3,420,107 | |||||||
| Option One Mortgage Loan Trust, |
| |||||||||
| Series 2006-1, Class 1A1 |
| |||||||||
| (LIBOR USD 1-Month plus 0.44%) |
| |||||||||
| 0.90% |
01/25/362 | 362,923 | 362,775 | |||||||
| Park Place Securities, Inc., Asset-Backed Pass-Through Certificates, |
|
|||||||||
| Series 2005-WCW3, Class M2 |
| |||||||||
| (LIBOR USD 1-Month plus 0.74%) |
| |||||||||
| 1.19% |
08/25/352 | 2,500,000 | 2,490,193 | |||||||
| PHH Alternative Mortgage Trust, |
| |||||||||
| Series 2007-3, Class A3 |
| |||||||||
| (LIBOR USD 1-Month plus 0.60%) |
| |||||||||
| 1.06% |
07/25/372 | 6,421,071 | 6,300,677 | |||||||
| PRPM, LLC, |
| |||||||||
| Series 2021-1, Class A1 |
| |||||||||
| 2.12% |
01/25/261,8 | 11,419,823 | 11,014,102 | |||||||
| PRPM, LLC, |
| |||||||||
| Series 2021-10, Class A1 (STEP-reset date 04/25/22) |
|
|||||||||
| 2.49% |
10/25/261 | 12,458,314 | 11,993,724 | |||||||
| PRPM, LLC, |
| |||||||||
| Series 2021-7, Class A1 (STEP-reset date 04/25/22) |
|
|||||||||
| 1.87% |
08/25/261 | 12,886,242 | 12,251,094 | |||||||
| Residential Accredit Loans Trust, |
| |||||||||
| Series 2005-QA3, Class NB1 |
| |||||||||
| 3.59% |
03/25/358 | 932,288 | 550,349 | |||||||
| Residential Asset Mortgage Products Trust, |
| |||||||||
| Series 2004-SL4, Class A3 |
| |||||||||
| 6.50% |
07/25/32 | 24,093 | 24,088 | |||||||
| Residential Asset Mortgage Products Trust, |
| |||||||||
| Series 2005-EFC1, Class M5 |
| |||||||||
| (LIBOR USD 1-Month plus 0.65%) |
| |||||||||
| 1.43% |
05/25/352 | 4,199,838 | 4,195,115 | |||||||
| Residential Asset Mortgage Products Trust, |
| |||||||||
| Series 2006-NC2, Class A3 |
| |||||||||
| (LIBOR USD 1-Month plus 0.58%) |
| |||||||||
| 1.04% |
02/25/362 | 996,323 | 992,495 | |||||||
| Residential Asset Securities Corp., |
| |||||||||
| Series 2005-KS11, Class M2 |
| |||||||||
| (LIBOR USD 1-Month plus 0.63%) |
| |||||||||
| 1.09% |
12/25/352 | 4,488,163 | 4,480,160 | |||||||
| Saxon Asset Securities Trust, |
| |||||||||
| Series 2006-2, Class M1 |
| |||||||||
| (LIBOR USD 1-Month plus 0.29%) |
| |||||||||
| 0.75% |
09/25/362 | 11,000,000 | 10,849,835 | |||||||
| Securitized Asset-Backed Receivables LLC Trust, |
| |||||||||
| Series 2006-CB1, Class AF2 (STEP-reset date 05/25/22) |
|
|||||||||
| 2.91% |
01/25/36 | 1,515,322 | 1,238,114 | |||||||
| Issues | Maturity Date |
Principal Amount |
Value | |||||||
| MORTGAGE-BACKED (continued) |
| |||||||||
| Non-Agency Mortgage-Backed (continued) |
| |||||||||
| Soundview Home Loan Trust, |
| |||||||||
| Series 2006-OPT4, Class 2A4 |
| |||||||||
| (LIBOR USD 1-Month plus 0.46%) |
| |||||||||
| 0.92% |
06/25/362 | $ | 4,655,684 | $ | 4,548,385 | |||||
| Specialty Underwriting & Residential Finance Trust, |
|
|||||||||
| Series 2005-BC2, Class M3 |
| |||||||||
| (LIBOR USD 1-Month plus 0.98%) |
| |||||||||
| 1.43% |
12/25/352 | 2,184,669 | 2,186,607 | |||||||
| Structured Asset Securities Corp. Mortgage Loan Trust, |
|
|||||||||
| Series 2006-BC6, Class A4 |
| |||||||||
| (LIBOR USD 1-Month plus 0.17%) |
| |||||||||
| 0.63% |
01/25/372 | 1,995,639 | 1,978,994 | |||||||
| Structured Asset Securities Corp. Mortgage Pass-Through |
|
|||||||||
| Certificates, |
| |||||||||
| Series 2003-26A, Class 3A5 |
| |||||||||
| 2.30% |
09/25/338 | 234,652 | 240,344 | |||||||
| Terwin Mortgage Trust, |
| |||||||||
| Series 2004-7HE, Class A1 |
| |||||||||
| (LIBOR USD 1-Month plus 1.10%) |
| |||||||||
| 1.56% |
07/25/341,2 | 74,910 | 73,627 | |||||||
| WaMu Mortgage Pass-Through Certificates, |
| |||||||||
| Series 2004-AR14, Class A1 |
| |||||||||
| 2.75% |
01/25/358 | 348,001 | 347,888 | |||||||
| WaMu Mortgage Pass-Through Certificates, |
| |||||||||
| Series 2004-CB2, Class 2A |
| |||||||||
| 5.50% |
07/25/34 | 1,147,300 | 1,136,590 | |||||||
| WaMu Mortgage Pass-Through Certificates, |
| |||||||||
| Series 2005-AR13, Class A1A1 |
| |||||||||
| (LIBOR USD 1-Month plus 0.58%) |
| |||||||||
| 1.04% |
10/25/452 | 1,109,641 | 1,098,300 | |||||||
| WaMu Mortgage Pass-Through Certificates, |
| |||||||||
| Series 2005-AR2, Class 2A21 |
| |||||||||
| (LIBOR USD 1-Month plus 0.66%) |
| |||||||||
| 1.12% |
01/25/452 | 157,689 | 156,054 | |||||||
|
|
|
|||||||||
| 317,229,915 | ||||||||||
|
|
|
|||||||||
| U.S. Agency Commercial Mortgage-Backed — 4.15% |
| |||||||||
| Fannie Mae-Aces, |
| |||||||||
| Series 2017-M15, Class A1 |
| |||||||||
| 2.96% |
09/25/278 | 3,045,905 | 3,069,776 | |||||||
| Freddie Mac Multifamily Structured Pass-Through Certificates, |
|
|||||||||
| Series K037, Class A1 |
| |||||||||
| 2.59% |
04/25/23 | 1,153,581 | 1,158,945 | |||||||
| Freddie Mac Multifamily Structured Pass-Through Certificates, |
|
|||||||||
| Series K038, Class A1 |
| |||||||||
| 2.60% |
10/25/23 | 654,597 | 656,372 | |||||||
| Freddie Mac Multifamily Structured Pass-Through Certificates, |
|
|||||||||
| Series K735, Class A1 |
| |||||||||
| 2.74% |
05/25/25 | 441,746 | 442,324 | |||||||
See accompanying Notes to Financial Statements.
| 139 / Annual Report March 2022 |
Table of Contents
Low Duration Bond Fund
Schedule of Portfolio Investments
March 31, 2022
| Issues | Maturity Date |
Principal Amount |
Value | |||||||
| MORTGAGE-BACKED (continued) |
| |||||||||
| U.S. Agency Commercial Mortgage-Backed (continued) |
| |||||||||
| Freddie Mac Multifamily Structured Pass-Through |
| |||||||||
| Certificates, |
| |||||||||
| Series KF27, Class A |
| |||||||||
| (LIBOR USD 1-Month plus 0.42%) |
| |||||||||
| 0.66% |
12/25/262 | $ | 824,365 | $ | 825,949 | |||||
| Freddie Mac Multifamily Structured Pass-Through |
| |||||||||
| Certificates, |
| |||||||||
| Series KF29, Class A |
| |||||||||
| (LIBOR USD 1-Month plus 0.36%) |
| |||||||||
| 0.60% |
02/25/242 | 1,661,523 | 1,664,102 | |||||||
| Freddie Mac Multifamily Structured Pass-Through |
| |||||||||
| Certificates, |
| |||||||||
| Series KF34, Class A |
| |||||||||
| (LIBOR USD 1-Month plus 0.36%) |
| |||||||||
| 0.60% |
08/25/242 | 1,211,889 | 1,213,579 | |||||||
| Freddie Mac Multifamily Structured Pass-Through |
| |||||||||
| Certificates, |
| |||||||||
| Series KF37, Class A |
| |||||||||
| (LIBOR USD 1-Month plus 0.36%) |
| |||||||||
| 0.60% |
09/25/272 | 788,206 | 789,513 | |||||||
| Freddie Mac Multifamily Structured Pass-Through |
| |||||||||
| Certificates, |
| |||||||||
| Series KF38, Class A |
| |||||||||
| (LIBOR USD 1-Month plus 0.33%) |
| |||||||||
| 0.57% |
09/25/242 | 2,475,483 | 2,478,444 | |||||||
| Freddie Mac Multifamily Structured Pass-Through |
| |||||||||
| Certificates, |
| |||||||||
| Series KF39, Class A |
| |||||||||
| (LIBOR USD 1-Month plus 0.32%) |
| |||||||||
| 0.56% |
11/25/242 | 1,431,421 | 1,433,363 | |||||||
| Freddie Mac Multifamily Structured Pass-Through |
| |||||||||
| Certificates, |
| |||||||||
| Series KF40, Class A |
| |||||||||
| (LIBOR USD 1-Month plus 0.34%) |
| |||||||||
| 0.58% |
11/25/272 | 593,265 | 593,966 | |||||||
| Freddie Mac Multifamily Structured Pass-Through |
| |||||||||
| Certificates, |
| |||||||||
| Series KF43, Class A |
| |||||||||
| (LIBOR USD 1-Month plus 0.24%) |
| |||||||||
| 0.48% |
01/25/282 | 2,229,088 | 2,230,828 | |||||||
| Freddie Mac Multifamily Structured Pass-Through |
| |||||||||
| Certificates, |
| |||||||||
| Series KF51, Class A |
| |||||||||
| (LIBOR USD 1-Month plus 0.40%) |
| |||||||||
| 0.64% |
08/25/252 | 3,047,557 | 3,040,618 | |||||||
| Freddie Mac Multifamily Structured Pass-Through |
| |||||||||
| Certificates, |
| |||||||||
| Series KF60, Class A |
| |||||||||
| (LIBOR USD 1-Month plus 0.49%) |
| |||||||||
| 0.73% |
02/25/262 | 4,053,591 | 4,062,880 | |||||||
| Freddie Mac Multifamily Structured Pass-Through |
| |||||||||
| Certificates, |
| |||||||||
| Series KF64, Class A |
| |||||||||
| (LIBOR USD 1-Month plus 0.44%) |
| |||||||||
| 0.68% |
06/25/262 | 6,096,969 | 6,110,088 | |||||||
| Issues | Maturity Date |
Principal Amount |
Value | |||||||
| MORTGAGE-BACKED (continued) |
| |||||||||
| U.S. Agency Commercial Mortgage-Backed (continued) |
| |||||||||
| Freddie Mac Multifamily Structured Pass-Through |
| |||||||||
| Certificates, |
| |||||||||
| Series KF72, Class A |
| |||||||||
| (LIBOR USD 1-Month plus 0.50%) |
| |||||||||
| 0.74% |
10/25/262 | $ | 5,940,400 | $ | 5,970,872 | |||||
| Freddie Mac Multifamily Structured Pass-Through |
| |||||||||
| Certificates, |
| |||||||||
| Series KF80, Class AL |
| |||||||||
| (LIBOR USD 1-Month plus 0.44%) |
| |||||||||
| 0.68% |
06/25/302 | 9,323,420 | 9,319,958 | |||||||
| Freddie Mac Multifamily Structured Pass-Through |
| |||||||||
| Certificates, |
| |||||||||
| Series KF85, Class AL |
| |||||||||
| (LIBOR USD 1-Month plus 0.30%) |
| |||||||||
| 0.54% |
08/25/302 | 4,655,585 | 4,637,178 | |||||||
| Freddie Mac Multifamily Structured Pass-Through |
| |||||||||
| Certificates, |
| |||||||||
| Series KJ24, Class A1 |
| |||||||||
| 2.28% |
05/25/26 | 1,808,898 | 1,815,298 | |||||||
| Freddie Mac Multifamily Structured Pass-Through |
| |||||||||
| Certificates, |
| |||||||||
| Series KJ26, Class A1 |
| |||||||||
| 2.14% |
07/25/25 | 9,105,495 | 9,084,315 | |||||||
| Freddie Mac Multifamily Structured Pass-Through |
| |||||||||
| Certificates, |
| |||||||||
| Series KJ29, Class A1 |
| |||||||||
| 0.74% |
01/25/26 | 6,807,198 | 6,555,304 | |||||||
| Freddie Mac Multifamily Structured Pass-Through |
| |||||||||
| Certificates, |
| |||||||||
| Series KJ30, Class A1 |
| |||||||||
| 0.53% |
01/25/25 | 5,632,413 | 5,454,142 | |||||||
| Freddie Mac Multifamily Structured Pass-Through |
| |||||||||
| Certificates, |
| |||||||||
| Series KJ31, Class A1 |
| |||||||||
| 0.57% |
05/25/26 | 8,386,839 | 8,073,986 | |||||||
| Freddie Mac Multifamily Structured Pass-Through |
| |||||||||
| Certificates, |
| |||||||||
| Series KJ34, Class A1 |
| |||||||||
| 0.68% |
06/25/26 | 6,783,382 | 6,368,114 | |||||||
| Freddie Mac Multifamily Structured Pass-Through |
| |||||||||
| Certificates, |
| |||||||||
| Series KJ37, Class A1 |
| |||||||||
| 1.68% |
12/25/27 | 13,453,539 | 12,976,194 | |||||||
| Freddie Mac Multifamily Structured Pass-Through |
| |||||||||
| Certificates, |
| |||||||||
| Series Q004, Class AFL |
| |||||||||
| (Federal Reserve US 12-Month Cumulative Average plus 0.74%) |
|
|||||||||
| 0.88% |
05/25/442 | 1,393,995 | 1,394,067 | |||||||
| Ginnie Mae, |
| |||||||||
| Series 2007-12, Class C |
| |||||||||
| 5.28% |
04/16/418 | 304,818 | 305,554 | |||||||
See accompanying Notes to Financial Statements.
| Annual Report March 2022 / 140 |
Table of Contents
Low Duration Bond Fund
Schedule of Portfolio Investments
March 31, 2022
| Issues | Maturity Date |
Principal Amount |
Value | |||||||
| MORTGAGE-BACKED (continued) |
| |||||||||
| U.S. Agency Commercial Mortgage-Backed (continued) |
| |||||||||
| Ginnie Mae, |
| |||||||||
| Series 2008-92, Class E |
| |||||||||
| 5.56% |
03/16/448 | $ | 1,729,344 | $ | 1,741,915 | |||||
|
|
|
| ||||||||
| 103,467,644 | ||||||||||
|
|
|
| ||||||||
| U.S. Agency Mortgage-Backed — 16.03% |
| |||||||||
| Fannie Mae Pool 567002 |
| |||||||||
| 8.00% |
05/01/23 | 1,310 | 1,320 | |||||||
| Fannie Mae Pool 735861 |
| |||||||||
| 6.50% |
09/01/33 | 7,421 | 7,894 | |||||||
| Fannie Mae Pool 770900 |
| |||||||||
| (LIBOR USD 12-Month plus 1.56%) |
| |||||||||
| 1.81% |
04/01/342 | 88,747 | 90,688 | |||||||
| Fannie Mae Pool AD0538 |
| |||||||||
| 6.00% |
05/01/24 | 62,498 | 64,106 | |||||||
| Fannie Mae Pool AE0083 |
| |||||||||
| 6.00% |
01/01/40 | 534,063 | 594,445 | |||||||
| Fannie Mae Pool AL0851 |
| |||||||||
| 6.00% |
10/01/40 | 656,327 | 728,499 | |||||||
| Fannie Mae Pool AL2206 |
| |||||||||
| 3.09% |
07/01/228 | 214,882 | 214,813 | |||||||
| Fannie Mae Pool AM4580 |
| |||||||||
| 3.43% |
10/01/23 | 6,054,486 | 6,113,644 | |||||||
| Fannie Mae REMICS, |
| |||||||||
| Series 1997-76, Class FS |
| |||||||||
| (LIBOR USD 1-Month plus 0.45%) |
| |||||||||
| 0.89% |
09/17/272 | 6,388 | 6,300 | |||||||
| Fannie Mae REMICS, |
| |||||||||
| Series 2001-60, Class OF |
| |||||||||
| (LIBOR USD 1-Month plus 0.95%) |
| |||||||||
| 1.41% |
10/25/312 | 404,141 | 412,163 | |||||||
| Fannie Mae REMICS, |
| |||||||||
| Series 2007-64, Class FA |
| |||||||||
| (LIBOR USD 1-Month plus 0.47%) |
| |||||||||
| 0.93% |
07/25/372 | 212,107 | 213,223 | |||||||
| Fannie Mae REMICS, |
| |||||||||
| Series 2009-85, Class LF |
| |||||||||
| (LIBOR USD 1-Month plus 1.20%) |
| |||||||||
| 1.66% |
10/25/492 | 2,005,868 | 2,066,634 | |||||||
| Fannie Mae REMICS, |
| |||||||||
| Series 2009-96, Class FA |
| |||||||||
| (LIBOR USD 1-Month plus 0.90%) |
| |||||||||
| 1.36% |
11/25/492 | 1,298,309 | 1,344,740 | |||||||
| Fannie Mae REMICS, |
| |||||||||
| Series 2010-109, Class PF |
| |||||||||
| (LIBOR USD 1-Month plus 0.40%) |
| |||||||||
| 0.86% |
10/25/402 | 672,531 | 675,768 | |||||||
| Fannie Mae REMICS, |
| |||||||||
| Series 2010-26, Class S (IO) |
| |||||||||
| (-1.00 X LIBOR USD 1-Month plus 6.23%, 6.23% Cap) |
| |||||||||
| 5.77% |
11/25/362 | 4,245,158 | 676,807 | |||||||
| Fannie Mae REMICS, |
| |||||||||
| Series 2010-43, Class DP |
| |||||||||
| 5.00% |
05/25/40 | 520,509 | 547,784 | |||||||
| Issues | Maturity Date |
Principal Amount |
Value | |||||||
| MORTGAGE-BACKED (continued) |
| |||||||||
| U.S. Agency Mortgage-Backed (continued) |
| |||||||||
| Fannie Mae REMICS, |
| |||||||||
| Series 2010-6, Class BF |
| |||||||||
| (LIBOR USD 1-Month plus 0.76%) |
| |||||||||
| 1.22% |
02/25/402 | $ | 1,026,095 | $ | 1,047,348 | |||||
| Fannie Mae REMICS, |
| |||||||||
| Series 2010-95, Class S (IO) |
| |||||||||
| (-1.00 X LIBOR USD 1-Month plus 6.60%, 6.60% Cap) |
|
|||||||||
| 6.14% |
09/25/402 | 3,377,739 | 607,070 | |||||||
| Fannie Mae REMICS, |
| |||||||||
| Series 2019-79, Class FA |
| |||||||||
| (LIBOR USD 1-Month plus 0.50%) |
| |||||||||
| 0.96% |
01/25/502 | 3,473,557 | 3,495,765 | |||||||
| Fannie Mae REMICS, |
| |||||||||
| Series 2020-10, Class FA |
| |||||||||
| (LIBOR USD 1-Month plus 0.50%) |
| |||||||||
| 0.96% |
03/25/502 | 7,466,455 | 7,512,298 | |||||||
| Freddie Mac Gold Pool A45796 |
| |||||||||
| 7.00% |
01/01/33 | 1,414 | 1,480 | |||||||
| Freddie Mac Gold Pool C46104 |
| |||||||||
| 6.50% |
09/01/29 | 3,564 | 3,832 | |||||||
| Freddie Mac Gold Pool G13032 |
| |||||||||
| 6.00% |
09/01/22 | 358 | 360 | |||||||
| Freddie Mac Gold Pool G13475 |
| |||||||||
| 6.00% |
01/01/24 | 1,856 | 1,871 | |||||||
| Freddie Mac REMICS, |
| |||||||||
| Series 2174, Class PN |
| |||||||||
| 6.00% |
07/15/29 | 217,527 | 230,957 | |||||||
| Freddie Mac REMICS, |
| |||||||||
| Series 2454, Class FQ |
| |||||||||
| (LIBOR USD 1-Month plus 1.00%) |
| |||||||||
| 1.40% |
06/15/312 | 3,716 | 3,794 | |||||||
| Freddie Mac REMICS, |
| |||||||||
| Series 2733, Class FB |
| |||||||||
| (LIBOR USD 1-Month plus 0.60%) |
| |||||||||
| 1.00% |
10/15/332 | 1,555,416 | 1,576,582 | |||||||
| Freddie Mac REMICS, |
| |||||||||
| Series 3071, Class TF |
| |||||||||
| (LIBOR USD 1-Month plus 0.30%) |
| |||||||||
| 0.70% |
04/15/352 | 1,029,164 | 1,029,860 | |||||||
| Freddie Mac REMICS, |
| |||||||||
| Series 3294, Class CB |
| |||||||||
| 5.50% |
03/15/37 | 200,094 | 217,497 | |||||||
| Freddie Mac REMICS, |
| |||||||||
| Series 3300, Class FA |
| |||||||||
| (LIBOR USD 1-Month plus 0.30%) |
| |||||||||
| 0.70% |
08/15/352 | 408,887 | 409,987 | |||||||
| Freddie Mac REMICS, |
| |||||||||
| Series 3325, Class NF |
| |||||||||
| (LIBOR USD 1-Month plus 0.30%) |
| |||||||||
| 0.70% |
08/15/352 | 1,054,458 | 1,057,295 | |||||||
| Freddie Mac REMICS, |
| |||||||||
| Series 3524, Class FC |
| |||||||||
| (LIBOR USD 1-Month plus 0.94%) |
| |||||||||
| 1.34% |
06/15/382 | 222,268 | 227,086 | |||||||
See accompanying Notes to Financial Statements.
| 141 / Annual Report March 2022 |
Table of Contents
Low Duration Bond Fund
Schedule of Portfolio Investments
March 31, 2022
| Issues | Maturity Date |
Principal Amount |
Value | |||||||
| MORTGAGE-BACKED (continued) |
| |||||||||
| U.S. Agency Mortgage-Backed (continued) |
| |||||||||
| Freddie Mac REMICS, |
| |||||||||
| Series 3531, Class FM |
| |||||||||
| (LIBOR USD 1-Month plus 0.90%) |
| |||||||||
| 1.30% |
05/15/392 | $ | 156,187 | $ | 159,805 | |||||
| Freddie Mac REMICS, |
| |||||||||
| Series 3792, Class DF |
| |||||||||
| (LIBOR USD 1-Month plus 0.40%) |
| |||||||||
| 0.80% |
11/15/402 | 82,324 | 82,453 | |||||||
| Freddie Mac REMICS, |
| |||||||||
| Series 4060, Class FJ |
| |||||||||
| (LIBOR USD 1-Month plus 0.35%) |
| |||||||||
| 0.75% |
02/15/412 | 681,629 | 682,434 | |||||||
| Freddie Mac REMICS, |
| |||||||||
| Series 4959, Class JF |
| |||||||||
| (LIBOR USD 1-Month plus 0.45%) |
| |||||||||
| 0.91% |
03/25/502 | 5,862,254 | 5,883,506 | |||||||
| Freddie Mac Strips, |
| |||||||||
| Series 240, Class F30 |
| |||||||||
| (LIBOR USD 1-Month plus 0.30%) |
| |||||||||
| 0.70% |
07/15/362 | 1,232,064 | 1,230,089 | |||||||
| Freddie Mac Strips, |
| |||||||||
| Series 263, Class F5 |
| |||||||||
| (LIBOR USD 1-Month plus 0.50%) |
| |||||||||
| 0.90% |
06/15/422 | 1,285,939 | 1,287,625 | |||||||
| Freddie Mac Strips, |
| |||||||||
| Series 319, Class F2 |
| |||||||||
| (LIBOR USD 1-Month plus 0.50%) |
| |||||||||
| 0.90% |
11/15/432 | 6,089,075 | 6,113,011 | |||||||
| Ginnie Mae (TBA) |
| |||||||||
| 2.00% |
04/20/52 | 13,200,000 | 12,556,176 | |||||||
| 2.50% |
04/20/52 | 52,000,000 | 50,411,938 | |||||||
| Ginnie Mae II Pool 1849 |
| |||||||||
| 8.50% |
08/20/24 | 94 | 95 | |||||||
| Ginnie Mae II Pool 2020 |
| |||||||||
| 8.50% |
06/20/25 | 163 | 165 | |||||||
| Ginnie Mae II Pool 2286 |
| |||||||||
| 8.50% |
09/20/26 | 109 | 110 | |||||||
| Ginnie Mae II Pool 2487 |
| |||||||||
| 8.50% |
09/20/27 | 2,413 | 2,509 | |||||||
| Ginnie Mae II Pool 80059 |
| |||||||||
| (US Treasury Yield Curve Rate T Note Constant Maturity |
|
|||||||||
| 1-Year plus 1.50%) |
| |||||||||
| 1.88% |
04/20/272 | 7,771 | 7,916 | |||||||
| Ginnie Mae II Pool 80589 |
| |||||||||
| (US Treasury Yield Curve Rate T Note Constant Maturity |
|
|||||||||
| 1-Year plus 1.50%) |
| |||||||||
| 2.00% |
03/20/322 | 9,255 | 9,349 | |||||||
| Ginnie Mae II Pool 80610 |
| |||||||||
| (US Treasury Yield Curve Rate T Note Constant Maturity |
|
|||||||||
| 1-Year plus 1.50%) |
| |||||||||
| 1.88% |
06/20/322 | 5,945 | 6,133 | |||||||
| Ginnie Mae II Pool 80968 |
| |||||||||
| (US Treasury Yield Curve Rate T Note Constant Maturity |
|
|||||||||
| 1-Year plus 1.50%) |
| |||||||||
| 1.63% |
07/20/342 | 164,847 | 169,010 | |||||||
| Issues | Maturity Date |
Principal Amount |
Value | |||||||
| MORTGAGE-BACKED (continued) |
| |||||||||
| U.S. Agency Mortgage-Backed (continued) |
| |||||||||
| Ginnie Mae II Pool 81201 |
| |||||||||
| (US Treasury Yield Curve Rate T Note Constant Maturity |
|
|||||||||
| 1-Year plus 2.00%) |
| |||||||||
| 2.50% |
01/20/352 | $ | 5,100 | $ | 5,148 | |||||
| Ginnie Mae II Pool 8599 |
| |||||||||
| (US Treasury Yield Curve Rate T Note Constant Maturity |
|
|||||||||
| 1-Year plus 1.50%) |
| |||||||||
| 3.00% |
02/20/252 | 5,294 | 5,308 | |||||||
| Ginnie Mae, |
| |||||||||
| Series 2009-106, Class XI (IO) |
| |||||||||
| (-1.00 X LIBOR USD 1-Month plus 6.80%, 6.80% Cap) |
|
|||||||||
| 6.35% |
05/20/372 | 2,650,822 | 244,587 | |||||||
| Ginnie Mae, |
| |||||||||
| Series 2013-53, Class AD |
| |||||||||
| 1.50% |
12/20/26 | 767,339 | 756,502 | |||||||
| UMBS (TBA) |
| |||||||||
| 2.00% |
04/01/52 | 13,450,000 | 12,478,094 | |||||||
| 2.00% |
05/01/52 | 62,425,000 | 57,844,079 | |||||||
| 2.50% |
05/01/52 | 169,950,000 | 161,820,090 | |||||||
| 3.00% |
05/01/52 | 58,325,000 | 56,939,784 | |||||||
|
|
|
| ||||||||
| 399,877,826 | ||||||||||
|
|
|
| ||||||||
| Total Mortgage-Backed (Cost $1,047,573,809) |
|
1,030,956,707 | ||||||||
|
|
|
| ||||||||
| MUNICIPAL BONDS — 0.92%* |
| |||||||||
| California — 0.20% |
| |||||||||
| Campbell Union School District General Obligation, School Improvements, Series B |
|
|||||||||
| 5.41% |
08/01/27 | 4,600,000 | 4,994,793 | |||||||
|
|
|
| ||||||||
| Colorado — 0.04% |
| |||||||||
| City & County of Denver Airport System Revenue Bonds, |
|
|||||||||
| Series C |
| |||||||||
| 0.88% |
11/15/23 | 895,000 | 871,615 | |||||||
|
|
|
| ||||||||
| Florida — 0.05% |
| |||||||||
| County of Miami-Dade Aviation Revenue Bonds, Airport and Marina Improvements, Series B |
|
|||||||||
| 2.14% |
10/01/28 | 445,000 | 413,487 | |||||||
| 2.29% |
10/01/29 | 985,000 | 912,224 | |||||||
|
|
|
| ||||||||
| 1,325,711 | ||||||||||
|
|
|
| ||||||||
| Maryland — 0.08% |
| |||||||||
| City of Baltimore General Obligation, School Improvements, Series C |
|
|||||||||
| 5.00% |
10/15/25 | 2,000,000 | 2,088,893 | |||||||
|
|
|
| ||||||||
| New York — 0.55% |
| |||||||||
| New York City Transitional Finance Authority Future Tax Secured Revenue Bonds, Public Improvements |
|
|||||||||
| 3.19% |
08/01/25 | 1,110,000 | 1,115,971 | |||||||
| New York City Transitional Finance Authority Future Tax Secured Revenue Bonds, Public Improvements, Subseries B2 |
|
|||||||||
| 2.31% |
11/01/26 | 4,060,000 | 3,927,555 | |||||||
See accompanying Notes to Financial Statements.
| Annual Report March 2022 / 142 |
Table of Contents
Low Duration Bond Fund
Schedule of Portfolio Investments
March 31, 2022
| Issues | Maturity Date |
Principal Amount |
Value | |||||||||
| MUNICIPAL BONDS (continued) |
| |||||||||||
| New York (continued) |
|
|||||||||||
| New York State Dormitory Authority Revenue Bonds, University & College Improvements, Series D |
|
|||||||||||
| 5.00% |
03/15/24 | $ | 4,040,000 | $ | 4,208,701 | |||||||
| New York State Dormitory Authority Revenue Bonds, |
|
|||||||||||
| University & College Improvements, Series F |
|
|||||||||||
| 5.19% |
03/15/24 | 4,360,000 | 4,557,821 | |||||||||
|
|
|
| ||||||||||
| 13,810,048 | ||||||||||||
|
|
|
| ||||||||||
| Total Municipal Bonds |
|
|||||||||||
| (Cost $24,055,346) |
|
23,091,060 | ||||||||||
|
|
|
| ||||||||||
| U.S. TREASURY SECURITIES — 25.02% |
| |||||||||||
| U.S. Treasury Notes — 25.02% |
| |||||||||||
| U.S. Treasury Notes |
|
|||||||||||
| 0.88% |
01/31/24 | 136,090,000 | 132,642,564 | |||||||||
| 1.50% |
02/29/24 | 148,983,000 | 146,829,731 | |||||||||
| 1.75% |
03/15/25 | 303,644,000 | 297,371,322 | |||||||||
| 2.25% |
03/31/24 | 42,805,000 | 42,748,150 | |||||||||
| 2.50% |
03/31/27 | 4,735,000 | 4,746,283 | |||||||||
|
|
|
| ||||||||||
| Total U.S. Treasury Securities |
|
|||||||||||
| (Cost $628,603,027) |
|
624,338,050 | ||||||||||
|
|
|
| ||||||||||
| Total Bonds — 109.81% |
|
|||||||||||
| (Cost $2,784,535,175) |
|
2,740,219,564 | ||||||||||
|
|
|
| ||||||||||
| Issues | Shares | Value | ||||||||||
| COMMON STOCK — 0.00% |
| |||||||||||
| Electric — 0.00% |
|
|||||||||||
| Homer City Holdings LLC†,4,5,10,11 |
|
106,501 | — | |||||||||
|
|
|
| ||||||||||
| Total Common Stock |
|
|||||||||||
| (Cost $6,078,660) |
|
|||||||||||
| Purchased Swaptions - 0.00% |
|
|||||||||||
| (Cost $939,000) |
|
11,892 | ||||||||||
|
|
|
| ||||||||||
| Purchased Options - 0.01% |
|
|||||||||||
| (Cost $1,092,332) |
|
309,550 | ||||||||||
|
|
|
| ||||||||||
| Issues | Maturity Date |
Principal Amount/Shares |
Value | |||||||||
| SHORT-TERM INVESTMENTS — 6.79% |
| |||||||||||
| Money Market Funds — 3.99% |
| |||||||||||
| Dreyfus Government Cash Management Fund |
|
|||||||||||
| 0.19%12 |
|
55,536,000 | 55,536,000 | |||||||||
| Fidelity Investments Money Market Funds - Government Portfolio |
|
|||||||||||
| 0.12%12,13 |
|
20,642 | 20,642 | |||||||||
| Morgan Stanley Institutional Liquidity Funds - Government Portfolio |
|
|||||||||||
| 0.23%12 |
|
43,943,000 | 43,943,000 | |||||||||
|
|
|
| ||||||||||
| 99,499,642 | ||||||||||||
|
|
|
| ||||||||||
| U.S. Treasury Bills — 2.80% |
|
|||||||||||
| U.S. Treasury Bills |
|
|||||||||||
| 0.18%14 |
06/23/22 | 20,000,000 | 19,978,558 | |||||||||
| Issues | Maturity Date |
Principal Amount/Shares |
Value | |||||||||
| SHORT-TERM INVESTMENTS (continued) |
| |||||||||||
| U.S. Treasury Bills (continued) |
|
|||||||||||
| 0.61%14 |
08/25/22 | $ | 50,000,000 | $ | 49,823,585 | |||||||
|
|
|
| ||||||||||
| 69,802,143 | ||||||||||||
|
|
|
| ||||||||||
| Total Short-Term Investments |
|
|||||||||||
| (Cost $169,368,823) |
|
169,301,785 | ||||||||||
|
|
|
| ||||||||||
| Total Investments Before Written Options - 116.61% |
|
|||||||||||
| (Cost $2,962,013,990) |
|
2,909,842,791 | ||||||||||
|
|
|
| ||||||||||
| Written Options - (0.28)% |
|
|||||||||||
| (Cost $(5,045,243)) |
|
(7,103,886 | ) | |||||||||
|
|
|
| ||||||||||
| Net unrealized depreciation on unfunded commitments - 0.00% |
|
(5,620 | ) | |||||||||
| Liabilities in Excess of Other Assets -(16.33)% |
|
(407,415,802 | ) | |||||||||
|
|
|
| ||||||||||
| Net Assets - 100.00% |
|
$ | 2,495,317,483 | |||||||||
|
|
|
| ||||||||||
| 1 | Securities exempt from registration under Rule 144A of the Securities Act of 1933, as amended. The securities may be resold in transactions exempt from registration, normally to qualified institutional buyers. |
| 2 | Floating rate security. The rate disclosed was in effect at March 31, 2022. |
| 3 | Foreign denominated security issued by foreign domiciled entity. |
| 4 | Security is valued using significant unobservable inputs and is classified as Level 3 in the fair value hierarchy. |
| 5 | Illiquid security as determined under procedures approved by the Board of Trustees. The aggregate value of illiquid securities is $9,022,505, which is 0.36% of total net assets. |
| 6 | Excluded from the investment total above is an unfunded delayed draw term loan commitment in an amount not to exceed $367,015, at an interest rate of 4.00% and a maturity of July 31, 2028. The investment is not accruing an unused commitment fee. |
| 7 | Excluded from the investment total above is an unfunded delayed draw term loan commitment in an amount not to exceed $359,149, at an interest rate of 0.00% and a maturity of February 15, 2029. The investment is accruing an unused commitment fee of 0.63% per annum. |
| 8 | Variable rate security. Interest rate disclosed is as of the most recent information available. Certain variable rate securities are not based on a published reference rate and spread but are determined by the issuer or agent and are based on current market conditions. |
| 9 | Zero coupon bond. The rate shown is the effective yield as of March 31, 2022. |
| 10 | Non-income producing security. |
| 11 | Security is currently in default with regard to scheduled interest or principal payments. |
| 12 | Represents the current yield as of March 31, 2022. |
| 13 | Securities, or a portion thereof, pledged as collateral for swaps. The total market value of collateral pledged is $27. |
| 14 | Represents annualized yield at date of purchase. |
| † | Fair valued security. The aggregate value of fair valued securities is $0, which is 0.00% of total net assets. Fair valued securities were not valued utilizing an independent quote but were valued pursuant to guidelines established by the Board of Trustees. See Notes to Financial Statements. |
| * | Securities with a call or reset feature will have an effective maturity date sooner than the stated maturity. |
| ** | Securities backed by mortgage or consumer loans where payment is periodically made will have an effective maturity date sooner than the stated maturity date. |
See accompanying Notes to Financial Statements.
| 143 / Annual Report March 2022 |
Table of Contents
Low Duration Bond Fund
Schedule of Portfolio Investments
March 31, 2022
Note: For Fund compliance purposes, the Fund’s industry classifications refer to any one or more of the industry sub-classifications used by one or more widely recognized market indexes or ratings group indexes, and/or as defined by Fund management. This definition may not apply for purposes of this report, which may combine industry sub-classifications for more meaningful presentation for investors.
(CLO): Collateralized Loan Obligation
(GMTN): Global Medium-Term Note
(IO): Interest Only
(LIBOR): London InterBank Offer Rate
(MTN): Medium-Term Note
(PO): Principal Only
(SOFR): Secured Overnight Financing Rate
(STEP): Step Coupon Bond
(TBA): To-Be-Announced
(USD): U.S. Dollar
| Description | Number of Contracts |
Expiration Date | Notional Amount | Value | Unrealized Appreciation (Depreciation) |
|||||||||||||||
| FUTURES CONTRACTS: LONG POSITIONS |
|
|||||||||||||||||||
| U.S. Treasury Two-Year Note |
3,636 | 06/30/22 | $ | 770,547,941 | $ | (7,870,050 | ) | $ | (7,870,050) | |||||||||||
| FUTURES CONTRACTS: SHORT POSITIONS |
|
|||||||||||||||||||
| U.S. Treasury Five-Year Note |
2,744 | 06/30/22 | (314,702,500 | ) | 7,215,032 | 7,215,032 | ||||||||||||||
| U.S. Treasury Ten-Year Ultra Bond |
662 | 06/21/22 | (89,680,313 | ) | 2,945,631 | 2,945,631 | ||||||||||||||
| U.S. Treasury Ultra Bond |
155 | 06/21/22 | (27,454,375 | ) | 1,007,672 | 1,007,672 | ||||||||||||||
|
|
|
|
|
|
|
|||||||||||||||
| (431,837,188 | ) | 11,168,335 | 11,168,335 | |||||||||||||||||
|
|
|
|
|
|
|
|||||||||||||||
| TOTAL FUTURES CONTRACTS |
$ | 338,710,753 | $ | 3,298,285 | $ | 3,298,285 | ||||||||||||||
|
|
|
|
|
|
|
|||||||||||||||
| Reference Obligation/Index | Financing Rate Paid by the Fund |
Payment Frequency |
Implied Credit Spread at 03/31/221 |
Counterparty | Expiration Date |
Notional Amount (000’s)2 |
Value3 | Premiums Paid |
Unrealized Appreciation |
|||||||||||||||||||||||||||
| SWAPS: CREDIT DEFAULT (SALES) - SINGLE ISSUES OTC4 |
|
|||||||||||||||||||||||||||||||||||
| 1011778 BC ULC/New Red |
|
Credit Suisse | ||||||||||||||||||||||||||||||||||
| Finance, Inc., 4.00%, due |
|
First Boston | ||||||||||||||||||||||||||||||||||
| 10/15/305 |
5.00% | 3 Months | 120 | International | 06/20/23 | $ | 6,695 | $ | 317,177 | $ | 268,806 | $ | 48,371 | |||||||||||||||||||||||
| Credit Suisse | ||||||||||||||||||||||||||||||||||||
| Berry Global, Inc., 5.63%, due |
|
First Boston | ||||||||||||||||||||||||||||||||||
| 07/15/27 |
5.00% | 3 Months | 175 | International | 12/20/23 | 3,425 | 190,920 | 181,182 | 9,738 | |||||||||||||||||||||||||||
|
|
|
|
|
|
|
|||||||||||||||||||||||||||||||
| TOTAL |
$ | 508,097 | $ | 449,988 | $ | 58,109 | ||||||||||||||||||||||||||||||
|
|
|
|
|
|
|
|||||||||||||||||||||||||||||||
| 1 | An implied credit spread is the spread in yield between a U.S. Treasury security and the referenced obligation or underlying investment that are identical in all respects except for the quality rating. Implied credit spreads, represented in absolute terms, utilized in determining the value of credit default swaps on corporate issues as of year end serve as an indicator of the current status of the payment performance risk and represent the likelihood of risk of default for the credit derivative. The implied credit spread of a particular referenced entity reflects the cost of buying/selling protection and may include upfront payments required to be made to enter the agreement. Wider credit spreads, in comparison to narrower credit spreads, represent a deterioration of the referenced entity’s credit soundness and a greater likelihood of risk of default or other credit event occurring as defined under the terms of the agreement. |
| 2 | The maximum potential amount for the Fund could be required to pay as a seller of credit protection or receive as a buyer of credit protection if a credit event occurs as defined under the terms of that particular swap agreement. |
| 3 | The quoted market prices are resulting values for credit default swap agreements on credit indices serve as an indicator of the current status of the payment/performance risk and represent the likelihood of an expected liability (or profit) for the credit derivative had the notional amount of the swap agreement been closed/sold as of year end. Increasing values (buy protection) or decreasing values (sell protection), when compared to the notional amount of the swap, represent a deterioration of the referenced entity’s credit soundness and a greater likelihood of risk of default or other credit event occurring as defined under the terms of the agreement. |
| 4 | If the Fund is a seller of protection and credit event occurs, as defined under the terms of that particular swap agreement, the Fund will either (i) pay to the buyer of protection the amount equal to the notional amount of the swap and take delivery of the referenced obligation or underlying investments comprising the referenced index or (ii) pay a net settlement amount in the form of cash or investments equal to the notional amount of the swap less the recovery value of the referenced obligation or underlying investments comprising the referenced index. |
| 5 | Security is valued using significant unobservable inputs and is classified as Level 3 in the fair value hierarchy. |
See accompanying Notes to Financial Statements.
| Annual Report March 2022 / 144 |
Table of Contents
Low Duration Bond Fund
Schedule of Portfolio Investments
March 31, 2022
| Description | Number of contracts |
Exercise Price |
Expiration Date |
Notional Amount | Value | |||||||||||||||
| PURCHASED CALL OPTIONS EXCHANGE TRADED |
||||||||||||||||||||
| 90-Day Euro Dollar Futures |
550 | $ | 98.00 | 12/19/22 | $ | 4,015,275 | $ | 247,500 | ||||||||||||
| IMM Eurodollar 1-Year MIDCV Future Options |
328 | 98.38 | 09/16/22 | 2,383,248 | 26,650 | |||||||||||||||
| IMM Eurodollar 1-Year MIDCV Future Options |
708 | 98.75 | 09/16/22 | 34,295,520 | 35,400 | |||||||||||||||
|
|
|
|
|
|||||||||||||||||
| TOTAL PURCHASED OPTIONS |
$ | 40,694,043 | $ | 309,550 | ||||||||||||||||
|
|
|
|
|
|||||||||||||||||
| Description | Number of contracts |
Exercise Price |
Expiration Date |
Notional Amount | Value | |||||||||||||||
| WRITTEN CALL OPTIONS EXCHANGE TRADED |
||||||||||||||||||||
| IMM Eurodollar 1-Year MIDCV Future Options |
1,610 | $ | 99.00 | 09/16/22 | $ | (70,189,560 | ) | $ | (60,375 | ) | ||||||||||
| IMM Eurodollar 2-Year MIDCV Future Options |
464 | 97.63 | 12/16/22 | (28,215,550 | ) | (319,000 | ) | |||||||||||||
| IMM Eurodollar 2-Year MIDCV Future Options |
775 | 97.88 | 12/16/22 | (47,127,265 | ) | (363,282 | ) | |||||||||||||
| 90-Day Euro Dollar Futures |
550 | 98.25 | 12/19/22 | (4,015,275 | ) | (171,875 | ) | |||||||||||||
|
|
|
|
|
|||||||||||||||||
| (149,547,650 | ) | (914,532 | ) | |||||||||||||||||
|
|
|
|
|
|||||||||||||||||
| WRITTEN PUT OPTIONS EXCHANGE TRADED |
||||||||||||||||||||
| IMM Eurodollar 1-Year MIDCV Future Options |
1,951 | $ | 97.63 | 09/16/22 | $ | (9,450,644 | ) | $ | (4,194,650 | ) | ||||||||||
| IMM Eurodollar 2-Year MIDCV Future Options |
1,239 | 97.38 | 12/16/22 | (75,342,816 | ) | (1,448,081 | ) | |||||||||||||
| 90-Day Euro Dollar Futures |
550 | 97.25 | 12/19/22 | (4,015,275 | ) | (543,125 | ) | |||||||||||||
|
|
|
|
|
|||||||||||||||||
| (88,808,735 | ) | (6,185,856 | ) | |||||||||||||||||
|
|
|
|
|
|||||||||||||||||
| TOTAL WRITTEN OPTIONS |
$ | (238,356,385 | ) | $ | (7,100,388 | ) | ||||||||||||||
|
|
|
|
|
|||||||||||||||||
| Received by the | ||||||||||||||||||||||||||||||||||||||||
| Fund | Fund | Paid by the Fund | ||||||||||||||||||||||||||||||||||||||
|
|
|
|||||||||||||||||||||||||||||||||||||||
| Description | Counterparty | Maturity Date |
Rate | Frequency | Rate | Frequency | Notional Amount |
Value | Premiums Paid |
Unrealized (Depreciation) |
||||||||||||||||||||||||||||||
| PURCHASED SWAPTIONS |
|
|||||||||||||||||||||||||||||||||||||||
| Option to enter into a 30-year Interest Rate Swap | |
Goldman Sachs International |
|
12/24/23 | |
3-month USD LIBOR |
|
Quarterly | 6.00 | % | Quarterly | $ | 300,000 | $ | 11,892 | $ | 939,000 | $ | (927,108 | ) | ||||||||||||||||||||
|
|
|
|
|
|
|
|
|
|||||||||||||||||||||||||||||||||
| Received by | ||||||||||||||||||||||||||||||
| the Fund | Paid by the Fund | |||||||||||||||||||||||||||||
| Notional | ||||||||||||||||||||||||||||||
| Purchase | Maturity | Amount | Premiums | Unrealized | ||||||||||||||||||||||||||
| Description | Counterparty | Date | Date | Rate | Frequency | Rate | Frequency | (000’s) | Value | (Received) | Appreciation | |||||||||||||||||||
| WRITTEN CALL SWAPTIONS |
||||||||||||||||||||||||||||||
| Option to enter into a 30-year Interest Rate Swap | Goldman Sachs International |
04/29/15 | 12/24/23 | 7.50% | Quarterly | 3-month USD LIBOR |
Quarterly | $ | 300 | $ | (3,498 | ) | $ | (540,000 | ) | $ | 536,502 | |||||||||||||
|
|
|
|
|
|
|
|
|
|||||||||||||||||||||||
See accompanying Notes to Financial Statements.
| 145 / Annual Report March 2022 |
Table of Contents
Opportunistic High Income Credit Fund
Schedule of Portfolio Investments
March 31, 2022
| Issues | Maturity Date |
Principal Amount |
Value | |||||||
| BONDS – 81.28% |
| |||||||||
| BANK LOANS — 7.94%* |
| |||||||||
| Communications — 0.66% |
| |||||||||
| Diamond Sports Group, LLC, |
| |||||||||
| Term Loan, 2nd Lien |
| |||||||||
| (SOFR plus 3.25%) |
| |||||||||
| 3.54% |
08/24/261 | $ | 17,909 | $ | 6,206 | |||||
| GTT Communications, Inc., |
| |||||||||
| Term Loan B, 1st Lien |
| |||||||||
| (PRIME plus 3.75%) |
| |||||||||
| 7.25% |
05/30/251 | 16,730 | 13,774 | |||||||
|
|
|
| ||||||||
| 19,980 | ||||||||||
|
|
|
| ||||||||
| Consumer Discretionary — 0.30% |
| |||||||||
| Naked Juice, LLC, |
| |||||||||
| Term Loan |
| |||||||||
| (SOFR plus 6.00%) |
| |||||||||
| 6.75% |
01/24/301 | 9,000 | 9,000 | |||||||
|
|
|
| ||||||||
| Entertainment — 0.85% |
| |||||||||
| Cineworld Finance U.S., Inc., |
| |||||||||
| Term Loan B, 1st Lien |
| |||||||||
| (LIBOR plus 2.50%) |
| |||||||||
| 4.00% |
02/28/251 | 15,852 | 12,276 | |||||||
| Crown Finance U.S., Inc., |
| |||||||||
| Term Loan B1, 1st Lien |
| |||||||||
| (LIBOR plus 7.00%) |
| |||||||||
| 7.00% |
05/23/241 | 11,469 | 13,576 | |||||||
|
|
|
| ||||||||
| 25,852 | ||||||||||
|
|
|
| ||||||||
| Food — 0.35% |
| |||||||||
| Sovos Brands Intermediate, Inc., |
| |||||||||
| Term Loan B, 1st Lien |
| |||||||||
| (LIBOR plus 3.75%) |
| |||||||||
| 4.50% |
06/08/281 | 10,777 | 10,690 | |||||||
|
|
|
| ||||||||
| Health Care — 1.21% |
| |||||||||
| Cano Health, LLC, |
| |||||||||
| Term Loan, 1st Lien |
| |||||||||
| (SOFR plus 4.00%) |
| |||||||||
| 4.51% |
11/23/271 | 12,903 | 12,732 | |||||||
| Endo Luxembourg Finance Co., |
| |||||||||
| Term Loan B, 1st Lien |
| |||||||||
| (LIBOR plus 5.00%) |
| |||||||||
| 5.75% |
03/27/281 | 12,902 | 12,121 | |||||||
| U.S. Renal Care, Inc., |
| |||||||||
| Term Loan B, 1st Lien |
| |||||||||
| (LIBOR plus 5.50%) |
| |||||||||
| 6.50% |
06/26/261 | 12,935 | 11,989 | |||||||
|
|
|
| ||||||||
| 36,842 | ||||||||||
|
|
|
| ||||||||
| Industrials — 1.54% |
| |||||||||
| Protective Industrial Products, Inc., |
| |||||||||
| Term Loan, 1st Lien |
| |||||||||
| (LIBOR plus 4.00%) |
| |||||||||
| 4.75% |
12/29/271 | 12,935 | 12,773 | |||||||
| Issues | Maturity Date |
Principal Amount |
Value | |||||||
| BANK LOANS (continued) |
| |||||||||
| Industrials (continued) |
| |||||||||
| SPX FLOW, Inc., |
| |||||||||
| Term Loan B, 1st Lien |
| |||||||||
| (SOFR plus 4.50%) |
| |||||||||
| 5.00% |
03/16/291 | $ | 7,500 | $ | 7,315 | |||||
| Transcendia Holdings, Inc., |
| |||||||||
| Term Loan B, 1st Lien |
| |||||||||
| (LIBOR plus 3.50%) |
| |||||||||
| 4.50% |
05/30/241 | 16,912 | 15,120 | |||||||
| Zep, Inc., |
| |||||||||
| Term Loan B, 1st Lien |
| |||||||||
| (LIBOR plus 4.00%) |
| |||||||||
| 5.00% |
08/12/241 | 12,223 | 11,734 | |||||||
|
|
|
| ||||||||
| 46,942 | ||||||||||
|
|
|
| ||||||||
| Information Technology — 0.42% |
| |||||||||
| Magenta Buyer LLC, |
| |||||||||
| Term Loan, 1st Lien |
| |||||||||
| (LIBOR plus 5.00%) |
| |||||||||
| 5.75% |
07/27/281 | 12,968 | 12,890 | |||||||
|
|
|
| ||||||||
| Materials — 0.43% |
| |||||||||
| Geon Performance Solutions, LLC, |
| |||||||||
| Term Loan B, 1st Lien |
| |||||||||
| (LIBOR plus 4.75%) |
| |||||||||
| 5.50% |
08/18/281 | 12,935 | 12,935 | |||||||
|
|
|
| ||||||||
| Retail — 0.50% |
| |||||||||
| Tacala Investment Corp., |
| |||||||||
| Term Loan B, 2nd Lien |
| |||||||||
| (LIBOR plus 7.50%) |
| |||||||||
| 8.25% |
02/04/281 | 15,500 | 15,326 | |||||||
|
|
|
| ||||||||
| Services — 1.04% |
| |||||||||
| PowerTeam Services LLC, |
| |||||||||
| Term Loan, 2nd Lien |
| |||||||||
| (LIBOR plus 7.25%) |
| |||||||||
| 8.26% |
03/06/261,2,3 | 33,000 | 31,515 | |||||||
|
|
|
| ||||||||
| Transportation — 0.64% |
| |||||||||
| Kenan Advantage Group, Inc. (The), |
| |||||||||
| Term Loan, 2nd Lien |
| |||||||||
| (LIBOR plus 7.25%) |
| |||||||||
| 8.00% |
09/01/271 | 20,000 | 19,400 | |||||||
|
|
|
| ||||||||
| Total Bank Loans |
| |||||||||
| (Cost $248,626) |
|
241,372 | ||||||||
|
|
|
| ||||||||
| CORPORATES — 63.50%* |
| |||||||||
| Banking — 0.91% |
| |||||||||
| Bank of America Corp., |
| |||||||||
| Series RR |
| |||||||||
| 4.38%4,5 |
10,000 | 9,423 | ||||||||
| Bank of New York Mellon Corp. (The), |
| |||||||||
| Series I |
| |||||||||
| 3.75%4,5 |
10,000 | 9,200 | ||||||||
See accompanying Notes to Financial Statements.
| Annual Report March 2022 / 146 |
Table of Contents
Opportunistic High Income Credit Fund
Schedule of Portfolio Investments
March 31, 2022
| Issues | Maturity Date |
Principal Amount |
Value | |||||||
| CORPORATES (continued) |
| |||||||||
| Banking (continued) |
| |||||||||
| U.S. Bancorp |
| |||||||||
| 3.70%4,5 |
$ | 10,000 | $ | 9,073 | ||||||
|
|
|
| ||||||||
| 27,696 | ||||||||||
|
|
|
| ||||||||
| Communications — 17.82% |
| |||||||||
| Altice France SA |
| |||||||||
| (France) |
| |||||||||
| 5.13% |
01/15/296,7 | 7,000 | 6,293 | |||||||
| 5.50% |
10/15/296,7 | 25,000 | 22,483 | |||||||
| Cable One, Inc. |
| |||||||||
| 4.00% |
11/15/306 | 25,000 | 23,125 | |||||||
| CCO Holdings, LLC/CCO Holdings Capital Corp. |
| |||||||||
| 4.25% |
01/15/346 | 19,000 | 16,530 | |||||||
| 4.50% |
06/01/336 | 2,000 | 1,797 | |||||||
| CommScope, Inc. |
| |||||||||
| 4.75% |
09/01/296 | 35,000 | 32,462 | |||||||
| CSC Holdings LLC |
| |||||||||
| 3.38% |
02/15/316 | 6,000 | 5,063 | |||||||
| 4.13% |
12/01/306 | 9,000 | 7,937 | |||||||
| 4.50% |
11/15/316 | 43,000 | 38,577 | |||||||
| 6.50% |
02/01/296 | 6,000 | 6,059 | |||||||
| Diamond Sports Group LLC/Diamond Sports Finance Co. |
|
|||||||||
| 6.63% |
08/15/276 | 30,000 | 6,254 | |||||||
| Diamond Sports Group, LLC/Diamond Sports Finance Co. |
|
|||||||||
| 5.38% |
08/15/266 | 47,000 | 18,447 | |||||||
| DIRECTV Financing LLC/DIRECTV Financing Co. Obligor, Inc. |
|
|||||||||
| 5.88% |
08/15/276 | 26,000 | 25,655 | |||||||
| DISH DBS Corp. |
| |||||||||
| 5.13% |
06/01/29 | 7,000 | 5,979 | |||||||
| 5.25% |
12/01/266 | 16,000 | 15,270 | |||||||
| DISH Network Corp. |
| |||||||||
| 3.38% |
08/15/26 | 26,000 | 23,452 | |||||||
| Gray Escrow II, Inc. |
| |||||||||
| 5.38% |
11/15/316 | 35,000 | 33,497 | |||||||
| Intelsat Jackson Holdings SA |
| |||||||||
| (Luxembourg) |
| |||||||||
| 6.50% |
03/15/306,7 | 47,000 | 47,002 | |||||||
| Level 3 Financing, Inc. |
| |||||||||
| 3.63% |
01/15/296 | 7,000 | 6,132 | |||||||
| 3.75% |
07/15/296 | 42,000 | 37,274 | |||||||
| 4.25% |
07/01/286 | 3,000 | 2,757 | |||||||
| Lumen Technologies, Inc. |
| |||||||||
| 5.38% |
06/15/296 | 38,000 | 33,894 | |||||||
| National CineMedia LLC |
| |||||||||
| 5.75% |
08/15/26 | 18,000 | 12,982 | |||||||
| Scripps Escrow II, Inc. |
| |||||||||
| 5.38% |
01/15/316 | 5,000 | 4,800 | |||||||
| Sinclair Television Group, Inc. |
| |||||||||
| 4.13% |
12/01/306 | 34,000 | 30,379 | |||||||
| Sirius XM Radio, Inc. |
| |||||||||
| 3.88% |
09/01/316 | 17,000 | 15,498 | |||||||
| Vmed O2 UK Financing I PLC |
| |||||||||
| (United Kingdom) |
| |||||||||
| 4.75% |
07/15/316,7 | 16,000 | 15,104 | |||||||
| Issues | Maturity Date |
Principal Amount |
Value | |||||||
| CORPORATES (continued) |
| |||||||||
| Communications (continued) |
| |||||||||
| VZ Secured Financing BV |
| |||||||||
| (Netherlands) |
| |||||||||
| 5.00% |
01/15/326,7 | $ | 16,000 | $ | 14,989 | |||||
| Zayo Group Holdings, Inc. |
| |||||||||
| 4.00% |
03/01/276 | 35,000 | 32,271 | |||||||
|
|
|
| ||||||||
| 541,962 | ||||||||||
|
|
|
| ||||||||
| Consumer Discretionary — 1.52% |
| |||||||||
| Magallanes, Inc. |
| |||||||||
| 5.14% |
03/15/526 | 30,000 | 30,731 | |||||||
| Triton Water Holdings, Inc. |
| |||||||||
| 6.25% |
04/01/296 | 18,000 | 15,570 | |||||||
|
|
|
| ||||||||
| 46,301 | ||||||||||
|
|
|
| ||||||||
| Electric — 1.55% |
| |||||||||
| Pike Corp. |
| |||||||||
| 5.50% |
09/01/286 | 50,000 | 47,211 | |||||||
|
|
|
| ||||||||
| Energy — 8.19% |
| |||||||||
| Energy Transfer LP, |
| |||||||||
| Series B |
| |||||||||
| 6.63%4,5 |
34,000 | 30,558 | ||||||||
| Global Partners LP/GLP Finance Corp. |
| |||||||||
| 6.88% |
01/15/29 | 24,000 | 23,745 | |||||||
| NGL Energy Operating LLC/NGL Energy Finance Corp. |
|
|||||||||
| 7.50% |
02/01/266 | 31,000 | 30,508 | |||||||
| Occidental Petroleum Corp. |
| |||||||||
| 0.00% |
10/10/368 | 98,000 | 52,763 | |||||||
| Ruby Pipeline LLC |
| |||||||||
| 8.00% |
04/01/222,3,6 | 27,061 | 25,166 | |||||||
| SM Energy Co. |
| |||||||||
| 6.50% |
07/15/28 | 13,000 | 13,432 | |||||||
| TransMontaigne Partners LP/TLP Finance Corp. |
| |||||||||
| 6.13% |
02/15/26 | 24,000 | 23,640 | |||||||
| USA Compression Partners LP/USA Compression Finance Corp. |
|
|||||||||
| 6.88% |
09/01/27 | 13,000 | 13,070 | |||||||
| Venture Global Calcasieu Pass LLC |
| |||||||||
| 3.88% |
08/15/296 | 5,000 | 4,869 | |||||||
| 4.13% |
08/15/316 | 32,000 | 31,462 | |||||||
|
|
|
| ||||||||
| 249,213 | ||||||||||
|
|
|
| ||||||||
| Entertainment — 0.34% |
| |||||||||
| Cinemark USA, Inc. |
| |||||||||
| 5.25% |
07/15/286 | 11,000 | 10,307 | |||||||
|
|
|
| ||||||||
| Finance — 1.03% |
| |||||||||
| American Express Co., |
| |||||||||
| Series D |
| |||||||||
| 3.55%4,5 |
10,000 | 9,087 | ||||||||
| Charles Schwab Corp. (The) |
| |||||||||
| 5.00%4,5 |
10,000 | 9,988 | ||||||||
| Jane Street Group/JSG Finance, Inc. |
| |||||||||
| 4.50% |
11/15/296 | 8,000 | 7,590 | |||||||
See accompanying Notes to Financial Statements.
| 147 / Annual Report March 2022 |
Table of Contents
Opportunistic High Income Credit Fund
Schedule of Portfolio Investments
March 31, 2022
| Issues | Maturity Date |
Principal Amount |
Value | |||||||
| CORPORATES (continued) |
| |||||||||
| Finance (continued) |
| |||||||||
| JPMorgan Chase & Co., |
| |||||||||
| Series KK |
| |||||||||
| 3.65%4,5 |
$ | 5,000 | $ | 4,688 | ||||||
|
|
|
| ||||||||
| 31,353 | ||||||||||
|
|
|
| ||||||||
| Food — 5.21% |
| |||||||||
| Chobani LLC/Chobani Finance Corp, Inc. |
| |||||||||
| 4.63% |
11/15/286 | 7,000 | 6,470 | |||||||
| JBS USA LUX SA/JBS USA Food Co./JBS USA Finance, Inc. |
|
|||||||||
| (Canada) |
| |||||||||
| 3.75% |
12/01/316,7 | 25,000 | 23,120 | |||||||
| 4.38% |
02/02/526,7 | 32,000 | 27,900 | |||||||
| Kraft Heinz Foods Co. |
| |||||||||
| 4.25% |
03/01/31 | 4,000 | 4,131 | |||||||
| 4.38% |
06/01/46 | 7,000 | 6,948 | |||||||
| 5.00% |
06/04/42 | 3,000 | 3,208 | |||||||
| 5.20% |
07/15/45 | 23,000 | 24,926 | |||||||
| Lamb Weston Holdings, Inc. |
| |||||||||
| 4.13% |
01/31/306 | 3,000 | 2,810 | |||||||
| Pilgrim’s Pride Corp. |
| |||||||||
| 3.50% |
03/01/326 | 23,000 | 20,130 | |||||||
| Post Holdings, Inc. |
| |||||||||
| 4.50% |
09/15/316 | 23,000 | 20,404 | |||||||
| 4.63% |
04/15/306 | 13,000 | 11,727 | |||||||
| Simmons Foods, Inc./Simmons Prepared Foods, Inc./ Simmons Pet Food, Inc./Simmons Feed |
|
|||||||||
| 4.63% |
03/01/296 | 7,000 | 6,572 | |||||||
|
|
|
| ||||||||
| 158,346 | ||||||||||
|
|
|
| ||||||||
| Gaming — 0.62% |
| |||||||||
| Caesars Entertainment, Inc. |
| |||||||||
| 4.63% |
10/15/296 | 4,000 | 3,755 | |||||||
| CDI Escrow Issuer, Inc. |
| |||||||||
| 5.75% |
04/01/306 | 15,000 | 15,171 | |||||||
|
|
|
| ||||||||
| 18,926 | ||||||||||
|
|
|
| ||||||||
| Health Care — 7.97% |
| |||||||||
| Bausch Health Cos., Inc. |
| |||||||||
| (Canada) |
| |||||||||
| 5.25% |
02/15/316,7 | 19,000 | 14,814 | |||||||
| Cano Health LLC |
| |||||||||
| 6.25% |
10/01/286 | 18,000 | 17,314 | |||||||
| Embecta Corp. |
| |||||||||
| 6.75% |
02/15/306 | 19,000 | 19,082 | |||||||
| Encompass Health Corp. |
| |||||||||
| 4.63% |
04/01/31 | 15,000 | 14,094 | |||||||
| Endo DAC/Endo Finance LLC/Endo Finco, Inc. |
| |||||||||
| (Ireland) |
| |||||||||
| 6.00% |
06/30/286,7 | 62,000 | 36,155 | |||||||
| Grifols Escrow Issuer SA |
| |||||||||
| (Spain) |
| |||||||||
| 4.75% |
10/15/286,7 | 16,000 | 15,170 | |||||||
| HCA, Inc. |
| |||||||||
| 4.63% |
03/15/526 | 15,000 | 15,208 | |||||||
| 5.63% |
09/01/28 | 10,000 | 10,825 | |||||||
| Issues | Maturity Date |
Principal Amount |
Value | |||||||
| CORPORATES (continued) |
| |||||||||
| Health Care (continued) |
| |||||||||
| 5.88% |
02/01/29 | $ | 8,000 | $ | 8,800 | |||||
| ModivCare Escrow Issuer, Inc. |
| |||||||||
| 5.00% |
10/01/296 | 19,000 | 17,729 | |||||||
| Molina Healthcare, Inc. |
| |||||||||
| 3.88% |
11/15/306 | 49,000 | 47,392 | |||||||
| 3.88% |
05/15/326 | 13,000 | 12,391 | |||||||
| Owens & Minor, Inc. |
| |||||||||
| 6.63% |
04/01/306 | 9,000 | 9,265 | |||||||
| Prime Healthcare Services, Inc. |
| |||||||||
| 7.25% |
11/01/256 | 4,000 | 4,110 | |||||||
|
|
|
| ||||||||
| 242,349 | ||||||||||
|
|
|
| ||||||||
| Industrials — 3.82% |
| |||||||||
| Ardagh Packaging Finance PLC/Ardagh Holdings USA, Inc. |
|
|||||||||
| (Canada) |
| |||||||||
| 5.25% |
08/15/276,7 | 27,000 | 25,059 | |||||||
| Artera Services LLC |
| |||||||||
| 9.03% |
12/04/256 | 14,000 | 14,005 | |||||||
| Clydesdale Acquisition Holdings, Inc. |
| |||||||||
| 6.63% |
04/15/296 | 15,000 | 15,169 | |||||||
| Energizer Holdings, Inc. |
| |||||||||
| 4.38% |
03/31/296 | 17,000 | 14,923 | |||||||
| Graham Packaging Co., Inc. |
| |||||||||
| 7.13% |
08/15/286 | 12,000 | 10,956 | |||||||
| OT Merger Corp. |
| |||||||||
| 7.88% |
10/15/296 | 32,000 | 28,181 | |||||||
| Titan Acquisition Ltd./Titan Co-Borrower LLC |
| |||||||||
| (Canada) |
| |||||||||
| 7.75% |
04/15/266,7 | 3,000 | 2,989 | |||||||
| Trivium Packaging Finance BV |
| |||||||||
| (Netherlands) |
| |||||||||
| 8.50% |
08/15/276,7 | 5,000 | 5,025 | |||||||
|
|
|
| ||||||||
| 116,307 | ||||||||||
|
|
|
| ||||||||
| Insurance — 1.96% |
| |||||||||
| Acrisure LLC/Acrisure Finance, Inc. |
| |||||||||
| 4.25% |
02/15/296 | 24,000 | 21,835 | |||||||
| 6.00% |
08/01/296 | 11,000 | 10,193 | |||||||
| Alliant Holdings Intermediate, LLC/Alliant Holdings |
| |||||||||
| Co.-Issuer |
| |||||||||
| 5.88% |
11/01/296 | 8,000 | 7,730 | |||||||
| AssuredPartners, Inc. |
| |||||||||
| 5.63% |
01/15/296 | 5,000 | 4,611 | |||||||
| Berkshire Hathaway Finance Corp. |
| |||||||||
| 3.85% |
03/15/52 | 10,000 | 10,233 | |||||||
| HUB International Ltd. |
| |||||||||
| 5.63% |
12/01/296 | 5,000 | 4,878 | |||||||
|
|
|
| ||||||||
| 59,480 | ||||||||||
|
|
|
| ||||||||
| Materials — 3.51% |
| |||||||||
| Allegheny Technologies, Inc. |
| |||||||||
| 5.13% |
10/01/31 | 7,000 | 6,589 | |||||||
| ASP Unifrax Holdings, Inc. |
| |||||||||
| 7.50% |
09/30/296 | 16,000 | 14,264 | |||||||
| Axalta Coating Systems, LLC |
| |||||||||
| 3.38% |
02/15/296 | 9,000 | 7,921 | |||||||
See accompanying Notes to Financial Statements.
| Annual Report March 2022 / 148 |
Table of Contents
Opportunistic High Income Credit Fund
Schedule of Portfolio Investments
March 31, 2022
| Issues | Maturity Date |
Principal Amount |
Value | |||||||
| CORPORATES (continued) |
| |||||||||
| Materials (continued) |
| |||||||||
| Carpenter Technology Corp. |
| |||||||||
| 7.63% |
03/15/30 | $ | 11,000 | $ | 11,263 | |||||
| EverArc Escrow SARL |
| |||||||||
| (Luxembourg) |
| |||||||||
| 5.00% |
10/30/296,7 | 62,000 | 56,769 | |||||||
| Valvoline, Inc. |
| |||||||||
| 3.63% |
06/15/316 | 6,000 | 5,194 | |||||||
| WR Grace Holdings, LLC |
| |||||||||
| 5.63% |
08/15/296 | 5,000 | 4,688 | |||||||
|
|
|
| ||||||||
| 106,688 | ||||||||||
|
|
|
| ||||||||
| Real Estate Investment Trust (REIT) — 0.37% |
| |||||||||
| Iron Mountain Information Management Services, Inc. |
|
|||||||||
| 5.00% |
07/15/326 | 8,000 | 7,529 | |||||||
| Iron Mountain, Inc. |
| |||||||||
| 4.50% |
02/15/316 | 4,000 | 3,709 | |||||||
|
|
|
| ||||||||
| 11,238 | ||||||||||
|
|
|
| ||||||||
| Retail — 4.61% |
| |||||||||
| 1011778 BC ULC/New Red Finance, Inc. |
| |||||||||
| (Canada) |
| |||||||||
| 4.00% |
10/15/306,7 | 11,000 | 9,951 | |||||||
| Fertitta Entertainment, LLC/Fertitta Entertainment Finance Co., Inc. |
|
|||||||||
| 6.75% |
01/15/306 | 32,000 | 29,520 | |||||||
| FirstCash, Inc. |
| |||||||||
| 4.63% |
09/01/286 | 5,000 | 4,660 | |||||||
| 5.63% |
01/01/306 | 24,000 | 23,091 | |||||||
| Michaels Cos., Inc. (The) |
| |||||||||
| 7.88% |
05/01/296 | 33,000 | 28,298 | |||||||
| Sonic Automotive, Inc. |
| |||||||||
| 4.88% |
11/15/316 | 50,000 | 44,620 | |||||||
|
|
|
| ||||||||
| 140,140 | ||||||||||
|
|
|
| ||||||||
| Services — 4.07% |
| |||||||||
| Adtalem Global Education, Inc. |
| |||||||||
| 5.50% |
03/01/286 | 16,000 | 15,499 | |||||||
| Allied Universal Holdco LLC/Allied Universal Finance Corp. |
|
|||||||||
| 6.00% |
06/01/296 | 13,000 | 11,492 | |||||||
| GFL Environmental, Inc. |
| |||||||||
| (Canada) |
| |||||||||
| 4.00% |
08/01/286,7 | 28,000 | 25,655 | |||||||
| Prime Security Services Borrower LLC/Prime Finance, Inc. |
|
|||||||||
| 3.38% |
08/31/276 | 17,000 | 15,610 | |||||||
| Rent-A-Center, Inc. |
| |||||||||
| 6.38% |
02/15/296 | 4,000 | 3,674 | |||||||
| S&P Global, Inc. |
| |||||||||
| 2.90% |
03/01/326 | 10,000 | 9,698 | |||||||
| WASH Multifamily Acquisition, Inc. |
| |||||||||
| 5.75% |
04/15/266 | 8,000 | 8,049 | |||||||
| Waste Pro USA, Inc. |
| |||||||||
| 5.50% |
02/15/266 | 36,000 | 34,063 | |||||||
|
|
|
| ||||||||
| 123,740 | ||||||||||
|
|
|
| ||||||||
| Total Corporates |
| |||||||||
| (Cost $2,043,455) |
|
1,931,257 | ||||||||
|
|
|
| ||||||||
| Issues | Maturity Date |
Principal Amount |
Value | |||||||
| MORTGAGE-BACKED — 9.84%** |
| |||||||||
| Non-Agency Commercial Mortgage-Backed — 4.01% |
| |||||||||
| BCRR Trust, |
| |||||||||
| Series 2016-FRR3, Class E |
| |||||||||
| (-1.00 X LIBOR USD 1-Month plus 18.35%) |
| |||||||||
| 2.04% |
05/26/261,6 | $ | 13,295 | $ | 12,010 | |||||
| Citigroup Commercial Mortgage Trust, |
| |||||||||
| Series 2013-GC11, Class XA (IO) |
| |||||||||
| 1.35% |
04/10/465 | 378,745 | 3,709 | |||||||
| Commercial Mortgage Trust, |
| |||||||||
| Series 2012-CR3, Class XA (IO) |
| |||||||||
| 1.82% |
10/15/455 | 664,888 | 1,841 | |||||||
| Commercial Mortgage Trust, |
| |||||||||
| Series 2012-CR5, Class XA (IO) |
| |||||||||
| 1.49% |
12/10/455 | 472,005 | 2,301 | |||||||
| Commercial Mortgage Trust, |
| |||||||||
| Series 2013-CR11, Class XA (IO) |
| |||||||||
| 0.91% |
08/10/505 | 615,165 | 6,552 | |||||||
| Commercial Mortgage Trust, |
| |||||||||
| Series 2013-LC6, Class XA (IO) |
| |||||||||
| 1.26% |
01/10/465 | 645,003 | 2,755 | |||||||
| Commercial Mortgage Trust, |
| |||||||||
| Series 2016-CR28, Class XA (IO) |
| |||||||||
| 0.71% |
02/10/495 | 762,394 | 15,154 | |||||||
| GS Mortgage Securities Corp. II, |
| |||||||||
| Series 2013-GC10, Class XA (IO) |
| |||||||||
| 1.47% |
02/10/465 | 345,056 | 2,781 | |||||||
| GS Mortgage Securities Trust, |
| |||||||||
| Series 2012-GCJ9, Class XA (IO) |
| |||||||||
| 1.91% |
11/10/455 | 913,662 | 5,440 | |||||||
| GS Mortgage Securities Trust, |
| |||||||||
| Series 2013-GC14, Class XA (IO) |
| |||||||||
| 0.54% |
08/10/465 | 485,192 | 2,882 | |||||||
| Impact Funding Affordable Multifamily Housing Mortgage Loan Trust, |
|
|||||||||
| Series 2010-1, Class A1 |
| |||||||||
| 5.31% |
01/25/516 | 7,761 | 7,804 | |||||||
| JPMBB Commercial Mortgage Securities Trust, |
| |||||||||
| Series 2013-C17, Class XA (IO) |
| |||||||||
| 0.72% |
01/15/475 | 707,604 | 7,148 | |||||||
| JPMBB Commercial Mortgage Securities Trust, |
| |||||||||
| Series 2014-C25, Class XA (IO) |
| |||||||||
| 0.82% |
11/15/475 | 160,175 | 2,876 | |||||||
| Morgan Stanley Bank of America Merrill Lynch Trust, |
| |||||||||
| Series 2013-C8, Class XA (IO) |
| |||||||||
| 0.90% |
12/15/485 | 312,518 | 1,561 | |||||||
| UBS-Barclays Commercial Mortgage Trust, |
| |||||||||
| Series 2012-C4, Class XA (IO) |
| |||||||||
| 1.57% |
12/10/455,6 | 1,948,182 | 6,846 | |||||||
| WF-RBS Commercial Mortgage Trust, |
| |||||||||
| Series 2012-C10, Class XA (IO) |
| |||||||||
| 1.48% |
12/15/455,6 | 1,155,389 | 6,621 | |||||||
| WF-RBS Commercial Mortgage Trust, |
| |||||||||
| Series 2012-C8, Class XA (IO) |
| |||||||||
| 1.69% |
08/15/455,6 | 538,833 | 26 | |||||||
| WF-RBS Commercial Mortgage Trust, |
| |||||||||
| Series 2012-C9, Class XB (IO) |
| |||||||||
| 0.72% |
11/15/455,6 | 2,058,000 | 6,781 | |||||||
See accompanying Notes to Financial Statements.
| 149 / Annual Report March 2022 |
Table of Contents
Opportunistic High Income Credit Fund
Schedule of Portfolio Investments
March 31, 2022
| Issues | Maturity Date |
Principal Amount |
Value | |||||||
| MORTGAGE-BACKED (continued) |
| |||||||||
| Non-Agency Commercial Mortgage-Backed (continued) |
| |||||||||
| WF-RBS Commercial Mortgage Trust, |
| |||||||||
| Series 2013-C11, Class XA (IO) |
| |||||||||
| 1.12% |
03/15/455,6 | $ | 806,014 | $ | 3,758 | |||||
| WF-RBS Commercial Mortgage Trust, |
| |||||||||
| Series 2013-C13, Class XA (IO) |
| |||||||||
| 1.17% |
05/15/455,6 | 1,150,234 | 9,925 | |||||||
| WF-RBS Commercial Mortgage Trust, |
| |||||||||
| Series 2013-C14, Class XA (IO) |
| |||||||||
| 0.66% |
06/15/465 | 1,028,285 | 5,199 | |||||||
| WF-RBS Commercial Mortgage Trust, |
| |||||||||
| Series 2013-C17, Class XA (IO) |
| |||||||||
| 1.05% |
12/15/465 | 599,918 | 7,975 | |||||||
|
|
|
| ||||||||
| 121,945 | ||||||||||
|
|
|
| ||||||||
| Non-Agency Mortgage-Backed — 4.66% |
| |||||||||
| American Home Mortgage Assets Trust, |
| |||||||||
| Series 2007-1, Class A1 |
| |||||||||
| (Federal Reserve US 12-Month Cumulative Average plus 0.70%) |
|
|||||||||
| 0.84% |
02/25/471 | 26,586 | 13,980 | |||||||
| IndyMac Index Mortgage Loan Trust, |
| |||||||||
| Series 2007-AR7, Class 1A1 |
| |||||||||
| 2.60% |
11/25/375 | 10,017 | 9,056 | |||||||
| JPMorgan Mortgage Trust, |
| |||||||||
| Series 2006-A4, Class 1A1 |
| |||||||||
| 2.91% |
06/25/365 | 23,625 | 19,638 | |||||||
| MASTR Adjustable Rate Mortgages Trust, |
| |||||||||
| Series 2004-13, Class 3A1 |
| |||||||||
| 2.76% |
11/21/345 | 46,439 | 46,359 | |||||||
| MASTR Alternative Loan Trust, |
| |||||||||
| Series 2006-2, Class 2A2 (IO) |
| |||||||||
| (-1.00 X LIBOR USD 1-Month plus 7.10%, 7.10% Cap) |
|
|||||||||
| 6.64% |
03/25/361,2,3 | 218,926 | 30,081 | |||||||
| WaMu Asset-Backed Certificates, |
| |||||||||
| Series 2007-HE2, Class 2A2 |
| |||||||||
| (LIBOR USD 1-Month plus 0.19%) |
| |||||||||
| 0.65% |
04/25/371 | 48,944 | 22,539 | |||||||
|
|
|
| ||||||||
| 141,653 | ||||||||||
|
|
|
| ||||||||
| U.S. Agency Commercial Mortgage-Backed — 1.17% |
| |||||||||
| Freddie Mac Multifamily Structured Pass-Through |
| |||||||||
| Certificates, |
| |||||||||
| Series K024, Class X3 (IO) |
| |||||||||
| 1.66% |
11/25/405 | 1,000,000 | 6,714 | |||||||
| Freddie Mac Multifamily Structured Pass-Through |
| |||||||||
| Certificates, |
| |||||||||
| Series K028, Class X3 (IO) |
| |||||||||
| 1.66% |
06/25/415 | 219,000 | 3,329 | |||||||
| Freddie Mac Multifamily Structured Pass-Through |
| |||||||||
| Certificates, |
| |||||||||
| Series K715, Class X3 (IO) |
| |||||||||
| 3.62% |
02/25/415 | 461,906 | 1,205 | |||||||
| Freddie Mac Multifamily Structured Pass-Through |
| |||||||||
| Certificates, |
| |||||||||
| Series K721, Class X1 (IO) |
| |||||||||
| 0.33% |
08/25/225 | 2,733,328 | 2,022 | |||||||
| Issues | Maturity Date |
Principal Amount |
Value | |||||||
| MORTGAGE-BACKED (continued) |
| |||||||||
| U.S. Agency Commercial Mortgage-Backed (continued) |
| |||||||||
| Freddie Mac Multifamily Structured Pass-Through |
| |||||||||
| Certificates, |
| |||||||||
| Series K721, Class X3 (IO) |
| |||||||||
| 1.31% |
11/25/425 | $ | 2,800,000 | $ | 15,709 | |||||
| FREMF Mortgage Trust, |
| |||||||||
| Series 2012-K20, Class X2A (IO) |
| |||||||||
| 0.20% |
05/25/456 | 2,055,992 | 11 | |||||||
| Ginnie Mae, |
| |||||||||
| Series 2012-27, Class IO (IO) |
| |||||||||
| 0.57% |
04/16/535 | 537,131 | 4,017 | |||||||
| Ginnie Mae, |
| |||||||||
| Series 2013-163, Class IO (IO) |
| |||||||||
| 1.04% |
02/16/465 | 149,918 | 2,782 | |||||||
|
|
|
| ||||||||
| 35,789 | ||||||||||
|
|
|
| ||||||||
| Total Mortgage-Backed (Cost $449,968) |
|
299,387 | ||||||||
|
|
|
| ||||||||
| Total Bonds — 81.28% (Cost $2,742,049) |
|
2,472,016 | ||||||||
|
|
|
| ||||||||
| Issues | Shares | Value | ||||||||
| COMMON STOCK — 12.48% |
| |||||||||
| Communication Services — 3.34% |
| |||||||||
| Altice USA, Inc.9 |
1,736 | 21,665 | ||||||||
| AT&T, Inc. |
562 | 13,280 | ||||||||
| National CineMedia, Inc. |
8,649 | 21,969 | ||||||||
| Nexstar Media Group, Inc. |
107 | 20,167 | ||||||||
| T-Mobile U.S., Inc.9 |
192 | 24,643 | ||||||||
|
|
|
| ||||||||
| 101,724 | ||||||||||
|
|
|
| ||||||||
| Consumer Discretionary — 1.75% |
| |||||||||
| Newell Brands, Inc. |
602 | 12,889 | ||||||||
| Qurate Retail, Inc. |
3,324 | 15,822 | ||||||||
| Rent-A-Center, Inc. |
809 | 20,379 | ||||||||
| Spectrum Brands Holdings, Inc. |
47 | 4,170 | ||||||||
|
|
|
| ||||||||
| 53,260 | ||||||||||
|
|
|
| ||||||||
| Financials — 1.11% |
| |||||||||
| FirstCash Holdings, Inc. |
240 | 16,882 | ||||||||
| Wells Fargo & Co. |
348 | 16,864 | ||||||||
|
|
|
| ||||||||
| 33,746 | ||||||||||
|
|
|
| ||||||||
| Gaming — 0.26% |
| |||||||||
| Penn National Gaming, Inc.9 |
188 | 7,975 | ||||||||
|
|
|
| ||||||||
| Health Care — 1.52% |
| |||||||||
| Bausch Health Cos., Inc.9 |
1,127 | 25,752 | ||||||||
| Centene Corp.9 |
243 | 20,458 | ||||||||
|
|
|
| ||||||||
| 46,210 | ||||||||||
|
|
|
| ||||||||
| Industrials — 0.92% |
| |||||||||
| Maxar Technologies, Inc. |
493 | 19,454 | ||||||||
| TransDigm Group, Inc.9 |
13 | 8,470 | ||||||||
|
|
|
| ||||||||
| 27,924 | ||||||||||
|
|
|
| ||||||||
See accompanying Notes to Financial Statements.
| Annual Report March 2022 / 150 |
Table of Contents
Opportunistic High Income Credit Fund
Schedule of Portfolio Investments
March 31, 2022
| Issues | Shares | Value | ||||||||
| COMMON STOCK — 12.48% (continued) |
| |||||||||
| Information Technology — 0.52% |
| |||||||||
| CommScope Holding Co., Inc.9 |
1,012 | $ | 7,975 | |||||||
| SS&C Technologies Holdings, Inc. |
105 | 7,877 | ||||||||
|
|
|
| ||||||||
| 15,852 | ||||||||||
|
|
|
| ||||||||
| Real Estate Investment Trust (REIT) — 1.27% |
| |||||||||
| Gaming and Leisure Properties, Inc. | 492 | 23,089 | ||||||||
| Hudson Pacific Properties, Inc. |
560 | 15,540 | ||||||||
|
|
|
| ||||||||
| 38,629 | ||||||||||
|
|
|
| ||||||||
| Transportation — 1.26% |
| |||||||||
| Hertz Global Holdings, Inc.9 |
1,725 | 38,209 | ||||||||
|
|
|
| ||||||||
| 38,209 | ||||||||||
|
|
|
| ||||||||
| Utilities — 0.53% |
| |||||||||
| FirstEnergy Corp. |
353 | 16,188 | ||||||||
|
|
|
| ||||||||
| Total Common Stock (Cost $418,175) |
|
379,717 | ||||||||
|
|
|
| ||||||||
| MASTER LIMITED PARTNERSHIPS — 2.63% |
| |||||||||
| Energy — 2.63% |
| |||||||||
| Enterprise Products Partners LP |
1,025 | 26,455 | ||||||||
| NGL Energy Partners LP9 |
8,366 | 18,573 | ||||||||
| Sunoco LP |
416 | 16,990 | ||||||||
| USA Compression Partners LP |
1,017 | 17,909 | ||||||||
|
|
|
| ||||||||
| 79,927 | ||||||||||
|
|
|
| ||||||||
| Total Master Limited Partnerships (Cost $63,737) |
|
79,927 | ||||||||
|
|
|
| ||||||||
| Issues | Maturity Date |
Principal Amount/Shares |
Value | |||||||
| SHORT-TERM INVESTMENTS — 3.20% |
| |||||||||
| Money Market Funds — 3.20% |
| |||||||||
| Fidelity Investments Money Market Funds - Government Portfolio |
|
|||||||||
| 0.12%10 |
97,209 | $ | 97,209 | |||||||
|
|
|
| ||||||||
| Total Short-Term Investments (Cost $97,209) |
| |||||||||
| Total Investments - 99.59% (Cost $3,321,170) |
|
3,028,869 | ||||||||
|
|
|
| ||||||||
| Cash and Other Assets, Less Liabilities - 0.41% |
|
12,475 | ||||||||
|
|
|
| ||||||||
| Net Assets - 100.00% |
|
$ | 3,041,344 | |||||||
|
|
|
| ||||||||
| 1 | Floating rate security. The rate disclosed was in effect at March 31, 2022. |
| 2 | Security is valued using significant unobservable inputs and is classified as Level 3 in the fair value hierarchy. |
| 3 | Illiquid security as determined under procedures approved by the Board of Trustees. The aggregate value of illiquid securities is $86,762, which is 2.85% of total net assets. |
| 4 | Perpetual security with no stated maturity date. |
| 5 | Variable rate security. Interest rate disclosed is as of the most recent information available. Certain variable rate securities are not based on a published reference rate and spread but are determined by the issuer or agent and are based on current market conditions. |
| 6 | Securities exempt from registration under Rule 144A of the Securities Act of 1933, as amended. The securities may be resold in transactions exempt from registration, normally to qualified institutional buyers. |
| 7 | Foreign denominated security issued by foreign domiciled entity. |
| 8 | Zero coupon bond. The rate shown is the effective yield as of March 31, 2022. |
| 9 | Non-income producing security. |
| 10 | Represents the current yield as of March 31, 2022. |
| * | Securities with a call or reset feature will have an effective maturity date sooner than the stated maturity. |
| ** | Securities backed by mortgage or consumer loans where payment is periodically made will have an effective maturity date sooner than the stated maturity date. |
Note: For Fund compliance purposes, the Fund’s industry classifications refer to any one or more of the industry sub-classifications used by one or more widely recognized market indexes or ratings group indexes, and/or as defined by Fund management. This definition may not apply for purposes of this report, which may combine industry sub-classifications for more meaningful presentation for investors.
(IO): Interest Only
(LIBOR): London InterBank Offer Rate
(S&P): Standard & Poor’s
(SOFR): Secured Overnight Financing Rate
(USD): U.S. Dollar
| Description | Number of Contracts |
Expiration Date | Notional Amount | Value | Unrealized (Depreciation) |
|||||||||||||||
| FUTURES CONTRACTS: LONG POSITIONS | ||||||||||||||||||||
| U.S. Treasury Five-Year Note |
2 | 06/30/22 | $ | 229,375 | $ | (6,598 | ) | $ | (6,598 | ) | ||||||||||
|
|
|
|
|
|
|
|||||||||||||||
See accompanying Notes to Financial Statements.
| 151 / Annual Report March 2022 |
Table of Contents
Schedule of Portfolio Investments
March 31, 2022
| Issues |
Maturity Date |
Principal Amount |
Value | |||||||||
| BONDS – 102.57% |
|
|||||||||||
| ASSET-BACKED SECURITIES — 17.57%** |
|
|||||||||||
| Aimco CLO, |
|
|||||||||||
| Series 2015-AA, Class BR2 |
|
|||||||||||
| (Cayman Islands) |
|
|||||||||||
| (LIBOR USD 3-Month plus 1.60%) |
|
|||||||||||
| 1.84% |
10/17/341,2,3 | $ | 70,000 | $ | 69,319 | |||||||
| Allegro CLO XII Ltd., |
|
|||||||||||
| Series 2020-1A, Class B |
|
|||||||||||
| (Cayman Islands) |
|
|||||||||||
| (LIBOR USD 3-Month plus 1.70%) |
|
|||||||||||
| 1.96% |
01/21/321,2,3 | 45,000 | 44,676 | |||||||||
| AMSR Trust, |
|
|||||||||||
| Series 2020-SFR1, Class I |
|
|||||||||||
| 8.19% |
04/17/371 | 100,000 | 100,760 | |||||||||
| Cedar Funding XII CLO Ltd., |
|
|||||||||||
| Series 2020-12A, Class A1R |
|
|||||||||||
| (Cayman Islands) |
|
|||||||||||
| (LIBOR USD 3-Month plus 1.13%) |
|
|||||||||||
| 1.39% |
10/25/341,2,3 | 180,000 | 178,372 | |||||||||
| CoreVest American Finance Trust, |
|
|||||||||||
| Series 2019-1, Class XA (IO) |
|
|||||||||||
| 2.16% |
03/15/521,4 | 350,689 | 14,670 | |||||||||
| CoreVest American Finance Trust, |
|
|||||||||||
| Series 2020-1, Class A2 |
|
|||||||||||
| 2.30% |
03/15/501 | 140,000 | 129,383 | |||||||||
| Crystal River CDO, |
|
|||||||||||
| Series 2005-1A, Class A |
|
|||||||||||
| (Cayman Islands) |
|
|||||||||||
| (LIBOR USD 3-Month plus 0.36%) |
|
|||||||||||
| 2.68% |
03/02/461,2,3,5,6 | 419,900 | 48,715 | |||||||||
| Dryden 85 CLO Ltd., |
|
|||||||||||
| Series 2020-85A, Class AR |
|
|||||||||||
| (Cayman Islands) |
|
|||||||||||
| (LIBOR USD 3-Month plus 1.15%) |
|
|||||||||||
| 1.39% |
10/15/351,2,3 | 150,000 | 148,782 | |||||||||
| Eaton Vance CLO Ltd., |
|
|||||||||||
| Series 2020-1A, Class AR |
|
|||||||||||
| (Cayman Islands) |
|
|||||||||||
| (LIBOR USD 3-Month plus 1.17%) |
|
|||||||||||
| 1.41% |
10/15/341,2,3 | 90,000 | 89,068 | |||||||||
| Global SC Finance II SRL, |
|
|||||||||||
| Series 2014-1A, Class A2 |
|
|||||||||||
| (Barbados) |
|
|||||||||||
| 3.09% |
07/17/291,3 | 70,815 | 69,779 | |||||||||
| Golub Capital Partners CLO 54M L.P, |
|
|||||||||||
| Series 2021-54A, Class A |
|
|||||||||||
| (Cayman Islands) |
|
|||||||||||
| (LIBOR USD 3-Month plus 1.53%) |
|
|||||||||||
| 1.85% |
08/05/331,2,3 | 90,000 | 89,455 | |||||||||
| Harvest Commercial Capital Loan Trust, |
|
|||||||||||
| Series 2019-1, Class A |
|
|||||||||||
| 3.29% |
09/25/461,4 | 55,215 | 53,574 | |||||||||
| HPS Loan Management Ltd. |
|
|||||||||||
| Series 10A-16, Class A1RR |
|
|||||||||||
| (Cayman Islands) |
|
|||||||||||
| (LIBOR USD 3-Month plus 1.14%) |
|
|||||||||||
| 1.39% |
04/20/341,2,3 | 85,000 | 84,334 | |||||||||
| Issues |
Maturity Date |
Principal Amount |
Value | |||||||||
| ASSET-BACKED SECURITIES (continued) |
|
|||||||||||
| KGS-Alpha SBA COOF Trust, |
|
|||||||||||
| Series 2015-1, Class A (IO) |
|
|||||||||||
| 1.81% |
10/25/351,4 | $ | 1,449,539 | $ | 38,730 | |||||||
| Lehman Brothers Small Balance Commercial Mortgage Trust, |
|
|||||||||||
| Series 2007-1A, Class 1A |
|
|||||||||||
| (LIBOR USD 1-Month plus 0.25%) |
|
|||||||||||
| 0.71% |
03/25/371,2 | 57,460 | 56,854 | |||||||||
| Neuberger Berman Loan Advisers CLO 43 Ltd., |
|
|||||||||||
| Series 2021-43A, Class A |
|
|||||||||||
| (Cayman Islands) |
|
|||||||||||
| (LIBOR USD 3-Month plus 1.13%) |
|
|||||||||||
| 1.37% |
07/17/351,2,3 | 85,000 | 84,541 | |||||||||
| OCP CLO Ltd., |
|
|||||||||||
| Series 2021-21A, Class B |
|
|||||||||||
| (Cayman Islands) |
|
|||||||||||
| (LIBOR USD 3-Month plus 1.70%) |
|
|||||||||||
| 1.95% |
07/20/341,2,3 | 50,000 | 49,533 | |||||||||
| OHA Credit Funding 7 Ltd., |
|
|||||||||||
| Series 2020-7A, Class AR |
|
|||||||||||
| (Cayman Islands) |
|
|||||||||||
| (CME Term SOFR 3-Month plus 1.30%) |
|
|||||||||||
| 2.15% |
02/24/371,2,3 | 150,000 | 149,373 | |||||||||
| Palmer Square Loan Funding Ltd., |
|
|||||||||||
| Series 2020-2A, Class A2 |
|
|||||||||||
| (Cayman Islands) |
|
|||||||||||
| (LIBOR USD 3-Month plus 1.55%) |
|
|||||||||||
| 1.80% |
04/20/281,2,3 | 100,000 | 99,976 | |||||||||
| Park Avenue Institutional Advisers CLO Ltd., |
|
|||||||||||
| Series 2021-1A, Class A2 |
|
|||||||||||
| (Cayman Islands) |
|
|||||||||||
| (LIBOR USD 3-Month plus 1.75%) |
|
|||||||||||
| 2.00% |
01/20/341,2,3 | 40,000 | 39,736 | |||||||||
| Progress Residential, |
|
|||||||||||
| Series 2021-SFR1, Class F |
|
|||||||||||
| 2.76% |
04/17/381 | 100,000 | 86,437 | |||||||||
| Skyline Aircraft Finance LLC, |
|
|||||||||||
| Series 2021-1, Class A |
|
|||||||||||
| 3.23% |
05/10/375,6 | 70,527 | 66,560 | |||||||||
| SLC Student Loan Trust, |
|
|||||||||||
| Series 2004-1, Class B |
|
|||||||||||
| (LIBOR USD 3-Month plus 0.29%) |
|
|||||||||||
| 0.80% |
08/15/312 | 123,058 | 114,517 | |||||||||
| SLM Student Loan Trust, |
|
|||||||||||
| Series 2007-7, Class B |
|
|||||||||||
| (LIBOR USD 3-Month plus 0.75%) |
|
|||||||||||
| 1.01% |
10/27/702 | 215,000 | 197,670 | |||||||||
| SLM Student Loan Trust, |
|
|||||||||||
| Series 2008-2, Class B |
|
|||||||||||
| (LIBOR USD 3-Month plus 1.20%) |
|
|||||||||||
| 1.46% |
01/25/832 | 340,000 | 323,496 | |||||||||
| SLM Student Loan Trust, |
|
|||||||||||
| Series 2008-3, Class B |
|
|||||||||||
| (LIBOR USD 3-Month plus 1.20%) |
|
|||||||||||
| 1.46% |
04/26/832 | 340,000 | 313,098 | |||||||||
See accompanying Notes to Financial Statements.
| Annual Report March 2022 / 152 |
Table of Contents
Strategic Income Fund
Schedule of Portfolio Investments
March 31, 2022
| Issues |
Maturity Date |
Principal Amount |
Value | |||||||||
| ASSET-BACKED SECURITIES (continued) |
|
|||||||||||
| SLM Student Loan Trust, |
|
|||||||||||
| Series 2008-4, Class B |
|
|||||||||||
| (LIBOR USD 3-Month plus 1.85%) |
|
|||||||||||
| 2.11% |
04/25/732 | $ | 340,000 | $ | 338,348 | |||||||
| SLM Student Loan Trust, |
|
|||||||||||
| Series 2008-5, Class B |
|
|||||||||||
| (LIBOR USD 3-Month plus 1.85%) |
|
|||||||||||
| 2.11% |
07/25/732 | 235,000 | 234,710 | |||||||||
| SLM Student Loan Trust, |
|
|||||||||||
| Series 2008-6, Class B |
|
|||||||||||
| (LIBOR USD 3-Month plus 1.85%) |
|
|||||||||||
| 2.11% |
07/26/832 | 340,000 | 332,632 | |||||||||
| Stratus CLO Ltd., |
|
|||||||||||
| Series 2021-3A, Class SUB |
|
|||||||||||
| (Cayman Islands) |
|
|||||||||||
| 0.00% |
12/29/291,3,4 | 250,000 | 239,980 | |||||||||
| Structured Receivables Finance LLC, |
|
|||||||||||
| Series 2010-A, Class B |
|
|||||||||||
| 7.61% |
01/16/461 | 267,867 | 284,546 | |||||||||
| Structured Receivables Finance LLC, |
|
|||||||||||
| Series 2010-B, Class B |
|
|||||||||||
| 7.97% |
08/15/361 | 296,130 | 329,084 | |||||||||
| TRESTLES CLO V Ltd., |
|
|||||||||||
| Series 2021-5A, Class A1 |
|
|||||||||||
| (Cayman Islands) |
|
|||||||||||
| (LIBOR USD 3-Month plus 1.17%) |
|
|||||||||||
| 1.33% |
10/20/341,2,3 | 90,000 | 88,990 | |||||||||
|
|
|
| ||||||||||
| Total Asset-Backed Securities (Cost $5,026,982) |
|
4,589,698 | ||||||||||
|
|
|
| ||||||||||
| CORPORATES — 36.73%* |
|
|||||||||||
| Banking — 6.89% |
|
|||||||||||
| Bank of America Corp. |
|
|||||||||||
| 2.30% |
07/21/324 | 60,000 | 53,442 | |||||||||
| 2.57% |
10/20/324 | 5,000 | 4,557 | |||||||||
| 2.69% |
04/22/324 | 10,000 | 9,195 | |||||||||
| 3.00% |
12/20/234 | 20,000 | 20,058 | |||||||||
| 3.37% |
01/23/264 | 110,000 | 110,009 | |||||||||
| Bank of America Corp. |
|
|||||||||||
| (MTN) |
|
|||||||||||
| 2.09% |
06/14/294 | 55,000 | 50,315 | |||||||||
| 3.97% |
02/07/304 | 25,000 | 25,432 | |||||||||
| Bank of America Corp., |
|
|||||||||||
| Series N |
|
|||||||||||
| 1.66% |
03/11/274 | 100,000 | 93,480 | |||||||||
| Bank of America Corp., |
|
|||||||||||
| Series RR |
|
|||||||||||
| 4.38%4,7 |
15,000 | 14,134 | ||||||||||
| Comerica, Inc. |
|
|||||||||||
| 5.63%4,7 |
45,000 | 46,800 | ||||||||||
| Credit Suisse Group AG |
|
|||||||||||
| (Switzerland) |
|
|||||||||||
| 1.31% |
02/02/271,3,4 | 30,000 | 26,829 | |||||||||
| 2.19% |
06/05/261,3,4 | 90,000 | 84,684 | |||||||||
| 2.59% |
09/11/251,3,4 | 5,000 | 4,825 | |||||||||
| 3.09% |
05/14/321,3,4 | 5,000 | 4,505 | |||||||||
| Issues |
Maturity Date |
Principal Amount |
Value | |||||||||
| CORPORATES (continued) |
|
|||||||||||
| Banking (continued) |
|
|||||||||||
| 3.75% |
03/26/253 | $ | 15,000 | $ | 14,955 | |||||||
| DNB Bank ASA |
|
|||||||||||
| (Norway) |
|
|||||||||||
| 1.13% |
09/16/261,3,4 | 45,000 | 41,358 | |||||||||
| HSBC Holdings PLC |
|
|||||||||||
| (United Kingdom) |
|
|||||||||||
| 1.59% |
05/24/273,4 | 25,000 | 22,850 | |||||||||
| 2.01% |
09/22/283,4 | 115,000 | 104,441 | |||||||||
| 2.80% |
05/24/323,4 | 30,000 | 27,328 | |||||||||
| 3.80% |
03/11/253,4 | 5,000 | 5,026 | |||||||||
| 4.29% |
09/12/263,4 | 10,000 | 10,131 | |||||||||
| JPMorgan Chase & Co. |
|
|||||||||||
| 0.77% |
08/09/254 | 15,000 | 14,236 | |||||||||
| 0.97% |
06/23/254 | 90,000 | 85,985 | |||||||||
| 1.58% |
04/22/274 | 55,000 | 51,268 | |||||||||
| 2.01% |
03/13/264 | 85,000 | 82,050 | |||||||||
| 2.58% |
04/22/324 | 50,000 | 45,879 | |||||||||
| Lloyds Banking Group PLC |
|
|||||||||||
| (United Kingdom) |
|
|||||||||||
| 2.91% |
11/07/233,4 | 140,000 | 140,239 | |||||||||
| Macquarie Group Ltd. |
|
|||||||||||
| (Australia) |
|
|||||||||||
| 2.69% |
06/23/321,3,4 | 30,000 | 26,490 | |||||||||
| 2.87% |
01/14/331,3,4 | 95,000 | 84,512 | |||||||||
| NatWest Group PLC |
|
|||||||||||
| (United Kingdom) |
|
|||||||||||
| 4.27% |
03/22/253,4 | 55,000 | 55,669 | |||||||||
| Santander UK Group Holdings PLC |
|
|||||||||||
| (United Kingdom) |
|
|||||||||||
| 1.53% |
08/21/263,4 | 35,000 | 32,211 | |||||||||
| 1.67% |
06/14/273,4 | 50,000 | 45,553 | |||||||||
| 4.80% |
11/15/243,4 | 65,000 | 66,508 | |||||||||
| U.S. Bancorp |
|
|||||||||||
| 3.70%4,7 |
15,000 | 13,610 | ||||||||||
| Wells Fargo & Co. |
|
|||||||||||
| (MTN) |
|
|||||||||||
| 2.39% |
06/02/284 | 75,000 | 71,006 | |||||||||
| 3.35% |
03/02/334 | 165,000 | 160,528 | |||||||||
| 3.53% |
03/24/284 | 50,000 | 49,948 | |||||||||
|
|
|
| ||||||||||
| 1,800,046 | ||||||||||||
|
|
|
| ||||||||||
| Communications — 5.86% |
|
|||||||||||
| AT&T, Inc. |
|
|||||||||||
| 2.55% |
12/01/33 | 93,000 | 82,810 | |||||||||
| 3.80% |
12/01/57 | 136,000 | 121,203 | |||||||||
| 4.75% |
05/15/46 | 15,000 | 16,353 | |||||||||
| Cable One, Inc. |
|
|||||||||||
| 4.00% |
11/15/301 | 37,000 | 34,225 | |||||||||
| Charter Communications Operating, LLC/Charter |
|
|||||||||||
| Communications Operating Capital |
|
|||||||||||
| 5.25% |
04/01/53 | 40,000 | 40,379 | |||||||||
| CommScope, Inc. |
|
|||||||||||
| 4.75% |
09/01/291 | 24,000 | 22,260 | |||||||||
| CSC Holdings LLC |
|
|||||||||||
| 4.13% |
12/01/301 | 30,000 | 26,454 | |||||||||
| 4.50% |
11/15/311 | 28,000 | 25,120 | |||||||||
See accompanying Notes to Financial Statements.
| 153 / Annual Report March 2022 |
Table of Contents
Strategic Income Fund
Schedule of Portfolio Investments
March 31, 2022
| Issues |
Maturity Date |
Principal Amount |
Value | |||||||||
| CORPORATES (continued) |
|
|||||||||||
| Communications (continued) |
|
|||||||||||
| 5.38% |
02/01/281 | $ | 5,000 | $ | 4,862 | |||||||
| 6.50% |
02/01/291 | 12,000 | 12,118 | |||||||||
| Diamond Sports Group, LLC/Diamond Sports Finance Co. |
|
|||||||||||
| 5.38% |
08/15/261 | 85,000 | 33,362 | |||||||||
| DIRECTV Financing LLC/DIRECTV Financing Co. Obligor, Inc. |
|
|||||||||||
| 5.88% |
08/15/271 | 30,000 | 29,602 | |||||||||
| Gray Escrow II, Inc. |
|
|||||||||||
| 5.38% |
11/15/311 | 15,000 | 14,356 | |||||||||
| Intelsat Jackson Holdings SA |
|
|||||||||||
| (Luxembourg) |
|
|||||||||||
| 6.50% |
03/15/301,3 | 48,000 | 48,002 | |||||||||
| Intelsat Jackson Holdings SA, |
|
|||||||||||
| Class B |
|
|||||||||||
| 8.50% |
10/15/241,3,5,6,8,9 | 38,000 | — | |||||||||
| Intelsat Jackson Holdings SA, |
|
|||||||||||
| Class B |
|
|||||||||||
| (Luxembourg) |
|
|||||||||||
| 9.75% |
07/15/251,3,5,6,8,9 | 71,000 | — | |||||||||
| Level 3 Financing, Inc. |
|
|||||||||||
| 3.40% |
03/01/271 | 10,000 | 9,442 | |||||||||
| 3.88% |
11/15/291 | 60,000 | 55,326 | |||||||||
| Lumen Technologies, Inc. |
|
|||||||||||
| 4.00% |
02/15/271 | 24,000 | 22,394 | |||||||||
| 5.38% |
06/15/291 | 42,000 | 37,463 | |||||||||
| National CineMedia LLC |
|
|||||||||||
| 5.88% |
04/15/281 | 49,000 | 42,894 | |||||||||
| Qwest Corp. |
|
|||||||||||
| 7.25% |
09/15/25 | 70,000 | 76,475 | |||||||||
| SES GLOBAL Americas Holdings GP |
|
|||||||||||
| 5.30% |
03/25/441 | 200,000 | 194,577 | |||||||||
| Sinclair Television Group, Inc. |
|
|||||||||||
| 4.13% |
12/01/301 | 52,000 | 46,462 | |||||||||
| Sprint Spectrum Co. LLC/Sprint Spectrum Co. II LLC/Sprint Spectrum Co. III LLC |
|
|||||||||||
| 4.74% |
03/20/251 | 142,500 | 145,554 | |||||||||
| Tencent Holdings Ltd. |
|
|||||||||||
| (Cayman Islands) |
|
|||||||||||
| 3.98% |
04/11/291,3 | 25,000 | 24,994 | |||||||||
| Time Warner Cable LLC |
|
|||||||||||
| 5.50% |
09/01/41 | 100,000 | 104,066 | |||||||||
| T-Mobile USA, Inc. |
|
|||||||||||
| 2.25% |
02/15/26 | 66,000 | 62,264 | |||||||||
| 2.55% |
02/15/31 | 10,000 | 9,084 | |||||||||
| 2.63% |
04/15/26 | 38,000 | 36,374 | |||||||||
| 3.88% |
04/15/30 | 35,000 | 35,184 | |||||||||
| Virgin Media Secured Finance PLC |
|
|||||||||||
| (United Kingdom) |
|
|||||||||||
| 5.50% |
05/15/291,3 | 66,000 | 65,611 | |||||||||
| Vodafone Group PLC |
|
|||||||||||
| (United Kingdom) |
|
|||||||||||
| 4.88% |
06/19/493 | 48,000 | 52,400 | |||||||||
|
|
|
| ||||||||||
| 1,531,670 | ||||||||||||
|
|
|
| ||||||||||
| Issues |
Maturity Date |
Principal Amount |
Value | |||||||||
| CORPORATES (continued) |
|
|||||||||||
| Consumer Discretionary — 1.32% |
|
|||||||||||
| Anheuser-Busch Cos. LLC/Anheuser-Busch InBev Worldwide, Inc. |
|
|||||||||||
| 4.70% |
02/01/36 | $ | 15,000 | $ | 16,325 | |||||||
| 4.90% |
02/01/46 | 65,000 | 72,393 | |||||||||
| BAT Capital Corp. |
|
|||||||||||
| 2.73% |
03/25/31 | 25,000 | 22,073 | |||||||||
| 4.39% |
08/15/37 | 20,000 | 18,642 | |||||||||
| 4.54% |
08/15/47 | 75,000 | 67,129 | |||||||||
| 5.65% |
03/16/52 | 25,000 | 25,418 | |||||||||
| Imperial Brands Finance PLC |
|
|||||||||||
| (United Kingdom) |
|
|||||||||||
| 3.13% |
07/26/241,3 | 25,000 | 24,792 | |||||||||
| Magallanes, Inc. |
|
|||||||||||
| 4.28% |
03/15/321 | 15,000 | 15,094 | |||||||||
| 5.05% |
03/15/421 | 55,000 | 56,140 | |||||||||
| 5.14% |
03/15/521 | 25,000 | 25,610 | |||||||||
|
|
|
| ||||||||||
| 343,616 | ||||||||||||
|
|
|
| ||||||||||
| Electric — 1.13% |
|
|||||||||||
| Alliant Energy Finance, LLC |
|
|||||||||||
| 3.60% |
03/01/321 | 55,000 | 53,708 | |||||||||
| Entergy Texas, Inc. |
|
|||||||||||
| 3.45% |
12/01/27 | 150,000 | 148,666 | |||||||||
| FirstEnergy Transmission LLC |
|
|||||||||||
| 2.87% |
09/15/281 | 39,000 | 36,255 | |||||||||
| Jersey Central Power & Light Co. |
|
|||||||||||
| 4.70% |
04/01/241 | 55,000 | 56,259 | |||||||||
|
|
|
| ||||||||||
| 294,888 | ||||||||||||
|
|
|
| ||||||||||
| Energy — 3.13% |
|
|||||||||||
| Energy Transfer LP |
|
|||||||||||
| 5.40% |
10/01/47 | 174,000 | 182,136 | |||||||||
| 5.50% |
06/01/27 | 3,000 | 3,228 | |||||||||
| Global Partners LP/GLP Finance Corp. |
|
|||||||||||
| 6.88% |
01/15/29 | 28,000 | 27,703 | |||||||||
| Kinder Morgan Energy Partners LP |
|
|||||||||||
| 5.00% |
08/15/42 | 45,000 | 46,196 | |||||||||
| Occidental Petroleum Corp. |
|
|||||||||||
| 0.00% |
10/10/3610 | 55,000 | 29,612 | |||||||||
| Petroleos Mexicanos |
|
|||||||||||
| (Mexico) |
|
|||||||||||
| 6.63% |
06/15/353 | 15,000 | 13,493 | |||||||||
| 6.75% |
09/21/473 | 50,000 | 40,736 | |||||||||
| 6.95% |
01/28/603 | 35,000 | 28,434 | |||||||||
| Rockies Express Pipeline LLC |
|
|||||||||||
| 4.80% |
05/15/301 | 100,000 | 95,750 | |||||||||
| Ruby Pipeline LLC |
|
|||||||||||
| 8.00% |
04/01/221,5,6 | 34,545 | 32,127 | |||||||||
| Southern Co. Gas Capital Corp. |
|
|||||||||||
| 3.88% |
11/15/25 | 70,000 | 71,326 | |||||||||
| Sunoco LP/Sunoco Finance Corp. |
|
|||||||||||
| 4.50% |
05/15/29 | 56,000 | 52,973 | |||||||||
| 4.50% |
04/30/301 | 9,000 | 8,305 | |||||||||
| TransMontaigne Partners LP/TLP Finance Corp. |
|
|||||||||||
| 6.13% |
02/15/26 | 35,000 | 34,475 | |||||||||
See accompanying Notes to Financial Statements.
| Annual Report March 2022 / 154 |
Table of Contents
Strategic Income Fund
Schedule of Portfolio Investments
March 31, 2022
| Issues |
Maturity Date |
Principal Amount |
Value | |||||||||
| CORPORATES (continued) |
|
|||||||||||
| Energy (continued) |
|
|||||||||||
| Transocean Pontus Ltd. |
|
|||||||||||
| (Cayman Islands) |
|
|||||||||||
| 6.13% |
08/01/251,3 | $ | 25,215 | $ | 25,102 | |||||||
| Transocean Poseidon Ltd. |
|
|||||||||||
| (Cayman Islands) |
|
|||||||||||
| 6.88% |
02/01/271,3 | 18,750 | 18,592 | |||||||||
| Transocean Proteus Ltd. |
|
|||||||||||
| (Cayman Islands) |
|
|||||||||||
| 6.25% |
12/01/241,3 | 9,500 | 9,442 | |||||||||
| USA Compression Partners LP/USA Compression Finance Corp. |
|
|||||||||||
| 6.88% |
04/01/26 | 32,000 | 32,342 | |||||||||
| 6.88% |
09/01/27 | 22,000 | 22,118 | |||||||||
| Venture Global Calcasieu Pass LLC |
|
|||||||||||
| 3.88% |
08/15/291 | 45,000 | 43,822 | |||||||||
|
|
|
| ||||||||||
| 817,912 | ||||||||||||
|
|
|
| ||||||||||
| Entertainment — 0.17% |
|
|||||||||||
| Cinemark USA, Inc. |
|
|||||||||||
| 5.25% |
07/15/281 | 32,000 | 29,984 | |||||||||
| WMG Acquisition Corp. |
|
|||||||||||
| 3.75% |
12/01/291 | 15,000 | 14,097 | |||||||||
|
|
|
| ||||||||||
| 44,081 | ||||||||||||
|
|
|
| ||||||||||
| Finance — 4.76% |
|
|||||||||||
| AerCap Ireland Capital DAC/AerCap Global Aviation Trust |
|
|||||||||||
| (Ireland) |
|
|||||||||||
| 2.45% |
10/29/263 | 75,000 | 69,369 | |||||||||
| 3.30% |
01/30/323 | 15,000 | 13,571 | |||||||||
| Air Lease Corp. |
|
|||||||||||
| (MTN) |
|
|||||||||||
| 2.30% |
02/01/25 | 75,000 | 72,211 | |||||||||
| American Express Co., |
|
|||||||||||
| Series D |
|
|||||||||||
| 3.55%4,7 |
15,000 | 13,631 | ||||||||||
| Avolon Holdings Funding Ltd. |
|
|||||||||||
| (Cayman Islands) |
|
|||||||||||
| 2.53% |
11/18/271,3 | 60,000 | 53,108 | |||||||||
| 3.25% |
02/15/271,3 | 10,000 | 9,439 | |||||||||
| Capital One Financial Corp. |
|
|||||||||||
| 3.27% |
03/01/304 | 40,000 | 38,717 | |||||||||
| Charles Schwab Corp. (The) |
|
|||||||||||
| 2.90% |
03/03/32 | 40,000 | 38,522 | |||||||||
| 5.00%4,7 |
15,000 | 14,982 | ||||||||||
| Citigroup, Inc. |
|
|||||||||||
| 1.28% |
11/03/254 | 30,000 | 28,551 | |||||||||
| 3.06% |
01/25/334 | 55,000 | 51,501 | |||||||||
| 3.11% |
04/08/264 | 25,000 | 24,829 | |||||||||
| 3.79% |
03/17/334 | 35,000 | 34,810 | |||||||||
| Citigroup, Inc., |
|
|||||||||||
| Series VAR |
|
|||||||||||
| 3.07% |
02/24/284 | 15,000 | 14,647 | |||||||||
| General Motors Financial Co., Inc. |
|
|||||||||||
| 3.15% |
06/30/22 | 75,000 | 75,255 | |||||||||
| 3.45% |
04/10/22 | 20,000 | 20,006 | |||||||||
| Issues |
Maturity Date |
Principal Amount |
Value | |||||||||
| CORPORATES (continued) |
|
|||||||||||
| Finance (continued) |
|
|||||||||||
| Goldman Sachs Group, Inc. (The) |
|
|||||||||||
| 0.93% |
10/21/244 | $ | 30,000 | $ | 29,095 | |||||||
| 1.22% |
12/06/23 | 75,000 | 73,255 | |||||||||
| 1.43% |
03/09/274 | 10,000 | 9,231 | |||||||||
| 1.54% |
09/10/274 | 90,000 | 82,527 | |||||||||
| 2.38% |
07/21/324 | 15,000 | 13,338 | |||||||||
| 3.10% |
02/24/334 | 55,000 | 51,901 | |||||||||
| 3.27% |
09/29/254 | 15,000 | 14,992 | |||||||||
| Goldman Sachs Group, Inc. (The), |
|
|||||||||||
| Series VAR |
|
|||||||||||
| 1.09% |
12/09/264 | 60,000 | 55,045 | |||||||||
| JPMorgan Chase & Co. |
|
|||||||||||
| 2.55% |
11/08/324 | 15,000 | 13,703 | |||||||||
| 2.95% |
02/24/284 | 20,000 | 19,524 | |||||||||
| Morgan Stanley |
|
|||||||||||
| 2.94% |
01/21/334 | 35,000 | 32,814 | |||||||||
| Morgan Stanley |
|
|||||||||||
| (GMTN) |
|
|||||||||||
| 0.79% |
01/22/254 | 40,000 | 38,424 | |||||||||
| Morgan Stanley |
|
|||||||||||
| (MTN) |
|
|||||||||||
| 1.16% |
10/21/254 | 120,000 | 114,099 | |||||||||
| 1.93% |
04/28/324 | 15,000 | 12,998 | |||||||||
| 2.51% |
10/20/324 | 5,000 | 4,529 | |||||||||
| Nationwide Building Society |
|
|||||||||||
| (United Kingdom) |
|
|||||||||||
| 3.77% |
03/08/241,3,4 | 50,000 | 50,296 | |||||||||
| 4.36% |
08/01/241,3,4 | 20,000 | 20,314 | |||||||||
| Park Aerospace Holdings Ltd. |
|
|||||||||||
| (Cayman Islands) |
|
|||||||||||
| 4.50% |
03/15/231,3 | 35,000 | 35,266 | |||||||||
|
|
|
| ||||||||||
| 1,244,500 | ||||||||||||
|
|
|
| ||||||||||
| Food — 1.19% |
|
|||||||||||
| Chobani LLC/Chobani Finance Corp, Inc. |
|
|||||||||||
| 4.63% |
11/15/281 | 27,000 | 24,958 | |||||||||
| JBS USA LUX SA/JBS USA Food Co./JBS USA Finance, Inc. |
|
|||||||||||
| (Canada) |
|
|||||||||||
| 3.75% |
12/01/311,3 | 52,000 | 48,089 | |||||||||
| 5.50% |
01/15/301,3 | 25,000 | 25,610 | |||||||||
| Kraft Heinz Foods Co. |
|
|||||||||||
| 5.00% |
06/04/42 | 74,000 | 79,132 | |||||||||
| Pilgrim’s Pride Corp. |
|
|||||||||||
| 3.50% |
03/01/321 | 30,000 | 26,256 | |||||||||
| 4.25% |
04/15/311 | 25,000 | 23,173 | |||||||||
| Post Holdings, Inc. |
|
|||||||||||
| 4.63% |
04/15/301 | 50,000 | 45,105 | |||||||||
| Smithfield Foods, Inc. |
|
|||||||||||
| 2.63% |
09/13/311 | 45,000 | 39,488 | |||||||||
|
|
|
| ||||||||||
| 311,811 | ||||||||||||
|
|
|
| ||||||||||
| Gaming — 0.11% |
|
|||||||||||
| Boyd Gaming Corp. |
|
|||||||||||
| 4.75% |
06/15/311 | 30,000 | 28,930 | |||||||||
|
|
|
| ||||||||||
See accompanying Notes to Financial Statements.
| 155 / Annual Report March 2022 |
Table of Contents
Strategic Income Fund
Schedule of Portfolio Investments
March 31, 2022
| Issues |
Maturity Date |
Principal Amount |
Value | |||||||||
| CORPORATES (continued) |
|
|||||||||||
| Health Care — 3.34% |
|
|||||||||||
| AbbVie, Inc. |
|
|||||||||||
| 3.60% |
05/14/25 | $ | 50,000 | $ | 50,704 | |||||||
| Amgen, Inc. |
|
|||||||||||
| 3.35% |
02/22/32 | 15,000 | 14,882 | |||||||||
| 4.40% |
02/22/62 | 15,000 | 15,588 | |||||||||
| Bausch Health Americas, Inc. |
|
|||||||||||
| 9.25% |
04/01/261 | 7,000 | 7,185 | |||||||||
| Bayer U.S. Finance II LLC |
|
|||||||||||
| 2.85% |
04/15/251 | 20,000 | 19,548 | |||||||||
| 4.38% |
12/15/281 | 70,000 | 71,657 | |||||||||
| 4.63% |
06/25/381 | 35,000 | 36,767 | |||||||||
| Centene Corp. |
|
|||||||||||
| 2.45% |
07/15/28 | 46,000 | 42,068 | |||||||||
| 3.00% |
10/15/30 | 59,000 | 54,281 | |||||||||
| CommonSpirit Health |
|
|||||||||||
| 2.78% |
10/01/30 | 40,000 | 37,115 | |||||||||
| CVS Health Corp. |
|
|||||||||||
| 5.05% |
03/25/48 | 70,000 | 79,394 | |||||||||
| Embecta Corp. |
|
|||||||||||
| 5.00% |
02/15/301 | 28,000 | 26,461 | |||||||||
| 6.75% |
02/15/301 | 13,000 | 13,056 | |||||||||
| Endo DAC/Endo Finance LLC/Endo Finco, Inc. |
|
|||||||||||
| (Ireland) |
|
|||||||||||
| 6.00% |
06/30/281,3 | 57,000 | 33,240 | |||||||||
| Endo Luxembourg Finance Co. I Sarl/Endo U.S., Inc. |
|
|||||||||||
| (Luxembourg) |
|
|||||||||||
| 6.13% |
04/01/291,3 | 13,000 | 11,879 | |||||||||
| Fresenius Medical Care U.S. Finance III, Inc. |
|
|||||||||||
| 1.88% |
12/01/261 | 30,000 | 27,875 | |||||||||
| HCA, Inc. |
|
|||||||||||
| 3.63% |
03/15/321 | 40,000 | 39,221 | |||||||||
| 5.25% |
04/15/25 | 12,000 | 12,643 | |||||||||
| 5.25% |
06/15/49 | 110,000 | 120,943 | |||||||||
| 5.63% |
09/01/28 | 14,000 | 15,155 | |||||||||
| ModivCare Escrow Issuer, Inc. |
|
|||||||||||
| 5.00% |
10/01/291 | 15,000 | 13,996 | |||||||||
| Molina Healthcare, Inc. |
|
|||||||||||
| 3.88% |
11/15/301 | 35,000 | 33,852 | |||||||||
| 3.88% |
05/15/321 | 40,000 | 38,124 | |||||||||
| Prime Healthcare Services, Inc. |
|
|||||||||||
| 7.25% |
11/01/251 | 43,000 | 44,183 | |||||||||
| Universal Health Services, Inc. |
|
|||||||||||
| 1.65% |
09/01/261 | 15,000 | 13,768 | |||||||||
|
|
|
| ||||||||||
| 873,585 | ||||||||||||
|
|
|
| ||||||||||
| Industrials — 2.44% |
|
|||||||||||
| Ardagh Packaging Finance PLC/Ardagh Holdings USA, Inc. |
|
|||||||||||
| (Canada) |
|
|||||||||||
| 5.25% |
08/15/271,3 | 29,000 | 26,928 | |||||||||
| Artera Services LLC |
|
|||||||||||
| 9.03% |
12/04/251 | 30,000 | 30,011 | |||||||||
| Ball Corp. |
|
|||||||||||
| 4.00% |
11/15/23 | 30,000 | 30,675 | |||||||||
| Berry Global, Inc. |
|
|||||||||||
| 1.65% |
01/15/27 | 5,000 | 4,562 | |||||||||
| 4.88% |
07/15/261 | 50,000 | 50,561 | |||||||||
| Issues |
Maturity Date |
Principal Amount |
Value | |||||||||
| CORPORATES (continued) |
|
|||||||||||
| Industrials (continued) |
|
|||||||||||
| Boeing Co. (The) |
|
|||||||||||
| 1.43% |
02/04/24 | $ | 60,000 | $ | 58,076 | |||||||
| 4.88% |
05/01/25 | 10,000 | 10,331 | |||||||||
| Clydesdale Acquisition Holdings, Inc. |
|
|||||||||||
| 6.63% |
04/15/291 | 13,000 | 13,146 | |||||||||
| Energizer Holdings, Inc. |
|
|||||||||||
| 6.50% |
12/31/271 | 27,000 | 26,762 | |||||||||
| General Electric Co. |
|
|||||||||||
| (MTN) |
|
|||||||||||
| (LIBOR USD 3-Month plus 0.48%) |
|
|||||||||||
| 0.99% |
08/15/362 | 325,000 | 279,955 | |||||||||
| Graphic Packaging International LLC |
|
|||||||||||
| 4.88% |
11/15/22 | 55,000 | 55,414 | |||||||||
| Mauser Packaging Solutions Holding Co. |
|
|||||||||||
| 5.50% |
04/15/241 | 5,000 | 4,987 | |||||||||
| OT Merger Corp. |
|
|||||||||||
| 7.88% |
10/15/291 | 45,000 | 39,629 | |||||||||
| Sealed Air Corp. |
|
|||||||||||
| 4.00% |
12/01/271 | 5,000 | 4,900 | |||||||||
|
|
|
| ||||||||||
| 635,937 | ||||||||||||
|
|
|
| ||||||||||
| Information Technology — 0.67% |
|
|||||||||||
| Broadcom, Inc. |
|
|||||||||||
| 4.30% |
11/15/32 | 15,000 | 15,235 | |||||||||
| NCR Corp. |
|
|||||||||||
| 5.13% |
04/15/291 | 37,000 | 35,625 | |||||||||
| Netflix, Inc. |
|
|||||||||||
| 5.88% |
02/15/25 | 50,000 | 53,412 | |||||||||
| Oracle Corp. |
|
|||||||||||
| 2.88% |
03/25/31 | 15,000 | 13,697 | |||||||||
| 3.80% |
11/15/37 | 10,000 | 9,004 | |||||||||
| 3.95% |
03/25/51 | 54,000 | 47,303 | |||||||||
|
|
|
| ||||||||||
| 174,276 | ||||||||||||
|
|
|
| ||||||||||
| Insurance — 1.48% |
|
|||||||||||
| Aon Corp./Aon Global Holdings PLC |
|
|||||||||||
| 3.90% |
02/28/52 | 30,000 | 29,735 | |||||||||
| Athene Global Funding |
|
|||||||||||
| 1.61% |
06/29/261 | 30,000 | 27,359 | |||||||||
| 3.21% |
03/08/271 | 25,000 | 24,096 | |||||||||
| (SOFR Rate plus 0.70%) |
|
|||||||||||
| 0.91% |
05/24/241,2 | 30,000 | 29,628 | |||||||||
| Berkshire Hathaway Finance Corp. |
|
|||||||||||
| 3.85% |
03/15/52 | 25,000 | 25,582 | |||||||||
| Brown & Brown, Inc. |
|
|||||||||||
| 4.95% |
03/17/52 | 20,000 | 21,375 | |||||||||
| Farmers Exchange Capital II |
|
|||||||||||
| 6.15% |
11/01/531,4 | 50,000 | 59,200 | |||||||||
| Nationwide Mutual Insurance Co. |
|
|||||||||||
| 3.12% |
12/15/241,4 | 75,000 | 75,052 | |||||||||
| Teachers Insurance & Annuity Association of America |
|
|||||||||||
| 4.27% |
05/15/471 | 65,000 | 68,853 | |||||||||
| Willis North America, Inc. |
|
|||||||||||
| 4.50% |
09/15/28 | 25,000 | 25,955 | |||||||||
|
|
|
| ||||||||||
| 386,835 | ||||||||||||
|
|
|
| ||||||||||
See accompanying Notes to Financial Statements.
| Annual Report March 2022 / 156 |
Table of Contents
Strategic Income Fund
Schedule of Portfolio Investments
March 31, 2022
| Issues |
Maturity Date |
Principal Amount |
Value | |||||||||
| CORPORATES (continued) |
|
|||||||||||
| Materials — 0.32% |
|
|||||||||||
| ASP Unifrax Holdings, Inc. |
|
|||||||||||
| 5.25% |
09/30/281 | $ | 30,000 | $ | 27,907 | |||||||
| EverArc Escrow SARL |
|
|||||||||||
| (Luxembourg) |
|
|||||||||||
| 5.00% |
10/30/291,3 | 36,000 | 32,963 | |||||||||
| International Flavors & Fragrances, Inc. |
|
|||||||||||
| 2.30% |
11/01/301 | 26,000 | 23,250 | |||||||||
|
|
|
| ||||||||||
| 84,120 | ||||||||||||
|
|
|
| ||||||||||
| Real Estate Investment Trust (REIT) — 1.72% |
|
|||||||||||
| American Assets Trust LP |
|
|||||||||||
| 3.38% |
02/01/31 | 30,000 | 28,231 | |||||||||
| American Campus Communities Operating Partnership LP |
|
|||||||||||
| 3.63% |
11/15/27 | 50,000 | 49,788 | |||||||||
| 3.75% |
04/15/23 | 35,000 | 35,310 | |||||||||
| CyrusOne LP/CyrusOne Finance Corp. |
|
|||||||||||
| 2.15% |
11/01/30 | 5,000 | 4,995 | |||||||||
| 2.90% |
11/15/24 | 80,000 | 80,220 | |||||||||
| 3.45% |
11/15/29 | 5,000 | 5,251 | |||||||||
| GLP Capital LP/GLP Financing II, Inc. |
|
|||||||||||
| 5.38% |
04/15/26 | 75,000 | 78,453 | |||||||||
| 5.75% |
06/01/28 | 25,000 | 26,947 | |||||||||
| Healthcare Trust of America Holdings LP |
|
|||||||||||
| 2.00% |
03/15/31 | 45,000 | 39,005 | |||||||||
| Iron Mountain Information Management Services, Inc. |
|
|||||||||||
| 5.00% |
07/15/321 | 30,000 | 28,231 | |||||||||
| LXP Industrial Trust |
|
|||||||||||
| 2.70% |
09/15/30 | 35,000 | 32,353 | |||||||||
| SL Green Operating Partnership LP |
|
|||||||||||
| 3.25% |
10/15/22 | 40,000 | 40,015 | |||||||||
|
|
|
| ||||||||||
| 448,799 | ||||||||||||
|
|
|
| ||||||||||
| Retail — 0.96% |
|
|||||||||||
| 1011778 BC ULC/New Red Finance, Inc. |
|
|||||||||||
| (Canada) |
|
|||||||||||
| 4.00% |
10/15/301,3 | 30,000 | 27,139 | |||||||||
| Asbury Automotive Group, Inc. |
|
|||||||||||
| 5.00% |
02/15/321 | 30,000 | 27,947 | |||||||||
| Bloomin’ Brands, Inc./OSI Restaurant Partners LLC |
|
|||||||||||
| 5.13% |
04/15/291 | 30,000 | 28,373 | |||||||||
| Dollar Tree, Inc. |
|
|||||||||||
| 4.00% |
05/15/25 | 40,000 | 40,962 | |||||||||
| Fertitta Entertainment, LLC/Fertitta Entertainment Finance |
|
|||||||||||
| Co., Inc. |
|
|||||||||||
| 6.75% |
01/15/301 | 45,000 | 41,512 | |||||||||
| FirstCash, Inc. |
|
|||||||||||
| 5.63% |
01/01/301 | 30,000 | 28,864 | |||||||||
| Michaels Cos., Inc. (The) |
|
|||||||||||
| 7.88% |
05/01/291 | 65,000 | 55,737 | |||||||||
|
|
|
| ||||||||||
| 250,534 | ||||||||||||
|
|
|
| ||||||||||
| Services — 0.62% |
|
|||||||||||
| Adtalem Global Education, Inc. |
|
|||||||||||
| 5.50% |
03/01/281 | 30,000 | 29,060 | |||||||||
| HealthEquity, Inc. |
|
|||||||||||
| 4.50% |
10/01/291 | 30,000 | 28,607 | |||||||||
| Issues |
Maturity Date |
Principal Amount |
Value | |||||||||
| CORPORATES (continued) |
|
|||||||||||
| Services (continued) |
|
|||||||||||
| Hertz Corp. (The) |
|
|||||||||||
| 4.63% |
12/01/261 | $ | 15,000 | $ | 14,047 | |||||||
| 5.00% |
12/01/291 | 15,000 | 13,676 | |||||||||
| Rent-A-Center, Inc. |
|
|||||||||||
| 6.38% |
02/15/291 | 35,000 | 32,145 | |||||||||
| Waste Pro USA, Inc. |
|
|||||||||||
| 5.50% |
02/15/261 | 48,000 | 45,417 | |||||||||
|
|
|
| ||||||||||
| 162,952 | ||||||||||||
|
|
|
| ||||||||||
| Transportation — 0.62% |
|
|||||||||||
| Continental Airlines Pass-Through Trust, |
|
|||||||||||
| Series 2007-1, Class B |
|
|||||||||||
| 6.90% |
04/19/22 | 53,281 | 53,281 | |||||||||
| JetBlue Airways Pass-Through Trust, |
|
|||||||||||
| Series 2020-1, Class A |
|
|||||||||||
| 4.00% |
11/15/32 | 93,456 | 93,021 | |||||||||
| Union Pacific Corp. |
|
|||||||||||
| 3.50% |
02/14/53 | 15,000 | 14,681 | |||||||||
|
|
|
| ||||||||||
| 160,983 | ||||||||||||
|
|
|
| ||||||||||
| Total Corporates (Cost $9,975,331) |
|
9,595,475 | ||||||||||
|
|
|
| ||||||||||
| FOREIGN GOVERNMENT OBLIGATIONS — 0.10% |
|
|||||||||||
| Foreign Government Obligations — 0.10% |
|
|||||||||||
| Airport Authority |
|
|||||||||||
| (Hong Kong) |
|
|||||||||||
| 3.25% |
01/12/521,3 | 30,000 | 27,226 | |||||||||
| Total Foreign Government Obligations |
|
|||||||||||
| (Cost $29,525) |
|
|||||||||||
| MORTGAGE-BACKED — 47.68%** |
|
|||||||||||
| Non-Agency Commercial Mortgage-Backed — 10.64% |
|
|||||||||||
| Banc of America Commercial Mortgage Trust, |
|
|||||||||||
| Series 2015-UBS7, Class XE (IO) |
|
|||||||||||
| 1.25% |
09/15/481,4 | 1,500,000 | 48,930 | |||||||||
| BCRR Trust, |
|
|||||||||||
| Series 2016-FRR3, Class E |
|
|||||||||||
| (-1.00 X LIBOR USD 1-Month plus 18.35%) |
|
|||||||||||
| 2.04% |
05/26/261,2 | 88,636 | 80,064 | |||||||||
| BX Commercial Mortgage Trust, |
|
|||||||||||
| Series 2020-FOX, Class F |
|
|||||||||||
| (LIBOR USD 1-Month plus 4.25%) |
|
|||||||||||
| 4.65% |
11/15/321,2 | 82,918 | 82,511 | |||||||||
| BX Commercial Mortgage Trust, |
|
|||||||||||
| Series 2020-FOX, Class G |
|
|||||||||||
| (LIBOR USD 1-Month plus 4.75%) |
|
|||||||||||
| 5.15% |
11/15/321,2 | 103,647 | 102,727 | |||||||||
| Citigroup Commercial Mortgage Trust, |
|
|||||||||||
| Series 2012-GC8, Class XA (IO) |
|
|||||||||||
| 1.72% |
09/10/451,4 | 1,060,407 | 1,204 | |||||||||
| Citigroup Commercial Mortgage Trust, |
|
|||||||||||
| Series 2013-GC11, Class XA (IO) |
|
|||||||||||
| 1.35% |
04/10/464 | 4,222,773 | 41,351 | |||||||||
See accompanying Notes to Financial Statements.
| 157 / Annual Report March 2022 |
Table of Contents
Strategic Income Fund
Schedule of Portfolio Investments
March 31, 2022
| Issues |
Maturity Date |
Principal Amount |
Value | |||||||||
| MORTGAGE-BACKED (continued) |
|
|||||||||||
| Non-Agency Commercial Mortgage-Backed (continued) |
|
|||||||||||
| Citigroup Commercial Mortgage Trust, |
|
|||||||||||
| Series 2014-GC25, Class XA (IO) |
|
|||||||||||
| 0.96% |
10/10/474 | $ | 4,055,661 | $ | 78,912 | |||||||
| COBALT CMBS Commercial Mortgage Trust, |
|
|||||||||||
| Series 2007-C2, Class X (IO) |
|
|||||||||||
| 0.45% |
04/15/471,4 | 259,148 | 1,045 | |||||||||
| Commercial Mortgage Trust, |
|
|||||||||||
| Series 2012-CR2, Class XA (IO) |
|
|||||||||||
| 1.60% |
08/15/454 | 14,085,333 | 5,633 | |||||||||
| Commercial Mortgage Trust, |
|
|||||||||||
| Series 2012-CR3, Class XA (IO) |
|
|||||||||||
| 1.82% |
10/15/454 | 6,403,738 | 17,734 | |||||||||
| Commercial Mortgage Trust, |
|
|||||||||||
| Series 2012-CR5, Class XA (IO) |
|
|||||||||||
| 1.49% |
12/10/454 | 4,436,851 | 21,627 | |||||||||
| Commercial Mortgage Trust, |
|
|||||||||||
| Series 2013-CR12, Class XA (IO) |
|
|||||||||||
| 1.10% |
10/10/464 | 1,718,437 | 22,818 | |||||||||
| Commercial Mortgage Trust, |
|
|||||||||||
| Series 2020-CBM, Class XCP (IO) |
|
|||||||||||
| 0.60% |
02/10/371,4 | 1,667,987 | 26,030 | |||||||||
| Credit Suisse Mortgage Capital Trust, |
|
|||||||||||
| Series 2014-USA, Class X1 (IO) |
|
|||||||||||
| 0.54% |
09/15/371,4 | 9,783,817 | 152,651 | |||||||||
| CSAIL Commercial Mortgage Trust, |
|
|||||||||||
| Series 2015-C1, Class XA (IO) |
|
|||||||||||
| 0.82% |
04/15/504 | 1,693,786 | 30,645 | |||||||||
| CSMC, |
|
|||||||||||
| Series 2018-SITE, Class B |
|
|||||||||||
| 4.53% |
04/15/361 | 100,000 | 98,294 | |||||||||
| CSMC, |
|
|||||||||||
| Series 2019-RIO, Class A |
|
|||||||||||
| (LIBOR USD 1-Month plus 3.02%) |
|
|||||||||||
| 4.02% |
12/15/221,2 | 100,000 | 99,864 | |||||||||
| DBWF Mortgage Trust, |
|
|||||||||||
| Series 2018-AMXP, Class B |
|
|||||||||||
| 4.00% |
05/05/351,4 | 100,000 | 98,220 | |||||||||
| European Loan Conduit No. 36 DAC, |
|
|||||||||||
| Series 36A, Class E |
|
|||||||||||
| (Ireland) |
|
|||||||||||
| (-1.00 X 3 month Euribor plus 3.35%, 8.35% Cap) |
|
|||||||||||
| 3.35% |
02/17/301,2,3 | 99,881 | 109,646 | |||||||||
| GS Mortgage Securities Corp. II, |
|
|||||||||||
| Series 2012-TMSQ, Class D |
|
|||||||||||
| 3.46% |
12/10/301,4 | 170,000 | 163,247 | |||||||||
| GS Mortgage Securities Corp. II, |
|
|||||||||||
| Series 2013-GC10, Class XA (IO) |
|
|||||||||||
| 1.47% |
02/10/464 | 3,842,520 | 30,967 | |||||||||
| GS Mortgage Securities Corp. Trust, |
|
|||||||||||
| Series 2020-UPTN, Class XA (IO) |
|
|||||||||||
| 0.35% |
02/10/371,4 | 940,000 | 8,798 | |||||||||
| GS Mortgage Securities Trust, |
|
|||||||||||
| Series 2012-GC6, Class XB (IO) |
|
|||||||||||
| 0.99% |
01/10/451,4 | 1,229,863 | 12 | |||||||||
| Issues |
Maturity Date |
Principal Amount |
Value | |||||||||
| MORTGAGE-BACKED (continued) |
|
|||||||||||
| Non-Agency Commercial Mortgage-Backed (continued) |
|
|||||||||||
| GS Mortgage Securities Trust, |
|
|||||||||||
| Series 2012-GCJ9, Class XA (IO) |
|
|||||||||||
| 1.91% |
11/10/454 | $ | 2,610,464 | $ | 15,543 | |||||||
| GS Mortgage Securities Trust, |
|
|||||||||||
| Series 2013-GC16, Class XB (IO) |
|
|||||||||||
| 0.15% |
11/10/464 | 45,024,000 | 137,560 | |||||||||
| GS Mortgage Securities Trust, |
|
|||||||||||
| Series 2014-GC24, Class XA (IO) |
|
|||||||||||
| 0.71% |
09/10/474 | 2,793,442 | 39,336 | |||||||||
| Impact Funding Affordable Multifamily Housing Mortgage Loan Trust, |
|
|||||||||||
| Series 2010-1, Class A1 |
|
|||||||||||
| 5.31% |
01/25/511 | 77,069 | 77,492 | |||||||||
| JPMBB Commercial Mortgage Securities Trust, |
|
|||||||||||
| Series 2013-C15, Class XA (IO) |
|
|||||||||||
| 1.02% |
11/15/454 | 7,334,044 | 86,640 | |||||||||
| JPMBB Commercial Mortgage Securities Trust, |
|
|||||||||||
| Series 2014-C19, Class A3 |
|
|||||||||||
| 3.67% |
04/15/47 | 47,574 | 46,496 | |||||||||
| JPMBB Commercial Mortgage Securities Trust, |
|
|||||||||||
| Series 2014-C21, Class XA (IO) |
|
|||||||||||
| 0.96% |
08/15/474 | 481,366 | 8,062 | |||||||||
| JPMBB Commercial Mortgage Securities Trust, |
|
|||||||||||
| Series 2014-C22, Class XA (IO) |
|
|||||||||||
| 0.82% |
09/15/474 | 7,871,249 | 122,091 | |||||||||
| JPMBB Commercial Mortgage Securities Trust, |
|
|||||||||||
| Series 2014-C25, Class XA (IO) |
|
|||||||||||
| 0.82% |
11/15/474 | 4,771,019 | 85,661 | |||||||||
| JPMBB Commercial Mortgage Securities Trust, |
|
|||||||||||
| Series 2014-C26, Class XA (IO) |
|
|||||||||||
| 0.96% |
01/15/484 | 2,757,410 | 55,520 | |||||||||
| JPMorgan Chase Commercial Mortgage Securities Trust, |
|
|||||||||||
| Series 2012-LC9, Class XA (IO) |
|
|||||||||||
| 1.39% |
12/15/474 | 1,587,674 | 9,003 | |||||||||
| JPMorgan Chase Commercial Mortgage Securities Trust, |
|
|||||||||||
| Series 2013-C13, Class XA (IO) |
|
|||||||||||
| 0.09% |
01/15/464 | 6,183,719 | 6,693 | |||||||||
| JPMorgan Chase Commercial Mortgage Securities Trust, |
|
|||||||||||
| Series 2013-C16, Class XA (IO) |
|
|||||||||||
| 0.86% |
12/15/464 | 5,192,804 | 54,183 | |||||||||
| JPMorgan Chase Commercial Mortgage Securities Trust, |
|
|||||||||||
| Series 2019-ICON, Class C |
|
|||||||||||
| 4.54% |
01/05/341 | 72,000 | 70,408 | |||||||||
| Ladder Capital Commercial Mortgage Mortgage Trust, |
|
|||||||||||
| Series 2013-GCP, Class XA (IO) |
|
|||||||||||
| 1.17% |
02/15/361,4 | 1,450,369 | 78,473 | |||||||||
| Med Trust, |
|
|||||||||||
| Series 2021-MDLN, Class G |
|
|||||||||||
| (LIBOR USD 1-Month plus 5.25%) |
|
|||||||||||
| 5.65% |
11/15/381,2 | 100,000 | 98,251 | |||||||||
| Morgan Stanley Bank of America Merrill Lynch Trust, |
|
|||||||||||
| Series 2013-C9, Class XB (IO) |
|
|||||||||||
| 0.30% |
05/15/461,4 | 12,532,749 | 44,638 | |||||||||
| Morgan Stanley Bank of America Merrill Lynch Trust, |
|
|||||||||||
| Series 2014-C19, Class XA (IO) |
|
|||||||||||
| 0.96% |
12/15/474 | 2,766,480 | 54,861 | |||||||||
See accompanying Notes to Financial Statements.
| Annual Report March 2022 / 158 |
Table of Contents
Strategic Income Fund
Schedule of Portfolio Investments
March 31, 2022
| Issues |
Maturity Date |
Principal Amount |
Value | |||||||||
| MORTGAGE-BACKED (continued) |
|
|||||||||||
| Non-Agency Commercial Mortgage-Backed (continued) |
|
|||||||||||
| Wells Fargo Commercial Mortgage Trust, |
|
|||||||||||
| Series 2015-NXS2, Class XA (IO) |
|
|||||||||||
| 0.65% |
07/15/584 | $ | 3,326,667 | $ | 57,562 | |||||||
| Wells Fargo Commercial Mortgage Trust, |
|
|||||||||||
| Series 2016-NXS6, Class XA (IO) |
|
|||||||||||
| 1.62% |
11/15/494 | 1,294,929 | 65,866 | |||||||||
| WF-RBS Commercial Mortgage Trust, |
|
|||||||||||
| Series 2012-C9, Class XA (IO) |
|
|||||||||||
| 1.85% |
11/15/451,4 | 5,505,973 | 19,103 | |||||||||
| WF-RBS Commercial Mortgage Trust, |
|
|||||||||||
| Series 2013-C12, Class XA (IO) |
|
|||||||||||
| 1.09% |
03/15/481,4 | 4,206,035 | 26,933 | |||||||||
| WF-RBS Commercial Mortgage Trust, |
|
|||||||||||
| Series 2013-C13, Class XB (IO) |
|
|||||||||||
| 0.46% |
05/15/451,4 | 10,000,000 | 47,062 | |||||||||
| WF-RBS Commercial Mortgage Trust, |
|
|||||||||||
| Series 2013-C14, Class XA (IO) |
|
|||||||||||
| 0.66% |
06/15/464 | 2,399,332 | 12,132 | |||||||||
| WF-RBS Commercial Mortgage Trust, |
|
|||||||||||
| Series 2013-C17, Class XA (IO) |
|
|||||||||||
| 1.05% |
12/15/464 | 5,440,054 | 72,319 | |||||||||
| WF-RBS Commercial Mortgage Trust, |
|
|||||||||||
| Series 2014-C21, Class XA (IO) |
|
|||||||||||
| 1.02% |
08/15/474 | 3,473,711 | 65,163 | |||||||||
|
|
|
| ||||||||||
| 2,779,981 | ||||||||||||
|
|
|
| ||||||||||
| Non-Agency Mortgage-Backed — 22.55% |
|
|||||||||||
| CIM Trust, |
|
|||||||||||
| Series 2021-NR2, Class A1 (STEP-reset date 05/25/22) |
|
|||||||||||
| 2.57% |
07/25/591 | 98,629 | 94,321 | |||||||||
| CIM Trust, |
|
|||||||||||
| Series 2021-R3, Class A1A |
|
|||||||||||
| 1.95% |
06/25/571,4 | 90,201 | 87,503 | |||||||||
| CIM Trust, |
|
|||||||||||
| Series 2021-R5, Class A1B |
|
|||||||||||
| 2.00% |
08/25/611,4 | 115,000 | 96,301 | |||||||||
| Conseco Finance Corp., |
|
|||||||||||
| Series 1999-5, Class A5 |
|
|||||||||||
| 7.86% |
03/01/304 | 76,663 | 39,438 | |||||||||
| Credit-Based Asset Servicing and Securitization LLC, Mortgage Loan Trust, |
|
|||||||||||
| Series 2007-CB2, Class A2C (STEP-reset date 05/25/22) |
|
|||||||||||
| 3.61% |
02/25/37 | 258,744 | 193,558 | |||||||||
| Credit-Based Asset Servicing and Securitization LLC, Mortgage Loan Trust, |
|
|||||||||||
| Series 2007-CB3, Class A3 (STEP-reset date 05/25/22) |
|
|||||||||||
| 3.31% |
03/25/37 | 874,385 | 421,906 | |||||||||
| First Franklin Mortgage Loan Trust, |
|
|||||||||||
| Series 2006-FF18, Class A2B |
|
|||||||||||
| (LIBOR USD 1-Month plus 0.11%) |
|
|||||||||||
| 0.57% |
12/25/372 | 320,365 | 298,187 | |||||||||
| First Franklin Mortgage Loan Trust, |
|
|||||||||||
| Series 2007-FF1, Class A2D |
|
|||||||||||
| (LIBOR USD 1-Month plus 0.22%) |
|
|||||||||||
| 0.68% |
01/25/382 | 816,185 | 522,399 | |||||||||
| Issues |
Maturity Date |
Principal Amount |
Value | |||||||||
| MORTGAGE-BACKED (continued) |
|
|||||||||||
| Non-Agency Mortgage-Backed (continued) |
|
|||||||||||
| First Franklin Mortgage Loan Trust, |
|
|||||||||||
| Series 2007-FF2, Class A2B |
|
|||||||||||
| (LIBOR USD 1-Month plus 0.10%) |
|
|||||||||||
| 0.56% |
03/25/372 | $ | 575,134 | $ | 326,845 | |||||||
| GMACM Mortgage Corp. Loan Trust, |
|
|||||||||||
| Series 2006-AR1, Class 1A1 |
|
|||||||||||
| 2.89% |
04/19/364 | 199,109 | 167,970 | |||||||||
| GreenPoint Mortgage Funding Trust, |
|
|||||||||||
| Series 2005-AR1, Class A2 |
|
|||||||||||
| (LIBOR USD 1-Month plus 0.44%) |
|
|||||||||||
| 0.90% |
06/25/452 | 116,563 | 111,437 | |||||||||
| GSR Mortgage Loan Trust, |
|
|||||||||||
| Series 2007-AR2, Class 5A1A |
|
|||||||||||
| 3.08% |
05/25/374 | 234,863 | 220,157 | |||||||||
| HSI Asset Loan Obligation Trust, |
|
|||||||||||
| Series 2007-2, Class 2A12 |
|
|||||||||||
| 6.00% |
09/25/37 | 253,022 | 222,025 | |||||||||
| Impac CMB Trust, |
|
|||||||||||
| Series 2004-4, Class 1A2 |
|
|||||||||||
| (LIBOR USD 1-Month plus 0.62%) |
|
|||||||||||
| 1.08% |
09/25/342 | 85,495 | 85,614 | |||||||||
| Impac CMB Trust, |
|
|||||||||||
| Series 2004-6, Class 1A2 |
|
|||||||||||
| (LIBOR USD 1-Month plus 0.78%) |
|
|||||||||||
| 1.24% |
10/25/342 | 114,315 | 114,567 | |||||||||
| IndyMac Index Mortgage Loan Trust, |
|
|||||||||||
| Series 2005-AR25, Class 2A1 |
|
|||||||||||
| 2.94% |
12/25/354 | 235,888 | 233,165 | |||||||||
| IndyMac Manufactured Housing Contract Pass-Through Certificates, |
|
|||||||||||
| Series 1997-1, Class A3 |
|
|||||||||||
| 6.61% |
02/25/28 | 55,639 | 55,818 | |||||||||
| IndyMac Manufactured Housing Contract Pass-Through Certificates, |
|
|||||||||||
| Series 1997-1, Class A4 |
|
|||||||||||
| 6.75% |
02/25/28 | 23,422 | 23,514 | |||||||||
| IndyMac Manufactured Housing Contract Pass-Through Certificates, |
|
|||||||||||
| Series 1998-1, Class A4 |
|
|||||||||||
| 6.49% |
09/25/28 | 43,393 | 44,766 | |||||||||
| IndyMac Manufactured Housing Contract Pass-Through Certificates, |
|
|||||||||||
| Series 1998-1, Class A5 |
|
|||||||||||
| 6.96% |
09/25/284 | 104,592 | 109,283 | |||||||||
| JPMorgan Mortgage Acquisition Trust, |
|
|||||||||||
| Series 2007-HE1, Class AF6 (STEP-reset date 05/25/22) |
|
|||||||||||
| 4.23% |
03/25/47 | 676,783 | 483,506 | |||||||||
| JPMorgan Mortgage Trust, |
|
|||||||||||
| Series 2006-S2, Class 2A2 |
|
|||||||||||
| 5.88% |
06/25/21 | 2,917 | 2,932 | |||||||||
| Merrill Lynch Alternative Note Asset Trust, |
|
|||||||||||
| Series 2007-A3, Class A2D |
|
|||||||||||
| (LIBOR USD 1-Month plus 0.66%) |
|
|||||||||||
| 1.12% |
04/25/372,5,6 | 1,696,107 | 85,217 | |||||||||
See accompanying Notes to Financial Statements.
| 159 / Annual Report March 2022 |
Table of Contents
Strategic Income Fund
Schedule of Portfolio Investments
March 31, 2022
| Issues |
Maturity Date |
Principal Amount |
Value | |||||||||
| MORTGAGE-BACKED (continued) |
|
|||||||||||
| Non-Agency Mortgage-Backed (continued) |
|
|||||||||||
| Merrill Lynch Mortgage Investors Trust, |
|
|||||||||||
| Series 2004-HE2, Class A2C |
|
|||||||||||
| (LIBOR USD 1-Month plus 1.16%) |
|
|||||||||||
| 1.62% |
08/25/352 | $ | 629,458 | $ | 609,728 | |||||||
| Mid-State Capital Corp. Trust, |
|
|||||||||||
| Series 2005-1, Class A |
|
|||||||||||
| 5.75% |
01/15/40 | 95,356 | 96,244 | |||||||||
| Mid-State Trust XI, |
|
|||||||||||
| Series 11, Class B |
|
|||||||||||
| 8.22% |
07/15/38 | 5,407 | 5,649 | |||||||||
| Morgan Stanley Mortgage Loan Trust, |
|
|||||||||||
| Series 2004-7AR, Class 2A4 |
|
|||||||||||
| 2.07% |
09/25/344 | 130,313 | 127,489 | |||||||||
| Morgan Stanley Mortgage Loan Trust, |
|
|||||||||||
| Series 2006-7, Class 5A2 |
|
|||||||||||
| 5.96% |
06/25/364 | 946,809 | 372,627 | |||||||||
| Oakwood Mortgage Investors, Inc., |
|
|||||||||||
| Series 1999-B, Class A4 |
|
|||||||||||
| 6.99% |
12/15/26 | 66,017 | 66,452 | |||||||||
| Oakwood Mortgage Investors, Inc., |
|
|||||||||||
| Series 2002-A, Class A3 |
|
|||||||||||
| 6.03% |
05/15/244 | 86,898 | 88,073 | |||||||||
| Residential Accredit Loans Trust, |
|
|||||||||||
| Series 2005-QA3, Class NB1 |
|
|||||||||||
| 3.59% |
03/25/354 | 119,565 | 70,582 | |||||||||
| Residential Asset Securities Corp., |
|
|||||||||||
| Series 2005-KS11, Class M3 |
|
|||||||||||
| (LIBOR USD 1-Month plus 0.66%) |
|
|||||||||||
| 1.12% |
12/25/352 | 164,736 | 166,351 | |||||||||
| Structured Adjustable Rate Mortgage Loan Trust, |
|
|||||||||||
| Series 2004-12, Class 2A |
|
|||||||||||
| 2.68% |
09/25/344 | 123,209 | 123,654 | |||||||||
| Terwin Mortgage Trust, |
|
|||||||||||
| Series 2004-7HE, Class A1 |
|
|||||||||||
| (LIBOR USD 1-Month plus 1.10%) |
|
|||||||||||
| 1.56% |
07/25/341,2 | 64,209 | 63,109 | |||||||||
| VOLT XCIV LLC, |
|
|||||||||||
| Series 2021-NPL3, Class A1 (STEP-reset date 04/25/22) |
|
|||||||||||
| 2.24% |
02/27/511 | 61,671 | 59,468 | |||||||||
|
|
|
| ||||||||||
| 5,889,855 | ||||||||||||
|
|
|
| ||||||||||
| U.S. Agency Commercial Mortgage-Backed — 5.20% |
|
|||||||||||
| Fannie Mae-Aces, |
|
|||||||||||
| Series 2016-M11, Class X2 (IO) |
|
|||||||||||
| 2.94% |
07/25/394 | 448,561 | 11,791 | |||||||||
| Freddie Mac Multifamily PC REMIC Trust, |
|
|||||||||||
| Series 2019-P002, Class X (IO) |
|
|||||||||||
| 0.77% |
07/25/334 | 535,000 | 51,271 | |||||||||
| Freddie Mac Multifamily Structured Pass-Through Certificates, |
|
|||||||||||
| Series K021, Class X3 (IO) |
|
|||||||||||
| 1.97% |
07/25/404 | 1,150,000 | 5,135 | |||||||||
| Freddie Mac Multifamily Structured Pass-Through Certificates, |
|
|||||||||||
| Series K022, Class X3 (IO) |
|
|||||||||||
| 1.81% |
08/25/404 | 5,250,000 | 30,390 | |||||||||
| Issues |
Maturity Date |
Principal Amount |
Value | |||||||||
| MORTGAGE-BACKED (continued) |
|
|||||||||||
| U.S. Agency Commercial Mortgage-Backed (continued) |
|
|||||||||||
| Freddie Mac Multifamily Structured Pass-Through Certificates, |
|
|||||||||||
| Series K023, Class X3 (IO) |
|
|||||||||||
| 1.69% |
10/25/404 | $ | 4,050,000 | $ | 22,922 | |||||||
| Freddie Mac Multifamily Structured Pass-Through Certificates, |
|
|||||||||||
| Series K024, Class X3 (IO) |
|
|||||||||||
| 1.66% |
11/25/404 | 8,000,000 | 53,707 | |||||||||
| Freddie Mac Multifamily Structured Pass-Through Certificates, |
|
|||||||||||
| Series K027, Class X3 (IO) |
|
|||||||||||
| 1.71% |
01/25/414 | 5,000,000 | 62,333 | |||||||||
| Freddie Mac Multifamily Structured Pass-Through Certificates, |
|
|||||||||||
| Series K028, Class X3 (IO) |
|
|||||||||||
| 1.66% |
06/25/414 | 2,142,000 | 32,562 | |||||||||
| Freddie Mac Multifamily Structured Pass-Through Certificates, |
|
|||||||||||
| Series K031, Class X3 (IO) |
|
|||||||||||
| 1.66% |
07/25/414 | 5,999,569 | 98,947 | |||||||||
| Freddie Mac Multifamily Structured Pass-Through Certificates, |
|
|||||||||||
| Series K034, Class X1 (IO) |
|
|||||||||||
| 0.05% |
07/25/234 | 6,084,084 | 6,121 | |||||||||
| Freddie Mac Multifamily Structured Pass-Through Certificates, |
|
|||||||||||
| Series K040, Class X3 (IO) |
|
|||||||||||
| 2.04% |
11/25/424 | 1,100,000 | 52,523 | |||||||||
| Freddie Mac Multifamily Structured Pass-Through Certificates, |
|
|||||||||||
| Series K047, Class X3 (IO) |
|
|||||||||||
| 1.50% |
06/25/434 | 1,676,868 | 72,802 | |||||||||
| Freddie Mac Multifamily Structured Pass-Through Certificates, |
|
|||||||||||
| Series K724, Class X1 (IO) |
|
|||||||||||
| 0.27% |
11/25/234 | 14,488,712 | 50,687 | |||||||||
| Freddie Mac Multifamily Structured Pass-Through Certificates, |
|
|||||||||||
| Series KC04, Class X1 (IO) |
|
|||||||||||
| 1.26% |
12/25/264 | 2,263,669 | 84,953 | |||||||||
| Freddie Mac Multifamily Structured Pass-Through Certificates, |
|
|||||||||||
| Series KC05, Class X1 (IO) |
|
|||||||||||
| 1.20% |
06/25/274 | 1,987,022 | 77,036 | |||||||||
| Freddie Mac Multifamily Structured Pass-Through Certificates, |
|
|||||||||||
| Series KS11, Class XFX (IO) |
|
|||||||||||
| 1.60% |
06/25/294 | 350,000 | 31,464 | |||||||||
| Freddie Mac Multifamily Structured Pass-Through Certificates, |
|
|||||||||||
| Series Q010, Class XPT2 (IO) |
|
|||||||||||
| 0.36% |
08/25/24 | 2,008,198 | 9,262 | |||||||||
| FREMF Mortgage Trust, |
|
|||||||||||
| Series 2012-K23, Class X2A (IO) |
|
|||||||||||
| 0.13% |
10/25/451 | 58,200,489 | 12,053 | |||||||||
See accompanying Notes to Financial Statements.
| Annual Report March 2022 / 160 |
Table of Contents
Strategic Income Fund
Schedule of Portfolio Investments
March 31, 2022
| Issues |
Maturity Date |
Principal Amount |
Value | |||||||||
| MORTGAGE-BACKED (continued) |
|
|||||||||||
| U.S. Agency Commercial Mortgage-Backed (continued) |
|
|||||||||||
| FREMF Mortgage Trust, |
|
|||||||||||
| Series 2017-K66, Class X2A (IO) |
|
|||||||||||
| 0.10% |
06/25/271 | $ | 26,748,192 | $ | 109,121 | |||||||
| FREMF Mortgage Trust, |
|
|||||||||||
| Series 2017-K726, Class X2B (IO) |
|
|||||||||||
| 0.10% |
07/25/491 | 25,000,000 | 48,787 | |||||||||
| Ginnie Mae, |
|
|||||||||||
| Series 2009-114, Class IO (IO) |
|
|||||||||||
| 0.02% |
10/16/494 | 4,508,464 | 324 | |||||||||
| Ginnie Mae, |
|
|||||||||||
| Series 2010-148, Class IO (IO) |
|
|||||||||||
| 0.29% |
09/16/504 | 1,450,619 | 15,473 | |||||||||
| Ginnie Mae, |
|
|||||||||||
| Series 2012-123, Class IO (IO) |
|
|||||||||||
| 0.64% |
12/16/514 | 2,243,109 | 33,366 | |||||||||
| Ginnie Mae, |
|
|||||||||||
| Series 2012-125, Class IO (IO) |
|
|||||||||||
| 0.18% |
02/16/534 | 8,237,198 | 49,036 | |||||||||
| Ginnie Mae, |
|
|||||||||||
| Series 2012-27, Class IO (IO) |
|
|||||||||||
| 0.57% |
04/16/534 | 5,945,489 | 44,464 | |||||||||
| Ginnie Mae, |
|
|||||||||||
| Series 2013-156, Class IO (IO) |
|
|||||||||||
| 0.32% |
06/16/554 | 5,040,334 | 50,839 | |||||||||
| Ginnie Mae, |
|
|||||||||||
| Series 2013-163, Class IO (IO) |
|
|||||||||||
| 1.04% |
02/16/464 | 1,676,924 | 31,119 | |||||||||
| Ginnie Mae, |
|
|||||||||||
| Series 2013-63, Class IO (IO) |
|
|||||||||||
| 0.78% |
09/16/514 | 6,899,131 | 124,344 | |||||||||
| Ginnie Mae, |
|
|||||||||||
| Series 2013-74, Class IO (IO) |
|
|||||||||||
| 0.56% |
12/16/534 | 3,030,428 | 43,447 | |||||||||
| Ginnie Mae, |
|
|||||||||||
| Series 2014-103, Class IO (IO) |
|
|||||||||||
| 0.20% |
05/16/554 | 890,156 | 9,235 | |||||||||
| Ginnie Mae, |
|
|||||||||||
| Series 2014-125, Class IO (IO) |
|
|||||||||||
| 0.94% |
11/16/544 | 652,807 | 21,487 | |||||||||
| Ginnie Mae, |
|
|||||||||||
| Series 2015-47, Class IO (IO) |
|
|||||||||||
| 0.39% |
10/16/564 | 557,373 | 11,639 | |||||||||
|
|
|
| ||||||||||
| 1,358,640 | ||||||||||||
|
|
|
| ||||||||||
| U.S. Agency Mortgage-Backed — 9.29% |
|
|||||||||||
| Fannie Mae REMICS, |
|
|||||||||||
| Series 1993-80, Class S |
|
|||||||||||
| (-1.22 X LIBOR USD 1-Month plus 10.88%, 10.88% Cap) |
|
|||||||||||
| 10.32% |
05/25/232 | 198 | 205 | |||||||||
| Fannie Mae REMICS, |
|
|||||||||||
| Series 2000-45, Class SA (IO) |
|
|||||||||||
| (-1.00 X LIBOR USD 1-Month plus 7.95%, 7.95% Cap) |
|
|||||||||||
| 7.48% |
12/18/302 | 57,021 | 4,584 | |||||||||
| Issues |
Maturity Date |
Principal Amount |
Value | |||||||||
| MORTGAGE-BACKED (continued) |
|
|||||||||||
| U.S. Agency Mortgage-Backed (continued) |
|
|||||||||||
| Fannie Mae REMICS, |
|
|||||||||||
| Series 2001-42, Class SB |
|
|||||||||||
| (-16.00 X LIBOR USD 1-Month plus 128.00%, 8.50% Cap) |
|
|||||||||||
| 8.50% |
09/25/312 | $ | 281 | $ | 299 | |||||||
| Fannie Mae REMICS, |
|
|||||||||||
| Series 2003-124, Class TS |
|
|||||||||||
| (-14.00 X LIBOR USD 1-Month plus 100.80%, 9.80% Cap) |
|
|||||||||||
| 9.80% |
01/25/342 | 2,900 | 2,972 | |||||||||
| Fannie Mae REMICS, |
|
|||||||||||
| Series 2005-92, Class US (IO) |
|
|||||||||||
| (-1.00 X LIBOR USD 1-Month plus 6.10%, 6.10% Cap) |
|
|||||||||||
| 5.64% |
10/25/252 | 302,492 | 13,039 | |||||||||
| Fannie Mae REMICS, |
|
|||||||||||
| Series 2006-125, Class SM (IO) |
|
|||||||||||
| (-1.00 X LIBOR USD 1-Month plus 7.20%, 7.20% Cap) |
|
|||||||||||
| 6.74% |
01/25/372 | 528,254 | 81,275 | |||||||||
| Fannie Mae REMICS, |
|
|||||||||||
| Series 2008-50, Class SA (IO) |
|
|||||||||||
| (-1.00 X LIBOR USD 1-Month plus 6.05%, 6.05% Cap) |
|
|||||||||||
| 5.59% |
11/25/362 | 659,266 | 93,196 | |||||||||
| Fannie Mae REMICS, |
|
|||||||||||
| Series 2010-43, Class KS (IO) |
|
|||||||||||
| (-1.00 X LIBOR USD 1-Month plus 6.42%, 6.42% Cap) |
|
|||||||||||
| 5.96% |
05/25/402 | 628,286 | 102,920 | |||||||||
| Freddie Mac REMICS, |
|
|||||||||||
| Series 1602, Class SN |
|
|||||||||||
| (-4.25 X PRIME plus 46.22%, 10.09% Cap) |
|
|||||||||||
| 10.09% |
10/15/232 | 2,552 | 2,608 | |||||||||
| Freddie Mac REMICS, |
|
|||||||||||
| Series 1673, Class SD |
|
|||||||||||
| (-2.15 X US Treasury Yield Curve Rate T Note Constant Maturity 10-Year plus 19.39%, 18.31% Cap) |
|
|||||||||||
| 15.10% |
02/15/242 | 13,751 | 14,799 | |||||||||
| Freddie Mac REMICS, |
|
|||||||||||
| Series 3247, Class SI (IO) |
|
|||||||||||
| (-1.00 X LIBOR USD 1-Month plus 6.65%, 0.15% Cap) |
|
|||||||||||
| 0.15% |
08/15/362 | 8,609,387 | 34,775 | |||||||||
| Freddie Mac REMICS, |
|
|||||||||||
| Series 3289, Class SD (IO) |
|
|||||||||||
| (-1.00 X LIBOR USD 1-Month plus 6.12%, 6.12% Cap) |
|
|||||||||||
| 5.72% |
03/15/372 | 516,341 | 62,782 | |||||||||
| Ginnie Mae, |
|
|||||||||||
| Series 2004-8, Class SE |
|
|||||||||||
| (-2.00 X LIBOR USD 1-Month plus 14.30%, 14.30% Cap) |
|
|||||||||||
| 13.41% |
11/26/232 | 8,821 | 9,342 | |||||||||
| UMBS (TBA) |
|
|||||||||||
| 2.00% |
04/01/52 | 50,000 | 46,387 | |||||||||
| 2.00% |
05/01/52 | 475,000 | 440,143 | |||||||||
| 2.50% |
05/01/52 | 875,000 | 833,143 | |||||||||
| 3.00% |
04/01/52 | 25,000 | 24,457 | |||||||||
| 3.00% |
05/01/52 | 675,000 | 658,969 | |||||||||
|
|
|
| ||||||||||
| 2,425,895 | ||||||||||||
|
|
|
| ||||||||||
| Total Mortgage-Backed (Cost $18,368,128) |
|
12,454,371 | ||||||||||
|
|
|
| ||||||||||
See accompanying Notes to Financial Statements.
| 161 / Annual Report March 2022 |
Table of Contents
Strategic Income Fund
Schedule of Portfolio Investments
March 31, 2022
| Issues |
Maturity Date |
Principal Amount |
Value | |||||||||
| MUNICIPAL BONDS — 0.49%* |
|
|||||||||||
| California — 0.17% |
|
|||||||||||
| California State University Revenue Bonds, University & College Improvements, Series B |
|
|||||||||||
| 2.37% |
11/01/35 | $ | 15,000 | $ | 12,823 | |||||||
| City of San Francisco Public Utilities Commission Water Revenue Bonds, Series E |
|
|||||||||||
| 2.83% |
11/01/41 | 35,000 | 31,496 | |||||||||
|
|
|
| ||||||||||
| 44,319 | ||||||||||||
|
|
|
| ||||||||||
| Florida — 0.05% |
|
|||||||||||
| County of Miami-Dade Aviation Revenue Bonds, Airport and Marina Improvements, Series B |
|
|||||||||||
| 2.86% |
10/01/35 | 15,000 | 13,868 | |||||||||
|
|
|
| ||||||||||
| New York — 0.27% |
|
|||||||||||
| Metropolitan Transportation Authority Revenue Bonds, Transit Improvements, Series C2 |
|
|||||||||||
| 5.18% |
11/15/49 | 5,000 | 5,718 | |||||||||
| New York City Transitional Finance Authority Future Tax Secured Revenue Bonds, Public Improvements, Subseries B3 |
|
|||||||||||
| 1.85% |
08/01/32 | 75,000 | 63,173 | |||||||||
|
|
|
| ||||||||||
| 68,891 | ||||||||||||
|
|
|
| ||||||||||
| Total Municipal Bonds |
|
|||||||||||
| (Cost $144,483) |
|
127,078 | ||||||||||
|
|
|
| ||||||||||
| Total Bonds — 102.57% |
|
|||||||||||
| (Cost $33,544,449) |
|
26,793,848 | ||||||||||
|
|
|
| ||||||||||
|
|
|
|||||||||||
| Issues | Shares | Value | ||||||||||
| COMMON STOCK — 0.34% |
|
|||||||||||
| Communications — 0.12% |
|
|||||||||||
| Intelsat Emergence SA3,5,6,8 |
|
|||||||||||
| (Luxembourg) | 1,041 | 31,230 | ||||||||||
|
|
|
| ||||||||||
| Financials — 0.22% |
|
|||||||||||
| AGNC Investment Corp. | 4,500 | 58,950 | ||||||||||
|
|
|
| ||||||||||
| Total Common Stock |
|
|||||||||||
| (Cost $93,492) |
|
90,180 | ||||||||||
|
|
|
| ||||||||||
| RIGHTS — 0.00% |
|
|||||||||||
| Communications — 0.00% |
|
|||||||||||
| Intelsat Jackson Holdings SA, Series A3,5,6,8 |
|
|||||||||||
| (Luxembourg) | 108 | — | ||||||||||
| Intelsat Jackson Holdings SA, Series B3,5,6,8 |
|
|||||||||||
| (Luxembourg) | 108 | — | ||||||||||
|
|
|
| ||||||||||
| — | ||||||||||||
|
|
|
| ||||||||||
| Total Rights |
|
|||||||||||
| (Cost $–) |
|
— | ||||||||||
|
|
|
| ||||||||||
| Issues | Maturity Date |
Principal Amount/Shares |
Value | |||||||||
| SHORT-TERM INVESTMENTS — 2.96% |
|
|||||||||||
| Money Market Funds — 2.96% |
|
|||||||||||
| Dreyfus Government Cash Management Fund |
|
|||||||||||
| 0.19%11 |
359,000 | $ | 359,000 | |||||||||
| Fidelity Investments Money Market Funds - Government Portfolio |
|
|||||||||||
| 0.12%11 |
22,105 | 22,105 | ||||||||||
| Morgan Stanley Institutional Liquidity Funds - Government Portfolio |
|
|||||||||||
| 0.23%11 |
392,000 | 392,000 | ||||||||||
|
|
|
| ||||||||||
| Total Short-Term Investments |
|
|||||||||||
| (Cost $773,105) |
|
773,105 | ||||||||||
|
|
|
| ||||||||||
| Total Investments Before Written Options - 105.87% |
|
|||||||||||
| (Cost $34,411,046) |
|
27,657,133 | ||||||||||
|
|
|
| ||||||||||
| Written Options - (0.14)% |
|
|||||||||||
| (Cost $(18,699)) |
|
(38,025 | ) | |||||||||
|
|
|
| ||||||||||
| Liabilities in Excess of Other Assets - (5.73)% |
|
(1,495,808 | ) | |||||||||
|
|
|
| ||||||||||
| Net Assets - 100.00% |
|
$ | 26,123,300 | |||||||||
|
|
|
| ||||||||||
| 1 | Securities exempt from registration under Rule 144A of the Securities Act of 1933, as amended. The securities may be resold in transactions exempt from registration, normally to qualified institutional buyers. |
| 2 | Floating rate security. The rate disclosed was in effect at March 31, 2022. |
| 3 | Foreign denominated security issued by foreign domiciled entity. |
| 4 | Variable rate security. Interest rate disclosed is as of the most recent information available. Certain variable rate securities are not based on a published reference rate and spread but are determined by the issuer or agent and are based on current market conditions. |
| 5 | Security is valued using significant unobservable inputs and is classified as Level 3 in the fair value hierarchy. |
| 6 | Illiquid security as determined under procedures approved by the Board of Trustees. The aggregate value of illiquid securities is $263,849, which is 1.01% of total net assets. |
| 7 | Perpetual security with no stated maturity date. |
| 8 | Non-income producing security. |
| 9 | Security is currently in default with regard to scheduled interest or principal payments. |
| 10 | Zero coupon bond. The rate shown is the effective yield as of March 31, 2022. |
| 11 | Represents the current yield as of March 31, 2022. |
| * | Securities with a call or reset feature will have an effective maturity date sooner than the stated maturity. |
| ** | Securities backed by mortgage or consumer loans where payment is periodically made will have an effective maturity date sooner than the stated maturity date. |
See accompanying Notes to Financial Statements.
| Annual Report March 2022 / 162 |
Table of Contents
Strategic Income Fund
Schedule of Portfolio Investments
March 31, 2022
Note: For Fund compliance purposes, the Fund’s industry classifications refer to any one or more of the industry sub-classifications used by one or more widely recognized market indexes or ratings group indexes, and/or as defined by Fund management. This definition may not apply for purposes of this report, which may combine industry sub-classifications for more meaningful presentation for investors.
(CDO): Collateralized Debt Obligation
(CLO): Collateralized Loan Obligation
(EUR): Euro
(EURIBOR): Euro InterBank Offer Rate
(GMTN): Global Medium-Term Note
(IO): Interest Only
(LIBOR): London InterBank Offer Rate
(MTN): Medium-Term Note
(SOFR): Secured Overnight Financing Rate
(STEP): Step Coupon Bond
(TBA): To-Be-Announced
(USD): U.S. Dollar
| Currency to be Purchased |
Currency to be Sold |
Counterparty |
Settlement Date |
Unrealized Appreciation (Depreciation) |
||||||||||||||||
| FOREIGN CURRENCY EXCHANGE CONTRACT |
|
|||||||||||||||||||
| EUR 100,000 |
USD 109,970 | Citigroup Global Markets, Inc. | 04/08/22 | $ | 1,321 | |||||||||||||||
|
|
|
|||||||||||||||||||
| USD 108,747 |
EUR 100,000 | Citigroup Global Markets, Inc. | 04/08/22 | (2,544 | ) | |||||||||||||||
| USD 110,401 |
EUR 100,000 | Citigroup Global Markets, Inc. | 07/08/22 | (1,328 | ) | |||||||||||||||
|
|
|
|||||||||||||||||||
| (3,872 | ) | |||||||||||||||||||
|
|
|
|||||||||||||||||||
| NET UNREALIZED DEPRECIATION |
|
$ | (2,551 | ) | ||||||||||||||||
|
|
|
|||||||||||||||||||
|
|
||||||||||||||||||||
| Description |
Number of Contracts |
Expiration Date | Notional Amount | Value | Unrealized Appreciation (Depreciation) |
|||||||||||||||
| FUTURES CONTRACTS: LONG POSITIONS |
|
|||||||||||||||||||
| U.S. Treasury Five-Year Note |
18 | 06/30/22 | $ | 2,064,375 | $ | (45,838 | ) | $ | (45,838 | ) | ||||||||||
| FUTURES CONTRACTS: SHORT POSITIONS |
|
|||||||||||||||||||
| U.S. Treasury Ten-Year Ultra Bond |
11 | 06/21/22 | (1,490,156 | ) | 48,320 | 48,320 | ||||||||||||||
| U.S. Treasury Ultra Bond |
7 | 06/21/22 | (1,239,875 | ) | 45,649 | 45,649 | ||||||||||||||
|
|
|
|
|
|
|
|||||||||||||||
| (2,730,031 | ) | 93,969 | 93,969 | |||||||||||||||||
|
|
|
|
|
|
|
|||||||||||||||
| TOTAL FUTURES CONTRACTS |
$ | (665,656 | ) | $ | 48,131 | $ | 48,131 | |||||||||||||
|
|
|
|
|
|
|
|||||||||||||||
| Description | Number of contracts |
Exercise Price |
Expiration Date |
Notional Amount | Value | |||||||||||||||
| WRITTEN CALL OPTIONS EXCHANGE TRADED |
||||||||||||||||||||
| IMM Eurodollar 2-Year MIDCV Future Options |
10 | $97.88 | 12/16/22 | $ | (608,094 | ) | $ | (4,687 | ) | |||||||||||
|
|
|
|
|
|||||||||||||||||
| WRITTEN PUT OPTIONS EXCHANGE TRADED |
||||||||||||||||||||
| IMM Eurodollar 2-Year MIDCV Future Options |
10 | $97.38 | 12/16/22 | $ | (608,094 | ) | $ | (11,688 | ) | |||||||||||
|
|
|
|
|
|||||||||||||||||
| Received by the | ||||||||||||||||||||||||||||||||||||||||||
| Fund | Paid by the Fund | |||||||||||||||||||||||||||||||||||||||||
| Notional | ||||||||||||||||||||||||||||||||||||||||||
| Purchase | Maturity | Amount | Premiums | Unrealized | ||||||||||||||||||||||||||||||||||||||
| Description | Counterparty | Date | Date | Rate | Frequency | Rate | Frequency | (000’s) | Value | (Received) | (Depreciation) | |||||||||||||||||||||||||||||||
| WRITTEN PUT SWAPTIONS | ||||||||||||||||||||||||||||||||||||||||||
| Option to enter into a 2-year Interest Rate Swap | Citigroup Global Markets, Inc. |
03/09/22 | 06/08/22 | 1.95 | % | |
Semi- annually |
|
|
3-month USD LIBOR |
|
Quarterly | $ | 1,400 | $ | (21,650 | ) | $ | (3,920 | ) | $ | (17,730 | ) | |||||||||||||||||||
|
|
|
|
|
|
|
|
|
|||||||||||||||||||||||||||||||||||
See accompanying Notes to Financial Statements.
| 163 / Annual Report March 2022 |
Table of Contents
Strategic Income Fund
Schedule of Portfolio Investments
March 31, 2022
| Received by the Fund | Paid by the Fund | |||||||||||||||||||||||||||||||
| Description | Maturity Date |
Rate | Frequency | Rate | Frequency | Notional Amount (000’s) |
Value | Premiums Paid |
Unrealized Appreciation (Depreciation) | |||||||||||||||||||||||
| SWAPS: INTEREST RATE | ||||||||||||||||||||||||||||||||
| Interest Rate Swap1 |
12/07/53 | 3-month USD LIBOR |
Quarterly | 1.74% | Semi-annually | $ | 65 | $ | 6,708 | $ | — | $ | 6,708 | |||||||||||||||||||
| Interest Rate Swap1 |
07/24/53 | 3-month USD LIBOR |
Quarterly | 1.81% | Semi-annually | 30 | 2,854 | — | 2,854 | |||||||||||||||||||||||
| Interest Rate Swap1 |
07/24/53 | 3-month USD LIBOR |
Quarterly | 1.77% | Semi-annually | 60 | 6,146 | — | 6,146 | |||||||||||||||||||||||
| Interest Rate Swap1 |
07/24/53 | 3-month USD LIBOR |
Quarterly | 1.79% | Semi-annually | 35 | 3,494 | — | 3,494 | |||||||||||||||||||||||
| Interest Rate Swap1 |
09/28/53 | 3-month USD LIBOR |
Quarterly | 1.87% | Semi-annually | 70 | 5,565 | — | 5,565 | |||||||||||||||||||||||
| Interest Rate Swap1 |
12/07/25 | 1.69% | Semi-annually | |
3-month USD LIBOR |
|
Quarterly | 795 | (16,000 | ) | — | (16,000 | ) | |||||||||||||||||||
| Interest Rate Swap1 |
07/24/25 | 1.07% | Semi-annually | |
3-month USD LIBOR |
|
Quarterly | 330 | (11,417 | ) | — | (11,417 | ) | |||||||||||||||||||
| Interest Rate Swap1 |
07/24/25 | 1.03% | Semi-annually | |
3-month USD LIBOR |
|
Quarterly | 660 | (23,414 | ) | — | (23,414 | ) | |||||||||||||||||||
| Interest Rate Swap1 |
07/24/25 | 1.03% | Semi-annually | |
3-month USD LIBOR |
|
Quarterly | 490 | (17,310 | ) | — | (17,310 | ) | |||||||||||||||||||
| Interest Rate Swap1 |
09/28/25 | 1.39% | Semi-annually | |
3-month USD LIBOR |
|
Quarterly | 830 | (22,615 | ) | — | (22,615 | ) | |||||||||||||||||||
|
|
|
|
|
|
|
|
|
| ||||||||||||||||||||||||
| TOTAL SWAPS CONTRACTS | $ | 3,365 | $ | (65,989 | ) | $ | — | $ | (65,989 | ) | ||||||||||||||||||||||
|
|
|
|
|
|
|
|
|
| ||||||||||||||||||||||||
| 1 | Centrally cleared. |
See accompanying Notes to Financial Statements.
| Annual Report March 2022 / 164 |
Table of Contents
Schedule of Portfolio Investments
March 31, 2022
| Issues | Maturity Date |
Principal Amount |
Value | |||||||||
| BONDS – 110.81% |
|
|||||||||||
| ASSET-BACKED SECURITIES — 4.34%** |
|
|||||||||||
| Academic Loan Funding Trust, |
|
|||||||||||
| Series 2012-1A, Class A2 |
|
|||||||||||
| (LIBOR USD 1-Month plus 1.10%) |
|
|||||||||||
| 1.56% |
12/27/441,2 | $ | 17,563,321 | $ | 17,454,374 | |||||||
| ACRES Commercial Realty Ltd., |
|
|||||||||||
| Series 2021-FL1, Class A |
|
|||||||||||
| (Cayman Islands) |
|
|||||||||||
| (LIBOR USD 1-Month plus 1.20%) |
|
|||||||||||
| 1.64% |
06/15/361,2,3 | 19,750,000 | 19,611,505 | |||||||||
| AGL CLO 1 Ltd., |
|
|||||||||||
| Series 2019-1A, Class BR |
|
|||||||||||
| (Cayman Islands) |
|
|||||||||||
| (LIBOR USD 3-Month plus 1.65%) |
|
|||||||||||
| 1.90% |
10/20/341,2,3 | 19,000,000 | 18,772,589 | |||||||||
| AGL CLO 17 Ltd., |
|
|||||||||||
| Series 2022-17A, Class A |
|
|||||||||||
| (Cayman Islands) |
|
|||||||||||
| (CME Term SOFR 3-Month plus 1.33%) |
|
|||||||||||
| 1.57% |
01/21/351,2,3 | 30,520,000 | 30,433,018 | |||||||||
| AIG CLO LLC, |
|
|||||||||||
| Series 2020-1A, Class AR |
|
|||||||||||
| (Cayman Islands) |
|
|||||||||||
| (LIBOR USD 3-Month plus 1.16%) |
|
|||||||||||
| 1.40% |
04/15/341,2,3 | 48,800,000 | 48,278,328 | |||||||||
| Aimco CLO 11 Ltd., |
|
|||||||||||
| Series 2020-11A, Class AR |
|
|||||||||||
| (Cayman Islands) |
|
|||||||||||
| (LIBOR USD 3-Month plus 1.13%) |
|
|||||||||||
| 1.37% |
10/17/341,2,3 | 7,100,000 | 7,032,181 | |||||||||
| AMMC CLO 15 Ltd., |
|
|||||||||||
| Series 2014-15A, Class AR3 |
|
|||||||||||
| (Cayman Islands) |
|
|||||||||||
| (LIBOR USD 3-Month plus 1.12%) |
|
|||||||||||
| 1.36% |
01/15/321,2,3 | 27,800,000 | 27,583,716 | |||||||||
| AMMC CLO 19 Ltd., |
|
|||||||||||
| Series 2016-19A, Class AR |
|
|||||||||||
| (Cayman Islands) |
|
|||||||||||
| (LIBOR USD 3-Month plus 1.14%) |
|
|||||||||||
| 1.38% |
10/16/281,2,3 | 27,555,426 | 27,503,897 | |||||||||
| Apidos CLO XXII, |
|
|||||||||||
| Series 2015-22A, Class A1R |
|
|||||||||||
| (Cayman Islands) |
|
|||||||||||
| (LIBOR USD 3-Month plus 1.06%) |
|
|||||||||||
| 1.31% |
04/20/311,2,3 | 21,475,000 | 21,339,708 | |||||||||
| Barings CLO Ltd., |
|
|||||||||||
| Series 2013-IA, Class AR |
|
|||||||||||
| (Cayman Islands) |
|
|||||||||||
| (LIBOR USD 3-Month plus 0.80%) |
|
|||||||||||
| 1.05% |
01/20/281,2,3 | 20,309,493 | 20,201,040 | |||||||||
| Barings CLO Ltd., |
|
|||||||||||
| Series 2018-3A, Class A1 |
|
|||||||||||
| (Cayman Islands) |
|
|||||||||||
| (LIBOR USD 3-Month plus 0.95%) |
|
|||||||||||
| 1.20% |
07/20/291,2,3 | 27,800,920 | 27,646,625 | |||||||||
| Issues | Maturity Date |
Principal Amount |
Value | |||||||||
| ASSET-BACKED SECURITIES (continued) |
|
|||||||||||
| Barings CLO Ltd., |
|
|||||||||||
| Series 2020-4A, Class A |
|
|||||||||||
| (Cayman Islands) |
|
|||||||||||
| (LIBOR USD 3-Month plus 1.22%) |
|
|||||||||||
| 1.47% |
01/20/321,2,3 | $ | 19,110,000 | $ | 19,040,248 | |||||||
| Bayview Commercial Asset Trust, |
|
|||||||||||
| Series 2004-2, Class A |
|
|||||||||||
| (LIBOR USD 1-Month plus 0.65%) |
|
|||||||||||
| 1.10% |
08/25/341,2 | 151,197 | 150,408 | |||||||||
| Bayview Commercial Asset Trust, |
|
|||||||||||
| Series 2004-3, Class A1 |
|
|||||||||||
| (LIBOR USD 1-Month plus 0.56%) |
|
|||||||||||
| 1.01% |
01/25/351,2 | 837,143 | 832,311 | |||||||||
| Bayview Commercial Asset Trust, |
|
|||||||||||
| Series 2005-1A, Class A1 |
|
|||||||||||
| (LIBOR USD 1-Month plus 0.45%) |
|
|||||||||||
| 0.91% |
04/25/351,2 | 1,843,870 | 1,794,805 | |||||||||
| BCRED MML CLO, LLC, |
|
|||||||||||
| Series 2022-1A, Class A1 |
|
|||||||||||
| (CME Term SOFR 3-Month plus 1.65%) |
|
|||||||||||
| 2.24% |
04/20/351,2 | 48,400,000 | 48,309,686 | |||||||||
| BlueMountain CLO XXXII Ltd., |
|
|||||||||||
| Series 2021-32A, Class B |
|
|||||||||||
| (Cayman Islands) |
|
|||||||||||
| (LIBOR USD 3-Month plus 1.70%) |
|
|||||||||||
| 1.94% |
10/15/341,2,3 | 25,000,000 | 24,747,750 | |||||||||
| BlueMountain Fuji U.S. CLO I Ltd., |
|
|||||||||||
| Series 2017-1A, Class A1R |
|
|||||||||||
| (Cayman Islands) |
|
|||||||||||
| (LIBOR USD 3-Month plus 0.98%) |
|
|||||||||||
| 1.23% |
07/20/291,2,3 | 28,145,000 | 27,950,800 | |||||||||
| Brazos Education Loan Authority, Inc., |
|
|||||||||||
| Series 2012-1, Class A1 |
|
|||||||||||
| (LIBOR USD 1-Month plus 0.70%) |
|
|||||||||||
| 1.16% |
12/26/352 | 26,772 | 26,507 | |||||||||
| Brazos Higher Education Authority, Inc., |
|
|||||||||||
| Series 2010-1, Class A2 |
|
|||||||||||
| (LIBOR USD 3-Month plus 1.20%) |
|
|||||||||||
| 1.70% |
02/25/352 | 12,315,000 | 12,391,386 | |||||||||
| Brazos Higher Education Authority, Inc., |
|
|||||||||||
| Series 2011-1, Class A3 |
|
|||||||||||
| (LIBOR USD 3-Month plus 1.05%) |
|
|||||||||||
| 1.55% |
11/25/332 | 16,050,000 | 15,964,580 | |||||||||
| Brazos Higher Education Authority, Inc., |
|
|||||||||||
| Series 2011-2, Class A3 |
|
|||||||||||
| (LIBOR USD 3-Month plus 1.00%) |
|
|||||||||||
| 1.26% |
10/27/362 | 24,361,000 | 24,209,219 | |||||||||
| CIFC Funding Ltd., |
|
|||||||||||
| Series 2020-2A, Class BR |
|
|||||||||||
| (Cayman Islands) |
|
|||||||||||
| (LIBOR USD 3-Month plus 1.60%) |
|
|||||||||||
| 1.85% |
10/20/341,2,3 | 9,000,000 | 8,841,060 | |||||||||
| CIFC Funding Ltd., |
|
|||||||||||
| Series 2021-6A, Class B |
|
|||||||||||
| (Cayman Islands) |
|
|||||||||||
| (LIBOR USD 3-Month plus 1.65%) |
|
|||||||||||
| 1.85% |
10/15/341,2,3 | 20,000,000 | 19,823,940 | |||||||||
See accompanying Notes to Financial Statements.
| 165 / Annual Report March 2022 |
Table of Contents
Total Return Bond Fund
Schedule of Portfolio Investments
March 31, 2022
| Issues |
Maturity Date |
Principal Amount |
Value | |||||||||
| ASSET-BACKED SECURITIES (continued) |
|
|||||||||||
| CIFC Funding Ltd., |
|
|||||||||||
| Series 2022-1A, Class A |
|
|||||||||||
| (Cayman Islands) |
|
|||||||||||
| (CME Term SOFR 3-Month plus 1.32%) |
|
|||||||||||
| 1.75% |
04/17/351,2,3 | $ | 35,000,000 | $ | 34,886,250 | |||||||
| CIT Education Loan Trust, |
|
|||||||||||
| Series 2007-1, Class B |
|
|||||||||||
| (LIBOR USD 3-Month plus 0.30%) |
|
|||||||||||
| 1.27% |
06/25/421,2 | 10,307,588 | 9,436,516 | |||||||||
| Clear Creek CLO, |
|
|||||||||||
| Series 2015-1A, Class AR |
|
|||||||||||
| (Cayman Islands) |
|
|||||||||||
| (LIBOR USD 3-Month plus 1.20%) |
|
|||||||||||
| 1.45% |
10/20/301,2,3 | 27,190,000 | 27,123,385 | |||||||||
| College Loan Corp. Trust, |
|
|||||||||||
| Series 2005-2, Class B |
|
|||||||||||
| (LIBOR USD 3-Month plus 0.49%) |
|
|||||||||||
| 0.73% |
01/15/372 | 1,996,529 | 1,899,327 | |||||||||
| Dryden 30 Senior Loan Fund, |
|
|||||||||||
| Series 2013-30A, Class AR |
|
|||||||||||
| (Cayman Islands) |
|
|||||||||||
| (LIBOR USD 3-Month plus 0.82%) |
|
|||||||||||
| 1.33% |
11/15/281,2,3 | 17,051,226 | 16,939,882 | |||||||||
| Dryden 83 CLO Ltd., |
|
|||||||||||
| Series 2020-83A, Class A |
|
|||||||||||
| (Cayman Islands) |
|
|||||||||||
| (LIBOR USD 3-Month plus 1.22%) |
|
|||||||||||
| 1.46% |
01/18/321,2,3 | 29,220,000 | 29,110,337 | |||||||||
| Dryden 92 CLO Ltd., |
|
|||||||||||
| Series 2021-92A, Class B |
|
|||||||||||
| (Cayman Islands) |
|
|||||||||||
| (LIBOR USD 3-Month plus 1.65%) |
|
|||||||||||
| 1.78% |
11/20/341,2,3 | 22,500,000 | 22,166,550 | |||||||||
| Dryden XXVI Senior Loan Fund, |
|
|||||||||||
| Series 2013-26A, Class AR |
|
|||||||||||
| (Cayman Islands) |
|
|||||||||||
| (LIBOR USD 3-Month plus 0.90%) |
|
|||||||||||
| 1.14% |
04/15/291,2,3 | 22,005,746 | 21,883,174 | |||||||||
| Eaton Vance CLO Ltd., |
|
|||||||||||
| Series 2013-1A, Class A13R |
|
|||||||||||
| (Cayman Islands) |
|
|||||||||||
| (LIBOR USD 3-Month plus 1.25%) |
|
|||||||||||
| 1.49% |
01/15/341,2,3 | 23,950,000 | 23,807,569 | |||||||||
| Eaton Vance CLO Ltd., |
|
|||||||||||
| Series 2020-1A, Class BR |
|
|||||||||||
| (Cayman Islands) |
|
|||||||||||
| (LIBOR USD 3-Month plus 1.65%) |
|
|||||||||||
| 1.89% |
10/15/341,2,3 | 25,000,000 | 24,645,000 | |||||||||
| ECMC Group Student Loan Trust, |
|
|||||||||||
| Series 2016-1A, Class A |
|
|||||||||||
| (LIBOR USD 1-Month plus 1.35%) |
|
|||||||||||
| 1.81% |
07/26/661,2 | 33,924,755 | 34,530,515 | |||||||||
| Education Loan Asset-Backed Trust I, |
|
|||||||||||
| Series 2013-1, Class A2 |
|
|||||||||||
| (LIBOR USD 1-Month plus 0.80%) |
|
|||||||||||
| 1.26% |
04/26/321,2 | 9,267,270 | 9,204,665 | |||||||||
| Issues | Maturity Date |
Principal Amount |
Value | |||||||||
| ASSET-BACKED SECURITIES (continued) |
|
|||||||||||
| Educational Funding of the South, Inc., |
|
|||||||||||
| Series 2011-1, Class A2 |
|
|||||||||||
| (LIBOR USD 3-Month plus 0.65%) |
|
|||||||||||
| 0.91% |
04/25/352 | $ | 10,803 | $ | 10,764 | |||||||
| Educational Funding of the South, Inc., |
|
|||||||||||
| Series 2012-1, Class A |
|
|||||||||||
| (LIBOR USD 1-Month plus 1.05%) |
|
|||||||||||
| 1.51% |
03/25/362 | 7,414,681 | 7,401,173 | |||||||||
| EFS Volunteer No. 2 LLC, |
|
|||||||||||
| Series 2012-1, Class A2 |
|
|||||||||||
| (LIBOR USD 1-Month plus 1.35%) |
|
|||||||||||
| 1.81% |
03/25/361,2 | 9,460,362 | 9,546,797 | |||||||||
| Elmwood CLO XI Ltd., |
|
|||||||||||
| Series 2021-4A, Class B |
|
|||||||||||
| (Cayman Islands) |
|
|||||||||||
| (LIBOR USD 3-Month plus 1.60%) |
|
|||||||||||
| 1.74% |
10/20/341,2,3 | 16,000,000 | 15,697,600 | |||||||||
| Flatiron CLO 21 Ltd., |
|
|||||||||||
| Series 2021-1A, Class A1 |
|
|||||||||||
| (Cayman Islands) |
|
|||||||||||
| (LIBOR USD 3-Month plus 1.11%) |
|
|||||||||||
| 1.36% |
07/19/341,2,3 | 52,500,000 | 51,794,925 | |||||||||
| GCO Education Loan Funding Trust, |
|
|||||||||||
| Series 2006-1, Class A11L |
|
|||||||||||
| (LIBOR USD 3-Month plus 0.23%) |
|
|||||||||||
| 0.73% |
05/25/362 | 25,000,000 | 24,481,397 | |||||||||
| Global SC Finance II SRL, |
|
|||||||||||
| Series 2014-1A, Class A2 |
|
|||||||||||
| (Barbados) |
|
|||||||||||
| 3.09% |
07/17/291,3 | 20,674,468 | 20,372,048 | |||||||||
| Goal Capital Funding Trust, |
|
|||||||||||
| Series 2006-1, Class B |
|
|||||||||||
| (LIBOR USD 3-Month plus 0.45%) |
|
|||||||||||
| 0.95% |
08/25/422 | 1,818,943 | 1,709,787 | |||||||||
| Goal Structured Solutions Trust, |
|
|||||||||||
| Series 2015-1, Class A |
|
|||||||||||
| (LIBOR USD 1-Month plus 0.65%) |
|
|||||||||||
| 1.11% |
09/25/411,2 | 15,225,654 | 15,042,304 | |||||||||
| GoldenTree Loan Management U.S. CLO 8 Ltd., |
|
|||||||||||
| Series 2020-8A, Class AR |
|
|||||||||||
| (Cayman Islands) |
|
|||||||||||
| (LIBOR USD 3-Month plus 1.15%) |
|
|||||||||||
| 1.40% |
10/20/341,2,3 | 36,180,000 | 35,787,085 | |||||||||
| GoldenTree Loan Opportunities IX Ltd., |
|
|||||||||||
| Series 2014-9A, Class AR2 |
|
|||||||||||
| (Cayman Islands) |
|
|||||||||||
| (LIBOR USD 3-Month plus 1.11%) |
|
|||||||||||
| 1.41% |
10/29/291,2,3 | 4,953,781 | 4,940,852 | |||||||||
| HPS Loan Management Ltd. |
|
|||||||||||
| Series 15A-19, Class A1R |
|
|||||||||||
| (United Kingdom) |
|
|||||||||||
| (CME Term SOFR 3-Month plus 1.32%) |
|
|||||||||||
| 1.60% |
01/22/351,2,3 | 35,720,000 | 35,446,742 | |||||||||
See accompanying Notes to Financial Statements.
| Annual Report March 2022 / 166 |
Table of Contents
Total Return Bond Fund
Schedule of Portfolio Investments
March 31, 2022
| Issues | Maturity Date |
Principal Amount |
Value | |||||||||
| ASSET-BACKED SECURITIES (continued) |
|
|||||||||||
| HPS Loan Management Ltd., |
|
|||||||||||
| Series 2021-16A, Class B |
|
|||||||||||
| (Cayman Islands) |
|
|||||||||||
| (LIBOR USD 3-Month plus 1.70%) |
|
|||||||||||
| 1.96% |
01/23/351,2,3 | $ | 19,250,000 | $ | 19,054,035 | |||||||
| J.G. Wentworth XXX LLC, |
|
|||||||||||
| Series 2013-3A, Class A |
|
|||||||||||
| 4.08% |
01/17/731 | 575,611 | 597,074 | |||||||||
| J.G. Wentworth XXXII LLC, |
|
|||||||||||
| Series 2014-2A, Class A |
|
|||||||||||
| 3.61% |
01/17/731 | 37,836,315 | 38,372,531 | |||||||||
| LCM XVIII LP, |
|
|||||||||||
| Series 19A, Class AR |
|
|||||||||||
| (Cayman Islands) |
|
|||||||||||
| (LIBOR USD 3-Month plus 1.24%) |
|
|||||||||||
| 1.48% |
07/15/271,2,3 | 7,725,504 | 7,713,684 | |||||||||
| LCM XX LP, |
|
|||||||||||
| Series 20A, Class AR |
|
|||||||||||
| (Cayman Islands) |
|
|||||||||||
| (LIBOR USD 3-Month plus 1.04%) |
|
|||||||||||
| 1.29% |
10/20/271,2,3 | 2,925,045 | 2,914,046 | |||||||||
| LCM XXI LP, |
|
|||||||||||
| Series 21A, Class AR |
|
|||||||||||
| (Cayman Islands) |
|
|||||||||||
| (LIBOR USD 3-Month plus 0.88%) |
|
|||||||||||
| 1.13% |
04/20/281,2,3 | 12,314,165 | 12,272,789 | |||||||||
| Lehman Brothers Small Balance Commercial Mortgage Trust, |
|
|||||||||||
| Series 2007-1A, Class 2A3 |
|
|||||||||||
| 5.62% |
03/25/371,4 | 624,295 | 633,048 | |||||||||
| LoanCore Issuer Ltd., |
|
|||||||||||
| Series 2018-CRE1, Class AS |
|
|||||||||||
| (Cayman Islands) |
|
|||||||||||
| (LIBOR USD 1-Month plus 1.50%) |
|
|||||||||||
| 1.90% |
05/15/281,2,3 | 13,000,000 | 12,950,965 | |||||||||
| LoanCore Issuer Ltd., |
|
|||||||||||
| Series 2021-CRE5, Class A |
|
|||||||||||
| (Cayman Islands) |
|
|||||||||||
| (LIBOR USD 1-Month plus 1.30%) |
|
|||||||||||
| 1.70% |
07/15/361,2,3 | 45,000,000 | 44,305,094 | |||||||||
| Lucali CLO Ltd., |
|
|||||||||||
| Series 2020-1A, Class A |
|
|||||||||||
| (Cayman Islands) |
|
|||||||||||
| (LIBOR USD 3-Month plus 1.21%) |
|
|||||||||||
| 1.45% |
01/15/331,2,3 | 11,550,000 | 11,499,295 | |||||||||
| Madison Park Funding XLVIII Ltd., |
|
|||||||||||
| Series 2021-48A, Class A |
|
|||||||||||
| (Cayman Islands) |
|
|||||||||||
| (LIBOR USD 3-Month plus 1.15%) |
|
|||||||||||
| 1.40% |
04/19/331,2,3 | 30,725,000 | 30,512,782 | |||||||||
| Madison Park Funding XXX Ltd., |
|
|||||||||||
| Series 2018-30A, Class A |
|
|||||||||||
| (Cayman Islands) |
|
|||||||||||
| (LIBOR USD 3-Month plus 0.75%) |
|
|||||||||||
| 0.99% |
04/15/291,2,3 | 7,018,804 | 6,965,461 | |||||||||
| Issues | Maturity Date |
Principal Amount |
Value | |||||||||
| ASSET-BACKED SECURITIES (continued) |
|
|||||||||||
| Madison Park Funding XXXVIII Ltd., |
|
|||||||||||
| Series 2021-38A, Class A |
|
|||||||||||
| (Cayman Islands) |
|
|||||||||||
| (LIBOR USD 3-Month plus 1.12%) |
|
|||||||||||
| 1.36% |
07/17/341,2,3 | $ | 20,500,000 | $ | 20,250,925 | |||||||
| Magnetite XXIII Ltd., |
|
|||||||||||
| Series 2019-23A, Class BR |
|
|||||||||||
| (Cayman Islands) |
|
|||||||||||
| (LIBOR USD 3-Month plus 1.65%) |
|
|||||||||||
| 1.77% |
01/25/351,2,3 | 20,000,000 | 19,703,000 | |||||||||
| Magnetite XXV Ltd., |
|
|||||||||||
| Series 2020-25A, Class A |
|
|||||||||||
| (Cayman Islands) |
|
|||||||||||
| (LIBOR USD 3-Month plus 1.20%) |
|
|||||||||||
| 1.46% |
01/25/321,2,3 | 27,025,000 | 26,903,388 | |||||||||
| Navient Student Loan Trust, |
|
|||||||||||
| Series 2014-1, Class A3 |
|
|||||||||||
| (LIBOR USD 1-Month plus 0.51%) |
|
|||||||||||
| 0.97% |
06/25/312 | 663,824 | 651,332 | |||||||||
| Navient Student Loan Trust, |
|
|||||||||||
| Series 2014-2, Class A |
|
|||||||||||
| (LIBOR USD 1-Month plus 0.64%) |
|
|||||||||||
| 1.10% |
03/25/832 | 32,856,836 | 32,347,446 | |||||||||
| Navient Student Loan Trust, |
|
|||||||||||
| Series 2014-3, Class A |
|
|||||||||||
| (LIBOR USD 1-Month plus 0.62%) |
|
|||||||||||
| 1.08% |
03/25/832 | 57,541,620 | 56,583,724 | |||||||||
| Navient Student Loan Trust, |
|
|||||||||||
| Series 2014-4, Class A |
|
|||||||||||
| (LIBOR USD 1-Month plus 0.62%) |
|
|||||||||||
| 1.08% |
03/25/832 | 84,809,811 | 83,399,315 | |||||||||
| Navient Student Loan Trust, |
|
|||||||||||
| Series 2014-6, Class A |
|
|||||||||||
| (LIBOR USD 1-Month plus 0.61%) |
|
|||||||||||
| 1.07% |
03/25/832 | 35,314,061 | 34,790,482 | |||||||||
| Navient Student Loan Trust, |
|
|||||||||||
| Series 2014-7, Class A |
|
|||||||||||
| (LIBOR USD 1-Month plus 0.61%) |
|
|||||||||||
| 1.07% |
03/25/832 | 72,548,469 | 71,478,698 | |||||||||
| Navient Student Loan Trust, |
|
|||||||||||
| Series 2015-1, Class A2 |
|
|||||||||||
| (LIBOR USD 1-Month plus 0.60%) |
|
|||||||||||
| 1.06% |
04/25/402 | 55,312,970 | 54,265,721 | |||||||||
| Navient Student Loan Trust, |
|
|||||||||||
| Series 2015-2, Class A3 |
|
|||||||||||
| (LIBOR USD 1-Month plus 0.57%) |
|
|||||||||||
| 1.03% |
11/26/402 | 108,885,913 | 107,291,745 | |||||||||
| Navient Student Loan Trust, |
|
|||||||||||
| Series 2016-7A, Class A |
|
|||||||||||
| (LIBOR USD 1-Month plus 1.15%) |
|
|||||||||||
| 1.61% |
03/25/661,2 | 55,767,544 | 55,942,386 | |||||||||
| Nelnet Student Loan Trust, |
|
|||||||||||
| Series 2006-1, Class A6 |
|
|||||||||||
| (LIBOR USD 3-Month plus 0.45%) |
|
|||||||||||
| 0.93% |
08/23/361,2 | 10,311,548 | 10,147,700 | |||||||||
See accompanying Notes to Financial Statements.
| 167 / Annual Report March 2022 |
Table of Contents
Total Return Bond Fund
Schedule of Portfolio Investments
March 31, 2022
| Issues | Maturity Date |
Principal Amount |
Value | |||||||||
| ASSET-BACKED SECURITIES (continued) |
|
|||||||||||
| Nelnet Student Loan Trust, |
|
|||||||||||
| Series 2012-5A, Class A |
|
|||||||||||
| (LIBOR USD 1-Month plus 0.60%) |
|
|||||||||||
| 1.06% |
10/27/361,2 | $ | 8,725,540 | $ | 8,584,426 | |||||||
| Nelnet Student Loan Trust, |
|
|||||||||||
| Series 2014-4A, Class A2 |
|
|||||||||||
| (LIBOR USD 1-Month plus 0.95%) |
|
|||||||||||
| 1.41% |
11/25/481,2 | 11,630,000 | 11,587,341 | |||||||||
| Nelnet Student Loan Trust, |
|
|||||||||||
| Series 2014-5A, Class A |
|
|||||||||||
| (LIBOR USD 1-Month plus 0.55%) |
|
|||||||||||
| 1.01% |
07/25/461,2 | 48,985,370 | 48,167,539 | |||||||||
| Nelnet Student Loan Trust, |
|
|||||||||||
| Series 2015-1A, Class A |
|
|||||||||||
| (LIBOR USD 1-Month plus 0.59%) |
|
|||||||||||
| 1.05% |
04/25/461,2 | 92,465,792 | 90,791,918 | |||||||||
| Nelnet Student Loan Trust, |
|
|||||||||||
| Series 2015-3A, Class A3 |
|
|||||||||||
| (LIBOR USD 1-Month plus 0.90%) |
|
|||||||||||
| 1.36% |
06/25/541,2 | 8,890,000 | 8,860,568 | |||||||||
| Neuberger Berman Loan Advisers CLO 33 Ltd., |
|
|||||||||||
| Series 2019-33A, Class BR |
|
|||||||||||
| (Cayman Islands) |
|
|||||||||||
| (LIBOR USD 3-Month plus 1.60%) |
|
|||||||||||
| 1.84% |
10/16/331,2,3 | 23,000,000 | 22,709,050 | |||||||||
| Neuberger Berman Loan Advisers CLO 36 Ltd., |
|
|||||||||||
| Series 2020-36A, Class A1R |
|
|||||||||||
| (Cayman Islands) |
|
|||||||||||
| (LIBOR USD 3-Month plus 1.25%) |
|
|||||||||||
| 1.50% |
04/20/331,2,3 | 25,455,000 | 25,340,351 | |||||||||
| Neuberger Berman Loan Advisers CLO 47 Ltd., |
|
|||||||||||
| Series 2022-47A, Class A |
|
|||||||||||
| (Cayman Islands) |
|
|||||||||||
| (CME Term SOFR 3-Month plus 1.30%) |
|
|||||||||||
| 1.55% |
04/14/351,2,3 | 31,785,000 | 31,560,916 | |||||||||
| North Carolina State Education Authority, |
|
|||||||||||
| Series A3, Class A3 |
|
|||||||||||
| (LIBOR USD 3-Month plus 0.90%) |
|
|||||||||||
| 1.16% |
10/25/412 | 13,617,303 | 13,616,015 | |||||||||
| NYACK Park CLO Ltd., |
|
|||||||||||
| Series 2021-1A, Class B1 |
|
|||||||||||
| (Cayman Islands) |
|
|||||||||||
| (LIBOR USD 3-Month plus 1.60%) |
|
|||||||||||
| 1.72% |
10/20/341,2,3 | 20,000,000 | 19,835,360 | |||||||||
| OCP CLO Ltd., |
|
|||||||||||
| Series 2020-19A, Class BR |
|
|||||||||||
| (Cayman Islands) |
|
|||||||||||
| (LIBOR USD 3-Month plus 1.70%) |
|
|||||||||||
| 1.95% |
10/20/341,2,3 | 15,500,000 | 15,352,626 | |||||||||
| Octagon Investment Partners 20-R Ltd., |
|
|||||||||||
| Series 2019-4A, Class BR |
|
|||||||||||
| (Cayman Islands) |
|
|||||||||||
| (LIBOR USD 3-Month plus 1.70%) |
|
|||||||||||
| 2.09% |
05/12/311,2,3 | 17,500,000 | 17,337,915 | |||||||||
| Issues | Maturity Date |
Principal Amount |
Value | |||||||||
| ASSET-BACKED SECURITIES (continued) |
|
|||||||||||
| Octagon Investment Partners 46 Ltd., |
|
|||||||||||
| Series 2020-2A, Class BR |
|
|||||||||||
| (Cayman Islands) |
|
|||||||||||
| (LIBOR USD 3-Month plus 1.65%) |
|
|||||||||||
| 1.89% |
07/15/361,2,3 | $ | 7,250,000 | $ | 7,156,953 | |||||||
| OHA Credit Funding 3 Ltd., |
|
|||||||||||
| Series 2019-3A, Class AR |
|
|||||||||||
| (Cayman Islands) |
|
|||||||||||
| (LIBOR USD 3-Month plus 1.14%) |
|
|||||||||||
| 1.39% |
07/02/351,2,3 | 33,250,000 | 32,923,818 | |||||||||
| OHA Credit Funding 7 Ltd., |
|
|||||||||||
| Series 2020-7A, Class AR |
|
|||||||||||
| (Cayman Islands) |
|
|||||||||||
| (CME Term SOFR 3-Month plus 1.30%) |
|
|||||||||||
| 2.15% |
02/24/371,2,3 | 18,785,000 | 18,706,535 | |||||||||
| Palmer Square CLO Ltd., |
|
|||||||||||
| Series 2020-3A, Class A1AR |
|
|||||||||||
| (Cayman Islands) |
|
|||||||||||
| (LIBOR USD 3-Month plus 1.08%) |
|
|||||||||||
| 1.59% |
11/15/311,2,3 | 22,100,000 | 21,951,267 | |||||||||
| Palmer Square CLO Ltd., |
|
|||||||||||
| Series 2021-4A, Class B |
|
|||||||||||
| (Cayman Islands) |
|
|||||||||||
| (LIBOR USD 3-Month plus 1.65%) |
|
|||||||||||
| 1.79% |
10/15/341,2,3 | 19,500,000 | 19,231,485 | |||||||||
| Palmer Square Loan Funding Ltd., |
|
|||||||||||
| Series 2019-1A, Class A1 |
|
|||||||||||
| (Cayman Islands) |
|
|||||||||||
| (LIBOR USD 3-Month plus 1.05%) |
|
|||||||||||
| 1.30% |
04/20/271,2,3 | 2,742,933 | 2,740,299 | |||||||||
| Palmer Square Loan Funding Ltd., |
|
|||||||||||
| Series 2019-4A, Class A1 |
|
|||||||||||
| (Cayman Islands) |
|
|||||||||||
| (LIBOR USD 3-Month plus 0.90%) |
|
|||||||||||
| 1.16% |
10/24/271,2,3 | 23,430,473 | 23,336,986 | |||||||||
| Palmer Square Loan Funding Ltd., |
|
|||||||||||
| Series 2020-2A, Class A1 |
|
|||||||||||
| (Cayman Islands) |
|
|||||||||||
| (LIBOR USD 3-Month plus 1.00%) |
|
|||||||||||
| 1.25% |
04/20/281,2,3 | 17,426,829 | 17,370,889 | |||||||||
| Park Avenue Institutional Advisers CLO Ltd., |
|
|||||||||||
| Series 2021-1A, Class A1A |
|
|||||||||||
| (Cayman Islands) |
|
|||||||||||
| (LIBOR USD 3-Month plus 1.39%) |
|
|||||||||||
| 1.64% |
01/20/341,2,3 | 50,000,000 | 49,726,400 | |||||||||
| PHEAA Student Loan Trust, |
|
|||||||||||
| Series 2015-1A, Class A |
|
|||||||||||
| (LIBOR USD 1-Month plus 0.60%) |
|
|||||||||||
| 1.06% |
10/25/411,2 | 96,168,082 | 94,182,438 | |||||||||
| Recette CLO Ltd., |
|
|||||||||||
| Series 2015-1A, Class ARR |
|
|||||||||||
| (Cayman Islands) |
|
|||||||||||
| (LIBOR USD 3-Month plus 1.08%) |
|
|||||||||||
| 1.33% |
04/20/341,2,3 | 42,730,000 | 42,174,510 | |||||||||
See accompanying Notes to Financial Statements.
| Annual Report March 2022 / 168 |
Table of Contents
Total Return Bond Fund
Schedule of Portfolio Investments
March 31, 2022
| Issues |
Maturity Date |
Principal Amount |
Value | |||||||||
| ASSET-BACKED SECURITIES (continued) |
|
|||||||||||
| Regatta XX Funding Ltd., |
|
|||||||||||
| Series 2021-2A, Class B |
|
|||||||||||
| (Cayman Islands) |
|
|||||||||||
| (LIBOR USD 3-Month plus 1.70%) |
|
|||||||||||
| 1.94% |
10/15/341,2,3 | $ | 12,000,000 | $ | 11,886,720 | |||||||
| Rockford Tower CLO Ltd., |
|
|||||||||||
| Series 2017-2A, Class AR |
|
|||||||||||
| (Cayman Islands) |
|
|||||||||||
| (LIBOR USD 3-Month plus 1.02%) |
|
|||||||||||
| 1.26% |
10/15/291,2,3 | 26,588,120 | 26,487,351 | |||||||||
| Rockford Tower CLO Ltd., |
|
|||||||||||
| Series 2017-3A, Class A |
|
|||||||||||
| (Cayman Islands) |
|
|||||||||||
| (LIBOR USD 3-Month plus 1.19%) |
|
|||||||||||
| 1.44% |
10/20/301,2,3 | 1,685,000 | 1,676,912 | |||||||||
| Rockford Tower CLO Ltd., |
|
|||||||||||
| Series 2019-2A, Class BR |
|
|||||||||||
| (Cayman Islands) |
|
|||||||||||
| (LIBOR USD 3-Month plus 1.65%) |
|
|||||||||||
| 2.13% |
08/20/321,2,3 | 20,000,000 | 19,829,880 | |||||||||
| Rockford Tower CLO Ltd., |
|
|||||||||||
| Series 2020-1A, Class A |
|
|||||||||||
| (Cayman Islands) |
|
|||||||||||
| (LIBOR USD 3-Month plus 1.28%) |
|
|||||||||||
| 1.53% |
01/20/321,2,3 | 23,840,000 | 23,793,989 | |||||||||
| Scholar Funding Trust, |
|
|||||||||||
| Series 2012-B, Class A2 |
|
|||||||||||
| (LIBOR USD 1-Month plus 1.10%) |
|
|||||||||||
| 1.55% |
03/28/461,2 | 18,458,490 | 18,596,571 | |||||||||
| Sixth Street CLO XVII Ltd., |
|
|||||||||||
| Series 2021-17A, Class A |
|
|||||||||||
| (Cayman Islands) |
|
|||||||||||
| (LIBOR USD 3-Month plus 1.24%) |
|
|||||||||||
| 1.49% |
01/20/341,2,3 | 40,930,000 | 40,608,700 | |||||||||
| Sixth Street CLO XX Ltd., |
|
|||||||||||
| Series 2021-20A, Class B |
|
|||||||||||
| (Cayman Islands) |
|
|||||||||||
| (LIBOR USD 3-Month plus 1.65%) |
|
|||||||||||
| 2.71% |
10/20/341,2,3 | 25,000,000 | 24,618,500 | |||||||||
| Skyline Aircraft Finance LLC, |
|
|||||||||||
| Series 2021-1, Class A |
|
|||||||||||
| 3.23% |
05/10/375,6 | 30,270,266 | 28,567,563 | |||||||||
| SLC Student Loan Trust, |
|
|||||||||||
| Series 2004-1, Class B |
|
|||||||||||
| (LIBOR USD 3-Month plus 0.29%) |
|
|||||||||||
| 0.80% |
08/15/312 | 236,558 | 220,139 | |||||||||
| SLC Student Loan Trust, |
|
|||||||||||
| Series 2008-1, Class A4A |
|
|||||||||||
| (LIBOR USD 3-Month plus 1.60%) |
|
|||||||||||
| 2.43% |
12/15/322 | 10,133,052 | 10,261,683 | |||||||||
| SLM Student Loan Trust, |
|
|||||||||||
| Series 2003-12, Class B |
|
|||||||||||
| (LIBOR USD 3-Month plus 0.59%) |
|
|||||||||||
| 1.42% |
12/15/682 | 46,300 | 44,541 | |||||||||
| Issues | Maturity Date |
Principal Amount |
Value | |||||||||
| ASSET-BACKED SECURITIES (continued) |
|
|||||||||||
| SLM Student Loan Trust, |
|
|||||||||||
| Series 2003-4, Class A5E |
|
|||||||||||
| (LIBOR USD 3-Month plus 0.75%) |
|
|||||||||||
| 1.58% |
03/15/331,2 | $ | 4,059,184 | $ | 3,971,269 | |||||||
| SLM Student Loan Trust, |
|
|||||||||||
| Series 2005-9, Class A7A |
|
|||||||||||
| (LIBOR USD 3-Month plus 0.60%) |
|
|||||||||||
| 0.86% |
01/25/412 | 52,003,940 | 51,336,952 | |||||||||
| SLM Student Loan Trust, |
|
|||||||||||
| Series 2006-2, Class A6 |
|
|||||||||||
| (LIBOR USD 3-Month plus 0.17%) |
|
|||||||||||
| 0.43% |
01/25/412 | 29,255,369 | 27,618,164 | |||||||||
| SLM Student Loan Trust, |
|
|||||||||||
| Series 2006-8, Class A6 |
|
|||||||||||
| (LIBOR USD 3-Month plus 0.16%) |
|
|||||||||||
| 0.42% |
01/25/412 | 30,938,677 | 29,649,605 | |||||||||
| SLM Student Loan Trust, |
|
|||||||||||
| Series 2007-1, Class A6 |
|
|||||||||||
| (LIBOR USD 3-Month plus 0.14%) |
|
|||||||||||
| 0.40% |
01/27/422 | 30,421,555 | 29,291,380 | |||||||||
| SLM Student Loan Trust, |
|
|||||||||||
| Series 2007-1, Class B |
|
|||||||||||
| (LIBOR USD 3-Month plus 0.22%) |
|
|||||||||||
| 0.48% |
01/27/422 | 3,555,983 | 3,292,778 | |||||||||
| SLM Student Loan Trust, |
|
|||||||||||
| Series 2007-6, Class B |
|
|||||||||||
| (LIBOR USD 3-Month plus 0.85%) |
|
|||||||||||
| 1.11% |
04/27/432 | 4,256,180 | 4,092,586 | |||||||||
| SLM Student Loan Trust, |
|
|||||||||||
| Series 2007-7, Class A4 |
|
|||||||||||
| (LIBOR USD 3-Month plus 0.33%) |
|
|||||||||||
| 0.59% |
01/25/222 | 247,282 | 241,695 | |||||||||
| SLM Student Loan Trust, |
|
|||||||||||
| Series 2008-2, Class A3 |
|
|||||||||||
| (LIBOR USD 3-Month plus 0.75%) |
|
|||||||||||
| 1.01% |
04/25/232 | 76,227,138 | 74,939,563 | |||||||||
| SLM Student Loan Trust, |
|
|||||||||||
| Series 2008-2, Class B |
|
|||||||||||
| (LIBOR USD 3-Month plus 1.20%) |
|
|||||||||||
| 1.46% |
01/25/832 | 38,874,000 | 36,987,043 | |||||||||
| SLM Student Loan Trust, |
|
|||||||||||
| Series 2008-3, Class A3 |
|
|||||||||||
| (LIBOR USD 3-Month plus 1.00%) |
|
|||||||||||
| 1.26% |
10/25/212 | 15,456 | 15,305 | |||||||||
| SLM Student Loan Trust, |
|
|||||||||||
| Series 2008-3, Class B |
|
|||||||||||
| (LIBOR USD 3-Month plus 1.20%) |
|
|||||||||||
| 1.46% |
04/26/832 | 2,260,000 | 2,081,183 | |||||||||
| SLM Student Loan Trust, |
|
|||||||||||
| Series 2008-4, Class A4 |
|
|||||||||||
| (LIBOR USD 3-Month plus 1.65%) |
|
|||||||||||
| 1.91% |
07/25/222 | 1,816,046 | 1,822,660 | |||||||||
| SLM Student Loan Trust, |
|
|||||||||||
| Series 2008-4, Class B |
|
|||||||||||
| (LIBOR USD 3-Month plus 1.85%) |
|
|||||||||||
| 2.11% |
04/25/732 | 8,849,000 | 8,805,995 | |||||||||
See accompanying Notes to Financial Statements.
| 169 / Annual Report March 2022 |
Table of Contents
Total Return Bond Fund
Schedule of Portfolio Investments
March 31, 2022
| Issues | Maturity Date |
Principal Amount |
Value | |||||||||
| ASSET-BACKED SECURITIES (continued) |
|
|||||||||||
| SLM Student Loan Trust, |
|
|||||||||||
| Series 2008-5, Class A4 |
|
|||||||||||
| (LIBOR USD 3-Month plus 1.70%) |
|
|||||||||||
| 1.96% |
07/25/232 | $ | 26,158,242 | $ | 26,248,255 | |||||||
| SLM Student Loan Trust, |
|
|||||||||||
| Series 2008-5, Class B |
|
|||||||||||
| (LIBOR USD 3-Month plus 1.85%) |
|
|||||||||||
| 2.11% |
07/25/732 | 37,199,000 | 37,153,053 | |||||||||
| SLM Student Loan Trust, |
|
|||||||||||
| Series 2008-6, Class A4 |
|
|||||||||||
| (LIBOR USD 3-Month plus 1.10%) |
|
|||||||||||
| 1.36% |
07/25/232 | 11,421,655 | 11,286,069 | |||||||||
| SLM Student Loan Trust, |
|
|||||||||||
| Series 2008-6, Class B |
|
|||||||||||
| (LIBOR USD 3-Month plus 1.85%) |
|
|||||||||||
| 2.11% |
07/26/832 | 31,424,000 | 30,742,995 | |||||||||
| SLM Student Loan Trust, |
|
|||||||||||
| Series 2008-7, Class B |
|
|||||||||||
| (LIBOR USD 3-Month plus 1.85%) |
|
|||||||||||
| 2.11% |
07/26/832 | 17,206,000 | 17,120,383 | |||||||||
| SLM Student Loan Trust, |
|
|||||||||||
| Series 2008-8, Class A4 |
|
|||||||||||
| (LIBOR USD 3-Month plus 1.50%) |
|
|||||||||||
| 1.76% |
04/25/232 | 2,350,899 | 2,357,162 | |||||||||
| SLM Student Loan Trust, |
|
|||||||||||
| Series 2008-8, Class B |
|
|||||||||||
| (LIBOR USD 3-Month plus 2.25%) |
|
|||||||||||
| 2.51% |
10/25/752 | 625,000 | 626,382 | |||||||||
| SLM Student Loan Trust, |
|
|||||||||||
| Series 2008-9, Class A |
|
|||||||||||
| (LIBOR USD 3-Month plus 1.50%) |
|
|||||||||||
| 1.76% |
04/25/232 | 53,683,833 | 53,686,344 | |||||||||
| SLM Student Loan Trust, |
|
|||||||||||
| Series 2008-9, Class B |
|
|||||||||||
| (LIBOR USD 3-Month plus 2.25%) |
|
|||||||||||
| 2.51% |
10/25/832 | 45,100,000 | 45,301,885 | |||||||||
| SLM Student Loan Trust, |
|
|||||||||||
| Series 2009-3, Class A |
|
|||||||||||
| (LIBOR USD 1-Month plus 0.75%) |
|
|||||||||||
| 1.21% |
01/25/451,2 | 137,001,112 | 135,721,823 | |||||||||
| SLM Student Loan Trust, |
|
|||||||||||
| Series 2011-1, Class A2 |
|
|||||||||||
| (LIBOR USD 1-Month plus 1.15%) |
|
|||||||||||
| 1.61% |
10/25/342 | 2,226,914 | 2,246,590 | |||||||||
| SLM Student Loan Trust, |
|
|||||||||||
| Series 2012-1, Class A3 |
|
|||||||||||
| (LIBOR USD 1-Month plus 0.95%) |
|
|||||||||||
| 1.41% |
09/25/282 | 563,551 | 554,204 | |||||||||
| SLM Student Loan Trust, |
|
|||||||||||
| Series 2012-2, Class A |
|
|||||||||||
| (LIBOR USD 1-Month plus 0.70%) |
|
|||||||||||
| 1.16% |
01/25/292 | 11,853,678 | 11,526,298 | |||||||||
| SLM Student Loan Trust, |
|
|||||||||||
| Series 2012-3, Class A |
|
|||||||||||
| (LIBOR USD 1-Month plus 0.65%) |
|
|||||||||||
| 1.11% |
12/27/382 | 13,852,047 | 13,689,992 | |||||||||
| Issues | Maturity Date |
Principal Amount |
Value | |||||||||
| ASSET-BACKED SECURITIES (continued) |
|
|||||||||||
| SLM Student Loan Trust, |
|
|||||||||||
| Series 2012-7, Class A3 |
|
|||||||||||
| (LIBOR USD 1-Month plus 0.65%) |
|
|||||||||||
| 1.11% |
05/26/262 | $ | 20,546,661 | $ | 20,109,701 | |||||||
| Student Loan Consolidation Center Student Loan Trust I, |
|
|||||||||||
| Series 2002-2, Class B2 |
|
|||||||||||
| (28 Day Auction Rate plus 0.00%) |
|
|||||||||||
| 1.61% |
07/01/421,2 | 17,450,000 | 16,077,331 | |||||||||
| Symphony CLO XXIX Ltd., |
|
|||||||||||
| Series 2021-29A, Class B |
|
|||||||||||
| (Cayman Islands) |
|
|||||||||||
| (LIBOR USD 3-Month plus 1.65%) |
|
|||||||||||
| 1.89% |
01/15/341,2,3 | 14,500,000 | 14,368,485 | |||||||||
| Treman Park CLO Ltd., |
|
|||||||||||
| Series 2015-1A, Class ARR |
|
|||||||||||
| (Cayman Islands) |
|
|||||||||||
| (LIBOR USD 3-Month plus 1.07%) |
|
|||||||||||
| 1.32% |
10/20/281,2,3 | 10,603,232 | 10,570,892 | |||||||||
| Trestles CLO IV Ltd., |
|
|||||||||||
| Series 2021-4A, Class A |
|
|||||||||||
| (Cayman Islands) |
|
|||||||||||
| (LIBOR USD 3-Month plus 1.17%) |
|
|||||||||||
| 1.43% |
07/21/341,2,3 | 50,000,000 | 49,512,000 | |||||||||
| Voya CLO Ltd., |
|
|||||||||||
| Series 2019-4A, Class BR |
|
|||||||||||
| (Cayman Islands) |
|
|||||||||||
| (LIBOR USD 3-Month plus 1.75%) |
|
|||||||||||
| 1.99% |
01/15/351,2,3 | 17,500,000 | 17,358,600 | |||||||||
| Voya CLO Ltd., |
|
|||||||||||
| Series 2020-2A, Class BR |
|
|||||||||||
| (Cayman Islands) |
|
|||||||||||
| (LIBOR USD 3-Month plus 1.70%) |
|
|||||||||||
| 1.95% |
07/19/341,2,3 | 11,825,000 | 11,707,637 | |||||||||
|
|
|
| ||||||||||
| Total Asset-Backed Securities |
|
|||||||||||
| (Cost $3,380,478,357) |
|
3,361,301,404 | ||||||||||
|
|
|
| ||||||||||
| BANK LOANS — 2.01%* |
|
|||||||||||
| Automotive — 0.02% |
|
|||||||||||
| Clarios Global LP, |
|
|||||||||||
| Term Loan B, 1st Lien |
|
|||||||||||
| (LIBOR plus 3.25%) |
|
|||||||||||
| 3.71% |
04/30/262 | 18,429,354 | 18,226,631 | |||||||||
|
|
|
| ||||||||||
| Communications — 0.43% |
|
|||||||||||
| CenturyLink, Inc., |
|
|||||||||||
| Term Loan A, 1st Lien |
|
|||||||||||
| (LIBOR plus 2.00%) |
|
|||||||||||
| 2.46% |
01/31/252 | 8,763,002 | 8,686,369 | |||||||||
| Term Loan B, 1st Lien |
|
|||||||||||
| (LIBOR plus 2.25%) |
|
|||||||||||
| 2.71% |
03/15/272 | 65,318,364 | 63,680,506 | |||||||||
| CSC Holdings LLC, |
|
|||||||||||
| Term Loan B, 1st Lien |
|
|||||||||||
| (LIBOR plus 2.25%) |
|
|||||||||||
| 2.65% |
07/17/252 | 15,849,905 | 15,632,048 | |||||||||
See accompanying Notes to Financial Statements.
| Annual Report March 2022 / 170 |
Table of Contents
Total Return Bond Fund
Schedule of Portfolio Investments
March 31, 2022
| Issues | Maturity Date |
Principal Amount |
Value | |||||||||
| BANK LOANS (continued) |
|
|||||||||||
| Communications (continued) |
|
|||||||||||
| Term Loan B5, 1st Lien |
|
|||||||||||
| (LIBOR plus 2.50%) |
|
|||||||||||
| 2.90% |
04/15/272 | $ | 9,464,157 | $ | 9,317,463 | |||||||
| Diamond Sports Group, LLC, |
|
|||||||||||
| Term Loan, 1st Lien |
|
|||||||||||
| (LIBOR plus 8.00%) |
|
|||||||||||
| 9.00% |
05/25/262 | 19,011,164 | 19,337,301 | |||||||||
| Term Loan, 2nd Lien |
|
|||||||||||
| (SOFR plus 3.25%) |
|
|||||||||||
| 3.54% |
08/24/262 | 66,532,418 | 23,057,807 | |||||||||
| DIRECTV Financing LLC, |
|
|||||||||||
| Term Loan, 1st Lien |
|
|||||||||||
| (LIBOR plus 5.00%) |
|
|||||||||||
| 5.75% |
08/02/272 | 46,518,050 | 46,527,121 | |||||||||
| EW Scripps Co., |
|
|||||||||||
| Term Loan B, 1st Lien |
|
|||||||||||
| (LIBOR plus 2.00%) |
|
|||||||||||
| 2.46% |
10/02/242 | 3,969,067 | 3,927,888 | |||||||||
| Frontier Communications Holdings LLC, |
|
|||||||||||
| Term Loan B, 1st Lien |
|
|||||||||||
| (LIBOR plus 3.75%) |
|
|||||||||||
| 4.81% |
05/01/282 | 16,607,250 | 16,385,792 | |||||||||
| Intelsat Jackson Holdings SA, |
|
|||||||||||
| Term Loan (Luxembourg) |
|
|||||||||||
| (SOFR plus 4.42%) |
|
|||||||||||
| 4.92% |
02/01/292,3 | 15,831,541 | 15,600,242 | |||||||||
| Level 3 Parent LLC, |
|
|||||||||||
| Term Loan B, 1st Lien |
|
|||||||||||
| (LIBOR plus 1.75%) |
|
|||||||||||
| 2.21% |
03/01/272 | 10,889,876 | 10,701,863 | |||||||||
| SBA Senior Finance II LLC, |
|
|||||||||||
| Term Loan B, 1st Lien |
|
|||||||||||
| (LIBOR plus 1.75%) |
|
|||||||||||
| 2.21% |
04/11/252 | 42,767,312 | 42,318,896 | |||||||||
| Sinclair Television Group, Inc., |
|
|||||||||||
| Term Loan B3, 1st Lien |
|
|||||||||||
| (LIBOR plus 3.00%) |
|
|||||||||||
| 3.46% |
04/01/282 | 12,753,625 | 12,474,703 | |||||||||
| Zayo Group Holdings, Inc., |
|
|||||||||||
| Term Loan, 1st Lien |
|
|||||||||||
| (LIBOR plus 3.00%) |
|
|||||||||||
| 3.46% |
03/09/272 | 47,411,678 | 46,206,710 | |||||||||
|
|
|
| ||||||||||
| 333,854,709 | ||||||||||||
|
|
|
| ||||||||||
| Consumer Discretionary — 0.07% |
|
|||||||||||
| AI Aqua Merger Sub, Inc., |
|
|||||||||||
| Term Loan B, 1st Lien |
|
|||||||||||
| (SOFR plus 4.00%) |
|
|||||||||||
| 4.00% |
07/31/282,7 | 1,100,000 | 1,090,034 | |||||||||
| Naked Juice, LLC, |
|
|||||||||||
| Term Loan |
|
|||||||||||
| (SOFR plus 3.25%) |
|
|||||||||||
| 4.00% |
01/24/292 | 44,853,901 | 44,213,163 | |||||||||
| Issues | Maturity Date |
Principal Amount |
Value | |||||||||
| BANK LOANS (continued) |
|
|||||||||||
| Consumer Discretionary (continued) |
|
|||||||||||
| Sunshine Luxembourg VII SARL, |
|
|||||||||||
| Term Loan B, 1st Lien |
|
|||||||||||
| (LIBOR plus 3.75%) |
|
|||||||||||
| 4.76% |
10/01/262 | $ | 7,646,475 | $ | 7,607,057 | |||||||
|
|
|
| ||||||||||
| 52,910,254 | ||||||||||||
|
|
|
| ||||||||||
| Electric — 0.09% |
|
|||||||||||
| CommScope, Inc., |
|
|||||||||||
| Term Loan B, 1st Lien |
|
|||||||||||
| (LIBOR plus 3.25%) |
|
|||||||||||
| 3.71% |
04/06/262 | 44,035,116 | 42,952,513 | |||||||||
| Homer City Generation LP, |
|
|||||||||||
| Term Loan B, 1st Lien |
|
|||||||||||
| (LIBOR plus 11.00%) |
|
|||||||||||
| 15.00% |
04/05/232,5,6 | 5,827,963 | 3,351,078 | |||||||||
| Vistra Operations Co., LLC, |
|
|||||||||||
| Term Loan B3, 1st Lien |
|
|||||||||||
| (LIBOR plus 1.75%) |
|
|||||||||||
| 2.19% |
12/31/252 | 4,358,928 | 4,320,787 | |||||||||
| 2.21% |
12/31/252 | 18,034,512 | 17,876,710 | |||||||||
|
|
|
| ||||||||||
| 68,501,088 | ||||||||||||
|
|
|
| ||||||||||
| Entertainment — 0.01% |
|
|||||||||||
| Cineworld Finance U.S., Inc., |
|
|||||||||||
| Term Loan B, 1st Lien |
|
|||||||||||
| (LIBOR plus 2.50%) |
|
|||||||||||
| 4.00% |
02/28/252 | 7,726,804 | 5,983,753 | |||||||||
|
|
|
| ||||||||||
| Finance — 0.21% |
|
|||||||||||
| Auris Lux III SA, |
|
|||||||||||
| Term Loan B, 1st Lien (Luxembourg) |
|
|||||||||||
| (LIBOR plus 3.75%) |
|
|||||||||||
| 4.21% |
02/27/262,3 | 1,458,653 | 1,424,469 | |||||||||
| Avolon TLB Borrower 1 U.S. LLC, |
|
|||||||||||
| Term Loan B5, 1st Lien |
|
|||||||||||
| (LIBOR plus 2.25%) |
|
|||||||||||
| 2.75% |
12/01/272 | 8,891,062 | 8,816,422 | |||||||||
| Mozart Borrower, LP, |
|
|||||||||||
| Term Loan B |
|
|||||||||||
| (LIBOR plus 3.25%) |
|
|||||||||||
| 3.75% |
10/23/282 | 40,495,000 | 40,138,037 | |||||||||
| Setanta Aircraft Leasing DAC, |
|
|||||||||||
| Term Loan B, 1st Lien |
|
|||||||||||
| (LIBOR plus 2.00%) |
|
|||||||||||
| 3.01% |
11/05/282 | 82,885,000 | 81,780,143 | |||||||||
| Telenet Financing USD LLC, |
|
|||||||||||
| Term Loan AR, 1st Lien |
|
|||||||||||
| (LIBOR plus 2.00%) |
|
|||||||||||
| 2.40% |
04/28/282 | 28,600,000 | 28,007,551 | |||||||||
|
|
|
| ||||||||||
| 160,166,622 | ||||||||||||
|
|
|
| ||||||||||
| Food — 0.06% |
|
|||||||||||
| Hostess Brands LLC, |
|
|||||||||||
| Term Loan, 1st Lien |
|
|||||||||||
| (LIBOR plus 2.25%) |
|
|||||||||||
| 3.00% |
08/03/252 | 43,027,227 | 42,547,043 | |||||||||
See accompanying Notes to Financial Statements.
| 171 / Annual Report March 2022 |
Table of Contents
Total Return Bond Fund
Schedule of Portfolio Investments
March 31, 2022
| Issues |
Maturity Date |
Principal Amount |
Value | |||||||||
| BANK LOANS (continued) |
|
|||||||||||
| Food (continued) |
|
|||||||||||
| JBS USA LUX SA, |
|
|||||||||||
| Term Loan B, 1st Lien (Canada) |
|
|||||||||||
| (LIBOR plus 2.00%) |
|
|||||||||||
| 2.80% |
05/01/262,3 | $ | 1,110,516 | $ | 1,102,304 | |||||||
|
|
|
| ||||||||||
| 43,649,347 | ||||||||||||
|
|
|
| ||||||||||
| Gaming — 0.05% |
|
|||||||||||
| Caesars Resort Collection LLC, |
|
|||||||||||
| Term Loan, 1st Lien |
|
|||||||||||
| (LIBOR plus 2.75%) |
|
|||||||||||
| 3.21% |
12/23/242 | 92,303 | 91,944 | |||||||||
| Churchill Downs, Inc., |
|
|||||||||||
| Term Loan B, 1st Lien |
|
|||||||||||
| (LIBOR plus 2.00%) |
|
|||||||||||
| 2.46% |
12/27/242 | 11,482,764 | 11,358,980 | |||||||||
| 2.46% |
03/17/282 | 12,870,000 | 12,730,618 | |||||||||
| Golden Nugget, LLC, |
|
|||||||||||
| Term Loan B, 1st Lien |
|
|||||||||||
| (SOFR plus 4.00%) |
|
|||||||||||
| 4.50% |
01/27/292 | 14,840,858 | 14,786,169 | |||||||||
|
|
|
| ||||||||||
| 38,967,711 | ||||||||||||
|
|
|
| ||||||||||
| Health Care — 0.58% |
|
|||||||||||
| Avantor Funding, Inc., |
|
|||||||||||
| Term Loan B5, 1st Lien |
|
|||||||||||
| (LIBOR plus 2.25%) |
|
|||||||||||
| 2.75% |
11/08/272 | 66,727,685 | 66,310,637 | |||||||||
| Avolon TLB Borrower 1 U.S. LLC, |
|
|||||||||||
| Term Loan B3, 1st Lien |
|
|||||||||||
| (LIBOR plus 1.75%) |
|
|||||||||||
| 2.50% |
01/15/252 | 6,520,459 | 6,429,205 | |||||||||
| Change Healthcare Holdings LLC, |
|
|||||||||||
| Term Loan B, 1st Lien |
|
|||||||||||
| (LIBOR plus 2.50%) |
|
|||||||||||
| 3.50% |
03/01/242 | 26,359,746 | 26,251,012 | |||||||||
| Elanco Animal Health, Inc., |
|
|||||||||||
| Term Loan B, 1st Lien |
|
|||||||||||
| (LIBOR plus 1.75%) |
|
|||||||||||
| 1.98% |
08/01/272 | 95,965,348 | 94,608,398 | |||||||||
| Endo Luxembourg Finance Co., |
|
|||||||||||
| Term Loan B, 1st Lien |
|
|||||||||||
| (LIBOR plus 5.00%) |
|
|||||||||||
| 5.75% |
03/27/282 | 65,950,338 | 61,959,023 | |||||||||
| Grifols Worldwide Operations USA, Inc., |
|
|||||||||||
| Term Loan B, 1st Lien |
|
|||||||||||
| (LIBOR plus 2.00%) |
|
|||||||||||
| 2.46% |
11/15/272 | 51,568,884 | 50,776,012 | |||||||||
| Horizon Therapeutics USA, Inc., |
|
|||||||||||
| Term Loan B, 1st Lien |
|
|||||||||||
| (LIBOR plus 1.75%) |
|
|||||||||||
| 2.25% |
03/15/282 | 55,563,583 | 55,094,904 | |||||||||
| Term Loan B1, 1st Lien |
|
|||||||||||
| (LIBOR plus 2.00%) |
|
|||||||||||
| 2.50% |
05/22/262 | 628,170 | 622,831 | |||||||||
| Issues |
Maturity Date |
Principal Amount |
Value | |||||||||
| BANK LOANS (continued) |
|
|||||||||||
| Health Care (continued) |
|
|||||||||||
| ICON Luxembourg SARL, |
|
|||||||||||
| Term Loan B, 1st Lien |
|
|||||||||||
| (LIBOR plus 2.25%) |
|
|||||||||||
| 3.31% |
07/03/282 | $ | 15,045,198 | $ | 14,993,518 | |||||||
| Indigo Merger Sub, Inc., |
|
|||||||||||
| Term Loan B, 1st Lien |
|
|||||||||||
| (LIBOR plus 2.25%) |
|
|||||||||||
| 3.31% |
07/03/282 | 3,748,421 | 3,735,545 | |||||||||
| Jazz Financing Lux SARL, |
|
|||||||||||
| Term Loan B, 1st Lien |
|
|||||||||||
| (LIBOR plus 3.50%) |
|
|||||||||||
| 4.00% |
05/05/282 | 42,836,300 | 42,731,994 | |||||||||
| Organon & Co., |
|
|||||||||||
| Term Loan B, 1st Lien |
|
|||||||||||
| (LIBOR plus 3.00%) |
|
|||||||||||
| 3.56% |
06/02/282 | 26,153,021 | 26,054,947 | |||||||||
| Valeant Pharmaceuticals International, Inc., |
|
|||||||||||
| Term Loan B, 1st Lien |
|
|||||||||||
| (LIBOR plus 2.75%) |
|
|||||||||||
| 3.21% |
11/27/252 | 3,785,588 | 3,757,196 | |||||||||
|
|
|
| ||||||||||
| 453,325,222 | ||||||||||||
|
|
|
| ||||||||||
| Industrials — 0.17% |
|
|||||||||||
| Berry Global, Inc., |
|
|||||||||||
| Term Loan Z, 1st Lien |
|
|||||||||||
| (LIBOR plus 1.75%) |
|
|||||||||||
| 2.07% |
07/01/262 | 71,273,684 | 70,393,811 | |||||||||
| Michaels Cos., Inc. (The), |
|
|||||||||||
| Term Loan, 1st Lien |
|
|||||||||||
| (LIBOR plus 4.25%) |
|
|||||||||||
| 5.26% |
04/15/282 | 28,028,200 | 26,362,064 | |||||||||
| TransDigm, Inc., |
|
|||||||||||
| Term Loan E, 1st Lien |
|
|||||||||||
| (LIBOR plus 2.25%) |
|
|||||||||||
| 2.71% |
05/30/252 | 18,219,298 | 17,923,234 | |||||||||
| Term Loan F, 1st Lien |
|
|||||||||||
| (LIBOR plus 2.25%) |
|
|||||||||||
| 2.71% |
12/09/252 | 5,349,028 | 5,266,279 | |||||||||
| Zep, Inc., |
|
|||||||||||
| Term Loan B, 1st Lien |
|
|||||||||||
| (LIBOR plus 4.00%) |
|
|||||||||||
| 5.00% |
08/12/242 | 10,067,140 | 9,664,454 | |||||||||
|
|
|
| ||||||||||
| 129,609,842 | ||||||||||||
|
|
|
| ||||||||||
| Information Technology — 0.15% |
|
|||||||||||
| AthenaHealth Group, Inc., |
|
|||||||||||
| Term Loan B, 1st Lien |
|
|||||||||||
| (SOFR plus 3.50%) |
|
|||||||||||
| 4.00% |
02/15/292,8 | 5,985,507 | 5,933,134 | |||||||||
| Entegris, Inc., |
|
|||||||||||
| Term Loan B, 1st Lien |
|
|||||||||||
| (SOFR plus 3.00%) |
|
|||||||||||
| 3.00% |
03/02/292 | 8,930,000 | 8,920,713 | |||||||||
See accompanying Notes to Financial Statements.
| Annual Report March 2022 / 172 |
Table of Contents
Total Return Bond Fund
Schedule of Portfolio Investments
March 31, 2022
| Issues |
Maturity Date |
Principal Amount |
Value | |||||||||
| BANK LOANS (continued) |
|
|||||||||||
| Information Technology (continued) |
|
|||||||||||
| Gainwell Acquisition Corp., |
|
|||||||||||
| Term Loan B, 1st Lien |
|
|||||||||||
| (LIBOR plus 4.00%) |
|
|||||||||||
| 5.01% |
10/01/272 | $ | 18,129,104 | $ | 18,129,103 | |||||||
| IQVIA, Inc., |
|
|||||||||||
| Term Loan B1, 1st Lien |
|
|||||||||||
| (LIBOR plus 1.75%) |
|
|||||||||||
| 2.21% |
03/07/242 | 13,837,268 | 13,759,433 | |||||||||
| Term Loan B3, 1st Lien |
|
|||||||||||
| (LIBOR plus 1.75%) |
|
|||||||||||
| 2.76% |
06/11/252 | 3,698,116 | 3,682,399 | |||||||||
| NortonLifeLock, Inc., |
|
|||||||||||
| Term Loan B, 1st Lien |
|
|||||||||||
| (SOFR plus 2.00%) |
|
|||||||||||
| 2.00% |
01/28/292 | 53,430,000 | 52,840,133 | |||||||||
| SS&C Technologies, Inc., |
|
|||||||||||
| Term Loan B3, 1st Lien |
|
|||||||||||
| (LIBOR plus 1.75%) |
|
|||||||||||
| 2.21% |
04/16/252 | 8,491,074 | 8,374,322 | |||||||||
| Term Loan B4, 1st Lien |
|
|||||||||||
| (LIBOR plus 1.75%) |
|
|||||||||||
| 2.21% |
04/16/252 | 6,892,878 | 6,798,101 | |||||||||
|
|
|
| ||||||||||
| 118,437,338 | ||||||||||||
|
|
|
| ||||||||||
| Insurance — 0.03% |
|
|||||||||||
| Acrisure LLC, |
|
|||||||||||
| Term Loan B, 1st Lien |
|
|||||||||||
| (LIBOR plus 3.50%) |
|
|||||||||||
| 3.96% |
02/15/272 | 26,233,079 | 25,916,183 | |||||||||
|
|
|
| ||||||||||
| Retail — 0.09% |
|
|||||||||||
| AmWINS Group, Inc., |
|
|||||||||||
| Term Loan B, 1st Lien |
|
|||||||||||
| (LIBOR plus 2.25%) |
|
|||||||||||
| 3.00% |
02/19/282 | 50,666,770 | 49,906,768 | |||||||||
| BC ULC, |
|
|||||||||||
| Term Loan B, 1st Lien (Canada) |
|
|||||||||||
| (LIBOR plus 1.75%) |
|
|||||||||||
| 2.21% |
11/19/262,3 | 23,489,998 | 23,027,480 | |||||||||
| KFC Holding Co., |
|
|||||||||||
| Term Loan B, 1st Lien |
|
|||||||||||
| (LIBOR plus 1.75%) |
|
|||||||||||
| 2.22% |
03/15/282 | 1,332,975 | 1,325,058 | |||||||||
|
|
|
| ||||||||||
| 74,259,306 | ||||||||||||
|
|
|
| ||||||||||
| Services — 0.04% |
|
|||||||||||
| GFL Environmental, Inc., |
|
|||||||||||
| Term Loan B, 1st Lien |
|
|||||||||||
| (LIBOR plus 3.00%) |
|
|||||||||||
| 3.50% |
05/30/252 | 12,146,001 | 12,119,462 | |||||||||
| PowerTeam Services LLC, |
|
|||||||||||
| Term Loan, 1st Lien |
|
|||||||||||
| (LIBOR plus 3.25%) |
|
|||||||||||
| 4.26% |
03/06/252 | 2,502,615 | 2,340,571 | |||||||||
| Issues |
Maturity Date |
Principal Amount |
Value | |||||||||
| BANK LOANS (continued) |
|
|||||||||||
| Services (continued) |
|
|||||||||||
| SS&C Technologies, Inc., |
|
|||||||||||
| Term Loan B5, 1st Lien |
|
|||||||||||
| (LIBOR plus 1.75%) |
|
|||||||||||
| 2.21% |
04/16/252 | $ | 1,313,579 | $ | 1,295,064 | |||||||
| Trans Union LLC, |
|
|||||||||||
| Term Loan B6 |
|
|||||||||||
| (LIBOR plus 2.25%) |
|
|||||||||||
| 2.75% |
12/01/282 | 14,707,662 | 14,621,843 | |||||||||
|
|
|
| ||||||||||
| 30,376,940 | ||||||||||||
|
|
|
| ||||||||||
| Transportation — 0.01% |
|
|||||||||||
| American Airlines, Inc., |
|
|||||||||||
| Term Loan B, 1st Lien |
|
|||||||||||
| (LIBOR plus 1.75%) |
|
|||||||||||
| 2.20% |
01/29/272 | 5,601,839 | 5,258,726 | |||||||||
|
|
|
| ||||||||||
| Total Bank Loans |
|
|||||||||||
| (Cost $1,589,882,730) |
|
1,559,443,672 | ||||||||||
|
|
|
| ||||||||||
| CORPORATES — 28.89%* |
|
|||||||||||
| Banking — 6.45% |
|
|||||||||||
| ABN AMRO Bank NV |
|
|||||||||||
| (Netherlands) |
|
|||||||||||
| 2.47% |
12/13/291,3,4 | 7,000,000 | 6,407,631 | |||||||||
| Bank of America Corp. |
|
|||||||||||
| 1.73% |
07/22/274 | 250,485,000 | 232,926,981 | |||||||||
| 2.30% |
07/21/324 | 5,755,000 | 5,126,012 | |||||||||
| 2.69% |
04/22/324 | 16,700,000 | 15,355,100 | |||||||||
| 2.97% |
02/04/334 | 95,074,000 | 89,247,762 | |||||||||
| 3.00% |
12/20/234 | 18,385,000 | 18,438,375 | |||||||||
| 3.55% |
03/05/244 | 6,000,000 | 6,041,223 | |||||||||
| Bank of America Corp. |
|
|||||||||||
| (MTN) |
|
|||||||||||
| 1.90% |
07/23/314 | 31,000,000 | 27,135,303 | |||||||||
| 2.02% |
02/13/264 | 14,932,000 | 14,385,500 | |||||||||
| 2.09% |
06/14/294 | 280,019,000 | 256,169,681 | |||||||||
| 3.46% |
03/15/254 | 17,545,000 | 17,659,865 | |||||||||
| (LIBOR USD 3-Month plus 0.65%) |
|
|||||||||||
| 1.17% |
12/01/262 | 50,000,000 | 48,163,675 | |||||||||
| Bank of America Corp., |
|
|||||||||||
| Series N |
|
|||||||||||
| 1.66% |
03/11/274 | 335,235,000 | 313,376,438 | |||||||||
| Credit Suisse Group AG |
|
|||||||||||
| (Switzerland) |
|
|||||||||||
| 1.31% |
02/02/271,3,4 | 130,675,000 | 116,862,421 | |||||||||
| 2.19% |
06/05/261,3,4 | 120,398,000 | 113,286,434 | |||||||||
| 2.59% |
09/11/251,3,4 | 50,708,000 | 48,937,885 | |||||||||
| 3.09% |
05/14/321,3,4 | 101,965,000 | 91,860,293 | |||||||||
| 4.28% |
01/09/281,3 | 43,970,000 | 43,986,197 | |||||||||
| Discover Bank |
|
|||||||||||
| (BKNT) |
|
|||||||||||
| 4.20% |
08/08/23 | 15,255,000 | 15,521,488 | |||||||||
| DNB Bank ASA |
|
|||||||||||
| (Norway) |
|
|||||||||||
| 0.86% |
09/30/251,3,4 | 122,145,000 | 115,769,751 | |||||||||
| 1.13% |
09/16/261,3,4 | 7,581,000 | 6,967,410 | |||||||||
| 1.61% |
03/30/281,3,4 | 5,940,000 | 5,377,046 | |||||||||
See accompanying Notes to Financial Statements.
| 173 / Annual Report March 2022 |
Table of Contents
Total Return Bond Fund
Schedule of Portfolio Investments
March 31, 2022
| Issues |
Maturity Date |
Principal Amount |
Value | |||||||||
| CORPORATES (continued) |
|
|||||||||||
| Banking (continued) |
|
|||||||||||
| Global Bank Corp. |
|
|||||||||||
| (Panama) |
|
|||||||||||
| 5.25% |
04/16/291,3,4 | $ | 2,400,000 | $ | 2,286,000 | |||||||
| HSBC Holdings PLC |
|
|||||||||||
| (United Kingdom) |
|
|||||||||||
| 1.59% |
05/24/273,4 | 27,550,000 | 25,180,931 | |||||||||
| 1.75% |
07/24/273,4 | 34,075,000 | 42,295,750 | |||||||||
| 2.01% |
09/22/283,4 | 183,122,000 | 166,308,002 | |||||||||
| 2.21% |
08/17/293,4 | 162,265,000 | 146,238,433 | |||||||||
| 2.25% |
11/22/273,4 | 8,415,000 | 7,843,417 | |||||||||
| 2.63% |
11/07/253,4 | 77,135,000 | 75,296,885 | |||||||||
| 2.80% |
05/24/323,4 | 11,540,000 | 10,512,155 | |||||||||
| 3.80% |
03/11/253,4 | 8,775,000 | 8,820,688 | |||||||||
| 4.04% |
03/13/283,4 | 20,000,000 | 20,088,371 | |||||||||
| 4.29% |
09/12/263,4 | 3,375,000 | 3,419,116 | |||||||||
| ING Groep NV |
|
|||||||||||
| (Netherlands) |
|
|||||||||||
| 4.02% |
03/28/283,4 | 2,015,000 | 2,029,751 | |||||||||
| 4.25% |
03/28/333,4 | 27,750,000 | 28,572,579 | |||||||||
| JPMorgan Chase & Co. |
|
|||||||||||
| 0.77% |
08/09/254 | 68,080,000 | 64,612,305 | |||||||||
| 0.97% |
06/23/254 | 134,380,000 | 128,384,543 | |||||||||
| 1.47% |
09/22/274 | 27,405,000 | 25,347,688 | |||||||||
| 1.58% |
04/22/274 | 120,391,000 | 112,221,032 | |||||||||
| 2.01% |
03/13/264 | 52,245,000 | 50,432,125 | |||||||||
| 2.08% |
04/22/264 | 22,845,000 | 22,035,234 | |||||||||
| 2.58% |
04/22/324 | 37,994,000 | 34,862,571 | |||||||||
| 3.22% |
03/01/254 | 34,600,000 | 34,738,391 | |||||||||
| 4.02% |
12/05/244 | 190,675,000 | 193,808,932 | |||||||||
| Lloyds Banking Group PLC |
|
|||||||||||
| (United Kingdom) |
|
|||||||||||
| 1.63% |
05/11/273,4 | 21,375,000 | 19,621,980 | |||||||||
| 2.91% |
11/07/233,4 | 256,085,000 | 256,521,292 | |||||||||
| 3.75% |
03/18/283,4 | 21,255,000 | 21,188,080 | |||||||||
| 3.87% |
07/09/253,4 | 27,225,000 | 27,527,615 | |||||||||
| 3.90% |
03/12/243 | 27,591,000 | 28,026,724 | |||||||||
| 4.05% |
08/16/233 | 10,510,000 | 10,701,015 | |||||||||
| Macquarie Group Ltd. |
|
|||||||||||
| (Australia) |
|
|||||||||||
| 1.20% |
10/14/251,3,4 | 70,515,000 | 66,707,066 | |||||||||
| 1.34% |
01/12/271,3,4 | 25,515,000 | 23,278,230 | |||||||||
| 1.63% |
09/23/271,3,4 | 35,840,000 | 32,342,167 | |||||||||
| 2.69% |
06/23/321,3,4 | 2,100,000 | 1,854,319 | |||||||||
| 2.87% |
01/14/331,3,4 | 122,595,000 | 109,059,838 | |||||||||
| 3.19% |
11/28/231,3,4 | 9,292,000 | 9,309,705 | |||||||||
| 4.15% |
03/27/241,3,4 | 9,600,000 | 9,717,543 | |||||||||
| 4.44% |
06/21/331,3,4 | 54,765,000 | 55,453,211 | |||||||||
| NatWest Group PLC |
|
|||||||||||
| (United Kingdom) |
|
|||||||||||
| 4.27% |
03/22/253,4 | 123,475,000 | 124,977,648 | |||||||||
| 4.52% |
06/25/243,4 | 12,162,000 | 12,349,101 | |||||||||
| Santander UK Group Holdings PLC |
|
|||||||||||
| (United Kingdom) |
|
|||||||||||
| 1.09% |
03/15/253,4 | 176,904,000 | 168,286,877 | |||||||||
| 1.53% |
08/21/263,4 | 43,234,000 | 39,789,544 | |||||||||
| 1.67% |
06/14/273,4 | 33,865,000 | 30,852,916 | |||||||||
| Issues |
Maturity Date |
Principal Amount |
Value | |||||||||
| CORPORATES (continued) |
|
|||||||||||
| Banking (continued) |
|
|||||||||||
| 2.47% |
01/11/283,4 | $ | 20,450,000 | $ | 19,044,556 | |||||||
| 3.37% |
01/05/243,4 | 28,945,000 | 29,044,209 | |||||||||
| 3.82% |
11/03/283,4 | 8,897,000 | 8,752,191 | |||||||||
| 4.80% |
11/15/243,4 | 114,250,000 | 116,900,493 | |||||||||
| Santander UK PLC |
|
|||||||||||
| (United Kingdom) |
|
|||||||||||
| 5.00% |
11/07/231,3 | 27,746,000 | 28,425,777 | |||||||||
| UBS AG |
|
|||||||||||
| (Switzerland) |
|
|||||||||||
| (SOFR Rate plus 0.45%) |
|
|||||||||||
| 0.63% |
08/09/241,2,3 | 98,100,000 | 97,410,688 | |||||||||
| UBS Group AG |
|
|||||||||||
| (Switzerland) |
|
|||||||||||
| 2.86% |
08/15/231,3,4 | 19,655,000 | 19,688,280 | |||||||||
| Wells Fargo & Co. |
|
|||||||||||
| 2.19% |
04/30/264 | 53,175,000 | 51,330,611 | |||||||||
| Wells Fargo & Co. |
|
|||||||||||
| (MTN) |
|
|||||||||||
| 2.16% |
02/11/264 | 62,158,000 | 60,166,654 | |||||||||
| 2.39% |
06/02/284 | 150,966,000 | 142,925,617 | |||||||||
| 2.88% |
10/30/304 | 168,638,000 | 160,671,151 | |||||||||
| 3.35% |
03/02/334 | 308,670,000 | 300,304,537 | |||||||||
| 3.53% |
03/24/284 | 93,649,000 | 93,551,409 | |||||||||
| 4.15% |
01/24/29 | 4,978,000 | 5,168,613 | |||||||||
| 5.01% |
04/04/514 | 6,515,000 | 7,766,356 | |||||||||
|
|
|
| ||||||||||
| 5,003,053,383 | ||||||||||||
|
|
|
| ||||||||||
| Communications — 4.36% |
|
|||||||||||
| AT&T, Inc. |
|
|||||||||||
| 2.55% |
12/01/33 | 75,325,000 | 67,071,828 | |||||||||
| 3.80% |
12/01/57 | 278,699,000 | 248,377,064 | |||||||||
| 4.30% |
12/15/42 | 30,960,000 | 30,798,807 | |||||||||
| 4.50% |
05/15/35 | 48,155,000 | 50,727,464 | |||||||||
| 4.75% |
05/15/46 | 146,527,000 | 159,738,740 | |||||||||
| 4.85% |
03/01/39 | 4,620,000 | 5,041,199 | |||||||||
| 5.25% |
03/01/37 | 141,704,000 | 161,561,696 | |||||||||
| C&W Senior Financing DAC |
|
|||||||||||
| (Ireland) |
|
|||||||||||
| 6.88% |
09/15/271,3 | 3,150,000 | 3,131,919 | |||||||||
| Cable One, Inc. |
|
|||||||||||
| 4.00% |
11/15/301 | 11,158,000 | 10,321,150 | |||||||||
| CCO Holdings LLC/CCO Holdings Capital Corp. |
|
|||||||||||
| 4.25% |
02/01/311 | 1,153,000 | 1,052,183 | |||||||||
| CCO Holdings, LLC/CCO Holdings Capital Corp. |
|
|||||||||||
| 4.25% |
01/15/341 | 12,901,000 | 11,223,870 | |||||||||
| 4.50% |
05/01/32 | 4,800,000 | 4,396,474 | |||||||||
| 4.50% |
06/01/331 | 3,958,000 | 3,555,629 | |||||||||
| Charter Communications Operating LLC/Charter |
|
|||||||||||
| Communications Operating Capital |
|
|||||||||||
| 2.30% |
02/01/32 | 10,000,000 | 8,556,465 | |||||||||
| 4.80% |
03/01/50 | 43,110,000 | 41,179,965 | |||||||||
| 5.38% |
04/01/38 | 2,030,000 | 2,095,247 | |||||||||
| 5.38% |
05/01/47 | 95,317,000 | 97,763,348 | |||||||||
| 5.75% |
04/01/48 | 19,313,000 | 20,543,238 | |||||||||
See accompanying Notes to Financial Statements.
| Annual Report March 2022 / 174 |
Table of Contents
Total Return Bond Fund
Schedule of Portfolio Investments
March 31, 2022
| Issues |
Maturity Date |
Principal Amount |
Value | |||||||||
| CORPORATES (continued) |
|
|||||||||||
| Communications (continued) |
|
|||||||||||
| Charter Communications Operating, LLC/Charter |
|
|||||||||||
| Communications Operating Capital |
|
|||||||||||
| 4.40% |
04/01/33 | $ | 11,490,000 | $ | 11,472,865 | |||||||
| 5.13% |
07/01/49 | 14,837,000 | 14,833,588 | |||||||||
| 5.25% |
04/01/53 | 120,525,000 | 121,667,272 | |||||||||
| CommScope, Inc. |
|
|||||||||||
| 4.75% |
09/01/291 | 37,115,000 | 34,424,163 | |||||||||
| Cox Communications, Inc. |
|
|||||||||||
| 2.60% |
06/15/311 | 9,790,000 | 8,861,682 | |||||||||
| CSC Holdings LLC |
|
|||||||||||
| 4.13% |
12/01/301 | 30,484,000 | 26,881,389 | |||||||||
| 4.50% |
11/15/311 | 68,204,000 | 61,188,127 | |||||||||
| 5.38% |
02/01/281 | 5,000,000 | 4,861,600 | |||||||||
| 6.50% |
02/01/291 | 37,179,000 | 37,545,957 | |||||||||
| Diamond Sports Group, LLC/Diamond Sports Finance Co. |
|
|||||||||||
| 5.38% |
08/15/261 | 117,716,000 | 46,203,530 | |||||||||
| Intelsat Jackson Holdings SA |
|
|||||||||||
| (Luxembourg) |
|
|||||||||||
| 6.50% |
03/15/301,3 | 153,780,000 | 153,785,270 | |||||||||
| Intelsat Jackson Holdings SA, |
|
|||||||||||
| Class B |
|
|||||||||||
| 8.50% |
10/15/241,3,5,6,9,10 | 149,759,000 | — | |||||||||
| Intelsat Jackson Holdings SA, |
|
|||||||||||
| Class B |
|
|||||||||||
| (Luxembourg) |
|
|||||||||||
| 5.50% |
08/01/233,5,6,9,10 | 54,920,000 | — | |||||||||
| 9.75% |
07/15/251,3,5,6,9,10 | 45,708,000 | — | |||||||||
| Level 3 Financing, Inc. |
|
|||||||||||
| 3.40% |
03/01/271 | 54,425,000 | 51,386,968 | |||||||||
| 3.63% |
01/15/291 | 19,205,000 | 16,822,649 | |||||||||
| 3.75% |
07/15/291 | 51,287,000 | 45,516,699 | |||||||||
| 3.88% |
11/15/291 | 118,191,000 | 108,984,512 | |||||||||
| 4.25% |
07/01/281 | 16,997,000 | 15,620,053 | |||||||||
| Lumen Technologies, Inc. |
|
|||||||||||
| 5.38% |
06/15/291 | 5,600,000 | 4,994,976 | |||||||||
| Netflix, Inc. |
|
|||||||||||
| 4.38% |
11/15/26 | 15,785,000 | 16,395,355 | |||||||||
| Paramount Global |
|
|||||||||||
| 3.45% |
10/04/26 | 2,913,000 | 2,868,136 | |||||||||
| 4.20% |
05/19/32 | 23,481,000 | 23,529,269 | |||||||||
| Qwest Corp. |
|
|||||||||||
| 7.25% |
09/15/25 | 4,044,000 | 4,418,070 | |||||||||
| SES GLOBAL Americas Holdings GP |
|
|||||||||||
| 5.30% |
03/25/441 | 55,170,000 | 53,674,108 | |||||||||
| SES SA |
|
|||||||||||
| (Luxembourg) |
|
|||||||||||
| 3.60% |
04/04/231,3 | 16,882,000 | 16,980,937 | |||||||||
| Sinclair Television Group, Inc. |
|
|||||||||||
| 4.13% |
12/01/301 | 12,461,000 | 11,133,904 | |||||||||
| Sprint Spectrum Co. LLC/Sprint Spectrum Co. II LLC/Sprint Spectrum Co. III LLC |
|
|||||||||||
| 4.74% |
03/20/251 | 140,299,500 | 143,306,242 | |||||||||
| 5.15% |
03/20/281 | 310,120,000 | 326,850,800 | |||||||||
| Tencent Holdings Ltd. |
|
|||||||||||
| (Cayman Islands) |
|
|||||||||||
| 2.88% |
04/22/311,3 | 5,535,000 | 5,061,227 | |||||||||
| Issues |
Maturity Date |
Principal Amount |
Value | |||||||||
| CORPORATES (continued) |
|
|||||||||||
| Communications (continued) |
|
|||||||||||
| 3.68% |
04/22/411,3 | $ | 22,760,000 | $ | 20,166,980 | |||||||
| 3.84% |
04/22/511,3 | 68,301,000 | 59,825,482 | |||||||||
| 3.98% |
04/11/291,3 | 9,225,000 | 9,222,971 | |||||||||
| Time Warner Cable LLC |
|
|||||||||||
| 4.50% |
09/15/42 | 18,977,000 | 17,599,089 | |||||||||
| 5.50% |
09/01/41 | 32,811,000 | 34,144,990 | |||||||||
| T-Mobile USA, Inc. |
|
|||||||||||
| 2.25% |
02/15/261 | 53,869,000 | 50,906,876 | |||||||||
| 2.55% |
02/15/31 | 10,083,000 | 9,159,208 | |||||||||
| 2.63% |
04/15/26 | 102,831,000 | 98,429,500 | |||||||||
| 2.63% |
02/15/29 | 5,073,000 | 4,642,962 | |||||||||
| 3.50% |
04/15/31 | 22,844,000 | 21,547,162 | |||||||||
| 3.75% |
04/15/27 | 38,847,000 | 39,142,907 | |||||||||
| 3.88% |
04/15/30 | 296,582,000 | 298,142,674 | |||||||||
| 4.38% |
04/15/40 | 3,715,000 | 3,741,860 | |||||||||
| 4.75% |
02/01/28 | 16,028,000 | 16,326,922 | |||||||||
| Verizon Communications, Inc. |
|
|||||||||||
| 2.36% |
03/15/321 | 100,379,000 | 90,807,517 | |||||||||
| 2.55% |
03/21/31 | 9,150,000 | 8,506,997 | |||||||||
| 4.50% |
08/10/33 | 7,316,000 | 7,868,918 | |||||||||
| Vodafone Group PLC |
|
|||||||||||
| (United Kingdom) |
|
|||||||||||
| 4.88% |
06/19/493 | 133,422,500 | 145,651,639 | |||||||||
| 5.25% |
05/30/483 | 78,950,500 | 88,696,321 | |||||||||
| Walt Disney Co. (The) |
|
|||||||||||
| 4.63% |
03/23/40 | 29,000,000 | 32,202,951 | |||||||||
| Zayo Group Holdings, Inc. |
|
|||||||||||
| 4.00% |
03/01/271 | 24,868,000 | 22,928,793 | |||||||||
|
|
|
| ||||||||||
| 3,376,068,353 | ||||||||||||
|
|
|
| ||||||||||
| Consumer Discretionary — 1.47% |
|
|||||||||||
| Altria Group, Inc. |
|
|||||||||||
| 3.70% |
02/04/51 | 995,000 | 811,742 | |||||||||
| Anheuser-Busch Cos. LLC/Anheuser-Busch InBev Worldwide, Inc. |
|
|||||||||||
| 4.70% |
02/01/36 | 45,442,000 | 49,455,475 | |||||||||
| 4.90% |
02/01/46 | 30,994,000 | 34,519,361 | |||||||||
| Anheuser-Busch InBev Worldwide, Inc. |
|
|||||||||||
| 4.35% |
06/01/40 | 27,155,000 | 28,329,874 | |||||||||
| 4.60% |
04/15/48 | 29,578,000 | 31,848,672 | |||||||||
| 4.60% |
06/01/60 | 63,922,000 | 68,018,299 | |||||||||
| Bacardi Ltd. |
|
|||||||||||
| (Bermuda) |
|
|||||||||||
| 4.45% |
05/15/251,3 | 24,780,000 | 25,386,748 | |||||||||
| 5.15% |
05/15/381,3 | 12,881,000 | 14,051,745 | |||||||||
| 5.30% |
05/15/481,3 | 23,831,000 | 26,733,781 | |||||||||
| BAT Capital Corp. |
|
|||||||||||
| 2.73% |
03/25/31 | 795,000 | 701,924 | |||||||||
| 3.56% |
08/15/27 | 8,003,000 | 7,790,729 | |||||||||
| 3.73% |
09/25/40 | 3,182,000 | 2,615,152 | |||||||||
| 3.98% |
09/25/50 | 13,755,000 | 11,184,326 | |||||||||
| 4.39% |
08/15/37 | 73,160,000 | 68,194,432 | |||||||||
| 4.54% |
08/15/47 | 119,665,000 | 107,106,045 | |||||||||
| 4.76% |
09/06/49 | 30,502,000 | 28,143,507 | |||||||||
| 5.28% |
04/02/50 | 5,356,000 | 5,317,856 | |||||||||
See accompanying Notes to Financial Statements.
| 175 / Annual Report March 2022 |
Table of Contents
Total Return Bond Fund
Schedule of Portfolio Investments
March 31, 2022
| Issues |
Maturity Date |
Principal Amount |
Value | |||||||||
| CORPORATES (continued) |
|
|||||||||||
| Consumer Discretionary (continued) |
|
|||||||||||
| BAT International Finance PLC |
|
|||||||||||
| (EMTN) |
|
|||||||||||
| (United Kingdom) |
|
|||||||||||
| 2.25% |
09/09/523 | $ | 71,770,000 | $ | 56,279,457 | |||||||
| Constellation Brands, Inc. |
|
|||||||||||
| 3.20% |
02/15/23 | 9,017,000 | 9,078,546 | |||||||||
| 4.65% |
11/15/28 | 7,350,000 | 7,767,089 | |||||||||
| GSK Consumer Healthcare Capital U.S., LLC |
|
|||||||||||
| 3.38% |
03/24/271 | 11,710,000 | 11,723,020 | |||||||||
| 3.63% |
03/24/321 | 5,490,000 | 5,490,309 | |||||||||
| GSK Consumer Healthcare Capital UK PLC |
|
|||||||||||
| (United Kingdom) |
|
|||||||||||
| 3.13% |
03/24/251,3 | 6,935,000 | 6,917,828 | |||||||||
| Imperial Brands Finance PLC |
|
|||||||||||
| (United Kingdom) |
|
|||||||||||
| 3.13% |
07/26/241,3 | 15,312,000 | 15,184,762 | |||||||||
| 3.50% |
02/11/231,3 | 4,800,000 | 4,825,026 | |||||||||
| 3.50% |
07/26/261,3 | 53,505,000 | 52,295,245 | |||||||||
| 3.75% |
07/21/221,3 | 4,540,000 | 4,554,972 | |||||||||
| 4.25% |
07/21/251,3 | 15,566,000 | 15,701,178 | |||||||||
| Imperial Brands Finance PLC |
|
|||||||||||
| (EMTN) |
|
|||||||||||
| (United Kingdom) |
|
|||||||||||
| 8.13% |
03/15/243 | 1,758,000 | 2,536,369 | |||||||||
| Magallanes, Inc. |
|
|||||||||||
| 3.43% |
03/15/241 | 3,000,000 | 3,016,588 | |||||||||
| 4.28% |
03/15/321 | 8,840,000 | 8,895,305 | |||||||||
| 5.05% |
03/15/421 | 16,935,000 | 17,286,073 | |||||||||
| 5.14% |
03/15/521 | 186,742,000 | 191,294,608 | |||||||||
| 5.39% |
03/15/621 | 106,895,000 | 110,515,534 | |||||||||
| Reynolds American, Inc. |
|
|||||||||||
| 5.70% |
08/15/35 | 34,320,000 | 36,187,596 | |||||||||
| 5.85% |
08/15/45 | 68,022,000 | 69,619,397 | |||||||||
|
|
|
| ||||||||||
| 1,139,378,570 | ||||||||||||
|
|
|
| ||||||||||
| Electric — 0.80% |
|
|||||||||||
| AEP Transmission Co. LLC, |
|
|||||||||||
| Series M |
|
|||||||||||
| 3.65% |
04/01/50 | 1,460,000 | 1,414,369 | |||||||||
| Alliant Energy Finance LLC |
|
|||||||||||
| 3.75% |
06/15/231 | 31,081,000 | 31,444,187 | |||||||||
| Alliant Energy Finance, LLC |
|
|||||||||||
| 3.60% |
03/01/321 | 4,515,000 | 4,408,932 | |||||||||
| American Electric Power Co., Inc. |
|
|||||||||||
| 2.03% |
03/15/24 | 4,935,000 | 4,854,235 | |||||||||
| American Electric Power Co., Inc., |
|
|||||||||||
| Series F |
|
|||||||||||
| 2.95% |
12/15/22 | 4,511,000 | 4,529,778 | |||||||||
| American Electric Power Co., Inc., |
|
|||||||||||
| Series J |
|
|||||||||||
| 4.30% |
12/01/28 | 8,480,000 | 8,780,010 | |||||||||
| American Transmission Systems, Inc. |
|
|||||||||||
| 2.65% |
01/15/321 | 15,040,000 | 13,924,888 | |||||||||
| Appalachian Power Co. |
|
|||||||||||
| 4.45% |
06/01/45 | 100,000 | 102,678 | |||||||||
| Issues |
Maturity Date |
Principal Amount |
Value | |||||||||
| CORPORATES (continued) |
|
|||||||||||
| Electric (continued) |
|
|||||||||||
| Appalachian Power Co., |
|
|||||||||||
| Series Z |
|
|||||||||||
| 3.70% |
05/01/50 | $ | 9,450,000 | $ | 8,870,116 | |||||||
| Black Hills Corp. |
|
|||||||||||
| 4.35% |
05/01/33 | 1,285,000 | 1,311,554 | |||||||||
| Consolidated Edison Co. of New York, Inc. |
|
|||||||||||
| 3.20% |
12/01/51 | 1,629,000 | 1,445,742 | |||||||||
| 3.70% |
11/15/59 | 4,740,000 | 4,379,447 | |||||||||
| Consolidated Edison Co. of New York, Inc., |
|
|||||||||||
| Series C |
|
|||||||||||
| 3.00% |
12/01/60 | 1,854,000 | 1,514,060 | |||||||||
| Consolidated Edison Co. of New York, Inc., |
|
|||||||||||
| Series E |
|
|||||||||||
| 4.65% |
12/01/48 | 14,546,000 | 16,040,289 | |||||||||
| Duke Energy Carolinas LLC |
|
|||||||||||
| 4.00% |
09/30/42 | 11,040,000 | 11,354,434 | |||||||||
| 4.25% |
12/15/41 | 14,683,000 | 15,410,835 | |||||||||
| Duke Energy Carolinas, LLC |
|
|||||||||||
| 2.85% |
03/15/32 | 60,000 | 58,058 | |||||||||
| 3.55% |
03/15/52 | 1,705,000 | 1,689,997 | |||||||||
| Duke Energy Corp. |
|
|||||||||||
| 2.55% |
06/15/31 | 41,835,000 | 38,424,575 | |||||||||
| Duke Energy Progress, LLC |
|
|||||||||||
| 3.40% |
04/01/32 | 13,830,000 | 13,914,931 | |||||||||
| Empresas Publicas de Medellin ESP, |
|
|||||||||||
| Series REGS |
|
|||||||||||
| (Colombia) |
|
|||||||||||
| 4.38% |
02/15/313 | 1,000,000 | 858,000 | |||||||||
| Evergy Missouri West, Inc. |
|
|||||||||||
| 3.75% |
03/15/321 | 4,380,000 | 4,417,262 | |||||||||
| Exelon Corp. |
|
|||||||||||
| 2.75% |
03/15/271 | 5,205,000 | 5,072,356 | |||||||||
| 3.35% |
03/15/321 | 30,105,000 | 29,386,516 | |||||||||
| 4.10% |
03/15/521 | 4,930,000 | 5,024,320 | |||||||||
| FirstEnergy Corp. |
|
|||||||||||
| 2.65% |
03/01/30 | 5,831,000 | 5,305,044 | |||||||||
| FirstEnergy Corp., |
|
|||||||||||
| Series B |
|
|||||||||||
| 2.25% |
09/01/30 | 3,775,000 | 3,351,785 | |||||||||
| FirstEnergy Corp., |
|
|||||||||||
| Series C |
|
|||||||||||
| 3.40% |
03/01/50 | 27,555,000 | 23,265,513 | |||||||||
| 7.38% |
11/15/31 | 6,400,000 | 7,913,280 | |||||||||
| FirstEnergy Transmission LLC |
|
|||||||||||
| 2.87% |
09/15/281 | 60,193,000 | 55,955,631 | |||||||||
| 4.35% |
01/15/251 | 23,330,000 | 23,481,267 | |||||||||
| 4.55% |
04/01/491 | 13,175,000 | 12,751,974 | |||||||||
| 5.45% |
07/15/441 | 24,625,000 | 26,968,199 | |||||||||
| Florida Power & Light Co. |
|
|||||||||||
| 3.70% |
12/01/47 | 1,340,000 | 1,371,433 | |||||||||
| Jersey Central Power & Light Co. |
|
|||||||||||
| 2.75% |
03/01/321 | 4,660,000 | 4,345,310 | |||||||||
| 4.30% |
01/15/261 | 6,945,000 | 7,097,594 | |||||||||
| 4.70% |
04/01/241 | 49,765,000 | 50,904,286 | |||||||||
| 6.40% |
05/15/36 | 11,630,000 | 14,022,732 | |||||||||
See accompanying Notes to Financial Statements.
| Annual Report March 2022 / 176 |
Table of Contents
Total Return Bond Fund
Schedule of Portfolio Investments
March 31, 2022
| Issues |
Maturity Date |
Principal Amount |
Value | |||||||||
| CORPORATES (continued) |
|
|||||||||||
| Electric (continued) |
|
|||||||||||
| Metropolitan Edison Co. |
|
|||||||||||
| 3.50% |
03/15/231 | $ | 10,715,000 | $ | 10,775,749 | |||||||
| 4.00% |
04/15/251 | 35,719,000 | 35,922,046 | |||||||||
| 4.30% |
01/15/291 | 18,381,000 | 19,137,620 | |||||||||
| Mong Duong Finance Holdings BV, |
|
|||||||||||
| Series REGS |
|
|||||||||||
| (Netherlands) |
|
|||||||||||
| 5.13% |
05/07/293 | 8,350,000 | 7,537,211 | |||||||||
| Pennsylvania Electric Co. |
|
|||||||||||
| 3.25% |
03/15/281 | 125,000 | 120,415 | |||||||||
| 4.15% |
04/15/251 | 28,335,000 | 28,801,884 | |||||||||
| Public Service Co. of New Mexico |
|
|||||||||||
| 3.85% |
08/01/25 | 14,390,000 | 14,647,677 | |||||||||
| Southwestern Electric Power Co., |
|
|||||||||||
| Series K |
|
|||||||||||
| 2.75% |
10/01/26 | 26,488,000 | 25,892,738 | |||||||||
| Tucson Electric Power Co. |
|
|||||||||||
| 4.85% |
12/01/48 | 8,755,000 | 9,903,904 | |||||||||
|
|
|
| ||||||||||
| 618,104,861 | ||||||||||||
|
|
|
| ||||||||||
| Energy — 1.91% |
|
|||||||||||
| Archrock Partners LP/Archrock Partners Finance Corp. |
|
|||||||||||
| 6.25% |
04/01/281 | 37,255,000 | 36,835,881 | |||||||||
| Boston Gas Co. |
|
|||||||||||
| 3.76% |
03/16/321 | 6,440,000 | 6,447,546 | |||||||||
| Ecopetrol SA |
|
|||||||||||
| (Colombia) |
|
|||||||||||
| 6.88% |
04/29/303 | 10,775,000 | 11,352,540 | |||||||||
| Energy Transfer LP |
|
|||||||||||
| 4.00% |
10/01/27 | 29,583,000 | 29,824,166 | |||||||||
| 4.20% |
04/15/27 | 8,404,000 | 8,570,811 | |||||||||
| 4.90% |
03/15/35 | 5,160,000 | 5,202,510 | |||||||||
| 4.95% |
05/15/28 | 9,231,000 | 9,612,279 | |||||||||
| 4.95% |
06/15/28 | 26,678,000 | 28,057,061 | |||||||||
| 5.00% |
05/15/50 | 43,460,000 | 44,105,062 | |||||||||
| 5.15% |
03/15/45 | 48,691,000 | 48,828,499 | |||||||||
| 5.35% |
05/15/45 | 4,421,000 | 4,571,695 | |||||||||
| 5.40% |
10/01/47 | 135,238,000 | 141,561,824 | |||||||||
| 5.50% |
06/01/27 | 37,352,000 | 40,185,352 | |||||||||
| 6.13% |
12/15/45 | 16,239,000 | 17,990,568 | |||||||||
| Exxon Mobil Corp. |
|
|||||||||||
| 3.57% |
03/06/45 | 1,433,000 | 1,404,966 | |||||||||
| 4.23% |
03/19/40 | 34,593,000 | 37,333,215 | |||||||||
| 4.33% |
03/19/50 | 5,530,000 | 6,194,119 | |||||||||
| Galaxy Pipeline Assets Bidco Ltd. |
|
|||||||||||
| (United Kingdom) |
|
|||||||||||
| 2.16% |
03/31/341,3 | 19,018,302 | 17,559,427 | |||||||||
| Hess Corp. |
|
|||||||||||
| 5.60% |
02/15/41 | 22,039,000 | 24,822,321 | |||||||||
| KazMunayGas National Co. JSC |
|
|||||||||||
| (Kazakhstan) |
|
|||||||||||
| 3.50% |
04/14/331,3 | 1,800,000 | 1,507,500 | |||||||||
| KazMunayGas National Co. JSC, |
|
|||||||||||
| Series REGS |
|
|||||||||||
| (Kazakhstan) |
|
|||||||||||
| 3.50% |
04/14/333 | 5,883,000 | 4,927,013 | |||||||||
| Issues |
Maturity Date |
Principal Amount |
Value | |||||||||
| CORPORATES (continued) |
|
|||||||||||
| Energy (continued) |
|
|||||||||||
| 4.75% |
04/19/273 | $ | 7,800,000 | $ | 7,503,229 | |||||||
| 5.38% |
04/24/303 | 2,251,000 | 2,169,273 | |||||||||
| KazTransGas JSC, |
|
|||||||||||
| Series REGS |
|
|||||||||||
| (Kazakhstan) |
|
|||||||||||
| 4.38% |
09/26/273 | 6,350,000 | 5,739,765 | |||||||||
| Kinder Morgan Energy Partners LP |
|
|||||||||||
| 4.70% |
11/01/42 | 2,171,000 | 2,172,801 | |||||||||
| 5.00% |
08/15/42 | 5,775,000 | 5,928,539 | |||||||||
| 5.40% |
09/01/44 | 5,000,000 | 5,422,871 | |||||||||
| Kinder Morgan, Inc. |
|
|||||||||||
| 5.55% |
06/01/45 | 4,831,000 | 5,400,145 | |||||||||
| Kinder Morgan, Inc. |
|
|||||||||||
| (GMTN) |
|
|||||||||||
| 7.80% |
08/01/31 | 150,000 | 192,286 | |||||||||
| Occidental Petroleum Corp. |
|
|||||||||||
| 0.00% |
10/10/3611 | 60,128,000 | 32,372,915 | |||||||||
| 4.50% |
07/15/44 | 7,811,000 | 7,479,183 | |||||||||
| Pertamina Persero PT |
|
|||||||||||
| (Indonesia) |
|
|||||||||||
| 3.10% |
08/27/301,3 | 44,071,000 | 41,880,671 | |||||||||
| Petroleos Mexicanos |
|
|||||||||||
| (Mexico) |
|
|||||||||||
| 6.63% |
06/15/353 | 14,192,000 | 12,765,704 | |||||||||
| 6.75% |
09/21/473 | 148,565,000 | 121,038,877 | |||||||||
| 6.95% |
01/28/603 | 34,555,000 | 28,072,482 | |||||||||
| 7.69% |
01/23/503 | 56,333,000 | 49,302,641 | |||||||||
| Petronas Capital Ltd. |
|
|||||||||||
| (Malaysia) |
|
|||||||||||
| 2.48% |
01/28/321,3 | 13,050,000 | 12,173,244 | |||||||||
| 3.50% |
04/21/301,3 | 34,277,000 | 35,017,383 | |||||||||
| Petronas Capital Ltd., |
|
|||||||||||
| Series REGS (EMTN) |
|
|||||||||||
| (Malaysia) |
|
|||||||||||
| 2.48% |
01/28/323 | 5,000,000 | 4,664,078 | |||||||||
| Phillips 66 Partners LP |
|
|||||||||||
| 4.90% |
10/01/46 | 5,485,000 | 6,043,078 | |||||||||
| Piedmont Natural Gas Co., Inc. |
|
|||||||||||
| 2.50% |
03/15/31 | 7,272,000 | 6,661,449 | |||||||||
| Plains All American Pipeline LP/PAA Finance Corp. |
|
|||||||||||
| 3.55% |
12/15/29 | 31,332,000 | 30,335,178 | |||||||||
| 3.80% |
09/15/30 | 8,920,000 | 8,763,789 | |||||||||
| Qatar Energy |
|
|||||||||||
| Series REGS |
|
|||||||||||
| (Qatar) |
|
|||||||||||
| 2.25% |
07/12/313 | 7,930,000 | 7,325,734 | |||||||||
| Rockies Express Pipeline LLC |
|
|||||||||||
| 4.80% |
05/15/301 | 5,125,000 | 4,907,188 | |||||||||
| 4.95% |
07/15/291 | 84,805,000 | 82,423,092 | |||||||||
| 6.88% |
04/15/401 | 44,867,000 | 44,530,497 | |||||||||
| Ruby Pipeline LLC |
|
|||||||||||
| 8.00% |
04/01/221,5,6 | 62,216,939 | 57,861,754 | |||||||||
| Saudi Arabian Oil Co., |
|
|||||||||||
| Series REGS |
|
|||||||||||
| (Saudi Arabia) |
|
|||||||||||
| 1.63% |
11/24/253 | 6,500,000 | 6,176,001 | |||||||||
See accompanying Notes to Financial Statements.
| 177 / Annual Report March 2022 |
Table of Contents
Total Return Bond Fund
Schedule of Portfolio Investments
March 31, 2022
| Issues |
Maturity Date |
Principal Amount |
Value | |||||||||
| CORPORATES (continued) |
|
|||||||||||
| Energy (continued) |
|
|||||||||||
| Shell International Finance BV |
|
|||||||||||
| (Netherlands) |
|
|||||||||||
| 2.88% |
11/26/413 | $ | 41,210,000 | $ | 37,109,143 | |||||||
| 3.00% |
11/26/513 | 27,894,000 | 24,974,322 | |||||||||
| 3.13% |
11/07/493 | 6,000,000 | 5,516,308 | |||||||||
| 3.75% |
09/12/463 | 13,197,000 | 13,393,977 | |||||||||
| 4.00% |
05/10/463 | 19,451,000 | 20,293,708 | |||||||||
| 4.55% |
08/12/433 | 5,000,000 | 5,577,597 | |||||||||
| Southern Co. Gas Capital Corp. |
|
|||||||||||
| 4.40% |
05/30/47 | 50,000 | 50,468 | |||||||||
| Southern Gas Corridor CJSC, |
|
|||||||||||
| Series REGS |
|
|||||||||||
| (Azerbaijan) |
|
|||||||||||
| 6.88% |
03/24/263 | 16,442,000 | 18,035,230 | |||||||||
| Sunoco LP/Sunoco Finance Corp. |
|
|||||||||||
| 4.50% |
04/30/301 | 15,841,000 | 14,618,075 | |||||||||
| TC PipeLines LP |
|
|||||||||||
| 4.38% |
03/13/25 | 2,198,000 | 2,251,400 | |||||||||
| TransMontaigne Partners LP/TLP Finance Corp. |
|
|||||||||||
| 6.13% |
02/15/26 | 28,675,000 | 28,244,875 | |||||||||
| Transocean Phoenix 2 Ltd. |
|
|||||||||||
| (Cayman Islands) |
|
|||||||||||
| 7.75% |
10/15/241,3 | 14,942,500 | 15,072,724 | |||||||||
| Transocean Pontus Ltd. |
|
|||||||||||
| (Cayman Islands) |
|
|||||||||||
| 6.13% |
08/01/251,3 | 13,038,000 | 12,979,329 | |||||||||
| Transocean Poseidon Ltd. |
|
|||||||||||
| (Cayman Islands) |
|
|||||||||||
| 6.88% |
02/01/271,3 | 29,399,063 | 29,151,963 | |||||||||
| Transocean Proteus Ltd. |
|
|||||||||||
| (Cayman Islands) |
|
|||||||||||
| 6.25% |
12/01/241,3 | 30,741,500 | 30,552,594 | |||||||||
| USA Compression Partners LP/USA Compression Finance |
|
|||||||||||
| Corp. |
|
|||||||||||
| 6.88% |
04/01/26 | 8,570,000 | 8,661,528 | |||||||||
| 6.88% |
09/01/27 | 18,450,000 | 18,549,353 | |||||||||
| Venture Global Calcasieu Pass LLC |
|
|||||||||||
| 3.88% |
11/01/331 | 20,000,000 | 19,141,893 | |||||||||
| 4.13% |
08/15/311 | 9,000,000 | 8,848,506 | |||||||||
| Williams Cos., Inc. (The) |
|
|||||||||||
| 5.40% |
03/04/44 | 5,000,000 | 5,515,689 | |||||||||
|
|
|
|||||||||||
| 1,479,756,884 | ||||||||||||
|
|
|
|||||||||||
| Finance — 4.95% |
|
|||||||||||
| AerCap Ireland Capital DAC/AerCap Global Aviation Trust |
|
|||||||||||
| (Ireland) |
|
|||||||||||
| 2.45% |
10/29/263 | 41,190,000 | 38,097,505 | |||||||||
| 3.00% |
10/29/283 | 54,175,000 | 49,954,506 | |||||||||
| 3.15% |
02/15/243 | 17,310,000 | 17,046,320 | |||||||||
| 3.30% |
01/23/233 | 6,426,000 | 6,448,576 | |||||||||
| 3.30% |
01/30/323 | 64,850,000 | 58,670,756 | |||||||||
| 3.50% |
01/15/253 | 2,815,000 | 2,768,250 | |||||||||
| 3.88% |
01/23/283 | 5,015,000 | 4,884,242 | |||||||||
| 4.63% |
07/01/223 | 3,030,000 | 3,044,581 | |||||||||
| 4.88% |
01/16/243 | 12,060,000 | 12,219,254 | |||||||||
| Issues |
Maturity Date |
Principal Amount |
Value | |||||||||
| CORPORATES (continued) |
|
|||||||||||
| Finance (continued) |
|
|||||||||||
| Air Lease Corp. |
|
|||||||||||
| 2.20% |
01/15/27 | $ | 48,265,000 | $ | 44,677,666 | |||||||
| 2.25% |
01/15/23 | 18,850,000 | 18,864,972 | |||||||||
| 3.00% |
09/15/23 | 28,655,000 | 28,557,235 | |||||||||
| 3.25% |
03/01/25 | 19,930,000 | 19,555,208 | |||||||||
| 3.25% |
10/01/29 | 5,000,000 | 4,727,734 | |||||||||
| 4.25% |
09/15/24 | 5,554,000 | 5,624,936 | |||||||||
| 4.63% |
10/01/28 | 2,000,000 | 2,039,047 | |||||||||
| Air Lease Corp. |
|
|||||||||||
| (MTN) |
|
|||||||||||
| 2.30% |
02/01/25 | 35,195,000 | 33,886,009 | |||||||||
| 2.88% |
01/15/26 | 10,055,000 | 9,717,792 | |||||||||
| 3.00% |
02/01/30 | 2,000,000 | 1,844,989 | |||||||||
| 4.25% |
02/01/24 | 5,000,000 | 5,065,577 | |||||||||
| Alta Wind Holdings LLC |
|
|||||||||||
| 7.00% |
06/30/351,5,6 | 3,397,987 | 3,711,142 | |||||||||
| American Express Co. |
|
|||||||||||
| 2.25% |
03/04/25 | 14,650,000 | 14,389,157 | |||||||||
| 2.55% |
03/04/27 | 22,600,000 | 21,975,627 | |||||||||
| Avolon Holdings Funding Ltd. |
|
|||||||||||
| (Cayman Islands) |
|
|||||||||||
| 2.53% |
11/18/271,3 | 169,840,000 | 150,330,379 | |||||||||
| 2.88% |
02/15/251,3 | 43,160,000 | 41,785,506 | |||||||||
| 3.25% |
02/15/271,3 | 17,880,000 | 16,878,196 | |||||||||
| 3.95% |
07/01/241,3 | 35,499,000 | 35,362,638 | |||||||||
| Capital One Financial Corp. |
|
|||||||||||
| 1.34% |
12/06/244 | 114,655,000 | 111,291,850 | |||||||||
| 2.64% |
03/03/264 | 13,265,000 | 13,002,752 | |||||||||
| Charles Schwab Corp. (The) |
|
|||||||||||
| 2.45% |
03/03/27 | 30,680,000 | 29,802,205 | |||||||||
| 2.90% |
03/03/32 | 8,310,000 | 8,003,043 | |||||||||
| Citigroup, Inc. |
|
|||||||||||
| 1.28% |
11/03/254 | 6,415,000 | 6,105,219 | |||||||||
| 1.46% |
06/09/274 | 161,263,000 | 148,537,758 | |||||||||
| 2.56% |
05/01/324 | 17,570,000 | 15,878,989 | |||||||||
| 2.57% |
06/03/314 | 51,761,000 | 47,511,908 | |||||||||
| 2.67% |
01/29/314 | 15,000,000 | 13,940,989 | |||||||||
| 3.06% |
01/25/334 | 184,605,000 | 172,861,580 | |||||||||
| 3.11% |
04/08/264 | 7,705,000 | 7,652,382 | |||||||||
| 3.52% |
10/27/284 | 22,030,000 | 21,853,613 | |||||||||
| 3.67% |
07/24/284 | 5,220,000 | 5,237,791 | |||||||||
| 3.79% |
03/17/334 | 98,040,000 | 97,506,428 | |||||||||
| 4.41% |
03/31/314 | 101,000 | 105,044 | |||||||||
| Citigroup, Inc., |
|
|||||||||||
| Series VAR |
|
|||||||||||
| 3.07% |
02/24/284 | 45,070,000 | 44,010,146 | |||||||||
| Discover Financial Services |
|
|||||||||||
| 3.85% |
11/21/22 | 8,794,000 | 8,904,815 | |||||||||
| Ford Motor Credit Co. LLC |
|
|||||||||||
| 4.25% |
09/20/22 | 19,823,000 | 19,968,302 | |||||||||
| (LIBOR USD 3-Month plus 1.08%) |
|
|||||||||||
| 1.38% |
08/03/222 | 11,865,000 | 11,826,439 | |||||||||
| GE Capital International Funding Co. |
|
|||||||||||
| (Ireland) |
|
|||||||||||
| 4.42% |
11/15/353 | 124,519,000 | 134,623,007 | |||||||||
See accompanying Notes to Financial Statements.
| Annual Report March 2022 / 178 |
Table of Contents
Total Return Bond Fund
Schedule of Portfolio Investments
March 31, 2022
| Issues |
Maturity Date |
Principal Amount |
Value | |||||||||
| CORPORATES (continued) |
|
|||||||||||
| Finance (continued) |
|
|||||||||||
| General Motors Financial Co., Inc. |
|
|||||||||||
| 3.15% |
06/30/22 | $ | 11,161,000 | $ | 11,198,867 | |||||||
| 3.45% |
04/10/22 | 24,235,000 | 24,242,629 | |||||||||
| Goldman Sachs Group, Inc. (The) |
|
|||||||||||
| 0.93% |
10/21/244 | 72,055,000 | 69,882,576 | |||||||||
| 1.22% |
12/06/23 | 192,325,000 | 187,849,274 | |||||||||
| 1.43% |
03/09/274 | 170,920,000 | 157,781,292 | |||||||||
| 1.54% |
09/10/274 | 106,330,000 | 97,500,565 | |||||||||
| 1.95% |
10/21/274 | 46,890,000 | 43,609,028 | |||||||||
| 2.38% |
07/21/324 | 66,543,000 | 59,169,942 | |||||||||
| 2.62% |
04/22/324 | 24,685,000 | 22,486,315 | |||||||||
| 2.65% |
10/21/324 | 15,567,000 | 14,107,703 | |||||||||
| 2.91% |
07/24/234 | 26,692,000 | 26,731,877 | |||||||||
| 2.91% |
06/05/234 | 4,605,000 | 4,613,840 | |||||||||
| 3.10% |
02/24/334 | 46,874,000 | 44,232,706 | |||||||||
| 3.20% |
02/23/23 | 51,252,000 | 51,728,833 | |||||||||
| 3.27% |
09/29/254 | 144,232,000 | 144,160,346 | |||||||||
| 3.50% |
04/01/25 | 42,324,000 | 42,695,812 | |||||||||
| Intercontinental Exchange, Inc. |
|
|||||||||||
| 1.85% |
09/15/32 | 2,372,000 | 2,056,730 | |||||||||
| JPMorgan Chase & Co. |
|
|||||||||||
| 1.56% |
12/10/254 | 147,510,000 | 141,227,220 | |||||||||
| 1.76% |
11/19/314 | 11,145,000 | 9,623,190 | |||||||||
| 2.55% |
11/08/324 | 53,282,000 | 48,674,634 | |||||||||
| 2.95% |
02/24/284 | 51,325,000 | 50,104,552 | |||||||||
| 2.96% |
01/25/334 | 71,627,000 | 67,650,849 | |||||||||
| 3.80% |
07/23/244 | 9,861,000 | 9,976,600 | |||||||||
| Morgan Stanley |
|
|||||||||||
| 0.79% |
05/30/254 | 62,230,000 | 59,166,213 | |||||||||
| 1.59% |
05/04/274 | 124,927,000 | 116,169,232 | |||||||||
| 2.94% |
01/21/334 | 13,592,000 | 12,742,957 | |||||||||
| Morgan Stanley |
|
|||||||||||
| (GMTN) |
|
|||||||||||
| 0.79% |
01/22/254 | 21,175,000 | 20,340,578 | |||||||||
| 1.51% |
07/20/274 | 5,285,000 | 4,875,179 | |||||||||
| 2.24% |
07/21/324 | 60,956,000 | 54,071,472 | |||||||||
| Morgan Stanley |
|
|||||||||||
| (MTN) |
|
|||||||||||
| 0.53% |
01/25/244 | 23,165,000 | 22,793,409 | |||||||||
| 1.16% |
10/21/254 | 178,926,000 | 170,126,729 | |||||||||
| 1.93% |
04/28/324 | 50,038,000 | 43,358,667 | |||||||||
| 2.51% |
10/20/324 | 51,911,000 | 47,026,745 | |||||||||
| Nationwide Building Society |
|
|||||||||||
| (United Kingdom) |
|
|||||||||||
| 2.97% |
02/16/281,3,4 | 120,650,000 | 115,059,745 | |||||||||
| 3.62% |
04/26/231,3,4 | 11,735,000 | 11,737,503 | |||||||||
| 3.77% |
03/08/241,3,4 | 55,190,000 | 55,516,670 | |||||||||
| 4.36% |
08/01/241,3,4 | 104,478,000 | 106,119,074 | |||||||||
| Park Aerospace Holdings Ltd. |
|
|||||||||||
| (Cayman Islands) |
|
|||||||||||
| 4.50% |
03/15/231,3 | 10,746,000 | 10,827,619 | |||||||||
| 5.50% |
02/15/241,3 | 26,855,000 | 27,505,278 | |||||||||
| Raymond James Financial, Inc. |
|
|||||||||||
| 4.95% |
07/15/46 | 46,716,000 | 52,846,814 | |||||||||
| Issues |
Maturity Date |
Principal Amount |
Value | |||||||||
| CORPORATES (continued) |
|
|||||||||||
| Finance (continued) |
|
|||||||||||
| TIAA FSB Holdings, Inc. |
|
|||||||||||
| 5.75% |
07/02/25 | $ | 4,045,000 | $ | 4,196,607 | |||||||
|
|
|
| ||||||||||
| 3,836,537,931 | ||||||||||||
|
|
|
| ||||||||||
| Food — 0.68% |
|
|||||||||||
| JBS USA LLC/JBS USA Finance, Inc. |
|
|||||||||||
| (Canada) |
|
|||||||||||
| 6.75% |
02/15/281,3 | 41,000,000 | 43,429,250 | |||||||||
| JBS USA LUX SA/JBS USA Food Co./JBS USA Finance, Inc. |
|
|||||||||||
| (Canada) |
|
|||||||||||
| 3.75% |
12/01/311,3 | 17,544,000 | 16,224,410 | |||||||||
| 4.38% |
02/02/521,3 | 58,603,000 | 51,095,166 | |||||||||
| 5.50% |
01/15/301,3 | 38,255,000 | 39,189,187 | |||||||||
| 6.50% |
04/15/291,3 | 33,928,000 | 35,997,329 | |||||||||
| Kraft Heinz Foods Co. |
|
|||||||||||
| 3.00% |
06/01/26 | 2,173,000 | 2,141,534 | |||||||||
| 4.38% |
06/01/46 | 2,882,000 | 2,860,583 | |||||||||
| 4.88% |
10/01/49 | 17,370,000 | 18,330,985 | |||||||||
| 5.00% |
07/15/35 | 24,594,000 | 26,402,397 | |||||||||
| 5.00% |
06/04/42 | 15,357,000 | 16,422,008 | |||||||||
| 5.20% |
07/15/45 | 70,637,000 | 76,552,849 | |||||||||
| 6.50% |
02/09/40 | 6,240,000 | 7,472,400 | |||||||||
| Pilgrim’s Pride Corp. |
|
|||||||||||
| 3.50% |
03/01/321 | 55,470,000 | 48,547,346 | |||||||||
| 4.25% |
04/15/311 | 1,429,000 | 1,324,554 | |||||||||
| 5.88% |
09/30/271 | 4,269,000 | 4,319,003 | |||||||||
| Post Holdings, Inc. |
|
|||||||||||
| 4.50% |
09/15/311 | 27,276,000 | 24,197,218 | |||||||||
| 4.63% |
04/15/301 | 74,045,000 | 66,795,994 | |||||||||
| Smithfield Foods, Inc. |
|
|||||||||||
| 2.63% |
09/13/311 | 14,435,000 | 12,666,922 | |||||||||
| 3.00% |
10/15/301 | 8,890,000 | 8,088,721 | |||||||||
| 4.25% |
02/01/271 | 24,855,000 | 25,291,185 | |||||||||
|
|
|
| ||||||||||
| 527,349,041 | ||||||||||||
|
|
|
| ||||||||||
| Gaming — 0.04% |
|
|||||||||||
| CDI Escrow Issuer, Inc. |
|
|||||||||||
| 5.75% |
04/01/301 | 30,044,000 | 30,386,802 | |||||||||
| MGM Resorts International |
|
|||||||||||
| 6.00% |
03/15/23 | 30,000 | 30,708 | |||||||||
|
|
|
| ||||||||||
| 30,417,510 | ||||||||||||
|
|
|
| ||||||||||
| Health Care — 3.80% |
|
|||||||||||
| AbbVie, Inc. |
|
|||||||||||
| 2.90% |
11/06/22 | 7,139,000 | 7,188,443 | |||||||||
| 3.25% |
10/01/22 | 5,719,000 | 5,748,042 | |||||||||
| 4.05% |
11/21/39 | 10,782,000 | 11,129,763 | |||||||||
| 4.25% |
11/21/49 | 5,420,000 | 5,666,029 | |||||||||
| 4.40% |
11/06/42 | 62,889,000 | 66,832,312 | |||||||||
| 4.45% |
05/14/46 | 11,444,000 | 12,211,520 | |||||||||
| 4.50% |
05/14/35 | 49,065,000 | 52,777,085 | |||||||||
| 4.55% |
03/15/35 | 33,431,000 | 35,968,694 | |||||||||
| American Medical Systems Europe BV |
|
|||||||||||
| (Netherlands) |
|
|||||||||||
| 1.63% |
03/08/313 | 5,855,000 | 6,358,550 | |||||||||
| 1.88% |
03/08/343 | 5,000,000 | 5,425,137 | |||||||||
See accompanying Notes to Financial Statements.
| 179 / Annual Report March 2022 |
Table of Contents
Total Return Bond Fund
Schedule of Portfolio Investments
March 31, 2022
| Issues |
Maturity Date |
Principal Amount |
Value | |||||||||
| CORPORATES (continued) |
|
|||||||||||
| Health Care (continued) |
|
|||||||||||
| Amgen, Inc. |
|
|||||||||||
| 3.00% |
02/22/29 | $ | 12,925,000 | $ | 12,703,513 | |||||||
| 3.35% |
02/22/32 | 36,865,000 | 36,575,184 | |||||||||
| 3.38% |
02/21/50 | 12,009,000 | 10,890,866 | |||||||||
| 4.20% |
02/22/52 | 31,080,000 | 32,221,510 | |||||||||
| 4.40% |
02/22/62 | 21,360,000 | 22,197,719 | |||||||||
| Baxter International, Inc. |
|
|||||||||||
| 0.87% |
12/01/231 | 13,013,000 | 12,602,396 | |||||||||
| Bayer U.S. Finance II LLC |
|
|||||||||||
| 2.85% |
04/15/251 | 2,805,000 | 2,741,552 | |||||||||
| 3.95% |
04/15/451 | 17,489,000 | 16,281,539 | |||||||||
| 4.25% |
12/15/251 | 19,992,000 | 20,351,191 | |||||||||
| 4.38% |
12/15/281 | 113,100,000 | 115,777,749 | |||||||||
| 4.40% |
07/15/441 | 69,196,000 | 67,057,975 | |||||||||
| 4.63% |
06/25/381 | 36,299,000 | 38,131,248 | |||||||||
| 4.88% |
06/25/481 | 88,246,000 | 95,229,587 | |||||||||
| 5.50% |
08/15/251 | 13,932,000 | 14,505,507 | |||||||||
| 5.50% |
07/30/351 | 3,820,000 | 4,222,037 | |||||||||
| Bayer U.S. Finance LLC |
|
|||||||||||
| 3.38% |
10/08/241 | 2,055,000 | 2,054,899 | |||||||||
| Becton Dickinson and Co. |
|
|||||||||||
| 2.82% |
05/20/30 | 20,388,000 | 19,457,223 | |||||||||
| 3.36% |
06/06/24 | 1,013,000 | 1,022,434 | |||||||||
| Bristol-Myers Squibb Co. |
|
|||||||||||
| 3.55% |
03/15/42 | 60,000,000 | 59,486,308 | |||||||||
| 3.70% |
03/15/52 | 14,060,000 | 14,159,981 | |||||||||
| Cedars-Sinai Health System, |
|
|||||||||||
| Series 2021 |
|
|||||||||||
| 2.29% |
08/15/31 | 12,870,000 | 11,756,630 | |||||||||
| Centene Corp. |
|
|||||||||||
| 2.45% |
07/15/28 | 31,858,000 | 29,135,028 | |||||||||
| 2.50% |
03/01/31 | 6,355,000 | 5,640,063 | |||||||||
| 3.00% |
10/15/30 | 138,275,000 | 127,214,383 | |||||||||
| 4.25% |
12/15/27 | 75,412,000 | 75,772,469 | |||||||||
| Cigna Corp. |
|
|||||||||||
| 3.20% |
03/15/40 | 4,157,000 | 3,790,067 | |||||||||
| 3.88% |
10/15/47 | 22,722,000 | 22,232,020 | |||||||||
| 4.80% |
08/15/38 | 26,478,000 | 29,075,480 | |||||||||
| 4.80% |
07/15/46 | 38,613,000 | 42,889,847 | |||||||||
| CommonSpirit Health |
|
|||||||||||
| 2.76% |
10/01/24 | 11,198,000 | 11,111,022 | |||||||||
| 2.78% |
10/01/30 | 19,835,000 | 18,404,285 | |||||||||
| 3.35% |
10/01/29 | 52,258,000 | 50,761,526 | |||||||||
| 4.35% |
11/01/42 | 2,860,000 | 2,894,720 | |||||||||
| CVS Health Corp. |
|
|||||||||||
| 2.75% |
12/01/22 | 31,624,000 | 31,786,951 | |||||||||
| 4.78% |
03/25/38 | 23,581,000 | 25,832,121 | |||||||||
| 4.88% |
07/20/35 | 22,450,000 | 24,662,164 | |||||||||
| 5.05% |
03/25/48 | 142,729,000 | 161,884,218 | |||||||||
| 5.13% |
07/20/45 | 60,105,000 | 68,044,704 | |||||||||
| Danaher Corp. |
|
|||||||||||
| 2.80% |
12/10/51 | 7,950,000 | 6,771,584 | |||||||||
| Embecta Corp. |
|
|||||||||||
| 5.00% |
02/15/301 | 16,820,000 | 15,895,179 | |||||||||
| 6.75% |
02/15/301 | 25,593,000 | 25,703,504 | |||||||||
| Issues |
Maturity Date |
Principal Amount |
Value | |||||||||
| CORPORATES (continued) |
|
|||||||||||
| Health Care (continued) |
|
|||||||||||
| Encompass Health Corp. |
|
|||||||||||
| 4.63% |
04/01/31 | $ | 8,196,000 | $ | 7,700,848 | |||||||
| Endo DAC/Endo Finance LLC/Endo Finco, Inc. |
|
|||||||||||
| (Ireland) |
|
|||||||||||
| 6.00% |
06/30/281,3 | 132,095,000 | 77,031,199 | |||||||||
| Fresenius Medical Care U.S. Finance III, Inc. |
|
|||||||||||
| 1.88% |
12/01/261 | 67,592,000 | 62,804,495 | |||||||||
| HCA, Inc. |
|
|||||||||||
| 2.38% |
07/15/31 | 563,000 | 503,599 | |||||||||
| 3.13% |
03/15/271 | 4,356,000 | 4,263,066 | |||||||||
| 3.63% |
03/15/321 | 65,720,000 | 64,440,676 | |||||||||
| 4.13% |
06/15/29 | 10,936,000 | 11,145,530 | |||||||||
| 4.38% |
03/15/421 | 15,000,000 | 14,834,454 | |||||||||
| 4.63% |
03/15/521 | 50,190,000 | 50,886,774 | |||||||||
| 5.25% |
04/15/25 | 7,749,000 | 8,164,142 | |||||||||
| 5.25% |
06/15/26 | 63,284,000 | 66,856,689 | |||||||||
| 5.25% |
06/15/49 | 188,662,000 | 207,430,552 | |||||||||
| 5.50% |
06/15/47 | 57,012,000 | 64,668,712 | |||||||||
| 5.63% |
09/01/28 | 24,411,000 | 26,424,907 | |||||||||
| 5.88% |
02/01/29 | 26,139,000 | 28,752,900 | |||||||||
| Humana, Inc. |
|
|||||||||||
| 0.65% |
08/03/23 | 118,205,000 | 115,358,301 | |||||||||
| ModivCare Escrow Issuer, Inc. |
|
|||||||||||
| 5.00% |
10/01/291 | 18,463,000 | 17,227,337 | |||||||||
| Molina Healthcare, Inc. |
|
|||||||||||
| 3.88% |
11/15/301 | 55,275,000 | 53,461,139 | |||||||||
| 3.88% |
05/15/321 | 59,994,000 | 57,180,898 | |||||||||
| 4.38% |
06/15/281 | 48,064,000 | 47,583,052 | |||||||||
| Mozart Debt Merger Sub, Inc. |
|
|||||||||||
| 3.88% |
04/01/291 | 11,352,000 | 10,511,523 | |||||||||
| NYU Langone Hospitals, |
|
|||||||||||
| Series 2020 |
|
|||||||||||
| 3.38% |
07/01/55 | 4,300,000 | 3,853,510 | |||||||||
| Option Care Health, Inc. |
|
|||||||||||
| 4.38% |
10/31/291 | 29,475,000 | 27,789,746 | |||||||||
| Organon & Co./Organon Foreign Debt Co.-Issuer BV |
|
|||||||||||
| 5.13% |
04/30/311 | 1,439,000 | 1,390,578 | |||||||||
| PerkinElmer, Inc. |
|
|||||||||||
| 0.55% |
09/15/23 | 35,000,000 | 34,020,475 | |||||||||
| 0.85% |
09/15/24 | 27,870,000 | 26,471,755 | |||||||||
| Royalty Pharma PLC |
|
|||||||||||
| (United Kingdom) |
|
|||||||||||
| 0.75% |
09/02/233 | 11,885,000 | 11,546,502 | |||||||||
| 1.75% |
09/02/273 | 11,295,000 | 10,276,079 | |||||||||
| Teleflex, Inc. |
|
|||||||||||
| 4.25% |
06/01/281 | 75,000 | 73,173 | |||||||||
| Thermo Fisher Scientific Finance I BV |
|
|||||||||||
| (Netherlands) |
|
|||||||||||
| 1.63% |
10/18/413 | 25,000,000 | 25,078,213 | |||||||||
| 2.00% |
10/18/513 | 66,294,000 | 67,197,199 | |||||||||
| UnitedHealth Group, Inc. |
|
|||||||||||
| 3.05% |
05/15/41 | 45,240,000 | 42,245,443 | |||||||||
| 3.25% |
05/15/51 | 36,055,000 | 34,122,868 | |||||||||
| 3.70% |
08/15/49 | 9,911,000 | 10,099,690 | |||||||||
| 4.25% |
04/15/47 | 13,825,000 | 15,041,344 | |||||||||
See accompanying Notes to Financial Statements.
| Annual Report March 2022 / 180 |
Table of Contents
Total Return Bond Fund
Schedule of Portfolio Investments
March 31, 2022
| Issues |
Maturity Date |
Principal Amount |
Value | |||||||||
| CORPORATES (continued) |
|
|||||||||||
| Health Care (continued) |
|
|||||||||||
| Universal Health Services, Inc. |
|
|||||||||||
| 1.65% |
09/01/261 | $ | 45,000,000 | $ | 41,303,582 | |||||||
|
|
|
| ||||||||||
| 2,945,974,908 | ||||||||||||
|
|
|
| ||||||||||
| Industrials — 0.75% |
|
|||||||||||
| Amcor Finance USA, Inc. |
|
|||||||||||
| 3.63% |
04/28/26 | 6,781,000 | 6,877,548 | |||||||||
| Ardagh Packaging Finance PLC/Ardagh Holdings USA, Inc. |
|
|||||||||||
| (Canada) |
|
|||||||||||
| 5.25% |
08/15/271,3 | 54,090,000 | 50,201,445 | |||||||||
| Artera Services LLC |
|
|||||||||||
| 9.03% |
12/04/251 | 50,815,000 | 50,834,216 | |||||||||
| BAE Systems PLC |
|
|||||||||||
| (United Kingdom) |
|
|||||||||||
| 4.13% |
06/08/223 | 33,964,000 | 44,908,133 | |||||||||
| Berry Global, Inc. |
|
|||||||||||
| 1.57% |
01/15/26 | 51,115,000 | 47,733,308 | |||||||||
| 1.65% |
01/15/27 | 9,576,000 | 8,738,102 | |||||||||
| 4.88% |
07/15/261 | 82,131,000 | 83,051,689 | |||||||||
| Boeing Co. (The) |
|
|||||||||||
| 1.17% |
02/04/23 | 12,010,000 | 11,876,329 | |||||||||
| 1.43% |
02/04/24 | 174,540,000 | 168,944,207 | |||||||||
| 4.88% |
05/01/25 | 19,940,000 | 20,599,131 | |||||||||
| General Electric Co. |
|
|||||||||||
| (MTN) |
|
|||||||||||
| (LIBOR USD 3-Month plus 0.38%) |
|
|||||||||||
| 0.70% |
05/05/262 | 1,785,000 | 1,757,467 | |||||||||
| (LIBOR USD 3-Month plus 0.48%) |
|
|||||||||||
| 0.99% |
08/15/362 | 11,550,000 | 9,949,190 | |||||||||
| General Electric Co., |
|
|||||||||||
| Series A (MTN) |
|
|||||||||||
| 6.75% |
03/15/32 | 12,906,000 | 16,292,697 | |||||||||
| Heathrow Funding Ltd. |
|
|||||||||||
| (United Kingdom) |
|
|||||||||||
| 5.23% |
02/15/231,3 | 34,415,000 | 46,453,984 | |||||||||
| L3Harris Technologies, Inc. |
|
|||||||||||
| 3.95% |
05/28/24 | 12,890,000 | 13,132,335 | |||||||||
|
|
|
| ||||||||||
| 581,349,781 | ||||||||||||
|
|
|
| ||||||||||
| Information Technology — 0.51% |
|
|||||||||||
| Broadcom, Inc. |
|
|||||||||||
| 3.14% |
11/15/351 | 10,000,000 | 8,826,718 | |||||||||
| 3.42% |
04/15/331 | 37,837,000 | 35,329,741 | |||||||||
| 4.30% |
11/15/32 | 44,480,000 | 45,177,577 | |||||||||
| Fiserv, Inc. |
|
|||||||||||
| 3.20% |
07/01/26 | 5,905,000 | 5,898,133 | |||||||||
| Intel Corp. |
|
|||||||||||
| 2.80% |
08/12/41 | 7,760,000 | 6,896,794 | |||||||||
| 3.05% |
08/12/51 | 25,200,000 | 22,442,344 | |||||||||
| 3.73% |
12/08/47 | 590,000 | 591,874 | |||||||||
| Netflix, Inc. |
|
|||||||||||
| 3.63% |
06/15/251 | 25,135,000 | 25,299,886 | |||||||||
| 5.88% |
02/15/25 | 8,950,000 | 9,560,720 | |||||||||
| Oracle Corp. |
|
|||||||||||
| 2.30% |
03/25/28 | 56,500,000 | 51,779,117 | |||||||||
| 2.80% |
04/01/27 | 7,928,000 | 7,599,544 | |||||||||
| Issues |
Maturity Date |
Principal Amount |
Value | |||||||||
| CORPORATES (continued) |
|
|||||||||||
| Information Technology (continued) |
|
|||||||||||
| 2.88% |
03/25/31 | $ | 1,850,000 | $ | 1,689,233 | |||||||
| 3.60% |
04/01/40 | 22,483,000 | 19,550,456 | |||||||||
| 3.60% |
04/01/50 | 42,900,000 | 35,685,995 | |||||||||
| 3.65% |
03/25/41 | 76,945,000 | 67,082,313 | |||||||||
| 3.85% |
07/15/36 | 23,336,000 | 21,527,885 | |||||||||
| 3.95% |
03/25/51 | 18,836,000 | 16,500,071 | |||||||||
| 4.00% |
11/15/47 | 6,955,000 | 6,169,253 | |||||||||
| 4.13% |
05/15/45 | 7,200,000 | 6,479,559 | |||||||||
|
|
|
| ||||||||||
| 394,087,213 | ||||||||||||
|
|
|
| ||||||||||
| Insurance — 1.18% |
|
|||||||||||
| Aon Corp./Aon Global Holdings PLC |
|
|||||||||||
| 3.90% |
02/28/52 | 79,250,000 | 78,550,853 | |||||||||
| Athene Global Funding |
|
|||||||||||
| 1.61% |
06/29/261 | 61,330,000 | 55,931,120 | |||||||||
| 1.99% |
08/19/281 | 11,040,000 | 9,703,720 | |||||||||
| 3.21% |
03/08/271 | 26,060,000 | 25,117,593 | |||||||||
| (SOFR Rate plus 0.70%) |
|
|||||||||||
| 0.91% |
05/24/241,2 | 146,955,000 | 145,130,911 | |||||||||
| Berkshire Hathaway Finance Corp. |
|
|||||||||||
| 2.88% |
03/15/32 | 30,435,000 | 29,536,662 | |||||||||
| 3.85% |
03/15/52 | 62,145,000 | 63,591,370 | |||||||||
| Farmers Exchange Capital |
|
|||||||||||
| 7.05% |
07/15/281 | 13,283,000 | 15,158,836 | |||||||||
| 7.20% |
07/15/481 | 18,415,000 | 25,268,058 | |||||||||
| Farmers Exchange Capital II |
|
|||||||||||
| 6.15% |
11/01/531,4 | 59,331,000 | 70,248,287 | |||||||||
| Farmers Exchange Capital III |
|
|||||||||||
| 5.45% |
10/15/541,4 | 80,605,000 | 90,999,730 | |||||||||
| Farmers Insurance Exchange |
|
|||||||||||
| 4.75% |
11/01/571,4 | 23,060,000 | 24,225,593 | |||||||||
| Metropolitan Life Global Funding I |
|
|||||||||||
| 3.30% |
03/21/291 | 16,005,000 | 15,908,663 | |||||||||
| Nationwide Mutual Insurance Co. |
|
|||||||||||
| 3.12% |
12/15/241,4 | 42,571,000 | 42,600,357 | |||||||||
| New York Life Insurance Co. |
|
|||||||||||
| 3.75% |
05/15/501 | 5,695,000 | 5,545,426 | |||||||||
| Protective Life Global Funding |
|
|||||||||||
| 1.90% |
07/06/281 | 56,210,000 | 50,716,748 | |||||||||
| Teachers Insurance & Annuity Association of America |
|
|||||||||||
| 3.30% |
05/15/501 | 116,155,000 | 103,294,528 | |||||||||
| 4.27% |
05/15/471 | 13,496,000 | 14,296,021 | |||||||||
| 4.38% |
09/15/541,4 | 35,635,000 | 35,517,445 | |||||||||
| Willis North America, Inc. |
|
|||||||||||
| 2.95% |
09/15/29 | 11,025,000 | 10,366,970 | |||||||||
| 4.50% |
09/15/28 | 5,079,000 | 5,273,070 | |||||||||
|
|
|
| ||||||||||
| 916,981,961 | ||||||||||||
|
|
|
| ||||||||||
| Materials — 0.21% |
|
|||||||||||
| Corp. Nacional del Cobre de Chile, |
|
|||||||||||
| Series REGS |
|
|||||||||||
| (Chile) |
|
|||||||||||
| 3.15% |
01/14/303 | 24,109,000 | 23,248,309 | |||||||||
| Indonesia Asahan Aluminium Persero PT |
|
|||||||||||
| (Indonesia) |
|
|||||||||||
| 6.53% |
11/15/281,3 | 9,000,000 | 10,012,095 | |||||||||
See accompanying Notes to Financial Statements.
| 181 / Annual Report March 2022 |
Table of Contents
Total Return Bond Fund
Schedule of Portfolio Investments
March 31, 2022
| Issues |
|
Maturity Date |
Principal Amount |
Value | ||||||||
| CORPORATES (continued) |
|
|||||||||||
| Materials (continued) |
|
|||||||||||
| Indonesia Asahan Aluminium Persero PT, |
|
|||||||||||
| Series REGS |
|
|||||||||||
| (Indonesia) |
|
|||||||||||
| 6.53% |
11/15/283 | $ | 5,767,000 | $ | 6,415,528 | |||||||
| International Flavors & Fragrances, Inc. |
|
|||||||||||
| 2.30% |
11/01/301 | 5,950,000 | 5,320,777 | |||||||||
| 3.27% |
11/15/401 | 6,000,000 | 5,364,765 | |||||||||
| 5.00% |
09/26/48 | 99,234,000 | 109,263,753 | |||||||||
|
|
|
| ||||||||||
| 159,625,227 | ||||||||||||
|
|
|
| ||||||||||
| Real Estate Investment Trust (REIT) — 1.08% |
|
|||||||||||
| American Campus Communities Operating Partnership LP |
|
|||||||||||
| 2.25% |
01/15/29 | 11,395,000 | 10,403,713 | |||||||||
| 3.30% |
07/15/26 | 21,300,000 | 21,212,886 | |||||||||
| 3.63% |
11/15/27 | 8,595,000 | 8,558,539 | |||||||||
| 3.75% |
04/15/23 | 45,679,000 | 46,083,554 | |||||||||
| 4.13% |
07/01/24 | 4,095,000 | 4,172,049 | |||||||||
| American Homes 4 Rent LP |
|
|||||||||||
| 4.30% |
04/15/52 | 5,035,000 | 4,895,883 | |||||||||
| Boston Properties LP |
|
|||||||||||
| 3.25% |
01/30/31 | 21,489,000 | 20,842,359 | |||||||||
| CyrusOne Europe Finance DAC |
|
|||||||||||
| (Ireland) |
|
|||||||||||
| 1.13% |
05/26/283 | 8,000,000 | 9,091,185 | |||||||||
| CyrusOne LP/CyrusOne Finance Corp. |
|
|||||||||||
| 1.45% |
01/22/27 | 29,565,000 | 34,075,884 | |||||||||
| 2.15% |
11/01/30 | 7,265,000 | 7,258,352 | |||||||||
| 2.90% |
11/15/24 | 86,883,000 | 87,121,494 | |||||||||
| 3.45% |
11/15/29 | 7,045,000 | 7,397,939 | |||||||||
| Federal Realty Investment Trust |
|
|||||||||||
| 7.48% |
08/15/26 | 18,825,000 | 21,252,177 | |||||||||
| GLP Capital LP/GLP Financing II, Inc. |
|
|||||||||||
| 3.35% |
09/01/24 | 33,037,000 | 33,017,178 | |||||||||
| 5.25% |
06/01/25 | 75,515,000 | 78,105,164 | |||||||||
| 5.30% |
01/15/29 | 34,755,000 | 36,636,636 | |||||||||
| 5.38% |
11/01/23 | 36,796,000 | 37,784,880 | |||||||||
| 5.38% |
04/15/26 | 99,048,000 | 103,607,546 | |||||||||
| 5.75% |
06/01/28 | 29,128,000 | 31,396,876 | |||||||||
| Healthcare Realty Trust, Inc. |
|
|||||||||||
| 3.88% |
05/01/25 | 20,446,000 | 20,703,701 | |||||||||
| Healthcare Trust of America Holdings LP |
|
|||||||||||
| 2.00% |
03/15/31 | 17,940,000 | 15,549,811 | |||||||||
| 3.10% |
02/15/30 | 5,095,000 | 4,871,811 | |||||||||
| 3.75% |
07/01/27 | 18,945,000 | 19,171,789 | |||||||||
| Hudson Pacific Properties LP |
|
|||||||||||
| 3.95% |
11/01/27 | 13,630,000 | 13,711,472 | |||||||||
| 4.65% |
04/01/29 | 9,585,000 | 10,062,424 | |||||||||
| Invitation Homes Operating Partnership LP |
|
|||||||||||
| 4.15% |
04/15/32 | 3,275,000 | 3,348,699 | |||||||||
| Kilroy Realty LP |
|
|||||||||||
| 3.45% |
12/15/24 | 28,590,000 | 28,680,362 | |||||||||
| Life Storage LP |
|
|||||||||||
| 3.88% |
12/15/27 | 6,960,000 | 7,052,480 | |||||||||
| MGM Growth Properties Operating Partnership LP/MGP Finance Co.-Issuer, Inc. |
|
|||||||||||
| 4.50% |
01/15/28 | 265,000 | 267,944 | |||||||||
| Issues |
|
Maturity Date |
Principal Amount |
Value | ||||||||
| CORPORATES (continued) |
|
|||||||||||
| Real Estate Investment Trust (REIT) (continued) |
| |||||||||||
| Mid-America Apartments LP |
|
|||||||||||
| 4.30% |
10/15/23 | $ | 9,636,000 | $ | 9,802,051 | |||||||
| SL Green Operating Partnership LP |
|
|||||||||||
| 3.25% |
10/15/22 | 49,011,000 | 49,029,210 | |||||||||
| SL Green Realty Corp. |
|
|||||||||||
| 4.50% |
12/01/22 | 15,845,000 | 15,942,185 | |||||||||
| Ventas Realty LP |
|
|||||||||||
| 3.50% |
02/01/25 | 12,540,000 | 12,585,211 | |||||||||
| 3.75% |
05/01/24 | 9,705,000 | 9,823,138 | |||||||||
| 4.00% |
03/01/28 | 2,000,000 | 2,036,696 | |||||||||
| 4.88% |
04/15/49 | 7,980,000 | 8,760,443 | |||||||||
|
|
|
| ||||||||||
| 834,313,721 | ||||||||||||
|
|
|
| ||||||||||
| Retail — 0.24% |
|
|||||||||||
| 7-Eleven, Inc. |
|
|||||||||||
| 0.63% |
02/10/231 | 58,715,000 | 57,810,842 | |||||||||
| Alimentation Couche-Tard, Inc. |
|
|||||||||||
| (Canada) |
|
|||||||||||
| 3.80% |
01/25/501,3 | 18,032,000 | 16,819,521 | |||||||||
| Fertitta Entertainment, LLC/Fertitta Entertainment Finance Co., Inc. |
|
|||||||||||
| 4.63% |
01/15/291 | 35,927,000 | 34,052,417 | |||||||||
| FirstCash, Inc. |
|
|||||||||||
| 5.63% |
01/01/301 | 4,726,000 | 4,547,041 | |||||||||
| Michaels Cos., Inc. (The) |
|
|||||||||||
| 7.88% |
05/01/291 | 83,531,000 | 71,627,415 | |||||||||
| Starbucks Corp. |
|
|||||||||||
| 3.00% |
02/14/32 | 2,795,000 | 2,673,531 | |||||||||
|
|
|
| ||||||||||
| 187,530,767 | ||||||||||||
|
|
|
| ||||||||||
| Services — 0.08% |
|
|||||||||||
| DP World Crescent Ltd. |
|
|||||||||||
| (Cayman Islands) |
|
|||||||||||
| 4.85% |
09/26/281,3 | 7,600,000 | 8,106,920 | |||||||||
| GFL Environmental, Inc. |
|
|||||||||||
| (Canada) |
|
|||||||||||
| 4.38% |
08/15/291,3 | 605,000 | 559,985 | |||||||||
| Moody’s Corp. |
|
|||||||||||
| 3.75% |
02/25/52 | 6,320,000 | 6,244,293 | |||||||||
| S&P Global, Inc. |
|
|||||||||||
| 2.70% |
03/01/291 | 17,000,000 | 16,479,035 | |||||||||
| 4.75% |
08/01/281 | 2,767,000 | 2,975,076 | |||||||||
| Waste Connections, Inc. |
|
|||||||||||
| (Canada) |
|
|||||||||||
| 3.20% |
06/01/323 | 6,515,000 | 6,351,876 | |||||||||
| Waste Pro USA, Inc. |
|
|||||||||||
| 5.50% |
02/15/261 | 23,750,000 | 22,471,894 | |||||||||
|
|
|
| ||||||||||
| 63,189,079 | ||||||||||||
|
|
|
| ||||||||||
| Transportation — 0.38% |
|
|||||||||||
| American Airlines Pass-Through Trust, |
|
|||||||||||
| Series 2013-1, Class A |
|
|||||||||||
| 4.00% |
07/15/25 | 10,838,446 | 10,078,491 | |||||||||
| American Airlines Pass-Through Trust, |
|
|||||||||||
| Series 2017-2, Class AA |
|
|||||||||||
| 3.35% |
10/15/29 | 16,166,862 | 15,545,660 | |||||||||
See accompanying Notes to Financial Statements.
| Annual Report March 2022 / 182 |
Table of Contents
Total Return Bond Fund
Schedule of Portfolio Investments
March 31, 2022
| Issues |
|
Maturity Date |
Principal Amount |
Value | ||||||||
| CORPORATES (continued) |
|
|||||||||||
| Transportation (continued) |
|
|||||||||||
| Continental Airlines Pass-Through Trust, |
|
|||||||||||
| Series 2007-1, Class A |
|
|||||||||||
| 5.98% |
04/19/22 | $ | 13,682,979 | $ | 13,702,825 | |||||||
| Continental Airlines Pass-Through Trust, |
|
|||||||||||
| Series 2007-1, Class B |
|
|||||||||||
| 6.90% |
04/19/22 | 50,265 | 50,266 | |||||||||
| Delta Air Lines Pass-Through Trust, |
|
|||||||||||
| Series 2020-1, Class AA |
|
|||||||||||
| 2.00% |
06/10/28 | 82,060,724 | 75,323,639 | |||||||||
| Empresa de Transporte de Pasajeros Metro SA |
|
|||||||||||
| (Chile) |
|
|||||||||||
| 3.65% |
05/07/301,3 | 9,660,000 | 9,688,014 | |||||||||
| JetBlue Airways Pass-Through Trust, |
|
|||||||||||
| Series 2020-1, Class A |
|
|||||||||||
| 4.00% |
11/15/32 | 9,953,096 | 9,906,744 | |||||||||
| Norfolk Southern Corp. |
|
|||||||||||
| 3.70% |
03/15/53 | 5,905,000 | 5,886,089 | |||||||||
| Northwest Airlines Pass-Through Trust, |
|
|||||||||||
| Series 2001-1, Class A-1 |
|
|||||||||||
| 7.04% |
04/01/22 | 115,767 | 116,346 | |||||||||
| SMBC Aviation Capital Finance DAC |
|
|||||||||||
| (Ireland) |
|
|||||||||||
| 3.00% |
07/15/221,3 | 20,315,000 | 20,345,769 | |||||||||
| U.S. Airways Pass-Through Trust, |
|
|||||||||||
| Series 2010-1, Class A |
|
|||||||||||
| 6.25% |
04/22/23 | 10,973,303 | 11,039,223 | |||||||||
| U.S. Airways Pass-Through Trust, |
|
|||||||||||
| Series 2011-1, Class A |
|
|||||||||||
| 7.13% |
10/22/23 | 2,190,509 | 2,247,567 | |||||||||
| U.S. Airways Pass-Through Trust, |
|
|||||||||||
| Series 2012-1, Class A |
|
|||||||||||
| 5.90% |
10/01/24 | 28,420,024 | 29,645,598 | |||||||||
| U.S. Airways Pass-Through Trust, |
|
|||||||||||
| Series 2012-2, Class A |
|
|||||||||||
| 4.63% |
06/03/25 | 7,107 | 6,876 | |||||||||
| Union Pacific Corp. |
|
|||||||||||
| 2.80% |
02/14/32 | 12,735,000 | 12,254,731 | |||||||||
| 3.20% |
05/20/41 | 10,000,000 | 9,483,977 | |||||||||
| 3.38% |
02/14/42 | 9,660,000 | 9,344,646 | |||||||||
| 3.50% |
02/14/53 | 22,460,000 | 21,981,981 | |||||||||
| United Airlines Pass-Through Trust, |
|
|||||||||||
| Series 2013-1, Class A |
|
|||||||||||
| 4.30% |
08/15/25 | 11,832,154 | 11,834,116 | |||||||||
| United Airlines Pass-Through Trust, |
|
|||||||||||
| Series 2018-1, Class AA |
|
|||||||||||
| 3.50% |
03/01/30 | 29,123,825 | 28,194,193 | |||||||||
|
|
|
| ||||||||||
| 296,676,751 | ||||||||||||
|
|
|
| ||||||||||
| Total Corporates |
|
|||||||||||
| (Cost $23,367,954,467) |
|
22,390,395,941 | ||||||||||
|
|
|
| ||||||||||
| Issues | Maturity Date |
Principal Amount |
Value | |||||||||
| FOREIGN GOVERNMENT OBLIGATIONS —1.17% |
| |||||||||||
| Foreign Government Obligations — 1.17% |
|
|||||||||||
| Abu Dhabi Government International Bond, |
|
|||||||||||
| Series REGS |
|
|||||||||||
| (United Arab Emirates) |
|
|||||||||||
| 2.50% |
09/30/293 | $ | 38,500,000 | $ | 37,808,425 | |||||||
| Airport Authority |
|
|||||||||||
| (Hong Kong) |
|
|||||||||||
| 2.50% |
01/12/321,3 | 8,040,000 | 7,517,440 | |||||||||
| 3.25% |
01/12/521,3 | 69,310,000 | 62,902,291 | |||||||||
| 3.50% |
01/12/621,3 | 5,435,000 | 5,087,024 | |||||||||
| Brazilian Government International Bond |
|
|||||||||||
| (Brazil) |
|
|||||||||||
| 2.88% |
06/06/253 | 24,818,000 | 24,396,094 | |||||||||
| 3.88% |
06/12/303 | 22,393,000 | 20,683,294 | |||||||||
| 4.63% |
01/13/283 | 11,020,000 | 11,097,140 | |||||||||
| Chile Government International Bond |
|
|||||||||||
| (Chile) |
|
|||||||||||
| 2.45% |
01/31/313 | 12,329,000 | 11,577,301 | |||||||||
| 3.24% |
02/06/283 | 11,522,000 | 11,556,566 | |||||||||
| Colombia Government International Bond |
|
|||||||||||
| (Colombia) |
|
|||||||||||
| 3.00% |
01/30/303 | 40,916,000 | 35,225,607 | |||||||||
| 3.13% |
04/15/313 | 15,100,000 | 12,815,370 | |||||||||
| 4.50% |
01/28/263 | 28,355,000 | 28,360,813 | |||||||||
| Croatia Government International Bond, |
|
|||||||||||
| Series REGS |
|
|||||||||||
| (Croatia) |
|
|||||||||||
| 6.00% |
01/26/243 | 18,065,000 | 19,154,591 | |||||||||
| Dominican Republic International Bond |
|
|||||||||||
| (Dominican Republic) |
|
|||||||||||
| 4.50% |
01/30/301,3 | 25,047,000 | 23,112,432 | |||||||||
| Dominican Republic International Bond, |
|
|||||||||||
| Series REGS |
|
|||||||||||
| (Dominican Republic) |
|
|||||||||||
| 4.88% |
09/23/323 | 19,530,000 | 17,784,116 | |||||||||
| Egypt Government International Bond |
|
|||||||||||
| (Egypt) |
|
|||||||||||
| 7.60% |
03/01/291,3 | 3,550,000 | 3,381,375 | |||||||||
| Egypt Government International Bond, |
|
|||||||||||
| Series REGS |
|
|||||||||||
| (Egypt) |
|
|||||||||||
| 5.25% |
10/06/253 | 4,765,000 | 4,619,191 | |||||||||
| Hungary Government International Bond |
|
|||||||||||
| (Hungary) |
|
|||||||||||
| 2.13% |
09/22/311,3 | 17,300,000 | 15,705,667 | |||||||||
| Indonesia Government International Bond |
|
|||||||||||
| (Indonesia) |
|
|||||||||||
| 2.85% |
02/14/303 | 29,861,000 | 29,450,636 | |||||||||
| Mexico Government International Bond |
|
|||||||||||
| (Mexico) |
|
|||||||||||
| 2.66% |
05/24/313 | 40,616,000 | 37,033,669 | |||||||||
| 3.75% |
01/11/283 | 54,600,000 | 55,817,580 | |||||||||
| 4.50% |
04/22/293 | 11,767,000 | 12,442,426 | |||||||||
| 4.75% |
04/27/323 | 5,485,000 | 5,827,812 | |||||||||
See accompanying Notes to Financial Statements.
| 183 / Annual Report March 2022 |
Table of Contents
Total Return Bond Fund
Schedule of Portfolio Investments
March 31, 2022
| Issues |
Maturity Date |
Principal Amount |
Value | |||||||||
| FOREIGN GOVERNMENT OBLIGATIONS (continued) |
|
|||||||||||
| Foreign Government Obligations (continued) |
|
|||||||||||
| Oman Government International Bond, |
|
|||||||||||
| Series REGS |
|
|||||||||||
| (Oman) |
|
|||||||||||
| 5.63% |
01/17/283 | $ | 10,500,000 | $ | 10,868,550 | |||||||
| Panama Government International Bond |
|
|||||||||||
| (Panama) |
|
|||||||||||
| 2.25% |
09/29/323 | 19,300,000 | 17,126,096 | |||||||||
| 3.16% |
01/23/303 | 55,874,000 | 54,782,781 | |||||||||
| 3.88% |
03/17/283 | 13,200,000 | 13,530,000 | |||||||||
| Paraguay Government International Bond |
|
|||||||||||
| (Paraguay) |
|
|||||||||||
| 2.74% |
01/29/331,3 | 9,800,000 | 8,694,266 | |||||||||
| 4.95% |
04/28/311,3 | 7,477,000 | 7,904,684 | |||||||||
| Perusahaan Penerbit SBSN Indonesia III |
|
|||||||||||
| (Indonesia) |
|
|||||||||||
| 2.80% |
06/23/301,3 | 17,340,000 | 17,017,476 | |||||||||
| Perusahaan Penerbit SBSN Indonesia III, |
|
|||||||||||
| Series REGS |
|
|||||||||||
| (Indonesia) |
|
|||||||||||
| 4.15% |
03/29/273 | 5,100,000 | 5,384,274 | |||||||||
| Peruvian Government International Bond |
|
|||||||||||
| (Peru) |
|
|||||||||||
| 2.84% |
06/20/303 | 20,541,000 | 19,774,821 | |||||||||
| 4.13% |
08/25/273 | 2,327,000 | 2,423,756 | |||||||||
| Philippine Government International Bond |
|
|||||||||||
| (Philippines) |
|
|||||||||||
| 1.65% |
06/10/313 | 8,405,000 | 7,522,475 | |||||||||
| 1.95% |
01/06/323 | 7,040,000 | 6,399,137 | |||||||||
| 2.46% |
05/05/303 | 4,565,000 | 4,359,575 | |||||||||
| Qatar Government International Bond, |
|
|||||||||||
| Series REGS |
|
|||||||||||
| (Qatar) |
|
|||||||||||
| 3.75% |
04/16/303 | 23,550,000 | 24,922,965 | |||||||||
| 4.50% |
04/23/283 | 35,553,000 | 38,766,991 | |||||||||
| Republic of South Africa Government International Bond |
|
|||||||||||
| (South Africa) |
|
|||||||||||
| 4.30% |
10/12/283 | 28,007,000 | 27,138,531 | |||||||||
| 4.85% |
09/30/293 | 29,185,000 | 28,621,729 | |||||||||
| Romanian Government International Bond, |
|
|||||||||||
| Series REGS |
|
|||||||||||
| (Romania) |
|
|||||||||||
| 3.00% |
02/14/313 | 26,000,000 | 24,104,262 | |||||||||
| Saudi Government International Bond, |
|
|||||||||||
| Series REGS (EMTN) |
|
|||||||||||
| (Saudi Arabia) |
|
|||||||||||
| 3.25% |
10/26/263 | 29,155,000 | 29,883,875 | |||||||||
| 3.25% |
10/22/303 | 16,040,000 | 16,219,648 | |||||||||
| 3.63% |
03/04/283 | 27,097,000 | 28,036,995 | |||||||||
| Uruguay Government International Bond |
|
|||||||||||
| (Uruguay) |
|
|||||||||||
| 4.38% |
01/23/313 | 20,570,000 | 22,408,958 | |||||||||
|
|
|
| ||||||||||
| Total Foreign Government Obligations |
|
|||||||||||
| (Cost $964,580,473) |
|
909,248,705 | ||||||||||
|
|
|
| ||||||||||
| Issues |
Maturity Date |
Principal Amount |
Value | |||||||||
| MORTGAGE-BACKED — 41.68%** |
|
|||||||||||
| Non-Agency Commercial Mortgage-Backed — 2.01% |
|
|||||||||||
| Banc of America Merrill Lynch Commercial Mortgage Trust, |
|
|||||||||||
| Series 2018-PARK, Class A |
|
|||||||||||
| 4.09% |
08/10/381,4 | $ | 122,930,000 | $ | 126,507,543 | |||||||
| Barclays Commercial Mortgage Securities Mortgage Trust, |
|
|||||||||||
| Series 2018-TALL, Class C |
|
|||||||||||
| (LIBOR USD 1-Month plus 1.12%) |
|
|||||||||||
| 1.52% |
03/15/371,2 | 18,000,000 | 17,178,653 | |||||||||
| BFLD Trust, |
|
|||||||||||
| Series 2020-OBRK, Class A |
|
|||||||||||
| (LIBOR USD 1-Month plus 2.05%) |
|
|||||||||||
| 2.45% |
11/15/281,2 | 65,000,000 | 64,415,098 | |||||||||
| BGME Trust, |
|
|||||||||||
| Series 2021-VR, Class A |
|
|||||||||||
| 2.99% |
01/10/431,4 | 20,000,000 | 19,136,542 | |||||||||
| BGME Trust, |
|
|||||||||||
| Series 2021-VR, Class B |
|
|||||||||||
| 2.99% |
01/10/431,4 | 32,137,000 | 30,072,452 | |||||||||
| BX Commercial Mortgage Trust, |
|
|||||||||||
| Series 2018-BIOA, Class E |
|
|||||||||||
| (LIBOR USD 1-Month plus 1.95%) |
|
|||||||||||
| 2.35% |
03/15/371,2 | 16,407,447 | 16,081,878 | |||||||||
| BX Commercial Mortgage Trust, |
|
|||||||||||
| Series 2019-XL, Class A |
|
|||||||||||
| (LIBOR USD 1-Month plus 0.92%) |
|
|||||||||||
| 1.32% |
10/15/361,2 | 182,454,411 | 181,670,054 | |||||||||
| BX Commercial Mortgage Trust, |
|
|||||||||||
| Series 2020-VIV4, Class A |
|
|||||||||||
| 2.84% |
03/09/441 | 180,165,000 | 168,534,769 | |||||||||
| BX Trust, |
|
|||||||||||
| Series 2019-OC11, Class A |
|
|||||||||||
| 3.20% |
12/09/411 | 42,270,000 | 40,895,659 | |||||||||
| CALI Mortgage Trust, |
|
|||||||||||
| Series 2019-101C, Class A |
|
|||||||||||
| 3.96% |
03/10/391 | 80,255,000 | 81,593,914 | |||||||||
| CALI Mortgage Trust, |
|
|||||||||||
| Series 2019-101C, Class XA (IO) |
|
|||||||||||
| 0.30% |
03/10/391,4 | 272,551,000 | 5,424,378 | |||||||||
| Capital Funding Mortgage Trust, |
|
|||||||||||
| Series 2021-M01, Class A |
|
|||||||||||
| (LIBOR USD 1-Month plus 2.25%) |
|
|||||||||||
| 2.75% |
12/19/241,2 | 90,174,646 | 89,814,597 | |||||||||
| Century Plaza Towers, |
|
|||||||||||
| Series 2019-CPT, Class A |
|
|||||||||||
| 2.87% |
11/13/391 | 32,645,000 | 30,872,347 | |||||||||
| Citigroup Commercial Mortgage Trust, |
|
|||||||||||
| Series 2015-GC31, Class A4 |
|
|||||||||||
| 3.76% |
06/10/48 | 10,000,000 | 10,072,026 | |||||||||
| Commercial Mortgage Trust, |
|
|||||||||||
| Series 2013-CR12, Class A4 |
|
|||||||||||
| 4.05% |
10/10/46 | 440,000 | 445,150 | |||||||||
| Credit Suisse Mortgage Capital Certificates, |
|
|||||||||||
| Series 2019-ICE4, Class A |
|
|||||||||||
| (LIBOR USD 1-Month plus 0.98%) |
|
|||||||||||
| 1.38% |
05/15/361,2 | 31,400,000 | 31,196,002 | |||||||||
See accompanying Notes to Financial Statements.
| Annual Report March 2022 / 184 |
Table of Contents
Total Return Bond Fund
Schedule of Portfolio Investments
March 31, 2022
| Issues |
Maturity Date |
Principal Amount |
Value | |||||||||
| MORTGAGE-BACKED (continued) |
|
|||||||||||
| Non-Agency Commercial Mortgage-Backed (continued) |
|
|||||||||||
| DC Office Trust, |
|
|||||||||||
| Series 2019-MTC, Class A |
|
|||||||||||
| 2.97% |
09/15/451 | $ | 31,135,000 | $ | 29,502,489 | |||||||
| Fontainebleau Miami Beach Trust, |
|
|||||||||||
| Series 2019-FBLU, Class A |
|
|||||||||||
| 3.14% |
12/10/361 | 35,000,000 | 34,316,578 | |||||||||
| GS Mortgage Securities Corp. Trust, |
|
|||||||||||
| Series 2019-BOCA, Class A |
|
|||||||||||
| (LIBOR USD 1-Month plus 1.20%) |
|
|||||||||||
| 1.60% |
06/15/381,2 | 10,000,000 | 9,981,476 | |||||||||
| Hudson Yards Mortgage Trust, |
|
|||||||||||
| Series 2019-30HY, Class A |
|
|||||||||||
| 3.23% |
07/10/391 | 84,915,000 | 82,638,318 | |||||||||
| Hudson Yards Mortgage Trust, |
|
|||||||||||
| Series 2019-55HY, Class A |
|
|||||||||||
| 2.94% |
12/10/411,4 | 81,025,000 | 77,523,983 | |||||||||
| KNDL Mortgage Trust, |
|
|||||||||||
| Series 2019-KNSQ, Class E |
|
|||||||||||
| (LIBOR USD 1-Month plus 1.80%) |
|
|||||||||||
| 2.20% |
05/15/361,2 | 26,449,000 | 26,099,860 | |||||||||
| NCMF Trust, |
|
|||||||||||
| Series 2022-MFP, Class A |
|
|||||||||||
| (CME Term SOFR 1-Month plus 1.74%) |
|
|||||||||||
| 2.04% |
03/15/391,2 | 115,900,000 | 115,287,747 | |||||||||
| One Bryant Park Trust, |
|
|||||||||||
| Series 2019-OBP, Class A |
|
|||||||||||
| 2.52% |
09/15/541 | 147,667,000 | 137,000,806 | |||||||||
| Queens Center Mortgage Trust, |
|
|||||||||||
| Series 2013-QCA, Class A |
|
|||||||||||
| 3.28% |
01/11/371 | 15,810,000 | 15,536,606 | |||||||||
| RBS Commercial Funding, Inc., Trust, |
|
|||||||||||
| Series 2013-GSP, Class A |
|
|||||||||||
| 3.83% |
01/15/321,4 | 48,830,000 | 48,941,330 | |||||||||
| SFAVE Commercial Mortgage Securities Trust, |
|
|||||||||||
| Series 2015-5AVE, Class A1 |
|
|||||||||||
| 3.87% |
01/05/431,4 | 56,465,000 | 53,799,570 | |||||||||
| SFAVE Commercial Mortgage Securities Trust, |
|
|||||||||||
| Series 2015-5AVE, Class A2B |
|
|||||||||||
| 4.14% |
01/05/431,4 | 8,710,000 | 8,345,184 | |||||||||
|
|
|
| ||||||||||
| 1,552,885,009 | ||||||||||||
|
|
|
| ||||||||||
| Non-Agency Mortgage-Backed — 7.36% |
|
|||||||||||
| 1301 Properties Owner LP |
|
|||||||||||
| 2.08% |
09/07/255,6 | 47,327,027 | 47,341,225 | |||||||||
| Aames Mortgage Trust, |
|
|||||||||||
| Series 2002-1, Class A3 (STEP-reset date 05/25/22) |
|
|||||||||||
| 7.40% |
06/25/32 | 27,113 | 26,317 | |||||||||
| Accredited Mortgage Loan Trust, |
|
|||||||||||
| Series 2007-1, Class A4 |
|
|||||||||||
| (LIBOR USD 1-Month plus 0.22%) |
|
|||||||||||
| 0.68% |
02/25/372 | 12,489,727 | 12,511,110 | |||||||||
| ACE Securities Corp. Home Equity Loan Trust, |
|
|||||||||||
| Series 2004-IN1, Class A1 |
|
|||||||||||
| (LIBOR USD 1-Month plus 0.64%) |
|
|||||||||||
| 1.10% |
05/25/342 | 130,155 | 128,399 | |||||||||
| Issues |
Maturity Date |
Principal Amount |
Value | |||||||||
| MORTGAGE-BACKED (continued) |
|
|||||||||||
| Non-Agency Mortgage-Backed (continued) |
|
|||||||||||
| ACE Securities Corp. Home Equity Loan Trust, |
|
|||||||||||
| Series 2006-HE3, Class A2C |
|
|||||||||||
| (LIBOR USD 1-Month plus 0.30%) |
|
|||||||||||
| 0.76% |
06/25/362 | $ | 2,593,727 | $ | 2,211,806 | |||||||
| ACE Securities Corp. Home Equity Loan Trust, |
|
|||||||||||
| Series 2007-ASP2, Class A1 |
|
|||||||||||
| (LIBOR USD 1-Month plus 0.38%) |
|
|||||||||||
| 0.84% |
06/25/372 | 30,843,398 | 25,791,049 | |||||||||
| Adjustable Rate Mortgage Trust, |
|
|||||||||||
| Series 2005-10, Class 6A1 |
|
|||||||||||
| (LIBOR USD 1-Month plus 0.54%) |
|
|||||||||||
| 1.00% |
01/25/362 | 186,955 | 182,117 | |||||||||
| Aegis Asset-Backed Securities Trust, |
|
|||||||||||
| Series 2005-5, Class 1A4 |
|
|||||||||||
| (LIBOR USD 1-Month plus 0.70%) |
|
|||||||||||
| 1.16% |
12/25/352 | 41,215 | 41,150 | |||||||||
| Ajax Mortgage Loan Trust, |
|
|||||||||||
| Series 2019-F, Class A1 (STEP-reset date 04/25/22) |
|
|||||||||||
| 2.86% |
07/25/591 | 141,640 | 139,966 | |||||||||
| Alternative Loan Trust, |
|
|||||||||||
| Series 2004-J6, Class 2A1 |
|
|||||||||||
| 6.50% |
11/25/31 | 2,220 | 2,226 | |||||||||
| Alternative Loan Trust, |
|
|||||||||||
| Series 2005-38, Class A1 |
|
|||||||||||
| (Federal Reserve US 12-Month Cumulative Average plus |
|
|||||||||||
| 1.50%) |
|
|||||||||||
| 1.64% |
09/25/352 | 332,750 | 309,581 | |||||||||
| Alternative Loan Trust, |
|
|||||||||||
| Series 2005-76, Class 2A1 |
|
|||||||||||
| (Federal Reserve US 12-Month Cumulative Average plus |
|
|||||||||||
| 1.00%) |
|
|||||||||||
| 1.14% |
02/25/362 | 35,880,282 | 33,602,859 | |||||||||
| Alternative Loan Trust, |
|
|||||||||||
| Series 2005-84, Class 1A1 |
|
|||||||||||
| 2.14% |
02/25/364 | 29,203 | 27,821 | |||||||||
| Alternative Loan Trust, |
|
|||||||||||
| Series 2006-HY13, Class 4A1 |
|
|||||||||||
| 3.12% |
02/25/374 | 966,678 | 959,972 | |||||||||
| Alternative Loan Trust, |
|
|||||||||||
| Series 2006-OC5, Class 2A2A |
|
|||||||||||
| (LIBOR USD 1-Month plus 0.34%) |
|
|||||||||||
| 0.80% |
06/25/462 | 980 | 982 | |||||||||
| Alternative Loan Trust, |
|
|||||||||||
| Series 2007-J1, Class 2A1 |
|
|||||||||||
| (LIBOR USD 1-Month plus 0.20%) |
|
|||||||||||
| 0.66% |
03/25/372 | 560,775 | 129,106 | |||||||||
| American Home Mortgage Assets Trust, |
|
|||||||||||
| Series 2006-3, Class 2A12 |
|
|||||||||||
| (Federal Reserve US 12-Month Cumulative Average plus |
|
|||||||||||
| 1.15%) |
|
|||||||||||
| 1.29% |
10/25/462 | 35,088,311 | 28,560,875 | |||||||||
| American Home Mortgage Assets Trust, |
|
|||||||||||
| Series 2007-2, Class A1 |
|
|||||||||||
| (LIBOR USD 1-Month plus 0.13%) |
|
|||||||||||
| 0.58% |
03/25/472 | 30,522,761 | 28,711,702 | |||||||||
See accompanying Notes to Financial Statements.
| 185 / Annual Report March 2022 |
Table of Contents
Total Return Bond Fund
Schedule of Portfolio Investments
March 31, 2022
| Issues |
Maturity Date |
Principal Amount |
Value | |||||||||
| MORTGAGE-BACKED (continued) |
|
|||||||||||
| Non-Agency Mortgage-Backed (continued) |
|
|||||||||||
| American Home Mortgage Investment Trust, |
|
|||||||||||
| Series 2004-3, Class 2A |
|
|||||||||||
| (LIBOR USD 6-Month plus 1.50%) |
|
|||||||||||
| 2.03% |
10/25/342 | $ | 3,953,469 | $ | 4,001,238 | |||||||
| Ameriquest Mortgage Securities Trust, |
|
|||||||||||
| Series 2006-R1, Class M1 |
|
|||||||||||
| (LIBOR USD 1-Month plus 0.59%) |
|
|||||||||||
| 1.04% |
03/25/362 | 4,870,794 | 4,901,742 | |||||||||
| Ameriquest Mortgage Securities, Inc., Asset-Backed Pass- Through Certificates, |
|
|||||||||||
| Series 2004-R10, Class A1 |
|
|||||||||||
| (LIBOR USD 1-Month plus 0.66%) |
|
|||||||||||
| 1.12% |
11/25/342 | 3,477,407 | 3,437,999 | |||||||||
| Amresco Residential Securities Corp. Mortgage Loan Trust, |
|
|||||||||||
| Series 1998-1, Class A5 (STEP-reset date 05/25/22) |
|
|||||||||||
| 7.53% |
10/25/27 | 11,101 | 11,298 | |||||||||
| Argent Securities, Inc., Asset-Backed Pass-Through Certificates, |
|
|||||||||||
| Series 2005-W2, Class M1 |
|
|||||||||||
| (LIBOR USD 1-Month plus 0.74%) |
|
|||||||||||
| 1.19% |
10/25/352 | 149,344 | 148,300 | |||||||||
| Argent Securities, Inc., Asset-Backed Pass-Through Certificates, |
|
|||||||||||
| Series 2005-W3, Class M1 |
|
|||||||||||
| (LIBOR USD 1-Month plus 0.66%) |
|
|||||||||||
| 1.12% |
11/25/352 | 18,415,963 | 18,215,356 | |||||||||
| Asset-Backed Funding Certificates, |
|
|||||||||||
| Series 2006-OPT3, Class A3B |
|
|||||||||||
| (LIBOR USD 1-Month plus 0.32%) |
|
|||||||||||
| 0.78% |
11/25/362 | 42,016,666 | 21,555,083 | |||||||||
| Asset-Backed Funding Certificates, |
|
|||||||||||
| Series 2007-WMC1, Class A2A |
|
|||||||||||
| (LIBOR USD 1-Month plus 0.75%) |
|
|||||||||||
| 1.21% |
06/25/372 | 22,692,398 | 20,987,799 | |||||||||
| Asset-Backed Funding Certificates, |
|
|||||||||||
| Series 2007-WMC1, Class A2B |
|
|||||||||||
| (LIBOR USD 1-Month plus 1.00%) |
|
|||||||||||
| 1.46% |
06/25/372 | 16,577,591 | 15,579,821 | |||||||||
| Asset-Backed Securities Corp. Home Equity Loan Trust, |
|
|||||||||||
| Series 2006-HE6, Class A5 |
|
|||||||||||
| (LIBOR USD 1-Month plus 0.23%) |
|
|||||||||||
| 0.69% |
11/25/362 | 18,411,000 | 18,251,245 | |||||||||
| Banc of America Funding Trust, |
|
|||||||||||
| Series 2003-2, Class 1A1 |
|
|||||||||||
| 6.50% |
06/25/32 | 11,323 | 11,181 | |||||||||
| Banc of America Funding Trust, |
|
|||||||||||
| Series 2006-D, Class 3A1 |
|
|||||||||||
| 3.00% |
05/20/364 | 2,799,233 | 2,609,282 | |||||||||
| Banc of America Funding Trust, |
|
|||||||||||
| Series 2006-E, Class 2A1 |
|
|||||||||||
| 2.65% |
06/20/364 | 38,453 | 37,028 | |||||||||
| Banc of America Funding Trust, |
|
|||||||||||
| Series 2006-H, Class 3A1 |
|
|||||||||||
| 2.92% |
09/20/464 | 668,502 | 617,716 | |||||||||
| Issues |
Maturity Date |
Principal Amount |
Value | |||||||||
| MORTGAGE-BACKED (continued) |
|
|||||||||||
| Non-Agency Mortgage-Backed (continued) |
|
|||||||||||
| Banc of America Funding Trust, |
|
|||||||||||
| Series 2015-R2, Class 1A1 |
|
|||||||||||
| (LIBOR USD 1-Month plus 0.14%) |
|
|||||||||||
| 0.60% |
08/27/361,2 | $ | 5,415,276 | $ | 5,356,918 | |||||||
| Banc of America Funding Trust, |
|
|||||||||||
| Series 2015-R5, Class 1A2 |
|
|||||||||||
| (LIBOR USD 1-Month plus 0.13%) |
|
|||||||||||
| 0.59% |
10/26/361,2 | 13,375,245 | 13,670,224 | |||||||||
| Banc of America Mortgage Trust, |
|
|||||||||||
| Series 2004-F, Class 1A1 |
|
|||||||||||
| 2.45% |
07/25/344 | 24,237 | 24,342 | |||||||||
| Banc of America Mortgage Trust, |
|
|||||||||||
| Series 2005-C, Class 2A2 |
|
|||||||||||
| 2.75% |
04/25/354 | 140,091 | 147,201 | |||||||||
| Banc of America Mortgage Trust, |
|
|||||||||||
| Series 2006-2, Class A2 |
|
|||||||||||
| (-1.00 X LIBOR USD 1-Month plus 6.00%, 6.00% Cap) |
|
|||||||||||
| 6.00% |
07/25/462 | 72,162 | 67,410 | |||||||||
| Banc of America Mortgage Trust, |
|
|||||||||||
| Series 2007-1, Class 1A24 |
|
|||||||||||
| 6.00% |
03/25/37 | 383,471 | 350,629 | |||||||||
| Banc of America Mortgage Trust, |
|
|||||||||||
| Series 2007-3, Class 1A1 |
|
|||||||||||
| 6.00% |
09/25/37 | 195,851 | 189,531 | |||||||||
| BCAP LLC Trust, |
|
|||||||||||
| Series 2007-AA2, Class 2A5 |
|
|||||||||||
| 6.00% |
04/25/37 | 221,795 | 142,130 | |||||||||
| BCAP LLC Trust, |
|
|||||||||||
| Series 2007-AA5, Class A1 |
|
|||||||||||
| (LIBOR USD 1-Month plus 1.30%) |
|
|||||||||||
| 1.76% |
09/25/472 | 14,616,628 | 14,102,679 | |||||||||
| Bear Stearns ALT-A Trust, |
|
|||||||||||
| Series 2005-4, Class 22A2 |
|
|||||||||||
| 2.72% |
05/25/354 | 9,475 | 9,135 | |||||||||
| Bear Stearns ALT-A Trust, |
|
|||||||||||
| Series 2006-4, Class 32A1 |
|
|||||||||||
| 2.96% |
07/25/364 | 1,420,864 | 837,866 | |||||||||
| Bear Stearns ARM Trust, |
|
|||||||||||
| Series 2004-1, Class 13A2 |
|
|||||||||||
| 3.07% |
04/25/344 | 4,276 | 4,234 | |||||||||
| Bear Stearns ARM Trust, |
|
|||||||||||
| Series 2004-10, Class 14A1 |
|
|||||||||||
| 2.68% |
01/25/354 | 1,750,253 | 1,762,221 | |||||||||
| Bear Stearns ARM Trust, |
|
|||||||||||
| Series 2006-4, Class 2A1 |
|
|||||||||||
| 2.80% |
10/25/364 | 244,077 | 226,725 | |||||||||
| Bear Stearns Asset-Backed Securities I Trust, |
|
|||||||||||
| Series 2005-AC5, Class 2A3 |
|
|||||||||||
| (LIBOR USD 1-Month plus 0.25%) |
|
|||||||||||
| 0.71% |
08/25/202 | 1,217,848 | 670,429 | |||||||||
| Bear Stearns Asset-Backed Securities I Trust, |
|
|||||||||||
| Series 2006-AC2, Class 21A3 |
|
|||||||||||
| 6.00% |
03/25/36 | 220,234 | 224,716 | |||||||||
See accompanying Notes to Financial Statements.
| Annual Report March 2022 / 186 |
Table of Contents
Total Return Bond Fund
Schedule of Portfolio Investments
March 31, 2022
| Issues |
Maturity Date |
Principal Amount |
Value | |||||||||
| MORTGAGE-BACKED (continued) |
|
|||||||||||
| Non-Agency Mortgage-Backed (continued) |
|
|||||||||||
| Bear Stearns Asset-Backed Securities I Trust, |
|
|||||||||||
| Series 2006-HE9, Class 3A |
|
|||||||||||
| (LIBOR USD 1-Month plus 0.14%) |
|
|||||||||||
| 0.60% |
11/25/362 | $ | 4,181,376 | $ | 4,035,346 | |||||||
| Bear Stearns Asset-Backed Securities Trust, |
|
|||||||||||
| Series 2003-AC7, Class A1 (STEP-reset date 05/25/22) |
|
|||||||||||
| 5.50% |
01/25/34 | 484,056 | 474,330 | |||||||||
| Bear Stearns Asset-Backed Securities Trust, |
|
|||||||||||
| Series 2003-AC7, Class A2 (STEP-reset date 05/25/22) |
|
|||||||||||
| 5.75% |
01/25/34 | 436,409 | 427,586 | |||||||||
| Bear Stearns Mortgage Funding Trust, |
|
|||||||||||
| Series 2006-AR3, Class 1A1 |
|
|||||||||||
| (LIBOR USD 1-Month plus 0.18%) |
|
|||||||||||
| 0.64% |
10/25/362 | 1,110,204 | 1,031,394 | |||||||||
| Bear Stearns Mortgage Funding Trust, |
|
|||||||||||
| Series 2006-AR5, Class 1A1 |
|
|||||||||||
| (LIBOR USD 1-Month plus 0.16%) |
|
|||||||||||
| 0.62% |
12/25/462 | 14,912,872 | 13,335,911 | |||||||||
| Bear Stearns Mortgage Funding Trust, |
|
|||||||||||
| Series 2007-AR5, Class 1A1A |
|
|||||||||||
| (LIBOR USD 1-Month plus 0.17%) |
|
|||||||||||
| 0.63% |
06/25/472 | 327,041 | 309,940 | |||||||||
| Carrington Mortgage Loan Trust, |
|
|||||||||||
| Series 2005-NC5, Class M1 |
|
|||||||||||
| (LIBOR USD 1-Month plus 0.72%) |
|
|||||||||||
| 1.18% |
10/25/352 | 61,378 | 62,006 | |||||||||
| Carrington Mortgage Loan Trust, |
|
|||||||||||
| Series 2006-NC1, Class A4 |
|
|||||||||||
| (LIBOR USD 1-Month plus 0.62%) |
|
|||||||||||
| 1.08% |
01/25/362 | 9,264,663 | 9,257,566 | |||||||||
| Carrington Mortgage Loan Trust, |
|
|||||||||||
| Series 2006-OPT1, Class M1 |
|
|||||||||||
| (LIBOR USD 1-Month plus 0.53%) |
|
|||||||||||
| 0.98% |
02/25/362 | 86,885 | 87,713 | |||||||||
| Chase Funding Trust, |
|
|||||||||||
| Series 2003-5, Class 2A2 |
|
|||||||||||
| (LIBOR USD 1-Month plus 0.60%) |
|
|||||||||||
| 1.06% |
07/25/332 | 3,059 | 2,961 | |||||||||
| Chase Funding Trust, |
|
|||||||||||
| Series 2004-2, Class 2A2 |
|
|||||||||||
| (LIBOR USD 1-Month plus 0.50%) |
|
|||||||||||
| 0.96% |
02/26/352 | 5,668 | 5,454 | |||||||||
| Chase Mortgage Finance Trust, |
|
|||||||||||
| Series 2006-A1, Class 1A2 |
|
|||||||||||
| 3.20% |
09/25/364 | 424,432 | 380,880 | |||||||||
| Chase Mortgage Finance Trust, |
|
|||||||||||
| Series 2006-S3, Class 2A1 |
|
|||||||||||
| 5.50% |
11/25/21 | 1,386,891 | 712,158 | |||||||||
| Chase Mortgage Finance Trust, |
|
|||||||||||
| Series 2007-A2, Class 2A3 |
|
|||||||||||
| 2.38% |
06/25/354 | 906,854 | 915,774 | |||||||||
| ChaseFlex Trust, |
|
|||||||||||
| Series 2005-2, Class 4A2 |
|
|||||||||||
| 5.50% |
06/25/36 | 290,121 | 170,829 | |||||||||
| Issues |
Maturity Date |
Principal Amount |
Value | |||||||||
| MORTGAGE-BACKED (continued) |
|
|||||||||||
| Non-Agency Mortgage-Backed (continued) |
|
|||||||||||
| ChaseFlex Trust, |
|
|||||||||||
| Series 2006-2, Class A2B |
|
|||||||||||
| (LIBOR USD 1-Month plus 0.20%) |
|
|||||||||||
| 0.66% |
09/25/362 | $ | 5,186,247 | $ | 4,519,594 | |||||||
| CIM Trust, |
|
|||||||||||
| Series 2018-R5, Class A1 |
|
|||||||||||
| 3.75% |
07/25/581,4 | 57,936,044 | 57,143,189 | |||||||||
| CIM Trust, |
|
|||||||||||
| Series 2018-R6, Class A1 |
|
|||||||||||
| (LIBOR USD 1-Month plus 1.08%) |
|
|||||||||||
| 1.31% |
09/25/581,2 | 54,157,393 | 53,052,127 | |||||||||
| CIM Trust, |
|
|||||||||||
| Series 2019-R1, Class A |
|
|||||||||||
| 3.25% |
10/25/581,4 | 181,059,142 | 169,531,469 | |||||||||
| CIM Trust, |
|
|||||||||||
| Series 2019-R3, Class A |
|
|||||||||||
| 2.63% |
06/25/581,4 | 121,386,212 | 114,377,579 | |||||||||
| CIM Trust, |
|
|||||||||||
| Series 2019-R4, Class A1 |
|
|||||||||||
| 3.00% |
10/25/591,4 | 113,611,671 | 115,471,801 | |||||||||
| CIM Trust, |
|
|||||||||||
| Series 2020-R1, Class A1 |
|
|||||||||||
| 2.85% |
10/27/591,4 | 159,938,733 | 150,881,850 | |||||||||
| CIM Trust, |
|
|||||||||||
| Series 2020-R3, Class A1A |
|
|||||||||||
| 4.00% |
01/26/601,4 | 140,383,954 | 136,833,083 | |||||||||
| CIM Trust, |
|
|||||||||||
| Series 2020-R4, Class A1A |
|
|||||||||||
| 3.30% |
06/25/601,4 | 83,885,634 | 79,281,706 | |||||||||
| CIM Trust, |
|
|||||||||||
| Series 2020-R6, Class A1A |
|
|||||||||||
| 2.25% |
12/25/601,4 | 172,506,537 | 162,128,906 | |||||||||
| CIM Trust, |
|
|||||||||||
| Series 2020-R7, Class A1A |
|
|||||||||||
| 2.25% |
12/27/611,4 | 279,464,407 | 263,988,367 | |||||||||
| CIM Trust, |
|
|||||||||||
| Series 2021-R1, Class A2 |
|
|||||||||||
| 2.40% |
08/25/561,4 | 104,088,698 | 99,772,806 | |||||||||
| CIM Trust, |
|
|||||||||||
| Series 2021-R2, Class A2 |
|
|||||||||||
| 2.50% |
01/25/571,4 | 98,772,482 | 94,830,828 | |||||||||
| CIM Trust, |
|
|||||||||||
| Series 2021-R3, Class A1A |
|
|||||||||||
| 1.95% |
06/25/571,4 | 338,702,812 | 328,571,534 | |||||||||
| CIM Trust, |
|
|||||||||||
| Series 2021-R4, Class A1A |
|
|||||||||||
| 2.00% |
05/01/611,4 | 248,615,539 | 235,737,254 | |||||||||
| CIM Trust, |
|
|||||||||||
| Series 2021-R5, Class A1A |
|
|||||||||||
| 2.00% |
08/25/611,4 | 242,964,036 | 229,066,493 | |||||||||
| CIT Mortgage Loan Trust, |
|
|||||||||||
| Series 2007-1, Class 1A |
|
|||||||||||
| (LIBOR USD 1-Month plus 1.35%) |
|
|||||||||||
| 1.81% |
10/25/371,2 | 21,669,260 | 21,699,792 | |||||||||
See accompanying Notes to Financial Statements.
| 187 / Annual Report March 2022 |
Table of Contents
Total Return Bond Fund
Schedule of Portfolio Investments
March 31, 2022
| Issues |
Maturity Date |
Principal Amount |
Value | |||||||||
| MORTGAGE-BACKED (continued) |
|
|||||||||||
| Non-Agency Mortgage-Backed (continued) |
|
|||||||||||
| Citicorp Mortgage Securities, Inc., |
|
|||||||||||
| Series 2005-1, Class 1A12 |
|
|||||||||||
| 5.00% |
02/25/35 | $ | 98,703 | $ | 99,558 | |||||||
| Citicorp Residential Mortgage Trust, |
|
|||||||||||
| Series 2006-2, Class A5 (STEP-reset date 05/25/22) |
|
|||||||||||
| 5.12% |
09/25/36 | 79,209 | 79,419 | |||||||||
| Citicorp Residential Mortgage Trust, |
|
|||||||||||
| Series 2007-1, Class A5 (STEP-reset date 05/25/22) |
|
|||||||||||
| 5.11% |
03/25/37 | 294,553 | 295,900 | |||||||||
| Citigroup Mortgage Loan Trust, |
|
|||||||||||
| Series 2006-AR2, Class 1A1 |
|
|||||||||||
| 2.77% |
03/25/364 | 7,981,291 | 6,859,245 | |||||||||
| Citigroup Mortgage Loan Trust, |
|
|||||||||||
| Series 2006-AR3, Class 1A2A |
|
|||||||||||
| 3.20% |
06/25/364 | 1,347,251 | 1,290,098 | |||||||||
| Citigroup Mortgage Loan Trust, |
|
|||||||||||
| Series 2006-HE2, Class M1 |
|
|||||||||||
| (LIBOR USD 1-Month plus 0.44%) |
|
|||||||||||
| 0.89% |
08/25/362 | 124,254 | 124,593 | |||||||||
| Citigroup Mortgage Loan Trust, |
|
|||||||||||
| Series 2006-WF2, Class A1 (STEP-reset date 05/25/22) |
|
|||||||||||
| 7.25% |
05/25/36 | 34,028,142 | 22,247,317 | |||||||||
| Citigroup Mortgage Loan Trust, |
|
|||||||||||
| Series 2007-6, Class 1A4A |
|
|||||||||||
| 2.17% |
03/25/374 | 204,654 | 178,327 | |||||||||
| Citigroup Mortgage Loan Trust, |
|
|||||||||||
| Series 2007-AR5, Class 1A1A |
|
|||||||||||
| 2.92% |
04/25/374 | 60,054 | 59,102 | |||||||||
| Citigroup Mortgage Loan Trust, |
|
|||||||||||
| Series 2014-5, Class 2A2 |
|
|||||||||||
| (LIBOR USD 1-Month plus 1.75%) |
|
|||||||||||
| 1.99% |
02/20/361,2 | 7,728,777 | 6,867,832 | |||||||||
| Citigroup Mortgage Loan Trust, |
|
|||||||||||
| Series 2015-2, Class 4A1 |
|
|||||||||||
| (LIBOR USD 1-Month plus 0.70%) |
|
|||||||||||
| 0.79% |
03/25/471,2 | 2,040,450 | 2,037,015 | |||||||||
| Citigroup Mortgage Loan Trust, Inc., |
|
|||||||||||
| Series 2004-HYB1, Class A41 |
|
|||||||||||
| 2.66% |
02/25/344 | 510 | 513 | |||||||||
| Citigroup Mortgage Loan Trust, Inc., |
|
|||||||||||
| Series 2005-5, Class 3A2A |
|
|||||||||||
| 2.61% |
10/25/354 | 383,079 | 256,211 | |||||||||
| Citigroup Mortgage Loan Trust, Inc., |
|
|||||||||||
| Series 2005-9, Class 1A1 |
|
|||||||||||
| (LIBOR USD 1-Month plus 0.26%) |
|
|||||||||||
| 0.72% |
11/25/352 | 110,074 | 97,580 | |||||||||
| Countrywide Asset-Backed Certificates Trust, |
|
|||||||||||
| Series 2005-13, Class AF4 |
|
|||||||||||
| 5.81% |
04/25/364 | 165,476 | 158,809 | |||||||||
| Countrywide Asset-Backed Certificates Trust, |
|
|||||||||||
| Series 2007-13, Class 2A2 |
|
|||||||||||
| (LIBOR USD 1-Month plus 0.80%) |
|
|||||||||||
| 1.26% |
10/25/472 | 7,971,040 | 7,811,176 | |||||||||
| Countrywide Home Loan Mortgage Pass-Through Trust, |
|
|||||||||||
| Series 2001-HYB1, Class 1A1 |
|
|||||||||||
| 1.75% |
06/19/314 | 7,300 | 6,963 | |||||||||
| Issues |
Maturity Date |
Principal Amount |
Value | |||||||||
| MORTGAGE-BACKED (continued) |
|
|||||||||||
| Non-Agency Mortgage-Backed (continued) |
|
|||||||||||
| Countrywide Home Loan Mortgage Pass-Through Trust, |
|
|||||||||||
| Series 2003-J8, Class 1A4 |
|
|||||||||||
| 5.25% |
09/25/23 | $ | 33,552 | $ | 33,270 | |||||||
| Countrywide Home Loan Mortgage Pass-Through Trust, |
|
|||||||||||
| Series 2004-14, Class 4A1 |
|
|||||||||||
| 2.45% |
08/25/344 | 610,101 | 610,101 | |||||||||
| Countrywide Home Loan Mortgage Pass-Through Trust, |
|
|||||||||||
| Series 2004-25, Class 1A1 |
|
|||||||||||
| (LIBOR USD 1-Month plus 0.66%) |
|
|||||||||||
| 1.12% |
02/25/352 | 79,982 | 77,326 | |||||||||
| Countrywide Home Loan Mortgage Pass-Through Trust, |
|
|||||||||||
| Series 2004-7, Class 2A1 |
|
|||||||||||
| 2.52% |
06/25/344 | 51,632 | 51,979 | |||||||||
| Countrywide Home Loan Mortgage Pass-Through Trust, |
|
|||||||||||
| Series 2004-HYB3, Class 1A |
|
|||||||||||
| 2.44% |
06/20/344 | 9,594 | 9,850 | |||||||||
| Countrywide Home Loan Mortgage Pass-Through Trust, |
|
|||||||||||
| Series 2004-HYB4, Class 2A1 |
|
|||||||||||
| 2.72% |
09/20/344 | 562,441 | 554,638 | |||||||||
| Countrywide Home Loan Mortgage Pass-Through Trust, |
|
|||||||||||
| Series 2005-11, Class 1A2 |
|
|||||||||||
| 3.28% |
04/25/354 | 626,517 | 602,915 | |||||||||
| Countrywide Home Loan Mortgage Pass-Through Trust, |
|
|||||||||||
| Series 2005-31, Class 2A3 |
|
|||||||||||
| 2.43% |
01/25/364 | 98,584 | 91,007 | |||||||||
| Countrywide Home Loan Mortgage Pass-Through Trust, |
|
|||||||||||
| Series 2005-9, Class 1A1 |
|
|||||||||||
| (LIBOR USD 1-Month plus 0.60%) |
|
|||||||||||
| 1.06% |
05/25/352 | 2,612,903 | 2,242,333 | |||||||||
| Countrywide Home Loan Mortgage Pass-Through Trust, |
|
|||||||||||
| Series 2007-HY5, Class 1A1 |
|
|||||||||||
| 3.43% |
09/25/474 | 531,362 | 490,566 | |||||||||
| Countrywide Home Loan Mortgage Pass-Through Trust, |
|
|||||||||||
| Series 2007-HYB1, Class 1A1 |
|
|||||||||||
| 3.32% |
03/25/374 | 994,452 | 883,256 | |||||||||
| Credit Suisse First Boston Mortgage Securities Corp., |
|
|||||||||||
| Series 2003-AR20, Class 2A4 |
|
|||||||||||
| 2.64% |
08/25/334 | 8,514 | 8,923 | |||||||||
| Credit Suisse First Boston Mortgage Securities Corp., |
|
|||||||||||
| Series 2005-6, Class 8A1 |
|
|||||||||||
| 4.50% |
07/25/20 | 2,784 | 2,733 | |||||||||
| Credit Suisse First Boston Mortgage-Backed Pass-Through Certificates, |
|
|||||||||||
| Series 2004-1, Class 2A1 |
|
|||||||||||
| 6.50% |
02/25/34 | 17,237 | 17,135 | |||||||||
| Credit Suisse First Boston Mortgage-Backed Pass-Through Certificates, |
|
|||||||||||
| Series 2004-AR5, Class 6A1 |
|
|||||||||||
| 2.29% |
06/25/344 | 63,440 | 66,069 | |||||||||
| Credit Suisse Mortgage Capital Certificates, |
|
|||||||||||
| Series 2021-RP11, Class CERT |
|
|||||||||||
| 3.78% |
10/27/611 | 10,882,696 | 11,042,338 | |||||||||
| Credit Suisse Mortgage Capital Trust, |
|
|||||||||||
| Series 2006-2, Class 5A1 |
|
|||||||||||
| (LIBOR USD 1-Month plus 0.70%) |
|
|||||||||||
| 1.16% |
03/25/362 | 3,207,940 | 1,001,608 | |||||||||
See accompanying Notes to Financial Statements.
| Annual Report March 2022 / 188 |
Table of Contents
Total Return Bond Fund
Schedule of Portfolio Investments
March 31, 2022
| Issues |
Maturity Date |
Principal Amount |
Value | |||||||||
| MORTGAGE-BACKED (continued) |
|
|||||||||||
| Non-Agency Mortgage-Backed (continued) |
|
|||||||||||
| Credit Suisse Mortgage Capital Trust, |
|
|||||||||||
| Series 2007-2, Class 3A4 |
|
|||||||||||
| 5.50% |
03/25/37 | $ | 1,153,177 | $ | 783,406 | |||||||
| Credit Suisse Mortgage Capital Trust, |
|
|||||||||||
| Series 2015-6R, Class 2A1 |
|
|||||||||||
| (LIBOR USD 1-Month plus 0.20%) |
|
|||||||||||
| 0.59% |
11/27/461,2 | 2,913,059 | 2,887,751 | |||||||||
| Credit Suisse Mortgage Capital Trust, |
|
|||||||||||
| Series 2020-RPL2, Class A12 |
|
|||||||||||
| 3.42% |
02/25/601,4 | 19,093,095 | 18,746,834 | |||||||||
| Credit Suisse Mortgage Capital Trust, |
|
|||||||||||
| Series 2021-RP11, Class PT |
|
|||||||||||
| 3.73% |
10/25/611,4 | 256,563,412 | 260,968,555 | |||||||||
| Credit Suisse Mortgage Capital Trust, |
|
|||||||||||
| Series 2021-RP11, Class SA (IO) |
|
|||||||||||
| 0.00% |
10/25/611,4,5,6 | 320,915 | 319,422 | |||||||||
| Credit-Based Asset Servicing and Securitization LLC, |
|
|||||||||||
| Series 2003-CB1, Class AF (STEP-reset date 05/25/22) |
|
|||||||||||
| 3.95% |
01/25/33 | 8,028 | 7,695 | |||||||||
| Credit-Based Asset Servicing and Securitization LLC, |
|
|||||||||||
| Series 2006-CB7, Class A1 |
|
|||||||||||
| (LIBOR USD 1-Month plus 0.14%) |
|
|||||||||||
| 0.74% |
10/25/362 | 40,098,711 | 33,091,224 | |||||||||
| Credit-Based Asset Servicing and Securitization LLC, |
|
|||||||||||
| Series 2006-CB8, Class A1 |
|
|||||||||||
| (LIBOR USD 1-Month plus 0.28%) |
|
|||||||||||
| 0.74% |
10/25/362 | 10,976,471 | 10,245,299 | |||||||||
| Credit-Based Asset Servicing and Securitization LLC, |
|
|||||||||||
| Series 2006-CB9, Class A3 |
|
|||||||||||
| (LIBOR USD 1-Month plus 0.15%) |
|
|||||||||||
| 0.61% |
11/25/362 | 24,851,474 | 14,226,919 | |||||||||
| Credit-Based Asset Servicing and Securitization LLC, |
|
|||||||||||
| Series 2007-CB1, Class AF4 (STEP-reset date 05/25/22) |
|
|||||||||||
| 3.16% |
01/25/37 | 6,472,837 | 2,421,328 | |||||||||
| Credit-Based Asset Servicing and Securitization LLC, |
|
|||||||||||
| Series 2007-CB1, Class AF5 (STEP-reset date 05/25/22) |
|
|||||||||||
| 3.16% |
01/25/37 | 12,164,002 | 4,553,515 | |||||||||
| Credit-Based Asset Servicing and Securitization LLC, |
|
|||||||||||
| Series 2007-CB5, Class A2 |
|
|||||||||||
| (LIBOR USD 1-Month plus 0.17%) |
|
|||||||||||
| 0.63% |
04/25/372 | 22,043,101 | 15,850,114 | |||||||||
| Credit-Based Asset Servicing and Securitization LLC, |
|
|||||||||||
| Mortgage Loan Trust, |
|
|||||||||||
| Series 2007-CB2, Class A2C (STEP-reset date 05/25/22) |
|
|||||||||||
| 3.61% |
02/25/37 | 26,820,930 | 20,063,866 | |||||||||
| Credit-Based Asset Servicing and Securitization LLC, |
|
|||||||||||
| Mortgage Loan Trust, |
|
|||||||||||
| Series 2007-CB2, Class A2D (STEP-reset date 05/25/22) |
|
|||||||||||
| 3.61% |
02/25/37 | 19,636,914 | 14,494,783 | |||||||||
| Credit-Based Asset Servicing and Securitization LLC, |
|
|||||||||||
| Mortgage Loan Trust, |
|
|||||||||||
| Series 2007-CB2, Class A2E (STEP-reset date 05/25/22) |
|
|||||||||||
| 3.61% |
02/25/37 | 3,570,942 | 2,671,129 | |||||||||
| CSAB Mortgage-Backed Trust, |
|
|||||||||||
| Series 2006-4, Class A6B (STEP-reset date 05/25/22) |
|
|||||||||||
| 6.28% |
12/25/36 | 5,268,016 | 362,402 | |||||||||
| Issues |
Maturity Date |
Principal Amount |
Value | |||||||||
| MORTGAGE-BACKED (continued) |
|
|||||||||||
| Non-Agency Mortgage-Backed (continued) |
|
|||||||||||
| CSMC 2022-RPL1 SA |
|
|||||||||||
| Series 2022-RPL1, Class SA |
|
|||||||||||
| 0.00% |
02/01/62†,1,4,5,6$ | 2,025,677 | $ | 2,025,521 | ||||||||
| CSMC, |
|
|||||||||||
| Series 2022-RPL1, Class PT |
|
|||||||||||
| 3.78% |
02/01/62†,1 | 279,303,895 | 290,629,053 | |||||||||
| CSMCM, |
|
|||||||||||
| Series 2022-RPL1, Class CERT |
|
|||||||||||
| 3.78% |
02/01/62†,1 | 11,659,796 | 12,132,575 | |||||||||
| Deutsche ALT-A Securities Mortgage Loan Trust, |
|
|||||||||||
| Series 2006-AR3, Class A1 |
|
|||||||||||
| (LIBOR USD 1-Month plus 0.38%) |
|
|||||||||||
| 0.84% |
08/25/362 | 2,258,540 | 2,220,494 | |||||||||
| Deutsche ALT-A Securities Mortgage Loan Trust, |
|
|||||||||||
| Series 2006-AR4, Class A1 |
|
|||||||||||
| (LIBOR USD 1-Month plus 0.26%) |
|
|||||||||||
| 0.72% |
12/25/362 | 1,522,920 | 686,475 | |||||||||
| Deutsche ALT-A Securities Mortgage Loan Trust, |
|
|||||||||||
| Series 2006-AR6, Class A6 |
|
|||||||||||
| (LIBOR USD 1-Month plus 0.38%) |
|
|||||||||||
| 0.84% |
02/25/372 | 423,092 | 412,633 | |||||||||
| Deutsche ALT-A Securities Mortgage Loan Trust, |
|
|||||||||||
| Series 2007-3, Class 1A1 |
|
|||||||||||
| (LIBOR USD 1-Month plus 1.70%) |
|
|||||||||||
| 1.93% |
10/25/472 | 21,541,476 | 18,989,140 | |||||||||
| Deutsche ALT-A Securities Mortgage Loan Trust, |
|
|||||||||||
| Series 2007-OA3, Class A1 |
|
|||||||||||
| (LIBOR USD 1-Month plus 0.14%) |
|
|||||||||||
| 0.60% |
07/25/472 | 30,835,625 | 29,160,202 | |||||||||
| Deutsche ALT-A Securities, Inc., Mortgage Loan Trust, |
|
|||||||||||
| Series 2005-6, Class 1A7 |
|
|||||||||||
| 5.50% |
12/25/35 | 272,497 | 257,089 | |||||||||
| Deutsche ALT-A Securities, Inc., Mortgage Loan Trust, |
|
|||||||||||
| Series 2006-AR1, Class 2A1 |
|
|||||||||||
| 2.82% |
02/25/364 | 599,917 | 494,098 | |||||||||
| DSLA Mortgage Loan Trust, |
|
|||||||||||
| Series 2004-AR4, Class 2A1A |
|
|||||||||||
| (LIBOR USD 1-Month plus 0.72%) |
|
|||||||||||
| 1.17% |
01/19/452 | 1,243,333 | 1,075,007 | |||||||||
| DSLA Mortgage Loan Trust, |
|
|||||||||||
| Series 2005-AR1, Class 2A1A |
|
|||||||||||
| (LIBOR USD 1-Month plus 0.50%) |
|
|||||||||||
| 0.95% |
02/19/452 | 90,104 | 89,086 | |||||||||
| DSLA Mortgage Loan Trust, |
|
|||||||||||
| Series 2005-AR3, Class 2A1A |
|
|||||||||||
| (LIBOR USD 1-Month plus 0.48%) |
|
|||||||||||
| 0.93% |
07/19/452 | 88,966 | 87,040 | |||||||||
| DSLA Mortgage Loan Trust, |
|
|||||||||||
| Series 2006-AR2, Class 2A1A |
|
|||||||||||
| (LIBOR USD 1-Month plus 0.20%) |
|
|||||||||||
| 0.65% |
10/19/362 | 14,330,846 | 11,116,102 | |||||||||
| DSLA Mortgage Loan Trust, |
|
|||||||||||
| Series 2007-AR1, Class 2A1A |
|
|||||||||||
| (LIBOR USD 1-Month plus 0.14%) |
|
|||||||||||
| 0.59% |
03/19/372 | 6,198,095 | 5,682,783 | |||||||||
See accompanying Notes to Financial Statements.
| 189 / Annual Report March 2022 |
Table of Contents
Total Return Bond Fund
Schedule of Portfolio Investments
March 31, 2022
| Issues |
Maturity Date |
Principal Amount |
Value | |||||||||
| MORTGAGE-BACKED (continued) |
|
|||||||||||
| Non-Agency Mortgage-Backed (continued) |
|
|||||||||||
| Equity One Mortgage Pass-Through Trust, |
|
|||||||||||
| Series 2002-4, Class M1 |
|
|||||||||||
| 5.22% |
02/25/334 | $ | 7,794 | $ | 7,545 | |||||||
| Equity One Mortgage Pass-Through Trust, |
|
|||||||||||
| Series 2002-5, Class M1 (STEP-reset date 05/25/22) |
|
|||||||||||
| 5.80% |
11/25/32 | 36,213 | 35,137 | |||||||||
| First Franklin Mortgage Loan Trust, |
|
|||||||||||
| Series 2006-FF13, Class A2C |
|
|||||||||||
| (LIBOR USD 1-Month plus 0.32%) |
|
|||||||||||
| 0.78% |
10/25/362 | 10,428,790 | 7,950,000 | |||||||||
| First Franklin Mortgage Loan Trust, |
|
|||||||||||
| Series 2006-FF13, Class A2D |
|
|||||||||||
| (LIBOR USD 1-Month plus 0.48%) |
|
|||||||||||
| 0.94% |
10/25/362 | 657,614 | 508,592 | |||||||||
| First Franklin Mortgage Loan Trust, |
|
|||||||||||
| Series 2006-FF18, Class A2B |
|
|||||||||||
| (LIBOR USD 1-Month plus 0.11%) |
|
|||||||||||
| 0.57% |
12/25/372 | 5,590,778 | 5,203,732 | |||||||||
| First Franklin Mortgage Loan Trust, |
|
|||||||||||
| Series 2006-FF18, Class A2C |
|
|||||||||||
| (LIBOR USD 1-Month plus 0.16%) |
|
|||||||||||
| 0.62% |
12/25/372 | 15,375,141 | 14,360,948 | |||||||||
| First Franklin Mortgage Loan Trust, |
|
|||||||||||
| Series 2006-FF18, Class A2D |
|
|||||||||||
| (LIBOR USD 1-Month plus 0.21%) |
|
|||||||||||
| 0.67% |
12/25/372 | 11,143,402 | 10,444,477 | |||||||||
| First Franklin Mortgage Loan Trust, |
|
|||||||||||
| Series 2006-FF5, Class 1A |
|
|||||||||||
| (LIBOR USD 1-Month plus 0.30%) |
|
|||||||||||
| 0.76% |
04/25/362 | 10,328,504 | 10,344,354 | |||||||||
| First Franklin Mortgage Loan Trust, |
|
|||||||||||
| Series 2006-FF8, Class IIA4 |
|
|||||||||||
| (LIBOR USD 1-Month plus 0.46%) |
|
|||||||||||
| 0.92% |
07/25/362 | 23,832,354 | 23,368,069 | |||||||||
| First Franklin Mortgage Loan Trust, |
|
|||||||||||
| Series 2007-FF1, Class A2C |
|
|||||||||||
| (LIBOR USD 1-Month plus 0.14%) |
|
|||||||||||
| 0.60% |
01/25/382 | 56,875,220 | 36,050,859 | |||||||||
| First Franklin Mortgage Loan Trust, |
|
|||||||||||
| Series 2007-FF2, Class A1 |
|
|||||||||||
| (LIBOR USD 1-Month plus 0.14%) |
|
|||||||||||
| 0.60% |
03/25/372 | 50,836,982 | 32,902,683 | |||||||||
| First Franklin Mortgage Loan Trust, |
|
|||||||||||
| Series 2007-FF2, Class A2B |
|
|||||||||||
| (LIBOR USD 1-Month plus 0.10%) |
|
|||||||||||
| 0.56% |
03/25/372 | 22,225,720 | 12,630,730 | |||||||||
| First Franklin Mortgage Loan Trust, |
|
|||||||||||
| Series 2007-FF2, Class A2C |
|
|||||||||||
| (LIBOR USD 1-Month plus 0.15%) |
|
|||||||||||
| 0.61% |
03/25/372 | 12,741,650 | 7,291,718 | |||||||||
| First Franklin Mortgage Loan Trust, |
|
|||||||||||
| Series 2007-FF2, Class A2D |
|
|||||||||||
| (LIBOR USD 1-Month plus 0.22%) |
|
|||||||||||
| 0.68% |
03/25/372 | 23,724,615 | 13,709,209 | |||||||||
| Issues |
Maturity Date |
Principal Amount |
Value | |||||||||
| MORTGAGE-BACKED (continued) |
|
|||||||||||
| Non-Agency Mortgage-Backed (continued) |
|
|||||||||||
| First Horizon Alternative Mortgage Securities Trust, |
|
|||||||||||
| Series 2004-AA2, Class 1A1 |
|
|||||||||||
| 2.24% |
08/25/344 | $ | 3,793,698 | $ | 3,745,292 | |||||||
| First Horizon Alternative Mortgage Securities Trust, |
|
|||||||||||
| Series 2004-AA3, Class A1 |
|
|||||||||||
| 2.37% |
09/25/344 | 12,595 | 12,370 | |||||||||
| First Horizon Alternative Mortgage Securities Trust, |
|
|||||||||||
| Series 2004-AA4, Class A1 |
|
|||||||||||
| 2.37% |
10/25/344 | 662,034 | 681,165 | |||||||||
| First Horizon Alternative Mortgage Securities Trust, |
|
|||||||||||
| Series 2005-AA10, Class 1A1 |
|
|||||||||||
| 2.44% |
12/25/354 | 8,494,840 | 7,900,185 | |||||||||
| First Horizon Alternative Mortgage Securities Trust, |
|
|||||||||||
| Series 2005-AA12, Class 2A1 |
|
|||||||||||
| 2.49% |
02/25/364 | 9,310,710 | 7,219,480 | |||||||||
| First Horizon Alternative Mortgage Securities Trust, |
|
|||||||||||
| Series 2005-AA4, Class 2A1 |
|
|||||||||||
| 2.31% |
06/25/354 | 8,579,049 | 8,290,780 | |||||||||
| First Horizon Alternative Mortgage Securities Trust, |
|
|||||||||||
| Series 2005-AA7, Class 2A1 |
|
|||||||||||
| 2.44% |
09/25/354 | 7,302,335 | 7,047,278 | |||||||||
| First Horizon Alternative Mortgage Securities Trust, |
|
|||||||||||
| Series 2005-AA8, Class 2A1 |
|
|||||||||||
| 2.45% |
10/25/354 | 9,803,001 | 7,228,249 | |||||||||
| First Horizon Alternative Mortgage Securities Trust, |
|
|||||||||||
| Series 2005-AA9, Class 2A1 |
|
|||||||||||
| 2.30% |
11/25/354 | 9,565,672 | 8,588,463 | |||||||||
| First Horizon Alternative Mortgage Securities Trust, |
|
|||||||||||
| Series 2006-AA1, Class 1A1 |
|
|||||||||||
| 2.48% |
03/25/364 | 9,909,047 | 8,216,045 | |||||||||
| First Horizon Alternative Mortgage Securities Trust, |
|
|||||||||||
| Series 2006-FA8, Class 1A7 |
|
|||||||||||
| 6.00% |
02/25/37 | 8,681 | 5,000 | |||||||||
| First Horizon Mortgage Pass-Through Trust, |
|
|||||||||||
| Series 2004-AR6, Class 2A1 |
|
|||||||||||
| 3.37% |
12/25/344 | 92,735 | 94,295 | |||||||||
| First Horizon Mortgage Pass-Through Trust, |
|
|||||||||||
| Series 2006-AR4, Class 1A2 |
|
|||||||||||
| 2.92% |
01/25/374 | 55,031 | 41,088 | |||||||||
| First Horizon Mortgage Pass-Through Trust, |
|
|||||||||||
| Series 2007-AR3, Class 1A1 |
|
|||||||||||
| 2.63% |
11/25/374 | 99,075 | 63,213 | |||||||||
| GMACM Home Equity Loan Trust, |
|
|||||||||||
| Series 2000-HE2, Class A1 |
|
|||||||||||
| (LIBOR USD 1-Month plus 0.44%) |
|
|||||||||||
| 0.54% |
06/25/302 | 10,283 | 9,929 | |||||||||
| GMACM Mortgage Corp. Loan Trust, |
|
|||||||||||
| Series 2005-AR6, Class 3A1 |
|
|||||||||||
| 2.86% |
11/19/354 | 325,434 | 323,508 | |||||||||
| GMACM Mortgage Corp. Loan Trust, |
|
|||||||||||
| Series 2006-AR2, Class 1A1 |
|
|||||||||||
| 2.68% |
05/19/364 | 1,552,643 | 969,984 | |||||||||
| GreenPoint Mortgage Funding Trust, |
|
|||||||||||
| Series 2005-AR3, Class 1A1 |
|
|||||||||||
| (LIBOR USD 1-Month plus 0.48%) |
|
|||||||||||
| 0.94% |
08/25/452 | 750,298 | 693,106 | |||||||||
See accompanying Notes to Financial Statements.
| Annual Report March 2022 / 190 |
Table of Contents
Total Return Bond Fund
Schedule of Portfolio Investments
March 31, 2022
| Issues |
Maturity Date |
Principal Amount |
Value | |||||||||
| MORTGAGE-BACKED (continued) |
|
|||||||||||
| Non-Agency Mortgage-Backed (continued) |
|
|||||||||||
| GreenPoint Mortgage Funding Trust, |
|
|||||||||||
| Series 2005-AR4, Class G41B |
|
|||||||||||
| (LIBOR USD 1-Month plus 0.20%) |
|
|||||||||||
| 0.66% |
10/25/452 | $ | 11,876,752 | $ | 11,249,439 | |||||||
| GS Mortgage-Backed Securities Trust, |
|
|||||||||||
| Series 2018-RPL1, Class A1A |
|
|||||||||||
| 3.75% |
10/25/571 | 24,826,808 | 24,717,667 | |||||||||
| GSAA Home Equity Trust, |
|
|||||||||||
| Series 2005-11, Class 2A2 |
|
|||||||||||
| (LIBOR USD 1-Month plus 0.64%) |
|
|||||||||||
| 1.10% |
10/25/352 | 104,373 | 103,720 | |||||||||
| GSAA Home Equity Trust, |
|
|||||||||||
| Series 2005-11, Class 3A2 |
|
|||||||||||
| (LIBOR USD 1-Month plus 0.64%) |
|
|||||||||||
| 1.10% |
10/25/352 | 45,732 | 45,551 | |||||||||
| GSAA Home Equity Trust, |
|
|||||||||||
| Series 2005-6, Class M1 |
|
|||||||||||
| (LIBOR USD 1-Month plus 0.65%) |
|
|||||||||||
| 1.10% |
06/25/352 | 81,398 | 81,468 | |||||||||
| GSAMP Trust, |
|
|||||||||||
| Series 2005-AHL2, Class A2D |
|
|||||||||||
| (LIBOR USD 1-Month plus 0.70%) |
|
|||||||||||
| 1.16% |
12/25/352 | 22,027,466 | 20,987,600 | |||||||||
| GSAMP Trust, |
|
|||||||||||
| Series 2006-NC1, Class A3 |
|
|||||||||||
| (LIBOR USD 1-Month plus 0.58%) |
|
|||||||||||
| 1.04% |
02/25/362 | 34,570 | 34,540 | |||||||||
| GSAMP Trust, |
|
|||||||||||
| Series 2007-HE2, Class A1 |
|
|||||||||||
| (LIBOR USD 1-Month plus 0.24%) |
|
|||||||||||
| 0.69% |
03/25/472 | 69,259,048 | 63,842,436 | |||||||||
| GSR Mortgage Loan Trust, |
|
|||||||||||
| Series 2004-9, Class 3A1 |
|
|||||||||||
| 2.59% |
08/25/344 | 1,950 | 1,903 | |||||||||
| GSR Mortgage Loan Trust, |
|
|||||||||||
| Series 2004-9, Class 5A7 |
|
|||||||||||
| 2.29% |
08/25/344 | 77,827 | 78,195 | |||||||||
| GSR Mortgage Loan Trust, |
|
|||||||||||
| Series 2005-AR5, Class 2A3 |
|
|||||||||||
| 2.64% |
10/25/354 | 1,911,740 | 1,262,432 | |||||||||
| GSR Mortgage Loan Trust, |
|
|||||||||||
| Series 2005-AR6, Class 4A5 |
|
|||||||||||
| 2.65% |
09/25/354 | 47,233 | 46,530 | |||||||||
| GSR Mortgage Loan Trust, |
|
|||||||||||
| Series 2007-AR2, Class 2A1 |
|
|||||||||||
| 2.79% |
05/25/374 | 1,317,785 | 934,751 | |||||||||
| HarborView Mortgage Loan Trust, |
|
|||||||||||
| Series 2004-1, Class 2A |
|
|||||||||||
| 2.17% |
04/19/344 | 3,694 | 3,579 | |||||||||
| HarborView Mortgage Loan Trust, |
|
|||||||||||
| Series 2004-11, Class 3A2A |
|
|||||||||||
| (LIBOR USD 1-Month plus 0.68%) |
|
|||||||||||
| 1.13% |
01/19/352 | 198,413 | 190,220 | |||||||||
| HarborView Mortgage Loan Trust, |
|
|||||||||||
| Series 2004-3, Class 1A |
|
|||||||||||
| 2.71% |
05/19/344 | 39,366 | 39,371 | |||||||||
| Issues |
Maturity Date |
Principal Amount |
Value | |||||||||
| MORTGAGE-BACKED (continued) |
|
|||||||||||
| Non-Agency Mortgage-Backed (continued) |
|
|||||||||||
| HarborView Mortgage Loan Trust, |
|
|||||||||||
| Series 2004-5, Class 2A6 |
|
|||||||||||
| 2.37% |
06/19/344 | $ | 1,399 | $ | 1,426 | |||||||
| HarborView Mortgage Loan Trust, |
|
|||||||||||
| Series 2005-3, Class 2A1A |
|
|||||||||||
| (LIBOR USD 1-Month plus 0.48%) |
|
|||||||||||
| 0.93% |
06/19/352 | 215,186 | 214,477 | |||||||||
| HarborView Mortgage Loan Trust, |
|
|||||||||||
| Series 2005-4, Class 2A |
|
|||||||||||
| 2.41% |
07/19/354 | 34,913 | 30,466 | |||||||||
| HarborView Mortgage Loan Trust, |
|
|||||||||||
| Series 2006-10, Class 1A1A |
|
|||||||||||
| (LIBOR USD 1-Month plus 0.20%) |
|
|||||||||||
| 0.36% |
11/19/362 | 54,612,437 | 48,578,124 | |||||||||
| HarborView Mortgage Loan Trust, |
|
|||||||||||
| Series 2006-7, Class 1A |
|
|||||||||||
| (LIBOR USD 1-Month plus 0.42%) |
|
|||||||||||
| 0.87% |
09/19/462 | 57,402,279 | 53,593,988 | |||||||||
| HarborView Mortgage Loan Trust, |
|
|||||||||||
| Series 2007-7, Class 1A1 |
|
|||||||||||
| (LIBOR USD 1-Month plus 1.00%) |
|
|||||||||||
| 1.46% |
10/25/372 | 19,014,063 | 16,322,075 | |||||||||
| HarborView Mortgage Loan Trust, |
|
|||||||||||
| Series 2007-7, Class 2A1A |
|
|||||||||||
| (LIBOR USD 1-Month plus 1.00%) |
|
|||||||||||
| 1.46% |
10/25/372 | 15,298,544 | 15,299,543 | |||||||||
| HSI Asset Securitization Corp. Trust, |
|
|||||||||||
| Series 2006-HE1, Class 1A1 |
|
|||||||||||
| (LIBOR USD 1-Month plus 0.28%) |
|
|||||||||||
| 0.74% |
10/25/362 | 54,083,313 | 21,840,378 | |||||||||
| Impac CMB Trust, |
|
|||||||||||
| Series 2004-8, Class 2A1 |
|
|||||||||||
| (LIBOR USD 1-Month plus 0.70%) |
|
|||||||||||
| 1.16% |
10/25/342 | 113,806 | 115,133 | |||||||||
| Impac CMB Trust, |
|
|||||||||||
| Series 2005-1, Class 1A1 |
|
|||||||||||
| (LIBOR USD 1-Month plus 0.52%) |
|
|||||||||||
| 0.98% |
04/25/352 | 2,210,782 | 2,137,641 | |||||||||
| Impac Secured Assets Trust, |
|
|||||||||||
| Series 2006-3, Class A1 |
|
|||||||||||
| (LIBOR USD 1-Month plus 0.34%) |
|
|||||||||||
| 0.80% |
11/25/362 | 4,995,423 | 4,808,656 | |||||||||
| Impac Secured Assets Trust, |
|
|||||||||||
| Series 2006-5, Class 1A1C |
|
|||||||||||
| (LIBOR USD 1-Month plus 0.54%) |
|
|||||||||||
| 1.00% |
02/25/372 | 8,052,079 | 7,756,368 | |||||||||
| Impac Secured Assets Trust, |
|
|||||||||||
| Series 2007-2, Class 1A1A |
|
|||||||||||
| (LIBOR USD 1-Month plus 0.11%) |
|
|||||||||||
| 0.57% |
05/25/372 | 3,087,844 | 2,635,547 | |||||||||
| Impac Secured Assets Trust, |
|
|||||||||||
| Series 2007-2, Class 1A1B |
|
|||||||||||
| (LIBOR USD 1-Month plus 0.25%) |
|
|||||||||||
| 0.71% |
05/25/372 | 38,486,638 | 32,996,423 | |||||||||
See accompanying Notes to Financial Statements.
| 191 / Annual Report March 2022 |
Table of Contents
Total Return Bond Fund
Schedule of Portfolio Investments
March 31, 2022
| Issues |
Maturity Date |
Principal Amount |
Value | |||||||||
| MORTGAGE-BACKED (continued) |
|
|||||||||||
| Non-Agency Mortgage-Backed (continued) |
|
|||||||||||
| IndyMac Index Mortgage Loan Trust, |
|
|||||||||||
| Series 2004-AR4, Class 1A |
|
|||||||||||
| 2.68% |
08/25/344 | $ | 863,023 | $ | 849,327 | |||||||
| IndyMac Index Mortgage Loan Trust, |
|
|||||||||||
| Series 2004-AR7, Class A2 |
|
|||||||||||
| (LIBOR USD 1-Month plus 0.86%) |
|
|||||||||||
| 1.32% |
09/25/342 | 40,819 | 39,444 | |||||||||
| IndyMac Index Mortgage Loan Trust, |
|
|||||||||||
| Series 2005-AR1, Class 4A1 |
|
|||||||||||
| 2.98% |
03/25/354 | 224,723 | 223,555 | |||||||||
| IndyMac Index Mortgage Loan Trust, |
|
|||||||||||
| Series 2005-AR17, Class 3A1 |
|
|||||||||||
| 2.76% |
09/25/354 | 3,103,614 | 2,439,182 | |||||||||
| IndyMac Index Mortgage Loan Trust, |
|
|||||||||||
| Series 2005-AR19, Class A1 |
|
|||||||||||
| 2.77% |
10/25/354 | 19,474,127 | 17,904,148 | |||||||||
| IndyMac Index Mortgage Loan Trust, |
|
|||||||||||
| Series 2005-AR31, Class 3A1 |
|
|||||||||||
| 2.76% |
01/25/364 | 648,210 | 632,743 | |||||||||
| IndyMac Index Mortgage Loan Trust, |
|
|||||||||||
| Series 2005-AR6, Class 2A1 |
|
|||||||||||
| (LIBOR USD 1-Month plus 0.48%) |
|
|||||||||||
| 0.94% |
04/25/352 | 386,575 | 347,847 | |||||||||
| IndyMac Index Mortgage Loan Trust, |
|
|||||||||||
| Series 2006-AR19, Class 1A2 |
|
|||||||||||
| 2.99% |
08/25/364 | 11,280,490 | 10,184,975 | |||||||||
| IndyMac Index Mortgage Loan Trust, |
|
|||||||||||
| Series 2006-AR21, Class A1 |
|
|||||||||||
| (LIBOR USD 1-Month plus 0.24%) |
|
|||||||||||
| 0.70% |
08/25/362 | 115,185 | 113,313 | |||||||||
| IndyMac Index Mortgage Loan Trust, |
|
|||||||||||
| Series 2006-AR27, Class 2A2 |
|
|||||||||||
| (LIBOR USD 1-Month plus 0.40%) |
|
|||||||||||
| 0.86% |
10/25/362 | 13,915,117 | 13,452,123 | |||||||||
| IndyMac Index Mortgage Loan Trust, |
|
|||||||||||
| Series 2006-AR35, Class 2A3A |
|
|||||||||||
| (LIBOR USD 1-Month plus 0.20%) |
|
|||||||||||
| 0.66% |
01/25/372 | 31,902,802 | 31,952,430 | |||||||||
| IndyMac Index Mortgage Loan Trust, |
|
|||||||||||
| Series 2006-AR7, Class 1A1 |
|
|||||||||||
| 2.82% |
05/25/364 | 3,242,989 | 3,100,325 | |||||||||
| IndyMac Index Mortgage Loan Trust, |
|
|||||||||||
| Series 2006-AR7, Class 2A1 |
|
|||||||||||
| 2.92% |
05/25/364 | 19,978,588 | 15,089,458 | |||||||||
| IndyMac Index Mortgage Loan Trust, |
|
|||||||||||
| Series 2007-AR1, Class 1A2 |
|
|||||||||||
| 3.02% |
03/25/374 | 363,707 | 330,881 | |||||||||
| IndyMac Index Mortgage Loan Trust, |
|
|||||||||||
| Series 2007-AR11, Class 1A1 |
|
|||||||||||
| 2.79% |
06/25/374 | 2,591,322 | 2,405,567 | |||||||||
| IndyMac Index Mortgage Loan Trust, |
|
|||||||||||
| Series 2007-AR7, Class 1A1 |
|
|||||||||||
| 2.60% |
11/25/374 | 1,744,245 | 1,576,841 | |||||||||
| Issues |
Maturity Date |
Principal Amount |
Value | |||||||||
| MORTGAGE-BACKED (continued) |
|
|||||||||||
| Non-Agency Mortgage-Backed (continued) |
|
|||||||||||
| IndyMac Manufactured Housing Contract Pass-Through Certificates, |
|
|||||||||||
| Series 1997-1, Class A3 |
|
|||||||||||
| 6.61% |
02/25/28 | $ | 34,456 | $ | 34,568 | |||||||
| JPMorgan Alternative Loan Trust, |
|
|||||||||||
| Series 2006-A2, Class 2A1 |
|
|||||||||||
| 3.02% |
05/25/364 | 442,299 | 331,957 | |||||||||
| JPMorgan Alternative Loan Trust, |
|
|||||||||||
| Series 2006-A2, Class 5A1 |
|
|||||||||||
| 3.19% |
05/25/364 | 4,537,709 | 3,035,687 | |||||||||
| JPMorgan Mortgage Acquisition Trust, |
|
|||||||||||
| Series 2006-WF1, Class A3A (STEP-reset date 05/25/22) |
|
|||||||||||
| 6.33% |
07/25/36 | 30,282,079 | 11,016,125 | |||||||||
| JPMorgan Mortgage Acquisition Trust, |
|
|||||||||||
| Series 2006-WF1, Class A6 (STEP-reset date 05/25/22) |
|
|||||||||||
| 6.50% |
07/25/36 | 4,222,763 | 1,652,316 | |||||||||
| JPMorgan Mortgage Acquisition Trust, |
|
|||||||||||
| Series 2007-CH4, Class A1 |
|
|||||||||||
| (LIBOR USD 1-Month plus 0.15%) |
|
|||||||||||
| 0.61% |
05/25/372 | 9,177,488 | 9,162,426 | |||||||||
| JPMorgan Mortgage Acquisition Trust, |
|
|||||||||||
| Series 2007-CH5, Class A5 |
|
|||||||||||
| (LIBOR USD 1-Month plus 0.26%) |
|
|||||||||||
| 0.72% |
06/25/372 | 89,210 | 88,946 | |||||||||
| JPMorgan Mortgage Acquisition Trust, |
|
|||||||||||
| Series 2007-HE1, Class AF1 |
|
|||||||||||
| (LIBOR USD 1-Month plus 0.10%) |
|
|||||||||||
| 0.56% |
03/25/472 | 114,597 | 68,926 | |||||||||
| JPMorgan Mortgage Acquisition Trust, |
|
|||||||||||
| Series 2007-HE1, Class AF2 (STEP-reset date 05/25/22) |
|
|||||||||||
| 4.23% |
03/25/47 | 7,496,737 | 5,356,048 | |||||||||
| JPMorgan Mortgage Acquisition Trust, |
|
|||||||||||
| Series 2007-HE1, Class AF3 (STEP-reset date 05/25/22) |
|
|||||||||||
| 4.23% |
05/25/35 | 6,309,419 | 4,507,695 | |||||||||
| JPMorgan Mortgage Acquisition Trust, |
|
|||||||||||
| Series 2007-HE1, Class AF4 (STEP-reset date 05/25/22) |
|
|||||||||||
| 4.23% |
03/25/47 | 2,867,918 | 2,048,881 | |||||||||
| JPMorgan Mortgage Acquisition Trust, |
|
|||||||||||
| Series 2007-HE1, Class AV4 |
|
|||||||||||
| (LIBOR USD 1-Month plus 0.28%) |
|
|||||||||||
| 0.74% |
03/25/472 | 240,000 | 232,441 | |||||||||
| JPMorgan Mortgage Trust, |
|
|||||||||||
| Series 2003-A2, Class 2A3 |
|
|||||||||||
| 1.68% |
11/25/334 | 63,910 | 62,948 | |||||||||
| JPMorgan Mortgage Trust, |
|
|||||||||||
| Series 2004-A4, Class 1A3 |
|
|||||||||||
| 2.24% |
09/25/344 | 177,774 | 173,395 | |||||||||
| JPMorgan Mortgage Trust, |
|
|||||||||||
| Series 2005-A5, Class TA1 |
|
|||||||||||
| 2.19% |
08/25/354 | 69,004 | 68,972 | |||||||||
| JPMorgan Mortgage Trust, |
|
|||||||||||
| Series 2005-S2, Class 4A3 |
|
|||||||||||
| 5.50% |
09/25/20 | 1,603,746 | 1,344,089 | |||||||||
| JPMorgan Mortgage Trust, |
|
|||||||||||
| Series 2006-A2, Class 5A3 |
|
|||||||||||
| 2.27% |
11/25/334 | 2,152 | 2,117 | |||||||||
See accompanying Notes to Financial Statements.
| Annual Report March 2022 / 192 |
Table of Contents
Total Return Bond Fund
Schedule of Portfolio Investments
March 31, 2022
| Issues | Maturity Date |
Principal Amount |
Value | |||||||
| MORTGAGE-BACKED (continued) |
|
|||||||||
| Non-Agency Mortgage-Backed (continued) |
|
|||||||||
| JPMorgan Mortgage Trust, |
|
|||||||||
| Series 2006-A3, Class 2A1 |
|
|||||||||
| 2.76% |
05/25/364 | $ | 546,824 | $ | 492,481 | |||||
| JPMorgan Mortgage Trust, |
|
|||||||||
| Series 2006-A3, Class 3A3 |
|
|||||||||
| 3.07% |
05/25/364 | 368,286 | 327,142 | |||||||
| JPMorgan Mortgage Trust, |
|
|||||||||
| Series 2006-A4, Class 1A1 |
|
|||||||||
| 2.91% |
06/25/364 | 305,000 | 253,524 | |||||||
| JPMorgan Mortgage Trust, |
|
|||||||||
| Series 2006-A4, Class 1A4 |
|
|||||||||
| 2.91% |
06/25/364 | 983,224 | 817,282 | |||||||
| JPMorgan Mortgage Trust, |
|
|||||||||
| Series 2006-A5, Class 2A4 |
|
|||||||||
| 2.76% |
08/25/364 | 282,943 | 255,391 | |||||||
| JPMorgan Mortgage Trust, |
|
|||||||||
| Series 2007-A1, Class 5A2 |
|
|||||||||
| 2.39% |
07/25/354 | 794,625 | 803,052 | |||||||
| JPMorgan Mortgage Trust, |
|
|||||||||
| Series 2007-A3, Class 2A3 |
|
|||||||||
| 2.68% |
05/25/374 | 1,459,431 | 1,260,056 | |||||||
| JPMorgan Mortgage Trust, |
|
|||||||||
| Series 2007-A3, Class 3A2 |
|
|||||||||
| 3.11% |
05/25/374 | 249,054 | 237,622 | |||||||
| JPMorgan Mortgage Trust, |
|
|||||||||
| Series 2007-A4, Class 1A1 |
|
|||||||||
| 3.24% |
06/25/374 | 2,079,252 | 1,830,984 | |||||||
| JPMorgan Mortgage Trust, |
|
|||||||||
| Series 2007-A4, Class 2A3 |
|
|||||||||
| 3.01% |
06/25/374 | 303,894 | 263,367 | |||||||
| JPMorgan Mortgage Trust, |
|
|||||||||
| Series 2021-13, Class A3A |
|
|||||||||
| 2.00% |
04/25/521,4 | 53,336,429 | 48,843,129 | |||||||
| JPMorgan Mortgage Trust, |
|
|||||||||
| Series 2021-14, Class A3A |
|
|||||||||
| 2.00% |
05/25/521,4 | 40,799,345 | 37,380,638 | |||||||
| Lehman ABS Mortgage Loan Trust, |
|
|||||||||
| Series 2007-1, Class 2A2 |
|
|||||||||
| (LIBOR USD 1-Month plus 0.20%) |
|
|||||||||
| 0.66% |
06/25/371,2 | 195,330 | 152,566 | |||||||
| Lehman XS Trust, |
|
|||||||||
| Series 2005-5N, Class 3A1A |
|
|||||||||
| (LIBOR USD 1-Month plus 0.30%) |
|
|||||||||
| 0.76% |
11/25/352 | 3,023,718 | 3,009,240 | |||||||
| Lehman XS Trust, |
|
|||||||||
| Series 2005-7N, Class 1A1A |
|
|||||||||
| (LIBOR USD 1-Month plus 0.54%) |
|
|||||||||
| 1.00% |
12/25/352 | 285,836 | 278,759 | |||||||
| Lehman XS Trust, |
|
|||||||||
| Series 2006-12N, Class A31A |
|
|||||||||
| (LIBOR USD 1-Month plus 0.40%) |
|
|||||||||
| 0.86% |
08/25/462 | 9,244,640 | 9,381,061 | |||||||
| Lehman XS Trust, |
|
|||||||||
| Series 2006-14N, Class 3A2 |
|
|||||||||
| (LIBOR USD 1-Month plus 0.24%) |
|
|||||||||
| 0.70% |
08/25/362 | 30,150 | 34,220 | |||||||
| Issues | Maturity Date |
Principal Amount |
Value | |||||||
| MORTGAGE-BACKED (continued) |
|
|||||||||
| Non-Agency Mortgage-Backed (continued) |
|
|||||||||
| Lehman XS Trust, |
|
|||||||||
| Series 2006-5, Class 1A1A |
|
|||||||||
| (LIBOR USD 1-Month plus 0.42%) |
|
|||||||||
| 0.88% |
04/25/362 | $ | 21,425,980 | $ | 19,881,163 | |||||
| Lehman XS Trust, |
|
|||||||||
| Series 2006-8, Class 1A1A |
|
|||||||||
| (LIBOR USD 1-Month plus 0.16%) |
|
|||||||||
| 0.78% |
06/25/362 | 28,335,460 | 26,982,331 | |||||||
| Lehman XS Trust, |
|
|||||||||
| Series 2007-4N, Class 1A3 |
|
|||||||||
| (LIBOR USD 1-Month plus 0.24%) |
|
|||||||||
| 0.70% |
03/25/472 | 18,604,861 | 18,349,081 | |||||||
| Long Beach Mortgage Loan Trust, |
|
|||||||||
| Series 2004-4, Class M1 |
|
|||||||||
| (LIBOR USD 1-Month plus 0.90%) |
|
|||||||||
| 1.36% |
10/25/342 | 82,767 | 81,504 | |||||||
| MASTR Adjustable Rate Mortgages Trust, |
|
|||||||||
| Series 2003-6, Class 4A2 |
|
|||||||||
| 3.02% |
01/25/344 | 22,595 | 23,695 | |||||||
| MASTR Adjustable Rate Mortgages Trust, |
|
|||||||||
| Series 2003-7, Class 3A1 |
|
|||||||||
| 1.91% |
11/25/334 | 466,131 | 453,403 | |||||||
| MASTR Adjustable Rate Mortgages Trust, |
|
|||||||||
| Series 2004-13, Class 3A1 |
|
|||||||||
| 2.76% |
11/21/344 | 2,204,463 | 2,200,672 | |||||||
| MASTR Adjustable Rate Mortgages Trust, |
|
|||||||||
| Series 2004-15, Class 9A1 |
|
|||||||||
| 2.80% |
10/25/344 | 64,381 | 64,617 | |||||||
| MASTR Adjustable Rate Mortgages Trust, |
|
|||||||||
| Series 2004-8, Class 2A1 |
|
|||||||||
| 2.39% |
09/25/344 | 1,478,705 | 1,460,221 | |||||||
| MASTR Adjustable Rate Mortgages Trust, |
|
|||||||||
| Series 2006-2, Class 5A1 |
|
|||||||||
| 3.04% |
05/25/364 | 5,364,070 | 3,289,483 | |||||||
| MASTR Asset-Backed Securities Trust, |
|
|||||||||
| Series 2006-HE4, Class A3 |
|
|||||||||
| (LIBOR USD 1-Month plus 0.30%) |
|
|||||||||
| 0.76% |
11/25/362 | 12,935,364 | 5,328,352 | |||||||
| MASTR Asset-Backed Securities Trust, |
|
|||||||||
| Series 2006-HE4, Class A4 |
|
|||||||||
| (LIBOR USD 1-Month plus 0.42%) |
|
|||||||||
| 0.88% |
11/25/362 | 3,593,157 | 1,411,987 | |||||||
| MASTR Asset-Backed Securities Trust, |
|
|||||||||
| Series 2007-HE1, Class A3 |
|
|||||||||
| (LIBOR USD 1-Month plus 0.21%) |
|
|||||||||
| 0.67% |
05/25/372 | 19,560,269 | 19,110,989 | |||||||
| MASTR Seasoned Securitization Trust, |
|
|||||||||
| Series 2004-1, Class 4A1 |
|
|||||||||
| 2.41% |
10/25/324 | 8,304 | 8,542 | |||||||
| Mellon Residential Funding Corp. Mortgage Pass-Through Certificates, |
|
|||||||||
| Series 2001-TBC1, Class A1 |
|
|||||||||
| (LIBOR USD 1-Month plus 0.70%) |
|
|||||||||
| 1.10% |
11/15/312 | 638,760 | 644,337 | |||||||
See accompanying Notes to Financial Statements.
| 193 / Annual Report March 2022 |
Table of Contents
Total Return Bond Fund
Schedule of Portfolio Investments
March 31, 2022
| Issues | Maturity Date |
Principal Amount |
Value | |||||||
| MORTGAGE-BACKED (continued) |
|
|||||||||
| Non-Agency Mortgage-Backed (continued) |
|
|||||||||
| Merrill Lynch First Franklin Mortgage Loan Trust, |
| |||||||||
| Series 2007-1, Class A1 |
|
|||||||||
| (LIBOR USD 1-Month plus 0.14%) |
|
|||||||||
| 0.60% |
04/25/372 | $ | 142,138,887 | $ | 78,886,343 | |||||
| Merrill Lynch First Franklin Mortgage Loan Trust, |
| |||||||||
| Series 2007-1, Class A2B |
|
|||||||||
| (LIBOR USD 1-Month plus 0.17%) |
|
|||||||||
| 0.63% |
04/25/372 | 28,373,445 | 14,437,388 | |||||||
| Merrill Lynch First Franklin Mortgage Loan Trust, |
| |||||||||
| Series 2007-1, Class A2C |
|
|||||||||
| (LIBOR USD 1-Month plus 0.25%) |
|
|||||||||
| 0.71% |
04/25/372 | 59,437,881 | 28,473,170 | |||||||
| Merrill Lynch First Franklin Mortgage Loan Trust, |
| |||||||||
| Series 2007-2, Class A2C |
|
|||||||||
| (LIBOR USD 1-Month plus 0.24%) |
|
|||||||||
| 0.70% |
05/25/372 | 28,970,433 | 14,808,183 | |||||||
| Merrill Lynch First Franklin Mortgage Loan Trust, |
| |||||||||
| Series 2007-2, Class A2D |
|
|||||||||
| (LIBOR USD 1-Month plus 0.32%) |
|
|||||||||
| 0.78% |
05/25/372 | 14,306,857 | 12,029,063 | |||||||
| Merrill Lynch First Franklin Mortgage Loan Trust, |
| |||||||||
| Series 2007-3, Class A2C |
|
|||||||||
| (LIBOR USD 1-Month plus 0.18%) |
|
|||||||||
| 0.64% |
06/25/372 | 11,266,353 | 10,432,038 | |||||||
| Merrill Lynch First Franklin Mortgage Loan Trust, |
| |||||||||
| Series 2007-3, Class A2D |
|
|||||||||
| (LIBOR USD 1-Month plus 0.25%) |
|
|||||||||
| 0.71% |
06/25/372 | 15,047,395 | 14,041,407 | |||||||
| Merrill Lynch First Franklin Mortgage Loan Trust, |
| |||||||||
| Series 2007-4, Class 2A2 |
|
|||||||||
| (LIBOR USD 1-Month plus 0.12%) |
|
|||||||||
| 0.58% |
07/25/372 | 24,834,094 | 20,177,920 | |||||||
| Merrill Lynch First Franklin Mortgage Loan Trust, |
| |||||||||
| Series 2007-4, Class 2A3 |
|
|||||||||
| (LIBOR USD 1-Month plus 0.16%) |
|
|||||||||
| 0.62% |
07/25/372 | 18,204,008 | 14,852,410 | |||||||
| Merrill Lynch Mortgage Investors Trust, |
|
|||||||||
| Series 2003-A6, Class 2A |
|
|||||||||
| 2.38% |
10/25/334 | 210,710 | 209,434 | |||||||
| Merrill Lynch Mortgage Investors Trust, |
|
|||||||||
| Series 2004-A4, Class A1 |
|
|||||||||
| 2.66% |
08/25/344 | 859,652 | 836,068 | |||||||
| Merrill Lynch Mortgage Investors Trust, |
|
|||||||||
| Series 2005-A10, Class A |
|
|||||||||
| (LIBOR USD 1-Month plus 0.42%) |
|
|||||||||
| 0.88% |
02/25/362 | 5,877 | 5,756 | |||||||
| Merrill Lynch Mortgage Investors Trust, |
|
|||||||||
| Series 2006-WMC2, Class A2B (STEP-reset date 05/25/22) |
|
|||||||||
| 3.80% |
03/25/37 | 28,302,356 | 8,824,683 | |||||||
| Merrill Lynch Mortgage Investors Trust, |
|
|||||||||
| Series 2006-WMC2, Class A2D (STEP-reset date 05/25/22) |
|
|||||||||
| 3.80% |
03/25/37 | 22,151,280 | 6,907,934 | |||||||
| Issues | Maturity Date |
Principal Amount |
Value | |||||||
| MORTGAGE-BACKED (continued) |
|
|||||||||
| Non-Agency Mortgage-Backed (continued) |
|
|||||||||
| Merrill Lynch Mortgage Investors Trust, |
|
|||||||||
| Series 2007-2, Class 1A1 |
|
|||||||||
| (US Treasury Yield Curve Rate T Note Constant Maturity 1-Year plus 2.40%) |
|
|||||||||
| 3.53% |
08/25/362 | $ | 2,182,071 | $ | 2,082,688 | |||||
| Mid-State Capital Corp. Trust, |
|
|||||||||
| Series 2005-1, Class A |
|
|||||||||
| 5.75% |
01/15/40 | 8,652,434 | 8,733,030 | |||||||
| Mid-State Capital Corp. Trust, |
|
|||||||||
| Series 2006-1, Class A |
|
|||||||||
| 5.79% |
10/15/401 | 7,453,824 | 7,537,652 | |||||||
| Mid-State Trust XI, |
|
|||||||||
| Series 11, Class A1 |
|
|||||||||
| 4.86% |
07/15/38 | 145,385 | 146,408 | |||||||
| Morgan Stanley Mortgage Loan Trust, |
|
|||||||||
| Series 2004-11AR, Class 1A1 |
|
|||||||||
| (LIBOR USD 1-Month plus 0.32%) |
|
|||||||||
| 0.78% |
01/25/352 | 81,468 | 75,340 | |||||||
| Morgan Stanley Mortgage Loan Trust, |
|
|||||||||
| Series 2004-7AR, Class 2A4 |
|
|||||||||
| 2.07% |
09/25/344 | 439,805 | 430,275 | |||||||
| Morgan Stanley Mortgage Loan Trust, |
|
|||||||||
| Series 2005-2AR, Class A |
|
|||||||||
| (LIBOR USD 1-Month plus 0.26%) |
|
|||||||||
| 0.72% |
04/25/352 | 1,148,732 | 1,112,617 | |||||||
| Morgan Stanley Mortgage Loan Trust, |
|
|||||||||
| Series 2006-7, Class 5A2 |
|
|||||||||
| 5.96% |
06/25/364 | 697,825 | 274,637 | |||||||
| Morgan Stanley Mortgage Loan Trust, |
|
|||||||||
| Series 2007-6XS, Class 1A2S (STEP-reset date 05/25/22) |
|
|||||||||
| 5.50% |
02/25/47 | 14,630 | 14,584 | |||||||
| Morgan Stanley Mortgage Loan Trust, |
|
|||||||||
| Series 2007-7AX, Class 2A1 |
|
|||||||||
| (LIBOR USD 1-Month plus 0.24%) |
|
|||||||||
| 0.70% |
04/25/372 | 4,411,419 | 1,632,279 | |||||||
| Morgan Stanley Resecuritization Trust, |
|
|||||||||
| Series 2013-R7, Class 2B |
|
|||||||||
| (-1.00 X LIBOR USD 1-Month plus 0.24%, 11.50% Cap) |
|
|||||||||
| 0.00% |
12/26/461,2 | — | — | |||||||
| MortgageIT Trust, |
|
|||||||||
| Series 2005-1, Class 1A1 |
|
|||||||||
| (LIBOR USD 1-Month plus 0.64%) |
|
|||||||||
| 1.10% |
02/25/352 | 2,447,584 | 2,445,133 | |||||||
| MortgageIT Trust, |
|
|||||||||
| Series 2005-4, Class A1 |
|
|||||||||
| (LIBOR USD 1-Month plus 0.56%) |
|
|||||||||
| 1.02% |
10/25/352 | 2,639,550 | 2,615,753 | |||||||
| MortgageIT Trust, |
|
|||||||||
| Series 2005-5, Class A1 |
|
|||||||||
| (LIBOR USD 1-Month plus 0.52%) |
|
|||||||||
| 0.98% |
12/25/352 | 477,244 | 477,755 | |||||||
| Nationstar Home Equity Loan Trust, |
|
|||||||||
| Series 2007-A, Class AV4 |
|
|||||||||
| (LIBOR USD 1-Month plus 0.23%) |
|
|||||||||
| 0.69% |
03/25/372 | 52,298 | 51,942 | |||||||
See accompanying Notes to Financial Statements.
| Annual Report March 2022 / 194 |
Table of Contents
Total Return Bond Fund
Schedule of Portfolio Investments
March 31, 2022
| Issues | Maturity Date |
Principal Amount |
Value | |||||||
| MORTGAGE-BACKED (continued) |
|
|||||||||
| Non-Agency Mortgage-Backed (continued) |
|
|||||||||
| Nationstar Home Equity Loan Trust, |
|
|||||||||
| Series 2007-C, Class 2AV4 |
|
|||||||||
| (LIBOR USD 1-Month plus 0.25%) |
|
|||||||||
| 0.71% |
06/25/372 | $ | 5,764,699 | $ | 5,644,140 | |||||
| New Century Home Equity Loan Trust, |
|
|||||||||
| Series 2003-6, Class M1 |
|
|||||||||
| (LIBOR USD 1-Month plus 1.08%) |
|
|||||||||
| 1.54% |
01/25/342 | 86,612 | 87,196 | |||||||
| New Century Home Equity Loan Trust, |
|
|||||||||
| Series 2005-1, Class M1 |
|
|||||||||
| (LIBOR USD 1-Month plus 0.68%) |
|
|||||||||
| 1.13% |
03/25/352 | 238,793 | 238,786 | |||||||
| New Century Home Equity Loan Trust, |
|
|||||||||
| Series 2005-D, Class A1 |
|
|||||||||
| (LIBOR USD 1-Month plus 0.44%) |
|
|||||||||
| 0.90% |
02/25/362 | 81,212 | 81,280 | |||||||
| New Century Home Equity Loan Trust, |
|
|||||||||
| Series 2005-D, Class A2D |
|
|||||||||
| (LIBOR USD 1-Month plus 0.66%) |
|
|||||||||
| 1.12% |
02/25/362 | 27,219 | 27,215 | |||||||
| NLT Trust, |
|
|||||||||
| Series 2021-INV3, Class PT |
|
|||||||||
| 0.00% |
11/25/561,4 | 187,001,646 | 193,845,907 | |||||||
| Nomura Home Equity Loan, Inc., Home Equity Loan Trust, |
|
|||||||||
| Series 2006-HE2, Class A4 |
|
|||||||||
| (LIBOR USD 1-Month plus 0.54%) |
|
|||||||||
| 1.00% |
03/25/362 | 6,326,992 | 6,317,076 | |||||||
| NRPL, |
|
|||||||||
| Series 2019-3A, Class A1 (STEP-reset date 05/25/22) |
|
|||||||||
| 3.00% |
07/25/591 | 51,381,908 | 51,202,980 | |||||||
| Oakwood Mortgage Investors, Inc., |
|
|||||||||
| Series 2000-A, Class A5 |
|
|||||||||
| 8.16% |
09/15/294 | 20,813,204 | 7,437,558 | |||||||
| Option One Mortgage Loan Trust, |
|
|||||||||
| Series 2006-1, Class 1A1 |
|
|||||||||
| (LIBOR USD 1-Month plus 0.44%) |
|
|||||||||
| 0.90% |
01/25/362 | 1,660,203 | 1,659,526 | |||||||
| Ownit Mortgage Loan Trust, |
|
|||||||||
| Series 2006-4, Class A1 |
|
|||||||||
| (LIBOR USD 1-Month plus 0.28%) |
|
|||||||||
| 0.74% |
05/25/372 | 9,910,932 | 9,666,557 | |||||||
| Ownit Mortgage Loan Trust, |
|
|||||||||
| Series 2006-4, Class A2D |
|
|||||||||
| (LIBOR USD 1-Month plus 0.48%) |
|
|||||||||
| 0.94% |
05/25/372 | 16,774,157 | 15,079,747 | |||||||
| Popular ABS Mortgage Pass-Through Trust, |
|
|||||||||
| Series 2005-6, Class A5 (STEP-reset date 05/25/22) |
|
|||||||||
| 3.40% |
01/25/36 | 22,735,122 | 20,481,366 | |||||||
| Popular ABS Mortgage Pass-Through Trust, |
|
|||||||||
| Series 2006-D, Class A3 |
|
|||||||||
| (LIBOR USD 1-Month plus 0.26%) |
|
|||||||||
| 0.72% |
11/25/362 | 25,901 | 25,628 | |||||||
| Popular ABS Mortgage Pass-Through Trust, |
|
|||||||||
| Series 2007-A, Class A3 |
|
|||||||||
| (LIBOR USD 1-Month plus 0.31%) |
|
|||||||||
| 0.77% |
06/25/472 | 23,015,500 | 21,997,874 | |||||||
| Issues | Maturity Date |
Principal Amount |
Value | |||||||
| MORTGAGE-BACKED (continued) |
|
|||||||||
| Non-Agency Mortgage-Backed (continued) |
|
|||||||||
| Popular ABS, Inc., |
|
|||||||||
| Series 1998-1, Class A2 (STEP-reset date 05/25/22) |
|
|||||||||
| 7.48% |
11/25/29 | $ | 46,449 | $ | 44,919 | |||||
| Project Colt (Acquired 03/08/2022, cost $100,000,000) |
|
|||||||||
| 1.95% |
03/10/275,6 | 100,000,000 | 99,980,000 | |||||||
| Residential Accredit Loans Trust, |
|
|||||||||
| Series 2005-QA12, Class CB1 |
|
|||||||||
| 3.48% |
12/25/354 | 3,611,695 | 1,929,643 | |||||||
| Residential Accredit Loans Trust, |
|
|||||||||
| Series 2005-QA4, Class A41 |
|
|||||||||
| 3.29% |
04/25/354 | 144,783 | 144,605 | |||||||
| Residential Accredit Loans Trust, |
|
|||||||||
| Series 2005-QA7, Class A1 |
|
|||||||||
| 3.32% |
07/25/354 | 2,316,635 | 1,795,176 | |||||||
| Residential Accredit Loans Trust, |
|
|||||||||
| Series 2005-QO5, Class A1 |
|
|||||||||
| (Federal Reserve US 12-Month Cumulative Average plus 1.00%) |
|
|||||||||
| 1.14% |
01/25/462 | 3,949,572 | 3,575,543 | |||||||
| Residential Accredit Loans Trust, |
|
|||||||||
| Series 2006-QA1, Class A11 |
|
|||||||||
| 4.17% |
01/25/364 | 100,565 | 85,346 | |||||||
| Residential Accredit Loans Trust, |
|
|||||||||
| Series 2006-QA1, Class A21 |
|
|||||||||
| 4.35% |
01/25/364 | 8,957,367 | 7,785,203 | |||||||
| Residential Accredit Loans Trust, |
|
|||||||||
| Series 2006-QA7, Class 2A1 |
|
|||||||||
| (LIBOR USD 1-Month plus 0.37%) |
|
|||||||||
| 0.83% |
08/25/362 | 15,638,116 | 15,063,856 | |||||||
| Residential Accredit Loans Trust, |
|
|||||||||
| Series 2006-QS10, Class AV (IO) |
|
|||||||||
| 0.58% |
08/25/364,5,6 | 15,965,677 | 303,211 | |||||||
| Residential Accredit Loans Trust, |
|
|||||||||
| Series 2006-QS12, Class 2A9 |
|
|||||||||
| (LIBOR USD 1-Month plus 0.38%) |
|
|||||||||
| 0.84% |
09/25/362 | 146,353 | 114,487 | |||||||
| Residential Accredit Loans Trust, |
|
|||||||||
| Series 2006-QS2, Class 1AV (IO) |
|
|||||||||
| 0.47% |
02/25/364,5,6 | 57,052,293 | 762,692 | |||||||
| Residential Accredit Loans Trust, |
|
|||||||||
| Series 2006-QS7, Class AV (IO) |
|
|||||||||
| 0.70% |
06/25/364,5,6 | 25,057,891 | 303,968 | |||||||
| Residential Accredit Loans Trust, |
|
|||||||||
| Series 2006-QS8, Class AV (IO) |
|
|||||||||
| 0.78% |
08/25/364,5,6 | 61,986,571 | 1,378,476 | |||||||
| Residential Accredit Loans Trust, |
|
|||||||||
| Series 2007-QS10, Class AV (IO) |
|
|||||||||
| 0.48% |
09/25/374,5,6 | 48,387,379 | 873,886 | |||||||
| Residential Accredit Loans Trust, |
|
|||||||||
| Series 2007-QS4, Class 3AV (IO) |
|
|||||||||
| 0.36% |
03/25/374,5,6 | 30,644,129 | 352,490 | |||||||
| Residential Accredit Loans Trust, |
|
|||||||||
| Series 2007-QS5, Class AV (IO) |
|
|||||||||
| 0.28% |
03/25/374,5,6 | 33,238,992 | 268,588 | |||||||
See accompanying Notes to Financial Statements.
| 195 / Annual Report March 2022 |
Table of Contents
Total Return Bond Fund
Schedule of Portfolio Investments
March 31, 2022
| Issues | Maturity Date |
Principal Amount |
Value | |||||||
| MORTGAGE-BACKED (continued) |
|
|||||||||
| Non-Agency Mortgage-Backed (continued) |
|
|||||||||
| Residential Accredit Loans Trust, |
|
|||||||||
| Series 2007-QS6, Class AV (IO) |
|
|||||||||
| 0.34% |
04/25/374,5,6 | $ | 70,415,085 | $ | 619,498 | |||||
| Residential Accredit Loans Trust, |
|
|||||||||
| Series 2007-QS7, Class 2AV (IO) |
|
|||||||||
| 0.38% |
06/25/374,5,6 | 25,357,556 | 279,346 | |||||||
| Residential Accredit Loans Trust, |
|
|||||||||
| Series 2007-QS8, Class AV (IO) |
|
|||||||||
| 0.43% |
06/25/374,5,6 | 61,562,831 | 953,380 | |||||||
| Residential Asset Mortgage Products Trust, |
|
|||||||||
| Series 2004-SL3, Class A4 |
|
|||||||||
| 8.50% |
12/25/31 | 16,605 | 9,891 | |||||||
| Residential Asset Securities Corp., |
|
|||||||||
| Series 2006-KS3, Class M1 |
|
|||||||||
| (LIBOR USD 1-Month plus 0.33%) |
|
|||||||||
| 0.95% |
04/25/362 | 467,674 | 467,626 | |||||||
| Residential Asset Securitization Trust, |
|
|||||||||
| Series 2004-IP2, Class 1A1 |
|
|||||||||
| 2.71% |
12/25/344 | 170,703 | 170,496 | |||||||
| Residential Asset Securitization Trust, |
|
|||||||||
| Series 2004-IP2, Class 2A1 |
|
|||||||||
| 2.84% |
12/25/344 | 11,313 | 10,974 | |||||||
| Residential Asset Securitization Trust, |
|
|||||||||
| Series 2004-IP2, Class 3A1 |
|
|||||||||
| 2.56% |
12/25/344 | 297,339 | 307,954 | |||||||
| Residential Asset Securitization Trust, |
|
|||||||||
| Series 2006-A7CB, Class 1A3 |
|
|||||||||
| 6.25% |
07/25/36 | 1,727,754 | 1,633,610 | |||||||
| Residential Funding Mortgage Securities Trust, |
|
|||||||||
| Series 2005-SA5, Class 1A |
|
|||||||||
| 3.06% |
11/25/354 | 2,447,980 | 1,670,031 | |||||||
| Residential Funding Mortgage Securities Trust, |
|
|||||||||
| Series 2006-SA3, Class 3A1 |
|
|||||||||
| 4.92% |
09/25/364 | 255,291 | 228,795 | |||||||
| Residential Funding Mortgage Securities Trust, |
|
|||||||||
| Series 2006-SA3, Class 4A1 |
|
|||||||||
| 4.78% |
09/25/364 | 5,510 | 4,623 | |||||||
| Residential Funding Mortgage Securities Trust, |
|
|||||||||
| Series 2006-SA4, Class 2A1 |
|
|||||||||
| 4.58% |
11/25/364 | 41,398 | 39,414 | |||||||
| Residential Funding Mortgage Securities Trust, |
|
|||||||||
| Series 2007-SA2, Class 2A2 |
|
|||||||||
| 3.33% |
04/25/374 | 967,348 | 880,127 | |||||||
| Saxon Asset Securities Trust, |
|
|||||||||
| Series 2001-2, Class AF6 (STEP-reset date 05/25/22) |
|
|||||||||
| 6.81% |
06/25/16 | 18 | 19 | |||||||
| Saxon Asset Securities Trust, |
|
|||||||||
| Series 2007-1, Class A2C |
|
|||||||||
| (LIBOR USD 1-Month plus 0.15%) |
|
|||||||||
| 0.61% |
01/25/472 | 677,395 | 676,167 | |||||||
| Saxon Asset Securities Trust, |
|
|||||||||
| Series 2007-2, Class A2C |
|
|||||||||
| (LIBOR USD 1-Month plus 0.24%) |
|
|||||||||
| 0.70% |
05/25/472 | 173,085 | 140,420 | |||||||
| Issues | Maturity Date |
Principal Amount |
Value | |||||||
| MORTGAGE-BACKED (continued) |
|
|||||||||
| Non-Agency Mortgage-Backed (continued) |
|
|||||||||
| Saxon Asset Securities Trust, |
|
|||||||||
| Series 2007-3, Class 2A3 |
|
|||||||||
| (LIBOR USD 1-Month plus 0.40%) |
|
|||||||||
| 0.86% |
09/25/472 | $ | 26,490,416 | $ | 25,326,029 | |||||
| Securitized Asset-Backed Receivables LLC Trust, |
| |||||||||
| Series 2006-CB1, Class AF2 (STEP-reset date 05/25/22) |
|
|||||||||
| 2.91% |
01/25/36 | 5,974,322 | 4,881,399 | |||||||
| Securitized Asset-Backed Receivables LLC Trust, |
|
|||||||||
| Series 2006-CB5, Class A3 |
|
|||||||||
| (LIBOR USD 1-Month plus 0.28%) |
|
|||||||||
| 0.74% |
06/25/362 | 218,583 | 164,842 | |||||||
| Securitized Asset-Backed Receivables LLC Trust, |
| |||||||||
| Series 2007-BR1, Class A2A |
|
|||||||||
| (LIBOR USD 1-Month plus 0.11%) |
|
|||||||||
| 0.57% |
02/25/372 | 5,585,088 | 2,950,750 | |||||||
| Securitized Asset-Backed Receivables LLC Trust, |
| |||||||||
| Series 2007-BR1, Class A2B |
|
|||||||||
| (LIBOR USD 1-Month plus 0.27%) |
|
|||||||||
| 0.73% |
02/25/372 | 27,647,931 | 14,841,347 | |||||||
| Securitized Asset-Backed Receivables LLC Trust, |
| |||||||||
| Series 2007-BR2, Class A2 |
|
|||||||||
| (LIBOR USD 1-Month plus 0.23%) |
|
|||||||||
| 0.69% |
02/25/372 | 36,311,168 | 19,339,521 | |||||||
| Securitized Asset-Backed Receivables LLC Trust, |
| |||||||||
| Series 2007-BR5, Class A2A |
|
|||||||||
| (LIBOR USD 1-Month plus 0.13%) |
|
|||||||||
| 0.59% |
05/25/372 | 13,542,495 | 11,165,637 | |||||||
| Securitized Asset-Backed Receivables LLC Trust, |
| |||||||||
| Series 2007-BR5, Class A2C |
|
|||||||||
| (LIBOR USD 1-Month plus 0.35%) |
|
|||||||||
| 0.81% |
05/25/372 | 10,213,633 | 8,582,297 | |||||||
| Securitized Asset-Backed Receivables LLC Trust, |
| |||||||||
| Series 2007-NC1, Class A2B |
|
|||||||||
| (LIBOR USD 1-Month plus 0.15%) |
|
|||||||||
| 0.61% |
12/25/362 | 27,745,003 | 18,444,265 | |||||||
| Securitized Asset-Backed Receivables LLC Trust, |
| |||||||||
| Series 2007-NC2, Class A2B |
|
|||||||||
| (LIBOR USD 1-Month plus 0.14%) |
|
|||||||||
| 0.60% |
01/25/372 | 14,693,458 | 13,335,875 | |||||||
| Sequoia Mortgage Trust, |
|
|||||||||
| Series 2003-2, Class A1 |
|
|||||||||
| (LIBOR USD 1-Month plus 0.66%) |
|
|||||||||
| 1.11% |
06/20/332 | 29,802 | 29,591 | |||||||
| Sequoia Mortgage Trust, |
|
|||||||||
| Series 2003-8, Class A1 |
|
|||||||||
| (LIBOR USD 1-Month plus 0.64%) |
|
|||||||||
| 1.09% |
01/20/342 | 999 | 978 | |||||||
| Sequoia Mortgage Trust, |
|
|||||||||
| Series 2004-3, Class A |
|
|||||||||
| (LIBOR USD 6-Month plus 0.50%) |
|
|||||||||
| 0.67% |
05/20/342 | 143,446 | 143,502 | |||||||
| Sequoia Mortgage Trust, |
|
|||||||||
| Series 2004-4, Class A |
|
|||||||||
| (LIBOR USD 6-Month plus 0.52%) |
|
|||||||||
| 0.69% |
05/20/342 | 72,540 | 69,937 | |||||||
See accompanying Notes to Financial Statements.
| Annual Report March 2022 / 196 |
Table of Contents
Total Return Bond Fund
Schedule of Portfolio Investments
March 31, 2022
| Issues | Maturity Date |
Principal Amount |
Value | |||||||
| MORTGAGE-BACKED (continued) |
|
|||||||||
| Non-Agency Mortgage-Backed (continued) |
|
|||||||||
| SG Mortgage Securities Trust, |
|
|||||||||
| Series 2007-NC1, Class A2 |
|
|||||||||
| (LIBOR USD 1-Month plus 0.24%) |
|
|||||||||
| 0.70% |
12/25/361,2 | $ | 12,775,630 | $ | 8,771,240 | |||||
| SHOW 2022-BIZ A |
|
|||||||||
| Series 2022-BIZ, Class A |
|
|||||||||
| 3.03% |
01/15/241,2 | 68,000,000 | 67,266,351 | |||||||
| Soundview Home Loan Trust, |
|
|||||||||
| Series 2005-OPT1, Class M2 |
|
|||||||||
| (LIBOR USD 1-Month plus 0.68%) |
|
|||||||||
| 1.13% |
06/25/352 | 9,739,427 | 9,695,455 | |||||||
| Structured Adjustable Rate Mortgage Loan Trust, |
| |||||||||
| Series 2004-1, Class 3A3 |
|
|||||||||
| 2.42% |
02/25/344 | 15,918 | 15,504 | |||||||
| Structured Adjustable Rate Mortgage Loan Trust, |
| |||||||||
| Series 2004-12, Class 2A |
|
|||||||||
| 2.68% |
09/25/344 | 2,794,851 | 2,804,937 | |||||||
| Structured Adjustable Rate Mortgage Loan Trust, |
| |||||||||
| Series 2004-14, Class 1A |
|
|||||||||
| 2.60% |
10/25/344 | 59,303 | 58,440 | |||||||
| Structured Adjustable Rate Mortgage Loan Trust, |
| |||||||||
| Series 2004-14, Class 2A |
|
|||||||||
| 2.46% |
10/25/344 | 3,665,574 | 3,689,669 | |||||||
| Structured Adjustable Rate Mortgage Loan Trust, |
| |||||||||
| Series 2004-15, Class A |
|
|||||||||
| 2.61% |
10/25/344 | 1,438,466 | 1,368,033 | |||||||
| Structured Adjustable Rate Mortgage Loan Trust, |
| |||||||||
| Series 2004-17, Class A1 |
|
|||||||||
| 1.26% |
11/25/344 | 27,864 | 26,432 | |||||||
| Structured Adjustable Rate Mortgage Loan Trust, |
| |||||||||
| Series 2004-20, Class 1A2 |
|
|||||||||
| 2.73% |
01/25/354 | 355,651 | 362,123 | |||||||
| Structured Adjustable Rate Mortgage Loan Trust, |
| |||||||||
| Series 2005-12, Class 3A1 |
|
|||||||||
| 2.34% |
06/25/354 | 769,965 | 713,285 | |||||||
| Structured Adjustable Rate Mortgage Loan Trust, |
| |||||||||
| Series 2005-18, Class 7A3 |
|
|||||||||
| 2.80% |
09/25/354 | 11,220,443 | 8,215,580 | |||||||
| Structured Adjustable Rate Mortgage Loan Trust, |
| |||||||||
| Series 2006-12, Class 1A1 |
|
|||||||||
| (LIBOR USD 1-Month plus 0.32%) |
|
|||||||||
| 0.78% |
01/25/372 | 16,145,620 | 15,304,010 | |||||||
| Structured Adjustable Rate Mortgage Loan Trust, |
| |||||||||
| Series 2007-9, Class 2A1 |
|
|||||||||
| 3.16% |
10/25/474 | 477,476 | 366,826 | |||||||
| Structured Asset Mortgage Investments II Trust, |
| |||||||||
| Series 2005-AR8, Class A1A |
|
|||||||||
| (LIBOR USD 1-Month plus 0.56%) |
|
|||||||||
| 1.02% |
02/25/362 | 433,792 | 414,119 | |||||||
| Structured Asset Mortgage Investments II Trust, |
| |||||||||
| Series 2005-AR8, Class A3 |
|
|||||||||
| (Federal Reserve US 12-Month Cumulative Average plus 2.00%) |
|
|||||||||
| 2.09% |
02/25/362 | 13,993,293 | 13,823,542 | |||||||
| Issues | Maturity Date |
Principal Amount |
Value | |||||||
| MORTGAGE-BACKED (continued) |
|
|||||||||
| Non-Agency Mortgage-Backed (continued) |
|
|||||||||
| Structured Asset Mortgage Investments II Trust, |
|
|||||||||
| Series 2006-AR7, Class A1A |
|
|||||||||
| (LIBOR USD 1-Month plus 0.42%) |
|
|||||||||
| 0.88% |
08/25/362 | $ | 15,952,404 | $ | 15,039,876 | |||||
| Structured Asset Mortgage Investments II Trust, |
|
|||||||||
| Series 2006-AR8, Class A1BG |
|
|||||||||
| (LIBOR USD 1-Month plus 0.12%) |
|
|||||||||
| 0.58% |
10/25/362 | 14,587,365 | 13,848,990 | |||||||
| Structured Asset Mortgage Investments II Trust, |
|
|||||||||
| Series 2007-AR6, Class A1 |
|
|||||||||
| (Federal Reserve US 12-Month Cumulative Average plus 1.50%) |
|
|||||||||
| 1.64% |
08/25/472 | 96,183,716 | 91,768,623 | |||||||
| Structured Asset Securities Corp. Mortgage Pass-Through Certificates, |
|
|||||||||
| Series 1997-2, Class 2A4 |
|
|||||||||
| 7.25% |
03/28/30 | 426 | 434 | |||||||
| Structured Asset Securities Corp. Mortgage Pass-Through Certificates, |
|
|||||||||
| Series 2003-26A, Class 3A5 |
|
|||||||||
| 2.30% |
09/25/334 | 94,413 | 96,703 | |||||||
| Structured Asset Securities Corp. Mortgage Pass-Through Certificates, |
|
|||||||||
| Series 2003-34A, Class 5A4 |
|
|||||||||
| 2.39% |
11/25/334 | 784,382 | 777,460 | |||||||
| Structured Asset Securities Corp. Trust, |
|
|||||||||
| Series 2005-5, Class 2A4 |
|
|||||||||
| 5.50% |
04/25/35 | 927,155 | 892,629 | |||||||
| SunTrust Adjustable Rate Mortgage Loan Trust, |
|
|||||||||
| Series 2007-3, Class 1A1 |
|
|||||||||
| 2.55% |
06/25/374 | 1,633,847 | 1,266,139 | |||||||
| Thornburg Mortgage Securities Trust, |
|
|||||||||
| Series 2004-4, Class 2A |
|
|||||||||
| 2.02% |
12/25/444 | 65,783 | 65,061 | |||||||
| Wachovia Mortgage Loan Trust, |
|
|||||||||
| Series 2006-ALT1, Class A3 |
|
|||||||||
| (LIBOR USD 1-Month plus 0.46%) |
|
|||||||||
| 0.92% |
01/25/372 | 11,321,024 | 5,640,351 | |||||||
| Wachovia Mortgage Loan Trust, |
|
|||||||||
| Series 2006-AMN1, Class A3 |
|
|||||||||
| (LIBOR USD 1-Month plus 0.48%) |
|
|||||||||
| 0.94% |
08/25/362 | 14,444,041 | 6,567,568 | |||||||
| WaMu Asset-Backed Certificates, |
|
|||||||||
| Series 2007-HE1, Class 2A2 |
|
|||||||||
| (LIBOR USD 1-Month plus 0.11%) |
|
|||||||||
| 0.57% |
01/25/372 | 3,172,895 | 1,780,452 | |||||||
| WaMu Asset-Backed Certificates, |
|
|||||||||
| Series 2007-HE1, Class 2A3 |
|
|||||||||
| (LIBOR USD 1-Month plus 0.15%) |
|
|||||||||
| 0.61% |
01/25/372 | 39,033,307 | 21,774,884 | |||||||
| WaMu Asset-Backed Certificates, |
|
|||||||||
| Series 2007-HE1, Class 2A4 |
|
|||||||||
| (LIBOR USD 1-Month plus 0.23%) |
|
|||||||||
| 0.69% |
01/25/372 | 9,831,955 | 5,538,474 | |||||||
See accompanying Notes to Financial Statements.
| 197 / Annual Report March 2022 |
Table of Contents
Total Return Bond Fund
Schedule of Portfolio Investments
March 31, 2022
| Issues | Maturity Date |
Principal Amount |
Value | |||||||
| MORTGAGE-BACKED (continued) |
|
|||||||||
| Non-Agency Mortgage-Backed (continued) |
|
|||||||||
| WaMu Mortgage Pass-Through Certificates, |
|
|||||||||
| Series 2003-AR6, Class A1 |
|
|||||||||
| 2.57% |
06/25/334 | $ | 1,843,881 | $ | 1,826,170 | |||||
| WaMu Mortgage Pass-Through Certificates, |
|
|||||||||
| Series 2004-AR3, Class A2 |
|
|||||||||
| 2.61% |
06/25/344 | 17,570 | 17,504 | |||||||
| WaMu Mortgage Pass-Through Certificates, |
|
|||||||||
| Series 2004-AR6, Class A |
|
|||||||||
| (LIBOR USD 1-Month plus 0.84%) |
|
|||||||||
| 1.30% |
05/25/442 | 287,324 | 289,157 | |||||||
| WaMu Mortgage Pass-Through Certificates, |
|
|||||||||
| Series 2005-3, Class 2A3 |
|
|||||||||
| (LIBOR USD 1-Month plus 0.55%) |
|
|||||||||
| 1.01% |
05/25/352 | 1,564,048 | 1,319,457 | |||||||
| WaMu Mortgage Pass-Through Certificates, |
|
|||||||||
| Series 2005-4, Class CB13 |
|
|||||||||
| (LIBOR USD 1-Month plus 0.50%) |
|
|||||||||
| 0.96% |
06/25/352 | 3,119,041 | 2,758,019 | |||||||
| WaMu Mortgage Pass-Through Certificates, |
|
|||||||||
| Series 2005-AR1, Class A1A |
|
|||||||||
| (LIBOR USD 1-Month plus 0.64%) |
|
|||||||||
| 1.10% |
01/25/452 | 386,847 | 379,583 | |||||||
| WaMu Mortgage Pass-Through Certificates, |
|
|||||||||
| Series 2005-AR11, Class A1A |
|
|||||||||
| (LIBOR USD 1-Month plus 0.64%) |
|
|||||||||
| 1.10% |
08/25/452 | 18,129,749 | 18,036,517 | |||||||
| WaMu Mortgage Pass-Through Certificates, |
|
|||||||||
| Series 2005-AR12, Class 1A6 |
|
|||||||||
| 2.85% |
10/25/354 | 604,058 | 597,942 | |||||||
| WaMu Mortgage Pass-Through Certificates, |
|
|||||||||
| Series 2005-AR13, Class A1A1 |
|
|||||||||
| (LIBOR USD 1-Month plus 0.58%) |
|
|||||||||
| 1.04% |
10/25/452 | 2,850,174 | 2,821,046 | |||||||
| WaMu Mortgage Pass-Through Certificates, |
|
|||||||||
| Series 2005-AR14, Class 2A1 |
|
|||||||||
| 2.86% |
12/25/354 | 2,495,770 | 2,509,255 | |||||||
| WaMu Mortgage Pass-Through Certificates, |
|
|||||||||
| Series 2005-AR15, Class A1A1 |
|
|||||||||
| (LIBOR USD 1-Month plus 0.52%) |
|
|||||||||
| 0.98% |
11/25/452 | 16,632,325 | 15,787,875 | |||||||
| WaMu Mortgage Pass-Through Certificates, |
|
|||||||||
| Series 2005-AR17, Class A1A1 |
|
|||||||||
| (LIBOR USD 1-Month plus 0.54%) |
|
|||||||||
| 1.00% |
12/25/452 | 8,094,278 | 7,826,397 | |||||||
| WaMu Mortgage Pass-Through Certificates, |
|
|||||||||
| Series 2005-AR19, Class A1A2 |
|
|||||||||
| (LIBOR USD 1-Month plus 0.58%) |
|
|||||||||
| 1.04% |
12/25/452 | 8,259,718 | 8,124,029 | |||||||
| WaMu Mortgage Pass-Through Certificates, |
|
|||||||||
| Series 2005-AR2, Class 1A1A |
|
|||||||||
| (LIBOR USD 1-Month plus 0.66%) |
|
|||||||||
| 1.12% |
01/25/452 | 9,135,817 | 9,134,420 | |||||||
| WaMu Mortgage Pass-Through Certificates, |
|
|||||||||
| Series 2005-AR2, Class 2A1A |
|
|||||||||
| (LIBOR USD 1-Month plus 0.62%) |
|
|||||||||
| 1.08% |
01/25/452 | 523,276 | 520,601 | |||||||
| Issues | Maturity Date |
Principal Amount |
Value | |||||||
| MORTGAGE-BACKED (continued) |
|
|||||||||
| Non-Agency Mortgage-Backed (continued) |
|
|||||||||
| WaMu Mortgage Pass-Through Certificates, |
|
|||||||||
| Series 2005-AR2, Class 2A21 |
|
|||||||||
| (LIBOR USD 1-Month plus 0.66%) |
|
|||||||||
| 1.12% |
01/25/452 | $ | 44,501 | $ | 44,040 | |||||
| WaMu Mortgage Pass-Through Certificates, |
|
|||||||||
| Series 2005-AR2, Class 2A23 |
|
|||||||||
| (LIBOR USD 1-Month plus 0.76%) |
|
|||||||||
| 1.22% |
01/25/452 | 1,858,150 | 1,842,973 | |||||||
| WaMu Mortgage Pass-Through Certificates, |
|
|||||||||
| Series 2005-AR6, Class 2A1A |
|
|||||||||
| (LIBOR USD 1-Month plus 0.46%) |
|
|||||||||
| 0.92% |
04/25/452 | 75,855 | 74,719 | |||||||
| WaMu Mortgage Pass-Through Certificates, |
|
|||||||||
| Series 2005-AR8, Class 1A1A |
|
|||||||||
| (LIBOR USD 1-Month plus 0.54%) |
|
|||||||||
| 1.00% |
07/25/452 | 80,549 | 78,481 | |||||||
| WaMu Mortgage Pass-Through Certificates, |
|
|||||||||
| Series 2006-AR1, Class 2A1A |
|
|||||||||
| (Federal Reserve US 12-Month Cumulative Average plus 1.07%) |
|
|||||||||
| 1.21% |
01/25/462 | 15,310,694 | 15,143,816 | |||||||
| WaMu Mortgage Pass-Through Certificates, |
|
|||||||||
| Series 2006-AR10, Class 1A4 |
|
|||||||||
| 2.89% |
09/25/364 | 7,837,510 | 7,575,167 | |||||||
| WaMu Mortgage Pass-Through Certificates, |
|
|||||||||
| Series 2006-AR16, Class 3A1 |
|
|||||||||
| 3.04% |
12/25/364 | 440,546 | 428,467 | |||||||
| WaMu Mortgage Pass-Through Certificates, |
|
|||||||||
| Series 2006-AR3, Class A1A |
|
|||||||||
| (Federal Reserve US 12-Month Cumulative Average plus 1.00%) |
|
|||||||||
| 1.14% |
02/25/462 | 9,145,162 | 8,944,907 | |||||||
| WaMu Mortgage Pass-Through Certificates, |
|
|||||||||
| Series 2006-AR4, Class 1A1A |
|
|||||||||
| (Federal Reserve US 12-Month Cumulative Average plus 0.94%) |
|
|||||||||
| 1.04% |
05/25/462 | 3,126,200 | 3,070,589 | |||||||
| WaMu Mortgage Pass-Through Certificates, |
|
|||||||||
| Series 2006-AR7, Class 2A |
|
|||||||||
| (Federal Reserve US 12-Month Cumulative Average plus 0.98%) |
|
|||||||||
| 1.12% |
07/25/462 | 6,239,060 | 5,951,988 | |||||||
| WaMu Mortgage Pass-Through Certificates, |
|
|||||||||
| Series 2007-HY7, Class 4A2 |
|
|||||||||
| 3.18% |
07/25/374 | 161,538 | 161,470 | |||||||
| WaMu Mortgage Pass-Through Certificates, |
|
|||||||||
| Series 2007-OA1, Class A1A |
|
|||||||||
| (Federal Reserve US 12-Month Cumulative Average plus 0.70%) |
|
|||||||||
| 0.84% |
02/25/472 | 8,699,953 | 8,560,606 | |||||||
| WaMu MSC Mortgage Pass-Through Certificates, |
| |||||||||
| Series 2002-AR1, Class 1A1 |
|
|||||||||
| 2.50% |
11/25/304 | 104,331 | 105,234 | |||||||
| Wells Fargo Alternative Loan Trust, |
|
|||||||||
| Series 2007-PA5, Class 1A1 |
|
|||||||||
| 6.25% |
11/25/37 | 93,809 | 88,560 | |||||||
See accompanying Notes to Financial Statements.
| Annual Report March 2022 / 198 |
Table of Contents
Total Return Bond Fund
Schedule of Portfolio Investments
March 31, 2022
| Issues | Maturity Date |
Principal Amount |
Value | |||||||
| MORTGAGE-BACKED (continued) |
|
|||||||||
| Non-Agency Mortgage-Backed (continued) |
| |||||||||
| Wells Fargo Mortgage-Backed Securities Trust, |
| |||||||||
| Series 2006-AR1, Class 1A1 |
|
|||||||||
| 2.67% |
03/25/364 | $ | 1,413,805 | $ | 1,339,336 | |||||
|
|
|
| ||||||||
| 5,702,349,600 | ||||||||||
|
|
|
| ||||||||
| U.S. Agency Commercial Mortgage-Backed — 0.00% |
|
|||||||||
| Freddie Mac Multifamily Structured Pass-Through Certificates, |
|
|||||||||
| Series K154, Class A2 |
|
|||||||||
| 3.42% |
04/25/32 | 750,000 | 776,699 | |||||||
| Freddie Mac Multifamily Structured Pass-Through Certificates, |
|
|||||||||
| Series K157, Class A3 |
|
|||||||||
| 3.99% |
08/25/334 | 300,000 | 326,469 | |||||||
|
|
|
| ||||||||
| 1,103,168 | ||||||||||
|
|
|
| ||||||||
| U.S. Agency Mortgage-Backed — 32.31% |
| |||||||||
| Fannie Mae Pool 190375 |
|
|||||||||
| 5.50% |
11/01/36 | 418,322 | 458,070 | |||||||
| Fannie Mae Pool 190396 |
|
|||||||||
| 4.50% |
06/01/39 | 5,612 | 5,972 | |||||||
| Fannie Mae Pool 313182 |
|
|||||||||
| 7.50% |
10/01/26 | 655 | 689 | |||||||
| Fannie Mae Pool 394854 |
|
|||||||||
| 6.50% |
05/01/27 | 376 | 404 | |||||||
| Fannie Mae Pool 545191 |
|
|||||||||
| 7.00% |
09/01/31 | 1,651 | 1,773 | |||||||
| Fannie Mae Pool 545756 |
|
|||||||||
| 7.00% |
06/01/32 | 368 | 414 | |||||||
| Fannie Mae Pool 606108 |
|
|||||||||
| 7.00% |
03/01/31 | 1,993 | 2,012 | |||||||
| Fannie Mae Pool 613142 |
|
|||||||||
| 7.00% |
11/01/31 | 6,919 | 7,668 | |||||||
| Fannie Mae Pool 625666 |
|
|||||||||
| 7.00% |
01/01/32 | 5,098 | 5,479 | |||||||
| Fannie Mae Pool 633698 |
|
|||||||||
| 7.50% |
02/01/31 | 23,145 | 25,625 | |||||||
| Fannie Mae Pool 655928 |
|
|||||||||
| 7.00% |
08/01/32 | 82,216 | 92,121 | |||||||
| Fannie Mae Pool 725257 |
|
|||||||||
| 5.50% |
02/01/34 | 586,003 | 641,780 | |||||||
| Fannie Mae Pool 734830 |
|
|||||||||
| 4.50% |
08/01/33 | 7,735 | 8,209 | |||||||
| Fannie Mae Pool 734922 |
|
|||||||||
| 4.50% |
09/01/33 | 1,019,043 | 1,084,357 | |||||||
| Fannie Mae Pool 735207 |
|
|||||||||
| 7.00% |
04/01/34 | 13,168 | 14,407 | |||||||
| Fannie Mae Pool 735224 |
|
|||||||||
| 5.50% |
02/01/35 | 1,995,611 | 2,186,374 | |||||||
| Fannie Mae Pool 735651 |
|
|||||||||
| 4.50% |
06/01/35 | 2,236,286 | 2,395,400 | |||||||
| Fannie Mae Pool 735686 |
|
|||||||||
| 6.50% |
12/01/22 | 11 | 11 | |||||||
| Fannie Mae Pool 740297 |
|
|||||||||
| 5.50% |
10/01/33 | 1,248 | 1,367 | |||||||
| Issues | Maturity Date |
Principal Amount |
Value | |||||||
| MORTGAGE-BACKED (continued) |
|
|||||||||
| U.S. Agency Mortgage-Backed (continued) |
|
|||||||||
| Fannie Mae Pool 745147 |
|
|||||||||
| 4.50% |
12/01/35 | $ | 14,105 | $ | 15,003 | |||||
| Fannie Mae Pool 753168 |
|
|||||||||
| 4.50% |
12/01/33 | 5,671 | 6,034 | |||||||
| Fannie Mae Pool 815422 |
|
|||||||||
| 4.50% |
02/01/35 | 25,895 | 27,418 | |||||||
| Fannie Mae Pool 839109 |
|
|||||||||
| (LIBOR USD 12-Month plus 1.91%) |
|
|||||||||
| 2.16% |
11/01/352 | 3,483 | 3,487 | |||||||
| Fannie Mae Pool 844773 |
|
|||||||||
| (LIBOR USD 12-Month plus 1.53%) |
|
|||||||||
| 1.78% |
12/01/352 | 2,892 | 2,895 | |||||||
| Fannie Mae Pool 888412 |
|
|||||||||
| 7.00% |
04/01/37 | 187,049 | 202,556 | |||||||
| Fannie Mae Pool 889184 |
|
|||||||||
| 5.50% |
09/01/36 | 2,032,965 | 2,227,751 | |||||||
| Fannie Mae Pool AB1613 |
|
|||||||||
| 4.00% |
10/01/40 | 18,295,299 | 19,152,513 | |||||||
| Fannie Mae Pool AB1803 |
|
|||||||||
| 4.00% |
11/01/40 | 22,649,277 | 23,731,277 | |||||||
| Fannie Mae Pool AB2127 |
|
|||||||||
| 3.50% |
01/01/26 | 6,272,449 | 6,411,482 | |||||||
| Fannie Mae Pool AB3679 |
|
|||||||||
| 3.50% |
10/01/41 | 7,467,605 | 7,619,029 | |||||||
| Fannie Mae Pool AB3864 |
|
|||||||||
| 3.50% |
11/01/41 | 5,786,697 | 5,904,781 | |||||||
| Fannie Mae Pool AB4045 |
|
|||||||||
| 3.50% |
12/01/41 | 7,411,489 | 7,574,531 | |||||||
| Fannie Mae Pool AB4262 |
|
|||||||||
| 3.50% |
01/01/32 | 3,755,316 | 3,839,739 | |||||||
| Fannie Mae Pool AB6385 |
|
|||||||||
| 3.00% |
10/01/42 | 235,730 | 235,326 | |||||||
| Fannie Mae Pool AB9703 |
|
|||||||||
| 3.50% |
06/01/43 | 13,319,941 | 13,616,819 | |||||||
| Fannie Mae Pool AC8279 |
|
|||||||||
| 4.50% |
08/01/39 | 8,980 | 9,512 | |||||||
| Fannie Mae Pool AE0138 |
|
|||||||||
| 4.50% |
03/01/40 | 34,614 | 36,830 | |||||||
| Fannie Mae Pool AE0482 |
|
|||||||||
| 5.50% |
01/01/38 | 4,906,891 | 5,330,379 | |||||||
| Fannie Mae Pool AH3780 |
|
|||||||||
| 4.00% |
02/01/41 | 8,937,141 | 9,356,718 | |||||||
| Fannie Mae Pool AJ1404 |
|
|||||||||
| 4.00% |
09/01/41 | 11,408,772 | 11,914,134 | |||||||
| Fannie Mae Pool AL0209 |
|
|||||||||
| 4.50% |
05/01/41 | 13,975,200 | 14,981,619 | |||||||
| Fannie Mae Pool AL0851 |
|
|||||||||
| 6.00% |
10/01/40 | 7,929,338 | 8,801,275 | |||||||
| Fannie Mae Pool AL2521 |
|
|||||||||
| 3.50% |
09/01/42 | 91,493 | 93,774 | |||||||
| Fannie Mae Pool AL4597 |
|
|||||||||
| 4.00% |
01/01/44 | 35,298,875 | 37,157,386 | |||||||
| Fannie Mae Pool AL6348 |
|
|||||||||
| 3.50% |
02/01/45 | 29,962 | 30,667 | |||||||
| Fannie Mae Pool AL7092 |
|
|||||||||
| 3.00% |
07/01/45 | 45,023 | 44,773 | |||||||
See accompanying Notes to Financial Statements.
| 199 / Annual Report March 2022 |
Table of Contents
Total Return Bond Fund
Schedule of Portfolio Investments
March 31, 2022
| Issues | Maturity Date |
Principal Amount |
Value | |||||||
| MORTGAGE-BACKED (continued) |
|
|||||||||
| U.S. Agency Mortgage-Backed (continued) |
|
|||||||||
| Fannie Mae Pool AL8037 |
|
|||||||||
| 4.50% |
07/01/34 | $ | 128,489 | $ | 133,883 | |||||
| Fannie Mae Pool AL8256 |
|
|||||||||
| 3.00% |
08/01/43 | 429,412 | 428,677 | |||||||
| Fannie Mae Pool AL8356 |
|
|||||||||
| 4.50% |
07/01/34 | 301,428 | 313,325 | |||||||
| Fannie Mae Pool AL8960 |
|
|||||||||
| 4.50% |
05/01/46 | 22,071,423 | 23,393,884 | |||||||
| Fannie Mae Pool AL9106 |
|
|||||||||
| 4.50% |
02/01/46 | 27,717,083 | 29,377,818 | |||||||
| Fannie Mae Pool AL9217 |
|
|||||||||
| 3.50% |
10/01/46 | 18,519,666 | 18,840,319 | |||||||
| Fannie Mae Pool AL9472 |
|
|||||||||
| 4.00% |
10/01/43 | 4,563,483 | 4,773,526 | |||||||
| Fannie Mae Pool AL9722 |
|
|||||||||
| 4.50% |
08/01/46 | 87,548,359 | 92,794,026 | |||||||
| Fannie Mae Pool AL9846 |
|
|||||||||
| 4.50% |
02/01/47 | 91,467,089 | 96,947,556 | |||||||
| Fannie Mae Pool AM4869 |
|
|||||||||
| 4.07% |
12/01/25 | 1,711,078 | 1,773,826 | |||||||
| Fannie Mae Pool AM6770 |
|
|||||||||
| 3.77% |
09/01/29 | 157,940 | 166,197 | |||||||
| Fannie Mae Pool AN7981 |
|
|||||||||
| 2.95% |
01/01/28 | 100,000 | 100,829 | |||||||
| Fannie Mae Pool AS8605 |
|
|||||||||
| 3.00% |
01/01/32 | 141,191 | 142,733 | |||||||
| Fannie Mae Pool AS8663 |
|
|||||||||
| 4.50% |
01/01/47 | 17,840,122 | 18,695,595 | |||||||
| Fannie Mae Pool AS9830 |
|
|||||||||
| 4.00% |
06/01/47 | 30,480,995 | 31,362,390 | |||||||
| Fannie Mae Pool AS9972 |
|
|||||||||
| 4.00% |
07/01/47 | 27,050,925 | 27,833,136 | |||||||
| Fannie Mae Pool AT9649 |
|
|||||||||
| 4.00% |
07/01/43 | 147,236 | 153,907 | |||||||
| Fannie Mae Pool AU3739 |
|
|||||||||
| 3.50% |
08/01/43 | 25,494,658 | 25,970,755 | |||||||
| Fannie Mae Pool BD2450 |
|
|||||||||
| 3.50% |
01/01/47 | 49,854 | 50,641 | |||||||
| Fannie Mae Pool BL6060 |
|
|||||||||
| 2.46% |
04/01/40 | 126,370,000 | 114,180,476 | |||||||
| Fannie Mae Pool BM4299 |
|
|||||||||
| 3.00% |
03/01/30 | 26,628,644 | 26,863,696 | |||||||
| Fannie Mae Pool BM4304 |
|
|||||||||
| 3.00% |
02/01/30 | 34,902,198 | 35,193,589 | |||||||
| Fannie Mae Pool BM5164 |
|
|||||||||
| 4.00% |
11/01/48 | 34,143,576 | 35,278,027 | |||||||
| Fannie Mae Pool BM5507 |
|
|||||||||
| 3.00% |
09/01/48 | 6,538,618 | 6,495,561 | |||||||
| Fannie Mae Pool BN4316 |
|
|||||||||
| 4.00% |
01/01/49 | 20,356 | 21,050 | |||||||
| Fannie Mae Pool BQ7006 |
|
|||||||||
| 2.00% |
01/01/52 | 111,757,601 | 103,742,486 | |||||||
| Fannie Mae Pool CA0862 |
|
|||||||||
| 3.50% |
09/01/47 | 2,651,252 | 2,685,861 | |||||||
| Fannie Mae Pool CA0996 |
|
|||||||||
| 3.50% |
01/01/48 | 35,458 | 35,887 | |||||||
| Issues | Maturity Date |
Principal Amount |
Value | |||||||
| MORTGAGE-BACKED (continued) |
|
|||||||||
| U.S. Agency Mortgage-Backed (continued) |
|
|||||||||
| Fannie Mae Pool CA1187 |
|
|||||||||
| 3.50% |
02/01/48 | $ | 44,726,352 | $ | 45,141,070 | |||||
| Fannie Mae Pool CA1191 |
|
|||||||||
| 3.50% |
11/01/47 | 3,027,729 | 3,065,360 | |||||||
| Fannie Mae Pool CA1710 |
|
|||||||||
| 4.50% |
05/01/48 | 102,567 | 106,784 | |||||||
| Fannie Mae Pool CA1711 |
|
|||||||||
| 4.50% |
05/01/48 | 9,919,009 | 10,347,377 | |||||||
| Fannie Mae Pool CA2208 |
|
|||||||||
| 4.50% |
08/01/48 | 23,055,503 | 24,001,921 | |||||||
| Fannie Mae Pool CA2327 |
|
|||||||||
| 4.00% |
09/01/48 | 28,300,175 | 29,355,183 | |||||||
| Fannie Mae Pool CA2493 |
|
|||||||||
| 4.50% |
10/01/48 | 6,507,127 | 6,758,662 | |||||||
| Fannie Mae Pool CA3633 |
|
|||||||||
| 3.50% |
06/01/49 | 21,018,928 | 21,220,028 | |||||||
| Fannie Mae Pool CA4011 |
|
|||||||||
| 3.50% |
08/01/49 | 18,757,929 | 18,624,701 | |||||||
| Fannie Mae Pool CA5689 |
|
|||||||||
| 3.00% |
05/01/50 | 67,324,385 | 66,454,749 | |||||||
| Fannie Mae Pool FM2310 |
|
|||||||||
| 3.00% |
01/01/48 | 10,126,472 | 10,043,158 | |||||||
| Fannie Mae Pool FM2318 |
|
|||||||||
| 3.50% |
09/01/49 | 178,143,291 | 179,898,127 | |||||||
| Fannie Mae Pool FM2388 |
|
|||||||||
| 3.50% |
04/01/48 | 18,430,773 | 18,746,240 | |||||||
| Fannie Mae Pool MA1146 |
|
|||||||||
| 4.00% |
08/01/42 | 22,092,325 | 23,222,595 | |||||||
| Fannie Mae Pool MA1177 |
|
|||||||||
| 3.50% |
09/01/42 | 28,661,705 | 29,451,665 | |||||||
| Fannie Mae Pool MA1404 |
|
|||||||||
| 3.50% |
04/01/43 | 59,900 | 61,234 | |||||||
| Fannie Mae Pool MA1432 |
|
|||||||||
| 3.00% |
05/01/33 | 47,329 | 47,494 | |||||||
| Fannie Mae Pool MA1459 |
|
|||||||||
| 3.00% |
06/01/33 | 22,165 | 22,242 | |||||||
| Fannie Mae Pool MA1527 |
|
|||||||||
| 3.00% |
08/01/33 | 32,651,387 | 32,765,235 | |||||||
| Fannie Mae Pool MA1561 |
|
|||||||||
| 3.00% |
09/01/33 | 20,695,540 | 20,767,701 | |||||||
| Fannie Mae Pool MA1582 |
|
|||||||||
| 3.50% |
09/01/43 | 9,842,440 | 10,061,623 | |||||||
| Fannie Mae Pool MA1584 |
|
|||||||||
| 3.50% |
09/01/33 | 31,611,486 | 32,300,737 | |||||||
| Fannie Mae Pool MA1608 |
|
|||||||||
| 3.50% |
10/01/33 | 22,204,717 | 22,688,864 | |||||||
| Fannie Mae Pool MA1982 |
|
|||||||||
| 3.50% |
08/01/34 | 43,821 | 44,291 | |||||||
| Fannie Mae Pool MA2895 |
|
|||||||||
| 3.00% |
02/01/47 | 45,773 | 45,472 | |||||||
| Fannie Mae Pool MA2960 |
|
|||||||||
| 4.00% |
04/01/47 | 24,445,231 | 25,152,095 | |||||||
| Fannie Mae Pool MA3027 |
|
|||||||||
| 4.00% |
06/01/47 | 17,841,260 | 18,357,162 | |||||||
| Fannie Mae Pool MA3029 |
|
|||||||||
| 3.00% |
06/01/32 | 22,072,640 | 22,350,210 | |||||||
See accompanying Notes to Financial Statements.
| Annual Report March 2022 / 200 |
Table of Contents
Total Return Bond Fund
Schedule of Portfolio Investments
March 31, 2022
| Issues | Maturity Date |
Principal Amount |
Value | |||||||
| MORTGAGE-BACKED (continued) |
|
|||||||||
| U.S. Agency Mortgage-Backed (continued) |
|
|||||||||
| Fannie Mae Pool MA3060 |
|
|||||||||
| 3.00% |
07/01/32 | $ | 9,680 | $ | 9,802 | |||||
| Fannie Mae Pool MA3120 |
|
|||||||||
| 3.50% |
09/01/47 | 1,362,368 | 1,380,152 | |||||||
| Fannie Mae Pool MA3182 |
|
|||||||||
| 3.50% |
11/01/47 | 28,897,259 | 29,226,931 | |||||||
| Fannie Mae Pool MA3210 |
|
|||||||||
| 3.50% |
12/01/47 | 50,014,283 | 50,463,088 | |||||||
| Fannie Mae Pool MA3238 |
|
|||||||||
| 3.50% |
01/01/48 | 43,317,017 | 43,841,859 | |||||||
| Fannie Mae Pool MA3276 |
|
|||||||||
| 3.50% |
02/01/48 | 16,990,734 | 17,148,277 | |||||||
| Fannie Mae Pool MA3305 |
|
|||||||||
| 3.50% |
03/01/48 | 22,950,355 | 23,218,158 | |||||||
| Fannie Mae Pool MA3332 |
|
|||||||||
| 3.50% |
04/01/48 | 62,105,681 | 62,597,065 | |||||||
| Fannie Mae Pool MA3364 |
|
|||||||||
| 3.50% |
05/01/33 | 8,214,501 | 8,423,022 | |||||||
| Fannie Mae Pool MA3537 |
|
|||||||||
| 4.50% |
12/01/48 | 13,712,876 | 14,243,484 | |||||||
| Fannie Mae Pool MA3811 |
|
|||||||||
| 3.00% |
10/01/49 | 6,265,897 | 6,110,963 | |||||||
| Fannie Mae Pool MA3846 |
|
|||||||||
| 3.00% |
11/01/49 | 37,516 | 36,588 | |||||||
| Fannie Mae Pool MA3942 |
|
|||||||||
| 3.00% |
02/01/50 | 13,864,529 | 13,462,308 | |||||||
| Fannie Mae Pool MA3997 |
|
|||||||||
| 3.00% |
04/01/50 | 16,261,616 | 15,789,853 | |||||||
| Fannie Mae Pool MA4093 |
|
|||||||||
| 2.00% |
08/01/40 | 170,437,827 | 160,621,949 | |||||||
| Fannie Mae Pool MA4128 |
|
|||||||||
| 2.00% |
09/01/40 | 141,378,118 | 133,235,276 | |||||||
| Fannie Mae Pool MA4152 |
|
|||||||||
| 2.00% |
10/01/40 | 175,212,075 | 165,122,893 | |||||||
| Fannie Mae Pool MA4176 |
|
|||||||||
| 2.00% |
11/01/40 | 43,661,261 | 41,146,303 | |||||||
| Fannie Mae Pool MA4333 |
|
|||||||||
| 2.00% |
05/01/41 | 80,373,618 | 75,725,568 | |||||||
| Fannie Mae REMICS, |
|
|||||||||
| Series 1992-123, Class Z |
|
|||||||||
| 7.50% |
07/25/22 | 27 | 27 | |||||||
| Fannie Mae REMICS, |
|
|||||||||
| Series 1993-132, Class D (PO) |
|
|||||||||
| 0.00% |
10/25/2211 | 962 | 961 | |||||||
| Fannie Mae REMICS, |
|
|||||||||
| Series 1993-29, Class PK |
|
|||||||||
| 7.00% |
03/25/23 | 169 | 171 | |||||||
| Fannie Mae REMICS, |
|
|||||||||
| Series 1994-55, Class H |
|
|||||||||
| 7.00% |
03/25/24 | 2,365 | 2,448 | |||||||
| Fannie Mae REMICS, |
|
|||||||||
| Series 1997-34, Class SA |
|
|||||||||
| (Cost of Funds for the 11th District of San Francisco * 1.236, 37.68% Cap) |
|
|||||||||
| 1.24% |
10/25/232 | 523 | 583 | |||||||
| Issues | Maturity Date |
Principal Amount |
Value | |||||||
| MORTGAGE-BACKED (continued) |
|
|||||||||
| U.S. Agency Mortgage-Backed (continued) |
|
|||||||||
| Fannie Mae REMICS, |
|
|||||||||
| Series 1998-37, Class VZ |
|
|||||||||
| 6.00% |
06/17/28 | $ | 1,242 | $ | 1,275 | |||||
| Fannie Mae REMICS, |
|
|||||||||
| Series 1999-11, Class Z |
|
|||||||||
| 5.50% |
03/25/29 | 17,668 | 17,805 | |||||||
| Fannie Mae REMICS, |
|
|||||||||
| Series 2001-52, Class YZ |
|
|||||||||
| 6.50% |
10/25/31 | 73,192 | 77,089 | |||||||
| Fannie Mae REMICS, |
|
|||||||||
| Series 2005-117, Class LC |
|
|||||||||
| 5.50% |
11/25/35 | 889,269 | 899,316 | |||||||
| Fannie Mae REMICS, |
|
|||||||||
| Series 2005-122, Class SG (IO) |
|
|||||||||
| (-1.00 X LIBOR USD 1-Month plus 6.60%, 6.60% Cap) |
|
|||||||||
| 6.14% |
11/25/352 | 29,384 | 2,294 | |||||||
| Fannie Mae REMICS, |
|
|||||||||
| Series 2005-92, Class US (IO) |
|
|||||||||
| (-1.00 X LIBOR USD 1-Month plus 6.10%, 6.10% Cap) |
|
|||||||||
| 5.64% |
10/25/252 | 1,440,076 | 62,075 | |||||||
| Fannie Mae REMICS, |
|
|||||||||
| Series 2006-4, Class WE |
|
|||||||||
| 4.50% |
02/25/36 | 29,062 | 30,213 | |||||||
| Fannie Mae REMICS, |
|
|||||||||
| Series 2006-49, Class SE |
|
|||||||||
| (-4.00 X LIBOR USD 1-Month plus 29.00%, 29.00% Cap) |
|
|||||||||
| 27.17% |
04/25/362 | 960,768 | 1,325,017 | |||||||
| Fannie Mae REMICS, |
|
|||||||||
| Series 2007-17, Class SI (IO) |
|
|||||||||
| (-1.00 X LIBOR USD 1-Month plus 6.40%, 6.40% Cap) |
|
|||||||||
| 5.94% |
03/25/372 | 798,267 | 104,711 | |||||||
| Fannie Mae REMICS, |
|
|||||||||
| Series 2007-34, Class SB (IO) |
|
|||||||||
| (-1.00 X LIBOR USD 1-Month plus 6.11%, 6.11% Cap) |
|
|||||||||
| 5.65% |
04/25/372 | 2,051,793 | 279,754 | |||||||
| Fannie Mae REMICS, |
|
|||||||||
| Series 2007-64, Class FA |
|
|||||||||
| (LIBOR USD 1-Month plus 0.47%) |
|
|||||||||
| 0.93% |
07/25/372 | 2,814 | 2,829 | |||||||
| Fannie Mae REMICS, |
|
|||||||||
| Series 2008-24, Class NA |
|
|||||||||
| 6.75% |
06/25/37 | 226,705 | 245,333 | |||||||
| Fannie Mae REMICS, |
|
|||||||||
| Series 2010-116, Class SE (IO) |
|
|||||||||
| (-1.00 X LIBOR USD 1-Month plus 6.60%, 6.60% Cap) |
|
|||||||||
| 6.14% |
10/25/402 | 2,414,437 | 378,366 | |||||||
| Fannie Mae REMICS, |
|
|||||||||
| Series 2010-17, Class SB (IO) |
|
|||||||||
| (-1.00 X LIBOR USD 1-Month plus 6.35%, 6.35% Cap) |
|
|||||||||
| 5.89% |
03/25/402 | 5,034,888 | 823,602 | |||||||
| Fannie Mae REMICS, |
|
|||||||||
| Series 2010-43, Class KS (IO) |
|
|||||||||
| (-1.00 X LIBOR USD 1-Month plus 6.42%, 6.42% Cap) |
|
|||||||||
| 5.96% |
05/25/402 | 8,855,600 | 1,450,639 | |||||||
See accompanying Notes to Financial Statements.
| 201 / Annual Report March 2022 |
Table of Contents
Total Return Bond Fund
Schedule of Portfolio Investments
March 31, 2022
| Issues | Maturity Date |
Principal Amount |
Value | |||||||
| MORTGAGE-BACKED (continued) |
|
|||||||||
| U.S. Agency Mortgage-Backed (continued) |
|
|||||||||
| Fannie Mae REMICS, |
|
|||||||||
| Series 2011-101, Class HE |
|
|||||||||
| 4.00% |
10/25/41 | $ | 10,100,000 | $ | 10,460,567 | |||||
| Fannie Mae REMICS, |
|
|||||||||
| Series 2011-111, Class DB |
|
|||||||||
| 4.00% |
11/25/41 | 8,746,042 | 9,030,065 | |||||||
| Fannie Mae REMICS, |
|
|||||||||
| Series 2012-84, Class VZ |
|
|||||||||
| 3.50% |
08/25/42 | 7,727,278 | 7,828,961 | |||||||
| Fannie Mae REMICS, |
|
|||||||||
| Series 2013-101, Class BO (PO) |
|
|||||||||
| 0.00% |
10/25/4311 | 11,077,587 | 9,009,120 | |||||||
| Fannie Mae REMICS, |
|
|||||||||
| Series 2013-101, Class CO (PO) |
|
|||||||||
| 0.00% |
10/25/4311 | 6,710,098 | 5,845,586 | |||||||
| Fannie Mae REMICS, |
|
|||||||||
| Series 2016-45, Class AF |
|
|||||||||
| (LIBOR USD 1-Month plus 0.50%) |
|
|||||||||
| 0.96% |
07/25/462 | 8,381,407 | 8,419,378 | |||||||
| Fannie Mae REMICS, |
|
|||||||||
| Series 2016-72, Class FA |
|
|||||||||
| (LIBOR USD 1-Month plus 0.50%) |
|
|||||||||
| 0.96% |
10/25/462 | 17,147,503 | 17,236,820 | |||||||
| Fannie Mae REMICS, |
|
|||||||||
| Series 2016-74, Class GF |
|
|||||||||
| (LIBOR USD 1-Month plus 0.50%) |
|
|||||||||
| 0.96% |
10/25/462 | 13,666,230 | 13,771,362 | |||||||
| Fannie Mae REMICS, |
|
|||||||||
| Series 2016-75, Class FL |
|
|||||||||
| (LIBOR USD 1-Month plus 0.50%) |
|
|||||||||
| 0.96% |
10/25/462 | 13,495,263 | 13,598,717 | |||||||
| Fannie Mae REMICS, |
|
|||||||||
| Series 2018-29, Class AP |
|
|||||||||
| 3.50% |
11/25/46 | 41,467,299 | 41,958,846 | |||||||
| Fannie Mae REMICS, |
|
|||||||||
| Series 2018-38, Class LA |
|
|||||||||
| 3.00% |
06/25/48 | 17,149,930 | 17,097,032 | |||||||
| Fannie Mae REMICS, |
|
|||||||||
| Series 2018-38, Class PA |
|
|||||||||
| 3.50% |
06/25/47 | 27,066 | 27,373 | |||||||
| Fannie Mae REMICS, |
|
|||||||||
| Series 2018-45, Class GA |
|
|||||||||
| 3.00% |
06/25/48 | 19,271,608 | 19,024,187 | |||||||
| Fannie Mae REMICS, |
|
|||||||||
| Series 2018-55, Class PA |
|
|||||||||
| 3.50% |
01/25/47 | 13,237,768 | 13,388,611 | |||||||
| Fannie Mae REMICS, |
|
|||||||||
| Series 2018-57, Class QA |
|
|||||||||
| 3.50% |
05/25/46 | 38,651 | 38,956 | |||||||
| Fannie Mae REMICS, |
|
|||||||||
| Series 2018-86, Class JA |
|
|||||||||
| 4.00% |
05/25/47 | 1,038,026 | 1,044,990 | |||||||
| Fannie Mae REMICS, |
|
|||||||||
| Series 2018-94, Class KD |
|
|||||||||
| 3.50% |
12/25/48 | 4,463,884 | 4,384,021 | |||||||
| Issues | Maturity Date |
Principal Amount |
Value | |||||||
| MORTGAGE-BACKED (continued) |
|
|||||||||
| U.S. Agency Mortgage-Backed (continued) |
|
|||||||||
| Fannie Mae REMICS, |
|
|||||||||
| Series 2019-1, Class AB |
|
|||||||||
| 3.50% |
02/25/49 | $ | 1,641,160 | $ | 1,636,960 | |||||
| Fannie Mae REMICS, |
|
|||||||||
| Series 2019-1, Class KP |
|
|||||||||
| 3.25% |
02/25/49 | 1,779,544 | 1,784,878 | |||||||
| Fannie Mae REMICS, |
|
|||||||||
| Series 2019-26, Class JE |
|
|||||||||
| 3.00% |
06/25/49 | 5,365,599 | 5,300,474 | |||||||
| Fannie Mae REMICS, |
|
|||||||||
| Series 2019-45, Class PA |
|
|||||||||
| 3.00% |
08/25/49 | 19,485,745 | 19,288,900 | |||||||
| Fannie Mae REMICS, |
|
|||||||||
| Series 2019-52, Class PA |
|
|||||||||
| 3.00% |
09/25/49 | 5,399,540 | 5,343,752 | |||||||
| Fannie Mae REMICS, |
|
|||||||||
| Series 2019-67, Class FE |
|
|||||||||
| (LIBOR USD 1-Month plus 0.45%) |
|
|||||||||
| 0.91% |
11/25/492 | 33,703,457 | 33,746,287 | |||||||
| Fannie Mae REMICS, |
|
|||||||||
| Series 2019-79, Class FA |
|
|||||||||
| (LIBOR USD 1-Month plus 0.50%) |
|
|||||||||
| 0.96% |
01/25/502 | 88,550 | 89,116 | |||||||
| Fannie Mae REMICS, |
|
|||||||||
| Series G92-36, Class Z |
|
|||||||||
| 7.00% |
07/25/22 | 1 | 1 | |||||||
| Fannie Mae REMICS, |
|
|||||||||
| Series G93-21, Class Z |
|
|||||||||
| 7.20% |
05/25/23 | 309 | 315 | |||||||
| Fannie Mae Trust, |
|
|||||||||
| Series 2003-W2, Class 2A9 |
|
|||||||||
| 5.90% |
07/25/42 | 18,976 | 20,356 | |||||||
| Freddie Mac Gold Pool A24156 |
|
|||||||||
| 6.50% |
10/01/31 | 84,506 | 90,875 | |||||||
| Freddie Mac Gold Pool A25162 |
|
|||||||||
| 5.50% |
05/01/34 | 979,083 | 1,054,212 | |||||||
| Freddie Mac Gold Pool A39012 |
|
|||||||||
| 5.50% |
06/01/35 | 24,872 | 26,922 | |||||||
| Freddie Mac Gold Pool A54856 |
|
|||||||||
| 5.00% |
01/01/34 | 2,214,567 | 2,396,392 | |||||||
| Freddie Mac Gold Pool A61164 |
|
|||||||||
| 5.00% |
04/01/36 | 7,042 | 7,462 | |||||||
| Freddie Mac Gold Pool A97038 |
|
|||||||||
| 4.00% |
02/01/41 | 6,892,915 | 7,133,520 | |||||||
| Freddie Mac Gold Pool C01492 |
|
|||||||||
| 5.00% |
02/01/33 | 321,919 | 340,201 | |||||||
| Freddie Mac Gold Pool C04546 |
|
|||||||||
| 3.00% |
02/01/43 | 12,199,784 | 12,198,014 | |||||||
| Freddie Mac Gold Pool C04573 |
|
|||||||||
| 3.00% |
03/01/43 | 15,336,881 | 15,326,749 | |||||||
| Freddie Mac Gold Pool C46104 |
|
|||||||||
| 6.50% |
09/01/29 | 7,714 | 8,295 | |||||||
| Freddie Mac Gold Pool C55789 |
|
|||||||||
| 7.50% |
10/01/27 | 3,165 | 3,336 | |||||||
| Freddie Mac Gold Pool C90573 |
|
|||||||||
| 6.50% |
08/01/22 | 1,450 | 1,460 | |||||||
See accompanying Notes to Financial Statements.
| Annual Report March 2022 / 202 |
Table of Contents
Total Return Bond Fund
Schedule of Portfolio Investments
March 31, 2022
| Issues |
Maturity Date |
Principal Amount |
Value | |||||||
| MORTGAGE-BACKED (continued) |
|
|||||||||
| U.S. Agency Mortgage-Backed (continued) |
|
|||||||||
| Freddie Mac Gold Pool E02402 |
|
|||||||||
| 6.00% |
10/01/22 | $ | 620 | $ | 624 | |||||
| Freddie Mac Gold Pool G00992 |
| |||||||||
| 7.00% |
11/01/28 | 397 | 425 | |||||||
| Freddie Mac Gold Pool G01515 |
| |||||||||
| 5.00% |
02/01/33 | 354,110 | 373,709 | |||||||
| Freddie Mac Gold Pool G02579 |
| |||||||||
| 5.00% |
12/01/34 | 541,157 | 586,098 | |||||||
| Freddie Mac Gold Pool G02884 |
| |||||||||
| 6.00% |
04/01/37 | 1,431,251 | 1,575,857 | |||||||
| Freddie Mac Gold Pool G02955 |
| |||||||||
| 5.50% |
03/01/37 | 2,198,160 | 2,401,111 | |||||||
| Freddie Mac Gold Pool G03357 |
| |||||||||
| 5.50% |
08/01/37 | 721,821 | 785,261 | |||||||
| Freddie Mac Gold Pool G03676 |
| |||||||||
| 5.50% |
12/01/37 | 1,329,585 | 1,459,139 | |||||||
| Freddie Mac Gold Pool G03783 |
| |||||||||
| 5.50% |
01/01/38 | 1,122,215 | 1,231,185 | |||||||
| Freddie Mac Gold Pool G03985 |
| |||||||||
| 6.00% |
03/01/38 | 10,115 | 11,231 | |||||||
| Freddie Mac Gold Pool G04438 |
| |||||||||
| 5.50% |
05/01/38 | 3,213,924 | 3,525,880 | |||||||
| Freddie Mac Gold Pool G04703 |
| |||||||||
| 5.50% |
08/01/38 | 2,334,191 | 2,559,036 | |||||||
| Freddie Mac Gold Pool G04706 |
| |||||||||
| 5.50% |
09/01/38 | 103,606 | 113,724 | |||||||
| Freddie Mac Gold Pool G05866 |
| |||||||||
| 4.50% |
02/01/40 | 10,253,568 | 10,926,980 | |||||||
| Freddie Mac Gold Pool G06361 |
| |||||||||
| 4.00% |
03/01/41 | 14,083 | 14,754 | |||||||
| Freddie Mac Gold Pool G06498 |
| |||||||||
| 4.00% |
04/01/41 | 13,463,066 | 14,102,104 | |||||||
| Freddie Mac Gold Pool G06499 |
| |||||||||
| 4.00% |
03/01/41 | 5,681,479 | 5,929,061 | |||||||
| Freddie Mac Gold Pool G07408 |
| |||||||||
| 3.50% |
06/01/43 | 14,411,923 | 14,743,713 | |||||||
| Freddie Mac Gold Pool G07786 |
| |||||||||
| 4.00% |
08/01/44 | 111,153,682 | 116,184,885 | |||||||
| Freddie Mac Gold Pool G07848 |
| |||||||||
| 3.50% |
04/01/44 | 68,286,428 | 69,956,032 | |||||||
| Freddie Mac Gold Pool G07849 |
| |||||||||
| 3.50% |
05/01/44 | 8,953,354 | 9,172,264 | |||||||
| Freddie Mac Gold Pool G07924 |
| |||||||||
| 3.50% |
01/01/45 | 10,163,123 | 10,367,147 | |||||||
| Freddie Mac Gold Pool G07925 |
| |||||||||
| 4.00% |
02/01/45 | 7,297,450 | 7,612,429 | |||||||
| Freddie Mac Gold Pool G08676 |
| |||||||||
| 3.50% |
11/01/45 | 24,136,307 | 24,585,808 | |||||||
| Freddie Mac Gold Pool G08681 |
| |||||||||
| 3.50% |
12/01/45 | 16,334,859 | 16,639,070 | |||||||
| Freddie Mac Gold Pool G08698 |
| |||||||||
| 3.50% |
03/01/46 | 837 | 851 | |||||||
| Freddie Mac Gold Pool G08710 |
| |||||||||
| 3.00% |
06/01/46 | 96,442,790 | 95,877,209 | |||||||
| Freddie Mac Gold Pool G08711 |
| |||||||||
| 3.50% |
06/01/46 | 6,953,237 | 7,053,134 | |||||||
| Issues | Maturity Date |
Principal Amount |
Value | |||||||
| MORTGAGE-BACKED (continued) |
|
|||||||||
| U.S. Agency Mortgage-Backed (continued) |
|
|||||||||
| Freddie Mac Gold Pool G08715 |
| |||||||||
| 3.00% |
08/01/46 | $ | 130,337,000 | $ | 129,572,649 | |||||
| Freddie Mac Gold Pool G08721 |
| |||||||||
| 3.00% |
09/01/46 | 13,283,592 | 13,205,691 | |||||||
| Freddie Mac Gold Pool G08722 |
| |||||||||
| 3.50% |
09/01/46 | 31,335,120 | 31,785,312 | |||||||
| Freddie Mac Gold Pool G08726 |
| |||||||||
| 3.00% |
10/01/46 | 141,391,332 | 140,562,154 | |||||||
| Freddie Mac Gold Pool G08727 |
| |||||||||
| 3.50% |
10/01/46 | 27,204,142 | 27,594,984 | |||||||
| Freddie Mac Gold Pool G08732 |
| |||||||||
| 3.00% |
11/01/46 | 86,828,904 | 86,319,703 | |||||||
| Freddie Mac Gold Pool G08741 |
| |||||||||
| 3.00% |
01/01/47 | 55,013,706 | 54,691,083 | |||||||
| Freddie Mac Gold Pool G08742 |
| |||||||||
| 3.50% |
01/01/47 | 43,604,919 | 44,231,391 | |||||||
| Freddie Mac Gold Pool G08747 |
| |||||||||
| 3.00% |
02/01/47 | 19,417,770 | 19,303,896 | |||||||
| Freddie Mac Gold Pool G08757 |
| |||||||||
| 3.50% |
04/01/47 | 16,011,922 | 16,248,298 | |||||||
| Freddie Mac Gold Pool G08758 |
| |||||||||
| 4.00% |
04/01/47 | 12,529 | 12,984 | |||||||
| Freddie Mac Gold Pool G08762 |
| |||||||||
| 4.00% |
05/01/47 | 12,692,501 | 13,123,642 | |||||||
| Freddie Mac Gold Pool G08779 |
| |||||||||
| 3.50% |
09/01/47 | 62,671 | 63,224 | |||||||
| Freddie Mac Gold Pool G08784 |
| |||||||||
| 3.50% |
10/01/47 | 54,589 | 55,137 | |||||||
| Freddie Mac Gold Pool G08792 |
| |||||||||
| 3.50% |
12/01/47 | 46,823 | 47,293 | |||||||
| Freddie Mac Gold Pool G08826 |
| |||||||||
| 5.00% |
06/01/48 | 9,943,786 | 10,468,413 | |||||||
| Freddie Mac Gold Pool G08833 |
|
|||||||||
| 5.00% |
07/01/48 | 6,209,390 | 6,536,993 | |||||||
| Freddie Mac Gold Pool G08838 |
| |||||||||
| 5.00% |
09/01/48 | 3,305,479 | 3,500,614 | |||||||
| Freddie Mac Gold Pool G08840 |
| |||||||||
| 5.00% |
08/01/48 | 931,252 | 982,656 | |||||||
| Freddie Mac Gold Pool G08843 |
| |||||||||
| 4.50% |
10/01/48 | 7,234,503 | 7,540,575 | |||||||
| Freddie Mac Gold Pool G08844 |
| |||||||||
| 5.00% |
10/01/48 | 8,615,226 | 9,069,759 | |||||||
| Freddie Mac Gold Pool G08848 |
| |||||||||
| 4.50% |
11/01/48 | 1,341,315 | 1,397,408 | |||||||
| Freddie Mac Gold Pool G08849 |
| |||||||||
| 5.00% |
11/01/48 | 3,427,001 | 3,627,728 | |||||||
| Freddie Mac Gold Pool G12824 |
| |||||||||
| 6.00% |
08/01/22 | 18,369 | 18,446 | |||||||
| Freddie Mac Gold Pool G12909 |
| |||||||||
| 6.00% |
11/01/22 | 107,226 | 108,305 | |||||||
| Freddie Mac Gold Pool G13032 |
| |||||||||
| 6.00% |
09/01/22 | 280 | 281 | |||||||
| Freddie Mac Gold Pool G16085 |
| |||||||||
| 2.50% |
02/01/32 | 3,092,787 | 3,067,365 | |||||||
| Freddie Mac Gold Pool G16502 |
| |||||||||
| 3.50% |
05/01/33 | 57,321 | 58,819 | |||||||
See accompanying Notes to Financial Statements.
| 203 / Annual Report March 2022 |
Table of Contents
Total Return Bond Fund
Schedule of Portfolio Investments
March 31, 2022
| Issues |
Maturity Date |
Principal Amount |
Value | |||||||
| MORTGAGE-BACKED (continued) |
|
|||||||||
| U.S. Agency Mortgage-Backed (continued) |
|
|||||||||
| Freddie Mac Gold Pool G16524 |
| |||||||||
| 3.50% |
05/01/33 | $ | 21,419,870 | $ | 22,017,650 | |||||
| Freddie Mac Gold Pool G16584 |
| |||||||||
| 3.50% |
08/01/33 | 3,167,765 | 3,250,564 | |||||||
| Freddie Mac Gold Pool G16607 |
| |||||||||
| 3.50% |
09/01/33 | 32,216,846 | 33,150,198 | |||||||
| Freddie Mac Gold Pool G16623 |
| |||||||||
| 2.50% |
09/01/32 | 24,532,436 | 24,324,443 | |||||||
| Freddie Mac Gold Pool G16755 |
| |||||||||
| 3.50% |
02/01/34 | 30,400,660 | 31,291,491 | |||||||
| Freddie Mac Gold Pool G16756 |
|
|||||||||
| 3.50% |
01/01/34 | 2,961,802 | 3,047,608 | |||||||
| Freddie Mac Gold Pool G18592 |
| |||||||||
| 3.00% |
03/01/31 | 21,854 | 22,124 | |||||||
| Freddie Mac Gold Pool G18596 |
| |||||||||
| 3.00% |
04/01/31 | 25,330,449 | 25,705,188 | |||||||
| Freddie Mac Gold Pool G18691 |
| |||||||||
| 3.00% |
06/01/33 | 9,153,918 | 9,259,824 | |||||||
| Freddie Mac Gold Pool G18692 |
| |||||||||
| 3.50% |
06/01/33 | 12,740,475 | 13,097,022 | |||||||
| Freddie Mac Gold Pool G18713 |
| |||||||||
| 3.50% |
11/01/33 | 14,935,825 | 15,287,495 | |||||||
| Freddie Mac Gold Pool G18716 |
| |||||||||
| 3.50% |
12/01/33 | 43,978 | 45,202 | |||||||
| Freddie Mac Gold Pool G60023 |
| |||||||||
| 3.50% |
04/01/45 | 10,808,715 | 11,039,211 | |||||||
| Freddie Mac Gold Pool G60080 |
| |||||||||
| 3.50% |
06/01/45 | 111,614,216 | 113,750,233 | |||||||
| Freddie Mac Gold Pool G60138 |
| |||||||||
| 3.50% |
08/01/45 | 90,119,554 | 92,041,353 | |||||||
| Freddie Mac Gold Pool G60238 |
| |||||||||
| 3.50% |
10/01/45 | 34,574,710 | 35,225,579 | |||||||
| Freddie Mac Gold Pool G60344 |
| |||||||||
| 4.00% |
12/01/45 | 84,169 | 87,518 | |||||||
| Freddie Mac Gold Pool G67700 |
| |||||||||
| 3.50% |
08/01/46 | 26,186,046 | 26,629,899 | |||||||
| Freddie Mac Gold Pool G67703 |
| |||||||||
| 3.50% |
04/01/47 | 265,607,114 | 270,109,155 | |||||||
| Freddie Mac Gold Pool G67706 |
| |||||||||
| 3.50% |
12/01/47 | 133,821,082 | 136,047,531 | |||||||
| Freddie Mac Gold Pool G67707 |
| |||||||||
| 3.50% |
01/01/48 | 345,338,817 | 351,364,562 | |||||||
| Freddie Mac Gold Pool G67708 |
| |||||||||
| 3.50% |
03/01/48 | 303,070,900 | 306,500,102 | |||||||
| Freddie Mac Gold Pool G67709 |
| |||||||||
| 3.50% |
03/01/48 | 226,819,561 | 229,789,400 | |||||||
| Freddie Mac Gold Pool G67710 |
| |||||||||
| 3.50% |
03/01/48 | 190,549,661 | 192,473,159 | |||||||
| Freddie Mac Gold Pool G67711 |
| |||||||||
| 4.00% |
03/01/48 | 57,140,871 | 59,207,616 | |||||||
| Freddie Mac Gold Pool G67713 |
| |||||||||
| 4.00% |
06/01/48 | 507,572 | 525,957 | |||||||
| Freddie Mac Gold Pool G67714 |
| |||||||||
| 4.00% |
07/01/48 | 84,880 | 87,859 | |||||||
| Freddie Mac Gold Pool G67717 |
| |||||||||
| 4.00% |
11/01/48 | 70,352,890 | 72,822,560 | |||||||
| Issues |
Maturity Date |
Principal Amount |
Value | |||||||
| MORTGAGE-BACKED (continued) |
|
|||||||||
| U.S. Agency Mortgage-Backed (continued) |
|
|||||||||
| Freddie Mac Gold Pool H00790 |
| |||||||||
| 5.50% |
05/01/37 | $ | 4,233 | $ | 4,562 | |||||
| Freddie Mac Gold Pool H05069 |
| |||||||||
| 5.50% |
05/01/37 | 121,835 | 131,270 | |||||||
| Freddie Mac Gold Pool Q05804 |
| |||||||||
| 4.00% |
01/01/42 | 24,353,886 | 25,617,492 | |||||||
| Freddie Mac Gold Pool U99097 |
| |||||||||
| 3.50% |
07/01/43 | 34,020,044 | 35,006,460 | |||||||
| Freddie Mac Gold Pool V62078 |
| |||||||||
| 3.50% |
08/01/33 | 3,180,018 | 3,279,135 | |||||||
| Freddie Mac Gold Pool V62129 |
| |||||||||
| 3.50% |
08/01/33 | 7,811,042 | 8,030,476 | |||||||
| Freddie Mac Gold Pool V80356 |
| |||||||||
| 3.50% |
08/01/43 | 24,034,495 | 24,542,709 | |||||||
| Freddie Mac Pool RB5077 |
| |||||||||
| 2.00% |
10/01/40 | 105,725,592 | 99,638,800 | |||||||
| Freddie Mac Pool RE6029 |
| |||||||||
| 3.00% |
02/01/50 | 4,585,542 | 4,452,511 | |||||||
| Freddie Mac Pool SD7502 |
| |||||||||
| 3.50% |
07/01/49 | 8,400,811 | 8,463,167 | |||||||
| Freddie Mac Pool SD7503 |
| |||||||||
| 3.50% |
08/01/49 | 18,568,834 | 18,751,750 | |||||||
| Freddie Mac Pool SD7511 |
| |||||||||
| 3.50% |
01/01/50 | 18,741,813 | 18,926,433 | |||||||
| Freddie Mac Pool ZA5103 |
| |||||||||
| 3.50% |
12/01/47 | 152,004 | 153,414 | |||||||
| Freddie Mac Pool ZA5128 |
| |||||||||
| 3.50% |
12/01/47 | 428,692 | 434,020 | |||||||
| Freddie Mac Pool ZM1779 |
| |||||||||
| 3.00% |
09/01/46 | 14,381,588 | 14,287,026 | |||||||
| Freddie Mac Pool ZM2285 |
| |||||||||
| 3.00% |
12/01/46 | 16,727,484 | 16,617,498 | |||||||
| Freddie Mac Pool ZS4693 |
| |||||||||
| 3.00% |
12/01/46 | 16,741,074 | 16,630,999 | |||||||
| Freddie Mac Pool ZS4768 |
| |||||||||
| 3.50% |
05/01/48 | 1,195,945 | 1,205,203 | |||||||
| Freddie Mac Pool ZT0277 |
| |||||||||
| 3.50% |
10/01/46 | 1,837,910 | 1,866,497 | |||||||
| Freddie Mac Pool ZT1403 |
| |||||||||
| 3.50% |
11/01/33 | 17,625,061 | 18,066,954 | |||||||
| Freddie Mac REMICS, |
| |||||||||
| Series 1980, Class Z |
| |||||||||
| 7.00% |
07/15/27 | 37,602 | 40,553 | |||||||
| Freddie Mac REMICS, |
| |||||||||
| Series 1983, Class Z |
| |||||||||
| 6.50% |
12/15/23 | 7,347 | 7,632 | |||||||
| Freddie Mac REMICS, |
| |||||||||
| Series 2098, Class TZ |
| |||||||||
| 6.00% |
01/15/28 | 162,253 | 171,137 | |||||||
| Freddie Mac REMICS, |
| |||||||||
| Series 2174, Class PN |
| |||||||||
| 6.00% |
07/15/29 | 8,943 | 9,496 | |||||||
| Freddie Mac REMICS, |
| |||||||||
| Series 2313, Class LA |
| |||||||||
| 6.50% |
05/15/31 | 4,262 | 4,605 | |||||||
See accompanying Notes to Financial Statements.
| Annual Report March 2022 / 204 |
Table of Contents
Total Return Bond Fund
Schedule of Portfolio Investments
March 31, 2022
| Issues |
Maturity Date |
Principal Amount |
Value | |||||||
| MORTGAGE-BACKED (continued) |
|
|||||||||
| U.S. Agency Mortgage-Backed (continued) |
|
|||||||||
| Freddie Mac REMICS, |
|
|||||||||
| Series 2433, Class SA |
|
|||||||||
| (-2.60 X LIBOR USD 1-Month plus 20.93%, 20.93% Cap) |
|
|||||||||
| 19.90% |
02/15/322 | $ | 5,194 | $ | 6,988 | |||||
| Freddie Mac REMICS, |
|
|||||||||
| Series 2481, Class AW |
|
|||||||||
| 6.50% |
08/15/32 | 15,668 | 16,490 | |||||||
| Freddie Mac REMICS, |
|
|||||||||
| Series 3019, Class SW (IO) |
|
|||||||||
| (-1.00 X LIBOR USD 1-Month plus 7.20%, 7.20% Cap) |
|
|||||||||
| 6.80% |
08/15/352 | 761,506 | 150,703 | |||||||
| Freddie Mac REMICS, |
|
|||||||||
| Series 3063, Class YG |
|
|||||||||
| 5.50% |
11/15/35 | 1,949,528 | 2,082,333 | |||||||
| Freddie Mac REMICS, |
|
|||||||||
| Series 3300, Class SA (IO) |
|
|||||||||
| (-1.00 X LIBOR USD 1-Month plus 7.20%, 7.20% Cap) |
|
|||||||||
| 6.80% |
08/15/352 | 336,679 | 49,967 | |||||||
| Freddie Mac REMICS, |
|
|||||||||
| Series 3752, Class XL |
|
|||||||||
| 4.50% |
11/15/40 | 32,633,325 | 33,987,083 | |||||||
| Freddie Mac REMICS, |
|
|||||||||
| Series 3891, Class HS (IO) |
|
|||||||||
| (-1.00 X LIBOR USD 1-Month plus 5.95%, 5.95% Cap) |
|
|||||||||
| 5.55% |
07/15/412 | 4,051,809 | 288,588 | |||||||
| Freddie Mac REMICS, |
|
|||||||||
| Series 3904, Class JB |
|
|||||||||
| 4.50% |
08/15/41 | 7,828,088 | 8,265,762 | |||||||
| Freddie Mac REMICS, |
|
|||||||||
| Series 3925, Class LB |
|
|||||||||
| 4.50% |
09/15/41 | 9,215,000 | 10,070,034 | |||||||
| Freddie Mac REMICS, |
|
|||||||||
| Series 3928, Class JD |
|
|||||||||
| 4.00% |
09/15/41 | 24,023,941 | 24,571,005 | |||||||
| Freddie Mac REMICS, |
|
|||||||||
| Series 4102, Class TC |
|
|||||||||
| 2.50% |
09/15/41 | 8,577,738 | 8,554,603 | |||||||
| Freddie Mac REMICS, |
|
|||||||||
| Series 4161, Class BA |
|
|||||||||
| 2.50% |
12/15/41 | 13,410,965 | 13,363,179 | |||||||
| Freddie Mac REMICS, |
|
|||||||||
| Series 4656, Class EZ |
|
|||||||||
| 4.00% |
02/15/47 | 189,885 | 199,521 | |||||||
| Freddie Mac REMICS, |
|
|||||||||
| Series 4818, Class CA |
|
|||||||||
| 3.00% |
04/15/48 | 1,439,839 | 1,413,104 | |||||||
| Freddie Mac REMICS, |
|
|||||||||
| Series 4846, Class PA |
|
|||||||||
| 4.00% |
06/15/47 | 306,368 | 311,133 | |||||||
| Freddie Mac REMICS, |
|
|||||||||
| Series 4852, Class CA |
|
|||||||||
| 4.00% |
11/15/47 | 12,610,369 | 12,660,291 | |||||||
| Freddie Mac REMICS, |
|
|||||||||
| Series 4860, Class BH |
|
|||||||||
| 3.50% |
10/15/48 | 3,260,867 | 3,291,725 | |||||||
| Issues |
Maturity Date |
Principal Amount |
Value | |||||||
| MORTGAGE-BACKED (continued) |
| |||||||||
| U.S. Agency Mortgage-Backed (continued) |
| |||||||||
| Freddie Mac REMICS, |
| |||||||||
| Series 4860, Class PA |
| |||||||||
| 3.50% |
02/15/49 | $ | 3,132,428 | $ | 3,143,322 | |||||
| Freddie Mac REMICS, |
| |||||||||
| Series 4879, Class BC |
| |||||||||
| 3.00% |
04/15/49 | 826,497 | 851,670 | |||||||
| Freddie Mac REMICS, |
| |||||||||
| Series 4896, Class DA |
| |||||||||
| 3.00% |
01/15/49 | 1,217,133 | 1,211,996 | |||||||
| Freddie Mac REMICS, |
| |||||||||
| Series 4937, Class MF |
| |||||||||
| (LIBOR USD 1-Month plus 0.45%) |
| |||||||||
| 0.91% |
12/25/492 | 6,886,075 | 6,931,127 | |||||||
| Freddie Mac Strips, |
| |||||||||
| Series 309, Class PO (PO) |
| |||||||||
| 0.00% |
08/15/4311 | 14,520,517 | 11,649,318 | |||||||
| Freddie Mac Strips, |
| |||||||||
| Series 319, Class F2 |
| |||||||||
| (LIBOR USD 1-Month plus 0.50%) |
| |||||||||
| 0.90% |
11/15/432 | 2,405,601 | 2,415,057 | |||||||
| Ginnie Mae (TBA) |
| |||||||||
| 2.00% |
04/20/52 | 407,350,000 | 387,481,679 | |||||||
| 2.50% |
04/20/52 | 1,119,400,000 | 1,085,213,916 | |||||||
| Ginnie Mae I Pool 782817 |
| |||||||||
| 4.50% |
11/15/39 | 10,774,785 | 11,660,025 | |||||||
| Ginnie Mae I Pool AA5452 |
| |||||||||
| 3.50% |
07/15/42 | 90,098 | 91,708 | |||||||
| Ginnie Mae II Pool 2631 |
| |||||||||
| 7.00% |
08/20/28 | 1,086 | 1,165 | |||||||
| Ginnie Mae II Pool 3388 |
| |||||||||
| 4.50% |
05/20/33 | 2,349 | 2,480 | |||||||
| Ginnie Mae II Pool 3427 |
| |||||||||
| 4.50% |
08/20/33 | 1,003 | 1,069 | |||||||
| Ginnie Mae II Pool 3554 |
| |||||||||
| 4.50% |
05/20/34 | 927 | 987 | |||||||
| Ginnie Mae II Pool 4058 |
| |||||||||
| 5.00% |
12/20/37 | 470 | 524 | |||||||
| Ginnie Mae II Pool 4342 |
| |||||||||
| 5.00% |
01/20/39 | 773 | 841 | |||||||
| Ginnie Mae II Pool 4520 |
| |||||||||
| 5.00% |
08/20/39 | 14,090 | 15,355 | |||||||
| Ginnie Mae II Pool 5140 |
| |||||||||
| 4.50% |
08/20/41 | 30,439 | 32,429 | |||||||
| Ginnie Mae II Pool 5175 |
| |||||||||
| 4.50% |
09/20/41 | 33,329 | 35,538 | |||||||
| Ginnie Mae II Pool 5281 |
| |||||||||
| 4.50% |
01/20/42 | 9,469 | 10,087 | |||||||
| Ginnie Mae II Pool 783591 |
| |||||||||
| 4.50% |
07/20/41 | 11,903 | 12,681 | |||||||
| Ginnie Mae II Pool 80968 |
| |||||||||
| (US Treasury Yield Curve Rate T Note Constant Maturity 1-Year plus 1.50%) |
|
|||||||||
| 1.63% |
07/20/342 | 7,998 | 8,200 | |||||||
See accompanying Notes to Financial Statements.
| 205 / Annual Report March 2022 |
Table of Contents
Total Return Bond Fund
Schedule of Portfolio Investments
March 31, 2022
| Issues |
Maturity Date |
Principal Amount |
Value | |||||||
| MORTGAGE-BACKED (continued) |
| |||||||||
| U.S. Agency Mortgage-Backed (continued) |
| |||||||||
| Ginnie Mae II Pool 81267 |
| |||||||||
| (US Treasury Yield Curve Rate T Note Constant Maturity 1-Year plus 1.50%) |
|
|||||||||
| 2.00% |
03/20/352 | $ | 10,255 | $ | 10,361 | |||||
| Ginnie Mae II Pool 81432 |
| |||||||||
| (US Treasury Yield Curve Rate T Note Constant Maturity 1-Year plus 1.50%) |
|
|||||||||
| 1.63% |
08/20/352 | 14,812 | 15,250 | |||||||
| Ginnie Mae II Pool 81497 |
| |||||||||
| (US Treasury Yield Curve Rate T Note Constant Maturity 1-Year plus 1.50%) |
|
|||||||||
| 1.75% |
10/20/352 | 11,876 | 12,202 | |||||||
| Ginnie Mae II Pool 8631 |
| |||||||||
| (US Treasury Yield Curve Rate T Note Constant Maturity 1-Year plus 1.50%) |
|
|||||||||
| 2.00% |
05/20/252 | 1,686 | 1,712 | |||||||
| Ginnie Mae II Pool 8644 |
| |||||||||
| (US Treasury Yield Curve Rate T Note Constant Maturity 1-Year plus 1.50%) |
|
|||||||||
| 2.50% |
06/20/252 | 2,082 | 2,085 | |||||||
| Ginnie Mae II Pool MA0627 |
| |||||||||
| 4.50% |
12/20/42 | 38,794 | 41,518 | |||||||
| Ginnie Mae II Pool MA0701 |
| |||||||||
| 4.50% |
01/20/43 | 37,739 | 40,205 | |||||||
| Ginnie Mae II Pool MA1157 |
| |||||||||
| 3.50% |
07/20/43 | 36,076 | 36,939 | |||||||
| Ginnie Mae II Pool MA1997 |
| |||||||||
| 4.50% |
06/20/44 | 9,763 | 10,497 | |||||||
| Ginnie Mae II Pool MA2374 |
| |||||||||
| 5.00% |
11/20/44 | 215,995 | 232,134 | |||||||
| Ginnie Mae II Pool MA2756 |
| |||||||||
| 4.50% |
04/20/45 | 20,580 | 22,076 | |||||||
| Ginnie Mae II Pool MA2828 |
| |||||||||
| 4.50% |
05/20/45 | 854,608 | 912,414 | |||||||
| Ginnie Mae II Pool MA2894 |
| |||||||||
| 4.50% |
06/20/45 | 337,883 | 361,562 | |||||||
| Ginnie Mae II Pool MA3036 |
| |||||||||
| 4.50% |
08/20/45 | 33,102 | 35,342 | |||||||
| Ginnie Mae II Pool MA3309 |
| |||||||||
| 3.00% |
12/20/45 | 6,553 | 6,554 | |||||||
| Ginnie Mae II Pool MA3456 |
| |||||||||
| 4.50% |
02/20/46 | 219,759 | 234,616 | |||||||
| Ginnie Mae II Pool MA3521 |
| |||||||||
| 3.50% |
03/20/46 | 25,177,521 | 25,741,790 | |||||||
| Ginnie Mae II Pool MA3524 |
| |||||||||
| 5.00% |
03/20/46 | 10,956 | 12,014 | |||||||
| Ginnie Mae II Pool MA3597 |
| |||||||||
| 3.50% |
04/20/46 | 63,320,609 | 64,474,335 | |||||||
| Ginnie Mae II Pool MA3600 |
| |||||||||
| 5.00% |
04/20/46 | 6,531,775 | 7,174,491 | |||||||
| Ginnie Mae II Pool MA3662 |
| |||||||||
| 3.00% |
05/20/46 | 2,434,986 | 2,430,275 | |||||||
| Ginnie Mae II Pool MA3663 |
| |||||||||
| 3.50% |
05/20/46 | 18,033,749 | 18,362,331 | |||||||
| Ginnie Mae II Pool MA3665 |
| |||||||||
| 4.50% |
05/20/46 | 90,420 | 96,304 | |||||||
| Issues | Maturity Date |
Principal Amount |
Value | |||||||
| MORTGAGE-BACKED (continued) |
| |||||||||
| U.S. Agency Mortgage-Backed (continued) |
| |||||||||
| Ginnie Mae II Pool MA3666 |
| |||||||||
| 5.00% |
05/20/46 | $ | 3,342,394 | $ | 3,665,102 | |||||
| Ginnie Mae II Pool MA3738 |
| |||||||||
| 4.50% |
06/20/46 | 381,375 | 406,193 | |||||||
| Ginnie Mae II Pool MA3739 |
| |||||||||
| 5.00% |
06/20/46 | 2,003,862 | 2,200,787 | |||||||
| Ginnie Mae II Pool MA3805 |
| |||||||||
| 4.50% |
07/20/46 | 3,141,096 | 3,343,543 | |||||||
| Ginnie Mae II Pool MA3806 |
| |||||||||
| 5.00% |
07/20/46 | 154,619 | 169,831 | |||||||
| Ginnie Mae II Pool MA3873 |
| |||||||||
| 3.00% |
08/20/46 | 18,633,693 | 18,567,221 | |||||||
| Ginnie Mae II Pool MA3876 |
| |||||||||
| 4.50% |
08/20/46 | 3,395,590 | 3,616,561 | |||||||
| Ginnie Mae II Pool MA3877 |
| |||||||||
| 5.00% |
08/20/46 | 736,965 | 792,030 | |||||||
| Ginnie Mae II Pool MA3937 |
| |||||||||
| 3.50% |
09/20/46 | 14,602,880 | 14,854,108 | |||||||
| Ginnie Mae II Pool MA3939 |
| |||||||||
| 4.50% |
09/20/46 | 1,793,012 | 1,927,756 | |||||||
| Ginnie Mae II Pool MA4003 |
| |||||||||
| 3.00% |
10/20/46 | 7,497,767 | 7,470,998 | |||||||
| Ginnie Mae II Pool MA4006 |
| |||||||||
| 4.50% |
10/20/46 | 2,036,146 | 2,168,650 | |||||||
| Ginnie Mae II Pool MA4007 |
| |||||||||
| 5.00% |
10/20/46 | 3,839,686 | 4,207,353 | |||||||
| Ginnie Mae II Pool MA4069 |
| |||||||||
| 3.50% |
11/20/46 | 45,685,202 | 46,427,506 | |||||||
| Ginnie Mae II Pool MA4071 |
| |||||||||
| 4.50% |
11/20/46 | 5,399,471 | 5,794,690 | |||||||
| Ginnie Mae II Pool MA4072 |
| |||||||||
| 5.00% |
11/20/46 | 1,130,366 | 1,241,430 | |||||||
| Ginnie Mae II Pool MA4126 |
| |||||||||
| 3.00% |
12/20/46 | 128,057,272 | 127,599,707 | |||||||
| Ginnie Mae II Pool MA4127 |
| |||||||||
| 3.50% |
12/20/46 | 50,702,348 | 51,513,123 | |||||||
| Ginnie Mae II Pool MA4129 |
| |||||||||
| 4.50% |
12/20/46 | 18,299,344 | 19,626,131 | |||||||
| Ginnie Mae II Pool MA4196 |
| |||||||||
| 3.50% |
01/20/47 | 11,752 | 11,986 | |||||||
| Ginnie Mae II Pool MA4198 |
| |||||||||
| 4.50% |
01/20/47 | 149,918 | 159,159 | |||||||
| Ginnie Mae II Pool MA4199 |
| |||||||||
| 5.00% |
01/20/47 | 3,211,147 | 3,518,583 | |||||||
| Ginnie Mae II Pool MA4264 |
| |||||||||
| 4.50% |
02/20/47 | 42,072,587 | 44,560,697 | |||||||
| Ginnie Mae II Pool MA4265 |
| |||||||||
| 5.00% |
02/20/47 | 804,421 | 880,047 | |||||||
| Ginnie Mae II Pool MA4324 |
| |||||||||
| 5.00% |
03/20/47 | 4,495,829 | 4,899,995 | |||||||
| Ginnie Mae II Pool MA4382 |
| |||||||||
| 3.50% |
04/20/47 | 29,054,190 | 29,481,979 | |||||||
| Ginnie Mae II Pool MA4384 |
| |||||||||
| 4.50% |
04/20/47 | 1,848,933 | 1,951,343 | |||||||
| Ginnie Mae II Pool MA4385 |
| |||||||||
| 5.00% |
04/20/47 | 7,805,034 | 8,371,136 | |||||||
See accompanying Notes to Financial Statements.
| Annual Report March 2022 / 206 |
Table of Contents
Total Return Bond Fund
Schedule of Portfolio Investments
March 31, 2022
| Issues | Maturity Date |
Principal Amount |
Value | |||||||
| MORTGAGE-BACKED (continued) |
| |||||||||
| U.S. Agency Mortgage-Backed (continued) |
| |||||||||
| Ginnie Mae II Pool MA4453 |
| |||||||||
| 4.50% |
05/20/47 | $ | 97,028,511 | $ | 102,402,775 | |||||
| Ginnie Mae II Pool MA4454 |
| |||||||||
| 5.00% |
05/20/47 | 16,191,961 | 17,234,987 | |||||||
| Ginnie Mae II Pool MA4510 |
| |||||||||
| 3.50% |
06/20/47 | 40,269 | 40,862 | |||||||
| Ginnie Mae II Pool MA4511 |
| |||||||||
| 4.00% |
06/20/47 | 5,753,281 | 5,931,142 | |||||||
| Ginnie Mae II Pool MA4512 |
| |||||||||
| 4.50% |
06/20/47 | 338,852 | 357,620 | |||||||
| Ginnie Mae II Pool MA4513 |
| |||||||||
| 5.00% |
06/20/47 | 319,560 | 341,975 | |||||||
| Ginnie Mae II Pool MA4586 |
| |||||||||
| 3.50% |
07/20/47 | 47,944,849 | 48,649,021 | |||||||
| Ginnie Mae II Pool MA4588 |
| |||||||||
| 4.50% |
07/20/47 | 55,200 | 58,171 | |||||||
| Ginnie Mae II Pool MA4589 |
| |||||||||
| 5.00% |
07/20/47 | 14,303,862 | 15,208,290 | |||||||
| Ginnie Mae II Pool MA4652 |
| |||||||||
| 3.50% |
08/20/47 | 3,624,734 | 3,690,112 | |||||||
| Ginnie Mae II Pool MA4655 |
| |||||||||
| 5.00% |
08/20/47 | 18,104,928 | 19,271,181 | |||||||
| Ginnie Mae II Pool MA4719 |
| |||||||||
| 3.50% |
09/20/47 | 45,523,846 | 46,160,331 | |||||||
| Ginnie Mae II Pool MA4720 |
| |||||||||
| 4.00% |
09/20/47 | 115,354 | 119,221 | |||||||
| Ginnie Mae II Pool MA4722 |
| |||||||||
| 5.00% |
09/20/47 | 349,769 | 372,187 | |||||||
| Ginnie Mae II Pool MA4781 |
| |||||||||
| 5.00% |
10/20/47 | 3,963,799 | 4,222,805 | |||||||
| Ginnie Mae II Pool MA4836 |
| |||||||||
| 3.00% |
11/20/47 | 101,172,042 | 101,055,512 | |||||||
| Ginnie Mae II Pool MA4837 |
| |||||||||
| 3.50% |
11/20/47 | 112,481,647 | 114,054,293 | |||||||
| Ginnie Mae II Pool MA4838 |
| |||||||||
| 4.00% |
11/20/47 | 38,526,990 | 39,747,049 | |||||||
| Ginnie Mae II Pool MA4840 |
| |||||||||
| 5.00% |
11/20/47 | 1,326,257 | 1,418,396 | |||||||
| Ginnie Mae II Pool MA4900 |
| |||||||||
| 3.50% |
12/20/47 | 7,234,536 | 7,335,684 | |||||||
| Ginnie Mae II Pool MA4901 |
| |||||||||
| 4.00% |
12/20/47 | 25,415,422 | 26,199,461 | |||||||
| Ginnie Mae II Pool MA4961 |
| |||||||||
| 3.00% |
01/20/48 | 344,582 | 343,199 | |||||||
| Ginnie Mae II Pool MA4963 |
| |||||||||
| 4.00% |
01/20/48 | 42,354,017 | 43,660,594 | |||||||
| Ginnie Mae II Pool MA5078 |
| |||||||||
| 4.00% |
03/20/48 | 64,882 | 67,227 | |||||||
| Ginnie Mae II Pool MA5137 |
| |||||||||
| 4.00% |
04/20/48 | 13,894,010 | 14,267,430 | |||||||
| Ginnie Mae II Pool MA5399 |
| |||||||||
| 4.50% |
08/20/48 | 3,207,619 | 3,330,635 | |||||||
| Ginnie Mae II Pool MA5466 |
| |||||||||
| 4.00% |
09/20/48 | 5,627,468 | 5,771,679 | |||||||
| Ginnie Mae II Pool MA5467 |
| |||||||||
| 4.50% |
09/20/48 | 29,750 | 30,957 | |||||||
| Issues | Maturity Date |
Principal Amount |
Value | |||||||
| MORTGAGE-BACKED (continued) |
| |||||||||
| U.S. Agency Mortgage-Backed (continued) |
| |||||||||
| Ginnie Mae II Pool MA5528 |
| |||||||||
| 4.00% |
10/20/48 | $ | 25,799,695 | $ | 26,454,801 | |||||
| Ginnie Mae II Pool MA5530 |
| |||||||||
| 5.00% |
10/20/48 | 5,063,879 | 5,280,039 | |||||||
| Ginnie Mae II Pool MA5651 |
| |||||||||
| 4.00% |
12/20/48 | 9,296 | 9,592 | |||||||
| Ginnie Mae II Pool MA6030 |
| |||||||||
| 3.50% |
07/20/49 | 11,150,932 | 11,064,572 | |||||||
| Ginnie Mae II Pool MA6080 |
| |||||||||
| 3.00% |
08/20/49 | 1,964 | 1,924 | |||||||
| Ginnie Mae II Pool MA6081 |
| |||||||||
| 3.50% |
08/20/49 | 4,214,654 | 4,182,013 | |||||||
| Ginnie Mae II Pool MA6209 |
| |||||||||
| 3.00% |
10/20/49 | 3,921,395 | 3,835,387 | |||||||
| Ginnie Mae II Pool MA6210 |
| |||||||||
| 3.50% |
10/20/49 | 2,073,416 | 2,054,766 | |||||||
| Ginnie Mae, |
| |||||||||
| Series 2003-86, Class ZK |
| |||||||||
| 5.00% |
10/20/33 | 4,073,028 | 4,310,134 | |||||||
| Ginnie Mae, |
| |||||||||
| Series 2007-35, Class PY (IO) |
| |||||||||
| (-1.00 X LIBOR USD 1-Month plus 6.75%, 6.75% Cap) |
|
|||||||||
| 6.32% |
06/16/372 | 7,695,966 | 1,342,760 | |||||||
| Ginnie Mae, |
| |||||||||
| Series 2009-106, Class SD (IO) |
| |||||||||
| (-1.00 X LIBOR USD 1-Month plus 6.25%, 6.25% Cap) |
|
|||||||||
| 5.80% |
03/20/362 | 6,708,978 | 507,446 | |||||||
| Ginnie Mae, |
| |||||||||
| Series 2009-106, Class XI (IO) |
| |||||||||
| (-1.00 X LIBOR USD 1-Month plus 6.80%, 6.80% Cap) |
|
|||||||||
| 6.35% |
05/20/372 | 16,846,092 | 1,554,359 | |||||||
| Ginnie Mae, |
| |||||||||
| Series 2009-124, Class SC (IO) |
| |||||||||
| (-1.00 X LIBOR USD 1-Month plus 6.48%, 6.48% Cap) |
|
|||||||||
| 6.03% |
12/20/392 | 2,613,843 | 435,333 | |||||||
| Ginnie Mae, |
| |||||||||
| Series 2009-66, Class XS (IO) |
| |||||||||
| (-1.00 X LIBOR USD 1-Month plus 6.80%, 6.80% Cap) |
|
|||||||||
| 6.37% |
07/16/392 | 19,842 | 1,877 | |||||||
| Ginnie Mae, |
| |||||||||
| Series 2009-8, Class PS (IO) |
| |||||||||
| (-1.00 X LIBOR USD 1-Month plus 6.30%, 6.30% Cap) |
|
|||||||||
| 5.87% |
08/16/382 | 25,648 | 1,151 | |||||||
| Ginnie Mae, |
| |||||||||
| Series 2010-4, Class SL (IO) |
| |||||||||
| (-1.00 X LIBOR USD 1-Month plus 6.40%, 6.40% Cap) |
|
|||||||||
| 5.97% |
01/16/402 | 34,416 | 5,269 | |||||||
| Ginnie Mae, |
| |||||||||
| Series 2010-4, Class SM (IO) |
| |||||||||
| (-1.00 X LIBOR USD 1-Month plus 5.80%, 5.80% Cap) |
|
|||||||||
| 5.37% |
01/16/402 | 6,257,424 | 878,116 | |||||||
| Ginnie Mae, |
| |||||||||
| Series 2010-6, Class BS (IO) |
| |||||||||
| (-1.00 X LIBOR USD 1-Month plus 6.50%, 6.50% Cap) |
|
|||||||||
| 6.07% |
09/16/392 | 733,286 | 29,154 | |||||||
See accompanying Notes to Financial Statements.
| 207 / Annual Report March 2022 |
Table of Contents
Total Return Bond Fund
Schedule of Portfolio Investments
March 31, 2022
| Issues | Maturity Date |
Principal Amount |
Value | |||||||
| MORTGAGE-BACKED (continued) |
|
|||||||||
| U.S. Agency Mortgage-Backed (continued) |
| |||||||||
| Ginnie Mae, |
|
|||||||||
| Series 2011-146, Class EI (IO) |
|
|||||||||
| 5.00% |
11/16/41 | $ | 85,450 | $ | 14,927 | |||||
| Ginnie Mae, |
|
|||||||||
| Series 2014-108, Class PA |
|
|||||||||
| 2.63% |
12/20/39 | 6,327,785 | 6,290,413 | |||||||
| Ginnie Mae, |
|
|||||||||
| Series 2018-124, Class NW |
|
|||||||||
| 3.50% |
09/20/48 | 858,037 | 868,624 | |||||||
| Ginnie Mae, |
|
|||||||||
| Series 2019-1, Class NP |
|
|||||||||
| 3.50% |
01/20/49 | 9,295,470 | 9,260,223 | |||||||
| Ginnie Mae, |
|
|||||||||
| Series 2019-119, Class JE |
|
|||||||||
| 3.00% |
09/20/49 | 5,899,415 | 5,876,714 | |||||||
| Ginnie Mae, |
|
|||||||||
| Series 2019-15, Class GT |
|
|||||||||
| 3.50% |
02/20/49 | 9,594,538 | 9,668,283 | |||||||
| Ginnie Mae, |
|
|||||||||
| Series 2019-44, Class CA |
|
|||||||||
| 3.50% |
12/20/48 | 1,610,521 | 1,615,382 | |||||||
| Ginnie Mae, |
|
|||||||||
| Series 2019-71, Class PT |
|
|||||||||
| 3.00% |
06/20/49 | 1,049,546 | 1,030,729 | |||||||
| Ginnie Mae, |
|
|||||||||
| Series 2019-86, Class C |
|
|||||||||
| 2.50% |
03/20/49 | 12,553,692 | 12,304,777 | |||||||
| Ginnie Mae, |
|
|||||||||
| Series 2019-90, Class HE |
|
|||||||||
| 3.00% |
07/20/49 | 9,907,992 | 9,670,138 | |||||||
| UMBS (TBA) |
|
|||||||||
| 2.00% |
04/01/37 | 1,083,850,000 | 1,052,571,227 | |||||||
| 2.00% |
04/01/52 | 872,100,000 | 809,081,461 | |||||||
| 2.00% |
05/01/52 | 4,826,150,000 | 4,471,993,600 | |||||||
| 2.50% |
04/01/37 | 850,250,000 | 840,256,961 | |||||||
| 2.50% |
05/01/52 | 6,796,975,000 | 6,471,827,631 | |||||||
| 3.00% |
04/01/52 | 537,775,000 | 526,095,199 | |||||||
| 3.00% |
05/01/52 | 1,862,825,000 | 1,818,582,999 | |||||||
|
|
|
| ||||||||
| 25,045,155,530 | ||||||||||
|
|
|
| ||||||||
| Total Mortgage-Backed |
|
|||||||||
| (Cost $32,886,034,655) |
|
32,301,493,307 | ||||||||
|
|
|
| ||||||||
| MUNICIPAL BONDS — 0.67%* |
|
|||||||||
| California — 0.28% |
|
|||||||||
| California State University Revenue Bonds, University & College Improvements, Series B |
|
|||||||||
| 2.14% |
11/01/33 | 14,500,000 | 12,520,095 | |||||||
| 2.27% |
11/01/34 | 23,510,000 | 20,769,547 | |||||||
| City of San Francisco Public Utilities Commission Water Revenue Bonds, Series E |
|
|||||||||
| 2.83% |
11/01/41 | 16,645,000 | 14,978,854 | |||||||
| Los Angeles Department of Airports Revenue Bonds, Port, Airport and Marina Improvements, Series A |
|
|||||||||
| 5.00% |
05/15/44 | 185,000 | 205,673 | |||||||
| Issues | Maturity Date |
Principal Amount |
Value | |||||||
| MUNICIPAL BONDS (continued) |
|
|||||||||
| California (continued) |
|
|||||||||
| Los Angeles Department of Water & Power Power System Revenue Bonds, Electric Light & Power Improvements, |
|
|||||||||
| Series C |
|
|||||||||
| 5.52% |
07/01/27 | $ | 12,625,000 | $ | 14,129,266 | |||||
| Los Angeles Department of Water & Power Water System Revenue Bonds, Water Utility Improvements, Series SY |
|
|||||||||
| 6.01% |
07/01/39 | 350,000 | 436,957 | |||||||
| Los Angeles Unified School District General Obligation Bonds, School Improvements, Series KR |
|
|||||||||
| 5.75% |
07/01/34 | 19,155,000 | 22,714,240 | |||||||
| Los Angeles Unified School District General Obligation Bonds, School Improvements, Series RY |
|
|||||||||
| 6.76% |
07/01/34 | 12,165,000 | 15,459,185 | |||||||
| Regents of the University of California Medical Center Pooled Revenue Bonds, Health, Hospital and Nursing Home Improvements, Series N |
|
|||||||||
| 3.01% |
05/15/50 | 57,945,000 | 50,818,515 | |||||||
| 3.26% |
05/15/60 | 34,700,000 | 31,084,711 | |||||||
| University of California, Taxable, College & University, Revenue Bonds, University & College Improvements, Series AP |
|
|||||||||
| 3.93% |
05/15/45 | 30,115,000 | 30,512,473 | |||||||
|
|
|
| ||||||||
| 213,629,516 | ||||||||||
|
|
|
| ||||||||
| Colorado — 0.03% |
|
|||||||||
| City & County of Denver Airport System Revenue Bonds, |
|
|||||||||
| Series C |
|
|||||||||
| 2.39% |
11/15/31 | 6,010,000 | 5,517,667 | |||||||
| 2.52% |
11/15/32 | 8,450,000 | 7,756,017 | |||||||
| 2.62% |
11/15/33 | 9,000,000 | 8,286,973 | |||||||
| 2.72% |
11/15/34 | 5,000,000 | 4,616,864 | |||||||
|
|
|
| ||||||||
| 26,177,521 | ||||||||||
|
|
|
| ||||||||
| Michigan — 0.05% |
|
|||||||||
| University of Michigan Revenue Bonds, Taxable, Revenue Bonds, University & College Improvements, Series A |
|
|||||||||
| 3.50% |
04/01/52 | 38,445,000 | 39,164,467 | |||||||
|
|
|
| ||||||||
| New Jersey — 0.00% |
|
|||||||||
| Jersey City Municipal Utilities Authority Revenue Bonds, Water Utility Improvements, Series B |
|
|||||||||
| 5.47% |
05/15/27 | 350,000 | 373,164 | |||||||
| New Jersey Turnpike Authority Revenue Bonds, Highway Revenue, Series F |
|
|||||||||
| 3.73% |
01/01/36 | 300,000 | 309,919 | |||||||
|
|
|
| ||||||||
| 683,083 | ||||||||||
|
|
|
| ||||||||
| New York — 0.29% |
|
|||||||||
| City of New York General Obligation Bonds, Public Improvements |
|
|||||||||
| 4.77% |
10/01/23 | 4,420,000 | 4,582,960 | |||||||
| 5.21% |
10/01/31 | 6,420,000 | 7,070,860 | |||||||
| 5.52% |
10/01/37 | 6,075,000 | 7,278,107 | |||||||
| City of New York General Obligation Bonds, Public Improvements, Series A |
|
|||||||||
| 3.00% |
08/01/34 | 15,185,000 | 14,275,256 | |||||||
See accompanying Notes to Financial Statements.
| Annual Report March 2022 / 208 |
Table of Contents
Total Return Bond Fund
Schedule of Portfolio Investments
March 31, 2022
| Issues | Maturity Date |
Principal Amount |
Value | |||||||
| MUNICIPAL BONDS (continued) |
|
|||||||||
| New York (continued) |
|
|||||||||
| City of New York General Obligation Bonds, Public Improvements, Series F |
|
|||||||||
| 3.62% |
04/01/31 | $ | 3,145,000 | $ | 3,173,169 | |||||
| Metropolitan Transportation Authority Revenue Bonds, Transit Improvements, Series C2 |
|
|||||||||
| 5.18% |
11/15/49 | 13,145,000 | 15,031,736 | |||||||
| New York City Transitional Finance Authority Future Tax Secured Revenue Bonds, Public Improvements |
|
|||||||||
| 5.51% |
08/01/37 | 25,000,000 | 29,910,945 | |||||||
| New York City Transitional Finance Authority Future Tax Secured Revenue Bonds, Public Improvements, Series A2 |
|
|||||||||
| 2.15% |
05/01/25 | 430,000 | 421,676 | |||||||
| New York City Transitional Finance Authority Future Tax Secured Revenue Bonds, Public Improvements, Series B3 |
|
|||||||||
| 2.00% |
08/01/35 | 4,055,000 | 3,197,735 | |||||||
| New York City Transitional Finance Authority Future Tax Secured Revenue Bonds, Public Improvements, Series D |
|
|||||||||
| 2.40% |
11/01/32 | 12,135,000 | 10,748,018 | |||||||
| New York City Transitional Finance Authority Future Tax Secured Revenue Bonds, Public Improvements, Series E |
|
|||||||||
| 1.97% |
02/01/33 | 3,090,000 | 2,600,208 | |||||||
| New York City Transitional Finance Authority Future Tax Secured Revenue Bonds, Public Improvements, Subseries C5 |
|
|||||||||
| 3.90% |
05/01/31 | 15,000,000 | 15,284,395 | |||||||
| New York City Transitional Finance Authority Future Tax Secured Revenue Bonds, Public Improvements, Subseries FI |
|
|||||||||
| 4.00% |
08/01/33 | 6,450,000 | 6,599,915 | |||||||
| New York City Transitional Finance Authority Future Tax Secured Revenue Bonds, Public Improvements, Subseries SU |
|
|||||||||
| 3.88% |
08/01/31 | 3,135,000 | 3,192,997 | |||||||
| New York City Transitional Finance Authority Future Tax Secured Revenue Bonds, School Improvements, Series G-3 |
|
|||||||||
| 5.27% |
05/01/27 | 13,135,000 | 14,331,362 | |||||||
| New York City Transitional Finance Authority Future Tax Secured Revenue Bonds, Series G |
|
|||||||||
| 2.45% |
11/01/34 | 3,000,000 | 2,621,697 | |||||||
| New York State Dormitory Authority Revenue Bonds, Series C |
|
|||||||||
| 1.95% |
03/15/29 | 7,895,000 | 7,222,726 | |||||||
| New York State Dormitory Authority Revenue Bonds, University & College Improvements |
|
|||||||||
| 5.29% |
03/15/33 | 44,990,000 | 50,218,094 | |||||||
| 5.43% |
03/15/39 | 21,400,000 | 25,012,348 | |||||||
| New York State Dormitory Authority Revenue Bonds, University & College Improvements, Series A |
|
|||||||||
| 4.00% |
03/15/47 | 155,000 | 161,651 | |||||||
| New York State Urban Development Corp. Revenue Bonds, Public Improvements |
|
|||||||||
| 5.77% |
03/15/39 | 150,000 | 168,858 | |||||||
|
|
|
| ||||||||
| 223,104,713 | ||||||||||
|
|
|
| ||||||||
| Issues | Maturity Date |
Principal Amount |
Value | |||||||
| MUNICIPAL BONDS (continued) |
|
|||||||||
| Texas — 0.02% | ||||||||||
| North Texas Tollway Authority Revenue Bonds |
| |||||||||
| 2.33% |
01/01/33 | $ | 765,000 | $ | 705,033 | |||||
| 2.43% |
01/01/34 | 10,000,000 | 9,256,477 | |||||||
| 2.53% |
01/01/35 | 8,000,000 | 7,432,204 | |||||||
| Texas A&M University Revenue Bonds, University & College Improvements, Series B |
|
|||||||||
| 2.69% |
05/15/25 | 350,000 | 349,512 | |||||||
|
|
|
| ||||||||
| 17,743,226 | ||||||||||
|
|
|
| ||||||||
| Total Municipal Bonds |
|
|||||||||
| (Cost $545,700,629) |
|
520,502,526 | ||||||||
|
|
|
| ||||||||
| U.S. TREASURY SECURITIES — 32.05% |
|
|||||||||
| U.S. Treasury Bonds — 7.33% |
|
|||||||||
| U.S. Treasury Bonds |
|
|||||||||
| 1.88% |
11/15/51 | 129,779,000 | 113,881,072 | |||||||
| 2.00% |
11/15/41 | 2,422,171,000 | 2,195,704,309 | |||||||
| 2.25% |
05/15/41 | 1,195,219,000 | 1,130,934,206 | |||||||
| 2.25% |
02/15/52 | 1,159,309,000 | 1,112,212,072 | |||||||
| 2.38% |
02/15/42 | 1,034,670,000 | 998,860,723 | |||||||
| U.S. Treasury Bonds - Treasury Inflation Indexed Bonds |
|
|||||||||
| 0.13% |
02/15/5212 | 128,376,016 | 133,315,180 | |||||||
|
|
|
| ||||||||
| 5,684,907,562 | ||||||||||
|
|
|
| ||||||||
| U.S. Treasury Notes — 24.72% |
|
|||||||||
| U.S. Treasury Notes |
|
|||||||||
| 0.75% |
12/31/23 | 1,171,495,000 | 1,141,269,515 | |||||||
| 0.88% |
01/31/24 | 2,717,678,000 | 2,648,833,700 | |||||||
| 1.25% |
12/31/26 | 619,911,000 | 585,828,727 | |||||||
| 1.50% |
02/29/2413 | 4,682,875,000 | 4,615,192,846 | |||||||
| 1.50% |
01/31/27 | 1,240,266,000 | 1,185,422,988 | |||||||
| 1.75% |
03/15/25 | 802,535,000 | 785,956,232 | |||||||
| 1.88% |
02/28/27 | 3,691,242,000 | 3,593,774,201 | |||||||
| 1.88% |
02/15/32 | 418,606,000 | 402,090,687 | |||||||
| 2.25% |
03/31/24 | 849,934,000 | 848,805,186 | |||||||
| 2.50% |
03/31/27 | 3,343,769,000 | 3,351,736,566 | |||||||
|
|
|
| ||||||||
| 19,158,910,648 | ||||||||||
|
|
|
| ||||||||
| Total U.S. Treasury Securities |
|
|||||||||
| (Cost $25,274,018,366) |
|
24,843,818,210 | ||||||||
|
|
|
| ||||||||
| Total Bonds — 110.81% |
|
|||||||||
| (Cost $88,008,649,677) |
|
85,886,203,765 | ||||||||
|
|
|
| ||||||||
| Issues | Shares | Value | ||||||||
| COMMON STOCK — 0.09% |
|
|||||||||
| Communications — 0.09% |
|
|||||||||
| Intelsat Emergence SA3,5,6,9 |
|
|||||||||
| (Luxembourg) |
2,394,859 | 71,845,770 | ||||||||
|
|
|
| ||||||||
| Electric — 0.00% |
|
|||||||||
| Homer City Holdings LLC†,5,6,9,10,14 | 1,180,703 | — | ||||||||
|
|
|
| ||||||||
| Total Common Stock |
|
|||||||||
| (Cost $145,415,216) |
|
71,845,770 | ||||||||
|
|
|
| ||||||||
See accompanying Notes to Financial Statements.
| 209 / Annual Report March 2022 |
Table of Contents
Total Return Bond Fund
Schedule of Portfolio Investments
March 31, 2022
| Issues | Shares | Value | ||||||||
| RIGHTS — 0.00% |
| |||||||||
| Communications — 0.00% |
| |||||||||
| Intelsat Jackson Holdings SA, Series A3,5,6,9 |
|
|||||||||
| (Luxembourg) |
250,803 | $ | — | |||||||
| Intelsat Jackson Holdings SA, Series B3,5,6,9 |
|
|||||||||
| (Luxembourg) |
250,803 | — | ||||||||
|
|
|
| ||||||||
| — | ||||||||||
|
|
|
| ||||||||
| Total Rights |
| |||||||||
| (Cost $–) |
|
— | ||||||||
|
|
|
| ||||||||
| Purchased Options - 0.01% |
| |||||||||
| (Cost $34,465,201) |
|
9,464,456 | ||||||||
|
|
|
| ||||||||
| Issues | Maturity Date |
Principal Amount/Shares |
Value | |||||||
| SHORT-TERM INVESTMENTS — 13.19% |
| |||||||||
| Money Market Funds — 2.38% |
| |||||||||
| Dreyfus Government Cash Management Fund |
| |||||||||
| 0.19%15 |
517,087,500 | 517,087,500 | ||||||||
| Fidelity Investments Money Market Funds - Government Portfolio |
|
|||||||||
| 0.12%15,16 |
586,973,554 | 586,973,554 | ||||||||
| Morgan Stanley Institutional Liquidity Funds - Government Portfolio |
|
|||||||||
| 0.23%15 |
742,223,500 | 742,223,500 | ||||||||
|
|
|
| ||||||||
| 1,846,284,554 | ||||||||||
|
|
|
| ||||||||
| U.S. Agency Discount Notes — 6.14% |
| |||||||||
| Federal Home Loan Bank |
| |||||||||
| 0.13%17 |
06/08/22 | $ | 500,000,000 | 499,425,970 | ||||||
| 0.13%17 |
06/15/22 | 500,000,000 | 499,366,915 | |||||||
| 0.24%17 |
08/08/22 | 250,000,000 | 249,198,643 | |||||||
| 0.55%17 |
08/15/22 | 1,000,000,000 | 997,042,650 | |||||||
| 0.45%17 |
08/29/22 | 500,000,000 | 498,136,865 | |||||||
| 0.66%17 |
09/15/22 | 500,000,000 | 497,605,985 | |||||||
| 0.99%17 |
10/05/22 | 200,000,000 | 198,854,932 | |||||||
| 1.04%17 |
06/14/24 | 746,595,000 | 722,774,289 | |||||||
| 1.20%17 |
12/23/24 | 173,195,000 | 167,179,638 | |||||||
| 1.61%17 |
09/04/24 | 218,955,000 | 215,598,685 | |||||||
| 1.61%17 |
09/04/24 | 218,700,000 | 214,481,767 | |||||||
|
|
|
| ||||||||
| 4,759,666,339 | ||||||||||
|
|
|
| ||||||||
| U.S. Treasury Bills — 4.67% |
| |||||||||
| U.S. Treasury Bills |
| |||||||||
| 0.49%17 |
07/14/22 | 500,000,000 | 499,104,450 | |||||||
| 0.36%17 |
07/21/22 | 500,000,000 | 498,920,825 | |||||||
| 0.37%17 |
07/28/22 | 500,000,000 | 498,770,835 | |||||||
| 0.57%17 |
08/04/22 | 500,000,000 | 498,623,845 | |||||||
| 0.57%17 |
08/11/22 | 500,000,000 | 498,460,000 | |||||||
| 0.65%17 |
08/18/22 | 500,000,000 | 498,378,350 | |||||||
| 0.61%17 |
08/25/22 | 577,867,000 | 575,828,112 | |||||||
| Issues | Maturity Date |
Principal Amount/Shares |
Value | |||||||
| SHORT-TERM INVESTMENTS (continued) |
|
|||||||||
| U.S. Treasury Bills (continued) |
|
|||||||||
| 0.65%17 |
09/01/22 | $ | 50,998,000 | $ | 50,800,765 | |||||
|
|
|
| ||||||||
| 3,618,887,182 | ||||||||||
|
|
|
| ||||||||
| Total Short-Term Investments |
|
|||||||||
| (Cost $10,269,880,168) |
|
10,224,838,075 | ||||||||
|
|
|
| ||||||||
| Total Investments Before Written Options - 124.10% |
|
|||||||||
| (Cost $98,458,410,262) |
|
96,192,352,066 | ||||||||
|
|
|
| ||||||||
| Written Options - (0.37)% |
|
|||||||||
| (Cost $(158,157,572)) |
|
(290,863,292 | ) | |||||||
|
|
|
| ||||||||
| Net unrealized appreciation on unfunded commitments - 0.00% |
|
7,880 | ||||||||
| Liabilities in Excess of Other Assets - (23.73)% |
|
(18,394,667,443 | ) | |||||||
|
|
|
| ||||||||
| Net Assets - 100.00% |
|
$ | 77,506,829,211 | |||||||
|
|
|
| ||||||||
| 1 | Securities exempt from registration under Rule 144A of the Securities Act of 1933, as amended. The securities may be resold in transactions exempt from registration, normally to qualified institutional buyers. |
| 2 | Floating rate security. The rate disclosed was in effect at March 31, 2022. |
| 3 | Foreign denominated security issued by foreign domiciled entity. |
| 4 | Variable rate security. Interest rate disclosed is as of the most recent information available. Certain variable rate securities are not based on a published reference rate and spread but are determined by the issuer or agent and are based on current market conditions. |
| 5 | Security is valued using significant unobservable inputs and is classified as Level 3 in the fair value hierarchy. |
| 6 | Illiquid security as determined under procedures approved by the Board of Trustees. The aggregate value of illiquid securities is $321,099,010, which is 0.41% of total net assets. |
| 7 | Excluded from the investment total above is an unfunded delayed draw term loan commitment in an amount not to exceed $247,735, at an interest rate of 4.00% and a maturity of July 31, 2028. The investment is not accruing an unused commitment fee. |
| 8 | Excluded from the investment total above is an unfunded delayed draw term loan commitment in an amount not to exceed $1,005,616, at an interest rate of 0.00% and a maturity of February 15, 2029. The investment is not accruing an unused commitment fee. |
| 9 | Non-income producing security. |
| 10 | Security is currently in default with regard to scheduled interest or principal payments. |
| 11 | Zero coupon bond. The rate shown is the effective yield as of March 31, 2022. |
| 12 | Inflation protected security. Principal amount reflects original security face amount. |
| 13 | All or a portion of this security’s market value is pledged as collateral for the reverse repurchase agreement. |
| 14 | Affiliated investment. |
| 15 | Represents the current yield as of March 31, 2022. |
| 16 | Securities, or a portion thereof, pledged as collateral for swaps. The total market value of collateral pledged is $29,229,572. |
| 17 | Represents annualized yield at date of purchase. |
| † | Fair valued security. The aggregate value of fair valued securities is $304,787,149, which is 0.39% of total net assets. Fair valued securities were not valued utilizing an independent quote but were valued pursuant to guidelines established by the Board of Trustees. See Notes to Financial Statements. |
| * | Securities with a call or reset feature will have an effective maturity date sooner than the stated maturity. |
| ** | Securities backed by mortgage or consumer loans where payment is periodically made will have an effective maturity date sooner than the stated maturity date. |
See accompanying Notes to Financial Statements.
| Annual Report March 2022 / 210 |
Table of Contents
Total Return Bond Fund
Schedule of Portfolio Investments
March 31, 2022
Note: For Fund compliance purposes, the Fund’s industry classifications refer to any one or more of the industry sub-classifications used by one or more widely recognized market indexes or ratings group indexes, and/or as defined by Fund management. This definition may not apply for purposes of this report, which may combine industry sub-classifications for more meaningful presentation for investors.
(BKNT): Bank Note
(CAD): Canadian Dollar
(CLO): Collateralized Loan Obligation
(EMTN): Euro Medium-Term Note
(EUR): Euro
(GBP): British Pound
(GMTN): Global Medium-Term Note
(IO): Interest Only
(LIBOR): London InterBank Offer Rate
(MTN): Medium-Term Note
(PO): Principal Only
(S&P): Standard & Poor’s
(SOFR): Secured Overnight Financing Rate
(STEP): Step Coupon Bond
(TBA): To-Be-Announced
(USD): U.S. Dollar
| Currency to be Purchased |
Currency to be Sold |
Counterparty | Settlement Date |
Unrealized Appreciation (Depreciation) |
||||||||||||||||||||
| FOREIGN CURRENCY EXCHANGE CONTRACT |
|
|||||||||||||||||||||||
| CAD 1,131,304,000 |
USD 886,984,202 | Citigroup Global Markets, Inc. | 04/08/22 | $ | 18,710,809 | |||||||||||||||||||
| EUR 148,673,000 |
USD 163,976,026 | Goldman Sachs International | 04/08/22 | 1,484,133 | ||||||||||||||||||||
| USD 168,138,805 |
EUR 148,673,000 | Goldman Sachs International | 04/08/22 | 2,678,646 | ||||||||||||||||||||
| USD 325,243,890 |
GBP 241,765,000 | Goldman Sachs International | 04/08/22 | 6,939,865 | ||||||||||||||||||||
|
|
|
|||||||||||||||||||||||
| 29,813,453 | ||||||||||||||||||||||||
|
|
|
|||||||||||||||||||||||
| GBP 241,765,000 |
USD 321,352,216 | Goldman Sachs International | 04/08/22 | (3,048,191) | ||||||||||||||||||||
| USD 883,919,876 |
CAD 1,131,304,000 | Citigroup Global Markets, Inc. | 04/08/22 | (21,775,135) | ||||||||||||||||||||
| USD 145,574,267 |
EUR 131,850,000 | Goldman Sachs International | 07/08/22 | (1,740,532) | ||||||||||||||||||||
| USD 196,402,201 |
GBP 149,974,000 | Goldman Sachs International | 07/08/22 | (1,015,106) | ||||||||||||||||||||
|
|
|
|||||||||||||||||||||||
| (27,578,964) | ||||||||||||||||||||||||
|
|
|
|||||||||||||||||||||||
| NET UNREALIZED APPRECIATION | $ | 2,234,489 | ||||||||||||||||||||||
|
|
|
|||||||||||||||||||||||
| Description | Number of Contracts |
Expiration Date | Notional Amount | Value | Unrealized Appreciation (Depreciation) |
|||||||||||||||
| FUTURES CONTRACTS: LONG POSITIONS |
|
|||||||||||||||||||
| Three-Month Canadian Bankers’ Acceptance Futures | 4,000 | 12/19/22 | $ | 777,310,756 | $ | (7,563,448) | $ | (7,563,448) | ||||||||||||
| U.S. Treasury Ultra Bond |
3,771 | 06/21/22 | 667,938,375 | (27,048,808) | (27,048,808) | |||||||||||||||
| U.S. Treasury Ten-Year Note |
3,000 | 06/21/22 | 368,625,000 | (2,675,981) | (2,675,981) | |||||||||||||||
| U.S. Treasury Two-Year Note |
595 | 06/30/22 | 126,093,516 | (1,531,222) | (1,531,222) | |||||||||||||||
|
|
|
|
|
|
|
|||||||||||||||
| 1,939,967,647 | (38,819,459) | (38,819,459) | ||||||||||||||||||
|
|
|
|
|
|
|
|||||||||||||||
| FUTURES CONTRACTS: SHORT POSITIONS |
|
|||||||||||||||||||
| U.S. Treasury Ten-Year Ultra Bond | 323 | 06/21/22 | (43,756,406) | (245,345) | (245,345) | |||||||||||||||
| U.S. Treasury Five-Year Note | 108 | 06/30/22 | (12,386,250) | 286,630 | 286,630 | |||||||||||||||
|
|
|
|
|
|
|
|||||||||||||||
| (56,142,656) | 41,285 | 41,285 | ||||||||||||||||||
|
|
|
|
|
|
|
|||||||||||||||
| TOTAL FUTURES CONTRACTS |
$ | 1,883,824,991 | $ | (38,778,174) | $ | (38,778,174) | ||||||||||||||
|
|
|
|
|
|
|
|||||||||||||||
| Reference Obligation/Index | Financing the Fund |
Payment Frequency |
Implied Credit Spread at 03/31/221 |
Counterparty | Expiration Date |
Notional Amount (000’s)2 |
Value3 | Premiums Paid |
Unrealized Appreciation |
|||||||||||||||||||||||||
| SWAPS: CREDIT DEFAULT (SALES) - SINGLE ISSUES OTC4 |
|
|||||||||||||||||||||||||||||||||
| 1011778 BC ULC/New Red |
|
Credit Suisse | ||||||||||||||||||||||||||||||||
| Finance, Inc., 4.00%, due |
|
First Boston | ||||||||||||||||||||||||||||||||
| 10/15/305 |
5.00% | 3 Months | 120 | International | 06/20/23 | $ 20,000 | $ | 947,503 | $ | 805,678 | $ | 141,826 | ||||||||||||||||||||||
| Credit Suisse | ||||||||||||||||||||||||||||||||||
| Berry Global, Inc., 5.63%, due |
|
First Boston | ||||||||||||||||||||||||||||||||
| 07/15/27 |
5.00% | 3 Months | 175 | International | 12/20/23 | 60,665 | 3,381,654 | 3,209,172 | 172,481 | |||||||||||||||||||||||||
|
|
|
|
|
|
|
|||||||||||||||||||||||||||||
| TOTAL |
$ | 4,329,157 | $ | 4,014,850 | $ | 314,307 | ||||||||||||||||||||||||||||
|
|
|
|
|
|
|
|||||||||||||||||||||||||||||
See accompanying Notes to Financial Statements.
| 211 / Annual Report March 2022 |
Table of Contents
Total Return Bond Fund
Schedule of Portfolio Investments
March 31, 2022
| 1 | An implied credit spread is the spread in yield between a U.S. Treasury security and the referenced obligation or underlying investment that are identical in all respects except for the quality rating. Implied credit spreads, represented in absolute terms, utilized in determining the value of credit default swaps on corporate issues as of year end serve as an indicator of the current status of the payment performance risk and represent the likelihood of risk of default for the credit derivative. The implied credit spread of a particular referenced entity reflects the cost of buying/selling protection and may include upfront payments required to be made to enter the agreement. Wider credit spreads, in comparison to narrower credit spreads, represent a deterioration of the referenced entity’s credit soundness and a greater likelihood of risk of default or other credit event occurring as defined under the terms of the agreement. |
| 2 | The maximum potential amount for the Fund could be required to pay as a seller of credit protection or receive as a buyer of credit protection if a credit event occurs as defined under the terms of that particular swap agreement. |
| 3 | The quoted market prices are resulting values for credit default swap agreements on credit indices serve as an indicator of the current status of the payment/performance risk and represent the likelihood of an expected liability (or profit) for the credit derivative had the notional amount of the swap agreement been closed/sold as of year end. Increasing values (buy protection) or decreasing values (sell protection), when compared to the notional amount of the swap, represent a deterioration of the referenced entity’s credit soundness and a greater likelihood of risk of default or other credit event occurring as defined under the terms of the agreement. |
| 4 | If the Fund is a seller of protection and credit event occurs, as defined under the terms of that particular swap agreement, the Fund will either (i) pay to the buyer of protection the amount equal to the notional amount of the swap and take delivery of the referenced obligation or underlying investments comprising the referenced index or (ii) pay a net settlement amount in the form of cash or investments equal to the notional amount of the swap less the recovery value of the referenced obligation or underlying investments comprising the referenced index. |
| 5 | Security is valued using significant unobservable inputs and is classified as Level 3 in the fair value hierarchy. |
| Description | Number of contracts |
Exercise Price |
Expiration Date |
Notional Amount | Value | |||||||||||||||
| PURCHASED CALL OPTIONS EXCHANGE TRADED |
||||||||||||||||||||
| 90-Day Euro Dollar Futures |
16,595 | $98.00 | 12/19/22 | $ | 121,151,797 | $ | 7,467,750 | |||||||||||||
| IMM Eurodollar 1-Year MIDCV Future Options |
10,533 | 98.38 | 09/16/22 | 76,532,778 | 855,806 | |||||||||||||||
| IMM Eurodollar 1-Year MIDCV Future Options |
22,818 | 98.75 | 09/16/22 | 1,105,303,920 | 1,140,900 | |||||||||||||||
|
|
|
|
|
|||||||||||||||||
| TOTAL PURCHASED OPTIONS |
$ | 1,302,988,495 | $ | 9,464,456 | ||||||||||||||||
|
|
|
|
|
|||||||||||||||||
| Description | Number of contracts |
Exercise Price |
Expiration Date |
Notional Amount | Value | |||||||||||||||
| WRITTEN CALL OPTIONS EXCHANGE TRADED |
||||||||||||||||||||
| IMM Eurodollar 1-Year MIDCV Future Options |
51,790 | $99.00 | 09/16/22 | $ | (2,257,836,840) | $ | (1,942,125) | |||||||||||||
| 90-Day Euro Dollar Futures |
16,595 | 98.25 | 12/19/22 | (121,151,797) | (5,185,938) | |||||||||||||||
| IMM Eurodollar 2-Year MIDCV Future Options |
13,524 | 97.63 | 12/16/22 | (822,385,988) | (9,297,750) | |||||||||||||||
| IMM Eurodollar 2-Year MIDCV Future Options |
26,275 | 97.88 | 12/16/22 | (1,597,766,328) | (12,316,406) | |||||||||||||||
|
|
|
|
|
|||||||||||||||||
| (4,799,140,953) | (28,742,219) | |||||||||||||||||||
|
|
|
|
|
|||||||||||||||||
| WRITTEN PUT OPTIONS EXCHANGE TRADED |
||||||||||||||||||||
| 90-Day Euro Dollar Futures |
16,595 | $97.25 | 12/19/22 | $ | (121,151,796) | $ | (16,387,563) | |||||||||||||
| IMM Eurodollar 1-Year MIDCV Future Options |
64,196 | 97.63 | 09/16/22 | (310,965,424) | (138,021,400) | |||||||||||||||
| IMM Eurodollar 2-Year MIDCV Future Options |
39,799 | 97.38 | 12/16/22 | (2,420,152,316) | (46,515,081) | |||||||||||||||
|
|
|
|
|
|||||||||||||||||
| (2,852,269,536) | (200,924,044) | |||||||||||||||||||
|
|
|
|
|
|||||||||||||||||
| TOTAL WRITTEN OPTIONS |
$ | (7,651,410,489) | $ | (229,666,263) | ||||||||||||||||
|
|
|
|
|
|||||||||||||||||
| Received by the Fund |
Paid by the Fund | |||||||||||||||||||||||||||||||||||||
| Description | Counterparty | Purchase Date |
Maturity Date |
Rate | Frequency | Rate | Frequency | Notional Amount (000’s) |
Value | Premiums (Received) |
Unrealized (Depreciation) |
|||||||||||||||||||||||||||
| WRITTEN PUT SWAPTIONS |
|
|||||||||||||||||||||||||||||||||||||
| Option to enter into a 2-year Interest Rate Swap | Citigroup Global Markets, Inc. | 03/08/22 | 06/08/22 | 1.95 | % | Semi-annually | 3-month USD LIBOR | Quarterly | $ | 712,510 | $ | (11,018,468 | ) | $ | (2,137,530 | ) | $ | (8,880,938 | ) | |||||||||||||||||||
| Option to enter into a 2-year Interest Rate Swap | Goldman Sachs International | 03/08/22 | 06/08/22 | 1.95 | % | Semi-annually | 3-month USD LIBOR | Quarterly | $ | 944,800 | $ | (14,610,671 | ) | $ | (2,834,400 | ) | $ | (11,776,271 | ) | |||||||||||||||||||
| Option to enter into a 2-year Interest Rate Swap | JPMorgan Chase | 03/08/22 | 06/08/22 | 1.95 | % | Semi-annually | 3-month USD LIBOR | Quarterly | $ | 1,300,000 | $ | (20,103,590 | ) | $ | (4,015,050 | ) | $ | (16,088,540 | ) | |||||||||||||||||||
See accompanying Notes to Financial Statements.
| Annual Report March 2022 / 212 |
Table of Contents
Total Return Bond Fund
Schedule of Portfolio Investments
March 31, 2022
| Received by the Fund |
Paid by the Fund | |||||||||||||||||||||||||||||||||||||||||||
| Description | Counterparty | Purchase Date |
Maturity Date |
Rate | Frequency | Rate | Frequency | Notional Amount (000’s) |
Value | Premiums (Received) |
Unrealized (Depreciation) |
|||||||||||||||||||||||||||||||||
| Option to enter into a 2-year Interest Rate Swap | |
Morgan Stanley |
|
03/08/22 | 06/08/22 | 1.95 | % | |
Semi- annually |
|
|
3-month USD LIBOR |
|
Quarterly | $ | 1,000,000 | $ | (15,464,300) | $ | (3,112,500) | $ | (12,351,800) | ||||||||||||||||||||||
|
|
|
|
|
|
|
|
|
|||||||||||||||||||||||||||||||||||||
| TOTAL WRITTEN SWAPTIONS |
|
$ | 3,957,310 | $ | (61,197,029) | $ | (12,099,480) | $ | (49,097,549) | |||||||||||||||||||||||||||||||||||
|
|
|
|
|
|
|
|
|
|||||||||||||||||||||||||||||||||||||
| Counterparty | Interest Rate |
Trade Date |
Maturity Date |
Repurchase Amount |
Principal Amount |
Value | ||||||||||||||||||
| REVERSE REPURCHASE AGREEMENTS |
||||||||||||||||||||||||
| Bank of America N.A. |
(2.200) | % | 03/31/22 | 04/01/22 | $ | (986,189,729) | $ | (986,250,000) | $ | (986,250,000) | ||||||||||||||
| Barclays Bank PLC |
(0.070) | % | 03/15/22 | 04/01/22 | (1,989,938,089) | (1,990,000,000) | (1,990,000,000) | |||||||||||||||||
| JPMorgan Chase |
(2.200) | % | 03/31/22 | 04/01/22 | (987,439,653) | (987,500,000) | (987,500,000) | |||||||||||||||||
|
|
|
|||||||||||||||||||||||
| TOTAL REVERSE REPURCHASE AGREEMENTS |
|
$ | (3,963,750,000) | |||||||||||||||||||||
|
|
|
|||||||||||||||||||||||
| Received by the Fund | Paid by the Fund | |||||||||||||||||||||||||||
| Description | Maturity Date |
Rate | Frequency | Rate | Frequency | Notional Amount (000’s) |
Value | Premiums Paid |
Unrealized Appreciation (Depreciation) | |||||||||||||||||||
| SWAPS: INTEREST RATE |
||||||||||||||||||||||||||||
| Interest Rate Swap1 |
12/07/53 | 3-month USD LIBOR | Quarterly | 1.74% | Semi-annually | $ | 186,740 | $ | 19,272,035 | $ | — | $ | 19,272,035 | |||||||||||||||
| Interest Rate Swap1 |
07/24/53 | 3-month USD LIBOR | Quarterly | 1.81% | Semi-annually | 85,605 | 8,144,032 | — | 8,144,032 | |||||||||||||||||||
| Interest Rate Swap1 |
07/24/53 | 3-month USD LIBOR | Quarterly | 1.77% | Semi-annually | 171,210 | 17,535,722 | — | 17,535,722 | |||||||||||||||||||
| Interest Rate Swap1 |
07/24/53 | 3-month USD LIBOR | Quarterly | 1.79% | Semi-annually | 126,690 | 12,646,158 | — | 12,646,158 | |||||||||||||||||||
| Interest Rate Swap1 |
09/28/53 | 3-month USD LIBOR | Quarterly | 1.87% | Semi-annually | 190,870 | 15,173,573 | — | 15,173,573 | |||||||||||||||||||
| Interest Rate Swap1 |
12/07/25 | 1.69% | Semi-annually | 3-month USD LIBOR | Quarterly | 2,227,980 | (44,838,989) | — | (44,838,989) | |||||||||||||||||||
| Interest Rate Swap1 |
07/24/25 | 1.07% | Semi-annually | 3-month USD LIBOR | Quarterly | 1,024,820 | (35,454,775) | — | (35,454,775) | |||||||||||||||||||
| Interest Rate Swap1 |
07/24/25 | 1.03% | Semi-annually | 3-month USD LIBOR | Quarterly | 2,049,640 | (72,713,028) | — | (72,713,028) | |||||||||||||||||||
| Interest Rate Swap1 |
07/24/25 | 1.03% | Semi-annually | 3-month USD LIBOR | Quarterly | 1,515,880 | (53,550,432) | — | (53,550,432) | |||||||||||||||||||
| Interest Rate Swap1 |
09/28/25 | 1.39% | Semi-annually | 3-month USD LIBOR | Quarterly | 2,236,795 | (60,945,059) | — | (60,945,059) | |||||||||||||||||||
|
|
|
|
|
|
|
|
|
|
| |||||||||||||||||||
| TOTAL SWAPS CONTRACTS |
$ | 9,816,230 | $ | (194,730,763) | $ | — | $ | (194,730,763) | ||||||||||||||||||||
|
|
|
|
|
|
|
|
|
|
| |||||||||||||||||||
| 1 | Centrally cleared. |
See accompanying Notes to Financial Statements.
| 213 / Annual Report March 2022 |
Table of Contents
Schedule of Portfolio Investments
March 31, 2022
| Issues | Maturity Date |
Principal Amount |
Value | |||||||
| BONDS – 97.08% |
| |||||||||
| ASSET-BACKED SECURITIES — 7.20%** |
| |||||||||
| Barings CLO Ltd., |
| |||||||||
| Series 2013-IA, Class AR |
| |||||||||
| (Cayman Islands) |
| |||||||||
| (LIBOR USD 3-Month plus 0.80%) |
| |||||||||
| 1.05% |
01/20/281,2,3 | $ | 1,069,323 | $ | 1,063,612 | |||||
| BSPRT Issuer Ltd., |
| |||||||||
| Series 2019-FL5, Class A |
| |||||||||
| (Cayman Islands) |
| |||||||||
| (LIBOR USD 1-Month plus 1.15%) |
| |||||||||
| 1.55% |
05/15/291,2,3 | 1,149,642 | 1,146,823 | |||||||
| Canyon Capital CLO Ltd., |
| |||||||||
| Series 2021-1A, Class X |
| |||||||||
| (Cayman Islands) |
| |||||||||
| (LIBOR USD 3-Month plus 0.80%) |
| |||||||||
| 1.04% |
04/15/341,2,3 | 525,000 | 523,231 | |||||||
| CLNC Ltd., |
| |||||||||
| Series 2019-FL1, Class A |
| |||||||||
| (Cayman Islands) |
| |||||||||
| (SOFR30A plus 1.36%) |
| |||||||||
| 1.41% |
08/20/351,2,3 | 1,098,261 | 1,089,514 | |||||||
| Educational Funding of the South, Inc., |
| |||||||||
| Series 2011-1, Class A2 |
| |||||||||
| (LIBOR USD 3-Month plus 0.65%) |
| |||||||||
| 0.91% |
04/25/352 | 511,339 | 509,481 | |||||||
| FS Rialto, |
| |||||||||
| Series 2019-FL1, Class A |
| |||||||||
| (Cayman Islands) |
| |||||||||
| (LIBOR USD 1-Month plus 1.20%) |
| |||||||||
| 1.63% |
12/16/361,2,3 | 654,305 | 645,765 | |||||||
| Higher Education Funding I, |
| |||||||||
| Series 2014-1, Class A |
| |||||||||
| (LIBOR USD 3-Month plus 1.05%) |
| |||||||||
| 1.55% |
05/25/341,2 | 184,357 | 184,569 | |||||||
| Invitation Homes Trust, |
| |||||||||
| Series 2018-SFR2, Class B |
| |||||||||
| (LIBOR USD 1-Month plus 1.08%) |
| |||||||||
| 1.48% |
06/17/371,2 | 999,843 | 992,857 | |||||||
| LCM 29 Ltd., |
| |||||||||
| Series 29A, Class XR |
| |||||||||
| (Cayman Islands) |
| |||||||||
| (LIBOR USD 3-Month plus 0.80%) |
| |||||||||
| 1.04% |
04/15/311,2,3 | 613,636 | 609,727 | |||||||
| LoanCore Issuer Ltd., |
| |||||||||
| Series 2018-CRE1, Class A |
| |||||||||
| (Cayman Islands) |
| |||||||||
| (LIBOR USD 1-Month plus 1.13%) |
| |||||||||
| 1.53% |
05/15/281,2,3 | 469,025 | 468,405 | |||||||
| LoanCore Issuer Ltd., |
| |||||||||
| Series 2018-CRE1, Class AS |
| |||||||||
| (Cayman Islands) |
| |||||||||
| (LIBOR USD 1-Month plus 1.50%) |
| |||||||||
| 1.90% |
05/15/281,2,3 | 1,010,000 | 1,006,190 | |||||||
| MF1 Ltd., |
| |||||||||
| Series 2020-FL4, Class A |
| |||||||||
| (CME Term SOFR 1-Month plus 1.81%) |
|
|||||||||
| 2.14% |
11/15/351,2 | 485,000 | 480,883 | |||||||
| Issues | Maturity Date |
Principal Amount |
Value | |||||||
| ASSET-BACKED SECURITIES (continued) |
| |||||||||
| Navient Private Education Refi Loan Trust, |
| |||||||||
| Series 2021-CA, Class A |
| |||||||||
| 1.06% |
10/15/691 | $ | 1,242,816 | $ | 1,182,495 | |||||
| Nelnet Student Loan Trust, |
| |||||||||
| Series 2012-5A, Class A |
| |||||||||
| (LIBOR USD 1-Month plus 0.60%) |
| |||||||||
| 1.06% |
10/27/361,2 | 264,337 | 260,062 | |||||||
| Octagon Investment Partners XIV Ltd., |
| |||||||||
| Series 2012-1A, Class AARR |
| |||||||||
| (Cayman Islands) |
| |||||||||
| (LIBOR USD 3-Month plus 0.95%) |
| |||||||||
| 1.19% |
07/15/291,2,3 | 675,000 | 671,427 | |||||||
| OHA Credit Funding 2 Ltd., |
| |||||||||
| Series 2019-2A, Class XR |
| |||||||||
| (Cayman Islands) |
| |||||||||
| (LIBOR USD 3-Month plus 0.80%) |
| |||||||||
| 1.06% |
04/21/341,2,3 | 156,250 | 155,816 | |||||||
| Palmer Square Loan Funding Ltd., |
| |||||||||
| Series 2020-1A, Class A1 |
| |||||||||
| (Cayman Islands) |
| |||||||||
| (LIBOR USD 3-Month plus 0.80%) |
| |||||||||
| 1.28% |
02/20/281,2,3 | 495,914 | 493,434 | |||||||
| Palmer Square Loan Funding Ltd., |
| |||||||||
| Series 2021-2A, Class A1 |
| |||||||||
| (Cayman Islands) |
| |||||||||
| (LIBOR USD 3-Month plus 0.80%) |
| |||||||||
| 1.28% |
05/20/291,2,3 | 580,442 | 576,187 | |||||||
| Progress Residential Trust, |
| |||||||||
| Series 2020-SFR2, Class A |
| |||||||||
| 2.08% |
06/17/371 | 884,000 | 846,244 | |||||||
| SLM Student Loan Trust, |
| |||||||||
| Series 2003-10A, Class A3 |
| |||||||||
| (LIBOR USD 3-Month plus 0.47%) |
| |||||||||
| 1.30% |
12/15/271,2 | 29,562 | 29,556 | |||||||
| SLM Student Loan Trust, |
| |||||||||
| Series 2003-14, Class A6 |
| |||||||||
| (LIBOR USD 3-Month plus 0.30%) |
| |||||||||
| 0.56% |
07/25/252 | 94,137 | 93,906 | |||||||
| SLM Student Loan Trust, |
| |||||||||
| Series 2007-8, Class A4 |
| |||||||||
| (LIBOR USD 3-Month plus 0.47%) |
| |||||||||
| 0.73% |
01/26/262 | 51,667 | 51,572 | |||||||
| SLM Student Loan Trust, |
| |||||||||
| Series 2013-4, Class A |
| |||||||||
| (LIBOR USD 1-Month plus 0.55%) |
| |||||||||
| 1.01% |
06/25/432 | 106,721 | 105,014 | |||||||
| Tricon American Homes Trust, |
| |||||||||
| Series 2017-SFR2, Class A |
| |||||||||
| 2.93% |
01/17/361 | 1,050,647 | 1,043,299 | |||||||
|
|
|
|||||||||
| Total Asset-Backed Securities (Cost $14,386,730) |
|
14,230,069 | ||||||||
|
|
|
|||||||||
| CORPORATES — 26.04%* |
| |||||||||
| Banking — 9.76% |
| |||||||||
| Bank of America Corp. |
| |||||||||
| 2.88% |
04/24/234 | 3,600,000 | 3,601,125 | |||||||
See accompanying Notes to Financial Statements.
| Annual Report March 2022 / 214 |
Table of Contents
Ultra Short Bond Fund
Schedule of Portfolio Investments
March 31, 2022
| Issues | Maturity Date |
Principal Amount |
Value | |||||||
| CORPORATES (continued) |
| |||||||||
| Banking (continued) |
| |||||||||
| Credit Suisse Group AG |
| |||||||||
| (Switzerland) |
| |||||||||
| 2.59% |
09/11/251,3,4 | $ | 235,000 | $ | 226,797 | |||||
| 3.80% |
06/09/233 | 580,000 | 585,626 | |||||||
| DNB Bank ASA |
| |||||||||
| (Norway) |
| |||||||||
| 0.86% |
09/30/251,3,4 | 715,000 | 677,681 | |||||||
| HSBC Holdings PLC |
| |||||||||
| (United Kingdom) |
| |||||||||
| 0.98% |
05/24/253,4 | 1,000,000 | 949,191 | |||||||
| (LIBOR USD 3-Month plus 1.00%) |
| |||||||||
| 1.49% |
05/18/242,3 | 795,000 | 796,517 | |||||||
| ING Groep NV |
| |||||||||
| (Netherlands) |
| |||||||||
| 3.87% |
03/28/263,4 | 510,000 | 512,741 | |||||||
| JPMorgan Chase & Co. |
| |||||||||
| 3.21% |
04/01/234 | 2,400,000 | 2,401,246 | |||||||
| Lloyds Banking Group PLC |
| |||||||||
| (United Kingdom) |
| |||||||||
| 2.91% |
11/07/233,4 | 1,345,000 | 1,347,292 | |||||||
| 3.51% |
03/18/263,4 | 200,000 | 199,083 | |||||||
| Macquarie Group Ltd. |
| |||||||||
| (Australia) |
| |||||||||
| 1.20% |
10/14/251,3,4 | 850,000 | 804,099 | |||||||
| 3.19% |
11/28/231,3,4 | 380,000 | 380,724 | |||||||
| Morgan Stanley |
| |||||||||
| (GMTN) |
| |||||||||
| 3.13% |
01/23/23 | 2,350,000 | 2,371,596 | |||||||
| NatWest Group PLC |
| |||||||||
| (United Kingdom) |
| |||||||||
| 3.50% |
05/15/233,4 | 1,000,000 | 1,001,449 | |||||||
| Santander UK Group Holdings PLC |
| |||||||||
| (United Kingdom) |
| |||||||||
| 3.37% |
01/05/243,4 | 1,600,000 | 1,605,484 | |||||||
| 4.80% |
11/15/243,4 | 425,000 | 434,860 | |||||||
| UBS AG |
| |||||||||
| (Switzerland) |
| |||||||||
| 0.70% |
08/09/241,3 | 610,000 | 578,474 | |||||||
| Wells Fargo & Co. |
| |||||||||
| (MTN) |
| |||||||||
| 3.75% |
01/24/24 | 805,000 | 820,062 | |||||||
|
|
|
| ||||||||
| 19,294,047 | ||||||||||
|
|
|
| ||||||||
| Communications — 1.21% |
| |||||||||
| Qwest Corp. |
| |||||||||
| 7.25% |
09/15/25 | 400,000 | 437,000 | |||||||
| SES SA |
| |||||||||
| (Luxembourg) |
| |||||||||
| 3.60% |
04/04/231,3 | 600,000 | 603,516 | |||||||
| Sprint Spectrum Co. LLC/Sprint Spectrum Co. II LLC/Sprint |
|
|||||||||
| Spectrum Co. III LLC |
| |||||||||
| 4.74% |
03/20/251 | 1,110,000 | 1,133,788 | |||||||
| 5.15% |
03/20/281 | 200,000 | 210,790 | |||||||
|
|
|
| ||||||||
| 2,385,094 | ||||||||||
|
|
|
| ||||||||
| Issues | Maturity Date |
Principal Amount |
Value | |||||||
| CORPORATES (continued) |
| |||||||||
| Consumer Discretionary — 1.51% |
| |||||||||
| GSK Consumer Healthcare Capital UK PLC |
| |||||||||
| (United Kingdom) |
| |||||||||
| 3.13% |
03/24/251,3 | $ | 815,000 | $ | 812,982 | |||||
| Imperial Brands Finance PLC |
| |||||||||
| (United Kingdom) |
| |||||||||
| 3.75% |
07/21/221,3 | 945,000 | 948,117 | |||||||
| Pernod Ricard SA |
| |||||||||
| (France) |
| |||||||||
| 4.25% |
07/15/221,3 | 600,000 | 604,329 | |||||||
| Reynolds American, Inc. |
| |||||||||
| 4.85% |
09/15/23 | 600,000 | 615,014 | |||||||
|
|
|
| ||||||||
| 2,980,442 | ||||||||||
|
|
|
| ||||||||
| Electric — 1.27% |
| |||||||||
| Alliant Energy Finance LLC |
| |||||||||
| 3.75% |
06/15/231 | 725,000 | 733,472 | |||||||
| American Electric Power Co., Inc. |
| |||||||||
| 2.03% |
03/15/24 | 620,000 | 609,853 | |||||||
| Dominion Energy, Inc., |
| |||||||||
| Series B |
| |||||||||
| 2.75% |
09/15/22 | 350,000 | 350,798 | |||||||
| NextEra Energy Capital Holdings, Inc. |
| |||||||||
| 2.94% |
03/21/24 | 825,000 | 825,435 | |||||||
|
|
|
| ||||||||
| 2,519,558 | ||||||||||
|
|
|
| ||||||||
| Energy — 1.00% |
| |||||||||
| Energy Transfer LP |
| |||||||||
| 5.95% |
12/01/25 | 900,000 | 963,550 | |||||||
| Southern Co. Gas Capital Corp. |
| |||||||||
| 3.88% |
11/15/25 | 1,000,000 | 1,018,942 | |||||||
|
|
|
| ||||||||
| 1,982,492 | ||||||||||
|
|
|
| ||||||||
| Finance — 3.53% |
| |||||||||
| AerCap Ireland Capital DAC/AerCap Global Aviation Trust |
|
|||||||||
| (Ireland) |
| |||||||||
| 3.15% |
02/15/243 | 510,000 | 502,231 | |||||||
| Air Lease Corp. |
| |||||||||
| 2.25% |
01/15/23 | 600,000 | 600,477 | |||||||
| American Express Co. |
| |||||||||
| 2.25% |
03/04/25 | 530,000 | 520,563 | |||||||
| Avolon Holdings Funding Ltd. |
| |||||||||
| (Cayman Islands) |
| |||||||||
| 2.53% |
11/18/271,3 | 383,000 | 339,005 | |||||||
| Capital One Financial Corp. |
| |||||||||
| 1.34% |
12/06/244 | 610,000 | 592,107 | |||||||
| Citigroup, Inc. |
| |||||||||
| (LIBOR USD 3-Month plus 0.95%) |
| |||||||||
| 1.21% |
07/24/232 | 308,000 | 308,538 | |||||||
| Goldman Sachs Group, Inc. (The) |
| |||||||||
| 1.22% |
12/06/23 | 1,045,000 | 1,020,681 | |||||||
| JPMorgan Chase & Co. |
| |||||||||
| 2.95% |
02/24/284 | 1,085,000 | 1,059,200 | |||||||
| Morgan Stanley |
| |||||||||
| 2.48% |
01/21/284 | 655,000 | 624,890 | |||||||
| Morgan Stanley |
| |||||||||
| (MTN) |
| |||||||||
| 0.53% |
01/25/244 | 90,000 | 88,556 | |||||||
See accompanying Notes to Financial Statements.
| 215 / Annual Report March 2022 |
Table of Contents
Ultra Short Bond Fund
Schedule of Portfolio Investments
March 31, 2022
| Issues | Maturity Date |
Principal Amount |
Value | |||||||
| CORPORATES (continued) |
| |||||||||
| Finance (continued) |
| |||||||||
| Nationwide Building Society |
| |||||||||
| (United Kingdom) |
| |||||||||
| 3.62% |
04/26/231,3,4 | $ | 540,000 | $ | 540,115 | |||||
| 3.77% |
03/08/241,3,4 | 680,000 | 684,025 | |||||||
| Park Aerospace Holdings Ltd. |
| |||||||||
| (Cayman Islands) |
| |||||||||
| 4.50% |
03/15/231,3 | 100,000 | 100,760 | |||||||
|
|
|
| ||||||||
| 6,981,148 | ||||||||||
|
|
|
| ||||||||
| Health Care — 3.16% |
| |||||||||
| AbbVie, Inc. |
| |||||||||
| 3.20% |
11/06/22 | 600,000 | 604,684 | |||||||
| 3.25% |
10/01/22 | 200,000 | 201,016 | |||||||
| Baxter International, Inc. |
| |||||||||
| 0.87% |
12/01/231 | 615,000 | 595,595 | |||||||
| Bayer U.S. Finance II LLC |
| |||||||||
| 2.20% |
07/15/221 | 600,000 | 600,000 | |||||||
| 3.88% |
12/15/231 | 1,140,000 | 1,152,390 | |||||||
| CVS Health Corp. |
| |||||||||
| 3.50% |
07/20/22 | 600,000 | 601,610 | |||||||
| Dignity Health |
| |||||||||
| 3.13% |
11/01/22 | 150,000 | 151,148 | |||||||
| Fresenius U.S. Finance II, Inc. |
| |||||||||
| 4.50% |
01/15/231 | 585,000 | 592,605 | |||||||
| Humana, Inc. |
| |||||||||
| 0.65% |
08/03/23 | 610,000 | 595,309 | |||||||
| 3.15% |
12/01/22 | 600,000 | 603,893 | |||||||
| Viatris, Inc. |
| |||||||||
| 1.13% |
06/22/22 | 550,000 | 549,974 | |||||||
|
|
|
| ||||||||
| 6,248,224 | ||||||||||
|
|
|
| ||||||||
| Industrials — 0.94% |
| |||||||||
| Berry Global, Inc. |
| |||||||||
| 0.95% |
02/15/24 | 635,000 | 608,066 | |||||||
| Boeing Co. (The) |
| |||||||||
| 1.43% |
02/04/24 | 375,000 | 362,977 | |||||||
| General Electric Co. |
| |||||||||
| (MTN) |
| |||||||||
| (LIBOR USD 3-Month plus 0.38%) |
| |||||||||
| 0.70% |
05/05/262 | 142,000 | 139,810 | |||||||
| Sydney Airport Finance Co. Pty Ltd. |
| |||||||||
| (Australia) |
| |||||||||
| 3.90% |
03/22/231,3 | 750,000 | 758,934 | |||||||
|
|
|
| ||||||||
| 1,869,787 | ||||||||||
|
|
|
| ||||||||
| Information Technology — 0.91% |
| |||||||||
| Netflix, Inc. |
| |||||||||
| 3.63% |
06/15/251 | 490,000 | 493,214 | |||||||
| NXP BV/NXP Funding LLC |
| |||||||||
| (Netherlands) |
| |||||||||
| 4.63% |
06/01/231,3 | 220,000 | 223,290 | |||||||
| Skyworks Solutions, Inc. |
| |||||||||
| 0.90% |
06/01/23 | 505,000 | 493,989 | |||||||
| VMware, Inc. |
| |||||||||
| 1.00% |
08/15/24 | 610,000 | 581,654 | |||||||
|
|
|
| ||||||||
| 1,792,147 | ||||||||||
|
|
|
| ||||||||
| Issues | Maturity Date |
Principal Amount |
Value | |||||||
| CORPORATES (continued) |
| |||||||||
| Insurance — 0.95% |
| |||||||||
| Athene Global Funding |
| |||||||||
| 2.51% |
03/08/241 | $ | 135,000 | $ | 133,019 | |||||
| (SOFR Rate plus 0.70%) |
| |||||||||
| 0.91% |
05/24/241,2 | 500,000 | 493,794 | |||||||
| Nationwide Mutual Insurance Co. |
| |||||||||
| 3.12% |
12/15/241,4 | 670,000 | 670,462 | |||||||
| Trinity Acquisition PLC |
| |||||||||
| (United Kingdom) |
| |||||||||
| 4.63% |
08/15/233 | 570,000 | 583,287 | |||||||
|
|
|
| ||||||||
| 1,880,562 | ||||||||||
|
|
|
| ||||||||
| Materials — 0.19% |
| |||||||||
| International Flavors & Fragrances, Inc. |
| |||||||||
| 0.70% |
09/15/221 | 375,000 | 373,293 | |||||||
|
|
|
| ||||||||
| Real Estate Investment Trust (REIT) — 1.57% |
| |||||||||
| American Campus Communities Operating Partnership LP |
|
|||||||||
| 3.75% |
04/15/23 | 672,000 | 677,952 | |||||||
| GLP Capital LP/GLP Financing II, Inc. |
| |||||||||
| 5.38% |
11/01/23 | 1,000,000 | 1,026,875 | |||||||
| Kilroy Realty LP |
| |||||||||
| 3.45% |
12/15/24 | 525,000 | 526,659 | |||||||
| SL Green Operating Partnership LP |
| |||||||||
| 3.25% |
10/15/22 | 870,000 | 870,323 | |||||||
|
|
|
| ||||||||
| 3,101,809 | ||||||||||
|
|
|
| ||||||||
| Transportation — 0.04% |
| |||||||||
| Continental Airlines Pass-Through Trust, |
| |||||||||
| Series 2007-1, Class A |
| |||||||||
| 5.98% |
04/19/22 | 75,103 | 75,211 | |||||||
| Northwest Airlines Pass-Through Trust, |
| |||||||||
| Series 2001-1, Class A-1 |
| |||||||||
| 7.04% |
04/01/22 | 12,371 | 12,433 | |||||||
|
|
|
| ||||||||
| 87,644 | ||||||||||
|
|
|
| ||||||||
| Total Corporates (Cost $52,463,745) |
|
51,496,247 | ||||||||
|
|
|
| ||||||||
| MORTGAGE-BACKED — 35.51%** |
| |||||||||
| Non-Agency Commercial Mortgage-Backed — 7.39% |
| |||||||||
| AREIT Trust, |
| |||||||||
| Series 2020-CRE4, Class A |
| |||||||||
| (Cayman Islands) |
| |||||||||
| (SOFR30A plus 2.73%) |
| |||||||||
| 2.78% |
04/15/371,2,3 | 153,483 | 153,435 | |||||||
| Barclays Commercial Mortgage Securities Mortgage Trust, |
|
|||||||||
| Series 2017-C1, Class A2 |
| |||||||||
| 3.19% |
02/15/50 | 79,265 | 79,157 | |||||||
| BXMT Ltd., |
| |||||||||
| Series 2020-FL2, Class A |
| |||||||||
| (Cayman Islands) |
| |||||||||
| (SOFR30A plus 1.01%) |
| |||||||||
| 1.06% |
02/15/381,2,3 | 575,000 | 572,167 | |||||||
| CFCRE Commercial Mortgage Trust, |
| |||||||||
| Series 2016-C4, Class ASB |
| |||||||||
| 3.09% |
05/10/58 | 369,052 | 369,806 | |||||||
See accompanying Notes to Financial Statements.
| Annual Report March 2022 / 216 |
Table of Contents
Ultra Short Bond Fund
Schedule of Portfolio Investments
March 31, 2022
| Issues | Maturity Date |
Principal Amount |
Value | |||||||
| MORTGAGE-BACKED (continued) |
| |||||||||
| Non-Agency Commercial Mortgage-Backed (continued) |
|
|||||||||
| Citigroup Commercial Mortgage Trust, |
| |||||||||
| Series 2016-C2, Class A2 |
| |||||||||
| 1.85% |
08/10/49 | $ | 407,000 | $ | 402,569 | |||||
| Commercial Mortgage Trust, |
| |||||||||
| Series 2013-CR9, Class ASB |
| |||||||||
| 3.83% |
07/10/45 | 150,842 | 151,996 | |||||||
| Commercial Mortgage Trust, |
| |||||||||
| Series 2013-LC6, Class XA (IO) |
| |||||||||
| 1.26% |
01/10/464 | 2,416,840 | 10,325 | |||||||
| Commercial Mortgage Trust, |
| |||||||||
| Series 2014-CR20, Class A3 |
| |||||||||
| 3.33% |
11/10/47 | 451,628 | 449,563 | |||||||
| DBWF Mortgage Trust, |
| |||||||||
| Series 2018-AMXP, Class A |
| |||||||||
| 3.75% |
05/05/351,4 | 1,500,000 | 1,502,410 | |||||||
| Great Wolf Trust, |
| |||||||||
| Series 2019-WOLF, Class A |
| |||||||||
| (LIBOR USD 1-Month plus 1.03%) |
| |||||||||
| 1.43% |
12/15/361,2 | 850,000 | 839,640 | |||||||
| GS Mortgage Securities Trust, |
| |||||||||
| Series 2012-ALOH, Class A |
| |||||||||
| 3.55% |
04/10/341 | 1,571,000 | 1,570,313 | |||||||
| GS Mortgage Securities Trust, |
| |||||||||
| Series 2013-GC14, Class A4 |
| |||||||||
| 3.96% |
08/10/46 | 706,454 | 704,584 | |||||||
| Irvine Core Office Trust, |
| |||||||||
| Series 2013-IRV, Class A1 |
| |||||||||
| 2.07% |
05/15/481 | 252,381 | 252,616 | |||||||
| JPMorgan Chase Commercial Mortgage Securities Trust, |
|
|||||||||
| Series 2012-C6, Class A3 |
| |||||||||
| 3.51% |
05/15/45 | 83,235 | 83,137 | |||||||
| JPMorgan Chase Commercial Mortgage Securities Trust, |
|
|||||||||
| Series 2013-C16, Class A3 |
| |||||||||
| 3.88% |
12/15/46 | 597,228 | 597,722 | |||||||
| LoanCore Issuer Ltd., |
| |||||||||
| Series 2019-CRE3, Class A |
| |||||||||
| (Cayman Islands) |
| |||||||||
| (LIBOR USD 1-Month plus 1.05%) |
| |||||||||
| 1.45% |
04/15/341,2,3 | 661,930 | 659,260 | |||||||
| Morgan Stanley Bank of America Merrill Lynch Trust, |
|
|||||||||
| Series 2013-C12, Class XA (IO) |
| |||||||||
| 0.57% |
10/15/464 | 2,680,822 | 16,381 | |||||||
| Morgan Stanley Bank of America Merrill Lynch Trust, |
|
|||||||||
| Series 2014-C15, Class A3 |
| |||||||||
| 3.77% |
04/15/47 | 93,809 | 94,349 | |||||||
| MSCG Trust, |
| |||||||||
| Series 2018-SELF, Class A |
| |||||||||
| (LIBOR USD 1-Month plus 0.90%) |
| |||||||||
| 1.30% |
10/15/371,2 | 1,300,000 | 1,290,545 | |||||||
| SREIT Trust, |
| |||||||||
| Series 2021-MFP, Class A |
| |||||||||
| (LIBOR USD 1-Month plus 0.73%) |
| |||||||||
| 1.13% |
11/15/381,2 | 1,130,000 | 1,108,336 | |||||||
| Issues | Maturity Date |
Principal Amount |
Value | |||||||
| MORTGAGE-BACKED (continued) |
|
|||||||||
| Non-Agency Commercial Mortgage-Backed (continued) |
|
|||||||||
| VMC Finance LLC, |
| |||||||||
| Series 2019-FL3, Class A |
| |||||||||
| (LIBOR USD 1-Month plus 1.10%) |
| |||||||||
| 1.54% |
09/15/361,2 | $ | 273,976 | $ | 273,068 | |||||
| Wells Fargo Commercial Mortgage Trust, |
| |||||||||
| Series 2017-SMP, Class A |
| |||||||||
| (LIBOR USD 1-Month plus 0.88%) |
| |||||||||
| 1.27% |
12/15/341,2 | 1,100,000 | 1,085,869 | |||||||
| Wells Fargo Commercial Mortgage Trust, |
| |||||||||
| Series 2018-C47, Class A2 |
| |||||||||
| 4.36% |
09/15/61 | 868,000 | 883,934 | |||||||
| WF-RBS Commercial Mortgage Trust, |
| |||||||||
| Series 2012-C7, Class A2 |
| |||||||||
| 3.43% |
06/15/45 | 194,460 | 194,243 | |||||||
| WF-RBS Commercial Mortgage Trust, |
| |||||||||
| Series 2012-C9, Class XA (IO) |
| |||||||||
| 1.85% |
11/15/451,4 | 1,258,946 | 4,368 | |||||||
| WF-RBS Commercial Mortgage Trust, |
| |||||||||
| Series 2014-C19, Class A3 |
| |||||||||
| 3.66% |
03/15/47 | 1,258,287 | 1,258,964 | |||||||
|
|
|
|||||||||
| 14,608,757 | ||||||||||
|
|
|
|||||||||
| Non-Agency Mortgage-Backed — 8.39% |
| |||||||||
| Aames Mortgage Investment Trust, |
| |||||||||
| Series 2006-1, Class A4 |
| |||||||||
| (LIBOR USD 1-Month plus 0.56%) |
| |||||||||
| 1.02% |
04/25/362 | 51,754 | 51,689 | |||||||
| Aames Mortgage Trust, |
| |||||||||
| Series 2002-1, Class A3 (STEP-reset date 05/25/22) |
|
|||||||||
| 7.40% |
06/25/32 | 13,556 | 13,158 | |||||||
| Adjustable Rate Mortgage Trust, |
| |||||||||
| Series 2005-1, Class 1A1 |
| |||||||||
| 2.72% |
05/25/354 | 21,901 | 21,429 | |||||||
| Ajax Mortgage Loan Trust, |
| |||||||||
| Series 2019-F, Class A1 (STEP-reset date 04/25/22) |
|
|||||||||
| 2.86% |
07/25/591 | 183,607 | 181,437 | |||||||
| Alternative Loan Trust, |
| |||||||||
| Series 2004-J6, Class 2A1 |
| |||||||||
| 6.50% |
11/25/31 | 18,170 | 18,225 | |||||||
| Ameriquest Mortgage Securities, Inc., Asset-Backed Pass- Through Certificates, |
|
|||||||||
| Series 2005-R10, Class M3 |
| |||||||||
| (LIBOR USD 1-Month plus 0.68%) |
| |||||||||
| 1.13% |
01/25/362 | 616,147 | 610,980 | |||||||
| Ameriquest Mortgage Securities, Inc., Asset-Backed Pass- Through Certificates, |
|
|||||||||
| Series 2005-R9, Class M1 |
| |||||||||
| (LIBOR USD 1-Month plus 0.71%) |
| |||||||||
| 1.16% |
11/25/352 | 969,377 | 962,290 | |||||||
| Banc of America Funding Trust, |
| |||||||||
| Series 2003-2, Class 1A1 |
| |||||||||
| 6.50% |
06/25/32 | 2,701 | 2,667 | |||||||
| Bear Stearns ALT-A Trust, |
| |||||||||
| Series 2005-2, Class 1M1 |
| |||||||||
| (LIBOR USD 1-Month plus 0.75%) |
| |||||||||
| 1.21% |
03/25/352 | 173,515 | 173,206 | |||||||
See accompanying Notes to Financial Statements.
| 217 / Annual Report March 2022 |
Table of Contents
Ultra Short Bond Fund
Schedule of Portfolio Investments
March 31, 2022
| Issues | Maturity Date |
Principal Amount |
Value | |||||||
| MORTGAGE-BACKED (continued) |
| |||||||||
| Non-Agency Mortgage-Backed (continued) |
| |||||||||
| Citigroup Mortgage Loan Trust, |
| |||||||||
| Series 2007-AMC4, Class A2D |
| |||||||||
| (LIBOR USD 1-Month plus 0.27%) |
| |||||||||
| 0.73% |
05/25/372 | $ | 298,371 | $ | 285,971 | |||||
| Citigroup Mortgage Loan Trust, Inc., |
| |||||||||
| Series 2004-HYB1, Class A41 |
| |||||||||
| 2.66% |
02/25/344 | 212 | 214 | |||||||
| Citigroup Mortgage Loan Trust, Inc., |
| |||||||||
| Series 2006-WFH4, Class M2 |
| |||||||||
| (LIBOR USD 1-Month plus 0.44%) |
| |||||||||
| 0.89% |
11/25/362 | 740,786 | 734,571 | |||||||
| Countrywide Asset-Backed Certificates Trust, |
| |||||||||
| Series 2005-11, Class MV3 |
| |||||||||
| (LIBOR USD 1-Month plus 0.80%) |
| |||||||||
| 1.25% |
02/25/362 | 35,335 | 35,323 | |||||||
| Countrywide Asset-Backed Certificates Trust, |
| |||||||||
| Series 2005-4, Class MV5 |
| |||||||||
| (LIBOR USD 1-Month plus 1.01%) |
| |||||||||
| 1.46% |
10/25/352 | 1,000,323 | 1,008,413 | |||||||
| Credit Suisse First Boston Mortgage Securities Corp., |
| |||||||||
| Series 2002-AR31, Class 4A2 |
| |||||||||
| 2.25% |
11/25/324 | 17,089 | 17,025 | |||||||
| DSLA Mortgage Loan Trust, |
| |||||||||
| Series 2004-AR3, Class 2A2A |
| |||||||||
| (LIBOR USD 1-Month plus 0.74%) |
| |||||||||
| 1.19% |
07/19/442 | 82,702 | 79,344 | |||||||
| Encore Credit Receivables Trust, |
| |||||||||
| Series 2005-3, Class M4 |
| |||||||||
| (LIBOR USD 1-Month plus 0.90%) |
| |||||||||
| 1.36% |
10/25/352 | 1,250,000 | 1,251,354 | |||||||
| First Franklin Mortgage Loan Trust, |
| |||||||||
| Series 2005-FF8, Class M2 |
| |||||||||
| (LIBOR USD 1-Month plus 0.78%) |
| |||||||||
| 1.24% |
09/25/352 | 847,787 | 847,125 | |||||||
| First Franklin Mortgage Loan Trust, |
| |||||||||
| Series 2005-FF9, Class A1 |
| |||||||||
| (LIBOR USD 1-Month plus 0.58%) |
| |||||||||
| 1.04% |
10/25/352 | 308,408 | 308,708 | |||||||
| First Franklin Mortgage Loan Trust, |
| |||||||||
| Series 2006-FFH1, Class M1 |
| |||||||||
| (LIBOR USD 1-Month plus 0.56%) |
| |||||||||
| 1.01% |
01/25/362 | 776,032 | 759,064 | |||||||
| GE Mortgage Services LLC, |
| |||||||||
| Series 1998-HE1, Class A7 |
| |||||||||
| 6.47% |
06/25/28 | 1 | 1 | |||||||
| GSAA Home Equity Trust, |
| |||||||||
| Series 2005-MTR1, Class A4 |
| |||||||||
| (LIBOR USD 1-Month plus 0.74%) |
| |||||||||
| 1.20% |
10/25/352 | 222,490 | 222,719 | |||||||
| GSAMP Trust, |
| |||||||||
| Series 2005-HE5, Class M3 |
| |||||||||
| (LIBOR USD 1-Month plus 0.69%) |
| |||||||||
| 1.15% |
11/25/352 | 370,259 | 368,079 | |||||||
| Issues | Maturity Date |
Principal Amount |
Value | |||||||
| MORTGAGE-BACKED (continued) |
| |||||||||
| Non-Agency Mortgage-Backed (continued) |
| |||||||||
| GSAMP Trust, |
| |||||||||
| Series 2006-HE3, Class A2C |
| |||||||||
| (LIBOR USD 1-Month plus 0.32%) |
| |||||||||
| 0.78% |
05/25/462 | $ | 382,796 | $ | 381,852 | |||||
| HomeBanc Mortgage Trust, |
| |||||||||
| Series 2005-4, Class A1 |
| |||||||||
| (LIBOR USD 1-Month plus 0.54%) |
| |||||||||
| 1.00% |
10/25/352 | 188,917 | 189,041 | |||||||
| HSI Asset Securitization Corp. Trust, |
| |||||||||
| Series 2006-OPT1, Class M1 |
| |||||||||
| (LIBOR USD 1-Month plus 0.54%) |
| |||||||||
| 1.00% |
12/25/352 | 142,698 | 141,860 | |||||||
| IndyMac Index Mortgage Loan Trust, |
| |||||||||
| Series 2004-AR12, Class A1 |
| |||||||||
| (LIBOR USD 1-Month plus 0.78%) |
| |||||||||
| 1.24% |
12/25/342 | 284,222 | 237,831 | |||||||
| IndyMac Index Mortgage Loan Trust, |
| |||||||||
| Series 2004-AR6, Class 6A1 |
| |||||||||
| 2.93% |
10/25/344 | 77,085 | 75,296 | |||||||
| JPMorgan Mortgage Acquisition Trust, |
| |||||||||
| Series 2007-CH4, Class A5 |
| |||||||||
| (LIBOR USD 1-Month plus 0.24%) |
| |||||||||
| 0.70% |
05/25/372 | 1,860,924 | 1,852,989 | |||||||
| JPMorgan Mortgage Trust, |
| |||||||||
| Series 2005-A2, Class 9A1 |
| |||||||||
| 2.13% |
04/25/354 | 71,339 | 72,013 | |||||||
| MASTR Adjustable Rate Mortgages Trust, |
| |||||||||
| Series 2004-12, Class 5A1 |
| |||||||||
| 2.61% |
10/25/344 | 89,836 | 89,836 | |||||||
| MASTR Adjustable Rate Mortgages Trust, |
| |||||||||
| Series 2007-1, Class I2A1 |
| |||||||||
| (LIBOR USD 1-Month plus 0.32%) |
| |||||||||
| 0.78% |
01/25/472 | 536,561 | 525,994 | |||||||
| MASTR Asset-Backed Securities Trust, |
| |||||||||
| Series 2005-OPT1, Class M3 |
| |||||||||
| (LIBOR USD 1-Month plus 0.69%) |
| |||||||||
| 1.15% |
03/25/352 | 261,250 | 261,449 | |||||||
| MASTR Seasoned Securitization Trust, |
| |||||||||
| Series 2004-1, Class 4A1 |
| |||||||||
| 2.41% |
10/25/324 | 18,388 | 18,914 | |||||||
| Merrill Lynch Mortgage Investors Trust, |
| |||||||||
| Series 2003-A1, Class 2A |
| |||||||||
| (LIBOR USD 12-Month plus 1.63%) |
| |||||||||
| 2.96% |
12/25/322 | 137,501 | 136,236 | |||||||
| MortgageIT Trust, |
| |||||||||
| Series 2005-1, Class 1A1 |
| |||||||||
| (LIBOR USD 1-Month plus 0.64%) |
| |||||||||
| 1.10% |
02/25/352 | 535,960 | 535,423 | |||||||
| Nomura Resecuritization Trust, |
| |||||||||
| Series 2014-8R, Class 2A1 |
| |||||||||
| 3.00% |
09/26/351,4 | 218,363 | 217,795 | |||||||
| Nomura Resecuritization Trust, |
| |||||||||
| Series 2015-9R, Class 2A1 (STEP-reset date 05/26/22) |
|
|||||||||
| 3.00% |
05/25/361 | 251,366 | 250,770 | |||||||
See accompanying Notes to Financial Statements.
| Annual Report March 2022 / 218 |
Table of Contents
Ultra Short Bond Fund
Schedule of Portfolio Investments
March 31, 2022
| Issues | Maturity Date |
Principal Amount |
Value | |||||||
| MORTGAGE-BACKED (continued) |
| |||||||||
| Non-Agency Mortgage-Backed (continued) |
| |||||||||
| Option One Mortgage Loan Trust Asset-Backed Certificates 2005-5, |
|
|||||||||
| Series 2005-5, Class M1 |
| |||||||||
| (LIBOR USD 1-Month plus 0.59%) |
| |||||||||
| 1.04% |
12/25/352 | $ | 388,222 | $ | 390,476 | |||||
| Park Place Securities, Inc., Asset-Backed Pass-Through Certificates, |
|
|||||||||
| Series 2005-WHQ3, Class M4 |
| |||||||||
| (LIBOR USD 1-Month plus 0.95%) |
| |||||||||
| 1.40% |
06/25/352 | 208,381 | 208,824 | |||||||
| Residential Asset Mortgage Products Trust, |
| |||||||||
| Series 2004-SL1, Class A2 |
| |||||||||
| 8.50% |
11/25/31 | 34,570 | 11 | |||||||
| Residential Asset Securities Corp., |
| |||||||||
| Series 2006-KS3, Class M1 |
| |||||||||
| (LIBOR USD 1-Month plus 0.33%) |
| |||||||||
| 0.95% |
04/25/362 | 447,590 | 447,544 | |||||||
| Residential Asset Securities Corp., |
| |||||||||
| Series 2006-KS7, Class A4 |
| |||||||||
| (LIBOR USD 1-Month plus 0.24%) |
| |||||||||
| 0.70% |
09/25/362 | 381,052 | 380,177 | |||||||
| Residential Asset Securitization Trust, |
| |||||||||
| Series 2004-IP2, Class 2A1 |
| |||||||||
| 2.84% |
12/25/344 | 56,138 | 54,457 | |||||||
| Soundview Home Loan Trust, |
| |||||||||
| Series 2005-OPT1, Class M2 |
| |||||||||
| (LIBOR USD 1-Month plus 0.68%) |
| |||||||||
| 1.13% |
06/25/352 | 865,563 | 861,655 | |||||||
| Soundview Home Loan Trust, |
| |||||||||
| Series 2006-1, Class A4 |
| |||||||||
| (LIBOR USD 1-Month plus 0.60%) |
| |||||||||
| 1.06% |
02/25/362 | 141,806 | 141,946 | |||||||
| Soundview Home Loan Trust, |
| |||||||||
| Series 2006-OPT3, Class 2A3 |
| |||||||||
| (LIBOR USD 1-Month plus 0.34%) |
| |||||||||
| 0.80% |
06/25/362 | 152,507 | 152,439 | |||||||
| Structured Asset Investment Loan Trust, |
| |||||||||
| Series 2005-HE3, Class M1 |
| |||||||||
| (LIBOR USD 1-Month plus 0.72%) |
| |||||||||
| 1.18% |
09/25/352 | 257,587 | 256,100 | |||||||
| Structured Asset Securities Corp. Mortgage Loan Trust, |
|
|||||||||
| Series 2006-EQ1A, Class A1 |
| |||||||||
| (LIBOR USD 1-Month plus 0.14%) |
| |||||||||
| 0.59% |
07/25/361,2 | 214,504 | 212,737 | |||||||
| Structured Asset Securities Corp. Mortgage Loan Trust, |
|
|||||||||
| Series 2006-OPT1, Class A1 |
| |||||||||
| (LIBOR USD 1-Month plus 0.18%) |
| |||||||||
| 0.64% |
04/25/362 | 426,862 | 415,930 | |||||||
| Terwin NIMs Trust, |
| |||||||||
| Series 2004-13AL, Class 2PX (IO) |
| |||||||||
| 0.34% |
08/25/341,5,6 | 1,144,556 | 13,941 | |||||||
| WaMu Mortgage Pass-Through Certificates, |
| |||||||||
| Series 2002-AR6, Class A |
| |||||||||
| (Federal Reserve US 12-Month Cumulative Average plus 1.40%) |
|
|||||||||
| 1.54% |
06/25/422 | 10,101 | 9,876 | |||||||
| Issues | Maturity Date |
Principal Amount |
Value | |||||||
| MORTGAGE-BACKED (continued) |
| |||||||||
| Non-Agency Mortgage-Backed (continued) |
| |||||||||
| WaMu Mortgage Pass-Through Certificates, |
| |||||||||
| Series 2003-AR6, Class A1 |
| |||||||||
| 2.57% |
06/25/334 | $ | 32,757 | $ | 32,442 | |||||
| WaMu Mortgage Pass-Through Certificates, |
| |||||||||
| Series 2005-4, Class CB13 |
| |||||||||
| (LIBOR USD 1-Month plus 0.50%) |
| |||||||||
| 0.96% |
06/25/352 | 94,386 | 83,461 | |||||||
|
|
|
| ||||||||
| 16,602,307 | ||||||||||
|
|
|
| ||||||||
| U.S. Agency Commercial Mortgage-Backed — 2.71% |
| |||||||||
| Freddie Mac Multifamily Structured Pass-Through Certificates, |
|
|||||||||
| Series K021, Class X1 (IO) |
| |||||||||
| 1.38% |
06/25/224 | 6,713,589 | 3,166 | |||||||
| Freddie Mac Multifamily Structured Pass-Through Certificates, |
|
|||||||||
| Series KJ24, Class A1 |
| |||||||||
| 2.28% |
05/25/26 | 74,433 | 74,696 | |||||||
| Freddie Mac Multifamily Structured Pass-Through Certificates, |
|
|||||||||
| Series KJ26, Class A1 |
| |||||||||
| 2.14% |
07/25/25 | 487,219 | 486,086 | |||||||
| Freddie Mac Multifamily Structured Pass-Through Certificates, |
|
|||||||||
| Series KJ28, Class A1 |
| |||||||||
| 1.77% |
02/25/25 | 147,409 | 146,756 | |||||||
| Freddie Mac Multifamily Structured Pass-Through Certificates, |
|
|||||||||
| Series KJ29, Class A1 |
| |||||||||
| 0.74% |
01/25/26 | 591,651 | 569,757 | |||||||
| Freddie Mac Multifamily Structured Pass-Through Certificates, |
|
|||||||||
| Series KJ31, Class A1 |
| |||||||||
| 0.57% |
05/25/26 | 727,301 | 700,171 | |||||||
| Freddie Mac Multifamily Structured Pass-Through Certificates, |
|
|||||||||
| Series KJ32, Class A1 |
|
|||||||||
| 0.52% |
06/25/25 | 927,366 | 892,292 | |||||||
| Freddie Mac Multifamily Structured Pass-Through Certificates, |
|
|||||||||
| Series KJ34, Class A1 |
| |||||||||
| 0.68% |
06/25/26 | 619,176 | 581,271 | |||||||
| Freddie Mac Multifamily Structured Pass-Through Certificates, |
|
|||||||||
| Series KS07, Class X (IO) |
| |||||||||
| 0.64% |
09/25/254 | 3,413,082 | 74,088 | |||||||
| Freddie Mac Multifamily Structured Pass-Through Certificates, |
|
|||||||||
| Series Q004, Class AFL |
| |||||||||
| (Federal Reserve US 12-Month Cumulative Average plus 0.74%) |
|
|||||||||
| 0.88% |
05/25/442 | 133,823 | 133,830 | |||||||
| Freddie Mac Multifamily Structured Pass-Through Certificates, |
|
|||||||||
| Series Q010, Class APT1 |
| |||||||||
| 2.61% |
04/25/464 | 80,569 | 82,488 | |||||||
See accompanying Notes to Financial Statements.
| 219 / Annual Report March 2022 |
Table of Contents
Ultra Short Bond Fund
Schedule of Portfolio Investments
March 31, 2022
| Issues | Maturity Date |
Principal Amount |
Value | |||||||
| MORTGAGE-BACKED (continued) |
| |||||||||
| U.S. Agency Commercial Mortgage-Backed (continued) |
|
|||||||||
| Ginnie Mae, |
| |||||||||
| Series 2007-12, Class C |
| |||||||||
| 5.28% |
04/16/414 | $ | 72,774 | $ | 72,950 | |||||
| Ginnie Mae, |
| |||||||||
| Series 2008-92, Class E |
| |||||||||
| 5.56% |
03/16/444 | 120,079 | 120,952 | |||||||
| Ginnie Mae, |
| |||||||||
| Series 2010-159, Class D |
| |||||||||
| 4.30% |
09/16/444 | 253,031 | 252,707 | |||||||
| Ginnie Mae, |
| |||||||||
| Series 2011-165, Class IO (IO) |
| |||||||||
| 0.00% |
10/16/514 | 2,752,947 | 99 | |||||||
| Ginnie Mae, |
| |||||||||
| Series 2011-58, Class C |
| |||||||||
| 3.87% |
08/16/514 | 87,135 | 87,398 | |||||||
| Ginnie Mae, |
| |||||||||
| Series 2011-92, Class C |
| |||||||||
| 3.74% |
04/16/524 | 1,054,072 | 1,038,275 | |||||||
| Ginnie Mae, |
| |||||||||
| Series 2012-135, Class IO (IO) |
| |||||||||
| 0.52% |
01/16/534 | 2,087,804 | 35,560 | |||||||
|
|
|
| ||||||||
| 5,352,542 | ||||||||||
|
|
|
| ||||||||
| U.S. Agency Mortgage-Backed — 17.02% |
| |||||||||
| Fannie Mae Pool 254548 |
| |||||||||
| 5.50% |
12/01/32 | 60,176 | 65,946 | |||||||
| Fannie Mae Pool 555098 |
| |||||||||
| (LIBOR USD 12-Month plus 1.51%) |
| |||||||||
| 1.76% |
11/01/322 | 11,202 | 11,208 | |||||||
| Fannie Mae Pool 555424 |
| |||||||||
| 5.50% |
05/01/33 | 39,779 | 42,644 | |||||||
| Fannie Mae Pool 567002 |
| |||||||||
| 8.00% |
05/01/23 | 1,250 | 1,260 | |||||||
| Fannie Mae Pool 655133 |
| |||||||||
| 7.00% |
08/01/32 | 5,758 | 5,949 | |||||||
| Fannie Mae Pool 655151 |
| |||||||||
| 7.00% |
08/01/32 | 4,886 | 4,961 | |||||||
| Fannie Mae Pool 762525 |
| |||||||||
| 6.50% |
11/01/33 | 13,565 | 14,036 | |||||||
| Fannie Mae Pool 770900 |
| |||||||||
| (LIBOR USD 12-Month plus 1.56%) |
| |||||||||
| 1.81% |
04/01/342 | 59,535 | 60,837 | |||||||
| Fannie Mae Pool AD0538 |
| |||||||||
| 6.00% |
05/01/24 | 8,522 | 8,742 | |||||||
| Fannie Mae Pool AE0443 |
| |||||||||
| 6.50% |
10/01/39 | 45,619 | 50,269 | |||||||
| Fannie Mae Pool AL0851 |
| |||||||||
| 6.00% |
10/01/40 | 40,773 | 45,257 | |||||||
| Fannie Mae Pool AM4580 |
| |||||||||
| 3.43% |
10/01/23 | 464,309 | 468,846 | |||||||
| Fannie Mae REMICS, |
| |||||||||
| Series 1993-80, Class S |
| |||||||||
| (-1.22 X LIBOR USD 1-Month plus 10.88%, 10.88% Cap) |
|
|||||||||
| 10.32% |
05/25/232 | 109 | 113 | |||||||
| Issues | Maturity Date |
Principal Amount |
Value | |||||||
| MORTGAGE-BACKED (continued) |
| |||||||||
| U.S. Agency Mortgage-Backed (continued) |
| |||||||||
| Fannie Mae REMICS, |
| |||||||||
| Series 2001-42, Class SB |
| |||||||||
| (-16.00 X LIBOR USD 1-Month plus 128.00%, 8.50% Cap) |
|
|||||||||
| 8.50% |
09/25/312 | $ | 763 | $ | 813 | |||||
| Fannie Mae REMICS, |
| |||||||||
| Series 2001-60, Class OF |
| |||||||||
| (LIBOR USD 1-Month plus 0.95%) |
| |||||||||
| 1.41% |
10/25/312 | 58,838 | 60,005 | |||||||
| Fannie Mae REMICS, |
| |||||||||
| Series 2002-30, Class FB |
| |||||||||
| (LIBOR USD 1-Month plus 1.00%) |
| |||||||||
| 1.46% |
08/25/312 | 62,756 | 63,753 | |||||||
| Fannie Mae REMICS, |
| |||||||||
| Series 2003-124, Class TS |
| |||||||||
| (-14.00 X LIBOR USD 1-Month plus 100.80%, 9.80% Cap) |
|
|||||||||
| 9.80% |
01/25/342 | 8,472 | 8,683 | |||||||
| Fannie Mae REMICS, |
| |||||||||
| Series 2004-60, Class FW |
| |||||||||
| (LIBOR USD 1-Month plus 0.45%) |
| |||||||||
| 0.91% |
04/25/342 | 182,469 | 183,273 | |||||||
| Fannie Mae REMICS, |
| |||||||||
| Series 2004-96, Class MT |
| |||||||||
| (-17.50 X LIBOR USD 1-Month plus 125.13%, 7.00% Cap) |
|
|||||||||
| 7.00% |
12/25/342 | 10,049 | 10,206 | |||||||
| Fannie Mae REMICS, |
| |||||||||
| Series 2005-73, Class DF |
| |||||||||
| (LIBOR USD 1-Month plus 0.25%) |
| |||||||||
| 0.71% |
08/25/352 | 100,561 | 100,341 | |||||||
| Fannie Mae REMICS, |
| |||||||||
| Series 2007-68, Class SC (IO) |
| |||||||||
| (-1.00 X LIBOR USD 1-Month plus 6.70%, 6.70% Cap) |
|
|||||||||
| 6.24% |
07/25/372 | 61,717 | 10,348 | |||||||
| Fannie Mae REMICS, |
| |||||||||
| Series 2010-109, Class PF |
| |||||||||
| (LIBOR USD 1-Month plus 0.40%) |
| |||||||||
| 0.86% |
10/25/402 | 40,878 | 41,074 | |||||||
| Fannie Mae REMICS, |
| |||||||||
| Series 2010-26, Class S (IO) |
| |||||||||
| (-1.00 X LIBOR USD 1-Month plus 6.23%, 6.23% Cap) |
|
|||||||||
| 5.77% |
11/25/362 | 234,993 | 37,465 | |||||||
| Fannie Mae REMICS, |
| |||||||||
| Series 2010-95, Class FB |
| |||||||||
| (LIBOR USD 1-Month plus 0.40%) |
| |||||||||
| 0.86% |
09/25/402 | 57,207 | 57,689 | |||||||
| Fannie Mae REMICS, |
| |||||||||
| Series 2011-47, Class GF |
| |||||||||
| (LIBOR USD 1-Month plus 0.57%) |
| |||||||||
| 1.03% |
06/25/412 | 791,176 | 798,296 | |||||||
| Fannie Mae REMICS, |
| |||||||||
| Series 2012-19, Class FP |
| |||||||||
| (LIBOR USD 1-Month plus 0.50%) |
| |||||||||
| 0.96% |
12/25/392 | 26,969 | 26,969 | |||||||
| Fannie Mae REMICS, |
| |||||||||
| Series 2018-79, Class FA |
| |||||||||
| (LIBOR USD 1-Month plus 0.25%) |
| |||||||||
| 0.71% |
11/25/482 | 52,116 | 51,739 | |||||||
See accompanying Notes to Financial Statements.
| Annual Report March 2022 / 220 |
Table of Contents
Ultra Short Bond Fund
Schedule of Portfolio Investments
March 31, 2022
| Issues | Maturity Date |
Principal Amount |
Value | |||||||
| MORTGAGE-BACKED (continued) |
| |||||||||
| U.S. Agency Mortgage-Backed (continued) |
| |||||||||
| Fannie Mae REMICS, |
| |||||||||
| Series 2019-79, Class FA |
| |||||||||
| (LIBOR USD 1-Month plus 0.50%) |
| |||||||||
| 0.96% |
01/25/502 | $ | 110,687 | $ | 111,394 | |||||
| Fannie Mae REMICS, |
| |||||||||
| Series 2020-10, Class FA |
| |||||||||
| (LIBOR USD 1-Month plus 0.50%) |
| |||||||||
| 0.96% |
03/25/502 | 377,600 | 379,919 | |||||||
| Freddie Mac REMICS, |
| |||||||||
| Series 1526, Class L |
| |||||||||
| 6.50% |
06/15/23 | 278 | 285 | |||||||
| Freddie Mac REMICS, |
| |||||||||
| Series 2368, Class AF |
| |||||||||
| (LIBOR USD 1-Month plus 0.95%) |
| |||||||||
| 1.35% |
10/15/312 | 54,451 | 55,495 | |||||||
| Freddie Mac REMICS, |
| |||||||||
| Series 2733, Class FB |
| |||||||||
| (LIBOR USD 1-Month plus 0.60%) |
| |||||||||
| 1.00% |
10/15/332 | 396,507 | 401,903 | |||||||
| Freddie Mac REMICS, |
| |||||||||
| Series 2990, Class LE |
| |||||||||
| (LIBOR USD 1-Month plus 0.32%) |
| |||||||||
| 0.72% |
10/15/342 | 87,444 | 87,474 | |||||||
| Freddie Mac REMICS, |
| |||||||||
| Series 3085, Class FW |
| |||||||||
| (LIBOR USD 1-Month plus 0.70%) |
| |||||||||
| 1.10% |
08/15/352 | 251,043 | 254,905 | |||||||
| Freddie Mac REMICS, |
| |||||||||
| Series 3300, Class FA |
| |||||||||
| (LIBOR USD 1-Month plus 0.30%) |
| |||||||||
| 0.70% |
08/15/352 | 233,637 | 234,266 | |||||||
| Freddie Mac REMICS, |
| |||||||||
| Series 3325, Class NF |
| |||||||||
| (LIBOR USD 1-Month plus 0.30%) |
| |||||||||
| 0.70% |
08/15/352 | 46,934 | 47,061 | |||||||
| Freddie Mac REMICS, |
| |||||||||
| Series 3792, Class DF |
| |||||||||
| (LIBOR USD 1-Month plus 0.40%) |
| |||||||||
| 0.80% |
11/15/402 | 24,890 | 24,929 | |||||||
| Freddie Mac REMICS, |
| |||||||||
| Series 3845, Class FQ |
| |||||||||
| (LIBOR USD 1-Month plus 0.25%) |
| |||||||||
| 0.65% |
02/15/262 | 2,213 | 2,212 | |||||||
| Freddie Mac REMICS, |
| |||||||||
| Series 3879, Class MF |
| |||||||||
| (LIBOR USD 1-Month plus 0.35%) |
| |||||||||
| 0.75% |
09/15/382 | 2,404 | 2,404 | |||||||
| Freddie Mac REMICS, |
| |||||||||
| Series 3895, Class BF |
| |||||||||
| (LIBOR USD 1-Month plus 0.50%) |
| |||||||||
| 0.90% |
07/15/412 | 154,435 | 156,084 | |||||||
| Freddie Mac REMICS, |
| |||||||||
| Series 3907, Class FM |
| |||||||||
| (LIBOR USD 1-Month plus 0.35%) |
| |||||||||
| 0.75% |
05/15/262 | 30,465 | 30,536 | |||||||
| Issues | Maturity Date |
Principal Amount |
Value | |||||||
| MORTGAGE-BACKED (continued) |
| |||||||||
| U.S. Agency Mortgage-Backed (continued) |
| |||||||||
| Freddie Mac REMICS, |
| |||||||||
| Series 3940, Class PF |
| |||||||||
| (LIBOR USD 1-Month plus 0.35%) |
| |||||||||
| 0.75% |
05/15/402 | $ | 5,639 | $ | 5,639 | |||||
| Freddie Mac REMICS, |
| |||||||||
| Series 3946, Class FD |
| |||||||||
| (LIBOR USD 1-Month plus 0.35%) |
| |||||||||
| 0.75% |
04/15/412 | 108,108 | 108,259 | |||||||
| Freddie Mac REMICS, |
| |||||||||
| Series 3946, Class FG |
| |||||||||
| (LIBOR USD 1-Month plus 0.35%) |
| |||||||||
| 0.75% |
10/15/392 | 43,807 | 43,825 | |||||||
| Freddie Mac Strips, |
| |||||||||
| Series 263, Class F5 |
| |||||||||
| (LIBOR USD 1-Month plus 0.50%) |
| |||||||||
| 0.90% |
06/15/422 | 172,875 | 173,101 | |||||||
| Ginnie Mae (TBA) |
| |||||||||
| 2.00% |
04/20/52 | 1,050,000 | 998,787 | |||||||
| 2.50% |
04/20/52 | 4,225,000 | 4,095,970 | |||||||
| Ginnie Mae I Pool BW5284 |
| |||||||||
| 3.55% |
10/15/50 | 1,171,101 | 1,171,101 | |||||||
| Ginnie Mae II Pool 80546 |
| |||||||||
| (US Treasury Yield Curve Rate T Note Constant Maturity 1-Year plus 1.50%) |
|
|||||||||
| 1.75% |
10/20/312 | 5,676 | 5,812 | |||||||
| Ginnie Mae II Pool 80610 |
| |||||||||
| (US Treasury Yield Curve Rate T Note Constant Maturity 1-Year plus 1.50%) |
|
|||||||||
| 1.88% |
06/20/322 | 70,625 | 72,860 | |||||||
| Ginnie Mae II Pool 80614 |
| |||||||||
| (US Treasury Yield Curve Rate T Note Constant Maturity 1-Year plus 1.50%) |
|
|||||||||
| 1.63% |
07/20/322 | 6,974 | 7,157 | |||||||
| Ginnie Mae II Pool 80687 |
| |||||||||
| (US Treasury Yield Curve Rate T Note Constant Maturity 1-Year plus 1.50%) |
|
|||||||||
| 1.88% |
04/20/332 | 52,336 | 53,010 | |||||||
| Ginnie Mae II Pool 8339 |
| |||||||||
| (US Treasury Yield Curve Rate T Note Constant Maturity 1-Year plus 1.50%) |
|
|||||||||
| 1.75% |
12/20/232 | 3,019 | 3,032 | |||||||
| Ginnie Mae II Pool 8684 |
| |||||||||
| (US Treasury Yield Curve Rate T Note Constant Maturity 1-Year plus 1.50%) |
|
|||||||||
| 1.63% |
08/20/252 | 9,715 | 9,887 | |||||||
| Ginnie Mae II Pool MA0331 |
| |||||||||
| (US Treasury Yield Curve Rate T Note Constant Maturity 1-Year plus 1.50%) |
|
|||||||||
| 1.63% |
08/20/422 | 43,027 | 44,514 | |||||||
| Ginnie Mae, |
| |||||||||
| Series 2002-72, Class FB |
| |||||||||
| (LIBOR USD 1-Month plus 0.40%) |
| |||||||||
| 0.85% |
10/20/322 | 57,410 | 57,602 | |||||||
See accompanying Notes to Financial Statements.
| 221 / Annual Report March 2022 |
Table of Contents
Ultra Short Bond Fund
Schedule of Portfolio Investments
March 31, 2022
| Issues | Maturity Date |
Principal Amount |
Value | |||||||
| MORTGAGE-BACKED (continued) |
|
|||||||||
| U.S. Agency Mortgage-Backed (continued) |
|
|||||||||
| Ginnie Mae, |
|
|||||||||
| Series 2002-72, Class FC |
|
|||||||||
| (LIBOR USD 1-Month plus 0.40%) |
|
|||||||||
| 0.85% |
10/20/322 | $ | 84,686 | $ | 84,969 | |||||
| Ginnie Mae, |
|
|||||||||
| Series 2004-2, Class FW |
|
|||||||||
| (LIBOR USD 1-Month plus 1.40%) |
|
|||||||||
| 1.63% |
01/16/342 | 329,088 | 335,505 | |||||||
| Ginnie Mae, |
|
|||||||||
| Series 2009-92, Class FC |
|
|||||||||
| (LIBOR USD 1-Month plus 0.80%) |
|
|||||||||
| 1.23% |
10/16/392 | 79,046 | 80,738 | |||||||
| Ginnie Mae, |
|
|||||||||
| Series 2010-19, Class FD |
|
|||||||||
| (LIBOR USD 1-Month plus 0.45%) |
|
|||||||||
| 0.88% |
07/16/392 | 28,072 | 28,212 | |||||||
| Ginnie Mae, |
|
|||||||||
| Series 2011-70, Class IL (IO) |
|
|||||||||
| (-1.00 X LIBOR USD 1-Month plus 7.10%, 0.60% Cap) |
| |||||||||
| 0.60% |
06/16/372 | 1,161,881 | 10,508 | |||||||
| UMBS (TBA) |
|
|||||||||
| 2.00% |
05/01/52 | 3,225,000 | 2,988,340 | |||||||
| 2.50% |
05/01/52 | 12,500,000 | 11,902,037 | |||||||
| 3.00% |
04/01/52 | 500,000 | 489,141 | |||||||
| 3.00% |
05/01/52 | 7,025,000 | 6,858,156 | |||||||
|
|
|
| ||||||||
| 33,647,751 | ||||||||||
|
|
|
| ||||||||
| Total Mortgage-Backed (Cost $71,102,451) |
|
70,211,357 | ||||||||
|
|
|
| ||||||||
| MUNICIPAL BONDS — 0.86%* |
|
|||||||||
| Colorado — 0.48% |
|
|||||||||
| City & County of Denver Airport System Revenue Bonds, |
| |||||||||
| Series C |
|
|||||||||
| 0.88% |
11/15/23 | 965,000 | 939,787 | |||||||
|
|
|
| ||||||||
| Florida — 0.38% |
|
|||||||||
| County of Miami-Dade Aviation Revenue Bonds, Airport and |
| |||||||||
| Marina Improvements, Series D |
|
|||||||||
| 2.32% |
10/01/22 | 755,000 | 758,347 | |||||||
|
|
|
| ||||||||
| Total Municipal Bonds (Cost $1,726,217) |
|
1,698,134 | ||||||||
|
|
|
| ||||||||
| U.S. TREASURY SECURITIES — 27.47% |
|
|||||||||
| U.S. Agency Discount Notes — 1.28% |
|
|||||||||
| U.S. International Development Finance Corp., |
| |||||||||
| Series 2 |
|
|||||||||
| 1.49% |
08/15/31 | 2,680,000 | 2,521,924 | |||||||
|
|
|
| ||||||||
| U.S. Treasury Notes — 26.19% |
|
|||||||||
| U.S. Treasury Floating Rate Notes |
|
|||||||||
| (US Treasury Bill Yield 3-Month plus 0.11%) |
|
|||||||||
| 0.98% |
04/30/222 | 10,000,000 | 10,002,132 | |||||||
| U.S. Treasury Notes |
|
|||||||||
| 0.88% |
01/31/24 | 3,479,000 | 3,390,870 | |||||||
| 1.50% |
02/29/24 | 10,887,000 | 10,729,649 | |||||||
| 1.75% |
03/15/25 | 27,933,000 | 27,355,960 | |||||||
| Issues | Maturity Date |
Principal Amount |
Value | |||||||
| U.S. TREASURY SECURITIES (continued) |
|
|||||||||
| U.S. Treasury Notes (continued) |
|
|||||||||
| 1.88% |
02/28/27 | $ | 90,000 | $ | 87,623 | |||||
| 2.25% |
03/31/24 | 225,000 | 224,701 | |||||||
| 2.50% |
03/31/27 | 5,000 | 5,012 | |||||||
|
|
|
| ||||||||
| 51,795,947 | ||||||||||
|
|
|
| ||||||||
| Total U.S. Treasury Securities (Cost $54,736,431) |
|
54,317,871 | ||||||||
|
|
|
| ||||||||
| Total Bonds — 97.08% |
|
|||||||||
| (Cost $194,415,574) |
|
191,953,678 | ||||||||
|
|
|
| ||||||||
| Issues | Shares | Value | ||||||||
| Purchased Options - 0.01% |
|
|||||||||
| (Cost $89,156) |
|
23,588 | ||||||||
|
|
|
| ||||||||
| Issues | Maturity Date |
Principal Amount/Shares |
Value | |||||||
| SHORT-TERM INVESTMENTS — 17.80% |
|
|||||||||
| Money Market Funds — 4.60% |
|
|||||||||
| Dreyfus Government Cash Management Fund |
| |||||||||
| 0.19%7 |
3,013,000 | 3,013,000 | ||||||||
| Morgan Stanley Institutional Liquidity Funds - Government Portfolio |
|
|||||||||
| 0.23%7 |
6,084,000 | 6,084,000 | ||||||||
|
|
|
| ||||||||
| 9,097,000 | ||||||||||
|
|
|
| ||||||||
| U.S. Agency Discount Notes — 3.61% |
|
|||||||||
| Federal Home Loan Bank |
|
|||||||||
| 1.04%8 |
06/14/24 | 2,430,000 | 2,352,469 | |||||||
| 1.20%8 |
12/23/24 | 3,660,000 | 3,532,882 | |||||||
| 3.22% |
09/04/24 | 1,270,000 | 1,248,018 | |||||||
|
|
|
| ||||||||
| 7,133,369 | ||||||||||
|
|
|
| ||||||||
| U.S. Treasury Bills — 9.59% |
|
|||||||||
| U.S. Treasury Bills |
|
|||||||||
| 0.07%8 |
04/28/22 | 7,000,000 | 6,999,468 | |||||||
| 0.08%8 |
05/26/22 | 5,000,000 | 4,997,708 | |||||||
| 0.18%8 |
06/23/22 | 2,000,000 | 1,997,856 | |||||||
| 0.61%8 |
08/25/22 | 5,000,000 | 4,982,359 | |||||||
|
|
|
| ||||||||
| 18,977,391 | ||||||||||
|
|
|
| ||||||||
| Total Short-Term Investments |
|
|||||||||
| (Cost $35,442,933) |
|
35,207,760 | ||||||||
| Total Investments Before Written Options - 114.89% |
|
|||||||||
| (Cost $229,947,663) |
|
227,185,026 | ||||||||
|
|
|
| ||||||||
| Written Options - (0.32)% |
|
|||||||||
| (Cost $(386,568)) |
|
(630,775 | ) | |||||||
|
|
|
| ||||||||
| Liabilities in Excess of Other Assets - (14.57)% |
|
(28,819,003 | ) | |||||||
|
|
|
| ||||||||
| Net Assets - 100.00% |
|
$ | 197,735,248 | |||||||
|
|
|
| ||||||||
| 1 | Securities exempt from registration under Rule 144A of the Securities Act of 1933, as amended. The securities may be resold in transactions exempt from registration, normally to qualified institutional buyers. |
| 2 | Floating rate security. The rate disclosed was in effect at March 31, 2022. |
See accompanying Notes to Financial Statements.
| Annual Report March 2022 / 222 |
Table of Contents
Ultra Short Bond Fund
Schedule of Portfolio Investments
March 31, 2022
| 3 | Foreign denominated security issued by foreign domiciled entity. |
| 4 | Variable rate security. Interest rate disclosed is as of the most recent information available. Certain variable rate securities are not based on a published reference rate and spread but are determined by the issuer or agent and are based on current market conditions. |
| 5 | Security is valued using significant unobservable inputs and is classified as Level 3 in the fair value hierarchy. |
| 6 | Illiquid security as determined under procedures approved by the Board of Trustees. The aggregate value of illiquid securities is $13,941, which is 0.01% of total net assets. |
| 7 | Represents the current yield as of March 31, 2022. |
| 8 | Represents annualized yield at date of purchase. |
| * | Securities with a call or reset feature will have an effective maturity date sooner than the stated maturity. |
| ** | Securities backed by mortgage or consumer loans where payment is periodically made will have an effective maturity date sooner than the stated maturity date. |
Note: For Fund compliance purposes, the Fund’s industry classifications refer to any one or more of the industry sub-classifications used by one or more widely recognized market indexes or ratings group indexes, and/or as defined by Fund management. This definition may not apply for purposes of this report, which may combine industry sub-classifications for more meaningful presentation for investors.
(CLO): Collateralized Loan Obligation
(GMTN): Global Medium-Term Note
(IO): Interest Only
(LIBOR): London InterBank Offer Rate
(MTN): Medium-Term Note
(SOFR): Secured Overnight Financing Rate
(STEP): Step Coupon Bond
(TBA): To-Be-Announced
(USD): U.S. Dollar
| Description | Number of Contracts |
Expiration Date | Notional Amount | Value | Unrealized Appreciation (Depreciation) |
|||||||||||||||
| FUTURES CONTRACTS: LONG POSITIONS |
|
|||||||||||||||||||
| U.S. Treasury Two-Year Note | 8 | 06/30/22 | $ | 1,695,375 | $ | (20,828) | $ | (20,828) | ||||||||||||
| FUTURES CONTRACTS: SHORT POSITIONS |
|
|||||||||||||||||||
| U.S. Treasury Five-Year Note | 167 | 06/30/22 | (19,152,813) | 500,111 | 500,111 | |||||||||||||||
| U.S. Treasury Ten-Year Ultra Bond | 44 | 06/21/22 | (5,960,625) | 195,704 | 195,704 | |||||||||||||||
| U.S. Treasury Ultra Bond | 11 | 06/21/22 | (1,948,375) | 70,053 | 70,053 | |||||||||||||||
|
|
|
|
|
|
|
|||||||||||||||
| (27,061,813) | 765,868 | 765,868 | ||||||||||||||||||
|
|
|
|
|
|
|
|||||||||||||||
| TOTAL FUTURES CONTRACTS |
$ | (25,366,438) | $ | 745,040 | $ | 745,040 | ||||||||||||||
|
|
|
|
|
|
|
|||||||||||||||
| Reference Obligation/Index | Financing Rate Paid by the Fund |
Payment Frequency |
Implied Credit Spread at 03/31/221 |
Counterparty | Expiration Date |
Notional Amount (000’s)2 |
Value3 | Premiums Paid |
Unrealized Appreciation |
|||||||||||||||||||
| SWAPS: CREDIT DEFAULT (SALES) - SINGLE ISSUES OTC4 |
|
|||||||||||||||||||||||||||
| Berry Global, Inc., 5.63%, due 07/15/27 | 5.00% | 3 Months | 175 | Credit Suisse First Boston International |
12/20/23 | $ | 390 | $ | 21,740 | $ | 20,631 | $ | 1,109 | |||||||||||||||
|
|
|
|
|
|
|
|||||||||||||||||||||||
| 1 | An implied credit spread is the spread in yield between a U.S. Treasury security and the referenced obligation or underlying investment that are identical in all respects except for the quality rating. Implied credit spreads, represented in absolute terms, utilized in determining the value of credit default swaps on corporate issues as of year end serve as an indicator of the current status of the payment performance risk and represent the likelihood of risk of default for the credit derivative. The implied credit spread of a particular referenced entity reflects the cost of buying/selling protection and may include upfront payments required to be made to enter the agreement. Wider credit spreads, in comparison to narrower credit spreads, represent a deterioration of the referenced entity’s credit soundness and a greater likelihood of risk of default or other credit event occurring as defined under the terms of the agreement. |
| 2 | The maximum potential amount for the Fund could be required to pay as a seller of credit protection or receive as a buyer of credit protection if a credit event occurs as defined under the terms of that particular swap agreement. |
| 3 | The quoted market prices are resulting values for credit default swap agreements on credit indices serve as an indicator of the current status of the payment/performance risk and represent the likelihood of an expected liability (or profit) for the credit derivative had the notional amount of the swap agreement been closed/sold as of year end. Increasing values (buy protection) or decreasing values (sell protection), when compared to the notional amount of the swap, represent a deterioration of the referenced entity’s credit soundness and a greater likelihood of risk of default or other credit event occurring as defined under the terms of the agreement. |
| 4 | If the Fund is a seller of protection and credit event occurs, as defined under the terms of that particular swap agreement, the Fund will either (i) pay to the buyer of protection the amount equal to the notional amount of the swap and take delivery of the referenced obligation or underlying investments comprising the referenced index or (ii) pay a net settlement amount in the form of cash or investments equal to the notional amount of the swap less the recovery value of the referenced obligation or underlying investments comprising the referenced index. |
See accompanying Notes to Financial Statements.
| 223 / Annual Report March 2022 |
Table of Contents
Ultra Short Bond Fund
Schedule of Portfolio Investments
March 31, 2022
| Description | Number of contracts |
Exercise Price |
Expiration Date |
Notional Amount | Value | |||||||||||||||
| PURCHASED CALL OPTIONS EXCHANGE TRADED |
|
|||||||||||||||||||
| 90-Day Euro Dollar Futures |
40 | $98.00 | 12/19/22 | $ | 292,020 | $ | 18,000 | |||||||||||||
| IMM Eurodollar 1-Year MIDCV Future Options |
30 | 98.38 | 09/16/22 | 217,980 | 2,438 | |||||||||||||||
| IMM Eurodollar 1-Year MIDCV Future Options |
63 | 98.75 | 09/16/22 | 3,051,720 | 3,150 | |||||||||||||||
|
|
|
|
|
|||||||||||||||||
| TOTAL PURCHASED OPTIONS |
$ | 3,561,720 | $ | 23,588 | ||||||||||||||||
|
|
|
|
|
|||||||||||||||||
| Description | Number of contracts |
Exercise Price |
Expiration Date |
Notional Amount | Value | |||||||||||||||
| WRITTEN CALL OPTIONS EXCHANGE TRADED |
|
|||||||||||||||||||
| IMM Eurodollar 1-Year MIDCV Future Options |
145 | $99.00 | 09/16/22 | $ | (6,321,420) | $ | (5,437) | |||||||||||||
| 90-Day Euro Dollar Futures |
40 | 98.25 | 12/19/22 | (292,020) | (12,500) | |||||||||||||||
| IMM Eurodollar 2-Year MIDCV Future Options |
34 | 97.63 | 12/16/22 | (2,067,519) | (23,375) | |||||||||||||||
| IMM Eurodollar 2-Year MIDCV Future Options |
70 | 97.88 | 12/16/22 | (4,256,656) | (32,813) | |||||||||||||||
|
|
|
|
|
|||||||||||||||||
| (12,937,615) | (74,125) | |||||||||||||||||||
|
|
|
|
|
|||||||||||||||||
| WRITTEN PUT OPTIONS EXCHANGE TRADED |
|
|||||||||||||||||||
| 90-Day Euro Dollar Futures |
40 | $97.25 | 12/19/22 | $ | (292,020) | $ | (39,500) | |||||||||||||
| IMM Eurodollar 1-Year MIDCV Future Options |
184 | 97.63 | 09/16/22 | (891,296) | (395,600) | |||||||||||||||
| IMM Eurodollar 2-Year MIDCV Future Options |
104 | 97.38 | 12/16/22 | (6,324,175) | (121,550) | |||||||||||||||
|
|
|
|
|
|||||||||||||||||
| (7,507,491) | (556,650) | |||||||||||||||||||
|
|
|
|
|
|||||||||||||||||
| TOTAL WRITTEN OPTIONS |
$ | (20,445,106) | $ | (630,775) | ||||||||||||||||
|
|
|
|
|
|||||||||||||||||
See accompanying Notes to Financial Statements.
| Annual Report March 2022 / 224 |
Table of Contents
Schedule of Portfolio Investments
March 31, 2022
| Issues | Maturity Date |
Principal Amount |
Value | |||||||
| BONDS – 100.05% |
| |||||||||
| ASSET-BACKED SECURITIES — 14.13%** |
| |||||||||
| 321 Henderson Receivables VI LLC, |
| |||||||||
| Series 2010-1A, Class B |
| |||||||||
| 9.31% |
07/15/611 | $ | 225,324 | $ | 249,646 | |||||
| A10 Bridge Asset Financing, |
| |||||||||
| Series 2021-D, Class A1FL |
| |||||||||
| (SOFR30A plus 1.45%) |
| |||||||||
| 1.50% |
10/01/38†,1,2 | 7,670,000 | 7,669,408 | |||||||
| ACAM Ltd., |
| |||||||||
| Series 2019-FL1, Class B |
| |||||||||
| (Cayman Islands) |
| |||||||||
| (SOFR30A plus 2.01%) |
| |||||||||
| 2.06% |
11/17/341,2,3 | 8,800,000 | 8,674,842 | |||||||
| ACRES Commercial Realty Ltd., |
| |||||||||
| Series 2021-FL1, Class AS |
| |||||||||
| (Cayman Islands) |
| |||||||||
| (LIBOR USD 1-Month plus 1.60%) |
| |||||||||
| 2.04% |
06/15/361,2,3 | 9,831,000 | 9,725,797 | |||||||
| AGL CLO 13 Ltd., |
| |||||||||
| Series 2021-13A, Class A1 |
| |||||||||
| (Cayman Islands) |
| |||||||||
| (LIBOR USD 3-Month plus 1.16%) |
| |||||||||
| 1.32% |
10/20/341,2,3 | 12,045,000 | 11,921,539 | |||||||
| AIG CLO Ltd., |
| |||||||||
| Series 2018-1A, Class BR |
| |||||||||
| (Cayman Islands) |
| |||||||||
| (LIBOR USD 3-Month plus 1.70%) |
| |||||||||
| 1.95% |
04/20/321,2,3 | 15,800,000 | 15,702,988 | |||||||
| Allegro CLO XII Ltd., |
| |||||||||
| Series 2020-1A, Class B |
| |||||||||
| (Cayman Islands) |
| |||||||||
| (LIBOR USD 3-Month plus 1.70%) |
| |||||||||
| 1.96% |
01/21/321,2,3 | 5,400,000 | 5,361,120 | |||||||
| AMSR Trust, |
| |||||||||
| Series 2020-SFR1, Class G |
| |||||||||
| 4.31% |
04/17/371 | 8,503,000 | 8,216,300 | |||||||
| Apidos CLO XXII, |
| |||||||||
| Series 2015-22A, Class A1R |
| |||||||||
| (Cayman Islands) |
| |||||||||
| (LIBOR USD 3-Month plus 1.06%) |
| |||||||||
| 1.31% |
04/20/311,2,3 | 5,000,000 | 4,968,500 | |||||||
| Barings CLO Ltd., |
| |||||||||
| Series 2018-3A, Class A1 |
| |||||||||
| (Cayman Islands) |
| |||||||||
| (LIBOR USD 3-Month plus 0.95%) |
| |||||||||
| 1.20% |
07/20/291,2,3 | 5,342,431 | 5,312,781 | |||||||
| Bayview Commercial Asset Trust, |
| |||||||||
| Series 2004-2, Class A |
| |||||||||
| (LIBOR USD 1-Month plus 0.65%) |
| |||||||||
| 1.10% |
08/25/341,2 | 555,558 | 552,656 | |||||||
| Bayview Commercial Asset Trust, |
| |||||||||
| Series 2004-3, Class A1 |
| |||||||||
| (LIBOR USD 1-Month plus 0.56%) |
| |||||||||
| 1.01% |
01/25/351,2 | 326,390 | 324,506 | |||||||
| Issues | Maturity Date |
Principal Amount |
Value | |||||||
| ASSET-BACKED SECURITIES (continued) |
| |||||||||
| Bayview Commercial Asset Trust, |
| |||||||||
| Series 2005-1A, Class A1 |
| |||||||||
| (LIBOR USD 1-Month plus 0.45%) |
| |||||||||
| 0.91% |
04/25/351,2 | $ | 594,999 | $ | 579,166 | |||||
| Blackrock Rainier CLO VI Ltd., |
| |||||||||
| Series 2021-6A, Class A |
| |||||||||
| (Cayman Islands) |
| |||||||||
| (LIBOR USD 3-Month plus 1.70%) |
| |||||||||
| 1.95% |
04/20/331,2,3 | 10,000,000 | 9,963,050 | |||||||
| BlueMountain CLO XXX Ltd., |
| |||||||||
| Series 2020-30A, Class AR |
| |||||||||
| (Cayman Islands) |
| |||||||||
| (CME Term SOFR 3-Month plus 1.37%) |
| |||||||||
| 1.59% |
04/15/351,2,3 | 10,050,000 | 10,006,282 | |||||||
| BlueMountain Fuji U.S. CLO I Ltd., |
| |||||||||
| Series 2017-1A, Class BR |
| |||||||||
| (Cayman Islands) |
| |||||||||
| (LIBOR USD 3-Month plus 1.50%) |
| |||||||||
| 1.75% |
07/20/291,2,3 | 5,800,000 | 5,707,954 | |||||||
| Brazos Higher Education Authority, Inc., |
| |||||||||
| Series 2011-1, Class A2 |
| |||||||||
| (LIBOR USD 3-Month plus 0.80%) |
| |||||||||
| 1.30% |
02/25/302 | 11,521 | 11,526 | |||||||
| BSPRT Issuer Ltd., |
| |||||||||
| Series 2021-FL7, Class A |
| |||||||||
| (Cayman Islands) |
| |||||||||
| (LIBOR USD 1-Month plus 1.32%) |
| |||||||||
| 1.72% |
12/15/381,2,3 | 9,400,000 | 9,287,354 | |||||||
| Carvana Auto Receivables Trust, |
| |||||||||
| Series 2021-N3, Class R |
| |||||||||
| 0.00% |
06/12/281 | 13,500 | 4,983,935 | |||||||
| Carvana Auto Receivables Trust, |
| |||||||||
| Series 2021-N4, Class R |
| |||||||||
| 0.00% |
09/12/281 | 8,600 | 2,634,748 | |||||||
| Carvana Auto Receivables Trust, |
| |||||||||
| Series 2021-P4, Class R |
| |||||||||
| 0.00% |
09/11/281 | 14,200 | 8,104,590 | |||||||
| Carvana Auto Receivables Trust, |
| |||||||||
| Series 2022-N1, Class R |
| |||||||||
| 0.00% |
12/11/28†,1 | 71,000 | 13,029,206 | |||||||
| Cedar Funding XII CLO Ltd., |
| |||||||||
| Series 2020-12A, Class A1R |
| |||||||||
| (Cayman Islands) |
| |||||||||
| (LIBOR USD 3-Month plus 1.13%) |
| |||||||||
| 1.39% |
10/25/341,2,3 | 10,000,000 | 9,909,570 | |||||||
| CF Hippolyta, LLC, |
| |||||||||
| Series 2020-1, Class B1 |
| |||||||||
| 2.28% |
07/15/601 | 7,364,028 | 6,953,368 | |||||||
| CIT Education Loan Trust, |
| |||||||||
| Series 2007-1, Class B |
| |||||||||
| (LIBOR USD 3-Month plus 0.30%) |
| |||||||||
| 1.27% |
06/25/421,2 | 1,798,881 | 1,646,861 | |||||||
| CoreVest American Finance Trust, |
| |||||||||
| Series 2019-1, Class XA (IO) |
| |||||||||
| 2.16% |
03/15/521,4 | 14,731,915 | 616,289 | |||||||
See accompanying Notes to Financial Statements.
| 225 / Annual Report March 2022 |
Table of Contents
Unconstrained Bond Fund
Schedule of Portfolio Investments
March 31, 2022
| Issues | Maturity Date |
Principal Amount |
Value | |||||||
| ASSET-BACKED SECURITIES (continued) |
| |||||||||
| CoreVest American Finance Trust, |
| |||||||||
| Series 2019-3, Class XA (IO) |
| |||||||||
| 2.04% |
10/15/521,4 | $ | 5,737,625 | $ | 316,256 | |||||
| CoreVest American Finance Trust, |
| |||||||||
| Series 2020-1, Class A2 |
| |||||||||
| 2.30% |
03/15/501 | 5,197,000 | 4,802,868 | |||||||
| CoreVest American Finance Trust, |
| |||||||||
| Series 2020-3, Class XA (IO) |
| |||||||||
| 3.69% |
08/15/531,4 | 16,502,790 | 1,992,959 | |||||||
| CoreVest American Finance Trust, |
| |||||||||
| Series 2020-4, Class XA (IO) |
| |||||||||
| 3.87% |
12/15/521,4 | 24,498,274 | 2,673,739 | |||||||
| CoreVest American Finance Trust, |
| |||||||||
| Series 2020-4, Class XB (IO) |
| |||||||||
| 2.83% |
12/15/521,4 | 12,500,000 | 1,388,071 | |||||||
| CoreVest American Finance Trust, |
| |||||||||
| Series 2021-3, Class XA (IO) |
| |||||||||
| 2.40% |
10/15/541,4 | 75,075,924 | 6,244,226 | |||||||
| DataBank Issuer, |
| |||||||||
| Series 2021-1A, Class A2 |
| |||||||||
| 2.06% |
02/27/511 | 9,565,000 | 8,855,857 | |||||||
| Dryden 30 Senior Loan Fund, |
| |||||||||
| Series 2013-30A, Class AR |
| |||||||||
| (Cayman Islands) |
| |||||||||
| (LIBOR USD 3-Month plus 0.82%) |
| |||||||||
| 1.33% |
11/15/281,2,3 | 6,707,448 | 6,663,648 | |||||||
| Eaton Vance CLO Ltd., |
| |||||||||
| Series 2013-1A, Class A13R |
| |||||||||
| (Cayman Islands) |
| |||||||||
| (LIBOR USD 3-Month plus 1.25%) |
| |||||||||
| 1.49% |
01/15/341,2,3 | 8,000,000 | 7,952,424 | |||||||
| ECMC Group Student Loan Trust, |
| |||||||||
| Series 2016-1A, Class A |
| |||||||||
| (LIBOR USD 1-Month plus 1.35%) |
| |||||||||
| 1.81% |
07/26/661,2 | 13,824,020 | 14,070,862 | |||||||
| ECMC Group Student Loan Trust, |
| |||||||||
| Series 2017-2A, Class A |
| |||||||||
| (LIBOR USD 1-Month plus 1.05%) |
| |||||||||
| 1.51% |
05/25/671,2 | 12,937,866 | 13,028,511 | |||||||
| Edsouth Indenture No. 3 LLC, |
| |||||||||
| Series 2012-2, Class A |
| |||||||||
| (LIBOR USD 1-Month plus 0.73%) |
| |||||||||
| 1.19% |
04/25/391,2 | 74,187 | 73,992 | |||||||
| Education Loan Asset-Backed Trust I, |
| |||||||||
| Series 2013-1, Class A2 |
| |||||||||
| (LIBOR USD 1-Month plus 0.80%) |
| |||||||||
| 1.26% |
04/26/321,2 | 2,520,494 | 2,503,467 | |||||||
| Educational Funding of the South, Inc., |
| |||||||||
| Series 2012-1, Class A |
| |||||||||
| (LIBOR USD 1-Month plus 1.05%) |
| |||||||||
| 1.51% |
03/25/362 | 44,943 | 44,861 | |||||||
| EFS Volunteer No. 2 LLC, |
| |||||||||
| Series 2012-1, Class A2 |
| |||||||||
| (LIBOR USD 1-Month plus 1.35%) |
| |||||||||
| 1.81% |
03/25/361,2 | 1,814,437 | 1,831,015 | |||||||
| Issues | Maturity Date |
Principal Amount |
Value | |||||||
| ASSET-BACKED SECURITIES (continued) |
| |||||||||
| Global SC Finance II SRL, |
| |||||||||
| Series 2014-1A, Class A2 |
| |||||||||
| (Barbados) |
| |||||||||
| 3.09% |
07/17/291,3 | $ | 589,737 | $ | 581,111 | |||||
| Goal Capital Funding Trust, |
| |||||||||
| Series 2006-1, Class B |
| |||||||||
| (LIBOR USD 3-Month plus 0.45%) |
| |||||||||
| 0.95% |
08/25/422 | 319,113 | 299,963 | |||||||
| GoldenTree Loan Management U.S. CLO 1 Ltd., |
| |||||||||
| Series 2021-9A, Class B |
| |||||||||
| (Cayman Islands) |
| |||||||||
| (LIBOR USD 3-Month plus 1.50%) |
| |||||||||
| 1.75% |
01/20/331,2,3 | 4,075,000 | 4,000,957 | |||||||
| Golub Capital Partners CLO 54M L.P, |
| |||||||||
| Series 2021-54A, Class A |
| |||||||||
| (Cayman Islands) |
| |||||||||
| (LIBOR USD 3-Month plus 1.53%) |
| |||||||||
| 1.85% |
08/05/331,2,3 | 10,150,000 | 10,088,501 | |||||||
| J.G. Wentworth XXXVII LLC, |
| |||||||||
| Series 2016-1A, Class A |
| |||||||||
| 3.41% |
06/15/671 | 5,628,387 | 5,598,548 | |||||||
| J.G. Wentworth XXXVIII LLC, |
| |||||||||
| Series 2017-1A, Class A |
| |||||||||
| 3.99% |
08/16/601 | 3,145,120 | 3,252,079 | |||||||
| KREF Ltd., |
| |||||||||
| Series 2021-FL2, Class AS |
| |||||||||
| (Cayman Islands) |
| |||||||||
| (LIBOR USD 1-Month plus 1.30%) |
| |||||||||
| 1.74% |
02/15/391,2,3 | 6,900,000 | 6,767,779 | |||||||
| LCM XXI LP, |
| |||||||||
| Series 21A, Class AR |
| |||||||||
| (Cayman Islands) |
| |||||||||
| (LIBOR USD 3-Month plus 0.88%) |
| |||||||||
| 1.13% |
04/20/281,2,3 | 1,359,158 | 1,354,592 | |||||||
| LCM XXIV Ltd., |
| |||||||||
| Series 24A, Class AR |
| |||||||||
| (Cayman Islands) |
| |||||||||
| (LIBOR USD 3-Month plus 0.98%) |
| |||||||||
| 1.23% |
03/20/301,2,3 | 15,000,000 | 14,912,940 | |||||||
| M360 LLC, |
| |||||||||
| Series 2019-CRE2, Class A |
| |||||||||
| (Cayman Islands) |
| |||||||||
| (SOFR30A plus 1.51%) |
| |||||||||
| 1.56% |
09/15/341,2,3 | 1,090,002 | 1,072,657 | |||||||
| Magnetite XXI Ltd., |
| |||||||||
| Series 2019-21A, Class BR |
| |||||||||
| (Cayman Islands) |
| |||||||||
| (LIBOR USD 3-Month plus 1.35%) |
| |||||||||
| 1.60% |
04/20/341,2,3 | 8,000,000 | 7,769,440 | |||||||
| MF1 Ltd., |
| |||||||||
| Series 2020-FL4, Class B |
| |||||||||
| (CME Term SOFR 1-Month plus 2.86%) |
| |||||||||
| 3.19% |
11/15/351,2 | 11,579,000 | 11,478,299 | |||||||
| MF1 Ltd., |
| |||||||||
| Series 2020-FL4, Class D |
| |||||||||
| (CME Term SOFR 1-Month plus 4.21%) |
| |||||||||
| 4.54% |
11/15/351,2 | 4,850,000 | 4,798,488 | |||||||
See accompanying Notes to Financial Statements.
| Annual Report March 2022 / 226 |
Table of Contents
Unconstrained Bond Fund
Schedule of Portfolio Investments
March 31, 2022
| Issues | Maturity Date |
Principal Amount |
Value | |||||||
| ASSET-BACKED SECURITIES (continued) |
| |||||||||
| MF1 Ltd., |
| |||||||||
| Series 2021-FL6, Class AS |
| |||||||||
| (Cayman Islands) |
| |||||||||
| (LIBOR USD 1-Month plus 1.45%) |
| |||||||||
| 1.92% |
07/16/361,2,3 | $ | 6,684,000 | $ | 6,578,499 | |||||
| Nelnet Student Loan Trust, |
| |||||||||
| Series 2006-2, Class B |
| |||||||||
| (LIBOR USD 3-Month plus 0.20%) |
| |||||||||
| 0.46% |
01/25/382 | 2,542,952 | 2,296,522 | |||||||
| Nelnet Student Loan Trust, |
| |||||||||
| Series 2007-1, Class A3 |
| |||||||||
| (LIBOR USD 3-Month plus 0.07%) |
| |||||||||
| 0.57% |
05/27/252 | 7,758 | 7,752 | |||||||
| Nelnet Student Loan Trust, |
| |||||||||
| Series 2012-5A, Class A |
| |||||||||
| (LIBOR USD 1-Month plus 0.60%) |
| |||||||||
| 1.06% |
10/27/361,2 | 78,816 | 77,541 | |||||||
| Nelnet Student Loan Trust, |
| |||||||||
| Series 2014-4A, Class A2 |
| |||||||||
| (LIBOR USD 1-Month plus 0.95%) |
| |||||||||
| 1.41% |
11/25/481,2 | 1,865,000 | 1,858,159 | |||||||
| Nelnet Student Loan Trust, |
| |||||||||
| Series 2015-1A, Class A |
| |||||||||
| (LIBOR USD 1-Month plus 0.59%) |
| |||||||||
| 1.05% |
04/25/461,2 | 1,614,931 | 1,585,696 | |||||||
| Nelnet Student Loan Trust, |
| |||||||||
| Series 2015-3A, Class A3 |
| |||||||||
| (LIBOR USD 1-Month plus 0.90%) |
| |||||||||
| 1.36% |
06/25/541,2 | 11,000,000 | 10,963,583 | |||||||
| Octagon Investment Partners 46 Ltd., |
| |||||||||
| Series 2020-2A, Class AR |
| |||||||||
| (Cayman Islands) |
| |||||||||
| (LIBOR USD 3-Month plus 1.16%) |
| |||||||||
| 1.40% |
07/15/361,2,3 | 11,700,000 | 11,602,598 | |||||||
| OHA Credit Funding 7 Ltd., |
| |||||||||
| Series 2020-7A, Class AR |
| |||||||||
| (Cayman Islands) |
| |||||||||
| (CME Term SOFR 3-Month plus 1.30%) |
| |||||||||
| 2.15% |
02/24/371,2,3 | 11,000,000 | 10,954,053 | |||||||
| OHA Credit Funding 8 Ltd., |
| |||||||||
| Series 2021-8A, Class B1 |
| |||||||||
| (Cayman Islands) |
| |||||||||
| (LIBOR USD 3-Month plus 1.50%) |
| |||||||||
| 1.74% |
01/18/341,2,3 | 6,650,000 | 6,509,220 | |||||||
| Palmer Square CLO Ltd., |
| |||||||||
| Series 2020-3A, Class A1AR |
| |||||||||
| (Cayman Islands) |
| |||||||||
| (LIBOR USD 3-Month plus 1.08%) |
| |||||||||
| 1.59% |
11/15/311,2,3 | 7,200,000 | 7,151,544 | |||||||
| Palmer Square Loan Funding Ltd., |
| |||||||||
| Series 2019-4A, Class A1 |
| |||||||||
| (Cayman Islands) |
| |||||||||
| (LIBOR USD 3-Month plus 0.90%) |
| |||||||||
| 1.16% |
10/24/271,2,3 | 1,492,077 | 1,486,124 | |||||||
| Issues | Maturity Date |
Principal Amount |
Value | |||||||
| ASSET-BACKED SECURITIES (continued) |
| |||||||||
| Palmer Square Loan Funding Ltd., |
| |||||||||
| Series 2020-2A, Class A2 |
| |||||||||
| (Cayman Islands) |
| |||||||||
| (LIBOR USD 3-Month plus 1.55%) |
| |||||||||
| 1.80% |
04/20/281,2,3 | $ | 3,785,000 | $ | 3,784,092 | |||||
| Park Avenue Institutional Advisers CLO Ltd., |
| |||||||||
| Series 2021-1A, Class A2 |
| |||||||||
| (Cayman Islands) |
| |||||||||
| (LIBOR USD 3-Month plus 1.75%) |
| |||||||||
| 2.00% |
01/20/341,2,3 | 5,000,000 | 4,966,995 | |||||||
| Regata XII Funding Ltd., |
| |||||||||
| Series 2019-1A, Class BR |
| |||||||||
| (Cayman Islands) |
| |||||||||
| (LIBOR USD 3-Month plus 1.60%) |
| |||||||||
| 1.84% |
10/15/321,2,3 | 3,890,000 | 3,850,983 | |||||||
| Sabey Data Center Issuer LLC, |
| |||||||||
| Series 2020-1, Class A2 |
| |||||||||
| 3.81% |
04/20/451 | 7,905,000 | 7,859,946 | |||||||
| Skyline Aircraft Finance LLC, |
| |||||||||
| Series 2021-1, Class A |
| |||||||||
| 3.23% |
05/10/375,6 | 9,685,733 | 9,140,910 | |||||||
| SLC Student Loan Trust, |
| |||||||||
| Series 2004-1, Class B |
| |||||||||
| (LIBOR USD 3-Month plus 0.29%) |
| |||||||||
| 0.80% |
08/15/312 | 382,315 | 355,780 | |||||||
| SLC Student Loan Trust, |
| |||||||||
| Series 2008-1, Class A4A |
| |||||||||
| (LIBOR USD 3-Month plus 1.60%) |
| |||||||||
| 2.43% |
12/15/322 | 2,112,414 | 2,139,229 | |||||||
| SLM Student Loan EDC Repackaging Trust, |
| |||||||||
| Series 2013-M1, Class M1R |
| |||||||||
| 0.00% |
10/28/291 | 6,250 | 5,223,919 | |||||||
| SLM Student Loan Trust, |
| |||||||||
| Series 2003-12, Class B |
| |||||||||
| (LIBOR USD 3-Month plus 0.59%) |
| |||||||||
| 1.42% |
12/15/682 | 3,644,069 | 3,505,610 | |||||||
| SLM Student Loan Trust, |
| |||||||||
| Series 2003-4, Class A5D |
| |||||||||
| (LIBOR USD 3-Month plus 0.75%) |
| |||||||||
| 1.58% |
03/15/331,2 | 1,729,717 | 1,696,169 | |||||||
| SLM Student Loan Trust, |
| |||||||||
| Series 2003-7, Class B |
| |||||||||
| (LIBOR USD 3-Month plus 0.57%) |
| |||||||||
| 1.40% |
09/15/392 | 2,563,751 | 2,417,541 | |||||||
| SLM Student Loan Trust, |
| |||||||||
| Series 2004-10, Class B |
| |||||||||
| (LIBOR USD 3-Month plus 0.37%) |
| |||||||||
| 0.63% |
01/25/402 | 7,622,683 | 7,253,547 | |||||||
| SLM Student Loan Trust, |
| |||||||||
| Series 2004-2, Class B |
| |||||||||
| (LIBOR USD 3-Month plus 0.47%) |
| |||||||||
| 0.73% |
07/25/392 | 452,097 | 432,590 | |||||||
| SLM Student Loan Trust, |
| |||||||||
| Series 2005-3, Class B |
| |||||||||
| (LIBOR USD 3-Month plus 0.15%) |
| |||||||||
| 0.41% |
04/25/402 | 2,487,763 | 2,316,110 | |||||||
See accompanying Notes to Financial Statements.
| 227 / Annual Report March 2022 |
Table of Contents
Unconstrained Bond Fund
Schedule of Portfolio Investments
March 31, 2022
| Issues | Maturity Date |
Principal Amount |
Value | |||||||
| ASSET-BACKED SECURITIES (continued) |
|
|||||||||
| SLM Student Loan Trust, |
|
|||||||||
| Series 2006-8, Class B |
|
|||||||||
| (LIBOR USD 3-Month plus 0.23%) |
|
|||||||||
| 0.49% |
01/25/412 | $ | 2,966,206 | $ | 2,758,879 | |||||
| SLM Student Loan Trust, |
|
|||||||||
| Series 2007-2, Class B |
|
|||||||||
| (LIBOR USD 3-Month plus 0.17%) |
|
|||||||||
| 0.43% |
07/25/252 | 12,800,000 | 11,871,020 | |||||||
| SLM Student Loan Trust, |
|
|||||||||
| Series 2007-7, Class B |
|
|||||||||
| (LIBOR USD 3-Month plus 0.75%) |
|
|||||||||
| 1.01% |
10/27/702 | 2,195,000 | 2,018,070 | |||||||
| SLM Student Loan Trust, |
|
|||||||||
| Series 2007-8, Class B |
|
|||||||||
| (LIBOR USD 3-Month plus 1.00%) |
|
|||||||||
| 1.26% |
04/27/832 | 4,281,635 | 4,176,523 | |||||||
| SLM Student Loan Trust, |
|
|||||||||
| Series 2008-2, Class A3 |
|
|||||||||
| (LIBOR USD 3-Month plus 0.75%) |
|
|||||||||
| 1.01% |
04/25/232 | 11,332,096 | 11,140,683 | |||||||
| SLM Student Loan Trust, |
|
|||||||||
| Series 2008-2, Class B |
|
|||||||||
| (LIBOR USD 3-Month plus 1.20%) |
|
|||||||||
| 1.46% |
01/25/832 | 1,000,000 | 951,460 | |||||||
| SLM Student Loan Trust, |
|
|||||||||
| Series 2008-3, Class B |
|
|||||||||
| (LIBOR USD 3-Month plus 1.20%) |
|
|||||||||
| 1.46% |
04/26/832 | 710,000 | 653,823 | |||||||
| SLM Student Loan Trust, |
|
|||||||||
| Series 2008-4, Class A4 |
|
|||||||||
| (LIBOR USD 3-Month plus 1.65%) |
|
|||||||||
| 1.91% |
07/25/222 | 950,583 | 954,045 | |||||||
| SLM Student Loan Trust, |
|
|||||||||
| Series 2008-4, Class B |
|
|||||||||
| (LIBOR USD 3-Month plus 1.85%) |
|
|||||||||
| 2.11% |
04/25/732 | 710,000 | 706,549 | |||||||
| SLM Student Loan Trust, |
|
|||||||||
| Series 2008-5, Class A4 |
|
|||||||||
| (LIBOR USD 3-Month plus 1.70%) |
|
|||||||||
| 1.96% |
07/25/232 | 6,525,181 | 6,547,635 | |||||||
| SLM Student Loan Trust, |
|
|||||||||
| Series 2008-5, Class B |
|
|||||||||
| (LIBOR USD 3-Month plus 1.85%) |
|
|||||||||
| 2.11% |
07/25/732 | 7,315,000 | 7,305,965 | |||||||
| SLM Student Loan Trust, |
|
|||||||||
| Series 2008-6, Class A4 |
|
|||||||||
| (LIBOR USD 3-Month plus 1.10%) |
|
|||||||||
| 1.36% |
07/25/232 | 10,316,146 | 10,193,683 | |||||||
| SLM Student Loan Trust, |
|
|||||||||
| Series 2008-6, Class B |
|
|||||||||
| (LIBOR USD 3-Month plus 1.85%) |
|
|||||||||
| 2.11% |
07/26/832 | 710,000 | 694,613 | |||||||
| SLM Student Loan Trust, |
|
|||||||||
| Series 2008-7, Class B |
|
|||||||||
| (LIBOR USD 3-Month plus 1.85%) |
|
|||||||||
| 2.11% |
07/26/832 | 820,000 | 815,920 | |||||||
| Issues | Maturity Date |
Principal Amount |
Value | |||||||
| ASSET-BACKED SECURITIES (continued) |
| |||||||||
| SLM Student Loan Trust, |
| |||||||||
| Series 2008-8, Class A4 |
| |||||||||
| (LIBOR USD 3-Month plus 1.50%) |
| |||||||||
| 1.76% |
04/25/232 | $ | 1,169,076 | $ | 1,172,191 | |||||
| SLM Student Loan Trust, |
| |||||||||
| Series 2008-8, Class B |
| |||||||||
| (LIBOR USD 3-Month plus 2.25%) |
| |||||||||
| 2.51% |
10/25/752 | 735,000 | 736,626 | |||||||
| SLM Student Loan Trust, |
| |||||||||
| Series 2008-9, Class A |
| |||||||||
| (LIBOR USD 3-Month plus 1.50%) |
| |||||||||
| 1.76% |
04/25/232 | 1,619,964 | 1,620,039 | |||||||
| SLM Student Loan Trust, |
| |||||||||
| Series 2008-9, Class B |
| |||||||||
| (LIBOR USD 3-Month plus 2.25%) |
| |||||||||
| 2.51% |
10/25/832 | 7,235,000 | 7,267,387 | |||||||
| SLM Student Loan Trust, |
| |||||||||
| Series 2009-3, Class A |
| |||||||||
| (LIBOR USD 1-Month plus 0.75%) |
| |||||||||
| 1.21% |
01/25/451,2 | 6,375,365 | 6,315,833 | |||||||
| SLM Student Loan Trust, |
| |||||||||
| Series 2011-2, Class A2 |
| |||||||||
| (LIBOR USD 1-Month plus 1.20%) |
| |||||||||
| 1.66% |
10/25/342 | 3,803,098 | 3,818,904 | |||||||
| SLM Student Loan Trust, |
| |||||||||
| Series 2012-1, Class A3 |
| |||||||||
| (LIBOR USD 1-Month plus 0.95%) |
| |||||||||
| 1.41% |
09/25/282 | 740,016 | 727,743 | |||||||
| SLM Student Loan Trust, |
| |||||||||
| Series 2012-2, Class A |
| |||||||||
| (LIBOR USD 1-Month plus 0.70%) |
| |||||||||
| 1.16% |
01/25/292 | 1,088,673 | 1,058,605 | |||||||
| SLM Student Loan Trust, |
| |||||||||
| Series 2012-7, Class A3 |
| |||||||||
| (LIBOR USD 1-Month plus 0.65%) |
| |||||||||
| 1.11% |
05/26/262 | 2,773,169 | 2,714,193 | |||||||
| SLM Student Loan Trust, |
| |||||||||
| Series 2012-7, Class B |
| |||||||||
| (LIBOR USD 1-Month plus 1.80%) |
| |||||||||
| 2.26% |
09/25/432 | 2,200,000 | 2,189,065 | |||||||
| SLM Student Loan Trust, |
| |||||||||
| Series 2013-4, Class A |
| |||||||||
| (LIBOR USD 1-Month plus 0.55%) |
| |||||||||
| 1.01% |
06/25/432 | 954,871 | 939,603 | |||||||
| SLM Student Loan Trust, |
| |||||||||
| Series 2014-1, Class A3 |
| |||||||||
| (LIBOR USD 1-Month plus 0.60%) |
| |||||||||
| 1.06% |
02/26/292 | 950,602 | 919,079 | |||||||
| Structured Receivables Finance LLC, |
| |||||||||
| Series 2010-A, Class B |
| |||||||||
| 7.61% |
01/16/461 | 1,464,898 | 1,556,109 | |||||||
| Structured Receivables Finance LLC, |
| |||||||||
| Series 2010-B, Class B |
| |||||||||
| 7.97% |
08/15/361 | 1,066,068 | 1,184,701 | |||||||
See accompanying Notes to Financial Statements.
| Annual Report March 2022 / 228 |
Table of Contents
Unconstrained Bond Fund
Schedule of Portfolio Investments
March 31, 2022
| Issues | Maturity Date |
Principal Amount |
Value | |||||||
| ASSET-BACKED SECURITIES (continued) |
| |||||||||
| Student Loan Consolidation Center Student Loan Trust I, |
|
|||||||||
| Series 2002-2, Class B2 |
| |||||||||
| (28 Day Auction Rate plus 0.00%) |
| |||||||||
| 1.61% |
07/01/421,2 | $ | 150,000 | $ | 138,201 | |||||
| TAL Advantage VII LLC, |
| |||||||||
| Series 2020-1A, Class A |
| |||||||||
| 2.05% |
09/20/451 | 9,014,750 | 8,463,414 | |||||||
| Textainer Marine Containers VIII Ltd., |
| |||||||||
| Series 2020-2A, Class A |
| |||||||||
| (Bermuda) |
| |||||||||
| 2.10% |
09/20/451,3 | 11,021,375 | 10,382,422 | |||||||
| Textainer Marine Containers VIII Ltd., |
| |||||||||
| Series 2020-3A, Class A |
| |||||||||
| (Bermuda) |
| |||||||||
| 2.11% |
09/20/451,3 | 7,512,450 | 7,060,866 | |||||||
| TIF Funding II LLC, |
| |||||||||
| Series 2020-1A, Class A |
| |||||||||
| 2.09% |
08/20/451 | 3,188,350 | 2,978,243 | |||||||
| TIF Funding II, LLC, |
| |||||||||
| Series 2021-1A, Class B |
| |||||||||
| 2.54% |
02/20/461 | 3,592,854 | 3,273,449 | |||||||
| TRESTLES CLO V Ltd., |
| |||||||||
| Series 2021-5A, Class A1 |
| |||||||||
| (Cayman Islands) |
| |||||||||
| (LIBOR USD 3-Month plus 1.17%) |
| |||||||||
| 1.33% |
10/20/341,2,3 | 12,500,000 | 12,359,750 | |||||||
| Triton Container Finance VIII, LLC, |
| |||||||||
| Series 2021-1A, Class B |
| |||||||||
| 2.58% |
03/20/461 | 2,804,475 | 2,565,126 | |||||||
|
|
|
| ||||||||
| Total Asset-Backed Securities |
| |||||||||
| (Cost $576,877,576) |
|
562,777,221 | ||||||||
|
|
|
| ||||||||
| BANK LOANS — 3.99%* |
| |||||||||
| Automotive — 0.01% |
| |||||||||
| Clarios Global LP, |
| |||||||||
| Term Loan B, 1st Lien |
| |||||||||
| (LIBOR plus 3.25%) |
| |||||||||
| 3.71% |
04/30/262 | 507,125 | 501,546 | |||||||
|
|
|
| ||||||||
| Communications — 0.61% |
| |||||||||
| CCI Buyer, Inc., |
| |||||||||
| Term Loan B, 1st Lien |
| |||||||||
| (SOFR plus 4.00%) |
| |||||||||
| 4.75% |
12/17/272 | 1,496,222 | 1,478,768 | |||||||
| CenturyLink, Inc., |
| |||||||||
| Term Loan B, 1st Lien |
| |||||||||
| (LIBOR plus 2.25%) |
| |||||||||
| 2.71% |
03/15/272 | 2,721,877 | 2,653,626 | |||||||
| Connect Finco SARL, |
| |||||||||
| Term Loan B, 1st Lien |
| |||||||||
| (LIBOR plus 3.50%) |
| |||||||||
| 4.50% |
12/11/262 | 2,940,000 | 2,920,155 | |||||||
| CSC Holdings LLC, |
| |||||||||
| Term Loan B, 1st Lien |
| |||||||||
| (LIBOR plus 2.25%) |
| |||||||||
| 2.65% |
07/17/252 | 1,036,399 | 1,022,153 | |||||||
| Issues | Maturity Date |
Principal Amount |
Value | |||||||
| BANK LOANS (continued) |
| |||||||||
| Communications (continued) |
| |||||||||
| Term Loan B5, 1st Lien |
| |||||||||
| (LIBOR plus 2.50%) |
| |||||||||
| 2.90% |
04/15/272 | $ | 1,036,776 | $ | 1,020,706 | |||||
| Diamond Sports Group, LLC, |
| |||||||||
| Term Loan, 1st Lien |
| |||||||||
| (LIBOR plus 8.00%) |
| |||||||||
| 9.00% |
05/25/262 | 412,476 | 419,551 | |||||||
| DIRECTV Financing LLC, |
| |||||||||
| Term Loan, 1st Lien |
| |||||||||
| (LIBOR plus 5.00%) |
| |||||||||
| 5.75% |
08/02/272 | 3,008,250 | 3,008,837 | |||||||
| Frontier Communications Holdings LLC, |
| |||||||||
| Term Loan B, 1st Lien |
| |||||||||
| (LIBOR plus 3.75%) |
| |||||||||
| 4.81% |
05/01/282 | 4,455,000 | 4,395,593 | |||||||
| GTT Communications BV, |
| |||||||||
| Term Loan B, 1st Lien |
| |||||||||
| (EURIBOR plus 3.25%) |
| |||||||||
| 3.25% |
05/31/252 | 630,446 | 583,536 | |||||||
| GTT Communications, Inc., |
| |||||||||
| Term Loan B, 1st Lien |
| |||||||||
| (PRIME plus 3.75%) |
| |||||||||
| 7.25% |
05/30/252 | 933,061 | 768,203 | |||||||
| Level 3 Parent LLC, |
| |||||||||
| Term Loan B, 1st Lien |
| |||||||||
| (LIBOR plus 1.75%) |
| |||||||||
| 2.21% |
03/01/272 | 2,750,000 | 2,702,521 | |||||||
| SBA Senior Finance II LLC, |
| |||||||||
| Term Loan B, 1st Lien |
| |||||||||
| (LIBOR plus 1.75%) |
| |||||||||
| 2.21% |
04/11/252 | 2,199,313 | 2,176,253 | |||||||
| Zayo Group Holdings, Inc., |
| |||||||||
| Term Loan, 1st Lien |
| |||||||||
| (LIBOR plus 3.00%) |
| |||||||||
| 3.46% |
03/09/272 | 1,113,487 | 1,085,188 | |||||||
|
|
|
| ||||||||
| 24,235,090 | ||||||||||
|
|
|
| ||||||||
| Consumer Discretionary — 0.45% |
| |||||||||
| ADMI Corp., |
| |||||||||
| Term Loan B2, 1st Lien |
| |||||||||
| (LIBOR plus 3.38%) |
| |||||||||
| 3.88% |
12/23/272 | 1,485,000 | 1,461,916 | |||||||
| Peraton Corp., |
| |||||||||
| Term Loan B, 1st Lien |
| |||||||||
| (LIBOR plus 3.75%) |
| |||||||||
| 4.50% |
02/01/282 | 4,423,112 | 4,400,996 | |||||||
| Sunshine Luxembourg VII SARL, |
| |||||||||
| Term Loan B, 1st Lien |
| |||||||||
| (LIBOR plus 3.75%) |
| |||||||||
| 4.76% |
10/01/262 | 3,465,000 | 3,447,138 | |||||||
| Triton Water Holdings, Inc., |
| |||||||||
| Term Loan B, 1st Lien |
| |||||||||
| (LIBOR plus 3.50%) |
| |||||||||
| 4.51% |
03/31/282 | 5,781,316 | 5,650,195 | |||||||
See accompanying Notes to Financial Statements.
| 229 / Annual Report March 2022 |
Table of Contents
Unconstrained Bond Fund
Schedule of Portfolio Investments
March 31, 2022
| Issues | Maturity Date |
Principal Amount |
Value | |||||||
| BANK LOANS (continued) |
| |||||||||
| Consumer Discretionary (continued) |
| |||||||||
| Waystar technologies, Inc., |
| |||||||||
| Term Loan B, 1st Lien |
| |||||||||
| (LIBOR plus 4.00%) |
| |||||||||
| 4.46% |
10/22/262 | $ | 2,935,113 | $ | 2,931,444 | |||||
|
|
|
| ||||||||
| 17,891,689 | ||||||||||
|
|
|
| ||||||||
| Electric — 0.02% |
| |||||||||
| CommScope, Inc., |
| |||||||||
| Term Loan B, 1st Lien |
| |||||||||
| (LIBOR plus 3.25%) |
| |||||||||
| 3.71% |
04/06/262 | 332,472 | 324,299 | |||||||
| Homer City Generation LP, |
| |||||||||
| Term Loan B, 1st Lien |
| |||||||||
| (LIBOR plus 11.00%) |
| |||||||||
| 15.00% |
04/05/232,5,6 | 515,547 | 296,439 | |||||||
| Vistra Operations Co., LLC, |
| |||||||||
| Term Loan B3, 1st Lien |
| |||||||||
| (LIBOR plus 1.75%) |
| |||||||||
| 2.19% |
12/31/252 | 55,058 | 54,576 | |||||||
| 2.21% |
12/31/252 | 227,794 | 225,800 | |||||||
|
|
|
| ||||||||
| 901,114 | ||||||||||
|
|
|
| ||||||||
| Entertainment — 0.12% |
| |||||||||
| Cineworld Finance U.S., Inc., |
| |||||||||
| Term Loan B, 1st Lien |
| |||||||||
| (LIBOR plus 2.50%) |
| |||||||||
| 4.00% |
02/28/252 | 4,437,930 | 3,436,799 | |||||||
| Crown Finance U.S., Inc., |
| |||||||||
| Term Loan B1, 1st Lien |
| |||||||||
| (LIBOR plus 7.00%) |
| |||||||||
| 7.00% |
05/23/242 | 1,095,766 | 1,297,119 | |||||||
|
|
|
| ||||||||
| 4,733,918 | ||||||||||
|
|
|
| ||||||||
| Finance — 0.16% |
| |||||||||
| Avolon TLB Borrower 1 U.S. LLC, |
| |||||||||
| Term Loan B5, 1st Lien |
| |||||||||
| (LIBOR plus 2.25%) |
| |||||||||
| 2.75% |
12/01/272 | 1,984,925 | 1,968,261 | |||||||
| DCG Acquisition Corp., |
| |||||||||
| Term Loan, 1st Lien |
| |||||||||
| (LIBOR plus 4.50%) |
| |||||||||
| 4.96% |
09/30/262 | 370,310 | 364,987 | |||||||
| Mozart Borrower, LP, |
| |||||||||
| Term Loan B |
| |||||||||
| (LIBOR plus 3.25%) |
| |||||||||
| 3.75% |
10/23/282 | 500,000 | 495,593 | |||||||
| Schweitzer-Mauduit International, Inc., |
| |||||||||
| Term Loan, 1st Lien |
| |||||||||
| (LIBOR plus 3.75%) |
| |||||||||
| 4.50% |
04/20/282 | 3,597,813 | 3,558,848 | |||||||
|
|
|
| ||||||||
| 6,387,689 | ||||||||||
|
|
|
| ||||||||
| Food — 0.16% |
| |||||||||
| Hostess Brands LLC, |
| |||||||||
| Term Loan, 1st Lien |
| |||||||||
| (LIBOR plus 2.25%) |
| |||||||||
| 3.00% |
08/03/252 | 1,026,316 | 1,014,862 | |||||||
| Issues | Maturity Date |
Principal Amount |
Value | |||||||
| BANK LOANS (continued) |
| |||||||||
| Food (continued) |
| |||||||||
| Houston Foods, Inc., |
| |||||||||
| Term Loan B, 1st Lien |
| |||||||||
| (LIBOR plus 3.75%) |
| |||||||||
| 6.21% |
07/20/252 | $ | 3,278,002 | $ | 3,097,712 | |||||
| Shearer’s Foods LLC, |
| |||||||||
| Term Loan B, 1st Lien |
| |||||||||
| (LIBOR plus 3.50%) |
| |||||||||
| 4.25% |
09/23/272 | 2,468,750 | 2,402,563 | |||||||
|
|
|
| ||||||||
| 6,515,137 | ||||||||||
|
|
|
| ||||||||
| Health Care — 0.53% |
| |||||||||
| Avolon TLB Borrower 1 U.S. LLC, |
| |||||||||
| Term Loan B3, 1st Lien |
| |||||||||
| (LIBOR plus 1.75%) |
| |||||||||
| 2.50% |
01/15/252 | 175,812 | 173,352 | |||||||
| Change Healthcare Holdings LLC, |
| |||||||||
| Term Loan B, 1st Lien |
| |||||||||
| (LIBOR plus 2.50%) |
| |||||||||
| 3.50% |
03/01/242 | 435,010 | 433,215 | |||||||
| Elanco Animal Health, Inc., |
| |||||||||
| Term Loan B, 1st Lien |
| |||||||||
| (LIBOR plus 1.75%) |
| |||||||||
| 1.98% |
08/01/272 | 3,683,647 | 3,631,560 | |||||||
| Endo Luxembourg Finance Co., |
| |||||||||
| Term Loan B, 1st Lien |
| |||||||||
| (LIBOR plus 5.00%) |
| |||||||||
| 5.75% |
03/27/282 | 3,019,500 | 2,836,760 | |||||||
| Grifols Worldwide Operations USA, Inc., |
| |||||||||
| Term Loan B, 1st Lien |
| |||||||||
| (LIBOR plus 2.00%) |
| |||||||||
| 2.46% |
11/15/272 | 2,568,651 | 2,529,158 | |||||||
| Horizon Therapeutics USA, Inc., |
| |||||||||
| Term Loan B, 1st Lien |
| |||||||||
| (LIBOR plus 1.75%) |
| |||||||||
| 2.25% |
03/15/282 | 3,801,600 | 3,769,533 | |||||||
| ICON Luxembourg SARL, |
| |||||||||
| Term Loan B, 1st Lien |
| |||||||||
| (LIBOR plus 2.25%) |
| |||||||||
| 3.31% |
07/03/282 | 1,293,179 | 1,288,737 | |||||||
| Indigo Merger Sub, Inc., |
| |||||||||
| Term Loan B, 1st Lien |
| |||||||||
| (LIBOR plus 2.25%) |
| |||||||||
| 3.31% |
07/03/282 | 322,196 | 321,090 | |||||||
| Pathway Vet Alliance LLC, |
| |||||||||
| Term Loan, 1st Lien |
| |||||||||
| (LIBOR plus 3.75%) |
| |||||||||
| 4.21% |
03/31/272 | 1,134,012 | 1,124,804 | |||||||
| Phoenix Newco, Inc., |
| |||||||||
| Term Loan, 1st Lien |
| |||||||||
| (LIBOR plus 3.50%) |
| |||||||||
| 4.00% |
11/15/282 | 2,526,000 | 2,510,667 | |||||||
| U.S. Renal Care, Inc., |
| |||||||||
| Term Loan B, 1st Lien |
| |||||||||
| (LIBOR plus 5.00%) |
| |||||||||
| 5.25% |
06/26/262 | 1,161,317 | 1,071,315 | |||||||
See accompanying Notes to Financial Statements.
| Annual Report March 2022 / 230 |
Table of Contents
Unconstrained Bond Fund
Schedule of Portfolio Investments
March 31, 2022
| Issues | Maturity Date |
Principal Amount |
Value | |||||||
| BANK LOANS (continued) |
| |||||||||
| Health Care (continued) |
| |||||||||
| (LIBOR plus 5.50%) |
| |||||||||
| 6.50% |
06/26/262 | $ | 497,500 | $ | 461,120 | |||||
| Valeant Pharmaceuticals International, Inc., |
| |||||||||
| Term Loan B, 1st Lien |
| |||||||||
| (LIBOR plus 3.00%) |
| |||||||||
| 3.46% |
06/02/252 | 954,073 | 948,110 | |||||||
|
|
|
| ||||||||
| 21,099,421 | ||||||||||
|
|
|
| ||||||||
| Industrials — 0.68% |
| |||||||||
| Arterrsa Services LLC, |
| |||||||||
| Term Loan, 1st Lien |
| |||||||||
| (LIBOR plus 3.50%) |
| |||||||||
| 4.51% |
03/06/252 | 1,985,000 | 1,866,396 | |||||||
| Berry Global, Inc., |
| |||||||||
| Term Loan Z, 1st Lien |
| |||||||||
| (LIBOR plus 1.75%) |
| |||||||||
| 2.07% |
07/01/262 | 4,807,567 | 4,748,217 | |||||||
| Charter Next generation, Inc., |
| |||||||||
| Term Loan, 1st Lien |
| |||||||||
| (LIBOR plus 3.75%) |
| |||||||||
| 4.50% |
12/01/272 | 3,316,500 | 3,302,504 | |||||||
| Clydesdale Acquisition Holdings, Inc., |
| |||||||||
| Term Loan, 1st Lien |
| |||||||||
| (SOFR plus 4.25%) |
| |||||||||
| 4.25% |
03/30/292,5 | 1,500,000 | 1,477,500 | |||||||
| Liqui-Box Corp., |
| |||||||||
| Term Loan B, 1st Lien |
| |||||||||
| (LIBOR plus 4.50%) |
| |||||||||
| 5.50% |
02/26/272 | 1,719,375 | 1,627,389 | |||||||
| Michaels Cos., Inc. (The), |
| |||||||||
| Term Loan, 1st Lien |
| |||||||||
| (LIBOR plus 4.25%) |
| |||||||||
| 5.26% |
04/15/282 | 3,473,750 | 3,267,253 | |||||||
| Plaze, Inc., |
| |||||||||
| Term Loan B, 1st Lien |
| |||||||||
| (LIBOR plus 3.50%) |
| |||||||||
| 4.51% |
08/03/262 | 1,711,466 | 1,655,843 | |||||||
| (LIBOR plus 3.75%) |
| |||||||||
| 4.76% |
08/03/262 | 3,456,250 | 3,343,922 | |||||||
| Proampac PG Borrower LLC, |
| |||||||||
| Term Loan B, 1st Lien |
| |||||||||
| (LIBOR plus 3.75%) |
| |||||||||
| 4.50% |
11/03/252 | 3,217,581 | 3,154,034 | |||||||
| TransDigm, Inc., |
| |||||||||
| Term Loan E, 1st Lien |
| |||||||||
| (LIBOR plus 2.25%) |
| |||||||||
| 2.71% |
05/30/252 | 488,750 | 480,808 | |||||||
| Zep, Inc., |
| |||||||||
| Term Loan B, 1st Lien |
| |||||||||
| (LIBOR plus 4.00%) |
| |||||||||
| 5.00% |
08/12/242 | 2,145,365 | 2,059,550 | |||||||
|
|
|
| ||||||||
| 26,983,416 | ||||||||||
|
|
|
| ||||||||
| Issues | Maturity Date |
Principal Amount |
Value | |||||||
| BANK LOANS (continued) |
| |||||||||
| Information Technology — 0.50% |
| |||||||||
| AppLovin Corp., |
| |||||||||
| Term Loan B, 1st Lien |
| |||||||||
| (LIBOR plus 3.25%) |
| |||||||||
| 3.25% |
08/15/252 | $ | 3,756,467 | $ | 3,742,681 | |||||
| CT Technologies Intermediate Holdings, Inc., |
| |||||||||
| Term Loan, 1st Lien |
| |||||||||
| (LIBOR plus 4.25%) |
| |||||||||
| 5.00% |
12/16/252 | 940,500 | 935,040 | |||||||
| EagleView Technology Co., |
| |||||||||
| Term Loan B, 1st Lien |
| |||||||||
| (LIBOR plus 3.50%) |
| |||||||||
| 4.51% |
08/14/252 | 5,158,355 | 5,031,562 | |||||||
| Gainwell Acquisition Corp., |
| |||||||||
| Term Loan B, 1st Lien |
| |||||||||
| (LIBOR plus 4.00%) |
| |||||||||
| 5.01% |
10/01/272 | 2,237,343 | 2,237,343 | |||||||
| Helios Software Holdings, Inc., |
| |||||||||
| Term Loan B, 1st Lien |
| |||||||||
| (LIBOR plus 3.75%) |
| |||||||||
| 5.25% |
03/11/282 | 1,657,143 | 1,644,723 | |||||||
| IQVIA, Inc., |
| |||||||||
| Term Loan B1, 1st Lien |
| |||||||||
| (LIBOR plus 1.75%) |
| |||||||||
| 2.21% |
03/07/242 | 643,453 | 639,833 | |||||||
| Term Loan B3, 1st Lien |
| |||||||||
| (LIBOR plus 1.75%) |
| |||||||||
| 2.76% |
06/11/252 | 909,227 | 905,363 | |||||||
| Spin Holdco, Inc., |
| |||||||||
| Term Loan B, 1st Lien |
| |||||||||
| (LIBOR plus 4.00%) |
| |||||||||
| 4.75% |
03/04/282 | 4,732,200 | 4,704,256 | |||||||
|
|
|
| ||||||||
| 19,840,801 | ||||||||||
|
|
|
| ||||||||
| Insurance — 0.03% |
| |||||||||
| Acrisure LLC, |
| |||||||||
| Term Loan B, 1st Lien |
| |||||||||
| (LIBOR plus 3.50%) |
| |||||||||
| 3.96% |
02/15/272 | 1,135,516 | 1,121,799 | |||||||
|
|
|
| ||||||||
| Materials — 0.07% |
| |||||||||
| Herens U.S. Holdco Corp., |
| |||||||||
| Term Loan B, 1st Lien |
| |||||||||
| (LIBOR plus 4.00%) |
| |||||||||
| 5.01% |
07/03/282 | 2,828,661 | 2,765,016 | |||||||
|
|
|
| ||||||||
| Real Estate Investment Trust (REIT) — 0.17% |
| |||||||||
| Aveanna Healthcare LLC, |
| |||||||||
| Term Loan B, 1st Lien |
| |||||||||
| (LIBOR plus 3.75%) |
| |||||||||
| 4.25% |
07/17/282,7 | 3,027,241 | 2,952,695 | |||||||
| Rent-A-Center, Inc., |
| |||||||||
| Term Loan B, 1st Lien |
| |||||||||
| (LIBOR plus 3.25%) |
| |||||||||
| 3.81% |
02/17/282 | 3,930,300 | 3,860,910 | |||||||
|
|
|
| ||||||||
| 6,813,605 | ||||||||||
|
|
|
| ||||||||
See accompanying Notes to Financial Statements.
| 231 / Annual Report March 2022 |
Table of Contents
Unconstrained Bond Fund
Schedule of Portfolio Investments
March 31, 2022
| Issues | Maturity Date |
Principal Amount |
Value | |||||||
| BANK LOANS (continued) |
|
|||||||||
| Retail — 0.34% |
|
|||||||||
| American Airlines, Inc., |
|
|||||||||
| Term Loan, 1st Lien |
|
|||||||||
| (LIBOR plus 4.75%) |
|
|||||||||
| 5.50% |
04/20/282 | $ | 2,397,259 | $ | 2,433,218 | |||||
| AmWINS Group, Inc., |
|
|||||||||
| Term Loan B, 1st Lien |
|
|||||||||
| (LIBOR plus 2.25%) |
|
|||||||||
| 3.00% |
02/19/282 | 7,159,406 | 7,052,016 | |||||||
| BC ULC, |
|
|||||||||
| Term Loan B, 1st Lien (Canada) |
|
|||||||||
| (LIBOR plus 1.75%) |
|
|||||||||
| 2.21% |
11/19/262,3 | 703,112 | 689,268 | |||||||
| BW Gas & Convenience Holdings LLC, |
|
|||||||||
| Term Loan B, 1st Lien |
|
|||||||||
| (LIBOR plus 3.50%) |
|
|||||||||
| 4.00% |
03/31/282 | 3,573,000 | 3,523,871 | |||||||
|
|
|
| ||||||||
| 13,698,373 | ||||||||||
|
|
|
| ||||||||
| Services — 0.09% |
|
|||||||||
| Amentum Government Services Holdings LLC, |
|
|||||||||
| Term Loan B, 1st Lien |
|
|||||||||
| (LIBOR plus 3.50%) |
|
|||||||||
| 3.96% |
01/29/272 | 2,969,773 | 2,942,541 | |||||||
| GFL Environmental, Inc., |
|
|||||||||
| Term Loan B, 1st Lien |
|
|||||||||
| (LIBOR plus 3.00%) |
|
|||||||||
| 3.50% |
05/30/252 | 594,760 | 593,460 | |||||||
|
|
|
| ||||||||
| 3,536,001 | ||||||||||
|
|
|
| ||||||||
| Transportation — 0.05% |
|
|||||||||
| Kenan Advantage Group, Inc. (The), |
|
|||||||||
| Term Loan, 2nd Lien |
|
|||||||||
| (LIBOR plus 7.25%) |
|
|||||||||
| 8.00% |
09/01/272 | 2,155,000 | 2,090,350 | |||||||
|
|
|
| ||||||||
| Total Bank Loans |
|
|||||||||
| (Cost $161,152,043) |
|
159,114,965 | ||||||||
|
|
|
| ||||||||
| CORPORATES — 30.77%* |
|
|||||||||
| Banking — 6.00% |
|
|||||||||
| Bank of America Corp. |
|
|||||||||
| 0.98% |
04/22/254 | 3,391,000 | 3,251,241 | |||||||
| 2.30% |
07/21/324 | 6,275,000 | 5,589,179 | |||||||
| 2.57% |
10/20/324 | 1,645,000 | 1,499,229 | |||||||
| 2.69% |
04/22/324 | 1,240,000 | 1,140,139 | |||||||
| 3.00% |
12/20/234 | 4,885,000 | 4,899,182 | |||||||
| Bank of America Corp. |
|
|||||||||
| (MTN) |
|
|||||||||
| 2.09% |
06/14/294 | 9,525,000 | 8,713,752 | |||||||
| 3.09% |
10/01/254 | 8,295,000 | 8,272,161 | |||||||
| 3.97% |
03/05/294 | 790,000 | 802,800 | |||||||
| (LIBOR USD 3-Month plus 0.65%) |
|
|||||||||
| 1.17% |
12/01/262 | 4,400,000 | 4,238,403 | |||||||
| Bank of America Corp., |
|
|||||||||
| Series N |
|
|||||||||
| 1.66% |
03/11/274 | 14,050,000 | 13,133,888 | |||||||
| Issues | Maturity Date |
Principal Amount |
Value | |||||||
| CORPORATES (continued) |
|
|||||||||
| Banking (continued) |
|
|||||||||
| Bank of America Corp., |
|
|||||||||
| Series RR |
|
|||||||||
| 4.38%4,8 |
$ | 2,340,000 | $ | 2,204,913 | ||||||
| Comerica, Inc. |
|
|||||||||
| 5.63%4,8 |
2,145,000 | 2,230,800 | ||||||||
| Credit Suisse Group AG |
|
|||||||||
| (Switzerland) |
|
|||||||||
| 1.31% |
02/02/271,3,4 | 3,045,000 | 2,723,138 | |||||||
| 2.19% |
06/05/261,3,4 | 8,574,000 | 8,067,558 | |||||||
| 2.59% |
09/11/251,3,4 | 3,775,000 | 3,643,223 | |||||||
| 3.09% |
05/14/321,3,4 | 3,560,000 | 3,207,205 | |||||||
| 3.75% |
03/26/253 | 2,595,000 | 2,587,294 | |||||||
| 4.28% |
01/09/281,3 | 940,000 | 940,346 | |||||||
| Discover Bank |
|
|||||||||
| (BKNT) |
|
|||||||||
| 3.45% |
07/27/26 | 2,811,000 | 2,798,789 | |||||||
| DNB Bank ASA |
|
|||||||||
| (Norway) |
|
|||||||||
| 1.13% |
09/16/261,3,4 | 165,000 | 151,645 | |||||||
| 1.61% |
03/30/281,3,4 | 6,000,000 | 5,431,360 | |||||||
| Global Bank Corp. |
|
|||||||||
| (Panama) |
|
|||||||||
| 5.25% |
04/16/291,3,4 | 600,000 | 571,500 | |||||||
| Global Bank Corp., |
|
|||||||||
| Series REGS |
|
|||||||||
| (Panama) |
|
|||||||||
| 5.25% |
04/16/293,4 | 1,000,000 | 952,500 | |||||||
| HSBC Holdings PLC |
|
|||||||||
| (United Kingdom) |
|
|||||||||
| 1.59% |
05/24/273,4 | 2,575,000 | 2,353,571 | |||||||
| 1.75% |
07/24/273,4 | 1,425,000 | 1,768,788 | |||||||
| 2.01% |
09/22/283,4 | 290,000 | 263,373 | |||||||
| 2.10% |
06/04/263,4 | 3,620,000 | 3,445,428 | |||||||
| 2.21% |
08/17/293,4 | 14,100,000 | 12,707,373 | |||||||
| 2.80% |
05/24/323,4 | 2,150,000 | 1,958,504 | |||||||
| 3.97% |
05/22/303,4 | 1,765,000 | 1,769,624 | |||||||
| 4.29% |
09/12/263,4 | 2,100,000 | 2,127,450 | |||||||
| JPMorgan Chase & Co. |
|
|||||||||
| 0.70% |
03/16/244 | 1,720,000 | 1,688,655 | |||||||
| 0.97% |
06/23/254 | 6,645,000 | 6,348,529 | |||||||
| 1.58% |
04/22/274 | 10,020,000 | 9,340,023 | |||||||
| 2.01% |
03/13/264 | 5,000,000 | 4,826,503 | |||||||
| 2.58% |
04/22/324 | 1,895,000 | 1,738,816 | |||||||
| Lloyds Banking Group PLC |
|
|||||||||
| (United Kingdom) |
|
|||||||||
| 1.63% |
05/11/273,4 | 2,000,000 | 1,835,975 | |||||||
| 2.91% |
11/07/233,4 | 5,175,000 | 5,183,817 | |||||||
| 3.75% |
03/18/283,4 | 3,345,000 | 3,334,468 | |||||||
| 3.87% |
07/09/253,4 | 8,725,000 | 8,821,981 | |||||||
| Macquarie Group Ltd. |
|
|||||||||
| (Australia) |
|
|||||||||
| 1.20% |
10/14/251,3,4 | 2,000,000 | 1,891,997 | |||||||
| 2.69% |
06/23/321,3,4 | 2,290,000 | 2,022,091 | |||||||
| 2.87% |
01/14/331,3,4 | 7,960,000 | 7,081,172 | |||||||
| 3.19% |
11/28/231,3,4 | 3,241,000 | 3,247,175 | |||||||
| 4.44% |
06/21/331,3,4 | 1,370,000 | 1,387,216 | |||||||
See accompanying Notes to Financial Statements.
| Annual Report March 2022 / 232 |
Table of Contents
Unconstrained Bond Fund
Schedule of Portfolio Investments
March 31, 2022
| Issues | Maturity Date |
Principal Amount |
Value | |||||||
| CORPORATES (continued) |
| |||||||||
| Banking (continued) |
| |||||||||
| NatWest Group PLC |
| |||||||||
| (United Kingdom) |
| |||||||||
| 4.27% |
03/22/253,4 | $ | 7,587,000 | $ | 7,679,331 | |||||
| Santander UK Group Holdings PLC |
| |||||||||
| (United Kingdom) |
| |||||||||
| 1.09% |
03/15/253,4 | 7,075,000 | 6,730,372 | |||||||
| 1.53% |
08/21/263,4 | 1,210,000 | 1,113,599 | |||||||
| 1.67% |
06/14/273,4 | 2,620,000 | 2,386,967 | |||||||
| 3.37% |
01/05/243,4 | 900,000 | 903,085 | |||||||
| 4.80% |
11/15/243,4 | 6,211,000 | 6,355,089 | |||||||
| Santander UK PLC |
| |||||||||
| (United Kingdom) |
| |||||||||
| 5.00% |
11/07/231,3 | 3,415,000 | 3,498,667 | |||||||
| U.S. Bancorp |
| |||||||||
| 3.70%4,8 |
1,980,000 | 1,796,525 | ||||||||
| UBS AG |
| |||||||||
| (Switzerland) |
| |||||||||
| 0.70% |
08/09/241,3 | 5,865,000 | 5,561,889 | |||||||
| Wells Fargo & Co. |
| |||||||||
| (MTN) |
| |||||||||
| 2.39% |
06/02/284 | 3,665,000 | 3,469,804 | |||||||
| 2.88% |
10/30/304 | 3,848,000 | 3,666,211 | |||||||
| 3.35% |
03/02/334 | 24,320,000 | 23,660,888 | |||||||
|
|
|
| ||||||||
| 239,015,201 | ||||||||||
|
|
|
| ||||||||
| Communications — 4.49% |
| |||||||||
| AT&T, Inc. |
| |||||||||
| 2.55% |
12/01/33 | 5,346,000 | 4,760,252 | |||||||
| 3.55% |
09/15/55 | 511,000 | 449,393 | |||||||
| 3.80% |
12/01/57 | 10,051,000 | 8,957,470 | |||||||
| 4.30% |
12/15/42 | 2,300,000 | 2,288,025 | |||||||
| 4.50% |
05/15/35 | 2,150,000 | 2,264,854 | |||||||
| 4.75% |
05/15/46 | 1,875,000 | 2,044,061 | |||||||
| 5.25% |
03/01/37 | 6,985,000 | 7,963,843 | |||||||
| C&W Senior Financing DAC |
| |||||||||
| (Ireland) |
| |||||||||
| 6.88% |
09/15/271,3 | 1,200,000 | 1,193,112 | |||||||
| Cable One, Inc. |
| |||||||||
| 4.00% |
11/15/301 | 3,956,000 | 3,659,300 | |||||||
| CCO Holdings, LLC/CCO Holdings Capital Corp. |
| |||||||||
| 4.25% |
01/15/341 | 4,000,000 | 3,480,000 | |||||||
| Charter Communications Operating LLC/Charter |
| |||||||||
| Communications Operating Capital |
| |||||||||
| 4.80% |
03/01/50 | 1,485,000 | 1,418,517 | |||||||
| 5.38% |
05/01/47 | 3,050,000 | 3,128,279 | |||||||
| 5.75% |
04/01/48 | 2,347,000 | 2,496,504 | |||||||
| Charter Communications Operating, LLC/Charter |
| |||||||||
| Communications Operating Capital |
| |||||||||
| 5.25% |
04/01/53 | 4,885,000 | 4,931,297 | |||||||
| CommScope, Inc. |
| |||||||||
| 4.75% |
09/01/291 | 3,449,000 | 3,198,947 | |||||||
| 6.00% |
03/01/261 | 3,566,000 | 3,611,645 | |||||||
| CSC Holdings LLC |
| |||||||||
| 3.38% |
02/15/311 | 744,000 | 627,844 | |||||||
| 4.50% |
11/15/311 | 7,046,000 | 6,321,206 | |||||||
| Issues | Maturity Date |
Principal Amount |
Value | |||||||
| CORPORATES (continued) |
| |||||||||
| Communications (continued) |
| |||||||||
| Diamond Sports Group LLC/Diamond Sports Finance Co. |
|
|||||||||
| 6.63% |
08/15/271 | $ | 12,630,000 | $ | 2,632,724 | |||||
| Diamond Sports Group, LLC/Diamond Sports Finance Co. |
|
|||||||||
| 5.38% |
08/15/261 | 8,511,000 | 3,340,567 | |||||||
| Gray Escrow II, Inc. |
| |||||||||
| 5.38% |
11/15/311 | 2,491,000 | 2,384,019 | |||||||
| Intelsat Jackson Holdings SA |
| |||||||||
| (Luxembourg) |
| |||||||||
| 6.50% |
03/15/301,3 | 7,112,000 | 7,112,244 | |||||||
| Intelsat Jackson Holdings SA, |
| |||||||||
| Class B |
| |||||||||
| 8.50% |
10/15/241,3,5,6,9,10 | 7,892,000 | — | |||||||
| Intelsat Jackson Holdings SA, |
| |||||||||
| Class B |
| |||||||||
| (Luxembourg) |
| |||||||||
| 9.75% |
07/15/251,3,5,6,9,10 | 6,820,000 | — | |||||||
| Level 3 Financing, Inc. |
| |||||||||
| 3.40% |
03/01/271 | 1,130,000 | 1,066,923 | |||||||
| 3.75% |
07/15/291 | 3,042,000 | 2,699,745 | |||||||
| 3.88% |
11/15/291 | 6,680,000 | 6,159,661 | |||||||
| Lumen Technologies, Inc. |
| |||||||||
| 5.38% |
06/15/291 | 3,796,000 | 3,385,880 | |||||||
| National CineMedia LLC |
| |||||||||
| 5.88% |
04/15/281 | 6,022,000 | 5,271,599 | |||||||
| SES GLOBAL Americas Holdings GP |
| |||||||||
| 5.30% |
03/25/441 | 8,494,000 | 8,263,692 | |||||||
| Sinclair Television Group, Inc. |
| |||||||||
| 4.13% |
12/01/301 | 5,883,000 | 5,256,461 | |||||||
| Sprint Spectrum Co. LLC/Sprint Spectrum Co. II LLC/Sprint |
|
|||||||||
| Spectrum Co. III LLC |
| |||||||||
| 4.74% |
03/20/251 | 11,658,750 | 11,908,607 | |||||||
| 5.15% |
03/20/281 | 12,400,000 | 13,068,973 | |||||||
| Tencent Holdings Ltd. |
| |||||||||
| (Cayman Islands) |
| |||||||||
| 3.84% |
04/22/511,3 | 3,585,000 | 3,140,135 | |||||||
| Time Warner Cable LLC |
| |||||||||
| 5.50% |
09/01/41 | 4,443,000 | 4,623,638 | |||||||
| T-Mobile USA, Inc. |
| |||||||||
| 2.25% |
02/15/261 | 2,557,000 | 2,419,599 | |||||||
| 2.55% |
02/15/31 | 2,190,000 | 1,989,355 | |||||||
| 2.63% |
02/15/29 | 565,000 | 517,105 | |||||||
| 3.88% |
04/15/30 | 10,237,000 | 10,290,869 | |||||||
| 4.38% |
04/15/40 | 2,000,000 | 2,014,461 | |||||||
| Verizon Communications, Inc. |
| |||||||||
| 2.36% |
03/15/321 | 4,910,000 | 4,441,815 | |||||||
| Virgin Media Secured Finance PLC |
| |||||||||
| (United Kingdom) |
| |||||||||
| 5.50% |
05/15/291,3 | 1,513,000 | 1,504,081 | |||||||
| Vodafone Group PLC |
| |||||||||
| (United Kingdom) |
| |||||||||
| 4.25% |
09/17/503 | 50,000 | 49,884 | |||||||
| 4.88% |
06/19/493 | 1,328,000 | 1,449,721 | |||||||
| 5.25% |
05/30/483 | 6,292,000 | 7,068,698 | |||||||
See accompanying Notes to Financial Statements.
| 233 / Annual Report March 2022 |
Table of Contents
Unconstrained Bond Fund
Schedule of Portfolio Investments
March 31, 2022
| Issues | Maturity Date |
Principal Amount |
Value | |||||||
| CORPORATES (continued) |
|
|||||||||
| Communications (continued) |
|
|||||||||
| Zayo Group Holdings, Inc. |
|
|||||||||
| 4.00% |
03/01/271 | $ | 4,491,000 | $ | 4,140,792 | |||||
|
|
|
| ||||||||
| 178,995,797 | ||||||||||
|
|
|
| ||||||||
| Consumer Discretionary — 1.48% |
|
|||||||||
| Anheuser-Busch Cos. LLC/Anheuser-Busch InBev |
| |||||||||
| Worldwide, Inc. |
|
|||||||||
| 4.70% |
02/01/36 | 3,200,000 | 3,482,627 | |||||||
| 4.90% |
02/01/46 | 3,921,000 | 4,366,987 | |||||||
| Bacardi Ltd. |
|
|||||||||
| (Bermuda) |
|
|||||||||
| 4.45% |
05/15/251,3 | 3,585,000 | 3,672,780 | |||||||
| 5.15% |
05/15/381,3 | 1,500,000 | 1,636,334 | |||||||
| BAT Capital Corp. |
|
|||||||||
| 2.73% |
03/25/31 | 915,000 | 807,875 | |||||||
| 4.54% |
08/15/47 | 500,000 | 447,524 | |||||||
| 4.70% |
04/02/27 | 1,390,000 | 1,424,576 | |||||||
| 5.65% |
03/16/52 | 4,125,000 | 4,193,948 | |||||||
| Becle, SAB de CV |
|
|||||||||
| (Mexico) |
|
|||||||||
| 2.50% |
10/14/311,3 | 4,450,000 | 3,956,918 | |||||||
| Imperial Brands Finance PLC |
|
|||||||||
| (United Kingdom) |
|
|||||||||
| 3.13% |
07/26/241,3 | 1,500,000 | 1,487,536 | |||||||
| 3.50% |
07/26/261,3 | 2,520,000 | 2,463,022 | |||||||
| 4.25% |
07/21/251,3 | 1,880,000 | 1,896,326 | |||||||
| Magallanes, Inc. |
|
|||||||||
| 4.28% |
03/15/321 | 2,005,000 | 2,017,544 | |||||||
| 5.05% |
03/15/421 | 7,970,000 | 8,135,223 | |||||||
| 5.14% |
03/15/521 | 6,182,000 | 6,332,712 | |||||||
| Reynolds American, Inc. |
|
|||||||||
| 5.85% |
08/15/45 | 12,245,000 | 12,532,556 | |||||||
|
|
|
| ||||||||
| 58,854,488 | ||||||||||
|
|
|
| ||||||||
| Electric — 0.89% |
|
|||||||||
| Alliant Energy Finance, LLC |
|
|||||||||
| 3.60% |
03/01/321 | 8,130,000 | 7,939,007 | |||||||
| Cleco Power LLC |
|
|||||||||
| 6.00% |
12/01/40 | 825,000 | 1,004,911 | |||||||
| Consolidated Edison Co. of New York, Inc. |
|
|||||||||
| 4.45% |
03/15/44 | 1,000,000 | 1,052,494 | |||||||
| Dominion Energy, Inc. |
|
|||||||||
| 5.75% |
10/01/544 | 2,515,000 | 2,556,610 | |||||||
| Duke Energy Carolinas LLC |
|
|||||||||
| 3.70% |
12/01/47 | 1,810,000 | 1,773,318 | |||||||
| Eskom Holdings SOC Ltd., |
|
|||||||||
| Series REGS |
|
|||||||||
| (South Africa) |
|
|||||||||
| 7.13% |
02/11/253 | 800,000 | 776,640 | |||||||
| FirstEnergy Transmission LLC |
|
|||||||||
| 2.87% |
09/15/281 | 9,558,000 | 8,885,151 | |||||||
| Metropolitan Edison Co. |
|
|||||||||
| 4.00% |
04/15/251 | 2,625,000 | 2,639,922 | |||||||
| Issues | Maturity Date |
Principal Amount |
Value | |||||||
| CORPORATES (continued) |
| |||||||||
| Electric (continued) |
| |||||||||
| Mong Duong Finance Holdings BV, |
| |||||||||
| Series REGS |
| |||||||||
| (Netherlands) |
| |||||||||
| 5.13% |
05/07/293 | $ | 900,000 | $ | 812,394 | |||||
| Public Service Co. of New Mexico |
| |||||||||
| 3.85% |
08/01/25 | 5,565,000 | 5,664,651 | |||||||
| Southwestern Electric Power Co., |
| |||||||||
| Series M |
| |||||||||
| 4.10% |
09/15/28 | 2,190,000 | 2,245,118 | |||||||
|
|
|
| ||||||||
| 35,350,216 | ||||||||||
|
|
|
| ||||||||
| Energy — 2.59% |
| |||||||||
| Archrock Partners LP/Archrock Partners Finance Corp. |
|
|||||||||
| 6.25% |
04/01/281 | 1,700,000 | 1,680,875 | |||||||
| Ecopetrol SA |
|
|||||||||
| (Colombia) |
|
|||||||||
| 6.88% |
04/29/303 | 1,575,000 | 1,659,420 | |||||||
| Enbridge Energy Partners LP |
|
|||||||||
| 5.88% |
10/15/25 | 2,190,000 | 2,361,996 | |||||||
| Energy Transfer LP |
|
|||||||||
| 4.40% |
03/15/27 | 1,448,000 | 1,467,271 | |||||||
| 4.95% |
06/15/28 | 2,000,000 | 2,103,386 | |||||||
| 5.00% |
05/15/50 | 1,902,000 | 1,930,231 | |||||||
| 5.15% |
03/15/45 | 1,901,000 | 1,906,368 | |||||||
| 5.40% |
10/01/47 | 4,716,000 | 4,936,523 | |||||||
| 6.13% |
12/15/45 | 500,000 | 553,931 | |||||||
| Energy Transfer LP, |
|
|||||||||
| Series B |
|
|||||||||
| 6.63%4,8 |
3,889,000 | 3,495,239 | ||||||||
| Exxon Mobil Corp. |
|
|||||||||
| 4.33% |
03/19/50 | 1,100,000 | 1,232,103 | |||||||
| Galaxy Pipeline Assets Bidco Ltd. |
|
|||||||||
| (United Kingdom) |
|
|||||||||
| 2.16% |
03/31/341,3 | 1,921,720 | 1,774,307 | |||||||
| Global Partners LP/GLP Finance Corp. |
|
|||||||||
| 6.88% |
01/15/29 | 4,137,000 | 4,093,065 | |||||||
| KazMunayGas National Co. JSC, |
|
|||||||||
| Series REGS |
|
|||||||||
| (Kazakhstan) |
|
|||||||||
| 3.50% |
04/14/333 | 336,000 | 281,400 | |||||||
| 4.75% |
04/19/273 | 500,000 | 480,976 | |||||||
| 5.38% |
04/24/303 | 2,129,000 | 2,051,703 | |||||||
| KazTransGas JSC, |
|
|||||||||
| Series REGS |
|
|||||||||
| (Kazakhstan) |
|
|||||||||
| 4.38% |
09/26/273 | 650,000 | 587,535 | |||||||
| Kinder Morgan Energy Partners LP |
|
|||||||||
| 5.00% |
08/15/42 | 1,090,000 | 1,118,980 | |||||||
| NGL Energy Operating LLC/NGL Energy Finance Corp. |
|
|||||||||
| 7.50% |
02/01/261 | 1,929,000 | 1,898,368 | |||||||
| Occidental Petroleum Corp. |
|
|||||||||
| 0.00% |
10/10/3611 | 7,308,000 | 3,934,627 | |||||||
| Pertamina Persero PT |
|
|||||||||
| (Indonesia) |
|
|||||||||
| 3.10% |
08/27/301,3 | 4,579,000 | 4,351,424 | |||||||
See accompanying Notes to Financial Statements.
| Annual Report March 2022 / 234 |
Table of Contents
Unconstrained Bond Fund
Schedule of Portfolio Investments
March 31, 2022
| Issues | Maturity Date |
Principal Amount |
Value | |||||||||
| CORPORATES (continued) |
|
|||||||||||
| Energy (continued) |
| |||||||||||
| Petroleos Mexicanos |
| |||||||||||
| (Mexico) |
||||||||||||
| 1.70% |
12/20/223 | $ | 15,000 | $ | 14,983 | |||||||
| 6.63% |
06/15/353 | 6,120,000 | 5,504,940 | |||||||||
| 6.75% |
09/21/473 | 3,815,000 | 3,108,157 | |||||||||
| 6.95% |
01/28/603 | 1,595,000 | 1,295,778 | |||||||||
| Petronas Capital Ltd. |
| |||||||||||
| (Malaysia) |
||||||||||||
| 2.48% |
01/28/321,3 | 2,050,000 | 1,912,272 | |||||||||
| 3.50% |
04/21/301,3 | 4,405,000 | 4,500,148 | |||||||||
| Plains All American Pipeline LP/PAA Finance Corp. |
|
|||||||||||
| 3.80% |
09/15/30 | 2,000,000 | 1,964,975 | |||||||||
| 4.50% |
12/15/26 | 1,505,000 | 1,545,751 | |||||||||
| Rockies Express Pipeline LLC |
| |||||||||||
| 4.80% |
05/15/301 | 2,000,000 | 1,915,000 | |||||||||
| 4.95% |
07/15/291 | 1,000,000 | 971,913 | |||||||||
| 6.88% |
04/15/401 | 3,175,000 | 3,151,188 | |||||||||
| Ruby Pipeline LLC |
| |||||||||||
| 8.00% |
04/01/221,5,6 | 3,943,939 | 3,667,864 | |||||||||
| Saudi Arabian Oil Co., |
| |||||||||||
| Series REGS |
||||||||||||
| (Saudi Arabia) |
| |||||||||||
| 1.63% |
11/24/253 | 1,100,000 | 1,045,169 | |||||||||
| Shell International Finance BV |
| |||||||||||
| (Netherlands) |
| |||||||||||
| 3.00% |
11/26/513 | 2,000,000 | 1,790,659 | |||||||||
| 4.00% |
05/10/463 | 2,180,000 | 2,274,448 | |||||||||
| Southern Co. Gas Capital Corp. |
| |||||||||||
| 3.25% |
06/15/26 | 2,935,000 | 2,924,299 | |||||||||
| 3.88% |
11/15/25 | 2,410,000 | 2,455,652 | |||||||||
| Southern Gas Corridor CJSC, |
| |||||||||||
| Series REGS |
| |||||||||||
| (Azerbaijan) |
||||||||||||
| 6.88% |
03/24/263 | 2,776,000 | 3,044,994 | |||||||||
| TransMontaigne Partners LP/TLP Finance Corp. |
| |||||||||||
| 6.13% |
02/15/26 | 3,846,000 | 3,788,310 | |||||||||
| Transocean Pontus Ltd. |
| |||||||||||
| (Cayman Islands) |
| |||||||||||
| 6.13% |
08/01/251,3 | 998,145 | 993,653 | |||||||||
| Transocean Poseidon Ltd. |
| |||||||||||
| (Cayman Islands) |
| |||||||||||
| 6.88% |
02/01/271,3 | 3,888,750 | 3,856,065 | |||||||||
| Transocean Proteus Ltd. |
| |||||||||||
| (Cayman Islands) |
| |||||||||||
| 6.25% |
12/01/241,3 | 1,805,500 | 1,794,405 | |||||||||
| USA Compression Partners LP/USA Compression Finance Corp. |
|
|||||||||||
| 6.88% |
09/01/27 | 1,777,000 | 1,786,569 | |||||||||
| Venture Global Calcasieu Pass LLC |
| |||||||||||
| 3.88% |
08/15/291 | 4,000,000 | 3,895,284 | |||||||||
|
|
|
| ||||||||||
| 103,102,204 | ||||||||||||
|
|
|
| ||||||||||
| Entertainment — 0.05% |
| |||||||||||
| WMG Acquisition Corp. |
| |||||||||||
| 3.75% |
12/01/291 | 2,050,000 | 1,926,549 | |||||||||
|
|
|
| ||||||||||
| Issues | Maturity Date |
Principal Amount |
Value | |||||||||
| CORPORATES (continued) |
|
|||||||||||
| Finance — 4.53% |
| |||||||||||
| AerCap Ireland Capital DAC/AerCap Global Aviation Trust |
|
|||||||||||
| (Ireland) |
||||||||||||
| 2.45% |
10/29/263 | $ | 4,125,000 | $ | 3,815,300 | |||||||
| 3.00% |
10/29/283 | 11,100,000 | 10,235,256 | |||||||||
| 3.88% |
01/23/283 | 1,090,000 | 1,061,580 | |||||||||
| Air Lease Corp. |
| |||||||||||
| 2.25% |
01/15/23 | 2,000,000 | 2,001,588 | |||||||||
| 3.88% |
07/03/23 | 2,862,000 | 2,892,016 | |||||||||
| American Express Co., |
| |||||||||||
| Series D |
| |||||||||||
| 3.55%4,8 |
2,350,000 | 2,135,489 | ||||||||||
| Avolon Holdings Funding Ltd. |
| |||||||||||
| (Cayman Islands) |
| |||||||||||
| 2.53% |
11/18/271,3 | 5,278,000 | 4,671,713 | |||||||||
| 2.88% |
02/15/251,3 | 4,555,000 | 4,409,940 | |||||||||
| 3.95% |
07/01/241,3 | 1,035,000 | 1,031,024 | |||||||||
| Capital One Financial Corp. |
| |||||||||||
| 3.27% |
03/01/304 | 5,645,000 | 5,463,975 | |||||||||
| Charles Schwab Corp. (The) |
| |||||||||||
| 2.90% |
03/03/32 | 6,045,000 | 5,821,708 | |||||||||
| 5.00%4,8 |
2,020,000 | 2,017,576 | ||||||||||
| Citigroup, Inc. |
| |||||||||||
| 1.28% |
11/03/254 | 2,680,000 | 2,550,582 | |||||||||
| 1.46% |
06/09/274 | 2,930,000 | 2,698,794 | |||||||||
| 2.67% |
01/29/314 | 1,500,000 | 1,394,099 | |||||||||
| 3.06% |
01/25/334 | 16,170,000 | 15,141,365 | |||||||||
| 3.79% |
03/17/334 | 5,180,000 | 5,151,809 | |||||||||
| 4.41% |
03/31/314 | 276,000 | 287,051 | |||||||||
| Citigroup, Inc., |
| |||||||||||
| Series VAR |
| |||||||||||
| 3.07% |
02/24/284 | 2,020,000 | 1,972,498 | |||||||||
| Ford Motor Credit Co. LLC |
|
|||||||||||
| (LIBOR USD 3-Month plus 1.08%) |
| |||||||||||
| 1.38% |
08/03/222 | 2,555,000 | 2,546,696 | |||||||||
| General Motors Financial Co., Inc. |
| |||||||||||
| 3.15% |
06/30/22 | 500,000 | 501,696 | |||||||||
| 3.45% |
04/10/22 | 675,000 | 675,213 | |||||||||
| Goldman Sachs Group, Inc. (The) |
| |||||||||||
| 0.93% |
10/21/244 | 5,565,000 | 5,397,218 | |||||||||
| 2.38% |
07/21/324 | 6,585,000 | 5,855,373 | |||||||||
| 2.65% |
10/21/324 | 3,598,000 | 3,260,713 | |||||||||
| 3.10% |
02/24/334 | 18,235,000 | 17,207,479 | |||||||||
| 3.27% |
09/29/254 | 12,035,000 | 12,029,021 | |||||||||
| JPMorgan Chase & Co. |
| |||||||||||
| 1.05% |
11/19/264 | 6,095,000 | 5,633,999 | |||||||||
| 1.56% |
12/10/254 | 4,505,000 | 4,313,122 | |||||||||
| 2.55% |
11/08/324 | 2,120,000 | 1,936,681 | |||||||||
| 2.95% |
02/24/284 | 2,625,000 | 2,562,581 | |||||||||
| Morgan Stanley |
| |||||||||||
| 0.79% |
05/30/254 | 11,395,000 | 10,833,987 | |||||||||
| 2.94% |
01/21/334 | 5,645,000 | 5,292,377 | |||||||||
| Morgan Stanley |
| |||||||||||
| (GMTN) |
||||||||||||
| 0.79% |
01/22/254 | 5,688,000 | 5,463,858 | |||||||||
| 2.24% |
07/21/324 | 4,715,000 | 4,182,476 | |||||||||
See accompanying Notes to Financial Statements.
| 235 / Annual Report March 2022 |
Table of Contents
Unconstrained Bond Fund
Schedule of Portfolio Investments
March 31, 2022
| Issues | Maturity Date |
Principal Amount |
Value | |||||||||
| CORPORATES (continued) |
|
|||||||||||
| Finance (continued) |
| |||||||||||
| Morgan Stanley |
| |||||||||||
| (MTN) |
||||||||||||
| 1.93% |
04/28/324 | $ | 2,220,000 | $ | 1,923,663 | |||||||
| 2.51% |
10/20/324 | 850,000 | 770,024 | |||||||||
| Nationwide Building Society |
| |||||||||||
| (United Kingdom) |
| |||||||||||
| 2.97% |
02/16/281,3,4 | 3,890,000 | 3,709,759 | |||||||||
| 3.62% |
04/26/231,3,4 | 5,000,000 | 5,001,067 | |||||||||
| 3.77% |
03/08/241,3,4 | 2,570,000 | 2,585,212 | |||||||||
| 4.36% |
08/01/241,3,4 | 2,490,000 | 2,529,111 | |||||||||
| Park Aerospace Holdings Ltd. |
| |||||||||||
| (Cayman Islands) |
| |||||||||||
| 4.50% |
03/15/231,3 | 455,000 | 458,456 | |||||||||
| 5.50% |
02/15/241,3 | 861,000 | 881,849 | |||||||||
|
|
|
| ||||||||||
| 180,304,994 | ||||||||||||
|
|
|
| ||||||||||
| Food — 0.92% |
| |||||||||||
| Chobani LLC/Chobani Finance Corp, Inc. |
| |||||||||||
| 4.63% |
11/15/281 | 2,091,000 | 1,932,847 | |||||||||
| JBS USA LUX SA/JBS USA Food Co./JBS USA Finance, Inc. |
|
|||||||||||
| (Canada) |
||||||||||||
| 5.50% |
01/15/301,3 | 1,005,000 | 1,029,542 | |||||||||
| 6.50% |
04/15/291,3 | 8,577,000 | 9,100,127 | |||||||||
| Kraft Heinz Foods Co. |
| |||||||||||
| 3.88% |
05/15/27 | 4,795,000 | 4,872,035 | |||||||||
| 4.88% |
10/01/49 | 424,000 | 447,458 | |||||||||
| 5.20% |
07/15/45 | 2,000,000 | 2,167,500 | |||||||||
| Pilgrim’s Pride Corp. |
| |||||||||||
| 4.25% |
04/15/311 | 4,000,000 | 3,707,639 | |||||||||
| Post Holdings, Inc. |
| |||||||||||
| 4.50% |
09/15/311 | 4,802,000 | 4,259,974 | |||||||||
| 4.63% |
04/15/301 | 4,535,000 | 4,091,023 | |||||||||
| Smithfield Foods, Inc. |
| |||||||||||
| 5.20% |
04/01/291 | 4,690,000 | 4,925,968 | |||||||||
|
|
|
| ||||||||||
| 36,534,113 | ||||||||||||
|
|
|
| ||||||||||
| Gaming — 0.14% |
| |||||||||||
| Boyd Gaming Corp. |
| |||||||||||
| 4.75% |
06/15/311 | 1,878,000 | 1,811,046 | |||||||||
| Caesars Entertainment, Inc. |
| |||||||||||
| 4.63% |
10/15/291 | 3,925,000 | 3,684,437 | |||||||||
|
|
|
| ||||||||||
| 5,495,483 | ||||||||||||
|
|
|
| ||||||||||
| Health Care — 3.43% |
| |||||||||||
| 180 Medical, Inc. |
| |||||||||||
| 3.88% |
10/15/291 | 2,245,000 | 2,127,137 | |||||||||
| AbbVie, Inc. |
| |||||||||||
| 3.25% |
10/01/22 | 3,170,000 | 3,186,098 | |||||||||
| 4.40% |
11/06/42 | 5,190,000 | 5,515,427 | |||||||||
| 4.45% |
05/14/46 | 2,350,000 | 2,507,608 | |||||||||
| American Medical Systems Europe BV |
| |||||||||||
| (Netherlands) |
||||||||||||
| 1.88% |
03/08/343 | 2,000,000 | 2,170,055 | |||||||||
| Amgen, Inc. |
| |||||||||||
| 3.35% |
02/22/32 | 1,955,000 | 1,939,631 | |||||||||
| 4.40% |
02/22/62 | 2,025,000 | 2,104,418 | |||||||||
| Issues | Maturity Date |
Principal Amount |
Value | |||||||||
| CORPORATES (continued) |
|
|||||||||||
| Health Care (continued) |
|
|||||||||||
| Bayer U.S. Finance II LLC |
| |||||||||||
| 4.25% |
12/15/251 | $ | 2,005,000 | $ | 2,041,023 | |||||||
| 4.38% |
12/15/281 | 8,135,000 | 8,327,604 | |||||||||
| 4.63% |
06/25/381 | 2,775,000 | 2,915,072 | |||||||||
| 4.88% |
06/25/481 | 4,415,000 | 4,764,393 | |||||||||
| 5.50% |
08/15/251 | 2,000,000 | 2,082,330 | |||||||||
| Becton Dickinson and Co. |
| |||||||||||
| 6.70% |
08/01/28 | 2,930,000 | 3,384,248 | |||||||||
| Centene Corp. |
| |||||||||||
| 2.45% |
07/15/28 | 13,561,000 | 12,401,912 | |||||||||
| Cigna Corp. |
| |||||||||||
| 3.88% |
10/15/47 | 4,825,000 | 4,720,953 | |||||||||
| CommonSpirit Health |
| |||||||||||
| 2.78% |
10/01/30 | 3,680,000 | 3,414,559 | |||||||||
| 3.91% |
10/01/50 | 1,220,000 | 1,167,729 | |||||||||
| CVS Health Corp. |
| |||||||||||
| 2.75% |
12/01/22 | 2,215,000 | 2,226,413 | |||||||||
| 5.05% |
03/25/48 | 5,417,000 | 6,143,999 | |||||||||
| 5.13% |
07/20/45 | 755,000 | 854,734 | |||||||||
| Embecta Corp. |
| |||||||||||
| 5.00% |
02/15/301 | 2,874,000 | 2,715,978 | |||||||||
| 6.75% |
02/15/301 | 3,000,000 | 3,012,953 | |||||||||
| Encompass Health Corp. |
| |||||||||||
| 4.63% |
04/01/31 | 1,878,000 | 1,764,543 | |||||||||
| Endo DAC/Endo Finance LLC/Endo Finco, Inc. |
| |||||||||||
| (Ireland) |
||||||||||||
| 6.00% |
06/30/281,3 | 8,604,000 | 5,017,423 | |||||||||
| Endo Luxembourg Finance Co. I Sarl/Endo U.S., Inc. |
|
|||||||||||
| (Luxembourg) |
| |||||||||||
| 6.13% |
04/01/291,3 | 1,948,000 | 1,780,057 | |||||||||
| HCA, Inc. |
| |||||||||||
| 3.50% |
07/15/51 | 855,000 | 745,423 | |||||||||
| 3.63% |
03/15/321 | 6,060,000 | 5,942,034 | |||||||||
| 4.13% |
06/15/29 | 2,400,000 | 2,445,983 | |||||||||
| 5.25% |
04/15/25 | 2,477,000 | 2,609,702 | |||||||||
| 5.25% |
06/15/26 | 6,420,000 | 6,782,440 | |||||||||
| 5.25% |
06/15/49 | 4,670,000 | 5,134,583 | |||||||||
| 5.50% |
06/15/47 | 3,785,000 | 4,293,326 | |||||||||
| ModivCare Escrow Issuer, Inc. |
| |||||||||||
| 5.00% |
10/01/291 | 4,000,000 | 3,732,294 | |||||||||
| Molina Healthcare, Inc. |
| |||||||||||
| 3.88% |
11/15/301 | 3,128,000 | 3,025,354 | |||||||||
| 4.38% |
06/15/281 | 6,500,000 | 6,434,958 | |||||||||
| Option Care Health, Inc. |
| |||||||||||
| 4.38% |
10/31/291 | 3,870,000 | 3,648,730 | |||||||||
| Prime Healthcare Services, Inc. |
| |||||||||||
| 7.25% |
11/01/251 | 1,754,000 | 1,802,235 | |||||||||
| Universal Health Services, Inc. |
| |||||||||||
| 1.65% |
09/01/261 | 1,500,000 | 1,376,786 | |||||||||
| 2.65% |
01/15/321 | 590,000 | 530,919 | |||||||||
|
|
|
| ||||||||||
| 136,791,064 | ||||||||||||
|
|
|
| ||||||||||
| Industrials — 1.02% |
| |||||||||||
| Amcor Finance USA, Inc. |
| |||||||||||
| 3.63% |
04/28/26 | 2,125,000 | 2,155,256 | |||||||||
See accompanying Notes to Financial Statements.
| Annual Report March 2022 / 236 |
Table of Contents
Unconstrained Bond Fund
Schedule of Portfolio Investments
March 31, 2022
| Issues | Maturity Date |
Principal Amount |
Value | |||||||||
| CORPORATES (continued) |
|
|||||||||||
| Industrials (continued) |
| |||||||||||
| Ardagh Packaging Finance PLC/Ardagh Holdings USA, Inc. |
|
|||||||||||
| (Canada) |
||||||||||||
| 5.25% |
08/15/271,3 | $ | 6,222,000 | $ | 5,777,438 | |||||||
| Artera Services LLC |
| |||||||||||
| 9.03% |
12/04/251 | 4,010,000 | 4,011,516 | |||||||||
| Berry Global, Inc. |
| |||||||||||
| 1.57% |
01/15/26 | 1,740,000 | 1,624,884 | |||||||||
| 4.88% |
07/15/261 | 1,195,000 | 1,208,396 | |||||||||
| Boeing Co. (The) |
| |||||||||||
| 1.43% |
02/04/24 | 8,790,000 | 8,508,191 | |||||||||
| Energizer Holdings, Inc. |
| |||||||||||
| 4.38% |
03/31/291 | 1,610,000 | 1,413,338 | |||||||||
| General Electric Co. |
| |||||||||||
| (MTN) |
||||||||||||
| (LIBOR USD 3-Month plus 0.48%) |
| |||||||||||
| 0.99% |
08/15/362 | 10,370,000 | 8,932,736 | |||||||||
| General Electric Co., |
| |||||||||||
| Series A (MTN) |
| |||||||||||
| 6.75% |
03/15/32 | 1,148,000 | 1,449,250 | |||||||||
| OT Merger Corp. |
| |||||||||||
| 7.88% |
10/15/291 | 6,500,000 | 5,724,204 | |||||||||
|
|
|
| ||||||||||
| 40,805,209 | ||||||||||||
|
|
|
| ||||||||||
| Information Technology — 0.51% |
|
|||||||||||
| Broadcom, Inc. |
| |||||||||||
| 4.30% |
11/15/32 | 2,270,000 | 2,305,601 | |||||||||
| Netfix, Inc. |
| |||||||||||
| 5.88% |
02/15/25 | 7,290,000 | 7,787,447 | |||||||||
| NXP BV/NXP Funding LLC |
| |||||||||||
| (Netherlands) |
||||||||||||
| 4.63% |
06/01/231,3 | 795,000 | 806,888 | |||||||||
| Oracle Corp. |
||||||||||||
| 2.88% |
03/25/31 | 1,245,000 | 1,136,808 | |||||||||
| 3.80% |
11/15/37 | 1,490,000 | 1,341,555 | |||||||||
| 3.95% |
03/25/51 | 7,901,000 | 6,921,165 | |||||||||
|
|
|
| ||||||||||
| 20,299,464 | ||||||||||||
|
|
|
| ||||||||||
| Insurance — 1.21% |
| |||||||||||
| Acrisure LLC/Acrisure Finance, Inc. |
| |||||||||||
| 4.25% |
02/15/291 | 4,660,000 | 4,239,682 | |||||||||
| Aon Corp./Aon Global Holdings PLC |
| |||||||||||
| 3.90% |
02/28/52 | 4,065,000 | 4,029,139 | |||||||||
| Athene Global Funding |
| |||||||||||
| 1.99% |
08/19/281 | 8,980,000 | 7,893,062 | |||||||||
| 2.72% |
01/07/291 | 1,535,000 | 1,412,693 | |||||||||
| 3.21% |
03/08/271 | 2,225,000 | 2,144,537 | |||||||||
| Berkshire Hathaway Finance Corp. |
| |||||||||||
| 3.85% |
03/15/52 | 4,105,000 | 4,200,540 | |||||||||
| Brown & Brown, Inc. |
| |||||||||||
| 4.95% |
03/17/52 | 2,980,000 | 3,184,905 | |||||||||
| Farmers Exchange Capital |
| |||||||||||
| 7.20% |
07/15/481 | 150,000 | 205,822 | |||||||||
| Farmers Exchange Capital II |
| |||||||||||
| 6.15% |
11/01/531,4 | 2,500,000 | 2,960,016 | |||||||||
| Farmers Insurance Exchange |
| |||||||||||
| 4.75% |
11/01/571,4 | 3,800,000 | 3,992,075 | |||||||||
| Issues | Maturity Date | Principal Amount |
Value | |||||||||
| CORPORATES (continued) |
|
|||||||||||
| Insurance (continued) |
| |||||||||||
| 8.63% |
05/01/241 | $ | 942,000 | $ | 1,030,145 | |||||||
| Nationwide Mutual Insurance Co. |
| |||||||||||
| 3.12% |
12/15/241,4 | 3,825,000 | 3,827,638 | |||||||||
| Teachers Insurance & Annuity Association of America |
|
|||||||||||
| 3.30% |
05/15/501 | 2,645,000 | 2,352,150 | |||||||||
| 4.27% |
05/15/471 | 480,000 | 508,454 | |||||||||
| 4.38% |
09/15/541,4 | 6,470,000 | 6,448,656 | |||||||||
|
|
|
| ||||||||||
| 48,429,514 | ||||||||||||
|
|
|
| ||||||||||
| Materials — 0.45% |
| |||||||||||
| ASP Unifrax Holdings, Inc. |
| |||||||||||
| 5.25% |
09/30/281 | 2,460,000 | 2,288,366 | |||||||||
| 7.50% |
09/30/291 | 1,020,000 | 909,352 | |||||||||
| Corp. Nacional del Cobre de Chile, |
| |||||||||||
| Series REGS |
| |||||||||||
| (Chile) |
||||||||||||
| 3.15% |
01/14/303 | 3,900,000 | 3,760,770 | |||||||||
| EverArc Escrow SARL |
| |||||||||||
| (Luxembourg) |
| |||||||||||
| 5.00% |
10/30/291,3 | 5,432,000 | 4,973,675 | |||||||||
| Indonesia Asahan Aluminium Persero PT |
| |||||||||||
| (Indonesia) |
| |||||||||||
| 6.53% |
11/15/281,3 | 5,508,000 | 6,127,402 | |||||||||
|
|
|
| ||||||||||
| 18,059,565 | ||||||||||||
|
|
|
| ||||||||||
| Real Estate Investment Trust (REIT) — 1.68% |
| |||||||||||
| American Assets Trust LP |
| |||||||||||
| 3.38% |
02/01/31 | 4,005,000 | 3,768,879 | |||||||||
| American Campus Communities Operating Partnership LP |
|
|||||||||||
| 3.63% |
11/15/27 | 2,246,000 | 2,236,472 | |||||||||
| 3.75% |
04/15/23 | 2,925,000 | 2,950,905 | |||||||||
| China Aoyuan Group Ltd. |
| |||||||||||
| (Cayman Islands) |
| |||||||||||
| 6.35% |
02/08/243,5,6,9,10 | 2,660,000 | 452,200 | |||||||||
| China SCE Group Holdings Ltd. |
| |||||||||||
| (Cayman Islands) |
| |||||||||||
| 7.00% |
05/02/253 | 1,070,000 | 568,082 | |||||||||
| CyrusOne LP/CyrusOne Finance Corp. |
| |||||||||||
| 2.90% |
11/15/24 | 4,185,000 | 4,196,488 | |||||||||
| 3.45% |
11/15/29 | 11,930,000 | 12,527,666 | |||||||||
| GLP Capital LP/GLP Financing II, Inc. |
| |||||||||||
| 5.30% |
01/15/29 | 2,280,000 | 2,403,439 | |||||||||
| 5.38% |
04/15/26 | 4,390,000 | 4,592,088 | |||||||||
| 5.75% |
06/01/28 | 6,241,000 | 6,727,132 | |||||||||
| Healthcare Realty Trust, Inc. |
| |||||||||||
| 3.88% |
05/01/25 | 2,190,000 | 2,217,603 | |||||||||
| Healthcare Trust of America Holdings LP |
| |||||||||||
| 2.00% |
03/15/31 | 1,705,000 | 1,477,839 | |||||||||
| 3.50% |
08/01/26 | 2,257,000 | 2,257,509 | |||||||||
| Hudson Pacific Properties LP |
| |||||||||||
| 3.95% |
11/01/27 | 2,500,000 | 2,514,944 | |||||||||
| Iron Mountain Information Management Services, Inc. |
|
|||||||||||
| 5.00% |
07/15/321 | 4,650,000 | 4,375,882 | |||||||||
| Iron Mountain, Inc. |
| |||||||||||
| 4.50% |
02/15/311 | 1,346,000 | 1,248,146 | |||||||||
See accompanying Notes to Financial Statements.
| 237 / Annual Report March 2022 |
Table of Contents
Unconstrained Bond Fund
Schedule of Portfolio Investments
March 31, 2022
| Issues | Maturity Date |
Principal Amount |
Value | |||||||||
| CORPORATES (continued) |
|
|||||||||||
| Real Estate Investment Trust (REIT) (continued) |
|
|||||||||||
| LXP Industrial Trust |
| |||||||||||
| 2.70% |
09/15/30 | $ | 2,000,000 | $ | 1,848,756 | |||||||
| Piedmont Operating Partnership LP |
| |||||||||||
| 3.40% |
06/01/23 | 4,520,000 | 4,527,207 | |||||||||
| Post Apartment Homes LP |
| |||||||||||
| 3.38% |
12/01/22 | 45,000 | 45,216 | |||||||||
| SL Green Realty Corp. |
| |||||||||||
| 4.50% |
12/01/22 | 3,000,000 | 3,018,400 | |||||||||
| Sunac China Holdings Ltd. |
| |||||||||||
| (Cayman Islands) |
| |||||||||||
| 6.50% |
01/10/253,6 | 2,515,000 | 639,523 | |||||||||
| 6.80% |
10/20/243,6 | 720,000 | 181,800 | |||||||||
| Times China Holdings Ltd. |
| |||||||||||
| (Cayman Islands) |
| |||||||||||
| 6.75% |
07/08/253 | 1,040,000 | 416,595 | |||||||||
| Ventas Realty LP |
| |||||||||||
| 3.25% |
10/15/26 | 630,000 | 624,658 | |||||||||
| 3.75% |
05/01/24 | 875,000 | 885,651 | |||||||||
| Zhenro Properties Group Ltd. |
| |||||||||||
| (Cayman Islands) |
| |||||||||||
| 6.63% |
01/07/263,5,6 | 1,810,000 | 208,150 | |||||||||
|
|
|
| ||||||||||
| 66,911,230 | ||||||||||||
|
|
|
| ||||||||||
| Retail — 0.59% |
| |||||||||||
| 1011778 BC ULC/New Red Finance, Inc. |
| |||||||||||
| (Canada) |
||||||||||||
| 4.00% |
10/15/301,3 | 1,997,000 | 1,806,566 | |||||||||
| Alimentation Couche-Tard, Inc. |
| |||||||||||
| (Canada) |
||||||||||||
| 3.55% |
07/26/271,3 | 1,935,000 | 1,924,870 | |||||||||
| Asbury Automotive Group, Inc. |
| |||||||||||
| 5.00% |
02/15/321 | 2,415,000 | 2,249,695 | |||||||||
| Bloomin’ Brands, Inc./OSI Restaurant Partners LLC |
|
|||||||||||
| 5.13% |
04/15/291 | 1,939,000 | 1,833,809 | |||||||||
| Fertitta Entertainment, LLC/Fertitta Entertainment Finance |
|
|||||||||||
| Co., Inc. |
| |||||||||||
| 6.75% |
01/15/301 | 7,231,000 | 6,670,598 | |||||||||
| FirstCash, Inc. |
| |||||||||||
| 5.63% |
01/01/301 | 4,160,000 | 4,002,474 | |||||||||
| Michaels Cos., Inc. (The) |
| |||||||||||
| 7.88% |
05/01/291 | 5,775,000 | 4,952,034 | |||||||||
|
|
|
| ||||||||||
| 23,440,046 | ||||||||||||
|
|
|
| ||||||||||
| Services — 0.66% |
| |||||||||||
| Adtalem Global Education, Inc. |
| |||||||||||
| 5.50% |
03/01/281 | 3,862,000 | 3,741,003 | |||||||||
| DP World Crescent Ltd. |
| |||||||||||
| (Cayman Islands) |
| |||||||||||
| 4.85% |
09/26/281,3 | 4,036,000 | 4,305,201 | |||||||||
| HealthEquity, Inc. |
| |||||||||||
| 4.50% |
10/01/291 | 5,084,000 | 4,847,833 | |||||||||
| Hertz Corp. (The) |
| |||||||||||
| 4.63% |
12/01/261 | 2,000,000 | 1,872,940 | |||||||||
| 5.00% |
12/01/291 | 5,680,000 | 5,178,740 | |||||||||
| Prime Security Services Borrower LLC/Prime Finance, Inc. |
|
|||||||||||
| 3.38% |
08/31/271 | 648,000 | 595,028 | |||||||||
| Issues | Maturity Date |
Principal Amount |
Value | |||||||||
| CORPORATES (continued) |
|
|||||||||||
| Services (continued) | ||||||||||||
| S&P Global, Inc. |
| |||||||||||
| 4.75% |
08/01/281 | $ | 1,750,000 | $ | 1,881,599 | |||||||
| Waste Pro USA, Inc. |
| |||||||||||
| 5.50% |
02/15/261 | 4,169,000 | 3,944,645 | |||||||||
|
|
|
| ||||||||||
| 26,366,989 | ||||||||||||
|
|
|
| ||||||||||
| Transportation — 0.13% |
| |||||||||||
| American Airlines Pass-Through Trust, |
| |||||||||||
| Series 2015-2, Class AA |
| |||||||||||
| 3.60% |
09/22/27 | 2,029,972 | 1,977,437 | |||||||||
| Continental Airlines Pass-Through Trust, |
| |||||||||||
| Series 2007-1, Class A |
| |||||||||||
| 5.98% |
04/19/22 | 488,168 | 488,876 | |||||||||
| U.S. Airways Pass-Through Trust, |
| |||||||||||
| Series 2010-1, Class A |
| |||||||||||
| 6.25% |
04/22/23 | 547,618 | 550,908 | |||||||||
| U.S. Airways Pass-Through Trust, |
| |||||||||||
| Series 2012-1, Class A |
| |||||||||||
| 5.90% |
10/01/24 | 56,934 | 59,389 | |||||||||
| Union Pacific Corp. |
| |||||||||||
| 3.50% |
02/14/53 | 2,030,000 | 1,986,795 | |||||||||
|
|
|
| ||||||||||
| 5,063,405 | ||||||||||||
|
|
|
| ||||||||||
| Total Corporates |
| |||||||||||
| (Cost $1,281,587,363) |
1,225,745,531 | |||||||||||
|
|
|
| ||||||||||
|
FOREIGN GOVERNMENT OBLIGATIONS — 3.16% |
|
|||||||||||
| Foreign Government Obligations — 3.16% |
|
|||||||||||
| Abu Dhabi Government International Bond, |
| |||||||||||
| Series REGS |
| |||||||||||
| (United Arab Emirates) |
| |||||||||||
| 2.50% |
09/30/293 | 3,798,000 | 3,729,777 | |||||||||
| Airport Authority |
| |||||||||||
| (Hong Kong) |
| |||||||||||
| 3.25% |
01/12/521,3 | 4,105,000 | 3,725,493 | |||||||||
| Bahrain Government International Bond, |
| |||||||||||
| Series REGS |
| |||||||||||
| (Bahrain) |
| |||||||||||
| 7.00% |
01/26/263 | 500,000 | 541,187 | |||||||||
| Brazilian Government International Bond |
| |||||||||||
| (Brazil) |
||||||||||||
| 2.88% |
06/06/253 | 3,600,000 | 3,538,800 | |||||||||
| 3.88% |
06/12/303 | 5,010,000 | 4,627,487 | |||||||||
| 4.63% |
01/13/283 | 830,000 | 835,810 | |||||||||
| CBB International Sukuk Co. 7 SPC, |
| |||||||||||
| Series REGS |
||||||||||||
| (Bahrain) |
||||||||||||
| 6.88% |
10/05/253 | 1,400,000 | 1,540,175 | |||||||||
| Chile Government International Bond |
| |||||||||||
| (Chile) |
||||||||||||
| 2.45% |
01/31/313 | 844,000 | 792,541 | |||||||||
| 3.24% |
02/06/283 | 1,678,000 | 1,683,034 | |||||||||
| Colombia Government International Bond |
| |||||||||||
| (Colombia) |
||||||||||||
| 3.00% |
01/30/303 | 6,398,000 | 5,508,198 | |||||||||
| 3.13% |
04/15/313 | 1,750,000 | 1,485,225 | |||||||||
| 4.50% |
01/28/263 | 3,855,000 | 3,855,790 | |||||||||
See accompanying Notes to Financial Statements.
| Annual Report March 2022 / 238 |
Table of Contents
Unconstrained Bond Fund
Schedule of Portfolio Investments
March 31, 2022
| Issues | Maturity Date |
Principal Amount |
Value | |||||||||
| FOREIGN GOVERNMENT OBLIGATIONS (continued) |
|
|||||||||||
| Foreign Government Obligations (continued) |
|
|||||||||||
| Dominican Republic International Bond |
| |||||||||||
| (Dominican Republic) |
| |||||||||||
| 4.50% |
01/30/301,3 | $ | 3,900,000 | $ | 3,598,774 | |||||||
| Dominican Republic International Bond, |
| |||||||||||
| Series REGS |
| |||||||||||
| (Dominican Republic) |
| |||||||||||
| 4.88% |
09/23/323 | 2,580,000 | 2,349,361 | |||||||||
| Egypt Government International Bond |
| |||||||||||
| (Egypt) |
||||||||||||
| 7.60% |
03/01/291,3 | 700,000 | 666,750 | |||||||||
| Egypt Government International Bond, |
| |||||||||||
| Series REGS |
| |||||||||||
| (Egypt) |
||||||||||||
| 5.25% |
10/06/253 | 1,700,000 | 1,647,980 | |||||||||
| Fondo MIVIVIENDA SA, |
| |||||||||||
| Series REGS |
| |||||||||||
| (Peru) |
| |||||||||||
| 3.50% |
01/31/233 | 650,000 | 656,110 | |||||||||
| Guatemala Government Bond |
| |||||||||||
| Series REGS |
| |||||||||||
| (Guam) |
| |||||||||||
| 4.90% |
06/01/303 | 1,072,000 | 1,098,117 | |||||||||
| Hungary Government International Bond |
| |||||||||||
| (Hungary) |
| |||||||||||
| 2.13% |
09/22/311,3 | 3,700,000 | 3,359,015 | |||||||||
| Indonesia Government International Bond |
| |||||||||||
| (Indonesia) |
| |||||||||||
| 2.85% |
02/14/303 | 3,100,000 | 3,057,398 | |||||||||
| Mexico Government International Bond |
| |||||||||||
| (Mexico) |
| |||||||||||
| 2.66% |
05/24/313 | 6,531,000 | 5,954,966 | |||||||||
| 3.75% |
01/11/283 | 6,125,000 | 6,261,587 | |||||||||
| 4.75% |
04/27/323 | 3,000,000 | 3,187,500 | |||||||||
| Oman Government International Bond, |
| |||||||||||
| Series REGS |
| |||||||||||
| (Oman) |
||||||||||||
| 5.63% |
01/17/283 | 3,900,000 | 4,036,890 | |||||||||
| Panama Government International Bond |
| |||||||||||
| (Panama) |
| |||||||||||
| 2.25% |
09/29/323 | 3,000,000 | 2,662,087 | |||||||||
| 3.16% |
01/23/303 | 6,131,000 | 6,011,262 | |||||||||
| Paraguay Government International Bond |
| |||||||||||
| (Paraguay) |
| |||||||||||
| 2.74% |
01/29/331,3 | 3,126,000 | 2,773,293 | |||||||||
| Perusahaan Penerbit SBSN Indonesia III |
| |||||||||||
| (Indonesia) |
||||||||||||
| 2.80% |
06/23/301,3 | 2,100,000 | 2,060,940 | |||||||||
| Peruvian Government International Bond |
| |||||||||||
| (Peru) |
| |||||||||||
| 2.84% |
06/20/303 | 4,025,000 | 3,874,868 | |||||||||
| 4.13% |
08/25/273 | 1,525,000 | 1,588,409 | |||||||||
| Philippine Government International Bond |
| |||||||||||
| (Philippines) |
| |||||||||||
| 1.65% |
06/10/313 | 741,000 | 663,195 | |||||||||
| 1.95% |
01/06/323 | 930,000 | 845,341 | |||||||||
| 2.46% |
05/05/303 | 2,334,000 | 2,228,970 | |||||||||
| Issues | Maturity Date |
Principal Amount |
Value | |||||||||
| FOREIGN GOVERNMENT OBLIGATIONS (continued) |
|
|||||||||||
| Foreign Government Obligations (continued) |
|
|||||||||||
| Qatar Government International Bond, |
| |||||||||||
| Series REGS |
| |||||||||||
| (Qatar) |
| |||||||||||
| 3.75% |
04/16/303 | $ | 2,640,000 | $ | 2,793,912 | |||||||
| 4.50% |
04/23/283 | 6,726,000 | 7,334,030 | |||||||||
| Republic of South Africa Government International Bond |
|
|||||||||||
| (South Africa) |
| |||||||||||
| 4.30% |
10/12/283 | 3,607,000 | 3,495,151 | |||||||||
| 4.85% |
09/30/293 | 4,655,000 | 4,565,158 | |||||||||
| Romanian Government International Bond, |
| |||||||||||
| Series REGS |
| |||||||||||
| (Romania) |
| |||||||||||
| 3.00% |
02/14/313 | 4,400,000 | 4,079,183 | |||||||||
| Saudi Government International Bond, |
| |||||||||||
| Series REGS (EMTN) |
| |||||||||||
| (Saudi Arabia) |
| |||||||||||
| 3.25% |
10/26/263 | 3,700,000 | 3,792,500 | |||||||||
| 3.25% |
10/22/303 | 2,220,000 | 2,244,864 | |||||||||
| 3.63% |
03/04/283 | 4,175,000 | 4,319,831 | |||||||||
| Uruguay Government International Bond |
| |||||||||||
| (Uruguay) |
| |||||||||||
| 4.38% |
01/23/313 | 2,788,717 | 3,038,028 | |||||||||
|
|
|
| ||||||||||
| Total Foreign Government Obligations |
| |||||||||||
| (Cost $134,495,435) |
126,108,987 | |||||||||||
|
|
|
| ||||||||||
|
MORTGAGE-BACKED — 46.10%** |
| |||||||||||
| Non-Agency Commercial Mortgage-Backed — 7.15% |
|
|||||||||||
| 1345 Avenue of the Americas & Park Avenue Plaza Trust, |
|
|||||||||||
| Series 2005-1, Class A3 |
| |||||||||||
| 5.28% |
08/10/351 | 11,400,333 | 11,592,508 | |||||||||
| AREIT Trust, |
||||||||||||
| Series 2020-CRE4, Class B |
| |||||||||||
| (Cayman Islands) |
| |||||||||||
| (SOFR30A plus 4.26%) |
| |||||||||||
| 4.31% |
04/15/371,2,3 | 9,450,000 | 9,435,844 | |||||||||
| Banc of America Merrill Lynch Commercial Mortgage Trust, |
|
|||||||||||
| Series 2018-PARK, Class A |
| |||||||||||
| 4.09% |
08/10/381,4 | 7,985,000 | 8,217,382 | |||||||||
| Banc of America Merrill Lynch Commercial Mortgage Trust, |
|
|||||||||||
| Series 2020-BHP3, Class A |
| |||||||||||
| (LIBOR USD 1-Month plus 1.90%) |
| |||||||||||
| 2.30% |
03/15/371,2 | 8,585,000 | 8,633,022 | |||||||||
| Banc of America Merrill Lynch Commercial Mortgage Trust, |
|
|||||||||||
| Series 2020-BOC, Class A |
|
|||||||||||
| 2.63% |
01/15/321 | 5,000,000 | 4,801,624 | |||||||||
| Banc of America Merrill Lynch Commercial Mortgage Trust, |
|
|||||||||||
| Series 2020-BOC, Class X (IO) |
| |||||||||||
| 0.47% |
01/15/321,4 | 98,610,000 | 1,910,633 | |||||||||
| BDS Ltd., |
| |||||||||||
| Series 2020-FL6, Class D |
| |||||||||||
| (Cayman Islands) |
| |||||||||||
| (SOFR30A plus 2.86%) |
| |||||||||||
| 2.91% |
09/15/351,2,3 | 7,801,000 | 7,716,687 | |||||||||
See accompanying Notes to Financial Statements.
| 239 / Annual Report March 2022 |
Table of Contents
Unconstrained Bond Fund
Schedule of Portfolio Investments
March 31, 2022
| Issues | Maturity Date |
Principal Amount |
Value | |||||||
| MORTGAGE-BACKED (continued) |
|
|||||||||
| Non-Agency Commercial Mortgage-Backed (continued) |
|
|||||||||
| BFLD Trust, |
| |||||||||
| Series 2021-FPM, Class A |
| |||||||||
| (LIBOR USD 1-Month plus 1.60%) |
| |||||||||
| 2.00% |
06/15/381,2 | $ | 7,182,000 | $ | 7,135,993 | |||||
| BX Commercial Mortgage Trust, |
| |||||||||
| Series 2018-IND, Class H |
| |||||||||
| (LIBOR USD 1-Month plus 3.00%) |
| |||||||||
| 3.40% |
11/15/351,2 | 7,760,200 | 7,671,624 | |||||||
| BX Commercial Mortgage Trust, |
| |||||||||
| Series 2021-XL2, Class J |
| |||||||||
| (LIBOR USD 1-Month plus 3.89%) |
| |||||||||
| 4.29% |
10/15/381,2 | 11,125,988 | 10,769,075 | |||||||
| BX Trust, |
| |||||||||
| Series 2019-OC11, Class A |
| |||||||||
| 3.20% |
12/09/411 | 7,060,000 | 6,830,455 | |||||||
| CALI Mortgage Trust, |
| |||||||||
| Series 2019-101C, Class A |
| |||||||||
| 3.96% |
03/10/391 | 7,375,000 | 7,498,039 | |||||||
| CAMB Commercial Mortgage Trust, |
| |||||||||
| Series 2019-LIFE, Class G |
| |||||||||
| (LIBOR USD 1-Month plus 3.25%) |
| |||||||||
| 3.65% |
12/15/371,2 | 8,503,000 | 8,196,059 | |||||||
| CD Mortgage Trust, |
| |||||||||
| Series 2016-CD1, Class XA (IO) |
| |||||||||
| 1.38% |
08/10/494 | 60,900,073 | 2,777,920 | |||||||
| Century Plaza Towers, |
| |||||||||
| Series 2019-CPT, Class A |
| |||||||||
| 2.87% |
11/13/391 | 6,125,000 | 5,792,407 | |||||||
| Citigroup Commercial Mortgage Trust, |
| |||||||||
| Series 2012-GC8, Class XA (IO) |
| |||||||||
| 1.72% |
09/10/451,4 | 27,835,126 | 31,615 | |||||||
| Citigroup Commercial Mortgage Trust, |
| |||||||||
| Series 2015-GC27, Class XA (IO) |
| |||||||||
| 1.33% |
02/10/484 | 64,068,309 | 1,904,789 | |||||||
| Commercial Mortgage Trust, |
| |||||||||
| Series 2012-CR4, Class XA (IO) |
| |||||||||
| 1.68% |
10/15/454 | 42,113,704 | 149,900 | |||||||
| Commercial Mortgage Trust, |
| |||||||||
| Series 2012-CR5, Class XA (IO) |
| |||||||||
| 1.49% |
12/10/454 | 67,170,203 | 327,408 | |||||||
| Commercial Mortgage Trust, |
| |||||||||
| Series 2013-CR13, Class XA (IO) |
| |||||||||
| 0.74% |
11/10/464 | 60,111,572 | 624,643 | |||||||
| Commercial Mortgage Trust, |
| |||||||||
| Series 2014-CR16, Class XA (IO) |
| |||||||||
| 0.94% |
04/10/474 | 101,775,786 | 1,560,335 | |||||||
| Commercial Mortgage Trust, |
| |||||||||
| Series 2020-CBM, Class XCP (IO) |
| |||||||||
| 0.60% |
02/10/371,4 | 68,872,262 | 1,074,810 | |||||||
| Credit Suisse Mortgage Capital Trust, |
| |||||||||
| Series 2020-TMIC, Class A |
| |||||||||
| (LIBOR USD 1-Month plus 3.00%) |
| |||||||||
| 3.40% |
12/15/351,2 | 11,515,000 | 11,488,596 | |||||||
| Issues | Maturity Date |
Principal Amount |
Value | |||||||
| MORTGAGE-BACKED (continued) |
|
|||||||||
| Non-Agency Commercial Mortgage-Backed (continued) |
|
|||||||||
| CSMC, |
| |||||||||
| Series 2019-RIO, Class A |
| |||||||||
| (LIBOR USD 1-Month plus 3.02%) |
| |||||||||
| 4.02% |
12/15/221,2 | $ | 7,252,000 | $ | 7,242,107 | |||||
| CSMC, |
| |||||||||
| Series 2021-BPNY, Class A |
| |||||||||
| (LIBOR USD 1-Month plus 3.71%) |
| |||||||||
| 4.11% |
08/15/231,2 | 12,734,000 | 12,585,733 | |||||||
| DBJPM Mortgage Trust, |
| |||||||||
| Series 2016-SFC, Class A |
| |||||||||
| 2.83% |
08/10/361 | 4,000,000 | 3,835,412 | |||||||
| DC Office Trust, |
| |||||||||
| Series 2019-MTC, Class A |
| |||||||||
| 2.97% |
09/15/451 | 6,555,000 | 6,211,300 | |||||||
| Grace Trust, |
| |||||||||
| Series 2020-GRCE, Class A |
| |||||||||
| 2.35% |
12/10/401 | 8,000,000 | 7,231,762 | |||||||
| GS Mortgage Securities Corp. Trust, |
| |||||||||
| Series 2020-UPTN, Class XA (IO) |
| |||||||||
| 0.35% |
02/10/371,4 | 40,999,000 | 383,720 | |||||||
| GS Mortgage Securities Trust, |
| |||||||||
| Series 2012-ALOH, Class A |
| |||||||||
| 3.55% |
04/10/341 | 10,940,000 | 10,935,215 | |||||||
| GS Mortgage Securities Trust, |
| |||||||||
| Series 2014-GC20, Class XA (IO) |
| |||||||||
| 1.06% |
04/10/474 | 58,771,895 | 919,487 | |||||||
| GSCG Trust, |
| |||||||||
| Series 2019-600C, Class G |
| |||||||||
| 3.99% |
09/06/341,4 | 9,212,000 | 8,328,825 | |||||||
| Hudson Yards Mortgage Trust, |
| |||||||||
| Series 2019-30HY, Class A |
| |||||||||
| 3.23% |
07/10/391 | 6,340,000 | 6,170,016 | |||||||
| Hudson Yards Mortgage Trust, |
| |||||||||
| Series 2019-55HY, Class A |
| |||||||||
| 2.94% |
12/10/411,4 | 6,555,000 | 6,271,764 | |||||||
| Hudson Yards Mortgage Trust, |
| |||||||||
| Series 2019-55HY, Class F |
| |||||||||
| 2.94% |
12/10/411,4 | 3,131,000 | 2,633,033 | |||||||
| ILPT Commercial Mortgage Trust, |
| |||||||||
| Series 2022-LPFX, Class A |
| |||||||||
| 3.38% |
03/15/321 | 11,770,000 | 11,543,285 | |||||||
| JPMorgan Chase Commercial Mortgage Securities Trust, |
|
|||||||||
| Series 2019-OSB, Class A |
| |||||||||
| 3.40% |
06/05/391 | 8,000,000 | 7,912,102 | |||||||
| Life Mortgage Trust, |
| |||||||||
| Series 2021-BMR, Class G |
| |||||||||
| (LIBOR USD 1-Month plus 2.95%) |
| |||||||||
| 3.35% |
03/15/381,2 | 10,535,474 | 10,096,803 | |||||||
| MF1 Ltd., |
| |||||||||
| Series 2020-FL3, Class AS |
| |||||||||
| (CME Term SOFR 1-Month plus 2.96%) |
| |||||||||
| 3.27% |
07/15/351,2 | 8,800,000 | 8,839,579 | |||||||
| MKT Mortgage Trust, |
| |||||||||
| Series 2020-525M, Class XA (IO) |
| |||||||||
| 0.21% |
02/12/401,4 | 147,585,000 | 2,264,411 | |||||||
See accompanying Notes to Financial Statements.
| Annual Report March 2022 / 240 |
Table of Contents
Unconstrained Bond Fund
Schedule of Portfolio Investments
March 31, 2022
| Issues | Maturity Date |
Principal Amount |
Value | |||||||
| MORTGAGE-BACKED (continued) |
|
|||||||||
| Non-Agency Commercial Mortgage-Backed (continued) |
|
|||||||||
| Morgan Stanley Bank of America Merrill Lynch Trust, |
|
|||||||||
| Series 2015-C22, Class XA (IO) |
| |||||||||
| 1.02% |
04/15/484 | $ | 69,856,357 | $ | 1,559,941 | |||||
| Morgan Stanley Bank of America Merrill Lynch Trust, |
|
|||||||||
| Series 2015-C24, Class XA (IO) |
| |||||||||
| 0.72% |
05/15/484 | 110,913,281 | 2,184,891 | |||||||
| Morgan Stanley Capital I Trust, |
| |||||||||
| Series 2018-MP, Class A |
| |||||||||
| 4.28% |
07/11/401,4 | 7,915,000 | 8,097,292 | |||||||
| Natixis Commercial Mortgage Securities Trust, |
|
|||||||||
| Series 2018-ALXA, Class E |
| |||||||||
| 4.32% |
01/15/431,4 | 1,095,000 | 1,002,967 | |||||||
| One Bryant Park Trust, |
| |||||||||
| Series 2019-OBP, Class A |
| |||||||||
| 2.52% |
09/15/541 | 6,895,000 | 6,396,965 | |||||||
| SFAVE Commercial Mortgage Securities Trust, |
|
|||||||||
| Series 2015-5AVE, Class A2B |
| |||||||||
| 4.14% |
01/05/431,4 | 1,840,000 | 1,762,932 | |||||||
| SFAVE Commercial Mortgage Securities Trust, |
|
|||||||||
| Series 2015-5AVE, Class C |
| |||||||||
| 4.39% |
01/05/431,4 | 10,000,000 | 7,971,223 | |||||||
| SFAVE Commercial Mortgage Securities Trust, |
|
|||||||||
| Series 2015-5AVE, Class D |
| |||||||||
| 4.39% |
01/05/431,4 | 13,330,000 | 9,895,950 | |||||||
| Wells Fargo Commercial Mortgage Trust, |
| |||||||||
| Series 2014-LC16, Class XA (IO) |
| |||||||||
| 1.10% |
08/15/504 | 44,373,798 | 802,276 | |||||||
| Wells Fargo Commercial Mortgage Trust, |
| |||||||||
| Series 2016-C33, Class XA (IO) |
| |||||||||
| 1.61% |
03/15/594 | 81,657,171 | 4,158,065 | |||||||
| WF-RBS Commercial Mortgage Trust, |
| |||||||||
| Series 2012-C10, Class XA (IO) |
| |||||||||
| 1.48% |
12/15/451,4 | 60,032,268 | 344,033 | |||||||
| WF-RBS Commercial Mortgage Trust, |
| |||||||||
| Series 2012-C8, Class XA (IO) |
| |||||||||
| 1.69% |
08/15/451,4 | 24,757,191 | 1,221 | |||||||
| WF-RBS Commercial Mortgage Trust, |
| |||||||||
| Series 2012-C9, Class XA (IO) |
| |||||||||
| 1.85% |
11/15/451,4 | 31,774,701 | 110,241 | |||||||
| WF-RBS Commercial Mortgage Trust, |
| |||||||||
| Series 2013-C14, Class XA (IO) |
| |||||||||
| 0.66% |
06/15/464 | 59,719,679 | 301,955 | |||||||
| WF-RBS Commercial Mortgage Trust, |
| |||||||||
| Series 2014-C23, Class XA (IO) |
| |||||||||
| 0.56% |
10/15/574 | 77,553,595 | 891,572 | |||||||
|
|
|
| ||||||||
| 285,027,446 | ||||||||||
| Non-Agency Mortgage-Backed — 25.75% |
|
|||||||||
| Accredited Mortgage Loan Trust, |
| |||||||||
| Series 2006-1, Class A4 |
| |||||||||
| (LIBOR USD 1-Month plus 0.28%) |
| |||||||||
| 0.47% |
04/25/362 | 896,852 | 891,767 | |||||||
| ACE Securities Corp. Home Equity Loan Trust, |
|
|||||||||
| Series 2006-HE3, Class A2C |
| |||||||||
| (LIBOR USD 1-Month plus 0.30%) |
| |||||||||
| 0.76% |
06/25/362 | 5,010,354 | 4,272,591 | |||||||
| Issues | Maturity Date |
Principal Amount |
Value | |||||||
| MORTGAGE-BACKED (continued) |
|
|||||||||
| Non-Agency Mortgage-Backed (continued) |
|
|||||||||
| ACE Securities Corp. Home Equity Loan Trust, |
| |||||||||
| Series 2006-OP2, Class A2C |
| |||||||||
| (LIBOR USD 1-Month plus 0.15%) |
| |||||||||
| 0.61% |
08/25/362 | $ | 85,233 | $ | 85,300 | |||||
| ACE Securities Corp. Home Equity Loan Trust, |
| |||||||||
| Series 2007-ASP1, Class A2D |
| |||||||||
| (LIBOR USD 1-Month plus 0.38%) |
| |||||||||
| 0.84% |
03/25/372 | 2,348,617 | 1,283,791 | |||||||
| Adjustable Rate Mortgage Trust, |
| |||||||||
| Series 2005-4, Class 5A1 |
| |||||||||
| 2.46% |
08/25/354 | 1,412,371 | 1,222,256 | |||||||
| Adjustable Rate Mortgage Trust, |
| |||||||||
| Series 2007-1, Class 1A1 |
| |||||||||
| 2.81% |
03/25/374 | 1,894,181 | 1,663,887 | |||||||
| Alternative Loan Trust, |
| |||||||||
| Series 2005-74T1, Class A1 |
| |||||||||
| 6.00% |
01/25/36 | 5,566,229 | 4,198,510 | |||||||
| Alternative Loan Trust, |
| |||||||||
| Series 2005-76, Class 1A1 |
| |||||||||
| (Federal Reserve US 12-Month Cumulative Average plus 1.48%) |
|
|||||||||
| 1.62% |
01/25/362 | 2,942,596 | 2,954,978 | |||||||
| Alternative Loan Trust, |
| |||||||||
| Series 2006-HY12, Class A5 |
| |||||||||
| 3.06% |
08/25/364 | 2,476,363 | 2,451,519 | |||||||
| American Home Mortgage Investment Trust, |
| |||||||||
| Series 2006-1, Class 11A1 |
| |||||||||
| (LIBOR USD 1-Month plus 0.28%) |
| |||||||||
| 0.74% |
03/25/462 | 9,603,484 | 9,145,455 | |||||||
| American Home Mortgage Investment Trust, |
| |||||||||
| Series 2006-1, Class 12A1 |
| |||||||||
| (LIBOR USD 1-Month plus 0.40%) |
| |||||||||
| 0.86% |
03/25/462 | 2,977,080 | 2,856,281 | |||||||
| Argent Securities, Inc., Asset-Backed Pass-Through Certificates, |
|
|||||||||
| Series 2006-W3, Class A2C |
| |||||||||
| (LIBOR USD 1-Month plus 0.36%) |
| |||||||||
| 0.82% |
04/25/362 | 39,812,490 | 15,782,525 | |||||||
| Asset-Backed Funding Certificates, |
| |||||||||
| Series 2007-NC1, Class A2 |
| |||||||||
| (LIBOR USD 1-Month plus 0.30%) |
| |||||||||
| 0.76% |
05/25/371,2 | 3,764,720 | 3,549,728 | |||||||
| Asset-Backed Funding Certificates, |
| |||||||||
| Series 2007-WMC1, Class A1A |
| |||||||||
| (LIBOR USD 1-Month plus 1.25%) |
| |||||||||
| 1.71% |
06/25/372 | 18,105,828 | 14,857,938 | |||||||
| Asset-Backed Funding Certificates, |
| |||||||||
| Series 2007-WMC1, Class A2B |
| |||||||||
| (LIBOR USD 1-Month plus 1.00%) |
| |||||||||
| 1.46% |
06/25/372 | 3,235,356 | 3,040,627 | |||||||
| Asset-Backed Securities Corp. Home Equity Loan Trust, |
|
|||||||||
| Series 2004-HE9, Class M1 |
| |||||||||
| (LIBOR USD 1-Month plus 0.98%) |
| |||||||||
| 1.43% |
12/25/342 | 1,245,398 | 1,225,885 | |||||||
See accompanying Notes to Financial Statements.
| 241 / Annual Report March 2022 |
Table of Contents
Unconstrained Bond Fund
Schedule of Portfolio Investments
March 31, 2022
| Issues | Maturity Date |
Principal Amount |
Value | |||||||
| MORTGAGE-BACKED (continued) |
| |||||||||
| Non-Agency Mortgage-Backed (continued) |
| |||||||||
| Asset-Backed Securities Corp. Home Equity Loan Trust, |
|
|||||||||
| Series 2006-HE1, Class A4 |
| |||||||||
| (LIBOR USD 1-Month plus 0.60%) |
| |||||||||
| 1.06% |
01/25/362 | $ | 742,380 | $ | 742,928 | |||||
| Asset-Backed Securities Corp. Home Equity Loan Trust, |
|
|||||||||
| Series 2006-HE5, Class A5 |
| |||||||||
| (LIBOR USD 1-Month plus 0.24%) |
| |||||||||
| 0.70% |
07/25/362 | 9,754,000 | 9,676,130 | |||||||
| Banc of America Alternative Loan Trust, |
| |||||||||
| Series 2003-8, Class 1CB1 |
| |||||||||
| 5.50% |
10/25/33 | 526,086 | 520,906 | |||||||
| Banc of America Funding Trust, |
| |||||||||
| Series 2004-B, Class 5A1 |
| |||||||||
| 2.54% |
11/20/344 | 174,055 | 175,692 | |||||||
| Banc of America Funding Trust, |
| |||||||||
| Series 2006-D, Class 3A1 |
| |||||||||
| 3.00% |
05/20/364 | 672,310 | 626,688 | |||||||
| Banc of America Funding Trust, |
| |||||||||
| Series 2015-R3, Class 6A2 |
| |||||||||
| 0.53% |
05/27/361,4 | 13,384,893 | 12,565,604 | |||||||
| Banc of America Mortgage Trust, |
| |||||||||
| Series 2005-K, Class 2A1 |
| |||||||||
| 2.47% |
12/25/354 | 850,534 | 822,663 | |||||||
| BCAP LLC Trust, |
| |||||||||
| Series 2007-AA1, Class 2A1 |
| |||||||||
| (LIBOR USD 1-Month plus 0.18%) |
| |||||||||
| 0.64% |
03/25/372 | 2,791,734 | 2,710,557 | |||||||
| BCAP LLC Trust, |
| |||||||||
| Series 2014-RR3, Class 4A1 |
| |||||||||
| 0.49% |
03/26/361,4 | 1,821,853 | 1,775,962 | |||||||
| Bear Stearns ALT-A Trust, |
| |||||||||
| Series 2005-1, Class M1 |
| |||||||||
| (LIBOR USD 1-Month plus 0.75%) |
| |||||||||
| 1.21% |
01/25/352 | 5,289,782 | 5,287,322 | |||||||
| Bear Stearns ALT-A Trust, |
| |||||||||
| Series 2005-2, Class 2A4 |
| |||||||||
| 2.86% |
04/25/354 | 1,121,247 | 1,104,514 | |||||||
| Bear Stearns ALT-A Trust, |
| |||||||||
| Series 2005-8, Class 11A1 |
| |||||||||
| (LIBOR USD 1-Month plus 0.54%) |
| |||||||||
| 1.00% |
10/25/352 | 5,847,072 | 5,720,937 | |||||||
| Bear Stearns ARM Trust, |
| |||||||||
| Series 2005-9, Class A1 |
| |||||||||
| (US Treasury Yield Curve Rate T Note Constant Maturity 1-Year plus 2.30%) |
|
|||||||||
| 2.38% |
10/25/352 | 1,133,302 | 1,150,084 | |||||||
| Bear Stearns Asset-Backed Securities I Trust, |
| |||||||||
| Series 2005-AC6, Class 1A3 |
| |||||||||
| 5.50% |
09/25/354 | 365,248 | 356,837 | |||||||
| Bear Stearns Asset-Backed Securities I Trust, |
| |||||||||
| Series 2006-AC2, Class 21A3 |
| |||||||||
| 6.00% |
03/25/36 | 25,838 | 26,364 | |||||||
| Bear Stearns Mortgage Funding Trust, |
| |||||||||
| Series 2007-AR4, Class 1A1 |
| |||||||||
| (LIBOR USD 1-Month plus 0.20%) |
| |||||||||
| 0.66% |
09/25/472 | 5,446,470 | 5,230,125 | |||||||
| Issues | Maturity Date |
Principal Amount |
Value | |||||||||
| MORTGAGE-BACKED (continued) |
|
|||||||||||
| Non-Agency Mortgage-Backed (continued) |
|
|||||||||||
| Bear Stearns Mortgage Funding Trust, |
| |||||||||||
| Series 2007-AR4, Class 2A1 |
| |||||||||||
| (LIBOR USD 1-Month plus 0.21%) |
| |||||||||||
| 0.67% |
06/25/372 | $ | 3,987,228 | $ | 3,912,764 | |||||||
| Carrington Mortgage Loan Trust, |
| |||||||||||
| Series 2005-OPT2, Class M4 |
| |||||||||||
| (LIBOR USD 1-Month plus 0.98%) |
| |||||||||||
| 1.43% |
05/25/352 | 827,892 | 831,978 | |||||||||
| Carrington Mortgage Loan Trust, |
| |||||||||||
| Series 2006-NC4, Class A4 |
| |||||||||||
| (LIBOR USD 1-Month plus 0.24%) |
| |||||||||||
| 0.70% |
10/25/362 | 14,364,300 | 13,074,950 | |||||||||
| Carrington Mortgage Loan Trust, |
| |||||||||||
| Series 2006-OPT1, Class M1 |
| |||||||||||
| (LIBOR USD 1-Month plus 0.53%) |
| |||||||||||
| 0.98% |
02/25/362 | 2,029,176 | 2,048,523 | |||||||||
| Chase Mortgage Finance Trust, |
| |||||||||||
| Series 2007-A1, Class 8A1 |
| |||||||||||
| 2.40% |
02/25/374 | 548,035 | 561,484 | |||||||||
| CIM Trust, |
| |||||||||||
| Series 2018-R5, Class A1 |
| |||||||||||
| 3.75% |
07/25/581,4 | 5,063,883 | 4,994,583 | |||||||||
| CIM Trust, |
| |||||||||||
| Series 2019-R3, Class A |
| |||||||||||
| 2.63% |
06/25/581,4 | 8,381,598 | 7,897,659 | |||||||||
| CIM Trust, |
||||||||||||
| Series 2020-NR1, Class A (STEP-reset date 05/25/22) |
|
|||||||||||
| 3.45% |
06/26/621 | 13,180,903 | 12,864,613 | |||||||||
| CIM Trust, |
| |||||||||||
| Series 2020-R1, Class A1 |
| |||||||||||
| 2.85% |
10/27/591,4 | 12,302,534 | 11,605,876 | |||||||||
| CIM Trust, |
| |||||||||||
| Series 2020-R3, Class A1A |
| |||||||||||
| 4.00% |
01/26/601,4 | 8,230,624 | 8,022,438 | |||||||||
| CIM Trust, |
| |||||||||||
| Series 2020-R6, Class A1A |
| |||||||||||
| 2.25% |
12/25/601,4 | 6,260,134 | 5,883,538 | |||||||||
| CIM Trust, |
| |||||||||||
| Series 2020-R7, Class A1A |
| |||||||||||
| 2.25% |
12/27/611,4 | 10,707,011 | 10,114,083 | |||||||||
| CIM Trust, |
| |||||||||||
| Series 2021-NR3, Class A1 (STEP-reset date 05/25/22) |
|
|||||||||||
| 2.57% |
06/25/571 | 5,735,130 | 5,737,756 | |||||||||
| CIM Trust, |
| |||||||||||
| Series 2021-NR4, Class A1 (STEP-reset date 05/25/22) |
|
|||||||||||
| 2.82% |
10/25/611 | 16,698,671 | 16,019,215 | |||||||||
| CIM Trust, |
| |||||||||||
| Series 2021-R3, Class A1B |
| |||||||||||
| 1.95% |
06/25/571,4 | 18,287,000 | 16,589,966 | |||||||||
| CIM Trust, |
| |||||||||||
| Series 2021-R4, Class A1A |
| |||||||||||
| 2.00% |
05/01/611,4 | 13,757,909 | 13,045,249 | |||||||||
| CIM Trust, |
| |||||||||||
| Series 2021-R5, Class A1A |
| |||||||||||
| 2.00% |
08/25/611,4 | 10,655,907 | 10,046,390 | |||||||||
See accompanying Notes to Financial Statements.
| Annual Report March 2022 / 242 |
Table of Contents
Unconstrained Bond Fund
Schedule of Portfolio Investments
March 31, 2022
| Issues | Maturity Date |
Principal Amount |
Value | |||||||
| MORTGAGE-BACKED (continued) |
| |||||||||
| Non-Agency Mortgage-Backed (continued) |
|
|||||||||
| Citigroup Mortgage Loan Trust, |
| |||||||||
| Series 2006-AR3, Class 1A2A |
| |||||||||
| 3.20% |
06/25/364 | $ | 96,081 | $ | 92,005 | |||||
| Citigroup Mortgage Loan Trust, |
| |||||||||
| Series 2006-HE3, Class A2C |
| |||||||||
| (LIBOR USD 1-Month plus 0.32%) |
| |||||||||
| 0.78% |
12/25/362 | 6,660,778 | 5,081,604 | |||||||
| Citigroup Mortgage Loan Trust, |
| |||||||||
| Series 2006-HE3, Class A2D |
| |||||||||
| (LIBOR USD 1-Month plus 0.46%) |
| |||||||||
| 0.92% |
12/25/362 | 7,118,389 | 5,491,456 | |||||||
| Citigroup Mortgage Loan Trust, Inc., |
| |||||||||
| Series 2005-9, Class 1A1 |
| |||||||||
| (LIBOR USD 1-Month plus 0.26%) |
| |||||||||
| 0.72% |
11/25/352 | 45,159 | 40,033 | |||||||
| Citigroup Mortgage Loan Trust, Inc., |
| |||||||||
| Series 2006-WFH2, Class M1 |
| |||||||||
| (LIBOR USD 1-Month plus 0.41%) |
| |||||||||
| 0.86% |
08/25/362 | 1,655,217 | 1,657,635 | |||||||
| Countrywide Home Loan Mortgage Pass-Through Trust, |
|
|||||||||
| Series 2005-3, Class 1A2 |
| |||||||||
| (LIBOR USD 1-Month plus 0.58%) |
| |||||||||
| 1.04% |
04/25/352 | 3,032,740 | 2,789,822 | |||||||
| Countrywide Home Loan Mortgage Pass-Through Trust, |
|
|||||||||
| Series 2005-9, Class 1A1 |
| |||||||||
| (LIBOR USD 1-Month plus 0.60%) |
| |||||||||
| 1.06% |
05/25/352 | 71,687 | 61,520 | |||||||
| Credit Suisse First Boston Mortgage Securities Corp., |
|
|||||||||
| Series 2003-AR26, Class 3A1 |
| |||||||||
| 2.49% |
11/25/334 | 434,931 | 431,550 | |||||||
| Credit Suisse First Boston Mortgage Securities Corp., |
|
|||||||||
| Series 2005-11, Class 1A1 |
| |||||||||
| 6.50% |
12/25/35 | 577,962 | 386,553 | |||||||
| Credit Suisse First Boston Mortgage-Backed Pass-Through Certificates, |
|
|||||||||
| Series 2004-AR5, Class 9A1 |
| |||||||||
| 2.20% |
06/25/344 | 30,219 | 29,859 | |||||||
| Credit Suisse Mortgage Capital Trust, |
| |||||||||
| Series 2006-8, Class 3A1 |
| |||||||||
| 6.00% |
10/25/21 | 24,959 | 14,223 | |||||||
| Credit Suisse Mortgage Capital Trust, |
| |||||||||
| Series 2020-RPL2, Class A12 |
| |||||||||
| 3.42% |
02/25/601,4 | 11,217,194 | 11,013,765 | |||||||
| Credit-Based Asset Servicing and Securitization LLC, |
|
|||||||||
| Series 2006-CB2, Class AF3 (STEP-reset date 05/25/22) |
|
|||||||||
| 3.00% |
12/25/36 | 705,107 | 713,078 | |||||||
| Credit-Based Asset Servicing and Securitization LLC, |
|
|||||||||
| Series 2006-CB9, Class A2 |
| |||||||||
| (LIBOR USD 1-Month plus 0.11%) |
| |||||||||
| 0.57% |
11/25/362 | 7,703,811 | 4,386,579 | |||||||
| Credit-Based Asset Servicing and Securitization LLC, |
|
|||||||||
| Series 2007-CB1, Class AF2 (STEP-reset date 05/25/22) |
|
|||||||||
| 3.16% |
01/25/37 | 2,626,123 | 981,137 | |||||||
| Issues | Maturity Date |
Principal Amount |
Value | |||||||
| MORTGAGE-BACKED (continued) |
|
|||||||||
| Non-Agency Mortgage-Backed (continued) |
|
|||||||||
| Credit-Based Asset Servicing and Securitization LLC, |
|
|||||||||
| Series 2007-CB4, Class A1A |
| |||||||||
| (LIBOR USD 1-Month plus 0.09%) |
| |||||||||
| 0.55% |
04/25/372 | $ | 1,269,067 | $ | 1,213,125 | |||||
| Credit-Based Asset Servicing and Securitization LLC, |
|
|||||||||
| Series 2007-CB5, Class A1 |
| |||||||||
| (LIBOR USD 1-Month plus 0.06%) |
| |||||||||
| 0.52% |
04/25/372 | 1,400,305 | 981,130 | |||||||
| Credit-Based Asset Servicing and Securitization LLC, |
|
|||||||||
| Mortgage Loan Trust, |
| |||||||||
| Series 2007-CB2, Class A2B (STEP-reset date 05/25/22) |
|
|||||||||
| 3.61% |
02/25/37 | 4,675,601 | 3,498,120 | |||||||
| Credit-Based Asset Servicing and Securitization LLC, |
|
|||||||||
| Mortgage Loan Trust, |
| |||||||||
| Series 2007-CB2, Class A2C (STEP-reset date 05/25/22) |
|
|||||||||
| 3.61% |
02/25/37 | 1,119,066 | 837,137 | |||||||
| Credit-Based Asset Servicing and Securitization LLC, |
|
|||||||||
| Mortgage Loan Trust, |
| |||||||||
| Series 2007-CB3, Class A3 (STEP-reset date 05/25/22) |
|
|||||||||
| 3.31% |
03/25/37 | 5,741,798 | 2,770,518 | |||||||
| CSMC Mortgage-Backed Trust, |
| |||||||||
| Series 2006-1, Class 1A4 |
| |||||||||
| 5.50% |
02/25/36 | 3,146,427 | 3,048,478 | |||||||
| CSMC Trust, |
| |||||||||
| Series 2021-RPL7, Class A1 |
| |||||||||
| 1.93% |
07/27/611,4 | 9,698,431 | 9,228,544 | |||||||
| CSMC, |
| |||||||||
| Series 2022-RPL1, Class PT |
| |||||||||
| 3.78% |
02/01/62†,1 | 13,740,000 | 14,297,127 | |||||||
| CSMCM Trust, |
| |||||||||
| Series 2018-SP3, Class CERT |
| |||||||||
| 1.52% |
10/25/581,4 | 15,433,776 | 14,331,557 | |||||||
| CSMCM, |
| |||||||||
| Series 2022-RPL1, Class CERT |
| |||||||||
| 3.78% |
02/01/62†,1 | 580,000 | 603,518 | |||||||
| DSLA Mortgage Loan Trust, |
| |||||||||
| Series 2004-AR4, Class 2A1A |
| |||||||||
| (LIBOR USD 1-Month plus 0.72%) |
| |||||||||
| 1.17% |
01/19/452 | 493,754 | 426,908 | |||||||
| DSLA Mortgage Loan Trust, |
| |||||||||
| Series 2005-AR6, Class 2A1A |
| |||||||||
| (LIBOR USD 1-Month plus 0.58%) |
| |||||||||
| 1.03% |
10/19/452 | 3,517,170 | 3,426,140 | |||||||
| DSLA Mortgage Loan Trust, |
| |||||||||
| Series 2006-AR2, Class 2A1A |
| |||||||||
| (LIBOR USD 1-Month plus 0.20%) |
| |||||||||
| 0.65% |
10/19/362 | 5,708,941 | 4,428,292 | |||||||
| DSLA Mortgage Loan Trust, |
| |||||||||
| Series 2007-AR1, Class 2A1A |
| |||||||||
| (LIBOR USD 1-Month plus 0.14%) |
| |||||||||
| 0.59% |
03/19/372 | 1,350,480 | 1,238,201 | |||||||
| First Franklin Mortgage Loan Trust, |
| |||||||||
| Series 2006-FF11, Class 2A3 |
| |||||||||
| (LIBOR USD 1-Month plus 0.30%) |
| |||||||||
| 0.76% |
08/25/362 | 5,398,603 | 5,130,381 | |||||||
See accompanying Notes to Financial Statements.
| 243 / Annual Report March 2022 |
Table of Contents
Unconstrained Bond Fund
Schedule of Portfolio Investments
March 31, 2022
| Issues | Maturity Date |
Principal Amount |
Value | |||||||
| MORTGAGE-BACKED (continued) |
| |||||||||
| Non-Agency Mortgage-Backed (continued) |
| |||||||||
| First Franklin Mortgage Loan Trust, |
| |||||||||
| Series 2006-FF13, Class A2C |
| |||||||||
| (LIBOR USD 1-Month plus 0.32%) |
| |||||||||
| 0.78% |
10/25/362 | $ | 13,292,408 | $ | 10,132,973 | |||||
| First Franklin Mortgage Loan Trust, |
| |||||||||
| Series 2006-FF18, Class A2D |
| |||||||||
| (LIBOR USD 1-Month plus 0.21%) |
| |||||||||
| 0.67% |
12/25/372 | 812,089 | 761,154 | |||||||
| First Franklin Mortgage Loan Trust, |
| |||||||||
| Series 2006-FF4, Class A3 |
| |||||||||
| (LIBOR USD 1-Month plus 0.56%) |
| |||||||||
| 1.02% |
03/25/362 | 5,137,856 | 5,037,546 | |||||||
| First Franklin Mortgage Loan Trust, |
| |||||||||
| Series 2006-FF9, Class 2A4 |
| |||||||||
| (LIBOR USD 1-Month plus 0.50%) |
| |||||||||
| 0.96% |
06/25/362 | 8,650,000 | 7,876,245 | |||||||
| First Franklin Mortgage Loan Trust, |
| |||||||||
| Series 2007-FF1, Class A2D |
| |||||||||
| (LIBOR USD 1-Month plus 0.22%) |
| |||||||||
| 0.68% |
01/25/382 | 4,295,712 | 2,749,469 | |||||||
| First Franklin Mortgage Loan Trust, |
| |||||||||
| Series 2007-FF2, Class A2B |
| |||||||||
| (LIBOR USD 1-Month plus 0.10%) |
| |||||||||
| 0.56% |
03/25/372 | 575,134 | 326,845 | |||||||
| First Horizon Alternative Mortgage Securities Trust, |
|
|||||||||
| Series 2004-AA3, Class A1 |
| |||||||||
| 2.37% |
09/25/344 | 196,834 | 193,328 | |||||||
| First Horizon Alternative Mortgage Securities Trust, |
|
|||||||||
| Series 2004-AA3, Class A3 |
| |||||||||
| 2.37% |
09/25/344 | 302,669 | 297,278 | |||||||
| First Horizon Alternative Mortgage Securities Trust, |
|
|||||||||
| Series 2005-AA10, Class 1A1 |
| |||||||||
| 2.44% |
12/25/354 | 881,332 | 819,637 | |||||||
| First Horizon Alternative Mortgage Securities Trust, |
|
|||||||||
| Series 2005-AA12, Class 2A1 |
| |||||||||
| 2.49% |
02/25/364 | 1,247,699 | 967,460 | |||||||
| First Horizon Alternative Mortgage Securities Trust, |
|
|||||||||
| Series 2005-AA2, Class 2A1 |
| |||||||||
| 2.73% |
04/25/354 | 1,818,539 | 1,909,430 | |||||||
| First Horizon Alternative Mortgage Securities Trust, |
|
|||||||||
| Series 2005-AA3, Class 3A1 |
| |||||||||
| 2.22% |
05/25/354 | 1,308,890 | 1,256,474 | |||||||
| First Horizon Alternative Mortgage Securities Trust, |
|
|||||||||
| Series 2005-AA7, Class 2A1 |
| |||||||||
| 2.44% |
09/25/354 | 1,664,283 | 1,606,153 | |||||||
| First Horizon Alternative Mortgage Securities Trust, |
|
|||||||||
| Series 2005-AA8, Class 2A1 |
| |||||||||
| 2.45% |
10/25/354 | 1,948,698 | 1,436,874 | |||||||
| First Horizon Alternative Mortgage Securities Trust, |
|
|||||||||
| Series 2005-AA9, Class 2A1 |
| |||||||||
| 2.30% |
11/25/354 | 1,200,006 | 1,077,416 | |||||||
| First Horizon Alternative Mortgage Securities Trust, |
|
|||||||||
| Series 2006-AA1, Class 1A1 |
| |||||||||
| 2.48% |
03/25/364 | 1,342,544 | 1,113,165 | |||||||
| Issues | Maturity Date |
Principal Amount |
Value | |||||||
| MORTGAGE-BACKED (continued) |
| |||||||||
| Non-Agency Mortgage-Backed (continued) |
| |||||||||
| First Horizon Alternative Mortgage Securities Trust, |
|
|||||||||
| Series 2006-AA7, Class A1 |
| |||||||||
| 2.70% |
01/25/374 | $ | 2,254,028 | $ | 1,926,890 | |||||
| First Horizon Mortgage Pass-Through Trust, |
|
|||||||||
| Series 2005-AR4, Class 1A1 |
| |||||||||
| 2.67% |
09/25/354 | 1,353,233 | 1,010,959 | |||||||
| First Horizon Mortgage Pass-Through Trust, |
|
|||||||||
| Series 2005-AR4, Class 2A1 |
| |||||||||
| 2.94% |
10/25/354 | 55,957 | 55,662 | |||||||
| First Horizon Mortgage Pass-Through Trust, |
| |||||||||
| Series 2005-AR5, Class 2A1 |
| |||||||||
| 2.71% |
11/25/354 | 698,529 | 606,032 | |||||||
| First Horizon Mortgage Pass-Through Trust, |
| |||||||||
| Series 2007-AR2, Class 1A2 |
| |||||||||
| 2.59% |
08/25/374 | 56,352 | 25,896 | |||||||
| GMACM Mortgage Corp. Loan Trust, |
| |||||||||
| Series 2005-AR5, Class 2A1 |
| |||||||||
| 2.76% |
09/19/354 | 1,316,388 | 1,037,428 | |||||||
| GMACM Mortgage Corp. Loan Trust, |
| |||||||||
| Series 2005-AR5, Class 3A1 |
| |||||||||
| 3.41% |
09/19/354 | 1,151,650 | 1,065,269 | |||||||
| GMACM Mortgage Corp. Loan Trust, |
| |||||||||
| Series 2006-AR1, Class 1A1 |
| |||||||||
| 2.89% |
04/19/364 | 2,919,450 | 2,462,870 | |||||||
| GreenPoint Mortgage Funding Trust, |
| |||||||||
| Series 2007-AR1, Class 2A1A |
| |||||||||
| (LIBOR USD 1-Month plus 0.20%) |
| |||||||||
| 0.66% |
03/25/472 | 9,993,399 | 9,445,888 | |||||||
| GSAMP Trust, |
| |||||||||
| Series 2007-FM2, Class A1 |
| |||||||||
| (LIBOR USD 1-Month plus 0.14%) |
| |||||||||
| 0.60% |
01/25/372 | 19,154,329 | 13,213,267 | |||||||
| GSR Mortgage Loan Trust, |
| |||||||||
| Series 2005-7F, Class 3A3 (IO) |
| |||||||||
| (-1.00 X LIBOR USD 1-Month plus 5.50%, 5.50% Cap) |
|
|||||||||
| 5.04% |
09/25/352,5,6 | 12,884 | 509 | |||||||
| GSR Mortgage Loan Trust, |
| |||||||||
| Series 2005-AR4, Class 5A1 |
| |||||||||
| 3.05% |
07/25/354 | 378,293 | 355,933 | |||||||
| GSR Mortgage Loan Trust, |
| |||||||||
| Series 2006-AR2, Class 2A1 |
| |||||||||
| 2.66% |
04/25/364 | 186,386 | 145,404 | |||||||
| GSR Mortgage Loan Trust, |
| |||||||||
| Series 2007-AR2, Class 5A1A |
| |||||||||
| 3.08% |
05/25/374 | 607,403 | 569,373 | |||||||
| HarborView Mortgage Loan Trust, |
| |||||||||
| Series 2005-10, Class 2A1A |
| |||||||||
| (LIBOR USD 1-Month plus 0.62%) |
| |||||||||
| 1.07% |
11/19/352 | 2,040,650 | 1,770,890 | |||||||
| HarborView Mortgage Loan Trust, |
| |||||||||
| Series 2006-7, Class 1A |
| |||||||||
| (LIBOR USD 1-Month plus 0.42%) |
| |||||||||
| 0.87% |
09/19/462 | 9,296,618 | 8,679,844 | |||||||
See accompanying Notes to Financial Statements.
| Annual Report March 2022 / 244 |
Table of Contents
Unconstrained Bond Fund
Schedule of Portfolio Investments
March 31, 2022
| Issues | Maturity Date |
Principal Amount |
Value | |||||||
| MORTGAGE-BACKED (continued) |
| |||||||||
| Non-Agency Mortgage-Backed (continued) |
| |||||||||
| HarborView Mortgage Loan Trust, |
| |||||||||
| Series 2007-6, Class 1A1A |
| |||||||||
| (LIBOR USD 1-Month plus 0.20%) |
| |||||||||
| 0.65% |
08/19/372 | $ | 10,829,359 | $ | 10,109,740 | |||||
| Home Equity Mortgage Loan Asset-Backed Trust, |
|
|||||||||
| Series 2005-D, Class AII4 |
| |||||||||
| (LIBOR USD 1-Month plus 0.70%) |
| |||||||||
| 1.16% |
03/25/362 | 2,743,399 | 2,705,609 | |||||||
| HSI Asset Securitization Corp. Trust, |
| |||||||||
| Series 2005-OPT1, Class M1 |
| |||||||||
| (LIBOR USD 1-Month plus 0.63%) |
| |||||||||
| 1.09% |
11/25/352 | 2,261,395 | 2,242,531 | |||||||
| HSI Asset Securitization Corp. Trust, |
| |||||||||
| Series 2006-HE1, Class 1A1 |
| |||||||||
| (LIBOR USD 1-Month plus 0.28%) |
| |||||||||
| 0.74% |
10/25/362 | 11,357,496 | 4,586,479 | |||||||
| HSI Asset Securitization Corp. Trust, |
| |||||||||
| Series 2006-HE2, Class 1A |
| |||||||||
| (LIBOR USD 1-Month plus 0.26%) |
| |||||||||
| 0.72% |
12/25/362 | 28,276,508 | 14,074,836 | |||||||
| HSI Asset Securitization Corp. Trust, |
| |||||||||
| Series 2006-WMC1, Class A1 |
| |||||||||
| (LIBOR USD 1-Month plus 0.10%) |
| |||||||||
| 0.56% |
07/25/362 | 10,594,400 | 5,698,380 | |||||||
| HSI Asset Securitization Corp. Trust, |
| |||||||||
| Series 2006-WMC1, Class A2 |
| |||||||||
| (LIBOR USD 1-Month plus 0.20%) |
| |||||||||
| 0.66% |
07/25/362 | 11,725,960 | 6,362,082 | |||||||
| HSI Asset Securitization Corp. Trust, |
| |||||||||
| Series 2006-WMC1, Class A4 |
| |||||||||
| (LIBOR USD 1-Month plus 0.50%) |
| |||||||||
| 0.96% |
07/25/362 | 10,253,803 | 5,707,825 | |||||||
| Impac CMB Trust, |
| |||||||||
| Series 2005-2, Class 1A1 |
| |||||||||
| (LIBOR USD 1-Month plus 0.52%) |
| |||||||||
| 0.98% |
04/25/352 | 2,430,733 | 2,404,136 | |||||||
| IndyMac Index Mortgage Loan Trust, |
| |||||||||
| Series 2005-AR14, Class 1A1A |
| |||||||||
| (LIBOR USD 1-Month plus 0.56%) |
| |||||||||
| 1.02% |
07/25/352 | 9,276,264 | 7,199,127 | |||||||
| IndyMac Index Mortgage Loan Trust, |
| |||||||||
| Series 2005-AR19, Class A1 |
| |||||||||
| 2.77% |
10/25/354 | 1,950,009 | 1,792,802 | |||||||
| IndyMac Index Mortgage Loan Trust, |
| |||||||||
| Series 2006-AR27, Class 1A3 |
| |||||||||
| (LIBOR USD 1-Month plus 0.54%) |
| |||||||||
| 1.00% |
10/25/362 | 5,407,527 | 2,850,747 | |||||||
| IndyMac Index Mortgage Loan Trust, |
| |||||||||
| Series 2006-AR4, Class A2A |
| |||||||||
| (LIBOR USD 1-Month plus 0.50%) |
| |||||||||
| 0.96% |
05/25/462 | 12,179,277 | 12,281,801 | |||||||
| IndyMac Index Mortgage Loan Trust, |
| |||||||||
| Series 2006-AR7, Class 3A1 |
| |||||||||
| 2.75% |
05/25/364 | 240,950 | 219,960 | |||||||
| Issues | Maturity Date |
Principal Amount |
Value | |||||||
| MORTGAGE-BACKED (continued) |
| |||||||||
| Non-Agency Mortgage-Backed (continued) |
| |||||||||
| IndyMac Index Mortgage Loan Trust, |
| |||||||||
| Series 2006-AR9, Class 3A3 |
| |||||||||
| 2.94% |
06/25/364 | $ | 2,878,920 | $ | 2,709,019 | |||||
| IndyMac Index Mortgage Loan Trust, |
| |||||||||
| Series 2007-FLX4, Class 2A1 |
| |||||||||
| (LIBOR USD 1-Month plus 0.18%) |
| |||||||||
| 0.64% |
07/25/372 | 14,310,081 | 13,788,539 | |||||||
| IndyMac Manufactured Housing Contract Pass-Through Certificates, |
|
|||||||||
| Series 1998-1, Class A4 |
| |||||||||
| 6.49% |
09/25/28 | 27,891 | 28,774 | |||||||
| JPMorgan Mortgage Acquisition Trust, |
| |||||||||
| Series 2006-ACC1, Class M1 |
| |||||||||
| (LIBOR USD 1-Month plus 0.41%) |
| |||||||||
| 0.86% |
05/25/362 | 1,401,559 | 1,415,083 | |||||||
| JPMorgan Mortgage Acquisition Trust, |
| |||||||||
| Series 2006-CH1, Class M2 |
| |||||||||
| (LIBOR USD 1-Month plus 0.29%) |
| |||||||||
| 0.75% |
07/25/362 | 6,351,481 | 6,328,911 | |||||||
| JPMorgan Mortgage Acquisition Trust, |
| |||||||||
| Series 2006-WMC4, Class A1A |
| |||||||||
| (LIBOR USD 1-Month plus 0.13%) |
| |||||||||
| 0.59% |
12/25/362 | 7,708,383 | 5,590,188 | |||||||
| JPMorgan Mortgage Acquisition Trust, |
| |||||||||
| Series 2006-WMC4, Class A4 |
| |||||||||
| (LIBOR USD 1-Month plus 0.15%) |
| |||||||||
| 0.61% |
12/25/362 | 9,610,257 | 5,812,654 | |||||||
| JPMorgan Mortgage Trust, |
| |||||||||
| Series 2005-A6, Class 7A1 |
| |||||||||
| 3.11% |
08/25/354 | 18,337 | 16,898 | |||||||
| JPMorgan Mortgage Trust, |
| |||||||||
| Series 2006-A3, Class 2A1 |
| |||||||||
| 2.76% |
05/25/364 | 19,470 | 17,535 | |||||||
| JPMorgan Mortgage Trust, |
| |||||||||
| Series 2006-S2, Class 2A2 |
| |||||||||
| 5.88% |
06/25/21 | 3,647 | 3,664 | |||||||
| Legacy Mortgage Asset Trust, |
| |||||||||
| Series 2017-RPL1, Class A |
| |||||||||
| (LIBOR USD 1-Month plus 1.75%) |
| |||||||||
| 2.20% |
01/28/701,2 | 4,763,708 | 4,726,284 | |||||||
| Legacy Mortgage Asset Trust, |
| |||||||||
| Series 2020-GS2, Class A1 (STEP-reset date 04/25/22) |
|
|||||||||
| 2.75% |
03/25/601 | 19,104,283 | 19,137,115 | |||||||
| Lehman XS Trust, |
| |||||||||
| Series 2005-4, Class 1A3 |
| |||||||||
| (LIBOR USD 1-Month plus 0.80%) |
| |||||||||
| 1.26% |
10/25/352 | 23,096 | 23,125 | |||||||
| Lehman XS Trust, |
| |||||||||
| Series 2005-5N, Class 3A1A |
| |||||||||
| (LIBOR USD 1-Month plus 0.30%) |
| |||||||||
| 0.76% |
11/25/352 | 1,386,102 | 1,379,465 | |||||||
| Lehman XS Trust, |
| |||||||||
| Series 2006-17, Class 1A3 |
| |||||||||
| (LIBOR USD 1-Month plus 0.50%) |
| |||||||||
| 0.96% |
08/25/462 | 14,646,056 | 13,962,665 | |||||||
See accompanying Notes to Financial Statements.
| 245 / Annual Report March 2022 |
Table of Contents
Unconstrained Bond Fund
Schedule of Portfolio Investments
March 31, 2022
| Issues | Maturity Date |
Principal Amount |
Value | |||||||
| MORTGAGE-BACKED (continued) |
|
|||||||||
| Non-Agency Mortgage-Backed (continued) |
|
|||||||||
| Lehman XS Trust, |
| |||||||||
| Series 2006-GP2, Class 1A5A |
| |||||||||
| (LIBOR USD 1-Month plus 0.42%) |
| |||||||||
| 0.88% |
06/25/462 | $ | 3,898,453 | $ | 3,786,024 | |||||
| Lehman XS Trust, |
| |||||||||
| Series 2007-18N, Class 1A1 |
| |||||||||
| (LIBOR USD 1-Month plus 0.85%) |
| |||||||||
| 1.31% |
10/25/372 | 4,466,530 | 4,296,071 | |||||||
| Long Beach Mortgage Loan Trust, |
| |||||||||
| Series 2006-2, Class 1A |
| |||||||||
| (LIBOR USD 1-Month plus 0.36%) |
| |||||||||
| 0.82% |
03/25/462 | 6,943,768 | 6,108,021 | |||||||
| Long Beach Mortgage Loan Trust, |
| |||||||||
| Series 2006-9, Class 2A2 |
| |||||||||
| (LIBOR USD 1-Month plus 0.11%) |
| |||||||||
| 0.57% |
10/25/362 | 50,686,128 | 18,146,483 | |||||||
| MASTR Adjustable Rate Mortgages Trust, |
| |||||||||
| Series 2003-7, Class 3A1 |
| |||||||||
| 1.91% |
11/25/334 | 134,603 | 130,928 | |||||||
| MASTR Adjustable Rate Mortgages Trust, |
| |||||||||
| Series 2004-15, Class 8A1 |
| |||||||||
| 3.80% |
10/25/344 | 124,703 | 122,316 | |||||||
| MASTR Adjustable Rate Mortgages Trust, |
| |||||||||
| Series 2004-3, Class 3A3 |
| |||||||||
| 2.53% |
04/25/344 | 40,216 | 40,237 | |||||||
| MASTR Adjustable Rate Mortgages Trust, |
| |||||||||
| Series 2006-OA2, Class 1A1 |
| |||||||||
| (Federal Reserve US 12-Month Cumulative Average plus 0.80%) |
|
|||||||||
| 0.94% |
12/25/462 | 17,819,765 | 15,921,594 | |||||||
| MASTR Adjustable Rate Mortgages Trust, |
| |||||||||
| Series 2007-2, Class A1 |
| |||||||||
| (LIBOR USD 1-Month plus 0.30%) |
| |||||||||
| 0.76% |
03/25/472 | 2,819,333 | 2,708,200 | |||||||
| MASTR Asset-Backed Securities Trust, |
| |||||||||
| Series 2006-WMC1, Class A3 |
| |||||||||
| (LIBOR USD 1-Month plus 0.36%) |
| |||||||||
| 0.82% |
02/25/362 | 17,392,923 | 8,207,522 | |||||||
| MASTR Asset-Backed Securities Trust, |
| |||||||||
| Series 2007-HE1, Class A4 |
| |||||||||
| (LIBOR USD 1-Month plus 0.28%) |
| |||||||||
| 0.74% |
05/25/372 | 3,150,000 | 2,848,551 | |||||||
| MASTR Asset-Backed Securities Trust, |
| |||||||||
| Series 2007-WMC1, Class A2 |
| |||||||||
| (LIBOR USD 1-Month plus 0.05%) |
| |||||||||
| 0.51% |
01/25/372 | 16,961,461 | 6,002,004 | |||||||
| Merrill Lynch Alternative Note Asset Trust, |
| |||||||||
| Series 2007-A3, Class A2D |
| |||||||||
| (LIBOR USD 1-Month plus 0.66%) |
| |||||||||
| 1.12% |
04/25/372,5,6 | 883,581 | 44,393 | |||||||
| Merrill Lynch Alternative Note Asset Trust, |
| |||||||||
| Series 2007-OAR2, Class A2 |
| |||||||||
| (LIBOR USD 1-Month plus 0.42%) |
| |||||||||
| 0.88% |
04/25/372 | 7,957,484 | 7,533,497 | |||||||
| Issues | Maturity Date |
Principal Amount |
Value | |||||||
| MORTGAGE-BACKED (continued) |
|
|||||||||
| Non-Agency Mortgage-Backed (continued) |
|
|||||||||
| Merrill Lynch First Franklin Mortgage Loan Trust, |
|
|||||||||
| Series 2007-1, Class A2C |
| |||||||||
| (LIBOR USD 1-Month plus 0.25%) |
| |||||||||
| 0.71% |
04/25/372 | $ | 18,276,968 | $ | 8,755,414 | |||||
| Merrill Lynch First Franklin Mortgage Loan Trust, |
|
|||||||||
| Series 2007-4, Class 2A4 |
| |||||||||
| (LIBOR USD 1-Month plus 0.25%) |
| |||||||||
| 0.71% |
07/25/372 | 954,748 | 786,408 | |||||||
| Merrill Lynch First Franklin Mortgage Loan Trust, |
|
|||||||||
| Series 2007-5, Class 1A |
| |||||||||
| (LIBOR USD 1-Month plus 0.85%) |
| |||||||||
| 1.31% |
10/25/372 | 24,933,498 | 16,421,044 | |||||||
| Merrill Lynch Mortgage Investors Trust, |
| |||||||||
| Series 2003-A6, Class 2A |
| |||||||||
| 2.38% |
10/25/334 | 100,872 | 100,261 | |||||||
| Merrill Lynch Mortgage Investors Trust, |
| |||||||||
| Series 2007-2, Class 1A1 |
| |||||||||
| (US Treasury Yield Curve Rate T Note Constant Maturity |
|
|||||||||
| 1-Year plus 2.40%) |
| |||||||||
| 3.53% |
08/25/362 | 818,764 | 781,473 | |||||||
| Morgan Stanley ABS Capital I Trust, |
| |||||||||
| Series 2006-NC2, Class A2D |
| |||||||||
| (LIBOR USD 1-Month plus 0.58%) |
| |||||||||
| 1.04% |
02/25/362 | 1,491,163 | 1,489,391 | |||||||
| Morgan Stanley ABS Capital I, Inc., Trust, |
| |||||||||
| Series 2006-HE4, Class A3 |
| |||||||||
| (LIBOR USD 1-Month plus 0.30%) |
| |||||||||
| 0.76% |
06/25/362 | 9,817,713 | 5,987,316 | |||||||
| Morgan Stanley ABS Capital I, Inc., Trust, |
| |||||||||
| Series 2006-HE4, Class A4 |
| |||||||||
| (LIBOR USD 1-Month plus 0.48%) |
| |||||||||
| 0.94% |
06/25/362 | 10,473,283 | 6,463,069 | |||||||
| Morgan Stanley ABS Capital I, Inc., Trust, |
| |||||||||
| Series 2007-NC3, Class A2C |
| |||||||||
| (LIBOR USD 1-Month plus 0.19%) |
| |||||||||
| 0.65% |
05/25/372 | 24,122,972 | 20,477,412 | |||||||
| Morgan Stanley Home Equity Loan Trust, |
| |||||||||
| Series 2006-3, Class A4 |
| |||||||||
| (LIBOR USD 1-Month plus 0.52%) |
| |||||||||
| 0.98% |
04/25/362 | 12,892,366 | 10,384,877 | |||||||
| Morgan Stanley Mortgage Loan Trust, |
| |||||||||
| Series 2004-7AR, Class 2A4 |
| |||||||||
| 2.07% |
09/25/344 | 228,047 | 223,106 | |||||||
| Morgan Stanley Mortgage Loan Trust, |
| |||||||||
| Series 2006-2, Class 1A |
| |||||||||
| 5.25% |
02/25/21 | 46,417 | 47,282 | |||||||
| MortgageIT Trust, |
| |||||||||
| Series 2005-2, Class 2A |
| |||||||||
| (LIBOR USD 1-Month plus 1.65%) |
| |||||||||
| 1.88% |
05/25/352 | 874,777 | 871,132 | |||||||
| New Century Home Equity Loan Trust, |
| |||||||||
| Series 2005-D, Class A2D |
| |||||||||
| (LIBOR USD 1-Month plus 0.66%) |
| |||||||||
| 1.12% |
02/25/362 | 631,482 | 631,379 | |||||||
See accompanying Notes to Financial Statements.
| Annual Report March 2022 / 246 |
Table of Contents
Unconstrained Bond Fund
Schedule of Portfolio Investments
March 31, 2022
| Issues | Maturity Date |
Principal Amount |
Value | |||||||||
| MORTGAGE-BACKED (continued) |
|
|||||||||||
| Non-Agency Mortgage-Backed (continued) |
|
|||||||||||
| New York Mortgage Trust, |
| |||||||||||
| Series 2005-3, Class A1 |
| |||||||||||
| (LIBOR USD 1-Month plus 0.48%) |
| |||||||||||
| 0.94% |
02/25/362 | $ | 299,420 | $ | 300,499 | |||||||
| Nomura Asset Acceptance Corp., |
| |||||||||||
| Series 2005-AR4, Class 4A1 |
| |||||||||||
| 3.24% |
08/25/354 | 2,330,809 | 1,900,210 | |||||||||
| Nomura Resecuritization Trust, |
| |||||||||||
| Series 2016-2R, Class 1A1 |
| |||||||||||
| 0.34% |
09/26/361,4 | 1,083,144 | 1,080,133 | |||||||||
| NRPL, |
||||||||||||
| Series 2019-3A, Class A1 (STEP-reset date 05/25/22) |
|
|||||||||||
| 3.00% |
07/25/591 | 10,557,492 | 10,520,728 | |||||||||
| Oakwood Mortgage Investors, Inc., |
| |||||||||||
| Series 2000-A, Class A5 |
| |||||||||||
| 8.16% |
09/15/294 | 10,331,953 | 3,692,103 | |||||||||
| Opteum Mortgage Acceptance Corp. Asset-Backed Pass-Through Certificates, Series 2005-3, Class M2 (LIBOR USD 1-Month plus 0.72%) |
|
|||||||||||
| 1.18% |
07/25/352 | 4,079,639 | 4,083,645 | |||||||||
| Option One Mortgage Loan Trust, |
| |||||||||||
| Series 2007-4, Class 2A2 |
| |||||||||||
| (LIBOR USD 1-Month plus 0.18%) |
| |||||||||||
| 0.64% |
04/25/372 | 13,880,095 | 9,342,278 | |||||||||
| Option One Mortgage Loan Trust, |
| |||||||||||
| Series 2007-5, Class 2A2 |
| |||||||||||
| (LIBOR USD 1-Month plus 0.17%) |
| |||||||||||
| 0.63% |
05/25/372 | 19,934,787 | 12,697,200 | |||||||||
| Ownit Mortgage Loan Trust, |
| |||||||||||
| Series 2006-2, Class A1 |
| |||||||||||
| (LIBOR USD 1-Month plus 0.42%) |
| |||||||||||
| 0.88% |
01/25/372 | 5,391,136 | 5,016,904 | |||||||||
| PHH Alternative Mortgage Trust, |
| |||||||||||
| Series 2007-2, Class 1A4 |
| |||||||||||
| (LIBOR USD 1-Month plus 0.60%) |
| |||||||||||
| 1.06% |
05/25/372 | 9,790,110 | 9,574,646 | |||||||||
| Popular ABS Mortgage Pass-Through Trust, |
| |||||||||||
| Series 2007-A, Class A3 |
| |||||||||||
| (LIBOR USD 1-Month plus 0.31%) |
| |||||||||||
| 0.77% |
06/25/472 | 5,152,000 | 4,924,205 | |||||||||
| PRET, LLC, |
| |||||||||||
| Series 2022-RN1, Class A1 (STEP-reset date 04/25/22) |
|
|||||||||||
| 3.72% |
07/25/511 | 17,565,730 | 17,266,837 | |||||||||
| PRPM LLC, |
| |||||||||||
| Series 2021-9, Class A1 |
| |||||||||||
| 2.36% |
10/25/261,4 | 16,390,745 | 15,731,632 | |||||||||
| PRPM, LLC, |
||||||||||||
| Series 2021-8, Class A1 |
| |||||||||||
| 1.74% |
09/25/261,4 | 9,385,114 | 8,936,135 | |||||||||
| RAAC Trust, |
||||||||||||
| Series 2005-SP1, Class 4A1 |
| |||||||||||
| 7.00% |
09/25/34 | 53,117 | 51,108 | |||||||||
| Residential Accredit Loans Trust, |
| |||||||||||
| Series 2005-QA13, Class 2A1 |
| |||||||||||
| 3.97% |
12/25/354 | 1,522,521 | 1,405,014 | |||||||||
| Issues | Maturity Date |
Principal Amount |
Value | |||||||
| MORTGAGE-BACKED (continued) |
|
|||||||||
| Non-Agency Mortgage-Backed (continued) |
|
|||||||||
| Residential Accredit Loans Trust, |
| |||||||||
| Series 2005-QA4, Class A41 |
| |||||||||
| 3.29% |
04/25/354 | $ | 11,806 | $ | 11,791 | |||||
| Residential Accredit Loans Trust, |
| |||||||||
| Series 2005-QA7, Class A21 |
| |||||||||
| 2.99% |
07/25/354 | 600,289 | 586,916 | |||||||
| Residential Accredit Loans Trust, |
| |||||||||
| Series 2005-QA8, Class CB21 |
| |||||||||
| 3.47% |
07/25/354 | 608,351 | 407,515 | |||||||
| Residential Accredit Loans Trust, |
| |||||||||
| Series 2006-QS13, Class 2A1 |
| |||||||||
| 5.75% |
09/25/21 | 5,243 | 4,532 | |||||||
| Residential Accredit Loans Trust, |
| |||||||||
| Series 2006-QS16, Class A6 |
| |||||||||
| 6.00% |
11/25/36 | 377,521 | 354,348 | |||||||
| Residential Accredit Loans Trust, |
| |||||||||
| Series 2007-QA3, Class A1 |
| |||||||||
| (LIBOR USD 1-Month plus 0.10%) |
| |||||||||
| 0.56% |
05/25/372 | 14,281,152 | 13,694,488 | |||||||
| Residential Accredit Loans Trust, |
| |||||||||
| Series 2007-QH6, Class A1 |
| |||||||||
| (LIBOR USD 1-Month plus 0.38%) |
| |||||||||
| 0.84% |
07/25/372 | 8,592,978 | 8,439,805 | |||||||
| Residential Accredit Loans Trust, |
| |||||||||
| Series 2007-QS1, Class 2AV (IO) |
| |||||||||
| 0.17% |
01/25/374,5,6 | 1,734,805 | 10,063 | |||||||
| Residential Asset Securities Corp., |
| |||||||||
| Series 2005-KS9, Class M4 |
| |||||||||
| (LIBOR USD 1-Month plus 0.60%) |
| |||||||||
| 1.36% |
10/25/352 | 149,368 | 149,541 | |||||||
| Residential Asset Securitization Trust, |
| |||||||||
| Series 2006-A9CB, Class A9 |
| |||||||||
| 6.00% |
09/25/36 | 4,941,626 | 2,121,497 | |||||||
| Residential Funding Mortgage Securities Trust, |
| |||||||||
| Series 2007-SA2, Class 1A |
| |||||||||
| 3.44% |
04/25/374 | 254,459 | 164,660 | |||||||
| Saxon Asset Securities Trust, |
| |||||||||
| Series 2005-4, Class M1 |
| |||||||||
| (LIBOR USD 1-Month plus 0.66%) |
| |||||||||
| 1.12% |
11/25/372 | 231,267 | 231,447 | |||||||
| Saxon Asset Securities Trust, |
| |||||||||
| Series 2007-2, Class A2C |
|
|||||||||
| (LIBOR USD 1-Month plus 0.24%) |
| |||||||||
| 0.70% |
05/25/472 | 13,979,947 | 11,341,646 | |||||||
| Securitized Asset-Backed Receivables LLC Trust, |
| |||||||||
| Series 2006-CB1, Class AF4 (STEP-reset date 05/25/22) |
|
|||||||||
| 2.91% |
01/25/36 | 3,832,871 | 3,537,106 | |||||||
| Securitized Asset-Backed Receivables LLC Trust, |
| |||||||||
| Series 2006-WM4, Class A1 |
| |||||||||
| (LIBOR USD 1-Month plus 0.38%) |
| |||||||||
| 0.84% |
11/25/361,2 | 9,428,785 | 5,397,426 | |||||||
| Securitized Asset-Backed Receivables LLC Trust, |
| |||||||||
| Series 2007-BR2, Class A2 |
| |||||||||
| (LIBOR USD 1-Month plus 0.23%) |
| |||||||||
| 0.69% |
02/25/372 | 1,053,366 | 561,029 | |||||||
See accompanying Notes to Financial Statements.
| 247 / Annual Report March 2022 |
Table of Contents
Unconstrained Bond Fund
Schedule of Portfolio Investments
March 31, 2022
| Issues | Maturity Date |
Principal Amount |
Value | |||||||
| MORTGAGE-BACKED (continued) |
|
|||||||||
| Non-Agency Mortgage-Backed (continued) |
|
|||||||||
| Securitized Asset-Backed Receivables LLC Trust, |
|
|||||||||
| Series 2007-BR4, Class A2B |
|
|||||||||
| (LIBOR USD 1-Month plus 0.20%) |
|
|||||||||
| 0.66% |
05/25/372 | $ | 1,949,927 | $ | 1,368,226 | |||||
| Securitized Asset-Backed Receivables LLC Trust, |
|
|||||||||
| Series 2007-NC1, Class A2B |
|
|||||||||
| (LIBOR USD 1-Month plus 0.15%) |
|
|||||||||
| 0.61% |
12/25/362 | 5,923,613 | 3,937,887 | |||||||
| Soundview Home Loan Trust, |
|
|||||||||
| Series 2006-WF2, Class M1 |
|
|||||||||
| (LIBOR USD 1-Month plus 0.33%) |
|
|||||||||
| 0.79% |
12/25/362 | 2,260,630 | 2,258,236 | |||||||
| Soundview Home Loan Trust, |
|
|||||||||
| Series 2007-OPT1, Class 2A3 |
|
|||||||||
| (LIBOR USD 1-Month plus 0.21%) |
|
|||||||||
| 0.67% |
06/25/372 | 20,367,386 | 15,395,467 | |||||||
| Soundview Home Loan Trust, |
|
|||||||||
| Series 2007-WMC1, Class 3A3 |
|
|||||||||
| (LIBOR USD 1-Month plus 0.26%) |
|
|||||||||
| 0.72% |
02/25/372 | 1,016,530 | 355,935 | |||||||
| Specialty Underwriting & Residential Finance Trust, |
|
|||||||||
| Series 2007-BC2, Class A1 |
|
|||||||||
| (LIBOR USD 1-Month plus 0.23%) |
|
|||||||||
| 0.69% |
04/25/372 | 21,964,350 | 17,512,220 | |||||||
| Structured Adjustable Rate Mortgage Loan Trust, |
|
|||||||||
| Series 2004-12, Class 2A |
|
|||||||||
| 2.68% |
09/25/344 | 450,664 | 452,291 | |||||||
| Structured Adjustable Rate Mortgage Loan Trust, |
|
|||||||||
| Series 2004-2, Class 4A2 |
|
|||||||||
| 2.71% |
03/25/344 | 863,180 | 843,295 | |||||||
| Structured Adjustable Rate Mortgage Loan Trust, |
|
|||||||||
| Series 2005-12, Class 3A1 |
|
|||||||||
| 2.34% |
06/25/354 | 510,219 | 472,661 | |||||||
| Structured Adjustable Rate Mortgage Loan Trust, |
|
|||||||||
| Series 2005-21, Class 2A |
|
|||||||||
| 2.54% |
11/25/354 | 809,098 | 694,872 | |||||||
| Structured Adjustable Rate Mortgage Loan Trust, |
|
|||||||||
| Series 2005-7, Class 1A3 |
|
|||||||||
| 2.96% |
04/25/354 | 2,251,478 | 2,283,588 | |||||||
| Structured Adjustable Rate Mortgage Loan Trust, |
|
|||||||||
| Series 2006-11, Class 1A1 |
|
|||||||||
| (LIBOR USD 1-Month plus 0.32%) |
|
|||||||||
| 0.78% |
12/25/362 | 1,161,141 | 1,131,392 | |||||||
| Structured Asset Investment Loan Trust, |
|
|||||||||
| Series 2004-6, Class A3 |
|
|||||||||
| (LIBOR USD 1-Month plus 0.80%) |
|
|||||||||
| 1.26% |
07/25/342 | 9,667,207 | 9,067,404 | |||||||
| Structured Asset Mortgage Investments II Trust, |
|
|||||||||
| Series 2006-AR3, Class 22A1 |
|
|||||||||
| 2.48% |
05/25/364 | 451,397 | 283,547 | |||||||
| Structured Asset Mortgage Investments II Trust, |
|
|||||||||
| Series 2006-AR5, Class 1A1 |
|
|||||||||
| (LIBOR USD 1-Month plus 0.42%) |
|
|||||||||
| 0.88% |
05/25/362 | 206,402 | 198,808 | |||||||
| Issues |
Maturity Date |
Principal Amount |
Value | |||||||
| MORTGAGE-BACKED (continued) |
|
|||||||||
| Non-Agency Mortgage-Backed (continued) |
|
|||||||||
| Structured Asset Mortgage Investments II Trust, |
|
|||||||||
| Series 2006-AR7, Class A1BG |
|
|||||||||
| (LIBOR USD 1-Month plus 0.12%) |
|
|||||||||
| 0.58% |
08/25/362 | $ | 9,776,356 | $ | 9,243,093 | |||||
| Structured Asset Mortgage Investments II Trust, |
|
|||||||||
| Series 2007-AR6, Class A1 |
|
|||||||||
| (Federal Reserve US 12-Month Cumulative Average plus 1.50%) |
|
|||||||||
| 1.64% |
08/25/472 | 9,911,713 | 9,456,738 | |||||||
| Structured Asset Securities Corp. Mortgage Loan Trust, |
|
|||||||||
| Series 2005-2XS, Class 2A2 |
|
|||||||||
| (LIBOR USD 1-Month plus 1.50%) |
|
|||||||||
| 1.73% |
02/25/352 | 65,833 | 66,313 | |||||||
| Structured Asset Securities Corp. Mortgage Loan Trust, |
|
|||||||||
| Series 2005-4XS, Class 2A1A |
|
|||||||||
| (LIBOR USD 1-Month plus 1.75%) |
|
|||||||||
| 1.98% |
03/25/352 | 1,111,153 | 1,133,096 | |||||||
| Structured Asset Securities Corp. Mortgage Pass-Through Certificates, |
|
|||||||||
| Series 2003-34A, Class 3A3 |
|
|||||||||
| 3.03% |
11/25/334 | 19,961 | 20,454 | |||||||
| SunTrust Adjustable Rate Mortgage Loan Trust, |
|
|||||||||
| Series 2007-4, Class 3A1 |
|
|||||||||
| 2.66% |
10/25/374 | 996,970 | 912,064 | |||||||
| SunTrust Adjustable Rate Mortgage Loan Trust, |
|
|||||||||
| Series 2007-S1, Class 2A1 |
|
|||||||||
| 2.52% |
01/25/374 | 383,018 | 393,978 | |||||||
| SunTrust Adjustable Rate Mortgage Loan Trust, |
|
|||||||||
| Series 2007-S1, Class 5A1 |
|
|||||||||
| 2.90% |
01/25/374 | 128,630 | 127,452 | |||||||
| VOLT XCIV LLC, |
|
|||||||||
| Series 2021-NPL3, Class A1 (STEP-reset date 04/25/22) |
|
|||||||||
| 2.24% |
02/27/511 | 13,476,935 | 12,995,453 | |||||||
| WaMu Asset-Backed Certificates, |
|
|||||||||
| Series 2007-HE1, Class 2A2 |
|
|||||||||
| (LIBOR USD 1-Month plus 0.11%) |
|
|||||||||
| 0.57% |
01/25/372 | 5,613,974 | 3,150,249 | |||||||
| WaMu Asset-Backed Certificates, |
|
|||||||||
| Series 2007-HE2, Class 2A2 |
|
|||||||||
| (LIBOR USD 1-Month plus 0.22%) |
|
|||||||||
| 0.68% |
02/25/372 | 29,289,542 | 10,864,472 | |||||||
| WaMu Mortgage Pass-Through Certificates, |
|
|||||||||
| Series 2004-AR13, Class A1A |
|
|||||||||
| (LIBOR USD 1-Month plus 0.72%) |
|
|||||||||
| 1.18% |
11/25/342 | 122,330 | 119,016 | |||||||
| WaMu Mortgage Pass-Through Certificates, |
|
|||||||||
| Series 2004-AR14, Class A1 |
|
|||||||||
| 2.75% |
01/25/354 | 403,263 | 403,132 | |||||||
| WaMu Mortgage Pass-Through Certificates, |
|
|||||||||
| Series 2004-AR6, Class A |
|
|||||||||
| (LIBOR USD 1-Month plus 0.84%) |
|
|||||||||
| 1.30% |
05/25/442 | 24,390 | 24,546 | |||||||
| WaMu Mortgage Pass-Through Certificates, |
|
|||||||||
| Series 2005-AR12, Class 1A6 |
|
|||||||||
| 2.85% |
10/25/354 | 824,994 | 816,641 | |||||||
See accompanying Notes to Financial Statements.
| Annual Report March 2022 / 248 |
Table of Contents
Unconstrained Bond Fund
Schedule of Portfolio Investments
March 31, 2022
| Issues | Maturity Date |
Principal Amount |
Value | |||||||
| MORTGAGE-BACKED (continued) |
|
|||||||||
| Non-Agency Mortgage-Backed (continued) |
|
|||||||||
| WaMu Mortgage Pass-Through Certificates, |
|
|||||||||
| Series 2005-AR14, Class 2A1 |
|
|||||||||
| 2.86% |
12/25/354 | $ | 20,909 | $ | 21,022 | |||||
| WaMu Mortgage Pass-Through Certificates, |
|
|||||||||
| Series 2005-AR16, Class 1A3 |
|
|||||||||
| 2.67% |
12/25/354 | 1,000,988 | 1,010,002 | |||||||
| WaMu Mortgage Pass-Through Certificates, |
|
|||||||||
| Series 2005-AR2, Class 2A21 |
|
|||||||||
| (LIBOR USD 1-Month plus 0.66%) |
|
|||||||||
| 1.12% |
01/25/452 | 440,504 | 435,937 | |||||||
| WaMu Mortgage Pass-Through Certificates, |
|
|||||||||
| Series 2005-AR9, Class A1A |
|
|||||||||
| (LIBOR USD 1-Month plus 0.64%) |
|
|||||||||
| 1.10% |
07/25/452 | 478,492 | 467,827 | |||||||
| WaMu Mortgage Pass-Through Certificates, |
|
|||||||||
| Series 2006-AR3, Class A1A |
|
|||||||||
| (Federal Reserve US 12-Month Cumulative Average plus 1.00%) |
|
|||||||||
| 1.14% |
02/25/462 | 3,523,518 | 3,446,362 | |||||||
| WaMu Mortgage Pass-Through Certificates, |
|
|||||||||
| Series 2006-AR4, Class 1A1A |
|
|||||||||
| (Federal Reserve US 12-Month Cumulative Average plus 0.94%) |
|
|||||||||
| 1.04% |
05/25/462 | 1,472,258 | 1,446,069 | |||||||
| WaMu Mortgage Pass-Through Certificates, |
|
|||||||||
| Series 2006-AR7, Class 2A |
|
|||||||||
| (Federal Reserve US 12-Month Cumulative Average plus 0.98%) |
|
|||||||||
| 1.12% |
07/25/462 | 3,477,090 | 3,317,102 | |||||||
| WaMu Mortgage Pass-Through Certificates, |
|
|||||||||
| Series 2007-HY3, Class 1A1 |
|
|||||||||
| 2.92% |
03/25/374 | 1,690,965 | 1,562,292 | |||||||
| WaMu Mortgage Pass-Through Certificates, |
|
|||||||||
| Series 2007-OA5, Class 1A |
|
|||||||||
| (Federal Reserve US 12-Month Cumulative Average plus 0.75%) |
|
|||||||||
| 0.89% |
06/25/472 | 1,361,119 | 1,290,704 | |||||||
| WaMu Mortgage Pass-Through Certificates, |
|
|||||||||
| Series 2007-OC1, Class A1 |
|
|||||||||
| (LIBOR USD 1-Month plus 0.24%) |
|
|||||||||
| 0.70% |
01/25/472 | 5,004,659 | 4,960,910 | |||||||
| Wells Fargo Alternative Loan Trust, |
|
|||||||||
| Series 2007-PA5, Class 1A1 |
|
|||||||||
| 6.25% |
11/25/37 | 1,586,289 | 1,497,515 | |||||||
| Wells Fargo Home Equity Asset-Backed Securities Trust, |
|
|||||||||
| Series 2007-1, Class A3 |
|
|||||||||
| (LIBOR USD 1-Month plus 0.64%) |
|
|||||||||
| 1.10% |
03/25/372 | 4,690,000 | 4,342,131 | |||||||
| Wells Fargo Mortgage-Backed Securities Trust, |
|
|||||||||
| Series 2006-AR14, Class 2A1 |
|
|||||||||
| 2.60% |
10/25/364 | 355,979 | 342,181 | |||||||
| Wells Fargo Mortgage-Backed Securities Trust, |
|
|||||||||
| Series 2006-AR4, Class 1A1 |
|
|||||||||
| 2.87% |
04/25/364 | 80,120 | 76,341 | |||||||
| 1,026,018,359 | ||||||||||
| Issues | Maturity Date |
Principal Amount |
Value | |||||||||
| MORTGAGE-BACKED (continued) |
|
|||||||||||
| U.S. Agency Commercial Mortgage-Backed — 1.15% |
|
|||||||||||
| Fannie Mae-Aces, |
| |||||||||||
| Series 2016-M11, Class X2 (IO) |
| |||||||||||
| 2.94% |
07/25/394 | $ | 18,227,249 | $ | 479,123 | |||||||
| Fannie Mae-Aces, |
| |||||||||||
| Series 2016-M2, Class X3 (IO) |
| |||||||||||
| 2.12% |
04/25/364 | 11,666,036 | 117,317 | |||||||||
| Fannie Mae-Aces, |
| |||||||||||
| Series 2016-M4, Class X2 (IO) |
| |||||||||||
| 2.65% |
01/25/394 | 35,539,516 | 1,004,286 | |||||||||
| Fannie Mae-Aces, |
| |||||||||||
| Series 2019-M29, Class X4 (IO) |
| |||||||||||
| 0.70% |
03/25/294 | 117,375,779 | 4,255,782 | |||||||||
| Freddie Mac Multifamily PC REMIC Trust, |
| |||||||||||
| Series 2019-P002, Class X (IO) |
| |||||||||||
| 0.77% |
07/25/334 | 14,520,699 | 1,391,567 | |||||||||
| Freddie Mac Multifamily Structured Pass-Through |
| |||||||||||
| Certificates, |
| |||||||||||
| Series K021, Class X3 (IO) |
| |||||||||||
| 1.97% |
07/25/404 | 26,660,903 | 119,040 | |||||||||
| Freddie Mac Multifamily Structured Pass-Through |
| |||||||||||
| Certificates, |
||||||||||||
| Series K022, Class X3 (IO) |
| |||||||||||
| 1.81% |
08/25/404 | 37,280,187 | 215,802 | |||||||||
| Freddie Mac Multifamily Structured Pass-Through |
| |||||||||||
| Certificates, |
||||||||||||
| Series K031, Class X1 (IO) |
| |||||||||||
| 0.18% |
04/25/234 | 354,284,559 | 621,805 | |||||||||
| Freddie Mac Multifamily Structured Pass-Through |
| |||||||||||
| Certificates, |
||||||||||||
| Series K043, Class X3 (IO) |
| |||||||||||
| 1.63% |
02/25/434 | 58,000,000 | 2,422,614 | |||||||||
| Freddie Mac Multifamily Structured Pass-Through |
| |||||||||||
| Certificates, |
||||||||||||
| Series K051, Class X3 (IO) |
| |||||||||||
| 1.61% |
10/25/434 | 44,865,280 | 2,362,103 | |||||||||
| Freddie Mac Multifamily Structured Pass-Through |
| |||||||||||
| Certificates, |
||||||||||||
| Series K054, Class X1 (IO) |
| |||||||||||
| 1.16% |
01/25/264 | 53,035,035 | 1,997,984 | |||||||||
| Freddie Mac Multifamily Structured Pass-Through |
| |||||||||||
| Certificates, |
||||||||||||
| Series K055, Class X3 (IO) |
| |||||||||||
| 1.64% |
04/25/444 | 32,000,000 | 1,832,282 | |||||||||
| Freddie Mac Multifamily Structured Pass-Through |
| |||||||||||
| Certificates, |
||||||||||||
| Series K056, Class X1 (IO) |
| |||||||||||
| 1.26% |
05/25/264 | 59,085,212 | 2,479,035 | |||||||||
| Freddie Mac Multifamily Structured Pass-Through |
| |||||||||||
| Certificates, |
||||||||||||
| Series K057, Class X1 (IO) |
| |||||||||||
| 1.17% |
07/25/264 | 121,723,493 | 5,029,615 | |||||||||
| Freddie Mac Multifamily Structured Pass-Through |
| |||||||||||
| Certificates, |
||||||||||||
| Series K726, Class X1 (IO) |
| |||||||||||
| 0.90% |
04/25/244 | 121,607,266 | 1,695,521 | |||||||||
See accompanying Notes to Financial Statements.
| 249 / Annual Report March 2022 |
Table of Contents
Unconstrained Bond Fund
Schedule of Portfolio Investments
March 31, 2022
| Issues | Maturity Date |
Principal Amount |
Value | |||||||||
| MORTGAGE-BACKED (continued) |
|
|||||||||||
| U.S. Agency Commercial Mortgage-Backed (continued) |
|
|||||||||||
| Freddie Mac Multifamily Structured Pass-Through Certificates, |
|
|||||||||||
| Series KC01, Class X1 (IO) |
|
|||||||||||
| 0.42% |
12/25/224 | $ | 31,156,710 | $ | 127,423 | |||||||
| Freddie Mac Multifamily Structured Pass-Through Certificates, |
|
|||||||||||
| Series KC05, Class X1 (IO) |
|
|||||||||||
| 1.20% |
06/25/274 | 88,571,524 | 3,433,883 | |||||||||
| Freddie Mac Multifamily Structured Pass-Through Certificates, |
|
|||||||||||
| Series KC07, Class X1 (IO) |
|
|||||||||||
| 0.73% |
09/25/264 | 84,627,979 | 1,940,037 | |||||||||
| Freddie Mac Multifamily Structured Pass-Through Certificates, |
|
|||||||||||
| Series KF31, Class A |
|
|||||||||||
| (LIBOR USD 1-Month plus 0.37%) |
|
|||||||||||
| 0.61% |
04/25/242 | 2,337,166 | 2,339,209 | |||||||||
| Freddie Mac Multifamily Structured Pass-Through Certificates, |
|
|||||||||||
| Series KIR1, Class X (IO) |
|
|||||||||||
| 1.05% |
03/25/264 | 115,095,458 | 3,995,746 | |||||||||
| Freddie Mac Multifamily Structured Pass-Through Certificates, |
|
|||||||||||
| Series KL05, Class X1HG (IO) |
|
|||||||||||
| 1.22% |
12/25/274 | 49,531,000 | 2,708,256 | |||||||||
| Freddie Mac Multifamily Structured Pass-Through Certificates, |
|
|||||||||||
| Series KS06, Class X (IO) |
|
|||||||||||
| 1.05% |
08/25/264 | 66,390,108 | 2,112,308 | |||||||||
| Freddie Mac Multifamily Structured Pass-Through Certificates, |
|
|||||||||||
| Series KS07, Class X (IO) |
|
|||||||||||
| 0.64% |
09/25/254 | 101,904,872 | 2,212,054 | |||||||||
| Ginnie Mae, |
||||||||||||
| Series 2011-152, Class IO (IO) |
| |||||||||||
| 0.02% |
08/16/514 | 5,839,814 | 2,653 | |||||||||
| Ginnie Mae, |
||||||||||||
| Series 2012-112, Class IO (IO) |
| |||||||||||
| 0.13% |
02/16/534 | 32,551,029 | 135,009 | |||||||||
| Ginnie Mae, |
||||||||||||
| Series 2012-78, Class IO (IO) |
| |||||||||||
| 0.11% |
06/16/524 | 43,682,033 | 85,232 | |||||||||
| Ginnie Mae, |
||||||||||||
| Series 2014-103, Class IO (IO) |
| |||||||||||
| 0.20% |
05/16/554 | 14,651,466 | 151,999 | |||||||||
| Ginnie Mae, |
||||||||||||
| Series 2014-125, Class IO (IO) |
| |||||||||||
| 0.94% |
11/16/544 | 11,024,820 | 362,885 | |||||||||
| 45,630,570 | ||||||||||||
| U.S. Agency Mortgage-Backed — 12.05% |
| |||||||||||
| Fannie Mae REMICS, |
| |||||||||||
| Series 2006-11, Class PS |
| |||||||||||
| (-3.67 X LIBOR USD 1-Month plus 24.57%, 24.57% Cap) |
|
|||||||||||
| 22.89% |
03/25/362 | 12,940 | 18,851 | |||||||||
| Issues | Maturity Date |
Principal Amount |
Value | |||||||
| MORTGAGE-BACKED (continued) |
|
|||||||||
| U.S. Agency Mortgage-Backed (continued) |
|
|||||||||
| Fannie Mae REMICS, |
|
|||||||||
| Series 2006-8, Class HJ (IO) |
|
|||||||||
| (-1.00 X LIBOR USD 1-Month plus 6.60%, 6.60% Cap) |
|
|||||||||
| 6.14% |
03/25/362 | $ | 614,599 | $ | 94,261 | |||||
| Fannie Mae REMICS, |
|
|||||||||
| Series 2007-52, Class LS (IO) |
| |||||||||
| (-1.00 X LIBOR USD 1-Month plus 6.05%, 6.05% Cap) |
|
|||||||||
| 5.59% |
06/25/372 | 28,097 | 3,111 | |||||||
| Fannie Mae REMICS, |
|
|||||||||
| Series 2007-77, Class SK (IO) |
| |||||||||
| (-1.00 X LIBOR USD 1-Month plus 5.87%, 5.87% Cap) |
|
|||||||||
| 5.41% |
08/25/372 | 59,454 | 7,659 | |||||||
| Fannie Mae REMICS, |
|
|||||||||
| Series 2007-88, Class JI (IO) |
| |||||||||
| (-1.00 X LIBOR USD 1-Month plus 6.45%, 6.45% Cap) |
|
|||||||||
| 5.99% |
04/25/372 | 660,961 | 98,974 | |||||||
| Fannie Mae REMICS, |
|
|||||||||
| Series 2008-18, Class SM (IO) |
|
|||||||||
| (-1.00 X LIBOR USD 1-Month plus 7.00%, 7.00% Cap) |
|
|||||||||
| 6.54% |
03/25/382 | 39,275 | 3,958 | |||||||
| Fannie Mae REMICS, |
|
|||||||||
| Series 2008-62, Class SN (IO) |
| |||||||||
| (-1.00 X LIBOR USD 1-Month plus 6.20%, 6.20% Cap) |
|
|||||||||
| 5.74% |
07/25/382 | 67,773 | 7,878 | |||||||
| Fannie Mae REMICS, |
|
|||||||||
| Series 2010-116, Class SE (IO) |
|
|||||||||
| (-1.00 X LIBOR USD 1-Month plus 6.60%, 6.60% Cap) |
|
|||||||||
| 6.14% |
10/25/402 | 34,292 | 5,374 | |||||||
| Fannie Mae REMICS, |
|
|||||||||
| Series 2012-56, Class FK |
|
|||||||||
| (LIBOR USD 1-Month plus 0.45%) |
|
|||||||||
| 0.91% |
06/25/422 | 2,266,232 | 2,272,515 | |||||||
| Fannie Mae REMICS, |
|
|||||||||
| Series 2013-5, Class GF |
|
|||||||||
| (LIBOR USD 1-Month plus 1.10%) |
|
|||||||||
| 1.56% |
10/25/422 | 147,389 | 147,381 | |||||||
| Fannie Mae REMICS, |
|
|||||||||
| Series 2014-49, Class CF |
|
|||||||||
| (LIBOR USD 1-Month plus 1.00%) |
|
|||||||||
| 1.23% |
07/25/432 | 4,638,826 | 4,710,024 | |||||||
| Fannie Mae REMICS, |
|
|||||||||
| Series 2019-33, Class FN |
|
|||||||||
| (LIBOR USD 1-Month plus 0.40%) |
|
|||||||||
| 0.86% |
07/25/492 | 4,458,215 | 4,464,181 | |||||||
| Freddie Mac REMICS, |
| |||||||||
| Series 2711, Class FA |
|
|||||||||
| (LIBOR USD 1-Month plus 1.00%) |
| |||||||||
| 1.40% |
11/15/332 | 39,215 | 40,279 | |||||||
| Freddie Mac REMICS, |
|
|||||||||
| Series 2733, Class FB |
|
|||||||||
| (LIBOR USD 1-Month plus 0.60%) |
|
|||||||||
| 1.00% |
10/15/332 | 158,894 | 161,057 | |||||||
| Freddie Mac REMICS, |
|
|||||||||
| Series 3339, Class JS |
| |||||||||
| (-6.50 X LIBOR USD 1-Month plus 42.84%, 42.84% Cap) |
|
|||||||||
| 40.26% |
07/15/372 | 9,360 | 16,820 | |||||||
See accompanying Notes to Financial Statements.
| Annual Report March 2022 / 250 |
Table of Contents
Unconstrained Bond Fund
Schedule of Portfolio Investments
March 31, 2022
| Issues | Maturity Date |
Principal Amount |
Value | |||||||||
| MORTGAGE-BACKED (continued) |
|
|||||||||||
| U.S. Agency Mortgage-Backed (continued) |
|
|||||||||||
| Freddie Mac REMICS, |
| |||||||||||
| Series 3404, Class AS (IO) |
| |||||||||||
| (-1.00 X LIBOR USD 1-Month plus 5.90%, 5.90% Cap) |
|
|||||||||||
| 5.50% |
01/15/382 | $ | 41,006 | $ | 6,771 | |||||||
| Freddie Mac REMICS, |
| |||||||||||
| Series 3439, Class SC (IO) |
| |||||||||||
| (-1.00 X LIBOR USD 1-Month plus 5.90%, 5.90% Cap) |
|
|||||||||||
| 5.50% |
04/15/382 | 31,536 | 3,627 | |||||||||
| Freddie Mac REMICS, |
| |||||||||||
| Series 3885, Class PO (PO) |
| |||||||||||
| 0.00% |
11/15/3311 | 12,324 | 10,899 | |||||||||
| Freddie Mac REMICS, |
| |||||||||||
| Series 4030, Class HS (IO) |
| |||||||||||
| (-1.00 X LIBOR USD 1-Month plus 6.61%, 6.61% Cap) |
|
|||||||||||
| 6.21% |
04/15/422 | 80,676 | 13,678 | |||||||||
| Freddie Mac REMICS, |
| |||||||||||
| Series 4919, Class FP |
| |||||||||||
| (LIBOR USD 1-Month plus 0.45%) |
| |||||||||||
| 0.91% |
09/25/492 | 3,878,068 | 3,883,686 | |||||||||
| Freddie Mac REMICS, |
| |||||||||||
| Series 4993, Class OP (PO) |
| |||||||||||
| 0.00% |
10/25/5811 | 2,900,317 | 2,735,257 | |||||||||
| Ginnie Mae, |
||||||||||||
| Series 2011-146, Class EI (IO) |
| |||||||||||
| 5.00% |
11/16/41 | 73,998 | 12,927 | |||||||||
| Ginnie Mae, |
||||||||||||
| Series 2011-70, Class IL (IO) |
| |||||||||||
| (-1.00 X LIBOR USD 1-Month plus 7.10%, 0.60% Cap) |
|
|||||||||||
| 0.60% |
06/16/372 | 425,165 | 3,845 | |||||||||
| Ginnie Mae, |
||||||||||||
| Series 2011-81, Class IC (IO) |
| |||||||||||
| (-1.00 X LIBOR USD 1-Month plus 6.72%, 0.62% Cap) |
|
|||||||||||
| 0.62% |
07/20/352 | 527,744 | 6,821 | |||||||||
| Ginnie Mae, |
||||||||||||
| Series 2013-135, Class CS (IO) |
| |||||||||||
| (-1.00 X LIBOR USD 1-Month plus 6.20%, 6.20% Cap) |
|
|||||||||||
| 5.77% |
09/16/432 | 1,678,128 | 251,304 | |||||||||
| Ginnie Mae, |
||||||||||||
| Series 2017-136, Class IO (IO) |
| |||||||||||
| 5.00% |
09/20/47 | 339,369 | 59,003 | |||||||||
| Ginnie Mae, |
||||||||||||
| Series 2019-86, Class FE |
| |||||||||||
| (LIBOR USD 1-Month plus 0.40%) |
| |||||||||||
| 0.85% |
07/20/492 | 4,690,789 | 4,689,600 | |||||||||
| Ginnie Mae, |
||||||||||||
| Series 2020-133, Class FA |
| |||||||||||
| 0.55% |
02/20/494 | 3,278,503 | 3,287,246 | |||||||||
| UMBS (TBA) |
||||||||||||
| 2.00% |
04/01/52 | 41,450,000 | 38,454,795 | |||||||||
| 2.00% |
05/01/52 | 125,300,000 | 116,105,135 | |||||||||
| 2.50% |
05/01/52 | 189,125,000 | 180,077,814 | |||||||||
| 3.00% |
04/01/52 | 5,075,000 | 4,964,777 | |||||||||
| Issues | Maturity Date |
Principal Amount |
Value | |||||||
| MORTGAGE-BACKED (continued) |
| |||||||||
| U.S. Agency Mortgage-Backed (continued) |
|
|||||||||
| 3.00% |
05/01/52 | $ | 116,100,000 | $ | 113,342,631 | |||||
|
|
|
| ||||||||
| 479,962,139 | ||||||||||
| Total Mortgage-Backed |
||||||||||
| (Cost $1,982,378,419) |
1,836,638,514 | |||||||||
|
|
|
| ||||||||
| MUNICIPAL BONDS — 0.48%* |
| |||||||||
| California — 0.23% |
|
|||||||||
| California State University Revenue Bonds, University & College Improvements, Series B |
|
|||||||||
| 2.37% |
11/01/35 | 1,995,000 | 1,705,460 | |||||||
| Los Angeles Department of Water & Power Water System Revenue Bonds, Water Utility Improvements, Series SY |
|
|||||||||
| 6.01% |
07/01/39 | 1,950,000 | 2,434,475 | |||||||
| Los Angeles Unified School District General Obligation Bonds, School Improvements, Series KR |
|
|||||||||
| 5.76% |
07/01/29 | 2,935,000 | 3,336,842 | |||||||
| Regents of the University of California Medical Center Pooled Revenue Bonds, Health, Hospital and Nursing Home Improvements, Series N |
|
|||||||||
| 3.26% |
05/15/60 | 1,790,000 | 1,603,505 | |||||||
| 9,080,282 | ||||||||||
| Florida — 0.11% |
|
|||||||||
| County of Miami-Dade Aviation Revenue Bonds, Airport and Marina Improvements, Series B |
|
|||||||||
| 2.81% |
10/01/34 | 1,000,000 | 921,527 | |||||||
| 2.86% |
10/01/35 | 1,750,000 | 1,617,892 | |||||||
| County of Miami-Dade Aviation Revenue Bonds, Airport and Marina Improvements, Series D |
|
|||||||||
| 3.35% |
10/01/29 | 2,000,000 | 1,996,379 | |||||||
| 4,535,798 | ||||||||||
| New York — 0.14% |
|
|||||||||
| Metropolitan Transportation Authority Revenue Bonds, Transit Improvements, Series C2 |
|
|||||||||
| 5.18% |
11/15/49 | 975,000 | 1,114,944 | |||||||
| New York City Transitional Finance Authority Future Tax Secured Revenue Bonds, Public Improvements, Subseries FI |
|
|||||||||
| 3.95% |
08/01/32 | 1,000,000 | 1,020,038 | |||||||
| New York State Dormitory Authority Revenue Bonds, |
|
|||||||||
| University & College Improvements |
|
|||||||||
| 5.29% |
03/15/33 | 3,100,000 | 3,460,238 | |||||||
|
|
|
| ||||||||
| 5,595,220 | ||||||||||
| Total Municipal Bonds |
||||||||||
| (Cost $20,217,476) |
19,211,300 | |||||||||
| U.S. TREASURY SECURITIES — 1.42% |
| |||||||||
| U.S. Treasury Notes — 1.42% |
| |||||||||
| U.S. Treasury Notes |
|
|||||||||
| 1.50% |
02/29/24 | 37,631,000 | 37,087,114 | |||||||
See accompanying Notes to Financial Statements.
| 251 / Annual Report March 2022 |
Table of Contents
Unconstrained Bond Fund
Schedule of Portfolio Investments
March 31, 2022
| Issues | Maturity Date |
Principal Amount |
Value | |||||||||
| U.S. TREASURY SECURITIES (continued) |
|
|||||||||||
| U.S. Treasury Notes (continued) |
|
|||||||||||
| 1.75% |
03/15/25 | $ | 20,061,000 | $ | 19,646,580 | |||||||
| Total U.S. Treasury Securities |
| |||||||||||
| (Cost $57,106,216) |
|
56,733,694 | ||||||||||
|
|
|
| ||||||||||
| Total Bonds — 100.05% |
| |||||||||||
| (Cost $4,213,814,528) |
|
3,986,330,212 | ||||||||||
|
|
|
| ||||||||||
| Issues | Shares | Value | ||||||||||
| COMMON STOCK — 0.30% |
| |||||||||||
| Communications — 0.11% |
| |||||||||||
| Intelsat Emergence SA3,5,6,9 |
| |||||||||||
| (Luxembourg) |
141,055 | 4,231,650 | ||||||||||
|
|
|
| ||||||||||
| Electric — 0.00% |
|
|||||||||||
| Homer City Holdings LLC†,5,6,9,10 |
|
112,222 | — | |||||||||
|
|
|
| ||||||||||
| Financials — 0.19% |
|
|||||||||||
| AGNC Investment Corp. |
|
582,000 | 7,624,200 | |||||||||
|
|
|
| ||||||||||
| Total Common Stock |
|
|||||||||||
| (Cost $17,826,353) |
|
11,855,850 | ||||||||||
|
|
|
| ||||||||||
| RIGHTS — 0.00% |
|
|||||||||||
| Communications — 0.00% |
| |||||||||||
| Intelsat Jackson Holdings SA, Series A3,5,6,9 (Luxembourg) |
|
14,771 | — | |||||||||
| Intelsat Jackson Holdings SA, Series B3,5,6,9 (Luxembourg) |
|
14,771 | — | |||||||||
|
|
|
| ||||||||||
| — | ||||||||||||
|
|
|
| ||||||||||
| Total Rights |
||||||||||||
| (Cost $–) |
— | |||||||||||
|
|
|
| ||||||||||
| Purchased Options - 0.01% |
|
|||||||||||
| (Cost $1,664,253) |
|
467,063 | ||||||||||
|
|
|
| ||||||||||
| Issues | Maturity Date |
Principal Amount/Shares |
Value | |||||||||
| SHORT-TERM INVESTMENTS — 10.32% |
| |||||||||||
| Money Market Funds — 4.78% |
| |||||||||||
| Dreyfus Government Cash Management Fund |
| |||||||||||
| 0.19%12 |
11,565,000 | 11,565,000 | ||||||||||
| Fidelity Investments Money Market Funds - Government Portfolio |
|
|||||||||||
| 0.12%12,13 |
761,390 | 761,390 | ||||||||||
| Morgan Stanley Institutional Liquidity Funds - Government Portfolio |
|
|||||||||||
| 0.23%12 |
177,930,000 | 177,930,000 | ||||||||||
| 190,256,390 | ||||||||||||
| U.S. Agency Discount Notes — 0.50% |
| |||||||||||
| Federal Home Loan Bank |
| |||||||||||
| 3.22% |
09/04/24 | 20,435,000 | 20,081,296 | |||||||||
| 20,081,296 | ||||||||||||
| Issues | Maturity Date |
Principal Amount/Shares |
Value | |||||||
| SHORT-TERM INVESTMENTS (continued) |
| |||||||||
| U.S. Treasury Bills — 5.04% |
|
|||||||||
| U.S. Treasury Bills |
|
|||||||||
| 0.13%14 |
04/12/22 | $ | 1,100,000 | $ | 1,099,955 | |||||
| 0.05%14 |
04/21/22 | 50,000,000 | 49,995,833 | |||||||
| 0.18%14 |
06/23/22 | 25,000,000 | 24,973,197 | |||||||
| 0.37%14 |
07/28/22 | 75,000,000 | 74,815,625 | |||||||
| 0.61%14 |
08/25/22 | 50,000,000 | 49,823,585 | |||||||
| 200,708,195 | ||||||||||
| Total Short-Term Investments |
| |||||||||
| (Cost $411,567,375) |
411,045,881 | |||||||||
|
|
|
| ||||||||
| Total Investments Before Written Options - 110.68% |
|
|||||||||
| (Cost $4,644,872,509) |
4,409,699,006 | |||||||||
|
|
|
| ||||||||
| Written Options - (0.35)% |
| |||||||||
| (Cost $(7,540,049)) |
(14,047,392 | ) | ||||||||
|
|
|
| ||||||||
| Net unrealized depreciation on unfunded commitments - 0.00% |
|
(13,886 | ) | |||||||
| Liabilities in Excess of Other Assets - (10.33)% |
|
(411,490,226 | ) | |||||||
|
|
|
| ||||||||
| Net Assets - 100.00% |
$ | 3,984,147,502 | ||||||||
|
|
|
| ||||||||
| 1 | Securities exempt from registration under Rule 144A of the Securities Act of 1933, as amended. The securities may be resold in transactions exempt from registration, normally to qualified institutional buyers. |
| 2 | Floating rate security. The rate disclosed was in effect at March 31, 2022. |
| 3 | Foreign denominated security issued by foreign domiciled entity. |
| 4 | Variable rate security. Interest rate disclosed is as of the most recent information available. Certain variable rate securities are not based on a published reference rate and spread but are determined by the issuer or agent and are based on current market conditions. |
| 5 | Security is valued using significant unobservable inputs and is classified as Level 3 in the fair value hierarchy. |
| 6 | Illiquid security as determined under procedures approved by the Board of Trustees. The aggregate value of illiquid securities is $18,873,501, which is 0.47% of total net assets. |
| 7 | Excluded from the investment total above is an unfunded delayed draw term loan commitment in an amount not to exceed $690,124, at an interest rate of 1.88% and a maturity of July 17, 2028. The investment is not accruing an unused commitment fee. |
| 8 | Perpetual security with no stated maturity date. |
| 9 | Non-income producing security. |
| 10 | Security is currently in default with regard to scheduled interest or principal payments. |
| 11 | Zero coupon bond. The rate shown is the effective yield as of March 31, 2022. |
| 12 | Represents the current yield as of March 31, 2022. |
| 13 | Securities, or a portion thereof, pledged as collateral for swaps. The total market value of collateral pledged is $761,390. |
| 14 | Represents annualized yield at date of purchase. |
| † | Fair valued security. The aggregate value of fair valued securities is $35,599,259, which is 0.89% of total net assets. Fair valued securities were not valued utilizing an independent quote but were valued pursuant to guidelines established by the Board of Trustees. See Notes to Financial Statements. |
| * | Securities with a call or reset feature will have an effective maturity date sooner than the stated maturity. |
| ** | Securities backed by mortgage or consumer loans where payment is periodically made will have an effective maturity date sooner than the stated maturity date. |
See accompanying Notes to Financial Statements.
| Annual Report March 2022 / 252 |
Table of Contents
Unconstrained Bond Fund
Schedule of Portfolio Investments
March 31, 2022
Note: For Fund compliance purposes, the Fund’s industry classifications refer to any one or more of the industry sub-classifications used by one or more widely recognized market indexes or ratings group indexes, and/or as defined by Fund management. This definition may not apply for purposes of this report, which may combine industry sub-classifications for more meaningful presentation for investors.
(BKNT): Bank Note
(CAD): Canadian Dollar
(CLO): Collateralized Loan Obligation
(EDC): Economic Development Corporation
(EMTN): Euro Medium-Term Note
(EUR): Euro
(EURIBOR): Euro InterBank Offer Rate
(GBP): British Pound
(GMTN): Global Medium-Term Note
(IO): Interest Only
(LIBOR): London InterBank Offer Rate
(MTN): Medium-Term Note
(PO): Principal Only
(S&P): Standard & Poor’s
(SOFR): Secured Overnight Financing Rate
(STEP): Step Coupon Bond
(TBA): To-Be-Announced
(USD): U.S. Dollar
| Currency to be Purchased |
Currency to be Sold |
Counterparty | Settlement Date |
Unrealized Appreciation (Depreciation) |
||||||
|
FOREIGN CURRENCY EXCHANGE CONTRACT |
||||||||||
| CAD 77,057,000 |
USD 60,415,540 | Citigroup Global Markets, Inc. | 04/08/22 | $ | 1,274,458 | |||||
| EUR 2,577,000 |
USD 2,835,071 | Goldman Sachs International | 04/08/22 | 32,906 | ||||||
| USD 5,016,355 |
GBP 3,739,000 | Goldman Sachs International | 04/08/22 | 93,645 | ||||||
|
|
|
|||||||||
| 1,401,009 | ||||||||||
|
|
|
|||||||||
| GBP 3,739,000 |
USD 5,020,989 | Goldman Sachs International | 04/08/22 | (98,280) | ||||||
| USD 60,082,494 |
CAD 77,057,000 | Citigroup Global Markets, Inc. | 04/08/22 | (1,607,503) | ||||||
| USD 2,864,501 |
EUR 2,577,000 | Goldman Sachs International | 04/08/22 | (3,476) | ||||||
| USD 2,713,853 |
EUR 2,458,000 | Goldman Sachs International | 07/08/22 | (32,448) | ||||||
| USD 1,798,046 |
GBP 1,373,000 | Goldman Sachs International | 07/08/22 | (9,293) | ||||||
|
|
|
|||||||||
| (1,751,000) | ||||||||||
|
|
|
|||||||||
| NET UNREALIZED DEPRECIATION |
$ | (349,991) | ||||||||
|
|
|
|||||||||
| Description | Number of Contracts |
Expiration Date | Notional Amount | Value | Unrealized Appreciation (Depreciation) |
|||||||||||||||
|
FUTURES CONTRACTS: LONG POSITIONS |
||||||||||||||||||||
| U.S. Treasury Five-Year Note |
3,883 | 06/30/22 | $ | 445,331,563 | $ | (11,026,317) | $ | (11,026,317) | ||||||||||||
| FUTURES CONTRACTS: SHORT POSITIONS |
||||||||||||||||||||
| U.S. Treasury Ten-Year Ultra Bond |
3,365 | 06/21/22 | (455,852,344) | 15,190,521 | 15,190,521 | |||||||||||||||
| U.S. Treasury Ultra Bond |
1,038 | 06/21/22 | (183,855,750) | 6,267,118 | 6,267,118 | |||||||||||||||
|
|
|
|
|
|
|
|||||||||||||||
| (639,708,094) | 21,457,639 | 21,457,639 | ||||||||||||||||||
|
|
|
|
|
|
|
|||||||||||||||
| TOTAL FUTURES CONTRACTS |
$ | (194,376,531) | $ | 10,431,322 | $ | 10,431,322 | ||||||||||||||
|
|
|
|
|
|
|
|||||||||||||||
| Reference Obligation/Index | Financing Rate Paid by the Fund |
Payment Frequency |
Implied Credit Spread at 03/31/221 |
Counterparty | Expiration Date |
Notional Amount (000’s)2 |
Value3 | Premiums Paid |
Unrealized Appreciation |
|||||||||||||||||||||||||||
| SWAPS: CREDIT DEFAULT (SALES) - SINGLE ISSUES OTC4 |
|
|||||||||||||||||||||||||||||||||||
| 1011778 BC ULC/New Red Finance, Inc., 4.00%, due 10/15/305 | 5.00% | 3 Months | 120 | |
Credit Suisse First Boston International |
|
06/20/23 | $ | 9,250 | $ | 438,220 | $ | 372,539 | $ | 65,682 | |||||||||||||||||||||
| Berry Global, Inc., 5.63%, due 07/15/27 | 5.00% | 3 Months | 175 | |
Credit Suisse First Boston International |
|
12/20/23 | 10,370 | 578,056 | 548,572 | 29,484 | |||||||||||||||||||||||||
|
|
|
|
|
|
|
|||||||||||||||||||||||||||||||
| TOTAL |
$ | 1,016,276 | $ | 921,111 | $ | 95,166 | ||||||||||||||||||||||||||||||
|
|
|
|
|
|
|
|||||||||||||||||||||||||||||||
See accompanying Notes to Financial Statements.
| 253 / Annual Report March 2022 |
Table of Contents
Unconstrained Bond Fund
Schedule of Portfolio Investments
March 31, 2022
| 1 | An implied credit spread is the spread in yield between a U.S. Treasury security and the referenced obligation or underlying investment that are identical in all respects except for the quality rating. Implied credit spreads, represented in absolute terms, utilized in determining the value of credit default swaps on corporate issues as of year end serve as an indicator of the current status of the payment performance risk and represent the likelihood of risk of default for the credit derivative. The implied credit spread of a particular referenced entity reflects the cost of buying/selling protection and may include upfront payments required to be made to enter the agreement. Wider credit spreads, in comparison to narrower credit spreads, represent a deterioration of the referenced entity’s credit soundness and a greater likelihood of risk of default or other credit event occurring as defined under the terms of the agreement. |
| 2 | The maximum potential amount for the Fund could be required to pay as a seller of credit protection or receive as a buyer of credit protection if a credit event occurs as defined under the terms of that particular swap agreement. |
| 3 | The quoted market prices are resulting values for credit default swap agreements on credit indices serve as an indicator of the current status of the payment/performance risk and represent the likelihood of an expected liability (or profit) for the credit derivative had the notional amount of the swap agreement been closed/sold as of year end. Increasing values (buy protection) or decreasing values (sell protection), when compared to the notional amount of the swap, represent a deterioration of the referenced entity’s credit soundness and a greater likelihood of risk of default or other credit event occurring as defined under the terms of the agreement. |
| 4 | If the Fund is a seller of protection and credit event occurs, as defined under the terms of that particular swap agreement, the Fund will either (i) pay to the buyer of protection the amount equal to the notional amount of the swap and take delivery of the referenced obligation or underlying investments comprising the referenced index or (ii) pay a net settlement amount in the form of cash or investments equal to the notional amount of the swap less the recovery value of the referenced obligation or underlying investments comprising the referenced index. |
| 5 | Security is valued using significant unobservable inputs and is classified as Level 3 in the fair value hierarchy. |
| Description | Number of contracts |
Exercise Price |
Expiration Date |
Notional Amount | Value | |||||||||||||||
| PURCHASED CALL OPTIONS EXCHANGE TRADED |
||||||||||||||||||||
| 90-Day Euro Dollar Futures |
825 | $98.00 | 12/19/22 | $ | 6,022,913 | $ | 371,250 | |||||||||||||
| IMM Eurodollar 1-Year MIDCV Future Options |
506 | 98.38 | 09/16/22 | 3,676,596 | 41,113 | |||||||||||||||
| IMM Eurodollar 1-Year MIDCV Future Options |
1,094 | 98.75 | 09/16/22 | 52,993,360 | 54,700 | |||||||||||||||
|
|
|
|
|
|||||||||||||||||
| TOTAL PURCHASED OPTIONS |
$ | 62,692,869 | $ | 467,063 | ||||||||||||||||
|
|
|
|
|
|||||||||||||||||
| Description | Number of contracts |
Exercise Price |
Expiration Date |
Notional Amount | Value | |||||||||||||||
| WRITTEN CALL OPTIONS EXCHANGE TRADED |
||||||||||||||||||||
| 90-Day Euro Dollar Futures |
825 | $98.25 | 12/19/22 | $ | (6,022,913 | ) | $ | (257,812 | ) | |||||||||||
| IMM Eurodollar 2-Year MIDCV Future Options |
742 | 97.63 | 12/16/22 | (45,120,556 | ) | (510,125 | ) | |||||||||||||
| IMM Eurodollar 2-Year MIDCV Future Options |
1,195 | 97.88 | 12/16/22 | (72,667,203 | ) | (560,156 | ) | |||||||||||||
| IMM Eurodollar 1-Year MIDCV Future Options |
2,485 | 99.00 | 09/16/22 | (108,336,060 | ) | (93,188 | ) | |||||||||||||
|
|
|
|
|
|||||||||||||||||
| (232,146,732 | ) | (1,421,281 | ) | |||||||||||||||||
|
|
|
|
|
|||||||||||||||||
| WRITTEN PUT OPTIONS EXCHANGE TRADED |
||||||||||||||||||||
| 90-Day Euro Dollar Futures |
825 | $97.25 | 12/19/22 | $ | (6,022,913 | ) | $ | (814,687 | ) | |||||||||||
| IMM Eurodollar 1-Year MIDCV Future Options |
2,986 | 97.63 | 09/16/22 | (14,464,184 | ) | (6,419,900 | ) | |||||||||||||
| IMM Eurodollar 2-Year MIDCV Future Options |
1,937 | 97.38 | 12/16/22 | (117,787,759 | ) | (2,263,869 | ) | |||||||||||||
|
|
|
|
|
|||||||||||||||||
| (138,274,856 | ) | (9,498,456 | ) | |||||||||||||||||
|
|
|
|
|
|||||||||||||||||
| TOTAL WRITTEN OPTIONS |
$ | (370,421,588 | ) | $ | (10,919,737 | ) | ||||||||||||||
|
|
|
|
|
|||||||||||||||||
| Received by the |
Paid by the Fund | |||||||||||||||||||||||||||||||||||||||||
| Description | Counterparty | Purchase Date |
Maturity Date |
Rate | Frequency | Rate | Frequency | Notional Amount (000’s) |
Value | Premiums (Received) |
Unrealized (Depreciation) |
|||||||||||||||||||||||||||||||
| WRITTEN PUT SWAPTIONS |
|
|||||||||||||||||||||||||||||||||||||||||
| Option to enter into a 2-year Interest Rate Swap | JPMorgan Chase |
03/09/22 | 06/08/22 | 1.95% | |
Semi- annually |
|
|
3-month USD LIBOR |
|
Quarterly | $ | 202,250 | $ | (3,127,655 | ) | $ | (582,480 | ) | $ | (2,545,175) | |||||||||||||||||||||
|
|
|
|
|
|
|
|
|
|||||||||||||||||||||||||||||||||||
See accompanying Notes to Financial Statements.
| Annual Report March 2022 / 254 |
Table of Contents
Unconstrained Bond Fund
Schedule of Portfolio Investments
March 31, 2022
| Received by the Fund | Paid by the Fund | |||||||||||||||||||||||||||||||||
| Description | Maturity Date |
Rate | Frequency | Rate | Frequency | Notional Amount (000’s) |
Value | Premiums Paid |
Unrealized Appreciation (Depreciation) |
|||||||||||||||||||||||||
| SWAPS: INTEREST RATE |
||||||||||||||||||||||||||||||||||
|
Interest Rate Swap1 |
12/07/53 | 3-month USD LIBOR |
Quarterly | 1.74% | Semi-annually | $ | 10,195 | $ | 1,052,150 | $ | — | $ | 1,052,150 | |||||||||||||||||||||
| Interest Rate Swap1 |
07/24/53 | 3-month USD LIBOR |
Quarterly | 1.81% | Semi-annually | 3,625 | 344,864 | — | 344,864 | |||||||||||||||||||||||||
| Interest Rate Swap1 |
07/24/53 | 3-month USD LIBOR |
Quarterly | 1.77% | Semi-annually | 7,250 | 742,562 | — | 742,562 | |||||||||||||||||||||||||
| Interest Rate Swap1 |
07/24/53 | 3-month USD LIBOR |
Quarterly | 1.79% | Semi-annually | 5,370 | 536,032 | — | 536,032 | |||||||||||||||||||||||||
| Interest Rate Swap1 |
09/28/53 | 3-month USD LIBOR |
Quarterly | 1.87% | Semi-annually | 10,130 | 805,304 | — | 805,304 | |||||||||||||||||||||||||
| Interest Rate Swap1 |
12/07/25 | 1.69% | Semi-annually | |
3-month USD LIBOR |
|
Quarterly | 121,935 | (2,453,991) | — | (2,453,991) | |||||||||||||||||||||||
| Interest Rate Swap1 |
07/24/25 | 1.07% | Semi-annually | |
3-month USD LIBOR |
|
Quarterly | 43,405 | (1,501,644) | — | (1,501,644) | |||||||||||||||||||||||
| Interest Rate Swap1 |
07/24/25 | 1.03% | Semi-annually | |
3-month USD LIBOR |
|
Quarterly | 86,810 | (3,079,671) | — | (3,079,671) | |||||||||||||||||||||||
| Interest Rate Swap1 |
07/24/25 | 1.03% | Semi-annually | |
3-month USD LIBOR |
|
Quarterly | 64,210 | (2,268,302) | — | (2,268,302) | |||||||||||||||||||||||
| Interest Rate Swap1 |
09/28/25 | 1.39% | Semi-annually | |
3-month USD LIBOR |
|
Quarterly | 118,685 | (3,233,763) | — | (3,233,763) | |||||||||||||||||||||||
|
|
|
|
|
|
|
|
|
|||||||||||||||||||||||||||
| TOTAL SWAPS CONTRACTS |
$ | 471,615 | $ | (9,056,459) | $ | — | $ | (9,056,459) | ||||||||||||||||||||||||||
|
|
|
|
|
|
|
|
|
|||||||||||||||||||||||||||
| 1 | Centrally cleared. |
See accompanying Notes to Financial Statements.
| 255 / Annual Report March 2022 |
Table of Contents
[THIS PAGE INTENTIONALLY LEFT BLANK]
Table of Contents
Statements of Assets and Liabilities
March 31, 2022
| ASSETS: |
ALPHATRAK 500 FUND |
CORPORATE BOND |
||||||||||||||||||
| Investments, at value - Unaffiliated (Cost $44,016,081, $13,578,996, $12,693,329, $253,410,106, $507,473,767 and $740,547,517, respectively) (Note 2) |
$ | 43,697,150 | $ | 12,423,600 | ||||||||||||||||
| Investments, at value - Affiliated (Cost $0, $0, $0, $0, $0 and $27,171,821, respectively) (Note 5) |
— | — | ||||||||||||||||||
| Cash and cash equivalents (Note 2) |
44 | — | ||||||||||||||||||
| Foreign Currency, at value (Cost $0, $0, $0, $1,096, $10,228 and $17,899, respectively) |
— | — | ||||||||||||||||||
| Cash on deposit with brokers for collateral on swaps (Note 2) |
— | 47,962 | ||||||||||||||||||
| Cash on deposit with brokers for collateral on futures (Note 2) |
2,708,000 | 42,000 | ||||||||||||||||||
| Receivable for securities sold |
1,852,471 | 78,400 | ||||||||||||||||||
| Receivable for capital stock sold |
570,851 | 226 | ||||||||||||||||||
| Dividends and interest receivable |
161,669 | 99,659 | ||||||||||||||||||
| Due from Adviser (Note 6) |
25,763 | 14,613 | ||||||||||||||||||
| Receivable for daily variation margin on futures contracts (Note 3) |
17,887 | 1,547 | ||||||||||||||||||
| Unrealized appreciation on foreign currency exchange contracts |
— | 4,548 | ||||||||||||||||||
| Unrealized appreciation on foreign currency transactions |
— | — | ||||||||||||||||||
| Net unrealized appreciation on unfunded commitments (Note 8) |
— | — | ||||||||||||||||||
| Premiums paid for swap contracts |
— | — | ||||||||||||||||||
| Unrealized appreciation on swap contracts |
— | 11,164 | ||||||||||||||||||
| Other assets |
14,037 | 21,673 | ||||||||||||||||||
|
|
|
|
|
|
||||||||||||||||
| Total assets |
49,047,872 | 12,745,392 | ||||||||||||||||||
|
|
|
|
|
|
||||||||||||||||
| Liabilities: |
||||||||||||||||||||
| Options written, at value (Premiums received $0, $1,848, $0, $74,002, $0 and $0, respectively) (Note 3) |
— | 10,206 | ||||||||||||||||||
| Bank overdraft |
— | 272 | ||||||||||||||||||
| Payable for securities purchased |
3,285,059 | 75,053 | ||||||||||||||||||
| Payable for daily variation margin on futures contracts (Note 3) |
560,475 | 3,094 | ||||||||||||||||||
| Payable for capital stock redeemed |
16,921 | 4,135 | ||||||||||||||||||
| Distributions payable |
79 | 226 | ||||||||||||||||||
| Unrealized depreciation on foreign currency exchange contracts |
— | 5,737 | ||||||||||||||||||
| Unrealized depreciation on foreign currency transactions |
— | — | ||||||||||||||||||
| Unrealized depreciation on swap contracts |
— | 39,241 | ||||||||||||||||||
| Net unrealized depreciation on unfunded commitments (Note 8) |
— | — | ||||||||||||||||||
| Advisory fees payable (Note 6) |
14,780 | 4,350 | ||||||||||||||||||
| Accrued distribution (12b-1) and service fees payable |
— | 1,246 | ||||||||||||||||||
| Administrative fees payable |
21,658 | 18,064 | ||||||||||||||||||
| Custodian fees payable |
11,207 | 17,344 | ||||||||||||||||||
| Accrued other expenses |
35,225 | 9,586 | ||||||||||||||||||
|
|
|
|
|
|
||||||||||||||||
| Total liabilities |
3,945,404 | 188,554 | ||||||||||||||||||
|
|
|
|
|
|
||||||||||||||||
| Net assets |
$ | 45,102,468 | $ | 12,556,838 | ||||||||||||||||
|
|
|
|
|
|
||||||||||||||||
| Class M Shares: |
||||||||||||||||||||
| Net assets (Applicable to 3,928,208, 568,258, 1,738, 3,651,661, 1,737,330 and 16,894,728,shares of beneficial interest issued and outstanding, respectively, unlimited number of shares authorized with a $0.01 par value) |
$ | 45,102,468 | $ | 5,621,577 | ||||||||||||||||
|
|
|
|
|
|
||||||||||||||||
| Net asset value, offering and redemption price per Class M share |
$ | 11.48 | $ | 9.89 | ||||||||||||||||
|
|
|
|
|
|
||||||||||||||||
| Class I Shares: |
||||||||||||||||||||
| Net assets (Applicable to 0, 701,050, 1,137,535, 20,317,792, 48,557,554 and 54,977,626,shares of beneficial interest issued and outstanding, respectively, unlimited number of shares authorized with a $0.01 par value) |
N/A | $ | 6,935,261 | |||||||||||||||||
|
|
|
|
|
|
||||||||||||||||
| Net asset value, offering and redemption price per Class I share |
N/A | $ | 9.89 | |||||||||||||||||
|
|
|
|
|
|
||||||||||||||||
| Plan Class Shares: |
||||||||||||||||||||
| Net assets (Applicable to 0, 0, 0, 0, 10 and 0, shares of beneficial interest issued and outstanding, respectively, unlimited number of shares authorized with a $0.01 par value) |
N/A | N/A | ||||||||||||||||||
|
|
|
|
|
|
||||||||||||||||
| Net asset value, offering and redemption price per Plan Class share |
N/A | N/A | ||||||||||||||||||
|
|
|
|
|
|
||||||||||||||||
| Net Assets Consist of: |
||||||||||||||||||||
| Paid-in Capital (Note 9) |
$ | 44,847,519 | $ | 13,793,344 | ||||||||||||||||
| Accumulated Earnings (Loss) |
254,949 | (1,236,506 | ) | |||||||||||||||||
|
|
|
|
|
|
||||||||||||||||
| Net assets |
$ | 45,102,468 | $ | 12,556,838 | ||||||||||||||||
|
|
|
|
|
|
||||||||||||||||
|
1 The net asset values of the Plan Class Shares of the Floating Rate Income Fund were calculated using unrounded net assets of $102.11 divided by the unrounded shares outstanding of 10.44. |
|
|||||||||||||||||||
See accompanying Notes to Financial Statements.
| 257 / Annual Report March 2022 |
Table of Contents
Metropolitan West Funds
Statements of Assets and Liabilities
March 31, 2022
|
ESG SECURITIZED FUND |
FLEXIBLE INCOME FUND |
FLOATING RATE INCOME FUND |
HIGH YIELD BOND FUND |
|||||||||||||||||||||||||||||||||||||
|
|
|
|
|
|
|
|
|
|
|
|
|
|
|
|
|
|
|
|
| |||||||||||||||||||||
| $ | 12,102,806 | $ | 232,585,465 | $ | 500,506,686 | $ | 713,111,119 | |||||||||||||||||||||||||||||||||
| — | — | — | — | |||||||||||||||||||||||||||||||||||||
| — | 9,407,444 | 1,304,084 | 342,624 | |||||||||||||||||||||||||||||||||||||
| — | 1,096 | 10,228 | 17,899 | |||||||||||||||||||||||||||||||||||||
| — | — | — | — | |||||||||||||||||||||||||||||||||||||
| 32,000 | 785,000 | — | 2,780,000 | |||||||||||||||||||||||||||||||||||||
| 908,306 | 32,378,175 | 11,715,163 | 13,463,863 | |||||||||||||||||||||||||||||||||||||
| 5,000 | 570,175 | 208,572 | 591,939 | |||||||||||||||||||||||||||||||||||||
| 23,172 | 1,912,708 | 1,153,545 | 8,050,748 | |||||||||||||||||||||||||||||||||||||
| 978 | 41,945 | 2,141 | 8,135 | |||||||||||||||||||||||||||||||||||||
| 1,148 | 72,559 | — | — | |||||||||||||||||||||||||||||||||||||
| 7,845 | 96,181 | 20,619 | 95,427 | |||||||||||||||||||||||||||||||||||||
| — | 42 | — | — | |||||||||||||||||||||||||||||||||||||
| — | 12 | — | — | |||||||||||||||||||||||||||||||||||||
| — | — | — | 291,033 | |||||||||||||||||||||||||||||||||||||
| — | — | — | 25,700 | |||||||||||||||||||||||||||||||||||||
| 6,620 | 27,289 | 15,126 | 16,964 | |||||||||||||||||||||||||||||||||||||
|
|
|
|
|
|
|
|
|
|||||||||||||||||||||||||||||||||
| 13,087,875 | 277,878,091 | 514,936,164 | 738,795,451 | |||||||||||||||||||||||||||||||||||||
|
|
|
|
|
|
|
|
|
|||||||||||||||||||||||||||||||||
| — | 81,875 | — | — | |||||||||||||||||||||||||||||||||||||
| — | — | — | — | |||||||||||||||||||||||||||||||||||||
| 2,377,293 | 66,515,773 | 21,905,341 | 14,194,287 | |||||||||||||||||||||||||||||||||||||
| 2,609 | 146,406 | — | 228,578 | |||||||||||||||||||||||||||||||||||||
| 1,371 | 1,140,071 | 355,288 | 1,054,122 | |||||||||||||||||||||||||||||||||||||
| — | 52,748 | 200,026 | 54,181 | |||||||||||||||||||||||||||||||||||||
| 1,715 | 104,882 | 7,881 | 37,530 | |||||||||||||||||||||||||||||||||||||
| 3 | — | — | 26 | |||||||||||||||||||||||||||||||||||||
| — | — | — | — | |||||||||||||||||||||||||||||||||||||
| — | — | 28,828 | 5,832 | |||||||||||||||||||||||||||||||||||||
| 3,664 | 76,571 | 228,084 | 320,356 | |||||||||||||||||||||||||||||||||||||
| 2 | 6,436 | 3,567 | 36,297 | |||||||||||||||||||||||||||||||||||||
| 14,427 | 43,525 | 40,714 | 24,265 | |||||||||||||||||||||||||||||||||||||
| 6,079 | 26,290 | 15,104 | 16,163 | |||||||||||||||||||||||||||||||||||||
| 9,547 | 25,013 | 42,302 | 114,602 | |||||||||||||||||||||||||||||||||||||
|
|
|
|
|
|
|
|
|
|||||||||||||||||||||||||||||||||
| 2,416,710 | 68,219,590 | 22,827,135 | 16,086,239 | |||||||||||||||||||||||||||||||||||||
|
|
|
|
|
|
|
|
|
|||||||||||||||||||||||||||||||||
| $ | 10,671,165 | $ | 209,658,501 | $ | 492,109,029 | $ | 722,709,212 | |||||||||||||||||||||||||||||||||
|
|
|
|
|
|
|
|
|
|||||||||||||||||||||||||||||||||
| $ | 16,265 | $ | 31,941,144 | $ | 17,003,497 | $ | 169,940,902 | |||||||||||||||||||||||||||||||||
|
|
|
|
|
|
|
|
|
|||||||||||||||||||||||||||||||||
| $ | 9.36 | $ | 8.75 | $ | 9.79 | $ | 10.06 | |||||||||||||||||||||||||||||||||
|
|
|
|
|
|
|
|
|
|||||||||||||||||||||||||||||||||
| $ | 10,654,900 | $ | 177,717,357 | $ | 475,105,430 | $ | 552,768,310 | |||||||||||||||||||||||||||||||||
|
|
|
|
|
|
|
|
|
|||||||||||||||||||||||||||||||||
| $ | 9.37 | $ | 8.75 | $ | 9.78 | $ | 10.05 | |||||||||||||||||||||||||||||||||
|
|
|
|
|
|
|
|
|
|||||||||||||||||||||||||||||||||
| N/A | N/A | $ | 102 | N/A | ||||||||||||||||||||||||||||||||||||
|
|
|
|
|
|
|
|
|
|||||||||||||||||||||||||||||||||
| N/A | N/A | $ | 9.781 | N/A | ||||||||||||||||||||||||||||||||||||
|
|
|
|
|
|
|
|
|
|||||||||||||||||||||||||||||||||
| $ | 11,366,424 | $ | 234,022,666 | $ | 500,587,078 | $ | 804,967,931 | |||||||||||||||||||||||||||||||||
| (695,259) | (24,364,165) | (8,478,049) | (82,258,719) | |||||||||||||||||||||||||||||||||||||
|
|
|
|
|
|
|
|
|
|||||||||||||||||||||||||||||||||
| $ | 10,671,165 | $ | 209,658,501 | $ | 492,109,029 | $ | 722,709,212 | |||||||||||||||||||||||||||||||||
|
|
|
|
|
|
|
|
|
|||||||||||||||||||||||||||||||||
See accompanying Notes to Financial Statements.
| Annual Report March 2022 / 258 |
Table of Contents
Metropolitan West Funds
Statements of Assets and Liabilities
March 31, 2022
| ASSETS: |
INTERMEDIATE BOND FUND |
INVESTMENT GRADE CREDIT FUND |
||||||||||||||||||
| Investments, at value - Unaffiliated (Cost $875,881,721, $13,482,058, $2,962,013,990, $3,321,170, $34,411,046 and $98,393,222,822, respectively) (Note 2) |
$ | 856,080,080 | $ | 11,718,057 | ||||||||||||||||
| Investments, at value - Affiliated (Cost $0, $0, $0, $0, $0 and $65,187,440, respectively) (Note 5) |
— | — | ||||||||||||||||||
| Cash and cash equivalents (Note 2) |
— | — | ||||||||||||||||||
| Cash on deposit with brokers for collateral on swaps (Note 2) |
36 | 77,882 | ||||||||||||||||||
| Cash on deposit with brokers for collateral on futures (Note 2) |
4,044,000 | 92,000 | ||||||||||||||||||
| Receivable for securities sold |
51,118,119 | 1,153,945 | ||||||||||||||||||
| Dividends and interest receivable |
2,925,762 | 125,965 | ||||||||||||||||||
| Receivable for capital stock sold |
848,527 | 790 | ||||||||||||||||||
| Unrealized appreciation on foreign currency exchange contracts |
258,747 | — | ||||||||||||||||||
| Premiums paid for swap contracts |
144,467 | — | ||||||||||||||||||
| Receivable for daily variation margin on futures contracts (Note 3) |
90,914 | 2,719 | ||||||||||||||||||
| Unrealized appreciation on swap contracts |
17,982 | 15,253 | ||||||||||||||||||
| Unrealized appreciation on foreign currency transactions |
4 | — | ||||||||||||||||||
| Net unrealized appreciation on unfunded commitments (Note 8) |
— | — | ||||||||||||||||||
| Due from Adviser (Note 6) |
— | 20,354 | ||||||||||||||||||
| Other assets |
12,734 | 22,102 | ||||||||||||||||||
|
|
|
|
|
|||||||||||||||||
| Total assets |
915,541,372 | 13,229,067 | ||||||||||||||||||
|
|
|
|
|
|||||||||||||||||
| Liabilities: |
||||||||||||||||||||
| Options written, at value (Premiums received $1,391,267, $9,237, $5,045,243, $0, $18,699 and $158,157,572, respectively) (Note 3) |
2,179,744 | 18,394 | ||||||||||||||||||
| Reverse repurchase agreements (Proceeds $0, $0, $0, $0, $0 and $3,963,750,000, respectively) (Note 3) |
— | — | ||||||||||||||||||
| Bank overdraft |
4,782,107 | 2,462 | ||||||||||||||||||
| Payable for securities purchased |
112,442,047 | 2,162,787 | ||||||||||||||||||
| Payable for capital stock redeemed |
2,306,167 | 17,609 | ||||||||||||||||||
| Unrealized depreciation on foreign currency exchange contracts |
327,873 | — | ||||||||||||||||||
| Payable for daily variation margin on futures contracts (Note 3) |
53,250 | 6,344 | ||||||||||||||||||
| Distributions payable |
733 | 702 | ||||||||||||||||||
| Unrealized depreciation on foreign currency transactions |
— | — | ||||||||||||||||||
| Unrealized depreciation on swap contracts |
— | 64,334 | ||||||||||||||||||
| Net unrealized depreciation on unfunded commitments (Note 8) |
— | — | ||||||||||||||||||
| Advisory fees payable (Note 6) |
238,190 | 3,770 | ||||||||||||||||||
| Accrued distribution (12b-1) and service fees payable |
4,467 | 488 | ||||||||||||||||||
| Administrative fees payable |
30,134 | 23,204 | ||||||||||||||||||
| Custodian fees payable |
29,928 | 19,664 | ||||||||||||||||||
| Audit fees payable |
38,606 | 6,675 | ||||||||||||||||||
| Accrued other expenses |
90,947 | 3,508 | ||||||||||||||||||
|
|
|
|
|
|||||||||||||||||
| Total liabilities |
122,524,193 | 2,329,941 | ||||||||||||||||||
|
|
|
|
|
|||||||||||||||||
| Net assets |
$ | 793,017,179 | $ | 10,899,126 | ||||||||||||||||
|
|
|
|
|
|||||||||||||||||
| Class M Shares: |
||||||||||||||||||||
| Net assets (Applicable to 2,450,422, 259,570, 55,362,416, 7,782, 2,439,193 and 609,964,109, shares of beneficial interest issued and outstanding, respectively, unlimited number of shares authorized with a $0.01 par value) |
$ | 24,746,337 | $ | 2,258,949 | ||||||||||||||||
|
|
|
|
|
|||||||||||||||||
| Net asset value, offering and redemption price per Class M share |
$ | 10.10 | $ | 8.70 | ||||||||||||||||
|
|
|
|
|
|||||||||||||||||
| Class I Shares: |
||||||||||||||||||||
| Net assets (Applicable to 76,102,332, 992,802, 235,428,672, 330,792, 1,351,121 and 4,611,465,986, shares of beneficial interest issued and outstanding, respectively, unlimited number of shares authorized with a $0.01 par value) |
$ | 768,270,842 | $ | 8,640,177 | ||||||||||||||||
|
|
|
|
|
|||||||||||||||||
| Net asset value, offering and redemption price per Class I share |
$ | 10.10 | $ | 8.70 | ||||||||||||||||
|
|
|
|
|
|||||||||||||||||
| Class I-2 Shares: |
||||||||||||||||||||
| Net assets (Applicable to 0, 0, 0, 0, 0 and 16,736,662, shares of beneficial interest issued and outstanding, respectively, unlimited number of shares authorized with a $0.01 par value) |
N/A | N/A | ||||||||||||||||||
|
|
|
|
|
|||||||||||||||||
| Net asset value, offering and redemption price per Class I-2 share |
N/A | N/A | ||||||||||||||||||
|
|
|
|
|
|||||||||||||||||
| Administrative Class Shares: |
||||||||||||||||||||
| Net assets (Applicable to 0, 0, 154,242, 0, 0 and 192,601,234, shares of beneficial interest issued and outstanding, respectively, unlimited number of shares authorized with a $0.01 par value) |
N/A | N/A | ||||||||||||||||||
|
|
|
|
|
|||||||||||||||||
| Net asset value, offering and redemption price per Administrative Class share |
N/A | N/A | ||||||||||||||||||
|
|
|
|
|
|||||||||||||||||
| Plan Class Shares: |
||||||||||||||||||||
| Net assets (Applicable to 0, 0, 0, 0, 0 and 2,324,492,622, shares of beneficial interest issued and outstanding, respectively, unlimited number of shares authorized with a $0.01 par value) |
N/A | N/A | ||||||||||||||||||
|
|
|
|
|
|||||||||||||||||
| Net asset value, offering and redemption price per Plan Class share |
N/A | N/A | ||||||||||||||||||
|
|
|
|
|
|||||||||||||||||
| Net Assets Consist of: |
||||||||||||||||||||
| Paid-in Capital (Note 9) |
$ | 835,388,867 | $ | 13,255,121 | ||||||||||||||||
| Accumulated Earnings (Loss) |
(42,371,688) | (2,355,995) | ||||||||||||||||||
|
|
|
|
|
|||||||||||||||||
| Net assets |
$ | 793,017,179 | $ | 10,899,126 | ||||||||||||||||
|
|
|
|
|
|||||||||||||||||
See accompanying Notes to Financial Statements.
| 259 / Annual Report March 2022 |
Table of Contents
Metropolitan West Funds
Statements of Assets and Liabilities
March 31, 2022
| LOW DURATION |
OPPORTUNISTIC HIGH INCOME CREDIT |
STRATEGIC INCOME FUND |
TOTAL RETURN BOND FUND |
|||||||||||||||||||||||||||||||||||||
| $ | 2,909,842,791 | $ | 3,028,869 | $ | 27,657,133 | $ | 96,192,352,066 | |||||||||||||||||||||||||||||||||
| — | — | — | — | |||||||||||||||||||||||||||||||||||||
| 9,700 | 856 | — | 450,374,581 | |||||||||||||||||||||||||||||||||||||
| 5,309,027 | — | 107,743 | 856,638,289 | |||||||||||||||||||||||||||||||||||||
| 16,673,000 | 21,000 | 351,000 | 409,415,000 | |||||||||||||||||||||||||||||||||||||
| 400,745,519 | 25,502 | 2,269,332 | 17,002,452,683 | |||||||||||||||||||||||||||||||||||||
| 7,849,922 | 50,571 | 353,870 | 318,782,585 | |||||||||||||||||||||||||||||||||||||
| 2,907,346 | — | 161,152 | 172,210,073 | |||||||||||||||||||||||||||||||||||||
| — | — | 1,321 | 29,813,453 | |||||||||||||||||||||||||||||||||||||
| 449,987 | — | — | 4,014,850 | |||||||||||||||||||||||||||||||||||||
| 596,537 | 281 | 2,531 | 5,454,762 | |||||||||||||||||||||||||||||||||||||
| 58,109 | — | 24,767 | 73,085,827 | |||||||||||||||||||||||||||||||||||||
| — | — | 6 | — | |||||||||||||||||||||||||||||||||||||
| — | — | — | 7,880 | |||||||||||||||||||||||||||||||||||||
| — | 2,668 | 28,297 | — | |||||||||||||||||||||||||||||||||||||
| 68,253 | 6,619 | 15,003 | 472,403 | |||||||||||||||||||||||||||||||||||||
|
|
|
|
|
|
|
|
|
|||||||||||||||||||||||||||||||||
| 3,344,510,191 | 3,136,366 | 30,972,155 | 115,515,074,452 | |||||||||||||||||||||||||||||||||||||
|
|
|
|
|
|
|
|
|
|||||||||||||||||||||||||||||||||
| 7,103,886 | — | 38,025 | 290,863,292 | |||||||||||||||||||||||||||||||||||||
| — | — | — | 3,963,750,000 | |||||||||||||||||||||||||||||||||||||
| — | — | 1,860 | — | |||||||||||||||||||||||||||||||||||||
| 835,071,794 | 64,836 | 4,274,041 | 33,126,477,638 | |||||||||||||||||||||||||||||||||||||
| 4,840,883 | 691 | 320,906 | 272,848,801 | |||||||||||||||||||||||||||||||||||||
| — | — | 3,872 | 27,578,964 | |||||||||||||||||||||||||||||||||||||
| 819,486 | — | 11,906 | 14,681,406 | |||||||||||||||||||||||||||||||||||||
| 132,291 | — | 6,126 | 10,072,103 | |||||||||||||||||||||||||||||||||||||
| — | — | — | 87,341 | |||||||||||||||||||||||||||||||||||||
| — | — | 90,756 | 267,502,283 | |||||||||||||||||||||||||||||||||||||
| 5,620 | — | — | — | |||||||||||||||||||||||||||||||||||||
| 647,479 | 1,283 | 14,793 | 23,401,341 | |||||||||||||||||||||||||||||||||||||
| 78,153 | 15 | 3,608 | 1,821,604 | |||||||||||||||||||||||||||||||||||||
| 56,092 | 13,944 | 23,553 | 782,690 | |||||||||||||||||||||||||||||||||||||
| 47,950 | 5,772 | 21,157 | 1,045,084 | |||||||||||||||||||||||||||||||||||||
| 37,715 | 6,748 | 32,830 | 151,813 | |||||||||||||||||||||||||||||||||||||
| 351,359 | 1,733 | 5,422 | 7,180,881 | |||||||||||||||||||||||||||||||||||||
|
|
|
|
|
|
|
|
|
|||||||||||||||||||||||||||||||||
| 849,192,708 | 95,022 | 4,848,855 | 38,008,245,241 | |||||||||||||||||||||||||||||||||||||
|
|
|
|
|
|
|
|
|
|||||||||||||||||||||||||||||||||
| $ | 2,495,317,483 | $ | 3,041,344 | $ | 26,123,300 | $ | 77,506,829,211 | |||||||||||||||||||||||||||||||||
|
|
|
|
|
|
|
|
|
|||||||||||||||||||||||||||||||||
| $ | 474,682,347 | $ | 69,966 | $ | 16,813,272 | $ | 6,213,222,891 | |||||||||||||||||||||||||||||||||
|
|
|
|
|
|
|
|
|
|||||||||||||||||||||||||||||||||
| $ | 8.57 | $ | 8.99 | $ | 6.89 | $ | 10.19 | |||||||||||||||||||||||||||||||||
|
|
|
|
|
|
|
|
|
|||||||||||||||||||||||||||||||||
| $ | 2,018,926,338 | $ | 2,971,378 | $ | 9,310,028 | $ | 46,961,971,022 | |||||||||||||||||||||||||||||||||
|
|
|
|
|
|
|
|
|
|||||||||||||||||||||||||||||||||
| $ | 8.58 | $ | 8.98 | $ | 6.89 | $ | 10.18 | |||||||||||||||||||||||||||||||||
|
|
|
|
|
|
|
|
|
|||||||||||||||||||||||||||||||||
| N/A | N/A | N/A | $ | 170,454,863 | ||||||||||||||||||||||||||||||||||||
|
|
|
|
|
|
|
|
|
|||||||||||||||||||||||||||||||||
| N/A | N/A | N/A | $ | 10.18 | ||||||||||||||||||||||||||||||||||||
|
|
|
|
|
|
|
|
|
|||||||||||||||||||||||||||||||||
| $ | 1,708,798 | N/A | N/A | $ | 1,963,315,371 | |||||||||||||||||||||||||||||||||||
|
|
|
|
|
|
|
|
|
|||||||||||||||||||||||||||||||||
| $ | 11.08 | N/A | N/A | $ | 10.19 | |||||||||||||||||||||||||||||||||||
|
|
|
|
|
|
|
|
|
|||||||||||||||||||||||||||||||||
| N/A | N/A | N/A | $ | 22,197,865,064 | ||||||||||||||||||||||||||||||||||||
|
|
|
|
|
|
|
|
|
|||||||||||||||||||||||||||||||||
| N/A | N/A | N/A | $ | 9.55 | ||||||||||||||||||||||||||||||||||||
|
|
|
|
|
|
|
|
|
|||||||||||||||||||||||||||||||||
| $ | 2,614,747,095 | $ | 3,377,257 | $ | 33,942,390 | $ | 82,598,655,003 | |||||||||||||||||||||||||||||||||
| (119,429,612) | (335,913) | (7,819,090) | (5,091,825,792) | |||||||||||||||||||||||||||||||||||||
|
|
|
|
|
|
|
|
|
|||||||||||||||||||||||||||||||||
| $ | 2,495,317,483 | $ | 3,041,344 | $ | 26,123,300 | $ | 77,506,829,211 | |||||||||||||||||||||||||||||||||
|
|
|
|
|
|
|
|
|
|||||||||||||||||||||||||||||||||
See accompanying Notes to Financial Statements.
| Annual Report March 2022 / 260 |
Table of Contents
Metropolitan West Funds
Statements of Assets and Liabilities
March 31, 2022
| ASSETS: |
ULTRA SHORT BOND FUND |
UNCONSTRAINED BOND FUND |
||||||||||||||||||||
| Investments, at value - Unaffiliated (Cost $229,947,663 and $4,644,872,509, respectively) (Note 2) |
$ | 227,185,026 | $ | 4,409,699,006 | ||||||||||||||||||
| Investments, at value - Affiliated (Cost $0 and $0, respectively) (Note 5) |
— | — | ||||||||||||||||||||
| Cash and cash equivalents (Note 2) |
20,373 | 1,109,908 | ||||||||||||||||||||
| Foreign Currency, at value (Cost $0 and $9,132, respectively) |
— | 9,132 | ||||||||||||||||||||
| Cash on deposit with brokers for collateral on swaps (Note 2) |
— | 30,552,139 | ||||||||||||||||||||
| Cash on deposit with brokers for collateral on futures (Note 2) |
1,286,000 | 28,859,000 | ||||||||||||||||||||
| Receivable for securities sold |
27,922,266 | 471,613,316 | ||||||||||||||||||||
| Receivable for capital stock sold |
663,317 | 11,005,559 | ||||||||||||||||||||
| Dividends and interest receivable |
576,016 | 20,349,000 | ||||||||||||||||||||
| Due from Adviser (Note 6) |
36,768 | — | ||||||||||||||||||||
| Premiums paid for swap contracts |
20,631 | 921,111 | ||||||||||||||||||||
| Receivable for daily variation margin on futures contracts (Note 3) |
1,312 | 546,028 | ||||||||||||||||||||
| Unrealized appreciation on swap contracts |
1,109 | 3,576,078 | ||||||||||||||||||||
| Unrealized appreciation on foreign currency exchange contracts |
— | 1,401,009 | ||||||||||||||||||||
| Unrealized appreciation on foreign currency transactions |
— | — | ||||||||||||||||||||
| Other assets |
13,179 | 150,962 | ||||||||||||||||||||
|
|
|
|
|
|||||||||||||||||||
| Total assets |
257,725,997 | 4,979,792,248 | ||||||||||||||||||||
|
|
|
|
|
|||||||||||||||||||
| Liabilities: |
||||||||||||||||||||||
| Options written, at value (Premiums received $386,568 and $7,540,049, respectively) (Note 3) |
630,775 | 14,047,392 | ||||||||||||||||||||
| Payable for securities purchased |
57,856,585 | 948,857,150 | ||||||||||||||||||||
| Payable for capital stock redeemed |
1,279,699 | 10,746,047 | ||||||||||||||||||||
| Payable for daily variation margin on futures contracts (Note 3) |
53,046 | 2,471,098 | ||||||||||||||||||||
| Distributions payable |
744 | 2,400,891 | ||||||||||||||||||||
| Unrealized depreciation on foreign currency exchange contracts |
— | 1,751,000 | ||||||||||||||||||||
| Unrealized depreciation on foreign currency transactions |
— | 614 | ||||||||||||||||||||
| Unrealized depreciation on swap contracts |
— | 12,537,371 | ||||||||||||||||||||
| Net unrealized depreciation on unfunded commitments (Note 8) |
— | 13,886 | ||||||||||||||||||||
| Advisory fees payable (Note 6) |
43,565 | 2,192,384 | ||||||||||||||||||||
| Accrued distribution (12b-1) and service fees payable |
6,064 | 46,311 | ||||||||||||||||||||
| Administrative fees payable |
25,794 | 84,577 | ||||||||||||||||||||
| Custodian fees payable |
16,618 | 84,913 | ||||||||||||||||||||
| Audit fees payable |
32,627 | 7,342 | ||||||||||||||||||||
| Accrued other expenses |
45,232 | 403,770 | ||||||||||||||||||||
|
|
|
|
|
|||||||||||||||||||
| Total liabilities |
59,990,749 | 995,644,746 | ||||||||||||||||||||
|
|
|
|
|
|||||||||||||||||||
| Net assets |
$ | 197,735,248 | $ | 3,984,147,502 | ||||||||||||||||||
|
|
|
|
|
|||||||||||||||||||
| Class M Shares: |
||||||||||||||||||||||
| Net assets (Applicable to 9,455,483 and 19,230,240, shares of beneficial interest issued and outstanding, respectively, unlimited number of shares authorized with a $0.01 par value) |
$ | 39,476,871 | $ | 214,791,825 | ||||||||||||||||||
|
|
|
|
|
|||||||||||||||||||
| Net asset value, offering and redemption price per Class M share |
$ | 4.18 | $ | 11.17 | ||||||||||||||||||
|
|
|
|
|
|||||||||||||||||||
| Class I Shares: |
||||||||||||||||||||||
| Net assets (Applicable to 37,852,952 and 326,977,316, shares of beneficial interest issued and outstanding, respectively, unlimited number of shares authorized with a $0.01 par value) |
$ | 158,258,377 | $ | 3,648,831,955 | ||||||||||||||||||
|
|
|
|
|
|||||||||||||||||||
| Net asset value, offering and redemption price per Class I share |
$ | 4.18 | $ | 11.16 | ||||||||||||||||||
|
|
|
|
|
|||||||||||||||||||
| Plan Class Shares: |
||||||||||||||||||||||
| Net assets (Applicable to 0 and 10,805,285, shares of beneficial interest issued and outstanding, respectively, unlimited number of shares authorized with a $0.01 par value) |
N/A | $ | 120,523,722 | |||||||||||||||||||
|
|
|
|
|
|||||||||||||||||||
| Net asset value, offering and redemption price per Plan Class share |
N/A | $ | 11.15 | |||||||||||||||||||
|
|
|
|
|
|||||||||||||||||||
| Net Assets Consist of: |
||||||||||||||||||||||
| Paid-in Capital (Note 9) |
$ | 207,256,465 | $ | 4,259,718,551 | ||||||||||||||||||
| Accumulated Earnings (Loss) |
(9,521,217) | (275,571,049) | ||||||||||||||||||||
|
|
|
|
|
|||||||||||||||||||
| Net assets |
$ | 197,735,248 | $ | 3,984,147,502 | ||||||||||||||||||
|
|
|
|
|
|||||||||||||||||||
See accompanying Notes to Financial Statements.
| 261 / Annual Report March 2022 |
Table of Contents
[THIS PAGE INTENTIONALLY LEFT BLANK]
Table of Contents
Statements of Operations
For the Year Ended March 31, 2022
| ALPHATRAK 500 FUND |
CORPORATE BOND
FUND |
|||||||||||||||||
| Investment Income: |
||||||||||||||||||
| Interest |
$ | 613,730 | $ | 365,912 | ||||||||||||||
| Dividends |
111,975 | 156 | ||||||||||||||||
|
|
|
|
|
|||||||||||||||
| Total investment income |
725,705 | 366,068 | ||||||||||||||||
|
|
|
|
|
|||||||||||||||
| Expenses: |
||||||||||||||||||
| Investment advisory fees (Note 6) |
43,827 | 53,109 | ||||||||||||||||
| Administration fees |
95,371 | 93,239 | ||||||||||||||||
| Distribution (12b-1) and service fees - class specific (Note 7): |
||||||||||||||||||
| Class M |
— | 16,672 | ||||||||||||||||
| Transfer agent fees |
37,590 | 38,491 | ||||||||||||||||
| Professional fees |
36,397 | 21,674 | ||||||||||||||||
| Registration and filing fees |
29,351 | 51,499 | ||||||||||||||||
| Custodian fees |
25,880 | 40,809 | ||||||||||||||||
| Regulatory administrative expense |
18,984 | 18,984 | ||||||||||||||||
| Reports to shareholders |
5,578 | 1,731 | ||||||||||||||||
| Miscellaneous expenses |
3,399 | 2,578 | ||||||||||||||||
| Listing fees |
800 | 1,600 | ||||||||||||||||
| Trustees’ fees and expenses |
574 | 173 | ||||||||||||||||
| Commitment fee |
56 | 75 | ||||||||||||||||
| Repayment of reimbursed expenses - Class M (Note 6) |
75,689 | — | ||||||||||||||||
| Repayment of reimbursed expenses - Class I (Note 6) |
— | — | ||||||||||||||||
|
|
|
|
|
|||||||||||||||
| Total operating expenses |
373,496 | 340,634 | ||||||||||||||||
| Expenses waived and reimbursed (Note 6) |
— | (257,575) | ||||||||||||||||
|
|
|
|
|
|||||||||||||||
| Net expenses |
373,496 | 83,059 | ||||||||||||||||
|
|
|
|
|
|||||||||||||||
| Net investment income |
352,209 | 283,009 | ||||||||||||||||
|
|
|
|
|
|||||||||||||||
| Realized and Change in Unrealized Gain (Loss) on Investments, Futures Contracts, Foreign Currency Exchange Contracts, Foreign Currency Transactions, Options and Swaptions Written and Swap Contracts: |
|
|||||||||||||||||
| Net realized gain (loss) on: |
||||||||||||||||||
| Investments - Unaffiliated |
462,817 | (8,971) | ||||||||||||||||
| Futures contracts |
3,179,476 | 3,104 | ||||||||||||||||
| Foreign currency exchange contracts |
27,511 | 8,101 | ||||||||||||||||
| Foreign currency transactions |
(2,499) | 699 | ||||||||||||||||
| Options and swaptions written |
— | — | ||||||||||||||||
| Swap contracts |
— | (27) | ||||||||||||||||
| Net change in unrealized appreciation (depreciation) on: |
||||||||||||||||||
| Investments - Unaffiliated |
(735,005) | (958,560) | ||||||||||||||||
| Futures contracts |
2,091,652 | (8,437) | ||||||||||||||||
| Foreign currency exchange contracts |
(20,568) | (1,189) | ||||||||||||||||
| Foreign currency transactions |
— | — | ||||||||||||||||
| Options and swaptions written |
— | (8,358) | ||||||||||||||||
| Swap contracts |
— | (28,077) | ||||||||||||||||
|
|
|
|
|
|||||||||||||||
| Net realized and change in unrealized gain (loss) on investments, futures contracts, foreign currency exchange contracts, foreign currency transactions, options and swaptions written and swap contracts |
5,003,384 | (1,001,715) | ||||||||||||||||
|
|
|
|
|
|||||||||||||||
| Net Increase (Decrease) in Net Assets from Operations |
$ | 5,355,593 | $ | (718,706) | ||||||||||||||
|
|
|
|
|
|||||||||||||||
1 For the period October 1, 2021 (Commencement of Operations) to March 31, 2022.
See accompanying Notes to Financial Statements.
| 263 / Annual Report March 2022 |
Table of Contents
Metropolitan West Funds
Statements of Operations
For the Year Ended March 31, 2022
| ESG SECURITIZED FUND1 |
FLEXIBLE INCOME FUND |
FLOATING RATE INCOME FUND |
HIGH YIELD BOND FUND |
||||||||||||||||||||||
| $ | 73,566 | $ | 18,287,961 | $ | 18,969,375 | $ | 35,511,337 | ||||||||||||||||||
| 91 | 8,398 | 7,239 | 18,573 | ||||||||||||||||||||||
|
|
|
|
|
|
|
|
|
||||||||||||||||||
| 73,657 | 18,296,359 | 18,976,614 | 35,529,910 | ||||||||||||||||||||||
|
|
|
|
|
|
|
|
|
||||||||||||||||||
| 20,586 | 814,868 | 2,599,287 | 3,970,632 | ||||||||||||||||||||||
| 35,988 | 206,779 | 218,255 | 139,384 | ||||||||||||||||||||||
| 7 | 60,875 | 37,921 | 496,687 | ||||||||||||||||||||||
| 15,551 | 204,981 | 249,391 | 561,984 | ||||||||||||||||||||||
| 9,926 | 39,036 | 34,125 | 37,300 | ||||||||||||||||||||||
| 1,747 | 67,794 | 81,201 | 89,031 | ||||||||||||||||||||||
| 6,079 | 69,263 | 36,223 | 38,316 | ||||||||||||||||||||||
| — | 18,984 | 18,984 | 18,984 | ||||||||||||||||||||||
| 1,015 | 5,585 | 19,773 | 23,083 | ||||||||||||||||||||||
| 326 | 4,861 | 9,597 | 14,893 | ||||||||||||||||||||||
| 1,600 | 1,600 | 2,400 | 1,600 | ||||||||||||||||||||||
| 67 | 2,327 | 6,042 | 10,176 | ||||||||||||||||||||||
| — | 1,101 | 2,606 | 4,470 | ||||||||||||||||||||||
| — | — | — | — | ||||||||||||||||||||||
| — | — | 8,239 | — | ||||||||||||||||||||||
|
|
|
|
|
|
|
|
|
||||||||||||||||||
| 92,892 | 1,498,054 | 3,324,044 | 5,406,540 | ||||||||||||||||||||||
| (67,666) | (441,229) | (14,896) | (145,095) | ||||||||||||||||||||||
|
|
|
|
|
|
|
|
|
||||||||||||||||||
| 25,226 | 1,056,825 | 3,309,148 | 5,261,445 | ||||||||||||||||||||||
|
|
|
|
|
|
|
|
|
||||||||||||||||||
| 48,431 | 17,239,534 | 15,667,466 | 30,268,465 | ||||||||||||||||||||||
|
|
|
|
|
|
|
|
|
||||||||||||||||||
| (178,537) | (2,327,445) | 481,354 | (1,676,256) | ||||||||||||||||||||||
| 40,277 | (768,323) | — | 28,753 | ||||||||||||||||||||||
| 1,849 | 162,378 | 523,157 | 141,516 | ||||||||||||||||||||||
| (824) | 8,409 | (26,273) | (42,634) | ||||||||||||||||||||||
| — | (41,185) | — | — | ||||||||||||||||||||||
| — | — | — | 103,924 | ||||||||||||||||||||||
| (590,523) | (17,854,384) | (8,898,950) | (40,521,550) | ||||||||||||||||||||||
| 26,379 | (549,918) | — | 1,656,821 | ||||||||||||||||||||||
| 6,130 | (22,005) | (404,486) | 57,897 | ||||||||||||||||||||||
| (3) | (3,964) | (26,829) | (40,820) | ||||||||||||||||||||||
| — | (7,873) | — | — | ||||||||||||||||||||||
| — | — | — | 16,004 | ||||||||||||||||||||||
|
|
|
|
|
|
|
|
|
||||||||||||||||||
| (695,252) | (21,404,310) | (8,352,027) | (40,276,345) | ||||||||||||||||||||||
|
|
|
|
|
|
|
|
|
||||||||||||||||||
| $ | (646,821) | $ | (4,164,776) | $ | 7,315,439 | $ | (10,007,880) | ||||||||||||||||||
|
|
|
|
|
|
|
|
|
||||||||||||||||||
See accompanying Notes to Financial Statements.
| Annual Report March 2022 / 264 |
Table of Contents
Metropolitan West Funds
Statements of Operations
For the Year Ended March 31, 2022
|
INTERMEDIATE |
INVESTMENT
GRADE |
||||||||||||||||
| Investment Income: |
|||||||||||||||||
| Interest |
$ | 14,410,496 | $ | 1,007,180 | |||||||||||||
| Dividends |
15,592 | 239 | |||||||||||||||
|
|
|
|
|
||||||||||||||
| Total investment income |
14,426,088 | 1,007,419 | |||||||||||||||
|
|
|
|
|
||||||||||||||
| Expenses: |
|||||||||||||||||
| Investment advisory fees (Note 6) |
2,870,144 | 66,458 | |||||||||||||||
| Administration fees |
143,931 | 105,665 | |||||||||||||||
| Distribution (12b-1) and service fees - class specific (Note 7): |
— | ||||||||||||||||
| Class M |
67,760 | 7,682 | |||||||||||||||
| Administrative Class |
— | — | |||||||||||||||
| Transfer agent fees |
631,111 | 41,142 | |||||||||||||||
| Custodian fees |
76,668 | 44,711 | |||||||||||||||
| Registration and filing fees |
57,110 | 50,590 | |||||||||||||||
| Professional fees |
44,037 | 21,688 | |||||||||||||||
| Regulatory administrative expense |
18,984 | 18,984 | |||||||||||||||
| Miscellaneous expenses |
16,453 | 2,609 | |||||||||||||||
| Trustees’ fees and expenses |
10,391 | 249 | |||||||||||||||
| Reports to shareholders |
9,640 | 2,270 | |||||||||||||||
| Commitment fee |
4,394 | 112 | |||||||||||||||
| Listing fees |
1,600 | 1,600 | |||||||||||||||
|
|
|
|
|
||||||||||||||
| Total operating expenses |
3,952,223 | 363,760 | |||||||||||||||
| Expenses waived and reimbursed (Note 6) |
(62) | (264,265) | |||||||||||||||
|
|
|
|
|
||||||||||||||
| Net expenses |
3,952,161 | 99,495 | |||||||||||||||
|
|
|
|
|
||||||||||||||
| Net investment income |
10,473,927 | 907,924 | |||||||||||||||
|
|
|
|
|
||||||||||||||
| Realized and Change in Unrealized Gain (Loss) on Investments, Futures Contracts, Foreign Currency Exchange Contracts, Foreign Currency Transactions, Options and Swaptions Written and Swap Contracts: |
|
||||||||||||||||
| Net realized gain (loss) on: |
|||||||||||||||||
| Investments - Unaffiliated |
(15,994,313) | (444,321) | |||||||||||||||
| Futures contracts |
(2,024,938) | (58,093) | |||||||||||||||
| Foreign currency exchange contracts |
451,123 | — | |||||||||||||||
| Foreign currency transactions |
39,356 | — | |||||||||||||||
| Options and swaptions written |
(1,233,044) | (4,097) | |||||||||||||||
| Swap contracts |
46,073 | (27) | |||||||||||||||
| Net change in unrealized appreciation (depreciation) on: |
|||||||||||||||||
| Investments - Unaffiliated |
(26,631,047) | (1,341,034) | |||||||||||||||
| Futures contracts |
(1,048,376) | (22,637) | |||||||||||||||
| Foreign currency exchange contracts |
(69,126) | — | |||||||||||||||
| Foreign currency transactions |
4 | — | |||||||||||||||
| Options and swaptions written |
(788,477) | (9,157) | |||||||||||||||
| Swap contracts |
15,180 | (49,081) | |||||||||||||||
|
|
|
|
|
||||||||||||||
| Net realized and change in unrealized (loss) on investments, futures contracts, foreign currency exchange contracts, foreign currency transactions, options and swaptions written and swap contracts |
(47,237,585) | (1,928,447) | |||||||||||||||
|
|
|
|
|
||||||||||||||
| Net (Decrease) in Net Assets from Operations |
$ | (36,763,658) | $ | (1,020,523) | |||||||||||||
|
|
|
|
|
||||||||||||||
1 For the period August 2, 2021 (Commencement of Operations) to March 31, 2022.
See accompanying Notes to Financial Statements.
| 265 / Annual Report March 2022 |
Table of Contents
Metropolitan West Funds
Statements of Operations
For the Year Ended March 31, 2022
| LOW DURATION BOND FUND |
OPPORTUNISTIC HIGH INCOME CREDIT FUND1 |
STRATEGIC INCOME FUND |
TOTAL RETURN BOND FUND |
||||||||||||||||||||||
| $ | 39,091,312 | $ | 252,720 | $ | 3,087,102 | $ | 1,582,929,379 | ||||||||||||||||||
| 38,145 | 8,010 | 1,552 | 1,086,006 | ||||||||||||||||||||||
|
|
|
|
|
|
|
|
|
||||||||||||||||||
| 39,129,457 | 260,730 | 3,088,654 | 1,584,015,385 | ||||||||||||||||||||||
|
|
|
|
|
|
|
|
|
||||||||||||||||||
| 7,947,583 | 9,989 | 468,065 | 303,311,997 | ||||||||||||||||||||||
| 287,573 | 48,655 | 108,824 | 4,403,211 | ||||||||||||||||||||||
| 892,906 | 44 | 43,829 | 14,671,855 | ||||||||||||||||||||||
| 6,444 | — | — | 8,380,709 | ||||||||||||||||||||||
| 2,284,621 | 20,221 | 57,356 | 48,086,596 | ||||||||||||||||||||||
| 119,327 | 9,649 | 41,067 | 2,480,106 | ||||||||||||||||||||||
| 113,406 | 1,747 | 49,341 | 920,967 | ||||||||||||||||||||||
| 46,781 | 9,919 | 35,078 | 363,060 | ||||||||||||||||||||||
| 18,984 | — | 18,984 | 18,984 | ||||||||||||||||||||||
| 44,950 | 163 | 3,259 | 1,525,969 | ||||||||||||||||||||||
| 33,718 | 26 | 345 | 1,099,869 | ||||||||||||||||||||||
| 21,993 | 6,417 | 9,829 | 819,167 | ||||||||||||||||||||||
| 14,695 | 8 | 126 | 482,314 | ||||||||||||||||||||||
| 2,400 | 1,600 | 1,600 | 4,000 | ||||||||||||||||||||||
|
|
|
|
|
|
|
|
|
||||||||||||||||||
| 11,835,381 | 108,438 | 837,703 | 386,568,804 | ||||||||||||||||||||||
| — | (96,407) | (566,609) | — | ||||||||||||||||||||||
|
|
|
|
|
|
|
|
|
||||||||||||||||||
| 11,835,381 | 12,031 | 271,094 | 386,568,804 | ||||||||||||||||||||||
|
|
|
|
|
|
|
|
|
||||||||||||||||||
| 27,294,076 | 248,699 | 2,817,560 | 1,197,446,581 | ||||||||||||||||||||||
|
|
|
|
|
|
|
|
|
||||||||||||||||||
| (36,485,217) | (9,348) | (1,183,895) | (1,458,293,186) | ||||||||||||||||||||||
| 5,991,163 | (11,230) | (17,595) | 25,039,677 | ||||||||||||||||||||||
| 1,443,076 | — | 4,225 | 89,284,721 | ||||||||||||||||||||||
| — | — | (1,474) | (1,921,252) | ||||||||||||||||||||||
| (3,988,866) | — | (8,194) | (113,197,139) | ||||||||||||||||||||||
| 141,728 | — | (44) | 1,344,382 | ||||||||||||||||||||||
| (57,844,618) | (292,301) | (2,290,792) | (3,001,495,494) | ||||||||||||||||||||||
| 1,134,224 | (6,598) | (56,303) | (20,208,067) | ||||||||||||||||||||||
| (1,422,086) | — | (2,551) | (40,046,116) | ||||||||||||||||||||||
| — | — | 5 | (92,679) | ||||||||||||||||||||||
| (2,594,047) | — | (19,326) | (129,106,670) | ||||||||||||||||||||||
| 49,796 | — | (65,989) | (194,563,694) | ||||||||||||||||||||||
|
|
|
|
|
|
|
|
|
||||||||||||||||||
| (93,574,847) | (319,477) | (3,641,933) | (4,843,255,517) | ||||||||||||||||||||||
|
|
|
|
|
|
|
|
|
||||||||||||||||||
| $ | (66,280,771) | $ | (70,778) | $ | (824,373) | $ | (3,645,808,936) | ||||||||||||||||||
|
|
|
|
|
|
|
|
|
||||||||||||||||||
See accompanying Notes to Financial Statements.
| Annual Report March 2022 / 266 |
Table of Contents
Metropolitan West Funds
Statements of Operations
For the Year Ended March 31, 2022
| ULTRA SHORT BOND FUND |
UNCONSTRAINED BOND FUND |
|||||||||||||||||||
| Investment Income: |
||||||||||||||||||||
| Interest |
$ | 2,392,172 | $ | 139,620,173 | ||||||||||||||||
| Dividends |
5,617 | 183,592 | ||||||||||||||||||
|
|
|
|
|
|||||||||||||||||
| Total investment income |
2,397,789 | 139,803,765 | ||||||||||||||||||
|
|
|
|
|
|||||||||||||||||
| Expenses: |
||||||||||||||||||||
| Investment advisory fees (Note 6) |
601,983 | 25,727,674 | ||||||||||||||||||
| Administration fees |
128,368 | 423,222 | ||||||||||||||||||
| Distribution (12b-1) and service fees - class specific (Note 7): |
||||||||||||||||||||
| Class M |
86,465 | 615,110 | ||||||||||||||||||
| Transfer agent fees |
254,260 | 2,617,707 | ||||||||||||||||||
| Registration and filing fees |
66,618 | 205,097 | ||||||||||||||||||
| Custodian fees |
43,551 | 211,155 | ||||||||||||||||||
| Professional fees |
35,271 | 61,742 | ||||||||||||||||||
| Regulatory administrative expense |
18,984 | 18,984 | ||||||||||||||||||
| Reports to shareholders |
12,662 | 46,827 | ||||||||||||||||||
| Miscellaneous expenses |
6,738 | 64,370 | ||||||||||||||||||
| Trustees’ fees and expenses |
3,105 | 50,295 | ||||||||||||||||||
| Listing fees |
1,600 | 2,400 | ||||||||||||||||||
| Commitment fee |
1,384 | 21,218 | ||||||||||||||||||
|
|
|
|
|
|||||||||||||||||
| Total operating expenses |
1,260,989 | 30,065,801 | ||||||||||||||||||
| Expenses waived and reimbursed (Note 6) |
(355,828) | — | ||||||||||||||||||
|
|
|
|
|
|||||||||||||||||
| Net expenses |
905,161 | 30,065,801 | ||||||||||||||||||
|
|
|
|
|
|||||||||||||||||
| Net investment income |
1,492,628 | 109,737,964 | ||||||||||||||||||
|
|
|
|
|
|||||||||||||||||
| Realized and Change in Unrealized Gain (Loss) on Investments, Futures Contracts, Foreign Currency Exchange Contracts, Foreign Currency Transactions, Options and Swaptions Written and Swap Contracts: |
|
|||||||||||||||||||
| Net realized gain (loss) on: |
||||||||||||||||||||
| Investments - Unaffiliated |
(2,386,197) | (19,332,656) | ||||||||||||||||||
| Futures contracts |
1,000,269 | (4,472,720) | ||||||||||||||||||
| Foreign currency exchange contracts |
334,738 | 5,097,667 | ||||||||||||||||||
| Foreign currency transactions |
(24,994) | (19,765) | ||||||||||||||||||
| Options and swaptions written |
(351,852) | (6,045,504) | ||||||||||||||||||
| Swap contracts |
8,103 | 308,001 | ||||||||||||||||||
| Net change in unrealized appreciation (depreciation) on: |
||||||||||||||||||||
| Investments - Unaffiliated |
(2,774,008) | (191,824,923) | ||||||||||||||||||
| Futures contracts |
612,945 | 354,297 | ||||||||||||||||||
| Foreign currency exchange contracts |
(264,437) | (2,502,148) | ||||||||||||||||||
| Foreign currency transactions |
— | (615) | ||||||||||||||||||
| Options and swaptions written |
(244,207) | (6,507,343) | ||||||||||||||||||
| Swap contracts |
163 | (8,986,462) | ||||||||||||||||||
|
|
|
|
|
|||||||||||||||||
| Net realized and change in unrealized (loss) on investments, futures contracts, foreign currency exchange contracts, foreign currency transactions, options and swaptions written and swap contracts |
(4,089,477) | (233,932,171) | ||||||||||||||||||
|
|
|
|
|
|||||||||||||||||
| Net (Decrease) in Net Assets from Operations |
$ | (2,596,849) | $ | (124,194,207) | ||||||||||||||||
|
|
|
|
|
|||||||||||||||||
See accompanying Notes to Financial Statements.
| 267 / Annual Report March 2022 |
Table of Contents
[THIS PAGE INTENTIONALLY LEFT BLANK]
Table of Contents
Statements of Changes in Net Assets
| ALPHATRAK 500 FUND |
||||||||||||||||||||
|
YEAR ENDED 2022 |
YEAR ENDED 2021 |
|||||||||||||||||||
| Operations: |
||||||||||||||||||||
| Net investment income |
$ | 352,209 | $ | 527,351 | ||||||||||||||||
| Net realized gain (loss) on investments |
462,817 | 21,713 | ||||||||||||||||||
| Net realized gain (loss) on futures contracts, foreign currency exchange contracts, foreign currency transactions, options and swaptions written and swap contracts |
3,204,488 | 11,470,191 | ||||||||||||||||||
| Net change in unrealized appreciation (depreciation) on investments |
(735,005) | 1,774,249 | ||||||||||||||||||
| Net change in unrealized appreciation (depreciation) on futures contracts, foreign currency exchange contracts, foreign currency transactions, options and swaptions written and swap contracts |
2,071,084 | 1,813,257 | ||||||||||||||||||
|
|
|
|
|
|||||||||||||||||
| Net increase (decrease) in net assets resulting from operations |
5,355,593 | 15,606,761 | ||||||||||||||||||
|
|
|
|
|
|||||||||||||||||
| Distributions to Shareholders: |
||||||||||||||||||||
| Class M |
(11,805,983) | (2,562,844) | ||||||||||||||||||
| Class I |
— | — | ||||||||||||||||||
|
|
|
|
|
|||||||||||||||||
| Total Distributions |
(11,805,983) | (2,562,844) | ||||||||||||||||||
|
|
|
|
|
|||||||||||||||||
| Capital Share Transactions: |
||||||||||||||||||||
| Class M: |
||||||||||||||||||||
| Proceeds from sale of shares |
17,532,245 | 8,125,307 | ||||||||||||||||||
| Shares issued in reinvestment of distributions |
11,710,130 | 2,556,028 | ||||||||||||||||||
| Cost of shares redeemed |
(14,459,312) | (16,021,598) | ||||||||||||||||||
|
|
|
|
|
|||||||||||||||||
| Total Class M capital share transactions |
14,783,063 | (5,340,263) | ||||||||||||||||||
|
|
|
|
|
|||||||||||||||||
| Class I: |
||||||||||||||||||||
| Proceeds from sale of shares |
— | — | ||||||||||||||||||
| Shares issued in reinvestment of distributions |
— | — | ||||||||||||||||||
| Cost of shares redeemed |
— | — | ||||||||||||||||||
|
|
|
|
|
|||||||||||||||||
| Total Class I capital share transactions |
— | — | ||||||||||||||||||
|
|
|
|
|
|||||||||||||||||
| Net increase (decrease) in net assets derived from capital share transactions |
14,783,063 | (5,340,263) | ||||||||||||||||||
|
|
|
|
|
|||||||||||||||||
| Net increase (decrease) in net assets |
8,332,673 | 7,703,654 | ||||||||||||||||||
| Net assets at beginning of period |
36,769,795 | 29,066,141 | ||||||||||||||||||
|
|
|
|
|
|||||||||||||||||
| Net assets at end of period |
$ | 45,102,468 | $ | 36,769,795 | ||||||||||||||||
|
|
|
|
|
|||||||||||||||||
1 For the period October 1, 2021 (Commencement of Operations) to March 31, 2022.
See accompanying Notes to Financial Statements.
| 269 / Annual Report March 2022 |
Table of Contents
Metropolitan West Funds
Statements of Changes in Net Assets
| CORPORATE BOND FUND |
ESG SECURITIZED |
FLEXIBLE
INCOME FUND |
||||||||||||||||||||||||||||||||||||||||||||||||||
| YEAR ENDED MARCH 31, 2022 |
YEAR ENDED MARCH 31, 2021 |
PERIOD ENDED MARCH 31, 2022 |
YEAR ENDED MARCH 31, 2022 |
YEAR ENDED MARCH 31, 2021 |
||||||||||||||||||||||||||||||||||||||||||||||||
| $ | 283,009 | $ | 286,040 | $ | 48,431 | $ | 17,239,534 | $ | 4,908,854 | |||||||||||||||||||||||||||||||||||||||||||
| (8,971) | 25,535 | (178,537) | (2,327,445) | (450,019) | ||||||||||||||||||||||||||||||||||||||||||||||||
| 11,877 | 47,444 | 41,302 | (638,721) | 827,523 | ||||||||||||||||||||||||||||||||||||||||||||||||
| (958,560) | (242,672) | (590,523) | (17,854,385) | (2,518,196) | ||||||||||||||||||||||||||||||||||||||||||||||||
| (46,061) | 21,784 | 32,506 | (583,759) | 382,408 | ||||||||||||||||||||||||||||||||||||||||||||||||
|
|
|
|
|
|
|
|
|
|
|
|||||||||||||||||||||||||||||||||||||||||||
| (718,706) | 138,131 | (646,821) | (4,164,776) | 3,150,570 | ||||||||||||||||||||||||||||||||||||||||||||||||
|
|
|
|
|
|
|
|
|
|
|
|||||||||||||||||||||||||||||||||||||||||||
| (175,170) | (203,386) | (27) | (2,339,927) | (662,014) | ||||||||||||||||||||||||||||||||||||||||||||||||
| (196,581) | (149,087) | (48,411) | (15,439,721) | (4,457,044) | ||||||||||||||||||||||||||||||||||||||||||||||||
|
|
|
|
|
|
|
|
|
|
|
|||||||||||||||||||||||||||||||||||||||||||
| (371,751) | (352,473) | (48,438) | (17,779,648) | (5,119,058) | ||||||||||||||||||||||||||||||||||||||||||||||||
|
|
|
|
|
|
|
|
|
|
|
|||||||||||||||||||||||||||||||||||||||||||
| 2,092,063 | 13,648,657 | 16,900 | 34,113,901 | 32,392,444 | ||||||||||||||||||||||||||||||||||||||||||||||||
| 173,672 | 201,816 | 27 | 2,241,577 | 642,289 | ||||||||||||||||||||||||||||||||||||||||||||||||
| (4,376,008) | (6,263,385) | — | (22,445,482) | (11,600,746) | ||||||||||||||||||||||||||||||||||||||||||||||||
|
|
|
|
|
|
|
|
|
|
|
|||||||||||||||||||||||||||||||||||||||||||
| (2,110,273) | 7,587,088 | 16,927 | 13,909,996 | 21,433,987 | ||||||||||||||||||||||||||||||||||||||||||||||||
|
|
|
|
|
|
|
|
|
|
|
|||||||||||||||||||||||||||||||||||||||||||
| 3,935,189 | 3,272,792 | 11,304,164 | 128,698,215 | 154,410,363 | ||||||||||||||||||||||||||||||||||||||||||||||||
| 194,382 | 147,918 | 48,411 | 15,356,960 | 4,446,944 | ||||||||||||||||||||||||||||||||||||||||||||||||
| (1,292,494) | (1,141,757) | (3,078) | (106,370,251) | (7,249,876) | ||||||||||||||||||||||||||||||||||||||||||||||||
|
|
|
|
|
|
|
|
|
|
|
|||||||||||||||||||||||||||||||||||||||||||
| 2,837,077 | 2,278,953 | 11,349,497 | 37,684,924 | 151,607,431 | ||||||||||||||||||||||||||||||||||||||||||||||||
|
|
|
|
|
|
|
|
|
|
|
|||||||||||||||||||||||||||||||||||||||||||
| 726,804 | 9,866,041 | 11,366,424 | 51,594,920 | 173,041,418 | ||||||||||||||||||||||||||||||||||||||||||||||||
|
|
|
|
|
|
|
|
|
|
|
|||||||||||||||||||||||||||||||||||||||||||
| (363,653) | 9,651,699 | 10,671,165 | 29,650,496 | 171,072,930 | ||||||||||||||||||||||||||||||||||||||||||||||||
| 12,920,491 | 3,268,792 | — | 180,008,005 | 8,935,075 | ||||||||||||||||||||||||||||||||||||||||||||||||
|
|
|
|
|
|
|
|
|
|
|
|||||||||||||||||||||||||||||||||||||||||||
| $ | 12,556,838 | $ | 12,920,491 | $ | 10,671,165 | $ | 209,658,501 | $ | 180,008,005 | |||||||||||||||||||||||||||||||||||||||||||
|
|
|
|
|
|
|
|
|
|
|
|||||||||||||||||||||||||||||||||||||||||||
See accompanying Notes to Financial Statements.
| Annual Report March 2022 / 270 |
Table of Contents
Metropolitan West Funds
Statements of Changes in Net Assets
| FLOATING RATE INCOME FUND |
||||||||||||||||||||
| YEAR ENDED 2022 |
YEAR ENDED 2021 |
|||||||||||||||||||
| Operations: |
||||||||||||||||||||
| Net investment income |
$ | 15,667,466 | $ | 10,056,510 | ||||||||||||||||
| Net realized gain (loss) on investments |
481,354 | 861,658 | ||||||||||||||||||
| Net realized gain (loss) on futures contracts, foreign currency exchange contracts, foreign currency transactions, options and swaptions written and swap contracts |
496,884 | 129,471 | ||||||||||||||||||
| Net change in unrealized appreciation (depreciation) on investments |
(8,898,950) | 26,740,238 | ||||||||||||||||||
| Net change in unrealized appreciation (depreciation) on futures contracts, foreign currency exchange contracts, foreign currency transactions, options and swaptions written and swap contracts |
(431,315) | 444,053 | ||||||||||||||||||
|
|
|
|
|
|||||||||||||||||
| Net increase (decrease) in net assets resulting from operations |
7,315,439 | 38,231,930 | ||||||||||||||||||
|
|
|
|
|
|||||||||||||||||
| Distributions to Shareholders: |
||||||||||||||||||||
| Class M |
(474,766) | (295,044) | ||||||||||||||||||
| Class I |
(15,224,684) | (9,868,566) | ||||||||||||||||||
| Plan Class |
(4) | (1) | ||||||||||||||||||
|
|
|
|
|
|||||||||||||||||
| Total Distributions |
(15,699,454) | (10,163,611) | ||||||||||||||||||
|
|
|
|
|
|||||||||||||||||
| Capital Share Transactions: |
||||||||||||||||||||
| Class M: |
||||||||||||||||||||
| Proceeds from sale of shares |
9,213,283 | 12,304,196 | ||||||||||||||||||
| Shares issued in reinvestment of distributions |
438,152 | 280,843 | ||||||||||||||||||
| Cost of shares redeemed |
(6,177,939) | (5,625,876) | ||||||||||||||||||
|
|
|
|
|
|||||||||||||||||
| Total Class M capital share transactions |
3,473,496 | 6,959,163 | ||||||||||||||||||
|
|
|
|
|
|||||||||||||||||
| Class I: |
||||||||||||||||||||
| Proceeds from sale of shares |
125,936,632 | 155,690,567 | ||||||||||||||||||
| Shares issued in reinvestment of distributions |
13,378,948 | 8,526,760 | ||||||||||||||||||
| Cost of shares redeemed |
(74,037,959) | (23,773,857) | ||||||||||||||||||
|
|
|
|
|
|||||||||||||||||
| Total Class I capital share transactions |
65,277,621 | 140,443,470 | ||||||||||||||||||
|
|
|
|
|
|||||||||||||||||
| Plan Class: |
||||||||||||||||||||
| Proceeds from sale of shares |
— | 100 | ||||||||||||||||||
| Shares issued in reinvestment of distributions |
4 | 1 | ||||||||||||||||||
|
|
|
|
|
|||||||||||||||||
| Total Plan Class capital share transactions |
4 | 101 | ||||||||||||||||||
|
|
|
|
|
|||||||||||||||||
| Net increase (decrease) in net assets derived from capital share transactions |
68,751,121 | 147,402,734 | ||||||||||||||||||
|
|
|
|
|
|||||||||||||||||
| Net increase (decrease) in net assets |
60,367,106 | 175,471,053 | ||||||||||||||||||
| Net assets at beginning of year |
431,741,923 | 256,270,870 | ||||||||||||||||||
|
|
|
|
|
|||||||||||||||||
| Net assets at end of year |
$ | 492,109,029 | $ | 431,741,923 | ||||||||||||||||
|
|
|
|
|
|||||||||||||||||
See accompanying Notes to Financial Statements.
| 271 / Annual Report March 2022 |
Table of Contents
Metropolitan West Funds
Statements of Changes in Net Assets
|
HIGH YIELD BOND FUND |
INTERMEDIATE BOND FUND |
INVESTMENT GRADE CREDIT FUND |
||||||||||||||||||||||||||||||||||||||||||||||||
| YEAR ENDED MARCH 31, 2022 |
YEAR ENDED MARCH 31, 2021 |
YEAR ENDED MARCH 31, 2022 |
YEAR ENDED MARCH 31, 2021 |
YEAR ENDED MARCH 31, 2022 |
YEAR ENDED MARCH 31, 2021 |
|||||||||||||||||||||||||||||||||||||||||||||
| $ | 30,268,465 | $ | 24,889,710 | $ | 10,473,927 | $ | 11,100,553 | $ | 907,924 | $ | 764,221 | |||||||||||||||||||||||||||||||||||||||
| (1,676,256) | 31,915,009 | (15,994,312) | 15,208,540 | (444,321) | (52,230) | |||||||||||||||||||||||||||||||||||||||||||||
| 231,559 | 2,999,256 | (2,721,431) | 3,572,735 | (62,217) | 127,668 | |||||||||||||||||||||||||||||||||||||||||||||
| (40,521,550) | 38,931,819 | (26,631,047) | 7,272,926 | (1,341,034) | (58,463) | |||||||||||||||||||||||||||||||||||||||||||||
| 1,689,902 | (660,307) | (1,890,795) | (2,238,949) | (80,875) | 27,307 | |||||||||||||||||||||||||||||||||||||||||||||
|
|
|
|
|
|
|
|
|
|
|
|
|
|||||||||||||||||||||||||||||||||||||||
| (10,007,880) | 98,075,487 | (36,763,658) | 34,915,805 | (1,020,523) | 808,503 | |||||||||||||||||||||||||||||||||||||||||||||
|
|
|
|
|
|
|
|
|
|
|
|
|
|||||||||||||||||||||||||||||||||||||||
| (7,194,383) | (6,482,162) | (443,189) | (1,392,395) | (149,533) | (144,289) | |||||||||||||||||||||||||||||||||||||||||||||
| (23,164,913) | (18,425,433) | (12,811,756) | (28,359,551) | (781,732) | (764,833) | |||||||||||||||||||||||||||||||||||||||||||||
| — | — | — | — | — | — | |||||||||||||||||||||||||||||||||||||||||||||
|
|
|
|
|
|
|
|
|
|
|
|
|
|||||||||||||||||||||||||||||||||||||||
| (30,359,296) | (24,907,595) | (13,254,945) | (29,751,946) | (931,265) | (909,122) | |||||||||||||||||||||||||||||||||||||||||||||
|
|
|
|
|
|
|
|
|
|
|
|
|
|||||||||||||||||||||||||||||||||||||||
| 45,528,862 | 128,950,497 | 6,888,933 | 14,300,978 | 4,340,421 | 4,313,649 | |||||||||||||||||||||||||||||||||||||||||||||
| 6,938,480 | 6,182,278 | 441,176 | 1,381,730 | 147,501 | 143,142 | |||||||||||||||||||||||||||||||||||||||||||||
| (71,472,671) | (84,380,539) | (17,389,296) | (13,231,790) | (4,007,782) | (3,117,649) | |||||||||||||||||||||||||||||||||||||||||||||
|
|
|
|
|
|
|
|
|
|
|
|
|
|||||||||||||||||||||||||||||||||||||||
| (19,005,329) | 50,752,236 | (10,059,187) | 2,450,918 | 480,140 | 1,339,142 | |||||||||||||||||||||||||||||||||||||||||||||
|
|
|
|
|
|
|
|
|
|
|
|
|
|||||||||||||||||||||||||||||||||||||||
| 299,304,142 | 496,253,964 | 156,352,081 | 235,831,557 | 17,529,268 | 4,570,081 | |||||||||||||||||||||||||||||||||||||||||||||
| 22,131,407 | 17,007,731 | 12,800,407 | 28,333,173 | 772,045 | 761,991 | |||||||||||||||||||||||||||||||||||||||||||||
| (309,772,975) | (282,701,987) | (118,572,331) | (196,139,375) | (18,161,123) | (1,607,145) | |||||||||||||||||||||||||||||||||||||||||||||
|
|
|
|
|
|
|
|
|
|
|
|
|
|||||||||||||||||||||||||||||||||||||||
| 11,662,574 | 230,559,708 | 50,580,157 | 68,025,355 | 140,190 | 3,724,927 | |||||||||||||||||||||||||||||||||||||||||||||
|
|
|
|
|
|
|
|
|
|
|
|
|
|||||||||||||||||||||||||||||||||||||||
| — | — | — | — | — | — | |||||||||||||||||||||||||||||||||||||||||||||
| — | — | — | — | — | — | |||||||||||||||||||||||||||||||||||||||||||||
|
|
|
|
|
|
|
|
|
|
|
|
|
|||||||||||||||||||||||||||||||||||||||
| — | — | — | — | — | — | |||||||||||||||||||||||||||||||||||||||||||||
|
|
|
|
|
|
|
|
|
|
|
|
|
|||||||||||||||||||||||||||||||||||||||
| (7,342,755) | 281,311,944 | 40,520,970 | 70,476,273 | 620,330 | 5,064,069 | |||||||||||||||||||||||||||||||||||||||||||||
|
|
|
|
|
|
|
|
|
|
|
|
|
|||||||||||||||||||||||||||||||||||||||
| (47,709,931) | 354,479,836 | (9,497,633) | 75,640,132 | (1,331,458) | 4,963,450 | |||||||||||||||||||||||||||||||||||||||||||||
| 770,419,143 | 415,939,307 | 802,514,812 | 726,874,680 | 12,230,584 | 7,267,134 | |||||||||||||||||||||||||||||||||||||||||||||
|
|
|
|
|
|
|
|
|
|
|
|
|
|||||||||||||||||||||||||||||||||||||||
| $ | 722,709,212 | $ | 770,419,143 | $ | 793,017,179 | $ | 802,514,812 | $ | 10,899,126 | $ | 12,230,584 | |||||||||||||||||||||||||||||||||||||||
|
|
|
|
|
|
|
|
|
|
|
|
|
|||||||||||||||||||||||||||||||||||||||
See accompanying Notes to Financial Statements.
| Annual Report March 2022 / 272 |
Table of Contents
Metropolitan West Funds
Statements of Changes in Net Assets
| LOW DURATION BOND FUND |
||||||||||||||||
| YEAR ENDED 2022 |
YEAR ENDED 2021 |
|||||||||||||||
| Operations: |
||||||||||||||||
| Net investment income |
$ | 27,294,076 | $ | 29,411,632 | ||||||||||||
| Net realized gain (loss) on investments |
(36,485,215) | 1,700,514 | ||||||||||||||
| Net realized gain (loss) on futures contracts, foreign currency exchange contracts, foreign currency transactions, options and swaptions written and swap contracts |
3,587,099 | 13,241,930 | ||||||||||||||
| Net change in unrealized appreciation (depreciation) on investments |
(57,844,618) | 35,458,148 | ||||||||||||||
| Net change in unrealized appreciation (depreciation) on futures contracts, foreign currency exchange contracts, foreign currency transactions, options and swaptions written and swap contracts |
(2,832,113) | 974,839 | ||||||||||||||
|
|
|
|
|
|||||||||||||
| Net increase (decrease) in net assets resulting from operations |
(66,280,771) | 80,787,063 | ||||||||||||||
|
|
|
|
|
|||||||||||||
| Distributions to Shareholders: |
||||||||||||||||
| Class M |
(4,077,753) | (5,196,975) | ||||||||||||||
| Class I |
(23,238,389) | (24,338,731) | ||||||||||||||
| Class I-2 |
— | — | ||||||||||||||
| Administrative Class |
(13,227) | (1,056) | ||||||||||||||
| Plan Class |
— | — | ||||||||||||||
|
|
|
|
|
|||||||||||||
| Total Distributions |
(27,329,369) | (29,536,762) | ||||||||||||||
|
|
|
|
|
|||||||||||||
| Capital Share Transactions: |
||||||||||||||||
| Class M: |
||||||||||||||||
| Proceeds from sale of shares |
110,632,030 | 118,060,426 | ||||||||||||||
| Shares issued in reinvestment of distributions |
4,002,713 | 5,086,410 | ||||||||||||||
| Cost of shares redeemed |
(68,254,259) | (139,138,520) | ||||||||||||||
|
|
|
|
|
|||||||||||||
| Total Class M capital share transactions |
46,380,484 | (15,991,684) | ||||||||||||||
|
|
|
|
|
|||||||||||||
| Class I: |
||||||||||||||||
| Proceeds from sale of shares |
901,301,727 | 933,006,583 | ||||||||||||||
| Shares issued in reinvestment of distributions |
21,716,728 | 22,805,603 | ||||||||||||||
| Cost of shares redeemed |
(862,338,899) | (417,147,385) | ||||||||||||||
|
|
|
|
|
|||||||||||||
| Total Class I capital share transactions |
60,679,556 | 538,664,801 | ||||||||||||||
|
|
|
|
|
|||||||||||||
| Class I-2: |
||||||||||||||||
| Proceeds from sale of shares |
— | — | ||||||||||||||
| Shares issued in reinvestment of distributions |
— | — | ||||||||||||||
| Cost of shares redeemed |
— | — | ||||||||||||||
|
|
|
|
|
|||||||||||||
| Total Class I-2 capital share transactions |
— | — | ||||||||||||||
|
|
|
|
|
|||||||||||||
| Administrative Class: |
||||||||||||||||
| Proceeds from sale of shares |
2,796,443 | 8,700 | ||||||||||||||
| Shares issued in reinvestment of distributions |
13,091 | 683 | ||||||||||||||
| Cost of shares redeemed |
(1,108,347) | (17,573) | ||||||||||||||
|
|
|
|
|
|||||||||||||
| Total Administrative Class capital share transactions |
1,701,187 | (8,190) | ||||||||||||||
|
|
|
|
|
|||||||||||||
| Plan Class: |
||||||||||||||||
| Proceeds from sale of shares |
— | — | ||||||||||||||
| Shares issued in reinvestment of distributions |
— | — | ||||||||||||||
| Cost of shares redeemed |
— | — | ||||||||||||||
|
|
|
|
|
|||||||||||||
| Total Plan Class capital share transactions |
— | — | ||||||||||||||
|
|
|
|
|
|||||||||||||
| Net increase (decrease) in net assets derived from capital share transactions |
108,761,227 | 522,664,927 | ||||||||||||||
|
|
|
|
|
|||||||||||||
| Net increase (decrease) in net assets |
15,151,087 | 573,915,228 | ||||||||||||||
| Net assets at beginning of period |
2,480,166,396 | 1,906,251,168 | ||||||||||||||
|
|
|
|
|
|||||||||||||
| Net assets at end of period |
$ | 2,495,317,483 | $ | 2,480,166,396 | ||||||||||||
|
|
|
|
|
|||||||||||||
1 For the period August 2, 2021 (Commencement of Operations) to March 31, 2022.
See accompanying Notes to Financial Statements.
| 273 / Annual Report March 2022 |
Table of Contents
Metropolitan West Funds
Statements of Changes in Net Assets
| OPPORTUNISTIC HIGH CREDIT FUND1 |
STRATEGIC INCOME FUND |
TOTAL RETURN BOND FUND |
||||||||||||||||||||||||||||||||||||||||||||
| PERIOD ENDED |
YEAR ENDED MARCH 31, 2022 |
YEAR ENDED MARCH 31, 2021 |
YEAR ENDED MARCH 31, 2022 |
YEAR ENDED MARCH 31, 2021 |
||||||||||||||||||||||||||||||||||||||||||
| $ | 248,699 | $ | 2,817,560 | $ | 2,346,661 | $ | 1,197,446,581 | $ | 1,292,401,141 | |||||||||||||||||||||||||||||||||||||
| (9,348) | (1,183,895) | 848,648 | (1,458,293,186) | 452,557,388 | ||||||||||||||||||||||||||||||||||||||||||
| (11,230) | (23,082) | (137,103) | 550,389 | 475,652,006 | ||||||||||||||||||||||||||||||||||||||||||
| (292,301) | (2,290,792) | 2,723,287 | (3,001,495,494) | 719,966,446 | ||||||||||||||||||||||||||||||||||||||||||
| (6,598) | (144,164) | 662,178 | (384,017,226) | (136,071,576) | ||||||||||||||||||||||||||||||||||||||||||
|
|
|
|
|
|
|
|
|
|
|
|||||||||||||||||||||||||||||||||||||
| (70,778) | (824,373) | 6,443,671 | (3,645,808,936) | 2,804,505,405 | ||||||||||||||||||||||||||||||||||||||||||
|
|
|
|
|
|
|
|
|
|
|
|||||||||||||||||||||||||||||||||||||
| (2,442) | (1,701,371) | (790,679) | (83,270,314) | (568,049,079) | ||||||||||||||||||||||||||||||||||||||||||
| (262,705) | (1,116,579) | (1,569,363) | (744,903,628) | (3,188,499,462) | ||||||||||||||||||||||||||||||||||||||||||
| — | — | — | (2,377,375) | (6,121,053) | ||||||||||||||||||||||||||||||||||||||||||
| — | — | — | (22,035,853) | (116,011,676) | ||||||||||||||||||||||||||||||||||||||||||
| — | — | — | (360,557,055) | (1,638,444,684) | ||||||||||||||||||||||||||||||||||||||||||
|
|
|
|
|
|
|
|
|
|
|
|||||||||||||||||||||||||||||||||||||
| (265,147) | (2,817,950) | (2,360,042) | (1,213,144,225) | (5,517,125,954) | ||||||||||||||||||||||||||||||||||||||||||
|
|
|
|
|
|
|
|
|
|
|
|||||||||||||||||||||||||||||||||||||
| 75,360 | 9,366,413 | 12,357,964 | 1,604,298,220 | 2,796,785,096 | ||||||||||||||||||||||||||||||||||||||||||
| 2,442 | 1,657,387 | 777,664 | 82,422,477 | 563,596,147 | ||||||||||||||||||||||||||||||||||||||||||
| (2,160) | (7,461,785) | (8,819,965) | (2,239,839,907) | (4,976,311,646) | ||||||||||||||||||||||||||||||||||||||||||
|
|
|
|
|
|
|
|
|
|
|
|||||||||||||||||||||||||||||||||||||
| 75,642 | 3,562,015 | 4,315,663 | (553,119,210) | (1,615,930,403) | ||||||||||||||||||||||||||||||||||||||||||
|
|
|
|
|
|
|
|
|
|
|
|||||||||||||||||||||||||||||||||||||
| 3,038,921 | 7,073,460 | 5,452,200 | 13,144,834,948 | 18,725,199,269 | ||||||||||||||||||||||||||||||||||||||||||
| 262,706 | 1,100,021 | 1,563,564 | 670,343,885 | 2,889,943,410 | ||||||||||||||||||||||||||||||||||||||||||
| — | (7,240,177) | (48,809,465) | (16,882,618,501) | (13,078,407,390) | ||||||||||||||||||||||||||||||||||||||||||
|
|
|
|
|
|
|
|
|
|
|
|||||||||||||||||||||||||||||||||||||
| 3,301,627 | 933,304 | (41,793,701) | (3,067,439,668) | 8,536,735,289 | ||||||||||||||||||||||||||||||||||||||||||
|
|
|
|
|
|
|
|
|
|
|
|||||||||||||||||||||||||||||||||||||
| — | — | — | 130,016,682 | 130,514,638 | ||||||||||||||||||||||||||||||||||||||||||
| — | — | — | 2,376,867 | 6,121,040 | ||||||||||||||||||||||||||||||||||||||||||
| — | — | — | (66,406,517) | (12,135,534) | ||||||||||||||||||||||||||||||||||||||||||
|
|
|
|
|
|
|
|
|
|
|
|||||||||||||||||||||||||||||||||||||
| — | — | — | 65,987,032 | 124,500,144 | ||||||||||||||||||||||||||||||||||||||||||
|
|
|
|
|
|
|
|
|
|
|
|||||||||||||||||||||||||||||||||||||
| — | — | — | 423,045,579 | 672,097,128 | ||||||||||||||||||||||||||||||||||||||||||
| — | — | — | 21,698,938 | 114,756,083 | ||||||||||||||||||||||||||||||||||||||||||
| — | — | — | (442,994,344) | (376,823,384) | ||||||||||||||||||||||||||||||||||||||||||
|
|
|
|
|
|
|
|
|
|
|
|||||||||||||||||||||||||||||||||||||
| — | — | — | 1,750,173 | 410,029,827 | ||||||||||||||||||||||||||||||||||||||||||
|
|
|
|
|
|
|
|
|
|
|
|||||||||||||||||||||||||||||||||||||
| — | — | — | 4,844,083,639 | 7,748,078,022 | ||||||||||||||||||||||||||||||||||||||||||
| — | — | — | 336,972,234 | 1,525,649,602 | ||||||||||||||||||||||||||||||||||||||||||
| — | — | — | (6,203,634,631) | (7,703,153,603) | ||||||||||||||||||||||||||||||||||||||||||
|
|
|
|
|
|
|
|
|
|
|
|||||||||||||||||||||||||||||||||||||
| — | — | — | (1,022,578,758) | 1,570,574,021 | ||||||||||||||||||||||||||||||||||||||||||
|
|
|
|
|
|
|
|
|
|
|
|||||||||||||||||||||||||||||||||||||
| 3,377,269 | 4,495,319 | (37,478,038) | (4,575,400,431) | 9,025,908,878 | ||||||||||||||||||||||||||||||||||||||||||
|
|
|
|
|
|
|
|
|
|
|
|||||||||||||||||||||||||||||||||||||
| 3,041,344 | 852,996 | (33,394,409) | (9,434,353,592) | 6,313,288,329 | ||||||||||||||||||||||||||||||||||||||||||
| — | 25,270,304 | 58,664,713 | 86,941,182,803 | 80,627,894,474 | ||||||||||||||||||||||||||||||||||||||||||
|
|
|
|
|
|
|
|
|
|
|
|||||||||||||||||||||||||||||||||||||
| $ | 3,041,344 | $ | 26,123,300 | $ | 25,270,304 | $ | 77,506,829,211 | $ | 86,941,182,803 | |||||||||||||||||||||||||||||||||||||
|
|
|
|
|
|
|
|
|
|
|
|||||||||||||||||||||||||||||||||||||
See accompanying Notes to Financial Statements.
| Annual Report March 2022 / 274 |
Table of Contents
Metropolitan West Funds
Statements of Changes in Net Assets
| ULTRA SHORT BOND FUND |
||||||||||||||||
| YEAR ENDED 2022 |
YEAR ENDED 2021 |
|||||||||||||||
| Operations: |
||||||||||||||||
| Net investment income |
$ | 1,492,628 | $ | 1,362,028 | ||||||||||||
| Net realized gain (loss) on investments |
(2,386,196) | (2,185,391) | ||||||||||||||
| Net realized gain (loss) on futures contracts, foreign currency exchange contracts, foreign currency transactions, options and swaptions written and swap contracts |
966,263 | 1,666,277 | ||||||||||||||
| Net change in unrealized appreciation (depreciation) on investments |
(2,774,008) | 919,153 | ||||||||||||||
| Net change in unrealized appreciation (depreciation) on futures contracts, foreign currency exchange contracts, foreign currency transactions, options and swaptions written and swap contracts |
104,464 | 396,651 | ||||||||||||||
|
|
|
|
|
|||||||||||||
| Net increase (decrease) in net assets resulting from operations |
(2,596,849) | 2,158,718 | ||||||||||||||
|
|
|
|
|
|||||||||||||
| Distributions to Shareholders: |
||||||||||||||||
| Class M |
(276,449) | (271,401) | ||||||||||||||
| Class I |
(1,258,061) | (1,091,869) | ||||||||||||||
| Plan Class |
— | — | ||||||||||||||
|
|
|
|
|
|||||||||||||
| Total Distributions |
(1,534,510) | (1,363,270) | ||||||||||||||
|
|
|
|
|
|||||||||||||
| Capital Share Transactions: |
||||||||||||||||
| Class M: |
||||||||||||||||
| Proceeds from sale of shares |
17,118,785 | 93,315,754 | ||||||||||||||
| Shares issued in reinvestment of distributions |
270,415 | 262,337 | ||||||||||||||
| Cost of shares redeemed |
(38,965,686) | (60,144,904) | ||||||||||||||
|
|
|
|
|
|||||||||||||
| Total Class M capital share transactions |
(21,576,486) | 33,433,187 | ||||||||||||||
|
|
|
|
|
|||||||||||||
| Class I: |
||||||||||||||||
| Proceeds from sale of shares |
108,718,474 | 175,164,379 | ||||||||||||||
| Shares issued in reinvestment of distributions |
1,257,404 | 1,090,987 | ||||||||||||||
| Cost of shares redeemed |
(129,705,501) | (72,005,589) | ||||||||||||||
|
|
|
|
|
|||||||||||||
| Total Class I capital share transactions |
(19,729,623) | 104,249,777 | ||||||||||||||
|
|
|
|
|
|||||||||||||
| Plan Class: |
||||||||||||||||
| Proceeds from sale of shares |
— | — | ||||||||||||||
| Shares issued in reinvestment of distributions |
— | — | ||||||||||||||
| Cost of shares redeemed |
— | — | ||||||||||||||
|
|
|
|
|
|||||||||||||
| Total Plan Class capital share transactions |
— | — | ||||||||||||||
|
|
|
|
|
|||||||||||||
| Net increase (decrease) in net assets derived from capital share transactions |
(41,306,109) | 137,682,964 | ||||||||||||||
|
|
|
|
|
|||||||||||||
| Net increase (decrease) in net assets |
(45,437,468) | 138,478,412 | ||||||||||||||
| Net assets at beginning of year |
243,172,716 | 104,694,304 | ||||||||||||||
|
|
|
|
|
|||||||||||||
| Net assets at end of year |
$ | 197,735,248 | $ | 243,172,716 | ||||||||||||
|
|
|
|
|
|||||||||||||
See accompanying Notes to Financial Statements.
| 275 / Annual Report March 2022 |
Table of Contents
Metropolitan West Funds
Statements of Changes in Net Assets
|
UNCONSTRAINED BOND FUND |
||||||||||||||||
| YEAR ENDED MARCH 31, 2022 |
YEAR ENDED MARCH 31, 2021 |
|||||||||||||||
| $ | 109,737,964 | $ | 91,663,110 | |||||||||||||
| (19,332,656) | 46,969,957 | |||||||||||||||
| (5,132,321) | 17,884,589 | |||||||||||||||
| (191,824,922) | 144,997,021 | |||||||||||||||
| (17,642,272) | 36,431,263 | |||||||||||||||
|
|
|
|
|
|||||||||||||
| (124,194,207) | 337,945,940 | |||||||||||||||
|
|
|
|
|
|||||||||||||
| (8,753,492) | (8,563,350) | |||||||||||||||
| (143,244,876) | (105,331,786) | |||||||||||||||
| (4,640,426) | (2,741,237) | |||||||||||||||
|
|
|
|
|
|||||||||||||
| (156,638,794) | (116,636,373) | |||||||||||||||
|
|
|
|
|
|||||||||||||
| 40,303,523 | 53,543,701 | |||||||||||||||
| 8,478,824 | 8,240,006 | |||||||||||||||
| (76,856,029) | (89,674,103) | |||||||||||||||
|
|
|
|
|
|||||||||||||
| (28,073,682) | (27,890,396) | |||||||||||||||
|
|
|
|
|
|||||||||||||
| 1,521,241,767 | 1,145,664,099 | |||||||||||||||
| 112,760,716 | 84,772,104 | |||||||||||||||
| (999,465,470) | (916,608,246) | |||||||||||||||
|
|
|
|
|
|||||||||||||
| 634,537,013 | 313,827,957 | |||||||||||||||
|
|
|
|
|
|||||||||||||
| 118,775,444 | 118,175,282 | |||||||||||||||
| 4,598,189 | 2,740,188 | |||||||||||||||
| (58,384,079) | (61,961,252) | |||||||||||||||
|
|
|
|
|
|||||||||||||
| 64,989,554 | 58,954,218 | |||||||||||||||
|
|
|
|
|
|||||||||||||
| 671,452,885 | 344,891,779 | |||||||||||||||
|
|
|
|
|
|||||||||||||
| 390,619,884 | 566,201,346 | |||||||||||||||
| 3,593,527,618 | 3,027,326,272 | |||||||||||||||
|
|
|
|
|
|||||||||||||
| $ | 3,984,147,502 | $ | 3,593,527,618 | |||||||||||||
|
|
|
|
|
|||||||||||||
See accompanying Notes to Financial Statements.
| Annual Report March 2022 / 276 |
Table of Contents
Financial Highlights
|
ALPHATRAK 500 FUND CLASS M |
||||||||||||||||||||||||||||||||||
| YEAR ENDED MARCH 31, 2022 |
YEAR ENDED MARCH 31, 2021 |
YEAR ENDED MARCH 31, 2020 |
YEAR ENDED MARCH 31, 2019 |
YEAR ENDED MARCH 31, 2018 |
||||||||||||||||||||||||||||||
| Net Asset Value, Beginning of Year |
$ | 13.26 | $ | 8.89 | $ | 10.73 | $ | 9.98 | $ | 8.95 | ||||||||||||||||||||||||
|
|
|
|
|
|
|
|
|
|
|
|||||||||||||||||||||||||
| Income from Investment Operations: |
||||||||||||||||||||||||||||||||||
| Net investment income1 |
0.11 | 0.18 | 0.31 | 0.22 | 0.09 | |||||||||||||||||||||||||||||
| Net realized and unrealized gain (loss) |
1.81 | 5.14 | (1.14) | 0.76 | 1.03 | |||||||||||||||||||||||||||||
|
|
|
|
|
|
|
|
|
|
|
|||||||||||||||||||||||||
| Total Income (Loss) from Investment Operations |
1.92 | 5.32 | (0.83) | 0.98 | 1.12 | |||||||||||||||||||||||||||||
|
|
|
|
|
|
|
|
|
|
|
|||||||||||||||||||||||||
| Less Distributions: |
||||||||||||||||||||||||||||||||||
| From net investment income |
(0.12) | (0.20) | (0.30) | (0.23) | (0.09) | |||||||||||||||||||||||||||||
| From net capital gains |
(3.58) | (0.75) | (0.71) | — | — | |||||||||||||||||||||||||||||
|
|
|
|
|
|
|
|
|
|
|
|||||||||||||||||||||||||
| Total Distributions |
(3.70) | (0.95) | (1.01) | (0.23) | (0.09) | |||||||||||||||||||||||||||||
|
|
|
|
|
|
|
|
|
|
|
|||||||||||||||||||||||||
| Net Asset Value, End of Year |
$ | 11.48 | $ | 13.26 | $ | 8.89 | $ | 10.73 | $ | 9.98 | ||||||||||||||||||||||||
|
|
|
|
|
|
|
|
|
|
|
|||||||||||||||||||||||||
| Total Return |
13.35% | 60.83% | (9.36)% | 9.93% | 12.52% | |||||||||||||||||||||||||||||
| Ratios/Supplemental Data: |
||||||||||||||||||||||||||||||||||
| Net Assets, end of year (in thousands) |
$ | 45,102 | $ | 36,770 | $ | 29,066 | $ | 21,202 | $ | 18,149 | ||||||||||||||||||||||||
| Ratio of Expenses to Average Net Assets |
||||||||||||||||||||||||||||||||||
| Before expense waivers and reimbursements |
0.83%2 | 1.26% | 1.04% | 1.39% | 0.90%3 | |||||||||||||||||||||||||||||
| After expense waivers and reimbursements |
0.83% | 0.90% | 0.90% | 0.90% | 0.90% | |||||||||||||||||||||||||||||
| Ratio of Net Investment Income to Average Net Assets |
||||||||||||||||||||||||||||||||||
| After expense waivers and reimbursements |
0.78% | 1.57% | 2.80% | 2.15% | 0.90% | |||||||||||||||||||||||||||||
| Portfolio Turnover Rate |
94% | 60% | 89% | 140% | 115% | |||||||||||||||||||||||||||||
| 1 | Per share numbers have been calculated using the average share method. |
| 2 | Includes recoupment of past waived fees. Excluding the recoupment of past waived fees, the ratio would have been 0.66%. |
| 3 | Includes recoupment of past waived fees. Excluding the recoupment of past waived fees, the ratio would have been 0.88%. |
See accompanying Notes to Financial Statements.
| 277 / Annual Report March 2022 |
Table of Contents
Metropolitan West Funds
Financial Highlights
| CORPORATE BOND FUND CLASS M* |
||||||||||||||||||||||||||||
| YEAR ENDED MARCH 31, 2022 |
YEAR ENDED MARCH 31, 2021 |
YEAR ENDED MARCH 31, 2020 |
PERIOD ENDED MARCH 31, 2019 |
|||||||||||||||||||||||||
| Net Asset Value, Beginning of Period |
$ | 10.65 | $ | 10.32 | $ | 10.31 | $ | 10.00 | ||||||||||||||||||||
|
|
|
|
|
|
|
|
|
|||||||||||||||||||||
| Income from Investment Operations: |
||||||||||||||||||||||||||||
| Net investment income1 |
0.22 | 0.28 | 0.88 | 0.41 | ||||||||||||||||||||||||
| Net realized and unrealized gain (loss) |
(0.69) | 0.50 | 0.06 | 0.34 | ||||||||||||||||||||||||
|
|
|
|
|
|
|
|
|
|||||||||||||||||||||
| Total Income (Loss) from Investment Operations |
(0.47) | 0.78 | 0.94 | 0.75 | ||||||||||||||||||||||||
|
|
|
|
|
|
|
|
|
|||||||||||||||||||||
| Less Distributions: |
||||||||||||||||||||||||||||
| From net investment income |
(0.22) | (0.40) | (0.86) | (0.41) | ||||||||||||||||||||||||
| From net capital gains |
(0.07) | (0.05) | (0.07) | (0.03) | ||||||||||||||||||||||||
|
|
|
|
|
|
|
|
|
|||||||||||||||||||||
| Total Distributions |
(0.29) | (0.45) | (0.93) | (0.44) | ||||||||||||||||||||||||
|
|
|
|
|
|
|
|
|
|||||||||||||||||||||
| Net Asset Value, End of Period |
$ | 9.89 | $ | 10.65 | $ | 10.32 | $ | 10.31 | ||||||||||||||||||||
|
|
|
|
|
|
|
|
|
|||||||||||||||||||||
| Total Return |
(4.67)% | 7.55% | 9.19% | 7.75%2 | ||||||||||||||||||||||||
| Ratios/Supplemental Data: |
||||||||||||||||||||||||||||
| Net Assets, end of period (in thousands) |
$ | 5,622 | $ | 8,190 | $ | 876 | $ | 803 | ||||||||||||||||||||
| Ratio of Expenses to Average Net Assets |
||||||||||||||||||||||||||||
| Before expense waivers and reimbursements |
2.73% | 3.16% | 8.55% | 9.81%3 | ||||||||||||||||||||||||
| After expense waivers and reimbursements |
0.75% | 0.75% | 0.75% | 0.75%3 | ||||||||||||||||||||||||
| Ratio of Net Investment Income to Average Net Assets |
||||||||||||||||||||||||||||
| After expense waivers and reimbursements |
2.01% | 2.54% | 8.31% | 5.47%3 | ||||||||||||||||||||||||
| Portfolio Turnover Rate |
148% | 84% | 65% | 159%2 | ||||||||||||||||||||||||
| * | The Corporate Bond Fund Class M Shares commenced operations on June 29, 2018. |
| 1 | Per share numbers have been calculated using the average share method. |
| 2 | Non-Annualized. |
| 3 | Annualized. |
See accompanying Notes to Financial Statements.
| Annual Report March 2022 / 278 |
Table of Contents
Metropolitan West Funds
Financial Highlights
| CORPORATE BOND FUND CLASS I* |
||||||||||||||||||||||||||||||||||||
|
|
YEAR ENDED MARCH 31, 2022 |
|
YEAR ENDED MARCH 31, 2021 |
|
YEAR ENDED MARCH 31, 2020 |
|
PERIOD ENDED MARCH 31, 2019 |
|||||||||||||||||||||||||||||
| Net Asset Value, Beginning of Period |
$ | 10.65 | $ | 10.32 | $ | 10.31 | $ | 10.00 | ||||||||||||||||||||||||||||
|
|
|
|
|
|
|
|
|
|||||||||||||||||||||||||||||
| Income from Investment Operations: |
||||||||||||||||||||||||||||||||||||
| Net investment income1 |
0.24 | 0.40 | 0.91 | 0.43 | ||||||||||||||||||||||||||||||||
| Net realized and unrealized gain (loss) |
(0.69) | 0.41 | 0.06 | 0.34 | ||||||||||||||||||||||||||||||||
|
|
|
|
|
|
|
|
|
|||||||||||||||||||||||||||||
| Total Income (Loss) from Investment Operations |
(0.45) | 0.81 | 0.97 | 0.77 | ||||||||||||||||||||||||||||||||
|
|
|
|
|
|
|
|
|
|||||||||||||||||||||||||||||
| Less Distributions: |
||||||||||||||||||||||||||||||||||||
| From net investment income |
(0.24) | (0.43) | (0.89) | (0.43) | ||||||||||||||||||||||||||||||||
| From net capital gains |
(0.07) | (0.05) | (0.07) | (0.03) | ||||||||||||||||||||||||||||||||
|
|
|
|
|
|
|
|
|
|||||||||||||||||||||||||||||
| Total Distributions |
(0.31) | (0.48) | (0.96) | (0.46) | ||||||||||||||||||||||||||||||||
|
|
|
|
|
|
|
|
|
|||||||||||||||||||||||||||||
| Net Asset Value, End of Period |
$ | 9.89 | $ | 10.65 | $ | 10.32 | $ | 10.31 | ||||||||||||||||||||||||||||
|
|
|
|
|
|
|
|
|
|||||||||||||||||||||||||||||
| Total Return |
(4.44)% | 7.81% | 9.46% | 7.95%2 | ||||||||||||||||||||||||||||||||
| Ratios/Supplemental Data: |
||||||||||||||||||||||||||||||||||||
| Net Assets, end of period (in thousands) |
$ | 6,935 | $ | 4,730 | $ | 2,392 | $ | 1,355 | ||||||||||||||||||||||||||||
| Ratio of Expenses to Average Net Assets |
||||||||||||||||||||||||||||||||||||
| Before expense waivers and reimbursements |
2.40% | 3.54% | 8.30% | 9.56%3 | ||||||||||||||||||||||||||||||||
| After expense waivers and reimbursements |
0.50% | 0.50% | 0.50% | 0.50%3 | ||||||||||||||||||||||||||||||||
| Ratio of Net Investment Income to Average Net Assets |
||||||||||||||||||||||||||||||||||||
| After expense waivers and reimbursements |
2.25% | 3.64% | 8.62% | 5.72%3 | ||||||||||||||||||||||||||||||||
| Portfolio Turnover Rate |
148% | 84% | 65% | 159%2 | ||||||||||||||||||||||||||||||||
| * | The Corporate Bond Fund Class I Shares commenced operations on June 29, 2018. |
| 1 | Per share numbers have been calculated using the average share method. |
| 2 | Non-Annualized. |
| 3 | Annualized. |
See accompanying Notes to Financial Statements.
| 279 / Annual Report March 2022 |
Table of Contents
Metropolitan West Funds
Financial Highlights
|
ESG SECURITIZED FUND CLASS M* |
||||||||||
|
PERIOD ENDED MARCH 31, 2022 |
||||||||||
| Net Asset Value, Beginning of Period |
$ | 10.00 | ||||||||
|
|
|
|||||||||
| Income from Investment Operations: |
||||||||||
| Net investment income1 |
0.05 | |||||||||
| Net realized and unrealized loss |
(0.61) | |||||||||
|
|
|
|||||||||
| Total (Loss) from Investment Operations |
(0.56) | |||||||||
|
|
|
|||||||||
| Less Distributions: |
||||||||||
| From net investment income |
(0.08) | |||||||||
|
|
|
|||||||||
| Net Asset Value, End of Period |
$ | 9.36 | ||||||||
|
|
|
|||||||||
| Total Return |
(5.60)%2 | |||||||||
| Ratios/Supplemental Data: |
||||||||||
| Net Assets, end of period (in thousands) |
$ | 16 | ||||||||
| Ratio of Expenses to Average Net Assets |
||||||||||
| Before expense waivers and reimbursements |
2.15%3 | |||||||||
| After expense waivers and reimbursements |
0.79%3 | |||||||||
| Ratio of Net Investment Income to Average Net Assets |
||||||||||
| After expense waivers and reimbursements |
0.97%3 | |||||||||
| Portfolio Turnover Rate |
276%2 | |||||||||
| * | The ESG Securitized Fund Class M Shares commenced operations on October 1, 2021. |
| 1 | Per share numbers have been calculated using the average share method. |
| 2 | Non-Annualized. |
| 3 | Annualized. |
See accompanying Notes to Financial Statements.
| Annual Report March 2022 / 280 |
Table of Contents
Metropolitan West Funds
Financial Highlights
|
ESG SECURITIZED FUND CLASS I* |
||||||||||
|
PERIOD ENDED MARCH 31, 2022 |
||||||||||
| Net Asset Value, Beginning of Period |
$ | 10.00 | ||||||||
|
|
|
|||||||||
| Income from Investment Operations: |
||||||||||
| Net investment income1 |
0.05 | |||||||||
| Net realized and unrealized loss |
(0.63) | |||||||||
|
|
|
|||||||||
| Total (Loss) from Investment Operations |
(0.58) | |||||||||
|
|
|
|||||||||
| Less Distributions: |
||||||||||
| From net investment income |
(0.05) | |||||||||
|
|
|
|||||||||
| Net Asset Value, End of Period |
$ | 9.37 | ||||||||
|
|
|
|||||||||
| Total Return |
(5.87)%2 | |||||||||
| Ratios/Supplemental Data: |
||||||||||
| Net Assets, end of period (in thousands) |
$ | 10,655 | ||||||||
| Ratio of Expenses to Average Net Assets |
||||||||||
| Before expense waivers and reimbursements |
1.80%3 | |||||||||
| After expense waivers and reimbursements |
0.49%3 | |||||||||
| Ratio of Net Investment Income to Average Net Assets |
||||||||||
| After expense waivers and reimbursements |
0.94%3 | |||||||||
| Portfolio Turnover Rate |
276%2 | |||||||||
| * | The ESG Securitized Fund Class I Shares commenced operations on October 1, 2021. |
| 1 | Per share numbers have been calculated using the average share method. |
| 2 | Non-Annualized. |
| 3 | Annualized. |
See accompanying Notes to Financial Statements.
| 281 / Annual Report March 2022 |
Table of Contents
Metropolitan West Funds
Financial Highlights
| FLEXIBLE INCOME FUND CLASS M* |
||||||||||||||||||||||||||||||||||||
|
YEAR ENDED MARCH 31, 2022 |
YEAR ENDED MARCH 31, 2021 |
YEAR ENDED MARCH 31, 2020 |
PERIOD ENDED MARCH 31, 2019 |
|||||||||||||||||||||||||||||||||
| Net Asset Value, Beginning of Period |
$ | 9.86 | $ | 9.82 | $ | 10.79 | $ | 10.00 | ||||||||||||||||||||||||||||
|
|
|
|
|
|
|
|
|
|||||||||||||||||||||||||||||
| Income from Investment Operations: |
||||||||||||||||||||||||||||||||||||
| Net investment income1 |
0.88 | 0.69 | 1.86 | 0.23 | ||||||||||||||||||||||||||||||||
| Net realized and unrealized gain (loss) |
(1.07) | 0.34 | (0.85) | 0.79 | ||||||||||||||||||||||||||||||||
|
|
|
|
|
|
|
|
|
|||||||||||||||||||||||||||||
| Total Income (Loss) from Investment Operations |
(0.19) | 1.03 | 1.01 | 1.02 | ||||||||||||||||||||||||||||||||
|
|
|
|
|
|
|
|
|
|||||||||||||||||||||||||||||
| Less Distributions: |
||||||||||||||||||||||||||||||||||||
| From net investment income |
(0.89) | (0.97) | (1.98) | (0.23) | ||||||||||||||||||||||||||||||||
| From net capital gains |
(0.03) | (0.02) | — | — | ||||||||||||||||||||||||||||||||
|
|
|
|
|
|
|
|
|
|||||||||||||||||||||||||||||
| Total Distributions |
(0.92) | (0.99) | (1.98) | (0.23) | ||||||||||||||||||||||||||||||||
|
|
|
|
|
|
|
|
|
|||||||||||||||||||||||||||||
| Net Asset Value, End of Period |
$ | 8.75 | $ | 9.86 | $ | 9.82 | $ | 10.79 | ||||||||||||||||||||||||||||
|
|
|
|
|
|
|
|
|
|||||||||||||||||||||||||||||
| Total Return |
(2.30)% | 10.89% | 9.82% | 10.25%2 | ||||||||||||||||||||||||||||||||
| Ratios/Supplemental Data: |
||||||||||||||||||||||||||||||||||||
| Net Assets, end of period (in thousands) |
$ | 31,941 | $ | 21,174 | $ | 1 | $ | 1 | ||||||||||||||||||||||||||||
| Ratio of Expenses to Average Net Assets |
||||||||||||||||||||||||||||||||||||
| Before expense waivers and reimbursements |
1.04% | 1.28% | 3.76% | 9.18%3 | ||||||||||||||||||||||||||||||||
| After expense waivers and reimbursements |
0.80% | 0.80% | 0.80% | 0.80%3 | ||||||||||||||||||||||||||||||||
| Ratio of Net Investment Income to Average Net Assets |
||||||||||||||||||||||||||||||||||||
| After expense waivers and reimbursements |
9.33% | 7.01% | 17.64% | 6.76%3 | ||||||||||||||||||||||||||||||||
| Portfolio Turnover Rate |
210% | 177% | 122% | 80%2 | ||||||||||||||||||||||||||||||||
| * | The Flexible Income Fund Class M Shares commenced operations on November 30, 2018. |
| 1 | Per share numbers have been calculated using the average share method. |
| 2 | Non-Annualized. |
| 3 | Annualized. |
See accompanying Notes to Financial Statements.
| Annual Report March 2022 / 282 |
Table of Contents
Metropolitan West Funds
Financial Highlights
| FLEXIBLE INCOME FUND CLASS I* |
||||||||||||||||||||||||||||||||||||
|
|
YEAR ENDED MARCH 31, 2022 |
|
YEAR ENDED MARCH 31, 2021 |
|
YEAR ENDED MARCH 31, 2020 |
|
PERIOD ENDED MARCH 31, 2019 |
|||||||||||||||||||||||||||||
| Net Asset Value, Beginning of Period |
$ | 9.86 | $ | 9.82 | $ | 10.78 | $ | 10.00 | ||||||||||||||||||||||||||||
|
|
|
|
|
|
|
|
|
|||||||||||||||||||||||||||||
| Income from Investment Operations: |
||||||||||||||||||||||||||||||||||||
| Net investment income1 |
0.91 | 0.73 | 1.90 | 0.24 | ||||||||||||||||||||||||||||||||
| Net realized and unrealized gain (loss) |
(1.08) | 0.30 | (0.85) | 0.78 | ||||||||||||||||||||||||||||||||
|
|
|
|
|
|
|
|
|
|||||||||||||||||||||||||||||
| Total Income (Loss) from Investment Operations |
(0.17) | 1.03 | 1.05 | 1.02 | ||||||||||||||||||||||||||||||||
|
|
|
|
|
|
|
|
|
|||||||||||||||||||||||||||||
| Less Distributions: |
||||||||||||||||||||||||||||||||||||
| From net investment income |
(0.91) | (0.97) | (2.01) | (0.24) | ||||||||||||||||||||||||||||||||
| From net capital gains |
(0.03) | (0.02) | — | — | ||||||||||||||||||||||||||||||||
|
|
|
|
|
|
|
|
|
|||||||||||||||||||||||||||||
| Total Distributions |
(0.94) | (0.99) | (2.01) | (0.24) | ||||||||||||||||||||||||||||||||
|
|
|
|
|
|
|
|
|
|||||||||||||||||||||||||||||
| Net Asset Value, End of Period |
$ | 8.75 | $ | 9.86 | $ | 9.82 | $ | 10.78 | ||||||||||||||||||||||||||||
|
|
|
|
|
|
|
|
|
|||||||||||||||||||||||||||||
| Total Return |
(2.05)% | 10.83% | 10.14% | 10.24%2 | ||||||||||||||||||||||||||||||||
| Ratios/Supplemental Data: |
||||||||||||||||||||||||||||||||||||
| Net Assets, end of period (in thousands) |
$ | 177,717 | $ | 158,834 | $ | 8,934 | $ | 5,435 | ||||||||||||||||||||||||||||
| Ratio of Expenses to Average Net Assets |
||||||||||||||||||||||||||||||||||||
| Before expense waivers and reimbursements |
0.79% | 1.01% | 3.51% | 8.82%3 | ||||||||||||||||||||||||||||||||
| After expense waivers and reimbursements |
0.55% | 0.55% | 0.55% | 0.55%3 | ||||||||||||||||||||||||||||||||
| Ratio of Net Investment Income to Average Net Assets |
||||||||||||||||||||||||||||||||||||
| After expense waivers and reimbursements |
9.55% | 7.41% | 18.14% | 7.16%3 | ||||||||||||||||||||||||||||||||
| Portfolio Turnover Rate |
210% | 177% | 122% | 80%2 | ||||||||||||||||||||||||||||||||
| * | The Flexible Income Fund Class I Shares commenced operations on November 30, 2018. |
| 1 | Per share numbers have been calculated using the average share method. |
| 2 | Non-Annualized. |
| 3 | Annualized. |
See accompanying Notes to Financial Statements.
| 283 / Annual Report March 2022 |
Table of Contents
Metropolitan West Funds
Financial Highlights
| FLOATING RATE INCOME FUND CLASS M |
||||||||||||||||||||||||||||||
| YEAR ENDED MARCH 31, 2022 |
YEAR ENDED MARCH 31, 2021 |
YEAR ENDED MARCH 31, 2020 |
YEAR ENDED MARCH 31, 2019 |
YEAR ENDED MARCH 31, 2018 |
||||||||||||||||||||||||||
| Net Asset Value, Beginning of Year |
$ | 9.95 | $ | 8.98 | $ | 9.90 | $ | 10.06 | $ | 10.06 | ||||||||||||||||||||
|
|
|
|
|
|
|
|
|
|
|
|||||||||||||||||||||
| Income from Investment Operations: |
||||||||||||||||||||||||||||||
| Net investment income1 |
0.31 | 0.30 | 0.42 | 0.42 | 0.36 | |||||||||||||||||||||||||
| Net realized and unrealized gain (loss) |
(0.16) | 0.97 | (0.92) | (0.15) | — | |||||||||||||||||||||||||
|
|
|
|
|
|
|
|
|
|
|
|||||||||||||||||||||
| Total Income (Loss) from Investment Operations |
0.15 | 1.27 | (0.50) | 0.27 | 0.36 | |||||||||||||||||||||||||
|
|
|
|
|
|
|
|
|
|
|
|||||||||||||||||||||
| Less Distributions: |
||||||||||||||||||||||||||||||
| From net investment income |
(0.31) | (0.30) | (0.42) | (0.43) | (0.36) | |||||||||||||||||||||||||
|
|
|
|
|
|
|
|
|
|
|
|||||||||||||||||||||
| Net Asset Value, End of Year |
$ | 9.79 | $ | 9.95 | $ | 8.98 | $ | 9.90 | $ | 10.06 | ||||||||||||||||||||
|
|
|
|
|
|
|
|
|
|
|
|||||||||||||||||||||
| Total Return |
1.50% | 14.30% | (5.36)% | 2.72% | 3.61% | |||||||||||||||||||||||||
| Ratios/Supplemental Data: |
||||||||||||||||||||||||||||||
| Net Assets, end of year (in thousands) |
$ | 17,003 | $ | 13,815 | $ | 6,084 | $ | 11,229 | $ | 15,802 | ||||||||||||||||||||
| Ratio of Expenses to Average Net Assets |
||||||||||||||||||||||||||||||
| Before expense waivers and reimbursements |
1.00% | 0.99% | 1.00% | 1.03% | 1.04% | |||||||||||||||||||||||||
| After expense waivers and reimbursements |
0.90% | 0.90% | 0.90% | 0.90% | 0.90% | |||||||||||||||||||||||||
| Ratio of Net Investment Income to Average Net Assets |
||||||||||||||||||||||||||||||
| After expense waivers and reimbursements |
3.12% | 3.05% | 4.27% | 4.23% | 3.53% | |||||||||||||||||||||||||
| Portfolio Turnover Rate |
49% | 38% | 51% | 52% | 71% | |||||||||||||||||||||||||
| 1 | Per share numbers have been calculated using the average share method. |
See accompanying Notes to Financial Statements.
| Annual Report March 2022 / 284 |
Table of Contents
Metropolitan West Funds
Financial Highlights
| FLOATING RATE INCOME FUND CLASS I |
||||||||||||||||||||||||||||||
| YEAR ENDED MARCH 31, 2022 |
YEAR ENDED MARCH 31, 2021 |
YEAR ENDED MARCH 31, 2020 |
YEAR ENDED MARCH 31, 2019 |
YEAR ENDED MARCH 31, 2018 |
||||||||||||||||||||||||||
| Net Asset Value, Beginning of Year |
$ | 9.95 | $ | 8.98 | $ | 9.90 | $ | 10.05 | $ | 10.06 | ||||||||||||||||||||
|
|
|
|
|
|
|
|
|
|
|
|||||||||||||||||||||
| Income from Investment Operations: |
||||||||||||||||||||||||||||||
| Net investment income1 |
0.33 | 0.32 | 0.44 | 0.45 | 0.38 | |||||||||||||||||||||||||
| Net realized and unrealized gain (loss) |
(0.17) | 0.97 | (0.92) | (0.15) | (0.01) | |||||||||||||||||||||||||
|
|
|
|
|
|
|
|
|
|
|
|||||||||||||||||||||
| Total Income (Loss) from Investment Operations |
0.16 | 1.29 | (0.48) | 0.30 | 0.37 | |||||||||||||||||||||||||
|
|
|
|
|
|
|
|
|
|
|
|||||||||||||||||||||
| False |
||||||||||||||||||||||||||||||
| Less Distributions: |
||||||||||||||||||||||||||||||
| From net investment income |
(0.33) | (0.32) | (0.44) | (0.45) | (0.38) | |||||||||||||||||||||||||
|
|
|
|
|
|
|
|
|
|
|
|||||||||||||||||||||
| Net Asset Value, End of Year |
$ | 9.78 | $ | 9.95 | $ | 8.98 | $ | 9.90 | $ | 10.05 | ||||||||||||||||||||
|
|
|
|
|
|
|
|
|
|
|
|||||||||||||||||||||
| Total Return |
1.61% | 14.52% | (5.17)% | 3.03% | 3.72% | |||||||||||||||||||||||||
| Ratios/Supplemental Data: |
||||||||||||||||||||||||||||||
| Net Assets, end of year (in thousands) |
$ | 475,105 | $ | 417,927 | $ | 250,187 | $ | 262,407 | $ | 237,759 | ||||||||||||||||||||
| Ratio of Expenses to Average Net Assets |
||||||||||||||||||||||||||||||
| Before expense waivers and reimbursements |
0.69%2 | 0.70%3 | 0.70% | 0.71% | 0.72% | |||||||||||||||||||||||||
| After expense waivers and reimbursements |
0.69% | 0.70% | 0.70% | 0.70% | 0.70% | |||||||||||||||||||||||||
| Ratio of Net Investment Income to Average Net Assets |
||||||||||||||||||||||||||||||
| After expense waivers and reimbursements |
3.32% | 3.25% | 4.47% | 4.50% | 3.77% | |||||||||||||||||||||||||
| Portfolio Turnover Rate |
49% | 38% | 51% | 52% | 71% | |||||||||||||||||||||||||
| 1 | Per share numbers have been calculated using the average share method. |
| 2 | Includes recoupment of past waived fees. Excluding the recoupment of past waived fees, the ratio would have been 0.69%. |
| 3 | Includes recoupment of past waived fees. Excluding the recoupment of past waived fees, the ratio would have been 0.68%. |
See accompanying Notes to Financial Statements.
| 285 / Annual Report March 2022 |
Table of Contents
Metropolitan West Funds
Financial Highlights
| FLOATING
RATE |
||||||||||||||||
| YEAR ENDED MARCH 31, 2022 |
PERIOD ENDED MARCH 31, 2021 |
|||||||||||||||
| Net Asset Value, Beginning of Period |
$ | 9.95 | $ | 9.97 | ||||||||||||
|
|
|
|
|
|||||||||||||
| Income from Investment Operations: |
||||||||||||||||
| Net investment income1 |
0.35 | 0.05 | ||||||||||||||
| Net realized and unrealized loss |
(0.18) | (0.02) | ||||||||||||||
|
|
|
|
|
|||||||||||||
| Total Income from Investment Operations |
0.17 | 0.03 | ||||||||||||||
|
|
|
|
|
|||||||||||||
| Less Distributions: |
||||||||||||||||
| From net investment income |
(0.34) | (0.05) | ||||||||||||||
|
|
|
|
|
|||||||||||||
| Net Asset Value, End of Period |
$ | 9.78 | $ | 9.95 | ||||||||||||
|
|
|
|
|
|||||||||||||
| Total Return |
1.76% | 0.31%2 | ||||||||||||||
| Ratios/Supplemental Data: |
||||||||||||||||
| Net Assets, end of period |
$ | 1023 | $ | 1003 | ||||||||||||
| Ratio of Expenses to Average Net Assets |
||||||||||||||||
| Before expense waivers and reimbursements |
0.65% | 0.62%4 | ||||||||||||||
| After expense waivers and reimbursements |
0.60% | 0.56%4 | ||||||||||||||
| Ratio of Net Investment Income to Average Net Assets |
||||||||||||||||
| After expense waivers and reimbursements |
3.53% | 3.15%4 | ||||||||||||||
| Portfolio Turnover Rate |
49% | 38%2 | ||||||||||||||
| * | The Floating Rate Income Fund Plan Class Shares commenced operations on January 29, 2021. |
| 1 | Per share numbers have been calculated using the average share method. |
| 2 | Non-Annualized. |
| 3 | Represents the whole number without rounding to the 000s. |
| 4 | Annualized. |
See accompanying Notes to Financial Statements.
| Annual Report March 2022 / 286 |
Table of Contents
Metropolitan West Funds
Financial Highlights
| HIGH YIELD BOND FUND CLASS M |
||||||||||||||||||||||||||||||
| YEAR ENDED MARCH 31, 2022 |
YEAR ENDED MARCH 31, 2021 |
YEAR ENDED MARCH 31, 2020 |
YEAR ENDED MARCH 31, 20191 |
YEAR ENDED MARCH 31, 20181 |
||||||||||||||||||||||||||
| Net Asset Value, Beginning of Year |
$ | 10.57 | $ | 9.27 | $ | 9.66 | $ | 9.55 | $ | 9.60 | ||||||||||||||||||||
|
|
|
|
|
|
|
|
|
|
|
|||||||||||||||||||||
| Income from Investment Operations: |
||||||||||||||||||||||||||||||
| Net investment income2 |
0.38 | 0.36 | 0.40 | 0.41 | 0.34 | |||||||||||||||||||||||||
| Net realized and unrealized gain (loss) |
(0.51) | 1.31 | (0.39) | 0.11 | (0.05) | |||||||||||||||||||||||||
|
|
|
|
|
|
|
|
|
|
|
|||||||||||||||||||||
| Total Income (Loss) from Investment Operations |
(0.13) | 1.67 | 0.01 | 0.52 | 0.29 | |||||||||||||||||||||||||
|
|
|
|
|
|
|
|
|
|
|
|||||||||||||||||||||
| Less Distributions: |
||||||||||||||||||||||||||||||
| From net investment income |
(0.38) | (0.37) | (0.40) | (0.41) | (0.34) | |||||||||||||||||||||||||
|
|
|
|
|
|
|
|
|
|
|
|||||||||||||||||||||
| Net Asset Value, End of Year |
$ | 10.06 | $ | 10.57 | $ | 9.27 | $ | 9.66 | $ | 9.55 | ||||||||||||||||||||
|
|
|
|
|
|
|
|
|
|
|
|||||||||||||||||||||
| Total Return |
(1.30)% | 18.14% | (0.06)% | 5.57% | 3.01% | |||||||||||||||||||||||||
| Ratios/Supplemental Data: |
||||||||||||||||||||||||||||||
| Net Assets, end of year (in thousands) |
$ | 169,941 | $ | 198,337 | $ | 126,587 | $ | 187,339 | $ | 211,021 | ||||||||||||||||||||
| Ratio of Expenses to Average Net Assets |
||||||||||||||||||||||||||||||
| Before expense waivers and reimbursements |
0.90% | 0.91% | 0.93% | 0.92% | 0.91% | |||||||||||||||||||||||||
| After expense waivers and reimbursements |
0.85% | 0.85% | 0.85% | 0.85% | 0.85% | |||||||||||||||||||||||||
| Ratio of Net Investment Income to Average Net Assets |
||||||||||||||||||||||||||||||
| After expense waivers and reimbursements |
3.61% | 3.53% | 4.07% | 4.33% | 3.47% | |||||||||||||||||||||||||
| Portfolio Turnover Rate |
117% | 108% | 181% | 120% | 167% | |||||||||||||||||||||||||
| 1 | Consolidated Financial Highlights. |
| 2 | Per share numbers have been calculated using the average share method. |
See accompanying Notes to Financial Statements.
| 287 / Annual Report March 2022 |
Table of Contents
Metropolitan West Funds
Financial Highlights
| HIGH YIELD BOND FUND CLASS I |
||||||||||||||||||||||||||||||
| YEAR ENDED MARCH 31, 2022 |
YEAR ENDED MARCH 31, 2021 |
YEAR ENDED MARCH 31, 2020 |
YEAR ENDED MARCH 31, 20191 |
YEAR ENDED MARCH 31, 20181 |
||||||||||||||||||||||||||
| Net Asset Value, Beginning of Year |
$ | 10.57 | $ | 9.26 | $ | 9.65 | $ | 9.55 | $ | 9.60 | ||||||||||||||||||||
|
|
|
|
|
|
|
|
|
|
|
|||||||||||||||||||||
| Income from Investment Operations: |
||||||||||||||||||||||||||||||
| Net investment income2 |
0.41 | 0.39 | 0.42 | 0.44 | 0.36 | |||||||||||||||||||||||||
| Net realized and unrealized gain (loss) |
(0.52) | 1.31 | (0.39) | 0.09 | (0.05) | |||||||||||||||||||||||||
|
|
|
|
|
|
|
|
|
|
|
|||||||||||||||||||||
| Total Income (Loss) from Investment Operations |
(0.11) | 1.70 | 0.03 | 0.53 | 0.31 | |||||||||||||||||||||||||
|
|
|
|
|
|
|
|
|
|
|
|||||||||||||||||||||
| Less Distributions: |
||||||||||||||||||||||||||||||
| From net investment income |
(0.41) | (0.39) | (0.42) | (0.43) | (0.36) | |||||||||||||||||||||||||
|
|
|
|
|
|
|
|
|
|
|
|||||||||||||||||||||
| Net Asset Value, End of Year |
$ | 10.05 | $ | 10.57 | $ | 9.26 | $ | 9.65 | $ | 9.55 | ||||||||||||||||||||
|
|
|
|
|
|
|
|
|
|
|
|||||||||||||||||||||
| Total Return |
(1.15)% | 18.56% | 0.19% | 5.72% | 3.27% | |||||||||||||||||||||||||
| Ratios/Supplemental Data: |
||||||||||||||||||||||||||||||
| Net Assets, end of year (in thousands) |
$ | 552,768 | $ | 572,082 | $ | 289,352 | $ | 293,241 | $ | 393,368 | ||||||||||||||||||||
| Ratio of Expenses to Average Net Assets |
||||||||||||||||||||||||||||||
| Before expense waivers and reimbursements |
0.61% | 0.61% | 0.62% | 0.63% | 0.63% | |||||||||||||||||||||||||
| After expense waivers and reimbursements |
0.60% | 0.60% | 0.60% | 0.60% | 0.60% | |||||||||||||||||||||||||
| Ratio of Net Investment Income to Average Net Assets |
||||||||||||||||||||||||||||||
| After expense waivers and reimbursements |
3.88% | 3.77% | 4.33% | 4.58% | 3.74% | |||||||||||||||||||||||||
| Portfolio Turnover Rate |
117% | 108% | 181% | 120% | 167% | |||||||||||||||||||||||||
| 1 | Consolidated Financial Highlights. |
| 2 | Per share numbers have been calculated using the average share method. |
See accompanying Notes to Financial Statements.
| Annual Report March 2022 / 288 |
Table of Contents
Metropolitan West Funds
Financial Highlights
| INTERMEDIATE BOND FUND CLASS M |
||||||||||||||||||||||||||||||||||||||||||
|
|
YEAR ENDED MARCH 31, |
|
YEAR ENDED MARCH 31, 2021 |
|
YEAR ENDED MARCH 31, 2020 |
|
YEAR ENDED MARCH 31, 2019 |
|
YEAR ENDED MARCH 31, 2018 |
|||||||||||||||||||||||||||||||||
| Net Asset Value, Beginning of Year |
$ | 10.74 | $ | 10.65 | $ | 10.37 | $ | 10.21 | $ | 10.37 | ||||||||||||||||||||||||||||||||
|
|
|
|
|
|
|
|
|
|
|
|||||||||||||||||||||||||||||||||
| Income from Investment Operations: |
||||||||||||||||||||||||||||||||||||||||||
| Net investment income1 |
0.11 | 0.13 | 0.26 | 0.25 | 0.18 | |||||||||||||||||||||||||||||||||||||
| Net realized and unrealized gain (loss) |
(0.61) | 0.36 | 0.28 | 0.17 | (0.16) | |||||||||||||||||||||||||||||||||||||
|
|
|
|
|
|
|
|
|
|
|
|||||||||||||||||||||||||||||||||
| Total Income (Loss) from Investment Operations |
(0.50) | 0.49 | 0.54 | 0.42 | 0.02 | |||||||||||||||||||||||||||||||||||||
|
|
|
|
|
|
|
|
|
|
|
|||||||||||||||||||||||||||||||||
| Less Distributions: |
||||||||||||||||||||||||||||||||||||||||||
| From net investment income |
(0.11) | (0.13) | (0.26) | (0.26) | (0.18) | |||||||||||||||||||||||||||||||||||||
| From net capital gains |
(0.03) | (0.27) | — | — | — | |||||||||||||||||||||||||||||||||||||
|
|
|
|
|
|
|
|
|
|
|
|||||||||||||||||||||||||||||||||
| Total Distributions |
(0.14) | (0.40) | (0.26) | (0.26) | (0.18) | |||||||||||||||||||||||||||||||||||||
|
|
|
|
|
|
|
|
|
|
|
|||||||||||||||||||||||||||||||||
| Net Asset Value, End of Year |
$ | 10.10 | $ | 10.74 | $ | 10.65 | $ | 10.37 | $ | 10.21 | ||||||||||||||||||||||||||||||||
|
|
|
|
|
|
|
|
|
|
|
|||||||||||||||||||||||||||||||||
| Total Return |
(4.63)% | 4.63% | 5.27% | 4.15% | 0.19% | |||||||||||||||||||||||||||||||||||||
| Ratios/Supplemental Data: |
||||||||||||||||||||||||||||||||||||||||||
| Net Assets, end of year (in thousands) |
$ | 24,746 | $ | 36,452 | $ | 33,836 | $ | 35,343 | $ | 52,942 | ||||||||||||||||||||||||||||||||
| Ratio of Expenses to Average Net Assets |
||||||||||||||||||||||||||||||||||||||||||
| Before expense waivers and reimbursements |
0.70% | 0.71% | 0.71% | 0.69% | 0.70%2 | |||||||||||||||||||||||||||||||||||||
| After expense waivers and reimbursements |
0.70% | 0.70% | 0.70% | 0.69% | 0.70% | |||||||||||||||||||||||||||||||||||||
| Ratio of Net Investment Income to Average Net Assets |
||||||||||||||||||||||||||||||||||||||||||
| After expense waivers and reimbursements |
1.04% | 1.22% | 2.49% | 2.49% | 1.71% | |||||||||||||||||||||||||||||||||||||
| Portfolio Turnover Rate |
399% | 372% | 393% | 277% | 251% | |||||||||||||||||||||||||||||||||||||
| 1 | Per share numbers have been calculated using the average share method. |
| 2 | Includes recoupment of past waived fees. Excluding the recoupment of past waived fees, the ratio would have been 0.67%. |
See accompanying Notes to Financial Statements.
| 289 / Annual Report March 2022 |
Table of Contents
Metropolitan West Funds
Financial Highlights
| INTERMEDIATE BOND FUND CLASS I |
||||||||||||||||||||||||||||||||||||||||||
| YEAR ENDED MARCH 31, 2022 |
YEAR ENDED MARCH 31, 2021 |
YEAR ENDED MARCH 31, 2020 |
YEAR ENDED MARCH 31, 2019 |
YEAR ENDED MARCH 31, 2018 |
||||||||||||||||||||||||||||||||||||||
| Net Asset Value, Beginning of Year |
$ | 10.73 | $ | 10.65 | $ | 10.36 | $ | 10.21 | $ | 10.37 | ||||||||||||||||||||||||||||||||
|
|
|
|
|
|
|
|
|
|
|
|||||||||||||||||||||||||||||||||
| Income from Investment Operations: |
||||||||||||||||||||||||||||||||||||||||||
| Net investment income1 |
0.14 | 0.16 | 0.29 | 0.28 | 0.20 | |||||||||||||||||||||||||||||||||||||
| Net realized and unrealized gain (loss) |
(0.60) | 0.35 | 0.28 | 0.15 | (0.15) | |||||||||||||||||||||||||||||||||||||
|
|
|
|
|
|
|
|
|
|
|
|||||||||||||||||||||||||||||||||
| Total Income (Loss) from Investment Operations |
(0.46) | 0.51 | 0.57 | 0.43 | 0.05 | |||||||||||||||||||||||||||||||||||||
|
|
|
|
|
|
|
|
|
|
|
|||||||||||||||||||||||||||||||||
| Less Distributions: |
||||||||||||||||||||||||||||||||||||||||||
| From net investment income |
(0.14) | (0.16) | (0.28) | (0.28) | (0.21) | |||||||||||||||||||||||||||||||||||||
| From net capital gains |
(0.03) | (0.27) | — | — | — | |||||||||||||||||||||||||||||||||||||
|
|
|
|
|
|
|
|
|
|
|
|||||||||||||||||||||||||||||||||
| Total Distributions |
(0.17) | (0.43) | (0.28) | (0.28) | (0.21) | |||||||||||||||||||||||||||||||||||||
|
|
|
|
|
|
|
|
|
|
|
|||||||||||||||||||||||||||||||||
| Net Asset Value, End of Year |
$ | 10.10 | $ | 10.73 | $ | 10.65 | $ | 10.36 | $ | 10.21 | ||||||||||||||||||||||||||||||||
|
|
|
|
|
|
|
|
|
|
|
|||||||||||||||||||||||||||||||||
| Total Return |
(4.33)% | 4.76% | 5.60% | 4.29% | 0.43% | |||||||||||||||||||||||||||||||||||||
| Ratios/Supplemental Data: |
||||||||||||||||||||||||||||||||||||||||||
| Net Assets, end of year (in thousands) |
$ | 768,271 | $ | 766,063 | $ | 693,038 | $ | 708,645 | $ | 768,254 | ||||||||||||||||||||||||||||||||
| Ratio of Expenses to Average Net Assets |
||||||||||||||||||||||||||||||||||||||||||
| Before expense waivers and reimbursements |
0.47% | 0.48% | 0.48% | 0.47% | 0.46% | |||||||||||||||||||||||||||||||||||||
| After expense waivers and reimbursements |
0.47% | 0.48% | 0.48% | 0.47% | 0.46% | |||||||||||||||||||||||||||||||||||||
| Ratio of Net Investment Income to Average Net Assets |
||||||||||||||||||||||||||||||||||||||||||
| After expense waivers and reimbursements |
1.29% | 1.44% | 2.69% | 2.74% | 1.97% | |||||||||||||||||||||||||||||||||||||
| Portfolio Turnover Rate |
399% | 372% | 393% | 277% | 251% | |||||||||||||||||||||||||||||||||||||
| 1 | Per share numbers have been calculated using the average share method. |
See accompanying Notes to Financial Statements.
| Annual Report March 2022 / 290 |
Table of Contents
Metropolitan West Funds
Financial Highlights
| INVESTMENT GRADE CREDIT FUND CLASS M* |
||||||||||||||||||||||||||||||||||
| YEAR ENDED MARCH 31, 2022 |
YEAR ENDED MARCH 31, 2021 |
YEAR ENDED MARCH 31, 2020 |
PERIOD ENDED MARCH 31, 2019 |
|||||||||||||||||||||||||||||||
| Net Asset Value, Beginning of Period |
$ | 9.67 | $ | 9.65 | $ | 10.31 | $ | 10.00 | ||||||||||||||||||||||||||
|
|
|
|
|
|
|
|
|
|||||||||||||||||||||||||||
| Income from Investment Operations: |
||||||||||||||||||||||||||||||||||
| Net investment income1 |
0.45 | 0.59 | 1.05 | 0.55 | ||||||||||||||||||||||||||||||
| Net realized and unrealized gain (loss) |
(0.95) | 0.17 | (0.55) | 0.33 | ||||||||||||||||||||||||||||||
|
|
|
|
|
|
|
|
|
|||||||||||||||||||||||||||
| Total Income (Loss) from Investment Operations |
(0.50) | 0.76 | 0.50 | 0.88 | ||||||||||||||||||||||||||||||
|
|
|
|
|
|
|
|
|
|||||||||||||||||||||||||||
| Less Distributions: |
||||||||||||||||||||||||||||||||||
| From net investment income |
(0.46) | (0.63) | (1.05) | (0.55) | ||||||||||||||||||||||||||||||
| From net capital gains |
(0.01) | (0.11) | (0.11) | (0.02) | ||||||||||||||||||||||||||||||
|
|
|
|
|
|
|
|
|
|||||||||||||||||||||||||||
| Total Distributions |
(0.47) | (0.74) | (1.16) | (0.57) | ||||||||||||||||||||||||||||||
|
|
|
|
|
|
|
|
|
|||||||||||||||||||||||||||
| Net Asset Value, End of Period |
$ | 8.70 | $ | 9.67 | $ | 9.65 | $ | 10.31 | ||||||||||||||||||||||||||
|
|
|
|
|
|
|
|
|
|||||||||||||||||||||||||||
| Total Return |
(5.42)% | 7.97% | 4.80% | 9.02%2 | ||||||||||||||||||||||||||||||
| Ratios/Supplemental Data: |
||||||||||||||||||||||||||||||||||
| Net Assets, end of period (in thousands) |
$ | 2,259 | $ | 2,126 | $ | 837 | $ | 799 | ||||||||||||||||||||||||||
| Ratio of Expenses to Average Net Assets |
||||||||||||||||||||||||||||||||||
| Before expense waivers and reimbursements |
2.16% | 2.93% | 3.86% | 4.78%3 | ||||||||||||||||||||||||||||||
| After expense waivers and reimbursements |
0.70% | 0.70% | 0.70% | 0.70%3 | ||||||||||||||||||||||||||||||
| Ratio of Net Investment Income to Average Net Assets |
||||||||||||||||||||||||||||||||||
| After expense waivers and reimbursements |
4.75% | 6.02% | 10.33% | 7.20%3 | ||||||||||||||||||||||||||||||
| Portfolio Turnover Rate |
345% | 92% | 76% | 199%2 | ||||||||||||||||||||||||||||||
| * | The Investment Grade Credit Fund Class M Shares commenced operations on June 29, 2018. |
| 1 | Per share numbers have been calculated using the average share method. |
| 2 | Non-Annualized. |
| 3 | Annualized. |
See accompanying Notes to Financial Statements.
| 291 / Annual Report March 2022 |
Table of Contents
Metropolitan West Funds
Financial Highlights
| INVESTMENT GRADE CREDIT FUND CLASS I* |
||||||||||||||||||||||||||||||||||
| YEAR ENDED MARCH 31, 2022 |
YEAR ENDED MARCH 31, 2021 |
YEAR ENDED MARCH 31, 2020 |
PERIOD ENDED MARCH 31, 2019 |
|||||||||||||||||||||||||||||||
| Net Asset Value, Beginning of Period |
$ | 9.67 | $ | 9.65 | $ | 10.31 | $ | 10.00 | ||||||||||||||||||||||||||
|
|
|
|
|
|
|
|
|
|||||||||||||||||||||||||||
| Income from Investment Operations: |
||||||||||||||||||||||||||||||||||
| Net investment income1 |
0.45 | 0.65 | 1.07 | 0.55 | ||||||||||||||||||||||||||||||
| Net realized and unrealized gain (loss) |
(0.93) | 0.13 | (0.55) | 0.34 | ||||||||||||||||||||||||||||||
|
|
|
|
|
|
|
|
|
|||||||||||||||||||||||||||
| Total Income (Loss) from Investment Operations |
(0.48) | 0.78 | 0.52 | 0.89 | ||||||||||||||||||||||||||||||
|
|
|
|
|
|
|
|
|
|||||||||||||||||||||||||||
| Less Distributions: |
||||||||||||||||||||||||||||||||||
| From net investment income |
(0.48) | (0.65) | (1.07) | (0.56) | ||||||||||||||||||||||||||||||
| From net capital gains |
(0.01) | (0.11) | (0.11) | (0.02) | ||||||||||||||||||||||||||||||
|
|
|
|
|
|
|
|
|
|||||||||||||||||||||||||||
| Total Distributions |
(0.49) | (0.76) | (1.18) | (0.58) | ||||||||||||||||||||||||||||||
|
|
|
|
|
|
|
|
|
|||||||||||||||||||||||||||
| Net Asset Value, End of Period |
$ | 8.70 | $ | 9.67 | $ | 9.65 | $ | 10.31 | ||||||||||||||||||||||||||
|
|
|
|
|
|
|
|
|
|||||||||||||||||||||||||||
| Total Return |
(5.22)% | 8.20% | 5.02% | 9.20%2 | ||||||||||||||||||||||||||||||
| Ratios/Supplemental Data: |
||||||||||||||||||||||||||||||||||
| Net Assets, end of period (in thousands) |
$ | 8,640 | $ | 10,105 | $ | 6,431 | $ | 5,081 | ||||||||||||||||||||||||||
| Ratio of Expenses to Average Net Assets |
||||||||||||||||||||||||||||||||||
| Before expense waivers and reimbursements |
1.87% | 2.68% | 3.61% | 4.53%3 | ||||||||||||||||||||||||||||||
| After expense waivers and reimbursements |
0.49% | 0.49% | 0.49% | 0.49%3 | ||||||||||||||||||||||||||||||
| Ratio of Net Investment Income to Average Net Assets |
||||||||||||||||||||||||||||||||||
| After expense waivers and reimbursements |
4.79% | 6.56% | 10.54% | 7.29%3 | ||||||||||||||||||||||||||||||
| Portfolio Turnover Rate |
345% | 92% | 76% | 199%2 | ||||||||||||||||||||||||||||||
| * | The Investment Grade Credit Fund Class I Shares commenced operations on June 29, 2018. |
| 1 | Per share numbers have been calculated using the average share method. |
| 2 | Non-Annualized. |
| 3 | Annualized. |
See accompanying Notes to Financial Statements.
| Annual Report March 2022 / 292 |
Table of Contents
Metropolitan West Funds
Financial Highlights
| LOW DURATION BOND FUND CLASS M |
||||||||||||||||||||||||||||||||||||||||
| YEAR ENDED MARCH 31, 2022 |
YEAR ENDED MARCH 31, 2021 |
YEAR ENDED MARCH 31, 2020 |
YEAR ENDED MARCH 31, 2019 |
YEAR ENDED MARCH 31, 2018 |
||||||||||||||||||||||||||||||||||||
| Net Asset Value, Beginning of Year |
$ | 8.88 | $ | 8.65 | $ | 8.68 | $ | 8.63 | $ | 8.72 | ||||||||||||||||||||||||||||||
|
|
|
|
|
|
|
|
|
|
|
|||||||||||||||||||||||||||||||
| Income from Investment Operations: |
||||||||||||||||||||||||||||||||||||||||
| Net investment income1 |
0.08 | 0.11 | 0.20 | 0.20 | 0.13 | |||||||||||||||||||||||||||||||||||
| Net realized and unrealized gain (loss) |
(0.31) | 0.23 | (0.03) | 0.05 | (0.09) | |||||||||||||||||||||||||||||||||||
|
|
|
|
|
|
|
|
|
|
|
|||||||||||||||||||||||||||||||
| Total Income (Loss) from Investment Operations |
(0.23) | 0.34 | 0.17 | 0.25 | 0.04 | |||||||||||||||||||||||||||||||||||
|
|
|
|
|
|
|
|
|
|
|
|||||||||||||||||||||||||||||||
| Less Distributions: |
||||||||||||||||||||||||||||||||||||||||
| From net investment income |
(0.08) | (0.11) | (0.20) | (0.20) | (0.13) | |||||||||||||||||||||||||||||||||||
| Return of capital |
— | — | — | (0.00)2 | — | |||||||||||||||||||||||||||||||||||
|
|
|
|
|
|
|
|
|
|
|
|||||||||||||||||||||||||||||||
| Total Distributions |
(0.08) | (0.11) | (0.20) | (0.20) | (0.13) | |||||||||||||||||||||||||||||||||||
|
|
|
|
|
|
|
|
|
|
|
|||||||||||||||||||||||||||||||
| Net Asset Value, End of Year |
$ | 8.57 | $ | 8.88 | $ | 8.65 | $ | 8.68 | $ | 8.63 | ||||||||||||||||||||||||||||||
|
|
|
|
|
|
|
|
|
|
|
|||||||||||||||||||||||||||||||
| Total Return |
(2.65)% | 3.91% | 1.93% | 2.93% | 0.48% | |||||||||||||||||||||||||||||||||||
| Ratios/Supplemental Data: |
||||||||||||||||||||||||||||||||||||||||
| Net Assets, end of year (in thousands) |
$ | 474,682 | $ | 445,538 | $ | 449,701 | $ | 580,434 | $ | 975,388 | ||||||||||||||||||||||||||||||
| Ratio of Expenses to Average Net Assets |
||||||||||||||||||||||||||||||||||||||||
| Before expense waivers and reimbursements |
0.62% | 0.62% | 0.62% | 0.62% | 0.62% | |||||||||||||||||||||||||||||||||||
| After expense waivers and reimbursements |
0.62% | 0.62% | 0.62% | 0.62% | 0.62% | |||||||||||||||||||||||||||||||||||
| Ratio of Net Investment Income to Average Net Assets |
||||||||||||||||||||||||||||||||||||||||
| After expense waivers and reimbursements |
0.87% | 1.22% | 2.32% | 2.29% | 1.45% | |||||||||||||||||||||||||||||||||||
| Portfolio Turnover Rate |
347% | 256% | 233% | 174% | 200% | |||||||||||||||||||||||||||||||||||
| 1 | Per share numbers have been calculated using the average share method. |
| 2 | Amount is greater than $(0.005) per share. |
See accompanying Notes to Financial Statements.
| 293 / Annual Report March 2022 |
Table of Contents
Metropolitan West Funds
Financial Highlights
| LOW DURATION BOND FUND CLASS I |
||||||||||||||||||||||||||||||||||||||||
| YEAR ENDED |
YEAR ENDED |
YEAR ENDED |
YEAR ENDED |
YEAR ENDED |
||||||||||||||||||||||||||||||||||||
| Net Asset Value, Beginning of Year |
$ | 8.88 | $ | 8.65 | $ | 8.68 | $ | 8.64 | $ | 8.72 | ||||||||||||||||||||||||||||||
|
|
|
|
|
|
|
|
|
|
|
|||||||||||||||||||||||||||||||
| Income from Investment Operations: |
||||||||||||||||||||||||||||||||||||||||
| Net investment income1 |
0.09 | 0.12 | 0.22 | 0.22 | 0.15 | |||||||||||||||||||||||||||||||||||
| Net realized and unrealized gain (loss) |
(0.30) | 0.24 | (0.03) | 0.04 | (0.08) | |||||||||||||||||||||||||||||||||||
|
|
|
|
|
|
|
|
|
|
|
|||||||||||||||||||||||||||||||
| Total Income (Loss) from Investment Operations |
(0.21) | 0.36 | 0.19 | 0.26 | 0.07 | |||||||||||||||||||||||||||||||||||
|
|
|
|
|
|
|
|
|
|
|
|||||||||||||||||||||||||||||||
| Less Distributions: |
||||||||||||||||||||||||||||||||||||||||
| From net investment income |
(0.09) | (0.13) | (0.22) | (0.22) | (0.15) | |||||||||||||||||||||||||||||||||||
| Return of capital |
— | — | — | (0.00)2 | — | |||||||||||||||||||||||||||||||||||
|
|
|
|
|
|
|
|
|
|
|
|||||||||||||||||||||||||||||||
| Total Distributions |
(0.09) | (0.13) | (0.22) | (0.22) | (0.15) | |||||||||||||||||||||||||||||||||||
|
|
|
|
|
|
|
|
|
|
|
|||||||||||||||||||||||||||||||
| Net Asset Value, End of Year |
$ | 8.58 | $ | 8.88 | $ | 8.65 | $ | 8.68 | $ | 8.64 | ||||||||||||||||||||||||||||||
|
|
|
|
|
|
|
|
|
|
|
|||||||||||||||||||||||||||||||
| Total Return |
(2.34)% | 4.12% | 2.14% | 3.03% | 0.81% | |||||||||||||||||||||||||||||||||||
| Ratios/Supplemental Data: |
||||||||||||||||||||||||||||||||||||||||
| Net Assets, end of year (in thousands) |
$ | 2,018,926 | $ | 2,034,540 | $ | 1,456,456 | $ | 1,578,279 | $ | 1,685,415 | ||||||||||||||||||||||||||||||
| Ratio of Expenses to Average Net Assets |
||||||||||||||||||||||||||||||||||||||||
| Before expense waivers and reimbursements |
0.41% | 0.42% | 0.42% | 0.41% | 0.40% | |||||||||||||||||||||||||||||||||||
| After expense waivers and reimbursements |
0.41% | 0.42% | 0.42% | 0.41% | 0.40% | |||||||||||||||||||||||||||||||||||
| Ratio of Net Investment Income to Average Net Assets |
||||||||||||||||||||||||||||||||||||||||
| After expense waivers and reimbursements |
1.07% | 1.39% | 2.51% | 2.53% | 1.68% | |||||||||||||||||||||||||||||||||||
| Portfolio Turnover Rate |
347% | 256% | 233% | 174% | 200% | |||||||||||||||||||||||||||||||||||
| 1 | Per share numbers have been calculated using the average share method. |
| 2 | Amount is greater than $(0.005) per share. |
See accompanying Notes to Financial Statements.
| Annual Report March 2022 / 294 |
Table of Contents
Metropolitan West Funds
Financial Highlights
| LOW DURATION BOND FUND ADMINISTRATIVE CLASS |
||||||||||||||||||||||||||||||||||||||||
| YEAR ENDED MARCH 31, 2022 |
YEAR ENDED MARCH 31, 2021 |
YEAR ENDED MARCH 31, 2020 |
YEAR ENDED MARCH 31, 2019 |
YEAR ENDED MARCH 31, 2018 |
||||||||||||||||||||||||||||||||||||
| Net Asset Value, Beginning of Year |
$ | 11.48 | $ | 11.18 | $ | 11.21 | $ | 11.16 | $ | 11.27 | ||||||||||||||||||||||||||||||
|
|
|
|
|
|
|
|
|
|
|
|||||||||||||||||||||||||||||||
| Income from Investment Operations: |
||||||||||||||||||||||||||||||||||||||||
| Net investment income1 |
0.09 | 0.13 | 0.26 | 0.23 | 0.15 | |||||||||||||||||||||||||||||||||||
| Net realized and unrealized gain (loss) |
(0.40) | 0.30 | (0.05) | 0.06 | (0.10) | |||||||||||||||||||||||||||||||||||
|
|
|
|
|
|
|
|
|
|
|
|||||||||||||||||||||||||||||||
| Total Income (Loss) from Investment Operations |
(0.31) | 0.43 | 0.21 | 0.29 | 0.05 | |||||||||||||||||||||||||||||||||||
|
|
|
|
|
|
|
|
|
|
|
|||||||||||||||||||||||||||||||
| Less Distributions: |
||||||||||||||||||||||||||||||||||||||||
| From net investment income |
(0.09) | (0.13) | (0.24) | (0.24) | (0.16) | |||||||||||||||||||||||||||||||||||
| Return of capital |
— | — | — | (0.00)2 | — | |||||||||||||||||||||||||||||||||||
|
|
|
|
|
|
|
|
|
|
|
|||||||||||||||||||||||||||||||
| Total Distributions |
(0.09) | (0.13) | (0.24) | (0.24) | (0.16) | |||||||||||||||||||||||||||||||||||
|
|
|
|
|
|
|
|
|
|
|
|||||||||||||||||||||||||||||||
| Net Asset Value, End of Year |
$ | 11.08 | $ | 11.48 | $ | 11.18 | $ | 11.21 | $ | 11.16 | ||||||||||||||||||||||||||||||
|
|
|
|
|
|
|
|
|
|
|
|||||||||||||||||||||||||||||||
| Total Return |
(2.74)% | 3.83% | 1.90% | 2.68% | 0.43% | |||||||||||||||||||||||||||||||||||
| Ratios/Supplemental Data: |
||||||||||||||||||||||||||||||||||||||||
| Net Assets, end of year (in thousands) |
$ | 1,709 | $ | 88 | $ | 94 | $ | 415 | $ | 5,374 | ||||||||||||||||||||||||||||||
| Ratio of Expenses to Average Net Assets |
||||||||||||||||||||||||||||||||||||||||
| Before expense waivers and reimbursements |
0.72% | 0.73% | 0.72% | 0.72% | 0.72% | |||||||||||||||||||||||||||||||||||
| After expense waivers and reimbursements |
0.72% | 0.73% | 0.72% | 0.72% | 0.72% | |||||||||||||||||||||||||||||||||||
| Ratio of Net Investment Income to Average Net Assets |
||||||||||||||||||||||||||||||||||||||||
| After expense waivers and reimbursements |
0.80% | 1.11% | 2.27% | 2.02% | 1.35% | |||||||||||||||||||||||||||||||||||
| Portfolio Turnover Rate |
347% | 256% | 233% | 174% | 200% | |||||||||||||||||||||||||||||||||||
| 1 | Per share numbers have been calculated using the average share method. |
| 2 | Amount is greater than $(0.005) per share. |
See accompanying Notes to Financial Statements.
| 295 / Annual Report March 2022 |
Table of Contents
Metropolitan West Funds
Financial Highlights
| OPPORTUNISTIC HIGH INCOME CREDIT FUND CLASS M* |
||||||||||||
| PERIOD ENDED MARCH 31, 2022 |
||||||||||||
| Net Asset Value, Beginning of Period |
$ | 10.00 | ||||||||||
|
|
|
|||||||||||
| Income from Investment Operations: |
||||||||||||
| Net investment income1 |
0.88 | |||||||||||
| Net realized and unrealized loss |
(1.07) | |||||||||||
|
|
|
|||||||||||
| Total (Loss) from Investment Operations |
(0.19) | |||||||||||
|
|
|
|||||||||||
| Less Distributions: |
||||||||||||
| From net investment income |
(0.76) | |||||||||||
| From net capital gains |
(0.06) | |||||||||||
|
|
|
|||||||||||
| Total Distributions |
(0.82) | |||||||||||
|
|
|
|||||||||||
| Net Asset Value, End of Period |
$ | 8.99 | ||||||||||
|
|
|
|||||||||||
| Total Return |
(2.09)%2 | |||||||||||
| Ratios/Supplemental Data: |
||||||||||||
| Net Assets, end of period (in thousands) |
$ | 70 | ||||||||||
| Ratio of Expenses to Average Net Assets |
||||||||||||
| Before expense waivers and reimbursements |
5.78%3 | |||||||||||
| After expense waivers and reimbursements |
0.85%3 | |||||||||||
| Ratio of Net Investment Income to Average Net Assets |
||||||||||||
| After expense waivers and reimbursements |
14.30%3 | |||||||||||
| Portfolio Turnover Rate |
104%2 | |||||||||||
| * | The Opportunistic High Income Credit Fund Class M Shares commenced operations on August 2, 2021. |
| 1 | Per share numbers have been calculated using the average share method. |
| 2 | Non-Annualized. |
| 3 | Annualized. |
See accompanying Notes to Financial Statements.
| Annual Report March 2022 / 296 |
Table of Contents
Metropolitan West Funds
Financial Highlights
| OPPORTUNISTIC HIGH INCOME CREDIT FUND CLASS I* |
||||||||||||
| PERIOD ENDED MARCH 31, 2022 |
||||||||||||
| Net Asset Value, Beginning of Period |
$ | 10.00 | ||||||||||
|
|
|
|||||||||||
| Income from Investment Operations: |
||||||||||||
| Net investment income1 |
0.80 | |||||||||||
| Net realized and unrealized loss |
(0.98) | |||||||||||
|
|
|
|||||||||||
| Total (Loss) from Investment Operations |
(0.18) | |||||||||||
|
|
|
|||||||||||
| Less Distributions: |
||||||||||||
| From net investment income |
(0.78) | |||||||||||
| From net capital gains |
(0.06) | |||||||||||
|
|
|
|||||||||||
| Total Distributions |
(0.84) | |||||||||||
|
|
|
|||||||||||
| Net Asset Value, End of Period |
$ | 8.98 | ||||||||||
|
|
|
|||||||||||
| Total Return |
(2.04)%2 | |||||||||||
| Ratios/Supplemental Data: |
||||||||||||
| Net Assets, end of period (in thousands) |
$ | 2,971 | ||||||||||
| Ratio of Expenses to Average Net Assets |
||||||||||||
| Before expense waivers and reimbursements |
5.42%3 | |||||||||||
| After expense waivers and reimbursements |
0.60%3 | |||||||||||
| Ratio of Net Investment Income to Average Net Assets |
||||||||||||
| After expense waivers and reimbursements |
12.43%3 | |||||||||||
| Portfolio Turnover Rate |
104%2 | |||||||||||
| * | The Opportunistic High Income Credit Fund Class I Shares commenced operations on August 2, 2021. |
| 1 | Per share numbers have been calculated using the average share method. |
| 2 | Non-Annualized. |
| 3 | Annualized. |
See accompanying Notes to Financial Statements.
| 297 / Annual Report March 2022 |
Table of Contents
Metropolitan West Funds
Financial Highlights
| STRATEGIC INCOME FUND CLASS M |
||||||||||||||||||||||||||||||||||||||||||||
|
|
YEAR ENDED MARCH 31, |
|
YEAR ENDED MARCH 31, |
|
YEAR ENDED MARCH 31, |
|
YEAR ENDED MARCH 31, |
|
YEAR ENDED MARCH 31, |
|
||||||||||||||||||||||||||||||||||
| Net Asset Value, Beginning of Year |
$ | 7.83 | $ | 7.29 | $ | 7.89 | $ | 7.99 | $ | 8.05 | ||||||||||||||||||||||||||||||||||
|
|
|
|
|
|
|
|
|
|
|
|||||||||||||||||||||||||||||||||||
| Income from Investment Operations: |
||||||||||||||||||||||||||||||||||||||||||||
| Net investment income1 |
0.73 | 0.47 | 0.31 | 0.32 | 0.25 | |||||||||||||||||||||||||||||||||||||||
| Net realized and unrealized gain (loss) |
(0.94) | 0.54 | (0.60) | (0.09) | (0.03) | |||||||||||||||||||||||||||||||||||||||
|
|
|
|
|
|
|
|
|
|
|
|||||||||||||||||||||||||||||||||||
| Total Income (Loss) from Investment Operations |
(0.21) | 1.01 | (0.29) | 0.23 | 0.22 | |||||||||||||||||||||||||||||||||||||||
|
|
|
|
|
|
|
|
|
|
|
|||||||||||||||||||||||||||||||||||
| Less Distributions: |
||||||||||||||||||||||||||||||||||||||||||||
| From net investment income |
(0.73) | (0.47) | (0.31) | (0.33) | (0.28) | |||||||||||||||||||||||||||||||||||||||
|
|
|
|
|
|
|
|
|
|
|
|||||||||||||||||||||||||||||||||||
| Net Asset Value, End of Year |
$ | 6.89 | $ | 7.83 | $ | 7.29 | $ | 7.89 | $ | 7.99 | ||||||||||||||||||||||||||||||||||
|
|
|
|
|
|
|
|
|
|
|
|||||||||||||||||||||||||||||||||||
| Total Return |
(2.99)% | 14.14% | (3.86)% | 3.01% | 2.78% | |||||||||||||||||||||||||||||||||||||||
| Ratios/Supplemental Data: |
||||||||||||||||||||||||||||||||||||||||||||
| Net Assets, end of year (in thousands) |
$ | 16,813 | $ | 15,471 | $ | 10,413 | $ | 17,908 | $ | 26,420 | ||||||||||||||||||||||||||||||||||
| Ratio of Expenses to Average Net Assets |
||||||||||||||||||||||||||||||||||||||||||||
| Before expense waivers and reimbursements |
3.02% | 2.73% | 2.43% | 1.84%2 | 2.45% | |||||||||||||||||||||||||||||||||||||||
| After expense waivers and reimbursements |
1.04% | 2.28% | 2.35% | 1.84% | 2.35% | |||||||||||||||||||||||||||||||||||||||
| Ratio of Net Investment Income to Average Net Assets |
||||||||||||||||||||||||||||||||||||||||||||
| After expense waivers and reimbursements |
9.71% | 6.12% | 3.95% | 4.10% | 3.15% | |||||||||||||||||||||||||||||||||||||||
| Portfolio Turnover Rate |
77% | 24% | 50% | 36% | 32% | |||||||||||||||||||||||||||||||||||||||
| 1 | Per share numbers have been calculated using the average share method. |
| 2 | Includes recoupment of past waived fees. Excluding the recoupment of past waived fees, the ratio would have been 1.67%. |
See accompanying Notes to Financial Statements.
| Annual Report March 2022 / 298 |
Table of Contents
Metropolitan West Funds
Financial Highlights
| STRATEGIC INCOME FUND CLASS I |
||||||||||||||||||||||||||||||||||||||||||||
| YEAR ENDED 2022 |
YEAR ENDED 2021 |
YEAR ENDED 2020 |
YEAR ENDED 2019 |
YEAR ENDED 2018 |
||||||||||||||||||||||||||||||||||||||||
| Net Asset Value, Beginning of Year |
$ | 7.83 | $ | 7.29 | $ | 7.89 | $ | 7.98 | $ | 8.05 | ||||||||||||||||||||||||||||||||||
|
|
|
|
|
|
|
|
|
|
|
|||||||||||||||||||||||||||||||||||
| Income from Investment Operations: |
||||||||||||||||||||||||||||||||||||||||||||
| Net investment income1 |
0.76 | 0.46 | 0.33 | 0.35 | 0.27 | |||||||||||||||||||||||||||||||||||||||
| Net realized and unrealized gain (loss) |
(0.95) | 0.56 | (0.60) | (0.09) | (0.04) | |||||||||||||||||||||||||||||||||||||||
|
|
|
|
|
|
|
|
|
|
|
|||||||||||||||||||||||||||||||||||
| Total Income (Loss) from Investment Operations |
(0.19) | 1.02 | (0.27) | 0.26 | 0.23 | |||||||||||||||||||||||||||||||||||||||
|
|
|
|
|
|
|
|
|
|
|
|||||||||||||||||||||||||||||||||||
| Less Distributions: |
||||||||||||||||||||||||||||||||||||||||||||
| From net investment income |
(0.75) | (0.48) | (0.33) | (0.35) | (0.30) | |||||||||||||||||||||||||||||||||||||||
|
|
|
|
|
|
|
|
|
|
|
|||||||||||||||||||||||||||||||||||
| Net Asset Value, End of Year |
$ | 6.89 | $ | 7.83 | $ | 7.29 | $ | 7.89 | $ | 7.98 | ||||||||||||||||||||||||||||||||||
|
|
|
|
|
|
|
|
|
|
|
|||||||||||||||||||||||||||||||||||
| Total Return |
(2.76)% | 14.19% | (3.61)% | 3.41% | 2.90% | |||||||||||||||||||||||||||||||||||||||
| Ratios/Supplemental Data: |
||||||||||||||||||||||||||||||||||||||||||||
| Net Assets, end of year (in thousands) |
$ | 9,310 | $ | 9,799 | $ | 48,252 | $ | 67,310 | $ | 69,791 | ||||||||||||||||||||||||||||||||||
| Ratio of Expenses to Average Net Assets |
||||||||||||||||||||||||||||||||||||||||||||
| Before expense waivers and reimbursements |
2.77% | 2.08%2 | 2.20% | 1.53%3 | 2.22% | |||||||||||||||||||||||||||||||||||||||
| After expense waivers and reimbursements |
0.80% | 2.08% | 2.10% | 1.53% | 2.10% | |||||||||||||||||||||||||||||||||||||||
| Ratio of Net Investment Income to Average Net Assets |
||||||||||||||||||||||||||||||||||||||||||||
| After expense waivers and reimbursements |
10.06% | 5.92% | 4.23% | 4.45% | 3.40% | |||||||||||||||||||||||||||||||||||||||
| Portfolio Turnover Rate |
77% | 24% | 50% | 36% | 32% | |||||||||||||||||||||||||||||||||||||||
| 1 | Per share numbers have been calculated using the average share method. |
| 2 | Includes recoupment of past waived fees. Excluding the recoupment of past waived fees, the ratio would have been 1.93%. |
| 3 | Includes recoupment of past waived fees. Excluding the recoupment of past waived fees, the ratio would have been 1.41%. |
See accompanying Notes to Financial Statements.
| 299 / Annual Report March 2022 |
Table of Contents
Metropolitan West Funds
Financial Highlights
| TOTAL RETURN BOND FUND CLASS M |
||||||||||||||||||||||||||||||||||||||||||
| YEAR ENDED MARCH 31, 2022 |
YEAR ENDED MARCH 31, 2021 |
YEAR ENDED MARCH 31, 2020 |
YEAR ENDED MARCH 31, 2019 |
YEAR ENDED MARCH 31, 2018 |
||||||||||||||||||||||||||||||||||||||
| Net Asset Value, Beginning of Year |
$ | 10.82 | $ | 11.12 | $ | 10.64 | $ | 10.46 | $ | 10.57 | ||||||||||||||||||||||||||||||||
|
|
|
|
|
|
|
|
|
|
|
|||||||||||||||||||||||||||||||||
| Income from Investment Operations: |
||||||||||||||||||||||||||||||||||||||||||
| Net investment income1 |
0.13 | 0.15 | 0.26 | 0.28 | 0.21 | |||||||||||||||||||||||||||||||||||||
| Net realized and unrealized gain (loss) |
(0.63) | 0.24 | 0.57 | 0.18 | (0.11) | |||||||||||||||||||||||||||||||||||||
|
|
|
|
|
|
|
|
|
|
|
|||||||||||||||||||||||||||||||||
| Total Income (Loss) from Investment Operations |
(0.50) | 0.39 | 0.83 | 0.46 | 0.10 | |||||||||||||||||||||||||||||||||||||
|
|
|
|
|
|
|
|
|
|
|
|||||||||||||||||||||||||||||||||
| Less Distributions: |
||||||||||||||||||||||||||||||||||||||||||
| From net investment income |
(0.13) | (0.15) | (0.26) | (0.28) | (0.21) | |||||||||||||||||||||||||||||||||||||
| From net capital gains |
(0.00)2 | (0.54) | (0.09) | — | — | |||||||||||||||||||||||||||||||||||||
|
|
|
|
|
|
|
|
|
|
|
|||||||||||||||||||||||||||||||||
| Total Distributions |
(0.13) | (0.69) | (0.35) | (0.28) | (0.21) | |||||||||||||||||||||||||||||||||||||
|
|
|
|
|
|
|
|
|
|
|
|||||||||||||||||||||||||||||||||
| Net Asset Value, End of Year |
$ | 10.19 | $ | 10.82 | $ | 11.12 | $ | 10.64 | $ | 10.46 | ||||||||||||||||||||||||||||||||
|
|
|
|
|
|
|
|
|
|
|
|||||||||||||||||||||||||||||||||
| Total Return |
(4.69)% | 3.31% | 7.93% | 4.49% | 0.94% | |||||||||||||||||||||||||||||||||||||
| Ratios/Supplemental Data: |
||||||||||||||||||||||||||||||||||||||||||
| Net Assets, end of year (in thousands) |
$ | 6,213,223 | $ | 7,154,434 | $ | 8,979,527 | $ | 9,560,056 | $ | 11,617,735 | ||||||||||||||||||||||||||||||||
| Ratio of Expenses to Average Net Assets |
||||||||||||||||||||||||||||||||||||||||||
| Before expense waivers and reimbursements |
0.65% | 0.67% | 0.67% | 0.67% | 0.67% | |||||||||||||||||||||||||||||||||||||
| After expense waivers and reimbursements |
0.65% | 0.67% | 0.67% | 0.67% | 0.67% | |||||||||||||||||||||||||||||||||||||
| Ratio of Net Investment Income to Average Net Assets |
||||||||||||||||||||||||||||||||||||||||||
| After expense waivers and reimbursements |
1.17% | 1.28% | 2.38% | 2.68% | 1.96% | |||||||||||||||||||||||||||||||||||||
| Portfolio Turnover Rate |
467% | 470% | 405% | 255% | 291% | |||||||||||||||||||||||||||||||||||||
| 1 | Per share numbers have been calculated using the average share method. |
| 2 | Amount is greater than $(0.005) per share. |
See accompanying Notes to Financial Statements.
| Annual Report March 2022 / 300 |
Table of Contents
Metropolitan West Funds
Financial Highlights
| TOTAL RETURN BOND FUND CLASS I |
||||||||||||||||||||||||||||||||||||||||||
| YEAR ENDED |
YEAR ENDED MARCH 31, 2021 |
YEAR ENDED MARCH 31, 2020 |
YEAR ENDED MARCH 31, 2019 |
YEAR ENDED MARCH 31, 2018 |
||||||||||||||||||||||||||||||||||||||
| Net Asset Value, Beginning of Year |
$ | 10.82 | $ | 11.12 | $ | 10.64 | $ | 10.46 | $ | 10.57 | ||||||||||||||||||||||||||||||||
|
|
|
|
|
|
|
|
|
|
|
|||||||||||||||||||||||||||||||||
| Income from Investment Operations: |
||||||||||||||||||||||||||||||||||||||||||
| Net investment income1 |
0.15 | 0.17 | 0.28 | 0.30 | 0.23 | |||||||||||||||||||||||||||||||||||||
| Net realized and unrealized gain (loss) |
(0.64) | 0.24 | 0.57 | 0.18 | (0.11) | |||||||||||||||||||||||||||||||||||||
|
|
|
|
|
|
|
|
|
|
|
|||||||||||||||||||||||||||||||||
| Total Income (Loss) from Investment Operations |
(0.49) | 0.41 | 0.85 | 0.48 | 0.12 | |||||||||||||||||||||||||||||||||||||
|
|
|
|
|
|
|
|
|
|
|
|||||||||||||||||||||||||||||||||
| Less Distributions: |
||||||||||||||||||||||||||||||||||||||||||
| From net investment income |
(0.15) | (0.17) | (0.28) | (0.30) | (0.23) | |||||||||||||||||||||||||||||||||||||
| From net capital gains |
(0.00)2 | (0.54) | (0.09) | — | — | |||||||||||||||||||||||||||||||||||||
|
|
|
|
|
|
|
|
|
|
|
|||||||||||||||||||||||||||||||||
| Total Distributions |
(0.15) | (0.71) | (0.37) | (0.30) | (0.23) | |||||||||||||||||||||||||||||||||||||
|
|
|
|
|
|
|
|
|
|
|
|||||||||||||||||||||||||||||||||
| Net Asset Value, End of Year |
$ | 10.18 | $ | 10.82 | $ | 11.12 | $ | 10.64 | $ | 10.46 | ||||||||||||||||||||||||||||||||
|
|
|
|
|
|
|
|
|
|
|
|||||||||||||||||||||||||||||||||
| Total Return |
(4.58)% | 3.54% | 8.16% | 4.72% | 1.17% | |||||||||||||||||||||||||||||||||||||
| Ratios/Supplemental Data: |
||||||||||||||||||||||||||||||||||||||||||
| Net Assets, end of year (in thousands) |
$ | 46,961,971 | $ | 52,980,073 | $ | 46,086,494 | $ | 40,927,700 | $ | 47,327,297 | ||||||||||||||||||||||||||||||||
| Ratio of Expenses to Average Net Assets |
||||||||||||||||||||||||||||||||||||||||||
| Before expense waivers and reimbursements |
0.44% | 0.45% | 0.45% | 0.44% | 0.44% | |||||||||||||||||||||||||||||||||||||
| After expense waivers and reimbursements |
0.44% | 0.45% | 0.45% | 0.44% | 0.44% | |||||||||||||||||||||||||||||||||||||
| Ratio of Net Investment Income to Average Net Assets |
||||||||||||||||||||||||||||||||||||||||||
| After expense waivers and reimbursements |
1.38% | 1.49% | 2.60% | 2.91% | 2.19% | |||||||||||||||||||||||||||||||||||||
| Portfolio Turnover Rate |
467% | 470% | 405% | 255% | 291% | |||||||||||||||||||||||||||||||||||||
| 1 | Per share numbers have been calculated using the average share method. |
| 2 | Amount is greater than $(0.005) per share. |
See accompanying Notes to Financial Statements.
| 301 / Annual Report March 2022 |
Table of Contents
Metropolitan West Funds
Financial Highlights
| TOTAL RETURN BOND FUND CLASS I-2* |
||||||||||||||||||||||||||
| YEAR ENDED MARCH 31, 2022 |
YEAR ENDED MARCH 31, 2021 |
PERIOD ENDED MARCH 31, 2020 |
||||||||||||||||||||||||
| Net Asset Value, Beginning of Period |
$ | 10.82 | $ | 11.12 | $ | 11.48 | ||||||||||||||||||||
|
|
|
|
|
|
|
|||||||||||||||||||||
| Income from Investment Operations: |
||||||||||||||||||||||||||
| Net investment income1 |
0.14 | 0.15 | 0.02 | |||||||||||||||||||||||
| Net realized and unrealized gain (loss) |
(0.64) | 0.27 | (0.36) | |||||||||||||||||||||||
|
|
|
|
|
|
|
|||||||||||||||||||||
| Total Income (Loss) from Investment Operations |
(0.50) | 0.42 | (0.34) | |||||||||||||||||||||||
|
|
|
|
|
|
|
|||||||||||||||||||||
| Less Distributions: |
||||||||||||||||||||||||||
| From net investment income |
(0.14) | (0.18) | (0.02) | |||||||||||||||||||||||
| From net capital gains |
(0.00)2 | (0.54) | — | |||||||||||||||||||||||
|
|
|
|
|
|
|
|||||||||||||||||||||
| Total Distributions |
(0.14) | (0.72) | (0.02) | |||||||||||||||||||||||
|
|
|
|
|
|
|
|||||||||||||||||||||
| Net Asset Value, End of Period |
$ | 10.18 | $ | 10.82 | $ | 11.12 | ||||||||||||||||||||
|
|
|
|
|
|
|
|||||||||||||||||||||
| Total Return |
(4.65)% | 3.65% | (2.93)%3 | |||||||||||||||||||||||
| Ratios/Supplemental Data: |
||||||||||||||||||||||||||
| Net Assets, end of period (in thousands) |
$ | 170,455 | $ | 116,857 | $ | 974 | ||||||||||||||||||||
| Ratio of Expenses to Average Net Assets |
||||||||||||||||||||||||||
| Before expense waivers and reimbursements |
0.52% | 0.52% | 0.33%5 | |||||||||||||||||||||||
| After expense waivers and reimbursements |
0.52% | 0.52% | 0.33%5 | |||||||||||||||||||||||
| Ratio of Net Investment Income to Average Net Assets |
||||||||||||||||||||||||||
| After expense waivers and reimbursements |
1.33% | 1.32% | 3.49%5 | |||||||||||||||||||||||
| Portfolio Turnover Rate |
467% | 470% | 405%3 | |||||||||||||||||||||||
| 5 | Annualized. |
| * | The Total Return Bond Fund Class I-2 Shares commenced operations on March 6, 2020. |
| 1 | Per share numbers have been calculated using the average share method. |
| 2 | Amount is greater than $(0.005) per share. |
| 3 | Non-Annualized. |
| 4 | Represents the whole number without rounding to the 000s. |
See accompanying Notes to Financial Statements.
| Annual Report March 2022 / 302 |
Table of Contents
Metropolitan West Funds
Financial Highlights
| TOTAL RETURN BOND FUND ADMINISTRATIVE CLASS |
||||||||||||||||||||||||||||||||||||||||||
|
|
YEAR ENDED MARCH 31, 2022 |
|
YEAR ENDED MARCH 31, 2021 |
|
YEAR ENDED MARCH 31, 2020 |
|
YEAR ENDED MARCH 31, 2019 |
|
YEAR ENDED MARCH 31, 2018 |
|||||||||||||||||||||||||||||||||
| Net Asset Value, Beginning of Year |
$ | 10.83 | $ | 11.13 | $ | 10.65 | $ | 10.47 | $ | 10.58 | ||||||||||||||||||||||||||||||||
|
|
|
|
|
|
|
|
|
|
|
|||||||||||||||||||||||||||||||||
| Income from Investment Operations: |
||||||||||||||||||||||||||||||||||||||||||
| Net investment income1 |
0.12 | 0.13 | 0.25 | 0.27 | 0.20 | |||||||||||||||||||||||||||||||||||||
| Net realized and unrealized gain (loss) |
(0.65) | 0.24 | 0.57 | 0.18 | (0.11) | |||||||||||||||||||||||||||||||||||||
|
|
|
|
|
|
|
|
|
|
|
|||||||||||||||||||||||||||||||||
| Total Income (Loss) from Investment Operations |
(0.53) | 0.37 | 0.82 | 0.45 | 0.09 | |||||||||||||||||||||||||||||||||||||
|
|
|
|
|
|
|
|
|
|
|
|||||||||||||||||||||||||||||||||
| Less Distributions: |
||||||||||||||||||||||||||||||||||||||||||
| From net investment income |
(0.11) | (0.13) | (0.25) | (0.27) | (0.20) | |||||||||||||||||||||||||||||||||||||
| From net capital gains |
(0.00)2 | (0.54) | (0.09) | — | — | |||||||||||||||||||||||||||||||||||||
|
|
|
|
|
|
|
|
|
|
|
|||||||||||||||||||||||||||||||||
| Total Distributions |
(0.11) | (0.67) | (0.34) | (0.27) | (0.20) | |||||||||||||||||||||||||||||||||||||
|
|
|
|
|
|
|
|
|
|
|
|||||||||||||||||||||||||||||||||
| Net Asset Value, End of Year |
$ | 10.19 | $ | 10.83 | $ | 11.13 | $ | 10.65 | $ | 10.47 | ||||||||||||||||||||||||||||||||
|
|
|
|
|
|
|
|
|
|
|
|||||||||||||||||||||||||||||||||
| Total Return |
(4.89)% | 3.19% | 7.80% | 4.36% | 0.83% | |||||||||||||||||||||||||||||||||||||
| Ratios/Supplemental Data: |
||||||||||||||||||||||||||||||||||||||||||
| Net Assets, end of year (in thousands) |
$ | 1,963,315 | $ | 2,083,842 | $ | 1,739,034 | $ | 1,011,637 | $ | 975,897 | ||||||||||||||||||||||||||||||||
| Ratio of Expenses to Average Net Assets |
||||||||||||||||||||||||||||||||||||||||||
| Before expense waivers and reimbursements |
0.77% | 0.78% | 0.78% | 0.78% | 0.78% | |||||||||||||||||||||||||||||||||||||
| After expense waivers and reimbursements |
0.77% | 0.78% | 0.78% | 0.78% | 0.78% | |||||||||||||||||||||||||||||||||||||
| Ratio of Net Investment Income to Average Net Assets |
||||||||||||||||||||||||||||||||||||||||||
| After expense waivers and reimbursements |
1.06% | 1.15% | 2.26% | 2.58% | 1.87% | |||||||||||||||||||||||||||||||||||||
| Portfolio Turnover Rate |
467% | 470% | 405% | 255% | 291% | |||||||||||||||||||||||||||||||||||||
| 1 | Per share numbers have been calculated using the average share method. |
| 2 | Amount is greater than $(0.005) per share. |
See accompanying Notes to Financial Statements.
| 303 / Annual Report March 2022 |
Table of Contents
Metropolitan West Funds
Financial Highlights
| TOTAL RETURN BOND FUND PLAN CLASS |
||||||||||||||||||||||||||||||||||||||||||
| YEAR ENDED MARCH 31, 2022 |
YEAR ENDED MARCH 31, 2021 |
YEAR ENDED MARCH 31, 2020 |
YEAR ENDED MARCH 31, 2019 |
YEAR ENDED MARCH 31, 2018 |
||||||||||||||||||||||||||||||||||||||
| Net Asset Value, Beginning of Year |
$ | 10.15 | $ | 10.46 | $ | 10.01 | $ | 9.84 | $ | 9.95 | ||||||||||||||||||||||||||||||||
|
|
|
|
|
|
|
|
|
|
|
|||||||||||||||||||||||||||||||||
| Income from Investment Operations: |
||||||||||||||||||||||||||||||||||||||||||
| Net investment income1 |
0.15 | 0.17 | 0.28 | 0.29 | 0.23 | |||||||||||||||||||||||||||||||||||||
| Net realized and unrealized gain (loss) |
(0.60) | 0.23 | 0.54 | 0.17 | (0.11) | |||||||||||||||||||||||||||||||||||||
|
|
|
|
|
|
|
|
|
|
|
|||||||||||||||||||||||||||||||||
| Total Income (Loss) from Investment Operations |
(0.45) | 0.40 | 0.82 | 0.46 | 0.12 | |||||||||||||||||||||||||||||||||||||
|
|
|
|
|
|
|
|
|
|
|
|||||||||||||||||||||||||||||||||
| Less Distributions: |
||||||||||||||||||||||||||||||||||||||||||
| From net investment income |
(0.15) | (0.17) | (0.28) | (0.29) | (0.23) | |||||||||||||||||||||||||||||||||||||
| From net capital gains |
(0.00)2 | (0.54) | (0.09) | — | — | |||||||||||||||||||||||||||||||||||||
|
|
|
|
|
|
|
|
|
|
|
|||||||||||||||||||||||||||||||||
| Total Distributions |
(0.15) | (0.71) | (0.37) | (0.29) | (0.23) | |||||||||||||||||||||||||||||||||||||
|
|
|
|
|
|
|
|
|
|
|
|||||||||||||||||||||||||||||||||
| Net Asset Value, End of Year |
$ | 9.55 | $ | 10.15 | $ | 10.46 | $ | 10.01 | $ | 9.84 | ||||||||||||||||||||||||||||||||
|
|
|
|
|
|
|
|
|
|
|
|||||||||||||||||||||||||||||||||
| Total Return |
(4.50)% | 3.65% | 8.29% | 4.80% | 1.18% | |||||||||||||||||||||||||||||||||||||
| Ratios/Supplemental Data: |
||||||||||||||||||||||||||||||||||||||||||
| Net Assets, end of year (in thousands) |
$ | 22,197,865 | $ | 24,605,977 | $ | 23,822,841 | $ | 20,611,577 | $ | 18,363,121 | ||||||||||||||||||||||||||||||||
| Ratio of Expenses to Average Net Assets |
||||||||||||||||||||||||||||||||||||||||||
| Before expense waivers and reimbursements |
0.36% | 0.37% | 0.37% | 0.37% | 0.37% | |||||||||||||||||||||||||||||||||||||
| After expense waivers and reimbursements |
0.36% | 0.37% | 0.37% | 0.37% | 0.37% | |||||||||||||||||||||||||||||||||||||
| Ratio of Net Investment Income to Average Net Assets |
||||||||||||||||||||||||||||||||||||||||||
| After expense waivers and reimbursements |
1.47% | 1.57% | 2.67% | 3.00% | 2.28% | |||||||||||||||||||||||||||||||||||||
| Portfolio Turnover Rate |
467% | 470% | 405% | 255% | 291% | |||||||||||||||||||||||||||||||||||||
| 1 | Per share numbers have been calculated using the average share method. |
| 2 | Amount is greater than $(0.005) per share. |
See accompanying Notes to Financial Statements.
| Annual Report March 2022 / 304 |
Table of Contents
Metropolitan West Funds
Financial Highlights
| ULTRA SHORT BOND FUND CLASS M |
||||||||||||||||||||||||||||||||||||||||||
|
|
YEAR ENDED MARCH 31, 2022 |
|
YEAR ENDED MARCH 31, 2021 |
|
YEAR ENDED MARCH 31, 2020 |
|
YEAR ENDED MARCH 31, 2019 |
|
YEAR ENDED MARCH 31, 2018 |
|||||||||||||||||||||||||||||||||
| Net Asset Value, Beginning of Year |
$ | 4.25 | $ | 4.23 | $ | 4.26 | $ | 4.25 | $ | 4.27 | ||||||||||||||||||||||||||||||||
|
|
|
|
|
|
|
|
|
|
|
|||||||||||||||||||||||||||||||||
| Income from Investment Operations: |
||||||||||||||||||||||||||||||||||||||||||
| Net investment income1 |
0.02 | 0.02 | 0.11 | 0.09 | 0.05 | |||||||||||||||||||||||||||||||||||||
| Net realized and unrealized gain (loss) |
(0.07) | 0.02 | (0.03) | 0.01 | (0.02) | |||||||||||||||||||||||||||||||||||||
|
|
|
|
|
|
|
|
|
|
|
|||||||||||||||||||||||||||||||||
| Total Income (Loss) from Investment Operations |
(0.05) | 0.04 | 0.08 | 0.10 | 0.03 | |||||||||||||||||||||||||||||||||||||
|
|
|
|
|
|
|
|
|
|
|
|||||||||||||||||||||||||||||||||
| Less Distributions: |
||||||||||||||||||||||||||||||||||||||||||
| From net investment income |
(0.02) | (0.02) | (0.11) | (0.09) | (0.05) | |||||||||||||||||||||||||||||||||||||
|
|
|
|
|
|
|
|
|
|
|
|||||||||||||||||||||||||||||||||
| Net Asset Value, End of Year |
$ | 4.18 | $ | 4.25 | $ | 4.23 | $ | 4.26 | $ | 4.25 | ||||||||||||||||||||||||||||||||
|
|
|
|
|
|
|
|
|
|
|
|||||||||||||||||||||||||||||||||
| Total Return |
(1.14)% | 1.03% | 1.85% | 2.37% | 0.68% | |||||||||||||||||||||||||||||||||||||
| Ratios/Supplemental Data: |
||||||||||||||||||||||||||||||||||||||||||
| Net Assets, end of year (in thousands) |
$ | 39,477 | $ | 61,925 | $ | 28,355 | $ | 34,376 | $ | 50,777 | ||||||||||||||||||||||||||||||||
| Ratio of Expenses to Average Net Assets |
||||||||||||||||||||||||||||||||||||||||||
| Before expense waivers and reimbursements |
0.64% | 0.65% | 0.77% | 0.74% | 0.69% | |||||||||||||||||||||||||||||||||||||
| After expense waivers and reimbursements |
0.50% | 0.50% | 0.50% | 0.50% | 0.50% | |||||||||||||||||||||||||||||||||||||
| Ratio of Net Investment Income to Average Net Assets |
||||||||||||||||||||||||||||||||||||||||||
| After expense waivers and reimbursements |
0.49% | 0.49% | 2.53% | 2.08% | 1.14% | |||||||||||||||||||||||||||||||||||||
| Portfolio Turnover Rate |
336% | 210% | 303% | 172% | 183% | |||||||||||||||||||||||||||||||||||||
| 1 | Per share numbers have been calculated using the average share method. |
See accompanying Notes to Financial Statements.
| 305 / Annual Report March 2022 |
Table of Contents
Metropolitan West Funds
Financial Highlights
| ULTRA SHORT BOND FUND CLASS I |
||||||||||||||||||||||||||||||||||||||||||
|
|
YEAR ENDED MARCH 31, 2022 |
|
YEAR ENDED MARCH 31, 2021 |
|
YEAR ENDED MARCH 31, 2020 |
|
YEAR ENDED MARCH 31, 2019 |
|
YEAR ENDED MARCH 31, 2018 |
|||||||||||||||||||||||||||||||||
| Net Asset Value, Beginning of Year |
$ | 4.26 | $ | 4.23 | $ | 4.27 | $ | 4.26 | $ | 4.27 | ||||||||||||||||||||||||||||||||
|
|
|
|
|
|
|
|
|
|
|
|||||||||||||||||||||||||||||||||
| Income from Investment Operations: |
||||||||||||||||||||||||||||||||||||||||||
| Net investment income1 |
0.03 | 0.03 | 0.12 | 0.10 | 0.06 | |||||||||||||||||||||||||||||||||||||
| Net realized and unrealized gain (loss) |
(0.08) | 0.03 | (0.04) | 0.01 | (0.01) | |||||||||||||||||||||||||||||||||||||
|
|
|
|
|
|
|
|
|
|
|
|||||||||||||||||||||||||||||||||
| Total Income (Loss) from Investment Operations |
(0.05) | 0.06 | 0.08 | 0.11 | 0.05 | |||||||||||||||||||||||||||||||||||||
|
|
|
|
|
|
|
|
|
|
|
|||||||||||||||||||||||||||||||||
| Less Distributions: |
||||||||||||||||||||||||||||||||||||||||||
| From net investment income |
(0.03) | (0.03) | (0.12) | (0.10) | (0.06) | |||||||||||||||||||||||||||||||||||||
|
|
|
|
|
|
|
|
|
|
|
|||||||||||||||||||||||||||||||||
| Net Asset Value, End of Year |
$ | 4.18 | $ | 4.26 | $ | 4.23 | $ | 4.27 | $ | 4.26 | ||||||||||||||||||||||||||||||||
|
|
|
|
|
|
|
|
|
|
|
|||||||||||||||||||||||||||||||||
| Total Return |
(1.21)% | 1.43% | 1.78% | 2.53% | 1.08% | |||||||||||||||||||||||||||||||||||||
| Ratios/Supplemental Data: |
||||||||||||||||||||||||||||||||||||||||||
| Net Assets, end of year (in thousands) |
$ | 158,258 | $ | 181,248 | $ | 76,340 | $ | 68,020 | $ | 68,698 | ||||||||||||||||||||||||||||||||
| Ratio of Expenses to Average Net Assets |
||||||||||||||||||||||||||||||||||||||||||
| Before expense waivers and reimbursements |
0.49% | 0.48% | 0.58% | 0.56% | 0.52% | |||||||||||||||||||||||||||||||||||||
| After expense waivers and reimbursements |
0.34% | 0.34% | 0.34% | 0.34% | 0.34% | |||||||||||||||||||||||||||||||||||||
| Ratio of Net Investment Income to Average Net Assets |
||||||||||||||||||||||||||||||||||||||||||
| After expense waivers and reimbursements |
0.66% | 0.67% | 2.70% | 2.27% | 1.30% | |||||||||||||||||||||||||||||||||||||
| Portfolio Turnover Rate |
336% | 210% | 303% | 172% | 183% | |||||||||||||||||||||||||||||||||||||
| 1 | Per share numbers have been calculated using the average share method. |
See accompanying Notes to Financial Statements.
| Annual Report March 2022 / 306 |
Table of Contents
Metropolitan West Funds
Financial Highlights
| UNCONSTRAINED BOND FUND CLASS M |
||||||||||||||||||||||||||||||||||||||||
|
|
YEAR ENDED MARCH 31, 2022 |
|
YEAR ENDED MARCH 31, 2021 |
|
YEAR ENDED MARCH 31, 2020 |
|
YEAR ENDED MARCH 31, 2019 |
|
YEAR ENDED MARCH 31, 2018 |
|||||||||||||||||||||||||||||||
| Net Asset Value, Beginning of Year |
$ | 11.96 | $ | 11.12 | $ | 11.80 | $ | 11.83 | $ | 11.90 | ||||||||||||||||||||||||||||||
|
|
|
|
|
|
|
|
|
|
|
|||||||||||||||||||||||||||||||
| Income from Investment Operations: |
||||||||||||||||||||||||||||||||||||||||
| Net investment income1 |
0.30 | 0.30 | 0.42 | 0.41 | 0.29 | |||||||||||||||||||||||||||||||||||
| Net realized and unrealized gain (loss) |
(0.66) | 0.93 | (0.69) | (0.03) | (0.03) | |||||||||||||||||||||||||||||||||||
|
|
|
|
|
|
|
|
|
|
|
|||||||||||||||||||||||||||||||
| Total Income (Loss) from Investment Operations |
(0.36) | 1.23 | (0.27) | 0.38 | 0.26 | |||||||||||||||||||||||||||||||||||
|
|
|
|
|
|
|
|
|
|
|
|||||||||||||||||||||||||||||||
| Less Distributions: |
||||||||||||||||||||||||||||||||||||||||
| From net investment income |
(0.30) | (0.30) | (0.41) | (0.41) | (0.31) | |||||||||||||||||||||||||||||||||||
| From net capital gains |
(0.13) | (0.09) | — | — | (0.02) | |||||||||||||||||||||||||||||||||||
| Return of capital |
— | — | — | (0.00)2 | — | |||||||||||||||||||||||||||||||||||
|
|
|
|
|
|
|
|
|
|
|
|||||||||||||||||||||||||||||||
| Total Distributions |
(0.43) | (0.39) | (0.41) | (0.41) | (0.33) | |||||||||||||||||||||||||||||||||||
|
|
|
|
|
|
|
|
|
|
|
|||||||||||||||||||||||||||||||
| Net Asset Value, End of Year |
$ | 11.17 | $ | 11.96 | $ | 11.12 | $ | 11.80 | $ | 11.83 | ||||||||||||||||||||||||||||||
|
|
|
|
|
|
|
|
|
|
|
|||||||||||||||||||||||||||||||
| Total Return |
(3.15)% | 11.14% | (2.47)% | 3.31% | 2.18% | |||||||||||||||||||||||||||||||||||
| Ratios/Supplemental Data: |
||||||||||||||||||||||||||||||||||||||||
| Net Assets, end of year (in thousands) |
$ | 214,792 | $ | 258,424 | $ | 267,139 | $ | 454,968 | $ | 642,999 | ||||||||||||||||||||||||||||||
| Ratio of Expenses to Average Net Assets |
||||||||||||||||||||||||||||||||||||||||
| Before expense waivers and reimbursements |
1.02% | 1.03% | 1.03% | 1.03%3 | 1.05% | |||||||||||||||||||||||||||||||||||
| After expense waivers and reimbursements |
1.02% | 1.03% | 1.03% | 1.03% | 1.04% | |||||||||||||||||||||||||||||||||||
| Ratio of Net Investment Income to Average Net Assets |
||||||||||||||||||||||||||||||||||||||||
| After expense waivers and reimbursements |
2.50% | 2.56% | 3.49% | 3.46% | 2.39% | |||||||||||||||||||||||||||||||||||
| Portfolio Turnover Rate |
182% | 165% | 85% | 43% | 62% | |||||||||||||||||||||||||||||||||||
| 1 | Per share numbers have been calculated using the average share method. |
| 2 | Amount is greater than $(0.005) per share. |
| 3 | Includes recoupment of past waived fees. Excluding the recoupment of past waived fees, the ratio would have been 0.99%. |
See accompanying Notes to Financial Statements.
| 307 / Annual Report March 2022 |
Table of Contents
Metropolitan West Funds
Financial Highlights
|
UNCONSTRAINED BOND FUND CLASS I |
||||||||||||||||||||||||||||||||||
| YEAR ENDED MARCH 31, 2022 |
YEAR ENDED MARCH 31, 2021 |
YEAR ENDED MARCH 31, 2020 |
YEAR ENDED MARCH 31, 2019 |
YEAR ENDED MARCH 31, 2018 |
||||||||||||||||||||||||||||||
| Net Asset Value, Beginning of Year |
$ | 11.95 | $ | 11.12 | $ | 11.79 | $ | 11.82 | $ | 11.89 | ||||||||||||||||||||||||
|
|
|
|
|
|
|
|
|
|
|
|||||||||||||||||||||||||
| Income from Investment Operations: |
||||||||||||||||||||||||||||||||||
| Net investment income1 |
0.33 | 0.33 | 0.44 | 0.44 | 0.33 | |||||||||||||||||||||||||||||
| Net realized and unrealized gain (loss) |
(0.66) | 0.92 | (0.67) | (0.02) | (0.04) | |||||||||||||||||||||||||||||
|
|
|
|
|
|
|
|
|
|
|
|||||||||||||||||||||||||
| Total Income (Loss) from Investment Operations |
(0.33) | 1.25 | (0.23) | 0.42 | 0.29 | |||||||||||||||||||||||||||||
|
|
|
|
|
|
|
|
|
|
|
|||||||||||||||||||||||||
| Less Distributions: |
||||||||||||||||||||||||||||||||||
| From net investment income |
(0.33) | (0.33) | (0.44) | (0.45) | (0.34) | |||||||||||||||||||||||||||||
| From net capital gains |
(0.13) | (0.09) | — | — | (0.02) | |||||||||||||||||||||||||||||
| Return of capital |
— | — | — | (0.00)2 | — | |||||||||||||||||||||||||||||
|
|
|
|
|
|
|
|
|
|
|
|||||||||||||||||||||||||
| Total Distributions |
(0.46) | (0.42) | (0.44) | (0.45) | (0.36) | |||||||||||||||||||||||||||||
|
|
|
|
|
|
|
|
|
|
|
|||||||||||||||||||||||||
| Net Asset Value, End of Year |
$ | 11.16 | $ | 11.95 | $ | 11.12 | $ | 11.79 | $ | 11.82 | ||||||||||||||||||||||||
|
|
|
|
|
|
|
|
|
|
|
|||||||||||||||||||||||||
| Total Return |
(2.88)% | 11.35% | (2.11)% | 3.60% | 2.49% | |||||||||||||||||||||||||||||
| Ratios/Supplemental Data: |
||||||||||||||||||||||||||||||||||
| Net Assets, end of year (in thousands) |
$ | 3,648,832 | $ | 3,271,289 | $ | 2,760,187 | $ | 2,651,631 | $ | 2,627,294 | ||||||||||||||||||||||||
| Ratio of Expenses to Average Net Assets |
||||||||||||||||||||||||||||||||||
| Before expense waivers and reimbursements |
0.74% | 0.75% | 0.75% | 0.75% | 0.73% | |||||||||||||||||||||||||||||
| After expense waivers and reimbursements |
0.74% | 0.75% | 0.75% | 0.75% | 0.73% | |||||||||||||||||||||||||||||
| Ratio of Net Investment Income to Average Net Assets |
||||||||||||||||||||||||||||||||||
| After expense waivers and reimbursements |
2.79% | 2.82% | 3.72% | 3.76% | 2.77% | |||||||||||||||||||||||||||||
| Portfolio Turnover Rate |
182% | 165% | 85% | 43% | 62% | |||||||||||||||||||||||||||||
| 1 | Per share numbers have been calculated using the average share method. |
| 2 | Amount is greater than $(0.005) per share. |
See accompanying Notes to Financial Statements.
| Annual Report March 2022 / 308 |
Table of Contents
Metropolitan West Funds
Financial Highlights
|
UNCONSTRAINED BOND FUND PLAN CLASS* |
||||||||||||||||||||||
| YEAR ENDED MARCH 31, 2022 |
YEAR ENDED MARCH 31, 2021 |
PERIOD ENDED MARCH 31, 2020 |
||||||||||||||||||||
| Net Asset Value, Beginning of Period |
$ | 11.94 | $ | 11.11 | $ | 11.96 | ||||||||||||||||
|
|
|
|
|
|
|
|||||||||||||||||
| Income from Investment Operations: |
||||||||||||||||||||||
| Net investment income1 |
0.34 | 0.34 | 0.03 | |||||||||||||||||||
| Net realized and unrealized gain (loss) |
(0.66) | 0.92 | (0.85) | |||||||||||||||||||
|
|
|
|
|
|
|
|||||||||||||||||
| Total Income (Loss) from Investment Operations |
(0.32) | 1.26 | (0.82) | |||||||||||||||||||
|
|
|
|
|
|
|
|||||||||||||||||
| Less Distributions: |
||||||||||||||||||||||
| From net investment income |
(0.34) | (0.34) | (0.03) | |||||||||||||||||||
| From net capital gains |
(0.13) | (0.09) | — | |||||||||||||||||||
|
|
|
|
|
|
|
|||||||||||||||||
| Total Distributions |
(0.47) | (0.43) | (0.03) | |||||||||||||||||||
|
|
|
|
|
|
|
|||||||||||||||||
| Net Asset Value, End of Period |
$ | 11.15 | $ | 11.94 | $ | 11.11 | ||||||||||||||||
|
|
|
|
|
|
|
|||||||||||||||||
| Total Return |
(2.83)% | 11.44% | (6.88)%2 | |||||||||||||||||||
| Ratios/Supplemental Data: |
||||||||||||||||||||||
| Net Assets, end of period (in thousands) |
$ | 120,524 | $ | 63,815 | $ | 933 | ||||||||||||||||
| Ratio of Expenses to Average Net Assets |
||||||||||||||||||||||
| Before expense waivers and reimbursements |
0.69% | 0.69% | 0.68%4 | |||||||||||||||||||
| After expense waivers and reimbursements |
0.69% | 0.69% | 0.68%4 | |||||||||||||||||||
| Ratio of Net Investment Income to Average Net Assets |
||||||||||||||||||||||
| After expense waivers and reimbursements |
2.87% | 2.88% | 4.06%4 | |||||||||||||||||||
| Portfolio Turnover Rate |
182% | 165% | 85%2 | |||||||||||||||||||
| * | The Unconstrained Bond Fund Plan Class Shares commenced operations on March 6, 2020. |
| 1 | Per share numbers have been calculated using the average share method. |
| 2 | Non-Annualized. |
| 3 | Represents the whole number without rounding to the 000s. |
| 4 | Annualized. |
See accompanying Notes to Financial Statements.
| 309 / Annual Report March 2022 |
Table of Contents
March 31, 2022
| 1. | SUMMARY OF ORGANIZATION |
The Metropolitan West Funds (the “Trust”) is an open-end management investment company organized as a Delaware statutory trust on December 9, 1996 and registered under the Investment Company Act of 1940, as amended (the “1940 Act”). Metropolitan West Asset Management, LLC (the “Adviser”), a federally registered investment adviser, provides the Funds (as defined below) with investment management services. The Trust currently consists of fourteen separate portfolios (each a “Fund” and collectively, the “Funds”): Metropolitan West AlphaTrak 500 Fund (the “AlphaTrak 500 Fund”), Metropolitan West Corporate Bond Fund (the “Corporate Bond Fund”), Metropolitan West ESG Securitized Fund (the “ESG Securitized Fund”), Metropolitan West Flexible Income Fund (the “Flexible Income Fund”), Metropolitan West Floating Rate Income Fund (the “Floating Rate Income Fund”), Metropolitan West High Yield Bond Fund (the “High Yield Bond Fund”), Metropolitan West Intermediate Bond Fund (the “Intermediate Bond Fund”), Metropolitan West Investment Grade Credit Fund (the “Investment Grade Credit Fund”), Metropolitan West Low Duration Bond Fund (the “Low Duration Bond Fund”), Metropolitan West Opportunistic High Income Credit Fund (the “Opportunistic High Income Credit Fund”), Metropolitan West Strategic Income Fund (the “Strategic Income Fund”), Metropolitan West Total Return Bond Fund (the “Total Return Bond Fund”), Metropolitan West Ultra Short Bond Fund (the “Ultra Short Bond Fund”) and Metropolitan West Unconstrained Bond Fund (the “Unconstrained Bond Fund”). The AlphaTrak 500 Fund commenced investment operations on June 29, 1998 with Class M shares. The Corporate Bond Fund commenced investment operations on June 29, 2018 with Class M and Class I shares. The ESG Securitized Fund commenced investment operations on October 1, 2021 with Class M and Class I shares. The Flexible Income Fund commenced investment operations on November 30, 2018 with Class M and Class I shares. The Floating Rate Income Fund commenced investment operations on June 28, 2013 with Class M and Class I shares. The Plan Class was added on January 29, 2021. The High Yield Bond Fund commenced investment operations on September 30, 2002 with Class M shares. Class I was added on March 31, 2003. The Intermediate Bond Fund commenced investment operations on June 28, 2002 with the Class I shares. Class M was added on June 30, 2004. The Investment Grade Credit Fund commenced investment operations on June 29, 2018 with Class M and Class I shares. The Low Duration Bond Fund commenced investment operations on March 31, 1997 with the Class M shares. Class I was added on March 31, 2000, and the Administrative Class was added on September 22, 2009. The Opportunistic High Income Credit Fund commenced investment operations on August 2, 2021 with Class M and Class I shares. The Strategic Income Fund commenced investment operations on June 30, 2003 with Class M shares. Class I was added on March 31, 2004. The Total Return Bond Fund commenced investment operations on March 31, 1997 with the Class M shares. Class I was added on March 31, 2000; Class I-2 was added on March 6, 2020; Administrative Class was added on December 18, 2009; and the Plan Class added on July 31, 2011. The Ultra Short Bond Fund commenced investment operations on June 30, 2003 with the Class M shares. Class I was added on July 31, 2004. The Unconstrained Bond Fund commenced investment operations on September 30, 2011 with Class M and Class I shares; and the Plan Class was added on March 6, 2020. Each Fund is an investment company following the accounting and reporting guidance of the Financial Accounting Standards Board (“FASB”) Accounting Standards Codification (“ASC”) No. 946, Financial Services – Investment Companies.
The AlphaTrak 500 Fund seeks to achieve a total return that exceeds the total return of the Standard & Poor’s 500 Index (the “S&P 500 Index”). The Fund combines non-leveraged investments in S&P 500 Index futures contracts and/or swaps with a diversified portfolio of fixed-income securities of varying maturities with a portfolio duration of up to three years. The Fund’s dollar-weighted average maturity is up to five years.
The Corporate Bond Fund seeks to maximize long-term total return, by investing, under normal circumstances, at least 80% of its assets, plus any borrowings for investment purposes, in a diversified portfolio of corporate debt instruments of varying maturities issued by U.S. and foreign corporations domiciled in developed market and emerging market countries. There is no limit on the weighted average maturity of the Fund’s portfolio, and the Fund’s average portfolio duration is expected, but not required, to vary from three to nine years.
The ESG Securitized Fund seeks to maximize current income and achieve above average long-term total return by investing, under normal circumstances, at least 80% of its net assets in debt securities issued by securitized vehicles and similar instruments that the Adviser believes satisfy one or more of its positive-screening environmental, social and governance (“ESG”) criteria to support sustainable initiatives. The Fund’s portfolio duration is two to eight years and the Fund’s dollar-weighted average maturity ranges from two to fifteen years.
The Flexible Income Fund seeks a high level of current income with a secondary objective of long-term capital appreciation by utilizing a flexible investment approach that allocates investments across a range of global investment opportunities related to credit, currencies and interest rates. There is no limit on the weighted average maturity of the Fund’s portfolio, and the Fund’s average portfolio duration is expected, but not required, to vary from zero to eight years.
| Annual Report March 2022 / 310 |
Table of Contents
Notes to Financial Statements (Continued)
The Floating Rate Income Fund seeks primarily to maximize current income with a secondary objective of long-term capital appreciation, by investing normally at least 80% of its net assets, plus any borrowings for investment purposes, in floating rate investments and in investments that are the economic equivalent of floating rate investments. The Fund’s portfolio securities may have any duration or maturity.
The High Yield Bond Fund seeks to maximize long-term total return consistent with preservation of capital. The Fund invests at least 80% of its net assets, plus any borrowings for investment purposes, in high yield bonds (commonly known as “junk bonds”). The remainder of the Fund’s net assets may be invested in investment grade securities rated by one of the nationally recognized statistical rating organizations or, if unrated, determined by the Adviser to be of comparable quality. The Fund’s portfolio duration is two to eight years. The Fund’s dollar-weighted average maturity is expected to range from two to fifteen years.
The Intermediate Bond Fund seeks to maximize current income, consistent with preservation of capital. The Fund invests at least 80% of its net assets, plus any borrowings for investment purposes, in fixed income securities it regards as bonds. The Fund’s portfolio duration is one to six years. The Fund’s dollar-weighted average maturity is expected to range from three to seven years.
The Investment Grade Credit Fund seeks to maximize long-term total return. The Fund invests at least 80% of its net assets, plus any borrowings for investment purposes, in securities and instruments it regards as bonds in the U.S and abroad, including emerging markets, and may purchase securities of varying maturities issued by domestic and foreign corporations and governments. There is no limit on the weighted average maturity of the Fund’s portfolio, and the Fund’s average portfolio duration is expected, but not required, to vary from two to eight years.
The Low Duration Bond Fund seeks to maximize current income, consistent with preservation of capital. The Fund invests at least 80% of its net assets, plus any borrowings for investment purposes, in fixed income securities it regards as bonds. The Fund’s portfolio duration is up to three years. The Fund’s dollar-weighted average maturity is expected to range from one to five years.
The Opportunistic High Income Credit Fund seeks to maximize total returns through a combination of current income and capital appreciation by investing at least 80% of its net assets in investments across a range of global investment opportunities related to income-generating credit securities, with an emphasis on higher volatility, lower-quality debt securities rated below investment grade, or unrated securities determined by the Adviser to be of comparable quality. There is no limit on the weighted average maturity of the Fund’s portfolio, and there is no limit on the Fund’s average portfolio duration.
The Strategic Income Fund seeks to maximize long-term total return without tracking any particular markets or indices. This Fund uses techniques intended to provide absolute (positive) returns in all markets by employing a strategy intended to produce high income while exploiting disparities or inefficiencies in markets. The Fund focuses on inefficiencies related to secured or asset-backed debt compared with unsecured and subordinated debt or equity of companies and issuers. Additionally, the Fund focuses on longer-term cyclical anomalies in the fixed income markets to both enhance yield and realize potential price appreciation. These anomalies include shifts in the portfolio’s duration, yield curve anomalies, and sector- and issue-specific dislocations.
The Total Return Bond Fund seeks to maximize long-term total return. The Fund invests at least 80% of its net assets, plus any borrowings for investment purposes, in fixed income securities it regards as bonds. The Fund’s portfolio duration is two to eight years. The Fund’s dollar-weighted average maturity is expected to range from two to fifteen years.
The Ultra Short Bond Fund seeks to maximize current income, consistent with preservation of capital. The Fund invests at least 80% of its net assets, plus any borrowings for investment purposes, in fixed income securities it regards as bonds. The Fund’s portfolio duration normally will remain within one year of its benchmark index. The Fund’s dollar-weighted average maturity normally exceeds one year.
The Unconstrained Bond Fund seeks to provide investors with positive long-term returns irrespective of general securities market conditions. The Fund intends to pursue its objective by utilizing a flexible investment approach that allocates investments across a range of global investment opportunities related to credit, currencies and interest rates. The Fund invests at least 80% of its net assets, plus any borrowings for investment purposes, in securities and instruments it regards as bonds in the U.S. and abroad, including emerging markets, and may purchase securities of varying maturities issued by domestic and foreign corporations and governments. There is no limit on the weighted average maturity of the Fund’s portfolio, and the average portfolio duration of the fixed-income portion of the Fund’s portfolio is expected to vary from negative three (-3) years to positive eight (8) years.
A more complete description of the objectives and strategies of each of the Funds can be found in the Prospectuses and the Statement of Additional Information, which can be obtained at www.tcw.com or by calling (800) 241-4671.
| 311 / Annual Report March 2022 |
Table of Contents
Notes to Financial Statements (Continued)
| 2. | SIGNIFICANT ACCOUNTING POLICIES |
The following is a summary of significant accounting policies consistently followed by the Trust:
Net Asset Value:
The Net Asset Value (“NAV”) of each class of a Fund is determined by dividing the net assets attributable to each class of shares of the Fund by the number of issued and outstanding shares of the class of the Fund on each business day as of 4 p.m. ET.
Security Valuation:
Fixed income securities for which market quotations are readily available are valued at prices as provided by independent pricing vendors or broker quotes. The Funds receive pricing information from independent pricing vendors approved by the Board of Trustees (the “Board” or the “Board of Trustees”). Securities with a demand feature exercisable within one to seven days are valued at par. The Funds also use a benchmark pricing system to the extent vendors’ prices for their securities are either inaccurate (such as when the reported prices are different from recent known market transactions) or are not available from another pricing source. For a security priced using this system, the Adviser initially selects a proxy composed of a relevant security (e.g., U.S. Treasury Note) or benchmark (e.g., LIBOR) and a multiplier, divisor or margin that the Adviser believes would together best reflect changes in the market value of the security. The value of the security changes daily based on changes to the market price of the assigned benchmark. The benchmark pricing system is continuously reviewed by the Adviser and implemented according to the pricing policy reviewed by the Board. S&P 500 Index futures contracts are valued at the first sale price after 4 p.m. ET on the Chicago Mercantile Exchange. All other futures contracts are valued at the official settlement price of the exchange on which those securities are traded. Equity securities, including depository receipts, are valued at the last reported sale price or the market’s closing price on the exchange or market on which such securities are traded, as of the close of business on the day the securities are being valued or, lacking any sales, at the average of the bid and ask prices. In cases where equity securities are traded on more than one exchange, the securities are valued on the exchange or market determined by the Adviser to be the broadest and most representative market, which may be either a securities exchange or the over-the-counter market. Equity options are valued at the average of the bid and ask prices. Securities and other assets that cannot be valued as described above will be valued at their fair value as determined by the Adviser under guidelines established by and under the general supervision and responsibility of the Board.
Investments in registered open-ended investment companies, including those classified as money market funds, are valued based upon the reported NAV of such investments.
Fair value methods approved by the Board of Trustees include, but are not limited to, obtaining market quotations from secondary pricing services, broker-dealers, or widely used quotation systems. General factors considered in determining the fair value of securities include fundamental analytical data, the nature and duration of any restrictions on disposition of the securities, and an evaluation of the forces that influence the market in which the investments are purchased and sold. These securities are either categorized as Level 2 or 3 depending on the relevant inputs used. In the event that the security or asset cannot be valued pursuant to one of the valuation methods established by the Board, the value of the security or asset will be determined in good faith by the Pricing Committee of the Board, generally based upon recommendations provided by the Adviser. When the Funds use these fair valuation methods applied by the Adviser that use significant unobservable inputs to determine NAV, securities will be priced by a method that the Board or persons acting at their direction believe accurately reflect fair value and are categorized as Level 3 of the fair value hierarchy. These methods may require subjective determinations about the value of a security. While the Trust’s policy is intended to result in a calculation of a Fund’s NAV that fairly reflects security values as of the time of pricing, the Funds cannot guarantee that values determined by the Board or persons acting at their direction would accurately reflect the price that the Funds could obtain for a security if it were to dispose of that security as of the time of pricing (for instance, in a forced or distressed sale). The prices used by the Funds may differ from the value that would be realized if the securities were sold.
Foreign Currency Translation:
The books and records of each Fund are maintained in U.S. dollars as follows: (1) foreign currency denominated securities and other assets and liabilities stated in foreign currencies are translated using the daily spot rate; and (2) purchases, sales, income and expenses are translated at the rate of exchange prevailing on the respective dates of such transactions. The resultant exchange gains and losses are included in net realized or net unrealized gain (loss) in the Statements of Operations. Pursuant to U.S. federal income tax regulations, certain foreign exchange gains and losses included in realized and unrealized gains and losses are reclassified to ordinary income for federal income tax purposes.
Foreign Taxes:
The Funds may be subject to withholding taxes on income and capital gains imposed by certain countries in which they invest. The withholding tax on income is netted against the income accrued or received. Any reclaimable taxes are recorded as income. The withholding tax on realized or unrealized gain is recorded as a liability.
| Annual Report March 2022 / 312 |
Table of Contents
Notes to Financial Statements (Continued)
Securities and Derivatives Transactions and Investment Income:
Securities transactions are accounted for no later than the first NAV calculation on the first business day following the trade date. However, for financial reporting purposes, portfolio securities transactions are reported on the trade date. Cost is determined and gains and losses are based on the first-in, first-out method for both financial statement and federal income tax purposes. Dividend income is recorded on the ex-dividend date. Interest income is accrued daily. Discounts, including original issue discount, and premiums on securities are amortized using the effective interest method.
Distributions to Shareholders:
Distributions to shareholders are recorded on the ex-dividend date. The Funds (except the AlphaTrak 500 Fund) expect to declare dividends daily and pay them monthly to shareholders. The AlphaTrak 500 Fund expects to declare and pay dividends to shareholders quarterly. Distributions of net capital gains, if any, will be made at least annually. The Board may determine to declare and make distributions more or less frequently.
Federal Income Taxation:
It is each Fund’s policy to continue to comply with the requirements of the Internal Revenue Code applicable to regulated investment companies and to distribute all of its net taxable income, including any net realized gain on investments, to its shareholders. Therefore, no federal income tax provision is required.
Income and long-term capital gain distributions are determined in accordance with federal income tax regulations, which may differ from accounting principles generally accepted in the United States of America (“GAAP”). Distributions determined in accordance with tax regulations may differ in amount or character from net investment income and realized gains for financial reporting purposes. Financial reporting records are adjusted for permanent book/tax differences to reflect tax character. Financial records are not adjusted for temporary differences.
Management has analyzed the Funds’ tax positions taken on federal income tax returns for all open tax years (current and prior three tax years), and has concluded that no provision for federal income tax is required in the Funds’ financial statements. The Funds are subject to examination by U.S. federal and state tax authorities for returns filed for the prior three and four fiscal years, respectively.
As of and during the year ended March 31, 2022, the Funds did not have a liability for any unrecognized tax benefits. The Funds recognize interest and penalties, if any, related to unrecognized tax benefits as income tax expense in the Statements of Operations. During the year, the Funds did not incur any interest or penalties.
Cash and Cash Equivalents:
The Trust has defined cash and cash equivalents as cash which can be in interest-bearing accounts. The Funds also maintain cash in bank account deposits that, at times, may exceed federally insured limits. The Funds have not experienced any losses in any such accounts.
Use of Estimates:
The preparation of financial statements in conformity with GAAP requires management to make estimates and assumptions that affect the reported amounts of assets and liabilities and disclosure of contingent assets and liabilities at the date of the financial statements and the reported amounts of increases and decreases in net assets from operations during the reporting period. Actual results could differ from those estimates.
Fair Value Measurements:
Various inputs are used in determining the fair value of investments, which are as follows:
| * Level 1 - | unadjusted quoted prices in active markets for identical securities | |
| * Level 2 - | other significant observable inputs (including quoted prices for similar securities, interest rates, prepayment speeds, credit risk, etc.) | |
| * Level 3 - | significant unobservable inputs that are not corroborated by observable market data | |
The inputs or methodology used for valuing investments are not necessarily an indication of the risk associated with investing in those investments and the determination of the significance of a particular input to the fair value measurement in its entirety requires judgment and consideration of factors specific to each security.
| 313 / Annual Report March 2022 |
Table of Contents
Notes to Financial Statements (Continued)
The availability of observable inputs can vary from security to security and is affected by a wide variety of factors, including, for example, the type of security, whether the security is new and not yet established in the marketplace, the liquidity of markets, and other characteristics particular to the security. To the extent that valuation is based on models or inputs that are less observable or unobservable in the market, the determination of fair value requires more judgment. Accordingly, the degree of judgment exercised in determining fair value is greatest for instruments categorized as Level 3.
In periods of market dislocation, the observability of prices and inputs may be reduced for many instruments. This condition, as well as changes related to liquidity of investments, could cause a security to be reclassified between Level 1, Level 2, or Level 3.
In certain cases, the inputs used to measure fair value may fall into different levels of the fair value hierarchy. In such cases, for disclosure purposes the level in the fair value hierarchy within which the fair value measurement falls in its entirety is determined based on the lowest level input that is significant to the fair value measurement in its entirety.
Asset-backed securities and mortgage-backed securities. The fair value of asset-backed securities and mortgage-backed securities is estimated based on models that consider the estimated cash flows of each debt tranche of the issuer, establish a benchmark yield, and develop an estimated tranche-specific spread to the benchmark yield based on the unique attributes of the tranche including, but not limited to, the prepayment speed assumptions and attributes of the collateral. To the extent the inputs are observable and timely, the values would be categorized as Level 2 of the fair value hierarchy; otherwise they would be categorized as Level 3.
Bank loans. The fair value of bank loans is estimated using recently executed transactions, market price quotations, credit/market events, and cross-asset pricing. Inputs are generally observable market inputs obtained from independent sources. Bank loans are generally categorized as Level 2 of the fair value hierarchy, unless key inputs are unobservable; they would then be categorized as Level 3.
Corporate bonds. The fair value of corporate bonds is estimated using recently executed transactions, market price quotations (where observable), bond spreads, or credit default swap spreads adjusted for any basis difference between cash and derivative instruments. Corporate bonds are generally categorized as Level 2 of the fair value hierarchy; in instances where prices, spreads, or any of the other aforementioned key inputs are unobservable, they are categorized as Level 3 of the hierarchy.
Credit default swaps. Credit default swaps are fair valued using pricing models that take into account, among other factors, information received from market makers and broker-dealers, default probabilities from index-specific credit spread curves, recovery rates, and cash flows. To the extent that these inputs are observable and timely, the fair values of credit default swaps would be categorized as Level 2; otherwise the fair values would be categorized as Level 3.
Equity securities. Securities such as common stocks and warrants are generally valued based on quoted prices from the applicable exchange. To the extent these securities are actively traded, valuation adjustments are not applied and they are categorized as Level 1 of the fair value hierarchy. Restricted securities issued by publicly held companies are valued at a discount to similar publicly traded securities and may be categorized as Level 2 of the fair value hierarchy to the extent that the discount is considered to be insignificant to the fair value measurement in its entirety; otherwise they may be categorized as Level 3. Restricted securities held in non-public entities are categorized as Level 3 of the fair value hierarchy because they trade infrequently, and therefore the inputs are unobservable.
Foreign currency contracts. The fair value of foreign currency contracts is derived from indices, reference rates, and other inputs or a combination of these factors. These contracts are normally valued on the basis of broker-dealer quotations or by pricing service providers. Depending on the product and the terms of the transaction, the value of financial derivatives can be estimated by a pricing service provider using a series of techniques, including simulation pricing models. The pricing models use inputs that are observed from actively quoted markets such as indices and exchange rates. Foreign currency contracts are categorized as Level 2 of the fair value hierarchy.
Futures contracts. Futures contracts and options on futures contracts are traded on commodity exchanges and are fair valued based on quoted prices from the applicable exchange, and to the extent valuation adjustments are not applied to futures contracts, they are categorized as Level 1. To the extent that valuation adjustments are observable and timely, the fair values of futures contracts would be categorized as Level 2; otherwise the fair values would be categorized as Level 3.
Interest rate swaps. Interest rate swaps are fair valued using pricing models that are based on real-time intraday snap shots of relevant interest rate curves that are built using the most actively traded securities for a given maturity. The pricing models also incorporate cash and money market rates. In addition, market data pertaining to interest rate swaps are monitored regularly to ensure that interest rates are properly depicting the current market rate. To the extent that these inputs are observable and timely, the fair values of interest rate swaps would be categorized as Level 2; otherwise the fair values would be categorized as Level 3.
| Annual Report March 2022 / 314 |
Table of Contents
Notes to Financial Statements (Continued)
Money market funds. Money market funds are open-ended mutual funds that invest in short-term debt securities. To the extent that these funds are valued based upon the reported NAV, they are categorized as Level 1 of the fair value hierarchy.
Municipal bonds. Municipal bonds are fair valued based on pricing models that take into account, among other factors, information received from market makers and broker-dealers, current trades, bid-wanted lists, offerings, market movements, the callability of the bond, state of issuance, benchmark yield curves, and bond insurance. To the extent that these inputs are observable and timely, the fair values of municipal bonds would be categorized as Level 2; otherwise the fair values would be categorized as Level 3.
Options and Swaptions contracts. Exchange-listed options contracts are traded on securities exchanges and are fair valued based on quoted prices from the applicable exchange, and to the extent valuation adjustments are not applied, they are categorized as Level 1. If valuation adjustments are applied and such adjustments are observable and timely, the fair values of exchange-listed options contracts would be categorized as Level 2; otherwise the fair values would be categorized as Level 3. Options and swaptions contracts traded over-the-counter (“OTC”) are fair valued based on pricing models and incorporate various inputs such as interest rates, credit spreads, currency exchange rates and volatility measurements for in-the-money, at-the-money, and out-of-the-money contracts based on a given strike price. To the extent that these inputs are observable and timely, the fair values of OTC options and swaptions contracts would be categorized as Level 2; otherwise the fair values would be categorized as Level 3.
Restricted securities. Restricted securities that are deemed to be both Rule 144A securities and illiquid, as well as restricted securities held in non-public entities, are categorized as Level 3 of the fair value hierarchy because they trade infrequently, and therefore the inputs are unobservable. Any other restricted securities are valued at a discount to similar publicly traded securities and may be categorized as Level 2 of the fair value hierarchy to the extent that the discount is considered to be insignificant to the fair value measurement in its entirety; otherwise they may be categorized as Level 3.
Short-term investments. Short-term investments (commercial paper and repurchase agreements) are valued using market price quotations, and are reflected as Level 2 of the fair value hierarchy.
Total return swaps. Total return swaps are fair valued using pricing models that take into account, among other factors, index spread curves, nominal values, modified duration values and cash flows. To the extent that these inputs are observable and timely, the fair values of total return swaps would be categorized as Level 2; otherwise the fair values would be categorized as Level 3.
U.S. and Foreign government and agency securities. U.S. and Foreign government and agency securities are normally valued using a model that incorporates market observable data such as reported sales of similar securities, broker quotes, yields, bids, offers, quoted market prices, and reference data. Some government securities are actively traded and transparent in the market place. As such, they can be categorized as Level 1. Other government and agencies securities are quoted based on similar securities and yields, and therefore would be categorized as Level 2.
As of March 31, 2022, Level 3 securities consist of certain asset-backed and mortgage-backed securities, bank loans, common stocks, corporate bonds and credit default swaps.
| 315 / Annual Report March 2022 |
Table of Contents
Notes to Financial Statements (Continued)
The summary of inputs used to value each Fund’s investments and other financial instruments carried at fair value as of March 31, 2022 is as follows:
| ALPHATRAK 500 FUND | LEVEL 1 | LEVEL 2 | LEVEL 3 | TOTAL | ||||||||||||
|
|
|
|
|
|
|
|
|
|||||||||
| Investments in Securities |
||||||||||||||||
| Assets: |
||||||||||||||||
| Short-Term Investments: |
||||||||||||||||
| Money Market Funds |
$ | 3,660,904 | $ | — | $ | — | $ | 3,660,904 | ||||||||
| U.S. Agency Discount Notes |
— | 1,192,777 | — | 1,192,777 | ||||||||||||
| U.S. Treasury Bills |
2,117,854 | — | — | 2,117,854 | ||||||||||||
| Long-Term Investments: |
||||||||||||||||
| Asset-Backed Securities |
— | 4,892,606 | — | 4,892,606 | ||||||||||||
| Common Stock |
— | — | 23,160 | 23,160 | ||||||||||||
| Corporates |
— | 12,798,946 | — | 12,798,946 | ||||||||||||
| Mortgage-Backed Securities |
— | 9,750,174 | 42,950 | 9,793,124 | ||||||||||||
| Municipal Bonds |
— | 904,364 | — | 904,364 | ||||||||||||
| Mutual Funds |
8,169,469 | — | — | 8,169,469 | ||||||||||||
| Rights |
— | — | — | — | ||||||||||||
| U.S. Treasury Securities |
143,946 | — | — | 143,946 | ||||||||||||
| Other Financial Instruments* |
||||||||||||||||
| Assets: |
||||||||||||||||
| Equity contracts |
2,224,884 | — | — | 2,224,884 | ||||||||||||
|
|
|
|
|
|
|
|
|
|||||||||
| Total |
$ | 16,317,057 | $ | 29,538,867 | $ | 66,110 | $ | 45,922,034 | ||||||||
|
|
|
|
|
|
|
|
|
|||||||||
| *Other financial instruments include futures. Equity contracts include futures. |
| |||||||||||||||
| CORPORATE BOND FUND | LEVEL 1 | LEVEL 2 | LEVEL 3 | TOTAL | ||||||||||||
|
|
|
|
|
|
|
|
|
|||||||||
| Investments in Securities |
||||||||||||||||
| Assets: |
||||||||||||||||
| Short-Term Investments: |
||||||||||||||||
| Money Market Funds |
$ | 355,236 | $ | — | $ | — | $ | 355,236 | ||||||||
| Long-Term Investments: |
||||||||||||||||
| Asset-Backed Securities |
— | — | 39,936 | 39,936 | ||||||||||||
| Corporates |
— | 11,219,336 | 5,355 | 11,224,691 | ||||||||||||
| Mortgage-Backed Securities |
— | 58,801 | 12,295 | 71,096 | ||||||||||||
| Municipal Bonds |
— | 364,007 | — | 364,007 | ||||||||||||
| U.S. Treasury Securities |
346,609 | 22,025 | — | 368,634 | ||||||||||||
| Other Financial Instruments* |
||||||||||||||||
| Assets: |
||||||||||||||||
| Foreign currency exchange contracts |
— | 4,548 | — | 4,548 | ||||||||||||
| Interest rate contracts |
18,676 | 11,164 | — | 29,840 | ||||||||||||
| Liabilities: |
||||||||||||||||
| Foreign currency exchange contracts |
— | (5,737) | — | (5,737) | ||||||||||||
| Interest rate contracts |
(6,138) | (49,447) | — | (55,585) | ||||||||||||
|
|
|
|
|
|
|
|
|
|||||||||
| Total |
$ | 714,383 | $ | 11,624,697 | $ | 57,586 | $ | 12,396,666 | ||||||||
|
|
|
|
|
|
|
|
|
|||||||||
*Other financial instruments include foreign currency exchange contracts, futures, swaps and written swaptions. Interest rate contracts include futures, swaps and written swaptions.
| Annual Report March 2022 / 316 |
Table of Contents
Notes to Financial Statements (Continued)
| ESG SECURITIZED FUND | LEVEL 1 | LEVEL 2 | LEVEL 3 | TOTAL | ||||||||||||
|
|
|
|
|
|
|
|
|
|||||||||
| Investments in Securities |
||||||||||||||||
| Assets: |
||||||||||||||||
| Short-Term Investments: |
||||||||||||||||
| Money Market Funds |
$ | 227,640 | $ | — | $ | — | $ | 227,640 | ||||||||
| U.S. Agency Discount Notes |
— | 96,810 | — | 96,810 | ||||||||||||
| Long-Term Investments: |
||||||||||||||||
| Asset-Backed Securities |
— | 693,007 | — | 693,007 | ||||||||||||
| Mortgage-Backed Securities |
— | 9,101,469 | — | 9,101,469 | ||||||||||||
| U.S. Treasury Securities |
1,983,880 | — | — | 1,983,880 | ||||||||||||
| Other Financial Instruments* |
||||||||||||||||
| Assets: |
||||||||||||||||
| Foreign currency exchange contracts |
— | 7,845 | — | 7,845 | ||||||||||||
| Interest rate contracts |
41,969 | — | — | 41,969 | ||||||||||||
| Liabilities: |
||||||||||||||||
| Foreign currency exchange contracts |
— | (1,715) | — | (1,715) | ||||||||||||
| Interest rate contracts |
(15,590) | — | — | (15,590) | ||||||||||||
|
|
|
|
|
|
|
|
|
|||||||||
| Total |
$ | 2,237,899 | $ | 9,897,416 | $ | — | $ | 12,135,315 | ||||||||
|
|
|
|
|
|
|
|
|
|||||||||
| *Other financial instruments include foreign currency exchange contracts and futures. Interest rate contracts include futures.
|
| |||||||||||||||
| FLEXIBLE INCOME FUND | LEVEL 1 | LEVEL 2 | LEVEL 3 | TOTAL | ||||||||||||
|
|
|
|
|
|
|
|
|
|||||||||
| Investments in Securities |
|
|||||||||||||||
| Assets: |
||||||||||||||||
| Short-Term Investments: |
||||||||||||||||
| Money Market Funds |
$ | 12,901,658 | $ | — | $ | — | $ | 12,901,658 | ||||||||
| U.S. Treasury Bills |
9,964,717 | — | — | 9,964,717 | ||||||||||||
| Long-Term Investments: |
||||||||||||||||
| Asset-Backed Securities |
— | 14,627,987 | 488,107 | 15,116,094 | ||||||||||||
| Bank Loans |
— | 14,400,380 | — | 14,400,380 | ||||||||||||
| Common Stock |
334,050 | — | 330,900 | 664,950 | ||||||||||||
| Corporates |
— | 73,285,767 | 531,973 | 73,817,740 | ||||||||||||
| Foreign Government Obligations |
— | 4,869,898 | — | 4,869,898 | ||||||||||||
| Mortgage-Backed Securities |
— | 95,001,692 | 1,948,536 | 96,950,228 | ||||||||||||
| Municipal Bonds |
— | 1,373,157 | — | 1,373,157 | ||||||||||||
| Rights |
— | — | — | — | ||||||||||||
| U.S. Treasury Securities |
2,493,467 | — | — | 2,493,467 | ||||||||||||
| Warrant |
— | 33,176 | — | 33,176 | ||||||||||||
| Other Financial Instruments* |
||||||||||||||||
| Assets: |
||||||||||||||||
| Foreign currency exchange contracts |
— | 96,181 | — | 96,181 | ||||||||||||
| Interest rate contracts |
1,274,283 | — | — | 1,274,283 | ||||||||||||
| Liabilities: |
||||||||||||||||
| Foreign currency exchange contracts |
— | (104,882) | — | (104,882) | ||||||||||||
| Interest rate contracts |
(1,564,435) | — | — | (1,564,435) | ||||||||||||
|
|
|
|
|
|
|
|
|
|||||||||
| Total |
$ | 25,403,740 | $ | 203,583,356 | $ | 3,299,516 | $ | 232,286,612 | ||||||||
|
|
|
|
|
|
|
|
|
|||||||||
*Other financial instruments include foreign currency exchange contracts, futures and written options. Interest rate contracts include futures and written options.
| 317 / Annual Report March 2022 |
Table of Contents
Notes to Financial Statements (Continued)
| FLOATING RATE INCOME FUND | LEVEL 1 | LEVEL 2 | LEVEL 3 | TOTAL | ||||||||||||
|
|
|
|
|
|
|
|
|
|||||||||
| Investments in Securities |
||||||||||||||||
| Assets: |
||||||||||||||||
| Short-Term Investments: |
||||||||||||||||
| Money Market Funds |
$ | 10,796,915 | $ | — | $ | — | $ | 10,796,915 | ||||||||
| U.S. Treasury Bills |
23,392,140 | — | — | 23,392,140 | ||||||||||||
| Long-Term Investments: |
||||||||||||||||
| Bank Loans |
— | 431,881,233 | 3,781,017 | 435,662,250 | ||||||||||||
| Common Stock |
— | — | 289,860 | 289,860 | ||||||||||||
| Corporates |
— | 30,315,646 | — | 30,315,646 | ||||||||||||
| Rights |
— | — | — | — | ||||||||||||
| Warrant |
— | 49,875 | — | 49,875 | ||||||||||||
| Other Financial Instruments* |
||||||||||||||||
| Assets: |
||||||||||||||||
| Foreign currency exchange contracts |
— | 20,619 | — | 20,619 | ||||||||||||
| Liabilities: |
||||||||||||||||
| Foreign currency exchange contracts |
— | (7,881) | — | (7,881) | ||||||||||||
|
|
|
|
|
|
|
|
|
|||||||||
| Total |
$ | 34,189,055 | $ | 462,259,492 | $ | 4,070,877 | $ | 500,519,424 | ||||||||
|
|
|
|
|
|
|
|
|
|||||||||
| *Other financial instruments include foreign currency exchange contracts. |
| |||||||||||||||
| HIGH YIELD BOND FUND | LEVEL 1 | LEVEL 2 | LEVEL 3 | TOTAL | ||||||||||||
|
|
|
|
|
|
|
|
|
|||||||||
| Investments in Securities |
|
|||||||||||||||
| Assets: |
||||||||||||||||
| Short-Term Investments: |
||||||||||||||||
| Money Market Funds |
$ | 31,292,239 | $ | — | $ | — | $ | 31,292,239 | ||||||||
| Long-Term Investments: |
||||||||||||||||
| Bank Loans |
— | 80,008,408 | 4,460,910 | 84,469,318 | ||||||||||||
| Common Stock |
4,127,671 | — | 3,763,050 | 7,890,721 | ||||||||||||
| Corporates |
— | 585,388,272 | 4,007,877 | 589,396,149 | ||||||||||||
| Rights |
— | — | — | — | ||||||||||||
| Warrant |
— | 62,641 | 51 | 62,692 | ||||||||||||
| Other Financial Instruments* |
||||||||||||||||
| Assets: |
||||||||||||||||
| Credit contracts |
— | 222,693 | 94,040 | 316,733 | ||||||||||||
| Foreign currency exchange contracts |
— | 95,427 | — | 95,427 | ||||||||||||
| Interest rate contracts |
1,711,536 | — | — | 1,711,536 | ||||||||||||
| Liabilities: |
||||||||||||||||
| Foreign currency exchange contracts |
— | (37,530) | — | (37,530) | ||||||||||||
|
|
|
|
|
|
|
|
|
|||||||||
| Total |
$ | 37,131,446 | $ | 665,739,911 | $ | 12,325,928 | $ | 715,197,285 | ||||||||
|
|
|
|
|
|
|
|
|
|||||||||
*Other financial instruments include foreign currency exchange contracts, futures and swaps. Credit contracts include swaps. Interest rate contracts include futures.
| Annual Report March 2022 / 318 |
Table of Contents
Notes to Financial Statements (Continued)
| INTERMEDIATE BOND FUND | LEVEL 1 | LEVEL 2 | LEVEL 3 | TOTAL | ||||||||||||
| Investments in Securities |
||||||||||||||||
| Assets: |
||||||||||||||||
| Short-Term Investments: |
||||||||||||||||
| Money Market Funds |
$ | 34,047,208 | $ | — | $ | — | $ | 34,047,208 | ||||||||
| Long-Term Investments: |
||||||||||||||||
| Asset-Backed Securities |
— | 52,145,385 | 2,041,174 | 54,186,559 | ||||||||||||
| Bank Loans |
— | 11,497,475 | — | 11,497,475 | ||||||||||||
| Common Stock |
— | — | 457,470 | 457,470 | ||||||||||||
| Corporates |
— | 260,796,096 | 522,068 | 261,318,164 | ||||||||||||
| Foreign Government Obligations |
— | 1,164,081 | — | 1,164,081 | ||||||||||||
| Mortgage-Backed Securities |
— | 125,076,917 | — | 125,076,917 | ||||||||||||
| Municipal Bonds |
— | 6,262,843 | — | 6,262,843 | ||||||||||||
| Purchased Options |
93,306 | — | — | 93,306 | ||||||||||||
| Rights |
— | — | — | — | ||||||||||||
| U.S. Treasury Securities |
361,976,057 | — | — | 361,976,057 | ||||||||||||
| Other Financial Instruments* |
||||||||||||||||
| Assets: |
||||||||||||||||
| Credit contracts |
— | 64,383 | 98,067 | 162,450 | ||||||||||||
| Foreign currency exchange contracts |
— | 258,747 | — | 258,747 | ||||||||||||
| Interest rate contracts |
315,375 | — | — | 315,375 | ||||||||||||
| Liabilities: |
||||||||||||||||
| Foreign currency exchange contracts |
— | (327,873) | — | (327,873) | ||||||||||||
| Interest rate contracts |
(3,460,788) | — | — | (3,460,788) | ||||||||||||
|
|
|
|
|
|
|
|
|
|||||||||
| Total |
$ | 392,971,158 | $ | 456,938,054 | $ | 3,118,779 | $ | 853,027,991 | ||||||||
|
|
|
|
|
|
|
|
|
|||||||||
| *Other financial instruments include foreign currency exchange contracts, futures, swaps and written options. Credit contracts include swaps. Interest rate contracts include futures and written options.
|
| |||||||||||||||
| INVESTMENT GRADE CREDIT FUND | LEVEL 1 | LEVEL 2 | LEVEL 3 | TOTAL | ||||||||||||
| Investments in Securities |
||||||||||||||||
| Assets: |
||||||||||||||||
| Short-Term Investments: |
||||||||||||||||
| Money Market Funds |
$ | 308,477 | $ | — | $ | — | $ | 308,477 | ||||||||
| Long-Term Investments: |
||||||||||||||||
| Asset-Backed Securities |
— | 556,856 | 35,499 | 592,355 | ||||||||||||
| Corporates |
— | 7,213,940 | 13,386 | 7,227,326 | ||||||||||||
| Mortgage-Backed Securities |
— | 2,697,911 | 37,672 | 2,735,583 | ||||||||||||
| Municipal Bonds |
— | 596,541 | — | 596,541 | ||||||||||||
| U.S. Treasury Securities |
257,775 | — | — | 257,775 | ||||||||||||
| Other Financial Instruments* |
||||||||||||||||
| Assets: |
||||||||||||||||
| Interest rate contracts |
65,228 | 15,253 | — | 80,481 | ||||||||||||
| Liabilities: |
||||||||||||||||
| Interest rate contracts |
(58,677) | (74,540) | — | (133,217) | ||||||||||||
|
|
|
|
|
|
|
|
|
|||||||||
| Total |
$ | 572,803 | $ | 11,005,961 | $ | 86,557 | $ | 11,665,321 | ||||||||
|
|
|
|
|
|
|
|
|
|||||||||
*Other financial instruments include futures, swaps, written options and written swaptions. Interest rate contracts include futures, swaps, written options and written swaptions.
| 319 / Annual Report March 2022 |
Table of Contents
Notes to Financial Statements (Continued)
| LOW DURATION BOND FUND | LEVEL 1 | LEVEL 2 | LEVEL 3 | TOTAL | ||||||||||||||
| Investments in Securities |
||||||||||||||||||
| Assets: |
||||||||||||||||||
| Short-Term Investments: |
||||||||||||||||||
| Money Market Funds |
$ | 99,499,642 | $ | — | $ | — | $ | 99,499,642 | ||||||||||
| U.S. Treasury Bills |
69,802,143 | — | — | 69,802,143 | ||||||||||||||
| Long-Term Investments: |
||||||||||||||||||
| Asset-Backed Securities |
— | 201,712,769 | 6,034,776 | 207,747,545 | ||||||||||||||
| Bank Loans |
— | 67,722,799 | — | 67,722,799 | ||||||||||||||
| Common Stock |
— | — | — | — | ||||||||||||||
| Corporates |
— | 784,267,098 | 2,096,305 | 786,363,403 | ||||||||||||||
| Mortgage-Backed Securities |
— | 1,030,065,283 | 891,424 | 1,030,956,707 | ||||||||||||||
| Municipal Bonds |
— | 23,091,060 | — | 23,091,060 | ||||||||||||||
| Purchased Options |
309,550 | — | — | 309,550 | ||||||||||||||
| Purchased Swaptions |
— | 11,892 | — | 11,892 | ||||||||||||||
| U.S. Treasury Securities |
624,338,050 | — | — | 624,338,050 | ||||||||||||||
| Other Financial Instruments* |
||||||||||||||||||
| Assets: |
||||||||||||||||||
| Credit contracts |
— | 190,920 | 317,177 | 508,097 | ||||||||||||||
| Interest rate contracts |
11,168,335 | — | — | 11,168,335 | ||||||||||||||
| Liabilities: |
||||||||||||||||||
| Interest rate contracts |
(14,970,438) | (3,498) | — | (14,973,936) | ||||||||||||||
|
|
|
|
|
|
|
|
|
|||||||||||
| Total |
$ | 790,147,282 | $ | 2,107,058,323 | $ | 9,339,682 | $ | 2,906,545,287 | ||||||||||
|
|
|
|
|
|
|
|
|
|||||||||||
|
*Other financial instruments include futures, swaps, written options and written swaptions. Credit contracts include swaps. Interest rate contracts include futures, written options and written swaptions.
|
| |||||||||||||||||
| OPPORTUNISTIC HIGH INCOME CREDIT FUND | LEVEL 1 | LEVEL 2 | LEVEL 3 | TOTAL | ||||||||||||||
| Investments in Securities |
||||||||||||||||||
| Assets: |
||||||||||||||||||
| Short-Term Investments: |
||||||||||||||||||
| Money Market Funds |
$ | 97,209 | $ | — | $ | — | $ | 97,209 | ||||||||||
| Long-Term Investments: |
||||||||||||||||||
| Bank Loans |
— | 209,857 | 31,515 | 241,372 | ||||||||||||||
| Common Stock |
379,717 | — | — | 379,717 | ||||||||||||||
| Corporates |
— | 1,906,091 | 25,166 | 1,931,257 | ||||||||||||||
| Master Limited Partnerships |
79,927 | — | — | 79,927 | ||||||||||||||
| Mortgage-Backed Securities |
— | 269,306 | 30,081 | 299,387 | ||||||||||||||
| Other Financial Instruments* |
||||||||||||||||||
| Liabilities: |
||||||||||||||||||
| Interest rate contracts |
(6,598) | — | — | (6,598) | ||||||||||||||
|
|
|
|
|
|
|
|
|
|||||||||||
| Total |
$ | 550,255 | $ | 2,385,254 | $ | 86,762 | $ | 3,022,271 | ||||||||||
|
|
|
|
|
|
|
|
|
|||||||||||
*Other financial instruments include futures. Interest rate contracts include futures.
| Annual Report March 2022 / 320 |
Table of Contents
Notes to Financial Statements (Continued)
| STRATEGIC INCOME FUND | LEVEL 1 | LEVEL 2 | LEVEL 3 | TOTAL | ||||||||||||
| Investments in Securities |
||||||||||||||||
| Assets: |
||||||||||||||||
| Short-Term Investments: |
||||||||||||||||
| Money Market Funds |
$ | 773,105 | $ | — | $ | — | $ | 773,105 | ||||||||
| Long-Term Investments: |
||||||||||||||||
| Asset-Backed Securities |
— | 4,474,423 | 115,275 | 4,589,698 | ||||||||||||
| Common Stock |
58,950 | — | 31,230 | 90,180 | ||||||||||||
| Corporates |
— | 9,563,348 | 32,127 | 9,595,475 | ||||||||||||
| Foreign Government Obligations |
— | 27,226 | — | 27,226 | ||||||||||||
| Mortgage-Backed Securities |
— | 12,369,154 | 85,217 | 12,454,371 | ||||||||||||
| Municipal Bonds |
— | 127,078 | — | 127,078 | ||||||||||||
| Rights |
— | — | — | — | ||||||||||||
| Other Financial Instruments* |
||||||||||||||||
| Assets: |
||||||||||||||||
| Foreign currency exchange contracts |
— | 1,321 | — | 1,321 | ||||||||||||
| Interest rate contracts |
93,969 | 24,767 | — | 118,736 | ||||||||||||
| Liabilities: |
||||||||||||||||
| Foreign currency exchange contracts |
— | (3,872) | — | (3,872) | ||||||||||||
| Interest rate contracts |
(62,213) | (112,406) | — | (174,620) | ||||||||||||
|
|
|
|
|
|
|
|
|
|||||||||
| Total |
$ | 863,810 | $ | 26,471,039 | $ | 263,849 | $ | 27,598,698 | ||||||||
|
|
|
|
|
|
|
|
|
|||||||||
| *Other financial instruments include foreign currency exchange contracts, futures, swaps, written options and written swaptions. Interest rate contracts include futures, swaps, written options and written swaptions. | ||||||||
| TOTAL RETURN BOND FUND | LEVEL 1 | LEVEL 2 | LEVEL 3 | TOTAL | ||||||||||||
| Investments in Securities |
||||||||||||||||
| Assets: |
||||||||||||||||
| Short-Term Investments: |
||||||||||||||||
| Money Market Funds |
$ | 1,846,284,554 | $ | — | $ | — | $ | 1,846,284,554 | ||||||||
| U.S. Agency Discount Notes |
— | 4,759,666,339 | — | 4,759,666,339 | ||||||||||||
| U.S. Treasury Bills |
3,618,887,182 | — | — | 3,618,887,182 | ||||||||||||
| Long-Term Investments: |
||||||||||||||||
| Asset-Backed Securities |
— | 3,332,733,841 | 28,567,563 | 3,361,301,404 | ||||||||||||
| Bank Loans |
— | 1,556,092,594 | 3,351,078 | 1,559,443,672 | ||||||||||||
| Common Stock |
— | — | 71,845,770 | 71,845,770 | ||||||||||||
| Corporates |
— | 22,328,823,045 | 61,572,896 | 22,390,395,941 | ||||||||||||
| Foreign Government Obligations |
— | 909,248,705 | — | 909,248,705 | ||||||||||||
| Mortgage-Backed Securities |
— | 32,145,731,604 | 155,761,703 | 32,301,493,307 | ||||||||||||
| Municipal Bonds |
— | 520,502,526 | — | 520,502,526 | ||||||||||||
| Purchased Options |
9,464,456 | — | — | 9,464,456 | ||||||||||||
| Rights |
— | — | — | — | ||||||||||||
| U.S. Treasury Securities |
24,710,503,030 | 133,315,180 | — | 24,843,818,210 | ||||||||||||
| Other Financial Instruments* |
||||||||||||||||
| Assets: |
||||||||||||||||
| Credit contracts |
— | 3,381,654 | 947,503 | 4,329,157 | ||||||||||||
| Foreign currency exchange contracts |
— | 29,813,453 | — | 29,813,453 | ||||||||||||
| Interest rate contracts |
286,630 | 72,771,520 | — | 73,058,150 | ||||||||||||
| Liabilities: |
||||||||||||||||
| Foreign currency exchange contracts |
— | (27,578,964) | — | (27,578,964) | ||||||||||||
| Interest rate contracts |
(268,731,067) | (328,699,312) | — | (597,430,379) | ||||||||||||
| Reverse Repurchase Agreements |
— | (3,963,750,000) | — | (3,963,750,000) | ||||||||||||
|
|
|
|
|
|
|
|
|
|||||||||
| Total |
$ | 29,916,694,785 | $ | 61,472,052,185 | $ | 322,046,513 | $ | 91,710,793,483 | ||||||||
|
|
|
|
|
|
|
|
|
|||||||||
*Other financial instruments include foreign currency exchange contracts, futures, reverse repurchase agreements, swaps, written options and written swaptions. Credit contracts include swaps. Interest rate contracts include futures, swaps, written options and written swaptions.
| 321 / Annual Report March 2022 |
Table of Contents
Notes to Financial Statements (Continued)
| ULTRA SHORT BOND FUND | LEVEL 1 | LEVEL 2 | LEVEL 3 | TOTAL | ||||||||||||
| Investments in Securities |
||||||||||||||||
| Assets: |
||||||||||||||||
| Short-Term Investments: |
||||||||||||||||
| Money Market Funds |
$ | 9,097,000 | $ | — | $ | — | $ | 9,097,000 | ||||||||
| U.S. Agency Discount Notes |
— | 7,133,369 | — | 7,133,369 | ||||||||||||
| U.S. Treasury Bills |
18,977,391 | — | — | 18,977,391 | ||||||||||||
| Long-Term Investments: |
||||||||||||||||
| Asset-Backed Securities |
— | 14,230,069 | — | 14,230,069 | ||||||||||||
| Corporates |
— | 51,496,247 | — | 51,496,247 | ||||||||||||
| Mortgage-Backed Securities |
— | 70,197,416 | 13,941 | 70,211,357 | ||||||||||||
| Municipal Bonds |
— | 1,698,134 | — | 1,698,134 | ||||||||||||
| Purchased Options |
23,588 | — | — | 23,588 | ||||||||||||
| U.S. Treasury Securities |
51,795,947 | 2,521,924 | — | 54,317,871 | ||||||||||||
| Other Financial Instruments* |
||||||||||||||||
| Assets: |
||||||||||||||||
| Credit contracts |
— | 21,740 | — | 21,740 | ||||||||||||
| Interest rate contracts |
765,868 | — | — | 765,868 | ||||||||||||
| Liabilities: |
||||||||||||||||
| Interest rate contracts |
(651,603) | — | — | (651,603) | ||||||||||||
|
|
|
|
|
|
|
|
|
|||||||||
| Total |
$ | 80,008,191 | $ | 147,298,899 | $ | 13,941 | $ | 227,321,031 | ||||||||
|
|
|
|
|
|
|
|
|
|||||||||
| *Other financial instruments include futures, swaps and written options. Credit contracts include swaps. Interest rate contracts include futures and written options.
|
| |||||||||||||||
| UNCONSTRAINED BOND FUND | LEVEL 1 | LEVEL 2 | LEVEL 3 | TOTAL | ||||||||||||
| Investments in Securities |
||||||||||||||||
| Assets: |
||||||||||||||||
| Short-Term Investments: |
||||||||||||||||
| Money Market Funds |
$ | 190,256,390 | $ | — | $ | — | $ | 190,256,390 | ||||||||
| U.S. Agency Discount Notes |
— | 20,081,296 | — | 20,081,296 | ||||||||||||
| U.S. Treasury Bills |
200,708,195 | — | — | 200,708,195 | ||||||||||||
| Long-Term Investments: |
||||||||||||||||
| Asset-Backed Securities |
— | 553,636,311 | 9,140,910 | 562,777,221 | ||||||||||||
| Bank Loans |
— | 157,341,026 | 1,773,939 | 159,114,965 | ||||||||||||
| Common Stock |
7,624,200 | — | 4,231,650 | 11,855,850 | ||||||||||||
| Corporates |
— | 1,221,417,317 | 4,328,214 | 1,225,745,531 | ||||||||||||
| Foreign Government Obligations |
— | 126,108,987 | — | 126,108,987 | ||||||||||||
| Mortgage-Backed Securities |
— | 1,836,583,549 | 54,965 | 1,836,638,514 | ||||||||||||
| Municipal Bonds |
— | 19,211,300 | — | 19,211,300 | ||||||||||||
| Purchased Options |
467,063 | — | — | 467,063 | ||||||||||||
| Rights |
— | — | — | — | ||||||||||||
| U.S. Treasury Securities |
56,733,694 | — | — | 56,733,694 | ||||||||||||
| Other Financial Instruments* |
||||||||||||||||
| Assets: |
||||||||||||||||
| Credit contracts |
— | 578,056 | 438,220 | 1,016,276 | ||||||||||||
| Foreign currency exchange contracts |
— | 1,401,009 | — | 1,401,009 | ||||||||||||
| Interest rate contracts |
21,457,639 | 3,480,912 | — | 24,938,551 | ||||||||||||
| Liabilities: |
||||||||||||||||
| Foreign currency exchange contracts |
— | (1,751,000) | — | (1,751,000) | ||||||||||||
| Interest rate contracts |
(21,946,054) | (15,665,026) | — | (37,611,080) | ||||||||||||
|
|
|
|
|
|
|
|
|
|||||||||
| Total |
$ | 455,301,127 | $ | 3,922,423,737 | $ | 19,967,898 | $ | 4,397,692,762 | ||||||||
|
|
|
|
|
|
|
|
|
|||||||||
*Other financial instruments include foreign currency exchange contracts, futures, swaps, written options and written swaptions. Credit contracts include swaps. Interest rate contracts include futures, swaps, written options and written swaptions.
| Annual Report March 2022 / 322 |
Table of Contents
Notes to Financial Statements (Continued)
Certain securities held by the Funds are categorized as Level 3 investments. Their prices may be derived by utilizing unobservable prior transaction values or information from third party valuation services. The value of Level 3 investments could be significantly affected by changes in these unobservable inputs.
For the year ended March 31, 2022, a reconciliation of Level 3 investments is presented when the Fund had a significant amount of Level 3 investments at the beginning and/or end of the period in relation to net assets. The following tables are a reconciliation of Level 3 investments for which significant unobservable inputs were used in determining fair value:
| ALPHATRAK 500 FUND |
COMMON STOCK |
MORTGAGE- BACKED SECURITIES | ||||||
| Balance as of |
$ | — | $ | 62,388 | ||||
| Accrued discounts/premiums |
— | (12,814 | ) | |||||
| Realized (loss) |
(28 | ) | — | |||||
| Change in unrealized (depreciation)* |
(2,702 | ) | (6,805 | ) | ||||
| Purchases |
25,890 | — | ||||||
| Sales |
— | — | ||||||
| Transfers into Level 3** |
— | 181 | ||||||
| Transfers out of Level 3** |
— | — | ||||||
|
|
|
|
|
|
| |||
| Balance as of |
$ | 23,160 | $ | 42,950 | ||||
|
|
|
|
|
|
| |||
*The change in unrealized appreciation (depreciation) on securities still held at March 31, 2022 was $(9,507) and is included in the related net realized gains (losses) and net change in appreciation (depreciation) in the Statements of Operations.
**Transfers into and transfers out of level 3 represent the values as of the end of the reporting period. As of March 31, 2021, the Fund used significant observable inputs in determining the value of certain investments. As of March 31, 2022, the Fund used significant unobservable inputs in determining the value of the same investments. As a result, investments with an end of period value of $181 transferred from level 2 to level 3 in the disclosure hierarchy.
| CORPORATE BOND FUND |
ASSET-BACKED SECURITIES |
CORPORATES | MORTGAGE- BACKED SECURITIES | |||||||||
| Balance as of |
$ | 44,118 | $ | 5,267 | $ | 25,014 | ||||||
| Accrued discounts/premiums |
— | (52 | ) | (1,894 | ) | |||||||
| Realized (loss) |
— | (5 | ) | — | ||||||||
| Change in unrealized appreciation (depreciation)* |
(1,701 | ) | 675 | (10,825 | ) | |||||||
| Purchases |
— | — | — | |||||||||
| Sales |
(2,481 | ) | (530 | ) | — | |||||||
| Transfers into Level 3** |
— | — | — | |||||||||
| Transfers out of Level 3** |
— | — | — | |||||||||
|
|
|
|
|
|
|
|
|
| ||||
| Balance as of |
$ | 39,936 | $ | 5,355 | $ | 12,295 | ||||||
|
|
|
|
|
|
|
|
|
| ||||
*The change in unrealized appreciation (depreciation) on securities still held at March 31, 2022 was $(11,852) and is included in the related net realized gains (losses) and net change in appreciation (depreciation) in the Statements of Operations.
**There were no transfers between level 2 and 3 for the year ended March 31, 2022.
323 / Annual Report March 2022
Table of Contents
Notes to Financial Statements (Continued)
| FLEXIBLE INCOME FUND |
ASSET-BACKED SECURITIES |
COMMON STOCK |
CORPORATES | MORTGAGE- BACKED SECURITIES | ||||||||||||
| Balance as of |
$ | 815,348 | $ | — | $ | 213,302 | $ | 2,696,696 | ||||||||
| Accrued discounts/premiums |
— | — | 66,687 | (139,815 | ) | |||||||||||
| Realized gain (loss) |
— | (72 | ) | 1,528 | (1,962 | ) | ||||||||||
| Change in unrealized (depreciation)* |
(20,794 | ) | (38,605 | ) | (50,465 | ) | (873,796 | ) | ||||||||
| Purchases |
— | 369,577 | 322,398 | — | ||||||||||||
| Sales |
(30,318 | ) | — | (21,477 | ) | (8,716 | ) | |||||||||
| Other** |
(276,129 | ) | — | — | 276,129 | |||||||||||
| Transfers into Level 3*** |
— | — | — | — | ||||||||||||
| Transfers out of Level 3*** |
— | — | — | — | ||||||||||||
|
|
|
|
|
|
|
|
|
|
|
|
| |||||
| Balance as of |
$ | 488,107 | $ | 330,900 | $ | 531,973 | $ | 1,948,536 | ||||||||
|
|
|
|
|
|
|
|
|
|
|
|
| |||||
*The change in unrealized appreciation (depreciation) on securities still held at March 31, 2022 was $(982,589) and is included in the related net realized gains (losses) and net change in appreciation (depreciation) in the Statements of Operations.
**Certain Level 3 investments were re-classified between Mortgage-Backed Securities – Non-Agency and Asset-Backed Securities.
***There were no transfers between level 2 and 3 for the year ended March 31, 2022.
| FLOATING RATE INCOME FUND |
BANK LOANS |
COMMON STOCK | ||||||
| Balance as of |
$ | 3,008,358 | $ | — | ||||
| Accrued discounts/premiums |
(80,999 | ) | — | |||||
| Realized (loss) |
(280,499 | ) | (7 | ) | ||||
| Change in unrealized appreciation (depreciation)* |
451,676 | (33,817 | ) | |||||
| Purchases |
2,698,971 | 323,684 | ||||||
| Sales |
(2,016,490 | ) | — | |||||
| Transfers into Level 3** |
— | — | ||||||
| Transfers out of Level 3** |
— | — | ||||||
|
|
|
|
|
|
| |||
| Balance as of |
$ | 3,781,017 | $ | 289,860 | ||||
|
|
|
|
|
|
| |||
*The change in unrealized appreciation (depreciation) on securities still held at March 31, 2022 was $29,489 and is included in the related net realized gains (losses) and net change in appreciation (depreciation) in the Statements of Operations.
**There were no transfers between level 2 and 3 for the year ended March 31, 2022.
| HIGH YIELD BOND FUND |
BANK LOANS |
COMMON STOCK |
CORPORATES | CREDIT DEFAULT SWAPS |
WARRANT | |||||||||||||||
| Balance as of |
$ | 2,009,394 | $ | — | $ | 1,124,446 | $ | — | $ | — | ||||||||||
| Accrued discounts/premiums |
1,426 | — | 468,336 | (44,416 | ) | — | ||||||||||||||
| Realized gain (loss) |
4,041 | (35 | ) | 8,056 | — | (1 | ) | |||||||||||||
| Change in unrealized appreciation (depreciation)* |
(75,136 | ) | (439,023 | ) | (176,950 | ) | 14,342 | (9 | ) | |||||||||||
| Purchases |
2,986,185 | 4,202,108 | 2,697,209 | 124,114 | 61 | |||||||||||||||
| Sales |
(465,000 | ) | — | (113,220 | ) | — | — | |||||||||||||
| Transfers into Level 3** |
— | — | — | — | — | |||||||||||||||
| Transfers out of Level 3** |
— | — | — | — | — | |||||||||||||||
|
|
|
|
|
|
|
|
|
|
|
|
|
|
|
| ||||||
| Balance as of |
$ | 4,460,910 | $ | 3,763,050 | $ | 4,007,877 | $ | 94,040 | $ | 51 | ||||||||||
|
|
|
|
|
|
|
|
|
|
|
|
|
|
|
| ||||||
*The change in unrealized appreciation (depreciation) on securities still held at March 31, 2022 was $(675,105) and is included in the related net realized gains (losses) and net change in appreciation (depreciation) in the Statements of Operations.
**There were no transfers between level 2 and 3 for the year ended March 31, 2022.
Annual Report March 2022 / 324
Table of Contents
Notes to Financial Statements (Continued)
| INTERMEDIATE BOND FUND |
ASSET-BACKED SECURITIES |
COMMON STOCK |
CORPORATES | CREDIT DEFAULT SWAPS | ||||||||||||
| Balance as of |
$ | 2,254,916 | $ | — | $ | 513,506 | $ | — | ||||||||
| Accrued discounts/premiums |
— | — | (5,918 | ) | (47,211 | ) | ||||||||||
| Realized (loss) |
— | (23 | ) | (545 | ) | — | ||||||||||
| Change in unrealized appreciation (depreciation)* |
(86,957 | ) | (53,372 | ) | 66,730 | 14,699 | ||||||||||
| Purchases |
— | 510,865 | — | 130,579 | ||||||||||||
| Sales |
(126,785 | ) | — | (51,705 | ) | — | ||||||||||
| Transfers into Level 3** |
— | — | — | — | ||||||||||||
| Transfers out of Level 3** |
— | — | — | — | ||||||||||||
|
|
|
|
|
|
|
|
|
|
|
|
| |||||
| Balance as of |
$ | 2,041,174 | $ | 457,470 | $ | 522,068 | $ | 98,067 | ||||||||
|
|
|
|
|
|
|
|
|
|
|
|
| |||||
*The change in unrealized appreciation (depreciation) on securities still held at March 31, 2022 was $(62,063) and is included in the related net realized gains (losses) and net change in appreciation (depreciation) in the Statements of Operations.
**There were no transfers between level 2 and 3 for the year ended March 31, 2022.
| INVESTMENT GRADE CREDIT FUND |
ASSET-BACKED SECURITIES |
CORPORATES | MORTGAGE- BACKED SECURITIES | |||||||||
| Balance as of |
$ | 39,216 | $ | 13,167 | $ | 65,397 | ||||||
| Accrued discounts/premiums |
— | (130 | ) | (3,085 | ) | |||||||
| Realized (loss) |
— | (12 | ) | — | ||||||||
| Change in unrealized appreciation (depreciation)* |
(1,512 | ) | 1,687 | (24,640 | ) | |||||||
| Purchases |
— | — | — | |||||||||
| Sales |
(2,205 | ) | (1,326 | ) | — | |||||||
| Transfers into Level 3** |
— | — | — | |||||||||
| Transfers out of Level 3** |
— | — | — | |||||||||
|
|
|
|
|
|
|
|
|
| ||||
| Balance as of |
$ | 35,499 | $ | 13,386 | $ | 37,672 | ||||||
|
|
|
|
|
|
|
|
|
| ||||
*The change in unrealized appreciation (depreciation) on securities still held at March 31, 2022 was $(24,465) and is included in the related net realized gains (losses) and net change in appreciation (depreciation) in the Statements of Operations.
**There were no transfers between level 2 and 3 for the year ended March 31, 2022.
| LOW DURATION BOND FUND |
ASSET-BACKED SECURITIES |
CORPORATES | CREDIT DEFAULT SWAPS |
MORTGAGE- BACKED SECURITIES | ||||||||||||
| Balance as of |
$ | 6,666,708 | $ | 2,061,924 | $ | — | $ | 1,343,373 | ||||||||
| Accrued discounts/premiums |
— | (26,448 | ) | (149,806 | ) | (63,325 | ) | |||||||||
| Realized (loss) |
— | (2,436 | ) | — | — | |||||||||||
| Change in unrealized appreciation (depreciation)* |
(257,091 | ) | 270,879 | 48,371 | (388,624 | ) | ||||||||||
| Purchases |
— | — | 418,612 | — | ||||||||||||
| Sales |
(374,841 | ) | (207,614 | ) | — | — | ||||||||||
| Transfers into Level 3** |
— | — | — | — | ||||||||||||
| Transfers out of Level 3** |
— | — | — | — | ||||||||||||
|
|
|
|
|
|
|
|
|
|
|
|
| |||||
| Balance as of |
$ | 6,034,776 | $ | 2,096,305 | $ | 317,177 | $ | 891,424 | ||||||||
|
|
|
|
|
|
|
|
|
|
|
|
| |||||
*The change in unrealized appreciation (depreciation) on securities still held at March 31, 2022 was $(336,693) and is included in the related net realized gains (losses) and net change in appreciation (depreciation) in the Statements of Operations.
**There were no transfers between level 2 and 3 for the year ended March 31, 2022.
325 / Annual Report March 2022
Table of Contents
Notes to Financial Statements (Continued)
| OPPORTUNISTIC HIGH INCOME CREDIT FUND |
BANK LOANS |
CORPORATES | MORTGAGE- BACKED SECURITIES | |||||||||
| Balance as of |
$ | — | $ | — | $ | — | ||||||
| Accrued discounts/premiums |
(11 | ) | 1,285 | (1,348 | ) | |||||||
| Realized gain (loss) |
— | — | — | |||||||||
| Change in unrealized (depreciation)** |
(1,639 | ) | (1,894 | ) | (6,900 | ) | ||||||
| Purchases |
33,165 | 25,775 | 38,329 | |||||||||
| Sales |
— | — | — | |||||||||
| Transfers into Level 3*** |
— | — | — | |||||||||
| Transfers out of Level 3*** |
— | — | — | |||||||||
|
|
|
|
|
|
|
|
|
| ||||
| Balance as of |
$ | 31,515 | $ | 25,166 | $ | 30,081 | ||||||
|
|
|
|
|
|
|
|
|
| ||||
*Commencement of Operations.
**The change in unrealized appreciation (depreciation) on securities still held at March 31, 2022 was $(10,434) and is included in the related net realized gains (losses) and net change in appreciation (depreciation) in the Statements of Operations.
***There were no transfers between level 2 and 3 for the year ended March 31, 2022.
| STRATEGIC INCOME FUND |
ASSET-BACKED SECURITIES |
COMMON STOCK |
CORPORATES | MORTGAGE- BACKED SECURITIES | ||||||||||||
| Balance as of |
$ | 122,413 | $ | — | $ | 31,600 | $ | 159,315 | ||||||||
| Accrued discounts/premiums |
255 | — | (469 | ) | 78,888 | |||||||||||
| Realized (loss) |
— | (26 | ) | (43 | ) | — | ||||||||||
| Change in unrealized appreciation (depreciation)* |
(3,259 | ) | (3,644 | ) | 4,221 | (152,986 | ) | |||||||||
| Purchases |
— | 34,900 | — | — | ||||||||||||
| Sales |
(4,134 | ) | — | (3,182 | ) | — | ||||||||||
| Transfers into Level 3** |
— | — | — | — | ||||||||||||
| Transfers out of Level 3** |
— | — | — | — | ||||||||||||
|
|
|
|
|
|
|
|
|
|
|
|
| |||||
| Balance as of |
$ | 115,275 | $ | 31,230 | $ | 32,127 | $ | 85,217 | ||||||||
|
|
|
|
|
|
|
|
|
|
|
|
| |||||
*The change in unrealized appreciation (depreciation) on securities still held at March 31, 2022 was $(155,669) and is included in the related net realized gains (losses) and net change in appreciation (depreciation) in the Statements of Operations.
**There were no transfers between level 2 and 3 for the year ended March 31, 2022.
| TOTAL RETURN BOND FUND |
ASSET-BACKED SECURITIES |
BANK LOANS |
COMMON STOCK |
CORPORATES | CREDIT DEFAULT SWAPS |
MORTGAGE- BACKED SECURITIES | ||||||||||||||||||
| Balance as of |
$ | 31,559,020 | $ | 4,248,631 | $ | — | $ | 54,418,554 | $ | — | $ | 8,525,700 | ||||||||||||
| Accrued discounts/premiums |
— | 49,933 | — | (209,358 | ) | (449,007 | ) | (1,388,927 | ) | |||||||||||||||
| Realized (loss) |
— | (181,197 | ) | (47 | ) | (116,642 | ) | — | — | |||||||||||||||
| Change in unrealized appreciation (depreciation)* |
(1,217,025 | ) | (946,302 | ) | (8,382,006 | ) | 5,997,108 | 141,825 | (1,048,689 | ) | ||||||||||||||
| Purchases |
— | 1,028,938 | 80,227,823 | 7,049,266 | 1,254,685 | 150,028,357 | ||||||||||||||||||
| Sales |
(1,774,432 | ) | (848,925 | ) | — | (5,566,032 | ) | — | (354,738 | ) | ||||||||||||||
| Transfers into Level 3** |
— | — | — | — | — | — | ||||||||||||||||||
| Transfers out of Level 3** |
— | — | — | — | — | — | ||||||||||||||||||
|
|
|
|
|
|
|
|
|
|
|
|
|
|
|
|
|
|
| |||||||
| Balance as of |
$ | 28,567,563 | $ | 3,351,078 | $ | 71,845,770 | $ | 61,572,896 | $ | 947,503 | $ | 155,761,703 | ||||||||||||
|
|
|
|
|
|
|
|
|
|
|
|
|
|
|
|
|
|
| |||||||
*The change in unrealized appreciation (depreciation) on securities still held at March 31, 2022 was $(5,485,643) and is included in the related net realized gains (losses) and net change in appreciation (depreciation) in the Statements of Operations.
**There were no transfers between level 2 and 3 for the year ended March 31, 2022.
Annual Report March 2022 / 326
Table of Contents
Notes to Financial Statements (Continued)
| ULTRA SHORT BOND FUND |
MORTGAGE- BACKED SECURITIES | |||
| Balance as of |
$ | 18,543 | ||
| Accrued discounts/premiums |
(6,167 | ) | ||
| Realized gain (loss) |
— | |||
| Change in unrealized appreciation* |
1,565 | |||
| Purchases |
— | |||
| Sales |
— | |||
| Transfers into Level 3** |
— | |||
| Transfers out of Level 3** |
— | |||
|
|
|
| ||
| Balance as of |
$ | 13,941 | ||
|
|
|
| ||
*The change in unrealized appreciation (depreciation) on securities still held at March 31, 2022 was $1,565 and is included in the related net realized gains (losses) and net change in appreciation (depreciation) in the Statements of Operations.
**There were no transfers between level 2 and 3 for the year ended March 31, 2022.
|
|
UNCONSTRAINED BOND FUND |
ASSET-BACKED SECURITIES |
BANK LOANS |
COMMON STOCK |
CORPORATES | CREDIT DEFAULT SWAPS |
MORTGAGE- BACKED SECURITIES | |||||||||||||||||||
| Balance as of |
$ | 10,098,102 | $ | 375,837 | $ | — | $ | 3,607,708 | $ | — | $ | 97,063 | ||||||||||||||
| Accrued discounts/premiums |
— | 4,414 | — | (14,292 | ) | (210,966 | ) | 38,031 | ||||||||||||||||||
| Realized (loss) |
— | (16,030 | ) | (26 | ) | (5,024 | ) | — | — | |||||||||||||||||
| Change in unrealized appreciation (depreciation)* |
(389,418 | ) | (68,706 | ) | (493,693 | ) | (1,430,646 | ) | 65,682 | (80,129 | ) | |||||||||||||||
| Purchases |
— | 1,553,521 | 4,725,369 | 2,533,725 | 583,504 | — | ||||||||||||||||||||
| Sales |
(567,774 | ) | (75,097 | ) | — | (363,257 | ) | — | — | |||||||||||||||||
| Transfers into Level 3** |
— | — | — | — | — | — | ||||||||||||||||||||
| Transfers out of Level 3** |
— | — | — | — | — | — | ||||||||||||||||||||
|
|
|
|
|
|
|
|
|
|
|
|
|
|
|
|
|
|
| |||||||||
| Balance as of |
$ | 9,140,910 | $ | 1,773,939 | $ | 4,231,650 | $ | 4,328,214 | $ | 438,220 | $ | 54,965 | ||||||||||||||
|
|
|
|
|
|
|
|
|
|
|
|
|
|
|
|
|
|
| |||||||||
*The change in unrealized appreciation (depreciation) on securities still held at March 31, 2022 was $(2,411,041) and is included in the related net realized gains (losses) and net change in appreciation (depreciation) in the Statements of Operations.
**There were no transfers between level 2 and 3 for the year ended March 31, 2022.
Significant unobservable valuations inputs for Level 3 investments as of March 31, 2022, are as follows:
| ALPHATRAK 500 FUND | FAIR VALUE AT 3/31/22 |
VALUATION TECHNIQUE* |
UNOBSERVABLE INPUT |
RANGE | WEIGHTED AVERAGE |
INPUT TO VALUATION IF INPUT INCREASES | ||||||||
| Common Stock |
$23,160 | Third-Party Vendor | Vendor Prices | $30.00 | $30.00 | Increase | ||||||||
| Corporate Securities |
$— | Broker Quote | Offered Quote | $— | $— | Increase | ||||||||
| Mortgage-Backed Securities- Commercial Mortgage-Backed |
$22,848 | Third-Party Vendor | Vendor Prices | $0.11 - $2.92 | $2.52 | Increase | ||||||||
| Mortgage-Backed Securities-Non-Agency |
$20,102 | Third-Party Vendor | Vendor Prices | $1.22 | $1.22 | Increase | ||||||||
| Mortgage-Backed Securities- U.S. Agency Commercial |
||||||||||||||
| Mortgage-Backed |
$— | Broker Quote | Offered Quote | $— | $— | Increase | ||||||||
| Rights |
$— | Broker Quote | Offered Quote | $— | $— | Increase | ||||||||
327 / Annual Report March 2022
Table of Contents
Notes to Financial Statements (Continued)
| CORPORATE BOND FUND | FAIR VALUE AT 3/31/22 |
VALUATION TECHNIQUE* |
UNOBSERVABLE INPUT |
RANGE | WEIGHTED AVERAGE |
INPUT TO VALUATION IF INPUT INCREASES | ||||||
| Asset-Backed Securities |
$39,936 | Broker Quote | Offered Quote | $94.38 | $94.38 | Increase | ||||||
| Corporate Securities |
$5,355 | Third-Party Vendor | Vendor Prices | $93.00 | $93.00 | Increase | ||||||
| Mortgage-Backed Securities-Commercial Mortgage-Backed |
$12,295 | Third-Party Vendor | Vendor Prices | $0.10 - $1.63 | $1.32 | Increase | ||||||
| FLEXIBLE INCOME FUND | FAIR VALUE AT 3/31/22 |
VALUATION TECHNIQUE* |
UNOBSERVABLE INPUT |
RANGE | WEIGHTED AVERAGE |
INPUT TO VALUATION IF INPUT INCREASES | ||||||
| Asset-Backed Securities |
$488,107 | Broker Quote | Offered Quote | $94.38 | $94.38 | Increase | ||||||
| Common Stock |
$330,900 | Third-Party Vendor | Vendor Prices | $30.00 | $30.00 | Increase | ||||||
| Corporate Securities |
$— | Broker Quote | Offered Quote | $— | $— | Increase | ||||||
| Corporate Securities |
$531,973 | Third-Party Vendor | Vendor Prices | $17.00 - $93.00 | $88.14 | Increase | ||||||
| Mortgage-Backed Securities- Commercial Mortgage-Backed |
$502,172 | Third-Party Vendor | Vendor Prices | $1.63 | $1.63 | Increase | ||||||
| Mortgage-Backed Securities-Non-Agency |
$1,446,364 | Third-Party Vendor | Vendor Prices | $2.05 - $20.99 | $5.27 | Increase | ||||||
| Rights |
$— | Broker Quote | Offered Quote | $— | $— | Increase | ||||||
| FLOATING RATE INCOME FUND | FAIR VALUE AT 3/31/22 |
VALUATION TECHNIQUE* |
UNOBSERVABLE INPUT |
RANGE | WEIGHTED AVERAGE |
INPUT TO VALUATION IF INPUT | ||||||
| Bank Loans |
$3,781,017 | Third-Party Vendor | Vendor Prices | $71.00 - $98.50 | $91.83 | Increase | ||||||
| Common Stock |
$289,860 | Third-Party Vendor | Vendor Prices | $30.00 | $30.00 | Increase | ||||||
| Corporate Securities |
$— | Broker Quote | Offered Quote | $— | $— | Increase | ||||||
| Rights |
$— | Broker Quote | Offered Quote | $— | $— | Increase | ||||||
| HIGH YIELD BOND FUND | FAIR VALUE AT 3/31/22 |
VALUATION TECHNIQUE* |
UNOBSERVABLE INPUT |
RANGE | WEIGHTED AVERAGE |
INPUT TO VALUATION IF INPUT INCREASES | ||||||
| Bank Loans |
$4,460,910 | Third-Party Vendor | Vendor Prices | $95.50 - $98.50 | $96.96 | Increase | ||||||
| Common Stock |
$— | Broker Quote | Offered Quote | $— | $— | Increase | ||||||
| Common Stock |
$3,763,050 | Third-Party Vendor | Vendor Prices | $30.00 | $30.00 | Increase | ||||||
| Corporate Securities |
$— | Broker Quote | Offered Quote | $— | $— | Increase | ||||||
| Corporate Securities |
$4,007,877 | Third-Party Vendor | Vendor Prices | $93.00 | $93.00 | Increase | ||||||
| Rights |
$— | Broker Quote | Offered Quote | $— | $— | Increase | ||||||
| Warrant |
$51 | Third-Party Vendor | Vendor Prices | $3.17 | $3.17 | Increase | ||||||
| Credit Default Swaps |
$94,040 | Broker Quote | Offered Quote | $4.58 | $4.58 | Increase |
Annual Report March 2022 / 328
Table of Contents
Notes to Financial Statements (Continued)
| INTERMEDIATE BOND FUND | FAIR VALUE AT 3/31/22 |
VALUATION TECHNIQUE* |
UNOBSERVABLE INPUT |
RANGE | WEIGHTED AVERAGE |
INPUT TO VALUATION |
||||||||
| Asset-Backed Securities |
$2,041,174 | Broker Quote | Offered Quote | $94.38 | $94.38 | Increase | ||||||||
| Common Stock |
$— | Broker Quote | Offered Quote | $— | $— | Increase | ||||||||
| Common Stock |
$457,470 | Third-Party Vendor |
Vendor Prices | $30.00 | $30.00 | Increase | ||||||||
| Corporate Securities |
$— | Broker Quote | Offered Quote | $— | $— | Increase | ||||||||
| Corporate Securities |
$522,068 | Third-Party Vendor |
Vendor Prices | $93.00 | $93.00 | Increase | ||||||||
| Rights |
$— | Broker Quote | Offered Quote | $— | $— | Increase | ||||||||
| Credit Default Swaps |
$98,067 | Broker Quote | Offered Quote | $4.58 | $4.58 | Increase | ||||||||
| INVESTMENT GRADE CREDIT FUND |
FAIR VALUE AT 3/31/22 |
VALUATION TECHNIQUE* |
UNOBSERVABLE INPUT |
RANGE | WEIGHTED AVERAGE |
INPUT TO VALUATION IF INPUT INCREASES |
||||||||
| Asset-Backed Securities |
$35,499 | Broker Quote | Offered Quote | $94.38 | $94.38 | Increase | ||||||||
| Corporate Securities |
$13,386 | Third-Party Vendor |
Vendor Prices | $93.00 | $93.00 | Increase | ||||||||
| Mortgage-Backed Securities- Commercial Mortgage-Backed |
$37,672 | Third-Party Vendor |
Vendor Prices | $0.11 - $1.63 | $1.47 | Increase | ||||||||
| LOW DURATION BOND FUND | FAIR VALUE AT 3/31/22 |
VALUATION TECHNIQUE* |
UNOBSERVABLE INPUT |
RANGE | WEIGHTED AVERAGE |
INPUT TO VALUATION IF INPUT INCREASES |
||||||||
| Asset-Backed Securities |
$6,034,776 | Broker Quote | Offered Quote | $94.38 | $94.38 | Increase | ||||||||
| Common Stock |
$— | Broker Quote | Offered Quote | $— | $— | Increase | ||||||||
| Corporate Securities |
$2,096,305 | Third-Party Vendor |
Vendor Prices | $93.00 | $93.00 | Increase | ||||||||
| Mortgage-Backed Securities-Non-Agency |
$891,424 | Third-Party Vendor |
Vendor Prices | $1.38 | $1.38 | Increase | ||||||||
| Credit Default Swaps |
$317,177 | Broker Quote | Offered Quote | $4.58 | $4.58 | Increase | ||||||||
| OPPORTUNISTIC HIGH INCOME CREDIT FUND |
FAIR VALUE AT 3/31/22 |
VALUATION TECHNIQUE* |
UNOBSERVABLE INPUT |
RANGE | WEIGHTED AVERAGE |
INPUT TO VALUATION IF INPUT INCREASES |
||||||||
| Bank Loans |
$31,515 | Third-Party Vendor |
Vendor Prices | $95.50 | $95.50 | Increase | ||||||||
| Corporate Securities |
$25,166 | Third-Party Vendor |
Vendor Prices | $93.00 | $93.00 | Increase | ||||||||
| Mortgage-Backed Securities-Non-Agency |
$30,081 | Third-Party Vendor |
Vendor Prices | $13.74 | $13.74 | Increase |
329 / Annual Report March 2022
Table of Contents
Notes to Financial Statements (Continued)
| STRATEGIC INCOME FUND | FAIR VALUE AT 3/31/22 |
VALUATION TECHNIQUE* |
UNOBSERVABLE INPUT |
RANGE | WEIGHTED AVERAGE |
INPUT TO VALUATION IF INPUT INCREASES |
||||||||
| Asset-Backed Securities |
$66,560 | Broker Quote | Offered Quote | $94.38 | $94.38 | Increase | ||||||||
| Asset-Backed Securities |
$48,715 | Third-Party Vendor | Vendor Prices | $11.60 | $11.60 | Increase | ||||||||
| Common Stock |
$31,230 | Third-Party Vendor | Vendor Prices | $30.00 | $30.00 | Increase | ||||||||
| Corporate Securities |
$— | Broker Quote | Offered Quote | $— | $— | Increase | ||||||||
| Corporate Securities |
$32,127 | Third-Party Vendor | Vendor Prices | $93.00 | $93.00 | Increase | ||||||||
| Mortgage-Backed Securities-Non-Agency |
$85,217 | Third-Party Vendor | Vendor Prices | $5.02 | $5.02 | Increase | ||||||||
| Rights |
$— | Broker Quote | Offered Quote | $— | $— | Increase | ||||||||
| TOTAL RETURN BOND FUND | FAIR VALUE AT 3/31/22 |
VALUATION TECHNIQUE* |
UNOBSERVABLE INPUT |
RANGE | WEIGHTED AVERAGE |
INPUT TO VALUATION IF INPUT INCREASES |
||||||||
| Asset-Backed Securities |
$28,567,563 | Broker Quote | Offered Quote | $94.38 | $94.38 | Increase | ||||||||
| Bank Loans |
$3,351,078 | Third-Party Vendor | Vendor Prices | $57.50 | $57.50 | Increase | ||||||||
| Common Stock |
$— | Broker Quote | Offered Quote | $— | $— | Increase | ||||||||
| Common Stock |
$71,845,770 | Third-Party Vendor | Vendor Prices | $30.00 | $30.00 | Increase | ||||||||
| Corporate Securities |
$— | Broker Quote | Offered Quote | $— | $— | Increase | ||||||||
| Corporate Securities |
$61,572,896 | Third-Party Vendor | Vendor Prices | $93.00 - $109.22 | $93.98 | Increase | ||||||||
| Mortgage-Backed Securities-Non-Agency |
$149,346,746 | Broker Quote | Offered Quote | $99.98 - $100.03 | $100.00 | Increase | ||||||||
| Mortgage-Backed Securities-Non-Agency |
$6,414,957 | Third-Party Vendor | Vendor Prices | $0.81 - $99.53 | $6.45 | Increase | ||||||||
| Rights |
$— | Broker Quote | Offered Quote | $— | $— | Increase | ||||||||
| Credit Default Swaps |
$947,503 | Broker Quote | Offered Quote | $4.58 | $4.58 | Increase | ||||||||
| ULTRA SHORT BOND FUND | FAIR VALUE AT 3/31/22 |
VALUATION TECHNIQUE* |
UNOBSERVABLE INPUT |
RANGE | WEIGHTED AVERAGE |
INPUT TO VALUATION IF INPUT INCREASES |
||||||||
| Mortgage-Backed Securities-Non-Agency |
$13,941 | Third-Party Vendor | Vendor Prices | $1.22 | $1.22 | Increase | ||||||||
| UNCONSTRAINED BOND FUND |
FAIR VALUE AT 3/31/22 |
VALUATION TECHNIQUE* |
UNOBSERVABLE INPUT |
RANGE | WEIGHTED AVERAGE |
INPUT TO VALUATION IF INPUT INCREASES |
||||||||
| Asset-Backed Securities |
$9,140,910 | Broker Quote | Offered Quote | $94.38 | $94.38 | Increase | ||||||||
| Bank Loans |
$1,773,939 | Third-Party Vendor | Vendor Prices | $57.50 - $98.50 | $91.65 | Increase | ||||||||
| Common Stock |
$— | Broker Quote | Offered Quote | $— | $— | Increase | ||||||||
| Common Stock |
$4,231,650 | Third-Party Vendor | Vendor Prices | $30.00 | $30.00 | Increase | ||||||||
| Corporate Securities |
$— | Broker Quote | Offered Quote | $— | $— | Increase | ||||||||
| Corporate Securities |
$4,328,214 | Third-Party Vendor | Vendor Prices | $11.50 - $93.00 | $81.14 | Increase | ||||||||
| Mortgage-Backed Securities-Non-Agency |
$54,965 | Third-Party Vendor | Vendor Prices | $0.58 - $5.02 | $4.20 | Increase | ||||||||
| Rights |
$— | Broker Quote | Offered Quote | $— | $— | Increase | ||||||||
| Credit Default Swaps |
$438,220 | Broker Quote | Offered Quote | $4.58 | $4.58 | Increase |
* The valuation technique employed on the Level 3 securities involves the use of vendor prices, broker quotes and benchmark pricing. The Adviser monitors the third-party brokers and vendors using the valuation process.
Annual Report March 2022 / 330
Table of Contents
Notes to Financial Statements (Continued)
Derivative Instruments Categorized by Risk Exposure:
The following is a summary of the location of derivative instruments on the Funds’ Statements of Assets and Liabilities as of March 31, 2022:
| LOCATION ON THE STATEMENTS OF ASSETS AND LIABILITIES | ||||
| DERIVATIVE TYPE | ASSET DERIVATIVES |
LIABILITY DERIVATIVES | ||
| Interest rate contracts |
Unrealized appreciation on swap contracts Premiums paid for swap contracts Receivable for daily variation margin Investments, at value | Unrealized depreciation on swap contracts Premiums received on swap contracts Payable for daily variation margin Options written | ||
| Credit contracts |
Unrealized appreciation on swap contracts Premiums paid for swap contracts | Unrealized depreciation on swap contracts Premiums received for swap contracts | ||
| Equity contracts |
Unrealized appreciation on swap contracts Premiums paid for swap contracts Receivable for daily variation margin — | Unrealized depreciation on swap contracts Premiums received for swap contracts Payable for daily variation margin Options written | ||
| Foreign currency exchange contracts |
Unrealized appreciation on foreign currency exchange contracts | Unrealized depreciation on foreign currency exchange contracts | ||
The following is a summary of the Funds’ derivative instrument holdings categorized by primary risk exposure as of March 31, 2022:
| ASSET DERIVATIVE INVESTMENTS | ||||||||||||||||||||||||
| ALPHATRAK 500 FUND |
CORPORATE BOND FUND |
ESG SECURITIZED FUND |
FLEXIBLE INCOME FUND |
FLOATING RATE INCOME FUND |
HIGH YIELD BOND FUND | |||||||||||||||||||
| Credit contracts: |
||||||||||||||||||||||||
| Swaps |
$ | — | $ | — | $ | — | $ | — | $ | — | $ | 316,733 | ||||||||||||
| Equity contracts: |
||||||||||||||||||||||||
| Futures1 |
2,224,884 | — | — | — | — | — | ||||||||||||||||||
| Interest contracts: |
||||||||||||||||||||||||
| Futures1 |
— | 18,676 | 41,969 | 1,274,283 | — | 1,711,536 | ||||||||||||||||||
| Swaps |
— | 11,164 | — | — | — | |||||||||||||||||||
| Foreign currency exchange contracts: |
||||||||||||||||||||||||
| Forwards |
— | 4,548 | 7,845 | 96,181 | 20,619 | 95,427 | ||||||||||||||||||
|
|
|
|
|
|
|
|
|
|
|
|
|
|
|
|
|
|
| |||||||
| Total |
$ | 2,224,884 | $ | 34,388 | $ | 49,814 | $ | 1,370,464 | $ | 20,619 | $ | 2,123,696 | ||||||||||||
|
|
|
|
|
|
|
|
|
|
|
|
|
|
|
|
|
|
| |||||||
| ASSET DERIVATIVE INVESTMENTS | ||||||||||||||||||||||||
| INTERMEDIATE BOND FUND |
INVESTMENT GRADE CREDIT FUND |
LOW DURATION BOND FUND |
OPPORTUNISTIC HIGH INCOME CREDIT FUND |
STRATEGIC INCOME FUND |
TOTAL RETURN BOND FUND | |||||||||||||||||||
| Credit contracts: |
||||||||||||||||||||||||
| Swaps |
$ | 162,450 | $ | — | $ | 508,097 | $ | — | $ | — | $ | 4,329,157 | ||||||||||||
| Interest contracts: |
||||||||||||||||||||||||
| Futures1 |
315,375 | 65,228 | 11,168,335 | — | 93,969 | 286,630 | ||||||||||||||||||
| Options and swaptions purchased |
93,306 | — | 321,442 | — | — | 9,464,456 | ||||||||||||||||||
| Swaps |
— | 15,253 | — | — | 24,767 | 72,771,520 | ||||||||||||||||||
| Foreign currency exchange contracts: |
||||||||||||||||||||||||
| Forwards |
258,747 | — | — | — | 1,321 | 29,813,453 | ||||||||||||||||||
|
|
|
|
|
|
|
|
|
|
|
|
|
|
|
|
|
|
| |||||||
| Total |
$ | 829,878 | $ | 80,481 | $ | 11,997,874 | $ | — | $ | 120,057 | $ | 116,665,216 | ||||||||||||
|
|
|
|
|
|
|
|
|
|
|
|
|
|
|
|
|
|
| |||||||
331 / Annual Report March 2022
Table of Contents
Notes to Financial Statements (Continued)
| ASSET DERIVATIVE INVESTMENTS | ||||||||||
| ULTRA SHORT BOND FUND |
UNCONSTRAINED BOND FUND | |||||||||
| Credit contracts: |
||||||||||
| Swaps |
$ | 21,740 | $ | 1,016,276 | ||||||
| Interest contracts: |
||||||||||
| Futures1 |
765,868 | 21,457,639 | ||||||||
| Options and swaptions purchased |
23,588 | 467,063 | ||||||||
| Swaps |
— | 3,480,912 | ||||||||
| Foreign currency exchange contracts: |
||||||||||
| Forwards |
— | 1,401,009 | ||||||||
|
|
|
|
|
|
| |||||
| Total |
$ | 811,196 | $ | 27,822,899 | ||||||
|
|
|
|
|
|
| |||||
1Includes cumulative appreciation (depreciation) of financial futures contracts as reported in the Schedules of Portfolio Investments. Only the current day’s margin variation is reported within the Statements of Assets and Liabilities.
| LIABILITY DERIVATIVE INVESTMENTS | ||||||||||||||||||||||||
| ALPHATRAK 500 FUND |
CORPORATE BOND FUND |
ESG SECURITIZED FUND |
FLEXIBLE INCOME FUND |
FLOATING RATE INCOME FUND |
HIGH YIELD BOND FUND | |||||||||||||||||||
| Interest contracts: |
||||||||||||||||||||||||
| Futures1 |
$ | — | $ | (6,138 | ) | $ | (15,590 | ) | $ | (1,482,559 | ) | $ | — | $ | — | |||||||||
| Options and swaptions written |
— | (10,206 | ) | — | (81,875 | ) | — | — | ||||||||||||||||
| Swaps |
— | (39,241 | ) | — | — | — | — | |||||||||||||||||
| Foreign currency exchange contracts: |
||||||||||||||||||||||||
| Forwards |
— | (5,737 | ) | (1,715 | ) | (104,882 | ) | (7,881 | ) | (37,530 | ) | |||||||||||||
|
|
|
|
|
|
|
|
|
|
|
|
|
|
|
|
|
|
| |||||||
| Total |
$ | — | $ | (61,322 | ) | $ | (17,305 | ) | $ | (1,669,316 | ) | $ | (7,881 | ) | $ | (37,530 | ) | |||||||
|
|
|
|
|
|
|
|
|
|
|
|
|
|
|
|
|
|
| |||||||
| LIABILITY DERIVATIVE INVESTMENTS | ||||||||||||||||||||||||
| INTERMEDIATE BOND FUND |
INVESTMENT GRADE CREDIT FUND |
LOW DURATION BOND FUND |
OPPORTUNISTIC HIGH INCOME CREDIT FUND |
STRATEGIC INCOME FUND |
TOTAL RETURN BOND FUND | |||||||||||||||||||
| Interest contracts: |
||||||||||||||||||||||||
| Futures1 |
$ | (1,281,044 | ) | $ | (50,489 | ) | $ | (7,870,050 | ) | $ | (6,598 | ) | $ | (45,838 | ) | $ | (39,064,804 | ) | ||||||
| Options and swaptions written |
(2,179,744 | ) | (18,394 | ) | (7,103,886 | ) | — | (38,025 | ) | (290,863,292 | ) | |||||||||||||
| Swaps |
— | (64,334 | ) | — | — | (90,756 | ) | (267,502,283 | ) | |||||||||||||||
| Foreign currency exchange contracts: |
||||||||||||||||||||||||
| Forwards |
(327,873 | ) | — | — | — | (3,872 | ) | (27,578,964 | ) | |||||||||||||||
|
|
|
|
|
|
|
|
|
|
|
|
|
|
|
|
|
|
| |||||||
| Total |
$ | (3,788,661 | ) | $ | (133,217 | ) | $ | (14,973,936 | ) | $ | (6,598 | ) | $ | (178,491 | ) | $ | (625,009,343 | ) | ||||||
|
|
|
|
|
|
|
|
|
|
|
|
|
|
|
|
|
|
| |||||||
| LIABILITY DERIVATIVE INVESTMENTS | ||||||||||||
| ULTRA SHORT | UNCONSTRAINED | |||||||||||
| BOND FUND | BOND FUND | |||||||||||
| Interest contracts: |
||||||||||||
| Futures1 |
$ | (20,828 | ) | $ | (11,026,317 | ) | ||||||
| Options and swaptions written |
(630,775 | ) | (14,047,392 | ) | ||||||||
| Swaps |
— | (12,537,371 | ) | |||||||||
| Foreign currency exchange contracts: |
||||||||||||
| Forwards |
— | (1,751,000 | ) | |||||||||
|
|
|
|
|
|
| |||||||
| Total |
$ | (651,603 | ) | $ | (39,362,080 | ) | ||||||
|
|
|
|
|
|
| |||||||
1Includes cumulative appreciation (depreciation) of financial futures contracts as reported in the Schedules of Portfolio Investments. Only the current day’s margin variation is reported within the Statements of Assets and Liabilities.
Annual Report March 2022 / 332
Table of Contents
Notes to Financial Statements (Continued)
The following is a summary of the Funds’ realized gain (loss) and change in unrealized appreciation (depreciation) on derivative investments recognized in the Statements of Operations categorized by primary risk exposure for the year ended March 31, 2022:
| REALIZED GAIN (LOSS) ON DERIVATIVES RECOGNIZED IN THE STATEMENTS OF OPERATIONS | ||||||||||||||||||||||||
| ALPHATRAK 500 FUND |
CORPORATE BOND FUND |
ESG SECURITIZED FUND |
FLEXIBLE INCOME FUND |
FLOATING RATE INCOME FUND |
HIGH YIELD BOND FUND | |||||||||||||||||||
| Credit contracts: |
||||||||||||||||||||||||
| Swaps |
$ | — | $ | — | $ | — | $ | — | $ | — | $ | 103,924 | ||||||||||||
| Equity contracts: |
||||||||||||||||||||||||
| Futures |
3,179,476 | — | — | — | — | — | ||||||||||||||||||
| Interest contracts: |
||||||||||||||||||||||||
| Futures |
— | 3,104 | 40,277 | (768,323 | ) | — | 28,753 | |||||||||||||||||
| Options and swaptions purchased1 |
— | — | — | — | — | — | ||||||||||||||||||
| Options and swaptions written |
— | — | — | (41,185 | ) | — | — | |||||||||||||||||
| Swaps |
— | (27 | ) | — | — | — | — | |||||||||||||||||
| Foreign currency exchange contracts: |
||||||||||||||||||||||||
| Forwards |
27,511 | 8,101 | 1,849 | 162,378 | 523,157 | 141,516 | ||||||||||||||||||
|
|
|
|
|
|
|
|
|
|
|
|
|
|
|
|
|
|
| |||||||
| Total |
$ | 3,206,987 | $ | 11,178 | $ | 42,126 | $ | (647,130 | ) | $ | 523,157 | $ | 274,193 | |||||||||||
|
|
|
|
|
|
|
|
|
|
|
|
|
|
|
|
|
|
| |||||||
| REALIZED GAIN (LOSS) ON DERIVATIVES RECOGNIZED IN THE STATEMENTS OF OPERATIONS | ||||||||||||||||||||||||
| INTERMEDIATE BOND FUND |
INVESTMENT GRADE CREDIT FUND |
LOW DURATION BOND FUND |
OPPORTUNISTIC HIGH INCOME CREDIT FUND |
STRATEGIC INCOME FUND |
TOTAL RETURN BOND FUND | |||||||||||||||||||
| Credit contracts: |
||||||||||||||||||||||||
| Swaps |
$ | 46,073 | $ | — | $ | 141,728 | $ | — | $ | — | $ | 1,469,692 | ||||||||||||
| Interest contracts: |
||||||||||||||||||||||||
| Futures |
(2,024,938 | ) | (58,093 | ) | 5,991,163 | (11,230 | ) | (17,595 | ) | 25,039,677 | ||||||||||||||
| Options and swaptions purchased1 |
417,991 | — | 1,371,642 | — | — | 54,459,939 | ||||||||||||||||||
| Options and swaptions written |
(1,233,044 | ) | (4,097 | ) | (3,988,866 | ) | — | (8,194 | ) | (113,197,139 | ) | |||||||||||||
| Swaps |
— | (27 | ) | — | — | (44 | ) | (125,310 | ) | |||||||||||||||
| Foreign currency exchange contracts: |
||||||||||||||||||||||||
| Forwards |
451,123 | — | 1,443,076 | — | 4,225 | 89,284,721 | ||||||||||||||||||
|
|
|
|
|
|
|
|
|
|
|
|
|
|
|
|
|
|
| |||||||
| Total |
$ | (2,342,795 | ) | $ | (62,217 | ) | $ | 4,958,743 | $ | (11,230 | ) | $ | (21,608 | ) | $ | 56,931,580 | ||||||||
|
|
|
|
|
|
|
|
|
|
|
|
|
|
|
|
|
|
| |||||||
| REALIZED GAIN (LOSS) ON DERIVATIVES RECOGNIZED IN THE STATEMENTS OF OPERATIONS | ||||||||||||||||||||||||
| ULTRA SHORT BOND FUND |
UNCONSTRAINED BOND FUND | |||||||||||||||||||||||
| Credit contracts: |
|
|||||||||||||||||||||||
| Swaps |
|
$ | 8,103 | $ | 314,098 | |||||||||||||||||||
| Interest contracts: |
|
|||||||||||||||||||||||
| Futures |
|
1,000,269 | (4,472,720 | ) | ||||||||||||||||||||
| Options and swaptions purchased1 |
|
125,971 | 1,952,076 | |||||||||||||||||||||
| Options and swaptions written |
|
(351,852 | ) | (6,045,504 | ) | |||||||||||||||||||
| Swaps |
|
— | (6,097 | ) | ||||||||||||||||||||
| Foreign currency exchange contracts: |
|
|||||||||||||||||||||||
| Forwards |
|
334,738 | 5,097,667 | |||||||||||||||||||||
|
|
|
|
|
|
| |||||||||||||||||||
| Total |
|
$ | 1,117,229 | $ | (3,160,480 | ) | ||||||||||||||||||
|
|
|
|
|
|
| |||||||||||||||||||
1Options and swaptions purchased are included in net realized gain (loss) from investments — unaffiliated.
333 / Annual Report March 2022
Table of Contents
Notes to Financial Statements (Continued)
| CHANGE IN UNREALIZED APPRECIATION (DEPRECIATION) ON DERIVATIVES RECOGNIZED IN THE STATEMENTS OF OPERATIONS |
||||||||||||||||||||||||
| ALPHATRAK 500 FUND |
CORPORATE BOND FUND |
ESG SECURITIZED FUND |
FLEXIBLE INCOME FUND |
FLOATING RATE INCOME FUND |
HIGH YIELD BOND FUND | |||||||||||||||||||
| Credit contracts: |
||||||||||||||||||||||||
| Swaps |
$ | — | $ | — | $ | — | $ | — | $ | — | $ | 16,004 | ||||||||||||
| Equity contracts: |
||||||||||||||||||||||||
| Futures |
2,091,652 | — | — | — | — | — | ||||||||||||||||||
| Interest contracts: |
||||||||||||||||||||||||
| Futures |
— | (8,437 | ) | 26,379 | (549,918 | ) | — | 1,656,821 | ||||||||||||||||
| Options and swaptions purchased1 |
— | — | — | — | — | — | ||||||||||||||||||
| Options and swaptions written |
— | (8,358 | ) | — | (7,873 | ) | — | — | ||||||||||||||||
| Swaps |
— | (28,077 | ) | — | — | — | — | |||||||||||||||||
| Foreign currency exchange contracts: |
||||||||||||||||||||||||
| Forwards |
(20,568 | ) | (1,189 | ) | 6,130 | (22,005 | ) | (404,486 | ) | 57,897 | ||||||||||||||
|
|
|
|
|
|
|
|
|
|
|
|
|
|
|
|
|
|
| |||||||
| Total |
$ | 2,071,084 | $ | (46,061 | ) | $ | 32,509 | $ | (579,796 | ) | $ | (404,486 | ) | $ | 1,730,722 | |||||||||
|
|
|
|
|
|
|
|
|
|
|
|
|
|
|
|
|
|
| |||||||
| CHANGE IN UNREALIZED APPRECIATION (DEPRECIATION) ON DERIVATIVES RECOGNIZED IN THE STATEMENTS OF OPERATIONS |
||||||||||||||||||||||||
| INTERMEDIATE BOND FUND |
INVESTMENT GRADE CREDIT FUND |
LOW DURATION BOND FUND |
OPPORTUNISTIC HIGH INCOME CREDIT FUND |
STRATEGIC INCOME FUND |
TOTAL RETURN BOND FUND | |||||||||||||||||||
| Credit contracts: |
||||||||||||||||||||||||
| Swaps |
$ | 15,180 | $ | — | $ | 49,796 | $ | — | $ | — | $ | 167,069 | ||||||||||||
| Interest contracts: |
||||||||||||||||||||||||
| Futures |
(1,048,376 | ) | (22,637 | ) | 1,134,224 | (6,598 | ) | (56,303 | ) | (20,208,067 | ) | |||||||||||||
| Options and swaptions purchased1 |
(238,284 | ) | — | (777,283 | ) | — | — | (34,584,907 | ) | |||||||||||||||
| Options and swaptions written |
(788,477 | ) | (9,157 | ) | (2,594,047 | ) | — | (19,326 | ) | (129,106,670 | ) | |||||||||||||
| Swaps |
— | (49,081 | ) | — | — | (65,989 | ) | (194,730,763 | ) | |||||||||||||||
| Foreign currency exchange contracts: |
||||||||||||||||||||||||
| Forwards |
(69,126 | ) | — | (1,422,086 | ) | — | (2,551 | ) | (40,046,116 | ) | ||||||||||||||
|
|
|
|
|
|
|
|
|
|
|
|
|
|
|
|
|
|
| |||||||
| Total |
$ | (2,129,083 | ) | $ | (80,875 | ) | $ | (3,609,396 | ) | $ | (6,598 | ) | $ | (144,169 | ) | $ | (418,509,454 | ) | ||||||
|
|
|
|
|
|
|
|
|
|
|
|
|
|
|
|
|
|
| |||||||
| CHANGE IN UNREALIZED APPRECIATION (DEPRECIATION) ON DERIVATIVES RECOGNIZED IN THE STATEMENTS OF OPERATIONS |
||||||||||||||||||||||||
| ULTRA SHORT BOND FUND |
UNCONSTRAINED BOND FUND | |||||||||||||||||||||||
| Credit contracts: |
|
|||||||||||||||||||||||
| Swaps |
|
$ | 163 | $ | 69,998 | |||||||||||||||||||
| Interest contracts: |
|
|||||||||||||||||||||||
| Futures |
|
612,945 | 354,297 | |||||||||||||||||||||
| Options and swaptions purchased1 |
|
(65,568 | ) | (1,197,191 | ) | |||||||||||||||||||
| Options and swaptions written |
|
(244,207 | ) | (6,507,343 | ) | |||||||||||||||||||
| Swaps |
|
— | (9,056,460 | ) | ||||||||||||||||||||
| Foreign currency exchange contracts: |
|
|||||||||||||||||||||||
| Forwards |
|
(264,437 | ) | (2,502,148 | ) | |||||||||||||||||||
|
|
|
|
|
|
| |||||||||||||||||||
| Total |
|
$ | 38,896 | $ | (18,838,847 | ) | ||||||||||||||||||
|
|
|
|
|
|
| |||||||||||||||||||
1Options purchased are included in net change in unrealized appreciation (depreciation) on investments.
Annual Report March 2022 / 334
Table of Contents
Notes to Financial Statements (Continued)
| AVERAGE PERIOD BALANCE OF OUTSTANDING DERIVATIVE FINANCIAL INSTRUMENTS1 | ||||||||||||||||||||||||
| ALPHATRAK 500 FUND |
CORPORATE BOND FUND |
ESG SECURITIZED FUND |
FLEXIBLE INCOME FUND |
FLOATING RATE INCOME FUND |
HIGH YIELD BOND FUND |
|||||||||||||||||||
| Financial futures contracts: |
||||||||||||||||||||||||
| Average number of contracts purchased |
163 | 8 | 3 | 394 | — | 294 | ||||||||||||||||||
| Average number of contracts sold |
— | 6 | 6 | 201 | — | 183 | ||||||||||||||||||
| Average value of contracts purchased |
$ | 1,368,999 | $ | 1,264 | $ | 4,455 | $ | 485,321 | $ | — | $ | 144,193 | ||||||||||||
| Average value of contracts sold |
$ | — | $ | 14,321 | $ | 14,229 | $ | 643,559 | $ | — | $ | 607,314 | ||||||||||||
| Written options: |
||||||||||||||||||||||||
| Average number of contracts |
— | — | — | 50 | — | — | ||||||||||||||||||
| Average notional value |
$ | — | $ | — | $ | — | $ | 41,347 | $ | — | $ | — | ||||||||||||
| Credit default swaps: |
||||||||||||||||||||||||
| Average number of contracts - sell protection |
— | — | — | — | — | 2 | ||||||||||||||||||
| Average notional value - sell protection |
$ | — | $ | — | $ | — | $ | — | $ | — | $ | 5,483,750 | ||||||||||||
| Interest rate swaps: |
||||||||||||||||||||||||
| Average number of contracts - pays fixed rate |
— | 1 | — | — | — | — | ||||||||||||||||||
| Average number of contracts - receives fixed rate |
— | 1 | — | — | — | — | ||||||||||||||||||
| Average notional - pays fixed rate |
$ | — | $ | 976 | $ | — | $ | — | $ | — | $ | — | ||||||||||||
| Average notional - receives fixed rate |
$ | — | $ | 170 | $ | — | $ | — | $ | — | $ | — | ||||||||||||
| Written swaptions: |
||||||||||||||||||||||||
| Average number of contracts |
— | 1 | — | — | — | — | ||||||||||||||||||
| Average notional value |
$ | — | $ | 462 | $ | — | $ | — | $ | — | $ | — | ||||||||||||
| Foreign currency exchange contracts: |
||||||||||||||||||||||||
| Average number of contracts sold |
1 | 1 | 2 | 8 | 3 | 3 | ||||||||||||||||||
| Average value of contracts sold |
$ | 1,168 | $ | 1,519 | $ | 1,829 | $ | 34,088 | $ | 29,117 | $ | 51,678 | ||||||||||||
335 / Annual Report March 2022
Table of Contents
Notes to Financial Statements (Continued)
| AVERAGE PERIOD BALANCE OF OUTSTANDING DERIVATIVE FINANCIAL INSTRUMENTS1 | ||||||||||||||||||||||||
| INTERMEDIATE BOND FUND |
INVESTMENT GRADE CREDIT FUND |
LOW DURATION BOND FUND |
OPPORTUNISTIC HIGH INCOME CREDIT FUND |
STRATEGIC INCOME FUND |
TOTAL RETURN BOND FUND |
|||||||||||||||||||
| Financial futures contracts: |
||||||||||||||||||||||||
| Average number of contracts purchased |
409 | 28 | 1,366 | 2 | 15 | 10,968 | ||||||||||||||||||
| Average number of contracts sold |
58 | 17 | 2,256 | — | 16 | 1,592 | ||||||||||||||||||
| Average value of contracts purchased |
$ | 392,495 | $ | 20,513 | $ | 2,091,932 | $ | 1,774 | $ | 15,710 | $ | 37,332,715 | ||||||||||||
| Average value of contracts sold |
$ | 227,924 | $ | 50,086 | $ | 4,283,019 | $ | — | $ | 64,101 | $ | 3,171,280 | ||||||||||||
| Purchased options: |
||||||||||||||||||||||||
| Average number of contracts |
327 | — | 1,072 | — | — | 38,772 | ||||||||||||||||||
| Average notional value |
$ | 193,152 | $ | — | $ | 633,522 | $ | — | $ | — | $ | 24,807,277 | ||||||||||||
| Written options: |
||||||||||||||||||||||||
| Average number of contracts |
1,082 | 5 | 3,522 | — | 10 | 122,901 | ||||||||||||||||||
| Average notional value |
$ | 539,756 | $ | 3,935 | $ | 1,749,532 | $ | — | $ | 7,870 | $ | 62,225,051 | ||||||||||||
| Credit default swaps: |
||||||||||||||||||||||||
| Average number of contracts - sell protection |
2 | — | 2 | — | — | 2 | ||||||||||||||||||
| Average notional value - sell protection |
$ | 2,707,500 | $ | — | $ | 8,446,250 | $ | — | $ | — | $ | 75,665,000 | ||||||||||||
| Interest rate swaps: |
||||||||||||||||||||||||
| Average number of contracts - pays fixed rate |
— | 4 | — | — | 4 | 4 | ||||||||||||||||||
| Average number of contracts - receives fixed rate |
— | 3 | — | — | 3 | 3 | ||||||||||||||||||
| Average notional - pays fixed rate |
$ | — | $ | 1,568 | $ | — | $ | — | $ | 1,956 | $ | 5,746,465 | ||||||||||||
| Average notional - receives fixed rate |
$ | — | $ | 101 | $ | — | $ | — | $ | 353 | $ | 1,012,028 | ||||||||||||
| Purchased swaptions: |
||||||||||||||||||||||||
| Average number of contracts |
— | — | 1 | — | — | 2 | ||||||||||||||||||
| Average notional value |
$ | — | $ | — | $ | 939,000 | $ | — | $ | — | $ | 8,172,180 | ||||||||||||
| Written swaptions: |
||||||||||||||||||||||||
| Average number of contracts |
— | 1 | 1 | — | 1 | 1 | ||||||||||||||||||
| Average notional value |
$ | — | $ | 462 | $ | 540,000 | $ | — | $ | 980 | $ | 3,024,870 | ||||||||||||
| Foreign currency exchange contracts: |
||||||||||||||||||||||||
| Average number of contracts sold |
2 | — | — | — | 1 | 8 | ||||||||||||||||||
| Average value of contracts sold |
$ | 85,273 | $ | — | $ | — | $ | — | $ | 1,306 | $ | 9,076,028 | ||||||||||||
Annual Report March 2022 / 336
Table of Contents
Notes to Financial Statements (Continued)
| AVERAGE PERIOD BALANCE OF OUTSTANDING DERIVATIVE FINANCIAL INSTRUMENTS1 | ||||||||
| ULTRA SHORT BOND FUND |
UNCONSTRAINED BOND FUND |
|||||||
| Financial futures contracts: |
||||||||
| Average number of contracts purchased |
2 | 4,010 | ||||||
| Average number of contracts sold |
215 | 3,291 | ||||||
| Average value of contracts purchased |
$ | 5,207 | $ | 4,411,110 | ||||
| Average value of contracts sold |
$ | 289,646 | $ | 11,480,804 | ||||
| Purchased options: |
||||||||
| Average number of contracts |
95 | 1,618 | ||||||
| Average notional value |
$ | 54,854 | $ | 960,166 | ||||
| Written options: |
||||||||
| Average number of contracts |
312 | 5,369 | ||||||
| Average notional value |
$ | 152,782 | $ | 2,693,149 | ||||
| Credit default swaps: |
||||||||
| Average number of contracts - sell protection |
1 | 2 | ||||||
| Average notional value - sell protection |
$ | 390,000 | $ | 17,307,500 | ||||
| Interest rate swaps: |
||||||||
| Average number of contracts - pays fixed rate |
— | 4 | ||||||
| Average number of contracts - receives fixed rate |
— | 3 | ||||||
| Average notional - pays fixed rate |
$ | — | $ | 268,755 | ||||
| Average notional - receives fixed rate |
$ | — | $ | 51,924 | ||||
| Written swaptions: |
||||||||
| Average number of contracts |
— | 1 | ||||||
| Average notional value |
$ | — | $ | 145,620 | ||||
| Foreign currency exchange contracts: |
||||||||
| Average number of contracts sold |
1 | 8 | ||||||
| Average value of contracts sold |
$ | 11,675 | $ | 556,952 | ||||
1Amounts disclosed represent the volume of derivative contracts for the year ended March 31, 2022.
Counterparty Credit Risk:
A derivative contract may suffer a mark-to-market loss if the value of the contract decreases due to an unfavorable change in the market rates or values of the underlying instrument. Losses can also occur if the counterparty does not perform under the contract.
A Fund’s risk of loss from counterparty credit risk on OTC derivatives is generally limited to the aggregate unrealized gain netted against any collateral held by such Fund. For OTC options purchased, each Fund bears the risk of loss of the amount of the premiums paid plus the positive change in market values net of any collateral held by such Fund should the counterparty fail to perform under the contracts. Options written by the Funds do not typically give rise to counterparty credit risk, as options written generally obligate the Funds to perform, and not the counterparty.
With exchange-traded purchased options and futures and centrally cleared swaps, there is less counterparty credit risk to the Funds since the exchange or clearinghouse, as counterparty to such instruments, guarantees against a possible default. The clearinghouse stands between the buyer and the seller of the contract; therefore, the credit risk is limited to failure of the clearinghouse. While offset rights may exist under applicable law, a Fund does not have a contractual right of offset against a clearing broker or clearinghouse in the event of a default (including the bankruptcy or insolvency) of the clearing broker or clearinghouse. Additionally, credit risk exists in exchange-traded futures and centrally cleared swaps with respect to initial and variation margin that is held in a clearing broker’s customer accounts. While clearing brokers are required to segregate customer margin from their own assets, in the event that a clearing broker becomes insolvent or goes into bankruptcy and at that time there is a shortfall in the aggregate amount of margin held by the clearing broker for all its clients, typically the shortfall would be allocated on a pro rata basis across all the clearing broker’s customers, potentially resulting in losses to the Funds.
In order to better define its contractual rights and to secure rights that will help the Funds mitigate their counterparty risk, a Fund may enter into an International Swaps and Derivatives Association, Inc. Master Agreement (“ISDA Master Agreement”) or similar agreement with its derivative contract counterparties. An ISDA Master Agreement is a bilateral agreement between each Fund and a counterparty that governs OTC derivatives and typically contains, among other things, collateral posting terms and netting
337 / Annual Report March 2022
Table of Contents
Notes to Financial Statements (Continued)
provisions in the event of a default and/or termination event. Under an ISDA Master Agreement, each Fund may, under certain circumstances, offset with the counterparty certain derivative financial instruments’ payables and/or receivables with collateral held and/or posted and create one single net payment. The provisions of the ISDA Master Agreement typically permit a single net payment in the event of default including the bankruptcy or insolvency of the counterparty. However, bankruptcy or insolvency laws of a particular jurisdiction may impose restrictions on or prohibitions against the right of offset in bankruptcy, insolvency or other events. In addition, certain ISDA Master Agreements allow counterparties to OTC derivatives to terminate derivative contracts prior to maturity in the event a Fund’s net assets decline by a stated percentage or the Fund fails to meet the terms of its ISDA Master Agreements, which would cause the Fund to accelerate payment of any net liability owed to the counterparty.
Collateral requirements:
For derivatives traded under an ISDA Master Agreement, the collateral requirements are typically calculated by netting the mark-to-market amount for each transaction under such agreement and comparing that amount to the value of any collateral currently pledged by a Fund and the counterparty.
Cash collateral that has been pledged to cover obligations of a Fund, if any, is reported separately on the Statements of Assets and Liabilities as cash pledged as collateral. Non-cash collateral pledged by a Fund, if any, is noted in the Schedules of Portfolio Investments. Generally, the amount of collateral due from or to a party has to exceed a minimum transfer amount threshold typically of $250,000 or $500,000 before a transfer is required, which is determined at the close of business of the Fund, and additional required collateral is delivered to/pledged by the Fund on the next business day. Typically, the Funds and counterparties are not permitted to sell, repledge or use the collateral they receive. To the extent amounts due to a Fund from its counterparties are not fully collateralized, contractually or otherwise, the Fund bears the risk of loss from counterparty non-performance. Each Fund attempts to mitigate counterparty risk by entering into agreements only with counterparties that it believes have the financial resources to honor their obligations and by monitoring the financial stability of those counterparties.
For financial reporting purposes, the Funds do not offset derivative assets and derivative liabilities that are subject to netting arrangements in the Statements of Assets and Liabilities.
The Funds have implemented the disclosure requirements pursuant to FASB Accounting Standards update No. 2011-11, Disclosures about Offsetting Assets and Liabilities that requires disclosures to make financial statements that are prepared under U.S. GAAP more comparable to those prepared under International Financial Reporting Standards. Under this guidance the Funds disclose in the Statements of Assets and Liabilities both gross and net information about instruments and transactions eligible for offset such as instruments and transactions subject to an agreement similar to a master netting arrangement. In addition, the Funds disclose collateral received and posted in connection with master netting agreements or similar arrangements.
The following table presents Corporate Bond Fund’s OTC derivative assets by counterparty net of amounts available for offset under an ISDA Master Agreement or similar agreements and net of the related collateral received or pledged by the Fund as of March 31, 2022:
| CORPORATE BOND FUND | ||||||||||||||||||||||||||||||
| COUNTERPARTY | GROSS DERIVATIVE ASSETS IN THE STATEMENT OF ASSETS AND LIABILITIES |
COLLATERAL RECEIVED1 |
DERIVATIVE ASSETS (LIABILITIES) AVAILABLE FOR OFFSET |
NET AMOUNT OF DERIVATIVE ASSETS2 |
||||||||||||||||||||||||||
| Citigroup Global Markets, Inc. | ||||||||||||||||||||||||||||||
| Foreign Currency Exchange Contracts |
$ | 4,548 | $ | — | $ | (4,548) | $ | — | ||||||||||||||||||||||
|
|
|
|
|
|
|
|
|
|||||||||||||||||||||||
| Total |
$ | 4,548 | $ | — | $ | (4,548) | $ | — | ||||||||||||||||||||||
|
|
|
|
|
|
|
|
|
|||||||||||||||||||||||
1Excess of collateral received for individual counterparty may not be shown for financial reporting purposes.
2Represents the net amount receivable from the counterparty in the event of default.
Annual Report March 2022 / 338
Table of Contents
Notes to Financial Statements (Continued)
The following table presents Corporate Bond Fund’s OTC derivative liabilities by counterparty net of amounts available for offset under an ISDA Master Agreement or similar agreements and net of the related collateral received or pledged by the Fund as of March 31, 2022:
| CORPORATE BOND FUND | ||||||||||||||||||||||||||||||||
| COUNTERPARTY | GROSS DERIVATIVE LIABILITIES IN THE STATEMENT OF ASSETS AND LIABILITIES |
COLLATERAL PLEDGED1 |
DERIVATIVE (ASSETS) LIABILITIES AVAILABLE FOR OFFSET |
NET AMOUNT OF DERIVATIVE LIABILITIES2 |
||||||||||||||||||||||||||||
| Citigroup Global Markets, Inc. | ||||||||||||||||||||||||||||||||
| Foreign Currency Exchange Contracts |
$ | 5,737 | $ | — | $ | (4,548) | $ | 1,189 | ||||||||||||||||||||||||
| Swaptions |
$ | 10,206 | $ | — | $ | — | $ | 10,206 | ||||||||||||||||||||||||
|
|
|
|
|
|
|
|
|
|||||||||||||||||||||||||
| Total |
$ | 15,943 | $ | — | $ | (4,548) | $ | 11,395 | ||||||||||||||||||||||||
|
|
|
|
|
|
|
|
|
|||||||||||||||||||||||||
1Excess of collateral pledged for individual counterparty may not be shown for financial reporting purposes.
2Represents the net amount payable to the counterparty in the event of default.
The following table presents ESG Securitized Fund’s OTC derivative assets by counterparty net of amounts available for offset under an ISDA Master Agreement or similar agreements and net of the related collateral received or pledged by the Fund as of March 31, 2022:
| ESG SECURITIZED FUND | ||||||||||||||||||||||||||||||||
| COUNTERPARTY | GROSS DERIVATIVE ASSETS IN THE STATEMENT OF ASSETS AND LIABILITIES |
COLLATERAL RECEIVED1 |
DERIVATIVE ASSETS (LIABILITIES) AVAILABLE FOR OFFSET |
NET AMOUNT OF DERIVATIVE ASSETS2 |
||||||||||||||||||||||||||||
| Bank of America N.A. |
||||||||||||||||||||||||||||||||
| Foreign Currency Exchange Contracts |
$ | 7,845 | $ | — | $ | (1,715) | $ | 6,130 | ||||||||||||||||||||||||
|
|
|
|
|
|
|
|
|
|||||||||||||||||||||||||
| Total |
$ | 7,845 | $ | — | $ | (1,715) | $ | 6,130 | ||||||||||||||||||||||||
|
|
|
|
|
|
|
|
|
|||||||||||||||||||||||||
1Excess of collateral received for individual counterparty may not be shown for financial reporting purposes.
2Represents the net amount receivable from the counterparty in the event of default.
The following table presents ESG Securitized Fund’s OTC derivative liabilities by counterparty net of amounts available for offset under an ISDA Master Agreement or similar agreements and net of the related collateral received or pledged by the Fund as of March 31, 2022:
| ESG SECURITIZED FUND | ||||||||||||||||||||||||||||||||
| COUNTERPARTY | GROSS DERIVATIVE LIABILITIES IN THE STATEMENT OF ASSETS AND LIABILITIES |
COLLATERAL PLEDGED1 |
DERIVATIVE (ASSETS) LIABILITIES AVAILABLE FOR OFFSET |
NET AMOUNT OF DERIVATIVE LIABILITIES2 |
||||||||||||||||||||||||||||
| Bank of America N.A. |
||||||||||||||||||||||||||||||||
| Foreign Currency Exchange Contracts |
$ | 1,715 | $ | — | $ | (1,715) | $ | — | ||||||||||||||||||||||||
|
|
|
|
|
|
|
|
|
|||||||||||||||||||||||||
| Total |
$ | 1,715 | $ | — | $ | (1,715) | $ | — | ||||||||||||||||||||||||
|
|
|
|
|
|
|
|
|
|||||||||||||||||||||||||
1Excess of collateral pledged for individual counterparty may not be shown for financial reporting purposes.
2Represents the net amount payable to the counterparty in the event of default.
339 / Annual Report March 2022
Table of Contents
Notes to Financial Statements (Continued)
The following table presents Flexible Income Fund’s OTC derivative assets by counterparty net of amounts available for offset under an ISDA Master Agreement or similar agreements and net of the related collateral received or pledged by the Fund as of March 31, 2022:
| FLEXIBLE INCOME FUND | ||||||||||||||||||||||||||||||||
| COUNTERPARTY | GROSS DERIVATIVE ASSETS IN THE STATEMENT OF ASSETS AND LIABILITIES |
COLLATERAL RECEIVED1 |
DERIVATIVE ASSETS (LIABILITIES) AVAILABLE FOR OFFSET |
NET AMOUNT OF DERIVATIVE ASSETS2 |
||||||||||||||||||||||||||||
| Citigroup Global Markets, Inc. | ||||||||||||||||||||||||||||||||
| Foreign Currency Exchange Contracts |
$ | 53,719 | $ | — | $ | (53,719) | $ | — | ||||||||||||||||||||||||
|
|
|
|
|
|
|
|
|
|||||||||||||||||||||||||
| Goldman Sachs International |
||||||||||||||||||||||||||||||||
| Foreign Currency Exchange Contracts |
$ | 42,462 | $ | — | $ | (19,695) | $ | 22,767 | ||||||||||||||||||||||||
|
|
|
|
|
|
|
|
|
|||||||||||||||||||||||||
| Total |
$ | 96,181 | $ | — | $ | (73,414) | $ | 22,767 | ||||||||||||||||||||||||
|
|
|
|
|
|
|
|
|
|||||||||||||||||||||||||
1Excess of collateral received for individual counterparty may not be shown for financial reporting purposes.
2Represents the net amount receivable from the counterparty in the event of default.
The following table presents Flexible Income Fund’s OTC derivative liabilities by counterparty net of amounts available for offset under an ISDA Master Agreement or similar agreements and net of the related collateral received or pledged by the Fund as of March 31, 2022:
| FLEXIBLE INCOME FUND | ||||||||||||||||||||||||||||||||
| COUNTERPARTY | GROSS DERIVATIVE LIABILITIES IN THE STATEMENT OF ASSETS AND LIABILITIES |
COLLATERAL PLEDGED1 |
DERIVATIVE (ASSETS) LIABILITIES AVAILABLE FOR OFFSET |
NET AMOUNT OF DERIVATIVE LIABILITIES2 |
||||||||||||||||||||||||||||
| Citigroup Global Markets, Inc. | ||||||||||||||||||||||||||||||||
| Foreign Currency Exchange Contracts |
$ | 85,187 | $ | — | $ | (53,719) | $ | 31,468 | ||||||||||||||||||||||||
|
|
|
|
|
|
|
|
|
|||||||||||||||||||||||||
| Goldman Sachs International | ||||||||||||||||||||||||||||||||
| Foreign Currency Exchange Contracts |
$ | 19,695 | $ | — | $ | (19,695) | $ | — | ||||||||||||||||||||||||
|
|
|
|
|
|
|
|
|
|||||||||||||||||||||||||
| Total |
$ | 104,882 | $ | — | $ | (73,414) | $ | 31,468 | ||||||||||||||||||||||||
|
|
|
|
|
|
|
|
|
|||||||||||||||||||||||||
1Excess of collateral pledged for individual counterparty may not be shown for financial reporting purposes.
2Represents the net amount payable to the counterparty in the event of default.
The following table presents Floating Rate Income Fund’s OTC derivative assets by counterparty net of amounts available for offset under an ISDA Master Agreement or similar agreements and net of the related collateral received or pledged by the Fund as of March 31, 2022:
| FLOATING RATE INCOME FUND | ||||||||||||||||||||||||||||||||
| COUNTERPARTY | GROSS DERIVATIVE ASSETS IN THE STATEMENT OF ASSETS AND LIABILITIES |
COLLATERAL RECEIVED1 |
DERIVATIVE ASSETS (LIABILITIES) AVAILABLE FOR OFFSET |
NET AMOUNT OF DERIVATIVE ASSETS2 |
||||||||||||||||||||||||||||
| Goldman Sachs International |
||||||||||||||||||||||||||||||||
| Foreign Currency Exchange Contracts |
$ | 20,619 | $ | — | $ | (7,881) | $ | 12,738 | ||||||||||||||||||||||||
|
|
|
|
|
|
|
|
|
|||||||||||||||||||||||||
| Total |
$ | 20,619 | $ | — | $ | (7,881) | $ | 12,738 | ||||||||||||||||||||||||
|
|
|
|
|
|
|
|
|
|||||||||||||||||||||||||
1Excess of collateral received for individual counterparty may not be shown for financial reporting purposes.
2Represents the net amount receivable from the counterparty in the event of default.
Annual Report March 2022 / 340
Table of Contents
Notes to Financial Statements (Continued)
The following table presents Floating Rate Income Fund’s OTC derivative liabilities by counterparty net of amounts available for offset under an ISDA Master Agreement or similar agreements and net of the related collateral received or pledged by the Fund as of March 31, 2022:
| FLOATING RATE INCOME FUND | ||||||||||||||||||||||||||||||||
| COUNTERPARTY | GROSS DERIVATIVE LIABILITIES IN THE STATEMENT OF ASSETS AND LIABILITIES |
COLLATERAL PLEDGED1 |
DERIVATIVE (ASSETS) LIABILITIES AVAILABLE FOR OFFSET |
NET AMOUNT OF DERIVATIVE LIABILITIES2 |
||||||||||||||||||||||||||||
| Goldman Sachs International | ||||||||||||||||||||||||||||||||
| Foreign Currency Exchange Contracts |
$ | 7,881 | $ | — | $ | (7,881) | $ | — | ||||||||||||||||||||||||
|
|
|
|
|
|
|
|
|
|||||||||||||||||||||||||
| Total |
$ | 7,881 | $ | — | $ | (7,881) | $ | — | ||||||||||||||||||||||||
|
|
|
|
|
|
|
|
|
|||||||||||||||||||||||||
1Excess of collateral pledged for individual counterparty may not be shown for financial reporting purposes.
2Represents the net amount payable to the counterparty in the event of default.
The following table presents High Yield Fund’s OTC derivative assets by counterparty net of amounts available for offset under an ISDA Master Agreement or similar agreements and net of the related collateral received or pledged by the Fund as of March 31, 2022:
| HIGH YIELD BOND FUND | ||||||||||||||||||||||||||||||||
| COUNTERPARTY | GROSS DERIVATIVE ASSETS IN THE STATEMENT OF ASSETS AND LIABILITIES |
COLLATERAL RECEIVED1 |
DERIVATIVE ASSETS (LIABILITIES) AVAILABLE FOR OFFSET |
NET AMOUNT OF DERIVATIVE ASSETS2 |
||||||||||||||||||||||||||||
| Credit Suisse First Boston International | ||||||||||||||||||||||||||||||||
| Credit Default Swaps |
$ | 316,733 | $ | (316,733) | $ | — | $ | — | ||||||||||||||||||||||||
|
|
|
|
|
|
|
|
|
|||||||||||||||||||||||||
| Goldman Sachs International |
||||||||||||||||||||||||||||||||
| Foreign Currency Exchange Contracts |
$ | 95,427 | $ | — | $ | (37,530) | $ | 57,897 | ||||||||||||||||||||||||
|
|
|
|
|
|
|
|
|
|||||||||||||||||||||||||
| Total |
$ | 412,160 | $ | (316,733) | $ | (37,530) | $ | 57,897 | ||||||||||||||||||||||||
|
|
|
|
|
|
|
|
|
|||||||||||||||||||||||||
1Excess of collateral received for individual counterparty may not be shown for financial reporting purposes.
2Represents the net amount receivable from the counterparty in the event of default.
The following table presents High Yield Fund’s OTC derivative liabilities by counterparty net of amounts available for offset under an ISDA Master Agreement or similar agreements and net of the related collateral received or pledged by the Fund as of March 31, 2022:
| HIGH YIELD BOND FUND | ||||||||||||||||||||||||||||||||
| COUNTERPARTY | GROSS DERIVATIVE LIABILITIES IN THE STATEMENT OF ASSETS AND LIABILITIES |
COLLATERAL PLEDGED1 |
DERIVATIVE (ASSETS) LIABILITIES AVAILABLE FOR OFFSET |
NET AMOUNT OF DERIVATIVE LIABILITIES2 |
||||||||||||||||||||||||||||
| Goldman Sachs International | ||||||||||||||||||||||||||||||||
| Foreign Currency Exchange Contracts |
$ | 37,530 | $ | — | $ | (37,530) | $ | — | ||||||||||||||||||||||||
|
|
|
|
|
|
|
|
|
|||||||||||||||||||||||||
| Total |
$ | 37,530 | $ | — | $ | (37,530) | $ | — | ||||||||||||||||||||||||
|
|
|
|
|
|
|
|
|
|||||||||||||||||||||||||
1Excess of collateral pledged for individual counterparty may not be shown for financial reporting purposes.
2Represents the net amount payable to the counterparty in the event of default.
341 / Annual Report March 2022
Table of Contents
Notes to Financial Statements (Continued)
The following table presents Intermediate Bond Fund’s OTC derivative assets by counterparty net of amounts available for offset under an ISDA Master Agreement or similar agreements and net of the related collateral received or pledged by the Fund as of March 31, 2022:
| INTERMEDIATE BOND FUND | ||||||||||||||||||||||||||||||||
| COUNTERPARTY | GROSS DERIVATIVE ASSETS IN THE STATEMENT OF ASSETS AND LIABILITIES |
COLLATERAL RECEIVED1 |
DERIVATIVE ASSETS (LIABILITIES) AVAILABLE FOR OFFSET |
NET AMOUNT OF DERIVATIVE ASSETS2 |
||||||||||||||||||||||||||||
| Citigroup Global Markets, Inc. | ||||||||||||||||||||||||||||||||
| Foreign Currency Exchange Contracts |
$ | 253,479 | $ | — | $ | (253,479) | $ | — | ||||||||||||||||||||||||
|
|
|
|
|
|
|
|
|
|||||||||||||||||||||||||
| Credit Suisse First Boston International | ||||||||||||||||||||||||||||||||
| Credit Default Swaps |
$ | 162,450 | $ | — | $ | — | $ | 162,450 | ||||||||||||||||||||||||
|
|
|
|
|
|
|
|
|
|||||||||||||||||||||||||
| Goldman Sachs International |
||||||||||||||||||||||||||||||||
| Foreign Currency Exchange Contracts |
$ | 5,268 | $ | — | $ | (5,268) | $ | — | ||||||||||||||||||||||||
|
|
|
|
|
|
|
|
|
|||||||||||||||||||||||||
| Total |
$ | 421,197 | $ | — | $ | (258,747) | $ | 162,450 | ||||||||||||||||||||||||
|
|
|
|
|
|
|
|
|
|||||||||||||||||||||||||
1Excess of collateral received for individual counterparty may not be shown for financial reporting purposes.
2Represents the net amount receivable from the counterparty in the event of default.
The following table presents Intermediate Bond Fund’s OTC derivative liabilities by counterparty net of amounts available for offset under an ISDA Master Agreement or similar agreements and net of the related collateral received or pledged by the Fund as of March 31, 2022:
| INTERMEDIATE BOND FUND | ||||||||||||||||||||||||||||||||
| COUNTERPARTY | GROSS DERIVATIVE LIABILITIES IN THE STATEMENT OF ASSETS AND LIABILITIES |
COLLATERAL PLEDGED1 |
DERIVATIVE (ASSETS) LIABILITIES AVAILABLE FOR OFFSET |
NET AMOUNT OF DERIVATIVE LIABILITIES2 |
||||||||||||||||||||||||||||
| Citigroup Global Markets, Inc. | ||||||||||||||||||||||||||||||||
| Foreign Currency Exchange Contracts |
$ | 319,719 | $ | — | $ | (253,479) | $ | 66,240 | ||||||||||||||||||||||||
|
|
|
|
|
|
|
|
|
|||||||||||||||||||||||||
| Goldman Sachs International | ||||||||||||||||||||||||||||||||
| Foreign Currency Exchange Contracts |
$ | 8,154 | $ | — | $ | (5,268) | $ | 2,886 | ||||||||||||||||||||||||
|
|
|
|
|
|
|
|
|
|||||||||||||||||||||||||
| Total |
$ | 327,873 | $ | — | $ | (258,747) | $ | 69,126 | ||||||||||||||||||||||||
|
|
|
|
|
|
|
|
|
|||||||||||||||||||||||||
1Excess of collateral pledged for individual counterparty may not be shown for financial reporting purposes.
2Represents the net amount payable to the counterparty in the event of default.
The following table presents Investment Grade Credit Fund’s OTC derivative liabilities by counterparty net of amounts available for offset under an ISDA Master Agreement or similar agreements and net of the related collateral received or pledged by the Fund as of March 31, 2022:
| INVESTMENT GRADE CREDIT FUND | ||||||||||||||||||||||||||||||||
| COUNTERPARTY | GROSS DERIVATIVE LIABILITIES IN THE STATEMENT OF ASSETS AND LIABILITIES |
COLLATERAL PLEDGED1 |
DERIVATIVE (ASSETS) LIABILITIES AVAILABLE FOR OFFSET |
NET AMOUNT OF DERIVATIVE LIABILITIES2 |
||||||||||||||||||||||||||||
| Citigroup Global Markets, Inc. | ||||||||||||||||||||||||||||||||
| Swaptions |
$ | 10,206 | $ | — | $ | — | $ | 10,206 | ||||||||||||||||||||||||
|
|
|
|
|
|
|
|
|
|||||||||||||||||||||||||
| Total |
$ | 10,206 | $ | — | $ | — | $ | 10,206 | ||||||||||||||||||||||||
|
|
|
|
|
|
|
|
|
|||||||||||||||||||||||||
1Excess of collateral pledged for individual counterparty may not be shown for financial reporting purposes.
2Represents the net amount payable to the counterparty in the event of default.
Annual Report March 2022 / 342
Table of Contents
Notes to Financial Statements (Continued)
The following table presents Low Duration Bond Fund’s OTC derivative assets by counterparty net of amounts available for offset under an ISDA Master Agreement or similar agreements and net of the related collateral received or pledged by the Fund as of March 31, 2022:
| LOW DURATION BOND FUND | ||||||||||||||||||||||||
| COUNTERPARTY | GROSS DERIVATIVE ASSETS IN THE STATEMENT OF ASSETS AND LIABILITIES |
COLLATERAL RECEIVED1 |
DERIVATIVE ASSETS (LIABILITIES) AVAILABLE FOR OFFSET |
NET AMOUNT OF DERIVATIVE ASSETS2 |
||||||||||||||||||||
| Credit Suisse First Boston International | ||||||||||||||||||||||||
| Credit Default Swaps |
$ | 508,097 | $ | (508,097) | $ | — | $ | — | ||||||||||||||||
|
|
|
|
|
|
|
|
|
|||||||||||||||||
| Goldman Sachs International | ||||||||||||||||||||||||
| Swaptions |
$ | 11,892 | $ | (8,394) | $ | (3,498) | $ | — | ||||||||||||||||
|
|
|
|
|
|
|
|
|
|||||||||||||||||
| Total |
$ | 519,989 | $ | (516,491) | $ | (3,498) | $ | — | ||||||||||||||||
|
|
|
|
|
|
|
|
|
|||||||||||||||||
1Excess of collateral received for individual counterparty may not be shown for financial reporting purposes.
2Represents the net amount receivable from the counterparty in the event of default.
The following table presents Low Duration Bond Fund’s OTC derivative liabilities by counterparty net of amounts available for offset under an ISDA Master Agreement or similar agreements and net of the related collateral received or pledged by the Fund as of March 31, 2022:
| LOW DURATION BOND FUND | ||||||||||||||||||||||
| COUNTERPARTY | GROSS DERIVATIVE LIABILITIES IN THE STATEMENT OF ASSETS AND LIABILITIES |
COLLATERAL PLEDGED1 |
DERIVATIVE (ASSETS) LIABILITIES AVAILABLE FOR OFFSET |
NET AMOUNT OF DERIVATIVE LIABILITIES2 |
||||||||||||||||||
| Goldman Sachs International |
||||||||||||||||||||||
| Swaptions |
$ | 3,498 | $ | — | $ | (3,498) | $ | — | ||||||||||||||
|
|
|
|
|
|
|
|
|
|||||||||||||||
| Total |
$ | 3,498 | $ | — | $ | (3,498) | $ | — | ||||||||||||||
|
|
|
|
|
|
|
|
|
|||||||||||||||
1Excess of collateral pledged for individual counterparty may not be shown for financial reporting purposes.
2Represents the net amount payable to the counterparty in the event of default.
The following table presents Strategic Income Fund’s OTC derivative assets by counterparty net of amounts available for offset under an ISDA Master Agreement or similar agreements and net of the related collateral received or pledged by the Fund as of March 31, 2022:
| STRATEGIC INCOME FUND | ||||||||||||||||||||||||
| COUNTERPARTY | GROSS DERIVATIVE ASSETS IN THE STATEMENT OF ASSETS AND LIABILITIES |
COLLATERAL RECEIVED1 |
DERIVATIVE ASSETS (LIABILITIES) AVAILABLE FOR OFFSET |
NET AMOUNT OF DERIVATIVE ASSETS2 |
||||||||||||||||||||
| Citigroup Global Markets, Inc. | ||||||||||||||||||||||||
| Foreign Currency Exchange Contracts |
$ | 1,321 | $ | — | $ | (1,321) | $ | — | ||||||||||||||||
|
|
|
|
|
|
|
|
|
|||||||||||||||||
| Total |
$ | 1,321 | $ | — | $ | (1,321) | $ | — | ||||||||||||||||
|
|
|
|
|
|
|
|
|
|||||||||||||||||
1Excess of collateral received for individual counterparty may not be shown for financial reporting purposes.
2Represents the net amount receivable from the counterparty in the event of default.
343 / Annual Report March 2022
Table of Contents
Notes to Financial Statements (Continued)
The following table presents Strategic Income Fund’s OTC derivative liabilities by counterparty net of amounts available for offset under an ISDA Master Agreement or similar agreements and net of the related collateral received or pledged by the Fund as of March 31, 2022:
| STRATEGIC INCOME FUND | ||||||||||||||||||||||||
| COUNTERPARTY | GROSS DERIVATIVE LIABILITIES IN THE STATEMENT OF ASSETS AND LIABILITIES |
COLLATERAL PLEDGED1 |
DERIVATIVE (ASSETS) LIABILITIES AVAILABLE FOR OFFSET |
NET AMOUNT OF DERIVATIVE LIABILITIES2 |
||||||||||||||||||||
| Citigroup Global Markets, Inc. | ||||||||||||||||||||||||
| Foreign Currency Exchange Contracts |
$ | 3,872 | $ | — | $ | (1,321 | ) | $ | 2,551 | |||||||||||||||
| Swaptions |
$ | 21,650 | $ | — | $ | — | $ | 21,650 | ||||||||||||||||
|
|
|
|
|
|
|
|
|
|||||||||||||||||
| Total |
$ | 25,522 | $ | — | $ | (1,321 | ) | $ | 24,201 | |||||||||||||||
|
|
|
|
|
|
|
|
|
|||||||||||||||||
1Excess of collateral pledged for individual counterparty may not be shown for financial reporting purposes.
2Represents the net amount payable to the counterparty in the event of default.
The following table presents Total Return Bond Fund’s OTC derivative assets by counterparty net of amounts available for offset under an ISDA Master Agreement or similar agreements and net of the related collateral received or pledged by the Fund as of March 31, 2022:
| TOTAL RETURN BOND FUND | ||||||||||||||||||||||||
| COUNTERPARTY | GROSS DERIVATIVE ASSETS IN THE STATEMENT OF ASSETS AND LIABILITIES |
COLLATERAL RECEIVED1 |
DERIVATIVE ASSETS (LIABILITIES) AVAILABLE FOR OFFSET |
NET AMOUNT OF |
||||||||||||||||||||
| Citigroup Global Markets, Inc. | ||||||||||||||||||||||||
| Foreign Currency Exchange Contracts |
$ | 18,710,809 | $ | — | $ | (18,710,809) | $ |
— |
|
|||||||||||||||
|
|
|
|
|
|
|
|
|
|||||||||||||||||
| Credit Suisse First Boston International | ||||||||||||||||||||||||
| Credit Default Swaps |
$ | 4,329,157 | $ | (4,240,000) | $ | — | $ | 89,157 | ||||||||||||||||
|
|
|
|
|
|
|
|
|
|||||||||||||||||
| Goldman Sachs International | ||||||||||||||||||||||||
| Foreign Currency Exchange Contracts |
$ | 11,102,644 | $ | — | $ | (5,803,829) | $ | 5,298,815 | ||||||||||||||||
|
|
|
|
|
|
|
|
|
|||||||||||||||||
| Total |
$ | 34,142,610 | $ | (4,240,000) | $ | (24,514,638) | $ | 5,387,972 | ||||||||||||||||
|
|
|
|
|
|
|
|
|
|||||||||||||||||
1Excess of collateral received for individual counterparty may not be shown for financial reporting purposes.
2Represents the net amount receivable from the counterparty in the event of default.
Annual Report March 2022 / 344
Table of Contents
Notes to Financial Statements (Continued)
The following table presents Total Return Bond Fund’s OTC derivative liabilities by counterparty net of amounts available for offset under an ISDA Master Agreement or similar agreements and net of the related collateral received or pledged by the Fund as of March 31, 2022:
| TOTAL RETURN BOND FUND | ||||||||||||||||||||||||||||
| COUNTERPARTY | GROSS DERIVATIVE LIABILITIES IN THE STATEMENT OF ASSETS AND LIABILITIES |
COLLATERAL PLEDGED1 |
DERIVATIVE (ASSETS) LIABILITIES AVAILABLE FOR OFFSET |
NET AMOUNT OF DERIVATIVE LIABILITIES2 |
||||||||||||||||||||||||
| Bank of America N.A. | ||||||||||||||||||||||||||||
| Reverse Repurchase Agreements |
$ | 986,250,000 | $ | (986,250,000) | $ | — | $ | — | ||||||||||||||||||||
|
|
|
|
|
|
|
|
|
|||||||||||||||||||||
| Barclay’s Capital | ||||||||||||||||||||||||||||
| Reverse Repurchase Agreements |
$ | 1,990,000,000 | $ | (1,990,000,000) | $ | — | $ | — | ||||||||||||||||||||
|
|
|
|
|
|
|
|
|
|||||||||||||||||||||
| Citigroup Global Markets, Inc. | ||||||||||||||||||||||||||||
| Foreign Currency Exchange Contracts |
$ | 21,775,135 | $ | (3,064,326) | $ | (18,710,809) | $ | — | ||||||||||||||||||||
| Swaptions |
$ | 11,018,468 | $ | (7,114,674) | $ | — | $ | 3,903,794 | ||||||||||||||||||||
|
|
|
|
|
|
|
|
|
|||||||||||||||||||||
| $ | 32,793,603 | $ | (10,179,000) | $ | (18,710,809) | $ | 3,903,794 | |||||||||||||||||||||
|
|
|
|
|
|
|
|
|
|||||||||||||||||||||
| Goldman Sachs International | ||||||||||||||||||||||||||||
| Foreign Currency Exchange Contracts |
$ | 5,803,829 | $ | — | $ | (5,803,829) | $ | — | ||||||||||||||||||||
| Swaptions |
$ | 14,610,671 | $ | (2,910,000) | $ | — | $ | 11,700,671 | ||||||||||||||||||||
|
|
|
|
|
|
|
|
|
|||||||||||||||||||||
| $ | 20,414,500 | $ | (2,910,000) | $ | (5,803,829) | $ | 11,700,671 | |||||||||||||||||||||
|
|
|
|
|
|
|
|
|
|||||||||||||||||||||
| JPMorgan Chase | ||||||||||||||||||||||||||||
| Reverse Repurchase Agreements |
$ | 987,500,000 | $ | (987,500,000) | $ | — | $ | — | ||||||||||||||||||||
| Swaptions |
$ | 20,103,590 | $ | (12,520,000) | $ | — | $ | 7,583,590 | ||||||||||||||||||||
|
|
|
|
|
|
|
|
|
|||||||||||||||||||||
| $ | 1,007,603,590 | $ | (1,000,020,000) | $ | — | $ | 7,583,590 | |||||||||||||||||||||
|
|
|
|
|
|
|
|
|
|||||||||||||||||||||
| Morgan Stanley | ||||||||||||||||||||||||||||
| Swaptions |
$ | 15,464,300 | $ | (3,618,000) | $ | — | $ | 11,846,300 | ||||||||||||||||||||
|
|
|
|
|
|
|
|
|
|||||||||||||||||||||
| Total |
$ | 4,052,525,993 | $ | (3,992,977,000) | $ | (24,514,638) | $ | 35,034,355 | ||||||||||||||||||||
|
|
|
|
|
|
|
|
|
|||||||||||||||||||||
1Excess of collateral pledged for individual counterparty may not be shown for financial reporting purposes.
2Represents the net amount payable to the counterparty in the event of default.
The following table presents Ultra Short Bond Fund’s OTC derivative assets counterparty net of amounts available for offset under an ISDA Master Agreement or similar agreements and net of the related collateral received or pledged by the Fund as of March 31, 2022:
| ULTRA SHORT BOND FUND | ||||||||||||||||||||||||
| COUNTERPARTY | GROSS DERIVATIVE ASSETS IN THE STATEMENT OF ASSETS AND LIABILITIES |
COLLATERAL RECEIVED1 |
DERIVATIVE ASSETS (LIABILITIES) AVAILABLE FOR OFFSET |
NET AMOUNT OF DERIVATIVE ASSETS2 |
||||||||||||||||||||
| Credit Suisse First Boston International | ||||||||||||||||||||||||
| Credit Default Swaps |
$ | 21,740 | $ | — | $ | — | $ | 21,740 | ||||||||||||||||
|
|
|
|
|
|
|
|
|
|||||||||||||||||
| Total |
$ | 21,740 | $ | — | $ | — | $ | 21,740 | ||||||||||||||||
|
|
|
|
|
|
|
|
|
|||||||||||||||||
1Excess of collateral received for individual counterparty may not be shown for financial reporting purposes.
2Represents the net amount receivable from the counterparty in the event of default.
345 / Annual Report March 2022
Table of Contents
Notes to Financial Statements (Continued)
The following table presents Unconstrained Bond Fund’s OTC derivative assets counterparty net of amounts available for offset under an ISDA Master Agreement or similar agreements and net of the related collateral received or pledged by the Fund as of March 31, 2022:
| UNCONSTRAINED BOND FUND | ||||||||||||||||||||||||||||
| COUNTERPARTY | GROSS DERIVATIVE ASSETS IN THE STATEMENT OF ASSETS AND LIABILITIES |
COLLATERAL RECEIVED1 |
DERIVATIVE ASSETS (LIABILITIES) AVAILABLE FOR OFFSET |
NET AMOUNT OF DERIVATIVE ASSETS2 |
||||||||||||||||||||||||
| Citigroup Global Markets, Inc. | ||||||||||||||||||||||||||||
| Foreign Currency Exchange Contracts |
$ | 1,274,458 | $ | — | $ | (1,274,458) | $ | — | ||||||||||||||||||||
|
|
|
|
|
|
|
|
|
|||||||||||||||||||||
| Credit Suisse First Boston International | ||||||||||||||||||||||||||||
| Credit Default Swaps |
$ | 1,016,276 | $ | (1,000,000) | $ | — | $ | 16,276 | ||||||||||||||||||||
|
|
|
|
|
|
|
|
|
|||||||||||||||||||||
| Goldman Sachs International | ||||||||||||||||||||||||||||
| Foreign Currency Exchange Contracts |
$ | 126,551 | $ | — | $ | (126,551) | $ | — | ||||||||||||||||||||
|
|
|
|
|
|
|
|
|
|||||||||||||||||||||
| Total |
$ | 2,417,285 | $ | (1,000,000) | $ | (1,401,009) | $ | 16,276 | ||||||||||||||||||||
|
|
|
|
|
|
|
|
|
|||||||||||||||||||||
1Excess of collateral received for individual counterparty may not be shown for financial reporting purposes.
2Represents the net amount receivable from the counterparty in the event of default.
The following table presents Unconstrained Bond Fund’s OTC derivative liabilities by counterparty net of amounts available for offset under an ISDA Master Agreement or similar agreements and net of the related collateral received or pledged by the Fund as of March 31, 2022:
| UNCONSTRAINED BOND FUND | ||||||||||||||||||||||||||||
| COUNTERPARTY | GROSS DERIVATIVE LIABILITIES IN THE STATEMENT OF ASSETS AND LIABILITIES |
COLLATERAL PLEDGED1 |
DERIVATIVE (ASSETS) LIABILITIES AVAILABLE FOR OFFSET |
NET AMOUNT OF DERIVATIVE LIABILITIES2 |
||||||||||||||||||||||||
| Citigroup Global Markets, Inc. | ||||||||||||||||||||||||||||
| Foreign Currency Exchange Contracts |
$ | 1,607,503 | $ | (333,000) | $ | (1,274,458) | $ | 45 | ||||||||||||||||||||
|
|
|
|
|
|
|
|
|
|||||||||||||||||||||
| Goldman Sachs International | ||||||||||||||||||||||||||||
| Foreign Currency Exchange Contracts |
$ | 143,497 | $ | — | $ | (126,551) | $ | 16,946 | ||||||||||||||||||||
|
|
|
|
|
|
|
|
|
|||||||||||||||||||||
| JPMorgan Chase | ||||||||||||||||||||||||||||
| Swaptions |
$ | 3,127,655 | $ | (1,855,000) | $ | — | $ | 1,272,655 | ||||||||||||||||||||
|
|
|
|
|
|
|
|
|
|||||||||||||||||||||
| Total |
$ | 4,878,655 | $ | (2,188,000) | $ | (1,401,009) | $ | 1,289,646 | ||||||||||||||||||||
|
|
|
|
|
|
|
|
|
|||||||||||||||||||||
1Excess of collateral pledged for individual counterparty may not be shown for financial reporting purposes.
2Represents the net amount payable to the counterparty in the event of default.
| 3. | PORTFOLIO INVESTMENTS |
The Funds may invest in mortgage pass-through securities which represent interests in pools of mortgages in which payments of both principal and interest on the securities are generally made monthly, in effect “passing through” monthly payments made by borrowers on the residential or commercial mortgage loans which underlie the securities (net of any fees paid to the issuer or guarantor of the securities). Mortgage pass-through securities differ from other forms of debt securities, which normally provide for periodic payment of interest in fixed amounts with principal payments at maturity or specified call dates.
The Funds may invest in securities issued by the Federal National Mortgage Association (“FNMA”) and the Federal Home Loan Mortgage Corp. (“FHLMC”). These are fixed-income securities that derive their value from or represent interests in a pool of mortgages or mortgage securities. An unexpectedly high rate of defaults on the mortgages held by a mortgage pool may adversely affect the value of a mortgage-backed security and could result in losses to the Funds. The risk of such defaults is generally higher in the case of mortgage pools that include sub-prime mortgages. Sub-prime mortgages refer to loans made to borrowers with weakened credit histories or with a lower capacity to make timely payments on their mortgages.
Additionally, securities issued by FNMA and FHLMC are not backed by or entitled to the full faith and credit of the United States and are supported by the right to the issuer to borrow from the Treasury.
Annual Report March 2022 / 346
Table of Contents
Notes to Financial Statements (Continued)
On September 7, 2008, the Federal Housing Finance Agency was appointed as conservator of FNMA and FHLMC. In addition, the U.S. Department of the Treasury has agreed to provide capital as needed to ensure FNMA and FHLMC continue to provide liquidity to the housing and mortgage markets.
The Funds may also invest in Collateralized Mortgage Obligations (“CMOs”). CMOs are debt obligations collateralized by residential or commercial mortgage loans or residential or commercial mortgage pass-through securities. Interest and principal are generally paid monthly. CMOs may be collateralized by whole mortgage loans or private mortgage pass-through securities but are more typically collateralized by portfolios of mortgage pass-through securities guaranteed by the Government National Mortgage Association (“GNMA”), FHLMC, or FNMA. The issuer of a series of CMOs may elect to be treated for tax purposes as a Real Estate Mortgage Investment Conduit. CMOs are structured into multiple classes, each bearing a different stated maturity. Monthly payment of principal received from the pool of underlying mortgages, including prepayments, is first returned to investors holding the shortest maturity class. Investors holding the longer maturity classes usually receive principal only after shorter classes have been retired. An investor may be partially protected against a sooner than desired return of principal because of the sequential payments.
The Funds may enter into to be announced (“TBA”) commitments to purchase or sell securities for a fixed price at a future date. TBA commitments are considered securities in themselves, and involve a risk of loss if the value of the security to be purchased or sold declines or increases prior to settlement date, which is in addition to the risk of decline in the value of the Funds’ other assets. Unsettled TBA commitments are valued at the current market value of the underlying securities, according to the procedures described in Note 2 under “Security Valuation”.
The Funds may invest in Collateralized Bond Obligations (“CBOs”), Collateralized Loan Obligations (“CLOs”) and other Collateralized Debt Obligations (“CDOs”), which are debt instruments backed solely by a pool of other debt securities. The risks of an investment in a CBO, CLO or other CDO depend largely on the type of the collateral securities and the class of the CBO, CLO or other CDO in which a Fund invests. Some CBOs, CLOs and other CDOs have credit ratings, but are typically issued in various classes with various priorities. Normally, CBOs, CLOs and other CDOs are privately offered and sold (that is, not registered under the securities laws) and may be characterized by the Funds as illiquid securities, but an active dealer market may exist for CBOs, CLOs and other CDOs that qualify for Rule 144A transactions. In addition to the normal interest rate, default and other risks of fixed income securities, CBOs, CLOs and other CDOs carry additional risks, including the possibility that distributions from collateral securities will not be adequate to make interest or other payments, the quality of the collateral may decline in value or default, the Funds may invest in CBOs, CLOs and other CDOs that are subordinate to other classes, there may be volatility in value, and the complex structure of the security may not be fully understood at the time of investment and produce disputes with the issuer or unexpected investment results.
The Funds may invest in stripped mortgage-backed securities issued by the U.S. government, its agencies and instrumentalities. Stripped mortgage-backed securities are usually structured with two classes that receive different proportions of the interest and principal distributions on a pool of mortgage assets. In certain cases, one class will receive all of the interest (the interest-only or “IO” class), while the other class will receive all of the principal (the principal-only or “PO” class). During the year ended March 31, 2022, certain interest-only securities were held as part of the overall mortgage portfolio holdings. The yield to maturity on IOs is sensitive to the rate of principal repayments (including prepayments) on the related underlying mortgage assets, and principal payments may have a material effect on yield to maturity. If the underlying mortgage assets experience greater than anticipated prepayments of principal, a Fund may not fully recoup its initial investment in IOs. Such securities will be considered liquid only if so determined in accordance with guidelines established by the Board. The Funds also may invest in stripped mortgage-backed securities that are privately issued. These securities will be considered illiquid for purposes of each Fund’s limit on illiquid securities.
The Funds may purchase participations in commercial loans, or may purchase assignments of such loans. Such indebtedness may be secured or unsecured. Loan participations typically represent direct participation in a loan to a corporate borrower, and generally are offered by banks or other financial institutions or lending syndicates. The Funds may participate in such syndications, or can buy part of a loan, becoming a part lender. When purchasing loan participations, a Fund assumes the credit risk associated with the corporate borrower and may assume the credit risk associated with an interposed bank or other financial intermediary. The participation interests in which a Fund intends to invest may not be rated by any nationally recognized rating service. Participations and assignments also involve special types of risk, including interest rate risk, liquidity risk, and the risk of being a lender. If a Fund purchases a participation, it may only be able to enforce its rights through the lender, and may assume the credit risk of the lender in addition to the borrower.
The Funds may also sell a debt or equity security short, that is, without owning it, and borrow the same security from a broker or other institution to complete the sale. The Adviser may use short sales when it believes a security is overvalued or as a partial hedge against a position in a related security of the same issuer held by a Fund. The Corporate Bond Fund, ESG Securitized Fund, Flexible Income Fund, High Yield Bond Fund, Investment Grade Credit Fund, Opportunistic High Income Credit Fund and Strategic
347 / Annual Report March 2022
Table of Contents
Notes to Financial Statements (Continued)
Income Fund may not make short sales of securities or maintain a short position if more than 33 1/3% of the Fund’s total assets (taken at current value) are held as collateral for such sales at any one time. The AlphaTrak 500 Fund, Intermediate Bond Fund, Low Duration Bond Fund, Total Return Bond Fund, Ultra Short Bond Fund and Unconstrained Bond Fund will not make total short sales exceeding 25% of the Fund’s total assets. The Floating Rate Income Fund will not make total short sales exceeding 15% of the Fund’s total assets. If the value of the security sold short increases, a Fund would lose money because it would need to replace the borrowed security by purchasing it at a higher price. The potential loss is unlimited. (If the short sale was intended as a hedge against another investment, the loss on the short sale may be fully or partially offset by gains in that other investment.) At March 31, 2022, the Funds did not hold any short debt or equity.
A lender may request that the borrowed securities be returned on short notice; if that occurs at a time when other short sellers of the subject security are receiving similar requests, a “short squeeze” can occur. This means that the Funds might be compelled, at the most disadvantageous time, to replace borrowed securities previously sold short, with purchases on the open market at prices significantly greater than those at which the securities were sold short. Short selling also may produce higher than normal portfolio turnover and result in increased transaction costs to the Funds. The Funds also may make short sales “against-the-box”, in which the Funds sell short securities they own. The Funds will incur transaction costs, including interest expenses, in connection with opening, maintaining and closing short sales against-the-box, which result in a “constructive sale”, requiring the Fund to recognize any taxable gain from the transaction.
The Funds may invest in payment-in-kind securities (“PIKs”). PIKs give the issuer the option at each interest payment date of making interest payments in either cash or additional debt securities. Those additional debt securities usually have the same terms, including maturity dates and interest rates, and associated risks as the original bonds. The daily market quotations of the original bonds may include the accrued interest (referred to as a dirty price) and require a pro-rata adjustment from the unrealized appreciation or depreciation on investments to interest receivable on the Statements of Assets and Liabilities.
For the year ended March 31, 2022, the Funds did not receive any in-kind payments with respect to PIK securities.
The Funds may invest in repurchase agreements. In a repurchase agreement, the Funds purchase a security from a counterparty who agrees to repurchase the same security at a mutually agreed upon date and price. On a daily basis, the counterparty is required to maintain collateral subject to the agreement and in value no less than the agreed repurchase amount. The agreements are conditioned upon the collateral being deposited under the Federal Reserve book entry system or held in a segregated account by the Funds’ custodian or designated sub-custodians under tri-party repurchase agreements. In the event the counterparty defaults and the fair value of the collateral declines, the Funds could experience losses, delays and costs in liquidating the collateral.
Master Repurchase Agreements (“MRAs”) permit each Fund, under certain circumstances including an event of default (such as bankruptcy or insolvency), to offset payables and/or receivables under the MRA with collateral held and/or posted to the counterparty and create one single net payment due to or from each Fund. However, bankruptcy or insolvency laws of a particular jurisdiction may impose restrictions on or prohibitions against such a right of offset in the event of an MRA counterparty’s bankruptcy or insolvency. Pursuant to the terms of the MRA, each Fund receives securities as collateral with a market value in excess of the repurchase price to be received by each Fund upon the maturity of the repurchase transaction. Upon a bankruptcy or insolvency of the MRA counterparty, each Fund recognizes a liability with respect to such excess collateral to reflect each Fund’s obligation under bankruptcy law to return the excess to the counterparty. As of March 31, 2022, the Funds did not hold any repurchase agreements.
The Funds may enter into reverse repurchase agreements, whereby a Fund sells securities concurrently with entering into an agreement to repurchase those securities at a later date at a fixed price. During the reverse repurchase agreement period, the Fund continues to receive principal and interest payments on those securities. Reverse repurchase agreements are speculative techniques involving leverage and are considered borrowings by the Fund for purposes of the percentage limitations applicable to borrowings. Securities sold under reverse repurchase agreements are recorded as a liability. Interest payments made are recorded as a component of interest expense. In periods of increased demand for the security, a Fund may receive a fee for use of the security by the counterparty, which may result in interest income to the Fund. A reverse repurchase agreement involves the risk that the market value of the security sold by a Fund may decline below the repurchase price of the security. A Fund will segregate assets determined to be liquid by the manager or otherwise cover its obligations under reverse repurchase agreements. The average dollar amount and average interest rate of reverse repurchase agreements in the Total Return Bond Fund for the year ended March 31, 2022, was $739,588,584 and (0.44)%.
Reverse repurchase transactions and treasury roll transactions are entered into by a Fund under MRAs. With reverse repurchase transactions and treasury roll transactions, typically the Funds and the counterparties are not permitted to sell, re-pledge, or use the collateral associated with the transaction. Pursuant to the terms of the MRA, a Fund receives or posts securities as collateral with a market value in excess of the repurchase price to be paid or received by a Fund upon the maturity of the transaction. Upon a bankruptcy or insolvency of the MRA counterparty, a Fund is considered an unsecured creditor with respect to excess collateral and, as such, the return of excess collateral may be delayed. As of March 31, 2022, the Total Return Bond Fund held reverse repurchase agreements.
Annual Report March 2022 / 348
Table of Contents
Notes to Financial Statements (Continued)
As of March 31, 2022, the following table is a summary of open reverse repurchase agreements by counterparty which are subject to offset under an MRA on a net basis:
| TOTAL RETURN BOND FUND | ||||||||||||
| COUNTERPARTY | REVERSE REPURCHASE AGREEMENTS |
FAIR VALUE OF NON-CASH COLLATERAL PLEDGED INCLUDING ACCRUED INTEREST1 |
NET AMOUNT | |||||||||
| Bank of America N.A. |
$ | 986,250,000 | $ | 986,250,000 | $ | — | ||||||
| Barclays Bank PLC |
1,990,000,000 | 1,990,000,000 | — | |||||||||
| JPMorgan Chase |
987,500,000 | 987,500,000 | — | |||||||||
|
|
|
|
|
|
|
|
|
|||||
| $ | 3,963,750,000 | $ | 3,963,750,000 | $ | — | |||||||
|
|
|
|
|
|
|
|
|
|||||
1Excess of collateral pledged for individual counterparty may not be shown for financial reporting purposes.
In the event the counterparty of securities under an MRA files for bankruptcy or becomes insolvent, a Fund’s use of the proceeds from the agreement may be restricted while the counterparty, or its trustee or receiver, determines whether or not to enforce a Fund’s obligation to repurchase the securities.
Each Fund may enter into when-issued, delayed-delivery, or forward commitment transactions in order to lock in the purchase price of the underlying security, or in order to adjust the interest rate exposure of the Fund’s existing portfolio. In when-issued, delayed-delivery, or forward commitment transactions, a Fund commits to purchase or sell particular securities, with payment and delivery to take place at a future date. Although a Fund does not pay for the securities or start earning interest on them until they are delivered, it immediately assumes the risks of ownership, including the risk of price fluctuation. If a Fund’s counterparty fails to deliver a security purchased on a when-issued, delayed-delivery, or forward commitment basis, there may be a loss, and that Fund may have missed an opportunity to make an alternative investment. Prior to settlement of these transactions, the value of the subject securities will fluctuate, reflecting interest rate changes. In addition, because a Fund is not required to pay for when-issued, delayed-delivery, or forward commitment securities until the delivery date, they may result in a form of leverage to the extent a Fund does not maintain liquid assets equal to the face amount of the contract. The Funds segregate assets (cash and/or securities) to cover the amounts outstanding related to these transactions.
Derivatives:
The Funds may engage in various portfolio investment strategies both to increase the return of the Funds and to economically hedge, or protect, their exposure to interest rate movements and movements in the securities markets. Losses may arise if the value of the contract decreases due to an unfavorable change in the price of the underlying security or if the counterparty does not perform under the contract. The Funds are subject to credit risk, equity price risk and interest rate risk in the normal course of pursuing their investment objectives by investing in various derivative financial instruments, as described below:
Over the reporting period, the Funds engaged in interest rate futures contracts, foreign currency exchange contracts, swap agreements and swaptions as a means of managing interest rate risk and yield curve positioning consistent with the Adviser’s current market perspectives. Additionally, credit default swaps were held for the purposes of (1) hedging valuation risks specific to identified market segments, industries and credits and (2) efficiently gaining income-bearing exposures to selected market segments, industries and credits. The market value of these instruments, realized and changes in unrealized gains and losses, and the types of contracts are included in the Schedule of Portfolio Investments and the Notes to Financial Statements.
Options - The Funds may purchase and write call and put options on securities, securities indices and on foreign currencies. A Fund may purchase put options on securities to seek to protect holdings in an underlying or related security against a substantial decline in market value. A Fund may purchase call options on securities to seek to protect against substantial increases in prices of securities the Fund intends to purchase pending its ability to invest in such securities in an orderly manner. The Fund pays a premium which is included as an asset on the Statements of Assets and Liabilities and subsequently marked-to-market to reflect the current value of the option. Premiums paid for purchasing options which expire are treated as realized losses. A Fund may write a call or put option only if the option is covered by the Fund holding a position in the underlying securities or by other means which would permit immediate satisfaction of the Fund’s obligation as writer of the option. When the Fund writes a call or put, an amount equal to the premium received is recorded as a liability and subsequently marked-to-market to reflect the current value of the option written. These liabilities are included on the Statements of Assets and Liabilities. Premiums received from writing options which expire are treated as realized gains. Premiums received from writing options which are exercised or closed are added to the proceeds or
349 / Annual Report March 2022
Table of Contents
Notes to Financial Statements (Continued)
offset against amounts paid on the underlying futures, swap, security or currency transaction to determine the realized gain (loss). The purchase and writing of options involves certain risks. During the option period, the covered call writer has, in return for the premium on the option, given up the opportunity to profit from a price increase in the underlying securities above the sum of the premium and exercise price, but as long as its obligation as a writer continues, has retained the risk of loss should the price of the underlying securities decline. The writer of an option has no control over the time when it may be required to fulfill its obligation as a writer of the option. Once an option writer has received an exercise notice, it cannot effect a closing purchase transaction in order to terminate its obligation under the option and must deliver the underlying securities at the exercise price. If a put or call option purchased by the Fund is not sold when it has remaining value, and if the market price of the underlying security, in the case of a put, remains equal to or greater than the exercise price or, in the case of a call, remains less than or equal to the exercise price, the Fund will lose its entire investment in the option. There can be no assurance that a liquid market will exist when a Fund seeks to close out an option position. Furthermore, if trading restrictions or suspensions are imposed on the options markets, a Fund may be unable to close out a position.
The Funds may execute transactions in both listed and over-the-counter options. Listed options involve minimal counterparty risk since listed options are guaranteed against default by the exchange on which they trade. Transactions in certain over-the-counter options may expose the Funds to the risk of default by the counterparty to the transaction. In the event of default by the counterparty to the over-the-counter option transaction, a Fund’s maximum amount of loss is the premium paid (as purchaser) or the unrealized loss of the contract (as writer). As of March 31, 2022, the Flexible Income Fund, Intermediate Bond Fund, Investment Grade Credit Fund, Low Duration Bond Fund, Strategic Income Fund, Total Return Bond Fund, Ultra Short Bond Fund and Unconstrained Bond Fund held written options.
Futures - The Funds purchased or sold exchange-traded futures contracts, which are contracts that obligate the Funds to make or take delivery of a financial instrument or the cash value of a security index at a specified future date at a specified price. The Funds may use futures contracts to manage exposure to the stock and bond markets or changes in interest rates and currency values, or for gaining exposure to markets. Risks of entering into futures contracts include the possibility that there may be an illiquid market at the time the Adviser to the Fund may be attempting to sell some or all of the Fund holdings or that a change in the value of the contract may not correlate with changes in the value of the underlying securities. Upon entering into a futures contract, the Fund is required to deposit either cash or securities (initial margin). Subsequent payments (variation margin) are made or received by the Fund, generally on a daily basis. The variation margin payments are equal to the daily changes in the contract value and are recorded as unrealized gains or losses. The Funds recognize a realized gain or loss when the contract is closed or expires.
Futures transactions involve minimal counterparty risk since futures contracts are guaranteed against default by the exchange on which they trade.
Foreign Currency - The Funds may hold foreign currency as an economic hedge against either specific transactions or portfolio instruments or to obtain exposure to foreign currencies (foreign currency exchange rate risk).
Foreign Currency Exchange Contracts - The Funds entered into foreign currency exchange contracts as an economic hedge against either specific transactions or portfolio instruments or to obtain exposure to foreign currencies (foreign currency exchange rate risk). A foreign currency exchange contract is an agreement between two parties to buy and sell a currency at a set exchange rate on a future date. Foreign currency exchange contracts, when used by a Fund, help to manage the overall exposure to the currencies in which some of the investments held by a Fund are denominated. The contract is marked-to-market daily and the change in market value is recorded by a Fund as an unrealized gain or loss. When the contract is closed, a Fund records a realized gain or loss equal to the difference between the value at the time it was opened and the value at the time it was closed. The use of foreign currency exchange contracts involves the risk that the value of a foreign currency exchange contract changes unfavorably due to movements in the value of the referenced foreign currencies and the risk that a counterparty to the contract does not perform its obligations under the agreement.
Swaps - The Funds invested in swap agreements. Swap agreements are two-party contracts entered into primarily by institutional investors for periods ranging from a few weeks to more than a year. In a standard swap transaction, two parties agree to exchange the returns earned on specific assets, such as the return on, or increase in value of, a particular dollar amount invested at a particular interest rate, in a particular foreign currency, or in a basket of securities representing a particular index. A swap contract may not be assigned without the consent of the counterparty (and in certain circumstances may not be assignable), and may result in losses in the event of a default or bankruptcy of the counterparty.
The Funds entered into credit default swap agreements to provide a measure of protection against defaults of the issuers (i.e., to reduce risk where a Fund owns or has exposure to the referenced obligation) or to take an active long or short position with respect to the likelihood of a particular issuer’s default. The buyer in a credit default contract is obligated to pay the seller a periodic stream of payments over the term of the contract provided no event of default has occurred. In the event of default, the seller must pay
Annual Report March 2022 / 350
Table of Contents
Notes to Financial Statements (Continued)
the buyer the par value (full notional value) of the reference obligation in exchange for the reference obligation. The Funds may be either the buyer or seller in such transactions. If a Fund is a buyer and no event of default occurs, the Fund loses its investment and recovers nothing. However, if an event of default occurs, the buyer receives full notional value for a reference obligation that may have little or no value. As a seller of a credit default swap, the Fund receives a fixed rate of income throughout the term of the contract, provided there is no default event. If an event of default occurs, the seller may pay the notional value of the reference obligation. The value of the reference obligation received by the seller, coupled with the periodic payments previously received may be less than the full notional value it pays to the buyer, resulting in a loss of value to the Fund. Credit default swaps involve greater risks than if the Fund had invested in the reference obligation directly. In addition to general market risks, credit default swaps are subject to illiquidity risk, counterparty risk and credit risk.
The aggregate fair value of credit default swaps in a net liability position is reflected as unrealized depreciation. The collateral posted for swap contracts, net of assets received as collateral, is also disclosed in the Notes to Schedules of Portfolio Investments. The maximum potential amount of future payments (undiscounted) that a portfolio as a seller of protection could be required to make under a credit default swap agreement is an amount equal to the notional amount of the agreement. These potential amounts are partially offset by any recovery values of the respective referenced obligations, upfront payments received upon entering into the agreement, or net amounts received from the settlement of buy protection credit default swap agreements entered into by a portfolio for the same referenced entity or entities. As of March 31, 2022, High Yield Bond Fund, Intermediate Bond Fund, Low Duration Bond Fund, Total Return Bond Fund, Ultra Short Bond Fund and Unconstrained Bond Fund had credit default swaps outstanding in the Funds.
The Funds entered into interest rate swap agreements. Interest rate swaps are agreements in which one party pays a floating rate of interest on a notional principal amount and receives a fixed rate of interest on the same notional principal amount for a specified period of time. Alternatively, a party may pay a fixed rate and receive a floating rate. In more complex swaps, the notional principal amount may decline (or amortize) over time. The Funds’ maximum risk of loss due to counterparty default is the discounted NAV of the cash flows paid to/received from the counterparty over the interest rate swap’s remaining life. The Funds enter into interest rate swaps to manage duration, the yield curve, or interest rate risk by economically hedging the value of the fixed-rate bonds which may decrease when interest rates rise (interest rate risk).
The Funds may write (sell) and purchase put and call swaptions. Swaption contracts written by the Funds represent an option that gives the purchaser the right, but not the obligation, to enter into a new swap agreement, or to shorten, extend, cancel or modify an existing swap agreement, on a future date on specified terms. Depending on the terms of the particular option agreement, a Fund will generally incur a greater degree of risk when it writes a swaption than it will incur when it purchases a swaption. When a Fund purchases a swaption, it risks losing only the amount of the premium it has paid should it decide to let the option expire unexercised. However, when a Fund writes a swaption, upon exercise of the option the Fund will become obligated according to the terms of the underlying agreement. At March 31, 2022, Corporate Bond Fund, Investment Grade Credit Fund, Low Duration Bond Fund, Strategic Income Fund, Total Return Bond Fund and Unconstrained Bond Fund held swaptions.
In addition to the securities listed above, the AlphaTrak 500 Fund invested in the following equity derivative instruments with a notional or contractual value up to its total assets: S&P 500 Index futures contracts, Mini S&P 500 Index futures contracts, options on the S&P 500 Index and S&P futures, and swap agreements involving the S&P 500 Index. When the above-listed S&P Index derivatives appear to be overvalued relative to the S&P 500 Index, the Fund may invest up to 100% in the common stocks that comprise the S&P 500 Index. The Fund may also invest up to 25% of its total assets in these stocks indirectly by purchasing interests in one or more mutual funds, asset pools, or trusts that invest in such stocks.
The Funds may enter into total return swap agreements. Total return swap is the generic name for any non-traditional swap where one party agrees to pay the other the “total return” of a defined underlying asset, usually in return for receiving a stream of LIBOR-based cash flows. The total return swap may be applied to any underlying asset but is most commonly used with equity indices, single stocks, bonds and defined portfolios of loans and mortgages. The total return swap is a mechanism for the user to accept the economic benefits of asset ownership without utilizing the balance sheet. The other leg of the swap, usually LIBOR, is spread to reflect the non-balance sheet nature of the product. Total return swaps can be designed with any underlying asset agreed between two parties.
As a result, unrealized gains are reported as an asset and unrealized losses are reported as a liability in the Statements of Assets and Liabilities. The change in the value of the swaps, including periodic amounts of interest paid or received on swaps, is reported as unrealized gains or losses in both the Statements of Assets and Liabilities and the Statements of Operations. A realized gain or loss is recorded upon payment or termination of swap agreements. Swap agreements are stated at fair value. Notional principal amounts are used upon payment or receipt of a periodic payment or termination of swap agreements to express the extent of involvement
351 / Annual Report March 2022
Table of Contents
Notes to Financial Statements (Continued)
in these transactions, but the amounts subject to credit risk are much smaller. At March 31, 2022, the Funds had outstanding swap agreements as listed in the Funds’ Schedules of Portfolio Investments. Swap transactions present risk of loss in excess of the related amounts in the Statements of Assets and Liabilities.
| 4. | RISK CONSIDERATIONS |
Foreign Investing Risk: The Funds may be exposed to the risk that the Funds’ share prices will fluctuate with market conditions, currency exchange rates and the economic and political climates in countries where the Funds invest.
Market Risk: Because the values of the Funds’ investments will fluctuate with market conditions, so will the value of your investment in the Funds. You could lose money on your investment in the Funds or the Funds could underperform other investments.
Liquidity Risk: The Funds’ investments in illiquid securities may reduce the returns of the Funds because they may not be able to sell the illiquid securities at an advantageous time or price. Investments in high-yield securities, foreign securities, derivatives or other securities with substantial market and/or credit risk tend to have the greatest exposure to liquidity risk. Certain investments in private placements and Rule 144A securities may be considered illiquid investments. The Funds may invest in private placements and Rule 144A securities.
Interest Rate Risk: The values of the Funds’ investments fluctuate in response to movements in interest rates. If rates rise, the values of debt securities generally fall. The longer the average duration of a Fund’s investment portfolio, the greater the change in value.
Mortgage-Backed and Other Asset-Backed Securities Risk: Each Fund may invest in mortgage-backed or other asset-backed securities. The values of some mortgaged-backed or other asset-backed securities may expose a Fund to a lower rate of return upon reinvestment of principal. When interest rates rise, the value of mortgage-related securities generally will decline; however, when interest rates are declining, the value of mortgage-related securities with prepayment features may not increase as much as other fixed-income securities. The rate of prepayments on underlying mortgages will affect the price and volatility of a mortgage-related security, and may shorten or extend the effective maturity of the security beyond what was anticipated at the time of purchase. If an unanticipated rate of prepayment on underlying mortgages increases the effective maturity of a mortgage-related security, the volatility of the security can be expected to increase. The value of these securities may fluctuate in response to the market’s perception of the creditworthiness of the issuers. Additionally, although mortgages and mortgage-related securities are generally supported by some form of government or private guarantee and/or insurance, there is no assurance that private guarantors or insurers will meet their obligations.
Derivatives Risk: Use of derivatives, which at times is an important part of the Funds’ investment strategy, involves risks different from, or possibly greater than, the risks associated with investing directly in securities and other traditional investments. Investments in derivatives could cause the Funds to lose more than the principal amount invested. Also, suitable derivative transactions may not be available in all circumstances and there can be no assurance that the Funds will engage in these transactions to reduce exposure to other risks when that would be beneficial.
Credit Risk: The values of any of the Funds’ investments may also decline in response to events affecting the issuer or its credit rating. The lower-rated debt securities in which the Fund may invest are considered speculative and are subject to greater volatility and risk of loss than investment-grade securities, particularly in deteriorating economic conditions. The value of some mortgage-related securities in which the Funds invest also may fall because of unanticipated levels of principal prepayments that can occur when interest rates decline.
Certain of the Funds invest a material portion of their assets in securities of issuers that hold mortgage- and asset-backed securities and direct investments in securities backed by commercial and residential mortgage loans and other financial assets. The value and related income of these securities are sensitive to changes in economic conditions, including delinquencies and/or defaults. Continuing shifts in the market’s perception of credit quality on securities backed by commercial and residential mortgage loans and other financial assets may result in increased volatility of market price and periods of illiquidity that can negatively impact the valuation of certain issuers held by the Funds.
Mortgage-backed securities (“MBS”) and asset-backed securities (“ABS”) are characterized and classified in a variety of different ways. These classifications include a view of the securities’ cash flow structure (pass-through, sequential pay, prepayment-protected, interest-only, principal-only, etc.), the security of the claim on the underlying assets (senior, mezzanine and subordinated), as well as types of underlying collateral (prime conforming loans, prime non-conforming loans, Alt-A loans, subprime loans, commercial loans, etc.). In many cases, the classification incorporates a degree of subjectivity: a particular loan might be categorized as “prime” by the underwriting standards of one mortgage issuer while another might classify the loan as “subprime.” In addition to other functions, the risk associated with an investment in a mortgage loan must take into account the nature of the collateral, the form and the level of credit enhancement, the vintage of the loan, the geography of the loan, the purpose of the loan (refinance versus purchase versus equity take-out), the borrower’s credit quality (e.g. FICO score), and whether the loan is a first trust deed or a second lien.
Annual Report March 2022 / 352
Table of Contents
Notes to Financial Statements (Continued)
The mortgage industry lacks a single bright-line as to what separates a subprime loan from an Alt-A loan. Often it is a combination of loan characteristics involving both borrower criteria as well as collateral criteria that determine which category a loan is placed in. However, in order to be both conservative and objective as possible, the Adviser applied the following criteria to the Funds’ residential mortgage and asset-backed holdings in coming up with its categorizations:
Sub Prime - Any asset-backed bond whose collateral was residential mortgages which were considered to be subprime, provided that the loans did not belong to the classification of manufactured housing loans.
Alt-A - Any mortgage-backed security whose average borrower FICO score was less than 730 and/or was listed as an Alt-A pool by Bloomberg were considered to be Alt-A bonds.
Counterparty Risk: The Funds may be exposed to counterparty risk, or the risk that an entity with which the Funds have unsettled or open transactions may default. Financial assets, which potentially expose the Funds to credit and counterparty risks, consist principally of investments and cash due from counterparties. The extent of the Funds’ exposure to credit and counterparty risks with respect to these financial assets is approximated by their fair value recorded in the Funds’ Statements of Assets and Liabilities.
Public Health Emergencies Risk and Impact of the Coronavirus (COVID-19): Pandemics and other local, national, and international public health emergencies, including outbreaks of infectious diseases such as SARS, H1N1/09 Flu, the Avian Flu, Ebola and the current outbreak of the novel coronavirus (“COVID-19”), can result, and in the case of COVID-19 is resulting, in market volatility and disruption, and any similar future emergencies may materially and adversely impact economic production and activity in ways that cannot be predicted, all of which could result in substantial investment losses.
The World Health Organization declared in March 2020 that the COVID-19 outbreak officially constitutes a “pandemic.” This outbreak has caused a worldwide public health emergency, straining healthcare resources and resulting in extensive and growing numbers of infections, hospitalizations and deaths. In an effort to contain COVID-19, local, regional, and national governments, as well as private businesses and other organizations, imposed and in some cases continue to impose severely restrictive measures, including instituting local and regional quarantines, restricting travel (including closing certain international borders), prohibiting public activity (including “stay-at-home,” “shelter-in-place,” and similar orders), and ordering the closure of a wide range of offices, businesses, schools, and other public venues. Consequently, COVID-19 has significantly diminished and disrupted global economic production and activity of all kinds and has contributed to both volatility and a severe decline in financial markets.
The ultimate impact of COVID-19 (and of the resulting precipitous decline and disruption in economic and commercial activity across many of the world’s economies) on global economic conditions, and on the operations, financial condition, and performance of any particular market, industry or business, is impossible to predict. However, ongoing and potential additional materially adverse effects, including further global, regional and local economic downturns (including recessions) of indeterminate duration and severity, are possible. Even if COVID-19’s spread is substantially contained, it will be difficult to assess what the longer-term impacts of an extended period of unprecedented economic dislocation and disruption will be on future economic developments, the health of certain markets, industries and businesses, and commercial and consumer behavior. The ongoing COVID-19 crisis and any other public health emergency that may arise in the future could have a significant adverse impact on our investments and result in significant investment losses.
LIBOR Risk: The London Interbank Offered Rate (“LIBOR”) historically has been and currently is used extensively in the U.S. and globally as a “benchmark” or “reference rate” for various commercial and financial contracts, including corporate and municipal bonds, bank loans, asset-backed and mortgage related securities, interest rate swaps and other derivatives. For example, debt securities in which a Fund invests may pay interest at floating rates based on LIBOR or may be subject to interest caps or floors based on LIBOR. A Fund’s derivative investments may also reference LIBOR. In July 2017, the head of the United Kingdom Financial Conduct Authority announced the intention to phase out the use of LIBOR by the end of 2021. However, the ICE Benchmark Administration, in its capacity as administrator of USD LIBOR, announced it would extend publication of 1-month, 3-month, and 6-month USD LIBOR by 19 months to June 2023. It is expected that market participants will transition to the use of different alternative reference or benchmark rates. Although regulators have encouraged the development and adoption of alternative rates such as the Secured Overnight Financing Rate (“SOFR”), there is currently no definitive information regarding the future utilization of LIBOR or of any particular replacement reference rate. Abandonment of or modifications to LIBOR could have adverse impacts on newly issued financial instruments and existing financial instruments that reference LIBOR. The expected discontinuation of LIBOR could have a significant impact on the financial markets and may present a material risk for certain market participants, including investment companies such as the Funds. Abandonment of or modifications to LIBOR could lead to significant short-and long-term uncertainty and market instability. The risks associated with this discontinuation and transition
353 / Annual Report March 2022
Table of Contents
Notes to Financial Statements (Continued)
may be exacerbated if the work necessary to effect an orderly transition to an alternative reference rate is not completed in a timely manner. It remains uncertain how such changes would be implemented and the effects such changes would have on the Funds, issuers of instruments in which the Funds invest, and the financial markets generally.
Bank Loan Risk: There is a risk of investing in corporate loans made by commercial banks and other financial institutions or institutional investors to companies that need capital to grow or restructure, which includes interest rate risk, liquidity risk and prepayment risk. The Fund may also be subject to the credit risk of other financial institutions and the risks associated with insufficient collateral securing a bank loan, limited available public information about a bank loan, delayed settlement, and less protection for holders of bank loans as compared to holders of registered securities. Bank loans are not registered and otherwise may not be treated as securities under the federal securities laws, meaning investors in loans have less protection against improper practices than investors in securities that are registered under or are otherwise subject to the protections of the securities laws.
| 5. | SECURITIES TRANSACTIONS |
Investment transactions for the year ended March 31, 2022, excluding U.S. government and short-term investments, were as follows:
| PORTFOLIO | PURCHASES | SALES | ||||||
| AlphaTrak 500 Fund |
$ | 27,453,488 | $ | 15,571,318 | ||||
| Corporate Bond Fund |
7,266,538 | 5,273,245 | ||||||
| ESG Securitized Fund |
6,895,070 | 1,785,261 | ||||||
| Flexible Income Fund |
119,486,077 | 81,689,886 | ||||||
| Floating Rate Income Fund |
295,370,792 | 216,047,914 | ||||||
| High Yield Bond Fund |
867,370,242 | 864,025,049 | ||||||
| Intermediate Bond Fund |
259,437,190 | 185,038,169 | ||||||
| Investment Grade Credit Fund |
16,180,064 | 13,574,981 | ||||||
| Low Duration Bond Fund |
1,155,749,685 | 951,937,413 | ||||||
| Opportunistic High Income Credit Fund |
6,003,203 | 2,892,087 | ||||||
| Strategic Income Fund |
12,847,477 | 6,241,976 | ||||||
| Total Return Bond Fund |
22,349,695,062 | 15,741,261,390 | ||||||
| Ultra Short Bond Fund |
61,409,695 | 69,106,753 | ||||||
| Unconstrained Bond Fund |
2,185,231,970 | 1,354,234,688 | ||||||
| Investment transactions in U.S. government securities for the year ended March 31, 2022 were as follows: |
| |||||||
| PORTFOLIO | PURCHASES | SALES | ||||||
| AlphaTrak 500 Fund |
$ | 17,379,168 | $ | 16,439,084 | ||||
| Corporate Bond Fund |
12,277,563 | 13,563,157 | ||||||
| ESG Securitized Fund |
37,295,518 | 29,735,085 | ||||||
| Flexible Income Fund |
330,190,133 | 324,530,155 | ||||||
| Intermediate Bond Fund |
3,144,699,776 | 3,198,849,816 | ||||||
| Investment Grade Credit Fund |
49,685,090 | 50,664,734 | ||||||
| Low Duration Bond Fund |
8,719,995,572 | 8,428,425,281 | ||||||
| Opportunistic High Income Credit Fund |
164,695 | 63,563 | ||||||
| Strategic Income Fund |
16,524,044 | 13,469,294 | ||||||
| Total Return Bond Fund |
417,844,557,821 | 429,265,026,647 | ||||||
| Ultra Short Bond Fund |
609,729,104 | 595,169,240 | ||||||
| Unconstrained Bond Fund |
5,342,148,250 | 5,400,195,080 | ||||||
Purchases include the Unconstrained Bond Fund purchase of certain securities from affiliated investment accounts for a total of $25,609,609. These trades are settled for cash in accordance with the valuation and other requirements set forth in Rule 17a-7 under the 1940 Act.
Annual Report March 2022 / 354
Table of Contents
Notes to Financial Statements (Continued)
Investment transactions in the shares of affiliated issuers for the year ended March 31, 2022 were as follows:
| VALUE AT BEGINNING OF YEAR |
PURCHASES | SALES | DIVIDEND/ INTEREST |
VALUE AT END OF YEAR |
REALIZED GAIN (LOSS) |
CHANGE IN UNREALIZED APPRECIATION (DEPRECIATION) |
||||||||||||||||||||||
| High Yield Bond Fund |
||||||||||||||||||||||||||||
| Homer City Holdings LLC |
$— | $— | $— | $— | $— | $— | $— | |||||||||||||||||||||
| Total Return Bond Fund |
||||||||||||||||||||||||||||
| Homer City Holdings LLC |
$— | $— | $— | $— | $— | $— | $— | |||||||||||||||||||||
| 6. | INVESTMENT ADVISORY SERVICES AND OTHER TRANSACTIONS |
As compensation for advisory services, the Adviser charges the Corporate Bond Fund, the ESG Securitized Fund, the Flexible Income Fund, the Floating Rate Income Fund, the High Yield Bond Fund, the Intermediate Bond Fund, the Investment Grade Credit Fund, the Low Duration Bond Fund, the Opportunistic High Income Credit Fund, the Total Return Bond Fund, the Ultra Short Bond Fund and the Unconstrained Bond Fund a fee, computed daily and payable monthly, at an annual rate of 0.40%, 0.40%, 0.45%, 0.55%, 0.50%, 0.35%, 0.35%, 0.30%, 0.50%, 0.35%, 0.25% and 0.65%, respectively, of each Fund’s average daily net assets. Effective February 1, 2022, the Adviser charges the AlphaTrak 500 Fund and the Strategic Income Fund 0.40% and 0.65%, respectively, of each Fund’s average daily net assets. Prior to February 1, 2022, the Adviser charged the AlphaTrak 500 Fund a basic fee of 0.35% of the Fund’s average daily net assets. The basic fee may have been adjusted upward or downward (by up to 0.35% of the Fund’s average daily net assets for the relevant three-month performance period), depending on whether, and to what extent, the investment performance of the AlphaTrak 500 Fund before management fees, for the relevant performance period, exceeded or was exceeded by, the performance of the S&P 500 Index, plus an annualized margin of 1.00% over the same period. Under this agreement, the basic fee decreased by 0.31% resulting in $15,233 total management fees for the period from April 1, 2021 through January 31, 2022.Prior to February 1, 2022, the Adviser charged the Strategic Income Fund a basic fee of 1.20% of the Fund’s average daily net assets. The basic fee may have been adjusted upward or downward (by up to 0.70% of the Fund’s average daily net assets for the relevant 12-month performance period), depending on whether, and to what extent, the investment performance of the Strategic Income Fund, for the relevant performance period, exceeded or was exceeded by, the performance of the ICE BofA U.S. 3-Month Treasury Bill Index Plus 200 bps over the same period. Under this agreement, the basic fee was increased by 0.62% resulting in $439,058 of total management fees for the period from April 1, 2021 through January 31, 2022.
The Adviser has agreed in an operating expenses agreement with the Trust to limit each Fund’s expenses (excluding interest, taxes, brokerage commissions, short sales dividend expense, acquired fund fees and expenses, and any expenses incurred in connection with any merger or reorganization or extraordinary expenses such as litigation) as described in the table below. The operating expenses agreement has a one-year term, renewable at the end of each fiscal year. Each Fund has agreed to reimburse the Adviser, for a period of up to three years, for any such payments to the extent that the Fund’s operating expenses are otherwise below its expense cap at both the time of the waiver and the recoupment. The Adviser’s obligation will not be recorded as a liability on the books of the applicable Fund to the extent that the total operating expenses of the Fund are at or above the expense cap. However, if the total operating expenses of a Fund fall below the expense cap, the reimbursement to the Adviser (up to the cap) will be accrued by the Fund as a liability if the Adviser seeks to recoup those amounts and the independent trustees have approved that reimbursement. The Adviser may not request or receive reimbursement from a Fund for prior reductions or reimbursements before the payment of a Fund’s operating expenses for the year.
355 / Annual Report March 2022
Table of Contents
Notes to Financial Statements (Continued)
Investment advisory fees and related contractual expense limitations for the year ended March 31, 2022, were as follows:
|
PORTFOLIO |
INVESTMENT ADVISORY FEE RATE | CONTRACTUAL EXPENSE LIMITATION1 | ||||||||||||||||||||
| CLASS M | CLASS I | CLASS I-2 | ADMINI- STRATIVE CLASS |
PLAN CLASS |
CLASS M | CLASS I | CLASS I-2 | ADMINI- STRATIVE CLASS |
PLAN CLASS |
| ||||||||||||
| AlphaTrak 500 Fund |
0.40%2 | N/A | N/A | N/A | N/A | 0.45%3 | N/A | N/A | N/A | N/A | ||||||||||||
| Corporate Bond Fund |
0.40% | 0.40% | N/A | N/A | N/A | 0.75% | 0.50% | N/A | N/A | N/A | ||||||||||||
| ESG Securitized Fund4 |
0.40% | 0.40% | N/A | N/A | N/A | 0.70% | 0.49% | N/A | N/A | N/A | ||||||||||||
| Flexible Income Fund |
0.45% | 0.45% | N/A | N/A | N/A | 0.80% | 0.55% | N/A | N/A | N/A | ||||||||||||
| Floating Rate Income Fund |
0.55% | 0.55% | N/A | N/A | 0.55% | 0.90% | 0.70% | N/A | N/A | 0.60% | ||||||||||||
| High Yield Bond Fund |
0.50% | 0.50% | N/A | N/A | N/A | 0.85% | 0.60% | N/A | N/A | N/A | ||||||||||||
| Intermediate Bond Fund |
0.35% | 0.35% | N/A | N/A | N/A | 0.70% | 0.49% | N/A | N/A | N/A | ||||||||||||
| Investment Grade Credit Fund |
0.35% | 0.35% | N/A | N/A | N/A | 0.70% | 0.49% | N/A | N/A | N/A | ||||||||||||
| Low Duration Bond Fund |
0.30% | 0.30% | N/A | 0.30% | N/A | 0.63% | 0.44% | N/A | 0.83% | N/A | ||||||||||||
| Opportunistic High Income Credit Fund5 |
0.50% | 0.50% | N/A | N/A | N/A | 0.85% | 0.60% | N/A | N/A | N/A | ||||||||||||
| Strategic Income Fund |
0.65%2 | 0.65%2 | N/A | N/A | N/A | 1.04% | 0.80% | N/A | N/A | N/A | ||||||||||||
| Total Return Bond Fund |
0.35% | 0.35% | 0.35% | 0.35% | 0.35% | 0.70% | 0.49% | 0.54% | 0.90% | 0.39% | ||||||||||||
| Ultra Short Bond Fund |
0.25% | 0.25% | N/A | N/A | N/A | 0.50% | 0.34% | N/A | N/A | N/A | ||||||||||||
| Unconstrained Bond Fund |
0.65% | 0.65% | N/A | N/A | 0.65% | 1.04% | 0.80% | N/A | N/A | 0.70% | ||||||||||||
1 The Adviser has agreed not to reduce or discontinue this contractual expense limitation until July 31, 2023, unless approved by the Board.
2 Effective February 1, 2022.
3 Effective February 1, 2022, the contractual expense limitation is 0.45%. Prior to February 1, 2022, the contractual expense limitation was 0.90%.
4 The ESG Securitized Fund commenced operations on October 1, 2021.
5 The Opportunistic High Income Credit Fund commenced operations on August 2, 2021.
At March 31, 2022, the balance of recoupable expenses with expiration dates for the Funds were as follows:
| PORTFOLIO | 2022 | 2023 | 2024 | 2025 | TOTAL | |||||||||||||||
| AlphaTrak 500 Fund |
$ | 12,433 | $ | 48,578 | $ | 122,267 | $ | — | $ | 183,278 | ||||||||||
| Corporate Bond Fund |
138,411 | 179,693 | 257,070 | 257,575 | 832,749 | |||||||||||||||
| ESG Securitized Fund |
— | — | — | 67,666 | 67,666 | |||||||||||||||
| Flexible Income Fund |
84,349 | 195,102 | 309,577 | 441,229 | 1,030,257 | |||||||||||||||
| Floating Rate Income Fund |
20,804 | 9,650 | 8,677 | 14,896 | 54,027 | |||||||||||||||
| High Yield Bond Fund |
201,390 | 195,809 | 158,414 | 145,095 | 700,708 | |||||||||||||||
| Intermediate Bond Fund |
— | 5,068 | 4,895 | 62 | 10,025 | |||||||||||||||
| Investment Grade Credit Fund |
142,645 | 191,069 | 259,548 | 264,265 | 857,527 | |||||||||||||||
| Opportunistic High Income Credit Fund |
— | — | — | 96,407 | 96,407 | |||||||||||||||
| Strategic Income Fund |
— | 40,102 | 58,687 | 566,609 | 665,398 | |||||||||||||||
| Ultra Short Bond Fund |
247,985 | 244,911 | 310,177 | 355,828 | 1,158,901 | |||||||||||||||
|
|
|
|
|
|
|
|
|
|
|
|
|
|
|
| ||||||
| Total |
$ | 848,017 | $ | 1,109,982 | $ | 1,489,312 | $ | 2,209,632 | $ | 5,656,943 | ||||||||||
|
|
|
|
|
|
|
|
|
|
|
|
|
|
|
| ||||||
Certain officers and trustees of the Funds are also officers and directors of the Adviser. Such officers and trustees serve without direct compensation from the Funds. For the period from January 1, 2020 to December 31, 2021, each of the independent trustees received an annual retainer of $135,000 and $10,000 for each meeting of the Board attended in person and $2,500 for each meeting attended telephonically. The chairman of the Board received an annual retainer of $55,500. The respective chairman of the Audit Committee and the Nominating and Governance Committee each received an additional annual retainer of $37,000 and $18,500, respectively. Effective January 1, 2022, the annual retainer for each independent trustee is $150,000, and the additional retainer for the chairman of the Board is $60,000. Also effective January 1, 2022, the additional retainer for the chairman of the Audit Committee and the chairman of the Nomination and Governance Committee is $40,000 and $20,000, respectively. The Trust has an unfunded, nonqualified deferred compensation plan (the “Deferred Compensation Plan”) for certain eligible Trustees. The Deferred Compensation Plan allows Trustees to defer some or all of their annual trustees’ fees otherwise payable by the Trust for a minimum of three years. The fees deferred are posted to a bookkeeping account maintained by the Trust. The various series of the Trust will use the returns on those Funds selected by the Trustee to determine the income, gains and losses to allocate to the account. At the time for commencing distributions from a Trustee’s deferral account, which is no later than when the Trustee ceases to be a member of the Board, deferred fees will be paid out in a single sum in cash or a maximum of 10 annual installments. The expenses related to the annual retainer, meeting fees, and/or any fluctuation in the selected Funds under the Deferred Compensation Plan are recorded in Trustees’ fees and expenses in the Statements of Operations.
Annual Report March 2022 / 356
Table of Contents
Notes to Financial Statements (Continued)
| 7. | SHARE MARKETING (12b-1) PLAN AND SHAREHOLDER SERVICING PLAN |
The Trust has a Share Marketing Plan (or the “12b-1 Plan”) pursuant to Rule 12b-1 of the 1940 Act with respect to Class M shares of the Corporate Bond Fund, the ESG Securitized Fund, the Flexible Income Fund, the Floating Rate Income Fund, the High Yield Bond Fund, the Intermediate Bond Fund, the Investment Grade Credit Fund, the Low Duration Bond Fund, the Opportunistic High Income Credit Fund, the Strategic Income Fund, the Total Return Bond Fund, the Ultra Short Bond Fund, the Unconstrained Bond Fund, and the Administrative Class shares of the Low Duration Bond Fund and Total Return Bond Fund. Under the 12b-1 Plan, the Trust pays TCW Funds Distributors, Inc., as the Trust’s distribution coordinator, an annual fee up to 0.25% of the particular Fund’s average daily net assets attributable to Class M shares and Administrative Class shares to reimburse expenses in connection with the promotion and distribution of shares of the respective Fund. The Adviser has undertaken to limit the Rule 12b-1 expenses to 0.16% for the Ultra Short Bond Fund, 0.19% for the Low Duration Bond Fund, and 0.21% for the Intermediate Bond Fund and the Total Return Bond Fund, for the year ended March 31, 2022. The AlphaTrak 500 Fund is currently not incurring Rule 12b-1 fees. The Adviser has contractually agreed, through July 31, 2023, to pay the distribution expenses of the AlphaTrak 500 Fund out of its own resources.
The Board of Trustees has adopted a Shareholder Servicing Plan that allows each Fund to pay to broker-dealers and other financial intermediaries a fee for shareholder services provided to Fund shareholders who invest in the Administrative Class shares of a Fund through the intermediary. The fee is payable under the Shareholder Servicing Plan at an annual rate not to exceed 0.25% of the particular Fund’s average daily net assets attributable to the Administrative Share class, but the Adviser has undertaken to limit these expenses for the current fiscal year to 0.20% of the Fund’s average daily net assets invested through the intermediary.
| 8. | COMMITMENTS AND CONTINGENCIES |
The Flexible Income Fund, Floating Rate Income Fund, High Yield Bond Fund, Low Duration Bond Fund, Total Return Bond Fund and Unconstrained Bond Fund had the following unfunded commitments and unrealized gain (loss) by investment as of March 31, 2022:
| FLEXIBLE INCOME FUND UNFUNDED COMMITMENTS |
MATURITY | AMOUNT | UNREALIZED GAIN (LOSS) | |||||||||
| Precision Medicine Group LLC, Delayed-Draw Term Loan, 1st Lien |
November | 2027 | $ | 45,404 | $ | (1,195) | ||||||
| Aveanna Healthcare LLC, Delayed-Draw Term Loan B, 1st Lien |
July | 2028 | 57,050 | (1,148) | ||||||||
| AthenaHealth Group, Inc., Delayed-Draw Term Loan B, 1st Lien |
February | 2029 | 143,659 | 2,355 | ||||||||
|
|
|
|
|
|||||||||
| Total Unfunded Commitments |
$ | 246,113 | $ | 12 | ||||||||
|
|
|
|
|
|||||||||
|
|
||||||||||||
| FLOATING RATE INCOME FUND UNFUNDED COMMITMENTS |
MATURITY | AMOUNT | UNREALIZED GAIN (LOSS) | |||||||||
| Precision Medicine Group LLC, Delayed-Draw Term Loan, 1st Lien |
November | 2027 | $ | 340,529 | $ | (6,839) | ||||||
| Refficiency Holdings LLC, Delayed-Draw Term Loan |
December | 2027 | 312,128 | (3,415) | ||||||||
| Dessert Holdings, Inc., Delayed-Draw Term Loan |
June | 2028 | 310,363 | (5,427) | ||||||||
| Aveanna Healthcare LLC, Delayed-Draw Term Loan B, 1st Lien |
July | 2028 | 368,066 | (7,406) | ||||||||
| AI Aqua Merger Sub, Inc., Delayed-Draw Term Loan, 1st Lien |
July | 2028 | 183,507 | (1,678) | ||||||||
| Trident TPI Holdings, Inc., Delayed-Draw Term Loan, 1st Lien |
September | 2028 | 45,711 | (500) | ||||||||
| Pacific Bells LLC, Delayed-Draw Term Loan B, 1st Lien |
November | 2028 | 5,116 | 11 | ||||||||
| AthenaHealth Group, Inc., Delayed-Draw Term Loan B, 1st Lien |
February | 2029 | 287,319 | (739) | ||||||||
| Dermatology Intermediate Holdings, Inc., Delayed-Draw Term Loan, 1st Lien |
April | 2029 | 280,630 | (2,835) | ||||||||
|
|
|
|
|
|||||||||
| Total Unfunded Commitments |
$ | 2,133,369 | $ | (28,828) | ||||||||
|
|
|
|
|
|||||||||
| HIGH YIELD BOND FUND UNFUNDED COMMITMENTS |
MATURITY | AMOUNT | UNREALIZED (LOSS) | |||||||||
| Aveanna Healthcare LLC, Delayed-Draw Term Loan B, 1st Lien |
July | 2028 | $ | 289,852 | $ | (5,832) | ||||||
|
|
|
|
|
|||||||||
| Total Unfunded Commitments |
$ | 289,852 | $ | (5,832) | ||||||||
|
|
|
|
|
|||||||||
357 / Annual Report March 2022
Table of Contents
Notes to Financial Statements (Continued)
|
LOW
DURATION BOND FUND |
MATURITY | AMOUNT | UNREALIZED (LOSS) | |||||||||
| AI Aqua Merger Sub, Inc., Delayed-Draw Term Loan, 1st Lien |
July | 2028 | $ | 367,015 | $ | (3,356) | ||||||
| AthenaHealth Group, Inc., Delayed-Draw Term Loan B, 1st Lien |
February | 2029 | 359,149 | (2,264) | ||||||||
|
|
|
|
|
|||||||||
| Total Unfunded Commitments |
$ | 726,164 | $ | (5,620) | ||||||||
|
|
|
|
|
|||||||||
|
TOTAL
RETURN BOND FUND |
MATURITY | AMOUNT | UNREALIZED GAIN (LOSS) | |||||||||
| AI Aqua Merger Sub, Inc., Delayed-Draw Term Loan, 1st Lien |
July | 2028 | $ | 247,735 | $ | (2,265) | ||||||
| AthenaHealth Group, Inc., Delayed-Draw Term Loan B, 1st Lien |
February | 2029 | 1,005,616 | 10,145 | ||||||||
|
|
|
|
|
|||||||||
| Total Unfunded Commitments |
$ | 1,253,351 | $ | 7,880 | ||||||||
|
|
|
|
|
|||||||||
|
UNCONSTRAINED BOND FUND
UNFUNDED COMMITMENTS |
MATURITY | AMOUNT | UNREALIZED (LOSS) | |||||||||
| Aveanna Healthcare LLC, Delayed-Draw Term Loan B, 1st Lien |
July | 2028 | $ | 690,124 | $ | (13,886) | ||||||
|
|
|
|
|
|||||||||
| Total Unfunded Commitments |
$ | 690,124 | $ | (13,886) | ||||||||
|
|
|
|
|
|||||||||
In the normal course of business, the Trust enters into contracts which provide a variety of representations and warranties, and that provide general indemnifications. Such contracts include those with certain service providers, brokers and trading counterparties. Any exposure to the Trust under these arrangements is unknown as it would involve future claims that may be made against the Trust; however, based on the Trust’s experience, the risk of loss is remote and no such claims are expected to occur. As such, the Trust has not accrued any liability in connection with such indemnifications.
| 9. | CAPITAL SHARE TRANSACTIONS |
Each Fund is authorized to issue an unlimited number of shares of beneficial interest with a par value of $0.01 per share. Transactions in shares of beneficial interest were as follows:
|
ALPHATRAK 500 FUND | ||||||||||||
|
CLASS M |
CLASS M | |||||||||||
| YEAR ENDED MARCH 31, 2022 |
YEAR ENDED MARCH 31, 2021 | |||||||||||
|
Change in Fund shares: |
||||||||||||
| Shares outstanding at beginning of year |
2,773,846 | 3,268,505 | ||||||||||
|
|
|
|
|
|||||||||
| Shares sold |
1,298,545 | 696,121 | ||||||||||
| Shares issued through reinvestment of distributions |
971,033 | 207,881 | ||||||||||
| Shares redeemed |
(1,115,216) | (1,398,661) | ||||||||||
|
|
|
|
|
|||||||||
| Net increase (decrease) in fund shares |
1,154,362 | (494,659) | ||||||||||
|
|
|
|
|
|||||||||
| Shares outstanding at end of year |
3,928,208 | 2,773,846 | ||||||||||
|
|
|
|
|
|||||||||
|
CORPORATE BOND FUND | ||||||||||||||||||||||||
|
CLASS M |
CLASS M | CLASS I | CLASS I | |||||||||||||||||||||
| YEAR ENDED MARCH 31, 2022 |
YEAR ENDED MARCH 31, 2021 |
YEAR ENDED MARCH 31, 2022 |
YEAR ENDED MARCH 31, 2021 | |||||||||||||||||||||
| Change in Fund shares: |
||||||||||||||||||||||||
| Shares outstanding at beginning of year |
768,830 | 84,928 | 444,057 | 231,865 | ||||||||||||||||||||
|
|
|
|
|
|
|
|
|
|||||||||||||||||
| Shares sold |
192,521 | 1,236,850 | 360,108 | 302,004 | ||||||||||||||||||||
| Shares issued through reinvestment of distributions |
16,192 | 18,359 | 18,162 | 13,508 | ||||||||||||||||||||
| Shares redeemed |
(409,285) | (571,307) | (121,277) | (103,320) | ||||||||||||||||||||
|
|
|
|
|
|
|
|
|
|||||||||||||||||
| Net increase (decrease) in fund shares |
(200,572) | 683,902 | 256,993 | 212,192 | ||||||||||||||||||||
|
|
|
|
|
|
|
|
|
|||||||||||||||||
| Shares outstanding at end of year |
568,258 | 768,830 | 701,050 | 444,057 | ||||||||||||||||||||
|
|
|
|
|
|
|
|
|
|||||||||||||||||
Annual Report March 2022 / 358
Table of Contents
Notes to Financial Statements (Continued)
|
ESG SECURITIZED FUND | ||||||||||||
|
CLASS M |
CLASS I | |||||||||||
| PERIOD ENDED MARCH 31, 2022* |
PERIOD ENDED MARCH 31, 2022* | |||||||||||
| Change in Fund shares: |
||||||||||||
| Shares outstanding at beginning of period |
— | — | ||||||||||
|
|
|
|
|
|||||||||
| Shares sold |
1,735 | 1,132,869 | ||||||||||
| Shares issued through reinvestment of distributions |
3 | 4,988 | ||||||||||
| Shares redeemed |
— | (322) | ||||||||||
|
|
|
|
|
|||||||||
| Net increase in fund shares |
1,738 | 1,137,535 | ||||||||||
|
|
|
|
|
|||||||||
| Shares outstanding at end of period |
1,738 | 1,137,535 | ||||||||||
|
|
|
|
|
|||||||||
* The Fund commenced operations on October 1, 2021.
|
FLEXIBLE INCOME FUND | ||||||||||||||||||||||||
|
CLASS M |
CLASS M | CLASS I | CLASS I | |||||||||||||||||||||
| YEAR ENDED MARCH 31, 2022 |
YEAR ENDED MARCH 31, 2021 |
YEAR ENDED MARCH 31, 2022 |
YEAR ENDED MARCH 31, 2021 | |||||||||||||||||||||
| Change in Fund shares: |
||||||||||||||||||||||||
| Shares outstanding at beginning of year |
2,147,224 | 123 | 16,108,761 | 909,949 | ||||||||||||||||||||
|
|
|
|
|
|
|
|
|
|||||||||||||||||
| Shares sold |
3,650,896 | 3,246,654 | 13,905,850 | 15,480,089 | ||||||||||||||||||||
| Shares issued through reinvestment of distributions |
237,569 | 64,488 | 1,621,341 | 446,626 | ||||||||||||||||||||
| Shares redeemed |
(2,384,028) | (1,164,041) | (11,318,160) | (727,903) | ||||||||||||||||||||
|
|
|
|
|
|
|
|
|
|||||||||||||||||
| Net increase in fund shares |
1,504,437 | 2,147,101 | 4,209,031 | 15,198,812 | ||||||||||||||||||||
|
|
|
|
|
|
|
|
|
|||||||||||||||||
| Shares outstanding at end of year |
3,651,661 | 2,147,224 | 20,317,792 | 16,108,761 | ||||||||||||||||||||
|
|
|
|
|
|
|
|
|
|||||||||||||||||
|
FLOATING RATE INCOME FUND | ||||||||||||||||||||||||
|
CLASS M |
CLASS M | CLASS I | CLASS I | |||||||||||||||||||||
| YEAR ENDED MARCH 31, 2022 |
YEAR ENDED MARCH 31, 2021 |
YEAR ENDED MARCH 31, 2022 |
YEAR ENDED MARCH 31, 2021 | |||||||||||||||||||||
| Change in Fund shares: |
||||||||||||||||||||||||
| Shares outstanding at beginning of year |
1,387,808 | 677,246 | 41,999,130 | 27,856,410 | ||||||||||||||||||||
|
|
|
|
|
|
|
|
|
|||||||||||||||||
| Shares sold |
927,690 | 1,261,859 | 12,676,785 | 15,726,159 | ||||||||||||||||||||
| Shares issued through reinvestment of distributions |
44,164 | 28,802 | 1,348,588 | 875,259 | ||||||||||||||||||||
| Shares redeemed |
(622,332) | (580,099) | (7,466,949) | (2,458,698) | ||||||||||||||||||||
|
|
|
|
|
|
|
|
|
|||||||||||||||||
| Net increase in fund shares |
349,522 | 710,562 | 6,558,424 | 14,142,720 | ||||||||||||||||||||
|
|
|
|
|
|
|
|
|
|||||||||||||||||
| Shares outstanding at end of year |
1,737,330 | 1,387,808 | 48,557,554 | 41,999,130 | ||||||||||||||||||||
|
|
|
|
|
|
|
|
|
|||||||||||||||||
| FLOATING RATE INCOME FUND | ||||||||||||
|
PLAN CLASS |
PLAN CLASS | |||||||||||
| YEAR ENDED MARCH 31, 2022 |
PERIOD ENDED MARCH 31, 2021* | |||||||||||
| Change in Fund shares: |
||||||||||||
| Shares outstanding at beginning of period |
10 | — | ||||||||||
|
|
|
|
|
|||||||||
| Shares sold |
— | 10 | ||||||||||
| Shares issued through reinvestment of distributions |
— | — | ||||||||||
|
|
|
|
|
|||||||||
| Net increase in fund shares |
— | 10 | ||||||||||
|
|
|
|
|
|||||||||
| Shares outstanding at end of period |
10 | 10 | ||||||||||
|
|
|
|
|
|||||||||
* The Fund commenced operations on January 29, 2021.
359 / Annual Report March 2022
Table of Contents
Notes to Financial Statements (Continued)
|
HIGH YIELD BOND FUND | ||||||||||||||||||||||||
| CLASS M | CLASS M | CLASS I | CLASS I | |||||||||||||||||||||
| YEAR ENDED MARCH 31, 2022 |
YEAR ENDED MARCH 31, 2021 |
YEAR ENDED MARCH 31, 2022 |
YEAR ENDED MARCH 31, 2021 | |||||||||||||||||||||
| Change in Fund shares: |
||||||||||||||||||||||||
| Shares outstanding at beginning of year |
18,755,387 | 13,656,919 | 54,120,573 | 31,231,832 | ||||||||||||||||||||
|
|
|
|
|
|
|
|
|
|||||||||||||||||
| Shares sold |
4,289,757 | 12,682,957 | 28,529,831 | 48,545,618 | ||||||||||||||||||||
| Shares issued through reinvestment of distributions |
658,585 | 598,528 | 2,104,002 | 1,644,258 | ||||||||||||||||||||
| Shares redeemed |
(6,809,001) | (8,183,017) | (29,776,780) | (27,301,135) | ||||||||||||||||||||
|
|
|
|
|
|
|
|
|
|||||||||||||||||
| Net increase (decrease) in fund shares |
(1,860,659) | 5,098,468 | 857,053 | 22,888,741 | ||||||||||||||||||||
|
|
|
|
|
|
|
|
|
|||||||||||||||||
| Shares outstanding at end of year |
16,894,728 | 18,755,387 | 54,977,626 | 54,120,573 | ||||||||||||||||||||
|
|
|
|
|
|
|
|
|
|||||||||||||||||
|
INTERMEDIATE BOND FUND | ||||||||||||||||||||||||
| CLASS M | CLASS M | CLASS I | CLASS I | |||||||||||||||||||||
| YEAR ENDED MARCH 31, 2022
|
YEAR ENDED MARCH 31, 2021 |
YEAR ENDED MARCH 31, 2022 |
YEAR ENDED MARCH 31, 2021 | |||||||||||||||||||||
| Change in Fund shares: |
||||||||||||||||||||||||
| Shares outstanding at beginning of year |
3,395,400 | 3,177,342 | 71,377,801 | 65,097,687 | ||||||||||||||||||||
|
|
|
|
|
|
|
|
|
|||||||||||||||||
| Shares sold |
645,465 | 1,297,628 | 14,653,122 | 21,529,757 | ||||||||||||||||||||
| Shares issued through reinvestment of distributions |
41,504 | 126,637 | 1,206,765 | 2,595,867 | ||||||||||||||||||||
| Shares redeemed |
(1,631,947) | (1,206,207) | (11,135,356) | (17,845,510) | ||||||||||||||||||||
|
|
|
|
|
|
|
|
|
|||||||||||||||||
| Net increase (decrease) in fund shares |
(944,978) | 218,058 | 4,724,531 | 6,280,114 | ||||||||||||||||||||
|
|
|
|
|
|
|
|
|
|||||||||||||||||
| Shares outstanding at end of year |
2,450,422 | 3,395,400 | 76,102,332 | 71,377,801 | ||||||||||||||||||||
|
|
|
|
|
|
|
|
|
|||||||||||||||||
|
INVESTMENT GRADE CREDIT FUND | ||||||||||||||||||||||||
| CLASS M | CLASS M | CLASS I | CLASS I | |||||||||||||||||||||
| YEAR ENDED MARCH 31, 2022 |
YEAR ENDED MARCH 31, 2021 |
YEAR ENDED MARCH 31, 2022 |
YEAR ENDED MARCH 31, 2021 | |||||||||||||||||||||
| Change in Fund shares: |
||||||||||||||||||||||||
| Shares outstanding at beginning of year |
219,784 | 86,723 | 1,044,749 | 666,665 | ||||||||||||||||||||
|
|
|
|
|
|
|
|
|
|||||||||||||||||
| Shares sold |
450,559 | 432,102 | 1,818,446 | 463,146 | ||||||||||||||||||||
| Shares issued through reinvestment of distributions |
15,710 | 14,422 | 81,937 | 76,716 | ||||||||||||||||||||
| Shares redeemed |
(426,483) | (313,463) | (1,952,330) | (161,778) | ||||||||||||||||||||
|
|
|
|
|
|
|
|
|
|||||||||||||||||
| Net increase (decrease) in fund shares |
39,786 | 133,061 | (51,947) | 378,084 | ||||||||||||||||||||
|
|
|
|
|
|
|
|
|
|||||||||||||||||
| Shares outstanding at end of year |
259,570 | 219,784 | 992,802 | 1,044,749 | ||||||||||||||||||||
|
|
|
|
|
|
|
|
|
|||||||||||||||||
|
LOW DURATION BOND FUND |
||||||||||||||||||||||||
| CLASS M | CLASS M | CLASS I | CLASS I | |||||||||||||||||||||
| YEAR ENDED MARCH 31, 2022 |
YEAR
ENDED MARCH 31, 2021 |
YEAR
ENDED MARCH 31, 2022 |
YEAR
ENDED MARCH 31, 2021 | |||||||||||||||||||||
| Change in Fund shares: |
||||||||||||||||||||||||
| Shares outstanding at beginning of year |
50,165,234 | 51,991,467 | 229,018,746 | 168,341,807 | ||||||||||||||||||||
|
|
|
|
|
|
|
|
|
|||||||||||||||||
| Shares sold |
12,487,486 | 13,288,674 | 101,789,983 | 105,146,438 | ||||||||||||||||||||
| Shares issued through reinvestment of distributions |
454,037 | 574,080 | 2,460,757 | 2,570,754 | ||||||||||||||||||||
| Shares redeemed |
(7,744,341) | (15,688,987) | (97,840,814) | (47,040,253) | ||||||||||||||||||||
|
|
|
|
|
|
|
|
|
|||||||||||||||||
| Net increase (decrease) in fund shares |
5,197,182 | (1,826,233) | 6,409,926 | 60,676,939 | ||||||||||||||||||||
|
|
|
|
|
|
|
|
|
|||||||||||||||||
| Shares outstanding at end of year |
55,362,416 | 50,165,234 | 235,428,672 | 229,018,746 | ||||||||||||||||||||
|
|
|
|
|
|
|
|
|
|||||||||||||||||
|
LOW DURATION BOND FUND | ||||||||||||
|
ADMINISTRATIVE |
ADMINISTRATIVE CLASS | |||||||||||
|
YEAR ENDED MARCH 31, 2022 |
YEAR ENDED MARCH 31, 2021 | |||||||||||
| Change in Fund shares: |
||||||||||||
| Shares outstanding at beginning of year |
7,678 | 8,384 | ||||||||||
|
|
|
|
|
|||||||||
| Shares sold |
243,605 | 763 | ||||||||||
| Shares issued through reinvestment of distributions |
1,151 | 60 | ||||||||||
| Shares redeemed |
(98,192) | (1,529) | ||||||||||
|
|
|
|
|
|||||||||
| Net increase (decrease) in fund shares |
146,564 | (706) | ||||||||||
|
|
|
|
|
|||||||||
| Shares outstanding at end of year |
154,242 | 7,678 | ||||||||||
|
|
|
|
|
|||||||||
Annual Report March 2022 / 360
Table of Contents
Notes to Financial Statements (Continued)
|
OPPORTUNISTIC HIGH | ||||||||||||
|
CLASS M |
CLASS I | |||||||||||
| PERIOD ENDED MARCH 31, 2022* |
PERIOD ENDED MARCH 31, 2022* | |||||||||||
| Change in Fund shares: |
||||||||||||
| Shares outstanding at beginning of period |
— | — | ||||||||||
|
|
|
|
|
|||||||||
| Shares sold |
7,752 | 303,418 | ||||||||||
| Shares issued through reinvestment of distributions |
264 | 27,374 | ||||||||||
| Shares redeemed |
(234) | — | ||||||||||
|
|
|
|
|
|||||||||
| Net increase in fund shares |
7,782 | 330,792 | ||||||||||
|
|
|
|
|
|||||||||
| Shares outstanding at end of period |
7,782 | 330,792 | ||||||||||
|
|
|
|
|
|||||||||
* The Fund commenced operations on August 2, 2021.
|
STRATEGIC INCOME FUND | ||||||||||||||||||||||||
|
CLASS M |
CLASS M | CLASS I | CLASS I | |||||||||||||||||||||
| YEAR ENDED MARCH 31, 2022 |
YEAR ENDED MARCH 31, 2021 |
YEAR ENDED MARCH 31, 2022 |
YEAR ENDED MARCH 31, 2021 | |||||||||||||||||||||
| Change in Fund shares: |
||||||||||||||||||||||||
| Shares outstanding at beginning of year |
1,975,844 | 1,428,333 | 1,251,843 | 6,621,937 | ||||||||||||||||||||
|
|
|
|
|
|
|
|
|
|||||||||||||||||
| Shares sold |
1,234,339 | 1,585,527 | 937,224 | 712,954 | ||||||||||||||||||||
| Shares issued through reinvestment of distributions |
222,558 | 99,943 | 147,770 | 202,975 | ||||||||||||||||||||
| Shares redeemed |
(993,548) | (1,137,959) | (985,716) | (6,286,023) | ||||||||||||||||||||
|
|
|
|
|
|
|
|
|
|||||||||||||||||
| Net increase (decrease) in fund shares |
463,349 | 547,511 | 99,278 | (5,370,094) | ||||||||||||||||||||
|
|
|
|
|
|
|
|
|
|||||||||||||||||
| Shares outstanding at end of year |
2,439,193 | 1,975,844 | 1,351,121 | 1,251,843 | ||||||||||||||||||||
|
|
|
|
|
|
|
|
|
|||||||||||||||||
|
TOTAL RETURN BOND FUND |
||||||||||||||||||||||||
|
CLASS M |
CLASS M | CLASS I | CLASS I | |||||||||||||||||||||
| YEAR ENDED MARCH 31, 2022 |
YEAR ENDED MARCH 31, 2021 |
YEAR ENDED MARCH 31, 2022 |
YEAR ENDED MARCH 31, 2021 | |||||||||||||||||||||
| Change in Fund shares: |
||||||||||||||||||||||||
| Shares outstanding at beginning of year |
661,139,405 | 807,293,176 | 4,897,035,762 | 4,144,455,446 | ||||||||||||||||||||
|
|
|
|
|
|
|
|
|
|||||||||||||||||
| Shares sold |
147,998,834 | 246,419,869 | 1,211,638,765 | 1,648,449,661 | ||||||||||||||||||||
| Shares issued through reinvestment of distributions |
7,623,648 | 50,332,883 | 61,975,142 | 258,093,148 | ||||||||||||||||||||
| Shares redeemed |
(206,797,778) | (442,906,523) | (1,559,183,683) | (1,153,962,493) | ||||||||||||||||||||
|
|
|
|
|
|
|
|
|
|||||||||||||||||
| Net increase (decrease) in fund shares |
(51,175,296) | (146,153,771) | (285,569,776) | 752,580,316 | ||||||||||||||||||||
|
|
|
|
|
|
|
|
|
|||||||||||||||||
| Shares outstanding at end of year |
609,964,109 | 661,139,405 | 4,611,465,986 | 4,897,035,762 | ||||||||||||||||||||
|
|
|
|
|
|
|
|
|
|||||||||||||||||
|
TOTAL RETURN BOND FUND | ||||||||||||
|
CLASS I-2 |
CLASS I-2 | |||||||||||
|
YEAR ENDED |
YEAR ENDED MARCH 31, 2021 | |||||||||||
| Change in Fund shares: |
||||||||||||
| Shares outstanding at beginning of year |
10,801,035 | 9 | ||||||||||
|
|
|
|
|
|||||||||
| Shares sold |
11,931,840 | 11,338,778 | ||||||||||
| Shares issued through reinvestment of distributions |
219,971 | 547,958 | ||||||||||
| Shares redeemed |
(6,216,184) | (1,085,710) | ||||||||||
|
|
|
|
|
|||||||||
| Net increase in fund shares |
5,935,627 | 10,801,026 | ||||||||||
|
|
|
|
|
|||||||||
| Shares outstanding at end of year |
16,736,662 | 10,801,035 | ||||||||||
|
|
|
|
|
|||||||||
361 / Annual Report March 2022
Table of Contents
Notes to Financial Statements (Continued)
|
TOTAL RETURN BOND FUND | ||||||||||||||||||||||||
| ADMINISTRATIVE CLASS |
ADMINISTRATIVE CLASS |
PLAN CLASS | PLAN CLASS | |||||||||||||||||||||
| YEAR ENDED MARCH 31, 2022 |
YEAR ENDED MARCH 31, 2021 |
YEAR ENDED MARCH 31, 2022 |
YEAR ENDED MARCH 31, 2021 | |||||||||||||||||||||
| Change in Fund shares: |
||||||||||||||||||||||||
| Shares outstanding at beginning of year |
192,427,211 | 156,243,805 | 2,425,345,101 | 2,277,531,666 | ||||||||||||||||||||
|
|
|
|
|
|
|
|
|
|||||||||||||||||
| Shares sold |
39,078,639 | 59,236,353 | 475,768,210 | 725,752,496 | ||||||||||||||||||||
| Shares issued through reinvestment of distributions |
2,008,237 | 10,248,450 | 33,232,551 | 145,266,719 | ||||||||||||||||||||
| Shares redeemed |
(40,912,853) | (33,301,397) | (609,853,240) | (723,205,780) | ||||||||||||||||||||
|
|
|
|
|
|
|
|
|
|||||||||||||||||
| Net increase (decrease) in fund shares |
174,023 | 36,183,406 | (100,852,479) | 147,813,435 | ||||||||||||||||||||
|
|
|
|
|
|
|
|
|
|||||||||||||||||
| Shares outstanding at end of year |
192,601,234 | 192,427,211 | 2,324,492,622 | 2,425,345,101 | ||||||||||||||||||||
|
|
|
|
|
|
|
|
|
|||||||||||||||||
|
ULTRA SHORT BOND FUND | ||||||||||||||||||||||||||
|
CLASS M |
CLASS M | CLASS I | CLASS I | |||||||||||||||||||||||
| YEAR ENDED MARCH 31, 2022 |
YEAR ENDED MARCH 31, 2021 |
YEAR ENDED MARCH 31, 2022 |
YEAR ENDED MARCH 31, 2021 | |||||||||||||||||||||||
| Change in Fund shares: |
||||||||||||||||||||||||||
| Shares outstanding at beginning of year |
14,559,872 | 6,709,806 | 42,554,510 | 18,036,590 | ||||||||||||||||||||||
|
|
|
|
|
|
|
|
|
|||||||||||||||||||
| Shares sold |
4,029,512 | 21,914,311 | 25,590,708 | 41,150,119 | ||||||||||||||||||||||
| Shares issued through reinvestment of distributions |
63,776 | 61,610 | 296,146 | 255,902 | ||||||||||||||||||||||
| Shares redeemed |
(9,197,677) | (14,125,855) | (30,588,412) | (16,888,101) | ||||||||||||||||||||||
|
|
|
|
|
|
|
|
|
|||||||||||||||||||
| Net increase (decrease) in fund shares |
(5,104,389) | 7,850,066 | (4,701,558) | 24,517,920 | ||||||||||||||||||||||
|
|
|
|
|
|
|
|
|
|||||||||||||||||||
| Shares outstanding at end of year |
9,455,483 | 14,559,872 | 37,852,952 | 42,554,510 | ||||||||||||||||||||||
|
|
|
|
|
|
|
|
|
|||||||||||||||||||
|
UNCONSTRAINED BOND FUND |
||||||||||||||||||||||||
|
CLASS M |
CLASS M | CLASS I | CLASS I | |||||||||||||||||||||
| YEAR ENDED MARCH 31, 2022 |
YEAR ENDED MARCH 31, 2021 |
YEAR ENDED MARCH 31, 2022 |
YEAR ENDED MARCH 31, 2021 | |||||||||||||||||||||
| Change in Fund shares: |
||||||||||||||||||||||||
| Shares outstanding at beginning of year |
21,607,830 | 24,012,697 | 273,766,820 | 248,328,242 | ||||||||||||||||||||
|
|
|
|
|
|
|
|
|
|||||||||||||||||
| Shares sold |
3,405,824 | 4,522,456 | 128,854,698 | 96,605,193 | ||||||||||||||||||||
| Shares issued through reinvestment of distributions |
720,405 | 693,758 | 9,599,441 | 7,137,466 | ||||||||||||||||||||
| Shares redeemed |
(6,503,819) | (7,621,081) | (85,243,643) | (78,304,081) | ||||||||||||||||||||
|
|
|
|
|
|
|
|
|
|||||||||||||||||
| Net increase (decrease) in fund shares |
(2,377,590) | (2,404,867) | 53,210,496 | 25,438,578 | ||||||||||||||||||||
|
|
|
|
|
|
|
|
|
|||||||||||||||||
| Shares outstanding at end of year |
19,230,240 | 21,607,830 | 326,977,316 | 273,766,820 | ||||||||||||||||||||
|
|
|
|
|
|
|
|
|
|||||||||||||||||
|
UNCONSTRAINED BOND FUND | ||||||||||||
|
PLAN CLASS |
PLAN CLASS | |||||||||||
| YEAR ENDED MARCH 31, 2022 |
YEAR ENDED MARCH 31, 2021 | |||||||||||
| Change in Fund shares: |
||||||||||||
| Shares outstanding at beginning of year |
5,342,862 | 8 | ||||||||||
|
|
|
|
|
|||||||||
| Shares sold |
9,973,405 | 10,304,063 | ||||||||||
| Shares issued through reinvestment of distributions |
391,609 | 230,276 | ||||||||||
| Shares redeemed |
(4,902,591) | (5,191,485) | ||||||||||
|
|
|
|
|
|||||||||
| Net increase in fund shares |
5,462,423 | 5,342,854 | ||||||||||
|
|
|
|
|
|||||||||
| Shares outstanding at end of year |
10,805,285 | 5,342,862 | ||||||||||
|
|
|
|
|
|||||||||
Annual Report March 2022 / 362
Table of Contents
Notes to Financial Statements (Continued)
| 10. | FEDERAL TAX INFORMATION |
Capital Loss Carryforwards:
At March 31, 2022, the following Funds had available for federal income tax purposes unused capital losses as follows:
| FUND | AMOUNT UTILIZED IN CURRENT YEAR |
SHORT-TERM NON-EXPIRING AMOUNTS* |
LONG-TERM NON-EXPIRING AMOUNTS* | |||||||||
| ESG Securitized Fund |
$ | — | $ | 88,339 | $ | — | ||||||
| Flexible Income Fund |
— | 1,750,308 | 1,632,496 | |||||||||
| Floating Rate Income Fund |
— | — | 1,423,408 | |||||||||
| High Yield Bond Fund |
3,413,616 | — | 26,334,362 | |||||||||
| Intermediate Bond Fund |
— | 20,164,497 | 305,230 | |||||||||
| Investment Grade Credit Fund |
— | 475,780 | 52,035 | |||||||||
| Low Duration Bond Fund |
— | 31,748,989 | 31,112,953 | |||||||||
| Strategic Income Fund |
— | 314,298 | 1,210,552 | |||||||||
| Total Return Bond Fund |
— | 57,536,725 | — | |||||||||
| Ultra Short Bond Fund |
— | 2,064,104 | 4,598,352 | |||||||||
| Unconstrained Bond Fund |
— | 23,088,513 | 5,378,232 | |||||||||
* Under the Modernization Act of 2010, capital losses incurred by the Funds after March 31, 2011 will not be subject to expiration.
Tax Basis of Distributable Income:
As of March 31, 2021, the components of accumulated earnings (accumulated losses) on a tax basis were as follows:
| ALPHATRAK 500 FUND |
CORPORATE BOND FUND |
ESG SECURITIZED FUND |
FLEXIBLE INCOME FUND |
FLOATING RATE INCOME FUND |
HIGH YIELD BOND FUND | |||||||||||||||||||||
| Undistributed ordinary income (inclusive of short-term gains) |
$ | 39,088 | $ | 222 | $ | 7,148 | $ | 124,156 | $ | 450,209 | $ | 2,345,083 | ||||||||||||||
| Undistributed long-term gains |
537,219 | — | — | — | — | — | ||||||||||||||||||||
| Other temporary differences |
(1,195) | (226) | — | (53,808) | (211,274) | (79,350) | ||||||||||||||||||||
| Accumulated capital loss carryforwards and post-October losses |
— | (38,248) | (88,339) | (3,382,804) | (1,423,408) | (26,334,362) | ||||||||||||||||||||
| Net unrealized appreciation (depreciation) |
(320,163) | (1,198,254) | (614,068) | (21,051,709) | (7,293,576) | (58,190,090) | ||||||||||||||||||||
|
|
|
|
|
|
|
|
|
|
|
|
|
|
|
|
|
|
| |||||||||
| Total accumulated earnings (losses) |
$ | 254,949 | $ | (1,236,506) | $ | (695,259) | $ | (24,364,165) | $ | (8,478,049) | $ | (82,258,719) | ||||||||||||||
|
|
|
|
|
|
|
|
|
|
|
|
|
|
|
|
|
|
| |||||||||
363 / Annual Report March 2022
Table of Contents
Notes to Financial Statements (Continued)
| INTERMEDIATE BOND FUND |
INVESTMENT GRADE CREDIT FUND |
LOW DURATION BOND FUND |
OPPORTUNISTIC HIGH INCOME CREDIT FUND |
STRATEGIC INCOME FUND |
TOTAL RETURN BOND FUND | |||||||||||||||||||||
| Undistributed ordinary income (inclusive of short-term gains) |
$ | — | $ | 874 | $ | 369,011 | $ | 3,517 | $ | 559,423 | $ | — | ||||||||||||||
| Undistributed long-term gains |
— | — | — | — | — | — | ||||||||||||||||||||
| Other temporary differences |
(42,335) | (702) | (276,009) | (5,053) | (13,635) | (13,522,698) | ||||||||||||||||||||
| Accumulated capital loss carryforwards and post-October losses |
(20,471,198) | (527,815) | (62,861,942) | (30,325) | (1,524,850) | (2,233,321,624) | ||||||||||||||||||||
| Net unrealized appreciation (depreciation) |
(21,858,155) | (1,828,352) | (56,660,672) | (304,052) | (6,840,028) | (2,844,981,470) | ||||||||||||||||||||
|
|
|
|
|
|
|
|
|
|
|
|
|
|
|
|
|
|
| |||||||||
| Total accumulated earnings (losses) |
$ | (42,371,688) | $ | (2,355,995) | $ | (119,429,612) | $ | (335,913) | $ | (7,819,090) | $ | (5,091,825,792) | ||||||||||||||
|
|
|
|
|
|
|
|
|
|
|
|
|
|
|
|
|
|
| |||||||||
| ULTRA SHORT BOND FUND |
UNCONSTRAINED BOND FUND | |||||||
| Undistributed ordinary income (inclusive of short-term gains) |
$ | 76,788 | $ | 2,782,795 | ||||
| Undistributed long-term gains |
— | — | ||||||
| Other temporary differences |
(9,363) | (2,528,266) | ||||||
| Accumulated capital loss carryforwards and post-October losses |
(6,662,456) | (28,466,745) | ||||||
| Net unrealized appreciation (depreciation) |
(2,926,186) | (247,358,833) | ||||||
|
|
|
|
|
|
| |||
| Total accumulated earnings (losses) |
$ | (9,521,217) | $ | (275,571,049) | ||||
|
|
|
|
|
|
| |||
Permanent differences incurred during the fiscal year ended March 31, 2022, resulting from differences in book and tax accounting have been reclassified at year-end as follows:
| FUND | INCREASE (DECREASE) ACCUMULATED EARNINGS (LOSS) |
INCREASE (DECREASE)
PAID-IN-CAPITAL |
||||||
| Opportunistic High Income Credit Fund |
$ | 12 | $ | (12) | ||||
| Total Return Bond Fund |
39,047,613 | (39,047,613) | ||||||
The permanent differences are due to non-deductible expenses and taxable overdistribution paid.
Tax Basis of Distributions to Shareholders:
| ALPHATRAK 500 FUND |
CORPORATE
BOND FUND | |||||||||||||||
| MARCH 31, 2022 | MARCH 31, 2021 | MARCH 31, 2022 | MARCH 31, 2021 | |||||||||||||
| Distributions from: | ||||||||||||||||
| Ordinary income (inclusive of short-term capital gains) |
$ | 4,904,144 | $ | 1,321,651 | $ | 315,930 | $ | 319,404 | ||||||||
| Net long-term capital gains |
6,902,086 | 1,241,454 | 55,831 | 32,833 | ||||||||||||
|
|
|
|
|
|
|
|
|
|
|
|
| |||||
| Total taxable distributions |
$ | 11,806,230 | $ | 2,563,105 | $ | 371,761 | $ | 352,237 | ||||||||
|
|
|
|
|
|
|
|
|
|
|
|
| |||||
Annual Report March 2022 / 364
Table of Contents
Notes to Financial Statements (Continued)
| ESG SECURITIZED FUND |
FLEXIBLE
INCOME FUND |
|||||||||||||||||
| MARCH 31, 2022 | MARCH 31, 2022 | MARCH 31, 2021 | ||||||||||||||||
| Distributions from: | ||||||||||||||||||
| Ordinary income (inclusive of short-term capital gains) |
$ | 48,438 | $ | 17,192,300 | $ | 5,004,078 | ||||||||||||
| Net long-term capital gains |
— | 540,585 | 108,995 | |||||||||||||||
|
|
|
|
|
|
|
|
|
|
||||||||||
| Total taxable distributions |
$ | 48,438 | $ | 17,732,885 | $ | 5,113,073 | ||||||||||||
|
|
|
|
|
|
|
|
|
|
||||||||||
| FLOATING RATE INCOME FUND |
HIGH YIELD BOND FUND |
|||||||||||||||||
| MARCH 31, 2022 | MARCH 31, 2021 | MARCH 31, 2022 | MARCH 31, 2021 | |||||||||||||||
| Distributions from: | ||||||||||||||||||
| Ordinary income (inclusive of short-term capital gains) |
$ | 15,620,404 | $ | 10,150,408 | $ | 30,481,103 | $ | 24,840,015 | ||||||||||
|
|
|
|
|
|
|
|
|
|
|
|
|
|||||||
| Total taxable distributions |
$ | 15,620,404 | $ | 10,150,408 | $ | 30,481,103 | $ | 24,840,015 | ||||||||||
|
|
|
|
|
|
|
|
|
|
|
|
|
|||||||
| INTERMEDIATE BOND FUND |
INVESTMENT GRADE CREDIT FUND |
|||||||||||||||||
| MARCH 31, 2022 | MARCH 31, 2021 | MARCH 31, 2022 | MARCH 31, 2021 | |||||||||||||||
| Distributions from: | ||||||||||||||||||
| Ordinary income (inclusive of short-term capital gains) |
$ | 10,530,092 | $ | 24,703,086 | $ | 930,563 | $ | 863,178 | ||||||||||
| Net long-term capital gains |
2,724,855 | 5,051,576 | — | 45,944 | ||||||||||||||
|
|
|
|
|
|
|
|
|
|
|
|
|
|||||||
| Total taxable distributions |
$ | 13,254,947 | $ | 29,754,662 | $ | 930,563 | $ | 909,122 | ||||||||||
|
|
|
|
|
|
|
|
|
|
|
|
|
|||||||
| LOW DURATION BOND FUND |
OPPORTUNISTIC HIGH INCOME CREDIT FUND |
|||||||||||||||||
| MARCH 31, 2022 | MARCH 31, 2021 | MARCH 31, 2022 | ||||||||||||||||
| Distributions from: | ||||||||||||||||||
| Ordinary income (inclusive of short-term capital gains) |
$ | 27,329,398 | $ | 29,545,421 | $ | 265,147 | ||||||||||||
|
|
|
|
|
|
|
|
|
|
||||||||||
| Total taxable distributions |
$ | 27,329,398 | $ | 29,545,421 | $ | 265,147 | ||||||||||||
|
|
|
|
|
|
|
|
|
|
||||||||||
| STRATEGIC INCOME FUND |
TOTAL RETURN BOND FUND |
|||||||||||||||||
| MARCH 31, 2022 | MARCH 31, 2021 | MARCH 31, 2022 | MARCH 31, 2021 | |||||||||||||||
| Distributions from: | ||||||||||||||||||
| Ordinary income (inclusive of short-term capital gains) |
$ | 2,814,589 | $ | 2,358,251 | $ | 1,211,584,483 | $ | 4,488,711,334 | ||||||||||
| Net long-term capital gains |
— | — | — | 1,033,756,885 | ||||||||||||||
|
|
|
|
|
|
|
|
|
|
|
|
|
|||||||
| Total taxable distributions |
$ | 2,814,589 | $ | 2,358,251 | $ | 1,211,584,483 | $ | 5,522,468,219 | ||||||||||
|
|
|
|
|
|
|
|
|
|
|
|
|
|||||||
| ULTRA SHORT BOND FUND |
UNCONSTRAINED BOND FUND |
|||||||||||||||||
| MARCH 31, 2022 | MARCH 31, 2021 | MARCH 31, 2022 | MARCH 31, 2021 | |||||||||||||||
| Distributions from: | ||||||||||||||||||
| Ordinary income (inclusive of short-term capital gains) |
$ | 1,534,325 | $ | 1,364,313 | $ | 135,350,036 | $ | 116,535,196 | ||||||||||
| Net long-term capital gains |
— | — | 20,305,457 | — | ||||||||||||||
|
|
|
|
|
|
|
|
|
|
|
|
|
|||||||
| Total taxable distributions |
$ | 1,534,325 | $ | 1,364,313 | $ | 155,655,493 | $ | 116,535,196 | ||||||||||
|
|
|
|
|
|
|
|
|
|
|
|
|
|||||||
365 / Annual Report March 2022
Table of Contents
Notes to Financial Statements (Continued)
Tax Cost
As of March 31, 2022, gross unrealized appreciation (depreciation) based on cost for federal income tax purposes were as follows:
| ALPHATRAK 500 FUND |
CORPORATE BOND FUND |
ESG SECURITIZED FUND |
FLEXIBLE INCOME FUND |
FLOATING RATE INCOME FUND |
HIGH YIELD BOND FUND |
|||||||||||||||||||||
| Tax Cost |
$ | 44,017,313 | $ | 13,585,419 | $ | 12,716,871 | $ | 253,637,227 | $ | 507,771,434 | $ | 771,321,051 | ||||||||||||||
| Gross unrealized appreciation |
932,986 | 40,787 | 941 | 1,189,430 | 1,810,348 | 7,335,763 | ||||||||||||||||||||
| Gross unrealized (depreciation) |
(1,253,149) | (1,202,606) | (615,006) | (22,241,192) | (9,075,096) | (65,545,695) | ||||||||||||||||||||
|
|
|
|
|
|
|
|
|
|
|
|
|
|
|
|
|
|||||||||||
| Net unrealized appreciation (depreciation) |
$ | (320,163) | $ | (1,161,819) | $ | (614,065) | $ | (21,051,762) | $ | (7,264,748) | $ | (58,209,932) | ||||||||||||||
|
|
|
|
|
|
|
|
|
|
|
|
|
|
|
|
|
|||||||||||
| INTERMEDIATE BOND FUND |
INVESTMENT GRADE CREDIT FUND |
LOW DURATION BOND FUND |
OPPORTUNISTIC HIGH INCOME CREDIT FUND |
STRATEGIC INCOME FUND |
TOTAL RETURN BOND FUND |
|||||||||||||||||||||
| Tax Cost |
$ | 878,191,184 | $ | 13,488,970 | $ | 2,967,864,533 | $ | 3,332,921 | $ | 34,413,447 | $ | 98,811,177,367 | ||||||||||||||
| Gross unrealized appreciation |
2,877,512 | 58,513 | 6,837,369 | 68,170 | 315,522 | 345,422,045 | ||||||||||||||||||||
| Gross unrealized (depreciation) |
(24,988,616) | (1,829,426) | (64,859,111) | (372,222) | (7,071,836) | (2,964,247,346) | ||||||||||||||||||||
|
|
|
|
|
|
|
|
|
|
|
|
|
|
|
|
|
|||||||||||
| Net unrealized appreciation (depreciation) |
$ | (22,111,104) | $ | (1,770,913) | $ | (58,021,742) | $ | (304,052) | $ | (6,756,314) | $ | (2,618,825,301) | ||||||||||||||
|
|
|
|
|
|
|
|
|
|
|
|
|
|
|
|
|
|||||||||||
| ULTRA SHORT BOND FUND |
UNCONSTRAINED BOND FUND |
|||||||||||||||||||||||||
| Tax Cost |
|
$ | 230,177,834 | $ | 4,646,718,489 | |||||||||||||||||||||
| Gross unrealized appreciation |
|
397,288 | 34,002,636 | |||||||||||||||||||||||
| Gross unrealized (depreciation) |
|
(3,390,096) | (271,022,119) | |||||||||||||||||||||||
|
|
|
|
|
|||||||||||||||||||||||
| Net unrealized appreciation (depreciation) |
|
$ | (2,992,808) | $ | (237,019,483) | |||||||||||||||||||||
|
|
|
|
|
|||||||||||||||||||||||
| 11. | COMMITTED LINE OF CREDIT |
The Funds have entered into a $350,000,000 committed revolving line of credit agreement with The Bank of New York Mellon (the “Bank”) for temporary borrowing purposes with an expiration date of October 8, 2022. The interest rate on borrowing is the federal funds rate plus 1.25%. There were no borrowings from the line of credit as of or during the year ended March 31, 2022. The Funds pay the Bank a commitment fee equal to 0.15% per annum on the daily unused portion of the committed line amount. The commitment fees incurred by the Funds are presented in the Statements of Operations. The commitment fees are allocated to each applicable portfolio in proportion to its relative average daily net assets and the interest expenses are charged directly to the applicable portfolio.
| 12. | SECURED BORROWINGS |
The contractual maturity of secured borrowings and type of collateral pledged as of March 31, 2022 are summarized in the following table:
| REMAINING CONTRACTUAL MATURITY OF THE AGREEMENTS | ||||||||||||||||||||||||||
| SECURED BORROWINGS | COLLATERAL TYPE | OVERNIGHT AND CONTINUOUS |
UP TO 30 DAYS | 31-90 DAYS | GREATER THAN 90 DAYS |
TOTAL | ||||||||||||||||||||
|
|
Total Return Bond Fund |
|||||||||||||||||||||||||
| Reverse repurchase agreements |
|
U.S. Treasury Obligations |
|
$ | 3,963,750,000 | $ | — | $ | — | $ | — | $ | 3,963,750,000 | |||||||||||||
|
|
|
|
|
|
|
|
|
|
|
|||||||||||||||||
| 13. | INDEMNIFICATIONS |
Under the Funds’ organizational documents, its officers and trustees are indemnified against certain liability arising out of the performance of their duties to the Funds. In addition, in the normal course of business, the Funds enter into contracts with their vendors and others that provide general indemnification. The Funds’ maximum exposure under these arrangements is unknown, as this would involve further claims that may be made against the Funds. However, based on experience, the Funds expect the risk of loss to be remote.
Annual Report March 2022 / 366
Table of Contents
Notes to Financial Statements (Continued)
| 14. | NEW ACCOUNTING PRONOUNCEMENT |
In January 2021, the Financial Accounting Standards Board issued Accounting Standards Update No. 2021-01 (“ASU 2021-01”), “Reference Rate Reform (Topic 848).” ASU 2021-01 is an update of ASU 2020-04, which is in response to concerns about structural risks of interbank offered rates, and particularly the risk of cessation of LIBOR; regulators have undertaken reference rate reform initiatives to identify alternative reference rates that are more observable or transaction based and less susceptible to manipulation. ASU 2020-04 provides optional guidance for a limited period of time to ease the potential burden in accounting for (or recognizing the effects of) reference rate reform on financial reporting. ASU 2020-04 is elective and applies to all entities, subject to meeting certain criteria, that have contracts, hedging relationships, and other transactions that reference LIBOR or another reference rate expected to be discontinued because of reference rate reform. The ASU 2021-01 update clarifies that certain optional expedients and exceptions in Topic 848 for contract modifications and hedge accounting apply to derivatives that are affected by the discounting transition. The amendments in this update are in effect for the Fund. There have been no impacts to date.
367 / Annual Report March 2022
Table of Contents
Report of Independent Registered Public Accounting Firm
To the Shareholders and the Board of Trustees of
the Metropolitan West Funds
Opinion on the Financial Statements and Financial Highlights
We have audited the accompanying statements of assets and liabilities of Metropolitan West Funds (the “Trust”) comprising the Metropolitan West AlphaTrak 500 Fund, Metropolitan West Corporate Bond Fund, Metropolitan West ESG Securitized Fund, Metropolitan West Flexible Income Fund, Metropolitan West Floating Rate Income Fund, Metropolitan West High Yield Bond Fund, Metropolitan West Intermediate Bond Fund, Metropolitan West Investment Grade Credit Fund, Metropolitan West Low Duration Bond Fund, Metropolitan West Opportunistic High Income Credit Fund, Metropolitan West Strategic Income Fund, Metropolitan West Total Return Bond Fund, Metropolitan West Ultra Short Bond Fund, and Metropolitan West Unconstrained Bond Fund (the “Funds”), including the schedules of portfolio investments, as of March 31, 2022, the related statements of operations for the year then ended, the statements of changes in net assets for each of the two years in the period then ended, and the financial highlights (as to Metropolitan West High Yield Bond Fund, consolidated financial highlights for the two years in the period ended March 31, 2019) for each of the five years in the period then ended for the Funds, except Metropolitan West Corporate Bond Fund, Metropolitan West Investment Grade Credit Fund, Metropolitan West Flexible Income Fund, Metropolitan West Opportunistic High Income Credit Fund, and Metropolitan West ESG Securitized Fund; the related statements of operations, changes in net assets, and financial highlights for the periods indicated in the table below for Metropolitan West Corporate Bond Fund, Metropolitan West Investment Grade Credit Fund, Metropolitan West Flexible Income Fund, Metropolitan West Opportunistic High Income Credit Fund, and Metropolitan West ESG Securitized Fund, and the related notes.
In our opinion, the financial statements and financial highlights present fairly, in all material respects, the financial position of each of the Funds listed above constituting Metropolitan West Funds as of March 31, 2022, and the results of their operations for the year then ended (or for the period listed in the table below), the changes in their net assets for each of the two years in the period then ended (or for the period listed in the table below), and the financial highlights for each of the five year years in the period then ended (or for the period listed in the table below), in conformity with accounting principles generally accepted in the United States of America.
| Individual Fund Comprising the Metropolitan West Funds |
Statement of Operations |
Statement of Changes in Net Assets |
Financial Highlights | |||
|
Metropolitan West Corporate Bond Fund |
For the year ended March 31, 2022 |
For the years ended March 31, 2022 and 2021 | For the years ended March 31, 2022, March 31, 2021, March 31, 2020, and the period from June 29, 2018 (commencement of operations) through March 31, 2019 | |||
|
Metropolitan West Investment Grade Credit Fund |
For the year ended March 31, 2022 |
For the years ended March 31, 2022 and 2021 | For the years ended March 31, 2022, March 31, 2021, March 31, 2020, and the period from June 29, 2018 (commencement of operations) through March 31, 2019 | |||
| Metropolitan West Flexible Income Fund | For the year ended March 31, 2022 |
For the years ended March 31, 2022 and 2021 | For the years ended March 31, 2022, March 31, 2021, March 31, 2020, and the period from June 29, 2018 (commencement of operations) through March 31, 2019 | |||
|
Metropolitan West Opportunistic High Income Credit Fund |
For the period from August 2, 2021 (commencement of operations) through March 31, 2022 | |||||
| Metropolitan West ESG Securitized Fund | For the period from October 1, 2021 (commencement of operations) through March 31, 2022 | |||||
Annual Report March 2022 / 368
Table of Contents
Basis for Opinion
These financial statements and financial highlights are the responsibility of the Funds’ management. Our responsibility is to express an opinion on the Funds’ financial statements and financial highlights based on our audits. We are a public accounting firm registered with the Public Company Accounting Oversight Board (United States) (PCAOB) and are required to be independent with respect to the Funds in accordance with the U.S. federal securities laws and the applicable rules and regulations of the Securities and Exchange Commission and the PCAOB.
We conducted our audits in accordance with the standards of the PCAOB. Those standards require that we plan and perform the audit to obtain reasonable assurance about whether the financial statements and financial highlights are free of material misstatement, whether due to error or fraud. The Funds are not required to have, nor were we engaged to perform, an audit of their internal control over financial reporting. As part of our audits, we are required to obtain an understanding of internal control over financial reporting but not for the purpose of expressing an opinion on the effectiveness of the Funds’ internal control over financial reporting. Accordingly, we express no such opinion.
Our audits included performing procedures to assess the risks of material misstatement of the financial statements and financial highlights, whether due to error or fraud, and performing procedures that respond to those risks. Such procedures included examining, on a test basis, evidence regarding the amounts and disclosures in the financial statements and financial highlights. Our audits also included evaluating the accounting principles used and significant estimates made by management, as well as evaluating the overall presentation of the financial statements and financial highlights. Our procedures included confirmation of securities owned as of March 31, 2022, by correspondence with the custodian, brokers, and agent banks; when replies were not received from brokers and agent banks, we performed other auditing procedures. We believe that our audits provide a reasonable basis for our opinion.
Los Angeles, California
May 25, 2022
We have served as the auditor of one or more TCW/Metropolitan West Funds investment companies since 1990.
369 / Annual Report March 2022
Table of Contents
Tax Information Notice
(Unaudited)
For shareholders that do not have a March 31, 2022 tax year end, this notice is for informational purposes only. For shareholders with a March 31, 2022 tax year end, please consult your tax advisor as to the pertinence of this notice. For the fiscal year ended March 31, 2022, each portfolio is reporting the following items with regard to distributions paid during the year. All information is based on financial information available as of the date of this annual report and, accordingly is subject to change. For each item, it is the intention of the Fund to report the maximum amount permitted under the Internal Revenue Code and the regulations thereunder.
| ALPHATRAK 500 FUND |
CORPORATE FUND |
ESG SECURITIZED FUND |
FLEXIBLE FUND |
FLOATING INCOME FUND |
HIGH YIELD BOND FUND | |||||||||||||||||||
| Net Investment Income Distributions |
2.82% | 76.46% | 100.00% | 96.95% | 100.00% | 100.00% | ||||||||||||||||||
| Short-Term Capital Gain Distributions |
38.72% | 8.52% | 0.00% | 0.00% | 0.00% | 0.00% | ||||||||||||||||||
| Long-Term Capital Gain Distributions |
58.46% | 15.02% | 0.00% | 3.05% | 0.00% | 0.00% | ||||||||||||||||||
| Return of Capital |
0.00% | 0.00% | 0.00% | 0.00% | 0.00% | 0.00% | ||||||||||||||||||
| Tax-Exempt Interest |
0.00% | 0.00% | 0.00% | 0.00% | 0.00% | 0.00% | ||||||||||||||||||
| Qualifying For Corporate Dividends Rec Deduction (1) |
0.00% | 0.00% | 0.00% | 0.00% | 0.02% | 0.00% | ||||||||||||||||||
| Qualifying Dividend Income (2) |
0.00% | 0.00% | 0.00% | 0.00% | 0.00% | 0.00% | ||||||||||||||||||
| U.S. Government Interest (3) |
0.64% | 2.53% | 13.31% | 0.35% | 0.16% | 0.03% | ||||||||||||||||||
| Foreign Tax Credit (4) |
0.00% | 0.00% | 0.00% | 0.00% | 0.00% | 0.00% | ||||||||||||||||||
| Qualified Interest Income (5) |
0.00% | 99.04% | 100.00% | 10.62% | 90.69% | 89.49% | ||||||||||||||||||
| Qualified Short-Term Capital Gain (6) |
100.00% | 100.00% | 0.00% | 0.00% | 0.00% | 0.00% | ||||||||||||||||||
| INTERMEDIATE BOND FUND |
INVESTMENT GRADE CREDIT FUND |
LOW DURATION BOND FUND |
OPPORTUNISTIC HIGH INCOME CREDIT FUND |
STRATEGIC INCOME FUND |
TOTAL RETURN BOND FUND | |||||||||||||||||||
| Net Investment Income Distributions |
79.44% | 97.49% | 100.00% | 92.78% | 100.00% | 100.00% | ||||||||||||||||||
| Short-Term Capital Gain Distributions |
0.00% | 2.51% | 0.00% | 7.22% | 0.00% | 0.00% | ||||||||||||||||||
| Long-Term Capital Gain Distributions |
20.56% | 0.00% | 0.00% | 0.00% | 0.00% | 0.00% | ||||||||||||||||||
| Return of Capital |
0.00% | 0.00% | 0.00% | 0.00% | 0.00% | 0.00% | ||||||||||||||||||
| Tax-Exempt Interest |
0.00% | 0.00% | 0.00% | 0.00% | 0.00% | 0.00% | ||||||||||||||||||
| Qualifying For Corporate Dividends Rec Deduction (1) |
0.00% | 0.00% | 0.00% | 2.57% | 0.00% | 0.00% | ||||||||||||||||||
| Qualifying Dividend Income (2) |
0.00% | 0.00% | 0.00% | 2.53% | 0.00% | 0.00% | ||||||||||||||||||
| U.S. Government Interest (3) |
23.38% | 1.20% | 5.77% | 0.02% | 0.43% | 20.79% | ||||||||||||||||||
| Foreign Tax Credit (4) |
0.00% | 0.00% | 0.00% | 0.00% | 0.00% | 0.00% | ||||||||||||||||||
| Qualified Interest Income (5) |
84.75% | 94.85% | 81.74% | 94.26% | 1.85% | 92.76% | ||||||||||||||||||
| Qualified Short-Term Capital Gain (6) |
0.00% | 100.00% | 0.00% | 100.00% | 0.00% | 0.00% | ||||||||||||||||||
| ULTRA SHORT BOND FUND |
UNCONSTRAINED BOND FUND |
|||||||||||||||||||||||
| Net Investment Income Distributions |
100.00% | 69.86% | ||||||||||||||||||||||
| Short-Term Capital Gain Distributions |
0.00% | 17.09% | ||||||||||||||||||||||
| Long-Term Capital Gain Distributions |
0.00% | 13.05% | ||||||||||||||||||||||
| Return of Capital |
0.00% | 0.00% | ||||||||||||||||||||||
| Tax-Exempt Interest |
0.00% | 0.00% | ||||||||||||||||||||||
| Qualifying For Corporate Dividends Rec Deduction (1) |
0.00% | 0.00% | ||||||||||||||||||||||
| Qualifying Dividend Income (2) |
0.00% | 0.00% | ||||||||||||||||||||||
| U.S. Government Interest (3) |
6.47% | 1.71% | ||||||||||||||||||||||
| Foreign Tax Credit (4) |
0.00% | 0.00% | ||||||||||||||||||||||
| Qualified Interest Income (5) |
93.10% | 72.24% | ||||||||||||||||||||||
| Qualified Short-Term Capital Gain (6) |
0.00% | 100.00% | ||||||||||||||||||||||
Annual Report March 2022 / 370
Table of Contents
| (1) | Qualifying dividends represent dividends which qualify for the corporate dividends received deduction and is reflected as a percentage of ordinary income distributions (the total of short-term capital gain and net investment income distributions). |
| (2) | The percentage in this column represents the amount of “Qualifying Dividend Income” as created by the Jobs and Growth Tax Relief Reconciliation Act of 2003 and is reflected as a percentage of ordinary income distributions (the total of short-term capital gain and net investment income distributions). |
| (3) | “U.S. Government Interest” represents the amount of interest that was derived from direct U.S. government obligations and distributed during the fiscal year. This amount is reflected as a percentage of total ordinary income distributions (the total of short-term capital gain and net investment income distributions). Generally, interest from direct U.S. government obligations is exempt from state income tax. However, for residents of California, Connecticut and New York, the statutory threshold requirements were not satisfied to permit exemption of these amounts from state income for this fund. |
| (4) | Foreign Tax Credit represents dividends which qualify for the foreign tax credit pass through and is reflected as a percentage of investment company taxable income (the total of short-term capital gain and net investment income). |
| (5) | The percentage in this column represents the amount of “Qualifying Interest Income” as created by The American Jobs Creation Act of 2004. The information is reflected as a percentage of net investment income distributions. |
| (6) | The percentage in this column represents the amount of “Qualifying Short Term Capital Gain” as created by The American Jobs Creation Act of 2004. The information is reflected as a percentage of short-term capital gain distributions. |
371 / Annual Report March 2022
Table of Contents
Liquidity Risk Management Program (Unaudited)
Rule 22e-4 under the 1940 Act (the “Liquidity Rule”) requires that all registered open-end management investment companies, including the Funds, establish a written liquidity risk management program (a “Liquidity Program”). Under a fund’s Liquidity Program, a fund must assess, manage and periodically review the fund’s liquidity risk, classify the liquidity of each of the fund’s portfolio investments, determine whether to specify highly liquid investment minimum (and, if so, at what level), limit illiquid investments to 15% of fund investments, and establish policies and procedures regarding how and when a fund will engage in redemptions in-kind. Consistent with the Liquidity Rule, the Board has approved the written Liquidity Program for the Funds and has designated a committee of professionals associated with the Adviser to administer the Funds’ Liquidity Program (the “Program Administrator”).
On March 14, 2022, the Board reviewed the Program Administrator’s written annual report (the “Report”) concerning the operation of the Funds’ Liquidity Program for the calendar year ended December 31, 2021 (the “Reporting Period”). The Report addressed the operation of the Liquidity Program and assessed its adequacy and effectiveness of implementation, including, where applicable, the operation of a Fund’s Highly Liquidity Investment Minimum (“HLIM”). The Report discussed, among other things: (1) the liquidity risk framework used to assess, manage, and periodically review each Fund’s liquidity risk and the results of this assessment; (2) the methodology and inputs for classifying each of the Fund’s investments into liquidity categories that reflect an estimate of their liquidity under current market conditions; (3) whether a Fund invested primarily in “Highly Liquid Investments” (as defined under the Liquidity Rule) and the operation and monitoring of the HLIM assigned to a Fund, as applicable; (4) whether a Fund invested more than 15% of its assets in “Illiquid Investments” (as defined under the Liquidity Rule) and the procedures for monitoring for this limit; and (5) the results of stress tests designed to assess liquidity under a hypothetical stressed scenario involving elevated redemptions. The Report concluded that the Liquidity Program was reasonably designed to assess and manage each Fund’s liquidity risk and was adequately and effectively implemented with respect to each Fund during the Reporting Period.
There can be no assurance that the Liquidity Program will achieve its objectives in the future. Please refer to your Fund’s prospectus for more information regarding the Fund’s exposure to liquidity risk and other principal risks to which an investment in the Fund may be subject.
Annual Report March 2022 / 372
Table of Contents
Privacy Policy
| The TCW Group, Inc. and Subsidiaries TCW Investment Management Company LLC TCW Asset Management Company LLC Metropolitan West Asset Management, LLC | ||
| TCW Funds Inc. |
TCW Direct Lending LLC | |
| TCW Strategic Income Fund, Inc. |
TCW Direct Lending VII LLC | |
| Metropolitan West Funds |
TCW Direct Lending VIII LLC | |
| Sepulveda Management LLC |
||
Effective May 2021
| WHAT YOU SHOULD KNOW |
At TCW, we recognize the importance of keeping information about you secure and confidential. We do not sell or share your nonpublic personal and financial information with marketers or others outside our affiliated group of companies.
We carefully manage information among our affiliated group of companies to safeguard your privacy and to provide you with consistently excellent service.
We are providing this notice to you to comply with the requirements of Regulation S-P, “Privacy of Consumer Financial Information,” issued by the United States Securities and Exchange Commission.
| OUR PRIVACY POLICY |
We, The TCW Group, Inc. and its subsidiaries, the TCW Funds, Inc., TCW Strategic Income Fund, Inc., the Metropolitan West Funds, Sepulveda Management LLC, TCW Direct Lending LLC, TCW Direct Lending VII LLC, and TCW Direct Lending VIII LLC (collectively, “TCW”) are committed to protecting the nonpublic personal and financial information of our customers and consumers who obtain or seek to obtain financial products or services primarily for personal, family or household purposes. We fulfill our commitment by establishing and implementing policies and systems to protect the security and confidentiality of this information.
In our offices, we limit access to nonpublic personal and financial information about you to those TCW personnel who need to know the information in order to provide products or services to you. We maintain physical, electronic, and procedural safeguards to protect your nonpublic personal and financial information.
| CATEGORIES OF INFORMATION WE COLLECT |
We may collect the following types of nonpublic personal and financial information about you from the following sources:
| • | Your name, address and identifying numbers, and other personal and financial information, from you and from identification cards and papers you submit to us, on applications, subscription agreements or other forms or communications. |
| • | Information about your account balances and financial transactions with us, our affiliated entities, or nonaffiliated third parties, from our internal sources, from affiliated entities and from nonaffiliated third parties. |
| • | Information about your account balances and financial transactions and other personal and financial information, from consumer credit reporting agencies or other nonaffiliated third parties, to verify information received from you or others. |
| CATEGORIES OF INFORMATION WE DISCLOSE TO NONAFFILIATED THIRD PARTIES |
We may disclose your name, address and account and other identifying numbers, as well as information about your pending or past transactions and other personal financial information, to nonaffiliated third parties, for our everyday business purposes such as necessary to execute, process, service and confirm your securities transactions and mutual fund transactions, to administer and service your account and commingled investment vehicles in which you are invested, to market our products and services through joint marketing arrangements or to respond to court orders and legal investigations.
We may disclose nonpublic personal and financial information concerning you to law enforcement agencies, federal regulatory agencies, self-regulatory organizations or other nonaffiliated third parties, if required or requested to do so by a court order, judicial subpoena or regulatory inquiry.
373 / Annual Report March 2022
Table of Contents
We do not otherwise disclose your nonpublic personal and financial information to nonaffiliated third parties, except where we believe in good faith that disclosure is required or permitted by law. Because we do not disclose your nonpublic personal and financial information to nonaffiliated third parties, our Customer Privacy Policy does not contain opt-out provisions.
| CATEGORIES OF INFORMATION WE DISCLOSE TO OUR AFFILIATED ENTITIES |
| • | We may disclose your name, address and account and other identifying numbers, account balances, information about your pending or past transactions and other personal financial information to our affiliated entities for any purpose. |
| • | We regularly disclose your name, address and account and other identifying numbers, account balances and information about your pending or past transactions to our affiliates to execute, process and confirm securities transactions or mutual fund transactions for you, to administer and service your account and commingled investment vehicles in which you are invested, or to market our products and services to you. |
| INFORMATION ABOUT FORMER CUSTOMERS |
We do not disclose nonpublic personal and financial information about former customers to nonaffiliated third parties unless required or requested to do so by a court order, judicial subpoena or regulatory inquiry, or otherwise where we believe in good faith that disclosure is required or permitted by law.
| QUESTIONS |
Should you have any questions about our Customer Privacy Policy, please contact us by email or by regular mail at the address at the end of this policy.
| REMINDER ABOUT TCW’S FINANCIAL PRODUCTS |
Financial products offered by The TCW Group, Inc. and its subsidiaries, the TCW Funds, Inc., TCW Strategic Income Fund, Inc., the Metropolitan West Funds, Sepulveda Management LLC, TCW Direct Lending LLC, TCW Direct Lending VII LLC, and TCW Direct Lending VIII LLC
| • | Are not guaranteed by a bank; |
| • | Are not obligations of The TCW Group, Inc. or of its subsidiaries; |
| • | Are not insured by the Federal Deposit Insurance Corporation; and |
| • | Are subject to investment risks, including possible loss of the principal amount committed or invested, and earnings thereon. |
| THE TCW GROUP, INC |
SEPULVEDA MANAGEMENT LLC | |
| TCW FUNDS, INC. |
TCW DIRECT LENDING LLC | |
| TCW STRATEGIC INCOME FUND, INC. |
TCW DIRECT LENDING VII LLC | |
| METROPOLITAN WEST FUNDS |
TCW DIRECT LENDING VIII LLC | |
| Attention: Privacy Officer | 865 South Figueroa St. Suite 1800 | Los Angeles, CA 90017 | email: privacy@tcw.com | ||
Annual Report March 2022 / 374
Table of Contents
[THIS PAGE INTENTIONALLY LEFT BLANK]
Table of Contents
[THIS PAGE INTENTIONALLY LEFT BLANK]
Table of Contents
[THIS PAGE INTENTIONALLY LEFT BLANK]
Table of Contents
TRUSTEES AND OFFICERS (Unaudited)
The business and affairs of the Trust and each Fund is under the direction of the Board of Trustees. Information pertaining to the Trustees and officers of the Trust is provided in the table below. The term “officer” means president, vice president, secretary, treasurer, controller, or any other officer who performs policy making functions. All officers serve without direct compensation from the Funds. You can find more information about the Trustees in the Statement of Additional Information which is available without charge by calling (800) 241-4671.
| NAME AND YEAR OF BIRTH*** |
POSITION(S) HELD WITH TRUST |
TERM OF OFFICE AND LENGTH OF TIME SERVED |
PRINCIPAL OCCUPATIONS DURING PAST FIVE YEARS |
NUMBER OF FUNDS IN FUND COMPLEX OVERSEEN BY TRUSTEE |
OTHER DIRECTORSHIPS HELD BY TRUSTEE | |||||
| Independent Trustees of the Trust*
| ||||||||||
| Ronald J. Consiglio (1943) |
Trustee | Indefinite term, since 2003 | Since 1999, Mr. Consiglio has served as the managing director of Synergy Trading, a securities-trading partnership. | 14 | Mannkind Corp. (pharmaceutical preparations) | |||||
| Patrick C. Haden (1953) |
Trustee | Indefinite term, since 2010 | President (since 2003), Wilson Ave. Consulting (business consulting firm); Senior Advisor to President (July 2016 -June 2017), Athletic Director (2010 - June 2016), University of Southern California. | 33 | Tetra Tech, Inc. (environmental consulting); Auto Club (affiliate of AAA); TCW Funds (mutual funds); TCW Strategic Income Fund, Inc. (closed-end fund) | |||||
| Martin Luther King III (1957) |
Trustee and Chairman of the Nominating and Governance Committee | Indefinite term, since 1997 | Since 1998, Mr. King has served as the President and Chief Executive Officer of The King Center. Since January 2006, he has served as Chief Executive Officer of Realizing the Dream, a non-profit organization that continues the humanitarian and liberating work of Dr. Martin Luther King, Jr. and Mrs. Coretta Scott King. He has been engaged as an independent motivational lecturer since 1980. | 14 | None | |||||
| Peter McMillan (1957) |
Trustee | Indefinite term, since 2008 | Co-founder (since 2019), Pacific Oak Capital Advisors (investment advisory firm); Co-founder, Managing Partner and Chief Investment Officer (since May 2013), Temescal Canyon Partners (investment advisory firm); Co-founder and Executive Vice President (2005 - 2019), KBS Capital Advisors (a manager of real estate investment trusts). | 33 | Pacific Oak Strategic Opportunity REIT (real estate investments); Keppel Pacific Oak U.S. REIT (real estate investments); Pacific Oak Residential Trust (real estate investments); TCW Funds, Inc. (mutual funds); TCW Strategic Income Fund, Inc. (closed-end fund); TCW DL VII Financing LLC (business development company) | |||||
Annual Report March 2022 / 378
Table of Contents
| NAME AND YEAR OF BIRTH*** |
POSITION(S) HELD WITH TRUST |
TERM OF OFFICE AND LENGTH OF TIME SERVED |
PRINCIPAL OCCUPATIONS DURING PAST FIVE YEARS |
NUMBER OF FUNDS IN FUND COMPLEX OVERSEEN BY TRUSTEE |
OTHER DIRECTORSHIPS HELD BY TRUSTEE | |||||
| Robert G. Rooney (1957) |
Trustee and Chairman of the Audit Committee | Indefinite term, since 2009 | Senior Financial Advisor (August 2020 – March 2021) and Chief Financial and Administrative Officer (November 2018 – August 2020), REEF Technology (real estate services and technology company); Chief Financial Officer (January 2018 - November 2018), Citizens Parking Inc. (parking services company); Chief Financial Officer (September 2015 – July 2017), Novitex Enterprise Solutions, Inc. (document management company). | 14 | None | |||||
| Andrew Tarica (1959) |
Trustee and Chairman of the Board | Indefinite term, since 2002 and 2008, respectively | Chief Executive Officer (since February 2001), Meadowbrook Capital Management (asset management company); Director of Fixed Income (since February 2022), Forest Road Securities (broker-dealer); Employee (2003 – January 2022), Cowen Prime Services (broker-dealer). | 33 | TCW Funds, Inc. (mutual funds); TCW Strategic Income Fund, Inc. (closed-end fund); TCW Direct Lending VII, LLC (business development company); TCW Direct Lending VIII, LLC (business development company) | |||||
| Interested Trustees** | ||||||||||
| Patrick Moore (1964) |
Trustee | Indefinite term, since 2014 | Mr. Moore is a Group Managing Director for the Adviser, TCW Investment Management Company LLC, TCW Asset Management Company LLC and TCW LLC. He has been with the Adviser since 2000. Mr. Moore is a member of the CFA Institute. | 14 | None | |||||
| Laird Landmann (1964) |
Trustee and Executive Vice President | Indefinite term, since 2008 and 2007, respectively | Mr. Landmann is President for the Adviser and Group Managing Director of The TCW Group, Inc., TCW Investment Management Company LLC, TCW Asset Management Company LLC and TCW LLC. Since August 1996, Mr. Landmann has been a Generalist Portfolio Manager with the Adviser and currently serves as the Adviser’s President. | 14 | None | |||||
| Officers of the Trust who are not Trustees | ||||||||||
| David B. Lippman (1958) |
President and Principal Executive Officer | Indefinite term, since November 2008 | Mr. Lippman is the Chief Executive Officer of the Adviser (since February 2013), and the Chief Executive Officer and President of The TCW Group, Inc., TCW Investment Management Company LLC, TCW Asset Management Company LLC and TCW LLC. He has been with the Adviser since 2008. | 1 | TCW Strategic Income Fund, Inc. (closed-end fund) | |||||
379 / Annual Report March 2022
Table of Contents
| NAME AND YEAR OF BIRTH*** |
POSITION(S) HELD WITH TRUST |
TERM OF OFFICE AND LENGTH OF TIME SERVED |
PRINCIPAL OCCUPATIONS DURING PAST FIVE YEARS**** |
NUMBER OF FUNDS IN FUND COMPLEX OVERSEEN BY TRUSTEE |
OTHER DIRECTORSHIPS HELD BY TRUSTEE | |||||
| Richard Villa (1964) |
Treasurer, Principal Financial Officer and Principal Accounting Officer | Indefinite term, since February 2021 | Mr. Villa is Executive Vice President, Chief Financial Officer and Assistant Secretary of the Adviser, TCW Investment Management Company LLC, TCW Asset Management Company LLC and The TCW Group, Inc. (since 2008); Treasurer and Principal Financial Officer and Accounting Officer of TCW Funds, Inc. and TCW Strategic Income Fund, Inc. (since February 2014); Executive Vice President, Financial Officer and Assistant Secretary of TCW LLC (since 2016). | N/A | N/A | |||||
| Eric Chan (1978) |
Assistant Treasurer | Indefinite term, since 2010 | Mr. Chan is Managing Director of Fund Operations for the Adviser, TCW Investment Management Company LLC, TCW Asset Management Company LLC and TCW LLC. He has been with the Adviser since November 2006. Mr. Chan is a Certified Public Accountant. | N/A | N/A | |||||
| Stephen M. Kane (1962) |
Executive Vice President | Indefinite term, since 2007 | Mr. Kane is a Group Managing Director for the Adviser, TCW Investment Management Company LLC, TCW Asset Management Company LLC and TCW LLC. He has been with the Adviser since August 1996. | N/A | N/A | |||||
| Gladys Xiques (1973) |
Chief Compliance Officer and Anti- Money Laundering Officer | Indefinite term, since January 2021 | Ms. Xiques is Managing Director and Global Chief Compliance Officer of the Adviser, TCW LLC, TCW Investment Management Company LLC and TCW Asset Management Company LLC (since January 2021); Global Chief Compliance Officer of The TCW Group, Inc. (since January 2021); Chief Compliance Officer and AML Officer of TCW Funds, Inc. and TCW Strategic Income Fund, Inc. (since January 2021); Senior Vice President of the Adviser, TCW LLC, TCW Investment Management Company LLC and TCW Asset Management Company LLC (February 2015 – December 2020). | N/A | N/A | |||||
| Meredith Jackson (1959) |
Vice President and Secretary | Indefinite term, since 2013 | Ms. Jackson is Executive Vice President, General Counsel and Secretary of the Adviser, TCW Investment Management Company LLC, The TCW Group, Inc., TCW Asset Management Company LLC (since February 2013) and TCW LLC (since January 2016), Senior Vice President, General Counsel and Secretary of TCW Funds, Inc. and TCW Strategic Income Fund, Inc. (since February 2013). | N/A | N/A | |||||
| * | Denotes a Trustee who is not an “interested” person of the Trust as defined in the 1940 Act. |
| ** | Denotes a Trustee who is an “interested” person of the Trust as defined in the 1940 Act, due to the relationship indicated with the Adviser. |
| *** | For purposes of Trust business, the address for all Trustees and officers is c/o Metropolitan West Asset Management, LLC, 865 South Figueroa Street, Suite 1800, Los Angeles, CA 90017. |
| **** | Positions with The TCW Group, Inc. and its affiliates may have changed over time. |
Annual Report March 2022 / 380
Table of Contents

MetWest Funds
865 South Figueroa Street, Suite 1800
Los Angeles, California 90017
800 241 4671
www.TCW.com
Board of Trustees
Ronald J. Consiglio
Patrick C. Haden
Martin Luther King, III
Laird R. Landmann
Peter McMillan
Patrick Moore
Robert G. Rooney
Andrew Tarica
Officers
David Lippman
President and Principal Executive Officer
Richard Villa
Treasurer, Principal Financial Officer and
Principal Accounting Officer
Gladys Xiques
Chief Compliance Officer and
Anti-Money Laundering Officer
Adviser
Metropolitan West Asset Management, LLC
865 South Figueroa Street, Suite 1800
Los Angeles, CA 90017
Custodian
The Bank of New York Mellon
One Wall Street
New York, NY 10286
Transfer Agent
BNY Mellon Investment Servicing (U.S.) Inc.
760 Moore Road
King of Prussia, PA 19406
Independent Registered Public Accounting Firm
Deloitte & Touche LLP
555 West 5th Street, Suite 2700
Los Angeles, CA 90013
Distributor
TCW Fund Distributors LLC
865 South Figueroa Street, Suite 1800
Los Angeles, CA 90017
Legal Counsel
Paul Hastings LLP
101 California Street, 48th Floor
San Francisco, CA 94111
For Additional Information about the MetWest Funds call:
(213) 244-0000 or (800) 241-4671 (toll-free) www.TCW.com
A description of the Funds’ proxy voting policies, procedures, and how the Funds voted proxies relating to their portfolios’ securities during the most recent 12-month period ending June 30 are available (i) without charge, upon request, by calling (800) 241-4671; (ii) on the Securities and Exchange Commission’s website at www.sec.gov.
In addition to its annual and semi-annual reports, the Funds file a complete schedule of portfolio holdings with the SEC for the first and third quarters of each fiscal year on Form NPORT-P. Such filings occur no later than 60 days after the end of the Funds’ first and third quarters and are available on the SEC’s website at www.sec.gov.
To reduce expenses, we may mail only one copy of the Fund’s prospectus and each annual and semi-annual report to those addresses shared by two or more accounts. If you wish to receive individual copies of these documents, please call us at (800) 241-4671 (or contact your financial institution). We will begin sending you individual copies thirty days after receiving your request.
This report is submitted for general information to the shareholders of the Funds. It is not authorized for distribution to prospective investors in the Funds unless preceded or accompanied by an effective Prospectus, which includes details regarding the Funds’ objectives, policies, expenses and other information.
FUNDap 5/2022
Table of Contents
| (b) | Not applicable. |
| Item 2. | Code of Ethics. |
| (a) | The registrant, as of the end of the period covered by this report, has adopted a code of ethics that applies to the registrant’s principal executive officer, principal financial officer, principal accounting officer or controller, or persons performing similar functions, regardless of whether these individuals are employed by the registrant or a third party. |
| (c) | There have been no amendments, during the period covered by this report, to a provision of the code of ethics that applies to the registrant’s principal executive officer, principal financial officer, principal accounting officer or controller, or persons performing similar functions, regardless of whether these individuals are employed by the registrant or a third party, and that relates to any element of the code of ethics description. |
| (d) | The registrant has not granted any waivers, including an implicit waiver, from a provision of the code of ethics that applies to the registrant’s principal executive officer, principal financial officer, principal accounting officer or controller, or persons performing similar functions, regardless of whether these individuals are employed by the registrant or a third party, that relates to one or more of the items set forth in paragraph (b) of this item’s instructions. |
| (f)(1) | Pursuant to Item 13(a)(1), the registrant is filing as an exhibit a copy of its code of ethics that applies to its principal executive officer, principal financial officer, principal accounting officer or controller, or persons performing similar functions. |
| Item 3. | Audit Committee Financial Expert. |
As of the end of the period covered by the report, the registrant’s board of directors has determined that Ronald Consiglio and Robert Rooney are qualified to serve as audit committee financial experts serving on its audit committee and they are “independent,” as defined by Item 3 of Form N-CSR.
| Item 4. | Principal Accountant Fees and Services. |
Audit Fees
| (a) | The aggregate fees billed for each of the last two fiscal years for professional services rendered by the principal accountant for the audit of the registrant’s annual financial statements or services that are normally provided by the accountant in connection with statutory and regulatory filings or engagements for those fiscal years are $592,285 in 2022 and $545,908 in 2021. |
Table of Contents
Audit-Related Fees
| (b) | The aggregate fees billed in each of the last two fiscal years for assurance and related services by the principal accountant that are reasonably related to the performance of the audit of the registrant’s financial statements and are not reported under paragraph (a) of this Item are $0 in 2022 and $0 in 2021. |
Tax Fees
| (c) | The aggregate fees billed in each of the last two fiscal years for professional services rendered by the principal accountant for tax compliance, tax advice, and tax planning are $115,878 in 2022 and $104,680 in 2021. |
All Other Fees
| (d) | The aggregate fees billed in each of the last two fiscal years for products and services provided by the principal accountant, other than the services reported in paragraphs (a) through (c) of this Item are $0 in 2022 and $0 in 2021. |
| (e) | Audit Committee’s pre-approval policies and procedures described in paragraph (c)(7) of Rule 2-01 of Regulation S-X. |
(e)(1) Pre-Approval Policies and Procedures. The Audit Committee (“Committee”) of the registrant is responsible for pre-approving (i) all audit and permissible non-audit services to be provided by the independent auditors to the registrant and (ii) all permissible non-audit services to be provided by the independent auditors to Metropolitan West Funds and any affiliate of Metropolitan West Funds that provides services to the registrant (a “Covered Services Provider”) if the independent auditors’ engagement relates directly to the operations and financial reporting of the registrant. The Committee may delegate its responsibility to pre-approve any such audit and permissible non-audit services to the Chairperson of the Committee, and the Chairperson must report to the Committee, at its next regularly scheduled meeting after the Chairperson’s pre-approval of such services, his or her decision(s). The Committee may also establish detailed pre-approval policies and procedures for pre-approval of such services in accordance with applicable laws, including the delegation of some or all of the Committee’s pre-approval responsibilities to other persons (other than Metropolitan West Funds or the registrant’s officers). Pre-approval by the Committee of any permissible non-audit services is not required so long as: (i) the aggregate amount of all such permissible non-audit services provided to the registrant, Metropolitan West Funds and any Covered Services Provider constitutes not more than 5% of the total amount of revenues paid by the registrant to its independent auditors during the fiscal year in which the permissible non-audit services are provided; (ii) the permissible non-audit services were not recognized by the registrant at the time of the engagement to be non-audit services; and (iii) such services are promptly brought to the attention of the Committee and approved by the Committee or the Chairperson prior to the completion of the audit.
(e)(2) The percentage of services described in each of paragraphs (b) through (d) of this Item that were approved by the audit committee pursuant to paragraph (c)(7)(i)(C) of Rule 2-01 of Regulation S-X are as follows:
(b) N/A
(c) 100%
(d) N/A
Table of Contents
| (f) | The percentage of hours expended on the principal accountant’s engagement to audit the registrant’s financial statements for the most recent fiscal year that were attributed to work performed by persons other than the principal accountant’s full-time, permanent employees was 0%. |
| (g) | The aggregate non-audit fees billed by the registrant’s accountant for services rendered to the registrant, and rendered to the registrant’s investment adviser (not including any sub-adviser whose role is primarily portfolio management and is subcontracted with or overseen by another investment adviser), and any entity controlling, controlled by, or under common control with the adviser that provides ongoing services to the registrant for each of the last two fiscal years of the registrant was $868,519 in 2022 and $751,087 in 2021. |
| (h) | The registrant’s audit committee of the board of directors has considered whether the provision of non-audit services that were rendered to the registrant’s investment adviser (not including any sub-adviser whose role is primarily portfolio management and is subcontracted with or overseen by another investment adviser), and any entity controlling, controlled by, or under common control with the investment adviser that provides ongoing services to the registrant that were not pre-approved pursuant to paragraph (c)(7)(ii) of Rule 2-01 of Regulation S-X is compatible with maintaining the principal accountant’s independence. |
| (i) | Not applicable. |
| (j) | Not applicable. |
| Item 5. | Audit Committee of Listed Registrants. |
Not applicable.
| Item 6. | Investments. |
| (a) | Schedule of Investments in securities of unaffiliated issuers as of the close of the reporting period is included as part of the report to shareholders filed under Item 1(a) of this form. |
| (b) | Not applicable. |
| Item 7. | Disclosure of Proxy Voting Policies and Procedures for Closed-End Management Investment Companies. |
Not applicable.
| Item 8. | Portfolio Managers of Closed-End Management Investment Companies. |
Not applicable.
| Item 9. | Purchases of Equity Securities by Closed-End Management Investment Company and Affiliated Purchasers. |
Not applicable.
Table of Contents
Item 10. Submission of Matters to a Vote of Security Holders.
There have been no material changes to the procedures by which shareholders may recommend nominees to the registrant’s board of directors, where those changes were implemented after the registrant last provided disclosure in response to the requirements of Item 407(c)(2)(iv) of Regulation S-K (17 CFR 229.407) (as required by Item 22(b)(15) of Schedule 14A (17 CFR 240.14a-101)), or this Item.
Item 11. Controls and Procedures.
| (a) | The registrant’s principal executive and principal financial officers, or persons performing similar functions, have concluded that the registrant’s disclosure controls and procedures (as defined in Rule 30a-3(c) under the Investment Company Act of 1940, as amended (the “1940 Act”) (17 CFR 270.30a-3(c))) are effective, as of a date within 90 days of the filing date of the report that includes the disclosure required by this paragraph, based on their evaluation of these controls and procedures required by Rule 30a-3(b) under the 1940 Act (17 CFR 270.30a-3(b)) and Rules 13a-15(b) or 15d-15(b) under the Securities Exchange Act of 1934, as amended (17 CFR 240.13a-15(b) or 240.15d-15(b)). |
| (b) | There were no changes in the registrant’s internal control over financial reporting (as defined in Rule 30a-3(d) under the 1940 Act (17 CFR 270.30a-3(d))) that occurred during the period covered by this report that have materially affected, or are reasonably likely to materially affect, the registrant’s internal control over financial reporting. |
Item 12. Disclosure of Securities Lending Activities for Closed-End Management Investment Companies.
Not applicable.
Item 13. Exhibits.
| (a)(1) | ||
| (a)(2) | ||
| There were no written solicitations to purchase securities under Rule 23c-1 under the Act sent or given during the period covered by the report by or on behalf of the Registrant to 10 or more persons. | ||
| There was no change in the Registrant’s independent public accountant during the period covered by the report. | ||
| (b) | ||
Table of Contents
SIGNATURES
Pursuant to the requirements of the Securities Exchange Act of 1934 and the Investment Company Act of 1940, the registrant has duly caused this report to be signed on its behalf by the undersigned, thereunto duly authorized.
| (Registrant) | Metropolitan West Funds |
| By (Signature and Title)* | /s/ David B. Lippman | |
| David B. Lippman, President and Principal Executive Officer (principal executive officer) |
| Date June 2, 2022 | ||
Pursuant to the requirements of the Securities Exchange Act of 1934 and the Investment Company Act of 1940, this report has been signed below by the following persons on behalf of the registrant and in the capacities and on the dates indicated.
| By (Signature and Title)* | /s/ David B. Lippman | |
| David B. Lippman, President and Principal Executive Officer (principal executive officer) |
| Date June 2, 2022 |
| By (Signature and Title)* | /s/ Richard Villa | |
| Richard Villa, Treasurer, Principal Financial Officer and Principal Accounting Officer (principal financial officer) |
| Date June 2, 2022 |
* Print the name and title of each signing officer under his or her signature.