UNITED STATES
SECURITIES AND EXCHANGE COMMISSION
Washington, D.C. 20549
SECURITIES AND EXCHANGE COMMISSION
Washington, D.C. 20549
FORM N-CSR
CERTIFIED SHAREHOLDER REPORT OF REGISTERED
MANAGEMENT INVESTMENT COMPANIES
Investment Company Act file number 811-07959
Advisors Series Trust
(Exact name of registrant as specified in charter)
(Exact name of registrant as specified in charter)
615 East Michigan Street
Milwaukee, WI 53202
(Address of principal executive offices) (Zip code)
(Address of principal executive offices) (Zip code)
Jeffrey T. Rauman, President/Chief Executive Officer
Advisors Series Trust
c/o U.S. Bancorp Fund Services, LLC
777 East Wisconsin Avenue, 5th Floor
Milwaukee, WI 53202
(Name and address of agent for service)
(Name and address of agent for service)
(626) 914-7363
(Registrant's telephone number, including area code)
Date of fiscal year end: October 31, 2021
Date of reporting period: April 30, 2021
Item 1. Reports to Stockholders.
(a)
Edgar Lomax Value Fund
Semi-Annual Report
For the period ended
April 30, 2021
EDGAR LOMAX VALUE FUND
Semi-Annual Report
April 30, 2021
Dear Fellow Shareholder:
As we cross the mid-point of the Edgar Lomax Value Fund’s (the “Fund”) fiscal year, we are pleased to report a solid gain from our stock holdings during the six-month span ended April 30, 2021. In
the first half of the fiscal year, overall stock performance was strongly impacted by two developments: 1) the announcement of better-than-expected quarterly earnings for many companies whose profitability was initially damaged by the onset of the
COVID pandemic; and 2) the rollout of three newly-approved COVID vaccines. Both of these developments were good for “large-cap value” stocks by showing investors that most large companies were learning to
operate profitably in a pandemic-driven economy and that the end of the current “locked down” constrained economy was on the horizon. The bottom-line message to investors: The now well-known “stay-at-home” companies should not be the only
profitable businesses going forward. In this environment, the Fund significantly outperformed the indexes during the six months, gaining 35.57% versus S&P 500 and S&P 500 Value respective returns of 28.85%
and 34.24%, respectively. Following is a summary of average annual total returns through April 30, 2021:
|
S&P 500
|
Morningstar Large-Cap
|
|||
|
Fund
|
Value Index
|
S&P 500 Index
|
Value Category
|
|
|
1-year
|
33.12%
|
40.90%
|
45.98%
|
46.42%
|
|
5-year
|
11.03%
|
12.67%
|
17.42%
|
12.01%
|
|
10-year
|
10.62%
|
11.27%
|
14.17%
|
10.35%
|
|
15-year
|
7.78%
|
7.74%
|
10.29%
|
7.61%
|
Performance data quoted represents past performance and does not guarantee future results. The investment return and principal value of an investment will fluctuate so that an
investor’s shares, when redeemed, may be worth more or less than their original cost. Current performance of the Fund may be lower or higher than the performance quoted. Performance data current to the most recent month end may be obtained by
calling (866) 205-0524 or visiting www.edgarlomax.com. Before deducting fees that the Advisor contractually waived or expenses of the Fund that the Advisor absorbed, the gross expense ratio is 1.05%*; however, after such waivers or absorptions, the
Fund’s maximum net expense ratio is 0.70%. Including the voluntary performance-based waiver arrangement, actual Total Annual Fund Operating Expenses (the net expenses that investors paid) were 0.70% for the fiscal year ended October 31, 2020.
Even after this recent outperformance, the Fund’s portfolio holds clear potential for strong relative results in the future. For example, its price-to-earnings ratio of 24.8 compares to S&P 500
Index and S&P 500 Value Index respective ratios of 37.5 and 38.0, respectively. Further, the Fund has the added advantage of paying a significantly higher dividend yield of 3.15% (the Fund’s subsidized and unsubsidized 30 day SEC Yield’s were
2.65% and 2.35%, respectively), compared to S&P 500 and S&P Value respective yields of 1.40% and 2.10%, respectively. While we do not expect this recent shift toward “value,” and away from “growth,” to occur in a straight line, we do believe
you are witnessing just the early stage of value’s longer-term reversal of fortune.
__________________
|
*
|
Figures are from the Fund’s prospectus dated February 28, 2021. The Advisor has contractually agreed to waive its fees and/or absorb expenses of the Fund to ensure that Net Annual Fund Operating Expenses do
not exceed 0.70% (excluding acquired funds fees and expenses, interest, taxes and extraordinary expenses) through at least February 28, 2022. In addition, the Advisor has voluntarily agreed to waive a portion of its investment advisory fee
contingent upon the Fund’s performance versus the S&P 500 Value Index. While the Advisor may discontinue its voluntary waiver any time after February 28, 2022, it has no current intention of doing so.
|
During the first six months of the fiscal year the Energy Sector rallied strongly, after being hit especially hard by the COVID-related shutdown that began in March of 2020, as investors began
envisioning a post-pandemic economy—the Fund’s Energy holdings were up 69.5%. Exxon and Chevron lead the Fund’s Energy holdings, up 80.8% and 80.2%, respectively, during this period. Both companies remain attractive with strong dividend yields:
6.0% for Exxon and 5.2% for Chevron.
As the U.S. economy opened up last fall, investors appeared to be preparing for higher interest rates in the future. As a result, investors appeared to move away from interest sensitive stocks like
those in the Utilities sector. It shouldn’t be a surprise that the Fund’s Utilities holdings’ strong return still lagged behind everything else with an average gain of 13%. For example, NextEra Energy was profitable throughout the period, even
beating earnings forecasts; however, its respectable return of 6.9% for the first half of the fiscal year was considerably behind the Fund’s overall performance of 35.6%. We feel that NextEra Energy’s strong earnings and 2.1% dividend yield make it
a continued attractive holding.
Please note that the entire list of Fund investments is included in this report in a section called “Schedule of Investments.”
Thank you, once again, for your confidence in our management of the Fund. We remain committed to handling your hard-earned money as carefully as we do our own.
Cordially,
 |
 |
|
Randall R. Eley
|
Thomas B. Murray
|
|
Chief Investment Officer
|
Portfolio Manager
|
____________________
Must be preceded or accompanied by a prospectus.
Mutual fund investing involves risk; principal loss is possible. “Value” investing as a strategy may be out of favor in the market for an extended period. Value stocks can perform differently from
the market as a whole and from other types of stocks.
Investment performance reflects expense waivers in effect. In the absence of such waivers, total return would be reduced.
The opinions expressed are those of The Edgar Lomax Company, the Fund’s investment advisor, are subject to change, and forecasts made cannot be guaranteed. Fund holdings and sector allocations are subject to change
and should not be considered recommendations to buy or sell any security. Please see the Schedule of Investments in this report for current Fund holdings information.
The Price-to-Earnings (P/E) Ratio is calculated by dividing the current price of a stock by the company’s trailing 12 months’ earnings per share.
The Dividend Yield is calculated by dividing a company’s per-share projected annual dividend payment by the company’s stock price per share.
The S&P 500® Index is an unmanaged capitalization-weighted index of 500 stocks designed to represent the broad domestic economy. The
S&P 500 Value Index is a capitalization-weighted index of stocks in the S&P 500® Index which exhibit strong value characteristics. You cannot invest directly in
an index.
2
EDGAR LOMAX VALUE FUND
EXPENSE EXAMPLE at April 30, 2021 (Unaudited)
Shareholders in mutual funds generally incur two types of costs: (1) transaction costs, including sales charges (loads) on purchase payments, reinvested dividends, or other distributions; redemption fees; and exchange
fees; and (2) ongoing costs, including management fees; distribution and/or service fees; and other Fund expenses. The Edgar Lomax Value Fund is a no-load mutual fund and has no shareholder transaction expenses.
This Example is intended to help you understand your ongoing costs (in dollars) of investing in the Fund and to compare these costs with the ongoing costs of investing in other mutual funds. The Example is based on an investment of $1,000 invested at
the beginning of the period and held for the entire period (11/1/20 – 4/30/21).
Actual Expenses
The first line of the table below provides information about actual account values and actual expenses. Although the Fund charges no sales load or transaction fees, you will be assessed fees for outgoing wire
transfers, returned checks, and stop payment orders at prevailing rates charged by U.S. Bancorp Fund Services, LLC, the Fund’s transfer agent. The Example below includes, but is not limited to, management fees, fund accounting, custody and transfer
agent fees. You may use the information in the first line of the table, together with the amount you invested, to estimate the expenses that you paid over the period. Simply divide your account value by $1,000 (for example, an $8,600 account value
divided by $1,000 = 8.6), then multiply the result by the number in the first line under the heading entitled “Expenses Paid During Period” to estimate the expenses you paid on your account during this period.
Hypothetical Example for Comparison Purposes
The second line of the table below provides information about hypothetical account values and hypothetical expenses based on the Fund’s actual expense ratio and an assumed rate of return of 5% per year before expenses,
which is not the Fund’s actual return. The hypothetical account values and expenses may not be used to estimate the actual ending account balance or expenses you paid for the period. You may use this information to compare the ongoing costs of
investing in the Fund and other funds. To do so, compare this 5% hypothetical example with the 5% hypothetical examples that appear in the shareholder reports of the other funds. Please note that the expenses shown in the table are meant to highlight
your ongoing costs only and will not help you determine the relative total costs of owning different funds, as they may charge transactional costs, such as sales charges (loads), redemption fees, or exchange fees.
|
Beginning
|
Ending
|
Expenses Paid
|
|
|
Account Value
|
Account Value
|
During Period*
|
|
|
11/1/20
|
4/30/21
|
11/1/20 – 4/30/21
|
|
|
Actual
|
$1,000.00
|
$1,355.70
|
$2.92
|
|
Hypothetical (5% return before expenses)
|
$1,000.00
|
$1,022.32
|
$2.51
|
|
*
|
Expenses are equal to the Fund’s annualized expense ratio of 0.50%, multiplied by the average account value over the period, multiplied by 181 (days in most recent fiscal half-year)/365 days
to reflect the one-half year expense.
|
3
EDGAR LOMAX VALUE FUND
INDUSTRY ALLOCATION OF PORTFOLIO ASSETS at April 30, 2021 (Unaudited)
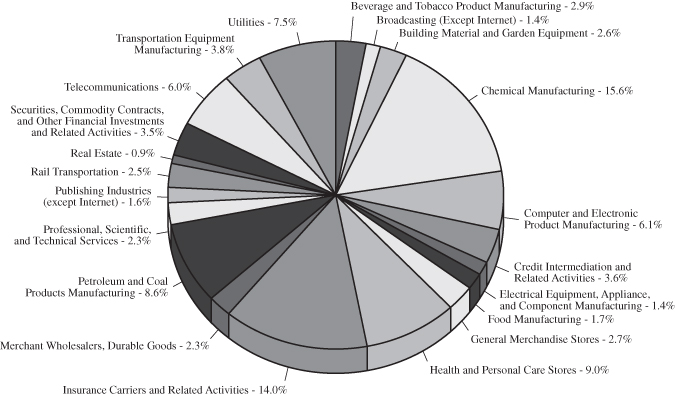
Percentages represent market value as a percentage of total investments.
4
EDGAR LOMAX VALUE FUND
SCHEDULE OF INVESTMENTS at April 30, 2021 (Unaudited)
|
Shares
|
COMMON STOCKS - 94.98%
|
Value
|
|||||
|
Beverage and Tobacco Product Manufacturing - 2.80%
|
|||||||
|
3,850
|
Altria Group, Inc.
|
$
|
183,837
|
||||
|
49,650
|
Coca-Cola Co.
|
2,680,107
|
|||||
|
2,863,944
|
|||||||
|
Broadcasting (except Internet) - 1.38%
|
|||||||
|
25,150
|
Comcast Corp. - Class A
|
1,412,173
|
|||||
|
Building Material and Garden Equipment - 2.44%
|
|||||||
|
5,000
|
Home Depot, Inc.
|
1,618,350
|
|||||
|
4,500
|
Lowe’s Cos., Inc.
|
883,125
|
|||||
|
2,501,475
|
|||||||
|
Chemical Manufacturing - 14.80%
|
|||||||
|
17,700
|
AbbVie, Inc.
|
1,973,550
|
|||||
|
8,700
|
Amgen, Inc.
|
2,084,868
|
|||||
|
9,400
|
Bristol-Myers Squibb Co.
|
586,748
|
|||||
|
7,000
|
Colgate-Palmolive Co.
|
564,900
|
|||||
|
10,450
|
Dow, Inc.
|
653,125
|
|||||
|
9,950
|
Gilead Sciences, Inc.
|
631,526
|
|||||
|
14,100
|
Johnson & Johnson
|
2,294,493
|
|||||
|
35,800
|
Merck & Co., Inc.
|
2,667,100
|
|||||
|
48,952
|
Pfizer, Inc.
|
1,891,995
|
|||||
|
13,600
|
Procter & Gamble Co.
|
1,814,512
|
|||||
|
15,162,817
|
|||||||
|
Computer and Electronic Product Manufacturing - 5.78%
|
|||||||
|
75,950
|
Cisco Systems, Inc.
|
3,866,614
|
|||||
|
18,400
|
Intel Corp.
|
1,058,552
|
|||||
|
5,500
|
Texas Instruments, Inc.
|
992,805
|
|||||
|
5,917,971
|
|||||||
The accompanying notes are an integral part of these financial statements.
5
EDGAR LOMAX VALUE FUND
SCHEDULE OF INVESTMENTS at April 30, 2021 (Unaudited), continued
|
Shares
|
COMMON STOCKS - 94.98%
|
Value
|
|||||
|
Credit Intermediation and Related Activities - 3.39%
|
|||||||
|
13,800
|
Bank of New York Mellon Corp.
|
$
|
688,344
|
||||
|
9,250
|
Capital One Financial Corp.
|
1,378,990
|
|||||
|
9,450
|
Citigroup, Inc.
|
673,218
|
|||||
|
12,400
|
U.S. Bancorp
|
735,940
|
|||||
|
3,476,492
|
|||||||
|
Electrical Equipment, Appliance, and
|
|||||||
|
Component Manufacturing - 1.34%
|
|||||||
|
15,150
|
Emerson Electric Co.
|
1,370,924
|
|||||
|
Food Manufacturing - 1.61%
|
|||||||
|
14,050
|
Kraft Heinz Co.
|
580,125
|
|||||
|
17,600
|
Mondelez International, Inc. - Class A
|
1,070,256
|
|||||
|
1,650,381
|
|||||||
|
General Merchandise Stores - 2.61%
|
|||||||
|
4,000
|
Target Corp.
|
829,040
|
|||||
|
13,150
|
Walmart, Inc.
|
1,839,817
|
|||||
|
2,668,857
|
|||||||
|
Health and Personal Care Stores - 8.57%
|
|||||||
|
58,300
|
CVS Health Corp.
|
4,454,120
|
|||||
|
81,450
|
Walgreens Boots Alliance, Inc.
|
4,324,995
|
|||||
|
8,779,115
|
|||||||
|
Insurance Carriers and Related Activities - 13.28%
|
|||||||
|
33,300
|
Allstate Corp.
|
4,222,440
|
|||||
|
15,450
|
American International Group, Inc.
|
748,552
|
|||||
|
89,950
|
MetLife, Inc.
|
5,723,519
|
|||||
|
2,200
|
Travelers Cos., Inc.
|
340,252
|
|||||
|
6,450
|
UnitedHealth Group, Inc.
|
2,572,260
|
|||||
|
13,607,023
|
|||||||
|
Merchant Wholesalers, Durable Goods - 2.21%
|
|||||||
|
11,500
|
3M Co.
|
2,267,110
|
|||||
The accompanying notes are an integral part of these financial statements.
6
EDGAR LOMAX VALUE FUND
SCHEDULE OF INVESTMENTS at April 30, 2021 (Unaudited), continued
|
Shares
|
COMMON STOCKS - 94.98%
|
Value
|
|||||
|
Petroleum and Coal Products Manufacturing - 8.13%
|
|||||||
|
37,700
|
Chevron Corp.
|
$
|
3,885,739
|
||||
|
12,050
|
ConocoPhillips
|
616,237
|
|||||
|
66,850
|
Exxon Mobil Corp.
|
3,826,494
|
|||||
|
8,328,470
|
|||||||
|
Professional, Scientific, and Technical Services - 2.20%
|
|||||||
|
15,900
|
International Business Machines Corp.
|
2,255,892
|
|||||
|
Publishing Industries (except Internet) - 1.52%
|
|||||||
|
20,500
|
Oracle Corp.
|
1,553,695
|
|||||
|
Rail Transportation - 2.33%
|
|||||||
|
10,750
|
Union Pacific Corp.
|
2,387,468
|
|||||
|
Real Estate - 0.81%
|
|||||||
|
6,850
|
Simon Property Group, Inc.
|
833,919
|
|||||
|
Securities, Commodity Contracts, and Other Financial Investments
|
|||||||
|
and Related Activities - 3.34%
|
|||||||
|
1,000
|
BlackRock, Inc.
|
819,300
|
|||||
|
5,000
|
Goldman Sachs Group, Inc.
|
1,742,250
|
|||||
|
10,350
|
Morgan Stanley
|
854,392
|
|||||
|
3,415,942
|
|||||||
|
Telecommunications - 5.66%
|
|||||||
|
83,800
|
AT&T, Inc.
|
2,632,158
|
|||||
|
54,850
|
Verizon Communications, Inc.
|
3,169,781
|
|||||
|
5,801,939
|
|||||||
|
Transportation Equipment Manufacturing - 3.60%
|
|||||||
|
16,200
|
General Dynamics Corp.
|
3,081,726
|
|||||
|
1,600
|
Lockheed Martin Corp.
|
608,896
|
|||||
|
3,690,622
|
|||||||
The accompanying notes are an integral part of these financial statements.
7
EDGAR LOMAX VALUE FUND
SCHEDULE OF INVESTMENTS at April 30, 2021 (Unaudited), continued
|
Shares
|
COMMON STOCKS - 94.98%
|
Value
|
|||||
|
Utilities - 7.18%
|
|||||||
|
16,300
|
Duke Energy Corp.
|
$
|
1,641,247
|
||||
|
57,100
|
Exelon Corp.
|
2,566,074
|
|||||
|
35,250
|
Kinder Morgan, Inc.
|
601,012
|
|||||
|
11,900
|
NextEra Energy, Inc.
|
922,369
|
|||||
|
24,450
|
Southern Co.
|
1,617,857
|
|||||
|
7,348,559
|
|||||||
|
TOTAL COMMON STOCKS (Cost $90,064,210)
|
97,294,788
|
||||||
|
Total Investments in Securities (Cost $90,064,210) - 94.98%
|
97,294,788
|
||||||
|
Other Assets in Excess of Liabilities - 5.02%
|
5,142,566
|
||||||
|
TOTAL NET ASSETS - 100.00%
|
$
|
102,437,354
|
|||||
The accompanying notes are an integral part of these financial statements.
8
EDGAR LOMAX VALUE FUND
STATEMENT OF ASSETS AND LIABILITIES at April 30, 2021 (Unaudited)
|
ASSETS
|
||||
|
Investments in securities, at value (identified cost $90,064,210)
|
$
|
97,294,788
|
||
|
Receivables
|
||||
|
Investment securities sold
|
5,328,210
|
|||
|
Fund shares sold
|
109,642
|
|||
|
Dividends and interest
|
209,867
|
|||
|
Prepaid expenses
|
16,278
|
|||
|
Total assets
|
102,958,785
|
|||
|
LIABILITIES
|
||||
|
Due to Custodian
|
334,084
|
|||
|
Payables
|
||||
|
Fund shares redeemed
|
55,331
|
|||
|
Administration fees
|
45,028
|
|||
|
Audit fees
|
31,413
|
|||
|
Transfer agent fees and expenses
|
23,407
|
|||
|
Fund accounting fees
|
9,597
|
|||
|
Advisory fees (Note 4)
|
8,139
|
|||
|
Shareholder reporting
|
7,069
|
|||
|
Chief Compliance Officer fee
|
3,689
|
|||
|
Custody fees
|
3,218
|
|||
|
Trustee fees and expenses
|
456
|
|||
|
Total liabilities
|
521,431
|
|||
|
NET ASSETS
|
$
|
102,437,354
|
||
|
CALCULATION OF NET ASSET VALUE PER SHARE
|
||||
|
Net assets applicable to shares outstanding
|
$
|
102,437,354
|
||
|
Shares issued and outstanding
|
||||
|
[unlimited number of shares (par value $0.01) authorized]
|
7,111,200
|
|||
|
Net asset value, offering and redemption price per share
|
$
|
14.41
|
||
|
COMPONENTS OF NET ASSETS
|
||||
|
Paid-in capital
|
$
|
91,192,482
|
||
|
Total distributable income
|
11,244,872
|
|||
|
Net assets
|
$
|
102,437,354
|
||
The accompanying notes are an integral part of these financial statements.
9
EDGAR LOMAX VALUE FUND
STATEMENT OF OPERATIONS – For the six months ended April 30, 2021 (Unaudited)
|
INVESTMENT INCOME
|
||||
|
Dividends
|
$
|
1,703,811
|
||
|
Interest
|
133
|
|||
|
Total investment income
|
1,703,944
|
|||
|
EXPENSES
|
||||
|
Advisory fees (Note 4)
|
269,802
|
|||
|
Administration fees (Note 4)
|
89,663
|
|||
|
Transfer agent fees and expenses (Note 4)
|
43,007
|
|||
|
Fund accounting fees (Note 4)
|
18,642
|
|||
|
Registration fees
|
12,904
|
|||
|
Audit fees
|
10,413
|
|||
|
Custody fees (Note 4)
|
10,189
|
|||
|
Trustee fees and expenses
|
7,478
|
|||
|
Chief Compliance Officer fee (Note 4)
|
7,438
|
|||
|
Reports to shareholders
|
6,045
|
|||
|
Legal fees
|
4,361
|
|||
|
Other expenses
|
2,537
|
|||
|
Insurance expense
|
1,744
|
|||
|
Total expenses
|
484,223
|
|||
|
Less: advisory fee waiver (Note 4)
|
(238,948
|
)
|
||
|
Net expenses
|
245,275
|
|||
|
Net investment income
|
1,458,669
|
|||
|
REALIZED AND UNREALIZED GAIN ON INVESTMENTS
|
||||
|
Net realized gain on investments
|
3,043,529
|
|||
|
Net change in unrealized appreciation/(depreciation) on investments
|
24,818,031
|
|||
|
Net realized and unrealized gain on investments
|
27,861,560
|
|||
|
Net increase in Net Assets Resulting from Operations
|
$
|
29,320,229
|
||
The accompanying notes are an integral part of these financial statements.
10
EDGAR LOMAX VALUE FUND
STATEMENTS OF CHANGES IN NET ASSETS
|
Six Months Ended
|
||||||||
|
April 30, 2021
|
Year Ended
|
|||||||
|
(Unaudited)
|
October 31, 2020
|
|||||||
|
INCREASE/(DECREASE) IN NET ASSETS FROM:
|
||||||||
|
OPERATIONS
|
||||||||
|
Net investment income
|
$
|
1,458,669
|
$
|
3,153,232
|
||||
|
Net realized gain on investments
|
3,043,529
|
11,665,416
|
||||||
|
Net change in unrealized appreciation/(depreciation) on investments
|
24,818,031
|
(33,269,727
|
)
|
|||||
|
Net increase/(decrease) in net assets resulting from operations
|
29,320,229
|
(18,451,079
|
)
|
|||||
|
DISTRIBUTIONS TO SHAREHOLDERS
|
||||||||
|
Total distributions to shareholders
|
(11,248,220
|
)
|
(2,708,829
|
)
|
||||
|
CAPITAL SHARE TRANSACTIONS
|
||||||||
|
Net decrease in net assets derived from
|
||||||||
|
net change in outstanding shares (a)
|
(1,713,983
|
)
|
(11,814,323
|
)
|
||||
|
Total increase/(decrease) in net assets
|
16,358,026
|
(32,974,231
|
)
|
|||||
|
NET ASSETS
|
||||||||
|
Beginning of period
|
86,079,328
|
119,053,559
|
||||||
|
End of period
|
$
|
102,437,354
|
$
|
86,079,328
|
||||
|
(a)
|
A summary of share transactions is as follows:
|
|
Six Months Ended
|
|||||||||||||||||
|
April 30, 2021
|
Year Ended
|
||||||||||||||||
|
(Unaudited)
|
October 31, 2020
|
||||||||||||||||
|
Shares
|
Paid-in Capital
|
Shares
|
Paid-in Capital
|
||||||||||||||
|
Shares sold
|
935,657
|
$
|
12,323,089
|
1,675,203
|
$
|
22,131,221
|
|||||||||||
|
Shares issued on reinvestments of distributions
|
887,808
|
11,195,257
|
182,897
|
2,694,076
|
|||||||||||||
|
Shares redeemed
|
(1,911,726
|
)
|
(25,232,329
|
)
|
(2,863,490
|
)
|
(36,639,620
|
)
|
|||||||||
|
Net decrease
|
(88,261
|
)
|
$
|
(1,713,983
|
)
|
(1,005,390
|
)
|
$
|
(11,814,323
|
)
|
|||||||
The accompanying notes are an integral part of these financial statements.
11
EDGAR LOMAX VALUE FUND
FINANCIAL HIGHLIGHTS
For a share outstanding throughout each period
|
Six Months Ended
|
||||||||||||||||||||||||
|
April 30, 2021
|
Year Ended October 31,
|
|||||||||||||||||||||||
|
(Unaudited)
|
2020
|
2019
|
2018
|
2017
|
2016
|
|||||||||||||||||||
|
Net asset value, beginning of period
|
$
|
11.96
|
$
|
14.51
|
$
|
15.33
|
$
|
15.25
|
$
|
13.00
|
$
|
13.95
|
||||||||||||
|
Income from investment operations:
|
||||||||||||||||||||||||
|
Net investment income
|
0.21
|
0.42
|
0.30
|
0.33
|
0.36
|
0.30
|
||||||||||||||||||
|
Net realized and unrealized
|
||||||||||||||||||||||||
|
gain/(loss) on investments
|
3.82
|
(2.65
|
)
|
0.87
|
1.06
|
2.25
|
0.60
|
|||||||||||||||||
|
Total from investment operations
|
4.03
|
(2.23
|
)
|
1.17
|
1.39
|
2.61
|
0.90
|
|||||||||||||||||
|
Less distributions:
|
||||||||||||||||||||||||
|
From net investment income
|
(0.44
|
)
|
(0.32
|
)
|
(0.31
|
)
|
(0.36
|
)
|
(0.29
|
)
|
(0.35
|
)
|
||||||||||||
|
From net realized
gain on investments |
(1.14
|
)
|
—
|
(1.68
|
)
|
(0.95
|
)
|
(0.07
|
)
|
(1.50
|
)
|
|||||||||||||
|
Total distributions
|
(1.58
|
)
|
(0.32
|
)
|
(1.99
|
)
|
(1.31
|
)
|
(0.36
|
)
|
(1.85
|
)
|
||||||||||||
|
Net asset value, end of period
|
$
|
14.41
|
$
|
11.96
|
$
|
14.51
|
$
|
15.33
|
$
|
15.25
|
$
|
13.00
|
||||||||||||
|
Total return
|
35.57
|
%‡
|
-15.83
|
%
|
9.07
|
%
|
9.44
|
%
|
20.43
|
%
|
7.70
|
%
|
||||||||||||
|
Ratios/supplemental data:
|
||||||||||||||||||||||||
|
Net assets, end of period (thousands)
|
$
|
102,437
|
$
|
86,079
|
$
|
119,054
|
$
|
85,308
|
$
|
81,873
|
$
|
77,809
|
||||||||||||
|
Ratio of expenses to average net assets:
|
||||||||||||||||||||||||
|
Before fees waived and
|
||||||||||||||||||||||||
|
expenses absorbed
|
0.99
|
%†
|
1.01
|
%
|
0.96
|
%
|
1.00
|
%
|
1.06
|
%
|
1.27
|
%
|
||||||||||||
|
After fees waived and
|
||||||||||||||||||||||||
|
expenses absorbed
|
0.50
|
%†
|
0.54
|
%
|
0.70
|
%
|
0.70
|
%
|
0.50
|
%
|
0.64
|
%
|
||||||||||||
|
Ratio of net investment income
|
||||||||||||||||||||||||
|
to average net assets:
|
||||||||||||||||||||||||
|
Before fees waived and
|
||||||||||||||||||||||||
|
expenses absorbed
|
2.48
|
%†
|
2.52
|
%
|
2.10
|
%
|
1.86
|
%
|
1.90
|
%
|
1.73
|
%
|
||||||||||||
|
After fees waived and
|
||||||||||||||||||||||||
|
expenses absorbed
|
2.97
|
%†
|
2.99
|
%
|
2.36
|
%
|
2.16
|
%
|
2.46
|
%
|
2.36
|
%
|
||||||||||||
|
Portfolio turnover rate
|
35.41
|
%‡
|
45.46
|
%
|
23.83
|
%
|
40.62
|
%
|
37.01
|
%
|
56.00
|
%
|
||||||||||||
|
†
|
Annualized
|
|
‡
|
Not Annualized
|
The accompanying notes are an integral part of these financial statements.
12
EDGAR LOMAX VALUE FUND
NOTES TO FINANCIAL STATEMENTS at April 30, 2021 (Unaudited)
NOTE 1 – ORGANIZATION
The Edgar Lomax Value Fund (the “Fund”) is a diversified series of Advisors Series Trust (the “Trust”), which is registered under the Investment Company Act of 1940, as amended, (the “1940 Act”) as
an open-end management investment company. The Fund follows the investment company accounting and reporting guidance of the Financial Accounting Standards Board (“FASB”) Accounting Standard Codification Topic 946 “Financial Services – Investment
Companies.” The Fund’s investment objective is to seek long-term capital growth while providing some income. The Fund began operations on December 12, 1997.
NOTE 2 – SIGNIFICANT ACCOUNTING POLICIES
The following is a summary of significant accounting policies consistently followed by the Fund. These policies are in conformity with accounting principles generally accepted in the United States of
America.
|
A.
|
Security Valuation: All investments in securities are recorded at their estimated fair value, as described in note 3.
|
|
|
B.
|
Federal Income Taxes: It is the Fund’s policy to comply with the requirements of Subchapter M of the Internal Revenue Code applicable to regulated investment companies
and to distribute substantially all of its taxable income to its shareholders. Therefore, no Federal income or excise tax provision is required.
|
|
|
The Fund recognizes the tax benefits of uncertain tax positions only where the position is “more likely than not” to be sustained assuming examination by tax authorities. The tax returns of the Fund’s prior
three fiscal years are open for examination. Management has reviewed all open tax years in major jurisdictions and has concluded that no liability for unrecognized tax benefits should be recorded related to uncertain tax positions taken or
expected to be taken on a tax return. The Fund identifies its major tax jurisdictions as U.S. Federal and the state of Wisconsin. The Fund is not aware of any tax positions for which it is reasonably possible that the total amounts of
unrecognized tax benefits will change materially in the next twelve months.
|
||
|
C.
|
Securities Transactions, Income and Distributions: Securities transactions are accounted for on the trade date. Realized gains and losses on securities sold are
determined on a first-in, first-out basis. Interest income is recorded on an accrual basis. Dividend income, income and capital gain distributions from underlying funds, and distributions to shareholders are recorded on the ex-dividend
date.
|
|
|
Common expenses of the Trust are typically allocated among the funds in the Trust based on a fund’s respective net assets, or by other equitable means.
|
||
|
The Fund distributes substantially all net investment income, if any, and net realized gains, if any, annually. Distributions from net realized gains for book purposes may include short-term capital gains.
All short-term capital gains are included in ordinary income for tax purposes.
|
||
|
The amount of dividends and distributions to shareholders from net investment income and net realized capital gains is determined in accordance with Federal income tax regulations, which differs from accounting
principles generally accepted in the United States of America. To the extent these book/tax differences are permanent, such amounts are reclassified within the capital accounts based on their Federal tax treatment.
|
13
EDGAR LOMAX VALUE FUND
NOTES TO FINANCIAL STATEMENTS at April 30, 2021 (Unaudited), continued
|
D.
|
Reclassification of Capital Accounts: Accounting principles generally accepted in the United States of America require that certain components of net assets relating to
permanent differences be reclassified between financial and tax reporting. These reclassifications have no effect on net assets or net asset value per share.
|
|
|
E.
|
Use of Estimates: The preparation of financial statements in conformity with accounting principles generally accepted in the United States of America requires management
to make estimates and assumptions that affect the reported amounts of assets and liabilities at the date of the financial statements and the reported amounts of increases and decreases in net assets during the reporting period. Actual results
could differ from those estimates.
|
|
|
F.
|
Events Subsequent to the Fiscal Period End: In preparing the financial statements as of April 30, 2021, management considered the impact of subsequent events for the
potential recognition or disclosure in the financial statements. Management has determined there were no subsequent events that would need to be disclosed in the Fund’s financial statements.
|
NOTE 3 – SECURITIES VALUATION
The Fund has adopted authoritative fair value accounting standards which establish an authoritative definition of fair value and set out a hierarchy for measuring fair value. These standards require
additional disclosures about the various inputs and valuation techniques used to develop the measurements of fair value, a discussion in changes in valuation techniques and related inputs during the period and expanded disclosure of valuation levels
for major security types. These inputs are summarized in the three broad levels listed below:
|
Level 1 –
|
Unadjusted quoted prices in active markets for identical assets or liabilities that the Fund has the ability to access.
|
|
|
Level 2 –
|
Observable inputs other than quoted prices included in level 1 that are observable for the asset or liability, either directly or indirectly. These inputs may include quoted prices for the identical instrument
on an inactive market, prices for similar instruments, interest rates, prepayment speeds, credit risk, yield curves, default rates and similar data.
|
|
|
Level 3 –
|
Unobservable inputs for the asset or liability, to the extent relevant observable inputs are not available, representing the Fund’s own assumptions about the assumptions a market participant would use in
valuing the asset or liability, and would be based on the best information available.
|
Following is a description of the valuation techniques applied to the Fund’s major categories of assets and liabilities measured at fair value on a recurring basis.
The Fund determines the fair value of its investments and computes its net asset value per share as of the close of regular trading on the New York Stock Exchange (4:00 pm EST).
Equity Securities: The Fund’s investments are carried at fair value. Securities that are primarily traded on a national securities exchange shall be valued at
the last sale price on the exchange on which they are primarily traded on the day of valuation or, if there has been no sale on such day, at the mean between the bid and asked prices. Securities primarily traded in the NASDAQ Global Market System
for which market quotations are readily available shall be valued using the NASDAQ Official Closing Price (“NOCP”). If the NOCP is not available, such securities shall be valued at the last sale price on the day of valuation, or if there has been no
sale on such day, at the mean
14
EDGAR LOMAX VALUE FUND
NOTES TO FINANCIAL STATEMENTS at April 30, 2021 (Unaudited), continued
between the bid and asked prices. Over-the-counter securities which are not traded in the NASDAQ Global Market System shall be valued at the most recent sales price. To the extent these securities are actively traded
and valuation adjustments are not applied, they are categorized in level 1 of the fair value hierarchy.
Investment Companies: Investments in open-end mutual funds, including money market funds, are generally priced at their net asset value per share provided by
the service agent of the funds and will be classified in level 1 of the fair value hierarchy.
Short-Term Securities: Short-term debt securities, including those securities having a maturity of 60 days or less, are valued at the evaluated mean between
the bid and asked prices. To the extent the inputs are observable and timely, these securities would be classified in level 2 of the fair value hierarchy.
The Board of Trustees (“Board”) has delegated day-to-day valuation issues to a Valuation Committee of the Trust which is comprised of representatives from the Fund’s administrator, U.S. Bancorp Fund
Services, LLC, doing business as U.S. Bank Global Fund Services (“Fund Services”). The function of the Valuation Committee is to value securities where current and reliable market quotations are not readily available or the closing price does not
represent fair value by following procedures approved by the Board. These procedures consider many factors, including the type of security, size of holding, trading volume and news events. All actions taken by the Valuation Committee are
subsequently reviewed and ratified by the Board.
Depending on the relative significance of the valuation inputs, fair valued securities may be classified in either level 2 or level 3 of the fair value hierarchy.
The inputs or methodology used for valuing securities are not an indication of the risk associated with investing in those securities. The following is a summary of the inputs used to value the
Fund’s securities as of April 30, 2021:
|
Level 1
|
Level 2
|
Level 3
|
Total
|
||||||||||||||
|
Common Stocks
|
|||||||||||||||||
|
Finance and Insurance
|
$
|
19,120,467
|
$
|
—
|
$
|
—
|
$
|
19,120,467
|
|||||||||
|
Information
|
5,598,026
|
—
|
—
|
5,598,026
|
|||||||||||||
|
Management of Companies and Enterprises
|
1,378,990
|
—
|
—
|
1,378,990
|
|||||||||||||
|
Manufacturing
|
36,750,263
|
—
|
—
|
36,750,263
|
|||||||||||||
|
Mining, Quarrying, and Oil and Gas Extraction
|
616,237
|
—
|
—
|
616,237
|
|||||||||||||
|
Professional, Scientific, and Technical Services
|
2,255,892
|
—
|
—
|
2,255,892
|
|||||||||||||
|
Real Estate and Rental and Leasing
|
833,919
|
—
|
—
|
833,919
|
|||||||||||||
|
Retail Trade
|
21,004,967
|
—
|
—
|
21,004,967
|
|||||||||||||
|
Transportation and Warehousing
|
2,387,468
|
—
|
—
|
2,387,468
|
|||||||||||||
|
Utilities
|
7,348,559
|
—
|
—
|
7,348,559
|
|||||||||||||
|
Total Common Stocks
|
97,294,788
|
—
|
—
|
97,294,788
|
|||||||||||||
|
Total Investments in Securities
|
$
|
97,294,788
|
$
|
—
|
$
|
—
|
$
|
97,294,788
|
|||||||||
Refer to the Fund’s schedule of investments for a detailed break-out of common stocks by industry classification.
15
EDGAR LOMAX VALUE FUND
NOTES TO FINANCIAL STATEMENTS at April 30, 2021 (Unaudited), continued
The global outbreak of COVID-19 (commonly referred to as “coronavirus”) has disrupted economic markets and the prolonged economic impact is uncertain. The ultimate economic fallout from the pandemic,
and the long-term impact on economies, markets, industries and individual issuers, are not known. The operational and financial performance of the issuers of securities in which the Fund invests depends on future developments, including the duration
and spread of the outbreak, and such uncertainty may in turn adversely affect the value and liquidity of the Fund’s investments, impair the Fund’s ability to satisfy redemption requests, and negatively impact the Fund’s performance.
NOTE 4 – INVESTMENT ADVISORY FEE AND OTHER TRANSACTIONS WITH AFFILIATES
The Edgar Lomax Company (the “Advisor”) provides the Fund with investment management services under an investment advisory agreement. The Advisor furnishes all investment advice, office space,
facilities, and provides most of the personnel needed by the Fund. As compensation for its services, the Advisor is entitled to a monthly fee at the annual rate of 0.55% based upon the average daily net assets of the Fund. Additionally, the Advisor
has agreed to voluntarily waive a portion of its management fee and pay certain Fund expenses such that “Total Annual Fund Operating Expenses” will decline to 0.50% for underperformance versus the S&P 500® Value Index during either the 3-year or 5-year period. While this voluntary management fee waiver can be discontinued at any time, the Advisor has no intention of doing so. For the six months ended April
30, 2021, the Fund incurred $269,802 in advisory fees, of which the Advisor voluntarily waived $24,528 resulting in net advisory fees of $245,274 before expense limitation waivers. This excludes additional voluntarily waived expenses of $73,582.
The Fund is responsible for its own operating expenses. The Advisor has contractually agreed to reduce fees payable to it by the Fund and to pay Fund operating expenses to the extent necessary to
limit Total Annual Fund Operating Expenses (excluding acquired fund fees and expenses, interest, taxes and extraordinary expenses) to 0.70% of average daily net assets. If the Advisor waives advisory fees under the arrangement described above, it has
also agreed to absorb all expenses, other than advisory fees. For the six months ended April 30, 2021, the Fund’s aggregate annual operating expenses were reduced to 0.50% of the Fund’s average daily net assets, including contractual expense limits.
Any such reduction made by the Advisor in its fees or payment of expenses which are the Fund’s obligation are subject to reimbursement by the Fund to the Advisor, if so requested by the Advisor, in any subsequent month in the 36-month period from the
date of the management fee reduction and expense payment if the aggregate amount actually paid by the Fund towards the operating expenses for such fiscal year (taking into account the reimbursement) will not cause the Fund to exceed the lesser of:
(1) the expense limitation in place at the time of the management fee reduction and expense payment; or (2) the expense limitation in place at the time of the reimbursement. Any such reimbursement is also contingent upon the Board’s review and
approval at the time the reimbursement is made. Such reimbursement may not be paid prior to the Fund’s payment of current ordinary operating expenses. For the six months ended April 30, 2021, excluding amounts voluntarily waived, the Advisor reduced
its fees and absorbed Fund expenses in the amount of $140,838; no amounts were reimbursed to the Advisor. The Advisor may recapture portions of the amounts shown below no later than the corresponding dates:
16
EDGAR LOMAX VALUE FUND
NOTES TO FINANCIAL STATEMENTS at April 30, 2021 (Unaudited), continued
|
Expires
|
Amount
|
||||
|
10/31/2021
|
$
|
124,325
|
|||
|
10/31/2022
|
280,759
|
||||
|
10/31/2023
|
322,112
|
||||
|
4/30/2024
|
140,838
|
||||
|
$
|
868,034
|
||||
Fund Services serves as the Fund’s administrator, fund accountant and transfer agent. U.S. Bank N.A. serves as the custodian (the “Custodian”) to the Fund. The Custodian is an affiliate of Fund
Services. Fund Services maintains the Fund’s books and records, calculates the Fund’s NAV, prepares various federal and state regulatory filings, coordinates the payment of fund expenses, reviews expense accruals and prepares materials supplied to
the Board. The officers of the Trust and the Chief Compliance Officer are also employees of Fund Services. Fees paid by the Fund for administration and accounting, transfer agency, custody and compliance services for the six months ended April 30,
2021 are disclosed in the Statement of Operations.
Quasar Distributors, LLC (“Quasar”) acts as the Fund’s principal underwriter in a continuous public offering of the Fund’s shares. Quasar is a wholly-owned broker-dealer subsidiary of Foreside
Financial Group, LLC.
The Fund has entered into agreements with various brokers, dealers and financial intermediaries to compensate them for transfer agent services that would otherwise be executed by Fund Services.
These sub-transfer agent services include pre-processing and quality control of new accounts, maintaining detailed shareholder account records, shareholder correspondence, answering customer inquiries regarding account status, and facilitating
shareholder telephone transactions. The Fund expensed $31,020 of sub-transfer agent fees during the six months ended April 30, 2021. These fees are included in the transfer agent fees and expenses amount indicated in the Statement of Operations.
NOTE 5 – PURCHASES AND SALES OF SECURITIES
For the six months ended April 30, 2021, the cost of purchases and the proceeds from sales of securities, excluding short-term securities, were $33,121,457 and $48,697,519, respectively. There were
no purchases or sales of long-term U.S. Government securities.
NOTE 6 – INCOME TAXES AND DISTRIBUTIONS TO SHAREHOLDERS
The tax character of distributions paid during the six months ended April 30, 2021 and the year ended October 31, 2020 were as follows:
|
Six Months Ended
|
Year Ended
|
|||||||
|
April 30, 2021
|
October 31, 2020
|
|||||||
|
Net investment income
|
$
|
3,122,859
|
$
|
2,708,829
|
||||
|
Long-term capital gains
|
8,125,361
|
—
|
||||||
17
EDGAR LOMAX VALUE FUND
NOTES TO FINANCIAL STATEMENTS at April 30, 2021 (Unaudited), continued
As of October 31, 2020, the Fund’s most recent fiscal year end, the components of accumulated earnings/(losses) on a tax basis were as follows:
|
Cost of investments (a)
|
$
|
103,629,043
|
||
|
Gross tax unrealized appreciation
|
4,899,018
|
|||
|
Gross tax unrealized depreciation
|
(22,512,633
|
)
|
||
|
Net tax unrealized depreciation (a)
|
(17,613,615
|
)
|
||
|
Undistributed ordinary income
|
2,661,117
|
|||
|
Undistributed long-term capital gain
|
8,125,361
|
|||
|
Total distributable earnings
|
10,786,478
|
|||
|
Total accumulated earnings/(losses)
|
$
|
(6,827,137
|
)
|
|
(a)
|
The difference between book-basis and tax-basis net unrealized depreciation is attributable primarily to the tax deferral of losses on wash sales. |
18
EDGAR LOMAX VALUE FUND
NOTICE TO SHAREHOLDERS at April 30, 2021 (Unaudited)
How to Obtain a Copy of the Fund’s Proxy Voting Policies
A description of the policies and procedures that the Fund uses to determine how to vote proxies relating to portfolio securities is available without charge upon request by calling 1-866-205-0524 or
on the U.S. Securities and Exchange Commission’s website at http://www.sec.gov.
How to Obtain a Copy of the Fund’s Proxy Voting Records for the 12-Month Period Ended June 30
Information regarding how the Fund voted proxies relating to portfolio securities during the most recent 12-month period ended June 30 is available without charge, upon request, by calling
1-866-205-0524. Furthermore, you can obtain the Fund’s proxy voting records on the SEC’s website at http://www.sec.gov.
Quarterly Filings on Form N-PORT
The Fund files its complete schedule of portfolio holdings with the SEC for the first and third quarters of each fiscal year on Part F of Form N-PORT. The Fund’s Form N-PORT is available on the
SEC’s website at http://www.sec.gov. Information included in the Fund’s Form N-PORT is also available by calling 1-866-205-0524.
HOUSEHOLDING (Unaudited)
In an effort to decrease costs, the Fund will reduce the number of duplicate prospectuses, supplements, and certain other shareholder documents that you receive by sending only one copy of each to
those addresses shown by two or more accounts. Please call the Fund’s transfer agent toll free at 1-866-205-0524 to request individual copies of these documents. The Fund will begin sending individual copies 30 days after receiving your request. This
policy does not apply to account statements.
19
EDGAR LOMAX VALUE FUND
APPROVAL OF INVESTMENT ADVISORY AGREEMENT (Unaudited)
At meetings held on October 19-20 and December 10-11, 2020, the Board (which is comprised of four persons, all of whom are Independent Trustees as defined under the Investment Company Act of 1940, as
amended), considered and approved, for another annual term, the continuance of the investment advisory agreement (the “Advisory Agreement”) between Advisors Series Trust (the “Trust”) and The Edgar Lomax Company (the “Advisor”) on behalf of the Edgar
Lomax Value Fund (the “Fund”). At both meetings, the Board received and reviewed substantial information regarding the Fund, the Advisor and the services provided by the Advisor to the Fund under the Advisory Agreement. This information, together
with the information provided to the Board throughout the course of the year, formed the primary (but not exclusive) basis for the Board’s determinations. Below is a summary of the factors considered by the Board and the conclusions that formed the
basis for the Board’s approval of the continuance of the Advisory Agreement:
|
1.
|
THE NATURE, EXTENT AND QUALITY OF THE SERVICES PROVIDED AND TO BE PROVIDED BY THE ADVISOR UNDER THE ADVISORY AGREEMENT. The Board considered the nature, extent and quality of the Advisor’s overall services
provided to the Fund, as well as its specific responsibilities in all aspects of day-to-day investment management of the Fund. The Board considered the qualifications, experience and responsibilities of the portfolio managers, as well as the
responsibilities of other key personnel of the Advisor involved in the day-to-day activities of the Fund. The Board also considered the resources and compliance structure of the Advisor, including information regarding its compliance
program, its chief compliance officer and the Advisor’s compliance record, as well as the Advisor’s cybersecurity program, liquidity risk management program, business continuity plan, and risk management process. Additionally, the Board
considered how the Advisor’s business continuity plan has operated during the recent COVID-19 pandemic. The Board further considered the prior relationship between the Advisor and the Trust, as well as the Board’s knowledge of the Advisor’s
operations, and noted that during the course of the prior year they had met with certain personnel of the Advisor in person or by videoconference to discuss the Fund’s performance and investment outlook as well as various marketing and
compliance topics. The Board concluded that the Advisor had the quality and depth of personnel, resources, investment processes and compliance policies and procedures essential to performing its duties under the Advisory Agreement and that
they were satisfied with the nature, overall quality and extent of such management services.
|
|
|
2.
|
THE FUND’S HISTORICAL PERFORMANCE AND THE OVERALL PERFORMANCE OF THE ADVISOR. In assessing the quality of the portfolio management delivered by the Advisor, the Board reviewed the short-term and long-term
performance of the Fund as of June 30, 2020, on both an absolute basis and in comparison to its peer funds utilizing Morningstar classifications, appropriate securities market benchmarks, and the Advisor’s similarly managed accounts. While
the Board considered both short-term and long-term performance, it placed greater emphasis on longer term performance. When reviewing performance against the comparative peer group universe, the Board took into account that the investment
objectives and strategies of the Fund, as well as its level of risk tolerance, may differ significantly from funds in the peer universe. When reviewing the Fund’s performance against broad market benchmarks, the Board took into account the
differences in portfolio construction between the Fund and such benchmarks as well as other differences between actively managed funds and passive benchmarks, such as objectives and risks. In
|
20
EDGAR LOMAX VALUE FUND
APPROVAL OF INVESTMENT ADVISORY AGREEMENT (Unaudited), continued
|
assessing periods of relative underperformance or outperformance, the Board took into account that relative performance can be significantly impacted by performance measurement periods and that some periods of
underperformance may be transitory in nature while others may reflect more significant underlying issues.
|
||
|
The Board noted that the Fund underperformed the peer group median of its Morningstar comparative universe for the one-year period and outperformed for the three-year, five-year and ten-year periods ended
June 30, 2020.
|
||
|
The Board reviewed the performance of the Fund against broad-based securities market benchmarks noting that it had underperformed its primary benchmark index for the one-, three-, five-, and ten-year periods
ended June 30, 2020. The Board also noted that the Fund underperformed its secondary benchmark index for the one-, three-, five, and ten-year periods ended June 30, 2020. The Fund additionally underperformed its tertiary benchmark index for
the one- and three-year periods and outperformed for the five- and ten-year periods ended June 30, 2020.
|
||
|
The Board also considered any differences in performance between the Advisor’s separately managed accounts and the performance of the Fund, noting that the Fund outperformed the similarly managed composite for
the one-year period and underperformed the similarly managed account composite for the three-, five-, and ten-year periods ended June 30, 2020.
|
||
|
3.
|
THE COSTS OF THE SERVICES TO BE PROVIDED BY THE ADVISOR AND THE STRUCTURE OF THE ADVISOR’S FEE UNDER THE ADVISORY AGREEMENT. In considering the advisory fee and total expenses of the Fund, the Board reviewed
comparisons to the peer funds and the Advisor’s similarly managed accounts for other types of clients, as well as all expense waivers and reimbursements for the Fund. When reviewing fees charged to other separately managed accounts, the
Board took into account the type of account and the differences in the management of that account that might be germane to the difference, if any, in the fees charged to such accounts.
|
|
|
The Board noted that the Advisor had contractually agreed to limit the annual expense ratio for the Fund to no more than 0.70% (the “Expense Cap”). Additionally, the Board noted that the Advisor had
voluntarily agreed to waive a portion of its advisory fees in the event, at the end of any month, the Fund’s trailing three-year and/or five-year average annual total return was less than that of a specific index. The Board noted that the
Fund’s total expense ratio was below its peer group median and average both within the broader universe of peers and among a narrower peer group, adjusted to include only funds with similar asset sizes. Additionally, the Board considered
that the contractual advisory fee was below the peer group median and average. The Board additionally noted that the contractual advisory fee was also below the median and average among a narrower peer group adjusted to include only funds
with similar asset sizes. The Board also considered that after advisory fee waivers and the reimbursement of Fund expenses necessary to maintain the Expense Cap, in addition to the voluntary expense limitation which was in effect during
portions of the period, the advisory fees received from the Fund were below the peer group median and average as of the year ended June 30, 2020.
|
21
EDGAR LOMAX VALUE FUND
APPROVAL OF INVESTMENT ADVISORY AGREEMENT (Unaudited), continued
|
The Board also considered the services the Advisor provided to its separately managed account clients, comparing the fees charged for those management services to the management fees charged to the Fund. The
Board found that the management fees charged to the Fund were in some cases higher than the fees charged to the Advisor’s similarly managed account clients due to the increased services provided to the Fund.
|
||
|
The Board determined that it would continue to monitor the appropriateness of the advisory fee for the Fund and concluded that, at this time, the fee to be paid to the Advisor was fair and reasonable.
|
||
|
4.
|
ECONOMIES OF SCALE. The Board also considered whether economies of scale were being realized by the Advisor that should be shared with shareholders. The Board further noted that the Advisor has contractually
agreed to reduce its advisory fees or reimburse Fund expenses so that the Fund does not exceed the specified Expense Cap. The Board noted that at current asset levels, it did not appear that there were additional significant economies of
scale being realized by the Advisor that should be shared with shareholders and concluded that it would continue to monitor economies of scale in the future as circumstances changed and assuming asset levels continue to increase.
|
|
|
5.
|
THE PROFITS TO BE REALIZED BY THE ADVISOR AND ITS AFFILIATES FROM THEIR RELATIONSHIP WITH THE FUND. The Board reviewed the Advisor’s financial information and took into account both the direct benefits and the
indirect benefits to the Advisor from advising the Fund. The Board considered the profitability to the Advisor from its relationship with the Fund and considered any additional material benefits derived by the Advisor from its relationship
with the Fund, such as “soft dollar” benefits that may be received in exchange for Fund brokerage. The Board also considered that the Fund does not charge Rule 12b-1 fees. The Board also reviewed information regarding fee offsets for
separate accounts invested in the Fund and determined that the Advisor was not receiving an advisory fee both at the separate account and at the Fund level for these accounts, and as a result was not receiving additional fall-out benefits
from these relationships. After such review, the Board determined that the profitability to the Advisor with respect to the Advisory Agreement was not excessive, and that the Advisor had maintained adequate resources and profit levels to
support the services it provides to the Fund.
|
No single factor was determinative of the Board’s decision to approve the continuance of the Advisory Agreement for the Fund, but rather the Trustees based their determination on the total mix of
information available to them. Based on a consideration of all the factors in their totality, the Trustees determined that the advisory arrangement with the Advisor, including the advisory fees, was fair and reasonable to the Fund. The Board,
including a majority of the Independent Trustees, therefore determined that the continuance of the Advisory Agreement for the Fund would be in the best interest of the Fund and its shareholders.
22
EDGAR LOMAX VALUE FUND
PRIVACY NOTICE
The Fund collects non-public information about you from the following sources:
|
•
|
Information we receive about you on applications or other forms;
|
|
•
|
Information you give us orally; and/or
|
|
•
|
Information about your transactions with us or others.
|
We do not disclose any non-public personal information about our customers or former customers without the customer’s authorization, except as permitted by law or in response to inquiries from governmental authorities.
We may share information with affiliated and unaffiliated third parties with whom we have contracts for servicing the Fund. We will provide unaffiliated third parties with only the information necessary to carry out their assigned responsibilities.
We maintain physical, electronic and procedural safeguards to guard your non-public personal information and require third parties to treat your personal information with the same high degree of confidentiality.
In the event that you hold shares of the Fund through a financial intermediary, including, but not limited to, a broker-dealer, bank, or trust company, the privacy policy of your financial intermediary would govern how
your non-public personal information would be shared by those entities with unaffiliated third parties.
23
Advisor
The Edgar Lomax Company
5971 Kingstowne Village Parkway, Suite 240
Alexandria, VA 22315
www.edgarlomax.com
Distributor
Quasar Distributors, LLC
111 East Kilbourn Avenue, Suite 2200
Milwaukee, WI 53202
Custodian
U.S. Bank N.A.
1555 North RiverCenter Drive, Suite 302
Milwaukee, WI 53212
Transfer Agent
U.S. Bank Global Fund Services
615 East Michigan Street
Milwaukee, WI 53202
1-866-205-0524
Independent Registered
Public Accounting Firm
Tait, Weller & Baker LLP
Two Liberty Place
50 South 16th Street, Suite 2900
Philadelphia, PA 19102
Legal Counsel
Sullivan & Worcester LLP
1633 Broadway, 32nd Floor
New York, NY 10019
This report is intended for the shareholders of the Fund and may not be used as sales literature unless preceded or accompanied by a current prospectus. To obtain a free prospectus please call 1-866-205-0524.
ED-SEMI
(b) Not applicable
Item 2. Code of Ethics.
Not applicable for semi-annual reports.
Item 3. Audit Committee Financial Expert.
Not applicable for semi-annual reports.
Item 4. Principal Accountant Fees and Services.
Not applicable for semi-annual reports.
Item 5. Audit Committee of Listed Registrants.
|
(a)
|
Not applicable to registrants who are not listed issuers (as defined in Rule 10A-3 under the Securities Exchange Act of 1934).
|
|
(b)
|
Not applicable.
|
Item 6. Investments.
|
(a)
|
Schedule of Investments is included as part of the report to shareholders filed under Item 1 of this Form.
|
|
(b)
|
Not Applicable.
|
Item 7. Disclosure of Proxy Voting Policies and Procedures for Closed-End Management Investment Companies.
Not applicable to open-end investment companies.
Item 8. Portfolio Managers of Closed-End Management Investment Companies.
Not applicable to open-end investment companies.
Item 9. Purchases of Equity Securities by Closed‑End Management Investment Company and Affiliated Purchasers.
Not applicable to open-end investment companies.
Item 10. Submission of Matters to a Vote of Security Holders.
There have been no material changes to the procedures by which shareholders may recommend nominees to the Registrant’s Board of Trustees.
Item 11. Controls and Procedures.
|
(a)
|
The Registrant’s President/Chief Executive Officer/Principal Executive Officer and Vice President/Treasurer/Principal Financial Officer have reviewed the Registrant's disclosure controls and procedures (as defined in Rule 30a-3(c)
under the Investment Company Act of 1940, as amended, (the “Act”)) as of a date within 90 days of the filing of this report, as required by Rule 30a-3(b) under the Act and Rules 13a-15(b) or 15d‑15(b) under the Securities Exchange Act of
1934. Based on their review, such officers have concluded that the disclosure controls and procedures are effective in ensuring that information required to be disclosed in this report is appropriately recorded, processed, summarized and
reported and made known to them by others within the Registrant and by the Registrant’s service provider.
|
|
(b)
|
There were no changes in the Registrant's internal control over financial reporting (as defined in Rule 30a-3(d) under the Act) that occurred during the period covered by this report that have materially affected, or are reasonably
likely to materially affect, the Registrant's internal control over financial reporting.
|
Item 12. Disclosure of Securities Lending Activities for Closed-End Management Investment Companies.
Not applicable to open-end investment companies.
Item 13. Exhibits.
|
(a)
|
(1) Any code of ethics or amendment thereto, that is the subject of the disclosure required by Item 2, to the extent that the registrant intends to satisfy Item 2 requirements through filing an
exhibit. Not Applicable.
|
(3) Any written solicitation to purchase securities under Rule 23c‑1 under the Act sent or given during the period covered by the report by or on behalf of the registrant to 10 or
more persons. Not applicable to open-end investment companies.
(4) Change in the registrant’s independent public accountant. There was no change in the registrant’s independent public accountant for the period covered by this report.
SIGNATURES
Pursuant to the requirements of the Securities Exchange Act of 1934 and the Investment Company Act of 1940, as amended, the registrant has duly caused this report to be signed on its behalf by the undersigned,
thereunto duly authorized.
(Registrant) Advisors Series Trust
By (Signature and Title)* /s/ Jeffrey T. Rauman
Jeffrey T. Rauman, President/Chief Executive
Officer/Principal Executive Officer
Date 7/8/2021
Pursuant to the requirements of the Securities Exchange Act of 1934 and the Investment Company Act of 1940, as amended, this report has been signed below by the following persons on behalf of the registrant and in the
capacities and on the dates indicated.
By (Signature and Title)* /s/ Jeffrey T. Rauman
Jeffrey T. Rauman, President/Chief Executive
Officer/Principal Executive Officer
Date 7/8/2021
By (Signature and Title)* /s/ Cheryl L. King
Cheryl L. King, Vice President/Treasurer/Principal
Financial Officer
Date 7/8/2021
* Print the name and title of each signing officer under his or her signature