UNITED STATES
SECURITIES AND EXCHANGE COMMISSION
Washington, D.C. 20549
SECURITIES AND EXCHANGE COMMISSION
Washington, D.C. 20549
FORM N-CSR
CERTIFIED SHAREHOLDER REPORT OF REGISTERED
MANAGEMENT INVESTMENT COMPANIES
Investment Company Act file number 811-07959
Advisors Series Trust
(Exact name of registrant as specified in charter)
(Exact name of registrant as specified in charter)
615 East Michigan Street
Milwaukee, WI 53202
(Address of principal executive offices) (Zip code)
(Address of principal executive offices) (Zip code)
Jeffrey T. Rauman, President/Chief Executive Officer
Advisors Series Trust
c/o U.S. Bancorp Fund Services, LLC
777 East Wisconsin Avenue, 10th Floor
Milwaukee, WI 53202
(Name and address of agent for service)
(Name and address of agent for service)
(414) 765-6872
(Registrant's telephone number, including area code)
Date of fiscal year end: September 30, 2018
Date of reporting period: September 30, 2018
Item 1. Reports to Stockholders.
SCHARF FUNDS
Scharf Fund
Institutional Class – LOGIX
Retail Class – LOGRX
Scharf Balanced Opportunity Fund
Institutional Class – LOGOX
Retail Class – LOGBX
Scharf Global Opportunity Fund
Retail Class – WRLDX
Scharf Alpha Opportunity Fund
Retail Class – HEDJX
ANNUAL REPORT
September 30, 2018
Scharf Investments, LLC
SCHARF FUNDS
TABLE OF CONTENTS
|
To Our Shareholders
|
2
|
|
|
Investment Highlights
|
12
|
|
|
Expense Examples
|
18
|
|
|
Sector Allocation of Portfolio Assets
|
21
|
|
|
Schedules of Investments
|
25
|
|
|
Statements of Assets and Liabilities
|
42
|
|
|
Statements of Operations
|
46
|
|
|
Statements of Changes in Net Assets
|
48
|
|
|
Statement of Cash Flows
|
54
|
|
|
Financial Highlights
|
55
|
|
|
Notes to Financial Statements
|
61
|
|
|
Report of Independent Registered Public Accounting Firm
|
82
|
|
|
Notice to Shareholders
|
83
|
|
|
Information about Trustees and Officers
|
85
|
|
|
Householding
|
88
|
|
|
Privacy Notice
|
89
|
SCHARF FUNDS
TO OUR SHAREHOLDERS
|
PERFORMANCE AS OF 9/30/2018
|
||||||
|
SCHARF FUND
|
||||||
|
Since
|
Since
|
|||||
|
6
|
One
|
Three
|
Five
|
Inception
|
Inception
|
|
|
Cumulative:
|
Months
|
Year
|
Year
|
Year
|
12/30/2011
|
1/28/2015
|
|
Scharf Fund – Institutional Class
|
8.05%
|
8.93%
|
30.16%
|
59.24%
|
116.08%
|
N/A
|
|
Scharf Fund – Retail Class
|
7.83%
|
8.58%
|
29.02%
|
N/A
|
N/A
|
26.89%
|
|
S&P 500® Index
|
11.41%
|
17.91%
|
61.43%
|
92.10%
|
166.96%
|
57.08%
|
|
(with dividends reinvested)
|
||||||
|
Annualized:
|
||||||
|
Scharf Fund – Institutional Class
|
—
|
—
|
9.19%
|
9.75%
|
12.08%
|
N/A
|
|
Scharf Fund – Retail Class
|
—
|
—
|
8.86%
|
N/A
|
N/A
|
6.70%
|
|
S&P 500® Index
|
—
|
—
|
17.31%
|
13.95%
|
15.65%
|
13.09%
|
|
(with dividends reinvested)
|
||||||
|
SCHARF BALANCED OPPORTUNITY FUND
|
||||||
|
Since
|
Since
|
|||||
|
6
|
One
|
Three
|
Five
|
Inception
|
Inception
|
|
|
Cumulative:
|
Months
|
Year
|
Year
|
Year
|
12/31/2012
|
1/21/2016
|
|
Scharf Balanced Opportunity
|
||||||
|
Fund – Institutional Class
|
5.70%
|
6.32%
|
22.43%
|
41.46%
|
60.03%
|
N/A
|
|
Scharf Balanced Opportunity
|
||||||
|
Fund – Retail Class
|
5.56%
|
6.00%
|
N/A
|
N/A
|
N/A
|
24.77%
|
|
Lipper Balanced Funds Index
|
4.23%
|
6.91%
|
30.00%
|
42.16%
|
56.87%
|
33.36%
|
|
(with dividends reinvested)
|
||||||
|
Bloomberg Barclays U.S.
|
||||||
|
Aggregate Bond Index
|
-0.14%
|
-1.22%
|
3.99%
|
11.28%
|
9.18%
|
3.64%
|
|
S&P 500® Index
|
||||||
|
(with dividends reinvested)
|
11.41%
|
17.91%
|
61.43%
|
92.10%
|
130.13%
|
64.77%
|
|
Annualized:
|
||||||
|
Scharf Balanced Opportunity
|
||||||
|
Fund – Institutional Class
|
—
|
—
|
6.98%
|
7.18%
|
8.52%
|
N/A
|
|
Scharf Balanced Opportunity
|
||||||
|
Fund – Retail Class
|
—
|
—
|
N/A
|
N/A
|
N/A
|
8.56%
|
|
Lipper Balanced Funds Index
|
—
|
—
|
9.14%
|
7.29%
|
8.15%
|
11.29%
|
|
(with dividends reinvested)
|
||||||
|
Bloomberg Barclays U.S.
|
||||||
|
Aggregate Bond Index
|
—
|
—
|
1.31%
|
2.16%
|
1.54%
|
1.34%
|
|
S&P 500® Index
|
||||||
|
(with dividends reinvested)
|
—
|
—
|
17.31%
|
13.95%
|
15.60%
|
20.37%
|
2
SCHARF FUNDS
|
SCHARF GLOBAL OPPORTUNITY FUND
|
|||||
|
Since
|
|||||
|
6
|
One
|
Three
|
Inception
|
||
|
Cumulative:
|
Months
|
Year
|
Year
|
10/14/2014
|
|
|
Scharf Global Opportunity Fund
|
9.48%
|
11.72%
|
41.85%
|
47.12%
|
|
|
MSCI All Country World Index (Net)
|
4.83%
|
9.77%
|
45.82%
|
42.84%
|
|
|
Annualized:
|
|||||
|
Scharf Global Opportunity Fund
|
—
|
—
|
12.34%
|
10.24%
|
|
|
MSCI All Country World Index (Net)
|
—
|
—
|
13.40%
|
9.42%
|
|
|
SCHARF ALPHA OPPORTUNITY FUND
|
|||||
|
Since
|
|||||
|
6
|
One
|
Inception
|
|||
|
Cumulative:
|
Months
|
Year
|
12/31/2015
|
||
|
Scharf Alpha Opportunity Fund
|
2.66%
|
0.79%
|
2.06%
|
||
|
HFRX Equity Hedge Index
|
-2.05%
|
1.79%
|
9.09%
|
||
|
Bloomberg Barclays U.S. Aggregate Bond Index
|
-0.14%
|
-1.22%
|
4.58%
|
||
|
S&P 500® Index (with dividends reinvested)
|
11.41%
|
17.91%
|
50.81%
|
||
|
Annualized:
|
|||||
|
Scharf Alpha Opportunity Fund
|
—
|
—
|
0.74%
|
||
|
HFRX Equity Hedge Index
|
—
|
—
|
3.22%
|
||
|
Bloomberg Barclays U.S. Aggregate Bond Index
|
—
|
—
|
1.64%
|
||
|
S&P 500® Index (with dividends reinvested)
|
—
|
—
|
16.11%
|
||
Performance data quoted represents past performance; past performance does not guarantee future results. The investment return and principal value of an investment will fluctuate so that an investor’s shares, when redeemed, may be worth more or less than their original cost. Current performance of the Funds may be lower or higher than the performance quoted. Performance data current to the most recent month end may be obtained by calling 1-866-572-4273.
The gross expense ratios, as of the Funds’ registration statement dated January 28, 2018, for the Scharf Fund Institutional Class, Scharf Fund Retail Class, Scharf Balanced Opportunity Fund Institutional Class, Scharf Balanced Opportunity Fund Retail Class, Scharf Global Opportunity Fund, and Scharf Alpha Opportunity Fund are 1.14%, 1.39%, 1.52%, 1.77%, 1.97%, and 3.20%, respectively. The net expense ratios, as of the Funds’ registration statement dated January 28, 2018, for the Scharf Fund Institutional Class, Scharf Fund Retail Class, Scharf Fund Scharf Balanced Opportunity Fund Institutional Class, Scharf Balanced Opportunity Fund Retail Class, Scharf Global Opportunity Fund, and Scharf Alpha Opportunity Fund represent the percentages paid by investors and are 1.01%, 1.26%, 1.02%, 1.27%, 0.71%, and 2.18%, respectively, after fee waivers and expense reimbursements, including acquired fund fees and expenses, interest, taxes and extraordinary expenses. Scharf Investments, LLC (the “Adviser”), the Funds’ investment adviser, has contractually agreed to waive fees through January 27, 2019 for the Scharf Fund, Scharf Balanced Opportunity Fund, Scharf Global Opportunity Fund, and Scharf Alpha Opportunity Fund. The Scharf Fund charges a 2.00% redemption fee on redemptions or exchanges of fund shares that are made within 60 days of purchase. The Scharf Balanced Opportunity Fund, Scharf Global Opportunity Fund, and Scharf Alpha Opportunity Fund charge a 2.00% redemption fee on redemptions or exchanges of fund shares that are made within 15 days of purchase. Had a redemption fee been included, returns would be lower.
3
SCHARF FUNDS
Dear Fellow Shareholders,
For the fiscal year ended September 30, 2018, the Scharf Fund Institutional Class and Retail Class returned 8.93% and 8.58%, respectively, compared to the 17.91% return for the S&P 500® Index (“S&P 500”). The key contributors to relative performance for the period were Microsoft Corp., Advance Auto Parts, Inc., Motorola Solutions, Inc., and Apple, Inc. The key detractors from relative performance were Sodexo SA, Allergan plc, CDK Global, Inc., and Comcast Corp.
For the fiscal year ended September 30, 2018, the Scharf Balanced Opportunity Fund (effective November 1, 2018, known as the Scharf Multi-Asset Opportunity Fund) Institutional Class and Retail Class returned 6.32% and 6.00%, respectively, compared to the 6.91% return for the Lipper Balanced Funds Index, -1.22% return for the Bloomberg Barclays U.S. Aggregate Bond Index, and 17.91% return for the S&P 500. The key contributors to relative performance for the period were Microsoft Corp., Advance Auto Parts, Inc. (“Advance Auto Parts”), Motorola Solutions, Inc., and Apple, Inc. The key detractors from relative performance were Sodexo SA, Allergan plc, CDK Global, Inc., and McKesson Corp. (“McKesson”).
For the fiscal year ended September 30, 2018, the Scharf Global Opportunity Fund returned 11.72% compared to the 9.77% return for the MSCI All Country World Index (Net). The key contributors to relative performance for the period were Advance Auto Parts, Inc., Microsoft Corp., Sherwin-Williams Co., and Sony Corp. The key detractors from relative performance were Sodexo SA, CDK Global, Inc., Allergan plc, and McKesson Corp.
For the fiscal year ended September 30, 2018, the Scharf Alpha Opportunity Fund returned 0.79% compared to the 1.79% return for the HFRX Equity Hedge Index, -1.22% return for the Bloomberg Barclays U.S. Aggregate Bond Index, and 17.91% return for the S&P 500. The key contributors to relative performance for the period were Microsoft Corp., Advance Auto Parts, Inc., Motorola Solutions, Inc., and Sherwin-Williams Co. The key detractors from relative performance were Sodexo SA, CDK Global, Inc., Dollar Tree, Inc., and Allergan plc.
It is hard to believe a decade has passed since the Global Financial Crisis had investors staring into the financial abyss. With unprecedented low interest rates and monetary stimulus since, a rising tide lifted all boats, but passive U.S. indices, growth and momentum stocks floated the highest. While momentum stocks may currently be in favor, our philosophy is rooted in the principle that it is safer and more profitable over the long-run to buy companies with a history of consistent earnings growth trading at a discount to their fair value. This approach will lead to periods of underperformance, especially in the later stages of a bull market. However, we do not worry about short-term stock sentiment if we believe the company’s long-term earnings power is intact. Fundamentally, we believe the market is overvaluing potential future earnings (e.g. growth stocks) and undervaluing actual current earnings (e.g. value stocks). We recognize that the past few years have been tough on a relative basis for the Scharf Funds but we remain vigilant in our attempt to construct portfolios exhibiting consistent earnings growth at favorable prices.
MARKET COMMENTARY
Surviving the Amazon Effect: In a momentum driven market, investors have become quick to dump a stock based on speculation or short-term factors while ignoring the company’s longer-term potential. One such example of this, which negatively impacted several of our stocks in mid-2018, was the announcement of Amazon’s acquisition of PillPack. An online and mail order pharmacy which charges a premium to ship pre-packaged doses of medicine, PillPack
4
SCHARF FUNDS
has a small subscriber base of roughly 50,000 (<0.0% market share). To put this into perspective, CVS Health Corp. (“CVS”) has roughly 25% market share and filled approximately 1.2 billion prescriptions in 2017. While no one should doubt the ability of Amazon to disrupt an industry, we remain skeptical that the purchase of a company with little market share or scale will have a significant near-term impact on the highly regulated and complex pharmacy industry. It took Walmart, the last significant competitor in drug retail, more than a decade to establish just a 5% market share despite its $4 generic drug promotion and high volume of daily customers. In addition, CVS and Walgreens Boots Alliance, Inc. (“Walgreens”) currently have mail order and multi-dose drug dispensing capabilities in place, but both companies have indicated that customers overwhelmingly elect to pick up their prescriptions in-store when presented with the option of mail order.
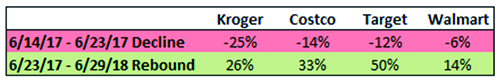
Walgreens, which reported strong earnings the same day as the PillPack announcement, declined roughly 10% on the news. CVS and McKesson also saw large declines. A similar story played out for the shares of supermarket companies when Amazon bought Whole Foods Market in June of 2017. Kroger, for example, was down roughly 25% a week after the announcement. More diverse retailers with grocery businesses also got punished as Costco, Target and Walmart declined 14%, 12% and 6%, respectively. These declines were short lived though as shares of the companies rebounded nicely over the following twelve months.
Grocery Stock Prices Slump then Rebound after Whole Foods Acquisition
|
Source: Bloomberg
|
It’s not just pharmacies and grocery stores that have come under siege. In fact, it is difficult to think of an industry that hasn’t been impacted by fears of an Amazon entry. After increasing reports early last year that Amazon was trying to move deeper into the auto parts segment, shares of auto parts retailers embarked on a slow and steady decline. Current Scharf stock, Advance Auto Parts, was our worst performing stock last year. This Amazon-induced selloff was clearly overdone as shares subsequently rebounded more than 100% off the lows, making it our best performing stock this year. While the stock still hasn’t returned to its all-time highs, this example illustrates the profound distinction between price and value. Prices are arbitrary and can deviate from value, often to a large degree, but over time they should converge. By maintaining a longer-term view and ignoring price volatility, we are able to buy businesses at a discount to their fair value. As successful value investor Preston Athey once said, “One thing you can do as a value investor is to arbitrage time and to recognize that you’re going to be early, but if you get the right price, it all works out in the end.”
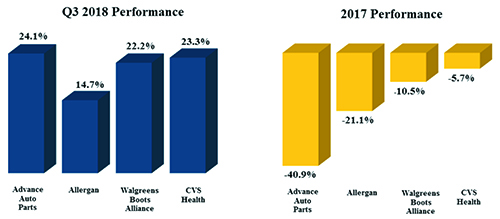
Revenge of the Downtrodden: While growth and momentum stocks continued to power forward this past quarter, we are starting to see signs in our own portfolio that indicate investors are recognizing the value in unfairly beaten up names selling at a discount to the market. The worst performing stocks in the Scharf Fund last year, for example, are among our best performers this most recent quarter.
5
SCHARF FUNDS
|
Source: Bloomberg. Performance quoted is stock performance and doesn’t represent gains/losses for Scharf Fund portfolios. Includes stocks that were owned in the Scharf Fund for all of 2017 and were still owned as of 9/30/2018.
|
Is sentiment finally starting to shift? If interest rates continue to rise, we believe this could be the case. Growth stocks, whose valuations are predicated on the potential for strong long-term earnings, tend to do well in low interest rate environments when the time value of money is low and growth is at a premium. Why is this the case? Imagine you had the option of $1 today or $1.25 five years from now. At a 0% rate of interest you would be wise to wait to receive the higher sum. If, however, you could invest $1 at a risk-free rate of 5% per year, you would have $1.28 in five years and would be smarter to take $1 today. In this way, investors ascribe a lower multiple to stocks, and growth stocks in particular, as rates rise. Thus, a rising rate environment tends to favor stocks trading at lower valuations. Just last week, as the 10-year treasury yield hit its highest mark since 2011, stocks across the board fell with technology shares leading the charge. With the Federal Reserve (“Fed”) on track for more rate increases in coming months, we believe higher multiple stocks could come under further pressure as investors seek safety in those trading at more attractive valuations.
S&P Priced for Unrealistic Future Growth: Now ten years into this current bull market, it is quite remarkable that the S&P just had its best quarter since the fourth quarter of 2013. Investors seemed to shrug off fears about inflation and tariffs and instead focused on the strong economy and robust corporate profits. Second quarter gross domestic product (“GDP’) growth was above 4% and roughly 80% of U.S. companies exceeded analyst earnings expectations, growing earnings 25% on a year-over-year basis. While these numbers were certainly cheered by investors, it is important to remember that they were largely propped up by fiscal stimulus and corporate friendly tax reform.
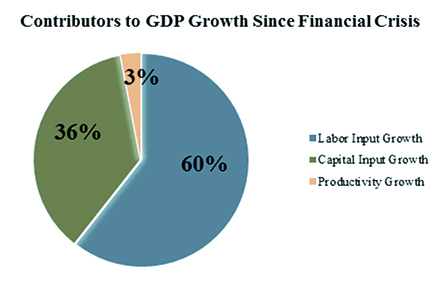
Going forward, there is reason to believe these numbers may not look as rosy. One quarter does not make a year, and despite the 4% GDP growth achieved in Q2, full year growth is expected to come in at just 3%. This is better than recent history but lower than the long-run average of 3.2%. Over the last 25 years, GDP growth has actually declined. Labor input growth, capital input growth, and productivity growth, the three contributors to GDP growth, have all failed to keep up with the levels achieved during the technology powered 1990s. Since the financial crisis, most of the recovery in GDP growth can be attributed to labor input growth (hiring) while productivity growth has been almost nonexistent.
6
SCHARF FUNDS
|
Source: Bernstein Research
|
As the economy runs out of workers, the largest piece of the above pie could shrink considerably. There are now under 6 million unemployed workers, and there are not enough unemployed job seekers available to fill demand for 7 million U.S. job offerings. A sign of the times: Amazon just raised their minimum wage by 36% from $11 to $15 an hour.
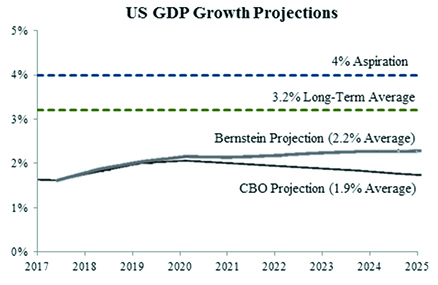
The Congressional Budget Office (“CBO”), which puts out a regular report with GDP growth projections, expects economic growth to be relatively strong this year and next but expects average growth over the next 10 years to come in at just 1.9%. Even with more aggressive assumptions of productivity growth in line with the late 1990s tech boom, GDP growth should only come in at 2.2%, according to a recent analysis from Bernstein Research. Many market participants, on the other hand, are unrealistically pricing in long term growth of 3-4% with some even calling for 5-6%.
|
Source: CBO and Bernstein U.S. Economic Analysis
|
With below average GDP growth going forward, it is difficult to imagine corporate earnings growth keeping pace with the strong double-digit gains of late. In fact, current projections call for markedly lower EPS growth rates over the next 4 quarters despite CBO expectations of strong economic growth up until 2020.
Global Financial Crisis Anniversary: September 15, 2018, marked the 10th Anniversary of the fall of Lehman Brothers. What initially began with falling house prices quickly morphed into a full blown financial panic. Federal Reserve Chairman, Ben Bernanke, and Treasury
7
SCHARF FUNDS
Secretary, Hank Paulsen, warned we might slide into a 1930’s style Great Depression without drastic action. In response, Congress quickly passed an emergency bank bailout, followed by bailouts of AIG, General Motors, Freddie Mac, and Fannie Mae.
The Federal Reserve reduced short-term rates to zero and kept them below inflation for nearly a decade. They also adopted an unconventional approach called Quantitative Easing, or QE, designed to lower long-term interest rates. In an effort to prop up the economy and the financial system, the Fed purchased an incredible $4.5 trillion in treasuries and mortgages. Did these unprecedented and experimental actions work? To that we have to say a resounding – Maybe!
Just as markets were overcome with fear ten years ago, today we are at the opposite end of the pendulum. Unemployment peaked at 10%, but today is near a 50-year low. Similarly, the Consumer Confidence Index is near all-time highs last reached on January 2000, a time of euphoria over the “New Economy” and the peak of the internet bubble. Whereas a decade ago stocks were in freefall, we are now in the longest continuous bull market in history. Even more amazing, we are less than a year away from this being the longest running economic expansion in history.
On the negative side, rates are too low by historical standards and the Federal Reserve still owns trillions of dollars in bonds purchased under QE. As a result, we expect them to raise rates by at least 0.25% every 3 months for the foreseeable future. While the economy should be able to handle rising rates, nobody knows for sure. QE was an untested experiment with unknown long-term ramifications. The unwinding of QE, as well as other similar programs in Europe and Japan, is not something that has been done before. To remove trillions of dollars of stimulus without any disruption to the global economy is no easy task. It might be akin to trying to hit a Nolan Ryan fastball down 0-2 in the count, it can be done, but the results are rarely positive.
The unwinding of QE could cause all sorts of disruptions in the global economy. One potential outcome is if short-term rates rise above long-term rates, an anomaly known as an “inverted yield curve.” Over the past 60 years, inverted yield curves have provided reliable warning signals of an upcoming economic slowdown. If this occurs, that would be an omen the sun is setting on this record-breaking bull market and economic expansion.
INVESTMENT STRATEGY
While we are always mindful of how economic conditions and current events impact companies, we continue to focus the bulk of our research on fundamental research and independent company analysis to identify securities which we believe are trading at significant discounts to fair value. The median stock in our portfolio currently has 61% upside to its historical median high P/E. We use a bottom-up, valuation-oriented strategy because stocks with low valuation ratios have often outperformed stocks with higher valuation ratios over the long term. By purchasing securities when they appear to be at a discount to fair value, we also hope to mitigate potential downside risk. In addition, the firm maintains a limited number of portfolios, favoring quality over quantity. We focus only on our best ideas as we believe owning too many stocks is counterproductive to enhancing risk/reward. Finally, we are style box agnostic and search for compelling investments in companies large and small, foreign and domestic. To that end, we are optimistic about the current portfolios and believe the Funds are well positioned for long-term investors.
8
SCHARF FUNDS
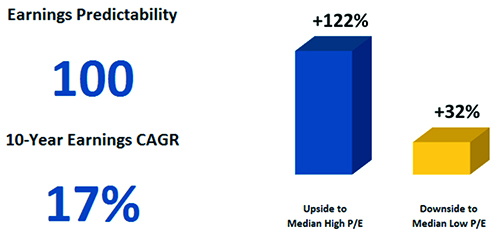
As an example, Starbucks Corp., (“Starbucks”) the dominant specialty coffee company in the U.S., has a proven track record of growth with high returns on capital and a very strong balance sheet. The iconic coffee company was an early adopter of technology in mobile payments and ordering and maintains a substantial lead over other restaurant chains. Starbucks is already very successful in China, with over 3,000 stores, but the growth opportunity there is enormous with management expecting China to be their biggest market someday. For comparison, the Americas segment has roughly 17,000 stores. Starbucks has an earnings predictability score of 100 and has compounded EPS at 17% over the last 10 years. As shown below, Starbucks recently traded below its median low P/E with 122% upside to its median high.
|
High Quality
|
Starbucks Favorability
|
|
Source: Value Line, Scharf Investments, LLC. Data as of 9/30/2018.
|
|
|
CAGR = Compound Annual Growth Rate
|
IN CLOSING
For over 30 years, Scharf Investments, LLC has operated as an independent, employee-owned firm dedicated to providing the highest quality investment management services. During this time, the firm has established a track record based on a disciplined investment approach. That approach continues today with the Scharf Fund, the Scharf Multi-Asset Opportunity Fund, the Scharf Global Opportunity Fund, and the Scharf Alpha Opportunity Fund.
One of our core beliefs has always been that our personal interests should be aligned with those of our clients. As such, every member of our investment committee is invested alongside our clients. On a personal level, as the first and one of the largest individual shareholders in each of the Funds, my family has a significant interest in the Funds’ success. As a shareholder, I hope you take comfort in the knowledge that having our own money invested alongside yours will be a powerful motivator to sharpen our focus.
We thank you for the trust and confidence you have placed in us. We welcome your comments and questions.

Brian Krawez
President and Portfolio Manager
9
SCHARF FUNDS
Mutual fund investing involves risk. Principal loss is possible. The Scharf Alpha Opportunity Fund is non-diversified, meaning it may concentrate its assets in fewer individual holdings than a diversified fund. Therefore, the Scharf Alpha Opportunity Fund is more exposed to volatility than a diversified fund. Diversification does not assure a profit, nor does it protect against a loss in a declining market. The Funds may invest in securities representing equity or debt. These securities may be issued by small- and medium-sized companies, which involve additional risks such as limited liquidity and greater volatility. The Funds may invest in foreign securities which involve greater volatility, political, economic and currency risks, and differences in accounting methods. These risks are greater for emerging markets. The Funds may invest in exchange-traded fund (“ETFs”) or mutual funds, the risks of owning either generally reflecting the risks of owning the underlying securities held by the ETF or mutual fund. The Funds follows an investment style that favors relatively low valuations. Investment in debt securities typically decrease in value when interest rates rise. This risk is usually greater for longer-term debt securities. Investment in lower-rated, non-rated and distressed securities presents a greater risk of loss to principal and interest than higher-rated securities. The Scharf Alpha Opportunity Fund may make short sales of securities, which involves the risk that losses may exceed the original amount invested. The Scharf Alpha Opportunity Fund may use leverage which may exaggerate the effect of any increase or decrease in the value of portfolio securities or the net asset value of the Fund, and money borrowed will be subject to interest costs.
Forward earnings and EPS Growth are not measures of the Fund’s future performance.
The S&P 500® Index is a broad based unmanaged index of 500 stocks, which is widely recognized as representative of the equity market in general.
The Lipper Balanced Funds Index is an index of open-end mutual funds whose primary objective is to conserve principal by maintaining at all times a balanced portfolio of both equities and bonds.
The Bloomberg Barclays U.S. Aggregate Bond Index is a broad-based benchmark that measures the investment grade, U.S. dollar-denominated, fixed-rate taxable bond market, including Treasuries, government related and corporate securities.
MSCI All Country World Index (Net) is a broad measure of stock performance throughout the world, with the exception of U.S. based companies.
The HFRX Equity Hedge Index encompasses various equity hedge strategies, also known as long/short equity, that combine core long holdings of equities with short sales of stock, stock indices, related derivatives, or other financial instruments related to the equity markets.
You cannot invest directly in an index.
Earnings Per Share (“EPS”) is the portion of a company’s profit allocated to each outstanding share of common stock and serves as an indicator of a company’s profitability.
Price to Earnings Ratio (P/E) is a valuation ratio of a company’s current share price compared to its per-share earnings. Upside to historical median P/E and downside to historical median P/E are terms used to describe the adviser’s estimated reward and risk of an individual security.
Earnings Growth is the percentage change in a firm’s earnings per share (EPS) over a specific period of time.
Value Line is an independent investment research and financial publishing firm.
Gross Domestic Product (“GDP”) represents the monetary value of all goods and services produced within a nation’s geographic borders over a specified period of time.
The Consumer Confidence Index measures the degree of optimism about the state of the economy that consumers are expressing through their activities of saving and spending.
10
SCHARF FUNDS
The information provided herein represents the opinion of the Funds’ manager, is subject to change at any time, is not guaranteed and should not be considered investment advice.
The Funds’ holdings and sector allocations are subject to change at any time and should not be considered recommendations to buy or sell any security. Please refer to the Schedule of Investments in this report for a complete list of Fund holdings.
Must be preceded or accompanied by a prospectus.
The Scharf Funds are distributed by Quasar Distributors, LLC.
11
SCHARF FUND
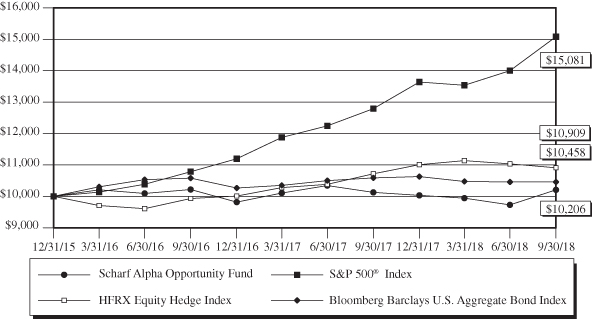
Comparison of the change in value of a hypothetical $10,000 investment
in the Scharf Fund – Institutional Class vs. the S&P 500® Index
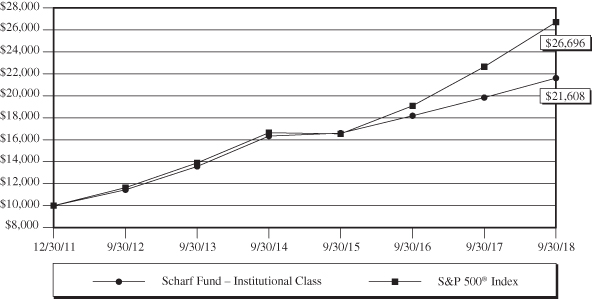
Average Annual Total Return for the Periods Ended 9/30/2018:
|
Since
|
Since
|
|||
|
Inception
|
Inception
|
|||
|
1 year
|
5 year
|
(12/30/11)
|
(1/28/15)
|
|
|
Scharf Fund – Institutional Class1
|
8.93%
|
9.75%
|
12.08%
|
—
|
|
Scharf Fund – Retail Class2
|
8.58%
|
—
|
—
|
6.70%
|
|
S&P 500® Index
|
17.91%
|
13.95%
|
15.65%
|
13.09%
|
Performance data quoted on this page represents past performance and does not guarantee future results. The investment return and principal value of an investment will fluctuate so that an investor’s shares, when redeemed, may be worth more or less than their original cost. Current performance of the Fund may be lower or higher than the performance quoted. Performance data current to the most recent month end may be obtained by calling 1-866-572-4273 (1-866-5SCHARF).
Returns reflect reinvestment of dividends and capital gains distributions. Fee waivers are in effect. In the absence of fee waivers, returns would be reduced. The performance data and graph do not reflect the deduction of taxes that a shareholder would pay on dividends, capital gains distributions, or redemption of Fund shares. The performance data and graph do not reflect the 2.00% redemption fee imposed on shares held 60 days or less. Indices do not incur expenses and are not available for investment.
The S&P 500® Index is an unmanaged capitalization-weighted index of 500 stocks designed to represent the broad domestic economy.
1 The Fund commenced operations on December 30, 2011.
2 The Fund commenced operations on January 28, 2015.
12
SCHARF BALANCED OPPORTUNITY FUND
Comparison of the change in value of a hypothetical $10,000 investment in
the Scharf Balanced Opportunity Fund vs. the Lipper Balanced Funds Index,
the S&P 500® Index, and the Bloomberg Barclays U.S. Aggregate Bond Index
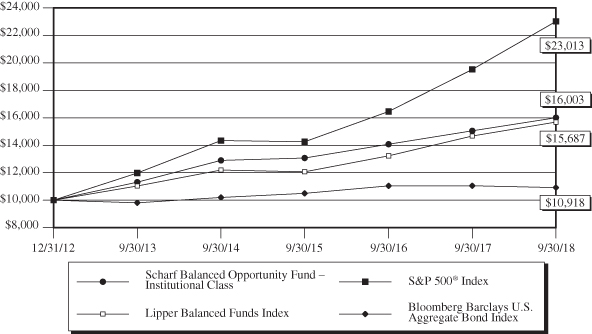
Average Annual Total Return for the Periods Ended 9/30/2018:
|
Since
|
Since
|
|||
|
Inception
|
Inception
|
|||
|
1 year
|
5 year
|
(12/31/12)
|
(1/12/16)
|
|
|
Scharf Balanced Opportunity Fund –
|
||||
|
Institutional Class1
|
6.32%
|
7.18%
|
8.52%
|
—
|
|
Scharf Balanced Opportunity Fund –
|
||||
|
Retail Class2
|
6.00%
|
—
|
—
|
8.56%
|
|
S&P 500® Index
|
17.91%
|
13.95%
|
15.60%
|
20.37%
|
|
Bloomberg Barclays U.S.
|
||||
|
Aggregate Bond Index
|
-1.22%
|
2.16%
|
1.54%
|
1.34%
|
|
Lipper Balanced Funds Index
|
6.91%
|
7.29%
|
8.15%
|
11.29%
|
Performance data quoted on this page represents past performance and does not guarantee future results. The investment return and principal value of an investment will fluctuate so that an investor’s shares, when redeemed, may be worth more or less than their original cost. Current performance of the Fund may be lower or higher than the performance quoted. Performance data current to the most recent month end may be obtained by calling 1-866-572-4273 (1-866-5SCHARF).
Returns reflect reinvestment of dividends and capital gains distributions. Fee waivers are in effect. In the absence of fee waivers, returns would be reduced. The performance data and graph do not reflect the deduction of taxes that a shareholder would pay on
13
SCHARF BALANCED OPPORTUNITY FUND
dividends, capital gains distributions, or redemption of Fund shares. The performance data and graph do not reflect the 2.00% redemption fee imposed on shares held 15 days or less. Indices do not incur expenses and are not available for investment.
The S&P 500® Index is an unmanaged capitalization-weighted index of 500 stocks designed to represent the broad domestic economy.
The Lipper Balanced Funds Index is an equally weighted index of the 30 largest U.S. balanced funds.
The Bloomberg Barclays U.S. Aggregate Bond Index is a broad based benchmark that measures the investment grade, U.S. dollar-denominated, fixed-rate taxable bond market, including Treasuries, government related and corporate securities.
1 The Fund commenced operations on December 31, 2012.
2 The Fund commenced operations on January 21, 2016.
14
SCHARF GLOBAL OPPORTUNITY FUND
Comparison of the change in value of a hypothetical $10,000 investment in the
Scharf Global Opportunity Fund vs. the MSCI World All Country Index (Net)
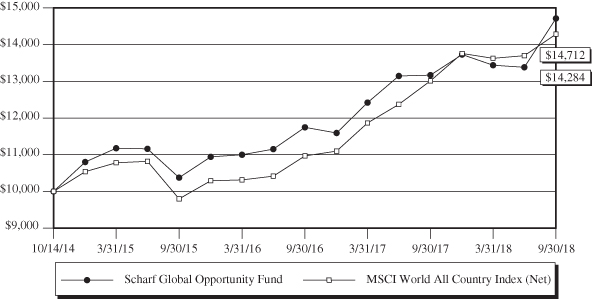
Average Annual Total Return for the Periods Ended 9/30/2018:
|
1 year
|
3 year
|
Since Inception1
|
|
|
Scharf Global Opportunity Fund
|
11.72%
|
12.34%
|
10.24%
|
|
MSCI World All Country Index (Net)
|
9.77%
|
13.40%
|
9.42%
|
Performance data quoted on this page represents past performance and does not guarantee future results. The investment return and principal value of an investment will fluctuate so that an investor’s shares, when redeemed, may be worth more or less than their original cost. Current performance of the Fund may be lower or higher than the performance quoted. Performance data current to the most recent month end may be obtained by calling 1-866-572-4273 (1-866-5SCHARF).
Returns reflect reinvestment of dividends and capital gains distributions. Fee waivers are in effect. In the absence of fee waivers, returns would be reduced. The performance data and graph do not reflect the deduction of taxes that a shareholder would pay on dividends, capital gains distributions, or redemption of Fund shares. The performance data and graph do not reflect the 2.00% redemption fee imposed on shares held 15 days or less. Indices do not incur expenses and are not available for investment.
The MSCI World All Country Index (Net) captures large and mid cap representation across 23 Developed Markets (DM) and 23 Emerging Markets (EM) countries. Net total return indexes reinvest dividends after the deduction of withholding taxes, using a tax rate appliable to non-resident institutional investors who do not benefit from double taxation treaties.
1 The Fund commenced operations on October 14, 2014.
15
SCHARF ALPHA OPPORTUNITY FUND
Comparison of the change in value of a hypothetical $10,000 investment in
the Scharf Alpha Opportunity Fund vs. the HFRX Equity Hedge Index,
the S&P 500® Index, and the Bloomberg Barclays U.S. Aggregate Bond Index
Cumulative Total Return for the Period Ended 9/30/2018:
|
1 year
|
Since Inception1
|
|
|
Scharf Alpha Opportunity Fund
|
0.79%
|
0.74%
|
|
HFRX Equity Hedge Index
|
1.79%
|
3.22%
|
|
Bloomberg Barclays U.S. Aggregate Bond Index
|
-1.22%
|
1.64%
|
|
S&P 500® Index
|
17.91%
|
16.11%
|
Performance data quoted on this page represents past performance and does not guarantee future results. The investment return and principal value of an investment will fluctuate so that an investor’s shares, when redeemed, may be worth more or less than their original cost. Current performance of the Fund may be lower or higher than the performance quoted. Performance data current to the most recent month end may be obtained by calling 1-866-572-4273 (1-866-5SCHARF).
Returns reflect reinvestment of dividends and capital gains distributions. Fee waivers are in effect. In the absence of fee waivers, returns would be reduced. The performance data and graph do not reflect the deduction of taxes that a shareholder would pay on dividends, capital gains distributions, or redemption of Fund shares. The performance data and graph do not reflect the 2.00% redemption fee imposed on shares held 15 days or less. Indices do not incur expenses and are not available for investment.
The HFRX Equity Hedge Index encompasses various equity hedge strategies, also known as long/short equity, that combine core long holdings of equities with short sales of stock, stock indices, related derivatives, or other financial instruments related to the equity markets.
16
SCHARF ALPHA OPPORTUNITY FUND
The S&P 500® Index is an unmanaged capitalization-weighted index of 500 stocks designed to represent the broad domestic economy.
The Bloomberg Barclays U.S. Aggregate Bond Index is a broad based benchmark that measures the investment grade, U.S. dollar-denominated, fixed-rate taxable bond market, including Treasuries, government related and corporate securities.
1 The Fund commenced operations on December 31, 2015.
17
SCHARF FUNDS
EXPENSE EXAMPLES at September 30, 2018 (Unaudited)
Shareholders in mutual funds generally incur two types of costs: (1) transaction costs, including sales charges (loads) on purchase payments, redemption fees, and exchange fees; and (2) ongoing costs, including management fees, distribution and/or service fees, and other fund expenses. The Scharf Fund, Scharf Balanced Opportunity Fund, Scharf Global Opportunity Fund, and the Scharf Alpha Opportunity Fund are no-load mutual funds. These Examples are intended to help you understand your ongoing costs (in dollars) of investing in the Funds and to compare these costs with the ongoing costs of investing in other mutual funds. The Example is based on an investment of $1,000 invested in the Scharf Fund, the Scharf Balanced Opportunity Fund, the Scharf Global Opportunity Fund, and the Scharf Alpha Opportunity Fund at the beginning of the period and held for the entire period (4/1/18-9/30/18).
Actual Expenses
The first line of each table below provides information about actual account values and actual expenses, with actual net expenses being limited. Effective January 28, 2018, per the operating expense limitation agreement, the actual net expenses are being limited to 0.99%, and 1.24%, for the Scharf Fund Institutional Class and Retail Class, respectively, and 0.70% for the Scharf Global Opportunity Fund. Prior to January 28, 2018, the Scharf Fund’s actual net expenses for the Institutional Class and Retail Class were limited to 1.09% and 1.34%, respectively, and 0.65% for the Scharf Global Opportunity Fund. Per the operating expense limitation agreement, the actual net expenses are being limited to 0.98% and 1.23% for the Scharf Balanced Opportunity Fund Institutional Class and Retail Class, respectively, and 1.00% for the Scharf Alpha Opportunity Fund. Although the Funds charge no sales load or transaction fees, you will be assessed fees for outgoing wire transfers, returned checks, and stop payment orders at prevailing rates charged by U.S. Bancorp Fund Services, LLC, the Funds’ transfer agent. The Examples below include, but are not limited to, management fees, fund accounting, custody and transfer agent fees. You may use the information in the first line of the tables, together with the amount you invested, to estimate the expenses that you paid over the period. Simply divide your account value by $1,000 (for example, an $8,600 account value divided by $1,000 = 8.6), then multiply the result by the number in the first line under the heading entitled “Expenses Paid During Period” to estimate the expenses you paid on your account during this period.
Hypothetical Example for Comparison Purposes
The second line of each table below provides information about hypothetical account values and hypothetical expenses based on the Funds’ actual expense ratio and an assumed rate of return of 5% per year before expenses, which is not the Funds’ actual return. The hypothetical account values and expenses may not be used to estimate the actual ending account balance or expenses you paid for the period. You may use this information to compare the ongoing costs of investing in the Funds and other funds.
18
SCHARF FUNDS
EXPENSE EXAMPLES at September 30, 2018 (Unaudited), Continued
To do so, compare this 5% hypothetical example with the 5% hypothetical examples that appear in the shareholder reports of the other funds. Please note that the expenses shown in the tables are meant to highlight your ongoing costs only and will not help you determine the relative total costs of owning different funds, as they may charge transaction costs, such as sales charges (loads), redemption fees, or exchange fees.|
Beginning
|
Ending
|
Expenses Paid
|
Annualized
|
|
|
Account Value
|
Account Value
|
During Period*
|
Expense
|
|
|
Scharf Fund
|
4/1/18
|
9/30/18
|
4/1/18-9/30/18
|
Ratio*
|
|
Institutional Class
|
||||
|
Actual
|
$1,000.00
|
$1,080.50
|
$4.54
|
0.87%
|
|
Hypothetical (5% return
|
||||
|
before expenses)
|
$1,000.00
|
$1,020.71
|
$4.41
|
0.87%
|
|
Retail Class
|
||||
|
Actual
|
$1,000.00
|
$1,078.30
|
$6.46
|
1.24%
|
|
Hypothetical (5% return
|
||||
|
before expenses)
|
$1,000.00
|
$1,018.85
|
$6.28
|
1.24%
|
|
Beginning
|
Ending
|
Expenses Paid
|
Annualized
|
|
|
Scharf Balanced
|
Account Value
|
Account Value
|
During Period*
|
Expense
|
|
Opportunity Fund
|
4/1/18
|
9/30/18
|
4/1/18-9/30/18
|
Ratio*
|
|
Institutional Class
|
||||
|
Actual
|
$1,000.00
|
$1,057.00
|
$5.05
|
0.98%
|
|
Hypothetical (5% return
|
||||
|
before expenses)
|
$1,000.00
|
$1,020.16
|
$4.96
|
0.98%
|
|
Retail Class
|
||||
|
Actual
|
$1,000.00
|
$1,055.60
|
$6.34
|
1.23%
|
|
Hypothetical (5% return
|
||||
|
before expenses)
|
$1,000.00
|
$1,018.90
|
$6.23
|
1.23%
|
|
Beginning
|
Ending
|
Expenses Paid
|
Annualized
|
|
|
Scharf Global
|
Account Value
|
Account Value
|
During Period*
|
Expense
|
|
Opportunity Fund
|
4/1/18
|
9/30/18
|
4/1/18-9/30/18
|
Ratio*
|
|
Retail Class
|
||||
|
Actual
|
$1,000.00
|
$1,094.80
|
$2.36
|
0.45%
|
|
Hypothetical (5% return
|
||||
|
before expenses)
|
$1,000.00
|
$1,022.81
|
$2.28
|
0.45%
|
19
SCHARF FUNDS
EXPENSE EXAMPLES at September 30, 2018 (Unaudited), Continued
|
Beginning
|
Ending
|
Expenses Paid
|
Annualized
|
|
|
Scharf Alpha
|
Account Value
|
Account Value
|
During Period*
|
Expense
|
|
Opportunity Fund
|
4/1/18
|
9/30/18
|
4/1/18-9/30/18
|
Ratio*
|
|
Retail Class
|
||||
|
Actual(1)
|
$1,000.00
|
$1,026.60
|
$8.94
|
1.76%
|
|
Hypothetical (5% return
|
||||
|
before expenses)(1)
|
$1,000.00
|
$1,016.24
|
$8.90
|
1.76%
|
|
(1)
|
Excluding interest expense and dividends on short positions, your actual expenses would be $4.87 and your hypothetical expenses would be $4.86.
|
|
*
|
Expenses are equal to the Fund’s annualized expense ratio of each class, multiplied by the average account value over the period, multiplied by 183 (days in most recent fiscal half-year)/365 days to reflect the one-half year expense.
|
20
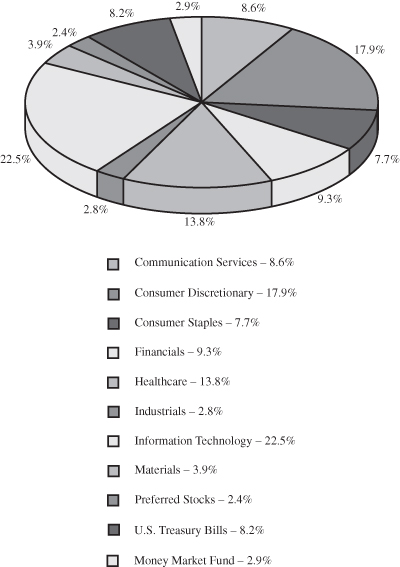
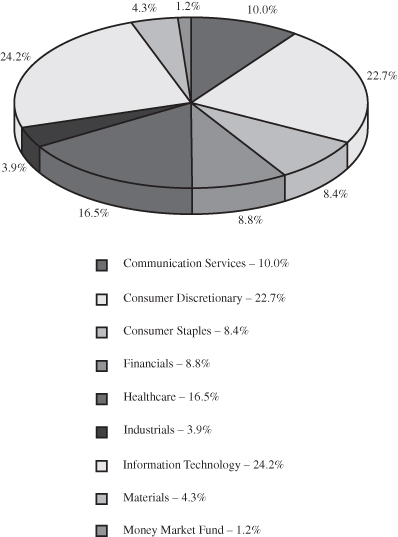
SCHARF FUND
SECTOR ALLOCATION OF PORTFOLIO ASSETS at September 30, 2018 (Unaudited)
The Global Industry Classification Standard (GICS®) was developed by and/or is the exclusive property of MSCI, Inc. and Standard & Poor Financial Services LLC (“S&P”). GICS is a service mark of MSCI and S&P and has been licensed for use by U.S. Bancorp Fund Services, LLC.
Percentages represent market value as a percentage of total investments.
21
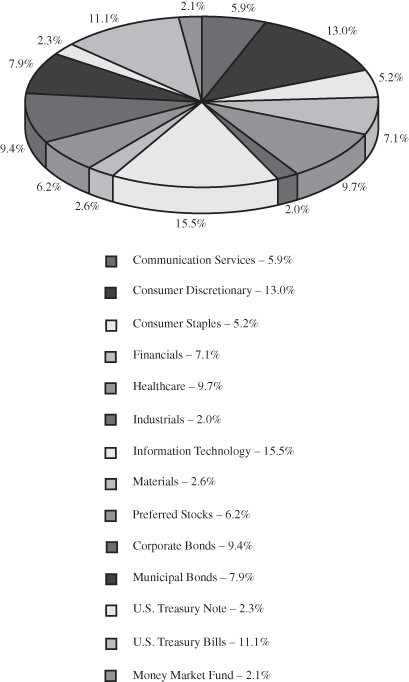
SCHARF BALANCED OPPORTUNITY FUND
SECTOR ALLOCATION OF PORTFOLIO ASSETS at September 30, 2018 (Unaudited)
The Global Industry Classification Standard (GICS®) was developed by and/or is the exclusive property of MSCI, Inc. and Standard & Poor Financial Services LLC (“S&P”). GICS is a service mark of MSCI and S&P and has been licensed for use by U.S. Bancorp Fund Services, LLC.
Percentages represent market value as a percentage of total investments.
22
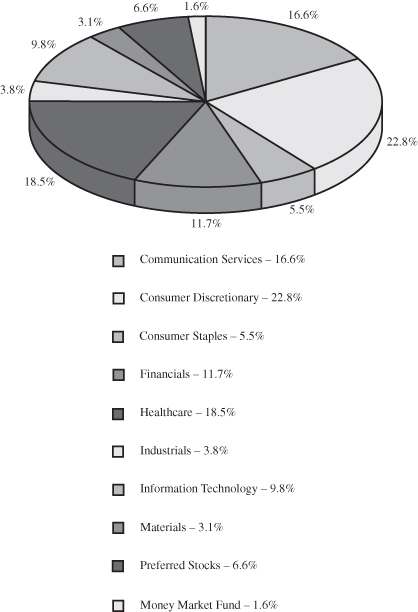
SCHARF GLOBAL OPPORTUNITY FUND
SECTOR ALLOCATION OF PORTFOLIO ASSETS at September 30, 2018 (Unaudited)
The Global Industry Classification Standard (GICS®) was developed by and/or is the exclusive property of MSCI, Inc. and Standard & Poor Financial Services LLC (“S&P”). GICS is a service mark of MSCI and S&P and has been licensed for use by U.S. Bancorp Fund Services, LLC.
Percentages represent market value as a percentage of total investments.
23
SCHARF Alpha OPPORTUNITY FUND
SECTOR ALLOCATION OF PORTFOLIO ASSETS at September 30, 2018 (Unaudited)
The Global Industry Classification Standard (GICS®) was developed by and/or is the exclusive property of MSCI, Inc. and Standard & Poor Financial Services LLC (“S&P”). GICS is a service mark of MSCI and S&P and has been licensed for use by U.S. Bancorp Fund Services, LLC.
Percentages represent market value as a percentage of total investments.
24
SCHARF FUND
SCHEDULE OF INVESTMENTS at September 30, 2018
|
Shares
|
COMMON STOCKS – 86.57%
|
Value
|
|||||
|
Auto Components – 2.19%
|
|||||||
|
429,300
|
Gentex Corp.
|
$
|
9,212,778
|
||||
|
Chemicals – 3.91%
|
|||||||
|
36,119
|
Sherwin-Williams Co.
|
16,441,730
|
|||||
|
Communications Equipment – 3.23%
|
|||||||
|
104,374
|
Motorola Solutions, Inc.
|
13,583,232
|
|||||
|
Diversified Financial Services – 4.34%
|
|||||||
|
85,173
|
Berkshire Hathaway, Inc. – Class B (a)
|
18,236,391
|
|||||
|
Food & Staples Retailing – 7.55%
|
|||||||
|
195,553
|
CVS Health Corp.
|
15,393,932
|
|||||
|
224,560
|
Walgreens Boots Alliance, Inc.
|
16,370,424
|
|||||
|
31,764,356
|
|||||||
|
Food Products – 3.76%
|
|||||||
|
155,200
|
Hershey Co.
|
15,830,400
|
|||||
|
Health Care Providers & Services – 3.69%
|
|||||||
|
22,835
|
Aetna, Inc.
|
4,632,080
|
|||||
|
82,214
|
McKesson Corp.
|
10,905,687
|
|||||
|
15,537,767
|
|||||||
|
Health Care Technology – 1.51%
|
|||||||
|
98,481
|
Cerner Corp. (a)
|
6,343,161
|
|||||
|
Hotels, Restaurants & Leisure – 5.31%
|
|||||||
|
55,625
|
Sodexo SA (b)
|
5,899,044
|
|||||
|
288,936
|
Starbucks Corp.
|
16,423,122
|
|||||
|
22,322,166
|
|||||||
|
Insurance – 5.01%
|
|||||||
|
136,926
|
Aon plc
|
21,056,480
|
|||||
|
Internet & Direct Marketing Retail – 3.20%
|
|||||||
|
6,788
|
Booking Holdings, Inc. (a)
|
13,467,392
|
|||||
|
IT Services – 1.76%
|
|||||||
|
95,997
|
Cognizant Technology Solutions Corp. – Class A
|
7,406,169
|
|||||
|
Media – 8.64%
|
|||||||
|
497,977
|
Comcast Corp. – Class A
|
17,633,366
|
|||||
|
108,000
|
Liberty Broadband Corp. (a)
|
9,104,400
|
|||||
The accompanying notes are an integral part of these financial statements.
25
SCHARF FUND
SCHEDULE OF INVESTMENTS at September 30, 2018, Continued
|
Shares
|
COMMON STOCKS – 86.57%, Continued
|
Value
|
|||||
|
Media – 8.64%, Continued
|
|||||||
|
16,609
|
Liberty Media Corp. – SiriusXM (a)
|
$
|
721,661
|
||||
|
75,784
|
Walt Disney Co.
|
8,862,181
|
|||||
|
36,321,608
|
|||||||
|
Multiline Retail – 3.27%
|
|||||||
|
168,822
|
Dollar Tree, Inc. (a)
|
13,767,434
|
|||||
|
Pharmaceuticals – 4.99%
|
|||||||
|
70,042
|
Allergan plc
|
13,341,600
|
|||||
|
88,496
|
Novartis AG – ADR
|
7,624,815
|
|||||
|
20,966,415
|
|||||||
|
Road & Rail – 2.76%
|
|||||||
|
102,566
|
Kansas City Southern
|
11,618,676
|
|||||
|
Software – 15.05%
|
|||||||
|
265,651
|
CDK Global, Inc.
|
16,619,127
|
|||||
|
225,179
|
Microsoft Corp.
|
25,753,722
|
|||||
|
405,621
|
Oracle Corp.
|
20,913,819
|
|||||
|
63,286,668
|
|||||||
|
Specialty Retail – 3.98%
|
|||||||
|
99,429
|
Advance Auto Parts, Inc.
|
16,736,884
|
|||||
|
Technology Hardware,
|
|||||||
|
Storage & Peripherals – 2.42%
|
|||||||
|
45,173
|
Apple, Inc.
|
10,197,353
|
|||||
|
TOTAL COMMON STOCKS
|
|||||||
|
(Cost $288,093,160)
|
364,097,060
|
||||||
|
PREFERRED STOCK – 2.45%
|
|||||||
|
Semiconductors &
|
|||||||
|
Semiconductor Equipment – 2.45%
|
|||||||
|
301,810
|
Samsung Electronics Co., Ltd. 3.03% (b)
|
10,298,408
|
|||||
|
TOTAL PREFERRED STOCK
|
|||||||
|
(Cost $4,925,806)
|
10,298,408
|
||||||
The accompanying notes are an integral part of these financial statements.
26
SCHARF FUND
SCHEDULE OF INVESTMENTS at September 30, 2018, Continued
|
Shares
|
SHORT-TERM INVESTMENTS – 11.04%
|
Value
|
|||||
|
Money Market Fund – 2.86%
|
|||||||
|
12,010,609
|
First American Treasury Obligations
|
||||||
|
Fund, Class Z, 1.96% (c)
|
$
|
12,010,609
|
|||||
|
TOTAL MONEY MARKET FUND
|
|||||||
|
(Cost $12,010,609)
|
12,010,609
|
||||||
|
Principal
|
|||||||
|
Amount
|
|||||||
|
U.S. Treasury Bills – 8.18%
|
|||||||
|
$
|
6,605,000
|
2.08%, 11/15/18 (d)
|
6,587,858
|
||||
|
27,967,000
|
2.12%, 12/20/18 (d)
|
27,835,011
|
|||||
|
TOTAL U.S. TREASURY BILLS
|
|||||||
|
(Cost $34,428,360)
|
34,422,869
|
||||||
|
TOTAL SHORT-TERM INVESTMENTS
|
|||||||
|
(Cost $46,438,969)
|
46,433,478
|
||||||
|
Total Investments in Securities
|
|||||||
|
(Cost $339,457,935) – 100.06%
|
420,828,946
|
||||||
|
Liabilities in Excess of Other Assets – (0.06)%
|
(259,263
|
)
|
|||||
|
TOTAL NET ASSETS – 100.00%
|
$
|
420,569,683
|
|||||
|
ADR
|
American Depository Receipt
|
|
(a)
|
Non-income producing security.
|
|
(b)
|
Foreign issuer.
|
|
(c)
|
Rate shown is the 7-day annualized yield as of September 30, 2018.
|
|
(d)
|
Rate shown is the discount rate at September 30, 2018.
|
The Global Industry Classification Standard (GICS®) was developed by and/or is the exclusive property of MSCI, Inc. and Standard & Poor Financial Services LLC (“S&P”). GICS is a service mark of MSCI and S&P and has been licensed for use by U.S. Bancorp Fund Services, LLC.
The accompanying notes are an integral part of these financial statements.
27
SCHARF BALANCED OPPORTUNITY FUND
SCHEDULE OF INVESTMENTS at September 30, 2018
|
Shares
|
COMMON STOCKS – 61.08%
|
Value
|
|||||
|
Auto Components – 1.51%
|
|||||||
|
37,901
|
Gentex Corp.
|
$
|
813,356
|
||||
|
Capital Markets – 0.52%
|
|||||||
|
6,758
|
Oaktree Cap Group, LLC
|
279,781
|
|||||
|
Chemicals – 2.57%
|
|||||||
|
3,031
|
Sherwin-Williams Co.
|
1,379,742
|
|||||
|
Communications Equipment – 2.11%
|
|||||||
|
8,715
|
Motorola Solutions, Inc.
|
1,134,170
|
|||||
|
Diversified Financial Services – 3.01%
|
|||||||
|
7,558
|
Berkshire Hathaway, Inc. – Class B (a)
|
1,618,243
|
|||||
|
Food & Staples Retailing – 4.92%
|
|||||||
|
16,515
|
CVS Health Corp.
|
1,300,061
|
|||||
|
18,439
|
Walgreens Boots Alliance, Inc.
|
1,344,203
|
|||||
|
2,644,264
|
|||||||
|
Food Products – 2.72%
|
|||||||
|
14,331
|
Hershey Co.
|
1,461,762
|
|||||
|
Health Care Providers & Services – 2.59%
|
|||||||
|
1,920
|
Aetna, Inc.
|
389,472
|
|||||
|
7,537
|
McKesson Corp.
|
999,783
|
|||||
|
1,389,255
|
|||||||
|
Health Care Technology – 1.09%
|
|||||||
|
9,135
|
Cerner Corp. (a)
|
588,385
|
|||||
|
Hotels, Restaurants & Leisure – 3.73%
|
|||||||
|
4,985
|
Sodexo SA (b)
|
528,661
|
|||||
|
26,005
|
Starbucks Corp.
|
1,478,124
|
|||||
|
2,006,785
|
|||||||
|
Insurance – 3.55%
|
|||||||
|
12,389
|
Aon plc
|
1,905,180
|
|||||
|
Internet & Direct Marketing Retail – 2.23%
|
|||||||
|
603
|
Booking Holdings, Inc. (a)
|
1,196,352
|
|||||
|
IT Services – 1.17%
|
|||||||
|
8,143
|
Cognizant Technology Solutions Corp. – Class A
|
628,232
|
|||||
The accompanying notes are an integral part of these financial statements.
28
SCHARF BALANCED OPPORTUNITY FUND
SCHEDULE OF INVESTMENTS at September 30, 2018, Continued
|
Shares
|
COMMON STOCKS – 61.08%, Continued
|
Value
|
|||||
|
Media – 5.93%
|
|||||||
|
44,719
|
Comcast Corp. – Class A
|
$
|
1,583,500
|
||||
|
9,600
|
Liberty Broadband Corp. (a)
|
809,280
|
|||||
|
6,772
|
Walt Disney Co.
|
791,918
|
|||||
|
3,184,698
|
|||||||
|
Multiline Retail – 2.85%
|
|||||||
|
18,760
|
Dollar Tree, Inc. (a)
|
1,529,878
|
|||||
|
Pharmaceuticals – 3.60%
|
|||||||
|
6,366
|
Allergan plc
|
1,212,596
|
|||||
|
8,371
|
Novartis AG – ADR
|
721,245
|
|||||
|
1,933,841
|
|||||||
|
Road & Rail – 2.01%
|
|||||||
|
9,550
|
Kansas City Southern
|
1,081,824
|
|||||
|
Software – 10.63%
|
|||||||
|
24,168
|
CDK Global, Inc.
|
1,511,950
|
|||||
|
20,105
|
Microsoft Corp.
|
2,299,409
|
|||||
|
36,806
|
Oracle Corp.
|
1,897,717
|
|||||
|
5,709,076
|
|||||||
|
Specialty Retail – 2.72%
|
|||||||
|
8,677
|
Advance Auto Parts, Inc.
|
1,460,599
|
|||||
|
Technology Hardware,
|
|||||||
|
Storage & Peripherals – 1.62%
|
|||||||
|
3,863
|
Apple, Inc.
|
872,034
|
|||||
|
TOTAL COMMON STOCKS
|
|||||||
|
(Cost $25,393,323)
|
32,817,457
|
||||||
|
PREFERRED STOCKS – 6.23%
|
|||||||
|
Closed-End Fund – 4.08%
|
|||||||
|
42,653
|
GDL Fund – Series C, 4.00%
|
2,194,070
|
|||||
|
Semiconductors &
|
|||||||
|
Semiconductor Equipment – 2.15%
|
|||||||
|
33,900
|
Samsung Electronics Co., Ltd. 3.03% (b)
|
1,156,741
|
|||||
|
TOTAL PREFERRED STOCKS
|
|||||||
|
(Cost $2,677,470)
|
3,350,811
|
||||||
The accompanying notes are an integral part of these financial statements.
29
SCHARF BALANCED OPPORTUNITY FUND
SCHEDULE OF INVESTMENTS at September 30, 2018, Continued
|
Principal
|
|||||||
|
Amount
|
CORPORATE BONDS – 9.38%
|
Value
|
|||||
|
Beverages – 0.26%
|
|||||||
|
Coca-Cola European Partners LLC
|
|||||||
|
$
|
85,000
|
4.50%, 9/1/2021
|
$
|
86,976
|
|||
|
PepsiCo, Inc.
|
|||||||
|
54,000
|
1.50%, 2/22/2019
|
53,772
|
|||||
|
140,748
|
|||||||
|
Communications Equipment – 0.74%
|
|||||||
|
Motorola Solutions, Inc.
|
|||||||
|
400,000
|
3.50%, 9/1/2021
|
397,254
|
|||||
|
Computer and Electronic
|
|||||||
|
Product Manufacturing – 0.18%
|
|||||||
|
Digital Equipment Corp.
|
|||||||
|
89,000
|
7.75%, 4/1/2023
|
96,727
|
|||||
|
Consumer Finance – 0.22%
|
|||||||
|
American Express Credit Corp.
|
|||||||
|
62,000
|
1.875%, 11/5/2018
|
61,988
|
|||||
|
Medtronic, Inc.
|
|||||||
|
54,000
|
2.50%, 3/15/2020
|
53,652
|
|||||
|
115,640
|
|||||||
|
Diversified Telecommunication Services – 0.50%
|
|||||||
|
AT&T, Inc.
|
|||||||
|
137,000
|
2.375%, 11/27/2018
|
136,956
|
|||||
|
130,000
|
5.80%, 2/15/2019
|
131,524
|
|||||
|
268,480
|
|||||||
|
Food & Staples Retailing – 0.15%
|
|||||||
|
Walgreens Boots Alliance, Inc.
|
|||||||
|
82,000
|
2.70%, 11/18/2019
|
81,748
|
|||||
|
Health Care Providers & Services – 0.06%
|
|||||||
|
Express Scripts Holding Co.
|
|||||||
|
34,000
|
2.25%, 6/15/2019
|
33,849
|
|||||
|
Insurance – 0.06%
|
|||||||
|
American International Group, Inc.
|
|||||||
|
34,000
|
2.30%, 7/16/2019
|
33,854
|
|||||
The accompanying notes are an integral part of these financial statements.
30
SCHARF BALANCED OPPORTUNITY FUND
SCHEDULE OF INVESTMENTS at September 30, 2018, Continued
|
Principal
|
|||||||
|
Amount
|
CORPORATE BONDS – 9.38%, Continued
|
Value
|
|||||
|
Internet Software & Services – 0.10%
|
|||||||
|
eBay, Inc.
|
|||||||
|
$
|
54,000
|
2.20%, 8/1/2019
|
$
|
53,735
|
|||
|
IT Services – 0.10%
|
|||||||
|
International Business Machines Corp.
|
|||||||
|
54,000
|
1.95%, 2/12/2019
|
53,902
|
|||||
|
Media – 0.02%
|
|||||||
|
Viacom, Inc.
|
|||||||
|
11,000
|
2.75%, 12/15/2019
|
10,941
|
|||||
|
Petroleum and Coal
|
|||||||
|
Products Manufacturing – 3.00%
|
|||||||
|
Murphy Oil USA, Inc.
|
|||||||
|
1,022,000
|
6.00%, 8/15/2023
|
1,055,215
|
|||||
|
557,000
|
5.625%, 5/1/2027
|
554,911
|
|||||
|
1,610,126
|
|||||||
|
Securities and Commodity Contracts
|
|||||||
|
Intermediation and Brokerage – 3.56%
|
|||||||
|
Goldman Sachs Group, Inc.
|
|||||||
|
2,281,000
|
4.00%, (3 Month LIBOR + 0.7675%) 6/1/2043 (c)
|
1,910,337
|
|||||
|
Specialty Retail – 0.38%
|
|||||||
|
Advance Auto Parts, Inc.
|
|||||||
|
50,000
|
5.75%, 5/1/2020
|
51,565
|
|||||
|
L Brands, Inc.
|
|||||||
|
56,000
|
7.00%, 5/1/2020
|
58,660
|
|||||
|
90,000
|
6.625%, 4/1/2021
|
95,319
|
|||||
|
205,544
|
|||||||
|
Technology Hardware,
|
|||||||
|
Storage & Peripherals – 0.05%
|
|||||||
|
HP, Inc.
|
|||||||
|
25,000
|
2.75%, 1/14/2019
|
25,012
|
|||||
|
TOTAL CORPORATE BONDS
|
|||||||
|
(Cost $4,784,526)
|
5,037,897
|
||||||
The accompanying notes are an integral part of these financial statements.
31
SCHARF BALANCED OPPORTUNITY FUND
SCHEDULE OF INVESTMENTS at September 30, 2018, Continued
|
Principal
|
|||||||
|
Amount
|
MUNICIPAL BONDS – 7.92%
|
Value
|
|||||
|
California Health Facilities Financing Authority,
|
|||||||
|
Revenue Bonds, Chinese Hospital Association
|
|||||||
|
$
|
10,000
|
3.00%, 6/1/2024, Series 2012
|
$
|
10,167
|
|||
|
California Health Facilities Financing
|
|||||||
|
Authority, Revenue Bonds, Persons with
|
|||||||
|
Developmental Disabilities
|
|||||||
|
80,000
|
7.11%, 2/1/2021, Series 2011B
|
85,044
|
|||||
|
145,000
|
7.875%, 2/1/2026, Series 2011B
|
157,798
|
|||||
|
California State, General Obligation,
|
|||||||
|
Highway Safety, Traffic Reduction,
|
|||||||
|
Air Quality and Port Security Bonds
|
|||||||
|
90,000
|
6.509%, 4/1/2039, Series 2009B
|
98,104
|
|||||
|
California State, General Obligation, Various Purpose
|
|||||||
|
125,000
|
6.20%, 10/1/2019
|
129,141
|
|||||
|
405,000
|
5.60%, 11/1/2020
|
427,097
|
|||||
|
745,000
|
6.65%, 3/1/2022, Series 2010
|
813,242
|
|||||
|
980,000
|
7.95%, 3/1/2036, Series 2010
|
1,044,866
|
|||||
|
Commonwealth of Massachusetts,
|
|||||||
|
Build America Bonds
|
|||||||
|
205,000
|
4.20%, 12/1/2021
|
209,809
|
|||||
|
Norman Y Mineta San Jose International Airport SJC
|
|||||||
|
550,000
|
5.00%, 3/1/2019
|
557,144
|
|||||
|
State of California, Build America Bonds
|
|||||||
|
35,000
|
5.70%, 11/1/2021
|
37,721
|
|||||
|
15,000
|
4.988%, 4/1/2039
|
15,860
|
|||||
|
State of Connecticut, Build America Bonds
|
|||||||
|
100,000
|
4.807%, 4/1/2022
|
102,071
|
|||||
|
240,000
|
5.20%, 12/1/2022
|
253,613
|
|||||
|
25,000
|
5.30%, 12/1/2023
|
26,815
|
|||||
|
10,000
|
5.027%, 4/1/2024
|
10,228
|
|||||
|
State of Florida, Build America Bonds
|
|||||||
|
10,000
|
4.65%, 6/1/2020
|
10,114
|
|||||
|
State of Georgia, Build America Bonds
|
|||||||
|
5,000
|
4.503%, 11/1/2025
|
5,176
|
|||||
|
State of Georgia, Economic Development Bonds
|
|||||||
|
10,000
|
3.24%, 10/1/2020
|
10,070
|
|||||
The accompanying notes are an integral part of these financial statements.
32
SCHARF BALANCED OPPORTUNITY FUND
SCHEDULE OF INVESTMENTS at September 30, 2018, Continued
|
Principal
|
|||||||
|
Amount
|
MUNICIPAL BONDS – 7.92%, Continued
|
Value
|
|||||
|
State of Georgia, School Construction Bonds
|
|||||||
|
$
|
15,000
|
4.35%, 2/1/2029
|
$
|
15,887
|
|||
|
State of Illinois, Build America Bonds
|
|||||||
|
100,000
|
5.547%, 4/1/2019
|
101,158
|
|||||
|
20,000
|
5.727%, 4/1/2020
|
20,528
|
|||||
|
State of Maryland, Build America Bonds
|
|||||||
|
10,000
|
4.10%, 3/1/2020
|
10,136
|
|||||
|
20,000
|
4.20%, 3/1/2021
|
20,449
|
|||||
|
5,000
|
4.55%, 8/15/2024
|
5,061
|
|||||
|
State of Michigan, General Obligation,
|
|||||||
|
School Loan and Refunding Bonds
|
|||||||
|
40,000
|
6.95%, 11/1/2020 Series 2009A
|
43,248
|
|||||
|
State of Ohio, Build America Bonds
|
|||||||
|
35,000
|
4.621%, 4/1/2020
|
35,874
|
|||||
|
TOTAL MUNICIPAL BONDS
|
|||||||
|
(Cost $4,421,063)
|
4,256,421
|
||||||
|
U.S. TREASURY NOTE – 2.29%
|
|||||||
|
U. S. Treasury Note – 2.29%
|
|||||||
|
1,245,000
|
1.50%, 11/30/2019
|
1,228,076
|
|||||
|
TOTAL U.S. TREASURY NOTE
|
|||||||
|
(Cost $1,241,063)
|
1,228,076
|
||||||
The accompanying notes are an integral part of these financial statements.
33
SCHARF BALANCED OPPORTUNITY FUND
SCHEDULE OF INVESTMENTS at September 30, 2018, Continued
|
Shares
|
SHORT-TERM INVESTMENTS – 13.24%
|
Value
|
|||||
|
Money Market Fund – 2.10%
|
|||||||
|
1,126,411
|
First American Treasury Obligations
|
||||||
|
Fund, Class Z, 1.96% (d)
|
$
|
1,126,411
|
|||||
|
TOTAL MONEY MARKET FUND
|
|||||||
|
(Cost $1,126,411)
|
1,126,411
|
||||||
|
Principal
|
|||||||
|
Amount
|
|||||||
|
U.S. Treasury Bills – 11.14%
|
|||||||
|
$
|
250,000
|
2.08%, 11/15/18 (e)
|
249,351
|
||||
|
1,100,000
|
2.12%, 12/20/18 (e)
|
1,094,809
|
|||||
|
695,000
|
2.28%, 2/28/19 (e)
|
688,412
|
|||||
|
4,000,000
|
2.30%, 3/28/19 (e)
|
3,954,511
|
|||||
|
TOTAL U.S. TREASURY BILLS
|
|||||||
|
(Cost $5,993,689)
|
5,987,083
|
||||||
|
TOTAL SHORT-TERM INVESTMENTS
|
|||||||
|
(Cost $7,120,100)
|
7,113,494
|
||||||
|
Total Investments in Securities
|
|||||||
|
(Cost $45,637,545) – 100.14%
|
53,804,156
|
||||||
|
Liabilities in Excess of Other Assets – (0.14)%
|
(77,589
|
)
|
|||||
|
TOTAL NET ASSETS – 100.00%
|
$
|
53,726,567
|
|||||
|
ADR
|
American Depository Receipt
|
|
LIBOR
|
London Interbank Offered Rate
|
|
(a)
|
Non-income producing security.
|
|
(b)
|
Foreign issuer.
|
|
(c)
|
Variable rate security. Rate shown reflects the rate in effect as of September 30, 2018.
|
|
(d)
|
Rate shown is the 7-day annualized yield as of September 30, 2018.
|
|
(e)
|
Rate shown is the discount rate at September 30, 2018.
|
The Global Industry Classification Standard (GICS®) was developed by and/or is the exclusive property of MSCI, Inc. and Standard & Poor Financial Services LLC (“S&P”). GICS is a service mark of MSCI and S&P and has been licensed for use by U.S. Bancorp Fund Services, LLC.
The accompanying notes are an integral part of these financial statements.
34
SCHARF GLOBAL OPPORTUNITY FUND
SCHEDULE OF INVESTMENTS at September 30, 2018
|
Shares
|
COMMON STOCKS – 80.84%
|
Value
|
|||||
|
Auto Components – 1.70%
|
|||||||
|
19,461
|
Gentex Corp.
|
$
|
417,633
|
||||
|
11,208
|
Nexen Corp. (b)
|
63,555
|
|||||
|
481,188
|
|||||||
|
Automobiles – 0.50%
|
|||||||
|
4,600
|
Subaru Corp. (b)
|
140,891
|
|||||
|
Beverages – 1.01%
|
|||||||
|
177,500
|
Becle, S.A.B. de C.V. (b)
|
286,538
|
|||||
|
Chemicals – 2.74%
|
|||||||
|
1,705
|
Sherwin-Williams Co.
|
776,133
|
|||||
|
Communications Equipment – 0.39%
|
|||||||
|
859
|
Motorola Solutions, Inc.
|
111,790
|
|||||
|
Diversified Financial Services – 3.79%
|
|||||||
|
5,021
|
Berkshire Hathaway, Inc. – Class B (a)
|
1,075,046
|
|||||
|
Food & Staples Retailing – 7.53%
|
|||||||
|
18,220
|
CVS Health Corp.
|
1,434,278
|
|||||
|
9,621
|
Walgreens Boots Alliance, Inc.
|
701,371
|
|||||
|
2,135,649
|
|||||||
|
Food Products – 1.39%
|
|||||||
|
1,120
|
Hershey Co.
|
114,240
|
|||||
|
3,375
|
Nestle SA – ADR
|
280,800
|
|||||
|
395,040
|
|||||||
|
Health Care Providers & Services – 4.24%
|
|||||||
|
3,869
|
Aetna, Inc.
|
784,827
|
|||||
|
3,145
|
McKesson Corp.
|
417,184
|
|||||
|
1,202,011
|
|||||||
|
Hotels, Restaurants & Leisure – 7.37%
|
|||||||
|
22,005
|
Compass Group plc (b)
|
489,306
|
|||||
|
178,500
|
Domino’s Pizza Group plc (b)
|
650,047
|
|||||
|
16,745
|
Starbucks Corp.
|
951,786
|
|||||
|
2,091,139
|
|||||||
|
Household Durables – 1.21%
|
|||||||
|
5,675
|
Sony Corp. – ADR
|
344,189
|
|||||
The accompanying notes are an integral part of these financial statements.
35
SCHARF GLOBAL OPPORTUNITY FUND
SCHEDULE OF INVESTMENTS at September 30, 2018, Continued
|
Shares
|
COMMON STOCKS – 80.84%, Continued
|
Value
|
|||||
|
Insurance – 6.54%
|
|||||||
|
95,615
|
AIA Group Ltd. (b)
|
$
|
853,754
|
||||
|
6,498
|
Aon plc
|
999,263
|
|||||
|
1,853,017
|
|||||||
|
Internet & Direct Marketing Retail – 3.09%
|
|||||||
|
441
|
Booking Holdings, Inc. (a)
|
874,944
|
|||||
|
Media – 11.51%
|
|||||||
|
32,250
|
Comcast Corp. – Class A
|
1,141,973
|
|||||
|
7,060
|
Liberty Broadband Corp. (a)
|
595,158
|
|||||
|
18,380
|
Liberty Media Corp. – SiriusXM (a)
|
798,611
|
|||||
|
6,215
|
Walt Disney Co.
|
726,782
|
|||||
|
3,262,524
|
|||||||
|
Multiline Retail – 2.47%
|
|||||||
|
8,585
|
Dollar Tree, Inc. (a)
|
700,107
|
|||||
|
Pharmaceuticals – 7.02%
|
|||||||
|
4,480
|
Allergan plc
|
853,350
|
|||||
|
13,194
|
Novartis AG – ADR
|
1,136,795
|
|||||
|
1,990,145
|
|||||||
|
Road & Rail – 3.33%
|
|||||||
|
8,344
|
Kansas City Southern
|
945,208
|
|||||
|
Software – 8.18%
|
|||||||
|
10,038
|
Microsoft Corp.
|
1,148,046
|
|||||
|
22,740
|
Oracle Corp.
|
1,172,475
|
|||||
|
2,320,521
|
|||||||
|
Specialty Retail – 3.76%
|
|||||||
|
6,328
|
Advance Auto Parts, Inc.
|
1,065,192
|
|||||
|
Wireless Telecommunication Services – 3.07%
|
|||||||
|
17,480
|
SoftBank Corp. – ADR (a)
|
869,630
|
|||||
|
TOTAL COMMON STOCKS
|
|||||||
|
(Cost $19,358,365)
|
22,920,902
|
||||||
The accompanying notes are an integral part of these financial statements.
36
SCHARF GLOBAL OPPORTUNITY FUND
SCHEDULE OF INVESTMENTS at September 30, 2018, Continued
|
Shares
|
PREFERRED STOCKS – 5.83%
|
Value
|
|||||
|
Auto Components – 0.44%
|
|||||||
|
14,157
|
Nexen Corp., 1.91% (b)
|
$
|
53,220
|
||||
|
19,043
|
Nexen Tire Corp., 2.49% (b)
|
72,533
|
|||||
|
125,753
|
|||||||
|
Capital Markets – 0.26%
|
|||||||
|
2,000
|
Korea Investment Holdings Co. Ltd., 4.16% (b)
|
72,481
|
|||||
|
Containers & Packaging – 0.04%
|
|||||||
|
5,450
|
NPC, 4.01% (b)
|
11,644
|
|||||
|
Personal Products – 0.55%
|
|||||||
|
830
|
Amorepacific Corp., 0.95% (b)
|
102,885
|
|||||
|
75
|
LG Household & Health Care Ltd., 1.13% (b)
|
54,361
|
|||||
|
157,246
|
|||||||
|
Semiconductors &
|
|||||||
|
Semiconductor Equipment – 4.54%
|
|||||||
|
37,700
|
Samsung Electronics Co., Ltd., 3.03% (b)
|
1,286,405
|
|||||
|
TOTAL PREFERRED STOCKS
|
|||||||
|
(Cost $1,132,678)
|
1,653,529
|
||||||
|
MONEY MARKET FUND – 1.39%
|
|||||||
|
392,817
|
First American Treasury Obligations
|
||||||
|
Fund, Class Z, 1.96% (c)
|
392,817
|
||||||
|
TOTAL MONEY MARKET FUND
|
|||||||
|
(Cost $392,817)
|
392,817
|
||||||
|
Total Investments in Securities
|
|||||||
|
(Cost $20,883,860) – 88.06%
|
24,967,248
|
||||||
|
Other Assets in Excess of Liabilities – 11.94%
|
3,385,343
|
||||||
|
TOTAL NET ASSETS – 100.00%
|
$
|
28,352,591
|
|||||
|
ADR
|
American Depository Receipt
|
|
(a)
|
Non-income producing security.
|
|
(b)
|
Foreign issuer.
|
|
(c)
|
Rate shown is the 7-day annualized yield as of September 30, 2018.
|
The Global Industry Classification Standard (GICS®) was developed by and/or is the exclusive property of MSCI, Inc. and Standard & Poor Financial Services LLC (“S&P”). GICS is a service mark of MSCI and S&P and has been licensed for use by U.S. Bancorp Fund Services, LLC.
The accompanying notes are an integral part of these financial statements.
37
SCHARF GLOBAL OPPORTUNITY FUND
SCHEDULE OF INVESTMENTS at September 30, 2018, Continued
COUNTRY ALLOCATION
|
Country
|
% of Net Assets
|
|
United States
|
72.9%
|
|
Republic of Korea
|
6.9%
|
|
Switzerland
|
5.7%
|
|
Japan
|
5.4%
|
|
United Kingdom
|
4.6%
|
|
Hong Kong
|
3.4%
|
|
Mexico
|
1.1%
|
|
100.0%
|
The accompanying notes are an integral part of these financial statements.
38
SCHARF ALPHA OPPORTUNITY FUND
SCHEDULE OF INVESTMENTS at September 30, 2018
|
Shares
|
COMMON STOCKS – 98.99%
|
Value
|
|||||
|
Auto Components – 3.12%
|
|||||||
|
30,515
|
Gentex Corp. (d)
|
$
|
654,852
|
||||
|
Chemicals – 4.34%
|
|||||||
|
2,004
|
Sherwin-Williams Co. (d)
|
912,241
|
|||||
|
Communications Equipment – 3.56%
|
|||||||
|
5,746
|
Motorola Solutions, Inc. (d)
|
747,784
|
|||||
|
Diversified Financial Services – 4.52%
|
|||||||
|
4,433
|
Berkshire Hathaway, Inc. – Class B (a) (d)
|
949,150
|
|||||
|
Food & Staples Retailing – 7.54%
|
|||||||
|
8,780
|
CVS Health Corp. (d)
|
691,162
|
|||||
|
12,233
|
Walgreens Boots Alliance, Inc. (d)
|
891,785
|
|||||
|
1,582,947
|
|||||||
|
Food Products – 4.12%
|
|||||||
|
8,470
|
Hershey Co.
|
863,940
|
|||||
|
Health Care Providers & Services – 6.72%
|
|||||||
|
4,387
|
Aetna, Inc.
|
889,903
|
|||||
|
3,920
|
McKesson Corp. (d)
|
519,988
|
|||||
|
1,409,891
|
|||||||
|
Hotels, Restaurants & Leisure – 7.79%
|
|||||||
|
19,580
|
Compass Group plc (b)
|
435,383
|
|||||
|
3,420
|
Sodexo SA (b)
|
362,692
|
|||||
|
14,725
|
Starbucks Corp.
|
836,969
|
|||||
|
1,635,044
|
|||||||
|
Insurance – 4.33%
|
|||||||
|
5,905
|
Aon plc (d)
|
908,071
|
|||||
|
Internet & Direct Marketing Retail – 3.65%
|
|||||||
|
386
|
Booking Holdings, Inc. (a) (d)
|
765,824
|
|||||
|
IT Services – 1.99%
|
|||||||
|
5,427
|
Cognizant Technology Solutions Corp. – Class A (d)
|
418,693
|
|||||
|
Media – 9.99%
|
|||||||
|
25,533
|
Comcast Corp. – Class A (d)
|
904,123
|
|||||
|
5,325
|
Liberty Broadband Corp. (a)
|
448,898
|
|||||
|
6,610
|
Liberty Media Corp. – SiriusXM (a)
|
287,205
|
|||||
The accompanying notes are an integral part of these financial statements.
39
SCHARF ALPHA OPPORTUNITY FUND
SCHEDULE OF INVESTMENTS at September 30, 2018, Continued
|
Shares
|
COMMON STOCKS – 98.99%, Continued
|
Value
|
|||||
|
Media – 9.99%, Continued
|
|||||||
|
3,917
|
Walt Disney Co.
|
$
|
458,053
|
||||
|
2,098,279
|
|||||||
|
Multiline Retail – 4.03%
|
|||||||
|
10,369
|
Dollar Tree, Inc. (a)
|
845,592
|
|||||
|
Pharmaceuticals – 6.49%
|
|||||||
|
4,983
|
Allergan plc (d)
|
949,162
|
|||||
|
4,806
|
Novartis AG – ADR (d)
|
414,085
|
|||||
|
1,363,247
|
|||||||
|
Road & Rail – 3.88%
|
|||||||
|
7,200
|
Kansas City Southern (d)
|
815,616
|
|||||
|
Software – 15.17%
|
|||||||
|
13,319
|
CDK Global, Inc.
|
833,237
|
|||||
|
11,032
|
Microsoft Corp. (d)
|
1,261,730
|
|||||
|
21,120
|
Oracle Corp. (d)
|
1,088,947
|
|||||
|
3,183,914
|
|||||||
|
Specialty Retail – 4.20%
|
|||||||
|
5,239
|
Advance Auto Parts, Inc. (d)
|
881,881
|
|||||
|
Technology Hardware,
|
|||||||
|
Storage & Peripherals – 3.55%
|
|||||||
|
2,254
|
Apple, Inc. (d)
|
508,818
|
|||||
|
226
|
Samsung Electronics Co., Ltd. (b)
|
236,622
|
|||||
|
745,440
|
|||||||
|
TOTAL COMMON STOCKS
|
|||||||
|
(Cost $17,762,976)
|
20,782,406
|
||||||
The accompanying notes are an integral part of these financial statements.
40
SCHARF ALPHA OPPORTUNITY FUND
SCHEDULE OF INVESTMENTS at September 30, 2018, Continued
|
Shares
|
MONEY MARKET FUND – 1.19%
|
Value
|
|||||
|
249,699
|
First American Treasury Obligations
|
||||||
|
Fund, Class Z, 1.96% (c)
|
$
|
249,699
|
|||||
|
TOTAL MONEY MARKET FUND
|
|||||||
|
(Cost $249,699)
|
249,699
|
||||||
|
Total Investments in Securities
|
|||||||
|
(Cost $18,012,675) – 100.18%
|
21,032,105
|
||||||
|
Liabilities in Excess of Other Assets – (0.18)%
|
(38,029
|
)
|
|||||
|
TOTAL NET ASSETS – 100.00%
|
$
|
20,994,076
|
|||||
|
ADR
|
American Depository Receipt
|
|
(a)
|
Non-income producing security.
|
|
(b)
|
Foreign issuer.
|
|
(c)
|
Rate shown is the 7-day annualized yield as of September 30, 2018.
|
|
(d)
|
All of a portion of the security has been segregated for open short positions.
|
SCHEDULE OF SECURITIES SOLD SHORT at September 30, 2018
|
Shares
|
SECURITIES SOLD SHORT – 56.24%
|
Value
|
|||||
|
Common Stock – 0.92%
|
|||||||
|
725
|
Tesla Inc.
|
$
|
191,958
|
||||
|
TOTAL COMMON STOCK
|
|||||||
|
(Proceeds $190,024)
|
191,958
|
||||||
|
Exchange-Traded Funds – 55.32%
|
|||||||
|
28,930
|
SPDR S&P 500 ETF Trust
|
8,410,530
|
|||||
|
17,245
|
Invesco QQQ Trust Series 1
|
3,203,949
|
|||||
|
TOTAL EXCHANGE-TRADED FUNDS
|
|||||||
|
(Proceeds $9,666,128)
|
11,614,479
|
||||||
|
TOTAL SECURITIES SOLD SHORT
|
|||||||
|
(Proceeds $9,856,152)
|
$
|
11,806,437
|
|||||
|
ETF
|
Exchange-Traded Fund
|
The Global Industry Classification Standard (GICS®) was developed by and/or is the exclusive property of MSCI, Inc. and Standard & Poor Financial Services LLC (“S&P”). GICS is a service mark of MSCI and S&P and has been licensed for use by U.S. Bancorp Fund Services, LLC.
The accompanying notes are an integral part of these financial statements.
41
SCHARF FUNDS
STATEMENTS OF ASSETS AND LIABILITIES at September 30, 2018
|
Scharf Balanced
|
||||||||
|
Scharf Fund
|
Opportunity Fund
|
|||||||
|
ASSETS
|
||||||||
|
Investments in securities, at value (identified cost
|
||||||||
|
$339,457,935 and $45,637,545, respectively)
|
$
|
420,828,946
|
$
|
53,804,156
|
||||
|
Receivables:
|
||||||||
|
Fund shares issued
|
133,554
|
—
|
||||||
|
Dividends and interest
|
220,416
|
120,212
|
||||||
|
Dividend tax reclaim
|
46,474
|
8,894
|
||||||
|
Prepaid expenses
|
19,871
|
5,254
|
||||||
|
Total assets
|
421,249,261
|
53,938,516
|
||||||
|
LIABILITIES
|
||||||||
|
Payables:
|
||||||||
|
Fund shares redeemed
|
175,485
|
130,294
|
||||||
|
Advisory fees
|
275,407
|
23,198
|
||||||
|
Shareholder servicing fees
|
68,783
|
8,064
|
||||||
|
Administration and fund accounting fees
|
61,739
|
12,369
|
||||||
|
Audit fees
|
21,987
|
21,987
|
||||||
|
12b-1 distribution fees
|
44,425
|
4,648
|
||||||
|
Custody fees
|
7,035
|
2,752
|
||||||
|
Transfer agent fees and expenses
|
10,762
|
4,138
|
||||||
|
Shareholder reporting
|
9,812
|
1,190
|
||||||
|
Chief Compliance Officer fee
|
1,500
|
1,500
|
||||||
|
Legal fees
|
2,150
|
1,488
|
||||||
|
Trustee fees and expenses
|
395
|
275
|
||||||
|
Accrued other expenses
|
98
|
46
|
||||||
|
Total liabilities
|
679,578
|
211,949
|
||||||
|
NET ASSETS
|
$
|
420,569,683
|
$
|
53,726,567
|
||||
The accompanying notes are an integral part of these financial statements.
42
SCHARF FUNDS
STATEMENTS OF ASSETS AND LIABILITIES at September 30, 2018, Continued
|
Scharf Balanced
|
||||||||
|
Scharf Fund
|
Opportunity Fund
|
|||||||
|
CALCULATION OF NET ASSET VALUE PER SHARE
|
||||||||
|
Institutional Shares
|
||||||||
|
Net assets applicable to shares outstanding
|
$
|
350,204,862
|
$
|
46,365,748
|
||||
|
Shares issued and outstanding [unlimited number of shares
|
||||||||
|
(par value $0.01) authorized]
|
7,496,447
|
1,380,941
|
||||||
|
Net asset value, offering and redemption price per share
|
$
|
46.72
|
$
|
33.58
|
||||
|
Retail Shares
|
||||||||
|
Net assets applicable to shares outstanding
|
$
|
70,364,821
|
$
|
7,360,819
|
||||
|
Shares issued and outstanding [unlimited number of shares
|
||||||||
|
(par value $0.01) authorized]
|
1,515,395
|
220,110
|
||||||
|
Net asset value, offering and redemption price per share
|
$
|
46.43
|
$
|
33.44
|
||||
|
COMPOSITION OF NET ASSETS
|
||||||||
|
Paid-in capital
|
$
|
311,379,256
|
$
|
42,860,659
|
||||
|
Total distributable earnings
|
109,190,427
|
10,865,908
|
||||||
|
Net assets
|
$
|
420,569,683
|
$
|
53,726,567
|
||||
The accompanying notes are an integral part of these financial statements.
43
SCHARF FUNDS
STATEMENTS OF ASSETS AND LIABILITIES at September 30, 2018
|
Scharf Global
|
Scharf Alpha
|
|||||||
|
Opportunity Fund
|
Opportunity Fund
|
|||||||
|
ASSETS
|
||||||||
|
Investments in securities, at value (identified cost
|
||||||||
|
$20,883,860 and $18,012,675, respectively)
|
$
|
24,967,248
|
$
|
21,032,105
|
||||
|
Cash
|
—
|
17,638
|
||||||
|
Deposits at broker for short securities
|
—
|
11,843,005
|
||||||
|
Receivables:
|
||||||||
|
Investments sold
|
4,455,696
|
—
|
||||||
|
Dividends and interest
|
18,926
|
8,005
|
||||||
|
Dividend tax reclaim
|
4,714
|
2,764
|
||||||
|
Due from Adviser (Note 4)
|
4,646
|
1,431
|
||||||
|
Prepaid expenses
|
16,978
|
10,680
|
||||||
|
Total assets
|
29,468,208
|
32,915,628
|
||||||
|
LIABILITIES
|
||||||||
|
Securities sold short (proceeds $0
|
||||||||
|
and $9,856,152, respectively)
|
—
|
11,806,437
|
||||||
|
Payables:
|
||||||||
|
Investments purchased
|
1,054,485
|
—
|
||||||
|
Fund shares redeemed
|
2,000
|
9,670
|
||||||
|
Dividends on short positions
|
—
|
47,587
|
||||||
|
Shareholder servicing fees
|
6,683
|
5,203
|
||||||
|
Administration and fund accounting fees
|
8,755
|
8,582
|
||||||
|
Audit fees
|
20,487
|
20,487
|
||||||
|
12b-1 distribution fees
|
15,361
|
16,120
|
||||||
|
Custody fees
|
2,365
|
2,123
|
||||||
|
Transfer agent fees and expenses
|
2,218
|
2,256
|
||||||
|
Shareholder reporting
|
480
|
478
|
||||||
|
Chief Compliance Officer fee
|
1,500
|
1,500
|
||||||
|
Legal fees
|
890
|
889
|
||||||
|
Trustee fees and expenses
|
—
|
220
|
||||||
|
Accrued other expenses
|
393
|
—
|
||||||
|
Total liabilities
|
1,115,617
|
11,921,552
|
||||||
|
NET ASSETS
|
$
|
28,352,591
|
$
|
20,994,076
|
||||
The accompanying notes are an integral part of these financial statements.
44
SCHARF FUNDS
STATEMENTS OF ASSETS AND LIABILITIES at September 30, 2018, Continued
|
Scharf Global
|
Scharf Alpha
|
|||||||
|
Opportunity Fund
|
Opportunity Fund
|
|||||||
|
CALCULATION OF NET ASSET VALUE PER SHARE
|
||||||||
|
Retail Shares
|
||||||||
|
Net assets applicable to shares outstanding
|
$
|
28,352,591
|
$
|
20,994,076
|
||||
|
Shares issued and outstanding [unlimited number of shares
|
||||||||
|
(par value $0.01) authorized]
|
905,722
|
877,678
|
||||||
|
Net asset value, offering and
|
||||||||
|
redemption price per share
|
$
|
31.30
|
$
|
23.92
|
||||
|
COMPOSITION OF NET ASSETS
|
||||||||
|
Paid-in capital
|
$
|
21,701,895
|
$
|
20,694,600
|
||||
|
Total distributable earnings
|
6,650,696
|
299,476
|
||||||
|
Net assets
|
$
|
28,352,591
|
$
|
20,994,076
|
||||
The accompanying notes are an integral part of these financial statements.
45
SCHARF FUNDS
STATEMENTS OF OPERATIONS For the Year Ended September 30, 2018
|
Scharf Balanced
|
||||||||
|
Scharf Fund
|
Opportunity Fund
|
|||||||
|
INVESTMENT INCOME
|
||||||||
|
Income
|
||||||||
|
Dividends (net of foreign tax withheld and issuance
|
||||||||
|
fees of $185,926 and $19,397, respectively)
|
$
|
7,076,313
|
$
|
664,103
|
||||
|
Interest
|
808,579
|
540,348
|
||||||
|
Total income
|
7,884,892
|
1,204,451
|
||||||
|
Expenses
|
||||||||
|
Advisory fees (Note 4)
|
4,708,850
|
587,563
|
||||||
|
Administration and fund accounting fees (Note 4)
|
354,180
|
81,946
|
||||||
|
Shareholder servicing fees – Institutional Class (Note 6)
|
139,810
|
44,690
|
||||||
|
Shareholder servicing fees – Retail Class (Note 6)
|
76,205
|
7,737
|
||||||
|
12b-1 distribution fees – Retail Class (Note 5)
|
196,242
|
19,351
|
||||||
|
Transfer agent fees and expenses (Note 4)
|
57,299
|
23,972
|
||||||
|
Custody fees (Note 4)
|
49,908
|
17,091
|
||||||
|
Registration fees
|
46,476
|
31,527
|
||||||
|
Audit fees
|
21,987
|
21,987
|
||||||
|
Reports to shareholders
|
21,576
|
2,211
|
||||||
|
Trustee fees and expenses
|
17,860
|
12,880
|
||||||
|
Miscellaneous expenses
|
12,458
|
5,944
|
||||||
|
Chief Compliance Officer fee (Note 4)
|
9,000
|
9,000
|
||||||
|
Insurance expense
|
8,613
|
2,411
|
||||||
|
Legal fees
|
7,224
|
5,955
|
||||||
|
Interest expense
|
907
|
—
|
||||||
|
Total expenses
|
5,728,595
|
874,265
|
||||||
|
Less: advisory fee waiver (Note 4)
|
(605,893
|
)
|
(280,214
|
)
|
||||
|
Net expenses
|
5,122,702
|
594,051
|
||||||
|
Net investment income
|
2,762,190
|
610,400
|
||||||
|
REALIZED AND UNREALIZED GAIN/(LOSS) ON
|
||||||||
|
INVESTMENTS AND FOREIGN CURRENCY
|
||||||||
|
Net realized gain/(loss) on:
|
||||||||
|
Investments
|
37,326,161
|
2,911,525
|
||||||
|
Foreign currency
|
4,956
|
(1,987
|
)
|
|||||
|
Net change in unrealized appreciation/(depreciation) on:
|
||||||||
|
Investments
|
(1,872,835
|
)
|
(53,551
|
)
|
||||
|
Foreign currency
|
(297
|
)
|
273
|
|||||
|
Net realized and unrealized gain on
|
||||||||
|
investments and foreign currency
|
35,457,985
|
2,856,260
|
||||||
|
Net Increase in Net Assets
|
||||||||
|
Resulting from Operations
|
$
|
38,220,175
|
$
|
3,466,660
|
||||
The accompanying notes are an integral part of these financial statements.
46
SCHARF FUNDS
STATEMENTS OF OPERATIONS For the Year Ended September 30, 2018
|
Scharf Global
|
Scharf Alpha
|
|||||||
|
Opportunity Fund
|
Opportunity Fund
|
|||||||
|
INVESTMENT INCOME
|
||||||||
|
Income
|
||||||||
|
Dividends (net of foreign tax withheld and issuance
|
||||||||
|
fees of $24,958 and $3,146, respectively)
|
$
|
432,378
|
$
|
328,772
|
||||
|
Interest
|
6,896
|
59,806
|
||||||
|
Total income
|
439,274
|
388,578
|
||||||
|
Expenses
|
||||||||
|
Advisory fees (Note 4)
|
297,703
|
219,499
|
||||||
|
Administration and fund accounting fees (Note 4)
|
51,907
|
50,562
|
||||||
|
12b-1 distribution fees – Retail Class (Note 5)
|
30,494
|
29,387
|
||||||
|
Shareholder servicing fees – Retail Class (Note 6)
|
26,973
|
18,573
|
||||||
|
Registration fees
|
21,859
|
16,756
|
||||||
|
Audit fees
|
18,987
|
18,986
|
||||||
|
Custody fees (Note 4)
|
17,858
|
14,223
|
||||||
|
Transfer agent fees and expenses (Note 4)
|
12,888
|
13,411
|
||||||
|
Trustee fees and expenses
|
12,263
|
12,417
|
||||||
|
Chief Compliance Officer fee (Note 4)
|
9,000
|
9,000
|
||||||
|
Miscellaneous expenses
|
7,454
|
9,463
|
||||||
|
Legal fees
|
5,410
|
5,413
|
||||||
|
Insurance expense
|
1,961
|
2,139
|
||||||
|
Reports to shareholders
|
1,203
|
1,305
|
||||||
|
Interest expense
|
428
|
1,245
|
||||||
|
Total expenses before dividends
|
||||||||
|
on short positions
|
516,388
|
422,379
|
||||||
|
Dividends on short positions
|
—
|
214,862
|
||||||
|
Total expenses before advisory fee waiver
|
||||||||
|
and expense reimbursement
|
516,388
|
637,241
|
||||||
|
Less: advisory fee waiver and
|
||||||||
|
expense reimbursement (Note 4)
|
(358,682
|
)
|
(230,304
|
)
|
||||
|
Net expenses
|
157,706
|
406,937
|
||||||
|
Net investment income/(loss)
|
281,568
|
(18,359
|
)
|
|||||
|
REALIZED AND UNREALIZED GAIN/(LOSS)
|
||||||||
|
ON INVESTMENTS, FOREIGN CURRENCY,
|
||||||||
|
PURCHASED OPTIONS AND SECURITIES SOLD SHORT
|
||||||||
|
Net realized gain/(loss) on:
|
||||||||
|
Investments
|
2,412,864
|
1,726,775
|
||||||
|
Foreign currency
|
(1,216
|
)
|
(26
|
)
|
||||
|
Purchased options
|
(89,226
|
)
|
—
|
|||||
|
Securities sold short
|
—
|
(2,399,251
|
)
|
|||||
|
Net change in unrealized appreciation/(depreciation) on:
|
||||||||
|
Investments
|
499,805
|
428,206
|
||||||
|
Foreign currency
|
(238
|
)
|
(4
|
)
|
||||
|
Purchased options
|
17,780
|
—
|
||||||
|
Securities sold short
|
—
|
391,800
|
||||||
|
Net realized and unrealized gain on
|
||||||||
|
investments, foreign currency,
|
||||||||
|
securities sold short and purchased options
|
2,839,769
|
147,500
|
||||||
|
Net Increase in Net Assets
|
||||||||
|
Resulting from Operations
|
$
|
3,121,337
|
$
|
129,141
|
||||
The accompanying notes are an integral part of these financial statements.
47
SCHARF FUND
STATEMENTS OF CHANGES IN NET ASSETS
|
Year Ended
|
Year Ended
|
|||||||
|
September 30, 2018
|
September 30, 2017
|
|||||||
|
INCREASE/(DECREASE) IN NET ASSETS FROM:
|
||||||||
|
OPERATIONS
|
||||||||
|
Net investment income
|
$
|
2,762,190
|
$
|
1,062,386
|
||||
|
Net realized gain from:
|
||||||||
|
Investments
|
37,326,161
|
14,918,138
|
||||||
|
Foreign currency
|
4,956
|
7,932
|
||||||
|
Capital gain distributions from
|
||||||||
|
regulated investment companies
|
—
|
382
|
||||||
|
Net change in unrealized appreciation/(depreciation) on:
|
||||||||
|
Investments
|
(1,872,835
|
)
|
33,693,587
|
|||||
|
Foreign currency
|
(297
|
)
|
2,673
|
|||||
|
Net increase in net assets resulting from operations
|
38,220,175
|
49,685,098
|
||||||
|
DISTRIBUTIONS TO SHAREHOLDERS
|
||||||||
|
Net dividends and distributions to shareholders –
|
||||||||
|
Institutional Class shares
|
(13,115,918
|
)
|
(836,345
|
)
|
||||
|
Net dividends and distributions to shareholders –
|
||||||||
|
Retail Class shares
|
(2,185,843
|
)
|
—
|
|||||
|
Total distributions to shareholders
|
(15,301,761
|
)
|
(836,345
|
)*
|
||||
|
CAPITAL SHARE TRANSACTIONS
|
||||||||
|
Net decrease in net assets derived
|
||||||||
|
from net change in outstanding shares (a)
|
(179,275,337
|
)
|
(79,145,637
|
)
|
||||
|
Total decrease in net assets
|
(156,356,923
|
)
|
(30,296,884
|
)
|
||||
|
NET ASSETS
|
||||||||
|
Beginning of year
|
576,926,606
|
607,223,490
|
||||||
|
End of year
|
$
|
420,569,683
|
$
|
576,926,606
|
**
|
|||
|
*
|
Includes net investment income distributions of $836,345.
|
|
|
**
|
Includes accumulated undistributed net investment income of $891,172.
|
The accompanying notes are an integral part of these financial statements.
48
SCHARF FUND
STATEMENTS OF CHANGES IN NET ASSETS, Continued
|
(a)
|
A summary of share transactions is as follows:
|
|
Institutional Class
|
|||||||||||||||||
|
Year Ended
|
Year Ended
|
||||||||||||||||
|
September 30, 2018
|
September 30, 2017
|
||||||||||||||||
|
Shares
|
Paid-in Capital
|
Shares
|
Paid-in Capital
|
||||||||||||||
|
Shares sold
|
918,803
|
$
|
40,683,762
|
2,003,817
|
$
|
83,841,086
|
|||||||||||
|
Shares issued on
|
|||||||||||||||||
|
reinvestments of distributions
|
294,773
|
13,070,222
|
20,558
|
828,692
|
|||||||||||||
|
Shares redeemed*
|
(4,791,034
|
)
|
(210,561,075
|
)
|
(3,527,496
|
)
|
(147,136,199
|
)
|
|||||||||
|
Net decrease
|
(3,577,458
|
)
|
$
|
(156,807,091
|
)
|
(1,503,121
|
)
|
$
|
(62,466,421
|
)
|
|||||||
|
* Net of redemption fees of
|
$ | 3,164 | $ | 2,840 | |||||||||||||
|
Retail Class
|
|||||||||||||||||
|
Year Ended
|
Year Ended
|
||||||||||||||||
|
September 30, 2018
|
September 30, 2017
|
||||||||||||||||
|
Shares
|
Paid-in Capital
|
Shares
|
Paid-in Capital
|
||||||||||||||
|
Shares sold
|
94,182
|
$
|
4,196,546
|
252,962
|
$
|
10,441,408
|
|||||||||||
|
Shares issued on
|
|||||||||||||||||
|
reinvestments of distributions
|
49,331
|
2,179,918
|
—
|
—
|
|||||||||||||
|
Shares redeemed*
|
(653,191
|
)
|
(28,844,711
|
)
|
(665,882
|
)
|
(27,120,624
|
)
|
|||||||||
|
Net decrease
|
(509,678
|
)
|
$
|
(22,468,247
|
)
|
(412,920
|
)
|
$
|
(16,679,216
|
)
|
|||||||
|
* Net of redemption fees of
|
$
|
65
|
$
|
4,350
|
|||||||||||||
|
R6 Class
|
|||||||||||||||||
|
January 29, 2018*
|
|||||||||||||||||
|
to
|
|||||||||||||||||
|
September 30, 2018**
|
|||||||||||||||||
|
Shares
|
Paid-in Capital
|
||||||||||||||||
|
Shares sold
|
2
|
$
|
100
|
||||||||||||||
|
Shares redeemed*
|
(2
|
)
|
(99
|
)
|
|||||||||||||
|
Net increase
|
—
|
$
|
1
|
||||||||||||||
|
*
|
Commencement of operations.
|
|
|
**
|
Ceased operations and was liquidated on September 14, 2018.
|
The accompanying notes are an integral part of these financial statements.
49
SCHARF BALANCED OPPORTUNITY FUND
STATEMENTS OF CHANGES IN NET ASSETS
|
Year Ended
|
Year Ended
|
|||||||
|
September 30, 2018
|
September 30, 2017
|
|||||||
|
INCREASE/(DECREASE) IN NET ASSETS FROM:
|
||||||||
|
OPERATIONS
|
||||||||
|
Net investment income
|
$
|
610,400
|
$
|
298,034
|
||||
|
Net realized gain/(loss) from:
|
||||||||
|
Investments
|
2,911,525
|
1,219,401
|
||||||
|
Foreign currency
|
(1,987
|
)
|
1,043
|
|||||
|
Capital gain distributions from
|
||||||||
|
regulated investment companies
|
—
|
96
|
||||||
|
Net change in unrealized appreciation/(depreciation) on:
|
||||||||
|
Investments
|
(53,551
|
)
|
2,866,990
|
|||||
|
Foreign currency
|
273
|
169
|
||||||
|
Net increase in net assets resulting from operations
|
3,466,660
|
4,385,733
|
||||||
|
DISTRIBUTIONS TO SHAREHOLDERS
|
||||||||
|
Net dividends and distributions to shareholders –
|
||||||||
|
Institutional Class shares
|
(1,184,539
|
)
|
(750,182
|
)
|
||||
|
Net dividends and distributions to shareholders –
|
||||||||
|
Retail Class shares
|
(164,551
|
)
|
(107,892
|
)
|
||||
|
Total distributions to shareholders
|
(1,349,090
|
)
|
(858,074
|
)*
|
||||
|
CAPITAL SHARE TRANSACTIONS
|
||||||||
|
Net increase/(decrease) in net assets derived from
|
||||||||
|
net change in outstanding shares (a)
|
(17,449,572
|
)
|
5,055,728
|
|||||
|
Total increase/(decrease) in net assets
|
(15,332,002
|
)
|
8,583,387
|
|||||
|
NET ASSETS
|
||||||||
|
Beginning of year
|
69,058,569
|
60,475,182
|
||||||
|
End of year
|
$
|
53,726,567
|
$
|
69,058,569
|
**
|
|||
|
*
|
Includes net investment income distributions of $365,561 and $48,151, and net realized gain distributions of $384,621 and $59,741 for the Institutional and Retail Class, respectively.
|
|
|
**
|
Includes accumulated undistributed net investment income of $120,153.
|
The accompanying notes are an integral part of these financial statements.
50
SCHARF BALANCED OPPORTUNITY FUND
STATEMENTS OF CHANGES IN NET ASSETS, Continued
|
(a)
|
A summary of share transactions is as follows:
|
|
Institutional Class
|
|||||||||||||||||
|
Year Ended
|
Year Ended
|
||||||||||||||||
|
September 30, 2018
|
September 30, 2017
|
||||||||||||||||
|
Shares
|
Paid-in Capital
|
Shares
|
Paid-in Capital
|
||||||||||||||
|
Shares sold
|
152,690
|
$
|
4,967,643
|
296,792
|
$
|
9,224,277
|
|||||||||||
|
Shares issued on
|
|||||||||||||||||
|
reinvestments of distributions
|
36,628
|
1,184,198
|
24,887
|
745,357
|
|||||||||||||
|
Shares redeemed*
|
(669,433
|
)
|
(21,676,720
|
)
|
(208,501
|
)
|
(6,469,050
|
)
|
|||||||||
|
Net increase/(decrease)
|
(480,115
|
)
|
$
|
(15,524,879
|
)
|
113,178
|
$
|
3,500,584
|
|||||||||
|
* Net of redemption fees of
|
$
|
—
|
$
|
4
|
|||||||||||||
|
Retail Class
|
|||||||||||||||||
|
Year Ended
|
Year Ended
|
||||||||||||||||
|
September 30, 2018
|
September 30, 2017
|
||||||||||||||||
|
Shares
|
Paid-in Capital
|
Shares
|
Paid-in Capital
|
||||||||||||||
|
Shares sold
|
26,301
|
$
|
849,386
|
82,197
|
$
|
2,533,898
|
|||||||||||
|
Shares issued on
|
|||||||||||||||||
|
reinvestments of distributions
|
5,099
|
164,551
|
3,607
|
107,89
|
|||||||||||||
|
Shares redeemed
|
(91,087
|
)
|
(2,938,630
|
)
|
(34,900
|
)
|
(1,086,646
|
)
|
|||||||||
|
Net increase/(decrease)
|
(59,687
|
)
|
$
|
(1,924,693
|
)
|
50,904
|
$
|
1,555,144
|
|||||||||
The accompanying notes are an integral part of these financial statements.
51
SCHARF GLOBAL OPPORTUNITY FUND
STATEMENTS OF CHANGES IN NET ASSETS
|
Year Ended
|
Year Ended
|
|||||||
|
September 30, 2018
|
September 30, 2017
|
|||||||
|
INCREASE/(DECREASE) IN NET ASSETS FROM:
|
||||||||
|
OPERATIONS
|
||||||||
|
Net investment income
|
$
|
281,568
|
$
|
183,836
|
||||
|
Net realized gain/(loss) from:
|
||||||||
|
Investments
|
2,412,864
|
1,302,134
|
||||||
|
Foreign currency
|
(1,216
|
)
|
(43
|
)
|
||||
|
Purchased options
|
(89,226
|
)
|
—
|
|||||
|
Capital gain distributions from
|
||||||||
|
regulated investment companies
|
—
|
2
|
||||||
|
Net change in unrealized appreciation/(depreciation) on:
|
||||||||
|
Investments
|
499,805
|
1,790,187
|
||||||
|
Foreign currency
|
(238
|
)
|
85
|
|||||
|
Purchased options
|
17,780
|
(17,780
|
)
|
|||||
|
Net increase in net assets resulting from operations
|
3,121,337
|
3,258,421
|
||||||
|
DISTRIBUTIONS TO SHAREHOLDERS
|
||||||||
|
Net dividends and distributions to shareholders
|
(1,811,431
|
)
|
(350,164
|
)
|
||||
|
Total distributions to shareholders
|
(1,811,431
|
)
|
(350,164
|
)*
|
||||
|
CAPITAL SHARE TRANSACTIONS
|
||||||||
|
Net decrease in net assets derived
|
||||||||
|
from net change in outstanding shares (a)
|
(3,264,460
|
)
|
(45,307
|
)
|
||||
|
Total increase/(decrease) in net assets
|
(1,954,554
|
)
|
2,862,950
|
|||||
|
NET ASSETS
|
||||||||
|
Beginning of year
|
30,307,145
|
27,444,195
|
||||||
|
End of year
|
$
|
28,352,591
|
$
|
30,307,145
|
**
|
|||
|
(a)
|
A summary of share transactions is as follows:
|
|
Year Ended
|
Year Ended
|
||||||||||||||||
|
September 30, 2018
|
September 30, 2017
|
||||||||||||||||
|
Shares
|
Paid-in Capital
|
Shares
|
Paid-in Capital
|
||||||||||||||
|
Shares sold
|
162,303
|
$
|
4,782,771
|
131,041
|
$
|
3,726,714
|
|||||||||||
|
Shares issued on
|
|||||||||||||||||
|
reinvestments of distributions
|
61,634
|
1,811,431
|
13,279
|
350,163
|
|||||||||||||
|
Shares redeemed*
|
(336,697
|
)
|
(9,858,662
|
)
|
(146,452
|
)
|
(4,122,184
|
)
|
|||||||||
|
Net decrease
|
(112,760
|
)
|
$
|
(3,264,460
|
)
|
(2,132
|
)
|
$
|
(45,307
|
)
|
|||||||
|
* Net of redemption fees of
|
$
|
4
|
$
|
92
|
|||||||||||||
|
*
|
Includes net investment income distribution of $145,384, and net realized gain distribution of $204,780.
|
|
|
**
|
Includes accumulated undistributed net investment income of $146,045.
|
The accompanying notes are an integral part of these financial statements.
52
SCHARF ALPHA OPPORTUNITY FUND
STATEMENTS OF CHANGES IN NET ASSETS
|
Year Ended
|
Year Ended
|
|||||||
|
September 30, 2018
|
September 30, 2017
|
|||||||
|
INCREASE/(DECREASE) IN NET ASSETS FROM:
|
||||||||
|
OPERATIONS
|
||||||||
|
Net investment loss
|
$
|
(18,359
|
)
|
$
|
(196,124
|
)
|
||
|
Net realized gain/(loss) from:
|
||||||||
|
Investments
|
1,726,775
|
587,909
|
||||||
|
Foreign currency
|
(26
|
)
|
14
|
|||||
|
Purchased options
|
—
|
(23,424
|
)
|
|||||
|
Securities sold short
|
(2,399,251
|
)
|
(565,375
|
)
|
||||
|
Capital gain distributions from
|
||||||||
|
regulated investment companies
|
—
|
3
|
||||||
|
Net change in unrealized appreciation/(depreciation) on:
|
||||||||
|
Investments
|
428,206
|
1,625,541
|
||||||
|
Foreign currency
|
(4
|
)
|
3
|
|||||
|
Purchased options
|
—
|
5,833
|
||||||
|
Securities sold short
|
391,800
|
(1,631,671
|
)
|
|||||
|
Net increase/(decrease) in net assets
|
||||||||
|
resulting from operations
|
129,141
|
(197,291
|
)
|
|||||
|
DISTRIBUTIONS TO SHAREHOLDERS
|
||||||||
|
Net dividends and distributions to shareholders
|
(463,472
|
)
|
(106,305
|
)
|
||||
|
Total distributions to shareholders
|
(463,472
|
)
|
(106,305
|
)*
|
||||
|
CAPITAL SHARE TRANSACTIONS
|
||||||||
|
Net increase/(decrease) in net assets derived
|
||||||||
|
from net change in outstanding shares (a)
|
(3,800,988
|
)
|
412,267
|
|||||
|
Total increase/(decrease) in net assets
|
(4,135,319
|
)
|
108,671
|
|||||
|
NET ASSETS
|
||||||||
|
Beginning of year
|
25,129,395
|
25,020,724
|
||||||
|
End of year
|
$
|
20,994,076
|
$
|
25,129,395
|
**
|
|||
|
(a)
|
A summary of share transactions is as follows:
|
|
Year Ended
|
Year Ended
|
||||||||||||||||
|
September 30, 2018
|
September 30, 2017
|
||||||||||||||||
|
Shares
|
Paid-in Capital
|
Shares
|
Paid-in Capital
|
||||||||||||||
|
Shares sold
|
112,877
|
$
|
2,660,266
|
361,662
|
$
|
8,699,395
|
|||||||||||
|
Shares issued on
|
|||||||||||||||||
|
reinvestments of distributions
|
16,096
|
382,590
|
3,871
|
91,211
|
|||||||||||||
|
Shares redeemed
|
(289,635
|
)
|
(6,843,844
|
)
|
(347,538
|
)
|
(8,378,339
|
)
|
|||||||||
|
Net increase/(decrease)
|
(160,662
|
)
|
$
|
(3,800,988
|
)
|
17,995
|
$
|
412,267
|
|||||||||
|
* Net of redemption fees of
|
$
|
52
|
$
|
—
|
|||||||||||||
|
*
|
Includes net realized gain distribution of $106,305.
|
|
|
**
|
Includes accumulated undistributed net investment loss of $(113,841).
|
The accompanying notes are an integral part of these financial statements.
53
SCHARF ALPHA OPPORTUNITY FUND
STATEMENT OF CASH FLOWS For the Year Ended September 30, 2018
|
Increase/(decrease) in cash —
|
||||
|
Cash flows from operating activities:
|
||||
|
Net increase/(decrease) in net assets from operations
|
$
|
129,141
|
||
|
Adjustments to reconcile net increase/(decrease) in
|
||||
|
net assets from operations to net cash provided by operating activities:
|
||||
|
Purchases of investment securities
|
(10,071,501
|
)
|
||
|
Proceeds for sales of investment securities
|
14,651,443
|
|||
|
Proceeds on securities sold short
|
5,544,432
|
|||
|
Closed short sale transactions
|
(11,010,934
|
)
|
||
|
Proceeds for short-term investments, net
|
1,221,393
|
|||
|
Decrease in deposits at broker
|
3,366,098
|
|||
|
Decrease in dividends and interest receivable
|
9,397
|
|||
|
Decrease in due from Adviser
|
421
|
|||
|
Increase in prepaid expenses and other assets
|
(3,441
|
)
|
||
|
Decrease in payable for dividends on short positions
|
(27,430
|
)
|
||
|
Decrease in accrued administration fees
|
(9,410
|
)
|
||
|
Increase in 12b-1 distribution and service fees
|
(11,538
|
)
|
||
|
Decrease in compliance fees
|
(1,500
|
)
|
||
|
Decrease in custody fees
|
(3,259
|
)
|
||
|
Decrease in transfer agent fees and expenses
|
(2,070
|
)
|
||
|
Decrease in other accrued expenses
|
(7,204
|
)
|
||
|
Unrealized depreciation on securities
|
(820,006
|
)
|
||
|
Net realized loss on investments
|
672,476
|
|||
|
Proceeds received through merger
|
448,705
|
|||
|
Net cash provided by operating activities
|
4,075,213
|
|||
|
Cash flows from financing activities:
|
||||
|
Proceeds from shares sold
|
2,830,266
|
|||
|
Payment on shares redeemed
|
(7,076,731
|
)
|
||
|
Distributions paid in cash
|
(80,882
|
)
|
||
|
Net cash used in financing activities
|
(4,327,347
|
)
|
||
|
Net decrease in cash
|
(252,134
|
)
|
||
|
Cash:
|
||||
|
Beginning balance
|
269,772
|
|||
|
Ending balance
|
$
|
17,638
|
||
|
Supplemental information:
|
||||
|
Non-cash financing activities not included herein consists of dividend
|
||||
|
reinvestment of dividends and distributions
|
$
|
382,590
|
||
|
Cash paid for interest
|
$
|
1,245
|
||
The accompanying notes are an integral part of these financial statements.
54
SCHARF FUND
FINANCIAL HIGHLIGHTS For a share outstanding throughout each year
|
Institutional Class
|
||||||||||||||||||||
|
Year Ended September 30,
|
||||||||||||||||||||
|
2018
|
2017
|
2016
|
2015
|
2014
|
||||||||||||||||
|
Net asset value,
|
||||||||||||||||||||
|
beginning of year
|
$
|
44.08
|
$
|
40.47
|
$
|
38.24
|
$
|
39.00
|
$
|
32.43
|
||||||||||
|
Income from investment operations:
|
||||||||||||||||||||
|
Net investment income^
|
0.26
|
0.09
|
0.06
|
0.03
|
0.05
|
|||||||||||||||
|
Net realized and unrealized
|
||||||||||||||||||||
|
gain on investments
|
||||||||||||||||||||
|
and foreign currency
|
3.61
|
3.59
|
3.53
|
0.60
|
6.56
|
|||||||||||||||
|
Total from investment operations
|
3.87
|
3.68
|
3.59
|
0.63
|
6.61
|
|||||||||||||||
|
Less distributions:
|
||||||||||||||||||||
|
From net investment income
|
(0.08
|
)
|
(0.07
|
)
|
(0.02
|
)
|
(0.03
|
)
|
(0.02
|
)
|
||||||||||
|
From net realized
|
||||||||||||||||||||
|
gain on investments
|
(1.15
|
)
|
—
|
(1.34
|
)
|
(1.36
|
)
|
(0.02
|
)
|
|||||||||||
|
Total distributions
|
(1.23
|
)
|
(0.07
|
)
|
(1.36
|
)
|
(1.39
|
)
|
(0.04
|
)
|
||||||||||
|
Paid-in capital from
|
||||||||||||||||||||
|
redemption fees^#
|
0.00
|
0.00
|
0.00
|
0.00
|
0.00
|
|||||||||||||||
|
Net asset value, end of year
|
$
|
46.72
|
$
|
44.08
|
$
|
40.47
|
$
|
38.24
|
$
|
39.00
|
||||||||||
|
Total return
|
8.93
|
%
|
9.10
|
%
|
9.52
|
%
|
1.62
|
%
|
20.39
|
%
|
||||||||||
|
Ratios/supplemental data:
|
||||||||||||||||||||
|
Net assets, end of year (thousands)
|
$
|
350,205
|
$
|
488,084
|
$
|
508,930
|
$
|
377,974
|
$
|
188,453
|
||||||||||
|
Ratio of expenses
|
||||||||||||||||||||
|
to average net assets:
|
||||||||||||||||||||
|
Before fee waivers
|
1.08
|
%
|
1.20
|
%
|
1.19
|
%
|
1.26
|
%
|
1.30
|
%
|
||||||||||
|
After fee waivers
|
0.96
|
%~ |
1.07
|
%
|
1.05
|
%
|
1.13
|
%**
|
1.25
|
%
|
||||||||||
|
Ratio of net investment income/(loss)
|
||||||||||||||||||||
|
to average net assets:
|
||||||||||||||||||||
|
Before fee waivers
|
0.47
|
%
|
0.09
|
%
|
0.02
|
%
|
(0.05
|
)%
|
0.08
|
%
|
||||||||||
|
After fee waivers
|
0.59
|
%
|
0.22
|
%
|
0.16
|
%
|
0.08
|
%
|
0.13
|
%
|
||||||||||
|
Portfolio turnover rate
|
39.71
|
%
|
21.63
|
%
|
30.58
|
%
|
33.85
|
%
|
31.20
|
%
|
||||||||||
|
**
|
Effective January 28, 2015, the adviser contractually agreed to lower the net annual operating expense limit to 1.09%.
|
|
|
^
|
Based on average shares outstanding.
|
|
|
#
|
Amount is less than $0.01.
|
|
|
~
|
Effective January 28, 2018, the adviser contractually agreed to lower the net annual operating expense limit to 0.99%.
|
The accompanying notes are an integral part of these financial statements.
55
SCHARF FUND
FINANCIAL HIGHLIGHTS For a share outstanding throughout each period
Retail Class
|
January 28,
|
||||||||||||||||
|
2015* to
|
||||||||||||||||
|
Year Ended September 30,
|
September 30,
|
|||||||||||||||
|
2018
|
2017
|
2016
|
2015
|
|||||||||||||
|
Net asset value, beginning of period
|
$
|
43.87
|
$
|
40.32
|
$
|
38.21
|
$
|
38.85
|
||||||||
|
Income from investment operations:
|
||||||||||||||||
|
Net investment income/(loss)^
|
0.12
|
(0.02
|
)
|
(0.05
|
)
|
(0.02
|
)
|
|||||||||
|
Net realized and unrealized
|
||||||||||||||||
|
gain/(loss) on investments
|
||||||||||||||||
|
and foreign currency
|
3.59
|
3.57
|
3.52
|
(0.62
|
)
|
|||||||||||
|
Total from investment operations
|
3.71
|
3.55
|
3.47
|
(0.64
|
)
|
|||||||||||
|
Less distributions:
|
||||||||||||||||
|
From net investment income
|
—
|
—
|
(0.02
|
)
|
—
|
|||||||||||
|
From net realized gain on investments
|
(1.15
|
)
|
—
|
(1.34
|
)
|
—
|
||||||||||
|
Total distributions
|
(1.15
|
)
|
—
|
(1.36
|
)
|
—
|
||||||||||
|
Paid-in capital from
|
||||||||||||||||
|
redemption fees^#
|
0.00
|
0.00
|
0.00
|
0.00
|
||||||||||||
|
Net asset value, end of period
|
$
|
46.43
|
$
|
43.87
|
$
|
40.32
|
$
|
38.21
|
||||||||
|
Total return
|
8.58
|
%
|
8.80
|
%
|
9.20
|
%
|
(1.65
|
)%‡
|
||||||||
|
Ratios/supplemental data:
|
||||||||||||||||
|
Net assets, end of period (thousands)
|
$
|
70,365
|
$
|
88,843
|
$
|
98,293
|
$
|
41,551
|
||||||||
|
Ratio of expenses to average net assets:
|
||||||||||||||||
|
Before fee waivers
|
1.39
|
%
|
1.47
|
%
|
1.47
|
%
|
1.53
|
%†
|
||||||||
|
After fee waivers
|
1.27
|
%~ |
1.34
|
%
|
1.34
|
%
|
1.34
|
%†
|
||||||||
|
Ratio of net investment income/(loss)
|
||||||||||||||||
|
to average net assets:
|
||||||||||||||||
|
Before fee waivers
|
0.16
|
%
|
(0.17
|
)%
|
(0.25
|
)%
|
(0.27
|
)%†
|
||||||||
|
After fee waivers
|
0.28
|
%
|
(0.04
|
)%
|
(0.12
|
)%
|
(0.08
|
)%†
|
||||||||
|
Portfolio turnover rate
|
39.71
|
%
|
21.63
|
%
|
30.58
|
%
|
33.85
|
%‡**
|
||||||||
|
*
|
Commencement of operations.
|
|
|
^
|
Based on average shares outstanding.
|
|
|
†
|
Annualized.
|
|
|
‡
|
Not annualized.
|
|
|
#
|
Amount is less than $0.01.
|
|
|
**
|
Portfolio turnover calculated for the year ended September 30, 2015.
|
|
|
~
|
Effective January 28, 2018, the adviser contractually agreed to lower the net annual operating expense limit to 1.24%.
|
The accompanying notes are an integral part of these financial statements.
56
SCHARF BALANCED OPPORTUNITY FUND
FINANCIAL HIGHLIGHTS For a share outstanding throughout each year
Institutional Class
|
Year Ended September 30,
|
||||||||||||||||||||
|
2018
|
2017
|
2016
|
2015
|
2014
|
||||||||||||||||
|
Net asset value,
|
||||||||||||||||||||
|
beginning of year
|
$
|
32.27
|
$
|
30.60
|
$
|
29.60
|
$
|
30.46
|
$
|
27.16
|
||||||||||
|
Income from investment operations:
|
||||||||||||||||||||
|
Net investment income
|
0.34
|
^ |
0.15
|
^ |
0.14
|
^ |
0.08
|
^ |
0.14
|
|||||||||||
|
Net realized and unrealized
|
||||||||||||||||||||
|
gain on investments
|
||||||||||||||||||||
|
and foreign currency
|
1.67
|
1.94
|
2.08
|
0.34
|
3.60
|
|||||||||||||||
|
Total from investment operations
|
2.01
|
2.09
|
2.22
|
0.42
|
3.74
|
|||||||||||||||
|
Less distributions:
|
||||||||||||||||||||
|
From net investment income
|
(0.07
|
)
|
(0.20
|
)
|
(0.07
|
)
|
(0.10
|
)
|
(0.14
|
)
|
||||||||||
|
From net realized
|
||||||||||||||||||||
|
gain on investments
|
(0.63
|
)
|
(0.22
|
)
|
(1.15
|
)
|
(1.18
|
)
|
(0.30
|
)
|
||||||||||
|
Total distributions
|
(0.70
|
)
|
(0.42
|
)
|
(1.22
|
)
|
(1.28
|
)
|
(0.44
|
)
|
||||||||||
|
Paid-in capital from
|
||||||||||||||||||||
|
redemption fees
|
—
|
0.00
|
^# |
0.00
|
^# |
0.00
|
^# |
—
|
||||||||||||
|
Net asset value, end of year
|
$
|
33.58
|
$
|
32.27
|
$
|
30.60
|
$
|
29.60
|
$
|
30.46
|
||||||||||
|
Total return
|
6.32
|
%
|
6.94
|
%
|
7.68
|
%
|
1.38
|
%
|
13.93
|
%
|
||||||||||
|
Ratios/supplemental data:
|
||||||||||||||||||||
|
Net assets, end of year (thousands)
|
$
|
46,366
|
$
|
60,061
|
$
|
53,485
|
$
|
47,064
|
$
|
37,935
|
||||||||||
|
Ratio of expenses to average net assets:
|
||||||||||||||||||||
|
Before fee waivers
|
1.44
|
%
|
1.47
|
%
|
1.47
|
%
|
1.45
|
%
|
1.69
|
%
|
||||||||||
|
After fee waivers
|
0.97
|
%
|
1.02
|
%**
|
1.08
|
%
|
1.20
|
%
|
1.20
|
%
|
||||||||||
|
Ratio of net investment income
|
||||||||||||||||||||
|
to average net assets:
|
||||||||||||||||||||
|
Before fee waivers
|
0.59
|
%
|
0.04
|
%
|
0.08
|
%
|
0.00
|
%
|
0.13
|
%
|
||||||||||
|
After fee waivers
|
1.06
|
%
|
0.49
|
%
|
0.47
|
%
|
0.25
|
%
|
0.62
|
%
|
||||||||||
|
Portfolio turnover rate
|
36.29
|
%
|
30.04
|
%
|
34.43
|
%
|
39.09
|
%
|
36.18
|
%
|
||||||||||
|
**
|
Effective June 30, 2017, the advisor contractually agreed to lower the net annual operating expense limit to 0.98%.
|
|
|
^
|
Based on average shares outstanding.
|
|
|
#
|
Amount is less than $0.01.
|
The accompanying notes are an integral part of these financial statements.
57
SCHARF BALANCED OPPORTUNITY FUND
FINANCIAL HIGHLIGHTS For a share outstanding throughout each period
Retail Class
|
January 21,
|
||||||||||||
|
2016* to
|
||||||||||||
|
Year Ended September 30,
|
September 30,
|
|||||||||||
|
2018
|
2017
|
2016
|
||||||||||
|
Net asset value, beginning of period
|
$
|
32.16
|
$
|
30.54
|
$
|
27.68
|
||||||
|
Income from investment operations:
|
||||||||||||
|
Net investment income^
|
0.26
|
0.07
|
0.05
|
|||||||||
|
Net realized and unrealized gain
|
||||||||||||
|
on investments and foreign currency
|
1.65
|
1.94
|
2.81
|
|||||||||
|
Total from investment operations
|
1.91
|
2.01
|
2.86
|
|||||||||
|
Less distributions:
|
||||||||||||
|
From net investment income
|
—
|
(0.17
|
)
|
|||||||||
|
From net realized gain on investments
|
(0.63
|
)
|
(0.22
|
)
|
—
|
|||||||
|
Total distributions
|
(0.63
|
)
|
(0.39
|
)
|
—
|
|||||||
|
Net asset value, end of period
|
$
|
33.44
|
$
|
32.16
|
$
|
30.54
|
||||||
|
Total return
|
6.00
|
%
|
6.68
|
%
|
10.33
|
%‡
|
||||||
|
Ratios/supplemental data:
|
||||||||||||
|
Net assets, end of period (thousands)
|
$
|
7,361
|
$
|
8,998
|
$
|
6,990
|
||||||
|
Ratio of expenses to average net assets:
|
||||||||||||
|
Before fee waivers
|
1.70
|
%
|
1.73
|
%
|
1.75
|
%†
|
||||||
|
After fee waivers
|
1.23
|
%
|
1.28
|
%~ |
1.30
|
%†
|
||||||
|
Ratio of net investment income/(loss)
|
||||||||||||
|
to average net assets:
|
||||||||||||
|
Before fee waivers
|
0.33
|
%
|
(0.21
|
)%
|
(0.23
|
)%†
|
||||||
|
After fee waivers
|
0.80
|
%
|
0.24
|
%
|
0.22
|
%†
|
||||||
|
Portfolio turnover rate
|
36.29
|
%
|
30.04
|
%
|
34.43
|
%‡**
|
||||||
|
*
|
Commencement of operations.
|
|
|
~
|
Effective June 30, 2017, the advisor contractually agreed to lower the net annual operating expense limit to 1.23%.
|
|
|
^
|
Based on average shares outstanding.
|
|
|
**
|
Portfolio turnover calculated for the period ended September 30, 2016.
|
|
|
†
|
Annualized.
|
|
|
‡
|
Not annualized.
|
|
The accompanying notes are an integral part of these financial statements.
58
SCHARF GLOBAL OPPORTUNITY FUND
FINANCIAL HIGHLIGHTS For a share outstanding throughout each period
Retail Class
|
October 14,
|
||||||||||||||||
|
2014* to
|
||||||||||||||||
|
Year Ended September 30,
|
September 30,
|
|||||||||||||||
|
2018
|
2017
|
2016
|
2015
|
|||||||||||||
|
Net asset value, beginning of period
|
$
|
29.76
|
$
|
26.89
|
$
|
24.87
|
$
|
24.00
|
||||||||
|
Income from investment operations:
|
||||||||||||||||
|
Net investment income
|
0.31
|
0.18
|
^ |
0.16
|
0.19
|
|||||||||||
|
Net realized and unrealized gain on
|
||||||||||||||||
|
investments, foreign currency
|
||||||||||||||||
|
and purchased options
|
3.05
|
3.03
|
3.06
|
0.71
|
||||||||||||
|
Total from investment operations
|
3.36
|
3.21
|
3.22
|
0.90
|
||||||||||||
|
Less distributions:
|
||||||||||||||||
|
From net investment income
|
(0.21
|
)
|
(0.14
|
)
|
(0.20
|
)
|
(0.03
|
)
|
||||||||
|
From net realized
|
||||||||||||||||
|
gain on investments
|
(1.61
|
)
|
(0.20
|
)
|
(1.00
|
)
|
—
|
|||||||||
|
Total distributions
|
(1.82
|
)
|
(0.34
|
)
|
(1.20
|
)
|
(0.03
|
)
|
||||||||
|
Paid-in capital from redemption fees
|
0.00
|
^# |
0.00
|
^# |
—
|
—
|
||||||||||
|
Net asset value, end of period
|
$
|
31.30
|
$
|
29.76
|
$
|
26.89
|
$
|
24.87
|
||||||||
|
Total return
|
11.72
|
%
|
12.10
|
%
|
13.21
|
%
|
3.75
|
%‡
|
||||||||
|
Ratios/supplemental data:
|
||||||||||||||||
|
Net assets, end of period (thousands)
|
$
|
28,353
|
$
|
30,307
|
$
|
27,444
|
$
|
18,348
|
||||||||
|
Ratio of expenses to average net assets:
|
||||||||||||||||
|
Before fee waivers and
|
||||||||||||||||
|
expense reimbursement
|
1.72
|
%
|
1.90
|
%
|
1.97
|
%
|
2.36
|
%†
|
||||||||
|
After fee waivers and
|
||||||||||||||||
|
expense reimbursement
|
0.52
|
%~ |
0.65
|
%
|
0.55
|
%
|
0.50
|
%†
|
||||||||
|
Ratio of net investment income/(loss)
|
||||||||||||||||
|
to average net assets:
|
||||||||||||||||
|
Before fee waivers and
|
||||||||||||||||
|
expense reimbursement
|
(0.26
|
)%
|
(0.60
|
)%
|
(0.74
|
)%
|
(1.01
|
)%†
|
||||||||
|
After fee waivers and
|
||||||||||||||||
|
expense reimbursement
|
0.94
|
%
|
0.65
|
%
|
0.68
|
%
|
0.85
|
%†
|
||||||||
|
Portfolio turnover rate
|
65.99
|
%
|
75.78
|
%
|
52.75
|
%
|
60.44
|
%‡**
|
||||||||
|
*
|
Commencement of operations.
|
|
|
^
|
Based on average shares outstanding.
|
|
|
†
|
Annualized.
|
|
|
‡
|
Not annualized.
|
|
|
**
|
Portfolio turnover calculated for the period ended September 30, 2015.
|
|
|
#
|
Amount is less than $0.01.
|
|
|
~
|
Effective January 28, 2018, the adviser contractually changed the net annual operating expense limit to 0.70%.
|
The accompanying notes are an integral part of these financial statements.
59
SCHARF ALPHA OPPORTUNITY FUND
FINANCIAL HIGHLIGHTS For a share outstanding throughout each period
Retail Class
|
December 31,
|
||||||||||||
|
2015* to
|
||||||||||||
|
Year Ended September 30,
|
September 30,
|
|||||||||||
|
2018
|
2017
|
2016
|
||||||||||
|
Net asset value, beginning of period
|
$
|
24.20
|
$
|
24.52
|
$
|
24.00
|
||||||
|
Income from investment operations:
|
||||||||||||
|
Net investment loss
|
(0.04
|
)
|
(0.19
|
)
|
(0.21
|
)^ | ||||||
|
Net realized and unrealized gain/(loss) on
|
||||||||||||
|
investments, foreign currency, purchased
|
||||||||||||
|
options and securities sold short
|
0.23
|
(0.03
|
)
|
0.73
|
||||||||
|
Total from investment operations
|
0.19
|
(0.22
|
)
|
0.52
|
||||||||
|
Less distributions:
|
||||||||||||
|
From net realized gain on investments
|
(0.47
|
)
|
(0.10
|
)
|
—
|
|||||||
|
Total distributions
|
(0.47
|
)
|
(0.10
|
)
|
—
|
|||||||
|
Paid-in capital from redemption fees
|
0.00
|
^# |
—
|
—
|
||||||||
|
Net asset value, end of period
|
$
|
23.92
|
$
|
24.20
|
$
|
24.52
|
||||||
|
Total return
|
0.79
|
%
|
(0.89
|
)%
|
2.17
|
%‡
|
||||||
|
Ratios/supplemental data:
|
||||||||||||
|
Net assets, end of period (thousands)
|
$
|
20,994
|
$
|
25,129
|
$
|
25,021
|
||||||
|
Ratio of expenses to average net assets:
|
||||||||||||
|
Before fee waivers and
|
||||||||||||
|
expense reimbursement
|
2.88
|
%
|
3.15
|
%
|
3.98
|
%†
|
||||||
|
After fee waivers and
|
||||||||||||
|
expense reimbursement
|
1.84
|
%
|
2.14
|
%
|
2.53
|
%†
|
||||||
|
Ratio of net investment loss
|
||||||||||||
|
to average net assets:
|
||||||||||||
|
Before fee waivers and
|
||||||||||||
|
expense reimbursement
|
(1.12
|
)%
|
(1.77
|
)%
|
(2.62
|
)%†
|
||||||
|
After fee waivers and
|
||||||||||||
|
expense reimbursement
|
(0.08
|
)%
|
(0.76
|
)%
|
(1.17
|
)%†
|
||||||
|
Portfolio turnover rate
|
59.57
|
%
|
27.42
|
%
|
25.13
|
%‡
|
||||||
|
*
|
Commencement of operations.
|
|
|
^
|
Based on average shares outstanding.
|
|
|
†
|
Annualized.
|
|
|
‡
|
Not annualized.
|
The accompanying notes are an integral part of these financial statements.
60
SCHARF FUNDS
NOTES TO FINANCIAL STATEMENTS at September 30, 2018
NOTE 1 – ORGANIZATION
The Scharf Fund, the Scharf Balanced Opportunity Fund, the Scharf Global Opportunity Fund, and the Scharf Alpha Opportunity Fund (each a “Fund” and collectively, the “Funds”) are each a series of Advisors Series Trust (the “Trust”), which is registered under the Investment Company Act of 1940, as amended, (the “1940 Act”) as an open-end management investment company. The Scharf Fund, the Scharf Balanced Opportunity Fund, and the Scharf Global Opportunity Fund are diversified and the Scharf Alpha Opportunity Fund is non-diversified. The Funds follow the investment company accounting and reporting guidance of the Financial Accounting Standards Board (FASB) Accounting Standard Codification Topic 946 “Financial Services – Investment Companies”.
The investment objective of the Scharf Fund and the Scharf Global Opportunity Fund is to seek long-term capital appreciation. The investment objective of the Scharf Balanced Opportunity Fund is to seek long-term capital appreciation and income. The investment objective of the Scharf Alpha Opportunity Fund is to seek long-term capital appreciation and to provide returns above inflation while exposing investors to less volatility than typical equity investments. The Scharf Fund Institutional Class, Retail Class, and R6 Class commenced operations on December 30, 2011, January 28, 2015, and January 29, 2018, respectively. On September 14, 2018 the Scharf Fund R6 Class ceased operations and was closed by the Adviser. The Scharf Balanced Opportunity Fund Institutional Class and Retail Class commenced operations on December 31, 2012 and January 21, 2016, respectively.
The Scharf Global Opportunity Fund commenced operations on October 14, 2014. The initial purchase into the Fund included a transfer in-kind of securities and cash. The transfer in-kind was nontaxable. The Fund issued 419,054 shares on October 14, 2014. The fair value and cost of securities received by the Fund was $7,814,245 and $6,536,468, respectively. In addition, the Fund received $2,243,043 of cash. For financial reporting purposes, assets received and shares issued by the Fund were recorded at fair value; however, the cost basis of the investments received was carried forward to align ongoing reporting of the Fund’s realized and unrealized gains and losses with amounts distributable to shareholders for tax purposes.
The Scharf Alpha Opportunity Fund commenced operations on December 31, 2015. The initial purchase into the Fund included a transfer in-kind of securities and cash. The transfer in-kind was nontaxable. The Fund issued 184,713 shares on December 31, 2015. The fair value and cost of securities received by the Fund was $3,729,932 and $3,291,912, respectively. In addition, the Fund received $703,175 of cash. For financial reporting purposes, assets received and shares issued by the Fund were recorded at fair value; however, the cost basis of the investments received was carried forward to align ongoing reporting of the Fund’s realized and unrealized gains and losses with amounts distributable to shareholders for tax purposes.
61
SCHARF FUNDS
NOTES TO FINANCIAL STATEMENTS at September 30, 2018, Continued
NOTE 2 – SIGNIFICANT ACCOUNTING POLICIES
The following is a summary of significant accounting policies consistently followed by the Funds. These policies are in conformity with accounting principles generally accepted in the United States of America.
|
A.
|
Security Valuation: All investments in securities are recorded at their estimated fair value, as described in note 3.
|
|
B.
|
Federal Income Taxes: It is the Funds’ policy to comply with the requirements of Subchapter M of the Internal Revenue Code applicable to regulated investment companies and to distribute substantially all of its taxable income to its shareholders. Therefore, no Federal income or excise tax provision is required.
|
|
The Funds recognize the tax benefits of uncertain tax positions only where the position is “more likely than not” to be sustained assuming examination by tax authorities. Management has analyzed the tax positions of the Scharf Fund, the Scharf Balanced Opportunity Fund, and the Scharf Global Opportunity Fund and has concluded that no liability for unrecognized tax benefits should be recorded related to uncertain tax positions taken on returns filed for the open tax years 2015-2017, or expected to be taken in the Funds’ 2018 tax returns. Management has analyzed the Scharf Alpha Opportunity Fund’s tax positions, and has concluded that no liability for unrecognized tax benefits should be recorded related to uncertain tax positions taken on returns filed for the open tax years 2016-2017, or expected to be taken in the Fund’s 2018 tax returns. The Funds identify their major tax jurisdictions as U.S. Federal and the state of Wisconsin; however, the Funds are not aware of any tax positions for which it is reasonably possible that the total amounts of unrecognized tax benefits will change materially in the next twelve months.
|
|
|
C.
|
Securities Transactions, Income and Distributions: Securities transactions are accounted for on the trade date. Realized gains and losses on securities sold are calculated on the basis of specified cost. Interest income is recorded on an accrual basis. Discounts and premiums on securities purchased are accreted/amortized over the life of the respective security using the effective interest method. Dividend income and distributions to shareholders are recorded on the ex-dividend date. Withholding taxes on foreign dividends have been provided for in accordance with each Fund’s understanding of the applicable country’s tax rules and rates.
|
|
Investment income, expenses (other than those specific to the class of shares), and realized and unrealized gains and losses on investments are allocated to the separate classes of each Fund based upon their relative net assets on the date income is earned or expensed and realized and unrealized gains and losses are incurred.
|
62
SCHARF FUNDS
NOTES TO FINANCIAL STATEMENTS at September 30, 2018, Continued
|
Each Fund is charged for those expenses that are directly attributable to the Fund, such as investment advisory, custody and transfer agent fees. Expenses that are not attributable to a Fund are typically allocated among the Funds in proportion to their respective net assets. Common expenses of the Trust are typically allocated among the funds in the Trust based on a fund’s respective net assets, or by other equitable means.
|
|
|
The Funds distribute substantially all net investment income, if any, and net realized capital gains, if any, annually. Distributions from net realized gains for book purposes may include short-term capital gains. All short-term capital gains are included in ordinary income for tax purposes.
|
|
|
The amount of dividends and distributions to shareholders from net investment income and net realized capital gains is determined in accordance with Federal income tax regulations, which differs from accounting principles generally accepted in the United States of America. To the extent these book/tax differences are permanent, such amounts are reclassified within the capital accounts based on their Federal tax treatment.
|
|
|
D.
|
Reclassification of Capital Accounts: Accounting principles generally accepted in the United States of America require that certain components of net assets relating to permanent differences be reclassified between financial and tax reporting. These reclassifications have no effect on net assets or net asset value per share.
|
|
For the year ended September 30, 2018, the Funds made the following permanent tax adjustments on the statements of assets and liabilities:
|
|
|
Distributable
|
Paid-in
|
|||||||
|
|
Earnings
|
Capital
|
|||||||
|
Scharf Fund
|
$
|
(10,587,310
|
)
|
$
|
10,587,310
|
||||
|
Scharf Balanced Opportunity Fund
|
(743,454
|
)
|
743,454
|
||||||
|
Scharf Global Opportunity Fund
|
(572,003
|
)
|
572,003
|
||||||
|
Scharf Alpha Opportunity Fund
|
132,231
|
(132,231
|
)
|
||||||
|
E.
|
Use of Estimates: The preparation of financial statements in conformity with accounting principles generally accepted in the United States of America requires management to make estimates and assumptions that affect the reported amounts of assets and liabilities at the date of the financial statements and the reported amounts of increases and decreases in net assets during the reporting period. Actual results could differ from those estimates.
|
|
F.
|
Redemption Fees: The Scharf Fund charges a 2.00% redemption fee to shareholders who redeem shares held for 60 days or less. The Scharf Balanced Opportunity Fund, the Scharf Global Opportunity Fund, and the Scharf Alpha
|
63
SCHARF FUNDS
NOTES TO FINANCIAL STATEMENTS at September 30, 2018, Continued
|
Opportunity Fund each charge a 2.00% redemption fee to shareholders who redeem shares held for 15 days or less. Such fees are retained by the Funds and accounted for as an addition to paid-in capital. During the year ended September 30, 2018, the Scharf Fund, Scharf Global Opportunity Fund and the Scharf Alpha Opportunity Fund retained $3,230, $4, and $52, respectively, in redemption fees.
|
|
|
G.
|
Foreign Securities: The Funds may invest in securities of foreign companies. Foreign economies may differ from the U.S. economy and individual foreign companies may differ from domestic companies in the same industry. Foreign companies or entities are frequently not subject to accounting and financial reporting standards applicable to domestic companies, and there may be less information available about foreign issuers. Securities of foreign issuers are generally less liquid and more volatile than those of comparable domestic issuers. There is frequently less government regulation of broker-dealers and issuers than in the United States. In addition, investments in foreign countries are subject to the possibility of expropriation, confiscatory taxation, political or social instability or diplomatic developments that could adversely affect the value of those investments.
|
|
H.
|
Leverage and Short Sales: The Scharf Alpha Opportunity Fund may use leverage in connection with its investment activities and may affect short sales of securities. Leverage can increase the investment returns of the Fund if the securities purchased increase in value in an amount exceeding the cost of the borrowing. However, if the securities decrease in value, the Fund will suffer a greater loss than would have resulted without the use of leverage. A short sale is the sale by the Fund of a security which it does not own in anticipation of purchasing the same security in the future at a lower price to close the short position. A short sale will be successful if the price of the shorted security decreases. However, if the underlying security goes up in price during the period in which the short position is outstanding, the Fund will realize a loss. The risk on a short sale is unlimited because the Fund must buy the shorted security at the higher price to complete the transaction. Therefore, short sales may be subject to greater risks than investments in long positions.
|
|
With a long position, the maximum sustainable loss is limited to the amount paid for the security plus the transaction costs, whereas there is no maximum attainable price of the shorted security. The Fund would also incur increased transaction costs associated with selling securities short. In addition, if the Fund sells securities short, it must maintain a segregated account with its custodian containing cash or high-grade securities equal to (i) the greater of the current market value of the securities sold short or the market value of such securities at the time they were sold short, less (ii) any collateral deposited with the Fund’s
|
64
SCHARF FUNDS
NOTES TO FINANCIAL STATEMENTS at September 30, 2018, Continued
|
broker (not including the proceeds from the short sales). The Fund may be required to add to the segregated account as the market price of a shorted security increases. As a result of maintaining and adding to its segregated account, the Fund may maintain higher levels of cash or liquid assets (for example, U.S. Treasury bills, repurchase agreements, high quality commercial paper and long equity positions) for collateral needs thus reducing its overall managed assets available for trading purposes. In lieu of maintaining cash or high-grade securities in a segregated account to cover the Fund’s short sale obligations, the Fund may earmark cash or high-grade securities on the Fund’s records or hold offsetting positions.
|
|
|
I.
|
Derivatives: The Funds have adopted the financial accounting reporting rules as required by the Derivatives and Hedging Topic of the FASB Accounting Standards Codification. The Funds are required to include enhanced disclosure that enables investors to understand how and why an entity uses derivatives, how derivatives are accounted for, and how derivative instruments affect an entity’s results of operations and financial position.
|
|
The Funds may utilize options for hedging purposes as well as direct investment. Some options strategies, including buying puts, tend to hedge the Funds’ investments against price fluctuations. Other strategies, such as writing puts and calls and buying calls, tend to increase market exposure. Options contracts may be combined with each other in order to adjust the risk and return characteristics of each Fund’s overall strategy in a manner deemed appropriate to the Adviser and consistent with each Fund’s investment objective and policies. When a call or put option is written, an amount equal to the premium received is recorded as a liability. The liability is marked-to-market daily to reflect the current fair value of the written option. When a written option expires, a gain is realized in the amount of the premium originally received. If a closing purchase contract is entered into, a gain or loss is realized in the amount of the original premium less the cost of the closing transaction. If a written call option is exercised, a gain or loss is realized from the sale of the underlying security, and the proceeds from such sale are increased by the premium originally received. If a written put option is exercised, the amount of the premium originally received reduces the cost of the security which is purchased upon the exercise of the option.
|
|
|
With options, there is minimal counterparty credit risk to the Funds since the options are covered or secured, which means that the Funds will own the underlying security or, to the extent they do not hold the security, will maintain liquid assets consisting of cash, short-term securities, or equity or debt securities equal to the market value of the security underlying the option, marked to market daily.
|
65
SCHARF FUNDS
NOTES TO FINANCIAL STATEMENTS at September 30, 2018, Continued
|
Options purchased are recorded as investments and marked-to-market daily to reflect the current fair value of the option contract. If an option purchased expires, a loss is realized in the amount of the cost of the option contract. If a closing transaction is entered into, a gain or loss is realized to the extent that the proceeds from the sale are greater or less than the cost of the option. If a purchase put option is exercised, a gain or loss is realized from the sale of the underlying security by adjusting the proceeds from such sale by the amount of the premium originally paid. If a purchased call option is exercised, the cost of the security purchased upon exercise is increased by the premium originally paid.
|
|
|
The Scharf Fund, the Scharf Balanced Opportunity Fund, and the Scharf Alpha Opportunity Fund did not invest in derivative instruments during the year ended September 30, 2018. The average monthly notional value of the purchased options held from September 2017 through January 2018 was $2,891,895. The purchased option held on September 30, 2017 in the Scharf Global Opportunity Fund expired in January 2018.
|
|
|
Scharf Global Opportunity Fund
|
|
|
The effect of derivative instruments on the statements of operations for the year ended September 30, 2018 is as follows:
|
|
Derivative Type
|
Location of Loss on Derivatives Recognized in Income
|
Value
|
|
|
Equity Contracts
|
Realized loss on purchased options
|
$ (89,226)
|
|
|
Equity Contracts
|
Change in unrealized appreciation on purchased options
|
$ 17,780
|
|
J.
|
Events Subsequent to the Fiscal Year End: In preparing the financial statements as of September 30, 2018, management considered the impact of subsequent events for potential recognition or disclosure in the financial statements. Refer to Note 11 for more information about subsequent events.
|
NOTE 3 – SECURITIES VALUATION
The Funds have adopted authoritative fair value accounting standards which establish an authoritative definition of fair value and set out a hierarchy for measuring fair value. These standards require additional disclosures about the various inputs and valuation techniques used to develop the measurements of fair value, a discussion in changes in valuation techniques and related inputs during the period and expanded disclosure of valuation levels for major security types. These inputs are summarized in the three broad levels listed below:
|
Level 1 –
|
Unadjusted quoted prices in active markets for identical assets or liabilities that the Funds have the ability to access.
|
|
|
Level 2 –
|
Observable inputs other than quoted prices included in level 1 that are observable for the asset or liability, either directly or indirectly. These
|
66
SCHARF FUNDS
NOTES TO FINANCIAL STATEMENTS at September 30, 2018, Continued
|
inputs may include quoted prices for the identical instrument on an inactive market, prices for similar instruments, interest rates, prepayment speeds, credit risk, yield curves, default rates and similar data.
|
||
|
Level 3 –
|
Unobservable inputs for the asset or liability, to the extent relevant observable inputs are not available, representing the Funds’ own assumptions about the assumptions a market participant would use in valuing the asset or liability, and would be based on the best information available.
|
Following is a description of the valuation techniques applied to the Funds’ major categories of assets and liabilities measured at fair value on a recurring basis.
Each Fund determines the fair value of its investments and computes its net asset value per share as of the close of regular trading on the New York Stock Exchange (4:00 pm EST).
Equity Securities: The Funds’ investments are carried at fair value. Equity securities, including common stocks, preferred stocks and exchange-traded funds that are primarily traded on a national securities exchange shall be valued at the last sale price on the exchange on which they are primarily traded on the day of valuation or, if there has been no sale on such day, at the mean between the bid and asked prices. Securities primarily traded in the NASDAQ Global Market System for which market quotations are readily available shall be valued using the NASDAQ Official Closing Price (“NOCP”). If the NOCP is not available, such securities shall be valued at the last sale price on the day of valuation, or if there has been no sale on such day, at the mean between the bid and asked prices. Over-the-counter securities which are not traded in the NASDAQ Global Market System shall be valued at the most recent sales price. Investments in open-end mutual funds are valued at their net asset value per share. To the extent, these securities are actively traded and valuation adjustments are not applied, they are categorized in level 1 of the fair value hierarchy.
Fixed Income Securities: Debt securities, such as corporate bonds, asset backed securities, municipal bonds, and U.S. government agency issues are valued at market on the basis of valuations furnished by an independent pricing service which utilizes both dealer-supplied valuations and formula-based techniques. The pricing service may consider recently executed transactions in securities of the issuer or comparable issuers, market price quotations (where observable), bond spreads, and fundamental data relating to the issuer. In addition, the model may incorporate market observable data such as reported sales of similar securities, broker quotes, yields, bids, offers, and reference data. Certain securities are valued principally using dealer quotations. These securities will generally be classified in level 2 of the fair value hierarchy.
67
SCHARF FUNDS
NOTES TO FINANCIAL STATEMENTS at September 30, 2018, Continued
Options: Exchange-traded options are valued at the composite price, using the National Best Bid and Offer quotes. Specifically, composite pricing looks at the last trades on the exchanges where the options are traded. If there are no trades for the option on a given business day, composite option pricing calculates the mean of the highest bid price and the lowest ask price across the exchanges where the option is traded. Exchange-traded options that are actively traded are categorized in level 1 of the fair value hierarchy.
Short-Term Securities: Short-term debt securities, including those securities having a maturity of 60 days or less, are valued at the evaluated mean between the bid and asked prices. To the extent the inputs are observable and timely, these securities would be classified in level 2 of the fair value hierarchy.
The Board of Trustees (the “Board”) has delegated day-to-day valuation issues to a Valuation Committee of the Trust which is comprised of representatives from U.S. Bancorp Fund Services, LLC, the Funds’ administrator. The function of the Valuation Committee is to value securities where current and reliable market quotations are not readily available or the closing price does not represent fair value by following procedures approved by the Board. These procedures consider many factors, including the type of security, size of holding, trading volume and news events. All actions taken by the Valuation Committee are reviewed and ratified by the Board.
Depending on the relative significance of the valuation inputs, fair valued securities may be classified in either level 2 or level 3 of the fair value hierarchy.
68
SCHARF FUNDS
NOTES TO FINANCIAL STATEMENTS at September 30, 2018, Continued
The inputs or methodology used for valuing securities are not an indication of the risk associated with investing in those securities. The following is a summary of the inputs used to value the Funds’ securities as of September 30, 2018:
Scharf Fund
|
Level 1
|
Level 2
|
Level 3
|
Total
|
|||||||||||||
|
Common Stocks
|
||||||||||||||||
|
Communication Services
|
$
|
36,321,608
|
$
|
—
|
$
|
—
|
$
|
36,321,608
|
||||||||
|
Consumer Discretionary
|
75,506,654
|
—
|
—
|
75,506,654
|
||||||||||||
|
Consumer Staples
|
32,200,824
|
—
|
—
|
32,200,824
|
||||||||||||
|
Financials
|
39,292,871
|
—
|
—
|
39,292,871
|
||||||||||||
|
Healthcare
|
58,241,276
|
—
|
—
|
58,241,276
|
||||||||||||
|
Industrials
|
11,618,677
|
—
|
—
|
11,618,677
|
||||||||||||
|
Information Technology
|
94,473,420
|
—
|
—
|
94,473,420
|
||||||||||||
|
Materials
|
16,441,730
|
—
|
—
|
16,441,730
|
||||||||||||
|
Total Common Stocks
|
364,097,060
|
—
|
—
|
364,097,060
|
||||||||||||
|
Preferred Stock
|
||||||||||||||||
|
Information Technology
|
10,298,408
|
—
|
—
|
10,298,408
|
||||||||||||
|
Total Preferred Stock
|
10,298,408
|
—
|
—
|
10,298,408
|
||||||||||||
|
U.S. Treasury Bills
|
—
|
34,422,869
|
—
|
34,422,869
|
||||||||||||
|
Money Market Fund
|
12,010,609
|
—
|
—
|
12,010,609
|
||||||||||||
|
Total Investments
|
||||||||||||||||
|
in Securities
|
$
|
386,406,077
|
$
|
34,422,869
|
$
|
—
|
$
|
420,828,946
|
||||||||
69
SCHARF FUNDS
NOTES TO FINANCIAL STATEMENTS at September 30, 2018, Continued
Scharf Balanced Opportunity Fund
|
Level 1
|
Level 2
|
Level 3
|
Total
|
|||||||||||||
|
Common Stocks
|
||||||||||||||||
|
Communication Services
|
$
|
3,184,698
|
$
|
—
|
$
|
—
|
$
|
3,184,698
|
||||||||
|
Consumer Discretionary
|
7,006,969
|
—
|
—
|
7,006,969
|
||||||||||||
|
Consumer Staples
|
2,805,965
|
—
|
—
|
2,805,965
|
||||||||||||
|
Financials
|
3,803,205
|
—
|
—
|
3,803,205
|
||||||||||||
|
Healthcare
|
5,211,542
|
—
|
—
|
5,211,542
|
||||||||||||
|
Industrials
|
1,081,824
|
—
|
—
|
1,081,824
|
||||||||||||
|
Information Technology
|
8,343,512
|
—
|
—
|
8,343,512
|
||||||||||||
|
Materials
|
1,379,742
|
—
|
—
|
1,379,742
|
||||||||||||
|
Total Common Stocks
|
32,817,457
|
—
|
—
|
32,817,457
|
||||||||||||
|
Preferred Stocks
|
||||||||||||||||
|
Closed-End Funds
|
2,194,070
|
—
|
—
|
2,194,070
|
||||||||||||
|
Information Technology
|
1,156,741
|
—
|
—
|
1,156,741
|
||||||||||||
|
Total Preferred Stocks
|
3,350,811
|
—
|
—
|
3,350,811
|
||||||||||||
|
Fixed Income
|
||||||||||||||||
|
Corporate Bonds
|
—
|
5,037,897
|
—
|
5,037,897
|
||||||||||||
|
Municipal Bonds
|
—
|
4,256,421
|
—
|
4,256,421
|
||||||||||||
|
Total Fixed Income
|
—
|
9,294,318
|
—
|
9,294,318
|
||||||||||||
|
U.S. Treasury Note
|
—
|
1,228,076
|
—
|
1,228,076
|
||||||||||||
|
Money Market Fund
|
1,126,411
|
—
|
—
|
1,126,411
|
||||||||||||
|
U.S. Treasury Bills
|
—
|
5,987,083
|
—
|
5,987,083
|
||||||||||||
|
Total Investments
|
||||||||||||||||
|
in Securities
|
$
|
37,294,679
|
$
|
16,509,477
|
$
|
—
|
$
|
53,804,156
|
||||||||
70
SCHARF FUNDS
NOTES TO FINANCIAL STATEMENTS at September 30, 2018, Continued
Scharf Global Opportunity Fund
|
Level 1
|
Level 2
|
Level 3
|
Total
|
|||||||||||||
|
Common Stocks
|
||||||||||||||||
|
Communication Services
|
$
|
4,132,154
|
$
|
—
|
$
|
—
|
$
|
4,132,154
|
||||||||
|
Consumer Discretionary
|
5,697,649
|
—
|
—
|
5,697,649
|
||||||||||||
|
Consumer Staples
|
1,382,949
|
—
|
—
|
1,382,949
|
||||||||||||
|
Financials
|
2,928,063
|
—
|
—
|
2,928,063
|
||||||||||||
|
Healthcare
|
4,626,435
|
—
|
—
|
4,626,435
|
||||||||||||
|
Industrials
|
945,208
|
—
|
—
|
945,208
|
||||||||||||
|
Information Technology
|
2,432,311
|
—
|
—
|
2,432,311
|
||||||||||||
|
Materials
|
776,133
|
—
|
—
|
776,133
|
||||||||||||
|
Total Common Stocks
|
22,920,902
|
—
|
—
|
22,920,902
|
||||||||||||
|
Preferred Stocks
|
||||||||||||||||
|
Consumer Discretionary
|
125,753
|
—
|
—
|
125,753
|
||||||||||||
|
Consumer Staples
|
157,246
|
—
|
—
|
157,246
|
||||||||||||
|
Financials
|
72,481
|
—
|
—
|
72,481
|
||||||||||||
|
Information Technology
|
1,286,405
|
—
|
—
|
1,286,405
|
||||||||||||
|
Materials
|
11,644
|
—
|
—
|
11,644
|
||||||||||||
|
Total Preferred Stocks
|
1,653,529
|
—
|
—
|
1,653,529
|
||||||||||||
|
Money Market Fund
|
392,817
|
—
|
—
|
392,817
|
||||||||||||
|
Total Investments
|
||||||||||||||||
|
in Securities
|
$
|
24,967,248
|
$
|
—
|
$
|
—
|
$
|
24,967,248
|
||||||||
71
SCHARF FUNDS
NOTES TO FINANCIAL STATEMENTS at September 30, 2018, Continued
Scharf Alpha Opportunity Fund
|
Level 1
|
Level 2
|
Level 3
|
Total
|
|||||||||||||
|
Assets:
|
||||||||||||||||
|
Common Stocks
|
||||||||||||||||
|
Communication Services
|
$
|
2,098,279
|
$
|
—
|
$
|
—
|
$
|
2,098,279
|
||||||||
|
Consumer Discretionary
|
4,783,193
|
—
|
—
|
4,783,193
|
||||||||||||
|
Consumer Staples
|
1,755,726
|
—
|
—
|
1,755,726
|
||||||||||||
|
Financials
|
1,857,221
|
—
|
—
|
1,857,221
|
||||||||||||
|
Healthcare
|
3,464,299
|
—
|
—
|
3,464,299
|
||||||||||||
|
Industrials
|
815,616
|
—
|
—
|
815,616
|
||||||||||||
|
Information Technology
|
5,095,831
|
—
|
—
|
5,095,831
|
||||||||||||
|
Materials
|
912,241
|
—
|
—
|
912,241
|
||||||||||||
|
Total Common Stocks
|
20,782,406
|
—
|
—
|
20,782,406
|
||||||||||||
|
Money Market Fund
|
249,699
|
—
|
—
|
249,699
|
||||||||||||
|
Total Investments
|
||||||||||||||||
|
in Securities
|
$
|
21,032,105
|
$
|
—
|
$
|
—
|
$
|
21,032,105
|
||||||||
|
Liabilities:
|
||||||||||||||||
|
Securities Sold Short
|
||||||||||||||||
|
Common Stock
|
$
|
191,958
|
$
|
—
|
$
|
—
|
$
|
191,958
|
||||||||
|
Exchange-Traded Funds
|
11,614,479
|
—
|
—
|
11,614,479
|
||||||||||||
|
Total Securities Sold Short
|
$
|
11,806,437
|
$
|
—
|
$
|
—
|
$
|
11,806,437
|
||||||||
Refer to the Funds’ schedule of investments for a detailed break-out of securities by industry classification. Transfers between levels are recognized at September 30, 2018, the end of the reporting period. There were no transfers between levels during the year ended September 30, 2018.
In August 2018, the Financial Accounting Standards Board issued Accounting Standard Update (“ASU”) 2018-13, Fair Value Measurement (Topic 820): Disclosure Framework—Changes to the Disclosure Requirements for Fair Value Measurement (“ASU 2018-13”). The primary focus of ASU 2018-13 is to improve the effectiveness of the disclosure requirements for fair value measurements. The changes affect all companies that are required to include fair value measurement disclosures. In general, the amendments in ASU 2018-13 are effective for all entities for fiscal years and interim periods within those fiscal years, beginning after December 15, 2019. An entity is permitted to early adopt the removed or modified disclosures upon the issuance of ASU 2018-13 and may delay adoption of the additional disclosures, which are required for public companies only, until their effective date. Management is currently evaluating the impact these changes will have on the Funds’ financial statements and disclosures.
72
SCHARF FUNDS
NOTES TO FINANCIAL STATEMENTS at September 30, 2018, Continued
NOTE 4 – INVESTMENT ADVISORY FEE AND OTHER TRANSACTIONS WITH AFFILIATES
The Funds have an investment advisory agreement with Scharf Investments, LLC (the “Adviser”) pursuant to which the Adviser is responsible for providing investment management services to the Funds. The Adviser furnished all investment advice, office space and facilities, and provides most of the personnel needed by each Fund. As compensation for its services, the Adviser is entitled to a fee, computed daily and payable monthly. Effective January 28, 2018, the Scharf Fund pays fees calculated at an annual rate of 0.89% based upon the average daily net assets of the Fund. Prior to January 28, 2018, the Scharf Fund paid fees calculated at an annual rate of 0.99% based upon the average daily net assets of the Fund. The Scharf Balanced Opportunity Fund, the Scharf Global Opportunity Fund, and the Scharf Alpha Opportunity Fund pay fees calculated at an annual rate of 0.99% based upon the average daily net assets of each Fund. For the year ended September 30, 2018, Funds incurred the following in advisory fees.
|
Advisory Fees
|
||
|
Scharf Fund
|
$4,708,850
|
|
|
Scharf Balanced Opportunity Fund
|
587,563
|
|
|
Scharf Global Opportunity Fund
|
297,703
|
|
|
Scharf Alpha Opportunity Fund
|
219,499
|
The Funds are responsible for their own operating expenses. The Adviser has agreed to reduce fees payable to it by the Funds and to pay Fund operating expenses (excluding class specific expenses such as the 0.25% 12b-1 fees applied to the Retail Class and 0.10% shareholder servicing fees applied to both the Institutional and Retail Class, acquired fund fees and expenses, interest expense, dividends on securities sold short, taxes and extraordinary expenses, see notes 5 and 6 for class specific information) to the extent necessary to limit the Fund’s aggregate annual operating expenses as follows:
|
Institutional Class
|
Retail Class
|
||
|
Scharf Fund*
|
0.89%
|
0.89%
|
|
|
Scharf Balanced Opportunity Fund
|
0.88%
|
0.88%
|
|
|
Scharf Global Opportunity Fund^
|
—
|
0.35%
|
|
|
Scharf Alpha Opportunity Fund
|
—
|
0.65%
|
|
|
Percent of average daily net assets of the Funds.
|
|
*
|
Prior to January 28, 2018, the Scharf Fund’s expense caps for the Institutional Class and Retail Class were 1.09% and 1.34%, respectively. These expense caps include 0.25% for 12b-1 fees in the Institutional Class and 0.10% for shareholder servicing fees in the Institutional Class and Retail Class.
|
|
|
^
|
Prior to January 28, 2018, the Scharf Global Opportunity Fund’s expense cap for the Retail Class was 0.65%. This expense cap includes 0.25% for 12b-1 fees and 0.10% for shareholder servicing fees.
|
73
SCHARF FUNDS
NOTES TO FINANCIAL STATEMENTS at September 30, 2018, Continued
Any such reduction made by the Adviser in its fees or payment of expenses which are the Funds’ obligation are subject to reimbursement by the Funds to the Adviser, if so requested by the Adviser, in any subsequent month in the three year period from the date of the management fee reduction and expense payment if the aggregate amount actually paid by the Funds toward the operating expenses for such fiscal year (taking into the account the reimbursement) will not cause the Fund to exceed the lesser of: (1) the expense limitation in place at the time of the management fee reduction and expense payment: or (2) the expense limitation in place at the time of the reimbursement. Any such reimbursement is also contingent upon Board of Trustees review and approval at the time the reimbursement is made. Such reimbursement may not be paid prior to the Funds’ payment of current ordinary operating expenses. For the year ended September 30, 2018, the Adviser reduced its fees in the amount of $605,893, $280,214, $358,682, and $230,304, for the Scharf Fund, the Scharf Balanced Opportunity Fund, the Scharf Global Opportunity Fund, and the Scharf Alpha Opportunity Fund, respectively.
No amounts were reimbursed to the Adviser. The expense limitation for the Scharf Fund, the Scharf Balanced Opportunity Fund, the Scharf Global Opportunity Fund, and the Scharf Alpha Opportunity Fund will remain in effect through at least January 27, 2019. The Expense Cap may be terminated only by the Board of Trustees (the “Board”) of the Trust. Cumulative expenses subject to recapture expire as follows:
|
Scharf Balanced
Opportunity
|
Scharf Global
Opportunity
|
Scharf Alpha
Opportunity
|
||||||||||||||||||||||||||||
|
Scharf Fund
|
Fund
|
Fund
|
Fund
|
|||||||||||||||||||||||||||
|
Date
|
Amount
|
Date
|
Amount
|
Date
|
Amount
|
Date
|
Amount
|
|||||||||||||||||||||||
|
9/30/
|
9/30/
|
9/30/
|
9/30/
|
|||||||||||||||||||||||||||
|
2019
|
$
|
742,298
|
2019
|
$
|
214,058
|
2019
|
$
|
331,358
|
2019
|
$
|
152,260
|
|||||||||||||||||||
|
9/30/
|
9/30/
|
9/30/
|
9/30/
|
|||||||||||||||||||||||||||
|
2020
|
777,429
|
2020
|
292,638
|
2020
|
355,261
|
2020
|
260,274
|
|||||||||||||||||||||||
|
Oct.
|
Oct.
|
Oct.
|
Oct.
|
|||||||||||||||||||||||||||
|
2020 –
|
2020 –
|
2020 –
|
2020 –
|
|||||||||||||||||||||||||||
|
Sept.
|
Sept.
|
Sept.
|
Sept.
|
|||||||||||||||||||||||||||
|
2021
|
605,893
|
2021
|
280,214
|
2021
|
358,682
|
2021
|
230,304
|
|||||||||||||||||||||||
|
$
|
2,125,620
|
$
|
786,910
|
$
|
1,045,301
|
$
|
642,838
|
|||||||||||||||||||||||
U.S. Bancorp Fund Services, LLC (“Fund Services” or the “Administrator”) doing business as U.S. Bank Global Fund Services, serves as the Funds’ administrator, fund accountant and transfer agent. In those capacities Fund Services maintains the Funds’ books and records, calculates the Funds’ NAV, prepares various federal and state regulatory filings, coordinates the payment of fund expenses, reviews expense accruals and prepares materials supplied to the Board of Trustees. The officers of the Trust and the Chief Compliance Officer are also employees of Fund Services.
74
SCHARF FUNDS
NOTES TO FINANCIAL STATEMENTS at September 30, 2018, Continued
Quasar Distributors, LLC (the “Distributor”) acts as the Funds’ principal underwriter in a continuous public offering of the Funds’ shares. U.S. Bank N.A. serves as custodian (the “Custodian”) to the Funds’. Both the Distributor and Custodian are affiliates of the Administrator.
For the year ended September 30, 2018, the Funds incurred the following expenses for administration and fund accounting, custody, transfer agency, and Chief Compliance Officer fees:
|
Scharf
|
Scharf
|
Scharf
|
|||
|
Balanced
|
Global
|
Alpha
|
|||
|
Scharf
|
Opportunity
|
Opportunity
|
Opportunity
|
||
|
Fund
|
Fund
|
Fund
|
Fund
|
||
|
Administration and
|
|||||
|
Fund Accounting
|
$354,180
|
$81,946
|
$51,907
|
$50,562
|
|
|
Custody
|
49,908
|
17,091
|
17,858
|
14,223
|
|
|
Transfer Agency (a)
|
38,900
|
21,739
|
11,865
|
12,715
|
|
|
Chief Compliance Officer
|
9,000
|
9,000
|
9,000
|
9,000
|
|
|
(a) Does not include out-of-pocket expenses.
|
|||||
At September 30, 2018, the Funds had payables due to Fund Services for administration and fund accounting, U.S. Bank, N.A. for custody fees, transfer agency, and Chief Compliance Officer fees in the following amounts:
|
Scharf
|
Scharf
|
Scharf
|
|||
|
Balanced
|
Global
|
Alpha
|
|||
|
Scharf
|
Opportunity
|
Opportunity
|
Opportunity
|
||
|
Fund
|
Fund
|
Fund
|
Fund
|
||
|
Administration and
|
|||||
|
Fund Accounting
|
$61,739
|
$12,369
|
$8,755
|
$8,582
|
|
|
Custody
|
7,035
|
2,752
|
2,365
|
2,123
|
|
|
Transfer Agency (a)
|
7,127
|
3,662
|
2,010
|
2,094
|
|
|
Chief Compliance Officer
|
1,500
|
1,500
|
1,500
|
1,500
|
|
|
(a) Does not include out-of-pocket expenses.
|
NOTE 5 – 12B-1 DISTRIBUTION FEES
The Retail Class of each Fund has adopted a Distribution Plan pursuant to Rule 12b-1 (the “Plan”). The Plan permits each class to pay for distribution and related expenses up to an annual rate of 0.25% of its average daily net assets. The expenses covered by the Plan may include the cost in connection with the promotion and distribution of shares and the provision of personal services to shareholders,
75
SCHARF FUNDS
NOTES TO FINANCIAL STATEMENTS at September 30, 2018, Continued
including, but not necessarily limited to, advertising, compensation to underwriters, dealers and selling personnel, the printing and mailing of prospectuses to other than current Fund shareholders, and the printing and mailing of sales literature. Payments made pursuant to the Plan will represent compensation for distribution and service activities, not reimbursements for specific expenses incurred. For the year ended September 30, 2018, the Funds paid the Distributor the following in 12b-1 fees:
|
12b-1 Fees
|
||
|
Scharf Fund – Retail Class
|
$196,242
|
|
|
Scharf Balanced Opportunity Fund – Retail Class
|
19,351
|
|
|
Scharf Global Opportunity Fund
|
30,494
|
|
|
Scharf Alpha Opportunity Fund
|
29,387
|
NOTE 6 – SHAREHOLDER SERVICING FEE
The Funds have entered into a Shareholder Servicing Agreement (the “Agreement”) with the Adviser, under which the Funds may pay servicing fees at an annual rate of up to 0.10% of the average daily net assets of each Fund. Payments to the Adviser under the Agreement may reimburse the Adviser for payments it makes to selected brokers, dealers and administrators which have entered into service agreements with the Adviser for services provided to shareholders of the Funds. The services provided by such intermediaries are primarily designed to assist shareholders of the Funds and include the furnishing of office space and equipment, telephone facilities, personnel and assistance to the Funds in servicing such shareholders. Services provided by such intermediaries also include the provision of support services to the Funds and include establishing and maintaining shareholders’ accounts and record processing, purchase and redemption transactions, answering routine client inquiries regarding the Funds, and providing such other personal services to shareholders as the Funds may reasonably request. For the year ended September 30, 2018, the Funds incurred the following shareholder servicing fees under the agreement:
|
Shareholder Servicing Fees
|
||
|
Scharf Fund
|
||
|
Institutional Class
|
$139,810
|
|
|
Retail Class
|
76,205
|
|
|
Scharf Balanced Opportunity Fund
|
||
|
Institutional Class
|
44,690
|
|
|
Retail Class
|
7,737
|
|
|
Scharf Global Opportunity Fund
|
26,973
|
|
|
Scharf Alpha Opportunity Fund
|
18,573
|
76
SCHARF FUNDS
NOTES TO FINANCIAL STATEMENTS at September 30, 2018, Continued
NOTE 7 – LINES OF CREDIT
The Scharf Fund, Scharf Balanced Opportunity Fund, Scharf Global Opportunity Fund, and Scharf Alpha Opportunity Fund have lines of credit in the amount of $20,000,000, $5,000,000, $2,500,000, and $1,500,000, respectively. These lines of credit are intended to provide short-term financing, if necessary, subject to certain restrictions, in connection with shareholder redemptions. The credit facility is with the Funds’ custodian, U.S. Bank N.A. During the year ended September 30, 2018, the Scharf Balanced Opportunity Fund did not draw upon its line of credit.
During the year ended September 30, 2018, the Scharf Fund drew on its line of credit. The Fund had an outstanding average balance of $18,833, paid a weighted average interest rate of 4.75%, and incurred interest expense of $907. The maximum borrowing by the Fund occurred on May 30, 2018 in the amount of $6,874,000. At September 30, 2018, the Fund had no outstanding loan amounts.
During the year ended September 30, 2018, the Scharf Global Opportunity Fund drew on its line of credit. The Fund had an outstanding average balance of $8,781, paid a weighted average interest rate of 4.81%, and incurred interest expense of $429. The maximum borrowing by the Fund occurred on April 24, 2018 in the amount of $797,000. At September 30, 2018, the Fund had no outstanding loan amounts.
During the year ended September 30, 2018, the Scharf Alpha Opportunity Fund drew on its line of credit. The Fund had an outstanding average balance of $29,838, paid a weighted average interest rate of 4.54%, and incurred interest expense of $1,373. The maximum borrowing by the Fund occurred on February 5, 2018 in the amount of $909,000. At September 30, 2018, the Fund had no outstanding loan amounts.
NOTE 8 – PURCHASES AND SALES OF SECURITIES
For the year ended September 30, 2018, the cost of purchases and the proceeds from sales of securities, excluding short-term securities, were as follows:
|
Purchases
|
Sales
|
||
|
Scharf Fund
|
$178,838,448
|
$308,217,731
|
|
|
Scharf Balanced Opportunity Fund
|
18,563,060
|
25,600,753
|
|
|
Scharf Global Opportunity Fund
|
19,193,149
|
25,096,363
|
|
|
Scharf Alpha Opportunity Fund
|
10,071,501
|
14,651,443
|
There were no purchases and sales of U.S. Government securities during the year ended September 30, 2018.
For the year ended September 30, 2018 the Scharf Alpha Opportunity Fund had $5,544,432 and $11,010,934 of proceeds from short sales and buy cover transactions, respectively. This activity is included in the portfolio turnover disclosed in the financial highlights.
77
SCHARF FUNDS
NOTES TO FINANCIAL STATEMENTS at September 30, 2018, Continued
NOTE 9 – INCOME TAXES AND DISTRIBUTIONS TO SHAREHOLDERS
As of September 30, 2018, the components of accumulated earnings/(losses) on a tax basis were as follows:
|
Scharf
|
||||||||
|
Balanced
|
||||||||
|
Scharf
|
Opportunity
|
|||||||
|
Fund
|
Fund
|
|||||||
|
Cost of investments (a)
|
$
|
340,674,372
|
$
|
45,862,896
|
||||
|
Gross unrealized appreciation
|
95,397,070
|
9,390,530
|
||||||
|
Gross unrealized depreciation
|
(15,242,496
|
)
|
(1,449,270
|
)
|
||||
|
Net unrealized appreciation (a)
|
80,154,574
|
7,941,260
|
||||||
|
Net unrealized appreciation/(depreciation)
|
||||||||
|
foreign currency
|
255
|
78
|
||||||
|
Undistributed ordinary income
|
2,767,146
|
610,626
|
||||||
|
Undistributed long-term capital gains
|
26,268,452
|
2,313,944
|
||||||
|
Total distributable earnings
|
29,035,598
|
2,924,570
|
||||||
|
Other accumulated gains/(losses)
|
—
|
—
|
||||||
|
Total accumulated earnings/(losses)
|
$
|
109,190,427
|
$
|
10,865,908
|
||||
|
Scharf Global
|
Scharf Alpha
|
|||||||
|
Opportunity
|
Opportunity
|
|||||||
|
Fund
|
Fund
|
|||||||
|
Cost of investments (a)
|
$
|
20,512,973
|
$
|
8,248,907
|
||||
|
Gross unrealized appreciation
|
5,596,406
|
2,612,571
|
||||||
|
Gross unrealized depreciation
|
(1,142,131
|
)
|
(1,635,810
|
)
|
||||
|
Net unrealized appreciation (a)
|
4,454,275
|
976,761
|
||||||
|
Net unrealized appreciation/(depreciation)
|
||||||||
|
foreign currency
|
(123
|
)
|
3
|
|||||
|
Undistributed ordinary income
|
521,814
|
—
|
||||||
|
Undistributed long-term capital gains
|
1,674,730
|
—
|
||||||
|
Total distributable earnings
|
2,196,544
|
—
|
||||||
|
Other accumulated gains/(losses)
|
—
|
(677,288
|
)
|
|||||
|
Total accumulated earnings/(losses)
|
$
|
6,650,696
|
$
|
299,476
|
||||
|
(a)
|
The difference between book-basis and tax basis cost and unrealized appreciation is attributable primarily to the tax deferral of losses on wash sales, tax adjustments related to partnerships and transfer in-kind.
|
78
SCHARF FUNDS
NOTES TO FINANCIAL STATEMENTS at September 30, 2018, Continued
Under the Regulated Investment Company Modernization Act of 2010 (the “Act”), net capital losses recognized after December 31, 2010, may be carried forward indefinitely, and their character is retained as short-term and/or long-term losses. Under the law in effect prior to the Act, pre-enactment net capital losses were carried forward for eight years and treated as short-term losses. As a transition rule, the Act requires that post-enactment net capital losses be used before pre-enactment net capital losses.
At September 30, 2018, the Scharf Alpha Opportunity Fund had a short-term capital loss carryforward of $677,288.
The capital losses may be carried forward indefinitely to offset future gains.
The tax character of distributions paid during the years ended September 30, 2018 and September 30, 2017 was as follows:
|
September 30, 2018
|
September 30, 2017
|
||||||||||||||||
|
Ordinary
|
Long-Term
|
Ordinary
|
Long-Term
|
||||||||||||||
|
Income
|
Capital Gains
|
Income
|
Capital Gains
|
||||||||||||||
|
Scharf Fund
|
$
|
891,172
|
$
|
14,410,589
|
$
|
836,345
|
$
|
—
|
|||||||||
|
Scharf Balanced
|
|||||||||||||||||
|
Opportunity Fund
|
124,082
|
1,225,008
|
413,712
|
444,362
|
|||||||||||||
|
Scharf Global
|
|||||||||||||||||
|
Opportunity Fund
|
230,126
|
1,581,305
|
145,384
|
204,780
|
|||||||||||||
|
Scharf Alpha
|
|||||||||||||||||
|
Opportunity Fund
|
—
|
463,472
|
28,875
|
77,430
|
|||||||||||||
The Scharf Balanced Opportunity Fund, Scharf Global Opportunity Fund and the Scharf Alpha Opportunity Fund designated as long-term capital gain dividend, pursuant to Internal Revenue Code Section 852(b)(3), the amount necessary to reduce the earnings and profits of the Funds related to net capital gain to zero for the tax year ended September 30, 2018.
NOTE 10 – PRINCIPAL RISKS
Below is a summary of some, but not all, of the principal risks of investing in the Funds, each of which may adversely affect a Fund’s net asset value and total return. The Funds’ most recent prospectus provides further descriptions of each Fund’s investment objective, principal investment strategies and principal risks.
|
•
|
Foreign and Emerging Market Securities Risk. Investments in foreign currencies and foreign issuers are subject to additional risks, including political and economic risks, greater volatility, civil conflicts and war, sanctions or other measures by the United States or other governments, liquidity risks, currency fluctuations, higher transaction costs, delayed settlement, possible foreign controls on investment, expropriation and
|
79
SCHARF FUNDS
NOTES TO FINANCIAL STATEMENTS at September 30, 2018, Continued
|
nationalization risks, and less stringent investor protection and disclosure standards of foreign markets. Events and evolving conditions in certain economies or markets may alter the risks associated with investments tied to countries or regions that historically were perceived as comparatively stable becoming riskier and more volatile. These risks are magnified in countries in “emerging markets.” Emerging market countries typically have less-established market economies than developed countries and may face greater social, economic, regulatory and political uncertainties. In addition, emerging markets typically present greater illiquidity and price volatility concerns due to smaller or limited local capital markets and greater difficulty in determining market valuations of securities due to limited public information on issuers.
|
||
|
•
|
Investment Style Risk. The Adviser follows an investing style that favors relatively low valuations. At times when this style is out of favor, the Funds may underperform funds that use different investing styles.
|
|
|
•
|
Small- and Medium-Sized Company Risk. Small- and medium-sized companies often have less predictable earnings, more limited product lines, markets, distribution channels or financial resources and the management of such companies may be dependent upon one or few key people. The market movements of equity securities of small- and medium-sized companies may be more abrupt and volatile than the market movements of equity securities of larger, more established companies or the stock market in general and small-sized companies in particular, are generally less liquid than the equity securities of larger companies.
|
|
|
•
|
Special Situations Risk. There is a risk that the special situation (i.e., spin-off, liquidation, merger, etc.) might not occur, which could have a negative impact on the price of the issuer’s securities and fail to produce gains or produce a loss for the Funds. In addition, investments in special situation companies may be illiquid and difficult to value, which will require a Fund to employ fair value procedures to value its holdings in such investments.
|
|
|
•
|
Non-Diversification Risk (Scharf Alpha Opportunity Fund). To the extent that the Fund invests its assets in fewer securities, the Fund is subject to a greater risk of loss if any of those securities become permanently impaired than a fund that invests more widely.
|
|
|
•
|
Short Sales Risk (Scharf Alpha Opportunity Fund). A short sale is the sale by the Fund of a security which it does not own in anticipation of purchasing the same security in the future at a lower price to close the short position. A short sale will be successful if the price of the shorted security decreases.
|
80
SCHARF FUNDS
NOTES TO FINANCIAL STATEMENTS at September 30, 2018, Continued
|
However, if the underlying security goes up in price during the period in which the short position is outstanding, the Fund will realize a loss. The risk on a short sale is unlimited because the Fund must buy the shorted security at the higher price to complete the transaction. Therefore, short sales may be subject to greater risks than investments in long positions.
|
||
|
•
|
Leverage Risk (Scharf Alpha Opportunity Fund). Leverage is investment exposure which exceeds the initial amount invested. Leverage can cause the portfolio to lose more than the principal amount invested. Leverage can magnify the portfolio’s gains and losses and therefore increase its volatility.
|
NOTE 11 – SUBSEQUENT EVENTS
On October 29, 2018 the Scharf Balanced Opportunity Fund Institutional Class and Scharf Balanced Opportunity Fund Retail Class changed their names to Scharf Multi-Asset Opportunity Fund Institutional Class and Scharf Multi-Asset Opportunity Fund Retail Class, respectively.
The President, Chief Executive Officer and Principal Executive Officer of the Trust resigned on October 25, 2018. The Board of Trustees will appoint a new President, Chief Executive Officer and Principal Executive Officer of the Trust at its December 2018 Board meeting. In the interim, in accordance with the Trust’s governing documents, the Vice Presidents of the Trust are authorized to carry out the duties of President.
81
SCHARF FUNDS
REPORT OF INDEPENDENT REGISTERED PUBLIC ACCOUNTING FIRM
To the Board of Trustees Advisors Series Trust and Shareholders of:
Scharf Funds
Opinion on the Financial Statements
We have audited the accompanying statements of assets and liabilities of the Scharf Fund, the Scharf Balanced Opportunity Fund, the Scharf Global Opportunity Fund, and the Scharf Alpha Opportunity Fund (the “Funds”), each a series of Advisors Series Trust (the “Trust”), including the schedules of investments, as of September 30, 2018, the related statements of operations and cash flow for the year then ended, the statements of changes in net assets for each of the two years in the period then ended, and with respect to Scharf Fund and Scharf Balanced Opportunity Fund, financial highlights for each of the five years in the period then ended, with respect to Scharf Global Opportunity Fund, financial highlights for each of the three years in the period then ended and for the period October 14, 2014 (commencement of operations) to September 30, 2015, with respect to Scharf Alpha Opportunity Fund, financial highlights for each of the two years in the period then ended and for the period December 31, 2015 (commencement of operations) to September 30, 2016, and the related notes (collectively referred to as the “financial statements”). In our opinion, the financial statements present fairly, in all material respects, the financial position of the Funds as of September 30, 2018, the results of their operations for the year then ended, the changes in their net assets for each of the two years in the period then ended, and their financial highlights for the periods indicated above, in conformity with accounting principles generally accepted in the United States of America.
Basis for Opinion
These financial statements are the responsibility of the Funds’ management. Our responsibility is to express an opinion on the Funds’ financial statements based on our audits. We are a public accounting firm registered with the Public Company Accounting Oversight Board (United States) (“PCAOB”) and are required to be independent with respect to the Funds in accordance with the U.S. federal securities laws and the applicable rules and regulations of the Securities and Exchange Commission and the PCAOB. We have served as the auditor of one or more of the funds in the Trust since 2003.
We conducted our audits in accordance with the standards of the PCAOB. Those standards require that we plan and perform the audits to obtain reasonable assurance about whether the financial statements are free of material misstatement, whether due to error or fraud. The Funds are not required to have, nor were we engaged to perform, an audit of the Funds’ internal control over financial reporting. As part of our audits we are required to obtain an understanding of internal control over financial reporting, but not for the purpose of expressing an opinion on the effectiveness of the Funds’ internal control over financial reporting. Accordingly, we express no such opinion.
Our audits included performing procedures to assess the risks of material misstatement of the financial statements, whether due to error or fraud, and performing procedures that respond to those risks. Such procedures included examining, on a test basis, evidence regarding the amounts and disclosures in the financial statements. Our audits also included evaluating the accounting principles used and significant estimates made by management, as well as evaluating the overall presentation of the financial statements. Our procedures included confirmation of securities owned as of September 30, 2018 by correspondence with the custodian and brokers. We believe that our audits provide a reasonable basis for our opinion.
TAIT, WELLER & BAKER LLP
Philadelphia, Pennsylvania
November 29, 2018
82
SCHARF FUNDS
NOTICE TO SHAREHOLDERS at September 30, 2018 (Unaudited)
For the year ended September 30, 2018, the Scharf Fund, the Scharf Balanced Opportunity Fund, the Scharf Global Opportunity Fund, and the Scharf Alpha Opportunity Fund designated $891,172, $124,082, $230,126 and $0, respectively, as ordinary income. The Scharf Fund, the Scharf Balanced Opportunity Fund, the Scharf Global Opportunity Fund, and the Scharf Alpha Opportunity Fund designated $14,410,589 $1,225,008, $1,581,305 and $463,472, respectively, as long-term capital gains for purposes of the dividends paid deduction.
For the year ended September 30, 2018, certain dividends paid by the Funds may be subject to a maximum tax rate of 23.8%, as provided by the Jobs and Growth Tax Relief Reconciliation Act of 2003. The percentage of dividends declared from net investment income designated as qualified dividend income for the Scharf Fund, the Scharf Balanced Opportunity Fund, the Scharf Global Opportunity Fund, and the Scharf Alpha Opportunity Fund was 100%, 100%, 93.98%, and 0%, respectively.
For corporate shareholders in the Scharf Fund, the Scharf Balanced Opportunity Fund, the Scharf Global Opportunity Fund, and the Scharf Alpha Opportunity Fund the percent of ordinary income distributions qualifying for the corporate dividends received deduction for the year ended September 30, 2018 was 100%, 99.65%, 87.77%, and 0%, respectively.
The percentage of taxable ordinary income distributions that are designated as short-term capital gain distributions under Internal Revenue Section 871(k)(2)(C) for the Scharf Fund, the Scharf Balanced Opportunity Fund, the Scharf Global Opportunity Fund, and the Scharf Alpha Opportunity Fund was 0%, 0%, 10.76%, and 0%, respectively.
How to Obtain a Copy of the Funds’ Proxy Voting Policies
A description of the policies and procedures that the Funds use to determine how to vote proxies relating to portfolio securities is available without charge upon request by calling 1-866-572-4273 (1-866-5SCHARF) or on the U.S. Securities and Exchange Commission’s (“SEC”) website at http://www.sec.gov.
How to Obtain a Copy of the Funds’ Proxy Voting Records for the 12-Month Period Ended June 30, 2018
Information regarding how the Funds voted proxies relating to portfolio securities during the most recent 12-month period ended June 30 is available without charge, upon request, by calling 1-866-572-4273 (1-866-5SCHARF). Furthermore, you can obtain the Fund’s proxy voting records on the SEC’s website at http://www.sec.gov.
83
SCHARF FUNDS
NOTICE TO SHAREHOLDERS at September 30, 2018 (Unaudited), Continued
Quarterly Filings on Form N-Q
The Funds file their complete schedule of portfolio holdings with the SEC for the first and third quarters of each fiscal year on Form N-Q. The Funds’ Form N-Q is available on the SEC’s website at http://www.sec.gov. The Funds’ Form N-Q may be reviewed and copied at the SEC’s Public Reference Room in Washington, DC and information on the operation of the Public Reference Room may be obtained by calling 1-202-551-8090. Information included in the Funds’ Form N-Q is also available by calling 1-866-572-4273 (1-866-5SCHARF).
84
SCHARF FUNDS
INFORMATION ABOUT TRUSTEES AND OFFICERS (Unaudited)
This chart provides information about the Trustees and Officers who oversee the Funds. Officers elected by the Trustees manage the day-to-day operations of the Funds and execute policies formulated by the Trustees.
Independent Trustees(1)
|
Term of
|
Number of
|
||||
|
Office
|
Portfolios
|
Other
|
|||
|
Position
|
and
|
Principal
|
in Fund
|
Directorships
|
|
|
Held
|
Length
|
Occupation
|
Complex
|
Held During
|
|
|
Name, Address
|
with the
|
of Time
|
During Past
|
Overseen by
|
Past Five
|
|
and Age
|
Trust
|
Served
|
Five Years
|
Trustee(2)
|
Years(3)
|
|
Gail S. Duree
|
Trustee
|
Indefinite
|
Director, Alpha
|
4
|
Trustee,
|
|
(age 72)
|
term; since
|
Gamma Delta
|
Advisors
|
||
|
615 E. Michigan Street
|
March
|
Housing Corporation
|
Series Trust
|
||
|
Milwaukee, WI 53202
|
2014.
|
(collegiate housing
|
(for series not
|
||
|
management) (2012
|
affiliated with
|
||||
|
to present); Trustee
|
the Funds);
|
||||
|
and Chair (2000 to
|
Independent
|
||||
|
2012), New Covenant
|
Trustee from
|
||||
|
Mutual Funds
|
1999 to 2012,
|
||||
|
(1999 to 2012); Director
|
New Covenant
|
||||
|
and Board Member,
|
Mutual Funds
|
||||
|
Alpha Gamma Delta
|
(an open-end
|
||||
|
Foundation
|
investment
|
||||
|
(philanthropic
|
company with
|
||||
|
organization)
|
4 portfolios).
|
||||
|
(2005 to 2011).
|
|||||
|
David G. Mertens
|
Trustee
|
Indefinite
|
Retired; formerly
|
4
|
Trustee,
|
|
(age 58)
|
term*;
|
Managing Director and
|
Advisors
|
||
|
615 E. Michigan Street
|
since
|
Vice President, Jensen
|
Series Trust
|
||
|
Milwaukee, WI 53202
|
March
|
Investment Management,
|
(for series not
|
||
|
2017.
|
Inc. (a privately-held
|
affiliated with
|
|||
|
investment advisory
|
the Funds).
|
||||
|
firm) (2002 to 2017).
|
|||||
|
George J. Rebhan
|
Chairman
|
Indefinite
|
Retired; formerly
|
4
|
Trustee,
|
|
(age 84)
|
of the
|
term; since
|
President, Hotchkis and
|
Advisors
|
|
|
615 E. Michigan Street
|
Board and
|
May
|
Wiley Funds (mutual
|
Series Trust
|
|
|
Milwaukee, WI 53202
|
Trustee
|
2002.
|
funds) (1985 to 1993).
|
(for series not
|
|
|
affiliated with
|
|||||
|
the Funds);
|
|||||
|
Independent
|
|||||
|
Trustee from
|
|||||
|
1999 to 2009,
|
|||||
|
E*TRADE
|
|||||
|
Funds.
|
85
SCHARF FUNDS
INFORMATION ABOUT TRUSTEES AND OFFICERS (Unaudited), Continued
|
Term of
|
Number of
|
||||
|
Office
|
Portfolios
|
Other
|
|||
|
Position
|
and
|
Principal
|
in Fund
|
Directorships
|
|
|
Held
|
Length
|
Occupation
|
Complex
|
Held During
|
|
|
Name, Address
|
with the
|
of Time
|
During Past
|
Overseen by
|
Past Five
|
|
and Age
|
Trust
|
Served
|
Five Years
|
Trustee(2)
|
Years(3)
|
|
Joe D. Redwine(4)
|
Trustee
|
Indefinite
|
Retired; formerly
|
4
|
Trustee,
|
|
(age 71)
|
term; since
|
President, CEO, U.S.
|
Advisors
|
||
|
615 E. Michigan Street
|
January
|
Bancorp Fund Services,
|
Series Trust
|
||
|
Milwaukee, WI 53202
|
2018.
|
LLC (May 1991 to July
|
(for series not
|
||
|
2017); formerly Manager,
|
affiliated with
|
||||
|
U.S. Bancorp Fund
|
the Funds).
|
||||
|
Services, LLC (1998 to
|
|||||
|
July 2017).
|
|||||
|
Raymond B. Woolson
|
Trustee
|
Indefinite
|
President, Apogee
|
4
|
Trustee,
|
|
(age 59)
|
term*;
|
Group, Inc. (financial
|
Advisors
|
||
|
615 E. Michigan Street
|
since
|
consulting firm)
|
Series Trust
|
||
|
Milwaukee, WI 53202
|
January
|
(1998 to present).
|
(for series not
|
||
|
2016.
|
affiliated with
|
||||
|
the Funds);
|
|||||
|
Independent
|
|||||
|
Trustee,
|
|||||
|
DoubleLine
|
|||||
|
Funds Trust
|
|||||
|
(an open-end
|
|||||
|
investment
|
|||||
|
company with
|
|||||
|
15 portfolios),
|
|||||
|
DoubleLine
|
|||||
|
Opportunistic
|
|||||
|
Credit Fund
|
|||||
|
and
|
|||||
|
DoubleLine
|
|||||
|
Income
|
|||||
|
Solutions
|
|||||
|
Fund, from
|
|||||
|
2010 to
|
|||||
|
present;
|
|||||
|
Independent
|
|||||
|
Trustee,
|
|||||
|
DoubleLine
|
|||||
|
Equity Funds
|
|||||
|
from 2010
|
|||||
|
to 2016.
|
86
SCHARF FUNDS
INFORMATION ABOUT TRUSTEES AND OFFICERS (Unaudited), Continued
Officers
|
Term of Office
|
|||
|
Name, Address
|
Position Held
|
and Length of
|
Principal Occupation
|
|
and Age
|
with the Trust
|
Time Served
|
During Past Five Years
|
|
Douglas G. Hess
|
President, Chief
|
Indefinite
|
Senior Vice President, Compliance and
|
|
(age 51)
|
Executive Officer
|
term; since
|
Administration, U.S. Bancorp Fund
|
|
615 E. Michigan Street
|
and Principal
|
June 2003.
|
Services, LLC (March 1997 to present).
|
|
Milwaukee, WI 53202
|
Executive Officer
|
||
|
Cheryl L. King
|
Treasurer and
|
Indefinite
|
Vice President, Compliance and
|
|
(age 57)
|
Principal
|
term; since
|
Administration, U.S. Bancorp Fund
|
|
615 E. Michigan Street
|
Financial Officer
|
December 2007.
|
Services, LLC (October 1998 to
|
|
Milwaukee, WI 53202
|
present).
|
||
|
Kevin J. Hayden
|
Assistant
|
Indefinite
|
Assistant Vice President, Compliance
|
|
(age 47)
|
Treasurer
|
term; since
|
and Administration, U.S. Bancorp Fund
|
|
615 E. Michigan Street
|
September 2013.
|
Services, LLC (June 2005 to present).
|
|
|
Milwaukee, WI 53202
|
|||
|
Michael L. Ceccato
|
Vice President,
|
Indefinite
|
Senior Vice President, U.S. Bancorp
|
|
(age 61)
|
Chief Compliance
|
term; since
|
Fund Services, LLC and Vice President,
|
|
615 E. Michigan Street
|
Officer and
|
September 2009.
|
U.S. Bank N.A. (February 2008 to
|
|
Milwaukee, WI 53202
|
AML Officer
|
present).
|
|
|
Emily R. Enslow, Esq.
|
Secretary
|
Indefinite
|
Vice President, U.S. Bancorp Fund
|
|
(age 31)
|
term; since
|
Services, LLC (July 2013 to present);
|
|
|
615 E. Michigan Street
|
December 2017.
|
Proxy Voting Coordinator and Class
|
|
|
Milwaukee, WI 53202
|
Action Administrator, Artisan Partners
|
||
|
Limited Partnership (September 2012
|
|||
|
to July 2013).
|
|
*
|
Under the Trust’s Agreement and Declaration of Trust, a Trustee serves during the continued lifetime of the Trust until he/she dies, resigns, is declared bankrupt or incompetent by a court of appropriate jurisdiction, or is removed, or, if sooner, until the election and qualification of his/her successor. In addition, the Trustees have designated a mandatory retirement age of 75, such that each Trustee first elected or appointed to the Board after December 1, 2015, serving as such on the date he or she reaches the age of 75, shall submit his or her resignation not later than the last day of the calendar year in which his or her 75th birthday occurs.
|
|
(1)
|
The Trustees of the Trust who are not “interested persons” of the Trust as defined under the 1940 Act (“Independent Trustees”).
|
|
(2)
|
As of September 30, 2018, the Trust was comprised of 41 active portfolios managed by unaffiliated investment advisers. The term “Fund Complex” applies only to the Funds. The Funds do not hold themselves out as related to any other series within the Trust for investment purposes, nor does it share the same investment adviser with any other series.
|
|
(3)
|
“Other Directorships Held” includes only directorships of companies required to register or file reports with the SEC under the Securities Exchange Act of 1934, as amended, (that is, “public companies”) or other investment companies registered under the 1940 Act.
|
|
(4)
|
Mr. Redwine became an Independent Trustee on January 1, 2018.
|
The Statement of Additional Information includes additional information about the Funds’ Trustees and Officers and is available, without charge, upon request by calling 1-888-861-7556.
87
SCHARF FUNDS
HOUSEHOLDING
In an effort to decrease costs, the Funds intend to reduce the number of duplicate prospectuses, annual and semi-annual reports, proxy statement and other similar documents you receive by sending only one copy of each to those addresses shared by two or more accounts and to shareholders the Transfer Agent reasonably believes are from the same family or household. Once implemented, if you would like to discontinue householding for your accounts, please call toll-free at 1-866-572-4273 (1-866-5SCHARF) to request individual copies of these documents. Once the Transfer Agent receives notice to stop householding, the Transfer Agent will begin sending individual copies thirty days after receiving your request. This policy does not apply to account statements.
88
SCHARF FUNDS
PRIVACY NOTICE
The Funds collect non-public information about you from the following sources:
|
•
|
Information we receive about you on applications or other forms;
|
|
•
|
Information you give us orally; and/or
|
|
•
|
Information about your transactions with us or others.
|
We do not disclose any non-public personal information about our customers or former customers without the customer’s authorization, except as permitted by law or in response to inquiries from governmental authorities. We may share information with affiliated and unaffiliated third parties with whom we have contracts for servicing the Funds. We will provide unaffiliated third parties with only the information necessary to carry out their assigned responsibilities. We maintain physical, electronic and procedural safeguards to guard your non-public personal information and require third parties to treat your personal information with the same high degree of confidentiality.
In the event that you hold shares of the Funds through a financial intermediary, including, but not limited to, a broker-dealer, bank, or trust company, the privacy policy of your financial intermediary would govern how your non-public personal information would be shared by those entities with unaffiliated third parties.
89
Investment Adviser
Scharf Investments, LLC
5619 Scotts Valley Drive, Suite 140
Scotts Valley, CA 95066
Distributor
Quasar Distributors, LLC
777 East Wisconsin Avenue, 6th Floor
Milwaukee, WI 53202
Custodian
U.S. Bank National Association
Custody Operations
1555 North River Center Drive, Suite 302
Milwaukee, WI 53212
Transfer Agent
U.S. Bancorp Fund Services, LLC
615 East Michigan Street
Milwaukee, WI 53202
(866) 572-4273
Independent Registered Public Accounting Firm
Tait, Weller & Baker LLP
Two Liberty Place
50 South 16th Street, Suite 2900
Philadelphia, PA 19102
Legal Counsel
Schiff Hardin LLP
666 Fifth Avenue, Suite 1700
New York, NY 10103
This report is intended for shareholders of the Funds and may not be used as sales literature unless preceded or accompanied by a current prospectus. For a current prospectus please call (866)-5SCHARF. Statements and other information herein are dated and are subject to change.
Item 2. Code of Ethics.
The registrant has adopted a code of ethics that applies to the registrant’s principal executive officer and principal financial officer. The registrant has not made any substantive amendments to its code of ethics during the period covered by this report. The registrant has not granted any waivers from any provisions of the code of ethics during the period covered by this report.
A copy of the registrant’s Code of Ethics is filed herewith.
Item 3. Audit Committee Financial Expert.
The registrant’s Board of Trustees has determined that there is at least one audit committee financial expert serving on its audit committee. Ms. Gail S. Duree is the “audit committee financial expert” and is considered to be “independent” as each term is defined in Item 3 of Form N‑CSR.
Item 4. Principal Accountant Fees and Services.
The registrant has engaged its principal accountant to perform audit services, audit-related services, tax services and other services during the past two fiscal years. “Audit services” refer to performing an audit of the registrant's annual financial statements or services that are normally provided by the accountant in connection with statutory and regulatory filings or engagements for those fiscal years. “Audit-related services” refer to the assurance and related services by the principal accountant that are reasonably related to the performance of the audit. “Tax services” refer to professional services rendered by the principal accountant for tax compliance, tax advice, and tax planning. There were no “other services” provided by the principal accountant. The following table details the aggregate fees billed or expected to be billed for each of the last two fiscal years for audit fees, audit-related fees, tax fees and other fees by the principal accountant.
|
FYE 9/30/2018
|
FYE 9/30/2017
|
|
|
Audit Fees
|
$70,600
|
$68,600
|
|
Audit-Related Fees
|
N/A
|
N/A
|
|
Tax Fees
|
$14,400
|
$14,000
|
|
All Other Fees
|
N/A
|
N/A
|
The audit committee has adopted pre-approval policies and procedures that require the audit committee to pre‑approve all audit and non‑audit services of the registrant, including services provided to any entity affiliated with the registrant.
The percentage of fees billed by Tait, Weller & Baker LLP applicable to non-audit services pursuant to waiver of pre-approval requirement were as follows:
|
FYE 9/30/2018
|
FYE 9/30/2017
|
|
|
Audit-Related Fees
|
0%
|
0%
|
|
Tax Fees
|
0%
|
0%
|
|
All Other Fees
|
0%
|
0%
|
All of the principal accountant’s hours spent on auditing the registrant’s financial statements were attributed to work performed by full‑time permanent employees of the principal accountant.
The following table indicates the non-audit fees billed or expected to be billed by the registrant’s accountant for services to the registrant and to the registrant’s investment adviser (and any other controlling entity, etc.—not sub-adviser) for the last two years. The audit committee of the Board of Trustees has considered whether the provision of non-audit services that were rendered to the registrant's investment adviser is compatible with maintaining the principal accountant's independence and has concluded that the provision of such non-audit services by the accountant has not compromised the accountant’s independence.
|
Non-Audit Related Fees
|
FYE 9/30/2018
|
FYE 9/30/2017
|
|
Registrant
|
N/A
|
N/A
|
|
Registrant’s Investment Adviser
|
N/A
|
N/A
|
Item 5. Audit Committee of Listed Registrants.
(a) Not applicable to registrants who are not listed issuers (as defined in Rule 10A-3 under the Securities Exchange Act of 1934).
(b) Not Applicable.
Item 6. Investments.
|
(a)
|
Schedule of Investments is included as part of the report to shareholders filed under Item 1 of this Form.
|
(b) Not Applicable.
Item 7. Disclosure of Proxy Voting Policies and Procedures for Closed-End Management Investment Companies.
Not applicable to open-end investment companies.
Item 8. Portfolio Managers of Closed-End Management Investment Companies.
Not applicable to open-end investment companies.
Item 9. Purchases of Equity Securities by Closed‑End Management Investment Company and Affiliated Purchasers.
Not applicable to open-end investment companies.
Item 10. Submission of Matters to a Vote of Security Holders.
There have been no material changes to the procedures by which shareholders may recommend nominees to the Registrant’s Board of Trustees.
Item 11. Controls and Procedures.
|
(a)
|
The Registrant’s President/Chief Executive Officer/Principal Executive Officer and Vice President/Treasurer/Principal Financial Officer have reviewed the Registrant's disclosure controls and procedures (as defined in Rule 30a-3(c) under the Investment Company Act of 1940, as amended, (the “Act”)) as of a date within 90 days of the filing of this report, as required by Rule 30a-3(b) under the Act and Rules 13a-15(b) or 15d‑15(b) under the Securities Exchange Act of 1934. Based on their review, such officers have concluded that the disclosure controls and procedures are effective in ensuring that information required to be disclosed in this report is appropriately recorded, processed, summarized and reported and made known to them by others within the Registrant and by the Registrant’s service provider.
|
|
(b)
|
There were no changes in the Registrant's internal control over financial reporting (as defined in Rule 30a-3(d) under the Act) that occurred during the fourth fiscal quarter of the period covered by this report that has materially affected, or is reasonably likely to materially affect, the Registrant's internal control over financial reporting.
|
Item 12. Disclosure of Securities Lending Activities for Closed-End Management Investment Companies.
Not applicable to open-end investment companies.
Item 13. Exhibits.
|
(a)
|
(1) Any code of ethics or amendment thereto, that is subject of the disclosure required by Item 2, to the extent that the registrant intends to satisfy Item 2 requirements through filing an exhibit. Filed herewith.
|
(2) A separate certification for each principal executive officer and principal financial officer pursuant to Section 302 of the Sarbanes-Oxley Act of 2002. Filed herewith.
(3) Any written solicitation to purchase securities under Rule 23c‑1 under the Act sent or given during the period covered by the report by or on behalf of the registrant to 10 or more persons. Not applicable to open-end investment companies.
(4) Change in the registrant’s independent public accountant. There was no change in the registrant’s independent public accountant for the period covered by this report.
|
(b)
|
Certification pursuant to Section 906 of the Sarbanes‑Oxley Act of 2002. Furnished herewith.
|
SIGNATURES
Pursuant to the requirements of the Securities Exchange Act of 1934 and the Investment Company Act of 1940, the registrant has duly caused this report to be signed on its behalf by the undersigned, thereunto duly authorized.
(Registrant) Advisors Series Trust
By (Signature and Title)* /s/ Jeffrey T. Rauman
Jeffrey T. Rauman
President/Chief Executive Officer/Principal Executive Officer
Date 12/10/18
Pursuant to the requirements of the Securities Exchange Act of 1934 and the Investment Company Act of 1940, this report has been signed below by the following persons on behalf of the registrant and in the capacities and on the dates indicated.
By (Signature and Title)* /s/ Jeffrey T. Rauman
Jeffrey T. Rauman
President/Chief Executive Officer/Principal Executive Officer
Date 12/10/18
By (Signature and Title)* /s/ Cheryl L. King
Cheryl L. King, Vice President/Treasurer/Principal Financial Officer
Date 12/10/18
* Print the name and title of each signing officer under his or her signature.