AS FILED WITH THE SECURITIES AND EXCHANGE COMMISSION ON OCTOBER 4, 2013
SECURITIES ACT FILE NO. 333-
UNITED STATES
SECURITIES AND EXCHANGE COMMISSION
WASHINGTON, DC 20549
FORM N-14
REGISTRATION STATEMENT
UNDER THE
SECURITIES ACT OF 1933
PRE-EFFECTIVE AMENDMENT NO. [ ]
POST-EFFECTIVE AMENDMENT NO. [ ]
CITY NATIONAL ROCHDALE FUNDS
(FORMERLY CNI CHARTER FUNDS)
(Exact Name of Registrant as Specified in Charter)
400 North Roxbury Drive
Beverly Hills, California 90210
(Address of Principal Executive Offices) (Zip Code)
(800) 708-8881
(Registrant’s Area Code and Telephone Number)
William J. Souza, Esq.
400 North Roxbury Drive
Beverly Hills, California 90210
(Name and Address of Agent for Service)
With Copies To:
Michael Glazer
Bingham McCutchen LLP
355 South Grand Avenue
Los Angeles, California 90071
Approximate Date of Proposed Public Offering: As soon as practicable after the effective date of this Registration Statement.
It is proposed that this filing become effective November 3, 2013 pursuant to Rule 488.
Title of Securities Being Registered: Institutional Class shares.
No filing fee is required because an indefinite number of shares have previously been registered pursuant to Rule 24f-2 under the Investment Company Act of 1940.
CITY NATIONAL ROCHDALE FUNDS
400 North Roxbury Drive
Beverly Hills, California 90210
1-888-889-0799
Dear Shareholder:
We are seeking your approval of the proposed reorganization of the City National Rochdale Full Maturity Fixed Income Fund series (the “Full Maturity Fund”) of City National Rochdale Funds (the “Trust”) into the City National Rochdale Intermediate Fixed Income Fund series (the “Intermediate Fund”) of the Trust. In the reorganization, holders of each of the Institutional Class and Class N shares of the Full Maturity Fund will receive newly created Institutional Class shares of the Intermediate Fund. City National Rochdale, LLC (“CNR”) is the investment adviser for both Funds. You are being asked to approve the proposed reorganization at a Special Meeting of Shareholders to be held on [ ], 2013 (the “Meeting”).
This reorganization is being proposed, among other reasons, to reduce the annual operating expenses borne by shareholders of the Full Maturity Fund. CNR does not expect significant future in-flows to the Full Maturity Fund and anticipates the assets of the Full Maturity Fund may continue to decrease in the future. After considering the viability of the Full Maturity Fund in light of its current size and limited prospects for future asset growth, CNR believes that maintaining the status quo would not be in shareholders’ best interests.
The Intermediate Fund has significantly more assets than the Full Maturity Fund ($152.5 million compared to $44.7 million as of July 31, 2013). The annual expense ratios for the Institutional Class shareholders and the Class N shareholders of the Full Maturity Fund for the period ended July 31, 2013 are 0.60% and 0.85%, respectively. The annual expense ratio for the Class N shareholders of the Intermediate Fund for the period ending July 31, 2013 is 0.99%, and Institutional Class shares of the combined Fund will maintain the Intermediate Fund’s current voluntary expense cap of 0.51%. Accordingly, after the Reorganization the gross and net total operating expenses of the Class N and Institutional Class shareholders of the Intermediate Fund will decrease.
The investment objective of the Full Maturity Fund is to seek to provide a high level of current income, consistent with the preservation of capital. The investment objective of the Intermediate Fund is to seek current income and, to the extent consistent with this goal, capital appreciation. Although the Funds do not share precisely the same focus, each Fund seeks current income.
If the proposed reorganization is approved by shareholders, at the close of business on ________, 2013, the Full Maturity Fund will transfer its assets to the Intermediate Fund and the Intermediate Fund will assume the liabilities of the Full Maturity Fund. On that date, you will receive shares of the Intermediate Fund of the same class and equal in aggregate net asset value to the value of your shares of the Full Maturity Fund. The reorganization is generally expected to be tax-free to both Funds and their shareholders. There will be no dilution of your investment.
CNR will bear the costs of the proposed reorganization, including legal, accounting and transfer agent costs other than transaction costs associated with the sale of any portion of the Full Maturity Fund’s portfolio required to effect the reorganization. Enclosed are various materials, including a Combined Prospectus and Proxy Statement and proxy ballot for the Meeting. The materials will provide you with detailed information about the proposed reorganization. CNR and the Board of Trustees of the Trust believe the reorganization is in the best interests of the shareholders of both Funds. The Board of Trustees and I urge you to vote in favor of the proposed reorganization.
Your vote is important. Please take a moment now to sign and return your proxy card in the enclosed postage paid return envelope. If we do not hear from you after a reasonable amount of time you may receive a telephone call from us, reminding you to vote your shares.
|
|
Sincerely,
|
|
|
/s/ Garrett R. D’Alessandro
|
|
|
Garrett R. D’Alessandro
President & Chief Executive Officer
|
CITY NATIONAL ROCHDALE FUNDS
FULL MATURITY FIXED INCOME FUND
400 North Roxbury Drive
Beverly Hills, California 90210
1-888-889-0799
NOTICE OF SPECIAL MEETING OF SHAREHOLDERS
To Be Held on [ ], 2013
A special meeting of Shareholders of the City National Rochdale Full Maturity Fixed Income Fund series (the “Full Maturity Fund”) of City National Rochdale Funds (the “Trust”) will be held on ________ __, 2013, at 10:00 a.m. Pacific Time, at 400 North Roxbury Drive, Beverly Hills, California 90210. The meeting will be held for the following purposes:
1. Reorganization of the Full Maturity Fund. For the shareholders of the Full Maturity Fund to consider and vote on a proposed reorganization of the Fund into the City National Rochdale Intermediate Fixed Income Fund series of the Trust and the subsequent dissolution of the Full Maturity Fund.
2. Other Business. To consider and act upon such other business as may properly come before the meeting or any adjournments.
The Board of Trustees of the Trust has unanimously approved the proposed reorganization. Please read the accompanying Combined Prospectus and Proxy Statement for a more complete discussion of the proposal.
Shareholders of the Full Maturity Fund of record as of the close of business on ______, 2013 are entitled to notice of, and to vote at, the special meeting or any adjournment thereof.
You are invited to attend the special meeting. If you cannot do so, please complete and return the accompanying proxy in the enclosed postage paid return envelope as promptly as possible. This is important for the purpose of ensuring a quorum at the special meeting. You may revoke your proxy at any time before it is exercised by signing and submitting a revised proxy, by giving written notice of revocation to the Trust at any time before the proxy is exercised, or by voting in person at the special meeting.
By Order of the Board of Trustees,
/s/ Garrett R. D’Alessandro
Garrett R. D’Alessandro
President & Chief Executive Officer
__________, 2013
The information in this Combined Prospectus and Proxy Statement is not complete and may be changed. We may not sell these securities until the registration statement filed with the Securities and Exchange Commission is effective. This Combined Prospectus and Proxy Statement is not an offer to sell these securities and it is not soliciting an offer to buy these securities in any state where the offer or sale is not permitted.
SUBJECT TO COMPLETION, DATED [ ], 2013
CITY NATIONAL ROCHDALE FUNDS
400 North Roxbury Drive
Beverly Hills, California 90210
1-800-708-8881
CITY NATIONAL ROCHDALE FUNDS
COMBINED PROSPECTUS AND PROXY STATEMENT
Dated __________, 2013
The Board of Trustees of City National Rochdale Funds (the “Trust”) is soliciting the enclosed proxies in connection with a special meeting (the “Meeting”) of shareholders of the City National Rochdale Full Maturity Fixed Income Fund series (the “Full Maturity Fund”) of the Trust.
The Meeting will be held on [ ], 2013 at 10:00 a.m. Pacific Time at the office of the Trust at 400 North Roxbury Drive, Beverly Hills, California 90210. The Meeting is being called to consider the proposed reorganization of the Full Maturity Fund into the City National Rochdale Intermediate Fixed Income Fund series (the “Intermediate Fund”) of the Trust and the subsequent dissolution of the Full Maturity Fund, and to transact such other business as may properly come before the meeting or any adjournments thereof. Each of the Full Maturity Fund and the Intermediate Fund is referred to herein as a “Fund” and they are collectively referred to as the “Funds.” Shareholders of record of the Full Maturity Fund as of _______, 2013 will be entitled to vote at the Meeting.
This Combined Prospectus and Proxy Statement (the “Prospectus/Proxy Statement”) is furnished to the shareholders of the Full Maturity Fund on behalf of the Board of Trustees of the Trust in connection with the solicitation of voting instructions for the Meeting. It is being mailed to shareholders of the Full Maturity Fund on or about [ ], 2013. The prospectus for the Intermediate Fund (the “Prospectus”) accompanies and is incorporated into this Prospectus/Proxy Statement. This Prospectus/Proxy Statement and the Prospectus set forth concisely the information about the Intermediate Fund and the proposed reorganization that Full Maturity Fund shareholders should know before voting on the reorganization. You should retain them for future reference.
Additional information about the Full Maturity Fund and the Intermediate Fund are included in their Prospectuses and Statements of Additional Information dated January 28, 2013 and April 30, 2013, respectively, as they may be amended and/or supplemented, which are incorporated by reference herein. (Additional information is also set forth in the Statement of Additional Information dated _____, 2013 relating to this Prospectus/Proxy Statement, which is also incorporated by reference herein). The Commission file numbers for the Trust’s registration statement containing the current Prospectuses and Statements of Additional Information for the Funds, as described above, are Registration No. 811-07923 and Registration No. 333-16093. Additional information about the Funds may also be obtained for the Full Maturity Fund from the Trust’s Annual Report for the fiscal year ended September 30, 2012 and for the Intermediate Fund from Rochdale Investment Trust’s Annual Report for the fiscal year ended December 31, 2012 with respect to its Rochdale Intermediate Fixed Income Fund Portfolio series (the predecessor of the Intermediate Fund), each of which have been filed with the SEC. Copies of the Prospectus, Statement of Additional Information, and Annual Report for the Funds may be obtained without charge by writing to the Funds at 400 North Roxbury Drive, Beverly Hills, California, 90210, by calling the Funds at 1-888-889-0799, or on the Funds’ website, www.citynationalrochdalefunds.com.
The SEC has not approved or disapproved these securities or passed on the adequacy of this prospectus. Any representation to the contrary is a criminal offense.
Dated: ________, 2013
TABLE OF CONTENTS
| Page | |
|
SUMMARY OF PROSPECTUS/PROXY STATEMENT
|
1
|
|
PROPOSED REORGANIZATION
|
19
|
|
VOTING AND MEETING PROCEDURES
|
25
|
|
GENERAL INFORMATION
|
27
|
|
FINANCIAL HIGHLIGHTS AND FINANCIAL STATEMENTS
|
27
|
|
INFORMATION FILED WITH THE SECURITIES AND EXCHANGE COMMISSION
|
28
|
|
APPENDIX A - AGREEMENT AND PLAN OF REORGANIZATION
|
A-1
|
-i-
SUMMARY OF PROSPECTUS/PROXY STATEMENT
Proposed Reorganization
The Trust is an open-end management investment company (referred to generally as a “mutual fund”). The Trust’s offices are located at 400 North Roxbury Drive, Beverly Hills, California 90210. The Trust’s phone number is 1-888-889-0799.
The Board of Trustees of the Trust (the “Board”) has called the Meeting to allow shareholders of the Full Maturity Fund to consider and vote on the proposed reorganization of the Full Maturity Fund into the Intermediate Fund (the “Reorganization”). The Board met on September 17, 2013 to discuss the proposal, and approved the Reorganization, subject to the approval of the Full Maturity Fund’s shareholders. The independent trustees – i.e., those trustees who are not “interested persons” of the Trust as that term is defined in the Investment Company Act of 1940, as amended (the “1940 Act”), unanimously approved the Reorganization.
The proposed Reorganization involves the transfer of substantially all of the assets and liabilities of the Full Maturity Fund to the Intermediate Fund in exchange for shares of the Intermediate Fund. The transfer of assets by the Full Maturity Fund will occur at their current market value, and shares of the Intermediate Fund to be issued to the Full Maturity Fund will be valued at their current net asset value, as determined in accordance with the Trust’s valuation procedures. Following this distribution, shares of the Intermediate Fund will be distributed to shareholders of the Full Maturity Fund and the Full Maturity Fund will be dissolved.
The Full Maturity Fund has two classes of shares: Institutional Class and Class N. The Intermediate Fund also has two classes of shares: Institutional Class and Class N. In the Reorganization, holders of each of the Institutional Class and Class N shares of the Full Maturity Fund will receive Institutional Class shares of the Intermediate Fund. The ownership restrictions on the Institutional Class shares of the Intermediate Fund will be waived with respect to the Full Maturity Fund shareholders exchanging their shares pursuant to the Reorganization. As a result of the proposed Reorganization, each shareholder of the Full Maturity Fund will receive full and fractional shares of the Institutional Class of the Intermediate Fund equal in aggregate value at the time of the exchange to the aggregate value of such shareholder’s shares of the Full Maturity Fund. The Reorganization is conditioned on the receipt by the Funds of an opinion from Bingham McCutchen LLP to the effect that the Reorganization will constitute a “reorganization” within the meaning of Section 368(a) of the Internal Revenue Code of 1986, as amended (the “Code”). Assuming that the Reorganization so qualifies, the Full Maturity Fund, the Intermediate Fund, and the shareholders of the Full Maturity Fund generally will recognize no gain or loss for federal income tax purposes as a result of the Reorganization.
City National Rochdale, LLC (“CNR”) serves as the investment adviser for, and has identical responsibilities with respect to, each Fund. Each Fund is a diversified fund, which means that it is limited as to amounts of issuers it may own with respect to 75% of its assets. Currently CNR engages Baird Advisors and Boyd Watterson Asset Management, LLC as sub advisers to manage a portion of the Full Maturity Fund’s portfolio. CNR does not intend to engage Baird Advisors or Boyd Watterson Asset Management, LLC to manage any portion of the Intermediate Fund’s portfolio after completion of the Reorganization.
The Funds have similar but not identical investment objectives and strategies. The investment objective of the Full Maturity Fund is to seek to provide a high level of current income, consistent with the preservation of capital. The investment objective of the Intermediate Fund is to seek current income and, to the extent consistent with this goal, capital appreciation. Although the Funds do not share precisely the same focus, each Fund seeks current income.
-1-
The Board believes that the proposed Reorganization is in the best interests of each Fund and its shareholders for the reasons listed below:
|
|
·
|
CNR expects that (i) the Full Maturity Fund shareholders will pay lower management fees and lower gross and net total operating expenses after the Reorganization is completed, and (ii) the Intermediate Fund shareholders will pay the same management fees and the same or lower gross and net total operating expenses after the Reorganization is completed.
|
|
|
·
|
CNR believes that the combined Intermediate Fund will be better positioned for growth than either the Full Maturity Fund or the Intermediate Fund is prior to the Reorganization.
|
|
|
·
|
The Reorganization will provide shareholders of the Full Maturity Fund with the opportunity to continue to utilize the services of CNR as manager of their equity portfolios on an uninterrupted basis.
|
|
|
·
|
The investment objectives and principal strategies of the Full Maturity Fund are similar to those of the Intermediate Fund. Although the Funds’ investment objectives are not identical, Full Maturity Fund shareholders will remain in a portfolio with similar investment strategies, as each Fund focuses on investment grade fixed income securities, maintains an intermediate duration profile and uses the Barclays Intermediate U.S. Government/Credit Index as its primary benchmark index.
|
|
|
·
|
CNR, rather than the shareholders of the Full Maturity Fund, will bear the costs of the Reorganization other than transaction costs associated with the sale of the Full Maturity Fund’s investment portfolio, including legal, accounting and transfer agent costs.
|
Comparison of Investment Objectives and Principal Strategies
The investment objectives and principal strategies of each Fund are set forth in the following table.
|
Full Maturity Fund
|
Intermediate Fund
|
|||
|
Investment Objectives
|
The Full Maturity Fund’s investment objective is to seek to provide a high level of current income, consistent with the preservation of capital.
|
The Intermediate Fund seeks current income and, to the extent consistent with this goal, capital appreciation.
|
||
|
Principal Strategies
|
At least 80% of the Full Maturity Fund’s net assets (including borrowings for
|
Under normal conditions, the Intermediate Fund invests at least
|
-2-
|
Full Maturity Fund
|
Intermediate Fund
|
|||
| investment purposes) consists of fixed income securities either issued or guaranteed by the U.S. Government or its agencies or instrumentalities, money market instruments, non-convertible fixed income securities (i.e., bonds which cannot be converted into stock) of U.S. companies and U.S. dollar-denominated debt obligations issued by foreign governments and corporations. |
80% of its net assets (plus any borrowings for investment purposes) in fixed income securities. The Intermediate Fund’s investments in fixed income securities consist primarily of fixed rate and variable rate corporate debt obligations, debt obligations of the U.S. Government and its agencies, bank obligations, commercial paper, repurchase agreements and Eurodollar obligations. In investing its assets the Intermediate Fund seeks to purchase debt obligations of corporate and government issuers that provide an attractive rate of current income or provide for an attractive return based on the maturity, duration, and credit quality of the issuer relative to comparable issuers included in the Barclays Intermediate U.S. Government/Credit Bond Index.
The Intermediate Fund also invests in bank loans, agency and non-agency mortgage-backed securities and asset-backed securities backed by the income generated by litigation proceeds purchase contracts (“Litigation Advance Notes”).
|
|||
| The Full Maturity Fund invests at least 80% of its net assets in securities having one of the three highest ratings of either Moody’s Investors Service or Standard & Poor’s (at least A-). The Full Maturity Fund may also invest up to 20% of its total assets in securities with a minimum credit rating from Moody’s or Standard & Poor’s of Baa3 or BBB-, respectively, or which, if unrated, are determined by a sub-adviser to be of comparable quality. | Under normal market conditions, the Intermediate Fund’s assets will principally be invested in investment grade fixed-income securities (i.e., obligations rated BBB- or better by S&P or Baa3 or better by Moody’s, or if unrated, determined by CNR to be of equal quality). The Intermediate Fund may also invest a portion of its assets in fixed-income securities rated below investment grade (commonly known as “junk” bonds). The Intermediate Fund may retain a security after it has been downgraded below the minimum credit rating if the adviser determines that doing so is in the best interests of the Intermediate Fund. |
-3-
|
Full Maturity Fund
|
Intermediate Fund
|
|||
|
|
The Intermediate Fund may invest more than 7.5% of its assets in obligations of the U.S. Government or any one of its agencies or of any corporate issuer, provided that the issuer has been rated at least an investment grade of A- by S&P Ratings Group (“S&P”) or A3 by Moody’s Investors Service, Inc. (“Moody’s”).
|
|||
|
At least 80% of the Full Maturity Fund’s net assets consist of fixed income securities with “full duration.” This investment strategy may be changed at any time, with 60 days’ prior notice to shareholders. CNR considers “full duration” to mean a portfolio with an average duration ranging from the average duration of the Barclays U.S. Intermediate Government/Credit Bond Index to that of the Barclays U.S. Aggregate Bond Index. As of September 30, 2013, those indices had average durations of [ ] and [ ] years, respectively. Duration is a weighted measure of the length of time required to receive the present value of future payments, both interest and principal, from a fixed income security. Each of the Full Maturity Fund’s sub-advisers actively manages the average duration of the portion of the Full Maturity Fund’s investments that it manages and determines which securities to purchase or sell in accordance with its individual analysis of prevailing interest rates and yields, the quality and value of particular securities, and the comparative risks and returns of alternative investments. The maturities of the securities held by the Full Maturity Fund are generally less than five years. |
The Intermediate Fund seeks to have an average portfolio maturity and duration between three and ten years, as such debt obligations generally pay a higher rate of current income than shorter maturity debt obligations.
|
|||
| The Full Maturity Fund may retain a security after it has been downgraded to any rating below the minimum credit rating if CNR determines that doing so is in the best interests of the Full Maturity Fund. The fixed income securities in which the Full Maturity Fund invests may |
The Intermediate Fund may continue to own a security as long as the dividend or interest yields satisfy the Intermediate Fund’s objectives, the credit quality meets CNR’s fundamental criteria and CNR believes valuation is
|
-4-
|
Full Maturity Fund
|
Intermediate Fund
|
|||
|
have fixed, variable or floating interest rates, as well as varying principal repayment and interest rate reset terms.
|
attractive and industry trends remain favorable. However, the Intermediate Fund may sell a security to obtain capital appreciation if the security increases in value as a result of declines in market interest rates or improvements in the creditworthiness of the issuer. |
Comparison of Principal Investment Risks
Each of the Full Maturity Fund and the Intermediate Fund is subject to “manager” risk, which is the risk that CNR’s assessment of companies whose securities are held by the Fund may prove incorrect, resulting in losses or poor performance, and “market” risk, which is the risk that the Fund may expose you to a sudden decline in a holding's price or an overall decline in the market. As with any fund, the value of your investment in the relevant Fund will fluctuate on a day-to-day and a cyclical basis with movements in the market, as well as in response to the activities of individual companies in which the Fund invests. In addition, individual companies may report poor results or be negatively affected by industry and/or economic trends and developments.
Each Fund is also subject to market risk of fixed income securities, prepayment risk, extension risk, management risk and defensive instruments risk. The Full Maturity Fund is subject to interest rate risk, issuer risk, government sponsored entities risk, rating agencies risk and sub-adviser allocation risk. The Intermediate Fund is subject to credit risk, liquidity risk, high yield (“junk”) bond risk and litigation proceeds purchase contract risk.
The non-overlapping risks to which investments in the Full Maturity Fund and the Intermediate Fund are subject are set forth below.
|
Full Maturity Fund
|
Intermediate Fund
|
|
|
Interest Rate Risk - The Full Maturity Fund’s yield typically moves in the same direction as movements in short-term interest rates, although it does not do so as quickly.
|
Credit Risk - Change in the credit quality rating of a security or changes in an issuer’s financial condition can affect the Intermediate Fund. A default on a security held by the Intermediate Fund could cause the value of your investment in the Intermediate Fund to decline. Investments in bank loans and lower rated debt securities involve high credit risks. There is a relatively high risk that the issuer of such loans or debt securities will fail to make timely payments of interest or principal, or go bankrupt. Credit risk may be high for the Intermediate Fund because it invests in junk bonds and lower rated investment quality fixed-income securities. |
|
| Issuer Risk - The Full Maturity Fund may be adversely affected if the issuers of securities that the Full Maturity Fund holds do not make their principal |
Liquidity Risk - Bank loans, high-yield bonds, floating rate securities and lower rated securities may experience illiquidity, particularly during certain periods of financial or economic distress, causing the
|
-5-
|
Full Maturity Fund
|
Intermediate Fund
|
|
|
or interest payments on time.
|
value of the Intermediate Fund’s investments to decline. It may be more difficult for the Intermediate Fund to sell its investments when illiquid or the Intermediate Fund may receive less than it expects to receive if the security were sold. Additionally, one or more of the instruments in which the Intermediate Fund invests may be permanently illiquid in nature and market prices for these instruments are unlikely to be readily available at any time. In the absence of readily available market prices or, as is expected to be the case for certain illiquid asset-backed investments, the absence of any pricing service or observable pricing inputs, the valuation process will depend on the evaluation of factors such as prevailing interests rates, creditworthiness of the issuer, the relative value of the cash flows represented by the underlying assets and other factors. The resulting values, although arrived upon through a good faith process, may be inaccurate and may affect the Intermediate Fund’s net asset value. |
|
| Government Sponsored Entities Risk - The Full Maturity Fund invests in securities issued by government-sponsored entities which may not be guaranteed or insured by the U.S. Government and may only be supported by the credit of the issuing agency. |
High Yield (“Junk”) Bond Risk - High yield bonds involve greater risks of default, downgrade, or price declines and are more volatile than investment grade securities. Issuers of high yield bonds may be more susceptible than other issuers to economic downturns and are subject to a greater risk that the issuer may not be able to pay interest of dividends and ultimately to repay principal upon maturity. Discontinuation of these payments could have a substantial adverse effect on the market value of the security.
|
|
| Rating Agencies Risk - A credit rating is not an absolute standard of quality, but rather a general indicator that reflects only the view of the originating rating agency. If a rating agency revises downward or withdraws its rating of a security in which the Full Maturity Fund invests, that security may become less liquid or may lose value. |
Litigation Proceeds Purchase Contract Risk - The owner of a litigation proceeds purchase contract is entitled to receive a specified sum of money when and if a claimant and/or the claimant’s attorney collects on the claim upon which the lawsuit is based. If no amounts are ever collected by the claimant or the claimant’s attorney in connection with the claim, no amount will be owed under the litigation proceeds purchase contract. Relevant laws and regulations with respect to such contract are complex, uncertain and subject to constant change. In addition, the possibility exists that the adverse party and/or its insurer could become insolvent and seek protection under the federal bankruptcy or state insolvency laws. Such action could delay or reduce the payments under the contracts, which in turn, could delay or reduce the principal and interest payments, thus negatively affecting the value of the Litigation Advance Notes. Additionally, there is no guarantee that the underlying cases will settle or resolve within the expected time period, or that litigation will not be prolonged, thereby creating the possibility of significant delay in the receipt of payments, which in turn, could delay or reduce the principal and interest payments on the Litigation Advance Notes. |
-6-
|
Full Maturity Fund
|
Intermediate Fund
|
|
|
Foreign Securities Risk - Foreign investments tend to be more volatile than domestic securities, and are subject to risks that are not typically associated with domestic securities (e.g., changes in currency rates and exchange control regulations, future political and economic developments and the possibility of seizure or nationalization of companies, or the imposition of withholding taxes on income).
Sub-Adviser Risk - The Full Maturity Fund’s performance is affected by CNR’s decisions concerning how much of the Full Maturity Fund’s portfolio to allocate for management by each of the Fund’s sub-advisers or to retain management by CNR.
|
Comparison of Shareholder Rights
Because each Fund is a series of the Trust, the Reorganization will not affect the rights and privileges of shareholders of any class of the Full Maturity Fund. For instance, after the Reorganization shareholders of each class of the Intermediate Fund will have the same exchange, purchase and redemption privileges as shareholders of the same class of the Full Maturity Fund prior to the Reorganization.
Comparison of Distribution
Because each Fund is a series of the Trust, shares of any class of the Intermediate Fund are distributed in the same way as shares of the same class of the Full Maturity Fund, and the method of their distribution will not be affected by the Reorganization. Institutional Class shares of the Intermediate Fund will not be subject to a 12b-1 fee.
-7-
Comparison of Purchase and Redemption Procedures
Because each Fund is a series of the Trust, the Reorganization will not affect the purchase and redemption procedures of either class of the Full Maturity Fund. After the Reorganization, Institutional Class shareholders of the Intermediate Fund will be able to exchange their shares as set forth above.
Comparison of Fees and Expenses
The types of fees and expenses of the Intermediate Fund are the same as those of the Full Maturity Fund. CNR receives investment advisory fees of 0.40% and 0.50% of average daily net assets from the Intermediate Fund and Full Maturity Fund, respectively, for serving as their investment adviser. The fees are accrued daily and paid monthly. The gross and net total operating expense ratios borne by the Class N and Institutional Class shareholders of the Full Maturity Fund are expected to decrease as a result of the Reorganization, as Institutional Class shares of the combined Fund will maintain a voluntary expense cap of 0.51% following the Reorganization. Shareholders of the Institutional Class and Class N shares of the Full Maturity Fund who exchange their share as a result of the Reorganization will not be subject to a shareholder servicing fee or 12b-1 fee. Class N shares of the Full Maturity Fund are currently subject to a 0.25% shareholder servicing fee and a 0.25% 12b-1 fee.
The following table shows the fees and expenses for the Full Maturity Fund and the Intermediate Fund, and the fees and expenses of the Intermediate Fund on a pro forma basis after giving effect to the proposed Reorganization, as of August 31, 2013, except as stated in footnote * below. As shown in the table, the fees and expenses of the Intermediate Fund, on a pro forma basis after giving effect to the proposed Reorganization, are expected to stay the same as or be lower in comparison with the current fees of the Intermediate Fund.
-8-
|
Full Maturity Fund
|
Intermediate Fund
|
Pro Forma
Intermediate Fund
|
||
|
Class N
Shares
|
Institutional
Class Shares
|
Class N
Shares
|
Institutional
Class Shares
|
|
|
Annual Fund Operating Expenses
(expenses that are deducted from Fund assets)
|
||||
|
Management Fee
|
0.50%
|
0.50%
|
0.40%
|
0.40%
|
|
Distribution (12b-1) Fees
|
0.25%
|
None
|
0.25%
|
None
|
|
Other Expenses
|
||||
|
Shareholder Servicing Fee
|
0.25%
|
None
|
0.25%
|
None
|
|
Other Fund Expenses+
|
0.10%
|
0.10%
|
0.09%
|
0.14%
|
|
Total Other Expenses
|
0.35%
|
0.10%
|
0.34%
|
0.14%
|
|
Total Annual Fund Operating Expenses
|
1.10%
|
0.60%
|
0.99%
|
0.54%
|
|
Fee Waiver and/or Expense Reimbursement*
|
(0.25%)
|
(0.00%)
|
(0.00%)
|
(0.00%)
|
|
Total Annual Fund Operating Expenses After Fee Waiver
and/or Expense Reimbursement
|
0.85%
|
0.60%
|
0.99%
|
0.54%
|
|
+
|
The increase in Pro Forma Other Expenses is attributable to a re-allocation methodology of certain trust level expenses effective with the Funds' fiscal year beginning on October 1, 2013.
|
-9-
The examples set forth below are intended to help you compare the cost of investing in the Full Maturity Fund, in the Intermediate Fund, and on a pro forma basis in the Intermediate Fund after giving effect to the Reorganization, and also to help you compare these costs with the cost of investing in other mutual funds. The examples assume that you invest $10,000 in the relevant Fund for the time periods indicated and then redeem all of your shares at the end of those periods. The examples also assume that your investment has a 5% return each year, that all dividends and other distributions are reinvested and that total operating expenses for the Fund are those shown in the tables above. Although your actual costs may be higher or lower, based on these assumptions, your costs would be:
|
Institutional Class
|
1 Year
|
3 Years
|
5 Years
|
10 Years
|
|
Full Maturity Fund:
|
$61
|
$192
|
$335
|
$750
|
|
Intermediate Fund:
|
$55
|
$173
|
$302
|
$677
|
|
Pro Forma Combined Intermediate Fund:
|
$55
|
$173
|
$302
|
$677
|
|
Class N
|
1 Year
|
3 Years
|
5 Years
|
10 Years
|
|
Full Maturity Fund:
|
$87
|
$274
|
$582
|
$1,318
|
|
Intermediate Fund:
|
$101
|
$315
|
$547
|
$1,213
|
Comparison of Performance Information
The following past performance information for each Fund is set forth below: (1) a bar chart showing changes in the Fund's performance for Institutional Class Shares from year to year for the last ten calendar years, and (2) a table detailing how the average annual total returns of the Fund, both before and after taxes, compared to those of broad-based market indices. The after-tax returns are shown for Institutional Class Shares only and are calculated using the historical highest individual federal marginal income tax rates and do not reflect the impact of state or local taxes. Actual after-tax returns depend on an investor’s tax situation and may differ from those shown. The performance of Institutional Class shares does not reflect Class N shares’ Rule 12b-1 fees and expenses. After-tax returns for Class N shares will vary from the after-tax returns shown above for Institutional Class shares. The after-tax returns shown are not relevant to investors who hold their Fund shares through tax-deferred arrangements, such as 401(k) plans or individual retirement accounts.
The bar chart and the performance table that follow illustrate some of the risks and volatility of an investment in the Fund by showing changes in the Fund’s performance from year to year and by showing the Fund’s average annual total returns for 1, 5 and 10 years and since inception. Of course, the Fund’s past performance (before and after taxes) does not necessarily indicate how the Fund will perform in the future. Call (888) 889-0799 or visit www.citynationalrochdalefunds.com to obtain updated performance information.
-10-
This bar chart shows the performance of the Full Maturity Fund’s Institutional Class shares based on a calendar year1.
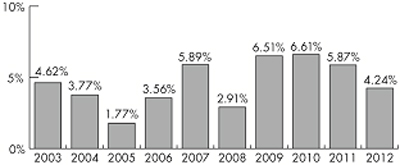 |
Best Quarter
4.14%
Q3 2009
|
Worst Quarter
(2.43)%
Q2 2004
|
This table shows the average annual total returns of each class of the Full Maturity Fund for the periods ended December 31, 2012. The table also shows how the Fund’s performance compares with the returns of an index comprised of companies similar to those held by the Fund.
Average Annual Total Returns* as of December 31, 2012
|
One Year
|
Five Years
|
Ten Years
|
|
|
Institutional Class
|
|||
|
Return Before Taxes
|
4.24%
|
5.22%
|
4.56%
|
|
Return After Taxes on Distributions
|
2.98%
|
3.85%
|
3.08%
|
|
Return After Taxes on Distributions and Distributions of Fund Shares
|
3.05%
|
3.72%
|
3.06%
|
|
Class N
|
|||
|
Return Before Taxes
|
4.08%
|
4.96%
|
4.34%
|
|
Barclays U.S. Intermediate Government/Credit Bond Index (Reflects no deduction for fees, expenses or taxes)
|
3.89%
|
5.18%
|
4.62%
|
|
Barclays U.S. Aggregate Bond Index (Reflects no deduction for fees, expenses or taxes)
|
4.21%
|
5.95%
|
5.18%
|
|
*
|
On September 30, 2005, the predecessor fund to the Full Maturity Fund (the "Predecessor Fund") reorganized into the Full Maturity Fund. The performance results for Institutional Class shares of the Full Maturity Fund before September 30, 2005, reflect the performance of the Predecessor Fund’s Class I shares. The performance results for Class N shares of the Full Maturity Fund before September 30, 2005 reflect the performance of the Predecessor Fund's Class A
|
|
1
|
The Full Maturity Fund’s total return from January 1, 2013 to September 30, 2013 was (1.89%).
|
-11-
This bar chart shows the performance of the Intermediate Fund’s Class N shares based on a calendar year2.
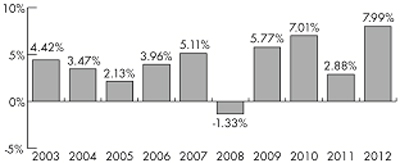 |
Highest
3.60%
9/30/2009
|
Lowest
(4.07%)
9/30/2008
|
This table shows the average annual total returns of the Class N shares of the Intermediate Fund for the periods ended December 31, 2012. The table also shows how the Intermediate Fund’s performance compares with the returns of an index comprised of companies similar to those held by the Intermediate Fund.
Average Annual Total Returns3 as of December 31, 2012
|
One Year
|
Five Years
|
Ten Years
|
|
|
Predecessor Fund
|
|||
|
Return Before Taxes
|
7.99%
|
4.41%
|
4.11%
|
|
Return After Taxes on Distributions
|
6.72%
|
3.02%
|
2.57%
|
|
Return After Taxes on Distributions and Distributions of Fund Shares
|
5.24%
|
2.96%
|
2.61%
|
|
Barclays U.S. Intermediate Government/Credit Bond Index (Reflects no deduction for fees, expenses or taxes)
|
3.89%
|
5.18%
|
4.62%
|
|
3
|
The Intermediate Fund commenced operations on March 29, 2013 and offered shares for public sale on April 1, 2013, after the reorganization of the Rochdale Intermediate Fund Fixed Income Portfolio into the Intermediate Fund.
|
-12-
The Adviser
CNR is the investment adviser to each Fund. CNR is located at 570 Lexington Avenue, New York, New York, 10022-6837. As of June 30, 2013, CNR managed assets of approximately $20 billion for individual and institutional investors.
CNR is a wholly owned subsidiary of City National, a federally chartered commercial bank founded in the early 1950s, with approximately $27.4 billion in assets under management as of June 30, 2013. City National is itself a wholly owned subsidiary of City National Corporation, a New York Stock Exchange listed company. City National has provided trust and fiduciary services, including investment management services, to individuals and businesses for over 50 years. City National currently provides investment management services to individuals, pension and profit sharing plans, endowments and foundations. As of June 30, 2013, City National and its affiliates had approximately $59.1 billion in assets under management or administration.
Subject to the oversight of the Trust’s Board of Trustees, CNR has complete discretion as to the purchase and sale of investments for the Full Maturity Fund and the Intermediate Fund, consistent with each Fund’s investment objective, policies and restrictions.
Portfolio Managers
The following individuals are primarily responsible for the day to day management of the Funds.
Full Maturity Fund
Daniel A. Tranchita and Gary A. Elfe are primarily responsible for the day-to-day management of the portion of the Full Maturity Fund’s assets managed by Baird Advisors and have served as portfolio managers for the Full Maturity Fund (including its predecessor entities, as applicable) since 2000. Mr. Tranchita received his undergraduate degree and his MBA from Marquette University and the Chartered Financial Analyst designation in 1993. Mr. Elfe received his MBA and his undergraduate degree from the University of Wisconsin-Madison.
Justin C. Waggoner is primarily responsible for the day-to-day management of the portion of the Full Maturity Fund’s assets managed by Boyd Watterson Asset Management, LLC and has served as portfolio manager for the Full Maturity Fund since 2007. Mr. Waggoner holds an MBA from Case Western Reserve University and a BS from Ohio State University.
Intermediate Fund
William C. Miller, Jr. and Paul C. Single have served as portfolio managers for the Intermediate Fund since April 2013. William C. Miller is Senior Vice President and Director – Fixed Income Investments of City National Rochdale and Paul C. Single is Senior Vice President and Director – Fixed Income Investments of City National Rochdale.
The fundamental and non-fundamental limitations of each Fund are subject are set forth in the following table. The fundamental limitations may only be amended with shareholder approval.
-13-
Comparison of Investment Restrictions
|
Full Maturity Fund
|
Intermediate Fund
|
|
| Fundamental Limitations | Fundamental Limitations | |
| The Full Maturity Fund may not issue senior securities as defined in the 1940 Act or borrow money, except that the Full Maturity Fund may borrow from banks for temporary or emergency purposes (but not for investment) in an amount up to 10% of the value of its total assets (including the amount borrowed) less liabilities (not including the amount borrowed) at the time the borrowing was made. While any such borrowings exist for the Full Maturity Fund, it will not purchase securities. (However, the Full Maturity Fund which is authorized to do so by its investment policies may lend securities, enter into repurchase agreements without limit and reverse repurchase agreements in an amount not exceeding 10% of its total assets, purchase securities on a when-issued or delayed delivery basis and enter into forward foreign currency contracts.) |
The Intermediate Fund may not borrow money, except as permitted by the 1940 Act and the rules and regulations promulgated thereunder, as each may be amended from time to time except to the extent that the Intermediate Fund may be permitted to do so by exemptive order, SEC release, no-action letter or similar relief or interpretations; or (b) mortgage, pledge or hypothecate any of its assets except in connection with any such borrowings described in (a). The Intermediate Fund may not issue senior securities, as defined in the 1940 Act except as permitted by rule, regulation or order of the SEC.
|
|
| The Full Maturity Fund may not purchase a security, other than government securities, if as a result of such purchase more than 5% of the value of the Full Maturity Fund’s assets would be invested in the securities of any one issuer, or the Full Maturity Fund would own more than 10% of the voting securities, or of any class of securities, of any one issuer, except that all of the investable assets of the Full Maturity Fund may be invested in another registered investment company having the same investment objective and substantially the same investment policies as the Full Maturity Fund. For purposes of this restriction, all outstanding indebtedness of an issuer is deemed to be a single class. | The Intermediate Fund may not purchase securities on margin, participate on a joint or joint and several basis in any securities trading account, or underwrite securities, except that this restriction does not preclude the Intermediate Fund from obtaining such short term credit as may be necessary for the clearance of purchases and sales of its portfolio securities. | |
|
The Full Maturity Fund may not purchase a security, other than government securities, if as a result of such purchase 25% or more of the value of the Full Maturity Fund’s total assets would be invested in the securities of issuers in any one industry or group of industries, except that all of the investable assets of the Full Maturity Fund may be invested in another registered investment company having the same investment objective and substantially the same investment policies as the Full Maturity Fund.
|
The Intermediate Fund may not act as an underwriter of securities of other issuers except as it may be deemed an underwriter in selling a portfolio security.
|
-14-
| The Full Maturity Fund may not purchase the securities (other than government securities) of an issuer having a record, together with predecessors, of less than three years’ continuous operations, if as a result of such purchase more than 5% of the value of the Full Maturity Fund’s total assets would be invested in such securities, except that this shall not prohibit the Full Maturity Fund from investing all of its investable assets in another registered investment company having the same investment objective and substantially the same investment policies as the Full Maturity Fund. | With respect to 75% of its total assets, the Intermediate Fund may not invest more than 5% of its total assets in securities of a single issuer or hold more than 10% of the voting securities of such issuer, except that this restriction does not apply to investment in the securities of the U.S. Government, its agencies or instrumentalities. | |
| The Full Maturity Fund may not make short sales of securities or purchase securities on margin, except for such short-term loans as are necessary for the clearance of purchases of securities. | The Intermediate Fund does not have a corresponding fundamental Investment limitation. | |
| The Full Maturity Fund may not engage in the underwriting of securities except insofar as the Full Maturity Fund may be deemed an underwriter under the 1933 Act in disposing of a security and except that all of the investable assets of the Full Maturity Fund may be invested in another registered investment company having the same investment objective and substantially the same investment policies as the Full Maturity Fund. | The Intermediate Fund does not have a corresponding fundamental Investment limitation. | |
|
The Full Maturity Fund may not purchase or sell real estate or interests therein, or purchase oil, gas or other mineral leases, rights or royalty contracts or development programs, except that the Full Maturity Fund may invest in the securities of issuers engaged in the foregoing activities and may invest in securities secured by real estate or interests therein.
|
The Intermediate Fund may not purchase or sell real estate, or commodities or commodity contracts, except that the Intermediate Fund may purchase or sell currencies (including forward currency exchange contracts), futures contracts, and related options and securities which are secured by real estate and securities of companies which invest or deal in real estate, such as real estate investment trusts (REITs).
|
|
| The Full Maturity Fund may not make loans of money or securities, except through the purchase of permitted investments (including repurchase and reverse repurchase agreements) and through the loan of securities (in an amount not exceeding one-third of total assets) by the Full Maturity Fund. | The Intermediate Fund may not make loans to others, except (a) through the purchase of debt securities in accordance with its investment objectives and policies, (b) through the lending of portfolio securities, or (c) to the extent the entry into a repurchase agreement is deemed to be a loan. |
-15-
| The Full Maturity Fund may not purchase or sell commodities or commodity contracts, except that the Full Maturity Fund may purchase and sell financial futures contracts and options on such contracts and may enter into forward foreign currency contracts and engage in the purchase and sale of foreign currency options and futures. | The Intermediate Fund does not have a corresponding fundamental Investment limitation. | |
| The Full Maturity Fund may not invest more than 5% of the value of the Full Maturity Fund’s total assets in warrants, including not more than 2% of such assets in warrants not listed on a U.S. stock exchange. (Rights and warrants attached to, received in exchange for, or as a distribution on, other securities are not subject to this restriction.) | The Intermediate Fund may not invest 25% or more of its net assets in the securities of companies engaged in any particular industry or particular group of industries (except securities issued or guaranteed by the United States Government, its agencies or instrumentalities). | |
| The Full Maturity Fund may not pledge, hypothecate, mortgage or otherwise encumber its assets, except as necessary to secure permitted borrowings. (Collateral arrangements and initial margin with respect to permitted options on securities, financial futures contracts and related options, and arrangements incident to other permitted practices, are not deemed to be subject to this restriction.) | The Intermediate Fund does not have a corresponding fundamental Investment limitation. | |
| The foregoing percentages (other than the limitation on borrowing) will apply at the time of the purchase of a security and will not be considered violated unless an excess or deficiency occurs immediately after or as a result of a purchase of such security. Except as otherwise indicated, these investment limitations and the goal of each Fund as set forth in the Prospectus are fundamental policies of the Full Maturity Funds and may not be changed without shareholder approval. Although the Full Maturity Fundamental Policies permit the Full Maturity Funds to enter into reverse repurchase agreements, the Full Maturity Funds do not currently intend to do so. Up to one-third of the Full Maturity Fund’s assets may be pledged to secure permitted borrowings by the Full Maturity Fund. | The foregoing percentages (other than the limitation on borrowing) will apply at the time of the purchase of a security and shall not be considered violated unless an excess or deficiency occurs immediately after or as a result of a purchase of such security. Up to one-third of the Intermediate Fund’s total assets may be pledged to secure permitted borrowings by the Intermediate Fund. | |
|
The Full Maturity Fund does not have a corresponding fundamental Investment limitation.
|
The Intermediate Fund may not invest in any issuer for purposes of exercising control or management.
|
-16-
|
Non-Fundamental Limitations
|
Non-Fundamental Limitations
|
|
| The following policies of the Full Maturity Fund, the Full Maturity Fund, the Diversified Equity Fund and the Socially Responsible Equity Fund are non-fundamental and may be changed by the Board without a vote of Fund shareholders. | The following policies of the Intermediate Fund are non-fundamental and may be changed by the Board without a vote of shareholders. | |
| The Full Maturity Fund may not purchase or hold securities that are illiquid or are otherwise not readily marketable (i.e., securities that cannot be disposed of for their approximate carrying value in seven days or less, which term includes repurchase agreements and time deposits maturing in more than seven days) if, in the aggregate, more than 10% of its net assets would be invested in illiquid securities. (As a matter of non-fundamental policy, repurchase agreements maturing in more than seven days, certain time deposits and over-the-counter options are considered to be illiquid.) | The Intermediate Fund may not invest, in the aggregate, more than 15% of its net assets in securities with legal or contractual restrictions on resale, securities which are not readily marketable, and repurchase agreements with more than seven days to maturity. | |
| The Full Maturity Fund may not invest for the pupose of exercising control or management of another company except that all the investable assets of the Full Maturity Fund may be invested in another registered investment company having the same investment objective and substantially the same investment policies as the Full Maturity Fund. | The Intermediate Fund does not have a corresponding non-fundamental limitation. | |
| The Full Maturity Fund may not invest, under normal circumstances, less than 80% of the value of its net assets (plus borrowings for investment purposes) in a particular type of investment that is suggested by the Full Maturity Fund’s name. A Fund will notify its shareholders at least 60 days prior to any change in such policy. | The Intermediate Fund may not make any change in the Intermediate Fund’s investment policies of investing at least 80% of its net assets in the investments suggested by the Intermediate Fund’s name without first providing the Intermediate Fund’s shareholders with at least 60 days’ prior notice. | |
|
The Full Maturity Fund may not purchase the stock or bonds of companies identified by the tobacco service of the RiskMetrics Group Social Issues Services. This service identifies those companies engaged in growing, processing or otherwise handling tobacco. If the Full Maturity Fund holds any such securities of an issuer which is subsequently identified by RiskMetrics as engaged in such activities, the securities will be sold within a reasonable time period, consistent with prudent investment practice.
|
The Intermediate Fund does not have a corresponding non-fundamental limitation.
|
-17-
| The Full Maturity Fund may not borrow money in an amount exceeding 10% of its total assets. A Fund will not borrow money for leverage purposes. For the purpose of this investment restriction, the use of options and futures transactions and the purchase of securities on a when-issued or delayed delivery basis shall not be deemed the borrowing of money. A Fund will not make additional investments while its borrowings exceed 5% of total assets. | The Intermediate Fund does not have a corresponding non-fundamental limitation. | |
|
Each of the foregoing percentage limitations (except with respect to the limitations on borrowing and investing in illiquid and not readily marketable securities) applies at the time of purchase. If, subsequent to the Full Maturity Fund’s purchase of an illiquid security, more than 10% of the Full Maturity Fund’s net assets are invested in illiquid securities because of changes in valuations, the Full Maturity Fund will, within a reasonable time, dispose of a portion of such securities so that the limit will not be exceeded.
|
Each of the foregoing percentage limitations (except with respect to the limitation on investing in illiquid and not readily marketable securities) applies at the time of purchase. If, subsequent to the Intermediate Fund’s purchase of an illiquid security, more than 15% of the Intermediate Fund’s net assets are invested in illiquid securities because of changes in valuations, the Intermediate Fund will, within a reasonable time, dispose of a portion of such holding so that the above set-forth limit will not be exceeded.
|
-18-
PROPOSED REORGANIZATION
The Board of Trustees of the Trust has approved a plan to reorganize the Full Maturity Fund into the Intermediate Fund. To proceed, we need the approval of the shareholders of the Full Maturity Fund. The following pages outline the important details of the proposed Reorganization.
Why Do We Want to Reorganize the Funds?
CNR proposed the Reorganization to the Board, and the Board is recommending the Reorganization to you, because, among other reasons, CNR does not expect significant future in-flows to the Full Maturity Fund and anticipates the assets of the Full Maturity Fund may decrease significantly in the future. After considering the viability of the Full Maturity Fund in light of its current size and the limited prospects for future asset growth, CNR and the Board believe that maintaining the status quo would not be in the shareholders’ best interests. The performance track record of the Full Maturity Fixed Income Fund was slightly better than the performance track record of the Intermediate Fixed Income Fund for the five- and ten-year periods ended June 30, 2013. However, the performance track record of the Intermediate Fixed Income Fund was better than the performance track record of the Full Maturity Fixed Income Fund for the one- and three-year and calendar year to date periods ended June 30, 2013. Because the investment advisory fee with respect to the Intermediate Fund (0.40% of average net assets) is less than its fee with respect to the Full Maturity Fund (0.50% of average net assets), and because certain operating expenses of the Intermediate Fund are shared across a larger pool of assets, CNR and the Board anticipate that if the Reorganization is approved, shareholders of the Full Maturity Fund will bear lower expense ratios as shareholders of the Intermediate Fund than they did as shareholders of the Full Maturity Fund. Further, CNR has voluntarily agreed to limit its fees or reimburse the Intermediate Fund for expenses to the extent necessary to keep the Institutional Class total annual fund operating expenses at or below 0.51%, which is lower than CNR’s expense limits of 0.68% and 0.93% for the Class N and Institutional Class shares of the Full Maturity Fund.
The Reorganization is not expected to result in the recognition of gain or loss by the Funds or their shareholders, and the receipt by the Funds of an opinion of counsel substantially to this effect is a condition the closing of the Reorganization.
Based upon their evaluation of the relevant information presented to them, and in light of their fiduciary duties under federal and state law, the Board has determined that the Reorganization is in the best interests of shareholders of the Full Maturity Fund and the Intermediate Fund. In approving the Reorganization, the Board considered the terms and conditions of a proposed Agreement and Plan of Reorganization between the Trust on behalf of the Full Maturity Fund and the Trust on behalf of the Intermediate Fund (the “Reorganization Agreement”) and the following factors, among others:
(1) The assets of the Full Maturity Fund are small ($44.7 million as of June 30, 2013) and its prospects for further growth are not good. CNR expects that after the consummation of the Reorganization, the combined Intermediate Fund will be better positioned for growth than the Full Maturity Fund is on its own.
(2) CNR expects that the total operating expenses of the Full Maturity Fund (as a percentage of the Fund’s average net assets) will increase as fixed costs are spread over a shrinking asset base. Because the investment advisory fee charged by CNR to the Intermediate Fund is less than CNR’s fee with respect to the Full Maturity Fund, and because certain operating expenses will be shared across a larger pool of assets, CNR expects that as a result of the Reorganization shareholders of the Full Maturity Fund will bear lower expense ratios as shareholders of the Intermediate Fund.
-19-
(3) The investment objectives, policies and strategies of the Intermediate Fund are similar to those of the Full Maturity Fund, and, accordingly, the reorganization will provide shareholders of the Full Maturity Fund with the continued opportunity to utilize the services of CNR as manager of their equity portfolios.
(4) The interests of the Funds’ shareholders will not be diluted as a result of the Reorganization. The assets and liabilities of the Full Maturity Fund will be transferred to the Intermediate Fund in exchange for shares of beneficial interest of the Intermediate Fund having a total value equal to the value of the assets the Full Maturity Fund transferred to the Intermediate Fund (net of any liabilities). However, all known liabilities of the Full Maturity Fund will be paid before the closing of the Reorganization, and it is therefore anticipated that no liabilities of the Full Maturity Fund will be transferred to the Intermediate Fund. The exchange will take place at net asset value and there will be no sales charge or other charge imposed as a result of the Reorganization. The Full Maturity Fund and the Intermediate Fund are subject to the same pricing and valuation procedures.
(5) No adverse federal income tax consequences are expected to result from the Reorganization, as the Reorganization is expected to qualify as a “reorganization” for federal income tax purposes.
(6) Intermediate Fund and Full Maturity Fund are managed by the same investment adviser, CNR. Furthermore, the other services and privileges available to the shareholders of the Intermediate Fund will be the same as those available to Full Maturity Fund shareholders.
(7) CNR will bear the costs of the Reorganization other than transaction costs associated with any sale of the Full Maturity Fund’s investment portfolio, including legal, accounting and transfer agent costs.
After consideration of the factors mentioned above and other relevant information, at a meeting held on September 17, 2013 the Board determined that the Reorganization is in the best interests of the Funds and their shareholders, and that the interests of the Full Maturity Fund’s shareholders will not be diluted as a result of the Reorganization, and unanimously approved the Reorganization Agreement and directed that it be submitted to shareholders for approval. The Board unanimously recommends that shareholders vote “FOR” approval of the Reorganization.
How Will We Accomplish the Reorganization?
The Reorganization Agreement, a copy of which is attached to this Prospectus/Proxy Statement as Exhibit A, spells out the terms and conditions of the Reorganization. If the shareholders of the Full Maturity Fund approve the Reorganization, the Reorganization essentially will involve the following steps, which will occur substantially simultaneously:
-20-
|
|
·
|
First, the Full Maturity Fund will transfer all of its assets and liabilities to the Intermediate Fund.
|
|
|
·
|
Second, in exchange for the assets transferred to the Intermediate Fund, the Full Maturity Fund will receive shares of beneficial interest of the Intermediate Fund having a total value equal to the value of the assets the Full Maturity Fund transferred to the Intermediate Fund (net of any liabilities).
|
|
|
·
|
Third, the Full Maturity Fund will distribute the shares of the Intermediate Fund which it receives to its shareholders and the Full Maturity Fund will dissolve.
|
|
|
·
|
Fourth, the Intermediate Fund will open an account for each shareholder of the Full Maturity Fund and will credit the shareholder with shares of the Intermediate Fund of the same class and having the same total value as the Full Maturity Fund shares that he or she owned on the date of the Reorganization. Share certificates will not be issued.
|
In essence, shareholders of the Full Maturity Fund who vote their shares in favor of the Reorganization are electing to exchange their shares of the Full Maturity Fund at net asset value for shares of the Intermediate Fund in a transaction that is not expected to result in a taxable gain or loss for federal income tax purposes.
Pursuant to the Reorganization Agreement, the number of Intermediate Fund shares to be issued to the Full Maturity Fund will be computed as of 4:00 PM Eastern time on the date preceding the closing date of the Reorganization in accordance with the regular practice of the Funds. The effectiveness of the Reorganization is contingent upon, among other things, obtaining approval of the shareholders of the Full Maturity Fund.
CNR will bear the costs of the proposed Reorganization, including legal, accounting and transfer agent costs. These costs will not be borne by the shareholders of either Fund.
If the Reorganization is approved by the Full Maturity Fund’s shareholders, it will take place as soon as feasible. Management of the Trust believes this should be accomplished by late in the fourth quarter of 2013 or the first quarter of 2014. However, at any time before the closing the Board may decide not to proceed with the Reorganization if, in the judgment of the Board, termination of the Reorganization would not have a material adverse effect on the shareholders of the Full Maturity Fund or the Intermediate Fund. At any time prior to or after approval of the Reorganization by the Full Maturity Fund’s shareholders, with Board approval, the President of the Trust may by written agreement amend any provision of the Reorganization Agreement, including substantive as well as ministerial changes, without the approval of shareholders, so long as such approval is not required by law and any such amendment will not have a material adverse effect on the benefits intended under the Reorganization Agreement to the shareholders of the Full Maturity Fund or the Intermediate Fund. Similarly, any of the terms or conditions of the Reorganization Agreement may be waived by the Board if, in its judgment such action or waiver will not have a material adverse effect on the benefits intended under the Reorganization Agreement to the shareholders of the Full Maturity Fund or the Intermediate Fund. In approving any such amendment, granting any such waiver or terminating the Reorganization, the Board will be subject to its fiduciary duties to, and will consider the best interests of, the Funds’ shareholders.
-21-
Are There Other Material Differences Between the Full Maturity Fund and the Intermediate Fund?
The differences in the investment objectives, principal strategies, principal risks and investment limitations of the Full Maturity Fund and the Intermediate Fund are as described above. As each Fund is a series of the Trust, there are no material differences between the rights of their respective shareholders. Baird Advisors and Boyd Watterson Asset Management, LLC currently serve as sub advisers of the Full Maturity Fund, but do not and will not serve as sub adviser of the Intermediate Fund. None of the Funds’ other service providers, including CNR as investment adviser, will change in connection with the Reorganization.
Federal Income Tax Consequences of the Reorganization
As a condition to the closing of the Reorganization, the Trust must receive an opinion of Bingham McCutchen LLP, counsel to the Trust, that the reorganization will constitute a “reorganization” within the meaning of Section 368 of the Internal Revenue Code of 1986, as amended (the “Code”), with each of the Full Maturity Fund and the Intermediate Fund being a “party to a reorganization” within the meaning of Section 368 of the Code. As a result:
• No gain or loss will be recognized by Full Maturity Fund on the transfer of the all of its assets to Intermediate Fund solely in exchange for shares of Intermediate Fund and the assumption by Intermediate Fund of all of the liabilities of Full Maturity Fund, or upon the distribution of the shares of Intermediate Fund to the shareholders of Full Maturity Fund, except for (i) gain or loss that may be recognized on the transfer of “section 1256 contracts” as defined in Section 1256(b) of the Code, (ii) gain that may be recognized on the transfer of stock in a “passive foreign investment company” as defined in Section 1297(a) of the Code, or (iii) any other gain that may be required to be recognized as a result of the closing of Full Maturity Fund’s taxable year or upon the transfer of an asset regardless of whether such transfer would otherwise be a non-recognition transaction under the Code;
• The tax basis in the hands of Intermediate Fund of each asset of Full Maturity Fund will be the same as the tax basis of such asset in the hands of Full Maturity Fund immediately prior to the transfer thereof, increased by the amount of gain (or decreased by the amount of loss), if any, recognized by Full Maturity Fund on the transfer;
• The holding period of each asset of Full Maturity Fund in the hands of Intermediate Fund, other than assets with respect to which gain or loss is required to be recognized, will include in each instance the period during which such asset was held by Full Maturity Fund;
• No gain or loss will be recognized by Intermediate Fund upon its receipt of the assets of Full Maturity Fund solely in exchange for shares of Intermediate Fund and the assumption of all the liabilities of Full Maturity Fund;
• No gain or loss will be recognized by the Full Maturity Fund shareholders upon the exchange of all of their Full Maturity Fund shares for Intermediate Fund shares as part of the Reorganization;
-22-
• The aggregate tax basis of the Intermediate Fund shares that each Full Maturity Fund shareholder receives in the Reorganization will be the same as the aggregate tax basis of the Full Maturity Fund shares exchanged therefor; and
• Each Full Maturity Fund shareholder’s holding period for the Intermediate Fund shares received in the Reorganization will include the period for which such shareholder held the Full Maturity Fund shares exchanged therefor, provided that the Full Maturity Fund shareholder held such Full Maturity Fund shares as capital assets on the date of exchange.
The Trust has not sought, and will not seek, a private ruling from the IRS with respect to the federal income tax consequences of the Reorganization. The opinion of counsel with respect to certain federal income tax consequences of the Reorganization is not binding on the IRS and does not preclude the IRS from adopting a contrary position. Shareholders should consult their own tax advisers concerning the potential tax consequences of the reorganization to them, including any applicable foreign, state or local income tax consequences.
Federal income tax law permits a regulated investment company to carry forward net capital losses that arose in tax years that began on or before December 22, 2010 (“Pre-2011 Losses”) for a period of up to eight taxable years. Net capital losses that arise in tax years beginning after December 22, 2010 (“Post-2010 Losses”) may generally be carried forward without limit, and such carryforwards must be fully utilized before the regulated investment company is permitted to utilize carryforwards of Pre-2011 Losses. As of September 30, 2012 or December 31, 2012, as applicable, the Funds have net capital loss carryforwards from their prior taxable years, as follows:
|
Fund
|
Capital Loss Carryforward
|
|
Intermediate Fund
|
$2,432
|
|
Full Maturity Fund
|
$0
|
The Funds’ Pre-2011 Losses and their expiration dates are as follows:
|
Fund
|
2016
(000)
|
2017
(000)
|
|
Intermediate Fund
|
$192
|
$2,240
|
|
Full Maturity Fund
|
$ -
|
$ -
|
The Funds’ Post-2010 Losses are as follows:
|
Fund
|
Post-2010 Losses
|
|
Intermediate Fund
|
$0
|
|
Full Maturity Fund
|
$0
|
-23-
The Reorganization is not expected to affect the combined Fund’s ability to use capital loss carryforwards. The ability of the combined Fund to use capital losses to offset gains (even in the absence of the Reorganization) also depends on factors other than loss limitations, such as the future realization of capital gains or losses.
How Will the Capitalization of the New Fund Compare with the Corresponding Existing Funds?
[The disclosure and table below will be updated to reflect capitalization information as of October 4, 2013 prior to the Prospectus/Proxy Statement being mailed to shareholders.]
The following table sets forth as of August 31, 2013: (i) the capitalization of each Fund and (ii) the pro forma capitalization of the Intermediate Fund, as adjusted to give effect to the Reorganization.
|
Full Maturity Fund
|
Class N
Shares
|
Institutional
Class Shares
|
Total of All
Class Shares
|
|
Aggregate Net Assets
|
$250,553
|
$44,282,461
|
$44,533,014
|
|
Shares Outstanding
|
24,227
|
4,277,790
|
4,302,017
|
|
Net Asset Value Per Share
|
$10.34
|
$10.35
|
$10.35
|
|
Intermediate Fund
|
Class N
Shares
|
Institutional
Class Shares
|
Total of All
Class Shares
|
|
Aggregate Net Assets
|
$154,411,889
|
$0
|
$154,411,889
|
|
Shares Outstanding
|
5,941,638
|
0
|
5,941,638
|
|
Net Asset Value Per Share
|
$25.99
|
$0
|
$25.99
|
|
Combined Pro forma
Intermediate Fund
|
Class N
Shares
|
Institutional
Class Shares
|
Total of All
Class Shares
|
|
Aggregate Net Assets
|
$154,411,889
|
$44,533,014
|
$198,944,903
|
|
Shares Outstanding
|
5,941,638
|
1,713,467
|
7,655,105
|
|
Net Asset Value Per Share
|
$25.99
|
$25.99
|
$25.99
|
Description of the Securities to be Issued
The Trust is registered with the SEC as an open-end management investment company and its Trustees are authorized to issue an unlimited number of shares of beneficial interest in each separate series, including the Intermediate Fund. Shares of each series of the Trust represent equal proportionate interests in the assets of that series only and have identical voting, dividend, redemption, liquidation, and other rights. All shares issued are fully paid and non-assessable, and shareholders have no preemptive or other rights to subscribe to any additional shares.
-24-
VOTING AND MEETING PROCEDURES
How to Vote
This proxy is being solicited by the Board of Trustees of the Trust. You can vote by mail or in person at the Meeting.
To vote by mail, sign and send us the enclosed Proxy voting card in the postage paid return envelope provided. If you vote by Proxy, you can revoke your Proxy by notifying the Secretary of the Trust in writing, or by returning a Proxy with a later date. You also can revoke a Proxy by voting in person at the Meeting. Even if you plan to attend the Meeting and vote in person, please return the enclosed Proxy card. This will help us ensure that an adequate number of shares are present at the Meeting.
THE BOARD OF TRUSTEES OF THE TRUST RECOMMENDS THAT YOU VOTE “FOR” THE PROPOSED REORGANIZATION.
Proxy Solicitation
In addition to the solicitation of proxies by mail, officers and employees of the Trust and CNR, without additional compensation, may solicit proxies in person or by telephone. CNR will reimburse banks, brokerage houses and other custodians, nominees and fiduciaries for the costs of forwarding soliciting materials to beneficial owners of shares entitled to vote at the Meeting.
Quorum Requirements
The presence in person or by proxy of one third of the outstanding shares of the Full Maturity Fund entitled to vote will constitute a quorum for the Meeting. If a quorum is not present, sufficient votes are not received by the date of the Meeting, or the holders of shares present in person or by proxy determine to adjourn the Meeting for any other reason, a person named as proxy may propose one or more adjournments from time to time to permit further solicitation of proxies. The Fund will count all shares represented by proxies that reflect abstentions and “broker non-votes” (i.e., shares held by brokers or nominees as to which instructions have not been received from the beneficial owners or the person entitled to vote, and the broker or nominee does not have discretionary voting power on the matter) as shares that are present and entitled to vote for purposes of determining a quorum. A majority of shares represented at the meeting can adjourn the meeting. The persons named as proxies will vote “FOR” adjournment with respect to a proposal those proxies which they are entitled to vote in favor of the proposal, and will vote those proxies they are required to vote against the proposal “AGAINST” such an adjournment. Abstentions and “broker non-votes” will have no effect on the outcome of a vote on adjournment.
Vote Required
Approval of the Reorganization requires the affirmative vote of the lesser of (i) 67% or more of the Full Maturity Fund shares present or represented at the meeting, if shareholders of more than 50% of all shares of the Full Maturity Fund are present or represented by proxy, or (ii) more than 50% of all shares of the Full Maturity Fund.
-25-
The Fund will count the number of votes cast “for” approval of the Reorganization to determine whether sufficient affirmative votes have been cast. Assuming the presence of a quorum, abstentions and broker non-votes have the effect of negative votes.
If the shareholders of the Full Maturity Fund do not approve the Reorganization or the Reorganization is not completed for any other reason, the Full Maturity Fund will continue its current form of operation until the Board determines what further action, if any, to recommend to the shareholders of the Fund.
Shareholders Entitled to Vote
Shareholders of the Funds at the close of business on ______ __, 2013 will be entitled to be present and vote at the Meeting. Shareholders are entitled to one vote for each share held and fractional votes for fractional shares held. As of that date, XXX shares of the Full Maturity Fund (XXX Class N shares and XXX Institutional Class shares) were outstanding.
[The disclosure and table below will be updated to reflect information regarding shareholders owning greater than 5%/25% of either Fund as of October 4, 2013 prior to the Prospectus/Proxy Statement being mailed to shareholders.]
As of ________, 2013, National Financial Services LLC on behalf of [_______] may be deemed to control the Full Maturity Fund by virtue of owning XX% of the outstanding shares of the Fund. As of that date, NFS LLC FEBO on behalf of City National Bank (“CNB”), which is affiliated with CNR, owned of record XX% of the outstanding shares of the Intermediate Fund. CNB is a national banking association located at 400 North Roxbury Drive, Beverly Hills, California 90210 and is a wholly-owned subsidiary of City National Corporation. These control relationships will continue to exist until such time as each of the above-described share ownerships represents 25% or less of the outstanding shares of the respective Fund. Through the exercise of voting rights with respect to shares of the Fund, the controlling person set forth above may be able to determine the outcome of shareholder voting on matters for which approval of shareholders is required.
The following table shows, to the knowledge of management of the Trust, the percentage of the total shares of each class of the Full Maturity Fund and the Intermediate Fund owned of record at the close of business of _______, 2013 by persons owning of record more than 5% of the outstanding shares of the respective class. The table also shows each such shareholder’s estimated percentage ownership of the same class of the combined Intermediate Fund, as adjusted to give effect to the Reorganization, based on such shareholder’s present holdings.
|
Full Maturity Fund Shareholder
|
Class
|
Percentage of
Outstanding
Shares in Class
|
Percentage of
Outstanding
Shares in Class
of Combined Fund
|
-26-
|
Intermediate Fund Shareholder
|
Class
|
Percentage of
Outstanding
Shares in Class
|
Percentage of
Outstanding
Shares in Class
of Combined Fund
|
The Trustees and officers of the Trust as a group owned beneficially less than 1% of each of the Full Maturity Fund’s and the Intermediate Fund’s outstanding shares as of ______, 2013.
GENERAL INFORMATION
The persons named in the accompanying Proxy will vote in each case as directed in the Proxy, but in the event an executed Proxy without instructions is received by the Trust, they intend to vote FOR the proposed Reorganization and may vote in their discretion with respect to other matters that may be presented to the Meeting.
Litigation
Neither the Full Maturity Fund nor the Intermediate Fund is involved in any litigation or proceeding that management believes is likely to have any material adverse financial effect upon the ability of CNR to provide investment advisory services or any material adverse effect upon either the Full Maturity Fund or the Intermediate Fund.
Other Matters to Come Before the Meeting
Management of the Trust does not know of any matters to be presented at the Meeting other than those described in this Prospectus/Proxy Statement. If other business should properly come before the Meeting, the Proxy holders will vote on them in accordance with their best judgment.
Shareholder Proposals
The Meeting is a special meeting of shareholders of the Full Maturity Fund. The Trust is not required, nor does it intend, to hold regular annual meetings of the Fund’s shareholders. If such a meeting is called, any shareholder who wishes to submit a proposal for consideration at the meeting should submit the proposal promptly to the Secretary of the Trust. Any proposal to be considered for submission to shareholders must comply with applicable federal and state laws.
FINANCIAL HIGHLIGHTS AND FINANCIAL STATEMENTS
The audited annual financial statements and financial highlights of the Full Maturity Fund for the year ended September 30, 2012 and the Intermediate Fund for the year ended December 31, 2012 are incorporated by reference into the Statement of Additional Information to this Combined Prospectus and Proxy Statement. The audited annual financial statements and financial highlights of the Funds have been audited by independent registered public accountants: KPMG LLP, for the Full Maturity Fund and Tait, Weller & Baker LLP for the Intermediate Fund, to the extent indicated in their reports thereon, and have been incorporated by reference in reliance upon such reports given upon the authority of such firms as experts in accounting and auditing. The unaudited financial statements and financial highlights of the Full Maturity Fund and the Intermediate Fund for the period ended March 31, 2013 are also incorporated by reference. The Intermediate Fund’s semi-annual report for the period ended March 31, 2013 accompanies this Combined Prospectus and Proxy Statement.
-27-
INFORMATION FILED WITH THE
SECURITIES AND EXCHANGE COMMISSION
Additional information about the Full Maturity Fund and the Intermediate Fund are included in their Prospectuses and Statements of Additional Information dated January 28, 2013 and April 30, 2013, respectively, as supplemented, which are incorporated by reference herein. (Additional information is also set forth in the Statement of Additional Information dated _____, 2013 relating to this Prospectus/Proxy Statement, which is also incorporated herein). The Commission file numbers for the Trust’s registration statement containing the current Prospectuses and Statements of Additional Information for the Funds, as described above, are Registration No. 811-07923 and Registration No. 333-16093. Additional information about the Funds may also be obtained for the Full Maturity Fund from the Trust’s Annual Report for the fiscal year ended September 30, 2012 and for the Intermediate Fund from Rochdale Investment Trust’s Annual Report for the fiscal year ended December 31, 2012 with respect to its Rochdale Intermediate Fixed Income Fund Portfolio series, each of which has been filed with the SEC. Copies of the Prospectus, Statement of Additional Information, and Annual Report for the Funds may be obtained without charge by writing to the Funds at 400 North Roxbury Drive, Beverly Hills, California, 90210, by calling the Funds at 1-888-889-0799, or on the Funds’ website, www.citynationalrochdalefunds.com. The Funds are subject to certain informational requirements of the Securities Exchange Act of 1934 and the 1940 Act, and in accordance with such requirements file reports, proxy statements, and other information with the SEC. Once available, these materials may be inspected and copied:
• At the Public Reference Facilities maintained by the SEC at 100 F Street, N.E., Room 1580, Washington, D.C. 20549;
• At the SEC's Regional Offices at 233 Broadway, New York, New York, 10279, and 175 W. Jackson Boulevard, Suite 900, Chicago, Illinois 60604;
• By e-mail request to publicinfo@sec.gov (for a duplicating fee); and
• On the SEC’s EDGAR database on the SEC’s Internet Web site at http://www.sec.gov.
*****
SHAREHOLDERS ARE REQUESTED TO DATE AND SIGN THE ENCLOSED PROXY AND RETURN IT IN THE ENCLOSED ENVELOPE.
-28-
APPENDIX A
AGREEMENT AND PLAN OF REORGANIZATION
This Agreement and Plan of Reorganization (this “Agreement”) is made as of this [ ] day of September, by and among City National Rochdale Funds, a Delaware statutory trust (the “Trust”), on behalf of the City National Rochdale Intermediate Fixed Income Fund, a separate series thereof (the “Intermediate Fund”), the Trust, on behalf of the City National Rochdale Full Maturity Fixed Income Fund, a separate series thereof (the “Full Maturity Fund”) and, solely for purposes of Section 4.4, City National Rochdale, LLC (“CNR”).
WHEREAS, the parties wish to effect a reorganization (the “Reorganization”) which will consist of the transfer of all of the assets of the Full Maturity Fund to the Intermediate Fund in exchange for the assumption by the Intermediate Fund of all of the liabilities of the Full Maturity Fund and the issuance by the Intermediate Fund of the number of Institutional Class Shares of the Intermediate Fund (the “Shares”) described in Section 1.1, and the distribution of the Shares by the Full Maturity Fund to its shareholders in complete liquidation and dissolution of the Full Maturity Fund, all as more fully set forth in this Agreement.
WHEREAS, the Board of Trustees of the Trust, including a majority of the Trustees who are not “interested persons” of the Trust, as defined in the Investment Company Act of 1940, as amended (the “1940 Act”), has determined that the Reorganization is in the best interests of the shareholders of the Full Maturity Fund and the Intermediate Fund, respectively, and that their interests would not be diluted as a result of the transactions contemplated thereby.
WHEREAS, this Agreement is intended to constitute a plan of a “reorganization” as defined in Section 368(a) of the United States Internal Revenue Code of 1986, as amended (the “Code”), and the Treasury Regulations promulgated thereunder, with respect to the Reorganization.
NOW THEREFORE, in consideration of the agreements contained in this Agreement, the parties agree as follows;
Article 1
Transfer of Assets and Liabilities
1.1 Transfer of Assets and Liabilities. Subject to the terms and conditions set forth herein, on the Closing Date (as hereafter defined) the Full Maturity Fund shall transfer all of its assets to the Intermediate Fund. In exchange therefor, the Intermediate Fund shall assume all of the liabilities of the Full Maturity Fund and deliver to the Full Maturity Fund a number of Shares which is equal to (i) the aggregate net asset value attributable to all outstanding shares of the Full Maturity Fund at the close of business on the business day preceding the Closing Date, divided by (ii) the net asset value per share of the Shares outstanding at the close of business on the business day preceding the Closing Date.
1.2 Liquidation of the Full Maturity Fund. Subject to the terms and conditions set forth herein, on the Closing Date the Full Maturity Fund shall liquidate and shall distribute pro rata to each of its shareholders of record in proportion to the respective numbers of shares held by such shareholders, determined as of the close of business on the business day preceding the Closing Date, the Shares received by the Full Maturity Fund pursuant to Section 1.1.
A-1
1.3 No Issuance of Share Certificates. The Full Maturity Fund shall accomplish the liquidation and distribution provided for herein by opening accounts on the books of the Intermediate Fund in the names of its shareholders and transferring to its shareholders the Shares credited to the account of the Full Maturity Fund on the books of the Intermediate Fund. No certificates evidencing Shares shall be issued.
1.4 Time and Date of Valuation. The number of Shares to be issued by the Intermediate Fund to the Full Maturity Fund shall be computed as of 4:00 p.m. (Eastern time) on the business day preceding the Closing Date in accordance with the regular practices of the Full Maturity Fund, the Intermediate Fund and the Trust.
1.5 Closing Time and Place. The Closing Date shall be [ ], 2013, or such later date on which all of the conditions set forth in Article 2 have been fulfilled or otherwise waived by the parties hereto, but in any event not later than [ ], 2013, or such later date as the parties may mutually agree. All acts taking place on the Closing Date shall be deemed to be taking place simultaneously as of the commencement of business on the Closing Date, unless otherwise provided. The closing of the Reorganization (the “Closing”) shall be held at [ ] (Pacific time) at the offices of Bingham McCutchen LLP, 355 S. Grand Avenue, Suite 4400, Los Angeles, California 90071, or such other time and/or place as the parties may mutually agree.
1.6 Delay of Valuation. If on the business day preceding the Closing Date (a) the primary trading market for portfolio securities of either party is closed to trading or trading thereon is restricted, or (b) trading or the reporting of trading is disrupted so that an accurate appraisal of the value of the net assets of either party and an accurate calculation of the number of shares held by each shareholder is impracticable, the Closing Date shall be postponed until the first business day after the day when trading shall have been fully resumed and reporting shall have been restored.
1.7 Termination of the Full Maturity Fund. As promptly as practicable after the Closing, the Full Maturity Fund shall dissolve.
Article 2
Conditions Precedent to the Effectiveness of the Reorganization
The respective obligation of each party to effect the reorganization contemplated by this Agreement is subject to the satisfaction or waiver on or prior to the Closing Date of the following conditions:
2.1 Shareholder Approval. On or prior to the Closing Date, the shareholders of the Full Maturity Fund shall have approved the transactions contemplated by this Agreement in accordance with the provisions of Delaware law and the 1940 Act.
2.2 No Injunctions or Restraints. On the Closing Date, no action, suit or other proceeding shall be pending before any court or government agency which seeks to restrain or prohibit or obtain damages or other relief in connection with this Agreement or the transactions contemplated hereby.
2.3 Consents. All consents of the other party and all other consents, orders and permits of Federal, state and local regulatory authorities deemed necessary by the Trust to permit consummation, in all material respects, of the transactions contemplated herein shall have been obtained, except where failure to obtain any such consent, order or permit would not involve a risk of a material adverse effect on the assets or properties of either party or the Trust.
A-2
2.4 Effective Registration Statement. The Form N-1A Registration Statement of the Trust and the Form N-14 Registration Statement of the Trust with respect to the Shares shall continue to be effective and no stop orders suspending the effectiveness thereof shall have been issued and, to the best knowledge of the parties hereto, no investigation or proceeding for that purpose shall have been instituted or be pending, threatened or contemplated.
2.5 Tax Opinion. The parties shall have received an opinion of Bingham McCutchen LLP substantially to the effect that, based upon certain facts, assumptions, certifications and representations, for federal income tax purposes:
|
|
(a)
|
The transfer of substantially all of the Full Maturity Fund’s assets to the Intermediate Fund in exchange for Shares and the assumption of the Full Maturity Fund’s liabilities, and the distribution of the Shares to the Full Maturity Fund’s shareholders in complete liquidation of the Full Maturity Fund, will constitute a “reorganization” within the meaning of Section 368(a) of the Code, and each of Full Maturity Fund and Intermediate Fund will be a “party to a reorganization” within the meaning of Section 368(b) of the Code;
|
|
|
(b)
|
No gain or loss will be recognized by Full Maturity Fund on the transfer of the all of its assets to Intermediate Fund solely in exchange for the Shares and the assumption by Intermediate Fund of all of the liabilities of Full Maturity Fund, or upon the distribution of the Shares to the shareholders of Full Maturity Fund, except for (i) gain or loss that may be recognized on the transfer of “section 1256 contracts” as defined in Section 1256(b) of the Code, (ii) gain that may be recognized on the transfer of stock in a “passive foreign investment company” as defined in Section 1297(a) of the Code, or (iii) any other gain that may be required to be recognized as a result of the closing of Full Maturity Fund’s taxable year or upon the transfer of an asset regardless of whether such transfer would otherwise be a non-recognition transaction under the Code;
|
|
|
(c)
|
The tax basis in the hands of Intermediate Fund of each asset of Full Maturity Fund will be the same as the tax basis of such asset in the hands of Full Maturity Fund immediately prior to the transfer thereof, increased by the amount of gain (or decreased by the amount of loss), if any, recognized by Full Maturity Fund on the transfer;
|
|
|
(d)
|
The holding period of each asset of Full Maturity Fund in the hands of Intermediate Fund, other than assets with respect to which gain or loss is required to be recognized, will include in each instance the period during which such asset was held by Full Maturity Fund;
|
|
|
(e)
|
No gain or loss will be recognized by Intermediate Fund upon its receipt of the assets of Full Maturity Fund solely in exchange for Shares and the assumption of all the liabilities of Full Maturity Fund;
|
|
|
(f)
|
No gain or loss will be recognized by the Full Maturity Fund shareholders upon the exchange of all of their Full Maturity Fund shares for Shares as part of the Reorganization;
|
A-3
|
|
(g)
|
The aggregate tax basis of the Shares that each Full Maturity Fund shareholder receives in the Reorganization will be the same as the aggregate tax basis of the Full Maturity Fund shares exchanged therefor;
|
|
|
(h)
|
Each Full Maturity Fund shareholder’s holding period for the Shares received in the Reorganization will include the period for which such shareholder held the Full Maturity Fund shares exchanged therefor, provided that the Full Maturity Fund shareholder held such Full Maturity Fund shares as capital assets on the date of exchange.
|
2.6 Covenants, Representations and Warranties. Each party shall have performed all of its covenants set forth in Article 4, and its representations and warranties set forth in Article 3 shall be true and correct in all material respects on and as of the Closing Date as if made on such date, and the President of the Trust shall have executed a certificate to such effect.
2.7 Statement of Assets and Liabilities. The Full Maturity Fund shall have delivered to the Trust on the Closing Date a statement of its assets and liabilities, prepared in accordance with generally accepted accounting principles consistently applied, together with a certificate of its Controller and Chief Operating Officer as to its portfolio securities and the federal income tax basis and holding period as of the Closing Date.
Article 3
Representations and Warranties
The parties represent and warrant as follows:
3.1 Structure and Standing. Each party represents and warrants that it is duly organized as a series of a statutory trust, validly existing and in good standing under the laws of the State of Delaware, and has the power to own all of its properties and assets and conduct its business.
3.2 Power. Each party represents and warrants that it has full power and authority to enter into and perform its obligations under this Agreement; the execution, delivery and performance of this Agreement has been duly authorized by all necessary action of the Board of Trustees of the Trust; this Agreement does not violate, and its performance will not result in violation of, any provision of the Declaration of Trust of the Trust, or any agreement, instrument or other undertaking to which it is a party or by which it is bound; and this Agreement constitutes its valid and binding contract enforceable in accordance with its terms, subject to the effects of bankruptcy, moratorium, fraudulent conveyance and similar laws relating to or affecting creditors’ rights generally and court decisions with respect thereto.
3.3 Litigation. Each party represents and warrants that no litigation or administrative proceeding or investigation of or before any court or governmental body is currently pending against it and, to the best of its knowledge, none is threatened against it or any of its properties or assets, which, if adversely determined, would materially and adversely affect its financial condition or the conduct of its business; it knows of no facts which might form the basis for the institution of such proceedings; and it is not a party to or subject to the provisions of any order, decree or judgment of any court or governmental body which materially and adversely affects its business or its ability to consummate the transactions herein contemplated.
3.4 Fund Assets. The Full Maturity Fund represents and warrants that on the Closing Date the assets received by the Intermediate Fund from the Full Maturity Fund will be delivered to the Intermediate Fund as provided in Section 1.1 free and clear of all liens, pledges, security interests, charges or other encumbrances of any nature whatsoever created by the Full Maturity Fund and without any restriction upon the transfer thereof, except for such liabilities assumed as provided in Section 1.1.
A-4
3.5 The Shares. The Intermediate Fund represents and warrants that on the Closing Date (a) the Shares to be delivered to the Full Maturity Fund as contemplated in this Agreement will be duly authorized, validly issued, fully paid and nonassessable; (b) no shareholder of the Intermediate Fund or any other series of the Trust has any preemptive right to subscription or purchase in respect thereof; (c) the Full Maturity Fund will acquire the Shares free and clear of all liens pledges, security interests, charges or other encumbrances of any nature whatsoever created by the Trust and without any restriction on the transfer thereof; and (d) the Shares will be duly qualified for offering to the public in all of the states of the United States in which such qualification is required or an exemption from such requirement shall have been obtained.
3.6 Tax Status and Filings. Each party represents and warrants that it is treated as a corporation separate from the other series of the Trust under Section 851(g) of the Code; it has satisfied the requirements of Subchapter M of the Code for treatment as a regulated investment company for each taxable year since its formation and has elected to be treated as such; it has filed or furnished all federal, state, and other tax returns and reports required by law to have been filed or furnished, and it has paid or made provision for payment of, so far as due, all federal, state and other taxes, interest and penalties; that no such return is currently being audited; and that no assessment has been asserted with respect to any such returns or reports.
3.7 Accuracy of Information. Each party represents and warrants that all information furnished by it to the other party for use in any documents which may be necessary in connection with the transactions contemplated by this Agreement will be accurate and complete and will comply in all material respects with federal securities and other laws and regulations applicable thereto.
3.8 Acquisition of the Shares. The Full Maturity Fund represents and warrants that the Shares it acquires pursuant to this Agreement are not being acquired for the purpose of making any distribution thereof, except in accordance with the terms of this Agreement.
3.9 Financial Statements. Each party represents and warrants that its Statement of Assets and Liabilities as of [ ], 2013 provided to the other party has been prepared in accordance with generally accepted accounting principles consistently applied, and fairly reflects the financial condition of such party as of such date, and there are no known contingent liabilities of such party as of such date not disclosed therein.
3.10 No Adverse Changes. Each party represents and warrants that since [ ], 2013, there has not been any material adverse change in its financial condition, assets, liabilities or business other than changes occurring in the ordinary course of business except as otherwise disclosed in writing to and accepted by the other party (for the purposes of this paragraph, a decline in net asset value per share of a party shall not constitute a material adverse change).
3.11 Proxy Statement. Each party represents and warrants that the Combined Proxy Statement and Prospectus contained in the Registration Statement on Form N-14 to be used in connection with the transaction contemplated hereby (only insofar as it relates to such party) will, on its effective date and on the Closing Date, not contain any untrue statement of material fact with respect to such party or omit to state a material fact required to be stated therein with respect to such party or necessary to make the statements therein with respect to such party, in light of the circumstances under which such statements were made, not materially misleading.
A-5
3.12 Tax Distribution. The Full Maturity Fund shall have distributed to its shareholders, in a distribution or distributions qualifying for the deduction for dividends paid under Section 561 of the Code, all of the Full Maturity Fund’s investment company taxable income (as defined in Section 852(b)(2) of the Code determined without regard to Section 852(b)(2)(D) of the Code) for its taxable year ending on the Closing Date, all of the excess of (i) its interest income excludable from gross income under Section 103(a) of the Code over (ii) its deductions disallowed under Sections 265 and 171(a)(2) of the Code for its taxable year ending on the Closing Date, and all of its net capital gain (as such term is used in Sections 852(b)(3)(A) and (C) of the Code), after reduction by any available capital loss carryforwards, for its taxable year ending on the Closing Date.
Article 4
Covenants
4.1 Conduct of Business. During the period from the date of this Agreement and continuing until the earlier of the termination of this Agreement or the Closing Date, each party shall operate its business in the ordinary course except as contemplated by this Agreement.
4.2 Shareholder Meeting. The Full Maturity Fund shall call a special meeting of its shareholders as soon as possible for the purpose of considering the reorganization contemplated by this Agreement.
4.3 Preparation of Combined Prospectus and Proxy Statement. As soon as reasonably practicable after the execution of this Agreement, the Intermediate Fund shall prepare and file a combined prospectus and proxy statement with respect to the reorganization with the United States Securities and Exchange Commission in form and substance satisfactory to both parties, and shall use its best efforts to provide that the combined prospectus and proxy statement can be distributed to the shareholders of the Full Maturity Fund as promptly as thereafter as practicable. As soon a reasonably practicable, the parties shall also prepare and file any other related filings required under applicable state securities laws.
4.4 Fees and Expenses. Whether or not this Agreement is consummated, CNR shall bear the costs and expenses incurred in connection with this Agreement and the transactions contemplated hereby; [provided, however, that the Full Maturity Fund shall bear the costs and expenses associated with the sale of any securities executed in order to facilitate the Reorganization]. Notwithstanding any of the foregoing, expenses will in any event be paid by the party directly incurring such expenses if and to the extent that the payment by another person of such expenses would result in the disqualification of such party as a “regulated investment company” within the meaning of Section 851 of the Code or would prevent the Reorganization from qualifying as a “reorganization” within the meaning of Section 368(a)(1) of the Code.
4.5 Provision of Documents. Each party agrees that it will, from time to time as and when reasonably requested by the other party, provide or cause to be provided to the other party such information, execute and deliver or cause to be executed and delivered to the other party such documents, and take or cause to be taken such further action, as the other party may deem necessary in order to carry out the intent of this Agreement.
A-6
4.6 The Full Maturity Fund Liabilities. The Full Maturity Fund will use its best efforts to discharge all of its financial liabilities and obligations prior to the Closing Date.
Article 5
Termination, Amendment and Waiver
5.1 Termination. This Agreement may be terminated by resolution of the Board of Trustees of the Trust at any time prior to the Closing Date, if
|
|
(a)
|
either party shall have breached any material provision of this Agreement; or
|
|
|
(b)
|
circumstances develop that, in the opinion of such Board, make proceeding with the Reorganization inadvisable; or
|
|
|
(c)
|
any governmental body shall have issued an order, decree or ruling having the effect of permanently enjoining, restraining or otherwise prohibiting the consummation of this Agreement.
|
5.2 Effect of Termination. In the event of any termination pursuant to Section 5.1, there shall be no liability for damage on the part of either party to the other party.
5.3 Amendment. This Agreement contains the entire agreement of the parties with respect to the Reorganization and may be amended prior to the Closing Date by the parties in writing at any time; provided, however, that there shall not be any amendment that by law requires approval by the shareholders of a party without obtaining such approval.
5.4 Waiver. At any time prior to the Closing Date, any of the terms or conditions of this Agreement may be waived by the Board of Trustees of the Trust if, in its judgment after consultation with legal counsel, such action or waiver will not have a material adverse effect on the benefits intended under this Agreement to the shareholders of the Full Maturity Fund or the Intermediate Fund, respectively.
Article 6
General Provisions
6.1 Governing Law. This Agreement shall be governed by and construed in accordance with the laws of the State of Delaware.
6.2 Assignment. This Agreement shall be binding upon and inure to the benefit of the parties hereto and their respective successors and assigns, but no assignment or transfer hereof or of any rights or obligations hereunder shall be made by either party without the written consent of the other party. Nothing herein expressed or implied is intended or shall be construed to confer upon or give any person other than the parties hereto and their respective successors and assigns any rights or remedies under or by reason of this Agreement.
6.3 Recourse. All persons dealing with the Intermediate Fund or the Full Maturity Fund must look solely to the property of the Intermediate Fund or the Full Maturity Fund for the enforcement of any claims against the Intermediate Fund or the Full Maturity Fund, respectively, as neither the trustees, officers, agents nor shareholders of the Trust, the Intermediate Fund or the Full Maturity Fund assume any personal liability for obligations entered into on behalf of the Intermediate Fund or the Full Maturity Fund, respectively.
A-7
6.4 Notices. Any notice, report, statement or demand required or permitted by any provisions of this Agreement shall be in writing and shall be given by prepaid telegraph, telecopy or certified mail addressed to either party at:
|
City National Rochdale Funds
|
||
|
Beverly Hills, CA 90210
|
||
|
Attn: Garrett R. D’Alessandro
|
||
|
with a copy to:
|
||
|
Bingham McCutchen LLP
|
||
|
Los Angeles, CA 90071
|
||
|
Attn: Michael Glazer
|
||
|
*** Signature Page Follows***
|
A-8
IN WITNESS WHEREOF, each party has caused this Agreement to be executed and attested on its behalf by its duly authorized representatives as of the date first above written.
|
CITY NATIONAL ROCHDALE FUNDS, on behalf of the City National Rochdale Full Maturity Fixed Income Fund
|
|||
|
By:
|
|
||
|
Garrett R. D’Alessandro
|
|||
|
President & Chief Executive Officer
|
|||
|
CITY NATIONAL ROCHDALE FUNDS, on behalf of the City National Rochdale Intermediate Fixed Income Fund
|
|||
|
By:
|
|
||
|
Garrett R. D’Alessandro
|
|||
|
President & Chief Executive Officer
|
|||
|
Solely for purposes of Section 4.4
|
|||
|
CITY NATIONAL ROCHDALE, LLC
|
|||
|
By:
|
|
||
A-9
CITY NATIONAL ROCHDALE FUNDS
City National Rochdale Intermediate Fixed Income Fund
400 North Roxbury Drive
Beverly Hills, California 90210
(Toll free) 1-888-889-0799
Relating to the Acquisition of the Assets and Liabilities of
City National Rochdale Full Maturity Fixed Income Fund
STATEMENT OF ADDITIONAL INFORMATION
__________, 2013
This Statement of Additional Information is not a prospectus and should be read in conjunction with the Prospectus/Proxy Statement dated ____________, 2013 (the “Prospectus/Proxy Statement”), which relates to the shares of the City National Rochdale Intermediate Fixed Income Fund (the “Intermediate Fund”), a separate series of the City National Rochdale Funds (the “Trust”), to be issued in exchange for shares of the City National Rochdale Full Maturity Fixed Income Fund (the “Full Maturity Fund” and, together with the Intermediate Fund, the “Funds”), also a separate series of the Trust. At a Special Meeting of Shareholders of the Trust to be held on _______, 2013 at [X:XX a.m. Eastern Time], shareholders of the Full Maturity Fund will be asked to approve the reorganization of the Full Maturity Fund into the Intermediate Fund, as described in the Prospectus/Proxy Statement (the “Reorganization”).
Unless otherwise indicated, capitalized terms used herein and not otherwise defined have the same meanings as are given to them in the Prospectus/Proxy Statement.
To obtain a copy of the Prospectus/Proxy Statement, free of charge, please write to the Trust at the address shown above or call the number shown above.
This Statement of Additional Information consists of this cover page and the documents listed below, each of which was filed electronically with the Securities and Exchange Commission (the “SEC”) and is incorporated herein by reference.
DOCUMENTS INCORPORATED BY REFERENCE
|
1. The Full Maturity Fund’s Statement of Additional Information, dated January 28, 2013, as supplemented September 10, 2013 (File No. 333-16093), as filed with the SEC on September 10, 2013 (Accession No. 0001398344-13-004353) is incorporated herein by reference.
|
|
2. The Intermediate Fund’s Statement of Additional Information, dated April 30, 2013, as supplemented September 10, 2013 (File No. 333-16093), as filed with the SEC on September 10, 2013 (Accession No. 0001398344-13-004356) is incorporated herein by reference.
|
|
3. The Full Maturity Fund’s Annual Report for the year ended September 30, 2012 (File No. 811-07923), as filed with the SEC on December 7, 2012 (Accession No. 0001398344-12-003779) is incorporated herein by reference.
|
|
4. The Intermediate Fund’s Annual Report for the year ended December 31, 2012 (File No. 811-08685), as filed with the SEC on March 8, 2013 (Accession No. 0001193125-13-097925) is incorporated herein by reference.
|
|
5. The Funds’ Semi-Annual Report for the fiscal period ended March 31, 2013 (File No. 811-07923), as filed with the SEC on June 10, 2013 (Accession No. 0001398344-13-002827) is incorporated herein by reference.
|
Pro forma financial statements reflecting the consummation of the Reorganization are included below.
Please retain this Statement of Additional Information for further reference.
|
Pro Forma Schedule of Investments (Unaudited)
|
|
City National Rochdale
|
|
Intermediate Fixed Income Fund and Full Maturity Fixed Income Fund
|
|
March 31, 2013
|
|
City National Rochdale Intermediate Fixed
Income Fund
|
City National Rochdale Full Maturity Fixed Income Fund
|
Proforma
Combined
|
||||||||||||||||||||||
|
Face Amount (000)
|
Value (000)
|
Face Amount (000)
|
Value (000)
|
Face Amount (000)
|
Value (000)
|
|||||||||||||||||||
|
Corporate Bonds - 70.1%
|
||||||||||||||||||||||||
|
Consumer Discretionary - 3.7%
|
||||||||||||||||||||||||
|
AutoZone, 3.700%, 04/15/22
|
$ | 250 | $ | 258 | $ | - | $ | - | $ | 250 | $ | 258 | ||||||||||||
|
Best Buy, 7.250%, 07/15/13
|
250 | 254 | - | - | 250 | 254 | ||||||||||||||||||
|
Best Buy, 3.750%, 03/15/16
|
300 | 300 | - | - | 300 | 300 | ||||||||||||||||||
|
CBS, 3.375%, 03/01/22
|
- | - | 175 | 178 | 175 | 178 | ||||||||||||||||||
|
Comcast, 3.125%, 07/15/22
|
200 | 205 | - | - | 200 | 205 | ||||||||||||||||||
|
DIRECTV Holdings, 3.500%, 03/01/16
|
- | - | 170 | 181 | 170 | 181 | ||||||||||||||||||
|
Expedia, 5.950%, 08/15/20
|
250 | 278 | - | - | 250 | 278 | ||||||||||||||||||
|
Gap, 5.950%, 04/12/21
|
495 | 566 | - | - | 495 | 566 | ||||||||||||||||||
|
Hasbro, 6.125%, 05/15/14
|
250 | 264 | - | - | 250 | 264 | ||||||||||||||||||
|
Johnson Controls, 5.500%, 01/15/16
|
- | - | 100 | 112 | 100 | 112 | ||||||||||||||||||
|
Lowe's, 5.000%, 10/15/15
|
- | - | 165 | 184 | 165 | 184 | ||||||||||||||||||
|
Royal Caribbean Cruises, 6.875%, 12/01/13
|
250 | 258 | - | - | 250 | 258 | ||||||||||||||||||
|
Scripps Networks Interactive, 2.700%, 12/15/16
|
1,000 | 1,052 | - | - | 1,000 | 1,052 | ||||||||||||||||||
|
Time Warner, 7.700%, 05/01/32
|
- | - | 150 | 204 | 150 | 204 | ||||||||||||||||||
|
Time Warner Cable, 4.125%, 02/15/21
|
- | - | 165 | 177 | 165 | 177 | ||||||||||||||||||
|
Toys R Us, 7.375%, 10/15/18
|
500 | 441 | - | - | 500 | 441 | ||||||||||||||||||
|
Toys R Us Property II, 8.500%, 12/01/17
|
21 | 22 | - | - | 21 | 22 | ||||||||||||||||||
|
Tupperware Brands, 4.750%, 06/01/21
|
500 | 527 | - | - | 500 | 527 | ||||||||||||||||||
|
Viacom, 6.250%, 04/30/16
|
- | - | 125 | 144 | 125 | 144 | ||||||||||||||||||
|
WPP Finance UK, 8.000%, 09/15/14
|
749 | 823 | - | - | 749 | 823 | ||||||||||||||||||
|
WPP Finance UK, 5.875%, 06/15/14
|
400 | 422 | - | - | 400 | 422 | ||||||||||||||||||
|
Yum! Brands, 6.250%, 03/15/18
|
- | - | 95 | 114 | 95 | 114 | ||||||||||||||||||
|
Total Consumer Discretionary
|
5,670 | 1,294 | 6,964 | |||||||||||||||||||||
|
Consumer Staples - 4.1%
|
||||||||||||||||||||||||
|
Avon Products, 6.500%, 03/01/19
|
250 | 284 | - | - | 250 | 284 | ||||||||||||||||||
|
Avon Products, 5.625%, 03/01/14
|
700 | 730 | - | - | 700 | 730 | ||||||||||||||||||
|
B&G Foods, 7.625%, 01/15/18
|
229 | 245 | - | - | 229 | 245 | ||||||||||||||||||
|
Bunge NA Finance, 5.900%, 04/01/17
|
- | - | 100 | 113 | 100 | 113 | ||||||||||||||||||
|
Campbell Soup, 8.875%, 05/01/21
|
350 | 484 | - | - | 350 | 484 | ||||||||||||||||||
|
ConAgra Foods, 4.950%, 08/15/20 (A)
|
410 | 470 | - | - | 410 | 470 | ||||||||||||||||||
|
ConAgra Foods, 1.900%, 01/25/18
|
200 | 202 | - | - | 200 | 202 | ||||||||||||||||||
|
CVS Caremark, 2.750%, 12/01/22
|
500 | 493 | - | - | 500 | 493 | ||||||||||||||||||
|
Kellogg, 3.125%, 05/17/22
|
250 | 259 | - | - | 250 | 259 | ||||||||||||||||||
|
Kraft Foods, 6.500%, 08/11/17
|
- | - | 150 | 181 | 150 | 181 | ||||||||||||||||||
|
Lorillard Tobacco, 8.125%, 06/23/19
|
500 | 636 | - | - | 500 | 636 | ||||||||||||||||||
|
PepsiAmericas, 4.875%, 01/15/15
|
250 | 269 | - | - | 250 | 269 | ||||||||||||||||||
|
PepsiCo, 3.125%, 11/01/20
|
- | - | 260 | 279 | 260 | 279 | ||||||||||||||||||
|
Reynolds American, 7.625%, 06/01/16
|
290 | 345 | - | - | 290 | 345 | ||||||||||||||||||
|
Reynolds American, 6.750%, 06/15/17
|
100 | 120 | - | - | 100 | 120 | ||||||||||||||||||
|
Safeway, 5.000%, 08/15/19
|
475 | 529 | - | - | 475 | 529 | ||||||||||||||||||
|
Safeway, 4.750%, 12/01/21
|
526 | 566 | - | - | 526 | 566 | ||||||||||||||||||
|
Safeway, 3.950%, 08/15/20
|
672 | 687 | - | - | 672 | 687 | ||||||||||||||||||
|
WM Wrigley Jr, 4.650%, 07/15/15
|
750 | 799 | - | - | 750 | 799 | ||||||||||||||||||
|
Total Consumer Staples
|
7,118 | 573 | 7,691 | |||||||||||||||||||||
|
Energy - 4.7%
|
||||||||||||||||||||||||
|
Anadarko Finance, 7.500%, 05/01/31
|
- | - | 150 | 199 | 150 | 199 | ||||||||||||||||||
|
Boardwalk Pipelines, 5.875%, 11/15/16
|
146 | 164 | - | - | 146 | 164 | ||||||||||||||||||
|
Boardwalk Pipelines, 5.750%, 09/15/19
|
175 | 203 | - | - | 175 | 203 | ||||||||||||||||||
|
Boardwalk Pipelines, 5.500%, 02/01/17
|
221 | 247 | - | - | 221 | 247 | ||||||||||||||||||
|
Boardwalk Pipelines, 5.200%, 06/01/18
|
84 | 93 | - | - | 84 | 93 | ||||||||||||||||||
|
BP Capital Markets, 3.200%, 03/11/16
|
- | - | 100 | 107 | 100 | 107 | ||||||||||||||||||
|
BP Capital Markets, 3.125%, 10/01/15
|
- | - | 345 | 364 | 345 | 364 | ||||||||||||||||||
|
Buckeye Partners, 6.050%, 01/15/18
|
155 | 177 | - | - | 155 | 177 | ||||||||||||||||||
|
Buckeye Partners, 4.625%, 07/15/13
|
400 | 404 | - | - | 400 | 404 | ||||||||||||||||||
|
Chesapeake Energy, 9.500%, 02/15/15
|
385 | 435 | - | - | 385 | 435 | ||||||||||||||||||
|
Copano Energy, 7.750%, 06/01/18
|
189 | 198 | - | - | 189 | 198 | ||||||||||||||||||
|
DCP Midstream, 9.750%, 03/15/19 (A)
|
- | - | 114 | 150 | 114 | 150 | ||||||||||||||||||
|
Ecopetrol, 7.625%, 07/23/19
|
250 | 313 | - | - | 250 | 313 | ||||||||||||||||||
|
Enbridge Energy Partners, 5.875%, 12/15/16
|
191 | 219 | - | - | 191 | 219 | ||||||||||||||||||
|
Enbridge Energy Partners, 5.350%, 12/15/14
|
20 | 21 | - | - | 20 | 21 | ||||||||||||||||||
|
Energy Transfer Partners, 9.700%, 03/15/19
|
330 | 445 | - | - | 330 | 445 | ||||||||||||||||||
|
Energy Transfer Partners, 9.000%, 04/15/19
|
189 | 249 | - | - | 189 | 249 | ||||||||||||||||||
|
Energy Transfer Partners, 6.625%, 10/15/36
|
- | - | 75 | 86 | 75 | 86 | ||||||||||||||||||
|
Energy Transfer Partners, 6.125%, 02/15/17
|
426 | 493 | - | - | 426 | 493 | ||||||||||||||||||
|
Energy Transfer Partners, 3.600%, 02/01/23
|
200 | 199 | - | - | 200 | 199 | ||||||||||||||||||
|
Enterprise Products Operating, 6.500%, 01/31/19
|
- | - | 140 | 174 | 140 | 174 | ||||||||||||||||||
|
Enterprise Products Operating, 3.700%, 06/01/15
|
- | - | 125 | 132 | 125 | 132 | ||||||||||||||||||
|
FMC Technologies, 3.450%, 10/01/22
|
200 | 203 | - | - | 200 | 203 | ||||||||||||||||||
|
Husky Energy, 3.950%, 04/15/22
|
- | - | 150 | 160 | 150 | 160 | ||||||||||||||||||
|
Kinder Morgan Energy Partners, 5.950%, 02/15/18
|
- | - | 150 | 179 | 150 | 179 | ||||||||||||||||||
|
Kinder Morgan Energy Partners, 5.625%, 02/15/15
|
284 | 309 | - | - | 284 | 309 | ||||||||||||||||||
|
Kinder Morgan Energy Partners, 5.300%, 09/15/20
|
- | - | 125 | 146 | 125 | 146 | ||||||||||||||||||
|
Marathon Oil, 6.000%, 10/01/17
|
- | - | 150 | 178 | 150 | 178 | ||||||||||||||||||
|
National Oilwell Varco, 6.125%, 08/15/15
|
100 | 101 | - | - | 100 | 101 | ||||||||||||||||||
|
ONEOK Partners, 2.000%, 10/01/17
|
- | - | 105 | 106 | 105 | 106 | ||||||||||||||||||
|
Petrobras International Finance - Pifco, 5.750%, 01/20/20
|
250 | 275 | 250 | 275 | ||||||||||||||||||||
|
Petrobras International Finance - Pifco, 2.875%, 02/06/15
|
500 | 510 | - | - | 500 | 510 | ||||||||||||||||||
|
Petrobras International Finance, 3.875%, 01/27/16
|
- | - | 100 | 105 | 100 | 105 | ||||||||||||||||||
|
Plains All American Pipeline, 5.875%, 08/15/16
|
205 | 227 | - | - | 205 | 227 | ||||||||||||||||||
|
PPL Energy Supply, 6.200%, 05/15/16
|
105 | 120 | - | - | 105 | 120 | ||||||||||||||||||
|
Puget Energy, 6.000%, 09/01/21
|
500 | 568 | - | - | 500 | 568 | ||||||||||||||||||
|
Sabine Pass LNG, 7.500%, 11/30/16
|
100 | 111 | - | - | 100 | 111 | ||||||||||||||||||
|
Spectra Energy Capital, 6.200%, 04/15/18
|
- | - | 75 | 91 | 75 | 91 | ||||||||||||||||||
|
Total Capital International, 1.500%, 02/17/17
|
- | - | 100 | 102 | 100 | 102 | ||||||||||||||||||
|
Williams Partners, 3.350%, 08/15/22
|
200 | 198 | - | - | 200 | 198 | ||||||||||||||||||
|
Total Energy
|
6,482 | 2,279 | 8,761 | |||||||||||||||||||||
|
Financials - 20.8%
|
||||||||||||||||||||||||
|
ACE INA Holdings, 2.700%, 03/13/23
|
850 | 846 | - | - | 850 | 846 | ||||||||||||||||||
|
Alleghany, 5.625%, 09/15/20
|
270 | 311 | - | - | 270 | 311 | ||||||||||||||||||
|
American Express Bank, 5.500%, 04/16/13
|
100 | 100 | - | - | 100 | 100 | ||||||||||||||||||
|
American Express Credit, MTN, 7.300%, 08/20/13
|
250 | 256 | - | - | 250 | 256 | ||||||||||||||||||
|
American Express Credit, MTN, 2.800%, 09/19/16
|
- | - | 175 | 185 | 175 | 185 | ||||||||||||||||||
|
Aon, 3.500%, 09/30/15
|
- | - | 200 | 211 | 200 | 211 | ||||||||||||||||||
|
Associates Corp of North America, 6.950%, 11/01/18
|
- | - | 150 | 183 | 150 | 183 | ||||||||||||||||||
|
Axis Specialty Finance, 5.875%, 06/01/20
|
250 | 285 | - | - | 250 | 285 | ||||||||||||||||||
|
Bank of America, 10.200%, 07/15/15
|
- | - | 100 | 117 | 100 | 117 | ||||||||||||||||||
|
Bank of America, 5.420%, 03/15/17 (A)
|
42 | 47 | - | - | 42 | 47 | ||||||||||||||||||
|
Bank of America, MTN, 5.650%, 05/01/18
|
- | - | 160 | 185 | 160 | 185 | ||||||||||||||||||
|
Bank of New York Mellon, MTN, 3.100%, 01/15/15
|
- | - | 175 | 183 | 175 | 183 | ||||||||||||||||||
|
Barclays Bank, 5.125%, 01/08/20
|
- | - | 100 | 115 | 100 | 115 | ||||||||||||||||||
|
BB&T, MTN, 1.600%, 08/15/17
|
- | - | 355 | 358 | 355 | 358 | ||||||||||||||||||
|
Bear Stearns, 7.250%, 02/01/18
|
- | - | 275 | 342 | 275 | 342 | ||||||||||||||||||
|
Bear Stearns, 5.550%, 01/22/17
|
468 | 534 | - | - | 468 | 534 | ||||||||||||||||||
|
Berkshire Hathaway, 3.000%, 02/11/23
|
250 | 254 | - | - | 250 | 254 | ||||||||||||||||||
|
Berkshire Hathaway, 1.550%, 02/09/18
|
300 | 304 | - | - | 300 | 304 | ||||||||||||||||||
|
Berkshire Hathaway Finance, 1.600%, 05/15/17
|
440 | 449 | - | - | 440 | 449 | ||||||||||||||||||
|
BlackRock, 3.500%, 12/10/14
|
- | - | 170 | 179 | 170 | 179 | ||||||||||||||||||
|
Bunge Finance, 8.500%, 06/15/19
|
105 | 135 | - | - | 105 | 135 | ||||||||||||||||||
|
Bunge Finance, 5.875%, 05/15/13
|
257 | 258 | - | - | 257 | 258 | ||||||||||||||||||
|
Bunge Finance, 5.100%, 07/15/15
|
500 | 542 | - | - | 500 | 542 | ||||||||||||||||||
|
Capital One Financial, 7.375%, 05/23/14
|
- | - | 100 | 107 | 100 | 107 | ||||||||||||||||||
|
Capital One, 1.500%, 03/22/18
|
475 | 470 | - | - | 475 | 470 | ||||||||||||||||||
|
Citigroup, 6.375%, 08/12/14
|
- | - | 170 | 182 | 170 | 182 | ||||||||||||||||||
|
Citigroup, 5.000%, 09/15/14
|
503 | 528 | - | - | 503 | 528 | ||||||||||||||||||
|
CNA Financial, 6.950%, 01/15/18
|
1,076 | 1,282 | - | - | 1,076 | 1,282 | ||||||||||||||||||
|
Commonwealth Bank of Australia, 5.000%, 10/15/19 (A)
|
- | - | 150 | 176 | 150 | 176 | ||||||||||||||||||
|
Countrywide Financial, MTN, 6.000%, 08/26/20 (C)
|
313 | 313 | - | - | 313 | 313 | ||||||||||||||||||
|
Credit Suisse NY, MTN, 5.300%, 08/13/19
|
- | - | 150 | 177 | 150 | 177 | ||||||||||||||||||
|
Deutsche Bank, MTN, 3.450%, 03/30/15
|
- | - | 100 | 105 | 100 | 105 | ||||||||||||||||||
|
Dresdner Bank NY, 7.250%, 09/15/15
|
1,000 | 1,081 | 150 | 162 | 1,150 | 1,243 | ||||||||||||||||||
|
ERAC USA Finance, 3.300%, 10/15/22 (A)
|
250 | 252 | - | - | 250 | 252 | ||||||||||||||||||
|
Fifth Third Bancorp, 3.625%, 01/25/16
|
- | - | 105 | 112 | 105 | 112 | ||||||||||||||||||
|
General Electric Capital, 2.250%, 11/09/15
|
- | - | 350 | 362 | 350 | 362 | ||||||||||||||||||
|
General Electric Capital, MTN, 6.000%, 08/07/19
|
- | - | 125 | 152 | 125 | 152 | ||||||||||||||||||
|
General Electric Capital, MTN, 5.625%, 09/15/17
|
300 | 352 | - | - | 300 | 352 | ||||||||||||||||||
|
General Electric Capital, MTN, 5.450%, 01/15/16
|
289 | 292 | - | - | 289 | 292 | ||||||||||||||||||
|
General Electric Capital, MTN, 4.375%, 09/16/20
|
- | - | 150 | 168 | 150 | 168 | ||||||||||||||||||
|
Goldman Sachs Group, 6.250%, 09/01/17
|
550 | 647 | - | - | 550 | 647 |
|
Goldman Sachs Group, 6.000%, 06/15/20
|
500 | 590 | - | - | 500 | 590 | ||||||||||||||||||
|
Goldman Sachs Group, 5.625%, 01/15/17
|
700 | 784 | - | - | 700 | 784 | ||||||||||||||||||
|
Goldman Sachs Group, 5.350%, 01/15/16
|
250 | 277 | - | - | 250 | 277 | ||||||||||||||||||
|
Goldman Sachs Group, 5.250%, 04/01/13
|
392 | 392 | - | - | 392 | 392 | ||||||||||||||||||
|
Goldman Sachs Group, 5.125%, 01/15/15
|
355 | 379 | - | - | 355 | 379 | ||||||||||||||||||
|
Goldman Sachs Group, 3.625%, 02/07/16
|
- | - | 355 | 377 | 355 | 377 | ||||||||||||||||||
|
HSBC Finance, 6.676%, 01/15/21 (A)
|
- | - | 83 | 98 | 83 | 98 | ||||||||||||||||||
|
Icahn Enterprises, 8.000%, 01/15/18
|
440 | 471 | - | - | 440 | 471 | ||||||||||||||||||
|
Icahn Enterprises, 7.750%, 01/15/16
|
305 | 318 | - | - | 305 | 318 | ||||||||||||||||||
|
ING Bank, 3.750%, 03/07/17 (A)
|
- | - | 200 | 213 | 200 | 213 | ||||||||||||||||||
|
Janus Capital Group, 6.700%, 06/15/17
|
600 | 687 | - | - | 600 | 687 | ||||||||||||||||||
|
Jefferies Group, 6.450%, 06/08/27
|
- | - | 100 | 110 | 100 | 110 | ||||||||||||||||||
|
Jefferies Group, 5.875%, 06/08/14
|
733 | 773 | - | - | 733 | 773 | ||||||||||||||||||
|
JPMorgan Chase, 4.250%, 10/15/20
|
- | - | 150 | 165 | 150 | 165 | ||||||||||||||||||
|
JPMorgan Chase, MTN, 5.300%, 05/15/18
|
150 | 148 | - | - | 150 | 148 | ||||||||||||||||||
|
KeyBank, 5.800%, 07/01/14
|
- | - | 150 | 159 | 150 | 159 | ||||||||||||||||||
|
Kookmin Bank, 7.250%, 05/14/14 (A)
|
- | - | 100 | 106 | 100 | 106 | ||||||||||||||||||
|
Lehman Brothers Holdings, MTN, 7.000%, 09/28/37 (D)
|
400 | 107 | - | - | 400 | 107 | ||||||||||||||||||
|
Manulife Financial, 3.400%, 09/17/15
|
- | - | 198 | 208 | 198 | 208 | ||||||||||||||||||
|
Marsh & McLennan, 5.750%, 09/15/15
|
- | - | 79 | 88 | 79 | 88 | ||||||||||||||||||
|
Merrill Lynch, 5.700%, 05/02/17
|
950 | 1,060 | - | - | 950 | 1,060 | ||||||||||||||||||
|
MetLife, 5.000%, 06/15/15
|
- | - | 175 | 191 | 175 | 191 | ||||||||||||||||||
|
Metropolitan Life Global Funding I, 3.875%, 04/11/22 (A)
|
- | - | 125 | 135 | 125 | 135 | ||||||||||||||||||
|
Moody's, 5.500%, 09/01/20
|
800 | 874 | - | - | 800 | 874 | ||||||||||||||||||
|
Morgan Stanley, 5.375%, 10/15/15
|
210 | 229 | - | - | 210 | 229 | ||||||||||||||||||
|
Morgan Stanley, 4.750%, 04/01/14
|
3,323 | 3,435 | 75 | 77 | 3,398 | 3,512 | ||||||||||||||||||
|
Morgan Stanley, 4.750%, 03/22/17
|
- | - | 165 | 182 | 165 | 182 | ||||||||||||||||||
|
Morgan Stanley, 4.200%, 11/20/14
|
250 | 262 | - | - | 250 | 262 | ||||||||||||||||||
|
Morgan Stanley, MTN, 6.625%, 04/01/18
|
- | - | 100 | 120 | 100 | 120 | ||||||||||||||||||
|
Morgan Stanley, MTN, 6.000%, 05/13/14
|
1,050 | 1,107 | - | - | 1,050 | 1,107 | ||||||||||||||||||
|
Morgan Stanley, MTN, 6.000%, 04/28/15
|
600 | 654 | - | - | 600 | 654 | ||||||||||||||||||
|
Morgan Stanley, MTN, 5.450%, 01/09/17
|
100 | 112 | - | - | 100 | 112 | ||||||||||||||||||
|
NASDAQ OMX Group, 5.550%, 01/15/20
|
1,249 | 1,347 | - | - | 1,249 | 1,347 | ||||||||||||||||||
|
National Bank of Canada, MTN, 1.450%, 11/07/17
|
750 | 747 | - | - | 750 | 747 | ||||||||||||||||||
|
National Rural Utilities Cooperative Finance, 10.375%, 11/01/18
|
- | - | 125 | 183 | 125 | 183 | ||||||||||||||||||
|
National Rural Utilities Cooperative Finance, 6.550%, 11/01/18
|
300 | 369 | - | - | 300 | 369 | ||||||||||||||||||
|
Nationsbank, 10.200%, 07/15/15
|
250 | 292 | - | - | 250 | 292 | ||||||||||||||||||
|
Nisource Capital Markets, MTN, 7.860%, 03/27/17
|
163 | 190 | - | - | 163 | 190 | ||||||||||||||||||
|
Nisource Finance, 5.400%, 07/15/14
|
266 | 281 | - | - | 266 | 281 | ||||||||||||||||||
|
PNC Funding, 4.250%, 09/21/15
|
- | - | 325 | 352 | 325 | 352 | ||||||||||||||||||
|
PNC Funding, 3.000%, 05/19/14
|
- | - | 125 | 129 | 125 | 129 | ||||||||||||||||||
|
Principal Financial Group, 3.300%, 09/15/22
|
200 | 203 | - | - | 200 | 203 | ||||||||||||||||||
|
Progressive, 7.000%, 10/01/13
|
40 | 41 | - | - | 40 | 41 | ||||||||||||||||||
|
Protective Life, 6.400%, 01/15/18
|
250 | 290 | - | - | 250 | 290 | ||||||||||||||||||
|
Protective Life, 4.300%, 06/01/13
|
- | - | 100 | 101 | 100 | 101 | ||||||||||||||||||
|
Prudential Financial, MTN, 6.200%, 01/15/15
|
- | - | 160 | 174 | 160 | 174 | ||||||||||||||||||
|
Prudential Financial, MTN, 5.375%, 06/21/20
|
- | - | 155 | 183 | 155 | 183 | ||||||||||||||||||
|
Salomon, MTN, 7.300%, 08/01/13
|
250 | 255 | - | - | 250 | 255 | ||||||||||||||||||
|
Silicon Valley Bank, 6.050%, 06/01/17
|
355 | 388 | - | - | 355 | 388 | ||||||||||||||||||
|
SLM, MTN, 5.050%, 11/14/14
|
500 | 527 | - | - | 500 | 527 | ||||||||||||||||||
|
SLM, MTN, 5.000%, 06/15/18
|
802 | 806 | - | - | 802 | 806 | ||||||||||||||||||
|
Sumitomo Mitsui Banking, 3.150%, 07/22/15 (A)
|
- | - | 200 | 210 | 200 | 210 | ||||||||||||||||||
|
SunTrust Banks, 6.000%, 09/11/17
|
- | - | 119 | 141 | 119 | 141 | ||||||||||||||||||
|
TD Ameritrade Holding, 5.600%, 12/01/19
|
- | - | 155 | 186 | 155 | 186 | ||||||||||||||||||
|
Toyota Motor Credit, MTN, 2.000%, 09/15/16
|
- | - | 100 | 103 | 100 | 103 | ||||||||||||||||||
|
UBS, MTN, 7.375%, 06/15/17
|
388 | 449 | - | - | 388 | 449 | ||||||||||||||||||
|
UFJ Finance Aruba, 6.750%, 07/15/13
|
- | - | 125 | 127 | 125 | 127 | ||||||||||||||||||
|
US Bancorp, MTN, 1.650%, 05/15/17
|
- | - | 345 | 352 | 345 | 352 | ||||||||||||||||||
|
WEA Finance, 7.500%, 06/02/14 (A)
|
- | - | 125 | 134 | 125 | 134 | ||||||||||||||||||
|
Wells Fargo Bank, 5.750%, 05/16/16
|
100 | 114 | - | - | 100 | 114 | ||||||||||||||||||
|
Wells Fargo, 3.625%, 04/15/15
|
- | - | 125 | 132 | 125 | 132 | ||||||||||||||||||
|
Wells Fargo, 2.625%, 12/15/16
|
235 | 247 | - | - | 235 | 247 | ||||||||||||||||||
|
Wells Fargo, 1.500%, 01/16/18
|
150 | 150 | - | - | 150 | 150 | ||||||||||||||||||
|
Wells Fargo, MTN, 3.450%, 02/13/23
|
250 | 252 | - | - | 250 | 252 | ||||||||||||||||||
|
Wells Fargo, MTN, 2.100%, 05/08/17
|
250 | 258 | 325 | 335 | 575 | 593 | ||||||||||||||||||
|
Westpac Banking, MTN, 1.600%, 01/12/18
|
250 | 253 | - | - | 250 | 253 | ||||||||||||||||||
|
Wilmington Trust, 8.500%, 04/02/18
|
315 | 396 | - | - | 315 | 396 | ||||||||||||||||||
|
Total Financials
|
30,052 | 8,832 | 38,884 | |||||||||||||||||||||
|
Healthcare -1.2%
|
||||||||||||||||||||||||
|
Actavis, 3.250%, 10/01/22
|
500 | 507 | - | - | 500 | 507 |
|
BioMed Realty, 3.850%, 04/15/16
|
500 | 531 | - | - | 500 | 531 | ||||||||||||||||||
|
Boston Scientific, 4.500%, 01/15/15
|
250 | 265 | - | - | 250 | 265 | ||||||||||||||||||
|
Express Scripts Holding, 3.500%, 11/15/16
|
- | - | 150 | 162 | 150 | 162 | ||||||||||||||||||
|
UnitedHealth Group, 4.750%, 02/10/14
|
- | - | 40 | 41 | 40 | 41 | ||||||||||||||||||
|
UnitedHealth Group, 4.700%, 02/15/21
|
- | - | 200 | 230 | 200 | 230 | ||||||||||||||||||
|
UnitedHealth Group, 1.625%, 03/15/19
|
250 | 251 | - | - | 250 | 251 | ||||||||||||||||||
|
Wyeth, 5.500%, 02/15/16
|
- | - | 160 | 182 | 160 | 182 | ||||||||||||||||||
|
Zimmer Holdings, 4.625%, 11/30/19
|
- | - | 75 | 85 | 75 | 85 | ||||||||||||||||||
|
Total Healthcare
|
1,554 | 700 | 2,254 | |||||||||||||||||||||
|
Industrials - 5.8%
|
||||||||||||||||||||||||
|
Avery Dennison, 5.375%, 04/15/20
|
405 | 442 | - | - | 405 | 442 | ||||||||||||||||||
|
Canadian National Railway, 2.250%, 11/15/22
|
650 | 640 | - | - | 650 | 640 | ||||||||||||||||||
|
Carlisle, 3.750%, 11/15/22
|
250 | 250 | - | - | 250 | 250 | ||||||||||||||||||
|
Caterpillar, 7.000%, 12/15/13
|
250 | 262 | - | - | 250 | 262 | ||||||||||||||||||
|
CNH America, 7.250%, 01/15/16
|
388 | 434 | - | - | 388 | 434 | ||||||||||||||||||
|
DCP Midstream Operating, 3.250%, 10/01/15
|
120 | 125 | - | - | 120 | 125 | ||||||||||||||||||
|
Eaton, 8.875%, 06/15/19
|
125 | 166 | - | - | 125 | 166 | ||||||||||||||||||
|
Embraer Overseas, 6.375%, 01/24/17
|
465 | 525 | - | - | 465 | 525 | ||||||||||||||||||
|
IDEX, 4.200%, 12/15/21
|
250 | 267 | - | - | 250 | 267 | ||||||||||||||||||
|
Ingersoll-Rand Global Holding, 9.500%, 04/15/14
|
250 | 272 | - | - | 250 | 272 | ||||||||||||||||||
|
International Lease Finance, MTN, 6.100%, 04/15/14
|
250 | 258 | - | - | 250 | 258 | ||||||||||||||||||
|
International Lease Finance, MTN, 5.650%, 06/01/14
|
197 | 206 | - | - | 197 | 206 | ||||||||||||||||||
|
Joy Global, 6.000%, 11/15/16
|
500 | 576 | - | - | 500 | 576 | ||||||||||||||||||
|
Lennox International, 4.900%, 05/15/17
|
250 | 273 | - | - | 250 | 273 | ||||||||||||||||||
|
Manitowoc, 9.500%, 02/15/18
|
148 | 163 | - | - | 148 | 163 | ||||||||||||||||||
|
NuStar Logistics, 8.150%, 04/15/18
|
250 | 286 | - | - | 250 | 286 | ||||||||||||||||||
|
NuStar Logistics, 4.800%, 09/01/20
|
200 | 198 | - | - | 200 | 198 | ||||||||||||||||||
|
Owens Corning, 6.500%, 12/01/16
|
620 | 698 | - | - | 620 | 698 | ||||||||||||||||||
|
Penske Truck Leasing LP, 4.875%, 07/11/22 (A)
|
200 | 211 | - | - | 200 | 211 | ||||||||||||||||||
|
Penske Truck Leasing LP, 4.250%, 01/17/23 (A)
|
300 | 302 | - | - | 300 | 302 | ||||||||||||||||||
|
Penske Truck Leasing LP, 3.375%, 03/15/18 (A)
|
250 | 260 | - | - | 250 | 260 | ||||||||||||||||||
|
Penske Truck Leasing LP, 2.500%, 03/15/16 (A)
|
500 | 512 | - | - | 500 | 512 | ||||||||||||||||||
|
Republic Services, 3.550%, 06/01/22
|
250 | 261 | - | - | 250 | 261 | ||||||||||||||||||
|
Roper Industries, 3.125%, 11/15/22
|
200 | 201 | - | - | 200 | 201 | ||||||||||||||||||
|
Roper Industries, 1.850%, 11/15/17
|
250 | 252 | - | - | 250 | 252 | ||||||||||||||||||
|
Rowan, 4.875%, 06/01/22
|
200 | 218 | - | - | 200 | 218 | ||||||||||||||||||
|
Spectra Energy Capital, 6.750%, 07/15/18
|
745 | 877 | - | - | 745 | 877 | ||||||||||||||||||
|
Spectra Energy, 5.500%, 03/01/14
|
240 | 250 | - | - | 240 | 250 | ||||||||||||||||||
|
Transocean, 7.375%, 04/15/18
|
494 | 590 | - | - | 494 | 590 | ||||||||||||||||||
|
Transocean, 6.000%, 03/15/18
|
500 | 566 | - | - | 500 | 566 | ||||||||||||||||||
|
Xylem, 3.550%, 09/20/16
|
200 | 213 | - | - | 200 | 213 | ||||||||||||||||||
|
Total Industrials
|
10,754 | - | 10,754 | |||||||||||||||||||||
|
Information Technology - 6.4%
|
||||||||||||||||||||||||
|
Advanced Micro Devices, 8.125%, 12/15/17
|
1,000 | 1,010 | - | - | 1,000 | 1,010 | ||||||||||||||||||
|
Arrow Electronics, 6.875%, 06/01/18
|
400 | 470 | - | - | 400 | 470 | ||||||||||||||||||
|
Avnet, 6.625%, 09/15/16
|
128 | 146 | - | - | 128 | 146 | ||||||||||||||||||
|
Cardtronics, 8.250%, 09/01/18 (E)
|
225 | 246 | - | - | 225 | 246 | ||||||||||||||||||
|
Cisco Systems, 5.500%, 01/15/40
|
- | - | 100 | 119 | 100 | 119 | ||||||||||||||||||
|
Dell, 5.650%, 04/15/18
|
500 | 522 | - | - | 500 | 522 | ||||||||||||||||||
|
Dell, 5.625%, 04/15/14
|
322 | 336 | - | - | 322 | 336 | ||||||||||||||||||
|
Fiserv, 3.500%, 10/01/22
|
250 | 249 | - | - | 250 | 249 | ||||||||||||||||||
|
Hewlett-Packard, 4.750%, 06/02/14
|
850 | 888 | - | - | 850 | 888 | ||||||||||||||||||
|
Hewlett-Packard, 4.650%, 12/09/21
|
- | - | 150 | 156 | 150 | 156 | ||||||||||||||||||
|
Hewlett-Packard, 2.125%, 09/13/15
|
- | - | 190 | 193 | 190 | 193 | ||||||||||||||||||
|
Hewlett-Packard, 1.550%, 05/30/14
|
920 | 924 | - | - | 920 | 924 | ||||||||||||||||||
|
KLA-Tencor, 6.900%, 05/01/18
|
200 | 240 | - | - | 200 | 240 | ||||||||||||||||||
|
Lexmark International, 5.125%, 03/15/20
|
2,250 | 2,305 | - | - | 2,250 | 2,305 | ||||||||||||||||||
|
Nokia, 5.375%, 05/15/19
|
950 | 905 | - | - | 950 | 905 | ||||||||||||||||||
|
Texas Instruments, 1.650%, 08/03/19
|
- | - | 345 | 344 | 345 | 344 | ||||||||||||||||||
|
Western Union, 5.253%, 04/01/20
|
2,000 | 2,143 | - | - | 2,000 | 2,143 | ||||||||||||||||||
|
Xerox, 8.250%, 05/15/14
|
473 | 510 | - | - | 473 | 510 | ||||||||||||||||||
|
Xerox, 6.350%, 05/15/18
|
- | - | 160 | 187 | 160 | 187 | ||||||||||||||||||
|
Total Information Technology
|
10,894 | 999 | 11,893 | |||||||||||||||||||||
|
Materials - 6.4%
|
||||||||||||||||||||||||
|
Airgas, 2.900%, 11/15/22
|
250 | 245 | - | - | 250 | 245 | ||||||||||||||||||
|
Alcoa, 6.750%, 07/15/18
|
700 | 799 | - | - | 700 | 799 | ||||||||||||||||||
|
Alcoa, 6.150%, 08/15/20
|
200 | 218 | - | - | 200 | 218 | ||||||||||||||||||
|
Alcoa, 5.720%, 02/23/19
|
385 | 414 | - | - | 385 | 414 | ||||||||||||||||||
|
AngloGold Ashanti Holdings, 5.375%, 04/15/20
|
1,317 | 1,394 | - | - | 1,317 | 1,394 | ||||||||||||||||||
|
ArcelorMittal, 9.500%, 02/15/15
|
400 | 452 | - | - | 400 | 452 | ||||||||||||||||||
|
ArcelorMittal, 6.125%, 06/01/18
|
800 | 864 | - | - | 800 | 864 |
|
ArcelorMittal, 5.375%, 06/01/13
|
250 | 252 | - | - | 250 | 252 | ||||||||||||||||||
|
ArcelorMittal, 10.350%, 06/01/19
|
200 | 252 | - | - | 200 | 252 | ||||||||||||||||||
|
Cabot, 5.000%, 10/01/16
|
300 | 334 | - | - | 300 | 334 | ||||||||||||||||||
|
International Paper, 5.500%, 01/15/14
|
465 | 480 | - | - | 465 | 480 | ||||||||||||||||||
|
Kinross, 5.125%, 09/01/21
|
303 | 317 | - | - | 303 | 317 | ||||||||||||||||||
|
Rio Tinto Finance USA, 8.950%, 05/01/14
|
100 | 109 | - | - | 100 | 109 | ||||||||||||||||||
|
Rio Tinto Finance USA, 6.500%, 07/15/18
|
- | - | 100 | 122 | 100 | 122 | ||||||||||||||||||
|
RPM International, 6.125%, 10/15/19
|
150 | 176 | - | - | 150 | 176 | ||||||||||||||||||
|
RPM International, 3.450%, 11/15/22
|
250 | 248 | - | - | 250 | 248 | ||||||||||||||||||
|
Southern Copper, 6.375%, 07/27/15
|
380 | 417 | - | - | 380 | 417 | ||||||||||||||||||
|
Vale Inco, 5.700%, 10/15/15
|
100 | 109 | - | - | 100 | 109 | ||||||||||||||||||
|
Vale Overseas, 6.875%, 11/21/36
|
- | - | 100 | 114 | 100 | 114 | ||||||||||||||||||
|
Vale Overseas, 5.625%, 09/15/19
|
350 | 395 | 165 | 186 | 515 | 581 | ||||||||||||||||||
|
Volkswagen International Finance, 2.375%, 03/22/17 (A)
|
- | - | 125 | 130 | 125 | 130 | ||||||||||||||||||
|
Vulcan Materials, 6.400%, 11/30/17
|
1,000 | 1,115 | - | - | 1,000 | 1,115 | ||||||||||||||||||
|
Worthington Industries, 6.500%, 04/15/20
|
250 | 273 | - | - | 250 | 273 | ||||||||||||||||||
|
Xstrata Canada, 6.000%, 10/15/15
|
1,192 | 1,322 | - | - | 1,192 | 1,322 | ||||||||||||||||||
|
Xstrata Canada, 5.500%, 06/15/17
|
1,010 | 1,142 | - | - | 1,010 | 1,142 | ||||||||||||||||||
|
Total Materials
|
11,327 | 552 | 11,879 | |||||||||||||||||||||
|
REITs - 5.4%
|
||||||||||||||||||||||||
|
Boston Properties, 5.875%, 10/15/19
|
- | - | 150 | 180 | 150 | 180 | ||||||||||||||||||
|
CommonWealth REIT, 6.650%, 01/15/18
|
300 | 344 | - | - | 300 | 344 | ||||||||||||||||||
|
CommonWealth REIT, 5.875%, 09/15/20
|
105 | 115 | - | - | 105 | 115 | ||||||||||||||||||
|
DDR, 4.625%, 07/15/22
|
250 | 270 | - | - | 250 | 270 | ||||||||||||||||||
|
Equity One, 3.750%, 11/15/22
|
250 | 249 | - | - | 250 | 249 | ||||||||||||||||||
|
HCP, 6.000%, 03/01/15
|
215 | 234 | - | - | 215 | 234 | ||||||||||||||||||
|
HCP, 6.000%, 01/30/17
|
350 | 405 | - | - | 350 | 405 | ||||||||||||||||||
|
HCP, 5.650%, 12/15/13
|
250 | 259 | - | - | 250 | 259 | ||||||||||||||||||
|
HCP, 2.625%, 02/01/20
|
- | - | 195 | 196 | 195 | 196 | ||||||||||||||||||
|
HCP, MTN, 6.300%, 09/15/16
|
462 | 535 | - | - | 462 | 535 | ||||||||||||||||||
|
Health Care REIT, 5.875%, 05/15/15
|
268 | 294 | - | - | 268 | 294 | ||||||||||||||||||
|
Health Care, 4.950%, 01/15/21
|
- | - | 165 | 184 | 165 | 184 | ||||||||||||||||||
|
Healthcare Realty Trust, 6.500%, 01/17/17
|
250 | 288 | - | - | 250 | 288 | ||||||||||||||||||
|
Healthcare Realty Trust, 5.125%, 04/01/14
|
695 | 725 | - | - | 695 | 725 | ||||||||||||||||||
|
Highwoods Realty, 3.625%, 01/15/23
|
200 | 198 | - | - | 200 | 198 | ||||||||||||||||||
|
Liberty Property, MTN, 7.500%, 01/15/18
|
177 | 216 | - | - | 177 | 216 | ||||||||||||||||||
|
National Retail Properties, 6.875%, 10/15/17
|
300 | 358 | - | - | 300 | 358 | ||||||||||||||||||
|
National Retail Properties, 3.800%, 10/15/22
|
350 | 358 | - | - | 350 | 358 | ||||||||||||||||||
|
Post Apartment Homes, 3.375%, 12/01/22
|
200 | 202 | - | - | 200 | 202 | ||||||||||||||||||
|
Prologis, 7.375%, 10/30/19
|
558 | 699 | - | - | 558 | 699 | ||||||||||||||||||
|
Prologis, 6.875%, 03/15/20
|
279 | 343 | - | - | 279 | 343 | ||||||||||||||||||
|
Realty Income, 5.950%, 09/15/16
|
129 | 148 | - | - | 129 | 148 | ||||||||||||||||||
|
Realty Income, 3.250%, 10/15/22
|
200 | 196 | - | - | 200 | 196 | ||||||||||||||||||
|
Senior Housing Properties Trust, 6.750%, 12/15/21
|
500 | 578 | - | - | 500 | 578 | ||||||||||||||||||
|
Senior Housing Properties Trust, 4.300%, 01/15/16
|
500 | 523 | - | - | 500 | 523 | ||||||||||||||||||
|
Simon Property Group, 6.100%, 05/01/16
|
600 | 686 | - | - | 600 | 686 | ||||||||||||||||||
|
Simon Property Group, 5.750%, 12/01/15
|
408 | 456 | - | - | 408 | 456 | ||||||||||||||||||
|
Simon Property Group, 2.150%, 09/15/17
|
- | - | 350 | 361 | 350 | 361 | ||||||||||||||||||
|
Tanger Properties, 6.150%, 11/15/15
|
115 | 130 | - | - | 115 | 130 | ||||||||||||||||||
|
Washington Real Estate Investment Trust, 3.950%, 10/15/22
|
250 | 255 | - | - | 250 | 255 | ||||||||||||||||||
|
Total REITs
|
9,064 | 921 | 9,985 | |||||||||||||||||||||
|
Shipping & Transportation - 0.9%
|
||||||||||||||||||||||||
|
Burlington Northern Santa Fe, 3.000%, 03/15/23
|
250 | 252 | - | - | 250 | 252 | ||||||||||||||||||
|
Federal Express 1998 Pass Through Trust, 7.020%, 01/15/16
|
568 | 620 | - | - | 568 | 620 | ||||||||||||||||||
|
GATX, 8.750%, 05/15/14
|
200 | 217 | - | - | 200 | 217 | ||||||||||||||||||
|
GATX, 6.000%, 02/15/18
|
170 | 191 | - | - | 170 | 191 | ||||||||||||||||||
|
Union Pacific, 4.875%, 01/15/15
|
400 | 429 | - | - | 400 | 429 | ||||||||||||||||||
|
Total Shipping & Transportation
|
1,709 | - | 1,709 | |||||||||||||||||||||
|
Telecommunication Services - 5.1%
|
||||||||||||||||||||||||
|
America Movil, 5.750%, 01/15/15
|
186 | 201 | - | - | 186 | 201 | ||||||||||||||||||
|
AT&T, 5.600%, 05/15/18
|
- | - | 310 | 368 | 310 | 368 | ||||||||||||||||||
|
British Telecommunications, 9.625%, 12/15/30
|
- | - | 100 | 155 | 100 | 155 | ||||||||||||||||||
|
CenturyLink, 6.450%, 06/15/21
|
355 | 376 | - | - | 355 | 376 | ||||||||||||||||||
|
CenturyLink, 5.800%, 03/15/22
|
250 | 253 | - | - | 250 | 253 | ||||||||||||||||||
|
COX Communications, 7.250%, 11/15/15
|
231 | 267 | - | - | 231 | 267 | ||||||||||||||||||
|
COX Communications, MTN, 6.850%, 01/15/18
|
224 | 270 | - | - | 224 | 270 | ||||||||||||||||||
|
Deutsche Telekom International Finance, 8.750%, 06/15/30
|
- | - | 75 | 106 | 75 | 106 | ||||||||||||||||||
|
Deutsche Telekom International Finance, 6.000%, 07/08/19
|
- | - | 50 | 60 | 50 | 60 | ||||||||||||||||||
|
GTE, 6.840%, 04/15/18
|
- | - | 100 | 124 | 100 | 124 | ||||||||||||||||||
|
New Cingular Wireless Services, 8.750%, 03/01/31
|
- | - | 75 | 117 | 75 | 117 |
|
Qwest, 6.500%, 06/01/17
|
100 | 116 | - | - | 100 | 116 | ||||||||||||||||||
|
Telecom Italia Capital, 7.200%, 07/18/36
|
- | - | 75 | 75 | 75 | 75 | ||||||||||||||||||
|
Telecom Italia Capital, 7.175%, 06/18/19
|
100 | 114 | - | - | 100 | 114 | ||||||||||||||||||
|
Telecom Italia Capital, 6.999%, 06/04/18
|
600 | 677 | - | - | 600 | 677 | ||||||||||||||||||
|
Telecom Italia Capital, 6.175%, 06/18/14
|
625 | 654 | - | - | 625 | 654 | ||||||||||||||||||
|
Telecom Italia Capital, 5.250%, 11/15/13
|
560 | 571 | - | - | 560 | 571 | ||||||||||||||||||
|
Telecom Italia Capital, 5.250%, 10/01/15
|
700 | 738 | - | - | 700 | 738 | ||||||||||||||||||
|
Telecom Italia Capital, 4.950%, 09/30/14
|
832 | 862 | - | - | 832 | 862 | ||||||||||||||||||
|
Telefonica Emisiones, 6.421%, 06/20/16
|
200 | 222 | 75 | 83 | 275 | 305 | ||||||||||||||||||
|
Telefonica Emisiones SAU, 6.221%, 07/03/17
|
286 | 320 | - | - | 286 | 320 | ||||||||||||||||||
|
Telefonica Emisiones SAU, 5.462%, 02/16/21
|
115 | 124 | - | - | 115 | 124 | ||||||||||||||||||
|
Telefonica Emisiones SAU, 5.134%, 04/27/20
|
300 | 316 | - | - | 300 | 316 | ||||||||||||||||||
|
Telefonica Emisiones SAU, 4.949%, 01/15/15
|
764 | 802 | - | - | 764 | 802 | ||||||||||||||||||
|
Telefonica Emisiones SAU, 3.992%, 02/16/16
|
500 | 521 | - | - | 500 | 521 | ||||||||||||||||||
|
Telefonica Emisiones SAU, 3.729%, 04/27/15
|
400 | 414 | - | - | 400 | 414 | ||||||||||||||||||
|
Verizon Communications, 3.000%, 04/01/16
|
- | - | 345 | 365 | 345 | 365 | ||||||||||||||||||
|
Verizon New England, 4.750%, 10/01/13
|
250 | 255 | - | - | 250 | 255 | ||||||||||||||||||
|
Total Telecommunication Services
|
8,073 | 1,453 | 9,526 | |||||||||||||||||||||
|
Utilities - 5.6%
|
||||||||||||||||||||||||
|
AES Gener, 7.500%, 03/25/14
|
61 | 64 | - | - | 61 | 64 | ||||||||||||||||||
|
American Water Capital, 6.085%, 10/15/17
|
310 | 370 | - | - | 310 | 370 | ||||||||||||||||||
|
AmeriGas Partners, 6.500%, 05/20/21
|
477 | 508 | - | - | 477 | 508 | ||||||||||||||||||
|
Arizona Public Service, 6.250%, 08/01/16
|
44 | 51 | - | - | 44 | 51 | ||||||||||||||||||
|
British Transco Finance, 6.625%, 06/01/18
|
128 | 158 | - | - | 128 | 158 | ||||||||||||||||||
|
Carolina Power & Light, 5.150%, 04/01/15
|
- | - | 80 | 87 | 80 | 87 | ||||||||||||||||||
|
Cleveland Electric Illuminating, 7.880%, 11/01/17
|
10 | 12 | - | - | 10 | 12 | ||||||||||||||||||
|
Cleveland Electric Illuminating, 5.700%, 04/01/17
|
10 | 11 | - | - | 10 | 11 | ||||||||||||||||||
|
Commonwealth Edison, 4.700%, 04/15/15
|
250 | 270 | - | - | 250 | 270 | ||||||||||||||||||
|
Enersis, 7.375%, 01/15/14
|
263 | 275 | - | - | 263 | 275 | ||||||||||||||||||
|
Entergy Mississippi, 4.950%, 06/01/18
|
39 | 39 | - | - | 39 | 39 | ||||||||||||||||||
|
Entergy Mississippi, 6.640%, 07/01/19
|
540 | 646 | - | - | 540 | 646 | ||||||||||||||||||
|
Entergy New Orleans, 5.250%, 08/01/13
|
250 | 253 | - | - | 250 | 253 | ||||||||||||||||||
|
Entergy Texas, 7.125%, 02/01/19
|
190 | 236 | - | - | 190 | 236 | ||||||||||||||||||
|
Exelon Generation, 4.250%, 06/15/22
|
- | - | 100 | 105 | 100 | 105 | ||||||||||||||||||
|
Exelon, 5.625%, 06/15/35
|
- | - | 75 | 83 | 75 | 83 | ||||||||||||||||||
|
Jersey Central Power & Light, 5.625%, 05/01/16
|
265 | 298 | - | - | 265 | 298 | ||||||||||||||||||
|
KeySpan, 8.000%, 11/15/30
|
- | - | 50 | 67 | 50 | 67 | ||||||||||||||||||
|
Korea Electric Power, 6.750%, 08/01/27
|
- | - | 75 | 102 | 75 | 102 | ||||||||||||||||||
|
Korea Electric Power, 7.750%, 04/01/13
|
- | - | 95 | 95 | 95 | 95 | ||||||||||||||||||
|
National Fuel Gas, 4.900%, 12/01/21
|
500 | 557 | - | - | 500 | 557 | ||||||||||||||||||
|
National Grid, 6.300%, 08/01/16
|
270 | 314 | - | - | 270 | 314 | ||||||||||||||||||
|
Northern Indiana Public Service, MTN, 7.590%, 06/12/17
|
440 | 513 | - | - | 440 | 513 | ||||||||||||||||||
|
NuStar Pipeline Operating Partnership, 5.875%, 06/01/13
|
570 | 573 | - | - | 570 | 573 | ||||||||||||||||||
|
Ohio Edison, 5.450%, 05/01/15
|
236 | 258 | - | - | 236 | 258 | ||||||||||||||||||
|
Ohio Edison, 6.400%, 07/15/16
|
217 | 252 | - | - | 217 | 252 | ||||||||||||||||||
|
ONEOK, 4.250%, 02/01/22
|
350 | 372 | 100 | 106 | 450 | 478 | ||||||||||||||||||
|
PacifiCorp, 5.450%, 09/15/13
|
500 | 511 | - | - | 500 | 511 | ||||||||||||||||||
|
Panhandle Eastern Pipe Line, 7.000%, 06/15/18
|
396 | 481 | - | - | 396 | 481 | ||||||||||||||||||
|
Pennsylvania Electric, 6.625%, 04/01/19
|
15 | 17 | - | - | 15 | 17 | ||||||||||||||||||
|
PPL Energy Supply, 5.700%, 10/15/15
|
- | - | 75 | 82 | 75 | 82 | ||||||||||||||||||
|
Puget Energy, 5.625%, 07/15/22
|
250 | 275 | - | - | 250 | 275 | ||||||||||||||||||
|
Puget Sound Energy, MTN, 6.740%, 06/15/18
|
57 | 71 | - | - | 57 | 71 | ||||||||||||||||||
|
Southwestern Electric Power, 3.550%, 02/15/22
|
500 | 521 | - | - | 500 | 521 | ||||||||||||||||||
|
Southwestern Electric Power, 5.875%, 03/01/18
|
581 | 683 | - | - | 581 | 683 | ||||||||||||||||||
|
Southwestern Public Service, 8.750%, 12/01/18
|
250 | 335 | - | - | 250 | 335 | ||||||||||||||||||
|
Trans-Allegheny Interstate Line, 4.000%, 01/15/15 (A)
|
- | - | 100 | 105 | 100 | 105 | ||||||||||||||||||
|
TransAlta, 5.750%, 12/15/13
|
480 | 496 | - | - | 480 | 496 | ||||||||||||||||||
|
Virginia Electric and Power, 8.875%, 11/15/38
|
- | - | 100 | 168 | 100 | 168 | ||||||||||||||||||
|
Xcel Energy, 5.613%, 04/01/17
|
10 | 12 | - | - | 10 | 12 | ||||||||||||||||||
|
Total Utilities
|
9,432 | 1,000 | 10,432 | |||||||||||||||||||||
|
Total Corporate Bonds
|
112,129 | 18,603 | 130,732 | |||||||||||||||||||||
|
U.S. Government Agency Obligations - 8.1%
|
||||||||||||||||||||||||
|
FFCB, 3.600%, 05/14/32
|
200 | 200 | - | - | 200 | 200 | ||||||||||||||||||
|
FFCB, 3.500%, 02/28/33
|
2,000 | 2,008 | - | - | 2,000 | 2,008 | ||||||||||||||||||
|
FHLB, 5.500%, 08/20/18
|
225 | 230 | - | - | 225 | 230 | ||||||||||||||||||
|
FHLB, 3.480%, 03/25/33
|
990 | 986 | - | - | 990 | 986 | ||||||||||||||||||
|
FHLB, 3.400%, 10/04/32
|
1,667 | 1,662 | - | - | 1,667 | 1,662 | ||||||||||||||||||
|
FHLB, 3.400%, 03/28/33
|
1,000 | 1,002 | - | - | 1,000 | 1,002 | ||||||||||||||||||
|
FHLB, 3.100%, 07/09/26
|
538 | 538 | - | - | 538 | 538 | ||||||||||||||||||
|
FHLB, 3.070%, 10/15/27
|
110 | 110 | - | - | 110 | 110 | ||||||||||||||||||
|
FHLMC, 5.500%, 05/01/37
|
38 | 41 | - | - | 38 | 41 | ||||||||||||||||||
|
FHLMC, 2.500%, 01/07/14
|
- | - | 380 | 387 | 380 | 387 |
|
FHLMC, 1.000%, 09/29/17
|
- | - | 560 | 564 | 560 | 564 | ||||||||||||||||||
|
FNMA, 4.625%, 10/15/13
|
- | - | 415 | 425 | 415 | 425 | ||||||||||||||||||
|
FNMA, 3.400%, 09/27/32
|
4,000 | 4,011 | - | - | 4,000 | 4,011 | ||||||||||||||||||
|
FNMA, 2.875%, 12/11/13
|
- | - | 460 | 469 | 460 | 469 | ||||||||||||||||||
|
FNMA, 2.375%, 07/28/15
|
- | - | 870 | 910 | 870 | 910 | ||||||||||||||||||
|
FNMA, 1.375%, 11/15/16
|
- | - | 530 | 546 | 530 | 546 | ||||||||||||||||||
|
FNMA, 1.125%, 04/27/17
|
- | - | 200 | 204 | 200 | 204 | ||||||||||||||||||
|
FNMA, 0.625%, 10/30/14
|
- | - | 905 | 910 | 905 | 910 | ||||||||||||||||||
|
Total U.S. Government Agency Obligations
|
10,788 | 4,415 | 15,203 | |||||||||||||||||||||
|
Preferred Stock - 6.4%
|
||||||||||||||||||||||||
|
Energy - 0.1%
|
||||||||||||||||||||||||
|
NextEra Energy Capital Holdings
|
10 | 260 | - | - | 10 | 260 | ||||||||||||||||||
|
Financials 2.6%
|
||||||||||||||||||||||||
|
BB&T
|
10 | 255 | - | - | 10 | 255 | ||||||||||||||||||
|
Charles Schwab
|
20 | 528 | - | - | 20 | 528 | ||||||||||||||||||
|
Citigroup*
|
10 | 249 | - | - | 10 | 249 | ||||||||||||||||||
|
Digital Realty Trust
|
10 | 270 | - | - | 10 | 270 | ||||||||||||||||||
|
Goldman Sachs Group
|
25 | 633 | - | - | 25 | 633 | ||||||||||||||||||
|
HSBC Holdings
|
30 | 843 | - | - | 30 | 843 | ||||||||||||||||||
|
JPMorgan Chase
|
20 | 506 | - | - | 20 | 506 | ||||||||||||||||||
|
Kimco Realty
|
10 | 254 | - | - | 10 | 254 | ||||||||||||||||||
|
PPL Capital Funding*
|
10 | 252 | - | - | 10 | 252 | ||||||||||||||||||
|
Prudential Financial
|
10 | 254 | - | - | 10 | 254 | ||||||||||||||||||
|
Vornado Realty Trust
|
20 | 509 | - | - | 20 | 509 | ||||||||||||||||||
|
Wells Fargo
|
10 | 255 | - | - | 10 | 255 | ||||||||||||||||||
|
Total Financials
|
4,808 | - | 4,808 | |||||||||||||||||||||
|
Industrials - 0.4%
|
||||||||||||||||||||||||
|
Pitney Bowes
|
10 | 257 | - | - | 10 | 257 | ||||||||||||||||||
|
Stanley Black & Decker
|
20 | 528 | - | - | 20 | 528 | ||||||||||||||||||
|
Total Industrials
|
785 | - | 785 | |||||||||||||||||||||
|
REITs -1.4%
|
||||||||||||||||||||||||
|
National Retail Properties
|
20 | 531 | - | - | 20 | 531 | ||||||||||||||||||
|
Realty Income
|
20 | 534 | - | - | 20 | 534 | ||||||||||||||||||
|
Senior Housing Properties Trust
|
53 | 1,315 | - | - | 53 | 1,315 | ||||||||||||||||||
|
Ventas Realty
|
10 | 252 | - | - | 10 | 252 | ||||||||||||||||||
|
Total REITs
|
2,632 | - | 2,632 | |||||||||||||||||||||
|
Telecommunication Services - 1.2%
|
||||||||||||||||||||||||
|
Qwest
|
44 | 1,172 | - | - | 44 | 1,172 | ||||||||||||||||||
|
Telephone & Data Systems
|
30 | 758 | - | - | 30 | 758 | ||||||||||||||||||
|
United States Cellular
|
10 | 265 | - | - | 10 | 265 | ||||||||||||||||||
|
Total Telecommunication Services
|
2,195 | - | 2,195 | |||||||||||||||||||||
|
Utilities - 0.7%
|
||||||||||||||||||||||||
|
DTE Energy
|
20 | 551 | - | - | 20 | 551 | ||||||||||||||||||
|
Entergy Louisiana
|
10 | 258 | - | - | 10 | 258 | ||||||||||||||||||
|
SCE Trust I
|
20 | 526 | - | - | 20 | 526 | ||||||||||||||||||
|
Total Utilities
|
1,335 | - | 1,335 | |||||||||||||||||||||
|
Total Preferred Stocks
|
12,015 | - | 12,015 | |||||||||||||||||||||
|
U.S. Treasury Obligations - 4.9%
|
||||||||||||||||||||||||
|
U.S. Treasury Bond, 6.250%, 08/15/23
|
- | - | 675 | 955 | 675 | 955 | ||||||||||||||||||
|
U.S. Treasury Bond, 5.250%, 11/15/28
|
- | - | 900 | 1,219 | 900 | 1,219 | ||||||||||||||||||
|
U.S. Treasury Bond, 2.625%, 04/30/16
|
- | - | 385 | 411 | 385 | 411 | ||||||||||||||||||
|
U.S. Treasury Bond, 2.625%, 11/15/20
|
- | - | 425 | 464 | 425 | 464 | ||||||||||||||||||
|
U.S. Treasury Bond, 0.875%, 07/31/19
|
- | - | 815 | 804 | 815 | 804 | ||||||||||||||||||
|
U.S. Treasury Note, 4.375%, 02/15/38
|
- | - | 950 | 1,188 | 950 | 1,188 | ||||||||||||||||||
|
U.S. Treasury Note, 2.750%, 02/15/19
|
- | - | 795 | 877 | 795 | 877 | ||||||||||||||||||
|
U.S. Treasury Note, 2.375%, 07/31/17
|
- | - | 710 | 763 | 710 | 763 | ||||||||||||||||||
|
U.S. Treasury Note, 1.750%, 05/15/22
|
- | - | 730 | 732 | 730 | 732 | ||||||||||||||||||
|
U.S. Treasury Note, 1.250%, 04/30/19
|
- | - | 1,675 | 1,698 | 1,675 | 1,698 | ||||||||||||||||||
|
Total U.S. Treasury Obligations
|
- | 9,111 | 9,111 | |||||||||||||||||||||
|
U.S. Government Mortgage-Backed Obligations - 4.8%
|
||||||||||||||||||||||||
|
FHLMC, Pool A93505, 4.500%, 08/01/40
|
- | - | 79 | 84 | 79 | 84 | ||||||||||||||||||
|
FHLMC, Pool A93996, 4.500%, 09/01/40
|
- | - | 111 | 119 | 111 | 119 | ||||||||||||||||||
|
FHLMC, Pool C03490, 4.500%, 08/01/40
|
- | - | 574 | 614 | 574 | 614 | ||||||||||||||||||
|
FHLMC, Pool C09015, 3.000%, 10/01/42
|
- | - | 269 | 276 | 269 | 276 |
|
FHLMC, Pool C20300, 6.500%, 01/01/29
|
- | - | 5 | 6 | 5 | 6 | ||||||||||||||||||
|
FHLMC, Pool E01280, 5.000%, 12/01/17
|
- | - | 9 | 10 | 9 | 10 | ||||||||||||||||||
|
FHLMC, Pool G04222, 5.500%, 04/01/38
|
- | - | 55 | 60 | 55 | 60 | ||||||||||||||||||
|
FHLMC, Pool G04913, 5.000%, 03/01/38
|
- | - | 172 | 185 | 172 | 185 | ||||||||||||||||||
|
FHLMC, Pool G08003, 6.000%, 07/01/34
|
- | - | 36 | 40 | 36 | 40 | ||||||||||||||||||
|
FHLMC, Pool G11431, 6.000%, 02/01/18
|
- | - | 6 | 6 | 6 | 6 | ||||||||||||||||||
|
FHLMC, Pool G11880, 5.000%, 12/01/20
|
- | - | 29 | 31 | 29 | 31 | ||||||||||||||||||
|
FHLMC, Pool G18124, 6.000%, 06/01/21
|
- | - | 21 | 24 | 21 | 24 | ||||||||||||||||||
|
FHLMC, Pool J19197, 3.000%, 05/01/27
|
- | - | 232 | 245 | 232 | 245 | ||||||||||||||||||
|
FHLMC, Pool Q08998, 3.500%, 06/01/42
|
- | - | 243 | 256 | 243 | 256 | ||||||||||||||||||
|
FHLMC, Pool Q10378, 3.000%, 08/01/42
|
- | - | 260 | 267 | 260 | 267 | ||||||||||||||||||
|
FHLMC ARM, 2.807%, 01/01/35 (B)
|
- | - | 6 | 7 | 6 | 7 | ||||||||||||||||||
|
FHLMC ARM, 2.801%, 01/01/35 (B)
|
- | - | 11 | 12 | 11 | 12 | ||||||||||||||||||
|
FHLMC ARM, 2.745%, 12/01/34 (B)
|
- | - | 18 | 19 | 18 | 19 | ||||||||||||||||||
|
FHLMC Multifamily Structured Pass-Through Certificates, Ser 2011-K704, Cl A2, 2.412%, 08/25/18
|
- | - | 400 | 422 | 400 | 422 | ||||||||||||||||||
|
FHLMC Multifamily Structured Pass-Through Certificates, Ser 2012-K705, Cl A2, 2.303%, 09/25/18
|
- | - | 200 | 210 | 200 | 210 | ||||||||||||||||||
|
FHLMC Multifamily Structured Pass-Through Certificates, Ser 2012-K706, Cl A2, 2.323%, 10/25/18
|
- | - | 150 | 157 | 150 | 157 | ||||||||||||||||||
|
FHLMC Multifamily Structured Pass-Through Certificates, Ser 2012-K708, Cl A2, 2.130%, 01/25/19
|
- | - | 300 | 311 | 300 | 311 | ||||||||||||||||||
|
FHLMC REMIC, Ser 2007-R010, Cl VA, 5.500%, 04/15/17
|
- | - | 44 | 44 | 44 | 44 | ||||||||||||||||||
|
FHLMC REMIC, Ser 2804, Cl VC, 5.000%, 07/15/21
|
- | - | 118 | 130 | 118 | 130 | ||||||||||||||||||
|
FNMA, Pool 252570, 6.500%, 07/01/29
|
- | - | 9 | 10 | 9 | 10 | ||||||||||||||||||
|
FNMA, Pool 253183, 7.500%, 04/01/30
|
- | - | 1 | 1 | 1 | 1 | ||||||||||||||||||
|
FNMA, Pool 253398, 8.000%, 08/01/30
|
- | - | 3 | 4 | 3 | 4 | ||||||||||||||||||
|
FNMA, Pool 254545, 5.000%, 12/01/17
|
- | - | 25 | 27 | 25 | 27 | ||||||||||||||||||
|
FNMA, Pool 254685, 5.000%, 04/01/18
|
- | - | 21 | 23 | 21 | 23 | ||||||||||||||||||
|
FNMA, Pool 254949, 5.000%, 11/01/33
|
- | - | 27 | 29 | 27 | 29 | ||||||||||||||||||
|
FNMA, Pool 255814, 5.500%, 08/01/35
|
- | - | 59 | 65 | 59 | 65 | ||||||||||||||||||
|
FNMA, Pool 303168, 9.500%, 02/01/25
|
- | - | 3 | 4 | 3 | 4 | ||||||||||||||||||
|
FNMA, Pool 725424, 5.500%, 04/01/34
|
- | - | 45 | 49 | 45 | 49 | ||||||||||||||||||
|
FNMA, Pool 735060, 6.000%, 11/01/34
|
- | - | 28 | 32 | 28 | 32 | ||||||||||||||||||
|
FNMA, Pool 735228, 5.500%, 02/01/35
|
- | - | 24 | 27 | 24 | 27 | ||||||||||||||||||
|
FNMA, Pool 735230, 5.500%, 02/01/35
|
- | - | 59 | 66 | 59 | 66 | ||||||||||||||||||
|
FNMA, Pool 745275, 5.000%, 02/01/36
|
- | - | 251 | 273 | 251 | 273 | ||||||||||||||||||
|
FNMA, Pool 745418, 5.500%, 04/01/36
|
- | - | 307 | 337 | 307 | 337 | ||||||||||||||||||
|
FNMA, Pool 844809, 5.000%, 11/01/35
|
- | - | 135 | 147 | 135 | 147 | ||||||||||||||||||
|
FNMA, Pool AD0454, 5.000%, 11/01/21
|
- | - | 66 | 72 | 66 | 72 | ||||||||||||||||||
|
FNMA, Pool AD8522, 4.000%, 08/01/40
|
- | - | 80 | 85 | 80 | 85 | ||||||||||||||||||
|
FNMA, Pool AE0828, 3.500%, 02/01/41
|
- | - | 484 | 511 | 484 | 511 | ||||||||||||||||||
|
FNMA, Pool AE0949, 4.000%, 02/01/41
|
- | - | 518 | 553 | 518 | 553 | ||||||||||||||||||
|
FNMA, Pool AH0621, 3.500%, 01/01/41
|
- | - | 121 | 128 | 121 | 128 | ||||||||||||||||||
|
FNMA, Pool AJ1407, 4.000%, 09/01/41
|
- | - | 120 | 128 | 120 | 128 | ||||||||||||||||||
|
FNMA, Pool AJ7689, 4.000%, 12/01/41
|
- | - | 366 | 391 | 366 | 391 | ||||||||||||||||||
|
FNMA, Pool AO2970, 3.000%, 05/01/42
|
- | - | 248 | 256 | 248 | 256 | ||||||||||||||||||
|
FNMA, Pool AO4137, 3.500%, 06/01/42
|
- | - | 270 | 286 | 270 | 286 | ||||||||||||||||||
|
FNMA, Pool MA1277, 2.500%, 12/01/27
|
- | - | 194 | 201 | 194 | 201 | ||||||||||||||||||
|
FNMA ARM, 2.590%, 04/01/35 (B)
|
- | - | 83 | 87 | 83 | 87 | ||||||||||||||||||
|
FNMA REMIC, Ser 33, Cl LD, 4.250%, 09/25/22
|
- | - | 7 | 7 | 7 | 7 | ||||||||||||||||||
|
FNMA Whole Loan, Ser W6, Cl 1A6, 5.500%, 07/25/34
|
- | - | 30 | 30 | 30 | 30 | ||||||||||||||||||
|
GNMA, Pool 780315, 9.500%, 12/15/17
|
- | - | 4 | 5 | 4 | 5 | ||||||||||||||||||
|
GNMA, Pool G2 4696, 4.500%, 05/20/40
|
- | - | 266 | 294 | 266 | 294 | ||||||||||||||||||
|
GNMA, Pool G2 4747, 5.000%, 07/20/40
|
- | - | 103 | 115 | 103 | 115 | ||||||||||||||||||
|
GNMA, Pool G2 4923, 4.500%, 01/20/41
|
- | - | 139 | 153 | 139 | 153 | ||||||||||||||||||
|
GNMA, Pool G2 MA0155, 4.000%, 06/20/42
|
- | - | 345 | 374 | 345 | 374 | ||||||||||||||||||
|
GNMA, Pool G2 MA0392, 3.500%, 09/20/42
|
- | - | 313 | 335 | 313 | 335 | ||||||||||||||||||
|
NCUA Guaranteed Notes, Ser 2010-C1, Cl A2, 2.900%, 10/29/20
|
- | - | 225 | 240 | 225 | 240 | ||||||||||||||||||
|
NCUA Guaranteed Notes, Ser 2010-R1, Cl 2A, 1.840%, 10/07/20
|
- | - | 76 | 77 | 76 | 77 | ||||||||||||||||||
|
Total U.S. Government Mortgage-Backed Obligations
|
- | 8,957 | 8,957 | |||||||||||||||||||||
|
Asset-Backed Securities - 1.4%
|
||||||||||||||||||||||||
|
American Express Credit Account Master Trust, Ser 2008-5, Cl A, 1.003%, 03/15/16 (B)
|
- | - | 200 | 201 | 200 | 201 | ||||||||||||||||||
|
American Express Credit Account Master Trust, Ser 2009-2, Cl A, 1.453%, 03/15/17 (B)
|
- | - | 575 | 584 | 575 | 584 | ||||||||||||||||||
|
Bayview Financial Acquisition Trust, Ser 2007-A, Cl 1A2, 6.205%, 05/28/37
|
- | - | 158 | 161 | 158 | 161 | ||||||||||||||||||
|
BT SPE (Acquired 07/06/11, Acquisition Cost $1,611,982), 9.250%, 06/06/16 (E) (F) (G)
|
1,612 | 1,561 | - | - | 1,612 | 1,561 |
|
Cityscape Home Equity Loan Trust, Ser 1997-C, Cl A4, 7.000%, 07/25/28
|
- | - | 3 | - | 3 | - | ||||||||||||||||||
|
Contimortgage Home Equity Loan Trust, Ser 1997-2, Cl A9, 7.090%, 04/15/28
|
- | - | - | - | - | - | ||||||||||||||||||
|
GMAC Mortgage Corporation Loan Trust, Ser 2004-GH1, Cl A6, 4.810%, 07/25/35
|
- | - | 60 | 58 | 60 | 58 | ||||||||||||||||||
|
Green Tree Financial, Ser 1997-7, Cl A6, 6.760%, 07/15/29
|
- | - | 42 | 45 | 42 | 45 | ||||||||||||||||||
|
RAAC, Ser 2004-SP1, Cl AI4, 5.285%, 08/25/27 (B)
|
- | - | 25 | 25 | 25 | 25 | ||||||||||||||||||
|
Residential Asset Mortgage Products, Ser 2002-RS3, Cl AI5, 5.572%, 06/25/32 (B)
|
- | - | 39 | 34 | 39 | 34 | ||||||||||||||||||
|
Total Asset-Backed Securities
|
1,561 | 1,108 | 2,669 | |||||||||||||||||||||
|
Commercial Mortgage-Backed Obligations - 1.1%
|
||||||||||||||||||||||||
|
Bear Stearns Commercial Mortgage Securities Trust 2005-PWR9, Ser PWR9, Cl A4A, 4.871%, 09/11/42
|
- | - | 200 | 216 | 200 | 216 | ||||||||||||||||||
|
Citigroup, Ser 2005-CD1, 5.219%, 07/15/44 (B)
|
- | - | 200 | 219 | 200 | 219 | ||||||||||||||||||
|
Citigroup, Ser 2007-CD4, Cl A2B, 5.205%, 12/11/49
|
- | - | 32 | 32 | 32 | 32 | ||||||||||||||||||
|
Commercial Mortgage, Ser 2005-C5, Cl A5A, Cl 0, 5.116%, 06/10/44 (B)
|
- | - | 275 | 299 | 275 | 299 | ||||||||||||||||||
|
Commercial Mortgage Trust, Ser CR2, Cl A4, 3.147%, 08/15/45
|
- | - | 125 | 130 | 125 | 130 | ||||||||||||||||||
|
GS Mortgage Securities II, Ser GCJ9, Cl A3, 2.773%, 11/10/45
|
- | - | 275 | 275 | 275 | 275 | ||||||||||||||||||
|
JPMorgan Chase Commercial Mortgage Securities Series 2005-CIBC12, Ser CB12, Cl A4, 4.895%, 09/12/37
|
- | - | 275 | 297 | 275 | 297 | ||||||||||||||||||
|
Morgan Stanley Bank of America Merrill Lynch Trust 2012-C6, Ser C6, Cl A4, 2.858%, 11/15/45
|
- | - | 275 | 278 | 275 | 278 | ||||||||||||||||||
|
Wachovia Bank Commercial Mortgage Trust, Ser 2005-C22, 5.297%, 12/15/44 (B)
|
- | - | 250 | 274 | 250 | 274 | ||||||||||||||||||
|
Total Commercial Mortgage-Backed Obligations
|
- | 2,020 | 2,020 | |||||||||||||||||||||
|
Residential Mortgage-Backed Securities - 0.1%
|
||||||||||||||||||||||||
|
Banc of America Alternative Loan Trust, Ser 2004-2, Cl 5A1, 5.500%, 03/25/19
|
- | - | 48 | 49 | 48 | 49 | ||||||||||||||||||
|
Chase Mortgage Finance, Ser 2003-S13, Cl A11, 5.500%, 11/25/33
|
- | - | 27 | 27 | 27 | 27 | ||||||||||||||||||
|
Residential Accredit Loans, Ser 2004-QS5, Cl A5, 4.750%, 04/25/34
|
- | - | 15 | 16 | 15 | 16 | ||||||||||||||||||
|
Residential Accredit Loans, Ser 2004-QS6, Cl A1, 5.000%, 05/25/19
|
- | - | 24 | 24 | 24 | 24 | ||||||||||||||||||
|
WaMu Mortgage Pass-Through Certificates, Ser 2004-CB2, Cl 5A, 5.000%, 07/25/19
|
- | - | 75 | 77 | 75 | 77 | ||||||||||||||||||
|
Total Residential Mortgage-Backed Securities
|
- | 193 | 193 | |||||||||||||||||||||
|
Sovereign Debt - 0.3%
|
||||||||||||||||||||||||
|
Province of Newfoundland Canada, 7.320%, 10/13/23
|
100 | 138 | - | - | 100 | 138 | ||||||||||||||||||
|
Province of Quebec Canada, 7.380%, 04/09/26
|
100 | 143 | - | - | 100 | 143 | ||||||||||||||||||
|
Region of Lombardy, 5.804%, 10/25/32
|
150 | 142 | - | - | 150 | 142 | ||||||||||||||||||
|
United Mexican States, MTN, 5.125%, 07/25/19
|
- | - | 100 | 117 | 100 | 117 | ||||||||||||||||||
|
Total Sovereign Debt
|
423 | 117 | 540 | |||||||||||||||||||||
|
Convertible Bonds - 0.3%
|
||||||||||||||||||||||||
|
Information Technology - 0.3%
|
||||||||||||||||||||||||
|
Advanced Micro Devices, 6.000%, 05/01/15
|
256 | 254 | - | - | 256 | 254 | ||||||||||||||||||
|
Linear Technology, 3.000%, 05/01/27
|
258 | 276 | - | - | 258 | 276 | ||||||||||||||||||
|
Total Information Technology
|
530 | - | 530 | |||||||||||||||||||||
|
Total Convertible Bonds
|
530 | - | 530 | |||||||||||||||||||||
|
Municipal Bond - 0.1%
|
||||||||||||||||||||||||
|
Puerto Rico
|
||||||||||||||||||||||||
|
Government Development Bank for Puerto Rico, Ser B, RB, 4.704%, 05/01/16
|
- | - | 100 | 101 | 100 | 101 | ||||||||||||||||||
|
Total Municipal Bond
|
- | 101 | 101 | |||||||||||||||||||||
|
Certificate of Deposit - 0.1%
|
||||||||||||||||||||||||
|
Swiss Bank, 7.375%, 07/15/15
|
175 | 190 | - | - | 175 | 190 | ||||||||||||||||||
|
Total Certificate of Deposit
|
190 | - | 190 |
|
Short-Term Investments - 1.6%
|
||||||||||||||||||||||||
|
CNI Government Money Market Fund, Cl I, 0.010%**†
|
- | - | 721 | 721 | 721 | 721 | ||||||||||||||||||
|
First American Government Obligations Fund, 0.020%**
|
1,616 | 1,616 | - | - | 1,616 | 1,616 | ||||||||||||||||||
|
SEI Daily Income Trust Government Fund, Cl A, 0.020%**
|
- | - | 721 | 721 | 721 | 721 | ||||||||||||||||||
|
Total Short-Term Investments
|
1,616 | 1,442 | 3,058 | |||||||||||||||||||||
|
Total Investments - 99.3% (Cost $177,842)
|
$ | 139,252 | $ | 46,067 | $ | 185,319 | ||||||||||||||||||
|
Other Assets in Excess of Liabilities - 0.7%
|
1,411 | (159 | ) | 1,252 | ||||||||||||||||||||
|
Net Assets - 100.0%
|
$ | 140,663 | $ | 45,908 | $ | 186,571 |
|
*
|
Non-income producing security.
|
|
**
|
The rate reported is the 7-day effective yield as of March 31, 2013.
|
|
†
|
Investment in Affiliate.
|
|
(A)
|
Security exempt from registration under Rule 144A of the Securities Act of 1933. These securities may be resold in transactions exempt from registration normally to qualified institutions. On March 31, 2013, the value of these securities amounted to $3,511 ($ Thousands), representing 1.9% of net assets.
|
|
(B)
|
Floating Rate Security — The rate reported is the rate in effect on March 31, 2013
|
|
(C)
|
Step Bond — The rate reported is the rate in effect on March 31, 2013. The coupon on a step bond changes on a specific date.
|
|
(D)
|
In default on interest payments. Rate shown represents the last coupon rate prior to default.
|
|
(E)
|
Security is considered illiquid.
|
|
(F)
|
Security is considered restricted. The total market value of such security as of March 31, 2013 was $1,561 ($ Thousands) and represented .08% of net assets.
|
|
(G)
|
Security fair valued using methods determined in good faith by the Fair Value Committee designated by the Board of Trustees. The total market value of such securities as of March 31, 2013 was $1,561 ($ Thousands) and represented 0.8% of net assets.
|
ARM — Adjustable Rate Mortgage
Cl — Class
FFCB — Federal Farm Credit Bank
FHLB — Federal Home Loan Bank
FHLMC — Federal Home Loan Mortgage Corporation
FNMA — Federal National Mortgage Association
GNMA — Government National Mortgage Association
MTN — Medium Term Note
NA — National Association
NCUA — National Credit Union Administration
RB — Revenue Bond
REITs — Real Estate Investment Trusts
REMIC — Real Estate Mortgage Investment Conduit
Ser — Series
SPE — Special Purpose Entity
Amounts designated as “—” are either $0 or have been rounded to $0.
|
City National Rochdale
|
|
Intermediate Fixed Income Fund and Full Maturity Fixed Income Fund
|
|
Pro Forma Statement of Assets and Liabilities (000) (Unaudited)
|
|
March 31, 2013
|
|
City National
Rochdale
Intermediate Fixed
Income Fund
|
City National
Rochdale
Full Maturity Fixed
Income Fund
|
Proforma
Adjustments
|
Pro Forma
Combined
|
|||||||||||||
|
ASSETS
|
|
|||||||||||||||
|
Cost of securities
|
$ | 133,444 | $ | 44,398 | $ | 177,842 | ||||||||||
|
Investments in securities, at value
|
$ | 139,252 | $ | 45,346 | $ | 184,598 | ||||||||||
|
Affiliated investments, at value
|
- | 721 | 721 | |||||||||||||
|
Cash
|
25 | 8 | 33 | |||||||||||||
|
Dividend and income receivable
|
1,641 | 323 | 1,964 | |||||||||||||
|
Receivable for capital shares sold
|
526 | 13 | 539 | |||||||||||||
|
Receivable for investment securities sold
|
250 | - | 250 | |||||||||||||
|
Prepaid expenses
|
14 | 3 | 17 | |||||||||||||
|
TOTAL ASSETS
|
141,708 | 46,414 | 188,122 | |||||||||||||
|
LIABILITIES
|
||||||||||||||||
|
Payable for investment securities purchased
|
717 | 456 | 1,173 | |||||||||||||
|
Payable for capital shares redeemed
|
175 | - | 175 | |||||||||||||
|
Investment adviser fees payable
|
46 | 19 | 65 | |||||||||||||
|
Shareholder servicing and distribution fees payable
|
29 | - | 29 | |||||||||||||
|
Administrative fees payable
|
5 | 2 | 7 | |||||||||||||
|
Payable for income distributions
|
- | 13 | 13 | |||||||||||||
|
Accrued expenses
|
73 | 16 |
|
89 | ||||||||||||
|
TOTAL LIABILITIES
|
1,045 | 506 | 1,551 | |||||||||||||
|
NET ASSETS
|
$ | 140,663 | $ | 45,908 | $ | 186,571 | ||||||||||
|
Institutional Class Shares:
|
||||||||||||||||
|
Net Assets ($Dollars)
|
$ | - | $ | 45,613,820 | $ | 294,602 | $ | 45,908,422 | ||||||||
|
Total shares outstanding at end of period
|
- | 4,252,567 | (2,547,082 | ) | 1,705,485 | |||||||||||
|
Net asset value, offering and redemption price per share
|
||||||||||||||||
|
(net assets ÷ shares outstanding)
|
$ | - | $ | 10.73 | $ | 26.92 | ||||||||||
|
Class N Shares:
|
||||||||||||||||
|
Net Assets ($Dollars)
|
$ | 140,663,361 | $ | 294,602 | $ | (294,602 | ) | $ | 140,663,361 | |||||||
|
Total shares outstanding at end of period
|
5,225,600 | 27,491 | (27,491 | ) | 5,225,600 | |||||||||||
|
Net asset value, offering and redemption price per share
|
||||||||||||||||
|
(net assets ÷ shares outstanding)
|
$ | 26.92 | $ | 10.72 | $ | 26.92 | ||||||||||
|
Pro Forma Combining Statement of Operations (000) (Unaudited)
|
|
For the Twelve Months Ended March 31, 2013
|
|
City National
Rochdale
Intermediate
Fixed
Income Fund
|
City National
Rochdale
Full Maturity
Fixed
Income Fund
|
Combined
|
Pro Forma
Adjustments
|
Pro Forma
Combined
|
|||||||||||||||||
|
Investment Income:
|
|||||||||||||||||||||
|
Dividends
|
$ | 465 | $ | - | $ | 465 | $ | - | $ | 465 | |||||||||||
|
Interest
|
5,042 | 1,299 | 6,341 | - | 6,341 | ||||||||||||||||
|
Income from securities lending
|
29 | - | 29 | - | 29 | ||||||||||||||||
|
TOTAL INCOME
|
5,536 | 1,299 | 6,835 | - | 6,835 | ||||||||||||||||
|
Expenses:
|
|||||||||||||||||||||
|
Investment advisory fees
|
483 | 235 | 718 | (49 | ) |
(a)
|
669 | ||||||||||||||
|
Shareholder servicing fees - Class N (2)
|
484 | 2 | 486 | (2 | ) |
(d)
|
484 | ||||||||||||||
|
Administration fees
|
158 | 22 | 180 | (63 | ) |
(b)
|
117 | ||||||||||||||
|
Fund accounting fees
|
60 | - | 60 | - | 60 | ||||||||||||||||
|
Trustees fees
|
7 | 2 | 9 | - | 9 | ||||||||||||||||
|
Professional fees
|
26 | 6 | 32 | - | 32 | ||||||||||||||||
|
Printing fees
|
9 | 2 | 11 | (2 | ) |
(e)
|
9 | ||||||||||||||
|
Transfer Agent fees
|
29 | 43 | 72 | - |
(f)
|
72 | |||||||||||||||
|
Custodian fees
|
45 | 2 | 47 | - | 47 | ||||||||||||||||
|
Registration and filing fees
|
32 | 2 | 34 | 2 |
(g)
|
36 | |||||||||||||||
|
Interest expense
|
56 | - | 56 | - | 56 | ||||||||||||||||
|
Insurance and other expenses
|
7 | 3 | 10 | - | 10 | ||||||||||||||||
|
Total expenses
|
1,396 | 319 | 1,715 | (114 | ) | 1,601 | |||||||||||||||
|
Less:
|
|||||||||||||||||||||
|
Waiver of investment advisory fees
|
(1 | ) | (1 | ) | (2 | ) | (262 | ) |
(c)
|
(264 | ) | ||||||||||
|
Net expenses
|
1,395 | 318 | 1,713 | (376 | ) | 1,337 | |||||||||||||||
|
Net investment income
|
4,141 | 981 | 5,122 | 376 | 5,498 | ||||||||||||||||
|
REALIZED AND UNREALIZED GAIN
|
|||||||||||||||||||||
|
ON INVESTMENTS
|
|||||||||||||||||||||
|
Net realized gain/loss on investments
|
300 | 569 | 869 | - | 869 | ||||||||||||||||
|
Net change in unrealized appreciation
|
|||||||||||||||||||||
|
on investments
|
1,408 | 169 | 1,577 | - | 1,577 | ||||||||||||||||
|
Net urealized and unrealized gain
|
1,708 | 738 | 2,446 | - | 2,446 | ||||||||||||||||
|
Net increase in net assets
|
|||||||||||||||||||||
|
resulting from operations
|
$ | 5,849 | $ | 1,719 | $ | 7,568 | $ | 376 | $ | 7,944 | |||||||||||
Notes to Pro Forma Financial Statements
City National Rochdale
Intermediate Fixed Income Fund and Full Maturity Fixed Income Fund
For the year ended March 31, 2013 (Unaudited)
1. Organization:
The City National Rochdale Funds (the "Trust") is organized as a Delaware business trust under an Amended and Restated Agreement and Declaration of Trust dated October 28, 1996. The Trust is registered under the Investment Company Act of 1940, as amended (the "1940 Act"), as an open-end management investment company with 17 funds.
City National Rochdale Full Maturity Fixed Income Fund (the “Target Fund”) is registered under the Investment Company Act of 1940 as a diversified open-end management investment company. The Target Fund’s investment objective is to provide a high level of current income, consistent with the preservation of capital. The Target Fund offers two classes of shares: Institutional Class and Class N.
The financial statements herein are those of the City National Rochdale Intermediate Fixed Income Fund (the “Acquiring Fund”). The Acquiring Fund seeks current income and to the extent consistent with this goal, capital appreciation. The Acquiring Fund offers two classes of shares: Institutional Class and Class N. Only the Class N shares had commenced operations as of March 31, 2013.
For the purposes of these Pro Forma Financial Statements, the financial information covers the period from April 1, 2012 to March 31, 2013.
2. Basis of Combination:
The accompanying unaudited Pro Forma Financial Statements Combining Schedules of Investments, Statements of Assets and Liabilities and Statements of Operations (“Pro Forma Financial Statements”) reflect the accounts of the Target Fund and the Acquiring Fund for the year ended March 31, 2013. These statements have been derived from the books and records utilized in calculating daily net asset values at March 31, 2013.
The Pro Forma Financial Statements should be read in conjunction with the historical financial statements of the Target Fund and the Acquiring Fund, which have been incorporated by reference in the Statement of Additional Information. The Target Fund and the Acquiring Fund each follow U.S generally accepted accounting principles (“GAAP”) applicable to management investment companies which are disclosed in the historical financial statements.
The Pro Forma Financial Statements give effect to the proposed exchange of assets of Institutional Class Shares and Class N Shares of the Target Fund, respectively, for Institutional Class Shares of the Acquiring Fund. Under generally accepted accounting principles, the Acquiring Fund will be the surviving entity for accounting purposes.
The Pro Forma Financial Statements have been adjusted to reflect the anticipated advisory fee arrangement for the Acquiring Fund. Certain other operating costs have also been adjusted to reflect anticipated expenses of the combined entity. Other costs which may change as a result of the reorganization are currently undeterminable.
All fees and expenses incurred directly in connection with the consummation of the Reorganization and the transactions contemplated by the Plan of Reorganization will be borne by the investment advisers to the Acquiring Fund and the Target Fund as agreed between them, without regard to whether the Reorganization is consummated.
The preparation of financial statements in conformity with GAAP requires management to make estimates and assumptions that affect the reported amounts of assets and liabilities and disclosure of contingent assets and liabilities at the date of the financial statements and the reported amounts of increases and decreases in net assets from operations during the reporting period. Actual results could differ from those estimates.
3. Security Valuation:
For purposes of calculating their daily net asset values (“NAV”), the Target Fund and the Acquiring Fund (collectively, the “Funds”) each generally values their investments as follows:
Securities listed on a securities exchange, market or automated quotation system for which quotations are readily available (except for securities traded on NASDAQ), including securities traded over the counter, are valued at the last quoted sale price on the primary exchange or market (foreign or domestic) on which they are traded, or, if there is no such reported sale, at the most recent quoted bid price. For securities traded on NASDAQ, the NASDAQ Official Closing Price will be used. Debt securities are priced based upon valuations provided by independent, third-party pricing agents, if available. Such values generally reflect the last reported sales price if the security is actively traded. The third-party pricing agents may also value debt securities at an evaluated bid price by employing methodologies that utilize actual market transactions, broker-supplied valuations, or other methodologies designed to identify the market value for such securities. Debt obligations with remaining maturities of sixty days or less may be valued at their amortized cost, which approximates market value. The prices for foreign securities are reported in local currency and converted to U.S. dollars using currency exchange rates. Prices for most securities held in the Funds are provided daily by recognized independent pricing agents. If a security price cannot be obtained from an independent, third-party pricing agent, the Funds seek to obtain a bid price from at least one independent broker.
Securities for which market prices are not "readily available" are valued in accordance with Fair Value Procedures established by the Funds' Board of Trustees (the "Board"). The Funds' Fair Value Procedures are implemented through a Fair Value Committee (the "Committee") designated by the Board. Some of the more common reasons that may necessitate that a security be valued using Fair Value Procedures include: the security's trading has been halted or suspended; the security has been de-listed from a national exchange; the security's primary trading market is temporarily closed at a time when under normal conditions it would be open; the security has not been traded for an extended period of time; the security's primary pricing source is not able or willing to provide a price; or trading of the security is subject to local government-imposed restrictions. When a security is valued in accordance with the Fair Value Procedures, the Committee will determine the value after taking into consideration relevant information reasonably available to the Committee. As of March 31, 2013, there were estimated fair valued securities of $1,561,000.
4. Shares of Beneficial Interest
The Pro Forma Institutional Class shares and Class N shares net asset values per share assume the issuance of 1,694,541 Institutional Class Shares and 10,944 Class N shares of the Acquiring Fund, in exchange for 4,252,567 Institutional Class shares and 27,491 Class N shares of the Target Fund, respectively, which would have been outstanding at March 31, 2013 in connection with the proposed reorganization, assuming the Target Fund and the Acquiring Fund had been combined as of such date.
5. Federal Income Taxes
It is the intention of the Target Fund and the Acquiring Fund to continue to qualify as a regulated investment company for Federal income tax purposes by complying with the appropriate provisions of Subchapter M of the Internal Revenue Code of 1986, as amended, and to distribute substantially all of its income to its shareholders. Accordingly, no provision for Federal income taxes has been made in the Pro Forma financial statements.
Management has analyzed the Acquiring Fund’s tax positions taken on federal income tax returns for all open tax years and has concluded that as of March 31, 2013, no provision for income tax would be required in the Acquiring Fund’s financial statements. The Acquiring Fund’s Federal and state income and Federal excise tax returns for tax years for which the applicable statutes of limitations have not expired are subject to examination by the Internal Revenue Service and state departments of revenue.
6. Pro Forma Adjustments
(a) An adjustment to the combined investment advisory fee reflects the fee structure of the Acquiring Fund and is calculated using the Acquiring Fund’s average net assets for the year ended March 31, 2013 in combination with the Target Fund’s average net assets for the same period.
(b) An adjustment to the combined administrative fee reflects the fee structure of the Acquiring Fund and is calculated using the Acquiring Fund’s average net assets for the year ended March 31, 2013 in combination with the Target Fund’s average net assets for the same period.
(c) Adjustment to reflect an investment advisory fee waiver, as based on the Pro Forma combined average daily net assets of the Target Fund and Acquiring Fund, of the expenses for the year ended March 31, 2013 that exceed the Acquiring Fund’s expense limitations.
(d) Adjustment to reflect the elimination of Shareholder Servicing Fee of the Target Fund applicable to Class N Shares, as such shares are being exchanged for Institutional Class Shares of the Acquiring Fund.
(e) Adjustment to reflect printing fees due to the combining of the Funds into one and based upon the expense structure for the Acquiring Fund.
(f) Adjustment to reflect transfer agent fees due to the combining of the Funds into one and based upon the current expense structure of the Acquiring Fund and the additional expense to be charged to the Acquiring Fund upon commencement of operations of the Institutional Class Shares.
(g) Adjustment to reflect share registration costs due to the combining of the Funds into one and based upon the current expense structure for the Acquiring Fund.
PART C
|
Item 15.
|
Indemnification
|
Please see Article VI of the Amended and Restated By-Laws of the City National Rochdale Funds (the “Registrant”), which have been filed as an exhibit to this registration statement. In addition, each trustee of the Registrant has entered into an Indemnification Agreement with the Registrant whereby the Registrant indemnifies and holds harmless each trustee against any costs, disbursements or expenses customarily incurred in any legal proceeding arising out of or in connection with the trustee’s service to the Registrant, to the fullest extent permitted by law, subject to certain conditions. Pursuant to Rule 484 under the Securities Act of 1933, as amended (the “Securities Act”), the Registrant furnishes the following undertaking:
Insofar as indemnification for liabilities arising under the Securities Act may be permitted to trustees, officers and controlling persons of the Registrant pursuant to the foregoing provisions, or otherwise, the Registrant has been advised that in the opinion of the Securities and Exchange Commission such indemnification is against public policy as expressed in the Securities Act and is, therefore, unenforceable. In the event that a claim for indemnification against such liabilities (other than the payment by the Registrant of expenses incurred or paid by a trustee, officer, or controlling person of the Registrant in the successful defense of any action, suit or proceeding) is asserted by such trustee, officer, or controlling person in connection with the securities being registered, the Registrant will, unless in the opinion of its counsel the matter has been settled by controlling precedent, submit to a court of appropriate jurisdiction the question whether such indemnification by it is against public policy as expressed in the Act and will be governed by the final adjudication of such issue.
Notwithstanding the provisions contained in the Registrant’s Amended and Restated By-Laws, in the absence of authorization by the appropriate court on the merits pursuant to Sections 4 and 5 of Article VI of said Amended and Restated By-Laws, any indemnification under said Article shall be made by Registrant only if authorized in the manner provided in either subsection (a) or (b) of Section 6 of said Article VI.
|
Item 16.
|
Exhibits
|
|
1)
|
Charter Documents:
|
|
|
a.
|
Certificate of Trust dated October 25, 1996 and amendments thereto dated February 11, 1998 and April 2, 1999. (H)
|
|
|
(i)
|
Certificate of Amendment dated August 15, 2013 to the Certificate of Trust dated October 25, 1996, as amended - filed herewith.
|
|
|
b.
|
Agreement and Declaration of Trust dated October 25, 1996. (A)
|
|
|
(i)
|
Amendment dated April 26, 1999, to the Agreement and Declaration of Trust dated October 25, 1996. (B)
|
|
|
(ii)
|
Amendment dated December 4, 2012, to the Agreement and Declaration of Trust dated October 25, 1996 as amended April 26, 1999. (I)
|
|
|
(iii)
|
Amendment dated August 15, 2013, to the Agreement and Declaration of Trust dated October 25, 1996 as amended April 26, 1999 - filed herewith.
|
1
|
2)
|
By-Laws:
|
|
|
a.
|
By-Laws dated October 25, 1996. (A)
|
|
|
b.
|
Amendment dated April 26, 1999, to the By-Laws dated October 25, 1996. (B)
|
|
|
c.
|
Amended and Restated By-Laws dated February 26, 2009. (H)
|
|
|
d.
|
Amendment dated August 29, 2013 to the Amended and Restated By-Laws dated February 26, 2009 - filed herewith.
|
|
3)
|
Not applicable.
|
|
4)
|
Agreement and Plan of Reorganization:
|
|
|
a.
|
Form of Agreement and Plan of Reorganization. (C)
|
|
5)
|
Not applicable.
|
|
6)
|
Investment Management Agreements:
|
|
|
a.
|
Investment Management Agreement dated October 1, 2005 between the Registrant and City National Asset Management, Inc. (now City National Rochdale, LLC) with respect to the City National Rochdale Full Maturity Fixed Income Fund (the “Full Maturity Fixed Income Fund”). (G)
|
|
|
b.
|
Expense Limitation and Reimbursement Agreement dated January 28, 2013 between the Registrant and City National Asset Management, Inc. (now City National Rochdale, LLC) with respect to the Full Maturity Fixed Income Fund. (H)
|
|
|
c.
|
Form of Investment Manager Agreement between City National Asset Management, Inc. (now City National Rochdale, LLC) and Robert W. Baird & Co. Incorporated with respect to the Full Maturity Fixed Income Fund. (J)
|
|
|
d.
|
Investment Manager Agreement dated December 27, 2012 between City National Asset Management, Inc. (now City National Rochdale, LLC) and Boyd Watterson Asset Management, LLC with respect to the Full Maturity Fixed Income Fund. (H)
|
|
|
e.
|
Investment Management Agreement dated March 28, 2013 between the Registrant and Rochdale Investment Management LLC (now City National Rochdale, LLC) with respect to the City National Rochdale Intermediate Fixed Income Fund (the “Intermediate Fixed Income Fund”). (I)
|
|
7)
|
Distribution Agreements:
|
|
|
a.
|
Distribution Agreement dated April 1, 1999 between the Registrant and SEI Investments Distribution Co. with respect to the Full Maturity Fixed Income Fund and Intermediate Fixed Income Fund. (I)
|
2
|
|
b.
|
AML Amendment dated March 13/14, 2006, to the Distribution Agreement dated April 1, 1999 between the Registrant and SEI Investments Distribution Co. with respect to the Full Maturity Fixed Income Fund and Intermediate Fixed Income Fund. (I)
|
|
|
c.
|
Form of Sub-Distribution and Servicing Agreement. (F)
|
|
8)
|
Not applicable.
|
|
9)
|
Custody Agreements:
|
|
|
a.
|
Custody Agreement dated August 1, 2011 between the Registrant and U.S. Bank National Association with respect to the Full Maturity Fixed Income Fund and Intermediate Fixed Income Fund. (E)
|
|
|
b.
|
First Amendment dated January 1, 2012, to the Custody Agreement dated August 1, 2011 between the Registrant and U.S. Bank National Association with respect to the Full Maturity Fixed Income Fund and Intermediate Fixed Income Fund. (I)
|
|
10)
|
Distribution Plan and Rule 18f-3 Plan:
|
|
|
a.
|
Rule 12b-1 Distribution Plan dated January 28, 2013 with respect to the Full Maturity Fixed Income Fund and Intermediate Fixed Income Fund. (H)
|
|
|
b.
|
Amended and Restated Multiple Class Plan dated February 19, 2013 with respect to the Full Maturity Fixed Income Fund and Intermediate Fixed Income Fund. (I)
|
|
|
c.
|
Revised Appendix A dated September 17, 2013 to the Amended and Restated Multiple Class Plan dated February 19, 2013 with respect to the Full Maturity Fixed Income Fund and Intermediate Fixed Income Fund - filed herewith.
|
|
11)
|
Opinion of Counsel:
|
|
|
a.
|
Opinion and consent of counsel as to the legality of the securities being registered - filed herewith.
|
|
12)
|
Tax Opinion:
|
|
|
a.
|
Form of opinion of counsel supporting tax matters and consequences to shareholders discussed in Part A of the Registration Statement on Form N-14 - filed herewith.
|
|
13)
|
Other Material Contracts:
|
|
|
a.
|
Amended and Restated Administration Agreement dated January 1, 2013 between the Registrant and SEI Investments Global Funds Services with respect to the Full Maturity Fixed Income Fund and Intermediate Fixed Income Fund. (I)
|
|
|
b.
|
Transfer Agent Servicing Agreement dated January 1, 2013 between the Registrant and U.S. Bancorp Fund Services, LLC with respect to the Full Maturity Fixed Income Fund and Intermediate Fixed Income Fund. (I)
|
3
|
|
c.
|
Amended and Restated Shareholder Services Agreement dated June 1, 2001 between the Registrant and City National Bank with respect to the Intermediate Fixed Income Fund. (F)
|
|
|
(i)
|
Amended Exhibit A dated December 4, 2012, to the Amended and Restated Shareholder Services Agreement dated June 1, 2001 between the Registrant and City National Bank with respect to the Intermediate Fixed Income Fund. (I)
|
|
|
d.
|
Form of Shareholder Services Agreement dated January 1, 2011 between the Registrant and City National Asset Management, Inc. with respect to the Full Maturity Fixed Income Fund. (G)
|
|
|
e.
|
Form of Shareholder Service Provider Agreement between City National Bank and RIM Securities, LLC with respect to the Full Maturity Fixed Income Fund and Intermediate Fixed Income Fund. (D)
|
|
14)
|
Other Opinions:
|
|
|
a.
|
Consent of Independent Registered Certified Public Accounting Firm, Tait, Weller & Baker LLP – filed herewith.
|
|
|
b.
|
Consent of Independent Registered Certified Public Accounting Firm, KPMG LLP - filed herewith.
|
|
15)
|
Not applicable.
|
|
16)
|
Powers of Attorney:
|
|
|
a.
|
Power of Attorney - filed herewith.
|
|
17)
|
Additional Exhibits:
|
|
|
a.
|
Form of Proxy Card - filed herewith.
|
|
|
b.
|
The Full Maturity Fixed Income Fund’s Statement of Additional Information, dated January 28, 2013, as supplemented September 10, 2013. (K)
|
|
|
c.
|
The Intermediate Fixed Income Fund’s Statement of Additional Information, dated April 30, 2013, as supplemented September 10, 2013. (K)
|
|
|
d.
|
The Full Maturity Fixed Income Fund’s Annual Report for the year ended September 30, 2012. (L)
|
|
|
e.
|
The Intermediate Fixed Income Fund’s Annual Report for the year ended December 31, 2012. (M)
|
|
|
f.
|
The Full Maturity Fixed Income Fund’s and Intermediate Fixed Income Fund’s Semi-Annual Report for the fiscal period ended March 31, 2013. (N)
|
All Exhibits filed previously are herein incorporated by reference as follows:
|
A.
|
Previously filed as an exhibit to Registrant’s Registration Statement on Form N-1A (File No. 333-16093) on November 14, 1996 and incorporated herein by reference.
|
4
|
B.
|
Previously filed as an exhibit to Post-Effective Amendment No. 8 to Registrant’s Registration Statement on Form N-1A (File No. 333-16093) on May 3, 1999 and incorporated herein by reference.
|
|
|
C.
|
Filed as Appendix A to Part A of this Registration Statement on Form N-14.
|
|
|
D.
|
Previously filed as an exhibit to Post-Effective Amendment No. 54 to Registrant’s Registration Statement on Form N-1A (File No. 333-16093) on November 21, 2012, and incorporated herein by reference.
|
|
|
E.
|
Previously filed as an exhibit to Post-Effective Amendment No. 44 to Registrant’s Registration Statement on Form N-1A (File No. 333-16093) on September 14, 2011, and incorporated herein by reference.
|
|
|
F.
|
Previously filed as an exhibit to Post-Effective Amendment No. 32 to Registrant’s Registration Statement on Form N-1A (File No. 333-16093) on June 27, 2007 and incorporated herein by reference.
|
|
|
G.
|
Previously filed as an exhibit to Post-Effective Amendment No. 41 to Registrant’s Registration Statement on Form N-1A (File No. 333-16093) on January 28, 2011, and incorporated herein by reference.
|
|
|
H.
|
Previously filed as an exhibit to Registrant’s Registration Statement on Form N-14 (File No. 333-186096) on January 28, 2013, and incorporated herein by reference.
|
|
|
I.
|
Previously filed as an exhibit to Registrant’s Post-Effective Amendment No. 62 (File No. 333-16093) on April 30, 2013, and incorporated herein by reference.
|
|
|
J.
|
Previously filed as an exhibit to Registrant’s Post-Effective Amendment No. 25 (File No. 333-16093) on May 13, 2005 and incorporated herein by reference.
|
|
|
K.
|
Previously filed as part of a 497 filing (File No. 333-16093) on September 10, 2013 and incorporated herein by reference.
|
|
|
L.
|
Previously filed on December 7, 2012 (File No. 811-07923) and incorporated herein by reference.
|
|
|
M.
|
Previously filed on March 8, 2013 (File No. 811-08685) and incorporated herein by reference.
|
|
|
N.
|
Previously filed on June 10, 2013 (File No. 811-07923) and incorporated herein by reference.
|
|
Item 17.
|
Undertakings
|
|
1.
|
The undersigned registrant agrees that prior to any public reoffering of the securities registered through the use of a prospectus which is a part of the registration statement by any person or party who is deemed to be an underwriter within the meaning of Rule 145(c) of the Securities Act, the reoffering prospectus will contain the information called for by the applicable registration form for reofferings by persons who may be deemed underwriters, in addition to the information called for by the other items of the applicable form.
|
5
|
2.
|
The undersigned registrant agrees that every prospectus that is filed under paragraph (1) above will be filed as a part of an amendment to the registration statement and will not be used until the amendment is effective, and that, in determining any liability under the 1933 Act, each post-effective amendment shall be deemed to be a new registration statement for the securities offered therein, and the offering of the securities at that time shall be deemed to be the initial bona fide offering of them.
|
|
3.
|
The undersigned registrant agrees that it shall file a final executed version of the legal opinion as to tax matters as an exhibit to the subsequent post-effective amendment to its registration statement on Form N-14 filed with the SEC upon the closing of the reorganization contemplated by this Registration Statement on Form N-14.
|
6
SIGNATURES
As required by the Securities Act of 1933, this registration statement has been signed on behalf of the Registrant, in the City of Beverly Hills, and State of California, on the 4th day of October, 2013.
|
CITY NATIONAL ROCHDALE FUNDS
|
||
|
By:
|
/s/ Garrett D’Alessandro
|
|
| Garrett D’Alessandro | ||
| President, Chief Executive Officer | ||
As required by the Securities Act of 1933, this registration statement has been signed by the following persons in the capacities and on the dates indicated.
|
Signature
|
Title
|
Date
|
|
|
/s/ Garrett D’Alessandro
|
President & Chief
|
October 4, 2013
|
|
|
Garrett D’Alessandro
|
Executive Officer
|
||
|
/s/ Eric Kleinschmidt
|
Controller & Chief
|
October 4, 2013
|
|
|
Eric Kleinschmidt
|
Operating Officer
|
||
|
Irwin G. Barnet*
|
Trustee
|
October 4, 2013
|
|
|
Irwin G. Barnet
|
|||
|
Vernon C. Kozlen*
|
Trustee
|
October 4, 2013
|
|
|
Vernon C. Kozlen
|
|||
|
William R. Sweet*
|
Trustee
|
October 4, 2013
|
|
|
William R. Sweet
|
|||
|
James R. Wolford*
|
Trustee
|
October 4, 2013
|
|
|
James R. Wolford
|
|||
|
Daniel A. Hanwacker*
|
Trustee
|
October 4, 2013
|
|
|
Daniel A. Hanwacker
|
|||
|
Jay C. Nadel*
|
Trustee
|
October 4, 2013
|
|
|
Jay C. Nadel
|
|||
|
Andrew S. Clare*
|
Trustee
|
October 4, 2013
|
|
|
Andrew S. Clare
|
|||
|
Jon C. Hunt*
|
Trustee
|
October 4, 2013
|
Jon C. Hunt
| * By: |
/s/ Garrett D’Alessandro
|
|
| Garrett D’Alessandro
Attorney-in-Fact, pursuant to Power of Attorney
|
||
7
EXHIBIT INDEX
|
Exhibit Number
|
Exhibit
|
|
1.A.I
|
Certificate of Amendment dated August 15, 2013 to the Certificate of Trust dated October 25, 1996, as amended.
|
|
1.B.III
|
Amendment dated August 15, 2013, to the Agreement and Declaration of Trust dated October 25, 1996 as amended April 26, 1999.
|
|
2.D
|
Amendment dated August 29, 2013 to the Amended and Restated By-Laws dated February 26, 2009.
|
|
10.C
|
Revised Appendix A dated September 17, 2013 to the Amended and Restated Multiple Class Plan dated February 19, 2 013.
|
|
11.A
|
Opinion and consent of counsel as to legality of the securities being registered.
|
|
12.A
|
Form of opinion of counsel supporting tax matters and consequences to shareholders discussed in Part A of the Registration Statement on Form N-14.
|
|
14.A
|
Consent of Independent Registered Certified Public Accounting Firm, Tait, Weller & Baker LLP.
|
|
14.B
|
Consent of Independent Registered Certified Public Accounting Firm, KPMG LLP.
|
|
16.A
|
Power of Attorney.
|
|
17.A
|
Form of Proxy Card.
|
8