000102621412/312024Q2☐X1xbrli:sharesiso4217:USDiso4217:USDxbrli:sharesxbrli:pureutr:Ratefmcc:loanfmcc:segment00010262142024-01-012024-06-3000010262142024-07-090001026214srt:ParentCompanyMember2024-06-300001026214us-gaap:VariableInterestEntityPrimaryBeneficiaryMember2024-06-3000010262142024-04-012024-06-3000010262142023-04-012023-06-3000010262142023-01-012023-06-3000010262142024-06-3000010262142023-12-310001026214us-gaap:VariableInterestEntityPrimaryBeneficiaryMember2023-12-310001026214fmcc:SeniorPreferredStockMember2024-03-310001026214us-gaap:PreferredStockMember2024-03-310001026214us-gaap:CommonStockMember2024-03-310001026214us-gaap:RetainedEarningsMember2024-03-310001026214us-gaap:AccumulatedOtherComprehensiveIncomeMember2024-03-310001026214us-gaap:TreasuryStockCommonMember2024-03-3100010262142024-03-310001026214us-gaap:RetainedEarningsMember2024-04-012024-06-300001026214us-gaap:AccumulatedOtherComprehensiveIncomeMember2024-04-012024-06-300001026214fmcc:SeniorPreferredStockMember2024-06-300001026214us-gaap:PreferredStockMember2024-06-300001026214us-gaap:CommonStockMember2024-06-300001026214us-gaap:RetainedEarningsMember2024-06-300001026214us-gaap:AccumulatedOtherComprehensiveIncomeMember2024-06-300001026214us-gaap:TreasuryStockCommonMember2024-06-300001026214fmcc:SeniorPreferredStockMember2023-03-310001026214us-gaap:PreferredStockMember2023-03-310001026214us-gaap:CommonStockMember2023-03-310001026214us-gaap:RetainedEarningsMember2023-03-310001026214us-gaap:AccumulatedOtherComprehensiveIncomeMember2023-03-310001026214us-gaap:TreasuryStockCommonMember2023-03-3100010262142023-03-310001026214us-gaap:RetainedEarningsMember2023-04-012023-06-300001026214us-gaap:AccumulatedOtherComprehensiveIncomeMember2023-04-012023-06-300001026214fmcc:SeniorPreferredStockMember2023-06-300001026214us-gaap:PreferredStockMember2023-06-300001026214us-gaap:CommonStockMember2023-06-300001026214us-gaap:RetainedEarningsMember2023-06-300001026214us-gaap:AccumulatedOtherComprehensiveIncomeMember2023-06-300001026214us-gaap:TreasuryStockCommonMember2023-06-3000010262142023-06-300001026214fmcc:SeniorPreferredStockMember2023-12-310001026214us-gaap:PreferredStockMember2023-12-310001026214us-gaap:CommonStockMember2023-12-310001026214us-gaap:RetainedEarningsMember2023-12-310001026214us-gaap:AccumulatedOtherComprehensiveIncomeMember2023-12-310001026214us-gaap:TreasuryStockCommonMember2023-12-310001026214us-gaap:RetainedEarningsMember2024-01-012024-06-300001026214us-gaap:AccumulatedOtherComprehensiveIncomeMember2024-01-012024-06-300001026214fmcc:SeniorPreferredStockMember2022-12-310001026214us-gaap:PreferredStockMember2022-12-310001026214us-gaap:CommonStockMember2022-12-310001026214us-gaap:RetainedEarningsMember2022-12-310001026214us-gaap:AccumulatedOtherComprehensiveIncomeMember2022-12-310001026214us-gaap:TreasuryStockCommonMember2022-12-3100010262142022-12-310001026214us-gaap:RetainedEarningsMember2023-01-012023-06-300001026214us-gaap:AccumulatedOtherComprehensiveIncomeMember2023-01-012023-06-300001026214us-gaap:VariableInterestEntityPrimaryBeneficiaryMember2024-01-012024-06-300001026214us-gaap:VariableInterestEntityPrimaryBeneficiaryMember2023-01-012023-06-300001026214srt:ParentCompanyMember2024-01-012024-06-300001026214srt:ParentCompanyMember2023-01-012023-06-300001026214us-gaap:MortgageBackedSecuritiesIssuedByUSGovernmentSponsoredEnterprisesMemberfmcc:SingleFamilyGuaranteeSegmentMemberus-gaap:VariableInterestEntityNotPrimaryBeneficiaryMember2024-06-300001026214fmcc:FannieMaesecuritiesbackingFreddieMacresecuritizationtrustMemberfmcc:SingleFamilyGuaranteeSegmentMemberus-gaap:VariableInterestEntityNotPrimaryBeneficiaryMember2024-06-300001026214fmcc:SingleFamilyGuaranteeSegmentMemberus-gaap:StructuredFinanceMemberus-gaap:VariableInterestEntityNotPrimaryBeneficiaryMember2024-06-300001026214fmcc:SingleFamilyGuaranteeSegmentMemberus-gaap:VariableInterestEntityNotPrimaryBeneficiaryMember2024-06-300001026214us-gaap:MortgageBackedSecuritiesIssuedByUSGovernmentSponsoredEnterprisesMemberus-gaap:VariableInterestEntityNotPrimaryBeneficiaryMemberfmcc:MultifamilySegmentMember2024-06-300001026214us-gaap:StructuredFinanceMemberus-gaap:VariableInterestEntityNotPrimaryBeneficiaryMemberfmcc:MultifamilySegmentMember2024-06-300001026214us-gaap:VariableInterestEntityNotPrimaryBeneficiaryMemberfmcc:MultifamilySegmentMember2024-06-300001026214fmcc:OtherSecuritizationProductMemberus-gaap:VariableInterestEntityNotPrimaryBeneficiaryMember2024-06-300001026214us-gaap:VariableInterestEntityNotPrimaryBeneficiaryMember2024-06-300001026214us-gaap:MortgageBackedSecuritiesIssuedByUSGovernmentSponsoredEnterprisesMemberfmcc:SingleFamilyGuaranteeSegmentMemberus-gaap:VariableInterestEntityNotPrimaryBeneficiaryMember2023-12-310001026214fmcc:FannieMaesecuritiesbackingFreddieMacresecuritizationtrustMemberfmcc:SingleFamilyGuaranteeSegmentMemberus-gaap:VariableInterestEntityNotPrimaryBeneficiaryMember2023-12-310001026214fmcc:SingleFamilyGuaranteeSegmentMemberus-gaap:StructuredFinanceMemberus-gaap:VariableInterestEntityNotPrimaryBeneficiaryMember2023-12-310001026214fmcc:SingleFamilyGuaranteeSegmentMemberus-gaap:VariableInterestEntityNotPrimaryBeneficiaryMember2023-12-310001026214us-gaap:MortgageBackedSecuritiesIssuedByUSGovernmentSponsoredEnterprisesMemberus-gaap:VariableInterestEntityNotPrimaryBeneficiaryMemberfmcc:MultifamilySegmentMember2023-12-310001026214us-gaap:StructuredFinanceMemberus-gaap:VariableInterestEntityNotPrimaryBeneficiaryMemberfmcc:MultifamilySegmentMember2023-12-310001026214us-gaap:VariableInterestEntityNotPrimaryBeneficiaryMemberfmcc:MultifamilySegmentMember2023-12-310001026214fmcc:OtherSecuritizationProductMemberus-gaap:VariableInterestEntityNotPrimaryBeneficiaryMember2023-12-310001026214us-gaap:VariableInterestEntityNotPrimaryBeneficiaryMember2023-12-310001026214srt:SingleFamilyMember2024-06-300001026214srt:MultifamilyMember2024-06-300001026214srt:SingleFamilyMember2023-12-310001026214srt:MultifamilyMember2023-12-310001026214fmcc:HeldforInvestmentMembersrt:SingleFamilyMember2024-04-012024-06-300001026214fmcc:HeldforInvestmentMembersrt:SingleFamilyMember2023-04-012023-06-300001026214fmcc:HeldforInvestmentMembersrt:SingleFamilyMember2024-01-012024-06-300001026214fmcc:HeldforInvestmentMembersrt:SingleFamilyMember2023-01-012023-06-300001026214srt:SingleFamilyMemberfmcc:HeldforSaleMember2024-04-012024-06-300001026214srt:SingleFamilyMemberfmcc:HeldforSaleMember2023-04-012023-06-300001026214srt:SingleFamilyMemberfmcc:HeldforSaleMember2024-01-012024-06-300001026214srt:SingleFamilyMemberfmcc:HeldforSaleMember2023-01-012023-06-300001026214fmcc:HeldforInvestmentMembersrt:MultifamilyMember2024-04-012024-06-300001026214fmcc:HeldforInvestmentMembersrt:MultifamilyMember2023-04-012023-06-300001026214fmcc:HeldforInvestmentMembersrt:MultifamilyMember2024-01-012024-06-300001026214fmcc:HeldforInvestmentMembersrt:MultifamilyMember2023-01-012023-06-300001026214srt:MultifamilyMemberfmcc:HeldforSaleMember2024-04-012024-06-300001026214srt:MultifamilyMemberfmcc:HeldforSaleMember2023-04-012023-06-300001026214srt:MultifamilyMemberfmcc:HeldforSaleMember2024-01-012024-06-300001026214srt:MultifamilyMemberfmcc:HeldforSaleMember2023-01-012023-06-300001026214fmcc:SingleFamily20And30YearOrMoreAmortizingFixedRateMember2024-06-300001026214fmcc:SingleFamily20And30YearOrMoreAmortizingFixedRateMember2024-03-310001026214fmcc:SingleFamily20And30YearOrMoreAmortizingFixedRateMember2024-04-012024-06-300001026214fmcc:SingleFamily20And30YearOrMoreAmortizingFixedRateMember2024-01-012024-06-300001026214fmcc:SingleFamily15YearOrLessAmortizingFixedRateMember2024-06-300001026214fmcc:SingleFamily15YearOrLessAmortizingFixedRateMember2024-03-310001026214fmcc:SingleFamily15YearOrLessAmortizingFixedRateMember2024-04-012024-06-300001026214fmcc:SingleFamily15YearOrLessAmortizingFixedRateMember2024-01-012024-06-300001026214fmcc:SingleFamilyAdjustableRateAndOtherMember2024-06-300001026214fmcc:SingleFamilyAdjustableRateAndOtherMember2024-03-310001026214fmcc:SingleFamilyAdjustableRateAndOtherMember2024-04-012024-06-300001026214fmcc:SingleFamilyAdjustableRateAndOtherMember2024-01-012024-06-300001026214srt:SingleFamilyMember2024-03-310001026214srt:SingleFamilyMember2024-04-012024-06-300001026214srt:SingleFamilyMember2024-01-012024-06-300001026214srt:MultifamilyMember2024-03-310001026214srt:MultifamilyMember2024-04-012024-06-300001026214srt:MultifamilyMember2024-01-012024-06-300001026214fmcc:SingleFamily20And30YearOrMoreAmortizingFixedRateMember2023-06-300001026214fmcc:SingleFamily20And30YearOrMoreAmortizingFixedRateMember2023-03-310001026214fmcc:SingleFamily20And30YearOrMoreAmortizingFixedRateMember2023-04-012023-06-300001026214fmcc:SingleFamily20And30YearOrMoreAmortizingFixedRateMember2023-01-012023-06-300001026214fmcc:SingleFamily15YearOrLessAmortizingFixedRateMember2023-06-300001026214fmcc:SingleFamily15YearOrLessAmortizingFixedRateMember2023-03-310001026214fmcc:SingleFamily15YearOrLessAmortizingFixedRateMember2023-04-012023-06-300001026214fmcc:SingleFamily15YearOrLessAmortizingFixedRateMember2023-01-012023-06-300001026214fmcc:SingleFamilyAdjustableRateAndOtherMember2023-06-300001026214fmcc:SingleFamilyAdjustableRateAndOtherMember2023-03-310001026214fmcc:SingleFamilyAdjustableRateAndOtherMember2023-04-012023-06-300001026214fmcc:SingleFamilyAdjustableRateAndOtherMember2023-01-012023-06-300001026214srt:SingleFamilyMember2023-06-300001026214srt:SingleFamilyMember2023-03-310001026214srt:SingleFamilyMember2023-04-012023-06-300001026214srt:SingleFamilyMember2023-01-012023-06-300001026214srt:MultifamilyMember2023-06-300001026214srt:MultifamilyMember2023-03-310001026214srt:MultifamilyMember2023-04-012023-06-300001026214srt:MultifamilyMember2023-01-012023-06-300001026214fmcc:DebtToValueRatioLessThan60PerentMemberfmcc:SingleFamily20And30YearOrMoreAmortizingFixedRateMember2024-06-300001026214fmcc:SingleFamily20And30YearOrMoreAmortizingFixedRateMemberus-gaap:LtvLessThan80PercentMember2024-06-300001026214fmcc:SingleFamily20And30YearOrMoreAmortizingFixedRateMemberfmcc:DebtToValueRatio80To90PercentMember2024-06-300001026214fmcc:SingleFamily20And30YearOrMoreAmortizingFixedRateMemberfmcc:DebtToValueRatio90To100PercentMember2024-06-300001026214fmcc:GreaterThan100LoanToValueRatioMemberfmcc:SingleFamily20And30YearOrMoreAmortizingFixedRateMember2024-06-300001026214fmcc:DebtToValueRatioLessThan60PerentMemberfmcc:SingleFamily15YearOrLessAmortizingFixedRateMember2024-06-300001026214us-gaap:LtvLessThan80PercentMemberfmcc:SingleFamily15YearOrLessAmortizingFixedRateMember2024-06-300001026214fmcc:SingleFamily15YearOrLessAmortizingFixedRateMemberfmcc:DebtToValueRatio80To90PercentMember2024-06-300001026214fmcc:DebtToValueRatio90To100PercentMemberfmcc:SingleFamily15YearOrLessAmortizingFixedRateMember2024-06-300001026214fmcc:GreaterThan100LoanToValueRatioMemberfmcc:SingleFamily15YearOrLessAmortizingFixedRateMember2024-06-300001026214fmcc:DebtToValueRatioLessThan60PerentMemberfmcc:SingleFamilyAdjustableRateAndOtherMember2024-06-300001026214fmcc:SingleFamilyAdjustableRateAndOtherMemberus-gaap:LtvLessThan80PercentMember2024-06-300001026214fmcc:SingleFamilyAdjustableRateAndOtherMemberfmcc:DebtToValueRatio80To90PercentMember2024-06-300001026214fmcc:SingleFamilyAdjustableRateAndOtherMemberfmcc:DebtToValueRatio90To100PercentMember2024-06-300001026214fmcc:GreaterThan100LoanToValueRatioMemberfmcc:SingleFamilyAdjustableRateAndOtherMember2024-06-300001026214srt:SingleFamilyMemberfmcc:DebtToValueRatioLessThan60PerentMember2024-06-300001026214srt:SingleFamilyMemberus-gaap:LtvLessThan80PercentMember2024-06-300001026214srt:SingleFamilyMemberfmcc:DebtToValueRatio80To90PercentMember2024-06-300001026214srt:SingleFamilyMemberfmcc:DebtToValueRatio90To100PercentMember2024-06-300001026214srt:SingleFamilyMemberfmcc:GreaterThan100LoanToValueRatioMember2024-06-300001026214fmcc:DebtToValueRatioLessThan60PerentMemberfmcc:SingleFamily20And30YearOrMoreAmortizingFixedRateMember2023-12-310001026214fmcc:SingleFamily20And30YearOrMoreAmortizingFixedRateMemberus-gaap:LtvLessThan80PercentMember2023-12-310001026214fmcc:SingleFamily20And30YearOrMoreAmortizingFixedRateMemberfmcc:DebtToValueRatio80To90PercentMember2023-12-310001026214fmcc:SingleFamily20And30YearOrMoreAmortizingFixedRateMemberfmcc:DebtToValueRatio90To100PercentMember2023-12-310001026214fmcc:GreaterThan100LoanToValueRatioMemberfmcc:SingleFamily20And30YearOrMoreAmortizingFixedRateMember2023-12-310001026214fmcc:SingleFamily20And30YearOrMoreAmortizingFixedRateMember2023-12-310001026214fmcc:SingleFamily20And30YearOrMoreAmortizingFixedRateMember2023-01-012023-12-310001026214fmcc:DebtToValueRatioLessThan60PerentMemberfmcc:SingleFamily15YearOrLessAmortizingFixedRateMember2023-12-310001026214us-gaap:LtvLessThan80PercentMemberfmcc:SingleFamily15YearOrLessAmortizingFixedRateMember2023-12-310001026214fmcc:SingleFamily15YearOrLessAmortizingFixedRateMemberfmcc:DebtToValueRatio80To90PercentMember2023-12-310001026214fmcc:DebtToValueRatio90To100PercentMemberfmcc:SingleFamily15YearOrLessAmortizingFixedRateMember2023-12-310001026214fmcc:GreaterThan100LoanToValueRatioMemberfmcc:SingleFamily15YearOrLessAmortizingFixedRateMember2023-12-310001026214fmcc:SingleFamily15YearOrLessAmortizingFixedRateMember2023-12-310001026214fmcc:SingleFamily15YearOrLessAmortizingFixedRateMember2023-01-012023-12-310001026214fmcc:DebtToValueRatioLessThan60PerentMemberfmcc:SingleFamilyAdjustableRateAndOtherMember2023-12-310001026214fmcc:SingleFamilyAdjustableRateAndOtherMemberus-gaap:LtvLessThan80PercentMember2023-12-310001026214fmcc:SingleFamilyAdjustableRateAndOtherMemberfmcc:DebtToValueRatio80To90PercentMember2023-12-310001026214fmcc:SingleFamilyAdjustableRateAndOtherMemberfmcc:DebtToValueRatio90To100PercentMember2023-12-310001026214fmcc:GreaterThan100LoanToValueRatioMemberfmcc:SingleFamilyAdjustableRateAndOtherMember2023-12-310001026214fmcc:SingleFamilyAdjustableRateAndOtherMember2023-12-310001026214fmcc:SingleFamilyAdjustableRateAndOtherMember2023-01-012023-12-310001026214srt:SingleFamilyMemberfmcc:DebtToValueRatioLessThan60PerentMember2023-12-310001026214srt:SingleFamilyMemberus-gaap:LtvLessThan80PercentMember2023-12-310001026214srt:SingleFamilyMemberfmcc:DebtToValueRatio80To90PercentMember2023-12-310001026214srt:SingleFamilyMemberfmcc:DebtToValueRatio90To100PercentMember2023-12-310001026214srt:SingleFamilyMemberfmcc:GreaterThan100LoanToValueRatioMember2023-12-3100010262142023-01-012023-12-310001026214us-gaap:PassMembersrt:MultifamilyMember2024-06-300001026214us-gaap:SpecialMentionMembersrt:MultifamilyMember2024-06-300001026214us-gaap:SubstandardMembersrt:MultifamilyMember2024-06-300001026214us-gaap:DoubtfulMembersrt:MultifamilyMember2024-06-300001026214us-gaap:PassMembersrt:MultifamilyMember2023-12-310001026214us-gaap:SpecialMentionMembersrt:MultifamilyMember2023-12-310001026214us-gaap:SubstandardMembersrt:MultifamilyMember2023-12-310001026214us-gaap:DoubtfulMembersrt:MultifamilyMember2023-12-310001026214us-gaap:FinancialAssetNotPastDueMemberfmcc:SingleFamily20And30YearOrMoreAmortizingFixedRateMember2024-06-300001026214us-gaap:FinancingReceivables30To59DaysPastDueMemberfmcc:SingleFamily20And30YearOrMoreAmortizingFixedRateMember2024-06-300001026214us-gaap:FinancingReceivables60To89DaysPastDueMemberfmcc:SingleFamily20And30YearOrMoreAmortizingFixedRateMember2024-06-300001026214us-gaap:FinancingReceivablesEqualToGreaterThan90DaysPastDueMemberfmcc:SingleFamily20And30YearOrMoreAmortizingFixedRateMember2024-06-300001026214us-gaap:FinancialAssetNotPastDueMemberfmcc:SingleFamily15YearOrLessAmortizingFixedRateMember2024-06-300001026214us-gaap:FinancingReceivables30To59DaysPastDueMemberfmcc:SingleFamily15YearOrLessAmortizingFixedRateMember2024-06-300001026214us-gaap:FinancingReceivables60To89DaysPastDueMemberfmcc:SingleFamily15YearOrLessAmortizingFixedRateMember2024-06-300001026214us-gaap:FinancingReceivablesEqualToGreaterThan90DaysPastDueMemberfmcc:SingleFamily15YearOrLessAmortizingFixedRateMember2024-06-300001026214us-gaap:FinancialAssetNotPastDueMemberfmcc:SingleFamilyAdjustableRateAndOtherMember2024-06-300001026214us-gaap:FinancingReceivables30To59DaysPastDueMemberfmcc:SingleFamilyAdjustableRateAndOtherMember2024-06-300001026214us-gaap:FinancingReceivables60To89DaysPastDueMemberfmcc:SingleFamilyAdjustableRateAndOtherMember2024-06-300001026214us-gaap:FinancingReceivablesEqualToGreaterThan90DaysPastDueMemberfmcc:SingleFamilyAdjustableRateAndOtherMember2024-06-300001026214us-gaap:FinancialAssetNotPastDueMembersrt:SingleFamilyMember2024-06-300001026214us-gaap:FinancingReceivables30To59DaysPastDueMembersrt:SingleFamilyMember2024-06-300001026214srt:SingleFamilyMemberus-gaap:FinancingReceivables60To89DaysPastDueMember2024-06-300001026214srt:SingleFamilyMemberus-gaap:FinancingReceivablesEqualToGreaterThan90DaysPastDueMember2024-06-300001026214us-gaap:FinancialAssetNotPastDueMembersrt:MultifamilyMember2024-06-300001026214us-gaap:FinancingReceivables30To59DaysPastDueMembersrt:MultifamilyMember2024-06-300001026214us-gaap:FinancingReceivables60To89DaysPastDueMembersrt:MultifamilyMember2024-06-300001026214srt:MultifamilyMemberus-gaap:FinancingReceivablesEqualToGreaterThan90DaysPastDueMember2024-06-300001026214us-gaap:FinancialAssetNotPastDueMember2024-06-300001026214us-gaap:FinancingReceivables30To59DaysPastDueMember2024-06-300001026214us-gaap:FinancingReceivables60To89DaysPastDueMember2024-06-300001026214us-gaap:FinancingReceivablesEqualToGreaterThan90DaysPastDueMember2024-06-300001026214us-gaap:FinancialAssetNotPastDueMemberfmcc:SingleFamily20And30YearOrMoreAmortizingFixedRateMember2023-12-310001026214us-gaap:FinancingReceivables30To59DaysPastDueMemberfmcc:SingleFamily20And30YearOrMoreAmortizingFixedRateMember2023-12-310001026214us-gaap:FinancingReceivables60To89DaysPastDueMemberfmcc:SingleFamily20And30YearOrMoreAmortizingFixedRateMember2023-12-310001026214us-gaap:FinancingReceivablesEqualToGreaterThan90DaysPastDueMemberfmcc:SingleFamily20And30YearOrMoreAmortizingFixedRateMember2023-12-310001026214us-gaap:FinancialAssetNotPastDueMemberfmcc:SingleFamily15YearOrLessAmortizingFixedRateMember2023-12-310001026214us-gaap:FinancingReceivables30To59DaysPastDueMemberfmcc:SingleFamily15YearOrLessAmortizingFixedRateMember2023-12-310001026214us-gaap:FinancingReceivables60To89DaysPastDueMemberfmcc:SingleFamily15YearOrLessAmortizingFixedRateMember2023-12-310001026214us-gaap:FinancingReceivablesEqualToGreaterThan90DaysPastDueMemberfmcc:SingleFamily15YearOrLessAmortizingFixedRateMember2023-12-310001026214us-gaap:FinancialAssetNotPastDueMemberfmcc:SingleFamilyAdjustableRateAndOtherMember2023-12-310001026214us-gaap:FinancingReceivables30To59DaysPastDueMemberfmcc:SingleFamilyAdjustableRateAndOtherMember2023-12-310001026214us-gaap:FinancingReceivables60To89DaysPastDueMemberfmcc:SingleFamilyAdjustableRateAndOtherMember2023-12-310001026214us-gaap:FinancingReceivablesEqualToGreaterThan90DaysPastDueMemberfmcc:SingleFamilyAdjustableRateAndOtherMember2023-12-310001026214us-gaap:FinancialAssetNotPastDueMembersrt:SingleFamilyMember2023-12-310001026214us-gaap:FinancingReceivables30To59DaysPastDueMembersrt:SingleFamilyMember2023-12-310001026214srt:SingleFamilyMemberus-gaap:FinancingReceivables60To89DaysPastDueMember2023-12-310001026214srt:SingleFamilyMemberus-gaap:FinancingReceivablesEqualToGreaterThan90DaysPastDueMember2023-12-310001026214us-gaap:FinancialAssetNotPastDueMembersrt:MultifamilyMember2023-12-310001026214us-gaap:FinancingReceivables30To59DaysPastDueMembersrt:MultifamilyMember2023-12-310001026214us-gaap:FinancingReceivables60To89DaysPastDueMembersrt:MultifamilyMember2023-12-310001026214srt:MultifamilyMemberus-gaap:FinancingReceivablesEqualToGreaterThan90DaysPastDueMember2023-12-310001026214us-gaap:FinancialAssetNotPastDueMember2023-12-310001026214us-gaap:FinancingReceivables30To59DaysPastDueMember2023-12-310001026214us-gaap:FinancingReceivables60To89DaysPastDueMember2023-12-310001026214us-gaap:FinancingReceivablesEqualToGreaterThan90DaysPastDueMember2023-12-310001026214fmcc:SingleFamily20And30YearOrMoreAmortizingFixedRateMemberfmcc:PaymentDelayMember2024-04-012024-06-300001026214fmcc:PaymentDelayAndTermExtensionMemberfmcc:SingleFamily20And30YearOrMoreAmortizingFixedRateMember2024-04-012024-06-300001026214fmcc:PaymentDelayInterestRateReductionAndTermExtensionMemberfmcc:SingleFamily20And30YearOrMoreAmortizingFixedRateMember2024-04-012024-06-300001026214fmcc:PaymentDelayMemberfmcc:SingleFamily15YearOrLessAmortizingFixedRateMember2024-04-012024-06-300001026214fmcc:PaymentDelayAndTermExtensionMemberfmcc:SingleFamily15YearOrLessAmortizingFixedRateMember2024-04-012024-06-300001026214fmcc:PaymentDelayInterestRateReductionAndTermExtensionMemberfmcc:SingleFamily15YearOrLessAmortizingFixedRateMember2024-04-012024-06-300001026214fmcc:SingleFamilyAdjustableRateAndOtherMemberfmcc:PaymentDelayMember2024-04-012024-06-300001026214fmcc:PaymentDelayAndTermExtensionMemberfmcc:SingleFamilyAdjustableRateAndOtherMember2024-04-012024-06-300001026214fmcc:PaymentDelayInterestRateReductionAndTermExtensionMemberfmcc:SingleFamilyAdjustableRateAndOtherMember2024-04-012024-06-300001026214srt:SingleFamilyMemberfmcc:PaymentDelayMember2024-04-012024-06-300001026214fmcc:PaymentDelayAndTermExtensionMembersrt:SingleFamilyMember2024-04-012024-06-300001026214srt:SingleFamilyMemberfmcc:PaymentDelayInterestRateReductionAndTermExtensionMember2024-04-012024-06-300001026214fmcc:SingleFamily20And30YearOrMoreAmortizingFixedRateMemberfmcc:PaymentDelayMember2023-04-012023-06-300001026214fmcc:PaymentDelayAndTermExtensionMemberfmcc:SingleFamily20And30YearOrMoreAmortizingFixedRateMember2023-04-012023-06-300001026214fmcc:PaymentDelayInterestRateReductionAndTermExtensionMemberfmcc:SingleFamily20And30YearOrMoreAmortizingFixedRateMember2023-04-012023-06-300001026214fmcc:PaymentDelayMemberfmcc:SingleFamily15YearOrLessAmortizingFixedRateMember2023-04-012023-06-300001026214fmcc:PaymentDelayAndTermExtensionMemberfmcc:SingleFamily15YearOrLessAmortizingFixedRateMember2023-04-012023-06-300001026214fmcc:PaymentDelayInterestRateReductionAndTermExtensionMemberfmcc:SingleFamily15YearOrLessAmortizingFixedRateMember2023-04-012023-06-300001026214fmcc:SingleFamilyAdjustableRateAndOtherMemberfmcc:PaymentDelayMember2023-04-012023-06-300001026214fmcc:PaymentDelayAndTermExtensionMemberfmcc:SingleFamilyAdjustableRateAndOtherMember2023-04-012023-06-300001026214fmcc:PaymentDelayInterestRateReductionAndTermExtensionMemberfmcc:SingleFamilyAdjustableRateAndOtherMember2023-04-012023-06-300001026214srt:SingleFamilyMemberfmcc:PaymentDelayMember2023-04-012023-06-300001026214fmcc:PaymentDelayAndTermExtensionMembersrt:SingleFamilyMember2023-04-012023-06-300001026214srt:SingleFamilyMemberfmcc:PaymentDelayInterestRateReductionAndTermExtensionMember2023-04-012023-06-300001026214fmcc:SingleFamily20And30YearOrMoreAmortizingFixedRateMemberfmcc:PaymentDelayMember2024-01-012024-06-300001026214fmcc:PaymentDelayAndTermExtensionMemberfmcc:SingleFamily20And30YearOrMoreAmortizingFixedRateMember2024-01-012024-06-300001026214fmcc:PaymentDelayInterestRateReductionAndTermExtensionMemberfmcc:SingleFamily20And30YearOrMoreAmortizingFixedRateMember2024-01-012024-06-300001026214fmcc:PaymentDelayMemberfmcc:SingleFamily15YearOrLessAmortizingFixedRateMember2024-01-012024-06-300001026214fmcc:PaymentDelayAndTermExtensionMemberfmcc:SingleFamily15YearOrLessAmortizingFixedRateMember2024-01-012024-06-300001026214fmcc:PaymentDelayInterestRateReductionAndTermExtensionMemberfmcc:SingleFamily15YearOrLessAmortizingFixedRateMember2024-01-012024-06-300001026214fmcc:SingleFamilyAdjustableRateAndOtherMemberfmcc:PaymentDelayMember2024-01-012024-06-300001026214fmcc:PaymentDelayAndTermExtensionMemberfmcc:SingleFamilyAdjustableRateAndOtherMember2024-01-012024-06-300001026214fmcc:PaymentDelayInterestRateReductionAndTermExtensionMemberfmcc:SingleFamilyAdjustableRateAndOtherMember2024-01-012024-06-300001026214srt:SingleFamilyMemberfmcc:PaymentDelayMember2024-01-012024-06-300001026214fmcc:PaymentDelayAndTermExtensionMembersrt:SingleFamilyMember2024-01-012024-06-300001026214srt:SingleFamilyMemberfmcc:PaymentDelayInterestRateReductionAndTermExtensionMember2024-01-012024-06-300001026214fmcc:SingleFamily20And30YearOrMoreAmortizingFixedRateMemberfmcc:PaymentDelayMember2023-01-012023-06-300001026214fmcc:PaymentDelayAndTermExtensionMemberfmcc:SingleFamily20And30YearOrMoreAmortizingFixedRateMember2023-01-012023-06-300001026214fmcc:PaymentDelayInterestRateReductionAndTermExtensionMemberfmcc:SingleFamily20And30YearOrMoreAmortizingFixedRateMember2023-01-012023-06-300001026214fmcc:PaymentDelayMemberfmcc:SingleFamily15YearOrLessAmortizingFixedRateMember2023-01-012023-06-300001026214fmcc:PaymentDelayAndTermExtensionMemberfmcc:SingleFamily15YearOrLessAmortizingFixedRateMember2023-01-012023-06-300001026214fmcc:PaymentDelayInterestRateReductionAndTermExtensionMemberfmcc:SingleFamily15YearOrLessAmortizingFixedRateMember2023-01-012023-06-300001026214fmcc:SingleFamilyAdjustableRateAndOtherMemberfmcc:PaymentDelayMember2023-01-012023-06-300001026214fmcc:PaymentDelayAndTermExtensionMemberfmcc:SingleFamilyAdjustableRateAndOtherMember2023-01-012023-06-300001026214fmcc:PaymentDelayInterestRateReductionAndTermExtensionMemberfmcc:SingleFamilyAdjustableRateAndOtherMember2023-01-012023-06-300001026214srt:SingleFamilyMemberfmcc:PaymentDelayMember2023-01-012023-06-300001026214fmcc:PaymentDelayAndTermExtensionMembersrt:SingleFamilyMember2023-01-012023-06-300001026214srt:SingleFamilyMemberfmcc:PaymentDelayInterestRateReductionAndTermExtensionMember2023-01-012023-06-300001026214fmcc:SingleFamily20And30YearOrMoreAmortizingFixedRateMemberus-gaap:FinancialAssetNotPastDueMember2024-06-300001026214us-gaap:FinancingReceivables30To59DaysPastDueMemberfmcc:SingleFamily20And30YearOrMoreAmortizingFixedRateMember2024-06-300001026214us-gaap:FinancingReceivables60To89DaysPastDueMemberfmcc:SingleFamily20And30YearOrMoreAmortizingFixedRateMember2024-06-300001026214us-gaap:FinancingReceivablesEqualToGreaterThan90DaysPastDueMemberfmcc:SingleFamily20And30YearOrMoreAmortizingFixedRateMember2024-06-300001026214us-gaap:FinancialAssetNotPastDueMemberfmcc:SingleFamily15YearOrLessAmortizingFixedRateMember2024-06-300001026214us-gaap:FinancingReceivables30To59DaysPastDueMemberfmcc:SingleFamily15YearOrLessAmortizingFixedRateMember2024-06-300001026214us-gaap:FinancingReceivables60To89DaysPastDueMemberfmcc:SingleFamily15YearOrLessAmortizingFixedRateMember2024-06-300001026214us-gaap:FinancingReceivablesEqualToGreaterThan90DaysPastDueMemberfmcc:SingleFamily15YearOrLessAmortizingFixedRateMember2024-06-300001026214fmcc:SingleFamilyAdjustableRateAndOtherMemberus-gaap:FinancialAssetNotPastDueMember2024-06-300001026214us-gaap:FinancingReceivables30To59DaysPastDueMemberfmcc:SingleFamilyAdjustableRateAndOtherMember2024-06-300001026214us-gaap:FinancingReceivables60To89DaysPastDueMemberfmcc:SingleFamilyAdjustableRateAndOtherMember2024-06-300001026214us-gaap:FinancingReceivablesEqualToGreaterThan90DaysPastDueMemberfmcc:SingleFamilyAdjustableRateAndOtherMember2024-06-300001026214srt:SingleFamilyMemberus-gaap:FinancialAssetNotPastDueMember2024-06-300001026214us-gaap:FinancingReceivables30To59DaysPastDueMembersrt:SingleFamilyMember2024-06-300001026214us-gaap:FinancingReceivables60To89DaysPastDueMembersrt:SingleFamilyMember2024-06-300001026214srt:SingleFamilyMemberus-gaap:FinancingReceivablesEqualToGreaterThan90DaysPastDueMember2024-06-300001026214fmcc:SingleFamily20And30YearOrMoreAmortizingFixedRateMemberus-gaap:FinancialAssetNotPastDueMember2023-06-300001026214us-gaap:FinancingReceivables30To59DaysPastDueMemberfmcc:SingleFamily20And30YearOrMoreAmortizingFixedRateMember2023-06-300001026214us-gaap:FinancingReceivables60To89DaysPastDueMemberfmcc:SingleFamily20And30YearOrMoreAmortizingFixedRateMember2023-06-300001026214us-gaap:FinancingReceivablesEqualToGreaterThan90DaysPastDueMemberfmcc:SingleFamily20And30YearOrMoreAmortizingFixedRateMember2023-06-300001026214us-gaap:FinancialAssetNotPastDueMemberfmcc:SingleFamily15YearOrLessAmortizingFixedRateMember2023-06-300001026214us-gaap:FinancingReceivables30To59DaysPastDueMemberfmcc:SingleFamily15YearOrLessAmortizingFixedRateMember2023-06-300001026214us-gaap:FinancingReceivables60To89DaysPastDueMemberfmcc:SingleFamily15YearOrLessAmortizingFixedRateMember2023-06-300001026214us-gaap:FinancingReceivablesEqualToGreaterThan90DaysPastDueMemberfmcc:SingleFamily15YearOrLessAmortizingFixedRateMember2023-06-300001026214fmcc:SingleFamilyAdjustableRateAndOtherMemberus-gaap:FinancialAssetNotPastDueMember2023-06-300001026214us-gaap:FinancingReceivables30To59DaysPastDueMemberfmcc:SingleFamilyAdjustableRateAndOtherMember2023-06-300001026214us-gaap:FinancingReceivables60To89DaysPastDueMemberfmcc:SingleFamilyAdjustableRateAndOtherMember2023-06-300001026214us-gaap:FinancingReceivablesEqualToGreaterThan90DaysPastDueMemberfmcc:SingleFamilyAdjustableRateAndOtherMember2023-06-300001026214srt:SingleFamilyMemberus-gaap:FinancialAssetNotPastDueMember2023-06-300001026214us-gaap:FinancingReceivables30To59DaysPastDueMembersrt:SingleFamilyMember2023-06-300001026214us-gaap:FinancingReceivables60To89DaysPastDueMembersrt:SingleFamilyMember2023-06-300001026214srt:SingleFamilyMemberus-gaap:FinancingReceivablesEqualToGreaterThan90DaysPastDueMember2023-06-300001026214srt:SingleFamilyMemberus-gaap:FinancialGuaranteeMember2024-06-300001026214srt:SingleFamilyMemberus-gaap:FinancialGuaranteeMember2024-01-012024-06-300001026214us-gaap:GuaranteeTypeOtherMembersrt:SingleFamilyMember2024-06-300001026214us-gaap:GuaranteeTypeOtherMembersrt:SingleFamilyMember2024-01-012024-06-300001026214srt:MultifamilyMemberus-gaap:FinancialGuaranteeMember2024-06-300001026214srt:MultifamilyMemberus-gaap:FinancialGuaranteeMember2024-01-012024-06-300001026214us-gaap:GuaranteeTypeOtherMembersrt:MultifamilyMember2024-06-300001026214us-gaap:GuaranteeTypeOtherMembersrt:MultifamilyMember2024-01-012024-06-300001026214fmcc:FannieMaesecuritiesbackingFreddieMacresecuritizationtrustMember2024-06-300001026214fmcc:FannieMaesecuritiesbackingFreddieMacresecuritizationtrustMember2024-01-012024-06-300001026214us-gaap:PaymentGuaranteeMember2024-06-300001026214us-gaap:PaymentGuaranteeMember2024-01-012024-06-300001026214srt:SingleFamilyMemberus-gaap:FinancialGuaranteeMember2023-12-310001026214srt:SingleFamilyMemberus-gaap:FinancialGuaranteeMember2023-01-012023-12-310001026214us-gaap:GuaranteeTypeOtherMembersrt:SingleFamilyMember2023-12-310001026214us-gaap:GuaranteeTypeOtherMembersrt:SingleFamilyMember2023-01-012023-12-310001026214srt:MultifamilyMemberus-gaap:FinancialGuaranteeMember2023-12-310001026214srt:MultifamilyMemberus-gaap:FinancialGuaranteeMember2023-01-012023-12-310001026214us-gaap:GuaranteeTypeOtherMembersrt:MultifamilyMember2023-12-310001026214us-gaap:GuaranteeTypeOtherMembersrt:MultifamilyMember2023-01-012023-12-310001026214fmcc:FannieMaesecuritiesbackingFreddieMacresecuritizationtrustMember2023-12-310001026214fmcc:FannieMaesecuritiesbackingFreddieMacresecuritizationtrustMember2023-01-012023-12-310001026214us-gaap:PaymentGuaranteeMember2023-12-310001026214us-gaap:PaymentGuaranteeMember2023-01-012023-12-310001026214fmcc:CRTRelatedDerivativesMember2024-06-300001026214fmcc:CRTRelatedDerivativesMember2023-12-310001026214srt:SingleFamilyMemberus-gaap:AllowanceForCreditLossMember2024-03-310001026214us-gaap:AllowanceForCreditLossMembersrt:MultifamilyMember2024-03-310001026214us-gaap:AllowanceForCreditLossMember2024-03-310001026214srt:SingleFamilyMemberus-gaap:AllowanceForCreditLossMember2023-03-310001026214us-gaap:AllowanceForCreditLossMembersrt:MultifamilyMember2023-03-310001026214us-gaap:AllowanceForCreditLossMember2023-03-310001026214srt:SingleFamilyMemberus-gaap:AllowanceForCreditLossMember2023-12-310001026214us-gaap:AllowanceForCreditLossMembersrt:MultifamilyMember2023-12-310001026214us-gaap:AllowanceForCreditLossMember2023-12-310001026214srt:SingleFamilyMemberus-gaap:AllowanceForCreditLossMember2022-12-310001026214us-gaap:AllowanceForCreditLossMembersrt:MultifamilyMember2022-12-310001026214us-gaap:AllowanceForCreditLossMember2022-12-310001026214srt:SingleFamilyMemberus-gaap:AllowanceForCreditLossMember2024-04-012024-06-300001026214us-gaap:AllowanceForCreditLossMembersrt:MultifamilyMember2024-04-012024-06-300001026214us-gaap:AllowanceForCreditLossMember2024-04-012024-06-300001026214srt:SingleFamilyMemberus-gaap:AllowanceForCreditLossMember2023-04-012023-06-300001026214us-gaap:AllowanceForCreditLossMembersrt:MultifamilyMember2023-04-012023-06-300001026214us-gaap:AllowanceForCreditLossMember2023-04-012023-06-300001026214srt:SingleFamilyMemberus-gaap:AllowanceForCreditLossMember2024-01-012024-06-300001026214us-gaap:AllowanceForCreditLossMembersrt:MultifamilyMember2024-01-012024-06-300001026214us-gaap:AllowanceForCreditLossMember2024-01-012024-06-300001026214srt:SingleFamilyMemberus-gaap:AllowanceForCreditLossMember2023-01-012023-06-300001026214us-gaap:AllowanceForCreditLossMembersrt:MultifamilyMember2023-01-012023-06-300001026214us-gaap:AllowanceForCreditLossMember2023-01-012023-06-300001026214srt:SingleFamilyMemberfmcc:HeldforInvestmentMember2024-06-300001026214srt:MultifamilyMemberfmcc:HeldforInvestmentMember2024-06-300001026214fmcc:HeldforInvestmentMember2024-06-300001026214srt:SingleFamilyMemberfmcc:HeldforInvestmentMember2023-06-300001026214srt:MultifamilyMemberfmcc:HeldforInvestmentMember2023-06-300001026214fmcc:HeldforInvestmentMember2023-06-300001026214srt:SingleFamilyMemberfmcc:OtherAllowanceForCreditLossesMember2024-06-300001026214srt:MultifamilyMemberfmcc:OtherAllowanceForCreditLossesMember2024-06-300001026214fmcc:OtherAllowanceForCreditLossesMember2024-06-300001026214srt:SingleFamilyMemberfmcc:OtherAllowanceForCreditLossesMember2023-06-300001026214srt:MultifamilyMemberfmcc:OtherAllowanceForCreditLossesMember2023-06-300001026214fmcc:OtherAllowanceForCreditLossesMember2023-06-300001026214us-gaap:MortgageBackedSecuritiesMember2024-06-300001026214us-gaap:MortgageBackedSecuritiesMember2023-12-310001026214fmcc:NonMortgageRelatedSecuritiesMember2024-06-300001026214fmcc:NonMortgageRelatedSecuritiesMember2023-12-310001026214us-gaap:AgencySecuritiesMember2024-06-300001026214fmcc:NonAgencyAndOtherMember2024-06-300001026214us-gaap:AgencySecuritiesMember2023-12-310001026214fmcc:NonAgencyAndOtherMember2023-12-310001026214srt:ParentCompanyMember2023-12-310001026214fmcc:Singlefamily20And30YearOrMoreFixedRateMembersrt:SingleFamilyMemberus-gaap:VariableInterestEntityPrimaryBeneficiaryMember2024-06-300001026214fmcc:Singlefamily20And30YearOrMoreFixedRateMembersrt:SingleFamilyMemberus-gaap:VariableInterestEntityPrimaryBeneficiaryMember2023-12-310001026214srt:SingleFamilyMemberus-gaap:VariableInterestEntityPrimaryBeneficiaryMemberfmcc:SingleFamily15YearFixedRateMember2024-06-300001026214srt:SingleFamilyMemberus-gaap:VariableInterestEntityPrimaryBeneficiaryMemberfmcc:SingleFamily15YearFixedRateMember2023-12-310001026214srt:SingleFamilyMemberus-gaap:VariableInterestEntityPrimaryBeneficiaryMemberfmcc:SingleFamilyAdjustableRateAndOtherMember2024-06-300001026214srt:SingleFamilyMemberus-gaap:VariableInterestEntityPrimaryBeneficiaryMemberfmcc:SingleFamilyAdjustableRateAndOtherMember2023-12-310001026214srt:SingleFamilyMemberus-gaap:VariableInterestEntityPrimaryBeneficiaryMember2024-06-300001026214srt:SingleFamilyMemberus-gaap:VariableInterestEntityPrimaryBeneficiaryMember2023-12-310001026214us-gaap:VariableInterestEntityPrimaryBeneficiaryMembersrt:MultifamilyMember2024-06-300001026214us-gaap:VariableInterestEntityPrimaryBeneficiaryMembersrt:MultifamilyMember2023-12-310001026214srt:ParentCompanyMemberfmcc:ReferenceBillsSecuritesAndDiscountNotesMember2024-06-300001026214srt:ParentCompanyMemberfmcc:ReferenceBillsSecuritesAndDiscountNotesMember2023-12-310001026214srt:ParentCompanyMemberfmcc:CallableMediumTermNotesMemberfmcc:FixedRateMember2024-06-300001026214srt:ParentCompanyMemberfmcc:CallableMediumTermNotesMemberfmcc:FixedRateMember2023-12-310001026214srt:ParentCompanyMemberfmcc:NonCallableMediumTermNotesMemberfmcc:FixedRateMember2024-06-300001026214srt:ParentCompanyMemberfmcc:NonCallableMediumTermNotesMemberfmcc:FixedRateMember2023-12-310001026214fmcc:NonCallableUSDollarReferenceNotesSecuritiesMembersrt:ParentCompanyMemberfmcc:FixedRateMember2024-06-300001026214fmcc:NonCallableUSDollarReferenceNotesSecuritiesMembersrt:ParentCompanyMemberfmcc:FixedRateMember2023-12-310001026214srt:ParentCompanyMemberus-gaap:StructuredFinanceMemberfmcc:FixedRateMember2024-06-300001026214srt:ParentCompanyMemberus-gaap:StructuredFinanceMemberfmcc:FixedRateMember2023-12-310001026214srt:ParentCompanyMemberfmcc:VariableRateMemberfmcc:CallableMediumTermNotesMember2024-06-300001026214srt:ParentCompanyMemberfmcc:VariableRateMemberfmcc:CallableMediumTermNotesMember2023-12-310001026214srt:ParentCompanyMemberfmcc:VariableRateMemberfmcc:NonCallableMediumTermNotesMember2024-06-300001026214srt:ParentCompanyMemberfmcc:VariableRateMemberfmcc:NonCallableMediumTermNotesMember2023-12-310001026214srt:ParentCompanyMemberfmcc:VariableRateMemberus-gaap:StructuredFinanceMember2024-06-300001026214srt:ParentCompanyMemberfmcc:VariableRateMemberus-gaap:StructuredFinanceMember2023-12-310001026214srt:ParentCompanyMemberfmcc:ZeroCouponMemberfmcc:NonCallableMediumTermNotesMember2024-06-300001026214srt:ParentCompanyMemberfmcc:ZeroCouponMemberfmcc:NonCallableMediumTermNotesMember2023-12-310001026214srt:ParentCompanyMemberfmcc:OtherMember2024-06-300001026214srt:ParentCompanyMemberfmcc:OtherMember2023-12-310001026214srt:ParentCompanyMemberfmcc:HedgingRelatedBasisAdjustmentsMember2024-06-300001026214srt:ParentCompanyMemberfmcc:HedgingRelatedBasisAdjustmentsMember2023-12-310001026214us-gaap:SwapMemberus-gaap:NotDesignatedAsHedgingInstrumentEconomicHedgeMember2024-06-300001026214us-gaap:SwapMemberus-gaap:NotDesignatedAsHedgingInstrumentEconomicHedgeMember2023-12-310001026214fmcc:WrittenOptionMemberus-gaap:ShortMemberus-gaap:NotDesignatedAsHedgingInstrumentEconomicHedgeMember2024-06-300001026214fmcc:WrittenOptionMemberus-gaap:ShortMemberus-gaap:NotDesignatedAsHedgingInstrumentEconomicHedgeMember2023-12-310001026214fmcc:PurchasedOptionsMemberus-gaap:LongMemberus-gaap:NotDesignatedAsHedgingInstrumentEconomicHedgeMember2024-06-300001026214fmcc:PurchasedOptionsMemberus-gaap:LongMemberus-gaap:NotDesignatedAsHedgingInstrumentEconomicHedgeMember2023-12-310001026214us-gaap:FutureMemberus-gaap:NotDesignatedAsHedgingInstrumentEconomicHedgeMember2024-06-300001026214us-gaap:FutureMemberus-gaap:NotDesignatedAsHedgingInstrumentEconomicHedgeMember2023-12-310001026214us-gaap:NondesignatedMemberus-gaap:NotDesignatedAsHedgingInstrumentEconomicHedgeMember2024-06-300001026214us-gaap:NondesignatedMemberus-gaap:NotDesignatedAsHedgingInstrumentEconomicHedgeMember2023-12-310001026214fmcc:CommitmentMemberus-gaap:NotDesignatedAsHedgingInstrumentEconomicHedgeMember2024-06-300001026214fmcc:CommitmentMemberus-gaap:NotDesignatedAsHedgingInstrumentEconomicHedgeMember2023-12-310001026214fmcc:CreditrisktransferMemberus-gaap:NotDesignatedAsHedgingInstrumentEconomicHedgeMember2024-06-300001026214fmcc:CreditrisktransferMemberus-gaap:NotDesignatedAsHedgingInstrumentEconomicHedgeMember2023-12-310001026214us-gaap:OtherContractMemberus-gaap:NotDesignatedAsHedgingInstrumentEconomicHedgeMember2024-06-300001026214us-gaap:OtherContractMemberus-gaap:NotDesignatedAsHedgingInstrumentEconomicHedgeMember2023-12-310001026214us-gaap:NotDesignatedAsHedgingInstrumentEconomicHedgeMember2024-06-300001026214us-gaap:NotDesignatedAsHedgingInstrumentEconomicHedgeMember2023-12-310001026214us-gaap:DesignatedAsHedgingInstrumentMemberus-gaap:SwapMemberus-gaap:FairValueHedgingMember2024-06-300001026214us-gaap:DesignatedAsHedgingInstrumentMemberus-gaap:SwapMemberus-gaap:FairValueHedgingMember2023-12-310001026214us-gaap:DesignatedAsHedgingInstrumentMemberus-gaap:FairValueHedgingMember2024-06-300001026214us-gaap:DesignatedAsHedgingInstrumentMemberus-gaap:FairValueHedgingMember2023-12-310001026214us-gaap:CreditDefaultSwaptionMemberus-gaap:NotDesignatedAsHedgingInstrumentEconomicHedgeMember2024-06-300001026214us-gaap:CreditDefaultSwaptionMemberus-gaap:NotDesignatedAsHedgingInstrumentEconomicHedgeMember2023-12-310001026214us-gaap:OverTheCounterMember2024-06-300001026214us-gaap:OverTheCounterMember2023-12-310001026214fmcc:ExchangeTradedAndClearedMember2024-06-300001026214fmcc:ExchangeTradedAndClearedMember2023-12-310001026214fmcc:CommitmentMember2024-06-300001026214fmcc:CommitmentMember2023-12-310001026214us-gaap:OtherContractMember2024-06-300001026214us-gaap:OtherContractMember2023-12-310001026214us-gaap:GainLossOnDerivativeInstrumentsMemberus-gaap:SwapMemberus-gaap:NotDesignatedAsHedgingInstrumentEconomicHedgeMember2024-04-012024-06-300001026214us-gaap:GainLossOnDerivativeInstrumentsMemberus-gaap:SwapMemberus-gaap:NotDesignatedAsHedgingInstrumentEconomicHedgeMember2023-04-012023-06-300001026214us-gaap:GainLossOnDerivativeInstrumentsMemberus-gaap:SwapMemberus-gaap:NotDesignatedAsHedgingInstrumentEconomicHedgeMember2024-01-012024-06-300001026214us-gaap:GainLossOnDerivativeInstrumentsMemberus-gaap:SwapMemberus-gaap:NotDesignatedAsHedgingInstrumentEconomicHedgeMember2023-01-012023-06-300001026214us-gaap:GainLossOnDerivativeInstrumentsMemberfmcc:WrittenOptionMemberus-gaap:ShortMemberus-gaap:NotDesignatedAsHedgingInstrumentEconomicHedgeMember2024-04-012024-06-300001026214us-gaap:GainLossOnDerivativeInstrumentsMemberfmcc:WrittenOptionMemberus-gaap:ShortMemberus-gaap:NotDesignatedAsHedgingInstrumentEconomicHedgeMember2023-04-012023-06-300001026214us-gaap:GainLossOnDerivativeInstrumentsMemberfmcc:WrittenOptionMemberus-gaap:ShortMemberus-gaap:NotDesignatedAsHedgingInstrumentEconomicHedgeMember2024-01-012024-06-300001026214us-gaap:GainLossOnDerivativeInstrumentsMemberfmcc:WrittenOptionMemberus-gaap:ShortMemberus-gaap:NotDesignatedAsHedgingInstrumentEconomicHedgeMember2023-01-012023-06-300001026214fmcc:PurchasedOptionsMemberus-gaap:GainLossOnDerivativeInstrumentsMemberus-gaap:LongMemberus-gaap:NotDesignatedAsHedgingInstrumentEconomicHedgeMember2024-04-012024-06-300001026214fmcc:PurchasedOptionsMemberus-gaap:GainLossOnDerivativeInstrumentsMemberus-gaap:LongMemberus-gaap:NotDesignatedAsHedgingInstrumentEconomicHedgeMember2023-04-012023-06-300001026214fmcc:PurchasedOptionsMemberus-gaap:GainLossOnDerivativeInstrumentsMemberus-gaap:LongMemberus-gaap:NotDesignatedAsHedgingInstrumentEconomicHedgeMember2024-01-012024-06-300001026214fmcc:PurchasedOptionsMemberus-gaap:GainLossOnDerivativeInstrumentsMemberus-gaap:LongMemberus-gaap:NotDesignatedAsHedgingInstrumentEconomicHedgeMember2023-01-012023-06-300001026214us-gaap:FutureMemberus-gaap:GainLossOnDerivativeInstrumentsMemberus-gaap:NotDesignatedAsHedgingInstrumentEconomicHedgeMember2024-04-012024-06-300001026214us-gaap:FutureMemberus-gaap:GainLossOnDerivativeInstrumentsMemberus-gaap:NotDesignatedAsHedgingInstrumentEconomicHedgeMember2023-04-012023-06-300001026214us-gaap:FutureMemberus-gaap:GainLossOnDerivativeInstrumentsMemberus-gaap:NotDesignatedAsHedgingInstrumentEconomicHedgeMember2024-01-012024-06-300001026214us-gaap:FutureMemberus-gaap:GainLossOnDerivativeInstrumentsMemberus-gaap:NotDesignatedAsHedgingInstrumentEconomicHedgeMember2023-01-012023-06-300001026214us-gaap:GainLossOnDerivativeInstrumentsMemberus-gaap:NotDesignatedAsHedgingInstrumentEconomicHedgeMemberus-gaap:InterestRateSwapMember2024-04-012024-06-300001026214us-gaap:GainLossOnDerivativeInstrumentsMemberus-gaap:NotDesignatedAsHedgingInstrumentEconomicHedgeMemberus-gaap:InterestRateSwapMember2023-04-012023-06-300001026214us-gaap:GainLossOnDerivativeInstrumentsMemberus-gaap:NotDesignatedAsHedgingInstrumentEconomicHedgeMemberus-gaap:InterestRateSwapMember2024-01-012024-06-300001026214us-gaap:GainLossOnDerivativeInstrumentsMemberus-gaap:NotDesignatedAsHedgingInstrumentEconomicHedgeMemberus-gaap:InterestRateSwapMember2023-01-012023-06-300001026214us-gaap:GainLossOnDerivativeInstrumentsMemberfmcc:CommitmentMemberus-gaap:NotDesignatedAsHedgingInstrumentEconomicHedgeMember2024-04-012024-06-300001026214us-gaap:GainLossOnDerivativeInstrumentsMemberfmcc:CommitmentMemberus-gaap:NotDesignatedAsHedgingInstrumentEconomicHedgeMember2023-04-012023-06-300001026214us-gaap:GainLossOnDerivativeInstrumentsMemberfmcc:CommitmentMemberus-gaap:NotDesignatedAsHedgingInstrumentEconomicHedgeMember2024-01-012024-06-300001026214us-gaap:GainLossOnDerivativeInstrumentsMemberfmcc:CommitmentMemberus-gaap:NotDesignatedAsHedgingInstrumentEconomicHedgeMember2023-01-012023-06-300001026214us-gaap:GainLossOnDerivativeInstrumentsMemberus-gaap:CreditRiskContractMemberus-gaap:NotDesignatedAsHedgingInstrumentEconomicHedgeMember2024-04-012024-06-300001026214us-gaap:GainLossOnDerivativeInstrumentsMemberus-gaap:CreditRiskContractMemberus-gaap:NotDesignatedAsHedgingInstrumentEconomicHedgeMember2023-04-012023-06-300001026214us-gaap:GainLossOnDerivativeInstrumentsMemberus-gaap:CreditRiskContractMemberus-gaap:NotDesignatedAsHedgingInstrumentEconomicHedgeMember2024-01-012024-06-300001026214us-gaap:GainLossOnDerivativeInstrumentsMemberus-gaap:CreditRiskContractMemberus-gaap:NotDesignatedAsHedgingInstrumentEconomicHedgeMember2023-01-012023-06-300001026214us-gaap:GainLossOnDerivativeInstrumentsMemberus-gaap:OtherContractMemberus-gaap:NotDesignatedAsHedgingInstrumentEconomicHedgeMember2024-04-012024-06-300001026214us-gaap:GainLossOnDerivativeInstrumentsMemberus-gaap:OtherContractMemberus-gaap:NotDesignatedAsHedgingInstrumentEconomicHedgeMember2023-04-012023-06-300001026214us-gaap:GainLossOnDerivativeInstrumentsMemberus-gaap:OtherContractMemberus-gaap:NotDesignatedAsHedgingInstrumentEconomicHedgeMember2024-01-012024-06-300001026214us-gaap:GainLossOnDerivativeInstrumentsMemberus-gaap:OtherContractMemberus-gaap:NotDesignatedAsHedgingInstrumentEconomicHedgeMember2023-01-012023-06-300001026214us-gaap:NotDesignatedAsHedgingInstrumentEconomicHedgeMember2024-04-012024-06-300001026214us-gaap:NotDesignatedAsHedgingInstrumentEconomicHedgeMember2023-04-012023-06-300001026214us-gaap:NotDesignatedAsHedgingInstrumentEconomicHedgeMember2024-01-012024-06-300001026214us-gaap:NotDesignatedAsHedgingInstrumentEconomicHedgeMember2023-01-012023-06-300001026214us-gaap:InterestIncomeMemberfmcc:InterestrateriskonheldforinvestmentmortgageloanMember2024-04-012024-06-300001026214us-gaap:InterestIncomeMemberfmcc:InterestrateriskonheldforinvestmentmortgageloanMember2023-04-012023-06-300001026214us-gaap:InterestExpenseMemberfmcc:InterestrateriskondebtMemberMember2024-04-012024-06-300001026214us-gaap:InterestExpenseMemberfmcc:InterestrateriskondebtMemberMember2023-04-012023-06-300001026214us-gaap:InterestIncomeMemberfmcc:InterestrateriskonheldforinvestmentmortgageloanMember2024-01-012024-06-300001026214us-gaap:InterestIncomeMemberfmcc:InterestrateriskonheldforinvestmentmortgageloanMember2023-01-012023-06-300001026214us-gaap:InterestExpenseMemberfmcc:InterestrateriskondebtMemberMember2024-01-012024-06-300001026214us-gaap:InterestExpenseMemberfmcc:InterestrateriskondebtMemberMember2023-01-012023-06-300001026214fmcc:HeldforInvestmentMember2024-06-300001026214fmcc:HeldforSaleMember2024-06-300001026214fmcc:HeldforInvestmentMember2023-12-310001026214fmcc:HeldforSaleMember2023-12-310001026214us-gaap:FederalFundsSoldAndSecuritiesBorrowedOrPurchasedUnderAgreementsToResellMember2024-06-300001026214us-gaap:FederalFundsSoldAndSecuritiesBorrowedOrPurchasedUnderAgreementsToResellMember2023-12-310001026214us-gaap:MaturityOvernightAndOnDemandMemberus-gaap:SecuritiesSoldUnderAgreementsToRepurchaseMemberus-gaap:USTreasurySecuritiesMemberus-gaap:AssetPledgedAsCollateralWithRightMember2024-06-300001026214us-gaap:SecuritiesSoldUnderAgreementsToRepurchaseMemberus-gaap:USTreasurySecuritiesMemberus-gaap:AssetPledgedAsCollateralWithRightMemberus-gaap:MaturityUpTo30DaysMember2024-06-300001026214us-gaap:Maturity30To90DaysMemberus-gaap:SecuritiesSoldUnderAgreementsToRepurchaseMemberus-gaap:USTreasurySecuritiesMemberus-gaap:AssetPledgedAsCollateralWithRightMember2024-06-300001026214us-gaap:SecuritiesSoldUnderAgreementsToRepurchaseMemberus-gaap:USTreasurySecuritiesMemberus-gaap:MaturityOver90DaysMemberus-gaap:AssetPledgedAsCollateralWithRightMember2024-06-300001026214us-gaap:SecuritiesSoldUnderAgreementsToRepurchaseMemberus-gaap:USTreasurySecuritiesMemberus-gaap:AssetPledgedAsCollateralWithRightMember2024-06-300001026214us-gaap:MaturityOvernightAndOnDemandMemberus-gaap:SecuritiesSoldUnderAgreementsToRepurchaseMemberus-gaap:USTreasurySecuritiesMemberus-gaap:AssetPledgedAsCollateralWithRightMember2023-12-310001026214us-gaap:SecuritiesSoldUnderAgreementsToRepurchaseMemberus-gaap:USTreasurySecuritiesMemberus-gaap:AssetPledgedAsCollateralWithRightMemberus-gaap:MaturityUpTo30DaysMember2023-12-310001026214us-gaap:Maturity30To90DaysMemberus-gaap:SecuritiesSoldUnderAgreementsToRepurchaseMemberus-gaap:USTreasurySecuritiesMemberus-gaap:AssetPledgedAsCollateralWithRightMember2023-12-310001026214us-gaap:SecuritiesSoldUnderAgreementsToRepurchaseMemberus-gaap:USTreasurySecuritiesMemberus-gaap:MaturityOver90DaysMemberus-gaap:AssetPledgedAsCollateralWithRightMember2023-12-310001026214us-gaap:SecuritiesSoldUnderAgreementsToRepurchaseMemberus-gaap:USTreasurySecuritiesMemberus-gaap:AssetPledgedAsCollateralWithRightMember2023-12-310001026214fmcc:TradingsecuritiesMemberus-gaap:DerivativeMemberus-gaap:AssetPledgedAsCollateralWithRightMember2024-06-300001026214fmcc:TradingsecuritiesMemberus-gaap:SecuritiesSoldUnderAgreementsToRepurchaseMemberus-gaap:AssetPledgedAsCollateralWithRightMember2024-06-300001026214fmcc:TradingsecuritiesMemberus-gaap:NotesPayableOtherPayablesMemberus-gaap:AssetPledgedAsCollateralWithRightMember2024-06-300001026214fmcc:TradingsecuritiesMemberus-gaap:AssetPledgedAsCollateralWithRightMember2024-06-300001026214us-gaap:DerivativeMemberus-gaap:NotesReceivableMemberus-gaap:AssetPledgedAsCollateralWithRightMember2024-06-300001026214us-gaap:SecuritiesSoldUnderAgreementsToRepurchaseMemberus-gaap:NotesReceivableMemberus-gaap:AssetPledgedAsCollateralWithRightMember2024-06-300001026214us-gaap:NotesReceivableMemberus-gaap:NotesPayableOtherPayablesMemberus-gaap:AssetPledgedAsCollateralWithRightMember2024-06-300001026214us-gaap:NotesReceivableMemberus-gaap:AssetPledgedAsCollateralWithRightMember2024-06-300001026214us-gaap:DerivativeMemberus-gaap:AssetPledgedAsCollateralWithRightMember2024-06-300001026214us-gaap:SecuritiesSoldUnderAgreementsToRepurchaseMemberus-gaap:AssetPledgedAsCollateralWithRightMember2024-06-300001026214us-gaap:NotesPayableOtherPayablesMemberus-gaap:AssetPledgedAsCollateralWithRightMember2024-06-300001026214us-gaap:AssetPledgedAsCollateralWithRightMember2024-06-300001026214fmcc:TradingsecuritiesMemberus-gaap:DerivativeMemberus-gaap:AssetPledgedAsCollateralWithRightMember2023-12-310001026214fmcc:TradingsecuritiesMemberus-gaap:SecuritiesSoldUnderAgreementsToRepurchaseMemberus-gaap:AssetPledgedAsCollateralWithRightMember2023-12-310001026214fmcc:TradingsecuritiesMemberus-gaap:NotesPayableOtherPayablesMemberus-gaap:AssetPledgedAsCollateralWithRightMember2023-12-310001026214fmcc:TradingsecuritiesMemberus-gaap:AssetPledgedAsCollateralWithRightMember2023-12-310001026214us-gaap:DerivativeMemberus-gaap:NotesReceivableMemberus-gaap:AssetPledgedAsCollateralWithRightMember2023-12-310001026214us-gaap:SecuritiesSoldUnderAgreementsToRepurchaseMemberus-gaap:NotesReceivableMemberus-gaap:AssetPledgedAsCollateralWithRightMember2023-12-310001026214us-gaap:NotesReceivableMemberus-gaap:NotesPayableOtherPayablesMemberus-gaap:AssetPledgedAsCollateralWithRightMember2023-12-310001026214us-gaap:NotesReceivableMemberus-gaap:AssetPledgedAsCollateralWithRightMember2023-12-310001026214us-gaap:DerivativeMemberus-gaap:AssetPledgedAsCollateralWithRightMember2023-12-310001026214us-gaap:SecuritiesSoldUnderAgreementsToRepurchaseMemberus-gaap:AssetPledgedAsCollateralWithRightMember2023-12-310001026214us-gaap:NotesPayableOtherPayablesMemberus-gaap:AssetPledgedAsCollateralWithRightMember2023-12-310001026214us-gaap:AssetPledgedAsCollateralWithRightMember2023-12-310001026214us-gaap:VariableInterestEntityPrimaryBeneficiaryMember2024-04-012024-06-300001026214us-gaap:VariableInterestEntityPrimaryBeneficiaryMember2023-04-012023-06-300001026214srt:ParentCompanyMember2024-04-012024-06-300001026214srt:ParentCompanyMember2023-04-012023-06-300001026214fmcc:SingleFamilyGuaranteeSegmentMemberus-gaap:OperatingSegmentsMember2024-04-012024-06-300001026214fmcc:MultifamilySegmentMemberus-gaap:OperatingSegmentsMember2024-04-012024-06-300001026214fmcc:SingleFamilyGuaranteeSegmentMemberus-gaap:OperatingSegmentsMember2023-04-012023-06-300001026214fmcc:MultifamilySegmentMemberus-gaap:OperatingSegmentsMember2023-04-012023-06-300001026214fmcc:SingleFamilyGuaranteeSegmentMemberus-gaap:OperatingSegmentsMember2024-01-012024-06-300001026214fmcc:MultifamilySegmentMemberus-gaap:OperatingSegmentsMember2024-01-012024-06-300001026214fmcc:SingleFamilyGuaranteeSegmentMemberus-gaap:OperatingSegmentsMember2023-01-012023-06-300001026214fmcc:MultifamilySegmentMemberus-gaap:OperatingSegmentsMember2023-01-012023-06-300001026214fmcc:SingleFamilyGuaranteeSegmentMemberus-gaap:OperatingSegmentsMember2024-06-300001026214fmcc:SingleFamilyGuaranteeSegmentMemberus-gaap:OperatingSegmentsMember2023-12-310001026214fmcc:MultifamilySegmentMemberus-gaap:OperatingSegmentsMember2024-06-300001026214fmcc:MultifamilySegmentMemberus-gaap:OperatingSegmentsMember2023-12-310001026214fmcc:OperatingSegmentsAndCorporateNonSegmentMemberus-gaap:OperatingSegmentsMember2024-06-300001026214fmcc:OperatingSegmentsAndCorporateNonSegmentMemberus-gaap:OperatingSegmentsMember2023-12-310001026214us-gaap:MaterialReconcilingItemsMember2024-06-300001026214us-gaap:MaterialReconcilingItemsMember2023-12-310001026214fmcc:WestMemberfmcc:SingleFamilyUnpaidPrincipalBalanceMemberus-gaap:GeographicConcentrationRiskMember2024-06-300001026214fmcc:WestMember2024-06-300001026214fmcc:NortheastMemberfmcc:SingleFamilyUnpaidPrincipalBalanceMemberus-gaap:GeographicConcentrationRiskMember2024-06-300001026214fmcc:NortheastMember2024-06-300001026214fmcc:SoutheastMemberfmcc:SingleFamilyUnpaidPrincipalBalanceMemberus-gaap:GeographicConcentrationRiskMember2024-06-300001026214fmcc:SoutheastMember2024-06-300001026214fmcc:SouthwestMemberfmcc:SingleFamilyUnpaidPrincipalBalanceMemberus-gaap:GeographicConcentrationRiskMember2024-06-300001026214fmcc:SouthwestMember2024-06-300001026214fmcc:NorthCentralMemberfmcc:SingleFamilyUnpaidPrincipalBalanceMemberus-gaap:GeographicConcentrationRiskMember2024-06-300001026214fmcc:NorthCentralMember2024-06-300001026214fmcc:SingleFamilyUnpaidPrincipalBalanceMemberus-gaap:GeographicConcentrationRiskMember2024-06-300001026214fmcc:SingleFamilyUnpaidPrincipalBalanceMemberstpr:CAus-gaap:GeographicConcentrationRiskMember2024-06-300001026214stpr:CA2024-06-300001026214stpr:TXfmcc:SingleFamilyUnpaidPrincipalBalanceMemberus-gaap:GeographicConcentrationRiskMember2024-06-300001026214stpr:TX2024-06-300001026214stpr:FLfmcc:SingleFamilyUnpaidPrincipalBalanceMemberus-gaap:GeographicConcentrationRiskMember2024-06-300001026214stpr:FL2024-06-300001026214stpr:NYfmcc:SingleFamilyUnpaidPrincipalBalanceMemberus-gaap:GeographicConcentrationRiskMember2024-06-300001026214stpr:NY2024-06-300001026214stpr:ILfmcc:SingleFamilyUnpaidPrincipalBalanceMemberus-gaap:GeographicConcentrationRiskMember2024-06-300001026214stpr:IL2024-06-300001026214fmcc:AllOtherStatesMemberfmcc:SingleFamilyUnpaidPrincipalBalanceMemberus-gaap:GeographicConcentrationRiskMember2024-06-300001026214fmcc:AllOtherStatesMember2024-06-300001026214fmcc:MultifamilyUnpaidPrincipalBalanceMemberfmcc:WestMemberus-gaap:GeographicConcentrationRiskMember2024-06-300001026214fmcc:NortheastMemberfmcc:MultifamilyUnpaidPrincipalBalanceMemberus-gaap:GeographicConcentrationRiskMember2024-06-300001026214fmcc:MultifamilyUnpaidPrincipalBalanceMemberfmcc:SouthwestMemberus-gaap:GeographicConcentrationRiskMember2024-06-300001026214fmcc:MultifamilyUnpaidPrincipalBalanceMemberfmcc:SoutheastMemberus-gaap:GeographicConcentrationRiskMember2024-06-300001026214fmcc:NorthCentralMemberfmcc:MultifamilyUnpaidPrincipalBalanceMemberus-gaap:GeographicConcentrationRiskMember2024-06-300001026214fmcc:MultifamilyUnpaidPrincipalBalanceMemberus-gaap:GeographicConcentrationRiskMember2024-06-300001026214fmcc:MultifamilyUnpaidPrincipalBalanceMemberstpr:CAus-gaap:GeographicConcentrationRiskMember2024-06-300001026214fmcc:MultifamilyUnpaidPrincipalBalanceMemberstpr:TXus-gaap:GeographicConcentrationRiskMember2024-06-300001026214stpr:FLfmcc:MultifamilyUnpaidPrincipalBalanceMemberus-gaap:GeographicConcentrationRiskMember2024-06-300001026214fmcc:MultifamilyUnpaidPrincipalBalanceMemberstpr:NYus-gaap:GeographicConcentrationRiskMember2024-06-300001026214fmcc:MultifamilyUnpaidPrincipalBalanceMemberstpr:GAus-gaap:GeographicConcentrationRiskMember2024-06-300001026214stpr:GA2024-06-300001026214fmcc:MultifamilyUnpaidPrincipalBalanceMemberfmcc:AllOtherStatesMemberus-gaap:GeographicConcentrationRiskMember2024-06-300001026214us-gaap:FairValueInputsLevel1Memberus-gaap:FairValueMeasurementsRecurringMember2024-06-300001026214us-gaap:FairValueInputsLevel2Memberus-gaap:FairValueMeasurementsRecurringMember2024-06-300001026214us-gaap:FairValueInputsLevel3Memberus-gaap:FairValueMeasurementsRecurringMember2024-06-300001026214us-gaap:FairValueMeasurementsRecurringMember2024-06-300001026214us-gaap:FairValueInputsLevel1Memberus-gaap:MortgageBackedSecuritiesMemberus-gaap:FairValueMeasurementsRecurringMember2024-06-300001026214us-gaap:FairValueInputsLevel2Memberus-gaap:MortgageBackedSecuritiesMemberus-gaap:FairValueMeasurementsRecurringMember2024-06-300001026214us-gaap:MortgageBackedSecuritiesMemberus-gaap:FairValueInputsLevel3Memberus-gaap:FairValueMeasurementsRecurringMember2024-06-300001026214us-gaap:MortgageBackedSecuritiesMemberus-gaap:FairValueMeasurementsRecurringMember2024-06-300001026214us-gaap:FairValueInputsLevel1Memberfmcc:NonMortgageRelatedSecuritiesMemberus-gaap:FairValueMeasurementsRecurringMember2024-06-300001026214us-gaap:FairValueInputsLevel2Memberfmcc:NonMortgageRelatedSecuritiesMemberus-gaap:FairValueMeasurementsRecurringMember2024-06-300001026214us-gaap:FairValueInputsLevel3Memberfmcc:NonMortgageRelatedSecuritiesMemberus-gaap:FairValueMeasurementsRecurringMember2024-06-300001026214fmcc:NonMortgageRelatedSecuritiesMemberus-gaap:FairValueMeasurementsRecurringMember2024-06-300001026214us-gaap:FairValueInputsLevel1Memberus-gaap:VariableInterestEntityPrimaryBeneficiaryMemberus-gaap:FairValueMeasurementsRecurringMember2024-06-300001026214us-gaap:FairValueInputsLevel2Memberus-gaap:VariableInterestEntityPrimaryBeneficiaryMemberus-gaap:FairValueMeasurementsRecurringMember2024-06-300001026214us-gaap:VariableInterestEntityPrimaryBeneficiaryMemberus-gaap:FairValueInputsLevel3Memberus-gaap:FairValueMeasurementsRecurringMember2024-06-300001026214us-gaap:VariableInterestEntityPrimaryBeneficiaryMemberus-gaap:FairValueMeasurementsRecurringMember2024-06-300001026214srt:ParentCompanyMemberus-gaap:FairValueInputsLevel1Memberus-gaap:FairValueMeasurementsRecurringMember2024-06-300001026214us-gaap:FairValueInputsLevel2Membersrt:ParentCompanyMemberus-gaap:FairValueMeasurementsRecurringMember2024-06-300001026214srt:ParentCompanyMemberus-gaap:FairValueInputsLevel3Memberus-gaap:FairValueMeasurementsRecurringMember2024-06-300001026214srt:ParentCompanyMemberus-gaap:FairValueMeasurementsRecurringMember2024-06-300001026214us-gaap:FairValueInputsLevel1Memberus-gaap:FairValueMeasurementsRecurringMember2023-12-310001026214us-gaap:FairValueInputsLevel2Memberus-gaap:FairValueMeasurementsRecurringMember2023-12-310001026214us-gaap:FairValueInputsLevel3Memberus-gaap:FairValueMeasurementsRecurringMember2023-12-310001026214us-gaap:FairValueMeasurementsRecurringMember2023-12-310001026214us-gaap:FairValueInputsLevel1Memberus-gaap:MortgageBackedSecuritiesMemberus-gaap:FairValueMeasurementsRecurringMember2023-12-310001026214us-gaap:FairValueInputsLevel2Memberus-gaap:MortgageBackedSecuritiesMemberus-gaap:FairValueMeasurementsRecurringMember2023-12-310001026214us-gaap:MortgageBackedSecuritiesMemberus-gaap:FairValueInputsLevel3Memberus-gaap:FairValueMeasurementsRecurringMember2023-12-310001026214us-gaap:MortgageBackedSecuritiesMemberus-gaap:FairValueMeasurementsRecurringMember2023-12-310001026214us-gaap:FairValueInputsLevel1Memberfmcc:NonMortgageRelatedSecuritiesMemberus-gaap:FairValueMeasurementsRecurringMember2023-12-310001026214us-gaap:FairValueInputsLevel2Memberfmcc:NonMortgageRelatedSecuritiesMemberus-gaap:FairValueMeasurementsRecurringMember2023-12-310001026214us-gaap:FairValueInputsLevel3Memberfmcc:NonMortgageRelatedSecuritiesMemberus-gaap:FairValueMeasurementsRecurringMember2023-12-310001026214fmcc:NonMortgageRelatedSecuritiesMemberus-gaap:FairValueMeasurementsRecurringMember2023-12-310001026214us-gaap:FairValueInputsLevel1Memberus-gaap:VariableInterestEntityPrimaryBeneficiaryMemberus-gaap:FairValueMeasurementsRecurringMember2023-12-310001026214us-gaap:FairValueInputsLevel2Memberus-gaap:VariableInterestEntityPrimaryBeneficiaryMemberus-gaap:FairValueMeasurementsRecurringMember2023-12-310001026214us-gaap:VariableInterestEntityPrimaryBeneficiaryMemberus-gaap:FairValueInputsLevel3Memberus-gaap:FairValueMeasurementsRecurringMember2023-12-310001026214us-gaap:VariableInterestEntityPrimaryBeneficiaryMemberus-gaap:FairValueMeasurementsRecurringMember2023-12-310001026214srt:ParentCompanyMemberus-gaap:FairValueInputsLevel1Memberus-gaap:FairValueMeasurementsRecurringMember2023-12-310001026214us-gaap:FairValueInputsLevel2Membersrt:ParentCompanyMemberus-gaap:FairValueMeasurementsRecurringMember2023-12-310001026214srt:ParentCompanyMemberus-gaap:FairValueInputsLevel3Memberus-gaap:FairValueMeasurementsRecurringMember2023-12-310001026214srt:ParentCompanyMemberus-gaap:FairValueMeasurementsRecurringMember2023-12-310001026214us-gaap:AvailableforsaleSecuritiesMember2024-03-310001026214us-gaap:AvailableforsaleSecuritiesMember2024-04-012024-06-300001026214us-gaap:AvailableforsaleSecuritiesMember2024-06-300001026214fmcc:TradingsecuritiesMember2024-03-310001026214fmcc:TradingsecuritiesMember2024-04-012024-06-300001026214fmcc:TradingsecuritiesMember2024-06-300001026214us-gaap:SecuritiesInvestmentMember2024-03-310001026214us-gaap:SecuritiesInvestmentMember2024-04-012024-06-300001026214us-gaap:SecuritiesInvestmentMember2024-06-300001026214fmcc:MortgageLoansHeldForSaleMember2024-03-310001026214fmcc:MortgageLoansHeldForSaleMember2024-04-012024-06-300001026214fmcc:MortgageLoansHeldForSaleMember2024-06-300001026214fmcc:MortgageLoansHeldForInvestmentMember2024-03-310001026214fmcc:MortgageLoansHeldForInvestmentMember2024-04-012024-06-300001026214fmcc:MortgageLoansHeldForInvestmentMember2024-06-300001026214fmcc:GuaranteeAssetMember2024-03-310001026214fmcc:GuaranteeAssetMember2024-04-012024-06-300001026214fmcc:GuaranteeAssetMember2024-06-300001026214fmcc:AllOtherAssetsMember2024-03-310001026214fmcc:AllOtherAssetsMember2024-04-012024-06-300001026214fmcc:AllOtherAssetsMember2024-06-300001026214fmcc:OtherAssetMember2024-03-310001026214fmcc:OtherAssetMember2024-04-012024-06-300001026214fmcc:OtherAssetMember2024-06-300001026214us-gaap:DebtMember2024-03-310001026214us-gaap:DebtMember2024-04-012024-06-300001026214us-gaap:DebtMember2024-06-300001026214us-gaap:OtherLiabilitiesMember2024-03-310001026214us-gaap:OtherLiabilitiesMember2024-04-012024-06-300001026214us-gaap:OtherLiabilitiesMember2024-06-300001026214us-gaap:AvailableforsaleSecuritiesMember2023-12-310001026214us-gaap:AvailableforsaleSecuritiesMember2024-01-012024-06-300001026214fmcc:TradingsecuritiesMember2023-12-310001026214fmcc:TradingsecuritiesMember2024-01-012024-06-300001026214us-gaap:SecuritiesInvestmentMember2023-12-310001026214us-gaap:SecuritiesInvestmentMember2024-01-012024-06-300001026214fmcc:MortgageLoansHeldForSaleMember2023-12-310001026214fmcc:MortgageLoansHeldForSaleMember2024-01-012024-06-300001026214fmcc:MortgageLoansHeldForInvestmentMember2023-12-310001026214fmcc:MortgageLoansHeldForInvestmentMember2024-01-012024-06-300001026214fmcc:GuaranteeAssetMember2023-12-310001026214fmcc:GuaranteeAssetMember2024-01-012024-06-300001026214fmcc:AllOtherAssetsMember2023-12-310001026214fmcc:AllOtherAssetsMember2024-01-012024-06-300001026214fmcc:OtherAssetMember2023-12-310001026214fmcc:OtherAssetMember2024-01-012024-06-300001026214us-gaap:DebtMember2023-12-310001026214us-gaap:DebtMember2024-01-012024-06-300001026214us-gaap:OtherLiabilitiesMember2023-12-310001026214us-gaap:OtherLiabilitiesMember2024-01-012024-06-300001026214us-gaap:AvailableforsaleSecuritiesMember2023-03-310001026214us-gaap:AvailableforsaleSecuritiesMember2023-04-012023-06-300001026214us-gaap:AvailableforsaleSecuritiesMember2023-06-300001026214fmcc:TradingsecuritiesMember2023-03-310001026214fmcc:TradingsecuritiesMember2023-04-012023-06-300001026214fmcc:TradingsecuritiesMember2023-06-300001026214us-gaap:SecuritiesInvestmentMember2023-03-310001026214us-gaap:SecuritiesInvestmentMember2023-04-012023-06-300001026214us-gaap:SecuritiesInvestmentMember2023-06-300001026214fmcc:MortgageLoansHeldForSaleMember2023-03-310001026214fmcc:MortgageLoansHeldForSaleMember2023-04-012023-06-300001026214fmcc:MortgageLoansHeldForSaleMember2023-06-300001026214fmcc:MortgageLoansHeldForInvestmentMember2023-03-310001026214fmcc:MortgageLoansHeldForInvestmentMember2023-04-012023-06-300001026214fmcc:MortgageLoansHeldForInvestmentMember2023-06-300001026214fmcc:GuaranteeAssetMember2023-03-310001026214fmcc:GuaranteeAssetMember2023-04-012023-06-300001026214fmcc:GuaranteeAssetMember2023-06-300001026214fmcc:AllOtherAssetsMember2023-03-310001026214fmcc:AllOtherAssetsMember2023-04-012023-06-300001026214fmcc:AllOtherAssetsMember2023-06-300001026214fmcc:OtherAssetMember2023-03-310001026214fmcc:OtherAssetMember2023-04-012023-06-300001026214fmcc:OtherAssetMember2023-06-300001026214us-gaap:DebtMember2023-03-310001026214us-gaap:DebtMember2023-04-012023-06-300001026214us-gaap:DebtMember2023-06-300001026214us-gaap:OtherLiabilitiesMember2023-03-310001026214us-gaap:OtherLiabilitiesMember2023-04-012023-06-300001026214us-gaap:OtherLiabilitiesMember2023-06-300001026214us-gaap:AvailableforsaleSecuritiesMember2022-12-310001026214us-gaap:AvailableforsaleSecuritiesMember2023-01-012023-06-300001026214fmcc:TradingsecuritiesMember2022-12-310001026214fmcc:TradingsecuritiesMember2023-01-012023-06-300001026214us-gaap:SecuritiesInvestmentMember2022-12-310001026214us-gaap:SecuritiesInvestmentMember2023-01-012023-06-300001026214fmcc:MortgageLoansHeldForSaleMember2022-12-310001026214fmcc:MortgageLoansHeldForSaleMember2023-01-012023-06-300001026214fmcc:MortgageLoansHeldForInvestmentMember2022-12-310001026214fmcc:MortgageLoansHeldForInvestmentMember2023-01-012023-06-300001026214fmcc:GuaranteeAssetMember2022-12-310001026214fmcc:GuaranteeAssetMember2023-01-012023-06-300001026214fmcc:AllOtherAssetsMember2022-12-310001026214fmcc:AllOtherAssetsMember2023-01-012023-06-300001026214fmcc:OtherAssetMember2022-12-310001026214fmcc:OtherAssetMember2023-01-012023-06-300001026214us-gaap:DebtMember2022-12-310001026214us-gaap:DebtMember2023-01-012023-06-300001026214us-gaap:OtherLiabilitiesMember2022-12-310001026214us-gaap:OtherLiabilitiesMember2023-01-012023-06-300001026214fmcc:MedianOfExternalSourcesMemberus-gaap:FairValueInputsLevel3Memberus-gaap:FairValueMeasurementsRecurringMember2024-06-300001026214fmcc:MedianOfExternalSourcesMemberus-gaap:AvailableforsaleSecuritiesMemberus-gaap:FairValueInputsLevel3Memberus-gaap:FairValueMeasurementsRecurringMembersrt:MinimumMember2024-01-012024-06-300001026214fmcc:MedianOfExternalSourcesMemberus-gaap:AvailableforsaleSecuritiesMembersrt:MaximumMemberus-gaap:FairValueInputsLevel3Memberus-gaap:FairValueMeasurementsRecurringMember2024-01-012024-06-300001026214fmcc:MedianOfExternalSourcesMembersrt:WeightedAverageMemberus-gaap:AvailableforsaleSecuritiesMemberus-gaap:FairValueInputsLevel3Memberus-gaap:FairValueMeasurementsRecurringMember2024-01-012024-06-300001026214fmcc:OtherValuationTechniquesMemberus-gaap:FairValueInputsLevel3Memberus-gaap:FairValueMeasurementsRecurringMember2024-06-300001026214us-gaap:FairValueInputsLevel3Memberfmcc:SingleExternalSourceMemberus-gaap:FairValueMeasurementsRecurringMember2024-06-300001026214us-gaap:FairValueInputsLevel3Memberfmcc:SingleExternalSourceMemberus-gaap:FairValueMeasurementsRecurringMembersrt:MinimumMemberfmcc:TradingsecuritiesMember2024-01-012024-06-300001026214srt:MaximumMemberus-gaap:FairValueInputsLevel3Memberfmcc:SingleExternalSourceMemberus-gaap:FairValueMeasurementsRecurringMemberfmcc:TradingsecuritiesMember2024-01-012024-06-300001026214srt:WeightedAverageMemberus-gaap:FairValueInputsLevel3Memberfmcc:SingleExternalSourceMemberus-gaap:FairValueMeasurementsRecurringMemberfmcc:TradingsecuritiesMember2024-01-012024-06-300001026214fmcc:MedianOfExternalSourcesMemberus-gaap:FairValueInputsLevel3Memberus-gaap:FairValueMeasurementsRecurringMembersrt:MinimumMemberfmcc:TradingsecuritiesMember2024-01-012024-06-300001026214fmcc:MedianOfExternalSourcesMembersrt:MaximumMemberus-gaap:FairValueInputsLevel3Memberus-gaap:FairValueMeasurementsRecurringMemberfmcc:TradingsecuritiesMember2024-01-012024-06-300001026214fmcc:MedianOfExternalSourcesMembersrt:WeightedAverageMemberus-gaap:FairValueInputsLevel3Memberus-gaap:FairValueMeasurementsRecurringMemberfmcc:TradingsecuritiesMember2024-01-012024-06-300001026214fmcc:MortgageLoansHeldForSaleMemberus-gaap:FairValueInputsLevel3Memberfmcc:SingleExternalSourceMemberus-gaap:FairValueMeasurementsRecurringMembersrt:MinimumMember2024-01-012024-06-300001026214fmcc:MortgageLoansHeldForSaleMembersrt:MaximumMemberus-gaap:FairValueInputsLevel3Memberfmcc:SingleExternalSourceMemberus-gaap:FairValueMeasurementsRecurringMember2024-01-012024-06-300001026214srt:WeightedAverageMemberfmcc:MortgageLoansHeldForSaleMemberus-gaap:FairValueInputsLevel3Memberfmcc:SingleExternalSourceMemberus-gaap:FairValueMeasurementsRecurringMember2024-01-012024-06-300001026214us-gaap:FairValueInputsLevel3Memberfmcc:SingleExternalSourceMemberfmcc:MortgageLoansHeldForInvestmentMemberus-gaap:FairValueMeasurementsRecurringMembersrt:MinimumMember2024-01-012024-06-300001026214srt:MaximumMemberus-gaap:FairValueInputsLevel3Memberfmcc:SingleExternalSourceMemberfmcc:MortgageLoansHeldForInvestmentMemberus-gaap:FairValueMeasurementsRecurringMember2024-01-012024-06-300001026214srt:WeightedAverageMemberus-gaap:FairValueInputsLevel3Memberfmcc:SingleExternalSourceMemberfmcc:MortgageLoansHeldForInvestmentMemberus-gaap:FairValueMeasurementsRecurringMember2024-01-012024-06-300001026214us-gaap:FairValueInputsLevel3Memberus-gaap:FairValueMeasurementsRecurringMemberus-gaap:ValuationTechniqueDiscountedCashFlowMember2024-06-300001026214fmcc:GuaranteeAssetMemberus-gaap:FairValueInputsLevel3Memberus-gaap:FairValueMeasurementsRecurringMemberus-gaap:ValuationTechniqueDiscountedCashFlowMembersrt:MinimumMember2024-01-012024-06-300001026214srt:MaximumMemberfmcc:GuaranteeAssetMemberus-gaap:FairValueInputsLevel3Memberus-gaap:FairValueMeasurementsRecurringMemberus-gaap:ValuationTechniqueDiscountedCashFlowMember2024-01-012024-06-300001026214srt:WeightedAverageMemberfmcc:GuaranteeAssetMemberus-gaap:FairValueInputsLevel3Memberus-gaap:FairValueMeasurementsRecurringMemberus-gaap:ValuationTechniqueDiscountedCashFlowMember2024-01-012024-06-300001026214fmcc:MedianOfExternalSourcesMemberus-gaap:FairValueInputsLevel3Memberus-gaap:FairValueMeasurementsRecurringMember2023-12-310001026214fmcc:MedianOfExternalSourcesMemberus-gaap:AvailableforsaleSecuritiesMemberus-gaap:FairValueInputsLevel3Memberus-gaap:FairValueMeasurementsRecurringMembersrt:MinimumMember2023-01-012023-12-310001026214fmcc:MedianOfExternalSourcesMemberus-gaap:AvailableforsaleSecuritiesMembersrt:MaximumMemberus-gaap:FairValueInputsLevel3Memberus-gaap:FairValueMeasurementsRecurringMember2023-01-012023-12-310001026214fmcc:MedianOfExternalSourcesMembersrt:WeightedAverageMemberus-gaap:AvailableforsaleSecuritiesMemberus-gaap:FairValueInputsLevel3Memberus-gaap:FairValueMeasurementsRecurringMember2023-01-012023-12-310001026214fmcc:OtherValuationTechniquesMemberus-gaap:FairValueInputsLevel3Memberus-gaap:FairValueMeasurementsRecurringMember2023-12-310001026214us-gaap:FairValueInputsLevel3Memberfmcc:SingleExternalSourceMemberus-gaap:FairValueMeasurementsRecurringMember2023-12-310001026214us-gaap:FairValueInputsLevel3Memberfmcc:SingleExternalSourceMemberus-gaap:FairValueMeasurementsRecurringMembersrt:MinimumMemberfmcc:TradingsecuritiesMember2023-01-012023-12-310001026214srt:MaximumMemberus-gaap:FairValueInputsLevel3Memberfmcc:SingleExternalSourceMemberus-gaap:FairValueMeasurementsRecurringMemberfmcc:TradingsecuritiesMember2023-01-012023-12-310001026214srt:WeightedAverageMemberus-gaap:FairValueInputsLevel3Memberfmcc:SingleExternalSourceMemberus-gaap:FairValueMeasurementsRecurringMemberfmcc:TradingsecuritiesMember2023-01-012023-12-310001026214fmcc:MortgageLoansHeldForSaleMemberus-gaap:FairValueInputsLevel3Memberfmcc:SingleExternalSourceMemberus-gaap:FairValueMeasurementsRecurringMembersrt:MinimumMember2023-01-012023-12-310001026214fmcc:MortgageLoansHeldForSaleMembersrt:MaximumMemberus-gaap:FairValueInputsLevel3Memberfmcc:SingleExternalSourceMemberus-gaap:FairValueMeasurementsRecurringMember2023-01-012023-12-310001026214srt:WeightedAverageMemberfmcc:MortgageLoansHeldForSaleMemberus-gaap:FairValueInputsLevel3Memberfmcc:SingleExternalSourceMemberus-gaap:FairValueMeasurementsRecurringMember2023-01-012023-12-310001026214us-gaap:FairValueInputsLevel3Memberfmcc:SingleExternalSourceMemberfmcc:MortgageLoansHeldForInvestmentMemberus-gaap:FairValueMeasurementsRecurringMembersrt:MinimumMember2023-01-012023-12-310001026214srt:MaximumMemberus-gaap:FairValueInputsLevel3Memberfmcc:SingleExternalSourceMemberfmcc:MortgageLoansHeldForInvestmentMemberus-gaap:FairValueMeasurementsRecurringMember2023-01-012023-12-310001026214srt:WeightedAverageMemberus-gaap:FairValueInputsLevel3Memberfmcc:SingleExternalSourceMemberfmcc:MortgageLoansHeldForInvestmentMemberus-gaap:FairValueMeasurementsRecurringMember2023-01-012023-12-310001026214us-gaap:FairValueInputsLevel3Memberus-gaap:FairValueMeasurementsRecurringMemberus-gaap:ValuationTechniqueDiscountedCashFlowMember2023-12-310001026214fmcc:GuaranteeAssetMemberus-gaap:FairValueInputsLevel3Memberus-gaap:FairValueMeasurementsRecurringMemberus-gaap:ValuationTechniqueDiscountedCashFlowMembersrt:MinimumMember2023-01-012023-12-310001026214srt:MaximumMemberfmcc:GuaranteeAssetMemberus-gaap:FairValueInputsLevel3Memberus-gaap:FairValueMeasurementsRecurringMemberus-gaap:ValuationTechniqueDiscountedCashFlowMember2023-01-012023-12-310001026214srt:WeightedAverageMemberfmcc:GuaranteeAssetMemberus-gaap:FairValueInputsLevel3Memberus-gaap:FairValueMeasurementsRecurringMemberus-gaap:ValuationTechniqueDiscountedCashFlowMember2023-01-012023-12-310001026214us-gaap:FairValueInputsLevel1Memberus-gaap:FairValueMeasurementsNonrecurringMember2024-06-300001026214us-gaap:FairValueInputsLevel2Memberus-gaap:FairValueMeasurementsNonrecurringMember2024-06-300001026214us-gaap:FairValueMeasurementsNonrecurringMemberus-gaap:FairValueInputsLevel3Member2024-06-300001026214us-gaap:FairValueMeasurementsNonrecurringMember2024-06-300001026214us-gaap:FairValueInputsLevel1Memberus-gaap:FairValueMeasurementsNonrecurringMember2023-12-310001026214us-gaap:FairValueInputsLevel2Memberus-gaap:FairValueMeasurementsNonrecurringMember2023-12-310001026214us-gaap:FairValueMeasurementsNonrecurringMemberus-gaap:FairValueInputsLevel3Member2023-12-310001026214us-gaap:FairValueMeasurementsNonrecurringMember2023-12-310001026214fmcc:MedianOfExternalSourcesMemberus-gaap:FairValueMeasurementsNonrecurringMemberus-gaap:ResidentialMortgageMemberus-gaap:FairValueInputsLevel3Member2024-06-300001026214fmcc:MedianOfExternalSourcesMemberus-gaap:FairValueMeasurementsNonrecurringMemberus-gaap:ResidentialMortgageMemberus-gaap:FairValueInputsLevel3Membersrt:MinimumMember2024-01-012024-06-300001026214fmcc:MedianOfExternalSourcesMemberus-gaap:FairValueMeasurementsNonrecurringMemberus-gaap:ResidentialMortgageMembersrt:MaximumMemberus-gaap:FairValueInputsLevel3Member2024-01-012024-06-300001026214fmcc:MedianOfExternalSourcesMembersrt:WeightedAverageMemberus-gaap:FairValueMeasurementsNonrecurringMemberus-gaap:ResidentialMortgageMemberus-gaap:FairValueInputsLevel3Member2024-01-012024-06-300001026214us-gaap:FairValueMeasurementsNonrecurringMemberus-gaap:ResidentialMortgageMemberfmcc:OtherValuationTechniquesMemberus-gaap:FairValueInputsLevel3Member2024-06-300001026214fmcc:MedianOfExternalSourcesMemberus-gaap:FairValueMeasurementsNonrecurringMemberus-gaap:ResidentialMortgageMemberus-gaap:FairValueInputsLevel3Member2023-12-310001026214fmcc:MedianOfExternalSourcesMemberus-gaap:FairValueMeasurementsNonrecurringMemberus-gaap:ResidentialMortgageMemberus-gaap:FairValueInputsLevel3Membersrt:MinimumMember2023-01-012023-12-310001026214fmcc:MedianOfExternalSourcesMemberus-gaap:FairValueMeasurementsNonrecurringMemberus-gaap:ResidentialMortgageMembersrt:MaximumMemberus-gaap:FairValueInputsLevel3Member2023-01-012023-12-310001026214fmcc:MedianOfExternalSourcesMembersrt:WeightedAverageMemberus-gaap:FairValueMeasurementsNonrecurringMemberus-gaap:ResidentialMortgageMemberus-gaap:FairValueInputsLevel3Member2023-01-012023-12-310001026214us-gaap:FairValueMeasurementsNonrecurringMemberus-gaap:ResidentialMortgageMemberfmcc:OtherValuationTechniquesMemberus-gaap:FairValueInputsLevel3Member2023-12-310001026214us-gaap:CarryingReportedAmountFairValueDisclosureMember2024-06-300001026214us-gaap:FairValueInputsLevel1Memberus-gaap:EstimateOfFairValueFairValueDisclosureMember2024-06-300001026214us-gaap:FairValueInputsLevel2Memberus-gaap:EstimateOfFairValueFairValueDisclosureMember2024-06-300001026214us-gaap:FairValueInputsLevel3Memberus-gaap:EstimateOfFairValueFairValueDisclosureMember2024-06-300001026214us-gaap:EstimateOfFairValueFairValueDisclosureMember2024-06-300001026214us-gaap:CarryingReportedAmountFairValueDisclosureMemberus-gaap:VariableInterestEntityPrimaryBeneficiaryMember2024-06-300001026214us-gaap:FairValueInputsLevel1Memberus-gaap:VariableInterestEntityPrimaryBeneficiaryMemberus-gaap:EstimateOfFairValueFairValueDisclosureMember2024-06-300001026214us-gaap:FairValueInputsLevel2Memberus-gaap:VariableInterestEntityPrimaryBeneficiaryMemberus-gaap:EstimateOfFairValueFairValueDisclosureMember2024-06-300001026214us-gaap:VariableInterestEntityPrimaryBeneficiaryMemberus-gaap:FairValueInputsLevel3Memberus-gaap:EstimateOfFairValueFairValueDisclosureMember2024-06-300001026214us-gaap:VariableInterestEntityPrimaryBeneficiaryMemberus-gaap:EstimateOfFairValueFairValueDisclosureMember2024-06-300001026214us-gaap:CarryingReportedAmountFairValueDisclosureMembersrt:ParentCompanyMember2024-06-300001026214srt:ParentCompanyMemberus-gaap:FairValueInputsLevel1Memberus-gaap:EstimateOfFairValueFairValueDisclosureMember2024-06-300001026214us-gaap:FairValueInputsLevel2Membersrt:ParentCompanyMemberus-gaap:EstimateOfFairValueFairValueDisclosureMember2024-06-300001026214srt:ParentCompanyMemberus-gaap:FairValueInputsLevel3Memberus-gaap:EstimateOfFairValueFairValueDisclosureMember2024-06-300001026214srt:ParentCompanyMemberus-gaap:EstimateOfFairValueFairValueDisclosureMember2024-06-300001026214us-gaap:CarryingReportedAmountFairValueDisclosureMember2023-12-310001026214us-gaap:FairValueInputsLevel1Memberus-gaap:EstimateOfFairValueFairValueDisclosureMember2023-12-310001026214us-gaap:FairValueInputsLevel2Memberus-gaap:EstimateOfFairValueFairValueDisclosureMember2023-12-310001026214us-gaap:FairValueInputsLevel3Memberus-gaap:EstimateOfFairValueFairValueDisclosureMember2023-12-310001026214us-gaap:EstimateOfFairValueFairValueDisclosureMember2023-12-310001026214us-gaap:CarryingReportedAmountFairValueDisclosureMemberus-gaap:VariableInterestEntityPrimaryBeneficiaryMember2023-12-310001026214us-gaap:FairValueInputsLevel1Memberus-gaap:VariableInterestEntityPrimaryBeneficiaryMemberus-gaap:EstimateOfFairValueFairValueDisclosureMember2023-12-310001026214us-gaap:FairValueInputsLevel2Memberus-gaap:VariableInterestEntityPrimaryBeneficiaryMemberus-gaap:EstimateOfFairValueFairValueDisclosureMember2023-12-310001026214us-gaap:VariableInterestEntityPrimaryBeneficiaryMemberus-gaap:FairValueInputsLevel3Memberus-gaap:EstimateOfFairValueFairValueDisclosureMember2023-12-310001026214us-gaap:VariableInterestEntityPrimaryBeneficiaryMemberus-gaap:EstimateOfFairValueFairValueDisclosureMember2023-12-310001026214us-gaap:CarryingReportedAmountFairValueDisclosureMembersrt:ParentCompanyMember2023-12-310001026214srt:ParentCompanyMemberus-gaap:FairValueInputsLevel1Memberus-gaap:EstimateOfFairValueFairValueDisclosureMember2023-12-310001026214us-gaap:FairValueInputsLevel2Membersrt:ParentCompanyMemberus-gaap:EstimateOfFairValueFairValueDisclosureMember2023-12-310001026214srt:ParentCompanyMemberus-gaap:FairValueInputsLevel3Memberus-gaap:EstimateOfFairValueFairValueDisclosureMember2023-12-310001026214srt:ParentCompanyMemberus-gaap:EstimateOfFairValueFairValueDisclosureMember2023-12-310001026214us-gaap:CarryingReportedAmountFairValueDisclosureMemberfmcc:AmortizedCostMember2024-06-300001026214us-gaap:CarryingReportedAmountFairValueDisclosureMemberfmcc:LowerOfCostOrFairValueMember2024-06-300001026214us-gaap:CarryingReportedAmountFairValueDisclosureMemberfmcc:FairValueThroughNetIncomeMember2024-06-300001026214us-gaap:CarryingReportedAmountFairValueDisclosureMemberfmcc:AmortizedCostMember2023-12-310001026214us-gaap:CarryingReportedAmountFairValueDisclosureMemberfmcc:LowerOfCostOrFairValueMember2023-12-310001026214us-gaap:CarryingReportedAmountFairValueDisclosureMemberfmcc:FairValueThroughNetIncomeMember2023-12-310001026214fmcc:HeldforSaleMember2024-06-300001026214fmcc:HeldforSaleMember2023-12-310001026214fmcc:HeldforInvestmentMember2024-06-300001026214fmcc:HeldforInvestmentMember2023-12-310001026214us-gaap:InterestOnlyStripMemberus-gaap:VariableInterestEntityPrimaryBeneficiaryMember2024-06-300001026214us-gaap:InterestOnlyStripMemberus-gaap:VariableInterestEntityPrimaryBeneficiaryMember2023-12-310001026214us-gaap:LoansReceivableMember2024-04-012024-06-300001026214us-gaap:LoansReceivableMember2023-04-012023-06-300001026214us-gaap:LoansReceivableMember2024-01-012024-06-300001026214us-gaap:LoansReceivableMember2023-01-012023-06-300001026214fmcc:HeldforInvestmentMember2024-04-012024-06-300001026214fmcc:HeldforInvestmentMember2023-04-012023-06-300001026214fmcc:HeldforInvestmentMember2024-01-012024-06-300001026214fmcc:HeldforInvestmentMember2023-01-012023-06-300001026214srt:ParentCompanyMemberus-gaap:LongTermDebtMember2024-04-012024-06-300001026214srt:ParentCompanyMemberus-gaap:LongTermDebtMember2023-04-012023-06-300001026214srt:ParentCompanyMemberus-gaap:LongTermDebtMember2024-01-012024-06-300001026214srt:ParentCompanyMemberus-gaap:LongTermDebtMember2023-01-012023-06-300001026214us-gaap:VariableInterestEntityPrimaryBeneficiaryMemberus-gaap:LongTermDebtMember2024-04-012024-06-300001026214us-gaap:VariableInterestEntityPrimaryBeneficiaryMemberus-gaap:LongTermDebtMember2023-04-012023-06-300001026214us-gaap:VariableInterestEntityPrimaryBeneficiaryMemberus-gaap:LongTermDebtMember2024-01-012024-06-300001026214us-gaap:VariableInterestEntityPrimaryBeneficiaryMemberus-gaap:LongTermDebtMember2023-01-012023-06-300001026214us-gaap:WrittenLoanCommitmentFairValueOptionMember2024-04-012024-06-300001026214us-gaap:WrittenLoanCommitmentFairValueOptionMember2023-04-012023-06-300001026214us-gaap:WrittenLoanCommitmentFairValueOptionMember2024-01-012024-06-300001026214us-gaap:WrittenLoanCommitmentFairValueOptionMember2023-01-012023-06-300001026214us-gaap:PendingLitigationMember2022-11-072022-11-070001026214fmcc:JuniorPreferredShareholderMemberus-gaap:JudicialRulingMember2023-08-142023-08-140001026214fmcc:CommonShareholderMemberus-gaap:JudicialRulingMember2023-08-142023-08-1400010262142023-09-300001026214fmcc:AvailableCapitalActualMember2024-06-300001026214fmcc:MinimumCapitalRequirementMember2024-06-300001026214fmcc:CapitalRequirementIncludingBufferMember2024-06-300001026214fmcc:AvailableCapitalActualMember2023-12-310001026214fmcc:MinimumCapitalRequirementMember2023-12-310001026214fmcc:CapitalRequirementIncludingBufferMember2023-12-31
UNITED STATES SECURITIES AND EXCHANGE COMMISSION
Washington, D.C. 20549
FORM 10-Q | | | | | |
☒ | QUARTERLY REPORT PURSUANT TO SECTION 13 OR 15(d) OF THE SECURITIES EXCHANGE ACT OF 1934. |
For the quarterly period ended June 30, 2024
or | | | | | |
| ☐ | TRANSITION REPORT PURSUANT TO SECTION 13 OR 15(d) OF THE SECURITIES EXCHANGE ACT OF 1934. |
For the transition period from to
Commission File Number: 001-34139
Federal Home Loan Mortgage Corporation
(Exact name of registrant as specified in its charter)
| | | | | | | | | | | | | | | | | | | | | | | | | | | | | | | | | | | | | | | | | | | | |
| Federally chartered | | 52-0904874 | | 8200 Jones Branch Drive | | 22102-3110 | | | (703) | 903-2000 | |
| corporation | | | | McLean, | Virginia | | | | | |
| (State or other jurisdiction of incorporation or organization) | | (I.R.S. Employer Identification No.) | | (Address of principal executive offices) | | (Zip Code) | | (Registrant's telephone number,
including area code) |
Securities registered pursuant to Section 12(b) of the Act:
| | | | | | | | |
| Title of each class | Trading Symbol(s) | Name of each exchange on which registered |
| None | N/A | N/A |
Indicate by check mark whether the registrant: (1) has filed all reports required to be filed by Section 13 or 15(d) of the Securities Exchange Act of 1934 during the preceding 12 months (or for such shorter period that the registrant was required to file such reports), and (2) has been subject to such filing requirements for the past 90 days. ☒ Yes ☐ No
Indicate by check mark whether the registrant has submitted electronically every Interactive Data File required to be submitted pursuant to Rule 405 of Regulation S-T (§232.405 of this chapter) during the preceding 12 months (or for such shorter period that the registrant was required to submit such files). ☒ Yes ☐ No
Indicate by check mark whether the registrant is a large accelerated filer, an accelerated filer, a non-accelerated filer, a smaller reporting company, or an emerging growth company. See the definitions of "large accelerated filer," "accelerated filer," "smaller reporting company," and "emerging growth company" in Rule 12b-2 of the Exchange Act. | | | | | | | | | | | | | | | | | | | | |
| | Large accelerated filer | ☐ | | | Accelerated filer | ☒ |
| | Non-accelerated filer | ☐ | | | Smaller reporting company | ☐ |
| Emerging growth company | ☐ | | | | |
If an emerging growth company, indicate by check mark if the registrant has elected not to use the extended transition period for complying with any new or revised financial accounting standards provided pursuant to Section 13(a) of the Exchange Act. ☐
Indicate by check mark whether the registrant is a shell company (as defined in Rule 12b-2 of the Exchange Act). Yes ☐ No ☒
As of July 9, 2024, there were 650,059,553 shares of the registrant's common stock outstanding.
Table of Contents
| | | | | |
| Page |
| MANAGEMENT'S DISCUSSION AND ANALYSIS OF FINANCIAL CONDITION AND RESULTS OF OPERATIONS | |
n Introduction | |
n Housing and Mortgage Market Conditions | |
n Consolidated Results of Operations | |
n Consolidated Balance Sheets Analysis | |
n Our Portfolios | |
n Our Business Segments | |
n Risk Management | |
l Credit Risk | |
l Market Risk | |
n Liquidity and Capital Resources | |
n Critical Accounting Estimates | |
| |
n Regulation and Supervision | |
n Forward-Looking Statements | |
| FINANCIAL STATEMENTS | |
| OTHER INFORMATION | |
| CONTROLS AND PROCEDURES | |
| EXHIBIT INDEX | |
| SIGNATURES | |
| FORM 10-Q INDEX | |
| | | | | | | | |
| Freddie Mac 2Q 2024 Form 10-Q | | i |
MD&A TABLE INDEX | | | | | | | | |
| Table | Description | Page |
| 1 | Summary of Consolidated Statements of Income and Comprehensive Income
| |
| 2 | Components of Net Interest Income | |
| 3 | Analysis of Net Interest Yield | |
| 4 | Components of Non-Interest Income | |
| 5 | (Provision) Benefit for Credit Losses | |
| 6 | Components of Non-Interest Expense | |
| 7 | Summarized Condensed Consolidated Balance Sheets | |
| 8 | Mortgage Portfolio | |
| 9 | Mortgage-Related Investments Portfolio | |
| 10 | Other Investments Portfolio | |
| 11 | Single-Family Segment Financial Results | |
| 12 | Multifamily Segment Financial Results | |
| 13 | Allowance for Credit Losses Activity | |
| 14 | Allowance for Credit Losses Ratios | |
| 15 | Single-Family New Business Activity | |
| 16 | Single-Family Mortgage Portfolio Newly Acquired Credit Enhancements | |
| 17 | Single-Family Mortgage Portfolio Credit Enhancement Coverage Outstanding | |
| 18 | Serious Delinquency Rates for Credit-Enhanced and Non-Credit-Enhanced Loans in Our Single-Family Mortgage Portfolio | |
| 19 | Credit Quality Characteristics of Our Single-Family Mortgage Portfolio | |
| 20 | Single-Family Mortgage Portfolio Attribute Combinations | |
| 21 | Single-Family Completed Loan Workout Activity | |
| 22 | Multifamily Mortgage Portfolio CRT Issuance | |
| 23 | Credit-Enhanced and Non-Credit-Enhanced Loans Underlying Our Multifamily Mortgage Portfolio | |
| 24 | Credit Quality of Our Multifamily Mortgage Portfolio Without Credit Enhancement | |
| 25 | PVS-YC and PVS-L Results Assuming Shifts of the Yield Curve | |
| 26 | Duration Gap and PVS Results | |
| 27 | PVS-L Results Before Derivatives and After Derivatives | |
| 28 | Earnings Sensitivity to Changes in Interest Rates | |
| 29 | Liquidity Sources | |
| 30 | Funding Sources | |
| 31 | Debt of Freddie Mac Activity | |
| 32 | Maturity and Redemption Dates | |
| 33 | Debt of Consolidated Trusts Activity | |
| 34 | Net Worth Activity | |
| 35 | Regulatory Capital Components | |
| 36 | Statutory Capital Components | |
| 37 | Capital Metrics Under ERCF | |
| 38 | Forecasted House Price Growth Rates | |
| | | | | | | | |
| Freddie Mac 2Q 2024 Form 10-Q | | ii |
| | | | | | | | |
| Management's Discussion and Analysis | | Introduction |
Management's Discussion and Analysis of Financial Condition and Results of Operations
This Quarterly Report on Form 10-Q includes forward-looking statements that are based on current expectations and that are subject to significant risks and uncertainties. These forward-looking statements are made as of the date of this Form 10-Q. We undertake no obligation to update any forward-looking statement to reflect events or circumstances after the date of this Form 10-Q. Actual results might differ significantly from those described in or implied by such statements due to various factors and uncertainties, including those described in the MD&A - Forward-Looking Statements section of this Form 10-Q and the Introduction and Risk Factors sections of our Annual Report on Form 10-K for the year ended December 31, 2023, or 2023 Annual Report.
Throughout this Form 10-Q, we use certain acronyms and terms that are defined in the Glossary of our 2023 Annual Report.
You should read the following MD&A in conjunction with our 2023 Annual Report and our condensed consolidated financial statements and accompanying notes for the three and six months ended June 30, 2024 included in Financial Statements.
INTRODUCTION
Freddie Mac is a GSE chartered by Congress in 1970, with a mission to provide liquidity, stability, and affordability to the U.S. housing market. We do this primarily by purchasing single-family and multifamily residential mortgage loans originated by lenders. In most instances, we package these loans into guaranteed mortgage-related securities, which are sold in the global capital markets, and transfer interest-rate and liquidity risks to third-party investors. In addition, we transfer a portion of our mortgage credit risk exposure to third-party investors through our credit risk transfer programs, which include securities- and insurance-based offerings. We also invest in mortgage loans, mortgage-related securities, and other types of assets. We do not originate mortgage loans or lend money directly to mortgage borrowers.
We support the U.S. housing market and the overall economy by enabling America's families to access mortgage loan funding with better terms and by providing consistent liquidity to the single-family and multifamily mortgage markets. We have helped many distressed borrowers keep their homes or avoid foreclosure and have helped many distressed renters avoid eviction.
Since September 2008, we have been operating in conservatorship, with FHFA as our Conservator. The conservatorship and related matters significantly affect our management, business activities, financial condition, and results of operations. Our future is uncertain, and the conservatorship has no specified termination date. We do not know what changes may occur to our business model during or following conservatorship, including whether we will continue to exist. In connection with our entry into conservatorship, we entered into the Purchase Agreement with Treasury, under which we issued Treasury both senior preferred stock and a warrant to purchase common stock. Our Purchase Agreement with Treasury is critical to keeping us solvent and avoiding the appointment of a receiver by FHFA under statutory mandatory receivership provisions. We believe the support provided by Treasury pursuant to the Purchase Agreement currently enables us to have adequate liquidity to conduct normal business activities. For additional information on the conservatorship and related matters and the Purchase Agreement, see our 2023 Annual Report.
| | | | | | | | |
| Freddie Mac 2Q 2024 Form 10-Q | | 1 |
| | | | | | | | |
| Management's Discussion and Analysis | | Introduction |
Business Results
Consolidated Financial Results Net Revenues and Net Income
(In billions)
Key Drivers:
n Net income was $2.8 billion, a decrease of 6% year-over-year, primarily driven by a credit reserve build in the current period compared to a credit reserve release in the prior year period, partially offset by higher net revenues.
n Net revenues were $6.0 billion, an increase of 12% year-over-year, driven by higher net interest income and higher non-interest income.
n Net worth was $53.2 billion as of June 30, 2024, up from $42.0 billion as of June 30, 2023. The quarterly increases in net worth have been, or will be, added to the aggregate liquidation preference of the senior preferred stock. The liquidation preference of the senior preferred stock was $123.1 billion on June 30, 2024, and will increase to $125.9 billion on September 30, 2024 based on the increase in net worth in 2Q 2024.
Market Liquidity
(In thousands)
We support the U.S. housing market by executing our mission to provide liquidity and help maintain credit availability for new and refinanced single-family mortgages as well as for rental housing. We provided $96 billion in liquidity to the mortgage market in 2Q 2024, which enabled the financing of 349,000 home purchases, refinancings, and rental units.
| | | | | | | | |
| Freddie Mac 2Q 2024 Form 10-Q | | 2 |
| | | | | | | | |
| Management's Discussion and Analysis | | Introduction |
Mortgage Portfolio Balances
Mortgage Portfolio
(UPB in billions)
Key Drivers:
n Our mortgage portfolio increased 2% year-over-year to $3.5 trillion at June 30, 2024, continuing to grow at a moderate pace as new business activity remained low.
l Our Single-Family mortgage portfolio was $3.1 trillion at June 30, 2024, up 2% year-over-year.
l Our Multifamily mortgage portfolio was $447 billion at June 30, 2024, up 5% year-over-year.
Credit Enhancement Coverage Single-Family Mortgage Portfolio with Credit Enhancement
(UPB in billions)
Multifamily Mortgage Portfolio with Credit Enhancement
(UPB in billions)
In addition to transferring interest-rate and liquidity risk to third-party investors through our securitization activities, we engage in various types of credit enhancements, such as primary mortgage insurance and CRT transactions, to reduce our credit risk exposure and transfer a portion of the credit risk on certain loans in our mortgage portfolio to third parties. At June 30, 2024, we had credit enhancement coverage on 62% of our Single-Family mortgage portfolio and 95% of our Multifamily mortgage portfolio. See MD&A - Risk Management – Credit Risk for additional information on our credit enhancements.
| | | | | | | | |
| Freddie Mac 2Q 2024 Form 10-Q | | 3 |
| | | | | | | | |
| Management's Discussion and Analysis | | Housing and Mortgage Market Conditions |
HOUSING AND MORTGAGE MARKET CONDITIONS
The following charts present certain housing and mortgage market indicators that can significantly affect our business and financial results. Certain market and macroeconomic prior period data have been updated to reflect revised historical data. For additional information on the effect of these indicators on our business and financial results, see MD&A – Consolidated Results of Operations and MD&A – Our Business Segments.
U.S. Single-Family Home Sales and House Prices
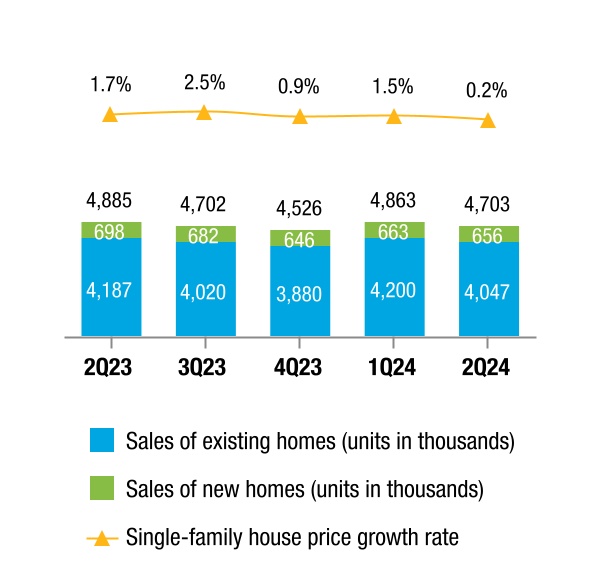 Sources: National Association of Realtors, U.S. Census Bureau, and Freddie Mac House Price Index (seasonally adjusted rate).
U.S. Single-Family Mortgage Originations
(UPB in billions)
Source: Freddie Mac and Inside Mortgage Finance.
Single-Family Serious Delinquency Rates
Source: Freddie Mac and National Delinquency Survey from the Mortgage Bankers Association. The 2Q 2024 total mortgage market rate is not yet available.
Single-Family Mortgage Debt Outstanding
(UPB in trillions)
Source: Freddie Mac and Federal Reserve Financial Accounts of the United States of America. The 2Q 2024 U.S. single-family mortgage debt outstanding balance is not yet available.
| | | | | | | | |
| Freddie Mac 2Q 2024 Form 10-Q | | 4 |
| | | | | | | | |
| Management's Discussion and Analysis | | Housing and Mortgage Market Conditions |
Apartment Vacancy Rates and Change in Effective Rents
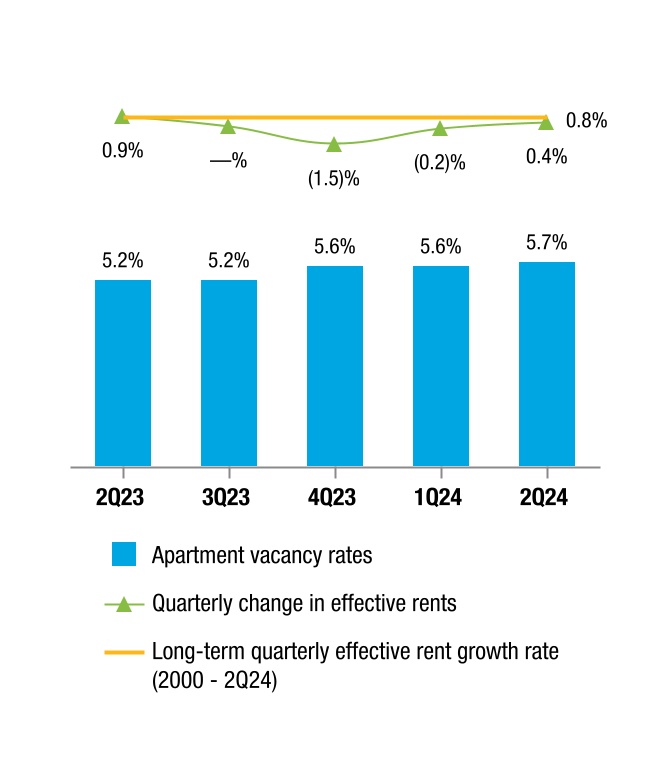 Source: Reis.
Multifamily Property Price Growth Rate
Source: Real Capital Analytics Commercial Property Price Index (RCA CPPI).
Multifamily Delinquency Rates
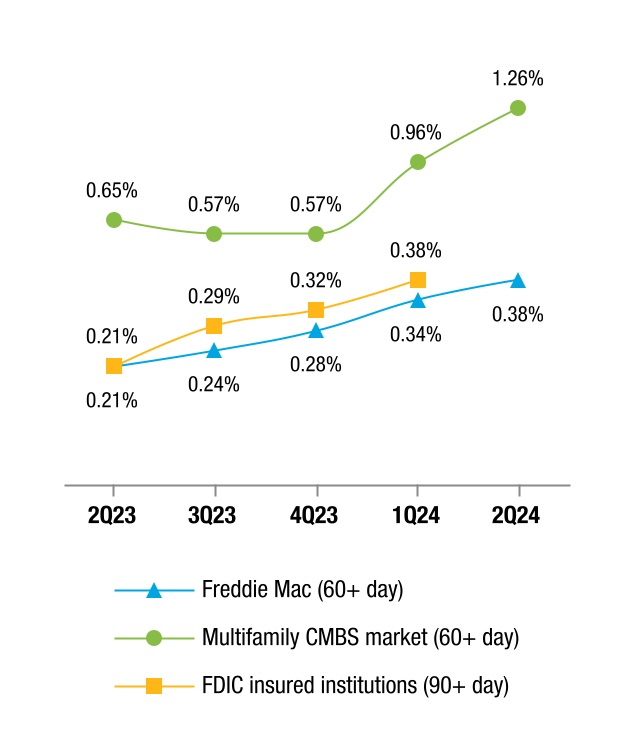 Source: Freddie Mac, FDIC Quarterly Banking Profile, Intex Solutions, Inc., and Wells Fargo Securities (Multifamily CMBS conduit market, excluding REOs). The 2Q 2024 delinquency rate for FDIC insured institutions is not yet available.
Multifamily Mortgage Debt Outstanding
(UPB in billions)
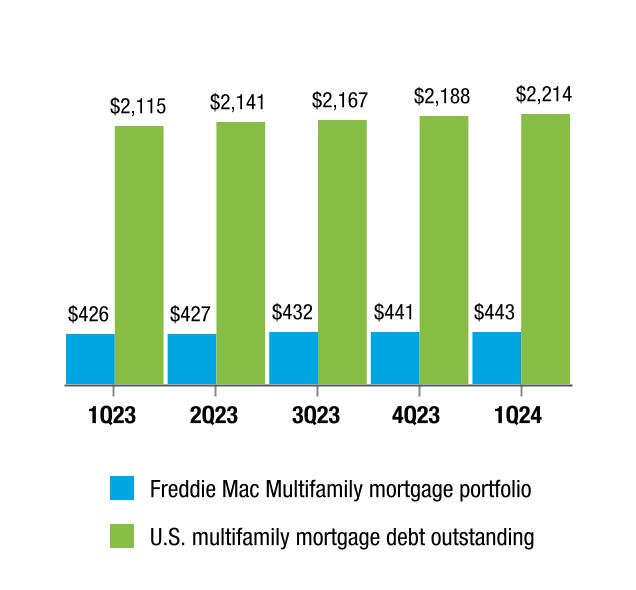 Source: Freddie Mac and Federal Reserve Financial Accounts of the United States of America. The 2Q 2024 U.S. multifamily mortgage debt outstanding balance is not yet available.
 | | | | | | | | |
| Freddie Mac 2Q 2024 Form 10-Q | | 5 |
| | | | | | | | |
| Management's Discussion and Analysis | | Consolidated Results of Operations |
CONSOLIDATED RESULTS OF OPERATIONS
The discussion of our consolidated results of operations should be read in conjunction with our condensed consolidated financial statements and accompanying notes.
The table below compares our summarized consolidated results of operations.
Table 1 - Summary of Consolidated Statements of Income and Comprehensive Income | | | | | | | | | | | | | | | | | | | | | | | | | | | | | | | | | | | | | | |
| | | | | Change | | | | | Change |
| (Dollars in millions) | | 2Q 2024 | 2Q 2023 | | $ | %(1) | | YTD 2024 | YTD 2023 | | $ | %(1) |
| Net interest income | | $4,928 | | $4,523 | | | $405 | | 9 | % | | $9,687 | | $9,024 | | | $663 | | 7 | % |
| Non-interest income | | 1,060 | | 816 | | | 244 | | 30 | | | 2,058 | | 1,142 | | | 916 | | 80 | |
| Net revenues | | 5,988 | | 5,339 | | | 649 | | 12 | | | 11,745 | | 10,166 | | | 1,579 | | 16 | |
| (Provision) benefit for credit losses | | (394) | | 537 | | | (931) | | NM | | (575) | | 142 | | | (717) | | NM |
| Non-interest expense | | (2,134) | | (2,204) | | | 70 | | 3 | | | (4,256) | | (4,136) | | | (120) | | (3) | |
| Income before income tax expense | | 3,460 | | 3,672 | | | (212) | | (6) | | | 6,914 | | 6,172 | | | 742 | | 12 | |
| Income tax expense | | (695) | | (728) | | | 33 | | 5 | | | (1,383) | | (1,233) | | | (150) | | (12) | |
| Net income | | 2,765 | | 2,944 | | | (179) | | (6) | | | 5,531 | | 4,939 | | | 592 | | 12 | |
Other comprehensive income (loss),
net of taxes and reclassification adjustments | | (5) | | (54) | | | 49 | | 91 | | | (30) | | — | | | (30) | | NM |
| Comprehensive income | | $2,760 | | $2,890 | | | ($130) | | (4) | % | | $5,501 | | $4,939 | | | $562 | | 11 | % |
(1)NM - not meaningful.
Net Revenues
The table below presents the components of net interest income.
Table 2 - Components of Net Interest Income | | | | | | | | | | | | | | | | | | | | | | | | | | | | | | | | | | | | | | |
| | | | | Change | | | | | Change |
| (Dollars in millions) | | 2Q 2024 | 2Q 2023 | | $ | % | | YTD 2024 | YTD 2023 | | $ | % |
| Guarantee net interest income: | | | | | | | | | | | | |
| Contractual net interest income | | $3,814 | | $3,658 | | | $156 | | 4 | % | | $7,586 | | $7,324 | | | $262 | | 4 | % |
| Deferred fee income | | 179 | | 232 | | | (53) | | (23) | | | 345 | | 439 | | | (94) | | (21) | |
| Total guarantee net interest income | | 3,993 | | 3,890 | | | 103 | | 3 | | | 7,931 | | 7,763 | | | 168 | | 2 | |
| Investments net interest income | | 1,570 | | 1,611 | | | (41) | | (3) | | | 3,084 | | 3,043 | | | 41 | | 1 | |
| Impact on net interest income from hedge accounting | | (635) | | (978) | | | 343 | | 35 | | | (1,328) | | (1,782) | | | 454 | | 25 | |
| Net interest income | | $4,928 | | $4,523 | | | $405 | | 9 | % | | $9,687 | | $9,024 | | | $663 | | 7 | % |
Key Drivers:
n Guarantee net interest income
l 2Q 2024 vs. 2Q 2023 and YTD 2024 vs. YTD 2023 - Increased primarily due to continued mortgage portfolio growth.
n Impact on net interest income from hedge accounting
l 2Q 2024 vs. 2Q 2023 and YTD 2024 vs. YTD 2023 - Decreased due to lower expense related to debt in hedge accounting relationships.
| | | | | | | | |
| Freddie Mac 2Q 2024 Form 10-Q | | 6 |
| | | | | | | | |
| Management's Discussion and Analysis | | Consolidated Results of Operations |
Net Interest Yield Analysis The table below presents a yield analysis of interest-earning assets and interest-bearing liabilities.
Table 3 - Analysis of Net Interest Yield | | | | | | | | | | | | | | | | | | | | | | | | | | | | | | | | |
| | 2Q 2024 | | 2Q 2023 | | | | | | |
| (Dollars in millions) | | Average Balance | Interest Income (Expense) | Average Rate | | Average Balance | Interest Income (Expense) | Average Rate | | | | | | |
| Interest-earning assets: | | | | | | | | | | | | | | |
| Cash and cash equivalents | | $11,368 | | $123 | | 4.26 | % | | $13,572 | | $135 | | 3.93 | % | | | | | | |
| Securities purchased under agreements to resell | | 116,817 | | 1,593 | | 5.46 | | | 127,016 | | 1,622 | | 5.11 | | | | | | | |
| Investment securities | | 41,899 | | 484 | | 4.62 | | | 39,617 | | 363 | | 3.67 | | | | | | | |
Mortgage loans(1) | | 3,113,656 | | 26,821 | | 3.45 | | | 3,047,556 | | 23,598 | | 3.10 | | | | | | | |
| Other assets | | 2,610 | | 43 | | 6.51 | | | 2,749 | | 37 | | 5.40 | | | | | | | |
| Total interest-earning assets | | 3,286,350 | | 29,064 | | 3.54 | | | 3,230,510 | | 25,755 | | 3.19 | | | | | | | |
| Interest-bearing liabilities: | | | | | | | | | | | | | | |
| Debt of consolidated trusts | | 3,049,378 | | (21,634) | | (2.84) | | | 2,984,057 | | (18,608) | | (2.49) | | | | | | | |
| Debt of Freddie Mac | | 180,158 | | (2,502) | | (5.55) | | | 201,432 | | (2,624) | | (5.21) | | | | | | | |
| Total interest-bearing liabilities | | 3,229,536 | | (24,136) | | (2.99) | | | 3,185,489 | | (21,232) | | (2.67) | | | | | | | |
| Impact of net non-interest-bearing funding | | 56,814 | | — | | 0.05 | | | 45,021 | | — | | 0.04 | | | | | | | |
| Total funding of interest-earning assets | | 3,286,350 | | (24,136) | | (2.94) | | | 3,230,510 | | (21,232) | | (2.63) | | | | | | | |
| Net interest income/yield | | | $4,928 | | 0.60 | % | | | $4,523 | | 0.56 | % | | | | | | |
| | | | | | | | | | | | | | |
(1)Loan fees included in net interest income were $0.3 billion during both 2Q 2024 and 2Q 2023.
| | | | | | | | | | | | | | | | | | | | | | | | | | |
| | | YTD 2024 | | YTD 2023 |
| (Dollars in millions) | | Average Balance | Interest Income (Expense) | Average Rate | | Average Balance | Interest Income (Expense) | Average Rate |
| Interest-earning assets: | | | | | | | | |
| Cash and cash equivalents | | $11,754 | | $248 | | 4.17 | % | | $13,665 | | $256 | | 3.72 | % |
| Securities purchased under agreements to resell | | 114,307 | | 3,125 | | 5.47 | | | 117,266 | | 2,842 | | 4.85 | |
| Investment securities | | 41,596 | | 954 | | 4.59 | | | 38,871 | | 679 | | 3.49 | |
Mortgage loans(1) | | 3,106,884 | | 53,050 | | 3.42 | | | 3,044,843 | 46,902 | 3.08 | |
| Other assets | | 2,197 | | 72 | | 6.49 | | | 2,339 | 63 | 5.36 | |
| Total interest-earning assets | | 3,276,738 | | 57,449 | | 3.50 | | | 3,216,984 | 50,742 | 3.15 | |
| Interest-bearing liabilities: | | | | | | | | |
| Debt of consolidated trusts | | 3,042,226 | | (42,756) | | (2.81) | | | 2,979,737 | | (36,869) | | (2.47) | |
| Debt of Freddie Mac | | 180,504 | | (5,006) | | (5.54) | | | 194,516 | | (4,849) | | (4.98) | |
| Total interest-bearing liabilities | | 3,222,730 | | (47,762) | | (2.96) | | | 3,174,253 | | (41,718) | | (2.63) | |
| Impact of net non-interest-bearing funding | | 54,008 | | — | | 0.05 | | | 42,731 | | — | | 0.03 | |
| Total funding of interest-earning assets | | 3,276,738 | | (47,762) | | (2.91) | | | 3,216,984 | | (41,718) | | (2.60) | |
| Net interest income/yield | | | $9,687 | | 0.59 | % | | | $9,024 | | 0.55 | % |
(1)Loan fees included in net interest income were $0.6 billion during both YTD 2024 and YTD 2023.
| | | | | | | | |
| Freddie Mac 2Q 2024 Form 10-Q | | 7 |
| | | | | | | | |
| Management's Discussion and Analysis | | Consolidated Results of Operations |
The table below presents the components of non-interest income.
Table 4 - Components of Non-Interest Income | | | | | | | | | | | | | | | | | | | | | | | | | | | | | | | | | | | | | | |
| | | | | Change | | | | | Change |
| (Dollars in millions) | | 2Q 2024 | 2Q 2023 | | $ | % | | YTD 2024 | YTD 2023 | | $ | % |
| Guarantee income | | $383 | | $309 | | | $74 | | 24 | % | | $879 | | $775 | | | $104 | | 13 | % |
| Investment gains, net | | 549 | | 411 | | | 138 | | 34 | | | 954 | | 186 | | | 768 | | 413 | |
| Other income | | 128 | | 96 | | | 32 | | 33 | | | 225 | | 181 | | | 44 | | 24 | |
| Non-interest income | | $1,060 | | $816 | | | $244 | | 30 | % | | $2,058 | | $1,142 | | | $916 | | 80 | % |
Key Drivers:
n Guarantee income
l 2Q 2024 vs. 2Q 2023 - Increased primarily due to lower fair value losses on guarantee assets as a result of smaller medium-term interest rate increases in 2Q 2024.
l YTD 2024 vs. YTD 2023 - Increased primarily due to favorable fair value changes on guarantee assets from prepayment rates.
n Investment gains, net
l 2Q 2024 vs. 2Q 2023 - Increased primarily due to impacts from interest-rate risk management activities.
l YTD 2024 vs. YTD 2023 - Increased primarily due to higher revenues from held-for-sale loan purchase and securitization activities and impacts from interest-rate risk management activities.
(Provision) Benefit for Credit Losses
The table below presents the components of provision for credit losses.
Table 5 - (Provision) Benefit for Credit Losses | | | | | | | | | | | | | | | | | | | | | | | | | | | | | | | | | | | | | | |
| | | | | Change | | | | | Change |
| (Dollars in millions) | | 2Q 2024 | 2Q 2023 | | $ | %(1) | | YTD 2024 | YTD 2023 | | $ | %(1) |
| Single-Family | | ($315) | | $638 | | | ($953) | | NM | | ($435) | | $320 | | | ($755) | | NM |
| Multifamily | | (79) | | (101) | | | 22 | | 22 | % | | (140) | | (178) | | | 38 | | 21 | % |
| (Provision) benefit for credit losses | | ($394) | | $537 | | | ($931) | | NM | | ($575) | | $142 | | | ($717) | | NM |
(1)NM - not meaningful.
Key Drivers:
n 2Q 2024 vs. 2Q 2023 - The provision for credit losses for 2Q 2024 was primarily driven by a credit reserve build in Single-Family attributable to new acquisitions. The benefit for credit losses for 2Q 2023 was primarily driven by a credit reserve release in Single-Family due to improvements in house prices, partially offset by a credit reserve build in Multifamily.
n YTD 2024 vs. YTD 2023 - The provision for credit losses for YTD 2024 was primarily driven by a credit reserve build in Single-Family attributable to new acquisitions and increasing mortgage interest rates. The benefit for credit losses for YTD 2023 was primarily driven by a credit reserve release in Single-Family due to improvements in house prices, partially offset by a credit reserve build in Multifamily.
| | | | | | | | |
| Freddie Mac 2Q 2024 Form 10-Q | | 8 |
| | | | | | | | |
| Management's Discussion and Analysis | | Consolidated Results of Operations |
Non-Interest Expense
The table below presents the components of non-interest expense.
Table 6 - Components of Non-Interest Expense | | | | | | | | | | | | | | | | | | | | | | | | | | | | | | | | | | | | | | |
| | | | | Change | | | | | Change |
| (Dollars in millions) | | 2Q 2024 | 2Q 2023 | | $ | % | | YTD 2024 | YTD 2023 | | $ | % |
| Salaries and employee benefits | | ($420) | | ($405) | | | ($15) | | (4) | % | | ($841) | | ($779) | | | ($62) | | (8) | % |
| Credit enhancement expense | | (588) | | (590) | | | 2 | | — | | | (1,185) | | (1,120) | | | (65) | | (6) | |
| Benefit for (decrease in) credit enhancement recoveries | | (7) | | (108) | | | 101 | | 94 | | | (6) | | (59) | | | 53 | | 90 | |
| Legislative assessments expense: | | | | | | | | | | | | |
| Legislated guarantee fees expense | | (728) | | (710) | | | (18) | | (3) | | | (1,452) | | (1,418) | | | (34) | | (2) | |
| Affordable housing funds allocation | | (40) | | (41) | | | 1 | | 2 | | | (70) | | (68) | | | (2) | | (3) | |
| Total legislative assessments expense | | (768) | | (751) | | | (17) | | (2) | | | (1,522) | | (1,486) | | | (36) | | (2) | |
| Other expense | | (351) | | (350) | | | (1) | | — | | | (702) | | (692) | | | (10) | | (1) | |
| Non-interest expense | | ($2,134) | | ($2,204) | | | $70 | | 3 | % | | ($4,256) | | ($4,136) | | | ($120) | | (3) | % |
Key Drivers:
n Credit enhancement expense
l YTD 2024 vs. YTD 2023 - Increased primarily due to higher expenses related to STACR Trust note repurchases.
n Benefit for (decrease in) credit enhancement recoveries
l 2Q 2024 vs. 2Q 2023 and YTD 2024 vs. YTD 2023 - Decreased primarily due to a smaller decrease in expected credit losses on covered loans.
n Legislative assessments expense
l YTD 2024 vs. YTD 2023 - Increased primarily due to higher legislated guarantee fees expense as a result of growth in our Single-Family mortgage portfolio.
| | | | | | | | |
| Freddie Mac 2Q 2024 Form 10-Q | | 9 |
| | | | | | | | |
| Management's Discussion and Analysis | | Consolidated Balance Sheets Analysis |
CONSOLIDATED BALANCE SHEETS ANALYSIS
The table below compares our summarized condensed consolidated balance sheets.
Table 7 - Summarized Condensed Consolidated Balance Sheets | | | | | | | | | | | | | | | | | | | | |
| | | | | Change |
| (Dollars in millions) | | June 30, 2024 | December 31, 2023 | | $ | % |
| Assets: | | | | | | |
| Cash and cash equivalents | | $5,532 | | $6,019 | | | ($487) | | (8) | % |
| Securities purchased under agreements to resell | | 97,180 | | 95,148 | | | 2,032 | | 2 | |
| Investment securities, at fair value | | 43,480 | | 43,275 | | | 205 | | — | |
| Mortgage loans held-for-sale | | 12,346 | | 12,941 | | | (595) | | (5) | |
| Mortgage loans held-for-investment | | 3,105,869 | | 3,083,665 | | | 22,204 | | 1 | |
| Accrued interest receivable, net | | 10,445 | | 9,925 | | | 520 | | 5 | |
| Deferred tax assets, net | | 4,795 | | 4,076 | | | 719 | | 18 | |
| Other assets | | 27,605 | | 25,927 | | | 1,678 | | 6 | |
| Total assets | | $3,307,252 | | $3,280,976 | | | $26,276 | | 1 | % |
| | | | | | |
| Liabilities and Equity: | | | | | | |
| Liabilities: | | | | | | |
| Accrued interest payable | | $9,346 | | $8,812 | | | $534 | | 6 | % |
| Debt | | 3,227,612 | | 3,208,346 | | | 19,266 | | 1 | |
| Other liabilities | | 17,071 | | 16,096 | | | 975 | | 6 | |
| Total liabilities | | 3,254,029 | | 3,233,254 | | | 20,775 | | 1 | |
| Total equity | | 53,223 | | 47,722 | | | 5,501 | | 12 | |
| Total liabilities and equity | | $3,307,252 | | $3,280,976 | | | $26,276 | | 1 | % |
Key Drivers:
As of June 30, 2024 compared to December 31, 2023:
n Mortgage loans held-for-investment increased primarily due to growth in our Single-Family mortgage portfolio.
n Debt increased due to an increase in debt of consolidated trusts driven by growth in our Single-Family mortgage portfolio.
| | | | | | | | |
| Freddie Mac 2Q 2024 Form 10-Q | | 10 |
| | | | | | | | |
| Management's Discussion and Analysis | | Our Portfolios |
OUR PORTFOLIOS
The table below presents the UPB of our mortgage portfolio by segment.
Table 8 - Mortgage Portfolio
| | | | | | | | | | | | | | | | | | | | | | | | | | |
| | June 30, 2024 | | December 31, 2023 |
| (In millions) | | Single-Family | Multifamily | Total | | Single-Family | Multifamily | Total |
| Mortgage loans held-for-investment: | | | | | | | | |
| By consolidated trusts | | $2,977,525 | $55,395 | $3,032,920 | | $2,963,296 | $47,433 | $3,010,729 |
| By Freddie Mac | | 39,012 | 9,719 | 48,731 | | 33,213 | 11,770 | 44,983 |
| Total mortgage loans held-for-investment | | 3,016,537 | | 65,114 | | 3,081,651 | | | 2,996,509 | | 59,203 | | 3,055,712 | |
| Mortgage loans held-for-sale | | 3,244 | | 9,660 | | 12,904 | | | 3,527 | | 9,905 | | 13,432 | |
| Total mortgage loans | | 3,019,781 | | 74,774 | | 3,094,555 | | | 3,000,036 | | 69,108 | | 3,069,144 | |
| Mortgage-related guarantees: | | | | | | | | |
| Mortgage loans held by nonconsolidated trusts | | 30,188 | | 361,442 | | 391,630 | | | 30,182 | | 360,928 | | 391,110 | |
| Other mortgage-related guarantees | | 8,325 | | 11,054 | | 19,379 | | | 8,692 | | 10,761 | | 19,453 | |
| Total mortgage-related guarantees | | 38,513 | | 372,496 | | 411,009 | | | 38,874 | | 371,689 | | 410,563 | |
| Total mortgage portfolio | | $3,058,294 | | $447,270 | | $3,505,564 | | | $3,038,910 | | $440,797 | | $3,479,707 | |
| Guaranteed mortgage-related securities: | | | | | | | | |
| Issued by consolidated trusts | | $2,988,924 | $55,426 | $3,044,350 | | $2,970,707 | $47,436 | $3,018,143 |
| Issued by nonconsolidated trusts | | 24,553 | 322,434 | 346,987 | | 24,600 | 321,262 | 345,862 |
| Total guaranteed mortgage-related securities | | $3,013,477 | | $377,860 | | $3,391,337 | | | $2,995,307 | | $368,698 | | $3,364,005 | |
Our investments portfolio consists of our mortgage-related investments portfolio and our other investments portfolio.
Mortgage-Related Investments Portfolio The Purchase Agreement limits the size of our mortgage-related investments portfolio to a maximum amount of $225 billion. The calculation of mortgage assets subject to the Purchase Agreement cap includes the UPB of mortgage assets and 10% of the notional value of interest-only securities. We are also subject to additional limitations on the size and composition of our mortgage-related investments portfolio pursuant to FHFA guidance. For additional information on the restrictions on our mortgage-related investments portfolio, see the MD&A - Conservatorship and Related Matters section in our 2023 Annual Report.
| | | | | | | | |
| Freddie Mac 2Q 2024 Form 10-Q | | 11 |
| | | | | | | | |
| Management's Discussion and Analysis | | Our Portfolios |
The table below presents the details of our mortgage-related investments portfolio.
Table 9 - Mortgage-Related Investments Portfolio
| | | | | | | | | | | | | | | | | | | | | | | | | | |
| | June 30, 2024 | | December 31, 2023 |
| (In millions) | | Single-Family | Multifamily | Total | | Single-Family | Multifamily | Total |
| Unsecuritized mortgage loans: | | | | | | | | |
Securitization pipeline loans(1) | | $12,397 | | $13,696 | | $26,093 | | | $8,225 | | $15,197 | | $23,422 | |
Other loans(2) | | 29,859 | | 5,683 | | 35,542 | | | 28,515 | | 6,478 | | 34,993 | |
| Total unsecuritized mortgage loans | | 42,256 | | 19,379 | | 61,635 | | | 36,740 | 21,675 | 58,415 |
| Mortgage-related securities: | | | | | | | | |
| Investment securities | | 2,890 | | 4,272 | | 7,162 | | | 2,667 | | 4,613 | | 7,280 | |
| Debt of consolidated trusts | | 18,234 | | 638 | | 18,872 | | | 18,639 | | 660 | | 19,299 | |
| Total mortgage-related securities | | 21,124 | | 4,910 | | 26,034 | | | 21,306 | | 5,273 | | 26,579 | |
| Mortgage-related investments portfolio | | $63,380 | | $24,289 | | $87,669 | | | $58,046 | | $26,948 | | $84,994 | |
| 10% of notional amount of interest-only securities | | | | $22,759 | | | | $22,186 |
| Mortgage-related investments portfolio for purposes of Purchase Agreement cap | | | | 110,428 | | | | 107,180 |
(1)Single-family and multifamily loans that we have purchased for cash and aggregate on our balance sheet for securitization within the normal course of business.
(2)Primarily includes delinquent and modified single-family loans that we have purchased from securitization trusts.
Other Investments Portfolio The table below presents the details of the carrying value of our other investments portfolio.
Table 10 - Other Investments Portfolio
| | | | | | | | | | | | | | | | | | | | | | | | | | | | | | | | |
| | June 30, 2024 | | December 31, 2023 |
| (In millions) | | Liquidity and Contingency Operating Portfolio | Custodial Account | Other | Total Other Investments Portfolio | | Liquidity and Contingency Operating Portfolio | Custodial Account | Other | Total Other Investments Portfolio |
| Cash and cash equivalents | | $4,326 | | $1,100 | | $106 | | $5,532 | | | $5,041 | | $890 | | $88 | | $6,019 | |
Securities purchased under agreements to resell | | 95,476 | | 12,692 | | 1,088 | | 109,256 | | | 94,904 | | 9,396 | | 1,093 | | 105,393 | |
Non-mortgage related securities(1) | | 25,488 | | — | | 5,501 | | 30,989 | | | 24,153 | | — | | 6,119 | | 30,272 | |
| Other assets | | — | | — | | 6,235 | | 6,235 | | | — | | — | | 5,555 | | 5,555 | |
| Other investments portfolio | | $125,290 | | $13,792 | | $12,930 | | $152,012 | | | $124,098 | | $10,286 | | $12,855 | | $147,239 | |
(1)Primarily consists of U.S. Treasury securities.
| | | | | | | | |
| Freddie Mac 2Q 2024 Form 10-Q | | 12 |
| | | | | | | | |
| Management's Discussion and Analysis | | Our Business Segments |
OUR BUSINESS SEGMENTS
As shown in the table below, we have two reportable segments, which are based on the way we manage our business.
| | | | | |
| Segment | Description |
| Single-Family | Reflects results from our purchase, securitization, and guarantee of single-family loans, our investments in single-family loans and mortgage-related securities, the management of Single-Family mortgage credit risk and market risk, and any results of our treasury function that are not allocated to each segment. |
|
|
| Multifamily | Reflects results from our purchase, securitization, and guarantee of multifamily loans, our investments in multifamily loans and mortgage-related securities, and the management of Multifamily mortgage credit risk and market risk. |
|
|
Segment Net Revenues and Net Income The charts below show our net revenues and net income by segment.
Segment Net Revenues
(In billions)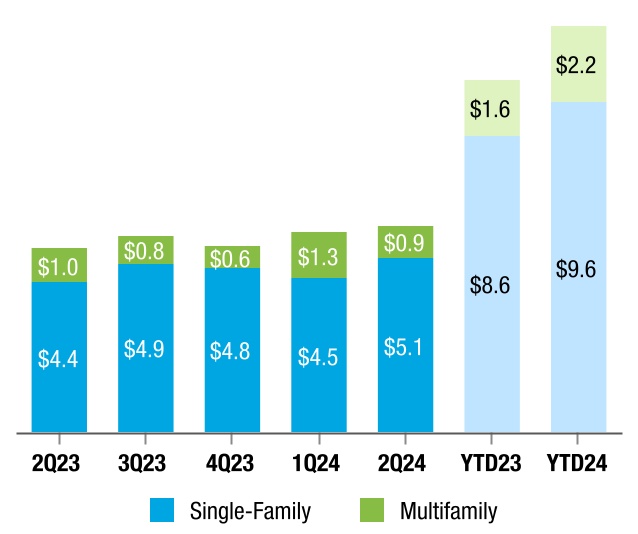
Segment Net Income
(In billions)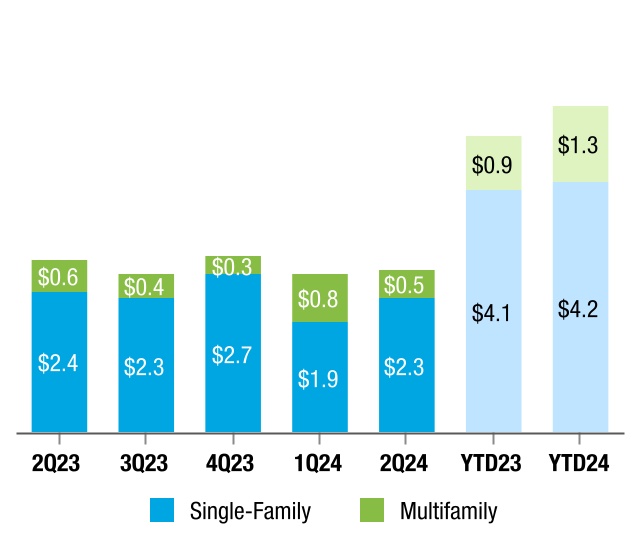
| | | | | | | | |
| Freddie Mac 2Q 2024 Form 10-Q | | 13 |
| | | | | |
| Management's Discussion and Analysis | Our Business Segments | Single-Family |
Single-Family
The charts, tables, and related discussion below present the business results of our Single-Family segment.
UPB of Single-Family Loan Purchases and Guarantees by Loan Purpose and Average Estimated Guarantee Fee Rate(1) on New Acquisitions
(UPB in billions)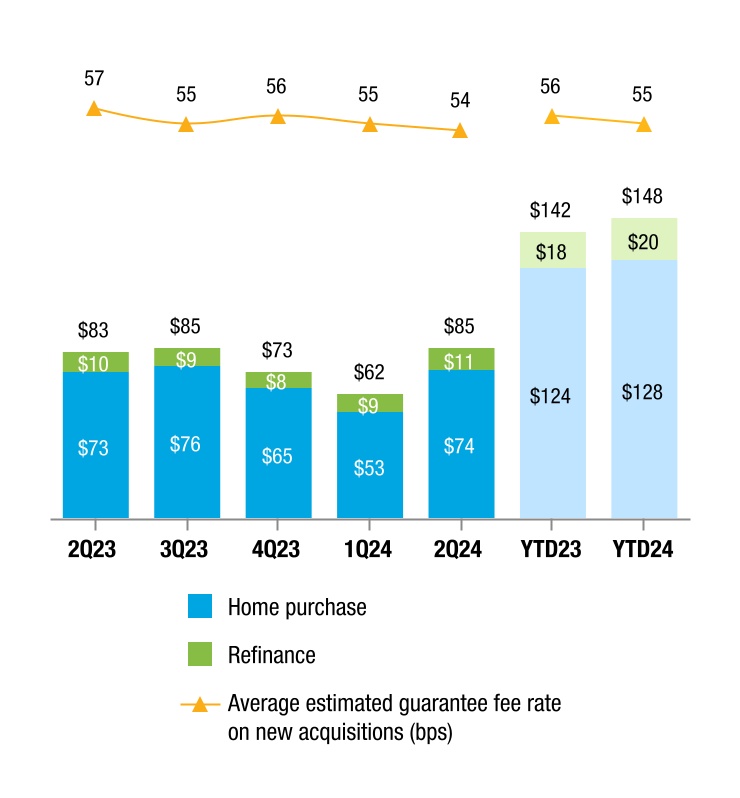
(1)Estimated guarantee fee rate calculation excludes the legislated guarantee fees and includes deferred fees recognized over the estimated life of the related loans.
Number of Families Helped to Own a Home and Average Loan UPB of New Acquisitions
(Loan count in thousands)
n 2Q 2024 vs. 2Q 2023 and YTD 2024 vs. YTD 2023
l Our loan purchase and guarantee activity increased slightly.
l The average loan size of new acquisitions increased due to a higher conforming loan limit and house price appreciation in recent quarters.
l Estimated guarantee fee rate calculations are based on month-end market rates for the month of acquisition. The average estimated guarantee fee rate on new acquisitions declined slightly due to changes in business mix and slower estimated prepayment rates based on such month-end market rates.
| | | | | | | | |
| Freddie Mac 2Q 2024 Form 10-Q | | 14 |
| | | | | |
| Management's Discussion and Analysis | Our Business Segments | Single-Family |
Single-Family Mortgage Portfolio Single-Family Mortgage Portfolio and Average Estimated Guarantee Fee Rate(1) on Mortgage Portfolio
(UPB in billions)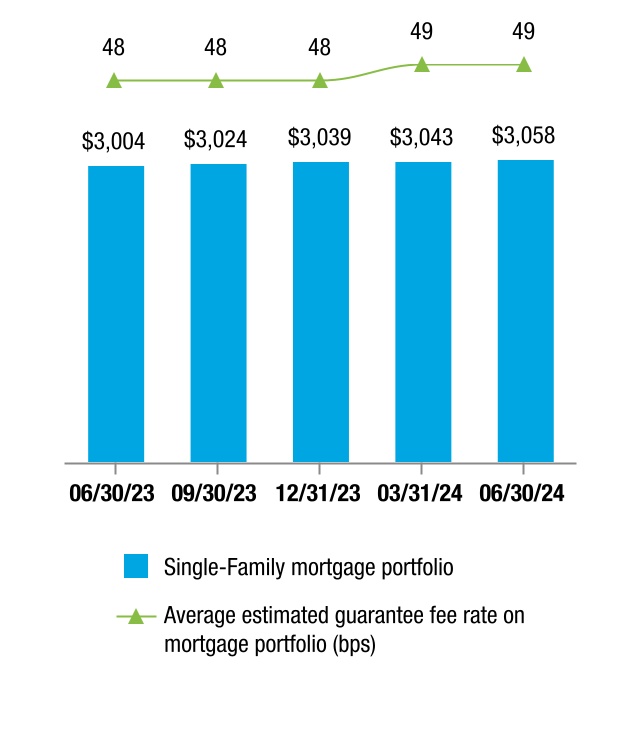
(1)Estimated guarantee fee rate is calculated as of acquisition and includes deferred fees recognized over the estimated life of the related loans. Estimated guarantee fee rate calculation excludes the legislated guarantee fees and certain loans, the majority of which are held by VIEs that we do not consolidate. The UPB of these excluded loans was $40 billion as of June 30, 2024.
Single-Family Mortgage Loans
(Loan count in millions) 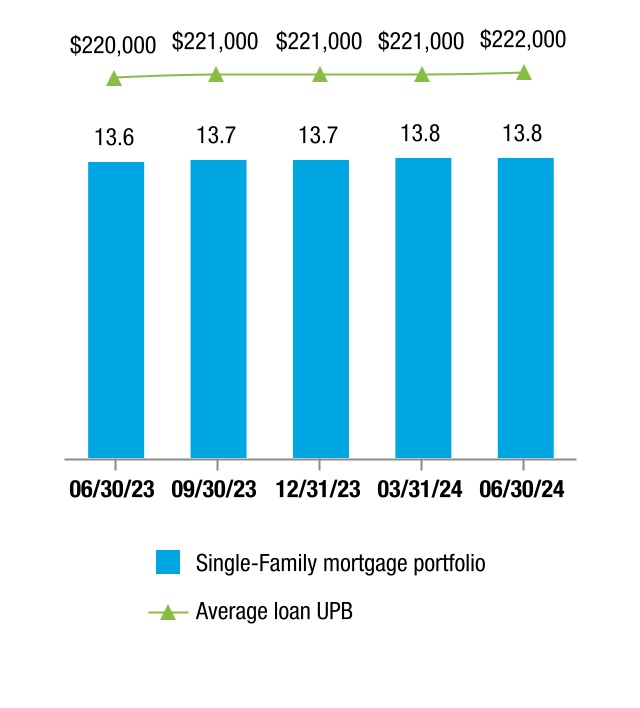
n Our Single-Family mortgage portfolio was $3.1 trillion at June 30, 2024, up 2% year-over-year. The mortgage portfolio continued to grow at a moderate pace as new business activity remained low.
n The average estimated guarantee fee rate on our Single-Family mortgage portfolio increased slightly year-over-year.
| | | | | | | | |
| Freddie Mac 2Q 2024 Form 10-Q | | 15 |
| | | | | |
| Management's Discussion and Analysis | Our Business Segments | Single-Family |
We obtain credit enhancements on a portion of our Single-Family mortgage portfolio to reduce the risk of future losses to us when borrowers default. The charts below provide the UPB of the mortgage loans acquired during the periods presented that were covered by primary mortgage insurance, the UPB of the mortgage loans covered by CRT transactions issued during the periods presented, and maximum coverage related to these credit enhancements. The primary mortgage insurance and CRT activities presented in these charts are not mutually exclusive as a single loan may be covered by both primary mortgage insurance and CRT transactions.
New Acquisitions Covered by Primary Mortgage Insurance
(In billions)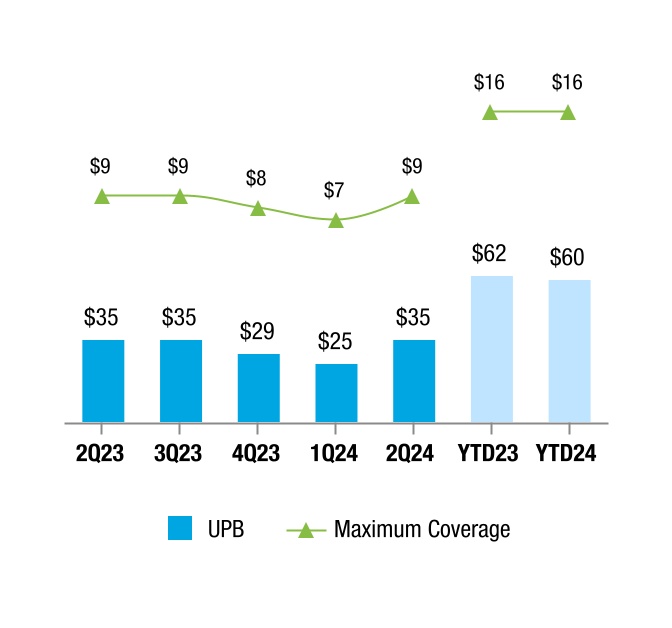
New CRT Issuance
(In billions)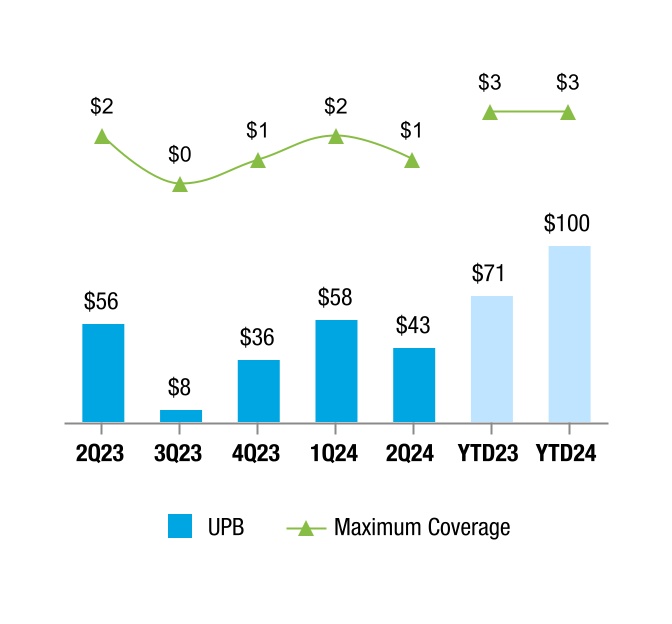
n 2Q 2024 vs. 2Q 2023 and YTD 2024 vs. YTD 2023
l The UPB of mortgage loans acquired during YTD 2024 that were covered by primary mortgage insurance decreased slightly year-over-year.
l The UPB of mortgage loans covered by CRT transactions issued during the period decreased in 2Q 2024 compared to 2Q 2023, as we continued to manage our CRT activities to meet the full-year 2024 CRT issuance target.
l The UPB of mortgage loans covered by CRT transactions issued during the period increased in YTD 2024 compared to YTD 2023 due to changes in business strategy in YTD 2023 that increased the timeline between loan acquisition and CRT issuance and resulted in a smaller population of loans that were covered by CRT transactions issued in YTD 2023.
See MD&A - Risk Management - Single-Family Mortgage Credit Risk - Transferring Credit Risk to Third-Party Investors for additional information on our credit enhancements.
| | | | | | | | |
| Freddie Mac 2Q 2024 Form 10-Q | | 16 |
| | | | | |
| Management's Discussion and Analysis | Our Business Segments | Single-Family |
The table below presents the results of operations for our Single-Family segment. See Note 11 for additional information about segment financial results.
Table 11 - Single-Family Segment Financial Results | | | | | | | | | | | | | | | | | | | | | | | | | | | | | | | | | | | | | | |
| | | | | Change | | | | | Change |
| (Dollars in millions) | | 2Q 2024 | 2Q 2023 | | $ | %(1) | | YTD 2024 | YTD 2023 | | $ | %(1) |
| Net interest income | | $4,635 | | $4,295 | | | $340 | | 8 | % | | $9,123 | | $8,591 | | | $532 | | 6 | % |
| Non-interest income | | 459 | | 65 | | | 394 | | 606 | | | 445 | | (28) | | | 473 | | NM |
| Net revenues | | 5,094 | | 4,360 | | | 734 | | 17 | | | 9,568 | | 8,563 | | | 1,005 | | 12 | |
| (Provision) benefit for credit losses | | (315) | | 638 | | | (953) | | NM | | (435) | | 320 | | | (755) | | NM |
| Non-interest expense | | (1,921) | | (2,028) | | | 107 | | 5 | | | (3,846) | | (3,811) | | | (35) | | (1) | |
| Income before Income tax expense | | 2,858 | | 2,970 | | | (112) | | (4) | | | 5,287 | | 5,072 | | | 215 | | 4 | |
| Income tax expense | | (574) | | (589) | | | 15 | | 3 | | | (1,058) | | (1,014) | | | (44) | | (4) | |
| Net income | | 2,284 | | 2,381 | | | (97) | | (4) | | | 4,229 | | 4,058 | | | 171 | | 4 | |
| Other comprehensive income (loss), net of taxes and reclassification adjustments | | (5) | | 2 | | | (7) | | NM | | (10) | | 1 | | | (11) | | NM |
| Comprehensive income | | $2,279 | | $2,383 | | | ($104) | | (4) | % | | $4,219 | | $4,059 | | | $160 | | 4 | % |
(1)NM - not meaningful.
Key Business Drivers:
n 2Q 2024 vs. 2Q 2023
l Net income of $2.3 billion, down 4% year-over-year.
–Net revenues were $5.1 billion, up 17% year-over-year.
◦Net interest income was $4.6 billion, up 8% year-over-year, primarily driven by continued mortgage portfolio growth and lower expense related to debt in hedge accounting relationships.
◦Non-interest income was $0.5 billion, up from $65 million in 2Q 2023, due to impacts from interest-rate risk management activities.
–Provision for credit losses was $0.3 billion for 2Q 2024, primarily driven by a credit reserve build attributable to new acquisitions. The benefit for credit losses of $0.6 billion for 2Q 2023 was primarily driven by a credit reserve release due to improvements in house prices.
n YTD 2024 vs. YTD 2023
l Net income of $4.2 billion, up 4% year-over-year.
–Net revenues were $9.6 billion, up 12% year-over-year.
◦Net interest income was $9.1 billion, up 6% year-over-year, primarily driven by continued mortgage portfolio growth and lower expense related to debt in hedge accounting relationships.
◦Non-interest income was $0.4 billion, up from ($28) million in 2Q 2023, due to impacts from interest-rate risk management activities.
–Provision for credit losses was $0.4 billion for YTD 2024, primarily driven by a credit reserve build attributable to new acquisitions and increasing mortgage interest rates. The benefit for credit losses of $0.3 billion for YTD 2023 was primarily driven by a credit reserve release due to improvements in house prices.
| | | | | | | | |
| Freddie Mac 2Q 2024 Form 10-Q | | 17 |
| | | | | | | | |
| Management's Discussion and Analysis | | Our Business Segments | Multifamily |
Multifamily
The charts, tables, and related discussion below present the business results of our Multifamily segment.
New Business Activity
(In billions)
Total Number of Rental Units Financed(1)
(In thousands)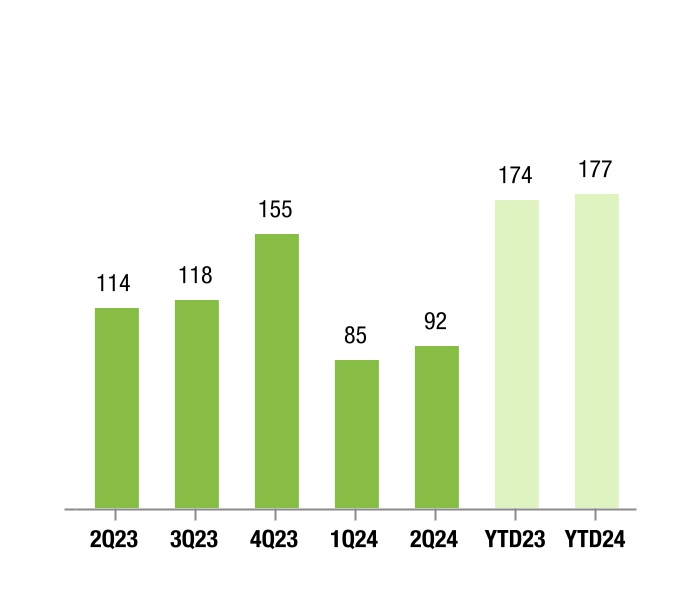
(1) Includes rental units financed by supplemental loans.
Key Drivers:
n 2Q 2024 vs. 2Q 2023 and YTD 2024 vs. YTD 2023 - The UPB of our new business activity remained low as the multifamily mortgage market continued to be adversely impacted by the higher interest rate environment. Approximately 63% of YTD 2024 activity, based on UPB, was mission-driven affordable housing, exceeding FHFA's minimum requirement of 50%.
n Our index lock agreements and outstanding commitments to purchase or guarantee multifamily assets were $18.8 billion and $17.1 billion as of June 30, 2024 and June 30, 2023, respectively.
| | | | | | | | |
| Freddie Mac 2Q 2024 Form 10-Q | | 18 |
| | | | | | | | |
| Management's Discussion and Analysis | | Our Business Segments | Multifamily |
Multifamily Mortgage Portfolio and Guarantee Exposure
Mortgage Portfolio
(In billions)
Guarantee Exposure
(In billions) 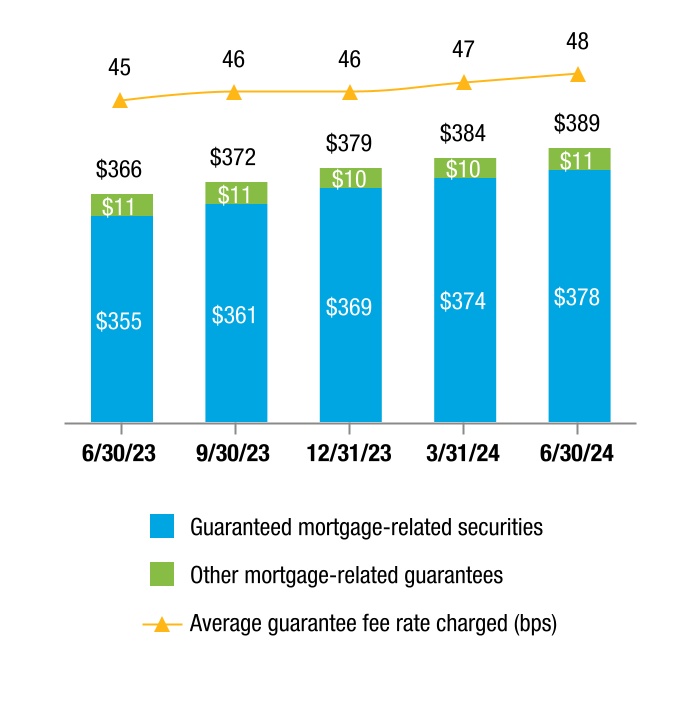
Key Drivers:
n 2Q 2024 vs. 2Q 2023
l Our mortgage portfolio increased by 5% year-over-year, driven by our new business activities, coupled with lower prepayment volume due to the high interest rate environment.
l Our guarantee exposure increased by 6% year-over-year, as our new mortgage-related security guarantees outpaced paydowns.
l The average guarantee fee rate on our guarantee exposures increased year-over-year, primarily due to continued issuances of fully-guaranteed securitization transactions for which we charge higher guarantee fee rates.
n In addition to our Multifamily mortgage portfolio, we have investments in LIHTC partnerships with carrying values totaling $3.8 billion and $3.5 billion as of June 30, 2024 and December 31, 2023, respectively.
| | | | | | | | |
| Freddie Mac 2Q 2024 Form 10-Q | | 19 |
| | | | | | | | |
| Management's Discussion and Analysis | | Our Business Segments | Multifamily |
Credit Enhancement Activities UPB Covered by New CRT Issuance New CRT Issuance Maximum Coverage
(In billions) (In billions)
Key Drivers:
n 2Q 2024 vs. 2Q 2023 and YTD 2024 vs. YTD 2023
l The UPB of mortgage loans covered by new CRT transactions decreased year-over-year, primarily due to a smaller average securitization pipeline balance during 2024, resulting in fewer securitizations with subordination. The maximum coverage increased slightly year-over-year in 2Q 2024 and remained flat in YTD 2024, primarily due to additional credit protection acquired for a pool of previously issued securitizations with subordination.
See MD&A - Risk Management - Multifamily Mortgage Credit Risk - Transferring Credit Risk to Third-Party Investors for more information on risk transfer transactions and credit enhancements on our Multifamily mortgage portfolio.
| | | | | | | | |
| Freddie Mac 2Q 2024 Form 10-Q | | 20 |
| | | | | | | | |
| Management's Discussion and Analysis | | Our Business Segments | Multifamily |
The table below presents the results of operations for our Multifamily segment. See Note 11 for additional information about segment financial results.
Table 12 - Multifamily Segment Financial Results | | | | | | | | | | | | | | | | | | | | | | | | | | | | | | | | | | | | | | |
| | | | | Change | | | | | Change |
| (Dollars in millions) | | 2Q 2024 | 2Q 2023 | | $ | %(1) | | YTD 2024 | YTD 2023 | | $ | %(1) |
| Net interest income | | $293 | | $228 | | | $65 | | 29 | % | | $564 | | $433 | | | $131 | | 30 | % |
| Non-interest income | | 601 | | 751 | | | (150) | | (20) | | | 1,613 | | 1,170 | | | 443 | | 38 | |
| | | | | | | | | | | | |
| | | | | | | | | | | | |
| | | | | | | | | | | | |
| Net revenues | | 894 | | 979 | | | (85) | | (9) | | | 2,177 | | 1,603 | | | 574 | | 36 | |
| (Provision) benefit for credit losses | | (79) | | (101) | | | 22 | | 22 | | | (140) | | (178) | | | 38 | | 21 | |
| Non-interest expense | | (213) | | (176) | | | (37) | | (21) | | | (410) | | (325) | | | (85) | | (26) | |
| | | | | | | | | | | | |
| | | | | | | | | | | | |
| | | | | | | | | | | | |
| | | | | | | | | | | | |
| | | | | | | | | | | | |
| Income before income tax expense | | 602 | | 702 | | | (100) | | (14) | | | 1,627 | | 1,100 | | | 527 | | 48 | |
| Income tax expense | | (121) | | (139) | | | 18 | | 13 | | | (325) | | (219) | | | (106) | | (48) | |
| Net income | | 481 | | 563 | | | (82) | | (15) | | | 1,302 | | 881 | | | 421 | | 48 | |
| Other comprehensive income (loss), net of taxes and reclassification adjustments | | — | | (56) | | | 56 | | NM | | (20) | | (1) | | | (19) | | NM |
| Comprehensive income | | $481 | | $507 | | | ($26) | | (5) | % | | $1,282 | | $880 | | | $402 | | 46 | % |
(1)NM - not meaningful.
Key Drivers:
n 2Q 2024 vs. 2Q 2023
l Net income of $0.5 billion, down from $0.6 billion.
–Net revenues of $0.9 billion, down from $1.0 billion.
◦Net interest income was $0.3 billion, up 29% year-over-year, primarily driven by continued mortgage portfolio growth and higher net yields on mortgage loans as a result of higher interest rates.
◦Non-interest income was $0.6 billion, down 20% year-over-year, as higher guarantee income was offset by impacts from interest-rate risk management activities and less favorable fair value changes from spreads.
n YTD 2024 vs. YTD 2023
l Net income of $1.3 billion, up from $0.9 billion.
–Net revenues of $2.2 billion, up from $1.6 billion.
◦Net interest income was $0.6 billion, up 30% year-over-year, primarily driven by continued mortgage portfolio growth and higher net yields on mortgage loans as a result of higher interest rates.
◦Non-interest income was $1.6 billion, up 38% year-over-year, primarily driven by higher revenues from guarantee income and held-for-sale loan purchase and securitization activities, coupled with impacts from interest-rate risk management activities.
| | | | | | | | |
| Freddie Mac 2Q 2024 Form 10-Q | | 21 |
| | | | | | | | |
| Management's Discussion and Analysis | | Risk Management |
RISK MANAGEMENT
To achieve our mission, we take risks as an integral part of our business activities. We are exposed to the following key types of risk: credit risk, market risk, liquidity risk, operational risk, compliance risk, legal risk, strategic risk, and reputation risk.
Credit Risk
Allowance for Credit Losses For financial assets measured at amortized cost, we recognize an allowance for credit losses that is deducted from or added to the amortized cost basis of the financial asset to present the net amount expected to be collected on the financial asset on the balance sheet.
For Single-Family credit exposures, we estimate the allowance for credit losses for loans on a pooled basis using a discounted cash flow model that evaluates a variety of factors to estimate the cash flows we expect to collect. The discounted cash flow model forecasts cash flows over the loan’s remaining contractual life, adjusted for expectations of prepayments, and using our historical experience, adjusted for current and forecasted economic conditions. These projections require significant management judgment, and we face uncertainties and risks related to the models we use for financial accounting and reporting purposes. For further information on our accounting policies and methods for estimating our allowance for credit losses and related management judgments, see MD&A - Critical Accounting Estimates.
For Multifamily credit exposures, we estimate the allowance for credit losses using a loss-rate method to estimate the net amount of cash flows we expect to collect. The loss rate method is based on a probability of default and loss given default framework that estimates credit losses by considering a loan’s underlying characteristics and current and forecasted economic conditions. Loan characteristics considered by our model include vintage, loan term, current DSCR, current LTV ratio, occupancy rate, and interest rate hedges. We generally forecast economic conditions over a reasonable and supportable two-year period prior to reverting to historical averages at the model input level over a five-year period, using a linear reversion method. We also consider as model inputs expected prepayments, contractually specified extensions, expected recoveries from collateral posting requirements, and expected recoveries from credit enhancements that are not freestanding contracts. Management adjustments to our model output may be necessary to take into consideration current economic events and other factors not considered within the model.
The tables below present a summary of the changes in our allowance for credit losses and key allowance for credit losses ratios.
Table 13 - Allowance for Credit Losses Activity
| | | | | | | | | | | | | | | | | | | | | | | | | | | | | | | | | | | | | | | | | | | | |
| | 2Q 2024 | 2Q 2023 | | YTD 2024 | YTD 2023 |
| (Dollars in millions) | | Single-Family | Multi-family | Total | Single-Family | Multi-family | Total | | Single-Family | Multi-family | Total | Single-Family | Multi-family | Total |
| Allowance for credit losses: |
| Beginning balance | | $6,508 | | $508 | | $7,016 | | $8,097 | | $224 | | $8,321 | | | $6,402 | | $447 | | $6,849 | | $7,746 | | $147 | | $7,893 | |
| Provision (benefit) for credit losses | | 315 | | 79 | | 394 | | (638) | | 101 | | (537) | | | 435 | | 140 | | 575 | | (320) | | 178 | | (142) | |
| Charge-offs | | (169) | | — | | (169) | | (111) | | — | | (111) | | | (292) | | — | | (292) | | (201) | | — | | (201) | |
| Recoveries collected | | 24 | | — | | 24 | | 29 | | — | | 29 | | | 50 | | — | | 50 | | 61 | | — | | 61 | |
| Net charge-offs | | (145) | | — | | (145) | | (82) | | — | | (82) | | | (242) | | — | | (242) | | (140) | | — | | (140) | |
Other(1) | | 82 | | — | | 82 | | 80 | | — | | 80 | | | 165 | | — | | 165 | | 171 | | — | | 171 | |
| Ending balance | | $6,760 | | $587 | | $7,347 | | $7,457 | | $325 | | $7,782 | | | $6,760 | | $587 | | $7,347 | | $7,457 | | $325 | | $7,782 | |
| | | | | | | | | | | | | | |
Average loans outstanding during the period(2) | | $3,042,676 | $61,674 | $3,104,350 | $2,991,397 | $48,309 | $3,039,706 | | $3,036,603 | $60,089 | $3,096,692 | $2,988,562 | $48,029 | $3,036,591 | |
| Net charge-offs to average loans outstanding | | — | % | — | % | — | % | — | % | — | % | — | % | | 0.01 | % | — | % | 0.01 | % | — | % | — | % | — | % |
| | | | | | | | | | | | | | |
| Components of ending balance of allowance for credit losses: |
| Mortgage loans held-for-investment | | $6,457 | | $382 | | $6,839 | | $7,088 | | $251 | | $7,339 | | | | | | | | |
| | | | | | | | | | | | | | |
| | | | | | | | | | | | | | |
| | | | | | | | | | | | | | |
Other(3) | | 303 | | 205 | | 508 | | 369 | | 74 | | 443 | | | | | | | | |
| Total ending balance | | $6,760 | | $587 | | $7,347 | | $7,457 | | $325 | | $7,782 | | | | | | | | |
Referenced footnotes are on the next page.
| | | | | | | | |
| Freddie Mac 2Q 2024 Form 10-Q | | 22 |
| | | | | | | | |
| Management's Discussion and Analysis | | Risk Management |
(1)Primarily includes capitalization of past due interest related to non-accrual loans that received payment deferral plans and loan modifications.
(2)Based on amortized cost basis of mortgage loans held-for-investment for which we have not elected the fair value option.
(3)Includes allowance for credit losses related to advances of pre-foreclosure costs and off-balance sheet credit exposures.
Table 14 - Allowance for Credit Losses Ratios
| | | | | | | | | | | | | | | | | | | | | | | |
| | June 30, 2024 | December 31, 2023 |
| (Dollars in millions) | | Single-Family | Multifamily | Total | Single-Family | Multifamily | Total |
| Allowance for credit losses ratios: |
Allowance for credit losses(1) to total loans outstanding | | 0.21 | % | 0.61 | % | 0.22 | % | 0.20 | % | 0.57 | % | 0.21 | % |
| Non-accrual loans to total loans outstanding | | 0.41 | | 0.18 | | 0.40 | | 0.44 | | 0.11 | | 0.44 | |
| Allowance for credit losses to non-accrual loans | | 51.90 | | 347.27 | | 54.49 | | 45.01 | | 509.38 | | 47.20 | |
| Balances: |
| Allowance for credit losses on mortgage loans held-for-investment | | $6,457 | | $382 | | $6,839 | | $6,057 | | $326 | | $6,383 | |
Total loans outstanding(2) | | 3,047,957 | | 62,760 | | 3,110,717 | | 3,031,136 | | 57,107 | | 3,088,243 | |
Non-accrual loans(2) | | 12,442 | | 110 | | 12,552 | | 13,458 | | 64 | | 13,522 | |
(1)Represents allowance for credit losses on mortgage loans held-for-investment.
(2)Based on amortized cost basis of mortgage loans held-for-investment for which we have not elected the fair value option.
As of June 30, 2024 compared to December 31, 2023:
n The ratio of allowance for credit losses to total loans outstanding increased slightly due to a credit reserve build in Single-Family attributable to new acquisitions and increasing mortgage interest rates.
n The ratio of allowance for credit losses to non-accrual loans increased primarily due to a credit reserve build in Single-Family and a decrease in the balance of loans in non-accrual status.
Single-Family Mortgage Credit Risk Maintaining Prudent Eligibility Standards and Quality Control Practices and Managing Seller/Servicer Performance Loan Purchase Credit Characteristics
We monitor and evaluate market conditions that could affect the credit quality of our single-family loan purchases. Additionally, when managing our new acquisitions, we consider our risk limits and guidance from FHFA and capital requirements under the ERCF. This may affect the volume and characteristics of our loan acquisitions.
The charts below show the credit profile of the single-family loans we purchased.
Weighted Average Original LTV Ratio 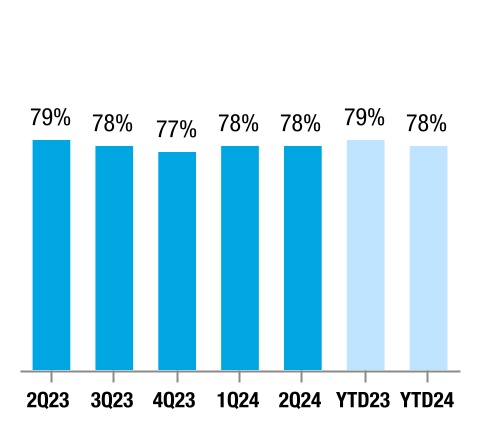
Weighted Average Original Credit Score(1)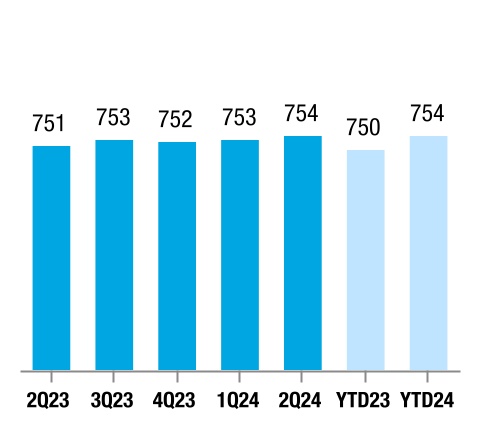
(1)Weighted average original credit score is generally based on three credit bureaus (Equifax, Experian, and TransUnion).
Weighted Average Original DTI Ratio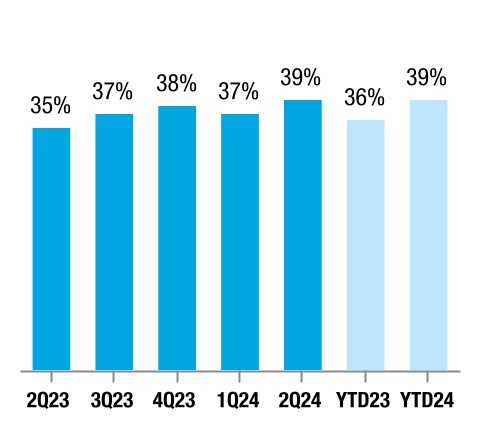
| | | | | | | | |
| Freddie Mac 2Q 2024 Form 10-Q | | 23 |
| | | | | | | | |
| Management's Discussion and Analysis | | Risk Management |
The table below contains additional information about the single-family loans we purchased.
Table 15 - Single-Family New Business Activity | | | | | | | | | | | | | | | | | | | | | | | | | | | | | | | | |
| | 2Q 2024 | 2Q 2023 | | YTD 2024 | YTD 2023 |
| (Dollars in millions) | | Amount | % of Total | Amount | % of Total | | Amount | % of Total | Amount | % of Total |
| 20- and 30-year, amortizing fixed-rate | | $81,519 | | 96 | % | $78,730 | | 95 | % | | $140,610 | | 95 | % | $134,199 | | 95 | % |
| 15-year or less, amortizing fixed-rate | | 3,036 | | 3 | | 3,038 | | 4 | | | 5,314 | | 4 | | 5,252 | | 4 | |
| Adjustable-rate | | 684 | | 1 | | 1,082 | | 1 | | | 1,584 | | 1 | | 2,364 | | 1 | |
| Total | | $85,239 | | 100 | % | $82,850 | | 100 | % | | $147,508 | | 100 | % | $141,815 | | 100 | % |
| | | | | | | | | | |
| Percentage of purchases | | | | | | | | | | |
| DTI ratio > 45% | | | 31 | % | | 26 | % | | | 30 | % | | 25 | % |
| Original LTV ratio > 90% | | | 26 | | | 27 | | | | 25 | | | 27 | |
| Transaction type: | | | | | | | | | | |
| Guarantor swap | | | 65 | | | 70 | | | | 65 | | | 71 | |
| Cash window | | | 35 | | | 30 | | | | 35 | | | 29 | |
| | | | | | | | | | |
| Property type: | | | | | | | | | | |
| Detached single-family houses and townhouses | | | 91 | | | 91 | | | | 91 | | | 91 | |
| Condominium or co-op | | | 9 | | | 9 | | | | 9 | | | 9 | |
| Occupancy type: | | | | | | | | | | |
| Primary residence | | | 93 | | | 92 | | | | 93 | | | 92 | |
| Second home | | | 2 | | | 2 | | | | 2 | | | 2 | |
| Investment property | | | 5 | | | 6 | | | | 5 | | | 6 | |
| Loan purpose: | | | | | | | | | | |
| Purchase | | | 87 | | | 88 | | | | 87 | | | 87 | |
| Cash-out refinance | | | 8 | | | 8 | | | | 8 | | | 9 | |
| Other refinance | | | 5 | | | 4 | | | | 5 | | | 4 | |
Transferring Credit Risk to Third-Party Investors We engage in various credit enhancement arrangements to reduce our credit risk exposure on our single-family loans.
Single-Family Mortgage Portfolio Newly Acquired Credit Enhancements
The table below provides the UPB of the mortgage loans acquired during the periods presented that were covered by primary mortgage insurance, the UPB of the mortgage loans covered by CRT transactions issued during the periods presented, and maximum coverage related to these newly acquired credit enhancements.
Table 16 - Single-Family Mortgage Portfolio Newly Acquired Credit Enhancements | | | | | | | | | | | | | | | | | |
| | 2Q 2024 | 2Q 2023 |
| (In millions) | | UPB(1)(2) | Maximum Coverage(3)(4) | UPB(1)(2) | Maximum Coverage(3)(4) |
| Primary mortgage insurance | | $34,623 | | $9,140 | | $35,283 | | $9,333 | |
| | | | | |
| CRT transactions: | | | | | |
| STACR | | 32,080 | | 1,005 | | 48,444 | | 1,591 | |
| ACIS | | 10,326 | | 334 | | 7,593 | | 293 | |
| Other | | 396 | | 120 | | 74 | | 74 | |
| | | | | |
| Total CRT issuance | | $42,802 | | $1,459 | | $56,111 | | $1,958 | |
Referenced footnotes are on the next page.
| | | | | | | | |
| Freddie Mac 2Q 2024 Form 10-Q | | 24 |
| | | | | | | | |
| Management's Discussion and Analysis | | Risk Management |
| | | | | | | | | | | | | | | | | |
| | YTD 2024 | YTD 2023 |
| (In millions) | | UPB(1)(2) | Maximum Coverage(3)(4) | UPB(1)(2) | Maximum Coverage(3)(4) |
| Primary mortgage insurance | | $59,758 | | $15,756 | | $61,801 | | $16,253 | |
| | | | | |
| CRT transactions: | | | | | |
| STACR | | 73,482 | | 2,289 | | 63,331 | | 2,202 | |
| ACIS | | 25,849 | | 893 | | 7,593 | | 293 | |
| Other | | 1,088 | | 227 | | 120 | | 120 | |
| | | | | |
| Total CRT issuance | | $100,419 | | $3,409 | | $71,044 | | $2,615 | |
(1) Represents the UPB of the mortgage assets, reference pool, or securitization trust, as applicable.
(2) The primary mortgage insurance and CRT transactions presented in this table are not mutually exclusive as a single loan may be covered by both primary mortgage insurance and CRT transactions.
(3) For primary mortgage insurance, represents the coverage as of the related loan acquisition. For STACR transactions, represents the balance held by third parties at issuance. For ACIS transactions, represents the aggregate limit of insurance purchased from third parties at issuance.
(4) The credit risk positions to which the maximum coverage applies may vary on a transaction-by-transaction basis.
Single-Family Mortgage Portfolio Credit Enhancement Coverage Outstanding
The table below provides information on the UPB and maximum coverage associated with credit-enhanced loans in our Single-Family mortgage portfolio.
Table 17 - Single-Family Mortgage Portfolio Credit Enhancement Coverage Outstanding | | | | | | | | | | | | | | |
| | June 30, 2024 |
| (Dollars in millions) | | UPB(1) | % of Portfolio | Maximum Coverage(2)(3) |
Primary mortgage insurance(4) | | $642,818 | | 21 | % | $168,999 | |
| STACR | | 1,191,826 | | 39 | | 30,045 | |
| ACIS | | 786,618 | | 26 | | 17,129 | |
| Other | | 39,428 | | 1 | | 10,805 | |
Less: UPB with multiple credit enhancements and other reconciling items(5) | | (760,697) | | (25) | | — | |
| Single-Family mortgage portfolio - credit-enhanced | | 1,899,993 | | 62 | | 226,978 | |
| Single-Family mortgage portfolio - non-credit-enhanced | | 1,158,301 | | 38 | | N/A |
| Total | | $3,058,294 | | 100 | % | $226,978 | |
| | | | | | | | | | | | | | |
| | December 31, 2023 |
| (Dollars in millions) | | UPB(1) | % of Portfolio | Maximum Coverage(2)(3) |
Primary mortgage insurance(4) | | $637,037 | | 21 | % | $165,738 | |
| STACR | | 1,175,837 | | 39 | | 31,222 | |
| ACIS | | 821,048 | | 27 | | 17,647 | |
| Other | | 39,901 | | 1 | | 11,027 | |
Less: UPB with multiple credit enhancements and other reconciling items(5) | | (813,966) | | (27) | | — | |
| Single-Family mortgage portfolio - credit-enhanced | | 1,859,857 | | 61 | | 225,634 | |
| Single-Family mortgage portfolio - non-credit-enhanced | | 1,179,053 | | 39 | | N/A |
| Total | | $3,038,910 | | 100 | % | $225,634 | |
(1) Represents the current UPB of the mortgage assets, reference pool, or securitization trust, as applicable.
(2) For STACR transactions, represents the outstanding balance held by third parties. For ACIS transactions, represents the remaining aggregate limit of insurance purchased from third parties.
(3) The credit risk positions to which the maximum coverage applies may vary on a transaction-by-transaction basis.
(4) Amounts exclude certain loans for which we do not control servicing, as the coverage information for these loans is not readily available to us.
(5) Other reconciling items primarily include timing differences in reporting cycles between the UPB of certain CRT transactions and the UPB of the underlying loans.
| | | | | | | | |
| Freddie Mac 2Q 2024 Form 10-Q | | 25 |
| | | | | | | | |
| Management's Discussion and Analysis | | Risk Management |
Credit Enhancement Coverage Characteristics
The table below provides the serious delinquency rates for the credit-enhanced and non-credit-enhanced loans in our Single-Family mortgage portfolio. The credit-enhanced categories are not mutually exclusive as a single loan may be covered by both primary mortgage insurance and other credit enhancements.
Table 18 - Serious Delinquency Rates for Credit-Enhanced and Non-Credit-Enhanced Loans in Our Single-Family Mortgage Portfolio | | | | | | | | | | | | | | | | | | | | |
| | June 30, 2024 | | December 31, 2023 |
(% of portfolio based on UPB)(1) | | % of Portfolio(2) | SDQ Rate | | % of Portfolio(2) | SDQ Rate |
| Credit-enhanced: | | | | | | |
| Primary mortgage insurance | | 21 | % | 0.90 | % | | 21 | % | 0.95 | % |
| CRT and other | | 55 | | 0.54 | | | 55 | | 0.60 | |
| Non-credit-enhanced | | 38 | | 0.39 | | | 39 | | 0.42 | |
| Total | | N/A | 0.50 | | | N/A | 0.55 | |
(1)Excludes loans underlying certain securitization products for which loan-level data is not available.
(2)Percentages do not total to 100% as a single loan may be included in multiple line items.
Credit Enhancement Recoveries
Our expected recovery receivable from freestanding credit enhancements was $0.1 billion as of both June 30, 2024 and December 31, 2023.
Monitoring Loan Performance and Characteristics We review loan performance, including delinquency statistics and related loan characteristics, in conjunction with housing market and economic conditions, to assess credit risk when estimating our allowance for credit losses.
Loan Characteristics
The table below contains details of the characteristics of the loans in our Single-Family mortgage portfolio.
Table 19 - Credit Quality Characteristics of Our Single-Family Mortgage Portfolio | | | | | | | | | | | | | | | | | | | | |
| | June 30, 2024 |
| (Dollars in millions) | | UPB | Original Credit
Score(1) | Current Credit
Score(1)(2) | Original
LTV Ratio | Current LTV
Ratio |
| Single-Family mortgage portfolio year of origination: | | | | | | |
| 2024 | | $125,198 | | 754 | 751 | 78 | % | 77 | % |
| 2023 | | 272,073 | | 751 | 747 | 79 | | 74 | |
| 2022 | | 417,571 | | 746 | 744 | 76 | | 67 | |
| 2021 | | 948,809 | | 752 | 756 | 71 | | 52 | |
| 2020 | | 693,026 | | 761 | 768 | 71 | | 45 | |
| 2019 and prior | | 601,617 | | 738 | 752 | 75 | | 34 | |
| Total | | $3,058,294 | | 750 | 755 | 74 | | 52 | |
| | | | | | | | | | | | | | | | | | | | |
| | December 31, 2023 |
| (Dollars in millions) | | UPB | Original Credit
Score (1) | Current Credit
Score(1)(2) | Original
LTV Ratio | Current LTV
Ratio |
| Single-Family mortgage portfolio year of origination: | | | | | | |
| 2023 | | $265,072 | | 751 | 745 | 79 | % | 75 | % |
| 2022 | | 433,252 | | 745 | 746 | 76 | | 68 | |
| 2021 | | 984,004 | | 752 | 756 | 71 | | 54 | |
| 2020 | | 719,822 | | 761 | 768 | 71 | | 46 | |
| 2019 | | 119,557 | | 746 | 753 | 76 | | 46 | |
| 2018 and prior | | 517,203 | | 736 | 751 | 75 | | 32 | |
| Total | | $3,038,910 | 750 | | 755 | | 73 | | 52 | |
Referenced footnotes are on the next page.
| | | | | | | | |
| Freddie Mac 2Q 2024 Form 10-Q | | 26 |
| | | | | | | | |
| Management's Discussion and Analysis | | Risk Management |
(1)Original credit score is generally based on three credit bureaus (Equifax, Experian, and TransUnion). Current credit score is based on Experian only.
(2)Credit scores for certain recently acquired loans may not have been updated by the credit bureau since the loan acquisition and therefore the original credit scores also represent the current credit scores.
The following table presents the combination of credit score and CLTV ratio attributes of loans in our Single-Family mortgage portfolio.
Table 20 - Single-Family Mortgage Portfolio Attribute Combinations(1) | | | | | | | | | | | | | | | | | | | | | | | | | | | | | | | | | | | | | | | | | | | | | | | | | | | | | | | | |
| | June 30, 2024 |
| | CLTV ≤ 60 | | CLTV > 60 to 80 | | CLTV > 80 to 90 | | CLTV > 90 to 100 | | CLTV > 100 | | All Loans |
| Original credit score | | % of Portfolio | SDQ Rate | | % of Portfolio | SDQ Rate(2) | | % of Portfolio | SDQ Rate(2) | | % of Portfolio | SDQ Rate(2) | | % of Portfolio | SDQ Rate(2) | | % of Portfolio | SDQ Rate |
| 740 and above | | 44 | % | 0.14 | % | | 15 | % | 0.22 | % | | 4 | % | 0.31 | % | | 2 | % | 0.26 | % | | — | % | NM | | 65 | % | 0.17% |
| 700 to 739 | | 13 | | 0.47 | | | 5 | | 0.79 | | | 2 | | 0.93 | | | 1 | | 0.65 | | | — | | NM | | 21 | | 0.57 |
| 680 to 699 | | 4 | | 0.81 | | | 2 | | 1.48 | | | — | | NM | | — | | NM | | — | | NM | | 6 | | 0.97 |
| 660 to 679 | | 3 | | 1.16 | | | 1 | | 2.10 | | | — | | NM | | — | | NM | | — | | NM | | 4 | | 1.34 |
| 620 to 659 | | 2 | | 1.80 | | | 1 | | 3.10 | | | — | | NM | | — | | NM | | — | | NM | | 3 | | 1.99 |
| Less than 620 | | 1 | | 4.03 | | | — | | NM | | — | | NM | | — | | NM | | — | | NM | | 1 | | 4.33 |
| Total | | 67 | % | 0.44 | | | 24 | % | 0.66 | | | 6 | % | 0.70 | | | 3 | % | 0.53 | | | — | % | NM | | 100 | % | 0.50 |
| | | | | | | | | | | | | | | | | | | | | | | | | | | | | | | | | | | | | | | | | | | | | | | | | | | | | | | | |
| | December 31, 2023 |
| | CLTV ≤ 60 | | CLTV > 60 to 80 | | CLTV > 80 to 90 | | CLTV > 90 to 100 | | CLTV > 100 | | All Loans |
| Original credit score | | % of Portfolio | SDQ Rate | | % of Portfolio | SDQ Rate(2) | | % of Portfolio | SDQ Rate(2) | | % of Portfolio | SDQ Rate(2) | | % of Portfolio | SDQ Rate(2) | | % of Portfolio | SDQ Rate |
| 740 and above | | 45 | % | 0.16 | % | | 15 | % | 0.24 | % | | 4 | % | 0.32 | % | | 1 | % | 0.27 | % | | — | % | NM | | 65 | % | 0.18 | % |
| 700 to 739 | | 13 | | 0.53 | | | 5 | | 0.82 | | | 2 | | 0.93 | | | 1 | | 0.59 | | | — | | NM | | 21 | | 0.61 | |
| 680 to 699 | | 4 | | 0.90 | | | 2 | | 1.50 | | | — | | NM | | — | | NM | | — | | NM | | 6 | | 1.05 | |
| 660 to 679 | | 3 | | 1.28 | | | 1 | | 2.18 | | | — | | NM | | — | | NM | | — | | NM | | 4 | | 1.45 | |
| 620 to 659 | | 2 | | 2.00 | | | 1 | | 3.37 | | | — | | NM | | — | | NM | | — | | NM | | 3 | | 2.21 | |
| Less than 620 | | 1 | | 4.41 | | | — | | NM | | — | | NM | | — | | NM | | — | | NM | | 1 | | 4.74 | |
| Total | | 68 | % | 0.49 | | 24 | % | 0.70 | | | 6 | % | 0.72 | | 2 | % | 0.52 | | | — | % | NM | | 100 | % | 0.55 |
(1) Excludes loans underlying certain securitization products for which original credit score is not available.
(2) NM - not meaningful due to the percentage of the portfolio rounding to zero.
Geographic Concentrations
We purchase mortgage loans from across the U.S. but do not purchase an equal number of loans from each state, leading to concentrations of credit risk in certain geographic areas. Local economic and other conditions can affect the borrower's ability to repay and the value of the underlying collateral. In addition, certain states and municipalities have passed or may pass laws that limit our ability to foreclose or evict and make it more difficult and costly to manage our risk.
See Note 12 for more information about the geographic distribution of our Single-Family mortgage portfolio.
| | | | | | | | |
| Freddie Mac 2Q 2024 Form 10-Q | | 27 |
| | | | | | | | |
| Management's Discussion and Analysis | | Risk Management |
Delinquency Rates
We report Single-Family delinquency rates based on the number of loans in our Single-Family mortgage portfolio that are past due as reported to us by our servicers as a percentage of the total number of loans in our Single-Family mortgage portfolio.
The chart below presents the delinquency rates of mortgage loans in our Single-Family mortgage portfolio.
The percentages of loans that were one month past due and two months past due increased as of June 30, 2024 compared to June 30, 2023. The percentage of loans one month past due can be volatile due to seasonality, whether the last day of the period falls on a weekend, and other factors that may not be indicative of default. As a result, the percentage of loans two months past due tends to be a better early performance indicator than the percentage of loans one month past due.
Our Single-Family serious delinquency rate has declined to 0.50% as of June 30, 2024, compared to 0.56% as of June 30, 2023. We have observed a higher serious delinquency rate during the first 12-24 months after origination for loans originated during 2022 and later compared to earlier vintages. See Note 3 for additional information on the payment status of our single-family mortgage loans.
Engaging in Loss Mitigation Activities We offer a variety of borrower assistance programs, including refinance programs for certain eligible loans and loan workout activities for struggling borrowers. For purposes of the disclosure below related to loss mitigation activities, we generally exclude loans for which we do not control servicing. See Note 3 for additional information on our loss mitigation activities. For information on our refinance programs, see the MD&A - Our Business Segments - Single-Family and MD&A - Risk Management - Credit Risk - Single-Family Mortgage Credit Risk sections in our 2023 Annual Report.
| | | | | | | | |
| Freddie Mac 2Q 2024 Form 10-Q | | 28 |
| | | | | | | | |
| Management's Discussion and Analysis | | Risk Management |
Loan Workout Activities
We continue to help struggling families retain their homes or otherwise avoid foreclosure through loan workouts. The table below provides details about the single-family loan workout activities that were completed during the periods presented.
Table 21 - Single-Family Completed Loan Workout Activity | | | | | | | | | | | | | | | | | |
| | 2Q 2024 | 2Q 2023 |
| (UPB in millions, loan count in thousands) | | UPB | Loan Count | UPB | Loan Count |
| Payment deferral plans | | $2,098 | | 8 | $2,191 | | 9 |
| Loan modifications | | 1,682 | | 6 | 1,227 | | 5 |
Forbearance plans and other(1) | | 1,057 | | 4 | 1,335 | | 6 |
| Total | | $4,837 | | 18 | $4,753 | | 20 |
| | | | | | | | | | | | | | | | | |
| | YTD 2024 | YTD 2023 |
| (UPB in millions, loan count in thousands) | | UPB | Loan Count | UPB | Loan Count |
| Payment deferral plans | | $4,768 | | 18 | $4,926 | | 20 |
| Loan modifications | | 3,064 | | 12 | 2,486 | | 11 |
Forbearance plans and other(1) | | 2,237 | | 9 | 2,825 | | 13 |
| Total | | $10,069 | | 39 | $10,237 | | 44 |
(1) The forbearance data is limited to loans in forbearance that were past due based on the loans' original contractual terms and excludes loans included in certain legacy transactions, as the forbearance data for such loans is either not reported to us by the servicers or is otherwise not readily available to us. Other includes repayment plans and foreclosure alternatives.
Our loan workout activity decreased, based on loan count, in the 2024 periods compared to the 2023 periods as the seriously delinquent loan population continued to decline. Completed loan workout activity includes forbearance plans where borrowers fully reinstated the loan to current status during or at the end of the forbearance period, payment deferral plans, loan modifications, successfully completed repayment plans, short sales, and deeds in lieu of foreclosure. Completed loan workout activity excludes active loss mitigation activity that was ongoing and had not been completed as of the end of the period, such as forbearance plans that had been initiated but not completed and trial period modifications. There were approximately 13,000 loans in active forbearance plans and approximately 13,000 loans in other active loss mitigation activity as of June 30, 2024.
| | | | | | | | |
| Freddie Mac 2Q 2024 Form 10-Q | | 29 |
| | | | | | | | |
| Management's Discussion and Analysis | | Risk Management |
Multifamily Mortgage Credit Risk Completing Our Own Underwriting, Credit and Legal Review for New Business Activity Our underwriting standards focus on the LTV ratio and DSCR, which estimates the value of the collateral and a borrower's ability to repay the loan using the secured property's cash flows, after expenses. The charts below provide the weighted average original LTV ratio and original DSCR for our new business activity.
Weighted Average Original LTV Ratio 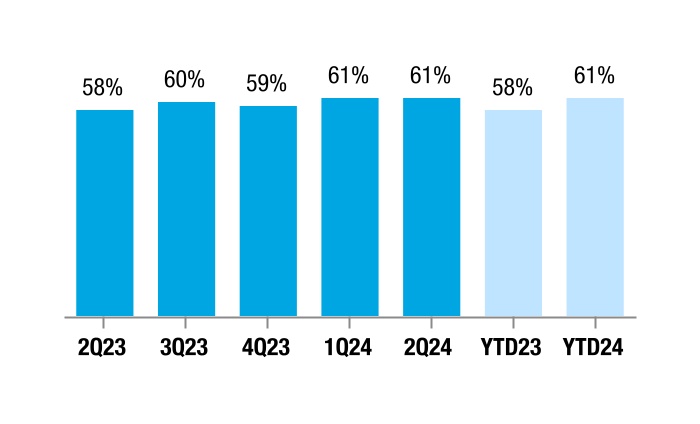
Weighted Average Original DSCR
Transferring Credit Risk to Third-Party Investors To reduce our credit risk exposure, we engage in a variety of CRT activities through which we have transferred a substantial amount of the expected and stressed credit risk on the Multifamily mortgage portfolio, thereby reducing our overall credit risk exposure and required capital.
Multifamily Mortgage Portfolio CRT Issuance
The table below provides the UPB of the mortgage loans covered by CRT transactions issued during the periods presented as well as the maximum coverage provided by those transactions.
Table 22 - Multifamily Mortgage Portfolio CRT Issuance | | | | | | | | | | | | | | | | | | | | | | | | | | | | | | | | | | | | | | |
| | 2Q 2024 | | 2Q 2023 | | YTD 2024 | | YTD 2023 |
| (In millions) | | UPB(1) | Maximum Coverage(2)(3) | | UPB(1) | Maximum Coverage(2)(3) | | UPB(1) | Maximum Coverage(2)(3) | | UPB(1) | Maximum Coverage(2)(3) |
| Subordination | | $6,462 | | $360 | | | $8,626 | | $610 | | | $13,060 | | $759 | | | $14,775 | | $1,035 | |
| SCR | | 8,171 | | 190 | | | 7,636 | | 102 | | | 8,171 | | 190 | | | 8,802 | | 207 | |
| MCIP | | 24,131 | | 518 | | | 7,636 | | 188 | | | 24,131 | | 518 | | | 7,636 | | 188 | |
| Lender risk-sharing | | 92 | | 14 | | | 321 | | 32 | | | 92 | | 14 | | | 560 | | 80 | |
| Less: UPB with more than one type of CRT | | (24,131) | | — | | | (7,636) | | — | | | (24,131) | | — | | | (7,636) | | — | |
| Total CRT issuance | | $14,725 | | $1,082 | | | $16,583 | | $932 | | | $21,323 | | $1,481 | | | $24,137 | | $1,510 | |
(1) Represents the UPB of the assets included in the associated reference pool or securitization trust, as applicable.
(2) For subordination, represents the UPB of the securities that are held by third parties at issuance and are subordinate to the securities we guarantee. For SCR transactions, represents the UPB of securities held by third parties at issuance. For MCIP transactions, represents the aggregate limit of insurance purchased from third parties at issuance. For lender risk-sharing, represents the amount of loss recovery that is available subject to the terms of counterparty agreements at issuance.
(3) The credit risk positions to which the maximum coverage applies may vary on a transaction-by-transaction basis.
Multifamily Mortgage Portfolio Credit Enhancement Coverage Outstanding
While we obtain various forms of credit protection in connection with the acquisition, guarantee, and/or securitization of a loan or group of loans, our principal credit enhancement type is subordination, which is created through our senior subordinate securitization transactions. Our maximum coverage provided by subordination in nonconsolidated VIEs was $38.9 billion and $39.5 billion, as of June 30, 2024 and December 31, 2023, respectively.
| | | | | | | | |
| Freddie Mac 2Q 2024 Form 10-Q | | 30 |
| | | | | | | | |
| Management's Discussion and Analysis | | Risk Management |
The table below presents the UPB and delinquency rates for both credit-enhanced and non-credit-enhanced loans underlying our Multifamily mortgage portfolio.
Table 23 - Credit-Enhanced and Non-Credit-Enhanced Loans Underlying Our Multifamily Mortgage Portfolio | | | | | | | | | | | | | | | | | | | | |
| | June 30, 2024 | | December 31, 2023 |
| (Dollars in millions) | | UPB | Delinquency Rate | | UPB | Delinquency Rate |
| Credit-enhanced: | | | | | | |
| Subordination | | $359,555 | | 0.39 | % | | $358,944 | | 0.26 | % |
| SCR/MCIP | | 54,932 | | 0.20 | | | 47,011 | | 0.23 | |
| Other | | 8,790 | | 0.89 | | | 8,844 | | 0.89 | |
| Total credit-enhanced | | 423,277 | | 0.38 | | | 414,799 | | 0.27 | |
| Non-credit-enhanced | | 23,993 | | 0.38 | | | 25,998 | | 0.51 | |
| Total | | $447,270 | | 0.38 | | | $440,797 | | 0.28 | |
The Multifamily delinquency rate increased to 0.38% at June 30, 2024, primarily driven by an increase in delinquent floating rate loans including small balance loans that are in their floating rate period. As of June 30, 2024, 95% of the delinquent loans in the Multifamily mortgage portfolio have credit enhancement coverage.
The table below contains details on the loans underlying our Multifamily mortgage portfolio that are not credit-enhanced.
Table 24 - Credit Quality of Our Multifamily Mortgage Portfolio Without Credit Enhancement | | | | | | | | | | | | | | | | | | | | | |
| | June 30, 2024 | | December 31, 2023 |
| (Dollars in millions) | | UPB | Delinquency Rate | | | UPB | Delinquency Rate |
| Mortgage loans held-for-sale | | $8,581 | | — | % | | | $8,823 | | — | % |
| Mortgage loans held-for-investment: | | | | | | | |
| Held by Freddie Mac | | 7,700 | | 1.01 | | | | 9,941 | | 1.21 | |
| Held by consolidated trusts | | 5,042 | | 0.26 | | | | 4,851 | | 0.27 | |
| Other mortgage-related guarantees | | 2,670 | | — | | | | 2,383 | | — | |
| Total | | $23,993 | | 0.38 | | | | $25,998 | | 0.51 | |
Market Risk
Our business segments have embedded exposure to market risk, which is the economic risk associated with adverse changes in interest rates, volatility, and spreads. Market risk can adversely affect future cash flows, or economic value, as well as earnings and net worth. The primary sources of interest-rate risk are our investments in mortgage-related assets, the debt we issue to fund these assets, and our Single-Family guarantees.
Our primary interest-rate risk measures are duration gap and Portfolio Value Sensitivity (PVS). Duration gap measures the difference in price sensitivity to interest rate changes between our financial assets and liabilities and is expressed in months relative to the value of assets. PVS is an estimate of the change in the present value of the cash flows of our financial assets and liabilities from an instantaneous shock to interest rates, assuming spreads are held constant and no rebalancing actions are undertaken. PVS is measured in two ways, one measuring the estimated sensitivity of our portfolio value to a 50 bps parallel movement in interest rates (PVS-L) and the other to a non-parallel movement resulting from a 25 bps change in the slope of the yield curve (PVS-YC). While we believe that duration gap and PVS are useful risk management tools, they should be understood as estimates rather than as precise measurements.
The tables below provide our duration gap, estimated point-in-time and minimum and maximum PVS-L and PVS-YC results, and an average of the daily values and standard deviation. The table below also provides PVS-L estimates assuming an immediate 100 bps shift in the yield curve. The interest-rate sensitivity of a mortgage portfolio varies across a wide range of interest rates.
| | | | | | | | |
| Freddie Mac 2Q 2024 Form 10-Q | | 31 |
| | | | | | | | |
| Management's Discussion and Analysis | | Risk Management |
Table 25 - PVS-YC and PVS-L Results Assuming Shifts of the Yield Curve | | | | | | | | | | | | | | | | | | | | | | | | | | | | | | | | |
| | June 30, 2024 | | December 31, 2023 |
| | PVS-YC | | PVS-L | | PVS-YC | | PVS-L |
| (In millions) | | 25 bps | | 50 bps | 100 bps | | 25 bps | | 50 bps | 100 bps |
Assuming shifts of the yield curve, (gains) losses on:(1) | | | | | | | | | | |
| Assets: | | | | | | | | | | |
Investments | | ($326) | | | ($3,387) | | ($6,870) | | | ($301) | | | $3,150 | | $6,229 | |
Guarantees(2) | | 24 | | | 364 | | 761 | | | 34 | | | (369) | | (678) | |
| Total assets | | (302) | | | (3,023) | | (6,109) | | | (267) | | | 2,781 | | 5,551 | |
| Liabilities | | (52) | | | 1,352 | | 2,631 | | | (52) | | | (1,519) | | (3,073) | |
| Derivatives | | 363 | | | 1,661 | | 3,426 | | | 322 | | | (1,274) | | (2,547) | |
| Total | | $9 | | | ($10) | | ($52) | | | $3 | | | ($12) | | ($69) | |
| PVS | | $9 | | | $— | | $— | | | $3 | | | $— | | $— | |
(1)The categorization of the PVS impact between assets, liabilities, and derivatives on this table is based upon the economic characteristics of those assets and liabilities, not their accounting classification. For example, purchase and sale commitments of mortgage-related securities and debt of consolidated trusts held by the mortgage-related investments portfolio are both categorized as assets on this table.
(2)Represents the interest-rate risk from our guarantees, which include buy-ups, float, and upfront fees (including buy-downs).
Table 26 - Duration Gap and PVS Results | | | | | | | | | | | | | | | | | | | | | | | | | | |
| | 2Q 2024 | | 2Q 2023 |
(Duration gap in months, dollars in millions) | | Duration Gap | PVS-YC 25 bps | PVS-L 50 bps | | Duration
Gap | PVS-YC
25 bps | PVS-L
50 bps |
| Average | | 0.1 | | $3 | | $— | | | 0.1 | | $2 | | $5 | |
| Minimum | | (0.1) | | — | | — | | | (0.1) | | — | | — | |
| Maximum | | 0.2 | | 9 | | 4 | | | 0.3 | | 6 | | 31 | |
| Standard deviation | | 0.1 | | 2 | | 1 | | | 0.1 | | 2 | | 9 | |
| | | | | | | | |
| | YTD 2024 | | YTD 2023 |
(Duration gap in months, dollars in millions) | | Duration
Gap | PVS-YC
25 bps | PVS-L
50 bps | | Duration
Gap | PVS-YC
25 bps | PVS-L
50 bps |
| Average | | 0.1 | | $3 | | $— | | | — | | $2 | | $4 | |
| Minimum | | (0.1) | | — | | — | | | (0.2) | | — | | — | |
| Maximum | | 0.2 | | 9 | | 5 | | | 0.3 | | 9 | | 31 | |
| Standard deviation | | 0.1 | | 2 | | 1 | | | 0.1 | | 2 | | 8 | |
Derivatives enable us to reduce our economic interest-rate risk exposure as we continue to align our derivative portfolio with the changing duration of our economically hedged assets and liabilities. The table below shows that the PVS-L risk levels, assuming a 50 bps shift in the yield curve for the periods presented, would have been higher if we had not used derivatives.
Table 27 - PVS-L Results Before Derivatives and After Derivatives | | | | | | | | | | | | | | | | | |
| | PVS-L (50 bps) | | |
| (In millions) | | Before Derivatives | After Derivatives | | Effect of Derivatives |
June 30, 2024 | | $1,538 | | $— | | | ($1,538) | |
December 31, 2023 | | 1,261 | | — | | | (1,261) | |
Earnings Sensitivity to Market Risk The GAAP accounting treatment for our financial assets and liabilities (i.e., some are measured at amortized cost, while others are measured at fair value) creates variability in our GAAP earnings when interest rates and spreads change. We manage this variability of GAAP earnings, which may not reflect the economics of our business, using fair value hedge accounting. See MD&A - Consolidated Results of Operations and MD&A - Our Business Segments for additional information on the effect of changes in interest rates and market spreads on our financial results.
| | | | | | | | |
| Freddie Mac 2Q 2024 Form 10-Q | | 32 |
| | | | | | | | |
| Management's Discussion and Analysis | | Risk Management |
Interest Rate-Related Earnings Sensitivity While we manage our interest-rate risk exposure on an economic basis to a low level as measured by our models, our GAAP financial results are subject to significant earnings variability from period to period based on changes in market conditions.
In an effort to reduce our GAAP earnings variability and better align our GAAP results with the economics of our business, we elect to use hedge accounting for certain single-family mortgage loans and certain debt instruments. See Note 8 for additional information on hedge accounting.
Earnings Sensitivity to Changes in Interest Rates
We evaluate a range of interest rate scenarios to determine the sensitivity of our earnings due to changes in interest rates and to determine our fair value hedge accounting strategies. The interest rate scenarios evaluated include parallel shifts in the yield curve in which interest rates increase or decrease by 100 bps, non-parallel shifts in the yield curve in which long-term interest rates increase or decrease by 100 bps, and non-parallel shifts in the yield curve in which short-term and medium-term interest rates increase or decrease by 100 bps. This evaluation identifies the net effect on comprehensive income from changes in fair value attributable to changes in interest rates for financial instruments measured at fair value, including the effects of fair value hedge accounting, for each of the identified scenarios. This evaluation does not include the net effect on comprehensive income from interest-rate sensitive items that are not measured at fair value (e.g., amortization of mortgage loan premiums and discounts, changes in fair value of held-for-sale mortgage loans for which we have not elected the fair value option, etc.) or from changes in our future contractual net interest income due to repricing of our interest-bearing assets and liabilities. The before-tax results of this evaluation are shown in the table below.
Table 28 - Earnings Sensitivity to Changes in Interest Rates | | | | | | | | | | | | | | |
| (In millions) | | June 30, 2024 | | June 30, 2023 |
Interest Rate Scenarios(1) | | | | |
| Parallel yield curve shifts: | | | | |
| +100 bps | | $17 | | | ($44) | |
| -100 bps | | (17) | | | 44 | |
| Non-parallel yield curve shifts - long-term interest rates: | | | | |
| +100 bps | | 194 | | | 130 | |
| -100 bps | | (194) | | | (130) | |
| Non-parallel yield curve shifts - short-term and medium-term interest rates: | | | | |
| +100 bps | | (176) | | | (175) | |
| -100 bps | | 176 | | | 175 | |
(1)The earnings sensitivity presented is calculated using the change in interest rates and net effective duration exposure.
The actual effect of changes in interest rates on our comprehensive income in any given period may vary based on a number of factors, including, but not limited to, the composition of our assets and liabilities, the actual changes in interest rates that are realized at different terms along the yield curve, and the effectiveness of our hedge accounting strategies. Even if implemented properly, our hedge accounting programs may not be effective in reducing earnings volatility, and our hedges may fail in any given future period, which could expose us to significant earnings variability in that period.
| | | | | | | | |
| Freddie Mac 2Q 2024 Form 10-Q | | 33 |
| | | | | | | | |
| Management's Discussion and Analysis | | Liquidity and Capital Resources |
LIQUIDITY AND CAPITAL RESOURCES
Our business activities require that we maintain adequate liquidity to meet our financial obligations as they come due and to meet the needs of customers in a timely and cost-efficient manner. We also must maintain adequate capital resources to avoid being placed into receivership by FHFA.
Liquidity
Primary Sources of Liquidity The table below lists the sources of our liquidity, the balances as of the dates shown, and a brief description of their importance to Freddie Mac.
Table 29 - Liquidity Sources | | | | | | | | | | | | | |
| (In millions) | June 30, 2024(1) | December 31, 2023(1) | Description | | |
| Other Investments Portfolio - Liquidity and Contingency Operating Portfolio | $125,290 | | $124,098 | | The liquidity and contingency operating portfolio, included within our other investments portfolio, is primarily used for short-term liquidity management. | | |
| Mortgage-Related Investments Portfolio | 24,107 | | 24,469 | | The liquid portion of our mortgage-related investments portfolio can be pledged or sold for liquidity purposes. The amount of cash we may be able to successfully raise may be substantially less than the balance. | | |
(1)Represents carrying value for the liquidity and contingency operating portfolio, included within our other investments portfolio, and UPB for the liquid portion of the mortgage-related investments portfolio.
Other Investments Portfolio Our other investments portfolio is important to our cash flow, collateral management, asset and liability management, and ability to provide liquidity and stability to the mortgage market.
Our liquidity and contingency operating portfolio primarily includes securities purchased under agreements to resell and non-mortgage-related securities. Our non-mortgage-related securities consist of U.S. Treasury securities and other investments that we could sell to provide us with an additional source of liquidity to fund our business operations. We also maintain non-interest-bearing deposits at the Federal Reserve Bank of New York and interest-bearing deposits at commercial banks. Our interest-bearing deposits at commercial banks, including custodial accounts, totaled $5.1 billion as of both June 30, 2024 and December 31, 2023. See MD&A - Our Portfolios - Investments Portfolio - Other Investments Portfolio for additional information about our other investments portfolio.
Mortgage-Related Investments Portfolio We invest principally in mortgage-related investments, certain categories of which are largely unencumbered and liquid. Our primary source of liquidity among these mortgage assets is our holdings of agency securities. See MD&A - Our Portfolios - Investments Portfolio - Mortgage-Related Investments Portfolio for additional information about our mortgage loans and mortgage-related securities.
| | | | | | | | |
| Freddie Mac 2Q 2024 Form 10-Q | | 34 |
| | | | | | | | |
| Management's Discussion and Analysis | | Liquidity and Capital Resources |
Primary Sources of Funding The table below lists the sources of our funding, the balances as of the dates shown, and a brief description of their importance to Freddie Mac.
Table 30 - Funding Sources | | | | | | | | | | | |
| (In millions) | June 30, 2024(1) | December 31, 2023(1) | Description |
| Debt of Freddie Mac | $161,373 | | $166,419 | | Debt of Freddie Mac is used to fund our business activities. |
| Debt of Consolidated Trusts | 3,066,239 | | 3,041,927 | | Debt of consolidated trusts is used primarily to fund our Single-Family guarantee activities. This type of debt is principally repaid by the cash flows of the associated mortgage loans. As a result, our repayment obligation is limited to amounts paid pursuant to our guarantee of principal and interest and to purchase modified or seriously delinquent loans from the trusts. |
(1)Represents the carrying value of debt balances after consideration of offsetting arrangements.
We issue debt of Freddie Mac to fund our operations. Competition for funding can vary with economic, financial market, and regulatory environments. The amount, type, and term of debt issued is based on a variety of factors and is designed to meet our ongoing cash needs and to comply with our Liquidity Management Framework.
The table below summarizes the par value and the average rate of debt of Freddie Mac securities we issued or paid off, including regularly scheduled principal payments, payments resulting from calls, and payments for repurchases. We call, exchange, or repurchase outstanding debt of Freddie Mac securities from time to time for a variety of reasons, including managing our funding composition and supporting the liquidity of our debt securities.
Table 31 - Debt of Freddie Mac Activity | | | | | | | | | | | | | | | | | | | | |
| | 2Q 2024 | | 2Q 2023 |
| (Dollars in millions) | | Par Value | Average Rate(1) | | Par Value | Average Rate(1) |
| Short-term: | | | | | | |
| Beginning balance | | $8,931 | | 5.37 | % | | $8,716 | | 4.36 | % |
| Issuances | | 16,760 | | 5.40 | | | 28,030 | | 4.65 | |
| Repayments | | — | | — | | | — | | — | |
| Maturities | | (17,238) | | 5.40 | | | (25,360) | | 4.31 | |
| Total short-term debt | | 8,453 | | 5.39 | | | 11,386 | | 5.08 | |
| | | | | | |
| | | | | | |
| | | | | | |
| | | | | | |
| | | | | | |
| | | | | | |
| Long-term: | | | | | | |
| Beginning balance | | 160,470 | | 3.24 | | | 181,384 | | 2.51 | |
| Issuances | | 13,445 | | 5.70 | | | 20,341 | | 5.44 | |
| Repayments | | (3,130) | | 5.74 | | | (4,020) | | 5.12 | |
| Maturities | | (10,746) | | 2.09 | | | (17,131) | | 0.83 | |
| Total long-term debt | | 160,039 | | 3.47 | | | 180,574 | | 3.21 | |
| Total debt of Freddie Mac, net | | $168,492 | | 3.57 | % | | $191,960 | | 3.32 | % |
| Referenced footnote is included after the year-to-date table. | | | | | | |
| | | | | | | | |
| Freddie Mac 2Q 2024 Form 10-Q | | 35 |
| | | | | | | | |
| Management's Discussion and Analysis | | Liquidity and Capital Resources |
| | | | | | | | | | | | | | | | | | | | |
| | YTD 2024 | | YTD 2023 |
| (Dollars in millions) | | Par Value | Average Rate(1) | | Par Value | Average Rate(1) |
| Short-term: | | | | | | |
| Beginning balance | | $6,032 | | 5.39 | % | | $7,716 | | 3.49 | % |
| Issuances | | 32,702 | | 5.35 | | | 78,769 | | 4.35 | |
| Repayments | | — | | — | | | — | | — | |
| Maturities | | (30,281) | | 5.34 | | | (75,099) | | 4.13 | |
| Total short-term debt | | 8,453 | | 5.39 | | | 11,386 | | 5.08 | |
| | | | | | |
| | | | | | |
| | | | | | |
| | | | | | |
| | | | | | |
| | | | | | |
| Long-term: | | | | | | |
| Beginning balance | | 168,009 | | 3.31 | | | 170,363 | | 2.22 | |
| Issuances | | 29,883 | | 5.52 | | | 34,533 | | 5.40 | |
| Repayments | | (23,943) | | 5.64 | | | (6,511) | | 5.43 | |
| Maturities | | (13,910) | | 2.21 | | | (17,811) | | 0.86 | |
| Total long-term debt | | 160,039 | | 3.47 | | | 180,574 | | 3.21 | |
| Total debt of Freddie Mac, net | | $168,492 | | 3.57 | % | | $191,960 | | 3.32 | % |
(1)Average rate is weighted based on par value.
As of June 30, 2024, our aggregate indebtedness pursuant to the Purchase Agreement was $168.5 billion, which was below the current $270.0 billion debt cap limit. Our aggregate indebtedness calculation primarily includes the par value of short- and long-term debt.
Maturity and Redemption Dates
The table below presents the par value of debt of Freddie Mac by contractual maturity date and earliest redemption date. The earliest redemption date includes callable debt at its earliest call date, and the contractual maturity date includes both callable debt and non-callable debt as of their respective maturity dates.
Table 32 - Maturity and Redemption Dates | | | | | | | | | | | | | | | | | | | | |
| | As of June 30, 2024 | | As of December 31, 2023 |
| (In millions) | | Contractual Maturity Date | Earliest Redemption Date | | Contractual Maturity Date | Earliest Redemption Date |
Debt of Freddie Mac(1): | | | | | | |
| 1 year or less | | $43,594 | | $142,702 | | | $47,276 | | $144,232 | |
| 1 year through 2 years | | 50,826 | | 11,906 | | | 61,187 | | 15,249 | |
| 2 years through 3 years | | 15,182 | | 136 | | | 15,645 | | 447 | |
| 3 years through 4 years | | 12,039 | | 414 | | | 12,530 | | 305 | |
| 4 years through 5 years | | 20,869 | | 245 | | | 10,947 | | 345 | |
| Thereafter | | 24,118 | | 11,225 | | | 24,278 | | 11,285 | |
STACR and SCR debt(2) | | 1,864 | | 1,864 | | | 2,177 | | 2,177 | |
| Total debt of Freddie Mac | | $168,492 | | $168,492 | | | $174,040 | | $174,040 | |
(1)As of June 30, 2024 and December 31, 2023, excludes $12.1 billion and $10.2 billion, respectively, of payables related to securities sold under agreements to repurchase that we offset against receivables related to securities purchased under agreements to resell on our condensed consolidated balance sheets.
(2)STACR debt notes and SCR debt notes are subject to prepayment risk as their payments are based upon the performance of a reference pool of mortgage assets that may be prepaid by the related mortgage borrowers at any time generally without penalty and are, therefore, included as a separate category in the table.
Debt of Consolidated Trusts The largest component of debt on our condensed consolidated balance sheets is debt of consolidated trusts, which relates to securitization transactions that we consolidate for accounting purposes. We primarily issue this type of debt by securitizing mortgage loans to fund our guarantee activities.
| | | | | | | | |
| Freddie Mac 2Q 2024 Form 10-Q | | 36 |
| | | | | | | | |
| Management's Discussion and Analysis | | Liquidity and Capital Resources |
The table below shows the issuance and extinguishment activity for the debt of consolidated trusts.
Table 33 - Debt of Consolidated Trusts Activity | | | | | | | | | | | | | | | | | |
| (In millions) | | 2Q 2024 | 2Q 2023 | YTD 2024 | YTD 2023 |
| Beginning balance | | $3,009,077 | | $2,938,721 | | $2,999,893 | | $2,929,567 | |
| Issuances | | 114,422 | | 114,546 | | 199,295 | | 201,567 | |
| Repayments and extinguishments | | (96,640) | | (92,271) | | (172,329) | | (170,138) | |
| Ending balance | | 3,026,859 | | 2,960,996 | | 3,026,859 | | 2,960,996 | |
Unamortized premiums and discounts | | 39,380 | | 46,282 | | 39,380 | | 46,282 | |
| Debt of consolidated trusts | | $3,066,239 | | $3,007,278 | | $3,066,239 | | $3,007,278 | |
Off-Balance Sheet Arrangements We enter into certain business arrangements that are not recorded on our condensed consolidated balance sheets or that may be recorded in amounts that differ from the full contractual or notional amount of the transaction that affect our short- and long-term liquidity needs. Our off-balance sheet arrangements primarily consist of guarantees and commitments. Certain of these arrangements present credit risk exposure. See Note 2 and Note 4 for additional information on these transactions. See MD&A - Risk Management - Credit Risk for additional information on our credit risk exposure on off-balance sheet arrangements.
Cash and cash equivalents (including restricted cash and cash equivalents) remained $5.5 billion as of June 30, 2024, unchanged from June 30, 2023.
| | | | | | | | |
| Freddie Mac 2Q 2024 Form 10-Q | | 37 |
| | | | | | | | |
| Management's Discussion and Analysis | | Liquidity and Capital Resources |
Capital Resources
The table below presents activity related to our net worth.
Table 34 - Net Worth Activity | | | | | | | | | | | | | | | | | | | | |
| (In millions) | | 2Q 2024 | 2Q 2023 | | YTD 2024 | YTD 2023 |
| Beginning balance | | $50,463 | | $39,067 | | | $47,722 | | $37,018 | |
| Comprehensive income | | 2,760 | | 2,890 | | | 5,501 | | 4,939 | |
| Capital draw from Treasury | | — | | — | | | — | | — | |
| Senior preferred stock dividends declared | | — | | — | | | — | | — | |
| Total equity / net worth | | $53,223 | | $41,957 | | | $53,223 | | $41,957 | |
| | | | | | |
| Remaining Treasury funding commitment | | $140,162 | | $140,162 | | | $140,162 | | $140,162 | |
| Aggregate draws under Purchase Agreement | | 71,648 | | 71,648 | | | 71,648 | | 71,648 | |
| Aggregate cash dividends paid to Treasury | | 119,680 | | 119,680 | | | 119,680 | | 119,680 | |
| Liquidation preference of the senior preferred stock | | 123,111 | | 111,715 | | | 123,111 | | 111,715 | |
FHFA published a final rule in November 2023 amending several provisions of the ERCF, with most of the amendments becoming effective in April 2024. For a description of our capital requirements under the ERCF, including the amended provisions, see the MD&A - Regulation and Supervision section in our 2023 Annual Report.
The charts below present the ERCF capital adequacy requirements under the risk-based capital requirement (CET1 capital ratio relative to RWA) and leverage capital requirement (Tier 1 capital ratio relative to ATA).
Risk-Based Capital Requirement: CET1 Capital Ratio
Leverage Capital Requirement: Tier 1 Capital Ratio
| | | | | | | | |
| Freddie Mac 2Q 2024 Form 10-Q | | 38 |
| | | | | | | | |
| Management's Discussion and Analysis | | Liquidity and Capital Resources |
Capital Metrics
The table below presents the components of our regulatory capital.
Table 35 - Regulatory Capital Components
| | | | | | | | | | | | | | | | | | | | | | | |
| (In millions) | | June 30, 2024 | | December 31, 2023 |
| Total equity | | $53,223 | | | $47,722 | |
| Less: | | | | |
| Senior preferred stock | | 72,648 | | | 72,648 | |
| Preferred stock | | 14,109 | | | 14,109 | |
| Common equity | | (33,534) | | | (39,035) | |
| Less: deferred tax assets arising from temporary differences that exceed 10% of CET1 capital and other regulatory adjustments | | 4,843 | | | 4,108 | |
| Common equity Tier 1 capital | | (38,377) | | | (43,143) | |
| Add: Preferred stock | | 14,109 | | | 14,109 | |
| Tier 1 capital | | (24,268) | | | (29,034) | |
| Tier 2 capital adjustments | | — | | | — | |
| Adjusted total capital | | ($24,268) | | | ($29,034) | |
The table below presents the components of our statutory capital.
Table 36 - Statutory Capital Components | | | | | | | | | | | | | | | | | | | | | | | |
| (In millions) | | June 30, 2024 | | December 31, 2023 |
| Total equity | | $53,223 | | | $47,722 | |
| Less: | | | | |
| Senior preferred stock | | 72,648 | | | 72,648 | |
| AOCI, net of taxes | | (52) | | | (22) | |
| Core capital | | (19,373) | | | (24,904) | |
General allowance for foreclosure losses(1) | | 7,347 | | | 6,849 | |
| Total capital | | ($12,026) | | | ($18,055) | |
(1)Represents our allowance for credit losses.
| | | | | | | | |
| Freddie Mac 2Q 2024 Form 10-Q | | 39 |
| | | | | | | | |
| Management's Discussion and Analysis | | Liquidity and Capital Resources |
The table below presents our capital metrics under the ERCF.
Table 37 - Capital Metrics Under ERCF | | | | | | | | | | | | | | | | | | | | | | | | | | | |
| (In billions) | | | | | June 30, 2024 | | December 31, 2023 |
| Adjusted total assets | | $3,749 | | | $3,775 |
| Risk-weighted assets (standardized approach): | | | | |
| Credit risk | | 880 | | | 884 |
| Market risk | | 53 | | | 54 |
| Operational risk | | 70 | | | 71 |
| Total risk-weighted assets | | $1,003 | | | $1,009 |
| | | | | | | | | |
| (In billions) | | | | | June 30, 2024 | | December 31, 2023 |
| Stress capital buffer | | $28 | | | $28 |
| Stability capital buffer | | 29 | | | 23 |
| Countercyclical capital buffer amount | | — | | | — |
| PCCBA | | $57 | | | $51 |
| PLBA | | $14 | | | $11 |
| | | | | | | | | |
| | | June 30, 2024 |
| (Dollars in billions) | | | Minimum
Capital
Requirement | Applicable Buffer(1) | Capital Requirement (Including Buffer(1)) | Available
Capital (Deficit) | Capital
Shortfall |
| Risk-based capital amounts: | | | | | | | |
| Total capital | | | $80 | | N/A | $80 | | ($12) | | ($92) | |
| CET1 capital | | | 45 | | $57 | | 102 | | (38) | | (140) | |
| Tier 1 capital | | | 60 | | 57 | | 117 | | (24) | | (141) | |
| Adjusted total capital | | | 80 | | 57 | | 137 | | (24) | | (161) | |
Risk-based capital ratios(2): | | | | | | | |
| Total capital | | | 8.0 | % | N/A | 8.0 | % | (1.2) | % | (9.2) | % |
| CET1 capital | | | 4.5 | | 5.7 | % | 10.2 | | (3.8) | | (14.0) | |
| Tier 1 capital | | | 6.0 | | 5.7 | | 11.7 | | (2.4) | | (14.1) | |
| Adjusted total capital | | | 8.0 | | 5.7 | | 13.7 | | (2.4) | | (16.1) | |
| Leverage capital amounts: | | | | | | | |
| Core capital | | | $94 | | N/A | $94 | | ($19) | | ($113) | |
| Tier 1 capital | | | 94 | | $14 | | 108 | | (24) | | (132) | |
Leverage capital ratios(3): | | | | | | | |
| Core capital | | | 2.5 | % | N/A | 2.5 | % | (0.5) | % | (3.0) | % |
| Tier 1 capital | | | 2.5 | | 0.4 | % | 2.9 | | (0.6) | | (3.5) | |
Referenced footnotes are included after the prior period table.
| | | | | | | | |
| Freddie Mac 2Q 2024 Form 10-Q | | 40 |
| | | | | | | | |
| Management's Discussion and Analysis | | Liquidity and Capital Resources |
| | | | | | | | | | | | | | | | | | | | | | | | | | | |
| | | December 31, 2023 |
| (Dollars in billions) | | | Minimum
Capital
Requirement | Applicable Buffer(1) | Capital Requirement (Including Buffer(1)) | Available
Capital (Deficit) | Capital
Shortfall |
| Risk-based capital amounts: | | | | | | | |
| Total capital | | | $81 | | N/A | $81 | | ($18) | | ($99) | |
| CET1 capital | | | 45 | | $51 | | 96 | | (43) | | (139) | |
| Tier 1 capital | | | 60 | | 51 | | 111 | | (29) | | (140) | |
| Adjusted total capital | | | 81 | | 51 | | 132 | | (29) | | (161) | |
Risk-based capital ratios(2): | | | | | | | |
| Total capital | | | 8.0 | % | N/A | 8.0 | % | (1.8) | % | (9.8) | % |
| CET1 capital | | | 4.5 | | 5.0 | % | 9.5 | | (4.3) | | (13.8) | |
| Tier 1 capital | | | 6.0 | | 5.0 | | 11.0 | | (2.9) | | (13.9) | |
| Adjusted total capital | | | 8.0 | | 5.0 | | 13.0 | | (2.9) | | (15.9) | |
| Leverage capital amounts: | | | | | | | |
| Core capital | | | $95 | | N/A | $95 | | ($25) | | ($120) | |
| Tier 1 capital | | | 95 | | $11 | | 106 | | (29) | | (135) | |
Leverage capital ratios(3): | | | | | | | |
| Core capital | | | 2.5 | % | N/A | 2.5 | % | (0.7) | % | (3.2) | % |
| Tier 1 capital | | | 2.5 | | 0.3 | % | 2.8 | | (0.8) | | (3.6) | |
(1)PCCBA for risk-based capital and PLBA for leverage capital.
(2)As a percentage of RWA.
(3)As a percentage of ATA.
At June 30, 2024, our maximum payout ratio under the ERCF was 0.0%.
See Note 15 for additional information on our capital amounts and ratios under the ERCF.
| | | | | | | | |
| Freddie Mac 2Q 2024 Form 10-Q | | 41 |
| | | | | | | | |
| Management's Discussion and Analysis | | Critical Accounting Estimates |
CRITICAL ACCOUNTING ESTIMATES
Our critical accounting estimates and policies relate to the Single-Family allowance for credit losses. For additional information about our critical accounting estimates and other significant accounting policies, see Note 1 and Critical Accounting Estimates in our 2023 Annual Report.
Single-Family Allowance for Credit Losses
The Single-Family allowance for credit losses represents our estimate of expected credit losses over the contractual term of the mortgage loans. The Single-Family allowance for credit losses pertains to all single-family loans classified as held-for-investment on our condensed consolidated balance sheets.
Determining the appropriateness of the Single-Family allowance for credit losses is a complex process that is subject to numerous estimates and assumptions requiring significant management judgment about matters that involve a high degree of subjectivity. This process involves the use of models that require us to make judgments about matters that are difficult to predict.
Changes in forecasted house price growth rates can have a significant effect on our allowance for credit losses estimates. The table below shows our nationwide forecasted house price growth rates that were used in determining our allowance for credit losses. See Note 5 for additional information regarding our current period provision for credit losses.
Table 38 - Forecasted House Price Growth Rates | | | | | | | | | | | |
| | 12-Month Forward | 13- to 24-Month Forward |
| | | |
| June 30, 2024 | | 0.6 | % | 0.5 | % |
| March 31, 2024 | | 0.2 | | 0.6 | |
| December 31, 2023 | | 2.8 | | 2.0 | |
| | | | | | | | |
| Freddie Mac 2Q 2024 Form 10-Q | | 42 |
| | | | | | | | |
| Management's Discussion and Analysis | Regulation and Supervision |
REGULATION AND SUPERVISION
In addition to oversight by FHFA as our Conservator, we are subject to regulation and oversight by FHFA under our Charter and the GSE Act and to certain regulation by other government agencies. FHFA has the power to require us from time to time to change our processes, take action and/or stop taking action that could impact our business. Furthermore, regulatory activities by other government agencies can affect us indirectly, even if we are not directly subject to such agencies' regulation or oversight. For example, regulations that modify requirements applicable to the purchase or servicing of mortgages can affect us.
Federal Housing Finance Agency
Closed-End Second-Lien Mortgage Pilot On June 21, 2024, FHFA announced its conditional approval for Freddie Mac to engage in a limited pilot to purchase certain single-family closed-end second-lien mortgages, following FHFA’s initial publication of the proposed new product for public comment under FHFA’s Prior Approval for Enterprise Products requirement. This conditional approval includes several incremental limitations on the product, including:
n A maximum volume of $2.5 billion in purchases for the pilot;
n A maximum duration of 18 months for the pilot;
n A maximum loan amount of $78,277, corresponding to certain subordinate-lien loan thresholds in the CFPB's definition of Qualified Mortgage;
n A minimum seasoning period of 24 months for the first mortgage; and
n Eligibility only for primary residences.
Upon the pilot’s conclusion, FHFA will analyze the data on Freddie Mac’s purchases of second-lien mortgages to determine whether the objectives of the pilot were met. FHFA has determined that any increase to the volume or extension of the duration of the pilot, or a conversion of the pilot to a programmatic activity, would be treated as a new product that is subject to public notice and comment and FHFA approval. Any subsequent approval would be informed by the preliminary results of the pilot.
FICO 10T and VantageScore 4.0 On July 11, 2024, FHFA announced the publication of historical VantageScore 4.0 credit scores to support the implementation of Freddie Mac and Fannie Mae’s updated credit score and credit reporting requirements. For additional information on this initiative, see our Quarterly Report on Form 10-Q for the quarter ended March 31, 2024. Multifamily Tenant Protections On July 12, 2024, FHFA announced a set of required tenant protections for multifamily properties financed by the Enterprises. Covered housing providers will be required to provide tenants with the following:
n 30-day written notice of a rent increase;
n 30-day written notice of a lease’s scheduled expiration; and
n 5-day grace period for late rent payments.
Freddie Mac will monitor and enforce these tenant protections, and failure to comply could result in the exercise of remedies under the applicable loan documents. These protections will apply to properties for which new loan applications are signed on or after the policy effective date, February 28, 2025. Freddie Mac expects to publish a detailed description of the tenant protection policy in August 2024.
Quality Control Standards for Automated Valuation Models On July 17, 2024, six federal regulatory agencies, including FHFA, issued a final rule, pursuant to the Dodd-Frank Act, designed to help ensure the credibility and integrity of models used in valuations for certain mortgages secured by a consumer’s principal dwelling. In particular, the rule will implement quality control standards for automated valuation models (AVMs) used by mortgage originators and secondary market issuers in valuing those homes.
Under the final rule, the agencies will require institutions that engage in certain transactions secured by a consumer’s principal dwelling to adopt policies, practices, procedures, and control systems designed to ensure a high level of confidence in
| | | | | | | | |
| Freddie Mac 2Q 2024 Form 10-Q | | 43 |
| | | | | | | | |
| Management's Discussion and Analysis | Regulation and Supervision |
estimates produced by AVMs; protect against data manipulation; seek to avoid conflicts of interest; require random sample testing and reviews; and comply with nondiscrimination laws. The rule takes effect on the first day of the calendar quarter following one year after publication in the Federal Register.
| | | | | | | | |
| Freddie Mac 2Q 2024 Form 10-Q | | 44 |
| | | | | | | | |
| Management's Discussion and Analysis | Forward-Looking Statements |
FORWARD-LOOKING STATEMENTS
We regularly communicate information concerning our business activities to investors, the news media, securities analysts, and others as part of our normal operations. Some of these communications, including this Form 10-Q, contain "forward-looking statements." Examples of forward-looking statements include, but are not limited to, statements pertaining to the conservatorship, our current expectations and objectives for the Single-Family and Multifamily segments of our business, our efforts to assist the housing market, our liquidity and capital management, economic and market conditions and trends including, but not limited to, changes in house prices and house price forecasts, our market share, the effect of legislative and regulatory developments and new accounting guidance, the credit quality of loans we own or guarantee, the costs and benefits of our CRT transactions, the impact of banking crises or failures, the effects of catastrophic events or significant climate change effects and actions taken in response thereto on our business, and our results of operations and financial condition. Forward-looking statements involve known and unknown risks and uncertainties, some of which are beyond our control. Forward-looking statements are often accompanied by, and identified with, terms such as "could," "may," "will," "believe," "expect," "anticipate," "forecast," and similar phrases. These statements are not historical facts, but rather represent our expectations based on current information, plans, judgments, assumptions, estimates, and projections. Actual results may differ significantly from those described in or implied by such forward-looking statements due to various factors and uncertainties, including those described in the Risk Factors section in our 2023 Annual Report, and including, without limitation, the following:
n The actions the federal government (including FHFA, Treasury, and Congress) and state governments may take, require us to take, or restrict us from taking, including actions to promote equitable access to affordable and sustainable housing, such as programs to implement the expectations in FHFA's Conservatorship Scorecards, recent requirements and guidance related to equitable housing and fair lending, and other objectives for us;
n Changes in the fiscal and monetary policies of the Federal Reserve, including changes in target interest rates and in the amount of agency MBS and agency CMBS held by the Federal Reserve;
n The effect of the restrictions on our business due to the conservatorship and the Purchase Agreement;
n The impact of any changes in our credit ratings or those of the U.S. government;
n Changes in our Charter, applicable legislative or regulatory requirements (including any legislation affecting the future status of our company), or the Purchase Agreement;
n Changes to our capital requirements and potential effects of such changes on our business strategies;
n Changes in tax laws;
n Changes in privacy and cybersecurity laws and regulations;
n Changes in accounting policies, practices, standards, or guidance;
n Changes in economic and market conditions, including volatility in the financial services industry, changes in employment rates, inflation, interest rates, spreads, and house prices;
n Changes in the U.S. mortgage market, including changes in the supply and type of loan products;
n The success of our efforts to mitigate our losses;
n The success of our strategy to transfer mortgage credit risk;
n Our ability to maintain adequate liquidity to fund our operations;
n Our ability to maintain the security and resiliency of our operational systems and infrastructure, including against cybersecurity incidents or other security incidents, whether due to insider error or malfeasance or system errors or vulnerabilities in our or our third parties' systems;
n Our ability to effectively execute our business strategies, implement significant changes, and improve efficiency;
n The adequacy of our risk management framework, including the adequacy of our regulatory capital framework prescribed by FHFA and internal models for measuring risk;
n Our ability to manage mortgage credit risk, including the effect of changes in underwriting and servicing practices;
n Our ability to limit or manage our economic exposure and GAAP earnings exposure to interest-rate volatility and spread volatility, including the availability of derivative financial instruments needed for interest-rate risk management purposes and our ability to apply hedge accounting;
n Our operational ability to issue new securities, make timely and correct payments on securities, and provide initial and ongoing disclosures;
n Our reliance on CSS and the CSP for the operation of the majority of our Single-Family securitization activities, limits on our influence over CSS Board decisions, and any additional changes FHFA may require in our relationship with, or support of, CSS;
n Performance of and changes in the methodologies, models, assumptions, and estimates we use to prepare our financial statements, make business decisions, and manage risks;
n Changes in investor demand for our debt or mortgage-related securities;
| | | | | | | | |
| Freddie Mac 2Q 2024 Form 10-Q | | 45 |
| | | | | | | | |
| Management's Discussion and Analysis | Forward-Looking Statements |
n Our ability to maintain market acceptance of our mortgage-related securities, including our ability to maintain alignment of the prepayment speeds and pricing performance of our and Fannie Mae's respective UMBS;
n Changes in the practices of loan originators, servicers, investors, and other participants in the secondary mortgage market including as a result of evolving AI regulation;
n Competition from other market participants, which could affect the pricing we offer for our products, the credit characteristics of the loans we purchase, and our ability to meet our affordable housing goals and other mandated activities;
n The adverse consequences on our business and operations that may occur from the transition to SOFR as the replacement for LIBOR;
n The availability of critical third parties, or their vendors and other business partners, to deliver products or services, or to manage risks, including cybersecurity risk, effectively;
n The occurrence of a catastrophic event or significant climate change effects in areas in which our offices, significant portions of our total mortgage portfolio, or the offices of critical third parties are located, and for which we may be uninsured or significantly underinsured; and
n Other factors and assumptions described in this Form 10-Q and our 2023 Annual Report, including in the MD&A section.
Forward-looking statements are made only as of the date of this Form 10-Q, and we undertake no obligation to update any forward-looking statements we make to reflect events or circumstances occurring after the date of this Form 10-Q.
| | | | | | | | |
| Freddie Mac 2Q 2024 Form 10-Q | | 46 |
| | | | | | | | |
| Freddie Mac 2Q 2024 Form 10-Q | | 47 |
| | | | | |
| Financial Statements | Condensed Consolidated Statements of Income and Comprehensive Income |
FREDDIE MAC
Condensed Consolidated Statements of Income and Comprehensive Income (Unaudited) | | | | | | | | | | | | | | | | | | | | |
(In millions, except share-related amounts) | | 2Q 2024 | 2Q 2023 | | YTD 2024 | YTD 2023 |
| Net interest income | | | | | | |
| Interest income | | $29,064 | | $25,755 | | | $57,449 | | $50,742 | |
| Interest expense | | (24,136) | | (21,232) | | | (47,762) | | (41,718) | |
| Net interest income | | 4,928 | | 4,523 | | | 9,687 | | 9,024 | |
| | | | | | |
| Non-interest income | | | | | | |
| Guarantee income | | 383 | | 309 | | | 879 | | 775 | |
| Investment gains, net | | 549 | | 411 | | | 954 | | 186 | |
| Other income | | 128 | | 96 | | | 225 | | 181 | |
| Non-interest income | | 1,060 | | 816 | | | 2,058 | | 1,142 | |
| Net revenues | | 5,988 | | 5,339 | | | 11,745 | | 10,166 | |
| | | | | | |
| (Provision) benefit for credit losses | | (394) | | 537 | | | (575) | | 142 | |
| | | | | | |
| Non-interest expense | | | | | | |
| Salaries and employee benefits | | (420) | | (405) | | | (841) | | (779) | |
| Credit enhancement expense | | (588) | | (590) | | | (1,185) | | (1,120) | |
| Benefit for (decrease in) credit enhancement recoveries | | (7) | | (108) | | | (6) | | (59) | |
| Legislative assessments expense | | (768) | | (751) | | | (1,522) | | (1,486) | |
| Other expense | | (351) | | (350) | | | (702) | | (692) | |
| Non-interest expense | | (2,134) | | (2,204) | | | (4,256) | | (4,136) | |
| | | | | | |
| Income before income tax expense | | 3,460 | | 3,672 | | | 6,914 | | 6,172 | |
| Income tax expense | | (695) | | (728) | | | (1,383) | | (1,233) | |
| Net income | | 2,765 | | 2,944 | | | 5,531 | | 4,939 | |
| Other comprehensive income (loss), net of taxes and reclassification adjustments | | (5) | | (54) | | | (30) | | — | |
| Comprehensive income | | $2,760 | | $2,890 | | | $5,501 | | $4,939 | |
| | | | | | |
| Net income | | $2,765 | | $2,944 | | | $5,531 | | $4,939 | |
| Amounts attributable to senior preferred stock | | (2,760) | | (2,890) | | | (5,501) | | (4,939) | |
| Net income attributable to common stockholders | | $5 | | $54 | | | $30 | | $— | |
| Net income per common share | | $0.00 | | $0.02 | | | $0.01 | | $0.00 | |
| Weighted average common shares (in millions) | | 3,234 | | 3,234 | | | 3,234 | | 3,234 | |
The accompanying notes are an integral part of these condensed consolidated financial statements.
| | | | | | | | |
| Freddie Mac 2Q 2024 Form 10-Q | | 48 |
| | | | | |
| Financial Statements | Condensed Consolidated Balance Sheets |
FREDDIE MAC
Condensed Consolidated Balance Sheets (Unaudited)
| | | | | | | | | | | |
| | June 30, | December 31, |
(In millions, except share-related amounts) | | 2024 | 2023 |
| Assets | | | |
Cash and cash equivalents (includes $1,206 and $978 of restricted cash and cash equivalents) | | $5,532 | | $6,019 | |
| Securities purchased under agreements to resell | | 97,180 | | 95,148 | |
| Investment securities, at fair value | | 43,480 | | 43,275 | |
Mortgage loans held-for-sale (includes $7,956 and $7,356 at fair value) | | 12,346 | | 12,941 | |
Mortgage loans held-for-investment (net of allowance for credit losses of $6,839 and $6,383 and includes $1,991 and $1,806 at fair value) | | 3,105,869 | | 3,083,665 | |
| Accrued interest receivable | | 10,445 | | 9,925 | |
| Deferred tax assets, net | | 4,795 | | 4,076 | |
Other assets (includes $5,968 and $6,095 at fair value) | | 27,605 | | 25,927 | |
| Total assets | | $3,307,252 | | $3,280,976 | |
| Liabilities and equity | | | |
| Liabilities | | | |
| Accrued interest payable | | $9,346 | | $8,812 | |
Debt (includes $2,850 and $2,476 at fair value) | | 3,227,612 | | 3,208,346 | |
Other liabilities (includes $1,054 and $873 at fair value) | | 17,071 | | 16,096 | |
| Total liabilities | | 3,254,029 | | 3,233,254 | |
| Commitments and contingencies | | | |
| Equity | | | |
Senior preferred stock (liquidation preference of $123,111 and $117,309) | | 72,648 | | 72,648 | |
| Preferred stock, at redemption value | | 14,109 | | 14,109 | |
Common stock, $0.00 par value, 4,000,000,000 shares authorized, 725,863,886 shares issued and 650,059,553 shares outstanding | | — | | — | |
| Retained earnings | | (29,597) | | (35,128) | |
| AOCI, net of taxes, related to: | | | |
| Available-for-sale securities | | 46 | | 72 | |
| Other | | (98) | | (94) | |
| AOCI, net of taxes | | (52) | | (22) | |
Treasury stock, at cost, 75,804,333 shares | | (3,885) | | (3,885) | |
Total equity | | 53,223 | | 47,722 | |
| Total liabilities and equity | | $3,307,252 | | $3,280,976 | |
The table below presents the carrying value and classification of the assets and liabilities of consolidated VIEs on our condensed consolidated balance sheets.
| | | | | | | | | | | |
| | June 30, | December 31, |
| (In millions) | | 2024 | 2023 |
| Assets: | | | |
Cash and cash equivalents (includes $1,100 and $890 of restricted cash and cash equivalents) | | $1,101 | $891 | |
| Securities purchased under agreements to resell | | 12,692 | 9,396 | |
| Investment securities, at fair value | | — | 65 | |
| Mortgage loans held-for-investment, net | | 3,058,317 | 3,039,461 | |
| Accrued interest receivable | | 9,321 | 8,885 | |
| Other assets | | 5,830 | 4,858 | |
| Total assets of consolidated VIEs | | $3,087,261 | $3,063,556 |
| Liabilities: | | | |
| Accrued interest payable | | $7,938 | | $7,527 | |
| Debt | | 3,066,239 | | 3,041,927 | |
| Total liabilities of consolidated VIEs | | $3,074,177 | | $3,049,454 | |
The accompanying notes are an integral part of these condensed consolidated financial statements.
| | | | | | | | |
| Freddie Mac 2Q 2024 Form 10-Q | | 49 |
| | | | | |
| Financial Statements | Condensed Consolidated Statements of Equity |
FREDDIE MAC
Condensed Consolidated Statements of Equity (Unaudited)
| | | | | | | | | | | | | | | | | | | | | | | | | | | | | | | | | | | |
| | Shares Outstanding | Senior Preferred Stock | Preferred Stock, at Redemption Value | Common Stock, at Par Value | Retained
Earnings | AOCI, Net of Tax | Treasury
Stock, at
Cost | Total Equity |
| (In millions) | | Senior Preferred Stock | Preferred Stock | Common Stock |
| Balance at March 31, 2024 | | 1 | | 464 | | 650 | | $72,648 | | $14,109 | | $— | | ($32,362) | | ($47) | | ($3,885) | | $50,463 | |
| Comprehensive income: | | | | | | | | | | | |
| Net income | | — | | — | | — | | — | | — | | — | | 2,765 | | — | | — | | 2,765 | |
| Other comprehensive income (loss): | | | | | | | | | | | |
Changes in net unrealized gains (losses) on available-for-sale securities (net of taxes of $1 million) | | — | | — | | — | | — | | — | | — | | — | | (3) | | — | | (3) | |
Reclassification adjustment for (gains) losses on available-for-sale securities included in net income (net of taxes of $1 million) | | — | | — | | — | | — | | — | | — | | — | | (2) | | — | | (2) | |
Other (net of taxes of $0 million) | | — | | — | | — | | — | | — | | — | | — | | — | | — | | — | |
| Comprehensive income | | — | | — | | — | | — | | — | | — | | 2,765 | | (5) | | — | | 2,760 | |
| Ending balance at June 30, 2024 | | 1 | | 464 | | 650 | | $72,648 | | $14,109 | | $— | | ($29,597) | | ($52) | | ($3,885) | | $53,223 | |
| | | | | | | | | | | |
| Balance at March 31, 2023 | | 1 | | 464 | | 650 | | $72,648 | | $14,109 | | $— | | ($43,671) | | ($134) | | ($3,885) | | $39,067 | |
| Comprehensive income: | | | | | | | | | | | |
| Net income | | — | | — | | — | | — | | — | | — | | 2,944 | | — | | — | | 2,944 | |
| Other comprehensive income (loss): | | | | | | | | | | | |
Changes in net unrealized gains (losses) on available-for-sale securities (net of taxes of $15 million) | | — | | — | | — | | — | | — | | — | | — | | (55) | | — | | (55) | |
Reclassification adjustment for (gains) losses on available-for-sale securities included in net income (net of taxes of $0 million) | | — | | — | | — | | — | | — | | — | | — | | (1) | | — | | (1) | |
Other (net of taxes of $0 million) | | — | | — | | — | | — | | — | | — | | — | | 2 | | — | | 2 | |
| Comprehensive income | | — | | — | | — | | — | | — | | — | | 2,944 | | (54) | | — | | 2,890 | |
| Ending balance at June 30, 2023 | | 1 | | 464 | | 650 | | $72,648 | | $14,109 | | $— | | ($40,727) | | ($188) | | ($3,885) | | $41,957 | |
| | | | | | | | | | | | | | | | | | | | | | | | | | | | | | | | | | | |
| | Shares Outstanding | Senior Preferred Stock | Preferred Stock, at Redemption Value | Common Stock, at Par Value | Retained
Earnings | AOCI, Net of Tax | Treasury Stock, at Cost | Total Equity |
| (In millions) | | Senior Preferred Stock | Preferred Stock | Common Stock |
| Balance at December 31, 2023 | | 1 | | 464 | | 650 | | $72,648 | | $14,109 | | $— | | ($35,128) | | ($22) | | ($3,885) | | $47,722 | |
| Comprehensive income: | | | | | | | | | | | |
| Net income | | — | | — | | — | | — | | — | | — | | 5,531 | | — | | — | | 5,531 | |
| Other comprehensive income (loss): | | | | | | | | | | | |
Changes in net unrealized gains (losses) on available-for-sale securities (net of taxes of $8 million) | | — | | — | | — | | — | | — | | — | | — | | (28) | | — | | (28) | |
Reclassification adjustment for (gains) losses on available-for-sale securities included in net income (net of taxes of $2 million) | | — | | — | | — | | — | | — | | — | | — | | 2 | | — | | 2 | |
Other (net of taxes of $1 million) | | — | | — | | — | | — | | — | | — | | — | | (4) | | — | | (4) | |
| Comprehensive income | | — | | — | | — | | — | | — | | — | | 5,531 | | (30) | | — | | 5,501 | |
| Ending balance at June 30, 2024 | | 1 | | 464 | | 650 | | $72,648 | | $14,109 | | $— | | ($29,597) | | ($52) | | ($3,885) | | $53,223 | |
| | | | | | | | | | | |
| Balance at December 31, 2022 | | 1 | | 464 | | 650 | | $72,648 | | $14,109 | | $— | | ($45,666) | | ($188) | | ($3,885) | | $37,018 | |
| Comprehensive income: | | | | | | | | | | | |
| Net income | | — | | — | | — | | — | | — | | — | | 4,939 | | — | | — | | 4,939 | |
| Other comprehensive income (loss): | | | | | | | | | | | |
Changes in net unrealized gains (losses) on available-for-sale securities (net of taxes of $1 million) | | — | | — | | — | | — | | — | | — | | — | | (3) | | — | | (3) | |
Reclassification adjustment for (gains) losses on available-for-sale securities included in net income (net of taxes of $0 million) | | — | | — | | — | | — | | — | | — | | — | | (1) | | — | | (1) | |
Other (net of taxes of $1 million) | | — | | — | | — | | — | | — | | — | | — | | 4 | | — | | 4 | |
| Comprehensive income | | — | | — | | — | | — | | — | | — | | 4,939 | | — | | — | | 4,939 | |
| Ending balance at June 30, 2023 | | 1 | | 464 | | 650 | | $72,648 | | $14,109 | | $— | | ($40,727) | | ($188) | | ($3,885) | | $41,957 | |
The accompanying notes are an integral part of these condensed consolidated financial statements.
| | | | | | | | |
| Freddie Mac 2Q 2024 Form 10-Q | | 50 |
| | | | | |
| Financial Statements | Condensed Consolidated Statements of Cash Flows |
FREDDIE MAC
Condensed Consolidated Statements of Cash Flows (Unaudited)
| | | | | | | | | | | |
| (In millions) | | YTD 2024 | YTD 2023 |
| Net cash provided by (used in) operating activities | | $3,821 | | $5,006 | |
| Cash flows from investing activities | | | |
| Investment securities: | | | |
| Purchases | | (41,294) | | (69,402) | |
| Proceeds from sales | | 35,976 | | 56,879 | |
| Proceeds from maturities and repayments | | 4,307 | | 9,373 | |
| Mortgage loans acquired held-for-investment: | | | |
| Purchases | | (57,665) | | (48,969) | |
| Proceeds from sales | | 1,430 | | 4,634 | |
| Proceeds from repayments | | 126,412 | | 121,259 | |
| Advances under secured lending arrangements | | (46,289) | | (47,709) | |
| Net (increase) decrease in securities purchased under agreements to resell | | (3,862) | | (22,267) | |
| Cash flows related to derivatives | | 3,111 | | 1,654 | |
| Other, net | | 201 | | (209) | |
| Net cash provided by (used in) investing activities | | 22,327 | | 5,243 | |
| Cash flows from financing activities | | | |
| Debt of consolidated trusts: | | | |
| Proceeds from issuance | | 102,983 | | 99,146 | |
| Repayments and redemptions | | (125,972) | | (121,120) | |
| Debt of Freddie Mac: | | | |
| Proceeds from issuance | | 62,410 | | 113,098 | |
| Repayments | | (67,882) | | (99,255) | |
| Net increase (decrease) in securities sold under agreements to repurchase | | 1,830 | | (2,824) | |
| Other, net | | (4) | | (140) | |
| Net cash provided by (used in) financing activities | | (26,635) | | (11,095) | |
| Net increase (decrease) in cash and cash equivalents (includes restricted cash and cash equivalents) | | (487) | | (846) | |
| Cash and cash equivalents (includes restricted cash and cash equivalents) at the beginning of year | | 6,019 | | 6,360 | |
| Cash and cash equivalents (includes restricted cash and cash equivalents) at end of period | | $5,532 | | $5,514 | |
| | | |
| Supplemental cash flow information | | | |
| Cash paid for: | | | |
| Debt interest | | $48,506 | | $42,058 | |
| Income taxes | | 2,250 | | 700 | |
| Non-cash investing and financing activities (Notes 3 and 6) | | | |
The accompanying notes are an integral part of these condensed consolidated financial statements. | | | | | | | | |
| Freddie Mac 2Q 2024 Form 10-Q | | 51 |
| | | | | |
| Financial Statements | Notes to the Condensed Consolidated Financial Statements | Note 1 |
Notes to Condensed Consolidated Financial Statements
NOTE 1
Summary of Significant Accounting Policies
Freddie Mac is a GSE chartered by Congress in 1970, with a mission to provide liquidity, stability, and affordability to the U.S. housing market. We are regulated by FHFA, the SEC, HUD, and Treasury, and are currently operating under the conservatorship of FHFA. The conservatorship and related matters significantly affect our management, business activities, financial condition, and results of operations. In connection with our entry into conservatorship, we entered into the Purchase Agreement with Treasury, under which we issued Treasury both senior preferred stock and a warrant to purchase common stock. Our Purchase Agreement with Treasury is critical to keeping us solvent and avoiding the appointment of a receiver by FHFA under statutory mandatory receivership provisions. We believe the support provided by Treasury pursuant to the Purchase Agreement currently enables us to have adequate liquidity to conduct normal business activities. For more information on the conservatorship, the roles of FHFA and Treasury, and the Purchase Agreement, see our 2023 Annual Report. Throughout our unaudited condensed consolidated financial statements and related notes, we use certain acronyms and terms which are defined in the Glossary of our 2023 Annual Report.
The accompanying unaudited condensed consolidated financial statements should be read in conjunction with the audited consolidated financial statements and related notes in our 2023 Annual Report.
The accompanying unaudited condensed consolidated financial statements have been prepared in accordance with GAAP and include our accounts as well as the accounts of other entities in which we have a controlling financial interest. All intercompany balances and transactions have been eliminated.
We are operating under the basis that we will realize assets and satisfy liabilities in the normal course of business as a going concern and in accordance with the authority provided by FHFA to our Board of Directors to oversee management's conduct of our business operations. In the opinion of management, our unaudited condensed consolidated financial statements contain all adjustments, which include only normal recurring adjustments, necessary for a fair statement of our results.
The preparation of our condensed consolidated financial statements requires management to make estimates and assumptions that affect the reported amounts of assets and liabilities, revenues and expenses, and disclosure of contingent assets and liabilities at the date of the financial statements. Management has made significant estimates to report the allowance for credit losses on single-family mortgage loans. Actual results could be different from these estimates.
Consolidation and Equity Investments For each entity with which we are involved, we determine whether the entity should be consolidated in our financial statements. We consolidate entities in which we have a controlling financial interest. The method for determining whether a controlling financial interest exists varies depending on whether the entity is a VIE. For entities that are not VIEs, we hold a controlling financial interest in entities where we hold a majority of the voting rights or a majority of a limited partnership's kick-out rights through voting interests. We do not currently consolidate any entities which are not VIEs. We use the equity method to account for our interests in entities in which we do not have a controlling financial interest, but over which we have significant influence.
We invest in LIHTC partnerships to support and preserve the supply of affordable housing. We have elected to account for these investments using the proportional amortization method when applicable. The carrying amount of our investments in LIHTC partnerships is presented in other assets on our condensed consolidated balance sheets and totaled $3.8 billion as of June 30, 2024.
| | | | | | | | |
| Freddie Mac 2Q 2024 Form 10-Q | | 52 |
| | | | | |
| Financial Statements | Notes to the Condensed Consolidated Financial Statements | Note 1 |
Recently Issued Accounting Guidance
| | | | | | | | | | | |
| Recently Adopted Accounting Guidance |
| Standard | Description | Date of
Adoption | Effect on Consolidated Financial Statements |
ASU 2023-02, Investments - Equity Method and Joint Ventures (Topic 323): Accounting for Investments in Tax Credit Structures Using the Proportional Amortization Method | The amendments in this Update expand the use of the proportional amortization method of accounting to equity investments in other tax credit structures that meet certain conditions. This Update also amends those conditions primarily to assess projected benefits on a discounted basis and expands the disclosure requirements of those investments. | January 1, 2024 | The adoption of these amendments did not have a material effect on our consolidated financial statements. See the preceding section Consolidation and Equity Investments for additional information.
|
| | | | | | | | | | | |
| Recently Issued Accounting Guidance, Not Yet Adopted Within Our Consolidated Financial Statements |
| Standard | Description | Date of
Adoption | Effect on Consolidated Financial Statements |
ASU 2023-07, Segment Reporting (Topic 280): Improvements to Reportable Segment Disclosures | The amendments in this Update require the disclosure of more detailed quantitative and qualitative information about significant segment expenses that are regularly provided to the CODM and included in each reported measure of segment profit or loss. | December 31, 2024 | We do not expect the adoption of
these amendments to have a
material effect on our consolidated
financial statements. |
ASU 2023-09, Income Taxes (Topic 740): Improvements to Income Tax Disclosures | The amendments in this Update require annual disclosure of more detailed tax rate reconciliation categories and income taxes paid by geography and jurisdiction. | January 1, 2025 | We do not expect the adoption of
these amendments to have a
material effect on our consolidated
financial statements. |
| | | | | | | | |
| Freddie Mac 2Q 2024 Form 10-Q | | 53 |
| | | | | |
| Financial Statements | Notes to the Condensed Consolidated Financial Statements | Note 2 |
NOTE 2
Securitizations and Variable Interest Entities
The table below presents the carrying amounts and classification of the assets and liabilities recorded on our condensed consolidated balance sheets that relate to our variable interests in VIEs for which we are not the primary beneficiary and with which we were involved in the design and creation and have a significant continuing involvement, our maximum exposure to loss as a result of our involvement with such VIEs, and the total assets of the VIEs. Our involvement with such VIEs primarily consists of guarantees that we have issued to the VIE, some of which are accounted for as derivative instruments, and investments in debt securities issued by the VIE. See Note 4 for additional information on our guarantees to nonconsolidated VIEs.
Total assets shown in the table below represents the remaining UPB of the mortgage loans or other noncash financial assets held by the VIE and excludes cash and nonfinancial assets held by the VIE. Maximum exposure to loss shown in the table below is primarily based on the remaining UPB of the guaranteed securities issued by the VIE and represents the contractual amounts that could be lost if the assets of the VIE (including the assets in the related reference pool for CRT products) became worthless at the balance sheet date, without consideration of proceeds from related collateral liquidation and possible recoveries under credit enhancements. We do not believe the maximum exposure to loss from our involvement with nonconsolidated VIEs is representative of the actual loss we are likely to incur based on our historical loss experience and after consideration of proceeds from related collateral liquidation and available credit enhancements.
Table 2.1 - Nonconsolidated VIEs
| | | | | | | | | | | | | | | | | | | | |
| | June 30, 2024 |
| | Carrying Amounts of the Assets and Liabilities On the Condensed Consolidated Balance Sheets | Total Assets | Maximum Exposure to Loss |
(In millions) | | Investment securities | Accrued Interest Receivable and Other Assets(1) | Liabilities(1) |
| Single-Family: | | | | | | |
| Securitization products | | $1,741 | | ($385) | | $45 | | $30,188 | | $24,553 | |
Resecuritization products(2) | | 4,678 | | 63 | | 744 | | 107,553 | | 107,553 | |
CRT products(3) | | — | | 90 | | 232 | | 28,260 | | 8 | |
| Total Single-Family | | 6,419 | | (232) | | 1,021 | | 166,001 | | 132,114 | |
| Multifamily: | | | | | | |
Securitization products(4) | | 5,523 | | 5,116 | | 4,565 | | 361,442 | | 322,434 | |
CRT products(3) | | — | | 21 | | 14 | | 1,541 | | 16 | |
| Total Multifamily | | 5,523 | | 5,137 | | 4,579 | | 362,983 | | 322,450 | |
| Other | | 1 | | 6 | | 5 | | 89 | | 465 | |
| Total | | $11,943 | | $4,911 | | $5,605 | | $529,073 | | $455,029 | |
Referenced footnotes are included after the prior period table.
| | | | | | | | |
| Freddie Mac 2Q 2024 Form 10-Q | | 54 |
| | | | | |
| Financial Statements | Notes to the Condensed Consolidated Financial Statements | Note 2 |
| | | | | | | | | | | | | | | | | | | | |
| | December 31, 2023 |
| | Carrying Amounts of the Assets and Liabilities On the Condensed Consolidated Balance Sheets | Total Assets | Maximum Exposure to Loss |
(In millions) | | Investment securities | Accrued Interest Receivable and Other Assets(1) | Liabilities(1) |
| Single-Family: | | | | | | |
| Securitization products | | $1,272 | | $172 | | $427 | | $30,298 | | $24,600 | |
Resecuritization products(2) | | 4,952 | | 67 | | 626 | | 110,320 | | 110,320 | |
CRT products(3) | | — | | 92 | | 220 | | 29,126 | | 14 | |
| Total Single-Family | | 6,224 | | 331 | | 1,273 | | 169,744 | | 134,934 | |
| Multifamily: | | | | | | |
Securitization products(4) | | 5,985 | | 5,082 | | 4,652 | | 360,928 | | 321,262 | |
CRT products(3) | | — | | 11 | | 7 | | 1,359 | | 8 | |
| Total Multifamily | | 5,985 | | 5,093 | | 4,659 | | 362,287 | | 321,270 | |
| Other | | — | | 7 | | 5 | | 117 | | 468 | |
| Total | | $12,209 | | $5,431 | | $5,937 | | $532,148 | | $456,672 | |
(1) Other assets primarily include our guarantee assets. Liabilities primarily include our guarantee obligations.
(2) Total assets and maximum exposure to loss are based on the UPB of Fannie Mae securities underlying commingled Freddie Mac resecuritization trusts. We exclude noncommingled resecuritization trusts from these amounts as we have already guaranteed the underlying collateral and therefore noncommingled resecuritizations do not involve any incremental assets or create any incremental exposure to credit risk. Total assets exclude less than $0.1 billion and $0.1 billion as of June 30, 2024 and December 31, 2023, respectively, of Fannie Mae securities that we have guaranteed that are included in resecuritization trusts that we have consolidated as we own all of the outstanding securities issued by the VIE.
(3) Maximum exposure to loss is based on our expected recovery receivables and excludes our obligations to make certain payments to the VIE to support payment of the interest due on the notes issued by the VIE, which we account for as derivative instruments. The notional value of these derivative instruments is equal to the total assets of the VIE.
(4) Includes total assets of $0.4 billion and $0.3 billion as of June 30, 2024 and December 31, 2023, respectively, related to VIEs in which our interest would no longer absorb significant variability as the guaranteed securities have completely paid off.
| | | | | | | | |
| Freddie Mac 2Q 2024 Form 10-Q | | 55 |
| | | | | |
| Financial Statements | Notes to the Condensed Consolidated Financial Statements | Note 3 |
NOTE 3
Mortgage Loans
The table below provides details of the loans on our condensed consolidated balance sheets.
Table 3.1 - Mortgage Loans | | | | | | | | | | | | | | | | | | | | | | | | | | |
| | June 30, 2024 | | December 31, 2023 |
| (In millions) | | Single-Family | Multifamily | Total | | Single-Family | Multifamily | Total |
| Held-for-sale UPB | | $3,244 | | $9,660 | | $12,904 | | | $3,527 | | $9,905 | | $13,432 | |
| Cost basis and fair value adjustments, net | | (627) | | 69 | | (558) | | | (712) | | 221 | | (491) | |
| Total held-for-sale loans, net | | 2,617 | | 9,729 | | 12,346 | | | 2,815 | | 10,126 | | 12,941 | |
| Held-for-investment UPB | | 3,016,537 | | 65,114 | | 3,081,651 | | | 2,996,509 | | 59,203 | | 3,055,712 | |
Cost basis and fair value adjustments, net(1) | | 31,420 | | (363) | | 31,057 | | | 34,627 | | (291) | | 34,336 | |
| Allowance for credit losses | | (6,457) | | (382) | | (6,839) | | | (6,057) | | (326) | | (6,383) | |
Total held-for-investment loans, net(2) | | 3,041,500 | | 64,369 | | 3,105,869 | | | 3,025,079 | | 58,586 | | 3,083,665 | |
| Total mortgage loans, net | | $3,044,117 | | $74,098 | | $3,118,215 | | | $3,027,894 | | $68,712 | | $3,096,606 | |
(1)Includes ($0.6) billion and ($0.2) billion of basis adjustments maintained on a closed portfolio basis related to existing portfolio layer method fair value hedge relationships as of June 30, 2024 and December 31, 2023, respectively.
(2)Includes $2.0 billion and $1.8 billion of multifamily held-for-investment loans for which we have elected the fair value option as of June 30, 2024 and December 31, 2023, respectively.
The table below provides details of the UPB of loans we purchased and sold during the periods presented.
Table 3.2 - Loans Purchased and Sold | | | | | | | | | | | | | | | | | | | | |
| (In millions) | | 2Q 2024 | 2Q 2023 | | YTD 2024 | YTD 2023 |
| Single-Family: | | | | | | |
| Purchases: | | | | | | |
Held-for-investment loans | | $85,239 | | $82,850 | | | $147,508 | | $141,815 | |
Sales of held-for-sale loans(1) | | 381 | | — | | | 999 | | — | |
Multifamily: | | | | | | |
| Purchases: | | | | | | |
Held-for-investment loans | | 3,791 | | 4,661 | | | 6,416 | | 8,010 | |
Held-for-sale loans | | 6,581 | | 7,398 | | | 13,040 | | 10,093 | |
Sales of held-for-sale loans(2) | | 6,462 | | 8,626 | | | 13,065 | | 14,776 | |
(1)Our sales of single-family loans reflect the sale of single-family seasoned loans.
(2)Our sales of multifamily loans occur primarily through the issuance of Multifamily K Certificates.
| | | | | | | | |
| Freddie Mac 2Q 2024 Form 10-Q | | 56 |
| | | | | |
| Financial Statements | Notes to the Condensed Consolidated Financial Statements | Note 3 |
The table below presents the allowance for credit losses or valuation allowance that was reversed or established due to loan reclassifications between held-for-investment and held-for-sale during the periods presented.
Table 3.3 - Loan Reclassifications(1) | | | | | | | | | | | | | | | | | | | | | | | |
| | 2Q 2024 | 2Q 2023 |
| (In millions) | | UPB | Allowance for Credit Losses Reversed or (Established) | Valuation Allowance (Established) or Reversed | UPB | Allowance for Credit Losses Reversed or (Established) | Valuation Allowance (Established) or Reversed |
| Single-Family reclassifications from: | | | | | | | |
| Held-for-investment to held-for-sale | | $691 | | $7 | | $— | | $— | | $— | | $— | |
Held-for-sale to held-for-investment(2) | | 43 | | 4 | | 5 | | — | | — | | — | |
| Multifamily reclassifications from: | | | | | | | |
| Held-for-investment to held-for-sale | | 577 | | 10 | | (39) | | 735 | | 1 | | (6) | |
Held-for-sale to held-for-investment(2) | | 378 | | — | | 6 | | 161 | | — | | — | |
| | | | | | | | | | | | | | | | | | | | | | | |
| | YTD 2024 | YTD 2023 |
| (In millions) | | UPB | Allowance for Credit Losses Reversed or (Established) | Valuation Allowance (Established) or Reversed | UPB | Allowance for Credit Losses Reversed or (Established) | Valuation Allowance (Established) or Reversed |
| Single-Family reclassifications from: | | | | | | | |
| Held-for-investment to held-for-sale | | $1,067 | | $15 | | $— | | $— | | $— | | $— | |
Held-for-sale to held-for-investment(2) | | 93 | | 8 | | 9 | | 48 | | 4 | | 4 | |
| Multifamily reclassifications from: | | | | | | | |
| Held-for-investment to held-for-sale | | 841 | | 11 | | (44) | | 5,466 | | 2 | | (33) | |
Held-for-sale to held-for-investment(2) | | 747 | | — | | 9 | | 722 | | — | | 16 | |
(1)Amounts exclude reclassifications related to loans for which we have elected the fair value option.
(2)Allowance for credit losses established upon loan reclassifications from held-for-sale to held-for-investment to reflect the net amount we expect to collect on the loan. Loans with prior charge-offs may have a negative allowance for credit losses established upon reclassification.
The table below presents the amortized cost basis of non-accrual loans as of the beginning and the end of the periods presented, including the interest income recognized for the period that is related to the loans on non-accrual status as of the period end.
Table 3.4 - Amortized Cost Basis of Held-for-Investment Loans on Non-Accrual(1)
| | | | | | | | | | | | | | | | | | | | |
| | Non-Accrual Amortized Cost Basis | | Interest Income Recognized(2) |
| (In millions) | | June 30, 2024 | March 31, 2024 | | 2Q 2024 | YTD 2024 |
| Single-Family: | | | | | | |
| 20- and 30-year or more, amortizing fixed-rate | | $11,773 | | $12,189 | | | $32 | | $88 | |
| 15-year or less, amortizing fixed-rate | | 439 | | 485 | | | 1 | | 2 | |
| Adjustable-rate and other | | 230 | | 247 | | | 1 | | 2 | |
| Total Single-Family | | 12,442 | | 12,921 | | | 34 | | 92 | |
| Total Multifamily | | 110 | | 103 | | | — | | 1 | |
| Total Single-Family and Multifamily | | $12,552 | | $13,024 | | | $34 | | $93 | |
Referenced footnotes are included after the prior period table.
| | | | | | | | |
| Freddie Mac 2Q 2024 Form 10-Q | | 57 |
| | | | | |
| Financial Statements | Notes to the Condensed Consolidated Financial Statements | Note 3 |
| | | | | | | | | | | | | | | | | | | | |
| | Non-Accrual Amortized Cost Basis | | Interest Income Recognized(2) |
| (In millions) | | June 30, 2023 | March 31, 2023 | | 2Q 2023 | YTD 2023 |
| Single-Family: | | | | | | |
| 20- and 30-year or more, amortizing fixed-rate | | $11,989 | | $9,348 | | | $28 | | $78 | |
| 15-year or less, amortizing fixed-rate | | 540 | | 434 | | | 1 | | 2 | |
| Adjustable-rate and other | | 323 | | 332 | | | 1 | | 2 | |
| Total Single-Family | | 12,852 | | 10,114 | | | 30 | | 82 | |
| Total Multifamily | | 56 | | 41 | | | 1 | | 1 | |
| Total Single-Family and Multifamily | | $12,908 | | $10,155 | | | $31 | | $83 | |
(1)Excludes amounts related to loans for which we have elected the fair value option.
(2)Represents the amount of payments received during the period, including those received while the loans were on accrual status, for the held-for-investment loans on non-accrual status as of period end.
The table below provides the amount of accrued interest receivable presented on our condensed consolidated balance sheets and the amount of accrued interest receivable related to loans on non-accrual status at the end of the periods that was charged off.
Table 3.5 - Accrued Interest Receivable and Related Charge-Offs | | | | | | | | | | | | | | | | | | | | | | | | | | |
| | Accrued Interest Receivable | | Accrued Interest Receivable Related Charge-Offs |
| (In millions) | | June 30, 2024 | December 31, 2023 | | 2Q 2024 | 2Q 2023 | YTD 2024 | YTD 2023 |
| Single-Family loans | | $9,260 | | $8,833 | | | ($46) | | ($88) | | ($92) | | ($136) | |
| Multifamily loans | | 306 | | 287 | | | — | | — | | (1) | | — | |
Single-Family
The current LTV ratio is one key factor we consider when estimating our allowance for credit losses for single-family loans. As current LTV ratios increase, the borrower's equity in the home decreases, which may negatively affect the borrower's ability to refinance or to sell the property for an amount at or above the balance of the outstanding loan.
The table below presents the amortized cost basis of single-family held-for-investment loans by current LTV ratio. Our current LTV ratios are estimates based on available data through the end of each period presented.
| | | | | | | | |
| Freddie Mac 2Q 2024 Form 10-Q | | 58 |
| | | | | |
| Financial Statements | Notes to the Condensed Consolidated Financial Statements | Note 3 |
Table 3.6 - Amortized Cost Basis of Single-Family Held-for-Investment Loans by Current LTV Ratio and Vintage | | | | | | | | | | | | | | | | | | | | | | | | | | |
| | June 30, 2024 |
| | Year of Origination | Total |
| (In millions) | | 2024 | 2023 | 2022 | 2021 | 2020 | Prior |
Current LTV ratio: | | | | | | | | |
20- and 30-year or more, amortizing fixed-rate | | | | | | | | |
| ≤ 60 | | $17,803 | | $43,085 | | $99,931 | | $538,602 | | $544,594 | | $486,458 | | $1,730,473 | |
| > 60 to 80 | | 46,007 | | 108,858 | | 183,168 | | 274,422 | | 71,139 | | 14,235 | | 697,829 | |
> 80 to 90 | | 22,261 | | 67,601 | | 77,377 | | 18,677 | | 1,019 | | 379 | | 187,314 | |
| > 90 to 100 | | 33,733 | | 40,380 | | 17,077 | | 1,193 | | 93 | | 81 | | 92,557 | |
> 100 | | 34 | | 162 | | 734 | | 49 | | 17 | | 69 | | 1,065 | |
Total 20- and 30-year or more, amortizing fixed-rate | | 119,838 | | 260,086 | | 378,287 | | 832,943 | | 616,862 | | 501,222 | | 2,709,238 | |
Current year-to-date gross charge-offs(1) | | — | | 2 | | 18 | | 26 | | 23 | | 94 | | 163 | |
15-year or less, amortizing fixed-rate | | | | | | | | |
| ≤ 60 | | 1,972 | | 4,458 | | 20,948 | | 116,532 | | 92,082 | | 60,394 | | 296,386 | |
| > 60 to 80 | | 1,955 | | 3,657 | | 6,059 | | 2,147 | | 115 | | 12 | | 13,945 | |
> 80 to 90 | | 322 | | 541 | | 248 | | 11 | | — | | 1 | | 1,123 | |
| > 90 to 100 | | 193 | | 84 | | 17 | | — | | — | | — | | 294 | |
> 100 | | — | | — | | — | | — | | — | | — | | — | |
| Total 15-year or less, amortizing fixed-rate | | 4,442 | | 8,740 | | 27,272 | | 118,690 | | 92,197 | | 60,407 | | 311,748 | |
Current year-to-date gross charge-offs(1) | | — | | — | | 1 | | 1 | | — | | 1 | | 3 | |
Adjustable-rate and other | | | | | | | | |
| ≤ 60 | | 180 | | 432 | | 1,712 | | 3,358 | | 1,406 | | 12,335 | | 19,423 | |
| > 60 to 80 | | 494 | | 1,307 | | 2,570 | | 854 | | 66 | | 202 | | 5,493 | |
> 80 to 90 | | 244 | | 793 | | 896 | | 32 | | 2 | | 16 | | 1,983 | |
| > 90 to 100 | | 184 | | 283 | | 205 | | 3 | | — | | 5 | | 680 | |
> 100 | | — | | 1 | | 8 | | — | | — | | 2 | | 11 | |
| Total adjustable-rate and other | | 1,102 | | 2,816 | | 5,391 | | 4,247 | | 1,474 | | 12,560 | | 27,590 | |
Current year-to-date gross charge-offs(1) | | — | | — | | — | | — | | — | | 1 | | 1 | |
Total for all loan product types by current LTV ratio: | | | | | | | | |
≤ 60 | | 19,955 | | 47,975 | | 122,591 | | 658,492 | | 638,082 | | 559,187 | | 2,046,282 | |
| > 60 to 80 | | 48,456 | | 113,822 | | 191,797 | | 277,423 | | 71,320 | | 14,449 | | 717,267 | |
> 80 to 90 | | 22,827 | | 68,935 | | 78,521 | | 18,720 | | 1,021 | | 396 | | 190,420 | |
| > 90 to 100 | | 34,110 | | 40,747 | | 17,299 | | 1,196 | | 93 | | 86 | | 93,531 | |
> 100 | | 34 | | 163 | | 742 | | 49 | | 17 | | 71 | | 1,076 | |
| Total Single-Family loans | | $125,382 | | $271,642 | | $410,950 | | $955,880 | | $710,533 | | $574,189 | | $3,048,576 | |
Total current year-to-date gross charge-offs(1) | | $— | | $2 | | $19 | | $27 | | $23 | | $96 | | $167 | |
Referenced footnotes are included after the prior period table.
| | | | | | | | |
| Freddie Mac 2Q 2024 Form 10-Q | | 59 |
| | | | | |
| Financial Statements | Notes to the Condensed Consolidated Financial Statements | Note 3 |
| | | | | | | | | | | | | | | | | | | | | | | | | | |
| | December 31, 2023 |
| | Year of Origination | Total |
| (In millions) | | 2023 | 2022 | 2021 | 2020 | 2019 | Prior |
Current LTV ratio: | | | | | | | | |
20- and 30-year or more, amortizing fixed-rate | | | | | | | | |
| ≤ 60 | | $39,500 | | $93,279 | | $513,267 | | $542,449 | | $94,348 | | $411,663 | | $1,694,506 | |
| > 60 to 80 | | 105,384 | | 183,251 | | 318,965 | | 95,102 | | 12,402 | | 7,296 | | 722,400 | |
| > 80 to 90 | | 55,973 | | 90,785 | | 27,750 | | 1,272 | | 213 | | 262 | | 176,255 | |
> 90 to 100 | | 51,994 | | 23,460 | | 1,542 | | 71 | | 16 | | 77 | | 77,160 | |
> 100 | | 28 | | 912 | | 24 | | 9 | | 5 | | 88 | | 1,066 | |
Total 20- and 30-year or more, amortizing fixed-rate | | 252,879 | | 391,687 | | 861,548 | | 638,903 | | 106,984 | | 419,386 | | 2,671,387 | |
Full-year gross charge-offs(1) | | — | | 12 | | 37 | | 43 | | 45 | | 243 | | 380 | |
15-year or less, amortizing fixed-rate | | | | | | | | |
| ≤ 60 | | 4,221 | | 20,246 | | 121,709 | | 98,338 | | 12,488 | | 56,493 | | 313,495 | |
| > 60 to 80 | | 3,973 | | 8,314 | | 4,491 | | 278 | | 19 | | 5 | | 17,080 | |
| > 80 to 90 | | 623 | | 509 | | 25 | | — | | — | | — | | 1,157 | |
> 90 to 100 | | 198 | | 33 | | 1 | | — | | — | | — | | 232 | |
> 100 | | 1 | | 1 | | — | | — | | — | | 1 | | 3 | |
| Total 15-year or less, amortizing fixed-rate | | 9,016 | | 29,103 | | 126,226 | | 98,616 | | 12,507 | | 56,499 | | 331,967 | |
Full-year gross charge-offs(1) | | — | | 1 | | 2 | | 1 | | — | | 2 | | 6 | |
Adjustable-rate and other | | | | | | | | |
| ≤ 60 | | 356 | | 1,650 | | 3,325 | | 1,465 | | 586 | | 12,950 | | 20,332 | |
| > 60 to 80 | | 1,153 | | 2,651 | | 1,105 | | 89 | | 25 | | 227 | | 5,250 | |
| > 80 to 90 | | 689 | | 1,040 | | 48 | | 3 | | — | | 18 | | 1,798 | |
> 90 to 100 | | 317 | | 276 | | 2 | | — | | — | | 8 | | 603 | |
> 100 | | — | | 16 | | — | | — | | — | | 4 | | 20 | |
| Total adjustable-rate and other | | 2,515 | | 5,633 | | 4,480 | | 1,557 | | 611 | | 13,207 | | 28,003 | |
Full-year gross charge-offs(1) | | — | | — | | — | | — | | — | | 1 | | 1 | |
Total for all loan product types by current LTV ratio: | | | | | | | | |
| ≤ 60 | | 44,077 | | 115,175 | | 638,301 | | 642,252 | | 107,422 | | 481,106 | | 2,028,333 | |
| > 60 to 80 | | 110,510 | | 194,216 | | 324,561 | | 95,469 | | 12,446 | | 7,528 | | 744,730 | |
| > 80 to 90 | | 57,285 | | 92,334 | | 27,823 | | 1,275 | | 213 | | 280 | | 179,210 | |
> 90 to 100 | | 52,509 | | 23,769 | | 1,545 | | 71 | | 16 | | 85 | | 77,995 | |
> 100 | | 29 | | 929 | | 24 | | 9 | | 5 | | 93 | | 1,089 | |
| Total Single-Family loans | | $264,410 | | $426,423 | | $992,254 | | $739,076 | | $120,102 | | $489,092 | | $3,031,357 | |
Total full-year gross charge-offs(1) | | $— | | $13 | | $39 | | $44 | | $45 | | $246 | | $387 | |
(1)Excludes charge-offs related to accrued interest receivable and advances of pre-foreclosure costs.
Multifamily
The table below presents the amortized cost basis of our multifamily held-for-investment loans, for which we have not elected the fair value option, by credit quality indicator, based on available data through the end of each period presented. These indicators involve significant management judgment and are defined as follows:
n "Pass" is current and adequately protected by the borrower's current financial strength and debt service capacity;
n "Special mention" has administrative issues that may affect future repayment prospects but does not have current credit weaknesses. In addition, this category generally includes loans in forbearance;
n "Substandard" has a weakness that jeopardizes the timely full repayment; and
n "Doubtful" has a weakness that makes collection or liquidation in full highly questionable and improbable based on existing conditions.
| | | | | | | | |
| Freddie Mac 2Q 2024 Form 10-Q | | 60 |
| | | | | |
| Financial Statements | Notes to the Condensed Consolidated Financial Statements | Note 3 |
Table 3.7 - Amortized Cost Basis of Multifamily Held-for-Investment Loans by Credit Quality Indicator and Vintage | | | | | | | | | | | | | | | | | | | | | | | | | | | | | | |
| | June 30, 2024 |
| | Year of Origination | Total |
| (In millions) | | 2024 | 2023 | 2022 | 2021 | 2020 | Prior | | Revolving Loans |
| Category: | | | | | | | | | | |
Pass | | $4,920 | | $14,658 | | $17,347 | | $7,219 | | $6,263 | | $7,501 | | | $2,254 | | $60,162 | |
Special mention | | — | | 19 | | 326 | | 63 | | 103 | | 404 | | | — | | 915 | |
Substandard | | — | | 29 | | 385 | | 355 | | 205 | | 709 | | | — | | 1,683 | |
Doubtful | | — | | — | | — | | — | | — | | — | | | — | | — | |
| Total | | $4,920 | | $14,706 | | $18,058 | | $7,637 | | $6,571 | | $8,614 | | | $2,254 | | $62,760 | |
| | | | | | | | | | | | | | | | | | | | | | | | | | | | | | |
| | December 31, 2023 |
| | Year of Origination | Total |
| (In millions) | | 2023 | 2022 | 2021 | 2020 | 2019 | Prior | | Revolving Loans |
| Category: | | | | | | | | | | |
Pass | | $13,804 | | $17,845 | | $7,430 | | $6,345 | | $4,420 | | $3,254 | | | $2,266 | | $55,364 | |
Special mention | | 20 | | 85 | | 28 | | 43 | | 294 | | 106 | | | — | | 576 | |
Substandard | | — | | 33 | | 188 | | 259 | | 223 | | 464 | | | — | | 1,167 | |
Doubtful | | — | | — | | — | | — | | — | | — | | | — | | — | |
| Total | | $13,824 | | $17,963 | | $7,646 | | $6,647 | | $4,937 | | $3,824 | | | $2,266 | | $57,107 | |
The table below presents the amortized cost basis of our single-family and multifamily held-for-investment loans, for which we have not elected the fair value option, by payment status.
Table 3.8 - Amortized Cost Basis of Held-for-Investment Loans by Payment Status(1) | | | | | | | | | | | | | | | | | | | | | | | |
| | June 30, 2024 |
| (In millions) | | Current | One Month Past Due | Two Months Past Due | Three Months or More Past Due, or in Foreclosure(2) | Total | Non-Accrual With No Allowance(3) |
| Single-Family: | | | | | | | |
| 20- and 30-year or more, amortizing fixed-rate | | $2,664,973 | | $27,125 | | $5,669 | | $11,471 | | $2,709,238 | | $386 | |
| 15-year or less, amortizing fixed-rate | | 309,466 | | 1,599 | | 256 | | 427 | | 311,748 | | 4 | |
| Adjustable-rate and other | | 26,925 | | 357 | | 82 | | 226 | | 27,590 | | 42 | |
| Total Single-Family | | 3,001,364 | | 29,081 | | 6,007 | | 12,124 | | 3,048,576 | | 432 | |
| Total Multifamily | | 62,617 | | 27 | | 6 | | 110 | | 62,760 | | 66 | |
| Total Single-Family and Multifamily | | $3,063,981 | | $29,108 | | $6,013 | | $12,234 | | $3,111,336 | | $498 | |
| | | | | | | | | | | | | | | | | | | | | | | |
| | December 31, 2023 |
| (In millions) | | Current | One
Month
Past Due | Two
Months
Past Due | Three Months or
More Past Due,
or in Foreclosure(2) | Total | Non-Accrual with No Allowance(3) |
| Single-Family: | | | | | | | |
| 20- and 30-year or more, amortizing fixed-rate | | $2,627,763 | | $25,528 | | $5,787 | | $12,309 | | $2,671,387 | | $406 | |
| 15-year or less, amortizing fixed-rate | | 329,601 | | 1,589 | | 270 | | 507 | | 331,967 | | 4 | |
| Adjustable-rate and other | | 27,317 | | 342 | | 95 | | 249 | | 28,003 | | 49 | |
| Total Single-Family | | 2,984,681 | | 27,459 | | 6,152 | | 13,065 | | 3,031,357 | | 459 | |
| Total Multifamily | | 57,031 | | 12 | | — | | 64 | | 57,107 | | 23 | |
| Total Single-Family and Multifamily | | $3,041,712 | | $27,471 | | $6,152 | | $13,129 | | $3,088,464 | | $482 | |
Referenced footnotes are on the next page.
| | | | | | | | |
| Freddie Mac 2Q 2024 Form 10-Q | | 61 |
| | | | | |
| Financial Statements | Notes to the Condensed Consolidated Financial Statements | Note 3 |
(1)There were no held-for-investment loans that were three months or more past due and accruing interest as of both June 30, 2024 and December 31, 2023.
(2)Includes $2.1 billion and $2.0 billion of single-family loans that were in the process of foreclosure as of June 30, 2024 and December 31, 2023, respectively.
(3)Loans with no allowance for loan losses primarily represent loans that were previously charged off and for which the amount we expect to collect is sufficiently in excess of the amortized cost to result in recovery of the entire amortized cost basis if the property were foreclosed upon or otherwise subject to disposition. We exclude the amounts of allowance for credit losses on advances of pre-foreclosure costs when determining whether a loan has an allowance for credit losses.
Single-Family Loan Restructurings
We offer several types of restructurings to single-family borrowers that may result in a payment delay, interest rate reduction, term extension, or combination thereof. We do not offer principal forgiveness.
For purposes of the disclosure related to single-family loan restructurings involving borrowers experiencing financial difficulty, we exclude loans that were held-for-sale either at the time of restructuring or at the period end. The table below presents the amortized cost basis of single-family held-for-investment loan restructurings involving borrowers experiencing financial difficulty that we entered into during the periods presented.
Table 3.9 - Single-Family Loan Restructurings Involving Borrowers Experiencing Financial Difficulty(1)
| | | | | | | | | | | | | | | | | | | | | |
| | 2Q 2024 |
| (Dollars in millions) | | Payment Delay(2) | | Payment Delay and Term Extension | Payment Delay, Term Extension, and Interest Rate Reduction | Total | Total as % of Class of Financing Receivable(3) |
| Single-Family: | | | | | | | |
| 20- and 30-year or more, amortizing fixed-rate | | $4,824 | | | $1,580 | | $13 | | $6,417 | | 0.2 | % |
| 15-year or less, amortizing fixed-rate | | 192 | | | — | | — | | 192 | | 0.1 | |
| Adjustable-rate and other | | 49 | | | 3 | | — | | 52 | | 0.2 | |
| Total Single-Family loan restructurings | | $5,065 | | | $1,583 | | $13 | | $6,661 | | 0.2 | |
| | | | | | | | | | | | | | | | | | | | | |
| | 2Q 2023 |
| (Dollars in millions) | | Payment Delay(2) | | Payment Delay and Term Extension | Payment Delay, Term Extension, and Interest Rate Reduction | Total | Total as % of Class of Financing Receivable(3) |
| Single-Family: | | | | | | | |
| 20- and 30-year or more, amortizing fixed-rate | | $5,328 | | | $1,116 | | $32 | | $6,476 | | 0.2 | % |
| 15-year or less, amortizing fixed-rate | | 265 | | | — | | — | | 265 | | 0.1 | |
| Adjustable-rate and other | | 63 | | | 8 | | 1 | | 72 | | 0.2 | |
| Total Single-Family loan restructurings | | $5,656 | | | $1,124 | | $33 | | $6,813 | | 0.2 | |
| | | | | | | | | | | | | | | | | | | | | |
| | YTD 2024 |
| (Dollars in millions) | | Payment Delay(2) | | Payment Delay and Term Extension | Payment Delay, Term Extension, and Interest Rate Reduction | Total | Total as % of Class of Financing Receivable(3) |
| Single-Family: | | | | | | | |
| 20- and 30-year or more, amortizing fixed-rate | | $9,447 | | | $2,835 | | $19 | | $12,301 | | 0.5 | % |
| 15-year or less, amortizing fixed-rate | | 378 | | | — | | — | | 378 | | 0.1 | |
| Adjustable-rate and other | | 95 | | | 6 | | 1 | | 102 | | 0.4 | |
| Total Single-Family loan restructurings | | $9,920 | | | $2,841 | | $20 | | $12,781 | | 0.4 | |
Referenced footnotes are on the next page.
| | | | | | | | |
| Freddie Mac 2Q 2024 Form 10-Q | | 62 |
| | | | | |
| Financial Statements | Notes to the Condensed Consolidated Financial Statements | Note 3 |
| | | | | | | | | | | | | | | | | | | | | |
| | YTD 2023 |
| (Dollars in millions) | | Payment Delay(2) | | Payment Delay and Term Extension | Payment Delay, Term Extension, and Interest Rate Reduction | Total | Total as % of Class of Financing Receivable(3) |
| Single-Family: | | | | | | | |
| 20- and 30-year or more, amortizing fixed-rate | | $10,607 | | | $2,148 | | $118 | | $12,873 | | 0.5 | % |
| 15-year or less, amortizing fixed-rate | | 547 | | | — | | — | | 547 | | 0.2 | |
| Adjustable-rate and other | | 123 | | | 18 | | 5 | | 146 | | 0.5 | |
| Total Single-Family loan restructurings | | $11,277 | | | $2,166 | | $123 | | $13,566 | | 0.5 | |
(1) Type of loan restructurings reflects the cumulative effects of the loan restructurings received during the period. Includes loan modifications in the period in which the borrower completes the trial period and the loan is permanently modified. The amortized cost basis of loans in trial period modification plans was $2.0 billion and $1.8 billion as of June 30, 2024 and June 30, 2023, respectively. Most of these loans are 20- and 30-year or more, amortizing fixed-rate loans.
(2) Includes $2.1 billion and $4.6 billion related to payment deferral plans for 2Q 2024 and YTD 2024, respectively, compared to $2.2 billion and $4.8 billion for 2Q 2023 and YTD 2023, respectively. Also includes forbearance plans, repayment plans, and loan modifications that only involve payment delays.
(3) Based on the amortized cost basis as of period end, divided by the total period-end amortized cost basis of the corresponding financing receivable class of single-family held-for-investment loans.
The table below shows the financial effect of single-family held-for-investment loan restructurings involving borrowers experiencing financial difficulty that we entered into during the periods presented.
Table 3.10 – Financial Effects of Single-Family Loan Restructurings Involving Borrowers Experiencing Financial Difficulty(1)
| | | | | | | | | | | | | | |
| | 2Q 2024 |
| (Dollars in thousands) | | Weighted-Average Interest Rate Reduction | Weighted-Average Months of Term Extension | Weighted-Average Payment Deferral or Principal Forbearance(2) |
| Single-Family: | | | | |
| 20- and 30-year or more, amortizing fixed-rate | | 0.5 | % | 168 | $17 | |
| 15-year or less, amortizing fixed-rate | | — | | 23 | 13 | |
| Adjustable-rate and other | | 0.8 | | 223 | 13 | |
| | | | | | | | | | | | | | |
| | 2Q 2023 |
| (Dollars in thousands) | | Weighted-Average Interest Rate Reduction | Weighted-Average Months of Term Extension | Weighted-Average Payment Deferral or Principal Forbearance(2) |
| Single-Family: | | | | |
| 20- and 30-year or more, amortizing fixed-rate | | 1.1 | % | 179 | $18 | |
| 15-year or less, amortizing fixed-rate | | — | | 0 | 16 | |
| Adjustable-rate and other | | 1.6 | | 201 | 15 | |
| | | | | | | | | | | | | | |
| | YTD 2024 |
| (Dollars in thousands) | | Weighted-Average Interest Rate Reduction | Weighted-Average Months of Term Extension | Weighted-Average Payment Deferral or Principal Forbearance(2) |
| Single-Family: | | | | |
| 20- and 30-year or more, amortizing fixed-rate | | 0.7 | % | 169 | $16 | |
| 15-year or less, amortizing fixed-rate | | — | | 23 | 13 | |
| Adjustable-rate and other | | 0.9 | | 217 | 14 | |
Referenced footnotes are on the next page.
| | | | | | | | |
| Freddie Mac 2Q 2024 Form 10-Q | | 63 |
| | | | | |
| Financial Statements | Notes to the Condensed Consolidated Financial Statements | Note 3 |
| | | | | | | | | | | | | | |
| | YTD 2023 |
| (Dollars in thousands) | | Weighted-Average Interest Rate Reduction | Weighted-Average Months of Term Extension | Weighted-Average Payment Deferral or Principal Forbearance(2) |
| Single-Family: | | | | |
| 20- and 30-year or more, amortizing fixed-rate | | 1.0 | % | 181 | $17 | |
| 15-year or less, amortizing fixed-rate | | — | | 0 | 16 | |
| Adjustable-rate and other | | 1.9 | | 200 | 17 | |
(1) Averages are based on payment deferral plans and loan modifications completed during the periods presented. The financial effects of forbearance plans and repayment plans consist of a payment delay of between one and twelve months. In addition, the financial effect of a forbearance plan is included at the time the forbearance plan is completed if the borrower exits forbearance by entering into a payment deferral plan or loan modification.
(2) Primarily related to payment deferral plans. Amounts are based on non-interest-bearing principal balances on the restructured loans.
The following table provides the amortized cost basis of single-family held-for-investment loans that had a payment default (i.e., loans that became two months delinquent) during the periods presented and had been restructured within the previous 12 months preceding the payment default, when the borrower was experiencing financial difficulty at the time of the restructuring.
Table 3.11 - Subsequent Defaults of Single-Family Restructured Loans Involving Borrowers Experiencing Financial Difficulty(1)
| | | | | | | | | | | | | | | | | | |
| | 2Q 2024 |
| (In millions) | | Payment Delay | | Payment Delay and Term Extension | Payment Delay, Term Extension, and Interest Rate Reduction | Total |
| Single-Family: | | | | | | |
| 20- and 30-year or more, amortizing fixed-rate | | $952 | | | $398 | | $3 | | $1,353 | |
| 15-year or less, amortizing fixed-rate | | 34 | | | — | | — | | 34 | |
| Adjustable-rate and other | | 8 | | | 1 | | — | | 9 | |
| Total Single-Family | | $994 | | | $399 | | $3 | | $1,396 | |
| | | | | | | | | | | | | | | | | | |
| | 2Q 2023 |
| (In millions) | | Payment Delay | | Payment Delay and Term Extension | Payment Delay, Term Extension, and Interest Rate Reduction | Total |
| Single-Family: | | | | | | |
| 20- and 30-year or more, amortizing fixed-rate | | $710 | | | $239 | | $131 | | $1,080 | |
| 15-year or less, amortizing fixed-rate | | 33 | | | — | | — | | 33 | |
| Adjustable-rate and other | | 11 | | | 2 | | 2 | | 15 | |
| Total Single-Family | | $754 | | | $241 | | $133 | | $1,128 | |
| | | | | | | | | | | | | | | | | | |
| | YTD 2024 |
| (In millions) | | Payment Delay | | Payment Delay and Term Extension | Payment Delay, Term Extension, and Interest Rate Reduction | Total |
| Single-Family: | | | | | | |
| 20- and 30-year or more, amortizing fixed-rate | | $1,620 | | | $725 | | $8 | | $2,353 | |
| 15-year or less, amortizing fixed-rate | | 55 | | | — | | — | | 55 | |
| Adjustable-rate and other | | 16 | | | 1 | | — | | 17 | |
| Total Single-Family | | $1,691 | | | $726 | | $8 | | $2,425 | |
Referenced footnotes are on the next page.
| | | | | | | | |
| Freddie Mac 2Q 2024 Form 10-Q | | 64 |
| | | | | |
| Financial Statements | Notes to the Condensed Consolidated Financial Statements | Note 3 |
| | | | | | | | | | | | | | | | | | |
| | YTD 2023 |
| (In millions) | | Payment Delay | | Payment Delay and Term Extension | Payment Delay, Term Extension, and Interest Rate Reduction | Total |
| Single-Family: | | | | | | |
| 20- and 30-year or more, amortizing fixed-rate | | $1,286 | | | $381 | | $305 | | $1,972 | |
| 15-year or less, amortizing fixed-rate | | 59 | | | — | | — | | 59 | |
| Adjustable-rate and other | | 18 | | | 3 | | 6 | | 27 | |
| Total Single-Family | | $1,363 | | | $384 | | $311 | | $2,058 | |
(1) Excludes forbearance plans and repayment plans as borrowers are typically past due based on the loan's original contractual terms at the time the borrowers enter into these plans.
The following table provides the single-family held-for-investment loan performance in the 12 months after a restructuring involving borrowers experiencing financial difficulty. While a single-family loan is in a forbearance plan or repayment plan, payments continue to be due based on the loan’s original contractual terms because the loan has not been permanently modified. As a result, we report single-family loans in forbearance plans and repayment plans as delinquent to the extent that payments are past due based on the loan’s original contractual terms. Loans that have been restructured by entering into a payment deferral plan or loan modification are reported as delinquent to the extent that payments are past due based on the loan's restructured terms.
Table 3.12 - Amortized Cost Basis of Single-Family Restructured Loans Involving Borrowers Experiencing Financial Difficulty by Payment Status
| | | | | | | | | | | | | | | | | | | | |
| | June 30, 2024 |
| (In millions) | | Current | One Month Past Due | Two Months Past Due | Three Months or More Past Due | Total |
| Single-Family: | | | | | | |
| 20- and 30-year or more, amortizing fixed-rate | | $11,169 | | $3,009 | | $1,537 | | $4,926 | | $20,641 | |
| 15-year or less, amortizing fixed-rate | | 352 | | 94 | | 54 | | 169 | | 669 | |
| Adjustable-rate and other | | 94 | | 20 | | 13 | | 51 | | 178 | |
| Total Single-Family | | $11,615 | | $3,123 | | $1,604 | | $5,146 | | $21,488 | |
| | | | | | | | | | | | | | | | | | | | |
| | June 30, 2023 |
| (In millions) | | Current | One Month Past Due | Two Months Past Due | Three Months or More Past Due | Total |
| Single-Family: | | | | | | |
| 20- and 30-year or more, amortizing fixed-rate | | $13,660 | | $2,341 | | $1,478 | | $6,244 | | $23,723 | |
| 15-year or less, amortizing fixed-rate | | 572 | | 94 | | 57 | | 281 | | 1,004 | |
| Adjustable-rate and other | | 158 | | 32 | | 19 | | 84 | | 293 | |
| Total Single-Family | | $14,390 | | $2,467 | | $1,554 | | $6,609 | | $25,020 | |
Non-Cash Investing and Financing Activities During YTD 2024 and YTD 2023, we acquired $96.8 billion and $100.9 billion, respectively, of loans held-for-investment in exchange for the issuance of debt of consolidated trusts in guarantor swap transactions. We received approximately $45.3 billion and $46.3 billion of loans held-for-investment from sellers during YTD 2024 and YTD 2023, respectively, to satisfy advances to lenders that were recorded in other assets on our condensed consolidated balance sheets.
| | | | | | | | |
| Freddie Mac 2Q 2024 Form 10-Q | | 65 |
| | | | | |
| Financial Statements | Notes to the Condensed Consolidated Financial Statements | Note 4 |
NOTE 4
Guarantees and Other Off-Balance Sheet Credit Exposures
The table below presents information about our mortgage-related guarantees and guarantees of Fannie Mae securities, including the UPB of the loans or securities underlying the guarantee, the maximum potential amount of future payments that we could be required to make under the guarantee, the liability we have recognized on our condensed consolidated balance sheets for the guarantee, and the maximum remaining term of the guarantee. This table does not include our unrecognized guarantees, such as guarantees to consolidated VIEs or to resecuritization trusts that do not expose us to incremental credit risk. We do not believe the potential amount of future payments we could be required to make is representative of the actual payments we will be required to make or the actual loss we are likely to incur, based on our historical loss experience and after consideration of proceeds from related collateral liquidation, including possible recoveries under credit enhancements.
Table 4.1 - Financial Guarantees
| | | | | | | | | | | | | | | | | |
| | June 30, 2024 |
(Dollars in millions, terms in years) | | UPB | Maximum Exposure | Recognized Liability(1) | Maximum Remaining Term |
| Single-Family mortgage-related guarantees: | | | | | |
Nonconsolidated securitization products(2) | | $30,188 | | $24,553 | | $396 | | 39 |
| Other mortgage-related guarantees | | 8,325 | | 8,325 | | 144 | | 28 |
| Total Single-Family mortgage-related guarantees | | 38,513 | | 32,878 | | 540 | | |
| Multifamily mortgage-related guarantees: | | | | | |
Nonconsolidated securitization products(2)(3) | | 361,442 | | 322,434 | | 4,349 | | 36 |
| Other mortgage-related guarantees | | 11,054 | | 11,054 | | 382 | | 34 |
| Total Multifamily mortgage-related guarantees | | 372,496 | | 333,488 | | 4,731 | | |
Guarantees of Fannie Mae securities(4) | | 107,553 | | 107,553 | | — | | 37 |
| Other | | 89 | | 465 | | — | | 30 |
| | | | | | | | | | | | | | | | | |
| | December 31, 2023 |
(Dollars in millions, terms in years) | | UPB | Maximum Exposure | Recognized Liability(1) | Maximum Remaining Term |
| Single-Family mortgage-related guarantees: | | | | | |
Nonconsolidated securitization products(2) | | $30,289 | | $24,600 | | $382 | | 40 |
| Other mortgage-related guarantees | | 8,692 | | 8,692 | | 161 | | 28 |
| Total Single-Family mortgage-related guarantees | | 38,981 | | 33,292 | | 543 | | |
| Multifamily mortgage-related guarantees: | | | | | |
Nonconsolidated securitization products(2)(3) | | 360,928 | | 321,262 | | 4,577 | | 36 |
| Other mortgage-related guarantees | | 10,761 | | 10,761 | | 383 | | 35 |
| Total Multifamily mortgage-related guarantees | | 371,689 | | 332,023 | | 4,960 | | |
Guarantees of Fannie Mae securities(4) | | 110,320 | | 110,320 | | — | | 38 |
| Other | | 117 | | 468 | | — | | 30 |
(1) Excludes allowance for credit losses on off-balance sheet credit exposures. See Note 5 for additional information on our allowance for credit losses on off-balance sheet credit exposures.
(2) Maximum exposure is based on remaining UPB of the guaranteed securities issued by the VIE.
(3) Includes UPB of $0.4 billion and $0.3 billion as of June 30, 2024 and December 31, 2023, respectively, related to VIEs in which our interest would no longer absorb significant variability as the guaranteed securities have completely paid off. In addition, includes guarantees that are accounted for as derivatives with UPB of $2.0 billion and $2.1 billion as of June 30, 2024 and December 31, 2023, respectively.
(4) Excludes less than $0.1 billion and $0.1 billion as of June 30, 2024 and December 31, 2023, respectively, of Fannie Mae securities that we have guaranteed that are included in resecuritization trusts that we have consolidated as we own all of the outstanding securities issued by the VIE.
| | | | | | | | |
| Freddie Mac 2Q 2024 Form 10-Q | | 66 |
| | | | | |
| Financial Statements | Notes to the Condensed Consolidated Financial Statements | Note 4 |
The table below presents the payment status of the mortgage loans underlying our mortgage-related guarantees.
Table 4.2 – UPB of Loans Underlying Our Mortgage-Related Guarantees by Payment Status | | | | | | | | | | | | | | | | | | | | |
| | June 30, 2024 |
| (In millions) | | Current | One Month Past Due | Two Months Past Due | Three Months or More Past Due, or in Foreclosure | Total |
| Single-Family | | $34,371 | | $2,019 | | $766 | | $1,357 | | $38,513 | |
| Multifamily | | 370,605 | | 387 | | 135 | | 1,369 | | 372,496 | |
| Total | | $404,976 | | $2,406 | | $901 | | $2,726 | | $411,009 | |
| | | | | | | | | | | | | | | | | | | | |
| | December 31, 2023 |
| (In millions) | | Current | One Month Past Due | Two Months Past Due | Three Months or More Past Due, or in Foreclosure | Total |
| Single-Family | | $34,524 | | $2,172 | | $827 | | $1,458 | | $38,981 | |
| Multifamily | | 369,785 | | 850 | | 98 | | 956 | | 371,689 | |
| Total | | $404,309 | | $3,022 | | $925 | | $2,414 | | $410,670 | |
Other Off-Balance Sheet Credit Exposures In addition to our guarantees, we enter into other agreements that expose us to off-balance sheet credit risk. These agreements may require us to transfer cash before or upon settlement of our contractual obligation. We recognize an allowance for credit losses for those agreements not measured at fair value or otherwise recognized in the financial statements. Most of these commitments expire in less than one year. See Note 5 for additional discussion of our allowance for credit losses on our off-balance sheet credit exposures. The table below presents our other off-balance sheet credit exposures.
Table 4.3 – Other Off-Balance Sheet Credit Exposures
| | | | | | | | | | | |
| (In millions) | | June 30, 2024 | December 31, 2023 |
Mortgage loan purchase commitments(1) | | $12,470 | | $10,378 | |
Unsettled securities purchased under agreements to resell, net(2) | | 44,803 | | 22,276 | |
Other commitments(3) | | 4,661 | | 4,701 | |
| Total | | $61,934 | | $37,355 | |
(1)Includes $2.4 billion and $1.9 billion of commitments for which we have elected the fair value option as of June 30, 2024 and December 31, 2023, respectively. Excludes mortgage loan purchase commitments accounted for as derivative instruments. See Note 8 for additional information on commitments accounted for as derivative instruments.
(2)Net of $4.0 billion of unsettled securities sold under agreements to repurchase as of December 31, 2023. There was no such activity as of June 30, 2024.
(3)Consists of unfunded portion of revolving lines of credit, liquidity guarantees, and other commitments.
| | | | | | | | |
| Freddie Mac 2Q 2024 Form 10-Q | | 67 |
| | | | | |
| Financial Statements | Notes to the Condensed Consolidated Financial Statements | Note 5 |
NOTE 5
Allowance for Credit Losses
The table below summarizes changes in our allowance for credit losses.
Table 5.1 - Details of the Allowance for Credit Losses | | | | | | | | | | | | | | | | | | | | | | | | | | | | | | | | | | | | | | | | | | | | |
| | 2Q 2024 | 2Q 2023 | | YTD 2024 | YTD 2023 |
| (In millions) | | Single-Family | Multi-family | Total | Single-Family | Multi-family | Total | | Single-Family | Multi-family | Total | Single-Family | Multi-family | Total |
| Beginning balance | | $6,508 | | $508 | | $7,016 | | $8,097 | | $224 | | $8,321 | | | $6,402 | | $447 | | $6,849 | | $7,746 | | $147 | | $7,893 | |
| Provision (benefit) for credit losses | | 315 | | 79 | | 394 | | (638) | | 101 | | (537) | | | 435 | | 140 | | 575 | | (320) | | 178 | | (142) | |
| Charge-offs | | (169) | | — | | (169) | | (111) | | — | | (111) | | | (292) | | — | | (292) | | (201) | | — | | (201) | |
| Recoveries collected | | 24 | | — | | 24 | | 29 | | — | | 29 | | | 50 | | — | | 50 | | 61 | | — | | 61 | |
Other(1) | | 82 | | — | | 82 | | 80 | | — | | 80 | | | 165 | | — | | 165 | | 171 | | — | | 171 | |
| Ending balance | | $6,760 | | $587 | | $7,347 | | $7,457 | | $325 | | $7,782 | | | $6,760 | | $587 | | $7,347 | | $7,457 | | $325 | | $7,782 | |
| | | | | | | | | | | | | | |
| Components of the ending balance of the allowance for credit losses: | | | | | | | |
| Mortgage loans held-for-investment | | $6,457 | | $382 | | $6,839 | | $7,088 | | $251 | | $7,339 | | | | | | | | |
Other(2) | | 303 | | 205 | | 508 | | 369 | | 74 | | 443 | | | | | | | | |
| | | | | | | | | | | | | | |
| | | | | | | | | | | | | | |
| | | | | | | | | | | | | | |
| Total ending balance | | $6,760 | | $587 | | $7,347 | | $7,457 | | $325 | | $7,782 | | | | | | | | |
(1)Primarily includes capitalization of past due interest related to non-accrual loans that received payment deferral plans and loan modifications.
(2)Includes allowance for credit losses related to advances of pre-foreclosure costs and off-balance sheet credit exposures.
n 2Q 2024 vs. 2Q 2023 - The provision for credit losses for 2Q 2024 was primarily driven by a credit reserve build in Single-Family attributable to new acquisitions. The benefit for credit losses for 2Q 2023 was primarily driven by a credit reserve release in Single-Family due to improvements in house prices, partially offset by a credit reserve build in Multifamily.
n YTD 2024 vs. YTD 2023 - The provision for credit losses for YTD 2024 was primarily driven by a credit reserve build in Single-Family attributable to new acquisitions and increasing mortgage interest rates. The benefit for credit losses for YTD 2023 was primarily driven by a credit reserve release in Single-Family due to improvements in house prices, partially offset by a credit reserve build in Multifamily.
In addition, charge-offs increased during the 2024 periods, compared to the 2023 periods, primarily due to a higher volume of transfers of single-family loans from held-for-investment to held-for-sale and the lower fair value of these loans as a result of higher mortgage interest rates.
| | | | | | | | |
| Freddie Mac 2Q 2024 Form 10-Q | | 68 |
| | | | | |
| Financial Statements | Notes to the Condensed Consolidated Financial Statements | Note 6 |
NOTE 6
Investment Securities
The table below summarizes the fair values of our investments in debt securities by classification.
Table 6.1 - Investment Securities | | | | | | | | | | | |
| (In millions) | | June 30, 2024 | December 31, 2023 |
| Trading securities | | $39,075 | | $38,385 | |
| Available-for-sale securities | | 4,405 | | 4,890 | |
| Total fair value of investment securities | | $43,480 | | $43,275 | |
The table below presents the fair values of our trading securities by major security type. Our non-mortgage-related securities primarily consist of investments in U.S. Treasury securities.
Table 6.2 - Trading Securities | | | | | | | | | | | |
| (In millions) | | June 30, 2024 | December 31, 2023 |
| Mortgage-related securities | | $8,086 | | $8,113 | |
| Non-mortgage-related securities | | 30,989 | | 30,272 | |
| Total fair value of trading securities | | $39,075 | | $38,385 | |
The table below provides details of our net trading gains (losses).
Table 6.3 - Net Trading Gains (Losses) | | | | | | | | | | | | | | | | | |
| (In millions) | | 2Q 2024 | 2Q 2023 | YTD 2024 | YTD 2023 |
| Net trading gains (losses) | | $40 | | ($377) | | ($199) | | ($113) | |
| Less: Net trading gains (losses) on securities sold | | (16) | | (55) | | (94) | | 71 | |
| Net trading gains (losses) recognized during the period related to securities still held at period end | | $56 | | ($322) | | ($105) | | ($184) | |
Available-for-Sale Securities The table below provides details of the securities classified as available-for-sale on our condensed consolidated balance sheets. At both June 30, 2024 and December 31, 2023, all available-for-sale securities were mortgage-related securities.
Table 6.4 - Available-for-Sale Securities | | | | | | | | | | | | | | | | | | | | |
| | June 30, 2024 |
| | Amortized
Cost
Basis | Gross Unrealized Gains in Other Comprehensive Income | Gross Unrealized
Losses in Other Comprehensive Income | Fair Value | Accrued Interest Receivable |
| (In millions) | |
| Agency mortgage-related securities | | $4,048 | | $4 | | ($123) | | $3,929 | | $9 | |
| Other mortgage-related securities | | 300 | | 188 | | (12) | | 476 | | 2 | |
| Total available-for-sale securities | | $4,348 | | $192 | | ($135) | | $4,405 | | $11 | |
| | | | | | | | | | | | | | | | | | | | |
| | December 31, 2023 |
| | Amortized
Cost
Basis | Gross Unrealized Gains in Other Comprehensive Income | Gross Unrealized
Losses in Other Comprehensive Income | Fair Value | Accrued Interest Receivable |
| (In millions) | |
| Agency mortgage-related securities | | $4,467 | | $13 | | ($110) | | $4,370 | | $10 | |
| Other mortgage-related securities | | 340 | | 188 | | (8) | | 520 | | 3 | |
| Total available-for-sale securities | | $4,807 | | $201 | | ($118) | | $4,890 | | $13 | |
| | | | | | | | |
| Freddie Mac 2Q 2024 Form 10-Q | | 69 |
| | | | | |
| Financial Statements | Notes to the Condensed Consolidated Financial Statements | Note 6 |
The fair value of our available-for-sale securities held at June 30, 2024 scheduled to contractually mature after ten years was $1.3 billion, with an additional $1.6 billion scheduled to contractually mature after five years through ten years.
The table below presents available-for-sale securities in a gross unrealized loss position and whether such securities have been in an unrealized loss position for less than 12 months, or 12 months or greater.
Table 6.5 - Available-for-Sale Securities in a Gross Unrealized Loss Position | | | | | | | | | | | | | | | | | | | | |
| | June 30, 2024 |
| | Less than 12 Months | | 12 Months or Greater |
| (In millions) | | Fair Value | Gross Unrealized Losses | | Fair Value | Gross Unrealized Losses |
| Agency mortgage-related securities | | $602 | | ($5) | | | $2,582 | | ($118) | |
| Other mortgage-related securities | | 10 | | (1) | | | 36 | | (11) | |
| Total available-for-sale securities in a gross unrealized loss position | | $612 | | ($6) | | | $2,618 | | ($129) | |
| | | | | | | | | | | | | | | | | | | | |
| | December 31, 2023 |
| | Less than 12 Months | | 12 Months or Greater |
| (In millions) | | Fair Value | Gross Unrealized Losses | | Fair Value | Gross Unrealized Losses |
| Agency mortgage-related securities | | $374 | | ($1) | | | $3,006 | | ($108) | |
| Other mortgage-related securities | | 23 | | (4) | | | 23 | | (5) | |
| Total available-for-sale securities in a gross unrealized loss position | | $397 | | ($5) | | | $3,029 | | ($113) | |
At June 30, 2024, the gross unrealized losses relate to 174 securities.
The table below summarizes the total proceeds, gross realized gains and gross realized losses from sales of available-for-sale securities.
Table 6.6 - Total Proceeds, Gross Realized Gains and Gross Realized Losses from Sales of Available-for-Sale Securities | | | | | | | | | | | | | | | | | |
| (In millions) | | 2Q 2024 | 2Q 2023 | YTD 2024 | YTD 2023 |
| Total proceeds | | $438 | | $433 | | $837 | | $892 | |
| Gross realized gains | | 2 | | 3 | | 3 | | 5 | |
| Gross realized losses | | (6) | | (2) | | (12) | | (4) | |
| Net realized gains (losses) | | ($4) | | $1 | | ($9) | | $1 | |
Non-Cash Investing and Financing Activities During YTD 2023, we recognized $1.7 billion of investment securities in exchange for the issuance of debt of consolidated trusts through partial sales of commingled single-class resecuritization products that were previously consolidated.
During YTD 2024 and YTD 2023, we derecognized $1.2 billion and $2.8 billion, respectively, of mortgage-related securities and debt of consolidated trusts where we were no longer deemed the primary beneficiary.
During 2Q 2024, we purchased $5.2 billion and sold $5.1 billion of non-mortgage-related securities that were traded, but not settled at June 30, 2024. We settled our purchase and sale obligations during 3Q 2024.
| | | | | | | | |
| Freddie Mac 2Q 2024 Form 10-Q | | 70 |
| | | | | |
| Financial Statements | Notes to the Condensed Consolidated Financial Statements | Note 7 |
NOTE 7
Debt
The table below summarizes the balances of total debt on our condensed consolidated balance sheets.
Table 7.1 - Total Debt | | | | | | | | | | | |
(In millions) | | June 30, 2024 | December 31, 2023 |
| Debt of consolidated trusts | | $3,066,239 | | $3,041,927 | |
| Debt of Freddie Mac: | | | |
Short-term debt | | 8,428 | | 5,976 | |
Long-term debt | | 152,945 | | 160,443 | |
| Total debt of Freddie Mac | | 161,373 | | 166,419 | |
Total debt | | $3,227,612 | | $3,208,346 | |
Debt of Consolidated Trusts The table below summarizes the debt of consolidated trusts based on underlying loan product type.
Table 7.2 - Debt of Consolidated Trusts | | | | | | | | | | | | | | | | | | | | | | | | | | | | | | | | |
| | June 30, 2024 | | December 31, 2023 |
| (Dollars in millions) | | Contractual Maturity | UPB | Carrying Amount(1) | Weighted Average Coupon(2) | | Contractual Maturity | UPB | Carrying Amount(1) | Weighted Average Coupon(2) |
| Single-Family: | | | | | | | | | | |
| 20-and 30-year or more, fixed-rate | | 2024 - 2061 | $2,640,798 | | $2,676,432 | | 3.19 | % | | 2024 - 2061 | $2,603,100 | | $2,640,550 | | 3.06 | % |
| 15-year or less, fixed-rate | | 2024 - 2039 | 307,170 | | 311,595 | | 2.24 | | | 2024 - 2039 | 326,242 | | 331,291 | | 2.20 | |
| Adjustable-rate and other | | 2024 - 2054 | 23,327 | | 23,803 | | 4.27 | | | 2024 - 2054 | 23,251 | | 23,749 | | 3.93 | |
| Total Single-Family | | | 2,971,295 | | 3,011,830 | | | | | 2,952,593 | | 2,995,590 | | |
| Multifamily | | 2024 - 2054 | 55,564 | | 54,409 | | 3.44 | | | 2024 - 2053 | 47,300 | | 46,337 | | 3.35 | |
| Total debt of consolidated trusts | | | $3,026,859 | | $3,066,239 | | | | | $2,999,893 | | $3,041,927 | | |
(1)Includes $2.5 billion and $2.1 billion as of June 30, 2024 and December 31, 2023, respectively, of debt of consolidated trusts that represents the fair value of debt for which the fair value option was elected.
(2)The effective interest rate for debt of consolidated trusts was 2.84% and 2.73% as of June 30, 2024 and December 31, 2023, respectively.
The table below summarizes the balances and effective interest rates for our short-term debt.
Table 7.3 - Short-Term Debt | | | | | | | | | | | | | | | | | | | | | | | | | | |
| | June 30, 2024 | | December 31, 2023 |
| (Dollars in millions) | | Par Value | Carrying Amount | Weighted
Average
Effective Rate | | Par Value | Carrying Amount | Weighted
Average
Effective Rate |
| | | | | | | | |
Discount notes and Reference Bills® | | $8,453 | | $8,428 | | 5.39 | % | | $6,032 | | $5,976 | | 5.39 | % |
| | | | | | | | |
| | | | | | | | |
| | | | | | | | |
| | | | | | | | |
| | | | | | | | |
| Freddie Mac 2Q 2024 Form 10-Q | | 71 |
| | | | | |
| Financial Statements | Notes to the Condensed Consolidated Financial Statements | Note 7 |
The table below summarizes our long-term debt.
Table 7.4 - Long-Term Debt | | | | | | | | | | | | | | | | | | | | | | | | | | | | | | | | |
| | June 30, 2024 | | December 31, 2023 |
| (Dollars in millions) | | Contractual Maturity | Par Value | Carrying Amount(1) | Weighted Average Effective Rate(2) | | Contractual Maturity | Par Value | Carrying Amount(1) | Weighted Average Effective Rate(2) |
| Long-term debt: | | | | | | | | | | |
| Fixed-rate: | | | | | | | | | | |
| Medium-term notes — callable | | 2024 - 2050 | $132,829 | | $132,732 | | 3.31 | % | | 2024 - 2050 | $139,344 | | $139,257 | | 3.13 | % |
| Medium-term notes — non-callable | | 2024 - 2028 | 569 | | 569 | | 2.01 | | | 2024 - 2028 | 1,573 | | 1,574 | | 0.98 | |
| Reference Notes securities — non-callable | | 2025 - 2032 | 18,162 | | 18,209 | | 3.19 | | | 2025 - 2032 | 18,162 | | 18,209 | | 3.19 | |
| SCR debt notes | | 2031 - 2032 | 79 | | 80 | | 13.00 | | | 2031 - 2032 | 82 | | 83 | | 13.00 | |
| Variable-rate: | | | | | | | | | | |
| Medium-term notes — callable | | 2024 - 2034 | 1,820 | | 1,818 | | 4.73 | | | 2024 - 2028 | 1,869 | | 1,867 | | 4.81 | |
| Medium-term notes — non-callable | | 2026 | 47 | | 47 | | 8.10 | | | 2026 | 47 | | 47 | | 8.10 | |
| STACR | | 2024 - 2042 | 1,785 | | 1,705 | | 11.97 | | | 2024 - 2042 | 2,095 | | 2,006 | | 11.45 | |
| Zero-coupon: | | | | | | | | | | |
| Medium-term notes — non-callable | | 2025 - 2039 | 4,748 | | 3,111 | | 6.19 | | | 2024 - 2039 | 4,836 | | 3,100 | | 6.17 | |
| Other | | 2047 - 2053 | — | | 121 | | 0.82 | | | 2047 - 2053 | — | | 121 | | 0.84 | |
| Hedging-related basis adjustments | | | N/A | (5,447) | | | | | N/A | (5,821) | | |
| Total long-term debt | | | $160,039 | | $152,945 | | 3.46 | % | | | $168,008 | | $160,443 | | 3.30 | % |
(1)Represents par value, net of associated discounts or premiums and issuance cost. Includes $0.4 billion at both June 30, 2024 and December 31, 2023 of long-term debt that represents the fair value of debt for which the fair value option was elected.
(2)Based on carrying amount.
The table below summarizes the contractual maturities of long-term debt and debt securities.
Table 7.5 - Contractual Maturities of Long-Term Debt and Debt Securities | | | | | | | | |
| | June 30, 2024 |
| (In millions) | | Amounts |
| Annual Maturities | | |
| Long-term debt (excluding STACR and SCR debt notes): | | |
| 2024 | | $16,827 | |
| 2025 | | 57,132 | |
| 2026 | | 18,762 | |
| 2027 | | 15,829 | |
| 2028 | | 10,183 | |
Thereafter | | 39,442 | |
Debt of consolidated trusts, STACR, and SCR debt notes(1) | | 3,028,723 | |
| Total | | 3,186,898 | |
Net discounts, premiums, debt issuance costs, hedge-related, and other basis adjustments(2) | | 32,286 | |
| Total debt of consolidated trusts, STACR, SCR, and long-term debt | | $3,219,184 | |
(1)Contractual maturities of these debt securities are not presented because they are subject to prepayment risk, as their payments are based upon the performance of a pool of mortgage assets that may be prepaid by the related mortgage borrower at any time generally without penalty.
(2)Other basis adjustments primarily represent changes in fair value on debt where we have elected the fair value option.
| | | | | | | | |
| Freddie Mac 2Q 2024 Form 10-Q | | 72 |
| | | | | |
| Financial Statements | Notes to the Condensed Consolidated Financial Statements | Note 8 |
NOTE 8
Derivatives
We analyze the interest-rate sensitivity of financial assets and liabilities across a variety of interest-rate scenarios based on market prices, models, and economics. We use derivatives primarily to hedge interest-rate sensitivity mismatches between our financial assets and liabilities. We designate certain derivatives as hedging instruments in qualifying hedge accounting relationships. Interest-rate risk management derivatives that are not designated in qualifying hedge accounting relationships are economic hedges of financial instruments measured at fair value on a recurring basis or of other transactions or instruments that expose us to interest-rate risk. When we use derivatives to mitigate our exposures, we consider a number of factors, including cost, exposure to counterparty credit risk, and our overall risk management strategy.
We apply fair value hedge accounting to certain single-family mortgage loans and certain issuances of debt where we hedge the changes in fair value of these items attributable to the designated benchmark interest rate, using interest-rate swaps.
Derivative Assets and Liabilities at Fair Value The table below presents the notional value and fair value of derivatives reported on our condensed consolidated balance sheets.
Table 8.1 - Derivative Assets and Liabilities at Fair Value
| | | | | | | | | | | | | | | | | | | | | | | | | | |
| | June 30, 2024 | | December 31, 2023 |
| | | Notional or
Contractual
Amount | Derivative Assets | Derivative Liabilities | | Notional or
Contractual
Amount | Derivative Assets | Derivative Liabilities |
| (In millions) | | |
| Not designated as hedges | | | | | | | | |
| Interest-rate risk management derivatives: | | | | | | | | |
| Swaps | | $324,115 | | $1,950 | | ($354) | | | $351,193 | | $1,638 | | ($462) | |
| Written options | | 47,070 | | — | | (1,796) | | | 48,227 | | — | | (1,746) | |
Purchased options(1) | | 81,890 | | 4,323 | | — | | | 89,790 | | 4,251 | | — | |
| Futures | | 135,121 | | — | | — | | | 132,982 | | — | | — | |
| Total interest-rate risk management derivatives | | 588,196 | | 6,273 | | (2,150) | | | 622,192 | | 5,889 | | (2,208) | |
| Mortgage commitment derivatives | | 38,800 | | 14 | | (14) | | | 26,911 | | 43 | | (10) | |
CRT-related derivatives(2) | | 29,846 | | — | | (247) | | | 30,578 | | — | | (228) | |
| Other | | 17,799 | | 31 | | (731) | | | 14,572 | | 3 | | (567) | |
| Total derivatives not designated as hedges | | 674,641 | | 6,318 | | (3,142) | | | 694,253 | | 5,935 | | (3,013) | |
| Designated as fair value hedges | | | | | | | | |
| Interest-rate risk management derivatives: | | | | | | | | |
| Swaps | | 173,066 | | 285 | | (5,343) | | | 172,202 | | 276 | | (5,658) | |
| Total derivatives designated as fair value hedges | | 173,066 | | 285 | | (5,343) | | | 172,202 | | 276 | | (5,658) | |
| Receivables (payables) | | | 148 | | (1) | | | | 17 | | (36) | |
Netting adjustments(3) | | | (6,271) | | 7,432 | | | | (5,742) | | 7,834 | |
| Total derivative portfolio, net | | $847,707 | | $480 | | ($1,054) | | | $866,455 | | $486 | | ($873) | |
(1)Includes swaptions on credit indices with a notional or contractual amount of $7.7 billion and $6.4 billion at June 30, 2024 and December 31, 2023, respectively, and a fair value of $2.0 million and $1.0 million at June 30, 2024 and December 31, 2023, respectively.
(2)Includes derivative instruments related to CRT transactions that are considered freestanding credit enhancements.
(3)Represents counterparty netting and cash collateral netting.
| | | | | | | | |
| Freddie Mac 2Q 2024 Form 10-Q | | 73 |
| | | | | |
| Financial Statements | Notes to the Condensed Consolidated Financial Statements | Note 8 |
Derivative Counterparty Credit Risk The table below presents offsetting and collateral information related to derivatives which are subject to enforceable master netting agreements or similar arrangements.
Table 8.2 - Offsetting of Derivatives
| | | | | | | | | | | | | | | | | | | | |
| | June 30, 2024 | | December 31, 2023 |
| | | Derivative Assets | Derivative Liabilities | | Derivative Assets | Derivative Liabilities |
| (In millions) | | |
| OTC derivatives | | $6,558 | | ($7,487) | | | $6,165 | | ($7,866) | |
| Cleared and exchange-traded derivatives | | 121 | | (7) | | | 13 | | (36) | |
| Mortgage commitment derivatives | | 41 | | (14) | | | 47 | | (10) | |
| Other | | 31 | | (978) | | | 3 | | (795) | |
| Total derivatives | | 6,751 | | (8,486) | | | 6,228 | | (8,707) | |
| Counterparty netting | | (4,189) | | 4,189 | | | (4,210) | | 4,210 | |
Cash collateral netting(1) | | (2,082) | | 3,243 | | | (1,532) | | 3,624 | |
| Net amount presented in the consolidated balance sheets | | 480 | | (1,054) | | | 486 | | (873) | |
Gross amount not offset in the consolidated balance sheets(2) | | (185) | | 23 | | | (366) | | 47 | |
| Net amount | | $295 | | ($1,031) | | | $120 | | ($826) | |
(1)Excess cash collateral held is presented as a derivative liability, while excess cash collateral posted is presented as a derivative asset.
(2)Does not include the fair value amount of non-cash collateral posted or held that exceeds the associated net asset or liability, netted by counterparty, presented on the condensed consolidated balance sheets.
Gains and Losses on Derivatives The table below presents the gains and losses on derivatives not designated in qualifying hedge relationships. These amounts are reported on our condensed consolidated statements of income as investment gains, net.
Table 8.3 - Gains and Losses on Derivatives | | | | | | | | | | | | | | | | | |
| (In millions) | | 2Q 2024 | 2Q 2023 | YTD 2024 | YTD 2023 |
| Not designated as hedges | | | | | |
| Interest-rate risk management derivatives: | | | | | |
| Swaps | | $136 | | $380 | | $398 | | $408 | |
| Written options | | (86) | | 82 | | (49) | | 277 | |
| Purchased options | | 242 | | (45) | | 298 | | (549) | |
| Futures | | 169 | | 519 | | 543 | | 212 | |
| Total interest-rate risk management derivatives fair value gains (losses) | | 461 | | 936 | | 1,190 | | 348 | |
| Mortgage commitment derivatives | | 32 | | 125 | | 72 | | 45 | |
CRT-related derivatives(1) | | 51 | | (68) | | 8 | | (144) | |
| Other | | (55) | | (64) | | (163) | | (3) | |
| Total derivatives not designated as hedges fair value gains (losses) | | $489 | | $929 | | $1,107 | | $246 | |
(1)Includes derivative instruments related to CRT transactions that are considered freestanding credit enhancements.
| | | | | | | | |
| Freddie Mac 2Q 2024 Form 10-Q | | 74 |
| | | | | |
| Financial Statements | Notes to the Condensed Consolidated Financial Statements | Note 8 |
The table below presents the effects of fair value hedge accounting by condensed consolidated statements of income line item, including the gains and losses on derivatives and hedged items designated in qualifying hedge relationships and other components due to the application of hedge accounting.
Table 8.4 - Gains and Losses on Fair Value Hedges | | | | | | | | | | | | | | | | | |
| | 2Q 2024 | 2Q 2023 |
| (In millions) | | Interest Income | Interest Expense | Interest Income | Interest Expense |
| Total amounts of income and expense line items presented in our condensed consolidated statements of income in which the effects of fair value hedges are recorded: | | $29,064 | | ($24,136) | | $25,755 | | ($21,232) | |
| | | | | |
| Interest contracts on mortgage loans held-for-investment: | | | | | |
| Gain (loss) on fair value hedging relationships: | | | | | |
| Hedged items | | (234) | | — | | (964) | | — | |
| Derivatives designated as hedging instruments | | 160 | | — | | 900 | | — | |
| Interest accruals on hedging instruments | | 240 | | — | | 251 | | — | |
| Discontinued hedge related basis adjustments amortization | | 73 | | — | | 39 | | — | |
| Interest contracts on debt: | | | | | |
| Gain (loss) on fair value hedging relationships: | | | | | |
| Hedged items | | — | | (511) | | — | | 725 | |
| Derivatives designated as hedging instruments | | — | | 519 | | — | | (749) | |
| Interest accruals on hedging instruments | | — | | (874) | | — | | (1,000) | |
| Discontinued hedge related basis adjustment amortization | | — | | (2) | | — | | (172) | |
| | | | | |
| | YTD 2024 | YTD 2023 |
| (In millions) | | Interest Income | Interest Expense | Interest Income | Interest Expense |
| Total amounts of income and expense line items presented in our condensed consolidated statements of income in which the effects of fair value hedges are recorded: | | $57,449 | | ($47,762) | | $50,742 | | ($41,718) | |
| | | | | |
| Interest contracts on mortgage loans held-for-investment: | | | | | |
| Gain (loss) on fair value hedging relationships: | | | | | |
| Hedged items | | (1,229) | | — | | 159 | | — | |
| Derivatives designated as hedging instruments | | 1,113 | | — | | (173) | | — | |
| Interest accruals on hedging instruments | | 474 | | — | | 462 | | — | |
| Discontinued hedge related basis adjustments amortization | | 116 | | — | | 70 | | — | |
| Interest contracts on debt: | | | | | |
| Gain (loss) on fair value hedging relationships: | | | | | |
| Hedged items | | — | | (377) | | — | | (810) | |
| Derivatives designated as hedging instruments | | — | | 392 | | — | | 785 | |
| Interest accruals on hedging instruments | | — | | (1,803) | | — | | (2,051) | |
| Discontinued hedge related basis adjustment amortization | | — | | (4) | | — | | (210) | |
| | | | | | | | |
| Freddie Mac 2Q 2024 Form 10-Q | | 75 |
| | | | | |
| Financial Statements | Notes to the Condensed Consolidated Financial Statements | Note 8 |
The table below presents the cumulative basis adjustments and the carrying amounts of the hedged item by its respective balance sheet line item.
Table 8.5 - Cumulative Basis Adjustments Due to Fair Value Hedging
| | | | | | | | | | | | | | | | | | | | | | | | | | | | | |
| | June 30, 2024 |
| | Carrying Amount Assets / (Liabilities) | | Cumulative Amount of Fair Value Hedging Basis Adjustment Included in the Carrying Amount | | Closed Portfolio Under the Portfolio Layer Method |
| (In millions) | | | Total | Under the Portfolio Layer Method | Discontinued - Hedge Related | | Total Amount by Amortized Cost Basis | Designated Amount by UPB |
| Mortgage loans held-for-investment | | $1,116,685 | | | ($3,366) | | ($619) | | ($2,747) | | | $57,515 | | $11,845 | |
| Mortgage loans held-for-sale | | 155 | | | 1 | | — | | 1 | | | — | | — | |
| Debt | | (134,838) | | | 5,447 | | — | | 23 | | | — | | — | |
| | | | | | | | | |
| | December 31, 2023 |
| | Carrying Amount Assets / (Liabilities) | | Cumulative Amount of Fair Value Hedging Basis Adjustment Included in the Carrying Amount | | Closed Portfolio Under the Portfolio Layer Method |
| (In millions) | | | Total | Under the Portfolio Layer Method | Discontinued - Hedge Related | | Total Amount by Amortized Cost Basis | Designated Amount by UPB |
| Mortgage loans held-for-investment | | $1,115,454 | | | ($2,253) | | ($220) | | ($2,033) | | | $59,786 | | $11,670 | |
| Mortgage loans held-for-sale | | 128 | | | 1 | | — | | 1 | | | — | | — | |
| Debt | | (143,407) | | | 5,821 | | — | | 29 | | | — | | — | |
| | | | | | | | |
| Freddie Mac 2Q 2024 Form 10-Q | | 76 |
| | | | | |
| Financial Statements | Notes to the Condensed Consolidated Financial Statements | Note 9 |
NOTE 9
Collateralized Agreements
Securities Purchased Under Agreements to Resell and Securities Sold Under Agreements to Repurchase The table below presents offsetting and collateral information related to securities purchased under agreements to resell, and securities sold under agreements to repurchase, which are subject to enforceable master netting agreements or similar arrangements.
Table 9.1 - Offsetting and Collateral Information of Certain Financial Assets and Liabilities | | | | | | | | | | | | | | | | | | | | |
| | June 30, 2024 |
| (In millions) | | Gross Amount Recognized | Amount
Offset in the Condensed
Consolidated
Balance Sheets | Net Amount
Presented in the Condensed Consolidated
Balance Sheets | Gross Amount Not Offset in the Condensed Consolidated Balance Sheets(1) | Net Amount |
| Assets: | | | | | | |
| Securities purchased under agreements to resell | | $109,256 | | ($12,076) | | $97,180 | | ($97,180) | | $— | |
| Liabilities: | | | | | | |
| Securities sold under agreements to repurchase | | (12,076) | | 12,076 | | — | | — | | — | |
| | | | | | | | | | | | | | | | | | | | |
| | | December 31, 2023 |
| (In millions) | | Gross Amount Recognized | Amount
Offset in the Condensed
Consolidated
Balance Sheets | Net Amount
Presented in the Condensed Consolidated
Balance Sheets | Gross Amount Not Offset in the Condensed Consolidated Balance Sheets(1) | Net Amount |
| Assets: | | | | | | |
| Securities purchased under agreements to resell | | $105,393 | | ($10,245) | | $95,148 | | ($95,148) | | $— | |
| Liabilities: | | | | | | |
| Securities sold under agreements to repurchase | | (10,245) | | 10,245 | | — | | — | | — | |
(1)For securities purchased under agreements to resell, includes $107.7 billion and $104.2 billion of collateral that we had the right to repledge as of June 30, 2024 and December 31, 2023, respectively. We repledged $0.2 billion and $0.4 billion of collateral as of June 30, 2024 and December 31, 2023, respectively.
The table below presents the remaining contractual maturity of our gross obligations for securities sold under agreements to repurchase. The collateral for such obligations consisted primarily of U.S. Treasury securities.
Table 9.2 - Remaining Contractual Maturity | | | | | | | | | | | | | | | | | | | | |
| | June 30, 2024 |
| (In millions) | | Overnight and Continuous | 30 Days or Less | After 30 Days Through 90 Days | Greater Than 90 Days | Total |
| Securities sold under agreements to repurchase | | $8,261 | | $3,815 | | $— | | $— | | $12,076 | |
| | | | | | | | | | | | | | | | | | | | |
| | December 31, 2023 |
| (In millions) | | Overnight and Continuous | 30 Days or Less | After 30 Days Through 90 Days | Greater Than 90 Days | Total |
| Securities sold under agreements to repurchase | | $— | | $10,245 | | $— | | $— | | $10,245 | |
| | | | | | | | |
| Freddie Mac 2Q 2024 Form 10-Q | | 77 |
| | | | | |
| Financial Statements | Notes to the Condensed Consolidated Financial Statements | Note 9 |
The table below summarizes the carrying value of the collateral pledged by us for derivatives and collateralized borrowing transactions, including securities that the secured party may repledge.
Table 9.3 - Collateral in the Form of Securities Pledged | | | | | | | | | | | | | | | | | |
| | June 30, 2024 |
| (In millions) | | Derivatives | Securities Sold Under Agreements to Repurchase | Other(1) | Total |
| | | | | |
| | | | | |
| | | | | |
| Trading securities | | $2,113 | | $5,259 | | $2,544 | | $9,916 | |
| Other assets | | — | | 4,823 | | — | | 4,823 | |
| Total securities pledged | | $2,113 | | $10,082 | | $2,544 | | $14,739 | |
| | | | | | | | | | | | | | | | | |
| | December 31, 2023 |
| (In millions) | | Derivatives | Securities Sold Under Agreements to Repurchase | Other(1) | Total |
| Trading securities | | $1,866 | | $3,666 | | $2,370 | | $7,902 | |
| Other assets | | — | | 4,555 | | — | | 4,555 | |
| Total securities pledged | | $1,866 | | $8,221 | | $2,370 | | $12,457 | |
(1)Includes other collateralized borrowings and collateral related to transactions with certain clearinghouses.
| | | | | | | | |
| Freddie Mac 2Q 2024 Form 10-Q | | 78 |
| | | | | |
| Financial Statements | Notes to the Condensed Consolidated Financial Statements | Note 10 |
NOTE 10
Net Interest Income
The table below presents the components of net interest income per our condensed consolidated statements of income.
Table 10.1 - Components of Net Interest Income | | | | | | | | | | | | | | | | | | | | |
| (In millions) | | 2Q 2024 | 2Q 2023 | | YTD 2024 | YTD 2023 |
| Interest income: | | | | | | |
| Mortgage loans | | $26,821 | | $23,598 | | | $53,050 | | $46,902 | |
| Investment securities | | 484 | | 363 | | | 954 | | 679 | |
| Securities purchased under agreements to resell | | 1,593 | | 1,622 | | | 3,125 | | 2,842 | |
| Other | | 166 | | 172 | | | 320 | | 319 | |
| Total interest income | | 29,064 | | 25,755 | | | 57,449 | | 50,742 | |
| Interest expense: | | | | | | |
| Debt of consolidated trusts | | (21,634) | | (18,608) | | | (42,756) | | (36,869) | |
| Debt of Freddie Mac: | | | | | | |
| Short-term debt | | (260) | | (248) | | | (516) | | (402) | |
| Long-term debt | | (2,242) | | (2,376) | | | (4,490) | | (4,447) | |
| Total interest expense | | (24,136) | | (21,232) | | | (47,762) | | (41,718) | |
| Net interest income | | 4,928 | | 4,523 | | | 9,687 | | 9,024 | |
| (Provision) benefit for credit losses | | (394) | | 537 | | | (575) | | 142 | |
| Net interest income after (provision) benefit for credit losses | | $4,534 | | $5,060 | | | $9,112 | | $9,166 | |
| | | | | | | | |
| Freddie Mac 2Q 2024 Form 10-Q | | 79 |
| | | | | |
| Financial Statements | Notes to the Condensed Consolidated Financial Statements | Note 11 |
NOTE 11
Segment Reporting
As shown in the table below, we have two reportable segments, Single-Family and Multifamily.
| | | | | |
Segment | Description |
Single-Family | Reflects results from our purchase, securitization, and guarantee of single-family loans, our investments in single-family loans and mortgage-related securities, the management of Single-Family mortgage credit risk and market risk, and any results of our treasury function that are not allocated to each segment.
|
|
|
Multifamily | Reflects results from our purchase, securitization, and guarantee of multifamily loans, our investments in multifamily loans and mortgage-related securities, and the management of Multifamily mortgage credit risk and market risk.
|
|
The table below presents the financial results for our Single-Family and Multifamily segments.
Table 11.1 - Segment Financial Results | | | | | | | | | | | | | | | | | | | | | | | | | | |
| | 2Q 2024 | | 2Q 2023 |
| | | | | | | | |
| (In millions) | | Single-Family | Multifamily | Total | | Single-Family | Multifamily | Total |
| Net interest income | | $4,635 | | $293 | | $4,928 | | | $4,295 | | $228 | | $4,523 | |
| Non-interest income | | | | | | | | |
| Guarantee income | | 26 | | 357 | | 383 | | | 16 | | 293 | | 309 | |
| Investment gains, net | | 335 | | 214 | | 549 | | | (4) | | 415 | | 411 | |
| Other income | | 98 | | 30 | | 128 | | | 53 | | 43 | | 96 | |
| Non-interest income | | 459 | | 601 | | 1,060 | | | 65 | | 751 | | 816 | |
| Net revenues | | 5,094 | | 894 | | 5,988 | | | 4,360 | | 979 | | 5,339 | |
| (Provision) benefit for credit losses | | (315) | | (79) | | (394) | | | 638 | | (101) | | 537 | |
| Non-interest expense | | (1,921) | | (213) | | (2,134) | | | (2,028) | | (176) | | (2,204) | |
| Income before income tax expense | | 2,858 | | 602 | | 3,460 | | | 2,970 | | 702 | | 3,672 | |
| Income tax expense | | (574) | | (121) | | (695) | | | (589) | | (139) | | (728) | |
| Net income | | 2,284 | | 481 | | 2,765 | | | 2,381 | | 563 | | 2,944 | |
| Other comprehensive income (loss), net of taxes and reclassification adjustments | | (5) | | — | | (5) | | | 2 | | (56) | | (54) | |
| Comprehensive income | | $2,279 | | $481 | | $2,760 | | | $2,383 | | $507 | | $2,890 | |
| | | | | | | | | | | | | | | | | | | | | | | | | | |
| | YTD 2024 | | YTD 2023 |
| (In millions) | | Single-Family | Multifamily | Total | | Single-Family | Multifamily | Total |
| Net interest income | | $9,123 | | $564 | | $9,687 | | | $8,591 | | $433 | | $9,024 | |
| Non-interest income | | | | | | | | |
| Guarantee income | | 45 | | 834 | | 879 | | | 48 | | 727 | | 775 | |
| Investment gains, net | | 249 | | 705 | | 954 | | | (183) | | 369 | | 186 | |
| Other income | | 151 | | 74 | | 225 | | | 107 | | 74 | | 181 | |
| Non-interest income | | 445 | | 1,613 | | 2,058 | | | (28) | | 1,170 | | 1,142 | |
| Net revenues | | 9,568 | | 2,177 | | 11,745 | | | 8,563 | | 1,603 | | 10,166 | |
| (Provision) benefit for credit losses | | (435) | | (140) | | (575) | | | 320 | | (178) | | 142 | |
| Non-interest expense | | (3,846) | | (410) | | (4,256) | | | (3,811) | | (325) | | (4,136) | |
| Income before income tax expense | | 5,287 | | 1,627 | | 6,914 | | | 5,072 | | 1,100 | | 6,172 | |
| Income tax expense | | (1,058) | | (325) | | (1,383) | | | (1,014) | | (219) | | (1,233) | |
| Net income | | 4,229 | | 1,302 | | 5,531 | | | 4,058 | | 881 | | 4,939 | |
| Other comprehensive income (loss), net of taxes and reclassification adjustments | | (10) | | (20) | | (30) | | | 1 | | (1) | | — | |
| Comprehensive income | | $4,219 | | $1,282 | | $5,501 | | | $4,059 | | $880 | | $4,939 | |
| | | | | | | | |
| Freddie Mac 2Q 2024 Form 10-Q | | 80 |
| | | | | |
| Financial Statements | Notes to the Condensed Consolidated Financial Statements | Note 11 |
The table below presents total assets for our Single-Family and Multifamily segments.
Table 11.2 - Segment Assets | | | | | | | | | | | | |
| (In millions) | | | June 30, 2024 | December 31, 2023 |
| Single-Family | | | $3,058,294 | | $3,038,910 | |
| Multifamily | | | 447,270 | | 440,797 | |
| Total segment assets | | | 3,505,564 | | 3,479,707 | |
Reconciling items(1) | | | (198,312) | | (198,731) | |
| Total assets per condensed consolidated balance sheets | | | $3,307,252 | | $3,280,976 | |
| | | | |
| | | | |
| | | | |
| | |
| | | | |
| | | | |
| | | | |
| | | | |
| | | | |
| | | | |
| | | | |
| | | | |
| | | | |
| | | | |
| | | | |
| | | | |
| | | | |
| | | | |
| | | | |
| | | | |
| | | | |
(1)Reconciling items include assets in our mortgage portfolio that are not recognized on our condensed consolidated balance sheets and assets recognized on our condensed consolidated balance sheets that are not allocated to the reportable segments.
| | | | | | | | |
| Freddie Mac 2Q 2024 Form 10-Q | | 81 |
| | | | | |
| Financial Statements | Notes to the Condensed Consolidated Financial Statements | Note 12 |
NOTE 12
Concentration of Credit and Other Risks
Single-Family Mortgage Portfolio The table below summarizes the concentration by geographic area of our Single-Family mortgage portfolio. See Note 2, Note 3, Note 4, and Note 5 for additional information about credit risk associated with single-family loans that we hold or guarantee.
Table 12.1 - Concentration of Credit Risk of Our Single-Family Mortgage Portfolio | | | | | | | | | | | | | | |
| | June 30, 2024 |
| (Dollars in millions) | | Portfolio UPB(1) | % of Portfolio | SDQ Rate |
Region:(2) | | | | |
| West | | $911,666 | | 30 | % | 0.39 | % |
| Northeast | | 705,636 | | 23 | | 0.58 | |
| Southeast | | 538,126 | | 18 | | 0.52 | |
| Southwest | | 457,553 | | 15 | | 0.50 | |
| North Central | | 444,965 | | 14 | | 0.51 | |
| Total | | $3,057,946 | | 100 | % | 0.50 | |
| State: | | | | |
| California | | $513,807 | | 17 | % | 0.38 | |
| Texas | | 217,601 | | 7 | | 0.54 | |
| Florida | | 203,773 | | 7 | | 0.58 | |
| New York | | 132,982 | | 4 | | 0.85 | |
| Illinois | | 114,247 | | 4 | | 0.66 | |
| All other | | 1,875,536 | | 61 | | 0.47 | |
| Total | | $3,057,946 | | 100 | % | 0.50 | |
(1)Excludes UPB of loans underlying certain securitization products for which data was not available.
(2)Region designation: West (AK, AZ, CA, GU, HI, ID, MT, NV, OR, UT, WA); Northeast (CT, DE, DC, MA, ME, MD, NH, NJ, NY, PA, RI, VT, VA, WV); Southeast (AL, FL, GA, KY, MS, NC, PR, SC, TN, VI); Southwest (AR, CO, KS, LA, MO, NE, NM, OK, TX, WY); North Central (IL, IN, IA, MI, MN, ND, OH, SD, WI).
| | | | | | | | |
| Freddie Mac 2Q 2024 Form 10-Q | | 82 |
| | | | | |
| Financial Statements | Notes to the Condensed Consolidated Financial Statements | Note 12 |
Multifamily Mortgage Portfolio The table below summarizes the concentration by geographic area of our Multifamily mortgage portfolio. See Note 2, Note 3, Note 4, and Note 5 for additional information about credit risk associated with multifamily loans that we hold or guarantee.
Table 12.2 - Concentration of Credit Risk of Our Multifamily Mortgage Portfolio | | | | | | | | | | | | | | | |
| June 30, 2024 | |
| (Dollars in millions) | | Portfolio UPB | % of Portfolio | Delinquency Rate(1) | |
Region(2)(3): | | | | | |
| West | | $110,686 | | 25 | % | 0.19 | % | |
| Northeast | | 108,977 | | 24 | | 0.76 | | |
| Southwest | | 92,349 | | 21 | | 0.34 | | |
| Southeast | | 91,038 | | 20 | | 0.16 | | |
| North Central | | 44,220 | | 10 | | 0.40 | | |
| Total | | $447,270 | | 100 | % | 0.38 | | |
State(3): | | | | | |
| California | | $59,055 | | 13 | % | 0.21 | |
| Texas | | 56,742 | | 13 | | 0.37 | |
| Florida | | 38,951 | | 9 | | 0.10 | |
| New York | | 34,615 | | 8 | | 1.93 | |
| Georgia | | 18,640 | | 4 | | 0.21 | |
| All other | | 239,267 | | 53 | | 0.25 | |
| Total | | $447,270 | | 100 | % | 0.38 | |
(1)Based on loans two monthly payments or more delinquent or in foreclosure.
(2)Region designation: West (AK, AZ, CA, GU, HI, ID, MT, NV, OR, UT, WA); Northeast (CT, DE, DC, MA, ME, MD, NH, NJ, NY, PA, RI, VT, VA, WV); Southwest (AR, CO, KS, LA, MO, NE, NM, OK, TX, WY); Southeast (AL, FL, GA, KY, MS, NC, PR, SC, TN, VI); North Central (IL, IN, IA, MI, MN, ND, OH, SD, WI).
(3)The UPB of loans collateralized by properties located in multiple regions or states are reported entirely in the region or state with the largest underlying collateral UPB as of origination.
| | | | | | | | |
| Freddie Mac 2Q 2024 Form 10-Q | | 83 |
| | | | | |
| Financial Statements | Notes to the Condensed Consolidated Financial Statements | Note 13 |
NOTE 13
Fair Value Disclosures
We use fair value measurements for the initial recording of certain assets and liabilities and periodic remeasurement of certain assets and liabilities on a recurring or non-recurring basis.
Assets and Liabilities Measured at Fair Value on a Recurring Basis The table below presents our assets and liabilities measured on our condensed consolidated balance sheets at fair value on a recurring basis subsequent to initial recognition, including instruments where we have elected the fair value option.
Table 13.1 - Assets and Liabilities Measured at Fair Value on a Recurring Basis | | | | | | | | | | | | | | | | | | | | |
| | June 30, 2024 |
(In millions) | | Level 1 | Level 2 | Level 3 | Netting Adjustments(1) | Total |
Assets: | | | | | | |
| Investment securities: | | | | | | |
| Available-for-sale | | $— | | $3,802 | | $603 | | $— | | $4,405 | |
| Trading: | | | | | | |
| Mortgage-related securities | | — | | 5,077 | | 3,009 | | — | | 8,086 | |
Non-mortgage-related securities | | 30,571 | | 418 | | — | | — | | 30,989 | |
| Total trading securities | | 30,571 | | 5,495 | | 3,009 | | — | | 39,075 | |
| Total investment securities | | 30,571 | | 9,297 | | 3,612 | | — | | 43,480 | |
| Mortgage loans held-for-sale | | — | | 7,329 | | 627 | | — | | 7,956 | |
| Mortgage loans held-for-investment | | — | | 1,215 | | 776 | | — | | 1,991 | |
| Other assets: | | | | | | |
| Guarantee assets | | — | | — | | 5,254 | | — | | 5,254 | |
| Derivative assets, net | | 1 | | 6,571 | | 31 | | (6,123) | | 480 | |
| Other assets | | — | | 62 | | 172 | | — | | 234 | |
| Total other assets | | 1 | | 6,633 | | 5,457 | | (6,123) | | 5,968 | |
| Total assets carried at fair value on a recurring basis | | $30,572 | | $24,474 | | $10,472 | | ($6,123) | | $59,395 | |
| Liabilities: | | | | | | |
| Debt: | | | | | | |
| Debt of consolidated trusts | | $— | | $2,117 | | $374 | | $— | | $2,491 | |
| Debt of Freddie Mac | | — | | 271 | | 88 | | — | | 359 | |
| Total debt | | — | | 2,388 | | 462 | | — | | 2,850 | |
| Other liabilities: | | | | | | |
| Derivative liabilities, net | | 7 | | 8,363 | | 115 | | (7,431) | | 1,054 | |
| Other liabilities | | — | | — | | — | | — | | — | |
| Total other liabilities | | 7 | | 8,363 | | 115 | | (7,431) | | 1,054 | |
| Total liabilities carried at fair value on a recurring basis | | $7 | | $10,751 | | $577 | | ($7,431) | | $3,904 | |
Referenced footnote is included after the prior period table.
| | | | | | | | |
| Freddie Mac 2Q 2024 Form 10-Q | | 84 |
| | | | | |
| Financial Statements | Notes to the Condensed Consolidated Financial Statements | Note 13 |
| | | | | | | | | | | | | | | | | | | | |
| | | December 31, 2023 |
| (In millions) | | Level 1 | Level 2 | Level 3 | Netting Adjustments(1) | Total |
| Assets: | | | | | | |
| Investment securities: | | | | | | |
| Available-for-sale | | $— | | $4,212 | | $678 | | $— | | $4,890 | |
| Trading: | | | | | | |
| Mortgage-related securities | | — | | 5,342 | | 2,771 | | — | | 8,113 | |
| Non-mortgage-related securities | | 29,854 | | 418 | | — | | — | | 30,272 | |
| Total trading securities | | 29,854 | | 5,760 | | 2,771 | | — | | 38,385 | |
| Total investment securities | | 29,854 | | 9,972 | | 3,449 | | — | | 43,275 | |
| Mortgage loans held-for-sale | | — | | 6,460 | | 896 | | — | | 7,356 | |
| Mortgage loans held-for-investment | | — | | 1,333 | | 473 | | — | | 1,806 | |
| Other assets: | | | | | | |
| Guarantee assets | | — | | — | | 5,351 | | — | | 5,351 | |
| Derivative assets, net | | — | | 6,209 | | 2 | | (5,725) | | 486 | |
| Other assets | | — | | 92 | | 166 | | — | | 258 | |
| Total other assets | | — | | 6,301 | | 5,519 | | (5,725) | | 6,095 | |
| Total assets carried at fair value on a recurring basis | | $29,854 | | $24,066 | | $10,337 | | ($5,725) | | $58,532 | |
| Liabilities: | | | | | | |
| Debt: | | | | | | |
| Debt of consolidated trusts | | $— | | $1,707 | | $343 | | $— | | $2,050 | |
| Debt of Freddie Mac | | — | | 336 | | 90 | | — | | 426 | |
| Total debt | | — | | 2,043 | | 433 | | — | | 2,476 | |
| Other liabilities: | | | | | | |
| Derivative liabilities, net | | — | | 8,608 | | 63 | | (7,798) | | 873 | |
| Other liabilities | | — | | — | | — | | — | | — | |
| Total other liabilities | | — | | 8,608 | | 63 | | (7,798) | | 873 | |
| Total liabilities carried at fair value on a recurring basis | | $— | | $10,651 | | $496 | | ($7,798) | | $3,349 | |
(1) Represents counterparty netting and cash collateral netting, and includes accrued interest receivable and payable.
Level 3 Fair Value Measurements The table below presents a reconciliation of all assets and liabilities measured on our condensed consolidated balance sheets at fair value on a recurring basis using significant unobservable inputs (Level 3), including transfers into and out of Level 3. The table also presents gains and losses due to changes in fair value, including both realized and unrealized gains and losses, recognized on our condensed consolidated statements of income for Level 3 assets and liabilities.
| | | | | | | | |
| Freddie Mac 2Q 2024 Form 10-Q | | 85 |
| | | | | |
| Financial Statements | Notes to the Condensed Consolidated Financial Statements | Note 13 |
Table 13.2 - Fair Value Measurements of Assets and Liabilities Using Significant Unobservable Inputs | | | | | | | | | | | | | | | | | | | | | | | | | | | | | | | | | | | | | | | | | | | | | | | | | | | | | | | | | | | | | | | | | | | | | | | | | | |
| | 2Q 2024 |
| | Balance,
April 1,
2024 | | Total Realized/Unrealized Gains/Losses(1) | | Purchases | | Issues | | Sales | | Settlements,
Net | | Transfers
into
Level 3 | | Transfers
out of
Level 3 | | Balance,
June 30,
2024 | | Change in Unrealized Gains/Losses(1) Included in Net Income Related to Assets and Liabilities Still Held as of June 30, 2024(2) | | Change in Unrealized Gains/Losses(1), Net of Tax, Included in OCI Related to Assets and Liabilities Still Held as of June 30, 2024 |
(In millions) | | | Included in
Earnings | | Included in Other
Comprehensive
Income | | | | | | | | | |
| | | | |
Assets | | | | | | | | | | | | | | | | | | | | | | | | |
| Investment securities: | | | | | | | | | | | | | | | | | | | | | | | | |
| Available-for-sale | | $637 | | | $— | | | ($1) | | | $— | | | $— | | | $— | | | ($33) | | | $— | | | $— | | | $603 | | | $— | | | ($1) | |
| Trading | | 3,002 | | | (105) | | | — | | | 136 | | | — | | | — | | | (24) | | | — | | | — | | | 3,009 | | | 13 | | | — | |
| Total investment securities | | 3,639 | | | (105) | | | (1) | | | 136 | | | — | | | — | | | (57) | | | — | | | — | | | 3,612 | | | 13 | | | (1) | |
| Mortgage loans held-for-sale | | 787 | | | — | | | — | | | 388 | | | — | | | (500) | | | — | | | — | | | (48) | | | 627 | | | — | | | — | |
| Mortgage loans held-for-investment | | 695 | | | (28) | | | — | | | — | | | — | | | — | | | (7) | | | 133 | | | (17) | | | 776 | | | (53) | | | — | |
Other assets: | | | | | | | | | | | | | | | | | | | | | | | | |
| Guarantee assets | | 5,341 | | | — | | | — | | | — | | | 142 | | | — | | | (229) | | | — | | | — | | | 5,254 | | | — | | | — | |
| Other assets | | 199 | | | 12 | | | — | | | (2) | | | 3 | | | (2) | | | (7) | | | — | | | — | | | 203 | | | 12 | | | — | |
| Total other assets | | 5,540 | | | 12 | | | — | | | (2) | | | 145 | | | (2) | | | (236) | | | — | | | — | | | 5,457 | | | 12 | | | — | |
| Total assets | | $10,661 | | | ($121) | | | ($1) | | | $522 | | | $145 | | | ($502) | | | ($300) | | | $133 | | | ($65) | | | $10,472 | | | ($28) | | | ($1) | |
| | | | | | | | | | | | | | | | | | | | | | | | |
Liabilities | | | | | | | | | | | | | | | | | | | | | | | | |
| Debt | | $450 | | | $— | | | $— | | | ($7) | | | $20 | | | $— | | | ($1) | | | $— | | | $— | | | $462 | | | $9 | | | $— | |
| Other liabilities | | 79 | | | (3) | | | — | | | 4 | | | 40 | | | — | | | (5) | | | — | | | — | | | 115 | | | (5) | | | — | |
| Total liabilities | | $529 | | | ($3) | | | $— | | | ($3) | | | $60 | | | $— | | | ($6) | | | $— | | | $— | | | $577 | | | $4 | | | $— | |
| | | | | | | | | | | | | | | | | | | | | | | | | | | | | | | | | | | | | | | | | | | | | | | | | | | | | | | | | | | | | | | | | | | | | | | | | | |
| | | | | | | | | | | | | | | | | | | | | | | | |
| | | YTD 2024 |
| | | Balance,
January 1,
2024 | | Total Realized/Unrealized Gains/Losses(1) | | Purchases | | Issues | | Sales | | Settlements,
Net | | Transfers
into
Level 3 | | Transfers
out of
Level 3 | | Balance,
June 30,
2024 | | Change in Unrealized Gains/Losses(1) Included in Net Income Related to Assets and Liabilities Still Held as of June 30, 2024(2) | | Change in Unrealized Gains/Losses(1), Net of Tax, Included in OCI Related to Assets and Liabilities Still Held as of June 30, 2024 |
| (In millions) | | | Included in
Earnings | | Included in Other
Comprehensive
Income | | | | | | | | | |
| | | | | |
| Assets | | | | | | | | | | | | | | | | | | | | | | | | |
| Investment securities: | | | | | | | | | | | | | | | | | | | | | | | | |
| Available-for-sale | | $678 | | | $— | | | ($6) | | | $— | | | $— | | | $— | | | ($69) | | | $— | | | $— | | | $603 | | | $— | | | ($5) | |
| Trading | | 2,771 | | | (218) | | | — | | | 496 | | | — | | | — | | | (40) | | | — | | | — | | | 3,009 | | | 32 | | | — | |
| Total investment securities | | 3,449 | | | (218) | | | (6) | | | 496 | | | — | | | — | | | (109) | | | — | | | — | | | 3,612 | | | 32 | | | (5) | |
| Mortgage loans held-for-sale | | 896 | | | (6) | | | — | | | 682 | | | — | | | (773) | | | — | | | 35 | | | (207) | | | 627 | | | — | | | — | |
| Mortgage loans held-for-investment | | 473 | | | (52) | | | — | | | — | | | — | | | — | | | (54) | | | 431 | | | (22) | | | 776 | | | (53) | | | — | |
| Other assets: | | | | | | | | | | | | | | | | | | | | | | | | |
| Guarantee assets | | 5,351 | | | 110 | | | — | | | — | | | 246 | | | — | | | (453) | | | — | | | — | | | 5,254 | | | 110 | | | — | |
| Other assets | | 168 | | | 32 | | | — | | | (12) | | | 4 | | | (7) | | | 18 | | | — | | | — | | | 203 | | | 30 | | | — | |
| Total other assets | | 5,519 | | | 142 | | | — | | | (12) | | | 250 | | | (7) | | | (435) | | | — | | | — | | | 5,457 | | | 140 | | | — | |
| Total assets | | $10,337 | | | ($134) | | | ($6) | | | $1,166 | | | $250 | | | ($780) | | | ($598) | | | $466 | | | ($229) | | | $10,472 | | | $119 | | | ($5) | |
| | | | | | | | | | | | | | | | | | | | | | | | |
| Liabilities | | | | | | | | | | | | | | | | | | | | | | | | |
| Debt | | $433 | | | $6 | | | $— | | | ($11) | | | $38 | | | $— | | | ($4) | | | $— | | | $— | | | $462 | | | $21 | | | $— | |
| Other liabilities | | 63 | | | 13 | | | — | | | 6 | | | 39 | | | — | | | (6) | | | — | | | — | | | 115 | | | 7 | | | — | |
| Total liabilities | | $496 | | | $19 | | | $— | | | ($5) | | | $77 | | | $— | | | ($10) | | | $— | | | $— | | | $577 | | | $28 | | | $— | |
| | | | | | | | |
| Freddie Mac 2Q 2024 Form 10-Q | | 86 |
| | | | | |
| Financial Statements | Notes to the Condensed Consolidated Financial Statements | Note 13 |
| | | | | | | | | | | | | | | | | | | | | | | | | | | | | | | | | | | | | | | | | | | | | | | | | | | | | | | | | | | | | | | | | | | | | | | | | | |
| | | 2Q 2023 |
| | | Balance,
April 1,
2023 | | Total Realized/Unrealized Gains/Losses(1) | | Purchases | | Issues | | Sales | | Settlements,
Net | | Transfers
into
Level 3 | | Transfers
out of
Level 3 | | Balance,
June 30,
2023 | | Change in Unrealized Gains/Losses(1) Included in Net Income Related to Assets and Liabilities Still Held as of June 30, 2023(2) | | Change in Unrealized Gains/Losses(1), Net of Tax, Included in OCI Related to Assets and Liabilities Still Held as of June 30, 2023 |
| (In millions) | | | Included in
Earnings | | Included in Other
Comprehensive
Income | | | | | | | | | |
| | | | | |
| Assets | | | | | | | | | | | | | | | | | | | | | | | | |
| Investment securities: | | | | | | | | | | | | | | | | | | | | | | | | |
| Available-for-sale | | $853 | | | $— | | | ($5) | | | $— | | | $— | | | $— | | | ($58) | | | $— | | | $— | | | $790 | | | $— | | | ($4) | |
| Trading | | 2,905 | | | (191) | | | — | | | 90 | | | — | | | — | | | (13) | | | — | | | (230) | | | 2,561 | | | (25) | | | — | |
| Total investment securities | | 3,758 | | | (191) | | | (5) | | | 90 | | | — | | | — | | | (71) | | | — | | | (230) | | | 3,351 | | | (25) | | | (4) | |
| Mortgage loans held-for-sale | | 347 | | | (30) | | | — | | | 727 | | | — | | | — | | | (9) | | | — | | | (154) | | | 881 | | | (31) | | | — | |
| Mortgage loans held-for-investment | | 64 | | | (13) | | | — | | | — | | | — | | | — | | | (6) | | | 142 | | | (17) | | | 170 | | | (12) | | | — | |
| Other assets: | | | | | | | | | | | | | | | | | | | | | | | | |
| Guarantee assets | | 5,432 | | | (79) | | | — | | | — | | | 192 | | | — | | | (222) | | | — | | | — | | | 5,323 | | | (79) | | | — | |
| Other assets | | 128 | | | 39 | | | — | | | (8) | | | 4 | | | — | | | (4) | | | — | | | — | | | 159 | | | 38 | | | — | |
| Total other assets | | 5,560 | | | (40) | | | — | | | (8) | | | 196 | | | — | | | (226) | | | — | | | — | | | 5,482 | | | (41) | | | — | |
| Total assets | | $9,729 | | | ($274) | | | ($5) | | | $809 | | | $196 | | | $— | | | ($312) | | | $142 | | | ($401) | | | $9,884 | | | ($109) | | | ($4) | |
| | | | | | | | | | | | | | | | | | | | | | | | |
Liabilities | | | | | | | | | | | | | | | | | | | | | | | | |
| Debt | | $384 | | | ($8) | | | $— | | | $— | | | $— | | | $— | | | ($2) | | | $— | | | $— | | | $374 | | | ($2) | | | $— | |
| Other liabilities | | 77 | | | 23 | | | — | | | — | | | — | | | — | | | (1) | | | — | | | — | | | 99 | | | 22 | | | — | |
| Total liabilities | | $461 | | | $15 | | | $— | | | $— | | | $— | | | $— | | | ($3) | | | $— | | | $— | | | $473 | | | $20 | | | $— | |
| | | | | | | | | | | | | | | | | | | | | | | | | | | | | | | | | | | | | | | | | | | | | | | | | | | | | | | | | | | | | | | | | | | | | | | | | | |
| | | | | | | | | | | | | | | | | | | | | | | | |
| | | YTD 2023 |
| | | Balance,
January 1,
2023 | | Total Realized/Unrealized Gains/Losses(1) | | Purchases | | Issues | | Sales | | Settlements,
Net | | Transfers
into
Level 3 | | Transfers
out of
Level 3 | | Balance,
June 30,
2023 | | Change in Unrealized Gains/Losses(1) Included in Net Income Related to Assets and Liabilities Still Held as of June 30, 2023(2) | | Change in Unrealized Gains/Losses(1), Net of Tax, Included in OCI Related to Assets and Liabilities Still Held as of June 30, 2023 |
| (In millions) | | | Included in
Earnings | | Included in Other
Comprehensive
Income | | | | | | | | |
| | | | | |
| Assets | | | | | | | | | | | | | | | | | | | | | | | | |
| Investment securities: | | | | | | | | | | | | | | | | | | | | | | | | |
| Available-for-sale | | $894 | | | $1 | | | ($9) | | | $— | | | $— | | | $— | | | ($96) | | | $— | | | $— | | | $790 | | | $— | | | ($7) | |
| Trading | | 2,731 | | | (329) | | | — | | | 183 | | | — | | | — | | | (24) | | | — | | | — | | | 2,561 | | | 10 | | | — | |
| Total investment securities | | 3,625 | | | (328) | | | (9) | | | 183 | | | — | | | — | | | (120) | | | — | | | — | | | 3,351 | | | 10 | | | (7) | |
| Mortgage loans held-for-sale | | 310 | | | (29) | | | — | | | 753 | | | — | | | — | | | (11) | | | 12 | | | (154) | | | 881 | | | (31) | | | — | |
| Mortgage loans held-for-investment | | 110 | | | (11) | | | — | | | — | | | — | | | — | | | (6) | | | 142 | | | (65) | | | 170 | | | (12) | | | — | |
| Other assets: | | | | | | | | | | | | | | | | | | | | | | | | — | |
| Guarantee assets | | 5,442 | | | 8 | | | — | | | — | | | 318 | | | — | | | (445) | | | — | | | — | | | 5,323 | | | 8 | | | — | |
| Other assets | | 131 | | | 55 | | | — | | | (18) | | | 3 | | | — | | | (12) | | | — | | | — | | | 159 | | | 54 | | | — | |
| Total other assets | | 5,573 | | | 63 | | | — | | | (18) | | | 321 | | | — | | | (457) | | | — | | | — | | | 5,482 | | | 62 | | | — | |
| Total assets | | $9,618 | | | ($305) | | | ($9) | | | $918 | | | $321 | | | $— | | | ($594) | | | $154 | | | ($219) | | | $9,884 | | | $29 | | | ($7) | |
| | | | | | | | | | | | | | | | | | | | | | | | |
| Liabilities | | | | | | | | | | | | | | | | | | | | | | | | |
| Debt | | $388 | | | ($19) | | | $— | | | $— | | | $11 | | | $— | | | ($6) | | | $— | | | $— | | | $374 | | | ($9) | | | $— | |
| Other liabilities | | 97 | | | 4 | | | — | | | — | | | — | | | — | | | (2) | | | — | | | — | | | 99 | | | 2 | | | — | |
| Total liabilities | | $485 | | | ($15) | | | $— | | | $— | | | $11 | | | $— | | | ($8) | | | $— | | | $— | | | $473 | | | ($7) | | | $— | |
(1)For assets, increase and decrease in earnings and other comprehensive income is shown as gains and (losses), respectively. For liabilities, increase and decrease in earnings and comprehensive income is shown as (gains) and losses, respectively.
(2)Represents the amount of total gains or losses for the period, included in earnings, attributable to the change in unrealized gains and losses related to assets and liabilities classified as Level 3 that were still held at June 30, 2024 and June 30, 2023.
| | | | | | | | |
| Freddie Mac 2Q 2024 Form 10-Q | | 87 |
| | | | | |
| Financial Statements | Notes to the Condensed Consolidated Financial Statements | Note 13 |
The table below provides valuation techniques, the range, and the weighted average of significant unobservable inputs for Level 3 assets and liabilities measured on our condensed consolidated balance sheets at fair value on a recurring basis.
Table 13.3 - Quantitative Information about Recurring Level 3 Fair Value Measurements | | | | | | | | | | | | | | | | | | | | | | | | | | | | | | | | |
| | June 30, 2024 |
| | | Level 3 Fair Value | | Predominant Valuation Technique(s) | | Unobservable Inputs |
(Dollars in millions, except for certain unobservable inputs as shown)
| | Type | | Range | | Weighted Average(1) |
| Assets | | | | | | | | | | |
| Investment securities: | | | | | | | | | | |
| Available-for-sale | | $451 | | | Median of external sources | | External pricing sources | | $59.9 - $69.9 | | $64.6 | |
| | | | | | | | | | |
| | | | | | | | | | |
| | | | | | | | | | |
| | | | | | | | | | |
| | 152 | | | Other | | | | | | |
| Trading | | 1,911 | | | Single external source | | External pricing source | | $0.0 - $3,922.9 | | $124.9 | |
| | 814 | | | Median of external sources | | External pricing sources | | $13.8 - $14.5 | | $14.2 | |
| | | | | | | | | | |
| | 284 | | | Other | | | | | | |
| Mortgage loans held-for-sale | | 627 | | | Single external source | | External pricing source | | $58.4 - $105.1 | | $100.3 | |
| Mortgage loans held-for-investment | | 776 | | | Single external source | | External pricing source | | $29.2 - $99.5 | | $80.0 | |
| Guarantee assets | | 4,928 | | | Discounted cash flows | | OAS | | 17 - 233 bps | | 47 bps |
| | 326 | | | Other | | | | | | |
Insignificant Level 3 assets(2) | | 203 | | | | | | | | | |
| Total Level 3 assets | | $10,472 | | | | | | | | | |
| Liabilities | | | | | | | | | | |
| | | | | | | | | | |
| | | | | | | | | | |
Insignificant Level 3 liabilities(2) | | 577 | | | | | | | | | |
| Total Level 3 liabilities | | $577 | | | | | | | | | |
| | | | | | | | | | | | | | | | | | | | | | | | | | | | | | | | |
| | | December 31, 2023 |
| | | Level 3
Fair
Value | | Predominant
Valuation
Technique(s) | | Unobservable Inputs |
(Dollars in millions, except for certain unobservable inputs as shown)
| | Type | | Range | | Weighted Average(1) |
Assets | | | | | | | | | | |
| Investment securities: | | | | | | | | | | |
| Available-for-sale | | $489 | | | Median of external sources | | External pricing sources | | $61.2 - $71.6 | | $66.7 | |
| | | | | | | | | | |
| | 189 | | | Other | | | | | | |
| Trading | | 2,085 | | | Single external source | | External pricing source | | $0.0 - $4,471.7 | | $147.3 | |
| | | | | | | | | | |
| | | | | | | | | | |
| | 686 | | | Other | | | | | | |
| Mortgage loans held-for-sale | | 896 | | | Single external source | | External pricing source | | $59.3 - $110.4 | | $100.3 | |
| Mortgage loans held-for-investment | | 473 | | | Single external source | | External pricing source | | $24.7 - $99.2 | | $74.7 | |
| Guarantee assets | | 5,014 | | | Discounted cash flows | | OAS | | 17 - 233 bps | | 47 bps |
| | 337 | | | Other | | | | | | |
Insignificant Level 3 assets(2) | | 168 | | | | | | | | | |
| Total Level 3 assets | | $10,337 | | | | | | | | | |
| Liabilities | | | | | | | | | | |
| | | | | | | | | | |
| | | | | | | | | | |
Insignificant Level 3 liabilities(2) | | 496 | | | | | | | | | |
| Total Level 3 liabilities | | $496 | | | | | | | | | |
(1) Unobservable inputs were weighted primarily by the relative fair value of the financial instruments.
(2) Represents the aggregate amount of Level 3 assets and liabilities measured at fair value on a recurring basis that are individually and in the aggregate insignificant.
| | | | | | | | |
| Freddie Mac 2Q 2024 Form 10-Q | | 88 |
| | | | | |
| Financial Statements | Notes to the Condensed Consolidated Financial Statements | Note 13 |
Assets Measured at Fair Value on a Non-Recurring Basis We may be required, from time to time, to measure certain assets at fair value on a non-recurring basis. These adjustments usually result from the application of lower-of-cost-or-fair-value accounting or measurement of impairment based on the fair value of the underlying collateral. Certain fair values in the tables below were not obtained as of period end, but were obtained during the period.
The table below presents assets measured on our condensed consolidated balance sheets at fair value on a non-recurring basis.
Table 13.4 - Assets Measured at Fair Value on a Non-Recurring Basis | | | | | | | | | | | | | | | | | | | | | | | | | | | | | | | | |
| | June 30, 2024 | | December 31, 2023 |
| (In millions) | | Level 1 | Level 2 | Level 3 | Total | | Level 1 | Level 2 | Level 3 | Total |
Mortgage loans(1) | | $— | | $363 | | $1,395 | | $1,758 | | | $— | | $640 | | $1,578 | | $2,218 | |
(1)Includes loans that are classified as held-for-investment and have an allowance for credit losses based on the fair value of the underlying collateral and held-for-sale loans where the fair value is below cost.
The table below provides valuation techniques, the range, and the weighted average of significant unobservable inputs for Level 3 assets measured on our condensed consolidated balance sheets at fair value on a non-recurring basis.
Table 13.5 - Quantitative Information About Non-Recurring Level 3 Fair Value Measurements | | | | | | | | | | | | | | | | | | | | | | | | | | |
| | June 30, 2024 |
| | Level 3 Fair Value | | Predominant Valuation Technique(s) | | Unobservable Inputs |
(Dollars in millions, except for certain unobservable inputs as shown) | | Type | Range | Weighted Average(1) |
| Mortgage loans | | $1,184 | | | Median of external sources | | External pricing sources | $74.6 - $100.8 | $83.7 |
| | 211 | | Other | | | | |
| Total | | $1,395 | | | | | | | |
| | | | | | | | |
| | | | | | | | |
| | | December 31, 2023 |
| | | Level 3 Fair Value | | Predominant Valuation Technique(s) | | Unobservable Inputs |
(Dollars in millions, except for certain unobservable inputs as shown) | | Type | Range | Weighted Average(1) |
| | | | | | | | |
| Mortgage loans | | $1,394 | | | Median of external sources | | External pricing sources | $72.9 - $98.8 | $82.4 |
| | 184 | | Other | | | | |
| Total | | $1,578 | | | | | | | |
(1) Unobservable inputs were weighted primarily by the relative fair value of the financial instruments.
| | | | | | | | |
| Freddie Mac 2Q 2024 Form 10-Q | | 89 |
| | | | | |
| Financial Statements | Notes to the Condensed Consolidated Financial Statements | Note 13 |
Fair Value of Financial Instruments The table below presents the carrying value and estimated fair value of our financial instruments. For certain types of financial instruments, such as cash and cash equivalents, securities purchased under agreements to resell, and certain debt, the carrying value on our condensed consolidated balance sheets approximates fair value, as these assets and liabilities are short-term in nature and have limited fair value volatility.
Table 13.6 - Fair Value of Financial Instruments | | | | | | | | | | | | | | | | | | | | | | | | | | | | | | | | | | | | | | | | | |
| | | June 30, 2024 |
| | GAAP Measurement Category(1) | Carrying Amount | | Fair Value |
| (In millions) | | | Level 1 | | Level 2 | | Level 3 | | Netting Adjustments(2) | | Total |
| Financial Assets | | | | | | | | | | | | | |
| Cash and cash equivalents | | Amortized cost | $5,532 | | | $5,532 | | | $— | | | $— | | | $— | | | $5,532 | |
| Securities purchased under agreements to resell | | Amortized cost | 97,180 | | | — | | | 109,256 | | | — | | | (12,076) | | | 97,180 | |
| Investment securities: | | | | | | | | | | | | | |
| Available-for-sale | | FV - OCI | 4,405 | | | — | | | 3,802 | | | 603 | | | — | | | 4,405 | |
| Trading | | FV - NI | 39,075 | | | 30,571 | | | 5,495 | | | 3,009 | | | — | | | 39,075 | |
| Total investment securities | | | 43,480 | | | 30,571 | | | 9,297 | | | 3,612 | | | — | | | 43,480 | |
| Mortgage loans: | | | | | | | | | | | | | |
| Mortgage loans held-for-sale | | | 12,346 | | | — | | | 9,200 | | | 3,332 | | | — | | | 12,532 | |
| Mortgage loans held-for-investment, net of allowance for credit losses | | | 3,105,869 | | | — | | | 2,407,165 | | | 279,070 | | | — | | | 2,686,235 | |
| Total mortgage loans | | Various(3) | 3,118,215 | | | — | | | 2,416,365 | | | 282,402 | | | — | | | 2,698,767 | |
| Other assets: | | | | | | | | | | | | | |
| Guarantee assets | | FV - NI | 5,254 | | | — | | | — | | | 5,256 | | | — | | | 5,256 | |
| Derivative assets, net | | FV - NI | 480 | | | 1 | | | 6,571 | | | 31 | | | (6,123) | | | 480 | |
Other assets(4) | | Various | 2,548 | | | — | | | 440 | | | 2,108 | | | — | | | 2,548 | |
| Total other assets | | | 8,282 | | | 1 | | | 7,011 | | | 7,395 | | | (6,123) | | | 8,284 | |
| Total financial assets | | | $3,272,689 | | | $36,104 | | | $2,541,929 | | | $293,409 | | | ($18,199) | | | $2,853,243 | |
| Financial Liabilities | | | | | | | | | | | | | |
| Debt: | | | | | | | | | | | | | |
| Debt of consolidated trusts | | | $3,066,239 | | | $— | | | $2,637,655 | | | $746 | | | $— | | | $2,638,401 | |
| Debt of Freddie Mac | | | 161,373 | | | — | | | 170,632 | | | 3,233 | | | (12,076) | | | 161,789 | |
| Total debt | | Various(5) | 3,227,612 | | | — | | | 2,808,287 | | | 3,979 | | | (12,076) | | | 2,800,190 | |
| Other liabilities: | | | | | | | | | | | | | |
| Guarantee obligations | | Amortized cost | 5,207 | | | — | | | 101 | | | 6,285 | | | — | | | 6,386 | |
| Derivative liabilities, net | | FV - NI | 1,054 | | | 7 | | | 8,363 | | | 115 | | | (7,431) | | | 1,054 | |
Other liabilities(4) | | FV - NI | 14 | | | — | | | 411 | | | 171 | | | — | | | 582 | |
| Total other liabilities | | | 6,275 | | | 7 | | | 8,875 | | | 6,571 | | | (7,431) | | | 8,022 | |
| Total financial liabilities | | | $3,233,887 | | | $7 | | | $2,817,162 | | | $10,550 | | | ($19,507) | | | $2,808,212 | |
Referenced footnotes are included after the prior period table.
| | | | | | | | |
| Freddie Mac 2Q 2024 Form 10-Q | | 90 |
| | | | | |
| Financial Statements | Notes to the Condensed Consolidated Financial Statements | Note 13 |
| | | | | | | | | | | | | | | | | | | | | | | | | | | | | | | | | | | | | | | | | |
| | | December 31, 2023 |
| | | GAAP Measurement Category(1) | Carrying Amount | | Fair Value |
| (In millions) | | | Level 1 | | Level 2 | | Level 3 | | Netting Adjustments(2) | | Total |
| Financial Assets | | | | | | | | | | | | | |
| Cash and cash equivalents | | Amortized cost | $6,019 | | | $6,019 | | | $— | | | $— | | | $— | | | $6,019 | |
| Securities purchased under agreements to resell | | Amortized cost | 95,148 | | | — | | | 105,393 | | | — | | | (10,245) | | | 95,148 | |
| Investment securities: | | | | | | | | | | | | | |
| Available-for-sale | | FV - OCI | 4,890 | | | — | | | 4,212 | | | 678 | | | — | | | 4,890 | |
| Trading | | FV - NI | 38,385 | | | 29,854 | | | 5,760 | | | 2,771 | | | — | | | 38,385 | |
| Total investment securities | | | 43,275 | | | 29,854 | | | 9,972 | | | 3,449 | | | — | | | 43,275 | |
| Mortgage loans: | | | | | | | | | | | | | |
| Mortgage loans held-for-sale | | | 12,941 | | | — | | | 9,276 | | | 3,868 | | | — | | | 13,144 | |
| Mortgage loans held-for-investment, net of allowance for credit losses | | | 3,083,665 | | | — | | | 2,466,127 | | | 254,877 | | | — | | | 2,721,004 | |
| Total mortgage loans | | Various(3) | 3,096,606 | | | — | | | 2,475,403 | | | 258,745 | | | — | | | 2,734,148 | |
| Other assets: | | | | | | | | | | | | | |
| Guarantee assets | | FV - NI | 5,351 | | | — | | | — | | | 5,353 | | | — | | | 5,353 | |
| Derivative assets, net | | FV - NI | 486 | | | — | | | 6,209 | | | 2 | | | (5,725) | | | 486 | |
Other assets(4) | | Various | 2,107 | | | — | | | 946 | | | 1,165 | | | — | | | 2,111 | |
| Total other assets | | | 7,944 | | | — | | | 7,155 | | | 6,520 | | | (5,725) | | | 7,950 | |
| Total financial assets | | | $3,248,992 | | | $35,873 | | | $2,597,923 | | | $268,714 | | | ($15,970) | | | $2,886,540 | |
| Financial Liabilities | | | | | | | | | | | | | |
| Debt: | | | | | | | | | | | | | |
| Debt of consolidated trusts | | | $3,041,927 | | | $— | | | $2,673,019 | | | $727 | | | $— | | | $2,673,746 | |
| Debt of Freddie Mac | | | 166,419 | | | — | | | 173,877 | | | 3,391 | | | (10,245) | | | 167,023 | |
| Total debt | | Various(5) | 3,208,346 | | | — | | | 2,846,896 | | | 4,118 | | | (10,245) | | | 2,840,769 | |
| Other liabilities: | | | | | | | | | | | | | |
| Guarantee obligations | | Amortized cost | 5,451 | | | — | | | 103 | | | 6,023 | | | — | | | 6,126 | |
| Derivative liabilities, net | | FV - NI | 873 | | | — | | | 8,608 | | | 63 | | | (7,798) | | | 873 | |
Other liabilities(4) | | FV - NI | 14 | | | — | | | 465 | | | 194 | | | — | | | 659 | |
| Total other liabilities | | | 6,338 | | | — | | | 9,176 | | | 6,280 | | | (7,798) | | | 7,658 | |
| Total financial liabilities | | | $3,214,684 | | | $— | | | $2,856,072 | | | $10,398 | | | ($18,043) | | | $2,848,427 | |
(1)FV - NI denotes fair value through net income. FV - OCI denotes fair value through other comprehensive income.
(2)Represents counterparty netting and cash collateral netting, and includes accrued interest receivable and payable.
(3)The GAAP carrying amounts measured at amortized cost, lower-of-cost-or-fair-value, and FV - NI were $3.1 trillion, $4.4 billion, and $9.9 billion as of June 30, 2024, respectively, and $3.1 trillion, $5.6 billion and $9.2 billion as of December 31, 2023, respectively.
(4)For other assets, includes advances to lenders, secured lending, and loan commitments. For other liabilities, includes loan commitments.
(5)The GAAP carrying amounts measured at amortized cost and FV - NI were $3.2 trillion and $2.9 billion as of June 30, 2024, respectively, and $3.2 trillion and $2.5 billion as of December 31, 2023, respectively.
| | | | | | | | |
| Freddie Mac 2Q 2024 Form 10-Q | | 91 |
| | | | | |
| Financial Statements | Notes to the Condensed Consolidated Financial Statements | Note 13 |
We elected the fair value option for certain mortgage loans and loan commitments and certain debt issuances.
The table below presents the fair value and UPB related to items for which we have elected the fair value option.
Table 13.7 - Difference between Fair Value and UPB for Certain Financial Instruments with Fair Value Option Elected(1) | | | | | | | | | | | | | | | | | | | | | | | | | | |
| | June 30, 2024 | | December 31, 2023 |
| (In millions) | | Fair value | UPB | Difference | | Fair value | UPB | Difference |
| Mortgage loans held-for-sale | | $7,956 | | $7,867 | | $89 | | | $7,356 | | $7,080 | | $276 | |
| Mortgage loans held-for-investment | | 1,991 | | 2,318 | | (327) | | | 1,806 | | 2,095 | | (289) | |
| Debt of Freddie Mac | | 177 | | 172 | | 5 | | | 240 | | 234 | | 6 | |
| Debt of consolidated trusts | | 2,116 | | 2,235 | | (119) | | | 1,705 | | 1,799 | | (94) | |
| Other assets (other liabilities) | | 62 | | N/A | N/A | | 95 | | N/A | N/A |
(1) Excludes interest-only securities related to debt of consolidated trusts and debt of Freddie Mac with a fair value of $0.6 billion and $0.5 billion as of June 30, 2024 and December 31, 2023, respectively.
Changes in Fair Value Under the Fair Value Option Election The table below presents the changes in fair value related to items for which we have elected the fair value option. These amounts are included in investment gains, net, on our condensed consolidated statements of income.
Table 13.8 - Changes in Fair Value Under the Fair Value Option Election | | | | | | | | | | | | | | | | | | | | |
| | 2Q 2024 | 2Q 2023 | | YTD 2024 | YTD 2023 |
| (In millions) | | Gains (Losses) | | Gains (Losses) |
| Mortgage loans held-for-sale | | ($21) | | ($127) | | | ($180) | | ($123) | |
| Mortgage loans held-for-investment | | (26) | | (30) | | | (57) | | (4) | |
| Debt of Freddie Mac | | 4 | | 5 | | | 5 | | 19 | |
| Debt of consolidated trusts | | (3) | | 35 | | | 6 | | — | |
| Other assets/other liabilities | | 99 | | (1) | | | 242 | | 54 | |
Changes in fair value attributable to instrument-specific credit risk were not material for the periods presented for assets or liabilities for which we elected the fair value option.
| | | | | | | | |
| Freddie Mac 2Q 2024 Form 10-Q | | 92 |
| | | | | |
| Financial Statements | Notes to the Condensed Consolidated Financial Statements | Note 14 |
NOTE 14
Legal Contingencies
We are involved, directly or indirectly, in a variety of legal and regulatory proceedings arising from time to time in the ordinary course of business (including, among other things, contractual disputes, personal injury claims, employment-related litigation, and other legal proceedings incidental to our business) and in connection with the conservatorship and Purchase Agreement. We are frequently involved, directly or indirectly, in litigation involving mortgage foreclosures. From time to time, we are also involved in proceedings arising from our termination of a seller's or servicer's eligibility to sell loans to, and/or service loans for, us. In these cases, the former seller or servicer sometimes seeks damages against us for wrongful termination under a variety of legal theories. In addition, we are sometimes sued in connection with the origination or servicing of loans. These suits typically involve claims alleging wrongful actions of sellers and servicers. Our contracts with our sellers and servicers generally provide for indemnification of Freddie Mac against liability arising from sellers' and servicers' wrongful actions with respect to loans sold to or serviced for Freddie Mac.
Litigation claims and proceedings of all types are subject to many uncertainties (including appeals and procedural filings), and there can be no assurance as to the ultimate outcome of those actions (including the matters described below). In accordance with the accounting guidance for contingencies, we reserve for litigation claims and assessments asserted or threatened against us when a loss is probable (as defined in such guidance) and the amount of the loss can be reasonably estimated. The actual costs of resolving legal actions may be substantially higher or lower than the amounts accrued for those actions.
It is not possible for us to predict the actions the U.S. government (including Treasury and FHFA) might take in connection with any of these lawsuits or any future lawsuits. However, it is possible that we could be adversely affected by these actions, including, for example, by changes to the Purchase Agreement, or any resulting actual or perceived changes in the level of U.S. government support for our business.
Putative Securities Class Action Lawsuit: Ohio Public Employees Retirement System vs. Freddie Mac, Syron, Et Al. This putative securities class action lawsuit was filed against Freddie Mac and certain former officers on January 18, 2008 in the U.S. District Court for the Northern District of Ohio purportedly on behalf of a class of purchasers of Freddie Mac stock from August 1, 2006 through November 20, 2007. FHFA later intervened as Conservator, and the plaintiff amended its complaint on several occasions. The plaintiff alleged, among other things, that the defendants violated federal securities laws by making false and misleading statements concerning our business, risk management, and the procedures we put into place to protect the company from problems in the mortgage industry. The plaintiff seeks unspecified damages and interest, and reasonable costs and expenses, including attorney and expert fees.
In August 2018, the District Court denied the plaintiff's motion for class certification. On April 6, 2023, the Sixth Circuit reversed the District Court's September 17, 2020 decision to grant the plaintiff's request for summary judgment and enter final judgment in favor of Freddie Mac and other defendants. The Sixth Circuit remanded the case to the District Court for further proceedings. On May 3, 2024, defendants filed motions for summary judgment. The trial in the District Court is scheduled to begin on October 6, 2025.
Litigation Concerning the Purchase Agreement in the U.S. District Court for the District of Columbia In re Fannie Mae/Freddie Mac Senior Preferred Stock Purchase Agreement Class Action Litigations. This is a consolidated class action lawsuit filed by private individual and institutional investors (collectively, "Class Plaintiffs") against FHFA, Fannie Mae, and Freddie Mac.
Fairholme Funds, Inc., et al. v. FHFA, et al. This is an individual plaintiffs’ lawsuit by certain institutional investors (“Individual Plaintiffs”) against FHFA, Fannie Mae, and Freddie Mac.
The Class Plaintiffs and Individual Plaintiffs (collectively "Plaintiffs") in the District of Columbia lawsuits filed an amended complaint on November 1, 2017 alleging claims for breach of contract, breach of the implied covenant of good faith and fair dealing, breach of fiduciary duties, and violation of Delaware and Virginia corporate law. Additionally, the Class Plaintiffs brought derivative claims against FHFA for breach of fiduciary duties and the Individual Plaintiffs brought claims under the Administrative Procedure Act. Both sets of claims are generally based on allegations that the net worth sweep dividend provisions of the senior preferred stock that were implemented pursuant to the August 2012 amendments nullified certain of the shareholders’ rights, including the rights to receive dividends and a liquidation preference. On September 28, 2018, the District
| | | | | | | | |
| Freddie Mac 2Q 2024 Form 10-Q | | 93 |
| | | | | |
| Financial Statements | Notes to the Condensed Consolidated Financial Statements | Note 14 |
Court dismissed all of the claims except those for breach of the implied covenant of good faith and fair dealing. The cases were consolidated for trial.
Court rulings limited the Plaintiffs’ damages theories to those based on the decline in Freddie Mac’s and Fannie Mae’s share value immediately after the Third Amendment. The Plaintiffs asserted losses based on the decline in value of Freddie Mac’s common and junior preferred stock from August 16 to August 17, 2012. During the trial in October and early November 2022, the Plaintiffs requested that the jury award $832 million plus pre-judgment interest as damages against Freddie Mac. The jury in that trial was not able to reach a unanimous verdict and on November 7, 2022 the judge declared a mistrial. The retrial started on July 24, 2023. On August 14, 2023, the jury returned a verdict against FHFA, Fannie Mae, and Freddie Mac awarding compensatory damages of $282 million to Freddie Mac junior preferred shareholders and $31 million to Freddie Mac common shareholders. The jury declined to award the Freddie Mac shareholders prejudgment interest. In 3Q 2023, we recorded a $313 million accrual in other expense on our condensed consolidated statements of income for the adverse judgment. On March 20, 2024, the District Court entered final judgment. On April 17, 2024, the defendants filed a motion requesting entry of judgment in their favor notwithstanding the jury verdict, which has been fully briefed.
| | | | | | | | |
| Freddie Mac 2Q 2024 Form 10-Q | | 94 |
| | | | | |
| Financial Statements | Notes to the Condensed Consolidated Financial Statements | Note 15 |
NOTE 15
Regulatory Capital
The table below presents our capital metrics under the ERCF.
Table 15.1 - ERCF Available Capital and Capital Requirements
| | | | | | | | | | | | | | | | | | | | | | | |
| (In billions) | June 30, 2024 | December 31, 2023 |
| Adjusted total assets | $3,749 | | $3,775 | |
| Risk-weighted assets (standardized approach) | 1,003 | | 1,009 | |
| | | | | | |
| | June 30, 2024 |
| | Amounts | Ratios |
| (Dollars in billions) | | Available Capital (Deficit) | Minimum
Capital
Requirement | Capital Requirement (Including Buffer(1)) | Available Capital (Deficit) Ratio(2) | Minimum Capital Requirement Ratio(2) | Capital Requirement Ratio(2) (Including Buffer(1)) |
| Risk-based capital: | | | | | | | |
| Total capital | | ($12) | | $80 | | $80 | | (1.2) | % | 8.0 | % | 8.0 | % |
| CET1 capital | | (38) | | 45 | | 102 | | (3.8) | | 4.5 | | 10.2 | |
| Tier 1 capital | | (24) | | 60 | | 117 | | (2.4) | | 6.0 | | 11.7 | |
| Adjusted total capital | | (24) | | 80 | | 137 | | (2.4) | | 8.0 | | 13.7 | |
| Leverage capital: | | | | | | | |
| Core capital | | (19) | | 94 | | 94 | | (0.5) | | 2.5 | | 2.5 | |
| Tier 1 capital | | (24) | | 94 | | 108 | | (0.6) | | 2.5 | | 2.9 | |
| | | | | | | |
| | December 31, 2023 |
| | Amounts | Ratios |
| (Dollars in billions) | | Available Capital (Deficit) | Minimum
Capital
Requirement | Capital Requirement (Including Buffer(1)) | Available Capital (Deficit) Ratio(2) | Minimum Capital Requirement Ratio(2) | Capital Requirement Ratio(2) (Including Buffer(1)) |
| Risk-based capital: | | | | | | | |
| Total capital | | ($18) | | $81 | | $81 | | (1.8) | % | 8.0 | % | 8.0 | % |
| CET1 capital | | (43) | | 45 | | 96 | | (4.3) | | 4.5 | | 9.5 | |
| Tier 1 capital | | (29) | | 60 | | 111 | | (2.9) | | 6.0 | | 11.0 | |
| Adjusted total capital | | (29) | | 81 | | 132 | | (2.9) | | 8.0 | | 13.0 | |
| Leverage capital: | | | | | | | |
| Core capital | | (25) | | 95 | | 95 | | (0.7) | | 2.5 | | 2.5 | |
| Tier 1 capital | | (29) | | 95 | | 106 | | (0.8) | | 2.5 | | 2.8 | |
(1)PCCBA for risk-based capital and PLBA for leverage capital.
(2)As a percentage of RWA for risk-based capital and ATA for leverage capital.
END OF CONDENSED CONSOLIDATED FINANCIAL STATEMENTS AND ACCOMPANYING NOTES
| | | | | | | | |
| Freddie Mac 2Q 2024 Form 10-Q | | 95 |
Other Information
LEGAL PROCEEDINGS
We are involved, directly or indirectly, in a variety of legal proceedings arising from time to time in the ordinary course of business and in connection with the conservatorship and Purchase Agreement. See Note 14 for additional information regarding our involvement as a party to various legal proceedings, including those in connection with the conservatorship and Purchase Agreement.
Over the last several years, numerous lawsuits have been filed against the U.S. government and, in some cases, the Secretary of the Treasury and the Director of FHFA, challenging certain government actions related to the conservatorship (including actions taken in connection with the imposition of conservatorship) and the Purchase Agreement. Freddie Mac is not a party to all of these lawsuits. Several of the lawsuits seek to invalidate the net worth sweep dividend provisions of the senior preferred stock, which were implemented pursuant to the August 2012 amendment to the Purchase Agreement. Some of these cases also have challenged the constitutionality of the structure of FHFA. A number of cases have been dismissed (some of which have been appealed), and others remain pending.
These cases include one that was filed in the U.S. Court of Federal Claims as a derivative lawsuit, purportedly on behalf of Freddie Mac as a “nominal” defendant: Reid and Fisher vs. the United States of America and Federal Home Loan Mortgage Corporation. This case was filed on February 26, 2014. The complaint alleges, among other items, that the net worth sweep dividend provisions of the senior preferred stock constitute an unlawful taking of private property for public use without just compensation. The plaintiffs ask that Freddie Mac be awarded just compensation for the U.S. government's alleged taking of its property, attorneys' fees, costs, and other expenses. The Court dismissed the case with prejudice on September 1, 2023 and entered judgment for the defendants. On October 31, 2023, the plaintiffs filed a notice of appeal to the Federal Circuit.
Pursuant to the Purchase Agreement, in addition to satisfying other conditions, all currently pending material litigation related to our conservatorship and/or the Purchase Agreement must be resolved or settled and we must indemnify Treasury and the United States from and against any loss, cost, or damage of any kind arising out of our placement into conservatorship or the August 2012 amendment to the Purchase Agreement in order to exit from conservatorship.
RISK FACTORS
This Form 10-Q should be read together with the Risk Factors section in our 2023 Annual Report, which describes various risks and uncertainties to which we are or may become subject. These risks and uncertainties could, directly or indirectly, adversely affect our business, financial condition, results of operations, cash flows, strategies, and/or prospects.
UNREGISTERED SALES OF EQUITY SECURITIES AND USE OF PROCEEDS
Recent Sales of Unregistered Securities
The securities we issue are "exempted securities" under the Securities Act of 1933, as amended. As a result, we do not file registration statements with the SEC with respect to offerings of our securities.
Following our entry into conservatorship, we suspended the operation of, and ceased making grants under, equity compensation plans. Previously, we had provided equity compensation under those plans to employees and members of the Board of Directors. Under the Purchase Agreement, we cannot issue any new options, rights to purchase, participations, or other equity interests without Treasury's prior approval.
Information About Certain Securities Issuances by Freddie Mac
We make available, free of charge through our website at www.freddiemac.com/investors, our annual reports on Form 10-K, quarterly reports on Form 10-Q, current reports on Form 8-K, and all other SEC reports and amendments to those reports as soon as reasonably practicable after we electronically file the material with the SEC. The SEC also maintains an internet site (www.sec.gov) that contains reports, proxy and information statements, and other information regarding companies that file electronically with the SEC.
We provide information on the ERCF on our website at www.freddiemac.com/investors.
| | | | | | | | |
| Freddie Mac 2Q 2024 Form 10-Q | | 96 |
We provide disclosure about our debt securities on our website at www.freddiemac.com/debt. From this address, investors can access the offering circular and related supplements for debt securities offerings under Freddie Mac's global debt facility, including pricing supplements for individual issuances of debt securities. Similar information about our STACR transactions and SCR transactions is available at crt.freddiemac.com and mf.freddiemac.com/investors, respectively.
We provide disclosure about our mortgage-related securities, some of which are off-balance sheet obligations (e.g., K Certificates and SB Certificates), on our website at www.freddiemac.com/mbs and mf.freddiemac.com/investors. From these addresses, investors can access information and documents, including offering circulars and offering circular supplements, for mortgage-related securities offerings.
We provide additional information, including product descriptions, investor presentations, securities issuance calendars, transactions volumes and details, redemption notices, Freddie Mac research, and material developments or other events that may be important to investors, in each case as applicable, on the websites for our business activities, which can be found at sf.freddiemac.com, mf.freddiemac.com, and capitalmarkets.freddiemac.com/capital-markets.
We provide information on our sustainability efforts on our website at freddiemac.com/about/sustainability.
OTHER INFORMATION
Insider Trading Arrangements and Policies
No executive officer or director adopted or terminated any contract, instruction, or written plan for the purchase or sale of, or any other such trading arrangement for, our securities during 2Q 2024. For additional information on executive officer and director compensation and security ownership by our executive officers and directors, see Directors, Corporate Governance, and Executive Officers, Executive Compensation, and Security Ownership of Certain Beneficial Owners and Management and Related Stockholder Matters in our 2023 Annual Report.
EXHIBITS
The exhibits are listed in the Exhibit Index of this Form 10-Q.
| | | | | | | | |
| Freddie Mac 2Q 2024 Form 10-Q | | 97 |
Controls and Procedures
EVALUATION OF DISCLOSURE CONTROLS AND PROCEDURES
Disclosure controls and procedures include, without limitation, controls and procedures designed to ensure that the information we are required to disclose in reports that we file or submit under the Exchange Act is recorded, processed, summarized, and reported within the time periods specified by the SEC's rules and forms and that such information is accumulated and communicated to management of the company, including the company's Interim CEO and Interim CFO, as appropriate, to allow timely decisions regarding required disclosure. In designing our disclosure controls and procedures, we recognize that any controls and procedures, no matter how well designed and operated, can provide only reasonable assurance of achieving the desired control objectives, and we must apply judgment in implementing possible controls and procedures.
Management, including the company's Interim CEO and Interim CFO, conducted an evaluation of the effectiveness of our disclosure controls and procedures as of June 30, 2024. As a result of management's evaluation, our Interim CEO and Interim CFO concluded that our disclosure controls and procedures were not effective as of June 30, 2024, at a reasonable level of assurance, because we have not been able to update our disclosure controls and procedures to provide reasonable assurance that information known by FHFA on an ongoing basis is communicated from FHFA to Freddie Mac's management in a manner that allows for timely decisions regarding our required disclosure under the federal securities laws. We consider this situation to be a material weakness in our internal control over financial reporting.
CHANGES IN INTERNAL CONTROL OVER FINANCIAL REPORTING DURING 2Q 2024
We evaluated the changes in our internal control over financial reporting that occurred during 2Q 2024 and concluded that there were no changes that materially affected, or are reasonably likely to materially affect, our internal control over financial reporting.
MITIGATING ACTIONS RELATED TO THE MATERIAL WEAKNESS IN INTERNAL CONTROL OVER FINANCIAL REPORTING
As described above under Evaluation of Disclosure Controls and Procedures, we have one material weakness in internal control over financial reporting as of June 30, 2024 that we have not remediated.
Given the structural nature of this material weakness, we believe it is likely that we will not remediate it while we are under conservatorship. However, both we and FHFA have continued to engage in activities and employ procedures and practices intended to permit accumulation and communication to management of information needed to meet our disclosure obligations under the federal securities laws. These include the following:
n FHFA has established the Division of Conservatorship Oversight and Readiness, which is intended to facilitate operation of the company with the oversight of the Conservator.
n We provide drafts of our SEC filings to FHFA personnel for their review and comment prior to filing. We also provide drafts of certain external press releases and statements to FHFA personnel for their review and comment prior to release.
n FHFA personnel, including senior officials, review our SEC filings prior to filing, including this Form 10-Q, and engage in discussions with us regarding issues associated with the information contained in those filings. Prior to filing this Form 10-Q, FHFA provided us with a written acknowledgment that it had reviewed the Form 10-Q, was not aware of any material misstatements or omissions in the Form 10-Q, and had no objection to our filing the Form 10-Q.
n Our senior management meets regularly with senior leadership at FHFA, including, but not limited to, the Director.
n FHFA representatives attend meetings frequently with various groups within the company to enhance the flow of information and to provide oversight on a variety of matters, including accounting, credit and capital markets management, external communications, and legal matters.
n Senior officials within FHFA's accounting group meet frequently with our senior financial executives regarding our accounting policies, practices, and procedures.
Although we and FHFA have attempted to design and implement disclosure policies and procedures to account for the conservatorship and accomplish the same objectives as disclosure controls and procedures for a typical reporting company, there are inherent structural limitations on our ability to design, implement, test, or operate effective disclosure controls and procedures under the circumstances of conservatorship. Despite our material weakness, we believe that our condensed consolidated financial statements for 2Q 2024 have been prepared in conformity with GAAP.
| | | | | | | | |
| Freddie Mac 2Q 2024 Form 10-Q | | 98 |
Exhibit Index
| | | | | |
| Exhibit | Description* |
| |
| 31.1 | |
| |
| |
| 31.2 | |
| |
| |
| 32.1 | |
| |
| |
| 32.2 | |
| |
| |
| |
| |
| |
| |
| |
| |
| |
| |
| |
| |
| |
| |
| |
| |
| |
| |
| |
| |
| 101.INS | XBRL Instance Document - the instance document does not appear in the Interactive Data File because its XBRL tags are embedded within the Inline XBRL document |
| |
| |
| 101.SCH | XBRL Taxonomy Extension Schema |
| |
| |
| 101. CAL | XBRL Taxonomy Extension Calculation |
| |
| |
| 101.DEF | XBRL Taxonomy Extension Definition |
| |
| |
| 101.LAB | XBRL Taxonomy Label |
| |
| |
| 101. PRE | XBRL Taxonomy Extension Presentation |
| |
| |
| 104 | Cover Page Interactive Data File - the cover page interactive data file does not appear in the Interactive Data File because its XBRL tags are embedded within the Inline XBRL document |
| |
| * | The SEC file numbers for the Registrant's Registration Statement on Form 10, Annual Reports on Form 10-K, Quarterly Reports on Form 10-Q, and Current Reports on Form 8-K are 000-53330 and 001-34139. |
| |
| |
| | | | | | | | |
| Freddie Mac 2Q 2024 Form 10-Q | | 99 |
Signatures
Pursuant to the requirements of the Securities Exchange Act of 1934, the registrant has duly caused this report to be signed on its behalf by the undersigned thereunto duly authorized.
| | | | | | | | |
| Federal Home Loan Mortgage Corporation |
| |
| By: | | /s/ Michael T. Hutchins |
| | Michael T. Hutchins |
| | President and Interim Chief Executive Officer |
| | (Principal Executive Officer) |
Date: July 31, 2024
| | | | | | | | |
| By: | | /s/ James Whitlinger |
| | James Whitlinger |
| | Interim Chief Financial Officer |
| | (Principal Financial Officer) |
Date: July 31, 2024
| | | | | | | | |
| Freddie Mac 2Q 2024 Form 10-Q | | 100 |
Form 10-Q Index
| | | | | | | | |
| Item Number | | Page(s) |
| PART I | FINANCIAL INFORMATION | |
| Item 1. | Financial Statements | |
| Item 2. | Management's Discussion and Analysis of Financial Condition and Results of Operations | |
| Item 3. | Quantitative and Qualitative Disclosures About Market Risk | |
| Item 4. | Controls and Procedures | |
| PART II | OTHER INFORMATION | |
| Item 1. | Legal Proceedings | |
| Item 1A. | Risk Factors | |
| Item 2. | Unregistered Sales of Equity Securities and Use of Proceeds | |
| Item 5. | Other Information | |
| Item 6. | Exhibits | |
| Exhibit Index | | |
| Signatures | | |
| | | | | | | | |
| Freddie Mac 2Q 2024 Form 10-Q | | 101 |