UNITED STATES
SECURITIES AND EXCHANGE COMMISSION
Washington, D.C. 20549
FORM N-CSR
CERTIFIED SHAREHOLDER REPORT OF REGISTERED MANAGEMENT INVESTMENT COMPANIES
Investment Company Act file number: 811-07899 and 811-07885
Name of Fund: BlackRock Index Funds, Inc.
BlackRock International Index Fund
BlackRock Small Cap Index Fund
Quantitative Master Series LLC
Master Small Cap Index Series
Fund Address: 100 Bellevue Parkway, Wilmington, DE 19809
Name and address of agent for service: John M. Perlowski, Chief Executive Officer, BlackRock Index Funds, Inc. and Quantitative Master Series LLC, 55 East 52nd Street, New York, NY 10055
Registrants’ telephone number, including area code: (800) 441-7762
Date of fiscal year end: 12/31/2016
Date of reporting period: 12/31/2016
Item 1 – Report to Stockholders
DECEMBER 31, 2016
|
ANNUAL REPORT
|

|
BlackRock Index Funds, Inc.
| Ø | BlackRock International Index Fund |
| Ø | BlackRock Small Cap Index Fund |
| Not FDIC Insured • May Lose Value • No Bank Guarantee |
| Table of Contents | ||||
| Page | ||||
| 3 | ||||
| Annual Report: |
||||
| 4 | ||||
| 8 | ||||
| 8 | ||||
| 8 | ||||
| Fund Financial Statements: |
||||
| 9 | ||||
| 19 | ||||
| 20 | ||||
| 21 | ||||
| 22 | ||||
| 28 | ||||
| Fund Report of Independent Registered Public Accounting Firm |
40 | |||
| 40 | ||||
| 41 | ||||
| Series Financial Statements: |
||||
| 42 | ||||
| 62 | ||||
| 63 | ||||
| 64 | ||||
| 64 | ||||
| 65 | ||||
| Series Report of Independent Registered Public Accounting Firm |
72 | |||
| 73 | ||||
| 74 | ||||
| 77 | ||||

| 2 | BLACKROCK INDEX FUNDS, INC. | DECEMBER 31, 2016 |
| The Markets in Review |
Dear Shareholder,
The year 2016 started on a fraught note with worries about slowing growth in China, plunging oil prices and sliding share prices. Then reflationary expectations in the United States helped drive a second-half global growth pick-up and big market reversals. As such, higher-quality asset classes such as Treasury bonds, municipals and investment grade credit prevailed in the first half of the year, only to struggle in the second. In contrast, risk assets sold off at the start of the year and rebounded in the latter half, with some asset classes posting strong year-end returns.
A key takeaway from 2016’s market performance is that economics can trump politics. The global reflationary theme — governments taking policy action to support growth — was the dominant driver of 2016 asset returns, outweighing significant political upheavals and uncertainty. This trend accelerated after the U.S. election on expectations for an extra boost to U.S. growth via fiscal policy.
Markets were remarkably resilient during the year. Spikes in equity volatility after big surprises such as the U.K.’s vote to leave the European Union and the outcome of the U.S. presidential election were short-lived. Instead, political surprises and initial sell-offs were seized upon as buying opportunities. We believe this reinforces the case for taking the long view rather than reacting to short-term market noise.
Asset returns varied widely in 2016. Perceived safe assets such as government bonds and low-volatility shares underperformed the higher-risk areas of the market. And the reversal of longstanding trends created opportunities, such as in the recovery of value stocks and commodities.
We expect some of these trends to extend into 2017 and see the potential for more flows into risk assets this year. Learn more by reading our market insights at blackrock.com.
Sincerely,

Rob Kapito
President, BlackRock Advisors, LLC

Rob Kapito
President, BlackRock Advisors, LLC
| Total Returns as of December 31, 2016 | ||||||||
| 6-month | 12-month | |||||||
| U.S. large cap equities |
7.82 | % | 11.96 | % | ||||
| U.S. small cap equities |
18.68 | 21.31 | ||||||
| International equities |
5.67 | 1.00 | ||||||
| Emerging market equities (MSCI Emerging Markets Index) |
4.49 | 11.19 | ||||||
| 3-month Treasury bills |
0.18 | 0.33 | ||||||
| U.S. Treasury securities |
(7.51 | ) | (0.16 | ) | ||||
| U.S. investment grade bonds |
(2.53 | ) | 2.65 | |||||
| Tax-exempt municipal bonds (S&P Municipal Bond Index) |
(3.43 | ) | 0.77 | |||||
| U.S. high yield bonds (Bloomberg Barclays U.S. Corporate High Yield 2% Issuer Capped Index) |
7.40 | 17.13 | ||||||
| Past performance is no guarantee of future results. Index performance is shown for illustrative purposes only. You cannot invest directly in an index. | ||||||||
| THIS PAGE NOT PART OF YOUR FUND REPORT | 3 |
| Fund Summary as of December 31, 2016 | BlackRock International Index Fund | |||
| Investment Objective |
BlackRock International Index Fund’s (the “Fund”) investment objective is to match the performance of the MSCI EAFE Index (Europe, Australasia, Far East) (the “MSCI EAFE Index”) in U.S. dollars with net dividends as closely as possible before the deduction of Fund expenses. On May 19, 2016, the Board approved the conversion of the Fund, a series of BlackRock Index Funds, Inc., from a “master-feeder” structure into a stand-alone mutual fund effective August 1, 2016.
| Portfolio Management Commentary |
The views expressed reflect the opinions of BlackRock as of the date of this report and are subject to change based on changes in market, economic or other conditions. These views are not intended to be a forecast of future events and are no guarantee of future results.
| Portfolio Information |
| 4 | BLACKROCK INDEX FUNDS, INC. | DECEMBER 31, 2016 |
| BlackRock International Index Fund |
| Total Return Based on a $10,000 Investment | ||
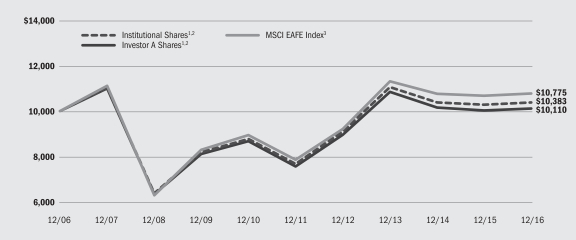
| 1 | Assuming transaction costs and other operating expenses, including administration fees, if any. |
| 2 | Prior to August 1, 2016, the Fund invested all of its assets in the Master International Index Series, a series of Quantative Master Series, LLC. The Master International Index Series invested in a statistically selected sample of equity securities included in the MSCI EAFE Index and in derivative instruments linked to the MSCI EAFE Index. |
| 3 | A free-float adjusted, market-capitalization weighted index designed to measure equity performance of developed markets, excluding the United States and Canada. |
| Performance Summary for the Period Ended December 31, 2016 | ||||||||
| 6-Month Total Returns |
Average Annual Total Returns4 | |||||||||||||||
| 1 Year | 5 Years | 10 Years | ||||||||||||||
| Institutional |
4.53 | % | 0.99 | % | 6.24 | % | 0.38 | % | ||||||||
| Investor A |
4.42 | 0.78 | 5.98 | 0.11 | ||||||||||||
| Class K |
4.57 | 1.03 | 6.30 | 0.42 | ||||||||||||
| MSCI EAFE Index |
5.67 | 1.00 | 6.53 | 0.75 | ||||||||||||
| 4 | See “About Fund Performance” on page 8 for a detailed description of share classes, including any related fees. |
| Past performance is not indicative of future results. |
| Performance results may include adjustments made for financial reporting purposes in accordance with U.S. generally accepted accounting principles. |
| Expense Example |
| Actual | Hypothetical7 | |||||||||||||||||||||||||||
| Beginning Account Value July 1, 2016 |
Ending Account Value December 31, 2016 |
Expenses Paid During the Period6 |
Beginning Account Value July 1, 2016 |
Ending Account Value December 31, 2016 |
Expenses Paid During the Period5 |
Annualized Expense Ratio |
||||||||||||||||||||||
| Institutional |
$ | 1,000.00 | $ | 1,045.30 | $ | 0.57 | $ | 1,000.00 | $ | 1,024.58 | $ | 0.56 | 0.11 | % | ||||||||||||||
| Investor A |
$ | 1,000.00 | $ | 1,044.20 | $ | 1.90 | $ | 1,000.00 | $ | 1,023.28 | $ | 1.88 | 0.37 | % | ||||||||||||||
| Class K |
$ | 1,000.00 | $ | 1,045.70 | $ | 0.36 | $ | 1,000.00 | $ | 1,024.78 | $ | 0.36 | 0.07 | % | ||||||||||||||
| 6 | For each class of the Fund, expenses are equal to the annualized net expense ratio for the class, multiplied by the average account value over the period, multiplied by 184/366 (to reflect the one-half year period shown). Because the Fund invested all of its assets in Master International Index prior to August 1, 2016, the expense example reflects the net expenses of both the Fund and Master International Index. |
| 7 | Hypothetical 5% return before expenses is calculated by prorating the number of days in the most recent fiscal half year divided by 366. |
| See “Disclosure of Expenses” on page 8 for further information on how expenses were calculated. |
| BLACKROCK INDEX FUNDS, INC. | DECEMBER 31, 2016 | 5 |
| Fund Summary as of December 31, 2016 | BlackRock Small Cap Index Fund |
| Investment Objective |
BlackRock Small Cap Index Fund’s (the “Fund”) investment objective is to match the performance of the Russell 2000® Index as closely as possible before the deduction of Fund expenses.
| Portfolio Management Commentary |
The views expressed reflect the opinions of BlackRock as of the date of this report and are subject to change based on changes in market, economic or other conditions. These views are not intended to be a forecast of future events and are no guarantee of future results.
| 6 | BLACKROCK INDEX FUNDS, INC. | DECEMBER 31, 2016 |
| BlackRock Small Cap Index Fund |
| Total Return Based on a $10,000 Investment |
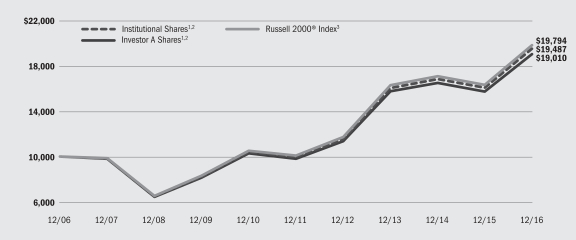
| 1 | Assuming transaction costs and other operating expenses, including administration fees, if any. |
| 2 | The Fund invests all of its assets in the Series. The Series may invest in a statistically selected sample of the stocks included in the Russell 2000® Index and in derivative instruments linked to the Russell 2000® Index. |
| 3 | An unmanaged index that is a subset of the Russell 3000® Index representing approximately 10% of the total market capitalization of that index. It includes approximately 2000 of the smallest securities based on a combination of their market cap and current index membership. |
| Performance Summary for the Period Ended December 31, 2016 |
|
6-Month Total Returns |
Average Annual Total Returns4 | |||||||||||||||
| 1 Year | 5 Years | 10 Years | ||||||||||||||
| Institutional |
18.62 | % | 21.33 | % | 14.44 | % | 6.90 | % | ||||||||
| Investor A |
18.49 | 21.04 | 14.18 | 6.63 | ||||||||||||
| Class K |
18.61 | 21.32 | 14.51 | 6.96 | ||||||||||||
| Russell 2000® Index |
18.68 | 21.31 | 14.46 | 7.07 | ||||||||||||
| 4 | See “About Fund Performance” on page 8 for a detailed description of share classes, including related fees, if any. |
| Past performance is not indicative of future results. |
| Performance results may include adjustments made for financial reporting purposes in accordance with U.S. generally accepted accounting principles. |
| Expense Example |
| Actual | Hypothetical7 | |||||||||||||||||||||||||||
| Beginning Account Value July 1, 2016 |
Ending December 31, 2016 |
Expenses Paid During the Period6 |
Beginning Account Value July 1, 2016 |
Ending Account Value December 31, 2016 |
Expenses Paid During the Period5 |
Annualized Expense Ratio |
||||||||||||||||||||||
| Institutional |
$ | 1,000.00 | $ | 1,186.20 | $ | 0.71 | $ | 1,000.00 | $ | 1,024.48 | $ | 0.66 | 0.13 | % | ||||||||||||||
| Investor A |
$ | 1,000.00 | $ | 1,184.90 | $ | 2.14 | $ | 1,000.00 | $ | 1,023.18 | $ | 1.98 | 0.39 | % | ||||||||||||||
| Class K |
$ | 1,000.00 | $ | 1,186.10 | $ | 0.49 | $ | 1,000.00 | $ | 1,024.68 | $ | 0.46 | 0.09 | % | ||||||||||||||
| 6 | For each class of the Fund, expenses are equal to the annualized net expense ratio for the class, multiplied by the average account value over the period, multiplied by 184/366 (to reflect the one-half year period shown). Because the Fund invests all of its assets in the Series, the expense example reflects the net expenses of both the Fund and the Series. |
| 7 | Hypothetical 5% annual return before expenses is calculated by prorating the number of days in the most recent fiscal half year divided by 366. |
| See “Disclosure of Expenses” on page 8 for further information on how expenses were calculated. |
| BLACKROCK INDEX FUNDS, INC. | DECEMBER 31, 2016 | 7 |
| About Fund Performance |
| Disclosure of Expenses |
| Derivative Financial Instruments |
| 8 | BLACKROCK INDEX FUNDS, INC. | DECEMBER 31, 2016 |
| BlackRock International Index Fund (Percentages shown are based on Net Assets) |
| Portfolio Abbreviations |
| ADR | American Depositary Receipts | |
| REIT | Real Estate Investment Trust |
See Notes to Financial Statements.
| BLACKROCK INDEX FUNDS, INC. | DECEMBER 31, 2016 | 9 |
| Schedule of Investments (continued) |
BlackRock International Index Fund |
See Notes to Financial Statements.
| 10 | BLACKROCK INDEX FUNDS, INC. | DECEMBER 31, 2016 |
| Schedule of Investments (continued) |
BlackRock International Index Fund |
See Notes to Financial Statements.
| BLACKROCK INDEX FUNDS, INC. | DECEMBER 31, 2016 | 11 |
| Schedule of Investments (continued) |
BlackRock International Index Fund |
See Notes to Financial Statements.
| 12 | BLACKROCK INDEX FUNDS, INC. | DECEMBER 31, 2016 |
| Schedule of Investments (continued) |
BlackRock International Index Fund |
See Notes to Financial Statements.
| BLACKROCK INDEX FUNDS, INC. | DECEMBER 31, 2016 | 13 |
| Schedule of Investments (continued) |
BlackRock International Index Fund |
See Notes to Financial Statements.
| 14 | BLACKROCK INDEX FUNDS, INC. | DECEMBER 31, 2016 |
| Schedule of Investments (continued) |
BlackRock International Index Fund |
See Notes to Financial Statements.
| BLACKROCK INDEX FUNDS, INC. | DECEMBER 31, 2016 | 15 |
| Schedule of Investments (continued) |
BlackRock International Index Fund |
| Notes to Schedule of Investments | ||
| (a) | A security contractually bound to one or more other securities to form a single saleable unit which cannot be sold separately. |
| (b) | Non-income producing security. |
| (c) | Security exempt from registration pursuant to Rule 144A under the Securities Act of 1933, as amended. These securities may be resold in transactions exempt from registration to qualified institutional investors. |
| (d) | Security, or a portion of security, is on loan. |
See Notes to Financial Statements.
| 16 | BLACKROCK INDEX FUNDS, INC. | DECEMBER 31, 2016 |
| Schedule of Investments (continued) |
BlackRock International Index Fund |
| (e) | During the year ended December 31, 2016, investments in issuers considered to be affiliates of the Fund for purposes of Section 2(a)(3) of the Investment Company Act of 1940, as amended, were as follows: |
| Affiliate |
Shares/ Investment |
Shares/ Investment |
Shares/ Investment |
Shares/ Investment |
Value at December 31, 2016 |
Income | Realized Gain |
|||||||||||||||||||||
| BlackRock Liquidity Funds, T-Fund, Institutional Class |
— | 25,377,782 | 1 | — | $ | 25,377,782 | $ | 25,377,782 | $ | 23,820 | $ | 71 | ||||||||||||||||
| BlackRock Liquidity Funds, TempFund, Institutional Class |
3,032,475 | 2 | — | (3,032,475 | )3 | — | — | 27,522 | — | |||||||||||||||||||
| SL Liquidity Series, LLC, Money Market Series |
$ | 5,230,513 | 2 | — | $ | (3,463,867 | )3 | $ | 1,766,646 | 1,766,823 | 364,179 | 4 | 116 | |||||||||||||||
| iShares MSCI EAFE |
— | 14,141,762 | (14,141,762 | ) | — | — | — | 2,245,870 | ||||||||||||||||||||
| Total |
|
$ | 27,144,605 | $ | 415,521 | $ | 2,246,057 | |||||||||||||||||||||
|
|
|
|
|
|
|
|||||||||||||||||||||||
| 1 Represents net shares purchased by the Fund and Master International Index.
2 Represents net shares/investment value held by Master International Index as of December 31, 2015.
3 Represents net shares/investment value sold by the Fund and Master International Index.
4 Represents securities lending income earned from the reinvestment of cash collateral from loaned securities, net of fees and collateral investment expenses, and other payments to and from borrowers of securities. |
| |||||||||||||||||||||||||||
| (f) | Current yield as of period end. |
| (g) | Security was purchased with the cash collateral from loaned securities. |
| Derivative Financial Instruments Outstanding as of Period End | ||
| Futures Contracts | ||||||||||||||
| Contracts Long |
Issue | Expiration | Notional Value |
Unrealized Appreciation |
||||||||||
| 1,778 | Euro STOXX 50 Index | March 2017 | $ | 61,332,740 | $ | 737,221 | ||||||||
| 439 | FTSE 100 Index | March 2017 | $ | 38,142,157 | 516,384 | |||||||||
| 467 | Nikkei 225 Index | March 2017 | $ | 38,099,209 | 16,041 | |||||||||
| 204 | SPI 200 Index | March 2017 | $ | 20,724,421 | 244,977 | |||||||||
| Total |
$ | 1,514,623 | ||||||||||||
|
|
|
|||||||||||||
| Derivative Financial Instruments Categorized by Risk Exposure |
As of period end, the fair values of derivative financial instruments located in the Statements of Assets and Liabilities were as follows:
| Assets — Derivative Financial Instruments | Commodity Contracts |
Credit Contracts |
Equity Contracts |
Foreign Currency Exchange Contracts |
Interest Rate Contracts |
Other Contracts |
Total | |||||||||||||||||||||||||
| Futures contracts |
Net unrealized appreciation | 1 | — | — | $ | 1,514,623 | — | — | — | $ | 1,514,623 | |||||||||||||||||||||
For the year ended December 31, 2016, the effect of derivative financial instruments in the Statements of Operation was as follows:
| Net Realized Gain (Loss) from: | Commodity Contracts |
Credit Contracts |
Equity Contracts |
Foreign Currency Exchange Contracts |
Interest Rate Contracts |
Other Contracts |
Total | |||||||||||||||||||||||||
| Futures contracts |
— | — | $ | 17,683,310 | 2 | — | — | — | $ | 17,683,310 | ||||||||||||||||||||||
| Net Change in Unrealized Appreciation (Depreciation) on: |
||||||||||||||||||||||||||||||||
| Futures contracts |
— | — | $ | 676,991 | 2 | — | — | — | $ | 676,991 | ||||||||||||||||||||||
|
1 Includes cumulative appreciation (depreciation) on futures contract, if any, as reported in the Schedule of Investments. Only current day’s variation margin is reported within the Statements of Assets and Liabilities.
2 Includes $9,032,965 and $(1,181,516) in realized gain/loss and unrealized gain/loss, respectively, allocated from Master International Index through July 31, 2016. |
| |||||||||||||||||||||||||||||||
| Average Quarterly Balances of Outstanding Derivative Financial Instruments |
| Futures contracts: | ||||
| Average notional value of contracts — long |
$ | 99,548,677 | 1 |
| 1 | The number represents the average quarterly balances of outstanding derivative financial instruments held at the Fund or Master International Index, prior to August 1, 2016. |
For more information about the Fund’s investment risks regarding derivative financial instruments, refer to the Notes to Financial Statements.
See Notes to Financial Statements.
| BLACKROCK INDEX FUNDS, INC. | DECEMBER 31, 2016 | 17 |
| Schedule of Investments (concluded) |
BlackRock International Index Fund |
| Fair Value Hierarchy as of Period End |
Various inputs are used in determining the fair value of investments and derivative financial instruments. For information about the Fund’s policy regarding valuation of investments and derivative financial instruments, refer to the Notes to Financial Statements.
The following tables summarize the Fund’s investments and derivative financial instruments categorized in the disclosure hierarchy:
| Level 1 | Level 2 | Level 3 | Total | |||||||||||||
| Assets: |
| |||||||||||||||
| Investments: | ||||||||||||||||
| Common Stocks: | ||||||||||||||||
| Australia |
— | $ | 348,743,906 | $ | 8 | $ | 348,743,914 | |||||||||
| Austria |
— | 9,151,531 | — | 9,151,531 | ||||||||||||
| Belgium |
$ | 32,031,252 | 24,393,817 | — | 56,425,069 | |||||||||||
| Denmark |
— | 78,186,588 | — | 78,186,588 | ||||||||||||
| Finland |
— | 45,934,749 | — | 45,934,749 | ||||||||||||
| France |
— | 481,265,944 | — | 481,265,944 | ||||||||||||
| Germany |
1,770,063 | 430,288,967 | — | 432,059,030 | ||||||||||||
| Hong Kong |
1,334,757 | 153,410,514 | — | 154,745,271 | ||||||||||||
| Ireland |
4,656,968 | 30,079,785 | — | 34,736,753 | ||||||||||||
| Israel |
20,747,347 | 11,444,649 | — | 32,191,996 | ||||||||||||
| Italy |
2,912,404 | 87,117,877 | — | 90,030,281 | ||||||||||||
| Japan |
— | 1,148,914,278 | — | 1,148,914,278 | ||||||||||||
| Luxembourg |
— | 2,847,468 | — | 2,847,468 | ||||||||||||
| Mexico |
— | 1,424,698 | — | 1,424,698 | ||||||||||||
| Netherlands |
13,935,536 | 231,916,196 | — | 245,851,732 | ||||||||||||
| New Zealand |
— | 8,470,839 | — | 8,470,839 | ||||||||||||
| Norway |
— | 31,535,780 | — | 31,535,780 | ||||||||||||
| Portugal |
— | 6,761,545 | — | 6,761,545 | ||||||||||||
| Singapore |
874,115 | 58,128,259 | — | 59,002,374 | ||||||||||||
| Spain |
— | 148,125,410 | — | 148,125,410 | ||||||||||||
| Sweden |
— | 135,107,450 | — | 135,107,450 | ||||||||||||
| Switzerland |
— | 433,629,772 | — | 433,629,772 | ||||||||||||
| United Arab Emirates |
— | 1,193,906 | — | 1,193,906 | ||||||||||||
| United Kingdom |
523,597 | 761,317,020 | — | 761,840,617 | ||||||||||||
| Preferred Stock |
— | 10,387,167 | — | 10,387,167 | ||||||||||||
| Rights |
163,089 | — | — | 163,089 | ||||||||||||
| Short-Term Securities |
25,377,782 | — | — | 25,377,782 | ||||||||||||
|
|
|
|||||||||||||||
| SubTotal |
$ | 104,326,910 | $ | 4,679,778,115 | $ | 8 | $ | 4,784,105,033 | ||||||||
|
|
|
|||||||||||||||
| Investments Valued at NAV1 |
1,766,823 | |||||||||||||||
|
|
|
|||||||||||||||
| Total |
$ | 4,785,871,856 | ||||||||||||||
|
|
|
|||||||||||||||
| Level 1 | Level 2 | Level 3 | Total | |||||||||||||
| Derivative Financial Instruments2 | ||||||||||||||||
| Assets: |
| |||||||||||||||
| Equity contracts |
$ | 1,514,623 | — | — | $ | 1,514,623 | ||||||||||
|
1 As of December 31, 2016, certain of the Fund’s investments were valued using NAV per share as no quoted market value is available and therefore have been excluded from the fair value hierarchy.
2 Derivative financial instruments are futures contracts, which are valued at the unrealized appreciation (depreciation) on the instrument. |
| |||||||||||||||
During the year ended December 31, 2016, there were no transfers between levels.
See Notes to Financial Statements.
| 18 | BLACKROCK INDEX FUNDS, INC. | DECEMBER 31, 2016 |
| Statements of Assets and Liabilities |
| December 31, 2016 | BlackRock International Index Fund |
BlackRock Small Cap Index Fund |
||||||
| Assets | ||||||||
| Investments at value — unaffiliated (including securities loaned at value of $1,016,353)1 |
$ | 4,758,727,251 | — | |||||
| Investments at value — from Master Small Cap Index Series (the “Series”)2 |
— | $ | 406,357,180 | |||||
| Investments at value — affiliated3 |
27,144,605 | — | ||||||
| Foreign currency at value4 |
126,780,023 | — | ||||||
| Cash pledged for futures contracts |
5,917,875 | — | ||||||
| Receivables: | ||||||||
| Capital shares sold |
23,181,970 | 1,077,559 | ||||||
| Dividends — unaffiliated |
9,633,501 | — | ||||||
| Investments sold |
1,360,825 | — | ||||||
| Variation margin on futures contracts |
234,258 | — | ||||||
| Securities lending income — affiliated |
48,749 | — | ||||||
| Dividends — affiliated |
5,522 | — | ||||||
| From the Administrator |
— | 6,253 | ||||||
| Withdrawals from the Series |
— | 2,611,689 | ||||||
| Prepaid expenses |
147,841 | 43,003 | ||||||
|
|
|
|||||||
| Total assets |
4,953,182,420 | 410,095,684 | ||||||
|
|
|
|||||||
| Liabilities | ||||||||
| Cash collateral on securities loaned at value |
1,766,695 | — | ||||||
| Payables: | ||||||||
| Capital shares redeemed |
18,998,911 | 3,689,248 | ||||||
| Variation margin on futures contracts |
763,592 | — | ||||||
| Professional fees |
104,586 | — | ||||||
| Investment advisory fees |
41,559 | — | ||||||
| Officer’s and Directors’ fees |
28,049 | — | ||||||
| Service fees |
48,837 | 24,941 | ||||||
| Administration fees |
— | 527 | ||||||
| Other affiliates |
14,395 | — | ||||||
| Other accrued expenses |
1,129,752 | 81,196 | ||||||
|
|
|
|||||||
| Total liabilities |
22,896,376 | 3,795,912 | ||||||
|
|
|
|||||||
| Net Assets |
$ | 4,930,286,044 | $ | 406,299,772 | ||||
|
|
|
|||||||
| Net Assets Consist of | ||||||||
| Paid-in capital |
$ | 5,151,148,156 | $ | 333,797,516 | ||||
| Undistributed (distributions in excess of) net investment income |
(5,856,612 | ) | 362,733 | |||||
| Undistributed net realized gain (accumulated net realized loss) |
(231,059,676 | ) | 27,402,249 | |||||
| Net unrealized appreciation (depreciation) |
16,054,176 | 44,737,274 | ||||||
|
|
|
|||||||
| Net Assets |
$ | 4,930,286,044 | $ | 406,299,772 | ||||
|
|
|
|||||||
| Institutional: | ||||||||
| Net assets |
$ | 649,763,133 | $ | 229,491,342 | ||||
|
|
|
|||||||
| Shares outstanding, $0.0001 par value |
55,995,334 | 12,921,212 | ||||||
|
|
|
|||||||
| Net asset value |
$ | 11.60 | $ | 17.76 | ||||
|
|
|
|||||||
| Shares authorized |
1.208 billion | 208 million | ||||||
|
|
|
|||||||
| Investor A: | ||||||||
| Net assets |
$ | 238,052,891 | $ | 116,722,078 | ||||
|
|
|
|||||||
| Shares outstanding, $0.0001 par value |
20,629,304 | 6,566,123 | ||||||
|
|
|
|||||||
| Net asset value |
$ | 11.54 | $ | 17.78 | ||||
|
|
|
|||||||
| Shares authorized |
208 million | 208 million | ||||||
|
|
|
|||||||
| Class K: | ||||||||
| Net assets |
$ | 4,042,470,020 | $ | 60,086,352 | ||||
|
|
|
|||||||
| Shares outstanding, $0.0001 par value |
348,173,358 | 3,376,971 | ||||||
|
|
|
|||||||
| Net asset value |
$ | 11.61 | $ | 17.79 | ||||
|
|
|
|||||||
| Shares authorized |
1.208 billion | 1.208 billion | ||||||
|
|
|
|||||||
| 1 Investments at cost — unaffiliated |
$ | 4,744,038,231 | — | |||||
| 2 Investments at cost — from Master Small Cap Index Series |
— | $ | 361,619,906 | |||||
| 3 Investments at cost — affiliated |
$ | 27,144,593 | — | |||||
| 4 Foreign currency at cost |
$ | 126,709,153 | |
— |
| |||
| See Notes to Financial Statements. | ||||||
| BLACKROCK INDEX FUNDS, INC. | DECEMBER 31, 2016 | 19 | ||||
| Statements of Operations |
| Year Ended December 31, 2016 | BlackRock International Index Fund |
BlackRock Small Cap Index Fund |
||||||
| Investment Income | ||||||||
| Dividends — unaffiliated |
$ | 43,204,422 | — | |||||
| Securities lending — affiliated — net |
112,153 | — | ||||||
| Dividends — affiliated |
24,304 | — | ||||||
| Interest — unaffiliated |
1,154 | — | ||||||
| Foreign taxes withheld |
(2,489,502 | ) | — | |||||
| Net investment income allocated from Master International Index/the Series: | ||||||||
| Dividends — unaffiliated |
91,662,709 | $ | 4,048,275 | |||||
| Securities lending — affiliated — net |
252,026 | 558,814 | ||||||
| Dividends — affiliated |
27,038 | 65,004 | ||||||
| Interest — unaffiliated |
— | 833 | ||||||
| Foreign taxes withheld |
(10,400,906 | ) | (1,519 | ) | ||||
| Expenses |
(967,751 | ) | (215,981 | ) | ||||
| Fees waived |
7,731 | 26,828 | ||||||
|
|
|
|||||||
| Total Investment Income |
121,433,378 | 4,482,254 | ||||||
|
|
|
|||||||
| Expenses | ||||||||
| Investment advisory |
179,649 | — | ||||||
| Administration |
203,749 | 119,257 | ||||||
| Service and distribution — class specific |
488,401 | 242,591 | ||||||
| Transfer agent — class specific |
953,717 | 135,640 | ||||||
| Accounting services |
217,435 | — | ||||||
| Custodian |
271,190 | — | ||||||
| Officer and Directors |
70,784 | 21 | ||||||
| Printing |
159,118 | 29,308 | ||||||
| Professional |
78,592 | 58,712 | ||||||
| Registration |
139,996 | 72,588 | ||||||
| Miscellaneous |
62,013 | 10,590 | ||||||
|
|
|
|||||||
| Total expenses |
2,824,644 | 668,707 | ||||||
| Less: | ||||||||
| Fees waived and/or reimbursed by the Manager |
(6,761 | ) | — | |||||
| Fees waived by the Administrator |
(73,679 | ) | (117,740 | ) | ||||
| Fees reimbursed by the Administrator |
— | (47,044 | ) | |||||
| Transfer agent fees waived and/or reimbursed — class specific |
(355,810 | ) | (32,564 | ) | ||||
| Fees paid indirectly |
(46 | ) | — | |||||
|
|
|
|||||||
| Total expenses after fees waived and/or reimbursed and paid indirectly |
2,388,348 | 471,359 | ||||||
|
|
|
|||||||
| Net investment income |
119,045,030 | 4,010,895 | ||||||
|
|
|
|||||||
| Realized and Unrealized Gain (Loss) | ||||||||
| Net realized gain (loss) allocated from the Series from: | ||||||||
| Net realized gain (loss) on investments, futures contracts, foreign currency transactions and capital gain distributions from investment companies — affiliated |
— | 3,092,483 | ||||||
| Net realized gain (loss) allocated from Master International Index Series for the period January 1, 2016 to July 31, 2016 from: | ||||||||
| Investments — unaffiliated |
(173,866,087 | ) | — | |||||
| Futures contracts |
9,032,965 | — | ||||||
| Foreign currency transactions |
4,167,690 | — | ||||||
|
|
|
|||||||
| (160,665,432 | ) | 3,092,483 | ||||||
|
|
|
|||||||
| Net realized gain (loss) from: | ||||||||
| Investments — unaffiliated |
1,008,420 | — | ||||||
| Investments — affiliated |
2,245,986 | — | ||||||
| Futures contracts |
8,650,345 | — | ||||||
| Foreign currency transactions |
(7,233,087 | ) | — | |||||
| Capital gain distributions from investment companies — affiliated |
71 | — | ||||||
|
|
|
|||||||
| 4,671,735 | — | |||||||
|
|
|
|||||||
| (155,993,697 | ) | 3,092,483 | ||||||
|
|
|
|||||||
| Net change in unrealized appreciation (depreciation) allocated from Master Small Cap Index Series on investments, futures contracts and foreign currency translations |
— | 58,844,843 | ||||||
| Net change in unrealized appreciation (depreciation) allocated from Master International Index Series for the period January 1, 2016 to July 31, 2016 from: | ||||||||
| Investments — unaffiliated |
189,418,651 | — | ||||||
| Futures contracts |
(1,181,516 | ) | — | |||||
| Foreign currency translations |
294,718 | — | ||||||
|
|
|
|||||||
| 188,531,853 | 58,844,843 | |||||||
|
|
|
|||||||
| Net change in unrealized appreciation (depreciation) on: | ||||||||
| Investments — unaffiliated |
(32,663,289 | ) | — | |||||
| Investments — affiliated |
12 | — | ||||||
| Futures contracts |
1,858,507 | — | ||||||
| Foreign currency translations |
(345,120 | ) | — | |||||
|
|
|
|||||||
| (31,149,890 | ) | — | ||||||
|
|
|
|||||||
| 157,381,963 | 58,844,843 | |||||||
|
|
|
|||||||
| Net realized and unrealized gain (loss) |
1,388,266 | 61,937,326 | ||||||
|
|
|
|||||||
| Net Increase in Net Assets Resulting from Operations |
$ | 120,433,296 | $ | 65,948,221 | ||||
|
|
|
|||||||
| See Notes to Financial Statements. | ||||||
| 20 | BLACKROCK INDEX FUNDS, INC. | DECEMBER 31, 2016 | ||||
| Statements of Changes in Net Assets |
| BlackRock International Index Fund | BlackRock Small Cap Index Fund | |||||||||||||||||||
| Year Ended December 31, | Year Ended December 31, | |||||||||||||||||||
| Increase (Decrease) in Net Assets: | 2016 | 2015 | 2016 | 2015 | ||||||||||||||||
| Operations | ||||||||||||||||||||
| Net investment income |
$ | 119,045,030 | $ | 74,354,152 | $ | 4,010,895 | $ | 2,591,228 | ||||||||||||
| Net realized gain (loss) |
(155,993,697 | ) | (62,073,557 | ) | 3,092,483 | 34,918,848 | ||||||||||||||
| Net change in unrealized appreciation (depreciation) |
157,381,963 | (120,265,106 | ) | 58,844,843 | (49,576,309 | ) | ||||||||||||||
|
|
|
|
|
|||||||||||||||||
| Net increase (decrease) in net assets resulting from operations |
120,433,296 | (107,984,511 | ) | 65,948,221 | (12,066,233 | ) | ||||||||||||||
|
|
|
|
|
|||||||||||||||||
| Distributions to Shareholders1 | ||||||||||||||||||||
| From net investment income: | ||||||||||||||||||||
| Institutional |
(17,200,955 | ) | (63,271,021 | ) | (2,573,983 | ) | (1,402,219 | ) | ||||||||||||
| Investor A |
(5,855,782 | ) | (3,190,483 | ) | (1,110,447 | ) | (528,291 | ) | ||||||||||||
| Class K |
(109,944,264 | ) | (2,423,152 | ) | (571,127 | ) | (69,493 | ) | ||||||||||||
| From net realized gain: | ||||||||||||||||||||
| Institutional |
— | — | (7,238,603 | ) | (3,470,794 | ) | ||||||||||||||
| Investor A |
— | — | (3,836,781 | ) | (2,316,445 | ) | ||||||||||||||
| Class K |
— | — | (1,583,983 | ) | (180,488 | ) | ||||||||||||||
|
|
|
|
|
|||||||||||||||||
| Decrease in net assets resulting from distributions to shareholders |
(133,001,001 | ) | (68,884,656 | ) | (16,914,924 | ) | (7,967,730 | ) | ||||||||||||
|
|
|
|
|
|||||||||||||||||
| Capital Share Transactions | ||||||||||||||||||||
| Net increase in net assets derived from capital share transactions |
1,958,596,053 | 1,047,843,791 | 112,849,771 | 130,987,610 | ||||||||||||||||
|
|
|
|
|
|||||||||||||||||
| Net Assets | ||||||||||||||||||||
| Total increase in net assets |
1,946,028,348 | 870,974,624 | 161,883,068 | 110,953,647 | ||||||||||||||||
| Beginning of year |
2,984,257,696 | 2,113,283,072 | 244,416,704 | 133,463,057 | ||||||||||||||||
|
|
|
|
|
|||||||||||||||||
| End of year |
$ | 4,930,286,044 | $ | 2,984,257,696 | $ | 406,299,772 | $ | 244,416,704 | ||||||||||||
|
|
|
|
|
|||||||||||||||||
| Undistributed (distributions in excess of) net investment income, end of year |
$ | (5,856,612 | ) | $ | 700,709 | $ | 362,733 | $ | 600,536 | |||||||||||
|
|
|
|
|
|||||||||||||||||
| 1 Distributions for annual periods determined in accordance with federal income tax regulations. |
||||||||||||||||||||
| See Notes to Financial Statements. | ||||||
| BLACKROCK INDEX FUNDS, INC. | DECEMBER 31, 2016 | 21 | ||||
| Financial Highlights | BlackRock International Index Fund |
| Institutional | ||||||||||||||||||||
| Year Ended December 31, | ||||||||||||||||||||
| 2016 | 2015 | 2014 | 2013 | 2012 | ||||||||||||||||
| Per Share Operating Performance | ||||||||||||||||||||
| Net asset value, beginning of year |
$ | 11.81 | $ | 12.21 | $ | 13.11 | $ | 11.06 | $ | 9.63 | ||||||||||
|
|
|
|||||||||||||||||||
| Net investment income1 |
0.28 | 0.34 | 0.24 | 0.32 | 0.33 | |||||||||||||||
| Net realized and unrealized gain (loss) |
(0.16 | ) | (0.46 | ) | (1.04 | ) | 2.04 | 1.45 | ||||||||||||
|
|
|
|||||||||||||||||||
| Net increase (decrease) from investment operations |
0.12 | (0.12 | ) | (0.80 | ) | 2.36 | 1.78 | |||||||||||||
|
|
|
|||||||||||||||||||
| Distributions from net investment income2 |
(0.33 | ) | (0.28 | ) | (0.10 | ) | (0.31 | ) | (0.35 | ) | ||||||||||
|
|
|
|||||||||||||||||||
| Net asset value, end of year |
$ | 11.60 | $ | 11.81 | $ | 12.21 | $ | 13.11 | $ | 11.06 | ||||||||||
|
|
|
|||||||||||||||||||
| Total Return3 | ||||||||||||||||||||
| Based on net asset value |
0.99% | (0.91 | )% | (6.13 | )% | 21.52% | 18.58% | |||||||||||||
|
|
|
|||||||||||||||||||
| Ratios to Average Net Assets4,5 | ||||||||||||||||||||
| Total expenses |
0.15% | 0.12% | 0.16% | 0.40% | 0.42% | |||||||||||||||
|
|
|
|||||||||||||||||||
| Total expenses after fees waived and/or reimbursed and paid indirectly |
0.11% | 0.09% | 0.11% | 0.35% | 0.34% | |||||||||||||||
|
|
|
|||||||||||||||||||
| Net investment income |
2.44% | 2.68% | 1.91% | 2.64% | 3.22% | |||||||||||||||
|
|
|
|||||||||||||||||||
| Supplemental Data | ||||||||||||||||||||
| Net assets, end of year (000) |
$ | 649,763 | $ | 2,702,936 | $ | 1,764,794 | $ | 71,826 | $ | 52,589 | ||||||||||
|
|
|
|||||||||||||||||||
| Portfolio turnover rate |
42% | 6 | 9% | 7 | 6% | 7 | 8% | 7 | 21% | 7 | ||||||||||
|
|
|
|||||||||||||||||||
| 1 | Based on average shares outstanding. |
| 2 | Distributions for annual periods determined in accordance with federal income tax regulations. |
| 3 | Where applicable, assumes the reinvestment of distributions. |
| 4 | Includes the Fund’s share of Master International Index’s allocated expenses and/or net investment income. |
| 5 | Includes the Fund’s share of Master International Index’s allocated fees waived of less than 0.01%. |
| 6 | Portfolio turnover rate includes transactions from Master International Index prior to August 1, 2016. |
| 7 | Portfolio turnover rate of Master International Index. |
| See Notes to Financial Statements. | ||||||
| 22 | BLACKROCK INDEX FUNDS, INC. | DECEMBER 31, 2016 | ||||
| Financial Highlights (continued) | BlackRock International Index Fund |
| Investor A | ||||||||||||||||||||
| Year Ended December 31, | ||||||||||||||||||||
| 2016 | 2015 | 2014 | 2013 | 2012 | ||||||||||||||||
| Per Share Operating Performance | ||||||||||||||||||||
| Net asset value, beginning of year |
$ | 11.75 | $ | 12.12 | $ | 13.02 | $ | 10.99 | $ | 9.57 | ||||||||||
|
|
|
|||||||||||||||||||
| Net investment income1 |
0.32 | 0.32 | 0.41 | 0.29 | 0.30 | |||||||||||||||
| Net realized and unrealized gain (loss) |
(0.23 | ) | (0.46 | ) | (1.25 | ) | 2.02 | 1.45 | ||||||||||||
|
|
|
|||||||||||||||||||
| Net increase (decrease) from investment operations |
0.09 | (0.14 | ) | (0.84 | ) | 2.31 | 1.75 | |||||||||||||
|
|
|
|||||||||||||||||||
| Distributions from net investment income2 |
(0.30 | ) | (0.23 | ) | (0.06 | ) | (0.28 | ) | (0.33 | ) | ||||||||||
|
|
|
|||||||||||||||||||
| Net asset value, end of year |
$ | 11.54 | $ | 11.75 | $ | 12.12 | $ | 13.02 | $ | 10.99 | ||||||||||
|
|
|
|||||||||||||||||||
| Total Return3 | ||||||||||||||||||||
| Based on net asset value |
0.78% | (1.14 | )% | (6.45 | )% | 21.20% | 18.33% | |||||||||||||
|
|
|
|||||||||||||||||||
| Ratios to Average Net Assets4,5 | ||||||||||||||||||||
| Total expenses |
0.38% | 0.42% | 0.52% | 0.69% | 0.69% | |||||||||||||||
|
|
|
|||||||||||||||||||
| Total expenses after fees waived and/or reimbursed and paid indirectly |
0.37% | 0.37% | 0.43% | 0.60% | 0.60% | |||||||||||||||
|
|
|
|||||||||||||||||||
| Net investment income |
2.78% | 2.54% | 3.13% | 2.41% | 2.90% | |||||||||||||||
|
|
|
|||||||||||||||||||
| Supplemental Data | ||||||||||||||||||||
| Net assets, end of year (000) |
$ | 238,053 | $ | 168,008 | $ | 332,475 | $ | 308,624 | $ | 223,754 | ||||||||||
|
|
|
|||||||||||||||||||
| Portfolio turnover rate |
42% | 6 | 9% | 7 | 6% | 7 | 8% | 7 | 21% | 7 | ||||||||||
|
|
|
|||||||||||||||||||
| 1 | Based on average shares outstanding. |
| 2 | Distributions for annual periods determined in accordance with federal income tax regulations. |
| 3 | Where applicable, assumes the reinvestment of distributions. |
| 4 | Includes the Fund’s share of Master International Index’s allocated expenses and/or net investment income. |
| 5 | Includes the Fund’s share of Master International Index’s allocated fees waived of less than 0.01%. |
| 6 | Portfolio turnover rate includes transactions from Master International Index prior to August 1, 2016. |
| 7 | Portfolio turnover rate of Master International Index. |
| See Notes to Financial Statements. | ||||||
| BLACKROCK INDEX FUNDS, INC. | DECEMBER 31, 2016 | 23 | ||||
| Financial Highlights (concluded) | BlackRock International Index Fund |
| Class K | ||||||||||||||||||||
| Year Ended December 31, | ||||||||||||||||||||
| 2016 | 2015 | 2014 | 2013 | 2012 | ||||||||||||||||
| Per Share Operating Performance | ||||||||||||||||||||
| Net asset value, beginning of year |
$ | 11.82 | $ | 12.21 | $ | 13.11 | $ | 11.06 | $ | 9.63 | ||||||||||
|
|
|
|||||||||||||||||||
| Net investment income1 |
0.38 | 0.28 | 0.34 | 0.28 | 0.22 | |||||||||||||||
| Net realized and unrealized gain (loss) |
(0.26 | ) | (0.38 | ) | (1.14 | ) | 2.09 | 1.57 | ||||||||||||
|
|
|
|||||||||||||||||||
| Net increase (decrease) from investment operations |
0.12 | (0.10 | ) | (0.80 | ) | 2.37 | 1.79 | |||||||||||||
|
|
|
|||||||||||||||||||
| Distributions from net investment income2 |
(0.33 | ) | (0.29 | ) | (0.10 | ) | (0.32 | ) | (0.36 | ) | ||||||||||
|
|
|
|||||||||||||||||||
| Net asset value, end of year |
$ | 11.61 | $ | 11.82 | $ | 12.21 | $ | 13.11 | $ | 11.06 | ||||||||||
|
|
|
|||||||||||||||||||
| Total Return3 | ||||||||||||||||||||
| Based on net asset value |
1.03% | (0.81 | )% | (6.12 | )% | 21.57% | 18.65% | |||||||||||||
|
|
|
|||||||||||||||||||
| Ratios to Average Net Assets4,5 | ||||||||||||||||||||
| Total expenses |
0.07% | 0.12% | 0.15% | 0.36% | 0.33% | |||||||||||||||
|
|
|
|||||||||||||||||||
| Total expenses after fees waived and/or reimbursed and paid indirectly |
0.07% | 0.07% | 0.11% | 0.30% | 0.29% | |||||||||||||||
|
|
|
|||||||||||||||||||
| Net investment income |
3.25% | 2.25% | 2.65% | 2.29% | 2.11% | |||||||||||||||
|
|
|
|||||||||||||||||||
| Supplemental Data | ||||||||||||||||||||
| Net assets, end of year (000) |
$ | 4,042,470 | $ | 113,314 | $ | 16,014 | $ | 2,336 | $ | 710 | ||||||||||
|
|
|
|||||||||||||||||||
| Portfolio turnover rate |
42% | 6 | 9% | 7 | 6% | 7 | 8% | 7 | 21% | 7 | ||||||||||
|
|
|
|||||||||||||||||||
| 1 | Based on average shares outstanding. |
| 2 | Distributions for annual periods determined in accordance with federal income tax regulations. |
| 3 | Where applicable, assumes the reinvestment of distributions. |
| 4 | Includes the Fund’s share of Master International Index’s allocated expenses and/or net investment income. |
| 5 | Includes the Fund’s share of Master International Index’s allocated fees waived of less than 0.01%. |
| 6 | Portfolio turnover rate includes transactions from Master International Index prior to August 1, 2016. |
| 7 | Portfolio turnover rate of Master International Index. |
| See Notes to Financial Statements. | ||||||
| 24 | BLACKROCK INDEX FUNDS, INC. | DECEMBER 31, 2016 | ||||
| Financial Highlights | BlackRock Small Cap Index Fund |
| Institutional | ||||||||||||||||||||
| Year Ended December 31, | ||||||||||||||||||||
| 2016 | 2015 | 2014 | 2013 | 2012 | ||||||||||||||||
| Per Share Operating Performance | ||||||||||||||||||||
| Net asset value, beginning of year |
$ | 15.32 | $ | 16.60 | $ | 17.51 | $ | 12.99 | $ | 11.51 | ||||||||||
|
|
|
|||||||||||||||||||
| Net investment income1 |
0.23 | 0.24 | 0.20 | 0.22 | 0.24 | |||||||||||||||
| Net realized and unrealized gain (loss) |
3.03 | (0.97 | ) | 0.56 | 4.83 | 1.61 | ||||||||||||||
|
|
|
|||||||||||||||||||
| Net increase (decrease) from investment operations |
3.26 | (0.73 | ) | 0.76 | 5.05 | 1.85 | ||||||||||||||
|
|
|
|||||||||||||||||||
| Distributions:2 | ||||||||||||||||||||
| From net investment income |
(0.22 | ) | (0.14 | ) | (0.26 | ) | (0.19 | ) | (0.37 | ) | ||||||||||
| From net realized gain |
(0.60 | ) | (0.41 | ) | (1.41 | ) | (0.34 | ) | — | |||||||||||
|
|
|
|||||||||||||||||||
| Total distributions |
(0.82 | ) | (0.55 | ) | (1.67 | ) | (0.53 | ) | (0.37 | ) | ||||||||||
|
|
|
|||||||||||||||||||
| Net asset value, end of year |
$ | 17.76 | $ | 15.32 | $ | 16.60 | $ | 17.51 | $ | 12.99 | ||||||||||
|
|
|
|||||||||||||||||||
| Total Return3 | ||||||||||||||||||||
| Based on net asset value |
21.33% | (4.43 | )% | 4.81% | 39.14% | 16.10% | ||||||||||||||
|
|
|
|||||||||||||||||||
| Ratios to Average Net Assets4,5 | ||||||||||||||||||||
| Total expenses |
0.19% | 6 | 0.22% | 0.35% | 0.51% | 0.60% | ||||||||||||||
|
|
|
|||||||||||||||||||
| Total expenses after fees waived and/or reimbursed |
0.14% | 6 | 0.16% | 0.23% | 0.29% | 0.28% | ||||||||||||||
|
|
|
|||||||||||||||||||
| Net investment income |
1.44% | 6 | 1.47% | 1.17% | 1.45% | 1.88% | ||||||||||||||
|
|
|
|||||||||||||||||||
| Supplemental Data | ||||||||||||||||||||
| Net assets, end of year (000) |
$ | 229,491 | $ | 148,148 | $ | 46,988 | $ | 60,707 | $ | 44,328 | ||||||||||
|
|
|
|||||||||||||||||||
| Portfolio turnover rate of the Series |
39% | 37% | 21% | 22% | 68% | |||||||||||||||
|
|
|
|||||||||||||||||||
| 1 | Based on average shares outstanding. |
| 2 | Distributions for annual periods determined in accordance with federal income tax regulations. |
| 3 | Where applicable, assumes the reinvestment of distributions. |
| 4 | Includes the Fund’s share of the Series’ allocated expenses and/or net investment income. |
| 5 | Includes the Fund’s share of the Series’ allocated fees waived of less than 0.01%. |
| 6 | Excludes expenses incurred indirectly of 0.01% as a result of the Series’ investments in underlying funds. |
| See Notes to Financial Statements. | ||||||
| BLACKROCK INDEX FUNDS, INC. | DECEMBER 31, 2016 | 25 | ||||
| Financial Highlights (continued) | BlackRock Small Cap Index Fund |
| Investor A | ||||||||||||||||||||
| Year Ended December 31, | ||||||||||||||||||||
| 2016 | 2015 | 2014 | 2013 | 2012 | ||||||||||||||||
| Per Share Operating Performance | ||||||||||||||||||||
| Net asset value, beginning of year |
$ | 15.34 | $ | 16.61 | $ | 17.52 | $ | 13.01 | $ | 11.51 | ||||||||||
|
|
|
|||||||||||||||||||
| Net investment income1 |
0.18 | 0.18 | 0.16 | 0.19 | 0.21 | |||||||||||||||
| Net realized and unrealized gain (loss) |
3.03 | (0.95 | ) | 0.56 | 4.82 | 1.62 | ||||||||||||||
|
|
|
|||||||||||||||||||
| Net increase (decrease) from investment operations |
3.21 | (0.77 | ) | 0.72 | 5.01 | 1.83 | ||||||||||||||
|
|
|
|||||||||||||||||||
| Distributions:2 | ||||||||||||||||||||
| From net investment income |
(0.17 | ) | (0.09 | ) | (0.22 | ) | (0.16 | ) | (0.33 | ) | ||||||||||
| From net realized gain |
(0.60 | ) | (0.41 | ) | (1.41 | ) | (0.34 | ) | — | |||||||||||
|
|
|
|||||||||||||||||||
| Total distributions |
(0.77 | ) | (0.50 | ) | (1.63 | ) | (0.50 | ) | (0.33 | ) | ||||||||||
|
|
|
|||||||||||||||||||
| Net asset value, end of year |
$ | 17.78 | $ | 15.34 | $ | 16.61 | $ | 17.52 | $ | 13.01 | ||||||||||
|
|
|
|||||||||||||||||||
| Total Return3 | ||||||||||||||||||||
| Based on net asset value |
21.04% | (4.66 | )% | 4.54% | 38.72% | 15.96% | ||||||||||||||
|
|
|
|||||||||||||||||||
| Ratios to Average Net Assets4,5 | ||||||||||||||||||||
| Total expenses |
0.49% | 6 | 0.53% | 0.63% | 0.77% | 0.88% | ||||||||||||||
|
|
|
|||||||||||||||||||
| Total expenses after fees waived and/or reimbursed |
0.41% | 6 | 0.43% | 0.48% | 0.55% | 0.55% | ||||||||||||||
|
|
|
|||||||||||||||||||
| Net investment income |
1.14% | 6 | 1.09% | 0.95% | 1.20% | 1.64% | ||||||||||||||
|
|
|
|||||||||||||||||||
| Supplemental Data | ||||||||||||||||||||
| Net assets, end of year (000) |
$ | 116,722 | $ | 87,930 | $ | 83,859 | $ | 83,118 | $ | 49,303 | ||||||||||
|
|
|
|||||||||||||||||||
| Portfolio turnover rate of the Series |
39% | 37% | 21% | 22% | 68% | |||||||||||||||
|
|
|
|||||||||||||||||||
| 1 | Based on average shares outstanding. |
| 2 | Distributions for annual periods determined in accordance with federal income tax regulations. |
| 3 | Where applicable, assumes the reinvestment of distributions. |
| 4 | Includes the Fund’s share of the Series’ allocated expenses and/or net investment income. |
| 5 | Includes the Fund’s share of the Series’ allocated fees waived of less than 0.01%. |
| 6 | Excludes expenses incurred indirectly of 0.01% as a result of the Series’ investments in underlying funds. |
| See Notes to Financial Statements. | ||||||
| 26 | BLACKROCK INDEX FUNDS, INC. | DECEMBER 31, 2016 | ||||
| Financial Highlights (concluded) | BlackRock Small Cap Index Fund |
| Class K | ||||||||||||||||||||
| Year Ended December 31, | ||||||||||||||||||||
| 2016 | 2015 | 2014 | 2013 | 2012 | ||||||||||||||||
| Per Share Operating Performance | ||||||||||||||||||||
| Net asset value, beginning of year |
$ | 15.35 | $ | 16.62 | $ | 17.53 | $ | 13.01 | $ | 11.51 | ||||||||||
|
|
|
|||||||||||||||||||
| Net investment income1 |
0.24 | 0.25 | 0.23 | 0.25 | 0.25 | |||||||||||||||
| Net realized and unrealized gain (loss) |
3.02 | (0.97 | ) | 0.54 | 4.81 | 1.62 | ||||||||||||||
|
|
|
|||||||||||||||||||
| Net increase (decrease) from investment operations |
3.26 | (0.72 | ) | 0.77 | 5.06 | 1.87 | ||||||||||||||
|
|
|
|||||||||||||||||||
| Distributions:2 | ||||||||||||||||||||
| From net investment income |
(0.22 | ) | (0.14 | ) | (0.27 | ) | (0.20 | ) | (0.37 | ) | ||||||||||
| From net realized gain |
(0.60 | ) | (0.41 | ) | (1.41 | ) | (0.34 | ) | — | |||||||||||
|
|
|
|||||||||||||||||||
| Total distributions |
(0.82 | ) | (0.55 | ) | (1.68 | ) | (0.54 | ) | (0.37 | ) | ||||||||||
|
|
|
|||||||||||||||||||
| Net asset value, end of year |
$ | 17.79 | $ | 15.35 | $ | 16.62 | $ | 17.53 | $ | 13.01 | ||||||||||
|
|
|
|||||||||||||||||||
| Total Return3 | ||||||||||||||||||||
| Based on net asset value |
21.32% | (4.41 | )% | 4.87% | 39.14% | 16.30% | ||||||||||||||
|
|
|
|||||||||||||||||||
| Ratios to Average Net Assets4,5 | ||||||||||||||||||||
| Total expenses |
0.17% | 6 | 0.21% | 0.32% | 0.49% | 0.68% | ||||||||||||||
|
|
|
|||||||||||||||||||
| Total expenses after fees waived and/or reimbursed |
0.10% | 6 | 0.13% | 0.18% | 0.25% | 0.25% | ||||||||||||||
|
|
|
|||||||||||||||||||
| Net investment income |
1.48% | 6 | 1.50% | 1.35% | 1.57% | 1.99% | ||||||||||||||
|
|
|
|||||||||||||||||||
| Supplemental Data | ||||||||||||||||||||
| Net assets, end of year (000) |
$ | 60,086 | $ | 8,338 | $ | 2,617 | $ | 1,196 | $ | 40 | ||||||||||
|
|
|
|||||||||||||||||||
| Portfolio turnover rate of the Series |
39% | 37% | 21% | 22% | 68% | |||||||||||||||
|
|
|
|||||||||||||||||||
| 1 | Based on average shares outstanding. |
| 2 | Distributions for annual periods determined in accordance with federal income tax regulations. |
| 3 | Where applicable, assumes the reinvestment of distributions. |
| 4 | Includes the Fund’s share of the Series’ allocated expenses and/or net investment income. |
| 5 | Includes the Fund’s share of the Series’ allocated fees waived of less than 0.01%. |
| 6 | Excludes expenses incurred indirectly of 0.01% as a result of the Series’ investments in underlying funds. |
| See Notes to Financial Statements. | ||||||
| BLACKROCK INDEX FUNDS, INC. | DECEMBER 31, 2016 | 27 | ||||
| Notes to Financial Statements | BlackRock Index Funds, Inc. |
1. Organization:
BlackRock International Index Fund and BlackRock Small Cap Index Fund are each a series of BlackRock Index Funds, Inc. (the “Corporation”), which is registered under the Investment Company Act of 1940, as amended (the “1940 Act”), as an open-end management investment company. The Corporation is organized as a Maryland corporation. The following are referred to herein collectively as the “Funds” or individually, a “Fund”:
| Fund Name | Herein Referred To As | Diversification Classification | ||
| BlackRock International Index Fund |
International Index | Diversified | ||
| BlackRock Small Cap Index Fund | Small Cap Index | Diversified |
Small Cap Index seeks to achieve its investment objectives by investing all of its assets in Master Small Cap Index Series (the “Series”), a series of Quantitative Master Series LLC (the “Master LLC”), an affiliate of Small Cap Index, which has the same investment objectives and strategies as Small Cap Index. The value of Small Cap Index’s investment in the Series reflects Small Cap Index’s proportionate interest in the net assets of the Series. The performance of Small Cap Index is directly affected by the performance of the Series. At December 31, 2016, the percentage of the Series owned by the Small Cap Index was 61.0%. The financial statements of the Series, including the Schedule of Investments, are included elsewhere in this report and should be read in conjunction with the Small Cap Index’s financial statements.
Prior to August 1, 2016, International Index invested all of its assets in Master International Index Series (“Master International Index”), an affiliate of International Index, which had the same investment objective and strategies as International Index. The value of International Index’s investment in Master International Index reflected International Index’s proportionate interest in the net assets of Master International Index. The performance of International Index was directly affected by the performance of Master International Index. As of July 31, 2016, International Index owned 100% of Master International Index. For the period January 1, 2016 to July 31, 2016, Master International Index allocated $80,580,847, $(160,665,432) and $188,531,853 from net investment income, net realized losses and net change in unrealized appreciation (depreciation), respectively, to International Index.
On August 1, 2016, International Index ceased to invest in Master International Index as part of a “master-feeder” structure and began to operate as a stand-alone fund. In connection with this change, International Index entered into a management agreement with BlackRock Advisors, LLC (the “Manager”), the terms of which are substantially the same as the management agreement between BlackRock Advisors, LLC and Master International Index, including the management fee rate. International Index received net assets of $3,542,759,348, which included net unrealized appreciation of $47,204,065, in exchange for its ownership in Master International Index which included net unrealized appreciation of $60,197,540. The cost basis for the investments received from Master International Index was carried forward to align ongoing reporting of International Index’s realized and unrealized gains and losses with amounts distributable to shareholders for tax purposes. The change into a stand-alone structure did not result in a change in net assets of International Index and did not create a taxable event for International Index.
The Funds offer multiple classes of shares. All classes of shares have identical voting, dividend, liquidation and other rights and are subject to the same terms and conditions, except that certain classes bear expenses related to the shareholder servicing and distribution of such shares. Institutional and Class K Shares are sold only to certain eligible investors. Investor A Shares are generally available through financial intermediaries. Each class has exclusive voting rights with respect to matters relating to its shareholder servicing and distribution expenditures. The Board of Directors of the Corporation and Board of Directors of the Master LLC are referred to throughout this report as the “Board of Directors” or the “Board” and the members are referred to as “Directors.”
| Share Class | Initial Sales Charge | CDSC | Conversion Privilege | |||||||||
| Institutional Shares |
No | No | None | |||||||||
| Investor A Shares |
No | No | None | |||||||||
| Class K Shares |
No | No | None | |||||||||
The Funds, together with certain other registered investment companies advised by BlackRock Advisors, LLC (the “Manager” and/or the “Administrator”) or its affiliates, are included in a complex of open-end funds referred to as the Equity-Liquidity Complex.
2. Significant Accounting Policies:
The financial statements are prepared in conformity with accounting principles generally accepted in the United States of America (“U.S. GAAP”), which may require management to make estimates and assumptions that affect the reported amounts of assets and liabilities in the financial statements, disclosure of contingent assets and liabilities at the date of the financial statements and the reported amounts of increases and decreases in net assets from operations during the reporting period. Actual results could differ from those estimates. Each Fund is considered an investment company under U.S. GAAP and follows the accounting and reporting guidance applicable to investment companies. Below is a summary of significant accounting policies:
Foreign Currency: International Index’s books and records are maintained in U.S. dollars. Purchases and sales of investments are recorded at the rates of exchange prevailing on the respective dates of such transactions. Generally, when the U.S. dollar rises in value against a foreign currency, the investments denominated in that currency will lose value; the opposite effect occurs if the U.S. dollar falls in relative value.
| 28 | BLACKROCK INDEX FUNDS, INC. | DECEMBER 31, 2016 |
| Notes to Financial Statements (continued) | BlackRock Index Funds, Inc. |
International Index does not isolate the portion of the results of operations arising as a result of changes in the exchange rates from the changes in the market prices of investments held or sold for financial reporting purposes. Accordingly, the effects of changes in exchange rates on investments are not segregated in the Statements of Operations from the effects of changes in market prices of those investments, but are included as a component of net realized and unrealized gain (loss) from investments. International Index reports realized currency gains (losses) on foreign currency related transactions as components of net realized gain (loss) for financial reporting purposes, whereas such components are generally treated as ordinary income for federal income tax purposes.
Segregation and Collateralization: In cases where International Index enters into certain investments (e.g., futures contracts) that would be treated as “senior securities” for 1940 Act purposes, International Index may segregate or designate on its books and records cash or liquid assets having a market value at least equal to the amount of its future obligations under such investments. Doing so allows the investment to be excluded from treatment as a “senior security.” Furthermore, if required by an exchange or counterparty agreement, International Index may be required to deliver/deposit cash and/or securities to/with an exchange, or broker-dealer or custodian as collateral for certain investments or obligations.
Investment Transactions and Investment Income: For International Index, for financial reporting purposes, investment transactions are recorded on the dates the transactions are entered into (the trade dates). Realized gains and losses on investment transactions are determined on the identified cost basis. Dividend income is recorded on the ex-dividend date. Dividends from foreign securities where the ex-dividend date may have passed are subsequently recorded when International Index is informed of the ex-dividend date. Under the applicable foreign tax laws, a withholding tax at various rates may be imposed on capital gains, dividends and interest. Upon notification from issuers, some of the dividend income received from a real estate investment trust may be redesignated as a reduction of cost of the related investment and/or realized gain. For Small Cap Index, for financial reporting purposes, contributions to and withdrawals from the Series are accounted for on a trade date basis. Small Cap Index records its proportionate share of the Series’ income, expenses and realized and unrealized gains and losses on a daily basis. Prior to August 1, 2016, International Index, for financial reporting purposes, contributions to and withdrawals from Master International Index were accounted for on a trade date basis. International Index recorded its proportionate share of Master International Index’s income, expenses and realized and unrealized gains and losses on a daily basis. In addition, the Funds accrue their own expenses. Income, expenses and realized and unrealized gains and losses are allocated daily to each class based on its relative net assets.
Distributions: Distributions paid by the Funds are recorded on the ex-dividend date. The character and timing of distributions are determined in accordance with federal income tax regulations, which may differ from U.S. GAAP.
Recent Accounting Standard: In April 2015, the Financial Accounting Standards Board issued “Disclosures for Investments in Certain Entities that Calculate Net Asset Value (“NAV”) per Share” which eliminates the requirement to categorize investments within the fair value hierarchy when fair value is based on the NAV per share and no quoted market value is available and have been excluded from the fair value hierarchy. As of December 31, 2016, certain investments of International Index were valued using NAV per share as no quoted market value is available and have been excluded from the fair value hierarchy.
In November 2016, the Financial Accounting Standards Board issued Accounting Standards Update “Restricted Cash” which will require entities to include the total of cash, cash equivalents, restricted cash, and restricted cash equivalents in the beginning and ending cash balances in the Statement of Cash Flows. The guidance will be applied retrospectively and is effective for fiscal years beginning after December 15, 2017, and interim periods within those years. Management is evaluating the impact, if any, of this guidance on the International Index’s presentation in the Statement of Cash Flows.
Indemnifications: In the normal course of business, a Fund enters into contracts that contain a variety of representations that provide general indemnification. A Fund’s maximum exposure under these arrangements is unknown because it involves future potential claims against a Fund, which cannot be predicted with any certainty.
Other: Expenses directly related to a Fund or its classes are charged to that Fund or the applicable class. Other operating expenses shared by several funds, including other funds managed by the Manager and/or Administrator, are prorated among those funds on the basis of relative net assets or other appropriate methods. Expenses directly related to the Funds and other shared expenses prorated to the Funds are allocated daily to each class based on its relative net assets or other appropriate methods.
Through May 31, 2016, the Funds had an arrangement with their custodian whereby credits were earned on uninvested cash balances, which could be used to reduce custody fees and/or overdraft charges. Credits previously earned may have been utilized until December 31, 2016. Under current arrangements effective June 1, 2016, the Funds no longer earn credits on uninvested cash, and may incur charges on uninvested cash balances and overdrafts, subject to certain conditions.
3. Investment Valuation and Fair Value Measurements:
Investment Valuation Policies: U.S. GAAP defines fair value as the price the Funds would receive to sell an asset or pay to transfer a liability in an orderly transaction between market participants at the measurement date. Small Cap Index’s policy is to value its financial instruments at fair value. Small Cap Index records its investment in the Series at fair value based on Small Cap Index’s proportionate interest in the net assets of the Series. Prior to August 1, 2016, International Index recorded its investment in Master International Index at fair value based on International Index’s proportionate interest in the net
| BLACKROCK INDEX FUNDS, INC. | DECEMBER 31, 2016 | 29 |
| Notes to Financial Statements (continued) | BlackRock Index Funds, Inc. | |||
assets of Master International Index. Valuation of securities held by the Series is discussed in Note 3 of the Series’ Notes to Financial Statements, which are included elsewhere in this report. International Index’s investments are valued at fair value (also referred to as “market value” within the financial statements) as of the close of trading on the New York Stock Exchange (“NYSE”) (generally 4:00 p.m., Eastern time) (or if the reporting date falls on a day the NYSE is closed, investments are valued at fair value as of the period end). U.S. GAAP defines fair value as the price the fund would receive to sell an asset or pay to transfer a liability in an orderly transaction between market participants at the measurement date. International Index determines the fair values of its financial instruments using various independent dealers or pricing services under policies approved by the Board. The BlackRock Global Valuation Methodologies Committee (the “Global Valuation Committee”) is the committee formed by management to develop global pricing policies and procedures and to oversee the pricing function for all financial instruments.
Fair Value Inputs and Methodologies: The following methods and inputs are used to establish the fair value of the International Index’s assets and liabilities:
| • | Equity investments traded on a recognized securities exchange are valued at the official closing price each day, if available. For equity investments traded on more than one exchange, the official closing price on the exchange where the stock is primarily traded is used. Equity investments traded on a recognized exchange for which there were no sales on that day may be valued at the last available bid (long positions) or ask (short positions) price. Generally, trading in foreign instruments is substantially completed each day at various times prior to the close of trading on the NYSE. Occasionally, events affecting the values of such instruments may occur between the foreign market close and the close of trading on the NYSE that may not be reflected in the computation of International Index’s net assets. Each business day, International Index uses a pricing service to assist with the valuation of certain foreign exchange-traded equity securities and foreign exchange-traded and over-the-counter (“OTC”) options (the “Systematic Fair Value Price”). Using current market factors, the Systematic Fair Value Price is designed to value such foreign securities and foreign options at fair value as of the close of trading on the NYSE, which follows the close of the local markets. |
| • | International Index values its investment in SL Liquidity Series, LLC, Money Market Series (the “Money Market Series”) at fair value, which is ordinarily based upon its pro rata ownership in the underlying fund’s net assets. The Money Market Series seeks current income consistent with maintaining liquidity and preserving capital. Although the Money Market Series is not registered under the 1940 Act, its investments may follow the parameters of investments by a money market fund that is subject to Rule 2a-7 under the 1940 Act. |
| • | Investments in open-end U.S. mutual funds are valued at net asset value (“NAV”) each business day. |
| • | Futures contracts traded on exchanges are valued at their last sale price. |
| • | Securities and other assets and liabilities denominated in foreign currencies are translated into U.S. dollars using exchange rates determined as of the close of trading on the NYSE. Forward foreign currency exchange contracts are valued at the mean between the bid and ask prices and are determined as of the close of trading on the NYSE. Interpolated values are derived when the settlement date of the contract is an interim date for which quotations are not available. |
If events (e.g., a company announcement, market volatility or a natural disaster) occur that are expected to materially affect the value of such investments, or in the event that the application of these methods of valuation results in a price for an investment that is deemed not to be representative of the market value of such investment, or if a price is not available, the investment will be valued by the Global Valuation Committee, or its delegate, in accordance with a policy approved by the Board as reflecting fair value (“Fair Valued Investments”). The fair valuation approaches that may be used by the Global Valuation Committee will include Market approach, Income approach and the Cost approach. Valuation techniques such as discounted cash flow, use of market comparables and matrix pricing are types of valuation approaches and typically used in determining fair value. When determining the price for Fair Valued Investments, the Global Valuation Committee, or its delegate, seeks to determine the price that International Index might reasonably expect to receive or pay from the current sale or purchase of that asset or liability in an arm’s-length transaction. Fair value determinations shall be based upon all available factors that the Global Valuation Committee, or its delegate, deems relevant and consistent with the principles of fair value measurement.
The Global Valuation Committee, or its delegate, employs various methods for calibrating valuation approaches for investments where an active market does not exist, including regular due diligence of Corporation’s pricing vendors, regular reviews of key inputs and assumptions, transactional back-testing or disposition analysis to compare unrealized gains and losses to realized gains and losses, reviews of missing or stale prices and large movements in market values and reviews of any market related activity. The pricing of all Fair Valued Investments is subsequently reported to the Board or a committee thereof on a quarterly basis. As a result of the inherent uncertainty in valuation of these investments, the fair values may differ from the values that would have been used had an active market existed.
For investments in equity or debt issued by privately-held companies or funds (“Private Company” or collectively, the “Private Companies”) and other Fair Valued Investments, the fair valuation approaches that are used by third party pricing services utilize one or a combination of, but not limited to, the following inputs.
| 30 | BLACKROCK INDEX FUNDS, INC. | DECEMBER 31, 2016 |
| Notes to Financial Statements (continued) | BlackRock Index Funds, Inc. |
| Standard Inputs Generally Considered By Third Party Pricing Services | ||
| Market approach |
(i) recent market transactions, including subsequent rounds of financing, in the underlying investment or comparable issuers; (ii) recapitalizations and other transactions across the capital structure; and (iii) market multiples of comparable issuers. | |
| Income approach |
(i) future cash flows discounted to present and adjusted as appropriate for liquidity, credit, and/or market risks; (ii) quoted prices for similar investments or assets in active markets; and (iii) other risk factors, such as interest rates, yield curves, volatilities, prepayment speeds, loss severities, credit risks, recovery rates, liquidation amounts and/or default rates. | |
| Cost approach |
(i) audited or unaudited financial statements, investor communications and financial or operational metrics issued by the Private Company; (ii) changes in the valuation of relevant indices or publicly traded companies comparable to the Private Company; (iii) relevant news and other public sources; and (iv) known secondary market transactions in the Private Company’s interests and merger or acquisition activity in companies comparable to the Private Company. |
Investments in series of preferred stock issued by Private Companies are typically valued utilizing market approach in determining the enterprise value of the company. Such investments often contain rights and preferences that differ from other series of preferred and common stock of the same issuer. Valuation techniques such as an option pricing model (“OPM”), a probability weighted expected return model (“PWERM”) or a hybrid of those techniques are used in allocating enterprise value of the company, as deemed appropriate under the circumstances. The use of OPM and PWERM techniques involve a determination of the exit scenarios of the investment in order to appropriately allocate the enterprise value of the company among the various parts of its capital structure.
The Private Companies are not subject to the public company disclosure, timing, and reporting standards as other investments held by International Index. Typically, the most recently available information by a Private Company is as of a date that is earlier than the date International Index is calculating its NAV. This factor may result in a difference between the value of the investment and the price International Index could receive upon the sale of the investment.
Fair Value Hierarchy: Various inputs are used in determining the fair value of investments and derivative financial instruments. These inputs to valuation techniques are categorized into a fair value hierarchy consisting of three broad levels for financial statement purposes as follows:
| • | Level 1 — unadjusted price quotations in active markets/exchanges for identical assets or liabilities that International Index has the ability to access |
| • | Level 2 — other observable inputs (including, but not limited to, quoted prices for similar assets or liabilities in markets that are active, quoted prices for identical or similar assets or liabilities in markets that are not active, inputs other than quoted prices that are observable for the assets or liabilities (such as interest rates, yield curves, volatilities, prepayment speeds, loss severities, credit risks and default rates) or other market–corroborated inputs) |
| • | Level 3 — unobservable inputs based on the best information available in the circumstances, to the extent observable inputs are not available (including International Index’s own assumptions used in determining the fair value of investments and derivative financial instruments) |
The hierarchy gives the highest priority to unadjusted quoted prices in active markets for identical assets or liabilities (Level 1 measurements) and the lowest priority to unobservable inputs (Level 3 measurements). Accordingly, the degree of judgment exercised in determining fair value is greatest for instruments categorized in Level 3. The inputs used to measure fair value may fall into different levels of the fair value hierarchy. In such cases, for disclosure purposes, the fair value hierarchy classification is determined based on the lowest level input that is significant to the fair value measurement in its entirety. Investments classified within Level 3 have significant unobservable inputs used by the Global Valuation Committee in determining the price for Fair Valued investments. Level 3 investments include equity or debt issued by Private Companies. There may not be a secondary market, and/or there are a limited number of investors. Level 3 investments may also be adjusted to reflect illiquidity and/or non-transferability, with the amount of such discount estimated by the Global Valuation Committee in the absence of market information.
Changes in valuation techniques may result in transfers into or out of an assigned level within the hierarchy. In accordance with the Corporation’s policy, transfers between different levels of the fair value hierarchy are deemed to have occurred as of the beginning of the reporting period. The categorization of a value determined for investments and derivative financial instruments is based on the pricing transparency of the investments and derivative financial instruments and is not necessarily an indication of the risks associated with investing in those securities.
4. Securities and Other Investments:
Preferred Stock: Preferred stock has a preference over common stock in liquidation (and generally in receiving dividends as well), but is subordinated to the liabilities of the issuer in all respects. As a general rule, the market value of preferred stock with a fixed dividend rate and no conversion element varies inversely with interest rates and perceived credit risk, while the market price of convertible preferred stock generally also reflects some element of conversion value. Because preferred stock is junior to debt securities and other obligations of the issuer, deterioration in the credit quality of the issuer will cause greater changes in the value of a preferred stock than in a more senior debt security with similar stated yield characteristics. Unlike interest payments on debt securities, preferred stock dividends are payable only if declared by the issuer’s board of directors. Preferred stock also may be subject to optional or mandatory redemption provisions.
| BLACKROCK INDEX FUNDS, INC. | DECEMBER 31, 2016 | 31 |
| Notes to Financial Statements (continued) | BlackRock Index Funds, Inc. | |||
Securities Lending: International Index may lend its securities to approved borrowers, such as brokers, dealers and other financial institutions. The borrower pledges and maintains with International Index collateral consisting of cash, an irrevocable letter of credit issued by a bank, or securities issued or guaranteed by the U.S. Government. The initial collateral received by International Index is required to have a value of at least 102% of the current value of the loaned securities for securities traded on U.S. exchanges and a value of at least 105% for all other securities. The collateral is maintained thereafter at a value equal to at least 100% of the current market value of the securities on loan. The market value of the loaned securities is determined at the close of each business day of International Index and any additional required collateral is delivered to International Index, or excess collateral returned by International Index, on the next business day. During the term of the loan, International Index is entitled to all distributions made on or in respect of the loaned securities, but does not receive interest income on securities received as collateral. Loans of securities are terminable at any time and the borrower, after notice, is required to return borrowed securities within the standard time period for settlement of securities transactions.
The market value of any securities on loan, all of which were classified as common stocks in International Index’s Schedule of Investments, and the value of any related collateral are shown separately in the Statements of Assets and Liabilities as a component of investments at value-unaffiliated, and collateral on securities loaned at value, respectively. As of period end, any securities on loan were collateralized by cash and/or U.S. Government obligations. Cash collateral invested by the securities lending agent, BlackRock Investment Management, LLC (“BIM”), if any, is disclosed in the Schedule of Investments.
Securities lending transactions are entered into by International Index under Master Securities Lending Agreements (each, an “MSLA”), which provide the right, in the event of default (including bankruptcy or insolvency), for the non-defaulting party to liquidate the collateral and calculate a net exposure to the defaulting party or request additional collateral. In the event that a borrower defaults, International Index, as lender, would offset the market value of the collateral received against the market value of the securities loaned. When the value of the collateral is greater than that of the market value of the securities loaned, the lender is left with a net amount payable to the defaulting party. However, bankruptcy or insolvency laws of a particular jurisdiction may impose restrictions on or prohibitions against such a right of offset in the event of an MSLA counterparty’s bankruptcy or insolvency. Under the MSLA, absent an event of default, the borrower can resell or re-pledge the loaned securities, and International Index can reinvest cash collateral received in connection with loaned securities. Upon an event of default, the parties’ obligations to return the securities or collateral to the other party are extinguished, and the parties can resell or re-pledge the loaned securities or the collateral received in connection with the loaned securities in order to satisfy the defaulting party’s net payment obligation for all transactions under the MSLA. The defaulting party remains liable for any deficiency.
As of period end, the following table is a summary of International Index’s securities lending agreements by counterparty which are subject to offset under an MSLA:
| Counterparty | Securities Loaned at Value |
Cash Collateral Received1 |
Net Amount |
|||||||||
| Credit Suisse Securities (USA) LLC |
$ | 233,446 | $ | (233,446 | ) | — | ||||||
| Morgan Stanley & Co. LLC |
417,391 | (417,391 | ) | — | ||||||||
| SG Americas Securities LLC |
365,516 | (365,516 | ) | — | ||||||||
|
|
|
|
|
|
|
|||||||
| Total |
$ | 1,016,353 | $ | (1,016,353 | ) | — | ||||||
|
|
|
|
|
|
|
|||||||
| 1 | Cash collateral with a value of $1,766,695 has been received in connection with securities lending agreements. Collateral received in excess of the value of securities loaned from the individual counterparty is not shown for financial reporting purposes. |
The risks of securities lending include the risk that the borrower may not provide additional collateral when required or may not return the securities when due. To mitigate these risks, International Index benefits from a borrower default indemnity provided by BIM. BIM’s indemnity allows for full replacement of the securities loaned if the collateral received does not cover the value on the securities loaned in the event of borrower default. International Index could suffer a loss if the value of an investment purchased with cash collateral falls below the market value of loaned securities or if the value of an investment purchased with cash collateral falls below the value of the original cash collateral received.
5. Derivative Financial Instruments:
International Index engages in various portfolio investment strategies using derivative contracts both to increase its returns and/or to manage its exposure to certain risks such as equity risk. Derivative financial instruments categorized by risk exposure are included in the Schedule of Investments. These contracts may be transacted on an exchange or OTC.
Futures Contracts: International Index invests in long and/or short positions in futures and options on futures contracts to gain exposure to, or manage exposure to, changes in interest rates (interest rate risk), changes in the value of equity securities (equity risk) or foreign currencies (foreign currency exchange rate risk).
Futures contracts are agreements between International Index and a counterparty to buy or sell a specific quantity of an underlying instrument at a specified price and on a specified date. Depending on the terms of a contract, it is settled either through physical delivery of the underlying instrument on the settlement date or by payment of a cash amount on the settlement date. Upon entering into a futures contract, International Index is required to deposit
| 32 | BLACKROCK INDEX FUNDS, INC. | DECEMBER 31, 2016 |
| Notes to Financial Statements (continued) | BlackRock Index Funds, Inc. |
initial margin with the broker in the form of cash or securities in an amount that varies depending on a contract’s size and risk profile. The initial margin deposit must then be maintained at an established level over the life of the contract.
Securities deposited as initial margin are designated in the Schedule of Investments and cash deposited, if any, is shown as cash pledged for futures contracts in the Statements of Assets and Liabilities. Pursuant to the contract, International Index agrees to receive from or pay to the broker an amount of cash equal to the daily fluctuation in market value of the contract (“variation margin”). Variation margin is recorded as unrealized appreciation (depreciation) and, if any, shown as variation margin receivable (or payable) on futures contracts in the Statements of Assets and Liabilities. When the contract is closed, a realized gain or loss is recorded in the Statements of Operations equal to the difference between the value of the contract at the time it was opened and the value at the time it was closed. The use of futures contracts involves the risk of an imperfect correlation in the movements in the price of futures contracts and interest, foreign currency exchange rates or underlying assets.
6. Investment Advisory and Administration Agreements and Other Transactions with Affiliates:
The PNC Financial Services Group, Inc. is the largest stockholder and an affiliate of BlackRock, Inc. (“BlackRock”) for 1940 Act purposes.
Investment Advisory and Administration: Effective August 1, 2016, the Corporation, on behalf of International Index, entered into an Investment Advisory Agreement with the Manager, International Index’s investment adviser, an indirect, wholly-owned subsidiary of BlackRock, to provide investment advisory and administration services. The Manager is responsible for the management of International Index’s portfolio and provides the personnel, facilities, equipment and certain other services necessary to the operations of International Index. For such services, International Index pays the Manager a monthly fee at an annual rate equal to 0.01% of the average daily value of the Fund’s net assets. Prior to August 1, 2016, International Index paid an administration fee of 0.01% of the average daily value of International Index’s net assets.
The Corporation, on behalf of Small Cap Index, entered into an Administration Agreement with the Administrator, an indirect, wholly-owned subsidiary of BlackRock, to provide administrative services (other than investment advice and related portfolio activities). For such services, Small Cap Index pays the Administrator a monthly fee at an annual rate of 0.04% of the average daily net assets of Small Cap Index. Small Cap Index does not pay an investment advisory fee or investment management fee.
Service Fees: The Corporation, on behalf of the Funds, entered into a Distribution Agreement and a Distribution Plan with BlackRock Investments, LLC (“BRIL”), an affiliate of the Manager. Pursuant to the Distribution Plan and in accordance with Rule 12b-1 under the 1940 Act, each Fund pays BRIL ongoing service and distribution fees. The fees are accrued daily and paid monthly at annual rates based upon the average daily net assets of the relevant share class of each Fund as follows:
| International Index | Small Cap Index | |||||||
| Investor A |
0.25% | 0.25% | ||||||
BRIL and broker-dealers, pursuant to sub-agreements with BRIL, provide shareholder servicing to the Funds. The ongoing service fee compensates BRIL and each broker-dealer for providing shareholder servicing related services to the shareholders.
For the year ended December 31, 2016, the following table shows the class specific service and distribution fees borne directly by each share class of each Fund:
| International Index | Small Cap Index | |||||||
| Investor A |
$ | 488,401 | $ | 242,591 | ||||
Transfer Agent: Pursuant to written agreements, certain financial intermediaries, some of which may be affiliates, provide Small Cap Index with sub-accounting, recordkeeping, sub-transfer agency and other administrative services with respect to sub-accounts they service. For these services, these entities receive an asset-based fee or an annual fee per shareholder account, which will vary depending on share class and/or net assets. For the year ended December 31, 2016, the Funds paid the following amounts to affiliates of BlackRock in return for these services, which are included in transfer agent — class specific in the Statements of Operations:
| Institutional | Investor A | Class K | Total | |||||||||||||
| Small Cap Index |
$ | 403 | — | — | $ | 403 | ||||||||||
| BLACKROCK INDEX FUNDS, INC. | DECEMBER 31, 2016 | 33 |
| Notes to Financial Statements (continued) | BlackRock Index Funds, Inc. | |||
The Manager and/or Administrator maintains a call center that is responsible for providing certain shareholder services to the Funds. Shareholder services include responding to inquiries and processing subscriptions and redemptions based upon instructions from shareholders. For the year ended December 31, 2016, each Fund reimbursed the Manager and/or Administrator the following amounts for costs incurred in running the call center, which are included in transfer agent — class specific in the Statements of Operations:
| Institutional | Investor A | Class K | Total | |||||||||||||
| International Index |
$ | 5,486 | $ | 2,709 | $ | 6,722 | $ | 14,917 | ||||||||
| Small Cap Index |
— | $ | 2,959 | $ | 162 | $ | 3,121 | |||||||||
For the year ended December 31, 2016, the following table shows the class specific transfer agent fees borne directly by each class of each Fund:
| Institutional | Investor A | Class K | Total | |||||||||||||
| International Index |
$ | 509,725 | $ | 137,275 | $ | 306,717 | $ | 953,717 | ||||||||
| Small Cap Index |
$ | 55,004 | $ | 76,756 | $ | 3,880 | $ | 135,640 | ||||||||
Expense Limitations, Waivers and Reimbursements: With respect to each Fund, the Manager and/or Administrator contractually agreed to waive and/or reimburse fees or expenses in order to limit expenses, excluding interest expense, dividend expense, tax expense, acquired fund fees and expenses, and certain other fund expenses, which constitute extraordinary expenses not incurred in the ordinary course of each Fund’s business (“expense limitation”). The current expense limitations as a percentage of each Fund’s average daily net assets are as follows:
| Institutional |
0.12% | |||
| Investor A |
0.37% | |||
| Class K |
0.07% |
Prior to October 5, 2016, for Small Cap Index, the expense limitations as a percentage of average daily net assets were as follows:
| Institutional |
0.17% | |||
| Investor A |
0.42% | |||
| Class K |
0.12% |
The Manager and/or Administrator has agreed not to reduce or discontinue these contractual expense limitations prior to May 1, 2018, unless approved by the Board, including a majority of the Directors who are not “interested persons” of the Funds, as defined in the 1940 Act (“Independent Directors”) or by a vote of a majority of the outstanding voting securities of the Funds. For the year ended December 31, 2016, the Manager and/or Administrator waived and/or reimbursed the following amounts, which are shown as fees waived by the Administrator, fees reimbursed by the Administrator, fees waived and/or reimbursed by the Manager and transfer agent fees waived and/or reimbursed — class specific, respectively, in the Statements of Operations.
| Institutional | Investor A | Class K | Total | |||||||||||||
| International Index |
$ | 37,722 | $ | 4,128 | $ | 31,829 | $ | 73,679 | ||||||||
| Small Cap Index |
$ | 97,017 | $ | 53,841 | $ | 13,926 | $ | 164,784 | ||||||||
For the year ended December 31, 2016, for International Index, the Manager waived and/or reimbursed $146, which is included in fees waived and/or reimbursed by the Manager in the Statements of Operations.
For the year ended December 31, 2016, the amounts shown as transfer agent fees waived and/or reimbursed-class specific were as follows:
| Institutional | Investor A | Class K | Total | |||||||||||||
| International Index |
$ | 242,739 | $ | 23,323 | $ | 89,748 | $ | 355,810 | ||||||||
| Small Cap Index |
— | $ | 28,696 | $ | 3,868 | $ | 32,564 | |||||||||
With respect to International Index, the Manager voluntarily agreed to waive its investment advisory fees by the amount of investment advisory fees the Fund pays to the Manager indirectly through its investment in affiliated money market funds. This amount is included in fees waived by the Manager in the Statements of Operations. For the year ended December 31, 2016, the amount waived was $6,181.
Effective September 1, 2016, the Manager voluntarily agreed to waive its advisory fee payable by International Index with respect to any portion of the Fund’s assets invested in equity or fixed-income mutual funds or exchange-traded funds that have a contractual management fee. Prior to September 1, 2016, the Manager did not waive such fees. This voluntary waiver may be reduced or discontinued at any time without notice. International Index waived $434 pursuant to these arrangements.
Securities Lending: The U.S. Securities and Exchange Commission has issued an exemptive order which permits BIM, an affiliate of the Manager, to serve as securities lending agent for International Index, subject to applicable conditions. As securities lending agent, BIM bears all operational costs directly related to securities lending. International Index is responsible for expenses in connection with the investment of cash collateral received for securities on loan (the “collateral investment expenses”). The cash collateral is invested in a private investment company managed by the Manager or its affiliates. However, BIM has agreed to cap the collateral investment expenses of the private investment company to an annual rate of 0.04%. The investment adviser to the private investment company will not charge any advisory fees with respect to shares purchased by International Index.
| 34 | BLACKROCK INDEX FUNDS, INC. | DECEMBER 31, 2016 |
| Notes to Financial Statements (continued) | BlackRock Index Funds, Inc. |
Securities lending income is equal to the total of income earned from the reinvestment of cash collateral, net of fees and other payments to and from borrowers of securities, and less the collateral investment expenses. International Index retains a portion of securities lending income and remits a remaining portion to BIM as compensation for its services as securities lending agent. Pursuant to a securities lending agreement, BIM may lend securities only when the difference between the borrower rebate rate and the risk free rate exceeds a certain level (such securities, the “specials only securities”).
Pursuant to such agreement, International Index retains 80% of securities lending income. In addition, commencing the business day following the date that the aggregate securities lending income earned across certain funds in the Equity-Liquidity Complex in a calendar year exceeds a specified threshold, International Index, pursuant to the securities lending agreement, will retain for the remainder of the calendar year securities lending income in an amount equal to 85% of securities lending income.
The share of securities lending income earned by International Index is shown as securities lending — affiliated — net in the Statements of Operations. For the year ended December 31, 2016, International Index paid BIM the following amounts in total for securities lending agent services and collateral investment fees:
| International Index |
$ | 91,048 |
Interfund Lending: In accordance with an exemptive order (the “Order”) from the U.S. Securities and Exchange Commission, each Fund may participate in a joint lending and borrowing facility for temporary purposes (the “Interfund Lending Program”), subject to compliance with the terms and conditions of the Order, and to the extent permitted by each Fund’s investment policies and restrictions. Each Fund is currently permitted to borrow and lend under the Interfund Lending Program.
A Fund may lend in aggregate up to 15% of its net assets, but no more than 5% of its net assets, to any one borrowing fund through the Interfund Lending Program. A Fund may not borrow through the Interfund Lending Program or from any other source more than 33 1/3% of its total assets or any lower threshold provided for by the Fund’s investment restrictions. If a Fund’s total outstanding borrowings exceed 10% of its total assets, each of its outstanding interfund loans will be subject to collateralization of at least 102% of the outstanding principal value of the loan. All interfund loans are for temporary or emergency purposes and the interest rate to be charged will be the average of the highest current overnight repurchase agreement rate available to a lending fund and the bank loan rate, as calculated according to a formula established by the Board.
During the year ended December 31, 2016, the Funds did not participate in the Interfund Lending Program.
Officers and Directors: Certain officers and/or directors of the Corporation are officers and/or directors of BlackRock or its affiliates. The Funds reimburse the Manager and/or Administrator for a portion of the compensation paid to the Corporations’ Chief Compliance Officer, which is included in Officer in the Statements of Operations.
Other Transactions: International Index may purchase securities from, or sell securities to, an affiliated fund provided the affiliation is due solely to having a common investment adviser, common officers, or common directors. For the year ended December 31, 2016, the purchase and sale transactions which resulted in net realized gains (losses) with an affiliated fund in compliance with Rule 17a-7 under the 1940 Act were as follows:
| Purchases | Sales | Net Realized Loss | ||
| $99,083,288 | $450,528 | $(49,570) |
7. Purchases and Sales:
For International Index, for the year ended December 31, 2016, purchases and sales of investments, excluding short-term securities were $3,422,611,379 and $1,587,879,095, respectively, including purchases and sales of investments of $1,185,893,972 and $718,874,015, respectively, from Master International Index prior to August 1, 2016.
8. Income Tax Information:
It is the Funds’ policy to comply with the requirements of the Internal Revenue Code of 1986, as amended, applicable to regulated investment companies, and to distribute substantially all of their taxable income to their shareholders. Therefore, no federal income tax provision is required.
Each Fund files U.S. federal and various state and local tax returns. No income tax returns are currently under examination. The statute of limitations on each Fund’s U.S. federal tax returns generally remains open for each of the four years ended December 31, 2016. The statutes of limitations on each Fund’s state and local tax returns may remain open for an additional year depending upon the jurisdiction.
Management has analyzed tax laws and regulations and their application to the Funds as of December 31, 2016, inclusive of the open tax return years, and does not believe that there are any uncertain tax positions that require recognition of a tax liability in the Funds’ financial statements.
| BLACKROCK INDEX FUNDS, INC. | DECEMBER 31, 2016 | 35 |
| Notes to Financial Statements (continued) | BlackRock Index Funds, Inc. | |||
U.S. GAAP requires that certain components of net assets be adjusted to reflect permanent differences between financial and tax reporting. These reclassifications have no effect on net assets or net asset values per share. As of period end, the following permanent differences attributable to the income recognized from partnership interests, foreign currency transactions, the character of proceeds from redeemed shares, and the expiration of capital loss carryforwards were reclassified to the following accounts:
| International Index | Small Cap Index | |||||||
| Paid in capital |
$ | (18,669,139 | ) | $ | 2,572,596 | |||
| Undistributed net investment income |
$ | 7,398,650 | $ | 6,859 | ||||
| Accumulated net realized loss |
$ | 11,270,489 | $ | (2,579,455 | ) | |||
The tax character of distributions paid was as follows:
| International Index | Small Cap Index | |||||||||||
| Ordinary income1 |
12/31/16 | $ | 133,001,001 | $ | 7,403,968 | |||||||
| 12/31/15 | $ | 68,884,656 | $ | 2,021,900 | ||||||||
| Long-term capital gains1 |
12/31/16 | — | 12,080,673 | |||||||||
| 12/31/15 | — | 5,945,830 | ||||||||||
|
|
|
|
|
|
|
|||||||
| Total |
12/31/16 | $ | 133,001,001 | $ | 19,484,641 | |||||||
|
|
|
|
|
|
|
|||||||
| 12/31/15 | $ | 68,884,656 | $ | 7,967,730 | ||||||||
|
|
|
|
|
|
|
|||||||
| 1 | Distribution amounts may include a portion of the proceeds from redeemed shares. |
As of period ended, the tax components of accumulated net earnings (losses) were as follows:
| International Index | Small Cap Index | |||||||||||
| Undistributed net investment income |
— | $ | 362,733 | |||||||||
| Capital loss carryforwards |
$ | (166,665,666 | ) | — | ||||||||
| Net unrealized gains (losses)1 |
(50,462,143 | ) | 72,139,523 | |||||||||
| Qualified late-year losses2 |
(3,734,303 | ) | — | |||||||||
|
|
|
|||||||||||
| Total |
$ | (220,862,112 | ) | $ | 72,502,256 | |||||||
|
|
|
|||||||||||
| 1 | The difference between book-basis and tax-basis net unrealized gains (losses) was attributable primarily to the timing of income recognition on partnership interests, the tax deferral of losses on wash sales, and the realization for tax purposes of unrealized gains on investments in passive foreign investment companies. |
| 2 | The Fund has elected to defer certain qualified late-year losses and recognize such losses in the next taxable year. |
As of period end, International Index had a capital loss carryforward available to offset future realized capital gains through the indicated expiration dates as follows:
| Expires December 31, | International Index | |||||||
| No expiration date1 |
$ | 160,069,480 | ||||||
| 2017 |
6,596,186 | |||||||
|
|
|
|||||||
| Total |
$ | 166,665,666 | ||||||
|
|
|
|||||||
| 1 | Must be utilized prior to losses subject to expiration. |
As of December 31, 2016, International Index’s gross unrealized appreciation and depreciation based on cost for federal income tax purposes were as follows:
| Tax cost |
$ | 4,836,429,129 | ||
|
|
|
|||
| Gross unrealized appreciation |
$ | 221,202,248 | ||
| Gross unrealized depreciation |
(271,759,521 | ) | ||
|
|
|
|||
| Net unrealized depreciation |
$ | (50,557,273 | ) | |
|
|
|
9. Bank Borrowings:
International Index, along with certain other funds managed by the Manager and its affiliates (“Participating Funds”), is a party to a 364-day, $2.1 billion credit agreement with a group of lenders. Under this agreement, International Index may borrow to fund shareholder redemptions. Excluding commitments designated for certain individual funds, the Participating Funds, including International Index, can borrow up to an aggregate commitment amount of $1.6 billion at any time outstanding, subject to asset coverage and other limitations as specified in the agreement. The credit agreement has the following terms: a fee of 0.12% per annum on unused commitment amounts and interest at a rate equal to the higher of (a) one-month LIBOR (but, in any event, not less than 0.00%) on the date the loan is made plus 0.80% per annum or (b) the Fed Funds rate (but, in any event, not less than 0.00%) in effect from time to time plus 0.80% per annum on amounts borrowed. The agreement expires in April 2017 unless extended or renewed. Prior to April 21, 2016, the credit agreement had a fee per annum of 0.06% on unused commitment amounts and interest at a rate equal to the higher of (a) one-month LIBOR (but, in any event, not less than 0.00%) on the date the loan is made plus 0.80% per annum or (b) the Fed Funds rate (but, in any event, not less than 0.00%) in effect from time to time plus 0.80% per annum on amounts borrowed. Participating Funds paid administration, legal and arrangement fees, which, if
| 36 | BLACKROCK INDEX FUNDS, INC. | DECEMBER 31, 2016 |
| Notes to Financial Statements (continued) | BlackRock Index Funds, Inc. |
applicable, are included in miscellaneous expenses in the Statements of Operations. These fees were allocated among such funds based upon portions of the aggregate commitment available to them and relative net assets of Participating Funds. During the year ended December 31, 2016, International Index did not borrow under the credit agreement.
10. Principal Risks:
In the normal course of business, International Index invests in securities and enter into transactions where risks exist due to fluctuations in the market (market risk) or failure of the issuer to meet all its obligations, including the ability to pay principal and interest when due (issuer credit risk). The value of securities held by International Index may decline in response to certain events, including those directly involving the issuers of securities owned by International Index. Changes arising from the general economy, the overall market and local, regional or global political and/or social instability, as well as currency, interest rate and price fluctuations, may also affect the securities’ value.
On October 11, 2016, BlackRock implemented certain changes required by amendments to Rule 2a-7 under the 1940 Act, which governs the operations of U.S. money market funds. International Index may be exposed to additional risks when reinvesting cash collateral in money market funds that do not seek to maintain a stable NAV per share of $1.00 and which may be subject to redemption gates or liquidity fees under certain circumstances.
Valuation Risk: The market values of equities, such as common stocks and preferred securities or equity related investments, such as futures and options, may decline due to general market conditions which are not specifically related to a particular company. They may also decline due to factors which affect a particular industry or industries. International Index may invest in illiquid investments and may experience difficulty in selling those investments in a timely manner at the price that they believe the investments are worth. Prices may fluctuate widely over short or extended periods in response to company, market or economic news. Markets also tend to move in cycles, with periods of rising and falling prices. This volatility may cause International Index’s NAV to experience significant increases or decreases over short periods of time. If there is a general decline in the securities and other markets, the NAV of International Index may lose value, regardless of the individual results of the securities and other instruments in which International Index invests.
The price a Fund could receive upon the sale of any particular portfolio investment may differ from International Index’s valuation of the investment, particularly for securities that trade in thin or volatile markets or that are valued using a fair valuation technique or a price provided by an independent pricing service. Changes to significant unobservable inputs and assumptions (i.e., publicly traded company multiples, growth rate, time to exit) due to the lack of observable inputs may significantly impact the resulting fair value and therefore International Index’s results of operations. As a result, the price received upon the sale of an investment may be less than the value ascribed by International Index, and International Index could realize a greater than expected loss or lesser than expected gain upon the sale of the investment. International Index’s ability to value its investments may also be impacted by technological issues and/or errors by pricing services or other third party service providers.
Counterparty Credit Risk: Similar to issuer credit risk, International Index may be exposed to counterparty credit risk, or the risk that an entity may fail to or be unable to perform on its commitments related to unsettled or open transactions. The Fund manages counterparty credit risk by entering into transactions only with counterparties that the Manager believes have the financial resources to honor their obligations and by monitoring the financial stability of those counterparties. Financial assets, which potentially expose the Fund to market, issuer and counterparty credit risks, consist principally of financial instruments and receivables due from counterparties. The extent of the Fund’s exposure to market, issuer and counterparty credit risks with respect to these financial assets is approximately their value recorded in the Statements of Assets and Liabilities, less any collateral held by the Fund.
A derivative contract may suffer a mark-to-market loss if the value of the contract decreases due to an unfavorable change in the market rates or values of the underlying instrument. Losses can also occur if the counterparty does not perform under the contract.
With exchange-traded futures, there is less counterparty credit risk to the Fund since the exchange or clearinghouse, as counterparty to such instruments, guarantees against a possible default. The clearinghouse stands between the buyer and the seller of the contract; therefore, credit risk is limited to failure of the clearinghouse. While offset rights may exist under applicable law, the Fund does not have a contractual right of offset against a clearing broker or clearinghouse in the event of a default (including the bankruptcy or insolvency). Additionally, credit risk exists in exchange-traded futures with respect to initial and variation margin that is held in a clearing broker’s customer accounts. While clearing brokers are required to segregate customer margin from their own assets, in the event that a clearing broker becomes insolvent or goes into bankruptcy and at that time there is a shortfall in the aggregate amount of margin held by the clearing broker for all its clients, typically the shortfall would be allocated on a pro rata basis across all the clearing broker’s customers, potentially resulting in losses to the Fund.
Concentration Risk: International Index invests a significant portion of its assets in securities of issuers located in Europe or with significant exposure to European issuers or countries. The European financial markets have recently experienced volatility and adverse trends due to concerns about economic downturns in, or rising government debt levels of, several European countries. These events may spread to other countries in Europe and may affect the value and liquidity of certain of the Fund’s investments.
The United Kingdom voted on June 23, 2016 to withdraw from the European Union, which may introduce significant new uncertainties and instability in the financial markets across Europe.
| BLACKROCK INDEX FUNDS, INC. | DECEMBER 31, 2016 | 37 |
| Notes to Financial Statements (continued) | BlackRock Index Funds, Inc. | |||
International Index invests a significant portion of its assets in securities of issuers located in Asia or with significant exposure to Asian issuers or countries. The Asian financial markets have recently experienced volatility and adverse trends due to concerns in several Asian countries regarding monetary policy, government intervention in the markets, rising government debt levels or economic downturns. These events may spread to other countries in Asia and may affect the value and liquidity of certain of the Fund’s investments.
As of period end, International Index’s investments had the following industry classifications:
| Industry | Percent of Net Assets |
|||
| Bank |
12 | % | ||
| Pharmaceuticals |
8 | |||
| Insurance |
6 | |||
| Oil, Gas & Consumable Fuels |
5 | |||
|
Other1 |
69 | |||
| 1 | All other industries held was less than 5% of net assets. |
11. Capital Share Transactions:
Transactions in capital shares for each class were as follows:
| Year Ended December 31, 2016 |
Year Ended December 31, 2015 |
|||||||||||||||||||
| International Index | Shares | Amount | Shares | Amount | ||||||||||||||||
| Institutional | ||||||||||||||||||||
| Shares sold |
46,940,980 | $ | 539,320,569 | 129,253,779 | $ | 1,676,077,062 | ||||||||||||||
| Shares issued in reinvestment of distributions |
1,417,534 | 16,387,510 | 5,397,919 | 62,660,086 | ||||||||||||||||
| Shares redeemed |
(221,253,679 | ) | (2,359,024,651 | ) | (50,322,944 | ) | (632,293,953 | ) | ||||||||||||
|
|
|
|
|
|||||||||||||||||
| Net increase (decrease) |
(172,895,165 | ) | $ | (1,803,316,572 | ) | 84,328,754 | $ | 1,106,443,195 | ||||||||||||
|
|
|
|
|
|||||||||||||||||
| Investor A | ||||||||||||||||||||
| Shares sold |
12,259,774 | $ | 140,963,736 | 10,737,540 | $ | 135,131,083 | ||||||||||||||
| Shares issued in reinvestment of distributions |
506,036 | 5,814,683 | 272,793 | 3,158,559 | ||||||||||||||||
| Shares redeemed |
(6,435,224 | ) | (74,118,861 | ) | (24,137,174 | ) | (298,272,532 | ) | ||||||||||||
|
|
|
|
|
|||||||||||||||||
| Net increase (decrease) |
6,330,586 | $ | 72,659,558 | (13,126,841 | ) | $ | (159,982,890 | ) | ||||||||||||
|
|
|
|
|
|||||||||||||||||
| Class K | ||||||||||||||||||||
| Shares sold |
470,599,166 | $ | 5,227,329,648 | 9,109,639 | $ | 111,769,916 | ||||||||||||||
| Shares issued in reinvestment of distributions |
7,791,229 | 90,071,735 | 145,522 | 1,687,623 | ||||||||||||||||
| Shares redeemed |
(139,807,306 | ) | (1,628,148,316 | ) | (976,141 | ) | (12,074,053 | ) | ||||||||||||
|
|
|
|
|
|||||||||||||||||
| Net increase |
338,583,089 | $ | 3,689,253,067 | 8,279,020 | $ | 101,383,486 | ||||||||||||||
|
|
|
|
|
|||||||||||||||||
| Total Net Increase |
172,018,510 | $ | 1,958,596,053 | 79,480,933 | $ | 1,047,843,791 | ||||||||||||||
|
|
|
|
|
|||||||||||||||||
| Small Cap Index | ||||||||||||||||||||
| Institutional | ||||||||||||||||||||
| Shares sold |
9,719,997 | $ | 152,952,403 | 10,457,624 | $ | 172,750,723 | ||||||||||||||
| Shares issued in reinvestment of distributions |
548,537 | 9,697,642 | 309,095 | 4,805,308 | ||||||||||||||||
| Shares redeemed |
(7,016,158 | ) | (110,173,690 | ) | (3,928,047 | ) | (64,210,331 | ) | ||||||||||||
|
|
|
|
|
|||||||||||||||||
| Net increase |
3,252,376 | $ | 52,476,355 | 6,838,672 | $ | 113,345,700 | ||||||||||||||
|
|
|
|
|
|||||||||||||||||
| Investor A | ||||||||||||||||||||
| Shares sold |
2,332,975 | $ | 36,799,680 | 2,588,913 | $ | 43,034,640 | ||||||||||||||
| Shares issued in reinvestment of distributions |
269,661 | 4,760,921 | 172,798 | 2,734,164 | ||||||||||||||||
| Shares redeemed |
(1,768,237 | ) | (28,054,830 | ) | (2,077,241 | ) | (34,522,308 | ) | ||||||||||||
|
|
|
|
|
|||||||||||||||||
| Net increase |
834,399 | $ | 13,505,771 | 684,470 | $ | 11,246,496 | ||||||||||||||
|
|
|
|
|
|||||||||||||||||
| 38 | BLACKROCK INDEX FUNDS, INC. | DECEMBER 31, 2016 |
| Notes to Financial Statements (concluded) | BlackRock Index Funds, Inc. |
| Year Ended December 31, 2016 |
Year Ended December 31, 2015 |
|||||||||||||||||||
| Small Cap Index (concluded) | Shares | Amount | Shares | Amount | ||||||||||||||||
| Class K | ||||||||||||||||||||
| Shares sold |
3,338,773 | $ | 54,919,479 | 437,622 | $ | 7,261,825 | ||||||||||||||
| Shares issued in reinvestment of distributions |
121,360 | 2,155,111 | 15,971 | 249,981 | ||||||||||||||||
| Shares redeemed |
(626,556 | ) | (10,206,945 | ) | (67,612 | ) | (1,116,392 | ) | ||||||||||||
|
|
|
|
|
|||||||||||||||||
| Net increase |
2,833,577 | $ | 46,867,645 | 385,981 | $ | 6,395,414 | ||||||||||||||
|
|
|
|
|
|||||||||||||||||
| Total Net Increase |
6,920,352 | $ | 112,849,771 | 7,909,123 | $ | 130,987,610 | ||||||||||||||
|
|
|
|
|
|||||||||||||||||
12. Subsequent Events:
Management has evaluated the impact of all subsequent events on the Funds through the date the financial statements were issued and has determined that there were no subsequent events requiring adjustment or additional disclosure in the financial statements.
| BLACKROCK INDEX FUNDS, INC. | DECEMBER 31, 2016 | 39 |
| Report of Independent Registered Public Accounting Firm | BlackRock Index Funds, Inc. |
To the Shareholders of BlackRock International Index Fund and BlackRock Small Cap Index Fund and Board of Directors of BlackRock Index Funds, Inc.:
We have audited the accompanying statements of assets and liabilities of BlackRock International Index Fund and BlackRock Small Cap Index Fund, each a series included in BlackRock Index Funds, Inc., (the “Funds”) including the schedule of investments of International Index Fund as of December 31, 2016, and the related statements of operations for the year then ended, the statements of changes in net assets for each of the two years in the period then ended, and the financial highlights for each of the periods presented. These financial statements and financial highlights are the responsibility of the Funds’ management. Our responsibility is to express an opinion on these financial statements and financial highlights based on our audits.
We conducted our audits in accordance with the standards of the Public Company Accounting Oversight Board (United States). Those standards require that we plan and perform the audits to obtain reasonable assurance about whether the financial statements and financial highlights are free of material misstatement. The Funds are not required to have, nor were we engaged to perform, an audit of its internal control over financial reporting. Our audits included consideration of internal control over financial reporting as a basis for designing audit procedures that are appropriate in the circumstances, but not for the purpose of expressing an opinion on the effectiveness of the Funds’ internal control over financial reporting. Accordingly, we express no such opinion. An audit also includes examining, on a test basis, evidence supporting the amounts and disclosures in the financial statements, assessing the accounting principles used and significant estimates made by management, as well as evaluating the overall financial statement presentation. We believe that our audits provide a reasonable basis for our opinion.
In our opinion, the financial statements and financial highlights referred to above present fairly, in all material respects, the financial position of BlackRock International Index Fund and BlackRock Small Cap Index Fund, each of BlackRock Index Funds, Inc., as of December 31, 2016, the results of their operations for the year then ended, the changes in their net assets for each of the two years in the period then ended, and the financial highlights for each of the periods presented, in conformity with accounting principles generally accepted in the United States of America.
Deloitte & Touche LLP
Boston, Massachusetts
February 23, 2017
| Important Tax Information (Unaudited) |
During the fiscal year ended December 31, 2016, the following information is provided with respect to the ordinary income distributions paid by the Funds.
| Payable Date | International Index |
Small Cap Index |
||||||||||
| Qualified Dividend Income for Individuals1,2 |
|
7/21/2016 12/16/2016 |
|
|
100.00% 85.33% |
|
|
73.79% 47.09% |
| |||
| Dividends Qualifying for the Dividend Received Deduction for Corporations1 |
|
7/21/2016 12/16/2016 |
|
|
— — |
|
|
69.36% 44.84% |
| |||
| Foreign Source Income2 |
|
7/21/2016 12/16/2016 |
|
|
100.00% 100.00% |
|
|
— — |
| |||
| Foreign Taxes Paid Per Share3 |
|
7/21/2016 12/16/2016 |
|
|
$0.000291 $0.031728 |
|
|
— — |
| |||
| 1 | The Fund hereby designates the percentage indicated above or the maximum amount allowable by law. |
| 2 | Expressed as a percentage of the cash distribution grossed-up for foreign taxes. |
| 3 | The foreign taxes paid represent taxes incurred by the Funds on income received by the Fund from foreign sources. Foreign taxes paid may be included in taxable income with an offsetting deduction from gross income or may be taken as a credit for taxes paid to foreign governments. You should consult your tax advisor regarding the appropriate treatment of foreign taxes paid. |
Additionally, Small Cap Index Fund distributed long-term capital gains of $0.074233 and $0.46844 per share to shareholders of record on July 20, 2016 and December 15, 2016, respectively.
| 40 | BLACKROCK INDEX FUNDS, INC. | DECEMBER 31, 2016 |
| Series Portfolio Information as of December 31, 2016 | Quantitative Master Series LLC |
| Master Small Cap Index Series |
| BLACKROCK INDEX FUNDS, INC. | DECEMBER 31, 2016 | 41 |
| Master Small Cap Index Series (Percentages shown are based on Net Assets) |
| Portfolio Abbreviations | ||
| REIT | Real Estate Investment Trust | |
| CVR | Contingent Value Rights |
See Notes to Financial Statements.
| 42 | BLACKROCK INDEX FUNDS, INC. | DECEMBER 31, 2016 |
| Schedule of Investments (continued) |
Master Small Cap Index Series |
See Notes to Financial Statements.
| BLACKROCK INDEX FUNDS, INC. | DECEMBER 31, 2016 | 43 |
| Schedule of Investments (continued) |
Master Small Cap Index Series |
See Notes to Financial Statements.
| 44 | BLACKROCK INDEX FUNDS, INC. | DECEMBER 31, 2016 |
| Schedule of Investments (continued) |
Master Small Cap Index Series |
See Notes to Financial Statements.
| BLACKROCK INDEX FUNDS, INC. | DECEMBER 31, 2016 | 45 |
| Schedule of Investments (continued) |
Master Small Cap Index Series |
See Notes to Financial Statements.
| 46 | BLACKROCK INDEX FUNDS, INC. | DECEMBER 31, 2016 |
| Schedule of Investments (continued) |
Master Small Cap Index Series |
See Notes to Financial Statements.
| BLACKROCK INDEX FUNDS, INC. | DECEMBER 31, 2016 | 47 |
| Schedule of Investments (continued) |
Master Small Cap Index Series |
See Notes to Financial Statements.
| 48 | BLACKROCK INDEX FUNDS, INC. | DECEMBER 31, 2016 |
| Schedule of Investments (continued) |
Master Small Cap Index Series |
See Notes to Financial Statements.
| BLACKROCK INDEX FUNDS, INC. | DECEMBER 31, 2016 | 49 |
| Schedule of Investments (continued) |
Master Small Cap Index Series |
See Notes to Financial Statements.
| 50 | BLACKROCK INDEX FUNDS, INC. | DECEMBER 31, 2016 |
| Schedule of Investments (continued) |
Master Small Cap Index Series |
See Notes to Financial Statements.
| BLACKROCK INDEX FUNDS, INC. | DECEMBER 31, 2016 | 51 |
| Schedule of Investments (continued) |
Master Small Cap Index Series |
See Notes to Financial Statements.
| 52 | BLACKROCK INDEX FUNDS, INC. | DECEMBER 31, 2016 |
| Schedule of Investments (continued) |
Master Small Cap Index Series |
See Notes to Financial Statements.
| BLACKROCK INDEX FUNDS, INC. | DECEMBER 31, 2016 | 53 |
| Schedule of Investments (continued) |
Master Small Cap Index Series |
See Notes to Financial Statements.
| 54 | BLACKROCK INDEX FUNDS, INC. | DECEMBER 31, 2016 |
| Schedule of Investments (continued) |
Master Small Cap Index Series |
See Notes to Financial Statements.
| BLACKROCK INDEX FUNDS, INC. | DECEMBER 31, 2016 | 55 |
| Schedule of Investments (continued) |
Master Small Cap Index Series |
See Notes to Financial Statements.
| 56 | BLACKROCK INDEX FUNDS, INC. | DECEMBER 31, 2016 |
| Schedule of Investments (continued) |
Master Small Cap Index Series |
See Notes to Financial Statements.
| BLACKROCK INDEX FUNDS, INC. | DECEMBER 31, 2016 | 57 |
| Schedule of Investments (continued) |
Master Small Cap Index Series |
See Notes to Financial Statements.
| 58 | BLACKROCK INDEX FUNDS, INC. | DECEMBER 31, 2016 |
| Schedule of Investments (continued) |
Master Small Cap Index Series |
| Notes to Schedule of Investments |
| (a) | Non-income producing security. |
| (b) | Security, or a portion of security, is on loan. |
See Notes to Financial Statements.
| BLACKROCK INDEX FUNDS, INC. | DECEMBER 31, 2016 | 59 |
| Schedule of Investments (continued) |
Master Small Cap Index Series |
| (c) | During the year ended December 31, 2016, investments in issuers considered to be affiliates of the Series for purposes of Section 2(a)(3) of the Investment Company Act of 1940, as amended, were as follows: |
| Affiliate |
Shares/ Investment Value |
Shares/ Investment |
Shares/ Investment Sold |
Shares/ Investment Value |
Value at December 31, 2016 |
Income | Realized Gain (Loss) |
|||||||||||||||||||||
| BlackRock Liquidity Funds, T-Fund, Institutional Class |
— | 37,279,916 | 1 | — | 37,279,916 | $ | 37,279,916 | $ | 18,841 | $ | 207 | |||||||||||||||||
| BlackRock Liquidity Funds, TempFund, Institutional Class |
232,669 | — | (232,669 | )2 | — | — | 56,505 | — | ||||||||||||||||||||
| PennyMac Financial Services, Inc. |
3,162 | — | — | 3,162 | 52,647 | — | — | |||||||||||||||||||||
| PennyMac Mortgage Investment Trust |
15,395 | 8,050 | (804 | ) | 22,641 | 370,633 | 38,673 | (5,115 | ) | |||||||||||||||||||
| SL Liquidity Series, LLC, Money Market Series |
$ | 10,324,484 | — | $ | (1,609,931 | )2 | $ | 8,714,553 | 8,715,424 | 1,016,450 | 3 | 235 | ||||||||||||||||
| Total |
|
$ | 46,418,620 | $ | 1,130,469 | $ | (4,673 | ) | ||||||||||||||||||||
|
|
|
|
|
|
|
|||||||||||||||||||||||
| 1 Represents net shares purchased. |
| |||||||||||||||||||||||||||
|
2 Represents net shares/investment value sold. |
| |||||||||||||||||||||||||||
|
3 Represents securities lending income earned from the reinvestment of cash collateral from loaned securities, net of fees and collateral investment expenses, and other payments to and from borrowers of securities. |
| |||||||||||||||||||||||||||
| (d) | Other interests represent beneficial interests in liquidation trusts and other reorganization or private entities. |
| (e) | Current yield as of period end. |
| (f) | Security was purchased with the cash collateral from loaned securities. |
| Derivative Financial Instruments Outstanding as of Period End |
Futures Contracts
| Contracts Long |
Issue | Expiration | Notional Value |
Unrealized Depreciation |
||||||||
| 265 | Russell 2000 E-Mini Index | March 2017 | $17,978,925 | $ | (66,231 | ) | ||||||
| Derivative Financial Instruments Categorized by Risk Exposure | ||
As of period end, the fair values of derivative financial instruments located in the Statement of Assets and Liabilities were as follows:
| Liabilities — Derivative Financial Instruments | Commodity Contracts |
Credit Contracts |
Equity Contracts |
Foreign Currency Exchange Contracts |
Interest Rate Contracts |
Other Contracts |
Total | |||||||||||||||||||||||||
| Futures contracts |
Net unrealized depreciation | 1 | — | — | $ | 66,231 | — | — | — | $ | 66,231 | |||||||||||||||||||||
For the year ended December 31, 2016, the effect of derivative financial instruments in the Statement of Operation was as follows:
| Net Realized Gain (Loss) from: | Commodity Contracts |
Credit Contracts |
Equity Contracts |
Foreign Currency Exchange Contracts |
Interest Rate Contracts |
Other Contracts |
Total | |||||||||||||||||||||||||
| Futures contracts |
|
— | — | $ | 5,797,384 | — | — | — | $ | 5,797,384 | ||||||||||||||||||||||
| Net Change in Unrealized Appreciation (Depreciation) on: |
|
|||||||||||||||||||||||||||||||
| Futures contracts |
— | — | $ | (43,878 | ) | — | — | — | $ | (43,878 | ) | |||||||||||||||||||||
| 1 Includes cumulative appreciation (depreciation) on futures contract, if any, as reported in the Schedule of Investments. Only current day’s variation margin is reported within the Statement of Assets and Liabilities. |
| |||||||||||||||||||||||||||||||
| Average Quarterly Balances of Outstanding Derivative Financial Instruments | ||
| Futures contracts: | ||||
| Average notional value of contracts — long |
$ | 12,056,671 |
See Notes to Financial Statements.
| 60 | BLACKROCK INDEX FUNDS, INC. | DECEMBER 31, 2016 |
| Schedule of Investments (concluded) |
Master Small Cap Index Series |
For more information about the Series’ investment risks regarding derivative financial instruments, refer to the Notes to Financial Statements.
| Fair Value Hierarchy as of Period End |
Various inputs are used in determining the fair value of investments and derivative financial instruments. For information about the Series’ policy regarding valuation of investments and derivative financial instruments, refer to the Notes to Financial Statements.
The following tables summarize the Series’ investments and derivative financial instruments categorized in the disclosure hierarchy:
| Level 1 | Level 2 | Level 3 | Total | |||||||||||||
| Assets: |
| |||||||||||||||
| Investments: | ||||||||||||||||
| Long-Term Investments:1 | ||||||||||||||||
| Common Stocks |
$ | 645,829,321 | — | $ | — | $ | 645,829,321 | |||||||||
| Other Interests |
— | — | 129 | 129 | ||||||||||||
| Rights |
— | — | 132,835 | 132,835 | ||||||||||||
| Short-Term Securities |
37,279,916 | — | — | 37,279,916 | ||||||||||||
|
|
|
|
|
|
|
|
|
|||||||||
| SubTotal |
$ | 683,109,237 | — | $ | 132,964 | $ | 683,242,201 | |||||||||
|
|
|
|
|
|
|
|
|
|||||||||
| Investments Valued at NAV2 | 8,715,424 | |||||||||||||||
|
|
|
|||||||||||||||
| Total |
$ | 691,957,625 | ||||||||||||||
|
|
|
|||||||||||||||
| Derivative Financial Instruments 3 |
| |||||||||||||||
| Liabilities: |
| |||||||||||||||
| Equity contracts |
$ | (66,231 | ) | — | — | $ | (66,231 | ) | ||||||||
|
|
|
|||||||||||||||
| 1 See above Schedule of Investments for values in each industry. |
| |||||||||||||||
| 2 As of December 31, 2016, certain of the Series’ investments were valued using NAV per share as no quoted market value is available and therefore have been excluded from the fair value hierarchy. |
| |||||||||||||||
| 3 Derivative financial instruments are futures contracts, which are valued at the unrealized appreciation (depreciation) on the instrument. |
| |||||||||||||||
During the year ended December 31, 2016, there were no transfers between levels.
See Notes to Financial Statements.
| BLACKROCK INDEX FUNDS, INC. | DECEMBER 31, 2016 | 61 |
| Statement of Assets and Liabilities | Master Small Cap Index Series |
| December 31, 2016 | ||||
| Assets | ||||
| Investments at value — unaffiliated (including securities loaned at value of $8,085,571) (cost — $490,874,426) |
$ | 645,539,005 | ||
| Investments at value — affiliated (cost — $46,499,371) |
46,418,620 | |||
| Cash pledged for futures contracts |
1,804,000 | |||
| Receivables: | ||||
| Contributions from investors |
9,141,322 | |||
| Dividends — unaffiliated |
785,476 | |||
| Securities lending income — affiliated |
75,686 | |||
| Dividends — affiliated |
18,499 | |||
| Prepaid expenses |
2,269 | |||
|
|
|
|||
| Total assets |
703,784,877 | |||
|
|
|
|||
| Liabilities | ||||
| Cash collateral on securities loaned at value |
8,714,610 | |||
| Payables: | ||||
| Investments purchased |
11,032,316 | |||
| Withdrawals to investors |
16,880,056 | |||
| Other accrued expenses |
259,959 | |||
| Variation margin on futures contracts |
190,552 | |||
| Investment advisory fees |
7,804 | |||
| Directors’ fees |
5,495 | |||
| Other affiliates |
4,078 | |||
|
|
|
|||
| Total liabilities |
37,094,870 | |||
|
|
|
|||
| Net Assets |
$ | 666,690,007 | ||
|
|
|
|||
| Net Assets Consist of | ||||
| Investors’ capital |
$ | 512,172,410 | ||
| Net unrealized appreciation (depreciation) |
154,517,597 | |||
|
|
|
|||
| Net Assets |
$ | 666,690,007 | ||
|
|
|
|||
| See Notes to Financial Statements. | ||||||
| 62 | BLACKROCK INDEX FUNDS, INC. | DECEMBER 31, 2016 | ||||
| Statement of Operations | Master Small Cap Index Series |
| Year Ended December 31, 2016 | ||||
| Investment Income | ||||
| Dividends — unaffiliated |
$ | 7,295,061 | ||
| Securities lending — affiliated — net |
1,016,450 | |||
| Dividends — affiliated |
114,019 | |||
| Interest — unaffiliated |
1,367 | |||
| Foreign taxes withheld |
(2,833 | ) | ||
|
|
|
|||
| Total investment income |
8,424,064 | |||
|
|
|
|||
| Expenses | ||||
| Custodian |
119,196 | |||
| Accounting services |
105,167 | |||
| Professional |
55,737 | |||
| Investment advisory |
54,232 | |||
| Directors |
23,855 | |||
| Pricing |
19,532 | |||
| Printing |
14,650 | |||
| Miscellaneous |
4,039 | |||
|
|
|
|||
| Total expenses |
396,408 | |||
| Less: | ||||
| Fees waived and/or reimbursed by the Manager |
(50,118 | ) | ||
| Fees paid indirectly |
(325 | ) | ||
|
|
|
|||
| Total expenses after fees waived and/or reimbursed and paid indirectly |
345,965 | |||
|
|
|
|||
| Net investment income |
8,078,099 | |||
|
|
|
|||
| Realized and Unrealized Gain (Loss) | ||||
| Net realized gain (loss) from: | ||||
| Investments — unaffiliated |
(3,070,434 | ) | ||
| Investments — affiliated |
(4,880 | ) | ||
| Futures contracts |
5,797,384 | |||
| Foreign currency transactions |
(21 | ) | ||
| Capital gain distributions from investment companies—affiliated |
207 | |||
|
|
|
|||
| 2,722,256 | ||||
|
|
|
|||
| Net change in unrealized appreciation (depreciation) on: | ||||
| Investments — unaffiliated |
108,593,255 | |||
| Investments — affiliated |
41,615 | |||
| Futures contracts |
(43,878 | ) | ||
| Foreign currency translations |
19 | |||
|
|
|
|||
| 108,591,011 | ||||
|
|
|
|||
| Net realized and unrealized gain |
111,313,267 | |||
|
|
|
|||
| Net Increase in Net Assets Resulting from Operations |
$ | 119,391,366 | ||
|
|
|
|||
| See Notes to Financial Statements. | ||||||
| BLACKROCK INDEX FUNDS, INC. | DECEMBER 31, 2016 | 63 | ||||
| Statements of Changes in Net Assets | Master Small Cap Index Series |
| Year Ended December 31, | ||||||||
| Increase (Decrease) in Net Assets: | 2016 | 2015 | ||||||
| Operations | ||||||||
| Net investment income |
$ | 8,078,099 | $ | 11,709,468 | ||||
| Net realized gain |
2,722,256 | 170,580,210 | ||||||
| Net change in unrealized appreciation (depreciation) |
108,591,011 | (219,673,337 | ) | |||||
|
|
|
|
|
|||||
| Net increase (decrease) in net assets resulting from operations |
119,391,366 | (37,383,659 | ) | |||||
|
|
|
|
|
|||||
| Capital Transactions | ||||||||
| Proceeds from contributions |
368,640,654 | 561,488,890 | ||||||
| Value of withdrawals |
(286,783,928 | ) | (759,598,222 | ) | ||||
|
|
|
|
|
|||||
| Net increase (decrease) in net assets derived from capital transactions |
81,856,726 | (198,109,332 | ) | |||||
|
|
|
|
|
|||||
| Net Assets | ||||||||
| Total increase (decrease) in net assets |
201,248,092 | (235,492,991 | ) | |||||
| Beginning of year |
465,441,915 | 700,934,906 | ||||||
|
|
|
|
|
|||||
| End of year |
$ | 666,690,007 | $ | 465,441,915 | ||||
|
|
|
|
|
|||||
| Financial Highlights | Master Small Cap Index Series |
| Year Ended December 31, | ||||||||||||||||||||
| 2016 | 2015 | 2014 | 2013 | 2012 | ||||||||||||||||
| Total Return | ||||||||||||||||||||
| Total return |
21.49% | (4.33 | )% | 5.05% | 39.11% | 16.52% | ||||||||||||||
|
|
|
|
|
|
|
|
|
|
|
|||||||||||
| Ratios to Average Net Assets | ||||||||||||||||||||
| Total expenses |
0.07% | 1 | 0.08% | 0.09% | 0.07% | 0.14% | ||||||||||||||
|
|
|
|
|
|
|
|
|
|
|
|||||||||||
| Total expenses after fees waived and/or reimbursed and paid indirectly |
0.06% | 1 | 0.07% | 0.08% | 0.06% | 0.08% | ||||||||||||||
|
|
|
|
|
|
|
|
|
|
|
|||||||||||
| Net investment income |
1.49% | 1 | 1.39% | 1.45% | 1.46% | 2.13% | ||||||||||||||
|
|
|
|
|
|
|
|
|
|
|
|||||||||||
| Supplemental Data | ||||||||||||||||||||
| Net assets, end of year (000) |
$ | 666,690 | $ | 465,442 | $ | 700,935 | $ | 859,398 | $ | 581,771 | ||||||||||
|
|
|
|
|
|
|
|
|
|
|
|||||||||||
| Portfolio turnover rate |
39% | 37% | 21% | 22% | 68% | |||||||||||||||
|
|
|
|
|
|
|
|
|
|
|
|||||||||||
| 1 | Excludes expenses incurred indirectly of 0.01% as a result of the Series’ investments in underlying funds. |
| See Notes to Financial Statements. | ||||||
| 64 | BLACKROCK INDEX FUNDS, INC. | DECEMBER 31, 2016 | ||||
| Notes to Financial Statements | Master Small Cap Index Series |
1. Organization:
Master Small Cap Index Series (“Master Small Cap Index”) (the “Series”) is a series of Quantitative Master Series LLC (the “Master LLC”) which is registered under the Investment Company Act of 1940, as amended (the “1940 Act”), as an open-end management investment company. The Master LLC is classified as diversified. The Master LLC’s Limited Liability Company Agreement permits the Board of Directors of the Master LLC (the “Board”) to issue non-transferable interests, subject to certain limitations.
The Series, together with certain other registered investment companies advised by BlackRock Advisors, LLC (the “Manager”) or its affiliates, is included in a complex of open-end funds referred to as the Equity-Liquidity Complex.
2. Significant Accounting Policies:
The financial statements are prepared in conformity with accounting principles generally accepted in the United States of America (“U.S. GAAP”), which may require management to make estimates and assumptions that affect the reported amounts of assets and liabilities in the financial statements, disclosure of contingent assets and liabilities at the date of the financial statements and the reported amounts of increases and decreases in net assets from operations during the reporting period. Actual results could differ from those estimates. The Series is considered an investment company under U.S. GAAP and follows the accounting and reporting guidance applicable to investment companies. Below is a summary of significant accounting policies:
Foreign Currency: The Series’ books and records are maintained in U.S. dollars. Purchases and sales of investments are recorded at the rates of exchange prevailing on the respective dates of such transactions. Generally, when the U.S. dollar rises in value against a foreign currency, the investments denominated in that currency will lose value; the opposite effect occurs if the U.S. dollar falls in relative value.
The Series does not isolate the portion of the results of operations arising as a result of changes in the exchange rates from the changes in the market prices of investments held or sold for financial reporting purposes. Accordingly, the effects of changes in exchange rates on investments are not segregated in the Statement of Operations from the effects of changes in market prices of those investments, but are included as a component of net realized and unrealized gain (loss) from investments. The Series reports realized currency gains (losses) on foreign currency related transactions as components of net realized gain (loss) for financial reporting purposes, whereas such components are generally treated as ordinary income for federal income tax purposes.
Segregation and Collateralization: In cases where the Series enters into certain investments (e.g., futures contracts), that would be treated as “senior securities” for 1940 Act purposes, the Series may segregate or designate on its books and records cash or liquid assets having a market value at least equal to the amount of its future obligations under such investments. Doing so allows the investment to be excluded from treatment as a “senior security.” Furthermore, if required by an exchange or counterparty agreement, the Series may be required to deliver/deposit cash and/or securities to/with an exchange, or broker-dealer or custodian as collateral for certain investments or obligations.
Investment Transactions and Investment Income: For financial reporting purposes, investment transactions are recorded on the dates the transactions are entered into (the trade dates). Realized gains and losses on investment transactions are determined on the identified cost basis. Dividend income is recorded on the ex-dividend date. Dividends from foreign securities where the ex-dividend date may have passed are subsequently recorded when the Series is informed of the ex-dividend date. Under the applicable foreign tax laws, a withholding tax at various rates may be imposed on capital gains, dividends and interest. Upon notification from issuers, some of the dividend income received from a real estate investment trust may be redesignated as a reduction of cost of the related investment and/or realized gain.
Recent Accounting Standard: In April 2015, the Financial Accounting Standards Board issued “Disclosures for Investments in Certain Entities that Calculate Net Asset Value (“NAV”) per Share” which eliminates the requirement to categorize investments within the fair value hierarchy when fair value is based on the NAV per share and no quoted market value is available. As of December 31, 2016, certain investments of the Series were valued using NAV per share as no quoted market value is available and have been excluded from the fair value hierarchy.
In November 2016, the Financial Accounting Standards Board issued Accounting Standards Update “Restricted Cash” which will require entities to include the total of cash, cash equivalents, restricted cash, and restricted cash equivalents in the beginning and ending cash balances in the Statement of Cash Flows. The guidance will be applied retrospectively and is effective for fiscal years beginning after December 15, 2017, and interim periods within those years. Management is evaluating the impact, if any, of this guidance on the Series’ presentation in the Statement of Cash Flows.
Indemnifications: In the normal course of business, the Series enters into contracts that contain a variety of representations that provide general indemnification. The Series’ maximum exposure under these arrangements is unknown because it involves future potential claims against the Series, which cannot be predicted with any certainty.
Other: Expenses directly related to the Series are charged to the Series. Other operating expenses shared by several funds, including other funds managed by the Manager, are prorated among those funds on the basis of relative net assets or other appropriate methods.
| BLACKROCK INDEX FUNDS, INC. | DECEMBER 31, 2016 | 65 |
| Notes to Financial Statements (continued) | Master Small Cap Index Series |
Through May 31, 2016, the Series had an arrangement with its custodian whereby credits were earned on uninvested cash balances, which could be used to reduce custody fees and/or overdraft charges. Credits previously earned may have been utilized until December 31, 2016. Under current arrangements effective June 1, 2016, the Series no longer earns credits on uninvested cash, and may incur charges on uninvested cash balances and overdrafts, subject to certain conditions.
3. Investment Valuation and Fair Value Measurements:
Investment Valuation Policies: The Series’ investments are valued at fair value (also referred to as “market value” within the financial statements) as of the close of trading on the New York Stock Exchange (“NYSE”) (generally 4:00 p.m., Eastern time)(or if the reporting date falls on a day the NYSE is closed, investments are valued at fair value as of the period end.) U.S. GAAP defines fair value as the price the Series would receive to sell an asset or pay to transfer a liability in an orderly transaction between market participants at the measurement date. The Series determines the fair values of its financial instruments using various independent dealers or pricing services under policies approved by the Board. The BlackRock Global Valuation Methodologies Committee (the “Global Valuation Committee”) is the committee formed by management to develop global pricing policies and procedures and to oversee the pricing function for all financial instruments.
Fair Value Inputs and Methodologies: The following methods and inputs are used to establish the fair value of Series’s assets and liabilities:
| • | Equity investments traded on a recognized securities exchange are valued at the official closing price each day, if available. For equity investments traded on more than one exchange, the official closing price on the exchange where the stock is primarily traded is used. Equity investments traded on a recognized exchange for which there were no sales on that day may be valued at the last available bid (long positions) or ask (short positions) price. Generally, trading in foreign instruments is substantially completed each day at various times prior to the close of trading on the NYSE. Occasionally, events affecting the values of such instruments may occur between the foreign market close and the close of trading on the NYSE that may not be reflected in the computation of the Series’ net assets. Each business day, the Series uses a pricing service to assist with the valuation of certain foreign exchange-traded equity securities and foreign exchange-traded and over-the-counter (“OTC”) options (the “Systematic Fair Value Price”). Using current market factors, the Systematic Fair Value Price is designed to value such foreign securities and foreign options at fair value as of the close of trading on the NYSE, which follows the close of the local markets. |
| • | Investments in open-end U.S. mutual funds are valued at net asset value (“NAV”) or each business day. |
| • | The Series values its investment in SL Liquidity Series, LLC, Money Market Series (the “Money Market Series”) at fair value, which is ordinarily based upon their pro rata ownership in the underlying fund’s net assets. The Money Market Series seeks current income consistent with maintaining liquidity and preserving capital. Although the Money Market Series is not registered under the 1940 Act, its investments may follow the parameters of investments by a money market fund that is subject to Rule 2a-7 under the 1940 Act. |
| • | Futures contracts traded on exchanges are valued at their last sale price. |
| • | Securities and other assets and liabilities denominated in foreign currencies are translated into U.S. dollars using exchange rates determined as of the close of trading on the NYSE. Forward foreign currency exchange contracts are valued at the mean between the bid and ask prices and are determined as of the close of trading on the NYSE. Interpolated values are derived when the settlement date of the contract is an interim date for which quotations are not available. |
If events (e.g., a company announcement, market volatility or a natural disaster) occur that are expected to materially affect the value of such investments, or in the event that the application of these methods of valuation results in a price for an investment that is deemed not to be representative of the market value of such investment, or if a price is not available, the investment will be valued by the Global Valuation Committee, or its delegate, in accordance with a policy approved by the Board as reflecting fair value (“Fair Valued Investments”). The fair valuation approaches that may be used by the Global Valuation Committee will include Market approach, Income approach and the Cost approach. Valuation techniques such as discounted cash flow, use of market comparables and matrix pricing are types of valuation approaches and typically used in determining fair value. When determining the price for Fair Valued Investments, the Global Valuation Committee, or its delegate, seeks to determine the price that the Series might reasonably expect to receive or pay from the current sale or purchase of that asset or liability in an arm’s-length transaction. Fair value determinations shall be based upon all available factors that the Global Valuation Committee, or its delegate, deems relevant and consistent with the principles of fair value measurement.
The Global Valuation Committee, or its delegate, employs various methods for calibrating valuation approaches for investments where an active market does not exist, including regular due diligence of the Series’ pricing vendors, regular reviews of key inputs and assumptions, transactional back-testing or disposition analysis to compare unrealized gains and losses to realized gains and losses, reviews of missing or stale prices and large movements in market values and reviews of any market related activity. The pricing of all Fair Valued Investments is subsequently reported to the Board or a committee thereof on a quarterly basis. As a result of the inherent uncertainty in valuation of these investments, the fair values may differ from the values that would have been used had an active market existed.
| 66 | BLACKROCK INDEX FUNDS, INC. | DECEMBER 31, 2016 |
| Notes to Financial Statements (continued) | Master Small Cap Index Series |
For investments in equity or debt issued by privately-held companies or funds (“Private Company” or collectively, the “Private Companies”) and other Fair Valued Investments, the fair valuation approaches that are used by third party pricing services utilize one or a combination of, but not limited to, the following inputs.
| Standard Inputs Generally Considered By Third Party Pricing Services | ||
| Market approach |
(i) recent market transactions, including subsequent rounds of financing, in the underlying investment or comparable issuers; (ii) recapitalizations and other transactions across the capital structure; and (iii) market multiples of comparable issuers. | |
| Income approach |
(i) future cash flows discounted to present and adjusted as appropriate for liquidity, credit, and/or market risks; (ii) quoted prices for similar investments or assets in active markets; and (iii) other risk factors, such as interest rates, yield curves, volatilities, prepayment speeds, loss severities, credit risks, recovery rates, liquidation amounts and/or default rates. | |
| Cost approach |
(i) audited or unaudited financial statements, investor communications and financial or operational metrics issued by the Private Company; (ii) changes in the valuation of relevant indices or publicly traded companies comparable to the Private Company; (iii) relevant news and other public sources; and (iv) known secondary market transactions in the Private Company’s interests and merger or acquisition activity in companies comparable to the Private Company. |
Investments in series of preferred stock issued by Private Companies are typically valued utilizing market approach in determining the enterprise value of the company. Such investments often contain rights and preferences that differ from other series of preferred and common stock of the same issuer. Valuation techniques such as an option pricing model (“OPM”), a probability weighted expected return model (“PWERM”) or a hybrid of those techniques are used in allocating enterprise value of the company, as deemed appropriate under the circumstances. The use of OPM and PWERM techniques involve a determination of the exit scenarios of the investment in order to appropriately allocate the enterprise value of the company among the various parts of its capital structure.
The Private Companies are not subject to the public company disclosure, timing, and reporting standards as other investments held by the Series. Typically, the most recently available information by a Private Company is as of a date that is earlier than the date the Series is calculating its NAV. This factor may result in a difference between the value of the investment and the price the Series could receive upon the sale of the investment.
Fair Value Hierarchy: Various inputs are used in determining the fair value of investments and derivative financial instruments. These inputs to valuation techniques are categorized into a fair value hierarchy consisting of three broad levels for financial statement purposes as follows:
| • | Level 1 — unadjusted price quotations in active markets/exchanges for identical assets or liabilities that the Series has the ability to access |
| • | Level 2 — other observable inputs (including, but not limited to, quoted prices for similar assets or liabilities in markets that are active, quoted prices for identical or similar assets or liabilities in markets that are not active, inputs other than quoted prices that are observable for the assets or liabilities (such as interest rates, yield curves, volatilities, prepayment speeds, loss severities, credit risks and default rates) or other market–corroborated inputs) |
| • | Level 3 — unobservable inputs based on the best information available in the circumstances, to the extent observable inputs are not available (including the Series’ own assumptions used in determining the fair value of investments and derivative financial instruments) |
The hierarchy gives the highest priority to unadjusted quoted prices in active markets for identical assets or liabilities (Level 1 measurements) and the lowest priority to unobservable inputs (Level 3 measurements). Accordingly, the degree of judgment exercised in determining fair value is greatest for instruments categorized in Level 3. The inputs used to measure fair value may fall into different levels of the fair value hierarchy. In such cases, for disclosure purposes, the fair value hierarchy classification is determined based on the lowest level input that is significant to the fair value measurement in its entirety. Investments classified within Level 3 have significant unobservable inputs used by the Global Valuation Committee in determining the price for Fair Valued investments. Level 3 investments include equity or debt issued by private companies. There may not be a secondary market, and/or there are a limited number of investors. Level 3 investments may also be adjusted to reflect illiquidity and/or non-transferability, with the amount of such discount estimated by the Global Valuation Committee in the absence of market information.
Changes in valuation techniques may result in transfers into or out of an assigned level within the hierarchy. In accordance with the Series’ policy, transfers between different levels of the fair value hierarchy are deemed to have occurred as of the beginning of the reporting period. The categorization of a value determined for investments and derivative financial instruments is based on the pricing transparency of the investments and derivative financial instruments and is not necessarily an indication of the risks associated with investing in those securities.
4. Securities and Other Investments:
Securities Lending: The Series may lend its securities to approved borrowers, such as brokers, dealers and other financial institutions. The borrower pledges and maintains with the Series collateral consisting of cash, an irrevocable letter of credit issued by a bank, or securities issued or guaranteed by the U.S. Government. The initial collateral received by the Series is required to have a value of at least 102% of the current value of the loaned securities for securities traded on U.S. exchanges and a value of at least 105% for all other securities. The collateral is maintained thereafter at a value equal to at
| BLACKROCK INDEX FUNDS, INC. | DECEMBER 31, 2016 | 67 |
| Notes to Financial Statements (continued) | Master Small Cap Index Series |
least 100% of the current market value of the securities on loan. The market value of the loaned securities is determined at the close of each business day of the Series and any additional required collateral is delivered to the Series, or excess collateral returned by the Series, on the next business day. During the term of the loan, the Series is entitled to all distributions made on or in respect of the loaned securities, but does not receive interest income on securities received as collateral. Loans of securities are terminable at any time and the borrower, after notice, is required to return borrowed securities within the standard time period for settlement of securities transactions.
The market value of any securities on loan, all of which were classified as common stocks in the Series’ Schedule of Investments, and the value of any related collateral are shown separately in the Statement of Assets and Liabilities as a component of investments at value-unaffiliated, and collateral on securities loaned at value, respectively. As of period end, any securities on loan were collateralized by cash and/or U.S. Government obligations. Cash collateral invested by the securities lending agent, BlackRock Investment Management, LLC (“BIM”) if any, is disclosed in the Schedule of Investments.
Securities lending transactions are entered into by the Series under Master Securities Lending Agreements (each, an “MSLA”), which provide the right, in the event of default (including bankruptcy or insolvency), for the non-defaulting party to liquidate the collateral and calculate a net exposure to the defaulting party or request additional collateral. In the event that a borrower defaults, the Series, as lender, would offset the market value of the collateral received against the market value of the securities loaned. When the value of the collateral is greater than that of the market value of the securities loaned, the lender is left with a net amount payable to the defaulting party. However, bankruptcy or insolvency laws of a particular jurisdiction may impose restrictions on or prohibitions against such a right of offset in the event of an MSLA counterparty’s bankruptcy or insolvency. Under the MSLA, absent an event of default, the borrower can resell or re-pledge the loaned securities, and the Series can reinvest cash collateral received in connection with loaned securities. Upon an event of default, the parties’ obligations to return the securities or collateral to the other party are extinguished, and the parties can resell or re-pledge the loaned securities or the collateral received in connection with the loaned securities in order to satisfy the defaulting party’s net payment obligation for all transactions under the MSLA. The defaulting party remains liable for any deficiency.
As of period end, the following table is a summary of the Series’ securities lending agreements by counterparty which are subject to offset under an MSLA:
| Counterparty | Securities Loaned at Value |
Cash Collateral Received1 |
Net Amount |
|||||||||
| Barclays Capital, Inc. |
$ | 379,353 | $ | (379,353 | ) | — | ||||||
| BNP Paribas S.A. |
286,997 | (286,997 | ) | — | ||||||||
| Citigroup Global Markets, Inc. |
207,175 | (207,175 | ) | — | ||||||||
| Credit Suisse Securities (USA) LLC. |
374,827 | (374,827 | ) | — | ||||||||
| Deutsche Bank AG. |
1,033,131 | (1,033,131 | ) | — | ||||||||
| Goldman Sachs & Co. |
1,100,854 | (1,100,854 | ) | — | ||||||||
| JP Morgan Securities LLC |
219,304 | (219,304 | ) | — | ||||||||
| Merrill Lynch, Pierce, Fenner & Smith, Inc. |
1,046,587 | (1,046,587 | ) | — | ||||||||
| Morgan Stanley |
1,507,776 | (1,507,776 | ) | — | ||||||||
| National Financial Services LLC |
295,537 | (295,537 | ) | — | ||||||||
| SG Americas Securities LLC |
900,027 | (900,027 | ) | — | ||||||||
| UBS Securities LLC |
734,003 | (734,003 | ) | — | ||||||||
|
|
|
|
|
|
|
|||||||
| Total |
$ | 8,085,571 | $ | (8,085,571 | ) | — | ||||||
|
|
|
|
|
|
|
|||||||
| 1 | Cash collateral with a value of $8,714,610 has been received in connection with securities lending agreements. Collateral received in excess of the value of securities loaned from the individual counterparty is not shown for financial reporting purposes. |
The risks of securities lending include the risk that the borrower may not provide additional collateral when required or may not return the securities when due. To mitigate these risks, the Series benefits from a borrower default indemnity provided by BIM. BIM’s indemnity allows for full replacement of the securities loaned if the collateral received does not cover the value on the securities loaned in the event of borrower default. The Series could suffer a loss if the value of an investment purchased with cash collateral falls below the market value of loaned securities or if the value of an investment purchased with cash collateral falls below the value of the original cash collateral received.
5. Derivative Financial Instruments:
The Series engages in various portfolio investment strategies using derivative contracts both to increase the returns of the Series and/or to manage its exposure to certain risks such as equity risk. Derivative financial instruments categorized by risk exposure are included in the Schedule of Investments. These contracts may be transacted on an exchange or OTC.
Futures Contracts: The Series invests in long and/or short positions in futures and options on futures contracts to gain exposure to, or manage exposure to changes in interest rates (interest rate risk), changes in the value of equity securities (equity risk).
Futures contracts are agreements between the Series and a counterparty to buy or sell a specific quantity of an underlying instrument at a specified price and on a specified date. Depending on the terms of a contract, it is settled either through physical delivery of the underlying instrument on the settlement date or by payment of a cash amount on the settlement date. Upon entering into a futures contract, the Series is required to deposit initial margin with the
| 68 | BLACKROCK INDEX FUNDS, INC. | DECEMBER 31, 2016 |
| Notes to Financial Statements (continued) | Master Small Cap Index Series |
broker in the form of cash or securities in an amount that varies depending on a contract’s size and risk profile. The initial margin deposit must then be maintained at an established level over the life of the contract.
Securities deposited as initial margin are designated in the Schedule of Investments and cash deposited, if any, is shown as cash pledged for futures contracts in the Statement of Assets and Liabilities. Pursuant to the contract, the Series agrees to receive from or pay to the broker an amount of cash equal to the daily fluctuation in market value of the contract (“variation margin”). Variation margin is recorded as unrealized appreciation (depreciation) and, if any, shown as variation margin receivable (or payable) on futures contracts in the Statement of Assets and Liabilities. When the contract is closed, a realized gain or loss is recorded in the Statement of Operations equal to the difference between the value of the contract at the time it was opened and the value at the time it was closed. The use of futures contracts involves the risk of an imperfect correlation in the movements in the price of futures contracts and interest, foreign currency exchange rates or underlying assets.
6. Investment Advisory Agreement and Other Transactions with Affiliates:
The PNC Financial Services Group, Inc. is the largest stockholder and an affiliate of BlackRock, Inc. (“BlackRock”) for 1940 Act purposes.
Investment Advisory: The Master LLC, on behalf of the Series, entered into an Investment Advisory Agreement with the Manager, the Series’ investment adviser, an indirect, wholly-owned subsidiary of BlackRock, to provide investment advisory and administration services. The Manager is responsible for the management of the Series’ portfolio and provides the personnel, facilities, equipment and certain other services necessary to the operations of the Series.
For such services, the Series pays the Manager a monthly fee at an annual rate equal to 0.01% of the average daily value of the Series’ net assets.
Waivers and Reimbursements: With respect to the Series, the Manager contractually agreed to waive and/or reimburse fees or expenses in order to limit expenses, excluding interest expense, dividend expense, tax expense, acquired fund fees and expenses, and certain other fund expenses, which constitute extraordinary expenses not incurred in the ordinary course of the Series’ business (“expense limitation”). The current expense limitation as a percentage of average daily net assets is 0.07%. Prior to October 5, 2016, the expense limitation as a percentage of average daily net assets was 0.08%. The Manager has agreed not to reduce or discontinue this contractual expense limitation prior to May 1, 2018, unless approved by the Board, including a majority of the directors who are not “interested persons” of the Series, as defined in the 1940 Act (“Independent Directors”) or by a vote of a majority of the outstanding voting securities of the Series. For the year ended December 31, 2016, the Manager waived $35,656, which is included in fees waived and/or reimbursed by the Manager in the Statement of Operations.
With respect to the Series, the Manager voluntarily agreed to waive its investment advisory fees by the amount of investment advisory fees the Series pays to the Manager indirectly through its investment in affiliated money market funds. This amount is included in fees waived and/or reimbursed by the Manager in the Statement of Operations. For the year ended December 31, 2016, the amount waived was $14,462.
Effective September 1, 2016, the Manager voluntarily agreed to waive its investment advisory fee with respect to any portion of the Series’ assets invested in equity or fixed-income mutual funds or exchange-traded funds that have a contractual management fee. Prior to September 1, 2016, the Manager did not waive such fees. This voluntary waiver may be reduced or discontinued at any time without notice.
For the year ended December 31, 2016, the Series reimbursed the Manager for certain accounting services, which is included in accounting services in the Statement of Operations. The reimbursement was $6,023.
Securities Lending: The U.S. Securities and Exchange Commission has issued an exemptive order which permits BIM, an affiliate of the Manager, to serve as securities lending agent for the Series, subject to applicable conditions. As securities lending agent, BIM bears all operational costs directly related to securities lending. The Series is responsible for expenses in connection with the investment of cash collateral received for securities on loan (the “collateral investment expenses”). The cash collateral is invested in a private investment company managed by the Manager or its affiliates. However, BIM has agreed to cap the collateral investment expenses of the private investment company to an annual rate of 0.04%. The investment adviser to the private investment company will not charge any advisory fees with respect to shares purchased by the Series.
Securities lending income is equal to the total of income earned from the reinvestment of cash collateral, net of fees and other payments to and from borrowers of securities, and less the collateral investment expenses. The Series retains a portion of securities lending income and remits a remaining portion to BIM as compensation for its services as securities lending agent. Pursuant to a securities lending agreement, BIM may lend securities only when the difference between the borrower rebate rate and the risk free rate exceeds a certain level (such securities, the “specials only securities”).
Pursuant to such agreement, the Series retains 80% of securities lending income. In addition, commencing the business day following the date that the aggregate securities lending income earned across certain funds in the Equity-Liquidity Complex in a calendar year exceeds a specified threshold, the Series, pursuant to the securities lending agreement, will retain for the remainder of the calendar year securities lending income in an amount equal to 85% of securities lending income.
| BLACKROCK INDEX FUNDS, INC. | DECEMBER 31, 2016 | 69 |
| Notes to Financial Statements (continued) | Master Small Cap Index Series |
The share of securities lending income earned by the Series is shown as securities lending — affiliated – net in the Statement of Operations. For the year ended December 31, 2016, the Series paid BIM the following amounts in total for securities lending agent services and collateral investment fees:
| Amounts |
$ | 254,126 |
Officers and Directors: Certain officers and/or directors of the Master LLC are officers and/or directors of BlackRock or its affiliates.
Other Transactions: The Series may purchase securities from, or sell securities to, an affiliated fund provided the affiliation is due solely to having a common investment adviser, common officers, or common directors. For the year ended December 31, 2016, the purchase and sale transactions and any resulted in net realized gains (losses) with an affiliated fund in compliance with Rule 17a-7 under the 1940 Act were as follows:
| Purchases | Sales | Net Realized Gain (Loss) | ||||||
| $33,673,951 |
$ | 19,880,873 | $ | 7,272,873 | ||||
7. Purchases and Sales:
For the year ended December 31, 2016, purchases and sales of investments, excluding short-term securities were $290,533,232 and $208,020,566, respectively.
8. Income Tax Information:
The Series is classified as a partnership for federal income tax purposes. As such, each investor in the Series is treated as the owner of its proportionate share of net assets, income, expenses and realized and unrealized gains and losses of the Series. Therefore, no federal income tax provision is required. It is intended that the Series’ assets will be managed so an investor in the Series can satisfy the requirements of Subchapter M of the Internal Revenue Code of 1986, as amended.
The Series files U.S. federal and various state and local tax returns. No income tax returns are currently under examination. The statute of limitations on the Series’ U.S. federal tax returns generally remains open for each of the four years ended December 31, 2016. The statutes of limitations on the Series’ state and local tax returns may remain open for an additional year depending upon the jurisdiction.
Management has analyzed tax laws and regulations and their application to the Series as of December 31, 2016, inclusive of the open tax return years, and does not believe that there are any uncertain tax positions that require recognition of a tax liability in the Series’ financial statements.
As of December 31, 2016, gross unrealized appreciation and depreciation based on cost for federal income tax purposes were as follows:
| Tax cost |
$ | 541,983,666 | ||
|
|
|
|||
| Gross unrealized appreciation |
$ | 181,403,678 | ||
| Gross unrealized depreciation |
(31,429,719 | ) | ||
|
|
|
|||
| Net unrealized appreciation |
$ | 149,973,959 | ||
|
|
|
9. Bank Borrowings:
The Master LLC, on behalf of the Series, along with certain other funds managed by the Manager and its affiliates (“Participating Funds”), is a party to a 364-day, $2.1 billion credit agreement with a group of lenders. Under this agreement, the Series may borrow to fund shareholder redemptions. Excluding commitments designated for certain individual funds, the Participating Funds, including the Series can borrow up to an aggregate commitment amount of $1.6 billion at any time outstanding, subject to asset coverage and other limitations as specified in the agreement. The credit agreement has the following terms: a fee of 0.12% per annum on unused commitment amounts and interest at a rate equal to the higher of (a) one-month LIBOR (but, in any event, not less than 0.00%) on the date the loan is made plus 0.80% per annum or (b) the Fed Funds rate (but, in any event, not less than 0.00%) in effect from time to time plus 0.80% per annum on amounts borrowed. The agreement expires in April 2017 unless extended or renewed. Prior to April 21, 2016, the credit agreement had a fee per annum of 0.06% on unused commitment amounts and interest at a rate equal to the higher of (a) one-month LIBOR (but, in any event, not less than 0.00%) on the date the loan is made plus 0.80% per annum or (b) the Fed Funds rate (but, in any event, not less than 0.00%) in effect from time to time plus 0.80% per annum on amounts borrowed. Participating Funds paid administration, legal and arrangement fees, which, if applicable, are included in miscellaneous expenses in the Statement of Operations. These fees were allocated among such funds based upon portions of the aggregate commitment available to them and relative net assets of Participating Funds. During the year ended December 31, 2016, the Series did not borrow under the credit agreement.
10. Principal Risks:
In the normal course of business, the Series invests in securities and enters into transactions where risks exist due to fluctuations in the market (market risk) or failure of the issuer to meet all its obligations, including the ability to pay principal and interest when due (issuer credit risk). The value of securities
| 70 | BLACKROCK INDEX FUNDS, INC. | DECEMBER 31, 2016 |
| Notes to Financial Statements (concluded) | Master Small Cap Index Series |
held by the Series may decline in response to certain events, including those directly involving the issuers of securities owned by the Series. Changes arising from the general economy, the overall market and local, regional or global political and/or social instability, as well as currency, interest rate and price fluctuations, may also affect the securities’ value.
On October 11, 2016, BlackRock implemented certain changes required by amendments to Rule 2a-7 under the 1940 Act, which governs the operations of U.S. money market funds. The Series may be exposed to additional risks when reinvesting cash collateral in money market funds that do not seek to maintain a stable NAV per share of $1.00 and which may be subject to redemption gates or liquidity fees under certain circumstances.
Valuation Risk: The market values of equities, such as common stocks and preferred securities or equity related investments, such as futures and options, may decline due to general market conditions which are not specifically related to a particular company. They may also decline due to factors which affect a particular industry or industries. The Series may invest in illiquid investments and may experience difficulty in selling those investments in a timely manner at the price that it believes the investments are worth. Prices may fluctuate widely over short or extended periods in response to company, market or economic news. Markets also tend to move in cycles, with periods of rising and falling prices. This volatility may cause the Series’ NAV to experience significant increases or decreases over short periods of time. If there is a general decline in the securities and other markets, the NAV of the Series may lose value, regardless of the individual results of the securities and other instruments in which the Series invests.
The price the Series could receive upon the sale of any particular portfolio investment may differ from the Series’ valuation of the investment, particularly for securities that trade in thin or volatile markets or that are valued using a fair valuation technique or a price provided by an independent pricing service. Changes to significant unobservable inputs and assumptions (i.e., publicly traded company multiples, growth rate, time to exit) due to the lack of observable inputs may significantly impact the resulting fair value and therefore the Series’ results of operations. As a result, the price received upon the sale of an investment may be less than the value ascribed by the Series, and the Series could realize a greater than expected loss or lesser than expected gain upon the sale of the investment. The Series’ ability to value its investments may also be impacted by technological issues and/or errors by pricing services or other third party service providers.
Counterparty Credit Risk: Similar to issuer credit risk, the Series may be exposed to counterparty credit risk, or the risk that an entity may fail to or be unable to perform on its commitments related to unsettled or open transactions. The Series manages counterparty credit risk by entering into transactions only with counterparties that the Manager believes have the financial resources to honor their obligations and by monitoring the financial stability of those counterparties. Financial assets, which potentially expose the Series to market, issuer and counterparty credit risks, consist principally of financial instruments and receivables due from counterparties. The extent of the Series’ exposure to market, issuer and counterparty credit risks with respect to these financial assets is approximately their value recorded in the Statement of Assets and Liabilities, less any collateral held by the Series.
A derivative contract may suffer a mark-to-market loss if the value of the contract decreases due to an unfavorable change in the market rates or values of the underlying instrument. Losses can also occur if the counterparty does not perform under the contract.
With exchange-traded futures there is less counterparty credit risk to the Series since the exchange or clearinghouse, as counterparty to such instruments, guarantees against a possible default. The clearinghouse stands between the buyer and the seller of the contract; therefore, credit risk is limited to failure of the clearinghouse. While offset rights may exist under applicable law, the Series does not have a contractual right of offset against a clearing broker or clearinghouse in the event of a default (including the bankruptcy or insolvency). Additionally, credit risk exists in exchange-traded futures with respect to initial and variation margin that is held in a clearing broker’s customer accounts. While clearing brokers are required to segregate customer margin from their own assets, in the event that a clearing broker becomes insolvent or goes into bankruptcy and at that time there is a shortfall in the aggregate amount of margin held by the clearing broker for all its clients, typically the shortfall would be allocated on a pro rata basis across all the clearing broker’s customers, potentially resulting in losses to the Series.
As of period end, the Series’ investments had the following industry classifications:
| Industry |
Percent of Net Assets |
|||
| Banks. |
11% | |||
| Real Estate Investment Trusts |
7 | |||
|
Other1 |
82 | |||
| 1 | All other industries held was less than 5% of net assets. |
11. Subsequent Events:
Management has evaluated the impact of all subsequent events on the Series through the date the financial statements were issued and has determined that there were no subsequent events requiring adjustment or additional disclosure in the financial statements.
| BLACKROCK INDEX FUNDS, INC. | DECEMBER 31, 2016 | 71 |
| Report of Independent Registered Public Accounting Firm | Master Small Cap Opinion |
To the Board of Directors of Quantitative Master Series LLC and the Investors of Master Small Cap Index Series:
We have audited the accompanying statement of assets and liabilities, including the schedule of investments of Master Small Cap Index Series, one of the series included in the Quantitative Master Series LLC, (the “Series”) as of December 31, 2016, and the related statements of operations for the year then ended, the statements of changes in net assets for each of the two years in the period then ended, and the financial highlights for each of the five years in the period then ended. These financial statements and financial highlights are the responsibility of the Series’ management. Our responsibility is to express an opinion on these financial statements and financial highlights based on our audits.
We conducted our audits in accordance with the standards of the Public Company Accounting Oversight Board (United States). Those standards require that we plan and perform the audit to obtain reasonable assurance about whether the financial statements and financial highlights are free of material misstatement. The Series is not required to have, nor were we engaged to perform, an audit of its internal control over financial reporting. Our audit included consideration of internal control over financial reporting as a basis for designing audit procedures that are appropriate in the circumstances, but not for the purpose of expressing an opinion on the effectiveness of the Series’ internal control over financial reporting. Accordingly, we express no such opinion. An audit also includes examining, on a test basis, evidence supporting the amounts and disclosures in the financial statements, assessing the accounting principles used and significant estimates made by management, as well as evaluating the overall financial statement presentation. Our procedures included confirmation of securities owned as of December 31, 2016, by correspondence with the custodian and brokers; where replies were not received from brokers, we performed other auditing procedures. We believe that our audits provide a reasonable basis for our opinion.
In our opinion, the financial statements and financial highlights referred to above present fairly, in all material respects, the financial position of Master Small Cap Index Series of Quantitative Master Series LLC, as of December 31, 2016, the results of its operations for the year then ended, the changes in its net assets for each of the two years in the period then ended, and the financial highlights for each of the five years in the period then ended, in conformity with accounting principles generally accepted in the United States of America.
Deloitte & Touche LLP
Boston, Massachusetts
February 23, 2017
| 72 | BLACKROCK INDEX FUNDS, INC. | DECEMBER 31, 2016 |
| Disclosure of Investment Advisory Agreement |
At an in-person meeting on May 19, 2016 (the “May 19 Meeting”), the Board of Directors of BlackRock Index Funds, Inc. (the “Corporation”), with respect to BlackRock International Index Fund (the “Fund”), a series of the Corporation, and the Board of Directors of Quantitative Master Series LLC (the “Master LLC”), with respect to Master International Index Series (the “Master Fund”), a series of the Master LLC, approved the conversion of the Fund from a feeder fund that invests its assets into the Master Fund into a stand-alone fund that makes direct investments. In connection with the conversion, the Board of Directors of the Master LLC also approved the termination of the Master Fund.
At the May 19 Meeting, the Board of Directors of the Corporation considered the initial approval of the proposed investment advisory agreement between BlackRock Advisors, LLC (the “Manager”) and the Corporation, on behalf of the Fund (the “Agreement”). The Board of the Corporation was informed that the Agreement was substantively the same as the investment advisory agreement in place at that time between the Manager and the Master LLC with respect to the Master Fund (the “Existing Agreement”).
On the date of the May 19 Meeting, the Board of the Corporation consisted of fifteen individuals, thirteen of whom were not “interested persons” of the Corporation as defined in the Investment Company Act of 1940, as amended (the “1940 Act”) (the “Independent Board Members”). Pursuant to the 1940 Act, the Board of the Corporation is required to consider the initial approval of the Agreement.
The Board of the Master LLC met in person on April 21, 2016 (the “April Meeting”) and on May 18-20, 2016 (the “May Meeting”) to consider the approval of the Existing Agreement on behalf of the Master Fund. Because the Fund was a “feeder” fund that invested all of its investable assets in the Master Fund, the Board of the Corporation also considered the approval of the Existing Agreement with respect to the Master Fund. At the May Meeting, the Board of the Master LLC, including the independent board members, approved the continuation of the Existing Agreement with respect to the Master Fund for a one-year term ending June 30, 2017. The Board of the Corporation, including the Independent Board Members, also considered the continuation of the Existing Agreement with respect to the Master Fund and found the Existing Agreement to be satisfactory.
The materials reviewed and the factors considered by the Board of the Corporation at the May 19 Meeting in connection with approval of the proposed Agreement were substantially the same as the materials reviewed and the factors the Board of the Corporation considered at the April Meeting and the May Meeting with respect to consideration of the approval of the Existing Agreement. A discussion of the basis for the Board of the Master LLC’s approval and the Board of the Corporation’s consideration of the Existing Agreement at the May Meeting is included in the semi-annual shareholder report of the Fund for the period ended June 30, 2016.
Following discussion, at the May 19 Meeting the Board of the Corporation, including the Independent Board Members, approved the Agreement between the Manager and the Corporation with respect to the Fund for a two-year term beginning on the effective date of the Agreement. Based upon its evaluation of all of the aforementioned factors in their totality, the Board of the Corporation, including the Independent Board Members, was satisfied that the terms of the Agreement were fair and reasonable and in the best interest of the Fund and its shareholders. In arriving at its decision to approve the Agreement, the Board of the Corporation did not identify any single factor or group of factors as all-important or controlling, but considered all factors together, and different Board members may have attributed different weights to the various factors considered. The Independent Board Members were also assisted by the advice of independent legal counsel in making this determination.
| BLACKROCK INDEX FUNDS, INC. | DECEMBER 31, 2016 | 73 |
| Officers and Directors1 |
| Name, Address2 and Year of Birth |
Position(s) Held with the Master LLC |
Length of Time Served4 |
Principal Occupation(s) During Past Five Years | Number of BlackRock- Advised Registered Investment Companies (“RICs”) Consisting of Investment Portfolios (“Portfolios”) Overseen |
Public Company and Other Investment Company Directorships | |||||
| Independent Directors3 | ||||||||||
| Rodney D. Johnson
1941 |
Chair of the Board and Director | Since 2007 | President, Fairmount Capital Advisors, Inc. from 1987 to 2013; Member of the Archdiocesan Investment Committee of the Archdiocese of Philadelphia from 2004 to 2012; Director, The Committee of Seventy (civic) from 2006 to 2012; Director, Fox Chase Cancer Center from 2004 to 2011; Director, The Mainstay (non-profit) since 2016. | 26 RICs consisting of 146 Portfolios |
None | |||||
| Susan J. Carter
1956 |
Director | Since 2016 | Director, Pacific Pension Institute since 2014; Advisory Board Member, Center for Private Equity and Entrepreneurship at Tuck School of Business since 1997; Senior Advisor, Commonfund Capital, Inc. (“CCI”) (investment adviser) in 2015; Chief Executive Officer, CCI from 2013 to 2014; President & Chief Executive Officer, CCI from 1997 to 2013; Advisory Board Member, Girls Who Invest since 2015; Advisory Board Member, Bridges Ventures since 2016; Trustee, Financial Accounting Foundation since 2017. | 26 RICs consisting of 146 Portfolios |
None | |||||
| Collette Chilton
1958 |
Director | Since 2015 | Chief Investment Officer, Williams College since 2006; Chief Investment Officer, Lucent Asset Management Corporation from 1998 to 2006. | 26 RICs consisting of 146 Portfolios |
None | |||||
| Neil A. Cotty
1954 |
Director | Since 2016 | Bank of America Corporation from 1996 to 2015, serving in various senior finance leadership roles, including Chief Accounting Officer, from 2009 to 2015, Chief Financial Officer of Global Banking, Markets and Wealth Management from 2008 to 2009, Chief Accounting Officer from 2004 to 2008, Chief Financial Officer of Consumer Bank from 2003 to 2004, Chief Financial Officer of Global Corporate Investment Bank from 1999 to 2002. | 26 RICs consisting of 146 Portfolios |
None | |||||
| Cynthia A. Montgomery
1952 |
Director | Since 2007 | Professor, Harvard Business School since 1989; Director, McLean Hospital from 2005 to 2012. | 26 RICs consisting of 146 Portfolios |
Newell Rubbermaid, Inc. (manufacturing) | |||||
| Joseph P. Platt
1947 |
Director | Since 2007 | General Partner, Thorn Partners, LP (private investments) since 1998; Director, WQED Multi-Media (public broadcasting not-for-profit) since 2001; Chair, Basic Health International (non-profit) since 2015. | 26 RICs consisting of 146 Portfolios |
Greenlight Capital Re, Ltd. (reinsurance company); Consol Energy Inc. | |||||
| Robert C. Robb, Jr.
1945 |
Director | Since 2007 | Partner, Lewis, Eckert, Robb and Company (management and financial consulting firm) since 1981 and Principal since 2010. | 26 RICs consisting of 146 Portfolios |
None | |||||
| Mark Stalnecker
1951 |
Director | Since 2015 | Chief Investment Officer, University of Delaware from 1999 to 2013; Trustee, Winterthur Museum and Country Estate from 2001 to 2015; Member of the Investment Committee, Delaware Public Employees’ Retirement System since 2002; Member of the Investment Committee, Christiana Care Health System since 2009; Member of the Investment Committee, Delaware Community Foundation from 2013 to 2014; Director, SEI Private Trust Co. from 2001 to 2014. | 26 RICs consisting of 146 Portfolios |
None | |||||
| Kenneth L. Urish
1951 |
Director | Since 2007 | Managing Partner, Urish Popeck & Co., LLC (certified public accountants and consultants) since 1976; Past-Chairman of the Professional Ethics Committee of the Pennsylvania Institute of Certified Public Accountants and Committee Member thereof since 2007; Member of External Advisory Board, The Pennsylvania State University Accounting Department since founding in 2001; Principal, UP Strategic Wealth Investment Advisors, LLC since 2013; Trustee, The Holy Family Institute from 2001 to 2010; President and Trustee, Pittsburgh Catholic Publishing Associates from 2003 to 2008; Director, Inter-Tel from 2006 to 2007. | 26 RICs consisting of 146 Portfolios |
None | |||||
| Claire A. Walton
1957 |
Director | Since 2016 | Chief Operating Officer and Chief Financial Officer of Liberty Square Asset Management, LP from 1998 to 2015; General Partner of Neon Liberty Capital Management, LLC since 2003; Director, Boston Hedge Fund Group since 2009; Director, Woodstock Ski Runners since 2013; Director, Massachusetts Council on Economic Education from 2013 to 2015. | 26 RICs consisting of 146 Portfolios |
None | |||||
| 74 | BLACKROCK INDEX FUNDS, INC. | DECEMBER 31, 2016 |
| Officers and Directors1 (continued) | ||||
| Name, Address2 and Year of Birth |
Position(s) Held with the Master LLC |
Length of Time Served4 |
Principal Occupation(s) During Past Five Years | Number of BlackRock- Advised Registered Investment Companies (“RICs”) Consisting of Investment Portfolios (“Portfolios”) Overseen |
Public Company and Other Investment Company Directorships | |||||
| Independent Directors3 (concluded) | ||||||||||
| Frederick W. Winter
1945 |
Director | Since 2007 | Director, Alkon Corporation since 1992; Dean Emeritus of the Joseph M. Katz School of Business, University of Pittsburgh, Dean and Professor from 1997 to 2005, Professor until 2013. | 26 RICs consisting of 146 Portfolios |
None | |||||
| Interested Directors5 | ||||||||||
| Barbara G. Novick
1960 |
Director | Since 2015 | Vice Chairman of BlackRock, Inc. since 2006; Chair of BlackRock’s Government Relations Steering Committee since 2009; Head of the Global Client Group of BlackRock, Inc. from 1988 to 2008. | 100 RICs consisting of 220 Portfolios |
None | |||||
| John M. Perlowski
1964 |
Director, President and Chief Executive Officer | Since 2015 (Director); Since 2010 (President and Chief Executive Officer) | Managing Director of BlackRock, Inc. since 2009; Head of BlackRock Global Fund & Accounting Services since 2009; Managing Director and Chief Operating Officer of the Global Product Group at Goldman Sachs Asset Management, L.P. from 2003 to 2009; Treasurer of Goldman Sachs Mutual Funds from 2003 to 2009 and Senior Vice President thereof from 2007 to 2009; Advisory Director of Goldman Sachs Offshore Funds from 2002 to 2009; Director of Family Resource Network (charitable foundation) since 2009. | 128 RICs consisting of 318 Portfolios |
None | |||||
| 1 As of February 23, 2017. | ||||||||||
| 2 The address of each Director is c/o BlackRock, Inc., 55 East 52nd Street, New York, NY 10055. | ||||||||||
| 3 Independent Directors serve until their resignation, retirement, removal or death, or until December 31 of the year in which they turn 75. The Board has determined to extend the terms of Independent Directors on a case-by-case basis, as appropriate. | ||||||||||
| 4 Following the combination of Merrill Lynch Investment Managers, L.P. (“MLIM”) and BlackRock, Inc. (“BlackRock”) in September 2006, the various legacy MLIM and legacy BlackRock fund boards were realigned and consolidated into three new fund boards in 2007. As a result, although the chart shows certain Independent Directors as joining the Board in 2007, those Independent Directors first became members of the boards of other legacy MLIM or legacy BlackRock funds as follows: Rodney D. Johnson, 1995; Cynthia A. Montgomery, 1994; Joseph P. Platt, 1999; Robert C. Robb, Jr., 1999; Kenneth L. Urish, 1999; and Frederick W. Winter, 1999. | ||||||||||
| 5 Ms. Novick and Mr. Perlowski are both “interested persons,” as defined in the 1940 Act, of the Corporation/Master LLC based on their positions with BlackRock and its affiliates. Mr. Perlowski and Ms. Novick are also board members of certain complexes of BlackRock registered open-end and closed-end funds. Mr. Perlowski is also a board member of the BlackRock Equity-Bond Complex and the BlackRock Closed-End Complex, and Ms. Novick is a board member of the BlackRock Closed-End Complex. | ||||||||||
| BLACKROCK INDEX FUNDS, INC. | DECEMBER 31, 2016 | 75 |
| Officers and Directors (concluded) |
| Name, Address1 and Year of Birth |
Position(s) Held with the Master LLC |
Length of Time Served as an Officer |
Principal Occupation(s) During Past Five Years | |||
| Officers Who Are Not Directors2 | ||||||
| Thomas Callahan
1968 |
Vice President | Since 2016 | Managing Director of BlackRock, Inc. since 2013; Head of BlackRock’s Global Cash Management Business since 2016; Co-Head of the Global Cash Management Business from 2014 to 2016; Deputy Head of the Global Cash Management Business from 2013 to 2014; Member of the Cash Management Group Executive Committee since 2013; Chief Executive Officer of NYSE Liffe U.S. from 2008 to 2013. | |||
| Jennifer McGovern
1977 |
Vice President | Since 2014 | Managing Director of BlackRock, Inc. since 2016; Director of BlackRock, Inc. from 2011 to 2015; Head of Product Structure and Oversight for BlackRock’s U.S. Wealth Advisory Group since 2013; Vice President of BlackRock, Inc. from 2008 to 2010. | |||
| Neal J. Andrews
1966 |
Chief Financial Officer | Since 2007 | Managing Director of BlackRock, Inc. since 2006; Senior Vice President and Line of Business Head of Fund Accounting and Administration at PNC Global Investment Servicing (U.S.) Inc. from 1992 to 2006. | |||
| Jay M. Fife
1970 |
Treasurer | Since 2007 | Managing Director of BlackRock, Inc. since 2007; Director of BlackRock, Inc. in 2006; Assistant Treasurer of the MLIM and Fund Asset Management, L.P. advised funds from 2005 to 2006; Director of MLIM Fund Services Group from 2001 to 2006. | |||
| Charles Park
1967 |
Chief Compliance Officer | Since 2014 | Anti-Money Laundering Compliance Officer for the BlackRock-advised Funds in the Equity-Bond Complex, the Equity-Liquidity Complex and the Closed-End Complex from 2014 to 2015; Chief Compliance Officer of BlackRock Advisors, LLC and the BlackRock-advised Funds in the Equity-Bond Complex, the Equity-Liquidity Complex and the Closed-End Complex since 2014; Principal of and Chief Compliance Officer for iShares® Delaware Trust Sponsor LLC since 2012 and BlackRock Fund Advisors (“BFA”) since 2006; Chief Compliance Officer for the BFA-advised iShares® exchange traded funds since 2006; Chief Compliance Officer for BlackRock Asset Management International Inc. since 2012. | |||
| Fernanda Piedra
1969 |
Anti-Money Laundering Compliance Officer | Since 2015 | Director of BlackRock, Inc. since 2014; Anti-Money Laundering Compliance Officer and Regional Head of Financial Crime for the Americas at BlackRock, Inc. since 2014; Head of Regulatory Changes and Remediation for the Asset Wealth Management Division of Deutsche Bank from 2010 to 2014; Vice President of Goldman Sachs (Anti-Money Laundering/Suspicious Activities Group) from 2004 to 2010. | |||
| Benjamin Archibald
1975 |
Secretary | Since 2012 | Managing Director of BlackRock, Inc. since 2014; Director of BlackRock, Inc. from 2010 to 2013; Secretary of the iShares® exchange traded funds since 2015; Secretary of the BlackRock-advised mutual funds since 2012. | |||
| 1 The address of each Officer is c/o BlackRock, Inc., 55 East 52nd Street, New York, NY 10055. | ||||||
|
2 Officers of the Corporation/Master LLC serve at the pleasure of the Board. | ||||||
| Further information about the Corporation’s/Master LLC’s Officers and Directors is available in the Fund’s Statement of Additional Information, which can be obtained without charge by calling (800) 441-7762. | ||||||
Effective December 31, 2016, David O. Beim and Dr. Matina S. Horner resigned as Directors of the Corporation/Master LLC.
| Investment Adviser and Administrator BlackRock Advisors, LLC Wilmington, DE 19809 |
Accounting Agent and Custodian State Street Bank and |
Independent Registered Public Accounting Firm Deloitte & Touche LLP Boston, MA 02116 |
Distributor BlackRock Investments, LLC New York, NY 10022 |
Address of the Funds 100 Bellevue Parkway Wilmington, DE 19809 | ||||
| Transfer Agent BNY Mellon Investment Servicing (US) Inc. Wilmington, DE 19809 |
Legal Counsel Sidley Austin LLP New York, NY 10019 |
|||||||
| 76 | BLACKROCK INDEX FUNDS, INC. | DECEMBER 31, 2016 |
| Additional Information |
| General Information |
Householding
The Funds will mail only one copy of shareholder documents, including prospectuses, annual and semi-annual reports and proxy statements, to shareholders with multiple accounts at the same address. This practice is commonly called “householding” and is intended to reduce expenses and eliminate duplicate mailings of shareholder documents. Mailings of your shareholder documents may be householded indefinitely unless you instruct us otherwise. If you do not want the mailing of these documents to be combined with those for other members of your household, please call the Funds at (800) 441-7762.
Availability of Quarterly Schedule of Investments
The Funds/Series file their complete schedule of portfolio holdings with the SEC for the first and third quarters of each fiscal year on Form N-Q. The Funds’/Series’ Forms N-Q are available on the SEC’s website at http://www.sec.gov and may also be reviewed and copied at the SEC’s Public Reference Room in Washington, D.C. Information on the operation of the Public Reference Room or how to access documents on the SEC’s website without charge may be obtained by calling (800) SEC-0330. The Funds’/Series’ Forms N-Q may also be obtained upon request and without charge by calling (800) 441-7762.
Availability of Proxy Voting Policies and Procedures
A description of the policies and procedures that the Funds/Series use to determine how to vote proxies relating to portfolio securities is available upon request and without charge (1) by calling (800) 441-7762; (2) at http://www.blackrock.com; and (3) on the SEC’s website at http://www.sec.gov.
Availability of Proxy Voting Record
Information about how the Funds/Series voted proxies relating to securities held in the Funds’/Series’ portfolio during the most recent 12-month period ended June 30 is available upon request and without charge (1) at http://www.blackrock.com or by calling (800) 441-7762; and (2) on the SEC’s website at http://www.sec.gov.
BlackRock’s Mutual Fund Family
BlackRock offers a diverse lineup of open-end mutual funds crossing all investment styles and managed by experts in equity, fixed income and tax-exempt investing. Visit http://www.blackrock.com for more information.
| Shareholder Privileges |
Account Information
Call us at (800) 441-7762 from 8:00 AM to 6:00 PM ET on any business day to get information about your account balances, recent transactions and share prices. You can also reach us on the Web at http://www.blackrock.com/funds.
Automatic Investment Plans
Investor Class shareholders who want to invest regularly can arrange to have $50 or more automatically deducted from their checking or savings account and invested in any of the BlackRock funds.
Systematic Withdrawal Plans
Investor Class shareholders can establish a systematic withdrawal plan and receive periodic payments of $50 or more from their BlackRock funds, as long as their account balance is at least $10,000.
Retirement Plans
Shareholders may make investments in conjunction with Traditional, Rollover, Roth, Coverdell, Simple IRAs, SEP IRAs and 403(b) Plans.
| BLACKROCK INDEX FUNDS, INC. | DECEMBER 31, 2016 | 77 |
| Additional Information (concluded) |
| BlackRock Privacy Principles |
BlackRock is committed to maintaining the privacy of its current and former fund investors and individual clients (collectively, “Clients”) and to safeguarding their non-public personal information. The following information is provided to help you understand what personal information BlackRock collects, how we protect that information and why in certain cases we share such information with select parties.
If you are located in a jurisdiction where specific laws, rules or regulations require BlackRock to provide you with additional or different privacy-related rights beyond what is set forth below, then BlackRock will comply with those specific laws, rules or regulations.
BlackRock obtains or verifies personal non-public information from and about you from different sources, including the following: (i) information we receive from you or, if applicable, your financial intermediary, on applications, forms or other documents; (ii) information about your transactions with us, our affiliates, or others; (iii) information we receive from a consumer reporting agency; and (iv) from visits to our websites.
BlackRock does not sell or disclose to non-affiliated third parties any non-public personal information about its Clients, except as permitted by law or as is necessary to respond to regulatory requests or to service Client accounts. These non-affiliated third parties are required to protect the confidentiality and security of this information and to use it only for its intended purpose.
We may share information with our affiliates to service your account or to provide you with information about other BlackRock products or services that may be of interest to you. In addition, BlackRock restricts access to non-public personal information about its Clients to those BlackRock employees with a legitimate business need for the information. BlackRock maintains physical, electronic and procedural safeguards that are designed to protect the non-public personal information of its Clients, including procedures relating to the proper storage and disposal of such information.
| 78 | BLACKROCK INDEX FUNDS, INC. | DECEMBER 31, 2016 |
This report is intended for current holders. It is not authorized for use as an offer of sale or a solicitation of an offer to buy shares of a Fund unless preceded or accompanied by the Fund’s current prospectus. Past performance results shown in this report should not be considered a representation of future performance. Investment returns and principal value of shares will fluctuate so that shares, when redeemed, may be worth more or less than their original cost. Statements and other information herein are as dated and are subject to change.

| Index2-12/16-AR |

|
| Item 2 – | Code of Ethics – Each registrant (or “Fund”) has adopted a code of ethics, as of the end of the period covered by this report, applicable to the registrant’s principal executive officer, principal financial officer, principal accounting officer or controller, or persons performing similar functions. During the period covered by this report, the code of ethics was amended to update certain information and to make other non-material changes. During the period covered by this report, there have been no waivers granted under the code of ethics. Each registrant undertakes to provide a copy of the code of ethics to any person upon request, without charge, by calling 1-800-441-7762. |
| Item 3 – | Audit Committee Financial Expert – Each registrant’s board of directors (the “board of directors”), has determined that (i) the registrant has the following audit committee financial expert serving on its audit committee and (ii) each audit committee financial expert is independent: Kenneth L. Urish |
Under applicable securities laws, a person determined to be an audit committee financial expert will not be deemed an “expert” for any purpose, including without limitation for the purposes of Section 11 of the Securities Act of 1933, as a result of being designated or identified as an audit committee financial expert. The designation or identification of a person as an audit committee financial expert does not impose on such person any duties, obligations, or liabilities greater than the duties, obligations, and liabilities imposed on such person as a member of the audit committee and board of directors in the absence of such designation or identification.
Item 4 – Principal Accountant Fees and Services
The following table presents fees billed by Deloitte & Touche LLP (“D&T”) in each of the last two fiscal years for the services rendered to the Funds:
| (a) Audit Fees | (b) Audit-Related Fees1 |
(c) Tax Fees2 | (d) All Other Fees3 | |||||||||||||
| Entity Name | Current Fiscal Year End |
Previous Fiscal Year End |
Current Fiscal Year End |
Previous Fiscal Year End |
Current Fiscal Year End |
Previous Fiscal Year End |
Current Fiscal Year End |
Previous Fiscal Year End | ||||||||
| BlackRock International Index Fund of BlackRock Index Funds, Inc. | $7,538 | $7,538 | $0 | $0 | $9,282 | $9,282 | $0 | $0 | ||||||||
| BlackRock Small Cap Index Fund of BlackRock Index Funds, Inc. | $7,538 | $7,538 | $0 | $0 | $11,424 | $11424 | $0 | $0 | ||||||||
| Master Small Cap Index Series of Quantitative Master Series LLC | $30,000 | $39,463 | $0 | $0 | $17,340 | $17,340 | $0 | $0 | ||||||||
The following table presents fees billed by D&T that were required to be approved by each registrant’s audit committee (each a “Committee”) for services that relate directly to the operations or financial reporting of the Fund and that are rendered on behalf of BlackRock Advisors, LLC (“Investment Adviser” or “BlackRock”) and entities controlling, controlled by, or under common control with BlackRock (not including any sub-adviser whose role is primarily portfolio management and is subcontracted with or overseen by another investment adviser) that provide ongoing services to the Fund (“Fund Service Providers”):
| Current Fiscal Year End | Previous Fiscal Year End | |||
| (b) Audit-Related Fees1 |
$0 | $0 | ||
| (c) Tax Fees2 |
$0 | $0 |
2
| (d) All Other Fees3 |
$2,129,000 | $2,391,000 |
1 The nature of the services includes assurance and related services reasonably related to the performance of the audit of financial statements not included in Audit Fees.
2 The nature of the services includes tax compliance, tax advice and tax planning.
3 Aggregate fees borne by BlackRock in connection with the review of compliance procedures and attestation thereto performed by D&T with respect to all of the registered closed-end funds and some of the registered open-end funds advised by BlackRock.
(e)(1) Audit Committee Pre-Approval Policies and Procedures:
Each Committee has adopted policies and procedures with regard to the pre-approval of services. Audit, audit-related and tax compliance services provided to the registrant on an annual basis require specific pre-approval by the registrant’s Committee. The Committee also must approve other non-audit services provided to the registrant and those non-audit services provided to the Investment Adviser and Fund Service Providers that relate directly to the operations and the financial reporting of the registrant. Certain of these non-audit services that the Committee believes are (a) consistent with the SEC’s auditor independence rules and (b) routine and recurring services that will not impair the independence of the independent accountants may be approved by the Committee without consideration on a specific case-by-case basis (“general pre-approval”). The term of any general pre-approval is 12 months from the date of the pre-approval, unless the Committee provides for a different period. Tax or other non-audit services provided to the registrants which have a direct impact on the operations or financial reporting of the registrant will only be deemed pre-approved provided that any individual project does not exceed $10,000 attributable to the registrant or $50,000 per project. For this purpose, multiple projects will be aggregated to determine if they exceed the previously mentioned cost levels.
Any proposed services exceeding the pre-approved cost levels will require specific pre-approval by the registrant’s Committee, as will any other services not subject to general pre-approval (e.g., unanticipated but permissible services). The Committee is informed of each service approved subject to general pre-approval at the next regularly scheduled in-person board meeting. At this meeting, an analysis of such services is presented to the Committee for ratification. The Committee may delegate to the Committee Chairman the authority to approve the provision of and fees for any specific engagement of permitted non-audit services, including services exceeding pre-approved cost levels.
(e)(2) None of the services described in each of Items 4(b) through (d) were approved by either Committee pursuant to the de minimus exception in paragraph (c)(7)(i)(C) of Rule 2-01 of Regulation S-X.
(f) Not Applicable
(g) The aggregate non-audit fees paid to the accountant for services rendered by the accountant to the registrant, the Investment Adviser and the Fund Service Providers were:
| Entity Name | Current Fiscal Year End |
Previous Fiscal Year End |
||||
| BlackRock International Index Fund of BlackRock Index Funds, Inc. | $9,282 | $9,282 | ||||
| BlackRock Small Cap Index Fund of BlackRock Index Funds, Inc. | $11,424 | $11424 | ||||
| Master Small Cap Index Series of Quantitative Master Series LLC | $17,340 | $17,340 |
Additionally, SSAE 16 Review (Formerly, SAS No. 70) fees for the current and previous fiscal years of $2,129,000 and $2,391,000, respectively, were billed by D&T to the Investment Adviser.
3
(h) Each Committee has considered and determined that the provision of non-audit services that were rendered to the Investment Adviser and the Fund Service Providers that were not pre-approved pursuant to paragraph (c)(7)(ii) of Rule 2-01 of Regulation S-X is compatible with maintaining the principal accountant’s independence.
| Item 5 – | Audit Committee of Listed Registrants – Not Applicable |
| Item 6 – | Investments |
(a) The registrants’ Schedules of Investments are included as part of the Report to Stockholders filed under Item 1 of this Form.
(b) Not Applicable due to no such divestments during the semi-annual period covered since the previous Form N-CSR filing.
| Item 7 – | Disclosure of Proxy Voting Policies and Procedures for Closed-End Management Investment Companies – Not Applicable |
| Item 8 – | Portfolio Managers of Closed-End Management Investment Companies – Not Applicable |
| Item 9 – | Purchases of Equity Securities by Closed-End Management Investment Company and Affiliated Purchasers – Not Applicable |
| Item 10 – | Submission of Matters to a Vote of Security Holders – There have been no material changes to these procedures. |
Item 11 – Controls and Procedures
(a) – The registrants’ principal executive and principal financial officers, or persons performing similar functions, have concluded that the registrants’ disclosure controls and procedures (as defined in Rule 30a-3(c) under the Investment Company Act of 1940, as amended (the “1940 Act”)) are effective as of a date within 90 days of the filing of this report based on the evaluation of these controls and procedures required by Rule 30a-3(b) under the 1940 Act and Rule 15(d)-15(b) under the Securities Exchange Act of 1934, as amended.
(b) – There were no changes in the registrants’ internal control over financial reporting (as defined in Rule 30a-3(d) under the 1940 Act) that occurred during the second fiscal quarter of the period covered by this report that have materially affected, or are reasonably likely to materially affect, the registrants’ internal control over financial reporting.
Item 12 – Exhibits attached hereto
(a)(1) – Code of Ethics – See Item 2
(a)(2) – Certifications – Attached hereto
(a)(3) – Not Applicable
(b) – Certifications – Attached hereto
4
Pursuant to the requirements of the Securities Exchange Act of 1934 and the Investment Company Act of 1940, each registrant has duly caused this report to be signed on its behalf by the undersigned, thereunto duly authorized.
BlackRock Index Funds, Inc. and Quantitative Master Series LLC
| By: | /s/ John M. Perlowski | |
| John M. Perlowski | ||
| Chief Executive Officer (principal executive officer) of | ||
| BlackRock Index Funds, Inc. and Quantitative Master Series LLC |
Date: March 6, 2017
Pursuant to the requirements of the Securities Exchange Act of 1934 and the Investment Company Act of 1940, this report has been signed below by the following persons on behalf of each registrant and in the capacities and on the dates indicated.
| By: | /s/ John M. Perlowski | |
| John M. Perlowski | ||
| Chief Executive Officer (principal executive officer) of | ||
| BlackRock Index Funds, Inc. and Quantitative Master Series LLC |
Date: March 6, 2017
| By: | /s/ Neal J. Andrews | |
| Neal J. Andrews | ||
| Chief Financial Officer (principal financial officer) of | ||
| BlackRock Index Funds, Inc. and Quantitative Master Series LLC |
Date: March 6, 2017
5