UNITED STATES
SECURITIES AND EXCHANGE COMMISSION
Washington, D.C. 20549
FORM N-CSR
CERTIFIED SHAREHOLDER REPORT OF REGISTERED MANAGEMENT INVESTMENT COMPANIES
Investment Company Act file number 811-07899 and 811-07885
|
Name of Fund: |
BlackRock Index Funds, Inc.: |
|
|
BlackRock International Index Fund |
|
|
BlackRock S&P 500 Index Fund |
|
|
BlackRock Small Cap Index Fund |
|
|
|
|
|
Quantitative Master Series LLC: |
|
|
Master International Index Series |
|
|
Master S&P 500 Index Series |
|
|
Master Small Cap Index Series |
Fund Address: 100 Bellevue Parkway, Wilmington, DE 19809
Name and address of agent for service: John M. Perlowski, Chief Executive Officer, BlackRock Index Funds, Inc. and Quantitative Master Series LLC, 55 East 52nd Street, New York, NY 10055
Registrants’ telephone number, including area code: (800) 441-7762
Date of fiscal year end: 12/31/2011
Date of reporting period: 12/31/2011
Item 1 – Report to Stockholders
|
|
|
|
|
December 31, 2011 |

|
|
|
|
|
Annual Report |
|
|
BlackRock International Index Fund | of BlackRock Index Funds, Inc. |
|
|
|
Not FDIC Insured § No Bank Guarantee § May Lose Value |
|
|
|
|
|
|
|
|
|
|
|
|
|
Table of Contents |
|
|
|
|
|
|
|
|
|
Page |
|
|
|
|
|
|
3 |
|
|
Annual Report: |
|
|
|
|
4 |
|
|
|
6 |
|
|
|
6 |
|
|
|
7 |
|
|
Fund Financial Statements: |
|
|
|
|
8 |
|
|
|
9 |
|
|
|
10 |
|
|
|
11 |
|
|
|
13 |
|
|
Fund Report of Independent Registered Public Accounting Firm |
|
16 |
|
|
16 |
|
|
|
17 |
|
|
Series Financial Statements: |
|
|
|
|
18 |
|
|
|
28 |
|
|
|
29 |
|
|
|
30 |
|
|
|
30 |
|
|
|
31 |
|
|
Series Report of Independent Registered Public Accounting Firm |
|
36 |
|
|
37 |
|
|
|
40 |
|
|
|
43 |
|
|
|
|
|
|
|
|
|
2 |
BLACKROCK INTERNATIONAL INDEX FUND |
DECEMBER 31, 2011 |
|
|
|
|
Investors endured a very difficult environment in 2011. Financial markets were extremely volatile as a number of high-profile global events drove frequent about-face changes in investor sentiment. As the year progressed, news flow increasingly influenced trading decisions, to the point where company fundamentals were largely ignored. In the end, lower-risk assets won the “risk on — risk off” trading tug-of-war that characterized 2011’s market activity.
Early in the year, political turmoil swept across the Middle East/North Africa region and prices of oil and other commodities soared. Natural disasters in Japan disrupted global supply chains and concerns mounted regarding US debt and deficit issues. Nevertheless, equities, commodities and high yield bonds outpaced the less risky asset classes as investors chose to focus on the continuing stream of strong corporate earnings and positive economic data.
Markets reversed sharply in May, however, when the heightened possibility of Greece defaulting on its debt rekindled fears about sovereign debt problems spreading across Europe. Concurrently, economic indicators signaled that the recovery had slowed in the United States and other developed nations. Confidence was further shaken by the prolonged debt ceiling debate in Washington, DC. On August 5th, Standard & Poor’s downgraded the US government’s credit rating and turmoil erupted in financial markets around the world. Extraordinary levels of volatility persisted in the months that followed as Greece teetered on the brink of default, debt problems escalated in Italy and Spain, and exposure to European sovereign bonds stressed banks globally. Late in the summer, economic data out of the United States and Europe grew increasingly bleak while China and other emerging economies began to show signs of slowing growth. By the end of the third quarter, equity markets had fallen nearly 20% from their April peak while safe-haven assets such as US Treasuries and gold had rallied to historical highs.
October brought enough positive economic data to assuage fears of a global double-dip recession. Additionally, after months of deliberation, European leaders began to show signs of progress toward stemming the region’s debt crisis. These encouraging developments brought investors back from the sidelines and risk assets rallied through the month. However, a lack of definitive details about Europe’s rescue plan soon raised doubts among investors and thwarted the rally at the end of October. The last two months of the year saw political instability in Greece, unsustainable yields on Italian bonds, and US policymakers bickering over budget issues. Global central bank actions and improving economic data energized investors, but confidence was easily tempered by sobering news flow that resurrected uncertainty about the ability of Europe’s leaders to ultimately contain the debt crisis.
Most equity markets failed to fully recover their late-summer losses, although US large cap stocks managed to finish the year with a marginal gain given their perceived safety and stronger US economic data. Conditions were worse overseas, and international markets experienced some significant downturns. Dividend-paying stocks performed relatively well as investors sought yield in the low interest rate environment. Fixed income securities benefited from declining yields and delivered positive returns for the year. US Treasury bonds outperformed other fixed income classes despite their quality rating downgrade, while municipal bonds also delivered superior results. Continued low short-term interest rates kept yields on money market securities near their all-time lows.
Many of the themes that caused uncertainty in 2011 are likely to persist well into 2012. While the investment landscape appears treacherous, BlackRock is working for you. We have a roadmap to show you the way.
Sincerely,

Rob Kapito
President, BlackRock
Advisors, LLC

“While the investment landscape appears treacherous, BlackRock is working for you. We have a roadmap to show you the way.”
|
|
|
Rob Kapito |
|
President, BlackRock
Advisors, LLC |
|
|
|
|
|
|
|
|
|
|
|
|
|
|
6-month |
|
12-month |
|
||
|
US large cap equities (S&P 500® Index) |
|
|
(3.69 |
)% |
|
2.11 |
% |
|
US small cap equities (Russell 2000® Index) |
|
|
(9.77 |
) |
|
(4.18 |
) |
|
International equities (MSCI Europe, Australasia, Far East Index) |
|
|
(16.31 |
) |
|
(12.14 |
) |
|
Emerging market equities (MSCI Emerging Markets Index) |
|
|
(19.13 |
) |
|
(18.42 |
) |
|
3-month Treasury bill (BofA Merrill Lynch 3-Month Treasury Bill Index) |
|
|
0.02 |
|
|
0.10 |
|
|
US Treasury securities (BofA Merrill Lynch 10-Year US Treasury Index) |
|
|
13.46 |
|
|
17.15 |
|
|
US investment grade bonds (Barclays Capital US Aggregate Bond Index) |
|
|
4.98 |
|
|
7.84 |
|
|
Tax-exempt municipal bonds (S&P Municipal Bond Index) |
|
|
5.78 |
|
|
10.62 |
|
|
US high yield bonds (Barclays Capital US Corporate High Yield 2% Issuer Capped Index) |
|
|
(0.02 |
) |
|
4.96 |
|
|
|
|
Past performance is no guarantee of future results. Index performance is shown for illustrative purposes only. You cannot invest directly in an index. |
|
|
|
|
|
|
|
|
|
|
|
|
|
|
|
|
|
|
|
|
BlackRock International Index Fund |
|
|
|
|
|
Investment Objective |
|
BlackRock International Index Fund’s (the “Fund”) investment objective is to match the performance of the MSCI EAFE Index (Europe, Australasia, Far East) (the “MSCI EAFE Index”) in U.S. dollars with net dividends as closely as possible before the deduction of Fund expenses.
|
|
|
|
Portfolio Management Commentary |
|
|
|
|
|
|
How did the Fund perform? |
|
|
|
|
• |
For the 12 months ended December 31,2011,Institutional and Investor A Shares of the Fund returned (12.55)% and (12.84)%, respectively, while the benchmark MSCI EAFE Index returned (12.14)% for the same period. The MSCI EAFE Index is a free float-adjusted, market capitalization-weighted index designed to measure equity performance of developed markets, excluding the United States and Canada. For the period beginning with its initial trading date of March 31, 2011 through December 31, 2011, the Fund’s Class K Shares returned (15.38)%. For the same period, the benchmark index returned (15.00)%. |
|
|
|
|
• |
Returns for the Fund’s respective share classes differ from the benchmark based on individual share-class expenses. The Fund invests all of its assets in Master International Index Series (the “Series”), a series of Quantitative Master Series LLC. |
|
|
|
|
|
Describe the market environment. |
|
|
|
|
• |
Early in the year, stocks moved unevenly higher despite political upheaval spreading across the Middle East/North Africa region and a sharp rise in oil and other commodity prices. March brought devastating natural disasters that left Japan with massive infrastructure damage, resulting in global supply chain disruptions. All the while, inflationary pressures persisted in developing countries. Nevertheless, the global economy continued to expand, although at a slower pace. Solid corporate profits, improving labor market conditions and reasonably upbeat leading indicators pushed most of the world’s equity markets forward. |
|
|
|
|
• |
After reaching their peak at the end of April, equities were met with a sharp reversal when the heightened possibility of Greece defaulting on its debt rekindled fears about the potential impact of the sovereign debt crisis spreading in Europe. Concurrently, it became evident that the pace of economic growth had slowed in the United States and other developed nations. In the United States, a prolonged debt ceiling debate revealed the ineffectiveness of the nation’s policymakers and ultimately led to Standard & Poor’s decision to downgrade the US government’s credit rating in early August. This announcement was the catalyst that spurred one of the most volatile periods in equity trading history. Stock markets across the world swooned as debt problems in Europe spread to Italy and Spain, and global economic indicators grew increasingly bleak. |
|
|
|
|
• |
Equities rebounded in October as stronger economic data from the United States helped to calm fears of a global double-dip recession and European leaders demonstrated greater unity in their quest to stem the debt crisis. After months of deliberation, at last finance ministers agreed upon a new plan to reduce Greece’s debt burden, recapitalize the region’s banks and increase the size of the euro-zone bailout fund. However, a lack of definitive details about the rescue plan raised doubts among investors and thwarted the rally at the end of October. International equities generally declined through the final two months of the year as political instability in Greece and Italy fueled uncertainty as to whether Europe’s leaders would be able to contain the crisis. Market volatility softened in December with the support of global central bank actions and improving economic data. |
|
|
|
|
• |
Of the 22 developed countries in the MSCI EAFE Index, only Ireland (+13.71%) and New Zealand (+5.54%) posted gains for the year (in USD). While equity markets sold off broadly across Europe, countries participating in the euro currency union saw particularly painful losses. Greece (–62.77%) finished well below all other countries in the index. Asian stocks were dragged down by the world’s debt problems and a weak outlook for consumer demand from Europe and the United States. Japan (–14.33%) also suffered the effects of its appreciating yen on its export-driven economy. From a sector perspective, health care (+5.63%) was the top performer in 2011. The defensive consumer staples sector (+4.14%) also outperformed amid highly volatile conditions. However, heightened uncertainty did not bode well for the more cyclical materials (–22.69%) sector and financials (–21.55%) were battered by the world’s debt problems. |
|
|
|
|
|
Describe recent portfolio activity. |
|
|
|
|
• |
During the 12-month period, as changes were made to the composition of the MSCI EAFE Index, the Series purchased and sold securities to maintain its objective of replicating the risks and return of the benchmark index. |
|
|
|
|
|
Describe portfolio positioning at period end. |
|
|
|
|
• |
The Series remains positioned to match the risk characteristics of its benchmark index, irrespective of the future direction of international markets. |
|
|
|
|
|
The views expressed reflect the opinions of BlackRock as of the date of this report and are subject to change based on changes in market, economic or other conditions. These views are not intended to be a forecast of future events and are no guarantee of future results. |
|
|
|
|
|
|
|
|
|
4 |
BLACKROCK INTERNATIONAL INDEX FUND |
DECEMBER 31, 2011 |
|
|
|
|
|
|
|
Total Return Based on a $10,000 Investment |
|
|
|
|
|
|
|
|
|
|
|
|
|
|
1 |
Assuming transaction costs and other operating expenses, including administration fees, if any. |
|
|
|
|
|
|
2 |
The Fund invests all of its assets in the Series. The Series may invest in a statistically selected sample of the equity securities included in the MSCI EAFE Index and other types of derivative instruments linked to the MSCI EAFE Index. |
|
|
|
|
|
|
3 |
This unmanaged index is a free-float adjusted, market capitalization-weighted index designed to measure equity performance of developed markets, excluding the United States and Canada. |

|
|
|
Performance Summary for the Period Ended December 31, 2011 |
|
|
|
|
|
|
|
|
|
|
|
|
|
|
|
|
|
|
6-Month |
|
Average Annual Total Returns4 |
|
||||||||
|
|
|
|
1 Year |
|
5 Years |
|
10 Years |
|
|||||
|
Institutional |
|
|
(16.98 |
)% |
|
(12.55 |
)% |
|
(5.17 |
)% |
|
4.30 |
% |
|
Investor A |
|
|
(17.14 |
) |
|
(12.84 |
) |
|
(5.43 |
) |
|
4.03 |
|
|
Class K5 |
|
|
(17.00 |
) |
|
(12.55 |
) |
|
(5.13 |
) |
|
4.34 |
|
|
MSCI EAFE Index |
|
|
(16.31 |
) |
|
(12.14 |
) |
|
(4.72 |
) |
|
4.67 |
|
|
|
|
|
|
|
4 |
Average annual total returns reflect reductions for service fees, if any. See “About Fund Performance” on page 6 for a detailed description of share classes, including any related fees, if any. |
|
|
5 |
Class K commenced operations on March 31, 2011. Past performance is not indicative of future results. |
|
|
|
|
|
|
|
|
|
|
|
|
BLACKROCK INTERNATIONAL INDEX FUND |
DECEMBER 31, 2011 |
5 |
|
|
|
|
|
|
|
|
|
|
• |
Institutional and Class K Shares are not subject to any sales charge. These shares bear no ongoing distribution or service fees and are available only to eligible investors. Prior to March 31, 2011, Class K Shares’ performance results are those of Institutional Shares restated to reflect Class K Shares’ fees. |
|
|
|
|
• |
Investor A Shares are not subject to any sales charge and bear no ongoing distribution fee. These shares are subject to an ongoing service fee of 0.25% per year. |
|
|
|
|
|
Performance information reflects past performance and does not guarantee future results. Current performance may be lower or higher than the performance data quoted. Refer to www.blackrock.com/funds to obtain performance data current to the most recent month end. Performance results do not reflect the deduction of taxes that a shareholder would pay on fund distributions or the redemption of fund shares. Figures shown in the performance table on the previous page assume reinvestment of all dividends and capital gain distributions, if any, at net asset value (“NAV”) on the ex-dividend date. Investment return and principal value of shares will fluctuate so that shares, when redeemed, may be worth more or less than their original cost. Dividends paid to each class of shares will vary because of the different levels of service and transfer agency fees applicable to each class, which are deducted from the income available to be paid to shareholders. The Fund’s administrator waived and/or reimbursed a portion of the Fund’s fee. Without such waiver and/or reimbursement, the Fund’s performance would have been lower. |
|
|
|
|
|
|
|
|
|
|
|
|
|
The Series may invest in various derivative financial instruments, including financial futures contracts and foreign currency exchange contracts as specified in Note 2 of the Series’ Notes to Financial Statements, which may constitute forms of economic leverage. Such derivative financial instruments are used to obtain exposure to a market without owning or taking physical custody of securities or to hedge market, equity and/or foreign currency exchange rate risks. Derivative financial instruments involve risks, including the imperfect correlation between the value of a derivative financial instrument and the underlying asset or illiquidity of the derivative financial instrument. The Series’ ability to use a derivative financial instrument successfully depends on the investment advisor’s ability to predict pertinent market movements accurately, which cannot be assured. The use of derivative financial instruments may result in losses greater than if they had not been used, may require the Series to sell or purchase portfolio investments at inopportune times or for distressed values, may limit the amount of appreciation the Series can realize on an investment, may result in lower dividends paid to shareholders or may cause the Series to hold an investment that it might otherwise sell. The Series’ investments in these instruments are discussed in detail in the Series’ Notes to Financial Statements. |
|
|
|
|
|
|
|
|
|
|
6 |
BLACKROCK INTERNATIONAL INDEX FUND |
DECEMBER 31, 2011 |
|
|
|
|
|
|
|
|
|
|
Shareholders of the Fund may incur the following charges: (a) expenses related to transactions, including exchange fees; and (b) operating expenses, including administration fees, service fees, including 12b-1 fees, and other Fund expenses. The expense example shown below (which is based on a hypothetical investment of $1,000 invested on July 1, 2011 and held through December 31, 2011) is intended to assist shareholders both in calculating expenses based on an investment in the Fund and in comparing these expenses with similar costs of investing in other mutual funds. |
|
|
|
|
|
The table provides information about actual account values and actual expenses. In order to estimate the expenses a shareholder paid during the period covered by this report, shareholders can divide their account value by $1,000 and then multiply the result by the number corresponding to their share class under the heading entitled “Expenses Paid During the Period.” |
|
|
|
|
|
The table also provides information about hypothetical account values and hypothetical expenses based on the Fund’s actual expense ratio and an assumed rate of return of 5% per year before expenses. In order to assist shareholders in comparing the ongoing expenses of investing in this Fund and other funds, compare the 5% hypothetical example with the 5% hypothetical examples that appear in other funds’ shareholder reports. |
|
|
|
|
|
The expenses shown in the table are intended to highlight shareholders’ ongoing costs only and do not reflect any transactional expenses, such as sales charges or exchange fees, if any. Therefore, the hypothetical example is useful in comparing ongoing expenses only, and will not help shareholders determine the relative total expenses of owning different funds. If these transactional expenses were included, shareholder expenses would have been higher. |
|
|
|
|
Expense Example |
|
|
|
|
|
|
|
|
|
|
|
|
|
|
|
|
|
|
|
|
|
|
|
|
|
|
|
Actual |
|
Hypothetical2 |
|
|
|
|
||||||||||||||
|
|
|
Beginning |
|
Ending |
|
Expenses
Paid |
|
Beginning |
|
Ending |
|
Expenses
Paid |
|
Annualized |
|
|||||||
|
Institutional |
|
$ |
1,000.00 |
|
$ |
830.20 |
|
$ |
1.61 |
|
$ |
1,000.00 |
|
$ |
1,023.44 |
|
$ |
1.79 |
|
|
0.35 |
% |
|
Investor A |
|
$ |
1,000.00 |
|
$ |
828.60 |
|
$ |
2.77 |
|
$ |
1,000.00 |
|
$ |
1,022.18 |
|
$ |
3.06 |
|
|
0.60 |
% |
|
Class K |
|
$ |
1,000.00 |
|
$ |
830.00 |
|
$ |
1.38 |
|
$ |
1,000.00 |
|
$ |
1,023.69 |
|
$ |
1.53 |
|
|
0.30 |
% |
|
|
|
|
|
|
1 |
For each class of the Fund, expenses are equal to the annualized expense ratio for the class, multiplied by the average account value over the period, multiplied by 184/365 (to reflect the one-half year period shown). Because the Fund invests significantly in the Series, the expense table example reflects the net expenses of both the Fund and the Series in which it invests. |
|
|
|
|
|
|
2 |
Hypothetical 5% return before expenses is calculated by pro rating the number of days in the most recent fiscal half year divided by 365. |
|
|
|
|
|
|
|
|
|
|
|
|
BLACKROCK INTERNATIONAL INDEX FUND |
DECEMBER 31, 2011 |
7 |
|
|
|
|
|
|
|
BlackRock International Index Fund |
|
|
|
|
|
|
|
Assets |
|
|
|
|
|
Investments at value — Master International Index Series (the “Series”) (cost — $261,846,380) |
|
$ |
238,545,799 |
|
|
Withdrawals receivable from the Series |
|
|
19,560,994 |
|
|
Capital shares sold receivable |
|
|
391,014 |
|
|
Prepaid expenses |
|
|
10,935 |
|
|
Total assets |
|
|
258,508,742 |
|
|
|
|
|
|
|
|
|
|
|
|
|
|
Liabilities |
|
|
|
|
|
|
|
|
|
|
|
Capital shares redeemed payable |
|
|
19,952,008 |
|
|
Service fees payable |
|
|
44,930 |
|
|
Administration fees payable |
|
|
18,739 |
|
|
Officer’s fees payable |
|
|
34 |
|
|
Other accrued expenses payable |
|
|
38,282 |
|
|
Total liabilities |
|
|
20,053,993 |
|
|
Net Assets |
|
$ |
238,454,749 |
|
|
|
|
|
|
|
|
|
|
|
|
|
|
Net Assets Consist of |
|
|
|
|
|
Paid-in capital |
|
$ |
291,054,684 |
|
|
Distribution in excess of net investment income |
|
|
(978,961 |
) |
|
Accumulated net realized loss allocated from the Series |
|
|
(28,320,393 |
) |
|
Net unrealized appreciation/depreciation allocated from the Series |
|
|
(23,300,581 |
) |
|
Net Assets |
|
$ |
238,454,749 |
|
|
|
|
|
|
|
|
|
|
|
|
|
|
Net Asset Value |
|
|
|
|
|
Institutional — Based on net assets of $70,168,677 and 7,286,581 shares outstanding, 125 million shares authorized, $0.0001 par value |
|
$ |
9.63 |
|
|
Investor A — Based on net assets of $168,265,665 and 17,578,959 shares outstanding, 125 million shares authorized, $0.0001 par value |
|
$ |
9.57 |
|
|
Class K — Based on net assets of $20,407 and 2,119 shares outstanding, 125 million shares authorized, $0.0001 par value |
|
$ |
9.63 |
|
|
|
|
|
|
See Notes to Financial Statements. |
||
|
|
|
|
|
|
|
|
|
8 |
BLACKROCK INTERNATIONAL INDEX FUND |
DECEMBER 31, 2011 |
|
|
|
|
|
|
|
BlackRock International Index Fund |
|
|
|
|
|
|
|
Year Ended December 31, 2011 |
|
|
|
|
|
Investment Income |
|
|
|
|
|
Net investment income allocated from the Series: |
|
|
|
|
|
Dividends — unaffiliated |
|
$ |
10,438,782 |
|
|
Foreign taxes withheld |
|
|
(1,045,454 |
) |
|
Dividends — affiliated |
|
|
646 |
|
|
Expenses |
|
|
(229,045 |
) |
|
Fees waived |
|
|
1,212 |
|
|
Total income |
|
|
9,166,141 |
|
|
|
|
|
|
|
|
|
|
|
|
|
|
Expenses |
|
|
|
|
|
Administration |
|
|
652,145 |
|
|
Service — Investor A |
|
|
419,222 |
|
|
Transfer agent — Institutional |
|
|
52,285 |
|
|
Transfer agent — Investor A |
|
|
98,666 |
|
|
Transfer agent — Class K |
|
|
13 |
|
|
Printing |
|
|
69,404 |
|
|
Registration |
|
|
60,741 |
|
|
Professional |
|
|
45,756 |
|
|
Officer |
|
|
148 |
|
|
Miscellaneous |
|
|
11,272 |
|
|
Total expenses |
|
|
1,409,652 |
|
|
Less fees waived by administrator |
|
|
(216,444 |
) |
|
Less transfer agent fees waived and/or reimbursed — class specific |
|
|
(55,024 |
) |
|
Total expenses after fees waived and/or reimbursed |
|
|
1,138,184 |
|
|
Net investment income |
|
|
8,027,957 |
|
|
|
|
|
|
|
|
|
|
|
|
|
|
Realized and Unrealized Loss Allocated from the Series |
|
|
|
|
|
Net realized loss from investments, financial futures contracts and foreign currency transactions |
|
|
(5,481,644 |
) |
|
Net change in unrealized appreciation/depreciation on investments, financial futures contracts and foreign currency transactions |
|
|
(37,431,256 |
) |
|
Total realized and unrealized loss |
|
|
(42,912,900 |
) |
|
Net Decrease in Net Assets Resulting from Operations |
|
$ |
(34,884,943 |
) |
|
|
|
|
|
|
|
|
|
|
|
|
BLACKROCK INTERNATIONAL INDEX FUND |
DECEMBER 31, 2011 |
9 |
|
|
|
|
|
|
|
BlackRock International Index Fund |
|
|
|
|
|
|
|
|
|
|
|
|
Year
Ended |
|
||||
|
Increase (Decrease) in Net Assets: |
|
2011 |
|
2010 |
|
||
|
Operations |
|
|
|
|
|
|
|
|
Net investment income |
|
$ |
8,027,957 |
|
$ |
5,781,869 |
|
|
Net realized loss |
|
|
(5,481,644 |
) |
|
(492,726 |
) |
|
Net change in unrealized appreciation/depreciation |
|
|
(37,431,256 |
) |
|
18,315,616 |
|
|
Net increase (decrease) in net assets resulting from operations |
|
|
(34,884,943 |
) |
|
23,604,759 |
|
|
|
|
|
|
|
|
|
|
|
|
|
|
|
|
|
|
|
|
Dividends to Shareholders From |
|
|
|
|
|
|
|
|
Net investment income: |
|
|
|
|
|
|
|
|
Institutional |
|
|
(3,165,026 |
) |
|
(3,316,785 |
) |
|
Investor A |
|
|
(5,380,392 |
) |
|
(4,386,720 |
) |
|
Class K |
|
|
(737 |
) |
|
— |
|
|
Decrease in net assets resulting from dividends to shareholders |
|
|
(8,546,155 |
) |
|
(7,703,505 |
) |
|
|
|
|
|
|
|
|
|
|
|
|
|
|
|
|
|
|
|
Capital Share Transactions |
|
|
|
|
|
|
|
|
Net increase in net assets derived from capital share transactions |
|
|
6,705,760 |
|
|
8,421,610 |
|
|
|
|
|
|
|
|
|
|
|
|
|
|
|
|
|
|
|
|
Redemption Fee |
|
|
|
|
|
|
|
|
Redemption fee |
|
|
1,682 |
|
|
3,026 |
|
|
|
|
|
|
|
|
|
|
|
|
|
|
|
|
|
|
|
|
Net Assets |
|
|
|
|
|
|
|
|
Total increase (decrease) in net assets |
|
|
(36,723,656 |
) |
|
24,325,890 |
|
|
Beginning of year |
|
|
275,178,405 |
|
|
250,852,515 |
|
|
End of year |
|
$ |
238,454,749 |
|
$ |
275,178,405 |
|
|
Distributions in excess of net investment income |
|
$ |
(978,961 |
) |
$ |
(652,102 |
) |
|
|
|
|
|
|
|
|
|
10 |
BLACKROCK INTERNATIONAL INDEX FUND |
DECEMBER 31, 2011 |
|
|
|
|
|
|
|
BlackRock International Index Fund |
|
|
|
|
|
|
|
|
|
|
|
|
|
|
|
|
|
|
|
|
|
|
|
|
|
|
|
|
|
|
|
|
|
|
|
|
|
Institutional |
|
|
Investor A |
|
||||||||||||||||||||||||||
|
|
|
Year Ended December 31, |
|
|
Year Ended December 31, |
|
||||||||||||||||||||||||||
|
|
|
2011 |
|
2010 |
|
2009 |
|
2008 |
|
2007 |
|
|
2011 |
|
2010 |
|
2009 |
|
2008 |
|
2007 |
|
||||||||||
|
Per Share Operating Performance |
|
|||||||||||||||||||||||||||||||
|
Net asset value, beginning of year |
|
$ |
11.42 |
|
$ |
10.97 |
|
$ |
8.75 |
|
$ |
15.73 |
|
$ |
15.14 |
|
|
$ |
11.36 |
|
$ |
10.91 |
|
$ |
8.71 |
|
$ |
15.65 |
|
$ |
15.07 |
|
|
Net investment income1 |
|
|
0.35 |
|
|
0.25 |
|
|
0.23 |
|
|
0.40 |
|
|
0.39 |
|
|
|
0.31 |
|
|
0.23 |
|
|
0.21 |
|
|
0.36 |
|
|
0.34 |
|
|
Net realized and unrealized gain (loss)2 |
|
|
(1.79 |
) |
|
0.53 |
|
|
2.25 |
|
|
(7.03 |
) |
|
1.16 |
|
|
|
(1.77 |
) |
|
0.52 |
|
|
2.23 |
|
|
(6.98 |
) |
|
1.16 |
|
|
Net increase (decrease) from investment operations |
|
|
(1.44 |
) |
|
0.78 |
|
|
2.48 |
|
|
(6.63 |
) |
|
1.55 |
|
|
|
(1.46 |
) |
|
0.75 |
|
|
2.44 |
|
|
(6.62 |
) |
|
1.50 |
|
|
Dividends and distributions from: |
|
|
|
|
|
|
|
|
|
|
|
|
|
|
|
|
|
|
|
|
|
|
|
|
|
|
|
|
|
|
|
|
|
Net investment income |
|
|
(0.35 |
) |
|
(0.33 |
) |
|
(0.26 |
) |
|
(0.31 |
) |
|
(0.47 |
) |
|
|
(0.33 |
) |
|
(0.30 |
) |
|
(0.24 |
) |
|
(0.28 |
) |
|
(0.43 |
) |
|
Net realized gain |
|
|
— |
|
|
— |
|
|
— |
|
|
(0.04 |
) |
|
(0.49 |
) |
|
|
— |
|
|
— |
|
|
— |
|
|
(0.04 |
) |
|
(0.49 |
) |
|
Total dividends and distributions |
|
|
(0.35 |
) |
|
(0.33 |
) |
|
(0.26 |
) |
|
(0.35 |
) |
|
(0.96 |
) |
|
|
(0.33 |
) |
|
(0.30 |
) |
|
(0.24 |
) |
|
(0.32 |
) |
|
(0.92 |
) |
|
Net asset value, end of year |
|
$ |
9.63 |
|
$ |
11.42 |
|
$ |
10.97 |
|
$ |
8.75 |
|
$ |
15.73 |
|
|
$ |
9.57 |
|
$ |
11.36 |
|
$ |
10.91 |
|
$ |
8.71 |
|
$ |
15.65 |
|
|
|
|
|
|
|
|
|
|
|
|
|
|
|
|
|
|
|
|
|
|
|
|
|
|
|
|
|
|
|
|
|
|
|
|
|
|
|||||||||||||||||||||||||||||||
|
Total Investment Return3 |
|
|||||||||||||||||||||||||||||||
|
Based on net asset value |
|
|
(12.55 |
)% |
|
7.26 |
% |
|
28.38 |
% |
|
(42.24 |
) % |
|
10.28 |
% |
|
|
(12.84 |
) % |
|
7.02 |
% |
|
28.00 |
% |
|
(42.41 |
) % |
|
9.98 |
% |
|
|
|
|
|
|
|
|
|
|
|
|
|
|
|
|
|
|
|
|
|
|
|
|
|
|
|
|
|
|
|
|
|
|
|
|
|
|||||||||||||||||||||||||||||||
|
Ratios to Average Net Assets4 |
|
|||||||||||||||||||||||||||||||
|
Total expenses |
|
|
0.44 |
%5 |
|
0.47 |
% |
|
0.54 |
% |
|
0.54 |
% |
|
0.54 |
% |
|
|
0.70 |
%5 |
|
0.74 |
% |
|
0.79 |
% |
|
0.79 |
% |
|
0.79 |
% |
|
Total expenses after fees waived and/or reimbursed |
|
|
0.35 |
%5 |
|
0.46 |
% |
|
0.54 |
% |
|
0.54 |
% |
|
0.54 |
% |
|
|
0.60 |
%5 |
|
0.73 |
% |
|
0.79 |
% |
|
0.79 |
% |
|
0.79 |
% |
|
Net investment income |
|
|
3.14 |
%5 |
|
2.35 |
% |
|
2.43 |
% |
|
3.11 |
% |
|
2.37 |
% |
|
|
2.84 |
%5 |
|
2.16 |
% |
|
2.27 |
% |
|
2.83 |
% |
|
2.11 |
% |
|
|
|
|
|
|
|
|
|
|
|
|
|
|
|
|
|
|
|
|
|
|
|
|
|
|
|
|
|
|
|
|
|
|
|
|
|
|||||||||||||||||||||||||||||||
|
Supplemental Data |
|
|||||||||||||||||||||||||||||||
|
Net assets, end of year (000) |
|
$ |
70,169 |
|
$ |
112,145 |
|
$ |
89,889 |
|
$ |
90,688 |
|
$ |
158,740 |
|
|
$ |
168,266 |
|
$ |
163,033 |
|
$ |
160,964 |
|
$ |
136,073 |
|
$ |
214,422 |
|
|
Portfolio turnover of the Series |
|
|
6 |
% |
|
8 |
% |
|
30 |
% |
|
30 |
% |
|
30 |
% |
|
|
6 |
% |
|
8 |
% |
|
30 |
% |
|
30 |
% |
|
30 |
% |
|
|
|
|
|
|
1 |
Based on average shares outstanding. |
|
|
2 |
Includes a redemption fee, which is less than $0.01 per share. |
|
|
3 |
Where applicable, total investment returns include the reinvestment of dividends and distributions. |
|
|
4 |
Includes the Fund’s share of the Series’ allocated net expenses and/or net investment income. |
|
|
5 |
Includes the Fund’s share of the Series’ allocated fees waived of less than 0.01%. |
|
|
|
|
|
|
|
|
|
|
|
|
BLACKROCK INTERNATIONAL INDEX FUND |
DECEMBER 31, 2011 |
11 |
|
|
|
|
|
|
|
Financial Highlights (concluded) |
BlackRock International Index Fund |
|
|
|
|
|
|
|
|
|
Class K |
|
|
|
|
|
Period |
|
|
|
Per Share Operating Performance |
|
|
|
|
|
Net asset value, beginning of period |
|
$ |
11.80 |
|
|
Net investment income2 |
|
|
0.26 |
|
|
Net realized and unrealized loss |
|
|
(2.08 |
) |
|
Net decrease from investment operations |
|
|
(1.82 |
) |
|
Dividends from net investment income |
|
|
(0.35 |
) |
|
Net asset value, end of period |
|
$ |
9.63 |
|
|
|
|
|
|
|
|
Total Investment Return3,4 |
|
|
|
|
|
Based on net asset value |
|
|
(15.38 |
)% |
|
|
|
|
|
|
|
Ratios to Average Net Assets5,6,7 |
|
|
|
|
|
Total expenses |
|
|
0.48 |
% |
|
Total expenses after fees waived and/or reimbursed |
|
|
0.30 |
% |
|
Net investment income |
|
|
3.27 |
% |
|
|
|
|
|
|
|
Supplemental Data |
|
|
|
|
|
Net assets, end of period (000) |
|
$ |
20 |
|
|
Portfolio turnover of the Series |
|
|
6 |
% |
|
|
|
|
|
|
1 |
Commencement of operations. |
|
|
|
|
|
|
2 |
Based on average shares outstanding. |
|
|
|
|
|
|
3 |
Where applicable, total investment returns include the reinvestment of dividends and distributions. |
|
|
|
|
|
|
4 |
Aggregate total investment return. |
|
|
|
|
|
|
5 |
Includes the Fund’s share of the Series’ allocated net expenses and/or net investment income. |
|
|
|
|
|
|
6 |
Annualized. |
|
|
|
|
|
|
7 |
Includes the Fund’s share of the Series’ allocated fees waived of less than 0.01%. |
|
|
|
|
|
|
|
See Notes to Financial Statements. |
||||
|
|
|
|
|
|
|
|
|
|
|
|
|
|
|
|
|
|
|
BlackRock International Index Fund |
1. Organization and Significant Accounting Policies:
BlackRock International Index Fund (the “Fund”), a series of BlackRock Index Funds, Inc. (the “Corporation”), is registered under the Investment Company Act of 1940, as amended (the “1940 Act”), as a diversified, open-end management investment company. The Corporation is organized as a Maryland corporation. The Fund seeks to achieve its investment objective by investing all of its assets in Master International Index Series (the “Series”) of Quantitative Master Series LLC (the “Master LLC”), which has the same investment objective and strategies as the Fund. The value of the Fund’s investment in the Series reflects the Fund’s proportionate interest in the net assets of the Series. The percentage of the Series owned by the Fund at December 31, 2011 was 27.9%. The performance of the Fund is directly affected by the performance of the Series. The financial statements of the Series, including the Schedule of Investments, are included elsewhere in this report and should be read in conjunction with the Fund’s financial statements. The Fund’s financial statements are prepared in conformity with accounting principles generally accepted in the United States of America (“US GAAP”), which may require management to make estimates and assumptions that affect the reported amounts and disclosures in the financial statements. Actual results could differ from those estimates. The Fund offers multiple classes of shares. The Fund’s Institutional, Investor A and Class K Shares are generally sold without a front-end or deferred sales charge. All classes of shares have identical voting, dividend, liquidation and other rights and the same terms and conditions, except that Investor A Shares bear certain expenses related to the shareholder servicing of such shares and have exclusive voting rights with respect to matters relating to its servicing expenditures. Class K Shares bear no ongoing distribution or service fee and are only available to eligible investors.
The following is a summary of significant accounting policies followed by the Fund:
Valuation: US GAAP defines fair value as the price the Fund would receive to sell an asset or pay to transfer a liability in an orderly transaction between market participants at the measurement date. The Fund’s policy is to fair value its financial instruments at market value. The Fund records its investment in the Series at fair value based on the Fund’s proportionate interest in the net assets of the Series. Valuation of securities held by the Series is discussed in Note 1 of the Series’ Notes to Financial Statements, which are included elsewhere in this report.
Investment Transactions and Investment Income: For financial reporting purposes, contributions to and withdrawals from the Series are accounted on a trade date basis. The Fund records daily its proportionate share of the Series’ income, expenses and realized and unrealized gains and losses. In addition, the Fund accrues its own expenses. Income, expenses and realized and unrealized gains and losses are allocated daily to each class based on its relative net assets.
Dividends and Distributions: Dividends and distributions paid by the Fund are recorded on the ex-dividend dates. The amount and timing of dividends and distributions are determined in accordance with federal income tax regulations, which may differ from US GAAP.
Income Taxes: It is the Fund’s policy to comply with the requirements of the Internal Revenue Code of 1986, as amended, applicable to regulated investment companies and to distribute substantially all of its taxable income to its shareholders. Therefore, no federal income tax provision is required.
The Fund files US federal and various state and local tax returns. No income tax returns are currently under examination. The statute of limitations on the Fund’s US federal tax returns remains open for each of the four years ended December 31, 2011. The statutes of limitations on the Fund’s state and local tax returns may remain open for an additional year depending upon the jurisdiction. Management does not believe there are any uncertain tax positions that require recognition of a tax liability.
Other: Expenses directly related to the Fund or its classes are charged to the Fund or class. Other operating expenses shared by several funds are pro rated among those funds on the basis of relative net assets or other appropriate methods. Other expenses of the Fund are allocated daily to each class based on its relative net assets.
2. Administration Agreement and Other Transactions with Affiliates:
The PNC Financial Services Group, Inc. (“PNC”) and Barclays Bank PLC (“Barclays”) are the largest stockholders of BlackRock, Inc. (“BlackRock”). Due to the ownership structure, PNC is an affiliate for 1940 Act purposes, but Barclays is not.
The Corporation, on behalf of the Fund, entered into an Administration Agreement with BlackRock Advisors, LLC (the “Administrator”), an indirect, wholly owned subsidiary of BlackRock, to provide administrative services (other than investment advice and related portfolio activities). For such services, the Fund pays the Administrator a monthly fee at an annual rate of 0.24% of the average daily value of the Fund’s net assets. The Fund does not pay an investment advisory fee or investment management fee.
The Administrator contractually agreed to waive and/or reimburse fees or expenses, excluding interest expense, dividend expense, acquired fund fees and expenses and certain other fund expenses, in order to limit expenses. The Administrator has agreed not to reduce or discontinue this contractual waiver or reimbursement prior to May 1, 2012 unless approved by the Corporation’s Board of Directors (the “Board”), including a majority of the independent directors. These amounts are shown as fees waived by administrator and transfer agent fees waived and/or reimbursed — class specific, respectively, in the Statement of Operations. The expense limitation as a percentage of average daily net assets is 0.35% for Institutional, 0.60% for Investor A and 0.30% for Class K Shares.
|
|
|
|
|
|
|
|
|
|
|
|
|
|
|
|
|
Notes to Financial Statements (continued) |
BlackRock International Index Fund |
For the year ended December 31, 2011, the amounts shown as transfer agent fees waived and/or reimbursed — class specific were as follows:
|
|
|
|
|
|
|
Institutional |
|
$ |
17,517 |
|
|
Investor A |
|
$ |
37,500 |
|
|
Class K |
|
$ |
7 |
|
In addition, the Administrator waived $216,444, which is shown as fees waived by administrator in the Statement of Operations.
The Corporation, on behalf of the Fund, entered into a Distribution Agreement and Distribution and Service Plan with BlackRock Investments, LLC (“BRIL”), an affiliate of BlackRock. Pursuant to the Distribution and Service Plan and in accordance with Rule 12b-1 under the 1940 Act, the Fund pays BRIL ongoing service fees with respect to its Investor A Shares. The fees are accrued daily and paid monthly at the annual rate of 0.25% based upon the average daily net assets attributable to Investor A Shares.
Pursuant to sub-agreements with BRIL, broker-dealers and BRIL provide shareholder services to the Fund. The ongoing service fee compensates BRIL and each broker-dealer for providing shareholder servicing to Investor A shareholders.
The Administrator maintains a call center, which is responsible for providing certain shareholder services to the Fund, such as responding to shareholder inquiries and processing transactions based upon instructions from shareholders with respect to the subscription and redemption of Fund shares. For the year ended December 31, 2011, the Fund reimbursed the Administrator the following amounts for costs incurred in running the call center, which are included in transfer agent — class specific in the Statement of Operations:
|
|
|
|
|
|
|
|
|
Call Center Fees |
|
|
|
Institutional |
|
$ |
480 |
|
|
Investor A |
|
$ |
2,257 |
|
|
Class K |
|
|
— |
|
Certain officers and/or directors of the Corporation are officers and/or directors of BlackRock or its affiliates. The Fund reimburses the Administrator for compensation paid to the Corporation’s Chief Compliance Officer.
3. Income Tax Information:
US GAAP requires that certain components of net assets be adjusted to reflect permanent differences between financial and tax reporting. These reclassifications have no effect on net assets or net asset values per share. The following permanent differences as of December 31, 2011 attributable to foreign currency transactions and the sale of stock of passive foreign investment companies by the Fund were reclassified to the following accounts:
|
|
|
|
|
|
|
Distributions in excess of net investment income |
|
$ |
191,339 |
|
|
Accumulated net realized loss allocated from the Series |
|
$ |
(191,339 |
) |
The tax character of distributions paid during the fiscal years ended December 31, 2011 and December 31, 2010 was as follows:
|
|
|
|
|
|
|
|
|
|
|
|
|
12/31/11 |
|
|
12/31/10 |
|
|
Ordinary income |
|
$ |
8,546,155 |
|
$ |
7,703,505 |
|
As of December 31, 2011, the tax components of accumulated net losses were as follows:
|
|
|
|
|
|
|
Undistributed ordinary income |
|
$ |
192,680 |
|
|
Capital loss carryforwards |
|
|
(12,452,641 |
) |
|
Net unrealized losses* |
|
|
(39,544,168 |
) |
|
Qualified late-year losses** |
|
|
(795,806 |
) |
|
Total |
|
$ |
(52,599,935 |
) |
|
|
|
|
* |
The difference between book-basis and tax-basis net unrealized losses was attributable primarily to the tax deferral of losses on wash sales, the realization for tax purposes of unrealized gains/losses on certain futures and foreign currency exchange contracts, the realization for tax purposes of unrealized gains on investments in passive foreign investment companies and the timing of expenses. |
|
|
|
|
** |
The Fund has elected to defer certain qualified late-year losses and recognize such losses in the year ending December 31, 2012. |
As of December 31, 2011, the Fund had capital loss carryforwards available to offset future realized capital gains through the indicated expiration dates as follows:
|
|
|
|
|
|
|
Expires December 31, |
|
|
|
|
|
2016 |
|
$ |
4,270,741 |
|
|
2017 |
|
|
6,596,186 |
|
|
No expiration date* |
|
|
1,585,714 |
|
|
Total |
|
$ |
12,452,641 |
|
|
|
|
|
* |
Must be utilized prior to losses subject to expiration. |
|
|
|
|
|
|
|
|
|
|
|
|
|
|
|
|
|
|
|
Notes to Financial Statements (concluded) |
BlackRock International Index Fund |
4. Capital Share Transactions:
Transactions in capital shares for each class were as follows:
|
|
|
|
|
|
|
|
|
|
|
|
|
|
|
|
|
|
|
|
Year
Ended |
|
|
|
Year
Ended |
|
||||||||
|
|
|
Shares |
|
Amount |
|
|
|
Shares |
|
Amount |
|
||||
|
|
|
|
|
|
|
|
|
|
|
|
|
|
|
|
|
|
Institutional |
|
|
|
|
|
|
|
|
|
|
|
|
|
|
|
|
Shares sold |
|
|
2,419,978 |
|
$ |
27,001,665 |
|
|
|
|
4,757,714 |
|
$ |
48,155,053 |
|
|
Shares issued to shareholders in reinvestment of dividends |
|
|
302,801 |
|
|
2,862,205 |
|
|
|
|
272,016 |
|
|
3,004,545 |
|
|
Shares redeemed |
|
|
(5,253,420 |
) |
|
(55,609,457 |
) |
|
|
|
(3,407,042 |
) |
|
(37,070,076 |
) |
|
Net increase (decrease) |
|
|
(2,530,641 |
) |
$ |
(25,745,587 |
) |
|
|
|
1,622,688 |
|
$ |
14,089,522 |
|
|
|
|
|
|
|
|
|
|
|
|
|
|
|
|
|
|
|
Investor A |
|
|
|
|
|
|
|
|
|
|
|
|
|
|
|
|
Shares sold |
|
|
5,442,480 |
|
$ |
57,248,032 |
|
|
|
|
3,080,972 |
|
$ |
31,744,710 |
|
|
Shares issued to shareholders in reinvestment of dividends |
|
|
567,625 |
|
|
5,330,566 |
|
|
|
|
395,583 |
|
|
4,329,347 |
|
|
Shares redeemed |
|
|
(2,785,511 |
) |
|
(30,152,251 |
) |
|
|
|
(3,876,688 |
) |
|
(41,741,969 |
) |
|
Net increase (decrease) |
|
|
3,224,594 |
|
$ |
32,426,347 |
|
|
|
|
(400,133 |
) |
$ |
(5,667,912 |
) |
|
|
|
|
|
|
|
|
|
|
|
|
|
|
|
|
|
|
Class K1 |
|
|
|
|
|
|
|
|
|
|
|
|
|
|
|
|
Shares sold |
|
|
2,119 |
|
$ |
25,000 |
|
|
|
|
— |
|
|
— |
|
|
Net increase |
|
|
2,119 |
|
$ |
25,000 |
|
|
|
|
— |
|
|
— |
|
|
|
|
|
|
|
1 |
For the period March 31, 2011 (commencement of operations) to December 31, 2011. |
Prior to April 1, 2011, there was a 2% redemption fee on shares redeemed or exchanged that have been held 30 days or less. The redemption fees were collected and retained by the Fund for the benefit of the remaining shareholders. The redemption fees were recorded as a credit to paid-in capital. Effective April 1, 2011, the redemption fee was terminated and is no longer charged by the Fund.
5. Subsequent Events:
Management has evaluated the impact of all subsequent events on the Series through the date the financial statements were issued and has determined that there were no subsequent events requiring adjustment or additional disclosure in the financial statements.
|
|
|
|
|
|
|
|
|
|
|
|
|
|
|
|
|
BlackRock International Index Fund |
To the Shareholders of BlackRock International Index Fund and Board of Directors of BlackRock Index Funds, Inc.:
We have audited the accompanying statement of assets and liabilities of BlackRock International Index Fund, one of the series constituting BlackRock Index Funds, Inc., (the “Fund”) as of December 31, 2011, and the related statement of operations for the year then ended, the statements of changes in net assets for each of the two years in the period then ended, and the financial highlights for each of the five years in the period then ended. These financial statements and financial highlights are the responsibility of the Fund’s management. Our responsibility is to express an opinion on these financial statements and financial highlights based on our audits.
We conducted our audits in accordance with the standards of the Public Company Accounting Oversight Board (United States). Those standards require that we plan and perform the audit to obtain reasonable assurance about whether the financial statements and financial highlights are free of material misstatement. The Fund is not required to have, nor were we engaged to perform, an audit of its internal control over financial reporting. Our audits included consideration of internal control over financial reporting as a basis for designing audit procedures that are appropriate in the circumstances, but not for the purpose of expressing an opinion on the effectiveness of the Fund’s internal control over financial reporting. Accordingly, we express no such opinion. An audit also includes examining, on a test basis, evidence supporting the amounts and disclosures in the financial statements, assessing the accounting principles used and significant estimates made by management, as well as evaluating the overall financial statement presentation. We believe that our audits provide a reasonable basis for our opinion.
In our opinion, the financial statements and financial highlights referred to above present fairly, in all material respects, the financial position of BlackRock International Index Fund of BlackRock Index Funds, Inc. as of December 31, 2011, the results of its operations for the year then ended, the changes in its net assets for each of the two years in the period then ended, and the financial highlights for each of the five years in the period then ended, in conformity with accounting principles generally accepted in the United States of America.
Deloitte
& Touche LLP
Boston, Massachusetts
February 22, 2012
|
|
|
|
The following information is provided with respect to the ordinary income distributions paid by the Fund for the taxable year ended December 31, 2011.
|
|
|
|
|
|
|
|
|
|
Payable Date |
|
Percentage/ |
|
|
Qualified Dividend Income for Individuals1,2 |
|
7/22/11 |
|
100.00 |
% |
|
|
|
12/13/11 |
|
100.00 |
% |
|
Foreign Source Income2 |
|
7/22/11 |
|
97.71 |
% |
|
|
|
12/13/11 |
|
97.71 |
% |
|
Foreign Taxes Paid Per Share3 |
|
7/22/11 |
|
$0.002533 |
|
|
|
|
12/13/11 |
|
$0.034811 |
|
|
|
|
|
|
|
1 |
The Fund hereby designates the percentage indicated or the maximum amount allowable by law. |
|
|
|
|
|
|
2 |
Expressed as a percentage of the cash distribution grossed-up for foreign taxes. |
|
|
|
|
|
|
3 |
The foreign taxes paid represent taxes incurred by the Fund on income received by the Fund from foreign sources. Foreign taxes paid may be included in taxable income with an offsetting deduction from gross income or may be taken as a credit for taxes paid to foreign governments. You should consult your tax advisor regarding the appropriate treatment of foreign taxes paid. |
|
|
|
|
|
|
|
|
|
|
|
|
|
|
|
|
|
Master International Index Series |
|
|
|
As of December 31, 2011 |
|
|
|
|
|
|
Ten Largest Holdings |
|
Percent
of |
|
|
Nestlé SA, Registered Shares |
|
2 |
% |
|
Vodafone Group Plc |
|
1 |
|
|
HSBC Holdings Plc |
|
1 |
|
|
BP Plc |
|
1 |
|
|
Novartis AG, Registered Shares |
|
1 |
|
|
Royal Dutch Shell Plc, Class A |
|
1 |
|
|
Roche Holding AG |
|
1 |
|
|
GlaxoSmithKline Plc |
|
1 |
|
|
BHP Billiton Ltd. |
|
1 |
|
|
Total SA |
|
1 |
|
|
|
|
|
|
|
Geographic Allocations |
|
Percent
of |
|
|
United Kingdom |
|
23 |
% |
|
Japan |
|
21 |
|
|
France |
|
9 |
|
|
Switzerland |
|
9 |
|
|
Australia |
|
8 |
|
|
Germany |
|
8 |
|
|
Spain |
|
3 |
|
|
Sweden |
|
3 |
|
|
Hong Kong |
|
3 |
|
|
Netherlands |
|
3 |
|
|
Italy |
|
2 |
|
|
Singapore |
|
2 |
|
|
Other1 |
|
6 |
|
|
|
|
|
|
|
1 |
Other includes a 1% or less investment in each of the following countries: Denmark, Belgium, Finland, Norway, Israel, Luxembourg, Ireland, Austria, Portugal, New Zealand, Bermuda, Greece and China. |
|
|
|
|
|
|
|
|
|
|
|
|
|
|
|
|
|
Master International Index Series |
|
|
(Percentages shown are based on Net Assets) |
|
|
|
|
|
|
|
|
|
|
Common Stocks |
|
Shares |
|
Value |
|
||
|
Australia — 8.4% |
|
|
|
|
|
|
|
|
AGL Energy Ltd. |
|
|
40,065 |
|
$ |
586,224 |
|
|
Alumina Ltd. |
|
|
210,098 |
|
|
240,533 |
|
|
Amcor Ltd. |
|
|
108,736 |
|
|
800,474 |
|
|
AMP Ltd. |
|
|
249,426 |
|
|
1,036,516 |
|
|
Asciano Ltd. |
|
|
87,349 |
|
|
401,399 |
|
|
ASX Ltd. |
|
|
15,855 |
|
|
494,908 |
|
|
Australia & New Zealand Banking Group Ltd. |
|
|
233,618 |
|
|
4,893,106 |
|
|
Bendigo and Adelaide Bank Ltd. |
|
|
33,458 |
|
|
273,843 |
|
|
BGP Holdings Plc |
|
|
783,183 |
|
|
10 |
|
|
BHP Billiton Ltd. |
|
|
285,460 |
|
|
10,076,350 |
|
|
Boral Ltd. |
|
|
64,514 |
|
|
236,893 |
|
|
Brambles Ltd. |
|
|
131,275 |
|
|
958,473 |
|
|
Caltex Australia Ltd. |
|
|
12,363 |
|
|
148,451 |
|
|
Campbell Brothers Ltd. |
|
|
6,048 |
|
|
302,851 |
|
|
CFS Retail Property Trust |
|
|
167,131 |
|
|
287,782 |
|
|
Coca-Cola Amatil Ltd. |
|
|
50,978 |
|
|
598,967 |
|
|
Cochlear Ltd. |
|
|
4,821 |
|
|
306,187 |
|
|
Commonwealth Bank of Australia Ltd. |
|
|
138,535 |
|
|
6,958,803 |
|
|
Computershare Ltd. |
|
|
39,834 |
|
|
325,603 |
|
|
Crown Ltd. |
|
|
42,229 |
|
|
348,335 |
|
|
CSL Ltd. |
|
|
46,592 |
|
|
1,519,030 |
|
|
Dexus Property Group |
|
|
436,867 |
|
|
370,228 |
|
|
Echo Entertainment Group Ltd. (a) |
|
|
59,379 |
|
|
217,731 |
|
|
Fairfax Media Ltd. |
|
|
210,117 |
|
|
154,789 |
|
|
Fortescue Metals Group Ltd. |
|
|
109,781 |
|
|
480,238 |
|
|
Goodman Group |
|
|
628,123 |
|
|
365,210 |
|
|
GPT Group |
|
|
157,850 |
|
|
494,745 |
|
|
Harvey Norman Holdings Ltd. |
|
|
51,396 |
|
|
95,945 |
|
|
Iluka Resources Ltd. |
|
|
37,489 |
|
|
593,789 |
|
|
Incitec Pivot Ltd. |
|
|
146,234 |
|
|
464,233 |
|
|
Insurance Australia Group Ltd. |
|
|
187,815 |
|
|
572,167 |
|
|
Leighton Holdings Ltd. |
|
|
13,328 |
|
|
259,089 |
|
|
Lend Lease Group |
|
|
49,505 |
|
|
362,524 |
|
|
Lynas Corp. Ltd. (a) |
|
|
159,398 |
|
|
170,316 |
|
|
Macquarie Group Ltd. |
|
|
30,375 |
|
|
737,598 |
|
|
Metcash Ltd. |
|
|
68,916 |
|
|
284,154 |
|
|
Mirvac Group |
|
|
299,239 |
|
|
360,533 |
|
|
National Australia Bank Ltd. |
|
|
195,601 |
|
|
4,659,516 |
|
|
Newcrest Mining Ltd. |
|
|
67,941 |
|
|
2,070,508 |
|
|
OneSteel Ltd. |
|
|
112,768 |
|
|
80,627 |
|
|
Orica Ltd. |
|
|
32,729 |
|
|
809,848 |
|
|
Origin Energy Ltd. |
|
|
94,512 |
|
|
1,288,822 |
|
|
OZ Minerals Ltd. |
|
|
28,782 |
|
|
294,419 |
|
|
Qantas Airways Ltd. (a) |
|
|
101,794 |
|
|
151,520 |
|
|
QBE Insurance Group Ltd. |
|
|
96,970 |
|
|
1,283,339 |
|
|
QR National Ltd. |
|
|
153,091 |
|
|
534,787 |
|
|
Ramsay Health Care Ltd. |
|
|
11,800 |
|
|
232,249 |
|
|
Rio Tinto Ltd. |
|
|
38,705 |
|
|
2,386,130 |
|
|
Santos Ltd. |
|
|
83,636 |
|
|
1,046,668 |
|
|
|
|
|
|
|
|
|
|
|
Common Stocks |
|
Shares |
|
Value |
|
||
|
Australia (concluded) |
|
|
|
|
|
|
|
|
Sims Metal Management Ltd. |
|
|
15,235 |
|
$ |
197,333 |
|
|
Sonic Healthcare Ltd. |
|
|
33,723 |
|
|
388,700 |
|
|
SP AusNet |
|
|
130,044 |
|
|
124,795 |
|
|
Stockland |
|
|
211,155 |
|
|
689,799 |
|
|
Suncorp-Metway Ltd. |
|
|
114,114 |
|
|
975,347 |
|
|
Sydney Airport |
|
|
31,261 |
|
|
84,970 |
|
|
Tabcorp Holdings Ltd. |
|
|
59,733 |
|
|
166,387 |
|
|
Tatts Group Ltd. |
|
|
120,798 |
|
|
301,115 |
|
|
Telstra Corp. Ltd. |
|
|
386,497 |
|
|
1,314,485 |
|
|
Toll Holdings Ltd. |
|
|
60,262 |
|
|
259,475 |
|
|
Transurban Group |
|
|
117,047 |
|
|
672,255 |
|
|
Wesfarmers Ltd., Ordinary Shares |
|
|
89,346 |
|
|
2,691,437 |
|
|
Westfield Group |
|
|
194,736 |
|
|
1,553,679 |
|
|
Westfield Retail Trust |
|
|
257,040 |
|
|
655,066 |
|
|
Westpac Banking Corp. |
|
|
269,295 |
|
|
5,497,451 |
|
|
Woodside Petroleum Ltd. |
|
|
56,346 |
|
|
1,763,803 |
|
|
Woolworths Ltd. |
|
|
108,073 |
|
|
2,774,056 |
|
|
WorleyParsons Ltd. |
|
|
17,415 |
|
|
456,032 |
|
|
|
|
|
|
|
|
72,182,645 |
|
|
Austria — 0.3% |
|
|
|
|
|
|
|
|
Erste Bank der Oesterreichischen Sparkassen AG |
|
|
17,307 |
|
|
303,814 |
|
|
Immoeast AG NPV |
|
|
30,711 |
|
|
— |
|
|
IMMOFINANZ Immobilien Anlagen AG (a) |
|
|
83,913 |
|
|
251,503 |
|
|
OMV AG |
|
|
14,801 |
|
|
448,352 |
|
|
Raiffeisen Bank International AG |
|
|
4,394 |
|
|
113,741 |
|
|
Telekom Austria AG |
|
|
30,477 |
|
|
364,607 |
|
|
Verbund AG |
|
|
6,339 |
|
|
169,982 |
|
|
Vienna Insurance Group |
|
|
3,349 |
|
|
132,275 |
|
|
Voestalpine AG |
|
|
9,814 |
|
|
274,967 |
|
|
|
|
|
|
|
|
2,059,241 |
|
|
Belgium — 0.9% |
|
|
|
|
|
|
|
|
Ageas |
|
|
192,525 |
|
|
297,438 |
|
|
Anheuser-Busch InBev NV |
|
|
71,338 |
|
|
4,353,990 |
|
|
Bekaert SA |
|
|
3,397 |
|
|
108,480 |
|
|
Belgacom SA |
|
|
13,656 |
|
|
427,290 |
|
|
Colruyt SA |
|
|
6,575 |
|
|
248,396 |
|
|
Delhaize Group |
|
|
9,128 |
|
|
511,652 |
|
|
Groupe Bruxelles Lambert SA |
|
|
7,252 |
|
|
482,436 |
|
|
KBC Bancassurance Holding |
|
|
13,906 |
|
|
173,877 |
|
|
Mobistar SA |
|
|
2,628 |
|
|
137,190 |
|
|
Solvay SA |
|
|
5,376 |
|
|
441,344 |
|
|
UCB SA |
|
|
9,154 |
|
|
384,039 |
|
|
Umicore SA |
|
|
10,323 |
|
|
423,986 |
|
|
|
|
|
|
|
|
7,990,118 |
|
|
Bermuda — 0.1% |
|
|
|
|
|
|
|
|
Seadrill Ltd. |
|
|
29,134 |
|
|
971,591 |
|
|
|
|
|
Portfolio Abbreviations |
|
|
|
|
|
AUD |
Australian Dollar |
|
CHF |
Swiss Franc |
|
DKK |
Danish Krone |
|
EUR |
Euro |
|
GBP |
British Pound |
|
HKD |
Hong Kong Dollar |
|
ILS |
Israeli New Shekel |
|
JPY |
Japanese Yen |
|
NOK |
Norwegian Krone |
|
SEK |
Swedish Krona |
|
SGD |
Singapore Dollar |
|
USD |
US Dollar |
|
|
|
|
|
|
||
|
18 |
BLACKROCK INTERNATIONAL INDEX FUND |
DECEMBER 31, 2011 |
|
|
|
|
|
|
|
Schedule of Investments (continued) |
Master International Index Series |
|
(Percentages shown are based on Net Assets) |
|
|
|
|
|
|
|
|
|
|
Common Stocks |
|
Shares |
|
Value |
|
||
|
China — 0.0% |
|
|
|
|
|
|
|
|
Foxconn International Holdings Ltd. (a) |
|
|
205,313 |
|
$ |
132,032 |
|
|
|
|
|
|
|
|
|
|
|
Denmark — 1.0% |
|
|
|
|
|
|
|
|
A.P. Moller — Maersk A/S, Class A |
|
|
47 |
|
|
291,930 |
|
|
A.P. Moller — Maersk A/S, Class B |
|
|
117 |
|
|
769,587 |
|
|
Carlsberg A/S, Class B |
|
|
9,589 |
|
|
675,195 |
|
|
Coloplast A/S, Class B |
|
|
2,006 |
|
|
287,859 |
|
|
Danske Bank A/S (a) |
|
|
58,674 |
|
|
741,403 |
|
|
DSV A/S |
|
|
18,614 |
|
|
332,632 |
|
|
Novo-Nordisk A/S, Class B |
|
|
37,789 |
|
|
4,341,321 |
|
|
Novozymes A/S, Class B |
|
|
20,200 |
|
|
622,321 |
|
|
TDC A/S |
|
|
34,011 |
|
|
272,373 |
|
|
Tryg A/S |
|
|
2,275 |
|
|
126,021 |
|
|
Vestas Wind Systems A/S (a) |
|
|
17,972 |
|
|
193,291 |
|
|
William Demant Holding A/S (a) |
|
|
2,194 |
|
|
181,976 |
|
|
|
|
|
|
|
|
8,835,909 |
|
|
Finland — 0.8% |
|
|
|
|
|
|
|
|
Elisa Corp. |
|
|
13,010 |
|
|
270,881 |
|
|
Fortum Oyj |
|
|
39,929 |
|
|
850,410 |
|
|
Kesko Oyj, Class B |
|
|
5,924 |
|
|
198,586 |
|
|
Kone Oyj, Class B |
|
|
13,791 |
|
|
713,965 |
|
|
Metso Oyj |
|
|
11,458 |
|
|
423,179 |
|
|
Neste Oil Oyj |
|
|
12,128 |
|
|
121,975 |
|
|
Nokia Oyj |
|
|
332,464 |
|
|
1,602,749 |
|
|
Nokian Renkaat Oyj |
|
|
9,981 |
|
|
320,463 |
|
|
Orion Oyj |
|
|
8,394 |
|
|
163,098 |
|
|
Pohjola Bank Plc |
|
|
11,663 |
|
|
113,012 |
|
|
Sampo Oyj |
|
|
37,251 |
|
|
921,444 |
|
|
Sanoma Oyj |
|
|
6,877 |
|
|
78,706 |
|
|
Stora Enso Oyj, Class R |
|
|
53,049 |
|
|
315,954 |
|
|
UPM-Kymmene Oyj |
|
|
46,882 |
|
|
513,764 |
|
|
Wartsila Oyj |
|
|
15,026 |
|
|
432,189 |
|
|
|
|
|
|
|
|
7,040,375 |
|
|
France — 8.5% |
|
|
|
|
|
|
|
|
Accor SA |
|
|
12,527 |
|
|
315,699 |
|
|
Aeroports de Paris |
|
|
3,212 |
|
|
219,720 |
|
|
Air Liquide |
|
|
25,205 |
|
|
3,112,254 |
|
|
Alcatel-Lucent SA (a) |
|
|
208,406 |
|
|
323,867 |
|
|
Alstom SA |
|
|
18,612 |
|
|
562,266 |
|
|
Arkema SA |
|
|
5,002 |
|
|
351,484 |
|
|
Atos Origin SA |
|
|
4,573 |
|
|
199,791 |
|
|
AXA SA |
|
|
154,552 |
|
|
1,997,772 |
|
|
BNP Paribas SA |
|
|
85,842 |
|
|
3,342,638 |
|
|
Bouygues SA |
|
|
16,962 |
|
|
533,467 |
|
|
Bureau Veritas SA |
|
|
4,928 |
|
|
357,947 |
|
|
Cap Gemini SA |
|
|
13,329 |
|
|
414,401 |
|
|
Carrefour SA |
|
|
51,233 |
|
|
1,165,642 |
|
|
Casino Guichard Perrachon SA |
|
|
4,970 |
|
|
417,926 |
|
|
Christian Dior SA |
|
|
4,874 |
|
|
575,316 |
|
|
Cie Générale de Géophysique — Veritas (a) |
|
|
12,556 |
|
|
291,450 |
|
|
Cie Générale des Etablissements Michelin, Class B |
|
|
15,964 |
|
|
940,619 |
|
|
CNP Assurances |
|
|
13,166 |
|
|
162,980 |
|
|
Compagnie de Saint-Gobain SA |
|
|
35,649 |
|
|
1,362,709 |
|
|
Credit Agricole SA |
|
|
89,561 |
|
|
501,790 |
|
|
Danone SA |
|
|
51,882 |
|
|
3,255,721 |
|
|
Dassault Systèmes SA |
|
|
5,426 |
|
|
433,443 |
|
|
Edenred |
|
|
14,253 |
|
|
349,626 |
|
|
EDP Renoveveis SA |
|
|
21,601 |
|
|
524,145 |
|
|
Eiffage SA |
|
|
3,633 |
|
|
87,532 |
|
|
Essilor International SA |
|
|
17,844 |
|
|
1,257,852 |
|
|
|
|
|
|
|
|
|
|
|
Common Stocks |
|
Shares |
|
Value |
|
||
|
France (concluded) |
|
|
|
|
|
|
|
|
Eurazeo |
|
|
2,935 |
|
$ |
104,036 |
|
|
Eutelsat Communications SA |
|
|
8,916 |
|
|
347,286 |
|
|
Foncière Des Regions |
|
|
2,385 |
|
|
152,587 |
|
|
France Telecom SA |
|
|
164,701 |
|
|
2,577,843 |
|
|
GDF Suez |
|
|
109,997 |
|
|
2,988,963 |
|
|
Gecina SA |
|
|
1,890 |
|
|
158,393 |
|
|
Groupe Eurotunnel SA |
|
|
48,702 |
|
|
330,409 |
|
|
ICADE |
|
|
2,075 |
|
|
162,599 |
|
|
Iliad SA |
|
|
1,651 |
|
|
203,209 |
|
|
Imerys SA |
|
|
3,156 |
|
|
144,753 |
|
|
JC Decaux SA (a) |
|
|
5,485 |
|
|
125,935 |
|
|
Klepierre |
|
|
9,565 |
|
|
271,772 |
|
|
L’Oreal SA |
|
|
21,351 |
|
|
2,223,700 |
|
|
Lafarge SA |
|
|
18,050 |
|
|
631,880 |
|
|
Lagardere S.C.A. |
|
|
10,377 |
|
|
273,199 |
|
|
Legrand Promesses |
|
|
20,060 |
|
|
642,535 |
|
|
LVMH Moët Hennessy Louis Vuitton SA |
|
|
22,576 |
|
|
3,180,160 |
|
|
Natixis |
|
|
82,834 |
|
|
206,987 |
|
|
Neopost SA |
|
|
2,895 |
|
|
194,685 |
|
|
Pernod-Ricard SA |
|
|
17,626 |
|
|
1,631,444 |
|
|
Peugeot SA |
|
|
14,075 |
|
|
219,265 |
|
|
Pinault-Printemps-Redoute |
|
|
6,750 |
|
|
963,490 |
|
|
Publicis Groupe |
|
|
12,893 |
|
|
591,714 |
|
|
Renault SA |
|
|
16,704 |
|
|
576,845 |
|
|
Safran SA |
|
|
15,031 |
|
|
449,518 |
|
|
Sanofi-Aventis |
|
|
101,865 |
|
|
7,446,097 |
|
|
Schneider Electric SA |
|
|
43,477 |
|
|
2,273,036 |
|
|
Scor SE |
|
|
15,483 |
|
|
361,019 |
|
|
Société BIC SA |
|
|
2,487 |
|
|
220,019 |
|
|
Société Générale SA |
|
|
58,542 |
|
|
1,292,350 |
|
|
Société Télévision Française 1 |
|
|
9,864 |
|
|
95,951 |
|
|
Sodexo Alliance SA |
|
|
8,521 |
|
|
609,864 |
|
|
Suez Environnement Co. |
|
|
25,071 |
|
|
288,039 |
|
|
Technip SA |
|
|
8,685 |
|
|
814,218 |
|
|
Thales SA |
|
|
9,102 |
|
|
286,501 |
|
|
Total SA |
|
|
188,677 |
|
|
9,627,782 |
|
|
Unibail-Rodamco SE |
|
|
8,160 |
|
|
1,460,421 |
|
|
Vallourec SA |
|
|
10,022 |
|
|
647,390 |
|
|
Veolia Environnement SA |
|
|
31,681 |
|
|
347,106 |
|
|
Vinci SA |
|
|
40,073 |
|
|
1,744,316 |
|
|
Vivendi SA |
|
|
110,760 |
|
|
2,417,837 |
|
|
Wendel SA |
|
|
2,796 |
|
|
185,601 |
|
|
|
|
|
|
|
|
72,528,811 |
|
|
Germany — 7.7% |
|
|
|
|
|
|
|
|
Adidas-Salomon AG |
|
|
18,565 |
|
|
1,206,225 |
|
|
Allianz AG, Registered Shares |
|
|
40,385 |
|
|
3,856,934 |
|
|
Axel Springer AG |
|
|
3,609 |
|
|
154,873 |
|
|
BASF SE |
|
|
81,626 |
|
|
5,682,672 |
|
|
Bayer AG, Registered Shares |
|
|
73,485 |
|
|
4,693,002 |
|
|
Bayerische Motoren Werke AG |
|
|
29,403 |
|
|
1,965,535 |
|
|
Bayerische Motoren Werke AG, Preference Shares |
|
|
4,787 |
|
|
226,011 |
|
|
Beiersdorf AG |
|
|
9,069 |
|
|
513,931 |
|
|
Brenntag AG |
|
|
3,030 |
|
|
281,766 |
|
|
Celesio AG |
|
|
7,348 |
|
|
116,230 |
|
|
Commerzbank AG (a) |
|
|
315,405 |
|
|
530,858 |
|
|
Continental AG (a) |
|
|
7,170 |
|
|
445,246 |
|
|
Daimler AG |
|
|
80,480 |
|
|
3,525,710 |
|
|
Deutsche Bank AG, Registered Shares |
|
|
82,579 |
|
|
3,129,819 |
|
|
Deutsche Boerse AG (a) |
|
|
17,292 |
|
|
905,025 |
|
|
Deutsche Lufthansa AG, Registered Shares |
|
|
19,985 |
|
|
237,713 |
|
|
Deutsche Post AG |
|
|
75,089 |
|
|
1,154,436 |
|
|
Deutsche Telekom AG, Registered Shares |
|
|
249,523 |
|
|
2,862,248 |
|
|
|
|
|
|
|
|
|||
|
|
BLACKROCK INTERNATIONAL INDEX FUND |
DECEMBER 31, 2011 |
19 |
|
|
|
|
|
|
|
Schedule of Investments (continued) |
Master International Index Series |
|
(Percentages shown are based on Net Assets) |
|
|
|
|
|
|
|
|
|
|
Common Stocks |
|
Shares |
|
Value |
|
||
|
Germany (concluded) |
|
|
|
|
|
|
|
|
E.ON AG |
|
|
160,005 |
|
$ |
3,448,131 |
|
|
Fraport AG |
|
|
3,268 |
|
|
160,607 |
|
|
Fresenius Medical Care AG & Co. |
|
|
18,534 |
|
|
1,258,906 |
|
|
Fresenius SE & Co. KGaA |
|
|
10,085 |
|
|
932,579 |
|
|
GEA Group AG |
|
|
15,650 |
|
|
441,814 |
|
|
Hannover Rueckversicherung AG, Registered Shares |
|
|
5,466 |
|
|
270,844 |
|
|
HeidelbergCement AG |
|
|
12,415 |
|
|
525,831 |
|
|
Henkel KGaA |
|
|
11,649 |
|
|
563,587 |
|
|
Henkel KGaA, Preference Shares |
|
|
15,800 |
|
|
910,841 |
|
|
Hochtief AG |
|
|
3,923 |
|
|
226,514 |
|
|
Infineon Technologies AG |
|
|
96,306 |
|
|
723,307 |
|
|
K+S AG |
|
|
15,264 |
|
|
688,433 |
|
|
Kabel Deutschland Holding AG (a) |
|
|
7,926 |
|
|
401,812 |
|
|
Lanxess AG |
|
|
7,556 |
|
|
390,242 |
|
|
Linde AG |
|
|
15,166 |
|
|
2,253,855 |
|
|
MAN AG |
|
|
5,734 |
|
|
509,317 |
|
|
Merck KGaA |
|
|
5,792 |
|
|
576,791 |
|
|
Metro AG |
|
|
11,620 |
|
|
423,702 |
|
|
Muenchener Rueckversicherungs AG, Registered Shares |
|
|
15,926 |
|
|
1,951,615 |
|
|
Porsche Automobil Holding SE, Preference Shares |
|
|
13,551 |
|
|
723,421 |
|
|
ProSieben SAT.1 Media AG, Preference Shares |
|
|
7,140 |
|
|
130,094 |
|
|
RWE AG |
|
|
43,444 |
|
|
1,525,031 |
|
|
RWE AG, Preference Shares |
|
|
3,320 |
|
|
109,224 |
|
|
Salzgitter AG |
|
|
3,611 |
|
|
180,107 |
|
|
SAP AG |
|
|
81,762 |
|
|
4,324,527 |
|
|
Siemens AG |
|
|
73,127 |
|
|
6,996,486 |
|
|
Suedzucker AG |
|
|
5,874 |
|
|
187,121 |
|
|
ThyssenKrupp AG |
|
|
34,723 |
|
|
796,641 |
|
|
United Internet AG |
|
|
9,819 |
|
|
175,026 |
|
|
Volkswagen AG |
|
|
2,694 |
|
|
360,660 |
|
|
Volkswagen AG, Preference Shares |
|
|
12,843 |
|
|
1,920,174 |
|
|
Wacker Chemie AG |
|
|
1,481 |
|
|
118,962 |
|
|
|
|
|
|
|
|
65,694,436 |
|
|
Greece — 0.1% |
|
|
|
|
|
|
|
|
Coca-Cola Hellenic Bottling Co. SA (a) |
|
|
16,733 |
|
|
282,620 |
|
|
Hellenic Telecommunications Organization SA |
|
|
21,160 |
|
|
76,145 |
|
|
National Bank of Greece SA (a) |
|
|
87,714 |
|
|
181,323 |
|
|
OPAP SA |
|
|
19,756 |
|
|
173,859 |
|
|
|
|
|
|
|
|
713,947 |
|
|
Hong Kong — 2.8% |
|
|
|
|
|
|
|
|
AIA Group Ltd. |
|
|
748,800 |
|
|
2,330,955 |
|
|
ASM Pacific Technology Ltd. |
|
|
18,004 |
|
|
201,649 |
|
|
Bank of East Asia Ltd. |
|
|
139,932 |
|
|
528,002 |
|
|
BOC Hong Kong Holdings Ltd. |
|
|
332,400 |
|
|
784,347 |
|
|
Cathay Pacific Airways Ltd. |
|
|
109,263 |
|
|
186,819 |
|
|
Cheung Kong Holdings Ltd. |
|
|
123,835 |
|
|
1,468,978 |
|
|
Cheung Kong Infrastructure Holdings Ltd. |
|
|
41,500 |
|
|
242,644 |
|
|
CLP Holdings Ltd. |
|
|
171,187 |
|
|
1,454,382 |
|
|
First Pacific Co. Ltd. |
|
|
190,000 |
|
|
197,142 |
|
|
Galaxy Entertainment Group Ltd. (a) |
|
|
106,000 |
|
|
192,686 |
|
|
Hang Lung Group Ltd. |
|
|
78,000 |
|
|
426,869 |
|
|
Hang Lung Properties Ltd. |
|
|
218,000 |
|
|
618,811 |
|
|
Hang Seng Bank Ltd. |
|
|
67,853 |
|
|
803,746 |
|
|
Henderson Land Development Co. Ltd. |
|
|
84,491 |
|
|
418,547 |
|
|
HKT Trust HKT Ltd. (a) |
|
|
369,000 |
|
|
211,900 |
|
|
The Hong Kong & China Gas Ltd. |
|
|
420,450 |
|
|
973,498 |
|
|
Hong Kong Exchanges and Clearing Ltd. |
|
|
91,027 |
|
|
1,448,420 |
|
|
Hopewell Holdings Ltd. |
|
|
53,349 |
|
|
136,272 |
|
|
|
|
|
|
|
|
|
|
|
Common Stocks |
|
Shares |
|
Value |
|
||
|
Hong Kong (concluded) |
|
|
|
|
|
|
|
|
Hutchison Whampoa Ltd. |
|
|
190,176 |
|
$ |
1,586,988 |
|
|
Hysan Development Co. Ltd. |
|
|
54,791 |
|
|
179,416 |
|
|
Kerry Properties Ltd. |
|
|
63,000 |
|
|
208,174 |
|
|
Li & Fung Ltd. |
|
|
497,980 |
|
|
917,588 |
|
|
Lifestyle International Holdings Ltd. |
|
|
52,466 |
|
|
115,483 |
|
|
The Link Real Estate Investment Trust |
|
|
201,414 |
|
|
740,739 |
|
|
MTR Corp. |
|
|
127,000 |
|
|
410,439 |
|
|
New World Development Ltd. |
|
|
325,226 |
|
|
261,136 |
|
|
NWS Holdings Ltd. |
|
|
115,500 |
|
|
169,824 |
|
|
Orient Overseas International Ltd. |
|
|
18,057 |
|
|
104,970 |
|
|
PCCW Ltd. |
|
|
369,000 |
|
|
126,615 |
|
|
Power Assets Holdings Ltd. |
|
|
123,500 |
|
|
913,162 |
|
|
Sands China Ltd. (a) |
|
|
217,000 |
|
|
608,812 |
|
|
Shangri-La Asia Ltd. |
|
|
129,905 |
|
|
223,773 |
|
|
Sino Land Co. Ltd. |
|
|
265,263 |
|
|
376,946 |
|
|
SJM Holdings Ltd. |
|
|
147,000 |
|
|
238,545 |
|
|
Sun Hung Kai Properties Ltd. |
|
|
126,324 |
|
|
1,578,660 |
|
|
Swire Pacific Ltd. Class A |
|
|
63,077 |
|
|
759,986 |
|
|
Wharf Holdings Ltd. |
|
|
134,357 |
|
|
605,638 |
|
|
Wheelock & Co. Ltd. |
|
|
81,000 |
|
|
200,289 |
|
|
Wing Hang Bank Ltd. |
|
|
17,000 |
|
|
139,082 |
|
|
Wynn Macau Ltd. |
|
|
135,200 |
|
|
337,508 |
|
|
Yue Yuen Industrial Holdings Ltd. |
|
|
64,285 |
|
|
202,860 |
|
|
|
|
|
|
|
|
23,632,300 |
|
|
Ireland — 0.3% |
|
|
|
|
|
|
|
|
Anglo Irish Bank Corp. Plc |
|
|
62,641 |
|
|
1 |
|
|
CRH Plc |
|
|
63,578 |
|
|
1,258,652 |
|
|
Elan Corp. Plc (a) |
|
|
44,805 |
|
|
621,108 |
|
|
James Hardie Industries SE |
|
|
39,740 |
|
|
277,052 |
|
|
Kerry Group Plc |
|
|
12,658 |
|
|
463,371 |
|
|
Ryanair Holdings Plc (a) |
|
|
29,444 |
|
|
137,725 |
|
|
|
|
|
|
|
|
2,757,909 |
|
|
Israel — 0.7% |
|
|
|
|
|
|
|
|
Bank Hapoalim Ltd. |
|
|
96,242 |
|
|
314,711 |
|
|
Bank Leumi Le-Israel BM |
|
|
105,341 |
|
|
302,507 |
|
|
Bezeq Israeli Telecommunication Corp. Ltd. |
|
|
157,237 |
|
|
288,532 |
|
|
Cellcom Israel Ltd. |
|
|
4,972 |
|
|
83,411 |
|
|
Delek Group Ltd. |
|
|
395 |
|
|
74,522 |
|
|
Elbit Systems Ltd. |
|
|
2,059 |
|
|
84,779 |
|
|
Israel Chemicals Ltd. |
|
|
40,108 |
|
|
417,701 |
|
|
The Israel Corp. Ltd. |
|
|
197 |
|
|
123,379 |
|
|
Israel Discount Bank Ltd. (a) |
|
|
75,065 |
|
|
100,754 |
|
|
Mizrahi Tefahot Bank Ltd. |
|
|
10,047 |
|
|
79,780 |
|
|
Nice Systems Ltd. (a) |
|
|
5,144 |
|
|
176,796 |
|
|
Partner Communications Co. Ltd. |
|
|
7,239 |
|
|
64,287 |
|
|
Teva Pharmaceutical Industries Ltd. |
|
|
83,618 |
|
|
3,375,413 |
|
|
|
|
|
|
|
|
5,486,572 |
|
|
Italy — 2.1% |
|
|
|
|
|
|
|
|
A2A SpA |
|
|
94,579 |
|
|
88,632 |
|
|
Assicurazioni Generali SpA |
|
|
103,655 |
|
|
1,555,999 |
|
|
Atlantia SpA |
|
|
28,601 |
|
|
456,512 |
|
|
Autogrill SpA |
|
|
9,990 |
|
|
97,112 |
|
|
Banca Carige SpA |
|
|
58,018 |
|
|
110,835 |
|
|
Banca Monte dei Paschi di Siena SpA |
|
|
436,913 |
|
|
141,895 |
|
|
Banco Popolare SpA |
|
|
151,959 |
|
|
196,041 |
|
|
Enel Green Power SpA |
|
|
154,583 |
|
|
322,143 |
|
|
Enel SpA |
|
|
584,629 |
|
|
2,371,683 |
|
|
Eni SpA |
|
|
213,549 |
|
|
4,402,875 |
|
|
Exor SpA |
|
|
5,439 |
|
|
109,043 |
|
|
Fiat Industrial SpA (a) |
|
|
68,731 |
|
|
585,548 |
|
|
|
|
|
|
|
||
|
20 |
BLACKROCK INTERNATIONAL INDEX FUND |
DECEMBER 31, 2011 |
|
|
|
|
|
|
|
Schedule of Investments (continued) |
Master International Index Series |
|
|
|
|
|
|
|
|
|
|
Common Stocks |
|
Shares |
|
Value |
|
||
|
Italy (concluded) |
|
|
|
|
|
|
|
|
Fiat SpA |
|
|
69,147 |
|
$ |
315,593 |
|
|
Finmeccanica SpA |
|
|
37,075 |
|
|
136,513 |
|
|
Intesa Sanpaolo SpA |
|
|
894,400 |
|
|
1,489,637 |
|
|
Intesa Sanpaolo SpA, Non-Convertible Savings Shares |
|
|
90,027 |
|
|
111,670 |
|
|
Luxottica Group SpA |
|
|
10,640 |
|
|
297,518 |
|
|
Mediaset SpA |
|
|
61,786 |
|
|
170,427 |
|
|
Mediobanca SpA |
|
|
47,138 |
|
|
270,559 |
|
|
Pirelli & C SpA |
|
|
22,125 |
|
|
185,469 |
|
|
Prysmian SpA |
|
|
17,540 |
|
|
216,720 |
|
|
Saipem SpA |
|
|
23,292 |
|
|
985,339 |
|
|
Snam Rete Gas SpA |
|
|
143,783 |
|
|
633,297 |
|
|
Telecom Italia SpA |
|
|
832,746 |
|
|
890,088 |
|
|
Telecom Italia SpA (Non-Convertible Savings Shares) |
|
|
547,064 |
|
|
489,517 |
|
|
Terna SpA |
|
|
109,934 |
|
|
369,967 |
|
|
UniCredit SpA |
|
|
123,309 |
|
|
1,017,069 |
|
|
Unione di Banche Italiane ScpA |
|
|
73,098 |
|
298,364 |
|
|
|
|
|
|
|
|
|
18,316,065 |
|
|
Japan — 21.2% |
|
|
|
|
|
|
|
|
ABC-Mart, Inc. |
|
|
2,200 |
|
|
83,573 |
|
|
Advantest Corp. |
|
|
12,800 |
|
|
121,561 |
|
|
Aeon Co. Ltd. |
|
|
53,800 |
|
|
736,961 |
|
|
Aeon Credit Service Co. Ltd. |
|
|
7,100 |
|
|
111,875 |
|
|
Aeon Mall Co. Ltd. |
|
|
6,800 |
|
|
144,260 |
|
|
Air Water, Inc. |
|
|
12,000 |
|
|
152,304 |
|
|
Aisin Seiki Co. Ltd. |
|
|
17,300 |
|
|
490,284 |
|
|
Ajinomoto Co., Inc. |
|
|
59,000 |
|
|
708,268 |
|
|
Alfresa Holdings Corp. |
|
|
3,700 |
|
|
155,737 |
|
|
All Nippon Airways Co. Ltd. |
|
|
75,000 |
|
|
209,566 |
|
|
Amada Co. Ltd. |
|
|
33,000 |
|
|
208,875 |
|
|
Aozora Bank Ltd. |
|
|
53,000 |
|
|
145,827 |
|
|
Asahi Breweries Ltd. |
|
|
34,300 |
|
|
752,435 |
|
|
Asahi Glass Co. Ltd. |
|
|
90,100 |
|
|
753,226 |
|
|
Asahi Kasei Corp. |
|
|
113,000 |
|
|
680,995 |
|
|
Asics Corp. |
|
|
13,000 |
|
|
146,122 |
|
|
Astellas Pharma, Inc. |
|
|
39,500 |
|
|
1,603,988 |
|
|
The Bank of Kyoto Ltd. |
|
|
29,000 |
|
|
249,333 |
|
|
The Bank of Yokohama Ltd. |
|
|
106,000 |
|
|
500,107 |
|
|
Benesse Holdings, Inc. |
|
|
5,900 |
|
|
285,217 |
|
|
Bridgestone Corp. |
|
|
57,800 |
|
|
1,309,065 |
|
|
Brother Industries Ltd. |
|
|
21,300 |
|
|
260,701 |
|
|
Canon, Inc. |
|
|
100,800 |
|
|
4,435,936 |
|
|
Casio Computer Co. Ltd. |
|
|
20,100 |
|
|
121,629 |
|
|
Central Japan Railway Co. |
|
|
134 |
|
|
1,130,863 |
|
|
The Chiba Bank Ltd. |
|
|
68,000 |
|
|
437,195 |
|
|
Chiyoda Corp. |
|
|
12,000 |
|
|
121,835 |
|
|
Chubu Electric Power Co., Inc. |
|
|
60,200 |
|
|
1,126,518 |
|
|
Chugai Pharmaceutical Co. Ltd. |
|
|
19,700 |
|
|
324,724 |
|
|
The Chugoku Bank Ltd. |
|
|
16,000 |
|
|
222,639 |
|
|
The Chugoku Electric Power Co., Inc. |
|
|
26,300 |
|
|
460,822 |
|
|
Citizen Holdings Co. Ltd. |
|
|
23,400 |
|
|
135,619 |
|
|
Coca-Cola West Co. Ltd. |
|
|
5,600 |
|
|
97,051 |
|
|
Cosmo Oil Co. Ltd. |
|
|
47,000 |
|
|
131,192 |
|
|
Credit Saison Co. Ltd. |
|
|
13,500 |
|
|
269,609 |
|
|
Dai Nippon Printing Co. Ltd. |
|
|
50,000 |
|
|
479,990 |
|
|
The Dai-ichi Life Insurance Co. |
|
|
798 |
|
|
783,394 |
|
|
Daicel Chemical Industries Ltd. |
|
|
26,000 |
|
|
157,927 |
|
|
Daido Steel Co. Ltd. |
|
|
25,000 |
|
|
156,072 |
|
|
|
|
|
|
|
|
|
|
|
Common Stocks |
|
Shares |
|
Value |
|
||
|
Japan (continued) |
|
|
|
|
|
|
|
|
Daihatsu Motor Co. Ltd. |
|
|
17,000 |
|
$ |
302,308 |
|
|
Daiichi Sankyo Co. Ltd. |
|
|
59,800 |
|
|
1,184,347 |
|
|
Daikin Industries Ltd. |
|
|
21,000 |
|
|
573,239 |
|
|
Dainippon Sumitomo Pharma Co. Ltd. |
|
|
12,800 |
|
|
145,676 |
|
|
Daito Trust Construction Co. Ltd. |
|
|
6,300 |
|
|
539,448 |
|
|
Daiwa House Industry Co. Ltd. |
|
|
41,000 |
|
|
490,141 |
|
|
Daiwa Securities Group Inc. |
|
|
150,000 |
|
|
466,403 |
|
|
Dena Co. Ltd. |
|
|
8,200 |
|
|
245,643 |
|
|
Denki Kagaku Kogyo KK |
|
|
41,000 |
|
|
151,087 |
|
|
Denso Corp. |
|
|
43,200 |
|
|
1,186,740 |
|
|
Dentsu Inc. |
|
|
16,213 |
|
|
493,222 |
|
|
East Japan Railway Co. |
|
|
30,249 |
|
|
1,928,021 |
|
|
Eisai Co. Ltd. |
|
|
22,400 |
|
|
926,489 |
|
|
Electric Power Development Co. |
|
|
10,600 |
|
|
281,879 |
|
|
Elpida Memory, Inc. (a) |
|
|
22,200 |
|
|
102,710 |
|
|
FamilyMart Co. Ltd. |
|
|
5,600 |
|
|
226,144 |
|
|
Fanuc Ltd. |
|
|
17,100 |
|
|
2,608,302 |
|
|
Fast Retailing Co. Ltd. |
|
|
4,600 |
|
|
836,762 |
|
|
Fuji Electric Co. Ltd. |
|
|
48,800 |
|
|
133,630 |
|
|
Fuji Film Holdings Corp. |
|
|
40,600 |
|
|
957,783 |
|
|
Fuji Heavy Industries Ltd. |
|
|
53,000 |
|
|
317,884 |
|
|
Fujitsu Ltd. |
|
|
163,000 |
|
|
845,146 |
|
|
Fukuoka Financial Group, Inc. |
|
|
70,000 |
|
|
293,289 |
|
|
Furukawa Electric Co. Ltd. |
|
|
54,000 |
|
|
123,896 |
|
|
Gree, Inc. |
|
|
8,100 |
|
|
278,448 |
|
|
GS Yuasa Corp. |
|
|
32,000 |
|
|
171,396 |
|
|
The Gunma Bank Ltd. |
|
|
35,000 |
|
|
191,894 |
|
|
The Hachijuni Bank Ltd. |
|
|
36,000 |
|
|
205,085 |
|
|
Hakuhodo DY Holdings, Inc. |
|
|
2,070 |
|
|
118,681 |
|
|
Hamamatsu Photonics KK |
|
|
6,100 |
|
|
212,678 |
|
|
Hino Motors Ltd. |
|
|
23,000 |
|
|
139,261 |
|
|
Hirose Electric Co. Ltd. |
|
|
2,800 |
|
|
244,906 |
|
|
The Hiroshima Bank Ltd. |
|
|
45,000 |
|
|
208,721 |
|
|
Hisamitsu Pharmaceutical Co., Inc. |
|
|
5,700 |
|
|
241,600 |
|
|
Hitachi Chemical Co. Ltd. |
|
|
9,400 |
|
|
164,545 |
|
|
Hitachi Construction Machinery Co. Ltd. |
|
|
9,800 |
|
|
164,392 |
|
|
Hitachi High-Technologies Corp. |
|
|
5,600 |
|
|
121,312 |
|
|
Hitachi Ltd. |
|
|
402,000 |
|
|
2,091,191 |
|
|
Hitachi Metals Ltd. |
|
|
13,000 |
|
|
141,077 |
|
|
Hokkaido Electric Power Co., Inc. |
|
|
16,100 |
|
|
228,859 |
|
|
Hokuhoku Financial Group, Inc. |
|
|
113,100 |
|
|
219,914 |
|
|
Hokuriku Electric Power Co. |
|
|
14,900 |
|
|
278,267 |
|
|
Honda Motor Co. Ltd. |
|
|
144,900 |
|
|
4,413,782 |
|
|
Hoya Corp. |
|
|
38,600 |
|
|
829,866 |
|
|
Ibiden Co. Ltd. |
|
|
11,000 |
|
|
216,569 |
|
|
Idemitsu Kosan Co. Ltd. |
|
|
2,000 |
|
|
206,114 |
|
|
IHI Corp. |
|
|
120,000 |
|
|
290,936 |
|
|
Inpex Corp. |
|
|
195 |
|
|
1,227,763 |
|
|
Isetan Mitsukoshi Holdings Ltd. |
|
|
33,905 |
|
|
354,211 |
|
|
Isuzu Motors Ltd. |
|
|
105,000 |
|
|
483,371 |
|
|
ITOCHU Corp. |
|
|
133,700 |
|
|
1,355,645 |
|
|
Itochu Techno-Solutions Corp. |
|
|
2,600 |
|
|
116,625 |
|
|
The Iyo Bank Ltd. |
|
|
22,000 |
|
|
216,788 |
|
|
J. Front Retailing Co. Ltd. |
|
|
44,600 |
|
|
214,998 |
|
|
Japan Petroleum Exploration Co. |
|
|
2,400 |
|
|
93,654 |
|
|
Japan Prime Realty Investment Corp. |
|
|
58 |
|
|
136,300 |
|
|
Japan Real Estate Investment Corp. |
|
|
42 |
|
|
326,997 |
|
|
Japan Retail Fund Investment Corp. |
|
|
171 |
|
|
252,954 |
|
|
The Japan Steel Works Ltd. |
|
|
28,000 |
|
|
194,231 |
|
|
Japan Tobacco, Inc. |
|
|
400 |
|
|
1,881,004 |
|
|
JFE Holdings, Inc. |
|
|
40,900 |
|
|
739,471 |
|
|
JGC Corp. |
|
|
18,000 |
|
|
432,156 |
|
|
|
|
|
|
|
|
|
|
|
|
|
BLACKROCK INTERNATIONAL INDEX FUND |
DECEMBER 31, 2011 |
21 |
|
|
|
|
|
|
|
Schedule of Investments (continued) |
Master International Index Series |
|
|
|
|
|
|
|
|
|
|
Common Stocks |
|
Shares |
|
Value |
|
||
|
Japan (continued) |
|
|
|
|
|
|
|
|
The Joyo Bank Ltd. |
|
|
59,000 |
|
$ |
260,374 |
|
|
JS Group Corp. |
|
|
23,800 |
|
|
456,148 |
|
|
JSR Corp. |
|
|
16,000 |
|
|
294,883 |
|
|
JTEKT Corp. |
|
|
19,900 |
|
|
194,487 |
|
|
Jupiter Telecommunications Co. Ltd. |
|
|
148 |
|
|
149,807 |
|
|
JX Holdings, Inc. |
|
|
199,360 |
|
|
1,203,057 |
|
|
Kajima Corp. |
|
|
76,800 |
|
|
235,699 |
|
|
Kamigumi Co. Ltd. |
|
|
23,000 |
|
|
198,524 |
|
|
Kaneka Corp. |
|
|
25,000 |
|
|
132,665 |
|
|
The Kansai Electric Power Co., Inc. |
|
|
66,700 |
|
|
1,024,589 |
|
|
Kansai Paint Co. Ltd. |
|
|
20,000 |
|
|
178,132 |
|
|
Kao Corp. |
|
|
46,700 |
|
|
1,274,256 |
|
|
Kawasaki Heavy Industries Ltd. |
|
|
125,000 |
|
|
310,109 |
|
|
Kawasaki Kisen Kaisha Ltd. |
|
|
65,000 |
|
|
117,043 |
|
|
KDDI Corp. |
|
|
259 |
|
|
1,663,375 |
|
|
Keikyu Corp. |
|
|
42,000 |
|
|
377,196 |
|
|
Keio Electric Railway Co. Ltd. |
|
|
50,000 |
|
|
352,661 |
|
|
Keisei Electric Railway Co. Ltd. |
|
|
24,000 |
|
|
176,456 |
|
|
Keyence Corp. |
|
|
3,720 |
|
|
896,667 |
|
|
Kikkoman Corp. |
|
|
12,000 |
|
|
137,645 |
|
|
Kinden Corp. |
|
|
12,000 |
|
|
101,161 |
|
|
Kintetsu Corp. |
|
|
146,000 |
|
|
570,266 |
|
|
Kirin Holdings Co. Ltd. |
|
|
71,000 |
|
|
862,702 |
|
|
Kobe Steel Ltd. |
|
|
225,000 |
|
|
347,742 |
|
|
Koito Manufacturing Co. Ltd. |
|
|
8,000 |
|
|
111,820 |
|
|
Komatsu Ltd. |
|
|
84,300 |
|
|
1,965,698 |
|
|
Konami Corp. |
|
|
8,200 |
|
|
245,211 |
|
|
Konica Minolta Holdings, Inc. |
|
|
42,000 |
|
|
312,303 |
|
|
Kubota Corp. |
|
|
102,000 |
|
|
853,591 |
|
|
Kuraray Co. Ltd. |
|
|
30,700 |
|
|
435,684 |
|
|
Kurita Water Industries Ltd. |
|
|
9,700 |
|
|
251,791 |
|
|
Kyocera Corp. |
|
|
13,600 |
|
|
1,090,633 |
|
|
Kyowa Hakko Kirin Co. Ltd. |
|
|
22,000 |
|
|
268,549 |
|
|
Kyushu Electric Power Co., Inc. |
|
|
36,200 |
|
|
518,558 |
|
|
Lawson, Inc. |
|
|
5,400 |
|
|
336,449 |
|
|
Mabuchi Motor Co. Ltd. |
|
|
2,100 |
|
|
87,220 |
|
|
Makita Corp. |
|
|
10,100 |
|
|
325,840 |
|
|
Marubeni Corp. |
|
|
144,000 |
|
|
876,497 |
|
|
Marui Group Co. Ltd. |
|
|
17,900 |
|
|
139,151 |
|
|
Maruichi Steel Tube Ltd. |
|
|
4,500 |
|
|
100,073 |
|
|
Mazda Motor Corp. (a) |
|
|
138,400 |
|
|
243,346 |
|
|
McDonald’s Holdings Co. Japan Ltd. |
|
|
6,200 |
|
|
166,947 |
|
|
Medipal Holdings Corp. |
|
|
13,900 |
|
|
145,125 |
|
|
Meiji Holdings Co. Ltd. |
|
|
6,193 |
|
|
256,486 |
|
|
Miraca Holdings, Inc. |
|
|
5,100 |
|
|
203,324 |
|
|
Mitsubishi Chemical Holdings Corp. |
|
|
122,000 |
|
|
668,612 |
|
|
Mitsubishi Corp. |
|
|
124,900 |
|
|
2,517,329 |
|
|
Mitsubishi Electric Corp. |
|
|
172,000 |
|
|
1,648,420 |
|
|
Mitsubishi Estate Co. Ltd. |
|
|
112,000 |
|
|
1,670,078 |
|
|
Mitsubishi Gas Chemical Co., Inc. |
|
|
35,000 |
|
|
194,076 |
|
|
Mitsubishi Heavy Industries Ltd. |
|
|
270,200 |
|
|
1,147,594 |
|
|
Mitsubishi Logistics Corp. |
|
|
11,000 |
|
|
121,819 |
|
|
Mitsubishi Materials Corp. |
|
|
101,000 |
|
|
273,066 |
|
|
Mitsubishi Motors Corp. (a) |
|
|
346,000 |
|
|
407,705 |
|
|
Mitsubishi Tanabe Pharma Corp. |
|
|
20,400 |
|
|
322,281 |
|
|
Mitsubishi UFJ Financial Group, Inc. |
|
|
1,132,074 |
|
|
4,792,612 |
|
|
Mitsubishi UFJ Lease & Finance Co. Ltd. |
|
|
5,260 |
|
|
208,192 |
|
|
Mitsui & Co. Ltd. |
|
|
154,400 |
|
|
2,393,083 |
|
|
Mitsui Chemicals, Inc. |
|
|
67,000 |
|
|
203,433 |
|
|
Mitsui Fudosan Co. Ltd. |
|
|
74,000 |
|
|
1,079,046 |
|
|
Mitsui OSK Lines Ltd. |
|
|
99,000 |
|
|
381,731 |
|
|
|
|
|
|
|
|
|
|
|
Common Stocks |
|
Shares |
|
Value |
|
||
|
Japan (continued) |
|
|
|
|
|
|
|
|
Mizuho Financial Group, Inc. |
|
|
2,026,164 |
|
$ |
2,743,647 |
|
|
MS&AD Insurance Group Holdings, Inc. |
|
|
50,570 |
|
|
933,451 |
|
|
Murata Manufacturing Co. Ltd. |
|
|
18,000 |
|
|
921,811 |
|
|
Nabtesco Corp. |
|
|
8,800 |
|
|
160,075 |
|
|
Namco Bandai Holdings, Inc. |
|
|
17,300 |
|
|
245,531 |
|
|
NEC Corp. (a) |
|
|
233,000 |
|
|
471,567 |
|
|
NGK Insulators Ltd. |
|
|
23,000 |
|
|
272,309 |
|
|
NGK Spark Plug Co. Ltd. |
|
|
12,000 |
|
|
148,307 |
|
|
NHK Spring Co. Ltd. |
|
|
14,000 |
|
|
123,736 |
|
|
Nidec Corp. |
|
|
9,700 |
|
|
842,211 |
|
|
Nikon Corp. |
|
|
30,200 |
|
|
669,248 |
|
|
Nintendo Co. Ltd. |
|
|
8,800 |
|
|
1,208,171 |
|
|
Nippon Building Fund, Inc. |
|
|
50 |
|
|
409,196 |
|
|
Nippon Electric Glass Co. |
|
|
33,500 |
|
|
329,782 |
|
|
Nippon Express Co. Ltd. |
|
|
77,000 |
|
|
299,325 |
|
|
Nippon Meat Packers, Inc. |
|
|
15,000 |
|
|
185,870 |
|
|
Nippon Paper Group, Inc. |
|
|
8,894 |
|
|
194,205 |
|
|
Nippon Sheet Glass Co. Ltd. |
|
|
77,000 |
|
|
143,503 |
|
|
Nippon Steel Corp. |
|
|
453,000 |
|
|
1,126,873 |
|
|
Nippon Telegraph & Telephone Corp. |
|
|
42,476 |
|
|
2,162,449 |
|
|
Nippon Yusen KK |
|
|
135,000 |
|
|
344,099 |
|
|
The Nishi-Nippon City Bank Ltd. |
|
|
62,000 |
|
|
177,842 |
|
|
Nissan Motor Co. Ltd. |
|
|
220,800 |
|
|
1,977,285 |
|
|
Nisshin Seifun Group, Inc. |
|
|
16,500 |
|
|
199,747 |
|
|
Nisshin Steel Co. Ltd. |
|
|
62,000 |
|
|
94,863 |
|
|
Nissin Foods Holdings Co. Ltd. |
|
|
5,200 |
|
|
203,880 |
|
|
Nitori Holdings Co. Ltd. |
|
|
3,350 |
|
|
314,122 |
|
|
Nitto Denko Corp. |
|
|
14,810 |
|
|
526,798 |
|
|
NKSJ Holdings, Inc. |
|
|
33,475 |
|
|
654,838 |
|
|
NOK Corp. |
|
|
9,700 |
|
|
165,473 |
|
|
Nomura Holdings, Inc. |
|
|
322,100 |
|
|
969,757 |
|
|
Nomura Real Estate Holdings, Inc. |
|
|
8,300 |
|
|
123,158 |
|
|
Nomura Real Estate Office Fund, Inc. |
|
|
25 |
|
|
128,300 |
|
|
Nomura Research Institute Ltd. |
|
|
9,000 |
|
|
203,037 |
|
|
NSK Ltd. |
|
|
39,000 |
|
|
251,911 |
|
|
NTN Corp. |
|
|
41,000 |
|
|
164,459 |
|
|
NTT Data Corp. |
|
|
115 |
|
|
366,183 |
|
|
NTT DoCoMo, Inc. |
|
|
1,357 |
|
|
2,491,479 |
|
|
NTT Urban Development Corp. |
|
|
115 |
|
|
78,206 |
|
|
Obayashi Corp. |
|
|
58,000 |
|
|
257,901 |
|
|
Odakyu Electric Railway Co. Ltd. |
|
|
56,000 |
|
|
541,384 |
|
|
OJI Paper Co. Ltd. |
|
|
72,000 |
|
|
369,655 |
|
|
Olympus Corp. |
|
|
18,800 |
|
|
247,124 |
|
|
Omron Corp. |
|
|
17,800 |
|
|
357,299 |
|
|
Ono Pharmaceutical Co. Ltd. |
|
|
7,500 |
|
|
420,625 |
|
|
Oracle Corp. Japan |
|
|
3,200 |
|
|
105,779 |
|
|
Oriental Land Co. Ltd. |
|
|
4,500 |
|
|
475,085 |
|
|
ORIX Corp. |
|
|
9,140 |
|
|
753,513 |
|
|
Osaka Gas Co. Ltd. |
|
|
169,000 |
|
|
667,701 |
|
|
Otsuka Corp. |
|
|
1,300 |
|
|
89,462 |
|
|
Otsuka Holdings Co. Ltd. |
|
|
22,600 |
|
|
634,287 |
|
|
Panasonic Corp. |
|
|
196,000 |
|
|
1,654,175 |
|
|
Rakuten, Inc. (a) |
|
|
650 |
|
|
699,303 |
|
|
Resona Holdings, Inc. |
|
|
169,056 |
|
|
744,186 |
|
|
Ricoh Co. Ltd. |
|
|
60,000 |
|
|
521,902 |
|
|
Rinnai Corp. |
|
|
3,000 |
|
|
214,814 |
|
|
Rohm Co. Ltd. |
|
|
8,600 |
|
|
399,908 |
|
|
Sankyo Co. Ltd. |
|
|
4,900 |
|
|
247,730 |
|
|
Sanrio Co. Ltd. |
|
|
3,900 |
|
|
200,035 |
|
|
Santen Pharmaceutical Co. Ltd. |
|
|
6,800 |
|
|
280,822 |
|
|
SBI Holdings, Inc. |
|
|
1,838 |
|
|
134,184 |
|
|
Secom Co. Ltd. |
|
|
18,700 |
|
|
859,905 |
|
|
|
|
|
|
|
|
|
|
22 |
BLACKROCK INTERNATIONAL INDEX FUND |
DECEMBER 31, 2011 |
|
|
|
|
|
|
|
Schedule of Investments (continued) |
Master International Index Series |
|
|
|
|
|
|
|
|
|
|
Common Stocks |
|
Shares |
|
Value |
|
||
|
Japan (continued) |
|
|
|
|
|
|
|
|
Sega Sammy Holdings, Inc. |
|
|
18,832 |
|
$ |
406,834 |
|
|
Seiko Epson Corp. |
|
|
11,900 |
|
|
157,288 |
|
|
Sekisui Chemical Co. Ltd. |
|
|
36,000 |
|
|
296,553 |
|
|
Sekisui House Ltd. |
|
|
52,000 |
|
|
462,092 |
|
|
Seven & I Holdings Co. Ltd. |
|
|
67,000 |
|
|
1,867,270 |
|
|
Seven Bank Ltd. |
|
|
44,000 |
|
|
86,105 |
|
|
Sharp Corp. |
|
|
89,000 |
|
|
775,818 |
|
|
Shikoku Electric Power Co. Inc. |
|
|
16,200 |
|
|
464,744 |
|
|
Shimadzu Corp. |
|
|
19,000 |
|
|
160,228 |
|
|
Shimamura Co. Ltd. |
|
|
1,900 |
|
|
194,132 |
|
|
Shimano, Inc. |
|
|
6,300 |
|
|
306,633 |
|
|
Shimizu Corp. |
|
|
53,000 |
|
|
222,755 |
|
|
Shin-Etsu Chemical Co. Ltd. |
|
|
36,500 |
|
|
1,792,872 |
|
|
Shinsei Bank Ltd. |
|
|
116,000 |
|
|
119,940 |
|
|
Shionogi & Co. Ltd. |
|
|
26,300 |
|
|
337,390 |
|
|
Shiseido Co. Ltd. |
|
|
32,200 |
|
|
591,280 |
|
|
The Shizuoka Bank Ltd. |
|
|
52,000 |
|
|
547,054 |
|
|
Showa Denko KK |
|
|
125,000 |
|
|
252,277 |
|
|
Showa Shell Sekiyu KK |
|
|
17,300 |
|
|
116,320 |
|
|
SMC Corp. |
|
|
4,700 |
|
|
756,163 |
|
|
Softbank Corp. |
|
|
78,800 |
|
|
2,314,203 |
|
|
Sojitz Corp. |
|
|
113,700 |
|
|
175,606 |
|
|
Sony Corp. |
|
|
89,200 |
|
|
1,608,363 |
|
|
Sony Financial Holdings, Inc. |
|
|
15,500 |
|
|
228,596 |
|
|
Square Enix Holdings Co. Ltd. |
|
|
5,300 |
|
|
103,872 |
|
|
Stanley Electric Co. Ltd. |
|
|
13,200 |
|
|
193,441 |
|
|
Sumco Corp. (a) |
|
|
10,600 |
|
|
78,030 |
|
|
Sumitomo Chemical Co. Ltd. |
|
|
142,000 |
|
|
515,575 |
|
|
Sumitomo Corp. |
|
|
99,900 |
|
|
1,350,362 |
|
|
Sumitomo Electric Industries Ltd. |
|
|
66,900 |
|
|
724,305 |
|
|
Sumitomo Heavy Industries Ltd. |
|
|
49,000 |
|
|
285,978 |
|
|
Sumitomo Metal Industries Ltd. |
|
|
302,000 |
|
|
547,696 |
|
|
Sumitomo Metal Mining Co. Ltd. |
|
|
47,000 |
|
|
601,703 |
|
|
Sumitomo Mitsui Financial Group, Inc. |
|
|
119,350 |
|
|
3,309,907 |
|
|
Sumitomo Mitsui Trust Holdings, Inc. |
|
|
276,820 |
|
|
811,785 |
|
|
Sumitomo Realty & Development Co. Ltd. |
|
|
32,000 |
|
|
559,111 |
|
|
Sumitomo Rubber Industries Ltd. |
|
|
15,800 |
|
|
189,731 |
|
|
Suruga Bank Ltd. |
|
|
17,000 |
|
|
151,732 |
|
|
Suzuken Co. Ltd. |
|
|
6,400 |
|
|
177,216 |
|
|
Suzuki Motor Corp. |
|
|
30,100 |
|
|
619,761 |
|
|
Sysmex Corp. |
|
|
6,700 |
|
|
217,830 |
|
|
T&D Holdings, Inc. |
|
|
51,900 |
|
|
483,237 |
|
|
Taisei Corp. |
|
|
93,000 |
|
|
235,741 |
|
|
Taisho Pharmaceutical Holdings Co. Ltd. (a) |
|
|
3,200 |
|
|
246,953 |
|
|
Taiyo Nippon Sanso Corp. |
|
|
21,000 |
|
|
146,038 |
|
|
Takashimaya Co. Ltd. |
|
|
21,000 |
|
|
151,257 |
|
|
Takeda Pharmaceutical Co. Ltd. |
|
|
70,200 |
|
|
3,083,568 |
|
|
TDK Corp. |
|
|
10,600 |
|
|
467,495 |
|
|
Teijin Ltd. |
|
|
85,000 |
|
|
260,782 |
|
|
Terumo Corp. |
|
|
14,700 |
|
|
691,040 |
|
|
THK Co. Ltd. |
|
|
10,900 |
|
|
214,705 |
|
|
Tobu Railway Co. Ltd. |
|
|
88,000 |
|
|
449,014 |
|
|
Toho Co. Ltd. |
|
|
9,900 |
|
|
176,299 |
|
|
Toho Gas Co. Ltd. |
|
|
38,000 |
|
|
241,959 |
|
|
Tohoku Electric Power Co. Inc. |
|
|
40,900 |
|
|
392,946 |
|
|
Tokio Marine Holdings, Inc. |
|
|
64,300 |
|
|
1,423,848 |
|
|
The Tokyo Electric Power Co., Inc. (a) |
|
|
130,000 |
|
|
311,979 |
|
|
Tokyo Electron Ltd. |
|
|
15,000 |
|
|
760,014 |
|
|
Tokyo Gas Co. Ltd. |
|
|
219,000 |
|
|
1,009,276 |
|
|
Tokyu Corp. |
|
|
98,000 |
|
|
482,609 |
|
|
Tokyu Land Corp. |
|
|
38,000 |
|
|
143,398 |
|
|
|
|
|
|
|
|
|
|
|
Common Stocks |
|
Shares |
|
Value |
|
||
|
Japan (concluded) |
|
|
|
|
|
|
|
|
TonenGeneral Sekiyu KK |
|
|
26,000 |
|
$ |
283,498 |
|
|
Toppan Printing Co. Ltd. |
|
|
50,000 |
|
|
367,079 |
|
|
Toray Industries, Inc. |
|
|
130,700 |
|
|
935,110 |
|
|
Toshiba Corp. |
|
|
358,000 |
|
|
1,461,011 |
|
|
Tosoh Corp. |
|
|
45,000 |
|
|
119,582 |
|
|
Toto Ltd. |
|
|
27,000 |
|
|
208,414 |
|
|
Toyo Seikan Kaisha Ltd. |
|
|
13,800 |
|
|
187,807 |
|
|
Toyo Suisan Kaisha Ltd. |
|
|
8,000 |
|
|
193,598 |
|
|
Toyoda Gosei Co. Ltd. |
|
|
5,700 |
|
|
90,271 |
|
|
Toyota Boshoku Corp. |
|
|
5,100 |
|
|
53,092 |
|
|
Toyota Industries Corp. |
|
|
15,400 |
|
|
416,658 |
|
|
Toyota Motor Corp. |
|
|
245,200 |
|
|
8,108,054 |
|
|
Toyota Tsusho Corp. |
|
|
19,000 |
|
|
334,910 |
|
|
Trend Micro, Inc. (a) |
|
|
8,800 |
|
|
262,412 |
|
|
Tsumura & Co. |
|
|
5,600 |
|
|
165,090 |
|
|
Ube Industries Ltd. |
|
|
84,000 |
|
|
229,597 |
|
|
Uni-charm Corp. |
|
|
10,200 |
|
|
502,903 |
|
|
Ushio, Inc. |
|
|
9,900 |
|
|
142,290 |
|
|
USS Co. Ltd. |
|
|
1,940 |
|
|
175,334 |
|
|
West Japan Railway Co. |
|
|
14,900 |
|
|
647,425 |
|
|
Yahoo! Japan Corp. |
|
|
1,284 |
|
|
413,080 |
|
|
Yakult Honsha Co. Ltd. |
|
|
8,700 |
|
|
273,515 |
|
|
Yamada Denki Co. Ltd. |
|
|
7,100 |
|
|
483,646 |
|
|
Yamaguchi Financial Group, Inc. |
|
|
18,000 |
|
|
171,518 |
|
|
Yamaha Corp. |
|
|
13,300 |
|
|
121,473 |
|
|
Yamaha Motor Co. Ltd. |
|
|
25,600 |
|
|
323,780 |
|
|
Yamato Holdings Co. Ltd. |
|
|
34,600 |
|
|
582,341 |
|
|
Yamato Kogyo Co. Ltd. |
|
|
3,800 |
|
|
108,761 |
|
|
Yamazaki Baking Co. Ltd. |
|
|
10,000 |
|
|
131,391 |
|
|
Yaskawa Electric Corp. |
|
|
19,000 |
|
|
160,905 |
|
|
Yokogawa Electric Corp. (a) |
|
|
19,500 |
|
|
175,098 |
|
|
|
|
|
|
|
|
181,431,998 |
|
|
Luxembourg — 0.4% |
|
|
|
|
|
|
|
|
ArcelorMittal |
|
|
76,199 |
|
|
1,384,570 |
|
|
Millicom International Cellular SA |
|
|
6,844 |
|
|
683,715 |
|
|
SES Global |
|
|
26,546 |
|
|
635,953 |
|
|
Tenaris SA |
|
|
41,856 |
|
|
769,780 |
|
|
|
|
|
|
|
|
3,474,018 |
|
|
Netherlands — 2.7% |
|
|
|
|
|
|
|
|
Aegon NV (a) |
|
|
154,577 |
|
|
617,797 |
|
|
Akzo Nobel NV |
|
|
20,547 |
|
|
990,151 |
|
|
ASML Holding NV |
|
|
38,288 |
|
|
1,599,345 |
|
|
Corio NV |
|
|
5,219 |
|
|
225,988 |
|
|
Delta Lloyd NV |
|
|
9,636 |
|
|
161,436 |
|
|
European Aeronautic Defence and Space Co. NV |
|
|
36,376 |
|
|
1,132,713 |
|
|
Fugro NV |
|
|
6,199 |
|
|
358,831 |
|
|
Heineken Holding NV |
|
|
10,186 |
|
|
416,269 |
|
|
Heineken NV |
|
|
22,994 |
|
|
1,064,515 |
|
|
ING Groep NV (a) |
|
|
340,216 |
|
|
2,433,088 |
|
|
Koninklijke Ahold NV |
|
|
103,122 |
|
|
1,386,021 |
|
|
Koninklijke Boskalis Westminster NV |
|
|
5,872 |
|
|
215,073 |
|
|
Koninklijke DSM NV |
|
|
13,844 |
|
|
639,890 |
|
|
Koninklijke KPN NV |
|
|
131,165 |
|
|
1,565,738 |
|
|
Koninklijke Philips Electronics NV |
|
|
89,592 |
|
|
1,879,792 |
|
|
Koninklijke Vopak NV |
|
|
6,300 |
|
|
332,217 |
|
|
QIAGEN NV (a) |
|
|
20,535 |
|
|
282,736 |
|
|
Randstad Holding NV |
|
|
10,816 |
|
|
318,179 |
|
|
Reed Elsevier NV |
|
|
60,952 |
|
|
709,201 |
|
|
SBM Offshore NV |
|
|
15,337 |
|
|
314,389 |
|
|
STMicroelectronics NV |
|
|
57,655 |
|
|
341,311 |
|
|
|
|
|
|
|
|
|
|
|
|
|
BLACKROCK INTERNATIONAL INDEX FUND |
DECEMBER 31, 2011 |
23 |
|
|
|
|
|
|
|
Schedule of Investments (continued) |
Master International Index Series |
|
|
|
|
|
|
|
|
|
|
Common Stocks |
|
|
Shares |
|
|
Value |
|
|
Netherlands (concluded) |
|
|
|
|
|
|
|
|
TNT Express NV |
|
|
32,089 |
|
$ |
238,998 |
|
|
Unilever NV |
|
|
144,761 |
|
|
4,977,398 |
|
|
Wolters Kluwer NV |
|
|
27,037 |
|
|
466,252 |
|
|
|
|
|
|
|
|
22,667,328 |
|
|
New Zealand — 0.1% |
|
|
|
|
|
|
|
|
Auckland International Airport Ltd. |
|
|
81,425 |
|
|
159,481 |
|
|
Contact Energy Ltd. (a) |
|
|
29,916 |
|
|
122,755 |
|
|
Fletcher Building Ltd. |
|
|
59,637 |
|
|
284,779 |
|
|
Sky City Ltd. |
|
|
51,491 |
|
|
137,568 |
|
|
Telecom Corp. of New Zealand Ltd. |
|
|
171,010 |
|
|
274,003 |
|
|
|
|
|
|
|
|
978,586 |
|
|
Norway — 0.8% |
|
|
|
|
|
|
|
|
Aker Solutions ASA |
|
|
14,045 |
|
|
147,218 |
|
|
DnB NOR ASA |
|
|
86,644 |
|
|
844,499 |
|
|
Gjensidige Forsikring ASA |
|
|
17,265 |
|
|
199,842 |
|
|
Norsk Hydro ASA |
|
|
83,258 |
|
|
384,332 |
|
|
Orkla ASA |
|
|
68,292 |
|
|
508,540 |
|
|
Statoil ASA |
|
|
99,131 |
|
|
2,538,772 |
|
|
Subsea 7 SA (a) |
|
|
24,861 |
|
|
458,937 |
|
|
Telenor ASA |
|
|
64,195 |
|
|
1,050,471 |
|
|
Yara International ASA |
|
|
16,632 |
|
|
663,944 |
|
|
|
|
|
|
|
|
6,796,555 |
|
|
Portugal — 0.2% |
|
|
|
|
|
|
|
|
Banco Espirito Santo SA, Registered Shares |
|
|
44,077 |
|
|
76,759 |
|
|
Cimpor-Cimentos de Portugal, SGPS SA |
|
|
19,097 |
|
|
131,172 |
|
|
Energias de Portugal SA |
|
|
172,968 |
|
|
534,189 |
|
|
Galp Energia SGPS SA |
|
|
20,400 |
|
|
299,728 |
|
|
Jeronimo Martins SGPS SA (a) |
|
|
19,300 |
|
|
318,786 |
|
|
Portugal Telecom SGPS SA, Registered Shares |
|
|
59,975 |
|
|
345,421 |
|
|
|
|
|
|
|
|
1,706,055 |
|
|
Singapore — 1.6% |
|
|
|
|
|
|
|
|
Ascendas Real Estate Investment Trust |
|
|
161,962 |
|
|
228,694 |
|
|
CapitaLand Ltd. |
|
|
232,749 |
|
|
396,103 |
|
|
CapitaMall Trust |
|
|
193,700 |
|
|
253,610 |
|
|
CapitaMalls Asia Ltd. |
|
|
127,000 |
|
|
110,603 |
|
|
City Developments Ltd. |
|
|
45,535 |
|
|
312,059 |
|
|
ComfortDelGro Corp. Ltd. |
|
|
173,816 |
|
|
189,655 |
|
|
Cosco Corp. (Singapore) Ltd. |
|
|
81,002 |
|
|
54,511 |
|
|
DBS Group Holdings Ltd. |
|
|
156,407 |
|
|
1,388,312 |
|
|
Fraser and Neave Ltd. |
|
|
82,096 |
|
|
391,906 |
|
|
Genting Singapore Plc (a) |
|
|
549,227 |
|
|
639,077 |
|
|
Global Logistic Properties Ltd. (a) |
|
|
158,000 |
|
|
213,595 |
|
|
Golden Agri-Resources Ltd. |
|
|
586,251 |
|
|
323,020 |
|
|
Hutchison Port Holdings Trust |
|
|
460,000 |
|
|
284,575 |
|
|
Jardine Cycle & Carriage Ltd. |
|
|
9,721 |
|
|
360,682 |
|
|
Keppel Corp. Ltd. |
|
|
126,577 |
|
|
906,017 |
|
|
Keppel Land Ltd. |
|
|
66,000 |
|
|
112,818 |
|
|
Neptune Orient Lines Ltd. |
|
|
73,350 |
|
|
63,430 |
|
|
Noble Group Ltd. |
|
|
351,840 |
|
|
305,699 |
|
|
Olam International Ltd. |
|
|
132,900 |
|
|
217,846 |
|
|
Oversea-Chinese Banking Corp. |
|
|
225,914 |
|
|
1,362,453 |
|
|
SembCorp Industries Ltd. |
|
|
89,590 |
|
|
279,436 |
|
|
Sembcorp Marine Ltd. |
|
|
74,197 |
|
|
218,056 |
|
|
Singapore Airlines Ltd. |
|
|
49,009 |
|
|
383,521 |
|
|
Singapore Exchange Ltd. |
|
|
76,000 |
|
|
359,228 |
|
|
Singapore Press Holdings Ltd. |
|
|
133,316 |
|
|
378,944 |
|
|
Singapore Technologies Engineering Ltd. |
|
|
138,213 |
|
|
286,687 |
|
|
Singapore Telecommunications Ltd. |
|
|
708,132 |
|
|
1,686,592 |
|
|
|
|
|
|
|
|
|
|
|
Common Stocks |
|
|
Shares |
|
|
Value |
|
|
Singapore (concluded) |
|
|
|
|
|
|
|
|
StarHub Ltd. |
|
|
52,157 |
|
$ |
117,020 |
|
|
United Overseas Bank Ltd. |
|
|
111,572 |
|
|
1,313,039 |
|
|
UOL Group Ltd. |
|
|
43,457 |
|
|
133,862 |
|
|
Wilmar International Ltd. |
|
|
167,670 |
|
|
646,367 |
|
|
Yangzijiang Shipbuilding Holdings Ltd. |
|
|
161,183 |
|
|
112,810 |
|
|
|
|
|
|
|
|
14,030,227 |
|
|
Spain — 3.2% |
|
|
|
|
|
|
|
|
Abertis Infraestructuras SA |
|
|
34,250 |
|
|
544,292 |
|
|
Acciona SA |
|
|
2,350 |
|
|
201,970 |
|
|
Acerinox SA |
|
|
9,281 |
|
|
118,634 |
|
|
ACS Actividades de Construccion y Servicios SA |
|
|
12,719 |
|
|
375,537 |
|
|
Amadeus IT Holding SA, Class A |
|
|
28,081 |
|
|
453,458 |
|
|
Banco Bilbao Vizcaya Argentaria SA |
|
|
407,238 |
|
|
3,508,029 |
|
|
Banco de Sabadell SA |
|
|
98,280 |
|
|
372,167 |
|
|
Banco Popular Espanol SA |
|
|
87,441 |
|
|
397,150 |
|
|
Banco Santander SA |
|
|
750,093 |
|
|
5,666,691 |
|
|
Bankia SA (a) |
|
|
78,282 |
|
|
364,233 |
|
|
Bankinter SA |
|
|
18,086 |
|
|
110,665 |
|
|
Criteria Caixacorp SA |
|
|
67,845 |
|
|
331,557 |
|
|
Distribuidora Internacional de Alimentacion SA (a) |
|
|
50,193 |
|
|
225,962 |
|
|
EDP Renovaveis SA (a) |
|
|
19,120 |
|
|
116,759 |
|
|
Enagas SA |
|
|
16,213 |
|
|
299,339 |
|
|
Ferrovial SA |
|
|
33,161 |
|
|
398,786 |
|
|
Fomento de Construcciones y Contratas SA |
|
|
4,845 |
|
|
125,088 |
|
|
Gas Natural SDG SA |
|
|
31,110 |
|
|
533,190 |
|
|
Grifols SA (a) |
|
|
12,868 |
|
|
215,613 |
|
|
Iberdrola SA |
|
|
339,573 |
|
|
2,121,119 |
|
|
Inditex SA |
|
|
19,368 |
|
|
1,581,105 |
|
|
Indra Sistemas SA |
|
|
8,623 |
|
|
109,322 |
|
|
International Consolidated Airlines Group SA (a) |
|
|
86,524 |
|
|
194,014 |
|
|
Mapfre SA |
|
|
68,993 |
|
|
218,224 |
|
|
Red Electrica de Espana |
|
|
9,707 |
|
|
414,511 |
|
|
Repsol YPF SA |
|
|
70,477 |
|
|
2,156,265 |
|
|
Telefonica SA |
|
|
365,060 |
|
|
6,289,311 |
|
|
Zardoya Otis SA |
|
|
12,911 |
|
|
176,559 |
|
|
|
|
|
|
|
|
27,619,550 |
|
|
Sweden — 3.0% |
|
|
|
|
|
|
|
|
Alfa Laval AB |
|
|
30,263 |
|
|
571,530 |
|
|
Assa Abloy AB, Series B |
|
|
27,837 |
|
|
696,082 |
|
|
Atlas Copco AB, Class A |
|
|
59,591 |
|
|
1,276,827 |
|
|
Atlas Copco AB, Class B |
|
|
34,978 |
|
|
662,140 |
|
|
Boliden AB |
|
|
24,882 |
|
|
360,976 |
|
|
Electrolux AB |
|
|
21,871 |
|
|
347,510 |
|
|
Getinge AB, Class B |
|
|
18,129 |
|
|
458,422 |
|
|
Hennes & Mauritz AB, B Shares |
|
|
90,831 |
|
|
2,913,853 |
|
|
Hexagon AB |
|
|
21,521 |
|
|
320,380 |
|
|
Holmen AB, Class B |
|
|
4,661 |
|
|
133,482 |
|
|
Husqvarna AB |
|
|
38,981 |
|
|
178,974 |
|
|
Industrivarden AB |
|
|
11,056 |
|
|
131,411 |
|
|
Investor AB |
|
|
39,881 |
|
|
741,736 |
|
|
Kinnevik Investment AB |
|
|
18,465 |
|
|
358,895 |
|
|
Lundin Petroleum AB (a) |
|
|
19,946 |
|
|
488,530 |
|
|
Modern Times Group AB |
|
|
4,461 |
|
|
212,481 |
|
|
Nordea Bank AB |
|
|
233,586 |
|
|
1,800,396 |
|
|
Ratos AB |
|
|
17,816 |
|
|
208,500 |
|
|
Sandvik AB |
|
|
89,454 |
|
|
1,093,617 |
|
|
Scania AB |
|
|
28,724 |
|
|
423,999 |
|
|
Securitas AB |
|
|
28,442 |
|
|
244,642 |
|
|
Skandinaviska Enskilda Banken AB, Class A |
|
|
125,005 |
|
|
725,280 |
|
|
Skanska AB, Class B |
|
|
35,924 |
|
|
592,918 |
|
|
|
|
|
|
|
|
See Notes to Financial Statements. |
|
|
||
|
|
|
|
|
|
|
|
|
|
|
|
|
Schedule of Investments (continued) |
Master International Index Series |
|
|
|
|
|
|
|
|
|
|
Common Stocks |
|
|
Shares |
|
|
Value |
|
|
Sweden (concluded) |
|
|
|
|
|
|
|
|
SKF AB, Class B |
|
|
34,686 |
|
$ |
731,197 |
|
|
SSAB AB, Series A |
|
|
13,368 |
|
|
117,062 |
|
|
Svenska Cellulosa AB |
|
|
51,208 |
|
|
755,943 |
|
|
Svenska Handelsbanken, Class A |
|
|
43,463 |
|
|
1,138,973 |
|
|
Swedbank AB, Class A |
|
|
71,029 |
|
|
916,601 |
|
|
Swedish Match AB |
|
|
18,871 |
|
|
668,477 |
|
|
Tele2 AB |
|
|
28,416 |
|
|
550,690 |
|
|
Telefonaktiebolaget LM Ericsson |
|
|
267,517 |
|
|
2,712,784 |
|
|
TeliaSonera AB |
|
|
192,135 |
|
|
1,301,903 |
|
|
Volvo AB, B Shares |
|
|
123,258 |
|
|
1,342,771 |
|
|
|
|
|
|
|
|
25,178,982 |
|
|
Switzerland — 8.5% |
|
|
|
|
|
|
|
|
ABB Ltd. (a) |
|
|
194,769 |
|
|
3,658,980 |
|
|
Actelion Ltd. (a) |
|
|
9,964 |
|
|
340,838 |
|
|
Adecco SA, Registered Shares (a) |
|
|
11,874 |
|
|
494,864 |
|
|
Aryzta AG |
|
|
7,612 |
|
|
367,227 |
|
|
Baloise Holding AG |
|
|
4,303 |
|
|
294,389 |
|
|
Barry Callebaut AG (a) |
|
|
162 |
|
|
159,381 |
|
|
Compagnie Financière Richemont SA |
|
|
46,364 |
|
|
2,332,234 |
|
|
Crédit Suisse Group AG (a) |
|
|
101,342 |
|
|
2,375,270 |
|
|
GAM Holdings Ltd. (a) |
|
|
17,488 |
|
|
189,386 |
|
|
Geberit AG (a) |
|
|
3,509 |
|
|
674,506 |
|
|
Givaudan SA (a) |
|
|
744 |
|
|
706,970 |
|
|
Holcim Ltd. (a) |
|
|
21,766 |
|
|
1,160,238 |
|
|
Julius Baer Group Ltd. (a) |
|
|
18,311 |
|
|
713,258 |
|
|
Kuehne & Nagel International AG |
|
|
4,840 |
|
|
541,979 |
|
|
Lindt & Spruengli AG |
|
|
81 |
|
|
240,677 |
|
|
Lindt & Spruengli AG, Registered Shares |
|
|
10 |
|
|
333,590 |
|
|
Lonza Group AG, Registered Shares (a) |
|
|
4,607 |
|
|
271,456 |
|
|
Nestlé SA, Registered Shares |
|
|
293,354 |
|
|
16,845,415 |
|
|
Novartis AG, Registered Shares |
|
|
207,450 |
|
|
11,843,954 |
|
|
Pargesa Holding SA |
|
|
2,442 |
|
|
159,516 |
|
|
Partners Group Holding AG |
|
|
1,195 |
|
|
208,183 |
|
|
Roche Holding AG |
|
|
62,450 |
|
|
10,561,435 |
|
|
Schindler Holding AG |
|
|
4,356 |
|
|
506,341 |
|
|
Schindler Holding AG, Registered Shares |
|
|
1,929 |
|
|
223,515 |
|
|
SGS SA |
|
|
486 |
|
|
801,580 |
|
|
Sika AG |
|
|
182 |
|
|
342,209 |
|
|
Sonova Holding AG, Registered Shares (a) |
|
|
4,403 |
|
|
458,715 |
|
|
Straumann Holding AG, Registered Shares |
|
|
656 |
|
|
112,984 |
|
|
Sulzer AG |
|
|
2,218 |
|
|
236,186 |
|
|
The Swatch Group Ltd., Bearer Shares |
|
|
2,736 |
|
|
1,018,385 |
|
|
The Swatch Group Ltd., Registered Shares |
|
|
3,943 |
|
|
261,476 |
|
|
Swiss Life Holding (a) |
|
|
2,722 |
|
|
249,304 |
|
|
Swiss Reinsurance Co., Registered Shares (a) |
|
|
30,650 |
|
|
1,558,237 |
|
|
Swisscom AG |
|
|
2,091 |
|
|
790,874 |
|
|
Syngenta AG, Registered Shares (a) |
|
|
8,403 |
|
|
2,469,225 |
|
|
Synthes, Inc. |
|
|
5,792 |
|
|
969,463 |
|
|
Transocean Ltd. |
|
|
30,693 |
|
|
1,181,315 |
|
|
UBS AG, Registered Shares (a) |
|
|
323,372 |
|
|
3,836,058 |
|
|
Zurich Financial Services AG (a) |
|
|
12,938 |
|
|
2,915,025 |
|
|
|
|
|
|
|
|
72,404,638 |
|
|
|
|
|
|
|
|
|
|
|
Common Stocks |
|
|
Shares |
|
|
Value |
|
|
United Kingdom — 22.9% |
|
|
|
|
|
|
|
|
3i Group Plc |
|
|
84,667 |
|
$ |
237,706 |
|
|
Admiral Group Plc |
|
|
17,676 |
|
|
234,347 |
|
|
Aggreko Plc |
|
|
23,574 |
|
|
737,651 |
|
|
Amec Plc |
|
|
29,771 |
|
|
419,276 |
|
|
Anglo American Plc |
|
|
117,576 |
|
|
4,343,274 |
|
|
Antofagasta Plc |
|
|
34,360 |
|
|
649,835 |
|
|
ARM Holdings Plc |
|
|
119,652 |
|
|
1,104,444 |
|
|
Associated British Foods Plc |
|
|
30,849 |
|
|
529,922 |
|
|
AstraZeneca Plc |
|
|
119,432 |
|
|
5,516,803 |
|
|
Aviva Plc |
|
|
254,041 |
|
|
1,181,629 |
|
|
Babcock International Group Plc |
|
|
32,179 |
|
|
367,118 |
|
|
BAE Systems Plc |
|
|
298,413 |
|
|
1,318,633 |
|
|
Balfour Beatty Plc |
|
|
60,162 |
|
|
247,294 |
|
|
Barclays Plc |
|
|
1,028,888 |
|
|
2,817,800 |
|
|
BG Group Plc |
|
|
301,273 |
|
|
6,436,288 |
|
|
BHP Billiton Plc |
|
|
187,699 |
|
|
5,487,504 |
|
|
BP Plc |
|
|
1,683,856 |
|
|
11,994,589 |
|
|
British American Tobacco Plc |
|
|
175,713 |
|
|
8,335,892 |
|
|
British Land Co. Plc |
|
|
73,115 |
|
|
524,772 |
|
|
British Sky Broadcasting Group Plc |
|
|
101,087 |
|
|
1,150,096 |
|
|
BT Group Plc |
|
|
690,341 |
|
|
2,046,296 |
|
|
Bunzl Plc |
|
|
29,609 |
|
|
406,281 |
|
|
Burberry Group Plc |
|
|
38,848 |
|
|
714,322 |
|
|
Cairn Energy Plc (a) |
|
|
126,105 |
|
|
518,455 |
|
|
The Capita Group Plc |
|
|
54,287 |
|
|
529,389 |
|
|
Capital Shopping Centres Group Plc |
|
|
48,885 |
|
|
236,855 |
|
|
Carnival Plc |
|
|
16,492 |
|
|
543,609 |
|
|
Centrica Plc |
|
|
459,271 |
|
|
2,062,815 |
|
|
Cobham Plc |
|
|
100,563 |
|
|
286,346 |
|
|
Compass Group Plc |
|
|
168,414 |
|
|
1,598,042 |
|
|
Diageo Plc |
|
|
222,517 |
|
|
4,862,016 |
|
|
Essar Energy Plc (a) |
|
|
29,542 |
|
|
78,693 |
|
|
Eurasian Natural Resources Corp. Plc |
|
|
23,514 |
|
|
231,906 |
|
|
Experian Plc |
|
|
89,049 |
|
|
1,210,402 |
|
|
Fresnillo Plc |
|
|
16,255 |
|
|
385,157 |
|
|
G4S Plc |
|
|
127,390 |
|
|
537,720 |
|
|
GKN Plc |
|
|
138,990 |
|
|
394,692 |
|
|
GlaxoSmithKline Plc |
|
|
451,042 |
|
|
10,277,406 |
|
|
Glencore International Plc |
|
|
74,829 |
|
|
456,900 |
|
|
Hammerson Plc |
|
|
63,897 |
|
|
356,809 |
|
|
HSBC Holdings Plc |
|
|
1,586,383 |
|
|
12,110,517 |
|
|
ICAP Plc |
|
|
49,487 |
|
|
266,560 |
|
|
Imperial Tobacco Group Plc |
|
|
90,028 |
|
|
3,406,705 |
|
|
Inmarsat Plc |
|
|
39,692 |
|
|
248,580 |
|
|
Intercontinental Hotels Group Plc |
|
|
26,163 |
|
|
470,407 |
|
|
International Power Plc |
|
|
136,900 |
|
|
715,845 |
|
|
Intertek Group Plc |
|
|
14,546 |
|
|
459,348 |
|
|
Invensys Plc |
|
|
73,682 |
|
|
240,959 |
|
|
Investec Plc |
|
|
44,581 |
|
|
234,614 |
|
|
ITV Plc |
|
|
324,659 |
|
|
342,981 |
|
|
J Sainsbury Plc |
|
|
109,355 |
|
|
514,135 |
|
|
Johnson Matthey Plc |
|
|
19,282 |
|
|
549,383 |
|
|
Kazakhmys Plc |
|
|
18,566 |
|
|
268,071 |
|
|
Kingfisher Plc |
|
|
209,579 |
|
|
814,423 |
|
|
Land Securities Group Plc |
|
|
69,522 |
|
|
685,694 |
|
|
Legal & General Group Plc |
|
|
520,545 |
|
|
831,869 |
|
|
Lloyds Banking Group Plc (a) |
|
|
3,660,302 |
|
|
1,470,271 |
|
|
|
|
|
|
|
|
|
See Notes to Financial Statements. |
|
|
|
|
|
|
|
|
|
|
|
|
|
|
|
|
|
|
|
Schedule of Investments (continued) |
Master International Index Series |
|
(Percentages shown are based on Net Assets) |
|
|
|
|
|
|
|
|
|
|
Common Stocks |
|
Shares |
|
Value |
|
||
|
United Kingdom (concluded) |
|
|
|
|
|
|
|
|
London Stock Exchange Group Plc |
|
|
13,856 |
|
$ |
170,407 |
|
|
Lonmin Plc |
|
|
14,124 |
|
|
215,199 |
|
|
Man Group Plc |
|
|
170,006 |
|
|
331,773 |
|
|
Marks & Spencer Group Plc |
|
|
142,712 |
|
|
689,271 |
|
|
Meggitt Plc |
|
|
69,658 |
|
|
381,295 |
|
|
National Grid Plc |
|
|
316,195 |
|
|
3,056,272 |
|
|
Next Plc |
|
|
15,058 |
|
|
638,824 |
|
|
Old Mutual Plc |
|
|
490,357 |
|
|
1,031,384 |
|
|
Pearson Plc |
|
|
72,299 |
|
|
1,356,958 |
|
|
Petrofac Ltd. |
|
|
23,369 |
|
|
522,654 |
|
|
Prudential Plc |
|
|
226,278 |
|
|
2,238,833 |
|
|
Randgold Resources Ltd. |
|
|
8,112 |
|
|
829,360 |
|
|
Reckitt Benckiser Group Plc |
|
|
55,004 |
|
|
2,712,798 |
|
|
Reed Elsevier Plc |
|
|
107,861 |
|
|
868,293 |
|
|
Resolution Ltd. |
|
|
127,197 |
|
|
495,844 |
|
|
Rexam Plc |
|
|
78,442 |
|
|
429,298 |
|
|
Rio Tinto Plc, Registered Shares |
|
|
124,326 |
|
|
6,072,891 |
|
|
Rolls-Royce Holdings Plc (a) |
|
|
166,247 |
|
|
1,924,833 |
|
|
Royal Bank of Scotland Group Plc (a) |
|
|
1,570,779 |
|
|
495,122 |
|
|
Royal Dutch Shell Plc, Class A |
|
|
321,693 |
|
|
11,802,677 |
|
|
Royal Dutch Shell Plc, Class B |
|
|
238,598 |
|
|
9,075,759 |
|
|
RSA Insurance Group Plc |
|
|
310,978 |
|
|
507,689 |
|
|
SABMiller Plc |
|
|
84,677 |
|
|
2,976,950 |
|
|
The Sage Group Plc |
|
|
119,005 |
|
|
543,777 |
|
|
Schroders Plc |
|
|
10,062 |
|
|
205,149 |
|
|
Scottish & Southern Energy Plc |
|
|
83,183 |
|
|
1,665,098 |
|
|
Segro Plc |
|
|
65,911 |
|
|
213,419 |
|
|
Serco Group Plc |
|
|
44,600 |
|
|
328,163 |
|
|
Severn Trent Plc |
|
|
21,510 |
|
|
499,156 |
|
|
Shire Plc |
|
|
49,939 |
|
|
1,735,585 |
|
|
Smith & Nephew Plc |
|
|
80,158 |
|
|
777,923 |
|
|
Smiths Group Plc |
|
|
35,177 |
|
|
499,224 |
|
|
Standard Chartered Plc |
|
|
211,416 |
|
|
4,624,199 |
|
|
Standard Life Plc |
|
|
210,131 |
|
|
673,259 |
|
|
Tate & Lyle Plc |
|
|
41,890 |
|
|
457,963 |
|
|
Tesco Plc |
|
|
712,289 |
|
|
4,456,676 |
|
|
Tui Travel Plc |
|
|
42,176 |
|
|
108,785 |
|
|
Tullow Oil Plc |
|
|
80,257 |
|
|
1,743,839 |
|
|
Unilever Plc |
|
|
114,039 |
|
|
3,824,193 |
|
|
United Utilities Group Plc |
|
|
60,262 |
|
|
566,648 |
|
|
Vedanta Resources Plc |
|
|
10,542 |
|
|
166,325 |
|
|
Vodafone Group Plc |
|
|
4,518,390 |
|
|
12,597,741 |
|
|
The Weir Group Plc |
|
|
18,965 |
|
|
598,606 |
|
|
Whitbread Plc |
|
|
15,173 |
|
|
368,378 |
|
|
WM Morrison Supermarkets Plc |
|
|
194,176 |
|
|
982,140 |
|
|
Wolseley Plc |
|
|
24,934 |
|
|
824,698 |
|
|
WPP Plc |
|
|
111,905 |
|
|
1,173,576 |
|
|
Xstrata Plc |
|
|
184,355 |
|
|
2,806,834 |
|
|
|
|
|
|
|
|
196,265,084 |
|
|
Total
Long-Term Investments |
|
|
|
|
|
840,894,972 |
|
|
|
|
|
|
|
|
|
|
|
Short-Term Securities |
|
Shares |
|
Value |
|
||
|
BlackRock Liquidity Funds, TempCash, Institutional Class, 0.07% (b)(c) |
|
|
1,969,251 |
|
$ |
1,969,251 |
|
|
Total
Short-Term Securities |
|
|
|
|
|
1,969,251 |
|
|
Total Investments (Cost — $877,933,228*) — 98.5% |
|
|
|
|
|
842,864,223 |
|
|
Other Assets Less Liabilities — 1.5% |
|
|
|
|
|
12,916,695 |
|
|
Net Assets — 100.0% |
|
|
|
|
$ |
855,780,918 |
|
|
|
|
|
|
|
|
|
|
|
|
|
|
* |
As of December 31, 2011, gross unrealized appreciation and gross unrealized depreciation based on cost for federal income tax purposes were as follows: |
|
|
|
|
|
|
|
Tax cost |
|
$ |
929,473,570 |
|
|
Gross unrealized appreciation |
|
$ |
108,922,210 |
|
|
Gross unrealized depreciation |
|
|
(195,531,557 |
) |
|
Net unrealized depreciation |
|
$ |
(86,609,347 |
) |
|
|
|
|
(a) |
Non-income producing
security. |
|
(b) |
Investments in companies considered to be an affiliate of the Series during the year, for purposes of Section 2(a)(3) of the Investment Company Act of 1940, as amended, were as follows: |
|
|
|
|
|
|
|
|
|
|
|
|
|
|
|
|
Affiliate |
|
Shares |
|
Net |
|
Shares |
|
Income |
|
||||
|
BlackRock Liquidity Funds, TempCash, Institutional Class |
|
|
2,576,868 |
|
|
(607,617 |
) |
|
1,969,251 |
|
$ |
2,226 |
|
|
|
|
|
(c) |
Represents the current yield as of report date. |
|
|
|
|
• |
Financial futures contracts purchased as of December 31, 2011 were as follows: |
|
|
|
|
|
|
|
|
|
|
|
|
|
|
|
|
Contracts |
|
Index |
|
Exchange |
|
Expiration |
|
Notional |
|
Unrealized |
|
||
|
101 |
|
DJ
Euro |
|
Eurex |
|
March 2012 |
|
$ |
3,017,001 |
|
$ |
50,452 |
|
|
|
|
|
|
|
|
|
|
|
|
|
|
|
|
|
27 |
|
E-Mini MSCI EAFE Index |
|
Chicago Mercantile |
|
March 2012 |
|
$ |
1,902,690 |
|
|
7,367 |
|
|
|
|
|
|
|
|
|
|
|
|
|
|
|
|
|
33 |
|
FTSE 100 Index |
|
NYSE Liffe |
|
March 2012 |
|
$ |
2,837,145 |
|
|
43,925 |
|
|
|
|
|
|
|
|
|
|
|
|
|
|
|
|
|
39 |
|
Nikkei 225 Index |
|
Singapore |
|
March 2012 |
|
$ |
2,143,303 |
|
|
(11,293 |
) |
|
|
|
|
|
|
|
|
|
|
|
|
|
|
|
|
12 |
|
SPI 200 Index |
|
Australian Securities Exchange |
|
March 2012 |
|
$ |
1,233,190 |
|
|
(33,841 |
) |
|
|
|
|
|
|
|
|
|
|
|
|
|
|
|
|
Total |
|
|
|
|
|
|
|
|
|
|
$ |
56,610 |
|
|
|
|
|
|
|
|
|
|
26 |
BLACKROCK INTERNATIONAL INDEX FUND |
DECEMBER 31, 2011 |
|
|
|
|
|
|
|
Schedule of Investments (concluded) |
Master International Index Series |
|
|
|
|
• |
Foreign currency exchange contracts as of December 31, 2011 were as follows: |
|
|
|
|
|
|
|
|
|
|
|
|
|
|
|
Currency |
|
Currency
|
|
Counterparty |
|
Settlement
|
|
Unrealized
|
|
|||
|
|
|
|
|
|
|
|
|
|
|
|
|
|
|
USD |
2,217,741 |
|
AUD |
2,163,000 |
|
Credit
Suisse |
|
1/03/12 |
|
$ |
5,424 |
|
|
|
|
|
|
|
|
|
|
|
|
|
|
|
|
USD |
1,518,530 |
|
CHF |
1,420,000 |
|
Credit
Suisse |
|
1/03/12 |
|
|
6,766 |
|
|
|
|
|
|
|
|
|
|
|
|
|
|
|
|
USD |
156,672 |
|
DKK |
897,000 |
|
Credit
Suisse |
|
1/03/12 |
|
|
489 |
|
|
|
|
|
|
|
|
|
|
|
|
|
|
|
|
USD |
6,685,473 |
|
EUR |
5,150,000 |
|
Credit
Suisse |
|
1/03/12 |
|
|
20,083 |
|
|
|
|
|
|
|
|
|
|
|
|
|
|
|
|
USD |
6,076,566 |
|
GBP |
3,910,000 |
|
Credit
Suisse |
|
1/03/12 |
|
|
4,336 |
|
|
|
|
|
|
|
|
|
|
|
|
|
|
|
|
USD |
527,002 |
|
HKD |
4,093,000 |
|
Credit
Suisse |
|
1/03/12 |
|
|
2 |
|
|
|
|
|
|
|
|
|
|
|
|
|
|
|
|
USD |
62,766 |
|
ILS |
240,000 |
|
Credit
Suisse |
|
1/03/12 |
|
|
(210) |
|
|
|
|
|
|
|
|
|
|
|
|
|
|
|
|
USD |
224,365 |
|
NOK |
1,339,000 |
|
Credit
Suisse |
|
1/03/12 |
|
|
484 |
|
|
|
|
|
|
|
|
|
|
|
|
|
|
|
|
USD |
576,780 |
|
SEK |
3,954,000 |
|
Credit
Suisse |
|
1/03/12 |
|
|
2,242 |
|
|
|
|
|
|
|
|
|
|
|
|
|
|
|
|
USD |
241,391 |
|
SGD |
313,000 |
|
Credit
Suisse |
|
1/03/12 |
|
|
74 |
|
|
|
|
|
|
|
|
|
|
|
|
|
|
|
|
AUD |
585,252 |
|
USD |
600,000 |
|
Credit
Suisse |
|
1/04/12 |
|
|
(1,405 |
) |
|
|
|
|
|
|
|
|
|
|
|
|
|
|
|
EUR |
1,386,580 |
|
USD |
1,800,000 |
|
Credit
Suisse |
|
1/04/12 |
|
|
(5,418 |
) |
|
|
|
|
|
|
|
|
|
|
|
|
|
|
|
GBP |
1,093,881 |
|
USD |
1,700,000 |
|
Credit
Suisse |
|
1/04/12 |
|
|
(1,203 |
) |
|
|
|
|
|
|
|
|
|
|
|
|
|
|
|
USD |
4,419,011 |
|
JPY |
340,000,000 |
|
Credit
Suisse |
|
1/04/12 |
|
|
1,705 |
|
|
|
|
|
|
|
|
|
|
|
|
|
|
|
|
Total |
|
|
|
|
|
|
|
|
|
$ |
33,369 |
|
|
|
|
|
|
• |
Fair Value Measurements — Various inputs are used in determining the fair value of investments and derivative financial instruments. These inputs are categorized into a disclosure hierarchy consisting of three broad levels for financial statement purposes as follows: |
|
|
|
|
|
|
|
• |
Level 1 — unadjusted price quotations in active markets/exchanges for identical assets and liabilities |
|
|
|
|
|
|
• |
Level 2 — other observable inputs (including, but not limited to: quoted prices for similar assets or liabilities in markets that are active, quoted prices for identical or similar assets or liabilities in markets that are not active, inputs other than quoted prices that are observable for the assets or liabilities (such as interest rates, yield curves, volatilities, prepayment speeds, loss severities, credit risks and default rates) or other market-corroborated inputs) |
|
|
|
|
|
|
• |
Level 3 — unobservable inputs based on the best information available in the circumstances, to the extent observable inputs are not available (including the Series’ own assumptions used in determining the fair value of investments and derivative financial instruments) |
|
|
|
|
|
Changes in valuation techniques may result in transfers in or out of an assigned level within the disclosure hierarchy. The categorization of a value determined for investments and derivative financial instruments is based on the pricing transparency of the investment and derivative financial instrument and does not necessarily correspond to the Series’ perceived risk of investing in those securities. For information about the Series’ policy regarding valuation of investments and derivative financial instruments and other significant accounting policies, please refer to Note 1 of the Notes to Financial Statements. |
||
|
|
||
|
The following tables summarize the inputs used as of December 31, 2011 in determining the fair valuation of the Series’ investments and derivative financial instruments: |
||
|
|
|
|
|
|
|
|
|
|
|
|
|
|
|
|
Valuation Inputs |
|
Level 1 |
|
Level 2 |
|
Level 3 |
|
Total |
|
||||
|
Assets: |
|
|
|
|
|
|
|
|
|
|
|
|
|
|
Investments: |
|
|
|
|
|
|
|
|
|
|
|
|
|
|
Long-Term Investments: |
|
|
|
|
|
|
|
|
|
|
|
|
|
|
Common Stocks: |
|
|
|
|
|
|
|
|
|
|
|
|
|
|
Australia |
|
|
— |
|
$ |
72,182,635 |
|
$ |
10 |
|
$ |
72,182,645 |
|
|
Austria |
|
|
— |
|
|
2,059,241 |
|
|
— |
|
|
2,059,241 |
|
|
Belgium |
|
|
— |
|
|
7,990,118 |
|
|
— |
|
|
7,990,118 |
|
|
Bermuda |
|
|
— |
|
|
971,591 |
|
|
— |
|
|
971,591 |
|
|
China |
|
|
— |
|
|
132,032 |
|
|
— |
|
|
132,032 |
|
|
Denmark |
|
|
— |
|
|
8,835,909 |
|
|
— |
|
|
8,835,909 |
|
|
Finland |
|
|
— |
|
|
7,040,375 |
|
|
— |
|
|
7,040,375 |
|
|
France |
|
|
— |
|
|
72,528,811 |
|
|
— |
|
|
72,528,811 |
|
|
Germany |
|
|
— |
|
|
65,694,436 |
|
|
— |
|
|
65,694,436 |
|
|
Greece |
|
$ |
282,620 |
|
|
431,327 |
|
|
— |
|
|
713,947 |
|
|
Hong Kong |
|
|
211,900 |
|
|
23,420,400 |
|
|
— |
|
|
23,632,300 |
|
|
Ireland |
|
|
— |
|
|
2,757,908 |
|
|
1 |
|
|
2,757,909 |
|
|
Israel |
|
|
— |
|
|
5,486,572 |
|
|
— |
|
|
5,486,572 |
|
|
Italy |
|
|
— |
|
|
18,316,065 |
|
|
— |
|
|
18,316,065 |
|
|
Japan |
|
|
246,953 |
|
|
181,185,045 |
|
|
— |
|
|
181,431,998 |
|
|
Luxembourg |
|
|
— |
|
|
3,474,018 |
|
|
— |
|
|
3,474,018 |
|
|
Netherlands |
|
|
1,064,515 |
|
|
21,602,813 |
|
|
— |
|
|
22,667,328 |
|
|
New Zealand |
|
|
— |
|
|
978,586 |
|
|
— |
|
|
978,586 |
|
|
Norway |
|
|
— |
|
|
6,796,555 |
|
|
— |
|
|
6,796,555 |
|
|
Portugal |
|
|
345,421 |
|
|
1,360,634 |
|
|
— |
|
|
1,706,055 |
|
|
Singapore |
|
|
284,575 |
|
|
13,745,652 |
|
|
— |
|
|
14,030,227 |
|
|
Spain |
|
|
364,233 |
|
|
27,255,317 |
|
|
— |
|
|
27,619,550 |
|
|
Sweden |
|
|
— |
|
|
25,178,982 |
|
|
— |
|
|
25,178,982 |
|
|
Switzerland |
|
|
— |
|
|
72,404,638 |
|
|
— |
|
|
72,404,638 |
|
|
United Kingdom |
|
|
— |
|
|
196,265,084 |
|
|
— |
|
|
196,265,084 |
|
|
Short-Term Securities |
|
|
1,969,251 |
|
|
— |
|
|
— |
|
|
1,969,251 |
|
|
Total |
|
$ |
4,769,468 |
|
$ |
838,094,744 |
|
$ |
11 |
|
$ |
842,864,223 |
|
|
|
|
|
|
|
|
|
|
|
|
|
|
|
|
|
Valuation Inputs |
|
Level 1 |
|
Level 2 |
|
Level 3 |
|
Total |
|
||||
|
Derivative Financial |
|
|
|
|
|
|
|
|
|
|
|
|
|
|
Instruments1 |
|
|
|
|
|
|
|
|
|
|
|
|
|
|
Assets: |
|
|
|
|
|
|
|
|
|
|
|
|
|
|
Equity contracts |
|
$ |
101,744 |
|
|
— |
|
|
— |
|
$ |
101,744 |
|
|
Foreign currency |
|
|
— |
|
$ |
41,605 |
|
|
— |
|
|
41,605 |
|
|
Liabilities: |
|
|
|
|
|
|
|
|
|
|
|
|
|
|
Equity contracts |
|
|
(45,134 |
) |
|
— |
|
|
— |
|
|
(45,134 |
) |
|
Foreign currency |
|
|
— |
|
|
(8,236 |
) |
|
— |
|
|
(8,236 |
) |
|
Total |
|
$ |
56,610 |
|
$ |
33,369 |
|
|
— |
|
$ |
89,979 |
|
|
|
|
|
|
|
1 |
Derivative financial instruments are financial futures contracts and foreign currency exchange contracts. Financial futures contracts and foreign currency exchange contracts are valued at the unrealized appreciation/depreciation on the instrument. |
|
|
|
|
|
|
|
|
|
|
|
|
BLACKROCK INTERNATIONAL INDEX FUND |
DECEMBER 31, 2011 |
27 |
|
|
|
|
|
|
|
Master International Index Series |
|
|
|
|
|
|
|
December 31, 2011 |
|
|
|
|
|
Assets |
|
|
|
|
|
Investments at value — unaffiliated (cost — $875,963,977) |
|
$ |
840,894,972 |
|
|
Investments at value — affiliated (cost — $1,969,251) |
|
|
1,969,251 |
|
|
Cash pledged as collateral for financial futures contracts |
|
|
776,000 |
|
|
Investments sold receivable |
|
|
18,956,284 |
|
|
Foreign currency at value (cost — $8,096,527) |
|
|
8,095,076 |
|
|
Dividends receivable |
|
|
4,422,925 |
|
|
Margin variation receivable |
|
|
95,898 |
|
|
Unrealized appreciation on foreign currency exchange contracts |
|
|
41,605 |
|
|
Prepaid expenses |
|
|
16,026 |
|
|
Total assets |
|
|
875,268,037 |
|
|
|
|
|
|
|
|
Liabilities |
|
|
|
|
|
Bank overdraft |
|
|
280,213 |
|
|
Withdrawals payable to investor |
|
|
18,748,858 |
|
|
Investments purchased payable |
|
|
211,900 |
|
|
Unrealized depreciation on foreign currency exchange contracts |
|
|
8,236 |
|
|
Investment advisory fees payable |
|
|
7,220 |
|
|
Other affiliates payable |
|
|
2,373 |
|
|
Directors’ fees payable |
|
|
459 |
|
|
Other accrued expenses payable |
|
|
227,860 |
|
|
Total liabilities |
|
|
19,487,119 |
|
|
Net Assets |
|
$ |
855,780,918 |
|
|
|
|
|
|
|
|
Net Assets Consist of |
|
|
|
|
|
Investors’ capital |
|
$ |
890,655,790 |
|
|
Net unrealized appreciation/depreciation |
|
|
(34,874,872 |
) |
|
Net Assets |
|
$ |
855,780,918 |
|
|
|
|
|
|
|
|
|
|
|
|
|
|
|
|
|
|
Master International Index Series |
|
|
|
|
|
|
|
Year Ended December 31, 2011 |
|
|
|
|
|
Investment Income |
|
|
|
|
|
Dividends — unaffiliated |
|
$ |
35,991,032 |
|
|
Foreign taxes withheld |
|
|
(3,619,477 |
) |
|
Dividends — affiliated |
|
|
2,226 |
|
|
Total income |
|
|
32,373,781 |
|
|
|
|
|
|
|
|
Expenses |
|
|
|
|
|
Investment advisory |
|
|
93,352 |
|
|
Custodian |
|
|
263,526 |
|
|
Accounting services |
|
|
180,326 |
|
|
Professional |
|
|
104,300 |
|
|
Pricing |
|
|
88,115 |
|
|
Directors |
|
|
24,565 |
|
|
Printing |
|
|
1,998 |
|
|
Miscellaneous |
|
|
29,815 |
|
|
Total expenses |
|
|
785,997 |
|
|
Less fees waived by advisor |
|
|
(4,114 |
) |
|
Total expenses after fees waived |
|
|
781,883 |
|
|
Net investment income |
|
|
31,591,898 |
|
|
|
|
|
|
|
|
Realized and Unrealized Gain (Loss) |
|
|
|
|
|
Net realized gain (loss) from: |
|
|
|
|
|
Investments |
|
|
(25,889,226 |
) |
|
Financial futures contracts |
|
|
(587,208 |
) |
|
Foreign currency transactions |
|
|
198,904 |
|
|
|
|
|
(26,277,530 |
) |
|
Net change in unrealized appreciation/depreciation on: |
|
|
|
|
|
Investments |
|
|
(123,595,786 |
) |
|
Financial futures contracts |
|
|
51,678 |
|
|
Foreign currency transactions |
|
|
(178,643 |
) |
|
|
|
|
(123,722,751 |
) |
|
Total realized and unrealized loss |
|
|
(150,000,281 |
) |
|
Net Decrease in Net Assets Resulting from Operations |
|
$ |
(118,408,383 |
) |
|
|
|
|
|
|
|
|
|
|
|
|
|
|
|
|
|
Master International Index Series |
|
|
|
|
|
|
|
|
|
|
|
|
Year
Ended |
|
||||
|
Increase (Decrease) in Net Assets: |
|
2011 |
|
2010 |
|
||
|
Operations |
|
|
|
|
|
|
|
|
Net investment income |
|
$ |
31,591,898 |
|
$ |
21,715,802 |
|
|
Net realized loss |
|
|
(26,277,530 |
) |
|
(21,606,488 |
) |
|
Net change in unrealized appreciation/depreciation |
|
|
(123,722,751 |
) |
|
84,313,481 |
|
|
Net increase (decrease) in net assets resulting from operations |
|
|
(118,408,383 |
) |
|
84,422,795 |
|
|
|
|
|
|
|
|
|
|
|
Capital Transactions |
|
|
|
|
|
|
|
|
|
|
|
|
|
|
|
|
|
Proceeds from contributions |
|
|
277,608,631 |
|
|
325,133,239 |
|
|
Value of withdrawals |
|
|
(226,119,685 |
) |
|
(236,135,595 |
) |
|
Net increase in net assets derived from capital transactions |
|
|
51,488,946 |
|
|
88,997,644 |
|
|
|
|
|
|
|
|
|
|
|
Net Assets |
|
|
|
|
|
|
|
|
Total increase (decrease) in net assets |
|
|
(66,919,437 |
) |
|
173,420,439 |
|
|
Beginning of year |
|
|
922,700,355 |
|
|
749,279,916 |
|
|
End of year |
|
$ |
855,780,918 |
|
$ |
922,700,355 |
|
|
|
|
|
|
|
|
Master International Index Series |
|
|
|
|
|
|
|
|
|
|
|
|
|
|
|
|
|
|
|
|
|
Year Ended December 31, |
|
|||||||||||||
|
|
|
2011 |
|
2010 |
|
2009 |
|
2008 |
|
2007 |
|
|||||
|
Total Investment Return |
|
|
|
|
|
|
|
|
|
|
|
|
|
|
|
|
|
Total investment return |
|
|
(12.34 |
)% |
|
7.66 |
% |
|
28.99 |
% |
|
(41.94 |
)% |
|
10.80 |
% |
|
|
|
|
|
|
|
|
|
|
|
|
|
|
|
|
|
|
|
Ratios to Average Net Assets |
|
|
|
|
|
|
|
|
|
|
|
|
|
|
|
|
|
Total expenses |
|
|
0.08 |
% |
|
0.11 |
% |
|
0.09 |
% |
|
0.11 |
% |
|
0.10 |
% |
|
Total expenses after fees waived and paid indirectly |
|
|
0.08 |
% |
|
0.10 |
% |
|
0.09 |
% |
|
0.10 |
% |
|
0.09 |
% |
|
Net investment income |
|
|
3.38 |
% |
|
2.73 |
% |
|
2.98 |
% |
|
3.54 |
% |
|
2.86 |
% |
|
|
|
|
|
|
|
|
|
|
|
|
|
|
|
|
|
|
|
Supplemental Data |
|
|
|
|
|
|
|
|
|
|
|
|
|
|
|
|
|
Net assets, end of year (000) |
|
$ |
855,781 |
|
$ |
922,700 |
|
$ |
749,280 |
|
$ |
706,119 |
|
$ |
1,143,172 |
|
|
Portfolio turnover |
|
|
6 |
% |
|
8 |
% |
|
30 |
% |
|
30 |
% |
|
30 |
% |
|
|
|
|
|
|
|
|
|
|
|
|
|
|
|
|
|
Master International Index Series |
1. Organization and Significant Accounting Policies:
Master International index Series (the “Series”), a non-diversified open-end management investment company, is a series of Quantitative Master Series LLC (the “Master LLC”). The Master LLC is registered as an investment company under the Investment Company Act of 1940, as amended (the “1940 Act”), and is organized as a Delaware limited liability company. The Master LLC’s Limited Liability Company Agreement permits the Board of Directors of the Master LLC (the “Board”) to issue non-transferable interests in the Master LLC, subject to certain limitations. The Series’ financial statements are prepared in conformity with accounting principles generally accepted in the United States of America (“US GAAP”), which may require management to make estimates and assumptions that affect the reported amounts and disclosure in the financial statements. Actual results could differ from those estimates.
The following is a summary of significant accounting policies followed by the Series:
Valuation: US GAAP defines fair value as the price the Series would receive to sell an asset or pay to transfer a liability in an orderly transaction between market participants at the measurement date. The Series fair values its financial instruments at market value using independent dealers or pricing services under policies approved by the Board. Equity investments traded on a recognized securities exchange or the NASDAQ Global Market System (“NASDAQ”) are valued at the last reported sale price that day or the NASDAQ official closing price, if applicable. For equity investments traded on more than one exchange, the last reported sale price on the exchange where the stock is primarily traded is used. Equity investments traded on a recognized exchange for which there were no sales on that day are valued at the last available bid (long positions) or ask (short positions) price. If no bid or ask price is available, the prior day’s price will be used, unless it is determined that such prior day’s price no longer reflects the fair value of the security. Financial futures contracts traded on exchanges are valued at their last sale price. Investments in open-end registered investment companies are valued at NAV each business day. Short-term securities with remaining maturities of 60 days or less may be valued at amortized cost, which approximates fair value.
Securities and other assets and liabilities denominated in foreign currencies are translated into US dollars using exchange rates determined as of the close of business on the New York Stock Exchange (“NYSE”). Foreign currency exchange contracts are valued at the mean between the bid and ask prices and are determined as of the close of business on the NYSE. Interpolated values are derived when the settlement date of the contract is an interim date for which quotations are not available.
In the event that application of these methods of valuation results in a price for an investment which is deemed not to be representative of the market value of such investment or if a price is not available, the investment will be valued in accordance with a policy approved by the Board as reflecting fair value (“Fair Value Assets”). When determining the price for Fair Value Assets, the investment advisor and/or the sub-advisor seeks to determine the price that the Series might reasonably expect to receive from the current sale of that asset in an arm’s-length transaction. Fair value determinations shall be based upon all available factors that the investment advisor and/or sub-advisor deems relevant. The pricing of all Fair Value Assets is subsequently reported to the Board or a committee thereof.
Generally, trading in foreign instruments is substantially completed each day at various times prior to the close of business on the NYSE. Occasionally, events affecting the values of such instruments may occur between the foreign market close and the close of business on the NYSE that may not be reflected in the computation of the Series’ net assets. If events (for example, a company announcement, market volatility or a natural disaster) occur during such periods that are expected to materially affect the value of such instruments, those instruments may be Fair Value Assets and be valued at their fair value, as determined in good faith by the investment advisor using a pricing service and/or policies approved by the Board. Each business day, the Series uses a pricing service to assist with the valuation of certain foreign exchange-traded equity securities and foreign exchange-traded and OTC options (the “Systematic Fair Value Price”). Using current market factors, the Systematic Fair Value Price is designed to value such foreign securities and foreign options at fair value as of the close of business on the NYSE, which follows the close of the local markets.
Foreign Currency Transactions: The Series’ books and records are maintained in US dollars. Purchases and sales of investment securities are recorded at the rates of exchange prevailing on the respective date of such transactions. Generally, when the US dollar rises in value against a foreign currency, the Series’ investments denominated in that currency will lose value because its currency is worth fewer US dollars; the opposite effect occurs if the US dollar falls in relative value.
The Series does not isolate the portion of the results of operations arising as a result of changes in the foreign exchange rates from the changes in the market prices of investments held or sold for financial reporting purposes. Accordingly, the effects of changes in foreign currency exchange rates on investments are not segregated on the Statement of Operations from the effects of changes in market prices of those investments but are included as a component of net realized and unrealized gain (loss) from investments. The Series reports realized currency gains (losses) on foreign currency related transactions as components of net realized gain (loss) for financial reporting purposes, whereas such components are treated as ordinary income for federal income tax purposes.
Segregation and Collateralization: In cases in which the 1940 Act and the interpretive positions of the Securities and Exchange Commission (“SEC”) require that the Series either deliver collateral or segregate assets in connection with certain investments (e.g., financial futures contracts and foreign currency exchange contracts), the Series will, consistent with SEC
|
|
|
|
|
|
|
|
|
|
|
|
BLACKROCK INTERNATIONAL INDEX FUND |
DECEMBER 31, 2011 |
31 |
|
|
|
|
|
|
|
Notes to Financial Statements (continued) |
Master International Index Series |
rules and/or certain interpretive letters issued by the SEC, segregate collateral or designate on its books and records cash or liquid securities having a market value at least equal to the amount that would otherwise be required to be physically segregated. Furthermore, based on requirements and agreements with certain exchanges and third party broker-dealers, each party to such transactions has requirements to deliver/deposit securities as collateral for certain investments.
Investment Transactions and Investment Income: For financial reporting purposes, investment transactions are recorded on the dates the transactions are entered into (the trade dates). Realized gains and losses on investment transactions are determined on the identified cost basis. Dividend income is recorded on the ex-dividend dates. Dividends from foreign securities where the ex-dividend date may have passed are subsequently recorded when the Series is informed of the ex-dividend date. Under the applicable foreign tax laws, a withholding tax at various rates may be imposed on capital gains, dividends and interest.
Income Taxes: The Series is classified as a partnership for federal income tax purposes. As such, each investor in the Series is treated as the owner of its proportionate share of net assets, income, expenses and realized and unrealized gains and losses of the Series. Therefore, no federal income tax provision is required. It is intended that the Series’ assets will be managed so an investor in the Series can satisfy the requirements of Subchapter M of the Internal Revenue Code of 1986, as amended.
The Series files US federal and various state and local tax returns. No income tax returns are currently under examination. The statute of limitations on the Series’ US federal tax returns remains open for each of the four years ended December 31, 2011. The statutes of limitations on the Series’ state and local tax returns may remain open for an additional year depending upon the jurisdiction. Management does not believe there are any uncertain tax positions that require recognition of a tax liability.
Recent Accounting Standard: In May 2011, the Financial Accounting Standards Board (the “FASB”) issued amended guidance to improve disclosure about fair value measurements which will require the following disclosures for fair value measurements categorized as Level 3: quantitative information about the unobservable inputs and assumptions used in the fair value measurement, a description of the valuation policies and procedures and a narrative description of the sensitivity of the fair value measurement to changes in unobservable inputs and the interrelationships between those unobservable inputs. In addition, the amounts and reasons for all transfers in and out of Level 1 and Level 2 will be required to be disclosed. The amended guidance is effective for financial statements for fiscal years beginning after December 15, 2011, and interim periods within those fiscal years. Management is evaluating the impact of this guidance on the Series’ financial statement disclosures.
In December 2011, the FASB issued guidance that will enhance current disclosure requirements on the offsetting of certain assets and liabilities. The new disclosures will be required for investments and derivative financial instruments subject to master netting agreements or similar agreements and will require an entity to disclose both gross and net information about such investments and transactions eligible for offset in the Statement of Assets and Liabilities. The guidance is effective for financial statements with fiscal years beginning on or after January 1, 2013, and interim periods within those fiscal years. Management is evaluating the impact of this guidance on the Series’ financial statement disclosures.
Other: Expenses directly related to the Series are charged to the Series. Other operating expenses shared by several funds are pro rated among those funds on the basis of relative net assets or other appropriate methods.
The Series has an arrangement with the custodian whereby fees may be reduced by credits earned on uninvested cash balances, which, if applicable, are shown as fees paid indirectly in the Statement of Operations. The custodian imposes fees on overdrawn cash balances, which can be offset by accumulated credits earned or may result in additional custody charges.
2. Derivative Financial Instruments:
The Series engages in various portfolio investment strategies using derivative contracts both to increase the returns of the Series and to economically hedge, or protect, its exposure to certain risks such as equity risk and foreign currency exchange rate risk. These contracts may be transacted on an exchange or OTC.
Losses may arise if the value of the contract decreases due to an unfavorable change in the market rates or values of the underlying instrument or if the counterparty does not perform under the contract. The Series’ maximum risk of loss from counterparty credit risk on OTC derivatives is generally the aggregate unrealized gain netted against any collateral pledged by/posted to the counterparty. Counterparty risk related to exchange-traded financial futures contracts is deemed to be minimal due to the protection against defaults provided by the exchange on which these contracts trade.
The Series may mitigate counterparty risk by procuring collateral and through netting provisions included within an International Swaps and Derivatives Association, Inc. master agreement (“ISDA Master Agreement”) implemented between the Series and each of its respective counterpar-ties. An ISDA Master Agreement allows the Series to offset with each separate counterparty certain derivative financial instrument’s payables and/or receivables with collateral held. The amount of collateral moved to/from applicable counterparties is generally based upon minimum transfer amounts of up to $500,000. To the extent amounts due to the Series from its counterparties are not fully collateralized contractually or otherwise, the Series bears the risk of loss from counterparty non-performance. See
|
|
|
|
|
|
|
|
|
|
|
|
|
|
|
|
32 |
BLACKROCK INTERNATIONAL INDEX FUND |
DECEMBER 31, 2011 |
|
|
|
|
|
|
|
Notes to Financial Statements (continued) |
Master International Index Series |
Note 1 “Segregation and Collateralization” for information with respect to collateral practices. In addition, the Series manages counterparty risk by entering into agreements only with counterparties that it believes have the financial resources to honor its obligations and by monitoring the financial stability of those counterparties.
Certain ISDA Master Agreements allow counterparties to OTC derivatives to terminate derivative contracts prior to maturity in the event the Series’ net assets decline by a stated percentage or the Series fails to meet the terms of its ISDA Master Agreements, which would cause the Series to accelerate payment of any net liability owed to the counterparty.
Financial Futures Contracts: The Series purchases or sells financial futures contracts and options on financial futures contracts to gain exposure to, or economically hedge against, changes in the value of equity securities (equity risk) or foreign currencies (foreign currency exchange rate risk). Financial futures contracts are agreements between the Series and counterparty to buy or sell a specific quantity of an underlying instrument at a specified price and at a specified date. Depending on the terms of the particular contract, futures contracts are settled either through physical delivery of the underlying instrument on the settlement date or by payment of a cash settlement amount on the settlement date. Pursuant to the contract, the Series agrees to receive from or pay to the broker an amount of cash equal to the daily fluctuation in value of the contract. Such receipts or payments are known as margin variation and are recorded by the Series as unrealized appreciation or depreciation. When the contract is closed, the Series records a realized gain or loss equal to the difference between the value of the contract at the time it was opened and the value at the time it was closed. The use of financial futures contracts involves the risk of an imperfect correlation in the movements in the price of financial futures contracts, interest rates and the underlying assets.
Foreign Currency Exchange Contracts: The Series enters into foreign currency exchange contracts as an economic hedge against either specific transactions or portfolio instruments or to obtain exposure to foreign currencies (foreign currency exchange rate risk). A foreign currency exchange contract is an agreement between two parties to buy and sell a currency at a set exchange rate on a future date. Foreign currency exchange contracts, when used by the Series, help to manage the overall exposure to the currencies in which some of the investments held by the Series are denominated. The contract is marked-to-market daily and the change in market value is recorded by the Series as an unrealized gain or loss. When the contract is closed, the Series records a realized gain or loss equal to the difference between the value at the time it was opened and the value at the time it was closed. The use of foreign currency exchange contracts involves the risk that the value of a foreign currency exchange contract changes unfavorably due to movements in the value of the referenced foreign currencies and the risk that a counterparty to the contract does not perform its obligations under the agreement.
Derivative Instruments Categorized by Risk Exposure:
|
|
|
|
|
|
|
|
|
|
|
|
|
|
Fair Values of Derivative Instruments as of December 31, 2011 |
|||||||||||
|
|
|
Asset Derivatives |
|
Liability Derivatives |
|
||||||
|
|
|
Statement
of |
|
|
Value |
|
Statement
of |
|
|
Value |
|
|
Equity contracts |
|
Net unrealized appreciation* |
|
$ |
101,744 |
|
Net unrealized depreciation* |
|
$ |
45,134 |
|
|
Foreign currency exchange contracts |
|
Unrealized appreciation on foreign currency exchange contracts |
|
$ |
41,605 |
|
Unrealized depreciation on foreign currency exchange contracts |
|
$ |
8,236 |
|
|
Total |
|
|
|
$ |
143,349 |
|
|
|
$ |
53,370 |
|
|
|
|
|
|
|
* |
Includes cumulative appreciation/depreciation on financial futures contracts as reported in the Schedule of Investments. Only current day’s margin variation is reported within the Statement of Assets and Liabilities. |
|
|
|
|
|
|
|
|
|
|
The Effect of Derivative Financial Instruments in the Statement of Operations Year Ended December 31, 2011 |
|
||||||
|
|
|
Net Realized Gain (Loss) From |
|
||||
|
|
|
Financial |
|
Foreign |
|
||
|
Equity contracts |
|
$ |
(587,208 |
) |
|
— |
|
|
Foreign currency exchange contracts |
|
|
— |
|
$ |
276,346 |
|
|
|
|
|
|
|
|
|
|
|
|
|
Net
Change in Unrealized |
|
||||
|
|
|
Financial |
|
Foreign |
|
||
|
Equity contracts |
|
$ |
51,678 |
|
|
— |
|
|
Foreign currency exchange contracts |
|
|
— |
|
$ |
33,369 |
|
For the year ended December 31, 2011, the average quarterly balances of outstanding derivative financial instruments were as follows:
|
|
|
|
|
|
|
Financial futures contracts: |
|
|
|
|
|
Average number of contracts purchased |
|
|
212 |
|
|
Average notional value of contracts purchased |
|
$ |
13,039,843 |
|
|
Foreign currency exchange contracts: |
|
|
|
|
|
Average number of contracts — US dollars purchased |
|
|
4 |
|
|
Average number of contracts — US dollars sold |
|
|
14 |
|
|
Average US dollar amounts purchased |
|
$ |
5,806,950 |
|
|
Average US dollar amounts sold |
|
$ |
4,186,119 |
|
|
|
|
|
|
|
|
|||
|
|
BLACKROCK INTERNATIONAL INDEX FUND |
DECEMBER 31, 2011 |
33 |
|
|
|
|
|
|
|
Notes to Financial Statements (continued) |
Master International Index Series |
3. Investment Advisory Agreement and Other Transactions with Affiliates:
The PNC Financial Services Group, Inc. (“PNC”) and Barclays Bank PLC (“Barclays”) are the largest stockholders of BlackRock, Inc. (“BlackRock”). Due to the ownership structure, PNC is an affiliate for 1940 Act purposes, but Barclays is not.
The Master LLC, on behalf of the Series, entered into an Investment Advisory Agreement with BlackRock Advisors, LLC (the “Manager”), the Master LLC’s investment advisor, an indirect, wholly owned subsidiary of BlackRock, to provide investment advisory and administration services. The Manager is responsible for the management of the Series’ portfolio and provides the necessary personnel, facilities, equipment and certain other services necessary to the operations of the Series. For such services, the Series pays the Manager a monthly fee at an annual rate of 0.01% of the average daily value of the Series’ net assets.
The Manager entered into a contractual arrangement with the Master LLC with respect to the Series under which the Manager will waive and/or reimburse its fees and/or expenses so that the total annual operating expenses incurred by the Series excluding interest expense, dividend expense, acquired fund fees and expenses and certain other Series’ expenses will not exceed 0.12% of the average daily value of the Series’ net assets. The Manager has agreed not to reduce or discontinue this contractual waiver or reimbursement prior to May 1, 2012 unless approved by the Board, including a majority of the Independent Directors. For the year ended December 31, 2011, the Manager waived $2,006, which is included in fees waived by advisor in the Statement of Operations.
The Manager voluntarily agreed to waive its investment advisory fees by the amount of investment advisory fees the Series pays to the Manager indirectly through its investment in affiliated money market funds. However, the Manager does not waive its investment advisory fees by the amount of investment advisory fees paid in connection with the Series’ investment in other affiliated investment companies, if any. For the year ended December 31, 2011, the Manager waived $2,108, which is included in fees waived by advisor in the Statement of Operations.
The Manager entered into a sub-advisory agreement with BlackRock Investment Management LLC (“BIM”), an affiliate of the Manager.The Manager pays BIM, for services it provides, a monthly fee that is a percentage of the investment advisory fees paid by the Series to the Manager.
For the year ended December 31, 2011, the Series reimbursed the Manager $10,033 for certain accounting services, which is included in accounting services in the Statement of Operations.
Certain officers and/or directors of the Master LLC are officers and/or directors of BlackRock or its affiliates.
4. Investments:
Purchases and sales of investments, excluding short-term securities, for the year ended December 31, 2011, were $143,935,118 and $59,509,316, respectively.
5. Borrowings:
The Master LLC, on behalf of the Series, along with certain other funds managed by the Manager and its affiliates, is a party to a $500 million credit agreement with a group of lenders, which expired in November 2011. The Series may borrow under the credit agreement to fund shareholder redemptions. Effective November 2010, the credit agreement had the following terms: a commitment fee of 0.08% per annum based on the Series’ pro rata share of the unused portion of the credit agreement and interest at a rate equal to the higher of (a) the one-month LIBOR plus 1.00% per annum or (b) the Fed Funds rate plus 1.00% per annum on amounts borrowed. In addition, the Series paid administration and arrangement fees which were allocated to the Series based on its net assets as of October 31, 2010. Effective November 2011, the credit agreement was renewed until November 2012 with the following terms: a commitment fee of 0.065% per annum based on the Series’ pro rata share of the unused portion of the credit agreement and interest at a rate equal to the higher of (a) the one-month LIBOR plus 0.80% per annum or (b) the Fed Funds rate plus 0.80% per annum on amounts borrowed. In addition, the Series paid administration and arrangement fees which were allocated to the Series based on its net assets as of October 31, 2011. The Series did not borrow under the credit agreement during the year ended December 31, 2011.
6. Concentration, Market and Credit Risk:
In the normal course of business, the Series invests in securities and enters into transactions where risks exist due to fluctuations in the market (market risk) or failure of the issuer of a security to meet all its obligations (issuer credit risk). The value of securities held by the Series may decline in response to certain events, including those directly involving the issuers whose securities are owned by the Series; conditions affecting the general economy; overall market changes; local, regional or global political, social or economic instability; and currency and interest rate and price fluctuations. Similar to issuer credit risk, the Series may be exposed to counterparty credit risk, or the risk that an entity with which the Series has unsettled or open transactions may fail to or be unable to perform on its commitments. The Series manages counterparty credit risk by entering into transactions only with counterparties that it believes have the financial resources to honor their obligations and by monitoring the financial stability of those counterparties. Financial assets, which potentially expose the Series to market, issuer and counterparty credit risks, consist principally of financial instruments and receivables due from counterparties. The extent of the Series’ exposure to market, issuer and counterparty credit risks with respect to these financial assets is generally approximated by their value recorded in the Series’ Statement of Assets and Liabilities, less any collateral held by the Series.
|
|
|
|
|
|
|
|
|
|
|
|
|
34 |
|
BLACKROCK INTERNATIONAL INDEX FUND |
|
DECEMBER 31, 2011 |
|
|
|
|
|
|
|
Notes to Financial Statements (concluded) |
Master International Index Series |
The Series invests a substantial amount of its assets in issuers located in a single country or a limited number of countries. When the Series concentrates its investments in this manner, it assumes the risk that economic, political and social conditions in those countries may have a significant impact on their investment performance. Foreign issuers may not be subject to the same uniform accounting, auditing and financial reporting standards and practices as used in the US. Foreign securities markets may also be less liquid, more volatile, and less subject to governmental supervision not typically associated with investing in US securities. Please see the Schedule of Investments for concentrations in specific countries.
As of December 31, 2011, the Series had the following industry classifications:
|
|
|
|
|
|
|
Industry |
|
Percent
of |
|
|
|
Commercial Banks |
|
|
11 |
% |
|
Pharmaceuticals |
|
|
9 |
% |
|
Oil & Gas Consumable Fuels |
|
|
8 |
% |
|
Metals & Mining |
|
|
6 |
% |
|
Other1 |
|
|
66 |
% |
|
|
|
|
|
|
1 |
All other industries held were each less than 5% of long-term investments. |
7. Subsequent Events:
Management has evaluated the impact of all subsequent events on the Series through the date the financial statements were issued and has determined that there were no subsequent events requiring adjustment or additional disclosure in the financial statements.
|
|
|
|
|
|
|
|
|
|
|
|
BLACKROCK INTERNATIONAL INDEX FUND |
DECEMBER 31, 2011 |
35 |
|
|
|
|
|
|
|
Master International Index Series |
To the Investors of Master International Index Series and Board of Directors of Quantitative Master Series LLC:
We have audited the accompanying statement of assets and liabilities, including the schedule of investments, of Master International Index Series, one of the portfolios constituting Quantitative Master Series LLC, (the “Master LLC”) as of December 31, 2011, and the related statement of operations for the year then ended, the statements of changes in net assets for each of the two years in the period then ended, and the financial highlights for each of the five years in the period then ended. These financial statements and financial highlights are the responsibility of the Master LLC’s management. Our responsibility is to express an opinion on these financial statements and financial highlights based on our audits.
We conducted our audits in accordance with the standards of the Public Company Accounting Oversight Board (United States). Those standards require that we plan and perform the audit to obtain reasonable assurance about whether the financial statements and financial highlights are free of material misstatement. The Master LLC is not required to have, nor were we engaged to perform, an audit of its internal control over financial reporting. Our audits included consideration of internal control over financial reporting as a basis for designing audit procedures that are appropriate in the circumstances, but not for the purpose of expressing an opinion on the effectiveness of the Master LLC’s internal control over financial reporting. Accordingly, we express no such opinion. An audit also includes examining, on a test basis, evidence supporting the amounts and disclosures in the financial statements, assessing the accounting principles used and significant estimates made by management, as well as evaluating the overall financial statement presentation. Our procedures included confirmation of securities owned as of December 31, 2011, by correspondence with the custodian and brokers; where replies were not received from brokers, we performed other auditing procedures. We believe that our audits provide a reasonable basis for our opinion.
In our opinion, the financial statements and financial highlights referred to above present fairly, in all material respects, the financial position of Master International Index Series of Quantitative Master Series LLC as of December 31, 2011, the results of its operations for the year then ended, the changes in its net assets for each of the two years in the period then ended, and the financial highlights for each of the five years in the period then ended, in conformity with accounting principles generally accepted in the United States of America.
Deloitte & Touche LLP
Boston, Massachusetts
February 22, 2012
|
|
|
|
|
|
|
|
|
36 |
BLACKROCK INTERNATIONAL INDEX FUND |
DECEMBER 31, 2011 |
|
|
|
|
|
|
|
|
|
|
|
|
|
|
|
|
|
Name, Address |
|
Position(s) |
|
Length |
|
Principal Occupation(s) During Past Five Years |
|
Number of BlackRock- |
|
Public |
|
Independent Directors1 |
||||||||||
|
Ronald W.
Forbes |
|
Co-Chairman |
|
Since |
|
Professor Emeritus of Finance, School of Business, State University of New York at Albany since 2000. |
|
33 RICs consisting of 107 Portfolios |
|
None |
|
Rodney D.
Johnson |
|
Co-Chairman |
|
Since |
|
President, Fairmount Capital Advisors, Inc. since 1987; Member of the Archdiocesan Investment Committee of the Archdiocese of Philadelphia since 2004; Director, The Committee of Seventy (civic) since 2006; Director, Fox Chase Cancer Center from 2004 to 2010. |
|
33 RICs consisting of 107 Portfolios |
|
None |
|
David O.
Beim |
|
Director |
|
Since |
|
Professor of Professional Practice at the Columbia University Graduate School of Business since 1991; Trustee, Phillips Exeter Academy since 2002; Chairman, Wave Hill, Inc. (public garden and cultural center) from 1990 to 2006. |
|
33 RICs consisting of 107 Portfolios |
|
None |
|
Dr. Matina
S. Horner |
|
Director |
|
Since |
|
Executive Vice President of Teachers Insurance and Annuity Association and College Retirement Equities Fund from 1989 to 2003. |
|
33 RICs consisting of 107 Portfolios |
|
NSTAR (electric and gas utility) |
|
Herbert I.
London |
|
Director |
|
Since |
|
Professor Emeritus, New York University since 2005; John M. Olin Professor of Humanities, New York University from 1993 to 2005 and Professor thereof from 1980 to 2005; President, Hudson Institute (policy research organization) since 1997 and Trustee thereof since 1980; Chairman of the Board of Trustees for Grantham University since 2006; Director, InnoCentive, Inc. (strategic solutions company) since 2005; Director, Cerego, LLC (software development and design) since 2005; Director, Cybersettle (dispute resolution technology) since 2009. |
|
33 RICs consisting of 107 Portfolios |
|
AIMS Worldwide, Inc. (marketing) |
|
Cynthia A.
Montgomery |
|
Director |
|
Since |
|
Professor, Harvard Business School since 1989; Director, McLean Hospital since 2005; Director, Harvard Business School Publishing from 2005 to 2010. |
|
33 RICs consisting of 107 Portfolios |
|
Newell Rubbermaid, Inc. (manufacturing) |
|
Joseph P.
Platt |
|
Director |
|
Since |
|
Director, The West Penn Allegheny Health System (a not-for-profit health system) since 2008; Director, Jones and Brown (Canadian insurance broker) since 1998; General Partner, Thorn Partners, LP (private investment) since 1998; Director, WQED Multi-Media (public broadcasting not-for-profit) since 2001; Partner, Amarna Corporation, LLC (private investment company) from 2002 to 2008. |
|
33 RICs consisting of 107 Portfolios |
|
Greenlight Capital Re, Ltd. (reinsurance company) |
|
Robert C.
Robb, Jr. |
|
Director |
|
Since |
|
Partner, Lewis, Eckert, Robb and Company (management and financial consulting firm) since 1981. |
|
33 RICs consisting of 107 Portfolios |
|
None |
|
Toby
Rosenblatt |
|
Director |
|
Since |
|
President, Founders Investments Ltd. (private investments) since 1999; Director, College Access Foundation of California (philanthropic foundation) since 2009; Director, Forward Management, LLC since 2007; Director, A.P. Pharma, Inc. (specialty pharmaceuticals) from 1983 to 2011; Director, The James Irvine Foundation (philanthropic foundation) from 1998 to 2008. |
|
33 RICs consisting of 107 Portfolios |
|
None |
|
|
|
|
|
|
|
|
|
|
|
|
BLACKROCK INTERNATIONAL INDEX FUND |
DECEMBER 31, 2011 |
37 |
|
|
|
|
|
Officers and Directors (continued) |
|
|
|
|
|
|
|
|
|
|
|
|
|
|
Name, Address |
|
Position(s) |
|
Length |
|
Principal Occupation(s) During Past Five Years |
|
Number of BlackRock- |
|
Public |
|
|
Independent Directors1 (concluded) |
|||||||||||
|
Kenneth L. Urish |
|
Director |
|
Since |
|
Managing Partner, Urish Popeck & Co., LLC (certified public accountants and consultants) since 1976; Chairman Elect of the Professional Ethics Committee of the Pennsylvania Institute of Certified Public Accountants and Committee Member thereof since 2007; Member of External Advisory Board, The Pennsylvania State University Accounting Department since 2001; Trustee, The Holy Family Foundation from 2001 to 2010; President and Trustee, Pittsburgh Catholic Publishing Associates from 2003 to 2008; Director, Inter-Tel from 2006 to 2007. |
|
33 RICs consisting of |
|
None |
|
|
Frederick W. Winter |
|
Director |
|
Since |
|
Professor and Dean Emeritus of the Joseph M. Katz
School of Business, University of Pittsburgh since 2005 and Dean thereof from
1997 to 2005; Director, Alkon Corporation (pneumatics) since 1992; Director,
Tippman Sports (recreation) since 2005; Director, Indotronix International
(IT services) from 2004 to 2008. |
|
33 RICs consisting of |
|
None |
|
|
|
|||||||||||
|
|
|
1 |
Directors serve until their resignation, removal or death, or until December 31 of the year in which they turn 72. The Board has approved extensions in terms of Directors who turn 72 prior to December 31, 2013. |
||||||||
|
|
|
|
|
|
|
|
|
|
|
|
|
|
|
|
2 |
Date shown is the earliest date a person has for the Corporation/Master LLC covered by this annual report. Following the combination of Merrill Lynch Investment Managers, L.P. (“MLIM”) and BlackRock, Inc. (“BlackRock”) in September 2006, the various legacy MLIM and legacy BlackRock Fund boards were realigned and consolidated into three new Fund boards in 2007. As a result, although the chart shows Directors as joining the Corporation’s/Master LLC’s board in 2007, each Director first became a member of the board of other legacy MLIM or legacy BlackRock Funds as follows: David O. Beim, 1998; Ronald W. Forbes, 1977; Dr. Matina S. Horner, 2004; Rodney D. Johnson, 1995; Herbert I. London, 1987; Cynthia A. Montgomery, 1994; Joseph P. Platt, 1999; Robert C. Robb, Jr., 1998; Toby Rosenblatt, 2005; Kenneth L. Urish, 1999; and Frederick W. Winter, 1999. |
||||||||
|
|
|
|
|
|
|
|
|
|
|
|
|
|
Interested Directors3 |
|||||||||||
|
Paul L. Audet |
|
Director |
|
Since |
|
Senior Managing Director, BlackRock and Head of BlackRock’s Real Estate business from 2008 to 2011; Member of BlackRock’s Global Operating and Corporate Risk Management Committees and of the BlackRock Alternative Investors Executive Committee and Investment Committee for the Private Equity Fund of Funds business since 2008; Head of BlackRock’s Global Cash Management business from 2005 to 2010; Acting Chief Financial Officer of BlackRock from 2007 to 2008; Chief Financial Officer of BlackRock from 1998 to 2005. |
|
159 RICs consisting of |
|
None |
|
|
Henry Gabbay
|
|
Director |
|
Since |
|
Consultant, BlackRock from 2007 to 2008; Managing
Director, BlackRock from 1989 to 2007; Chief Administrative Officer,
BlackRock Advisors, LLC from 1998 to 2007; President of BlackRock Funds and
BlackRock Bond Allocation Target Shares from 2005 to 2007 and Treasurer of
certain closed-end funds in the BlackRock fund complex from 1989 to 2006. |
|
159 RICs consisting of |
|
None |
|
|
|
|||||||||||
|
|
|
3 |
Mr. Audet is an “interested person,” as defined in the 1940 Act, of the Corporation/Master LLC based on his position with BlackRock and its affiliates. Mr. Gabbay is an “interested person” of the Corporation/Master LLC based on his former positions with BlackRock and its affiliates as well as his ownership of BlackRock and The PNC Financial Services Group, Inc. securities. Mr. Audet and Mr. Gabbay are also Directors of the BlackRock registered closed-end funds and Directors of other BlackRock registered open-end funds. Directors serve until their resignation, removal or death, or until December 31 of the year in which they turn 72. |
||||||||
|
|
|
|
|
|
|
|
|
38 |
BLACKROCK INTERNATIONAL INDEX FUND |
DECEMBER 31, 2011 |
|
|
|
|
|
Officers and Directors (concluded) |
|
|
|
|
|
|
|
|
|
|
Name,
Address |
|
Position(s) |
|
Length |
|
Principal Occupation(s) During Past Five Years |
|
|
Officers1 |
|
|
|
|
|
|
|
|
John M.
Perlowski |
|
President and |
|
Since |
|
Managing Director of BlackRock since 2009; Global Head of BlackRock Fund Administration since 2009; Managing Director and Chief Operating Officer of the Global Product Group at Goldman Sachs Asset Management, L.P. from 2003 to 2009; Treasurer of Goldman Sachs Mutual Funds from 2003 to 2009 and Senior Vice President thereof from 2007 to 2009; Director of Goldman Sachs Offshore Funds from 2002 to 2009; Director of Family Resource Network (charitable foundation) since 2009. |
|
|
Brendan
Kyne |
|
Vice |
|
Since |
|
Managing Director of BlackRock since 2010; Director of BlackRock from 2008 to 2009; Head of Product Development and Management for BlackRock’s U.S. Retail Group since 2009 and Co-head thereof from 2007 to 2009; Vice President of BlackRock from 2005 to 2008. |
|
|
Neal
Andrews |
|
Chief |
|
Since |
|
Managing Director of BlackRock since 2006; Senior Vice President and Line of Business Head of Fund Accounting and Administration at PNC Global Investment Servicing (U.S.) Inc. from 1992 to 2006. |
|
|
Jay Fife |
|
Treasurer |
|
Since |
|
Managing Director of BlackRock since 2007; Director of BlackRock in 2006; Assistant Treasurer of the MLIM and Fund Asset Management, L.P. advised funds from 2005 to 2006; Director of MLIM Fund Services Group from 2001 to 2006. |
|
|
Brian
Kindelan |
|
Chief Compliance |
|
Since |
|
Chief Compliance Officer of the BlackRock-advised funds since 2007; Managing Director and Senior Counsel of BlackRock since 2005. |
|
|
Ira P.
Shapiro |
|
Secretary |
|
Since |
|
Managing Director of BlackRock since 2009; Managing Director and Associate General Counsel of Barclays Global Investors from 2008 to 2009 and Principal thereof from 2004 to 2008. |
|
|
|
|
1 |
Officers of the Corporation/Master LLC serve at the pleasure of the Board. |
||||
|
|
|
Further information about the Officers and Directors is available in the Corporation’s/Master LLC’s Statement of Additional Information, which can be obtained without charge by calling (800) 441-7762. |
|||||
|
|
|
Investment Advisor |
|
|
|
BlackRock Advisors, LLC |
|
Wilmington, DE 19809 |
|
|
|
Sub-Advisor |
|
|
|
BlackRock Investment Management, LLC |
|
Princeton, NJ 08540 |
|
|
|
Custodian |
|
|
|
JPMorgan Chase Bank, N.A. |
|
Brooklyn, NY 11245 |
|
|
|
Transfer Agent |
|
|
|
BNY Mellon Investment Servicing (US) Inc. |
|
Wilmington, DE 19809 |
|
|
|
Distributor |
|
|
|
BlackRock Investments, LLC |
|
New York, NY 10022 |
|
|
|
Legal Counsel |
|
|
|
Sidley Austin LLP |
|
New York, NY 10019 |
|
|
|
Accounting Agent |
|
|
|
State Street Bank and Trust Company |
|
Boston, MA 02110 |
|
|
|
Independent Registered Public Accounting Firm |
|
|
|
Deloitte & Touche LLP |
|
Boston, MA 02116 |
|
|
|
Address of the Fund |
|
|
|
100 Bellevue Parkway |
|
Wilmington, DE 19809 |
|
|
|
Effective September 22,
2011, Richard S. Davis resigned as Director of the Corporation and the |
|
|
|
|
|
|
|
|
|
|
|
|
BLACKROCK INTERNATIONAL INDEX FUND |
DECEMBER 31, 2011 |
39 |
|
|
|
|
|
|
|
General Information |
Electronic Delivery
Electronic copies of most financial reports and prospectuses are available on the Fund’s website or shareholders can sign up for e-mail notifications of quarterly statements, annual and semi-annual reports and prospectuses by enrolling in the Fund’s electronic delivery program.
To enroll:
Shareholders Who Hold Accounts with Investment Advisors, Banks or Brokerages:
Please contact your financial advisor. Please note that not all investment advisors, banks or brokerages may offer this service.
Shareholders Who Hold Accounts Directly with BlackRock:
|
|
|
|
1) |
Access the BlackRock website at http://www.blackrock.com/edelivery |
|
|
|
|
2) |
Select “eDelivery” under the “More Information” section |
|
|
|
|
3) |
Log into your account |
Householding
The Fund will mail only one copy of shareholder documents, including prospectuses, annual and semi-annual reports and proxy statements, to shareholders with multiple accounts at the same address. This practice is commonly called “householding” and is intended to reduce expenses and eliminate duplicate mailings of shareholder documents. Mailings of your shareholder documents may be householded indefinitely unless you instruct us otherwise. If you do not want the mailing of these documents to be combined with those for other members of your household, please call the Fund at (800) 441-7762.
Availability of Quarterly Schedule of Investments
The Fund/Series file their complete schedule of portfolio holdings with the SEC for the first and third quarters of each fiscal year on Form N-Q. The Fund’s/Series’ Forms N-Q are available on the SEC’s website at http://www.sec.gov and may also be reviewed and copied at the SEC’s Public Reference Room in Washington, D.C. Information on how to access documents on the SEC’s website without charge may be obtained by calling (800) SEC-0330.The Fund’s/Series’ Forms N-Q may also be obtained upon request and without charge by calling (800) 441-7762.
Availability of Proxy Voting Policies and Procedures
A description of the policies and procedures that the Fund/Series use to determine how to vote proxies relating to portfolio securities is available (1) without charge, upon request, by calling (800) 441-7762; (2) at http://www.blackrock.com; and (3) on the SEC website at http://www.sec.gov.
Availability of Proxy Voting Record
Information about how the Fund/Series voted proxies relating to securities held in the Fund’s/Series’ portfolio during the most recent 12-month period ended June 30 is available upon request and without charge (1) at http://www.blackrock.com or by calling (800) 441-7762 and (2) on the SEC’s website at http://www.sec.gov.
|
|
|
|
|
|
|
|
|
40 |
BLACKROCK INTERNATIONAL INDEX FUND |
DECEMBER 31, 2011 |
|
|
|
|
|
Additional Information (continued) |
|
|
|
Shareholder Privileges |
Account Information
Call us at (800) 441-7762 from 8:00 AM to 6:00 PM EST on any business day to get information about your account balances, recent transactions and share prices. You can also reach us on the Web at http://www.blackrock.com/funds.
Automatic Investment Plans
Investor Class shareholders who want to invest regularly can arrange to have $50 or more automatically deducted from their checking or savings account and invested in any of the BlackRock funds.
Systematic Withdrawal Plans
Investor Class shareholders can establish a systematic withdrawal plan and receive periodic payments of $50 or more from their BlackRock funds, as long as their account balance is at least $10,000.
Retirement Plans
Shareholders may make investments in conjunction with Traditional, Rollover, Roth, Coverdell, Simple IRAs, SEP IRAs and 403(b) Plans.
|
|
|
|
|
|
|
|
|
|
|
|
BLACKROCK INTERNATIONAL INDEX FUND |
DECEMBER 31, 2011 |
41 |
|
|
|
|
|
Additional Information (concluded) |
|
|
|
BlackRock Privacy Principles |
BlackRock is committed to maintaining the privacy of its current and former fund investors and individual clients (collectively, “Clients”) and to safeguarding their non-public personal information. The following information is provided to help you understand what personal information BlackRock collects, how we protect that information and why in certain cases we share such information with select parties.
If you are located in a jurisdiction where specific laws, rules or regulations require BlackRock to provide you with additional or different privacy-related rights beyond what is set forth below, then BlackRock will comply with those specific laws, rules or regulations.
BlackRock obtains or verifies personal non-public information from and about you from different sources, including the following: (i) information we receive from you or, if applicable, your financial intermediary, on applications, forms or other documents; (ii) information about your transactions with us, our affiliates, or others; (iii) information we receive from a consumer reporting agency; and (iv) from visits to our websites.
BlackRock does not sell or disclose to non-affiliated third parties any non-public personal information about its Clients, except as permitted by law or as is necessary to respond to regulatory requests or to service Client accounts. These non-affiliated third parties are required to protect the confidentiality and security of this information and to use it only for its intended purpose.
We may share information with our affiliates to service your account or to provide you with information about other BlackRock products or services that may be of interest to you. In addition, BlackRock restricts access to non-public personal information about its Clients to those BlackRock employees with a legitimate business need for the information. BlackRock maintains physical, electronic and procedural safeguards that are designed to protect the non-public personal information of its Clients, including procedures relating to the proper storage and disposal of such information.
|
|
|
|
|
|
|
|
|
42 |
BLACKROCK INTERNATIONAL INDEX FUND |
DECEMBER 31, 2011 |
|
|
|
|
BlackRock offers a diverse lineup of open-end mutual funds crossing all investment styles and managed by experts in equity, fixed income and tax-exempt investing.
|
|
|
Equity Funds |
|
|
|
BlackRock ACWI ex-US Index Fund |
|
BlackRock All-Cap Energy & Resources Portfolio |
|
BlackRock Asset Allocation Portfolio† |
|
BlackRock Balanced Capital Fund† |
|
BlackRock Basic Value Fund |
|
BlackRock Capital Appreciation Fund |
|
BlackRock China Fund |
|
BlackRock Commodity Strategies Fund |
|
BlackRock Emerging Markets Long/Short Equity Fund |
|
BlackRock Energy & Resources Portfolio |
|
BlackRock Equity Dividend Fund |
|
BlackRock EuroFund |
|
BlackRock Focus Growth Fund |
|
BlackRock Global Allocation Fund† |
|
BlackRock Global Dividend Income Portfolio |
|
BlackRock Global Dynamic Equity Fund |
|
BlackRock Global Emerging Markets Fund |
|
BlackRock Global Opportunities Portfolio |
|
BlackRock Global SmallCap Fund |
|
BlackRock Health Sciences Opportunities Portfolio |
|
BlackRock Index Equity Portfolio |
|
BlackRock India Fund |
|
BlackRock International Fund |
|
BlackRock International Index Fund |
|
BlackRock International Opportunities Portfolio |
|
BlackRock Large Cap Core Fund |
|
BlackRock Large Cap Core Plus Fund |
|
BlackRock Large Cap Growth Fund |
|
BlackRock Large Cap Value Fund |
|
BlackRock Latin America Fund |
|
BlackRock Mid-Cap Growth Equity Portfolio |
|
BlackRock Mid-Cap Value Equity Portfolio |
|
BlackRock Mid Cap Value Opportunities Fund |
|
BlackRock Natural Resources Trust |
|
BlackRock Pacific Fund |
|
BlackRock Russell 1000 Index Fund |
|
BlackRock Science & Technology Opportunities Portfolio |
|
BlackRock Small Cap Growth Equity Portfolio |
|
BlackRock Small Cap Growth Fund II |
|
BlackRock Small Cap Index Fund |
|
BlackRock S&P 500 Index Fund |
|
BlackRock S&P 500 Stock Fund |
|
BlackRock U.S. Opportunities Portfolio |
|
BlackRock Value Opportunities Fund |
|
BlackRock World Gold Fund |
|
|
|
|
|
Fixed Income Funds |
|
|
|
BlackRock Bond Index Fund |
|
BlackRock Core Bond Portfolio |
|
BlackRock Emerging Market Debt Portfolio |
|
BlackRock Floating Rate Income Portfolio |
|
BlackRock Global Long/Short Credit Fund |
|
BlackRock GNMA Portfolio |
|
BlackRock High Yield Bond Portfolio |
|
BlackRock Inflation Protected Bond Portfolio |
|
BlackRock International Bond Portfolio |
|
BlackRock Long Duration Bond Portfolio |
|
BlackRock Low Duration Bond Portfolio |
|
BlackRock Multi-Asset Income Portfolio† |
|
BlackRock Multi-Sector Bond Portfolio |
|
BlackRock Strategic Income Opportunities Portfolio |
|
BlackRock Total Return Fund |
|
BlackRock US Government Bond Portfolio |
|
BlackRock World Income Fund |
|
US Mortgage Portfolio |
|
|
|
|
|
Municipal Bond Funds |
|
|
|
BlackRock California Municipal Bond Fund |
|
BlackRock High Yield Municipal Fund |
|
BlackRock Intermediate Municipal Fund |
|
BlackRock National Municipal Fund |
|
BlackRock New Jersey Municipal Bond Fund |
|
BlackRock New York Municipal Bond Fund |
|
BlackRock Pennsylvania Municipal Bond Fund |
|
BlackRock Short-Term Municipal Fund |
|
|
|
|
|
Target Risk & Target Date Funds† |
|
|
|
BlackRock Prepared Portfolios |
|
Conservative Prepared Portfolio |
|
Moderate Prepared Portfolio |
|
Growth Prepared Portfolio |
|
Aggressive Growth Prepared Portfolio |
|
BlackRock Lifecycle Prepared Portfolios |
|
2015 |
|
2020 |
|
2025 |
|
2030 |
|
2035 |
|
2040 |
|
2045 |
|
2050 |
|
LifePath Portfolios |
|
Retirement |
|
2020 |
|
2025 |
|
2030 |
|
2035 |
|
2040 |
|
2045 |
|
2050 |
|
2055 |
|
LifePath Index Portfolios |
|
Retirement |
|
2020 |
|
2025 |
|
2030 |
|
2035 |
|
2040 |
|
2045 |
|
2050 |
|
2055 |
|
|
|
|
† |
Mixed asset fund. |
BlackRock mutual funds are currently distributed by BlackRock Investments, LLC. You should consider the investment objectives, risks, charges and expenses of the funds under consideration carefully before investing. Each fund’s prospectus contains this and other information and is available at www.blackrock.com or by calling (800) 441-7762 or from your financial advisor. The prospectus should be read carefully before investing.
|
|
|
|
|
|
|
|
|
|
|
|
BLACKROCK INTERNATIONAL INDEX FUND |
DECEMBER 31, 2011 |
43 |
This report is transmitted to shareholders only. It is not authorized for use as an offer of sale or a solicitation of an offer to buy shares of the Fund unless accompanied or preceded by the Fund’s current prospectus. Past performance results shown in this report should not be considered a representation of future performance. Investment returns and principal value of shares will fluctuate so that shares, when redeemed, may be worth more or less than their original cost. Statements and other information herein are as dated and are subject to change. Please see the Fund’s prospectus for a description of risks associated with global investments.
|
|
|
|
|
|
|
|
|
|
#Index 2-12/11-AR |
|


|
|
|
|
|
December 31, 2011 |

|
|
|
|
|
Annual Report |
|
|
|
|
|
BlackRock S&P 500 Index Fund | of BlackRock Index Funds, Inc. |
|
|
|
|
Not FDIC Insured § No Bank Guarantee § May Lose Value |
|
|
|
|
|
|
|
|
Table of Contents |
|
|
|
|
|
|
Page |
|
|
|
|
3 |
|
|
Annual Report: |
|
|
4 |
|
|
6 |
|
|
6 |
|
|
Fund Financial Statements: |
|
|
7 |
|
|
8 |
|
|
9 |
|
|
10 |
|
|
11 |
|
|
Fund Report of Independent Registered Public Accounting Firm |
14 |
|
14 |
|
|
15 |
|
|
Series Financial Statements: |
|
|
16 |
|
|
23 |
|
|
24 |
|
|
25 |
|
|
26 |
|
|
27 |
|
|
Series Report of Independent Registered Public Accounting Firm |
31 |
|
32 |
|
|
35 |
|
|
38 |
|
|
|
|
|
|
|
|
|
|
|
2 |
|
BLACKROCK S&P 500 INDEX FUND |
DECEMBER 31, 2011 |
|
|
|
|
Investors endured a very difficult environment in 2011. Financial markets were extremely volatile as a number of high-profile global events drove frequent about-face changes in investor sentiment. As the year progressed, news flow increasingly influenced trading decisions, to the point where company fundamentals were largely ignored. In the end, lower-risk assets won the “risk on — risk off” trading tug-of-war that characterized 2011’s market activity.
Early in the year, political turmoil swept across the Middle East/North Africa region and prices of oil and other commodities soared. Natural disasters in Japan disrupted global supply chains and concerns mounted regarding US debt and deficit issues. Nevertheless, equities, commodities and high yield bonds outpaced the less risky asset classes as investors chose to focus on the continuing stream of strong corporate earnings and positive economic data.
Markets reversed sharply in May, however, when the heightened possibility of Greece defaulting on its debt rekindled fears about sovereign debt problems spreading across Europe. Concurrently, economic indicators signaled that the recovery had slowed in the United States and other developed nations. Confidence was further shaken by the prolonged debt ceiling debate in Washington, DC. On August 5th, Standard & Poor’s downgraded the US government’s credit rating and turmoil erupted in financial markets around the world. Extraordinary levels of volatility persisted in the months that followed as Greece teetered on the brink of default, debt problems escalated in Italy and Spain, and exposure to European sovereign bonds stressed banks globally. Late in the summer, economic data out of the United States and Europe grew increasingly bleak while China and other emerging economies began to show signs of slowing growth. By the end of the third quarter, equity markets had fallen nearly 20% from their April peak while safe-haven assets such as US Treasuries and gold had rallied to historical highs.
October brought enough positive economic data to assuage fears of a global double-dip recession. Additionally, after months of deliberation, European leaders began to show signs of progress toward stemming the region’s debt crisis. These encouraging developments brought investors back from the sidelines and risk assets rallied through the month. However, a lack of definitive details about Europe’s rescue plan soon raised doubts among investors and thwarted the rally at the end of October. The last two months of the year saw political instability in Greece, unsustainable yields on Italian bonds, and US policymakers bickering over budget issues. Global central bank actions and improving economic data energized investors, but confidence was easily tempered by sobering news flow that resurrected uncertainty about the ability of Europe’s leaders to ultimately contain the debt crisis.
Most equity markets failed to fully recover their late-summer losses, although US large cap stocks managed to finish the year with a marginal gain given their perceived safety and stronger US economic data. Conditions were worse overseas, and international markets experienced some significant downturns. Dividend-paying stocks performed relatively well as investors sought yield in the low interest rate environment. Fixed income securities benefited from declining yields and delivered positive returns for the year. US Treasury bonds outperformed other fixed income classes despite their quality rating downgrade, while municipal bonds also delivered superior results. Continued low short-term interest rates kept yields on money market securities near their all-time lows.
Many of the themes that caused uncertainty in 2011 are likely to persist well into 2012. While the investment landscape appears treacherous, BlackRock is working for you. We have a roadmap to show you the way.
Sincerely,

Rob Kapito
President, BlackRock
Advisors, LLC

“While the investment landscape appears treacherous, BlackRock is working for you. We have a roadmap to show you the way.”
Rob Kapito
President, BlackRock Advisors, LLC
|
|
|
|
|
|
|
|
|
|
|
|
|
|
|
|
|
|
|
Total Returns as of December 31, 2011 |
|
|
|
|
|
|
|
|
|
|
|
|
|
|
|
|
|
|
|
6-month |
|
12-month |
|
||
|
US large cap equities |
|
|
(3.69 |
)% |
|
2.11 |
% |
|
(S&P 500® Index) |
|
|
|
|
|
|
|
|
US small cap equities |
|
|
(9.77 |
) |
|
(4.18 |
) |
|
(Russell 2000® Index) |
|
|
|
|
|
|
|
|
International equities |
|
|
(16.31 |
) |
|
(12.14 |
) |
|
(MSCI Europe, Australasia, |
|
|
|
|
|
|
|
|
Far East Index) |
|
|
|
|
|
|
|
|
Emerging market |
|
|
(19.13 |
) |
|
(18.42 |
) |
|
equities (MSCI Emerging |
|
|
|
|
|
|
|
|
Markets Index) |
|
|
|
|
|
|
|
|
3-month Treasury |
|
|
0.02 |
|
|
0.10 |
|
|
bill (BofA Merrill Lynch |
|
|
|
|
|
|
|
|
3-Month Treasury |
|
|
|
|
|
|
|
|
Bill Index) |
|
|
|
|
|
|
|
|
US Treasury securities |
|
|
13.46 |
|
|
17.15 |
|
|
(BofA Merrill Lynch 10- |
|
|
|
|
|
|
|
|
Year US Treasury Index) |
|
|
|
|
|
|
|
|
US investment grade |
|
|
4.98 |
|
|
7.84 |
|
|
bonds (Barclays |
|
|
|
|
|
|
|
|
Capital US Aggregate |
|
|
|
|
|
|
|
|
Bond Index) |
|
|
|
|
|
|
|
|
Tax-exempt municipal |
|
|
5.78 |
|
|
10.62 |
|
|
bonds (S&P Municipal |
|
|
|
|
|
|
|
|
Bond Index) |
|
|
|
|
|
|
|
|
US high yield bonds |
|
|
(0.02 |
) |
|
4.96 |
|
|
(Barclays Capital US |
|
|
|
|
|
|
|
|
Corporate High Yield 2% |
|
|
|
|
|
|
|
|
Issuer Capped Index) |
|
|
|
|
|
|
|
|
|
|
Past performance is no guarantee of future results. Index performance is shown for illustrative purposes only. You cannot invest directly in an index. |
|
|
|
|
|
|
|
|
|
|
|
|
THIS PAGE NOT PART OF YOUR FUND REPORT |
3 |
|
|
|
|
|
|
|
BlackRock S&P 500 Index Fund |
|
|
|
|
|
Investment Objective |
||
|
|
||
|
BlackRock S&P 500 Index Fund’s (the “Fund”), a series of BlackRock Index Funds, Inc. (the “Corporation”), investment objective is to match the performance of the Standard & Poor’s (“S&P”) 500® Index as closely as possible before the deduction of Fund expenses. |
||
|
|
|
|
|
Portfolio Management Commentary |
||
|
|
|
|
|
|
How did the Fund perform? |
|
|
|
|
|
|
• |
For the 12 months ended December 31,2011,Institutional and Investor A Shares of the Fund returned 1.80% and 1.58%, respectively, while the benchmark S&P 500® Index returned 2.11% for the same period. The S&P 500® Index is an unmanaged index that covers 500 industrial, utility, transportation and financial companies of the US markets (mostly New York Stock Exchange (“NYSE”) issues), representing 75% of NYSE market capitalization and 30% of NYSE issues. |
|
|
|
|
|
|
• |
Returns for the Fund’s respective share classes differ from the benchmark index based on individual share-class expenses. The Fund invests all of its assets in Master S&P 500 Index Series (the “Series”), a series of Quantitative Master Series LLC. |
|
|
|
|
|
|
|
Describe the market environment. |
|
|
|
|
|
|
• |
Early in the year, stocks moved unevenly higher despite political upheaval spreading across the Middle East/North Africa region and a sharp rise in oil and other commodity prices. March brought devastating natural disasters in Japan, resulting in global supply chain disruptions. But equity markets were remarkably resilient as the global economic recovery appeared to be on track and investors were gradually increasing their appetite for risk. After peaking in late April, equities were met with a sharp reversal when the heightened possibility of Greece defaulting on its debt rekindled fears about the potential impact of the sovereign debt crisis spreading in Europe. In the United States, a prolonged debt ceiling debate ultimately led to Standard & Poor’s decision to downgrade the US government’s credit rating in early August. This announcement spurred one of the most volatile periods in trading history. Stock markets across the world whip-sawed on hopes and fears driven by news flow. Equities swooned as debt problems in Europe spread to Italy and Spain, and global economic indicators grew increasingly bleak. |
|
|
|
|
|
|
• |
US stocks staged a strong rebound in October as the domestic labor market improved and corporate profits continued to beat analysts’ expectations. Encouraging news from Europe also contributed to the rally. After months of deliberation, European leaders agreed upon a new plan to reduce Greece’s debt burden, recapitalize the region’s banks and increase the size of the euro-zone bailout fund. However, a lack of definitive details about the rescue plan soon raised doubts among investors and thwarted the rally at the end of October. In November, political instability in Greece and Italy fueled uncertainty as to whether Europe’s leaders would be able to contain the crisis. In the United States, bickering lawmakers failed to reach an agreement on reducing the US budget deficit, further undermining investors’ confidence in policymakers on both sides of the Atlantic. Market volatility softened in December with the support of global central bank actions and continued improvement in economic data. |
|
|
|
|
|
|
• |
For the year, US stocks outperformed most international markets given their relative safety during a time of heightened uncertainty overseas. Dividend-paying stocks performed particularly well as investors sought yield in a low interest rate environment. From a sector perspective, utilities (+19.91%) led the index for 2011. The defensive consumer staples sector (+13.99%) performed well amid high volatility, as did health care stocks (+12.73%), which benefited from increased merger and acquisition activity during the year. Battered by the world’s debt problems, financials (–17.06%) saw the largest losses. The more cyclical materials (–9.75%) and industrials (–0.59%) sectors also declined amid heightened uncertainty about the global economy. |
|
|
|
|
|
|
|
Describe recent portfolio activity. |
|
|
|
|
|
|
• |
During the 12-month period, as changes were made to the composition of the S&P 500® Index, the Series purchased and sold securities to maintain its objective of replicating the risks and return of the benchmark index. |
|
|
|
|
|
|
|
Describe portfolio positioning at period end. |
|
|
|
|
|
|
• |
The Series remains positioned to match the risk characteristics of its benchmark index, irrespective of the market’s future direction. |
|
|
|
|
|
|
|
|
The views expressed reflect the opinions of BlackRock as of the date of this report and are subject to change based on changes in market, economic or other conditions. These views are not intended to be a forecast of future events and are no guarantee of future results. |
|
|
|
|
|
Derivative Financial Instruments |
||
|
|
||
|
The Series may invest in various derivative financial instruments, including financial futures contracts as specified in Note 2 of the Series’ Notes to Financial Statements, which may constitute forms of economic leverage. Such derivative financial instruments are used to obtain exposure to a market without owning or taking physical custody of securities or to hedge market and/or equity risks. Derivative financial instruments involve risks, including the imperfect correlation between the value of a derivative financial instrument and the underlying asset or illiquidity of the derivative financial instrument. The Series’ ability to use a derivative financial instrument successfully depends on the investment advisor’s ability to predict pertinent market movements accurately, which cannot be assured. The use of derivative financial instruments may result in losses greater than if they had not been used, may require the Series to sell or purchase portfolio investments at inopportune times or for distressed values, may limit the amount of appreciation the Series can realize on an investment or may cause the Series to hold an investment that it might otherwise sell. The Series’ investments in these instruments are discussed in detail in the Series’ Notes to Financial Statements. |
||
|
|
|
|
|
|
|
|
|
|
|
4 |
|
BLACKROCK S&P 500 INDEX FUND |
DECEMBER 31, 2011 |
|
|
|
|
|
|
|
Total Return Based on a $10,000 Investment |
|
|
|
|
|
|
|
|
|
|
|
|
|
|
1 |
Assuming transaction costs and other operating expenses, including investment advisory fees and administration fees, if any. |
|
|
|
|
|
|
2 |
The Fund invests all of its assets in the Series. The Series’ investments are allocated among common stocks in approximately the same weightings as the S&P 500® Index. |
|
|
|
|
|
|
3 |
This unmanaged index covers 500 industrial, utility, transportation and financial companies of the US markets (mostly NYSE), representing about 75% of NYSE market capitalization and 30% of NYSE issues. |
|
|
|
|
|
Performance Summary for the Period Ended December 31, 2011 |
||
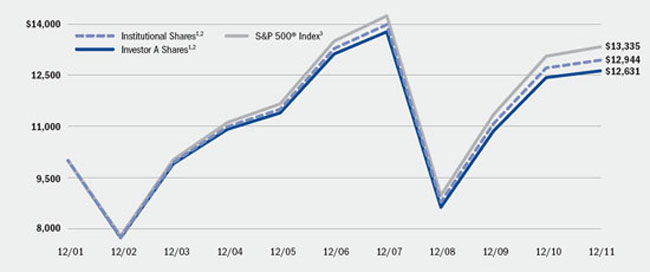
|
|
|
|
|
|
|
|
|
|
|
|
|
|
|
|
|
|
|
|
Average Annual Total Returns4 |
|
||||||||
|
|
|
6-Month |
|
1 Year |
|
5 Years |
|
10 Years |
|
||||
|
Institutional |
|
(3.83 |
)% |
|
1.80 |
% |
|
(0.52 |
)% |
|
2.61 |
% |
|
|
Investor A |
|
(3.98 |
) |
|
1.58 |
|
|
(0.77 |
) |
|
2.36 |
|
|
|
S&P 500® Index |
|
(3.69 |
) |
|
2.11 |
|
|
(0.25 |
) |
|
2.92 |
|
|
|
|
|
|
|
|
4 |
Average annual total returns reflect reductions for service fees. See “About Fund Performance” on page 6 for a detailed description of share classes, including any related fees. Past performance is not indicative of future results. |
|
|
|
|
|
|
|
|
|
|
|
|
BLACKROCK S&P 500 INDEX FUND |
DECEMBER 31, 2011 |
5 |
|
|
|
|
|
|
|
|
|
|
|
|
|
• |
Institutional Shares are not subject to any sales charge. These shares bear no ongoing distribution or service fees and are available only to eligible investors. |
|
|
|
|
• |
Investor A Shares are not subject to any sales charge and bear no ongoing distribution fee. These shares are subject to an ongoing service fee of 0.25% per year. |
Performance information reflects past performance and does not guarantee future results. Current performance may be lower or higher than the performance data quoted. Refer to www.blackrock.com/funds to obtain performance data current to the most recent month end. Performance results do not reflect the deduction of taxes that a shareholder would pay on Fund distributions or the redemption of Fund shares. Figures shown in the performance table on the previous page assume reinvestment of all dividends and capital gain distributions, if any, at net asset value (“NAV”) on the ex-dividend date. Investment return and principal value of shares will fluctuate so that shares, when redeemed, may be worth more or less than their original cost. Dividends paid to each class of shares will vary because of the different levels of service and transfer agency fees applicable to each class, which are deducted from the income available to be paid to shareholders. The Fund’s administrator waived a portion of its fee. Without such waiver, the Fund’s performance would have been lower.
|
|
|
|
Shareholders of the Fund may incur the following charges: (a) expenses related to transactions, including exchange fees; and (b) operating expenses, including administration fees, service fees, including 12b-1 fees, and other Fund expenses. The expense example shown below (which is based on a hypothetical investment of $1,000 invested on July 1, 2011 and held through December 31, 2011) is intended to assist shareholders both in calculating expenses based on an investment in the Fund and in comparing these expenses with similar costs of investing in other mutual funds.
The table provides information about actual account values and actual expenses. In order to estimate the expenses a shareholder paid during the period covered by this report, shareholders can divide their account value by $1,000 and then multiply the result by the number corresponding to their share class under the heading entitled “Expenses Paid During the Period.”
The table also provides information about hypothetical account values and hypothetical expenses based on the Fund’s actual expense ratio and an assumed rate of return of 5% per year before expenses. In order to assist shareholders in comparing the ongoing expenses of investing in this Fund and other funds, compare the 5% hypothetical example with the 5% hypothetical examples that appear in other funds’ shareholder reports.
The expenses shown in the table are intended to highlight shareholders’ ongoing costs only and do not reflect any transactional expenses, such as sales charges or exchange fees, if any. Therefore, the hypothetical example is useful in comparing ongoing expenses only, and will not help shareholders determine the relative total expenses of owning different funds. If these transactional expenses were included, shareholder expenses would have been higher.
|
|
|
Expense Example |
|
|
|
|
|
|
|
|
|
|
|
|
|
|
|
|
|
|
|
|
Actual |
|
Hypothetical2 |
|
|
|
||||||||
|
|
|
Beginning |
|
Ending |
|
Expenses
Paid |
|
Beginning |
|
Ending |
|
Expenses
Paid |
|
Annualized |
|
|
Institutional |
|
$1,000.00 |
|
$961.70 |
|
$1.53 |
|
$1,000.00 |
|
$1,023.64 |
|
$1.58 |
|
0.31% |
|
|
Investor A |
|
$1,000.00 |
|
$960.20 |
|
$2.82 |
|
$1,000.00 |
|
$1,022.33 |
|
$2.91 |
|
0.57% |
|
|
|
|
|
|
|
1 |
For each class of the Fund, expenses are equal to the annualized expense ratio for the class, multiplied by the average account value over the period, multiplied by 184/365 (to reflect the one-half year period shown). Because the Fund is a feeder fund, the expense table example reflects the expenses of both the Fund and the Series in which it invests. Expenses are net of waiver. |
|
|
||
|
|
2 |
Hypothetical 5% annual return before expenses is calculated by pro rating the number of days in the most recent fiscal half year divided by 365. |
|
|
|
|
|
|
|
|
|
|
|
6 |
|
BLACKROCK S&P 500 INDEX FUND |
DECEMBER 31, 2011 |
|
|
|
|
|
|
|
BlackRock S&P 500 Index Fund |
|
|
|
|
|
|
|
Assets |
|
|
|
|
|
Investments at value — Series (cost — $1,404,199,070) |
|
$ |
1,773,233,951 |
|
|
Withdrawals receivable from the Series |
|
|
9,297,113 |
|
|
Capital shares sold receivable |
|
|
4,845,455 |
|
|
Prepaid expenses |
|
|
2,227 |
|
|
Total assets |
|
|
1,787,378,746 |
|
|
|
|
|
|
|
|
Liabilities |
|
|
|
|
|
Capital shares redeemed payable |
|
|
14,142,568 |
|
|
Administration fees payable |
|
|
292,319 |
|
|
Service fees payable |
|
|
146,701 |
|
|
Officer’s fees payable |
|
|
243 |
|
|
Other accrued expenses payable |
|
|
292,936 |
|
|
Total liabilities |
|
|
14,874,767 |
|
|
Net Assets |
|
$ |
1,772,503,979 |
|
|
|
|
|
|
|
|
Net Assets Consist of |
|
|
|
|
|
Paid-in capital |
|
$ |
1,579,515,138 |
|
|
Undistributed net investment income |
|
|
463,110 |
|
|
Accumulated net realized loss allocated from the Series |
|
|
(176,509,150 |
) |
|
Net unrealized appreciation/depreciation allocated from the Series |
|
|
369,034,881 |
|
|
Net Assets |
|
$ |
1,772,503,979 |
|
|
|
|
|
|
|
|
Net Asset Value |
|
|
|
|
|
Institutional — Based on net assets of $1,059,688,755 and 68,992,482 shares outstanding, 250 million shares authorized, $0.0001 par value |
|
$ |
15.36 |
|
|
Investor A — Based on net assets of $712,815,224 and 46,481,722 shares outstanding, 250 million shares authorized, $0.0001 par value |
|
$ |
15.34 |
|
|
|
|
|
|
|
|
|
|
|
|
|
BLACKROCK S&P 500 INDEX FUND |
DECEMBER 31, 2011 |
7 |
|
|
|
|
|
|
|
BlackRock S&P 500 Index Fund |
|
|
|
|
|
|
|
Investment Income |
|
|
|
|
|
Net investment income allocated from the Series: |
|
|
|
|
|
Dividends — unaffiliated |
|
$ |
37,466,295 |
|
|
Dividends — affiliated |
|
|
208,957 |
|
|
Securities lending — affiliated |
|
|
233,300 |
|
|
Foreign taxes withheld |
|
|
(33,345 |
) |
|
Expenses |
|
|
(735,084 |
) |
|
Fees waived |
|
|
99,579 |
|
|
Total income |
|
|
37,239,702 |
|
|
|
|
|
|
|
|
Expenses |
|
|
|
|
|
Administration |
|
|
3,520,480 |
|
|
Service — Investor A |
|
|
1,847,320 |
|
|
Transfer agent — Institutional |
|
|
620,681 |
|
|
Transfer agent — Investor A |
|
|
487,024 |
|
|
Printing |
|
|
108,925 |
|
|
Licensing |
|
|
74,416 |
|
|
Registration |
|
|
71,397 |
|
|
Professional |
|
|
29,780 |
|
|
Officer |
|
|
984 |
|
|
Miscellaneous |
|
|
16,340 |
|
|
Total expenses |
|
|
6,777,347 |
|
|
Less fees waived by administrator — class specific |
|
|
(808 |
) |
|
Total expenses after fees waived |
|
|
6,776,539 |
|
|
Net investment income |
|
|
30,463,163 |
|
|
|
|
|
|
|
|
Realized and Unrealized Gain (Loss) Allocated from the Series |
|
|
|
|
|
Net realized gain from investments and financial futures contracts |
|
|
10,124,645 |
|
|
Net change in unrealized appreciation/depreciation on investments and financial futures contracts |
|
|
(7,501,223 |
) |
|
Total realized and unrealized gain |
|
|
2,623,422 |
|
|
Net Increase in Net Assets Resulting from Operations |
|
$ |
33,086,585 |
|
|
|
|
|
|
|
|
|
|
|
|
8 |
|
BLACKROCK S&P 500 INDEX FUND |
DECEMBER 31, 2011 |
|
|
|
|
|
|
|
|
|
|
BlackRock S&P 500 Index Fund |
|
|
|
|
|
|
|
|
|
|
|
|
Year
Ended |
|
||||
|
Increase (Decrease) in Net Assets: |
|
2011 |
|
2010 |
|
||
|
Operations |
|
|
|
|
|
|
|
|
Net investment income |
|
$ |
30,463,163 |
|
$ |
27,377,084 |
|
|
Net realized gain |
|
|
10,124,645 |
|
|
14,775,569 |
|
|
Net change in unrealized appreciation/depreciation |
|
|
(7,501,223 |
) |
|
187,677,017 |
|
|
Net increase in net assets resulting from operations |
|
|
33,086,585 |
|
|
229,829,670 |
|
|
|
|
|
|
|
|
|
|
|
Dividends to Shareholders From |
|
|
|
|
|
|
|
|
Net investment income: |
|
|
|
|
|
|
|
|
Institutional |
|
|
(19,464,643 |
) |
|
(17,049,427 |
) |
|
Investor A |
|
|
(11,312,293 |
) |
|
(10,565,502 |
) |
|
Decrease in net assets resulting from dividends to shareholders |
|
|
(30,776,936 |
) |
|
(27,614,929 |
) |
|
|
|
|
|
|
|
|
|
|
Capital Share Transactions |
|
|
|
|
|
|
|
|
Net increase (decrease) in net assets derived from capital share transactions |
|
|
9,550,070 |
|
|
(98,558,385 |
) |
|
|
|
|
|
|
|
|
|
|
Net Assets |
|
|
|
|
|
|
|
|
Total increase in net assets |
|
|
11,859,719 |
|
|
103,656,356 |
|
|
Beginning of year |
|
|
1,760,644,260 |
|
|
1,656,987,904 |
|
|
End of year |
|
$ |
1,772,503,979 |
|
$ |
1,760,644,260 |
|
|
Undistributed net investment income |
|
$ |
463,110 |
|
$ |
776,883 |
|
|
|
|
|
|
|
See Notes to Financial Statements. |
|
|
|
|
|
|
|
|
|
|
BLACKROCK S&P 500 INDEX FUND |
DECEMBER 31, 2011 |
9 |
|
|
|
|
|
|
|
|
|
|
BlackRock S&P 500 Index Fund |
|
|
|
|
|
|
|
|
|
|
|
|
|
|
|
|
|
|
|
|
|
|
|
|
|
|
|
|
|
|
|
|
|
|
|
|
Institutional |
|
Investor A |
|
||||||||||||||||||||||||||
|
|
|
Year Ended December 31, |
|
Year Ended December 31, |
|
||||||||||||||||||||||||||
|
|
|
2011 |
|
2010 |
|
2009 |
|
2008 |
|
2007 |
|
2011 |
|
2010 |
|
2009 |
|
2008 |
|
2007 |
|
||||||||||
|
Per Share Operating Performance |
|
||||||||||||||||||||||||||||||
|
Net asset value, beginning of year |
|
$ |
15.38 |
|
$ |
13.63 |
|
$ |
11.00 |
|
$ |
18.01 |
|
$ |
17.40 |
|
$ |
15.35 |
|
$ |
13.61 |
|
$ |
10.98 |
|
$ |
17.96 |
|
$ |
17.36 |
|
|
Net investment income1 |
|
|
0.28 |
|
|
0.24 |
|
|
0.23 |
|
|
0.31 |
|
|
0.30 |
|
|
0.24 |
|
|
0.21 |
|
|
0.20 |
|
|
0.27 |
|
|
0.25 |
|
|
Net realized and unrealized gain (loss) |
|
|
(0.01 |
) |
|
1.77 |
|
|
2.64 |
|
|
(7.01 |
) |
|
0.62 |
|
|
(0.01 |
) |
|
1.75 |
|
|
2.64 |
|
|
(6.98 |
) |
|
0.61 |
|
|
Net increase (decrease) from investment operations |
|
|
0.27 |
|
|
2.01 |
|
|
2.87 |
|
|
(6.70 |
) |
|
0.92 |
|
|
0.23 |
|
|
1.96 |
|
|
2.84 |
|
|
(6.71 |
) |
|
0.86 |
|
|
Dividends from net investment income |
|
|
(0.29 |
) |
|
(0.26 |
) |
|
(0.24 |
) |
|
(0.31 |
) |
|
(0.31 |
) |
|
(0.24 |
) |
|
(0.22 |
) |
|
(0.21 |
) |
|
(0.27 |
) |
|
(0.26 |
) |
|
Net asset value, end of year |
|
$ |
15.36 |
|
$ |
15.38 |
|
$ |
13.63 |
|
$ |
11.00 |
|
$ |
18.01 |
|
$ |
15.34 |
|
$ |
15.35 |
|
$ |
13.61 |
|
$ |
10.98 |
|
$ |
17.96 |
|
|
|
|
|
|
|
|
|
|
|
|
|
|
|
|
|
|
|
|
|
|
|
|
|
|
|
|
|
|
|
|
|
|
|
Total Investment Return2 |
|
||||||||||||||||||||||||||||||
|
Based on net asset value |
|
|
1.80 |
% |
|
14.75 |
% |
|
26.15 |
% |
|
(37.20 |
)% |
|
5.29 |
% |
|
1.58 |
% |
|
14.42 |
% |
|
25.92 |
% |
|
(37.36 |
)% |
|
4.97 |
% |
|
|
|
|
|
|
|
|
|
|
|
|
|
|
|
|
|
|
|
|
|
|
|
|
|
|
|
|
|
|
|
|
|
|
Ratios to Average Net Assets3 |
|
||||||||||||||||||||||||||||||
|
Total expenses |
|
|
0.30 |
%4 |
|
0.33 |
% |
|
0.35 |
% |
|
0.35 |
% |
|
0.34 |
% |
|
0.56 |
%4 |
|
0.58 |
% |
|
0.61 |
% |
|
0.60 |
% |
|
0.60 |
% |
|
Net investment income |
|
|
1.80 |
%4 |
|
1.74 |
% |
|
2.02 |
% |
|
2.00 |
% |
|
1.64 |
% |
|
1.53 |
%4 |
|
1.49 |
% |
|
1.76 |
% |
|
1.75 |
% |
|
1.38 |
% |
|
|
|
|
|
|
|
|
|
|
|
|
|
|
|
|
|
|
|
|
|
|
|
|
|
|
|
|
|
|
|
|
|
|
Supplemental Data |
|
||||||||||||||||||||||||||||||
|
Net assets, end of year (000) |
|
$ |
1,059,689 |
|
$ |
1,018,080 |
|
$ |
951,380 |
|
$ |
813,527 |
|
$ |
1,779,030 |
|
$ |
712,815 |
|
$ |
742,564 |
|
$ |
705,608 |
|
$ |
579,920 |
|
$ |
930,377 |
|
|
Portfolio turnover of the Series |
|
|
6 |
% |
|
5 |
% |
|
7 |
% |
|
8 |
% |
|
4 |
% |
|
6 |
% |
|
5 |
% |
|
7 |
% |
|
8 |
% |
|
4 |
% |
|
|
|
|
|
|
1 |
Based on average shares outstanding. |
|
|
|
|
|
|
2 |
Where applicable, total investment returns include the reinvestment of dividends and distributions. |
|
|
|
|
|
|
3 |
Includes the Fund’s share of the Series’ allocated expenses and/or net investment income. |
|
|
|
|
|
|
4 |
Includes the Fund’s share of the Series’ allocated fees waived of less than 0.01%. |
|
|
|
|
|
See Notes to Financial Statements. |
|
|
|
|
|
|
|
10 |
BLACKROCK S&P 500 INDEX FUND |
DECEMBER 31, 2011 |
|
|
|
|
|
|
|
|
|
|
BlackRock S&P 500 Index Fund |
1. Organization and Significant Accounting Policies:
BlackRock S&P 500 Index Fund (the “Fund”), a series of BlackRock Index Funds, Inc. (the “Corporation”), is registered under the Investment Company Act of 1940, as amended (the “1940 Act”), as a diversified, open-end management investment company. The Corporation is organized as a Maryland corporation. The Fund seeks to achieve its investment objective by investing all of its assets in Master S&P 500 Index Series (the “Series”), a series of Quantitative Master Series LLC, which has the same investment objective and strategies as the Fund. The value of the Fund’s investment in the Series reflects the Fund’s proportionate interest in the net assets of the Series. The percentage of the Series owned by the Fund at December 31, 2011 was 77.7%. The performance of the Fund is directly affected by the performance of the Series. The financial statements of the Series, including the Schedule of Investments, are included elsewhere in this report and should be read in conjunction with the Fund’s financial statements. The Fund’s financial statements are prepared in conformity with accounting principles generally accepted in the United States of America (“US GAAP”), which may require management to make estimates and assumptions that affect the reported amounts and disclosures in the financial statements. Actual results could differ from those estimates. The Fund offers two classes of shares. Institutional Shares are sold without a sales charge and only to certain eligible investors. Investor A Shares are sold without a front-end sales charge. Both classes of shares have identical voting, dividend, liquidation and other rights and the same terms and conditions, except that Investor A Shares bear certain expenses related to the shareholder servicing of such shares and have exclusive voting rights with respect to matters relating to its shareholder servicing expenditures.
The following is a summary of significant accounting policies followed by the Fund:
Valuation: US GAAP defines fair value as the price the Fund would receive to sell an asset or pay to transfer a liability in an orderly transaction between market participants at the measurement date. The Fund’s policy is to fair value its financial instruments at market value. The Fund records its investment in the Series at fair value based on the Fund’s proportionate interest in the net assets of the Series. Valuation of securities held by the Series is discussed in Note 1 of the Series’ Notes to Financial Statements, which are included elsewhere in this report.
Investment Transactions and Investment Income: For financial reporting purposes, contributions to and withdrawals from the Series are accounted on a trade date basis. The Fund records daily its proportionate share of the Series’ income, expenses and realized and unrealized gains and losses. Realized and unrealized gains and losses are adjusted for utilizing partnership tax allocation rules. In addition, the Fund accrues its own expenses. Income, expenses and realized and unrealized gains and losses are allocated daily to each class based on its relative net assets.
Dividends and Distributions: Dividends and distributions paid by the Fund are recorded on the ex-dividend dates. The amount and timing of dividends and distributions are determined in accordance with federal income tax regulations, which may differ from US GAAP.
Income Taxes: It is the Fund’s policy to comply with the requirements of the Internal Revenue Code of 1986, as amended, applicable to regulated investment companies and to distribute substantially all of its taxable income to its shareholders. Therefore, no federal income tax provision is required.
The Fund files US federal and various state and local tax returns. No income tax returns are currently under examination. The statute of limitations on the Fund’s US federal tax returns remains open for each of the four years ended December 31, 2011. The statutes of limitations on the Fund’s state and local tax returns may remain open for an additional year depending upon the jurisdiction. Management does not believe there are any uncertain tax positions that require recognition of a tax liability.
Recent Accounting Standard: In May 2011, the Financial Accounting Standards Board (the “FASB”) issued amended guidance to improve disclosure about fair value measurements which will require the following disclosures for fair value measurements categorized as Level 3: quantitative information about the unobservable inputs and assumptions used in the fair value measurement, a description of the valuation policies and procedures and a narrative description of the sensitivity of the fair value measurement to changes in unobservable inputs and the interrelationships between those unobservable inputs. In addition, the amounts and reasons for all transfers in and out of Level 1 and Level 2 will be required to be disclosed. The amended guidance is effective for financial statements for fiscal years beginning after December 15, 2011, and interim periods within those fiscal years. Management is evaluating the impact of this guidance on the Series’ financial statement disclosures.
In December 2011, the FASB issued guidance that will enhance current disclosure requirements on the offsetting of certain assets and liabilities. The new disclosures will be required for investments and derivative financial instruments subject to master netting agreements or similar agreements and will require an entity to disclose both gross and net information about such investments and transactions eligible for offset in the Statement of Assets and Liabilities. The guidance is effective for financial statements with fiscal years beginning on or after January 1, 2013, and interim periods within those fiscal years. Management is evaluating the impact of this guidance on the Series’ financial statement disclosures.
Other: Expenses directly related to the Fund or its classes are charged to the Fund or class. Other operating expenses shared by several funds are pro rated among those funds on the basis of relative net assets or other appropriate methods. Other expenses of the Fund are allocated daily to each class based on its relative net assets.
|
|
|
|
|
|
|
|||
|
|
|||
|
|
BLACKROCK S&P 500 INDEX FUND |
DECEMBER 31, 2011 |
11 |
|
|
|
|
|
|
|
|
|
|
Notes to Financial Statements (continued) |
BlackRock S&P 500 Index Fund |
2. Administration Agreement and Other Transactions with Affiliates:
The PNC Financial Services Group, Inc. (“PNC”) and Barclays Bank PLC (“Barclays”) are the largest stockholders of BlackRock, Inc. (“BlackRock”). Due to the ownership structure, PNC is an affiliate for 1940 Act purposes, but Barclays is not.
The Corporation, on behalf of the Fund, entered into an Administration Agreement with BlackRock Advisors, LLC (the “Administrator”), an indirect, wholly owned subsidiary of BlackRock, to provide administrative services (other than investment advice and related portfolio activities). For such services, the Fund pays the Administrator a monthly fee at an annual rate of 0.195% of the Fund’s average daily net assets. The Fund does not pay an investment advisory fee or investment management fee.
The Administrator voluntarily agreed to waive and/or reimburse fees or expenses, excluding interest expense, dividend expense, acquired fund fees and expenses and certain other Fund expenses, in order to limit expenses. The expense limitation as a percentage of average daily net assets is 0.40% for Institutional Shares and 0.65% for Investor A Shares. The Administrator may reduce or discontinue this waiver and/or reimbursement at any time without notice.
The Corporation, on behalf of the Fund, entered into a Distribution Agreement and Distribution Plan with BlackRock Investments, LLC (“BRIL”), an affiliate of BlackRock. Pursuant to the Distribution Plan and in accordance with Rule 12b-1 under the 1940 Act, the Fund pays BRIL ongoing service fees with respect to its Investor A Shares. The fees are accrued daily and paid monthly at an annual rate of 0.25% based upon the average daily net assets of Investor A Shares. Pursuant to sub-agreements with BRIL, broker-dealers and BRIL provide shareholder servicing and distribution services to the Fund. The ongoing service and/or distribution fee compensates BRIL and each broker-dealer for providing shareholder servicing and/or distribution related services to Investor A shareholders.
The Administrator maintains a call center, which is responsible for providing certain shareholder services to the Fund, such as responding to shareholder inquiries and processing transactions based upon instructions from shareholders with respect to the subscription and redemption of Fund shares. For the year ended December 31, 2011, the Fund reimbursed the Administrator the following amounts for costs incurred in running the call center, which are included in transfer agent — class specific in the Statement of Operations:
|
|
|
|
|
|
|
|
||||
|
Institutional |
|
$ |
3,892 |
|
|
Investor A |
|
$ |
8,705 |
|
Pursuant to written agreements, certain financial intermediaries, some of which may be affiliates, provide the Fund with sub-accounting, recordkeeping, sub-transfer agency and other administrative services with respect to sub-accounts they service. For these services, these entities receive an annual fee per shareholder account, which will vary depending on share class and/or net assets. For the year ended December 31, 2011, the Fund paid the following to affiliates in return for these services, which is included in transfer agent - class specific in the Statement of Operations:
|
|
|
|
|
|
|
Institutional |
|
$ |
2,929 |
|
|
Investor A |
|
$ |
3,207 |
|
Certain officers and/or directors of the Corporation are officers and/or directors of BlackRock or its affiliates. The Fund reimburses the Administrator for compensation paid to the Corporation’s Chief Compliance Officer.
3. Income Tax Information:
The tax character of distributions paid during the fiscal years ended December 31, 2011 and December 31, 2010 was as follows:
|
|
|
|
|
|
|
|
|
|
|
|
|
12/31/11 |
|
|
12/31/10 |
|
|
Ordinary income |
|
$ |
30,776,936 |
|
$ |
27,614,929 |
|
As of December 31, 2011, the tax components of accumulated net earnings were as follows:
|
|
|
|
|
|
|
Undistributed ordinary income |
|
$ |
463,110 |
|
|
Capital loss carryforwards |
|
|
(83,065,196 |
) |
|
Net unrealized gains1 |
|
|
275,686,016 |
|
|
Qualified late-year losses2 |
|
|
(95,089 |
) |
|
Total |
|
$ |
192,988,841 |
|
|
|
|
|
1 |
The difference between book-basis
and tax-basis net unrealized gains was attributable primarily to the timing
and recognition of partnership income. |
|
2 |
The Fund has elected to defer certain qualified late-year losses and recognize such losses in the year ending December 31, 2012. |
As of December 31, 2011, the Fund had capital loss carryforwards available to offset future realized capital gains through the indicated expiration dates as follows:
|
|
|
|
|
|
|
Expires December 31, |
|
|
|
|
|
2012 |
|
$ |
12,985,387 |
|
|
2013 |
|
|
28,402,088 |
|
|
2014 |
|
|
26,517,609 |
|
|
2017 |
|
|
14,948,603 |
|
|
No expiration date3 |
|
|
211,509 |
|
|
Total |
|
$ |
83,065,196 |
|
|
|
|
|
3 |
Must be utilized prior to losses subject to expiration. |
|
|
|
|
|
|
|
|||
|
12 |
|
BLACKROCK S&P 500 INDEX FUND |
DECEMBER 31, 2011 |
|
|
|
|
|
|
|
Notes to Financial Statements (concluded) |
BlackRock S&P 500 Index Fund |
4. Capital Share Transactions:
Transactions in capital shares for each class were as follows:
|
|
|
|
|
|
|
|
|
|
|
|
|
|
|
|
|
|
Year Ended |
|
Year Ended |
|
||||||||
|
|
|
|
Shares |
|
|
Amount |
|
|
Shares |
|
|
Amount |
|
|
Institutional |
|
|
|
|
|
|
|
|
|
|
|
|
|
|
Shares sold |
|
|
32,311,858 |
|
$ |
503,490,398 |
|
|
29,561,942 |
|
$ |
415,514,624 |
|
|
Shares issued to shareholders in reinvestment of dividends |
|
|
1,252,755 |
|
|
18,576,495 |
|
|
1,076,994 |
|
|
16,287,469 |
|
|
Shares redeemed |
|
|
(30,773,695 |
) |
|
(480,523,283 |
) |
|
(34,242,137 |
) |
|
(481,214,108 |
) |
|
Net increase (decrease) |
|
|
2,790,918 |
|
$ |
41,543,610 |
|
|
(3,603,201 |
) |
$ |
(49,412,015 |
) |
|
|
|||||||||||||
|
Investor A |
|
|
|
|
|
|
|
|
|
|
|
|
|
|
Shares sold |
|
|
11,381,733 |
|
$ |
176,069,705 |
|
|
9,986,596 |
|
$ |
139,337,943 |
|
|
Shares issued to shareholders in reinvestment of dividends |
|
|
706,429 |
|
|
10,464,979 |
|
|
646,756 |
|
|
9,759,878 |
|
|
Shares redeemed |
|
|
(13,975,275 |
) |
|
(218,528,224 |
) |
|
(14,119,788 |
) |
|
(198,244,191 |
) |
|
Net decrease |
|
|
(1,887,113 |
) |
$ |
(31,993,540 |
) |
|
(3,486,436 |
) |
$ |
(49,146,370 |
) |
Prior to April 1, 2011, there was a 2% redemption fee on shares redeemed or exchanged that have been held 30 days or less. The redemption fees were collected and retained by the Fund for the benefit of the remaining shareholders. The redemption fees were recorded as a credit to paid-in capital. Effective April 1, 2011, the redemption fee was terminated and is no longer charged by the Fund.
5. Subsequent Events:
Management has evaluated the impact of all subsequent events on the Fund through the date the financial statements were issued and has determined that there were no subsequent events requiring adjustment or additional disclosure in the financial statements.
|
|
|
|
|
|
|
|||
|
|
|||
|
|
BLACKROCK S&P 500 INDEX FUND |
DECEMBER 31, 2011 |
13 |
|
|
|
|
|
|
|
BlackRock S&P 500 Index Fund |
To the Shareholders of BlackRock S&P 500 Index Fund and Board of Directors of BlackRock Index Funds, Inc.:
We have audited the accompanying statement of assets and liabilities of BlackRock S&P 500 Index Fund, one of the series constituting BlackRock Index Funds, Inc. (the “Fund”), as of December 31, 2011, and the related statement of operations for the year then ended, the statements of changes in net assets for each of the two years in the period then ended, and the financial highlights for each of the five years in the period then ended. These financial statements and financial highlights are the responsibility of the Fund’s management. Our responsibility is to express an opinion on these financial statements and financial highlights based on our audits.
We conducted our audits in accordance with the standards of the Public Company Accounting Oversight Board (United States).Those standards require that we plan and perform the audit to obtain reasonable assurance about whether the financial statements and financial highlights are free of material misstatement.The Fund is not required to have, nor were we engaged to perform, an audit of its internal control over financial reporting. Our audits included consideration of internal control over financial reporting as a basis for designing audit procedures that are appropriate in the circumstances, but not for the purpose of expressing an opinion on the effectiveness of the Fund’s internal control over financial reporting. Accordingly, we express no such opinion. An audit also includes examining, on a test basis, evidence supporting the amounts and disclosures in the financial statements, assessing the accounting principles used and significant estimates made by management, as well as evaluating the overall financial statement presentation. We believe that our audits provide a reasonable basis for our opinion.
In our opinion, the financial statements and financial highlights referred to above present fairly, in all material respects, the financial position of BlackRock S&P 500 Index Fund of BlackRock Index Funds, Inc. as of December 31, 2011, the results of its operations for the year then ended, the changes in its net assets for each of the two years in the period then ended, and the financial highlights for each of the five years in the period then ended, in conformity with accounting principles generally accepted in the United States of America.
Deloitte
& Touche LLP
Boston, Massachusetts
February 27, 2012
|
|
|
|
|
|
All of the ordinary income distributions paid by BlackRock S&P 500 Index Fund of BlackRock Index Funds, Inc. during the fiscal year ended December 31, 2011 qualify for the dividends received deduction for corporations and consist entirely of qualified dividend income for individuals.
|
|
|
|
|
|
|
|||
|
14 |
|
BLACKROCK S&P 500 INDEX FUND |
DECEMBER 31, 2011 |
|
|
|
|
|
|
|
Master S&P 500 Index Series |
|
|
|
As of December 31, 2011 |
|
|
|
|
|
|
|
Ten Largest Holdings |
Percent
of |
|
||
|
Exxon Mobil Corp. |
|
|
4 |
% |
|
Apple, Inc. |
|
|
3 |
|
|
International Business Machines Corp. |
|
|
2 |
|
|
Chevron Corp. |
|
|
2 |
|
|
Microsoft Corp. |
|
|
2 |
|
|
General Electric Co. |
|
|
2 |
|
|
The Procter & Gamble Co. |
|
|
2 |
|
|
AT&T, Inc. |
|
|
2 |
|
|
Johnson & Johnson |
|
|
2 |
|
|
Pfizer, Inc. |
|
|
1 |
|
|
|
|
|
|
|
|
Sector Allocations |
Percent
of |
|
||
|
Information Technology |
|
|
19 |
% |
|
Financials |
|
|
13 |
|
|
Energy |
|
|
12 |
|
|
Health Care |
|
|
12 |
|
|
Consumer Staples |
|
|
12 |
|
|
Consumer Discretionary |
|
|
11 |
|
|
Industrials |
|
|
11 |
|
|
Utilities |
|
|
4 |
|
|
Materials |
|
|
3 |
|
|
Telecommunication Services |
|
|
3 |
|
|
|
|
|
|
For Series compliance purposes, the Series’ sector classifications refer to any one or more of the industry sub-classifications used by one or more widely recognized market indexes or rating group indexes, and/or as defined by Series management. These definitions may not apply for purposes of this report, which may combine such sector sub-classifications for reporting ease. |
|
|
|
|
|
|
|
|
|
|
|
|
BLACKROCK S&P 500 INDEX FUND |
DECEMBER 31, 2011 |
15 |
|
|
|
|
|
|
|
Master S&P 500 Index Series |
|
|
|
(Percentages shown are based on Net Assets) |
|
|
|
|
|
|
|
|
|
|
Common Stocks |
|
Shares |
|
Value |
|
||
|
Aerospace & Defense — 2.6% |
|
|
|
|
|
|
|
|
Boeing Co. |
|
|
147,728 |
|
$ |
10,835,849 |
|
|
General Dynamics Corp. |
|
|
70,808 |
|
|
4,702,359 |
|
|
Goodrich Corp. |
|
|
24,931 |
|
|
3,083,965 |
|
|
Honeywell International, Inc. |
|
|
153,780 |
|
|
8,357,943 |
|
|
L-3 Communications Holdings, Inc. |
|
|
19,889 |
|
|
1,326,199 |
|
|
Lockheed Martin Corp. |
|
|
52,760 |
|
|
4,268,284 |
|
|
Northrop Grumman Corp. |
|
|
52,132 |
|
|
3,048,679 |
|
|
Precision Castparts Corp. |
|
|
28,714 |
|
|
4,731,780 |
|
|
Raytheon Co. |
|
|
68,834 |
|
|
3,330,189 |
|
|
Rockwell Collins, Inc. |
|
|
30,087 |
|
|
1,665,917 |
|
|
Textron, Inc. |
|
|
54,961 |
|
|
1,016,229 |
|
|
United Technologies Corp. |
|
|
180,088 |
|
|
13,162,632 |
|
|
|
|
|
|
|
|
59,530,025 |
|
|
Air Freight & Logistics — 1.0% |
|
|
|
|
|
|
|
|
C.H. Robinson Worldwide, Inc. |
|
|
32,676 |
|
|
2,280,131 |
|
|
Expeditors International of Washington, Inc. |
|
|
42,025 |
|
|
1,721,344 |
|
|
FedEx Corp. |
|
|
63,177 |
|
|
5,275,911 |
|
|
United Parcel Service, Inc., Class B |
|
|
191,792 |
|
|
14,037,257 |
|
|
|
|
|
|
|
|
23,314,643 |
|
|
Airlines — 0.1% |
|
|
|
|
|
|
|
|
Southwest Airlines Co. |
|
|
152,530 |
|
|
1,305,657 |
|
|
Auto Components — 0.3% |
|
|
|
|
|
|
|
|
BorgWarner, Inc. (a) |
|
|
21,794 |
|
|
1,389,150 |
|
|
The Goodyear Tire & Rubber Co. (a) |
|
|
48,676 |
|
|
689,739 |
|
|
Johnson Controls, Inc. |
|
|
135,470 |
|
|
4,234,792 |
|
|
|
|
|
|
|
|
6,313,681 |
|
|
Automobiles — 0.4% |
|
|
|
|
|
|
|
|
Ford Motor Co. (a) |
|
|
755,228 |
|
|
8,126,254 |
|
|
Harley-Davidson, Inc. |
|
|
46,252 |
|
|
1,797,815 |
|
|
|
|
|
|
|
|
9,924,069 |
|
|
Beverages — 2.7% |
|
|
|
|
|
|
|
|
Beam, Inc. |
|
|
31,012 |
|
|
1,588,745 |
|
|
Brown-Forman Corp., Class B |
|
|
19,987 |
|
|
1,609,153 |
|
|
The Coca-Cola Co. |
|
|
451,354 |
|
|
31,581,239 |
|
|
Coca-Cola Enterprises, Inc. |
|
|
62,117 |
|
|
1,601,376 |
|
|
Constellation Brands, Inc., Class A (a) |
|
|
34,507 |
|
|
713,260 |
|
|
Dr. Pepper Snapple Group, Inc. |
|
|
42,788 |
|
|
1,689,270 |
|
|
Molson Coors Brewing Co., Class B |
|
|
30,869 |
|
|
1,344,036 |
|
|
PepsiCo, Inc. |
|
|
310,707 |
|
|
20,615,410 |
|
|
|
|
|
|
|
|
60,742,489 |
|
|
Biotechnology — 1.2% |
|
|
|
|
|
|
|
|
Amgen, Inc. |
|
|
157,670 |
|
|
10,123,991 |
|
|
Biogen Idec, Inc. (a) |
|
|
48,383 |
|
|
5,324,549 |
|
|
Celgene Corp. (a)(b) |
|
|
88,257 |
|
|
5,966,173 |
|
|
Gilead Sciences, Inc. (a) |
|
|
149,332 |
|
|
6,112,159 |
|
|
|
|
|
|
|
|
27,526,872 |
|
|
Building Products — 0.0% |
|
|
|
|
|
|
|
|
Masco Corp. |
|
|
71,775 |
|
|
752,202 |
|
|
Capital Markets — 1.8% |
|
|
|
|
|
|
|
|
Ameriprise Financial, Inc. |
|
|
45,019 |
|
|
2,234,743 |
|
|
The Bank of New York Mellon Corp. |
|
|
241,110 |
|
|
4,800,500 |
|
|
BlackRock, Inc. (c) |
|
|
19,881 |
|
|
3,543,590 |
|
|
The Charles Schwab Corp. |
|
|
215,385 |
|
|
2,425,235 |
|
|
|
|
|
|
|
|
|
|
|
Common Stocks |
|
Shares |
|
Value |
|
||
|
Capital Markets (concluded) |
|
|
|
|
|
|
|
|
E*Trade Financial Corp. (a) |
|
|
49,472 |
|
$ |
393,797 |
|
|
Federated Investors, Inc., Class B |
|
|
17,875 |
|
|
270,806 |
|
|
Franklin Resources, Inc. |
|
|
28,848 |
|
|
2,771,139 |
|
|
The Goldman Sachs Group, Inc. |
|
|
97,860 |
|
|
8,849,480 |
|
|
Invesco Ltd. |
|
|
90,057 |
|
|
1,809,245 |
|
|
Legg Mason, Inc. |
|
|
23,879 |
|
|
574,290 |
|
|
Morgan Stanley |
|
|
295,542 |
|
|
4,471,551 |
|
|
Northern Trust Corp. |
|
|
47,752 |
|
|
1,893,844 |
|
|
State Street Corp. |
|
|
97,829 |
|
|
3,943,487 |
|
|
T. Rowe Price Group, Inc. |
|
|
49,963 |
|
|
2,845,393 |
|
|
|
|
|
|
|
|
40,827,100 |
|
|
Chemicals — 2.2% |
|
|
|
|
|
|
|
|
Air Products & Chemicals, Inc. |
|
|
41,857 |
|
|
3,565,798 |
|
|
Airgas, Inc. |
|
|
13,490 |
|
|
1,053,299 |
|
|
CF Industries Holdings, Inc. |
|
|
12,945 |
|
|
1,876,766 |
|
|
The Dow Chemical Co. |
|
|
234,715 |
|
|
6,750,403 |
|
|
E.I. du Pont de Nemours & Co. |
|
|
183,687 |
|
|
8,409,191 |
|
|
Eastman Chemical Co. |
|
|
27,314 |
|
|
1,066,885 |
|
|
Ecolab, Inc. |
|
|
59,760 |
|
|
3,454,726 |
|
|
FMC Corp. |
|
|
14,134 |
|
|
1,216,089 |
|
|
International Flavors & Fragrances, Inc. |
|
|
15,939 |
|
|
835,522 |
|
|
Monsanto Co. |
|
|
106,383 |
|
|
7,454,257 |
|
|
The Mosaic Co. |
|
|
59,386 |
|
|
2,994,836 |
|
|
PPG Industries, Inc. |
|
|
30,513 |
|
|
2,547,530 |
|
|
Praxair, Inc. |
|
|
59,593 |
|
|
6,370,492 |
|
|
The Sherwin-Williams Co. |
|
|
16,908 |
|
|
1,509,377 |
|
|
Sigma-Aldrich Corp. |
|
|
23,871 |
|
|
1,490,983 |
|
|
|
|
|
|
|
|
50,596,154 |
|
|
Commercial Banks — 2.6% |
|
|
|
|
|
|
|
|
BB&T Corp. |
|
|
138,972 |
|
|
3,497,925 |
|
|
Comerica, Inc. |
|
|
39,746 |
|
|
1,025,447 |
|
|
Fifth Third Bancorp |
|
|
182,257 |
|
|
2,318,309 |
|
|
First Horizon National Corp. |
|
|
52,072 |
|
|
416,576 |
|
|
Huntington Bancshares, Inc. |
|
|
172,439 |
|
|
946,690 |
|
|
KeyCorp |
|
|
188,820 |
|
|
1,452,026 |
|
|
M&T Bank Corp. |
|
|
24,888 |
|
|
1,899,950 |
|
|
Regions Financial Corp. |
|
|
251,789 |
|
|
1,082,693 |
|
|
SunTrust Banks, Inc. |
|
|
106,381 |
|
|
1,882,944 |
|
|
The PNC Financial Services Group, Inc. (c) |
|
|
104,451 |
|
|
6,023,689 |
|
|
U.S. Bancorp |
|
|
379,325 |
|
|
10,260,741 |
|
|
Wells Fargo & Co. |
|
|
1,047,998 |
|
|
28,882,825 |
|
|
Zions Bancorporation |
|
|
36,844 |
|
|
599,820 |
|
|
|
|
|
|
|
|
60,289,635 |
|
|
Commercial Services & Supplies — 0.4% |
|
|
|
|
|
|
|
|
Avery Dennison Corp. |
|
|
21,121 |
|
|
605,750 |
|
|
Cintas Corp. |
|
|
22,106 |
|
|
769,510 |
|
|
Iron Mountain, Inc. |
|
|
36,982 |
|
|
1,139,046 |
|
|
Pitney Bowes, Inc. |
|
|
40,065 |
|
|
742,805 |
|
|
R.R. Donnelley & Sons Co. |
|
|
37,493 |
|
|
541,024 |
|
|
Republic Services, Inc., Class A |
|
|
62,665 |
|
|
1,726,421 |
|
|
Stericycle, Inc. (a) |
|
|
17,065 |
|
|
1,329,705 |
|
|
Waste Management, Inc. |
|
|
91,564 |
|
|
2,995,058 |
|
|
|
|
|
|
|
|
9,849,319 |
|
|
|
|
|
|
|
|
|
|
16 |
BLACKROCK S&P 500 INDEX FUND |
DECEMBER 31, 2011 |
|
|
|
|
|
|
|
Schedule of Investments (continued) |
Master S&P 500 Index Series |
|
|
(Percentages shown are based on Net Assets) |
|
|
|
|
|
|
|
|
|
|
Common Stocks |
|
Shares |
|
Value |
|
||
|
Communications Equipment — 2.1% |
|
|
|
|
|
|
|
|
Cisco Systems, Inc. |
|
|
1,068,390 |
|
$ |
19,316,491 |
|
|
F5 Networks, Inc. (a) |
|
|
15,809 |
|
|
1,677,651 |
|
|
Harris Corp. |
|
|
22,448 |
|
|
809,026 |
|
|
JDS Uniphase Corp. (a)(b) |
|
|
45,268 |
|
|
472,598 |
|
|
Juniper Networks, Inc. (a) |
|
|
104,627 |
|
|
2,135,437 |
|
|
Motorola Mobility Holdings, Inc. (a) |
|
|
52,422 |
|
|
2,033,973 |
|
|
Motorola Solutions, Inc. |
|
|
57,199 |
|
|
2,647,742 |
|
|
QUALCOMM, Inc. |
|
|
334,067 |
|
|
18,273,465 |
|
|
|
|
|
|
|
|
47,366,383 |
|
|
Computers & Peripherals — 4.6% |
|
|
|
|
|
|
|
|
Apple, Inc. (a) |
|
|
184,688 |
|
|
74,798,640 |
|
|
Dell, Inc. (a) |
|
|
303,638 |
|
|
4,442,224 |
|
|
EMC Corp. (a) |
|
|
405,495 |
|
|
8,734,362 |
|
|
Hewlett-Packard Co. |
|
|
394,944 |
|
|
10,173,758 |
|
|
Lexmark International, Inc., Class A |
|
|
14,358 |
|
|
474,819 |
|
|
NetApp, Inc. (a) |
|
|
71,341 |
|
|
2,587,538 |
|
|
SanDisk Corp. (a) |
|
|
47,815 |
|
|
2,352,976 |
|
|
Western Digital Corp. (a) |
|
|
46,724 |
|
|
1,446,108 |
|
|
|
|
|
|
|
|
105,010,425 |
|
|
Construction & Engineering — 0.2% |
|
|
|
|
|
|
|
|
Fluor Corp. |
|
|
33,372 |
|
|
1,676,943 |
|
|
Jacobs Engineering Group, Inc. (a) |
|
|
25,278 |
|
|
1,025,781 |
|
|
Quanta Services, Inc. (a) |
|
|
42,063 |
|
|
906,037 |
|
|
|
|
|
|
|
|
3,608,761 |
|
|
Construction Materials — 0.0% |
|
|
|
|
|
|
|
|
Vulcan Materials Co. |
|
|
25,535 |
|
|
1,004,802 |
|
|
Consumer Finance — 0.8% |
|
|
|
|
|
|
|
|
American Express Co. |
|
|
200,856 |
|
|
9,474,377 |
|
|
Capital One Financial Corp. |
|
|
91,530 |
|
|
3,870,804 |
|
|
Discover Financial Services |
|
|
109,369 |
|
|
2,624,856 |
|
|
SLM Corp. |
|
|
101,002 |
|
|
1,353,427 |
|
|
|
|
|
|
|
|
17,323,464 |
|
|
Containers & Packaging — 0.1% |
|
|
|
|
|
|
|
|
Ball Corp. |
|
|
32,412 |
|
|
1,157,433 |
|
|
Bemis Co. |
|
|
20,268 |
|
|
609,661 |
|
|
Owens-Illinois, Inc. (a) |
|
|
32,836 |
|
|
636,362 |
|
|
Sealed Air Corp. |
|
|
31,882 |
|
|
548,689 |
|
|
|
|
|
|
|
|
2,952,145 |
|
|
Distributors — 0.1% |
|
|
|
|
|
|
|
|
Genuine Parts Co. |
|
|
31,063 |
|
|
1,901,056 |
|
|
Diversified Consumer Services — 0.1% |
|
|
|
|
|
|
|
|
Apollo Group, Inc., Class A (a) |
|
|
23,032 |
|
|
1,240,734 |
|
|
DeVry, Inc. |
|
|
12,027 |
|
|
462,559 |
|
|
H&R Block, Inc. |
|
|
58,389 |
|
|
953,492 |
|
|
|
|
|
|
|
|
2,656,785 |
|
|
Diversified Financial Services — 2.7% |
|
|
|
|
|
|
|
|
Bank of America Corp. |
|
|
2,014,629 |
|
|
11,201,337 |
|
|
Citigroup, Inc. |
|
|
581,076 |
|
|
15,288,110 |
|
|
CME Group, Inc. |
|
|
13,166 |
|
|
3,208,159 |
|
|
IntercontinentalExchange, Inc. (a) |
|
|
14,392 |
|
|
1,734,956 |
|
|
JPMorgan Chase & Co. |
|
|
755,132 |
|
|
25,108,139 |
|
|
Leucadia National Corp. |
|
|
39,675 |
|
|
902,209 |
|
|
Moody’s Corp. |
|
|
38,282 |
|
|
1,289,338 |
|
|
The NASDAQ OMX Group, Inc. (a) |
|
|
25,271 |
|
|
619,392 |
|
|
NYSE Euronext |
|
|
51,879 |
|
|
1,354,042 |
|
|
|
|
|
|
|
|
60,705,682 |
|
|
|
|
|
|
|
|
|
|
|
Common Stocks |
|
Shares |
|
Value |
|
||
|
Diversified Telecommunication Services — 2.9% |
|
|
|
|
|
|
|
|
AT&T, Inc. |
|
|
1,177,641 |
|
$ |
35,611,864 |
|
|
CenturyLink, Inc. |
|
|
122,987 |
|
|
4,575,117 |
|
|
Frontier Communications Corp. |
|
|
197,227 |
|
|
1,015,719 |
|
|
Verizon Communications, Inc. |
|
|
562,635 |
|
|
22,572,916 |
|
|
Windstream Corp. |
|
|
115,750 |
|
|
1,358,905 |
|
|
|
|
|
|
|
|
65,134,521 |
|
|
Electric Utilities — 2.1% |
|
|
|
|
|
|
|
|
American Electric Power Co., Inc. |
|
|
96,146 |
|
|
3,971,791 |
|
|
Duke Energy Corp. |
|
|
264,550 |
|
|
5,820,100 |
|
|
Edison International |
|
|
64,590 |
|
|
2,674,026 |
|
|
Entergy Corp. |
|
|
35,028 |
|
|
2,558,795 |
|
|
Exelon Corp. |
|
|
131,606 |
|
|
5,707,752 |
|
|
FirstEnergy Corp. |
|
|
83,318 |
|
|
3,690,988 |
|
|
NextEra Energy, Inc. |
|
|
84,151 |
|
|
5,123,113 |
|
|
Northeast Utilities, Inc. |
|
|
35,437 |
|
|
1,278,213 |
|
|
Pepco Holdings, Inc. |
|
|
44,573 |
|
|
904,832 |
|
|
Pinnacle West Capital Corp. |
|
|
21,601 |
|
|
1,040,736 |
|
|
PPL Corp. |
|
|
115,170 |
|
|
3,388,301 |
|
|
Progress Energy, Inc. |
|
|
58,739 |
|
|
3,290,559 |
|
|
The Southern Co. |
|
|
171,292 |
|
|
7,929,107 |
|
|
|
|
|
|
|
|
47,378,313 |
|
|
Electrical Equipment — 0.5% |
|
|
|
|
|
|
|
|
Cooper Industries Plc |
|
|
31,472 |
|
|
1,704,209 |
|
|
Emerson Electric Co. |
|
|
146,264 |
|
|
6,814,440 |
|
|
Rockwell Automation, Inc. |
|
|
28,103 |
|
|
2,061,917 |
|
|
Roper Industries, Inc. |
|
|
19,283 |
|
|
1,675,114 |
|
|
|
|
|
|
|
|
12,255,680 |
|
|
Electronic
Equipment, Instruments & |
|
|
|
|
|
|
|
|
Amphenol Corp., Class A |
|
|
32,519 |
|
|
1,476,038 |
|
|
Corning, Inc. |
|
|
312,934 |
|
|
4,061,883 |
|
|
Flir Systems, Inc. |
|
|
30,227 |
|
|
757,791 |
|
|
Jabil Circuit, Inc. |
|
|
36,118 |
|
|
710,080 |
|
|
Molex, Inc. |
|
|
27,036 |
|
|
645,079 |
|
|
TE Connectivity Ltd. |
|
|
83,898 |
|
|
2,584,897 |
|
|
|
|
|
|
|
|
10,235,768 |
|
|
Energy Equipment & Services — 2.0% |
|
|
|
|
|
|
|
|
Baker Hughes, Inc. |
|
|
86,907 |
|
|
4,227,157 |
|
|
Cameron International Corp. (a) |
|
|
48,576 |
|
|
2,389,453 |
|
|
Diamond Offshore Drilling, Inc. |
|
|
13,622 |
|
|
752,752 |
|
|
FMC Technologies, Inc. (a) |
|
|
47,589 |
|
|
2,485,574 |
|
|
Halliburton Co. |
|
|
182,693 |
|
|
6,304,735 |
|
|
Helmerich & Payne, Inc. |
|
|
21,209 |
|
|
1,237,757 |
|
|
Nabors Industries Ltd. (a) |
|
|
57,465 |
|
|
996,443 |
|
|
National Oilwell Varco, Inc. |
|
|
84,128 |
|
|
5,719,863 |
|
|
Noble Corp. (a) |
|
|
50,011 |
|
|
1,511,332 |
|
|
Rowan Cos., Inc. (a) |
|
|
24,609 |
|
|
746,391 |
|
|
Schlumberger Ltd. |
|
|
266,735 |
|
|
18,220,668 |
|
|
|
|
|
|
|
|
44,592,125 |
|
|
Food & Staples Retailing — 2.4% |
|
|
|
|
|
|
|
|
Costco Wholesale Corp. |
|
|
86,132 |
|
|
7,176,518 |
|
|
CVS Caremark Corp. |
|
|
258,717 |
|
|
10,550,480 |
|
|
The Kroger Co. |
|
|
118,782 |
|
|
2,876,900 |
|
|
Safeway, Inc. |
|
|
66,703 |
|
|
1,403,431 |
|
|
SUPERVALU, Inc. |
|
|
42,043 |
|
|
341,389 |
|
|
|
|
|
|
|
|
|
|
|
|
|
BLACKROCK S&P 500 INDEX FUND |
DECEMBER 31, 2011 |
17 |
|
|
|
|
|
|
|
Schedule of Investments (continued) |
Master S&P 500 Index Series |
|
|
(Percentages shown are based on Net Assets) |
|
|
|
|
|
|
|
|
|
|
Common Stocks |
|
Shares |
|
Value |
|
||
|
Food & Staples Retailing (concluded) |
|
|
|
|
|
|
|
|
SYSCO Corp. |
|
|
117,434 |
|
$ |
3,444,339 |
|
|
Wal-Mart Stores, Inc. |
|
|
347,112 |
|
|
20,743,413 |
|
|
Walgreen Co. |
|
|
176,800 |
|
|
5,845,008 |
|
|
Whole Foods Market, Inc. |
|
|
31,774 |
|
|
2,210,835 |
|
|
|
|
|
|
|
|
54,592,313 |
|
|
Food Products — 1.9% |
|
|
|
|
|
|
|
|
Archer-Daniels-Midland Co. |
|
|
132,838 |
|
|
3,799,167 |
|
|
Campbell Soup Co. |
|
|
35,683 |
|
|
1,186,103 |
|
|
ConAgra Foods, Inc. |
|
|
82,150 |
|
|
2,168,760 |
|
|
Dean Foods Co. (a) |
|
|
36,435 |
|
|
408,072 |
|
|
General Mills, Inc. |
|
|
128,109 |
|
|
5,176,885 |
|
|
H.J. Heinz Co. |
|
|
63,610 |
|
|
3,437,484 |
|
|
The Hershey Co. |
|
|
30,322 |
|
|
1,873,293 |
|
|
Hormel Foods Corp. |
|
|
27,708 |
|
|
811,567 |
|
|
The J.M. Smucker Co. |
|
|
22,737 |
|
|
1,777,351 |
|
|
Kellogg Co. |
|
|
49,492 |
|
|
2,502,810 |
|
|
Kraft Foods, Inc. |
|
|
351,147 |
|
|
13,118,852 |
|
|
McCormick & Co., Inc. |
|
|
26,144 |
|
|
1,318,181 |
|
|
Mead Johnson Nutrition Co. |
|
|
40,409 |
|
|
2,777,311 |
|
|
Sara Lee Corp. |
|
|
117,768 |
|
|
2,228,171 |
|
|
Tyson Foods, Inc., Class A |
|
|
57,791 |
|
|
1,192,806 |
|
|
|
|
|
|
|
|
43,776,813 |
|
|
Gas Utilities — 0.1% |
|
|
|
|
|
|
|
|
AGL Resources, Inc. |
|
|
23,084 |
|
|
975,530 |
|
|
Oneok, Inc. |
|
|
20,516 |
|
|
1,778,532 |
|
|
|
|
|
|
|
|
2,754,062 |
|
|
Health Care Equipment & Supplies — 1.8% |
|
|
|
|
|
|
|
|
Baxter International, Inc. |
|
|
112,105 |
|
|
5,546,955 |
|
|
Becton Dickinson & Co. |
|
|
42,742 |
|
|
3,193,682 |
|
|
Boston Scientific Corp. (a) |
|
|
291,090 |
|
|
1,554,421 |
|
|
C.R. Bard, Inc. |
|
|
17,170 |
|
|
1,468,035 |
|
|
CareFusion Corp. (a) |
|
|
44,810 |
|
|
1,138,622 |
|
|
Covidien Plc |
|
|
95,929 |
|
|
4,317,764 |
|
|
Dentsply International, Inc. |
|
|
28,214 |
|
|
987,208 |
|
|
Edwards Lifesciences Corp. (a) |
|
|
22,779 |
|
|
1,610,475 |
|
|
Intuitive Surgical, Inc. (a) |
|
|
7,744 |
|
|
3,585,549 |
|
|
Medtronic, Inc. |
|
|
209,731 |
|
|
8,022,211 |
|
|
St. Jude Medical, Inc. |
|
|
63,473 |
|
|
2,177,124 |
|
|
Stryker Corp. |
|
|
64,379 |
|
|
3,200,280 |
|
|
Varian Medical Systems, Inc. (a) |
|
|
22,412 |
|
|
1,504,518 |
|
|
Zimmer Holdings, Inc. (a) |
|
|
35,661 |
|
|
1,905,011 |
|
|
|
|
|
|
|
|
40,211,855 |
|
|
Health Care Providers & Services — 2.1% |
|
|
|
|
|
|
|
|
Aetna, Inc. |
|
|
72,062 |
|
|
3,040,296 |
|
|
AmerisourceBergen Corp. |
|
|
51,416 |
|
|
1,912,161 |
|
|
Cardinal Health, Inc. |
|
|
68,770 |
|
|
2,792,750 |
|
|
Cigna Corp. |
|
|
56,794 |
|
|
2,385,348 |
|
|
Coventry Health Care, Inc. (a) |
|
|
28,058 |
|
|
852,121 |
|
|
DaVita, Inc. (a) |
|
|
18,605 |
|
|
1,410,445 |
|
|
Express Scripts, Inc. (a) |
|
|
96,728 |
|
|
4,322,774 |
|
|
Humana, Inc. |
|
|
32,338 |
|
|
2,833,132 |
|
|
Laboratory Corp. of America Holdings (a) |
|
|
19,488 |
|
|
1,675,383 |
|
|
McKesson Corp. |
|
|
48,800 |
|
|
3,802,008 |
|
|
Medco Health Solutions, Inc. (a) |
|
|
77,093 |
|
|
4,309,499 |
|
|
Patterson Cos., Inc. |
|
|
17,499 |
|
|
516,571 |
|
|
|
|
|
|
|
|
|
|
|
Common Stocks |
|
Shares |
|
Value |
|
||
|
Health Care Providers & Services (concluded) |
|
|
|
|
|
|
|
|
Quest Diagnostics, Inc. |
|
|
31,365 |
|
$ |
1,821,052 |
|
|
Tenet Healthcare Corp. (a) |
|
|
86,116 |
|
|
441,775 |
|
|
UnitedHealth Group, Inc. |
|
|
212,065 |
|
|
10,747,454 |
|
|
WellPoint, Inc. |
|
|
69,168 |
|
|
4,582,380 |
|
|
|
|
|
|
|
|
47,445,149 |
|
|
Health Care Technology — 0.1% |
|
|
|
|
|
|
|
|
Cerner Corp. (a) |
|
|
28,808 |
|
|
1,764,490 |
|
|
Hotels, Restaurants & Leisure — 2.0% |
|
|
|
|
|
|
|
|
Carnival Corp. |
|
|
90,011 |
|
|
2,937,959 |
|
|
Chipotle Mexican Grill, Inc. (a) |
|
|
6,211 |
|
|
2,097,703 |
|
|
Darden Restaurants, Inc. |
|
|
26,233 |
|
|
1,195,700 |
|
|
International Game Technology |
|
|
58,962 |
|
|
1,014,146 |
|
|
Marriott International, Inc., Class A |
|
|
53,125 |
|
|
1,549,656 |
|
|
McDonald’s Corp. |
|
|
203,352 |
|
|
20,402,306 |
|
|
Starbucks Corp. |
|
|
148,058 |
|
|
6,812,149 |
|
|
Starwood Hotels & Resorts Worldwide, Inc. |
|
|
38,078 |
|
|
1,826,602 |
|
|
Wyndham Worldwide Corp. |
|
|
30,245 |
|
|
1,144,168 |
|
|
Wynn Resorts Ltd. |
|
|
15,845 |
|
|
1,750,714 |
|
|
Yum! Brands, Inc. |
|
|
91,555 |
|
|
5,402,661 |
|
|
|
|
|
|
|
|
46,133,764 |
|
|
Household Durables — 0.3% |
|
|
|
|
|
|
|
|
D.R. Horton, Inc. |
|
|
54,299 |
|
|
684,710 |
|
|
Harman International Industries, Inc. |
|
|
13,861 |
|
|
527,272 |
|
|
Leggett & Platt, Inc. |
|
|
27,889 |
|
|
642,563 |
|
|
Lennar Corp., Class A |
|
|
31,994 |
|
|
628,682 |
|
|
Newell Rubbermaid, Inc. |
|
|
57,751 |
|
|
932,679 |
|
|
Pulte Group, Inc. (a) |
|
|
66,768 |
|
|
421,306 |
|
|
Stanley Black & Decker, Inc. |
|
|
33,677 |
|
|
2,276,565 |
|
|
Whirlpool Corp. |
|
|
15,142 |
|
|
718,488 |
|
|
|
|
|
|
|
|
6,832,265 |
|
|
Household Products — 2.3% |
|
|
|
|
|
|
|
|
The Clorox Co. |
|
|
26,360 |
|
|
1,754,521 |
|
|
Colgate-Palmolive Co. |
|
|
96,171 |
|
|
8,885,239 |
|
|
Kimberly-Clark Corp. |
|
|
78,226 |
|
|
5,754,304 |
|
|
The Procter & Gamble Co. |
|
|
546,753 |
|
|
36,473,893 |
|
|
|
|
|
|
|
|
52,867,957 |
|
|
Independent
Power Producers & |
|
|
|
|
|
|
|
|
The AES Corp. (a) |
|
|
128,370 |
|
|
1,519,901 |
|
|
Constellation Energy Group, Inc. |
|
|
39,893 |
|
|
1,582,555 |
|
|
NRG Energy, Inc. (a) |
|
|
44,632 |
|
|
808,732 |
|
|
|
|
|
|
|
|
3,911,188 |
|
|
Industrial Conglomerates — 2.3% |
|
|
|
|
|
|
|
|
3M Co. |
|
|
139,301 |
|
|
11,385,071 |
|
|
General Electric Co. |
|
|
2,097,992 |
|
|
37,575,037 |
|
|
Tyco International Ltd. |
|
|
92,005 |
|
|
4,297,553 |
|
|
|
|
|
|
|
|
53,257,661 |
|
|
Insurance — 3.5% |
|
|
|
|
|
|
|
|
ACE Ltd. |
|
|
66,961 |
|
|
4,695,305 |
|
|
Aflac, Inc. |
|
|
93,040 |
|
|
4,024,910 |
|
|
The Allstate Corp. |
|
|
100,527 |
|
|
2,755,445 |
|
|
American International Group, Inc. (a) |
|
|
86,553 |
|
|
2,008,030 |
|
|
Aon Corp. |
|
|
64,302 |
|
|
3,009,334 |
|
|
Assurant, Inc. |
|
|
18,239 |
|
|
748,893 |
|
|
Berkshire Hathaway, Inc., Class B (a) |
|
|
349,379 |
|
|
26,657,618 |
|
|
Chubb Corp. |
|
|
55,299 |
|
|
3,827,797 |
|
|
Cincinnati Financial Corp. |
|
|
32,018 |
|
|
975,268 |
|
|
|
|
|
|
|
|
|
|
18 |
BLACKROCK S&P 500 INDEX FUND |
DECEMBER 31, 2011 |
|
|
|
|
|
|
|
Schedule of Investments (continued) |
Master S&P 500 Index Series |
|
|
(Percentages shown are based on Net Assets) |
|
|
|
|
|
|
|
|
|
|
Common Stocks |
|
Shares |
|
Value |
|
||
|
Insurance (concluded) |
|
|
|
|
|
|
|
|
Genworth Financial, Inc., Class A (a) |
|
|
98,319 |
|
$ |
643,989 |
|
|
Hartford Financial Services Group, Inc. |
|
|
88,267 |
|
|
1,434,339 |
|
|
Lincoln National Corp. |
|
|
60,075 |
|
|
1,166,657 |
|
|
Loews Corp. |
|
|
60,290 |
|
|
2,269,919 |
|
|
Marsh & McLennan Cos., Inc. |
|
|
106,697 |
|
|
3,373,759 |
|
|
MetLife, Inc. |
|
|
210,051 |
|
|
6,549,390 |
|
|
Principal Financial Group, Inc. |
|
|
60,759 |
|
|
1,494,671 |
|
|
The Progressive Corp. |
|
|
122,698 |
|
|
2,393,838 |
|
|
Prudential Financial, Inc. |
|
|
93,850 |
|
|
4,703,762 |
|
|
Torchmark Corp. |
|
|
20,326 |
|
|
881,945 |
|
|
The Travelers Cos., Inc. |
|
|
81,900 |
|
|
4,846,023 |
|
|
Unum Group |
|
|
57,210 |
|
|
1,205,415 |
|
|
XL Group Plc |
|
|
62,777 |
|
|
1,241,101 |
|
|
|
|
|
|
|
|
80,907,408 |
|
|
Internet & Catalog Retail — 0.8% |
|
|
|
|
|
|
|
|
Amazon.com, Inc. (a) |
|
|
72,308 |
|
|
12,516,515 |
|
|
Expedia, Inc. |
|
|
18,499 |
|
|
536,841 |
|
|
Netflix, Inc. (a) |
|
|
10,968 |
|
|
759,972 |
|
|
Priceline.com, Inc. (a) |
|
|
9,914 |
|
|
4,636,877 |
|
|
TripAdvisor, Inc. (a) |
|
|
18,499 |
|
|
466,360 |
|
|
|
|
|
|
|
|
18,916,565 |
|
|
Internet Software & Services — 2.0% |
|
|
|
|
|
|
|
|
Akamai Technologies, Inc. (a) |
|
|
35,748 |
|
|
1,153,945 |
|
|
eBay, Inc. (a) |
|
|
228,229 |
|
|
6,922,186 |
|
|
Google, Inc., Class A (a) |
|
|
50,205 |
|
|
32,427,409 |
|
|
VeriSign, Inc. |
|
|
31,693 |
|
|
1,132,074 |
|
|
Yahoo! Inc. (a) |
|
|
246,645 |
|
|
3,978,384 |
|
|
|
|
|
|
|
|
45,613,998 |
|
|
IT Services — 3.9% |
|
|
|
|
|
|
|
|
Accenture Plc, Class A (b) |
|
|
127,303 |
|
|
6,776,339 |
|
|
Automatic Data Processing, Inc. |
|
|
97,043 |
|
|
5,241,292 |
|
|
Cognizant Technology Solutions Corp. (a)(b) |
|
|
60,163 |
|
|
3,869,082 |
|
|
Computer Sciences Corp. |
|
|
31,026 |
|
|
735,316 |
|
|
Fidelity National Information Services, Inc. |
|
|
48,315 |
|
|
1,284,696 |
|
|
Fiserv, Inc. (a) |
|
|
28,049 |
|
|
1,647,598 |
|
|
International Business Machines Corp. |
|
|
234,217 |
|
|
43,067,822 |
|
|
MasterCard, Inc., Class A |
|
|
21,188 |
|
|
7,899,310 |
|
|
Paychex, Inc. |
|
|
63,860 |
|
|
1,922,825 |
|
|
SAIC, Inc. (a) |
|
|
54,323 |
|
|
667,630 |
|
|
Teradata Corp. (a) |
|
|
33,348 |
|
|
1,617,711 |
|
|
Total System Services, Inc. |
|
|
32,385 |
|
|
633,451 |
|
|
Visa, Inc., Class A |
|
|
101,088 |
|
|
10,263,465 |
|
|
The Western Union Co. |
|
|
123,192 |
|
|
2,249,486 |
|
|
|
|
|
|
|
|
87,876,023 |
|
|
Leisure Equipment & Products — 0.1% |
|
|
|
|
|
|
|
|
Hasbro, Inc. |
|
|
22,497 |
|
|
717,429 |
|
|
Mattel, Inc. |
|
|
67,226 |
|
|
1,866,194 |
|
|
|
|
|
|
|
|
2,583,623 |
|
|
Life Sciences Tools & Services — 0.4% |
|
|
|
|
|
|
|
|
Agilent Technologies, Inc. (a) |
|
|
68,797 |
|
|
2,403,079 |
|
|
Life Technologies Corp. (a) |
|
|
35,250 |
|
|
1,371,577 |
|
|
PerkinElmer, Inc. |
|
|
22,558 |
|
|
451,160 |
|
|
Thermo Fisher Scientific, Inc. (a) |
|
|
75,216 |
|
|
3,382,464 |
|
|
Waters Corp. (a)(b) |
|
|
17,833 |
|
|
1,320,534 |
|
|
|
|
|
|
|
|
8,928,814 |
|
|
|
|
|
|
|
|
|
|
|
Common Stocks |
|
Shares |
|
Value |
|
||
|
Machinery — 2.1% |
|
|
|
|
|
|
|
|
Caterpillar, Inc. |
|
|
128,522 |
|
$ |
11,644,093 |
|
|
Cummins, Inc. |
|
|
38,352 |
|
|
3,375,743 |
|
|
Danaher Corp. |
|
|
113,462 |
|
|
5,337,253 |
|
|
Deere & Co. |
|
|
82,195 |
|
|
6,357,783 |
|
|
Dover Corp. |
|
|
36,860 |
|
|
2,139,723 |
|
|
Eaton Corp. |
|
|
66,104 |
|
|
2,877,507 |
|
|
Flowserve Corp. |
|
|
11,045 |
|
|
1,096,989 |
|
|
Illinois Tool Works, Inc. |
|
|
96,079 |
|
|
4,487,850 |
|
|
Ingersoll-Rand Plc |
|
|
61,857 |
|
|
1,884,783 |
|
|
Joy Global, Inc. |
|
|
20,825 |
|
|
1,561,250 |
|
|
PACCAR, Inc. |
|
|
70,817 |
|
|
2,653,513 |
|
|
Pall Corp. |
|
|
22,898 |
|
|
1,308,621 |
|
|
Parker Hannifin Corp. |
|
|
30,061 |
|
|
2,292,151 |
|
|
Snap-On, Inc. |
|
|
11,621 |
|
|
588,255 |
|
|
Xylem, Inc. |
|
|
36,724 |
|
|
943,440 |
|
|
|
|
|
|
|
|
48,548,954 |
|
|
Media — 3.1% |
|
|
|
|
|
|
|
|
Cablevision Systems Corp., Class A |
|
|
44,529 |
|
|
633,202 |
|
|
CBS Corp., Class B |
|
|
130,148 |
|
|
3,532,217 |
|
|
Comcast Corp., Class A |
|
|
541,441 |
|
|
12,837,566 |
|
|
DIRECTV, Class A (a) |
|
|
140,275 |
|
|
5,998,159 |
|
|
Discovery Communications, Inc., Class A (a) |
|
|
52,587 |
|
|
2,154,489 |
|
|
Gannett Co., Inc. |
|
|
48,077 |
|
|
642,790 |
|
|
Interpublic Group of Cos., Inc. |
|
|
89,482 |
|
|
870,660 |
|
|
The McGraw-Hill Cos., Inc. |
|
|
58,368 |
|
|
2,624,809 |
|
|
News Corp., Class A |
|
|
435,926 |
|
|
7,776,920 |
|
|
Omnicom Group, Inc. |
|
|
54,887 |
|
|
2,446,862 |
|
|
Scripps Networks Interactive |
|
|
19,391 |
|
|
822,566 |
|
|
Time Warner Cable, Inc. |
|
|
63,458 |
|
|
4,034,025 |
|
|
Time Warner, Inc. |
|
|
198,966 |
|
|
7,190,631 |
|
|
Viacom, Inc., Class B |
|
|
109,795 |
|
|
4,985,791 |
|
|
Walt Disney Co. |
|
|
357,061 |
|
|
13,389,788 |
|
|
The Washington Post Co., Class B |
|
|
979 |
|
|
368,897 |
|
|
|
|
|
|
|
|
70,309,372 |
|
|
Metals & Mining — 0.9% |
|
|
|
|
|
|
|
|
Alcoa, Inc. |
|
|
210,862 |
|
|
1,823,956 |
|
|
Allegheny Technologies, Inc. |
|
|
21,000 |
|
|
1,003,800 |
|
|
Cliffs Natural Resources, Inc. |
|
|
28,162 |
|
|
1,755,901 |
|
|
Freeport-McMoRan Copper & Gold, Inc., Class B |
|
|
188,296 |
|
|
6,927,410 |
|
|
Newmont Mining Corp. |
|
|
98,235 |
|
|
5,895,082 |
|
|
Nucor Corp. |
|
|
63,229 |
|
|
2,501,972 |
|
|
Titanium Metals Corp. |
|
|
15,489 |
|
|
232,025 |
|
|
United States Steel Corp. |
|
|
28,711 |
|
|
759,693 |
|
|
|
|
|
|
|
|
20,899,839 |
|
|
Multi-Utilities — 1.5% |
|
|
|
|
|
|
|
|
Ameren Corp. |
|
|
47,888 |
|
|
1,586,529 |
|
|
CenterPoint Energy, Inc. |
|
|
84,385 |
|
|
1,695,295 |
|
|
CMS Energy Corp. |
|
|
49,899 |
|
|
1,101,770 |
|
|
Consolidated Edison, Inc. |
|
|
58,370 |
|
|
3,620,691 |
|
|
Dominion Resources, Inc. |
|
|
113,086 |
|
|
6,002,605 |
|
|
DTE Energy Co. |
|
|
33,553 |
|
|
1,826,961 |
|
|
Integrys Energy Group, Inc. |
|
|
15,394 |
|
|
834,047 |
|
|
NiSource, Inc. |
|
|
55,609 |
|
|
1,324,050 |
|
|
PG&E Corp. |
|
|
80,789 |
|
|
3,330,123 |
|
|
Public Service Enterprise Group, Inc. |
|
|
100,882 |
|
|
3,330,115 |
|
|
SCANA Corp. |
|
|
23,095 |
|
|
1,040,661 |
|
|
|
|
|
|
|
|
|
|
|
|
|
BLACKROCK S&P 500 INDEX FUND |
DECEMBER 31, 2011 |
19 |
|
|
|
|
|
|
|
Schedule of Investments (continued) |
Master S&P 500 Index Series |
|
|
(Percentages shown are based on Net Assets) |
|
|
|
|
|
|
|
|
|
|
Common Stocks |
|
Shares |
|
Value |
|
||
|
Multi-Utilities (concluded) |
|
|
|
|
|
|
|
|
Sempra Energy |
|
|
47,851 |
|
$ |
2,631,805 |
|
|
TECO Energy, Inc. |
|
|
42,961 |
|
|
822,273 |
|
|
Wisconsin Energy Corp. |
|
|
46,317 |
|
|
1,619,242 |
|
|
Xcel Energy, Inc. |
|
|
96,784 |
|
|
2,675,110 |
|
|
|
|
|
|
|
|
33,441,277 |
|
|
Multiline Retail — 0.8% |
|
|
|
|
|
|
|
|
Big Lots, Inc. (a) |
|
|
12,995 |
|
|
490,691 |
|
|
Dollar Tree, Inc. (a) |
|
|
23,668 |
|
|
1,967,047 |
|
|
Family Dollar Stores, Inc. |
|
|
23,020 |
|
|
1,327,333 |
|
|
JCPenney Co., Inc. |
|
|
28,325 |
|
|
995,624 |
|
|
Kohl’s Corp. |
|
|
50,420 |
|
|
2,488,227 |
|
|
Macy’s, Inc. |
|
|
82,987 |
|
|
2,670,522 |
|
|
Nordstrom, Inc. |
|
|
32,253 |
|
|
1,603,297 |
|
|
Sears Holdings Corp. (a)(b) |
|
|
7,629 |
|
|
242,450 |
|
|
Target Corp. |
|
|
133,391 |
|
|
6,832,287 |
|
|
|
|
|
|
|
|
18,617,478 |
|
|
Office Electronics — 0.1% |
|
|
|
|
|
|
|
|
Xerox Corp. |
|
|
275,579 |
|
|
2,193,609 |
|
|
Oil, Gas & Consumable Fuels — 10.2% |
|
|
|
|
|
|
|
|
Alpha Natural Resources, Inc. (a) |
|
|
43,831 |
|
|
895,467 |
|
|
Anadarko Petroleum Corp. |
|
|
98,946 |
|
|
7,552,548 |
|
|
Apache Corp. |
|
|
76,287 |
|
|
6,910,076 |
|
|
Cabot Oil & Gas Corp. |
|
|
20,705 |
|
|
1,571,509 |
|
|
Chesapeake Energy Corp. |
|
|
130,935 |
|
|
2,918,541 |
|
|
Chevron Corp. |
|
|
395,751 |
|
|
42,107,906 |
|
|
ConocoPhillips |
|
|
263,874 |
|
|
19,228,498 |
|
|
Consol Energy, Inc. |
|
|
44,929 |
|
|
1,648,894 |
|
|
Denbury Resources, Inc. (a) |
|
|
79,731 |
|
|
1,203,938 |
|
|
Devon Energy Corp. |
|
|
80,307 |
|
|
4,979,034 |
|
|
El Paso Corp. |
|
|
153,547 |
|
|
4,079,744 |
|
|
EOG Resources, Inc. |
|
|
53,546 |
|
|
5,274,816 |
|
|
EQT Corp. |
|
|
29,615 |
|
|
1,622,606 |
|
|
Exxon Mobil Corp. (c) |
|
|
952,482 |
|
|
80,732,374 |
|
|
Hess Corp. |
|
|
59,005 |
|
|
3,351,484 |
|
|
Marathon Oil Corp. |
|
|
139,484 |
|
|
4,082,697 |
|
|
Marathon Petroleum Corp. |
|
|
70,636 |
|
|
2,351,472 |
|
|
Murphy Oil Corp. |
|
|
38,344 |
|
|
2,137,295 |
|
|
Newfield Exploration Co. (a) |
|
|
26,203 |
|
|
988,639 |
|
|
Noble Energy, Inc. |
|
|
34,973 |
|
|
3,301,102 |
|
|
Occidental Petroleum Corp. |
|
|
161,341 |
|
|
15,117,652 |
|
|
Peabody Energy Corp. |
|
|
53,662 |
|
|
1,776,749 |
|
|
Pioneer Natural Resources Co. |
|
|
24,339 |
|
|
2,177,854 |
|
|
QEP Resources, Inc. |
|
|
35,057 |
|
|
1,027,170 |
|
|
Range Resources Corp. |
|
|
31,132 |
|
|
1,928,316 |
|
|
Southwestern Energy Co. (a) |
|
|
68,950 |
|
|
2,202,263 |
|
|
Spectra Energy Corp. |
|
|
129,532 |
|
|
3,983,109 |
|
|
Sunoco, Inc. |
|
|
21,405 |
|
|
878,033 |
|
|
Tesoro Corp. (a)(b) |
|
|
28,563 |
|
|
667,232 |
|
|
Valero Energy Corp. |
|
|
110,513 |
|
|
2,326,299 |
|
|
Williams Cos., Inc. |
|
|
117,344 |
|
|
3,874,699 |
|
|
|
|
|
|
|
|
232,898,016 |
|
|
Paper & Forest Products — 0.2% |
|
|
|
|
|
|
|
|
International Paper Co. |
|
|
86,608 |
|
|
2,563,597 |
|
|
MeadWestvaco Corp. |
|
|
33,827 |
|
|
1,013,118 |
|
|
|
|
|
|
|
|
3,576,715 |
|
|
|
|
|
|
|
|
|
|
|
Common Stocks |
|
Shares |
|
Value |
|
||
|
Personal Products — 0.2% |
|
|
|
|
|
|
|
|
Avon Products, Inc. |
|
|
85,348 |
|
$ |
1,491,030 |
|
|
The Estée Lauder Cos., Inc., Class A |
|
|
22,222 |
|
|
2,495,975 |
|
|
|
|
|
|
|
|
3,987,005 |
|
|
Pharmaceuticals — 6.2% |
|
|
|
|
|
|
|
|
Abbott Laboratories |
|
|
309,599 |
|
|
17,408,752 |
|
|
Allergan, Inc. |
|
|
60,647 |
|
|
5,321,168 |
|
|
Bristol-Myers Squibb Co. |
|
|
336,802 |
|
|
11,868,903 |
|
|
Eli Lilly & Co. |
|
|
202,509 |
|
|
8,416,274 |
|
|
Forest Laboratories, Inc. (a) |
|
|
52,494 |
|
|
1,588,468 |
|
|
Hospira, Inc. (a) |
|
|
32,674 |
|
|
992,309 |
|
|
Johnson & Johnson |
|
|
542,686 |
|
|
35,589,348 |
|
|
Merck & Co., Inc. |
|
|
605,725 |
|
|
22,835,833 |
|
|
Mylan, Inc. (a) |
|
|
84,467 |
|
|
1,812,662 |
|
|
Perrigo Co. |
|
|
18,528 |
|
|
1,802,774 |
|
|
Pfizer, Inc. |
|
|
1,527,597 |
|
|
33,057,199 |
|
|
Watson Pharmaceuticals, Inc. (a) |
|
|
25,268 |
|
|
1,524,671 |
|
|
|
|
|
|
|
|
142,218,361 |
|
|
Professional Services — 0.1% |
|
|
|
|
|
|
|
|
Dun & Bradstreet Corp. |
|
|
9,608 |
|
|
718,967 |
|
|
Equifax, Inc. |
|
|
24,260 |
|
|
939,832 |
|
|
Robert Half International, Inc. |
|
|
28,714 |
|
|
817,200 |
|
|
|
|
|
|
|
|
2,475,999 |
|
|
Real Estate Investment Trusts (REITs) — 1.8% |
|
|
|
|
|
|
|
|
Apartment Investment & Management Co., Class A |
|
|
23,585 |
|
|
540,332 |
|
|
AvalonBay Communities, Inc. |
|
|
18,917 |
|
|
2,470,560 |
|
|
Boston Properties, Inc. |
|
|
29,379 |
|
|
2,926,148 |
|
|
Equity Residential |
|
|
59,110 |
|
|
3,371,043 |
|
|
HCP, Inc. |
|
|
81,196 |
|
|
3,363,950 |
|
|
Health Care REIT, Inc. |
|
|
37,737 |
|
|
2,057,799 |
|
|
Host Marriott Corp. (b) |
|
|
139,920 |
|
|
2,066,618 |
|
|
Kimco Realty Corp. |
|
|
80,650 |
|
|
1,309,756 |
|
|
Plum Creek Timber Co., Inc. |
|
|
32,101 |
|
|
1,173,613 |
|
|
ProLogis |
|
|
90,946 |
|
|
2,600,146 |
|
|
Public Storage |
|
|
28,266 |
|
|
3,800,646 |
|
|
Simon Property Group, Inc. |
|
|
58,375 |
|
|
7,526,873 |
|
|
Ventas, Inc. |
|
|
57,434 |
|
|
3,166,337 |
|
|
Vornado Realty Trust |
|
|
36,819 |
|
|
2,829,908 |
|
|
Weyerhaeuser Co. |
|
|
106,738 |
|
|
1,992,799 |
|
|
|
|
|
|
|
|
41,196,528 |
|
|
Real Estate Management & Development — 0.0% |
|
|
|
|
|
|
|
|
CBRE Group, Inc. (a) |
|
|
64,326 |
|
|
979,042 |
|
|
Road & Rail — 0.9% |
|
|
|
|
|
|
|
|
CSX Corp. |
|
|
208,778 |
|
|
4,396,864 |
|
|
Norfolk Southern Corp. |
|
|
66,829 |
|
|
4,869,161 |
|
|
Ryder System, Inc. |
|
|
10,227 |
|
|
543,463 |
|
|
Union Pacific Corp. |
|
|
96,085 |
|
|
10,179,245 |
|
|
|
|
|
|
|
|
19,988,733 |
|
|
Semiconductors
& Semiconductor |
|
|
|
|
|
|
|
|
Advanced Micro Devices, Inc. (a) |
|
|
117,638 |
|
|
635,245 |
|
|
Altera Corp. |
|
|
63,664 |
|
|
2,361,934 |
|
|
Analog Devices, Inc. |
|
|
59,332 |
|
|
2,122,899 |
|
|
Applied Materials, Inc. |
|
|
259,175 |
|
|
2,775,764 |
|
|
Broadcom Corp., Class A (a) |
|
|
96,536 |
|
|
2,834,297 |
|
|
First Solar, Inc. (a)(b) |
|
|
11,840 |
|
|
399,718 |
|
|
|
|
|
|
|
|
|
|
20 |
BLACKROCK S&P 500 INDEX FUND |
DECEMBER 31, 2011 |
|
|
|
|
|
|
|
Schedule of Investments (continued) |
Master S&P 500 Index Series |
|
|
(Percentages shown are based on Net Assets) |
|
|
|
|
|
|
|
|
|
|
Common Stocks |
|
Shares |
|
Value |
|
||
|
Semiconductors
& Semiconductor |
|
|
|
|
|
|
|
|
Intel Corp. |
|
|
1,011,942 |
|
$ |
24,539,594 |
|
|
KLA-Tencor Corp. |
|
|
33,092 |
|
|
1,596,689 |
|
|
Linear Technology Corp. |
|
|
45,162 |
|
|
1,356,215 |
|
|
LSI Corp. (a)(b) |
|
|
112,665 |
|
|
670,357 |
|
|
Microchip Technology, Inc. |
|
|
37,769 |
|
|
1,383,479 |
|
|
Micron Technology, Inc. (a) |
|
|
195,774 |
|
|
1,231,419 |
|
|
Novellus Systems, Inc. (a) |
|
|
13,305 |
|
|
549,363 |
|
|
NVIDIA Corp. (a) |
|
|
121,376 |
|
|
1,682,271 |
|
|
Teradyne, Inc. (a) |
|
|
36,815 |
|
|
501,788 |
|
|
Texas Instruments, Inc. |
|
|
227,019 |
|
|
6,608,523 |
|
|
Xilinx, Inc. |
|
|
52,542 |
|
|
1,684,497 |
|
|
|
|
|
|
|
|
52,934,052 |
|
|
Software — 3.5% |
|
|
|
|
|
|
|
|
Adobe Systems, Inc. (a) |
|
|
97,854 |
|
|
2,766,333 |
|
|
Autodesk, Inc. (a) |
|
|
45,343 |
|
|
1,375,253 |
|
|
BMC Software, Inc. (a) |
|
|
33,275 |
|
|
1,090,754 |
|
|
CA, Inc. |
|
|
72,686 |
|
|
1,469,347 |
|
|
Citrix Systems, Inc. (a) |
|
|
36,980 |
|
|
2,245,426 |
|
|
Electronic Arts, Inc. (a) |
|
|
66,242 |
|
|
1,364,585 |
|
|
Intuit, Inc. |
|
|
59,123 |
|
|
3,109,279 |
|
|
Microsoft Corp. |
|
|
1,487,808 |
|
|
38,623,496 |
|
|
Oracle Corp. |
|
|
781,989 |
|
|
20,058,018 |
|
|
Red Hat, Inc. (a) |
|
|
38,247 |
|
|
1,579,219 |
|
|
Salesforce.com, Inc. (a) |
|
|
27,068 |
|
|
2,746,319 |
|
|
Symantec Corp. (a) |
|
|
145,540 |
|
|
2,277,701 |
|
|
|
|
|
|
|
|
78,705,730 |
|
|
Specialty Retail — 2.0% |
|
|
|
|
|
|
|
|
Abercrombie & Fitch Co., Class A |
|
|
17,230 |
|
|
841,513 |
|
|
AutoNation, Inc. (a) |
|
|
9,293 |
|
|
342,633 |
|
|
AutoZone, Inc. (a) |
|
|
5,558 |
|
|
1,806,183 |
|
|
Bed Bath & Beyond, Inc. (a) |
|
|
47,500 |
|
|
2,753,575 |
|
|
Best Buy Co., Inc. |
|
|
57,568 |
|
|
1,345,364 |
|
|
CarMax, Inc. (a)(b) |
|
|
44,839 |
|
|
1,366,693 |
|
|
GameStop Corp., Class A (a)(b) |
|
|
27,568 |
|
|
665,216 |
|
|
The Gap, Inc. |
|
|
68,750 |
|
|
1,275,312 |
|
|
Home Depot, Inc. |
|
|
306,393 |
|
|
12,880,762 |
|
|
Limited Brands, Inc. |
|
|
49,063 |
|
|
1,979,692 |
|
|
Lowe’s Cos., Inc. |
|
|
248,964 |
|
|
6,318,706 |
|
|
O’Reilly Automotive, Inc. (a) |
|
|
25,647 |
|
|
2,050,478 |
|
|
Orchard Supply Hardware Stores Corp., Class A (a) |
|
|
345 |
|
|
1,296 |
|
|
Ross Stores, Inc. |
|
|
45,812 |
|
|
2,177,444 |
|
|
Staples, Inc. |
|
|
139,086 |
|
|
1,931,904 |
|
|
Tiffany & Co. |
|
|
25,219 |
|
|
1,671,011 |
|
|
TJX Cos., Inc. |
|
|
74,987 |
|
|
4,840,411 |
|
|
Urban Outfitters, Inc. (a) |
|
|
21,330 |
|
|
587,855 |
|
|
|
|
|
|
|
|
44,836,048 |
|
|
Textiles, Apparel & Luxury Goods — 0.6% |
|
|
|
|
|
|
|
|
Coach, Inc. |
|
|
58,096 |
|
|
3,546,180 |
|
|
NIKE, Inc., Class B |
|
|
73,739 |
|
|
7,106,227 |
|
|
Ralph Lauren Corp. |
|
|
12,825 |
|
|
1,770,876 |
|
|
VF Corp. |
|
|
17,344 |
|
|
2,202,515 |
|
|
|
|
|
|
|
|
14,625,798 |
|
|
Thrifts & Mortgage Finance — 0.1% |
|
|
|
|
|
|
|
|
Hudson City Bancorp, Inc. |
|
|
105,568 |
|
|
659,800 |
|
|
People’s United Financial, Inc. |
|
|
70,118 |
|
|
901,016 |
|
|
|
|
|
|
|
|
1,560,816 |
|
|
|
|
|
|
|
|
|
|
|
Common Stocks |
|
Shares |
|
Value |
|
||
|
Tobacco — 2.0% |
|
|
|
|
|
|
|
|
Altria Group, Inc. |
|
|
408,728 |
|
$ |
12,118,785 |
|
|
Lorillard, Inc. |
|
|
26,854 |
|
|
3,061,356 |
|
|
Philip Morris International, Inc. |
|
|
345,190 |
|
|
27,090,511 |
|
|
Reynolds American, Inc. |
|
|
67,485 |
|
|
2,795,229 |
|
|
|
|
|
|
|
|
45,065,881 |
|
|
Trading Companies & Distributors — 0.2% |
|
|
|
|
|
|
|
|
Fastenal Co. |
|
|
58,521 |
|
|
2,552,101 |
|
|
W.W. Grainger, Inc. |
|
|
12,049 |
|
|
2,255,452 |
|
|
|
|
|
|
|
|
4,807,553 |
|
|
Wireless Telecommunication Services — 0.3% |
|
|
|
|
|
|
|
|
American Tower Corp., Class A |
|
|
78,080 |
|
|
4,685,581 |
|
|
MetroPCS Communications, Inc. (a) |
|
|
59,003 |
|
|
512,146 |
|
|
Sprint Nextel Corp. (a) |
|
|
593,351 |
|
|
1,388,441 |
|
|
|
|
|
|
|
|
6,586,168 |
|
|
Total Common Stocks — 99.2% |
|
|
|
|
|
2,261,924,678 |
|
|
|
|
|
|
|
|
|
|
|
|
|||||||
|
Preferred Stocks |
|
|
|
|
|
|
|
|
Specialty Retail — 0.0% |
|
|
|
|
|
|
|
|
Orchard Supply Hardware Stores Corp., |
|
|
345 |
|
|
1,296 |
|
|
Total
Long-Term Investments |
|
|
|
|
|
2,261,925,974 |
|
|
|
|
|
|
|
|
|
|
|
|
|||||||
|
Short-Term Securities |
|
|
|
|
|
|
|
|
BlackRock Liquidity Funds, TempFund, |
|
|
20,822,036 |
|
|
20,822,036 |
|
|
|
|
|
|
|
|
|
|
|
|
|
Beneficial |
|
|
|
|
|
|
BlackRock Liquidity Series, LLC |
|
$ |
21,533 |
|
|
21,533,097 |
|
|
Total
Short-Term Securities |
|
|
|
|
|
42,355,133 |
|
|
Total Investments (Cost — $1,863,172,156*) — 101.0% |
|
|
|
|
|
2,304,281,107 |
|
|
Liabilities in Excess of Other Assets — (1.0)% |
|
|
|
|
|
(23,214,529 |
) |
|
Net Assets — 100.0% |
|
|
|
|
$ |
2,281,066,578 |
|
|
|
|
|
|
|
|
|
|
|
* |
The cost and unrealized appreciation (depreciation) of investments as of December 31, 2011, as computed for federal income tax purposes, were as follows: |
|
|
|
|
|
|
|
|
|
|
Aggregate cost |
|
|
|
|
$ |
1,466,579,071 |
|
|
Gross unrealized appreciation |
|
|
|
|
$ |
955,842,971 |
|
|
Gross unrealized depreciation |
|
|
|
|
|
118,140,935 |
|
|
Net unrealized appreciation |
|
|
|
|
$ |
837,702,036 |
|
|
|
|
|
(a) |
Non-income producing security. |
|
|
|
|
(b) |
Security, or a portion of security, is on loan. |
|
|
|
|
(c) |
All or a portion of security has been pledged as collateral in connection with open financial futures contracts. |
|
|
|
|
|
|
|
|
|
|
|
|
BLACKROCK S&P 500 INDEX FUND |
DECEMBER 31, 2011 |
21 |
|
|
|
|
|
|
|
Schedule of Investments (concluded) |
Master S&P 500 Index Series |
|
|
|
|
(d) |
Investments in companies considered to be an affiliate of the Series during the year, for purposes of Section 2(a)(3) of the Investment Company Act of 1940, as amended, were as follows: |
|
|
|
|
|
|
|
|
|
|
|
|
|
|
|
|
|
|
|
|
|
|
|
|
|
Affiliate |
|
Beneficial
Interest/ |
|
Shares |
|
Beneficial |
|
Beneficial
Interest/ |
|
Value |
|
Realized |
|
Income |
|
|||||||
|
BlackRock, Inc. |
|
|
— |
|
|
21,176 |
|
|
(1,295 |
) |
|
19,881 |
|
$ |
3,543,590 |
|
$ |
(23,504 |
) |
$ |
80,375 |
|
|
BlackRock Liquidity Funds, TempFund, Institutional Class |
|
|
11,774,805 |
|
|
9,047,231 |
1 |
|
— |
|
|
20,822,036 |
|
$ |
20,822,036 |
|
$ |
307 |
|
$ |
10,485 |
|
|
BlackRock Liquidity Series, LLC Money Market Series |
|
$ |
135,284,520 |
|
|
— |
|
$ |
(113,751,423 |
)2 |
$ |
21,533,097 |
|
$ |
21,533,097 |
|
|
— |
|
$ |
290,233 |
|
|
The PNC Financial Services Group, Inc. |
|
|
108,792 |
|
|
3,620 |
|
|
(7,961 |
) |
|
104,451 |
|
$ |
6,023,689 |
|
$ |
16,408 |
|
$ |
181,911 |
|
|
|
|
|
|
|
1 |
Represents net shares purchased. |
|
|
|
|
|
|
2 |
Represents net beneficial interest sold. |
|
|
|
|
(e) |
Represents the current yield as of report date. |
|
|
|
|
(f) |
Security was purchased with the cash collateral from loaned securities. |
|
|
|
|
• |
Financial futures contracts sold as of December 31,2011 were as follows: |
|
|
|
|
|
|
|
|
|
|
|
|
|
Contracts |
|
Issue |
|
Exchange |
|
Expiration |
|
Notional |
|
Unrealized |
|
382 |
|
S&P
500 |
|
Chicago
|
|
March 2012 |
|
$23,924,660 |
|
$(44,721) |
|
|
|
|
|
• |
Fair Value Measurements — Various inputs are used in determining the fair value of investments and derivative financial instruments. These inputs are categorized into a disclosure hierarchy consisting of three broad levels for financial statement purposes as follows: |
|
|
|
|
|
|
|
• |
Level 1 — unadjusted price quotations in active markets/exchanges for identical assets and liabilities |
|
|
|
|
|
|
• |
Level 2 — other observable inputs (including, but not limited to: quoted prices for similar assets or liabilities in markets that are active, quoted prices for identical or similar assets or liabilities in markets that are not active, inputs other than quoted prices that are observable for the assets or liabilities (such as interest rates, yield curves, volatilities, prepayment speeds, loss severities, credit risks and default rates) or other market-corroborated inputs) |
|
|
|
|
|
|
• |
Level 3 — unobservable inputs based on the best information available in the circumstances, to the extent observable inputs are not available (including the Series’ own assumptions used in determining the fair value of investments and derivative financial instruments) |
Changes in valuation techniques may result in transfers in or out of an assigned level within the disclosure hierarchy. The categorization of a value determined for investments and derivative financial instruments is based on the pricing transparency of the investment and derivative financial instrument and does not necessarily correspond to the Series’ perceived risk of investing in those securities. For information about the Series’ policy regarding valuation of investments and derivative financial instruments and other significant accounting policies, please refer to Note 1 of the Notes to Financial Statements.
The following tables summarize the inputs used as of December 31, 2011 in determining the fair valuation of the Series’ investments and derivative financial instruments:
|
|
|
|
|
|
|
|
|
|
|
|
|
|
|
|
Valuation Inputs |
|
Level 1 |
|
Level 2 |
|
Level 3 |
|
Total |
|
||||
|
Assets: |
|
|
|
|
|
|
|
|
|
|
|
|
|
|
Investments: |
|
|
|
|
|
|
|
|
|
|
|
|
|
|
Long-Term Investments3 |
|
$ |
2,261,923,382 |
|
$ |
2,592 |
|
|
— |
|
$ |
2,261,925,974 |
|
|
Short-Term Securities |
|
|
20,822,036 |
|
|
21,533,097 |
|
|
— |
|
|
42,355,133 |
|
|
Total |
|
$ |
2,282,745,418 |
|
$ |
21,535,689 |
|
|
— |
|
$ |
2,304,281,107 |
|
|
|
|
|
|
|
3 |
See above schedule of investments for values in each industry excluding Level 2, Specialty Retail, within the table. |
|
|
|
|
|
|
|
|
|
|
|
|
|
|
|
|
Valuation Inputs |
|
Level 1 |
|
Level 2 |
|
Level 3 |
|
Total |
|
||||
|
Derivative Financial Instruments4 |
|
|
|
|
|
|
|
|
|
|
|
|
|
|
Liabilities: |
|
|
|
|
|
|
|
|
|
|
|
|
|
|
Equity contracts |
|
$ |
(44,721 |
) |
|
— |
|
|
— |
|
$ |
(44,721 |
) |
|
|
|
|
|
|
3 |
Derivative financial instruments are financial futures contracts, which are valued at the unrealized appreciation/depreciation on the instrument. |
|
|
|
|
|
|
|
|
|
22 |
BLACKROCK S&P 500 INDEX FUND |
DECEMBER 31, 2011 |
|
|
|
|
|
|
|
Master S&P 500 Index Series |
|
|
|
|
|
|
|
December 31, 2011 |
|
|
|
|
|
Assets |
|
|
|
|
|
Investments at value — unaffiliated (including securities loaned of $20,985,148) (cost — $1,812,366,267) |
|
$ |
2,252,358,695 |
|
|
Investments at value — affiliated (cost — $50,805,889) |
|
|
51,922,412 |
|
|
Investments sold receivable |
|
|
7,724,027 |
|
|
Dividends receivable |
|
|
3,433,513 |
|
|
Securities lending income receivable — affiliated |
|
|
40,701 |
|
|
Prepaid expenses |
|
|
43,537 |
|
|
Total assets |
|
|
2,315,522,885 |
|
|
|
|
|
|
|
|
Liabilities |
|
|
|
|
|
Collateral on securities loaned at value |
|
|
21,533,097 |
|
|
Margin variation payable |
|
|
89,170 |
|
|
Investment advisory fees payable |
|
|
38,405 |
|
|
Other affiliates payable |
|
|
5,916 |
|
|
Directors’ fees payable |
|
|
943 |
|
|
Withdrawals payable to investors |
|
|
12,587,583 |
|
|
Other accrued expenses payable |
|
|
201,193 |
|
|
Total liabilities |
|
|
34,456,307 |
|
|
Net Assets |
|
$ |
2,281,066,578 |
|
|
|
|
|
|
|
|
Net Assets Consist of |
|
|
|
|
|
Investors’ capital |
|
$ |
1,840,002,348 |
|
|
Net unrealized appreciation/depreciation |
|
|
441,064,230 |
|
|
Net Assets |
|
$ |
2,281,066,578 |
|
|
|
|
|
|
|
See Notes to Financial Statements. |
|||
|
|
|
|
|
|
|
BLACKROCK S&P 500 INDEX FUND |
DECEMBER 31, 2011 |
23 |
|
|
|
|
|
|
|
Master S&P 500 Index Series |
|
|
|
|
|
|
|
Year Ended December 31, 2011 |
|
|
|
|
|
Investment Income |
|
|
|
|
|
Dividends — unaffiliated |
|
$ |
48,964,963 |
|
|
Foreign taxes withheld |
|
|
(43,371 |
) |
|
Dividends — affiliated |
|
|
272,771 |
|
|
Securities lending — affiliated |
|
|
305,591 |
|
|
Total income |
|
|
49,499,954 |
|
|
|
|
|
|
|
|
Expenses |
|
|
|
|
|
Investment advisory |
|
|
236,277 |
|
|
Accounting services |
|
|
383,755 |
|
|
Custodian |
|
|
111,432 |
|
|
Professional |
|
|
101,513 |
|
|
Directors |
|
|
57,219 |
|
|
Registration |
|
|
20,000 |
|
|
Printing |
|
|
4,733 |
|
|
Miscellaneous |
|
|
46,642 |
|
|
Total expenses |
|
|
961,571 |
|
|
Less fees waived by advisor |
|
|
(130,251 |
) |
|
Total expenses after fees waived |
|
|
831,320 |
|
|
Net investment income |
|
|
48,668,634 |
|
|
|
|
|
|
|
|
Realized and Unrealized Gain (Loss) |
|
|
|
|
|
Net realized gain (loss) from: |
|
|
|
|
|
Investments — unaffiliated |
|
|
(2,425,254 |
) |
|
Investments — affiliated |
|
|
(6,789 |
) |
|
Financial futures contracts |
|
|
(2,311,537 |
) |
|
|
|
|
(4,743,580 |
) |
|
Net change in unrealized appreciation/depreciation on: |
|
|
|
|
|
Investments |
|
|
9,277,367 |
|
|
Financial futures contracts |
|
|
(55,374 |
) |
|
|
|
|
9,221,993 |
|
|
Total realized and unrealized gain |
|
|
4,478,413 |
|
|
Net Increase in Net Assets Resulting from Operations |
|
$ |
53,147,047 |
|
|
|
|
|
|
See Notes to Financial Statements. |
||
|
|
||
|
24 |
BLACKROCK S&P 500 INDEX FUND |
DECEMBER 31, 2011 |
|
|
|
|
|
|
|
Master S&P 500 Index Series |
|
|
|
|
|
|
|
|
|
|
|
|
Year
Ended |
|
||||
|
Increase (Decrease) in Net Assets: |
|
2011 |
|
2010 |
|
||
|
Operations |
|
|
|
|
|
|
|
|
Net investment income |
|
$ |
48,668,634 |
|
$ |
46,035,411 |
|
|
Net realized gain (loss) |
|
|
(4,743,580 |
) |
|
(5,190,154 |
) |
|
Net change in unrealized appreciation/depreciation |
|
|
9,221,993 |
|
|
279,529,123 |
|
|
Net increase in net assets resulting from operations |
|
|
53,147,047 |
|
|
320,374,380 |
|
|
|
|
|
|
|
|
|
|
|
Capital Transactions |
|
|
|
|
|
|
|
|
Proceeds from contributions |
|
|
758,612,964 |
|
|
601,567,988 |
|
|
Value of withdrawals |
|
|
(894,677,279 |
) |
|
(836,617,134 |
) |
|
Net decrease in net assets derived from capital transactions |
|
|
(136,064,315 |
) |
|
(235,049,146 |
) |
|
|
|
|
|
|
|
|
|
|
Net Assets |
|
|
|
|
|
|
|
|
Total increase (decrease) in net assets |
|
|
(82,917,268 |
) |
|
85,325,234 |
|
|
Beginning of year |
|
|
2,363,983,846 |
|
|
2,278,658,612 |
|
|
End of year |
|
$ |
2,281,066,578 |
|
$ |
2,363,983,846 |
|
|
|
|
|
|
|
See Notes to Financial Statements. |
|||
|
|
|
|
|
|
|
BLACKROCK S&P 500 INDEX FUND |
DECEMBER 31, 2011 |
25 |
|
|
|
|
|
|
|
Master S&P 500 Index Series |
|
|
|
|
|
|
|
|
|
|
|
|
|
|
|
|
|
|
|
|
|
Year Ended December 31, |
|
|||||||||||||
|
|
|
2011 |
|
2010 |
|
2009 |
|
2008 |
|
2007 |
|
|||||
|
Total Investment Return |
|
|
|
|
|
|
|
|
|
|
|
|
|
|
|
|
|
Total investment return |
|
|
2.06 |
% |
|
15.11 |
% |
|
26.61 |
% |
|
(36.92 |
)% |
|
5.56 |
% |
|
|
|
|
|
|
|
|
|
|
|
|
|
|
|
|
|
|
|
Ratios to Average Net Assets |
|
|
|
|
|
|
|
|
|
|
|
|
|
|
|
|
|
Total expenses |
|
|
0.04 |
% |
|
0.04 |
% |
|
0.05 |
% |
|
0.04 |
% |
|
0.04 |
% |
|
Total expenses after fees waived and paid indirectly |
|
|
0.03 |
% |
|
0.04 |
% |
|
0.04 |
% |
|
0.04 |
% |
|
0.03 |
% |
|
Net investment income |
|
|
2.06 |
% |
|
2.03 |
% |
|
2.32 |
% |
|
2.31 |
% |
|
1.95 |
% |
|
|
|
|
|
|
|
|
|
|
|
|
|
|
|
|
|
|
|
Supplemental Data |
|
|
|
|
|
|
|
|
|
|
|
|
|
|
|
|
|
Net assets, end of year (000) |
|
$ |
2,281,067 |
|
$ |
2,363,984 |
|
$ |
2,278,659 |
|
$ |
1,953,848 |
|
$ |
3,721,171 |
|
|
Portfolio turnover |
|
|
6 |
% |
|
5 |
% |
|
7 |
% |
|
8 |
% |
|
4 |
% |
|
|
|
|
|
See Notes to Financial Statements. |
||
|
|
||
|
26 |
BLACKROCK S&P 500 INDEX FUND |
DECEMBER 31, 2011 |
|
|
|
|
|
|
|
Master S&P 500 Index Series |
1. Organization and Significant Accounting Policies:
Master S&P 500 Index Series (the “Series”), a diversified, open-end management investment company, is a series of Quantitative Master Series LLC (the “Master LLC”). The Master LLC is registered as an investment company under the Investment Company Act of 1940, as amended (the “1940 Act”), and is organized as a Delaware limited liability company. The Master LLC’s Limited Liability Company Agreement permits the Board of Directors of the Master LLC (the “Board”) to issue nontransferable interests in the Master LLC, subject to certain limitations. The Series’ financial statements are prepared in conformity with accounting principles generally accepted in the United States of America (“US GAAP”), which may require management to make estimates and assumptions that affect the reported amounts and disclosures in the financial statements. Actual results could differ from those estimates.
The following is a summary of significant accounting policies followed by the Series:
Valuation: US GAAP defines fair value as the price the Series would receive to sell an asset or pay to transfer a liability in an orderly transaction between market participants at the measurement date. The Series fair values its financial instruments at market value using independent dealers or pricing services under policies approved by the Board. Equity investments traded on a recognized securities exchange or the NASDAQ Global Market System (“NASDAQ”) are valued at the last reported sale price that day or the NASDAQ official closing price, if applicable. For equity investments traded on more than one exchange, the last reported sale price on the exchange where the stock is primarily traded is used. Equity investments traded on a recognized exchange for which there were no sales on that day are valued at the last available bid (long positions) or ask (short positions) price. If no bid or ask price is available, the prior day’s price will be used, unless it is determined that such prior day’s price no longer reflects the fair value of the security. Financial futures contracts traded on exchanges are valued at their last sale price. Investments in open-end registered investment companies are valued at NAV each business day. Short-term securities with remaining maturities of 60 days or less may be valued at amortized cost, which approximates fair value.
The Series values its investments in BlackRock Liquidity Series, LLC Money Market Series (the “Money Market Series”) at fair value, which is ordinarily based upon its pro rata ownership in the underlying fund’s net assets. The Money Market Series seeks current income consistent with maintaining liquidity and preserving capital. Although the Money Market Series is not registered under the 1940 Act, its investments will follow the parameters of investments by a money market fund that is subject to Rule 2a-7 under the 1940 Act. The Series may withdraw up to 25% of its investment daily, although the manager of the Money Market Series, in its sole discretion, may permit an investor to withdraw more than 25% on any one day.
In the event that application of these methods of valuation results in a price for an investment which is deemed not to be representative of the market value of such investment or if a price is not available, the investment will be valued in accordance with a policy approved by the Board as reflecting fair value (“Fair Value Assets”). When determining the price for Fair Value Assets, the investment advisor and/or the sub-advisor seeks to determine the price that the Series might reasonably expect to receive from the current sale of that asset in an arm’s-length transaction. Fair value determinations shall be based upon all available factors that the investment advisor and/or sub-advisor deems relevant. The pricing of all Fair Value Assets is subsequently reported to the Board or a committee thereof.
Segregation and Collateralization: In cases in which the 1940 Act and the interpretive positions of the Securities and Exchange Commission (“SEC”) require that the Series either deliver collateral or segregate assets in connection with certain investments (e.g., financial futures contracts), the Series will, consistent with SEC rules and/or certain interpretive letters issued by the SEC, segregate collateral or designate on its books and records cash or liquid securities having a market value at least equal to the amount that would otherwise be required to be physically segregated. Furthermore, based on requirements and agreements with certain exchanges and third party broker-dealers, each party to such transactions has requirements to deliver/deposit securities as collateral for certain investments.
Investment Transactions and Investment Income: For financial reporting purposes, investment transactions are recorded on the dates the transactions are entered into (the trade dates). Realized gains and losses on investment transactions are determined on the identified cost basis. Dividend income is recorded on the ex-dividend dates. Upon notification from issuers, some of the dividend income received from a real estate investment trust may be redesignated as a reduction of cost of the related investment and/or realized gain. Interest income, including amortization and accretion of premiums and discounts on debt securities, is recognized on the accrual basis.
Securities Lending: The Series may lend securities to approved borrowers, such as banks, brokers and other financial institutions. The borrower pledges cash, securities issued or guaranteed by the US government or irrevocable letters of credit issued by a bank as collateral, which will be maintained at all times in an amount equal to at least 100% of the current market value of the loaned securities. The market value of the loaned securities is determined at the close of business of the Series and any additional required collateral is delivered to the Series on the next business day. Securities lending income, as disclosed in the Statement of Operations, represents the income earned from the investment of the cash collateral, net of rebates paid to, or fees paid by, borrowers and less the fees paid to the securities lending agent. During the term of the loan, the Series earns interest income on the securities loaned but does not
|
|
|
|
|
|
|
|
|
|
|
|
BLACKROCK S&P 500 INDEX FUND |
DECEMBER 31, 2011 |
27 |
|
|
|
|
|
|
|
Notes to Financial Statements (continued) |
Master S&P 500 Index Series |
receive interest income on the securities received as collateral. Loans of securities are terminable at any time and the borrower, after notice, is required to return borrowed securities within the standard time period for settlement of securities transactions. In the event that the borrower defaults on its obligation to return borrowed securities because of insolvency or for any other reason, the Series could experience delays and costs in gaining access to the collateral. The Series also could suffer a loss if the value of an investment purchased with cash collateral falls below the market value of loaned securities or if the value of an investment purchased with cash collateral falls below the value of the original cash collateral received. During the year ended December 31, 2011, any securities on loan were collateralized by cash.
Income Taxes: The Series is classified as a partnership for federal income tax purposes. As such, each investor in the Series is treated as the owner of its proportionate share of net assets, income, expenses and realized and unrealized gains and losses of the Series. Therefore, no federal income tax provision is required. It is intended that the Series’ assets will be managed so an investor in the Series can satisfy the requirements of Subchapter M of the Internal Revenue Code of 1986, as amended.
The Series files US federal and various state and local tax returns. No income tax returns are currently under examination. The statute of limitations on the Series’ US federal tax returns remains open for each of the four years ended December 31, 2011. The statutes of limitations on the Series’ state and local tax returns may remain open for an additional year depending upon the jurisdiction. Management does not believe there are any uncertain tax positions that require recognition of a tax liability.
Recent Accounting Standards: In May 2011, the Financial Accounting Standards Board (the “FASB”) issued amended guidance to improve disclosure about fair value measurements which will require the following disclosures for fair value measurements categorized as Level 3: quantitative information about the unobservable inputs and assumptions used in the fair value measurement, a description of the valuation policies and procedures and a narrative description of the sensitivity of the fair value measurement to changes in unobservable inputs and the interrelationships between those unobservable inputs. In addition, the amounts and reasons for all transfers in and out of Level 1 and Level 2 will be required to be disclosed. The amended guidance is effective for financial statements for fiscal years beginning after December 15, 2011, and interim periods within those fiscal years. Management is evaluating the impact of this guidance on the Series’ financial statement disclosures.
In December 2011, the FASB issued guidance that will enhance current disclosure requirements on the offsetting of certain assets and liabilities. The new disclosures will be required for investments and derivative financial instruments subject to master netting agreements or similar agreements and will require an entity to disclose both gross and net information about such investments and transactions eligible for offset in the Statement of Assets and Liabilities. The guidance is effective for financial statements with fiscal years beginning on or after January 1, 2013, and interim periods within those fiscal years. Management is evaluating the impact of this guidance on the Series’ financial statement disclosures.
Other: Expenses directly related to the Series are charged to the Series. Other operating expenses shared by several funds are pro rated among those funds on the basis of relative net assets or other appropriate methods.
The Series has an arrangement with the custodian whereby fees may be reduced by credits earned on uninvested cash balances, which, if applicable, are shown as fees paid indirectly in the Statement of Operations. The custodian imposes fees on overdrawn cash balances, which can be offset by accumulated credits earned or may result in additional custody charges.
2. Derivative Financial Instruments:
The Series engages in various portfolio investment strategies using derivative contracts both to increase the returns of the Series and to economically hedge, or protect, its exposure to certain risks such as equity risk. These contracts may be transacted on an exchange.
Losses may arise if the value of the contract decreases due to an unfavorable change in the market rates or values of the underlying instrument or if the counterparty does not perform under the contract. Counterparty risk related to exchange-traded financial futures contracts is deemed to be minimal due to the protection against defaults provided by the exchange on which these contracts trade.
Financial Futures Contracts: The Series purchases or sells financial futures contracts and options on financial futures contracts to gain exposure to, or economically hedge against, changes in the value of equity securities (equity risk). Financial futures contracts are agreements between the Series and counterparty to buy or sell a specific quantity of an underlying instrument at a specified price and at a specified date. Depending on the terms of the particular contract, futures contracts are settled either through physical delivery of the underlying instrument on the settlement date or by payment of a cash settlement amount on the settlement date. Pursuant to the contract, the Series agrees to receive from or pay to the broker an amount of cash equal to the daily fluctuation in value of the contract. Such receipts or payments are known as margin variation and are recorded by the Series as unrealized appreciation or depreciation. When the contract is closed, the Series records a realized gain or loss equal to the difference between the value of the contract at the time it was opened and the value at the time it was closed. The use of financial futures contracts involves the risk of an imperfect correlation in the movements in the price of financial futures contracts, interest rates and the underlying assets.
|
|
|
|
|
|
|
|
|
|
|
28 |
|
BLACKROCK S&P 500 INDEX FUND |
DECEMBER 31, 2011 |
|
|
|
|
|
|
|
Notes to Financial Statements (continued) |
Master S&P 500 Index Series |
Derivative Financial Instruments Categorized by Risk Exposure:
|
|
|
|
|
|
|
|
|
Fair Values of Derivative Financial Instruments as of December 31, 2011 |
||||||
|
|
|
Liability Derivatives |
|
|||
|
|
|
Statement
of |
|
Value |
|
|
|
Equity contracts |
|
Net |
|
$ |
44,721 |
|
|
|
|
|
|
|
1 |
Includes cumulative appreciation/depreciation on financial futures contracts as reported in the Schedule of Investments. Only current day’s margin variation is reported within the Statement of Assets and Liabilities. |
|
|
|
|
|
|
|
The
Effect of Derivative Financial Instruments in the Statement of Operations |
||||
|
|
|
Net Realized Loss From |
|
|
|
Equity contracts: |
|
|
|
|
|
Financial futures contracts |
|
|
$ (2,311,537) |
|
|
|
|
|
|
|
|
|
|
Net
Change in Unrealized |
|
|
|
Equity contracts: |
|
|
|
|
|
Financial futures contracts |
|
|
$ (55,374) |
|
For the year ended December 31, 2011, the average quarterly balances of outstanding derivative financial instruments were as follows:
|
|
|
|
|
|
|
Financial futures contracts: |
|
|
|
|
|
Average number of contracts purchased |
|
|
289 |
|
|
Average notional value of contracts purchased |
|
$ |
18,167,765 |
|
3. Investment Advisory Agreement and Other Transactions with Affiliates:
The PNC Financial Services Group, Inc. (“PNC”) and Barclays Bank PLC (“Barclays”) are the largest stockholders of BlackRock, Inc. (“BlackRock”). Due to the ownership structure, PNC is an affiliate for 1940 Act purposes, but Barclays is not.
The Master LLC, on behalf of the Series, entered into an Investment Advisory Agreement with BlackRock Advisors, LLC (the “Manager”), the Series’ investment advisor, an indirect, wholly owned subsidiary of BlackRock, to provide investment advisory and administration services. The Manager is responsible for the management of the Series’ portfolio and provides the necessary personnel, facilities, equipment and certain other services necessary to the operations of the Series. For such services, the Series pays the Manager a monthly fee at an annual rate of 0.01% of the Series’ average daily net assets.
The Manager contractually agreed to waive its investment advisory fee by 0.005% of the Series’ average daily net assets. The Manager has agreed not to reduce or discontinue this contractual waiver prior to May 1, 2012 unless approved by the Board, including a majority of the Independent Directors. For the year ended December 31, 2011, the Manager waived $93,567, which is included in fees waived by advisor in the Statement of Operations.
The Manager voluntarily agreed to waive its investment advisory fees by the amount of investment advisory fees the Series pays to the Manager indirectly through its investment in affiliated money market funds. However, the Manager does not waive its investment advisory fees by the amount of investment advisory fees paid in connection with the Series’ investment in other affiliated investment companies, if any. For the year ended December 31, 2011, the Manager waived $36,684, which is included in fees waived by advisor in the Statement of Operations.
The Manager entered into a sub-advisory agreement with BlackRock Investment Management, LLC (“BIM”), an affiliate of the Manager. The Manager pays BIM, for services it provides, a monthly fee that is a percentage of the investment advisory fees paid by the Series to the Manager.
For the year ended December 31, 2011, the Series reimbursed the Manager $24,984 for certain accounting services, which is included in accounting services in the Statement of Operations.
The Master LLC, on behalf of the Series, received an exemptive order from the SEC permitting it, among other things, to pay an affiliated securities lending agent a fee based on a share of the income derived from the securities lending activities and has retained BIM as the securities lending agent. BIM may, on behalf of the Series, invest cash collateral received by the Series for such loans, among other things, in a private investment company managed by the Manager or in registered money market funds advised by the Manager or its affiliates. As securities lending agent, BIM is responsible for all transaction fees and all other operational costs relating to securities lending activities, other than extraordinary expenses. BIM does not receive any fees for managing the cash collateral. The market value of securities on loan and the value of the related collateral, if applicable, are shown in the Statement of Assets and Liabilities as securities loaned at value and collateral on securities loaned at value, respectively. The cash collateral invested by BIM is disclosed in the Schedule of Investments. Securities lending income is equal to the total of income earned from the reinvestment of cash collateral, net of rebates paid to, or fees paid by, borrowers of securities. The Series retains 65% of securities lending income and pays a fee to BIM equal to 35% of such income. The share of income earned by the Series on such investments is shown as securities lending — affiliated in the Statement of Operations. For the year ended December 31, 2011, BIM received $88,333 in securities lending agent fees related to securities lending activities for the Series.
|
|
|
|
|
|
|
|
|
|
|
|
BLACKROCK S&P 500 INDEX FUND |
DECEMBER 31, 2011 |
29 |
|
|
|
|
|
|
|
Notes to Financial Statements (concluded) |
Master S&P 500 Index Series |
Certain officers and/or directors of the Master LLC are officers and/or directors of BlackRock or its affiliates.
4. Investments:
Purchases and sales of investments, excluding short-term securities for the year ended December 31, 2011, were $131,646,545 and $238,632,831, respectively.
5. Borrowings:
The Master LLC, on behalf of the Series, along with certain other funds managed by the Manager and its affiliates, is a party to a $500 million credit agreement with a group of lenders, which expired in November 2011. The Series may borrow under the credit agreement to fund shareholder redemptions. Effective November 2010, the credit agreement had the following terms: a commitment fee of 0.08% per annum based on the Series’ pro rata share of the unused portion of the credit agreement and interest at a rate equal to the higher of (a) the one-month LIBOR plus 1.00% per annum or (b) the Fed Funds rate plus 1.00% per annum on amounts borrowed. In addition, the Series paid administration and arrangement fees which were allocated to the Series based on its net assets as of October 31, 2010. Effective November 2011, the credit agreement was renewed until November 2012 with the following terms: a commitment fee of 0.065% per annum based on the Series’ pro rata share of the unused portion of the credit agreement and interest at a rate equal to the higher of (a) the one-month LIBOR plus 0.80% per annum or (b) the Fed Funds rate plus 0.80% per annum on amounts borrowed. In addition, the Series paid administration and arrangement fees which were allocated to the Series based on its net assets as of October 31, 2011. The Series did not borrow under the credit agreement during the year ended December 31, 2011.
6. Concentration, Market and Credit Risk:
In the normal course of business, the Series invests in securities and enters into transactions where risks exist due to fluctuations in the market (market risk) or failure of the issuer of a security to meet all its obligations (issuer credit risk). The value of securities held by the Series may decline in response to certain events, including those directly involving the issuers whose securities are owned by the Series; conditions affecting the general economy; overall market changes; local, regional or global political, social or economic instability; and currency and interest rate and price fluctuations. Similar to issuer credit risk, the Series may be exposed to counterparty credit risk, or the risk that an entity with which the Series has unsettled or open transactions may fail to or be unable to perform on its commitments. The Series manages counterparty credit risk by entering into transactions only with counterparties that it believes have the financial resources to honor their obligations and by monitoring the financial stability of those counterparties. Financial assets, which potentially expose the Series to market, issuer and counterparty credit risks, consist principally of financial instruments and receivables due from counterparties. The extent of the Series’ exposure to market, issuer and counterparty credit risks with respect to these financial assets is generally approximated by their value recorded in the Series’ Statement of Assets and Liabilities, less any collateral held by the Series.
7. Subsequent Events:
Management has evaluated the impact of all subsequent events on the Series through the date the financial statements were issued and has determined that there were no subsequent events requiring adjustment or additional disclosure in the financial statements.
|
|
|
|
|
|
|
|
|
|
|
30 |
|
BLACKROCK S&P 500 INDEX FUND |
DECEMBER 31, 2011 |
|
|
|
|
|
|
|
Master S&P 500 Index Series |
To the Investors of Master S&P 500 Index Series and Board of Directors of Quantitative Master Series LLC:
We have audited the accompanying statement of assets and liabilities, including the schedule of investments, of Master S&P 500 Index Series, one of the portfolios constituting Quantitative Master Series LLC (the “Master LLC”), as of December 31, 2011, and the related statement of operations for the year then ended, the statements of changes in net assets for each of the two years in the period then ended, and the financial highlights for each of the five years in the period then ended. These financial statements and financial highlights are the responsibility of the Master LLC’s management. Our responsibility is to express an opinion on these financial statements and financial highlights based on our audits.
We conducted our audits in accordance with the standards of the Public Company Accounting Oversight Board (United States). Those standards require that we plan and perform the audit to obtain reasonable assurance about whether the financial statements and financial highlights are free of material misstatement. The Master LLC is not required to have, nor were we engaged to perform, an audit of its internal control over financial reporting. Our audits included consideration of internal control over financial reporting as a basis for designing audit procedures that are appropriate in the circumstances, but not for the purpose of expressing an opinion on the effectiveness of the Master LLC’s internal control over financial reporting. Accordingly, we express no such opinion. An audit also includes examining, on a test basis, evidence supporting the amounts and disclosures in the financial statements, assessing the accounting principles used and significant estimates made by management, as well as evaluating the overall financial statement presentation. Our procedures included confirmation of securities owned as of December 31, 2011, by correspondence with the custodian and brokers. We believe that our audits provide a reasonable basis for our opinion.
In our opinion, the financial statements and financial highlights referred to above present fairly, in all material respects, the financial position of Master S&P 500 Index Series of Quantitative Master Series LLC as of December 31, 2011, the results of its operations for the year then ended, the changes in its net assets for each of the two years in the period then ended, and the financial highlights for each of the five years in the period then ended, in conformity with accounting principles generally accepted in the United States of America.
|
|
|
Deloitte & Touche LLP |
|
Boston, Massachusetts |
|
February 27, 2012 |
|
|
|
|
|
|
|
|
|
|
|
|
BLACKROCK S&P 500 INDEX FUND |
DECEMBER 31, 2011 |
31 |
|
|
|
|
|
|
|
|
|
|
|
|
|
|
|
|
|
Name, Address |
|
Position(s) |
|
Length |
|
Principal Occupation(s) During Past Five Years |
|
Number of BlackRock- |
|
Public |
|
Independent Directors1 |
||||||||||
|
Ronald W.
Forbes |
|
Co-Chairman of the Board and Director |
|
Since 2007 |
|
Professor Emeritus of Finance, School of Business, State University of New York at Albany since 2000. |
|
33 RICs consisting of 107 Portfolios |
|
None |
|
Rodney D.
Johnson |
|
Co-Chairman of the Board and Director |
|
Since 2007 |
|
President, Fairmount Capital Advisors, Inc. since 1987; Member of the Archdiocesan Investment Committee of the Archdiocese of Philadelphia since 2004; Director, The Committee of Seventy (civic) since 2006; Director, Fox Chase Cancer Center from 2004 to 2010. |
|
33 RICs consisting of 107 Portfolios |
|
None |
|
David O.
Beim |
|
Director |
|
Since 2007 |
|
Professor of Professional Practice at the Columbia University Graduate School of Business since 1991; Trustee, Phillips Exeter Academy since 2002; Chairman, Wave Hill, Inc. (public garden and cultural center) from 1990 to 2006. |
|
33 RICs consisting of 107 Portfolios |
|
None |
|
Dr. Matina
S. Horner |
|
Director |
|
Since 2007 |
|
Executive Vice President of Teachers Insurance and Annuity Association and College Retirement Equities Fund from 1989 to 2003. |
|
33 RICs consisting of 107 Portfolios |
|
NSTAR (electric and gas utility) |
|
Herbert I.
London |
|
Director |
|
Since 2007 |
|
Professor Emeritus, New York University since 2005; John M. Olin Professor of Humanities, New York University from 1993 to 2005 and Professor thereof from 1980 to 2005; President, Hudson Institute (policy research organization) since 1997 and Trustee thereof since 1980; Chairman of the Board of Trustees for Grantham University since 2006; Director, InnoCentive, Inc. (strategic solutions company) since 2005; Director, Cerego, LLC (software development and design) since 2005; Director, Cybersettle (dispute resolution technology) since 2009. |
|
33 RICs consisting of 107 Portfolios |
|
AIMS Worldwide, Inc. (marketing) |
|
Cynthia A.
Montgomery |
|
Director |
|
Since 2007 |
|
Professor, Harvard Business School since 1989; Director, McLean Hospital since 2005; Director, Harvard Business School Publishing from 2005 to 2010. |
|
33 RICs consisting of 107 Portfolios |
|
Newell Rubbermaid, Inc. (manufacturing) |
|
Joseph P.
Platt |
|
Director |
|
Since 2007 |
|
Director, The West Penn Allegheny Health System (a not-for-profit health system) since 2008; Director, Jones and Brown (Canadian insurance broker) since 1998; General Partner, Thorn Partners, LP (private investment) since 1998; Director, WQED Multi-Media (public broadcasting not-for-profit) since 2001; Partner, Amarna Corporation, LLC (private investment company) from 2002 to 2008. |
|
33 RICs consisting of 107 Portfolios |
|
Greenlight Capital Re, Ltd. (reinsurance company) |
|
Robert C.
Robb, Jr. |
|
Director |
|
Since 2007 |
|
Partner, Lewis, Eckert, Robb and Company (management and financial consulting firm) since 1981. |
|
33 RICs consisting of 107 Portfolios |
|
None |
|
Toby Rosenblatt |
|
Director |
|
Since 2007 |
|
President, Founders Investments Ltd. (private investments) since 1999; Director, College Access Foundation of California (philanthropic foundation) since 2009; Director, Forward Management, LLC since 2007; Director, A.P. Pharma, Inc. (specialty pharmaceuticals) from 1983 to 2011; Director, The James Irvine Foundation (philanthropic foundation) from 1998 to 2008. |
|
33 RICs consisting of 107 Portfolios |
|
None |
|
|
|
|
|
|
|
|
|
|
|
32 |
|
BLACKROCK S&P 500 INDEX FUND |
DECEMBER 31, 2011 |
|
|
|
|
|
Officers and Directors (continued) |
|
|
|
|
|
|
|
|
|
|
|
|
|
|
Name, Address |
|
Position(s) |
|
Length |
|
Principal Occupation(s) During Past Five Years |
|
Number of BlackRock- |
|
Public |
|
|
Independent Directors1 (concluded) |
|||||||||||
|
Kenneth L.
Urish |
|
Director |
|
Since 2007 |
|
Managing Partner, Urish Popeck & Co., LLC (certified public accountants and consultants) since 1976; Chairman Elect of the Professional Ethics Committee of the Pennsylvania Institute of Certified Public Accountants and Committee Member thereof since 2007; Member of External Advisory Board, The Pennsylvania State University Accounting Department since 2001; Trustee, The Holy Family Foundation from 2001 to 2010; President and Trustee, Pittsburgh Catholic Publishing Associates from 2003 to 2008; Director, Inter-Tel from 2006 to 2007. |
|
33 RICs consisting of 107 Portfolios |
|
None |
|
|
Frederick
W. Winter |
|
Director |
|
Since 2007 |
|
Professor and Dean Emeritus of the Joseph M. Katz School of Business, University of Pittsburgh since 2005 and Dean thereof from 1997 to 2005; Director, Alkon Corporation (pneumatics) since 1992; Director, Tippman Sports (recreation) since 2005; Director, Indotronix International (IT services) from 2004 to 2008. |
|
33 RICs consisting of 107 Portfolios |
|
None |
|
|
|
|
|
|
|
|
|
|
|
|
|
|
|
|
|
1 |
Directors serve until their resignation, removal or death, or until December 31 of the year in which they turn 72. The Board has approved extensions in terms of Directors who turn 72 prior to December 31, 2013. |
||||||||
|
|
|
|
|
|
|
|
|
|
|
|
|
|
|
|
2 |
Date shown is the earliest date a person has served for the Corporation/Master LLC covered by this annual report. Following the combination of Merrill Lynch Investment Managers, L.P. (“MLIM”) and BlackRock, Inc. (“BlackRock”) in September 2006, the various legacy MLIM and legacy BlackRock Fund boards were realigned and consolidated into three new Fund boards in 2007. As a result, although the chart shows Directors as joining the Corporation’s/Master LLC’s board in 2007, each Director first became a member of the board of other legacy MLIM or legacy BlackRock Funds as follows: David O. Beim, 1998; Ronald W. Forbes, 1977; Dr. Matina S. Horner, 2004; Rodney D. Johnson, 1995; Herbert I. London, 1987; Cynthia A. Montgomery, 1994; Joseph P. Platt, 1999; Robert C. Robb, Jr., 1998; Toby Rosenblatt, 2005; Kenneth L. Urish, 1999; and Frederick W. Winter, 1999. |
||||||||
|
|
|
|
|
|
|
|
|
|
|
|
|
|
Interested Directors3 |
|||||||||||
|
Paul L.
Audet |
|
Director |
|
Since 2011 |
|
Senior Managing Director, BlackRock and Head of BlackRock’s Real Estate business from 2008 to 2011; Member of BlackRock’s Global Operating and Corporate Risk Management Committees and of the BlackRock Alternative Investors Executive Committee and Investment Committee for the Private Equity Fund of Funds business since 2008; Head of BlackRock’s Global Cash Management business from 2005 to 2010; Acting Chief Financial Officer of BlackRock from 2007 to 2008; Chief Financial Officer of BlackRock from 1998 to 2005. |
|
159 RICs consisting of 286 Portfolios |
|
None |
|
|
Henry
Gabbay |
|
Director |
|
Since 2007 |
|
Consultant, BlackRock from 2007 to 2008; Managing Director, BlackRock from 1989 to 2007; Chief Administrative Officer, BlackRock Advisors, LLC from 1998 to 2007; President of BlackRock Funds and BlackRock Bond Allocation Target Shares from 2005 to 2007 and Treasurer of certain closed-end funds in the BlackRock fund complex from 1989 to 2006. |
|
159 RICs consisting of 286 Portfolios |
|
None |
|
|
|
|
|
|
|
|
|
|
|
|
|
|
|
|
|
3 |
Mr. Audet is an “interested person,” as defined in the 1940 Act, of the Corporation/Master LLC based on his position with BlackRock and its affiliates. Mr. Gabbay is an “interested person” of the Corporation/Master LLC based on his former positions with BlackRock and its affiliates as well as his ownership of BlackRock and The PNC Financial Services Group, Inc. securities. Mr. Audet and Mr. Gabbay are also Directors of the BlackRock registered closed-end funds and Directors of other BlackRock registered open-end funds. Directors serve until their resignation, removal or death, or until December 31 of the year in which they turn 72. |
||||||||
|
|
|
|
|
|
|
|
|
|
|
|
BLACKROCK S&P 500 INDEX FUND |
DECEMBER 31, 2011 |
33 |
|
|
|
|
|
Officers and Directors (concluded) |
|
|
|
|
|
|
|
|
|
|
Name, Address |
|
Position(s) |
|
Length |
|
Principal Occupation(s) During Past Five Years |
|
|
Officers1 |
|||||||
|
John M.
Perlowski |
|
President and Chief Executive Officer |
|
Since 2010 |
|
Managing Director of BlackRock since 2009; Global Head of BlackRock Fund Administration since 2009; Managing Director and Chief Operating Officer of the Global Product Group at Goldman Sachs Asset Management, L.P. from 2003 to 2009; Treasurer of Goldman Sachs Mutual Funds from 2003 to 2009 and Senior Vice President thereof from 2007 to 2009; Director of Goldman Sachs Offshore Funds from 2002 to 2009; Director of Family Resource Network (charitable foundation) since 2009. |
|
|
Brendan
Kyne |
|
Vice President |
|
Since 2009 |
|
Managing Director of BlackRock since 2010; Director of BlackRock from 2008 to 2009; Head of Product Development and Management for BlackRock’s U.S. Retail Group since 2009 and Co-head thereof from 2007 to 2009; Vice President of BlackRock from 2005 to 2008. |
|
|
Neal
Andrews |
|
Chief Financial Officer |
|
Since 2007 |
|
Managing Director of BlackRock since 2006; Senior Vice President and Line of Business Head of Fund Accounting and Administration at PNC Global Investment Servicing (U.S.) Inc. from 1992 to 2006. |
|
|
Jay Fife |
|
Treasurer |
|
Since 2007 |
|
Managing Director of BlackRock since 2007; Director of BlackRock in 2006; Assistant Treasurer of the MLIM and Fund Asset Management, L.P. advised funds from 2005 to 2006; Director of MLIM Fund Services Group from 2001 to 2006. |
|
|
Brian
Kindelan |
|
Chief Compliance Officer and Anti-Money Laundering Officer |
|
Since 2007 |
|
Chief Compliance Officer of the BlackRock-advised funds since 2007; Managing Director and Senior Counsel of BlackRock since 2005. |
|
|
Ira P.
Shapiro |
|
Secretary |
|
Since 2010 |
|
Managing Director of BlackRock since 2009; Managing Director and Associate General Counsel of Barclays Global Investors from 2008 to 2009 and Principal thereof from 2004 to 2008. |
|
|
|
|
|
|
||||
|
|
|
1 |
Officers of the Corporation/Master LLC serve at the pleasure of the Board. |
||||
|
|
|
Further information about the Officers and Directors is available in the Corporation’s/Master LLC’s Statement of Additional Information, which can be obtained without charge by calling (800) 441-7762. |
|||||
|
|
|
Investment Advisor |
|
BlackRock Advisors, LLC |
|
Wilmington, DE 19809 |
|
|
|
Sub-Advisor |
|
BlackRock Investment Management, LLC |
|
Princeton, NJ 08540 |
|
|
|
Custodian |
|
State Street Bank and Trust Company |
|
Boston, MA 02110 |
|
|
|
Transfer Agent |
|
BNY Mellon Investment Servicing (US) Inc. |
|
Wilmington, DE 19809 |
|
|
|
Distributor |
|
BlackRock Investments, LLC |
|
New York, NY 10022 |
|
|
|
Legal Counsel |
|
Sidley Austin LLP |
|
New York, NY 10019 |
|
|
|
Accounting Agent |
|
State Street Bank and Trust Company |
|
Boston, MA 02110 |
|
|
|
Independent Registered Public Accounting Firm |
|
Deloitte & Touche LLP |
|
Boston, MA 02116 |
|
|
|
Address of the Fund |
|
100 Bellevue Parkway |
|
Wilmington, DE 19809 |
|
|
|
Effective September 22, 2011, Richard S. Davis resigned as Director of the Corporation and the Master LLC, and Paul L. Audet became Director of the Corporation and the Master LLC. |
|
|
|
|
|
|
|
|
|
|
|
34 |
|
BLACKROCK S&P 500 INDEX FUND |
DECEMBER 31, 2011 |
|
|
|
|
|
General Information |
Electronic Delivery
Electronic copies of most financial reports and prospectuses are available on the Fund’s website or shareholders can sign up for e-mail notifications of quarterly statements, annual and semi-annual reports and prospectuses by enrolling in the Fund’s electronic delivery program.
To enroll:
Shareholders Who Hold Accounts with Investment Advisors, Banks or Brokerages:
Please contact your financial advisor. Please note that not all investment advisors, banks or brokerages may offer this service.
Shareholders Who Hold Accounts Directly with BlackRock:
1) Access the BlackRock website at http://www.blackrock.com/edelivery
2) Select “eDelivery” under the “More Information” section
3) Log into your account
Householding
The Fund will mail only one copy of shareholder documents, including prospectuses, annual and semi-annual reports and proxy statements, to shareholders with multiple accounts at the same address. This practice is commonly called “householding” and is intended to reduce expenses and eliminate duplicate mailings of shareholder documents. Mailings of your shareholder documents may be householded indefinitely unless you instruct us otherwise. If you do not want the mailing of these documents to be combined with those for other members of your household, please call the Fund at (800) 441-7762.
Availability of Quarterly Schedule of Investments
The Fund/Series file their complete schedule of portfolio holdings with the SEC for the first and third quarters of each fiscal year on Form N-Q. The Fund’s/Series’ Forms N-Q are available on the SEC’s website at http://www.sec.gov and may also be reviewed and copied at the SEC’s Public Reference Room in Washington, D.C. Information on how to access documents on the SEC’s website without charge may be obtained by calling (800) SEC-0330.The Fund’s/Series’ Forms N-Q may also be obtained upon request and without charge by calling (800) 441-7762.
Availability of Proxy Voting Policies and Procedures
A description of the policies and procedures that the Fund/Series use to determine how to vote proxies relating to portfolio securities is available (1) without charge, upon request, by calling (800) 441-7762; (2) at http://www.blackrock.com; and (3) on the SEC’s website at http://www.sec.gov.
Availability of Proxy Voting Record
Information about how the Fund/Series voted proxies relating to securities held in the Fund’s/Series’ portfolio during the most recent 12-month period ended June 30 is available upon request and without charge (1) at http://www.blackrock.com or by calling (800) 441-7762 and (2) on the SEC’s website at http://www.sec.gov.
|
|
|
|
|
|
|
|
|
|
|
|
BLACKROCK S&P 500 INDEX FUND |
DECEMBER 31, 2011 |
35 |
|
|
|
|
|
Additional Information (continued) |
|
|
|
Shareholder Privileges |
Account Information
Call us at (800) 441-7762 from 8:00 AM to 6:00 PM EST on any business day to get information about your account balances, recent transactions and share prices. You can also reach us on the Web at http://www.blackrock.com/funds.
Automatic Investment Plans
Investor Class shareholders who want to invest regularly can arrange to have $50 or more automatically deducted from their checking or savings account and invested in any of the BlackRock funds.
Systematic Withdrawal Plans
Investor Class shareholders can establish a systematic withdrawal plan and receive periodic payments of $50 or more from their BlackRock funds, as long as their account balance is at least $10,000.
Retirement Plans
Shareholders may make investments in conjunction with Traditional, Rollover, Roth, Coverdell, Simple IRAs, SEP IRAs and 403(b) Plans.
|
|
|
|
|
|
|
|
|
|
|
36 |
|
BLACKROCK S&P 500 INDEX FUND |
DECEMBER 31, 2011 |
|
|
|
|
|
Additional Information (concluded) |
|
|
|
BlackRock Privacy Principles |
BlackRock is committed to maintaining the privacy of its current and former fund investors and individual clients (collectively, “Clients”) and to safeguarding their non-public personal information. The following information is provided to help you understand what personal information BlackRock collects, how we protect that information and why in certain cases we share such information with select parties.
If you are located in a jurisdiction where specific laws, rules or regulations require BlackRock to provide you with additional or different privacy-related rights beyond what is set forth below, then BlackRock will comply with those specific laws, rules or regulations.
BlackRock obtains or verifies personal non-public information from and about you from different sources, including the following: (i) information we receive from you or, if applicable, your financial intermediary, on applications, forms or other documents; (ii) information about your transactions with us, our affiliates, or others; (iii) information we receive from a consumer reporting agency; and (iv) from visits to our websites.
BlackRock does not sell or disclose to non-affiliated third parties any non-public personal information about its Clients, except as permitted by law or as is necessary to respond to regulatory requests or to service Client accounts. These non-affiliated third parties are required to protect the confidentiality and security of this information and to use it only for its intended purpose.
We may share information with our affiliates to service your account or to provide you with information about other BlackRock products or services that may be of interest to you. In addition, BlackRock restricts access to non-public personal information about its Clients to those BlackRock employees with a legitimate business need for the information. BlackRock maintains physical, electronic and procedural safeguards that are designed to protect the non-public personal information of its Clients, including procedures relating to the proper storage and disposal of such information.
|
|
|
|
|
|
|
|
|
|
|
|
BLACKROCK S&P 500 INDEX FUND |
DECEMBER 31, 2011 |
37 |
|
|
|
|
BlackRock offers a diverse lineup of open-end mutual funds crossing all investment styles and managed by experts in equity, fixed income and tax-exempt investing.
|
|
|
Equity Funds |
|
|
|
BlackRock ACWI ex-US Index Fund |
|
BlackRock All-Cap Energy & Resources Portfolio |
|
BlackRock Asset Allocation Portfolio† |
|
BlackRock Balanced Capital Fund† |
|
BlackRock Basic Value Fund |
|
BlackRock Capital Appreciation Fund |
|
BlackRock China Fund |
|
BlackRock Commodity Strategies Fund |
|
BlackRock Emerging Markets Long/Short Equity Fund |
|
BlackRock Energy & Resources Portfolio |
|
BlackRock Equity Dividend Fund |
|
BlackRock EuroFund |
|
BlackRock Focus Growth Fund |
|
BlackRock Global Allocation Fund† |
|
BlackRock Global Dividend Income Portfolio |
|
BlackRock Global Dynamic Equity Fund |
|
BlackRock Global Emerging Markets Fund |
|
BlackRock Global Opportunities Portfolio |
|
BlackRock Global SmallCap Fund |
|
BlackRock Health Sciences Opportunities Portfolio |
|
BlackRock Index Equity Portfolio |
|
BlackRock India Fund |
|
BlackRock International Fund |
|
BlackRock International Index Fund |
|
BlackRock International Opportunities Portfolio |
|
BlackRock Large Cap Core Fund |
|
BlackRock Large Cap Core Plus Fund |
|
BlackRock Large Cap Growth Fund |
|
BlackRock Large Cap Value Fund |
|
BlackRock Latin America Fund |
|
BlackRock Mid-Cap Growth Equity Portfolio |
|
BlackRock Mid-Cap Value Equity Portfolio |
|
BlackRock Mid Cap Value Opportunities Fund |
|
BlackRock Natural Resources Trust |
|
BlackRock Pacific Fund |
|
BlackRock Russell 1000 Index Fund |
|
BlackRock Science & Technology Opportunities Portfolio |
|
BlackRock Small Cap Growth Equity Portfolio |
|
BlackRock Small Cap Growth Fund II |
|
BlackRock Small Cap Index Fund |
|
BlackRock S&P 500 Index Fund |
|
BlackRock S&P 500 Stock Fund |
|
BlackRock U.S. Opportunities Portfolio |
|
BlackRock Value Opportunities Fund |
|
BlackRock World Gold Fund |
|
|
|
|
|
Fixed Income Funds |
|
|
|
BlackRock Bond Index Fund |
|
BlackRock Core Bond Portfolio |
|
BlackRock Emerging Market Debt Portfolio |
|
BlackRock Floating Rate Income Portfolio |
|
BlackRock Global Long/Short Credit Fund |
|
BlackRock GNMA Portfolio |
|
BlackRock High Yield Bond Portfolio |
|
BlackRock Inflation Protected Bond Portfolio |
|
BlackRock International Bond Portfolio |
|
BlackRock Long Duration Bond Portfolio |
|
BlackRock Low Duration Bond Portfolio |
|
BlackRock Multi-Asset Income Portfolio† |
|
BlackRock Multi-Sector Bond Portfolio |
|
BlackRock Strategic Income Opportunities Portfolio |
|
BlackRock Total Return Fund |
|
BlackRock US Government Bond Portfolio |
|
BlackRock World Income Fund |
|
US Mortgage Portfolio |
|
|
|
Municipal Bond Funds |
|
|
|
BlackRock California Municipal Bond Fund |
|
BlackRock High Yield Municipal Fund |
|
BlackRock Intermediate Municipal Fund |
|
BlackRock National Municipal Fund |
|
BlackRock New Jersey Municipal Bond Fund |
|
BlackRock New York Municipal Bond Fund |
|
BlackRock Pennsylvania Municipal Bond Fund |
|
BlackRock Short-Term Municipal Fund |
|
|
|
Target Risk & Target Date Funds† |
|
|
|
BlackRock Prepared Portfolios |
|
Conservative Prepared Portfolio |
|
Moderate Prepared Portfolio |
|
Growth Prepared Portfolio |
|
Aggressive Growth Prepared Portfolio |
|
|
|
BlackRock Lifecycle Prepared Portfolios |
|
2015 |
|
2020 |
|
2025 |
|
2030 |
|
2035 |
|
2040 |
|
2045 |
|
2050 |
|
|
|
LifePath Portfolios |
|
2020 |
|
2025 |
|
2030 |
|
2035 |
|
2040 |
|
2045 |
|
2050 |
|
2055 |
|
|
|
LifePath Index Portfolios |
|
2020 |
|
2025 |
|
2030 |
|
2035 |
|
2040 |
|
2045 |
|
2050 |
|
2055 |
|
|
|
|
|
|
† |
Mixed asset fund. |
BlackRock mutual funds are currently distributed by BlackRock Investments, LLC. You should consider the investment objectives, risks, charges and expenses of the funds under consideration carefully before investing. Each fund’s prospectus contains this and other information and is available at www.blackrock.com or by calling (800) 441-7762 or from your financial advisor. The prospectus should be read carefully before investing.
|
|
|
|
|
|
|
|
|
|
|
38 |
|
BLACKROCK S&P 500 INDEX FUND |
DECEMBER 31, 2011 |
This report is not authorized for use as an offer of sale or a solicitation of an offer to buy shares of the Fund unless accompanied or preceded by the Fund’s current prospectus. Past performance results shown in this report should not be considered a representation of future performance. Investment returns and principal value of shares will fluctuate so that shares, when redeemed, may be worth more or less than their original cost. Statements and other information herein are as dated and are subject to change.

|
|
|
|
#Index 4-12/11-AR |
|

|
|
|
|
|
December 31, 2011 |

|
|
|
Annual Report |
|
|
|
BlackRock Small Cap Index Fund | of BlackRock Index Funds, Inc. |
|
|
|
Not FDIC Insured § No Bank Guarantee § May Lose Value |
|
|
|
|
|
Table of Contents |
|
|
|
|
|
|
|
Page |
|
|
||
|
|
3 |
|
|
Annual Report: |
|
|
|
|
4 |
|
|
|
6 |
|
|
|
6 |
|
|
Fund Financial Statements: |
|
|
|
|
7 |
|
|
|
8 |
|
|
|
9 |
|
|
|
10 |
|
|
|
12 |
|
|
Fund Report of Independent Registered Public Accounting Firm |
|
15 |
|
|
15 |
|
|
|
16 |
|
|
Series Financial Statements: |
|
|
|
|
17 |
|
|
|
38 |
|
|
|
39 |
|
|
|
40 |
|
|
|
40 |
|
|
|
41 |
|
|
Series Report of Independent Registered Public Accounting Firm |
|
45 |
|
|
46 |
|
|
|
49 |
|
|
|
51 |
|
|
|
|
|
|
|
|
|
2 |
BLACKROCK SMALL CAP INDEX FUND |
DECEMBER 31, 2011 |
|
|
|
|
Investors endured a very difficult environment in 2011. Financial markets were extremely volatile as a number of high-profile global events drove frequent about-face changes in investor sentiment. As the year progressed, news flow increasingly influenced trading decisions, to the point where company fundamentals were largely ignored. In the end, lower-risk assets won the “risk on — risk off” trading tug-of-war that characterized 2011’s market activity.
Early in the year, political turmoil swept across the Middle East/North Africa region and prices of oil and other commodities soared. Natural disasters in Japan disrupted global supply chains and concerns mounted regarding US debt and deficit issues. Nevertheless, equities, commodities and high yield bonds outpaced the less risky asset classes as investors chose to focus on the continuing stream of strong corporate earnings and positive economic data.
Markets reversed sharply in May, however, when the heightened possibility of Greece defaulting on its debt rekindled fears about sovereign debt problems spreading across Europe. Concurrently, economic indicators signaled that the recovery had slowed in the United States and other developed nations. Confidence was further shaken by the prolonged debt ceiling debate in Washington, DC. On August 5th, Standard & Poor’s downgraded the US government’s credit rating and turmoil erupted in financial markets around the world. Extraordinary levels of volatility persisted in the months that followed as Greece teetered on the brink of default, debt problems escalated in Italy and Spain, and exposure to European sovereign bonds stressed banks globally. Late in the summer, economic data out of the United States and Europe grew increasingly bleak while China and other emerging economies began to show signs of slowing growth. By the end of the third quarter, equity markets had fallen nearly 20% from their April peak while safe-haven assets such as US Treasuries and gold had rallied to historical highs.
October brought enough positive economic data to assuage fears of a global double-dip recession. Additionally, after months of deliberation, European leaders began to show signs of progress toward stemming the region’s debt crisis. These encouraging developments brought investors back from the sidelines and risk assets rallied through the month. However, a lack of definitive details about Europe’s rescue plan soon raised doubts among investors and thwarted the rally at the end of October. The last two months of the year saw political instability in Greece, unsustainable yields on Italian bonds, and US policymakers bickering over budget issues. Global central bank actions and improving economic data energized investors, but confidence was easily tempered by sobering news flow that resurrected uncertainty about the ability of Europe’s leaders to ultimately contain the debt crisis.
Most equity markets failed to fully recover their late-summer losses, although US large cap stocks managed to finish the year with a marginal gain given their perceived safety and stronger US economic data. Conditions were worse overseas, and international markets experienced some significant downturns. Dividend-paying stocks performed relatively well as investors sought yield in the low interest rate environment. Fixed income securities benefited from declining yields and delivered positive returns for the year. US Treasury bonds outperformed other fixed income classes despite their quality rating downgrade, while municipal bonds also delivered superior results. Continued low short-term interest rates kept yields on money market securities near their all-time lows.
Many of the themes that caused uncertainty in 2011 are likely to persist well into 2012. While the investment landscape appears treacherous, BlackRock is working for you. We have a roadmap to show you the way.
Sincerely,

Rob Kapito
President, BlackRock
Advisors, LLC

“While the investment landscape appears treacherous, BlackRock is working for you. We have a roadmap to show you the way.”
|
|
|
Rob Kapito |
|
President, BlackRock
Advisors, LLC |
|
|
|
|
|
|
|
|
|
|
|
|
|
|
6-month |
|
12-month |
|
||
|
US large cap equities (S&P 500® Index) |
|
|
(3.69 |
)% |
|
2.11 |
% |
|
US small cap equities (Russell 2000® Index) |
|
|
(9.77 |
) |
|
(4.18 |
) |
|
International equities (MSCI Europe, Australasia, Far East Index) |
|
|
(16.31 |
) |
|
(12.14 |
) |
|
Emerging market equities (MSCI Emerging Markets Index) |
|
|
(19.13 |
) |
|
(18.42 |
) |
|
3-month Treasury bill (BofA Merrill Lynch 3-Month Treasury Bill Index) |
|
|
0.02 |
|
|
0.10 |
|
|
US Treasury securities (BofA Merrill Lynch 10-Year US Treasury Index) |
|
|
13.46 |
|
|
17.15 |
|
|
US investment grade bonds (Barclays Capital US Aggregate Bond Index) |
|
|
4.98 |
|
|
7.84 |
|
|
Tax-exempt municipal bonds (S&P Municipal Bond Index) |
|
|
5.78 |
|
|
10.62 |
|
|
US high yield bonds (Barclays Capital US Corporate High Yield 2% Issuer Capped Index) |
|
|
(0.02 |
) |
|
4.96 |
|
|
|
|
Past performance is no guarantee of future results. Index performance is shown for illustrative purposes only. You cannot invest directly in an index. |
|
|
|
|
|
|
|
|
|
|
|
|
|
|
|
|
|
|
|
|
|
|
BlackRock Small Cap Index Fund |
|
|
|
|
Investment Objective |
BlackRock Small Cap Index Fund’s (the “Fund”), a series of BlackRock Index Funds, Inc. (the “Corporation”), investment objective is to match the performance of the Russell 2000® Index (the “Russell 2000®”) as closely as possible before the deduction of Fund expenses.
|
|
|
Portfolio Management Commentary |
|
|
|
|
|
How did the Fund perform? |
|
|
|
|
• |
For the 12 months ended December 31,2011,the Fund,through its investment in Master Small Cap Index Series (the “Series”) of Quantitative Master Series LLC (the “Master LLC”), underperformed the benchmark Russell 2000® Index. For the period beginning with its initial trading date of March 31, 2011 through December 31, 2011, the Fund’s Class K Shares returned (11.42)%, underperforming the benchmark index, which returned (11.22)%. |
|
|
|
|
• |
Returns for the Fund’s respective share classes differ from the benchmark index based on individual share-class expenses. |
|
|
|
|
|
Describe the market environment. |
|
|
|
|
• |
Early in the year, stocks moved unevenly higher despite political upheaval spreading across the Middle East/North Africa region and a sharp rise in oil and other commodity prices. March brought devastating natural disasters in Japan, resulting in global supply chain disruptions. But equity markets were remarkably resilient as the global economic recovery appeared to be on track and investors were gradually increasing their appetite for risk. After peaking in late April, equities were met with a sharp reversal when the heightened possibility of Greece defaulting on its debt rekindled fears about the potential impact of the sovereign debt crisis spreading in Europe. In the United States, a prolonged debt ceiling debate ultimately led to Standard & Poor’s decision to downgrade the US government’s credit rating in early August. This announcement spurred one of the most volatile periods in trading history. Stock markets across the world whip-sawed on hopes and fears driven by news flow. Equities swooned as debt problems in Europe spread to Italy and Spain, and global economic indicators grew increasingly bleak. |
|
|
|
|
• |
US stocks staged a strong rebound in October as the domestic labor market improved and corporate profits continued to beat analyst expectations. Encouraging news from Europe also contributed to the rally. After months of deliberation, European leaders agreed upon a new plan to reduce Greece’s debt burden, recapitalize the region’s banks and increase the size of the euro-zone bailout fund. However, a lack of definitive details about the rescue plan soon raised doubts among investors and thwarted the rally at the end of October. In November, political instability in Greece and Italy fueled uncertainty as to whether Europe’s leaders would be able to contain the crisis. In the United States, bickering lawmakers failed to reach an agreement on reducing the US budget deficit, further undermining investors’ confidence in policymakers on both sides of the Atlantic. Market volatility softened in December with the support of global central bank actions and continued improvement in economic data. |
|
|
|
|
• |
Small cap stocks, as represented by the Russell 2000® Index, fell 4.18% for the year. Given high market volatility and heightened uncertainty about economic growth, the more cyclically sensitive sectors were hurt the most. Materials (–12.22%) led the decline, followed by energy (–8.11%), and consumer discretionary (–7.13%). Defensive areas performed well, with utilities gaining 16.64% over the year, followed by consumer staples (+7.81%) and health care (+2.09%). |
|
|
|
|
|
Describe recent portfolio activity. |
|
|
|
|
• |
During the 12-month period, as changes were made to the composition of the Russell 2000® Index, the Series purchased and sold securities to maintain its objective of replicating the risks and return of the benchmark index. |
|
|
|
|
|
Describe portfolio positioning at period end. |
|
|
|
|
• |
The Series remains positioned to match the risk characteristics of its benchmark index, irrespective of the market’s future direction. |
|
|
|
|
|
The views expressed reflect the opinions of BlackRock as of the date of this report and are subject to change based on changes in market, economic or other conditions. These views are not intended to be a forecast of future events and are no guarantee of future results. |
|
|
|
|
Derivative Financial Instruments |
|
The Series may invest in various derivative financial instruments, including financial futures contracts as specified in Note 2 of the Series’ Notes to Financial Statements, which may constitute forms of economic leverage. Such derivative financial instruments are used to obtain exposure to a market without owning or taking physical custody of securities or to hedge market and/or equity risks. Derivative financial instruments involve risks, including the imperfect correlation between the value of a derivative financial instrument and the underlying asset or illiquidity of the derivative financial instrument. The Series’ ability to use a derivative financial instrument successfully depends on the investment advisor’s ability to predict pertinent market movements accurately, which cannot be assured. The use of derivative financial instruments may result in losses greater than if they had not been used, may require the Series to sell or purchase portfolio investments at inopportune times or for distressed values, may limit the amount of appreciation the Series can realize on an investment, may result in lower dividends paid to shareholders or may cause the Series to hold an investment that it might otherwise sell. The Series’ investments in these instruments are discussed in detail in the Series’ Notes to Financial Statements.
|
|
|
|
|
|
|
|
|
4 |
BLACKROCK SMALL CAP INDEX FUND |
DECEMBER 31, 2011 |
|
|
|
|
|
|
|
|
|
Total Return Based on a $10,000 Investment |
|
|
|
|
|
|
|
|
|
|
|
|
|
|
1 |
Assuming transaction costs and other operating expenses, including investment advisory fees and administration fees, if any. |
|
|
|
|
|
|
2 |
The Fund invests all of its assets in the Series of the Master LLC. The Series may invest in a statistically selected sample of the stocks included in the Russell 2000® Index and other types of financial instruments linked to the Russell 2000® Index. |
|
|
|
|
|
|
3 |
This unmanaged index is comprised of approximately 2,000 smaller-capitalization common stocks from various industrial sectors. |
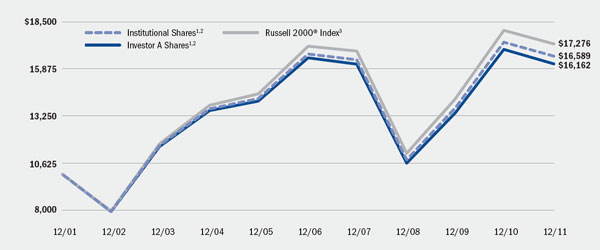
|
|
|
Performance Summary for the Period Ended December 31, 2011 |
|
|
|
|
|
|
|
|
|
|
|
|
|
|
|
|
|
|
6-Month |
|
Average Annual Total Returns4 |
|
||||||||
|
|
|
|
|
1 Year |
|
|
5 Years |
|
|
10 Years |
|
||
|
Institutional |
|
|
(9.88 |
)% |
|
(4.49 |
)% |
|
(0.15 |
)% |
|
5.19 |
% |
|
Investor A |
|
|
(9.99 |
) |
|
(4.76 |
) |
|
(0.41 |
) |
|
4.92 |
|
|
Class K5 |
|
|
(9.84 |
) |
|
(4.44 |
) |
|
(0.10 |
) |
|
5.24 |
|
|
Russell 2000® Index |
|
|
(9.77 |
) |
|
(4.18 |
) |
|
0.15 |
|
|
5.62 |
|
|
|
|
|
|
|
|
|
|
|
|
|
|
|
|
|
|
|
|
|
|
4 |
Average annual total returns reflect reductions for service fees, if any. See “About Fund Performance” on page 6 for a detailed description of share classes, including any related fees, if any. |
|
|
|
|
|
|
5 |
Class K commenced operations on March 31, 2011. |
|
|
|
|
|
|
|
Past performance is not indicative of future results. |
|
|
|
|
|
|
|
|
|
|
|
|
BLACKROCK SMALL CAP INDEX FUND |
DECEMBER 31, 2011 |
5 |
|
|
|
|
|
|
|
|
|
|
|
|
• |
Institutional and Class K Shares are not subject to any sales charge. These shares bear no ongoing distribution or service fees and are available only to eligible investors. Prior to March 31, 2011, Class K Shares’ performance results are those of Institutional Shares restated to reflect Class K Shares’ fees. |
|
|
|
|
• |
Investor A Shares are not subject to any sales charge and bear no ongoing distribution fee. These shares are subject to an ongoing service fee of 0.25% per year. |
|
|
|
|
|
Performance information reflects past performance and does not guarantee future results. Current performance may be lower or higher than the performance data quoted. Refer to www.blackrock.com/funds to obtain performance data current to the most recent month end. Performance results do not reflect the deduction of taxes that a shareholder would pay on fund distributions or the redemption of fund shares. Figures shown in the performance tables on page 5 assume reinvestment of all dividends and capital gain distributions, if any, at net asset value (“NAV”) on the ex-dividend date. Investment return and principal value of shares will fluctuate so that shares, when redeemed, may be worth more or less than their original cost. Dividends paid to each class of shares will vary because of the different levels of service and transfer agency fees applicable to each class, which are deducted from the income available to be paid to shareholders. The Fund’s administrator waived and/or reimbursed a portion of the Fund’s fee.Without such waiver and/or reimbursement, the Fund’s performance would have been lower. |
|
|
|
|
|
|
Shareholders of the Fund may incur the following charges: (a) expenses related to transactions, including exchange fees; and (b) operating expenses, including administration fees, service fees, including 12b-1 fees, and other Fund expenses. The expense example shown below (which is based on a hypothetical investment of $1,000 invested on July 1, 2011 and held through December 31, 2011) is intended to assist shareholders both in calculating expenses based on an investment in the Fund and in comparing these expenses with similar costs of investing in other mutual funds.
The table provides information about actual account values and actual expenses. In order to estimate the expenses a shareholder paid during the period covered by this report, shareholders can divide their account value by $1,000 and then multiply the result by the number corresponding to their share class under the heading entitled “Expenses Paid During the Period.”
The table also provides information about hypothetical account values and hypothetical expenses based on the Fund’s actual expense ratio and an assumed rate of return of 5% per year before expenses. In order to assist shareholders in comparing the ongoing expenses of investing in this Fund and other funds, compare the 5% hypothetical example with the 5% hypothetical examples that appear in other funds’ shareholder reports.
The expenses shown in the table are intended to highlight shareholders’ ongoing costs only and do not reflect any transactional expenses, such as sales charges or exchange fees, if any. Therefore, the hypothetical example is useful in comparing ongoing expenses only, and will not help shareholders determine the relative total expenses of owning different funds. If these transactional expenses were included, shareholder expenses would have been higher.
|
|
|
|
|
|
|
|
|
|
|
|
|
|
|
|
|
|
|
|
|
|
|
|
|
Expense Example |
||||||||||||||||||||||
|
|
|
|
|
|
|
|
|
|
|
|
|
|
|
|
|
|
|
|
|
|
|
|
|
|
|
Actual |
|
Hypothetical2 |
|
|
|
|
||||||||||||||
|
|
|
Beginning |
|
Ending |
|
Expenses
Paid |
|
Beginning |
|
Ending |
|
Expenses
Paid |
|
Annualized |
|
|||||||
|
Institutional |
|
$ |
1,000.00 |
|
$ |
900.40 |
|
$ |
1.44 |
|
$ |
1,000.00 |
|
$ |
1,023.71 |
|
$ |
1.53 |
|
|
0.30 |
% |
|
Investor A |
|
$ |
1,000.00 |
|
$ |
900.10 |
|
$ |
2.63 |
|
$ |
1,000.00 |
|
$ |
1,022.41 |
|
$ |
2.80 |
|
|
0.55 |
% |
|
Class K |
|
$ |
1,000.00 |
|
$ |
901.60 |
|
$ |
1.20 |
|
$ |
1,000.00 |
|
$ |
1,023.91 |
|
$ |
1.28 |
|
|
0.25 |
% |
|
|
|
|
|
|
1 |
For each class of the Fund, expenses are equal to the annualized expense ratio for the class, multiplied by the average account value over the period, multiplied by 184/365 (to reflect the one-half year period shown). Because the Fund is a feeder fund, the expense table example reflects the expenses of both the Fund and the Series in which it invests. Expenses are net of waiver. |
|
|
|
|
|
|
2 |
Hypothetical 5% annual return before expenses is calculated by pro rating the number of days in the most recent fiscal half year divided by 365. |
|
|
|
|
|
|
|
|
|
6 |
BLACKROCK SMALL CAP INDEX FUND |
DECEMBER 31, 2011 |
|
|
|
|
BlackRock Small Cap Index Fund |
|
|
|
|
|
|
|
December 31, 2011 |
|
|
|
|
|
Assets |
|
|
|
|
|
Investments at value — Master Small Cap Index Series (the “Series”) (cost — $86,415,344) |
|
$ |
95,141,124 |
|
|
Withdrawals receivable from the Series |
|
|
22,470,714 |
|
|
Capital shares sold receivable |
|
|
42,235 |
|
|
Receivable from administrator |
|
|
13,045 |
|
|
Prepaid expenses |
|
|
3,452 |
|
|
Total assets |
|
|
117,670,570 |
|
|
|
|
|
|
|
|
Liabilities |
|
|
|
|
|
Capital shares redeemed payable |
|
|
22,512,949 |
|
|
Service fees payable |
|
|
9,490 |
|
|
Other accrued expenses payable |
|
|
34,632 |
|
|
Total liabilities |
|
|
22,557,071 |
|
|
Net Assets |
|
$ |
95,113,499 |
|
|
|
|
|
|
|
|
Net Assets Consist of |
|
|
|
|
|
Paid-in capital |
|
$ |
101,968,003 |
|
|
Distributions in excess of net investment income |
|
|
(29,319 |
) |
|
Accumulated net realized loss allocated from the Series |
|
|
(15,550,965 |
) |
|
Net unrealized appreciation/depreciation allocated from the Series |
|
|
8,725,780 |
|
|
Net Assets |
|
$ |
95,113,499 |
|
|
|
|
|
|
|
|
Net Asset Value |
|
|
|
|
|
Institutional — Based on net assets of $49,829,009 and 4,330,788 shares outstanding, 125 million shares authorized, $0.0001 par value |
|
$ |
11.51 |
|
|
Investor A — Based on net assets of $45,262,645 and 3,933,310 shares outstanding, 125 million shares authorized, $0.0001 par value |
|
$ |
11.51 |
|
|
Class K — Based on net assets of $21,845 and 1,898 shares outstanding, 125 million shares authorized, $0.0001 par value |
|
$ |
11.51 |
|
|
|
|
|
|
|
See Notes to Financial Statements. |
|||
|
|
|
|
|
|
|
BLACKROCK SMALL CAP INDEX FUND |
DECEMBER 31, 2011 |
7 |
|
|
|
|
BlackRock Small Cap Index Fund |
|
|
|
|
|
|
|
Year Ended December 31, 2011 |
|
|
|
|
|
Investment Income |
|
|
|
|
|
Net investment income allocated from the Series: |
|
|
|
|
|
Dividends — unaffiliated |
|
$ |
1,596,485 |
|
|
Foreign taxes withheld |
|
|
(1,052 |
) |
|
Securities lending — affiliated |
|
|
152,155 |
|
|
Dividends — affiliated |
|
|
10,001 |
|
|
Expenses |
|
|
(112,645 |
) |
|
Fees waived |
|
|
22,797 |
|
|
Total income |
|
|
1,667,741 |
|
|
|
|
|
|
|
|
Expenses |
|
|
|
|
|
Administration |
|
|
354,703 |
|
|
Service — Investor A |
|
|
120,021 |
|
|
Transfer agent — Institutional |
|
|
42,534 |
|
|
Transfer agent — Investor A |
|
|
34,704 |
|
|
Transfer agent — Class K |
|
|
17 |
|
|
Printing |
|
|
73,415 |
|
|
Professional |
|
|
65,111 |
|
|
Registration |
|
|
63,737 |
|
|
Officer |
|
|
66 |
|
|
Miscellaneous |
|
|
10,310 |
|
|
Total expenses |
|
|
764,618 |
|
|
Less fees waived by administrator |
|
|
(335,235 |
) |
|
Less transfer agent fees waived and/or reimbursed — class specific |
|
|
(30,791 |
) |
|
Total expenses after fees waived and/or reimbursed |
|
|
398,592 |
|
|
Net investment income |
|
|
1,269,149 |
|
|
|
|
|
|
|
|
Realized and Unrealized Gain (Loss) Allocated from the Series |
|
|
|
|
|
Net realized gain from investments, financial futures contracts and short positions |
|
|
9,515,016 |
|
|
Net change in unrealized appreciation/depreciation on investments, financial futures contracts and short positions |
|
|
(17,093,077 |
) |
|
Total realized and unrealized loss |
|
|
(7,578,061 |
) |
|
Net Decrease in Net Assets Resulting from Operations |
|
$ |
(6,308,912 |
) |
|
|
|
|
|
See Notes to Financial Statements. |
||
|
|
|
|
|
8 |
BLACKROCK SMALL CAP INDEX FUND |
DECEMBER 31, 2011 |
|
|
|
|
BlackRock Small Cap Index Fund |
|
|
|
|
|
|
|
|
|
|
|
|
Year
Ended |
|||||
|
Increase (Decrease) in Net Assets: |
|
2011 |
|
2010 |
|
||
|
Operations |
|
|
|
|
|
|
|
|
Net investment income |
|
$ |
1,269,149 |
|
$ |
701,254 |
|
|
Net realized gain |
|
|
9,515,016 |
|
|
1,597,176 |
|
|
Net change in unrealized appreciation/depreciation |
|
|
(17,093,077 |
) |
|
22,605,830 |
|
|
Net increase (decrease) in net assets resulting from operations |
|
|
(6,308,912 |
) |
|
24,904,260 |
|
|
|
|
|
|
|
|
|
|
|
Dividends to Shareholders From |
|
|
|
|
|
|
|
|
Net investment income: |
|
|
|
|
|
|
|
|
Institutional |
|
|
(898,403 |
) |
|
(491,823 |
) |
|
Investor A |
|
|
(451,389 |
) |
|
(221,254 |
) |
|
Class K |
|
|
(285 |
) |
|
— |
|
|
Decrease in net assets resulting from dividends to shareholders |
|
|
(1,350,077 |
) |
|
(713,077 |
) |
|
|
|
|
|
|
|
|
|
|
Capital Share Transactions |
|
|
|
|
|
|
|
|
Net increase (decrease) in net assets derived from capital share transactions |
|
|
(15,925,751 |
) |
|
418,291 |
|
|
|
|
|
|
|
|
|
|
|
Redemption Fee |
|
|
|
|
|
|
|
|
Redemption fee |
|
|
2,818 |
|
|
2,525 |
|
|
|
|
|
|
|
|
|
|
|
Net Assets |
|
|
|
|
|
|
|
|
Total increase (decrease) in net assets |
|
|
(23,581,922 |
) |
|
24,611,999 |
|
|
Beginning of year |
|
|
118,695,421 |
|
|
94,083,422 |
|
|
End of year |
|
$ |
95,113,499 |
|
$ |
118,695,421 |
|
|
Undistributed (distributions in excess of) net investment income |
|
$ |
(29,319 |
) |
$ |
30,409 |
|
|
|
|
|
|
|
See Notes to Financial Statements. |
|||
|
|
|
|
|
|
|
BLACKROCK SMALL CAP INDEX FUND |
DECEMBER 31, 2011 |
9 |
|
|
|
|
BlackRock Small Cap Index Fund |
|
|
|
|
|
|
|
|
|
|
|
|
|
|
|
|
|
|
|
|
|
|
|
|
|
|
|
|
|
|
|
|
|
|
|
|
|
Institutional |
|
Investor A |
||||||||||||||||||||||||||||
|
|
|
Year Ended December 31, |
|
Year Ended December 31, |
||||||||||||||||||||||||||||
|
|
|
2011 |
|
2010 |
|
2009 |
|
2008 |
|
2007 |
|
|
2011 |
|
2010 |
|
2009 |
|
2008 |
|
2007 |
|
||||||||||
|
Per Share Operating Performance |
|
|
|
|
|
|
|
|
|
|
|
|
|
|
|
|
|
|
|
|
|
|
|
|
|
|
|
|
|
|
|
|
|
Net asset value, beginning of year |
|
$ |
12.21 |
|
$ |
9.70 |
|
$ |
7.71 |
|
$ |
13.79 |
|
$ |
15.48 |
|
|
$ |
12.21 |
|
$ |
9.71 |
|
$ |
7.72 |
|
$ |
13.79 |
|
$ |
15.47 |
|
|
Net investment income1 |
|
|
0.14 |
|
|
0.08 |
|
|
0.07 |
|
|
0.14 |
|
|
0.20 |
|
|
|
0.11 |
|
|
0.06 |
|
|
0.05 |
|
|
0.11 |
|
|
0.15 |
|
|
Net realized and unrealized gain (loss)2 |
|
|
(0.69 |
) |
|
2.51 |
|
|
1.98 |
|
|
(4.86 |
) |
|
(0.50 |
) |
|
|
(0.70 |
) |
|
2.50 |
|
|
1.98 |
|
|
(4.85 |
) |
|
(0.48 |
) |
|
Net increase (decrease) from |
|
|
|
|
|
|
|
|
|
|
|
|
|
|
|
|
|
|
|
|
|
|
|
|
|
|
|
|
|
|
|
|
|
investment operations |
|
|
(0.55 |
) |
|
2.59 |
|
|
2.05 |
|
|
(4.72 |
) |
|
(0.30 |
) |
|
|
(0.59 |
) |
|
2.56 |
|
|
2.03 |
|
|
(4.74 |
) |
|
(0.33 |
) |
|
Dividends and distributions from: |
|
|
|
|
|
|
|
|
|
|
|
|
|
|
|
|
|
|
|
|
|
|
|
|
|
|
|
|
|
|
|
|
|
Net investment income |
|
|
(0.15 |
) |
|
(0.08 |
) |
|
(0.06 |
) |
|
(0.15 |
) |
|
(0.20 |
) |
|
|
(0.11 |
) |
|
(0.06 |
) |
|
(0.04 |
) |
|
(0.12 |
) |
|
(0.16 |
) |
|
Net realized gain |
|
|
— |
|
|
— |
|
|
— |
|
|
(1.09 |
) |
|
(1.19 |
) |
|
|
— |
|
|
— |
|
|
— |
|
|
(1.09 |
) |
|
(1.19 |
) |
|
Tax return of capital |
|
|
— |
|
|
— |
|
|
— |
|
|
(0.12 |
) |
|
— |
|
|
|
— |
|
|
— |
|
|
— |
|
|
(0.12 |
) |
|
— |
|
|
Total dividends and distributions |
|
|
(0.15 |
) |
|
(0.08 |
) |
|
(0.06 |
) |
|
(1.36 |
) |
|
(1.39 |
) |
|
|
(0.11 |
) |
|
(0.06 |
) |
|
(0.04 |
) |
|
(1.33 |
) |
|
(1.35 |
) |
|
Net asset value, end of year |
|
$ |
11.51 |
|
$ |
12.21 |
|
$ |
9.70 |
|
$ |
7.71 |
|
$ |
13.79 |
|
|
$ |
11.51 |
|
$ |
12.21 |
|
$ |
9.71 |
|
$ |
7.72 |
|
$ |
13.79 |
|
|
|
|
|
|
|
|
|
|
|
|
|
|
|
|
|
|
|
|
|
|
|
|
|
|
|
|
|
|
|
|
|
|
|
|
Total Investment Return3 |
|
|
|
|
|
|
|
|
|
|
|
|
|
|
|
|
|
|
|
|
|
|
|
|
|
|
|
|
|
|
|
|
|
Based on net asset value |
|
|
(4.49 |
)% |
|
26.77 |
% |
|
26.67 |
% |
|
(34.01 |
)% |
|
(1.91 |
)% |
|
|
(4.76 |
)% |
|
26.35 |
% |
|
26.36 |
% |
|
(34.19 |
)% |
|
(2.12 |
)% |
|
|
|
|
|
|
|
|
|
|
|
|
|
|
|
|
|
|
|
|
|
|
|
|
|
|
|
|
|
|
|
|
|
|
|
Ratios to Average Net Assets4 |
|
|
|
|
|
|
|
|
|
|
|
|
|
|
|
|
|
|
|
|
|
|
|
|
|
|
|
|
|
|
|
|
|
Total expenses |
|
|
0.61 |
%5 |
|
0.57 |
% |
|
0.56 |
% |
|
0.53 |
% |
|
0.48 |
% |
|
|
0.88 |
%5 |
|
0.80 |
% |
|
0.82 |
% |
|
0.80 |
% |
|
0.73 |
% |
|
Total expenses after fees waived and/or reimbursed |
|
|
0.30 |
%5 |
|
0.52 |
% |
|
0.56 |
% |
|
0.52 |
% |
|
0.48 |
% |
|
|
0.55 |
%5 |
|
0.78 |
% |
|
0.82 |
% |
|
0.79 |
% |
|
0.73 |
% |
|
Net investment income |
|
|
1.14 |
%5 |
|
0.80 |
% |
|
0.85 |
% |
|
1.19 |
% |
|
1.23 |
% |
|
|
0.88 |
%5 |
|
0.53 |
% |
|
0.59 |
% |
|
0.91 |
% |
|
0.98 |
% |
|
|
|
|
|
|
|
|
|
|
|
|
|
|
|
|
|
|
|
|
|
|
|
|
|
|
|
|
|
|
|
|
|
|
|
Supplemental Data |
|
|
|
|
|
|
|
|
|
|
|
|
|
|
|
|
|
|
|
|
|
|
|
|
|
|
|
|
|
|
|
|
|
Net assets, end of year (000) |
|
$ |
49,829 |
|
$ |
71,443 |
|
$ |
55,744 |
|
$ |
46,285 |
|
$ |
66,085 |
|
|
$ |
45,263 |
|
$ |
47,252 |
|
$ |
38,340 |
|
$ |
29,787 |
|
$ |
47,605 |
|
|
Portfolio turnover of the Series |
|
|
31 |
% |
|
42 |
% |
|
43 |
% |
|
42 |
% |
|
26 |
% |
|
|
31 |
% |
|
42 |
% |
|
43 |
% |
|
42 |
% |
|
26 |
% |
|
|
|
|
|
|
1 |
Based on average shares outstanding. |
|
|
|
|
|
|
2 |
Includes a redemption fee, which is less than $0.01 per share. |
|
|
|
|
|
|
3 |
Where applicable, total investment returns include the reinvestment of dividends and distributions. |
|
|
|
|
|
|
4 |
Includes the Fund’s share of the Series’ allocated net expenses and/or net investment income. |
|
|
|
|
|
|
5 |
Includes the Fund’s share of the Series’ allocated fees waived of less than 0.01%. |
|
|
|
|
|
See Notes to Financial Statements. |
||
|
|
|
|
|
10 |
BLACKROCK SMALL CAP INDEX FUND |
DECEMBER 31, 2011 |
|
|
|
|
Financial Highlights (concluded) |
BlackRock Small Cap Index Fund |
|
|
|
|
|
|
|
|
|
Class K |
|
|
|
|
|
Period |
|
|
|
Per Share Operating Performance |
|
|
|
|
|
Net asset value, beginning of period |
|
$ |
13.17 |
|
|
Net investment income2 |
|
|
0.11 |
|
|
Net realized and unrealized loss |
|
|
(1.62 |
) |
|
Net decrease from investment operations |
|
|
(1.51 |
) |
|
Dividends from net investment income |
|
|
(0.15 |
) |
|
Net asset value, end of period |
|
$ |
11.51 |
|
|
|
|
|
|
|
|
Total Investment Return3 |
|
|
|
|
|
Based on net asset value |
|
|
(11.42 |
)%7 |
|
|
|
|
|
|
|
Ratios to Average Net Assets4 |
|
|
|
|
|
Total expenses |
|
|
0.68 |
%5,6 |
|
Total expenses after fees waived and/or reimbursed |
|
|
0.25 |
%5,6 |
|
Net investment income |
|
|
1.28 |
%5,6 |
|
|
|
|
|
|
|
Supplemental Data |
|
|
|
|
|
Net assets, end of period (000) |
|
$ |
22 |
|
|
Portfolio turnover of the Series |
|
|
31 |
% |
|
|
|
|
|
|
1 |
Commencement of operations. |
|
|
|
|
|
|
2 |
Based on average shares outstanding. |
|
|
|
|
|
|
3 |
Where applicable, total investment returns include the reinvestment of dividends and distributions. |
|
|
|
|
|
|
4 |
Includes the Fund’s share of the Series’ allocated net expenses and/or net investment income. |
|
|
|
|
|
|
5 |
Annualized. |
|
|
|
|
|
|
6 |
Includes the Fund’s share of the Series’ allocated fees waived of less than 0.01%. |
|
|
|
|
|
|
7 |
Aggregate total investment return. |
|
|
|
|
|
|
See Notes to Financial Statements. |
|||
|
|
|
|
|
|
|
BLACKROCK SMALL CAP INDEX FUND |
DECEMBER 31, 2011 |
11 |
|
|
|
|
|
|
|
BlackRock Small Cap Index Fund |
1. Organization and Significant Accounting Policies:
BlackRock Small Cap Index Fund (the “Fund”), a series of BlackRock Index Funds, Inc. (“the Corporation”), is registered under the Investment Company Act of 1940, as amended (the “1940 Act”), as a diversified, open-end management investment company. The Corporation is organized as a Maryland corporation. The Fund seeks to achieve its investment objective by investing all of its assets in Master Small Cap Index Series (the “Series”), a series of Quantitative Master Series LLC (the “Master LLC”), which has the same investment objective and strategies as the Fund. The value of the Fund’s investment in the Series reflects the Fund’s proportionate interest in the net assets of the Series. The performance of the Fund is directly affected by the performance of the Series. The percentage of the Series owned by the Fund at December 31, 2011 was 18%. The Fund’s financial statements are prepared in conformity with accounting principles generally accepted in the United States of America (“US GAAP”), which may require management to make estimates and assumptions that affect the reported amounts and disclosures in the financial statements. Actual results could differ from those estimates. The Fund offers multiple classes of shares. Institutional Shares and Class K Shares are sold without a sales charge and only to certain eligible investors. Investor A Shares are generally sold without a front-end sales charge. All classes of shares have identical voting, dividend, liquidation and other rights and the same terms and conditions, except that Investor A Shares bear certain expenses related to the shareholder servicing of such shares.
The following is a summary of significant accounting policies followed by the Fund:
Valuation: US GAAP defines fair value as the price the Fund would receive to sell an asset or pay to transfer a liability in an orderly transaction between market participants at the measurement date. The Fund’s policy is to fair value its financial instruments at market value. The Fund records its investment in the Series at fair value based on the Fund’s proportionate interest in the net assets of the Series. Valuation of securities held by the Series is discussed in Note 1 of the Series’ Notes to Financial Statements, which are included elsewhere in this report.
Investment Transactions and Investment Income: For financial reporting purposes, contributions to and withdrawals from the Series are accounted on a trade date basis. The Fund records daily its proportionate share of the Series’ income, expenses and realized and unrealized gains and losses. Realized and unrealized gains and losses are adjusted for utilizing partnership tax allocation rules. In addition, the Fund accrues its own expenses.
Dividends and Distributions: Dividends and distributions paid by the Fund are recorded on the ex-dividend dates. The amount and timing of dividends and distributions are determined in accordance with federal income tax regulations, which may differ from US GAAP.
Income Taxes: It is the Fund’s policy to comply with the requirements of the Internal Revenue Code of 1986, as amended, applicable to regulated investment companies and to distribute substantially all of its taxable income to its shareholders. Therefore, no federal income tax provision is required.
The Fund files US federal and various state and local tax returns. No income tax returns are currently under examination. The statute of limitations on the Fund’s US federal tax returns remains open for each of the four years ended December 31, 2011. The statutes of limitations on the Fund’s state and local tax returns may remain open for an additional year depending upon the jurisdiction. Management does not believe there are any uncertain tax positions that require recognition of a tax liability.
Recent Accounting Standard: In May 2011, the Financial Accounting Standards Board (the “FASB”) issued amended guidance to improve disclosure about fair value measurements which will require the following disclosures for fair value measurements categorized as Level 3: quantitative information about the unobservable inputs and assumptions used in the fair value measurement, a description of the valuation policies and procedures and a narrative description of the sensitivity of the fair value measurement to changes in unobservable inputs and the interrelationships between those unobservable inputs. In addition, the amounts and reasons for all transfers in and out of Level 1 and Level 2 will be required to be disclosed. The amended guidance is effective for financial statements for fiscal years beginning after December 15, 2011, and interim periods within those fiscal years. Management is evaluating the impact of this guidance on the Fund’s financial statement disclosures.
In December 2011, the FASB issued guidance that will enhance current disclosure requirements on the offsetting of certain assets and liabilities. The new disclosures will be required for investments and derivative financial instruments subject to master netting agreements or similar agreements and will require an entity to disclose both gross and net information about such investments and transactions eligible for offset in the Statement of Assets and Liabilities. The guidance is effective for financial statements with fiscal years beginning on or after January 1, 2013, and interim periods within those fiscal years. Management is evaluating the impact of this guidance on the Fund’s financial statement disclosures.
Other: Expenses directly related to the Fund or its classes are charged to the Fund or class. Other operating expenses shared by several funds are pro rated among those funds on the basis of relative net assets or other appropriate methods. Other expenses of the Fund are allocated daily to each class based on its relative net assets.
The Series has an arrangement with the custodian whereby fees may be reduced by credits earned on uninvested cash balances, which, if applicable, are shown as fees paid indirectly in the Statement of Operations. The custodian imposes fees on overdrawn cash balances, which can be offset by accumulated credits earned or may result in additional custody charges.
|
|
|
|
|
|
|
|
|
12 |
BLACKROCK SMALL CAP INDEX FUND |
DECEMBER 31, 2011 |
|
|
|
|
|
|
|
Notes to Financial Statements (continued) |
BlackRock Small Cap Index Fund |
2. Administration Agreement and Other Transactions with Affiliates:
The PNC Financial Services Group, Inc. (“PNC”) and Barclays Bank PLC (“Barclays”) are the largest stockholders of BlackRock, Inc. (“BlackRock”). Due to the ownership structure, PNC is an affiliate for 1940 Act purposes, but Barclays is not.
The Corporation, on behalf of the Fund, entered into an Administration Agreement with BlackRock Advisors, LLC (the “Administrator”), an indirect, wholly owned subsidiary of BlackRock, to provide administrative services (other than investment advice and related portfolio activities). For such services, the Fund pays the Administrator a monthly fee at an annual rate of 0.29% of the average daily value of the Fund’s net assets. The Fund does not pay an investment advisory fee or investment management fee.
The Administrator contractually agreed to waive and/or reimburse fees or expenses, excluding interest expense, dividend expense, acquired fund fees and expenses and certain other fund expenses in order to limit total annual Fund operating expenses as a percentage of average daily net assets to 0.30% for Institutional Shares, 0.55% for Investor A Shares and 0.25% for Class K Shares until May 1, 2012. The Administrator has agreed not to reduce or discontinue this contractual waiver or reimbursement unless approved by the Board of Directors, including a majority of the Independent Directors.
As a result of these agreements, the Administrator waived and/or reimbursed the following amounts, which are shown as transfer agent fees waived and/or reimbursed — class specific in the Statement of Operations:
|
|
|
|
|
|
|
Institutional |
|
$ |
14,243 |
|
|
Investor A |
|
$ |
16,531 |
|
|
Class K |
|
$ |
17 |
|
In addition, the Administrator waived $335,235 which is shown as fees waived by administrator in the Statement of Operations.
The Corporation, on behalf of the Fund, entered into a Distribution Agreement and Distribution and Service Plan with BlackRock Investments, LLC (“BRIL”), an affiliate of the Administrator. Pursuant to the Distribution and Service Plan and in accordance with Rule 12b-1 under the 1940 Act, the Fund pays BRIL ongoing service fees with respect to its Investor A Shares. The fees are accrued daily and paid monthly at the annual rate of 0.25% based upon the average daily net assets attributable to Investor A Shares.
Pursuant to sub-agreements with BRIL, broker-dealers and BRIL provide shareholder servicing services to the Fund. The ongoing service fee compensates BRIL and each broker-dealer for providing shareholder servicing to Investor A shareholders.
The Administrator maintains a call center, which is responsible for providing certain shareholder services to the Fund, such as responding to shareholder inquiries and processing transactions based upon instructions from shareholders with respect to the subscription and redemption of Fund shares.
For the year ended December 31, 2011, the Fund reimbursed the Administrator the following amounts for costs incurred in running the call center, which are included in transfer agent — class specific in the Statement of Operations:
|
|
|
|
|
|
|
Institutional |
|
$ |
372 |
|
|
Investor A |
|
$ |
1,044 |
|
Pursuant to written agreements, certain financial intermediaries, some of which may be affiliates, provide the Fund with sub-accounting, record-keeping, sub-transfer agency and other administrative services with respect to sub-accounts they service. For these services, these entities receive an annual fee per shareholder account, which will vary depending on share class and/or net assets. For the year ended December 31, 2011, the Fund paid the following to affiliates in return for these services, which is included in transfer agent in the Statement of Operations:
|
|
|
|
|
|
|
Institutional |
|
$ |
32 |
|
|
Investor A |
|
$ |
271 |
|
Certain officers and/or directors of the Corporation are officers and/or directors of BlackRock or its affiliates. The Fund reimburses the Administrator for compensation paid to the Corporation’s Chief Compliance Officer.
3. Income Tax Information:
US GAAP requires that certain components of net assets be adjusted to reflect permanent differences between financial and tax reporting. These reclassifications have no effect on net assets or net asset values per share. The following permanent differences as of December 31, 2011 attributable to foreign currency transactions, the reclassification of distributions and the sale of stock of passive foreign investment companies were reclassified to the following accounts:
|
|
|
|
|
|
|
Paid-in capital |
|
$ |
(13,431 |
) |
|
Distributions in excess of net investment income |
|
$ |
21,200 |
|
|
Accumulated net realized loss |
|
$ |
(7,769 |
) |
The tax character of distributions paid during the fiscal years ended December 31, 2011 and December 31, 2010 was as follows:
|
|
|
|
|
|
|
|
|
|
|
|
|
12/31/11 |
|
|
12/31/10 |
|
|
Distributions paid from: |
|
|
|
|
|
|
|
|
Ordinary income |
|
$ |
1,350,077 |
|
$ |
713,077 |
|
|
|
|
|
|
|
|
|
|
|
|
|
|
|
|
|
|
BLACKROCK SMALL CAP INDEX FUND |
DECEMBER 31, 2011 |
13 |
|
|
|
|
|
|
|
Notes to Financial Statements (concluded) |
BlackRock Small Cap Index Fund |
As of December 31, 2011, the tax components of accumulated net losses were as follows:
|
|
|
|
|
|
|
Capital loss carryforwards |
|
$ |
(13,583,281 |
) |
|
Net unrealized gains1 |
|
|
6,729,099 |
|
|
Qualified late-year losses2 |
|
|
(322 |
) |
|
Total |
|
$ |
(6,854,504 |
) |
|
|
|
|
|
|
1 |
The difference between book-basis and tax-basis net unrealized gains was attributable primarily to the tax deferral of losses on wash sales, the realization for tax purposes of unrealized gains on investments in passive foreign investment companies, the treatment of certain security lending transactions, the realization for tax purposes of unrealized gains/losses on certain futures contracts and other temporary differences. |
|
|
||
|
|
2 |
The Fund has elected to defer certain late-year losses and recognize such losses in the year ending December 31, 2012. |
As of December 31, 2011, the Fund had capital loss carryforwards available to offset future realized capital gains through the indicated expiration date as follows:
|
|
|
|
|
|
|
Expires December 31, |
|
|
|
|
|
2017 |
|
$ |
13,583,281 |
|
4. Capital Share Transactions:
Transactions in capital shares for each class were as follows:
|
|
|
|
|
|
|
|
|
|
|
|
|
|
|
|
|
|
|
Year
Ended |
|
|
Year
Ended |
|
||||||||
|
|
|
Shares |
|
Amount |
|
|
Shares |
|
Amount |
|
||||
|
Institutional |
|
|
|
|
|
|
|
|
|
|
|
|
|
|
|
Shares sold |
|
|
2,230,820 |
|
$ |
27,256,806 |
|
|
|
2,098,681 |
|
$ |
22,240,658 |
|
|
Shares issued to shareholders in reinvestment of dividends |
|
|
74,998 |
|
|
854,792 |
|
|
|
39,323 |
|
|
469,746 |
|
|
Shares redeemed |
|
|
(3,827,916 |
) |
|
(45,027,943 |
) |
|
(2,028,999 |
) |
|
(21,560,365 |
) |
|
|
Net increase (decrease) |
|
|
(1,522,098 |
) |
$ |
(16,916,345 |
) |
|
|
109,005 |
|
$ |
1,150,039 |
|
|
|
|
|
|
|
|
|
|
|
|
|
|
|
|
|
|
Investor A |
|
|
|
|
|
|
|
|
|
|
|
|
|
|
|
Shares sold |
|
|
920,917 |
|
$ |
11,298,590 |
|
|
|
747,472 |
|
$ |
7,965,898 |
|
|
Shares issued to shareholders in reinvestment of dividends |
|
|
37,402 |
|
|
414,562 |
|
|
|
16,979 |
|
|
201,821 |
|
|
Shares redeemed |
|
|
(895,970 |
) |
|
(10,747,558 |
) |
|
|
(842,665 |
) |
|
(8,899,467 |
) |
|
Net increase (decrease) |
|
|
62,349 |
|
$ |
965,594 |
|
|
|
(78,214 |
) |
$ |
(731,748 |
) |
|
|
|
|
|
|
|
|
|
|
|
|
|
|
|
|
|
Class K1 |
|
|
|
|
|
|
|
|
|
|
|
|
|
|
|
Shares sold |
|
|
1,898 |
|
$ |
25,000 |
|
|
|
— |
|
|
— |
|
|
Shares redeemed |
|
|
— |
|
|
— |
|
|
|
— |
|
|
— |
|
|
Net increase |
|
|
1,898 |
|
$ |
25,000 |
|
|
|
— |
|
|
— |
|
|
|
|
|
|
|
1 |
For the period March 31, 2011 (commencement of operations) to December 31, 2011. |
Prior to April 1, 2011, there was a 2% redemption fee on shares redeemed or exchanged that have been held 30 days or less. The redemption fees were collected and retained by the Fund for the benefit of the remaining shareholders. The redemption fees were recorded as a credit to paid-in capital. Effective April 1, 2011, the redemption fee was terminated and is no longer charged by the Fund.
5. Subsequent Events:
Management has evaluated the impact of all subsequent events on the Fund through the date the financial statements were issued and has determined that there were no subsequent events requiring adjustment or additional disclosure in the financial statements.
|
|
|
|
|
|
|
|
|
14 |
BLACKROCK SMALL CAP INDEX FUND |
DECEMBER 31, 2011 |
|
|
|
|
|
|
|
BlackRock Small Cap Index Fund |
To the Shareholders of BlackRock Small Cap Index Fund and Board of Directors of BlackRock Index Funds, Inc.:
We have audited the accompanying statement of assets and liabilities of BlackRock Small Cap Index Fund, one of the series constituting BlackRock Index Funds, Inc. (the “Fund”), as of December 31, 2011, and the related statement of operations for the year then ended, the statements of changes in net assets for each of the two years in the period then ended, and the financial highlights for each of the five years in the period then ended. These financial statements and financial highlights are the responsibility of the Fund’s management. Our responsibility is to express an opinion on these financial statements and financial highlights based on our audits.
We conducted our audits in accordance with the standards of the Public Company Accounting Oversight Board (United States). Those standards require that we plan and perform the audit to obtain reasonable assurance about whether the financial statements and financial highlights are free of material misstatement. The Fund is not required to have, nor were we engaged to perform, an audit of its internal control over financial reporting. Our audits included consideration of internal control over financial reporting as a basis for designing audit procedures that are appropriate in the circumstances, but not for the purpose of expressing an opinion on the effectiveness of the Fund’s internal control over financial reporting. Accordingly, we express no such opinion. An audit also includes examining, on a test basis, evidence supporting the amounts and disclosures in the financial statements, assessing the accounting principles used and significant estimates made by management, as well as evaluating the overall financial statement presentation. We believe that our audits provide a reasonable basis for our opinion.
In our opinion, the financial statements and financial highlights referred to above present fairly, in all material respects, the financial position of BlackRock Small Cap Index Fund, one of the series constituting BlackRock Index Funds, Inc. as of December 31, 2011, the results of its operations for the year then ended, the changes in its net assets for each of the two years in the period then ended, and the financial highlights for each of the five years in the period then ended, in conformity with accounting principles generally accepted in the United States of America.
Deloitte & Touche LLP
Boston, Massachusetts
February 22, 2012
|
|
|
|
The following information is provided with respect to the ordinary income distributions paid by the Fund for the taxable year ended December 31, 2011.
|
|
|
|
|
|
|
|
|
|
|
|
Payable |
|
Percentage |
|
||
|
Qualified Dividend Income for Individuals1 |
|
|
7/22/11 |
|
|
100.00 |
% |
|
|
|
|
12/15/11 |
|
|
84.79 |
% |
|
Dividends Qualifying for the Dividend Received Deduction for Corporations1 |
|
|
7/22/11 |
|
|
100.00 |
% |
|
|
|
|
12/15/11 |
|
|
83.22 |
% |
|
|
|
|
|
|
|
|
|
|
|
|
|
|
|
|
|
|
|
|
|
BLACKROCK SMALL CAP INDEX FUND |
DECEMBER 31, 2011 |
15 |
|
|
|
|
|
|
|
Master Small Cap Index Series |
|
|
|
|
|
|
|
As of December 31, 2011 |
|
|
|
|
|
|
|
|
|
|
|
Ten Largest Holdings |
|
Percent
of |
|
|
|
HealthSpring, Inc. |
|
|
0.3 |
% |
|
Netlogic Microsystems, Inc. |
|
|
0.3 |
|
|
SuccessFactors, Inc. |
|
|
0.3 |
|
|
Clean Harbors, Inc. |
|
|
0.3 |
|
|
World Fuel Services Corp. |
|
|
0.3 |
|
|
Jack Henry & Associates, Inc. |
|
|
0.3 |
|
|
American Campus Communities, Inc. |
|
|
0.3 |
|
|
Salix Pharmaceuticals Ltd. |
|
|
0.3 |
|
|
BioMed Realty Trust, Inc. |
|
|
0.3 |
|
|
Onyx Pharmaceuticals, Inc. |
|
|
0.3 |
|
|
|
|
|
|
|
|
Sector Allocations |
|
Percent
of |
|
|
|
Energy |
|
|
22 |
% |
|
Information Technology |
|
|
16 |
|
|
Industrials |
|
|
16 |
|
|
Consumer Discretionary |
|
|
13 |
|
|
Health Care |
|
|
13 |
|
|
Financials |
|
|
7 |
|
|
Materials |
|
|
4 |
|
|
Utilities |
|
|
4 |
|
|
Consumer Staples |
|
|
4 |
|
|
Telecommunication Services |
|
|
1 |
|
|
|
|
|
|
For Series compliance purposes, the Series’ sector classifications refer to any one or more of the sector sub-classifications used by one or more widely recognized market indexes, and/or as defined by Series management. These definitions may not apply for purposes of this report, which may combine such sector sub-classifications for reporting ease. |
|
|
|
|
|
|
|
|
|
16 |
BLACKROCK SMALL CAP INDEX FUND |
DECEMBER 31, 2011 |
|
|
|
|
|
|
|
Master Small Cap Index Series |
|
|
|
(Percentages shown are based on Net Assets) |
|
|
|
|
|
|
|
|
|
|
Common Stocks |
|
Shares |
|
Value |
|
||
|
Advertising Agencies — 0.6% |
|
|
|
|
|
|
|
|
Arbitron, Inc. |
|
|
12,861 |
|
$ |
442,547 |
|
|
Constant Contact, Inc. (a) |
|
|
13,957 |
|
|
323,942 |
|
|
Digital Generation, Inc. (a) |
|
|
13,033 |
|
|
155,353 |
|
|
Harte-Hanks, Inc. |
|
|
21,080 |
|
|
191,617 |
|
|
Marchex, Inc., Class B |
|
|
10,143 |
|
|
63,394 |
|
|
MDC Partners, Inc. |
|
|
11,888 |
|
|
160,726 |
|
|
National CineMedia, Inc. |
|
|
26,169 |
|
|
324,496 |
|
|
QuinStreet, Inc. (a)(b) |
|
|
13,057 |
|
|
122,213 |
|
|
ReachLocal, Inc. (a) |
|
|
4,991 |
|
|
30,844 |
|
|
Travelzoo, Inc. (a)(b) |
|
|
2,584 |
|
|
63,515 |
|
|
Valassis Communications, Inc. (a) |
|
|
21,211 |
|
|
407,888 |
|
|
ValueClick, Inc. (a) |
|
|
37,224 |
|
|
606,379 |
|
|
Viad Corp. |
|
|
9,664 |
|
|
168,927 |
|
|
|
|
|
|
|
|
3,061,841 |
|
|
Aerospace — 1.6% |
|
|
|
|
|
|
|
|
AAR Corp. |
|
|
18,838 |
|
|
361,124 |
|
|
AeroVironment, Inc. (a) |
|
|
7,999 |
|
|
251,729 |
|
|
Astronics Corp. (a) |
|
|
4,865 |
|
|
174,216 |
|
|
Ceradyne, Inc. (a) |
|
|
11,811 |
|
|
316,299 |
|
|
Cubic Corp. |
|
|
7,488 |
|
|
326,402 |
|
|
Curtiss-Wright Corp. |
|
|
21,984 |
|
|
776,695 |
|
|
Ducommun, Inc. |
|
|
4,790 |
|
|
61,072 |
|
|
Esterline Technologies Corp. (a) |
|
|
14,432 |
|
|
807,759 |
|
|
GenCorp, Inc. (a) |
|
|
27,859 |
|
|
148,210 |
|
|
Heico Corp. |
|
|
19,762 |
|
|
1,155,682 |
|
|
Kaman Corp., Class A |
|
|
12,460 |
|
|
340,407 |
|
|
Kratos Defense & Security Solutions, Inc. (a) |
|
|
15,692 |
|
|
93,681 |
|
|
LMI Aerospace, Inc. (a) |
|
|
4,348 |
|
|
76,307 |
|
|
Moog, Inc., Class A (a) |
|
|
21,508 |
|
|
944,846 |
|
|
Orbital Sciences Corp. (a) |
|
|
27,701 |
|
|
402,495 |
|
|
Teledyne Technologies, Inc. (a) |
|
|
17,395 |
|
|
954,116 |
|
|
Triumph Group, Inc. |
|
|
17,806 |
|
|
1,040,761 |
|
|
|
|
|
|
|
|
8,231,801 |
|
|
Agriculture, Fishing & Ranching — 0.4% |
|
|
|
|
|
|
|
|
Alico, Inc. |
|
|
1,685 |
|
|
32,638 |
|
|
The Andersons, Inc. |
|
|
8,811 |
|
|
384,688 |
|
|
Cadiz, Inc. (a) |
|
|
5,584 |
|
|
53,774 |
|
|
Cal-Maine Foods, Inc. |
|
|
6,723 |
|
|
245,860 |
|
|
Calavo Growers, Inc. |
|
|
5,636 |
|
|
144,733 |
|
|
Fresh Del Monte Produce, Inc. |
|
|
17,282 |
|
|
432,223 |
|
|
Limoneira Co. |
|
|
3,633 |
|
|
61,434 |
|
|
Pilgrims Pride Corp. (a) |
|
|
24,058 |
|
|
138,574 |
|
|
Sanderson Farms, Inc. |
|
|
10,477 |
|
|
525,212 |
|
|
Seaboard Corp. |
|
|
148 |
|
|
301,328 |
|
|
|
|
|
|
|
|
2,320,464 |
|
|
Air Transport — 0.9% |
|
|
|
|
|
|
|
|
Air Transport Services Group, Inc. (a) |
|
|
25,588 |
|
|
120,775 |
|
|
Alaska Air Group, Inc. (a) |
|
|
16,989 |
|
|
1,275,704 |
|
|
Allegiant Travel Co. (a) |
|
|
7,037 |
|
|
375,354 |
|
|
Atlas Air Worldwide Holdings, Inc. (a) |
|
|
12,450 |
|
|
478,454 |
|
|
Bristow Group, Inc. |
|
|
17,180 |
|
|
814,160 |
|
|
Hawaiian Holdings, Inc. (a) |
|
|
24,139 |
|
|
140,006 |
|
|
JetBlue Airways Corp. (a) |
|
|
116,995 |
|
|
608,374 |
|
|
PHI, Inc. (a)(b) |
|
|
6,178 |
|
|
153,523 |
|
|
Republic Airways Holdings, Inc. (a) |
|
|
22,894 |
|
|
78,526 |
|
|
SkyWest, Inc. |
|
|
25,174 |
|
|
316,941 |
|
|
Spirit Airlines, Inc. (a) |
|
|
7,451 |
|
|
116,236 |
|
|
US Airways Group, Inc. (a) |
|
|
76,869 |
|
|
389,726 |
|
|
|
|
|
|
|
|
4,867,779 |
|
|
|
|
|
|
|
|
|
|
|
Common Stocks |
|
Shares |
|
Value |
|
||
|
Alternative Energy — 0.1% |
|
|
|
|
|
|
|
|
Ameresco, Inc. (a) |
|
|
8,379 |
|
$ |
114,960 |
|
|
Amyris, Inc. (a) |
|
|
8,356 |
|
|
96,428 |
|
|
EnerNOC, Inc. (a) |
|
|
11,010 |
|
|
119,679 |
|
|
Gevo, Inc. (a) |
|
|
3,174 |
|
|
19,965 |
|
|
Green Plains Renewable Energy, Inc. (a) |
|
|
8,820 |
|
|
86,083 |
|
|
Rex American Resources Corp. (a) |
|
|
2,909 |
|
|
64,318 |
|
|
Solazyme, Inc. (a) |
|
|
5,350 |
|
|
63,665 |
|
|
Syntroleum Corp. (a) |
|
|
40,907 |
|
|
39,271 |
|
|
USEC, Inc. (a) |
|
|
55,202 |
|
|
62,930 |
|
|
|
|
|
|
|
|
667,299 |
|
|
Aluminum — 0.1% |
|
|
|
|
|
|
|
|
Century Aluminum Co. (a)(b) |
|
|
24,481 |
|
|
208,333 |
|
|
Kaiser Aluminum Corp. |
|
|
7,704 |
|
|
353,460 |
|
|
Noranda Aluminum Holding Corp. |
|
|
10,818 |
|
|
89,248 |
|
|
|
|
|
|
|
|
651,041 |
|
|
Asset Management & Custodian — 0.9% |
|
|
|
|
|
|
|
|
Apollo Investment Corp. |
|
|
93,077 |
|
|
599,416 |
|
|
Arlington Asset Investment Corp. |
|
|
3,065 |
|
|
65,376 |
|
|
Artio Global Investors, Inc. |
|
|
14,900 |
|
|
72,712 |
|
|
Calamos Asset Management, Inc., Class A |
|
|
9,041 |
|
|
113,103 |
|
|
Capital Southwest Corp. |
|
|
1,379 |
|
|
112,457 |
|
|
CIFC Corp. (a) |
|
|
5,795 |
|
|
31,293 |
|
|
Cohen & Steers, Inc. (b) |
|
|
8,435 |
|
|
243,771 |
|
|
Cowen Group, Inc., Class A (a) |
|
|
31,390 |
|
|
81,300 |
|
|
Diamond Hill Investments Group, Inc. |
|
|
1,201 |
|
|
88,850 |
|
|
Epoch Holding Corp. |
|
|
7,035 |
|
|
156,388 |
|
|
Fifth Street Finance Corp. |
|
|
34,386 |
|
|
329,074 |
|
|
Financial Engines, Inc. (a) |
|
|
18,161 |
|
|
405,535 |
|
|
GAMCO Investors, Inc., Class A |
|
|
3,210 |
|
|
139,603 |
|
|
Golub Capital BDC, Inc. |
|
|
4,768 |
|
|
73,904 |
|
|
Harris & Harris Group, Inc. (a) |
|
|
14,393 |
|
|
49,800 |
|
|
JMP Group, Inc. |
|
|
7,041 |
|
|
50,343 |
|
|
Kohlberg Capital Corp. |
|
|
8,986 |
|
|
56,702 |
|
|
Manning & Napier, Inc. (a) |
|
|
6,217 |
|
|
77,650 |
|
|
MCG Capital Corp. |
|
|
36,848 |
|
|
147,024 |
|
|
Medley Capital Corp. |
|
|
5,182 |
|
|
53,893 |
|
|
MVC Capital, Inc. |
|
|
11,427 |
|
|
132,439 |
|
|
National Financial Partners Corp. (a) |
|
|
19,642 |
|
|
265,560 |
|
|
New Mountain Finance Corp. |
|
|
3,300 |
|
|
44,253 |
|
|
NGP Capital Resources Co. |
|
|
10,343 |
|
|
74,366 |
|
|
Oppenheimer Holdings, Inc. |
|
|
4,915 |
|
|
79,132 |
|
|
Pzena Investment Management, Inc., Class A |
|
|
4,481 |
|
|
19,403 |
|
|
Solar Capital Ltd. |
|
|
17,315 |
|
|
382,488 |
|
|
Solar Senior Capital Ltd. |
|
|
3,605 |
|
|
56,779 |
|
|
THL Credit, Inc. |
|
|
4,417 |
|
|
53,932 |
|
|
TICC Capital Corp. |
|
|
15,439 |
|
|
133,547 |
|
|
Virtus Investment Partners, Inc. (a) |
|
|
2,596 |
|
|
197,322 |
|
|
Westwood Holdings Group, Inc. |
|
|
2,973 |
|
|
108,663 |
|
|
|
|
|
|
|
|
4,496,078 |
|
|
Auto Parts — 0.6% |
|
|
|
|
|
|
|
|
American Axle & Manufacturing Holdings, Inc. (a) |
|
|
31,624 |
|
|
312,761 |
|
|
Amerigon, Inc. (a) |
|
|
10,517 |
|
|
149,972 |
|
|
Dana Holding Corp. (a) |
|
|
69,306 |
|
|
842,068 |
|
|
Dorman Products, Inc. (a) |
|
|
5,112 |
|
|
188,786 |
|
|
Exide Technologies (a) |
|
|
36,702 |
|
|
96,526 |
|
|
Fuel Systems Solutions, Inc. (a) |
|
|
7,893 |
|
|
130,156 |
|
|
Meritor, Inc. (a) |
|
|
44,831 |
|
|
238,501 |
|
|
Motorcar Parts of America, Inc. (a) |
|
|
5,939 |
|
|
44,543 |
|
|
Standard Motor Products, Inc. |
|
|
9,318 |
|
|
186,826 |
|
|
Stoneridge, Inc. (a) |
|
|
12,293 |
|
|
103,630 |
|
|
|
|
|
|
|
See Notes to Financial Statements. |
|||
|
|
|
|
|
|
|
BLACKROCK SMALL CAP INDEX FUND |
DECEMBER 31, 2011 |
17 |
|
|
|
|
|
|
|
Schedule of Investments (continued) |
Master Small Cap Index Series |
|
|
(Percentages shown are based on Net Assets) |
|
|
|
|
|
|
|
|
|
|
Common Stocks |
|
Shares |
|
Value |
|
||
|
Auto Parts (concluded) |
|
|
|
|
|
|
|
|
Superior Industries International, Inc. |
|
|
11,085 |
|
$ |
183,346 |
|
|
Tenneco, Inc. (a) |
|
|
28,636 |
|
|
852,780 |
|
|
Tower International, Inc. (a) |
|
|
2,846 |
|
|
30,566 |
|
|
U.S. Auto Parts Network, Inc. (a) |
|
|
7,363 |
|
|
32,176 |
|
|
|
|
|
|
|
|
3,392,637 |
|
|
Auto Services — 0.1% |
|
|
|
|
|
|
|
|
Cooper Tire & Rubber Co. |
|
|
29,448 |
|
|
412,567 |
|
|
Back Office Support, HR & Consulting — 1.8% |
|
|
|
|
|
|
|
|
The Advisory Board Co. (a) |
|
|
7,499 |
|
|
556,501 |
|
|
Angie’s List, Inc. (a) |
|
|
5,057 |
|
|
81,418 |
|
|
Barrett Business Services, Inc. |
|
|
3,641 |
|
|
72,674 |
|
|
CBIZ, Inc. (a) |
|
|
18,554 |
|
|
113,365 |
|
|
CDI Corp. |
|
|
6,205 |
|
|
85,691 |
|
|
Compass Diversified Holdings |
|
|
19,217 |
|
|
238,099 |
|
|
Convergys Corp. (a) |
|
|
49,854 |
|
|
636,636 |
|
|
Corporate Executive Board Co. |
|
|
16,369 |
|
|
623,659 |
|
|
CoStar Group, Inc. (a)(b) |
|
|
11,974 |
|
|
799,025 |
|
|
CRA International, Inc. (a) |
|
|
5,046 |
|
|
100,113 |
|
|
Dice Holdings, Inc. (a) |
|
|
23,039 |
|
|
190,993 |
|
|
ExlService Holdings, Inc. (a) |
|
|
7,650 |
|
|
171,130 |
|
|
Forrester Research, Inc. (a) |
|
|
6,958 |
|
|
236,155 |
|
|
FTI Consulting, Inc. (a)(b) |
|
|
19,882 |
|
|
843,394 |
|
|
GP Strategies Corp. (a) |
|
|
7,057 |
|
|
95,128 |
|
|
The Hackett Group, Inc. (a) |
|
|
15,070 |
|
|
56,362 |
|
|
Heidrick & Struggles International, Inc. |
|
|
8,447 |
|
|
181,948 |
|
|
Hudson Highland Group, Inc. (a) |
|
|
15,667 |
|
|
75,045 |
|
|
Huron Consulting Group, Inc. (a)(b) |
|
|
10,499 |
|
|
406,731 |
|
|
ICF International, Inc. (a)(b) |
|
|
9,308 |
|
|
230,652 |
|
|
Insperity, Inc. |
|
|
10,875 |
|
|
275,681 |
|
|
Kelly Services, Inc., Class A |
|
|
12,634 |
|
|
172,833 |
|
|
Kforce, Inc. (a) |
|
|
14,105 |
|
|
173,915 |
|
|
Korn/Ferry International (a) |
|
|
22,290 |
|
|
380,267 |
|
|
Liquidity Services, Inc. (a) |
|
|
8,965 |
|
|
330,808 |
|
|
LoopNet, Inc. (a) |
|
|
7,773 |
|
|
142,090 |
|
|
MAXIMUS, Inc. |
|
|
16,423 |
|
|
679,091 |
|
|
Navigant Consulting, Inc. (a) |
|
|
24,447 |
|
|
278,940 |
|
|
On Assignment, Inc. (a) |
|
|
17,556 |
|
|
196,276 |
|
|
PRGX Global, Inc. (a) |
|
|
9,030 |
|
|
53,729 |
|
|
Resources Connection, Inc. |
|
|
22,045 |
|
|
233,457 |
|
|
RPX Corp. (a) |
|
|
4,907 |
|
|
62,074 |
|
|
ServiceSource International, Inc. (a) |
|
|
4,982 |
|
|
78,168 |
|
|
Stream Global Services, Inc. (a) |
|
|
4,386 |
|
|
14,518 |
|
|
SYKES Enterprises, Inc. (a) |
|
|
18,812 |
|
|
294,596 |
|
|
TeleTech Holdings, Inc. (a) |
|
|
12,042 |
|
|
195,080 |
|
|
TrueBlue, Inc. (a) |
|
|
19,035 |
|
|
264,206 |
|
|
|
|
|
|
|
|
9,620,448 |
|
|
Banks: Diversified — 6.3% |
|
|
|
|
|
|
|
|
1st Source Corp. |
|
|
7,354 |
|
|
186,277 |
|
|
1st United Bancorp, Inc. (a) |
|
|
13,212 |
|
|
73,327 |
|
|
Alliance Financial Corp. |
|
|
2,330 |
|
|
71,950 |
|
|
Ameris Bancorp (a) |
|
|
11,398 |
|
|
117,171 |
|
|
Ames National Corp. |
|
|
4,133 |
|
|
80,594 |
|
|
Arrow Financial Corp. |
|
|
4,961 |
|
|
116,286 |
|
|
Bancfirst Corp. |
|
|
3,306 |
|
|
124,107 |
|
|
Banco Latinoamericana De Comercio Exterior SA |
|
|
13,331 |
|
|
213,963 |
|
|
Bancorp Rhode Island, Inc. |
|
|
1,873 |
|
|
82,531 |
|
|
The Bancorp, Inc. (a) |
|
|
14,102 |
|
|
101,957 |
|
|
BancorpSouth, Inc. |
|
|
39,816 |
|
|
438,772 |
|
|
Bank of Kentucky Financial Corp. |
|
|
2,848 |
|
|
57,102 |
|
|
|
|
|
|
|
|
|
|
|
Common Stocks |
|
|
Shares |
|
|
Value |
|
|
Banks: Diversified (continued) |
|
|
|
|
|
|
|
|
Bank of Marin Bancorp |
|
|
2,601 |
|
$ |
97,772 |
|
|
Bank of the Ozarks, Inc. |
|
|
13,389 |
|
|
396,716 |
|
|
Banner Corp. |
|
|
7,916 |
|
|
135,759 |
|
|
BBCN Bancorp, Inc. (a) |
|
|
35,325 |
|
|
333,821 |
|
|
Boston Private Financial Holdings, Inc. |
|
|
36,710 |
|
|
291,477 |
|
|
Bridge Bancorp, Inc. |
|
|
3,392 |
|
|
67,501 |
|
|
Bridge Capital Holdings (a) |
|
|
4,508 |
|
|
46,883 |
|
|
Bryn Mawr Bank Corp. |
|
|
5,291 |
|
|
103,122 |
|
|
Camden National Corp. |
|
|
3,737 |
|
|
121,826 |
|
|
Cape Bancorp, Inc. (a) |
|
|
5,423 |
|
|
42,571 |
|
|
Capital Bank Corp. (a) |
|
|
6,327 |
|
|
12,717 |
|
|
Capital City Bank Group, Inc. |
|
|
5,673 |
|
|
54,177 |
|
|
Cardinal Financial Corp. |
|
|
13,926 |
|
|
149,565 |
|
|
Cascade Bancorp (a) |
|
|
3,435 |
|
|
15,045 |
|
|
Cathay General Bancorp |
|
|
37,395 |
|
|
558,307 |
|
|
Center Bancorp, Inc. |
|
|
5,927 |
|
|
57,907 |
|
|
Centerstate Banks, Inc. |
|
|
14,491 |
|
|
95,930 |
|
|
Central Pacific Financial Corp. (a) |
|
|
7,237 |
|
|
93,502 |
|
|
Century Bancorp, Inc., Class A |
|
|
1,675 |
|
|
47,302 |
|
|
Chemical Financial Corp. |
|
|
13,206 |
|
|
281,552 |
|
|
Citizens & Northern Corp. |
|
|
5,901 |
|
|
108,991 |
|
|
City Holding Co. |
|
|
7,337 |
|
|
248,651 |
|
|
CNB Financial Corp. |
|
|
6,085 |
|
|
96,021 |
|
|
CoBiz Financial, Inc. |
|
|
15,809 |
|
|
91,218 |
|
|
Columbia Banking System, Inc. |
|
|
18,827 |
|
|
362,796 |
|
|
Community Bank System, Inc. |
|
|
17,552 |
|
|
487,946 |
|
|
Community Trust Bancorp, Inc. |
|
|
6,708 |
|
|
197,349 |
|
|
CVB Financial Corp. |
|
|
42,651 |
|
|
427,790 |
|
|
Eagle Bancorp, Inc. (a) |
|
|
8,081 |
|
|
117,498 |
|
|
Encore Bancshares, Inc. (a) |
|
|
4,094 |
|
|
55,351 |
|
|
Enterprise Bancorp, Inc. |
|
|
2,804 |
|
|
40,097 |
|
|
Enterprise Financial Services Corp. |
|
|
7,656 |
|
|
113,309 |
|
|
F.N.B. Corp. |
|
|
60,515 |
|
|
684,425 |
|
|
Financial Institutions, Inc. |
|
|
6,687 |
|
|
107,928 |
|
|
First Bancorp, Inc. |
|
|
4,404 |
|
|
67,690 |
|
|
First Bancorp, North Carolina |
|
|
7,340 |
|
|
81,841 |
|
|
First Busey Corp. |
|
|
37,217 |
|
|
186,085 |
|
|
First Commonwealth Financial Corp. |
|
|
50,187 |
|
|
263,984 |
|
|
First Community Bancshares, Inc. |
|
|
7,710 |
|
|
96,221 |
|
|
First Connecticut Bancorp, Inc. |
|
|
8,692 |
|
|
113,083 |
|
|
First Financial Bancorp |
|
|
27,804 |
|
|
462,659 |
|
|
First Financial Bankshares, Inc. (b) |
|
|
15,022 |
|
|
502,185 |
|
|
First Financial Corp. |
|
|
5,388 |
|
|
179,313 |
|
|
First Interstate Bancsystem, Inc. |
|
|
7,621 |
|
|
99,302 |
|
|
First Merchants Corp. |
|
|
12,313 |
|
|
104,291 |
|
|
First Midwest Bancorp, Inc. |
|
|
35,511 |
|
|
359,726 |
|
|
The First of Long Island Corp. |
|
|
3,762 |
|
|
99,016 |
|
|
FirstMerit Corp. |
|
|
52,016 |
|
|
787,002 |
|
|
German American Bancorp, Inc. |
|
|
6,154 |
|
|
111,941 |
|
|
Glacier Bancorp, Inc. |
|
|
34,338 |
|
|
413,086 |
|
|
Hampton Roads Bankshares, Inc. (a) |
|
|
5,285 |
|
|
14,481 |
|
|
Hancock Holding Co. |
|
|
36,287 |
|
|
1,160,095 |
|
|
Hanmi Financial Corp. (a) |
|
|
15,050 |
|
|
111,370 |
|
|
Heartland Financial USA, Inc. |
|
|
6,487 |
|
|
99,511 |
|
|
Heritage Commerce Corp. (a) |
|
|
10,305 |
|
|
48,846 |
|
|
Home Bancshares, Inc. |
|
|
10,725 |
|
|
277,885 |
|
|
Hudson Valley Holding Corp. |
|
|
7,536 |
|
|
159,914 |
|
|
IBERIABANK Corp. |
|
|
14,049 |
|
|
692,616 |
|
|
Independent Bank Corp./MA |
|
|
10,267 |
|
|
280,186 |
|
|
International Bancshares Corp. |
|
|
25,322 |
|
|
464,279 |
|
|
Investors Bancorp, Inc. (a) |
|
|
21,983 |
|
|
296,331 |
|
|
Lakeland Bancorp, Inc. |
|
|
10,583 |
|
|
91,225 |
|
|
Lakeland Financial Corp. |
|
|
7,812 |
|
|
202,096 |
|
|
|
|
|
|
See Notes to Financial Statements. |
||
|
|
|
|
|
18 |
BLACKROCK SMALL CAP INDEX FUND |
DECEMBER 31, 2011 |
|
|
|
|
|
|
|
Schedule of Investments (continued) |
Master Small Cap Index Series |
|
|
(Percentages shown are based on Net Assets) |
|
|
|
|
|
|
|
|
|
|
Common Stocks |
|
Shares |
|
Value |
|
||
|
Banks: Diversified (continued) |
|
|
|
|
|
|
|
|
MainSource Financial Group, Inc. |
|
|
9,641 |
|
$ |
85,130 |
|
|
MB Financial, Inc. |
|
|
25,891 |
|
|
442,736 |
|
|
Merchants Bancshares, Inc. |
|
|
2,398 |
|
|
70,022 |
|
|
Meridian Interstate Bancorp, Inc. (a) |
|
|
4,122 |
|
|
51,319 |
|
|
Metro Bancorp, Inc. (a) |
|
|
6,710 |
|
|
56,230 |
|
|
Midsouth Bancorp, Inc. |
|
|
3,863 |
|
|
50,258 |
|
|
National Bankshares, Inc. |
|
|
3,448 |
|
|
96,268 |
|
|
National Penn Bancshares, Inc. |
|
|
58,859 |
|
|
496,770 |
|
|
NBT Bancorp, Inc. |
|
|
16,528 |
|
|
365,765 |
|
|
Old National Bancorp |
|
|
45,135 |
|
|
525,823 |
|
|
Oriental Financial Group, Inc. |
|
|
21,599 |
|
|
261,564 |
|
|
Orrstown Financial Service, Inc. |
|
|
3,709 |
|
|
30,599 |
|
|
Pacific Capital Bancorp NA (a) |
|
|
2,041 |
|
|
57,638 |
|
|
Pacific Continental Corp. |
|
|
8,979 |
|
|
79,464 |
|
|
PacWest Bancorp |
|
|
14,437 |
|
|
273,581 |
|
|
Park National Corp. |
|
|
6,182 |
|
|
402,201 |
|
|
Park Sterling Corp. (a) |
|
|
15,426 |
|
|
62,938 |
|
|
Penns Woods Bancorp, Inc. |
|
|
1,904 |
|
|
73,837 |
|
|
Peoples Bancorp, Inc. |
|
|
5,152 |
|
|
76,301 |
|
|
Pinnacle Financial Partners, Inc. (a) |
|
|
16,249 |
|
|
262,421 |
|
|
PrivateBancorp, Inc. |
|
|
28,584 |
|
|
313,852 |
|
|
Prosperity Bancshares, Inc. |
|
|
22,302 |
|
|
899,886 |
|
|
Provident Financial Services, Inc. |
|
|
28,798 |
|
|
385,605 |
|
|
Renasant Corp. |
|
|
12,098 |
|
|
181,470 |
|
|
Republic Bancorp, Inc., Class A |
|
|
4,797 |
|
|
109,851 |
|
|
Rockville Financial, Inc. |
|
|
14,124 |
|
|
146,325 |
|
|
Roma Financial Corp. |
|
|
3,866 |
|
|
38,041 |
|
|
S&T Bancorp, Inc. |
|
|
13,479 |
|
|
263,514 |
|
|
Sandy Spring Bancorp, Inc. |
|
|
11,533 |
|
|
202,404 |
|
|
SCBT Financial Corp. |
|
|
6,728 |
|
|
195,179 |
|
|
Seacoast Banking Corp. of Florida (a) |
|
|
33,522 |
|
|
50,953 |
|
|
Sierra Bancorp |
|
|
5,988 |
|
|
52,694 |
|
|
Signature Bank (a)(b) |
|
|
21,865 |
|
|
1,311,681 |
|
|
Simmons First National Corp., Class A |
|
|
8,348 |
|
|
226,982 |
|
|
Southside Bancshares, Inc. |
|
|
7,890 |
|
|
170,897 |
|
|
Southwest Bancorp, Inc. (a) |
|
|
9,409 |
|
|
56,078 |
|
|
State Bancorp, Inc. |
|
|
7,391 |
|
|
90,170 |
|
|
State Bank Financial Corp. (a) |
|
|
15,081 |
|
|
227,874 |
|
|
StellarOne Corp. |
|
|
11,084 |
|
|
126,136 |
|
|
Sterling Bancorp |
|
|
15,049 |
|
|
130,023 |
|
|
Sterling Financial Corp. (a) |
|
|
12,809 |
|
|
213,910 |
|
|
Suffolk Bancorp (a) |
|
|
4,831 |
|
|
52,127 |
|
|
Sun Bancorp, Inc. (a) |
|
|
20,014 |
|
|
48,434 |
|
|
Susquehanna Bancshares, Inc. |
|
|
74,447 |
|
|
623,866 |
|
|
SVB Financial Group (a) |
|
|
20,359 |
|
|
970,921 |
|
|
SY Bancorp, Inc. |
|
|
5,896 |
|
|
121,045 |
|
|
Taylor Capital Group, Inc. (a) |
|
|
6,124 |
|
|
59,525 |
|
|
Texas Capital Bancshares, Inc. (a) |
|
|
17,711 |
|
|
542,134 |
|
|
Tompkins Trustco, Inc. |
|
|
3,920 |
|
|
150,959 |
|
|
Tower Bancorp, Inc. |
|
|
5,043 |
|
|
143,927 |
|
|
Towne Bank (b) |
|
|
11,744 |
|
|
143,747 |
|
|
Trico Bancshares |
|
|
6,893 |
|
|
98,018 |
|
|
TrustCo Bank Corp. NY |
|
|
44,783 |
|
|
251,233 |
|
|
Trustmark Corp. |
|
|
30,495 |
|
|
740,724 |
|
|
UMB Financial Corp. |
|
|
15,282 |
|
|
569,255 |
|
|
Umpqua Holdings Corp. |
|
|
54,520 |
|
|
675,503 |
|
|
Union First Market Bankshares Corp. |
|
|
9,809 |
|
|
130,362 |
|
|
United Bankshares, Inc. |
|
|
10,792 |
|
|
305,090 |
|
|
United Community Banks, Inc. (a) |
|
|
19,865 |
|
|
138,856 |
|
|
Univest Corp. of Pennsylvania |
|
|
8,218 |
|
|
120,312 |
|
|
Virginia Commerce Bancorp (a) |
|
|
11,263 |
|
|
87,063 |
|
|
|
|
|
|
|
|
|
|
|
Common Stocks |
|
Shares |
|
Value |
|
||
|
Banks: Diversified (concluded) |
|
|
|
|
|
|
|
|
Washington Banking Co. |
|
|
7,434 |
|
$ |
88,539 |
|
|
Washington Trust Bancorp, Inc. |
|
|
6,889 |
|
|
164,372 |
|
|
Webster Financial Corp. |
|
|
34,235 |
|
|
698,052 |
|
|
WesBanco, Inc. |
|
|
11,135 |
|
|
216,798 |
|
|
West Bancorp., Inc. |
|
|
7,601 |
|
|
72,818 |
|
|
West Coast Bancorp (a) |
|
|
5,344 |
|
|
83,366 |
|
|
Westamerica Bancorp. |
|
|
13,793 |
|
|
605,513 |
|
|
Western Alliance Bancorp (a)(b) |
|
|
33,174 |
|
|
206,674 |
|
|
Wilshire Bancorp, Inc. (a) |
|
|
29,027 |
|
|
105,368 |
|
|
Wintrust Financial Corp. |
|
|
16,620 |
|
|
466,191 |
|
|
|
|
|
|
|
|
33,528,301 |
|
|
Banks: Savings, Thrift & Mortgage Lending — 1.0% |
|
|
|
|
|
|
|
|
Apollo Residential Mortgage, Inc. |
|
|
4,861 |
|
|
74,179 |
|
|
Astoria Financial Corp. |
|
|
41,394 |
|
|
351,435 |
|
|
Bank Mutual Corp. |
|
|
22,470 |
|
|
71,455 |
|
|
BankFinancial Corp. |
|
|
10,632 |
|
|
58,689 |
|
|
Beneficial Mutual Bancorp, Inc. (a)(b) |
|
|
15,917 |
|
|
133,066 |
|
|
Berkshire Hills Bancorp, Inc. |
|
|
9,944 |
|
|
220,657 |
|
|
BofI Holding, Inc. (a) |
|
|
4,297 |
|
|
69,826 |
|
|
Brookline Bancorp, Inc. |
|
|
28,293 |
|
|
238,793 |
|
|
Charter Financial Corp. |
|
|
3,276 |
|
|
30,336 |
|
|
Clifton Savings Bancorp, Inc. |
|
|
4,248 |
|
|
39,421 |
|
|
Dime Community Bancshares, Inc. |
|
|
14,897 |
|
|
187,702 |
|
|
Doral Financial Corp. (a) |
|
|
64,583 |
|
|
61,741 |
|
|
ESB Financial Corp. |
|
|
6,028 |
|
|
84,814 |
|
|
ESSA Bancorp, Inc. |
|
|
5,166 |
|
|
54,088 |
|
|
First Defiance Financial Corp. |
|
|
4,613 |
|
|
67,304 |
|
|
First Financial Holdings, Inc. |
|
|
7,961 |
|
|
71,092 |
|
|
First Pactrust Bancorp, Inc. |
|
|
5,032 |
|
|
51,578 |
|
|
Flagstar BanCorp., Inc. (a) |
|
|
56,611 |
|
|
28,589 |
|
|
Flushing Financial Corp. |
|
|
15,062 |
|
|
190,233 |
|
|
Fox Chase BanCorp., Inc. |
|
|
6,530 |
|
|
82,474 |
|
|
Franklin Financial Corp. (a) |
|
|
6,569 |
|
|
77,777 |
|
|
Great Southern Bancorp, Inc. |
|
|
4,928 |
|
|
116,252 |
|
|
Heritage Financial Corp. |
|
|
7,429 |
|
|
93,308 |
|
|
Home Federal Bancorp, Inc. |
|
|
8,025 |
|
|
83,460 |
|
|
Kearny Financial Corp. |
|
|
6,555 |
|
|
62,273 |
|
|
Northfield Bancorp, Inc. |
|
|
8,225 |
|
|
116,466 |
|
|
Northwest Bancshares, Inc. |
|
|
46,340 |
|
|
576,470 |
|
|
OceanFirst Financial Corp. |
|
|
7,093 |
|
|
92,706 |
|
|
Ocwen Financial Corp. (a) |
|
|
45,602 |
|
|
660,317 |
|
|
OmniAmerican Bancorp, Inc. (a) |
|
|
5,659 |
|
|
88,846 |
|
|
Oritani Financial Corp. |
|
|
21,772 |
|
|
278,028 |
|
|
Provident New York Bancorp |
|
|
18,444 |
|
|
122,468 |
|
|
Territorial BanCorp., Inc. |
|
|
5,258 |
|
|
103,845 |
|
|
United Financial Bancorp, Inc. |
|
|
7,725 |
|
|
124,295 |
|
|
ViewPoint Financial Group |
|
|
16,550 |
|
|
215,315 |
|
|
Westfield Financial, Inc. |
|
|
13,531 |
|
|
99,588 |
|
|
WSFS Financial Corp. |
|
|
3,029 |
|
|
108,923 |
|
|
|
|
|
|
|
|
5,187,809 |
|
|
Beverage: Brewers & Distillers — 0.1% |
|
|
|
|
|
|
|
|
Boston Beer Co., Inc., Class A (a)(b) |
|
|
3,882 |
|
|
421,430 |
|
|
Central European Distribution Corp. (a) |
|
|
34,442 |
|
|
150,684 |
|
|
Craft Brewers Alliance, Inc. (a) |
|
|
4,934 |
|
|
29,702 |
|
|
|
|
|
|
|
|
601,816 |
|
|
Beverage: Soft Drinks — 0.2% |
|
|
|
|
|
|
|
|
Coca-Cola Bottling Co. Consolidated |
|
|
2,141 |
|
|
125,355 |
|
|
Farmer Bros. Co. |
|
|
3,056 |
|
|
23,348 |
|
|
Heckmann Corp. (a) |
|
|
47,562 |
|
|
316,287 |
|
|
|
|
|
|
|
See Notes to Financial Statements. |
|||
|
|
|
|
|
|
|
BLACKROCK SMALL CAP INDEX FUND |
DECEMBER 31, 2011 |
19 |
|
|
|
|
|
|
|
Schedule of Investments (continued) |
Master Small Cap Index Series |
|
|
(Percentages shown are based on Net Assets) |
|
|
|
|
|
|
|
|
|
|
Common Stocks |
|
Shares |
|
Value |
|
||
|
Beverage: Soft Drinks (concluded) |
|
|
|
|
|
|
|
|
National Beverage Corp. |
|
|
5,489 |
|
$ |
88,208 |
|
|
Peet’s Coffee & Tea, Inc. (a) |
|
|
6,073 |
|
|
380,656 |
|
|
Primo Water Corp. (a) |
|
|
7,266 |
|
|
22,089 |
|
|
|
|
|
|
|
|
955,943 |
|
|
Biotechnology — 3.7% |
|
|
|
|
|
|
|
|
Accelrys, Inc. (a) |
|
|
26,249 |
|
|
176,393 |
|
|
Acorda Therapeutics, Inc. (a) |
|
|
18,687 |
|
|
445,498 |
|
|
Aegerion Pharmaceuticals, Inc. (a) |
|
|
4,226 |
|
|
70,743 |
|
|
Affymax, Inc. (a) |
|
|
16,675 |
|
|
110,222 |
|
|
Albany Molecular Research, Inc. (a) |
|
|
9,593 |
|
|
28,107 |
|
|
Alimera Sciences, Inc. (a) |
|
|
5,767 |
|
|
7,209 |
|
|
Alkermes Plc (a)(b) |
|
|
45,193 |
|
|
784,550 |
|
|
Allos Therapeutics, Inc. (a) |
|
|
38,324 |
|
|
54,420 |
|
|
Alnylam Pharmaceuticals, Inc. (a) |
|
|
17,488 |
|
|
142,527 |
|
|
AMAG Pharmaceuticals, Inc. (a) |
|
|
9,994 |
|
|
188,987 |
|
|
Amicus Therapeutics, Inc. (a) |
|
|
8,128 |
|
|
27,960 |
|
|
Anthera Pharmaceuticals, Inc. (a) |
|
|
10,448 |
|
|
64,151 |
|
|
Arena Pharmaceuticals, Inc. (a) |
|
|
68,959 |
|
|
128,953 |
|
|
Ariad Pharmaceuticals, Inc. (a)(b) |
|
|
62,549 |
|
|
766,225 |
|
|
Arqule, Inc. (a) |
|
|
25,347 |
|
|
142,957 |
|
|
Array Biopharma, Inc. (a) |
|
|
27,130 |
|
|
58,601 |
|
|
Astex Pharmaceuticals (a) |
|
|
25,639 |
|
|
48,458 |
|
|
AVEO Pharmaceuticals, Inc. (a) |
|
|
14,826 |
|
|
255,007 |
|
|
AVI BioPharma, Inc. (a) |
|
|
69,690 |
|
|
51,919 |
|
|
BG Medicine, Inc. (a) |
|
|
3,856 |
|
|
18,200 |
|
|
BioMimetic Therapeutics, Inc. (a) |
|
|
9,391 |
|
|
26,764 |
|
|
BioSante Pharmaceuticals, Inc. (a)(b) |
|
|
54,499 |
|
|
27,364 |
|
|
BioTime, Inc. (a) |
|
|
11,732 |
|
|
68,163 |
|
|
Cell Therapeutics, Inc. (a)(b) |
|
|
91,830 |
|
|
106,523 |
|
|
Celldex Therapeutics, Inc. (a) |
|
|
21,027 |
|
|
54,670 |
|
|
Cepheid, Inc. (a)(b) |
|
|
29,269 |
|
|
1,007,146 |
|
|
Chelsea Therapeutics International, Inc. (a) |
|
|
25,436 |
|
|
130,487 |
|
|
Clovis Oncology, Inc. (a) |
|
|
5,322 |
|
|
74,987 |
|
|
Codexis, Inc. (a) |
|
|
11,740 |
|
|
62,222 |
|
|
Complete Genomics, Inc. (a) |
|
|
5,216 |
|
|
15,283 |
|
|
Cornerstone Therapeutics, Inc. (a) |
|
|
3,620 |
|
|
20,272 |
|
|
Cubist Pharmaceuticals, Inc. (a) |
|
|
28,380 |
|
|
1,124,416 |
|
|
Curis, Inc. (a)(b) |
|
|
36,259 |
|
|
169,692 |
|
|
Cytori Therapeutics, Inc. (a) |
|
|
24,751 |
|
|
54,452 |
|
|
Dyax Corp. (a)(b) |
|
|
46,950 |
|
|
63,852 |
|
|
Dynavax Technologies Corp. (a)(b) |
|
|
72,760 |
|
|
241,563 |
|
|
Emergent Biosolutions, Inc. (a) |
|
|
11,533 |
|
|
194,216 |
|
|
Enzo Biochem, Inc. (a) |
|
|
17,475 |
|
|
39,144 |
|
|
Enzon Pharmaceuticals, Inc. (a) |
|
|
17,766 |
|
|
119,032 |
|
|
Exact Sciences Corp. (a) |
|
|
26,799 |
|
|
217,608 |
|
|
Exelixis, Inc. (a) |
|
|
60,653 |
|
|
287,192 |
|
|
Furiex Pharmaceuticals, Inc. (a) |
|
|
4,683 |
|
|
78,253 |
|
|
Genomic Health, Inc. (a) |
|
|
8,029 |
|
|
203,856 |
|
|
Geron Corp. (a) |
|
|
61,464 |
|
|
90,967 |
|
|
GTx, Inc. (a) |
|
|
10,826 |
|
|
36,375 |
|
|
Halozyme Therapeutics, Inc. (a) |
|
|
38,938 |
|
|
370,300 |
|
|
Harvard Bioscience, Inc. (a) |
|
|
11,322 |
|
|
43,816 |
|
|
Horizon Pharma, Inc. (a) |
|
|
1,874 |
|
|
7,496 |
|
|
Idenix Pharmaceuticals, Inc. (a) |
|
|
28,561 |
|
|
212,637 |
|
|
ImmunoGen, Inc. (a) |
|
|
35,631 |
|
|
412,607 |
|
|
Immunomedics, Inc. (a) |
|
|
31,017 |
|
|
103,287 |
|
|
Incyte Corp. (a)(b) |
|
|
41,877 |
|
|
628,574 |
|
|
Inhibitex, Inc. (a) |
|
|
30,148 |
|
|
329,819 |
|
|
Insmed, Inc. (a) |
|
|
11,122 |
|
|
33,922 |
|
|
InterMune, Inc. (a) |
|
|
25,649 |
|
|
323,177 |
|
|
|
|
|
|
|
|
|
|
|
Common Stocks |
|
Shares |
|
Value |
|
||
|
Biotechnology (concluded) |
|
|
|
|
|
|
|
|
Kensey Nash Corp. (b) |
|
|
3,937 |
|
$ |
75,551 |
|
|
Keryx Biopharmaceuticals, Inc. (a) |
|
|
32,268 |
|
|
81,638 |
|
|
Lexicon Genetics, Inc. (a) |
|
|
80,559 |
|
|
103,921 |
|
|
Ligand Pharmaceuticals, Inc. (a) |
|
|
9,305 |
|
|
110,450 |
|
|
MannKind Corp. (a)(b) |
|
|
36,643 |
|
|
91,607 |
|
|
Maxygen, Inc. (a) |
|
|
13,547 |
|
|
76,270 |
|
|
Medivation, Inc. (a) |
|
|
14,841 |
|
|
684,319 |
|
|
Metabolix, Inc. (a) |
|
|
15,941 |
|
|
72,532 |
|
|
Micromet, Inc. (a) |
|
|
43,432 |
|
|
312,276 |
|
|
Momenta Pharmaceuticals, Inc. (a) |
|
|
21,877 |
|
|
380,441 |
|
|
Nabi Biopharmaceuticals (a) |
|
|
19,002 |
|
|
35,724 |
|
|
Nektar Therapeutics (a) |
|
|
54,138 |
|
|
302,902 |
|
|
Neurocrine Biosciences, Inc. (a) |
|
|
23,366 |
|
|
198,611 |
|
|
Novavax, Inc. (a) |
|
|
45,860 |
|
|
57,784 |
|
|
NPS Pharmaceuticals, Inc. (a) |
|
|
40,749 |
|
|
268,536 |
|
|
Nymox Pharmaceutical Corp. (a) |
|
|
9,022 |
|
|
74,161 |
|
|
OncoGenex Pharmaceutical, Inc. (a) |
|
|
4,607 |
|
|
54,086 |
|
|
Oncothyreon, Inc. (a) |
|
|
19,722 |
|
|
149,493 |
|
|
Onyx Pharmaceuticals, Inc. (a) |
|
|
30,009 |
|
|
1,318,896 |
|
|
Opko Health, Inc. (a) |
|
|
51,573 |
|
|
252,708 |
|
|
Orexigen Therapeutics, Inc. (a) |
|
|
15,819 |
|
|
25,469 |
|
|
Osiris Therapeutics, Inc. (a) |
|
|
8,201 |
|
|
43,875 |
|
|
Pacific Biosciences of California, Inc. (a) |
|
|
15,866 |
|
|
44,425 |
|
|
PDL BioPharma, Inc. |
|
|
66,353 |
|
|
411,389 |
|
|
Peregrine Pharmaceuticals, Inc. (a)(b) |
|
|
38,877 |
|
|
40,043 |
|
|
PharmAthene, Inc. (a)(b) |
|
|
18,525 |
|
|
23,527 |
|
|
Progenics Pharmaceuticals, Inc. (a)(b) |
|
|
13,911 |
|
|
118,800 |
|
|
Raptor Pharmaceutical Corp. (a) |
|
|
22,335 |
|
|
139,817 |
|
|
Rigel Pharmaceuticals, Inc. (a) |
|
|
32,599 |
|
|
257,206 |
|
|
RTI Biologics, Inc. (a) |
|
|
26,166 |
|
|
116,177 |
|
|
Sangamo Biosciences, Inc. (a) |
|
|
24,948 |
|
|
70,852 |
|
|
Savient Pharmaceuticals, Inc. (a) |
|
|
33,443 |
|
|
74,578 |
|
|
Seattle Genetics, Inc. (a) |
|
|
45,691 |
|
|
763,725 |
|
|
Sequenom, Inc. (a) |
|
|
46,918 |
|
|
208,785 |
|
|
Sucampo Pharmaceuticals, Inc., Class A (a) |
|
|
5,721 |
|
|
25,344 |
|
|
Sunesis Pharmaceuticals, Inc. (a) |
|
|
15,250 |
|
|
17,842 |
|
|
Synta Pharmaceuticals Corp. (a) |
|
|
10,853 |
|
|
50,684 |
|
|
Targacept, Inc. (a) |
|
|
12,893 |
|
|
71,814 |
|
|
Theravance, Inc. (a) |
|
|
32,665 |
|
|
721,896 |
|
|
Transcept Pharmaceuticals, Inc. (a)(b) |
|
|
2,688 |
|
|
21,047 |
|
|
Trius Therapeutics, Inc. (a) |
|
|
3,551 |
|
|
25,390 |
|
|
Vanda Pharmaceuticals, Inc. (a) |
|
|
13,196 |
|
|
62,813 |
|
|
ViroPharma, Inc. (a) |
|
|
33,516 |
|
|
918,003 |
|
|
Zalicus, Inc. (a)(b) |
|
|
35,119 |
|
|
42,494 |
|
|
ZIOPHARM Oncology, Inc. (a) |
|
|
27,753 |
|
|
122,391 |
|
|
|
|
|
|
|
|
19,671,513 |
|
|
Building Materials — 0.9% |
|
|
|
|
|
|
|
|
Acuity Brands, Inc. |
|
|
20,537 |
|
|
1,088,461 |
|
|
Builders FirstSource, Inc. (a) |
|
|
21,372 |
|
|
43,599 |
|
|
Gibraltar Industries, Inc. (a) |
|
|
14,402 |
|
|
201,052 |
|
|
Griffon Corp. |
|
|
22,622 |
|
|
206,539 |
|
|
Headwaters, Inc. (a) |
|
|
28,990 |
|
|
64,358 |
|
|
Louisiana-Pacific Corp. (a) |
|
|
62,589 |
|
|
505,093 |
|
|
LSI Industries, Inc. |
|
|
9,040 |
|
|
54,240 |
|
|
NCI Building Systems, Inc. (a) |
|
|
9,238 |
|
|
100,417 |
|
|
Quanex Building Products Corp. |
|
|
18,027 |
|
|
270,766 |
|
|
Simpson Manufacturing Co., Inc. |
|
|
19,715 |
|
|
663,607 |
|
|
Texas Industries, Inc. |
|
|
10,790 |
|
|
332,116 |
|
|
Trex Co., Inc. (a) |
|
|
7,373 |
|
|
168,915 |
|
|
Watsco, Inc. |
|
|
13,315 |
|
|
874,263 |
|
|
|
|
|
|
|
|
4,573,426 |
|
|
|
|
|
|
See Notes to Financial Statements. |
||
|
|
|
|
|
20 |
BLACKROCK SMALL CAP INDEX FUND |
DECEMBER 31, 2011 |
|
|
|
|
|
|
|
Schedule of Investments (continued) |
Master Small Cap Index Series |
|
|
(Percentages shown are based on Net Assets) |
|
|
|
|
|
|
|
|
|
|
Common Stocks |
|
Shares |
|
Value |
|
||
|
Building: Climate Control — 0.1% |
|
|
|
|
|
|
|
|
Aaon, Inc. |
|
|
8,936 |
|
$ |
183,099 |
|
|
Comfort Systems USA, Inc. |
|
|
18,097 |
|
|
194,000 |
|
|
Interline Brands, Inc. (a) |
|
|
15,794 |
|
|
245,912 |
|
|
|
|
|
|
|
|
623,011 |
|
|
Building: Roofing, Wallboard & Plumbing — 0.1% |
|
|
|
|
|
|
|
|
Beacon Roofing Supply, Inc. (a) |
|
|
21,793 |
|
|
440,872 |
|
|
USG Corp. (a) |
|
|
33,848 |
|
|
343,896 |
|
|
|
|
|
|
|
|
784,768 |
|
|
Cable Television Services — 0.0% |
|
|
|
|
|
|
|
|
Knology, Inc. (a) |
|
|
14,221 |
|
|
201,938 |
|
|
Casinos & Gambling — 0.3% |
|
|
|
|
|
|
|
|
Ameristar Casinos, Inc. |
|
|
15,206 |
|
|
262,912 |
|
|
Boyd Gaming Corp. (a) |
|
|
25,912 |
|
|
193,303 |
|
|
Isle of Capri Casinos, Inc. (a) |
|
|
9,331 |
|
|
43,576 |
|
|
Monarch Casino & Resort, Inc. (a) |
|
|
4,275 |
|
|
43,562 |
|
|
Multimedia Games Holding Co., Inc. (a) |
|
|
12,816 |
|
|
101,759 |
|
|
Pinnacle Entertainment, Inc. (a)(b) |
|
|
29,308 |
|
|
297,769 |
|
|
Scientific Games Corp., Class A (a) |
|
|
27,561 |
|
|
267,342 |
|
|
Shuffle Master, Inc. (a) |
|
|
25,648 |
|
|
300,595 |
|
|
|
|
|
|
|
|
1,510,818 |
|
|
Cement — 0.1% |
|
|
|
|
|
|
|
|
Eagle Materials, Inc. |
|
|
21,110 |
|
|
541,683 |
|
|
Chemicals: Diversified — 0.9% |
|
|
|
|
|
|
|
|
Aceto Corp. |
|
|
12,685 |
|
|
87,527 |
|
|
American Vanguard Corp. |
|
|
10,585 |
|
|
141,204 |
|
|
Chemtura Corp. (a) |
|
|
45,627 |
|
|
517,410 |
|
|
Georgia Gulf Corp. (a) |
|
|
16,099 |
|
|
313,770 |
|
|
Hawkins, Inc. |
|
|
4,122 |
|
|
151,937 |
|
|
Innophos Holdings, Inc. |
|
|
10,284 |
|
|
499,391 |
|
|
KMG Chemicals, Inc. |
|
|
3,276 |
|
|
56,577 |
|
|
Landec Corp. (a) |
|
|
12,333 |
|
|
68,078 |
|
|
LSB Industries, Inc. (a) |
|
|
8,711 |
|
|
244,169 |
|
|
Olin Corp. |
|
|
37,781 |
|
|
742,397 |
|
|
OM Group, Inc. (a) |
|
|
14,683 |
|
|
328,752 |
|
|
Omnova Solutions, Inc. (a) |
|
|
21,063 |
|
|
97,100 |
|
|
PolyOne Corp. |
|
|
44,255 |
|
|
511,145 |
|
|
Sensient Technologies Corp. |
|
|
23,737 |
|
|
899,632 |
|
|
TPC Group, Inc. (a)(b) |
|
|
6,280 |
|
|
146,512 |
|
|
|
|
|
|
|
|
4,805,601 |
|
|
Chemicals: Specialty — 0.6% |
|
|
|
|
|
|
|
|
Balchem Corp. |
|
|
13,657 |
|
|
553,655 |
|
|
Calgon Carbon Corp. (a)(b) |
|
|
26,748 |
|
|
420,211 |
|
|
FutureFuel Corp. |
|
|
8,898 |
|
|
110,513 |
|
|
Innospec, Inc. (a) |
|
|
11,252 |
|
|
315,844 |
|
|
Kraton Performance Polymers, Inc. (a) |
|
|
15,128 |
|
|
307,098 |
|
|
NewMarket Corp. |
|
|
4,269 |
|
|
845,731 |
|
|
Quaker Chemical Corp. |
|
|
6,093 |
|
|
236,957 |
|
|
Senomyx, Inc. (a) |
|
|
18,904 |
|
|
65,786 |
|
|
Stepan Co. |
|
|
3,833 |
|
|
307,253 |
|
|
Zep, Inc. |
|
|
10,420 |
|
|
145,672 |
|
|
|
|
|
|
|
|
3,308,720 |
|
|
|
|
|
|
|
|
|
|
|
Common Stocks |
|
Shares |
|
Value |
|
||
|
Coal — 0.2% |
|
|
|
|
|
|
|
|
Cloud Peak Energy, Inc. (a) |
|
|
28,842 |
|
$ |
557,227 |
|
|
Hallador Energy Co. |
|
|
1,890 |
|
|
18,768 |
|
|
James River Coal Co. (a) |
|
|
16,850 |
|
|
116,602 |
|
|
KiOR, Inc. (a)(b) |
|
|
5,344 |
|
|
54,402 |
|
|
L&L Energy, Inc. (a) |
|
|
10,867 |
|
|
28,145 |
|
|
Patriot Coal Corp. (a) |
|
|
43,300 |
|
|
366,751 |
|
|
Westmoreland Coal Co. (a) |
|
|
4,597 |
|
|
58,612 |
|
|
|
|
|
|
|
|
1,200,507 |
|
|
Commercial Finance & Mortgage Companies — 0.1% |
|
|
|
|
|
|
|
|
Federal Agricultural Mortgage Corp., Class B |
|
|
4,712 |
|
|
84,910 |
|
|
Medallion Financial Corp. |
|
|
7,296 |
|
|
83,028 |
|
|
NewStar Financial, Inc. (a) |
|
|
13,163 |
|
|
133,868 |
|
|
Walker & Dunlop, Inc. (a) |
|
|
5,217 |
|
|
65,526 |
|
|
|
|
|
|
|
|
367,332 |
|
|
Commercial Services: Rental & Leasing — 0.7% |
|
|
|
|
|
|
|
|
Aircastle Ltd. |
|
|
26,032 |
|
|
331,127 |
|
|
CAI International, Inc. (a) |
|
|
5,751 |
|
|
88,910 |
|
|
Electro Rent Corp. |
|
|
8,960 |
|
|
153,664 |
|
|
Essex Rental Corp. (a) |
|
|
8,437 |
|
|
24,889 |
|
|
H&E Equipment Services, Inc. (a) |
|
|
13,595 |
|
|
182,445 |
|
|
Marlin Business Services, Inc. |
|
|
4,181 |
|
|
53,099 |
|
|
McGrath RentCorp |
|
|
11,539 |
|
|
334,516 |
|
|
Mobile Mini, Inc. (a) |
|
|
17,414 |
|
|
303,874 |
|
|
PHH Corp. (a) |
|
|
26,657 |
|
|
285,230 |
|
|
RSC Holdings, Inc. (a) |
|
|
32,099 |
|
|
593,831 |
|
|
SeaCube Container Leasing Ltd. |
|
|
5,201 |
|
|
77,027 |
|
|
TAL International Group, Inc. |
|
|
10,420 |
|
|
299,992 |
|
|
United Rentals, Inc. (a) |
|
|
29,605 |
|
|
874,828 |
|
|
|
|
|
|
|
|
3,603,432 |
|
|
Commercial Vehicles & Parts — 0.2% |
|
|
|
|
|
|
|
|
Accuride Corp. (a) |
|
|
19,181 |
|
|
136,569 |
|
|
Commercial Vehicle Group, Inc. (a) |
|
|
13,680 |
|
|
123,667 |
|
|
Miller Industries, Inc. |
|
|
5,264 |
|
|
82,803 |
|
|
Modine Manufacturing Co. (a) |
|
|
22,091 |
|
|
208,981 |
|
|
Rush Enterprises, Inc., Class A (a)(b) |
|
|
15,350 |
|
|
321,122 |
|
|
Spartan Motors, Inc. |
|
|
15,902 |
|
|
76,488 |
|
|
Wabash National Corp. (a) |
|
|
32,495 |
|
|
254,761 |
|
|
|
|
|
|
|
|
1,204,391 |
|
|
Communications Technology — 2.3% |
|
|
|
|
|
|
|
|
AboveNet, Inc. (a) |
|
|
10,997 |
|
|
714,915 |
|
|
Adtran, Inc. |
|
|
30,645 |
|
|
924,253 |
|
|
Anaren, Inc. (a) |
|
|
7,125 |
|
|
118,418 |
|
|
Anixter International, Inc. (a) |
|
|
13,734 |
|
|
819,096 |
|
|
Aruba Networks, Inc. (a) |
|
|
40,444 |
|
|
749,023 |
|
|
Aviat Networks, Inc. (a) |
|
|
28,869 |
|
|
52,830 |
|
|
Bel Fuse, Inc. |
|
|
4,981 |
|
|
93,394 |
|
|
Black Box Corp. |
|
|
8,535 |
|
|
239,321 |
|
|
Calix, Inc. (a) |
|
|
17,910 |
|
|
115,878 |
|
|
Comtech Telecommunications Corp. |
|
|
9,616 |
|
|
275,210 |
|
|
Dialogic, Inc. (a) |
|
|
7,985 |
|
|
9,582 |
|
|
Digi International, Inc. (a)(b) |
|
|
12,034 |
|
|
134,299 |
|
|
DigitalGlobe, Inc. (a)(b) |
|
|
16,707 |
|
|
285,857 |
|
|
Echelon Corp. (a) |
|
|
16,496 |
|
|
80,336 |
|
|
Emulex Corp. (a) |
|
|
41,653 |
|
|
285,740 |
|
|
Extreme Networks, Inc. (a) |
|
|
43,809 |
|
|
127,922 |
|
|
Finisar Corp. (a) |
|
|
42,470 |
|
|
711,160 |
|
|
GeoEye, Inc. (a) |
|
|
10,462 |
|
|
232,466 |
|
|
Globecomm Systems, Inc. (a) |
|
|
10,616 |
|
|
145,227 |
|
|
|
|
|
|
|
See Notes to Financial Statements. |
|||
|
|
|
|
|
|
|
BLACKROCK SMALL CAP INDEX FUND |
DECEMBER 31, 2011 |
21 |
|
|
|
|
|
|
|
Schedule of Investments (continued) |
Master Small Cap Index Series |
|
(Percentages shown are based on Net Assets) |
|
|
|
|
|
|
|
|
|
|
Common Stocks |
|
Shares |
|
Value |
|
||
|
Communications Technology (concluded) |
|
|
|
|
|
|
|
|
GSI Technology, Inc. (a) |
|
|
10,035 |
|
$ |
46,964 |
|
|
Harmonic, Inc. (a) |
|
|
54,502 |
|
|
274,690 |
|
|
Infinera Corp. (a) |
|
|
49,540 |
|
|
311,111 |
|
|
InterDigital, Inc. |
|
|
21,483 |
|
|
936,014 |
|
|
Ixia (a)(b) |
|
|
18,338 |
|
|
192,732 |
|
|
KVH Industries, Inc. (a) |
|
|
6,918 |
|
|
53,822 |
|
|
Loral Space & Communications Ltd. (a) |
|
|
5,155 |
|
|
334,456 |
|
|
Meru Networks, Inc. (a) |
|
|
5,640 |
|
|
23,293 |
|
|
NeoPhotonics Corp. (a) |
|
|
4,439 |
|
|
20,331 |
|
|
NETGEAR, Inc. (a) |
|
|
17,357 |
|
|
582,675 |
|
|
Novatel Wireless, Inc. (a) |
|
|
14,979 |
|
|
46,884 |
|
|
Numerex Corp. (a) |
|
|
4,487 |
|
|
36,928 |
|
|
Oclaro, Inc. (a) |
|
|
23,691 |
|
|
66,809 |
|
|
Oplink Communications, Inc. (a) |
|
|
9,252 |
|
|
152,380 |
|
|
Plantronics, Inc. |
|
|
20,611 |
|
|
734,576 |
|
|
Procera Networks, Inc. (a) |
|
|
6,820 |
|
|
106,256 |
|
|
SeaChange International, Inc. (a) |
|
|
12,532 |
|
|
88,100 |
|
|
Shoretel, Inc. (a) |
|
|
22,395 |
|
|
142,880 |
|
|
Sonus Networks, Inc. (a) |
|
|
100,190 |
|
|
240,456 |
|
|
Sycamore Networks, Inc. (a) |
|
|
9,507 |
|
|
170,175 |
|
|
Tekelec (a)(b) |
|
|
29,249 |
|
|
319,692 |
|
|
TeleNav, Inc. (a) |
|
|
7,552 |
|
|
58,981 |
|
|
Viasat, Inc. (a) |
|
|
17,177 |
|
|
792,203 |
|
|
Westell Technologies, Inc., Class A (a) |
|
|
26,028 |
|
|
57,782 |
|
|
|
|
|
|
|
|
11,905,117 |
|
|
Computer Services Software & Systems — 6.1% |
|
|
|
|
|
|
|
|
ACI Worldwide, Inc. (a)(c) |
|
|
15,817 |
|
|
452,999 |
|
|
The Active Network, Inc. (a) |
|
|
5,703 |
|
|
77,561 |
|
|
Actuate Corp. (a) |
|
|
18,315 |
|
|
107,326 |
|
|
Acxiom Corp. (a) |
|
|
38,502 |
|
|
470,109 |
|
|
American Reprographics Co. (a) |
|
|
17,682 |
|
|
81,160 |
|
|
American Software, Inc., Class A |
|
|
10,828 |
|
|
102,325 |
|
|
Aspen Technology, Inc. (a)(b) |
|
|
40,063 |
|
|
695,093 |
|
|
Avid Technology, Inc. (a)(b) |
|
|
14,055 |
|
|
119,889 |
|
|
Bankrate, Inc. (a) |
|
|
10,872 |
|
|
233,748 |
|
|
Blackbaud, Inc. |
|
|
21,106 |
|
|
584,636 |
|
|
Blue Coat Systems, Inc. (a) |
|
|
20,622 |
|
|
524,830 |
|
|
Bottomline Technologies, Inc. (a) |
|
|
17,015 |
|
|
394,238 |
|
|
BroadSoft, Inc. (a) |
|
|
10,685 |
|
|
322,687 |
|
|
CACI International, Inc., Class A (a) |
|
|
12,476 |
|
|
697,658 |
|
|
Callidus Software, Inc. (a) |
|
|
14,234 |
|
|
91,382 |
|
|
Ciber, Inc. (a)(b) |
|
|
30,256 |
|
|
116,788 |
|
|
CommVault Systems, Inc. (a) |
|
|
20,857 |
|
|
891,011 |
|
|
Computer Task Group, Inc. (a) |
|
|
7,187 |
|
|
101,193 |
|
|
ComScore, Inc. (a) |
|
|
15,107 |
|
|
320,268 |
|
|
Concur Technologies, Inc. (a) |
|
|
21,148 |
|
|
1,074,107 |
|
|
Convio, Inc. (a) |
|
|
5,542 |
|
|
61,295 |
|
|
Cornerstone OnDemand, Inc. (a) |
|
|
5,360 |
|
|
97,766 |
|
|
CSG Systems International, Inc. (a) |
|
|
16,392 |
|
|
241,126 |
|
|
DealerTrack Holdings, Inc. (a)(b) |
|
|
19,483 |
|
|
531,107 |
|
|
Deltek, Inc. (a)(b) |
|
|
10,549 |
|
|
103,591 |
|
|
Demand Media, Inc. (a) |
|
|
4,024 |
|
|
26,760 |
|
|
DemandTec, Inc. (a) |
|
|
15,307 |
|
|
201,593 |
|
|
Digimarc Corp. (a) |
|
|
2,939 |
|
|
70,213 |
|
|
Digital River, Inc. (a) |
|
|
17,682 |
|
|
265,584 |
|
|
DynaVox, Inc., Class A (a) |
|
|
4,834 |
|
|
17,596 |
|
|
EarthLink, Inc. |
|
|
52,039 |
|
|
335,131 |
|
|
Ebix, Inc. |
|
|
13,662 |
|
|
301,930 |
|
|
Envestnet, Inc. (a) |
|
|
9,172 |
|
|
109,697 |
|
|
EPIQ Systems, Inc. |
|
|
14,859 |
|
|
178,605 |
|
|
|
|
|
|
|
|
|
|
|
Common Stocks |
|
Shares |
|
Value |
|
||
|
Computer
Services Software & Systems |
|
|
|
|
|
|
|
|
ePlus, Inc. (a) |
|
|
1,831 |
|
$ |
51,781 |
|
|
FalconStor Software, Inc. (a) |
|
|
14,017 |
|
|
36,164 |
|
|
FriendFinder Networks, Inc. (a) |
|
|
3,035 |
|
|
2,276 |
|
|
Guidance Software, Inc. (a) |
|
|
6,830 |
|
|
44,258 |
|
|
ICG Group, Inc. (a) |
|
|
17,563 |
|
|
135,586 |
|
|
iGate Corp. (a) |
|
|
14,715 |
|
|
231,467 |
|
|
Imperva, Inc. (a) |
|
|
2,735 |
|
|
95,205 |
|
|
Infospace, Inc. (a) |
|
|
18,547 |
|
|
203,832 |
|
|
Interactive Intelligence Group, Inc. (a)(b) |
|
|
6,757 |
|
|
154,870 |
|
|
Internap Network Services Corp. (a) |
|
|
24,809 |
|
|
147,365 |
|
|
IntraLinks Holdings, Inc. (a) |
|
|
15,188 |
|
|
94,773 |
|
|
JDA Software Group, Inc. (a) |
|
|
20,039 |
|
|
649,063 |
|
|
Kenexa Corp. (a) |
|
|
12,527 |
|
|
334,471 |
|
|
Keynote Systems, Inc. |
|
|
6,942 |
|
|
142,589 |
|
|
The KEYW Holding Corp. (a) |
|
|
8,656 |
|
|
64,054 |
|
|
KIT Digital, Inc. (a)(b) |
|
|
18,191 |
|
|
153,714 |
|
|
Limelight Networks, Inc. (a) |
|
|
32,208 |
|
|
95,336 |
|
|
Lionbridge Technologies, Inc. (a) |
|
|
29,524 |
|
|
67,610 |
|
|
LivePerson, Inc. (a) |
|
|
24,920 |
|
|
312,746 |
|
|
LogMeIn, Inc. (a) |
|
|
9,635 |
|
|
371,429 |
|
|
Magma Design Automation, Inc. (a) |
|
|
31,676 |
|
|
227,434 |
|
|
Manhattan Associates, Inc. (a) |
|
|
9,674 |
|
|
391,604 |
|
|
Mantech International Corp., Class A |
|
|
11,024 |
|
|
344,390 |
|
|
Mentor Graphics Corp. (a) |
|
|
45,617 |
|
|
618,567 |
|
|
Mercury Computer Systems, Inc. (a) |
|
|
14,333 |
|
|
190,486 |
|
|
MicroStrategy, Inc., Class A (a) |
|
|
3,783 |
|
|
409,775 |
|
|
Moduslink Global Solutions, Inc. |
|
|
20,698 |
|
|
111,769 |
|
|
Monotype Imaging Holdings, Inc. (a)(b) |
|
|
16,949 |
|
|
264,235 |
|
|
Motricity, Inc. (a) |
|
|
19,184 |
|
|
17,266 |
|
|
NCI, Inc., Class A (a) |
|
|
3,213 |
|
|
37,431 |
|
|
NetScout Systems, Inc. (a) |
|
|
17,728 |
|
|
312,013 |
|
|
NetSuite, Inc. (a) |
|
|
12,895 |
|
|
522,892 |
|
|
NIC, Inc. |
|
|
30,289 |
|
|
403,147 |
|
|
OpenTable, Inc. (a)(b) |
|
|
11,141 |
|
|
435,947 |
|
|
Openwave Systems, Inc. (a) |
|
|
40,665 |
|
|
64,251 |
|
|
Opnet Technologies, Inc. |
|
|
6,825 |
|
|
250,273 |
|
|
Parametric Technology Corp. (a) |
|
|
56,455 |
|
|
1,030,868 |
|
|
PDF Solutions, Inc. (a) |
|
|
11,144 |
|
|
77,674 |
|
|
Pegasystems, Inc. |
|
|
7,875 |
|
|
231,525 |
|
|
Perficient, Inc. (a)(b) |
|
|
11,480 |
|
|
114,915 |
|
|
Progress Software Corp. (a) |
|
|
31,765 |
|
|
614,653 |
|
|
PROS Holdings, Inc. (a) |
|
|
10,219 |
|
|
152,059 |
|
|
QAD, Inc. (a) |
|
|
3,165 |
|
|
33,232 |
|
|
QLIK Technologies, Inc. (a) |
|
|
33,352 |
|
|
807,118 |
|
|
Quepasa Corp. (a)(b) |
|
|
3,821 |
|
|
12,686 |
|
|
Quest Software, Inc. (a) |
|
|
26,894 |
|
|
500,228 |
|
|
RealNetworks, Inc. |
|
|
9,829 |
|
|
73,717 |
|
|
RealPage, Inc. (a) |
|
|
14,370 |
|
|
363,130 |
|
|
Responsys, Inc. (a) |
|
|
4,229 |
|
|
37,596 |
|
|
RightNow Technologies, Inc. (a) |
|
|
11,662 |
|
|
498,317 |
|
|
Saba Software, Inc. (a) |
|
|
13,390 |
|
|
105,647 |
|
|
Sapient Corp. |
|
|
51,795 |
|
|
652,617 |
|
|
SciQuest, Inc. (a) |
|
|
5,946 |
|
|
84,849 |
|
|
Smith Micro Software, Inc. (a) |
|
|
18,591 |
|
|
21,008 |
|
|
SolarWinds, Inc. (a) |
|
|
26,986 |
|
|
754,259 |
|
|
Sourcefire, Inc. (a) |
|
|
13,459 |
|
|
435,802 |
|
|
SPS Commerce, Inc. (a) |
|
|
3,980 |
|
|
103,281 |
|
|
SS&C Technologies Holdings, Inc. (a)(b) |
|
|
11,931 |
|
|
215,474 |
|
|
SuccessFactors, Inc. (a) |
|
|
39,517 |
|
|
1,575,543 |
|
|
Support.com, Inc. (a) |
|
|
22,615 |
|
|
50,884 |
|
|
Synchronoss Technologies, Inc. (a) |
|
|
12,524 |
|
|
378,350 |
|
|
|
|
|
|
See Notes to Financial Statements. |
||
|
|
|
|
|
22 |
BLACKROCK SMALL CAP INDEX FUND |
DECEMBER 31, 2011 |
|
|
|
|
|
|
|
Schedule of Investments (continued) |
Master Small Cap Index Series |
|
(Percentages shown are based on Net Assets) |
|
|
|
|
|
|
|
|
|
|
Common Stocks |
|
Shares |
|
Value |
|
||
|
Computer
Services Software & Systems |
|
|
|
|
|
|
|
|
SYNNEX Corp. (a) |
|
|
11,869 |
|
$ |
361,530 |
|
|
Syntel, Inc. |
|
|
7,305 |
|
|
341,655 |
|
|
Taleo Corp., Class A (a) |
|
|
19,450 |
|
|
752,520 |
|
|
Tangoe, Inc. (a) |
|
|
4,772 |
|
|
73,489 |
|
|
TechTarget, Inc. (a) |
|
|
7,257 |
|
|
42,381 |
|
|
TeleCommunication Systems, Inc., Class A (a) |
|
|
21,452 |
|
|
50,412 |
|
|
TNS, Inc. (a)(b) |
|
|
12,035 |
|
|
213,260 |
|
|
Tyler Technologies, Inc. (a) |
|
|
14,063 |
|
|
423,437 |
|
|
Ultimate Software Group, Inc. (a) |
|
|
12,234 |
|
|
796,678 |
|
|
Unisys Corp. (a) |
|
|
20,420 |
|
|
402,478 |
|
|
United Online, Inc. |
|
|
42,036 |
|
|
228,676 |
|
|
VASCO Data Security International, Inc. (a) |
|
|
12,601 |
|
|
82,159 |
|
|
Verint Systems, Inc. (a) |
|
|
10,021 |
|
|
275,978 |
|
|
VirnetX Holding Corp. (a)(b) |
|
|
19,300 |
|
|
481,921 |
|
|
Virtusa Corp. (a) |
|
|
7,196 |
|
|
104,198 |
|
|
Wave Systems Corp., Class A (a) |
|
|
38,544 |
|
|
83,640 |
|
|
Web.Com Group, Inc. (a) |
|
|
13,766 |
|
|
157,621 |
|
|
Websense, Inc. (a) |
|
|
18,929 |
|
|
354,540 |
|
|
Zillow, Inc. (a)(b) |
|
|
1,856 |
|
|
41,723 |
|
|
Zix Corp. (a) |
|
|
31,609 |
|
|
89,137 |
|
|
|
|
|
|
|
|
32,273,936 |
|
|
Computer Technology — 0.6% |
|
|
|
|
|
|
|
|
Cray, Inc. (a) |
|
|
17,225 |
|
|
111,446 |
|
|
Dot Hill Systems Corp. (a) |
|
|
28,725 |
|
|
38,204 |
|
|
Dynamics Research Corp. (a) |
|
|
4,341 |
|
|
49,227 |
|
|
Identive Group, Inc. (a) |
|
|
17,865 |
|
|
39,839 |
|
|
Imation Corp. (a) |
|
|
14,003 |
|
|
80,237 |
|
|
Immersion Corp. (a) |
|
|
13,595 |
|
|
70,422 |
|
|
Insight Enterprises, Inc. (a) |
|
|
20,783 |
|
|
317,772 |
|
|
Intermec, Inc. (a) |
|
|
28,245 |
|
|
193,761 |
|
|
OCZ Technology Group, Inc. (a)(b) |
|
|
24,417 |
|
|
161,396 |
|
|
PC Connection, Inc. |
|
|
4,240 |
|
|
47,022 |
|
|
Quantum Corp. (a)(b) |
|
|
107,063 |
|
|
256,951 |
|
|
Radisys Corp. (a) |
|
|
9,084 |
|
|
45,965 |
|
|
Rimage Corp. |
|
|
4,334 |
|
|
48,758 |
|
|
Safeguard Scientifics, Inc. (a) |
|
|
9,786 |
|
|
154,521 |
|
|
Silicon Graphics International Corp. (a) |
|
|
14,717 |
|
|
168,657 |
|
|
STEC, Inc. (a) |
|
|
17,477 |
|
|
150,127 |
|
|
Stratasys, Inc. (a) |
|
|
10,039 |
|
|
305,286 |
|
|
Super Micro Computer, Inc. (a)(b) |
|
|
12,754 |
|
|
199,983 |
|
|
Synaptics, Inc. (a) |
|
|
15,242 |
|
|
459,546 |
|
|
Xyratex Ltd. |
|
|
13,453 |
|
|
179,194 |
|
|
|
|
|
|
|
|
3,078,314 |
|
|
Construction — 0.4% |
|
|
|
|
|
|
|
|
Aegion Corp. (a) |
|
|
18,778 |
|
|
288,055 |
|
|
EMCOR Group, Inc. |
|
|
31,693 |
|
|
849,689 |
|
|
Granite Construction, Inc. |
|
|
18,340 |
|
|
435,025 |
|
|
Great Lakes Dredge & Dock Corp. |
|
|
28,057 |
|
|
155,997 |
|
|
Orion Marine Group, Inc. (a) |
|
|
12,922 |
|
|
85,931 |
|
|
Primoris Services Corp. |
|
|
12,693 |
|
|
189,506 |
|
|
Sterling Construction Co., Inc. (a) |
|
|
7,801 |
|
|
84,017 |
|
|
Tutor Perini Corp. (a) |
|
|
14,835 |
|
|
183,064 |
|
|
|
|
|
|
|
|
2,271,284 |
|
|
Consumer Electronics — 0.2% |
|
|
|
|
|
|
|
|
RealD, Inc. (a) |
|
|
19,562 |
|
|
155,322 |
|
|
Skullcandy, Inc. (a)(b) |
|
|
4,396 |
|
|
55,038 |
|
|
TiVo, Inc. (a)(b) |
|
|
56,430 |
|
|
506,177 |
|
|
Universal Electronics, Inc. (a)(b) |
|
|
7,133 |
|
|
120,334 |
|
|
|
|
|
|
|
|
|
|
|
Common Stocks |
|
Shares |
|
Value |
|
||
|
Consumer Electronics (concluded) |
|
|
|
|
|
|
|
|
VOXX International Corp. (a) |
|
|
8,683 |
|
$ |
73,371 |
|
|
XO Group, Inc. (a) |
|
|
13,531 |
|
|
112,849 |
|
|
Zagg, Inc. (a)(b) |
|
|
10,337 |
|
|
73,083 |
|
|
|
|
|
|
|
|
1,096,174 |
|
|
Consumer Lending — 0.8% |
|
|
|
|
|
|
|
|
Advance America, Cash Advance Centers, Inc. |
|
|
26,449 |
|
|
236,719 |
|
|
Cash America International, Inc. |
|
|
13,996 |
|
|
652,633 |
|
|
Credit Acceptance Corp. (a) |
|
|
3,203 |
|
|
263,543 |
|
|
Encore Capital Group, Inc. (a) |
|
|
7,752 |
|
|
164,807 |
|
|
Ezcorp, Inc. (a) |
|
|
22,360 |
|
|
589,633 |
|
|
First Cash Financial Services, Inc. (a) |
|
|
14,932 |
|
|
523,964 |
|
|
The First Marblehead Corp. (a) |
|
|
26,647 |
|
|
31,177 |
|
|
Imperial Holdings, Inc. (a) |
|
|
9,011 |
|
|
16,941 |
|
|
MGIC Investment Corp. (a) |
|
|
89,132 |
|
|
332,462 |
|
|
MoneyGram International, Inc. (a) |
|
|
5,083 |
|
|
90,223 |
|
|
Nelnet, Inc., Class A |
|
|
12,337 |
|
|
301,886 |
|
|
Netspend Holdings, Inc. (a) |
|
|
12,805 |
|
|
103,849 |
|
|
Nicholas Financial, Inc. |
|
|
4,794 |
|
|
61,459 |
|
|
Portfolio Recovery Associates, Inc. (a)(b) |
|
|
8,159 |
|
|
550,896 |
|
|
World Acceptance Corp. (a) |
|
|
7,172 |
|
|
527,142 |
|
|
|
|
|
|
|
|
4,447,334 |
|
|
Consumer Services: Miscellaneous — 0.5% |
|
|
|
|
|
|
|
|
Ancestry.com, Inc. (a) |
|
|
14,983 |
|
|
344,010 |
|
|
Coinstar, Inc. (a)(b) |
|
|
14,849 |
|
|
677,708 |
|
|
Core-Mark Holdings Co., Inc. |
|
|
5,369 |
|
|
212,613 |
|
|
Move, Inc. (a) |
|
|
18,840 |
|
|
119,069 |
|
|
NutriSystem, Inc. |
|
|
12,826 |
|
|
165,840 |
|
|
Sotheby’s, Class A |
|
|
32,021 |
|
|
913,559 |
|
|
Steiner Leisure Ltd. (a) |
|
|
7,123 |
|
|
323,313 |
|
|
|
|
|
|
|
|
2,756,112 |
|
|
Containers & Packaging — 0.1% |
|
|
|
|
|
|
|
|
AEP Industries, Inc. (a) |
|
|
2,035 |
|
|
57,285 |
|
|
Graphic Packaging Holding Co. (a)(b) |
|
|
75,722 |
|
|
322,576 |
|
|
Myers Industries, Inc. |
|
|
14,210 |
|
|
175,351 |
|
|
|
|
|
|
|
|
555,212 |
|
|
Copper — 0.0% |
|
|
|
|
|
|
|
|
Revett Minerals, Inc. (a) |
|
|
11,474 |
|
|
54,157 |
|
|
Cosmetics — 0.1% |
|
|
|
|
|
|
|
|
Elizabeth Arden, Inc. (a)(b) |
|
|
11,589 |
|
|
429,257 |
|
|
Inter Parfums, Inc. |
|
|
7,716 |
|
|
120,061 |
|
|
Revlon, Inc., Class A (a) |
|
|
5,183 |
|
|
77,071 |
|
|
|
|
|
|
|
|
626,389 |
|
|
Diversified Financial Services — 0.5% |
|
|
|
|
|
|
|
|
California First National Bancorp |
|
|
748 |
|
|
12,028 |
|
|
DFC Global Corp. (a) |
|
|
20,690 |
|
|
373,661 |
|
|
Duff & Phelps Corp. |
|
|
14,556 |
|
|
211,062 |
|
|
Edelman Financial Group, Inc. |
|
|
9,526 |
|
|
62,586 |
|
|
Evercore Partners, Inc., Class A |
|
|
9,972 |
|
|
265,455 |
|
|
FBR & Co. (a) |
|
|
22,110 |
|
|
45,325 |
|
|
Fidus Investment Corp. |
|
|
2,247 |
|
|
29,144 |
|
|
Gleacher & Co., Inc. (a) |
|
|
33,671 |
|
|
56,567 |
|
|
Intersections, Inc. |
|
|
4,528 |
|
|
50,215 |
|
|
Main Street Capital Corp. |
|
|
10,768 |
|
|
228,712 |
|
|
Piper Jaffray Cos. (a) |
|
|
7,480 |
|
|
151,096 |
|
|
Stifel Financial Corp. (a)(b) |
|
|
25,457 |
|
|
815,897 |
|
|
Triangle Capital Corp. |
|
|
10,488 |
|
|
200,531 |
|
|
|
|
|
|
|
|
2,502,279 |
|
|
|
|
|
|
|
See Notes to Financial Statements. |
|||
|
|
|
|
|
|
|
BLACKROCK SMALL CAP INDEX FUND |
DECEMBER 31, 2011 |
23 |
|
|
|
|
|
|
|
Schedule of Investments (continued) |
Master Small Cap Index Series |
|
(Percentages shown are based on Net Assets) |
|
|
|
|
|
|
|
|
|
|
Common Stocks |
|
Shares |
|
Value |
|
||
|
Diversified Manufacturing Operations — 0.4% |
|
|
|
|
|
|
|
|
A.M. Castle & Co. (a) |
|
|
7,685 |
|
$ |
72,700 |
|
|
Barnes Group, Inc. |
|
|
25,822 |
|
|
622,568 |
|
|
Federal Signal Corp. (a) |
|
|
29,432 |
|
|
122,143 |
|
|
Lydall, Inc. (a) |
|
|
8,147 |
|
|
77,315 |
|
|
OSI Systems, Inc. (a) |
|
|
9,027 |
|
|
440,337 |
|
|
Raven Industries, Inc. |
|
|
8,572 |
|
|
530,607 |
|
|
Standex International Corp. |
|
|
5,924 |
|
|
202,423 |
|
|
Trimas Corp. (a)(b) |
|
|
12,109 |
|
|
217,357 |
|
|
|
|
|
|
|
|
2,285,450 |
|
|
Diversified Materials & Processing — 0.9% |
|
|
|
|
|
|
|
|
Belden, Inc. |
|
|
22,456 |
|
|
747,336 |
|
|
Cabot Microelectronics Corp. (a) |
|
|
11,139 |
|
|
526,318 |
|
|
Clarcor, Inc. |
|
|
23,877 |
|
|
1,193,611 |
|
|
Encore Wire Corp. |
|
|
8,804 |
|
|
228,024 |
|
|
Harbinger Group, Inc. (a) |
|
|
3,798 |
|
|
15,230 |
|
|
Hexcel Corp. (a)(b) |
|
|
46,405 |
|
|
1,123,465 |
|
|
Insteel Industries, Inc. |
|
|
8,191 |
|
|
90,019 |
|
|
Koppers Holdings, Inc. |
|
|
9,762 |
|
|
335,422 |
|
|
NL Industries, Inc. |
|
|
3,389 |
|
|
43,955 |
|
|
Tredegar Corp. |
|
|
11,341 |
|
|
251,997 |
|
|
Uranium Energy Corp. (a)(b) |
|
|
36,447 |
|
|
111,528 |
|
|
|
|
|
|
|
|
4,666,905 |
|
|
Diversified Media — 0.1% |
|
|
|
|
|
|
|
|
Belo Corp., Class A |
|
|
43,892 |
|
|
276,520 |
|
|
EW Scripps Co. (a) |
|
|
14,938 |
|
|
119,653 |
|
|
|
|
|
|
|
|
396,173 |
|
|
Diversified Retail — 0.5% |
|
|
|
|
|
|
|
|
99 Cents Only Stores (a) |
|
|
22,157 |
|
|
486,346 |
|
|
The Bon-Ton Stores, Inc. |
|
|
6,149 |
|
|
20,722 |
|
|
Fred’s, Inc. |
|
|
17,534 |
|
|
255,646 |
|
|
Geeknet, Inc. (a) |
|
|
2,182 |
|
|
37,203 |
|
|
Gordmans Stores, Inc. (a) |
|
|
2,697 |
|
|
33,901 |
|
|
HSN, Inc. |
|
|
18,931 |
|
|
686,438 |
|
|
Overstock.com, Inc. (a) |
|
|
5,374 |
|
|
42,132 |
|
|
PriceSmart, Inc. |
|
|
8,418 |
|
|
585,809 |
|
|
Saks, Inc. (a) |
|
|
54,655 |
|
|
532,886 |
|
|
Tuesday Morning Corp. (a) |
|
|
20,424 |
|
|
70,463 |
|
|
ValueVision Media, Inc., Class A (a) |
|
|
18,625 |
|
|
35,015 |
|
|
Winmark Corp. |
|
|
1,041 |
|
|
59,722 |
|
|
|
|
|
|
|
|
2,846,283 |
|
|
Drug & Grocery Store Chains — 0.9% |
|
|
|
|
|
|
|
|
Arden Group, Inc., Class A |
|
|
552 |
|
|
49,686 |
|
|
Casey’s General Stores, Inc. |
|
|
18,001 |
|
|
927,231 |
|
|
The Fresh Market, Inc. (a) |
|
|
13,348 |
|
|
532,585 |
|
|
GNC Holdings, Inc. (a) |
|
|
10,812 |
|
|
313,007 |
|
|
Ingles Markets, Inc., Class A |
|
|
5,792 |
|
|
87,228 |
|
|
Nash Finch Co. |
|
|
5,726 |
|
|
167,657 |
|
|
The Pantry, Inc. (a) |
|
|
10,871 |
|
|
130,126 |
|
|
PetMed Express, Inc. |
|
|
9,710 |
|
|
100,790 |
|
|
Rite Aid Corp. (a) |
|
|
279,057 |
|
|
351,612 |
|
|
Ruddick Corp. |
|
|
23,311 |
|
|
993,981 |
|
|
Spartan Stores, Inc. |
|
|
10,711 |
|
|
198,153 |
|
|
Susser Holdings Corp. (a) |
|
|
4,438 |
|
|
100,388 |
|
|
Village Super Market, Inc., Class A |
|
|
3,020 |
|
|
85,919 |
|
|
Weis Markets, Inc. |
|
|
5,278 |
|
|
210,803 |
|
|
Winn-Dixie Stores, Inc. (a) |
|
|
26,513 |
|
|
248,692 |
|
|
|
|
|
|
|
|
4,497,858 |
|
|
|
|
|
|
|
|
|
|
|
Common Stocks |
|
Shares |
|
Value |
|
||
|
Education Services — 0.5% |
|
|
|
|
|
|
|
|
Ambassadors Group, Inc. |
|
|
8,473 |
|
$ |
38,213 |
|
|
American Public Education, Inc. (a) |
|
|
8,462 |
|
|
366,235 |
|
|
Archipelago Learning, Inc. (a)(b) |
|
|
6,056 |
|
|
58,562 |
|
|
Bridgepoint Education, Inc. (a)(b) |
|
|
8,469 |
|
|
194,787 |
|
|
Cambium Learning Group, Inc. (a) |
|
|
7,733 |
|
|
23,354 |
|
|
Capella Education Co. (a) |
|
|
6,860 |
|
|
247,303 |
|
|
Corinthian Colleges, Inc. (a) |
|
|
37,719 |
|
|
81,850 |
|
|
Franklin Covey Co. (a) |
|
|
6,113 |
|
|
51,777 |
|
|
Grand Canyon Education, Inc. (a) |
|
|
13,564 |
|
|
216,481 |
|
|
HealthStream, Inc. (a) |
|
|
8,588 |
|
|
158,449 |
|
|
K12, Inc. (a) |
|
|
12,316 |
|
|
220,949 |
|
|
Lincoln Educational Services Corp. |
|
|
10,581 |
|
|
83,590 |
|
|
National American University Holdings, Inc. |
|
|
4,580 |
|
|
34,716 |
|
|
Rosetta Stone, Inc. (a)(b) |
|
|
5,080 |
|
|
38,760 |
|
|
School Specialty, Inc. (a) |
|
|
8,243 |
|
|
20,608 |
|
|
Strayer Education, Inc. |
|
|
5,808 |
|
|
564,480 |
|
|
Universal Technical Institute, Inc. (a) |
|
|
10,127 |
|
|
129,423 |
|
|
|
|
|
|
|
|
2,529,537 |
|
|
Electronic Components — 0.7% |
|
|
|
|
|
|
|
|
3D Systems Corp. (a) |
|
|
19,872 |
|
|
286,157 |
|
|
Acacia Research — Acacia Technologies (a) |
|
|
20,254 |
|
|
739,473 |
|
|
Checkpoint Systems, Inc. (a) |
|
|
19,037 |
|
|
208,265 |
|
|
DDi Corp. |
|
|
7,096 |
|
|
66,206 |
|
|
InvenSense, Inc. (a) |
|
|
4,973 |
|
|
49,531 |
|
|
Kemet Corp. (a) |
|
|
20,986 |
|
|
147,951 |
|
|
LeCroy Corp. (a) |
|
|
7,724 |
|
|
64,959 |
|
|
Methode Electronics, Inc. |
|
|
17,593 |
|
|
145,846 |
|
|
Microvision, Inc. (a) |
|
|
56,035 |
|
|
20,178 |
|
|
Multi-Fineline Electronix, Inc. (a) |
|
|
4,198 |
|
|
86,269 |
|
|
NVE Corp. (a) |
|
|
2,245 |
|
|
124,665 |
|
|
Park Electrochemical Corp. |
|
|
9,856 |
|
|
252,511 |
|
|
Pulse Electronics Corp. |
|
|
19,580 |
|
|
54,824 |
|
|
Rogers Corp. (a) |
|
|
7,560 |
|
|
278,661 |
|
|
ScanSource, Inc. (a) |
|
|
12,795 |
|
|
460,620 |
|
|
TTM Technologies, Inc. (a)(b) |
|
|
24,623 |
|
|
269,868 |
|
|
Universal Display Corp. (a)(b) |
|
|
18,220 |
|
|
668,492 |
|
|
Viasystems Group, Inc. (a) |
|
|
1,439 |
|
|
24,348 |
|
|
|
|
|
|
|
|
3,948,824 |
|
|
Electronic Entertainment — 0.2% |
|
|
|
|
|
|
|
|
DTS, Inc. (a) |
|
|
8,252 |
|
|
224,784 |
|
|
Glu Mobile, Inc. (a)(b) |
|
|
22,231 |
|
|
69,805 |
|
|
Take-Two Interactive Software, Inc. (a) |
|
|
34,807 |
|
|
471,635 |
|
|
THQ, Inc. (a) |
|
|
33,039 |
|
|
25,110 |
|
|
|
|
|
|
|
|
791,334 |
|
|
Electronics — 0.5% |
|
|
|
|
|
|
|
|
Agilysys, Inc. (a) |
|
|
8,745 |
|
|
69,523 |
|
|
American Science & Engineering, Inc. |
|
|
4,292 |
|
|
292,328 |
|
|
Coherent, Inc. (a) |
|
|
11,171 |
|
|
583,908 |
|
|
Daktronics, Inc. |
|
|
16,567 |
|
|
158,546 |
|
|
II-VI, Inc. (a)(b) |
|
|
24,531 |
|
|
450,389 |
|
|
iRobot Corp. (a) |
|
|
11,264 |
|
|
336,230 |
|
|
Newport Corp. (a) |
|
|
17,763 |
|
|
241,755 |
|
|
Richardson Electronics Ltd. |
|
|
6,507 |
|
|
79,971 |
|
|
Rofin-Sinar Technologies, Inc. (a) |
|
|
13,494 |
|
|
308,338 |
|
|
SRS Labs, Inc. (a) |
|
|
5,970 |
|
|
34,328 |
|
|
|
|
|
|
|
|
2,555,316 |
|
|
|
|
|
|
See Notes to Financial Statements. |
||
|
|
|
|
|
24 |
BLACKROCK SMALL CAP INDEX FUND |
DECEMBER 31, 2011 |
|
|
|
|
|
|
|
Schedule of Investments (continued) |
Master Small Cap Index Series |
|
(Percentages shown are based on Net Assets) |
|
|
|
|
|
|
|
|
|
|
Common Stocks |
|
Shares |
|
Value |
|
||
|
Energy Equipment — 0.1% |
|
|
|
|
|
|
|
|
C&J Energy Services, Inc. (a) |
|
|
5,637 |
|
$ |
117,982 |
|
|
Capstone Turbine Corp. (a)(b) |
|
|
116,980 |
|
|
135,697 |
|
|
FuelCell Energy, Inc. (a) |
|
|
60,604 |
|
|
52,847 |
|
|
PowerSecure International, Inc. (a) |
|
|
8,655 |
|
|
42,842 |
|
|
STR Holdings, Inc. (a)(b) |
|
|
14,354 |
|
|
118,134 |
|
|
|
|
|
|
|
|
467,502 |
|
|
Engineering & Contracting Services — 0.5% |
|
|
|
|
|
|
|
|
Argan, Inc. |
|
|
3,614 |
|
|
54,969 |
|
|
Dycom Industries, Inc. (a) |
|
|
16,707 |
|
|
349,510 |
|
|
Exponent, Inc. (a) |
|
|
6,266 |
|
|
288,048 |
|
|
Furmamite Corp. (a)(b) |
|
|
17,702 |
|
|
111,700 |
|
|
Hill International, Inc. (a) |
|
|
11,825 |
|
|
60,781 |
|
|
Layne Christensen Co. (a) |
|
|
9,302 |
|
|
225,108 |
|
|
Mastec, Inc. (a)(b) |
|
|
26,858 |
|
|
466,523 |
|
|
Michael Baker Corp. (a) |
|
|
3,914 |
|
|
76,754 |
|
|
Mistras Group, Inc. (a) |
|
|
6,974 |
|
|
177,767 |
|
|
MYR Group, Inc. (a) |
|
|
9,556 |
|
|
182,902 |
|
|
Tetra Tech, Inc. (a) |
|
|
29,561 |
|
|
638,222 |
|
|
UniTek Global Services, Inc. (a) |
|
|
5,345 |
|
|
24,213 |
|
|
VSE Corp. |
|
|
1,973 |
|
|
47,904 |
|
|
|
|
|
|
|
|
2,704,401 |
|
|
Entertainment — 0.4% |
|
|
|
|
|
|
|
|
Ascent Capital Group, Inc., Class A (a)(b) |
|
|
6,776 |
|
|
343,679 |
|
|
Cinemark Holdings, Inc. |
|
|
44,025 |
|
|
814,022 |
|
|
Lions Gate Entertainment Corp. (a) |
|
|
21,300 |
|
|
177,216 |
|
|
Live Nation Entertainment, Inc. (a) |
|
|
66,892 |
|
|
555,873 |
|
|
Rentrak Corp. (a) |
|
|
4,526 |
|
|
64,631 |
|
|
World Wrestling Entertainment, Inc. |
|
|
13,062 |
|
|
121,738 |
|
|
|
|
|
|
|
|
2,077,159 |
|
|
Environmental,
Maintenance, & Security |
|
|
|
|
|
|
|
|
ABM Industries, Inc. |
|
|
25,134 |
|
|
518,263 |
|
|
The Brink’s Co. |
|
|
22,125 |
|
|
594,720 |
|
|
G&K Services, Inc., Class A |
|
|
8,860 |
|
|
257,915 |
|
|
The Geo Group, Inc. (a) |
|
|
30,686 |
|
|
513,991 |
|
|
Healthcare Services Group, Inc. |
|
|
31,492 |
|
|
557,093 |
|
|
Mac-Gray Corp. |
|
|
5,780 |
|
|
79,706 |
|
|
Rollins, Inc. |
|
|
30,136 |
|
|
669,622 |
|
|
Standard Parking Corp. (a)(b) |
|
|
7,452 |
|
|
133,167 |
|
|
Swisher Hygiene, Inc. (a) |
|
|
40,256 |
|
|
150,557 |
|
|
Unifirst Corp. |
|
|
6,701 |
|
|
380,215 |
|
|
|
|
|
|
|
|
3,855,249 |
|
|
Fertilizers — 0.0% |
|
|
|
|
|
|
|
|
Rentech, Inc. (a) |
|
|
60,976 |
|
|
79,879 |
|
|
Financial Data & Systems — 1.0% |
|
|
|
|
|
|
|
|
Advent Software, Inc. (a) |
|
|
15,559 |
|
|
379,017 |
|
|
Cardtronics, Inc. (a) |
|
|
20,390 |
|
|
551,754 |
|
|
Cass Information Systems, Inc. |
|
|
4,395 |
|
|
159,934 |
|
|
Euronet Worldwide, Inc. (a) |
|
|
24,259 |
|
|
448,306 |
|
|
Fair Isaac Corp. |
|
|
16,911 |
|
|
606,090 |
|
|
Global Cash Access, Inc. (a) |
|
|
14,592 |
|
|
64,935 |
|
|
Heartland Payment Systems, Inc. |
|
|
18,248 |
|
|
444,521 |
|
|
Higher One Holdings, Inc. (a)(b) |
|
|
14,494 |
|
|
267,269 |
|
|
Jack Henry & Associates, Inc. |
|
|
40,893 |
|
|
1,374,414 |
|
|
S1 Corp. (a) |
|
|
26,518 |
|
|
253,777 |
|
|
Wright Express Corp. (a)(b) |
|
|
18,299 |
|
|
993,270 |
|
|
|
|
|
|
|
|
5,543,287 |
|
|
|
|
|
|
|
|
|
|
|
Common Stocks |
|
Shares |
|
Value |
|
||
|
Foods — 1.2% |
|
|
|
|
|
|
|
|
B&G Foods, Inc., Class A |
|
|
22,720 |
|
$ |
546,870 |
|
|
The Chefs’ Warehouse, Inc. (a) |
|
|
4,851 |
|
|
86,639 |
|
|
Chiquita Brands International, Inc. (a) |
|
|
21,500 |
|
|
179,310 |
|
|
Diamond Foods, Inc. (b) |
|
|
10,405 |
|
|
335,769 |
|
|
Dole Food Co., Inc. (a)(b) |
|
|
16,959 |
|
|
146,695 |
|
|
Hain Celestial Group, Inc. (a) |
|
|
16,964 |
|
|
621,900 |
|
|
J&J Snack Foods Corp. |
|
|
6,785 |
|
|
361,505 |
|
|
Lancaster Colony Corp. |
|
|
8,875 |
|
|
615,393 |
|
|
Lifeway Foods, Inc. (a) |
|
|
2,168 |
|
|
20,900 |
|
|
Medifast, Inc. (a)(b) |
|
|
6,526 |
|
|
89,537 |
|
|
Natures Sunshine Prods, Inc. (a) |
|
|
5,336 |
|
|
82,815 |
|
|
Nutraceutical International Corp. (a) |
|
|
4,321 |
|
|
48,914 |
|
|
Omega Protein Corp. (a) |
|
|
9,091 |
|
|
64,819 |
|
|
Schiff Nutrition International, Inc. (a) |
|
|
5,693 |
|
|
60,915 |
|
|
Seneca Foods Corp. (a) |
|
|
4,368 |
|
|
112,782 |
|
|
Smart Balance, Inc. (a)(b) |
|
|
28,204 |
|
|
151,173 |
|
|
Snyders-Lance, Inc. |
|
|
22,408 |
|
|
504,180 |
|
|
Synutra International, Inc. (a)(b) |
|
|
8,141 |
|
|
41,193 |
|
|
Tootsie Roll Industries, Inc. |
|
|
11,318 |
|
|
267,897 |
|
|
TreeHouse Foods, Inc. (a) |
|
|
16,803 |
|
|
1,098,580 |
|
|
United Natural Foods, Inc. (a)(b) |
|
|
22,903 |
|
|
916,349 |
|
|
|
|
|
|
|
|
6,354,135 |
|
|
Forest Products — 0.1% |
|
|
|
|
|
|
|
|
Deltic Timber Corp. |
|
|
5,102 |
|
|
308,110 |
|
|
Universal Forest Products, Inc. |
|
|
9,235 |
|
|
285,084 |
|
|
|
|
|
|
|
|
593,194 |
|
|
Forms & Bulk Printing Services — 0.3% |
|
|
|
|
|
|
|
|
Consolidated Graphics, Inc. (a) |
|
|
3,997 |
|
|
192,975 |
|
|
Deluxe Corp. |
|
|
24,380 |
|
|
554,889 |
|
|
Ennis, Inc. |
|
|
12,397 |
|
|
165,252 |
|
|
Innerworkings, Inc. (a) |
|
|
12,211 |
|
|
113,685 |
|
|
Multi-Color Corp. |
|
|
5,395 |
|
|
138,813 |
|
|
Quad/Graphics, Inc. |
|
|
11,953 |
|
|
171,406 |
|
|
Schawk, Inc. |
|
|
5,492 |
|
|
61,565 |
|
|
|
|
|
|
|
|
1,398,585 |
|
|
Fruit & Grain Processing — 0.0% |
|
|
|
|
|
|
|
|
MGP Ingredients, Inc. |
|
|
5,933 |
|
|
29,902 |
|
|
Funeral Parlors & Cemeteries — 0.2% |
|
|
|
|
|
|
|
|
Hillenbrand, Inc. |
|
|
29,712 |
|
|
663,172 |
|
|
Matthews International Corp., Class A |
|
|
13,983 |
|
|
439,485 |
|
|
Stewart Enterprises, Inc., Class A |
|
|
37,517 |
|
|
216,098 |
|
|
|
|
|
|
|
|
1,318,755 |
|
|
Gas Pipeline — 0.1% |
|
|
|
|
|
|
|
|
Crosstex Energy, Inc. |
|
|
19,431 |
|
|
245,608 |
|
|
SemGroup Corp. (a)(b) |
|
|
19,777 |
|
|
515,388 |
|
|
|
|
|
|
|
|
760,996 |
|
|
Glass — 0.0% |
|
|
|
|
|
|
|
|
Apogee Enterprises, Inc. |
|
|
13,399 |
|
|
164,272 |
|
|
Gold — 0.4% |
|
|
|
|
|
|
|
|
Coeur d’Alene Mines Corp. (a) |
|
|
42,408 |
|
|
1,023,729 |
|
|
Gold Resource Corp. |
|
|
13,460 |
|
|
286,025 |
|
|
Golden Star Resources Ltd. (a)(b) |
|
|
122,752 |
|
|
202,541 |
|
|
Jaguar Mining, Inc. (a)(b) |
|
|
39,992 |
|
|
255,149 |
|
|
Midway Gold Corp. (a) |
|
|
40,597 |
|
|
85,660 |
|
|
U.S. Gold Corp. (a) |
|
|
49,992 |
|
|
167,973 |
|
|
Vista Gold Corp. (a) |
|
|
33,160 |
|
|
101,801 |
|
|
|
|
|
|
|
|
2,122,878 |
|
|
|
|
|
|
|
See Notes to Financial Statements. |
|||
|
|
|
|
|
|
|
BLACKROCK SMALL CAP INDEX FUND |
DECEMBER 31, 2011 |
25 |
|
|
|
|
|
|
|
Schedule of Investments (continued) |
Master Small Cap Index Series |
|
(Percentages shown are based on Net Assets) |
|
|
|
|
|
|
|
|
|
|
Common Stocks |
|
Shares |
|
Value |
|
||
|
Health Care Facilities — 0.6% |
|
|
|
|
|
|
|
|
Amsurg Corp. (a) |
|
|
14,801 |
|
$ |
385,418 |
|
|
Assisted Living Concepts, Inc. |
|
|
9,281 |
|
|
138,194 |
|
|
Capital Senior Living Corp. (a) |
|
|
12,922 |
|
|
102,601 |
|
|
Emeritus Corp. (a) |
|
|
14,469 |
|
|
253,352 |
|
|
The Ensign Group, Inc. |
|
|
7,718 |
|
|
189,091 |
|
|
Five Star Quality Care, Inc. (a) |
|
|
19,302 |
|
|
57,906 |
|
|
Hanger Orthopedic Group, Inc. (a) |
|
|
15,856 |
|
|
296,349 |
|
|
HealthSouth Corp. (a) |
|
|
45,064 |
|
|
796,281 |
|
|
Kindred Healthcare, Inc. (a)(b) |
|
|
24,649 |
|
|
290,119 |
|
|
National Healthcare Corp. |
|
|
4,865 |
|
|
203,843 |
|
|
Select Medical Holdings Corp. (a)(b) |
|
|
21,240 |
|
|
180,115 |
|
|
Skilled Healthcare Group, Inc., Class A (a) |
|
|
8,991 |
|
|
49,091 |
|
|
Sunrise Senior Living, Inc. (a) |
|
|
27,289 |
|
|
176,833 |
|
|
US Physical Therapy, Inc. |
|
|
5,563 |
|
|
109,480 |
|
|
Vanguard Health Systems, Inc. (a) |
|
|
14,470 |
|
|
147,883 |
|
|
|
|
|
|
|
|
3,376,556 |
|
|
Health Care Management Services — 1.1% |
|
|
|
|
|
|
|
|
American Dental Partners, Inc. (a) |
|
|
7,275 |
|
|
136,988 |
|
|
Bioscript, Inc. (a) |
|
|
19,292 |
|
|
105,334 |
|
|
Centene Corp. (a) |
|
|
23,701 |
|
|
938,323 |
|
|
Computer Programs & Systems, Inc. |
|
|
5,248 |
|
|
268,225 |
|
|
HealthSpring, Inc. (a) |
|
|
32,105 |
|
|
1,751,007 |
|
|
Magellan Health Services, Inc. (a) |
|
|
13,463 |
|
|
666,015 |
|
|
Metropolitan Health Networks, Inc. (a) |
|
|
20,140 |
|
|
150,446 |
|
|
Molina Healthcare, Inc. (a)(b) |
|
|
13,303 |
|
|
297,056 |
|
|
National Research Corp. |
|
|
821 |
|
|
31,863 |
|
|
Triple-S Management Corp. (a) |
|
|
9,321 |
|
|
186,606 |
|
|
Universal American Corp. |
|
|
15,309 |
|
|
194,577 |
|
|
WellCare Health Plans, Inc. (a) |
|
|
20,166 |
|
|
1,058,715 |
|
|
|
|
|
|
|
|
5,785,155 |
|
|
Health Care Services — 1.4% |
|
|
|
|
|
|
|
|
Accretive Health, Inc. (a)(b) |
|
|
18,956 |
|
|
435,609 |
|
|
Air Methods Corp. (a) |
|
|
5,365 |
|
|
453,074 |
|
|
Alliance Healthcare Services, Inc. (a) |
|
|
12,487 |
|
|
15,734 |
|
|
Almost Family, Inc. (a) |
|
|
4,000 |
|
|
66,320 |
|
|
Amedisys, Inc. (a) |
|
|
13,985 |
|
|
152,576 |
|
|
AMN Healthcare Services, Inc. (a) |
|
|
18,439 |
|
|
81,685 |
|
|
athenahealth, Inc. (a) |
|
|
16,510 |
|
|
810,971 |
|
|
CardioNet, Inc. (a) |
|
|
12,314 |
|
|
29,184 |
|
|
Chemed Corp. |
|
|
9,400 |
|
|
481,374 |
|
|
Chindex International, Inc. (a) |
|
|
5,206 |
|
|
44,355 |
|
|
Corvel Corp. (a)(b) |
|
|
3,006 |
|
|
155,440 |
|
|
Cross Country Healthcare, Inc. (a) |
|
|
13,175 |
|
|
73,121 |
|
|
ePocrates, Inc. (a) |
|
|
3,229 |
|
|
25,186 |
|
|
ExamWorks Group, Inc. (a) |
|
|
12,860 |
|
|
121,913 |
|
|
Gentiva Health Services, Inc. (a) |
|
|
14,662 |
|
|
98,969 |
|
|
Healthways, Inc. (a) |
|
|
16,153 |
|
|
110,810 |
|
|
HMS Holdings Corp. (a) |
|
|
40,142 |
|
|
1,283,741 |
|
|
IPC The Hospitalist Co., Inc. (a)(b) |
|
|
7,750 |
|
|
354,330 |
|
|
LHC Group, Inc. (a) |
|
|
7,498 |
|
|
96,199 |
|
|
Medidata Solutions, Inc. (a) |
|
|
9,937 |
|
|
216,130 |
|
|
MedQuist Holdings, Inc. (a) |
|
|
15,801 |
|
|
152,006 |
|
|
MWI Veterinary Supply, Inc. (a) |
|
|
5,954 |
|
|
395,584 |
|
|
Omnicell, Inc. (a)(b) |
|
|
15,704 |
|
|
259,430 |
|
|
PharMerica Corp. (a) |
|
|
13,882 |
|
|
210,729 |
|
|
Quality Systems, Inc. |
|
|
18,354 |
|
|
678,914 |
|
|
Sun Healthcare Group, Inc. (a) |
|
|
11,809 |
|
|
45,819 |
|
|
Team Health Holdings, Inc. (a) |
|
|
12,613 |
|
|
278,369 |
|
|
Transcend Services, Inc. (a) |
|
|
4,103 |
|
|
97,364 |
|
|
|
|
|
|
|
|
7,224,936 |
|
|
|
|
|
|
|
|
|
|
|
Common Stocks |
|
Shares |
|
Value |
|
||
|
Health Care: Miscellaneous — 0.1% |
|
|
|
|
|
|
|
|
MedAssets, Inc. (a) |
|
|
22,561 |
|
$ |
208,689 |
|
|
The Providence Service Corp. (a) |
|
|
6,087 |
|
|
83,757 |
|
|
|
|
|
|
|
|
292,446 |
|
|
Home Building — 0.3% |
|
|
|
|
|
|
|
|
Beazer Homes USA, Inc. (a)(b) |
|
|
35,484 |
|
|
88,000 |
|
|
Hovnanian Enterprises, Inc., Class A (a)(b) |
|
|
29,261 |
|
|
42,429 |
|
|
KB Home |
|
|
36,488 |
|
|
245,199 |
|
|
M/I Homes, Inc. (a) |
|
|
8,906 |
|
|
85,498 |
|
|
MDC Holdings, Inc. |
|
|
17,806 |
|
|
313,920 |
|
|
Meritage Homes Corp. (a)(b) |
|
|
13,242 |
|
|
307,082 |
|
|
Ryland Group, Inc. |
|
|
21,024 |
|
|
331,338 |
|
|
Standard-Pacific Corp. (a) |
|
|
50,460 |
|
|
160,463 |
|
|
|
|
|
|
|
|
1,573,929 |
|
|
Hotel/Motel — 0.2% |
|
|
|
|
|
|
|
|
Gaylord Entertainment Co. (a) |
|
|
16,877 |
|
|
407,411 |
|
|
Marcus Corp. |
|
|
9,730 |
|
|
122,695 |
|
|
Morgans Hotel Group Co. (a) |
|
|
10,390 |
|
|
61,301 |
|
|
Orient Express Hotels Ltd., Class A (a) |
|
|
45,225 |
|
|
337,831 |
|
|
Red Lion Hotels Corp. (a) |
|
|
6,853 |
|
|
47,491 |
|
|
|
|
|
|
|
|
976,729 |
|
|
Household Appliances — 0.0% |
|
|
|
|
|
|
|
|
National Presto Industries, Inc. |
|
|
2,272 |
|
|
212,659 |
|
|
Household Equipment & Products — 0.2% |
|
|
|
|
|
|
|
|
American Greetings Corp., Class A |
|
|
19,151 |
|
|
239,579 |
|
|
Blyth, Inc. |
|
|
2,468 |
|
|
140,182 |
|
|
Central Garden & Pet Co., Class A (a) |
|
|
19,962 |
|
|
166,084 |
|
|
CSS Industries, Inc. |
|
|
3,805 |
|
|
75,796 |
|
|
Helen of Troy Ltd. (a)(b) |
|
|
14,639 |
|
|
449,417 |
|
|
Libbey, Inc. (a) |
|
|
9,434 |
|
|
120,189 |
|
|
Summer Infant, Inc. (a) |
|
|
6,386 |
|
|
44,958 |
|
|
|
|
|
|
|
|
1,236,205 |
|
|
Household Furnishings — 0.3% |
|
|
|
|
|
|
|
|
American Woodmark Corp. |
|
|
4,442 |
|
|
60,678 |
|
|
Ethan Allen Interiors, Inc. |
|
|
11,455 |
|
|
271,598 |
|
|
Furniture Brands International, Inc. (a) |
|
|
17,997 |
|
|
22,136 |
|
|
Kirkland’s, Inc. (a) |
|
|
7,813 |
|
|
103,913 |
|
|
La-Z-Boy, Inc. (a) |
|
|
24,613 |
|
|
292,895 |
|
|
Lifetime Brands, Inc. |
|
|
4,588 |
|
|
55,698 |
|
|
Sealy Corp. (a) |
|
|
22,615 |
|
|
38,898 |
|
|
Select Comfort Corp. (a) |
|
|
26,369 |
|
|
571,943 |
|
|
|
|
|
|
|
|
1,417,759 |
|
|
Insurance: Life — 0.7% |
|
|
|
|
|
|
|
|
American Equity Investment Life Holding Co. |
|
|
28,222 |
|
|
293,509 |
|
|
Citizens, Inc. (a) |
|
|
18,001 |
|
|
174,430 |
|
|
CNO Financial Group, Inc. (a)(b) |
|
|
105,106 |
|
|
663,219 |
|
|
Delphi Financial Group, Inc., Class A |
|
|
22,895 |
|
|
1,014,248 |
|
|
FBL Financial Group, Inc., Class A |
|
|
6,097 |
|
|
207,420 |
|
|
Independence Holding Co. |
|
|
3,234 |
|
|
26,292 |
|
|
Kansas City Life Insurance Co. |
|
|
1,939 |
|
|
63,638 |
|
|
National Western Life Insurance Co., Class A |
|
|
1,025 |
|
|
139,564 |
|
|
The Phoenix Cos., Inc. (a) |
|
|
55,522 |
|
|
93,277 |
|
|
Presidential Life Corp. |
|
|
10,338 |
|
|
103,276 |
|
|
Primerica, Inc. |
|
|
16,070 |
|
|
373,467 |
|
|
Symetra Financial Corp. |
|
|
32,141 |
|
|
291,519 |
|
|
|
|
|
|
|
|
3,443,859 |
|
|
|
|
|
|
See Notes to Financial Statements. |
||
|
|
|
|
|
26 |
BLACKROCK SMALL CAP INDEX FUND |
DECEMBER 31, 2011 |
|
|
|
|
|
|
|
Schedule of Investments (continued) |
Master Small Cap Index Series |
|
(Percentages shown are based on Net Assets) |
|
|
|
|
|
|
|
|
|
|
Common Stocks |
|
Shares |
|
Value |
|
||
|
Insurance: Multi-Line — 0.5% |
|
|
|
|
|
|
|
|
Alterra Capital Holdings Ltd. |
|
|
43,121 |
|
$ |
1,018,949 |
|
|
Crawford & Co., Class B |
|
|
12,825 |
|
|
79,002 |
|
|
eHealth, Inc. (a) |
|
|
9,732 |
|
|
143,061 |
|
|
Flagstone Reinsurance Holdings SA |
|
|
25,091 |
|
|
208,004 |
|
|
Fortegra Financial Corp. (a) |
|
|
2,884 |
|
|
19,265 |
|
|
Horace Mann Educators Corp. |
|
|
19,062 |
|
|
261,340 |
|
|
Maiden Holdings Ltd. |
|
|
24,243 |
|
|
212,369 |
|
|
Pico Holdings, Inc. (a) |
|
|
10,804 |
|
|
222,346 |
|
|
Platinum Underwriters Holdings Ltd. |
|
|
17,744 |
|
|
605,248 |
|
|
|
|
|
|
|
|
2,769,584 |
|
|
Insurance: Property-Casualty — 1.6% |
|
|
|
|
|
|
|
|
American Safety Insurance Holdings Ltd. (a) |
|
|
4,999 |
|
|
108,728 |
|
|
Amerisafe, Inc. (a) |
|
|
8,816 |
|
|
204,972 |
|
|
AmTrust Financial Services, Inc. |
|
|
11,563 |
|
|
274,621 |
|
|
Argo Group International Holdings Ltd. |
|
|
13,125 |
|
|
380,100 |
|
|
Baldwin & Lyons, Inc., Class B |
|
|
4,154 |
|
|
90,557 |
|
|
Donegal Group, Inc., Class A |
|
|
3,731 |
|
|
52,831 |
|
|
EMC Insurance Group, Inc. |
|
|
2,404 |
|
|
49,450 |
|
|
Employers Holdings, Inc. |
|
|
10,430 |
|
|
188,679 |
|
|
Enstar Group Ltd. (a)(b) |
|
|
3,270 |
|
|
321,114 |
|
|
First American Financial Corp. |
|
|
50,011 |
|
|
633,639 |
|
|
Global Indemnity Plc (a) |
|
|
6,538 |
|
|
129,649 |
|
|
Greenlight Capital Re Ltd. (a) |
|
|
13,364 |
|
|
316,326 |
|
|
Hallmark Financial Services, Inc. (a) |
|
|
5,643 |
|
|
39,445 |
|
|
Harleysville Group, Inc. |
|
|
5,832 |
|
|
329,916 |
|
|
Hilltop Holdings, Inc. (a) |
|
|
19,048 |
|
|
160,956 |
|
|
Infinity Property & Casualty Corp. |
|
|
5,929 |
|
|
336,411 |
|
|
Meadowbrook Insurance Group, Inc. |
|
|
25,541 |
|
|
272,778 |
|
|
Montpelier Re Holdings Ltd. (b) |
|
|
29,708 |
|
|
527,317 |
|
|
National Interstate Corp. |
|
|
3,410 |
|
|
84,125 |
|
|
Navigators Group, Inc. (a) |
|
|
5,566 |
|
|
265,387 |
|
|
OneBeacon Insurance Group Ltd. |
|
|
10,682 |
|
|
164,396 |
|
|
ProAssurance Corp. |
|
|
14,523 |
|
|
1,159,226 |
|
|
Radian Group, Inc. |
|
|
63,300 |
|
|
148,122 |
|
|
RLI Corp. |
|
|
8,749 |
|
|
637,452 |
|
|
Safety Insurance Group, Inc. |
|
|
6,101 |
|
|
246,969 |
|
|
SeaBright Holdings, Inc. |
|
|
9,719 |
|
|
74,350 |
|
|
Selective Insurance Group, Inc. |
|
|
25,804 |
|
|
457,505 |
|
|
State Auto Financial Corp. |
|
|
7,153 |
|
|
97,209 |
|
|
Stewart Information Services Corp. |
|
|
8,673 |
|
|
100,173 |
|
|
Tower Group, Inc. |
|
|
17,623 |
|
|
355,456 |
|
|
United Fire & Casualty Co. |
|
|
10,340 |
|
|
208,661 |
|
|
Universal Insurance Holdings, Inc. |
|
|
9,601 |
|
|
34,372 |
|
|
|
|
|
|
|
|
8,450,892 |
|
|
International Trade & Diversified Logistic — 0.0% |
|
|
|
|
|
|
|
|
Global Sources Ltd. (a) |
|
|
5,710 |
|
|
27,694 |
|
|
Leisure Time — 1.0% |
|
|
|
|
|
|
|
|
Black Diamond, Inc. (a) |
|
|
6,315 |
|
|
47,173 |
|
|
Callaway Golf Co. |
|
|
30,501 |
|
|
168,671 |
|
|
Churchill Downs, Inc. |
|
|
5,942 |
|
|
309,756 |
|
|
International Speedway Corp., Class A |
|
|
13,960 |
|
|
353,886 |
|
|
Interval Leisure Group, Inc. (a) |
|
|
19,070 |
|
|
259,543 |
|
|
Johnson Outdoors, Inc. (a) |
|
|
2,238 |
|
|
34,353 |
|
|
Life Time Fitness, Inc. (a) |
|
|
20,029 |
|
|
936,356 |
|
|
Orbitz Worldwide, Inc. (a) |
|
|
9,706 |
|
|
36,495 |
|
|
Pool Corp. |
|
|
22,827 |
|
|
687,093 |
|
|
Six Flags Entertainment Corp. |
|
|
19,748 |
|
|
814,408 |
|
|
Smith & Wesson Holding Corp. (a) |
|
|
28,537 |
|
|
124,421 |
|
|
Speedway Motorsports, Inc. |
|
|
5,600 |
|
|
85,848 |
|
|
|
|
|
|
|
|
|
|
|
Common Stocks |
|
Shares |
|
Value |
|
||
|
Leisure Time (concluded) |
|
|
|
|
|
|
|
|
Steinway Musical Instruments, Inc. (a) |
|
|
3,113 |
|
$ |
77,950 |
|
|
Sturm Ruger & Co., Inc. |
|
|
8,939 |
|
|
299,099 |
|
|
Town Sports International Holdings, Inc. (a) |
|
|
9,527 |
|
|
70,023 |
|
|
Vail Resorts, Inc. |
|
|
17,051 |
|
|
722,280 |
|
|
West Marine, Inc. (a) |
|
|
6,834 |
|
|
79,479 |
|
|
|
|
|
|
|
|
5,106,834 |
|
|
Luxury Items — 0.0% |
|
|
|
|
|
|
|
|
Movado Group, Inc. |
|
|
8,215 |
|
|
149,267 |
|
|
Machinery: Agricultural — 0.2% |
|
|
|
|
|
|
|
|
Alamo Group, Inc. |
|
|
3,161 |
|
|
85,126 |
|
|
Lindsay Manufacturing Co. |
|
|
5,949 |
|
|
326,541 |
|
|
Titan International, Inc. |
|
|
19,942 |
|
|
388,071 |
|
|
Titan Machinery, Inc. (a) |
|
|
7,295 |
|
|
158,520 |
|
|
|
|
|
|
|
|
958,258 |
|
|
Machinery: Construction & Handling — 0.1% |
|
|
|
|
|
|
|
|
Astec Industries, Inc. (a)(b) |
|
|
9,444 |
|
|
304,191 |
|
|
Douglas Dynamics, Inc. |
|
|
8,847 |
|
|
129,343 |
|
|
NACCO Industries, Inc., Class A |
|
|
2,762 |
|
|
246,426 |
|
|
|
|
|
|
|
|
679,960 |
|
|
Machinery: Engines — 0.1% |
|
|
|
|
|
|
|
|
Briggs & Stratton Corp. |
|
|
23,907 |
|
|
370,319 |
|
|
Machinery: Industrial — 1.3% |
|
|
|
|
|
|
|
|
Actuant Corp., Class A |
|
|
32,487 |
|
|
737,130 |
|
|
Altra Holdings, Inc. (a) |
|
|
12,752 |
|
|
240,120 |
|
|
Applied Industrial Technologies, Inc. |
|
|
20,078 |
|
|
706,143 |
|
|
Chart Industries, Inc. (a) |
|
|
13,922 |
|
|
752,763 |
|
|
Colfax Corp. (a)(b) |
|
|
11,643 |
|
|
331,593 |
|
|
Columbus McKinnon Corp. (a) |
|
|
9,137 |
|
|
115,949 |
|
|
DXP Enterprises, Inc. (a) |
|
|
4,107 |
|
|
132,245 |
|
|
EnPro Industries, Inc. (a) |
|
|
9,771 |
|
|
322,248 |
|
|
Flow International Corp. (a) |
|
|
22,530 |
|
|
78,855 |
|
|
Graham Corp. |
|
|
4,683 |
|
|
105,086 |
|
|
John Bean Technologies Corp. |
|
|
13,578 |
|
|
208,694 |
|
|
Kadant, Inc. (a) |
|
|
5,840 |
|
|
132,042 |
|
|
Middleby Corp. (a) |
|
|
8,873 |
|
|
834,417 |
|
|
MTS Systems Corp. |
|
|
7,391 |
|
|
301,183 |
|
|
Omega Flex, Inc. (a) |
|
|
1,035 |
|
|
14,625 |
|
|
Sauer-Danfoss, Inc. (a) |
|
|
5,491 |
|
|
198,829 |
|
|
Tecumseh Products Co., Class A (a) |
|
|
9,230 |
|
|
43,381 |
|
|
Tennant Co. |
|
|
9,074 |
|
|
352,706 |
|
|
Twin Disc, Inc. |
|
|
4,023 |
|
|
146,115 |
|
|
Woodward, Inc. |
|
|
29,162 |
|
|
1,193,601 |
|
|
|
|
|
|
|
|
6,947,725 |
|
|
Machinery: Specialty — 0.1% |
|
|
|
|
|
|
|
|
Albany International Corp., Class A |
|
|
13,090 |
|
|
302,641 |
|
|
Cascade Corp. |
|
|
4,350 |
|
|
205,189 |
|
|
Hurco Cos., Inc. (a) |
|
|
3,007 |
|
|
63,147 |
|
|
Xerium Technologies, Inc. (a) |
|
|
4,914 |
|
|
32,138 |
|
|
|
|
|
|
|
|
603,115 |
|
|
Manufactured Housing — 0.0% |
|
|
|
|
|
|
|
|
Cavco Industries, Inc. (a) |
|
|
3,234 |
|
|
129,554 |
|
|
Skyline Corp. |
|
|
3,592 |
|
|
15,625 |
|
|
|
|
|
|
|
|
145,179 |
|
|
|
|
|
|
|
See Notes to Financial Statements. |
|||
|
|
|
|
|
|
|
BLACKROCK SMALL CAP INDEX FUND |
DECEMBER 31, 2011 |
27 |
|
|
|
|
|
|
|
Schedule of Investments (continued) |
Master Small Cap Index Series |
|
(Percentages shown are based on Net Assets) |
|
|
|
|
|
|
|
|
|
|
Common Stocks |
|
Shares |
|
Value |
|
||
|
Medical & Dental Instruments & Supplies — 2.3% |
|
|
|
|
|
|
|
|
Abiomed, Inc. (a) |
|
|
15,032 |
|
$ |
277,641 |
|
|
Align Technology, Inc. (a) |
|
|
29,091 |
|
|
690,184 |
|
|
Alphatec Holdings, Inc. (a) |
|
|
26,027 |
|
|
44,766 |
|
|
AngioDynamics, Inc. (a) |
|
|
11,832 |
|
|
175,232 |
|
|
Antares Pharma, Inc. (a) |
|
|
41,066 |
|
|
90,345 |
|
|
AtriCure, Inc. (a) |
|
|
6,689 |
|
|
74,248 |
|
|
Atrion Corp. |
|
|
745 |
|
|
178,971 |
|
|
Biolase Technology, Inc. (a)(b) |
|
|
15,131 |
|
|
38,887 |
|
|
Cantel Medical Corp. |
|
|
6,260 |
|
|
174,842 |
|
|
Cardiovascular Systems, Inc. (a) |
|
|
7,037 |
|
|
69,314 |
|
|
Cerus Corp. (a) |
|
|
22,757 |
|
|
63,720 |
|
|
Conceptus, Inc. (a)(b) |
|
|
14,783 |
|
|
186,857 |
|
|
CONMED Corp. (a) |
|
|
13,407 |
|
|
344,158 |
|
|
CryoLife, Inc. (a) |
|
|
13,061 |
|
|
62,693 |
|
|
Delcath Systems, Inc. (a) |
|
|
22,814 |
|
|
69,583 |
|
|
Endologix, Inc. (a)(b) |
|
|
23,197 |
|
|
266,302 |
|
|
Exactech, Inc. (a) |
|
|
3,914 |
|
|
64,464 |
|
|
Hansen Medical, Inc. (a) |
|
|
22,917 |
|
|
59,126 |
|
|
Heartware International, Inc. (a)(b) |
|
|
5,667 |
|
|
391,023 |
|
|
ICU Medical, Inc. (a)(b) |
|
|
5,745 |
|
|
258,525 |
|
|
Insulet Corp. (a) |
|
|
21,774 |
|
|
410,004 |
|
|
Integra LifeSciences Holdings Corp. (a) |
|
|
9,273 |
|
|
285,887 |
|
|
Invacare Corp. |
|
|
13,565 |
|
|
207,409 |
|
|
Landauer, Inc. |
|
|
4,458 |
|
|
229,587 |
|
|
MAKO Surgical Corp. (a)(b) |
|
|
15,142 |
|
|
381,730 |
|
|
Medical Action Industries, Inc. (a) |
|
|
7,424 |
|
|
38,827 |
|
|
Medtox Scientific, Inc. (a) |
|
|
3,636 |
|
|
51,086 |
|
|
Meridian Bioscience, Inc. |
|
|
19,492 |
|
|
367,229 |
|
|
Merit Medical Systems, Inc. (a) |
|
|
19,871 |
|
|
265,874 |
|
|
Navidea Biopharmaceuticals, Inc. (a)(b) |
|
|
44,826 |
|
|
117,444 |
|
|
Neogen Corp. (a)(b) |
|
|
11,018 |
|
|
337,591 |
|
|
NuVasive, Inc. (a) |
|
|
20,025 |
|
|
252,115 |
|
|
OraSure Technologies, Inc. (a) |
|
|
22,164 |
|
|
201,914 |
|
|
Orthofix International NV (a)(b) |
|
|
8,540 |
|
|
300,864 |
|
|
Owens & Minor, Inc. |
|
|
30,182 |
|
|
838,758 |
|
|
PSS World Medical, Inc. (a) |
|
|
26,276 |
|
|
635,616 |
|
|
Quidel Corp. (a) |
|
|
13,503 |
|
|
204,300 |
|
|
Rockwell Medical Technologies, Inc. (a) |
|
|
7,600 |
|
|
64,372 |
|
|
Staar Surgical Co. (a) |
|
|
16,890 |
|
|
177,176 |
|
|
Steris Corp. |
|
|
28,068 |
|
|
836,988 |
|
|
SurModics, Inc. (a) |
|
|
7,255 |
|
|
106,358 |
|
|
Symmetry Medical, Inc. (a)(b) |
|
|
17,287 |
|
|
138,123 |
|
|
Synovis Life Technologies, Inc. (a) |
|
|
5,430 |
|
|
151,117 |
|
|
Tornier NV (a) |
|
|
5,003 |
|
|
90,054 |
|
|
Unilife Corp. (a)(b) |
|
|
31,256 |
|
|
97,519 |
|
|
Uroplasty, Inc. (a) |
|
|
9,381 |
|
|
39,869 |
|
|
Vascular Solutions, Inc. (a) |
|
|
8,035 |
|
|
89,430 |
|
|
Volcano Corp. (a)(b) |
|
|
24,687 |
|
|
587,304 |
|
|
West Pharmaceutical Services, Inc. |
|
|
15,857 |
|
|
601,773 |
|
|
Wright Medical Group, Inc. (a) |
|
|
18,472 |
|
|
304,788 |
|
|
Young Innovations, Inc. |
|
|
2,668 |
|
|
79,053 |
|
|
|
|
|
|
|
|
12,071,040 |
|
|
Medical Equipment — 1.2% |
|
|
|
|
|
|
|
|
Abaxis, Inc. (a) |
|
|
10,684 |
|
|
295,626 |
|
|
Accuray, Inc. (a)(b) |
|
|
32,499 |
|
|
137,471 |
|
|
Affymetrix, Inc. (a) |
|
|
33,479 |
|
|
136,929 |
|
|
Analogic Corp. |
|
|
5,942 |
|
|
340,595 |
|
|
ArthroCare Corp. (a) |
|
|
12,943 |
|
|
410,034 |
|
|
Bacterin International Holdings, Inc. (a) |
|
|
11,255 |
|
|
32,189 |
|
|
Cyberonics, Inc. (a)(b) |
|
|
13,413 |
|
|
449,336 |
|
|
|
|
|
|
|
|
|
|
|
Common Stocks |
|
Shares |
|
Value |
|
||
|
Medical Equipment (concluded) |
|
|
|
|
|
|
|
|
Cynosure, Inc., Class A (a) |
|
|
4,437 |
|
$ |
52,179 |
|
|
DexCom, Inc. (a)(b) |
|
|
31,840 |
|
|
296,430 |
|
|
Fluidigm Corp. (a) |
|
|
3,010 |
|
|
39,612 |
|
|
Greatbatch, Inc. (a)(b) |
|
|
11,021 |
|
|
243,564 |
|
|
Haemonetics Corp. (a) |
|
|
12,151 |
|
|
743,884 |
|
|
IRIS International, Inc. (a) |
|
|
8,469 |
|
|
79,185 |
|
|
Luminex Corp. (a)(b) |
|
|
17,913 |
|
|
380,293 |
|
|
Masimo Corp. (a) |
|
|
24,916 |
|
|
465,556 |
|
|
Merge Healthcare, Inc. (a)(b) |
|
|
26,322 |
|
|
127,662 |
|
|
Natus Medical, Inc. (a)(b) |
|
|
13,783 |
|
|
129,974 |
|
|
NxStage Medical, Inc. (a)(b) |
|
|
21,142 |
|
|
375,905 |
|
|
Palomar Medical Technologies, Inc. (a) |
|
|
8,833 |
|
|
82,147 |
|
|
Solta Medical, Inc. (a) |
|
|
28,997 |
|
|
91,051 |
|
|
SonoSite, Inc. (a) |
|
|
6,525 |
|
|
351,437 |
|
|
Spectranetic Corp. (a) |
|
|
15,846 |
|
|
114,408 |
|
|
Stereotaxis, Inc. (a)(b) |
|
|
22,866 |
|
|
18,832 |
|
|
Synergetics USA, Inc. (a) |
|
|
10,435 |
|
|
77,010 |
|
|
Zeltiq Aesthetics, Inc. (a)(b) |
|
|
3,371 |
|
|
38,295 |
|
|
Zoll Medical Corp. (a) |
|
|
10,385 |
|
|
656,124 |
|
|
|
|
|
|
|
|
6,165,728 |
|
|
Medical Services — 0.2% |
|
|
|
|
|
|
|
|
Bio-Reference Labs, Inc. (a) |
|
|
11,626 |
|
|
189,155 |
|
|
eResearch Technology, Inc. (a) |
|
|
23,294 |
|
|
109,249 |
|
|
Neostem, Inc. (a) |
|
|
10,587 |
|
|
5,367 |
|
|
Parexel International Corp. (a) |
|
|
27,893 |
|
|
578,501 |
|
|
RadNet, Inc. (a) |
|
|
15,292 |
|
|
32,572 |
|
|
|
|
|
|
|
|
914,844 |
|
|
Metal Fabricating — 0.6% |
|
|
|
|
|
|
|
|
Ampco-Pittsburgh Corp. |
|
|
4,056 |
|
|
78,443 |
|
|
Compx International, Inc. |
|
|
465 |
|
|
6,849 |
|
|
Dynamic Materials Corp. |
|
|
6,343 |
|
|
125,465 |
|
|
Haynes International, Inc. |
|
|
5,787 |
|
|
315,970 |
|
|
Kaydon Corp. |
|
|
15,457 |
|
|
471,438 |
|
|
L.B. Foster Co., Class A |
|
|
4,278 |
|
|
121,025 |
|
|
Lawson Products, Inc. |
|
|
1,669 |
|
|
25,753 |
|
|
Metals USA Holdings Corp. (a) |
|
|
5,466 |
|
|
61,492 |
|
|
Mueller Industries, Inc. |
|
|
17,918 |
|
|
688,410 |
|
|
Mueller Water Products, Inc., Series A |
|
|
73,779 |
|
|
180,021 |
|
|
NN, Inc. (a) |
|
|
7,696 |
|
|
46,176 |
|
|
Northwest Pipe Co. (a) |
|
|
4,314 |
|
|
98,618 |
|
|
RBC Bearings, Inc. (a)(b) |
|
|
10,388 |
|
|
433,180 |
|
|
RTI International Metals, Inc. (a) |
|
|
14,290 |
|
|
331,671 |
|
|
Worthington Industries, Inc. |
|
|
27,245 |
|
|
446,273 |
|
|
|
|
|
|
|
|
3,430,784 |
|
|
Metals & Minerals: Diversified — 0.6% |
|
|
|
|
|
|
|
|
AMCOL International Corp. |
|
|
11,555 |
|
|
310,252 |
|
|
General Moly, Inc. (a)(b) |
|
|
31,951 |
|
|
98,729 |
|
|
Globe Specialty Metals, Inc. |
|
|
29,875 |
|
|
400,026 |
|
|
Hecla Mining Co. |
|
|
132,357 |
|
|
692,227 |
|
|
Materion Corp. (a)(b) |
|
|
9,674 |
|
|
234,885 |
|
|
Minerals Technologies, Inc. |
|
|
8,637 |
|
|
488,250 |
|
|
Oil-Dri Corp. of America |
|
|
2,369 |
|
|
47,948 |
|
|
Paramount Gold and Silver Corp. (a)(b) |
|
|
55,682 |
|
|
119,159 |
|
|
SunCoke Energy, Inc. (a) |
|
|
6,236 |
|
|
69,843 |
|
|
Thompson Creek Metals Co., Inc. (a) |
|
|
72,435 |
|
|
504,148 |
|
|
United States Lime & Minerals, Inc. (a) |
|
|
1,227 |
|
|
73,755 |
|
|
Ur-Energy, Inc. (a) |
|
|
52,825 |
|
|
45,377 |
|
|
Uranerz Energy Corp. (a)(b) |
|
|
30,397 |
|
|
55,322 |
|
|
|
|
|
|
See Notes to Financial Statements. |
||
|
|
|
|
|
28 |
BLACKROCK SMALL CAP INDEX FUND |
DECEMBER 31, 2011 |
|
|
|
|
|
|
|
Schedule of Investments (continued) |
Master Small Cap Index Series |
|
|
|
|
|
|
|
|
|
|
Common Stocks |
|
Shares |
|
Value |
|
||
|
Metals & Minerals: Diversified (concluded) |
|
|
|
|
|
|
|
|
Uranium Resources, Inc. (a)(b) |
|
|
47,358 |
|
$ |
34,382 |
|
|
US Energy Corp. — Wyoming (a) |
|
|
12,129 |
|
|
35,295 |
|
|
|
|
|
|
|
|
3,209,598 |
|
|
Miscellaneous Consumer Staples — 0.0% |
|
|
|
|
|
|
|
|
Spectrum Brands Holdings, Inc. (a) |
|
|
7,890 |
|
|
216,186 |
|
|
Office Supplies & Equipment — 0.6% |
|
|
|
|
|
|
|
|
ACCO Brands Corp. (a) |
|
|
26,177 |
|
|
252,608 |
|
|
AT Cross Co. (a) |
|
|
4,711 |
|
|
53,140 |
|
|
Electronics for Imaging, Inc. (a) |
|
|
22,108 |
|
|
315,039 |
|
|
Herman Miller, Inc. |
|
|
27,163 |
|
|
501,157 |
|
|
HNI Corp. |
|
|
21,239 |
|
|
554,338 |
|
|
Kimball International, Inc., Class B |
|
|
14,562 |
|
|
73,829 |
|
|
Knoll, Inc. |
|
|
22,706 |
|
|
337,184 |
|
|
Steelcase, Inc., Class A |
|
|
37,773 |
|
|
281,787 |
|
|
United Stationers, Inc. |
|
|
20,191 |
|
|
657,419 |
|
|
|
|
|
|
|
|
3,026,501 |
|
|
Offshore Drilling & Other Services — 0.1% |
|
|
|
|
|
|
|
|
Hercules Offshore, Inc. (a) |
|
|
54,560 |
|
|
242,246 |
|
|
Vantage Drilling Co. (a) |
|
|
81,823 |
|
|
94,915 |
|
|
|
|
|
|
|
|
337,161 |
|
|
Oil Well Equipment & Services — 1.9% |
|
|
|
|
|
|
|
|
Basic Energy Services, Inc. (a)(b) |
|
|
11,412 |
|
|
224,816 |
|
|
Cal Dive International, Inc. (a) |
|
|
45,279 |
|
|
101,878 |
|
|
Complete Production Services, Inc. (a) |
|
|
37,404 |
|
|
1,255,278 |
|
|
Dawson Geophysical Co. (a)(b) |
|
|
3,753 |
|
|
148,356 |
|
|
Dril-Quip, Inc. (a) |
|
|
16,281 |
|
|
1,071,615 |
|
|
Exterran Holdings, Inc. (a) |
|
|
30,232 |
|
|
275,111 |
|
|
Flotek Industries, Inc. (a) |
|
|
23,662 |
|
|
235,674 |
|
|
Geokinetics, Inc. (a) |
|
|
4,972 |
|
|
10,690 |
|
|
Global Geophysical Services, Inc. (a) |
|
|
8,570 |
|
|
57,590 |
|
|
Golar LNG Ltd. |
|
|
18,899 |
|
|
840,061 |
|
|
Gulf Island Fabrication, Inc. |
|
|
6,818 |
|
|
199,154 |
|
|
Helix Energy Solutions Group, Inc. (a) |
|
|
50,225 |
|
|
793,555 |
|
|
Hornbeck Offshore Services, Inc. (a) |
|
|
14,614 |
|
|
453,326 |
|
|
ION Geophysical Corp. (a) |
|
|
62,335 |
|
|
382,114 |
|
|
Key Energy Services, Inc. (a)(b) |
|
|
59,128 |
|
|
914,710 |
|
|
Lufkin Industries, Inc. |
|
|
14,433 |
|
|
971,485 |
|
|
Matrix Service Co. (a) |
|
|
12,587 |
|
|
118,821 |
|
|
Mitcham Industries, Inc. (a) |
|
|
5,707 |
|
|
124,641 |
|
|
Natural Gas Services Group, Inc. (a) |
|
|
5,790 |
|
|
83,723 |
|
|
Newpark Resources, Inc. (a)(b) |
|
|
42,869 |
|
|
407,256 |
|
|
OYO Geospace Corp. (a)(b) |
|
|
2,059 |
|
|
159,222 |
|
|
Parker Drilling Co. (a) |
|
|
55,343 |
|
|
396,809 |
|
|
Pioneer Drilling Co. (a) |
|
|
29,247 |
|
|
283,111 |
|
|
RigNet, Inc. (a) |
|
|
2,632 |
|
|
44,060 |
|
|
Tesco Corp. (a) |
|
|
14,361 |
|
|
181,523 |
|
|
Tetra Technologies, Inc. (a) |
|
|
36,470 |
|
|
340,630 |
|
|
Union Drilling, Inc. (a) |
|
|
6,948 |
|
|
43,356 |
|
|
Willbros Group, Inc. (a) |
|
|
19,055 |
|
|
69,932 |
|
|
|
|
|
|
|
|
10,188,497 |
|
|
Oil: Crude Producers — 3.1% |
|
|
|
|
|
|
|
|
Abraxas Petroleum Corp. (a) |
|
|
39,095 |
|
|
129,014 |
|
|
Apco Oil and Gas International, Inc. |
|
|
4,327 |
|
|
353,602 |
|
|
Approach Resources, Inc. (a) |
|
|
12,348 |
|
|
363,155 |
|
|
ATP Oil & Gas Corp. (a)(b) |
|
|
21,096 |
|
|
155,267 |
|
|
Berry Petroleum Co., Class A |
|
|
24,425 |
|
|
1,026,339 |
|
|
Bill Barrett Corp. (a) |
|
|
22,347 |
|
|
761,362 |
|
|
|
|
|
|
|
|
|
|
|
Common Stocks |
|
Shares |
|
Value |
|
||
|
Oil: Crude Producers (concluded) |
|
|
|
|
|
|
|
|
BPZ Resources, Inc. (a)(b) |
|
|
48,421 |
|
$ |
137,516 |
|
|
Callon Petroleum Co. (a) |
|
|
18,282 |
|
|
90,862 |
|
|
CAMAC Energy, Inc. (a) |
|
|
30,744 |
|
|
31,051 |
|
|
Carrizo Oil & Gas, Inc. (a) |
|
|
18,443 |
|
|
485,973 |
|
|
Cheniere Energy, Inc. (a) |
|
|
39,224 |
|
|
340,857 |
|
|
Clayton Williams Energy, Inc. (a) |
|
|
2,801 |
|
|
212,540 |
|
|
Comstock Resources, Inc. (a) |
|
|
22,561 |
|
|
345,183 |
|
|
Contango Oil & Gas Co. (a) |
|
|
5,769 |
|
|
335,640 |
|
|
Crimson Exploration, Inc. (a) |
|
|
10,671 |
|
|
30,519 |
|
|
Endeavour International Corp. (a)(b) |
|
|
17,609 |
|
|
153,022 |
|
|
Energy Partners Ltd. (a) |
|
|
13,752 |
|
|
200,779 |
|
|
Energy XXI Bermuda Ltd. (a) |
|
|
35,686 |
|
|
1,137,670 |
|
|
Evolution Petroleum Corp. (a) |
|
|
7,349 |
|
|
59,159 |
|
|
FX Energy, Inc. (a) |
|
|
24,891 |
|
|
119,477 |
|
|
Gastar Exploration Ltd. (a) |
|
|
27,138 |
|
|
86,299 |
|
|
GeoResources, Inc. (a) |
|
|
9,515 |
|
|
278,885 |
|
|
GMX Resources, Inc. (a)(b) |
|
|
29,313 |
|
|
36,641 |
|
|
Goodrich Petroleum Corp. (a) |
|
|
12,264 |
|
|
168,385 |
|
|
Gulfport Energy Corp. (a)(b) |
|
|
21,612 |
|
|
636,473 |
|
|
Harvest Natural Resources, Inc. (a)(b) |
|
|
16,095 |
|
|
118,781 |
|
|
Houston American Energy Corp. (a) |
|
|
7,876 |
|
|
96,008 |
|
|
Hyperdynamics Corp. (a)(b) |
|
|
73,797 |
|
|
180,803 |
|
|
Isramco, Inc. (a)(b) |
|
|
519 |
|
|
46,482 |
|
|
Kodiak Oil & Gas Corp. (a) |
|
|
122,099 |
|
|
1,159,940 |
|
|
Magnum Hunter Resources Corp. (a)(b) |
|
|
52,832 |
|
|
284,764 |
|
|
McMoRan Exploration Co. (a) |
|
|
46,551 |
|
|
677,317 |
|
|
Northern Oil And Gas, Inc. (a) |
|
|
29,918 |
|
|
717,434 |
|
|
Oasis Petroleum, Inc. (a) |
|
|
28,205 |
|
|
820,483 |
|
|
Panhandle Oil & Gas, Inc. |
|
|
3,334 |
|
|
109,389 |
|
|
Penn Virginia Corp. |
|
|
21,677 |
|
|
114,671 |
|
|
Petroleum Development Corp. (a)(b) |
|
|
11,148 |
|
|
391,406 |
|
|
Petroquest Energy, Inc. (a) |
|
|
26,582 |
|
|
175,441 |
|
|
Resolute Energy Corp. (a) |
|
|
21,799 |
|
|
235,429 |
|
|
Rex Energy Corp. (a) |
|
|
16,543 |
|
|
244,175 |
|
|
Rosetta Resources, Inc. (a) |
|
|
25,101 |
|
|
1,091,893 |
|
|
Stone Energy Corp. (a) |
|
|
23,223 |
|
|
612,623 |
|
|
Swift Energy Co. (a) |
|
|
20,100 |
|
|
597,372 |
|
|
Triangle Petroleum Corp. (a) |
|
|
20,435 |
|
|
121,997 |
|
|
Vaalco Energy, Inc. (a) |
|
|
24,357 |
|
|
147,116 |
|
|
Venoco, Inc. (a) |
|
|
14,035 |
|
|
95,017 |
|
|
Voyager Oil & Gas, Inc. (a) |
|
|
22,061 |
|
|
56,697 |
|
|
W&T Offshore, Inc. |
|
|
16,551 |
|
|
351,047 |
|
|
Warren Resources, Inc. (a) |
|
|
34,143 |
|
|
111,306 |
|
|
Zion Oil & Gas, Inc. (a) |
|
|
14,905 |
|
|
32,940 |
|
|
|
|
|
|
|
|
16,266,201 |
|
|
Oil: Integrated — 0.1% |
|
|
|
|
|
|
|
|
Targa Resources, Inc. |
|
|
7,763 |
|
|
315,876 |
|
|
Oil: Refining & Marketing — 0.6% |
|
|
|
|
|
|
|
|
Alon USA Energy, Inc. |
|
|
5,327 |
|
|
46,398 |
|
|
Clean Energy Fuels Corp. (a)(b) |
|
|
23,709 |
|
|
295,414 |
|
|
CVR Energy, Inc. (a) |
|
|
41,695 |
|
|
780,947 |
|
|
Delek US Holdings, Inc. |
|
|
6,993 |
|
|
79,790 |
|
|
Miller Energy Resources, Inc. (a)(b) |
|
|
14,093 |
|
|
39,320 |
|
|
Western Refining, Inc. |
|
|
25,158 |
|
|
334,350 |
|
|
World Fuel Services Corp. |
|
|
33,656 |
|
|
1,412,879 |
|
|
|
|
|
|
|
|
2,989,098 |
|
|
|
|
|
|
|
See Notes to Financial Statements. |
|||
|
|
|
|
|
|
|
BLACKROCK SMALL CAP INDEX FUND |
DECEMBER 31, 2011 |
29 |
|
|
|
|
|
|
|
Schedule of Investments (continued) |
Master Small Cap Index Series |
|
Common Stocks |
|
Shares |
|
Value |
|
||
|
Paints & Coatings — 0.1% |
|
|
|
|
|
|
|
|
Chase Corp. |
|
|
2,961 |
|
$ |
41,158 |
|
|
Ferro Corp. (a) |
|
|
41,124 |
|
|
201,096 |
|
|
H.B. Fuller Co. |
|
|
23,426 |
|
|
541,375 |
|
|
|
|
|
|
|
|
783,629 |
|
|
Paper — 0.5% |
|
|
|
|
|
|
|
|
Boise, Inc. |
|
|
43,378 |
|
|
308,851 |
|
|
Buckeye Technologies, Inc. |
|
|
18,895 |
|
|
631,849 |
|
|
Clearwater Paper Corp. (a) |
|
|
10,888 |
|
|
387,722 |
|
|
Kapstone Paper and Packaging Corp. (a) |
|
|
18,475 |
|
|
290,797 |
|
|
Neenah Paper, Inc. (a) |
|
|
7,042 |
|
|
157,177 |
|
|
P.H. Glatfelter Co. |
|
|
20,610 |
|
|
291,013 |
|
|
Schweitzer-Mauduit International, Inc. |
|
|
7,619 |
|
|
506,359 |
|
|
Verso Paper Corp. (a) |
|
|
7,798 |
|
|
7,486 |
|
|
Wausau Paper Corp. |
|
|
23,292 |
|
|
192,392 |
|
|
|
|
|
|
|
|
2,773,646 |
|
|
Personal Care — 0.1% |
|
|
|
|
|
|
|
|
Female Health Co. |
|
|
9,039 |
|
|
40,766 |
|
|
USANA Health Sciences, Inc. (a) |
|
|
3,094 |
|
|
93,965 |
|
|
WD-40 Co. |
|
|
7,584 |
|
|
306,469 |
|
|
|
|
|
|
|
|
441,200 |
|
|
Pharmaceuticals — 2.1% |
|
|
|
|
|
|
|
|
Achillion Pharmaceuticals, Inc. (a) |
|
|
22,518 |
|
|
171,587 |
|
|
Acura Pharmaceuticals, Inc. (a)(b) |
|
|
5,146 |
|
|
17,960 |
|
|
Akorn, Inc. (a) |
|
|
26,658 |
|
|
296,437 |
|
|
Ampio Pharmaceuticals, Inc. (a) |
|
|
9,874 |
|
|
42,162 |
|
|
Anacor Pharmaceuticals, Inc. (a) |
|
|
4,928 |
|
|
30,554 |
|
|
Ardea Biosciences, Inc. (a)(b) |
|
|
7,990 |
|
|
134,312 |
|
|
Auxilium Pharmaceuticals, Inc. (a) |
|
|
22,704 |
|
|
452,491 |
|
|
Avanir Pharmaceuticals, Inc. (a) |
|
|
58,920 |
|
|
120,786 |
|
|
BioCryst Pharmaceuticals, Inc. (a) |
|
|
13,221 |
|
|
32,656 |
|
|
Biospecifics Technologies (a) |
|
|
2,290 |
|
|
38,060 |
|
|
Cadence Pharmaceuticals, Inc. (a) |
|
|
23,966 |
|
|
94,666 |
|
|
Cambrex Corp. (a) |
|
|
13,881 |
|
|
99,666 |
|
|
Cleveland BioLabs, Inc. (a) |
|
|
14,174 |
|
|
40,538 |
|
|
Columbia Laboratories, Inc. (a)(b) |
|
|
18,549 |
|
|
46,373 |
|
|
Corcept Therapeutics, Inc. (a) |
|
|
19,494 |
|
|
66,669 |
|
|
Depomed, Inc. (a) |
|
|
25,551 |
|
|
132,354 |
|
|
Durect Corp. (a) |
|
|
38,471 |
|
|
45,396 |
|
|
Dusa Pharmaceuticals, Inc. (a) |
|
|
11,325 |
|
|
49,603 |
|
|
Endocyte, Inc. (a) |
|
|
8,597 |
|
|
32,325 |
|
|
Hi-Tech Pharmacal Co., Inc. (a) |
|
|
4,926 |
|
|
191,572 |
|
|
Impax Laboratories, Inc. (a)(b) |
|
|
30,988 |
|
|
625,028 |
|
|
Infinity Pharmaceuticals, Inc. (a) |
|
|
9,072 |
|
|
80,196 |
|
|
Ironwood Pharmaceuticals, Inc. (a) |
|
|
23,990 |
|
|
287,160 |
|
|
Isis Pharmaceuticals, Inc. (a) |
|
|
47,196 |
|
|
340,283 |
|
|
ISTA Pharmaceuticals, Inc. (a) |
|
|
15,264 |
|
|
107,611 |
|
|
Jazz Pharmaceuticals, Inc. (a) |
|
|
10,474 |
|
|
404,611 |
|
|
K-V Pharmaceutical Co., Class A (a) |
|
|
23,470 |
|
|
32,858 |
|
|
Lannett Co., Inc. (a) |
|
|
8,104 |
|
|
35,820 |
|
|
MAP Pharmaceuticals, Inc. (a) |
|
|
10,405 |
|
|
137,034 |
|
|
The Medicines Co. (a) |
|
|
25,557 |
|
|
476,382 |
|
|
Medicis Pharmaceutical Corp., Class A |
|
|
29,273 |
|
|
973,327 |
|
|
Obagi Medical Products, Inc. (a) |
|
|
8,902 |
|
|
90,444 |
|
|
Optimer Pharmaceuticals, Inc. (a)(b) |
|
|
21,947 |
|
|
268,631 |
|
|
Pacira Pharmaceuticals, Inc. (a) |
|
|
3,318 |
|
|
28,701 |
|
|
Pain Therapeutics, Inc. (a) |
|
|
18,264 |
|
|
69,403 |
|
|
Par Pharmaceutical Cos., Inc. (a) |
|
|
17,182 |
|
|
562,367 |
|
|
Pernix Therapeutics Holdings, Inc. (a) |
|
|
1,687 |
|
|
15,622 |
|
|
|
|
|
|
|
|
|
|
|
Common Stocks |
|
Shares |
|
Value |
|
||
|
Pharmaceuticals (concluded) |
|
|
|
|
|
|
|
|
Pharmacyclics, Inc. (a) |
|
|
21,753 |
|
$ |
322,379 |
|
|
Pozen, Inc. (a) |
|
|
12,270 |
|
|
48,467 |
|
|
Prestige Brands Holdings, Inc. (a) |
|
|
23,899 |
|
|
269,342 |
|
|
Questcor Pharmaceuticals, Inc. (a) |
|
|
25,174 |
|
|
1,046,735 |
|
|
Sagent Pharmaceuticals, Inc. (a) |
|
|
3,074 |
|
|
64,554 |
|
|
Salix Pharmaceuticals Ltd. (a) |
|
|
27,677 |
|
|
1,324,344 |
|
|
Santarus, Inc. (a) |
|
|
25,288 |
|
|
83,703 |
|
|
Sciclone Pharmaceuticals, Inc. (a)(b) |
|
|
16,383 |
|
|
70,283 |
|
|
SIGA Technologies, Inc. (a)(b) |
|
|
15,618 |
|
|
39,357 |
|
|
Spectrum Pharmaceuticals, Inc. (a)(b) |
|
|
27,212 |
|
|
398,112 |
|
|
Vical, Inc. (a) |
|
|
34,062 |
|
|
150,213 |
|
|
Vivus, Inc. (a) |
|
|
42,154 |
|
|
411,001 |
|
|
Xenoport, Inc. (a) |
|
|
16,389 |
|
|
62,442 |
|
|
Zogenix, Inc. (a) |
|
|
9,795 |
|
|
21,941 |
|
|
|
|
|
|
|
|
10,984,518 |
|
|
Photography — 0.0% |
|
|
|
|
|
|
|
|
Eastman Kodak Co. (a)(b) |
|
|
137,534 |
|
|
89,328 |
|
|
Plastics — 0.1% |
|
|
|
|
|
|
|
|
A. Schulman, Inc. |
|
|
14,633 |
|
|
309,927 |
|
|
Spartech Corp. (a) |
|
|
14,719 |
|
|
69,621 |
|
|
|
|
|
|
|
|
379,548 |
|
|
Power Transmission Equipment — 0.2% |
|
|
|
|
|
|
|
|
Active Power, Inc. (a) |
|
|
40,379 |
|
|
26,650 |
|
|
Advanced Energy Industries, Inc. (a) |
|
|
20,680 |
|
|
221,896 |
|
|
Generac Holdings, Inc. (a) |
|
|
11,802 |
|
|
330,810 |
|
|
Global Power Equipment Group, Inc. (a) |
|
|
7,461 |
|
|
177,199 |
|
|
Maxwell Technologies, Inc. (a) |
|
|
13,224 |
|
|
214,758 |
|
|
Powell Industries, Inc. (a) |
|
|
4,174 |
|
|
130,563 |
|
|
Power-One, Inc. (a) |
|
|
32,347 |
|
|
126,477 |
|
|
Vicor Corp. |
|
|
9,374 |
|
|
74,617 |
|
|
|
|
|
|
|
|
1,302,970 |
|
|
Precious Metals & Minerals — 0.2% |
|
|
|
|
|
|
|
|
Golden Minerals Co. (a) |
|
|
13,345 |
|
|
77,535 |
|
|
Horsehead Holding Corp. (a) |
|
|
20,743 |
|
|
186,894 |
|
|
Stillwater Mining Co. (a) |
|
|
54,646 |
|
|
571,597 |
|
|
|
|
|
|
|
|
836,026 |
|
|
Printing & Copying Services — 0.0% |
|
|
|
|
|
|
|
|
Casella Waste Systems, Inc. (a) |
|
|
11,898 |
|
|
76,147 |
|
|
Cenveo, Inc. (a) |
|
|
25,778 |
|
|
87,645 |
|
|
|
|
|
|
|
|
163,792 |
|
|
Producer Durables: Miscellaneous — 0.1% |
|
|
|
|
|
|
|
|
Blount International, Inc. (a) |
|
|
23,010 |
|
|
334,105 |
|
|
Park-Ohio Holdings Corp. (a)(b) |
|
|
3,889 |
|
|
69,380 |
|
|
|
|
|
|
|
|
403,485 |
|
|
Production Technology Equipment — 1.3% |
|
|
|
|
|
|
|
|
ATMI, Inc. (a)(b)(c) |
|
|
15,023 |
|
|
300,911 |
|
|
Axcelis Technologies, Inc. (a) |
|
|
50,821 |
|
|
67,592 |
|
|
Brooks Automation, Inc. |
|
|
31,418 |
|
|
322,663 |
|
|
Cognex Corp. |
|
|
19,650 |
|
|
703,274 |
|
|
Cohu, Inc. |
|
|
11,475 |
|
|
130,241 |
|
|
Cymer, Inc. (a) |
|
|
14,461 |
|
|
719,579 |
|
|
Electro Scientific Industries, Inc. |
|
|
10,686 |
|
|
154,733 |
|
|
Entegris, Inc. (a) |
|
|
63,753 |
|
|
556,245 |
|
|
FEI Co. (a) |
|
|
18,330 |
|
|
747,497 |
|
|
FSI International, Inc. (a) |
|
|
18,509 |
|
|
67,743 |
|
|
GSI Group, Inc. (a) |
|
|
12,244 |
|
|
125,256 |
|
|
Intevac, Inc. (a)(b) |
|
|
10,909 |
|
|
80,727 |
|
|
Kulicke & Soffa Industries, Inc. (a) |
|
|
34,180 |
|
|
316,165 |
|
|
|
|
|
|
See Notes to Financial Statements. |
||
|
|
|
|
|
30 |
BLACKROCK SMALL CAP INDEX FUND |
DECEMBER 31, 2011 |
|
|
|
|
|
|
|
Schedule of Investments (continued) |
Master Small Cap Index Series |
|
|
|
|
|
|
|
|
|
|
Common Stocks |
|
Shares |
|
Value |
|
||
|
Production Technology Equipment (concluded) |
|
|
|
|
|
|
|
|
LTX-Credence Corp. (a) |
|
|
23,507 |
|
$ |
125,763 |
|
|
MKS Instruments, Inc. |
|
|
24,760 |
|
|
688,823 |
|
|
Nanometrics, Inc. (a) |
|
|
9,536 |
|
|
175,653 |
|
|
Photronics, Inc. (a) |
|
|
27,962 |
|
|
170,009 |
|
|
Rudolph Technologies, Inc. (a)(b) |
|
|
14,997 |
|
|
138,872 |
|
|
Tessera Technologies, Inc. (a) |
|
|
24,262 |
|
|
406,389 |
|
|
Ultra Clean Holdings, Inc. (a) |
|
|
10,712 |
|
|
65,450 |
|
|
Ultratech, Inc. (a) |
|
|
11,911 |
|
|
292,653 |
|
|
Veeco Instruments, Inc. (a) |
|
|
19,309 |
|
|
401,627 |
|
|
|
|
|
|
|
|
6,757,865 |
|
|
Publishing — 0.4% |
|
|
|
|
|
|
|
|
AH Belo Corp. |
|
|
8,552 |
|
|
40,622 |
|
|
Courier Corp. |
|
|
4,851 |
|
|
56,902 |
|
|
The Dolan Co. (a) |
|
|
14,336 |
|
|
122,143 |
|
|
Journal Communications, Inc., Class A (a) |
|
|
20,633 |
|
|
90,785 |
|
|
Martha Stewart Living Omnimedia, Inc., Class A |
|
|
12,937 |
|
|
56,923 |
|
|
McClatchy Co., Class A (a)(b) |
|
|
27,142 |
|
|
64,869 |
|
|
Meredith Corp. |
|
|
17,216 |
|
|
562,102 |
|
|
The New York Times Co., Class A (a) |
|
|
64,963 |
|
|
502,164 |
|
|
Scholastic Corp. |
|
|
12,577 |
|
|
376,933 |
|
|
Value Line, Inc. |
|
|
699 |
|
|
7,186 |
|
|
|
|
|
|
|
|
1,880,629 |
|
|
Radio & TV Broadcasters — 0.2% |
|
|
|
|
|
|
|
|
Central European Media Enterprises, Ltd. (a) |
|
|
17,350 |
|
|
113,122 |
|
|
Crown Media Holdings, Inc., Class A (a)(b) |
|
|
18,488 |
|
|
22,370 |
|
|
Cumulus Media, Inc., Class A (a) |
|
|
17,291 |
|
|
57,752 |
|
|
Dial Global, Inc. (a)(b) |
|
|
2,711 |
|
|
8,648 |
|
|
Entercom Communications Corp. (a) |
|
|
11,465 |
|
|
70,510 |
|
|
Entravision Communications Corp., Class A |
|
|
25,376 |
|
|
39,587 |
|
|
Fisher Communications, Inc. (a) |
|
|
4,138 |
|
|
119,299 |
|
|
Gray Television, Inc. (a) |
|
|
24,582 |
|
|
39,823 |
|
|
Lin TV Corp., Class A (a) |
|
|
13,877 |
|
|
58,700 |
|
|
Nexstar Broadcasting Group, Inc., Class A (a) |
|
|
4,924 |
|
|
38,604 |
|
|
Outdoor Channel Holdings, Inc. |
|
|
6,875 |
|
|
51,287 |
|
|
Saga Communications, Inc. (a) |
|
|
1,766 |
|
|
66,013 |
|
|
Sinclair Broadcast Group, Inc., Class A |
|
|
23,901 |
|
|
270,798 |
|
|
|
|
|
|
|
|
956,513 |
|
|
Railroad Equipment — 0.1% |
|
|
|
|
|
|
|
|
American Railcar Industries, Inc. (a) |
|
|
4,644 |
|
|
111,131 |
|
|
Freightcar America, Inc. (a) |
|
|
5,687 |
|
|
119,142 |
|
|
Greenbrier Cos., Inc. (a)(b) |
|
|
9,371 |
|
|
227,528 |
|
|
|
|
|
|
|
|
457,801 |
|
|
Railroads — 0.2% |
|
|
|
|
|
|
|
|
Genesee & Wyoming, Inc., Class A (a) |
|
|
18,773 |
|
|
1,137,268 |
|
|
Railamerica, Inc. (a) |
|
|
10,096 |
|
|
150,330 |
|
|
|
|
|
|
|
|
1,287,598 |
|
|
Real Estate — 0.2% |
|
|
|
|
|
|
|
|
Avatar Holdings, Inc. (a) |
|
|
4,497 |
|
|
32,288 |
|
|
Consolidated-Tomoka Land Co. |
|
|
1,911 |
|
|
51,731 |
|
|
Forestar Group, Inc. (a) |
|
|
16,822 |
|
|
254,517 |
|
|
Griffin Land & Nurseries, Inc. |
|
|
1,164 |
|
|
30,799 |
|
|
HFF, Inc., Class A (a) |
|
|
13,975 |
|
|
144,362 |
|
|
Kennedy-Wilson Holdings, Inc. |
|
|
12,531 |
|
|
132,578 |
|
|
Tejon Ranch Co. (a) |
|
|
6,748 |
|
|
165,191 |
|
|
|
|
|
|
|
|
811,466 |
|
|
|
|
|
|
|
|
|
|
|
Common Stocks |
|
Shares |
|
Value |
|
||
|
Real Estate Investment Trusts (REITs) — 8.8% |
|
|
|
|
|
|
|
|
Acadia Realty Trust |
|
|
20,137 |
|
$ |
405,559 |
|
|
AG Mortgage Investment Trust, Inc. |
|
|
3,062 |
|
|
61,638 |
|
|
Agree Realty Corp. |
|
|
4,742 |
|
|
115,610 |
|
|
Alexander’s, Inc. |
|
|
971 |
|
|
359,299 |
|
|
American Assets Trust, Inc. |
|
|
15,204 |
|
|
311,834 |
|
|
American Campus Communities, Inc. (b) |
|
|
32,143 |
|
|
1,348,720 |
|
|
American Capital Mortgage Investment Corp. |
|
|
3,909 |
|
|
73,567 |
|
|
Anworth Mortgage Asset Corp. |
|
|
64,052 |
|
|
402,247 |
|
|
Apollo Commercial Real Estate Finance, Inc. |
|
|
9,499 |
|
|
124,722 |
|
|
ARMOUR Residential REIT, Inc. |
|
|
43,834 |
|
|
309,030 |
|
|
Ashford Hospitality Trust, Inc. |
|
|
24,768 |
|
|
198,144 |
|
|
Associated Estates Realty Corp. (b) |
|
|
19,664 |
|
|
313,641 |
|
|
BioMed Realty Trust, Inc. |
|
|
72,964 |
|
|
1,319,189 |
|
|
Campus Crest Communities, Inc. |
|
|
14,513 |
|
|
146,001 |
|
|
CapLease, Inc. |
|
|
32,521 |
|
|
131,385 |
|
|
Capstead Mortgage Corp. |
|
|
40,185 |
|
|
499,901 |
|
|
CBL & Associates Properties, Inc. |
|
|
70,399 |
|
|
1,105,264 |
|
|
Cedar Realty Trust, Inc. (b) |
|
|
26,860 |
|
|
115,767 |
|
|
Chatham Lodging Trust |
|
|
6,479 |
|
|
69,844 |
|
|
Chesapeake Lodging Trust |
|
|
15,357 |
|
|
237,419 |
|
|
Cogdell Spencer, Inc. |
|
|
21,267 |
|
|
90,385 |
|
|
Colonial Properties Trust |
|
|
39,605 |
|
|
826,160 |
|
|
Colony Financial, Inc. |
|
|
15,599 |
|
|
245,060 |
|
|
Coresite Realty Corp. |
|
|
9,402 |
|
|
167,544 |
|
|
Cousins Properties, Inc. |
|
|
43,528 |
|
|
279,014 |
|
|
CreXus Investment Corp. |
|
|
27,378 |
|
|
284,184 |
|
|
CubeSmart |
|
|
58,198 |
|
|
619,227 |
|
|
CYS Investments, Inc. |
|
|
39,038 |
|
|
512,959 |
|
|
DCT Industrial Trust, Inc. (b) |
|
|
116,750 |
|
|
597,760 |
|
|
DiamondRock Hospitality Co. (b) |
|
|
79,639 |
|
|
767,720 |
|
|
Dupont Fabros Technology, Inc. (b) |
|
|
27,889 |
|
|
675,472 |
|
|
Dynex Capital Corp. (b) |
|
|
19,046 |
|
|
173,890 |
|
|
Eastgroup Properties, Inc. (b) |
|
|
12,823 |
|
|
557,544 |
|
|
Education Realty Trust, Inc. |
|
|
43,647 |
|
|
446,509 |
|
|
Entertainment Properties Trust |
|
|
22,142 |
|
|
967,827 |
|
|
Equity Lifestyle Properties, Inc. |
|
|
14,552 |
|
|
970,473 |
|
|
Equity One, Inc. |
|
|
25,574 |
|
|
434,247 |
|
|
Excel Trust, Inc. |
|
|
14,478 |
|
|
173,736 |
|
|
Extra Space Storage, Inc. |
|
|
44,523 |
|
|
1,078,792 |
|
|
FelCor Lodging Trust, Inc. (a)(b) |
|
|
59,255 |
|
|
180,728 |
|
|
First Industrial Realty Trust, Inc. (a) |
|
|
41,078 |
|
|
420,228 |
|
|
First Potomac Realty Trust |
|
|
23,835 |
|
|
311,047 |
|
|
Franklin Street Properties Corp. |
|
|
33,899 |
|
|
337,295 |
|
|
Getty Realty Corp. |
|
|
12,483 |
|
|
174,138 |
|
|
Gladstone Commercial Corp. |
|
|
5,278 |
|
|
92,629 |
|
|
Glimcher Realty Trust (b) |
|
|
50,927 |
|
|
468,528 |
|
|
Government Properties Income Trust |
|
|
16,874 |
|
|
380,509 |
|
|
Hatteras Financial Corp. |
|
|
35,450 |
|
|
934,817 |
|
|
Healthcare Realty Trust, Inc. (b) |
|
|
36,970 |
|
|
687,272 |
|
|
Hersha Hospitality Trust (b) |
|
|
67,135 |
|
|
327,619 |
|
|
Highwoods Properties, Inc. |
|
|
34,223 |
|
|
1,015,396 |
|
|
Home Properties, Inc. |
|
|
22,735 |
|
|
1,308,854 |
|
|
Hudson Pacific Properties, Inc. |
|
|
10,451 |
|
|
147,986 |
|
|
Inland Real Estate Corp. |
|
|
36,938 |
|
|
281,098 |
|
|
InvesCo. Mortgage Capital, Inc. |
|
|
54,883 |
|
|
771,106 |
|
|
Investors Real Estate Trust |
|
|
38,380 |
|
|
279,982 |
|
|
iStar Financial, Inc. (a) |
|
|
38,768 |
|
|
205,083 |
|
|
Kilroy Realty Corp. |
|
|
27,727 |
|
|
1,055,567 |
|
|
Kite Realty Group Trust |
|
|
26,774 |
|
|
120,751 |
|
|
LaSalle Hotel Properties |
|
|
40,388 |
|
|
977,793 |
|
|
Lexington Corporate Properties Trust |
|
|
57,057 |
|
|
427,357 |
|
|
LTC Properties, Inc. (b) |
|
|
14,459 |
|
|
446,205 |
|
|
|
|
|
|
|
See Notes to Financial Statements. |
|||
|
|
|
|
|
|
|
BLACKROCK SMALL CAP INDEX FUND |
DECEMBER 31, 2011 |
31 |
|
|
|
|
|
|
|
Schedule of Investments (continued) |
Master Small Cap Index Series |
|
|
|
|
|
|
|
|
|
|
Common Stocks |
|
Shares |
|
Value |
|
||
|
Real Estate Investment Trusts (REITs) (concluded) |
|
|
|
|
|
|
|
|
Medical Properties Trust, Inc. |
|
|
53,322 |
|
$ |
526,288 |
|
|
MFA Financial, Inc. |
|
|
169,299 |
|
|
1,137,689 |
|
|
Mid-America Apartment Communities, Inc. |
|
|
17,371 |
|
|
1,086,556 |
|
|
Mission West Properties, Inc. |
|
|
8,317 |
|
|
75,019 |
|
|
Monmouth Real Estate Investment Corp., Class A |
|
|
18,412 |
|
|
168,470 |
|
|
MPG Office Trust, Inc. (a) |
|
|
23,522 |
|
|
46,809 |
|
|
National Health Investors, Inc. |
|
|
11,611 |
|
|
510,652 |
|
|
National Retail Properties, Inc. |
|
|
49,500 |
|
|
1,305,810 |
|
|
Newcastle Investment Corp. |
|
|
50,057 |
|
|
232,765 |
|
|
NorthStar Realty Finance Corp. |
|
|
45,477 |
|
|
216,925 |
|
|
Omega Healthcare Investors, Inc. (b) |
|
|
48,346 |
|
|
935,495 |
|
|
One Liberty Properties, Inc. |
|
|
5,342 |
|
|
88,143 |
|
|
Parkway Properties, Inc. |
|
|
10,326 |
|
|
101,814 |
|
|
Pebblebrook Hotel Trust |
|
|
24,167 |
|
|
463,523 |
|
|
Pennsylvania Real Estate Investment Trust (b) |
|
|
26,471 |
|
|
276,357 |
|
|
PennyMac Mortgage Investment Trust (d) |
|
|
13,158 |
|
|
218,686 |
|
|
Post Properties, Inc. |
|
|
23,611 |
|
|
1,032,273 |
|
|
Potlatch Corp. (b) |
|
|
19,111 |
|
|
594,543 |
|
|
PS Business Parks, Inc. |
|
|
8,838 |
|
|
489,890 |
|
|
RAIT Financial Trust |
|
|
18,666 |
|
|
88,664 |
|
|
Ramco-Gershenson Properties Trust |
|
|
18,454 |
|
|
181,403 |
|
|
Redwood Trust, Inc. |
|
|
37,226 |
|
|
378,961 |
|
|
Resource Capital Corp. |
|
|
36,793 |
|
|
206,409 |
|
|
Retail Opportunity Investments Corp. |
|
|
23,410 |
|
|
277,174 |
|
|
RLJ Lodging Trust |
|
|
13,104 |
|
|
220,540 |
|
|
Sabra Healthcare REIT, Inc. |
|
|
17,561 |
|
|
212,312 |
|
|
Saul Centers, Inc. |
|
|
3,471 |
|
|
122,943 |
|
|
Sovran Self Storage, Inc. |
|
|
13,157 |
|
|
561,409 |
|
|
STAG Industrial, Inc. |
|
|
7,275 |
|
|
83,444 |
|
|
Starwood Property Trust, Inc. |
|
|
44,307 |
|
|
820,123 |
|
|
Strategic Hotel Capital, Inc. (a) |
|
|
82,968 |
|
|
445,538 |
|
|
Summit Hotel Properties, Inc. |
|
|
13,024 |
|
|
122,947 |
|
|
Sun Communities, Inc. |
|
|
10,064 |
|
|
367,638 |
|
|
Sunstone Hotel Investors, Inc. (a) |
|
|
56,088 |
|
|
457,117 |
|
|
Tanger Factory Outlet Centers, Inc. |
|
|
40,689 |
|
|
1,193,001 |
|
|
Terreno Realty Corp. |
|
|
4,348 |
|
|
65,829 |
|
|
Two Harbors Investment Corp. |
|
|
66,738 |
|
|
616,659 |
|
|
UMH Properties, Inc. |
|
|
5,972 |
|
|
55,599 |
|
|
Universal Health Realty Income Trust |
|
|
3,196 |
|
|
124,644 |
|
|
Urstadt Biddle Properties, Inc., Class A |
|
|
11,063 |
|
|
200,019 |
|
|
Walter Investment Management Corp. |
|
|
12,226 |
|
|
250,755 |
|
|
Washington Real Estate Investment Trust |
|
|
31,302 |
|
|
856,110 |
|
|
Whitestone REIT |
|
|
3,393 |
|
|
40,377 |
|
|
Winthrop Realty Trust |
|
|
13,820 |
|
|
140,549 |
|
|
|
|
|
|
|
|
46,467,143 |
|
|
Recreational Vehicles & Boats — 0.2% |
|
|
|
|
|
|
|
|
Arctic Cat, Inc. (a) |
|
|
5,767 |
|
|
130,046 |
|
|
Brunswick Corp. |
|
|
42,191 |
|
|
761,970 |
|
|
Drew Industries, Inc. (a) |
|
|
9,061 |
|
|
222,266 |
|
|
Marine Products Corp. (a) |
|
|
5,167 |
|
|
25,628 |
|
|
Winnebago Industries, Inc. (a) |
|
|
13,802 |
|
|
101,859 |
|
|
|
|
|
|
|
|
1,241,769 |
|
|
Rental & Leasing Services: Consumer — 0.6% |
|
|
|
|
|
|
|
|
Amerco, Inc. (a) |
|
|
4,103 |
|
|
362,705 |
|
|
Avis Budget Group, Inc. (a) |
|
|
49,773 |
|
|
533,567 |
|
|
Dollar Thrifty Automotive Group, Inc. (a)(b) |
|
|
13,704 |
|
|
962,843 |
|
|
Rent-A-Center, Inc. |
|
|
27,827 |
|
|
1,029,599 |
|
|
Zipcar, Inc. (a)(b) |
|
|
4,728 |
|
|
63,450 |
|
|
|
|
|
|
|
|
2,952,164 |
|
|
|
|
|
|
|
|
|
|
|
Common Stocks |
|
Shares |
|
Value |
|
||
|
Restaurants — 1.5% |
|
|
|
|
|
|
|
|
AFC Enterprises, Inc. (a) |
|
|
11,748 |
|
$ |
172,696 |
|
|
Benihana, Inc. |
|
|
6,608 |
|
|
67,600 |
|
|
Biglari Holdings, Inc. (a) |
|
|
574 |
|
|
211,370 |
|
|
BJ’s Restaurants, Inc. (a) |
|
|
11,392 |
|
|
516,285 |
|
|
Bob Evans Farms, Inc. |
|
|
14,370 |
|
|
481,970 |
|
|
Bravo Brio Restaurant Group, Inc. (a) |
|
|
9,141 |
|
|
156,768 |
|
|
Buffalo Wild Wings, Inc. (a)(b) |
|
|
8,672 |
|
|
585,447 |
|
|
Caribou Coffee Co., Inc. (a) |
|
|
5,988 |
|
|
83,533 |
|
|
Carrols Restaurant Group, Inc. (a) |
|
|
6,117 |
|
|
70,774 |
|
|
CEC Entertainment, Inc. |
|
|
9,405 |
|
|
324,002 |
|
|
The Cheesecake Factory, Inc. (a) |
|
|
27,375 |
|
|
803,456 |
|
|
Cracker Barrel Old Country Store, Inc. |
|
|
10,866 |
|
|
547,755 |
|
|
Denny’s Corp. (a) |
|
|
46,958 |
|
|
176,562 |
|
|
DineEquity, Inc. (a)(b) |
|
|
7,325 |
|
|
309,188 |
|
|
Domino’s Pizza, Inc. (a) |
|
|
27,560 |
|
|
935,662 |
|
|
Einstein Noah Restaurant Group, Inc. |
|
|
2,927 |
|
|
46,305 |
|
|
Ellie Mae, Inc. (a) |
|
|
4,123 |
|
|
23,295 |
|
|
Jack in the Box, Inc. (a) |
|
|
20,802 |
|
|
434,762 |
|
|
Jamba, Inc. (a) |
|
|
30,157 |
|
|
39,506 |
|
|
Krispy Kreme Doughnuts, Inc. (a) |
|
|
27,765 |
|
|
181,583 |
|
|
Luby’s, Inc. (a) |
|
|
9,063 |
|
|
40,874 |
|
|
McCormick & Schmick’s Seafood Restaurants, Inc. (a) |
|
|
6,279 |
|
|
54,878 |
|
|
O’Charleys, Inc. (a)(b) |
|
|
9,011 |
|
|
49,470 |
|
|
P.F. Chang’s China Bistro, Inc. |
|
|
10,069 |
|
|
311,233 |
|
|
Papa John’s International, Inc. (a) |
|
|
8,834 |
|
|
332,865 |
|
|
Red Robin Gourmet Burgers, Inc. (a) |
|
|
6,146 |
|
|
170,244 |
|
|
Ruby Tuesday, Inc. (a) |
|
|
30,978 |
|
|
213,748 |
|
|
Ruth’s Hospitality Group, Inc. (a) |
|
|
16,781 |
|
|
83,402 |
|
|
Sonic Corp. (a) |
|
|
29,287 |
|
|
197,102 |
|
|
Texas Roadhouse, Inc., Class A |
|
|
29,859 |
|
|
444,899 |
|
|
|
|
|
|
|
|
8,067,234 |
|
|
Scientific Instruments: Control & Filter — 0.7% |
|
|
|
|
|
|
|
|
Brady Corp. |
|
|
22,505 |
|
|
710,483 |
|
|
CIRCOR International, Inc. |
|
|
8,163 |
|
|
288,236 |
|
|
Energy Recovery, Inc. (a) |
|
|
21,246 |
|
|
54,815 |
|
|
ESCO Technologies, Inc. |
|
|
12,605 |
|
|
362,772 |
|
|
The Gorman-Rupp Co. |
|
|
7,232 |
|
|
196,349 |
|
|
Mine Safety Appliances Co. |
|
|
12,901 |
|
|
427,281 |
|
|
PMFG, Inc. (a) |
|
|
8,340 |
|
|
162,713 |
|
|
Robbins & Myers, Inc. |
|
|
18,684 |
|
|
907,108 |
|
|
Sun Hydraulics, Inc. |
|
|
9,550 |
|
|
223,756 |
|
|
Thermon Group Holdings, Inc. (a) |
|
|
4,742 |
|
|
83,554 |
|
|
Watts Water Technologies, Inc., Class A |
|
|
14,252 |
|
|
487,561 |
|
|
X-Rite, Inc. (a) |
|
|
12,373 |
|
|
57,411 |
|
|
|
|
|
|
|
|
3,962,039 |
|
|
Scientific Instruments: Electrical — 0.6% |
|
|
|
|
|
|
|
|
A123 Systems, Inc. (a) |
|
|
41,814 |
|
|
67,321 |
|
|
American Superconductor Corp. (a)(b) |
|
|
21,173 |
|
|
78,128 |
|
|
A.O. Smith Corp. |
|
|
18,001 |
|
|
722,200 |
|
|
AZZ, Inc. |
|
|
5,942 |
|
|
270,005 |
|
|
Broadwind Energy, Inc. (a) |
|
|
55,821 |
|
|
37,958 |
|
|
Coleman Cable, Inc. (a) |
|
|
4,183 |
|
|
36,392 |
|
|
EnerSys (a) |
|
|
22,602 |
|
|
586,974 |
|
|
Franklin Electric Co., Inc. |
|
|
11,029 |
|
|
480,423 |
|
|
Houston Wire & Cable Co. |
|
|
8,477 |
|
|
117,152 |
|
|
Littelfuse, Inc. |
|
|
10,766 |
|
|
462,723 |
|
|
Preformed Line Products Co. |
|
|
1,130 |
|
|
67,416 |
|
|
SatCon Technology Corp. (a) |
|
|
25,649 |
|
|
15,392 |
|
|
Taser International, Inc. (a) |
|
|
26,372 |
|
|
135,025 |
|
|
Valence Technology, Inc. (a) |
|
|
36,478 |
|
|
35,748 |
|
|
|
|
|
|
|
|
3,112,857 |
|
|
|
|
|
|
See Notes to Financial Statements. |
||
|
|
|
|
|
32 |
BLACKROCK SMALL CAP INDEX FUND |
DECEMBER 31, 2011 |
|
|
|
|
|
|
|
Schedule of Investments (continued) |
Master Small Cap Index Series |
|
(Percentages shown are based on Net Assets) |
|
|
|
|
|
|
|
|
|
|
Common Stocks |
|
Shares |
|
Value |
|
||
|
Scientific Instruments: Gauges & Meters — 0.2% |
|
|
|
|
|
|
|
|
Badger Meter, Inc. |
|
|
7,144 |
|
$ |
210,248 |
|
|
Faro Technologies, Inc. (a) |
|
|
7,742 |
|
|
356,132 |
|
|
Measurement Specialties, Inc. (a) |
|
|
7,089 |
|
|
198,209 |
|
|
Vishay Precision Group, Inc. (a) |
|
|
5,788 |
|
|
92,492 |
|
|
Zygo Corp. (a) |
|
|
7,548 |
|
|
133,222 |
|
|
|
|
|
|
|
|
990,303 |
|
|
Scientific Instruments: Pollution Control — 0.6% |
|
|
|
|
|
|
|
|
Clean Harbors, Inc. (a)(b) |
|
|
22,189 |
|
|
1,414,105 |
|
|
Darling International, Inc. (a) |
|
|
55,459 |
|
|
737,050 |
|
|
EnergySolutions, Inc. (a) |
|
|
37,817 |
|
|
116,855 |
|
|
Fuel Tech, Inc. (a) |
|
|
8,724 |
|
|
57,404 |
|
|
Heritage-Crystal Clean, Inc. (a) |
|
|
2,328 |
|
|
38,552 |
|
|
Met-Pro Corp. |
|
|
6,875 |
|
|
62,150 |
|
|
Metalico, Inc. (a) |
|
|
18,767 |
|
|
61,743 |
|
|
Team, Inc. (a)(b) |
|
|
9,223 |
|
|
274,384 |
|
|
TRC Cos., Inc. (a) |
|
|
8,414 |
|
|
50,568 |
|
|
US Ecology, Inc. |
|
|
8,742 |
|
|
164,175 |
|
|
WCA Waste Corp. (a) |
|
|
7,998 |
|
|
52,067 |
|
|
|
|
|
|
|
|
3,029,053 |
|
|
Securities Brokerage & Services — 0.4% |
|
|
|
|
|
|
|
|
BGC Partners, Inc. |
|
|
36,076 |
|
|
214,291 |
|
|
FXCM, Inc. |
|
|
8,047 |
|
|
78,458 |
|
|
Gain Capital Holdings, Inc. |
|
|
4,017 |
|
|
26,914 |
|
|
GFI Group, Inc. |
|
|
33,832 |
|
|
139,388 |
|
|
Gladstone Investment Corp. |
|
|
10,319 |
|
|
75,019 |
|
|
International FCStone, Inc. (a) |
|
|
6,258 |
|
|
147,501 |
|
|
Investment Technology Group, Inc. (a) |
|
|
19,558 |
|
|
211,422 |
|
|
KBW, Inc. |
|
|
15,670 |
|
|
237,871 |
|
|
Knight Capital Group, Inc., Class A (a)(b) |
|
|
47,508 |
|
|
561,545 |
|
|
Ladenburg Thalmann Financial Services, Inc. (a) |
|
|
50,629 |
|
|
125,560 |
|
|
MarketAxess Holdings, Inc. |
|
|
13,602 |
|
|
409,556 |
|
|
SWS Group, Inc. |
|
|
13,881 |
|
|
95,362 |
|
|
|
|
|
|
|
|
2,322,887 |
|
|
Semiconductors & Components — 2.5% |
|
|
|
|
|
|
|
|
Advanced Analogic Technologies, Inc. (a) |
|
|
20,241 |
|
|
116,993 |
|
|
Aeroflex Holding Corp. (a) |
|
|
9,312 |
|
|
95,355 |
|
|
Alpha & Omega Semiconductor, Ltd. (a) |
|
|
6,712 |
|
|
49,065 |
|
|
Amkor Technology, Inc. (a) |
|
|
45,952 |
|
|
200,351 |
|
|
Amtech Systems, Inc. (a) |
|
|
4,791 |
|
|
40,771 |
|
|
Anadigics, Inc. (a) |
|
|
33,114 |
|
|
72,520 |
|
|
Applied Micro Circuits Corp. (a) |
|
|
30,106 |
|
|
202,312 |
|
|
AXT, Inc. (a) |
|
|
15,101 |
|
|
62,971 |
|
|
Cavium, Inc. (a)(b) |
|
|
22,941 |
|
|
652,213 |
|
|
Ceva, Inc. (a) |
|
|
10,912 |
|
|
330,197 |
|
|
Cirrus Logic, Inc. (a)(b) |
|
|
31,390 |
|
|
497,532 |
|
|
Diodes, Inc. (a) |
|
|
16,767 |
|
|
357,137 |
|
|
DSP Group, Inc. (a) |
|
|
6,828 |
|
|
35,574 |
|
|
eMagin Corp. (a) |
|
|
8,794 |
|
|
32,538 |
|
|
Emcore Corp. (a) |
|
|
45,287 |
|
|
39,051 |
|
|
Entropic Communications, Inc. (a) |
|
|
40,737 |
|
|
208,166 |
|
|
Exar Corp. (a) |
|
|
17,246 |
|
|
112,099 |
|
|
Formfactor, Inc. (a) |
|
|
23,966 |
|
|
121,268 |
|
|
GT Advanced Technologies, Inc. (a) |
|
|
59,734 |
|
|
432,474 |
|
|
Hittite Microwave Corp. (a) |
|
|
14,843 |
|
|
732,947 |
|
|
Inphi Corp. (a) |
|
|
10,151 |
|
|
121,406 |
|
|
Integrated Device Technology, Inc. (a) |
|
|
70,337 |
|
|
384,040 |
|
|
Integrated Silicon Solutions, Inc. (a) |
|
|
12,738 |
|
|
116,425 |
|
|
IXYS Corp. (a)(b) |
|
|
11,502 |
|
|
124,567 |
|
|
|
|
|
|
|
|
|
|
|
Common Stocks |
|
Shares |
|
Value |
|
||
|
Semiconductors & Components (concluded) |
|
|
|
|
|
|
|
|
Kopin Corp. (a) |
|
|
31,808 |
|
$ |
123,415 |
|
|
Lattice Semiconductor Corp. (a) |
|
|
55,925 |
|
|
332,195 |
|
|
MaxLinear, Inc., Class A (a) |
|
|
7,258 |
|
|
34,476 |
|
|
Micrel, Inc. |
|
|
23,977 |
|
|
242,407 |
|
|
Microsemi Corp. (a) |
|
|
40,967 |
|
|
686,197 |
|
|
Mindspeed Technologies, Inc. (a) |
|
|
16,376 |
|
|
75,002 |
|
|
MIPS Technologies, Inc. (a) |
|
|
25,060 |
|
|
111,768 |
|
|
Monolithic Power Systems, Inc. (a)(b) |
|
|
14,221 |
|
|
214,310 |
|
|
MoSys, Inc. (a) |
|
|
14,912 |
|
|
62,630 |
|
|
Netlogic Microsystems, Inc. (a) |
|
|
32,357 |
|
|
1,603,937 |
|
|
Omnivision Technologies, Inc. (a)(b) |
|
|
27,520 |
|
|
336,707 |
|
|
Pericom Semiconductor Corp. (a) |
|
|
11,937 |
|
|
90,841 |
|
|
PLX Technology, Inc. (a) |
|
|
20,997 |
|
|
60,261 |
|
|
Power Integrations, Inc. |
|
|
13,671 |
|
|
453,330 |
|
|
Rambus, Inc. (a)(b) |
|
|
46,589 |
|
|
351,747 |
|
|
RF Micro Devices, Inc. (a) |
|
|
130,895 |
|
|
706,833 |
|
|
Rubicon Technology, Inc. (a) |
|
|
8,141 |
|
|
76,444 |
|
|
Semtech Corp. (a)(b) |
|
|
30,919 |
|
|
767,410 |
|
|
Sigma Designs, Inc. (a) |
|
|
14,969 |
|
|
89,814 |
|
|
Silicon Image, Inc. (a) |
|
|
37,771 |
|
|
177,524 |
|
|
Spansion, Inc., Class A (a) |
|
|
23,901 |
|
|
197,900 |
|
|
Standard Microsystems Corp. (a) |
|
|
10,907 |
|
|
281,073 |
|
|
Supertex, Inc. (a) |
|
|
4,884 |
|
|
92,210 |
|
|
TriQuint Semiconductor, Inc. (a) |
|
|
77,968 |
|
|
379,704 |
|
|
Volterra Semiconductor Corp. (a)(b) |
|
|
11,645 |
|
|
298,228 |
|
|
|
|
|
|
|
|
12,984,335 |
|
|
Shipping — 0.3% |
|
|
|
|
|
|
|
|
Baltic Trading Ltd. |
|
|
7,643 |
|
|
36,304 |
|
|
DHT Holdings, Inc. |
|
|
32,967 |
|
|
24,396 |
|
|
Eagle Bulk Shipping, Inc. (b) |
|
|
31,914 |
|
|
30,066 |
|
|
Excel Maritime Carriers Ltd. (a)(b) |
|
|
23,021 |
|
|
33,381 |
|
|
Frontline, Ltd. (b) |
|
|
24,303 |
|
|
104,260 |
|
|
Genco Shipping & Trading Ltd. (a) |
|
|
13,959 |
|
|
94,363 |
|
|
Gulfmark Offshore, Inc., Class A (a) |
|
|
11,234 |
|
|
471,940 |
|
|
International Shipholding Corp. |
|
|
2,580 |
|
|
48,220 |
|
|
Knightsbridge Tankers Ltd. |
|
|
10,484 |
|
|
143,316 |
|
|
Nordic American Tankers Ltd. |
|
|
22,468 |
|
|
269,391 |
|
|
Overseas Shipholding Group, Inc. (b) |
|
|
12,618 |
|
|
137,915 |
|
|
Scorpio Tankers, Inc. (a) |
|
|
14,308 |
|
|
69,966 |
|
|
Ship Finance International Ltd. (b) |
|
|
21,504 |
|
|
200,847 |
|
|
Teekay Tankers Ltd., Class A |
|
|
19,801 |
|
|
69,700 |
|
|
Ultrapetrol Bahamas Ltd. (a)(b) |
|
|
10,220 |
|
|
30,456 |
|
|
|
|
|
|
|
|
1,764,521 |
|
|
Specialty Retail — 3.5% |
|
|
|
|
|
|
|
|
1-800-FLOWERS.COM, Inc., Class A (a) |
|
|
12,405 |
|
|
27,291 |
|
|
Aéropostale, Inc. (a)(b) |
|
|
38,282 |
|
|
583,800 |
|
|
America’s Car Mart, Inc. (a) |
|
|
4,050 |
|
|
158,679 |
|
|
ANN, Inc. (a) |
|
|
24,655 |
|
|
610,951 |
|
|
Asbury Automotive Group, Inc. (a)(b) |
|
|
13,794 |
|
|
297,399 |
|
|
Ascena Retail Group, Inc. (a) |
|
|
29,757 |
|
|
884,378 |
|
|
Barnes & Noble, Inc. (b) |
|
|
13,761 |
|
|
199,259 |
|
|
bebe Stores, Inc. |
|
|
18,298 |
|
|
152,422 |
|
|
Big 5 Sporting Goods Corp. |
|
|
10,429 |
|
|
108,879 |
|
|
Blue Nile, Inc. (a)(b) |
|
|
5,647 |
|
|
230,849 |
|
|
Body Central Corp. (a) |
|
|
5,569 |
|
|
139,002 |
|
|
Brown Shoe Co., Inc. |
|
|
19,927 |
|
|
177,350 |
|
|
The Buckle, Inc. |
|
|
12,770 |
|
|
521,910 |
|
|
Build-A-Bear Workshop, Inc. (a) |
|
|
6,847 |
|
|
57,926 |
|
|
Cabela’s, Inc., Class A (a) |
|
|
20,510 |
|
|
521,364 |
|
|
Casual Male Retail Group, Inc. (a) |
|
|
19,782 |
|
|
67,654 |
|
|
|
|
|
|
|
See Notes to Financial Statements. |
|||
|
|
|
|
|
|
|
BLACKROCK SMALL CAP INDEX FUND |
DECEMBER 31, 2011 |
33 |
|
|
|
|
|
|
|
Schedule of Investments (continued) |
Master Small Cap Index Series |
|
(Percentages shown are based on Net Assets) |
|
|
|
|
|
|
|
|
|
|
Common Stocks |
|
Shares |
|
Value |
|
||
|
Specialty Retail (concluded) |
|
|
|
|
|
|
|
|
The Cato Corp., Class A |
|
|
13,131 |
|
$ |
317,770 |
|
|
Charming Shoppes, Inc. (a) |
|
|
55,178 |
|
|
270,372 |
|
|
The Children’s Place Retail Stores, Inc. (a) |
|
|
12,352 |
|
|
656,138 |
|
|
Christopher & Banks Corp. |
|
|
16,329 |
|
|
38,210 |
|
|
Citi Trends, Inc. (a) |
|
|
6,846 |
|
|
60,108 |
|
|
Coldwater Creek, Inc. (a) |
|
|
34,136 |
|
|
40,280 |
|
|
Collective Brands, Inc. (a) |
|
|
29,157 |
|
|
418,986 |
|
|
Conn’s, Inc. (a) |
|
|
6,889 |
|
|
76,468 |
|
|
Cost Plus, Inc. (a) |
|
|
9,004 |
|
|
87,789 |
|
|
Destination Maternity Corp. |
|
|
5,091 |
|
|
85,122 |
|
|
Express, Inc. (a) |
|
|
26,150 |
|
|
521,431 |
|
|
The Finish Line, Inc., Class A |
|
|
24,573 |
|
|
473,890 |
|
|
Francesca’s Holdings Corp. (a) |
|
|
4,707 |
|
|
81,431 |
|
|
Genesco, Inc. (a) |
|
|
11,219 |
|
|
692,661 |
|
|
Group 1 Automotive, Inc. |
|
|
10,757 |
|
|
557,213 |
|
|
Haverty Furniture Cos., Inc. |
|
|
8,913 |
|
|
97,865 |
|
|
hhgregg, Inc. (a)(b) |
|
|
7,977 |
|
|
115,268 |
|
|
Hibbett Sports, Inc. (a)(b) |
|
|
12,972 |
|
|
586,075 |
|
|
Hot Topic, Inc. |
|
|
20,091 |
|
|
132,802 |
|
|
Jos. A. Bank Clothiers, Inc. (a) |
|
|
13,086 |
|
|
638,073 |
|
|
Lithia Motors, Inc., Class A |
|
|
10,441 |
|
|
228,240 |
|
|
Lumber Liquidators Holdings, Inc. (a) |
|
|
10,957 |
|
|
193,501 |
|
|
MarineMax, Inc. (a) |
|
|
11,075 |
|
|
72,209 |
|
|
Mattress Firm Holding Corp. (a) |
|
|
2,841 |
|
|
65,883 |
|
|
The Men’s Wearhouse, Inc. |
|
|
24,398 |
|
|
790,739 |
|
|
Monro Muffler, Inc. |
|
|
14,430 |
|
|
559,740 |
|
|
New York & Co. (a) |
|
|
13,808 |
|
|
36,729 |
|
|
Nu Skin Enterprises, Inc., Class A |
|
|
25,970 |
|
|
1,261,363 |
|
|
Office Depot, Inc. (a) |
|
|
131,668 |
|
|
283,086 |
|
|
OfficeMax, Inc. (a)(b) |
|
|
40,715 |
|
|
184,846 |
|
|
Pacific Sunwear of California, Inc. (a) |
|
|
21,866 |
|
|
37,391 |
|
|
Penske Auto Group, Inc. |
|
|
21,121 |
|
|
406,579 |
|
|
The Pep Boys — Manny, Moe & Jack |
|
|
24,952 |
|
|
274,472 |
|
|
Pier 1 Imports, Inc. (a) |
|
|
46,518 |
|
|
647,996 |
|
|
Regis Corp. |
|
|
27,366 |
|
|
452,907 |
|
|
Rue21, Inc. (a) |
|
|
7,101 |
|
|
153,382 |
|
|
Shoe Carnival, Inc. (a) |
|
|
4,340 |
|
|
111,538 |
|
|
Shutterfly, Inc. (a)(b) |
|
|
14,089 |
|
|
320,666 |
|
|
Sonic Automotive, Inc. |
|
|
19,073 |
|
|
282,471 |
|
|
Stage Stores, Inc. |
|
|
14,775 |
|
|
205,225 |
|
|
Stamps.com, Inc. (a) |
|
|
5,024 |
|
|
131,277 |
|
|
Stein Mart, Inc. (a) |
|
|
13,130 |
|
|
89,415 |
|
|
Systemax, Inc. (a) |
|
|
5,123 |
|
|
84,068 |
|
|
The Talbots, Inc. (a) |
|
|
32,730 |
|
|
87,062 |
|
|
Teavana Holdings, Inc. (a)(b) |
|
|
3,323 |
|
|
62,406 |
|
|
Vitamin Shoppe, Inc. (a)(b) |
|
|
11,737 |
|
|
468,072 |
|
|
The Wet Seal, Inc., Class A (a)(b) |
|
|
42,954 |
|
|
140,030 |
|
|
Zale Corp. (a) |
|
|
15,179 |
|
|
57,832 |
|
|
Zumiez, Inc. (a) |
|
|
10,081 |
|
|
279,849 |
|
|
|
|
|
|
|
|
18,656,039 |
|
|
Steel — 0.1% |
|
|
|
|
|
|
|
|
Carbonite, Inc. (a)(b) |
|
|
3,583 |
|
|
39,772 |
|
|
Handy & Harman Ltd. (a) |
|
|
2,848 |
|
|
28,195 |
|
|
Olympic Steel, Inc. |
|
|
4,391 |
|
|
102,398 |
|
|
Shiloh Industries, Inc. (a) |
|
|
2,458 |
|
|
20,598 |
|
|
TMS International Corp. (a) |
|
|
6,026 |
|
|
59,537 |
|
|
Universal Stainless & Alloy Products, Inc. (a) |
|
|
3,373 |
|
|
126,015 |
|
|
|
|
|
|
|
|
376,515 |
|
|
|
|
|
|
|
|
|
|
|
Common Stocks |
|
Shares |
|
Value |
|
||
|
Sugar — 0.0% |
|
|
|
|
|
|
|
|
Imperial Sugar Co., New Shares |
|
|
6,145 |
|
$ |
21,938 |
|
|
Synthetic Fibers & Chemicals — 0.0% |
|
|
|
|
|
|
|
|
Zoltek Cos., Inc. (a) |
|
|
13,062 |
|
|
99,532 |
|
|
Technology: Miscellaneous — 0.4% |
|
|
|
|
|
|
|
|
Benchmark Electronics, Inc. (a)(b) |
|
|
28,743 |
|
|
387,168 |
|
|
CTS Corp. |
|
|
16,321 |
|
|
150,153 |
|
|
Fabrinet (a) |
|
|
9,664 |
|
|
132,204 |
|
|
Pendrell Corp. (a) |
|
|
72,206 |
|
|
184,847 |
|
|
Plexus Corp. (a)(b) |
|
|
16,842 |
|
|
461,134 |
|
|
Sanmina-SCI Corp. (a) |
|
|
38,163 |
|
|
355,298 |
|
|
Vocus, Inc. (a)(b) |
|
|
8,346 |
|
|
184,363 |
|
|
|
|
|
|
|
|
1,855,167 |
|
|
Telecommunications Equipment — 0.2% |
|
|
|
|
|
|
|
|
Arris Group, Inc. (a) |
|
|
58,618 |
|
|
634,247 |
|
|
Brightpoint, Inc. (a) |
|
|
32,309 |
|
|
347,645 |
|
|
Communications Systems, Inc. |
|
|
3,259 |
|
|
45,821 |
|
|
OpNext, Inc. (a) |
|
|
22,764 |
|
|
18,389 |
|
|
Powerwave Technologies, Inc. (a) |
|
|
15,092 |
|
|
31,391 |
|
|
Symmetricom, Inc. (a) |
|
|
20,561 |
|
|
110,824 |
|
|
Ubiquiti Networks, Inc. (a) |
|
|
4,122 |
|
|
75,144 |
|
|
|
|
|
|
|
|
1,263,461 |
|
|
Textile Products — 0.1% |
|
|
|
|
|
|
|
|
Interface, Inc., Class A |
|
|
25,007 |
|
|
288,581 |
|
|
Unifi, Inc. (a) |
|
|
6,344 |
|
|
48,214 |
|
|
|
|
|
|
|
|
336,795 |
|
|
Textiles Apparel & Shoes — 1.5% |
|
|
|
|
|
|
|
|
Carter’s, Inc. (a) |
|
|
23,272 |
|
|
926,458 |
|
|
Cherokee, Inc. |
|
|
3,904 |
|
|
45,560 |
|
|
Columbia Sportswear Co. |
|
|
5,744 |
|
|
267,383 |
|
|
Crocs, Inc. (a) |
|
|
42,782 |
|
|
631,890 |
|
|
Delta Apparel, Inc. (a) |
|
|
3,425 |
|
|
65,383 |
|
|
G-III Apparel Group Ltd. (a) |
|
|
7,831 |
|
|
195,070 |
|
|
Iconix Brand Group, Inc. (a) |
|
|
34,558 |
|
|
562,950 |
|
|
The Jones Group, Inc. |
|
|
38,353 |
|
|
404,624 |
|
|
K-Swiss, Inc., Class A (a)(b) |
|
|
11,855 |
|
|
34,617 |
|
|
Kenneth Cole Productions, Inc., Class A (a) |
|
|
3,535 |
|
|
37,436 |
|
|
Liz Claiborne, Inc. (a)(b) |
|
|
44,833 |
|
|
386,909 |
|
|
Maidenform Brands, Inc. (a) |
|
|
11,075 |
|
|
202,673 |
|
|
Oxford Industries, Inc. |
|
|
6,077 |
|
|
274,194 |
|
|
Perry Ellis International, Inc. (a) |
|
|
5,688 |
|
|
80,883 |
|
|
Quiksilver, Inc. (a) |
|
|
61,538 |
|
|
222,152 |
|
|
R.G. Barry Corp. |
|
|
3,978 |
|
|
48,054 |
|
|
Skechers U.S.A., Inc., Class A (a) |
|
|
17,728 |
|
|
214,863 |
|
|
Steven Madden Ltd. (a)(b) |
|
|
17,927 |
|
|
618,482 |
|
|
True Religion Apparel, Inc. (a) |
|
|
12,218 |
|
|
422,498 |
|
|
Vera Bradley, Inc. (a)(b) |
|
|
9,370 |
|
|
302,183 |
|
|
The Warnaco Group, Inc. (a) |
|
|
19,167 |
|
|
959,117 |
|
|
Weyco Group, Inc. |
|
|
3,267 |
|
|
80,205 |
|
|
Wolverine World Wide, Inc. |
|
|
23,499 |
|
|
837,504 |
|
|
|
|
|
|
|
|
7,821,088 |
|
|
|
|
|
|
See Notes to Financial Statements. |
||
|
|
|
|
|
34 |
BLACKROCK SMALL CAP INDEX FUND |
DECEMBER 31, 2011 |
|
|
|
|
|
|
|
Schedule of Investments (continued) |
Master Small Cap Index Series |
|
|
(Percentages shown are based on Net Assets) |
|
|
|
|
|
|
|
|
|
|
Common Stocks |
|
Shares |
|
Value |
|
||
|
Tobacco — 0.2% |
|
|
|
|
|
|
|
|
Alliance One International, Inc. (a)(b) |
|
|
41,120 |
|
$ |
111,847 |
|
|
Star Scientific, Inc. (a)(b) |
|
|
51,044 |
|
|
111,276 |
|
|
Universal Corp. |
|
|
10,967 |
|
|
504,043 |
|
|
Vector Group Ltd. |
|
|
22,795 |
|
|
404,839 |
|
|
|
|
|
|
|
|
1,132,005 |
|
|
Toys — 0.1% |
|
|
|
|
|
|
|
|
Jakks Pacific, Inc. |
|
|
12,853 |
|
|
181,356 |
|
|
Leapfrog Enterprises, Inc. (a) |
|
|
19,671 |
|
109,961 |
||
|
|
|
|
|
|
|
291,317 |
|
|
Transportation Miscellaneous — 0.2% |
|
|
|
|
|
|
|
|
Echo Global Logistics, Inc. (a) |
|
|
5,322 |
|
|
85,950 |
|
|
HUB Group, Inc., Class A (a)(b) |
|
|
17,428 |
|
|
565,190 |
|
|
Odyssey Marine Exploration, Inc. (a)(b) |
|
|
34,442 |
|
|
94,371 |
|
|
Pacer International, Inc. (a) |
|
|
16,164 |
|
|
86,477 |
|
|
Textainer Group Holdings Ltd. |
|
|
5,421 |
|
|
157,860 |
|
|
Wesco Aircraft Holdings, Inc. (a) |
|
|
9,952 |
|
|
139,229 |
|
|
|
|
|
|
|
|
1,129,077 |
|
|
Truckers — 0.7% |
|
|
|
|
|
|
|
|
Arkansas Best Corp. |
|
|
12,031 |
|
|
231,837 |
|
|
Celadon Group, Inc. |
|
|
9,536 |
|
|
112,620 |
|
|
Covenant Transport Group, Inc., Class A (a) |
|
|
3,660 |
|
|
10,870 |
|
|
Forward Air Corp. |
|
|
13,930 |
|
|
446,456 |
|
|
Heartland Express, Inc. |
|
|
23,892 |
|
|
341,417 |
|
|
Knight Transportation, Inc. |
|
|
28,925 |
|
|
452,387 |
|
|
Marten Transport Ltd. |
|
|
7,346 |
|
|
132,155 |
|
|
Old Dominion Freight Line, Inc. (a)(b) |
|
|
22,472 |
|
|
910,790 |
|
|
Patriot Transportation Holding, Inc. (a) |
|
|
2,889 |
|
|
62,691 |
|
|
Quality Distribution, Inc. (a) |
|
|
7,090 |
|
|
79,763 |
|
|
Roadrunner Transportation Systems, Inc. (a) |
|
|
4,102 |
|
|
57,961 |
|
|
Saia, Inc. (a) |
|
|
7,443 |
|
|
92,889 |
|
|
Swift Transportation Co. (a) |
|
|
37,502 |
|
|
309,016 |
|
|
Universal Truckload Services, Inc. |
|
|
2,617 |
|
|
47,499 |
|
|
Werner Enterprises, Inc. |
|
|
20,748 |
|
500,027 |
||
|
|
|
|
|
|
|
3,788,378 |
|
|
Utilities: Electrical — 2.2% |
|
|
|
|
|
|
|
|
Allete, Inc. |
|
|
15,139 |
|
|
635,535 |
|
|
Atlantic Power Corp. (a) |
|
|
53,785 |
|
|
769,125 |
|
|
Avista Corp. |
|
|
27,328 |
|
|
703,696 |
|
|
Black Hills Corp. |
|
|
18,671 |
|
|
626,972 |
|
|
Central Vermont Public Service Corp. |
|
|
6,326 |
|
|
222,043 |
|
|
CH Energy Group, Inc. |
|
|
7,378 |
|
|
430,728 |
|
|
Cleco Corp. |
|
|
28,897 |
|
|
1,100,976 |
|
|
Dynegy, Inc. (a) |
|
|
48,545 |
|
|
134,470 |
|
|
El Paso Electric Co. |
|
|
19,925 |
|
|
690,202 |
|
|
The Empire District Electric Co. |
|
|
19,884 |
|
|
419,354 |
|
|
Genie Energy Ltd. |
|
|
7,144 |
|
|
56,652 |
|
|
IDACORP, Inc. |
|
|
23,481 |
|
|
995,829 |
|
|
MGE Energy, Inc. |
|
|
10,979 |
|
|
513,488 |
|
|
NorthWestern Corp. |
|
|
17,208 |
|
|
615,874 |
|
|
Otter Tail Corp. |
|
|
17,142 |
|
|
377,467 |
|
|
Pike Electric Corp. (a) |
|
|
7,664 |
|
|
55,104 |
|
|
PNM Resources, Inc. |
|
|
37,769 |
|
|
688,529 |
|
|
Portland General Electric Co. |
|
|
35,695 |
|
|
902,726 |
|
|
UIL Holdings Corp. |
|
|
23,954 |
|
|
847,253 |
|
|
Unisource Energy Corp. |
|
|
17,369 |
|
|
641,263 |
|
|
Unitil Corp. |
|
|
5,128 |
|
145,533 |
||
|
|
|
|
|
|
|
11,572,819 |
|
|
|
|
|
|
|
|
|
|
|
Common Stocks |
|
Shares |
|
Value |
|
||
|
Utilities: Gas Distributors — 1.2% |
|
|
|
|
|
|
|
|
Chesapeake Utilities Corp. |
|
|
4,537 |
|
$ |
196,679 |
|
|
The Laclede Group, Inc. |
|
|
10,659 |
|
|
431,370 |
|
|
New Jersey Resources Corp. |
|
|
19,639 |
|
|
966,239 |
|
|
Northwest Natural Gas Co. |
|
|
12,661 |
|
|
606,841 |
|
|
Piedmont Natural Gas Co. |
|
|
34,111 |
|
|
1,159,092 |
|
|
South Jersey Industries, Inc. |
|
|
14,215 |
|
|
807,554 |
|
|
Southwest Gas Corp. |
|
|
21,751 |
|
|
924,200 |
|
|
WGL Holdings, Inc. |
|
|
24,310 |
|
1,074,988 |
||
|
|
|
|
|
|
|
6,166,963 |
|
|
Utilities: Miscellaneous — 0.0% |
|
|
|
|
|
|
|
|
Ormat Technologies, Inc. |
|
|
8,558 |
|
|
154,301 |
|
|
Utilities: Telecommunications — 0.8% |
|
|
|
|
|
|
|
|
8x8, Inc. (a) |
|
|
29,090 |
|
|
92,215 |
|
|
Alaska Communications Systems Group, Inc. (b) |
|
|
21,152 |
|
|
63,668 |
|
|
Atlantic Tele-Network, Inc. |
|
|
4,449 |
|
|
173,734 |
|
|
Boingo Wireless, Inc. (a) |
|
|
2,887 |
|
|
24,828 |
|
|
Cbeyond Communications, Inc. (a) |
|
|
13,294 |
|
|
106,485 |
|
|
Cincinnati Bell, Inc. (a)(b) |
|
|
94,239 |
|
|
285,544 |
|
|
Cogent Communications Group, Inc. (a) |
|
|
21,735 |
|
|
367,104 |
|
|
Consolidated Communications Holdings, Inc. |
|
|
12,421 |
|
|
236,620 |
|
|
Fairpoint Communications, Inc. (a)(b) |
|
|
9,874 |
|
|
42,754 |
|
|
General Communication, Inc., Class A (a)(b) |
|
|
19,656 |
|
|
192,432 |
|
|
Globalstar, Inc. (a)(b) |
|
|
53,210 |
|
|
28,733 |
|
|
HickoryTech Corp. |
|
|
6,392 |
|
|
70,823 |
|
|
IDT Corp., Class B |
|
|
6,633 |
|
|
62,218 |
|
|
inContact, Inc. (a) |
|
|
14,490 |
|
|
64,191 |
|
|
Iridium Communications, Inc. (a) |
|
|
20,569 |
|
|
158,587 |
|
|
j2 Global, Inc. |
|
|
21,748 |
|
|
611,989 |
|
|
Leap Wireless International, Inc. (a) |
|
|
28,860 |
|
|
268,109 |
|
|
Lumos Networks Corp. |
|
|
7,122 |
|
|
109,252 |
|
|
Neutral Tandem, Inc. (a) |
|
|
14,905 |
|
|
159,335 |
|
|
NTELOS Holdings Corp. |
|
|
7,130 |
|
|
145,309 |
|
|
ORBCOMM, Inc. (a) |
|
|
16,916 |
|
|
50,579 |
|
|
Premiere Global Services, Inc. (a) |
|
|
24,806 |
|
|
210,107 |
|
|
Shenandoah Telecom Co. |
|
|
11,346 |
|
|
118,906 |
|
|
SureWest Communications |
|
|
6,570 |
|
|
79,037 |
|
|
Towerstream Corp. (a) |
|
|
21,052 |
|
|
44,209 |
|
|
USA Mobility, Inc. |
|
|
10,601 |
|
|
147,036 |
|
|
Vonage Holdings Corp. (a) |
|
|
65,884 |
|
|
161,416 |
|
|
|
|
|
|
|
|
4,075,220 |
|
|
Utilities: Water — 0.3% |
|
|
|
|
|
|
|
|
American States Water Co. |
|
|
8,867 |
|
|
309,458 |
|
|
Artesian Resources Corp., Class A |
|
|
3,370 |
|
|
63,457 |
|
|
California Water Service Group |
|
|
19,894 |
|
|
363,264 |
|
|
Connecticut Water Service, Inc. |
|
|
4,126 |
|
|
111,938 |
|
|
Consolidated Water Co., Inc. |
|
|
6,937 |
|
|
59,520 |
|
|
Middlesex Water Co. |
|
|
7,501 |
|
|
139,969 |
|
|
Pennichuck Corp. |
|
|
2,179 |
|
|
62,821 |
|
|
SJW Corp. |
|
|
6,783 |
|
|
160,350 |
|
|
York Water Co. |
|
|
6,152 |
|
|
108,521 |
|
|
|
|
|
|
|
|
1,379,298 |
|
|
Total Common Stocks — 98.7% |
|
|
|
|
|
522,151,952 |
|
|
|
|
|
|
|
See Notes to Financial Statements. |
|||
|
|
|
|
|
|
|
BLACKROCK SMALL CAP INDEX FUND |
DECEMBER 31, 2011 |
35 |
|
|
|
|
|
|
|
Schedule of Investments (continued) |
Master Small Cap Index Series |
|
|
(Percentages shown are based on Net Assets) |
|
|
|
|
|
|
|
|
|
|
Investment Companies |
|
Shares |
|
Value |
|
||
|
Asset Management & Custodian — 0.2% |
|
|
|
|
|
|
|
|
BlackRock Kelso Capital Corp. (d) |
|
|
34,792 |
|
$ |
283,903 |
|
|
Gladstone Capital Corp. |
|
|
10,173 |
|
|
77,620 |
|
|
Hercules Technology Growth Capital, Inc. |
|
|
20,886 |
|
|
197,164 |
|
|
Pennantpark Investment Corp. |
|
|
21,738 |
|
|
219,336 |
|
|
Prospect Capital Corp. |
|
|
51,782 |
|
481,055 |
||
|
|
|
|
|
|
|
1,259,078 |
|
|
Total Investment Companies — 0.2% |
|
|
|
|
|
1,259,078 |
|
|
|
|
|
|
|
|
|
|
|
|
|
|
|
|
|
|
|
|
Machinery: Industrial — 0.0% |
|
|
|
|
|
|
|
|
Gerber Scientific, Inc. (a)(e) |
|
|
12,866 |
|
|
129 |
|
|
Total Other Interests — 0.0% |
|
|
|
|
|
129 |
|
|
|
|
|
|
|
|
|
|
|
|
|
|
|
|
|
|
|
|
Oil: Crude Producers — 0.0% |
|
|
|
|
|
|
|
|
Magnum Hunter Resources Corp. (Expires 10/14/13) |
|
|
5,700 |
|
|
— |
|
|
Total Warrants — 0.0% |
|
|
|
|
|
— |
|
|
Total
Long-Term Investments |
|
|
|
|
|
523,411,159 |
|
|
|
|
|
|
|
|
|
|
|
Short-Term Securities |
|
Shares |
|
Value |
|
||
|
BlackRock Liquidity Funds, TempFund, |
|
|
7,771,176 |
|
$ |
7,771,176 |
|
|
|
|
|
|
|
|
|
|
|
|
|
Beneficial
|
|
|
|
|
|
|
BlackRock Liquidity Series, LLC |
|
$ |
58,202 |
|
|
58,201,803 |
|
|
Total
Short-Term Securities |
|
|
|
|
|
65,972,979 |
|
|
Total Investments (Cost — $540,569,559*) — 111.4% |
|
|
|
|
|
589,384,138 |
|
|
Liabilities in Excess of Other Assets — (11.4)% |
|
|
|
|
|
(60,330,561 |
) |
|
Net Assets — 100.0% |
|
|
|
|
$ |
529,053,577 |
|
|
|
|
|
|
|
|
* |
As of December 31, 2011, gross unrealized appreciation and gross unrealized depreciation based on cost for federal income tax purposes were as follows: |
|
|
|
|
|
|
|
Tax cost |
|
$ |
552,096,089 |
|
|
Gross unrealized appreciation |
|
$ |
84,839,369 |
|
|
Gross unrealized depreciation |
|
|
(47,551,320 |
) |
|
Net unrealized appreciation |
|
$ |
37,288,049 |
|
|
|
|
|
(a) |
Non-income producing security. |
|
|
|
|
(b) |
Security, or a portion of security, is on loan. |
|
|
|
|
(c) |
All or a portion of security has been pledged as collateral in connection with open financial futures contracts. |
|
|
|
|
(d) |
Investments in companies considered to be an affiliate of the Series during the year, for purposes of Section 2(a)(3) of the Investment Company Act of 1940, as amended, were as follows: |
|
|
|
|
|
|
|
|
|
|
|
|
|
|
|
|
|
|
|
|
|
|
|
|
|
Affiliate |
|
Shares/ |
|
Shares/ |
|
Shares Sold |
|
Shares/ |
|
Value
at |
|
Realized |
|
Income |
|
|||||||
|
BlackRock Kelso Capital Corp. |
|
|
20,122 |
|
|
19,019 |
|
|
(4,349 |
) |
|
34,792 |
|
$ |
283,903 |
|
$ |
(11,522 |
) |
$ |
28,204 |
|
|
BlackRock Liquidity Funds, TempFund, |
|
|
7,181,244 |
|
|
589,198 |
1 |
|
— |
|
|
7,771,176 |
|
$ |
7,771,176 |
|
$ |
139 |
|
$ |
8,079 |
|
|
BlackRock Liquidity Series, LLC |
|
$ |
8,152,630 |
|
$ |
50,049,173 |
1 |
|
— |
|
$ |
58,201,803 |
|
$ |
58,201,803 |
|
|
— |
|
$ |
639,806 |
|
|
PennyMac Mortgage Investment Trust |
|
|
5,329 |
|
|
10,221 |
|
|
(2,392 |
) |
|
13,158 |
|
$ |
218,686 |
|
$ |
(5,810 |
) |
$ |
19,341 |
|
|
|
|
|
|
|
1 |
Represents net shares/beneficial interest purchased. |
|
|
|
|
(e) |
Other interests represent beneficial interests in liquidation trusts and other reorganization or private entities. |
|
|
|
|
(f) |
Warrants entitle the Series to purchase a predetermined number of shares of common stock and are non-income producing. The purchase price and number of shares are subject to adjustment under certain conditions until the expiration date, if any. |
|
|
|
|
(g) |
Represents the current yield as of report date. |
|
|
|
|
(h) |
Security was purchased with the cash collateral from loaned securities. |
|
|
|
|
|
See Notes to Financial Statements. |
||
|
|
|
|
|
36 |
BLACKROCK SMALL CAP INDEX FUND |
DECEMBER 31, 2011 |
|
|
|
|
|
|
|
Schedule of Investments (concluded) |
Master Small Cap Index Series |
|
|
|
|
• |
Financial futures contracts purchased as of December 31, 2011 were as follows: |
|
|
|
|
|
|
|
|
|
|
|
|
|
|
|
|
|
|
|
Contracts |
|
Issue |
|
Exchange |
|
Expiration |
|
Notional
|
|
Unrealized
|
|
|||||
|
125 |
|
Russell |
|
ICE
Futures |
|
March |
|
$ |
9,235,000 |
|
$ |
(7,075 |
) |
|||
|
|
|
|
|
• |
For Series compliance purposes, the Series’industry classifications refer to any one or more of the industry sub-classifications used by one or more widely recognized market indexes or rating group indexes, and/or as defined by Series management. These definitions may not apply for purposes of this report, which may combine such industry sub-classifications for reporting ease. |
|
|
|
|
|
|
• |
Fair Value Measurements — Various inputs are used in determining the fair value of investments and derivative financial instruments. These inputs are categorized into a disclosure hierarchy consisting of three broad levels for financial statement purposes as follows: |
|
|
|
|
|
|
|
• |
Level 1 — unadjusted price quotations in active markets/exchanges for identical assets and liabilities |
|
|
|
|
|
|
• |
Level 2 — other observable inputs (including, but not limited to: quoted prices for similar assets or liabilities in markets that are active, quoted prices for identical or similar assets or liabilities in markets that are not active, inputs other than quoted prices that are observable for the assets or liabilities (such as interest rates, yield curves, volatilities, prepayment speeds, loss severities, credit risks and default rates) or other market-corroborated inputs) |
|
|
|
|
|
|
• |
Level 3 — unobservable inputs based on the best information available in the circumstances, to the extent observable inputs are not available (including the Series’ own assumptions used in determining the fair value of investments and derivative financial instruments) |
|
|
|
|
|
|
Changes in valuation techniques may result in transfers in or out of an assigned level within the disclosure hierarchy. The categorization of a value determined for investments and derivative financial instruments is based on the pricing transparency of the investment and derivative financial instrument and does not necessarily correspond to the Series’ perceived risk of investing in those securities. For information about the Series’ policy regarding valuation of investments and derivative financial instruments and other significant accounting policies, please refer to Note 1 of the Notes to Financial Statements. |
|
|
|
|
|
|
The following tables summarize the inputs used as of December 31, 2011 in determining the fair valuation of the Series’ investments and derivative financial instruments: |
||
|
|
|
|
|
|
|
|
|
|
|
|
|
|
|
|
Valuation Inputs |
|
Level 1 |
|
Level 2 |
|
Level 3 |
|
Total |
|
||||
|
Assets: |
|
|
|
|
|
|
|
|
|
|
|
|
|
|
Investments: |
|
|
|
|
|
|
|
|
|
|
|
|
|
|
Long-Term Investments: |
|
|
|
|
|
|
|
|
|
|
|
|
|
|
Common Stocks1 |
|
$ |
522,069,421 |
|
$ |
82,531 |
|
|
— |
|
$ |
522,151,952 |
|
|
Investment |
|
|
1,259,078 |
|
|
— |
|
|
— |
|
|
1,259,078 |
|
|
Other Interests |
|
|
— |
|
|
129 |
|
|
— |
|
|
129 |
|
|
Short-Term Securities |
|
|
7,771,176 |
|
|
58,201,803 |
|
|
— |
|
|
65,972,979 |
|
|
Total |
|
$ |
531,099,675 |
|
$ |
58,284,463 |
|
|
— |
|
$ |
589,384,138 |
|
|
|
|
|
|
|
1 |
See above Schedule of Investments for values in each industry excluding Level 2, Banks: Diversified, within the table. |
|
|
|
|
|
|
|
|
|
|
|
|
|
|
|
|
Valuation Inputs |
|
Level 1 |
|
Level 2 |
|
Level 3 |
|
Total |
|
||||
|
Derivative Financial |
|
|
|
|
|
|
|
|
|
|
|
|
|
|
Liabilities: |
|
|
|
|
|
|
|
|
|
|
|
|
|
|
Equity Contracts |
|
$ |
(7,075 |
) |
|
— |
|
|
— |
|
$ |
(7,075 |
) |
|
|
|
|
|
|
2 |
Derivative financial instruments are financial futures contracts, which are valued at the unrealized appreciation/depreciation on the instrument. |
|
|
|
|
|
|
See Notes to Financial Statements. |
|||
|
|
|
|
|
|
|
BLACKROCK SMALL CAP INDEX FUND |
DECEMBER 31, 2011 |
37 |
|
|
|
|
|
|
|
Master Small Cap Index Series |
|
|
|
|
|
|
|
December 31, 2011 |
|
|
|
|
|
Assets |
|
|
|
|
|
Investments at value — unaffiliated (including securities loaned of $56,207,758) (cost — $474,050,799) |
|
$ |
522,908,570 |
|
|
Investments at value — affiliated (cost — $66,518,760) |
|
|
66,475,568 |
|
|
Cash pledged as collateral for financial futures contracts |
|
|
727,000 |
|
|
Investments sold receivable |
|
|
26,702,011 |
|
|
Dividends receivable |
|
|
778,995 |
|
|
Securities lending income receivable — affiliated |
|
|
129,452 |
|
|
Receivable from advisor |
|
|
34,365 |
|
|
Prepaid expenses |
|
|
23,514 |
|
|
Total assets |
|
|
617,779,475 |
|
|
|
|
|
|
|
|
Liabilities |
|
|
|
|
|
Bank overdraft |
|
|
79,371 |
|
|
Collateral on securities loaned at value |
|
|
58,201,803 |
|
|
Margin variation payable |
|
|
34,832 |
|
|
Other affiliates payable |
|
|
2,958 |
|
|
Directors’ fees payable |
|
|
383 |
|
|
Withdrawals payable to investor |
|
|
30,303,810 |
|
|
Other accrued expenses payable |
|
|
102,741 |
|
|
Total liabilities |
|
|
88,725,898 |
|
|
Net Assets |
|
$ |
529,053,577 |
|
|
|
|
|
|
|
|
Net Assets Consist of |
|
|
|
|
|
Investors’ capital |
|
$ |
480,246,059 |
|
|
Net unrealized appreciation/depreciation |
|
|
48,807,518 |
|
|
Net Assets |
|
$ |
529,053,577 |
|
|
|
|
|
|
|
|
|
|
38 |
BLACKROCK SMALL CAP INDEX FUND |
DECEMBER 31, 2011 |
|
|
|
|
|
|
|
Master Small Cap Index Series |
|
|
|
|
|
|
|
Year Ended December 31, 2011 |
|
|
|
|
|
Investment Income |
|
|
|
|
|
Dividends — unaffiliated |
|
$ |
6,035,188 |
|
|
Foreign taxes withheld |
|
|
(4,470 |
) |
|
Dividends — affiliated |
|
|
55,624 |
|
|
Securities lending — affiliated |
|
|
639,806 |
|
|
Total income |
|
|
6,726,148 |
|
|
|
|
|
|
|
|
Expenses |
|
|
|
|
|
Investment advisory |
|
|
43,820 |
|
|
Custodian |
|
|
135,602 |
|
|
Accounting services |
|
|
115,227 |
|
|
Professional |
|
|
87,054 |
|
|
Directors |
|
|
12,588 |
|
|
Printing |
|
|
1,199 |
|
|
Miscellaneous |
|
|
19,098 |
|
|
Total expenses |
|
|
414,588 |
|
|
Less fees waived and/or reimbursed by advisor |
|
|
(93,339 |
) |
|
Total expenses after fees waived and/or reimbursed |
|
|
321,249 |
|
|
Net investment income |
|
|
6,404,899 |
|
|
|
|
|
|
|
|
Realized and Unrealized Gain (Loss) |
|
|
|
|
|
Net realized gain (loss) from: |
|
|
|
|
|
Investments — unaffiliated |
|
|
8,294,002 |
|
|
Investments — affiliated |
|
|
(17,193 |
) |
|
Financial futures contracts |
|
|
(1,236,622 |
) |
|
Foreign currency transactions |
|
|
78 |
|
|
Short positions |
|
|
56,001 |
|
|
|
|
|
7,096,266 |
|
|
Net change in unrealized appreciation/depreciation on: |
|
|
|
|
|
Investments |
|
|
(46,193,675 |
) |
|
Financial futures contracts |
|
|
(6,698 |
) |
|
Foreign currency transactions |
|
|
14 |
|
|
|
|
|
(46,200,359 |
) |
|
Total realized and unrealized loss |
|
|
(39,104,093 |
) |
|
Net Decrease in Net Assets Resulting from Operations |
|
$ |
(32,699,194 |
) |
|
|
|
|
|
|
|
|
|
|
|
|
BLACKROCK SMALL CAP INDEX FUND |
DECEMBER 31, 2011 |
39 |
|
|
|
|
|
|
|
Master Small Cap Index Series |
|
|
|
|
|
|
|
|
|
|
|
|
Year
Ended |
|
||||
|
Increase (Decrease) in Net Assets: |
|
2011 |
|
2010 |
|
||
|
Operations |
|
|
|
|
|
|
|
|
Net investment income |
|
$ |
6,404,899 |
|
$ |
3,501,724 |
|
|
Net realized gain (loss) |
|
|
7,096,266 |
|
|
(9,889,317 |
) |
|
Net change in unrealized appreciation/depreciation |
|
|
(46,200,359 |
) |
|
60,704,760 |
|
|
Net increase (decrease) in net assets resulting from operations |
|
|
(32,699,194 |
) |
|
54,317,167 |
|
|
|
|
|
|
|
|
|
|
|
Capital Transactions |
|
|
|
|
|
|
|
|
Proceeds from contributions |
|
|
449,939,216 |
|
|
226,075,632 |
|
|
Value of withdrawals |
|
|
(226,358,426 |
) |
|
(171,857,514 |
) |
|
Net increase in net assets derived from capital transactions |
|
|
223,580,790 |
|
|
54,218,118 |
|
|
|
|
|
|
|
|
|
|
|
Net Assets |
|
|
|
|
|
|
|
|
Total increase in net assets |
|
|
190,881,596 |
|
|
108,535,285 |
|
|
Beginning of year |
|
|
338,171,981 |
|
|
229,636,696 |
|
|
End of year |
|
$ |
529,053,577 |
|
$ |
338,171,981 |
|
|
|
|
|
|
|
|
Master Small Cap Index Series |
|
|
|
|
|
|
|
|
|
|
|
|
|
|
|
|
|
|
|
|
|
Year Ended December 31, |
|
|||||||||||||
|
|
|
2011 |
|
2010 |
|
2009 |
|
2008 |
|
2007 |
|
|||||
|
Total Investment Return |
|
|
|
|
|
|
|
|
|
|
|
|
|
|
|
|
|
Total investment return |
|
|
(4.30 |
)% |
|
27.19 |
% |
|
27.37 |
% |
|
(33.57 |
)% |
|
(1.46 |
)% |
|
|
|
|
|
|
|
|
|
|
|
|
|
|
|
|
|
|
|
Ratios to Average Net Assets |
|
|
|
|
|
|
|
|
|
|
|
|
|
|
|
|
|
Total expenses |
|
|
0.09 |
% |
|
0.12 |
% |
|
0.09 |
% |
|
0.08 |
% |
|
0.06 |
% |
|
Total expenses after fees waived and/or reimbursed and fees paid indirectly |
|
|
0.07 |
% |
|
0.08 |
% |
|
0.07 |
% |
|
0.07 |
% |
|
0.06 |
% |
|
Net investment income |
|
|
1.46 |
% |
|
1.27 |
% |
|
1.27 |
% |
|
1.60 |
% |
|
1.69 |
% |
|
|
|
|
|
|
|
|
|
|
|
|
|
|
|
|
|
|
|
Supplemental Data |
|
|
|
|
|
|
|
|
|
|
|
|
|
|
|
|
|
Net assets, end of year (000) |
|
$ |
529,054 |
|
$ |
338,172 |
|
$ |
229,637 |
|
$ |
344,720 |
|
$ |
630,394 |
|
|
Portfolio turnover |
|
|
31 |
% |
|
42 |
% |
|
43 |
% |
|
42 |
% |
|
26 |
% |
|
|
|
|
|
|
|
|
|
40 |
BLACKROCK SMALL CAP INDEX FUND |
DECEMBER 31, 2011 |
|
|
|
|
|
|
|
Master Small Cap Index Series |
1. Organization and Significant Accounting Policies:
Master Small Cap Index Series (the “Series”), a diversified, open-end management investment company, is a series of Quantitative Master Series LLC (the “Master LLC”). The Master LLC is registered as an investment company under the Investment Company Act of 1940, as amended (the “1940 Act”), and is organized as a Delaware limited liability company. The Master LLC’s Limited Liability Company Agreement permits the Board of Directors of the Master LLC (the “Board”) to issue nontransferable interests, subject to certain limitations. The Series’ financial statements are prepared in conformity with accounting principles generally accepted in the United States of America (“US GAAP”), which may require management to make estimates and assumptions that affect the reported amounts and disclosures in the financial statements. Actual results could differ from those estimates.
The following is a summary of significant accounting policies followed by the Series:
Valuation: US GAAP defines fair value as the price the Series would receive to sell an asset or pay to transfer a liability in an orderly transaction between market participants at the measurement date. The Series fair values its financial instruments at market value using independent dealers or pricing services under policies approved by the Board. Equity investments traded on a recognized securities exchange or the NASDAQ Global Market System (“NASDAQ”) are valued at the last reported sale price that day or the NASDAQ official closing price, if applicable. For equity investments traded on more than one exchange, the last reported sale price on the exchange where the stock is primarily traded is used. Equity investments traded on a recognized exchange for which there were no sales on that day are valued at the last available bid (long positions) or ask (short positions) price. If no bid or ask price is available, the prior day’s price will be used, unless it is determined that such prior day’s price no longer reflects the fair value of the security. Financial futures contracts traded on exchanges are valued at their last sale price. Investments in open-end registered investment companies are valued at NAV each business day. Short-term securities with remaining maturities of 60 days or less may be valued at amortized cost, which approximates fair value.
The Series values its investments in BlackRock Liquidity Series, LLC Money Market Series (the “Money Market Series”) at fair value, which is ordinarily based upon its pro rata ownership in the underlying fund’s net assets. The Money Market Series seeks current income consistent with maintaining liquidity and preserving capital. Although the Money Market Series is not registered under the 1940 Act, its investments will follow the parameters of investments by a money market fund that is subject to Rule 2a-7 under the 1940 Act. The Series may withdraw up to 25% of its investment daily, although the manager of the Money Market Series, in its sole discretion, may permit an investor to withdraw more than 25% on any one day.
In the event that application of these methods of valuation results in a price for an investment which is deemed not to be representative of the market value of such investment or if a price is not available, the investment will be valued in accordance with a policy approved by the Board as reflecting fair value (“Fair Value Assets”). When determining the price for Fair Value Assets, the investment advisor and/or the sub-advisor seeks to determine the price that the Series might reasonably expect to receive from the current sale of that asset in an arm’s-length transaction. Fair value determinations shall be based upon all available factors that the investment advisor and/or sub-advisor deems relevant. The pricing of all Fair Value Assets is subsequently reported to the Board or a committee thereof.
Segregation and Collateralization: In cases in which the 1940 Act and the interpretive positions of the Securities and Exchange Commission (“SEC”) require that the Series either deliver collateral or segregate assets in connection with certain investments (e.g., financial futures contracts), the Series will, consistent with SEC rules and/or certain interpretive letters issued by the SEC, segregate collateral or designate on its books and records cash or liquid securities having a market value at least equal to the amount that would otherwise be required to be physically segregated. Furthermore, based on requirements and agreements with certain exchanges and third party broker-dealers, each party to such transactions has requirements to deliver/deposit securities as collateral for certain investments.
Investment Transactions and Investment Income: For financial reporting purposes, investment transactions are recorded on the dates the transactions are entered into (the trade dates). Realized gains and losses on investment transactions are determined on the identified cost basis. Dividend income is recorded on the ex-dividend dates. Dividends from foreign securities where the ex-dividend date may have passed are subsequently recorded when the Series is informed of the ex-dividend date. Under the applicable foreign tax laws, a withholding tax at various rates may be imposed on capital gains, dividends and interest. Upon notification from issuers, some of the dividend income received from a real estate investment trust may be redesignated as a reduction of cost of the related investment and/or realized gain. Interest income, including amortization and accretion of premiums and discounts on debt securities, is recognized on the accrual basis.
Securities Lending: The Series may lend securities to approved borrowers, such as banks, brokers and other financial institutions. The borrower pledges cash, securities issued or guaranteed by the US government or irrevocable letters of credit issued by a bank as collateral, which will be maintained at all times in an amount equal to at least 100% of the current market value of the loaned securities. The market value of the loaned securities is determined at the close of business of the Series and any additional required collateral is delivered to the Series on the next business day. Securities lending income, as disclosed in the Statement of
|
|
|
|
|
|
|
|
|
|
|
|
BLACKROCK SMALL CAP INDEX FUND |
DECEMBER 31, 2011 |
41 |
|
|
|
|
|
|
|
Notes to Financial Statements (continued) |
Master Small Cap Index Series |
Operations, represents the income earned from the investment of the cash collateral, net of rebates paid to, or fees paid by, borrowers and less the fees paid to the securities lending agent. During the term of the loan, the Series earns dividend or interest income on the securities loaned but does not receive interest income on the securities received as collateral. Loans of securities are terminable at any time and the borrower, after notice, is required to return borrowed securities within the standard time period for settlement of securities transactions. In the event that the borrower defaults on its obligation to return borrowed securities because of insolvency or for any other reason, the Series could experience delays and costs in gaining access to the collateral. The Series also could suffer a loss if the value of an investment purchased with cash collateral falls below the market value of loaned securities or if the value of an investment purchased with cash collateral falls below the value of the original cash collateral received. During the year ended December 31, 2011, any securities on loan were collateralized by cash.
Income Taxes: The Series is classified as a partnership for federal income tax purposes. As such, each investor in the Series is treated as the owner of its proportionate share of net assets, income, expenses and realized and unrealized gains and losses of the Series. Therefore, no federal income tax provision is required. It is intended that the Series’ assets will be managed so an investor in the Series can satisfy the requirements of Subchapter M of the Internal Revenue Code of 1986, as amended.
The Series files US federal and various state and local tax returns. No income tax returns are currently under examination. The statute of limitations on the Series’ US federal tax returns remains open for each of the four years ended December 31, 2011. The statutes of limitations on the Series’ state and local tax returns may remain open for an additional year depending upon the jurisdiction. Management does not believe there are any uncertain tax positions that require recognition of a tax liability.
Recent Accounting Standard: In May 2011, the Financial Accounting Standards Board (the “FASB”) issued amended guidance to improve disclosure about fair value measurements which will require the following disclosures for fair value measurements categorized as Level 3: quantitative information about the unobservable inputs and assumptions used in the fair value measurement, a description of the valuation policies and procedures and a narrative description of the sensitivity of the fair value measurement to changes in unobservable inputs and the interrelationships between those unobservable inputs. In addition, the amounts and reasons for all transfers in and out of Level 1 and Level 2 will be required to be disclosed. The amended guidance is effective for financial statements for fiscal years beginning after December 15, 2011, and interim periods within those fiscal years. Management is evaluating the impact of this guidance on the Series’ financial statement disclosures.
In December 2011, the FASB issued guidance that will enhance current disclosure requirements on the offsetting of certain assets and liabilities. The new disclosures will be required for investments and derivative financial instruments subject to master netting agreements or similar agreements and will require an entity to disclose both gross and net information about such investments and transactions eligible for offset in the Statement of Assets and Liabilities. The guidance is effective for financial statements with fiscal years beginning on or after January 1, 2013, and interim periods within those fiscal years. Management is evaluating the impact of this guidance on the Series’ financial statement disclosures.
Other: Expenses directly related to the Series are charged to the Series. Other operating expenses shared by several funds are pro rated among those funds on the basis of relative net assets or other appropriate methods.
The Series has an arrangement with the custodian whereby fees may be reduced by credits earned on uninvested cash balances, which, if applicable, are shown as fees paid indirectly in the Statement of Operations. The custodian imposes fees on overdrawn cash balances, which can be offset by accumulated credits earned or may result in additional custody charges.
2. Derivative Financial Instruments:
The Series engages in various portfolio investment strategies using derivative contracts both to increase the returns of the Series and to economically hedge, or protect, its exposure to certain risks such as equity risk. These contracts may be transacted on an exchange.
Losses may arise if the value of the contract decreases due to an unfavorable change in the market rates or values of the underlying instrument or if the counterparty does not perform under the contract. Counterparty risk related to exchange-traded financial futures contracts is deemed to be minimal due to the protection against defaults provided by the exchange on which these contracts trade.
Financial Futures Contracts: The Series purchases or sells financial futures contracts and options on financial futures contracts to gain exposure to, or economically hedge against, changes in the value of equity securities (equity risk). Financial futures contracts are agreements between the Series and counterparty to buy or sell a specific quantity of an underlying instrument at a specified price and at a specified date. Depending on the terms of the particular contract, futures contracts are settled either through physical delivery of the underlying instrument on the settlement date or by payment of a cash settlement amount on the settlement date. Pursuant to the contract, the Series agrees to receive from or pay to the broker an amount of cash equal to the daily fluctuation in value of the contract. Such receipts or payments are known as margin variation and are recorded by the Series as unrealized appreciation or depreciation. When the contract is closed, the Series records a realized gain or loss equal to the difference
|
|
|
|
|
|
|
|
|
42 |
BLACKROCK SMALL CAP INDEX FUND |
DECEMBER 31, 2011 |
|
|
|
|
|
|
|
Notes to Financial Statements (continued) |
Master Small Cap Index Series |
between the value of the contract at the time it was opened and the value at the time it was closed. The use of financial futures contracts involves the risk of an imperfect correlation in the movements in the price of financial futures contracts, interest rates and the underlying assets.
Derivative Financial Instruments Categorized by Risk Exposure:
|
|
|
|||
|
Fair Values of Derivative Financial Instruments as of December 31, 2011 |
|
|||
|
|
Liability Derivatives |
|
||
|
|
Statement
of |
Value |
|
|
|
Equity contracts |
Net unrealized |
$ |
(7,075 |
) |
|
* |
Includes cumulative appreciation/depreciation on financial futures contracts as reported in the Schedule of Investments. Only current day’s margin variation is reported within the Statement of Assets and Liabilities. |
|
|
|||
|
The Effect of Derivative Financial Instruments in the Statement of Operations Year Ended December 31, 2011 |
|||
|
|
|
Net Realized Loss From |
|
|
|
|
Financial Futures Contracts |
|
|
Equity contracts |
|
$(1,236,622) |
|
|
|
|
Net
Change in Unrealized |
|
|
|
|
Financial Futures Contracts |
|
|
Equity contracts |
|
$ (6,698) |
|
For the year ended December 31, 2011, the average quarterly balances of outstanding derivative financial instruments were as follows:
|
|
|
|
|
|
|
Financial futures contracts: |
||||
|
Average number of contracts purchased |
102 |
|||
|
Average notional value of contracts purchased |
|
$ |
7,600,278 |
|
3. Investment Advisory Agreement and Other Transactions with Affiliates:
The PNC Financial Services Group, Inc. (“PNC”) and Barclays Bank PLC (“Barclays”) are the largest stockholders of BlackRock, Inc. (“BlackRock”). Due to the ownership structure, PNC is an affiliate for 1940 Act purposes, but Barclays is not.
The Master LLC, on behalf of the Series, entered into an Investment Advisory Agreement with BlackRock Advisors, LLC (the “Manager”), the Series’ investment advisor, an indirect, wholly owned subsidiary of BlackRock, to provide investment advisory and administration services. The Manager is responsible for the management of the Series’ portfolio and provides the necessary personnel, facilities, equipment and certain other services necessary to the operations of the Series. For such services, the Series pays the Manager a monthly fee at an annual rate of 0.01% of the Series’ average daily net assets.
The Manager entered into a contractual arrangement with the Master LLC with respect to the Series under which the Manager will waive and/or reimburse its fees and/or expenses so that the total annual operating expenses incurred by the Series (excluding interest expense, acquired fund fees and certain other Series’ expenses) will not exceed 0.08% of the average daily value of the Series’ net assets. The Manager has agreed not to reduce or discontinue this contractual waiver or reimbursement prior to May 1, 2012 unless approved by the Board, including a majority of the Independent directors. For the year ended December 31, 2011, the Manager waived and/or reimbursed $88,527, which is included in fees waived and/or reimbursed by advisor in the Statement of Operations.
The Manager voluntarily agreed to waive its investment advisory fees by the amount of investment advisory fees the Series pays to the Manager indirectly through its investment in affiliated money market funds. However, the Manager does not waive its investment advisory fees by the amount of investment advisory fees paid in connection with the Series’ investment in other affiliated investment companies, if any. For the year ended December 31, 2011, the Manager waived $4,812, which is included in fees waived and/or reimbursed by advisor in the Statement of Operations.
The Manager entered into a sub-advisory agreement with BlackRock Investment Management, LLC (“BIM”), an affiliate of the Manager. The Manager pays BIM, for services it provides, a monthly fee that is a percentage of the investment advisory fees paid by the Series to the Manager.
For the year ended December 31, 2011, the Series reimbursed the Manager $5,446 for certain accounting services, which is included in accounting services in the Statement of Operations.
The Master LLC, on behalf of the Series, received an exemptive order from the SEC permitting it, among other things, to pay an affiliated securities lending agent a fee based on a share of the income derived from the securities lending activities and has retained BIM as the securities lending agent. BIM may, on behalf of the Series, invest cash collateral received by the Series for such loans, among other things, in a private investment company managed by the Manager or in registered money market funds advised by the Manager or its affiliates. The market value of securities on loan and the value of the related collateral, if applicable, are shown in the Statement of Assets and Liabilities as securities loaned at value and collateral on securities loaned at value, respectively. The cash collateral invested by BIM is disclosed in the Schedule of Investments. The share of income earned by the Series on such investments is shown as securities lending — affiliated in the Statement of Operations. For the year ended December 31, 2011, BIM received $290,249 in securities lending agent fees related to securities lending activities for the Series.
Certain officers and/or directors of the Master LLC are officers and/or directors of BlackRock or its affiliates.
|
|
|
|
|
|
|
|
|
|
|
|
|
|
|
|
|
BLACKROCK SMALL CAP INDEX FUND |
DECEMBER 31, 2011 |
43 |
|
|
|
|
|
|
|
Notes to Financial Statements (concluded) |
Master Small Cap Index Series |
4. Investments:
Purchases and sales of investments, excluding short-term securities, for the year ended December 31, 2011, were $371,105,816 and $139,139,069, respectively.
5. Borrowings:
The Master LLC, on behalf of the Series, along with certain other funds managed by the Manager and its affiliates, is a party to a $500 million credit agreement with a group of lenders, which expired in November 2011. The Series may borrow under the credit agreement to fund shareholder redemptions. Effective November 2010, the credit agreement had the following terms: a commitment fee of 0.08% per annum based on the Series’ pro rata share of the unused portion of the credit agreement and interest at a rate equal to the higher of (a) the one-month London Interbank Offered Rate (“LIBOR”) plus 1.00% per annum or (b) the Fed Funds rate plus 1.00% per annum on amounts borrowed. In addition, the Series paid administration and arrangement fees which were allocated to the Series based on its net assets as of October 31, 2010. Effective November 2011, the credit agreement was renewed until November 2012 with the following terms: a commitment fee of 0.065% per annum based on the Series’ pro rata share of the unused portion of the credit agreement and interest at a rate equal to the higher of (a) the one-month LIBOR plus 0.80% per annum or (b) the Fed Funds rate plus 0.80% per annum on amounts borrowed. In addition, the Series paid administration and arrangement fees which were allocated to the Series based on its net assets as of October 31, 2011. The Series did not borrow under the credit agreement during the year ended December 31, 2011.
6. Concentration, Market and Credit Risk:
In the normal course of business, the Series invests in securities and enters into transactions where risks exist due to fluctuations in the market (market risk) or failure of the issuer of a security to meet all its obligations (issuer credit risk). The value of securities held by the Series may decline in response to certain events, including those directly involving the issuers whose securities are owned by the Series; conditions affecting the general economy; overall market changes; local, regional or global political, social or economic instability; and currency and interest rate and price fluctuations. Similar to issuer credit risk, the Series may be exposed to counterparty credit risk, or the risk that an entity with which the Series has unsettled or open transactions may fail to or be unable to perform on its commitments. The Series manages counterparty credit risk by entering into transactions only with counterparties that it believes have the financial resources to honor their obligations and by monitoring the financial stability of those counterparties. Financial assets, which potentially expose the Series to market, issuer and counterparty credit risks, consist principally of financial instruments and receivables due from counterparties. The extent of the Series’ exposure to market, issuer and counterparty credit risks with respect to these financial assets is generally approximated by their value recorded in the Series’ Statement of Assets and Liabilities, less any collateral held by the Series.
As of December 31, 2011, the Series invested a significant portion of its assets in securities in the energy sector. Changes in economic conditions affecting the energy sector would have a greater impact on the Series and could affect the value, income and/or liquidity of positions in such securities.
7. Subsequent Events:
Management has evaluated the impact of all subsequent events on the Series through the date the financial statements were issued and has determined that there were no subsequent events requiring adjustment or additional disclosure in the financial statements.
|
|
|
|
|
|
|
|
|
44 |
BLACKROCK SMALL CAP INDEX FUND |
DECEMBER 31, 2011 |
|
|
|
|
|
|
|
Master Small Cap Index Series |
To the Investors of Master Small Cap Index Series and Board of Directors of Quantitative Master Series LLC:
We have audited the accompanying statement of assets and liabilities, including the schedule of investments, of Master Small Cap Index Series, one of the portfolios constituting Quantitative Master Series LLC (the “Master LLC”), as of December 31, 2011, and the related statement of operations for the year then ended, the statements of changes in net assets for each of the two years in the period then ended, and the financial highlights for each of the five years in the period then ended. These financial statements and financial highlights are the responsibility of the Master LLC’s management. Our responsibility is to express an opinion on these financial statements and financial highlights based on our audits.
We conducted our audits in accordance with the standards of the Public Company Accounting Oversight Board (United States). Those standards require that we plan and perform the audit to obtain reasonable assurance about whether the financial statements and financial highlights are free of material misstatement. The Master LLC is not required to have, nor were we engaged to perform, an audit of its internal control over financial reporting. Our audits included consideration of internal control over financial reporting as a basis for designing audit procedures that are appropriate in the circumstances, but not for the purpose of expressing an opinion on the effectiveness of the Master LLC’s internal control over financial reporting. Accordingly, we express no such opinion. An audit also includes examining, on a test basis, evidence supporting the amounts and disclosures in the financial statements, assessing the accounting principles used and significant estimates made by management, as well as evaluating the overall financial statement presentation. Our procedures included confirmation of securities owned as of December 31, 2011, by correspondence with the custodian and brokers. We believe that our audits provide a reasonable basis for our opinion.
In our opinion, the financial statements and financial highlights referred to above present fairly, in all material respects, the financial position of Master Small Cap Index Series, one of the portfolios constituting Quantitative Master Series LLC as of December 31, 2011, the results of its operations for the year then ended, the changes in its net assets for each of the two years in the period then ended, and the financial highlights for each of the five years in the period then ended, in conformity with accounting principles generally accepted in the United States of America.
Deloitte & Touche LLP
Boston, Massachusetts
February 22, 2012
|
|
|
|
|
|
|
|
|
|
|
|
BLACKROCK SMALL CAP INDEX FUND |
DECEMBER 31, 2011 |
45 |
|
|
|
|
|
|
|
|
|
|
|
|
|
|
|
|
|
Name, Address |
|
Position(s) |
|
Length |
|
Principal Occupation(s) During Past Five Years |
|
Number of BlackRock- |
|
Public |
|
Independent Directors1 |
||||||||||
|
Ronald W.
Forbes |
|
Co-Chairman of the Board and Director |
|
Since 2007 |
|
Professor Emeritus of Finance, School of Business, State University of New York at Albany since 2000. |
|
33 RICs consisting of 107 Portfolios |
|
None |
|
Rodney D.
Johnson |
|
Co-Chairman of the Board and Director |
|
Since 2007 |
|
President, Fairmount Capital Advisors, Inc. since 1987; Member of the Archdiocesan Investment Committee of the Archdiocese of Philadelphia since 2004; Director, The Committee of Seventy (civic) since 2006; Director, Fox Chase Cancer Center from 2004 to 2010. |
|
33 RICs consisting of 107 Portfolios |
|
None |
|
David O.
Beim |
|
Director |
|
Since 2007 |
|
Professor of Professional Practice at the Columbia University Graduate School of Business since 1991; Trustee, Phillips Exeter Academy since 2002; Chairman, Wave Hill, Inc. (public garden and cultural center) from 1990 to 2006. |
|
33 RICs consisting of 107 Portfolios |
|
None |
|
Dr. Matina
S. Horner |
|
Director |
|
Since 2007 |
|
Executive Vice President of Teachers Insurance and Annuity Association and College Retirement Equities Fund from 1989 to 2003. |
|
33 RICs consisting of 107 Portfolios |
|
NSTAR (electric and gas utility) |
|
Herbert I.
London |
|
Director |
|
Since 2007 |
|
Professor Emeritus, New York University since 2005; John M. Olin Professor of Humanities, New York University from 1993 to 2005 and Professor thereof from 1980 to 2005; President, Hudson Institute (policy research organization) since 1997 and Trustee thereof since 1980; Chairman of the Board of Trustees for Grantham University since 2006; Director, InnoCentive, Inc. (strategic solutions company) since 2005; Director, Cerego, LLC (software development and design) since 2005; Director, Cybersettle (dispute resolution technology) since 2009. |
|
33 RICs consisting of 107 Portfolios |
|
AIMS Worldwide, Inc. (marketing) |
|
Cynthia A.
Montgomery |
|
Director |
|
Since 2007 |
|
Professor, Harvard Business School since 1989; Director, McLean Hospital since 2005; Director, Harvard Business School Publishing from 2005 to 2010. |
|
33 RICs consisting of 107 Portfolios |
|
Newell Rubbermaid, Inc. (manufacturing) |
|
Joseph P.
Platt |
|
Director |
|
Since 2007 |
|
Director, The West Penn Allegheny Health System (a not-for-profit health system) since 2008; Director, Jones and Brown (Canadian insurance broker) since 1998; General Partner, Thorn Partners, LP (private investment) since 1998; Director, WQED Multi-Media (public broadcasting not-for-profit) since 2001; Partner, Amarna Corporation, LLC (private investment company) from 2002 to 2008. |
|
33 RICs consisting of 107 Portfolios |
|
Greenlight Capital Re, Ltd. (reinsurance company) |
|
Robert C.
Robb, Jr. |
|
Director |
|
Since 2007 |
|
Partner, Lewis, Eckert, Robb and Company (management and financial consulting firm) since 1981. |
|
33 RICs consisting of 107 Portfolios |
|
None |
|
Toby
Rosenblatt |
|
Director |
|
Since 2007 |
|
President, Founders Investments Ltd. (private investments) since 1999; Director, College Access Foundation of California (philanthropic foundation) since 2009; Director, Forward Management, LLC since 2007; Director, A.P. Pharma, Inc. (specialty pharmaceuticals) from 1983 to 2011; Director, The James Irvine Foundation (philanthropic foundation) from 1998 to 2008. |
|
33 RICs consisting of 107 Portfolios |
|
None |
|
|
|
|
|
|
|
|
|
46 |
BLACKROCK SMALL CAP INDEX FUND |
DECEMBER 31, 2011 |
|
|
|
|
|
Officers and Directors (continued) |
|
|
|
|
|
|
|
|
|
|
|
|
|
Name, Address |
|
Position(s) |
|
Length |
|
Principal Occupation(s) During Past Five Years |
|
Number of BlackRock- |
|
Public |
|
Independent Directors1 (concluded) |
||||||||||
|
Kenneth L.
Urish |
|
Director |
|
Since 2007 |
|
Managing Partner, Urish Popeck & Co., LLC (certified public accountants and consultants) since 1976; Chairman Elect of the Professional Ethics Committee of the Pennsylvania Institute of Certified Public Accountants and Committee Member thereof since 2007; Member of External Advisory Board, The Pennsylvania State University Accounting Department since 2001; Trustee, The Holy Family Foundation from 2001 to 2010; President and Trustee, Pittsburgh Catholic Publishing Associates from 2003 to 2008; Director, Inter-Tel from 2006 to 2007. |
|
33 RICs consisting of 107 Portfolios |
|
None |
|
Frederick
W. Winter |
|
Director |
|
Since 2007 |
|
Professor and Dean Emeritus of the Joseph M. Katz School of Business, University of Pittsburgh since 2005 and Dean thereof from 1997 to 2005; Director, Alkon Corporation (pneumatics) since 1992; Director, Tippman Sports (recreation) since 2005; Director, Indotronix International (IT services) from 2004 to 2008. |
|
33 RICs consisting of 107 Portfolios |
|
None |
|
|
|
|
|
|
1 |
Directors serve until their resignation, removal or death, or until December 31 of the year in which they turn 72. The Board has approved extensions in terms of Directors who turn 72 prior to December 31, 2013. |
|
|
||
|
|
2 |
Date shown is the earliest date a person has served for the Corporation/Master LLC covered by this annual report. Following the combination of Merrill Lynch Investment Managers, L.P. (“MLIM”) and BlackRock, Inc. (“BlackRock”) in September 2006, the various legacy MLIM and legacy BlackRock Fund boards were realigned and consolidated into three new Fund boards in 2007. As a result, although the chart shows Directors as joining the Corporation’s/Master LLC’s board in 2007, each Director first became a member of the board of other legacy MLIM or legacy BlackRock Funds as follows: David O. Beim, 1998; Ronald W. Forbes, 1977; Dr. Matina S. Horner, 2004; Rodney D. Johnson, 1995; Herbert I. London, 1987; Cynthia A. Montgomery, 1994; Joseph P. Platt, 1999; Robert C. Robb, Jr., 1998; Toby Rosenblatt, 2005; Kenneth L. Urish, 1999; and Frederick W. Winter, 1999. |
|
|
|
|
|
|
|
|
|
|
|
|
|
Interested Directors3 |
||||||||||
|
Paul L.
Audet |
|
Director |
|
Since 2011 |
|
Senior Managing Director, BlackRock and Head of BlackRock’s Real Estate business from 2008 to 2011; Member of BlackRock’s Global Operating and Corporate Risk Management Committees and of the BlackRock Alternative Investors Executive Committee and Investment Committee for the Private Equity Fund of Funds business since 2008; Head of BlackRock’s Global Cash Management business from 2005 to 2010; Acting Chief Financial Officer of BlackRock from 2007 to 2008; Chief Financial Officer of BlackRock from 1998 to 2005. |
|
159 RICs consisting of 286 Portfolios |
|
None |
|
Henry
Gabbay |
|
Director |
|
Since 2007 |
|
Consultant, BlackRock from 2007 to 2008; Managing Director, BlackRock from 1989 to 2007; Chief Administrative Officer, BlackRock Advisors, LLC from 1998 to 2007; President of BlackRock Funds and BlackRock Bond Allocation Target Shares from 2005 to 2007 and Treasurer of certain closed-end funds in the BlackRock fund complex from 1989 to 2006. |
|
159 RICs consisting of 286 Portfolios |
|
None |
|
|
|
|
|
|
3 |
Mr. Audet is an “interested person,” as defined in the 1940 Act, of the Corporation/Master LLC based on his position with BlackRock and its affiliates. Mr. Gabbay is an “interested person” of the Corporation/Master LLC based on his former positions with BlackRock and its affiliates as well as his ownership of BlackRock and The PNC Financial Services Group, Inc. securities. Mr. Audet and Mr. Gabbay are also Directors of the BlackRock registered closed-end funds and Directors of other BlackRock registered open-end funds. Directors serve until their resignation, removal or death, or until December 31 of the year in which they turn 72. |
|
|
|
|
|
|
|
|
|
|
|
|
BLACKROCK SMALL CAP INDEX FUND |
DECEMBER 31, 2011 |
47 |
|
|
|
|
|
Officers and Directors (concluded) |
|
|
|
|
|
|
|
|
|
Name, Address |
|
Position(s) |
|
Length |
|
Principal Occupation(s) During Past Five Years |
|
Officers1 |
||||||
|
John M.
Perlowski |
|
President and Chief Executive Officer |
|
Since 2010 |
|
Managing Director of BlackRock since 2009; Global Head of BlackRock Fund Administration since 2009; Managing Director and Chief Operating Officer of the Global Product Group at Goldman Sachs Asset Management, L.P. from 2003 to 2009; Treasurer of Goldman Sachs Mutual Funds from 2003 to 2009 and Senior Vice President thereof from 2007 to 2009; Director of Goldman Sachs Offshore Funds from 2002 to 2009; Director of Family Resource Network (charitable foundation) since 2009. |
|
Brendan
Kyne |
|
Vice President |
|
Since 2009 |
|
Managing Director of BlackRock since 2010; Director of BlackRock from 2008 to 2009; Head of Product Development and Management for BlackRock’s U.S. Retail Group since 2009 and Co-head thereof from 2007 to 2009;Vice President of BlackRock from 2005 to 2008. |
|
Neal
Andrews |
|
Chief Financial Officer |
|
Since 2007 |
|
Managing Director of BlackRock since 2006; Senior Vice President and Line of Business Head of Fund Accounting and Administration at PNC Global Investment Servicing (U.S.) Inc. from 1992 to 2006. |
|
Jay Fife |
|
Treasurer |
|
Since 2007 |
|
Managing Director of BlackRock since 2007; Director of BlackRock in 2006; Assistant Treasurer of the MLIM and Fund Asset Management, L.P. advised funds from 2005 to 2006; Director of MLIM Fund Services Group from 2001 to 2006. |
|
Brian
Kindelan |
|
Chief Compliance Officer and Anti-Money Laundering Officer |
|
Since 2007 |
|
Chief Compliance Officer of the BlackRock-advised funds since 2007; Managing Director and Senior Counsel of BlackRock since 2005. |
|
Ira P.
Shapiro |
|
Secretary |
|
Since 2010 |
|
Managing Director of BlackRock since 2009; Managing Director and Associate General Counsel of Barclays Global Investors from 2008 to 2009 and Principal thereof from 2004 to 2008. |
|
|
|
|
|
|
1 |
Officers of the Corporation/Master LLC serve at the pleasure of the Board. |
|
|
Further information about the Officers and Directors is available in the Corporation’s/Master LLC’s Statement of Additional Information, which can be obtained without charge by calling (800) 441-7762. |
|
|
|
|
|
|
Investment Advisor |
|
BlackRock Advisors, LLC |
|
Wilmington, DE 19809 |
|
|
|
Sub-Advisor |
|
BlackRock Investment Management, LLC |
|
Princeton, NJ 08540 |
|
|
|
Custodian |
|
State Street Bank and Trust Company |
|
Boston, MA 02110 |
|
|
|
Transfer Agent |
|
BNY Mellon Investment Servicing (US) Inc. |
|
Wilmington, DE 19809 |
|
|
|
Distributor |
|
BlackRock Investments, LLC |
|
New York, NY 10022 |
|
|
|
Legal Counsel |
|
Sidley Austin LLP |
|
New York, NY 10019 |
|
|
|
Accounting Agent |
|
State Street Bank and Trust Company |
|
Boston, MA 02110 |
|
|
|
Independent Registered Public Accounting Firm |
|
Deloitte & Touche LLP |
|
Boston, MA 02116 |
|
|
|
Address of the Fund |
|
100 Bellevue Parkway |
|
Wilmington, DE 19809 |
|
|
|
Effective September 22, 2011, Richard S. Davis resigned as Director of the Corporation and the Master LLC, and Paul L. Audet became Director of the Corporation and the Master LLC. |
|
|
|
|
|
|
|
|
|
48 |
BLACKROCK SMALL CAP INDEX FUND |
DECEMBER 31, 2011 |
|
|
|
|
|
|
|
General Information |
Electronic Delivery
Electronic copies of most financial reports and prospectuses are available on the Fund’s website or shareholders can sign up for e-mail notifications of quarterly statements, annual and semi-annual reports and prospectuses by enrolling in the Fund’s electronic delivery program.
To enroll:
Shareholders Who Hold Accounts with Investment Advisors, Banks or Brokerages:
Please contact your financial advisor. Please note that not all investment advisors, banks or brokerages may offer this service.
Shareholders Who Hold Accounts Directly with BlackRock:
|
|
|
|
1) |
Access the BlackRock website at |
|
|
http://www.blackrock.com/edelivery |
|
|
|
|
2) |
Select “eDelivery” under the “More Information” section |
|
|
|
|
3) |
Log into your account |
Householding
The Fund will mail only one copy of shareholder documents, including prospectuses, annual and semi-annual reports and proxy statements, to shareholders with multiple accounts at the same address. This practice is commonly called “householding” and is intended to reduce expenses and eliminate duplicate mailings of shareholder documents. Mailings of your shareholder documents may be householded indefinitely unless you instruct us otherwise. If you do not want the mailing of these documents to be combined with those for other members of your household, please call the Fund at (800) 441-7762.
Availability of Quarterly Schedule of Investments
The Fund/Series file their complete schedule of portfolio holdings with the SEC for the first and third quarters of each fiscal year on Form N-Q. The Fund’s/Series’ Forms N-Q are available on the SEC’s website at http://www.sec.gov and may also be reviewed and copied at the SEC’s Public Reference Room in Washington, D.C. Information on how to access documents on the SEC’s website without charge may be obtained by calling (800) SEC-0330. The Fund’s/Series’ Forms N-Q may also be obtained upon request and without charge by calling (800) 441-7762.
Availability of Proxy Voting Policies and Procedures
A description of the policies and procedures that the Fund/Series use to determine how to vote proxies relating to portfolio securities is available (1) without charge, upon request, by calling (800) 441-7762; (2) at http://www.blackrock.com; and (3) on the SEC’s website at http://www.sec.gov.
Availability of Proxy Voting Record
Information about how the Fund/Series voted proxies relating to securities held in the Fund’s/Series’ portfolio during the most recent 12-month period ended June 30 is available upon request and without charge (1) at http://www.blackrock.com or by calling (800) 441-7762 and (2) on the SEC’s website at http://www.sec.gov.
|
|
|
|
|
|
|
|
|
|
|
|
BLACKROCK SMALL CAP INDEX FUND |
DECEMBER 31, 2011 |
49 |
|
|
|
|
|
Additional Information (concluded) |
|
|
|
BlackRock Privacy Principles |
BlackRock is committed to maintaining the privacy of its current and former fund investors and individual clients (collectively, “Clients”) and to safeguarding their non-public personal information. The following information is provided to help you understand what personal information BlackRock collects, how we protect that information and why in certain cases we share such information with select parties.
If you are located in a jurisdiction where specific laws, rules or regulations require BlackRock to provide you with additional or different privacy-related rights beyond what is set forth below, then BlackRock will comply with those specific laws, rules or regulations.
BlackRock obtains or verifies personal non-public information from and about you from different sources, including the following: (i) information we receive from you or, if applicable, your financial intermediary, on applications, forms or other documents; (ii) information about your transactions with us, our affiliates, or others; (iii) information we receive from a consumer reporting agency; and (iv) from visits to our websites.
BlackRock does not sell or disclose to non-affiliated third parties any non-public personal information about its Clients, except as permitted by law or as is necessary to respond to regulatory requests or to service Client accounts. These non-affiliated third parties are required to protect the confidentiality and security of this information and to use it only for its intended purpose.
We may share information with our affiliates to service your account or to provide you with information about other BlackRock products or services that may be of interest to you. In addition, BlackRock restricts access to non-public personal information about its Clients to those BlackRock employees with a legitimate business need for the information. BlackRock maintains physical, electronic and procedural safeguards that are designed to protect the non-public personal information of its Clients, including procedures relating to the proper storage and disposal of such information.
|
|
|
Shareholder Privileges |
Account Information
Call us at (800) 441-7762 from 8:00 AM to 6:00 PM EST on any business day to get information about your account balances, recent transactions and share prices. You can also reach us on the Web at http://www.blackrock.com/funds.
Automatic Investment Plans
Investor Class shareholders who want to invest regularly can arrange to have $50 or more automatically deducted from their checking or savings account and invested in any of the BlackRock funds.
Systematic Withdrawal Plans
Investor Class shareholders can establish a systematic withdrawal plan and receive periodic payments of $50 or more from their BlackRock funds, as long as their account balance is at least $10,000.
Retirement Plans
Shareholders may make investments in conjunction with Traditional, Rollover, Roth, Coverdell, Simple IRAs, SEP IRAs and 403(b) Plans.
|
|
|
|
|
|
|
|
|
50 |
BLACKROCK SMALL CAP INDEX FUND |
DECEMBER 31, 2011 |
|
|
|
|
BlackRock offers a diverse lineup of open-end mutual funds crossing all investment styles and managed by experts in equity, fixed income and tax-exempt investing.
|
|
|
Equity Funds |
|
|
|
BlackRock ACWI ex-US Index Fund |
|
BlackRock All-Cap Energy & Resources Portfolio |
|
BlackRock Asset Allocation Portfolio† |
|
BlackRock Balanced Capital Fund† |
|
BlackRock Basic Value Fund |
|
BlackRock Capital Appreciation Fund |
|
BlackRock China Fund |
|
BlackRock Commodity Strategies Fund |
|
BlackRock Emerging Markets Long/Short Equity Fund |
|
BlackRock Energy & Resources Portfolio |
|
BlackRock Equity Dividend Fund |
|
BlackRock EuroFund |
|
BlackRock Focus Growth Fund |
|
BlackRock Global Allocation Fund† |
|
BlackRock Global Dividend Income Portfolio |
|
BlackRock Global Dynamic Equity Fund |
|
BlackRock Global Emerging Markets Fund |
|
BlackRock Global Opportunities Portfolio |
|
BlackRock Global SmallCap Fund |
|
BlackRock Health Sciences Opportunities Portfolio |
|
BlackRock Index Equity Portfolio |
|
BlackRock India Fund |
|
BlackRock International Fund |
|
BlackRock International Index Fund |
|
BlackRock International Opportunities Portfolio |
|
BlackRock Large Cap Core Fund |
|
BlackRock Large Cap Core Plus Fund |
|
BlackRock Large Cap Growth Fund |
|
BlackRock Large Cap Value Fund |
|
BlackRock Latin America Fund |
|
BlackRock Mid-Cap Growth Equity Portfolio |
|
BlackRock Mid-Cap Value Equity Portfolio |
|
BlackRock Mid Cap Value Opportunities Fund |
|
BlackRock Natural Resources Trust |
|
BlackRock Pacific Fund |
|
BlackRock Russell 1000 Index Fund |
|
BlackRock Science & Technology Opportunities Portfolio |
|
BlackRock Small Cap Growth Equity Portfolio |
|
BlackRock Small Cap Growth Fund II |
|
BlackRock Small Cap Index Fund |
|
BlackRock S&P 500 Index Fund |
|
BlackRock S&P 500 Stock Fund |
|
BlackRock U.S. Opportunities Portfolio |
|
BlackRock Value Opportunities Fund |
|
BlackRock World Gold Fund |
|
|
|
Fixed Income Funds |
|
|
|
BlackRock Bond Index Fund |
|
BlackRock Core Bond Portfolio |
|
BlackRock Emerging Market Debt Portfolio |
|
BlackRock Floating Rate Income Portfolio |
|
BlackRock Global Long/Short Credit Fund |
|
BlackRock GNMA Portfolio |
|
BlackRock High Yield Bond Portfolio |
|
BlackRock Inflation Protected Bond Portfolio |
|
BlackRock International Bond Portfolio |
|
BlackRock Long Duration Bond Portfolio |
|
BlackRock Low Duration Bond Portfolio |
|
BlackRock Multi-Asset Income Portfolio† |
|
BlackRock Multi-Sector Bond Portfolio |
|
BlackRock Strategic Income Opportunities Portfolio |
|
BlackRock Total Return Fund |
|
BlackRock US Government Bond Portfolio |
|
BlackRock World Income Fund |
|
US Mortgage Portfolio |
|
|
|
Municipal Bond Funds |
|
|
|
BlackRock California Municipal Bond Fund |
|
BlackRock High Yield Municipal Fund |
|
BlackRock Intermediate Municipal Fund |
|
BlackRock National Municipal Fund |
|
BlackRock New Jersey Municipal Bond Fund |
|
BlackRock New York Municipal Bond Fund |
|
BlackRock Pennsylvania Municipal Bond Fund |
|
BlackRock Short-Term Municipal Fund |
|
|
|
Target Risk & Target Date Funds† |
|
|
|
BlackRock Prepared Portfolios |
|
|
|
BlackRock Lifecycle Prepared Portfolios |
|
2015 |
|
2020 |
|
2025 |
|
2030 |
|
2035 |
|
2040 |
|
2045 |
|
2050 |
|
|
|
LifePath Portfolios |
|
2020 |
|
2025 |
|
2030 |
|
2035 |
|
2040 |
|
2045 |
|
2050 |
|
2055 |
|
|
|
LifePath
Index Portfolios |
|
2020 |
|
2025 |
|
2030 |
|
2035 |
|
2040 |
|
2045 |
|
2050 |
|
2055 |
|
|
|
† Mixed asset fund. |
BlackRock mutual funds are currently distributed by BlackRock Investments, LLC. You should consider the investment objectives, risks, charges and expenses of the funds under consideration carefully before investing. Each fund’s prospectus contains this and other information and is available at www.blackrock.com or by calling (800) 441-7762 or from your financial advisor. The prospectus should be read carefully before investing.
|
|
|
|
|
|
|
|
|
|
|
|
BLACKROCK SMALL CAP INDEX FUND |
DECEMBER 31, 2011 |
51 |
This report is transmitted to shareholders only. It is not authorized for use as an offer of sale or a solicitation of an offer to buy shares of the Fund unless accompanied or preceded by the Fund’s current prospectus. Past performance results shown in this report should not be considered a representation of future performance. Investment returns and principal value of shares will fluctuate so that shares, when redeemed, may be worth more or less than their original cost. Statements and other information herein are as dated and are subject to change.

|
|
|
|
#Index 3-12/11-AR |
|

|
Item 2 – |
Code of Ethics – Each registrant (or “Fund”) has adopted a code of ethics, as of the end of the period covered by this report, applicable to the registrant’s principal executive officer, principal financial officer, principal accounting officer or controller, or persons performing similar functions. During the period covered by this report, there have been no amendments to or waivers granted under the code of ethics. A copy of the code of ethics is available without charge at www.blackrock.com. |
|
|
|
|
Item 3 – |
Audit Committee Financial Expert – Each registrant’s board of directors (the “board of directors”), has determined that (i) the registrant has the following audit committee financial expert serving on its audit committee and (ii) each audit committee financial expert is independent: |
|
|
Kenneth L. Urish |
|
|
|
|
|
Under applicable securities laws, a person determined to be an audit committee financial expert will not be deemed an “expert” for any purpose, including without limitation for the purposes of Section 11 of the Securities Act of 1933, as a result of being designated or identified as an audit committee financial expert. The designation or identification of a person as an audit committee financial expert does not impose on such person any duties, obligations, or liabilities greater than the duties, obligations, and liabilities imposed on such person as a member of the audit committee and board of directors in the absence of such designation or identification. |
|
|
|
|
Item 4 – |
Principal Accountant Fees and Services |
|
|
|
|
|
The following table presents fees billed by Deloitte & Touche LLP (“D&T”) in each of the last two fiscal years for the services rendered to the Funds: |
|
|
(a) Audit Fees |
(b) Audit-Related Fees1 |
(c) Tax Fees2 |
(d) All Other Fees3 |
||||
|
Entity Name |
Current |
Previous |
Current |
Previous |
Current |
Previous |
Current |
Previous |
|
BlackRock International Index Fund of BlackRock Index Funds, Inc. |
$7,000 |
$6,800 |
$3,000 |
$0 |
$8,600 |
$6,100 |
$0 |
$46 |
|
BlackRock S&P 500 Index Fund of BlackRock Index Funds, Inc. |
$7,000 |
$6,800 |
$0 |
$0 |
$12,350 |
$6,100 |
$0 |
$329 |
|
BlackRock Small Cap Index Fund of BlackRock Index Funds, Inc. |
$7,000 |
$6,800 |
$3,000 |
$0 |
$10,700 |
$6,100 |
$0 |
$17 |
|
Master International Index Series of Quantitative Master Series LLC |
$36,800 |
$35,700 |
$1,750 |
$0 |
$17,000 |
$17,000 |
$0 |
$0 |
|
Master S&P 500 Index Series of Quantitative Master Series LLC |
$34,500 |
$33,500 |
$13,300 |
$0 |
$18,600 |
$17,000 |
$0 |
$0 |
|
Master Small Cap Index Series of Quantitative Master Series LLC |
$38,100 |
$37,000 |
$1,750 |
$0 |
$17,000 |
$17,000 |
$0 |
$0 |
|
|
The following table presents fees billed by D&T that were required to be approved by each registrant’s audit committee (each a “Committee”) for services that relate directly to the operations or financial reporting of the Fund and that are rendered on behalf of BlackRock Advisors, LLC (“Investment Adviser” or “BlackRock”) and entities controlling, controlled by, or under common control with BlackRock (not including any sub-adviser whose role is primarily portfolio management and is subcontracted with or overseen by another investment adviser) that provide ongoing services to the Fund (“Fund Service Providers”): |
|
|
Current Fiscal Year End |
Previous Fiscal Year End |
|
(b) Audit-Related Fees1 |
$0 |
$0 |
|
(c) Tax Fees2 |
$0 |
$0 |
|
(d) All Other Fees3 |
$3,030,000 |
$2,950,000 |
1 The nature of the services includes assurance and related services reasonably related to the performance of the audit of financial statements not included in Audit Fees.
2 The nature of the services includes tax compliance, tax advice and tax planning.
3 Aggregate fees borne by BlackRock in connection with the review of compliance procedures and attestation thereto performed by D&T with respect to all of the registered closed-end funds and some of the registered open-end funds advised by BlackRock.
|
|
(e)(1) Audit Committee Pre-Approval Policies and Procedures: |
|
|
|
|
|
Each Committee has adopted policies and procedures with regard to the pre-approval of services. Audit, audit-related and tax compliance services provided to the registrants on an annual basis require specific pre-approval by the registrant’s Committee. The Committee also must approve other non-audit services provided to the registrant and those non-audit services provided to the Investment Adviser and Fund Service Providers that relate directly to the operations and the financial reporting of the registrant. Certain of these non-audit services that the Committee believes are a) consistent with the SEC’s auditor independence rules and b) routine and recurring services that will not impair the independence of the independent accountants may be approved by the Committee without consideration on a specific case-by-case basis (“general pre-approval”). The term of any general pre-approval is 12 months from the date of the pre-approval, unless the Committee provides for a different period. Tax or other non-audit services provided to a registrant which have a direct impact on the operations or financial reporting of the registrant will only be deemed pre-approved provided that any individual project does not exceed $10,000 attributable to the registrant or $50,000 per project. For this purpose, multiple projects will be aggregated to determine if they exceed the previously mentioned cost levels. |
|
|
|
|
|
Any proposed services exceeding the pre-approved cost levels will require specific pre-approval by the registrant’s Committee, as will any other services not subject to general pre-approval (e.g., unanticipated but permissible services). The Committee is informed of each service approved subject to general pre-approval at the next regularly scheduled in-person board meeting. At this meeting, an analysis of such services is presented to the Committee for ratification. The Committee may delegate to the Committee Chairman the authority to approve the provision of and fees for any specific engagement of permitted non-audit services, including services exceeding pre-approved cost levels. |
|
|
|
|
|
(e)(2) None of the services described in each of Items 4(b) through (d) were approved by either Committee pursuant to the de minimus exception in paragraph (c)(7)(i)(C) of Rule 2-01 of Regulation S-X. |
|
|
|
|
|
(f) Not Applicable |
|
|
(g) The aggregate non-audit fees paid to the accountant for services rendered by the accountant to the registrants, the Investment Adviser and the Fund Service Providers were: |
|
Entity Name |
Current Fiscal Year |
Previous Fiscal Year |
|
BlackRock International Index Fund of BlackRock Index Funds, Inc. |
$11,600 |
$16,923 |
|
BlackRock S&P 500 Index Fund of BlackRock Index Funds, Inc. |
$12,350 |
$17,206 |
|
BlackRock Small Cap Index Fund of BlackRock Index Funds, Inc. |
$13,700 |
$16,894 |
|
Master International Index Series of Quantitative Master Series LLC |
$18,750 |
$27,777 |
|
Master S&P 500 Index Series of Quantitative Master Series LLC |
$31,900 |
$27,777 |
|
Master Small Cap Index Series of Quantitative Master Series LLC |
$18,750 |
$27,777 |
|
|
Additionally, SAS No. 70 fees for the current and previous fiscal years of $3,030,000 and $2,950,000, respectively, were billed by D&T to the Investment Adviser. |
|
|
|
|
|
(h) Each Committee has considered and determined that the provision of non-audit services that were rendered to the Investment Adviser and the Fund Service Providers that were not pre-approved pursuant to paragraph (c)(7)(ii) of Rule 2-01 of Regulation S-X is compatible with maintaining the principal accountant’s independence. |
|
|
|
|
Item 5 – |
Audit Committee of Listed Registrants – Not Applicable |
|
|
|
|
Item 6 – |
Investments |
|
|
(a) The registrants’ Schedules of Investments are included as part of the Reports to Stockholders filed under Item 1 of this Form. |
|
|
(b) Not Applicable due to no such divestments during the semi-annual period covered since the previous Form N-CSR filing. |
|
|
|
|
Item 7 – |
Disclosure of Proxy Voting Policies and Procedures for Closed-End Management Investment Companies – Not Applicable |
|
|
|
|
Item 8 – |
Portfolio Managers of Closed-End Management Investment Companies – Not Applicable |
|
|
|
|
Item 9 – |
Purchases of Equity Securities by Closed-End Management Investment Company and Affiliated Purchasers – Not Applicable |
|
|
|
|
Item 10 – |
Submission of Matters to a Vote of Security Holders – There have been no material changes to these procedures. |
|
|
|
|
Item 11 – |
Controls and Procedures |
|
11(a) – |
The registrants’ principal executive and principal financial officers, or persons performing similar functions, have concluded that the registrants’ disclosure controls and procedures (as defined in Rule 30a-3(c) under the Investment Company Act of 1940, as amended (the “1940 Act”)) are effective as of a date within 90 days of the filing of this report based on the evaluation of these controls and procedures required by Rule 30a-3(b) under the 1940 Act and Rule 15d-15(b) under the Securities Exchange Act of 1934, as amended. |
|
|
|
|
11(b) – |
There were no changes in the registrants’ internal control over financial reporting (as defined in Rule 30a-3(d) under the 1940 Act) that occurred during the second fiscal quarter of the period covered by this report that have materially affected, or are reasonably likely to materially affect, the registrants’ internal control over financial reporting. |
|
|
|
|
Item 12 – |
Exhibits attached hereto |
|
|
|
|
12(a)(1) – |
Code of Ethics – See Item 2 |
|
|
|
|
12(a)(2) – |
Certifications – Attached hereto |
|
|
|
|
12(a)(3) – |
Not Applicable |
|
|
|
|
12(b) – |
Certifications – Attached hereto |
|
|
Pursuant to the requirements of the Securities Exchange Act of 1934 and the Investment Company Act of 1940, each registrant has duly caused this report to be signed on its behalf by the undersigned, thereunto duly authorized. |
||
|
|
|
||
|
|
BlackRock Index Funds, Inc. and Quantitative Master Series LLC |
||
|
|
|
||
| By: | /s/ John M. Perlowski | ||
| John M. Perlowski | |||
| Chief Executive Officer (principal executive officer) of | |||
| BlackRock Index Funds, Inc. and Quantitative Master Series LLC | |||
| Date: March 1, 2012 | |||
| Pursuant to the requirements of the Securities Exchange Act of 1934 and the Investment Company Act of 1940, this report has been signed below by the following persons on behalf of each registrant and in the capacities and on the dates indicated. | |||
| By: | /s/ John M. Perlowski | ||
| John M. Perlowski | |||
| Chief Executive Officer (principal executive officer) of | |||
| BlackRock Index Funds, Inc. and Quantitative Master Series LLC | |||
| Date: March 1, 2012 | |||
| By: | /s/ Neal J. Andrews | ||
| Neal J. Andrews | |||
| Chief Financial Officer (principal financial officer) of | |||
| BlackRock Index Funds, Inc. and Quantitative Master Series LLC | |||
| Date: March 1, 2012 | |||