DocumentExhibit 99.6
BIGHORN PERMIAN RESOURCES
Estimated
Future Reserves and Income Attributable to Certain Leasehold and Royalty Interests
Bank Pricing Parameters
Beginning January 1, 2022
RYDER SCOTT COMPANY PETROLEUM CONSULTANTS
BIGHORN PERMIAN RESOURCES TABLE OF CONTENTS
DISCUSSION
PETROLEUM RESERVES DEFINITIONS
TABLE NO.
PROPERTY RANKING . . . . . . . . . . . . . . . . . . . . . . . . . . . . . . . . . . . . . . . . . . . . . . . . . . . . . . . . . . . . . . . . . . . . . . . . . . . . . A SUMMARY OF GROSS AND NET RESERVE AND INCOME DATA . . . . . . . . . . . . . . . . . . . . . . . . . . . . . . . . . . B SUMMARY OF INITIAL BASIC DATA . . . . . . . . . . . . . . . . . . . . . . . . . . . . . . . . . . . . . . . . . . . . . . . . . . . . . . . . . . . . . . . C
GRAND SUMMARIES
TOTAL PROVED . . . . . . . . . . . . . . . . . . . . . . . . . . . . . . . . . . . . . . . . . . . . . . . . . . . . . . . . . . . . . . . . . . . . . . . . . . . . . . . . 1
PROVED PRODUCING . . . . . . . . . . . . . . . . . . . . . . . . . . . . . . . . . . . . . . . . . . . . . . . . . . . . . . . . . . . . . . . . . . . . . . . . . 2
PROVED NON-PRODUCING . . . . . . . . . . . . . . . . . . . . . . . . . . . . . . . . . . . . . . . . . . . . . . . . . . . . . . . . . . . . . . . . . . . 3
PROVED UNDEVELOPED . . . . . . . . . . . . . . . . . . . . . . . . . . . . . . . . . . . . . . . . . . . . . . . . . . . . . . . . . . . . . . . . . . . . . . 4
RYDER SCOTT COMPANY PETROLEUM CONSULTANTS - TBPE FIRM LICENSE No. F-1580
| | | | | | | | |
| TBPELS REGISTERED ENGINEERING FIRM F-1580 | | FAX (713) 651-0849 |
| 1100 LOUISIANA SUITE 4600 | HOUSTON, TEXAS 77002-5294 | TELEPHONE (713) 651 -9191 |
March 18, 2022
Bighorn Permian Resources 5221 N O’Connor Blvd, #1100
Irving, Texas 75039
Ladies and Gentlemen:
At your request, Ryder Scott Company, L.P. (Ryder Scott) has prepared an estimate of the proved reserves, future production and income attributable to certain leasehold and royalty interests of Bighorn Permian Resources (BPR) beginning January 1, 2022. The subject properties are located in the state of Texas. The reserves volumes included herein were estimated based on the definitions and disclosure guidelines contained in the Society of Petroleum Engineers (SPE), World Petroleum Council (WPC), American Association of Petroleum Geologists (AAPG), Society of Petroleum Evaluation Engineers (SPEE), Society of Exploration Geophysicists (SEG), Society of Petrophysicists and Well Log Analysts (SPWLA), and European Association of Geoscientists & Engineers (EAGE) 2018 Petroleum Resources Management System (SPE-PRMS), which were revised in June 2018. The reserves volumes were estimated based on varying price and constant cost parameters (SPE-PRMS forecast case), provided by BPR. Such forecasts were based on projected escalations or other forward looking changes to current prices and/or costs as noted. The results of our third party study, completed on March 17, 2022, are presented herein.
The properties evaluated by Ryder Scott represent 100 percent of the total net proved liquid hydrocarbon reserves and 100 percent of the total net proved gas reserves of BPR beginning January 1, 2021.
The estimated reserves presented in this report, beginning January 1, 2022, are related to hydrocarbon prices based on varying price parameters. As a result of both economic and political forces, there is substantial uncertainty regarding the forecasting of future hydrocarbon prices. Consequently, actual future prices may vary considerably from the prices assumed in this report. The recoverable reserves volumes and the income attributable thereto have a direct relationship to the hydrocarbon prices actually received; therefore, volumes of reserves actually recovered and amounts of income actually received may differ significantly from the estimated quantities presented in this report. The results of this study are summarized as follows.
| | | | | | | | |
| SUITE 2800, 350 7TH AVENUE, S.W. | CALGARY, ALBERTA T2P 3N9 | TEL (403) 262-2799 |
| 633 17TH STREET, SUITE 1700 | DENVER, COLORADO 80202 | TEL (303) 339-8110 |
| | |
Bighorn Permian Resources March 18, 2022 Page 2 |
| | | | | | | | | | | | | | | | | | | | | | | |
BANK PRICING PARAMETERS Estimated Net Reserves and Income Data Certain Leasehold and Royalty Interests of Bighorn Permian Resources Beginning January 1, 2022 |
| | | | | | | |
| Proved Reserves |
| Developed | | | | Total |
| Producing | | Non-Producing | | Undeveloped | | Proved |
| Net Reserves | | | | | | | |
| Oil/Condensate – Mbbl | 28,905 | | | 349 | | | 26,929 | | | 56,183 | |
| Plant Products - Mbbl | 45,564 | | | 871 | | | 14,751 | | | 61,186 | |
| Gas – MMcf | 366,738 | | | 7,011 | | | 118,733 | | | 492,482 | |
| | | | | | | |
| Income Data ($M) | | | | | | | |
| Future Gross Revenue | $ | 4,376,418 | | | $ | 68,935 | | | $ | 2,546,753 | | | $ | 6,992,106 | |
| Deductions | 1,619,734 | | | 28,739 | | | 1,136,083 | | | 2,784,556 | |
| Future Net Income (FNI) | $ | 2,756,684 | | | $ | 40,196 | | | $ | 1,410,670 | | | $ | 4,207,550 | |
| | | | | | | |
| Discounted FNI @ 10% | $ | 1,561,436 | | | $ | 22,591 | | | $ | 503,176 | | | $ | 2,087,203 | |
Liquid hydrocarbons are expressed in standard 42 U.S. gallon barrels and shown herein as thousands of barrels (Mbbl). All gas volumes are expressed in millions of cubic feet (MMcf) at the official temperature and pressure bases of the areas in which the gas volumes are located. All gas reserves volumes are reported on an “as sold” basis. In this report, the revenues, deductions, and income data are expressed as thousands of U.S. dollars ($M).
The estimates of the reserves, future production, and income attributable to properties in this report were prepared using the economic software package ARIESTM Petroleum Economics and Reserves Software, a copyrighted program of Halliburton. The program was used at the request of BPR. Ryder Scott has found this program to be generally acceptable, but notes that certain summaries and calculations may vary due to rounding and may not exactly match the sum of the properties being summarized. Furthermore, one line economic summaries may vary slightly from the more detailed cash flow projections of the same properties, also due to rounding. The rounding differences are not material.
The future gross revenue is after the deduction of production taxes. The deductions incorporate the normal direct costs of operating the wells, ad valorem taxes, recompletion costs, development costs, and certain abandonment costs net of salvage. Certain gas transportation costs are included as “Other” deductions in the cash flows. The future net income is before the deduction of state and federal income taxes and general administrative overhead, and has not been adjusted for outstanding loans that may exist nor does it include any adjustment for cash on hand or undistributed income.
Liquid hydrocarbon reserves account for approximately 81 percent of the total future gross revenue from proved reserves and gas reserves account for the remaining 19 percent of total future gross revenue from the proved reserves reported herein.
The discounted future net income shown above was calculated using a discount rate of 10 percent per annum compounded monthly. Future net income was discounted at four other discount rates which were also compounded monthly. These results are shown in summary form as follows.
| | |
RYDER SCOTT COMPANY PETROLEUM CONSULTANTS |
| | |
Bighorn Permian Resources March 18, 2022 Page 3 |
| | | | | | | | | | | | | | |
| | Discounted Future Net Income ($M) As of January 1, 2022 |
Discount Rate
Percent | | | Total
Proved | |
| | | | |
| 5 | | | $2,799,708 | |
| 15 | | | $1,667,454 | |
| 20 | | | $1,393,876 | |
| 25 | | | $1,202,746 | |
The results shown above are presented for your information and should not be construed as our estimate of fair market value.
Reserves Included in This Report
At the request of BPR, this report only includes proved reserves, which conform to the definitions of reserves sponsored and approved by the SPE, WPC, AAPG, SPEE, SEG, SPWLA and EAGE as set forth in the 2018 SPE-PRMS and where applicable, based on varying price and constant cost parameters (SPE-PRMS forecast case). The estimated quantities of reserves presented in this report, based on varying price and constant cost parameters (SPE-PRMS forecast case), may differ significantly from the quantities which would be estimated using constant price and cost parameters (SPE-PRMS constant case). Abridged versions of the SPE-PRMS reserves terms and definitions used herein are included as attachments to this report and entitled “PETROLEUM RESERVES and RESOURCES CLASSIFICATIONS and DEFINITIONS.”
The various reserves development and production status categories are defined in the attachment to this report entitled “PETROLEUM RESERVES STATUS DEFINITIONS and GUIDELINES.” The developed proved non-producing reserves included herein consist of the shut-in status category.
No attempt was made to quantify or otherwise account for any accumulated gas production imbalances that may exist. The gas volumes presented herein do not include volumes of gas consumed in operations as reserves.
Reserves Classification
Recoverable petroleum resources may be classified according to the SPE-PRMS into one of three principal resources classifications: prospective resources, contingent resources, or reserves. Only the proved reserves classification is addressed in this report. The distinction between prospective and contingent resources depends on whether or not there exists one or more wells and other data indicating the potential for moveable hydrocarbons (e.g. the discovery status). Discovered petroleum resources may be classified as either contingent resources or as reserves depending on the chance that if a project is implemented it will reach commercial producing status (e.g. chance of commerciality - Pc). The distinction between various “classifications” of resources and reserves relates to their discovery status and increasing chance of commerciality. Commerciality is not solely determined based on the economic status of a project which refers to the situation where the income from an operation exceeds the expenses involved in, or attributable to, that operation. Conditions addressed in the determination of commerciality also include technological, economic, legal, environmental, social, and governmental factors. While economic factors are generally related to costs and product prices, the underlying influences include, but are not limited to, market conditions, transportation and processing infrastructure, fiscal terms and taxes.
| | |
RYDER SCOTT COMPANY PETROLEUM CONSULTANTS |
| | |
Bighorn Permian Resources March 18, 2022 Page 4 |
At BPR’s request, this report addresses only the proved reserves attributable to the properties evaluated herein and not the probable and possible reserves and resources (if any).
Reserves Uncertainty
All reserves estimates involve an assessment of the uncertainty relating the likelihood that the actual remaining quantities recovered will be greater or less than the estimated quantities determined as of the date the estimate is made. The uncertainty depends chiefly on the amount of reliable geologic and engineering data available at the time of the estimate and the interpretation of these data. Estimates will generally be revised only as additional geologic or engineering data becomes available or as economic conditions change.
Reserves are “those quantities of petroleum anticipated to be commercially recoverable by application of development projects to known accumulations from a given date forward under defined conditions.” The relative degree of uncertainty may be conveyed by placing reserves into one of two principal categories, either proved or unproved.
Proved oil and gas reserves are “those quantities of petroleum that, by analysis of geoscience and engineering data, can be estimated with reasonable certainty to be commercially recoverable, from a given date forward, from known reservoirs and under defined economic conditions, operating methods, and government regulations.”
Unproved reserves are less certain to be recovered than proved reserves and may be further sub- categorized as probable and possible reserves to denote progressively increasing uncertainty in their recoverability. Probable reserves are “those additional reserves that analysis of geoscience and engineering data indicates are less likely to be recovered than proved reserves but more certain to be recovered than possible reserves.” For probable reserves, it is “equally likely that actual remaining quantities recovered will be greater than or less than the sum of the estimated proved plus probable reserves” (cumulative 2P volumes). Possible reserves are “those additional reserves that analysis of geoscience and engineering data indicates are less likely to be recoverable than probable reserves.” For possible reserves, the “total quantities ultimately recovered from the project have a low probability to exceed the sum of the proved plus probable plus possible reserves” (cumulative 3P volumes).
The reserves included herein were estimated using deterministic methods.
Estimates of reserves may increase or decrease as a result of future operations, effects of regulation by governmental agencies or geopolitical risks. As a result, the estimates of oil and gas reserves have an intrinsic uncertainty. The reserves included in this report are therefore estimates only and should not be construed as being exact quantities. They may or may not be actually recovered, and if recovered, the revenues therefrom and the actual costs related thereto could be more or less than the estimated amounts.
Possible Effects of Regulation
BPR’s operations may be subject to various levels of governmental controls and regulations. These controls and regulations may include matters relating to land tenure and leasing, the legal rights to produce hydrocarbons, drilling and production practices, environmental protection, marketing and pricing policies, royalties, various taxes and levies including income tax, and are subject to change from time to time. Such changes in governmental regulations and policies may cause volumes of reserves
| | |
RYDER SCOTT COMPANY PETROLEUM CONSULTANTS |
| | |
Bighorn Permian Resources March 18, 2022 Page 5 |
actually recovered and amounts of income actually received to differ significantly from the estimated quantities.
The estimates of reserves presented herein were based upon a detailed study of the properties in which BPR owns an interest; however, we have not made any field examination of the properties. No consideration was given in this report to potential environmental liabilities that may exist nor were any costs included for potential liability to restore and clean up damages, if any, caused by past operating practices.
Methodology Employed for Estimates of Reserves
The estimation of reserves quantities involves two distinct determinations. The first determination results in the estimation of the quantities of recoverable oil and gas and the second determination results in the estimation of the uncertainty associated with those estimated quantities. The process of estimating the quantities of recoverable oil and gas reserves relies on the use of certain generally accepted analytical procedures. These analytical procedures fall into three broad categories or methods: (1) performance- based methods, (2) volumetric-based methods and (3) analogy. These methods may be used individually or in combination by the reserves evaluator in the process of estimating the quantities of reserves. Reserves evaluators must select the method or combination of methods which in their professional judgment is most appropriate given the nature and amount of reliable geoscience and engineering data available at the time of the estimate, the established or anticipated performance characteristics of the reservoir being evaluated, and the stage of development or producing maturity of the property.
In many cases, the analysis of the available geoscience and engineering data and the subsequent interpretation of these data may indicate a range of possible outcomes in an estimate, irrespective of the method selected by the evaluator. When a range in the quantity of recoverable hydrocarbons is identified, the evaluator must determine the uncertainty associated with the incremental quantities of those recoverable hydrocarbons. If the quantities are estimated using the deterministic incremental approach, the uncertainty for each discrete incremental quantity is addressed by the reserves category assigned by the evaluator. Therefore, it is the categorization of incremental recoverable quantities that addresses the inherent uncertainty in the estimated quantities reported.
Estimates of reserves quantities and their associated categories or classifications may be revised in the future as additional geoscience or engineering data become available. Furthermore, estimates of the recoverable quantities and their associated categories or classifications may also be revised due to other factors such as changes in economic conditions, results of future operations, effects of regulation by governmental agencies or geopolitical or economic risks as previously noted herein.
The proved reserves for the properties included herein were estimated by performance methods and analogy. Approximately 99 percent of the proved producing reserves attributable to producing wells and/or reservoirs were estimated by decline curve analysis. This method utilized extrapolations of historical production and pressure data available through December 2021 in those cases where such data were considered to be definitive. The data utilized in this analysis were furnished to Ryder Scott by BPR or obtained from public data sources and were considered sufficient for the purpose thereof. The remaining 1 percent of the proved producing reserves were estimated by analogy. This method was used where there were inadequate historical performance data to establish a definitive trend and where the use of production performance data as a basis for the reserve estimates was considered to be inappropriate.
| | |
RYDER SCOTT COMPANY PETROLEUM CONSULTANTS |
| | |
Bighorn Permian Resources March 18, 2022 Page 6 |
Reserves attributable to non-producing and undeveloped status categories included herein were estimated by analogy. This analysis utilized pertinent well data furnished to Ryder Scott by BPR or which we have obtained from public data sources that were available through December 2021. The data utilized from the analogues along with the well data were considered sufficient for the purpose thereof.
Assumptions and Data Considered for Estimates of Reserves
To estimate recoverable oil and gas reserves and related future net cash flows, we consider many factors and assumptions including, but not limited to, the use of reservoir parameters derived from geological, geophysical and engineering data which cannot be measured directly, economic criteria based on the cost and price assumptions as noted herein, and forecasts of future production rates. Under the SPE-PRMS Section 1.1.0.6, “reserves are those quantities of petroleum anticipated to be commercially recoverable by application of development projects to known accumulations from a given date forward under defined conditions.”
BPR has informed us that they have furnished us all of the material accounts, records, geological and engineering data, and reports and other data required for this investigation. In preparing our forecasts of future production and income, we have relied upon data furnished by BPR with respect to property interests owned, production and well tests from examined wells, normal direct costs of operating the wells or leases, other costs such as transportation and/or processing fees, ad valorem and production taxes, recompletion and development costs, development plans, abandonment costs after salvage, product prices, geological structural and isochore maps, well logs, core analyses, and pressure measurements. Ryder Scott reviewed such factual data for its reasonableness; however, we have not conducted an independent verification of the data supplied by BPR.
In summary, we consider the assumptions, data, methods and analytical procedures used in this report appropriate for the purpose hereof, and we have used all such methods and procedures that we consider necessary and appropriate to prepare the estimates of reserves herein.
Future Production Rates
For wells currently on production, our forecasts of future production rates are based on historical performance data. If no production decline trend has been established, future production rates were adjusted for the effects of curtailment where appropriate and tied to analog performance data. An estimated rate of decline was then applied until depletion of the reserves. If a decline trend has been established, this trend was used as the basis for estimating future production rates.
Test data and other related information were used to estimate the anticipated initial production rates for those wells or locations that are not currently producing. For reserves not yet on production, sales were estimated to commence at an anticipated date furnished by BPR. Wells or locations that are not currently producing may start producing earlier or later than anticipated in our estimates due to unforeseen factors causing a change in the timing to initiate production. Such factors may include delays due to weather, the availability of rigs, the sequence of drilling, completing and/or recompleting wells and/or constraints set by regulatory bodies.
The future production rates from wells currently on production or wells or locations that are not currently producing may be more or less than estimated because of changes including, but not limited to, reservoir performance, operating conditions related to surface facilities, compression and artificial lift, pipeline capacity and/or operating conditions, producing market demand and/or allowables or other constraints set by regulatory bodies.
| | |
RYDER SCOTT COMPANY PETROLEUM CONSULTANTS |
| | |
Bighorn Permian Resources March 18, 2022 Page 7 |
Hydrocarbon Prices
The future hydrocarbon price parameters and escalations used in this report were specified by BPR and are noted below. Estimates of future price parameters have been revised in the past because of changes in governmental policies, changes in hydrocarbon supply and demand, and variations in general economic conditions. The price parameters used in this report may be revised in the future for similar reasons.
Forecasted Pricing (Before Differentials)
| | | | | | | | | | | | | | | | | | | | |
Year | | Oil $/BBL | | NGL $/BBL | | Gas $/MMBTU |
2022 | | 88.84 | | 40.85 | | 4.78 |
2023 | | 78.71 | | 36.19 | | 3.91 |
2024 | | 73.91 | | 33.98 | | 3.47 |
2025 | | 70.89 | | 32.60 | | 3.46 |
2026 | | 68.61 | | 31.55 | | 3.49 |
2027 Forward | | 67.77 | | 31.16 | | 3.82 |
The estimates of future gas prices used herein give consideration to contract provisions and market prices in the various gas producing areas represented in this report. Gas prices may be subject to seasonal variations and other factors and may lead to periodic curtailments by both buyers and sellers.
Product prices which were actually used for each property reflect adjustments for gravity, quality, local conditions, and/or distance from market, referred to herein as “differentials.” The differentials used in the preparation of this report were furnished to us by BPR.
The effects of derivative instruments designated as price hedges of oil and gas quantities are not reflected in our estimated individual property evaluations.
Costs
Operating costs for the leases and wells in this report were furnished by BPR and are based on the operating expense reports of BPR and include only those costs directly applicable to the leases or wells. The operating costs include a portion of general and administrative costs allocated directly to the leases and wells. For operated properties, the operating costs include an appropriate level of corporate general administrative and overhead costs. The operating costs for non-operated properties include the COPAS overhead costs that are allocated directly to the leases and wells under terms of operating agreements. The operating costs furnished to us were accepted as factual data and reviewed by us for their reasonableness; however, we have not conducted an independent verification of the operating cost data used by BPR. No deduction was made for loan repayments, interest expenses, or exploration and development prepayments that were not charged directly to the leases or wells.
Development costs were furnished to us by BPR and are based on authorizations for expenditure for the proposed work or actual costs for similar projects. The development costs furnished to us were accepted as factual data and reviewed by us for their reasonableness; however, we have not conducted an independent verification of these costs. The estimated net cost of abandonment after salvage was included for properties where abandonment costs net of salvage were material. The estimates of the net abandonment costs furnished by BPR were accepted without independent verification.
| | |
RYDER SCOTT COMPANY PETROLEUM CONSULTANTS |
| | |
Bighorn Permian Resources March 18, 2022 Page 8 |
Because of the direct relationship between volumes of undeveloped reserves and development plans, we include in the undeveloped reserves category only those volumes assigned to undeveloped locations that we have been assured will definitely be drilled. In accordance with SPE-PRMS guidelines, “a reasonable time frame for the initiation of development depends on the specific circumstances and varies according to the scope of the project. While 5 years is recommended as a benchmark, a longer time frame could be applied where, for example, development of an economic project is deferred at the option of the producer for, among other things, market-related reasons, or to meet contractual or strategic objectives.” BPR has assured us of their intent, commitment, and ability to proceed with the development activities included in this report and that they are not aware of any legal, regulatory, or political obstacles that would significantly alter their plans.
Costs were held constant for the life of the project.
Standards of Independence and Professional Qualification
Ryder Scott is an independent petroleum engineering consulting firm that has been providing petroleum consulting services throughout the world since 1937. Ryder Scott is employee-owned and maintains offices in Houston, Texas; Denver, Colorado; and Calgary, Alberta, Canada. We have approximately eighty engineers and geoscientists on our permanent staff. By virtue of the size of our firm and the large number of clients for which we provide services, no single client or job represents a material portion of our annual revenue. We do not serve as officers or directors of any privately-owned or publicly-traded oil and gas company and are separate and independent from the operating and investment decision-making process of our clients. This allows us to bring the highest level of independence and objectivity to each engagement for our services.
Ryder Scott actively participates in industry related professional societies and organizes an annual public forum focused on the subject of reserves evaluations and SEC regulations. Many of our staff have authored or co-authored technical papers on the subject of reserves related topics. We encourage our staff to maintain and enhance their professional skills by actively participating in ongoing continuing education.
Prior to becoming an officer of the Company, Ryder Scott requires that staff engineers and geoscientists have received professional accreditation in the form of a registered or certified professional engineer’s license or a registered or certified professional geoscientist’s license, or the equivalent thereof, from an appropriate governmental authority or a recognized self-regulating professional organization. Regulating agencies require that, in order to maintain active status, a certain amount of continuing education hours be completed annually, including an hour of ethics training. Ryder Scott fully supports this technical and ethics training with our internal requirement mentioned above.
We are independent petroleum engineers with respect to BPR. Neither we nor any of our employees have any financial interest in the subject properties and neither the employment to do this work nor the compensation is contingent on our estimates of reserves for the properties which were reviewed.
The results of this study, presented herein, are based on technical analysis conducted by teams of geoscientists and engineers from Ryder Scott. The professional qualifications of the undersigned, the technical person primarily responsible for overseeing the evaluation of the reserves information discussed in this report, are included as an attachment to this letter.
| | |
RYDER SCOTT COMPANY PETROLEUM CONSULTANTS |
| | |
Bighorn Permian Resources March 18, 2022 Page 9 |
Terms of Usage
This report was prepared for the exclusive use and sole benefit of Bighorn Permian Resources and may not be put to other use without our prior written consent for such use. The data and work papers used in the preparation of this report are available for examination by authorized parties in our offices. Please contact us if we can be of further service.
Very truly yours,
RYDER SCOTT COMPANY, L.P.
TBPELS Firm Registration No. F-1580
MEW (FWZ)/pl
| | |
RYDER SCOTT COMPANY PETROLEUM CONSULTANTS |
Professional Qualifications of Primary Technical Person
The conclusions presented in this report are the result of technical analysis conducted by teams of geoscientists and engineers from Ryder Scott Company, L.P. Ms. Marsha E. Wellmann was the primary technical person responsible for overseeing the estimate of the reserves, future production and income prepared by Ryder Scott presented herein.
Ms. Wellmann, an employee of Ryder Scott Company L.P. (Ryder Scott) since 2012, is a Vice President responsible for coordinating and supervising staff and consulting engineers of the company in ongoing reservoir evaluation studies throughout North America and the Gulf of Mexico. Before joining Ryder Scott, Ms. Wellmann served in a number of engineering positions. For more information regarding Ms. Wellmann geographic and job specific experience, please refer to the Ryder Scott Company website at www.ryderscott.com/Company/Employees.
Ms. Wellmann earned a Bachelor of Science degree in Petroleum Engineering and a Business Foundations Certificate from The University of Texas at Austin in 2002 and is a registered Professional Engineer in the State of Texas. She is also a member of the Society of Petroleum Engineers.
In addition to gaining experience and competency through prior work experience, the Texas Board of Professional Engineers requires a minimum of fifteen hours of continuing education annually, including at least one hour in the area of professional ethics, which Ms. Wellmann fulfills. As part of her 2021 continuing education hours, Ms. Wellmann attended 41 hours of formalized training including various professional society presentations covering such topics as the definitions and disclosure guidelines contained in the United States Securities and Exchange Commission Title 17, Code of Federal Regulations, Modernization of Oil and Gas Reporting, Final Rule released January 14, 2009 in the Federal Register, the SPE/WPC/AAPG/SPEE Petroleum Resources Management System, reservoir engineering, geoscience and petroleum economics evaluation methods, procedures and software and ethics for consultants.
Based on her educational background, professional training and more than 15 years of practical experience in the estimation and evaluation of petroleum reserves, Ms. Wellmann has attained the professional qualifications as a Reserves Estimator set forth in Article III of the “Standards Pertaining to the Estimating and Auditing of Oil and Gas Reserves Information” promulgated by the Society of Petroleum Engineers as of June 2019.
| | |
RYDER SCOTT COMPANY PETROLEUM CONSULTANTS |
PETROLEUM RESERVES and RESOURCES CLASSIFICATIONS and DEFINITIONS
As Adapted From:
2018 PETROLEUM RESOURCES MANAGEMENT SYSTEM (SPE-PRMS)1
Sponsored and Approved by: SOCIETY OF PETROLEUM ENGINEERS (SPE)
WORLD PETROLEUM COUNCIL (WPC)
AMERICAN ASSOCIATION OF PETROLEUM GEOLOGISTS (AAPG) SOCIETY OF PETROLEUM EVALUATION ENGINEERS (SPEE) SOCIETY OF EXPLORATION GEOPHYSICISTS (SEG)
SOCIETY OF PETROPHYSICISTS AND WELL LOG ANALYSTS (SPWLA) EUROPEAN ASSOCIATION OF GEOSCIENTISTS & ENGINEERS (EAGE)
SECTION A - PREAMBLE - RESERVES
Reserves are those quantities of petroleum which are anticipated to be commercially recovered from known accumulations from a given date forward under defined conditions. All reserve estimates involve some degree of uncertainty. The uncertainty depends chiefly on the amount of reliable geologic and engineering data available at the time of the estimate and the interpretation of these data. The relative degree of uncertainty may be conveyed by placing reserves into one of two principal classifications, either proved or unproved. Unproved reserves are less certain to be recovered than proved reserves and may be further sub-classified as probable and possible reserves to denote progressively increasing uncertainty in their recoverability.
Estimation of reserves is done under conditions of uncertainty. The method of estimation is called deterministic if a single best estimate of reserves is made based on known geological, engineering, and economic data. The method of estimation is called probabilistic when the known geological, engineering, and economic data are used to generate a range of estimates and their associated probabilities. Identifying reserves as proved, probable, and possible has been the most frequent categorization method and gives an indication of the probability of recovery. Because of the differences in uncertainty, caution should be exercised when aggregating reserves of different categories.
Reserves estimates will generally be revised as additional geologic or engineering data becomes available or as economic conditions change.
Reserves may be attributed to either natural energy or improved recovery methods. Improved recovery methods include all methods for supplementing natural reservoir energy or altering natural forces in the reservoir to increase ultimate recovery. Examples of such methods are pressure maintenance, cycling, waterflooding, thermal methods, chemical flooding, and the use of miscible and immiscible displacement fluids. Other improved recovery methods may be developed in the future as petroleum technology continues to evolve.

1Petroleum Resources Management System prepared by the Oil and Gas Reserves Committee of the Society of Petroleum Engineers (SPE); reviewed and jointly sponsored by the World Petroleum Council (WPC), the American Association of Petroleum Geologists (AAPG), the Society of Petroleum Evaluation Engineers (SPEE), Society of Exploration Geophysicists (SEG), Society of Petrophysicists and Well Log Analysts (SPWLA), and European Association of Geoscientists & Engineers (EAGE), March 2007 and revised June 2018.
| | |
RYDER SCOTT COMPANY PETROLEUM CONSULTANTS |
| | |
PETROLEUM RESERVES and RESOURCES CLASSIFICATIONS and DEFINITIONS Page 2 |
Reserves may be attributed to either conventional or unconventional petroleum accumulations under the SPE-PRMS. Petroleum accumulations are considered as either conventional or unconventional based on the nature of their in-place characteristics, extraction method applied, or degree of processing prior to sale. Examples of unconventional petroleum accumulations include coalbed or coalseam methane (CBM/CSM), basin-centered gas (low permeability), tight gas and tight oil (low permeability), shale gas, gas hydrates, natural bitumen (very high viscosity oil) and oil shale deposits. These unconventional accumulations may require specialized extraction technology and/or significant processing prior to sale. The SPE-PRMS acknowledges unconventional petroleum accumulations as reserves regardless of their in-place characteristics, the extraction method applied, or the degree of processing required.
Reserves do not include quantities of petroleum being held in inventory and may be reduced for usage, processing losses and/or non-hydrocarbons that must be removed prior to sale.
SPE-PRMS RESERVES DEFINITIONS
In March 2007, the Society of Petroleum Engineers (SPE), World Petroleum Council (WPC), American Association of Petroleum Geologists (AAPG), and Society of Petroleum Evaluation Engineers (SPEE) jointly approved the “Petroleum Resources Management System” (“SPE-PRMS”); subsequently also supported by the Society of Exploration Geophysicists (SEG), Society of Petrophysicists and Well Log Analysts (SPWLA), and European Association of Geoscientists & Engineers (EAGE). SPE-PRMS was revised in June 2018. The SPE-PRMS consolidates, builds on, and replaces guidance previously contained in the 2000 “Petroleum Resources Classification and Definitions” and the 2001 “Guidelines for the Evaluation of Petroleum Reserves and Resources” publications.
The intent of the SPE, WPC, AAPG, SPEE, SEG, SPWLA, and EAGE in approving additional categories beyond proved reserves is to facilitate consistency among professionals using such terms. In presenting these definitions, none of these organizations are recommending public disclosure of reserves categorized as unproved. Public disclosure of the quantities categorized as unproved reserves is left to the discretion of the countries or companies involved and should not be construed as replacing guidelines for public disclosures under the guidelines established by regulatory and/or other governmental agencies.
Reference should be made to the full SPE-PRMS for the complete definitions and guidelines as the following definitions, descriptions and explanations rely wholly or in part on excerpts from the SPE- PRMS document (direct passages excerpted from the SPE-PRMS document are denoted in italics and footnoted with Section references herein).
RESERVES DEFINITIONS
Reserves. Reserves are those quantities of petroleum anticipated to be commercially recoverable by application of development projects to known accumulations from a given date forward under defined conditions. Reserves must satisfy four criteria: they must be discovered, recoverable, commercial and remaining based on the development project(s) applied. Reserves are further categorized in accordance with the level of certainty associated with the estimates and may be sub-classified based on project maturity and/or characterized by the development and production status.2
2Table 1, “Reserves”, Definition & Guidelines
| | |
RYDER SCOTT COMPANY PETROLEUM CONSULTANTS |
| | |
PETROLEUM RESERVES and RESOURCES CLASSIFICATIONS and DEFINITIONS Page 3 |
ADDITIONAL TERMS USED IN RESERVES EVALUATIONS (SPE-PRMS DEFINITIONS)
Improved recovery. Improved Recovery is the extraction of additional petroleum, beyond primary recovery, from naturally occurring reservoirs by supplementing the natural forces in the reservoir. It includes waterflooding and gas injection for pressure maintenance, secondary processes, tertiary processes and any other means of supplementing natural reservoir recovery processes. Improved recovery also includes thermal and chemical processes to improve the in-situ mobility of viscous forms of petroleum. (Also called enhanced recovery.)3
Improved recovery projects must meet the same Reserves technical and commercial maturity criteria as primary recovery projects.4 Similarly there should be an expectation that the project will be economically viable, which includes the requirement that there is evidence of firm intention to proceed with development within a reasonable time-frame5 (generally within 5 years; further delays should be clearly justified). If there is significant project risk, the forecast incremental recoveries should be classified as Contingent Resources.
The judgment on commerciality is based on pilot project results within the subject reservoir or by comparison to a reservoir with analogous rock and fluid properties and where a similar established improved recovery project has been successfully applied.6
Incremental recoveries through improved recovery methods that have yet to be established through routine, commercially successful applications are included as Reserves only after a favorable production response from the subject reservoir from either (a) a representative pilot or (b) an installed portion of the project, where the response provides support for the analysis on which the project is based. The improved recovery project’s resources will remain classified as Contingent Resources Development Pending until the pilot has demonstrated both technical and commercial feasibility and the full project passes the Justified for Development “decision gate.” 7
The types of in-place petroleum resources defined as conventional and unconventional may require different evaluation approaches and/or extraction methods. However, the PRMS resources definitions, together with the classification system, apply to all types of petroleum accumulations regardless of the in-place characteristics, extraction method applied, or degree of processing required.8
A project is commercial when there is evidence of a firm intention to proceed with development within a reasonable time-frame. Typically, this requires that the best estimate case meet or exceed the minimum evaluation decision criteria (e.g., rate of return, investment payout time). There must be a reasonable expectation that all required internal and external approvals will be forthcoming. Also, there must be evidence of a technically mature, feasible development plan and the essential social, environmental, economic, political, legal, regulatory, decision criteria, and contractual conditions are met.9
A reasonable time-frame for the initiation of development depends on the specific circumstances and varies according to the scope of the project. While five years is recommended as a benchmark, a longer time-frame could be applied where justifiable; for example, development of economic projects that take longer than five years to be developed or are deferred to meet contractual or strategic objectives. In
3Appendix A, “Improved Recovery”
4Section 2.3.4.2
5Table 1, “Reserves”, Guidelines
6Section 2.3.4.3
7Section 2.3.4.4
8Section 2.4.0.1
9Appendix A, “Commercial”
| | |
RYDER SCOTT COMPANY PETROLEUM CONSULTANTS |
| | |
PETROLEUM RESERVES and RESOURCES CLASSIFICATIONS and DEFINITIONS Page 4 |
all cases, the justification for classification as Reserves should be clearly documented.10
PROVED RESERVES (SPE-PRMS DEFINITIONS)
Proved oil and gas reserves. Proved Reserves are those quantities of petroleum that, by analysis of geoscience and engineering data, can be estimated with reasonable certainty to be commercially recoverable, from a given date forward from known reservoirs under defined economic conditions, operating methods, and government regulations. If deterministic methods are used, the term “reasonable certainty” is intended to express a high degree of confidence that the quantities will be recovered. If probabilistic methods are used, there should be at least a 90% probability (P90) that the quantities actually recovered will equal or exceed the estimate.
The area of the reservoir considered as Proved includes:
(1)the area delineated by drilling and defined by fluid contacts, if any, and
(2)adjacent undrilled portions of the reservoir that can reasonably be judged as continuous with it and commercially productive on the basis of available geoscience and engineering data. 11
In the absence of data on fluid contacts, Proved quantities in a reservoir are limited by the lowest known hydrocarbons (LKH) as seen in a well penetration unless otherwise indicated by definitive geoscience, engineering, or performance data. Such definitive information may include pressure gradient analysis and seismic indicators. Seismic data alone may not be sufficient to define fluid contacts for Proved. (see “2001 Supplemental Guidelines”, Chapter 8).
Reserves in undeveloped locations may be classified as Proved provided that:
A.The locations are in undrilled areas of the reservoir that can be judged with reasonable certainty to be commercially mature and economically productive.
B.Interpretations of available geoscience and engineering data indicate with reasonable certainty that the objective formation is laterally continuous with drilled Proved locations.
For Proved Reserves, the recovery efficiency applied to these reservoirs should be defined based on a range of possibilities supported by analogs and sound engineering judgment considering the characteristics of the Proved area and the applied development program.12
PROBABLE RESERVES (SPE-PRMS DEFINITIONS)
Probable oil and gas reserves. Probable Reserves are those additional Reserves that analysis of geoscience and engineering data indicates are less likely to be recovered than Proved Reserves but more certain to be recovered than Possible Reserves. It is equally likely that actual remaining quantities recovered will be greater than or less than the sum of the estimated Proved plus Probable reserves (2P). In this context, when probabilistic methods are used, there should be at least a 50% probability that the actual quantities recovered will equal or exceed the 2P estimate.
10Section 2.1.2.3
11Table 3, “Proved Reserves”, Definition & Guidelines
12Table 3, “Proved Reserves”, Definition & Guidelines
| | |
RYDER SCOTT COMPANY PETROLEUM CONSULTANTS |
| | |
PETROLEUM RESERVES and RESOURCES CLASSIFICATIONS and DEFINITIONS Page 5 |
Probable Reserves may be assigned to areas of a reservoir adjacent to Proved where data control or interpretations of available data are less certain. The interpreted reservoir continuity may not meet the reasonable certainty criteria. Probable estimates also include incremental recoveries associated with project recovery efficiencies beyond that assumed for Proved.13
POSSIBLE RESERVES (SPE-PRMS DEFINITIONS)
Possible oil and gas reserves. Possible Reserves are those additional reserves that analysis of geoscience and engineering data indicates are less likely to be recoverable than Probable Reserves. The total quantities ultimately recovered from the project have a low probability to exceed the sum of Proved plus Probable plus Possible (3P), which is equivalent to the high-estimate scenario. When probabilistic methods are used, there should be at least a 10% probability (P10) that the actual quantities recovered will equal or exceed the 3P estimate.
Possible Reserves may be assigned to areas of a reservoir adjacent to Probable where data control and interpretations of available data are progressively less certain. Frequently, this may be in areas where geoscience and engineering data are unable to clearly define the area and vertical reservoir limits of economic production from the reservoir by a defined, commercially mature project. Possible estimates also include incremental quantities associated with project recovery efficiencies beyond that assumed for Probable.14
SECTION B - PREAMBLE – RESERVES & RESOURCES
Reserves and resources classification systems are intended to provide a consistent approach to estimating petroleum quantities and evaluating projects and thereby allow the evaluator to follow the progression of changes in the exploration and production life cycle of a reservoir, field, or project that arise as a result of obtaining more technical information or as a result of a change in the economic status. Most systems incorporate terminology to describe the progression of a project from the delineation of an initial prospect, to the confirmation of the prospect through exploration drilling, onto the appraisal and development phase, and finally from initial production through depletion. The evaluation elements consider the risk of geologic discovery and the technical uncertainties together with a determination of the chance of achieving the commercial maturation status of a petroleum project.15 These reserves and resources definitions thus provide the decision making framework to manage risk and uncertainty through the classification and categorization of the recoverable hydrocarbon volumes.
The term resources as used herein is intended to encompass all quantities of petroleum naturally occurring within the Earth’s crust, both discovered and undiscovered (whether recoverable or unrecoverable), plus those quantities already produced. Further it includes all types of petroleum whether currently considered as conventional or unconventional resources.16
Reserves are a subset of resources and are those quantities of petroleum anticipated to be commercially recoverable by application of development projects to known accumulations from a given date forward under defined conditions. Reserves must satisfy four criteria: discovered, recoverable, commercial, and remaining (as of the evaluation’s effective date) based on the development project(s) applied.17
13Table 3, “Probable Reserves”, Definition & Guidelines 14 Table 3, “Possible Reserves”, Definition & Guidelines 15 Section 1.0.0.1 A
16Section 1.1.0.2
17Section 1.1.0.6 A 1
| | |
RYDER SCOTT COMPANY PETROLEUM CONSULTANTS |
| | |
PETROLEUM RESERVES and RESOURCES CLASSIFICATIONS and DEFINITIONS Page 6 |
All reserves and resources estimates involve some degree of uncertainty. The uncertainty depends chiefly on the amount of reliable geologic and engineering data available at the time of the estimate and the interpretation of these data. Estimates will generally be revised as additional geologic or engineering data becomes available or as economic conditions change. Commercial factors must also be considered in the classification of resources.
Estimation of reserves and resources is done under conditions of uncertainty. The method of estimation is called deterministic if a single best estimate of reserves and resources is made based on known geological, engineering, and economic data. The method of estimation is called probabilistic when the known geological, engineering, and economic data are used to generate a range of estimates and their associated probabilities. Because of the differences in uncertainty, caution should be exercised when aggregating quantities of petroleum from different reserves categories and/or resources classifications.
Reserves and resources may be attributed to either natural energy or improved recovery methods. Improved recovery methods include all methods for supplementing natural reservoir energy or altering natural forces in the reservoir to increase ultimate recovery. Examples of such methods are pressure maintenance, cycling, waterflooding, thermal methods, chemical flooding, and the use of miscible and immiscible displacement fluids. Other improved recovery methods may be developed in the future as petroleum technology continues to evolve.
Reserves and resources may be attributed to either conventional or unconventional petroleum accumulations under the SPE-PRMS. Petroleum accumulations are considered as either conventional or unconventional based on the nature of their in-place characteristics, extraction method applied, or degree of processing prior to sale. Examples of unconventional petroleum accumulations include coalbed or coalseam methane (CBM/CSM), basin-centered gas (low permeability), tight gas and tight oil (low permeability), shale gas, gas hydrates, natural bitumen (very high viscosity oil) and oil shale deposits. These unconventional accumulations may require specialized extraction technology and/or significant processing prior to sale. The SPE-PRMS acknowledges unconventional petroleum accumulations as reserves and resources regardless of their in-place characteristics, the extraction method applied, or the degree of processing required.
Reserves and resources do not include quantities of petroleum being held in inventory and may be reduced for usage, processing losses and/or non-hydrocarbons that must be removed prior to sale.
SPE-PRMS RESOURCES DEFINITIONS
In March 2007, the Society of Petroleum Engineers (SPE), World Petroleum Council (WPC), American Association of Petroleum Geologists (AAPG), and Society of Petroleum Evaluation Engineers (SPEE) jointly approved the “Petroleum Resources Management System” (“SPE-PRMS”); subsequently supported by the Society of Exploration Geophysicists (SEG), Society of Petrophysicists and Well Log Analysts (SPWLA), and European Association of Geoscientists & Engineers (EAGE). SPE-PRMS was revised in June 2018. The SPE-PRMS consolidates, builds on, and replaces guidance previously contained in the 2000 “Petroleum Resources Classification and Definitions” and the 2001 “Guidelines for the Evaluation of Petroleum Reserves and Resources” publications.
Reference should be made to the full SPE-PRMS for the complete definitions and guidelines as the following definitions, descriptions and explanations rely wholly or in part on excerpts from the SPE- PRMS document (direct passages excerpted from the SPE-PRMS document are denoted in italics and footnoted with Section references herein). For convenience, Table 1: “Recoverable Resources Classes and Sub-Classes” from the SPE-PRMS has been reproduced in full and included as an attachment to this document.
| | |
RYDER SCOTT COMPANY PETROLEUM CONSULTANTS |
| | |
PETROLEUM RESERVES and RESOURCES CLASSIFICATIONS and DEFINITIONS Page 7 |
The SPE-PRMS incorporates the petroleum initially-in-place as well as the recoverable and unrecoverable petroleum quantities into a common resources classification framework. Petroleum is defined as a naturally occurring mixture consisting of hydrocarbons in the gaseous, liquid, or solid state.18
The SPE-PRMS defines the major resources classes: Production, Reserves, Contingent Resources, and Prospective Resources, as well as Unrecoverable petroleum. The basic classification scheme requires establishment of criteria for a petroleum discovery and thereafter the distinction between commercial (Reserves) and sub-commercial projects (Contingent Resources) in known accumulations. Under this classification scheme, estimated recoverable quantities from accumulations that have yet to be discovered are termed Prospective Resources. Further, the SPE-PRMS includes all types of petroleum whether currently considered “conventional” or “unconventional”.
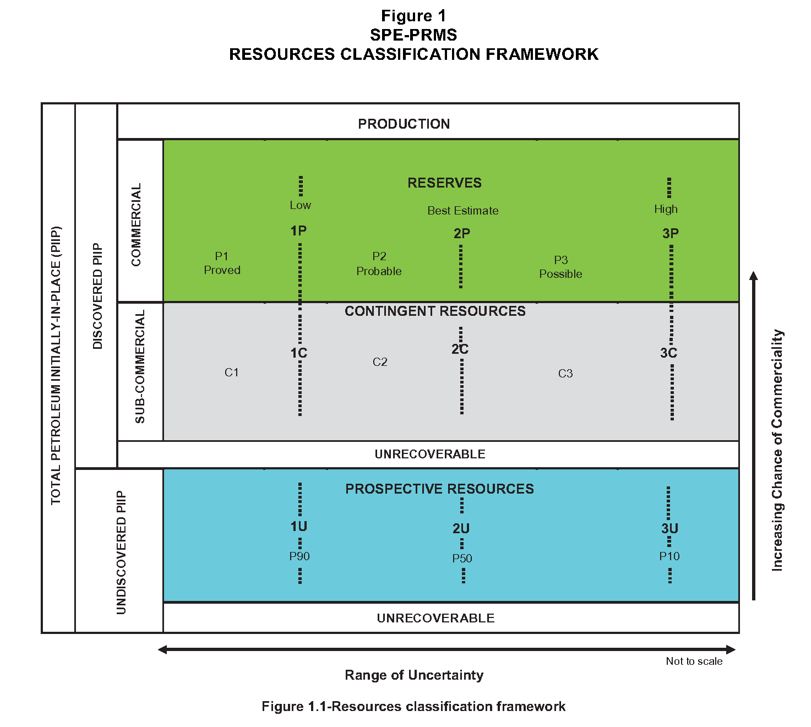
Figure 1 shown at the end of this document is a graphical representation of the SPE-PRMS resources classification system. The SPE-PRMS “classifies” reserves and resources according to project maturity and increasing chance of commerciality (vertical axis), which is the chance that a project will be committed for development and reach commercial producing status.19 It also “categorizes” reserves and resources according to the range of uncertainty (horizontal axis) of the estimated quantities potentially recoverable from an accumulation by a project.20 The following definitions apply to the major subdivisions within the resources classification:
RESOURCES CLASSIFICATION (SPE-PRMS)
Recoverable petroleum resources as described herein may be classified into one of three principal resources classifications: Prospective Resources, Contingent Resources, or Reserves. The distinction between Prospective and Contingent Resources depends on whether or not there exists one or more wells and other data indicating the potential for moveable hydrocarbons (e.g. the discovery status). Discovered petroleum resources may be classified as either Contingent Resources or as Reserves depending on the chance that if a project is implemented it will reach commercial producing status (e.g. chance of commerciality). The distinction between various “classifications” of Resources and Reserves relates to their discovery status and increasing chance of commerciality as described herein.
TOTAL PETROLEUM-INITIALLY-IN-PLACE
Total Petroleum-Initially-in-Place (PIIP) is all quantities of petroleum that are estimated to exist originally in naturally occurring accumulations, discovered and undiscovered, before production.21
Total Petroleum-Initially-in-Place may be subdivided into Discovered Petroleum-Initially-in-Place and Undiscovered Petroleum-Initially-in-Place, with Discovered Petroleum-Initially-in-Place being limited to known accumulations.
It is recognized that not all of the Petroleum-Initially-in-Place quantities may constitute potentially recoverable resources since the estimation of the proportion which may be recoverable can be subject to significant uncertainty and will change with variations in commercial circumstances, technological developments and data availability.
18Section 1.1.0.1
19Section 1.1.0.4
20Section 1.1.0.4
21Section 1.1.0.5 A
| | |
RYDER SCOTT COMPANY PETROLEUM CONSULTANTS |
| | |
PETROLEUM RESERVES and RESOURCES CLASSIFICATIONS and DEFINITIONS Page 8 |
Given the aforementioned constraints, a portion of the Petroleum-Initially-in-Place may need to be classified as Unrecoverable.
DISCOVERED PETROLEUM-INITIALLY-IN-PLACE
Discovered PIIP is the quantity of petroleum that is estimated, as of a given date, to be contained in known accumulations before production.22
Discovered PIIP may be subdivided into Commercial and Sub-commercial categories, with the estimated potentially recoverable portion being classified as Reserves and Contingent Resources respectively, as defined below.
KNOWN ACCUMULATION
The SPE-PRMS defines an accumulation as an individual body of naturally occurring petroleum in a reservoir.23 For an accumulation to be considered as “known”, it must have been discovered. Discovered is defined as a petroleum accumulation where one or several exploratory wells through testing, sampling, and/or logging have demonstrated the existence of a significant quantity of potentially recoverable hydrocarbons and thus have established a known accumulation.24 The SPE-PRMS states that in this context, “significant” implies that there is evidence of a sufficient quantity of petroleum to justify estimating the in-place volume demonstrated by the well(s) and for evaluating the potential for technical recovery.25 Known accumulations may contain Reserves and/or Contingent Resources.
RESERVES
Reserves are defined as those quantities of petroleum anticipated to be commercially recoverable by application of development projects to known accumulations from a given date forward under defined conditions. Reserves must further satisfy four criteria: discovered, recoverable, commercial, and remaining (as of the evaluation’s effective date) based on the development project(s) applied.26
Reserves are further categorized in accordance with the range of uncertainty and should be sub- classified based on project maturity and/or characterized by development and production status.27 Reference should be made to the full SPE-PRMS for the complete definitions and guidelines.
CONTINGENT RESOURCES
Contingent Resources are those quantities of petroleum estimated, as of a given date, to be potentially recoverable from known accumulations, by the application of development project(s) not currently considered to be commercial owing to one or more contingencies. Contingent Resources have an associated chance of development. Contingent Resources may include, for example, projects for which there are currently no viable markets, or where commercial recovery is dependent on technology under development, or where evaluation of the accumulation is insufficient to clearly assess
22Section 1.1.0.5 B
23Appendix A, “Accumulation” 24 Appendix A, “Discovered” 25 Appendix A, “Discovered” 26 Section 1.1.0.6 A.1.
27 Section 1.1.0.6 A.3
| | |
RYDER SCOTT COMPANY PETROLEUM CONSULTANTS |
| | |
PETROLEUM RESERVES and RESOURCES CLASSIFICATIONS and DEFINITIONS Page 9 |
commerciality. Contingent Resources are further categorized in accordance with the range of uncertainty associated with the estimates and should be sub-classified based on project maturity and/or economic status. 28 Reference should be made to the full SPE-PRMS for the complete definitions and guidelines.
UNDISCOVERED PETROLEUM-INITIALLY-IN-PLACE
Undiscovered PIIP is that quantity of petroleum estimated, as of a given date, to be contained within accumulations yet to be discovered.29
The estimated potentially recoverable portion of Undiscovered PIIP is classified as Prospective Resources, as defined below.
PROSPECTIVE RESOURCES
Prospective Resources are those quantities of petroleum estimated, as of a given date, to be potentially recoverable from undiscovered accumulations by application of future development projects. Prospective Resources have both an associated chance of geologic discovery and a chance of development. Prospective Resources are further categorized in accordance with the range of uncertainty associated with recoverable estimates, assuming discovery and development, and may be sub-classified based on project maturity.30 Reference should be made to the full SPE-PRMS for the complete definitions and guidelines.
UNRECOVERABLE
Unrecoverable Resources are that portion of either discovered or undiscovered PIIP evaluated, as of a given date, to be unrecoverable by the currently defined project(s). A portion of these quantities may become recoverable in the future as commercial circumstances change, technology is developed, or additional data are acquired. The remaining portion may never be recovered because of physical/chemical constraints represented by subsurface interaction of fluids and reservoir rocks.31
ADDITIONAL TERMS USED IN RESOURCES CLASSIFICATION (SPE-PRMS)
CHANCE OF COMMERCIALITY
The “Chance of Commerciality”, as denoted in the SPE-PRMS and as shown in Figure 1, is the estimated probability that the project will achieve commercial maturity to be developed. For Prospective Resources, this is the product of the chance of geologic discovery and the chance of development. For Contingent Resources and Reserves, it is equal to the chance of development.32
The chance of commerciality is determined by the probability of a discrete event occurring. In the context of the SPE-PRMS, the discrete event is comprised of one of several conditions, as noted below, which impact the project’s commercial viability.
28Section 1.1.0.6 B.
29Section 1.1.0.6 C.
30Section 1.1.0.6 D.
31Section 1.1.0.6 E.
32Appendix A, “Chance of Commerciality”
| | |
RYDER SCOTT COMPANY PETROLEUM CONSULTANTS |
| | |
PETROLEUM RESERVES and RESOURCES CLASSIFICATIONS and DEFINITIONS Page 10 |
The commercial viability of a development project within a field’s development plan is dependent on a forecast of the conditions that will exist during the time period encompassed by the project. Conditions include technical, economic (e.g., hurdle rates, commodity prices), operating and capital costs, marketing, sales route(s), and legal, environmental, social, and governmental factors forecast to exist and impact the project during the time period being evaluated. While economic factors can be summarized as forecast costs and product prices, the underlying influences include, but are not limited to, market conditions (e.g., inflation, market factors, and contingencies), exchange rates, transportation and processing infrastructure, fiscal terms, and taxes.33
A project may constitute the development of a well, a single reservoir, or a small field; an incremental development in a producing field; or the integrated development of a field or several fields together with the associated processing facilities (e.g., compression).34 An accumulation or potential accumulation of petroleum is often subject to several separate and distinct projects that are at different stages of exploration or development. Thus, an accumulation may have recoverable quantities in several resources classes simultaneously.35
COMMERCIALITY APPLIED TO RESERVES
Discovered recoverable quantities (Contingent Resources) may be considered commercially mature, and thus attain Reserves classification, if the entity claiming commerciality has demonstrated a firm intention to proceed with development. This means the entity has satisfied the internal decision criteria (typically rate of return at or above the weighted average cost-of-capital or the hurdle rate). Commerciality is achieved with the entity’s commitment to the project and all of the following criteria:
A.Evidence of a technically mature, feasible development plan.
B.Evidence of financial appropriations either being in place or having a high likelihood of being secured to implement the project.
C.Evidence to support a reasonable time-frame for development.
D.A reasonable assessment that the development projects will have positive economics and meet defined investment and operating criteria. This assessment is performed on the estimated entitlement forecast quantities and associated cash flow on which the investment decision is made (see Section 3.1.1, Net Cash-Flow Evaluation).
E.A reasonable expectation that there will be a market for forecast sales quantities of the production required to justify development. There should also be similar confidence that all produced streams (e.g., oil, gas, water, CO2) can be sold, stored, re-injected, or otherwise appropriately disposed.
F.Evidence that the necessary production and transportation facilities are available or can be made available.
G.Evidence that legal, contractual, environmental, regulatory, and government approvals are in place or will be forthcoming, together with resolving any social and economic concerns.36
33 Section 1.2.0.10
34Section 1.2.0.4
35Section 1.2.0.8
36Section 2.1.2.1
| | |
RYDER SCOTT COMPANY PETROLEUM CONSULTANTS |
| | |
PETROLEUM RESERVES and RESOURCES CLASSIFICATIONS and DEFINITIONS Page 11 |
To be included in the Reserves class, a project must be sufficiently defined to establish both its technical and commercial viability as noted above (in Section 2.1.2.1). There must be a reasonable expectation that all required internal and external approvals will be forthcoming and evidence of firm intention to proceed with development within a reasonable time-frame. A reasonable time-frame for the initiation of development depends on the specific circumstances and varies according to the scope of the project. While five years is recommended as a benchmark, a longer time-frame could be applied where justifiable; for example, development of economic projects that take longer than five years to be developed or are deferred to meet contractual or strategic objectives. In all cases, the justification for classification as Reserves should be clearly documented.37
For a project to be included in a Reserves class, there must be a high confidence in the commercial maturity and economic producibility of the reservoir as supported by actual production or formation tests. In certain cases, Reserves may be assigned on the basis of well logs and/or core analysis that indicate that the subject reservoir is hydrocarbon-bearing and is analogous to reservoirs in the same area that are producing or have demonstrated the ability to produce on formation tests.38
COMMERCIALITY APPLIED TO CONTINGENT RESOURCES
Potentially recoverable quantities from known accumulations that are not currently considered to be commercially recoverable owing to one or more contingencies39 should be classified as Contingent Resources.
Based on assumptions regarding future conditions and the impact on ultimate economic viability, projects currently classified as Contingent Resources may be broadly divided into two groups:
A.Economically Viable Contingent Resources are those quantities associated with technically feasible projects where cash flows are positive under reasonably forecasted conditions but are not Reserves because it does not meet the commercial criteria defined above (in Section 2.1.2.).
B.Economically Not Viable Contingent Resources are those quantities for which development projects are not expected to yield positive cash flows under reasonable forecast conditions.40
Unrecoverable Resources are that portion of either discovered or undiscovered PIIP evaluated, as of a given date, to be unrecoverable by the currently defined project(s).41
RESOURCES CATEGORIZATION (SPE-PRMS)
All estimates of the quantities of petroleum potentially recoverable from an accumulation classified as having Prospective or Contingent Resources or Reserves involve uncertainty. The relative degree of uncertainty may be conveyed by placing the estimated quantities into one of several “categories” as described herein.
37Section 2.1.2.3
38Table 1 “Reserves”, Guidelines
39Table 1, “Contingent Resources”, Definition
40 Section 2.1.3.7.1
41Section 1.1.0.6 E.
| | |
RYDER SCOTT COMPANY PETROLEUM CONSULTANTS |
| | |
PETROLEUM RESERVES and RESOURCES CLASSIFICATIONS and DEFINITIONS Page 12 |
RANGE OF UNCERTAINTY
The Range of Uncertainty, as denoted in the SPE-PRMS and as shown in Figure 1, reflects a range of estimated quantities potentially recoverable from an accumulation by a project. Evaluators may assess recoverable quantities and categorize results by uncertainty using the deterministic incremental method, the deterministic scenario (cumulative) method, geostatistical methods, or probabilistic methods (see Section 4.2, Resources Assessment Methods). Also, combinations of these methods may be used.42
DETERMINISTIC METHODS (SPE-PRMS)
For estimates using Deterministic Methods, an evaluator chooses an assessment method based on discrete estimate(s) made based on available geoscience, engineering, and economic data and corresponds to a given level of certainty.43
In the deterministic method, quantities are estimated by taking a discrete value or array of values for each input parameter to produce a discrete result. For the low-, best- and high-case estimates, the internally consistent deterministic inputs are selected to reflect the resultant confidence of the project scenario and the constraints applied for the resources category and resources class. A single outcome of recoverable quantities is derived for each deterministic increment or scenario. Two approaches are included in the deterministic method—the scenario (or cumulative) method and the incremental method— and should yield similar results.44
RESERVES
For Reserves, the general cumulative terms low/best/high forecasts are used to estimate the resulting 1P/2P/3P quantities, respectively. The associated incremental quantities are termed Proved (P1), Probable (P2) and Possible (P3).45
CONTINGENT RESOURCES
For Contingent Resources, the range of uncertainty is generally expressed in deterministic scenario (cumulative) terms or in terms of probability using probabilistic methods. For Contingent Resources, the general cumulative terms low/best/high estimates are used to estimate the resulting 1C/2C/3C quantities, respectively. The terms C1, C2, and C3 are defined for incremental quantities of Contingent Resources.46
Should evaluators choose to characterize the range of uncertainty for Contingent in discrete incremental quantities, they should denote such quantities as such and provide sufficient detail in their report to allow an independent evaluator or auditor to clearly understand the basis for estimation and categorization of the recoverable quantities.
42Section 2.2.2.1
43Appendix A, “Deterministic Method”
44Section 4.2.1.1
45Section 2.2.2.2
46Section 2.2.2.3
| | |
RYDER SCOTT COMPANY PETROLEUM CONSULTANTS |
| | |
PETROLEUM RESERVES and RESOURCES CLASSIFICATIONS and DEFINITIONS Page 13 |
PROSPECTIVE RESOURCES
For Prospective Resources, the range of uncertainty is generally expressed in deterministic scenario (cumulative) terms as low, best and high estimates or in terms of probability using probabilistic methods. For Prospective Resources, the general cumulative terms low/best/high estimates also apply and are used to estimate the resulting 1U/2U/3U quantities. No specific terms are defined for incremental quantities within Prospective Resources.47
BEST ESTIMATE
To best communicate uncertainty in estimates of resources volumes, a range of potential results can be reported. However, if a single representative result is required to be reported, the “best estimate” should represent the most realistic assessment of recoverable quantities. If probablilstic methods are used, there should be at least a 50% probability (P50) that the quantities actually recovered will equal or exceed the best estimate.48 The term "best estimate" is used here as a generic expression for the estimate considered being closest to the quantity that will actually be recovered from the accumulation between the date of the estimate and the time of abandonment. The best estimate is generally considered to represent the sum of Proved and Probable estimates (2P) for Reserves or 2C when Contingent Resources are cited, when aggregating a field, multiple fields, or an entity’s resources.49 It should be noted that under the deterministic incremental method, discrete estimates are made for each category and should not be aggregated without due consideration of associated confidence.50 In the case of Contingent Resources and Prospective Resources, the best estimate would be represented by the 2C and 2U, respectively. If probabilistic methods are used, this term would generally be a measure of central tendency of the uncertainty distribution (most likely/mode, median/P50 or mean). The terms "Low Estimate" and "High Estimate" should provide a reasonable assessment of the range of uncertainty in the Best Estimate.
PROBABILISTIC METHODS (SPE-PRMS)
If probabilistic methods are used, these estimated quantities should be based on methodologies analogous to those applicable to the definitions of Reserves, Contingent Resources and Prospective Resources; therefore, in general, the resulting probabilities should correspond to the deterministic (cumulative) terms as follows:
•There should be at least a 90% probability (P90) that the quantities actually recovered will equal or exceed the 1P, 1C or 1U (Low Estimate).
•There should be at least a 50% probability (P50) that the quantities actually recovered will equal or exceed the 2P, 2C or 2U (Best Estimate).
•There should be at least a 10% probability (P10) that the quantities actually recovered will equal or exceed the 3P, 3C or 3U (High Estimate).
COMPARABILITY OF SIMILAR RESERVES AND RESOURCES CATEGORIES
As indicated in Figure 1, the 1C, 2C and 3C Contingent Resources estimates and the 1U, 2U and 3U Prospective Resources estimates of potentially recoverable volumes should reflect some comparability with the reserves categories of Proved (1P), Proved plus Probable (2P) and Proved plus
47Section 2.2.2.4
48Appendix A, “Best Estimate”, Definition
49 Section 2.2.2.10
50 Section 2.2.2.11
| | |
RYDER SCOTT COMPANY PETROLEUM CONSULTANTS |
| | |
PETROLEUM RESERVES and RESOURCES CLASSIFICATIONS and DEFINITIONS Page 14 |
Probable plus Possible (3P), respectively. While there may be significant chance that sub-commercial and undiscovered accumulations will not achieve commercial production, it is useful to consider the range of potentially recoverable quantities independent of such likelihood when considering what resources class to assign the project quantities.51
Without new technical information, there should be no change in the distribution of technically recoverable resources and the categorization boundaries when conditions are satisfied to reclassify a project from Contingent Resources to Reserves.52
AGGREGATION
Petroleum quantities classified as Reserves, Contingent Resources, or Prospective Resources should not be aggregated with each other without a clear understanding and explanation of the technical and commercial risk involved with their classification. In particular, there may be a chance that accumulations containing Contingent Resources and/or Prospective Resources will not achieve commercial maturity.53 Similarly, reserves and resources of different categories should not be aggregated with each other without due consideration of the significant differences in the criteria associated with their categorization.
51Section 2.2.1.6
52Section 2.2.2.6
53Section 4.2.6.1
| | |
RYDER SCOTT COMPANY PETROLEUM CONSULTANTS |
| | |
PETROLEUM RESERVES and RESOURCES CLASSIFICATIONS and DEFINITIONS Page 15 |
RESOURCES CLASSIFICATION SYSTEM (SPE-PRMS)
GRAPHICAL REPRESENTATION
Figure 1 is a graphical representation of the SPE-PRMS resources classification framework. The horizontal axis reflects the range of uncertainty of estimated quantities potentially recoverable from an accumulation by a project, while the vertical axis represents the chance of commerciality, which is the chance that a project will be committed for development and reach commercial producing status.54
54Section 1.1.0.4
| | |
RYDER SCOTT COMPANY PETROLEUM CONSULTANTS |
| | |
PETROLEUM RESERVES and RESOURCES CLASSIFICATIONS and DEFINITIONS Page 16 |
RESOURCES CLASSIFICATION SYSTEM (SPE-PRMS)
GRAPHICAL REPRESENTATION
Figure 2 is a graphical illustration of the manner in which SPE-PRMS resources may be sub- classified according to project maturity levels and the associated actions (i.e., business decisions) required to move a project toward commercial production.55
55 Section 2.1.3.5.1
| | |
RYDER SCOTT COMPANY PETROLEUM CONSULTANTS |
Table 1—Recoverable Resources Classes and Sub-Classes1
| | | | | | | | |
| Class/Sub-Class | Definition | Guidelines |
| Reserves | Reserves are those quantities of petroleum anticipated to be commercially recoverable by application of development projects to known accumulations from a given date forward under defined conditions. | Reserves must satisfy four criteria: discovered, recoverable, commercial, and remaining based on the development project(s) applied. Reserves are further categorized in accordance with the level of certainty associated with the estimates and may be sub- classified based on project maturity and/or characterized by the development and production status.
To be included in the Reserves class, a project must be sufficiently defined to establish its commercial viability (see Section 2.1.2, Determination of Commerciality). This includes the requirement that there is evidence of firm intention to proceed with development within a reasonable time-frame.
A reasonable time-frame for the initiation of development depends on the specific circumstances and varies according to the scope of the project. While five years is recommended as a benchmark, a longer time-frame could be applied where, for example, development of an economic project is deferred at the option of the producer for, among other things, market-related reasons or to meet contractual or strategic objectives. In all cases, the justification for classification as Reserves should be clearly documented.
To be included in the Reserves class, there must be a high confidence in the commercial maturity and economic producibility of the reservoir as supported by actual production or formation tests. In certain cases, Reserves may be assigned on the basis of well logs and/or core analysis that indicate that the subject reservoir is hydrocarbon-bearing and is analogous to reservoirs in the same area that are producing or have demonstrated the ability to produce on formation tests. |
| On Production | The development project is currently producing or capable of producing and selling petroleum to market. | The key criterion is that the project is receiving income from sales, rather than that the approved development project is necessarily complete. Includes Developed Producing Reserves.
The project decision gate is the decision to initiate or continue economic production from the project. |
Approved for Development
| All necessary approvals have been obtained, capital funds have been committed, and implementation of the development project is ready to begin or is under way. | At this point, it must be certain that the development project is going ahead. The project must not be subject to any contingencies, such as outstanding regulatory approvals or sales contracts. Forecast capital expenditures should be included in the reporting entity’s current or following year’s approved budget.
The project decision gate is the decision to start investing capital in the construction of production facilities and/or drilling development wells. |
| | |
RYDER SCOTT COMPANY PETROLEUM CONSULTANTS |
| | |
Petroleum Resources Classification and Definitions Table 1 (cont’d) As Adapted from: 2018 SPE-PRMS1 Page 2 |
| | | | | | | | |
| Class/Sub-Class | Definition | Guidelines |
Justified for Development | Implementation of the development project is justified on the basis of reasonable forecast commercial conditions at the time of reporting, and there are reasonable expectations that all necessary approvals/contracts will be obtained. | To move to this level of project maturity, and hence have Reserves associated with it, the development project must be commercially viable at the time of reporting (see Section 2.1.2, Determination of Commerciality) and the specific circumstances of the project. All participating entities have agreed and there is evidence of acommitted project (firm intention to proceed with development within a reasonable time-frame}) There must be no known contingencies that could preclude the development from proceeding (see Reserves class).
The project decision gate is the decision by the reporting entity and its partners, if any, that the project has reached a level of technical and commercial maturity sufficient to justify proceeding with development at that point in time. |
Contingent Resources | Those quantities of petroleum estimated, as of a given date, to be potentially recoverable from known accumulations by application of development projects, but which are not currently considered to be commercially recoverable owing to one or more contingencies. | Contingent Resources may include, for example, projects for which there are currently no viable markets, where commercial recovery is dependent on technology under development, where evaluation of the accumulation is insufficient to clearly assess commerciality, where the development plan is not yet approved, or where regulatory or social acceptance issues may exist.
Contingent Resources are further categorized in accordance with the level of certainty associated with the estimates and may be sub-classified based on project maturity and/or characterized by the economic status. |
Development Pending | A discovered accumulation where project activities are ongoing to justify commercial development in the foreseeable future. | The project is seen to have reasonable potential for eventual commercial development, to the extent that further data acquisition (e.g., drilling, seismic data) and/or evaluations are currently ongoing with a view to confirming that the project is commercially viable and providing the basis for selection of an appropriate development plan. The critical contingencies have been identified and are reasonably expected to be resolved within a reasonable time-frame. Note that disappointing appraisal/evaluation results could lead to a reclassification of the project to On Hold or Not Viable status.
The project decision gate is the decision to undertake further data acquisition and/or studies designed to move the project to a level of technical and commercial maturity at which a decision can be made to proceed with development and production. |
| | |
RYDER SCOTT COMPANY PETROLEUM CONSULTANTS |
| | |
Petroleum Resources Classification and Definitions Table 1 (cont’d) As Adapted from: 2018 SPE-PRMS1 Page 3 |
| | | | | | | | |
| Class/Sub-Class | Definition | Guidelines |
Development on Hold | A discovered accumulation where project activities are on hold and/or where justification as a commercial development may be subject to significant delay. | The project is seen to have potential for commercial development. Development may be subject to a significant time delay. Note that a change in circumstances, such that there is no longer a probable chance that a critical contingency can be removed in the foreseeable future, could lead to a reclassification of the project to Not Viable status.
The project decision gate is the decision to either proceed with additional evaluation designed to clarify the potential for eventual commercial development or to temporarily suspend or delay further activities pending resolution of external contingencies. |
Development Unclarified | A discovered accumulation where project activities are under evaluation and where justification as a commercial development is unknown based on available information. | The project is seen to have potential for eventual commercial development, but further appraisal/evaluation activities are ongoing to clarify the potential for eventual commercial development.
This sub-class requires active appraisal or evaluation and should not be maintained without a plan for future evaluation. The sub-class should reflect the actions required to move a project toward commercial maturity and economic production. |
Development Not Viable | A discovered accumulation for which there are no current plans to develop or to acquire additional data at the time because of limited production potential. | The project is not seen to have potential for eventual commercial development at the time of reporting, but the theoretically recoverable quantities are recorded so that the potential opportunity will be recognized in the event of a major change in technology or commercial conditions.
The project decision gate is the decision not to undertake further data acquisition or studies on the project for the foreseeable future. |
Prospective Resources | Those quantities of petroleum that are estimated, as of a given date, to be potentially recoverable from undiscovered accumulations. | Potential accumulations are evaluated according to the chance of geologic discovery and, assuming a discovery, the estimated quantities that would be recoverable under defined development projects. It is recognized that the development programs will be of significantly less detail and depend more heavily on analog developments in the earlier phases of exploration. |
| Prospect | A project associated with a potential accumulation that is sufficiently well defined to represent a viable drilling target. | Project activities are focused on assessing the chance of geologic discovery and, assuming discovery, the range of potential recoverable quantities under a commercial development program. |
| Lead | A project associated with a potential accumulation that is currently poorly defined and requires more data acquisition and/or evaluation to be classified as a Prospect. | Project activities are focused on acquiring additional data and/or undertaking further evaluation designed to confirm whether or not the Lead can be matured into a Prospect. Such evaluation includes the assessment of the chance of geologic discovery and, assuming discovery, the range of potential recovery under feasible development scenarios. |
| Play | A project associated with a prospective trend of potential prospects, but that requires more data acquisition and/or evaluation to define specific Leads or Prospects. | Project activities are focused on acquiring additional data and/or undertaking further evaluation designed to define specific Leads or Prospects for more detailed analysis of their chance of geologic discovery and, assuming discovery, the range of potential recovery under hypothetical development scenarios. |
| | |
RYDER SCOTT COMPANY PETROLEUM CONSULTANTS |
PETROLEUM RESERVES STATUS DEFINITIONS and GUIDELINES
As Adapted From:
2018 PETROLEUM RESOURCES MANAGEMENT SYSTEM (SPE-PRMS)
Sponsored and Approved by: SOCIETY OF PETROLEUM ENGINEERS (SPE)
WORLD PETROLEUM COUNCIL (WPC)
AMERICAN ASSOCIATION OF PETROLEUM GEOLOGISTS (AAPG) SOCIETY OF PETROLEUM EVALUATION ENGINEERS (SPEE) SOCIETY OF EXPLORATION GEOPHYSICISTS (SEG)
SOCIETY OF PETROPHYSICISTS AND WELL LOG ANALYSTS (SPWLA) EUROPEAN ASSOCIATION OF GEOSCIENTISTS & ENGINEERS (EAGE)
RESERVES
Reserves status categories define the development and producing status of wells and reservoirs.
The SPE-PRMS Table 2 defines the reserves status categories as follows:
DEVELOPED RESERVES (SPE-PRMS DEFINITIONS)
Developed Reserves are expected quantities to be recovered from existing wells and facilities.
Reserves are considered developed only after the necessary equipment has been installed, or when the costs to do so are relatively minor compared to the cost of a well. Where required facilities become unavailable, it may be necessary to reclassify Developed Reserves as Undeveloped. Developed Reserves may be further sub-classified as Producing or Non-Producing.
Developed Producing
Developed Producing Reserves are expected quantities to be recovered from completion intervals that are open and producing at the effective date of the estimate.
Improved recovery reserves are considered producing only after the improved recovery project is in operation.
Developed Non-Producing
Developed Non-Producing Reserves include shut-in and behind-pipe Reserves.
Shut-In
Shut-in Reserves are expected to be recovered from:
(1)completion intervals that are open at the time of the estimate but which have not yet started producing;
(2)wells which were shut-in for market conditions or pipeline connections; or
(3)wells not capable of production for mechanical reasons.
Behind-Pipe
Behind-pipe Reserves are expected to be recovered from zones in existing wells that will require additional completion work or future re-completion before start of production with minor cost to access these reserves.
| | |
RYDER SCOTT COMPANY PETROLEUM CONSULTANTS |
PETROLEUM RESERVES STATUS DEFINITIONS and GUIDELINES
Page 2
In all cases, production can be initiated or restored with relatively low expenditure compared to the cost of drilling a new well.
UNDEVELOPED RESERVES (SPE-PRMS DEFINITIONS)
Undeveloped Reserves are quantities expected to be recovered through future significant investments.
Undeveloped Reserves are to be produced:
(1)from new wells on undrilled acreage in known accumulations;
(2)from deepening existing wells to a different (but known) reservoir;
(3)from infill wells that will increase recovery, or
(4)where a relatively large expenditure (e.g. when compared to the cost of drilling a new well) is required to
(a)recomplete an existing well or
(b) install production or transportation facilities for primary or improved recovery projects.
| | |
RYDER SCOTT COMPANY PETROLEUM CONSULTANTS |