UNITED STATES
SECURITIES AND EXCHANGE COMMISSION
WASHINGTON, D.C. 20549
CURRENT REPORT
PURSUANT TO SECTION 13 OR 15(d) OF THE SECURITIES EXCHANGE ACT OF 1934
January 7, 2020
(Date of the earliest event reported)
Simulations Plus, Inc.
(Exact name of registrant as specified in its charter)
California | 001-32046 | 95-4595609 |
(State or other jurisdiction of incorporation) | (Commission File Number) | (I.R.S. Employer Identification No.) |
42505 10th Street West, Lancaster, California 93534-7059
(Address of principal executive offices) (Zip Code)
661-723-7723
Registrant's telephone number, including area code
Check the appropriate box below if the Form 8-K filing is intended to simultaneously satisfy the filing obligation of the registrant under any of the following provisions:
☐ Written communications pursuant to Rule 425 under the Securities Act (17 CFR 230.425)
☐ Soliciting material pursuant to Rule 14z-12 under Exchange Act (17 CFR 240.14a-12)
☐ Pre-commencement communications pursuant to Rule 14d-2(b) under Exchange Act (17 CFR 240.14d-2(b))
☐ Pre-commencement communications pursuant to Rule 13e-4(c) under Exchange Act (17 CFR 240.13e-4(c))
Title of each class | Trading Symbol(s) | Name of each exchange on which registered |
None | N/A | N/A |
Indicate by check mark whether the registrant is an emerging growth company as defined in Rule 405 of the Securities Act of 1933 (§230.405 of this chapter) or Rule 12b-2 of the Securities Exchange Act of 1934 (§240.12b-2 of this chapter). Emerging Growth Company ☐
If an emerging growth company, indicate by check mark if the registrant has elected not to use the extended transition period for complying with any new or revised financial accounting standards provided pursuant to Section 13(a) of the Exchange Act. ☐
Item 7.01 | Regulation FD Disclosure |
On January 9, 2020, Simulations Plus, Inc., a California corporation (the "Company"), issued a press release announcing that its board of directors has declared a quarterly cash dividend of $0.06 per share of common stock, payable on February 3, 2020 to shareholders of record on January 27, 2020.
A copy of the press release is attached hereto as Exhibit 99.1 and incorporated herein by reference.
Item 8.01 | Other Events |
On January 9, 2020, Simulations Plus, Inc., a California corporation (the "Company"), issued a press release announcing financial results for its first fiscal quarter of fiscal year 2020 ended November 30, 2019. The press release is furnished as Exhibit 99.1 to this Current Report on Form 8-K.
On January 9, 2020, Simulations Plus, Inc., a California corporation (the "Company"), held an investor conference call reporting its first fiscal quarter financial results of fiscal year 2020 ended November 30, 2019. The PowerPoint slides, which were used for this Investor Conference Call, are attached herein as exhibit 99.2 to this Current Report on Form 8-K.
The information contained in this Current Report on Form 8-K shall not be deemed to be "filed" for purposes of Section 18 of the Securities Exchange Act of 1934, as amended (the "Exchange Act"), or otherwise subject to the liabilities of that section, nor shall such information be deemed incorporated by reference in any filing under the Securities Act of 1933, as amended (the "Securities Act"), or the Exchange Act, except as shall be expressly set forth by specific reference in such a filing. The information set forth in this Current Report on Form 8-K shall not be deemed an admission as to the materiality of any information in this report on Current Report on Form 8-K that is required to be disclosed solely to satisfy the requirements of Regulation FD.
This report on Form 8-K (the "Report"), including the disclosures set forth herein, contains certain forward-looking statements that involve substantial risks and uncertainties. When used herein, the terms "anticipates," "expects," "estimates," "believes" and similar expressions, as they relate to us or our management, are intended to identify such forward-looking statements.
Forward-looking statements in this Report or hereafter, including in other publicly available documents filed with the Securities and Exchange Commission (the "Commission"), reports to the stockholders of Simulations Plus, Inc., a California corporation (the "Company" or "us," "our" or "we") and other publicly available statements issued or released by us involve known and unknown risks, uncertainties and other factors which could cause our actual results, performance (financial or operating) or achievements to differ from the future results, performance (financial or operating) or achievements expressed or implied by such forward-looking statements. Such future results are based upon management's best estimates based upon current conditions and the most recent results of operations. These risks include, but are not limited to, the risks set forth herein and in such other documents filed with the Commission, each of which could adversely affect our business and the accuracy of the forward-looking statements contained herein. Our actual results, performance or achievements may differ materially from those expressed or implied by such forward-looking statements.
Item 9.01 | Financial Statements and Exhibits |
(d) Exhibits
99.1 | Press release issued on January 9, 2020. |
99.2 | PowerPoint presentation at the Investor Conference Call on January 9, 2020. |
2 |
SIGNATURES
Pursuant to the requirements of the Securities Exchange Act of 1934, the registrant has duly caused this report to be signed on its behalf by the undersigned thereunto duly authorized.
SIMULATIONS PLUS, INC. | ||
Dated: January 10, 2020 | By: /s/ John R. Kneisel | |
John R. Kneisel | ||
Chief Financial Officer |
3 |
Exhibit 99.1
For Further Information:
Simulations Plus, Inc.
42505 10th Street West
Lancaster, CA 93534-7059
CONTACT:
Simulations Plus Investor Relations | Hayden IR | |
Ms. Renee Bouche | Mr. Cameron Donahue | |
661-723-7723 | 651-653-1854 | |
renee@simulations-plus.com | cameron@haydenir.com |
For Immediate Release:
January 9, 2020
Simulations Plus Reports Record First Quarter FY2020 Financial Results
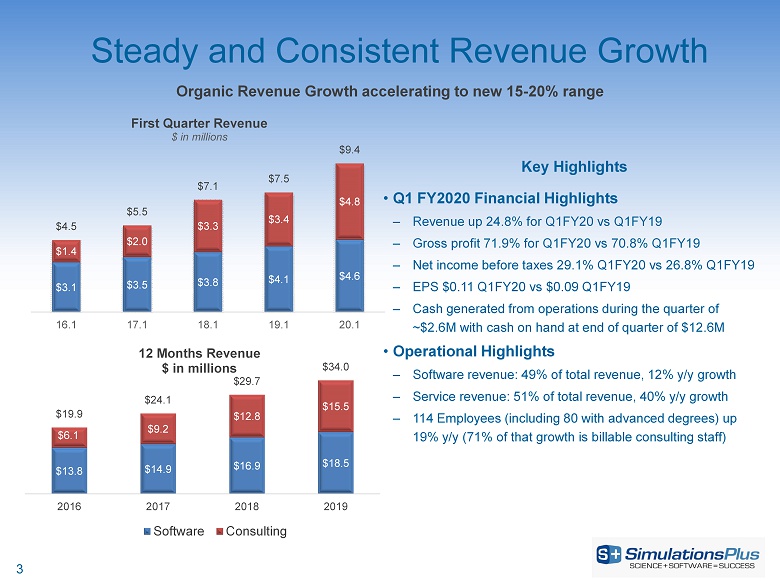
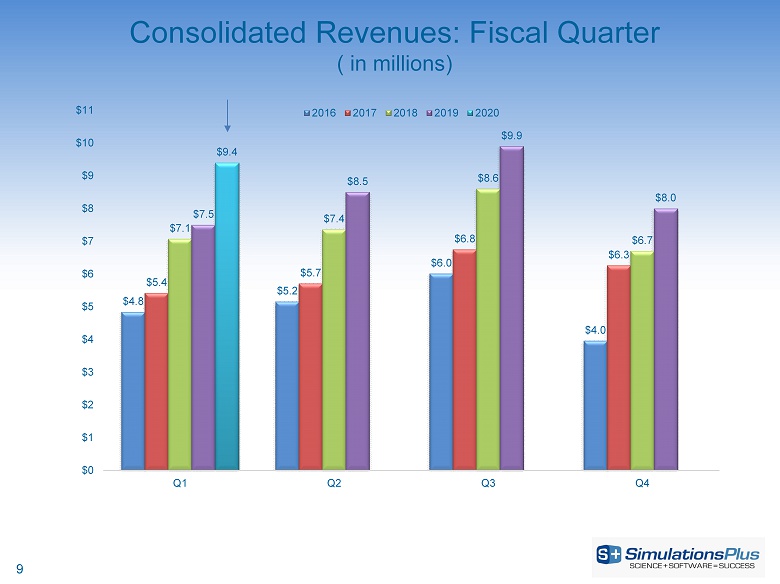
First quarter net revenues of $9.4 million reflecting 24.8% year-over-year growth
Board of Directors announces quarterly dividend of $0.06 per share
LANCASTER, CA, January 9, 2020 – Simulations Plus, Inc. (Nasdaq:SLP), the leading provider of modeling and simulation solutions for the pharmaceutical, biotechnology, chemicals, and consumer goods industries, today reported financial results for its first quarter of fiscal year 2020, the period ended November 30, 2019 (1QFY20).
1QFY20 highlights compared with 1QFY19:
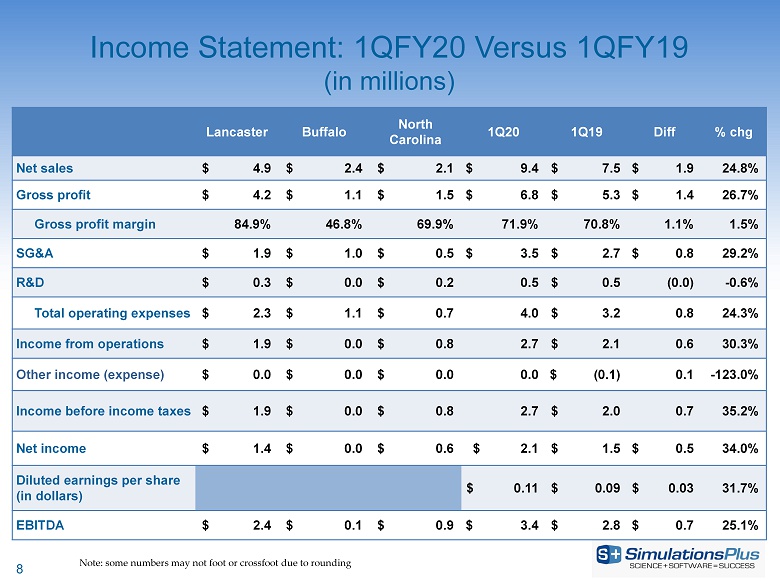
· | Net revenues increased 24.8%, or $1.9 million, to $9.4 million from $7.5 million |
· | Gross profit increased 26.7%, or $1.4 million, to $6.8 million from $5.3 million |
· | Gross profit as a percentage of revenues increased to 71.9% from 70.8% |
· | SG&A was $3.5 million, an increase of 29.2%, or $794,000, from $2.7 million |
· | SG&A as a percentage of revenues increased to 37.4% from 36.1% |
· | R&D expense decreased slightly to $526,000 from $530,000 |
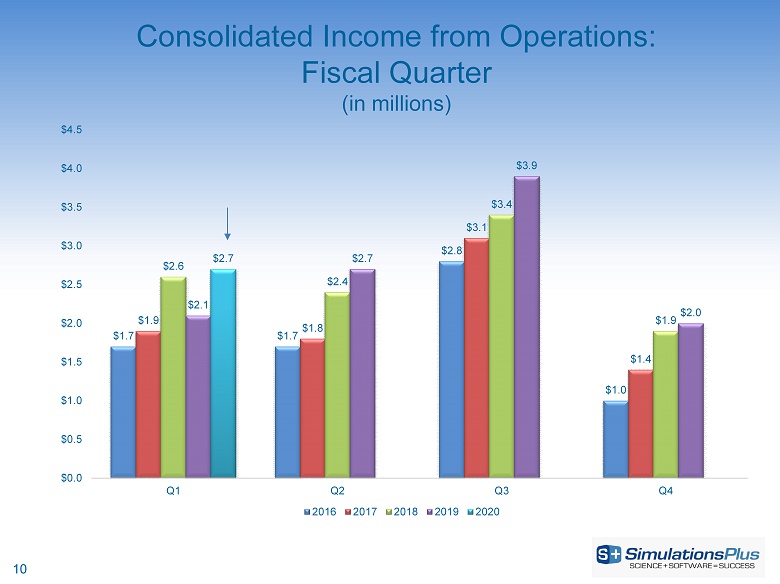
· | Income before taxes increased to $2.7 million from $2.0 million |
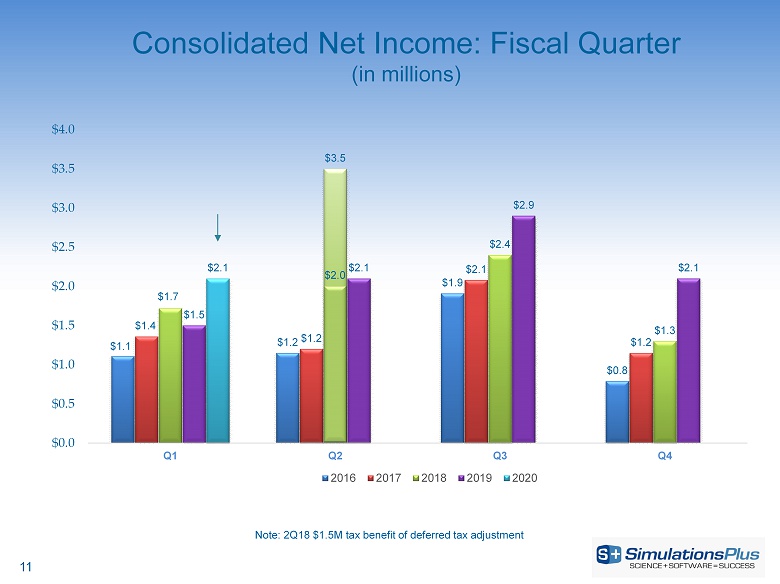
· | Net income increased $522,000, or 34.0%, to $2.1 million from $1.5 million |
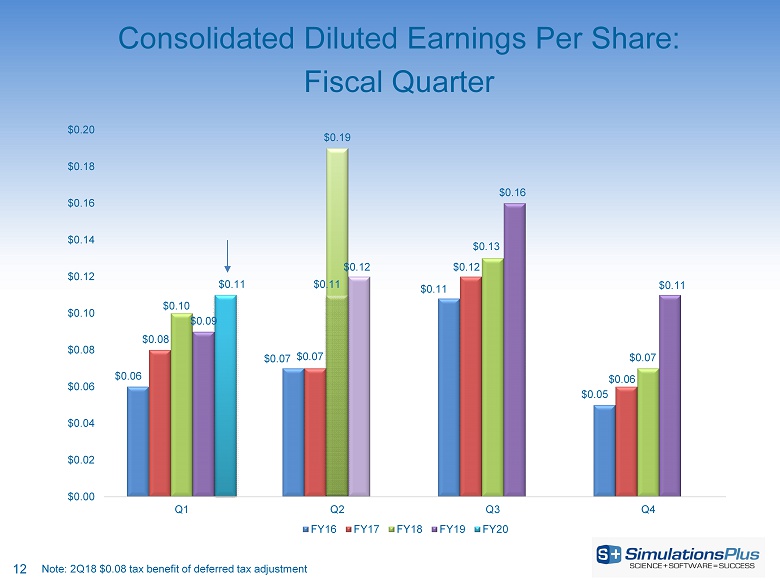
· | Diluted earnings per share increased $0.02 to $0.11 from $0.09 per share |
Shawn O’Connor, chief executive officer of Simulations Plus, said: “This was a very strong start to our fiscal year thereby demonstrating the effects of our investments in sales and marketing and scientific consulting resources to accelerate our revenue growth above historical levels. The quarter also benefitted from our consulting team’s response to accelerated project delivery requests from two clients in support of critical development and regulatory strategies. This underscores the value we provide our customers and the dedication of our scientists to support our client’s success. We continue to expect full-year growth in the 15-20% range.
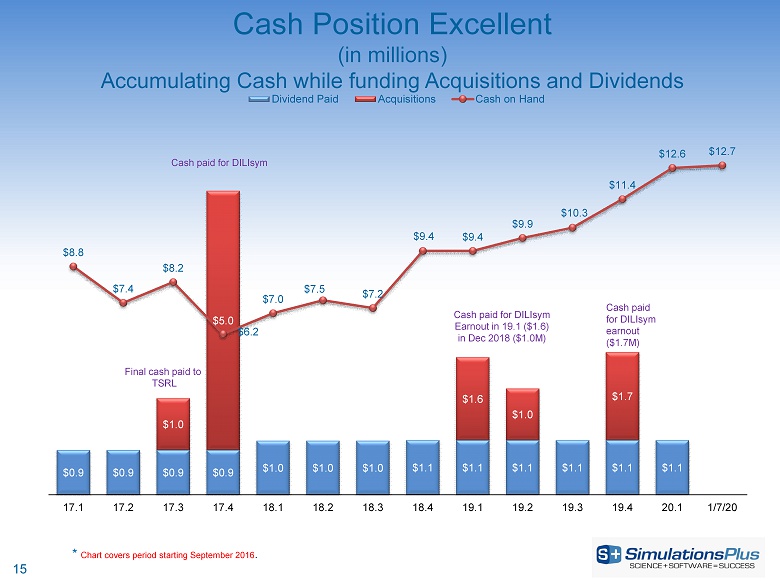
John Kneisel, chief financial officer of Simulations Plus, added: “Simulations Plus continues to generate strong revenue growth which produced an increase in fully diluted EPS of $0.02. Net cash provided by operations remains solid at $2.6 million this quarter. During the quarter, we adopted the provisions of ASC 842, Leases. Under the standard we have recognized operating leases as Right-of-Use assets, with a corresponding lease liability. As of the beginning of this fiscal year, we increased assets and liabilities by approximately $903,000 which will be taken to expense over the life of the respective leases. The effect on operating income was not significant as the amount expensed approximates the rental commitments; moreover, we do not anticipate any material effect on operating earnings going forward.”
1 |
Quarterly Dividend Declared
The Company’s Board of Directors has declared a cash dividend of $0.06 per share of the Company’s common stock payable on February 3, 2020, to shareholders of record as of January 27, 2020. The declaration of any future dividends will be determined by the Board of Directors each quarter and will depend on earnings, financial condition, capital requirements, and other factors.
Investor Conference Call
The Company has announced an investor conference call that will be webcast live at 1:15 p.m. PST/4:15 p.m. EST on Thursday, January 9, 2020. The live webcast/teleconference will be accessible by registering here. Please dial in five to ten minutes prior to the scheduled start time. A live, listen-only webcast will also be available by dialing (914) 614-3221, and entering access code 601-658-992. A replay of the webcast will be available at the Investors section of the Simulations Plus website following the call.
About Simulations Plus, Inc.
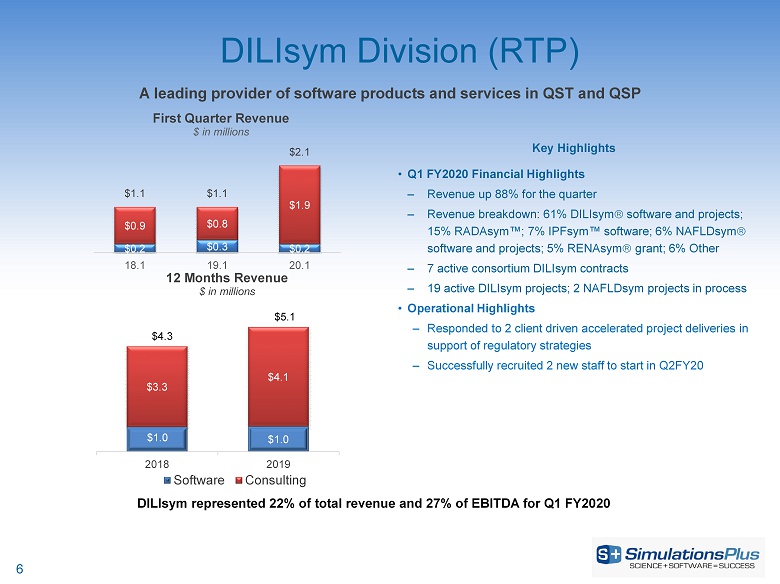
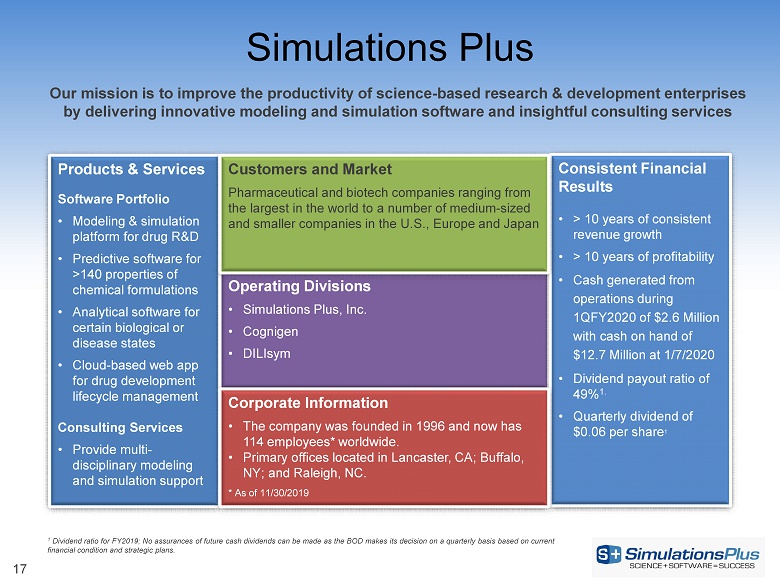
Simulations Plus, Inc., is a premier developer of drug discovery and development software as well as a leading provider of both preclinical and clinical pharmacometric consulting services for regulatory submissions and quantitative systems pharmacology models for drug-induced liver injury and nonalcoholic fatty liver disease. The company is a global leader focused on improving the ways scientists use knowledge and data to predict the properties and outcomes of pharmaceutical, biotechnology, and chemical agents. Our software is licensed to and used in the conduct of drug research by major pharmaceutical, biotechnology, chemical, and consumer goods companies and regulatory agencies worldwide. Our innovations in integrating new and existing science in medicinal chemistry, computational chemistry, pharmaceutical science, biology, and physiology into our software have made us the leading software provider for physiologically based pharmacokinetic modeling and simulation. For more information, visit our website at www.simulations-plus.com.
Safe Harbor Statement Under the Private Securities Litigation Reform Act of 1995 – With the exception of historical information, the matters discussed in this press release are forward-looking statements that involve a number of risks and uncertainties. Our actual future results could differ significantly from those statements. Factors that could cause or contribute to such differences include, but are not limited to: our ability to maintain our competitive advantages, acceptance of our new software products as well as improved versions of our existing software by our customers, the general economics of the pharmaceutical industry, our ability to finance growth, our ability to continue to attract and retain highly qualified technical staff, and a sustainable market. Further information on our risk factors is contained in our quarterly and annual reports and filed with the U.S. Securities and Exchange Commission.
Follow us on Twitter | LinkedIn | YouTube
--Tables follow --
2 |
SIMULATIONS PLUS, INC.
CONDENSED CONSOLIDATED BALANCE SHEETS
As of
(Unaudited) | (Audited) | |||||||
November 30, | August 31, | |||||||
ASSETS | ||||||||
2019 | 2019 | |||||||
Current assets | ||||||||
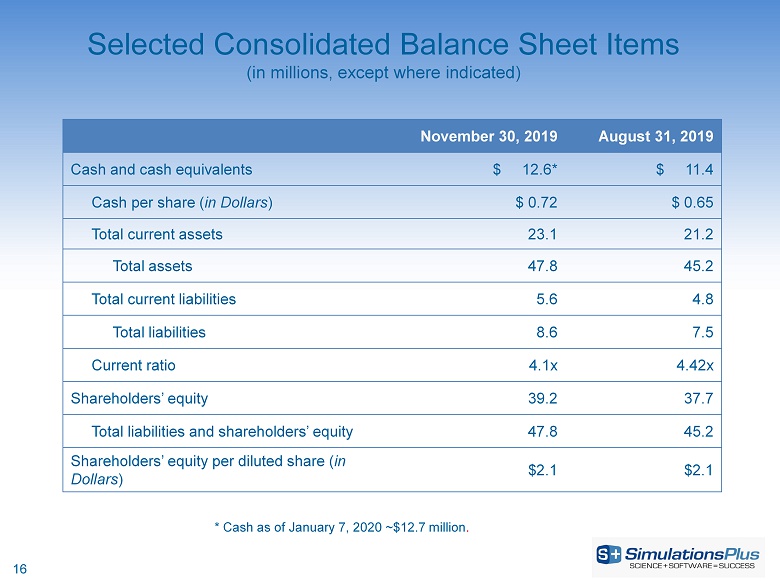
Cash and cash equivalents | $ | 12,610,446 | $ | 11,435,499 | ||||
Accounts receivable, net of allowance for doubtful accounts of $0 | 6,353,416 | 5,026,558 | ||||||
Revenues in excess of billings | 3,480,934 | 3,233,659 | ||||||
Prepaid income taxes | 87,078 | 765,110 | ||||||
Prepaid expenses and other current assets | 561,129 | 704,316 | ||||||
Total current assets | 23,093,003 | 21,165,142 | ||||||
Long-term assets | ||||||||
Capitalized computer software development costs, net of accumulated amortization of $12,669,722 and $12,356,055 | 5,152,941 | 4,959,736 | ||||||
Property and equipment, net | 334,763 | 341,145 | ||||||
Operating lease right of use asset | 770,853 | – | ||||||
Intellectual property, net of accumulated amortization of $4,181,042 and $3,948,750 | 4,793,958 | 5,026,249 | ||||||
Other intangible assets net of accumulated amortization of $1,296,875 and $1,210,000 | 3,193,125 | 3,280,000 | ||||||
Goodwill | 10,387,198 | 10,387,198 | ||||||
Other assets | 37,227 | 37,227 | ||||||
Total assets | $ | 47,763,068 | $ | 45,196,697 | ||||
LIABILITIES AND SHAREHOLDERS' EQUITY | ||||||||
Current liabilities | ||||||||
Accounts payable | $ | 584,944 | $ | 204,075 | ||||
Accrued payroll and other expenses | 1,597,643 | 1,639,038 | ||||||
Income taxes payable | – | – | ||||||
Current portion - Contracts payable | 1,761,028 | 1,761,028 | ||||||
Billings in excess of revenues | 889,699 | 798,549 | ||||||
Operating lease liability, current portion | 528,055 | – | ||||||
Deferred revenue | 271,739 | 380,787 | ||||||
Total current liabilities | 5,633,108 | 4,783,477 | ||||||
Long-term liabilities | ||||||||
Deferred income taxes, net | 2,703,711 | 2,731,616 | ||||||
Operating Lease Liability | 240,072 | – | ||||||
Total liabilities | 8,576,891 | 7,515,093 | ||||||
Commitments and contingencies | ||||||||
Shareholders' equity | ||||||||
Preferred stock, $0.001 par value, 10,000,000 shares authorized, no shares issued and outstanding | $ | – | $ | – | ||||
Common stock, $0.001 par value, 50,000,000 shares authorized, 17,623,324 and 17,591,834 shares issued and outstanding | 7,626 | 7,595 | ||||||
Additional paid-in capital | 15,822,118 | 15,319,474 | ||||||
Retained earnings | 23,356,433 | 22,354,535 | ||||||
Total shareholders' equity | $ | 39,186,177 | $ | 37,681,604 | ||||
Total liabilities and shareholders' equity | $ | 47,763,068 | $ | 45,196,697 |
3 |
SIMULATIONS PLUS, INC.
CONDENSED CONSOLIDATED STATEMENTS OF OPERATIONS
For the three months ended November 30,
Three months ended | ||||||||
(Unaudited) | ||||||||
2019 | 2018 | |||||||
Revenues | $ | 9,401,103 | $ | 7,535,903 | ||||
Cost of revenues | 2,642,908 | 2,200,371 | ||||||
Gross margin | 6,758,195 | 5,335,532 | ||||||
Operating expenses | ||||||||
Selling, general, and administrative | 3,513,361 | 2,719,151 | ||||||
Research and development | 526,352 | 529,636 | ||||||
Total operating expenses | 4,039,713 | 3,248,787 | ||||||
Income from operations | 2,718,482 | 2,086,745 | ||||||
Other income (expense) | ||||||||
Interest income | 11,274 | 3,672 | ||||||
Interest expense | – | (38,188 | ) | |||||
(Loss) income on currency exchange | 3,711 | (30,611 | ) | |||||
Total other income (expense) | 14,985 | (65,127 | ) | |||||
Income before provision for income taxes | 2,733,467 | 2,021,618 | ||||||
Provision for income taxes | (675,190 | ) | (485,671 | ) | ||||
Net Income | $ | 2,058,277 | $ | 1,535,947 | ||||
Earnings per share | ||||||||
Basic | $ | 0.12 | $ | 0.09 | ||||
Diluted | $ | 0.11 | $ | 0.09 | ||||
Weighted-average common shares outstanding | ||||||||
Basic | 17,608,991 | 17,421,838 | ||||||
Diluted | 18,306,998 | 17,997,735 |
4 |
Exhibit 99.2
Q1FY2020 Investor Conference Call Shawn O’Connor, CEO John Kneisel, CFO January 9, 2020 (NASDAQ:SLP)
2 With the exception of historical information, the matters discussed in this presentation are forward - looking statements that involve a number of risks and uncertainties . The actual results of the Company could differ significantly from those statements . Factors that could cause or contribute to such differences include but are not limited to : continuing demand for the Company’s products, competitive factors, the Company’s ability to finance future growth, the Company’s ability to produce and market new products in a timely fashion, the Company’s ability to continue to attract and retain skilled personnel, and the Company’s ability to sustain or improve current levels of productivity . Further information on the Company’s risk factors is contained in the Company’s quarterly and annual reports and filed with the Securities and Exchange Commission . Safe Harbor Statement
Steady and Consistent Revenue Growth 3 Organic Revenue Growth accelerating to new 15 - 20% range $13.8 $14.9 $16.9 $18.5 $6.1 $9.2 $12.8 $15.5 $19.9 $24.1 $29.7 $34.0 2016 2017 2018 2019 12 Months Revenue $ in millions Software Consulting Key Highlights • Q1 FY2020 Financial Highlights – Revenue up 24.8% for Q1FY20 vs Q1FY19 – Gross profit 71.9% for Q1FY20 vs 70.8% Q1FY19 – Net income before taxes 29.1% Q1FY20 vs 26.8% Q1FY19 – EPS $ 0.11 Q1FY20 vs $0.09 Q1FY19 – Cash generated from operations during the quarter of ~$2.6M with cash on hand at end of quarter of $12.6M • Operational Highlights – Software revenue: 49% of total revenue, 12% y/y growth – Service revenue: 51% of total revenue, 40% y/y growth – 114 Employees (including 80 with advanced degrees) up 19% y/y (71% of that growth is billable consulting staff) $3.1 $3.5 $3.8 $4.1 $4.6 $1.4 $2.0 $3.3 $3.4 $4.8 $4.5 $5.5 $7.1 $7.5 $9.4 16.1 17.1 18.1 19.1 20.1 First Quarter Revenue $ in millions
Simulations Plus Division (Lancaster) 4 The genesis of the company… providing software, training and consulting services $13.6 $14.5 $15.7 $17.3 $0.9 $1.1 $1.8 $2.3 $14.5 $15.6 $17.5 $19.6 2016 2017 2018 2019 12 Months Revenue $ in millions Software Consulting Simulations Plus represented 52.5% of total revenue and 69% of EBITDA for Q1 FY2020 Key Highlights • Q1 FY2020 Financial Highlights – Revenue up 13% for the quarter – Q1 Revenue breakdown: 69% Renewal ; 19% New Licenses ; 12% consulting – Renewal rates: 85% (accounts) and 98% (fees) – License Units (235) up 12% y/y – 16 new commercial companies and 22 non - profit groups – Projects with 26 companies and 9 funded collaborations • Operational Highlights – New funded collaboration with Bayer AG to advance the ADMET Predictor machine learning software for use within integrated drug discovery workflows – New funded collaboration agreement with a large pharmaceutical company to enhance the PKPlus ™ software – New funded collaboration with a large pharmaceutical company to modify the mechanistic oral absorption model in GastroPlus to support gastrointestinal disease research $3.1 $3.4 $3.5 $3.8 $4.3 $0.3 $0.3 $0.5 $0.6 $0.6 $3.4 $3.7 $4.0 $4.4 $4.9 16.1 17.1 18.1 19.1 20.1 First Quarter Revenue $ in millions
Key Highlights • Q1 FY2020 Financial Highlights – Revenue up 16% for the quarter – 33 contracts and 15 new projects initiated during quarter – 18 proposals outstanding with 11 companies at the start of 2QFY20 • Operational Highlights – Efficient leadership transition – Recruited 5 new staff into consulting group – 101 active projects across 34 companies in the quarter – Exit the quarter with approximately $6.5 million project backlog Cognigen Division (Buffalo) 5 A leading provider of population modeling and simulation services for the pharma and biotech industries $0.2 $0.2 $0.2 $0.2 $5.4 $7.1 $7.7 $9.2 $5.6 $7.3 $7.9 $9.4 2016 2017 2018 2019 12 Months Revenue $ in millions Software Consulting Cognigen represented 25.5% of total revenue and 4% of EBITDA for Q1 FY2020 $0.04 $0.06 $0.07 $0.04 $0.06 $1.4 $1.7 $1.9 $2.1 $2.3 $1.4 $1.8 $2.0 $2.1 $2.4 16.1 17.1 18.1 19.1 20.1 First Quarter Revenue $ in millions
$1.0 $1.0 $3.3 $4.1 $4.3 $5.1 2018 2019 12 Months Revenue $ in millions Software Consulting DILIsym Division (RTP) 6 A leading provider of software products and services in QST and QSP Key Highlights • Q1 FY2020 Financial Highlights – Revenue up 88% for the quarter – Revenue breakdown: 61% DILIsym software and projects; 15% RADAsym ™; 7% IPFsym ™ software; 6% NAFLDsym software and projects; 5% RENAsym grant; 6% Other – 7 active consortium DILIsym contracts – 19 active DILIsym projects; 2 NAFLDsym projects in process • Operational Highlights – Responded to 2 client driven accelerated project deliveries in support of regulatory strategies – Successfully recruited 2 new staff to start in Q2FY20 DILIsym represented 22% of total revenue and 27% of EBITDA for Q1 FY2020 $0.2 $0.3 $0.2 $0.9 $0.8 $1.9 $1.1 $1.1 $2.1 18.1 19.1 20.1 First Quarter Revenue $ in millions
Financial Results
8 Income Statement: 1QFY20 Versus 1QFY19 (in millions) Lancaster Buffalo North Carolina 1Q20 1Q19 Diff % chg Net sales $ 4.9 $ 2.4 $ 2.1 $ 9.4 $ 7.5 $ 1.9 24.8% Gross profit $ 4.2 $ 1.1 $ 1.5 $ 6.8 $ 5.3 $ 1.4 26.7% Gross profit margin 84.9% 46.8% 69.9% 71.9% 70.8% 1.1% 1.5% SG&A $ 1.9 $ 1.0 $ 0.5 $ 3.5 $ 2.7 $ 0.8 29.2% R&D $ 0.3 $ 0.0 $ 0.2 0.5 $ 0.5 (0.0) - 0.6% Total operating expenses $ 2.3 $ 1.1 $ 0.7 4.0 $ 3.2 0.8 24.3% Income from operations $ 1.9 $ 0.0 $ 0.8 2.7 $ 2.1 0.6 30.3% Other income (expense) $ 0.0 $ 0.0 $ 0.0 0.0 $ (0.1) 0.1 - 123.0% Income before income taxes $ 1.9 $ 0.0 $ 0.8 2.7 $ 2.0 0.7 35.2% Net income $ 1.4 $ 0.0 $ 0.6 $ 2.1 $ 1.5 $ 0.5 34.0% Diluted earnings per share (in dollars) $ 0.11 $ 0.09 $ 0.03 31.7% EBITDA $ 2.4 $ 0.1 $ 0.9 $ 3.4 $ 2.8 $ 0.7 25.1% Note: some numbers may not foot or crossfoot due to rounding
9 Consolidated Revenues: Fiscal Quarter ( in millions) $4.8 $5.2 $6.0 $4.0 $5.4 $5.7 $6.8 $6.3 $7.1 $7.4 $8.6 $6.7 $7.5 $8.5 $9.9 $8.0 $9.4 $0 $1 $2 $3 $4 $5 $6 $7 $8 $9 $10 $11 Q1 Q2 Q3 Q4 2016 2017 2018 2019 2020
10 Consolidated Income from Operations: Fiscal Quarter (in millions) $1.7 $1.7 $2.8 $1.0 $1.9 $1.8 $3.1 $1.4 $2.6 $2.4 $3.4 $1.9 $2.1 $2.7 $3.9 $2.0 $2.7 $0.0 $0.5 $1.0 $1.5 $2.0 $2.5 $3.0 $3.5 $4.0 $4.5 Q1 Q2 Q3 Q4 2016 2017 2018 2019 2020
$1.1 $1.2 $1.9 $0.8 $1.4 $1.2 $2.1 $1.2 $1.7 $3.5 $2.4 $1.3 $1.5 $2.1 $2.9 $2.1 $2.1 $0.0 $0.5 $1.0 $1.5 $2.0 $2.5 $3.0 $3.5 $4.0 Q1 Q2 Q3 Q4 2016 2017 2018 2019 2020 $2.0 11 Note: 2Q18 $1.5M tax benefit of deferred tax adjustment Consolidated Net Income: Fiscal Quarter (in millions)
12 Consolidated Diluted Earnings Per Share: Fiscal Quarter $0.06 $0.07 $0.11 $0.05 $0.08 $0.07 $0.12 $0.06 $0.10 $0.19 $0.13 $0.07 $0.09 $0.12 $0.16 $0.11 $0.11 $0.00 $0.02 $0.04 $0.06 $0.08 $0.10 $0.12 $0.14 $0.16 $0.18 $0.20 Q1 Q2 Q3 Q4 FY16 FY17 FY18 FY19 FY20 $0.11 Note: 2Q18 $0.08 tax benefit of deferred tax adjustment
13 Consolidated EBITDA: Fiscal Quarter (in millions) $2.2 $2.2 $3.3 $1.5 $2.5 $2.3 $3.6 $2.0 $3.2 $3.1 $4.1 $2.6 $2.8 $3.4 $4.6 $2.7 $3.4 $0 $1 $2 $3 $4 $5 Q1 Q2 Q3 Q4 2016 2017 2018 2019 2020
Revenue by Region – First Quarter 2020 Europe 16 % Americas 68 % Asia 16 % Japan = 50% Korea = 25% China = 20% Other = 5% 14 A global and diversified base of revenue
15 Cash Position Excellent (in millions) Accumulating Cash while funding Acquisitions and Dividends $0.9 $0.9 $0.9 $0.9 $1.0 $1.0 $1.0 $1.1 $1.1 $1.1 $1.1 $1.1 $1.1 $1.0 $5.0 $1.6 $1.0 $1.7 $8.8 $7.4 $8.2 $6.2 $7.0 $7.5 $7.2 $9.4 $9.4 $9.9 $10.3 $11.4 $12.6 $12.7 17.1 17.2 17.3 17.4 18.1 18.2 18.3 18.4 19.1 19.2 19.3 19.4 20.1 1/7/20 Dividend Paid Acquisitions Cash on Hand Cash paid for DILIsym Earnout in 19.1 ($1.6) in Dec 2018 ($1.0M) * Chart covers period starting September 2016 . Cash paid for DILIsym earnout ($1.7M) Cash paid for DILIsym Final cash paid to t TSRL
16 Selected Consolidated Balance Sheet Items (in millions, except where indicated) November 30, 2019 August 31, 2019 Cash and cash equivalents $ 12.6* $ 11.4 Cash per share ( in Dollars ) $ 0.72 $ 0.65 Total current assets 23.1 21.2 Total assets 47.8 45.2 Total current liabilities 5.6 4.8 Total liabilities 8.6 7.5 Current ratio 4.1x 4.42x Shareholders’ equity 39.2 37.7 Total liabilities and shareholders’ equity 47.8 45.2 Shareholders’ equity per diluted share ( in Dollars ) $2.1 $2.1 * Cash as of January 7, 2020 ~$12.7 million .
1 Dividend ratio for FY2019; No assurances of future cash dividends can be made as the BOD makes its decision on a quarterly ba si s based on current financial condition and strategic plans. Products & Services Software Portfolio • Modeling & simulation platform for drug R&D • Predictive software for >140 properties of chemical formulations • Analytical software for certain biological or disease states • Cloud - based web app for drug development lifecycle management Consulting Services • Provide multi - disciplinary modeling and simulation support Operating Divisions • Simulations Plus, Inc. • Cognigen • DILIsym Consistent Financial Results • > 10 years of consistent revenue growth • > 10 years of profitability • Cash generated from operations during 1QFY2020 of $2.6 Million with cash on hand of $12.7 Million at 1/7/2020 • Dividend payout ratio of 49% 1. • Quarterly dividend of $0.06 per share 1 Customers and Market Pharmaceutical and biotech companies ranging from the largest in the world to a number of medium - sized and smaller companies in the U.S., Europe and Japan Corporate Information • The company was founded in 1996 and now has 114 employees* worldwide. • Primary offices located in Lancaster, CA; Buffalo, NY; and Raleigh, NC. * As of 11/30/2019 Simulations Plus Our mission is to improve the productivity of science - based research & development enterprises by delivering innovative modeling and simulation software and insightful consulting services 17
18 Thank you! https://www.linkedin.com/company/simulations - plus https://www.linkedin.com/company/cognigen https://www.linkedin.com/company/dilisym
-/^#.@VX!O9[J[;N"VQ?TY_6MZU^'7A2T VZ/#)C_ )ZY?^=<
MLL?26UV="PDWN?--%?4T7A/P]"08]&L5(Z8A%64T+28W#)IMJK#N(A6?]HQ_
ME*^ION?*%%?6G]EZ?_SY6_\ W[%5V\.Z*P(;2[0@]1Y0H_M&/\H_J;[GRG17
MU!/X(\,W"D/HEESW6( _I6!J/PA\-7B'[,D]G(3G='(2/R.15QS"F]TT0\)-
M;,^?J*Z7QAX,OO"%ZD=PPFMI<^3.HP&QU!'8US5=D9*:YH['/*+B[,****HD
M*56*L&!P0J(:MN%%%% @KU'X7^/)K.]B
MT'4I2]I,=MO(YYB;TSZ']*\NIR.T
::=F>NG=705XO\ &V]+:AIMB#\J1M*1
MZ$G']*]HKYR^*-\+WQW>@9Q %AP?4#FNO QO6OV,,4[4[=SC:***]H\P****
M "BBB@ HHHH **** "BBB@ J>R@^U7UO;C_EK(J?F<5!73?#ZQ^W^.-,C*Y5
M)/,8>PYJ9RY8N78J*O)(^E+:$6]I# .D:*GY#%2T45\V>R%?.7Q1OA>^.[T*
M?E@"PXSW Y_6OHQF"*68X &2:^4=