UNITED STATES
SECURITIES AND EXCHANGE COMMISSION
WASHINGTON, D.C. 20549
FORM 8-K
CURRENT REPORT
PURSUANT TO SECTION 13 OR 15(d) OF THE SECURITIES EXCHANGE ACT OF 1934
July 14, 2016
(Date of the earliest event reported)
Simulations Plus, Inc.
(Exact name of registrant as specified in its charter)
California | 001-32046 | 95-4595609 |
(State or other jurisdiction of incorporation) | (Commission File Number) | (I.R.S. Employer Identification No.) |
42505 10th Street West, Lancaster, California 93534-7059
(Address of principal executive offices) (Zip Code)
661-723-7723
Registrant's telephone number, including area code
Check the appropriate box below if the Form 8-K filing is intended to simultaneously satisfy the filing obligation of the registrant under any of the following provisions:
[ ] Written communications pursuant to Rule 425 under the Securities Act (17 CFR 230.425)
[ ] Soliciting material pursuant to Rule 14z-12 under Exchange Act (17 CFR 240.14a-12)
[ ] Pre-commencement communications pursuant to Rule 14d-2(b) under Exchange Act (17 CFR 240.14d-2(b))
[ ] Pre-commencement communications pursuant to Rule 13e-4(c) under Exchange Act (17 CFR 240.13e-4(c))
Item 8.01 Other Events
On July 14, 2016, Simulations Plus, Inc., a California corporation (the "Company"), issued a press release announcing financial results for its third quarter and nine months of fiscal year 2016 ended May 31, 2016. The press release is furnished as Exhibit 99.1 to this Current Report on Form 8-K.
On July 14, 2016, Simulations Plus, Inc., a California corporation (the "Company"), held a conference call reporting its financial results for its third quarter and nine months of fiscal year 2016 ended May 31, 2016. The PowerPoint slides, which were used for this Conference Call, are attached herein as exhibit 99.2 to this Current Report on Form 8-K.
The information contained in this Current Report on Form 8-K shall not be deemed to be "filed" for purposes of Section 18 of the Securities Exchange Act of 1934, as amended (the "Exchange Act"), or otherwise subject to the liabilities of that section, nor shall such information be deemed incorporated by reference in any filing under the Securities Act of 1933, as amended (the "Securities Act"), or the Exchange Act, except as shall be expressly set forth by specific reference in such a filing. The information set forth in this Current Report on Form 8-K shall not be deemed an admission as to the materiality of any information in this report on Current Report on Form 8-K that is required to be disclosed solely to satisfy the requirements of Regulation FD.
This report on Form 8-K (the "Report"), including the disclosures set forth herein, contains certain forward-looking statements that involve substantial risks and uncertainties. When used herein, the terms "anticipates," "expects," "estimates," "believes" and similar expressions, as they relate to us or our management, are intended to identify such forward-looking statements.
Forward-looking statements in this Report or hereafter, including in other publicly available documents filed with the Securities and Exchange Commission (the "Commission"), reports to the stockholders of Simulations Plus, Inc., a California corporation (the "Company" or "us," "our" or "we") and other publicly available statements issued or released by us involve known and unknown risks, uncertainties and other factors which could cause our actual results, performance (financial or operating) or achievements to differ from the future results, performance (financial or operating) or achievements expressed or implied by such forward-looking statements. Such future results are based upon management's best estimates based upon current conditions and the most recent results of operations. These risks include, but are not limited to, the risks set forth herein and in such other documents filed with the Commission, each of which could adversely affect our business and the accuracy of the forward-looking statements contained herein. Our actual results, performance or achievements may differ materially from those expressed or implied by such forward-looking statements.
Item 9.01 Financial Statements and Exhibits
(d) Exhibits
99.1 | Press release issued on July 14, 2016. |
99.2 | PowerPoint presentation at the Conference Call on July 14, 2016. |
2 |
SIGNATURES
Pursuant to the requirements of the Securities Exchange Act of 1934, the registrant has duly caused this report to be signed on its behalf by the undersigned thereunto duly authorized.
SIMULATIONS PLUS, INC. | ||
Dated: July 15, 2016 | By: | /s/ John R. Kneisel |
John R. Kneisel Chief Financial Officer |
3 |
Exhibit 99.1
For Further Information:
Simulations Plus, Inc.
42505 10th Street West
Lancaster, CA 93534-7059
CONTACT: | |
Simulations Plus Investor Relations | Hayden IR |
Ms. Renee Bouche | Mr. Cameron Donahue |
661-723-7723 | 651-653-1854 |
renee@simulations-plus.com | cameron@haydenir.com |
For Immediate Release:
July 14, 2016
Simulations Plus Reports Third Quarter FY2016 Financial Results
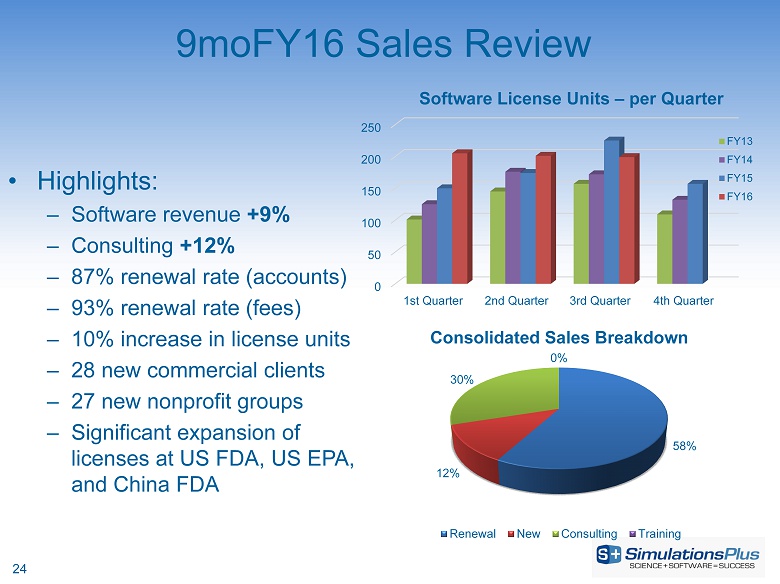
Record quarterly revenue, 9moFY16 diluted EPS increased 23% to a record $0.242 from $0.196
LANCASTER, CA, July 14, 2016 – Simulations Plus, Inc. (NASDAQ: SLP), the premier provider of simulation and modeling software and consulting services for pharmaceutical discovery and development from the earliest discovery through all phases of clinical trials, today reported financial results for its third quarter of fiscal year 2016 (3QFY16) and the first nine months of fiscal year 2016 (9moFY16), the period ended May 31, 2016.
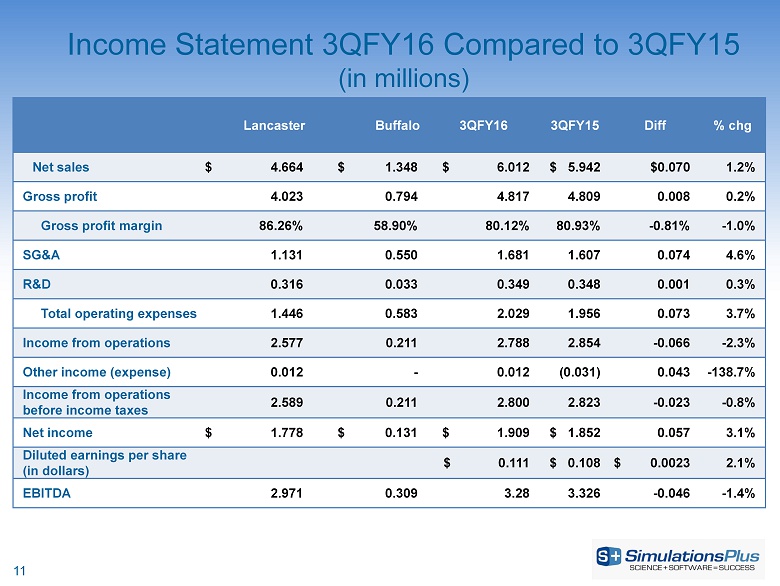
3QFY16 highlights compared with 3QFY15:
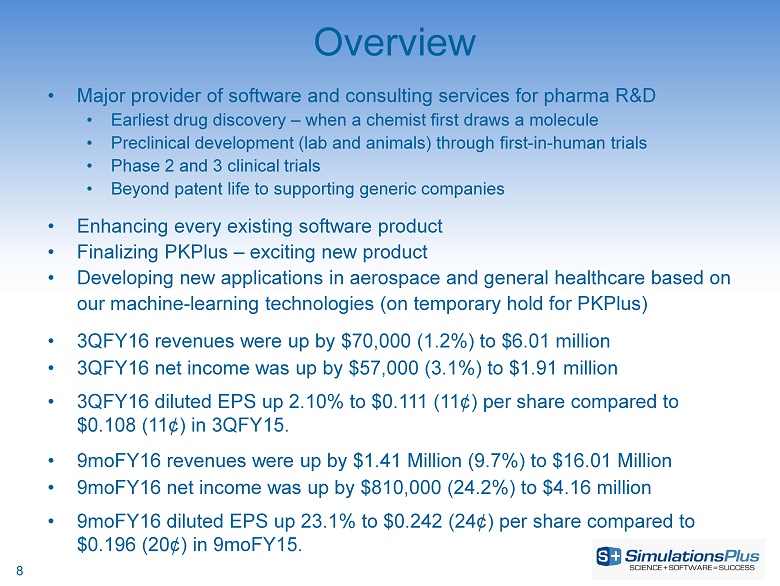
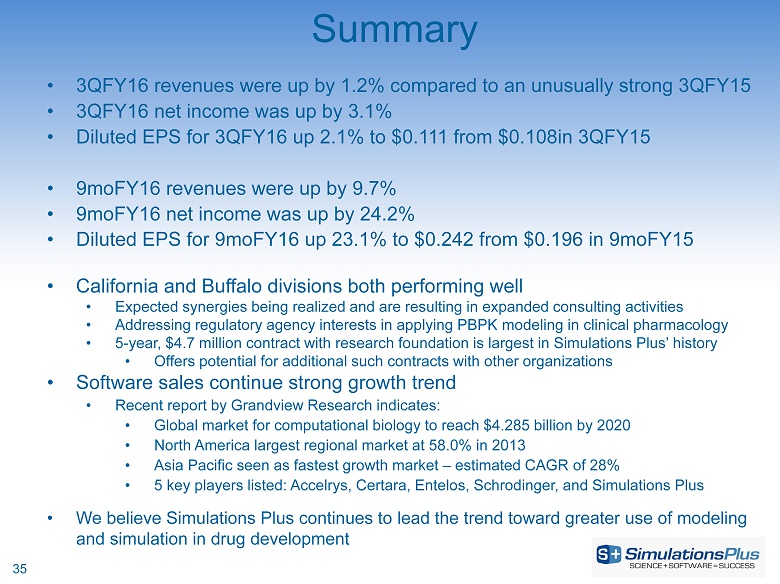
· | Net revenues increased 1.2% to $6.01 million, an increase of $70,000 from $5.94 million |
· | Gross profit was up 0.2% to $4.82 million, an increase of $8,000 from $4.81 million |
· | SG&A was $1.68 million, an increase of 4.6% or $73,000 from $1.61 million |
· | R&D expenditures were $617,000, an increase of $23,000, or 3.8% over $594,000 |
o | In 3QFY16, $269,000 was capitalized and $348,000 was expensed |
o | In 3QFY15, $246,000 was capitalized and $348,000 was expensed |
· | Income before taxes decreased 0.8% to $2.80 million, a decrease of $22,000 from $2.82 million |
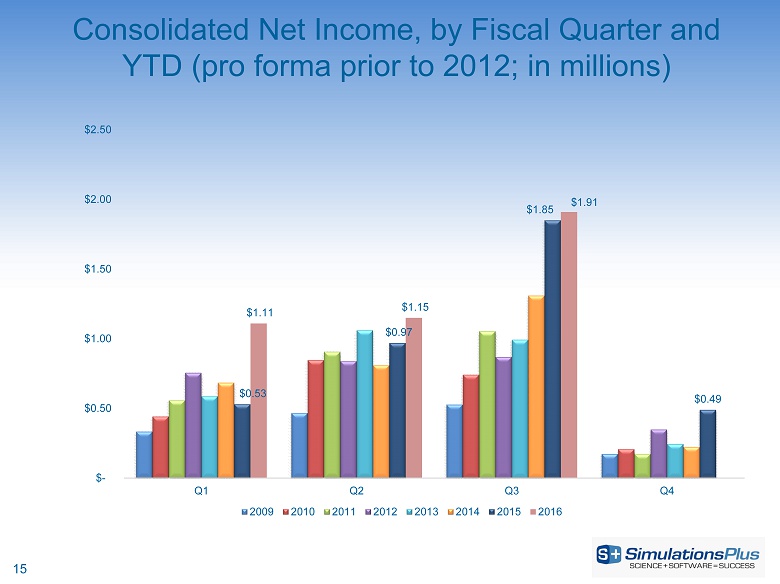
· | Net income increased 3.1% to $1.91 million, an increase of $57,000 from $1.85 million |
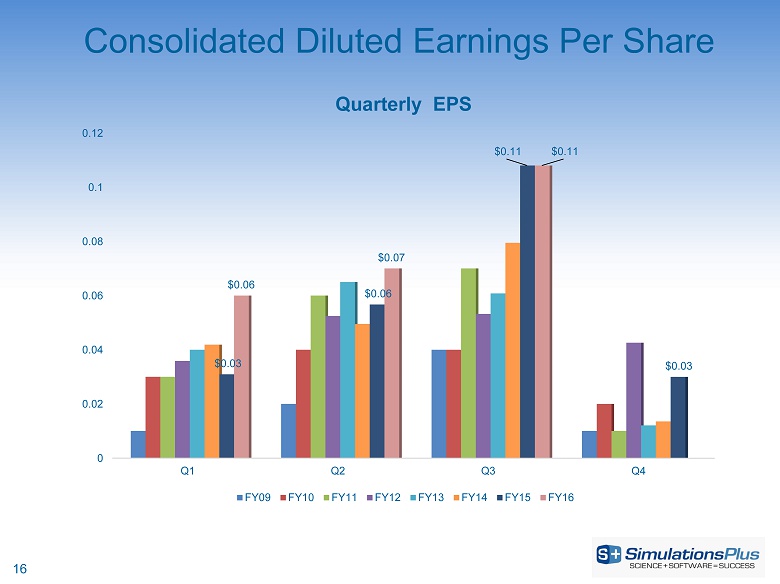
· | Diluted earnings per share increased 2.1% to $0.111 from $0.108 |
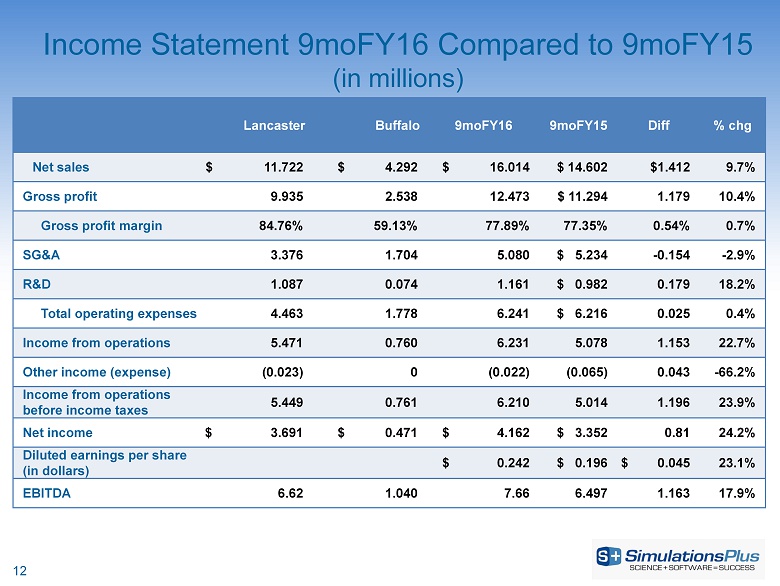
9moFY16 highlights compared with 9moFY15:
· | Net revenues increased 9.7% to $16.01 million, an increase of $1.41 million from $14.60 million |
· | Gross profit was up 10.4% to $12.47 million, an increase of $1.18 million from $11.29 million |
· | SG&A was $5.08 million, a decrease of $154,000, or 2.9%, from $5.23 million |
· | R&D expenditures were $1.974 million, an increase of $17,000, or 0.9% over $1.957 million |
o | For 9moFY16, $814,000 was capitalized and $1.16 million was expensed |
o | For 9moFY15, $976,000 was capitalized and $982,000 was expensed |
· | Income before taxes increased 23.9% to $6.21 million, an increase of $1.2 million from $5.01 million |
· | Net income increased 24.2% to $4.16 million, an increase of $810,000 from $3.35 million |
· | Diluted earnings per share increased 23.1% to $0.242 from $0.196 |
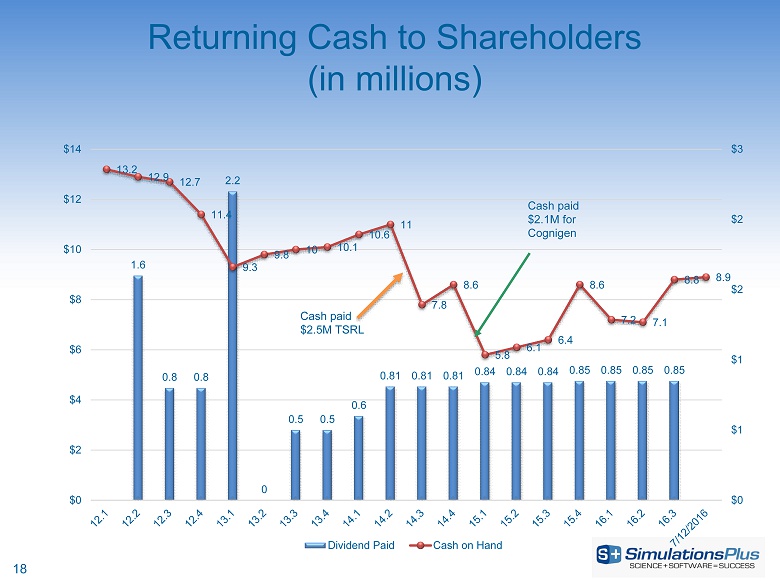
John Kneisel, chief financial officer of Simulations Plus, said: “The Company continues to produce record financial results, with year-to-date sales up nearly 10% and net income increased by 24%, speaking to our operational efficiency and demonstrating the leverage inherent in our business model. The Company’s strong cash position enables continuing investment in software products while being able to reward shareholders by providing continuing quarterly dividends. As always, such distributions are at the discretion of the Board of Directors.”
1 |
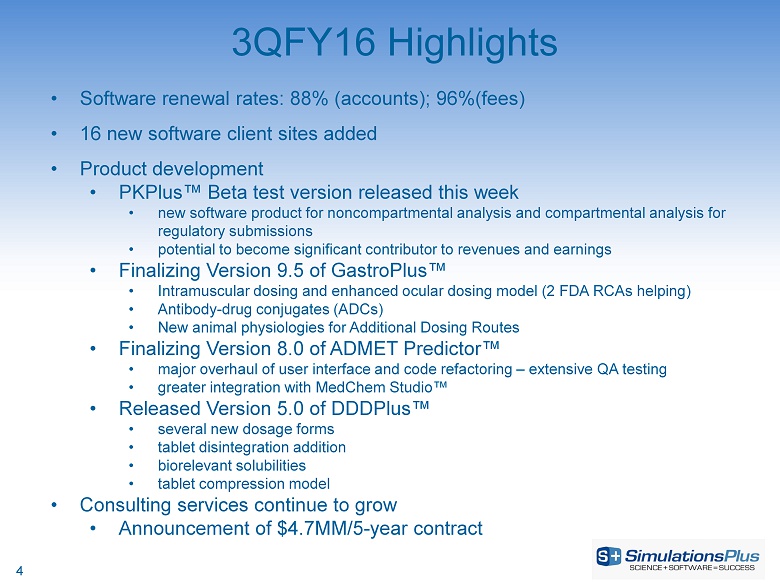
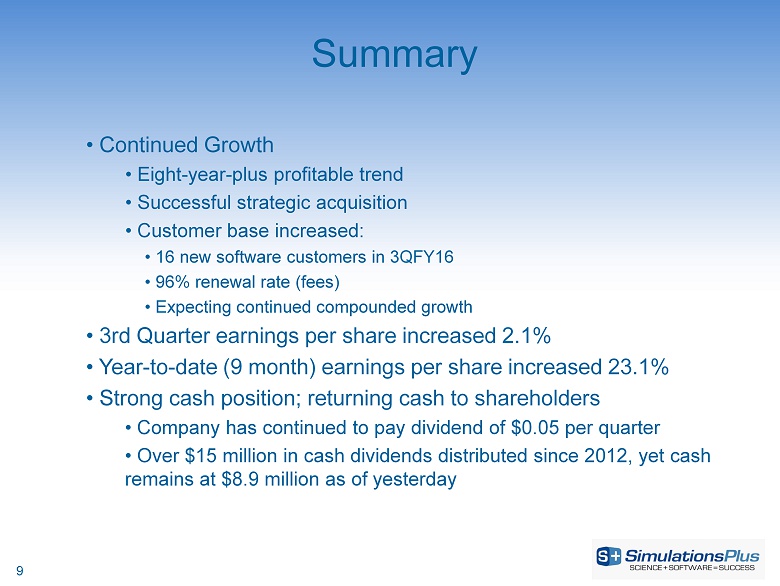
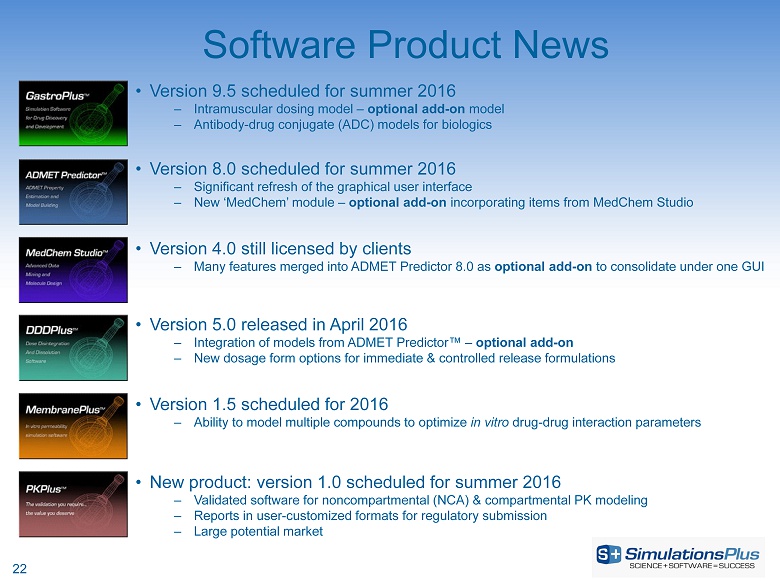
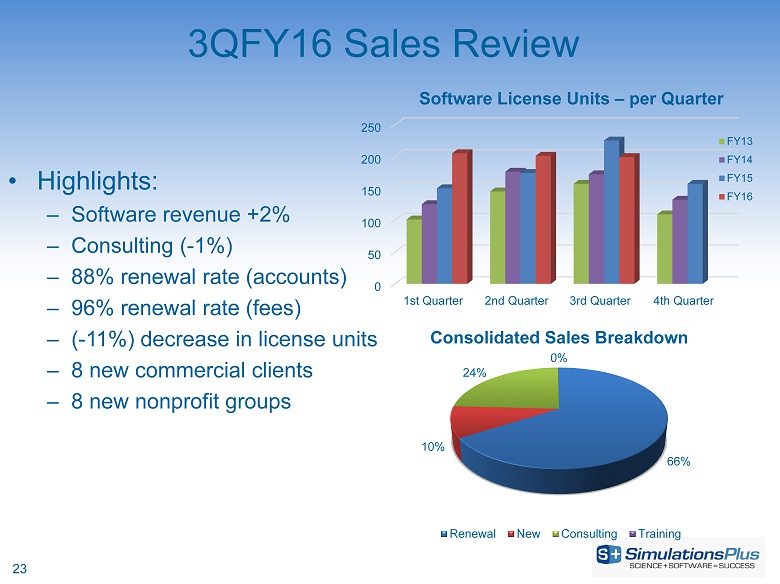
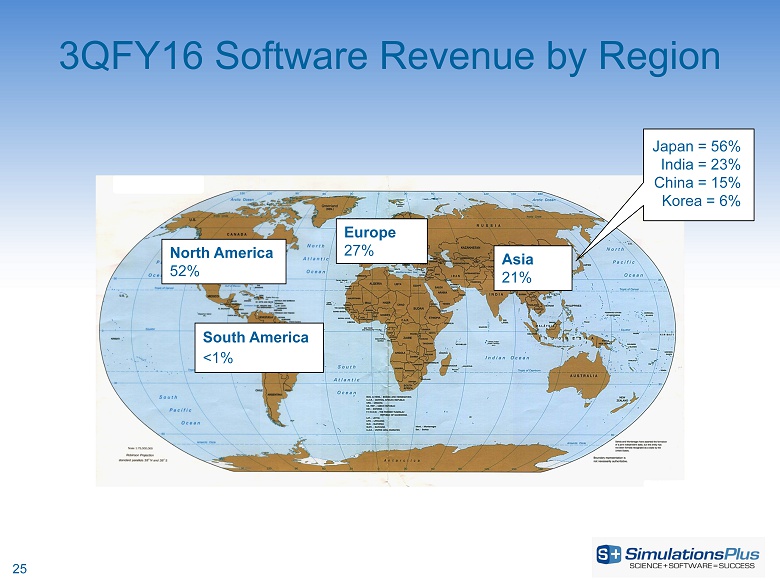
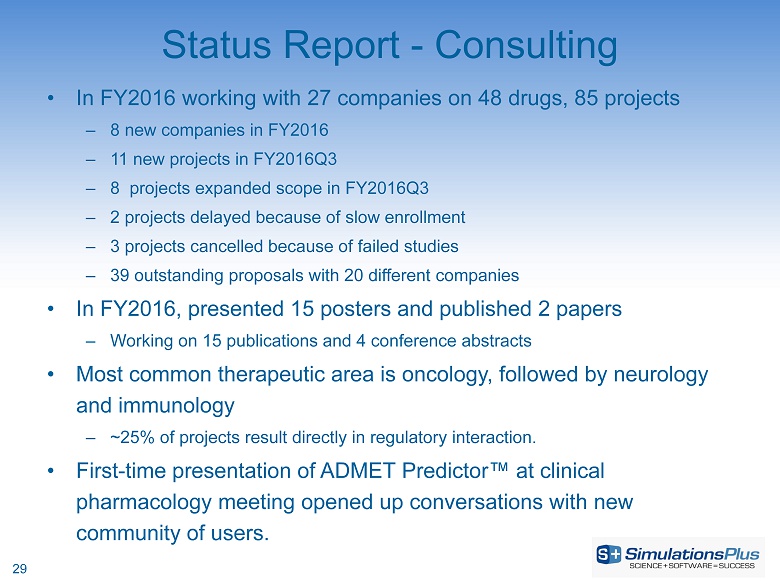
John DiBella, vice president for marketing and sales of Simulations Plus, said: “While revenue growth for 3QFY16 was lower than our historical averages, it is compared with an exceptionally strong third quarter in FY15. We executed on several fronts and achieved the highest quarter in our history for both revenues and earnings. Software renewal rates exceeded 88% (accounts) and 96% (fees) for the quarter, and we added 16 new clients, with several coming from India. The first nine months of FY2016 have shown strong growth trends in both software and consulting services revenue, and along with the imminent release of our new PKPlus™ software, we have a full pipeline of new contracts keeping our experts busy as we move towards FY2017. We believe our aggressive marketing and training programs, coupled with positive underlying sales fundamentals, set us up nicely to end FY2016 on a strong note.”
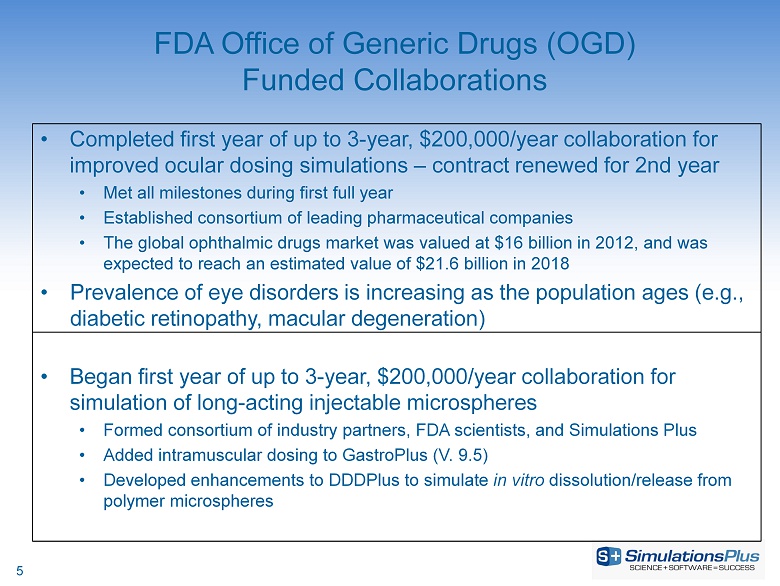
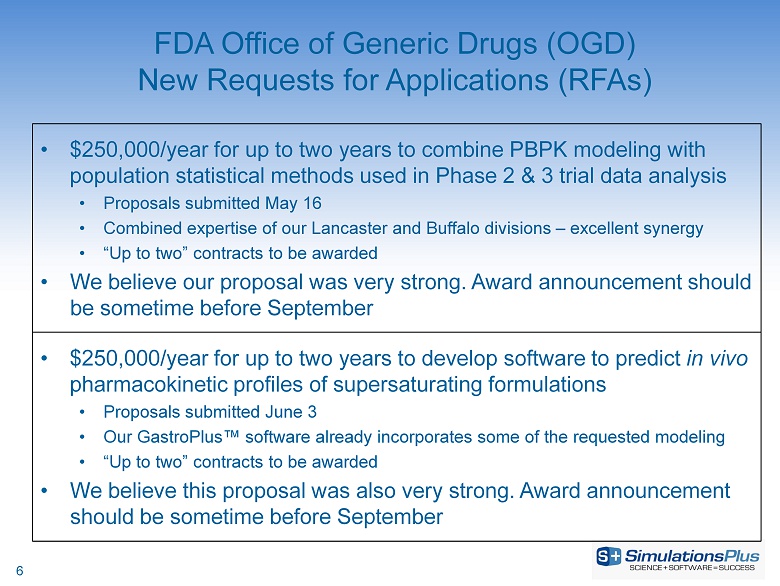
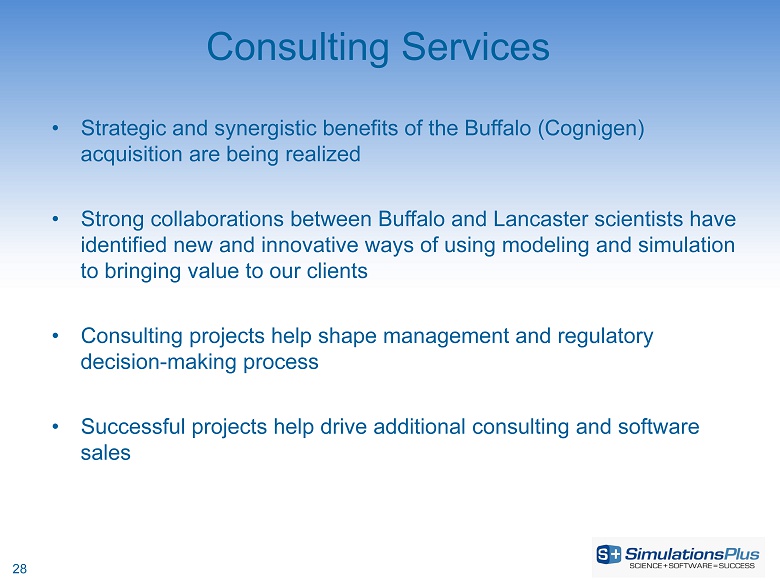
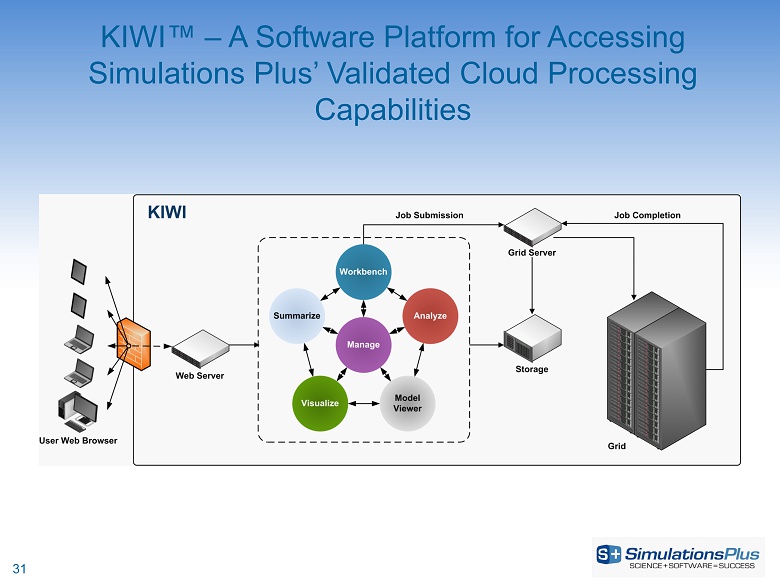
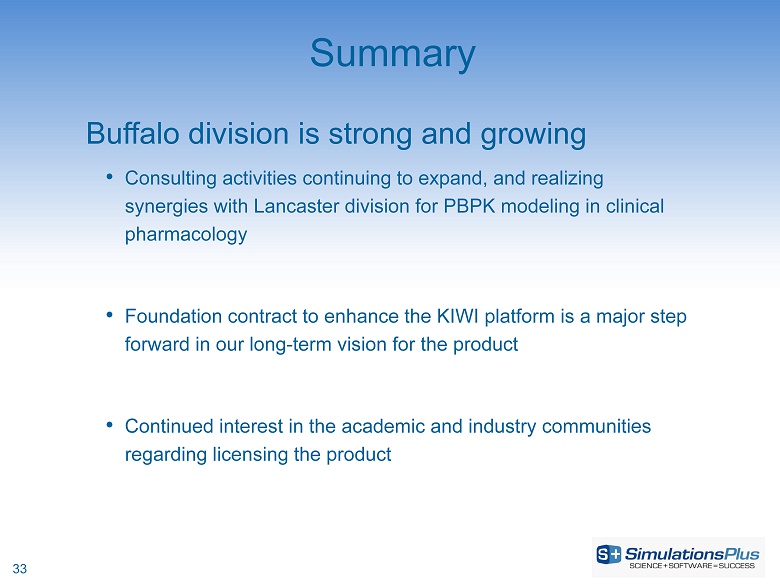
Ted Grasela, president of Simulations Plus, added: “The recently announced 5-year, $4.7 million contract to expand and further develop the KIWI™ software platform for a major research foundation is expected to add significantly to the revenue growth of our Buffalo division. We believe this effort, which is based on our secure in-house computing cloud, has the potential to lead to additional opportunities for such services, both with this foundation and with pharmaceutical companies and other research organizations around the world. In addition, we are now routinely providing physiologically based pharmacokinetics (PBPK) analysis to clinical pharmacology groups as we have realized the expected synergies between our Lancaster and Buffalo divisions.”
Walt Woltosz, chairman and chief executive officer of Simulations Plus, concluded: “This month marks the 20th anniversary of Simulations Plus. Driving the evolution of the pharmaceutical industry over the past two decades from minimal use of simulation and modeling to widespread adoption by industry and regulatory agencies has been very satisfying. As John DiBella noted, our nine-month results demonstrate excellent continued revenues and earnings growth. Now we are beginning to perform on our five-year contract and expecting the release of our newest software product, PKPlus™, along with updates to GastroPlus™ and ADMET Predictor™, all in the fourth fiscal quarter. We’re excited about these developments and expect them to contribute to a strong finish to FY2016.”
Investor Conference Call
The Company will host a conference call on July 14, 2016, at 4:15 p.m. Eastern Time. All interested parties are invited to join the call by registering at this link. On registering, you will receive a confirmation e-mail with instructions for joining the call. Please dial in five to ten minutes prior to the scheduled start time. For listen-only mode, you may dial (213) 929-4232, and enter access code 790-046-526.
About Simulations Plus, Inc.
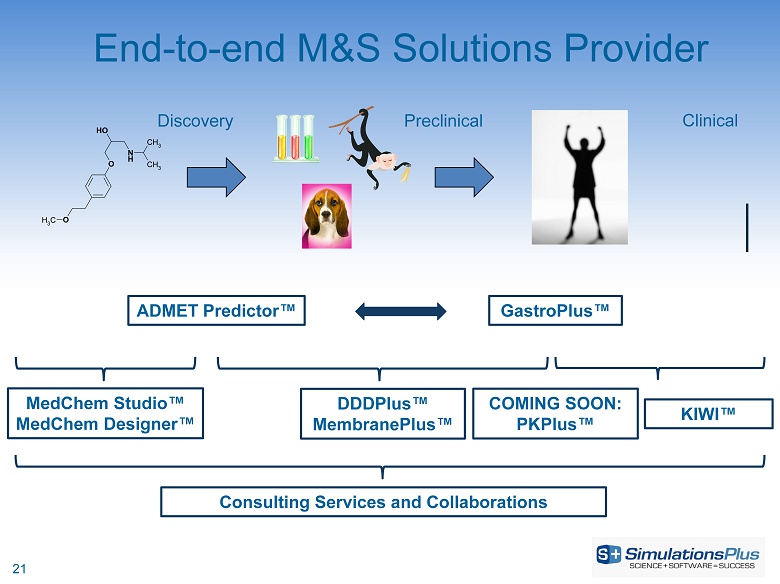
Simulations Plus, Inc. is a premier developer of drug discovery and development software as well as a leading provider of both preclinical and clinical pharmacometric consulting services for regulatory submissions. The company is a global leader focused on improving the ways scientists use knowledge and data to predict the properties and outcomes of pharmaceutical and biotechnology agents. Our software is licensed to and used in the conduct of drug research by major pharmaceutical and biotechnology companies and regulatory agencies worldwide. Our innovations in integrating new and existing science in medicinal chemistry, computational chemistry, pharmaceutical science, biology, and physiology into our software have made us the leading software provider for physiologically based pharmacokinetic modeling and simulation. For more information, visit our website at www.simulations-plus.com.
Follow Us on Twitter
Safe Harbor Statement Under the Private Securities Litigation Reform Act of 1995 – With the exception of historical information, the matters discussed in this press release are forward-looking statements that involve a number of risks and uncertainties. Words like “believe,” “expect” and “anticipate” mean that these are our best estimates as of this writing, but that there can be no assurances that expected or anticipated results or events will actually take place, so our actual future results could differ significantly from those statements. Factors that could cause or contribute to such differences include, but are not limited to: our ability to maintain our competitive advantages, acceptance of new software and improved versions of our existing software by our customers, the general economics of the pharmaceutical industry, our ability to finance growth, our ability to continue to attract and retain highly qualified technical staff, our ability to identify and close acquisitions on terms favorable to the Company, and a sustainable market. Further information on our risk factors is contained in our quarterly and annual reports as filed with the U.S. Securities and Exchange Commission.
2 |
SIMULATIONS PLUS, INC.
CONDENSED CONSOLIDATED BALANCE SHEETS
As of
(Unaudited) | (Audited) | |||||||
May 31, | August 31, | |||||||
ASSETS | ||||||||
2016 | 2015 | |||||||
Current assets | ||||||||
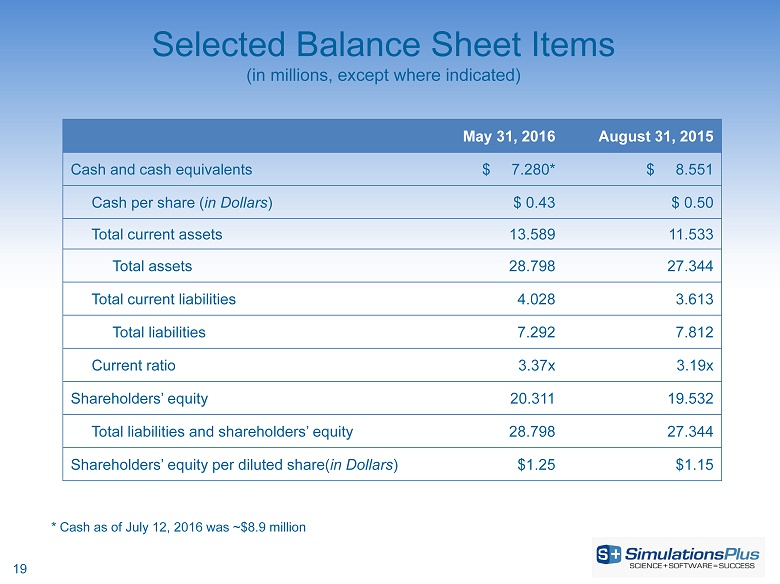
Cash and cash equivalents | $ | 7,279,683 | $ | 8,551,275 | ||||
Accounts receivable, net of allowance for doubtful accounts of $0 | 4,582,573 | 1,593,707 | ||||||
Revenues in excess of billings | 1,039,897 | 795,125 | ||||||
Prepaid income taxes | 108,690 | – | ||||||
Prepaid expenses and other current assets | 288,164 | 381,718 | ||||||
Deferred income taxes | 289,835 | 210,972 | ||||||
Total current assets | 13,588,842 | 11,532,797 | ||||||
Long-term assets | ||||||||
Capitalized computer software development costs, net of accumulated amortization of $8,368,000 and $7,632,421 | 3,878,342 | 3,798,339 | ||||||
Property and equipment, net | 297,385 | 413,510 | ||||||
Intellectual property, net of accumulated amortization of $1,256,875 and $801,250 | 4,818,125 | 5,273,750 | ||||||
Other intangible assets net of accumulated amortization of $258,125 and $147,500 | 1,391,875 | 1,502,500 | ||||||
Goodwill | 4,789,248 | 4,789,248 | ||||||
Other assets | 34,082 | 34,082 | ||||||
Total assets | $ | 28,797,899 | $ | 27,344,226 | ||||
LIABILITIES AND SHAREHOLDERS' EQUITY | ||||||||
Current liabilities | ||||||||
Accounts payable | $ | 184,996 | $ | 209,407 | ||||
Accrued payroll and other expenses | 510,792 | 429,580 | ||||||
Accrued bonuses to officers | 90,750 | 121,000 | ||||||
Income taxes payable | – | 43,602 | ||||||
Other current liabilities | 13,239 | 19,859 | ||||||
Current portion - Contracts payable | 2,854,404 | 2,604,404 | ||||||
Billings in excess of revenues | 112,445 | 106,534 | ||||||
Deferred revenue | 261,266 | 78,945 | ||||||
Total current liabilities | 4,027,892 | 3,613,331 | ||||||
Long-term liabilities | ||||||||
Deferred income taxes | 3,264,372 | 3,190,419 | ||||||
Payments due under Contracts payable | – | 1,000,000 | ||||||
Other long-term liabilities | – | 8,274 | ||||||
Total liabilities | $ | 7,292,264 | $ | 7,812,024 | ||||
Commitments and contingencies | ||||||||
Shareholders' equity | ||||||||
Preferred stock, $0.001 par value 10,000,000 shares authorized no shares issued and outstanding | $ | – | $ | – | ||||
Common stock, $0.001 par value 50,000,000 shares authorized 17,032,364 and 16,943,001 shares issued and outstanding | 5,504 | 5,414 | ||||||
Additional paid-in capital | 10,078,647 | 9,714,290 | ||||||
Retained earnings | 11,421,484 | 9,812,498 | ||||||
Total shareholders' equity | $ | 21,505,635 | $ | 19,532,202 | ||||
Total liabilities and shareholders' equity | $ | 28,797,899 | $ | 27,344,226 |
3 |
SIMULATIONS PLUS, INC.
CONDENSED CONSOLIDATED STATEMENTS OF OPERATIONS
For the three and nine months ended May 31,
Three months ended | Nine months ended | |||||||||||||||
(Unaudited) | (Unaudited) | |||||||||||||||
2016 | 2015 | 2016 | 2015 | |||||||||||||
Net Revenues | $ | 6,012,193 | $ | 5,942,082 | $ | 16,014,539 | $ | 14,602,464 | ||||||||
Cost of revenues | 1,194,815 | 1,132,695 | 3,541,903 | 3,308,277 | ||||||||||||
Gross margin | 4,817,378 | 4,809,387 | 12,472,636 | 11,294,187 | ||||||||||||
Operating expenses | ||||||||||||||||
Selling, general, and administrative | 1,680,707 | 1,607,317 | 5,079,985 | 5,234,311 | ||||||||||||
Research and development | 348,427 | 348,285 | 1,161,124 | 981,633 | ||||||||||||
Total operating expenses | 2,029,134 | 1,955,602 | 6,241,109 | 6,215,944 | ||||||||||||
Income from operations | 2,788,244 | 2,853,785 | 6,231,527 | 5,078,243 | ||||||||||||
Other income (expense) | ||||||||||||||||
Interest income | 4,553 | 4,391 | 13,507 | 13,394 | ||||||||||||
Gain(loss) on currency exchange | 7,733 | (35,632 | ) | (35,490 | ) | (78,107 | ) | |||||||||
Total other income (expense) | 12,286 | (31,241 | ) | (21,983 | ) | (64,713 | ) | |||||||||
Income from operations before provision for income taxes | 2,800,530 | 2,822,544 | 6,209,544 | 5,013,530 | ||||||||||||
Provision for income taxes | (891,191 | ) | (970,122 | ) | (2,048,383 | ) | (1,661,972 | ) | ||||||||
Net Income | $ | 1,909,339 | $ | 1,852,422 | $ | 4,161,161 | $ | 3,351,558 | ||||||||
Earnings per share | ||||||||||||||||
Basic | $ | 0.11 | $ | 0.11 | $ | 0.24 | $ | 0.20 | ||||||||
Diluted | $ | 0.11 | $ | 0.11 | $ | 0.24 | $ | 0.20 | ||||||||
Weighted-average common shares outstanding | ||||||||||||||||
Basic | 17,028,634 | 16,862,128 | 17,000,228 | 16,847,191 | ||||||||||||
Diluted | 17,227,540 | 17,073,155 | 17,219,835 | 17,070,334 |
4 |
Exhibit 99.2
( NASDAQ:SLP ) Investor Conference Call July 14, 2016
2 With the exception of historical information, the matters discussed in this presentation are forward - looking statements that involve a number of risks and uncertainties . The actual results of the Company could differ significantly from those statements . Factors that could cause or contribute to such differences include, but are not limited to : continuing demand for the Company’s products, competitive factors, the Company’s ability to finance future growth, the Company’s ability to produce and market new products in a timely fashion, the Company’s ability to continue to attract and retain skilled personnel, and the Company’s ability to sustain or improve current levels of productivity . Further information on the Company’s risk factors is contained in the Company’s quarterly and annual reports and filed with the Securities and Exchange Commission . Safe Harbor Statement
3 Highlights Walt Woltosz Chairman and Chief Executive Officer
4 • Software renewal rates: 88% (accounts); 96%(fees) • 16 new software client sites added • Product development • PKPlus™ Beta test version released this week • new software product for noncompartmental analysis and compartmental analysis for regulatory submissions • potential to become significant contributor to revenues and earnings • Finalizing Version 9.5 of GastroPlus ™ • Intramuscular dosing and enhanced ocular dosing model (2 FDA RCAs helping) • Antibody - drug conjugates (ADCs) • New animal physiologies for Additional Dosing Routes • Finalizing Version 8.0 of ADMET Predictor ™ • major overhaul of user interface and code refactoring – extensive QA testing • greater integration with MedChem Studio™ • Released Version 5.0 of DDDPlus ™ • several new dosage forms • tablet disintegration addition • biorelevant solubilities • tablet compression model • Consulting services continue to grow • Announcement of $4.7MM/5 - year contract 3QFY16 Highlights
5 • Completed first year of up to 3 - year, $200,000/year collaboration for improved ocular dosing simulations – contract renewed for 2nd year • Met all milestones during first full year • Established consortium of leading pharmaceutical companies • The global ophthalmic drugs market was valued at $16 billion in 2012, and was expected to reach an estimated value of $21.6 billion in 2018 • Prevalence of eye disorders is increasing as the population ages (e.g., diabetic retinopathy, macular degeneration) FDA Office of Generic Drugs (OGD) Funded Collaborations • Began first year of up to 3 - year, $200,000/year collaboration for simulation of long - acting injectable microspheres • Formed consortium of industry partners, FDA scientists, and Simulations Plus • Added intramuscular dosing to GastroPlus (V. 9.5) • Developed enhancements to DDDPlus to simulate in vitro dissolution/release from polymer microspheres
6 • $250,000/year for up to two years to combine PBPK modeling with population statistical methods used in Phase 2 & 3 trial data analysis • Proposals submitted May 16 • Combined expertise of our Lancaster and Buffalo divisions – excellent synergy • “Up to two” contracts to be awarded • We believe our proposal was very strong. Award announcement should be sometime before September FDA Office of Generic Drugs (OGD) New Requests for Applications (RFAs) • $250,000/year for up to two years to develop software to predict in vivo pharmacokinetic profiles of supersaturating formulations • Proposals submitted June 3 • Our GastroPlus™ software already incorporates some of the requested modeling • “Up to two” contracts to be awarded • We believe this proposal was also very strong. Award announcement should be sometime before September
7 • AEROModeler™ • Application of our artificial neural network ensemble (ANNE) technology to: • Predict aerodynamic force coefficients for missiles • Classify missiles from radar tracking data • Discriminate between warheads and decoys from sensor data • Recent USAF contact (June) has identified another potential application • Exploring several government and industry contacts • Put on temporary hold to allow development team to focus on PKPlus • MRIModeler™ • Application of our ANNE technology to analysis of magnetic resonance imaging (MRI) data to classify patients as healthy or likely to experience various disease states • Put on temporary hold to allow development team to focus on PKPlus Exploring Business Opportunities Outside of Pharmaceutical Industry
8 • Major provider of software and consulting services for pharma R&D • Earliest drug discovery – when a chemist first draws a molecule • Preclinical development (lab and animals) through first - in - human trials • Phase 2 and 3 clinical trials • Beyond patent life to supporting generic companies • Enhancing every existing software product • Finalizing PKPlus – exciting new product • Developing new applications in aerospace and general healthcare based on our machine - learning technologies (on temporary hold for PKPlus) • 3 QFY16 revenues were up by $ 7 0,000 (1.2%) to $6.01 million • 3 QFY16 net income was up by $57,000 (3.1%) to $1.91 million • 3 QFY16 diluted EPS up 2.10% to $0.111 (11¢) per share compared to $ 0.108 (11¢) in 3QFY15 . • 9 moFY16 revenues were up by $1.41 Million (9.7%) to $16.01 Million • 9moFY16 net income was up by $810,000 (24.2%) to $4.16 million • 9moFY16 diluted EPS up 23.1% to $ 0.242 (24¢) per share compared to $ 0.196 (20¢) in 9moFY15 . Overview
9 • Continued Growth • Eight - year - plus profitable trend • Successful strategic acquisition • Customer base increased: • 16 new software customers in 3QFY16 • 96% renewal rate (fees) • Expecting continued compounded growth • 3rd Quarter earnings per share increased 2.1% • Year - to - date (9 month) earnings per share increased 23.1% • Strong cash position; returning cash to shareholders • Company has continued to pay dividend of $0.05 per quarter • Over $15 million in cash dividends distributed since 2012, yet cash remains at $8.9 million as of yesterday Summary
10 Financial Overview John Kneisel Chief Financial Officer
11 Income Statement 3 QFY16 Compared to 3QFY15 (in millions) Lancaster Buffalo 3QFY16 3QFY15 Diff % chg Net sales $ 4.664 $ 1.348 $ 6.012 $ 5.942 $0.070 1.2% Gross profit 4.023 0.794 4.817 4.809 0.008 0.2% Gross profit margin 86.26% 58.90% 80.12% 80.93% - 0.81% - 1.0% SG&A 1.131 0.550 1.681 1.607 0.074 4.6% R&D 0.316 0.033 0.349 0.348 0.001 0.3% Total operating expenses 1.446 0.583 2.029 1.956 0.073 3.7% Income from operations 2.577 0.211 2.788 2.854 - 0.066 - 2.3% Other income (expense) 0.012 - 0.012 (0.031) 0.043 - 138.7% Income from operations before income taxes 2.589 0.211 2.800 2.823 - 0.023 - 0.8% Net income $ 1.778 $ 0.131 $ 1.909 $ 1.852 0.057 3.1% Diluted earnings per share (in dollars) $ 0.111 $ 0.108 $ 0.0023 2.1% EBITDA 2.971 0.309 3.28 3.326 - 0.046 - 1.4%
12 Income Statement 9moFY16 Compared to 9moFY15 (in millions) Lancaster Buffalo 9moFY16 9moFY15 Diff % chg Net sales $ 11.722 $ 4.292 $ 16.014 $ 14.602 $1.412 9.7% Gross profit 9.935 2.538 12.473 $ 11.294 1.179 10.4% Gross profit margin 84.76% 59.13% 77.89% 77.35% 0.54% 0.7% SG&A 3.376 1.704 5.080 $ 5.234 - 0.154 - 2.9% R&D 1.087 0.074 1.161 $ 0.982 0.179 18.2% Total operating expenses 4.463 1.778 6.241 $ 6.216 0.025 0.4% Income from operations 5.471 0.760 6.231 5.078 1.153 22.7% Other income (expense) ( 0.023) 0 (0.022) (0.065) 0.043 - 66.2% Income from operations before income taxes 5.449 0.761 6.210 5.014 1.196 23.9% Net income $ 3.691 $ 0.471 $ 4.162 $ 3.352 0.81 24.2% Diluted earnings per share (in dollars) $ 0.242 $ 0.196 $ 0.045 23.1% EBITDA 6.62 1.040 7.66 6.497 1.163 17.9%
13 Consolidated Revenues, by Fiscal Quarter and YTD (pro forma prior to 2012; in millions) 4.01 4.57 5.94 3.71 4.84 5.16 6.01 $0 $1 $2 $3 $4 $5 $6 $7 Q1 Q2 Q3 Q4 2009 2010 2011 2012 2013 2014 2015 2016
14 Consolidated Gross Profit, by Fiscal Quarter & YTD (pro forma prior to 2012; in millions) 3.09 3.45 4.83 2.64 3.76 3.9 4.82 $0 $1 $2 $3 $4 $5 $6 Q1 Q2 Q3 Q4 2009 2010 2011 2012 2013 2014 2015 2016
15 Consolidated Net Income, by Fiscal Quarter and YTD (pro forma prior to 2012; in millions) $0.53 $0.97 $1.85 $0.49 $1.11 $1.15 $1.91 $- $0.50 $1.00 $1.50 $2.00 $2.50 Q1 Q2 Q3 Q4 2009 2010 2011 2012 2013 2014 2015 2016
16 Consolidated Diluted Earnings Per Share 0 0.02 0.04 0.06 0.08 0.1 0.12 Q1 Q2 Q3 Q4 $0.03 $0.06 $0.11 $0.03 $0.06 $0.07 $0.11 Quarterly EPS FY09 FY10 FY11 FY12 FY13 FY14 FY15 FY16
17 Consolidated EBITDA, by Fiscal Quarter & YTD (in millions) 1.22 1.97 3.33 1.19 2.2 2.18 3.28 $0 $1 $2 $3 $4 Q1 Q2 Q3 Q4 2009 2010 2011 2012 2013 2014 2015 2016
18 Returning Cash to Shareholders (in millions) 1.6 0.8 0.8 2.2 0 0.5 0.5 0.6 0.81 0.81 0.81 0.84 0.84 0.84 0.85 0.85 0.85 0.85 13.2 12.9 12.7 11.4 9.3 9.8 10 10.1 10.6 11 7.8 8.6 5.8 6.1 6.4 8.6 7.2 7.1 8.8 8.9 $0 $1 $1 $2 $2 $3 $0 $2 $4 $6 $8 $10 $12 $14 Dividend Paid Cash on Hand Cash paid $2.5M TSRL Cash paid $2.1M for Cognigen
19 Selected Balance Sheet Items (in millions, except where indicated) May 31, 2016 August 31, 2015 Cash and cash equivalents $ 7.280* $ 8.551 Cash per share ( in Dollars ) $ 0.43 $ 0.50 Total current assets 13.589 11.533 Total assets 28.798 27.344 Total current liabilities 4.028 3.613 Total liabilities 7.292 7.812 Current ratio 3.37x 3.19x Shareholders’ equity 20.311 19.532 Total liabilities and shareholders’ equity 28.798 27.344 Shareholders’ equity per diluted share( in Dollars ) $1.25 $1.15 * Cash as of July 12, 2016 was ~$8.9 million
20 Marketing and Sales John DiBella VP of Marketing and Sales
21 End - to - end M&S Solutions Provider N H O OH O CH 3 CH 3 CH 3 ADMET Predictor™ GastroPlus ™ MedChem Studio™ MedChem Designer™ DDDPlus ™ MembranePlus™ Consulting Services and Collaborations Discovery Preclinical C linical COMING SOON: PKPlus™ KIWI™
22 • Version 9.5 scheduled for summer 2016 ‒ Intramuscular dosing model – optional add - on model ‒ Antibody - drug conjugate (ADC) models for biologics • Version 8.0 scheduled for summer 2016 ‒ Significant refresh of the graphical user interface ‒ New ‘MedChem’ module – optional add - on incorporating items from MedChem Studio • Version 4 .0 still licensed by clients ‒ Many features merged into ADMET Predictor 8.0 as optional add - on to consolidate under one GUI Software Product News • Version 5.0 released in April 2016 ‒ Integration of models from ADMET Predictor™ – optional add - on ‒ New dosage form options for immediate & controlled release formulations • Version 1.5 scheduled for 2016 ‒ Ability to model multiple compounds to optimize in vitro drug - drug interaction parameters • New product: v ersion 1.0 scheduled for summer 2016 ‒ Validated software for noncompartmental (NCA) & compartmental PK modeling ‒ Reports in user - customized formats for regulatory submission ‒ Large potential market
23 3 QFY16 Sales Review • Highlights: – Software revenue + 2 % – C onsulting ( - 1%) – 88% renewal rate (accounts) – 96% renewal rate (fees) – ( - 11%) decrease in license units – 8 new commercial clients – 8 new nonprofit groups 66% 10% 24% 0% Consolidated Sales Breakdown Renewal New Consulting Training 0 50 100 150 200 250 1st Quarter 2nd Quarter 3rd Quarter 4th Quarter Software License Units – per Quarter FY13 FY14 FY15 FY16
24 9 moFY16 Sales Review • Highlights: – Software revenue + 9 % – C onsulting +12% – 87% renewal rate (accounts) – 93% renewal rate (fees) – 10% increase in license units – 28 new commercial clients – 27 new nonprofit groups – Significant expansion of licenses at US FDA, US EPA, and China FDA 58% 12% 30% 0% Consolidated Sales Breakdown Renewal New Consulting Training 0 50 100 150 200 250 1st Quarter 2nd Quarter 3rd Quarter 4th Quarter Software License Units – per Quarter FY13 FY14 FY15 FY16
25 3 QFY16 Software Revenue by Region Europe 27% North America 52% Asia 21% South America <1% Japan = 56% India = 23% China = 15% Korea = 6 %
26 Marketing Activities – 3QFY16 • Website redesign – Design finalized and new content being developed – summer launch • Conferences and scientific meetings – 16 scientific meetings attended; co - authors on 1 2 presentations – Invited speaker at FDA meeting on oral absorption modeling • Trainings and workshops – Workshops hosted in China, Europe and US • 2 - day seminar with China FDA drew >80 FDA scientists – Workshops scheduled in US and Japan in fall – PKPlus™ roadshow in Boston drew global audience at 2 large pharma companies • Strategic digital marketing initiatives – Hosted 4 webinars on our software updates and applications – Active updates: LinkedIn, Twitter, YouTube, and Facebook accounts – Continued web - based advertising for all programs – 14 peer - reviewed publications citing use of software
27 Buffalo Division Update Re - imagining the future of science - based research and development Ted Grasela President
28 Consulting Services • Strategic and synergistic benefits of the Buffalo (Cognigen) acquisition are being realized • Strong collaborations between Buffalo and Lancaster scientists have identified new and innovative ways of using modeling and simulation to bringing value to our clients • Consulting projects help shape management and regulatory decision - making process • Successful projects help drive additional consulting and software sales
29 Status Report - Consulting • In FY2016 working with 27 companies on 48 drugs, 85 projects – 8 new companies in FY2016 – 11 new projects in FY2016Q3 – 8 projects expanded scope in FY2016Q3 – 2 projects delayed because of slow enrollment – 3 projects cancelled because of failed studies – 39 outstanding proposals with 20 different companies • In FY2016, presented 15 posters and published 2 papers – Working on 15 publications and 4 conference abstracts • Most common therapeutic area is oncology, followed by neurology and immunology – ~25% of projects result directly in regulatory interaction. • First - time presentation of ADMET Predictor™ at clinical pharmacology meeting opened up conversations with new community of users.
30 • Analysis in R&D can be messy • Data and inputs coming from many groups • Careful synthesis and communication is essential • The industry has enormous computing power • The industry lacks tools for harnessing that power Behind the scenes in R&D Coping with complexity and chaos
31 KIWI™ – A Software Platform for Accessing Simulations Plus’ Validated Cloud Processing Capabilities
32 • Signed a $4.7 million contract with a major foundation to implement a KIWI platform for global teams engaged in model - based drug development; 5 - year term contingent on satisfactory completion of milestones • Project builds on our extensive process - related research; enables substantial enhancements to the KIWI platform • Enhancements will provide a scaffold with broad applicability and will be available to academic and industry clients of KIWI • We expect to close on 3 KIWI licenses in FY2016Q4 • Have several KIWI demonstrations ongoing with research groups ranging from academics to large pharma . KIWI Update
33 Summary Buffalo division is strong and growing • Consulting activities continuing to expand, and realizing synergies with Lancaster division for PBPK modeling in clinical pharmacology • Foundation contract to enhance the KIWI platform is a major step forward in our long - term vision for the product • Continued interest in the academic and industry communities regarding licensing the product
34 Final Summary Walt Woltosz Chairman and Chief Executive Officer
!9X(F&8;9EW?WG;C/XDUYIX,M?M?BRP7&0C^:?\ @()_F!7??$BZ\CPR
M(0>9YE7\!\W]!7.?#&U\S6;JZ/2&':/JQ_\ K&JHMJA.;W9-9)UX06R+OQ2N
MN-/M!_M2G] /ZU9^%]KLTV]NRO\ K)0@/LHS_6N<^(ER9_%+QYRL,2H!^I_G
M7>> X%A\(6A7K(7=OKN(_I2J>YA4N_\ PXZ?OXIOM_PQT,LBPQ/(YPJ*6/T%
M>!QJVJ:VH.6:YN.?^!-_]>O7O&>L1:5X>N%+@3W"&*).YSP3] *\U\#VOVKQ
M;9#M&3*?P'^.*,(N2G*HPQ;YZD::/2O&8DB\'7JP \(JG']W(!_2O*?#FJ0:
M-KEO?7$!FCBS\JXR"01D9^M>NZ[XCTK12EOJ.\^>A.P1[@1T.:Y_3_#7A/Q-
M%+=6$%S#&C[&VL5&<9X!SZU-"HH4VIIV?4JO3#]4M+0:BPDNX+T%D+@=5PA([]^]=_10!YL_A#QKX
MA>*T\6:UI\FDK*LLD%@I1I"IR 24Z9]ZU/$GA'5I-?\ ^$@\+:C'8ZI)$()Q
M/S%*@Z97:>?\*[6B@#S6X\/_ !.U.WDLM0U_1H[.=3'-]E1@Y0\$ F/CBM:3
MP,8+_P (G3Y8UM-"WAUE8[W!3&1@8)SR>E=I10!YJ?"'C?3->UF]T#6-,M[?
M4;HW#).A9O;^ XK9T"P\?0:Q%)KNL:7
HKT9MR,4)NX-*QXS^T39QG3[@[
M!]QA@H,]<_YZ5\&_%"S$=_)M*C,C9 4"OOC]H2(G3KEA$?N-\VP^O^?RKX7^
M)MNXO9"L++ESU0BOU#@^=J1\%Q+&]0\^,//_ -E1Y7^=U:)MWS_^NC[._O\
MK7W_ +1'R'*9WE?YW4>5_G=6C]G?W_6C[._O^M'M$'*9WE?YW4>5_G=6C]G?
MW_6C[._O^M'M$'*9WE?YW4>5_G=6C]G?W_6C[._O^M'M$'*9WE?YW4>5_G=6
MC]G?W_6C[._O^M'M$'*9WE?YW4>5_G=6C]G?W_6C[._O^M'M$'*9WE?YW4>5
M_G=6C]G?W_6C[._O^M'M$'*9WE?YW4>5_G=6C]G?W_6C[._O^M'M$'*9WE?Y
MW4>5_G=6C]G?W_6C[._O^M'M$'*9WE?YW4>5_G=6C]G?W_6C[._O^M'M$'*7
M/*'H/^^J/*'H/^^JT?L[^GZT?9W]/UKD]H;\IG>4/0?]]4>4/0?]]5H_9W]/
MUH^SOZ?K1[0.4SO*'H/^^J/*'H/^^JT?L[^GZT?9W]/UH]H'*9WE#T'_ 'U1
MY0]!_P!]5H_9W]/UH^SOZ?K1[0.4SO*'H/\ OJCRAZ#_ +ZK1^SOZ?K1]G?T
M_6CV@ 8R;GVYJ9Y?A*&-G&JG&/*I14FX_%TG)1
ME9K5;:O2YI3S?,,3EM.=%QE-3E";@E+X4_>A!RCS)WB][J.J3/<-!_;#^!/B
MO]FW4_VJO"FNWVI>%M&AD;5([6R O;:1"F^!X790)0)(VQNVE75E8JP)\PTW
M_@KK^R!=36KZS!XYT6RNW54U;5O">+5<]&+0RR,1CGY58X[&O.[#XN:-\1/V
M"OVD/!&H_ '0_AWXV\'S/;>/M*\-QA;.ZOI)V3SQAGP^^VGC9=\@_=JPD8.
MON/PMTS0-:_X)0Z;IWC=8YM%/P1DDOX[HYC6--/=P_/ *,JNK#E652,$ U,\
M'@L-%NK"3O445[RNDXQDG=)J7Q:;)JQ4,QS'&2BL/5@K4G-W@[.2G*+5G)2C
M\-FM6G?>Q[5::SX?OO#L7C"S\06DNCS6"WT6JQ7"O;O:F/S!.)%R#&4^?<."
MO->:?LM?MA?!?]L&PUN^^$$VL*?#\UNFHV^M6*6\H$XD,3J%D?*GRI!G((*\
MCD9^3I?CIKGPB_X(;^'X+^]=-6\8G4/#6BF23YS9R:A>&=B#SL%M'/$#T DB
M[8%87['?QR_9K^%'[&/ OQG\)ZUJ2DAM/TGQ':W,
MXPNXYCC
F?LS?\-;0:A?W_@_^RX;_
M ,S3[9'N=CSI 8_++J!*DK&-U+?*R.,G'.Y)\7? ]O\ Q/VB;ZZNK;PTWA%
M/$A>>%1.MD]J+I04#$>:48#8&.7(4$YS7YV?%Z[\1?L7?!'Q]^R-XIN+N[\$
M_%+PAI_B;X9ZC*I<6UZ9K.6[LV8# ^5&4\\&*!\+]I8UZA^WC\8[+P/_ ,$R
M_@K\&5U]=/G^(7A#PW%?W)1G^SZ9::?9S3R%5^;_ %S6O ^\HD49Y%>A+)J<
MITE3;:J5&D_[BCS;=U:2?FMCR8<1U8TZTJJ494J2