UNITED STATES
SECURITIES AND EXCHANGE COMMISSION
WASHINGTON, D.C. 20549
FORM 8-K
CURRENT REPORT
PURSUANT TO SECTION 13 OR 15(d) OF THE SECURITIES EXCHANGE ACT OF 1934
April 13, 2016
(Date of the earliest event reported)
Simulations Plus, Inc.
(Exact name of registrant as specified in its charter)
California | 001-32046 | 95-4595609 |
(State or other jurisdiction of incorporation) | (Commission File Number) | (I.R.S. Employer Identification No.) |
42505 10th Street West, Lancaster, California 93534-7059
(Address of principal executive offices) (Zip Code)
661-723-7723
Registrant's telephone number, including area code
Check the appropriate box below if the Form 8-K filing is intended to simultaneously satisfy the filing obligation of the registrant under any of the following provisions:
o | Written communications pursuant to Rule 425 under the Securities Act (17 CFR 230.425) |
o | Soliciting material pursuant to Rule 14z-12 under Exchange Act (17 CFR 240.14a-12) |
o | Pre-commencement communications pursuant to Rule 14d-2(b) under Exchange Act (17 CFR 240.14d-2(b)) |
o | Pre-commencement communications pursuant to Rule 13e-4(c) under Exchange Act (17 CFR 240.13e-4(c)) |
Item 8.01 Other Events
On April 13, 2016, Simulations Plus, Inc., a California corporation (the "Company"), issued a press release announcing financial results for its second quarter and six months of fiscal year 2016 ended February 29, 2016. The press release is furnished as Exhibit 99.1 to this Current Report on Form 8-K.
On April 13, 2016, Simulations Plus, Inc., a California corporation (the "Company"), held a conference call reporting its financial results for its second quarter and six months of fiscal year 2016 ended February 29, 2016. The PowerPoint slides, which were used for this Conference Call, are attached herein as exhibit 99.2 to this Current Report on Form 8-K.
The information contained in this Current Report on Form 8-K shall not be deemed to be "filed" for purposes of Section 18 of the Securities Exchange Act of 1934, as amended (the "Exchange Act"), or otherwise subject to the liabilities of that section, nor shall such information be deemed incorporated by reference in any filing under the Securities Act of 1933, as amended (the "Securities Act"), or the Exchange Act, except as shall be expressly set forth by specific reference in such a filing. The information set forth in this Current Report on Form 8-K shall not be deemed an admission as to the materiality of any information in this report on Current Report on Form 8-K that is required to be disclosed solely to satisfy the requirements of Regulation FD.
This report on Form 8-K (the "Report"), including the disclosures set forth herein, contains certain forward-looking statements that involve substantial risks and uncertainties. When used herein, the terms "anticipates," "expects," "estimates," "believes" and similar expressions, as they relate to us or our management, are intended to identify such forward-looking statements.
Forward-looking statements in this Report or hereafter, including in other publicly available documents filed with the Securities and Exchange Commission (the "Commission"), reports to the stockholders of Simulations Plus, Inc., a California corporation (the "Company" or "us," "our" or "we") and other publicly available statements issued or released by us involve known and unknown risks, uncertainties and other factors which could cause our actual results, performance (financial or operating) or achievements to differ from the future results, performance (financial or operating) or achievements expressed or implied by such forward-looking statements. Such future results are based upon management's best estimates based upon current conditions and the most recent results of operations. These risks include, but are not limited to, the risks set forth herein and in such other documents filed with the Commission, each of which could adversely affect our business and the accuracy of the forward-looking statements contained herein. Our actual results, performance or achievements may differ materially from those expressed or implied by such forward-looking statements.
Item 9.01 Financial Statements and Exhibits
(d) Exhibits
99.1 Press release issued on April 13, 2016.
99.2 PowerPoint presentation at the Conference Call on April 13, 2016.
2 |
SIGNATURES
Pursuant to the requirements of the Securities Exchange Act of 1934, the registrant has duly caused this report to be signed on its behalf by the undersigned thereunto duly authorized.
SIMULATIONS PLUS, INC. | |
Dated: April 14, 2016 | By: /s/ John R Kneisel |
John R. Kneisel | |
Chief Financial Officer |
3 |
Exhibit 99.1
For Further Information:
Simulations Plus, Inc.
42505 10th Street West
Lancaster, CA 93534-7059
CONTACT: | |
Simulations Plus Investor Relations | Hayden IR |
Ms. Renee Bouche | Mr. Cameron Donahue |
661-723-7723 | 651-653-1854 |
renee@simulations-plus.com | cameron@haydenir.com |
For Immediate Release:
April 13, 2016
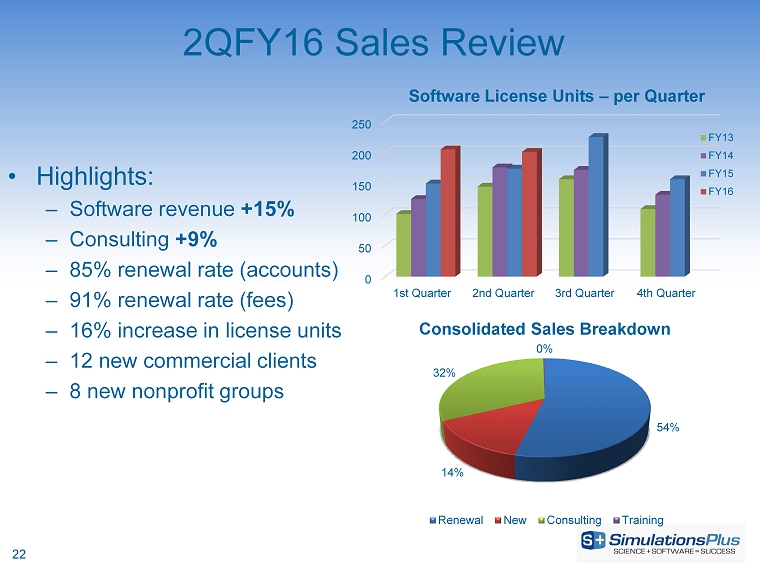
Simulations Plus Reports Second Quarter FY2016 Financial Results
Record second quarter as revenues grow 12.9%, net income up 18%
LANCASTER, CA, April 13, 2016 – Simulations Plus, Inc. (NASDAQ: SLP), the premier provider of simulation and modeling software and consulting services for all phases of pharmaceutical discovery and development from the earliest discovery through all phases of clinical trials, today reported financial results for its second quarter of fiscal year 2016, the period ended February 29, 2016 (2QFY16).
2QFY16 highlights compared with 2QFY15:
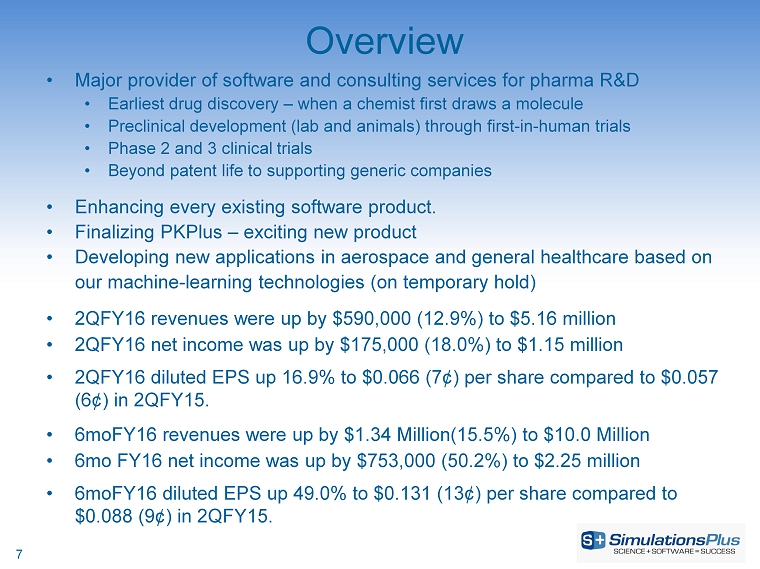
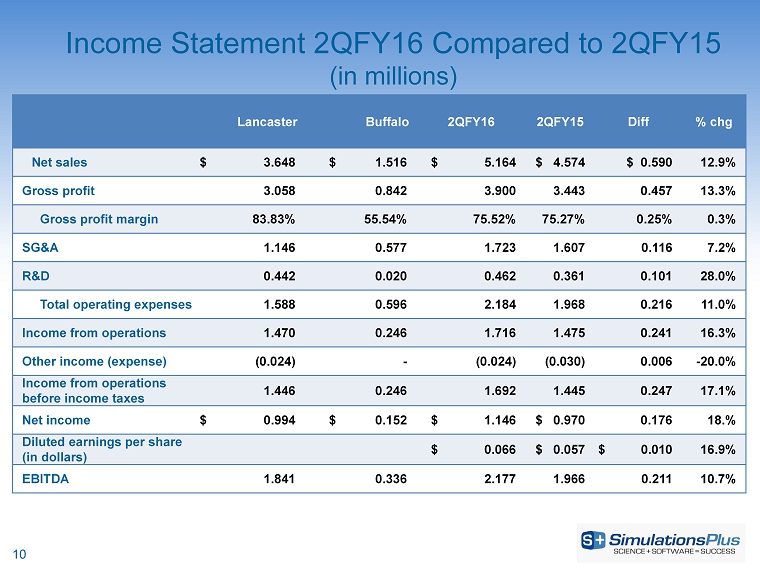
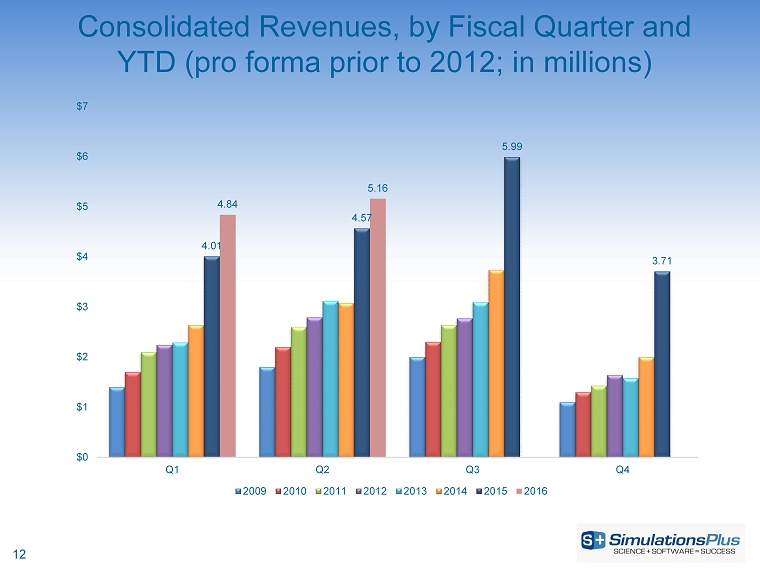
· | Net revenues increased 12.9%, or $590,000, to $5.16 million from $4.57 million |
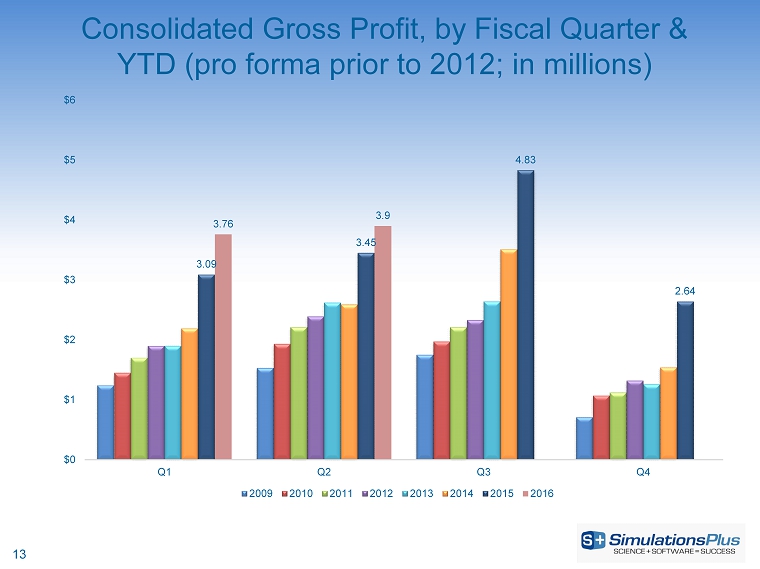
· | Gross profit increased 13.3%, or $457,000, to $3.90 million from $3.44 million |
· | SG&A increased 7.2%, or $115,000, to $1.72 million from $1.61 million |
· | Income before taxes increased 17.1%, or $247,000, to $1.69 million from $1.44 million |
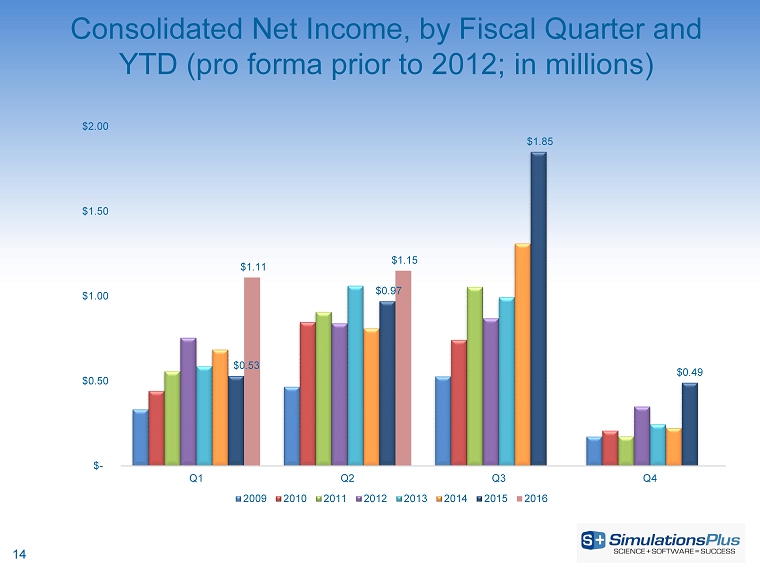
· | Net income was up by 18%, or $175,000, to $1.15 million from $970,000 |
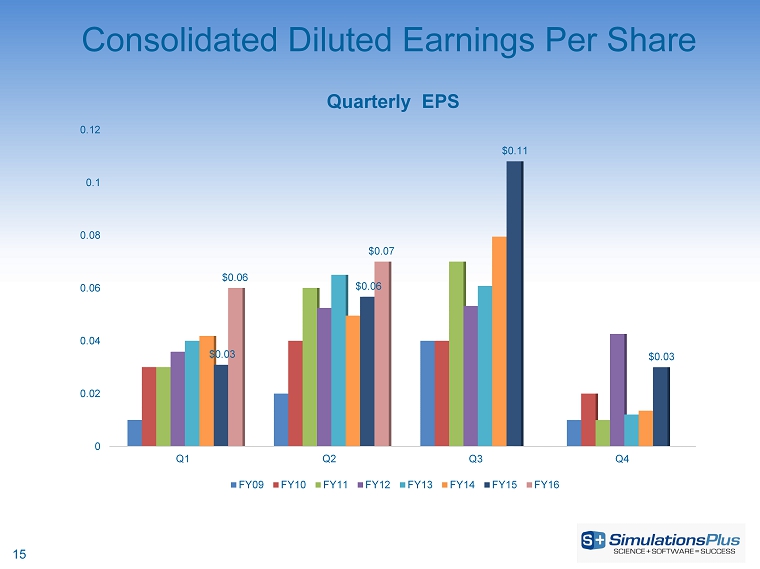
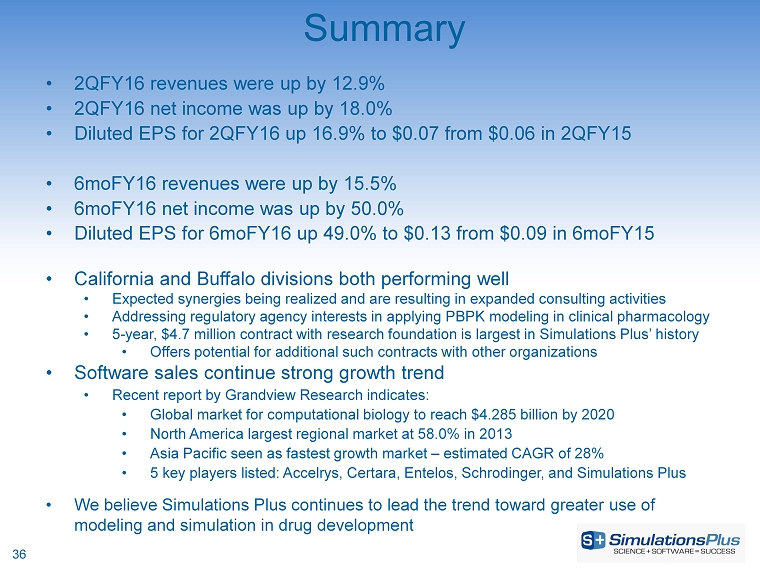
· | Diluted earnings per share increased 16.9% to $0.066 from $0.057 per share |
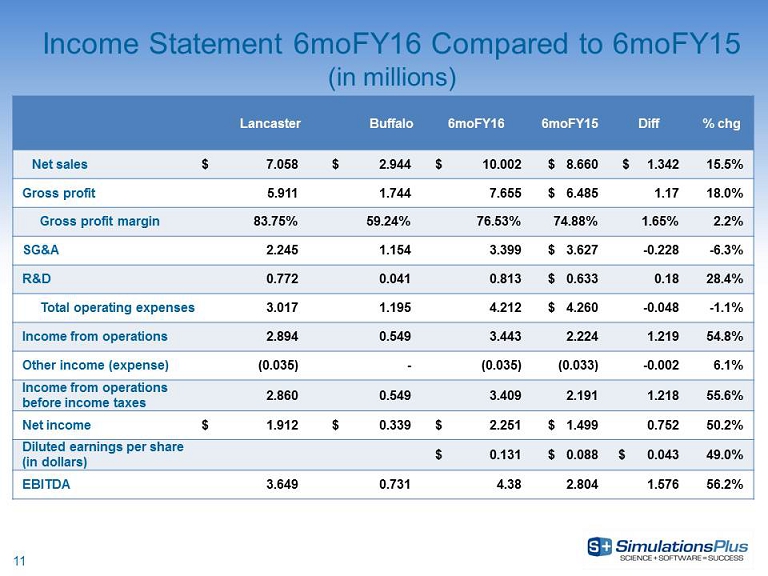
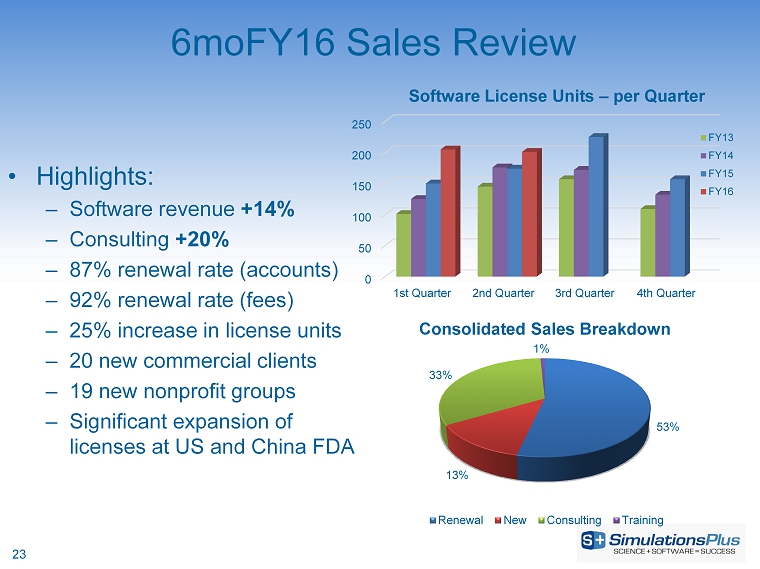
6moFY16 highlights compared with 6moFY15:
· | Net revenues increased 15.5%, or $1.34 million, to $10 million from $8.66 million |
· | Gross profit increased 18%, or $1.17 million, to $7.66 million from $6.48 million |
· | SG&A decreased 6.3%, or $228,000, to $3.4 million from $3.63 million |
· | R&D expenditures increased 8.8%, or $110,000, to $1.36 million from $1.25 million in 6moFY15 |
o | In 6moFY16, $545,000 was capitalized and $813,000 was expensed |
o | In 6moFY15, $631,000 was capitalized and $633,000 was expensed |
· | Income before taxes increased 55.6%, or $1.22 million, to $3.41 million from $2.19 million |
· | Net income increased 50.2%, or $753,000, to $2.25 million from $1.5 million |
· | Diluted earnings per share increased 49.0% to $0.131 per share from $0.088 per share |
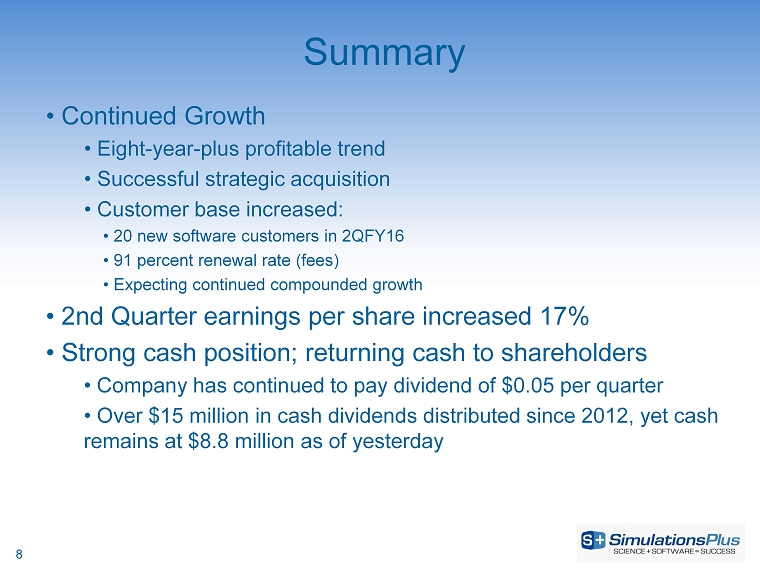
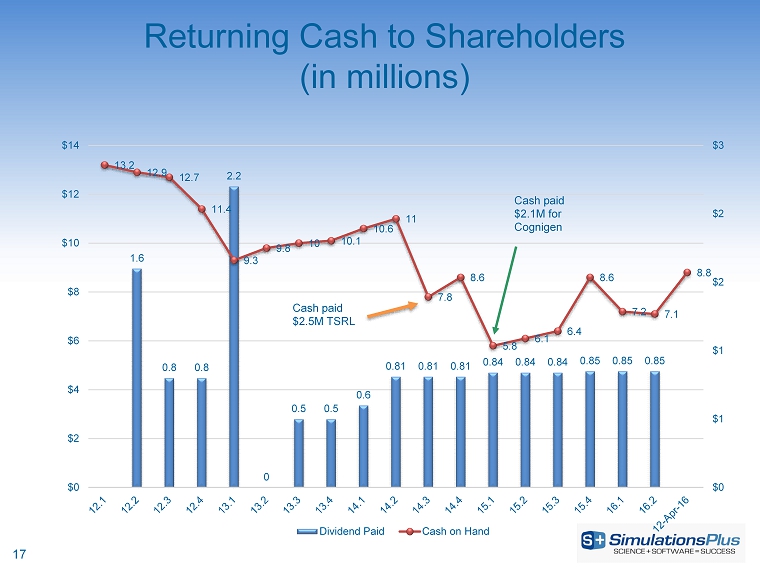
John Kneisel, chief financial officer of Simulations Plus, said: “We continue our nearly decade-long trend of consistent revenue and earnings growth. Cash is back up above $8 million after two dividend distributions totaling over $1.7 million. As announced earlier, we will use approximately $1.47 million in cash this fiscal year to make a payment to TSRL as part of the royalty agreement buyout announced in May 2014, and the final payment to the former shareholders of Cognigen Corporation to close out our acquisition of Cognigen that took place in September 2014. We expect our cash reserves to remain more than adequate after these disbursements, and we anticipate continuing our quarterly dividend distributions; although, such distributions are always at the discretion of the Board of Directors, which votes on them each quarter.”
1 |
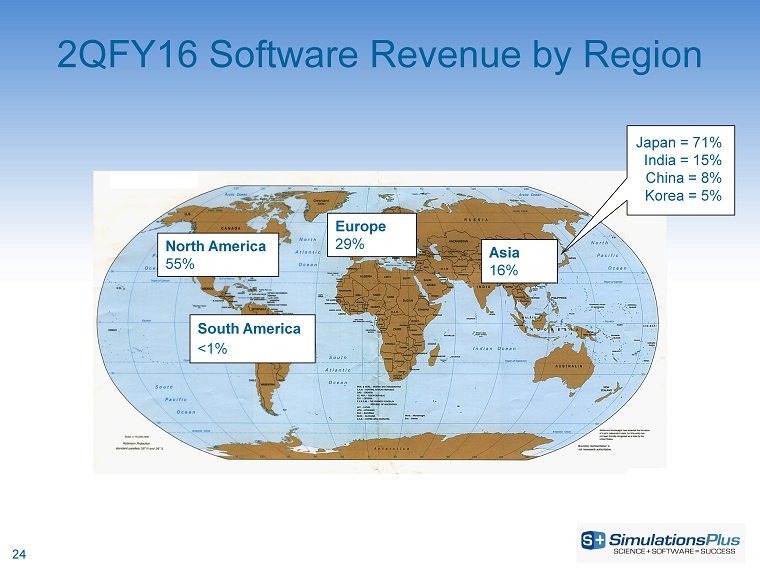
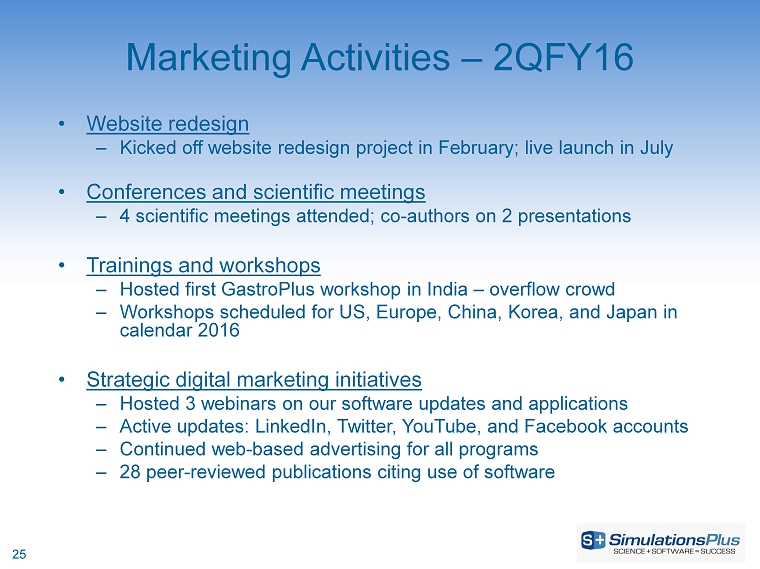
John DiBella, vice president for marketing and sales of Simulations Plus, said: “At the halfway point of FY2016, we have maintained solid renewal rates for software licenses and continued growth in new license sales and consulting revenues. The marketing and sales staff and our scientists have supported our aggressive marketing and sales program with attendance and presentations at key scientific meetings, conducting training workshops and webinars, and providing the strong customer support that is a hallmark of Simulations Plus in the industry.”
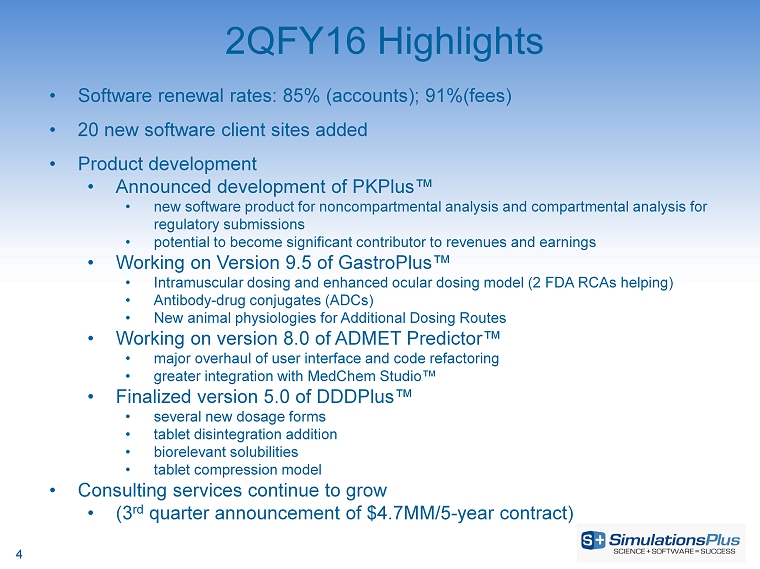
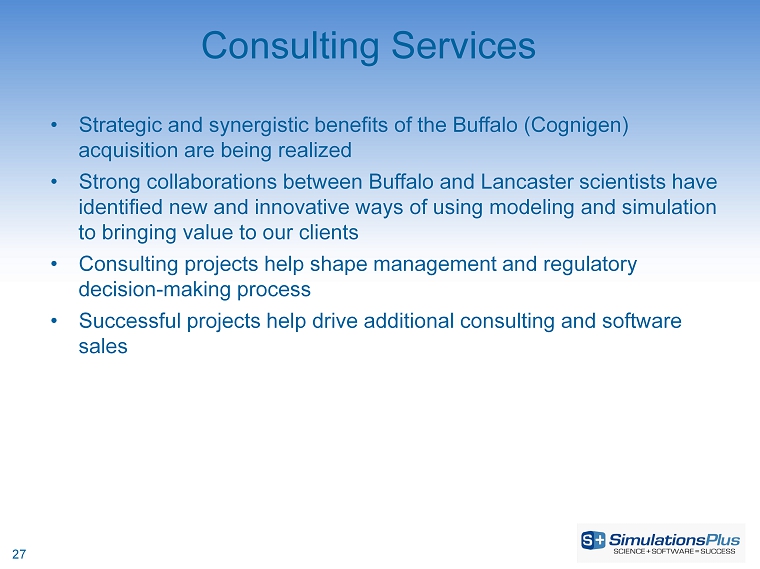
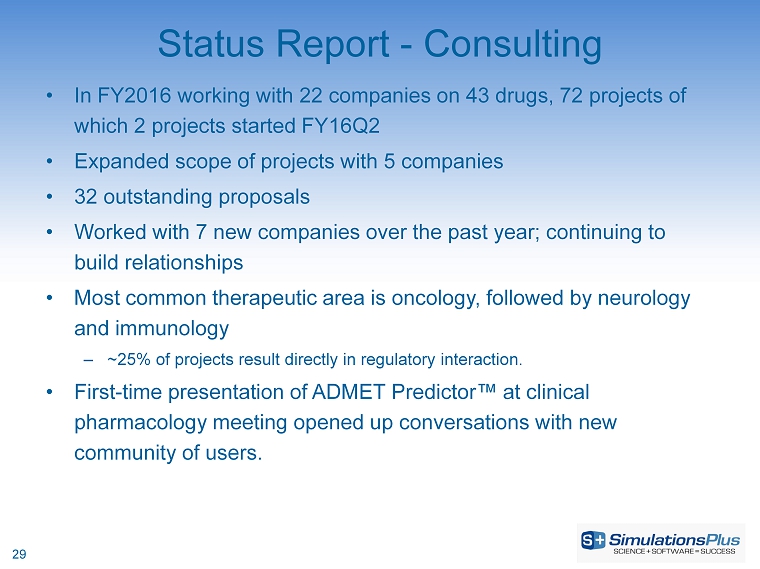
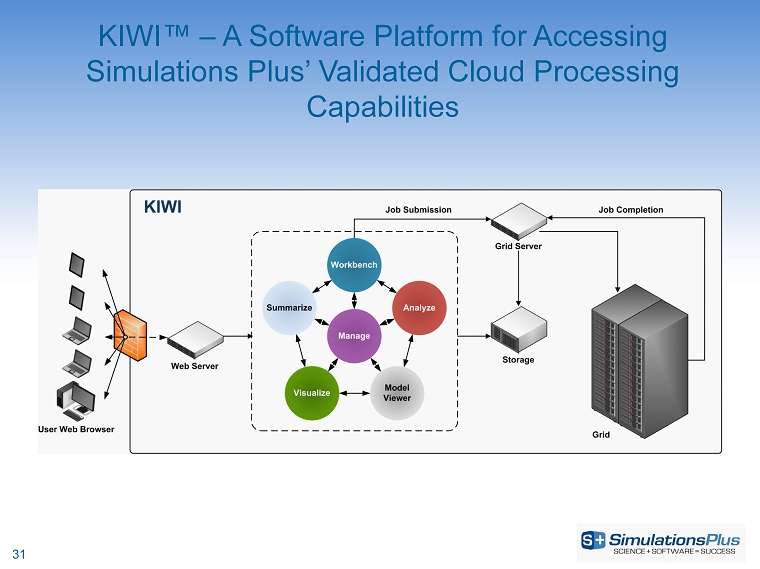
Ted Grasela, president of Simulations Plus, added: “The addition of the recently announced 5-year, $4.7 million contract for data management and consulting services with a major research foundation will add significantly to the revenue growth of our Buffalo division. We believe this effort, which is based on our secure in-house computing cloud and our unique KIWI™ software platform, has the potential to lead to additional opportunities for such services with a number of other research organizations around the world. And we are now routinely providing physiologically based pharmacokinetics (PBPK) analysis to clinical pharmacology groups as we realize the expected synergies between our Lancaster and Buffalo divisions.”
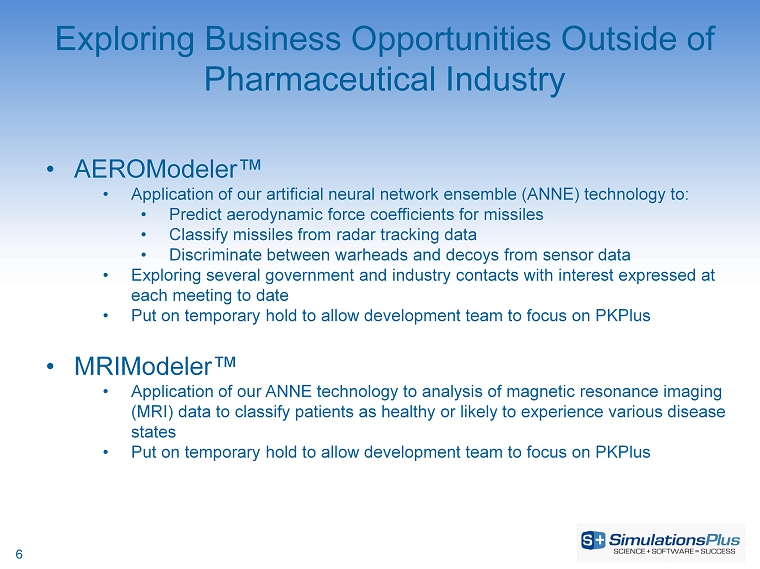
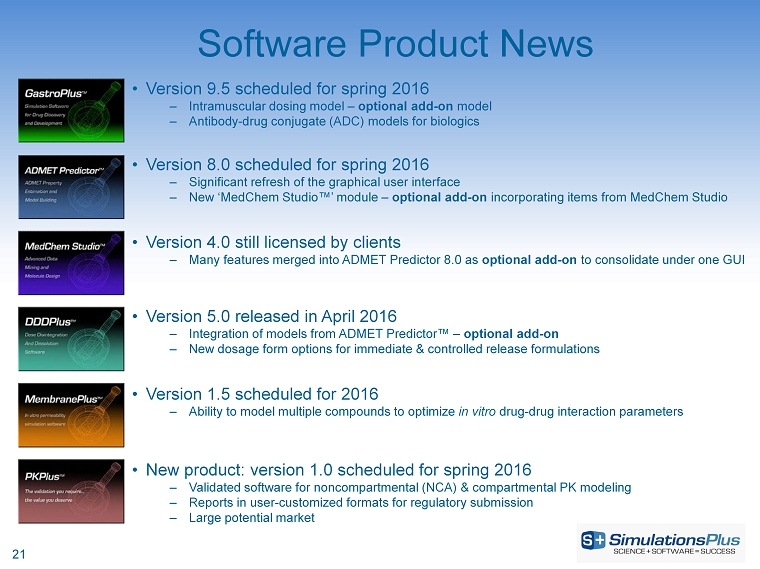
Walt Woltosz, chairman and chief executive officer of Simulations Plus, concluded: “As John DiBella noted, we’re halfway through FY2016, with six-month results showing excellent continued revenues and earnings growth. Now we are beginning to perform on our 5-year contract and expecting the release of our newest software product, PKPlus™, along with updates to two other programs, in the third fiscal quarter. We’re excited about these developments and expect them to add to a strong finish to FY2016.”
Investor Conference Call
The Company will host a conference call on April 13, 2016, at 4:15 p.m. Eastern Time. All interested parties are invited to join the call by registering at: https://attendee.gotowebinar.com/register/5014190111345805827. On registering, you will receive a confirmation e-mail with instructions for joining the call. Please dial in five to ten minutes prior to the scheduled start time. For listen-only mode, you may dial (646) 307-1720, and enter access code 439-293-425.
About Simulations Plus, Inc.
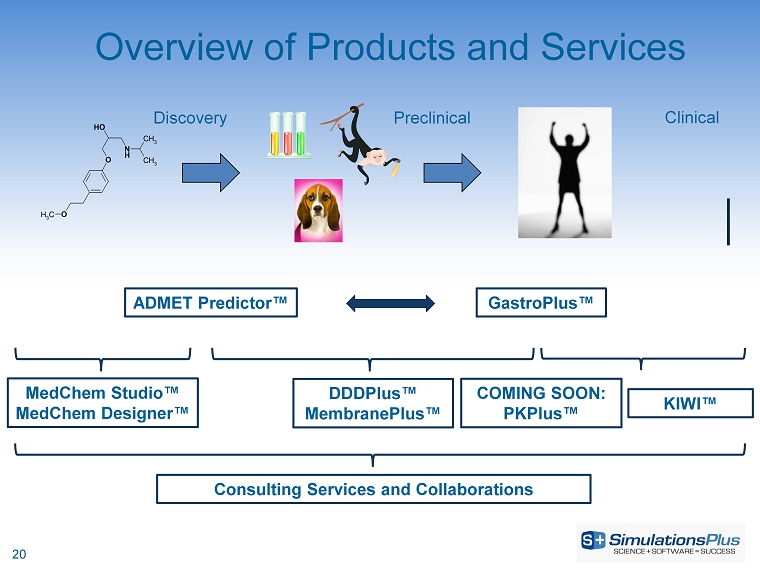
Simulations Plus, Inc. is a premier developer of drug discovery and development software as well as a leading provider of both preclinical and clinical pharmacometric consulting services for regulatory submissions. The company is a global leader focused on improving the ways scientists use knowledge and data to predict the properties and outcomes of pharmaceutical and biotechnology agents. Our software is licensed to and used in the conduct of drug research by major pharmaceutical and biotechnology companies and regulatory agencies worldwide. Our innovations in integrating new and existing science in medicinal chemistry, computational chemistry, pharmaceutical science, biology, and physiology into our software have made us the leading software provider for physiologically based pharmacokinetic modeling and simulation. For more information, visit our website at www.simulations-plus.com.
Follow Us on Twitter
Safe Harbor Statement Under the Private Securities Litigation Reform Act of 1995 – With the exception of historical information, the matters discussed in this press release are forward-looking statements that involve a number of risks and uncertainties. Words like “believe,” “expect” and “anticipate” mean that these are our best estimates as of this writing, but that there can be no assurances that expected or anticipated results or events will actually take place, so our actual future results could differ significantly from those statements. Factors that could cause or contribute to such differences include, but are not limited to: our ability to maintain our competitive advantages, acceptance of new software and improved versions of our existing software by our customers, the general economics of the pharmaceutical industry, our ability to finance growth, our ability to continue to attract and retain highly qualified technical staff, our ability to identify and close acquisitions on terms favorable to the Company, and a sustainable market. Further information on our risk factors is contained in our quarterly and annual reports as filed with the U.S. Securities and Exchange Commission.
--Tables follow --
2 |
SIMULATIONS PLUS, INC.
CONDENSED CONSOLIDATED BALANCE SHEETS
As of
(Unaudited) | (Audited) | |||||||
February 29, | August 31, | |||||||
ASSETS | ||||||||
2016 | 2015 | |||||||
Current assets | ||||||||
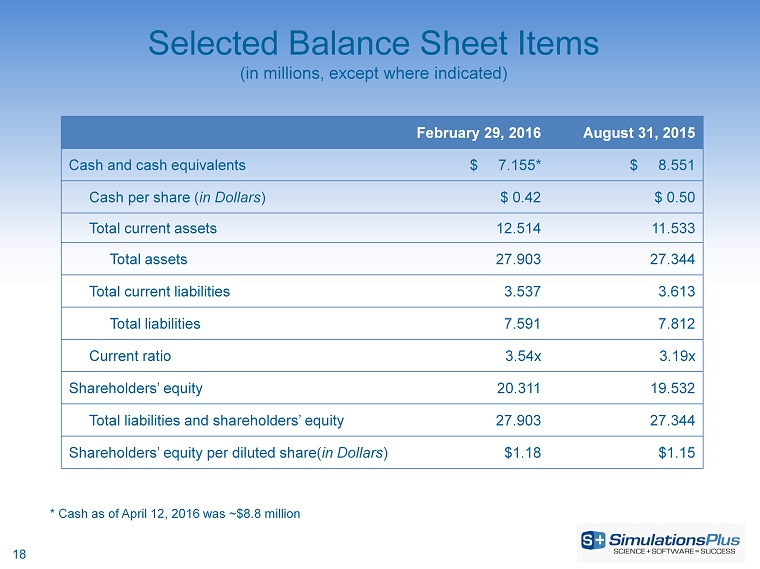
Cash and cash equivalents | $ | 7,062,993 | $ | 8,551,275 | ||||
Accounts receivable, net of allowance for doubtful accounts of $0 | 3,808,081 | 1,593,707 | ||||||
Revenues in excess of billings | 856,558 | 795,125 | ||||||
Prepaid income taxes | 240,116 | – | ||||||
Prepaid expenses and other current assets | 309,152 | 381,718 | ||||||
Deferred income taxes | 237,557 | 210,972 | ||||||
Total current assets | 12,514,457 | 11,532,797 | ||||||
Long-term assets | ||||||||
Capitalized computer software development costs, | ||||||||
net of accumulated amortization of $8,126,958 and $7,632,421 | 3,849,025 | 3,798,339 | ||||||
Property and equipment, net | 317,019 | 413,510 | ||||||
Intellectual property, net of accumulated amortization of $1,105,000 and $801,250 | 4,970,000 | 5,273,750 | ||||||
Other intangible assets net of accumulated amortization of $221,250 and $147,500 | 1,428,750 | 1,502,500 | ||||||
Goodwill | 4,789,248 | 4,789,248 | ||||||
Other assets | 34,082 | 34,082 | ||||||
Total assets | $ | 27,902,581 | $ | 27,344,226 | ||||
LIABILITIES AND SHAREHOLDERS' EQUITY | ||||||||
Current liabilities | ||||||||
Accounts payable | $ | 126,078 | $ | 209,407 | ||||
Accrued payroll and other expenses | 441,088 | 429,580 | ||||||
Accrued bonuses to officer | 60,500 | 121,000 | ||||||
Income taxes payable | – | 43,602 | ||||||
Other current liabilities | 18,204 | 19,859 | ||||||
Current portion - Contracts payable | 2,604,404 | 2,604,404 | ||||||
Billings in excess of revenues | 172,297 | 106,534 | ||||||
Deferred revenue | 114,631 | 78,945 | ||||||
Total current liabilities | 3,537,202 | 3,613,331 | ||||||
Long-term liabilities | ||||||||
Deferred income taxes | 3,054,076 | 3,190,419 | ||||||
Payments due under Contracts payable | 1,000,000 | 1,000,000 | ||||||
Other long-term liabilities | – | 8,274 | ||||||
Total liabilities | $ | 7,591,278 | $ | 7,812,024 | ||||
Commitments and contingencies | – | – | ||||||
Shareholders' equity | ||||||||
Preferred stock, $0.001 par value | ||||||||
10,000,000 shares authorized | ||||||||
no shares issued and outstanding | $ | – | $ | – | ||||
Common stock, $0.001 par value | ||||||||
50,000,000 shares authorized | ||||||||
17,018,001 and 16,943,001 shares issued and outstanding | 5,489 | 5,414 | ||||||
Additional paid-in capital | 9,942,194 | 9,714,290 | ||||||
Retained earnings | 10,363,620 | 9,812,498 | ||||||
Total shareholders' equity | $ | 20,311,303 | $ | 19,532,202 | ||||
Total liabilities and shareholders' equity | $ | 27,902,581 | $ | 27,344,226 |
3 |
SIMULATIONS PLUS, INC.
CONDENSED CONSOLIDATED STATEMENTS OF OPERATIONS
For the three and six months ended February 29 and 28,
Three months ended | Six months ended | |||||||||||||||
(Unaudited) | (Unaudited) | |||||||||||||||
2016 | 2015 | 2016 | 2015 | |||||||||||||
Net Revenues | $ | 5,163,726 | $ | 4,574,191 | $ | 10,002,346 | $ | 8,660,382 | ||||||||
Cost of revenues | 1,263,741 | 1,130,907 | 2,347,088 | 2,175,582 | ||||||||||||
Gross profit | 3,899,985 | 3,443,284 | 7,655,258 | 6,484,800 | ||||||||||||
Operating expenses | ||||||||||||||||
Selling, general, and administrative | 1,722,844 | 1,607,495 | 3,399,278 | 3,626,994 | ||||||||||||
Research and development | 461,389 | 360,708 | 812,696 | 633,348 | ||||||||||||
Total operating expenses | 2,184,233 | 1,968,203 | 4,211,974 | 4,260,342 | ||||||||||||
Income from operations | 1,715,752 | 1,475,081 | 3,443,284 | 2,224,458 | ||||||||||||
Other income (expense) | ||||||||||||||||
Interest income | 4,486 | 4,412 | 8,953 | 9,004 | ||||||||||||
Gain(loss) on currency exchange | (28,330 | ) | (34,684 | ) | (43,224 | ) | (42,475 | ) | ||||||||
Total other income (expense) | (23,844 | ) | (30,272 | ) | (34,271 | ) | (33,471 | ) | ||||||||
Income from operations before prook, vision for income taxes | 1,691,908 | 1,444,809 | 3,409,013 | 2,190,987 | ||||||||||||
Provision for income taxes | (546,559 | ) | (474,576 | ) | (1,157,191 | ) | (691,851 | ) | ||||||||
Net Income | $ | 1,145,349 | $ | 970,233 | $ | 2,251,822 | $ | 1,499,136 | ||||||||
Earnings per share | ||||||||||||||||
Basic | $ | 0.07 | $ | 0.06 | $ | 0.13 | $ | 0.09 | ||||||||
Diluted | $ | 0.07 | $ | 0.06 | $ | 0.13 | $ | 0.09 | ||||||||
Weighted-average common shares outstanding | ||||||||||||||||
Basic | 17,005,649 | 16,848,983 | 16,985,869 | 16,839,599 | ||||||||||||
Diluted | 17,268,144 | 17,105,412 | 17,230,099 | 17,096,357 |
4 |
Exhibit 99.2
( NASDAQ:SLP ) Investor Conference Call April 13, 2016
2 With the exception of historical information, the matters discussed in this presentation are forward - looking statements that involve a number of risks and uncertainties . The actual results of the Company could differ significantly from those statements . Factors that could cause or contribute to such differences include, but are not limited to : continuing demand for the Company’s products, competitive factors, the Company’s ability to finance future growth, the Company’s ability to produce and market new products in a timely fashion, the Company’s ability to continue to attract and retain skilled personnel, and the Company’s ability to sustain or improve current levels of productivity . Further information on the Company’s risk factors is contained in the Company’s quarterly and annual reports and filed with the Securities and Exchange Commission . Safe Harbor Statement
3 Highlights Walt Woltosz Chairman and Chief Executive Officer
4 • Software renewal rates: 85% (accounts); 91%(fees) • 20 new software client sites added • Product development • Announced development of PKPlus ™ • new software product for noncompartmental analysis and compartmental analysis for regulatory submissions • potential to become significant contributor to revenues and earnings • Working on Version 9.5 of GastroPlus ™ • Intramuscular dosing and enhanced ocular dosing model (2 FDA RCAs helping) • Antibody - drug conjugates (ADCs) • New animal physiologies for Additional Dosing Routes • Working on version 8.0 of ADMET Predictor ™ • major overhaul of user interface and code refactoring • greater integration with MedChem Studio™ • Finalized version 5.0 of DDDPlus ™ • several new dosage forms • tablet disintegration addition • biorelevant solubilities • tablet compression model • Consulting services continue to grow • (3 rd quarter announcement of $4.7MM/5 - year contract) 2 QFY16 Highlights
5 • Completed first year of up to 3 - year, $200,000/year collaboration for improved ocular dosing simulations – contract renewed for 2nd year • Met all milestones during first full year • Established consortium of leading pharmaceutical companies • The global ophthalmic drugs market was valued at $16 billion in 2012, and was expected to reach an estimated value of $21.6 billion in 2018 • Prevalence of eye disorders is increasing, such as diabetic retinopathy and macular degeneration FDA Office of Generic Drugs (OGD) Funded Collaborations • Began first year of up to 3 - year, $200,000/year collaboration for simulation of long - acting injectable microspheres • Formed consortium of industry partners, FDA scientists, and Simulations Plus • Added intramuscular dosing to GastroPlus • Developing enhancements to DDDPlus to simulate in vitro dissolution/release from polymer microspheres
6 • AEROModeler™ • Application of our artificial neural network ensemble (ANNE) technology to: • Predict aerodynamic force coefficients for missiles • Classify missiles from radar tracking data • Discriminate between warheads and decoys from sensor data • Exploring several government and industry contacts with interest expressed at each meeting to date • Put on temporary hold to allow development team to focus on PKPlus • MRIModeler™ • Application of our ANNE technology to analysis of magnetic resonance imaging (MRI) data to classify patients as healthy or likely to experience various disease states • Put on temporary hold to allow development team to focus on PKPlus Exploring Business Opportunities Outside of Pharmaceutical Industry
7 • Major provider of software and consulting services for pharma R&D • Earliest drug discovery – when a chemist first draws a molecule • Preclinical development (lab and animals) through first - in - human trials • Phase 2 and 3 clinical trials • Beyond patent life to supporting generic companies • Enhancing every existing software product. • Finalizing PKPlus – exciting new product • Developing new applications in aerospace and general healthcare based on our machine - learning technologies (on temporary hold) • 2 QFY16 revenues were up by $590,000 (12.9%) to $5.16 million • 2QFY16 net income was up by $175,000 (18.0%) to $1.15 million • 2QFY16 diluted EPS up 16.9% to $ 0.066 (7¢) per share compared to $0.057 (6¢) in 2QFY15. • 6moFY16 revenues were up by $1.34 Million(15.5%) to $10.0 Million • 6mo FY16 net income was up by $ 753,000 ( 50.2%) to $2.25 million • 6moFY16 diluted EPS up 49.0% to $ 0.131 (13¢) per share compared to $ 0.088 (9¢) in 2QFY15. Overview
8 • Continued Growth • Eight - year - plus profitable trend • Successful strategic acquisition • Customer base increased: • 20 new software customers in 2QFY16 • 91 percent renewal rate (fees) • Expecting continued compounded growth • 2nd Quarter earnings per share increased 17% • Strong cash position; returning cash to shareholders • Company has continued to pay dividend of $0.05 per quarter • Over $15 million in cash dividends distributed since 2012, yet cash remains at $8.8 million as of yesterday Summary
9 Financial Overview John Kneisel Chief Financial Officer
10 Income Statement 2 QFY16 Compared to 2QFY15 (in millions) Lancaster Buffalo 6moQFY16 6moFY15 Diff % chg Net sales $ 3.648 $ 1.516 $ 5.164 $ 4.574 $ 0.590 12.9% Gross profit 3.058 0.842 3.900 3.443 0.457 13.3% Gross profit margin 83.83% 55.54% 75.52% 75.27% 0.25% 0.3% SG&A 1.146 0.577 1.723 1.607 0.116 7.2% R&D 0.442 0.020 0.462 0.361 0.101 28.0% Total operating expenses 1.588 0.596 2.184 1.968 0.216 11.0% Income from operations 1.470 0.246 1.716 1.475 0.241 16.3% Other income (expense) ( 0.024) - (0.024) (0.030) 0.006 - 20.0% Income from operations before income taxes 1.446 0.246 1.692 1.445 0.247 17.1% Net income $ 0.994 $ 0.152 $ 1.146 $ 0.970 0.176 18.% Diluted earnings per share (in dollars) $ 0.066 $ 0.057 $ 0.010 16.9% EBITDA 1.841 0.336 2.177 1.966 0.211 10.7%
11 Income Statement 6moFY16 Compared to 6moFY15 (in millions) Lancaster Buffalo 2QFY16 2QFY15 Diff % chg Net sales $ 7.058 $ 2.944 $ 10.002 $ 8.660 $ 1.342 15.5% Gross profit 5.911 1.744 7.655 $ 6.485 1.17 18.0% Gross profit margin 83.75% 59.24% 76.53% 74.88% 1.65% 2.2% SG&A 2.245 1.154 3.399 $ 3.627 - 0.228 - 6.3% R&D 0.772 0.041 0.813 $ 0.633 0.18 28.4% Total operating expenses 3.017 1.195 4.212 $ 4.260 - 0.048 - 1.1% Income from operations 2.894 0.549 3.443 2.224 1.219 54.8% Other income (expense) ( 0.035) - (0.035) (0.033) - 0.002 6.1% Income from operations before income taxes 2.860 0.549 3.409 2.191 1.218 55.6% Net income $ 1.912 $ 0.339 $ 2.251 $ 1.499 0.752 50.2% Diluted earnings per share (in dollars) $ 0.131 $ 0.088 $ 0.043 49.0% EBITDA 3.649 0.731 4.38 2.804 1.576 56.2%
12 Consolidated Revenues, by Fiscal Quarter and YTD (pro forma prior to 2012; in millions) 4.01 4.57 5.99 3.71 4.84 5.16 $0 $1 $2 $3 $4 $5 $6 $7 Q1 Q2 Q3 Q4 2009 2010 2011 2012 2013 2014 2015 2016
13 Consolidated Gross Profit, by Fiscal Quarter & YTD (pro forma prior to 2012; in millions) 3.09 3.45 4.83 2.64 3.76 3.9 $0 $1 $2 $3 $4 $5 $6 Q1 Q2 Q3 Q4 2009 2010 2011 2012 2013 2014 2015 2016
14 Consolidated Net Income, by Fiscal Quarter and YTD (pro forma prior to 2012; in millions) $0.53 $0.97 $1.85 $0.49 $1.11 $1.15 $- $0.50 $1.00 $1.50 $2.00 Q1 Q2 Q3 Q4 2009 2010 2011 2012 2013 2014 2015 2016
15 Consolidated Diluted Earnings Per Share 0 0.02 0.04 0.06 0.08 0.1 0.12 Q1 Q2 Q3 Q4 $0.03 $0.06 $0.11 $0.03 $0.06 $0.07 Quarterly EPS FY09 FY10 FY11 FY12 FY13 FY14 FY15 FY16
16 Consolidated EBITDA, by Fiscal Quarter & YTD (in millions) 1.22 1.97 3.33 1.19 2.2 2.18 $0 $1 $2 $3 $4 Q1 Q2 Q3 Q4 2009 2010 2011 2012 2013 2014 2015 2016
17 Returning Cash to Shareholders (in millions) 1.6 0.8 0.8 2.2 0 0.5 0.5 0.6 0.81 0.81 0.81 0.84 0.84 0.84 0.85 0.85 0.85 13.2 12.9 12.7 11.4 9.3 9.8 10 10.1 10.6 11 7.8 8.6 5.8 6.1 6.4 8.6 7.2 7.1 8.8 $0 $1 $1 $2 $2 $3 $0 $2 $4 $6 $8 $10 $12 $14 Dividend Paid Cash on Hand Cash paid $2.5M TSRL Cash paid $2.1M for Cognigen
18 Selected Balance Sheet Items (in millions, except where indicated) February 29, 2016 August 31, 2015 Cash and cash equivalents $ 7.155* $ 8.551 Cash per share ( in Dollars ) $ 0.42 $ 0.50 Total current assets 12.514 11.533 Total assets 27.903 27.344 Total current liabilities 3.537 3.613 Total liabilities 7.591 7.812 Current ratio 3.54x 3.19x Shareholders’ equity 20.311 19.532 Total liabilities and shareholders’ equity 27.903 27.344 Shareholders’ equity per diluted share( in Dollars ) $1.18 $1.15 * Cash as of April 12, 2016 was ~$8.8 million
19 Marketing and Sales John DiBella VP of Marketing and Sales
20 Overview of Products and Services N H O OH O CH 3 CH 3 CH 3 ADMET Predictor™ GastroPlus ™ MedChem Studio™ MedChem Designer™ DDDPlus ™ MembranePlus™ Consulting Services and Collaborations Discovery Preclinical C linical COMING SOON: PKPlus™ KIWI™
21 • Version 9.5 scheduled for spring 2016 ‒ Intramuscular dosing model – optional add - on model ‒ Antibody - drug conjugate (ADC) models for biologics • Version 8.0 scheduled for spring 2016 ‒ Significant refresh of the graphical user interface ‒ New ‘MedChem Studio™’ module – optional add - on incorporating items from MedChem Studio • Version 4 .0 still licensed by clients ‒ Many features merged into ADMET Predictor 8.0 as optional add - on to consolidate under one GUI Software Product News • Version 5.0 released in April 2016 ‒ Integration of models from ADMET Predictor™ – optional add - on ‒ New dosage form options for immediate & controlled release formulations • Version 1.5 scheduled for 2016 ‒ Ability to model multiple compounds to optimize in vitro drug - drug interaction parameters • New product: v ersion 1.0 scheduled for spring 2016 ‒ Validated software for noncompartmental (NCA) & compartmental PK modeling ‒ Reports in user - customized formats for regulatory submission ‒ Large potential market
22 2 QFY16 Sales Review • Highlights: – Software revenue +15% – C onsulting +9% – 85% renewal rate (accounts) – 91% renewal rate (fees) – 16% increase in license units – 12 new commercial clients – 8 new nonprofit groups 54% 14% 32% 0% Consolidated Sales Breakdown Renewal New Consulting Training 0 50 100 150 200 250 1st Quarter 2nd Quarter 3rd Quarter 4th Quarter Software License Units – per Quarter FY13 FY14 FY15 FY16
23 6moFY16 Sales Review • Highlights: – Software revenue +14% – C onsulting +20% – 87% renewal rate (accounts) – 92% renewal rate (fees) – 25% increase in license units – 20 new commercial clients – 19 new nonprofit groups – Significant expansion of licenses at US and China FDA 53% 13% 33% 1% Consolidated Sales Breakdown Renewal New Consulting Training 0 50 100 150 200 250 1st Quarter 2nd Quarter 3rd Quarter 4th Quarter Software License Units – per Quarter FY13 FY14 FY15 FY16
24 2 QFY16 Software Revenue by Region Europe 29% North America 55% Asia 16% South America <1% Japan = 71% India = 15% China = 8 % Korea = 5%
25 Marketing Activities – 2QFY16 • Website redesign – Kicked off website redesign project in February; live launch in July • Conferences and scientific meetings – 4 scientific meetings attended; co - authors on 2 presentations • Trainings and workshops – Hosted first GastroPlus workshop in India – overflow crowd – W orkshops scheduled for US, Europe, China, Korea, and Japan in calendar 2016 • Strategic digital marketing initiatives – Hosted 3 webinars on our software updates and applications – Active updates: LinkedIn, Twitter, YouTube, and Facebook accounts – Continued web - based advertising for all programs – 28 peer - reviewed publications citing use of software
26 Buffalo Division Update Re - imagining the future of science - based research and development Ted Grasela President
27 Consulting Services • Strategic and synergistic benefits of the Buffalo (Cognigen) acquisition are being realized • Strong collaborations between Buffalo and Lancaster scientists have identified new and innovative ways of using modeling and simulation to bringing value to our clients • Consulting projects help shape management and regulatory decision - making process • Successful projects help drive additional consulting and software sales
28 Cutting Edge Scientific Projects • Emerging applications of systems pharmacology and PBPK – O ncology (ongoing) – Diabetes (ongoing) – Nonalcoholic steatohepatitis (new) – Ophthalmology (new) • Working to develop “platform” opportunities (same model; different drugs) – Successful ongoing project shaping early clinical research
29 Status Report - Consulting • In FY2016 working with 22 companies on 43 drugs, 72 projects of which 2 projects started FY16Q2 • Expanded scope of projects with 5 companies • 32 outstanding proposals • Worked with 7 new companies over the past year; continuing to build relationships • Most common therapeutic area is oncology, followed by neurology and immunology – ~25% of projects result directly in regulatory interaction. • First - time presentation of ADMET Predictor™ at clinical pharmacology meeting opened up conversations with new community of users.
30 • Analysis in R&D can be messy • Data and inputs coming from many groups • Careful synthesis and communication is essential • The industry has enormous computing power • The industry lacks tools for harnessing that power Behind the scenes in R&D Coping with complexity and chaos
31 KIWI™ – A Software Platform for Accessing Simulations Plus’ Validated Cloud Processing Capabilities
32 • Signed a $4.7 million contract with a major foundation to implement a KIWI platform for global teams engaged in model - based drug development; 5 - year term contingent on satisfactory completion of milestones • KIWI will become an integral driver of the foundation’s efforts to accelerate the eradication of underserved diseases • This initiative provides much - needed support in terms of computer processing power and organizational and communication tools for complex modeling and simulation projects • Ultimately, the goal is to reduce the risks and cost of drug development and speed the delivery of new life - saving medicines KIWI Update
33 • Project builds on our extensive process - related research; enables substantial enhancements to the KIWI platform • Enhancements will provide a scaffold with broad applicability and will be available to academic and industry clients of KIWI • Our long - term goal is to creating an innovative framework for collaboration that increases the value of emerging scientific research KIWI Update - Continued
34 Summary Buffalo division is strong and growing • Revenues and earnings up and contributing to overall growth of Simulations Plus • Consulting activities continuing to expand, and realizing synergies with Lancaster division for PBPK modeling in clinical pharmacology • New contract to enhance the KIWI platform is a major step forward in our long - term vision for the product
35 Final Summary Walt Woltosz Chairman and Chief Executive Officer
36 • 2QFY16 revenues were up by 12.9% • 2QFY16 net income was up by 18.0% • Diluted EPS for 2QFY16 up 16.9% to $0.07 from $0.06 in 2QFY15 • 6moFY16 revenues were up by 15.5% • 6moFY16 net income was up by 50.0% • Diluted EPS for 6moFY16 up 49.0% to $0.13 from $0.09 in 6moFY15 • California and Buffalo divisions both performing well • Expected synergies being realized and are resulting in expanded consulting activities • Addressing regulatory agency interests in applying PBPK modeling in clinical pharmacology • 5 - year, $4.7 million contract with research foundation is largest in Simulations Plus’ history • Offers potential for additional such contracts with other organizations • Software sales continue strong growth trend • Recent report by Grandview Research indicates: • Global market for computational biology to reach $4.285 billion by 2020 • North America largest regional market at 58.0% in 2013 • Asia Pacific seen as fastest growth market – estimated CAGR of 28% • 5 key players listed: Accelrys , Certara , Entelos , Schrodinger, and Simulations Plus • We believe Simulations Plus continues to lead the trend toward greater use of modeling and simulation in drug development Summary
">!O#C-^(.&LQSGB'B#+ZN9
MXK!8;.L7E=''4ZE%5X3Q]=_6'A,+AH8W PIX?+L+2Q&+KR;K8BEAZ4W7VRO.
M^->*>*^- 7]?B?#GAO^UO"[AN=*>!QN>Y15S7B7$QQ
ME98C%JE@:&)CAJ$<14G1PM6M6E5HP=&A&24*DH0G.DHGQV&\2>)O[(\5.)85
M:>.P.19Q1RGAG#2P>'>'PCK8^OAGBJ\\/3IU\52H4(T:TU7K2C*4Z49SA&JV
M^ZM_^"X.N>+=4OM/^%/[%OCWQ^MIB5DM/'E_
'=9\#6TEYX?M]1\,>-&LO&VGW6O6B^$;F[;5QX,TBT@_/3_ (+[_P#!
M/4_"CQ1XT_;[/Q?_ +>'QY^.'@+P(/A-_P *_P#[+_X17/P@U2'^U#X\_P"$
MVU$ZY@?"K=]B_P"$-TC)UW'VL#3,ZAZ=_P $9_\ @L1^T%XZ^/?@;]D?]J+Q
M6_Q6\/\ Q*CU;1OAK\3]>MK*'Q]X6\6:/X?N]