UNITED STATES
SECURITIES AND EXCHANGE COMMISSION
WASHINGTON, D.C. 20549
FORM 8-K
CURRENT REPORT
PURSUANT TO SECTION 13 OR 15(d) OF THE SECURITIES EXCHANGE ACT OF 1934
November 25, 2014
(Date of the earliest event reported)
Simulations Plus, Inc.
(Exact name of registrant as specified in its charter)
California | 001-32046 | 95-4595609 |
(State or other jurisdiction of incorporation) | (Commission File Number) | (I.R.S. Employer Identification No.) |
42505 10th Street West, Lancaster, California 93534-7059
(Address of principal executive offices) (Zip Code)
661-723-7723
Registrant's telephone number, including area code
Check the appropriate box below if the Form 8-K filing is intended to simultaneously satisfy the filing obligation of the registrant under any of the following provisions:
[ ] Written communications pursuant to Rule 425 under the Securities Act (17 CFR 230.425)
[ ] Soliciting material pursuant to Rule 14z-12 under Exchange Act (17 CFR 240.14a-12)
[ ] Pre-commencement communications pursuant to Rule 14d-2(b) under Exchange Act (17 CFR 240.14d-2(b))
[ ] Pre-commencement communications pursuant to Rule 13e-4(c) under Exchange Act (17 CFR 240.13e-4(c))
Item 8.01 Other Events
On November 25, 2014, Simulations Plus, Inc., a California corporation (the "Company"), held a conference call reporting its financial result for the fourth fiscal quarter and fiscal year ended August 31, 2014.
The press release and the PowerPoint slides, which were used for this Conference Call, are attached herein as exhibits.
This report on Form 8-K (the "Report"), including the disclosures set forth herein, contains certain forward-looking statements that involve substantial risks and uncertainties. When used herein, the terms "anticipates," "expects," "estimates," "believes" and similar expressions, as they relate to us or our management, are intended to identify such forward-looking statements.
Forward-looking statements in this Report or hereafter, including in other publicly available documents filed with the Securities and Exchange Commission (the "Commission"), reports to the stockholders of Simulations Plus, Inc., a California corporation (the "Company" or "us," "our" or "we") and other publicly available statements issued or released by us involve known and unknown risks, uncertainties and other factors which could cause our actual results, performance (financial or operating) or achievements to differ from the future results, performance (financial or operating) or achievements expressed or implied by such forward-looking statements. Such future results are based upon management's best estimates based upon current conditions and the most recent results of operations. These risks include, but are not limited to, the risks set forth herein and in such other documents filed with the Commission, each of which could adversely affect our business and the accuracy of the forward-looking statements contained herein. Our actual results, performance or achievements may differ materially from those expressed or implied by such forward-looking statements.
Item 9.01 Financial Statements and Exhibits
(d) Exhibits
99.1 | Press Release | |
99.2 | PowerPoint presentation at the Conference Call on November 25, 2014. |
2 |
SIGNATURES
Pursuant to the requirements of the Securities Exchange Act of 1934, the registrant has duly caused this report to be signed on its behalf by the undersigned thereunto duly authorized.
SIMULATIONS PLUS, INC. | ||
Dated: November 25, 2014 | By: | /s/ John R. Kneisel |
John R. Kneisel Chief Financial Officer |
3 |
EXHIBIT 99.1
Simulations Plus
Integrating Science and Software
For Further Information:
Simulations Plus, Inc.
42505 10th Street West
Lancaster, CA 93534-7059
CONTACT:
Simulations Plus Investor Relations | Hayden IR |
Ms. Renee Bouche | Mr. Cameron Donahue |
661-723-7723 | 651-653-1854 |
renee@simulations-plus.com | cameron@haydenir.com |
For Immediate Release:
November 25, 2014
Simulations Plus Reports FY2014 and Fourth Quarter FY2014 Financial Results
Full Fiscal Year Pharmaceutical Software and Services Up 13.8%, Fourth Quarter Revenues up 27.4%
LANCASTER, CA, November 25, 2014 – Simulations Plus, Inc. (NASDAQ: SLP), a leading provider of software for pharmaceutical discovery and development, today reported its financial results for its 2014 fiscal year (FY14) and fourth quarter (4Q14) ended August 31, 2014.
On September 2, 2014, Simulations Plus acquired Cognigen Corporation, a leading provider of pharmacometric modeling and simulation services and clinical pharmacology consulting for the pharmaceutical and biotechnology industries. Pursuant to the agreement, Cognigen has become a wholly owned subsidiary of Simulations Plus and is continuing to operate under the Cognigen name. The acquisition is expected to add approximately $5 million to the revenues of the combined company in the coming fiscal year. As a result of the acquisition, the total number of Simulations Plus employees increased from 30 to 65.
In 1997, Simulations Plus entered into a royalty agreement with Therapeutic Systems Research Laboratories (TSRL), pursuant to which royalties were paid to TSRL from revenues on each license for GastroPlus basic software. On May 15, 2014, the Company entered into a buyout agreement with TSRL. Under the terms of the Agreement, Simulations Plus will no longer pay royalties on each license of the GastroPlus software. The buyout of the prior agreement will be amortized at a constant rate of $150,000 per quarter until it is completely amortized, after which no further expense will be incurred. For most quarters, this will result in a savings over the royalty payments that would have been made in the past.
Results for the 2014 fiscal year (FY14):
· | Revenues were $11.46 million, representing an increase of 13.8% over $10.07 million in FY13 |
· | SG&A expense increased 25.1% to $4.44 million from $3.55 million in FY13 |
o | As a percent of sales, SG&A increased to 38.7% from 35.3% in FY13 |
§ | Almost 75% of the 3.4% increase was from one-time legal expense increases associated with the Cognigen acquisition |
· | R&D expense was $0.95 million, an increase of 18.7% from $0.80 million in FY13 |
· | Net income was $3.03 million, representing an increase of 4.8% from $2.89 million in FY13 |
· | Net income from operations increased 9.0% |
· | The company’s effective income tax rate increased approximately 0.65% to 33% |
· | Net income per fully diluted share was $0.184, representing an increase of 4.3% from $0.177 for FY13 |
· | Cash decreased to $8.6 million, representing a decrease of $1.6 million, or 15.4%, from $10.2 million at the end of FY13 |
o | The decrease was mainly due to $2.5 million used toward the buyout of a former royalty agreement with TSRL |
· | Shareholders’ equity increased to $15.4 million, representing an increase of $1.2 million, or 8.4%, from $14.2 million at the end of FY13 |
o | This increase was mainly due to the issuance of $1.0 million of stock as part of the buyout of the former royalty agreement with TSRL. |
1 |
Results for the fourth quarter FY14 (4Q14):
· | Revenues were $2.0 million, representing an increase of 27.4% over $1.6 million in 4Q13 |
o | In the fourth quarter, after the preliminary revenues release, the Company recognized an additional $193,000 of revenues based on the final annual review of deferred revenues |
· | SG&A increased 23.4% to $1.06 million from $0.86 million in 4Q13 |
o | Almost 85% of the 23.4% increase was due to one-time costs associated with the Cognigen acquisition |
· | R&D expense was $0.20 million, an increase of 20.2% from $0.17 million in 4Q13 |
· | Net income was $0.25 million, representing a decrease of 29.8 % over $0.35 million in 4Q13, due primarily to one-time charges for the Cognigen acquisition |
· | Earnings per fully diluted share were $0.013, representing a decrease of 10.4% over $0.015 in 4Q13 |
Walt Woltosz, chairman and chief executive officer of Simulations Plus, added: “Our continued growth is a tribute to our marketing and sales staff and our scientific team, whose ongoing efforts to keep us out in front of the technologies in which we specialize have enabled us to hold onto our leadership position in a competitive market. The new developments now underway are expected to continue this trend, and we believe our continued aggressive marketing and sales program and training workshops have been bolstering our pipeline for continued growth.”
Mr. Woltosz continued, “With the strategic acquisition of Cognigen just after the close of this reporting period, we are positioned to lead the way to the integration of mechanistic physiologically based pharmacokinetics (PBPK) modeling as a critical support tool for clinical pharmacology. This is an exciting step forward for both Simulations Plus and Cognigen. Dr. Ted Grasela, the former President of Cognigen, has been appointed President of the combined companies and has joined the board of directors. I remain as Chairman and CEO. At my request, my new contract reduced my time to 60% of my productive time with a proportionate reduction in salary and benefits. We have started the process of integrating the management teams of both companies. I’m especially looking forward to devoting my time to products, services, and business development.”
Dr. Grasela added, “I have been impressed with the talented team at Simulations Plus, the loyalty of the end users of our software, and the creative applications of our software to address challenges in pharmaceutical research and development. I remain excited about the opportunities this merger affords for the future of modeling and simulation activities within the discipline of clinical pharmacology. The recent push by regulatory agencies to use PBPK, a strength of Simulations Plus, in clinical pharmacology, a strength of Cognigen, makes the timing of this merger ideal.”
John Kneisel, chief financial officer for Simulations Plus, said: “We completed another record fiscal year, with revenues increasing 13.8% and net income topping the $3 million mark for the first time. We also set a new record for 4th quarter revenues. We continued to invest in R&D, through the expansion of scientific staff as well as salary increases for existing staff, strengthening our competitive position. The SG&A increase of 25.1% was due to increased commission expenses based on higher sales made by our dealers in Japan and China, and approximately $290,000 in nonrecurring legal expenses associated with document review and negotiations associated with the TSRL agreement, as well as extensive due diligence associated with the September 2014 acquisition of Cognigen Corporation.”
2 |
John DiBella, vice president for marketing and sales for Simulations Plus, said: “4Q14 was very strong for software sales, as revenue from new licenses comprised 25.5% of total revenue, and renewal rates, in terms of both accounts and revenue, exceeded 90%. Consulting service revenue saw a 7% decrease compared to 4Q13. For FY14, revenue from new licenses comprised 18.6% of total revenue, with 77 new organizations, or new departments at existing organizations, now utilizing our technology. Included among these new licenses were orders from major regulatory agencies in the US, Europe, and Asia, along with companies outside our core pharmaceutical market. We also experienced a robust 91% account, and 96% revenue, renewal rate for the year. With our continued focus on education and training, coupled with the release of MembranePlus™ and upgrades to several existing products, we are in a good position to capitalize on the increased adoption of modeling & simulation technology across several industries.”
Investor Conference Call November 25, 2014, 4:15 PM EST/1:15 PM PST
A conference call will be webcast live and may be accessed by first registering at the following website: https://attendee.gotowebinar.com/register/1195372911604984578. Upon registering, you will receive a confirmation e-mail with a unique link and instructions for joining the call. Please dial in five to ten minutes prior to the scheduled start time. For listen-only mode, you may dial (415) 655-0051, and enter access code 938-068-155.
About Simulations Plus, Inc.
Simulations Plus, Inc., is a premier developer of groundbreaking drug discovery and development simulation software, which is licensed to and used in the conduct of drug research by major pharmaceutical and biotechnology companies worldwide. We also provide consulting expertise to pharmaceutical and chemical companies worldwide. For more information, visit our Web site at www.simulations-plus.com.
Follow Us on Twitter
Safe Harbor Statement Under the Private Securities Litigation Reform Act of 1995 – With the exception of historical information, the matters discussed in this press release are forward-looking statements that involve a number of risks and uncertainties. Our actual future results could differ significantly from those statements. Factors that could cause or contribute to such differences include, but are not limited to: our ability to maintain our competitive advantages, acceptance of our new software products as well as improved versions of our existing software by our customers, the general economics of the pharmaceutical industry, our ability to finance growth, our ability to continue to attract and retain highly qualified technical staff, and a sustainable market. Further information on our risk factors is contained in our quarterly and annual reports as filed with the U.S. Securities and Exchange Commission.
Tables follow
3 |
SIMULATIONS PLUS, INC.
STATEMENTS OF OPERATIONS
For the years ended August 31, 2014 and 2013
2014 | 2013 | |||||||
ASSETS | ||||||||
Current assets | ||||||||
Cash and cash equivalents | $ | 8,614,929 | $ | 10,179,298 | ||||
Prepaid income taxes | 748,359 | 301,573 | ||||||
Accounts receivable, net of allowance for doubtful accounts of $0 | 1,708,158 | 1,910,615 | ||||||
Contracts receivable | 158,914 | 203,913 | ||||||
Prepaid expenses and other current assets | 188,160 | 192,173 | ||||||
Deferred income taxes | 114,846 | 184,258 | ||||||
Total current assets | 11,533,366 | 12,971,830 | ||||||
Long-term assets | ||||||||
Capitalized computer software development costs, net of accumulated amortization of $6,609,283 and $5,801,578 | 3,452,541 | 2,891,169 | ||||||
Property and equipment, net | 95,242 | 117,987 | ||||||
Intellectual property, net of accumulated amortization of $193,750 and $11,250 | 5,881,250 | 63,750 | ||||||
Other assets | 18,445 | 18,445 | ||||||
Total assets | $ | 20,980,844 | $ | 16,063,181 | ||||
LIABILITIES AND SHAREHOLDERS' EQUITY | ||||||||
Current liabilities | ||||||||
Accounts payable | $ | 130,547 | $ | 146,011 | ||||
Accrued payroll and other expenses | 340,709 | 311,209 | ||||||
Accrued bonuses to officer | 120,000 | 60,000 | ||||||
Other current liabilities | 19,859 | 19,859 | ||||||
Current portion - Contract payable | 750,000 | – | ||||||
Deferred revenue | 30,370 | 89,227 | ||||||
Total current liabilities | 1,391,485 | 626,306 | ||||||
Long-term liabilities | ||||||||
Deferred income taxes | 2,375,874 | 1,146,389 | ||||||
Payments due under Contract payable | 1,750,000 | – | ||||||
Other long-term liabilities | 28,134 | 47,993 | ||||||
Total liabilities | 5,545,493 | 1,820,688 | ||||||
Commitments and contingencies | ||||||||
Shareholders' equity | ||||||||
Preferred stock, $0.001 par value 10,000,000 shares authorized no shares issued and outstanding | – | – | ||||||
Common stock, $0.001 par value 50,000,000 shares authorized 16,349,955 and 16,030,894 shares issued and outstanding | 4,821 | 4,502 | ||||||
Additional paid-in capital | 6,085,427 | 4,842,794 | ||||||
Retained earnings | 9,345,103 | 9,395,197 | ||||||
Total shareholders' equity | 15,435,351 | 14,242,493 | ||||||
Total liabilities and shareholders' equity | $ | 20,980,844 | $ | 16,063,181 |
4 |
SIMULATIONS PLUS, INC.
STATEMENTS OF OPERATIONS
For the years ended August 31, 2014 and 2013
2014 | 2013 | |||||||
Net sales | $ | 11,460,880 | $ | 10,070,770 | ||||
Cost of sales | 1,629,069 | 1,646,530 | ||||||
Gross profit | 9,831,811 | 8,424,240 | ||||||
Operating expenses | ||||||||
Selling, general, and administrative | 4,439,665 | 3,549,495 | ||||||
Research and development | 952,774 | 802,374 | ||||||
Total operating expenses | 5,392,439 | 4,351,869 | ||||||
Income from operations | 4,439,372 | 4,072,371 | ||||||
Other income (expense) | ||||||||
Interest income | 31,437 | 49,492 | ||||||
Miscellaneous income | – | 35,488 | ||||||
Gain on currency exchange | 42,488 | 99,429 | ||||||
Total other income (expense) | 73,925 | 184,409 | ||||||
Income before provision for income taxes | 4,513,297 | 4,256,780 | ||||||
Provision for income taxes | (1,487,806 | ) | (1,370,182 | ) | ||||
Net Income | $ | 3,025,491 | $ | 2,886,598 | ||||
Earnings per share | ||||||||
Basic | $ | 0.19 | $ | 0.18 | ||||
Diluted | $ | 0.18 | $ | 0.18 | ||||
Weighted-average common shares outstanding | ||||||||
Basic | 16,173,674 | 15,996,432 | ||||||
Diluted | 16,407,751 | 16,319,983 |
5 |
EXHIBIT 99.2
Simulations Plus, Inc. (NASDAQ:SLP) Fiscal Year 2014 and 4 th Quarter FY14 Conference Call and Webinar November 25, 2014 Copyright (c) 2014 Simulations Plus, Inc. 1
With the exception of historical information, the matters discussed in this presentation are forward - looking statements that involve a number of risks and uncertainties. The actual results of the Company could differ significantly from those statements. Factors that could cause or contribute to such differences include, but are not limited to: continuing demand for the Company’s products, competitive factors, the Company’s ability to finance future growth, the Company’s ability to produce and market new products in a timely fashion, the Company’s ability to continue to attract and retain skilled personnel, and the Company’s ability to sustain or improve current levels of productivity. Further information on the Company’s risk factors is contained in the Company’s quarterly and annual reports and filed with the Securities and Exchange Commission. Safe Harbor Statement Copyright (c) 2014 Simulations Plus, Inc. 2
• 4Q14 compared to 4Q13 : – 28 th consecutive profitable quarter, and a new record 4 th quarter – Revenues were $1.997 million, a 27.4% increase ($430K) from $1.568 million • $190,000 of revenues were recognized in this quarter the result of a final annual review of deferred revenues on multiyear sales • Without this adjustment, revenues would have been up approximately 15% – Gross profit was $1.537 million in 4Q14 vs $1.259 million in 4Q13, up 22.1% • Software licensing revenues increased • In 4Q14, $ 150,000 of amortization was expensed to amortize the buyout of the former TSRL agreement, while the actual royalty expense in 4Q13 was $80,000 because Q4 (summer) is the slowest quarter. FY14 royalties under the former agreement would have averaged approximately $171,000 per quarter – SG&A increased 23.4% to $1.061 million from $ 0.859 million • As a percent of revenues, SG&A decreased to 53.1% from 54.8% in 4Q13 • 85% of the 23.4% increase was due to one - time costs associated with the Cognigen acquisition – R&D expense increased 20.2% to $202,000 from $168,000 in 4Q13 • Expansion of life sciences staff in 2014 SLP 4Q14 Highlights Fiscal quarter ended 8/31/14:
• 4Q14 compared to 4Q13 :( con’t ) – Operating income increased $45,000 or 18.3% to $288,000 in 4Q14 – Income taxes increased $67,000 in 4Q14, • 4Q13 income taxes were a credit of $2,000 based on 4Q13 year end tax adjustments. – Net Income decreased 8.9% to $223,000 from $245,000 in 4Q13 – Diluted earnings per share was $0.013, a decrease from $0.015 in 4Q13 – Cash dividend of $0.05/share was distributed during 4Q14 SLP 4Q14 Highlights Fiscal quarter ended 8/31/14:
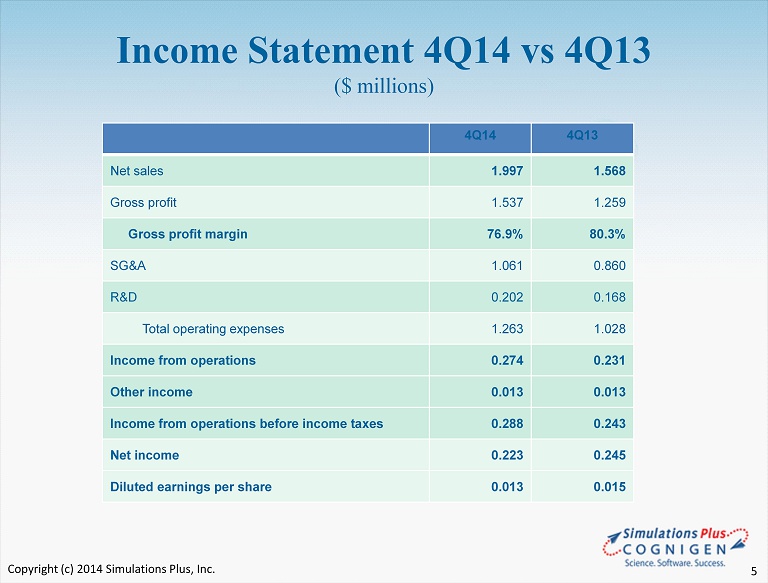
Income Statement 4Q14 vs 4Q13 ($ millions) 4Q14 4Q13 Net sales 1.997 1.568 Gross profit 1.537 1.259 Gross profit margin 76.9% 80.3% SG&A 1.061 0.860 R&D 0.202 0.168 Total operating expenses 1.263 1.028 Income from operations 0.274 0.231 Other income 0.013 0.013 Income from operations before income taxes 0.288 0.243 Net income 0.223 0.245 Diluted earnings per share 0.013 0.015 Copyright (c) 2014 Simulations Plus, Inc. 5
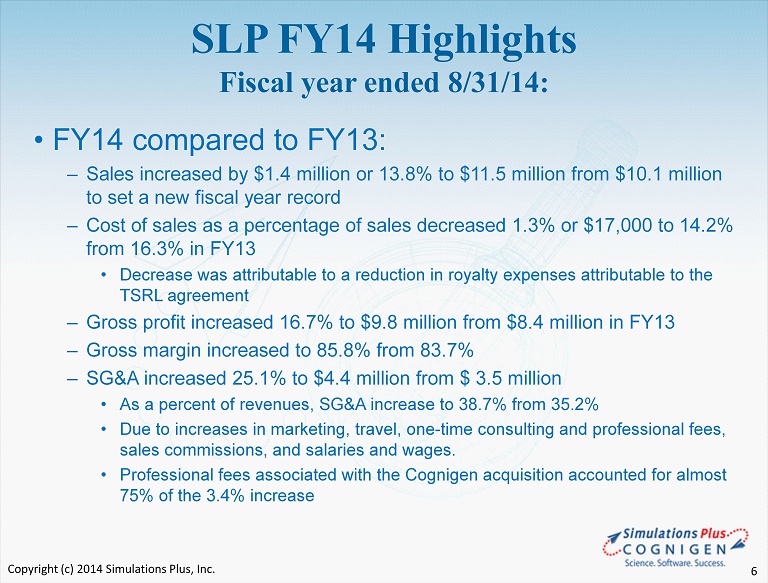
• FY14 compared to FY13: – Sales increased by $1.4 million or 13.8% to $11.5 million from $10.1 million to set a new fiscal year record – Cost of sales as a percentage of sales decreased 1.3% or $ 17,000 to 14.2% from 16.3% in FY13 • Decrease was attributable to a reduction in royalty expenses attributable to the TSRL agreement – Gross profit increased 16.7% to $9.8 million from $8.4 million in FY13 – Gross margin increased to 85.8% from 83.7% – SG&A increased 25.1% to $4.4 million from $ 3.5 million • As a percent of revenues, SG&A increase to 38.7% from 35.2% • Due to increases in marketing, travel, one - time consulting and professional fees, sales commissions, and salaries and wages. • Professional fees associated with the Cognigen acquisition accounted for almost 75% of the 3.4% increase SLP FY14 Highlights Fiscal year ended 8/31/14: Copyright (c) 2014 Simulations Plus, Inc. 6
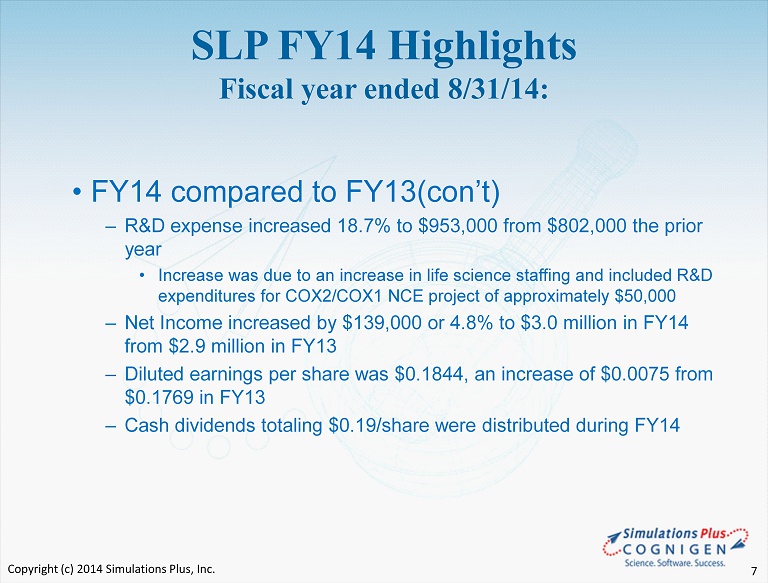
• FY14 compared to FY13 ( con’t ) – R&D expense increased 18.7% to $953,000 from $802,000 the prior year • Increase was due to an increase in life science staffing and included R&D expenditures for COX2/COX1 NCE project of approximately $50,000 – Net Income increased by $139,000 or 4.8% to $3.0 million in FY14 from $ 2.9 million in FY13 – Diluted earnings per share was $0.1844, an increase of $0.0075 from $0.1769 in FY13 – Cash dividends totaling $0.19/share were distributed during FY14 SLP FY14 Highlights Fiscal year ended 8/31/14: Copyright (c) 2014 Simulations Plus, Inc. 7
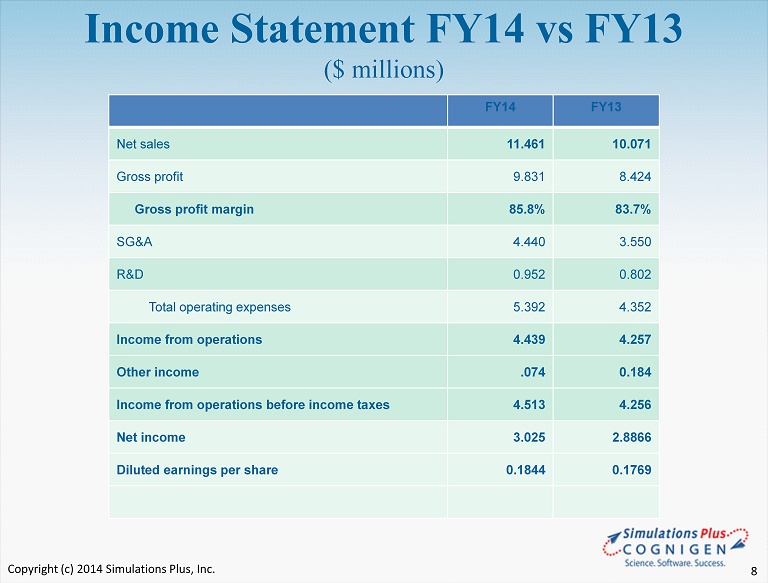
Income Statement FY14 vs FY13 ($ millions) FY14 FY13 Net sales 11.461 10.071 Gross profit 9.831 8.424 Gross profit margin 85.8% 83.7% SG&A 4.440 3.550 R&D 0.952 0.802 Total operating expenses 5.392 4.352 Income from operations 4.439 4.257 Other income .074 0.184 Income from operations before income taxes 4.513 4.256 Net income 3.025 2.8866 Diluted earnings per share 0.1844 0.1769 Copyright (c) 2014 Simulations Plus, Inc. 8
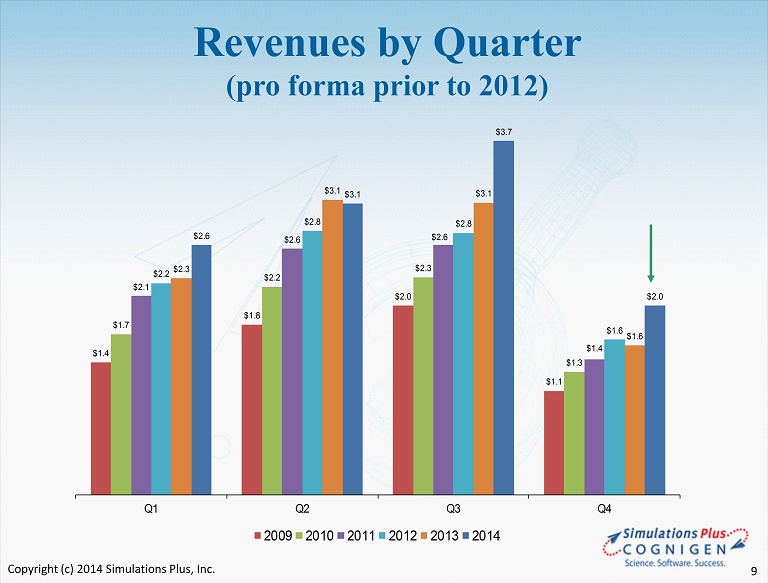
$1.4 $1.8 $2.0 $1.1 $1.7 $2.2 $2.3 $1.3 $2.1 $2.6 $2.6 $1.4 $2.2 $2.8 $2.8 $1.6 $2.3 $3.1 $3.1 $1.6 $2.6 $3.1 $3.7 $2.0 Q1 Q2 Q3 Q4 2009 2010 2011 2012 2013 2014 Revenues by Quarter (pro forma prior to 2012) Copyright (c) 2014 Simulations Plus, Inc. 9
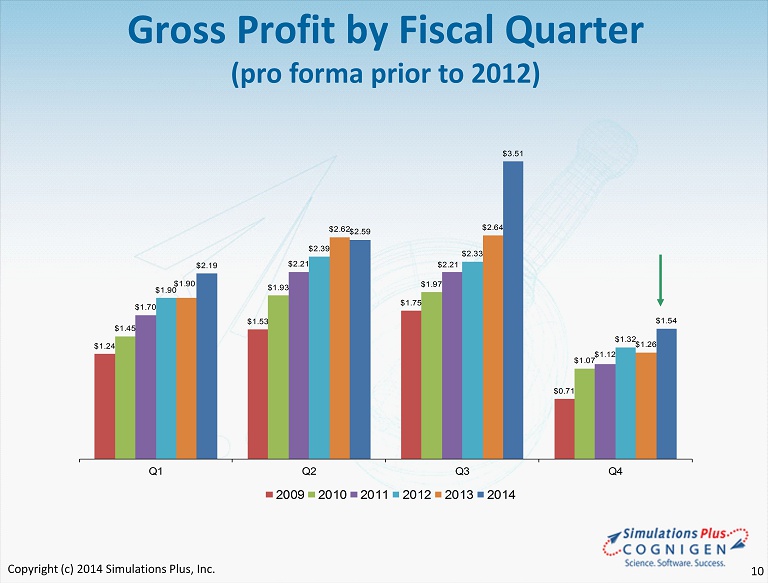
$1.24 $1.53 $1.75 $0.71 $1.45 $1.93 $1.97 $1.07 $1.70 $2.21 $2.21 $1.12 $1.90 $2.39 $2.33 $1.32 $1.90 $2.62 $2.64 $1.26 $2.19 $2.59 $3.51 $1.54 Q1 Q2 Q3 Q4 2009 2010 2011 2012 2013 2014 Gross Profit by Fiscal Quarter (pro forma prior to 2012) Copyright (c) 2014 Simulations Plus, Inc. 10
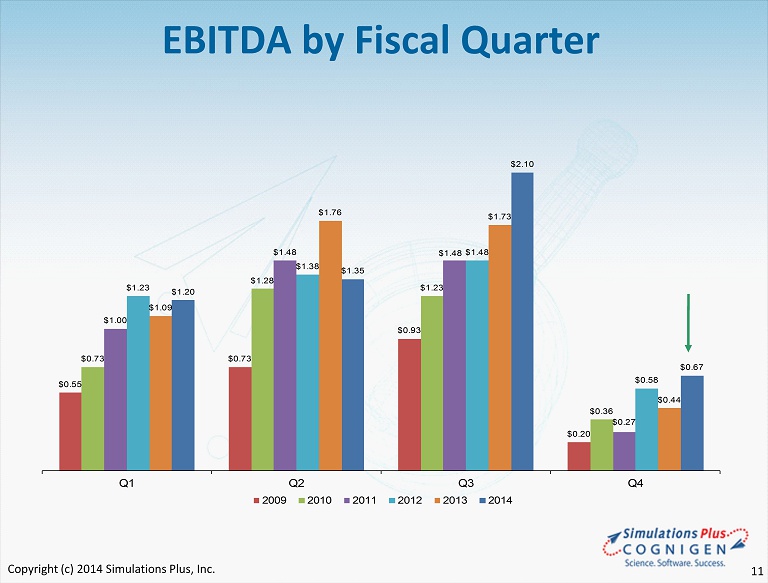
$0.55 $0.73 $0.93 $0.20 $0.73 $1.28 $1.23 $0.36 $1.00 $1.48 $1.48 $0.27 $1.23 $1.38 $1.48 $0.58 $1.09 $1.76 $1.73 $0.44 $1.20 $1.35 $2.10 $0.67 Q1 Q2 Q3 Q4 2009 2010 2011 2012 2013 2014 EBITDA by Fiscal Quarter Copyright (c) 2014 Simulations Plus, Inc. 11
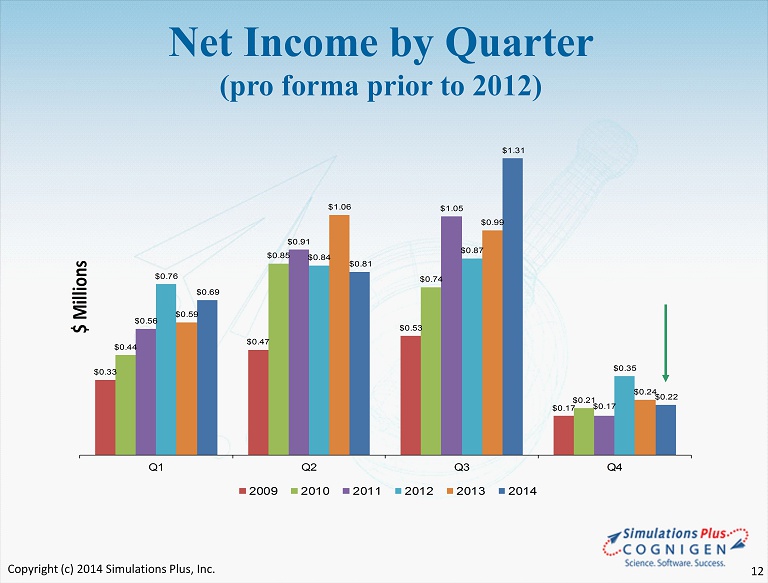
Net Income by Quarter (pro forma prior to 2012) $0.33 $0.47 $0.53 $0.17 $0.44 $0.85 $0.74 $0.21 $0.56 $0.91 $1.05 $0.17 $0.76 $0.84 $0.87 $0.35 $0.59 $1.06 $0.99 $0.24 $0.69 $0.81 $1.31 $0.22 Q1 Q2 Q3 Q4 $ Millions 2009 2010 2011 2012 2013 2014 Copyright (c) 2014 Simulations Plus, Inc. 12
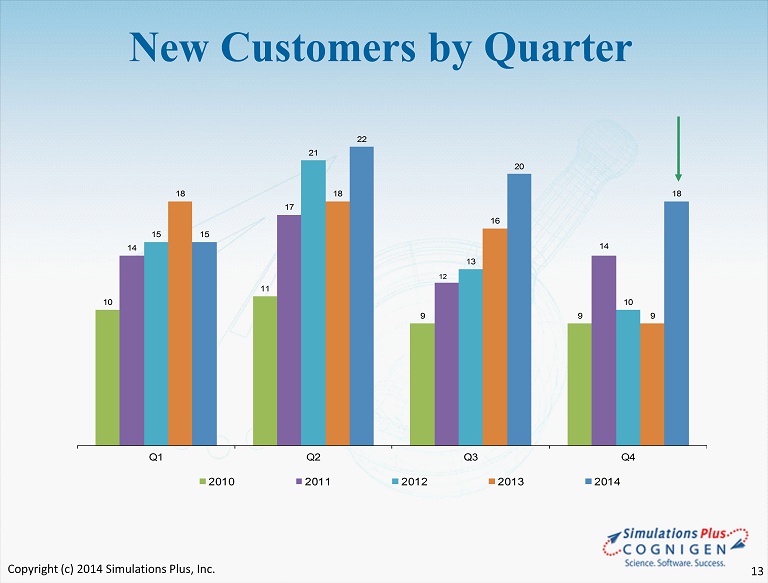
10 11 9 9 14 17 12 14 15 21 13 10 18 18 16 9 15 22 20 18 Q1 Q2 Q3 Q4 2010 2011 2012 2013 2014 New Customers by Quarter Copyright (c) 2014 Simulations Plus, Inc. 13
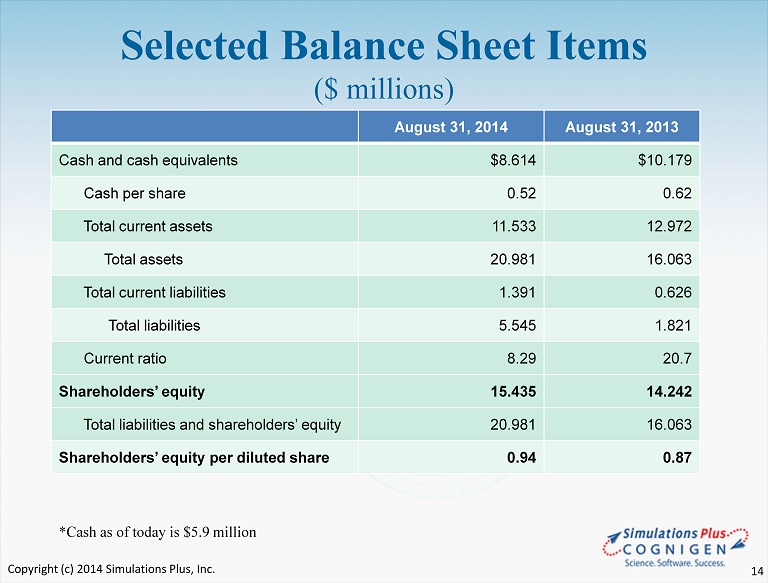
Selected Balance Sheet Items ($ millions) August 31, 2014 August 31, 2013 Cash and cash equivalents $8.614 $10.179 Cash per share 0.52 0.62 Total current assets 11.533 12.972 Total assets 20.981 16.063 Total current liabilities 1.391 0.626 Total liabilities 5.545 1.821 Current ratio 8.29 20.7 Shareholders’ equity 15.435 14.242 Total liabilities and shareholders’ equity 20.981 16.063 Shareholders’ equity per diluted share 0.94 0.87 *Cash as of today is $5.9 million Copyright (c) 2014 Simulations Plus, Inc. 14
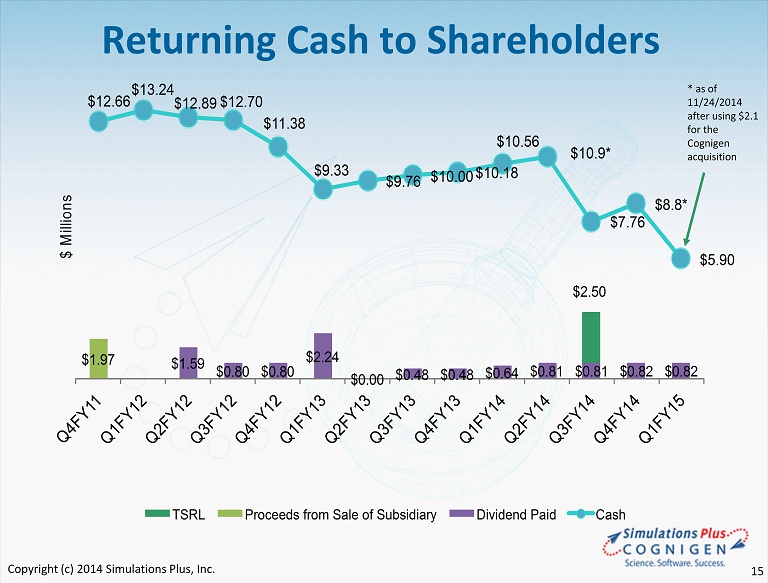
$1.59 $0.80 $0.80 $2.24 $0.00 $0.48 $0.48 $0.64 $0.81 $0.81 $0.82 $0.82 $1.97 $2.50 $12.66 $13.24 $12.89 $12.70 $11.38 $9.33 $9.76 $10.00 $10.18 $10.56 $10.9* $7.76 $8.8* $5.90 Q 4 F Y 1 1 Q 1 F Y 1 2 Q 2 F Y 1 2 Q 3 F Y 1 2 Q 4 F Y 1 2 Q 1 F Y 1 3 Q 2 F Y 1 3 Q 3 F Y 1 3 Q 4 F Y 1 3 Q 1 F Y 1 4 Q 2 F Y 1 4 Q 3 F Y 1 4 Q 4 F Y 1 4 Q 1 F Y 1 5 $ M i l l i o n s TSRL Proceeds from Sale of Subsidiary Dividend Paid Cash Returning Cash to Shareholders * as of 11/24/ 2014 after using $2.1 for the Cognigen acquisition Copyright (c) 2014 Simulations Plus, Inc. 15
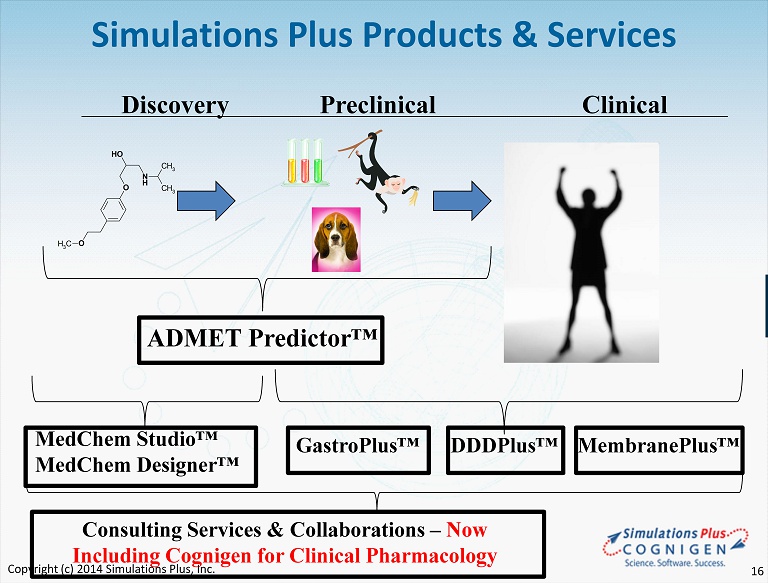
N H O OH O CH 3 CH 3 CH 3 Discovery Preclinical Clinical MedChem Studio™ MedChem Designer™ GastroPlus™ DDDPlus™ ADMET Predictor™ Simulations Plus Products & Services Consulting Services & Collaborations – Now Including Cognigen for Clinical Pharmacology MembranePlus™ Copyright (c) 2014 Simulations Plus, Inc. 16
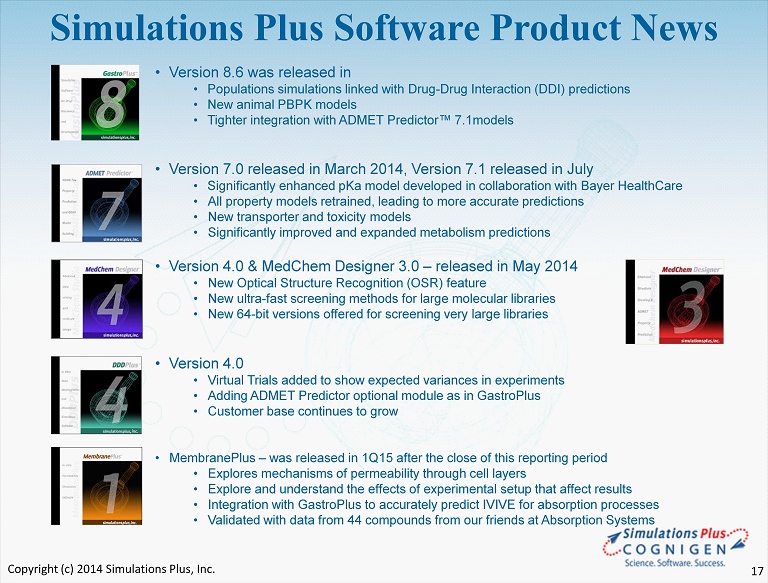
Simulations Plus Software Product News • Version 8.6 was released in • Populations simulations linked with Drug - Drug Interaction (DDI) predictions • New animal PBPK models • Tighter integration with ADMET Predictor™ 7.1models • Version 7.0 released in March 2014, Version 7.1 released in July • Significantly enhanced pKa model developed in collaboration with Bayer HealthCare • All property models retrained, leading to more accurate predictions • New transporter and toxicity models • Significantly improved and expanded metabolism predictions • Version 4.0 & MedChem Designer 3.0 – released in May 2014 • New Optical Structure Recognition (OSR) feature • New ultra - fast screening methods for large molecular libraries • New 64 - bit versions offered for screening very large libraries • Version 4.0 • Virtual Trials added to show expected variances in experiments • Adding ADMET Predictor optional module as in GastroPlus • Customer base continues to grow • MembranePlus – was released in 1Q15 after the close of this reporting period • Explores mechanisms of permeability through cell layers • Explore and understand the effects of experimental setup that affect results • Integration with GastroPlus to accurately predict IVIVE for absorption processes • Validated with data from 44 compounds from our friends at Absorption Systems Copyright (c) 2014 Simulations Plus, Inc. 17
Incorporated in 1992 in Buffalo, NY First contract research organization to offer PK/PD modeling and simulation services to Pharma 35 employees: ~1/3 scientists, ~1/3 data programmers, ~1/3 administrative support Cognigen Corporation: History Copyright (c) 2014 Simulations Plus, Inc. 18
Modeling & simulation support for 30 - 40 drugs per year Total of >100 different compounds over the last 5 years Experience in all phases of development Pre - clinical through commercialization, Phase 1 – Phase 4 Well - established quality management system and successful client audit record 44 client audits over the last 10 years; no findings Track record of successfully utilizing pharmacometric modeling and simulation to support regulatory filings >25 regulatory submissions over the last 5 years alone Cognigen Corporation: Overview Copyright (c) 2014 Simulations Plus, Inc. 19
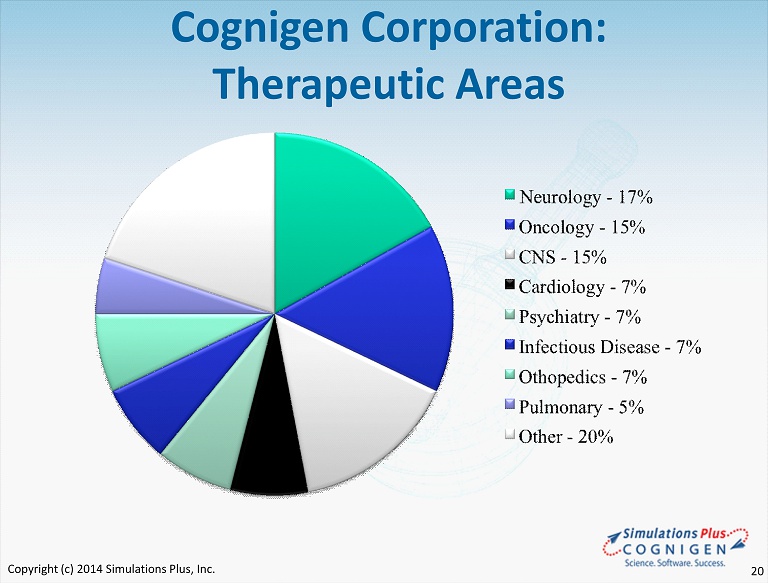
Cognigen Corporation: Therapeutic Areas Copyright (c) 2014 Simulations Plus, Inc. 20
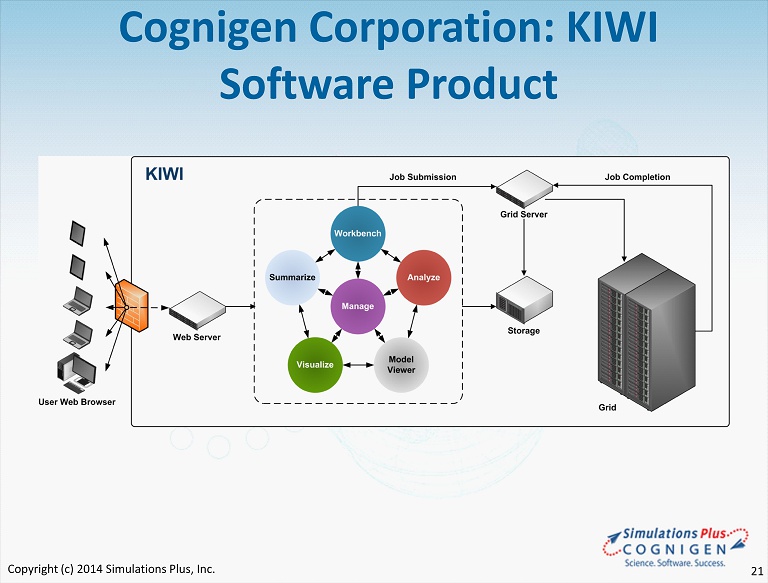
Cognigen Corporation: KIWI Software Product Copyright (c) 2014 Simulations Plus, Inc. 21
Marketing and Sales Program • Conferences/Scientific Meetings continue to be primary source of leads • During FY14 we participated in 48 scientific meetings and conferences in the U.S., Europe, and Asia with 30 scientific posters and presentations. In 1Q14, we presented at our first aerospace conference. (In 1Q15 we presented at our first MRI conference.) • Trainings and Workshops • Conducted 21 on - site training courses at client sites in FY14 • Conducted training workshops in Germany, New Jersey, Japan and Korea • Strategic Digital Marketing Initiatives continue • Hosted 7 webinars on our new software updates & applications - over 1100 registrations • Active updates of LinkedIn, Facebook, and Twitter accounts help with outreach programs • Collaborations/Consulting/Grants – Ongoing 5 - year collaboration with the FDA Center for Food Safety and Applied Nutrition to build toxicity models with ADMET Predictor/Modeler™ for food additives and contaminants – 5 - year collaboration with the FDA’s Office of Testing and Research to determine the value of mechanistic absorption modeling and IVIVCs – New funded collaboration with the FDA to further improve our ocular modeling capabilities – Consulting studies continue – 5 active projects, 4 in proposal stage • We believe fundamental industry shift continues – GastroPlus User Group now has over 560 members on LinkedIn – 75 new customers during FY14 (includes new companies as well as new departments within existing large customers) – New companies in U.S., Europe, India, Japan, China, and Korea – New divisions at the U.S. EPA and Chinese FDA added licenses of multiple programs Copyright (c) 2014 Simulations Plus, Inc. 22
Additional Growth Opportunities • MembranePlus™: new software product to simulate in vitro permeability experiments • Released in 1Q15 after the end of this reporting period • Continued enhancement of current software products are expected to expand coverage into new areas: • Dermal and improved oral cavity dosing modules in GastroPlus™ • Addition of biologics (antibodies) to GastroPlus • Addition of large animals to GastroPlus • Penetration of clinical pharmacology departments to provide more detailed mechanistic modeling for clinical trial data analysis • Cloud offering – using cloud computing to offer our software and services • AEROModeler™ - new software product to predict aerodynamic force coefficients for arbitrary missile shapes at any Mach number and angle of attack • Other aerospace opportunities also identified • MRIModeler™ - application of our artificial neural network ensemble (ANNE) technology to analysis of magnetic resonance imaging (MRI) data to classify patients as healthy or likely to experience autism Copyright (c) 2014 Simulations Plus, Inc. 23
Summary • For FY14: - Revenues and earnings continued six - year - plus profitable trend - Record revenues and earnings - Buyout of royalty agreement that is expected to reduce expenses going forward • Continuing to Grow: - Staff expansions continued in FY14 in Simulations Plus, then 35 new staff added with acquisition of Cognigen just after the end of the fiscal year - Continuing to seek and interview additional scientists and engineers - Life Sciences and Computational Technologies teams support marketing and sales • Aggressive Marketing and Sales Activities - Continue intensive conference/trade show/workshop schedule - Workshops scheduled for North America, Europe and Asia in 2015 - New courses offered that focus on specific research functions • Strong cash position – returning cash to shareholders - Cash dividends totaling approximately $9 million have been distributed, yet cash remains at nearly $5.6 million as of today. Dividend expected to remain at $0.05/share/quarter, subject to Board of Directors approval each quarter Copyright (c) 2014 Simulations Plus, Inc. 24
Q&A Copyright (c) 2014 Simulations Plus, Inc. 25
R97-NOS$Q8Z9R.GUXZ_Y^JM`/F)B'09R.GUXJ
MP43DE<#W7[O7KQ_G^847/*8]<@7BCG\@]DRL8%^;,789R.GUX_S_)3`%SN
MBZ)SD?SX_P`_RL!$ZE,?4=.G7B@(@(RF.F &X//R]_RZ4+;X"@*3@\Y'T]N1_GZS^0P/W#Z9VC\NG3_`#]00-Q\AXX^
MZ..G'3I_GZG,PLB!8.F5/#=AGT]N1S_GN"#`'RGKSQ]/;D?Y^LXMR!G;C'&-
MO3IQTZ4\'G`_^M0;<TYCVGYB>.3S
MT/KUI?*7NW3[V3TZ\GG_`#_(N%BN8@,Y9??)^O\`A_GL&(
O'O^GY5]4@/]F73`X/V>3.1C`VGKQTY_3\CG861-
MI:$:5;<_\NT?0?[*]/>IMA]#^`^G3WIFE%3I-J#C_CVCZ?[J>]3C`'7'3OTZ
M>_6IT+Y;D>QO3\A_GF@ICG!_+_/-28&.N..YZ=/?K00/[V./7I[]>M&@@KC@_P#CP^O7WJ0XYRW8YR?KSUZT,N,D[>,YR?KR>>O^?H:!RD1'
M7/\`X]^/7W_S]0C'_P!E_7WJ1@H.",X!SG'/7D\_Y_D?+D9'8GD#GKUYHN@Y
M1FPX!`/MD?SHV'^Z?;(_G4B@8!S]0>_N>:`!D9;/U/7I[T:!RD81NP(^H^G7
MVH((Z^G?\.OM_GZ2(!P=V>G<<_=]Z3`)4'G)'/'/3WZ?Y^JN@Y2,#_)_K[4H
M0GG!_+_/%.4*0..I]N>G'7I2H%(S[],]?;KTIW0*4H>X/3G`^O
M3VJ0@?W_`/Q[K[=>E!`()W=SC!^O'6BZ'RD94C[V?P'UZ>U)M)YQG_=_'I[5
M*ZY)PPQS@YZ=>!S_`)_D8`!'`)/\)Z=>!S1="42,J>X//H/Y4;,G@?\`?(_E
M3V7+'#<9]>GL.:`,=6`)/\)Z?3FBZ#E&!&R.#_P$?3I[T!&XP#[;1].GO4BX
M)X;'3TZ=.:50O'S8Z=^A^7WZT:!RD6QLYQ^0^G3WK\X?V]_P#@IK^V%^P=
M^W9K6@S>$;+7/AEJNEZ;+X:TC7M--O%,!90?:I+.]B4/YHN3,KA_-5>/W8^4
MU^D6%'?'3OTZ>_6J7B3PWX:\8Z%-X8\9>'=/UC2[@#[1IFK645U;R$="T4H9
M&/U!ZUZ>58W!X'$N6)HJK!IIQ>F]M4^C5OQW/)SG+L;C\*H83$.C4BU)22O>
MR:M)=4[Z^B/R2_:<_P""_'BWXT?`[Q!\)/A]^SE:>$9_$^CW&EZGKE_XN.I&
M"TN(VBG$,:VEN%D:-F42,QV[B0N0&'HO_!!G]B#XE^!-Q321RS7^QL,D6V%(XB1B42R,/E5&?[X\*?LJ_LK^`];C\
M2^!OV8?AOHFI0MYD&I:1X$TVVN(6SG