0001022671--12-312024Q2falsehttp://fasb.org/us-gaap/2024#OtherAssetsNoncurrenthttp://fasb.org/us-gaap/2024#OtherAssetsNoncurrenthttp://fasb.org/us-gaap/2024#OtherAssetsNoncurrenthttp://fasb.org/us-gaap/2024#OtherAssetsNoncurrenthttp://fasb.org/us-gaap/2024#OtherAssetsNoncurrenthttp://fasb.org/us-gaap/2024#OtherAssetsNoncurrent0001022671us-gaap:FairValueInputsLevel3Memberus-gaap:FairValueMeasurementsRecurringMember2024-06-300001022671us-gaap:FairValueInputsLevel2Memberus-gaap:FairValueMeasurementsRecurringMember2024-06-300001022671us-gaap:FairValueInputsLevel1Memberus-gaap:FairValueMeasurementsRecurringMember2024-06-300001022671us-gaap:FairValueMeasurementsRecurringMember2024-06-300001022671us-gaap:FairValueInputsLevel3Memberus-gaap:FairValueMeasurementsRecurringMember2023-12-310001022671us-gaap:FairValueInputsLevel2Memberus-gaap:FairValueMeasurementsRecurringMember2023-12-310001022671us-gaap:FairValueInputsLevel1Memberus-gaap:FairValueMeasurementsRecurringMember2023-12-310001022671us-gaap:FairValueMeasurementsRecurringMember2023-12-310001022671stld:UnitedSteelSupplyLlcMember2024-01-012024-06-300001022671stld:MesabiNuggetMember2024-01-012024-06-300001022671stld:UnitedSteelSupplyLlcMember2023-01-012023-12-310001022671stld:MesabiNuggetMember2023-01-012023-12-310001022671us-gaap:TreasuryStockCommonMember2024-06-300001022671us-gaap:RetainedEarningsMember2024-06-300001022671us-gaap:NoncontrollingInterestMember2024-06-300001022671us-gaap:CommonStockMember2024-06-300001022671us-gaap:AdditionalPaidInCapitalMember2024-06-300001022671us-gaap:AccumulatedOtherComprehensiveIncomeMember2024-06-300001022671stld:RedeemableNoncontrollingInterestMember2024-06-300001022671us-gaap:TreasuryStockCommonMember2024-03-310001022671us-gaap:RetainedEarningsMember2024-03-310001022671us-gaap:NoncontrollingInterestMember2024-03-310001022671us-gaap:CommonStockMember2024-03-310001022671us-gaap:AdditionalPaidInCapitalMember2024-03-310001022671us-gaap:AccumulatedOtherComprehensiveIncomeMember2024-03-310001022671stld:RedeemableNoncontrollingInterestMember2024-03-310001022671us-gaap:TreasuryStockCommonMember2023-12-310001022671us-gaap:RetainedEarningsMember2023-12-310001022671us-gaap:NoncontrollingInterestMember2023-12-310001022671us-gaap:CommonStockMember2023-12-310001022671us-gaap:AdditionalPaidInCapitalMember2023-12-310001022671us-gaap:AccumulatedOtherComprehensiveIncomeMember2023-12-310001022671stld:RedeemableNoncontrollingInterestMember2023-12-310001022671us-gaap:TreasuryStockCommonMember2023-06-300001022671us-gaap:RetainedEarningsMember2023-06-300001022671us-gaap:NoncontrollingInterestMember2023-06-300001022671us-gaap:CommonStockMember2023-06-300001022671us-gaap:AdditionalPaidInCapitalMember2023-06-300001022671us-gaap:AccumulatedOtherComprehensiveIncomeMember2023-06-300001022671stld:RedeemableNoncontrollingInterestMember2023-06-300001022671us-gaap:TreasuryStockCommonMember2023-03-310001022671us-gaap:RetainedEarningsMember2023-03-310001022671us-gaap:NoncontrollingInterestMember2023-03-310001022671us-gaap:CommonStockMember2023-03-310001022671us-gaap:AdditionalPaidInCapitalMember2023-03-310001022671us-gaap:AccumulatedOtherComprehensiveIncomeMember2023-03-310001022671stld:RedeemableNoncontrollingInterestMember2023-03-310001022671us-gaap:TreasuryStockCommonMember2022-12-310001022671us-gaap:RetainedEarningsMember2022-12-310001022671us-gaap:NoncontrollingInterestMember2022-12-310001022671us-gaap:CommonStockMember2022-12-310001022671us-gaap:AdditionalPaidInCapitalMember2022-12-310001022671us-gaap:AccumulatedOtherComprehensiveIncomeMember2022-12-310001022671stld:RedeemableNoncontrollingInterestMember2022-12-310001022671us-gaap:TreasuryStockCommonMember2024-04-012024-06-300001022671us-gaap:AdditionalPaidInCapitalMember2024-04-012024-06-300001022671us-gaap:TreasuryStockCommonMember2024-01-012024-03-310001022671us-gaap:AdditionalPaidInCapitalMember2024-01-012024-03-310001022671us-gaap:TreasuryStockCommonMember2023-04-012023-06-300001022671us-gaap:AdditionalPaidInCapitalMember2023-04-012023-06-300001022671us-gaap:TreasuryStockCommonMember2023-01-012023-03-310001022671us-gaap:AdditionalPaidInCapitalMember2023-01-012023-03-310001022671us-gaap:OperatingSegmentsMemberus-gaap:NonUsMemberus-gaap:CorporateAndOtherMember2024-04-012024-06-300001022671us-gaap:OperatingSegmentsMemberus-gaap:NonUsMemberstld:SteelOperationsMember2024-04-012024-06-300001022671us-gaap:OperatingSegmentsMemberus-gaap:NonUsMemberstld:SteelFabricationOperationsMember2024-04-012024-06-300001022671us-gaap:OperatingSegmentsMemberus-gaap:NonUsMemberstld:MetalsRecyclingOperationsMember2024-04-012024-06-300001022671us-gaap:OperatingSegmentsMemberstld:SteelOperationsMemberstld:OtherSegmentsMember2024-04-012024-06-300001022671us-gaap:OperatingSegmentsMemberstld:SteelFabricationOperationsMemberstld:OtherSegmentsMember2024-04-012024-06-300001022671us-gaap:OperatingSegmentsMemberstld:MetalsRecyclingOperationsMemberstld:OtherSegmentsMember2024-04-012024-06-300001022671us-gaap:OperatingSegmentsMemberstld:AluminumOperationsMemberstld:OtherSegmentsMember2024-04-012024-06-300001022671us-gaap:OperatingSegmentsMembercountry:USus-gaap:CorporateAndOtherMember2024-04-012024-06-300001022671us-gaap:OperatingSegmentsMembercountry:USstld:SteelOperationsMember2024-04-012024-06-300001022671us-gaap:OperatingSegmentsMembercountry:USstld:SteelFabricationOperationsMember2024-04-012024-06-300001022671us-gaap:OperatingSegmentsMembercountry:USstld:MetalsRecyclingOperationsMember2024-04-012024-06-300001022671us-gaap:IntersegmentEliminationMemberstld:OtherSegmentsMember2024-04-012024-06-300001022671us-gaap:RelatedPartyMember2024-04-012024-06-300001022671us-gaap:NonUsMember2024-04-012024-06-300001022671us-gaap:NonrelatedPartyMember2024-04-012024-06-300001022671country:US2024-04-012024-06-300001022671us-gaap:OperatingSegmentsMemberus-gaap:NonUsMemberus-gaap:CorporateAndOtherMember2024-01-012024-06-300001022671us-gaap:OperatingSegmentsMemberus-gaap:NonUsMemberstld:SteelOperationsMember2024-01-012024-06-300001022671us-gaap:OperatingSegmentsMemberus-gaap:NonUsMemberstld:SteelFabricationOperationsMember2024-01-012024-06-300001022671us-gaap:OperatingSegmentsMemberus-gaap:NonUsMemberstld:MetalsRecyclingOperationsMember2024-01-012024-06-300001022671us-gaap:OperatingSegmentsMemberstld:SteelOperationsMemberstld:OtherSegmentsMember2024-01-012024-06-300001022671us-gaap:OperatingSegmentsMemberstld:SteelFabricationOperationsMemberstld:OtherSegmentsMember2024-01-012024-06-300001022671us-gaap:OperatingSegmentsMemberstld:MetalsRecyclingOperationsMemberstld:OtherSegmentsMember2024-01-012024-06-300001022671us-gaap:OperatingSegmentsMemberstld:AluminumOperationsMemberstld:OtherSegmentsMember2024-01-012024-06-300001022671us-gaap:OperatingSegmentsMembercountry:USus-gaap:CorporateAndOtherMember2024-01-012024-06-300001022671us-gaap:OperatingSegmentsMembercountry:USstld:SteelOperationsMember2024-01-012024-06-300001022671us-gaap:OperatingSegmentsMembercountry:USstld:SteelFabricationOperationsMember2024-01-012024-06-300001022671us-gaap:OperatingSegmentsMembercountry:USstld:MetalsRecyclingOperationsMember2024-01-012024-06-300001022671us-gaap:IntersegmentEliminationMemberstld:OtherSegmentsMember2024-01-012024-06-300001022671us-gaap:RelatedPartyMember2024-01-012024-06-300001022671us-gaap:NonUsMember2024-01-012024-06-300001022671us-gaap:NonrelatedPartyMember2024-01-012024-06-300001022671country:US2024-01-012024-06-300001022671us-gaap:OperatingSegmentsMemberus-gaap:NonUsMemberus-gaap:CorporateAndOtherMember2023-04-012023-06-300001022671us-gaap:OperatingSegmentsMemberus-gaap:NonUsMemberstld:SteelOperationsMember2023-04-012023-06-300001022671us-gaap:OperatingSegmentsMemberus-gaap:NonUsMemberstld:SteelFabricationOperationsMember2023-04-012023-06-300001022671us-gaap:OperatingSegmentsMemberus-gaap:NonUsMemberstld:MetalsRecyclingOperationsMember2023-04-012023-06-300001022671us-gaap:OperatingSegmentsMemberus-gaap:CorporateAndOtherMemberstld:OtherSegmentsMember2023-04-012023-06-300001022671us-gaap:OperatingSegmentsMemberstld:SteelOperationsMemberstld:OtherSegmentsMember2023-04-012023-06-300001022671us-gaap:OperatingSegmentsMemberstld:SteelFabricationOperationsMemberstld:OtherSegmentsMember2023-04-012023-06-300001022671us-gaap:OperatingSegmentsMemberstld:MetalsRecyclingOperationsMemberstld:OtherSegmentsMember2023-04-012023-06-300001022671us-gaap:OperatingSegmentsMembercountry:USus-gaap:CorporateAndOtherMember2023-04-012023-06-300001022671us-gaap:OperatingSegmentsMembercountry:USstld:SteelOperationsMember2023-04-012023-06-300001022671us-gaap:OperatingSegmentsMembercountry:USstld:SteelFabricationOperationsMember2023-04-012023-06-300001022671us-gaap:OperatingSegmentsMembercountry:USstld:MetalsRecyclingOperationsMember2023-04-012023-06-300001022671us-gaap:IntersegmentEliminationMemberstld:OtherSegmentsMember2023-04-012023-06-300001022671us-gaap:RelatedPartyMember2023-04-012023-06-300001022671us-gaap:NonUsMember2023-04-012023-06-300001022671us-gaap:NonrelatedPartyMember2023-04-012023-06-300001022671country:US2023-04-012023-06-300001022671us-gaap:OperatingSegmentsMemberus-gaap:NonUsMemberus-gaap:CorporateAndOtherMember2023-01-012023-06-300001022671us-gaap:OperatingSegmentsMemberus-gaap:NonUsMemberstld:SteelOperationsMember2023-01-012023-06-300001022671us-gaap:OperatingSegmentsMemberus-gaap:NonUsMemberstld:SteelFabricationOperationsMember2023-01-012023-06-300001022671us-gaap:OperatingSegmentsMemberus-gaap:NonUsMemberstld:MetalsRecyclingOperationsMember2023-01-012023-06-300001022671us-gaap:OperatingSegmentsMemberus-gaap:CorporateAndOtherMemberstld:OtherSegmentsMember2023-01-012023-06-300001022671us-gaap:OperatingSegmentsMemberstld:SteelOperationsMemberstld:OtherSegmentsMember2023-01-012023-06-300001022671us-gaap:OperatingSegmentsMemberstld:SteelFabricationOperationsMemberstld:OtherSegmentsMember2023-01-012023-06-300001022671us-gaap:OperatingSegmentsMemberstld:MetalsRecyclingOperationsMemberstld:OtherSegmentsMember2023-01-012023-06-300001022671us-gaap:OperatingSegmentsMembercountry:USus-gaap:CorporateAndOtherMember2023-01-012023-06-300001022671us-gaap:OperatingSegmentsMembercountry:USstld:SteelOperationsMember2023-01-012023-06-300001022671us-gaap:OperatingSegmentsMembercountry:USstld:SteelFabricationOperationsMember2023-01-012023-06-300001022671us-gaap:OperatingSegmentsMembercountry:USstld:MetalsRecyclingOperationsMember2023-01-012023-06-300001022671us-gaap:IntersegmentEliminationMemberstld:OtherSegmentsMember2023-01-012023-06-300001022671us-gaap:RelatedPartyMember2023-01-012023-06-300001022671us-gaap:NonUsMember2023-01-012023-06-300001022671us-gaap:NonrelatedPartyMember2023-01-012023-06-300001022671country:US2023-01-012023-06-300001022671stld:UnitedSteelSupplyLlcMember2024-06-300001022671stld:MesabiNuggetMember2024-06-300001022671stld:UnitedSteelSupplyLlcMember2023-12-310001022671stld:MesabiNuggetMember2023-12-310001022671us-gaap:AccumulatedOtherComprehensiveIncomeMember2024-04-012024-06-300001022671us-gaap:AccumulatedOtherComprehensiveIncomeMember2024-01-012024-03-310001022671us-gaap:AccumulatedOtherComprehensiveIncomeMember2023-04-012023-06-300001022671us-gaap:AccumulatedOtherComprehensiveIncomeMember2023-01-012023-03-310001022671us-gaap:NoncontrollingInterestMember2024-04-012024-06-300001022671stld:RedeemableNoncontrollingInterestMember2023-01-012023-03-310001022671us-gaap:NoncontrollingInterestMember2024-01-012024-03-310001022671us-gaap:NoncontrollingInterestMember2023-04-012023-06-300001022671stld:RedeemableNoncontrollingInterestMember2023-04-012023-06-300001022671us-gaap:NoncontrollingInterestMember2023-01-012023-03-310001022671us-gaap:FairValueInputsLevel2Member2024-06-300001022671us-gaap:FairValueInputsLevel2Member2023-12-310001022671us-gaap:IntersegmentEliminationMember2024-04-012024-06-300001022671us-gaap:IntersegmentEliminationMember2024-01-012024-06-300001022671us-gaap:OperatingSegmentsMemberstld:AluminumOperationsMember2023-04-012023-06-300001022671us-gaap:IntersegmentEliminationMember2023-04-012023-06-300001022671us-gaap:OperatingSegmentsMemberstld:AluminumOperationsMember2023-01-012023-06-300001022671us-gaap:IntersegmentEliminationMember2023-01-012023-06-300001022671stld:SteelOperationsMember2024-06-300001022671stld:SteelFabricationOperationsMember2024-06-300001022671stld:MetalsRecyclingOperationsMember2024-06-300001022671stld:SteelOperationsMember2023-12-310001022671stld:SteelFabricationOperationsMember2023-12-310001022671stld:MetalsRecyclingOperationsMember2023-12-310001022671us-gaap:RetainedEarningsMember2024-04-012024-06-300001022671us-gaap:RetainedEarningsMember2024-01-012024-03-3100010226712024-01-012024-03-310001022671us-gaap:RetainedEarningsMember2023-04-012023-06-300001022671us-gaap:RetainedEarningsMember2023-01-012023-03-3100010226712023-01-012023-03-310001022671us-gaap:CommodityContractMemberus-gaap:FairValueInputsLevel3Memberus-gaap:FairValueMeasurementsRecurringMemberus-gaap:FutureMember2024-06-300001022671us-gaap:CommodityContractMemberus-gaap:FairValueInputsLevel2Memberus-gaap:FairValueMeasurementsRecurringMemberus-gaap:FutureMember2024-06-300001022671us-gaap:CommodityContractMemberus-gaap:FairValueInputsLevel1Memberus-gaap:FairValueMeasurementsRecurringMemberus-gaap:FutureMember2024-06-300001022671us-gaap:CommodityContractMemberus-gaap:FairValueMeasurementsRecurringMemberus-gaap:FutureMember2024-06-300001022671us-gaap:CommodityContractMemberus-gaap:FairValueInputsLevel3Memberus-gaap:FairValueMeasurementsRecurringMemberus-gaap:FutureMember2023-12-310001022671us-gaap:CommodityContractMemberus-gaap:FairValueInputsLevel2Memberus-gaap:FairValueMeasurementsRecurringMemberus-gaap:FutureMember2023-12-310001022671us-gaap:CommodityContractMemberus-gaap:FairValueInputsLevel1Memberus-gaap:FairValueMeasurementsRecurringMemberus-gaap:FutureMember2023-12-310001022671us-gaap:CommodityContractMemberus-gaap:FairValueMeasurementsRecurringMemberus-gaap:FutureMember2023-12-310001022671us-gaap:CommodityContractMemberus-gaap:FutureMember2024-06-300001022671us-gaap:CommodityContractMemberus-gaap:FutureMember2023-12-310001022671us-gaap:OperatingSegmentsMemberstld:SteelOperationsMember2024-04-012024-06-300001022671us-gaap:OperatingSegmentsMemberstld:SteelFabricationOperationsMember2024-04-012024-06-300001022671us-gaap:OperatingSegmentsMemberstld:MetalsRecyclingOperationsMember2024-04-012024-06-300001022671us-gaap:OperatingSegmentsMemberstld:AluminumOperationsMember2024-04-012024-06-300001022671us-gaap:OperatingSegmentsMemberstld:SteelOperationsMember2024-01-012024-06-300001022671us-gaap:OperatingSegmentsMemberstld:SteelFabricationOperationsMember2024-01-012024-06-300001022671us-gaap:OperatingSegmentsMemberstld:MetalsRecyclingOperationsMember2024-01-012024-06-300001022671us-gaap:OperatingSegmentsMemberstld:AluminumOperationsMember2024-01-012024-06-300001022671us-gaap:OperatingSegmentsMemberstld:SteelOperationsMember2023-04-012023-06-300001022671us-gaap:OperatingSegmentsMemberstld:SteelFabricationOperationsMember2023-04-012023-06-300001022671us-gaap:OperatingSegmentsMemberstld:MetalsRecyclingOperationsMember2023-04-012023-06-300001022671us-gaap:OperatingSegmentsMemberstld:SteelOperationsMember2023-01-012023-06-300001022671us-gaap:OperatingSegmentsMemberstld:SteelFabricationOperationsMember2023-01-012023-06-300001022671us-gaap:OperatingSegmentsMemberstld:MetalsRecyclingOperationsMember2023-01-012023-06-300001022671stld:SeniorNotes2.80PercentDue2024Memberus-gaap:SubsequentEventMember2024-07-310001022671stld:Notes5.375PercentDue2034Memberus-gaap:SubsequentEventMember2024-07-3100010226712024-03-3100010226712023-06-3000010226712023-03-3100010226712022-12-310001022671us-gaap:OperatingSegmentsMemberstld:SteelOperationsMember2024-06-300001022671us-gaap:OperatingSegmentsMemberstld:SteelFabricationOperationsMember2024-06-300001022671us-gaap:OperatingSegmentsMemberstld:MetalsRecyclingOperationsMember2024-06-300001022671us-gaap:OperatingSegmentsMemberstld:AluminumOperationsMember2024-06-300001022671us-gaap:OperatingSegmentsMemberus-gaap:CorporateAndOtherMember2024-04-012024-06-300001022671us-gaap:OperatingSegmentsMemberus-gaap:CorporateAndOtherMember2024-01-012024-06-300001022671us-gaap:OperatingSegmentsMemberus-gaap:CorporateAndOtherMember2023-04-012023-06-300001022671us-gaap:OperatingSegmentsMemberus-gaap:CorporateAndOtherMember2023-01-012023-06-3000010226712024-06-3000010226712023-12-310001022671us-gaap:RelatedPartyMember2024-06-300001022671us-gaap:NonrelatedPartyMember2024-06-300001022671us-gaap:RelatedPartyMember2023-12-310001022671us-gaap:NonrelatedPartyMember2023-12-310001022671stld:UnityAluminumInc.Memberstld:AluminumOperationsMember2024-01-012024-06-300001022671us-gaap:OperatingSegmentsMemberus-gaap:CorporateAndOtherMember2024-06-3000010226712023-04-012023-06-3000010226712023-01-012023-06-300001022671us-gaap:IntersegmentEliminationMember2024-06-3000010226712024-04-012024-06-3000010226712024-08-0600010226712024-01-012024-06-30xbrli:sharesiso4217:USDstld:itemiso4217:USDxbrli:sharesxbrli:purestld:segment

Table of Contents

st

UNITED STATES

SECURITIES AND EXCHANGE COMMISSION

WASHINGTON, D.C. 20549

FORM 10-Q

     Quarterly Report Pursuant to Section 13 or 15(d) of the Securities Exchange Act of 1934 for the quarterly period

      ended June 30, 2024

OR

       Transition Report Pursuant to Section 13 or 15(d) of the Securities Exchange Act of 1934 for the transition period from _______ to _______

Commission File Number 0-21719

Steel Dynamics, Inc.

(Exact name of registrant as specified in its charter)

Indiana


35-1929476

(State or other jurisdiction of incorporation or organization)

(I.R.S. Employer Identification No.)

7575 West Jefferson Blvd, Fort Wayne, IN

46804

(Address of principal executive offices)

(Zip Code)

Registrant’s telephone number, including area code: (260) 969-3500

Not Applicable

(Former name, former address and former fiscal year, if changed since last report.)

Securities registered pursuant to Section 12(b) of the Act.

Title of each class

Trading Symbol

Name of each exchange on which registered

Common Stock voting, $0.0025 par value

STLD

NASDAQ Global Select Market

Indicate by check mark whether the registrant (1) has filed all reports required to be filed by Section 13 or 15(d) of the Securities Exchange Act of 1934 during the preceding 12 months (or for such shorter period that the registrant was required to file such reports), and (2) has been subject to such filing requirements for the past 90 days. Yes    No

Indicate by check mark whether the registrant has submitted electronically every Interactive Data File required to be submitted pursuant to Rule 405 of Regulation S-T (§232.405 of this chapter) during the preceding 12 months (or for such shorter period that the registrant was required to submit such files).   Yes    No

Indicate by check mark whether the registrant is a large accelerated filer, an accelerated filer, a non-accelerated filer, a smaller reporting company, or an emerging growth company. See the definitions of “large accelerated filer,” “accelerated filer,” “smaller reporting company,” and “emerging growth company” in Rule 12b-2 of the Exchange Act.


Large accelerated filer


Accelerated filer


Non-accelerated filer

Smaller reporting company  

Emerging growth company

If an emerging growth company, indicate by check mark if the registrant has elected not to use the extended transition period for complying with any new or revised financial accounting standards provided pursuant to Section 13(a) of the Exchange Act.  

Indicate by check mark whether the registrant is a shell company (as defined in Rule 12b-2 of the Exchange Act). Yes  No

As of August 6, 2024, Registrant had 154,302,528 outstanding shares of common stock.

Table of Contents

STEEL DYNAMICS, INC.

Table of Contents

PART I. Financial Information

Item 1.

Financial Statements:

Page

Consolidated Balance Sheets as of June 30, 2024 (unaudited) and December 31, 2023

1

Consolidated Statements of Income for the three and six-month periods ended June 30, 2024 and 2023 (unaudited)

2

Consolidated Statements of Comprehensive Income for the three and six-month periods ended June 30, 2024 and 2023 (unaudited)

3

Consolidated Statements of Cash Flows for the three and six-month periods ended June 30, 2024 and 2023 (unaudited)

4

Notes to Consolidated Financial Statements (unaudited)

5

Item 2.

Management’s Discussion and Analysis of Financial Condition and Results of Operations

15

Item 3.

Quantitative and Qualitative Disclosures about Market Risk

24

Item 4.

Controls and Procedures

24

PART II. Other Information

Item 1.

Legal Proceedings

25

Item 1A.

Risk Factors

25

Item 2.

Unregistered Sales of Equity Securities and Use of Proceeds

25

Item 3.

Defaults Upon Senior Securities

25

Item 4.

Mine Safety Disclosures

25

Item 5.

Other Information

25

Item 6.

Exhibits

26

Exhibit Index

27

Signature

28

Table of Contents

STEEL DYNAMICS, INC.

CONSOLIDATED BALANCE SHEETS

(in thousands, except share data)

June 30,

December 31,

2024

2023

Assets

(unaudited)

Current assets

Cash and equivalents

$

829,980

$

1,400,887

Short-term investments

418,367

721,210

Accounts receivable, net

1,695,840

1,535,062

Accounts receivable-related parties

79,552

73,245

Inventories

3,073,637

2,894,632

Other current assets

141,635

162,790

Total current assets

6,239,011

6,787,826

Property, plant and equipment, net

7,433,564

6,734,218

Intangible assets, net

242,450

257,759

Goodwill

477,471

477,471

Other assets

668,761

651,146

Total assets

$

15,061,257

$

14,908,420

Liabilities and Equity

Current liabilities

Accounts payable

$

1,205,679

$

1,078,645

Accounts payable-related parties

7,729

9,685

Income taxes payable

6,070

5,524

Accrued payroll and benefits

277,307

469,143

Accrued expenses

343,525

309,312

Current maturities of long-term debt

815,642

459,987

Total current liabilities

2,655,952

2,332,296

Long-term debt

2,212,802

2,611,069

Deferred income taxes

928,321

944,768

Other liabilities

143,968

180,760

Total liabilities

5,941,043

6,068,893

Commitments and contingencies

Redeemable noncontrolling interests

171,212

171,212

Equity

Common stock voting, $0.0025 par value; 900,000,000 shares authorized;

268,142,204 and 268,112,991 shares issued; and 155,617,909 and 160,018,100

shares outstanding, as of June 30, 2024 and December 31, 2023, respectively

651

651

Treasury stock, at cost; 112,524,295 and 108,094,891 shares,

as of June 30, 2024 and December 31, 2023, respectively

(6,489,369)

(5,897,606)

Additional paid-in capital

1,207,771

1,217,610

Retained earnings

14,413,148

13,545,590

Accumulated other comprehensive income (loss)

(1,428)

421

Total Steel Dynamics, Inc. equity

9,130,773

8,866,666

Noncontrolling interests

(181,771)

(198,351)

Total equity

8,949,002

8,668,315

Total liabilities and equity

$

15,061,257

$

14,908,420

See notes to consolidated financial statements.

1

Table of Contents

STEEL DYNAMICS, INC.

CONSOLIDATED STATEMENTS OF INCOME (UNAUDITED)

(in thousands, except per share data)

Three-Month Periods Ended

Six-Month Periods Ended

June 30,

June 30,

2024

2023

2024

2023

Net sales

Unrelated parties

$

4,443,994

$

4,930,422

$

8,940,813

$

9,675,775

Related parties

188,640

151,208

385,824

299,061

Total net sales

4,632,634

5,081,630

9,326,637

9,974,836

Costs of goods sold

3,857,797

3,774,772

7,571,002

7,611,856

Gross profit

774,837

1,306,858

1,755,635

2,362,980

Selling, general and administrative expenses

160,016

141,209

319,523

285,518

Profit sharing

48,053

90,990

110,705

160,565

Amortization of intangible assets

7,645

10,924

15,309

17,802

Operating income

559,123

1,063,735

1,310,098

1,899,095

Interest expense, net of capitalized interest

12,719

20,767

24,697

43,274

Other (income) expense, net

(18,708)

(31,348)

(45,492)

(66,284)

Income before income taxes

565,112

1,074,316

1,330,893

1,922,105

Income tax expense

133,422

258,139

311,703

461,595

Net income

431,690

816,177

1,019,190

1,460,510

Net income attributable to noncontrolling interests

(3,692)

(4,070)

(7,151)

(11,093)

Net income attributable to Steel Dynamics, Inc.

$

427,998

$

812,107

$

1,012,039

$

1,449,417

Basic earnings per share attributable to Steel

Dynamics, Inc. stockholders

$

2.73

$

4.83

$

6.42

$

8.54

Weighted average common shares outstanding

156,856

168,009

157,761

169,803

Diluted earnings per share attributable to Steel

Dynamics, Inc. stockholders, including the effect

of assumed conversions when dilutive

$

2.72

$

4.81

$

6.39

$

8.49

Weighted average common shares and share equivalents outstanding

157,579

168,865

158,467

170,672

Dividends declared per share

$

0.46

$

0.425

$

0.92

$

0.85

See notes to consolidated financial statements.

2

Table of Contents

STEEL DYNAMICS, INC.

CONSOLIDATED STATEMENTS OF COMPREHENSIVE INCOME (UNAUDITED)

(in thousands)

Three-Month Periods Ended

Six-Month Periods Ended

June 30,

June 30,

2024

2023

2024

2023

Net income

$

431,690

$

816,177

$

1,019,190

$

1,460,510

Other comprehensive income - net unrealized (loss) gain on cash

flow hedging derivatives, net of income tax expense (benefit) of

($452) and ($247) for the three months ended, and ($590) and $44

for the six months ended June 30, 2024 and 2023, respectively

(1,415)

(773)

(1,849)

138

Comprehensive income

430,275

815,404

1,017,341

1,460,648

Comprehensive income attributable to noncontrolling interests

(3,692)

(4,070)

(7,151)

(11,093)

Comprehensive income attributable to Steel Dynamics, Inc.

$

426,583

$

811,334

$

1,010,190

$

1,449,555

See notes to consolidated financial statements.

3

Table of Contents

STEEL DYNAMICS, INC.

CONSOLIDATED STATEMENTS OF CASH FLOWS (UNAUDITED)

(in thousands)

Three-Month Periods Ended

Six-Month Periods Ended

June 30,

June 30,

2024

2023

2024

2023

Operating activities:

Net income

$

431,690

$

816,177

$

1,019,190

$

1,460,510

Adjustments to reconcile net income to net cash provided by

operating activities:

Depreciation and amortization

117,053

110,970

232,305

218,664

Equity-based compensation

13,013

11,678

28,625

27,756

Deferred income taxes

4,577

43,380

(16,447)

52,388

Other adjustments

(6,403)

1,541

12,302

(8,465)

Changes in certain assets and liabilities:

Accounts receivable

(36,332)

(16,971)

(167,085)

(87,893)

Inventories

(46,645)

(55,158)

(179,670)

85,954

Other assets

1,973

(4,923)

(10,203)

2,919

Accounts payable

(27,251)

(114,013)

2,248

3,299

Income taxes receivable/payable

(145,676)

(85,486)

19,988

103,761

Accrued expenses

76,562

100,611

(203,475)

(317,304)

Net cash provided by operating activities

382,561

807,806

737,778

1,541,589

Investing activities:

Purchases of property, plant and equipment

(419,166)

(358,280)

(793,476)

(584,599)

Purchases of short-term investments

(63,180)

(165,052)

(269,053)

(521,829)

Proceeds from maturities of short-term investments

298,314

267,969

571,308

539,076

Other investing activities

(25,554)

(217,905)

(11,299)

(215,562)

Net cash used in investing activities

(209,586)

(473,268)

(502,520)

(782,914)

Financing activities:

Issuance of current and long-term debt

580,613

327,132

959,881

721,042

Repayment of current and long-term debt

(590,053)

(321,143)

(1,003,992)

(726,422)

Dividends paid

(72,624)

(72,323)

(140,632)

(131,121)

Purchases of treasury stock

(309,064)

(380,206)

(607,123)

(734,203)

Other financing activities

8,778

(17,579)

(14,330)

(41,028)

Net cash used in financing activities

(382,350)

(464,119)

(806,196)

(911,732)

Decrease in cash, cash equivalents, and restricted cash

(209,375)

(129,581)

(570,938)

(153,057)

Cash, cash equivalents, and restricted cash at beginning of period

1,044,901

1,610,443

1,406,464

1,633,919

Cash, cash equivalents, and restricted cash at end of period

$

835,526

$

1,480,862

$

835,526

$

1,480,862

Supplemental disclosure information:

Cash paid for interest

$

41,037

$

41,781

$

50,364

$

51,377

Cash paid for income taxes, net

$

273,323

$

308,055

$

301,713

$

312,758

See notes to consolidated financial statements.

4

Table of Contents

STEEL DYNAMICS, INC.

NOTES TO CONSOLIDATED FINANCIAL STATEMENTS (UNAUDITED)

Note 1. Description of the Business and Significant Accounting Policies

Description of the Business

Steel Dynamics, Inc. (SDI), together with its subsidiaries (the company), is one of the largest and most diversified domestic steel producers and metals recycler, combined with a meaningful steel fabrication manufacturing platform. Effective the fourth quarter 2023, the company changed its reportable segments, consistent with how it currently manages the business, representing four reporting segments: steel operations, metals recycling operations, steel fabrication operations, and aluminum operations. Segment information provided within this Form 10-Q, including within Note 7. Segment Information, has been recast for all prior periods consistent with the current reportable segment presentation.

Steel Operations Segment. Steel operations include the company’s electric arc furnace (EAF) steel mills, including Butler Flat Roll Division, Columbus Flat Roll Division, Southwest-Sinton Flat Roll Division, Structural and Rail Division, Engineered Bar Products Division, Roanoke Bar Division, Steel of West Virginia, steel coating and processing operations at The Techs, Heartland Flat Roll Division, United Steel Supply (USS), Vulcan Threaded Products, Inc., warehouse operations in Mexico, and SDI Biocarbon Solutions, LLC, a joint venture to construct and operate a biocarbon production facility.

Metals Recycling Operations Segment. Metals recycling operations include the company’s OmniSource ferrous and nonferrous processing, transportation, marketing, brokerage, and scrap management services primarily throughout the United States and in Central and Northern Mexico.

Steel Fabrication Operations Segment. Steel fabrication operations include the company’s New Millennium Building Systems’ joist and deck plants located throughout the United States (US), and in Northern Mexico. Revenues from these plants are generated from the fabrication of trusses, girders, steel joists and steel deck used within the non-residential construction industry.

Aluminum Operations Segment. Aluminum operations include the recycled aluminum flat rolled products mill being constructed in Columbus, Mississippi, and two satellite recycled aluminum slab centers in the southwest United States and central Mexico. The flat rolled products mill is a joint venture concurrently formed with Unity Aluminum, Inc. of which SDI has a 94.4% equity interest. Construction has begun on the flat rolled products mill and the recycled aluminum slab centers with the flat rolled mill operations expected to begin mid-2025 and operations at the Mexico and US recycled slab centers in late 2024 and mid-2025, respectively.

Other. Other operations consist of subsidiary operations that are below the company’s quantitative thresholds required for reportable segments and primarily consist of certain joint ventures and the company’s idled Minnesota ironmaking operations. Also included in “Other” are certain unallocated corporate accounts, such as the company’s senior unsecured credit facility, senior notes, certain other investments and certain profit sharing expenses.

Significant Accounting Policies

Principles of Consolidation

The consolidated financial statements include the accounts of SDI, together with its wholly- and majority-owned or controlled subsidiaries, after elimination of intercompany accounts and transactions. Noncontrolling and redeemable noncontrolling interests represent the noncontrolling owners’ proportionate share in the equity, income, or losses of the company’s majority-owned or controlled consolidated subsidiaries. Redeemable noncontrolling interests related to USS (owned 90% by SDI) are $60.0 million at June 30, 2024 and December 31, 2023. Redeemable noncontrolling interests related to Mesabi Nugget (owned 86% by SDI) are $111.2 million at June 30, 2024 and December 31, 2023.

5

Table of Contents

STEEL DYNAMICS, INC.

NOTES TO CONSOLIDATED FINANCIAL STATEMENTS (UNAUDITED)

Note 1. Description of the Business and Significant Accounting Policies (Continued)

Use of Estimates

These consolidated financial statements are prepared in conformity with accounting principles generally accepted in the United States, and accordingly, include amounts that require management to make estimates and assumptions that affect the amounts reported in the consolidated financial statements and in the notes thereto. Actual results may differ from these estimates and assumptions.

In the opinion of management, these financial statements reflect all normal recurring adjustments necessary for a fair presentation of the interim period results. These consolidated financial statements and notes should be read in conjunction with the audited financial statements and notes thereto included in the company’s Annual Report on Form 10-K for the year ended December 31, 2023.

Cash and Equivalents, and Restricted Cash

Cash and equivalents include all highly liquid investments with a maturity of three months or less at the date of acquisition. Restricted cash is primarily funds held in escrow as required by various insurance and government organizations. The balance of cash, cash equivalents and restricted cash in the consolidated statements of cash flows includes restricted cash of $5.6 million at June 30, 2024, $5.5 million at March 31, 2024, $5.6 million at December 31, 2023, $5.5 million at June 30, 2023, $5.5 million at March 31, 2023 and $5.5 million at December 31, 2022, which are recorded in Other Assets (noncurrent) in the company’s consolidated balance sheets.

Short-Term Investments

Short-term investments include investments with maturity dates of longer than three months but less than one year when purchased. The company’s short-term investments are classified as trading securities. Interest income from invested cash and short-term investments was $20.6 million and $25.5 million for the three-month periods ended June 30, 2024 and 2023, respectively, $46.9 million and $51.5 million for the six-month periods ended June 30, 2024 and 2023, respectively, and is recorded in other (income) expense, net as earned. The company’s short-term investments were $418.4 million and $721.2 million as of June 30, 2024 and December 31, 2023, respectively.

Goodwill

The company’s goodwill consisted of the following at June 30, 2024, and December 31, 2023 (in thousands):

June 30,

December 31,

2024

2023

Steel Operations Segment

$

272,133

$

272,133

Metals Recycling Operations Segment

203,413

203,413

Steel Fabrication Operations Segment

1,925

1,925

$

477,471

$

477,471

6

Table of Contents

STEEL DYNAMICS, INC.

NOTES TO CONSOLIDATED FINANCIAL STATEMENTS (UNAUDITED)

Note 1. Description of the Business and Significant Accounting Policies (Continued)

Credit Losses

The company is exposed to credit risk in the event of nonpayment of accounts receivable by customers. The company mitigates its exposure to credit risk, which it generally extends on an unsecured basis, by performing ongoing credit evaluations and taking further action if necessary, such as requiring letters of credit or other security interests to support the customer receivable. The allowance for credit losses for accounts receivable is based on the company’s reasonable estimate of known credit risks and historical experience, adjusted for current and anticipated economic and other pertinent factors affecting the company’s customers, that may differ from historical experience. Customer accounts receivable are written off when all collection efforts have been exhausted and the amounts are deemed uncollectible.

At June 30, 2024, the company reported $1,775.4 million of accounts receivable, net of allowances for credit losses of $8.0 million. Changes in the allowance were not material for each of the three and six-month periods ended June 30, 2024 and 2023.

Derivative Financial Instruments

The company routinely enters into forward exchange traded futures to manage price risk associated with nonferrous metal inventory, as well as purchases and sales of nonferrous (primarily aluminum and copper) and ferrous metals, to reduce exposure to commodity related price fluctuations. The company does not enter into these derivative financial instruments for speculative purposes. The company recognizes all derivatives as either assets or liabilities in the consolidated balance sheets and measures those instruments at fair value. Derivatives that are not designated as hedges must be adjusted to fair value through earnings. Changes in the fair value of derivatives that are designated as hedges, depending on the nature of the hedge, are recognized as either an offset against the change in fair value of the hedged balance sheet item in the case of fair value hedges or as other comprehensive income in the case of cash flow hedges, until the hedged item is recognized in earnings. The ineffective portion of a derivative’s change in fair value is immediately recognized in earnings for fair value hedges. The company offsets fair value amounts recognized for derivative instruments executed with the same counterparty under master netting agreements.

The fair value of the Company’s derivative instruments, along with required margin deposit amounts with the same counterparty under master netting arrangements, totaled $34.9 million at June 30, 2024 and $24.0 million at December 31, 2023, and are reflected in other current assets in the consolidated balance sheets. Total gains and losses related to derivatives in fair value hedging relationships, as well as those not designated as hedging instruments, are recognized in costs of goods sold and were not material for each of the three and six-month periods ended June 30, 2024 and 2023. Derivatives accounted for as cash flow hedges, for which gains and losses are recognized in other comprehensive income, along with net amounts reclassified from accumulated other comprehensive income, were not material for each of the three and six-month periods ended June 30, 2024 and 2023.

Recently Issued Accounting Pronouncements

In November 2023, the Financial Accounting Standards Board (FASB) issued Accounting Standards Update (ASU) 2023-07, Segment Reporting (Topic 280): Improvements to Reportable Segment Disclosures, which is intended to improve reportable segment disclosure requirements, primarily through enhanced disclosures about significant segment expenses. The guidance is effective for fiscal years beginning after December 15, 2023, and interim periods within fiscal years beginning after December 15, 2024. Early adoption is permitted. The guidance is to be applied retrospectively to all prior periods presented in the financial statements. Upon transition, the segment expense categories and amounts disclosed in the prior periods should be based on the significant segment expense categories identified and disclosed in the period of adoption. The company is currently evaluating the potential impact of adopting this new guidance on the consolidated financial statements and related disclosures.

7

Table of Contents

STEEL DYNAMICS, INC.

NOTES TO CONSOLIDATED FINANCIAL STATEMENTS (UNAUDITED)

Note 1. Description of the Business and Significant Accounting Policies (Continued)

In December 2023, the FASB issued ASU 2023-09, Income Taxes (Topic 740): Improvements to Income Tax Disclosures, which modifies the rules on income tax disclosures to require entities to disclose specific categories in the rate reconciliation, the income or loss from continuing operations before income tax expense or benefit (separated between domestic and foreign) and income tax expense or benefit from continuing operations (separated by federal, state and foreign). ASU 2023-09 also requires entities to disclose their income tax payments to international, federal, state and local jurisdictions, among other changes. The guidance is effective for annual periods beginning after December 15, 2024. Early adoption is permitted for annual financial statements that have not yet been issued or made available for issuance. ASU 2023-09 is to be applied on a prospective basis, but retrospective application is permitted. The company is currently evaluating the potential impact of adopting this new guidance on the consolidated financial statements and related disclosures.

Subsequent Event

In July 2024, the company issued $600.0 million of 5.375% notes due 2034. The net proceeds from these notes are intended to be used for general corporate purposes, which may include the repayment at or prior to maturity of the company’s 2.800% senior notes due December 2024, working capital, capital expenditures, advances for or investments in the company’s subsidiaries, acquisitions, redemption and repayment of other outstanding indebtedness, and purchases of the company’s common stock.

Note 2. Earnings Per Share

Basic earnings per share is based on the weighted average shares of common stock outstanding during the period. Diluted earnings per share assumes the weighted average dilutive effect of common share equivalents outstanding during the period applied to the company’s basic earnings per share. Common share equivalents represent potentially dilutive restricted stock units, deferred stock units, restricted stock, and performance awards, and are excluded from the computation in periods in which they have an anti-dilutive effect. There were no anti-dilutive common share equivalents as of or for the three and six-month periods ended June 30, 2024 and 2023.

Three-Month Periods Ended June 30,

2024

2023

Weighted

Weighted

Average

Average

Net Income

Shares

Per Share

Net Income

Shares

Per Share

(Numerator)

(Denominator)

Amount

(Numerator)

(Denominator)

Amount

Basic earnings per share

$

427,998

156,856

$

2.73

$

812,107

168,009

$

4.83

Dilutive common share equivalents

-

723

-

856

Diluted earnings per share

$

427,998

157,579

$

2.72

$

812,107

168,865

$

4.81

Six-Month Periods Ended June 30,

2024

2023

Weighted

Weighted

Average

Average

Net Income

Shares

Per Share

Net Income

Shares

Per Share

(Numerator)

(Denominator)

Amount

(Numerator)

(Denominator)

Amount

Basic earnings per share

$

1,012,039

157,761

$

6.42

$

1,449,417

169,803

$

8.54

Dilutive common share equivalents

-

706

-

869

Diluted earnings per share

$

1,012,039

158,467

$

6.39

$

1,449,417

170,672

$

8.49

8

Table of Contents

STEEL DYNAMICS, INC.

NOTES TO CONSOLIDATED FINANCIAL STATEMENTS (UNAUDITED)

Note 3. Inventories

Inventories are stated at lower of cost or net realizable value. Cost is determined using a weighted average cost method for raw materials (including scrap and purchased steel substrate) and supplies, and on a first-in, first-out basis for other inventory. Inventory consisted of the following (in thousands):

June 30,

December 31,

2024

2023

Raw materials

$

1,339,472

$

1,226,272

Supplies

761,987

711,653

Work in progress

316,022

296,932

Finished goods

656,156

659,775

Total inventories

$

3,073,637

$

2,894,632

Note 4. Changes in Equity

The following tables provide a reconciliation of the beginning and ending carrying amounts of total equity, equity attributable to stockholders of Steel Dynamics, Inc., and equity and redeemable amounts attributable to noncontrolling interests for each of the three and six-month periods ended June 30, 2024 and 2023 (in thousands).

Stockholders of Steel Dynamics, Inc.

Accumulated

Additional

Other

Redeemable

Common

Treasury

Paid-In

Retained

Comprehensive

Noncontrolling

Total

Noncontrolling

Stock

Stock

Capital

Earnings

Income (Loss)

Interests

Equity

Interests

Balances at December 31, 2023

$

651

$

(5,897,606)

$

1,217,610

$

13,545,590

$

421

$

(198,351)

$

8,668,315

$

171,212

Dividends declared

-

-

-

(72,624)

-

-

(72,624)

-

Noncontrolling investors, net

-

-

-

-

-

(969)

(969)

-

Share repurchases

-

(298,059)

-

-

-

-

(298,059)

-

Equity-based compensation

-

13,391

(20,434)

(139)

-

-

(7,182)

-

Net income

-

-

-

584,041

-

3,459

587,500

-

Other comprehensive loss, net of tax

-

-

-

-

(434)

-

(434)

-

Balances at March 31, 2024

651

(6,182,274)

1,197,176

14,056,868

(13)

(195,861)

8,876,547

171,212

Dividends declared

-

-

-

(71,584)

-

-

(71,584)

-

Noncontrolling investors, net

-

-

-

-

-

10,398

10,398

-

Share repurchases

-

(309,064)

-

-

-

-

(309,064)

-

Equity-based compensation

-

1,969

10,595

(134)

-

-

12,430

-

Net income

-

-

-

427,998

-

3,692

431,690

-

Other comprehensive loss, net of tax

-

-

-

-

(1,415)

-

(1,415)

-

Balances at June 30, 2024

$

651

$

(6,489,369)

$

1,207,771

$

14,413,148

$

(1,428)

$

(181,771)

$

8,949,002

$

171,212

9

Table of Contents

STEEL DYNAMICS, INC.

NOTES TO CONSOLIDATED FINANCIAL STATEMENTS (UNAUDITED)

Note 4. Changes in Equity (Continued)

Stockholders of Steel Dynamics, Inc.

Accumulated

Additional

Other

Redeemable

Common

Treasury

Paid-In

Retained

Comprehensive

Noncontrolling

Total

Noncontrolling

Stock

Stock

Capital

Earnings

Income (Loss)

Interests

Equity

Interests

Balances at December 31, 2022

$

650

$

(4,459,513)

$

1,212,566

$

11,375,765

$

889

$

(216,055)

$

7,914,302

$

181,503

Dividends declared

-

-

-

(72,316)

-

-

(72,316)

-

Noncontrolling investors, net

-

-

-

-

-

(7,387)

(7,387)

4,702

Share repurchases

-

(353,997)

-

-

-

-

(353,997)

-

Equity-based compensation

-

12,997

(18,487)

(138)

-

-

(5,628)

-

Net income

-

-

-

637,310

-

7,023

644,333

-

Other comprehensive income, net of tax

-

-

-

-

911

-

911

-

Balances at March 31, 2023

650

(4,800,513)

1,194,079

11,940,621

1,800

(216,419)

8,120,218

186,205

Dividends declared

-

-

-

(70,694)

-

-

(70,694)

-

Noncontrolling investors, net

-

-

-

-

-

(1,877)

(1,877)

(14,993)

Share repurchases

-

(380,206)

-

-

-

-

(380,206)

-

Equity-based compensation

-

997

10,055

(140)

-

-

10,912

-

Net income

-

-

-

812,107

-

4,070

816,177

-

Other comprehensive loss, net of tax

-

-

-

-

(773)

-

(773)

-

Balances at June 30, 2023

$

650

$

(5,179,722)

$

1,204,134

$

12,681,894

$

1,027

$

(214,226)

$

8,493,757

$

171,212

Note 5. Fair Value Measurements

Accounting standards provide a comprehensive framework for measuring fair value and sets forth a definition of fair value and establishes a hierarchy prioritizing the inputs to valuation techniques, giving the highest priority to quoted prices in active markets for identical assets and liabilities and the lowest priority to unobservable value inputs. Levels within the hierarchy are defined as follows:

Level 1—Unadjusted quoted prices for identical assets and liabilities in active markets;
Level 2—Quoted prices for similar assets and liabilities in active markets (other than those included in Level 1) which are observable for the asset or liability, either directly or indirectly; and
Level 3—Valuations derived from valuation techniques in which one or more significant inputs or significant value drivers are unobservable.

10

Table of Contents

STEEL DYNAMICS, INC.

NOTES TO CONSOLIDATED FINANCIAL STATEMENTS (UNAUDITED)

Note 5. Fair Value Measurements (Continued)

The following table sets forth financial assets and liabilities measured at fair value on a recurring basis in the consolidated balance sheets and the respective levels to which the fair value measurements are classified within the fair value hierarchy as of June 30, 2024 and December 31, 2023 (in thousands):

Quoted Prices

Significant

in Active

Other

Significant

Markets for

Observable

Unobservable

Identical Assets

Inputs

Inputs

Total

(Level 1)

(Level 2)

(Level 3)

June 30, 2024

Short-term investments

$

418,367

$

-

$

418,367

$

-

Commodity futures – financial assets

25,248

-

25,248

-

Commodity futures – financial liabilities

16,659

-

16,659

-

December 31, 2023

Short-term investments

$

721,210

$

-

$

721,210

$

-

Commodity futures – financial assets

2,483

-

2,483

-

Commodity futures – financial liabilities

9,305

-

9,305

-

The carrying amounts of financial instruments including cash equivalents approximate fair value (Level 1). The fair values of short-term investments and commodity futures contracts are estimated by the use of quoted market prices, estimates obtained from brokers, and other appropriate valuation techniques based on references available (Level 2). The fair value of long-term debt, including current maturities, as determined by quoted market prices (Level 2), was approximately $2.8 billion at June 30, 2024 and December 31, 2023 (with a corresponding carrying amount in the consolidated balance sheet of $3.1 billion at June 30, 2024 and December 31, 2023).

Note 6. Commitments and Contingencies

The company is involved in various routine litigation matters, including administrative proceedings, regulatory proceedings, governmental investigations, environmental matters, and commercial and construction contract disputes, none of which are expected to have a material impact on the company’s financial condition, results of operations, or liquidity.

11

Table of Contents

STEEL DYNAMICS, INC.

NOTES TO CONSOLIDATED FINANCIAL STATEMENTS (UNAUDITED)

Note 7. Segment Information

The company’s operations are primarily organized and managed by reportable operating segments. In the fourth quarter 2023, the company changed its reportable segments, consistent with how it currently manages the business, which include steel operations (including warehousing operations previously included in “Other”), metals recycling operations, steel fabrication operations, and a newly created aluminum operations. The segment operations are more fully described in Note 1 to the consolidated financial statements. Operating segment performance and resource allocations are primarily based on operating results before income taxes. The accounting policies of the reportable segments are consistent with those described in Note 1 to the consolidated financial statements. Intra-segment sales and any related profits are eliminated in consolidation. Amounts included in the category “Other” are from subsidiary operations that are below the quantitative thresholds required for reportable segments and primarily consist of certain joint ventures and the idled Minnesota ironmaking operations. Also included in “Other” are certain unallocated corporate accounts, such as the company’s senior unsecured credit facility, senior notes, certain other investments and certain profit sharing expenses.

The company’s segment results, with prior periods recast consistent with our current reportable segments presentation, including disaggregated revenue by segment to external, external non-United States, and other segment customers, are as follows (in thousands):

Metals

Steel

For the three-month period ended

Steel

Recycling

Fabrication

Aluminum

June 30, 2024

Operations

Operations

Operations

Operations

Other

Eliminations

Consolidated

Net sales - disaggregated revenue

External

$

2,937,985

$

392,697

$

472,790

$

-

$

439,464

$

-

$

4,242,936

External Non-U.S.

194,247

193,735

42

-

1,674

-

389,698

Other segments

115,730

585,774

904

1,865

-

(704,273)

-

3,247,962

1,172,206

473,736

1,865

441,138

(704,273)

4,632,634

Operating income (loss)

438,620

28,225

180,740

(19,248)

(73,935)

(1)

4,721

559,123

Income (loss) before income taxes

439,540

22,562

179,864

(20,829)

(37,543)

(18,482)

565,112

Depreciation and amortization

87,497

19,427

2,777

507

6,845

-

117,053

Capital expenditures

131,662

16,194

7,709

272,270

14,095

(22,764)

419,166

As of June 30, 2024

Assets

$

8,870,515

$

1,595,874

$

791,533

$

1,968,632

$

3,029,749

(2)

$

(1,195,046)

(3)

$

15,061,257

Footnotes related to the three-month period ended June 30, 2024, segment results (in millions):

(1)

Corporate selling, general, & administrative expenses

$

(24.7)

(2)

Cash and equivalents

$

706.8

Companywide equity-based compensation

(12.6)

Short-term and other investments

654.0

Company profit sharing component

(48.3)

Accounts receivable

43.3

Other, net

11.7

Inventories

101.7

$

(73.9)

Property, plant and equipment, net

136.6

Intra-company debt

1,042.1

Investments in unconsolidated affiliates

216.7

Other

128.5

$

3,029.7

(3)

Elimination of intra-company receivables

$

(118.6)

Elimination of intra-company debt

(1,042.1)

Other

(34.3)

$

(1,195.0)

12

Table of Contents

STEEL DYNAMICS, INC.

NOTES TO CONSOLIDATED FINANCIAL STATEMENTS (UNAUDITED)

Note 7. Segment Information (Continued)

Metals

Steel

For the three-month period ended

Steel

Recycling

Fabrication

Aluminum

June 30, 2023

Operations

Operations

Operations

Operations

Other

Eliminations

Consolidated

Net sales - disaggregated revenue

External

$

3,123,512

$

368,561

$

779,374

$

-

$

259,927

$

-

$

4,531,374

External Non-U.S.

326,043

223,812

35

-

366

-

550,256

Other segments

145,887

575,752

189

-

269

(722,097)

-

3,595,442

1,168,125

779,598

-

260,562

(722,097)

5,081,630

Operating income (loss)

699,719

33,005

462,080

(3,410)

(120,970)

(1)

(6,689)

1,063,735

Income (loss) before income taxes

701,669

38,225

462,207

(3,387)

(117,299)

(7,099)

1,074,316

Depreciation and amortization

80,701

20,761

2,422

-

7,086

-

110,970

Capital expenditures

101,869

25,259

7,138

219,098

4,916

-

358,280

Footnotes related to the three-month period ended June 30, 2023, segment results (in millions):

(1)

Corporate selling, general, & administrative expenses

$

(22.6)

Companywide equity-based compensation

(11.2)

Company profit sharing component

(88.0)

Other, net

0.8

$

(121.0)

Metals

Steel

For the six-month period ended

Steel

Recycling

Fabrication

Aluminum

June 30, 2024

Operations

Operations

Operations

Operations

Other

Eliminations

Consolidated

Net sales - disaggregated revenue

External

$

6,071,595

$

783,620

$

918,886

$

-

$

747,323

$

-

$

8,521,424

External Non-U.S.

426,874

372,285

1,125

-

4,929

-

805,213

Other segments

264,021

1,110,342

5,488

1,865

-

(1,381,716)

-

6,762,490

2,266,247

925,499

1,865

752,252

(1,381,716)

9,326,637

Operating income (loss)

1,109,551

46,953

359,080

(32,779)

(171,807)

(1)

(900)

1,310,098

Income (loss) before income taxes

1,114,352

44,071

358,231

(34,640)

(126,616)

(24,505)

1,330,893

Depreciation and amortization

175,004

37,897

5,459

527

13,418

-

232,305

Capital expenditures

227,495

48,058

13,145

509,598

17,944

(22,764)

793,476

Footnotes related to the six-month period ended June 30, 2024, segment results (in millions):

(1)

Corporate selling, general, & administrative expenses

$

(50.0)

Companywide equity-based compensation

(27.1)

Company profit sharing component

(111.3)

Other, net

16.6

$

(171.8)

13

Table of Contents

STEEL DYNAMICS, INC.

NOTES TO CONSOLIDATED FINANCIAL STATEMENTS (UNAUDITED)

Note 7. Segment Information (Continued)

Metals

Steel

For the six-month period ended

Steel

Recycling

Fabrication

Aluminum

June 30, 2023

Operations

Operations

Operations

Operations

Other

Eliminations

Consolidated

Net sales - disaggregated revenue

External

$

5,970,760

$

751,364

$

1,648,076

$

-

$

612,194

$

-

$

8,982,394

External Non-U.S.

567,285

424,477

101

-

579

-

992,442

Other segments

229,096

1,154,211

225

-

269

(1,383,801)

-

6,767,141

2,330,052

1,648,402

-

613,042

(1,383,801)

9,974,836

Operating income (loss)

1,041,627

72,693

1,013,352

(5,832)

(217,636)

(1)

(5,109)

1,899,095

Income (loss) before income taxes

1,044,758

83,774

1,013,619

(5,793)

(208,378)

(5,875)

1,922,105

Depreciation and amortization

165,233

35,126

4,753

-

13,552

-

218,664

Capital expenditures

222,497

44,956

11,634

293,918

11,594

-

584,599

Footnotes related to the six-month period ended June 30, 2023, segment results (in millions):

(1)

Corporate SG&A

$

(46.2)

Companywide equity-based compensation

(24.8)

Company profit sharing component

(156.9)

Other, net

10.3

$

(217.6)

14

Table of Contents

ITEM 2.    MANAGEMENT’S DISCUSSION AND ANALYSIS OF FINANCIAL CONDITION AND RESULTS OF OPERATIONS

Forward-Looking Statements

This report contains some predictive statements about future events, including statements related to conditions in domestic or global economies, conditions in steel, aluminum, and recycled metals market places, Steel Dynamics' revenues, costs of purchased materials, future profitability and earnings, and the operation of new, existing or planned facilities. These statements, which we generally precede or accompany by such typical conditional words as "anticipate", "intend", "believe", "estimate", "plan", "seek", "project", or "expect", or by the words "may", "will", or "should", are intended to be made as "forward-looking", subject to many risks and uncertainties, within the safe harbor protections of the Private Securities Litigation Reform Act of 1995. These statements speak only as of this date and are based upon information and assumptions, which we consider reasonable as of this date, concerning our businesses and the environments in which they operate. Such predictive statements are not guarantees of future performance, and we undertake no duty to update or revise any such statements. Some factors that could cause such forward-looking statements to turn out differently than anticipated include: (1) domestic and global economic factors; (2) global steelmaking overcapacity and imports of steel, together with increased scrap prices; (3) pandemics, epidemics, widespread illness or other health issues; (4) the cyclical nature of the steel industry and the industries we serve; (5) volatility and major fluctuations in prices and availability of scrap metal, scrap substitutes and supplies, and our potential inability to pass higher costs on to our customers; (6) cost and availability of electricity, natural gas, oil, and other energy resources are subject to volatile market conditions; (7) increased environmental, greenhouse gas emissions and sustainability considerations from our customers or related regulations; (8) compliance with and changes in environmental and remediation requirements; (9) significant price and other forms of competition from other steel and aluminum producers, scrap processors and alternative materials; (10) availability of an adequate source of supply of scrap for our metals recycling operations; (11) cybersecurity threats and risks to the security of our sensitive data and information technology; (12) the implementation of our growth strategy; (13) litigation and legal compliance; (14) unexpected equipment downtime or shutdowns; (15) governmental agencies may refuse to grant or renew some of our licenses and permits; (16) our senior unsecured credit facility contains, and any future financing agreements may contain, restrictive covenants that may limit our flexibility; and (17) the impacts of impairment charges.

More specifically, we refer you to our more detailed explanation of these and other factors and risks that may cause such predictive statements to turn out differently, as set forth in our most recent Annual Report on Form 10-K under the headings Special Note Regarding Forward-Looking Statements and Risk Factors for the year ended December 31, 2023, in our quarterly reports on Form 10-Q, or in other reports which we from time to time file with the Securities and Exchange Commission. These reports are available publicly on the Securities and Exchange Commission website, www.sec.gov, and on our website, www.steeldynamics.com under “Investors – SEC Filings.”

Description of the Business

We are one of the largest domestic steel producers and metal recyclers in the United States, based on estimated steelmaking and steel coating capacity of approximately 16 million tons and actual metals recycling volumes, with one of the most diversified product and end market portfolios in the domestic steel industry, combined with meaningful downstream steel fabrication operations. The company’s primary sources of revenue are currently from the manufacture and sale of steel products, the processing and sale of recycled ferrous and nonferrous metals, and the fabrication and sale of steel joists and deck products.

Operating Statement Classifications

Net Sales. Net sales from our operations are a factor of volumes shipped, product mix and related pricing. We charge premium prices for certain grades of steel, product dimensions, certain smaller volumes, and for value-added processing or coating of our steel products. Except for the steel fabrication operations, we recognize revenues from sales and the allowance for estimated returns and claims from these sales at the point in time control of the product transfers to the customer, upon shipment or delivery. Our steel fabrication operations recognize revenues over time based on completed fabricated tons to date as a percentage of total tons required for each contract.

15

Table of Contents

Costs of Goods Sold. Our costs of goods sold represent all direct and indirect costs associated with the manufacture of our products. The principal elements of these costs are scrap and scrap substitutes (which represent the most significant single component of our consolidated costs of goods sold), steel substrate, direct and indirect labor and related benefits, alloys, zinc, transportation and freight, repairs and maintenance, utilities such as electricity and natural gas, and depreciation.

Selling, General and Administrative Expenses. Selling, general and administrative expenses consist of all costs associated with our sales, finance and accounting, and administrative departments, including, among other items, labor and related benefits, and professional services.

Companywide profit sharing and amortization of intangible assets are each separately presented in the statement of income.

Interest Expense, net of Capitalized Interest. Interest expense consists of interest associated with our senior credit facilities and other debt, net of interest costs that are required to be capitalized during the construction period of certain capital investment projects.

Other (Income) Expense, net. Other income consists of interest income earned on our temporary cash deposits, short-term and other investments, and any other non-operating income activity, including income from investments in unconsolidated affiliates accounted for under the equity method. Other expense consists of any non-operating costs, such as certain acquisition and financing expenses.

Results Overview

In the second quarter of 2024 we achieved quarterly steel shipments of 3.2 million tons, as steel demand was solid. Our metals recycling operations benefitted from consistent domestic steel industry demand during the second quarter of 2024 compared to the same period in 2023, while our steel fabrication segment achieved strong results on seasonally solid non-residential construction demand.

Consolidated operating income decreased $504.6 million, or 47%, to $559.1 million for the second quarter of 2024, compared to the second quarter of 2023 as metal spread contracted across all operating platforms. Second quarter 2024 net income attributable to Steel Dynamics, Inc. decreased $384.1 million, or 47%, to $428.0 million, compared to the second quarter of 2023, consistent with decreased operating income.

Consolidated operating income decreased $589.0 million, or 31%, to $1.3 billion for the first half of 2024, compared to the first half of 2023. First half 2024 net income attributable to Steel Dynamics, Inc. decreased $437.4 million, or 30%, to $1.0 billion, compared to the first half of 2023, consistent with decreased operating income.

16

Table of Contents

Segment Operating Results 2024 vs. 2023 (dollars in thousands)

Three Months Ended June 30,

Six Months Ended June 30,

2024

% Change

2023

2024

% Change

2023

Net sales:

Steel Operations Segment

$

3,247,962

(10)%

$

3,595,442

$

6,762,490

(0)%

$

6,767,141

Metals Recycling Operations Segment

1,172,206

0%

1,168,125

2,266,247

(3)%

2,330,052

Steel Fabrication Operations Segment

473,736

(39)%

779,598

925,499

(44)%

1,648,402

Aluminum Operations Segment

1,865

-

-

1,865

-

-

Other

441,138

69%

260,562

752,252

23%

613,042

5,336,907

5,803,727

10,708,353

11,358,637

Intra-company

(704,273)

(722,097)

(1,381,716)

(1,383,801)

$

4,632,634

(9)%

$

5,081,630

$

9,326,637

(6)%

$

9,974,836

Operating income (loss):

Steel Operations Segment

$

438,620

(37)%

$

699,719

$

1,109,551

7%

$

1,041,627

Metals Recycling Operations Segment

28,225

(14)%

33,005

46,953

(35)%

72,693

Steel Fabrication Operations Segment

180,740

(61)%

462,080

359,080

(65)%

1,013,352

Aluminum Operations Segment

(19,248)

(464)%

(3,410)

(32,779)

(462)%

(5,832)

Other

(73,935)

39%

(120,970)

(171,807)

21%

(217,636)

554,402

1,070,424

1,310,998

1,904,204

Intra-company

4,721

(6,689)

(900)

(5,109)

$

559,123

(47)%

$

1,063,735

$

1,310,098

(31)%

$

1,899,095

Steel Operations Segment

Steel operations include our electric arc furnace (EAF) steel mills, including Butler Flat Roll Division, Columbus Flat Roll Division, Southwest-Sinton Flat Roll Division, Structural and Rail Division, Engineered Bar Products Division, Roanoke Bar Division, Steel of West Virginia, steel coating and processing operations at The Techs, Heartland Flat Roll Division, United Steel Supply (USS), Vulcan Threaded Products, Inc., warehouse operations in Mexico, and SDI Biocarbon Solutions, LLC, a joint venture to construct and operate a biocarbon production facility. Steel operations accounted for 68% and 67% of our consolidated net sales during the three-month periods ended June 30, 2024 and 2023, respectively, and 70% and 65% during the six-month periods ended June 30, 2024 and 2023, respectively.

Steel Operations Segment Shipments (tons):

Three Months Ended June 30,

Six Months Ended June 30,

2024

% Change

2023

2024

% Change

2023

Total shipments

3,203,200

(2)%

3,265,166

6,458,794

(2)%

6,610,314

Intra-segment shipments

(348,489)

(386,665)

(681,122)

(778,046)

Steel Operations Segment shipments

2,854,711

(1)%

2,878,501

5,777,672

(1)%

5,832,268

External shipments

2,753,117

(0)%

2,756,922

5,556,686

(1)%

5,626,243

17

Table of Contents

Graphic

Steel Operations Segment Results 2024 vs. 2023

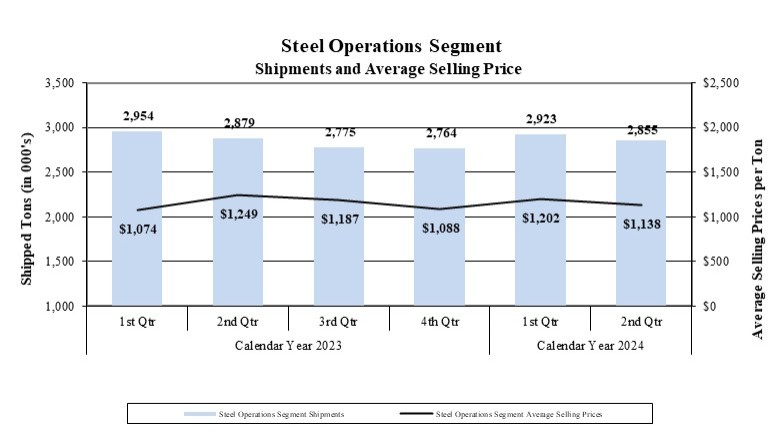
During the second quarter of 2024, our steel operations achieved shipments of 3.2 million tons (2.9 million excluding intra-segment). Despite steady steel demand during the quarter, we experienced customer order inconsistency within steel operations, with decreasing scrap prices and customers continuing to manage to low steel inventory levels. Second quarter 2024 total steel segment average selling prices decreased 9%, or $111 per ton, compared to the second quarter of 2023. Steel operations segment shipments remained flat in the second quarter 2024, as compared to the second quarter of 2023. Net sales for the steel operations in the second quarter 2024 decreased 10% compared to the same period in 2023, due to the decrease in average steel selling prices and shipments. Net sales for the steel operations were flat in the first half of 2024 when compared to the same period in 2023.

Metallic raw materials used in our electric arc furnaces represent our single most significant steel manufacturing cost, generally comprising approximately 55% to 65% of our steel mill operations’ manufacturing costs. Our metallic raw material cost per net ton consumed in our steel operations decreased $57 per ton, or 13%, in the second quarter of 2024, compared to the same period in 2023, consistent with overall decreased domestic scrap pricing noted below in the Metals Recycling Operations segment discussion. In the first half of 2024, our metallic raw material cost per ton decreased $25, or 6%, compared to the same period in 2023

In the second quarter of 2024, as a result of average selling prices decreasing more than scrap costs, metal spread (which we define as the difference between average steel mill selling prices and the cost of ferrous scrap consumed in our steel mills) decreased 7% compared to the second quarter of 2023. As a result of this metal spread compression, operating income for the steel operations decreased 37%, to $438.6 million, in the second quarter of 2024, compared to the same period in 2023. First half 2024 operating income increased 7%, to $1.1 billion, compared to the first half of 2023 due primarily to a 4% increase in metal spread, as scrap costs decreased more than selling prices.

18

Table of Contents

Metals Recycling Operations Segment

Metals recycling operations include our OmniSource ferrous and nonferrous processing, transportation, marketing, brokerage, and scrap management services primarily throughout the United States and in Central and Northern Mexico. Our steel mills utilize a large portion of the ferrous scrap sold by our metals recycling operations as raw material in our steelmaking operations, and the remainder is sold to other consumers, such as other steel manufacturers and foundries. In the second quarters of 2024 and 2023, 61% and 62%, respectively, of metals recycling operations ferrous scrap was sold to our own steel mills, while our steel mill utilization was 81% and 84% in the second quarters of 2024 and 2023, respectively. Metals recycling operations accounted for 13% of our consolidated net sales during the three-month period ended June 30, 2024 and 12% during the three-month period ended June 30, 2023 and six-month periods ended June 30, 2024 and 2023.

Metals Recycling Operations Segment Shipments:

Three Months Ended June 30,

Six Months Ended June 30,

2024

% Change

2023

2024

% Change

2023

Ferrous metal (gross tons)

Total

1,507,229

(1)%

1,520,164

2,960,848

(0)%

2,972,985

Inter-company

(916,109)

(942,185)

(1,832,755)

(1,827,603)

External shipments

591,120

2%

577,979

1,128,093

(2)%

1,145,382

Nonferrous metals (thousands of pounds)

Total

304,017

9%

279,763

593,453

5%

565,600

Inter-company

(49,664)

(35,403)

(79,144)

(80,509)

External shipments

254,353

4%

244,360

514,309

6%

485,091

Metals Recycling Operations Segment Results 2024 vs. 2023

During the second quarter of 2024, our metals recycling operations benefited from solid domestic steel industry demand, with ferrous scrap shipments that remained flat compared to the same period in 2023, while nonferrous shipments increased 9%. Ferrous scrap average selling prices decreased 13% during the second quarter of 2024 compared to the same period in 2023, while nonferrous scrap prices increased 16%, resulting in flat segment net sales. Ferrous metal spreads (which we define as the difference between average selling prices and the cost of purchased scrap) increased 5% during the second quarter of 2024 compared to the same period in 2023, and nonferrous metal spreads decreased 22%, primarily due to a 40% increase in inter-company sales volumes. As a result of the decreased nonferrous metals spreads, metals recycling operations operating income decreased 14% to $28.2 million in the second quarter of 2024 compared to the second quarter of 2023.

Net sales for our metals recycling operations in the first half of 2024 decreased 3% compared to the same period in 2023, driven by decreased ferrous scrap pricing. Ferrous scrap average selling prices declined 7% during the first half of 2024 compared to the same period in 2023, while nonferrous average selling prices were flat. Ferrous shipments were flat and nonferrous shipments increased 5% in the first half of 2024 compared to the first half of 2023. Ferrous metal spreads decreased 2%, while nonferrous metal spreads decreased 14% in the first half of 2024 compared to the first half of 2023. Metals recycling operations operating income in the first half of 2024 of $47.0 million decreased 35% from the first half of 2023 due to the decreased metal spreads.

19

Table of Contents

Steel Fabrication Operations Segment

Steel fabrication operations include the company’s New Millennium Building Systems’ joist and deck plants located throughout the United States, and in Northern Mexico. Revenues from these plants are generated from the fabrication of trusses, girders, steel joists and steel deck used within the non-residential construction industry. Steel fabrication operations accounted for 10% and 15% of our consolidated net sales during the three-month periods ended June 30, 2024 and 2023, respectively, and 10% and 17% during the six-month periods ended June 30, 2024 and 2023, respectively.

Graphic

Steel Fabrication Operations Segment Results 2024 vs. 2023

Net sales for the steel fabrication operations decreased 39% during the second quarter of 2024 compared to the same period in 2023, as average selling prices decreased $1,406 per ton, or 32%, and volume decreased 11% from the second quarter of 2023. While demand remained historically strong, second quarter 2024 was impacted by lower shipments and falling selling prices, which remain above pre-pandemic pricing levels. Our steel fabrication operations continue to benefit from the solid non-residential construction market, as evidenced by a historically strong order backlog that extends through the fourth quarter 2024. The continued onshoring of manufacturing, coupled with the robust U.S. infrastructure and industrial build-outs, supports consistent strong demand.

The purchase of various steel products is the largest single cost of production for our steel fabrication operations, historically representing approximately two-thirds of the total cost of manufacturing. The average cost per ton of steel consumed was flat in the second quarter of 2024 compared to the same period in 2023. As a result of decreased selling prices per ton, metal spread (which we define as the difference between average selling prices and the cost of purchased steel) contracted 44% in the second quarter of 2024 compared to the same period in 2023. This metal spread compression coupled with decreased volume resulted in operating income decreasing 61% to $180.7 million in the second quarter 2024, compared to $462.1 million in the same period in 2023. For the first half of 2024, operating income decreased 65% to $359.1 million compared to the first half of 2023, due to a 47% decrease in metal spread.

20

Table of Contents

Aluminum Operations Segment

Aluminum operations include the recycled aluminum flat rolled products mill being constructed in Columbus, Mississippi, and two satellite recycled aluminum slab centers in the southwest United States (US) and central Mexico. The flat rolled products mill is a joint venture concurrently formed with Unity Aluminum, Inc. of which SDI has a 94.4% equity interest. Construction has begun on the flat rolled products mill and the recycled aluminum slab centers with the flat rolled mill operations expected to begin mid-2025 and operations at the Mexico and US recycled slab centers in late 2024 and mid-2025, respectively. The results of this segment currently consist of construction and start-up costs recorded in selling, general and administrative expenses, included within the discussion of consolidated results within the Other Consolidated Results section below. During the first half of 2024, there were no additional results of operations, such as those related to shipments or production, to be discussed.

Other Consolidated Results

Second Quarter Consolidated Results 2024 vs. 2023

Selling, General and Administrative Expenses. Selling, general and administrative expenses of $160.0 million during the second quarter of 2024 increased 13% from $141.2 million during the second quarter of 2023 primarily due to an increase in payroll and benefits expense related to the execution of our growth strategy during 2024. Selling, general and administrative expenses represented 3.5% and 2.8% of net sales during second quarter 2024 and 2023, respectively.

Profit sharing expense during the second quarter of 2024 of $48.1 million decreased 47% from the $91.0 million during the same period in 2023, consistent with decreased pretax earnings. Profit sharing expense for eligible employees is 8% of consolidated pretax income excluding noncontrolling interests and other items.

Interest Expense, net of Capitalized Interest. During the second quarter of 2024, interest expense was $12.7 million, a decrease of $8.0 million compared to the second quarter of 2023. The lower interest expense in the second quarter 2024 compared to the same period in 2023 was due to higher capitalized interest in 2024 related to construction within the aluminum operations segment.

Other (Income) Expense, net.  Net other income was $18.7 million in the second quarter of 2024, compared to $31.3 million in the second quarter of 2023, due primarily to the impact of foreign currency exchange rate losses of $10.0 million in 2024 compared to gains of $4.0 million in 2023.

Income Tax Expense. Second quarter 2024 income tax expense of $133.4 million, at an effective income tax rate of 23.6%, decreased 48% compared to the $258.1 million, at an effective income tax rate of 24.0%, during the second quarter of 2023, consistent with decreased pretax earnings.

First Half Consolidated Results 2024 vs. 2023

Selling, General and Administrative Expenses. Selling, general and administrative expenses of $319.5 million during the first half of 2024 increased 12% from $285.5 million during the first half of 2023 primarily due to an increase in payroll and benefits expense related to the execution of our growth strategy during 2024. Selling, general and administrative expenses represented 3.4% and 2.9% of net sales during the first half of 2024 and 2023, respectively.

Profit sharing expense during the first half of 2024 of $110.7 million decreased 31% from the $160.6 million during the same period in 2023, consistent with decreased pretax earnings.

Interest Expense, net of Capitalized Interest. During the first half of 2024, interest expense of $24.7 million decreased 43% from $43.3 million during the first half of 2023. The lower interest expense in the first half of 2024 compared to the same period in 2023 was due to higher capitalized interest in 2024 related to construction at our Sinton and Heartland divisions, and within the aluminum operations segment.

21

Table of Contents

Other (Income) Expense, net.  Net other income was $45.5 million in the first half of 2024, compared to $66.3 million in the first half of 2023, due primarily to the impact of foreign currency exchange rate losses of $9.1 million in 2024 compared to gains of $8.6 million in 2023.

Income Tax Expense. First half 2024 income tax expense of $311.7 million, at an effective income tax rate of 23.4%, decreased 32% compared to the $461.6 million, at an effective income tax rate of 24.0%, during the first half of 2023, consistent with decreased pretax earnings.

Liquidity and Capital Resources

Capital Resources and Long-term Debt. Our business is capital intensive and requires substantial expenditures for, among other things, the purchase and maintenance of equipment used in our operations, and to remain in compliance with environmental laws. Our short-term and long-term liquidity needs arise primarily from working capital requirements, capital expenditures, including expansion projects, principal and interest payments related to our outstanding indebtedness, dividends to our shareholders, and potential stock repurchases and acquisitions or investments. We have met and intend to continue to meet these liquidity requirements primarily with available cash and cash provided by operations, long-term borrowings, and we also have availability under our unsecured Revolver. Our liquidity at June 30, 2024, is as follows (in thousands):

Cash and equivalents

$

829,980

Short-term and other investments

654,018

Revolver availability

1,190,725

Total liquidity

$

2,674,723

Our total outstanding debt of $3.1 billion is consistent with our total outstanding debt at December 31, 2023. Our total long-term debt to capitalization ratio (representing our long-term debt, including current maturities, divided by the sum of our long-term debt, redeemable noncontrolling interests, and our total stockholders’ equity) was 24.9% and 25.8% at June 30, 2024 and December 31, 2023, respectively.

In July 2024, we issued $600.0 million of 5.375% notes due 2034. The net proceeds from these notes are intended to be used for general corporate purposes, which may include the repayment at or prior to maturity of our 2.800% senior notes due December 2024, working capital, capital expenditures, advances for or investments in subsidiaries, acquisitions, redemption and repayment of other outstanding indebtedness, and purchases of our common stock.

Our unsecured credit agreement has a senior unsecured revolving credit facility (Facility), which provides a $1.2 billion Revolver and matures in July 2028. Subject to certain conditions, we have the ability to increase the Facility size by $500.0 million. The unsecured Revolver is available to fund working capital, capital expenditures, and other general corporate purposes. The Facility contains financial covenants and other covenants pertaining to our ability to incur indebtedness and permit liens on certain assets. Our ability to borrow funds within the terms of the unsecured Revolver is dependent upon our continued compliance with the financial and other covenants. At June 30, 2024, we had $1.2 billion of availability on the Revolver, $9.3 million of outstanding letters of credit and other obligations which reduce availability, and there were no borrowings outstanding.

The financial covenants under our Facility state that we must maintain an interest coverage ratio of not less than 2.50:1.00. Our interest coverage ratio is calculated by dividing our last-twelve-months (LTM) consolidated Adjusted EBITDA as defined in the Facility (earnings before interest, taxes, depreciation, amortization, and certain other non-cash transactions as defined in the Facility) by our LTM gross interest expense, less amortization of financing fees. In addition, a debt to capitalization ratio of not more than 0.60:1.00 must be maintained. At June 30, 2024, our interest coverage ratio and debt to capitalization ratio were 30.84:1.00 and 0.25:1.00, respectively. We were, therefore, in compliance with these covenants at June 30, 2024, and we anticipate we will continue to be in compliance during the next twelve months.

22

Table of Contents

Working Capital (representing excess of current assets over current liabilities). We generated cash flow from operations of $737.8 million in the first half of 2024 compared to $1.5 billion in the same 2023 period. Working capital decreased $872.5 million, or 20%, during the first half of 2024 to $3.6 billion at June 30, 2024, due to a $570.9 million decrease in cash and equivalents, and a $355.7 million increase in current maturities of long-term debt, as our $400 million 2.400% senior notes due 2025 were recorded as current in June 2024.

Capital Investments. During the first half of 2024, we invested $793.5 million in property, plant and equipment, primarily within our steel operations segment and aluminum operations segment, compared with $584.6 million invested during the same period in 2023. We are currently executing our plan to invest $2.7 billion in a new state-of-the-art low-carbon recycled aluminum flat rolled products mill with two supporting satellite recycled aluminum slab centers, which is planned to be funded by available cash and cash flow from operations. Related expenditures began in the third quarter of 2022 and are expected to continue through early 2025. Our liquidity of $2.7 billion and anticipated future operating cash flow generation is sufficient to provide for our planned 2024 capital requirements.

Cash Dividends. As a reflection of continued confidence in our current and future cash flow generation capability and financial position, we increased our quarterly cash dividend by 8% to $0.46 per share in the first quarter of 2024 (from $0.425 per share for each quarter in 2023), resulting in declared cash dividends of $144.2 million during the first half of 2024, compared to $143.0 million during the same period in 2023. We paid cash dividends of $140.6 million and $131.1 million during the first half of 2024 and 2023, respectively. Our board of directors, along with executive management, approves the payment of dividends on a quarterly basis. The determination to pay cash dividends in the future is at the discretion of our board of directors, after taking into account various factors, including our financial condition, results of operations, outstanding indebtedness, current and anticipated cash needs and growth plans.

Other. Our board of directors has authorized share repurchase programs during prior years, the most recent of which occurred in November 2023 for a program of up to $1.5 billion of the company’s common stock. Under the share repurchase programs, purchases take place as and when we determine in open market or private transactions made based upon the market price of our common stock, the nature of other investment opportunities or growth projects, our cash flows from operations, and general economic conditions. The share repurchase programs do not require us to acquire any specific number of shares, and may be modified, suspended, extended, or terminated by us at any time. The share repurchase programs do not have an expiration date. There were $607.1 million and $734.2 million of share repurchases during the first half of 2024 and 2023, respectively. As of June 30, 2024, we had $793.2 million remaining available to purchase under the November 2023 share repurchase program.

Our ability to meet our debt service obligations and reduce our total debt will depend upon our future performance which, in turn, will depend upon general economic, financial, and business conditions, along with competition, legislation and regulatory factors that are largely beyond our control. In addition, we cannot assure that our operating results, cash flows, access to credit markets and capital resources will be sufficient for repayment of our indebtedness in the future. We believe that based upon current levels of operations and anticipated growth, cash flows from operations, together with other available sources of funds, including borrowings under our Facility, if necessary, will be adequate for the next twelve months for making required payments of principal and interest on our indebtedness, funding working capital requirements, and funding anticipated capital expenditures.

23

Table of Contents

ITEM 3.    QUANTITATIVE AND QUALITATIVE DISCLOSURES ABOUT MARKET RISK

Commodity Risk

In the normal course of business, we are exposed to the market risk and price fluctuations related to the sale of our products and to the purchase of raw materials used in our operations, such as metallic raw materials, electricity, water, natural gas and its transportation services, fuel, air products, zinc, and electrodes. Our risk strategy associated with product sales has generally been to obtain competitive prices for our products and to allow operating results to reflect market price movements dictated by supply and demand.

Our risk strategy associated with the purchase of raw materials utilized within our operations has generally been to make some commitments with suppliers relating to future expected requirements for some commodities such as electricity, water, natural gas and its transportation services, fuel, air products, zinc, and electrodes. Certain of these commitments contain provisions which require us to “take or pay” for specified quantities without regard to actual usage for periods of generally up to 5 years for physical commodity requirements and commodity transportation requirements, with some extending beyond, and for up to 16 years for air products and 28 years for water products. We utilized such “take or pay” requirements during the past three years under these contracts. We believe that production requirements will be such that consumption of the products or services purchased under these commitments will occur in the normal production process.

In our metals recycling and steel operations, we have certain fixed price contracts with various customers and suppliers for future delivery of nonferrous and ferrous metals. Our risk strategy has been to enter into base metal financial contracts with the goal to protect the profit margin, within certain parameters, that was contemplated when we entered into the transaction with the customer or vendor. As of June 30, 2024, substantially all of these financial contracts have a settlement date within the next twelve months. We believe the customer contracts associated with the financial contracts will be fully consummated.

ITEM 4.    CONTROLS AND PROCEDURES

(a)Evaluation of Disclosure Controls and Procedures

As required, we carried out an evaluation, under the supervision and with the participation of our principal executive officer and principal financial officer, of the effectiveness of our disclosure controls and procedures, as defined in rules 13a-15(e) and 15d-15(e) under the Securities Exchange Act of 1934, as amended (the Exchange Act). Based on this evaluation, our principal executive officer and principal financial officer concluded that, as of June 30, 2024, the end of the period covered by this quarterly report, our disclosure controls and procedures were designed to provide and were effective to provide reasonable assurance that the information required to be disclosed by us in the reports we file or submit under the Exchange Act is recorded, processed, summarized and reported within the time periods specified in the applicable rules and forms, and that it is accumulated and communicated to our management, including our principal executive and principal financial officers, as appropriate to allow timely decisions regarding required disclosure.

(b)Changes in Internal Controls Over Financial Reporting

No changes in our internal control over financial reporting (as defined in Rules 13a-15(f) and 15d-15(f) under the Exchange Act) occurred during the fiscal quarter ended June 30, 2024, that has materially affected, or is reasonably likely to materially affect, our internal control over financial reporting.

24

Table of Contents

PART II OTHER INFORMATION

ITEM 1.    LEGAL PROCEEDINGS

We are involved in various litigation matters, including administrative proceedings, regulatory proceedings, governmental investigations, environmental matters, and commercial and construction contract disputes, none of which are currently expected to have a material impact on our financial condition, results of operations, or liquidity.

We may also be involved from time to time in various governmental investigations, regulatory proceedings or judicial actions seeking penalties, injunctive relief, and/or remediation under federal, state and local environmental laws and regulations. The United States EPA has conducted such investigations and proceedings involving us, in some instances along with state environmental regulators, under various environmental laws, including RCRA, CERCLA, the Clean Water Act and the Clean Air Act. Some of these matters have resulted in fines or penalties, exclusive of interest and costs, which did not exceed $1 million in aggregate, as of June 30, 2024.

ITEM 1A.    RISK FACTORS

No material changes have occurred to the indicated risk factors as disclosed in our Annual Report on Form 10-K for the year ended December 31, 2023.

ITEM 2.    UNREGISTERED SALES OF EQUITY SECURITIES AND USE OF PROCEEDS

(c) Issuer Purchases of Equity Securities

We purchased the following equity securities registered by us pursuant to Section 12 of the Exchange Act during the three-month period ended June 30, 2024.

Period

Total Number of Shares Purchased

Average Price Paid per Share

Total Number of Shares Purchased as Part of Publicly Announced Programs (1)

Maximum Dollar Value of Shares That May Yet be Purchased Under the Programs
(in thousands) (1)

Quarter ended June 30, 2024

April 1 - 30

471,362

$

139.15

471,362

$

1,034,241

May 1 - 31

1,080,287

134.70

1,080,287

890,192

June 1 - 30

768,905

127.41

768,905

793,214

2,320,554

2,320,554

(1)In November 2023, our board of directors authorized a share repurchase program of up to $1.5 billion of the company’s common stock.

ITEM 3.    DEFAULTS UPON SENIOR SECURITIES

None.

ITEM 4.    MINE SAFETY DISCLOSURES

None.

ITEM 5.    OTHER INFORMATION

During the three-month period ended June 30, 2024, none of the Company’s directors or executive officers adopted, modified or terminated a “Rule 10b5-1 trading arrangement” or a “non-Rule 10b5-1 trading arrangement” as such terms are defined under Item 408 of Regulation S-K.

25

Table of Contents

ITEM 6.    EXHIBITS

Reference is made to the Exhibit Index preceding the signature page hereto, which Exhibit Index is hereby incorporated into this item.

26

Table of Contents

EXHIBIT INDEX

Articles of Incorporation

3.1

Amended and Restated Articles of Incorporation of Steel Dynamics, Inc., reflecting all amendments thereto through May 11, 2023, incorporated herein by reference from Exhibit 3.1 to our Form 10-Q filed August 8, 2023.

3.2

Amended and Restated Bylaws of Steel Dynamics, Inc., reflecting all amendments thereto through January 31, 2024, incorporated herein by reference from Exhibit 3.2 to our Form 10-K filed February 29, 2024.

Instruments Defining the Rights of Security Holders, Including Indentures

4.42

First Supplemental Indenture, relating to our issuance of $600 million 5.375% Notes due 2034, dated as of July 3, 2024, between Steel Dynamics, Inc. and U.S. Bank Trust Company, National Association, as Trustee, incorporated herein by reference from Exhibit 4.2 to our Form 8-K filed July 5, 2024.

4.43

Form of 5.375% Notes due 2034 (included in Exhibit 4.42), incorporated herein by reference from Exhibit 4.3 to our Form 8-K filed July 5, 2024.

Executive Officer Certifications

31.1*

Certification of Chief Executive Officer required by Item 307 of Regulation S-K as promulgated by the Securities and Exchange Commission and pursuant to Section 302 of the Sarbanes-Oxley Act of 2002.

31.2*

Certification of Chief Financial Officer required by Item 307 of Regulation S-K as promulgated by the Securities and Exchange Commission and pursuant to Section 302 of the Sarbanes-Oxley Act of 2002.

32.1*

Certification of Chief Executive Officer Pursuant to 18 U.S.C Section 1350, as Adopted Pursuant to Section 906 of the Sarbanes-Oxley Act of 2002.

32.2*

Certification of Chief Financial Officer Pursuant to 18 U.S.C Section 1350, as Adopted Pursuant to Section 906 of the Sarbanes-Oxley Act of 2002.

XBRL Documents

101.INS*

XBRL Instance Document - the instance document does not appear in the Interactive Data File because its XBRL tags are embedded within the Inline XBRL document.

101.SCH*

Inline XBRL Taxonomy Extension Schema Document

101.CAL*

Inline XBRL Taxonomy Extension Calculation Document

101.DEF*

Inline XBRL Taxonomy Definition Document

101.LAB*

Inline XBRL Taxonomy Extension Label Document

101.PRE*

Inline XBRL Taxonomy Presentation Document

104*

Cover Page Interactive Data File (formatted as Inline XBRL and contained in Exhibit 101)

*

Filed concurrently herewith

27

Table of Contents

SIGNATURE

Pursuant to the requirements of the Securities Exchange Act of 1934, the registrant has duly caused this report to be signed on its behalf by the undersigned, thereunto duly authorized.

August 8, 2024


STEEL DYNAMICS, INC.

By:

/s/ Theresa E. Wagler

Theresa E. Wagler

Executive Vice President and Chief Financial Officer

(Principal Financial Officer and Principal Accounting Officer)

28