Vanguard Explorer Value™ Fund
Prospectus
December 22, 2023
Investor Shares
Vanguard Explorer Value Fund Investor Shares (VEVFX)
This prospectus contains financial data for the Fund through the fiscal year ended August 31, 2023.
The Securities and Exchange Commission (SEC) has not approved or disapproved these securities or passed upon the adequacy of this prospectus. Any representation to the contrary is a criminal offense.
(Fees paid directly from your investment)
|
| |
|
Sales Charge (Load) Imposed on Purchases |
|
|
Purchase Fee |
|
|
Sales Charge (Load) Imposed on Reinvested Dividends |
|
|
Redemption Fee |
|
|
Account Service Fee Per Year
(for certain fund account balances below $5,000,000) |
$ |
(Expenses that you pay each year as a percentage of the value of your investment)
|
| |
|
Management Fees |
% |
|
12b-1 Distribution Fee |
|
|
Other Expenses |
% |
|
Total Annual Fund Operating Expenses |
% |
1
|
1 Year |
3 Years |
5 Years |
10 Years |
|
$ |
$ |
$ |
$ |
2
3
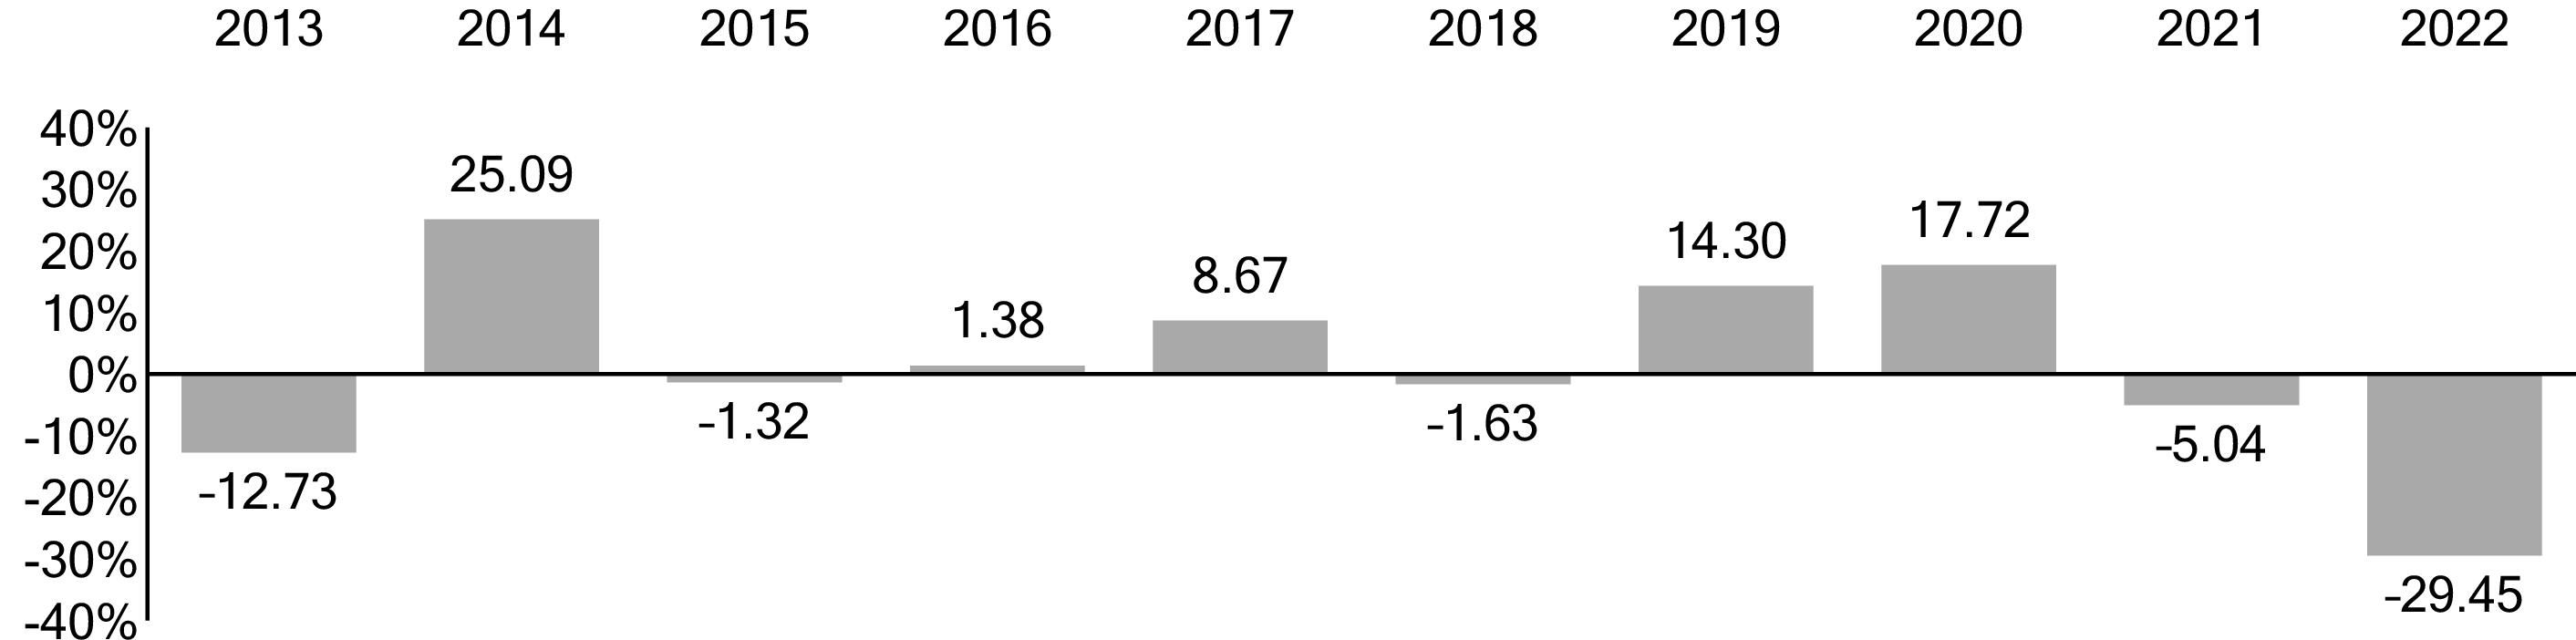
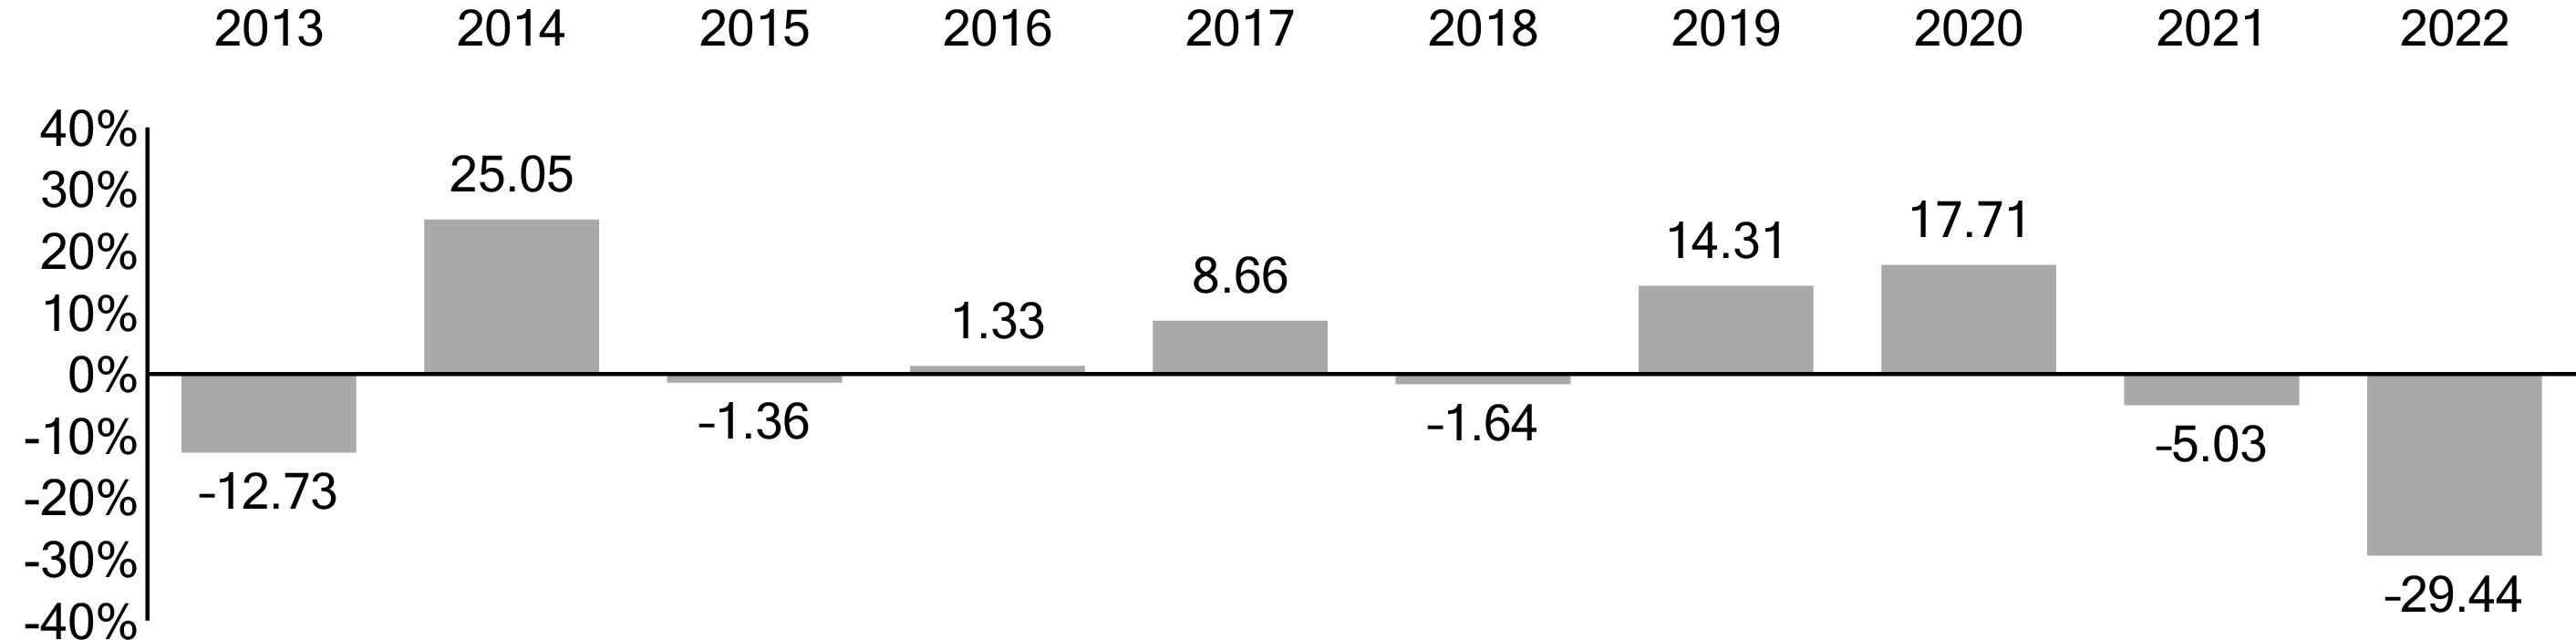
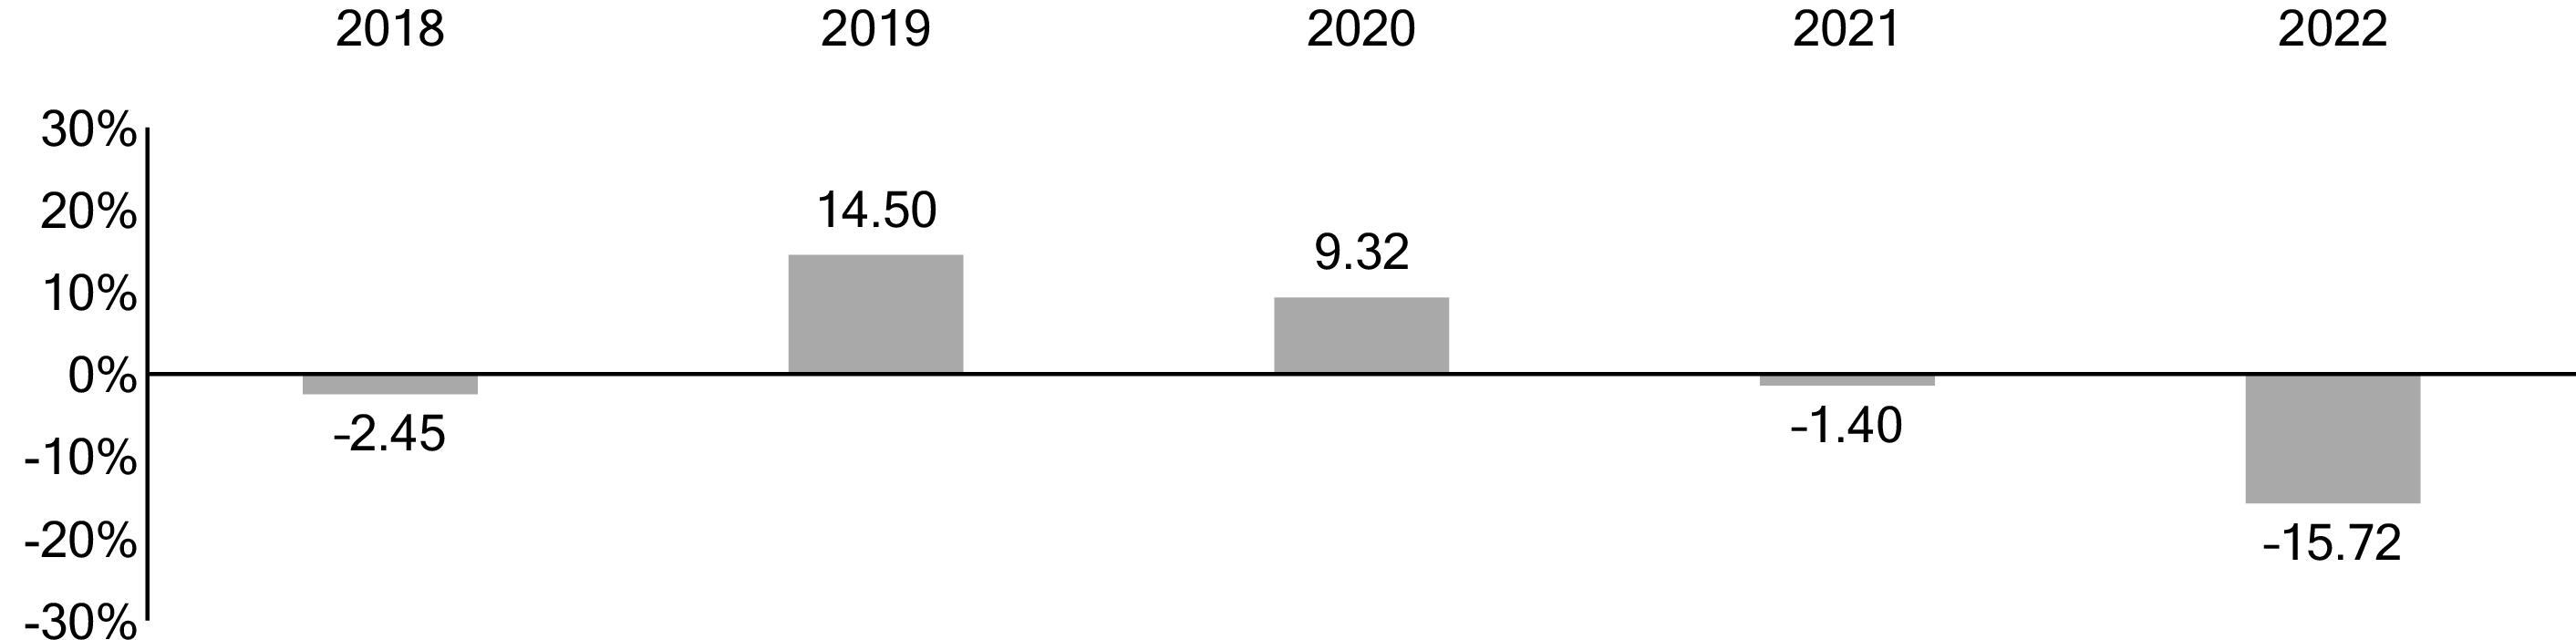
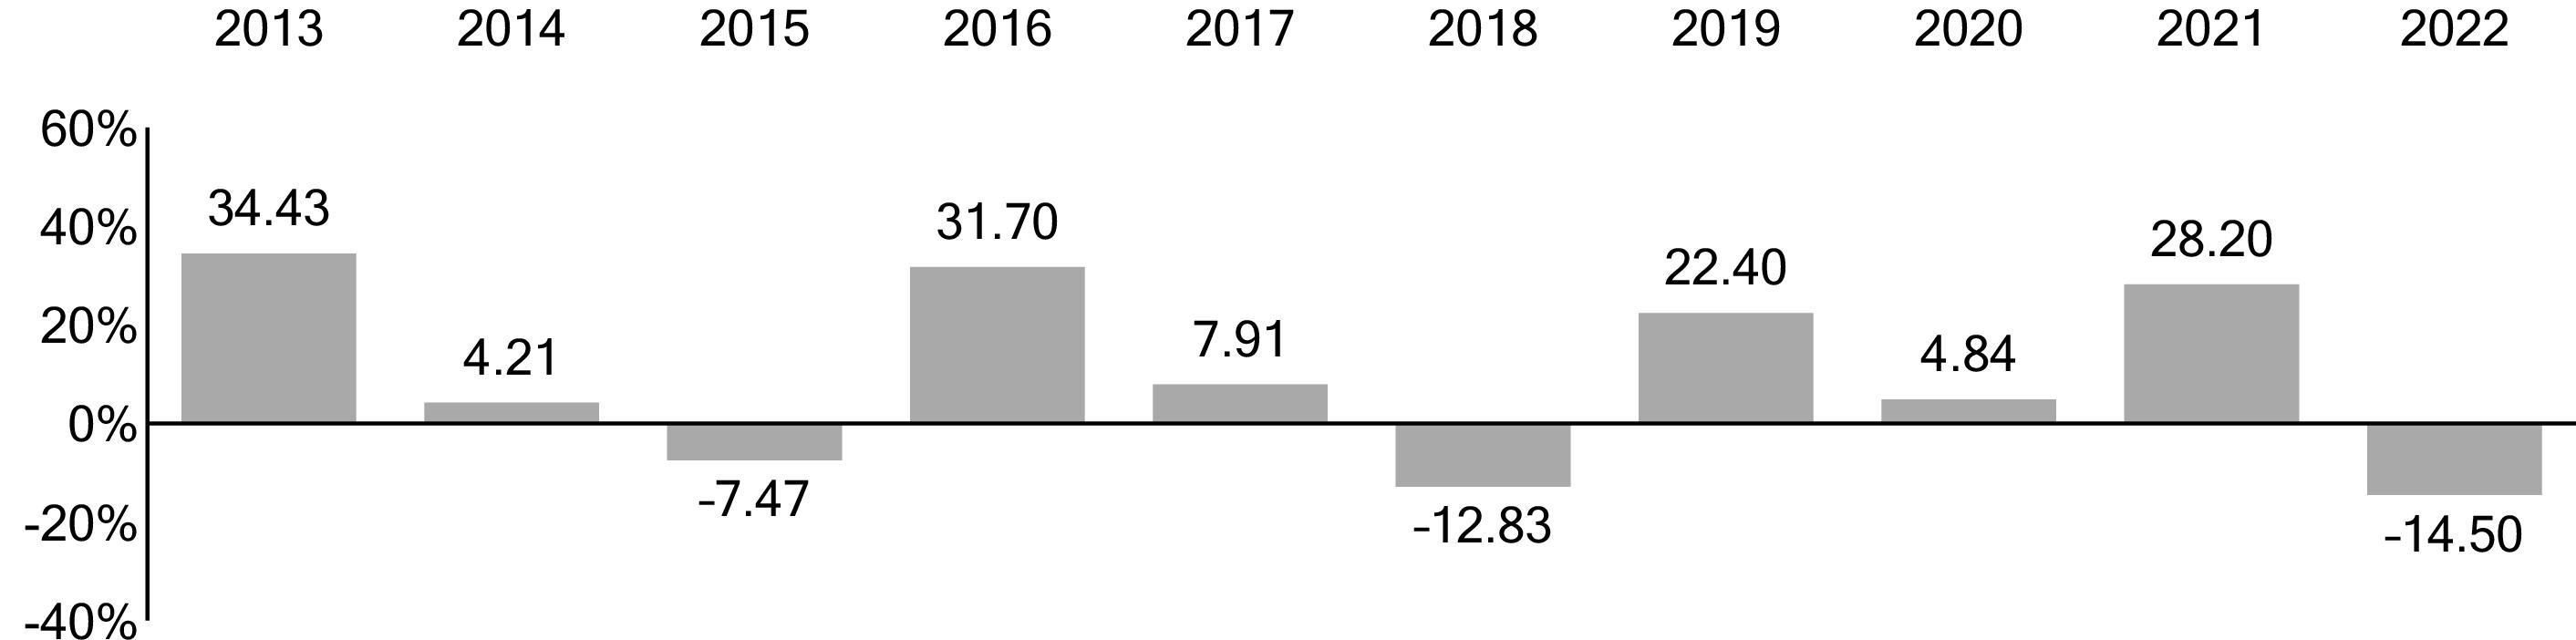
1 The year-to-date return as of the most recent calendar quarter, which ended on September 30, 2023, was 2.43%.
|
|
Total Return |
Quarter |
|
|
% |
|
|
|
-
% |
|
|
|
1 Year |
5 Years |
10 Years |
|
Vanguard Explorer Value Fund Investor Shares |
|
|
|
|
Return Before Taxes |
-
% |
% |
% |
|
Return After Taxes on Distributions |
- |
|
|
|
Return After Taxes on Distributions and Sale of Fund Shares |
- |
|
|
|
Russell 2500 Value Index
(reflects no deduction for fees, expenses, or taxes) |
-
% |
% |
% |
|
Dow Jones U.S. Total Stock Market Float Adjusted Index
(reflects no deduction for fees, expenses, or taxes) |
- |
|
|
4
Investment Advisors
Ariel Investments, LLC (Ariel)
Cardinal Capital Management, L.L.C. (Cardinal Capital)
Frontier Capital Management Co., LLC (Frontier Capital)
Cardinal Capital Management, L.L.C. (Cardinal Capital)
Frontier Capital Management Co., LLC (Frontier Capital)
Portfolio Managers
Kenneth E. Kuhrt, CPA, Executive Vice President and Portfolio Manager of Ariel. He has co-managed a portion of the Fund since January 2022.
John W. Rogers, Jr., Chairman, Co-CEO & Chief Investment Officer and Lead Portfolio Manager of Ariel. He has co-managed a portion of the Fund since January 2022.
Robert H. Fields, Partner and Portfolio Manager of Cardinal Capital. He has co-managed a portion of the Fund since 2016.
Eugene Fox III, Managing Partner and Portfolio Manager of Cardinal Capital. He has co-managed a portion of the Fund since its inception in 2010.
Robert B. Kirkpatrick, CFA, Managing Partner and Portfolio Manager of Cardinal Capital. He has co-managed a portion of the Fund since its inception in 2010.
Rachel D. Matthews, Partner and Portfolio Manager of Cardinal Capital. She has co-managed a portion of the Fund since 2013.
Rushan Jiang, CFA, Partner and Portfolio Manager of Frontier Capital. He has co-managed a portion of the Fund since 2019.
William A. Teichner, CFA, Managing Partner and Portfolio Manager of Frontier Capital. He has co-managed a portion of the Fund since its inception in 2010.
Purchase and Sale of Fund Shares
You may purchase or redeem shares online through our website (vanguard.com), by mail (The Vanguard Group, P.O. Box 982901, El Paso, TX 79998-2901), or by telephone (800-662-2739). The minimum investment amount required to open and maintain a Fund account for Investor Shares is $3,000. The minimum investment amount required to add to an existing Fund account is generally $1. Financial intermediaries, institutional clients, and Vanguard-advised clients should contact Vanguard for information on special eligibility rules that may apply to them regarding Investor Shares. If you are investing through an intermediary, please contact that firm directly for more information regarding your
5
eligibility. If you are investing through an employer-sponsored retirement or savings plan, your plan administrator or your benefits office can provide you with detailed information on how you can invest through your plan.
Tax Information
The Fund’s distributions may be taxable as ordinary income or capital gain. If you are investing through a tax-advantaged account, such as an IRA or an employer-sponsored retirement or savings plan, special tax rules apply.
Payments to Financial Intermediaries
The Fund and its investment advisors do not pay financial intermediaries for sales of Fund shares.
6
More on the Fund
This prospectus describes the principal risks you would face as a Fund shareholder. It is important to keep in mind one of the main principles of investing: generally, the higher the risk of losing money, the higher the potential reward. The reverse, also, is generally true: the lower the risk, the lower the potential reward. As you consider an investment in any mutual fund, you should take into account your personal tolerance for fluctuations in the securities markets. Look for this
 symbol throughout the prospectus. It is used to mark detailed information about the more significant risks that you would confront as a Fund shareholder. To highlight terms and concepts important to mutual fund investors, we have provided Plain Talk® explanations along the way. Reading the prospectus will help you decide whether the Fund is the right investment for you. We suggest that you keep this prospectus for future reference.
symbol throughout the prospectus. It is used to mark detailed information about the more significant risks that you would confront as a Fund shareholder. To highlight terms and concepts important to mutual fund investors, we have provided Plain Talk® explanations along the way. Reading the prospectus will help you decide whether the Fund is the right investment for you. We suggest that you keep this prospectus for future reference. |
Plain Talk About Fund Expenses |
|
All mutual funds have operating expenses. These expenses, which are
deducted from a fund’s gross income, are expressed as a percentage of the
net assets of the fund. Assuming that operating expenses remain as stated in
the Fees and Expenses section, Vanguard Explorer Value Fund’s expense
ratio would be 0.49%, or $4.90 per $1,000 of average net assets. The
average expense ratio for small-cap value funds in 2022 was 1.23%, or
$12.30 per $1,000 of average net assets (derived from data provided by
Lipper, a Thomson Reuters Company, which reports on the mutual
fund industry). |
|
Plain Talk About Costs of Investing |
|
Costs are an important consideration in choosing a mutual fund. That is
because you, as a shareholder, pay a proportionate share of the costs of
operating a fund and any transaction costs incurred when the fund buys or
sells securities. These costs can erode a substantial portion of the gross
income or the capital appreciation a fund achieves. Even seemingly small
differences in expenses can, over time, have a dramatic effect on a
fund’s performance. |
The following sections explain the principal investment strategies and policies that the Fund uses in pursuit of its investment objective. The Fund's board of trustees, which oversees the Fund's management, may change investment strategies or policies in the interest of shareholders without a shareholder vote,
7
unless those strategies or policies are designated as fundamental. Note that the Fund’s investment objective is not fundamental and may be changed without a shareholder vote.
Market Exposure
The Fund invests mainly in common stocks of small and mid-size companies that are considered to have low prices in relation to their cash flow and book value. These stocks may have above-average dividend yields.
|
Plain Talk About Growth Funds and Value Funds |
|
Growth investing and value investing are two styles employed by stock-fund
managers. Growth funds generally invest in stocks of companies believed to
have above-average potential for growth in revenue, earnings, cash flow, or
other similar criteria. These stocks typically have low dividend yields, if any,
and above-average prices in relation to measures such as earnings and book
value. Value funds typically invest in stocks whose prices are below average
in relation to those measures; these stocks often have above-average
dividend yields. Value stocks also may remain undervalued by the market for
long periods of time. Growth and value stocks have historically produced
similar long-term returns, though each category has periods when it
outperforms the other. |
Stocks of publicly traded companies are often classified according to market capitalization, which is the market value of a company’s outstanding shares. These classifications typically include small-cap, mid-cap, and large-cap. It is important to understand that there are no “official” definitions of small-, mid-, and large-cap, even among Vanguard fund advisors, and that market capitalization ranges can change over time. The asset-weighted median market capitalization of the Fund's stock holdings as of August 31, 2023, was $4.8 billion.
Because it invests mainly in stocks, the Fund is subject to certain risks.
The Fund is subject to stock market risk, which is the chance that stock prices overall will decline. Stock markets tend to move in cycles, with periods of rising prices and periods of falling prices.
The Fund focuses on the stocks of small and mid-size companies. Historically, small- and mid-cap stocks have been more volatile than—and at times have performed quite differently from—the broader markets. Small-cap stocks in particular tend to be more volatile in price. This volatility is the result of several factors, which may include (but are not limited to) less certain growth and
8
dividend prospects for smaller companies, fewer financial reserves during adverse market conditions, less access to capital funding, and generally greater sensitivity to changes within the company.
The Fund is subject to investment style risk, which is the chance that returns from small- and mid-capitalization value stocks will trail returns from the overall stock market. Historically, small- and mid-cap stocks have been more volatile in price than the large-cap stocks that dominate the overall market, and they often perform quite differently. The stock prices of small and mid-size companies tend to experience greater volatility because, among other things, these companies tend to be more sensitive to changing economic conditions.
Market disruptions can adversely affect local and global markets as well as normal market conditions and operations. Any such disruptions could have an adverse impact on the value of the Fund's investments and Fund performance.
Security Selection
The Fund uses multiple investment advisors. Each advisor independently selects and maintains a portfolio of common stocks for the Fund.
Each advisor employs active investment management methods, which means that securities are bought and sold according to the advisor’s evaluations of companies and their financial prospects, the prices of the securities, and the stock market and the economy in general. Each advisor will sell a security when, in the view of the advisor, it is no longer as attractive as an alternative investment or if the advisor deems it to be in the best interest of the Fund. Different advisors may reach different conclusions on the same security.
Although each advisor uses a traditional, bottom-up investment approach, each uses a different process to select securities for its portion of the Fund’s assets.
Ariel employs an investment philosophy seeking unique opportunities in various market conditions, and united by four principles: active patience, teamwork, focused expertise, and independent thinking. Ariel seeks to take advantage of the market’s short-term view to drive long-term results for our shareholders. As disciplined, bottom-up, fundamental value investors, portfolio construction is based on a combination of conviction and valuation of a company. Ariel favors companies with strong brands and franchises that produce or deliver high-quality products or services. Ariel also conducts in-depth analysis on a company’s overall financial structure and strategic goals with a three- to five-year horizon in mind.
9
Cardinal Capital employs a cash-flow-oriented investment process. Cardinal Capital believes that a company’s stock price is ultimately determined by its ability to generate excess cash flow and redeploy that cash to enhance shareholder value. The investment process is based on detailed five-year projections that include an analysis of the company’s financials and interviews with the company’s management. Cardinal Capital looks for companies with significant free cash flow, stable and predictable business models, and competent management.
Frontier Capital selects stocks by identifying companies that the advisor believes are undervalued relative to their long-term intrinsic value. The advisor’s fundamental, bottom-up investment approach seeks companies with solid business models, unrecognized earnings power, and attractive valuations across a variety of measures (price-to-book, enterprise value-to-sales, and price-to-earnings power).
The Fund is subject to manager risk, which is the chance that poor security selection will cause the Fund to underperform relevant benchmarks or other funds with a similar investment objective.
The ability of an advisor to purchase or dispose of certain Fund investments is or may be restricted or impaired because of limitations imposed by law, regulation, or by certain regulators or issuers. As a result, an advisor may be required to limit purchases or sell existing investments. If the Fund is required to limit its investment in a particular issuer, then the Fund may seek to obtain regulatory relief or special permission from an issuer to exceed a certain percentage ownership in that issuer's shares. Other options the Fund may pursue include seeking to obtain economic exposure to that issuer through alternative means, such as through a derivative or through investment in a wholly owned subsidiary, both of which may be more costly than owning securities of the issuer directly. Ownership restrictions and limitations could result in unanticipated tax consequences to the Fund that may affect the amount, timing, and character of distributions to shareholders. See Other Investment Policies and Risks for further information related to derivatives.
Other Investment Policies and Risks
In addition to investing in small- and mid-cap value stocks, the Fund may make other kinds of investments to achieve its investment objective.
Although the Fund typically does not make significant investments in foreign securities, it reserves the right to invest up to 30% of its assets in foreign securities, which may include depositary receipts. Foreign securities may be traded on U.S. or foreign markets. To the extent that it owns foreign securities,
10
the Fund is subject to country risk and currency risk. Country risk is the chance that world events—such as political upheaval, financial troubles, or natural disasters—will adversely affect the value of securities issued by companies in foreign countries. In addition, the prices of foreign stocks and the prices of U.S. stocks have, at times, moved in opposite directions. Currency risk is the chance that the value of a foreign investment, measured in U.S. dollars, will decrease because of unfavorable changes in currency exchange rates.
The Fund may invest, to a limited extent, in derivatives. Generally speaking, a derivative is a financial contract whose value is based on the value of a financial asset (such as a stock, a bond, or a currency), a physical asset (such as gold, oil, or wheat), a market index, or a reference rate. Investments in derivatives may subject the Fund to risks different from, and possibly greater than, those of investments directly in the underlying securities or assets. The Fund will not use derivatives for speculation or for the purpose of leveraging (magnifying) investment returns.
The Fund may enter into foreign currency exchange forward contracts, which are a type of derivative. A foreign currency exchange forward contract is an agreement to buy or sell a currency at a specific price on a specific date, usually 30, 60, or 90 days in the future. In other words, the contract guarantees an exchange rate on a given date. Advisors of funds that invest in foreign securities can use these contracts to guard against unfavorable changes in currency exchange rates. These contracts, however, would not prevent the Fund's securities from falling in value as a result of risks other than unfavorable currency exchange movements.
The Vanguard Group, Inc. (Vanguard) administers a small portion of the Fund's assets to facilitate cash flows to and from the Fund's advisors. The Fund may invest these assets in equity futures, which are a type of derivative, and/or shares of exchange-traded funds (ETFs), including Vanguard equity ETF Shares. These equity futures and ETFs typically provide returns similar to those of common stocks. The Fund may also purchase futures or ETFs when doing so will reduce the Fund's transaction costs or have the potential to add value because the instruments are favorably priced. Vanguard receives no additional revenue from Fund assets invested in ETF Shares of other Vanguard funds. Fund assets invested in ETF Shares of other Vanguard funds are excluded when allocating to the Fund its share of the costs of Vanguard operations.
11
|
Plain Talk About Derivatives |
|
Derivatives can take many forms. Some forms of derivatives—such as
exchange-traded futures and options on securities, commodities, or
indexes—have been trading on regulated exchanges for decades. These
types of derivatives are standardized contracts that can easily be bought and
sold and whose market values are determined and published daily. On the
other hand, non-exchange-traded derivatives—such as certain swap
agreements and foreign currency exchange forward contracts—tend to be
more specialized or complex and may be more difficult to accurately value. |
Cash Management
The Fund's daily cash balance may be invested in Vanguard Market Liquidity Fund and/or Vanguard Municipal Cash Management Fund (each, a CMT Fund), which are low-cost money market funds. When investing in a CMT Fund, the Fund bears its proportionate share of the expenses of the CMT Fund in which it invests. Vanguard receives no additional revenue from Fund assets invested in a CMT Fund.
Redemption Requests
Methods used to meet redemption requests. Under normal circumstances, the Fund typically expects to meet redemptions with positive cash flows. When this is not an option, the Fund seeks to first meet redemptions cross section of the Fund’s holdings to meet redemptions, while also factoring in transaction costs. Additionally, the Fund may work with larger clients to implement their redemptions in a manner that is least disruptive to the portfolio; see “Potentially disruptive redemptions” under Redeeming Shares in the Investing With Vanguard section.
Under certain circumstances, including under stressed market conditions, there are additional tools that the Fund may use in order to meet redemptions, including advancing the settlement of market trades with counterparties to match investor redemption payments or delaying settlement of an investor’s transaction to match trade settlement within regulatory requirements. The Fund may also suspend payment of redemption proceeds for up to seven days; see “Emergency circumstances” under Redeeming Shares in the Investing With Vanguard section. Additionally under these unusual circumstances, the Fund may borrow money (subject to certain regulatory conditions and if available under board-approved procedures) through an interfund lending facility; through a bank line-of-credit, including a joint committed credit facility; or through an uncommitted line-of-credit from Vanguard in order to meet redemption requests.
12
Potential redemption activity impacts. At times, the Fund may experience adverse effects when certain large shareholders, or multiple shareholders comprising significant ownership of the Fund, redeem large amounts of shares of the Fund. Large redemptions may cause the Fund to sell portfolio securities at times when it would not otherwise do so. This may result in the Fund distributing capital gains or other taxable income to non-redeeming shareholders. Large redemptions may also increase the Fund's transaction costs. Redemption activity can occur for many reasons, including shareholder reactions to market movements or other events unrelated to Vanguard’s actions, or when Vanguard makes product changes that, for example, may result in a shareholder redeeming shares of the Fund to purchase shares of another similar fund or investment vehicle. When experiencing large redemptions, the Fund reserves the right to pay all or part of the redemption in-kind and/or delay payment of the redemption proceeds for up to seven calendar days; see “Potentially disruptive redemptions” under Redeeming Shares in the Investing With Vanguard section.
Temporary Investment Measures
The Fund may temporarily depart from its normal investment policies and strategies when an advisor believes that doing so is in the Fund's best interest, so long as the strategy or policy employed is consistent with the Fund's investment objective. For instance, the Fund may invest beyond its normal limits in derivatives or exchange-traded funds that are consistent with the Fund's investment objective when those instruments are more favorably priced or provide needed liquidity, as might be the case if the Fund is transitioning assets from one advisor to another or receives large cash flows that it cannot prudently invest immediately.
In addition, the Fund may take temporary defensive positions that are inconsistent with its normal investment policies and strategies—for instance, by allocating substantial assets to cash equivalent investments or other less volatile instruments— in response to adverse or unusual market, economic, political, or other conditions. In doing so, the Fund may succeed in avoiding losses but may otherwise fail to achieve its investment objective.
Frequent Trading or Market-Timing
Background. Some investors try to profit from strategies involving frequent trading of mutual fund shares, such as market-timing. For funds holding foreign securities, investors may try to take advantage of an anticipated difference between the price of the fund’s shares and price movements in overseas markets, a practice also known as time-zone arbitrage. Investors also may try to engage in frequent trading of funds holding investments such as small-cap stocks and high-yield bonds. As money is shifted into and out of a fund by a
13
shareholder engaging in frequent trading, the fund incurs costs for buying and selling securities, resulting in increased brokerage and administrative costs. These costs are borne by all fund shareholders, including the long-term investors who do not generate the costs. In addition, frequent trading may interfere with an advisor’s ability to efficiently manage the fund.
Policies to address frequent trading. The Vanguard funds (other than money market funds and short-term bond funds, but including Vanguard Short-Term Inflation-Protected Securities Index Fund) do not knowingly accommodate frequent trading. The board of trustees of each Vanguard fund (other than money market funds and short-term bond funds, but including Vanguard Short-Term Inflation-Protected Securities Index Fund) has adopted policies and procedures reasonably designed to detect and discourage frequent trading and, in some cases, to compensate the fund for the costs associated with it. These policies and procedures do not apply to ETF Shares because frequent trading in ETF Shares generally does not disrupt portfolio management or otherwise harm fund shareholders. Although there is no assurance that Vanguard will be able to detect or prevent frequent trading or market-timing in all circumstances, the following policies have been adopted to address these issues:
• Each Vanguard fund reserves the right to reject any purchase request—including exchanges from other Vanguard funds—without notice and regardless of size. For example, a purchase request could be rejected because the investor has a history of frequent trading or if Vanguard determines that such purchase may negatively affect a fund’s operation or performance.
• Each Vanguard fund (other than money market funds and short-term bond funds, but including Vanguard Short-Term Inflation-Protected Securities Index Fund) generally prohibits, except as otherwise noted in the Investing With Vanguard section, an investor’s purchases or exchanges into a fund account for 30 calendar days after the investor has redeemed or exchanged out of that fund account.
• Certain Vanguard funds charge shareholders purchase and/or redemption fees on transactions.
See the Investing With Vanguard section of this prospectus for further details on Vanguard’s transaction policies.
Each Vanguard fund (other than retail and government money market funds), in determining its net asset value, will use fair-value pricing when appropriate, as described in the Share Price section. Fair-value pricing may reduce or eliminate the profitability of certain frequent-trading strategies.
Do not invest with Vanguard if you are a market-timer.
14
A precautionary note to investment companies: The Fund's shares are issued by a registered investment company, and therefore the acquisition of such shares by other investment companies and private funds is subject to the restrictions of Section 12(d)(1) of the Investment Company Act of 1940 (the 1940 Act). SEC Rule 12d1-4 under the 1940 Act permits registered investment companies to invest in other registered investment companies beyond the limits in Section 12(d)(1), subject to certain conditions, including that funds with different investment advisors must enter into a fund of funds investment agreement.
Turnover Rate
Although the Fund generally seeks to invest for the long term, it may sell securities regardless of how long they have been held. The Financial Highlights section of this prospectus shows historical turnover rates for the Fund. A turnover rate of 100%, for example, would mean that the Fund had sold and replaced securities valued at 100% of its net assets within a one-year period. In general, the greater the turnover rate, the greater the impact transaction costs will have on a fund’s return. Also, funds with high turnover rates may be more likely to generate capital gains, including short-term capital gains, that must be distributed to shareholders and will be taxable to shareholders investing through a taxable account.
The Fund and Vanguard
The Fund is a member of The Vanguard Group, Inc. (Vanguard), a family of over 200 funds. All of the funds that are members of Vanguard (other than funds of funds) share in the expenses associated with administrative services and business operations, such as personnel, office space, and equipment.
Vanguard Marketing Corporation provides marketing services to the funds. Although fund shareholders do not pay sales commissions or 12b-1 distribution fees, each fund (other than a fund of funds) or each share class of a fund (in the case of a fund with multiple share classes) pays its allocated share of the Vanguard funds’ marketing costs.
15
|
Plain Talk About Vanguard’s Unique Corporate Structure |
|
Vanguard is owned jointly by the funds it oversees and thus indirectly by the
shareholders in those funds. Most other mutual funds are operated by
management companies that are owned by third parties—either public or
private stockholders—and not by the funds they serve. |
Investment Advisors
The Fund uses a multimanager approach. Each advisor independently manages its assigned portion of the Fund’s assets, subject to the supervision and oversight of Vanguard and the Fund’s board of trustees. The board of trustees designates the proportion of Fund assets to be managed by each advisor and may change these proportions at any time.
• Ariel Investments, LLC, 200 East Randolph Street, Suite 2900, Chicago, IL 60601, is an investment management firm founded in 1983. As of August 31, 2023, the firm managed approximately $16.4 billion in assets.
• Cardinal Capital Management, L.L.C., Four Greenwich Office Park, Greenwich, CT 06831, is an investment management firm founded in 1995. As of August 31, 2023, the firm managed approximately $2.9 billion in assets.
• Frontier Capital Management Co., LLC, 99 Summer Street, Boston, MA 02110, is an investment management firm founded in 1980. As of August 31, 2023, the firm managed approximately $9.9 billion in assets.
The Fund pays each of its investment advisors a base fee plus or minus a performance adjustment. The base fee, which is paid quarterly, is a percentage of average daily net assets managed by the advisor during the most recent fiscal quarter. The base fee has breakpoints, which means that the percentage declines as assets go up. The performance adjustment, also paid quarterly, is based on the cumulative total return of each advisor’s portion of the Fund relative to that of the Russell 2000 Value Index (for Frontier Capital) or the Russell 2500 Value Index (for Ariel and Cardinal Capital) over the preceding 36-month period.
For the fiscal year ended August 31, 2023, the aggregate advisory fee represented an effective annual rate of 0.31% of the Fund’s average net assets before a performance-based decrease of 0.04%.
16
Under the terms of an SEC exemption, the Fund's board of trustees may, without prior approval from shareholders, change the terms of an advisory agreement with a third-party investment advisor or hire a new third-party investment advisor—either as a replacement for an existing advisor or as an additional advisor. Any significant change in the Fund's advisory arrangements will be communicated to shareholders in writing. As the Fund's sponsor and overall manager, Vanguard may provide investment advisory services to the Fund at any time. Vanguard may also recommend to the board of trustees that an advisor be hired, terminated, or replaced or that the terms of an existing advisory agreement be revised. The Fund has filed an application seeking a similar SEC exemption with respect to investment advisors that are wholly owned subsidiaries of Vanguard. If the exemption is granted, the Fund may rely on the new SEC relief.
For a discussion of why the board of trustees approved the Fund's investment advisory agreements, see the most recent semiannual report to shareholders covering the fiscal period ended February 28.
17
The managers primarily responsible for the day-to-day management of the Fund are:
Kenneth E. Kuhrt, CPA, Executive Vice President and Portfolio Manager of Ariel. He has worked in investment management since 2002, has managed investment portfolios since 2011, has been with Ariel since 2004, and has co-managed a portion of the Fund since January 2022. Education: B.S., University of Illinois at Urbana-Champaign; M.B.A., University of Chicago.
John W. Rogers, Jr., Chairman, Co-CEO & Chief Investment Officer and Lead Portfolio Manager of Ariel. He has worked in investment management since 1981, has managed investment portfolios and has been with Ariel since 1983, and has co-managed a portion of the Fund since January 2022. Education: A.B., Princeton University.
Robert H. Fields, Partner and Portfolio Manager of Cardinal Capital. He has worked in investment management since 1998, has been with Cardinal Capital since 2013, has managed investment portfolios since 2015, and has co-managed a portion of the Fund since 2016. Education: B.A., Ball State University; M.B.A., University of Pennsylvania.
Eugene Fox III, Managing Partner and Portfolio Manager of Cardinal Capital. He has worked in investment management since 1987, has managed investment portfolios and has been with Cardinal Capital since 1995, and has co-managed a portion of the Fund since its inception in 2010. Education: B.A., University of Virginia; M.B.A., University of Chicago.
Robert B. Kirkpatrick, CFA, Managing Partner and Portfolio Manager of Cardinal Capital. He has worked in investment management and has managed investment portfolios since 1985, has been with Cardinal Capital since 2000, and has co-managed a portion of the Fund since its inception in 2010. Education: B.A., Williams College.
Rachel D. Matthews, Partner and Portfolio Manager of Cardinal Capital. She has worked in investment management since 1989, has been with Cardinal Capital since 2001, has managed investment portfolios since 2009, and has co-managed a portion of the Fund since 2013. Education: B.A., Columbia University; M.B.A., New York University.
18
Rushan Jiang, CFA, Partner and Portfolio Manager of Frontier Capital. He has worked in investment management since 2003, has been with Frontier Capital since 2005, has managed investment portfolios since 2014, and has co-managed a portion of the Fund since 2019. Education: B.S., University of Texas; M.S., Stanford University; M.B.A., Massachusetts Institute of Technology.
William A. Teichner, CFA, Managing Partner and Portfolio Manager of Frontier Capital. He has worked in investment management with Frontier Capital since 1992, has managed investment portfolios since 1999, and has co-managed a portion of the Fund since its inception in 2010. Education: B.A., Columbia University; M.B.A., Harvard Business School.
The Fund's Statement of Additional Information provides information about each portfolio manager’s compensation, other accounts under management, and ownership of shares of the Fund.
Dividends, Capital Gains, and Taxes
Fund Distributions
The Fund distributes to shareholders virtually all of its net income (interest and dividends, less expenses) as well as any net short-term or long-term capital gains realized from the sale of its holdings. From time to time, the Fund may also make distributions that are treated as a return of capital. Income and capital gains distributions, if any, generally occur annually in December. In addition, the Fund may occasionally make a supplemental distribution at some other time during the year.
You can receive distributions of income or capital gains in cash, or you can have them automatically reinvested in more shares of the Fund. However, if you are investing through an employer-sponsored retirement or savings plan, your distributions will be automatically reinvested in additional Fund shares.
19
|
Plain Talk About Distributions |
|
As a shareholder, you are entitled to your portion of a fund’s income from
interest and dividends as well as capital gains from the fund’s sale of
investments. Income consists of both the dividends that the fund earns from
any stock holdings and the interest it receives from any money market and
bond investments. Capital gains are realized whenever the fund sells
securities for higher prices than it paid for them. These capital gains are
either short-term or long-term, depending on whether the fund held the
securities for one year or less or for more than one year. |
Basic Tax Points
Investors in taxable accounts should be aware of the following basic federal income tax points:
• Distributions are taxable to you whether or not you reinvest these amounts in additional Fund shares.
• Distributions declared in December—if paid to you by the end of January—are taxable as if received in December.
• Any dividend distribution or short-term capital gains distribution that you receive is taxable to you as ordinary income. If you are an individual and meet certain holding-period requirements with respect to your Fund shares, you may be eligible for reduced tax rates on “qualified dividend income,” if any, or a special tax deduction on “qualified REIT dividends,” if any, distributed by the Fund.
• Any distribution of net long-term capital gains is taxable to you as long-term capital gains, no matter how long you have owned shares in the Fund.
• Capital gains distributions may vary considerably from year to year as a result of the Fund's normal investment activities and cash flows.
• Your cost basis in the Fund will be decreased by the amount of any return of capital that you receive. This, in turn, will affect the amount of any capital gain or loss that you realize when selling or exchanging your Fund shares.
• Return of capital distributions generally are not taxable to you until your cost basis has been reduced to zero. If your cost basis is at zero, return of capital distributions will be treated as capital gains.
• A sale or exchange of Fund shares is a taxable event. This means that you may have a capital gain to report as income, or a capital loss to report as a deduction, when you complete your tax return.
20
• Vanguard (or your intermediary) will send you a statement each year showing the tax status of all of your distributions.
Individuals, trusts, and estates whose income exceeds certain threshold amounts are subject to a 3.8% Medicare contribution tax on “net investment income.” Net investment income takes into account distributions paid by the Fund and capital gains from any sale or exchange of Fund shares.
Dividend distributions and capital gains distributions that you receive, as well as your gains or losses from any sale or exchange of Fund shares, may be subject to state and local income taxes.
This prospectus provides general tax information only. If you are investing through a tax-advantaged account, such as an IRA or an employer-sponsored retirement or savings plan, special tax rules apply. Please consult your tax advisor for detailed information about any tax consequences for you.
|
Plain Talk About Buying a Dividend |
|
Unless you are a tax-exempt investor or investing through a tax-advantaged
account (such as an IRA or an employer-sponsored retirement or savings
plan), you should consider avoiding a purchase of fund shares shortly before
the fund makes a distribution, because doing so can cost you money in
taxes. This is known as “buying a dividend.” For example: On December 15,
you invest $5,000, buying 250 shares for $20 each. If the fund pays a
distribution of $1 per share on December 16, its share price will drop to $19
(not counting market change). You still have only $5,000 (250 shares x $19 =
$4,750 in share value, plus 250 shares x $1 = $250 in distributions), but you
owe tax on the $250 distribution you received—even if you reinvest it in more
shares. To avoid buying a dividend, check a fund’s distribution schedule
before you invest. |
General Information
Backup withholding. By law, Vanguard must withhold 24% of any taxable distributions or redemptions from your account if you do not:
• Provide your correct taxpayer identification number.
• Certify that the taxpayer identification number is correct.
• Confirm that you are not subject to backup withholding.
Similarly, Vanguard (or your intermediary) must withhold taxes from your account if the IRS instructs us to do so.
21
Foreign investors. Vanguard funds offered for sale in the United States (Vanguard U.S. funds), including the Fund offered in this prospectus, are not widely available outside the United States. Non-U.S. investors should be aware that U.S. withholding and estate taxes and certain U.S. tax reporting requirements may apply to any investments in Vanguard U.S. funds. Foreign investors should visit the non-U.S. investors page on our website at vanguard.com for information on Vanguard’s non-U.S. products.
Invalid addresses. If a dividend distribution or capital gains distribution check mailed to your address of record is returned as undeliverable, Vanguard will automatically reinvest the distribution and all future distributions until you provide us with a valid mailing address. Reinvestments will receive the net asset value calculated on the date of the reinvestment.
Share Price
Share price, also known as net asset value (NAV), is calculated as of the close of regular trading on the New York Stock Exchange (NYSE), generally 4 p.m., Eastern time, on each day that the NYSE is open for business (a business day). In the rare event the NYSE experiences unanticipated disruptions and is unavailable at the close of the trading day, NAVs will be calculated as of the close of regular trading on the Nasdaq (or another alternate exchange if the Nasdaq is unavailable, as determined at Vanguard’s discretion), generally 4 p.m., Eastern time. The NAV per share is computed by dividing the total assets, minus liabilities, of the Fund by the number of Fund shares outstanding. On U.S. holidays or other days when the NYSE is closed, the NAV is not calculated, and the Fund does not sell or redeem shares. However, on those days the value of the Fund’s assets may be affected to the extent that the Fund holds securities that change in value on those days (such as foreign securities that trade on foreign markets that are open).
Stocks held by a Vanguard fund are valued at their market value when reliable market quotations are readily available from the principal exchange or market on which they are traded. Such securities are generally valued at their official closing price, the last reported sales price, or if there were no sales that day, the mean between the closing bid and asking prices. When a fund determines that market quotations either are not readily available or do not accurately reflect the value of a security, the security is priced at its fair value (the amount that the owner might reasonably expect to receive upon the current sale of the security).
The values of any foreign securities held by a fund are converted into U.S. dollars using an exchange rate obtained from an independent third party as of the close of regular trading on the NYSE. The values of any mutual fund shares,
22
including institutional money market fund shares, held by a fund are based on the NAVs of the shares. The values of any ETF shares or closed-end fund shares held by a fund are based on the market value of the shares.
A fund also will use fair-value pricing if the value of a security it holds has been materially affected by events occurring before the fund's pricing time but after the close of the principal exchange or market on which the security is traded. This most commonly occurs with foreign securities, which may trade on foreign exchanges that close many hours before the fund's pricing time. Intervening events might be company-specific (e.g., earnings report, merger announcement) or country-specific or regional/global (e.g., natural disaster, economic or political news, interest rate change, act of terrorism). Intervening events include price movements in U.S. markets that exceed a specified threshold or that are otherwise deemed to affect the value of foreign securities.
Fair-value pricing may be used for domestic securities—for example, if (1) trading in a security is halted and does not resume before the fund's pricing time or a security does not trade in the course of a day and (2) the fund holds enough of the security that its price could affect the NAV.
Fair-value prices are determined by Vanguard according to procedures adopted by the board of trustees. When fair-value pricing is employed, the prices of securities used by a fund to calculate the NAV may differ from quoted or published prices for the same securities.
The Fund has authorized certain financial intermediaries and their designees, and may, from time to time, authorize certain funds of funds for which Vanguard serves as the investment advisor (Vanguard Funds of Funds), to accept orders to buy or sell fund shares on its behalf. The Fund will be deemed to receive an order when accepted by the financial intermediary, its designee, or one of the Vanguard Funds of Funds, and the order will receive the NAV next computed by the Fund after such acceptance.
Vanguard fund share prices are published daily on our website at vanguard.com/prices.
23
Financial Highlights
Financial highlights information is intended to help you understand a fund’s performance for the past five years (or, if shorter, its period of operations). Certain information reflects financial results for a single fund share. Total return represents the rate that an investor would have earned or lost each period on an investment in a fund or share class (assuming reinvestment of all distributions). This information has been obtained from the financial statements audited by PricewaterhouseCoopers LLP, an independent registered public accounting firm, whose report, along with fund financial statements, is included in a fund’s most recent annual report to shareholders. You may obtain a free copy of a fund’s latest annual or semiannual report, which is available upon request.
Vanguard Explorer Value Fund
|
|
Year Ended August 31, | ||||
|
2023 |
2022 |
2021 |
2020 |
2019 | |
|
Net Asset Value, Beginning of Period |
$39.93 |
$46.26 |
$30.32 |
$33.49 |
$40.53 |
|
Investment Operations |
|
|
|
|
|
|
Net Investment Income1 |
.586 |
.461 |
.351 |
.400 |
.494 |
|
Net Realized and Unrealized Gain (Loss) on Investments |
2.308 |
(4.910) |
15.911 |
(3.032) |
(4.921) |
|
Total from Investment Operations |
2.894 |
(4.449) |
16.262 |
(2.632) |
(4.427) |
|
Distributions |
|
|
|
|
|
|
Dividends from Net Investment Income |
(.495) |
(.352) |
(.322) |
(.538) |
(.366) |
|
Distributions from Realized Capital Gains |
(.979) |
(1.529) |
— |
— |
(2.247) |
|
Total Distributions |
(1.474) |
(1.881) |
(.322) |
(.538) |
(2.613) |
|
Net Asset Value, End of Period |
$41.35 |
$39.93 |
$46.26 |
$30.32 |
$33.49 |
|
Total Return2 |
7.43% |
-10.05% |
53.90% |
-8.12% |
-10.10% |
|
Ratios/Supplemental Data |
|
|
|
|
|
|
Net Assets, End of Period (Millions) |
$959 |
$1,083 |
$1,164 |
$563 |
$655 |
|
Ratio of Total Expenses to Average Net Assets3 |
0.49%4 |
0.53%4 |
0.52% |
0.64% |
0.55% |
|
Ratio of Net Investment Income to Average Net Assets |
1.48% |
1.05% |
0.85% |
1.28% |
1.45% |
|
Portfolio Turnover Rate |
23% |
31% |
41% |
42% |
27% |
|
|
|
|
1 |
Calculated based on average shares outstanding. |
|
2 |
Total returns do not include account service fees that may have applied in the periods shown.
Fund prospectuses provide information about any applicable account service fees. |
|
3 |
Includes performance-based investment advisory fee increases (decreases) of (0.04%),
0.02%, 0.01%, 0.09%, and 0.01%. |
|
4 |
The ratio of expenses to average net assets for the period net of reduction from broker
commission abatement arrangements was 0.49% and 0.53%, respectively. |
24
Investing With Vanguard
This section of the prospectus explains the basics of doing business with Vanguard. Vanguard fund shares can be held indirectly through an intermediary, such as a bank, a broker, or an investment advisor. If you hold Vanguard fund shares indirectly through an intermediary (including shares held in a brokerage account through Vanguard Brokerage Services®), please see Investing With Vanguard Through Other Firms, and also refer to your account agreement with the intermediary for information about transacting in that account. If you hold Vanguard fund shares through an employer-sponsored retirement or savings plan, please see Employer-Sponsored Plans. Vanguard reserves the right to change the policies in this section without notice. Please call or check online for current information. See Contacting Vanguard.
In certain circumstances, Vanguard fund shares can be held directly with Vanguard. If you hold Vanguard fund shares directly with Vanguard, you should carefully read each topic within this section that pertains to your relationship with Vanguard. Vanguard reserves the right, upon reasonable notice, to discontinue the ability to hold Vanguard fund shares directly with Vanguard for any or all investors and/or to transfer such shares to an affiliate or other financial institution.
In certain circumstances, Vanguard fund shares can be held directly with Vanguard. If you hold Vanguard fund shares directly with Vanguard, you should carefully read each topic within this section that pertains to your relationship with Vanguard. Vanguard reserves the right, upon reasonable notice, to discontinue the ability to hold Vanguard fund shares directly with Vanguard for any or all investors and/or to transfer such shares to an affiliate or other financial institution.
For Vanguard fund shares held directly with Vanguard, each fund you hold in an account is a separate “fund account.” For example, if you hold three funds in a nonretirement account titled in your own name, two funds in a nonretirement account titled jointly with your spouse, and one fund in an individual retirement account, you have six fund accounts—and this is true even if you hold the same fund in multiple accounts. Note that each reference to “you” in this prospectus applies to any one or more registered account owners or persons authorized to transact on your account.
Purchasing Shares
Vanguard reserves the right, without notice, to increase or decrease the minimum amount required to open or maintain a fund account or to add to an existing fund account.
Investment minimums may differ for certain categories of investors.
Account Minimums
To open and maintain an account. $3,000. Financial intermediaries, institutional clients, and Vanguard-advised clients should contact Vanguard for information on special eligibility rules that may apply to them regarding Investor Shares. If you are investing through an intermediary, please contact that firm directly for more information regarding your eligibility.
25
To add to an existing account. Generally $1.
How to Initiate a Purchase Request
Be sure to check Exchanging Shares, Frequent-Trading Limitations, and Other Rules You Should Know before placing your purchase request.
Online. You may open certain types of accounts, request a purchase of shares, and request an exchange through our website or our mobile application if your account is eligible and you are registered for online access.
By telephone. You may call Vanguard to begin the account registration process or request that the account-opening forms be sent to you. You may also call Vanguard to request a purchase of shares in your account or to request an exchange. See Contacting Vanguard.
By mail. You may send Vanguard your account registration form and check to open a new fund account. To add to an existing fund account, you may send your check with an Invest-by-Mail form (from a transaction confirmation or your account statement) or with a deposit slip (available online).
How to Pay for a Purchase
By electronic bank transfer. You may purchase shares of a Vanguard fund through an electronic transfer of money from a bank account. To establish the electronic bank transfer service on an account, you must designate the bank account online, complete a form, or fill out the appropriate section of your account registration form. After the service is set up on your account, you can purchase shares by electronic bank transfer on a regular schedule (Automatic Investment Plan), if eligible, or upon request. Your purchase request can be initiated online (if you are registered for online access), by telephone, or by mail.
By wire. Wiring instructions vary for different types of purchases. Please call Vanguard for instructions and policies on purchasing shares by wire. See Contacting Vanguard.
By check. You may make initial or additional purchases to your fund account by sending a check with a deposit slip or by utilizing our mobile application if your account is eligible and you are registered for online access. Also see How to Initiate a Purchase Request. Make your check payable to Vanguard and include the appropriate fund number (Vanguard—1690).
By exchange. You may purchase shares of a Vanguard fund using the proceeds from the simultaneous redemption of shares of another Vanguard fund. You may initiate an exchange online (if you are registered for online access), by telephone, or by mail with an exchange form. See Exchanging Shares.
26
Trade Date
The trade date for any purchase request received in good order will depend on the day and time Vanguard receives your request, the manner in which you are paying, and the type of fund you are purchasing. Your purchase will be executed using the NAV as calculated on the trade date. NAVs are calculated only on days that the NYSE is open for trading (a business day). In the rare event the NYSE experiences unanticipated disruptions and is unavailable at the close of the trading day, NAVs will be calculated as of the close of regular trading on the Nasdaq (or another alternate exchange if the Nasdaq is unavailable, as determined at Vanguard’s discretion), generally 4 p.m., Eastern time. The time selected for NAV calculation in this rare event shall also serve as the conclusion of the trading day. See Share Price.
For purchases by check into all funds other than money market funds and for purchases by exchange, wire, or electronic bank transfer into all funds: If the purchase request is received by Vanguard on a business day before the close of regular trading on the NYSE (generally 4 p.m., Eastern time), the trade date for the purchase will be the same day. If the purchase request is received on a business day after the close of regular trading on the NYSE, or on a nonbusiness day, the trade date for the purchase will be the next business day.
For purchases by check into money market funds: If the purchase request is received by Vanguard on a business day before the close of regular trading on the NYSE (generally 4 p.m., Eastern time), the trade date for the purchase will be the next business day. If the purchase request is received on a business day after the close of regular trading on the NYSE, or on a nonbusiness day, the trade date for the purchase will be the second business day following the day Vanguard receives the purchase request. Because money market instruments must be purchased with federal funds and it takes a money market mutual fund one business day to convert check proceeds into federal funds, the trade date for the purchase will be one business day later than for other funds.
If applicable, orders by Vanguard Fund of Funds will be treated as received by the Fund at the same time that corresponding orders are received in proper form by the Vanguard Fund of Funds.
If your purchase request is not accurate and complete, it may be rejected. See Other Rules You Should Know—Good Order.
For further information about purchase transactions, consult our website at vanguard.com or see Contacting Vanguard.
27
Other Purchase Rules You Should Know
Check purchases. All purchase checks must be written in U.S. dollars, be drawn on a U.S. bank, and be accompanied by good order instructions. Vanguard does not accept cash, traveler’s checks, starter checks, or money orders. In addition, Vanguard may refuse checks that are not made payable to Vanguard.
New accounts. We are required by law to obtain from you certain personal information that we will use to verify your identity. If you do not provide the information, we may not be able to open your account. If we are unable to verify your identity, Vanguard reserves the right, without notice, to close your account or take such other steps as we deem reasonable. Certain types of accounts may require additional documentation.
Refused or rejected purchase requests. Vanguard reserves the right to stop selling fund shares or to reject any purchase request at any time and without notice, including, but not limited to, purchases requested by exchange from another Vanguard fund. This also includes the right to reject any purchase request because the investor has a history of frequent trading or because the purchase may negatively affect a fund’s operation or performance.
Large purchases. Call Vanguard before attempting to invest a large dollar amount.
No cancellations. Vanguard will not accept your request to cancel any purchase request once processing has begun. Please be careful when placing a purchase request.
Redeeming Shares
How to Initiate a Redemption Request
Be sure to check Exchanging Shares, Frequent-Trading Limitations, and Other Rules You Should Know before placing your redemption request.
Online. You may request a redemption of shares or request an exchange through our website or our mobile application if your account is eligible and you are registered for online access.
By telephone. You may call Vanguard to request a redemption of shares or an exchange. See Contacting Vanguard.
By mail. You may send a form (available online) to Vanguard to redeem from a fund account or to make an exchange.
28
How to Receive Redemption Proceeds
By electronic bank transfer. You may have the proceeds of a fund redemption sent directly to a designated bank account. To establish the electronic bank transfer service on an account, you must designate a bank account online, complete a form, or fill out the appropriate section of your account registration form. After the service is set up on your account, you can redeem shares by electronic bank transfer on a regular schedule (Automatic Withdrawal Plan), if eligible, or upon request. Your redemption request can be initiated online (if you are registered for online access), by telephone, or by mail.
By wire. To receive your proceeds by wire, you may instruct Vanguard to wire your redemption proceeds ($100 minimum) to a previously designated bank account. To establish the wire redemption service, you generally must designate a bank account online, complete a form, or fill out the appropriate section of your account registration form.
Please note that Vanguard charges a $10 wire fee for outgoing wire redemptions. The fee is assessed in addition to, rather than being withheld from, redemption proceeds and is paid directly to the fund in which you invest. For example, if you redeem $100 via a wire, you will receive the full $100, and the $10 fee will be assessed to your fund account through an additional redemption of fund shares. If you redeem your entire fund account, your redemption proceeds will be reduced by the amount of the fee. The wire fee does not apply to accounts held by Flagship and Flagship Select clients; accounts held through intermediaries, including Vanguard Brokerage Services; or accounts held by institutional clients.
By exchange. You may have the proceeds of a Vanguard fund redemption invested directly in shares of another Vanguard fund. You may initiate an exchange online (if you are registered for online access), by telephone, or by mail. See Exchanging Shares.
By check. If you have not chosen another redemption method, Vanguard will mail you a redemption check, generally payable to all registered account owners, normally within two business days of your trade date, and generally to the address of record.
Trade Date
The trade date for any redemption request received in good order will depend on the day and time Vanguard receives your request and the manner in which you are redeeming. Your redemption will be executed using the NAV as calculated on the trade date. NAVs are calculated only on days that the NYSE is open for trading (a business day). In the rare event the NYSE experiences unanticipated disruptions and is unavailable at the close of the trading day, NAVs will be
29
calculated as of the close of regular trading on the Nasdaq (or another alternate exchange if the Nasdaq is unavailable, as determined at Vanguard’s discretion), generally 4 p.m., Eastern time. The time selected for NAV calculation in this rare event shall also serve as the conclusion of the trading day. See Share Price.
For redemptions by check, exchange, or wire: If the redemption request is received by Vanguard on a business day before the close of regular trading on the NYSE (generally 4 p.m., Eastern time), the trade date will be the same day. If the redemption request is received on a business day after the close of regular trading on the NYSE, or on a nonbusiness day, the trade date will be the next business day.
• Note on timing of wire redemptions from money market funds: For telephone requests received by Vanguard on a business day before 10:45 a.m., Eastern time (2 p.m., Eastern time, for Vanguard Cash Reserves Federal Money Market Fund; 12:30 p.m., Eastern time, for Vanguard Federal Money Market Fund), the redemption proceeds generally will leave Vanguard by the close of business the same day. For telephone requests received by Vanguard on a business day after those cut-off times, or on a nonbusiness day, and for all requests other than by telephone, the redemption proceeds generally will leave Vanguard by the close of business on the next business day.
• Note on timing of wire redemptions from all other funds: For requests received by Vanguard on a business day before the close of regular trading on the NYSE (generally 4 p.m., Eastern time), the redemption proceeds generally will leave Vanguard by the close of business on the next business day. For requests received by Vanguard on a business day after the close of regular trading on the NYSE, or on a nonbusiness day, the redemption proceeds generally will leave Vanguard by the close of business on the second business day after Vanguard receives the request.
For redemptions by electronic bank transfer: If the redemption request is received by Vanguard on a business day before the close of regular trading on the NYSE (generally 4 p.m., Eastern time), the trade date will be the same day. If the redemption request is received on a business day after the close of regular trading on the NYSE, or on a nonbusiness day, the trade date will be the next business day.
If your redemption request is not accurate and complete, it may be rejected. If we are unable to send your redemption proceeds by wire or electronic bank transfer because the receiving institution rejects the transfer, Vanguard will make additional efforts to complete your transaction. If Vanguard is still unable to complete the transaction, we may send the proceeds of the redemption to you by
30
check, generally payable to all registered account owners, or use your proceeds to purchase new shares of the fund from which you sold shares for the purpose of the wire or electronic bank transfer transaction. See Other Rules You Should Know—Good Order.
If your redemption request is received in good order, we typically expect that redemption proceeds will be paid by the Fund within one business day of the trade date; however, in certain circumstances, investors may experience a longer settlement period at the time of the transaction. For further information, see “Potentially disruptive redemptions” and “Emergency circumstances.”
For further information about redemption transactions, consult our website at vanguard.com or see Contacting Vanguard.
Other Redemption Rules You Should Know
Documentation for certain accounts. Special documentation may be required to redeem from certain types of accounts, such as trust, corporate, nonprofit, or retirement accounts. Please call us before attempting to redeem from these types of accounts.
Potentially disruptive redemptions. Vanguard reserves the right to pay all or part of a redemption in kind—that is, in the form of securities—if we reasonably believe that a cash redemption would negatively affect the fund’s operation or performance or that the shareholder may be engaged in market-timing or frequent trading. Under these circumstances, Vanguard also reserves the right to delay payment of the redemption proceeds for up to seven calendar days. By calling us before you attempt to redeem a large dollar amount, you may avoid in-kind or delayed payment of your redemption. Please see Frequent-Trading Limitations for information about Vanguard's policies to limit frequent trading.
Recently purchased shares. Although you can redeem shares at any time, proceeds may not be made available to you until the fund collects payment for your purchase. This may take up to seven calendar days for shares purchased by check or by electronic bank transfer. If you have written a check on a fund in an account with checkwriting privileges, that check may be rejected if your fund account does not have a sufficient available balance.
Address change. If you change your address online or by telephone, there may be up to a 14-day restriction (starting on the business day after your address is changed) on your ability to request check redemptions online and by telephone. You can request a redemption in writing (using a form available online) at any time. Confirmations of address changes are sent to both the old and new addresses.
31
Payment to a different person or address. At your request, we can make your redemption check payable, or wire your redemption proceeds, to a different person or send it to a different address. However, this generally requires the written consent of all registered account owners and may require additional documentation, such as a signature guarantee or a notarized signature. You may obtain a signature guarantee from some commercial or savings banks, credit unions, trust companies, or member firms of a U.S. stock exchange.
No cancellations. Vanguard will not accept your request to cancel any redemption request once processing has begun. Please be careful when placing a redemption request.
Emergency circumstances. Vanguard funds can postpone payment of redemption proceeds for up to seven calendar days. In addition, Vanguard funds can suspend redemptions and/or postpone payments of redemption proceeds beyond seven calendar days at times when the NYSE is closed or during emergency circumstances, as determined by the SEC.
Exchanging Shares
An exchange occurs when you use the proceeds from the redemption of shares of one Vanguard fund to simultaneously purchase shares of a different Vanguard fund. You can make exchange requests online (if you are registered for online access), by telephone, or by mail. See Purchasing Shares and Redeeming Shares.
If the NYSE is open for regular trading (generally until 4 p.m., Eastern time, on a business day) at the time an exchange request is received in good order, the trade date generally will be the same day. See Other Rules You Should Know—Good Order for additional information on all transaction requests.
Vanguard will not accept your request to cancel any exchange request once processing has begun. Please be careful when placing an exchange request.
Call Vanguard before attempting to exchange a large dollar amount. By calling us before you attempt to exchange a large dollar amount, you may avoid delayed or rejected transactions.
Please note that Vanguard reserves the right, without notice, to revise or terminate the exchange privilege, limit the amount of any exchange, or reject an exchange, at any time, for any reason. See Frequent-Trading Limitations for additional restrictions on exchanges.
32
Frequent-Trading Limitations
Because excessive transactions can disrupt management of a fund and increase the fund’s costs for all shareholders, the board of trustees of each Vanguard fund places certain limits on frequent trading in the funds. Each Vanguard fund (other than money market funds and short-term bond funds, but including Vanguard Short-Term Inflation-Protected Securities Index Fund) limits an investor’s purchases or exchanges into a fund account for 30 calendar days after the investor has redeemed or exchanged out of that fund account. ETF Shares are not subject to these frequent-trading limits.
For Vanguard Retirement Investment Program pooled plans, the limitations apply to exchanges made online or by telephone.
These frequent-trading limitations do not apply to the following:
• Certain transactions below dollar value or other thresholds specified by Vanguard.
• In-kind transactions to a shareholder’s donor advised fund managed by Vanguard Charitable.
• Purchases of shares with reinvested dividend or capital gains distributions.
• Transactions through Vanguard’s Automatic Investment Plan, Automatic Exchange Service, Direct Deposit Service, Automatic Withdrawal Plan, Required Minimum Distribution Service, Vanguard Small Business Online®, and certain transactions through intermediaries relating to systematic trades and required minimum distributions.
• Discretionary transactions through Vanguard Personal Advisor Services®, Vanguard Institutional Advisory Services®, Vanguard Digital Advisor™, and discretionary (advisor-directed) transactions through certain intermediaries.
• Redemptions of shares to pay fund or account fees.
• Redemptions of shares to remove excess shareholder contributions to certain types of retirement accounts (including, but not limited to, IRAs and Vanguard Individual 401(k) Plans).
• Transfers and reregistrations of shares within the same fund.
• Purchases of shares by asset transfer or direct rollover.
• Conversions of shares from one share class to another in the same fund.
• Checkwriting redemptions.
• Section 529 college savings plans.
• Certain approved institutional portfolios and asset allocation programs, as well as trades made by funds or trusts managed by Vanguard or its affiliates that
33
invest in other Vanguard funds. (Please note that shareholders of Vanguard’s funds of funds are subject to the limitations.)
For participants in employer-sponsored defined contribution plans,* the frequent-trading limitations do not apply to:
• Purchases of shares with participant payroll or employer contributions or loan repayments.
• Purchases of shares with reinvested dividend or capital gains distributions.
• Distributions, loans, and in-service withdrawals from a plan.
• Redemptions of shares as part of a plan termination or at the direction of the plan.
• Transactions executed through the Vanguard Managed Account Program.
• Redemptions of shares to pay fund or account fees.
• Share or asset transfers or rollovers.
• Reregistrations of shares.
• Conversions of shares from one share class to another in the same fund.
• Exchange requests submitted by written request to Vanguard. (Exchange requests submitted by fax, if otherwise permitted, are subject to the limitations.)
* The following Vanguard fund accounts are subject to the frequent-trading limitations: SEP-IRAs, SIMPLE IRAs, certain Individual 403(b)(7) Custodial Accounts, and Vanguard Individual 401(k) Plans.
Accounts Held by Institutions (Other Than Defined Contribution Plans)
Vanguard will systematically monitor for frequent trading in institutional clients’ accounts. If we detect suspicious trading activity, we will investigate and take appropriate action, which may include applying to a client’s accounts the 30-day policy previously described, prohibiting a client’s purchases of fund shares, and/or revoking the client’s exchange privilege.
Accounts Held by Intermediaries
When intermediaries establish accounts in Vanguard funds for the benefit of their clients, we cannot always monitor the trading activity of the individual clients. However, we review trading activity at the intermediary (omnibus) level, and if we detect suspicious activity, we will investigate and take appropriate action. If necessary, Vanguard may prohibit additional purchases of fund shares by an intermediary, including for the benefit of certain of the intermediary’s clients. Intermediaries also may monitor their clients’ trading activities with respect to Vanguard funds.
34
For those Vanguard funds that charge purchase and/or redemption fees, intermediaries will be asked to assess these fees on client accounts and remit these fees to the funds. The application of purchase and redemption fees and frequent-trading limitations may vary among intermediaries. There are no assurances that Vanguard will successfully identify all intermediaries or that intermediaries will properly assess purchase and redemption fees or administer frequent-trading limitations. If you invest with Vanguard through an intermediary, please read that firm’s materials carefully to learn of any other rules or fees that may apply.
Other Rules You Should Know
Prospectus and Shareholder Report Mailings
When two or more shareholders have the same last name and address, just one summary prospectus (or prospectus) and/or shareholder report may be sent in an attempt to eliminate the unnecessary expense of duplicate mailings. You may request individual prospectuses and reports by contacting our Client Services Department in writing, by telephone, or online. See Contacting Vanguard.
Vanguard.com
Registration. If you are a registered user of vanguard.com, you can review your account holdings; buy, sell, or exchange shares of most Vanguard funds; and perform most other transactions through our website. You must register for this service online.
Electronic delivery. Vanguard can deliver your account statements, transaction confirmations, prospectuses, certain tax forms, and shareholder reports electronically. If you are a registered user of vanguard.com, you can consent to the electronic delivery of these documents by logging on and changing your mailing preferences under “Account Maintenance.” You can revoke your electronic consent at any time through our website, and we will begin to send paper copies of these documents within 30 days of receiving your revocation.
Telephone Transactions
Automatic. When we set up your account, we will automatically enable you to do business with us by telephone, unless you instruct us otherwise in writing.
35
Proof of a caller’s authority. We reserve the right to refuse a telephone request if the caller is unable to provide the requested information or if we reasonably believe that the caller is not an individual authorized to act on the account. Before we allow a caller to act on an account, we may request the following information:
• Authorization to act on the account (as the account owner or by legal documentation or other means).
• Account registration and address.
• Fund name and account number, if applicable.
• Other information relating to the caller, the account owner, or the account.
Good Order
We reserve the right to reject any transaction instructions that are not in “good order.” Good order generally means that your instructions:
• Are provided by the person(s) authorized in accordance with Vanguard’s policies and procedures to access the account and request transactions.
• Include the fund name and account number.
• Include the amount of the transaction (stated in dollars, shares, or percentage).
Written instructions also must generally be provided on a Vanguard form and include:
• Signature(s) and date from the authorized person(s).
• Signature guarantees or notarized signatures, if required for the type of transaction. (Call Vanguard for specific requirements.)
• Any supporting documentation that may be required.
Good order requirements may vary among types of accounts and transactions. For more information, consult our website at vanguard.com or see Contacting Vanguard.
Vanguard reserves the right, without notice, to revise the requirements for good order.
Future Trade-Date Requests
Vanguard does not accept requests to hold a purchase, redemption, or exchange transaction for a future date. All such requests will receive trade dates as previously described in Purchasing Shares, Redeeming Shares, and Exchanging Shares. Vanguard reserves the right to return future-dated purchase checks.
36
Accounts With More Than One Owner
If an account has more than one owner or authorized person, Vanguard generally will accept instructions from any one owner or authorized person.
Responsibility for Fraud
You should take precautions to protect yourself from fraud. Keep your account-related information private, and review any account confirmations, statements, or other information that we provide to you as soon as you receive them. Let us know immediately if you discover unauthorized activity or see something on your account that you do not understand or that looks unusual.
Vanguard will not be responsible for losses that result from transactions by a person who we reasonably believe is authorized to act on your account.
Uncashed Checks
Please cash your distribution or redemption checks promptly. Vanguard will not pay interest on uncashed checks. Vanguard may be required to transfer assets related to uncashed checks to a state under the state’s abandoned property law.
Dormant Accounts
If your account has no activity in it for a period of time, Vanguard may be required to transfer it to a state under the state’s abandoned property law, subject to potential federal or state withholding taxes.
Unusual Circumstances
If you experience difficulty contacting Vanguard online or by telephone, you can send us your transaction request on a Vanguard form by regular or express mail.
Investing With Vanguard Through Other Firms
You may purchase or sell shares of most Vanguard funds through a financial intermediary, such as a bank, a broker, or an investment advisor. Please consult your financial intermediary to determine which, if any, shares are available through that firm and to learn about other rules that may apply. Your financial intermediary can provide you with account information and any required tax forms. You may be required to pay a commission on purchases of mutual fund shares made through a financial intermediary.
Please see Frequent-Trading Limitations—Accounts Held by Intermediaries for information about the assessment of any purchase or redemption fees and the monitoring of frequent trading for accounts held by intermediaries.
37
Account Service Fee
Vanguard may charge a $25 account service fee on fund accounts that have a balance below $5,000,000 for any reason, including market fluctuation. The account service fee may be applied to both retirement and nonretirement fund accounts and may be assessed on fund accounts in all Vanguard funds, regardless of the account minimum. The fee, which will be collected by redeeming fund shares in the amount of $25, will be deducted from fund accounts subject to the fee once per calendar year.
Certain account types have alternative fee structures, including SIMPLE IRAs, Vanguard Retirement Investment Program pooled plans, and Vanguard Individual 401(k) Plans.
Low-Balance Accounts
The Fund reserves the right to liquidate a fund account whose balance falls below the account minimum for any reason, including market fluctuation. This liquidation policy applies to nonretirement fund accounts and accounts that are held through intermediaries. Any such liquidation will be preceded by written notice to the investor.
Right to Change Policies
In addition to the rights expressly stated elsewhere in this prospectus, Vanguard reserves the right, without notice, to (1) alter, add, or discontinue any conditions of purchase (including eligibility requirements), redemption, exchange, service, or privilege at any time and (2) alter, impose, discontinue, or waive any purchase fee, redemption fee, account service fee, or other fee charged to a shareholder or a group of shareholders. Changes may affect any or all investors. These actions will be taken when, at the sole discretion of Vanguard management, Vanguard believes they are in the best interest of a fund.
Account Restrictions
Vanguard reserves the right to: (1) redeem all or a portion of a fund/account to meet a legal obligation, including tax withholding, tax lien, garnishment order, or other obligation imposed on your account by a court or government agency; (2) redeem shares, close an account, or suspend account privileges, features, or options in the case of threatening conduct or activity; (3) redeem shares, close an account, or suspend account privileges, features, or options if Vanguard believes or suspects that not doing so could result in a suspicious, fraudulent, or illegal transaction; (4) place restrictions on the ability to redeem any or all shares in an account if it is required to do so by a court or government agency; (5) place restrictions on the ability to redeem any or all shares in an account if Vanguard believes that doing so will prevent fraud, financial exploitation or abuse, or to
38
protect vulnerable investors; (6) freeze any account and/or suspend account services if Vanguard has received reasonable notice of a dispute regarding the assets in an account, including notice of a dispute between the registered or beneficial account owners; and (7) freeze any account and/or suspend account services upon initial notification to Vanguard of the death of an account owner.
Shareholder Rights
The Fund’s Agreement and Declaration of Trust, as amended, requires a shareholder bringing a derivative action on behalf of Vanguard Scottsdale Funds (the Trust) that is subject to a pre-suit demand to collectively hold at least 10% of the outstanding shares of the Trust or at least 10% of the outstanding shares of the series or class to which the demand relates and to undertake to reimburse the Trust for the expense of any counsel or advisors used when considering the merits of the demand in the event that the board of trustees determines not to bring such action. In each case, these requirements do not apply to claims arising under the federal securities laws to the extent that any such federal securities laws, rules, or regulations do not permit such application.
Fund and Account Updates
Confirmation Statements
We will send (or provide through our website, whichever you prefer) a confirmation of your trade date and the amount of your transaction when you buy, sell, or exchange shares. However, we will not send confirmations reflecting only checkwriting redemptions or the reinvestment of dividend or capital gains distributions. For any month in which you had a checkwriting redemption, a Checkwriting Activity Statement will be sent to you itemizing the checkwriting redemptions for that month. Promptly review each confirmation statement that we provide to you. It is important that you contact Vanguard immediately with any questions you may have about any transaction reflected on a confirmation statement, or Vanguard will consider the transaction properly processed.
Portfolio Summaries
We will send (or provide through our website, whichever you prefer) quarterly portfolio summaries to help you keep track of your accounts throughout the year. Each summary shows the market value of your account at the close of the statement period, as well as all distributions, purchases, redemptions, exchanges, and transfers for the current calendar quarter (or month). Promptly review each summary that we provide to you. It is important that you contact
39
Vanguard immediately with any questions you may have about any transaction reflected on the summary, or Vanguard will consider the transaction properly processed.
Tax Information Statements
For most accounts, Vanguard (or your intermediary) is required to provide annual tax forms to assist you in preparing your income tax returns. These forms are generally available for each calendar year early in the following year. Registered users of vanguard.com can also view certain forms through our website. Vanguard (or your intermediary) may also provide you with additional tax-related documentation. For more information, consult our website at vanguard.com or see Contacting Vanguard.
Annual and Semiannual Reports
We will send (or provide through our website, whichever you prefer) reports about Vanguard Explorer Value Fund twice a year, in April and October. These reports include overviews of the financial markets and provide the following specific Fund information:
• Performance assessments and comparisons with industry benchmarks.
• Financial statements with listings of Fund holdings.
Portfolio Holdings
Please consult the Fund's Statement of Additional Information or our website for a description of the policies and procedures that govern disclosure of the Fund’s portfolio holdings.
Employer-Sponsored Plans
Your plan administrator or your employee benefits office can provide you with detailed information on how to participate in your plan and how to elect the Fund as an investment option.
• If you have any questions about the Fund or Vanguard, including those about the Fund’s investment objective, strategies, or risks, contact Vanguard Participant Services toll-free at 800-523-1188 or visit our website at vanguard.com.
• If you have questions about your account, contact your plan administrator or the organization that provides recordkeeping services for your plan.
• Be sure to carefully read each topic that pertains to your transactions with Vanguard.
40
Vanguard reserves the right to change its policies without notice to shareholders.
Transactions
Processing times for your transaction requests may differ among recordkeepers or among transaction and funding types. Your plan’s recordkeeper (which may also be Vanguard) will determine the necessary processing time frames for your transaction requests prior to submission to the Fund. Consult your recordkeeper or plan administrator for more information.
If Vanguard is serving as your plan recordkeeper and if your transaction involves one or more investments with an early cut-off time for processing or another trading restriction, your entire transaction will be subject to the restriction when the trade date for your transaction is determined.
41
Contacting Vanguard
|
Web |
|
|
Vanguard.com |
For the most complete source of Vanguard news
For fund, account, and service information
For most account transactions
For literature requests
24 hours a day, 7 days a week |
|
Phone | |
|
Investor Information 800-662-7447
(Text telephone for people with
hearing impairment at 800-749-7273) |
For fund and service information
For literature requests |
|
Client Services 800-662-2739
(Text telephone for people with
hearing impairment at 800-749-7273) |
For account information
For most account transactions |
|
Participant Services 800-523-1188
(Text telephone for people with
hearing impairment at 800-749-7273) |
For information and services for participants in
employer-sponsored plans |
|
Institutional Division
888-809-8102 |
For information and services for large institutional
investors |
|
Financial Advisor and Intermediary
Sales Support 800-997-2798 |
For information and services for financial intermediaries
including financial advisors, broker-dealers, trust
institutions, and insurance companies |
|
Financial Advisory and Intermediary
Trading Support 800-669-0498 |
For account information and trading support for
financial intermediaries including financial advisors,
broker-dealers, trust institutions, and insurance
companies |
42
Additional Information
The Fund's Bylaws require, unless the Trust otherwise consents in writing, that the U.S. Federal District Courts be the sole and exclusive forum for the resolution of complaints under the Securities Act of 1933. This provision may limit a shareholder’s ability to bring a claim in a different forum and may result in increased shareholder costs in pursuing such a claim.
|
Vanguard Fund |
Inception
Date |
Newspaper
Abbreviation |
Vanguard
Fund Number |
CUSIP
Number |
|
Vanguard Explorer Value Fund |
3/30/2010 |
ExpValFd |
1690 |
92206C748 |
CGS identifiers have been provided by CUSIP Global Services, managed on behalf of the American Bankers Association by Standard & Poor’s Financial Services, LLC, and are not for use or dissemination in a manner that would serve as a substitute for any CUSIP service. The CUSIP Database, © 2023 American Bankers Association. “CUSIP” is a registered trademark of the American Bankers Association.
CFA® is a registered trademark owned by CFA Institute.
43
Glossary of Investment Terms
Capital Gains Distributions. Payments to mutual fund shareholders of gains realized on securities that a fund has sold at a profit, minus any realized losses.
Cash Equivalent Investments. Cash deposits, short-term bank deposits, and money market instruments that include U.S. Treasury bills and notes, bank certificates of deposit (CDs), repurchase agreements, commercial paper, and banker’s acceptances.
Common Stock. A security representing ownership rights in a corporation.
Dividend Distributions. Payments to mutual fund shareholders of income from interest or dividends generated by a fund's investments.
Dow Jones U.S. Total Stock Market Float Adjusted Index. An index that represents the entire U.S. stock market and tracks more than 5,000 stocks, excluding shares of securities not available for public trading.
Expense Ratio. A fund's total annual operating expenses expressed as a percentage of the fund's average net assets. The expense ratio includes management and administrative expenses, but it does not include the transaction costs of buying and selling portfolio securities.
Inception Date. The date on which the assets of a fund are first invested in accordance with the fund's investment objective. For funds with a subscription period, the inception date is the day after that period ends. Investment performance is generally measured from the inception date.
Joint Committed Credit Facility. The Fund participates, along with other funds managed by Vanguard, in a committed credit facility provided by a syndicate of lenders pursuant to a credit agreement that may be renewed annually; each Vanguard fund is individually liable for its borrowings, if any, under the credit facility. The amount and terms of the committed credit facility are subject to approval by the Fund's board of trustees and renegotiation with the lender syndicate on an annual basis.
Median Market Capitalization. An indicator of the size of companies in which a fund invests; the midpoint of market capitalization (market price x shares outstanding) of a fund's stocks, weighted by the proportion of the fund's assets invested in each stock. Stocks representing half of the fund's assets have market capitalizations above the median, and the rest are below it.
44
Mutual Fund. An investment company that pools the money of many people and invests it in a variety of securities in an effort to achieve a specific objective over time.
New York Stock Exchange (NYSE). A stock exchange based in New York City that is open for regular trading on business days, Monday through Friday, from 9:30 a.m. to 4 p.m., Eastern time.
Return of Capital. A return of capital occurs when a fund's distributions exceed its earnings in a fiscal year. A return of capital is a return of all or part of your original investment or amounts paid in excess of your original investment in a fund. In general, a return of capital reduces your cost basis in a fund's shares and is not taxable to you until your cost basis has been reduced to zero.
Russell 2500 Value Index. An index that measures the performance of those Russell 2500 companies with lower price/book ratios and lower predicted and historical growth rates.
Securities. Stocks, bonds, money market instruments, and other investments.
Total Return. A percentage change, over a specified time period, in a mutual fund's net asset value, assuming the reinvestment of all distributions of dividends and capital gains.
Volatility. The fluctuations in value of a mutual fund or other security. The greater a fund's volatility, the wider the fluctuations in its returns.
Yield. Income (interest or dividends) earned by an investment, expressed as a percentage of the investment’s price.
Connect with Vanguard® ˃ vanguard.com
For More Information
If you would like more information about Vanguard Explorer Value Fund, the following documents are available free upon request:
Annual/Semiannual Reports to Shareholders
Additional information about the Fund's investments is available in the Fund's annual and semiannual reports to shareholders. In the annual report, you will find a discussion of the market conditions and investment strategies that significantly affected the Fund's performance during its last fiscal year.
Statement of Additional Information (SAI)
The SAI provides more detailed information about the Fund and is incorporated by reference into (and thus legally a part of) this prospectus.
To receive a free copy of the latest annual or semiannual report or the SAI, or to request additional information about the Fund or other Vanguard funds, please visit vanguard.com or contact us as follows:
If you are an individual investor:
Telephone: 800-662-7447; Text telephone for people with hearing impairment: 800-749-7273
Telephone: 800-662-7447; Text telephone for people with hearing impairment: 800-749-7273
If you are a participant in an employer-sponsored plan:
Telephone: 800-523-1188; Text telephone for people with hearing impairment: 800-749-7273
Telephone: 800-523-1188; Text telephone for people with hearing impairment: 800-749-7273
If you are a current Vanguard shareholder and would like information about your account, account transactions, and/or account statements, please call:
Client Services Department
Telephone: 800-662-2739; Text telephone for people with hearing impairment: 800-749-7273
Telephone: 800-662-2739; Text telephone for people with hearing impairment: 800-749-7273
Information Provided by the SEC
Reports and other information about the Fund are available in the EDGAR database on the SEC’s website at sec.gov, or you can receive copies of this information, for a fee, by electronic request at the following email address: publicinfo@sec.gov.
Fund's Investment Company Act file number: 811-07803
© 2023 The Vanguard Group, Inc. All rights reserved.
Vanguard Marketing Corporation, Distributor.
P 1690 122023
Vanguard Marketing Corporation, Distributor.
P 1690 122023