SECURITIES AND EXCHANGE COMMISSION
Washington, D.C. 20549
FORM N-1A
REGISTRATION STATEMENT
(NO. 333-11763)
REGISTRATION STATEMENT
(NO. 333-11763)
UNDER THE SECURITIES ACT OF 1933
☒
Pre-Effective Amendment No.
☐
Post-Effective Amendment No. 66
☒
and
REGISTRATION STATEMENT
(NO. 811-07803)
(NO. 811-07803)
UNDER THE INVESTMENT COMPANY ACT OF 1940
Amendment No. 67
☒
(Exact Name of Registrant as Specified in Declaration of Trust)
P.O. Box 2600, Valley Forge, PA 19482
(Address of Principal Executive Office)
Registrant’s Telephone Number (610) 669-1000
(Address of Principal Executive Office)
Registrant’s Telephone Number (610) 669-1000
Anne E. Robinson, Esquire
P.O. Box 876
Valley Forge, PA 19482
P.O. Box 876
Valley Forge, PA 19482
It is proposed that this filing will become effective (check appropriate box)
☐
immediately upon filing pursuant to paragraph (b)
☒
on December 22, 2023 , pursuant to paragraph (b)
☐
60 days after filing pursuant to paragraph (a)(1)
☐
on (date) pursuant to paragraph (a)(1)
☐
75 days after filing pursuant to paragraph (a)(2)
☐
on (date) pursuant to paragraph (a)(2) of rule 485 If appropriate, check the following box:
☐
This post-effective amendment designates a new effective date for a previously filed post-effective amendment.

Vanguard Explorer Value™ Fund
Prospectus
December 22, 2023
Investor Shares
Vanguard Explorer Value Fund Investor Shares (VEVFX)
This prospectus contains financial data for the Fund through the fiscal year ended August 31, 2023.
The Securities and Exchange Commission (SEC) has not approved or disapproved these securities or passed upon the adequacy of this prospectus. Any representation to the contrary is a criminal offense.
(Fees paid directly from your investment)
|
| |
|
Sales Charge (Load) Imposed on Purchases |
|
|
Purchase Fee |
|
|
Sales Charge (Load) Imposed on Reinvested Dividends |
|
|
Redemption Fee |
|
|
Account Service Fee Per Year
(for certain fund account balances below $5,000,000) |
$ |
(Expenses that you pay each year as a percentage of the value of your investment)
|
| |
|
Management Fees |
% |
|
12b-1 Distribution Fee |
|
|
Other Expenses |
% |
|
Total Annual Fund Operating Expenses |
% |
1
|
1 Year |
3 Years |
5 Years |
10 Years |
|
$ |
$ |
$ |
$ |
2
3
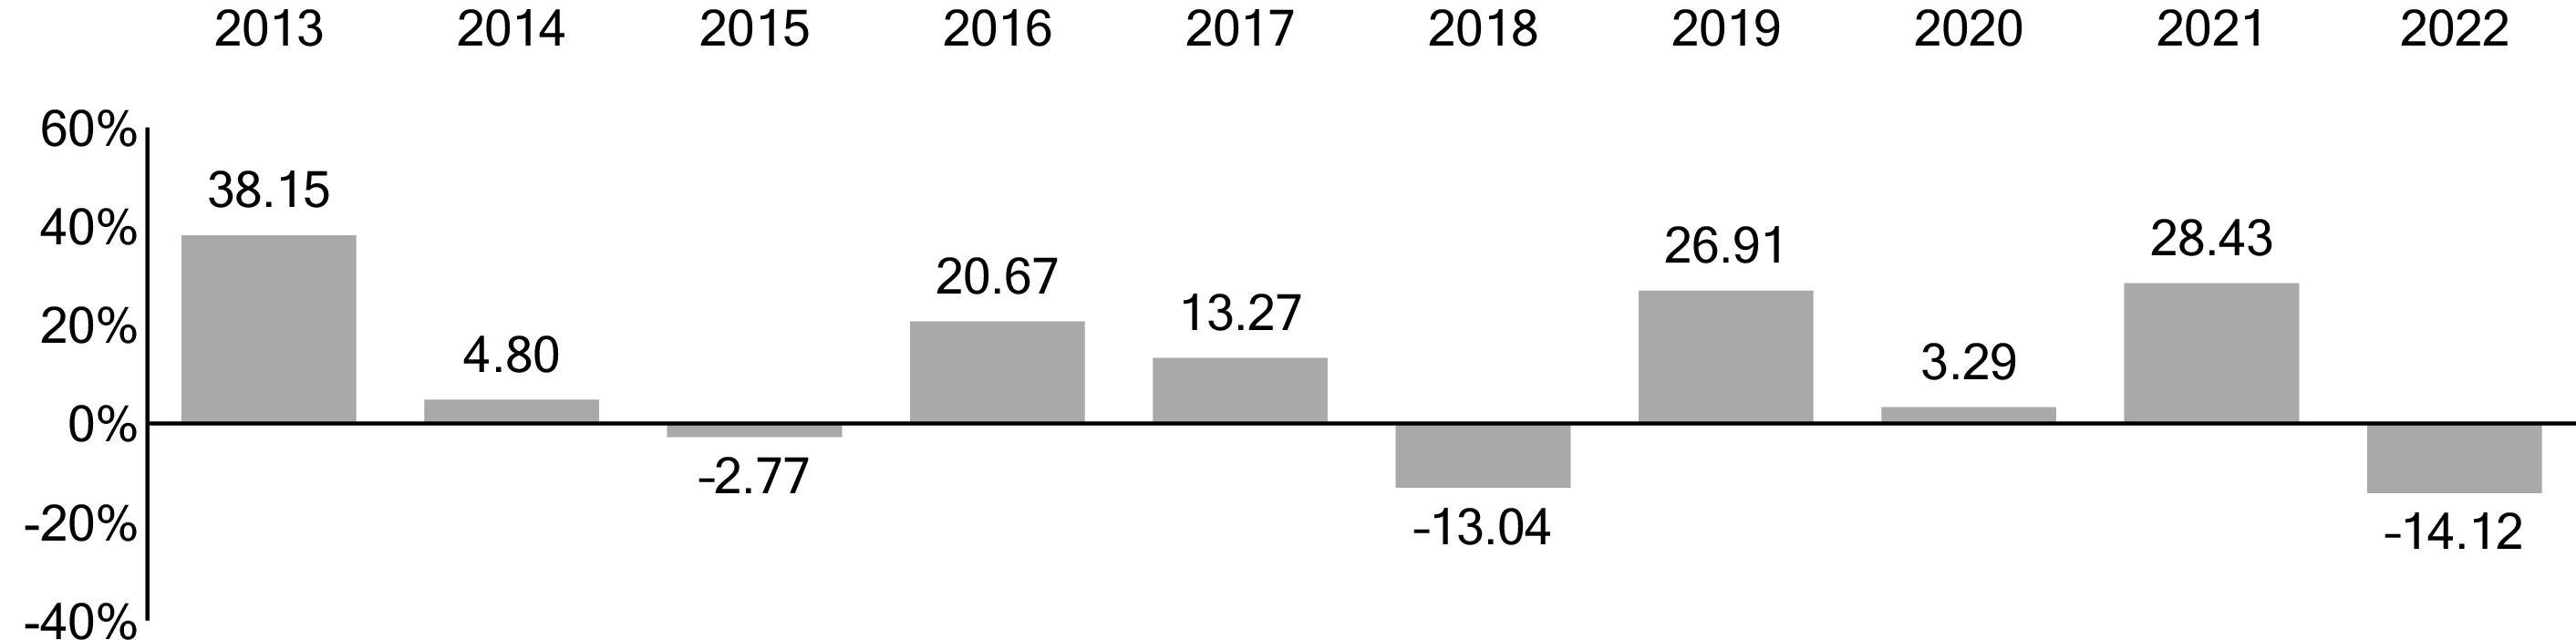
1 The year-to-date return as of the most recent calendar quarter, which ended on September 30, 2023, was 2.43%.
|
|
Total Return |
Quarter |
|
|
% |
|
|
|
-
% |
|
|
|
1 Year |
5 Years |
10 Years |
|
Vanguard Explorer Value Fund Investor Shares |
|
|
|
|
Return Before Taxes |
-
% |
% |
% |
|
Return After Taxes on Distributions |
- |
|
|
|
Return After Taxes on Distributions and Sale of Fund Shares |
- |
|
|
|
Russell 2500 Value Index
(reflects no deduction for fees, expenses, or taxes) |
-
% |
% |
% |
|
Dow Jones U.S. Total Stock Market Float Adjusted Index
(reflects no deduction for fees, expenses, or taxes) |
- |
|
|
4
Investment Advisors
Ariel Investments, LLC (Ariel)
Cardinal Capital Management, L.L.C. (Cardinal Capital)
Frontier Capital Management Co., LLC (Frontier Capital)
Cardinal Capital Management, L.L.C. (Cardinal Capital)
Frontier Capital Management Co., LLC (Frontier Capital)
Portfolio Managers
Kenneth E. Kuhrt, CPA, Executive Vice President and Portfolio Manager of Ariel. He has co-managed a portion of the Fund since January 2022.
John W. Rogers, Jr., Chairman, Co-CEO & Chief Investment Officer and Lead Portfolio Manager of Ariel. He has co-managed a portion of the Fund since January 2022.
Robert H. Fields, Partner and Portfolio Manager of Cardinal Capital. He has co-managed a portion of the Fund since 2016.
Eugene Fox III, Managing Partner and Portfolio Manager of Cardinal Capital. He has co-managed a portion of the Fund since its inception in 2010.
Robert B. Kirkpatrick, CFA, Managing Partner and Portfolio Manager of Cardinal Capital. He has co-managed a portion of the Fund since its inception in 2010.
Rachel D. Matthews, Partner and Portfolio Manager of Cardinal Capital. She has co-managed a portion of the Fund since 2013.
Rushan Jiang, CFA, Partner and Portfolio Manager of Frontier Capital. He has co-managed a portion of the Fund since 2019.
William A. Teichner, CFA, Managing Partner and Portfolio Manager of Frontier Capital. He has co-managed a portion of the Fund since its inception in 2010.
Purchase and Sale of Fund Shares
You may purchase or redeem shares online through our website (vanguard.com), by mail (The Vanguard Group, P.O. Box 982901, El Paso, TX 79998-2901), or by telephone (800-662-2739). The minimum investment amount required to open and maintain a Fund account for Investor Shares is $3,000. The minimum investment amount required to add to an existing Fund account is generally $1. Financial intermediaries, institutional clients, and Vanguard-advised clients should contact Vanguard for information on special eligibility rules that may apply to them regarding Investor Shares. If you are investing through an intermediary, please contact that firm directly for more information regarding your
5
eligibility. If you are investing through an employer-sponsored retirement or savings plan, your plan administrator or your benefits office can provide you with detailed information on how you can invest through your plan.
Tax Information
The Fund’s distributions may be taxable as ordinary income or capital gain. If you are investing through a tax-advantaged account, such as an IRA or an employer-sponsored retirement or savings plan, special tax rules apply.
Payments to Financial Intermediaries
The Fund and its investment advisors do not pay financial intermediaries for sales of Fund shares.
6
More on the Fund
This prospectus describes the principal risks you would face as a Fund shareholder. It is important to keep in mind one of the main principles of investing: generally, the higher the risk of losing money, the higher the potential reward. The reverse, also, is generally true: the lower the risk, the lower the potential reward. As you consider an investment in any mutual fund, you should take into account your personal tolerance for fluctuations in the securities markets. Look for this
 symbol throughout the prospectus. It is used to mark detailed information about the more significant risks that you would confront as a Fund shareholder. To highlight terms and concepts important to mutual fund investors, we have provided Plain Talk® explanations along the way. Reading the prospectus will help you decide whether the Fund is the right investment for you. We suggest that you keep this prospectus for future reference.
symbol throughout the prospectus. It is used to mark detailed information about the more significant risks that you would confront as a Fund shareholder. To highlight terms and concepts important to mutual fund investors, we have provided Plain Talk® explanations along the way. Reading the prospectus will help you decide whether the Fund is the right investment for you. We suggest that you keep this prospectus for future reference. |
Plain Talk About Fund Expenses |
|
All mutual funds have operating expenses. These expenses, which are
deducted from a fund’s gross income, are expressed as a percentage of the
net assets of the fund. Assuming that operating expenses remain as stated in
the Fees and Expenses section, Vanguard Explorer Value Fund’s expense
ratio would be 0.49%, or $4.90 per $1,000 of average net assets. The
average expense ratio for small-cap value funds in 2022 was 1.23%, or
$12.30 per $1,000 of average net assets (derived from data provided by
Lipper, a Thomson Reuters Company, which reports on the mutual
fund industry). |
|
Plain Talk About Costs of Investing |
|
Costs are an important consideration in choosing a mutual fund. That is
because you, as a shareholder, pay a proportionate share of the costs of
operating a fund and any transaction costs incurred when the fund buys or
sells securities. These costs can erode a substantial portion of the gross
income or the capital appreciation a fund achieves. Even seemingly small
differences in expenses can, over time, have a dramatic effect on a
fund’s performance. |
The following sections explain the principal investment strategies and policies that the Fund uses in pursuit of its investment objective. The Fund's board of trustees, which oversees the Fund's management, may change investment strategies or policies in the interest of shareholders without a shareholder vote,
7
unless those strategies or policies are designated as fundamental. Note that the Fund’s investment objective is not fundamental and may be changed without a shareholder vote.
Market Exposure
The Fund invests mainly in common stocks of small and mid-size companies that are considered to have low prices in relation to their cash flow and book value. These stocks may have above-average dividend yields.
|
Plain Talk About Growth Funds and Value Funds |
|
Growth investing and value investing are two styles employed by stock-fund
managers. Growth funds generally invest in stocks of companies believed to
have above-average potential for growth in revenue, earnings, cash flow, or
other similar criteria. These stocks typically have low dividend yields, if any,
and above-average prices in relation to measures such as earnings and book
value. Value funds typically invest in stocks whose prices are below average
in relation to those measures; these stocks often have above-average
dividend yields. Value stocks also may remain undervalued by the market for
long periods of time. Growth and value stocks have historically produced
similar long-term returns, though each category has periods when it
outperforms the other. |
Stocks of publicly traded companies are often classified according to market capitalization, which is the market value of a company’s outstanding shares. These classifications typically include small-cap, mid-cap, and large-cap. It is important to understand that there are no “official” definitions of small-, mid-, and large-cap, even among Vanguard fund advisors, and that market capitalization ranges can change over time. The asset-weighted median market capitalization of the Fund's stock holdings as of August 31, 2023, was $4.8 billion.
Because it invests mainly in stocks, the Fund is subject to certain risks.
The Fund is subject to stock market risk, which is the chance that stock prices overall will decline. Stock markets tend to move in cycles, with periods of rising prices and periods of falling prices.
The Fund focuses on the stocks of small and mid-size companies. Historically, small- and mid-cap stocks have been more volatile than—and at times have performed quite differently from—the broader markets. Small-cap stocks in particular tend to be more volatile in price. This volatility is the result of several factors, which may include (but are not limited to) less certain growth and
8
dividend prospects for smaller companies, fewer financial reserves during adverse market conditions, less access to capital funding, and generally greater sensitivity to changes within the company.
The Fund is subject to investment style risk, which is the chance that returns from small- and mid-capitalization value stocks will trail returns from the overall stock market. Historically, small- and mid-cap stocks have been more volatile in price than the large-cap stocks that dominate the overall market, and they often perform quite differently. The stock prices of small and mid-size companies tend to experience greater volatility because, among other things, these companies tend to be more sensitive to changing economic conditions.
Market disruptions can adversely affect local and global markets as well as normal market conditions and operations. Any such disruptions could have an adverse impact on the value of the Fund's investments and Fund performance.
Security Selection
The Fund uses multiple investment advisors. Each advisor independently selects and maintains a portfolio of common stocks for the Fund.
Each advisor employs active investment management methods, which means that securities are bought and sold according to the advisor’s evaluations of companies and their financial prospects, the prices of the securities, and the stock market and the economy in general. Each advisor will sell a security when, in the view of the advisor, it is no longer as attractive as an alternative investment or if the advisor deems it to be in the best interest of the Fund. Different advisors may reach different conclusions on the same security.
Although each advisor uses a traditional, bottom-up investment approach, each uses a different process to select securities for its portion of the Fund’s assets.
Ariel employs an investment philosophy seeking unique opportunities in various market conditions, and united by four principles: active patience, teamwork, focused expertise, and independent thinking. Ariel seeks to take advantage of the market’s short-term view to drive long-term results for our shareholders. As disciplined, bottom-up, fundamental value investors, portfolio construction is based on a combination of conviction and valuation of a company. Ariel favors companies with strong brands and franchises that produce or deliver high-quality products or services. Ariel also conducts in-depth analysis on a company’s overall financial structure and strategic goals with a three- to five-year horizon in mind.
9
Cardinal Capital employs a cash-flow-oriented investment process. Cardinal Capital believes that a company’s stock price is ultimately determined by its ability to generate excess cash flow and redeploy that cash to enhance shareholder value. The investment process is based on detailed five-year projections that include an analysis of the company’s financials and interviews with the company’s management. Cardinal Capital looks for companies with significant free cash flow, stable and predictable business models, and competent management.
Frontier Capital selects stocks by identifying companies that the advisor believes are undervalued relative to their long-term intrinsic value. The advisor’s fundamental, bottom-up investment approach seeks companies with solid business models, unrecognized earnings power, and attractive valuations across a variety of measures (price-to-book, enterprise value-to-sales, and price-to-earnings power).
The Fund is subject to manager risk, which is the chance that poor security selection will cause the Fund to underperform relevant benchmarks or other funds with a similar investment objective.
The ability of an advisor to purchase or dispose of certain Fund investments is or may be restricted or impaired because of limitations imposed by law, regulation, or by certain regulators or issuers. As a result, an advisor may be required to limit purchases or sell existing investments. If the Fund is required to limit its investment in a particular issuer, then the Fund may seek to obtain regulatory relief or special permission from an issuer to exceed a certain percentage ownership in that issuer's shares. Other options the Fund may pursue include seeking to obtain economic exposure to that issuer through alternative means, such as through a derivative or through investment in a wholly owned subsidiary, both of which may be more costly than owning securities of the issuer directly. Ownership restrictions and limitations could result in unanticipated tax consequences to the Fund that may affect the amount, timing, and character of distributions to shareholders. See Other Investment Policies and Risks for further information related to derivatives.
Other Investment Policies and Risks
In addition to investing in small- and mid-cap value stocks, the Fund may make other kinds of investments to achieve its investment objective.
Although the Fund typically does not make significant investments in foreign securities, it reserves the right to invest up to 30% of its assets in foreign securities, which may include depositary receipts. Foreign securities may be traded on U.S. or foreign markets. To the extent that it owns foreign securities,
10
the Fund is subject to country risk and currency risk. Country risk is the chance that world events—such as political upheaval, financial troubles, or natural disasters—will adversely affect the value of securities issued by companies in foreign countries. In addition, the prices of foreign stocks and the prices of U.S. stocks have, at times, moved in opposite directions. Currency risk is the chance that the value of a foreign investment, measured in U.S. dollars, will decrease because of unfavorable changes in currency exchange rates.
The Fund may invest, to a limited extent, in derivatives. Generally speaking, a derivative is a financial contract whose value is based on the value of a financial asset (such as a stock, a bond, or a currency), a physical asset (such as gold, oil, or wheat), a market index, or a reference rate. Investments in derivatives may subject the Fund to risks different from, and possibly greater than, those of investments directly in the underlying securities or assets. The Fund will not use derivatives for speculation or for the purpose of leveraging (magnifying) investment returns.
The Fund may enter into foreign currency exchange forward contracts, which are a type of derivative. A foreign currency exchange forward contract is an agreement to buy or sell a currency at a specific price on a specific date, usually 30, 60, or 90 days in the future. In other words, the contract guarantees an exchange rate on a given date. Advisors of funds that invest in foreign securities can use these contracts to guard against unfavorable changes in currency exchange rates. These contracts, however, would not prevent the Fund's securities from falling in value as a result of risks other than unfavorable currency exchange movements.
The Vanguard Group, Inc. (Vanguard) administers a small portion of the Fund's assets to facilitate cash flows to and from the Fund's advisors. The Fund may invest these assets in equity futures, which are a type of derivative, and/or shares of exchange-traded funds (ETFs), including Vanguard equity ETF Shares. These equity futures and ETFs typically provide returns similar to those of common stocks. The Fund may also purchase futures or ETFs when doing so will reduce the Fund's transaction costs or have the potential to add value because the instruments are favorably priced. Vanguard receives no additional revenue from Fund assets invested in ETF Shares of other Vanguard funds. Fund assets invested in ETF Shares of other Vanguard funds are excluded when allocating to the Fund its share of the costs of Vanguard operations.
11
|
Plain Talk About Derivatives |
|
Derivatives can take many forms. Some forms of derivatives—such as
exchange-traded futures and options on securities, commodities, or
indexes—have been trading on regulated exchanges for decades. These
types of derivatives are standardized contracts that can easily be bought and
sold and whose market values are determined and published daily. On the
other hand, non-exchange-traded derivatives—such as certain swap
agreements and foreign currency exchange forward contracts—tend to be
more specialized or complex and may be more difficult to accurately value. |
Cash Management
The Fund's daily cash balance may be invested in Vanguard Market Liquidity Fund and/or Vanguard Municipal Cash Management Fund (each, a CMT Fund), which are low-cost money market funds. When investing in a CMT Fund, the Fund bears its proportionate share of the expenses of the CMT Fund in which it invests. Vanguard receives no additional revenue from Fund assets invested in a CMT Fund.
Redemption Requests
Methods used to meet redemption requests. Under normal circumstances, the Fund typically expects to meet redemptions with positive cash flows. When this is not an option, the Fund seeks to first meet redemptions cross section of the Fund’s holdings to meet redemptions, while also factoring in transaction costs. Additionally, the Fund may work with larger clients to implement their redemptions in a manner that is least disruptive to the portfolio; see “Potentially disruptive redemptions” under Redeeming Shares in the Investing With Vanguard section.
Under certain circumstances, including under stressed market conditions, there are additional tools that the Fund may use in order to meet redemptions, including advancing the settlement of market trades with counterparties to match investor redemption payments or delaying settlement of an investor’s transaction to match trade settlement within regulatory requirements. The Fund may also suspend payment of redemption proceeds for up to seven days; see “Emergency circumstances” under Redeeming Shares in the Investing With Vanguard section. Additionally under these unusual circumstances, the Fund may borrow money (subject to certain regulatory conditions and if available under board-approved procedures) through an interfund lending facility; through a bank line-of-credit, including a joint committed credit facility; or through an uncommitted line-of-credit from Vanguard in order to meet redemption requests.
12
Potential redemption activity impacts. At times, the Fund may experience adverse effects when certain large shareholders, or multiple shareholders comprising significant ownership of the Fund, redeem large amounts of shares of the Fund. Large redemptions may cause the Fund to sell portfolio securities at times when it would not otherwise do so. This may result in the Fund distributing capital gains or other taxable income to non-redeeming shareholders. Large redemptions may also increase the Fund's transaction costs. Redemption activity can occur for many reasons, including shareholder reactions to market movements or other events unrelated to Vanguard’s actions, or when Vanguard makes product changes that, for example, may result in a shareholder redeeming shares of the Fund to purchase shares of another similar fund or investment vehicle. When experiencing large redemptions, the Fund reserves the right to pay all or part of the redemption in-kind and/or delay payment of the redemption proceeds for up to seven calendar days; see “Potentially disruptive redemptions” under Redeeming Shares in the Investing With Vanguard section.
Temporary Investment Measures
The Fund may temporarily depart from its normal investment policies and strategies when an advisor believes that doing so is in the Fund's best interest, so long as the strategy or policy employed is consistent with the Fund's investment objective. For instance, the Fund may invest beyond its normal limits in derivatives or exchange-traded funds that are consistent with the Fund's investment objective when those instruments are more favorably priced or provide needed liquidity, as might be the case if the Fund is transitioning assets from one advisor to another or receives large cash flows that it cannot prudently invest immediately.
In addition, the Fund may take temporary defensive positions that are inconsistent with its normal investment policies and strategies—for instance, by allocating substantial assets to cash equivalent investments or other less volatile instruments— in response to adverse or unusual market, economic, political, or other conditions. In doing so, the Fund may succeed in avoiding losses but may otherwise fail to achieve its investment objective.
Frequent Trading or Market-Timing
Background. Some investors try to profit from strategies involving frequent trading of mutual fund shares, such as market-timing. For funds holding foreign securities, investors may try to take advantage of an anticipated difference between the price of the fund’s shares and price movements in overseas markets, a practice also known as time-zone arbitrage. Investors also may try to engage in frequent trading of funds holding investments such as small-cap stocks and high-yield bonds. As money is shifted into and out of a fund by a
13
shareholder engaging in frequent trading, the fund incurs costs for buying and selling securities, resulting in increased brokerage and administrative costs. These costs are borne by all fund shareholders, including the long-term investors who do not generate the costs. In addition, frequent trading may interfere with an advisor’s ability to efficiently manage the fund.
Policies to address frequent trading. The Vanguard funds (other than money market funds and short-term bond funds, but including Vanguard Short-Term Inflation-Protected Securities Index Fund) do not knowingly accommodate frequent trading. The board of trustees of each Vanguard fund (other than money market funds and short-term bond funds, but including Vanguard Short-Term Inflation-Protected Securities Index Fund) has adopted policies and procedures reasonably designed to detect and discourage frequent trading and, in some cases, to compensate the fund for the costs associated with it. These policies and procedures do not apply to ETF Shares because frequent trading in ETF Shares generally does not disrupt portfolio management or otherwise harm fund shareholders. Although there is no assurance that Vanguard will be able to detect or prevent frequent trading or market-timing in all circumstances, the following policies have been adopted to address these issues:
• Each Vanguard fund reserves the right to reject any purchase request—including exchanges from other Vanguard funds—without notice and regardless of size. For example, a purchase request could be rejected because the investor has a history of frequent trading or if Vanguard determines that such purchase may negatively affect a fund’s operation or performance.
• Each Vanguard fund (other than money market funds and short-term bond funds, but including Vanguard Short-Term Inflation-Protected Securities Index Fund) generally prohibits, except as otherwise noted in the Investing With Vanguard section, an investor’s purchases or exchanges into a fund account for 30 calendar days after the investor has redeemed or exchanged out of that fund account.
• Certain Vanguard funds charge shareholders purchase and/or redemption fees on transactions.
See the Investing With Vanguard section of this prospectus for further details on Vanguard’s transaction policies.
Each Vanguard fund (other than retail and government money market funds), in determining its net asset value, will use fair-value pricing when appropriate, as described in the Share Price section. Fair-value pricing may reduce or eliminate the profitability of certain frequent-trading strategies.
Do not invest with Vanguard if you are a market-timer.
14
A precautionary note to investment companies: The Fund's shares are issued by a registered investment company, and therefore the acquisition of such shares by other investment companies and private funds is subject to the restrictions of Section 12(d)(1) of the Investment Company Act of 1940 (the 1940 Act). SEC Rule 12d1-4 under the 1940 Act permits registered investment companies to invest in other registered investment companies beyond the limits in Section 12(d)(1), subject to certain conditions, including that funds with different investment advisors must enter into a fund of funds investment agreement.
Turnover Rate
Although the Fund generally seeks to invest for the long term, it may sell securities regardless of how long they have been held. The Financial Highlights section of this prospectus shows historical turnover rates for the Fund. A turnover rate of 100%, for example, would mean that the Fund had sold and replaced securities valued at 100% of its net assets within a one-year period. In general, the greater the turnover rate, the greater the impact transaction costs will have on a fund’s return. Also, funds with high turnover rates may be more likely to generate capital gains, including short-term capital gains, that must be distributed to shareholders and will be taxable to shareholders investing through a taxable account.
The Fund and Vanguard
The Fund is a member of The Vanguard Group, Inc. (Vanguard), a family of over 200 funds. All of the funds that are members of Vanguard (other than funds of funds) share in the expenses associated with administrative services and business operations, such as personnel, office space, and equipment.
Vanguard Marketing Corporation provides marketing services to the funds. Although fund shareholders do not pay sales commissions or 12b-1 distribution fees, each fund (other than a fund of funds) or each share class of a fund (in the case of a fund with multiple share classes) pays its allocated share of the Vanguard funds’ marketing costs.
15
|
Plain Talk About Vanguard’s Unique Corporate Structure |
|
Vanguard is owned jointly by the funds it oversees and thus indirectly by the
shareholders in those funds. Most other mutual funds are operated by
management companies that are owned by third parties—either public or
private stockholders—and not by the funds they serve. |
Investment Advisors
The Fund uses a multimanager approach. Each advisor independently manages its assigned portion of the Fund’s assets, subject to the supervision and oversight of Vanguard and the Fund’s board of trustees. The board of trustees designates the proportion of Fund assets to be managed by each advisor and may change these proportions at any time.
• Ariel Investments, LLC, 200 East Randolph Street, Suite 2900, Chicago, IL 60601, is an investment management firm founded in 1983. As of August 31, 2023, the firm managed approximately $16.4 billion in assets.
• Cardinal Capital Management, L.L.C., Four Greenwich Office Park, Greenwich, CT 06831, is an investment management firm founded in 1995. As of August 31, 2023, the firm managed approximately $2.9 billion in assets.
• Frontier Capital Management Co., LLC, 99 Summer Street, Boston, MA 02110, is an investment management firm founded in 1980. As of August 31, 2023, the firm managed approximately $9.9 billion in assets.
The Fund pays each of its investment advisors a base fee plus or minus a performance adjustment. The base fee, which is paid quarterly, is a percentage of average daily net assets managed by the advisor during the most recent fiscal quarter. The base fee has breakpoints, which means that the percentage declines as assets go up. The performance adjustment, also paid quarterly, is based on the cumulative total return of each advisor’s portion of the Fund relative to that of the Russell 2000 Value Index (for Frontier Capital) or the Russell 2500 Value Index (for Ariel and Cardinal Capital) over the preceding 36-month period.
For the fiscal year ended August 31, 2023, the aggregate advisory fee represented an effective annual rate of 0.31% of the Fund’s average net assets before a performance-based decrease of 0.04%.
16
Under the terms of an SEC exemption, the Fund's board of trustees may, without prior approval from shareholders, change the terms of an advisory agreement with a third-party investment advisor or hire a new third-party investment advisor—either as a replacement for an existing advisor or as an additional advisor. Any significant change in the Fund's advisory arrangements will be communicated to shareholders in writing. As the Fund's sponsor and overall manager, Vanguard may provide investment advisory services to the Fund at any time. Vanguard may also recommend to the board of trustees that an advisor be hired, terminated, or replaced or that the terms of an existing advisory agreement be revised. The Fund has filed an application seeking a similar SEC exemption with respect to investment advisors that are wholly owned subsidiaries of Vanguard. If the exemption is granted, the Fund may rely on the new SEC relief.
For a discussion of why the board of trustees approved the Fund's investment advisory agreements, see the most recent semiannual report to shareholders covering the fiscal period ended February 28.
17
The managers primarily responsible for the day-to-day management of the Fund are:
Kenneth E. Kuhrt, CPA, Executive Vice President and Portfolio Manager of Ariel. He has worked in investment management since 2002, has managed investment portfolios since 2011, has been with Ariel since 2004, and has co-managed a portion of the Fund since January 2022. Education: B.S., University of Illinois at Urbana-Champaign; M.B.A., University of Chicago.
John W. Rogers, Jr., Chairman, Co-CEO & Chief Investment Officer and Lead Portfolio Manager of Ariel. He has worked in investment management since 1981, has managed investment portfolios and has been with Ariel since 1983, and has co-managed a portion of the Fund since January 2022. Education: A.B., Princeton University.
Robert H. Fields, Partner and Portfolio Manager of Cardinal Capital. He has worked in investment management since 1998, has been with Cardinal Capital since 2013, has managed investment portfolios since 2015, and has co-managed a portion of the Fund since 2016. Education: B.A., Ball State University; M.B.A., University of Pennsylvania.
Eugene Fox III, Managing Partner and Portfolio Manager of Cardinal Capital. He has worked in investment management since 1987, has managed investment portfolios and has been with Cardinal Capital since 1995, and has co-managed a portion of the Fund since its inception in 2010. Education: B.A., University of Virginia; M.B.A., University of Chicago.
Robert B. Kirkpatrick, CFA, Managing Partner and Portfolio Manager of Cardinal Capital. He has worked in investment management and has managed investment portfolios since 1985, has been with Cardinal Capital since 2000, and has co-managed a portion of the Fund since its inception in 2010. Education: B.A., Williams College.
Rachel D. Matthews, Partner and Portfolio Manager of Cardinal Capital. She has worked in investment management since 1989, has been with Cardinal Capital since 2001, has managed investment portfolios since 2009, and has co-managed a portion of the Fund since 2013. Education: B.A., Columbia University; M.B.A., New York University.
18
Rushan Jiang, CFA, Partner and Portfolio Manager of Frontier Capital. He has worked in investment management since 2003, has been with Frontier Capital since 2005, has managed investment portfolios since 2014, and has co-managed a portion of the Fund since 2019. Education: B.S., University of Texas; M.S., Stanford University; M.B.A., Massachusetts Institute of Technology.
William A. Teichner, CFA, Managing Partner and Portfolio Manager of Frontier Capital. He has worked in investment management with Frontier Capital since 1992, has managed investment portfolios since 1999, and has co-managed a portion of the Fund since its inception in 2010. Education: B.A., Columbia University; M.B.A., Harvard Business School.
The Fund's Statement of Additional Information provides information about each portfolio manager’s compensation, other accounts under management, and ownership of shares of the Fund.
Dividends, Capital Gains, and Taxes
Fund Distributions
The Fund distributes to shareholders virtually all of its net income (interest and dividends, less expenses) as well as any net short-term or long-term capital gains realized from the sale of its holdings. From time to time, the Fund may also make distributions that are treated as a return of capital. Income and capital gains distributions, if any, generally occur annually in December. In addition, the Fund may occasionally make a supplemental distribution at some other time during the year.
You can receive distributions of income or capital gains in cash, or you can have them automatically reinvested in more shares of the Fund. However, if you are investing through an employer-sponsored retirement or savings plan, your distributions will be automatically reinvested in additional Fund shares.
19
|
Plain Talk About Distributions |
|
As a shareholder, you are entitled to your portion of a fund’s income from
interest and dividends as well as capital gains from the fund’s sale of
investments. Income consists of both the dividends that the fund earns from
any stock holdings and the interest it receives from any money market and
bond investments. Capital gains are realized whenever the fund sells
securities for higher prices than it paid for them. These capital gains are
either short-term or long-term, depending on whether the fund held the
securities for one year or less or for more than one year. |
Basic Tax Points
Investors in taxable accounts should be aware of the following basic federal income tax points:
• Distributions are taxable to you whether or not you reinvest these amounts in additional Fund shares.
• Distributions declared in December—if paid to you by the end of January—are taxable as if received in December.
• Any dividend distribution or short-term capital gains distribution that you receive is taxable to you as ordinary income. If you are an individual and meet certain holding-period requirements with respect to your Fund shares, you may be eligible for reduced tax rates on “qualified dividend income,” if any, or a special tax deduction on “qualified REIT dividends,” if any, distributed by the Fund.
• Any distribution of net long-term capital gains is taxable to you as long-term capital gains, no matter how long you have owned shares in the Fund.
• Capital gains distributions may vary considerably from year to year as a result of the Fund's normal investment activities and cash flows.
• Your cost basis in the Fund will be decreased by the amount of any return of capital that you receive. This, in turn, will affect the amount of any capital gain or loss that you realize when selling or exchanging your Fund shares.
• Return of capital distributions generally are not taxable to you until your cost basis has been reduced to zero. If your cost basis is at zero, return of capital distributions will be treated as capital gains.
• A sale or exchange of Fund shares is a taxable event. This means that you may have a capital gain to report as income, or a capital loss to report as a deduction, when you complete your tax return.
20
• Vanguard (or your intermediary) will send you a statement each year showing the tax status of all of your distributions.
Individuals, trusts, and estates whose income exceeds certain threshold amounts are subject to a 3.8% Medicare contribution tax on “net investment income.” Net investment income takes into account distributions paid by the Fund and capital gains from any sale or exchange of Fund shares.
Dividend distributions and capital gains distributions that you receive, as well as your gains or losses from any sale or exchange of Fund shares, may be subject to state and local income taxes.
This prospectus provides general tax information only. If you are investing through a tax-advantaged account, such as an IRA or an employer-sponsored retirement or savings plan, special tax rules apply. Please consult your tax advisor for detailed information about any tax consequences for you.
|
Plain Talk About Buying a Dividend |
|
Unless you are a tax-exempt investor or investing through a tax-advantaged
account (such as an IRA or an employer-sponsored retirement or savings
plan), you should consider avoiding a purchase of fund shares shortly before
the fund makes a distribution, because doing so can cost you money in
taxes. This is known as “buying a dividend.” For example: On December 15,
you invest $5,000, buying 250 shares for $20 each. If the fund pays a
distribution of $1 per share on December 16, its share price will drop to $19
(not counting market change). You still have only $5,000 (250 shares x $19 =
$4,750 in share value, plus 250 shares x $1 = $250 in distributions), but you
owe tax on the $250 distribution you received—even if you reinvest it in more
shares. To avoid buying a dividend, check a fund’s distribution schedule
before you invest. |
General Information
Backup withholding. By law, Vanguard must withhold 24% of any taxable distributions or redemptions from your account if you do not:
• Provide your correct taxpayer identification number.
• Certify that the taxpayer identification number is correct.
• Confirm that you are not subject to backup withholding.
Similarly, Vanguard (or your intermediary) must withhold taxes from your account if the IRS instructs us to do so.
21
Foreign investors. Vanguard funds offered for sale in the United States (Vanguard U.S. funds), including the Fund offered in this prospectus, are not widely available outside the United States. Non-U.S. investors should be aware that U.S. withholding and estate taxes and certain U.S. tax reporting requirements may apply to any investments in Vanguard U.S. funds. Foreign investors should visit the non-U.S. investors page on our website at vanguard.com for information on Vanguard’s non-U.S. products.
Invalid addresses. If a dividend distribution or capital gains distribution check mailed to your address of record is returned as undeliverable, Vanguard will automatically reinvest the distribution and all future distributions until you provide us with a valid mailing address. Reinvestments will receive the net asset value calculated on the date of the reinvestment.
Share Price
Share price, also known as net asset value (NAV), is calculated as of the close of regular trading on the New York Stock Exchange (NYSE), generally 4 p.m., Eastern time, on each day that the NYSE is open for business (a business day). In the rare event the NYSE experiences unanticipated disruptions and is unavailable at the close of the trading day, NAVs will be calculated as of the close of regular trading on the Nasdaq (or another alternate exchange if the Nasdaq is unavailable, as determined at Vanguard’s discretion), generally 4 p.m., Eastern time. The NAV per share is computed by dividing the total assets, minus liabilities, of the Fund by the number of Fund shares outstanding. On U.S. holidays or other days when the NYSE is closed, the NAV is not calculated, and the Fund does not sell or redeem shares. However, on those days the value of the Fund’s assets may be affected to the extent that the Fund holds securities that change in value on those days (such as foreign securities that trade on foreign markets that are open).
Stocks held by a Vanguard fund are valued at their market value when reliable market quotations are readily available from the principal exchange or market on which they are traded. Such securities are generally valued at their official closing price, the last reported sales price, or if there were no sales that day, the mean between the closing bid and asking prices. When a fund determines that market quotations either are not readily available or do not accurately reflect the value of a security, the security is priced at its fair value (the amount that the owner might reasonably expect to receive upon the current sale of the security).
The values of any foreign securities held by a fund are converted into U.S. dollars using an exchange rate obtained from an independent third party as of the close of regular trading on the NYSE. The values of any mutual fund shares,
22
including institutional money market fund shares, held by a fund are based on the NAVs of the shares. The values of any ETF shares or closed-end fund shares held by a fund are based on the market value of the shares.
A fund also will use fair-value pricing if the value of a security it holds has been materially affected by events occurring before the fund's pricing time but after the close of the principal exchange or market on which the security is traded. This most commonly occurs with foreign securities, which may trade on foreign exchanges that close many hours before the fund's pricing time. Intervening events might be company-specific (e.g., earnings report, merger announcement) or country-specific or regional/global (e.g., natural disaster, economic or political news, interest rate change, act of terrorism). Intervening events include price movements in U.S. markets that exceed a specified threshold or that are otherwise deemed to affect the value of foreign securities.
Fair-value pricing may be used for domestic securities—for example, if (1) trading in a security is halted and does not resume before the fund's pricing time or a security does not trade in the course of a day and (2) the fund holds enough of the security that its price could affect the NAV.
Fair-value prices are determined by Vanguard according to procedures adopted by the board of trustees. When fair-value pricing is employed, the prices of securities used by a fund to calculate the NAV may differ from quoted or published prices for the same securities.
The Fund has authorized certain financial intermediaries and their designees, and may, from time to time, authorize certain funds of funds for which Vanguard serves as the investment advisor (Vanguard Funds of Funds), to accept orders to buy or sell fund shares on its behalf. The Fund will be deemed to receive an order when accepted by the financial intermediary, its designee, or one of the Vanguard Funds of Funds, and the order will receive the NAV next computed by the Fund after such acceptance.
Vanguard fund share prices are published daily on our website at vanguard.com/prices.
23
Financial Highlights
Financial highlights information is intended to help you understand a fund’s performance for the past five years (or, if shorter, its period of operations). Certain information reflects financial results for a single fund share. Total return represents the rate that an investor would have earned or lost each period on an investment in a fund or share class (assuming reinvestment of all distributions). This information has been obtained from the financial statements audited by PricewaterhouseCoopers LLP, an independent registered public accounting firm, whose report, along with fund financial statements, is included in a fund’s most recent annual report to shareholders. You may obtain a free copy of a fund’s latest annual or semiannual report, which is available upon request.
Vanguard Explorer Value Fund
|
|
Year Ended August 31, | ||||
|
2023 |
2022 |
2021 |
2020 |
2019 | |
|
Net Asset Value, Beginning of Period |
$39.93 |
$46.26 |
$30.32 |
$33.49 |
$40.53 |
|
Investment Operations |
|
|
|
|
|
|
Net Investment Income1 |
.586 |
.461 |
.351 |
.400 |
.494 |
|
Net Realized and Unrealized Gain (Loss) on Investments |
2.308 |
(4.910) |
15.911 |
(3.032) |
(4.921) |
|
Total from Investment Operations |
2.894 |
(4.449) |
16.262 |
(2.632) |
(4.427) |
|
Distributions |
|
|
|
|
|
|
Dividends from Net Investment Income |
(.495) |
(.352) |
(.322) |
(.538) |
(.366) |
|
Distributions from Realized Capital Gains |
(.979) |
(1.529) |
— |
— |
(2.247) |
|
Total Distributions |
(1.474) |
(1.881) |
(.322) |
(.538) |
(2.613) |
|
Net Asset Value, End of Period |
$41.35 |
$39.93 |
$46.26 |
$30.32 |
$33.49 |
|
Total Return2 |
7.43% |
-10.05% |
53.90% |
-8.12% |
-10.10% |
|
Ratios/Supplemental Data |
|
|
|
|
|
|
Net Assets, End of Period (Millions) |
$959 |
$1,083 |
$1,164 |
$563 |
$655 |
|
Ratio of Total Expenses to Average Net Assets3 |
0.49%4 |
0.53%4 |
0.52% |
0.64% |
0.55% |
|
Ratio of Net Investment Income to Average Net Assets |
1.48% |
1.05% |
0.85% |
1.28% |
1.45% |
|
Portfolio Turnover Rate |
23% |
31% |
41% |
42% |
27% |
|
|
|
|
1 |
Calculated based on average shares outstanding. |
|
2 |
Total returns do not include account service fees that may have applied in the periods shown.
Fund prospectuses provide information about any applicable account service fees. |
|
3 |
Includes performance-based investment advisory fee increases (decreases) of (0.04%),
0.02%, 0.01%, 0.09%, and 0.01%. |
|
4 |
The ratio of expenses to average net assets for the period net of reduction from broker
commission abatement arrangements was 0.49% and 0.53%, respectively. |
24
Investing With Vanguard
This section of the prospectus explains the basics of doing business with Vanguard. Vanguard fund shares can be held indirectly through an intermediary, such as a bank, a broker, or an investment advisor. If you hold Vanguard fund shares indirectly through an intermediary (including shares held in a brokerage account through Vanguard Brokerage Services®), please see Investing With Vanguard Through Other Firms, and also refer to your account agreement with the intermediary for information about transacting in that account. If you hold Vanguard fund shares through an employer-sponsored retirement or savings plan, please see Employer-Sponsored Plans. Vanguard reserves the right to change the policies in this section without notice. Please call or check online for current information. See Contacting Vanguard.
In certain circumstances, Vanguard fund shares can be held directly with Vanguard. If you hold Vanguard fund shares directly with Vanguard, you should carefully read each topic within this section that pertains to your relationship with Vanguard. Vanguard reserves the right, upon reasonable notice, to discontinue the ability to hold Vanguard fund shares directly with Vanguard for any or all investors and/or to transfer such shares to an affiliate or other financial institution.
In certain circumstances, Vanguard fund shares can be held directly with Vanguard. If you hold Vanguard fund shares directly with Vanguard, you should carefully read each topic within this section that pertains to your relationship with Vanguard. Vanguard reserves the right, upon reasonable notice, to discontinue the ability to hold Vanguard fund shares directly with Vanguard for any or all investors and/or to transfer such shares to an affiliate or other financial institution.
For Vanguard fund shares held directly with Vanguard, each fund you hold in an account is a separate “fund account.” For example, if you hold three funds in a nonretirement account titled in your own name, two funds in a nonretirement account titled jointly with your spouse, and one fund in an individual retirement account, you have six fund accounts—and this is true even if you hold the same fund in multiple accounts. Note that each reference to “you” in this prospectus applies to any one or more registered account owners or persons authorized to transact on your account.
Purchasing Shares
Vanguard reserves the right, without notice, to increase or decrease the minimum amount required to open or maintain a fund account or to add to an existing fund account.
Investment minimums may differ for certain categories of investors.
Account Minimums
To open and maintain an account. $3,000. Financial intermediaries, institutional clients, and Vanguard-advised clients should contact Vanguard for information on special eligibility rules that may apply to them regarding Investor Shares. If you are investing through an intermediary, please contact that firm directly for more information regarding your eligibility.
25
To add to an existing account. Generally $1.
How to Initiate a Purchase Request
Be sure to check Exchanging Shares, Frequent-Trading Limitations, and Other Rules You Should Know before placing your purchase request.
Online. You may open certain types of accounts, request a purchase of shares, and request an exchange through our website or our mobile application if your account is eligible and you are registered for online access.
By telephone. You may call Vanguard to begin the account registration process or request that the account-opening forms be sent to you. You may also call Vanguard to request a purchase of shares in your account or to request an exchange. See Contacting Vanguard.
By mail. You may send Vanguard your account registration form and check to open a new fund account. To add to an existing fund account, you may send your check with an Invest-by-Mail form (from a transaction confirmation or your account statement) or with a deposit slip (available online).
How to Pay for a Purchase
By electronic bank transfer. You may purchase shares of a Vanguard fund through an electronic transfer of money from a bank account. To establish the electronic bank transfer service on an account, you must designate the bank account online, complete a form, or fill out the appropriate section of your account registration form. After the service is set up on your account, you can purchase shares by electronic bank transfer on a regular schedule (Automatic Investment Plan), if eligible, or upon request. Your purchase request can be initiated online (if you are registered for online access), by telephone, or by mail.
By wire. Wiring instructions vary for different types of purchases. Please call Vanguard for instructions and policies on purchasing shares by wire. See Contacting Vanguard.
By check. You may make initial or additional purchases to your fund account by sending a check with a deposit slip or by utilizing our mobile application if your account is eligible and you are registered for online access. Also see How to Initiate a Purchase Request. Make your check payable to Vanguard and include the appropriate fund number (Vanguard—1690).
By exchange. You may purchase shares of a Vanguard fund using the proceeds from the simultaneous redemption of shares of another Vanguard fund. You may initiate an exchange online (if you are registered for online access), by telephone, or by mail with an exchange form. See Exchanging Shares.
26
Trade Date
The trade date for any purchase request received in good order will depend on the day and time Vanguard receives your request, the manner in which you are paying, and the type of fund you are purchasing. Your purchase will be executed using the NAV as calculated on the trade date. NAVs are calculated only on days that the NYSE is open for trading (a business day). In the rare event the NYSE experiences unanticipated disruptions and is unavailable at the close of the trading day, NAVs will be calculated as of the close of regular trading on the Nasdaq (or another alternate exchange if the Nasdaq is unavailable, as determined at Vanguard’s discretion), generally 4 p.m., Eastern time. The time selected for NAV calculation in this rare event shall also serve as the conclusion of the trading day. See Share Price.
For purchases by check into all funds other than money market funds and for purchases by exchange, wire, or electronic bank transfer into all funds: If the purchase request is received by Vanguard on a business day before the close of regular trading on the NYSE (generally 4 p.m., Eastern time), the trade date for the purchase will be the same day. If the purchase request is received on a business day after the close of regular trading on the NYSE, or on a nonbusiness day, the trade date for the purchase will be the next business day.
For purchases by check into money market funds: If the purchase request is received by Vanguard on a business day before the close of regular trading on the NYSE (generally 4 p.m., Eastern time), the trade date for the purchase will be the next business day. If the purchase request is received on a business day after the close of regular trading on the NYSE, or on a nonbusiness day, the trade date for the purchase will be the second business day following the day Vanguard receives the purchase request. Because money market instruments must be purchased with federal funds and it takes a money market mutual fund one business day to convert check proceeds into federal funds, the trade date for the purchase will be one business day later than for other funds.
If applicable, orders by Vanguard Fund of Funds will be treated as received by the Fund at the same time that corresponding orders are received in proper form by the Vanguard Fund of Funds.
If your purchase request is not accurate and complete, it may be rejected. See Other Rules You Should Know—Good Order.
For further information about purchase transactions, consult our website at vanguard.com or see Contacting Vanguard.
27
Other Purchase Rules You Should Know
Check purchases. All purchase checks must be written in U.S. dollars, be drawn on a U.S. bank, and be accompanied by good order instructions. Vanguard does not accept cash, traveler’s checks, starter checks, or money orders. In addition, Vanguard may refuse checks that are not made payable to Vanguard.
New accounts. We are required by law to obtain from you certain personal information that we will use to verify your identity. If you do not provide the information, we may not be able to open your account. If we are unable to verify your identity, Vanguard reserves the right, without notice, to close your account or take such other steps as we deem reasonable. Certain types of accounts may require additional documentation.
Refused or rejected purchase requests. Vanguard reserves the right to stop selling fund shares or to reject any purchase request at any time and without notice, including, but not limited to, purchases requested by exchange from another Vanguard fund. This also includes the right to reject any purchase request because the investor has a history of frequent trading or because the purchase may negatively affect a fund’s operation or performance.
Large purchases. Call Vanguard before attempting to invest a large dollar amount.
No cancellations. Vanguard will not accept your request to cancel any purchase request once processing has begun. Please be careful when placing a purchase request.
Redeeming Shares
How to Initiate a Redemption Request
Be sure to check Exchanging Shares, Frequent-Trading Limitations, and Other Rules You Should Know before placing your redemption request.
Online. You may request a redemption of shares or request an exchange through our website or our mobile application if your account is eligible and you are registered for online access.
By telephone. You may call Vanguard to request a redemption of shares or an exchange. See Contacting Vanguard.
By mail. You may send a form (available online) to Vanguard to redeem from a fund account or to make an exchange.
28
How to Receive Redemption Proceeds
By electronic bank transfer. You may have the proceeds of a fund redemption sent directly to a designated bank account. To establish the electronic bank transfer service on an account, you must designate a bank account online, complete a form, or fill out the appropriate section of your account registration form. After the service is set up on your account, you can redeem shares by electronic bank transfer on a regular schedule (Automatic Withdrawal Plan), if eligible, or upon request. Your redemption request can be initiated online (if you are registered for online access), by telephone, or by mail.
By wire. To receive your proceeds by wire, you may instruct Vanguard to wire your redemption proceeds ($100 minimum) to a previously designated bank account. To establish the wire redemption service, you generally must designate a bank account online, complete a form, or fill out the appropriate section of your account registration form.
Please note that Vanguard charges a $10 wire fee for outgoing wire redemptions. The fee is assessed in addition to, rather than being withheld from, redemption proceeds and is paid directly to the fund in which you invest. For example, if you redeem $100 via a wire, you will receive the full $100, and the $10 fee will be assessed to your fund account through an additional redemption of fund shares. If you redeem your entire fund account, your redemption proceeds will be reduced by the amount of the fee. The wire fee does not apply to accounts held by Flagship and Flagship Select clients; accounts held through intermediaries, including Vanguard Brokerage Services; or accounts held by institutional clients.
By exchange. You may have the proceeds of a Vanguard fund redemption invested directly in shares of another Vanguard fund. You may initiate an exchange online (if you are registered for online access), by telephone, or by mail. See Exchanging Shares.
By check. If you have not chosen another redemption method, Vanguard will mail you a redemption check, generally payable to all registered account owners, normally within two business days of your trade date, and generally to the address of record.
Trade Date
The trade date for any redemption request received in good order will depend on the day and time Vanguard receives your request and the manner in which you are redeeming. Your redemption will be executed using the NAV as calculated on the trade date. NAVs are calculated only on days that the NYSE is open for trading (a business day). In the rare event the NYSE experiences unanticipated disruptions and is unavailable at the close of the trading day, NAVs will be
29
calculated as of the close of regular trading on the Nasdaq (or another alternate exchange if the Nasdaq is unavailable, as determined at Vanguard’s discretion), generally 4 p.m., Eastern time. The time selected for NAV calculation in this rare event shall also serve as the conclusion of the trading day. See Share Price.
For redemptions by check, exchange, or wire: If the redemption request is received by Vanguard on a business day before the close of regular trading on the NYSE (generally 4 p.m., Eastern time), the trade date will be the same day. If the redemption request is received on a business day after the close of regular trading on the NYSE, or on a nonbusiness day, the trade date will be the next business day.
• Note on timing of wire redemptions from money market funds: For telephone requests received by Vanguard on a business day before 10:45 a.m., Eastern time (2 p.m., Eastern time, for Vanguard Cash Reserves Federal Money Market Fund; 12:30 p.m., Eastern time, for Vanguard Federal Money Market Fund), the redemption proceeds generally will leave Vanguard by the close of business the same day. For telephone requests received by Vanguard on a business day after those cut-off times, or on a nonbusiness day, and for all requests other than by telephone, the redemption proceeds generally will leave Vanguard by the close of business on the next business day.
• Note on timing of wire redemptions from all other funds: For requests received by Vanguard on a business day before the close of regular trading on the NYSE (generally 4 p.m., Eastern time), the redemption proceeds generally will leave Vanguard by the close of business on the next business day. For requests received by Vanguard on a business day after the close of regular trading on the NYSE, or on a nonbusiness day, the redemption proceeds generally will leave Vanguard by the close of business on the second business day after Vanguard receives the request.
For redemptions by electronic bank transfer: If the redemption request is received by Vanguard on a business day before the close of regular trading on the NYSE (generally 4 p.m., Eastern time), the trade date will be the same day. If the redemption request is received on a business day after the close of regular trading on the NYSE, or on a nonbusiness day, the trade date will be the next business day.
If your redemption request is not accurate and complete, it may be rejected. If we are unable to send your redemption proceeds by wire or electronic bank transfer because the receiving institution rejects the transfer, Vanguard will make additional efforts to complete your transaction. If Vanguard is still unable to complete the transaction, we may send the proceeds of the redemption to you by
30
check, generally payable to all registered account owners, or use your proceeds to purchase new shares of the fund from which you sold shares for the purpose of the wire or electronic bank transfer transaction. See Other Rules You Should Know—Good Order.
If your redemption request is received in good order, we typically expect that redemption proceeds will be paid by the Fund within one business day of the trade date; however, in certain circumstances, investors may experience a longer settlement period at the time of the transaction. For further information, see “Potentially disruptive redemptions” and “Emergency circumstances.”
For further information about redemption transactions, consult our website at vanguard.com or see Contacting Vanguard.
Other Redemption Rules You Should Know
Documentation for certain accounts. Special documentation may be required to redeem from certain types of accounts, such as trust, corporate, nonprofit, or retirement accounts. Please call us before attempting to redeem from these types of accounts.
Potentially disruptive redemptions. Vanguard reserves the right to pay all or part of a redemption in kind—that is, in the form of securities—if we reasonably believe that a cash redemption would negatively affect the fund’s operation or performance or that the shareholder may be engaged in market-timing or frequent trading. Under these circumstances, Vanguard also reserves the right to delay payment of the redemption proceeds for up to seven calendar days. By calling us before you attempt to redeem a large dollar amount, you may avoid in-kind or delayed payment of your redemption. Please see Frequent-Trading Limitations for information about Vanguard's policies to limit frequent trading.
Recently purchased shares. Although you can redeem shares at any time, proceeds may not be made available to you until the fund collects payment for your purchase. This may take up to seven calendar days for shares purchased by check or by electronic bank transfer. If you have written a check on a fund in an account with checkwriting privileges, that check may be rejected if your fund account does not have a sufficient available balance.
Address change. If you change your address online or by telephone, there may be up to a 14-day restriction (starting on the business day after your address is changed) on your ability to request check redemptions online and by telephone. You can request a redemption in writing (using a form available online) at any time. Confirmations of address changes are sent to both the old and new addresses.
31
Payment to a different person or address. At your request, we can make your redemption check payable, or wire your redemption proceeds, to a different person or send it to a different address. However, this generally requires the written consent of all registered account owners and may require additional documentation, such as a signature guarantee or a notarized signature. You may obtain a signature guarantee from some commercial or savings banks, credit unions, trust companies, or member firms of a U.S. stock exchange.
No cancellations. Vanguard will not accept your request to cancel any redemption request once processing has begun. Please be careful when placing a redemption request.
Emergency circumstances. Vanguard funds can postpone payment of redemption proceeds for up to seven calendar days. In addition, Vanguard funds can suspend redemptions and/or postpone payments of redemption proceeds beyond seven calendar days at times when the NYSE is closed or during emergency circumstances, as determined by the SEC.
Exchanging Shares
An exchange occurs when you use the proceeds from the redemption of shares of one Vanguard fund to simultaneously purchase shares of a different Vanguard fund. You can make exchange requests online (if you are registered for online access), by telephone, or by mail. See Purchasing Shares and Redeeming Shares.
If the NYSE is open for regular trading (generally until 4 p.m., Eastern time, on a business day) at the time an exchange request is received in good order, the trade date generally will be the same day. See Other Rules You Should Know—Good Order for additional information on all transaction requests.
Vanguard will not accept your request to cancel any exchange request once processing has begun. Please be careful when placing an exchange request.
Call Vanguard before attempting to exchange a large dollar amount. By calling us before you attempt to exchange a large dollar amount, you may avoid delayed or rejected transactions.
Please note that Vanguard reserves the right, without notice, to revise or terminate the exchange privilege, limit the amount of any exchange, or reject an exchange, at any time, for any reason. See Frequent-Trading Limitations for additional restrictions on exchanges.
32
Frequent-Trading Limitations
Because excessive transactions can disrupt management of a fund and increase the fund’s costs for all shareholders, the board of trustees of each Vanguard fund places certain limits on frequent trading in the funds. Each Vanguard fund (other than money market funds and short-term bond funds, but including Vanguard Short-Term Inflation-Protected Securities Index Fund) limits an investor’s purchases or exchanges into a fund account for 30 calendar days after the investor has redeemed or exchanged out of that fund account. ETF Shares are not subject to these frequent-trading limits.
For Vanguard Retirement Investment Program pooled plans, the limitations apply to exchanges made online or by telephone.
These frequent-trading limitations do not apply to the following:
• Certain transactions below dollar value or other thresholds specified by Vanguard.
• In-kind transactions to a shareholder’s donor advised fund managed by Vanguard Charitable.
• Purchases of shares with reinvested dividend or capital gains distributions.
• Transactions through Vanguard’s Automatic Investment Plan, Automatic Exchange Service, Direct Deposit Service, Automatic Withdrawal Plan, Required Minimum Distribution Service, Vanguard Small Business Online®, and certain transactions through intermediaries relating to systematic trades and required minimum distributions.
• Discretionary transactions through Vanguard Personal Advisor Services®, Vanguard Institutional Advisory Services®, Vanguard Digital Advisor™, and discretionary (advisor-directed) transactions through certain intermediaries.
• Redemptions of shares to pay fund or account fees.
• Redemptions of shares to remove excess shareholder contributions to certain types of retirement accounts (including, but not limited to, IRAs and Vanguard Individual 401(k) Plans).
• Transfers and reregistrations of shares within the same fund.
• Purchases of shares by asset transfer or direct rollover.
• Conversions of shares from one share class to another in the same fund.
• Checkwriting redemptions.
• Section 529 college savings plans.
• Certain approved institutional portfolios and asset allocation programs, as well as trades made by funds or trusts managed by Vanguard or its affiliates that
33
invest in other Vanguard funds. (Please note that shareholders of Vanguard’s funds of funds are subject to the limitations.)
For participants in employer-sponsored defined contribution plans,* the frequent-trading limitations do not apply to:
• Purchases of shares with participant payroll or employer contributions or loan repayments.
• Purchases of shares with reinvested dividend or capital gains distributions.
• Distributions, loans, and in-service withdrawals from a plan.
• Redemptions of shares as part of a plan termination or at the direction of the plan.
• Transactions executed through the Vanguard Managed Account Program.
• Redemptions of shares to pay fund or account fees.
• Share or asset transfers or rollovers.
• Reregistrations of shares.
• Conversions of shares from one share class to another in the same fund.
• Exchange requests submitted by written request to Vanguard. (Exchange requests submitted by fax, if otherwise permitted, are subject to the limitations.)
* The following Vanguard fund accounts are subject to the frequent-trading limitations: SEP-IRAs, SIMPLE IRAs, certain Individual 403(b)(7) Custodial Accounts, and Vanguard Individual 401(k) Plans.
Accounts Held by Institutions (Other Than Defined Contribution Plans)
Vanguard will systematically monitor for frequent trading in institutional clients’ accounts. If we detect suspicious trading activity, we will investigate and take appropriate action, which may include applying to a client’s accounts the 30-day policy previously described, prohibiting a client’s purchases of fund shares, and/or revoking the client’s exchange privilege.
Accounts Held by Intermediaries
When intermediaries establish accounts in Vanguard funds for the benefit of their clients, we cannot always monitor the trading activity of the individual clients. However, we review trading activity at the intermediary (omnibus) level, and if we detect suspicious activity, we will investigate and take appropriate action. If necessary, Vanguard may prohibit additional purchases of fund shares by an intermediary, including for the benefit of certain of the intermediary’s clients. Intermediaries also may monitor their clients’ trading activities with respect to Vanguard funds.
34
For those Vanguard funds that charge purchase and/or redemption fees, intermediaries will be asked to assess these fees on client accounts and remit these fees to the funds. The application of purchase and redemption fees and frequent-trading limitations may vary among intermediaries. There are no assurances that Vanguard will successfully identify all intermediaries or that intermediaries will properly assess purchase and redemption fees or administer frequent-trading limitations. If you invest with Vanguard through an intermediary, please read that firm’s materials carefully to learn of any other rules or fees that may apply.
Other Rules You Should Know
Prospectus and Shareholder Report Mailings
When two or more shareholders have the same last name and address, just one summary prospectus (or prospectus) and/or shareholder report may be sent in an attempt to eliminate the unnecessary expense of duplicate mailings. You may request individual prospectuses and reports by contacting our Client Services Department in writing, by telephone, or online. See Contacting Vanguard.
Vanguard.com
Registration. If you are a registered user of vanguard.com, you can review your account holdings; buy, sell, or exchange shares of most Vanguard funds; and perform most other transactions through our website. You must register for this service online.
Electronic delivery. Vanguard can deliver your account statements, transaction confirmations, prospectuses, certain tax forms, and shareholder reports electronically. If you are a registered user of vanguard.com, you can consent to the electronic delivery of these documents by logging on and changing your mailing preferences under “Account Maintenance.” You can revoke your electronic consent at any time through our website, and we will begin to send paper copies of these documents within 30 days of receiving your revocation.
Telephone Transactions
Automatic. When we set up your account, we will automatically enable you to do business with us by telephone, unless you instruct us otherwise in writing.
35
Proof of a caller’s authority. We reserve the right to refuse a telephone request if the caller is unable to provide the requested information or if we reasonably believe that the caller is not an individual authorized to act on the account. Before we allow a caller to act on an account, we may request the following information:
• Authorization to act on the account (as the account owner or by legal documentation or other means).
• Account registration and address.
• Fund name and account number, if applicable.
• Other information relating to the caller, the account owner, or the account.
Good Order
We reserve the right to reject any transaction instructions that are not in “good order.” Good order generally means that your instructions:
• Are provided by the person(s) authorized in accordance with Vanguard’s policies and procedures to access the account and request transactions.
• Include the fund name and account number.
• Include the amount of the transaction (stated in dollars, shares, or percentage).
Written instructions also must generally be provided on a Vanguard form and include:
• Signature(s) and date from the authorized person(s).
• Signature guarantees or notarized signatures, if required for the type of transaction. (Call Vanguard for specific requirements.)
• Any supporting documentation that may be required.
Good order requirements may vary among types of accounts and transactions. For more information, consult our website at vanguard.com or see Contacting Vanguard.
Vanguard reserves the right, without notice, to revise the requirements for good order.
Future Trade-Date Requests
Vanguard does not accept requests to hold a purchase, redemption, or exchange transaction for a future date. All such requests will receive trade dates as previously described in Purchasing Shares, Redeeming Shares, and Exchanging Shares. Vanguard reserves the right to return future-dated purchase checks.
36
Accounts With More Than One Owner
If an account has more than one owner or authorized person, Vanguard generally will accept instructions from any one owner or authorized person.
Responsibility for Fraud
You should take precautions to protect yourself from fraud. Keep your account-related information private, and review any account confirmations, statements, or other information that we provide to you as soon as you receive them. Let us know immediately if you discover unauthorized activity or see something on your account that you do not understand or that looks unusual.
Vanguard will not be responsible for losses that result from transactions by a person who we reasonably believe is authorized to act on your account.
Uncashed Checks
Please cash your distribution or redemption checks promptly. Vanguard will not pay interest on uncashed checks. Vanguard may be required to transfer assets related to uncashed checks to a state under the state’s abandoned property law.
Dormant Accounts
If your account has no activity in it for a period of time, Vanguard may be required to transfer it to a state under the state’s abandoned property law, subject to potential federal or state withholding taxes.
Unusual Circumstances
If you experience difficulty contacting Vanguard online or by telephone, you can send us your transaction request on a Vanguard form by regular or express mail.
Investing With Vanguard Through Other Firms
You may purchase or sell shares of most Vanguard funds through a financial intermediary, such as a bank, a broker, or an investment advisor. Please consult your financial intermediary to determine which, if any, shares are available through that firm and to learn about other rules that may apply. Your financial intermediary can provide you with account information and any required tax forms. You may be required to pay a commission on purchases of mutual fund shares made through a financial intermediary.
Please see Frequent-Trading Limitations—Accounts Held by Intermediaries for information about the assessment of any purchase or redemption fees and the monitoring of frequent trading for accounts held by intermediaries.
37
Account Service Fee
Vanguard may charge a $25 account service fee on fund accounts that have a balance below $5,000,000 for any reason, including market fluctuation. The account service fee may be applied to both retirement and nonretirement fund accounts and may be assessed on fund accounts in all Vanguard funds, regardless of the account minimum. The fee, which will be collected by redeeming fund shares in the amount of $25, will be deducted from fund accounts subject to the fee once per calendar year.
Certain account types have alternative fee structures, including SIMPLE IRAs, Vanguard Retirement Investment Program pooled plans, and Vanguard Individual 401(k) Plans.
Low-Balance Accounts
The Fund reserves the right to liquidate a fund account whose balance falls below the account minimum for any reason, including market fluctuation. This liquidation policy applies to nonretirement fund accounts and accounts that are held through intermediaries. Any such liquidation will be preceded by written notice to the investor.
Right to Change Policies
In addition to the rights expressly stated elsewhere in this prospectus, Vanguard reserves the right, without notice, to (1) alter, add, or discontinue any conditions of purchase (including eligibility requirements), redemption, exchange, service, or privilege at any time and (2) alter, impose, discontinue, or waive any purchase fee, redemption fee, account service fee, or other fee charged to a shareholder or a group of shareholders. Changes may affect any or all investors. These actions will be taken when, at the sole discretion of Vanguard management, Vanguard believes they are in the best interest of a fund.
Account Restrictions
Vanguard reserves the right to: (1) redeem all or a portion of a fund/account to meet a legal obligation, including tax withholding, tax lien, garnishment order, or other obligation imposed on your account by a court or government agency; (2) redeem shares, close an account, or suspend account privileges, features, or options in the case of threatening conduct or activity; (3) redeem shares, close an account, or suspend account privileges, features, or options if Vanguard believes or suspects that not doing so could result in a suspicious, fraudulent, or illegal transaction; (4) place restrictions on the ability to redeem any or all shares in an account if it is required to do so by a court or government agency; (5) place restrictions on the ability to redeem any or all shares in an account if Vanguard believes that doing so will prevent fraud, financial exploitation or abuse, or to
38
protect vulnerable investors; (6) freeze any account and/or suspend account services if Vanguard has received reasonable notice of a dispute regarding the assets in an account, including notice of a dispute between the registered or beneficial account owners; and (7) freeze any account and/or suspend account services upon initial notification to Vanguard of the death of an account owner.
Shareholder Rights
The Fund’s Agreement and Declaration of Trust, as amended, requires a shareholder bringing a derivative action on behalf of Vanguard Scottsdale Funds (the Trust) that is subject to a pre-suit demand to collectively hold at least 10% of the outstanding shares of the Trust or at least 10% of the outstanding shares of the series or class to which the demand relates and to undertake to reimburse the Trust for the expense of any counsel or advisors used when considering the merits of the demand in the event that the board of trustees determines not to bring such action. In each case, these requirements do not apply to claims arising under the federal securities laws to the extent that any such federal securities laws, rules, or regulations do not permit such application.
Fund and Account Updates
Confirmation Statements
We will send (or provide through our website, whichever you prefer) a confirmation of your trade date and the amount of your transaction when you buy, sell, or exchange shares. However, we will not send confirmations reflecting only checkwriting redemptions or the reinvestment of dividend or capital gains distributions. For any month in which you had a checkwriting redemption, a Checkwriting Activity Statement will be sent to you itemizing the checkwriting redemptions for that month. Promptly review each confirmation statement that we provide to you. It is important that you contact Vanguard immediately with any questions you may have about any transaction reflected on a confirmation statement, or Vanguard will consider the transaction properly processed.
Portfolio Summaries
We will send (or provide through our website, whichever you prefer) quarterly portfolio summaries to help you keep track of your accounts throughout the year. Each summary shows the market value of your account at the close of the statement period, as well as all distributions, purchases, redemptions, exchanges, and transfers for the current calendar quarter (or month). Promptly review each summary that we provide to you. It is important that you contact
39
Vanguard immediately with any questions you may have about any transaction reflected on the summary, or Vanguard will consider the transaction properly processed.
Tax Information Statements
For most accounts, Vanguard (or your intermediary) is required to provide annual tax forms to assist you in preparing your income tax returns. These forms are generally available for each calendar year early in the following year. Registered users of vanguard.com can also view certain forms through our website. Vanguard (or your intermediary) may also provide you with additional tax-related documentation. For more information, consult our website at vanguard.com or see Contacting Vanguard.
Annual and Semiannual Reports
We will send (or provide through our website, whichever you prefer) reports about Vanguard Explorer Value Fund twice a year, in April and October. These reports include overviews of the financial markets and provide the following specific Fund information:
• Performance assessments and comparisons with industry benchmarks.
• Financial statements with listings of Fund holdings.
Portfolio Holdings
Please consult the Fund's Statement of Additional Information or our website for a description of the policies and procedures that govern disclosure of the Fund’s portfolio holdings.
Employer-Sponsored Plans
Your plan administrator or your employee benefits office can provide you with detailed information on how to participate in your plan and how to elect the Fund as an investment option.
• If you have any questions about the Fund or Vanguard, including those about the Fund’s investment objective, strategies, or risks, contact Vanguard Participant Services toll-free at 800-523-1188 or visit our website at vanguard.com.
• If you have questions about your account, contact your plan administrator or the organization that provides recordkeeping services for your plan.
• Be sure to carefully read each topic that pertains to your transactions with Vanguard.
40
Vanguard reserves the right to change its policies without notice to shareholders.
Transactions
Processing times for your transaction requests may differ among recordkeepers or among transaction and funding types. Your plan’s recordkeeper (which may also be Vanguard) will determine the necessary processing time frames for your transaction requests prior to submission to the Fund. Consult your recordkeeper or plan administrator for more information.
If Vanguard is serving as your plan recordkeeper and if your transaction involves one or more investments with an early cut-off time for processing or another trading restriction, your entire transaction will be subject to the restriction when the trade date for your transaction is determined.
41
Contacting Vanguard
|
Web |
|
|
Vanguard.com |
For the most complete source of Vanguard news
For fund, account, and service information
For most account transactions
For literature requests
24 hours a day, 7 days a week |
|
Phone | |
|
Investor Information 800-662-7447
(Text telephone for people with
hearing impairment at 800-749-7273) |
For fund and service information
For literature requests |
|
Client Services 800-662-2739
(Text telephone for people with
hearing impairment at 800-749-7273) |
For account information
For most account transactions |
|
Participant Services 800-523-1188
(Text telephone for people with
hearing impairment at 800-749-7273) |
For information and services for participants in
employer-sponsored plans |
|
Institutional Division
888-809-8102 |
For information and services for large institutional
investors |
|
Financial Advisor and Intermediary
Sales Support 800-997-2798 |
For information and services for financial intermediaries
including financial advisors, broker-dealers, trust
institutions, and insurance companies |
|
Financial Advisory and Intermediary
Trading Support 800-669-0498 |
For account information and trading support for
financial intermediaries including financial advisors,
broker-dealers, trust institutions, and insurance
companies |
42
Additional Information
The Fund's Bylaws require, unless the Trust otherwise consents in writing, that the U.S. Federal District Courts be the sole and exclusive forum for the resolution of complaints under the Securities Act of 1933. This provision may limit a shareholder’s ability to bring a claim in a different forum and may result in increased shareholder costs in pursuing such a claim.
|
Vanguard Fund |
Inception
Date |
Newspaper
Abbreviation |
Vanguard
Fund Number |
CUSIP
Number |
|
Vanguard Explorer Value Fund |
3/30/2010 |
ExpValFd |
1690 |
92206C748 |
CGS identifiers have been provided by CUSIP Global Services, managed on behalf of the American Bankers Association by Standard & Poor’s Financial Services, LLC, and are not for use or dissemination in a manner that would serve as a substitute for any CUSIP service. The CUSIP Database, © 2023 American Bankers Association. “CUSIP” is a registered trademark of the American Bankers Association.
CFA® is a registered trademark owned by CFA Institute.
43
Glossary of Investment Terms
Capital Gains Distributions. Payments to mutual fund shareholders of gains realized on securities that a fund has sold at a profit, minus any realized losses.
Cash Equivalent Investments. Cash deposits, short-term bank deposits, and money market instruments that include U.S. Treasury bills and notes, bank certificates of deposit (CDs), repurchase agreements, commercial paper, and banker’s acceptances.
Common Stock. A security representing ownership rights in a corporation.
Dividend Distributions. Payments to mutual fund shareholders of income from interest or dividends generated by a fund's investments.
Dow Jones U.S. Total Stock Market Float Adjusted Index. An index that represents the entire U.S. stock market and tracks more than 5,000 stocks, excluding shares of securities not available for public trading.
Expense Ratio. A fund's total annual operating expenses expressed as a percentage of the fund's average net assets. The expense ratio includes management and administrative expenses, but it does not include the transaction costs of buying and selling portfolio securities.
Inception Date. The date on which the assets of a fund are first invested in accordance with the fund's investment objective. For funds with a subscription period, the inception date is the day after that period ends. Investment performance is generally measured from the inception date.
Joint Committed Credit Facility. The Fund participates, along with other funds managed by Vanguard, in a committed credit facility provided by a syndicate of lenders pursuant to a credit agreement that may be renewed annually; each Vanguard fund is individually liable for its borrowings, if any, under the credit facility. The amount and terms of the committed credit facility are subject to approval by the Fund's board of trustees and renegotiation with the lender syndicate on an annual basis.
Median Market Capitalization. An indicator of the size of companies in which a fund invests; the midpoint of market capitalization (market price x shares outstanding) of a fund's stocks, weighted by the proportion of the fund's assets invested in each stock. Stocks representing half of the fund's assets have market capitalizations above the median, and the rest are below it.
44
Mutual Fund. An investment company that pools the money of many people and invests it in a variety of securities in an effort to achieve a specific objective over time.
New York Stock Exchange (NYSE). A stock exchange based in New York City that is open for regular trading on business days, Monday through Friday, from 9:30 a.m. to 4 p.m., Eastern time.
Return of Capital. A return of capital occurs when a fund's distributions exceed its earnings in a fiscal year. A return of capital is a return of all or part of your original investment or amounts paid in excess of your original investment in a fund. In general, a return of capital reduces your cost basis in a fund's shares and is not taxable to you until your cost basis has been reduced to zero.
Russell 2500 Value Index. An index that measures the performance of those Russell 2500 companies with lower price/book ratios and lower predicted and historical growth rates.
Securities. Stocks, bonds, money market instruments, and other investments.
Total Return. A percentage change, over a specified time period, in a mutual fund's net asset value, assuming the reinvestment of all distributions of dividends and capital gains.
Volatility. The fluctuations in value of a mutual fund or other security. The greater a fund's volatility, the wider the fluctuations in its returns.
Yield. Income (interest or dividends) earned by an investment, expressed as a percentage of the investment’s price.
Connect with Vanguard® ˃ vanguard.com
For More Information
If you would like more information about Vanguard Explorer Value Fund, the following documents are available free upon request:
Annual/Semiannual Reports to Shareholders
Additional information about the Fund's investments is available in the Fund's annual and semiannual reports to shareholders. In the annual report, you will find a discussion of the market conditions and investment strategies that significantly affected the Fund's performance during its last fiscal year.
Statement of Additional Information (SAI)
The SAI provides more detailed information about the Fund and is incorporated by reference into (and thus legally a part of) this prospectus.
To receive a free copy of the latest annual or semiannual report or the SAI, or to request additional information about the Fund or other Vanguard funds, please visit vanguard.com or contact us as follows:
If you are an individual investor:
Telephone: 800-662-7447; Text telephone for people with hearing impairment: 800-749-7273
Telephone: 800-662-7447; Text telephone for people with hearing impairment: 800-749-7273
If you are a participant in an employer-sponsored plan:
Telephone: 800-523-1188; Text telephone for people with hearing impairment: 800-749-7273
Telephone: 800-523-1188; Text telephone for people with hearing impairment: 800-749-7273
If you are a current Vanguard shareholder and would like information about your account, account transactions, and/or account statements, please call:
Client Services Department
Telephone: 800-662-2739; Text telephone for people with hearing impairment: 800-749-7273
Telephone: 800-662-2739; Text telephone for people with hearing impairment: 800-749-7273
Information Provided by the SEC
Reports and other information about the Fund are available in the EDGAR database on the SEC’s website at sec.gov, or you can receive copies of this information, for a fee, by electronic request at the following email address: publicinfo@sec.gov.
Fund's Investment Company Act file number: 811-07803
© 2023 The Vanguard Group, Inc. All rights reserved.
Vanguard Marketing Corporation, Distributor.
P 1690 122023
Vanguard Marketing Corporation, Distributor.
P 1690 122023
Vanguard Sector Bond Index Funds
Prospectus
December 22, 2023
AdmiralTM Shares
Vanguard Short-Term Treasury Index Fund Admiral Shares (VSBSX)
Vanguard Intermediate-Term Treasury Index Fund Admiral Shares (VSIGX)
Vanguard Long-Term Treasury Index Fund Admiral Shares (VLGSX)
Vanguard Short-Term Corporate Bond Index Fund Admiral Shares (VSCSX)
Vanguard Intermediate-Term Corporate Bond Index Fund Admiral Shares (VICSX)
Vanguard Long-Term Corporate Bond Index Fund Admiral Shares (VLTCX)
Vanguard Mortgage-Backed Securities Index Fund Admiral Shares (VMBSX)
This prospectus contains financial data for the Funds through the fiscal year ended August 31, 2023.
The Securities and Exchange Commission (SEC) has not approved or disapproved these securities or passed upon the adequacy of this prospectus. Any representation to the contrary is a criminal offense.
(Fees paid directly from your investment)
|
| |
|
Sales Charge (Load) Imposed on Purchases |
|
|
Purchase Fee |
|
|
Sales Charge (Load) Imposed on Reinvested Dividends |
|
|
Redemption Fee |
|
|
Account Service Fee Per Year
(for certain fund account balances below $5,000,000) |
$ |
(Expenses that you pay each year as a percentage of the value of your investment)
|
| |
|
Management Fees |
% |
|
12b-1 Distribution Fee |
|
|
Other Expenses |
% |
|
Total Annual Fund Operating Expenses |
% |
1
|
1 Year |
3 Years |
5 Years |
10 Years |
|
$ |
$ |
$ |
$ |
2
3
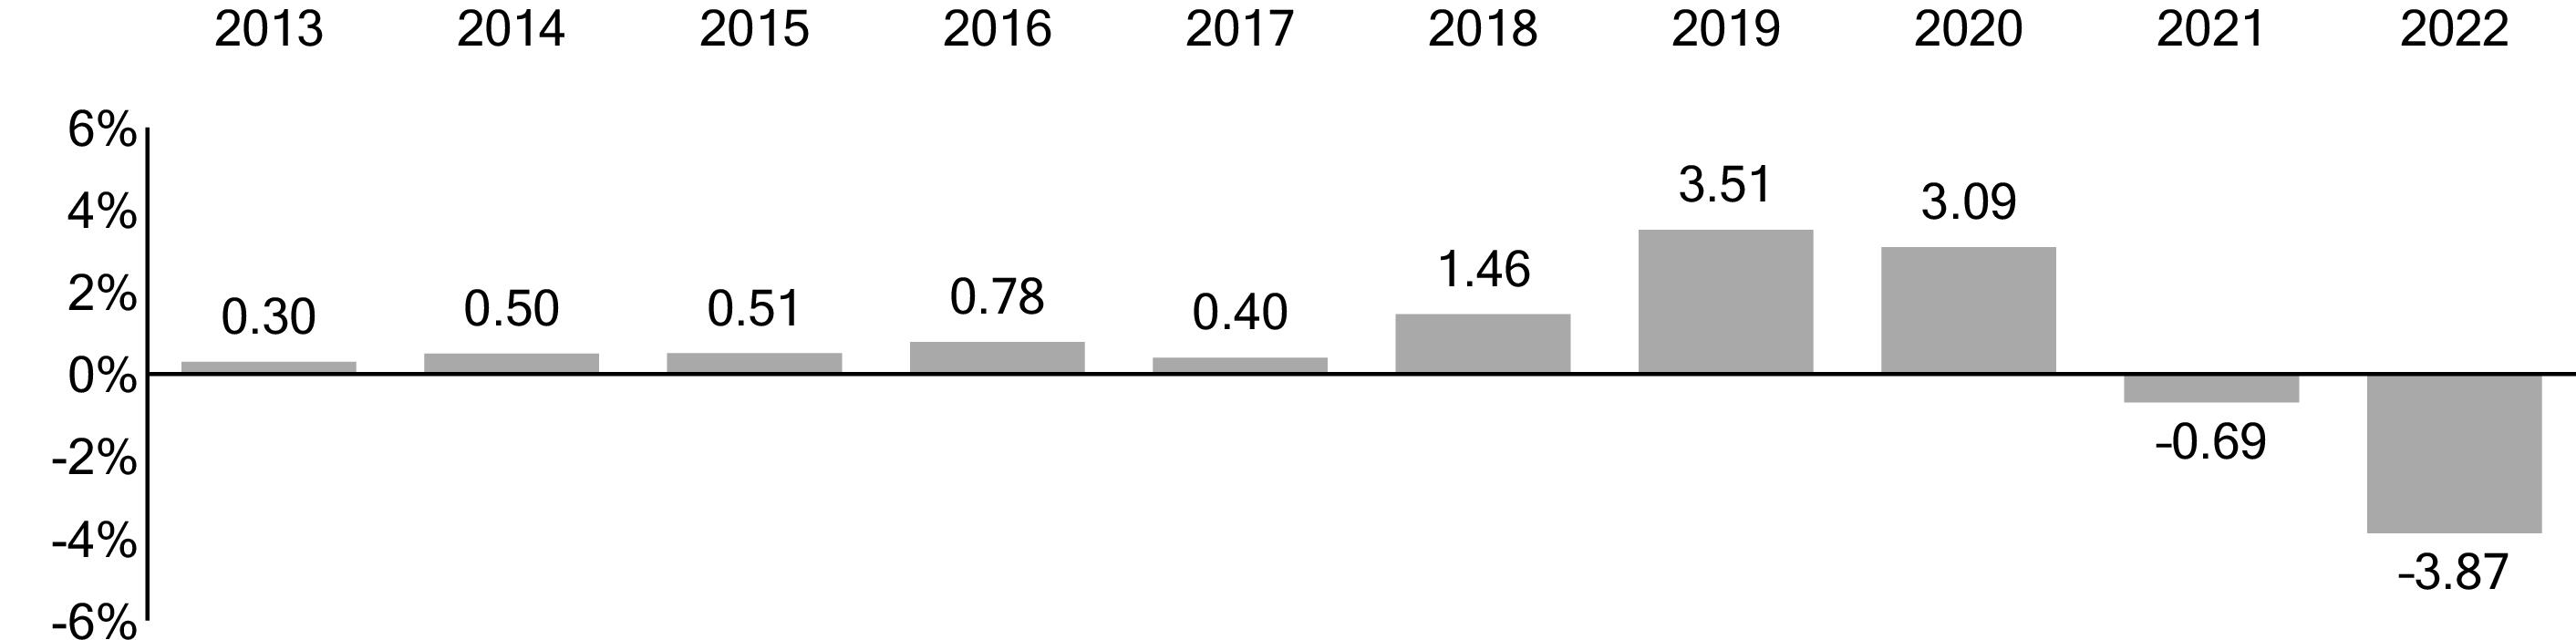
1 The year-to-date return as of the most recent calendar quarter, which ended on September 30, 2023, was 1.67%.
|
|
Total Return |
Quarter |
|
|
% |
|
|
|
-
% |
|
|
|
1 Year |
5 Years |
10 Years |
|
Vanguard Short-Term Treasury Index Fund
Admiral Shares |
|
|
|
|
Return Before Taxes |
-
% |
% |
% |
|
Return After Taxes on Distributions |
- |
|
|
|
Return After Taxes on Distributions and Sale of Fund Shares |
- |
|
|
|
Bloomberg U.S. Treasury 1-3 Year Index
(reflects no deduction for fees, expenses, or taxes) |
-
% |
% |
% |
|
Spliced Bloomberg U.S. Treasury 1-3 Year Index in USD
(reflects no deduction for fees, expenses, or taxes) |
- |
|
|
|
Bloomberg U.S. Aggregate Float Adjusted Index
(reflects no deduction for fees, expenses, or taxes) |
- |
|
|
4
Investment Advisor
The Vanguard Group, Inc. (Vanguard)
Portfolio Manager
Joshua C. Barrickman, CFA, Principal of Vanguard and co-head of Vanguard’s Fixed Income Indexing Americas. He has managed the Fund since 2013.
Purchase and Sale of Fund Shares
You may purchase or redeem shares online through our website (vanguard.com), by mail (The Vanguard Group, P.O. Box 982901, El Paso, TX 79998-2901), or by telephone (800-662-2739). The minimum investment amount required to open and maintain a Fund account for Admiral Shares is $3,000. The minimum investment amount required to add to an existing Fund account is generally $1. Financial intermediaries, institutional clients, and Vanguard-advised clients should contact Vanguard for information on special eligibility rules that may apply to them regarding Admiral Shares. If you are investing through an intermediary, please contact that firm directly for more information regarding your eligibility. If you are investing through an employer-sponsored retirement or savings plan, your plan administrator or your benefits office can provide you with detailed information on how you can invest through your plan.
Tax Information
The Fund’s distributions may be taxable as ordinary income or capital gain. If you are investing through a tax-advantaged account, such as an IRA or an employer-sponsored retirement or savings plan, special tax rules apply.
Payments to Financial Intermediaries
The Fund and its investment advisor do not pay financial intermediaries for sales of Fund shares.
5
(Fees paid directly from your investment)
|
| |
|
Sales Charge (Load) Imposed on Purchases |
|
|
Purchase Fee |
|
|
Sales Charge (Load) Imposed on Reinvested Dividends |
|
|
Redemption Fee |
|
|
Account Service Fee Per Year
(for certain fund account balances below $5,000,000) |
$ |
(Expenses that you pay each year as a percentage of the value of your investment)
|
| |
|
Management Fees |
% |
|
12b-1 Distribution Fee |
|
|
Other Expenses |
% |
|
Total Annual Fund Operating Expenses |
% |
6
|
1 Year |
3 Years |
5 Years |
10 Years |
|
$ |
$ |
$ |
$ |
7
8
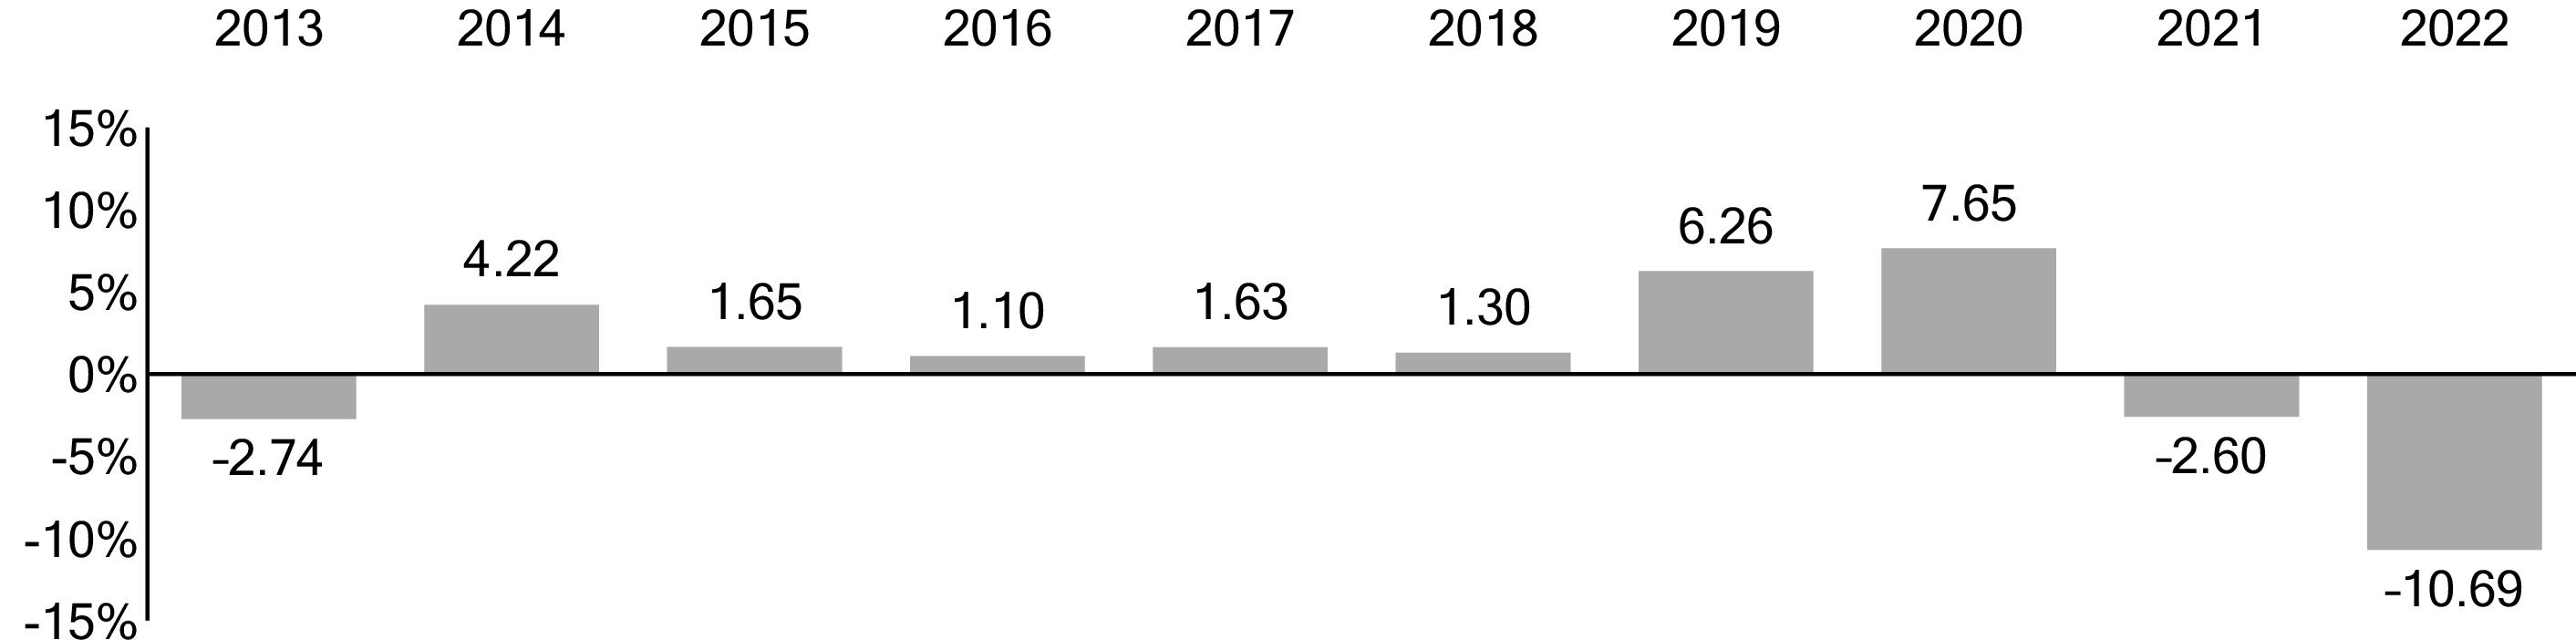
1 The year-to-date return as of the most recent calendar quarter, which ended on September 30, 2023, was -0.54%.
|
|
Total Return |
Quarter |
|
|
% |
|
|
|
-
% |
|
|
|
1 Year |
5 Years |
10 Years |
|
Vanguard Intermediate-Term Treasury Index Fund
Admiral Shares |
|
|
|
|
Return Before Taxes |
-
% |
% |
% |
|
Return After Taxes on Distributions |
- |
- |
- |
|
Return After Taxes on Distributions and Sale of Fund Shares |
- |
- |
|
|
Bloomberg U.S. Treasury 3-10 Year Index
(reflects no deduction for fees, expenses, or taxes) |
-
% |
% |
% |
|
Spliced Bloomberg U.S. Treasury 3-10 Year Index in USD
(reflects no deduction for fees, expenses, or taxes) |
- |
|
|
|
Bloomberg U.S. Aggregate Float Adjusted Index
(reflects no deduction for fees, expenses, or taxes) |
- |
|
|
9
Investment Advisor
The Vanguard Group, Inc. (Vanguard)
Portfolio Manager
Joshua C. Barrickman, CFA, Principal of Vanguard and co-head of Vanguard’s Fixed Income Indexing Americas. He has managed the Fund since 2013.
Purchase and Sale of Fund Shares
You may purchase or redeem shares online through our website (vanguard.com), by mail (The Vanguard Group, P.O. Box 982901, El Paso, TX 79998-2901), or by telephone (800-662-2739). The minimum investment amount required to open and maintain a Fund account for Admiral Shares is $3,000. The minimum investment amount required to add to an existing Fund account is generally $1. Financial intermediaries, institutional clients, and Vanguard-advised clients should contact Vanguard for information on special eligibility rules that may apply to them regarding Admiral Shares. If you are investing through an intermediary, please contact that firm directly for more information regarding your eligibility. If you are investing through an employer-sponsored retirement or savings plan, your plan administrator or your benefits office can provide you with detailed information on how you can invest through your plan.
Tax Information
The Fund’s distributions may be taxable as ordinary income or capital gain. If you are investing through a tax-advantaged account, such as an IRA or an employer-sponsored retirement or savings plan, special tax rules apply.
Payments to Financial Intermediaries
The Fund and its investment advisor do not pay financial intermediaries for sales of Fund shares.
10
(Fees paid directly from your investment)
|
| |
|
Sales Charge (Load) Imposed on Purchases |
|
|
Purchase Fee |
|
|
Sales Charge (Load) Imposed on Reinvested Dividends |
|
|
Redemption Fee |
|
|
Account Service Fee Per Year
(for certain fund account balances below $5,000,000) |
$ |
(Expenses that you pay each year as a percentage of the value of your investment)
|
| |
|
Management Fees |
% |
|
12b-1 Distribution Fee |
|
|
Other Expenses |
% |
|
Total Annual Fund Operating Expenses |
% |
11
|
1 Year |
3 Years |
5 Years |
10 Years |
|
$ |
$ |
$ |
$ |
12
13

1 The year-to-date return as of the most recent calendar quarter, which ended on September 30, 2023, was -7.98%.
|
|
Total Return |
Quarter |
|
|
% |
|
|
|
-
% |
|
|
|
1 Year |
5 Years |
10 Years |
|
Vanguard Long-Term Treasury Index Fund
Admiral Shares |
|
|
|
|
Return Before Taxes |
-
% |
-
% |
% |
|
Return After Taxes on Distributions |
- |
- |
- |
|
Return After Taxes on Distributions and Sale of Fund Shares |
- |
- |
- |
|
Bloomberg U.S. Long Treasury Bond Index
(reflects no deduction for fees, expenses, or taxes) |
-
% |
-
% |
% |
|
Spliced Bloomberg U.S. Long Treasury Index in USD
(reflects no deduction for fees, expenses, or taxes) |
- |
- |
|
|
Bloomberg U.S. Aggregate Float Adjusted Index
(reflects no deduction for fees, expenses, or taxes) |
- |
|
|
14
Investment Advisor
The Vanguard Group, Inc. (Vanguard)
Portfolio Manager
Joshua C. Barrickman, CFA, Principal of Vanguard and co-head of Vanguard’s Fixed Income Indexing Americas. He has managed the Fund since 2013.
Purchase and Sale of Fund Shares
You may purchase or redeem shares online through our website (vanguard.com), by mail (The Vanguard Group, P.O. Box 982901, El Paso, TX 79998-2901), or by telephone (800-662-2739). The minimum investment amount required to open and maintain a Fund account for Admiral Shares is $3,000. The minimum investment amount required to add to an existing Fund account is generally $1. Financial intermediaries, institutional clients, and Vanguard-advised clients should contact Vanguard for information on special eligibility rules that may apply to them regarding Admiral Shares. If you are investing through an intermediary, please contact that firm directly for more information regarding your eligibility. If you are investing through an employer-sponsored retirement or savings plan, your plan administrator or your benefits office can provide you with detailed information on how you can invest through your plan.
Tax Information
The Fund’s distributions may be taxable as ordinary income or capital gain. If you are investing through a tax-advantaged account, such as an IRA or an employer-sponsored retirement or savings plan, special tax rules apply.
Payments to Financial Intermediaries
The Fund and its investment advisor do not pay financial intermediaries for sales of Fund shares.
15
(Fees paid directly from your investment)
|
| |
|
Sales Charge (Load) Imposed on Purchases |
|
|
Purchase Fee |
|
|
Sales Charge (Load) Imposed on Reinvested Dividends |
|
|
Redemption Fee |
|
|
Account Service Fee Per Year
(for certain fund account balances below $5,000,000) |
$ |
(Expenses that you pay each year as a percentage of the value of your investment)
|
| |
|
Management Fees |
% |
|
12b-1 Distribution Fee |
|
|
Other Expenses |
% |
|
Total Annual Fund Operating Expenses |
% |
16
|
1 Year |
3 Years |
5 Years |
10 Years |
|
$ |
$ |
$ |
$ |
17
18

1 The year-to-date return as of the most recent calendar quarter, which ended on September 30, 2023, was 2.02%.
|
|
Total Return |
Quarter |
|
|
% |
|
|
|
-
% |
|
|
|
1 Year |
5 Years |
10 Years |
|
Vanguard Short-Term Corporate Bond Index Fund
Admiral Shares |
|
|
|
|
Return Before Taxes |
-
% |
% |
% |
|
Return After Taxes on Distributions |
- |
|
|
|
Return After Taxes on Distributions and Sale of Fund Shares |
- |
|
|
|
Bloomberg U.S. 1-5 Year Corporate Bond Index
(reflects no deduction for fees, expenses, or taxes) |
-
% |
% |
% |
|
Bloomberg U.S. Aggregate Float Adjusted Index
(reflects no deduction for fees, expenses, or taxes) |
- |
|
|
19
Investment Advisor
The Vanguard Group, Inc. (Vanguard)
Portfolio Manager
Joshua C. Barrickman, CFA, Principal of Vanguard and co-head of Vanguard’s Fixed Income Indexing Americas. He has managed the Fund since its inception in 2009.
Purchase and Sale of Fund Shares
You may purchase or redeem shares online through our website (vanguard.com), by mail (The Vanguard Group, P.O. Box 982901, El Paso, TX 79998-2901), or by telephone (800-662-2739). The minimum investment amount required to open and maintain a Fund account for Admiral Shares is $3,000. The minimum investment amount required to add to an existing Fund account is generally $1. Financial intermediaries, institutional clients, and Vanguard-advised clients should contact Vanguard for information on special eligibility rules that may apply to them regarding Admiral Shares. If you are investing through an intermediary, please contact that firm directly for more information regarding your eligibility. If you are investing through an employer-sponsored retirement or savings plan, your plan administrator or your benefits office can provide you with detailed information on how you can invest through your plan.
Tax Information
The Fund’s distributions may be taxable as ordinary income or capital gain. If you are investing through a tax-advantaged account, such as an IRA or an employer-sponsored retirement or savings plan, special tax rules apply.
Payments to Financial Intermediaries
The Fund and its investment advisor do not pay financial intermediaries for sales of Fund shares.
20
(Fees paid directly from your investment)
|
| |
|
Sales Charge (Load) Imposed on Purchases |
|
|
Purchase Fee |
% |
|
Sales Charge (Load) Imposed on Reinvested Dividends |
|
|
Redemption Fee |
|
|
Account Service Fee Per Year
(for certain fund account balances below $5,000,000) |
$ |
(Expenses that you pay each year as a percentage of the value of your investment)
|
| |
|
Management Fees |
% |
|
12b-1 Distribution Fee |
|
|
Other Expenses |
% |
|
Total Annual Fund Operating Expenses |
% |
21
|
1 Year |
3 Years |
5 Years |
10 Years |
|
$ |
$ |
$ |
$ |
22
23
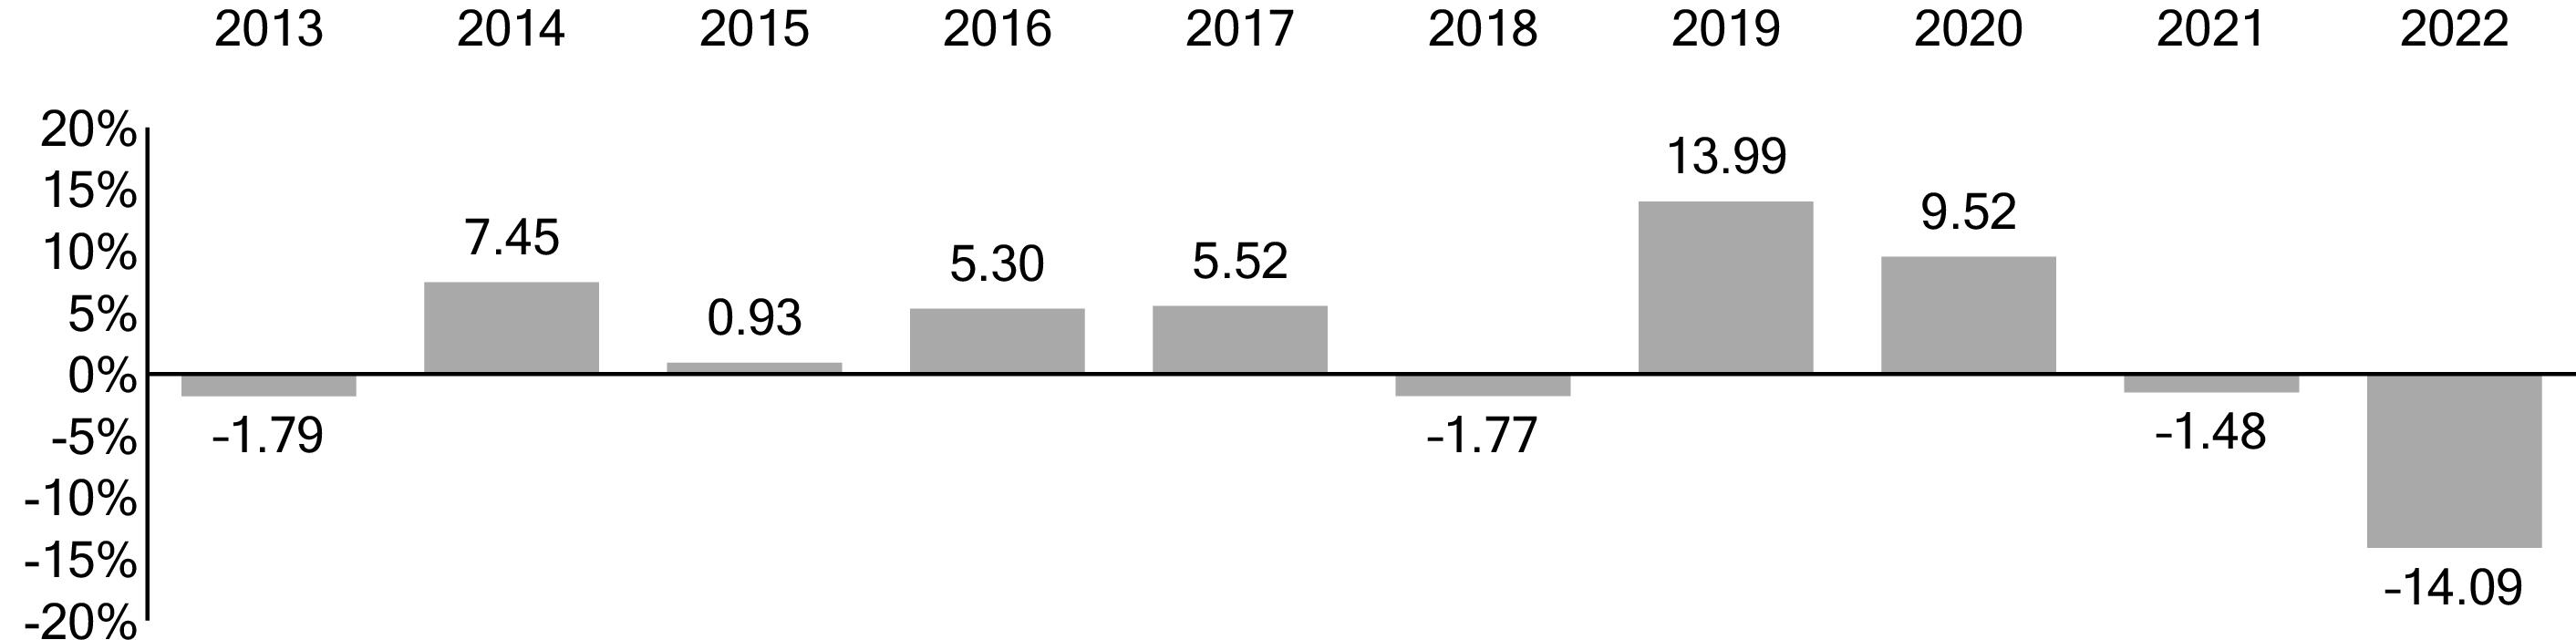
1 The year-to-date return as of the most recent calendar quarter, which ended on September 30, 2023, was 0.51%.
|
|
Total Return |
Quarter |
|
|
% |
|
|
|
-
% |
|
|
|
1 Year |
5 Years |
10 Years |
|
Vanguard Intermediate-Term Corporate Bond Index Fund
Admiral Shares |
|
|
|
|
Return Before Taxes |
-
% |
% |
% |
|
Return After Taxes on Distributions |
- |
- |
|
|
Return After Taxes on Distributions and Sale of Fund Shares |
- |
|
|
|
Bloomberg U.S. 5-10 Year Corporate Bond Index
(reflects no deduction for fees, expenses, or taxes) |
-
% |
% |
% |
|
Bloomberg U.S. Aggregate Float Adjusted Index
(reflects no deduction for fees, expenses, or taxes) |
- |
|
|
24
Investment Advisor
The Vanguard Group, Inc. (Vanguard)
Portfolio Manager
Joshua C. Barrickman, CFA, Principal of Vanguard and co-head of Vanguard’s Fixed Income Indexing Americas. He has managed the Fund since its inception in 2009.
Purchase and Sale of Fund Shares
You may purchase or redeem shares online through our website (vanguard.com), by mail (The Vanguard Group, P.O. Box 982901, El Paso, TX 79998-2901), or by telephone (800-662-2739). The minimum investment amount required to open and maintain a Fund account for Admiral Shares is $3,000. The minimum investment amount required to add to an existing Fund account is generally $1. Financial intermediaries, institutional clients, and Vanguard-advised clients should contact Vanguard for information on special eligibility rules that may apply to them regarding Admiral Shares. If you are investing through an intermediary, please contact that firm directly for more information regarding your eligibility. If you are investing through an employer-sponsored retirement or savings plan, your plan administrator or your benefits office can provide you with detailed information on how you can invest through your plan.
Tax Information
The Fund’s distributions may be taxable as ordinary income or capital gain. If you are investing through a tax-advantaged account, such as an IRA or an employer-sponsored retirement or savings plan, special tax rules apply.
Payments to Financial Intermediaries
The Fund and its investment advisor do not pay financial intermediaries for sales of Fund shares.
25
(Fees paid directly from your investment)
|
| |
|
Sales Charge (Load) Imposed on Purchases |
|
|
Purchase Fee |
% |
|
Sales Charge (Load) Imposed on Reinvested Dividends |
|
|
Redemption Fee |
|
|
Account Service Fee Per Year
(for certain fund account balances below $5,000,000) |
$ |
(Expenses that you pay each year as a percentage of the value of your investment)
|
| |
|
Management Fees |
% |
|
12b-1 Distribution Fee |
|
|
Other Expenses |
% |
|
Total Annual Fund Operating Expenses |
% |
26
|
1 Year |
3 Years |
5 Years |
10 Years |
|
$ |
$ |
$ |
$ |
27
28

1 The year-to-date return as of the most recent calendar quarter, which ended on September 30, 2023, was -2.43%.
|
|
Total Return |
Quarter |
|
|
% |
|
|
|
-
% |
|
|
|
1 Year |
5 Years |
10 Years |
|
Vanguard Long-Term Corporate Bond Index Fund
Admiral Shares |
|
|
|
|
Return Before Taxes |
-
% |
-
% |
% |
|
Return After Taxes on Distributions |
- |
- |
|
|
Return After Taxes on Distributions and Sale of Fund Shares |
- |
- |
|
|
Bloomberg U.S. 10+ Year Corporate Bond Index
(reflects no deduction for fees, expenses, or taxes) |
-
% |
-
% |
% |
|
Bloomberg U.S. Aggregate Float Adjusted Index
(reflects no deduction for fees, expenses, or taxes) |
- |
|
|
29
Investment Advisor
The Vanguard Group, Inc. (Vanguard)
Portfolio Manager
Joshua C. Barrickman, CFA, Principal of Vanguard and co-head of Vanguard’s Fixed Income Indexing Americas. He has managed the Fund since its inception in 2009.
Purchase and Sale of Fund Shares
You may purchase or redeem shares online through our website (vanguard.com), by mail (The Vanguard Group, P.O. Box 982901, El Paso, TX 79998-2901), or by telephone (800-662-2739). The minimum investment amount required to open and maintain a Fund account for Admiral Shares is $3,000. The minimum investment amount required to add to an existing Fund account is generally $1. Financial intermediaries, institutional clients, and Vanguard-advised clients should contact Vanguard for information on special eligibility rules that may apply to them regarding Admiral Shares. If you are investing through an intermediary, please contact that firm directly for more information regarding your eligibility. If you are investing through an employer-sponsored retirement or savings plan, your plan administrator or your benefits office can provide you with detailed information on how you can invest through your plan.
Tax Information
The Fund’s distributions may be taxable as ordinary income or capital gain. If you are investing through a tax-advantaged account, such as an IRA or an employer-sponsored retirement or savings plan, special tax rules apply.
Payments to Financial Intermediaries
The Fund and its investment advisor do not pay financial intermediaries for sales of Fund shares.
30
(Fees paid directly from your investment)
|
| |
|
Sales Charge (Load) Imposed on Purchases |
|
|
Purchase Fee |
|
|
Sales Charge (Load) Imposed on Reinvested Dividends |
|
|
Redemption Fee |
|
|
Account Service Fee Per Year
(for certain fund account balances below $5,000,000) |
$ |
(Expenses that you pay each year as a percentage of the value of your investment)
|
| |
|
Management Fees |
% |
|
12b-1 Distribution Fee |
|
|
Other Expenses |
% |
|
Total Annual Fund Operating Expenses |
% |
31
|
1 Year |
3 Years |
5 Years |
10 Years |
|
$ |
$ |
$ |
$ |
32
33

1 The year-to-date return as of the most recent calendar quarter, which ended on September 30, 2023, was -2.15%.
|
|
Total Return |
Quarter |
|
|
% |
|
|
|
-
% |
|
34
|
|
1 Year |
5 Years |
10 Years |
|
Vanguard Mortgage-Backed Securities Index Fund
Admiral Shares |
|
|
|
|
Return Before Taxes |
-
% |
-
% |
% |
|
Return After Taxes on Distributions |
- |
- |
- |
|
Return After Taxes on Distributions and Sale of Fund Shares |
- |
- |
|
|
Bloomberg U.S. MBS Float Adjusted Index
(reflects no deduction for fees, expenses, or taxes) |
-
% |
-
% |
% |
|
Bloomberg U.S. Aggregate Float Adjusted Index
(reflects no deduction for fees, expenses, or taxes) |
- |
|
|
Investment Advisor
The Vanguard Group, Inc. (Vanguard)
Portfolio Manager
Joshua C. Barrickman, CFA, Principal of Vanguard and co-head of Vanguard’s Fixed Income Indexing Americas. He has managed the Fund since 2013.
35
Purchase and Sale of Fund Shares
You may purchase or redeem shares online through our website (vanguard.com), by mail (The Vanguard Group, P.O. Box 982901, El Paso, TX 79998-2901), or by telephone (800-662-2739). The minimum investment amount required to open and maintain a Fund account for Admiral Shares is $3,000. The minimum investment amount required to add to an existing Fund account is generally $1. Financial intermediaries, institutional clients, and Vanguard-advised clients should contact Vanguard for information on special eligibility rules that may apply to them regarding Admiral Shares. If you are investing through an intermediary, please contact that firm directly for more information regarding your eligibility. If you are investing through an employer-sponsored retirement or savings plan, your plan administrator or your benefits office can provide you with detailed information on how you can invest through your plan.
Tax Information
The Fund’s distributions may be taxable as ordinary income or capital gain. If you are investing through a tax-advantaged account, such as an IRA or an employer-sponsored retirement or savings plan, special tax rules apply.
Payments to Financial Intermediaries
The Fund and its investment advisor do not pay financial intermediaries for sales of Fund shares.
36
Investing in Index Funds
What Is Indexing?
Indexing is an investment strategy for tracking the performance of a specified market benchmark, or “index.” An index is a group of securities whose overall performance is used as a standard to measure the investment performance of a particular market. There are many types of indexes. Some represent entire markets—such as the U.S. stock market or the U.S. bond market. Other indexes cover market segments—such as small-capitalization stocks or short-term bonds. One cannot invest directly in an index.
The index provider determines the securities to include in the index and the weighting of each security in the index. Under normal circumstances, the index provider will rebalance an index on a regular schedule. An index provider may carry out additional ad hoc index rebalances or delay or cancel a scheduled rebalance. Generally, the index provider does not provide any warranty, or accept any liability, with respect to the quality, accuracy, or completeness of either the target index or its related data. Errors made by the index provider may occur from time to time and may not be identified by the index provider for a period of time or at all. Vanguard does not provide any warranty or guarantee against such errors. Therefore, the gains, losses, or costs associated with the index provider’s errors will generally be borne by the index fund and its shareholders.
An index fund seeks to hold all, or a representative sample, of the securities that make up its target index. Index funds attempt to mirror the performance of the target index, for better or worse. However, an index fund generally does not perform exactly like its target index. For example, index funds have operating expenses and transaction costs. Market indexes do not, and therefore they will usually have a slight performance advantage over funds that track them. The ability of an index fund to match its performance to that of its target index can also be impacted by, among other things, the timing and size of cash flows, asset valuation differences, and the size of the fund. Market disruptions could also have an adverse effect on a fund’s ability to adjust its exposure to the required levels in order to track the index. The risk that a fund may not track the performance of its target index may be heightened during times of increased market volatility or other unusual market conditions.
Index funds typically have the following characteristics:
• Variety of investments. Depending on a fund’s benchmark index, the fund may invest in the securities of a variety of companies, industries, and/or governments or government agencies.
• Relative performance consistency. Because they seek to track market benchmarks, index funds usually do not perform dramatically better or worse than their benchmarks.
• Low cost. Index funds are generally inexpensive to run compared with actively managed funds. They have low or no research costs and typically keep trading activity—and thus dealer markups and other transaction costs—to a minimum compared with actively managed funds.
37
More on the Funds
This prospectus describes the principal risks you would face as a Fund shareholder. It is important to keep in mind one of the main principles of investing: generally, the higher the risk of losing money, the higher the potential reward. The reverse, also, is generally true: the lower the risk, the lower the potential reward. As you consider an investment in any mutual fund, you should take into account your personal tolerance for fluctuations in the securities markets. Look for this
symbol throughout the prospectus. It is used to mark detailed information about the more significant risks that you would confront as a Fund shareholder. To highlight terms and concepts important to mutual fund investors, we have provided Plain Talk® explanations along the way. Reading the prospectus will help you decide whether a Fund is the right investment for you. We suggest that you keep this prospectus for future reference.
symbol throughout the prospectus. It is used to mark detailed information about the more significant risks that you would confront as a Fund shareholder. To highlight terms and concepts important to mutual fund investors, we have provided Plain Talk® explanations along the way. Reading the prospectus will help you decide whether a Fund is the right investment for you. We suggest that you keep this prospectus for future reference.Share Class Overview
This prospectus offers the Funds' Admiral Shares. A separate prospectus offers the Funds' Institutional Shares, which are generally for investors who invest a minimum of $5 million. In addition, each Fund issues ETF Shares (an exchange-traded class of shares), which are also offered through a separate prospectus.
All share classes offered by a Fund have the same investment objective, strategies, and policies. However, different share classes may have different expenses; as a result, their investment returns may differ.
|
Plain Talk About Costs of Investing |
|
Costs are an important consideration in choosing a mutual fund. That is
because you, as a shareholder, pay a proportionate share of the costs of
operating a fund and any transaction costs incurred when the fund buys or
sells securities, including costs generated by shareholders of other share
classes offered by the fund. These costs can erode a substantial portion of
the gross income or the capital appreciation a fund achieves. Even
seemingly small differences in expenses can, over time, have a dramatic
effect on a fund’s performance. |
The following sections explain the principal investment strategies and policies that each Fund uses in pursuit of its investment objective. The Funds' board of trustees, which oversees each Fund's management, may change investment strategies or policies in the interest of shareholders without a shareholder vote, unless those strategies or policies are designated as fundamental. Note that each Fund’s investment objective is not fundamental and may be changed
38
without a shareholder vote. However, each Fund’s policy of investing at least 80% of its assets in bonds that are included in its target index may be changed only upon 60 days’ notice to shareholders.
Market Exposure
Each Fund is subject to interest rate risk, which is the chance that bond prices will decline because of rising interest rates. Interest rate risk should be low for short-term bond funds, moderate for intermediate-term bond funds, and high for long-term bond funds.
Although fixed income securities (commonly referred to as bonds) are often thought to be less risky than stocks, there have been periods when bond prices have fallen significantly because of rising interest rates. For instance, prices of long-term bonds fell by almost 48% between December 1976 and September 1981.
To illustrate the relationship between bond prices and interest rates, the following table shows the effect of a 1% and a 2% change (both up and down) in interest rates on the values of three noncallable bonds (i.e., bonds that cannot be redeemed by the issuer) of different maturities, each with a face value of $1,000.
How Interest Rate Changes Affect the Value of a $1,000 Bond1
|
Type of Bond (Maturity) |
After a 1%
Increase |
After a 1%
Decrease |
After a 2%
Increase |
After a 2%
Decrease |
|
Short-Term (2.5 years) |
$977 |
$1,024 |
$954 |
$1,049 |
|
Intermediate-Term (10 years) |
922 |
1,086 |
851 |
1,180 |
|
Long-Term (20 years) |
874 |
1,150 |
769 |
1,328 |
1 Assuming a 4% coupon rate.
These figures are for illustration only; you should not regard them as an indication of future performance of the bond market as a whole or the Funds in particular.
39
|
Plain Talk About Bonds and Interest Rates |
|
As a rule, when interest rates rise, bond prices fall. The opposite is also true:
Bond prices go up when interest rates fall. Why do bond prices and interest
rates move in opposite directions? Let’s assume that you hold a bond
offering a 4% yield. A year later, interest rates are on the rise and bonds of
comparable quality and maturity are offered with a 5% yield. With
higher-yielding bonds available, you would have trouble selling your 4% bond
for the price you paid—you would probably have to lower your asking price.
On the other hand, if interest rates were falling and 3% bonds were being
offered, you should be able to sell your 4% bond for more than you paid. |
|
How mortgage-backed securities are different: In general, declining interest
rates will not lift the prices of mortgage-backed securities—such as those
guaranteed by the Government National Mortgage Association—as much as
the prices of comparable bonds. Why? Because when interest rates fall, the
bond market tends to discount the prices of mortgage-backed securities for
prepayment risk—the possibility that homeowners will refinance their
mortgages at lower rates and cause the bonds to be paid off prior to maturity.
In part to compensate for this prepayment possibility, mortgage-backed
securities tend to offer higher yields than other bonds of comparable credit
quality and maturity. In contrast, when interest rates rise, prepayments tend
to slow down, subjecting mortgage-backed securities to extension risk—the
possibility that homeowners will repay their mortgages at slower rates. This
will lengthen the duration or average life of mortgage-backed securities held
by a fund and delay the fund’s ability to reinvest proceeds at higher interest
rates, making the fund more sensitive to changes in interest rates. |
Changes in interest rates can affect bond income as well as bond prices.
Each Fund is subject to income risk, which is the chance that the Fund's income will decline because of falling interest rates. A fund's income declines when interest rates fall because the fund then must invest new cash flow and cash from maturing bonds in lower-yielding bonds. Income risk is generally higher for short-term bond funds and lower for long-term bond funds.
40
|
Plain Talk About Bond Maturities |
|
A bond is issued with a specific maturity date—the date when the issuer must
pay back the bond’s principal (face value). Bond maturities range from less
than 1 year to more than 30 years. Typically, the longer a bond’s maturity, the
more price risk you, as a bond investor, will face as interest rates rise—but
also the higher the potential yield you could receive. Longer-term bonds are
generally more suitable for investors willing to take a greater risk of price
fluctuations to get higher and more stable interest income. Shorter-term bond
investors should be willing to accept lower yields and greater income
variability in return for less fluctuation in the value of their investment. The
stated maturity of a bond may differ from the effective maturity of a bond,
which takes into consideration that an action such as a call or refunding may
cause bonds to be repaid before their stated maturity dates. |
Although falling interest rates tend to strengthen bond prices, they can cause other problems for bond fund investors—bond calls and prepayments.
Each Fund (other than Vanguard Mortgage-Backed Securities Index Fund) is subject to call risk, which is the chance that during periods of falling interest rates, issuers of callable bonds may call (redeem) securities with higher coupon rates or interest rates before their maturity dates. The Fund would then lose any price appreciation above the bond’s call price and would be forced to reinvest the unanticipated proceeds at lower interest rates, resulting in a decline in the Fund’s income. Such redemptions and subsequent reinvestments would also increase the Fund’s portfolio turnover rate.
The indexes that Vanguard Treasury and Corporate Bond Index Funds seek to track include only a limited number of callable bonds. Thus, call risk for these Funds should be very low.
Vanguard Mortgage-Backed Securities Index Fund is subject to prepayment risk, which is the chance that during periods of falling interest rates, homeowners will refinance their mortgages before their maturity dates, resulting in prepayment of mortgage-backed securities held by the Fund. The Fund would then lose any price appreciation above the mortgage’s principal and would be forced to reinvest the unanticipated proceeds at lower interest rates, resulting in a decline in the Fund’s income. Such prepayments and subsequent reinvestments would also increase the Fund's portfolio turnover rate. Prepayment risk is high for the Fund.
41
Vanguard Mortgage-Backed Securities Index Fund is subject to extension risk, which is the chance that during periods of rising interest rates, homeowners will repay their mortgages at slower rates. This will lengthen the duration or average life of mortgage-backed securities held by the Fund and delay the Fund’s ability to reinvest proceeds at higher interest rates. Extension risk is high for the Fund.
Each Fund (other than the three Treasury Index Funds) is subject to credit risk, which is the chance that a bond issuer will fail to pay interest or principal in a timely manner or that negative perceptions of the issuer’s ability to make such payments will cause the price of that bond to decline.
|
Plain Talk About Credit Quality |
|
A bond’s credit quality rating is an assessment of the issuer’s ability to pay
interest on the bond and, ultimately, to repay the principal. The lower the
credit quality, the greater the perceived chance that the bond issuer will
default, or fail to meet its payment obligations. All things being equal, the
lower a bond’s credit quality, the higher its yield should be to compensate
investors for assuming additional risk. Mortgage-backed securities typically
have higher yields than comparable-quality corporate or government bonds
to make up for their higher prepayment risk. |
Vanguard Mortgage-Backed Securities Index Fund has low credit risk. The three Treasury Index Funds invest primarily in U.S. Treasury securities and have high credit quality and low credit risk. The three Corporate Bond Index Funds are expected to have moderate credit risk as a result of their investments in investment-grade bonds. Investment-grade bonds are those rated BBB/Baa or higher by a credit rating agency, and therefore investment-grade bonds are a mixture of high-and medium-quality bonds.
Vanguard Short-Term Corporate Bond Index, Intermediate-Term Corporate Bond Index, Long-Term Corporate Bond Index, and Mortgage-Backed Securities Index Funds are subject to liquidity risk, which is the chance that a Fund may not be able to sell a security in a timely manner at a desired price.
Corporate bonds are traded among dealers and brokers that connect buyers with sellers. Liquidity in the corporate bond market may be challenged depending on overall economic conditions and credit tightening. There may be little trading in the secondary market for particular bonds and other debt securities, which may make them more difficult to value or sell.
42
To a limited extent, Corporate Bond Index Funds are subject to event risk, which is the chance that corporate fixed income securities held by these Funds may suffer a substantial decline in credit quality and market value because of a restructuring of the companies that issued the securities or because of other factors negatively affecting issuers.
|
Plain Talk About Types of Bonds |
|
Bonds are issued (sold) by many sources: Corporations issue corporate
bonds; the federal government issues U.S. Treasury bonds; agencies of the
federal government issue agency bonds; financial institutions issue
asset-backed bonds; and mortgage holders issue “mortgage-backed”
pass-through certificates. Each issuer is responsible for paying back the
bond’s initial value as well as for making periodic interest payments. Many
bonds issued by government agencies and entities are neither guaranteed
nor insured by the U.S. government. |
Market disruptions can adversely affect local and global markets as well as normal market conditions and operations. Any such disruptions could have an adverse impact on the value of a Fund's investments and Fund performance.
Security Selection
Index sampling strategy. Because it would be very expensive and inefficient to buy and sell all bonds held in its target index—which is an indexing strategy called “replication”—each Fund uses index “sampling” techniques to select securities. Using computer programs, each Fund’s advisor generally selects a representative sample of securities that approximates the full target index in terms of key risk factors and other characteristics. These factors include duration, cash flow, quality, and callability of the underlying bonds. In addition, each Fund keeps sector and subsector exposure within tight boundaries relative to its target index. Because the Funds do not hold all of the securities included in their target indexes, some of the securities (and issuers) that are held will likely be overweighted (or underweighted) compared with the target indexes. The maximum overweight (or underweight) is constrained at the issuer level with the goal of producing well-diversified credit exposure in the portfolio.
The components of the target indices of each Fund are reconstituted and rebalanced on a monthly basis. Each index rebalances as a float-adjusted market-weighted index, and bonds may enter or fall out of the index on a monthly basis. New securities are added to and removed from an index in connection with the month-end index rebalancing process.
43
Each Fund is subject to index sampling risk, which is the chance that the securities selected for the Fund, in the aggregate, will not provide investment performance matching that of the Fund's target index. Index sampling risk is expected to be low for each Fund.
The following table shows the number of bonds held by each Fund, as well as the number of bonds in each Fund’s target index, as of August 31, 2023.
|
Vanguard Fund |
Number of
Bonds in Fund |
Number of Bonds
in Target Index |
|
Vanguard Short-Term Treasury Index Fund |
97 |
157 |
|
Vanguard Intermediate-Term Treasury
Index Fund |
109 |
109 |
|
Vanguard Long-Term Treasury Index Fund |
78 |
78 |
|
Vanguard Short-Term Corporate Bond
Index Fund |
2,498 |
2,704 |
|
Vanguard Intermediate-Term Corporate
Bond Index Fund |
2,085 |
2,090 |
|
Vanguard Long-Term Corporate Bond
Index Fund |
2,794 |
2,885 |
|
Vanguard Mortgage-Backed Securities
Index Fund |
1,1691 |
932 |
1 Issues are mortgage pools grouped by coupon.
Types of bonds. Each Fund seeks to track an index that is a subset of the Bloomberg U.S. Aggregate Float Adjusted Index (the Aggregate Index). The Aggregate Index measures the total universe of taxable fixed income securities in the United States—including government, corporate, and international dollar-denominated bonds, as well as mortgage-backed securities—all with maturities of at least 1 year. Taken together, the seven Funds cover approximately 97% of the Aggregate Index; the only sectors not covered are asset-backed bonds, bonds issued by foreign governments (unless guaranteed by the U.S. government), taxable state and municipal bonds, and commercial mortgage-backed securities.
44
The following grid shows, at a glance, the types of financial instruments that may be purchased by each Fund. An explanation of each type of financial instrument follows the grid.
|
|
Treasury Index
Funds |
Corporate Bond
Index Funds |
Mortgage-Backed
Securities
Index Fund |
|
Corporate Debt Obligations |
|
• |
|
|
U.S. Government and Agency
Bonds |
• |
• |
• |
|
Mortgage-Backed Securities |
|
|
• |
|
Mortgage Dollar Rolls |
|
|
• |
|
Cash Equivalent Investments,
Including Repurchase Agreements |
• |
• |
• |
|
Futures, Options, and Other
Derivatives |
• |
• |
• |
|
International Dollar-Denominated
Bonds |
|
• |
|
• Corporate debt obligations—usually called bonds—represent loans by an investor to a corporation.
• U.S. government and agency bonds represent loans by investors to the U.S. Treasury or a wide variety of government agencies and instrumentalities. Securities issued by most U.S. government entities are neither guaranteed by the U.S. Treasury nor backed by the full faith and credit of the U.S. government. These entities include, among others, the Federal Home Loan Banks (FHLBs), the Federal National Mortgage Association (FNMA), and the Federal Home Loan Mortgage Corporation (FHLMC). Securities issued by the U.S. Treasury and a small number of U.S. government agencies, such as the Government National Mortgage Association (GNMA), are backed by the full faith and credit of the U.S. government. The market values of U.S. government and agency securities and U.S. Treasury securities are subject to fluctuation.
• Mortgage-backed securities represent partial ownership interest in pools of commercial or residential mortgage loans made by financial institutions to finance a borrower’s real estate purchase. These loans are packaged by private or governmental issuers for sale to investors. As the underlying mortgage loans are paid by borrowers, the investors receive payments of interest and principal. To be announced (TBA) securities represent an agreement to buy or sell mortgage-backed securities with agreed-upon characteristics for a fixed unit price, with settlement on a scheduled future date beyond the typical settlement period for most other securities.
45
• Mortgage dollar rolls are transactions in which a fund sells mortgage-backed securities to a dealer and simultaneously agrees to purchase similar securities in the future at a predetermined price. These transactions simulate an investment in mortgage-backed securities and have the potential to enhance a fund’s returns and reduce its administrative burdens, compared with holding mortgage-backed securities directly. These transactions may increase a fund’s portfolio turnover rate. Mortgage dollar rolls will be used only if consistent with a fund's investment objective and risk profile.
• Cash equivalent investments is a blanket term that describes a variety of short-term fixed income investments, including money market instruments, commercial paper, bank certificates of deposit, banker’s acceptances, and repurchase agreements. Repurchase agreements represent short-term (normally overnight) loans by a fund to banks or large securities dealers. Vanguard Treasury Index Funds and Vanguard Mortgage-Backed Securities Index Fund may invest only in repurchase agreements that are collateralized by U.S. Treasury or U.S. government agency securities. Repurchase agreements can carry several risks. For instance, if the seller is unable to repurchase the securities as promised, a fund may experience a loss when trying to sell the securities to another buyer. Also, if the seller becomes insolvent, a bankruptcy court may determine that the securities do not belong to a fund and order that the securities be used to pay off the seller’s debts. The Funds‘ advisor believes that these risks can be controlled through careful security selection and monitoring.
• Futures, options, and other derivatives are described in detail under Other Investment Policies and Risks.
• International dollar-denominated bonds are bonds denominated in U.S. dollars and issued by foreign governments and companies. To the extent that a Fund owns foreign bonds, it is subject to country risk, which is the chance that world events—such as political upheaval, financial troubles, or natural disasters—will adversely affect the value and/or liquidity of securities issued by companies in foreign countries. In addition, the prices of foreign bonds and the prices of U.S. bonds have, at times, moved in opposite directions. Because the bond’s value is designated in dollars rather than in the currency of the issuer’s country, the investor is not exposed to currency risk; rather, the issuer assumes that risk, usually to attract U.S. investors. Although currency movements do not affect the value of international dollar-denominated bonds directly, they could affect the value indirectly by adversely affecting the issuer’s ability (or the market’s perception of the issuer’s ability) to pay interest or repay principal.
46
|
Plain Talk About U.S. Government-Sponsored Enterprises |
|
A variety of U.S. government-sponsored enterprises (GSEs), such as the
Federal Home Loan Mortgage Corporation (FHLMC), the Federal National
Mortgage Association (FNMA), and the Federal Home Loan Banks (FHLBs),
issue debt and mortgage-backed securities. Although GSEs may be chartered
or sponsored by acts of Congress, they are not funded by congressional
appropriations. In September of 2008, the U.S. Treasury placed FNMA and
FHLMC under conservatorship and appointed the Federal Housing Finance
Agency (FHFA) to manage their daily operations. In addition, the U.S. Treasury
entered into purchase agreements with FNMA and FHLMC to provide them
with capital in exchange for senior preferred stock. Generally, a GSE’s
securities are neither issued nor guaranteed by the U.S. Treasury and are not
backed by the full faith and credit of the U.S. government. In most cases, these
securities are supported only by the credit of the GSE, standing alone. In some
cases, a GSE’s securities may be supported by the ability of the GSE to
borrow from the U.S. Treasury or may be supported by the U.S. government in
some other way. Securities issued by the Government National Mortgage
Association (GNMA), however, are backed by the full faith and credit of the
U.S. government. |
Other Investment Policies and Risks
Under normal circumstances, each Fund will invest at least 80% of its assets in bonds held in its target index. Up to 20% of each Fund’s assets may be used to purchase nonpublic, investment-grade securities, generally referred to as 144A securities, as well as smaller public issues or medium-term notes not included in the index because of the small size of the issue. The vast majority of these securities will have characteristics and risks similar to those in the target index. Subject to the same 20% limit, each Fund may also purchase other investments that are outside of its target index or may hold bonds that, when acquired, were included in the index but subsequently were removed.
Each Fund reserves the right to substitute a different index for the index it currently tracks if the current index is discontinued, if the Fund's agreement with the provider of its target index is terminated, or for any other reason determined in good faith by the Fund’s board of trustees. In any such instance, the substitute index would represent the same market segment as the current index.
Each Fund may invest in derivatives. In general, investments in derivatives may involve risks different from, and possibly greater than, those of investments directly in the underlying securities or assets.
47
Generally speaking, a derivative is a financial contract whose value is based on the value of a financial asset (such as a stock, a bond, or a currency), a physical asset (such as gold, oil, or wheat), a market index, or a reference rate. Each Fund may invest in derivatives only if the expected risks and rewards of the derivatives are consistent with the investment objective, policies, strategies, and risks of the Fund as disclosed in this prospectus. In particular, derivatives will be used only when they may help the advisor to accomplish one or more of the following:
• Invest in eligible asset classes with greater efficiency and lower cost than is possible through direct investment.
• Add value when these instruments are attractively priced.
• Adjust sensitivity to changes in interest rates.
• Adjust overall credit risk of the portfolio.
The Funds' derivative investments may include fixed income futures contracts, fixed income options, interest rate swaps, total return swaps, credit default swaps, or other derivatives. Losses (or gains) involving futures contracts can sometimes be substantial—in part because a relatively small price movement in a futures contract may result in an immediate and substantial loss (or gain) for a fund. Similar risks exist for other types of derivatives.
The Funds' derivative investments may include fixed income futures contracts, fixed income options, interest rate swaps, total return swaps, credit default swaps, or other derivatives. Losses (or gains) involving futures contracts can sometimes be substantial—in part because a relatively small price movement in a futures contract may result in an immediate and substantial loss (or gain) for a fund. Similar risks exist for other types of derivatives.
|
Plain Talk About Derivatives |
|
Derivatives can take many forms. Some forms of derivatives—such as
exchange-traded futures and options on securities, commodities, or
indexes—have been trading on regulated exchanges for decades. These
types of derivatives are standardized contracts that can easily be bought and
sold and whose market values are determined and published daily. On the
other hand, non-exchange-traded derivatives—such as certain swap
agreements—tend to be more specialized or complex and may be more
difficult to accurately value. |
Each Fund may invest a small portion of its assets in fixed income futures, which are a type of derivative, and/or shares of exchange-traded funds (ETFs). These fixed income futures and ETFs typically provide returns similar to those of the bonds listed in the index, or in a subset of the index, the Fund seeks to track. A Fund may purchase futures or ETFs when doing so will reduce the Fund’s transaction costs, facilitate cash management, mitigate risk, or have the potential to add value because the instruments are favorably priced. Vanguard receives no additional revenue from Fund assets invested in ETF Shares of other Vanguard
48
funds. Fund assets invested in ETF Shares of other Vanguard funds are excluded when allocating to the Fund its share of the costs of Vanguard operations.
Cash Management
Each Fund's daily cash balance may be invested in Vanguard Market Liquidity Fund and/or Vanguard Municipal Cash Management Fund (each, a CMT Fund), which are low-cost money market funds. When investing in a CMT Fund, each Fund bears its proportionate share of the expenses of the CMT Fund in which it invests. Vanguard receives no additional revenue from Fund assets invested in a CMT Fund.
Redemption Requests
Methods used to meet redemption requests. Under normal circumstances, each Fund typically expects to meet redemptions with positive cash flows. When this is not an option, each Fund seeks to maintain its risk exposure by selling a cross section of the Fund’s holdings to meet redemptions, while also factoring in transaction costs. Additionally, a Fund may work with larger clients to implement their redemptions in a manner that is least disruptive to the portfolio; see “Potentially disruptive redemptions” under Redeeming Shares in the Investing With Vanguard section.
Under certain circumstances, including under stressed market conditions, there are additional tools that each Fund may use in order to meet redemptions, including advancing the settlement of market trades with counterparties to match investor redemption payments or delaying settlement of an investor’s transaction to match trade settlement within regulatory requirements. A Fund may also suspend payment of redemption proceeds for up to seven days; see “Emergency circumstances” under Redeeming Shares in the Investing With Vanguard section. Additionally under these unusual circumstances, a Fund may borrow money (subject to certain regulatory conditions and if available under board-approved procedures) through an interfund lending facility; through a bank line-of-credit, including a joint committed credit facility; or through an uncommitted line-of-credit from Vanguard in order to meet redemption requests.
Potential redemption activity impacts. At times, a Fund may experience adverse effects when certain large shareholders, or multiple shareholders comprising significant ownership of the Fund or a share class of the Fund, redeem large amounts of shares of the Fund. Large redemptions may cause a Fund to sell portfolio securities at times when it would not otherwise do so. This may result in a Fund distributing capital gains or other taxable income to non-redeeming shareholders. Large redemptions may also increase a Fund's transaction costs. Redemption activity can occur for many reasons, including
49
shareholder reactions to market movements or other events unrelated to Vanguard’s actions, or when Vanguard makes product changes that, for example, may result in a shareholder redeeming shares of a Fund to purchase shares of another similar fund or investment vehicle. When experiencing large redemptions, the Fund reserves the right to pay all or part of the redemption in-kind and/or delay payment of the redemption proceeds for up to seven calendar days; see “Potentially disruptive redemptions” under Redeeming Shares in the Investing With Vanguard section.
Temporary Investment Measures
Each Fund may temporarily depart from its normal investment policies and strategies when the advisor believes that doing so is in the Fund's best interest, so long as the strategy or policy employed is consistent with the Fund's investment objective. For instance, the Fund may invest beyond its normal limits in derivatives or exchange-traded funds that are consistent with the Fund's investment objective when those instruments are more favorably priced or provide needed liquidity, as might be the case when the Fund receives large cash flows that it cannot prudently invest immediately.
Purchase and Transaction Fees
Vanguard Intermediate-Term and Long-Term Corporate Bond Index Funds charge fees of 0.25% and 1.00%, respectively, on all purchases of shares, including shares that you purchase by exchange from another Vanguard fund. In addition, Vanguard Short-Term and Intermediate-Term Corporate Bond Index Funds each reserve the right to impose a transaction fee on any purchase that, in the opinion of the advisor, would disrupt efficient management of the Fund. The advisor believes that it may be necessary to impose a transaction fee of 0.25% for Vanguard Short-Term Corporate Bond Index Fund and a transaction fee of 0.50% for Vanguard Intermediate-Term Corporate Bond Index Fund. The advisor may impose this transaction fee if an investor’s aggregate purchases into a Fund over a 12-month period exceed, or are expected to exceed, $100 million for Vanguard Short-Term Corporate Bond Index Fund or $50 million for Vanguard Intermediate-Term Corporate Bond Index Fund.
Unlike a sales charge or load paid to a broker or a fund management company, purchase and transaction fees are paid directly to the Fund to offset the costs of buying securities.
See Investing With Vanguard for more information about fees.
Unlike a sales charge or load paid to a broker or a fund management company, purchase and transaction fees are paid directly to the Fund to offset the costs of buying securities.
See Investing With Vanguard for more information about fees.
50
Frequent Trading or Market-Timing
Background. Some investors try to profit from strategies involving frequent trading of mutual fund shares, such as market-timing. For funds holding foreign securities, investors may try to take advantage of an anticipated difference between the price of the fund’s shares and price movements in overseas markets, a practice also known as time-zone arbitrage. Investors also may try to engage in frequent trading of funds holding investments such as small-cap stocks and high-yield bonds. As money is shifted into and out of a fund by a shareholder engaging in frequent trading, the fund incurs costs for buying and selling securities, resulting in increased brokerage and administrative costs. These costs are borne by all fund shareholders, including the long-term investors who do not generate the costs. In addition, frequent trading may interfere with an advisor’s ability to efficiently manage the fund.
Policies to address frequent trading. The Vanguard funds (other than money market funds and short-term bond funds, but including Vanguard Short-Term Inflation-Protected Securities Index Fund) do not knowingly accommodate frequent trading. The board of trustees of each Vanguard fund (other than money market funds and short-term bond funds, but including Vanguard Short-Term Inflation-Protected Securities Index Fund) has adopted policies and procedures reasonably designed to detect and discourage frequent trading and, in some cases, to compensate the fund for the costs associated with it. These policies and procedures do not apply to ETF Shares because frequent trading in ETF Shares generally does not disrupt portfolio management or otherwise harm fund shareholders. Although there is no assurance that Vanguard will be able to detect or prevent frequent trading or market-timing in all circumstances, the following policies have been adopted to address these issues:
• Each Vanguard fund reserves the right to reject any purchase request—including exchanges from other Vanguard funds—without notice and regardless of size. For example, a purchase request could be rejected because the investor has a history of frequent trading or if Vanguard determines that such purchase may negatively affect a fund’s operation or performance.
• Each Vanguard fund (other than money market funds and short-term bond funds, but including Vanguard Short-Term Inflation-Protected Securities Index Fund) generally prohibits, except as otherwise noted in the Investing With Vanguard section, an investor’s purchases or exchanges into a fund account for 30 calendar days after the investor has redeemed or exchanged out of that fund account.
• Certain Vanguard funds charge shareholders purchase and/or redemption fees on transactions.
51
See the Investing With Vanguard section of this prospectus for further details on Vanguard’s transaction policies.
Each Vanguard fund (other than retail and government money market funds), in determining its net asset value, will use fair-value pricing when appropriate, as described in the Share Price section. Fair-value pricing may reduce or eliminate the profitability of certain frequent-trading strategies.
Do not invest with Vanguard if you are a market-timer.
A precautionary note to investment companies: Each Fund's shares are issued by registered investment companies, and therefore the acquisition of such shares by other investment companies and private funds is subject to the restrictions of Section 12(d)(1) of the Investment Company Act of 1940 (the 1940 Act). SEC Rule 12d1-4 under the 1940 Act permits registered investment companies to invest in other registered investment companies beyond the limits in Section 12(d)(1), subject to certain conditions, including that funds with different investment advisors must enter into a fund of funds investment agreement.
Turnover Rate
Although the Funds generally seek to invest for the long term, each Fund may sell securities regardless of how long they have been held. Generally, an index fund sells securities in response to redemption requests from shareholders of conventional (i.e., not exchange-traded) shares or to changes in the composition of its target index or in an effort to manage the fund’s duration. The Financial Highlights section of this prospectus shows historical turnover rates for the Funds. A turnover rate of 100%, for example, would mean that a Fund had sold and replaced securities valued at 100% of its net assets within a one-year period. Shorter-term bonds will mature or be sold—and need to be replaced—more frequently than longer-term bonds. As a result, shorter-term bond funds tend to have higher turnover rates than longer-term bond funds. In general, the greater the turnover rate, the greater the impact transaction costs will have on a fund’s return. Also, funds with high turnover rates may be more likely to generate capital gains, including short-term capital gains, that must be distributed to shareholders and will be taxable to shareholders investing through a taxable account.
52
The Funds and Vanguard
Each Fund is a member of The Vanguard Group, Inc. (Vanguard), a family of over 200 funds. All of the funds that are members of Vanguard (other than funds of funds) share in the expenses associated with administrative services and business operations, such as personnel, office space, and equipment.
Vanguard Marketing Corporation provides marketing services to the funds. Although fund shareholders do not pay sales commissions or 12b-1 distribution fees, each fund (other than a fund of funds) or each share class of a fund (in the case of a fund with multiple share classes) pays its allocated share of the Vanguard funds’ marketing costs.
|
Plain Talk About Vanguard’s Unique Corporate Structure |
|
Vanguard is owned jointly by the funds it oversees and thus indirectly by the
shareholders in those funds. Most other mutual funds are operated by
management companies that are owned by third parties—either public or
private stockholders—and not by the funds they serve. |
Investment Advisor
The Vanguard Group, Inc., P.O. Box 2600, Valley Forge, PA 19482, which began operations in 1975, serves as advisor to the Funds through its Fixed Income Group. As of August 31, 2023, Vanguard served as advisor for approximately $6.8 trillion in assets. Vanguard provides investment advisory services to the Funds pursuant to the Funds’ Service Agreement and subject to the supervision and oversight of the trustees and officers of the Funds.
For the fiscal year ended August 31, 2023, the advisory expenses for each Fund represented an effective annual rate of less than 0.01% of the Fund’s average net assets.
Under the terms of an SEC exemption, the Funds' board of trustees may, without prior approval from shareholders, change the terms of an advisory agreement with a third-party investment advisor or hire a new third-party investment advisor—either as a replacement for an existing advisor or as an additional advisor. Any significant change in a Fund's advisory arrangements will be communicated to shareholders in writing. As the Funds' sponsor and overall manager, Vanguard may provide investment advisory services to a Fund at any time. Vanguard may also recommend to the board of trustees that an advisor be
53
hired, terminated, or replaced or that the terms of an existing advisory agreement be revised. The Funds have filed an application seeking a similar SEC exemption with respect to investment advisors that are wholly owned subsidiaries of Vanguard. If the exemption is granted, the Funds may rely on the new SEC relief.
For a discussion of why the board of trustees approved each Fund's investment advisory arrangement, see the most recent annual report to shareholders covering the fiscal year ended August 31.
The manager primarily responsible for the day-to-day management of the Funds is:
Joshua C. Barrickman, CFA, Principal of Vanguard and co-head of Vanguard’s Fixed Income Indexing Americas. He has been with Vanguard since 1998; has worked in investment management since 1999; has managed investment portfolios since 2005; has managed Vanguard Short-Term, Intermediate-Term, and Long-Term Corporate Bond Index Funds since their inceptions in 2009; and has managed Vanguard Short-Term, Intermediate-Term, and Long-Term Treasury Index Funds and managed Vanguard Mortgage-Backed Securities Index Fund since 2013. Education: B.S., Ohio Northern University; M.B.A., Lehigh University.
The Funds' Statement of Additional Information provides information about the portfolio manager’s compensation, other accounts under management, and ownership of shares of the Funds.
Dividends, Capital Gains, and Taxes
Fund Distributions
Each Fund distributes to shareholders virtually all of its net income (interest less expenses) as well as any net short-term or long-term capital gains realized from the sale of its holdings. From time to time, each Fund may also make distributions that are treated as a return of capital. Income dividends generally are declared and distributed monthly; capital gains distributions, if any, generally occur annually in December. In addition, each Fund may occasionally make a supplemental distribution at some other time during the year.
You can receive distributions of income or capital gains in cash, or you can have them automatically reinvested in more shares of the Fund. However, if you are investing through an employer-sponsored retirement or savings plan, your distributions will be automatically reinvested in additional Fund shares.
54
|
Plain Talk About Distributions |
|
As a shareholder, you are entitled to your portion of a fund’s income from
interest as well as capital gains from the fund’s sale of investments. Income
consists of interest the fund earns from its money market and bond
investments. Capital gains are realized whenever the fund sells securities for
higher prices than it paid for them. These capital gains are either short-term
or long-term, depending on whether the fund held the securities for one year
or less or for more than one year. |
Basic Tax Points
Investors in taxable accounts should be aware of the following basic federal income tax points:
• Distributions are taxable to you whether or not you reinvest these amounts in additional Fund shares.
• Distributions declared in December—if paid to you by the end of January—are taxable as if received in December.
• Any income dividend distribution or short-term capital gains distribution that you receive is taxable to you as ordinary income.
• Any distribution of net long-term capital gains is taxable to you as long-term capital gains, no matter how long you have owned shares in the Fund.
• Capital gains distributions may vary considerably from year to year as a result of the Funds' normal investment activities and cash flows.
• Your cost basis in the Fund will be decreased by the amount of any return of capital that you receive. This, in turn, will affect the amount of any capital gain or loss that you realize when selling your Fund shares.
• Return of capital distributions generally are not taxable to you until your cost basis has been reduced to zero. If your cost basis is at zero, return of capital distributions will be treated as capital gains.
• A sale or exchange of Fund shares is a taxable event. This means that you may have a capital gain to report as income, or a capital loss to report as a deduction, when you complete your tax return.
• Any conversion between classes of shares of the same fund is a nontaxable
event. By contrast, an exchange between classes of shares of different funds is a taxable event.
event. By contrast, an exchange between classes of shares of different funds is a taxable event.
• Vanguard (or your intermediary) will send you a statement each year showing the tax status of all of your distributions.
55
Individuals, trusts, and estates whose income exceeds certain threshold amounts are subject to a 3.8% Medicare contribution tax on “net investment income.” Net investment income takes into account distributions paid by the Fund and capital gains from any sale or exchange of Fund shares.
Income dividends and capital gains distributions that you receive, as well as your gains or losses from any sale or exchange of Fund shares, may be subject to state and local income taxes. Depending on your state’s rules, however, any dividends attributable to interest earned on direct obligations of the U.S. government may be exempt from state and local taxes. Vanguard will notify you each year how much, if any, of your dividends may qualify for this exemption.
This prospectus provides general tax information only. If you are investing through a tax-advantaged account, such as an IRA or an employer-sponsored retirement or savings plan, special tax rules apply. Please consult your tax advisor for detailed information about any tax consequences for you.
General Information
Backup withholding. By law, Vanguard must withhold 24% of any taxable distributions or redemptions from your account if you do not:
• Provide your correct taxpayer identification number.
• Certify that the taxpayer identification number is correct.
• Confirm that you are not subject to backup withholding.
Similarly, Vanguard (or your intermediary) must withhold taxes from your account if the IRS instructs us to do so.
Foreign investors. Vanguard funds offered for sale in the United States (Vanguard U.S. funds), including the Funds offered in this prospectus, are not widely available outside the United States. Non-U.S. investors should be aware that U.S. withholding and estate taxes and certain U.S. tax reporting requirements may apply to any investments in Vanguard U.S. funds. Foreign investors should visit the non-U.S. investors page on our website at vanguard.com for information on Vanguard’s non-U.S. products.
Invalid addresses. If an income dividend distribution or capital gains distribution check mailed to your address of record is returned as undeliverable, Vanguard will automatically reinvest the distribution and all future distributions until you provide us with a valid mailing address. Reinvestments will receive the net asset value calculated on the date of the reinvestment.
56
Share Price
Share price, also known as net asset value (NAV), is calculated as of the close of regular trading on the New York Stock Exchange (NYSE), generally 4 p.m., Eastern time, on each day that the NYSE is open for business (a business day). In the rare event the NYSE experiences unanticipated disruptions and is unavailable at the close of the trading day, NAVs will be calculated as of the close of regular trading on the Nasdaq (or another alternate exchange if the Nasdaq is unavailable, as determined at Vanguard’s discretion), generally 4 p.m., Eastern time. Each share class has its own NAV, which is computed by dividing the total assets, minus liabilities, allocated to the share class by the number of Fund shares outstanding for that class. On U.S. holidays or other days when the NYSE is closed, the NAV is not calculated, and the Funds do not sell or redeem shares. However, on those days the value of a Fund’s assets may be affected to the extent that the Fund holds securities that change in value on those days (such as foreign securities that trade on foreign markets that are open).
Debt securities held by a Vanguard fund are valued based on information furnished by an independent pricing service or market quotations. When a fund determines that pricing-service information or market quotations either are not readily available or do not accurately reflect the value of a security, the security is priced at its fair value (the amount that the owner might reasonably expect to receive upon the current sale of the security).
The values of any foreign securities held by a fund are converted into U.S. dollars using an exchange rate obtained from an independent third party as of the close of regular trading on the NYSE. The values of any mutual fund shares, including institutional money market fund shares, held by a fund are based on the NAVs of the shares. The values of any ETF shares or closed-end fund shares held by a fund are based on the market value of the shares.
A fund also may use fair-value pricing on bond market holidays when the fund is open for business (such as Columbus Day and Veterans Day). Fair-value prices are determined by Vanguard according to procedures adopted by the board of trustees. When fair-value pricing is employed, the prices of securities used by a fund to calculate the NAV may differ from quoted or published prices for the same securities.
Each Fund has authorized certain financial intermediaries and their designees, and may, from time to time, authorize certain funds of funds for which Vanguard serves as the investment advisor (Vanguard Funds of Funds), to accept orders to buy or sell fund shares on its behalf. The Fund will be deemed to receive an
57
order when accepted by the financial intermediary, its designee, or one of the Vanguard Funds of Funds, and the order will receive the NAV next computed by the Fund after such acceptance.
Vanguard fund share prices are published daily on our website at vanguard.com/prices.
58
Financial Highlights
Financial highlights information is intended to help you understand a fund’s performance for the past five years (or, if shorter, its period of operations). Certain information reflects financial results for a single fund share. Total return represents the rate that an investor would have earned or lost each period on an investment in a fund or share class (assuming reinvestment of all distributions). This information has been obtained from the financial statements audited by PricewaterhouseCoopers LLP, an independent registered public accounting firm, whose report, along with fund financial statements, is included in a fund’s most recent annual report to shareholders. You may obtain a free copy of a fund’s latest annual or semiannual report, which is available upon request.
Vanguard Short-Term Treasury Index Fund Admiral Shares
|
For a Share Outstanding Throughout Each Period |
Year Ended August 31, | ||||
|
2023 |
2022 |
2021 |
2020 |
2019 | |
|
Net Asset Value, Beginning of Period |
$19.50 |
$20.51 |
$20.71 |
$20.35 |
$19.95 |
|
Investment Operations |
|
|
|
|
|
|
Net Investment Income1 |
.529 |
.114 |
.095 |
.312 |
.472 |
|
Net Realized and Unrealized Gain (Loss) on Investments |
(.294) |
(.949) |
(.078) |
.375 |
.384 |
|
Total from Investment Operations |
.235 |
(.835) |
.017 |
.687 |
.856 |
|
Distributions |
|
|
|
|
|
|
Dividends from Net Investment Income |
(.515) |
(.112) |
(.093) |
(.327) |
(.456) |
|
Distributions from Realized Capital Gains |
— |
(.063) |
(.124) |
— |
— |
|
Total Distributions |
(.515) |
(.175) |
(.217) |
(.327) |
(.456) |
|
Net Asset Value, End of Period |
$19.22 |
$19.50 |
$20.51 |
$20.71 |
$20.35 |
|
Total Return2 |
1.22% |
-4.09% |
0.08% |
3.41% |
4.34% |
|
Ratios/Supplemental Data |
|
|
|
|
|
|
Net Assets, End of Period (Millions) |
$2,925 |
$2,506 |
$2,430 |
$2,748 |
$1,596 |
|
Ratio of Total Expenses to Average Net Assets |
0.07%3 |
0.07%3 |
0.07% |
0.07% |
0.07% |
|
Ratio of Net Investment Income to Average Net Assets |
2.74% |
0.57% |
0.46% |
1.52% |
2.35% |
|
Portfolio Turnover Rate4 |
81% |
59% |
66% |
67% |
55% |
|
|
|
|
|
|
|
|
|
|
|
1 |
Calculated based on average shares outstanding. |
|
2 |
Total returns do not include account service fees that may have applied in the periods shown.
Fund prospectuses provide information about any applicable account service fees. |
|
3 |
The ratio of expenses to average net assets for the period net of reduction from custody fee
offset arrangements was 0.07%. |
|
4 |
Excludes the value of portfolio securities received or delivered as a result of in-kind purchases
or redemptions of the fund’s capital shares, including ETF Creation Units. |
59
Vanguard Intermediate-Term Treasury Index Fund Admiral Shares
|
For a Share Outstanding Throughout Each Period |
Year Ended August 31, | ||||
|
2023 |
2022 |
2021 |
2020 |
2019 | |
|
Net Asset Value, Beginning of Period |
$20.35 |
$23.04 |
$23.78 |
$22.68 |
$21.13 |
|
Investment Operations |
|
|
|
|
|
|
Net Investment Income1 |
.490 |
.283 |
.267 |
.416 |
.507 |
|
Net Realized and Unrealized Gain (Loss) on Investments |
(.741) |
(2.575) |
(.577) |
1.101 |
1.540 |
|
Total from Investment Operations |
(.251) |
(2.292) |
(.310) |
1.517 |
2.047 |
|
Distributions |
|
|
|
|
|
|
Dividends from Net Investment Income |
(.479) |
(.274) |
(.265) |
(.417) |
(.497) |
|
Distributions from Realized Capital Gains |
— |
(.124) |
(.165) |
— |
— |
|
Total Distributions |
(.479) |
(.398) |
(.430) |
(.417) |
(.497) |
|
Net Asset Value, End of Period |
$19.62 |
$20.35 |
$23.04 |
$23.78 |
$22.68 |
|
Total Return2 |
-1.24% |
-10.05% |
-1.31% |
6.76% |
9.83% |
|
Ratios/Supplemental Data |
|
|
|
|
|
|
Net Assets, End of Period (Millions) |
$3,165 |
$2,886 |
$2,646 |
$2,740 |
$1,887 |
|
Ratio of Total Expenses to Average Net Assets |
0.07%3 |
0.07%3 |
0.07% |
0.07% |
0.07% |
|
Ratio of Net Investment Income to Average Net Assets |
2.46% |
1.31% |
1.15% |
1.79% |
2.34% |
|
Portfolio Turnover Rate4 |
36% |
36% |
33% |
28% |
29% |
|
|
|
|
|
|
|
|
|
|
|
1 |
Calculated based on average shares outstanding. |
|
2 |
Total returns do not include account service fees that may have applied in the periods shown.
Fund prospectuses provide information about any applicable account service fees. |
|
3 |
The ratio of expenses to average net assets for the period net of reduction from custody fee
offset arrangements was 0.07%. |
|
4 |
Excludes the value of portfolio securities received or delivered as a result of in-kind purchases
or redemptions of the fund’s capital shares, including ETF Creation Units. |
60
Vanguard Long-Term Treasury Index Fund Admiral Shares
|
For a Share Outstanding Throughout Each Period |
Year Ended August 31, | ||||
|
2023 |
2022 |
2021 |
2020 |
2019 | |
|
Net Asset Value, Beginning of Period |
$22.98 |
$30.35 |
$33.24 |
$30.28 |
$24.95 |
|
Investment Operations |
|
|
|
|
|
|
Net Investment Income1 |
.659 |
.565 |
.545 |
.637 |
.706 |
|
Net Realized and Unrealized Gain (Loss) on Investments |
(2.873) |
(7.380) |
(2.799) |
2.955 |
5.316 |
|
Total from Investment Operations |
(2.214) |
(6.815) |
(2.254) |
3.592 |
6.022 |
|
Distributions |
|
|
|
|
|
|
Dividends from Net Investment Income |
(.646) |
(.555) |
(.538) |
(.632) |
(.692) |
|
Distributions from Realized Capital Gains |
— |
— |
(.098) |
— |
— |
|
Total Distributions |
(.646) |
(.555) |
(.636) |
(.632) |
(.692) |
|
Net Asset Value, End of Period |
$20.12 |
$22.98 |
$30.35 |
$33.24 |
$30.28 |
|
Total Return2 |
-9.73% |
-22.69% |
-6.78% |
12.00% |
24.67% |
|
Ratios/Supplemental Data |
|
|
|
|
|
|
Net Assets, End of Period (Millions) |
$1,089 |
$1,369 |
$1,947 |
$1,800 |
$1,053 |
|
Ratio of Total Expenses to Average Net Assets |
0.07%3 |
0.07%3 |
0.07% |
0.07% |
0.07% |
|
Ratio of Net Investment Income to Average Net Assets |
3.10% |
2.09% |
1.79% |
2.01% |
2.73% |
|
Portfolio Turnover Rate4 |
20% |
19% |
22% |
29% |
16% |
|
|
|
|
|
|
|
|
|
|
|
1 |
Calculated based on average shares outstanding. |
|
2 |
Total returns do not include account service fees that may have applied in the periods shown.
Fund prospectuses provide information about any applicable account service fees. |
|
3 |
The ratio of expenses to average net assets for the period net of reduction from custody fee
offset arrangements was 0.07%. |
|
4 |
Excludes the value of portfolio securities received or delivered as a result of in-kind purchases
or redemptions of the fund’s capital shares, including ETF Creation Units. |
61
Vanguard Short-Term Corporate Bond Index Fund Admiral Shares
|
For a Share Outstanding Throughout Each Period |
Year Ended August 31, | ||||
|
2023 |
2022 |
2021 |
2020 |
2019 | |
|
Net Asset Value, Beginning of Period |
$20.70 |
$22.49 |
$22.55 |
$22.06 |
$21.28 |
|
Investment Operations |
|
|
|
|
|
|
Net Investment Income1 |
.566 |
.351 |
.385 |
.578 |
.625 |
|
Net Realized and Unrealized Gain (Loss) on Investments |
(.126) |
(1.741) |
(.063) |
.485 |
.777 |
|
Total from Investment Operations |
.440 |
(1.390) |
.322 |
1.063 |
1.402 |
|
Distributions |
|
|
|
|
|
|
Dividends from Net Investment Income |
(.570) |
(.350) |
(.382) |
(.573) |
(.622) |
|
Distributions from Realized Capital Gains |
— |
(.050) |
— |
— |
— |
|
Total Distributions |
(.570) |
(.400) |
(.382) |
(.573) |
(.622) |
|
Net Asset Value, End of Period |
$20.57 |
$20.70 |
$22.49 |
$22.55 |
$22.06 |
|
Total Return2 |
2.17% |
-6.24% |
1.44% |
4.90% |
6.70% |
|
Ratios/Supplemental Data |
|
|
|
|
|
|
Net Assets, End of Period (Millions) |
$4,060 |
$4,647 |
$5,435 |
$4,703 |
$4,312 |
|
Ratio of Total Expenses to Average Net Assets |
0.07%3 |
0.07%3 |
0.07% |
0.07% |
0.07% |
|
Ratio of Net Investment Income to Average Net Assets |
2.75% |
1.63% |
1.71% |
2.61% |
2.90% |
|
Portfolio Turnover Rate4 |
63% |
50% |
42% |
56% |
51% |
|
|
|
|
|
|
|
|
|
|
|
1 |
Calculated based on average shares outstanding. |
|
2 |
Total returns do not include account service fees that may have applied in the periods shown.
Fund prospectuses provide information about any applicable account service fees. |
|
3 |
The ratio of expenses to average net assets for the period net of reduction from custody fee
offset arrangements was 0.07%. |
|
4 |
Excludes the value of portfolio securities received or delivered as a result of in-kind purchases
or redemptions of the fund’s capital shares, including ETF Creation Units. |
62
Vanguard Intermediate-Term Corporate Bond Index Fund Admiral Shares
|
For a Share Outstanding Throughout Each Period |
Year Ended August 31, | ||||
|
2023 |
2022 |
2021 |
2020 |
2019 | |
|
Net Asset Value, Beginning of Period |
$21.49 |
$25.75 |
$25.86 |
$24.71 |
$22.61 |
|
Investment Operations |
|
|
|
|
|
|
Net Investment Income1 |
.752 |
.577 |
.578 |
.747 |
.839 |
|
Net Realized and Unrealized Gain (Loss) on Investments |
(.429) |
(4.098) |
(.062) |
1.138 |
2.097 |
|
Total from Investment Operations |
.323 |
(3.521) |
.516 |
1.885 |
2.936 |
|
Distributions |
|
|
|
|
|
|
Dividends from Net Investment Income |
(.753) |
(.579) |
(.572) |
(.735) |
(.836) |
|
Distributions from Realized Capital Gains |
— |
(.160) |
(.054) |
— |
— |
|
Total Distributions |
(.753) |
(.739) |
(.626) |
(.735) |
(.836) |
|
Net Asset Value, End of Period |
$21.06 |
$21.49 |
$25.75 |
$25.86 |
$24.71 |
|
Total Return2 |
1.55% |
-13.90% |
2.03% |
7.79% |
13.30% |
|
Ratios/Supplemental Data |
|
|
|
|
|
|
Net Assets, End of Period (Millions) |
$1,156 |
$1,139 |
$1,587 |
$1,549 |
$1,381 |
|
Ratio of Total Expenses to Average Net Assets |
0.07%3 |
0.07%3 |
0.07% |
0.07% |
0.07% |
|
Ratio of Net Investment Income to Average Net Assets |
3.56% |
2.44% |
2.25% |
3.01% |
3.63% |
|
Portfolio Turnover Rate4 |
76% |
58% |
53% |
72% |
59% |
|
|
|
|
|
|
|
|
|
|
|
1 |
Calculated based on average shares outstanding. |
|
2 |
Total returns do not include transaction or account service fees that may have applied in the
periods shown. Fund prospectuses provide information about any applicable transaction and
account service fees. |
|
3 |
The ratio of expenses to average net assets for the period net of reduction from custody fee
offset arrangements was 0.07%. |
|
4 |
Excludes the value of portfolio securities received or delivered as a result of in-kind purchases
or redemptions of the fund’s capital shares, including ETF Creation Units. |
63
Vanguard Long-Term Corporate Bond Index Fund Admiral Shares
|
For a Share Outstanding Throughout Each Period |
Year Ended August 31, | ||||
|
2023 |
2022 |
2021 |
2020 |
2019 | |
|
Net Asset Value, Beginning of Period |
$21.56 |
$29.03 |
$28.68 |
$27.55 |
$23.65 |
|
Investment Operations |
|
|
|
|
|
|
Net Investment Income1 |
.984 |
.875 |
.877 |
.988 |
1.053 |
|
Net Realized and Unrealized Gain (Loss) on Investments2 |
(1.260) |
(7.473) |
.345 |
1.125 |
3.895 |
|
Total from Investment Operations |
(.276) |
(6.598) |
1.222 |
2.113 |
4.948 |
|
Distributions |
|
|
|
|
|
|
Dividends from Net Investment Income |
(.964) |
(.872) |
(.872) |
(.983) |
(1.048) |
|
Distributions from Realized Capital Gains |
— |
— |
— |
— |
— |
|
Total Distributions |
(.964) |
(.872) |
(.872) |
(.983) |
(1.048) |
|
Net Asset Value, End of Period |
$20.32 |
$21.56 |
$29.03 |
$28.68 |
$27.55 |
|
Total Return3 |
-1.25% |
-23.10% |
4.37% |
7.87% |
21.64% |
|
Ratios/Supplemental Data |
|
|
|
|
|
|
Net Assets, End of Period (Millions) |
$319 |
$272 |
$314 |
$320 |
$256 |
|
Ratio of Total Expenses to Average Net Assets |
0.07%4 |
0.07%4 |
0.07% |
0.07% |
0.07% |
|
Ratio of Net Investment Income to Average Net Assets |
4.75% |
3.44% |
3.08% |
3.58% |
4.34% |
|
Portfolio Turnover Rate5 |
33% |
31% |
36% |
62% |
47% |
|
|
|
|
|
|
|
|
|
|
|
1 |
Calculated based on average shares outstanding. |
|
2 |
Includes increases from purchase fees of $.01, $.00, $.01, $.00, and $.00. |
|
3 |
Total returns do not include transaction or account service fees that may have applied in the
periods shown. Fund prospectuses provide information about any applicable transaction and
account service fees. |
|
4 |
The ratio of expenses to average net assets for the period net of reduction from custody fee
offset arrangements was 0.07%. |
|
5 |
Excludes the value of portfolio securities received or delivered as a result of in-kind purchases
or redemptions of the fund’s capital shares, including ETF Creation Units. |
64
Vanguard Mortgage-Backed Securities Index Fund Admiral Shares
|
For a Share Outstanding Throughout Each Period |
Year Ended August 31, | ||||
|
2023 |
2022 |
2021 |
2020 |
2019 | |
|
Net Asset Value, Beginning of Period |
$18.98 |
$21.37 |
$21.72 |
$21.26 |
$20.51 |
|
Investment Operations |
|
|
|
|
|
|
Net Investment Income1 |
.563 |
.328 |
.211 |
.470 |
.622 |
|
Net Realized and Unrealized Gain (Loss) on Investments |
(.934) |
(2.391) |
(.292) |
.463 |
.742 |
|
Total from Investment Operations |
(.371) |
(2.063) |
(.081) |
.933 |
1.364 |
|
Distributions |
|
|
|
|
|
|
Dividends from Net Investment Income |
(.559) |
(.327) |
(.225) |
(.473) |
(.614) |
|
Distributions from Realized Capital Gains |
— |
— |
(.044) |
— |
— |
|
Total Distributions |
(.559) |
(.327) |
(.269) |
(.473) |
(.614) |
|
Net Asset Value, End of Period |
$18.05 |
$18.98 |
$21.37 |
$21.72 |
$21.26 |
|
Total Return2 |
-1.96% |
-9.72% |
-0.38% |
4.43% |
6.77% |
|
Ratios/Supplemental Data |
|
|
|
|
|
|
Net Assets, End of Period (Millions) |
$1,242 |
$1,219 |
$1,419 |
$1,159 |
$841 |
|
Ratio of Total Expenses to Average Net Assets |
0.07%3 |
0.07%3 |
0.07% |
0.07% |
0.07% |
|
Ratio of Net Investment Income to Average Net Assets |
3.07% |
1.62% |
0.98% |
2.18% |
2.99% |
|
Portfolio Turnover Rate4 |
101% |
170% |
316% |
218% |
190% |
|
|
|
|
|
|
|
|
|
|
|
1 |
Calculated based on average shares outstanding. |
|
2 |
Total returns do not include account service fees that may have applied in the periods shown.
Fund prospectuses provide information about any applicable account service fees. |
|
3 |
The ratio of expenses to average net assets for the period net of reduction from custody fee
offset arrangements was 0.07%. |
|
4 |
Includes 80%, 113%, 237%, 11%, and 34%, respectively, attributable to mortgage-dollar-
roll activity. |
65
Investing With Vanguard
This section of the prospectus explains the basics of doing business with Vanguard. Vanguard fund shares can be held indirectly through an intermediary, such as a bank, a broker, or an investment advisor. If you hold Vanguard fund shares indirectly through an intermediary (including shares held in a brokerage account through Vanguard Brokerage Services®), please see Investing With Vanguard Through Other Firms, and also refer to your account agreement with the intermediary for information about transacting in that account. If you hold Vanguard fund shares through an employer-sponsored retirement or savings plan, please see Employer-Sponsored Plans. Vanguard reserves the right to change the policies in this section without notice. Please call or check online for current information. See Contacting Vanguard.
In certain circumstances, Vanguard fund shares can be held directly with Vanguard. If you hold Vanguard fund shares directly with Vanguard, you should carefully read each topic within this section that pertains to your relationship with Vanguard. Vanguard reserves the right, upon reasonable notice, to discontinue the ability to hold Vanguard fund shares directly with Vanguard for any or all investors and/or to transfer such shares to an affiliate or other financial institution.
In certain circumstances, Vanguard fund shares can be held directly with Vanguard. If you hold Vanguard fund shares directly with Vanguard, you should carefully read each topic within this section that pertains to your relationship with Vanguard. Vanguard reserves the right, upon reasonable notice, to discontinue the ability to hold Vanguard fund shares directly with Vanguard for any or all investors and/or to transfer such shares to an affiliate or other financial institution.
For Vanguard fund shares held directly with Vanguard, each fund you hold in an account is a separate “fund account.” For example, if you hold three funds in a nonretirement account titled in your own name, two funds in a nonretirement account titled jointly with your spouse, and one fund in an individual retirement account, you have six fund accounts—and this is true even if you hold the same fund in multiple accounts. Note that each reference to “you” in this prospectus applies to any one or more registered account owners or persons authorized to transact on your account.
Purchasing Shares
Vanguard reserves the right, without notice, to increase or decrease the minimum amount required to open, convert shares to, or maintain a fund account or to add to an existing fund account.
Investment minimums may differ for certain categories of investors.
Account Minimums for Admiral Shares
To open and maintain an account. $3,000. Financial intermediaries, institutional clients, and Vanguard-advised clients should contact Vanguard for information on special eligibility rules that may apply to them regarding Admiral Shares. If you are investing through an intermediary, please contact that firm directly for more information regarding your eligibility.
66
To add to an existing account. Generally $1.
How to Initiate a Purchase Request
Be sure to check Exchanging Shares, Frequent-Trading Limitations, and Other Rules You Should Know before placing your purchase request.
Online. You may open certain types of accounts, request a purchase of shares, and request an exchange through our website or our mobile application if your account is eligible and you are registered for online access.
By telephone. You may call Vanguard to begin the account registration process or request that the account-opening forms be sent to you. You may also call Vanguard to request a purchase of shares in your account or to request an exchange. See Contacting Vanguard.
By mail. You may send Vanguard your account registration form and check to open a new fund account. To add to an existing fund account, you may send your check with an Invest-by-Mail form (from a transaction confirmation or your account statement) or with a deposit slip (available online).
How to Pay for a Purchase
By electronic bank transfer. You may purchase shares of a Vanguard fund through an electronic transfer of money from a bank account. To establish the electronic bank transfer service on an account, you must designate the bank account online, complete a form, or fill out the appropriate section of your account registration form. After the service is set up on your account, you can purchase shares by electronic bank transfer on a regular schedule (Automatic Investment Plan), if eligible, or upon request. Your purchase request can be initiated online (if you are registered for online access), by telephone, or by mail.
By wire. Wiring instructions vary for different types of purchases. Please call Vanguard for instructions and policies on purchasing shares by wire. See Contacting Vanguard.
By check. You may make initial or additional purchases to your fund account by sending a check with a deposit slip or by utilizing our mobile application if your account is eligible and you are registered for online access. Also see How to Initiate a Purchase Request. Make your check payable to Vanguard and include the appropriate fund number (Vanguard—xx). For a list of Fund numbers (for Funds in this prospectus), see Additional Information.
67
By exchange. You may purchase shares of a Vanguard fund using the proceeds from the simultaneous redemption of shares of another Vanguard fund. You may initiate an exchange online (if you are registered for online access), by telephone, or by mail with an exchange form. See Exchanging Shares.
Trade Date
The trade date for any purchase request received in good order will depend on the day and time Vanguard receives your request, the manner in which you are paying, and the type of fund you are purchasing. Your purchase will be executed using the NAV as calculated on the trade date. NAVs are calculated only on days that the NYSE is open for trading (a business day). In the rare event the NYSE experiences unanticipated disruptions and is unavailable at the close of the trading day, NAVs will be calculated as of the close of regular trading on the Nasdaq (or another alternate exchange if the Nasdaq is unavailable, as determined at Vanguard’s discretion), generally 4 p.m., Eastern time. The time selected for NAV calculation in this rare event shall also serve as the conclusion of the trading day. See Share Price.
For purchases by check into all funds other than money market funds and for purchases by exchange, wire, or electronic bank transfer into all funds: If the purchase request is received by Vanguard on a business day before the close of regular trading on the NYSE (generally 4 p.m., Eastern time), the trade date for the purchase will be the same day. If the purchase request is received on a business day after the close of regular trading on the NYSE, or on a nonbusiness day, the trade date for the purchase will be the next business day.
For purchases by check into money market funds: If the purchase request is received by Vanguard on a business day before the close of regular trading on the NYSE (generally 4 p.m., Eastern time), the trade date for the purchase will be the next business day. If the purchase request is received on a business day after the close of regular trading on the NYSE, or on a nonbusiness day, the trade date for the purchase will be the second business day following the day Vanguard receives the purchase request. Because money market instruments must be purchased with federal funds and it takes a money market mutual fund one business day to convert check proceeds into federal funds, the trade date for the purchase will be one business day later than for other funds.
If applicable, orders by Vanguard Funds of Funds will be treated as received by a Fund at the same time that the corresponding orders are received in proper form by the Vanguard Fund of Funds.
If your purchase request is not accurate and complete, it may be rejected. See Other Rules You Should Know—Good Order.
68
For further information about purchase transactions, consult our website at vanguard.com or see Contacting Vanguard.
Purchase and Transaction Fees
Vanguard Intermediate-Term and Long-Term Corporate Bond Index Funds charge fees of 0.25% and 1.00%, respectively, on all purchases of shares, including shares that you purchase by exchange from another Vanguard fund. In addition, Vanguard Short-Term and Intermediate-Term Corporate Bond Index Funds each reserve the right to impose a transaction fee on any purchase that, in the opinion of the advisor, would disrupt efficient management of the Fund. The advisor believes that it may be necessary to impose a transaction fee of 0.25% for Vanguard Short-Term Corporate Bond Index Fund and a transaction fee of 0.50% for Vanguard Intermediate-Term Corporate Bond Index Fund. The advisor may impose this transaction fee if an investor’s aggregate purchases into a Fund over a 12-month period exceed, or are expected to exceed, $100 million for Vanguard Short-Term Corporate Bond Index Fund or $50 million for Vanguard Intermediate-Term Corporate Bond Index Fund.
Purchase fees will not apply to Vanguard fund account purchases in the following circumstances: (1) purchases of shares through reinvested dividends or capital gains distributions; (2) share transfers, rollovers, or reregistrations within the same fund; (3) conversions of shares from one share class to another in the same fund; (4) purchases in kind; and (5) share rollovers in an IRA within the same Vanguard fund for plans in which Vanguard serves as a recordkeeper. Unlike a sales charge or load paid to a broker or a fund management company, purchase and transaction fees are paid directly to the Fund to offset the costs of buying securities.
Purchase fees will not apply to Vanguard fund account purchases in the following circumstances: (1) purchases of shares through reinvested dividends or capital gains distributions; (2) share transfers, rollovers, or reregistrations within the same fund; (3) conversions of shares from one share class to another in the same fund; (4) purchases in kind; and (5) share rollovers in an IRA within the same Vanguard fund for plans in which Vanguard serves as a recordkeeper. Unlike a sales charge or load paid to a broker or a fund management company, purchase and transaction fees are paid directly to the Fund to offset the costs of buying securities.
Other Purchase Rules You Should Know
Admiral Shares. Admiral Shares generally are not available for SIMPLE IRAs and Vanguard Individual 401(k) Plans.
Check purchases. All purchase checks must be written in U.S. dollars, be drawn on a U.S. bank, and be accompanied by good order instructions. Vanguard does not accept cash, traveler’s checks, starter checks, or money orders. In addition, Vanguard may refuse checks that are not made payable to Vanguard.
New accounts. We are required by law to obtain from you certain personal information that we will use to verify your identity. If you do not provide the information, we may not be able to open your account. If we are unable to verify your identity, Vanguard reserves the right, without notice, to close your account or take such other steps as we deem reasonable. Certain types of accounts may require additional documentation.
69
Refused or rejected purchase requests. Vanguard reserves the right to stop selling fund shares or to reject any purchase request at any time and without notice, including, but not limited to, purchases requested by exchange from another Vanguard fund. This also includes the right to reject any purchase request because the investor has a history of frequent trading or because the purchase may negatively affect a fund’s operation or performance.
Large purchases. Call Vanguard before attempting to invest a large dollar amount.
No cancellations. Vanguard will not accept your request to cancel any purchase request once processing has begun. Please be careful when placing a purchase request.
Converting Shares
When a conversion occurs, you receive shares of one class in place of shares of another class of the same fund. At the time of conversion, the dollar value of the “new” shares you receive equals the dollar value of the “old” shares that were converted. In other words, the conversion has no effect on the value of your investment in the fund at the time of the conversion. However, the number of shares you own after the conversion may be greater than or less than the number of shares you owned before the conversion, depending on the NAVs of the two share classes.
Vanguard will not accept your request to cancel any self-directed conversion request once processing has begun. Please be careful when placing a conversion request.
A conversion between share classes of the same fund is a nontaxable event.
Trade Date
The trade date for any conversion request received in good order will depend on the day and time Vanguard receives your request. Your conversion will be executed using the NAVs of the different share classes on the trade date. NAVs are calculated only on days that the NYSE is open for trading (a business day). In the rare event the NYSE experiences unanticipated disruptions and is unavailable at the close of the trading day, NAVs will be calculated as of the close of regular trading on the Nasdaq (or another alternate exchange if the Nasdaq is unavailable, as determined at Vanguard’s discretion), generally 4 p.m., Eastern time. The time selected for NAV calculation in this rare event shall also serve as the conclusion of the trading day. See Share Price.
70
For a conversion request (other than a request to convert to ETF Shares) received by Vanguard on a business day before the close of regular trading on the NYSE (generally 4 p.m., Eastern time), the trade date will be the same day. For a conversion request received on a business day after the close of regular trading on the NYSE, or on a nonbusiness day, the trade date will be the next business day. See Other Rules You Should Know.
Conversions to Institutional Shares
You are eligible for a self-directed conversion from Admiral Shares to Institutional Shares of the same Fund (if available), provided that your account meets all eligibility requirements. You may request a conversion through our website (if you are registered for online access), or you may contact Vanguard by telephone or by mail to request this transaction. Accounts that qualify for Institutional Shares will not be automatically converted.
Conversions to ETF Shares
Owners of conventional (i.e., not exchange-traded) shares issued by a Fund may convert those shares to ETF Shares of equivalent value of the same fund. Please note that investors who own conventional shares through a 401(k) plan or other employer-sponsored retirement or benefit plan generally may not convert those shares to ETF Shares and should check with their plan sponsor or recordkeeper. ETF Shares, whether acquired through a conversion or purchased on the secondary market, cannot be converted to conventional shares by a shareholder. Also, ETF Shares of one fund cannot be exchanged for ETF Shares of another fund.
ETF Shares must be held in a brokerage account. Thus, before converting conventional shares to ETF Shares, you must have an existing, or open a new, brokerage account. This account may be with Vanguard Brokerage Services or with any other brokerage firm.
Vanguard Brokerage Services does not impose a fee on conversions from conventional shares to Vanguard ETF Shares. However, other brokerage firms may charge a fee to process a conversion. Vanguard reserves the right, in the future, to impose a transaction fee on conversions or to limit, temporarily suspend, or terminate the conversion privilege. For additional information on converting conventional shares to ETF Shares, please contact Vanguard to obtain a prospectus for ETF Shares. See Contacting Vanguard.
71
Mandatory Conversions to Admiral Shares
If an account no longer meets the balance requirements for Institutional Shares, Vanguard may automatically convert the shares in the account to Admiral Shares. A decline in the account balance because of market movement may result in such a conversion. Vanguard will notify the investor in writing before any mandatory conversion occurs.
Redeeming Shares
How to Initiate a Redemption Request
Be sure to check Exchanging Shares, Frequent-Trading Limitations, and Other Rules You Should Know before placing your redemption request.
Online. You may request a redemption of shares or request an exchange through our website or our mobile application if your account is eligible and you are registered for online access.
By telephone. You may call Vanguard to request a redemption of shares or an exchange. See Contacting Vanguard.
By mail. You may send a form (available online) to Vanguard to redeem from a fund account or to make an exchange.
How to Receive Redemption Proceeds
By electronic bank transfer. You may have the proceeds of a fund redemption sent directly to a designated bank account. To establish the electronic bank transfer service on an account, you must designate a bank account online, complete a form, or fill out the appropriate section of your account registration form. After the service is set up on your account, you can redeem shares by electronic bank transfer on a regular schedule (Automatic Withdrawal Plan), if eligible, or upon request. Your redemption request can be initiated online (if you are registered for online access), by telephone, or by mail.
By wire. To receive your proceeds by wire, you may instruct Vanguard to wire your redemption proceeds ($100 minimum) to a previously designated bank account. To establish the wire redemption service, you generally must designate a bank account online, complete a form, or fill out the appropriate section of your account registration form.
Please note that Vanguard charges a $10 wire fee for outgoing wire redemptions. The fee is assessed in addition to, rather than being withheld from, redemption proceeds and is paid directly to the fund in which you invest. For example, if you redeem $100 via a wire, you will receive the full $100, and the $10 fee will be
72
assessed to your fund account through an additional redemption of fund shares. If you redeem your entire fund account, your redemption proceeds will be reduced by the amount of the fee. The wire fee does not apply to accounts held by Flagship and Flagship Select clients; accounts held through intermediaries, including Vanguard Brokerage Services; or accounts held by institutional clients.
By exchange. You may have the proceeds of a Vanguard fund redemption invested directly in shares of another Vanguard fund. You may initiate an exchange online (if you are registered for online access), by telephone, or by mail. See Exchanging Shares.
By check. If you have not chosen another redemption method, Vanguard will mail you a redemption check, generally payable to all registered account owners, normally within two business days of your trade date, and generally to the address of record.
Trade Date
The trade date for any redemption request received in good order will depend on the day and time Vanguard receives your request and the manner in which you are redeeming. Your redemption will be executed using the NAV as calculated on the trade date. NAVs are calculated only on days that the NYSE is open for trading (a business day). In the rare event the NYSE experiences unanticipated disruptions and is unavailable at the close of the trading day, NAVs will be calculated as of the close of regular trading on the Nasdaq (or another alternate exchange if the Nasdaq is unavailable, as determined at Vanguard’s discretion), generally 4 p.m., Eastern time. The time selected for NAV calculation in this rare event shall also serve as the conclusion of the trading day. See Share Price.
For redemptions by check, exchange, or wire: If the redemption request is received by Vanguard on a business day before the close of regular trading on the NYSE (generally 4 p.m., Eastern time), the trade date will be the same day. If the redemption request is received on a business day after the close of regular trading on the NYSE, or on a nonbusiness day, the trade date will be the next business day.
• Note on timing of wire redemptions from money market funds: For telephone requests received by Vanguard on a business day before 10:45 a.m., Eastern time (2 p.m., Eastern time, for Vanguard Cash Reserves Federal Money Market Fund; 12:30 p.m., Eastern time, for Vanguard Federal Money Market Fund), the redemption proceeds generally will leave Vanguard by the close of business the same day. For telephone requests received by Vanguard on a business day after those cut-off times, or on a nonbusiness day, and for all requests other than by telephone, the redemption proceeds
73
generally will leave Vanguard by the close of business on the next business day.
• Note on timing of wire redemptions from all other funds: For requests received by Vanguard on a business day before the close of regular trading on the NYSE (generally 4 p.m., Eastern time), the redemption proceeds generally will leave Vanguard by the close of business on the next business day. For requests received by Vanguard on a business day after the close of regular trading on the NYSE, or on a nonbusiness day, the redemption proceeds generally will leave Vanguard by the close of business on the second business day after Vanguard receives the request.
For redemptions by electronic bank transfer: If the redemption request is received by Vanguard on a business day before the close of regular trading on the NYSE (generally 4 p.m., Eastern time), the trade date will be the same day. If the redemption request is received on a business day after the close of regular trading on the NYSE, or on a nonbusiness day, the trade date will be the next business day.
If your redemption request is not accurate and complete, it may be rejected. If we are unable to send your redemption proceeds by wire or electronic bank transfer because the receiving institution rejects the transfer, Vanguard will make additional efforts to complete your transaction. If Vanguard is still unable to complete the transaction, we may send the proceeds of the redemption to you by check, generally payable to all registered account owners, or use your proceeds to purchase new shares of the fund from which you sold shares for the purpose of the wire or electronic bank transfer transaction. See Other Rules You Should Know—Good Order.
If your redemption request is received in good order, we typically expect that redemption proceeds will be paid by a Fund within one business day of the trade date; however, in certain circumstances, investors may experience a longer settlement period at the time of the transaction. For further information, see “Potentially disruptive redemptions” and “Emergency circumstances.”
For further information about redemption transactions, consult our website at vanguard.com or see Contacting Vanguard.
Other Redemption Rules You Should Know
Documentation for certain accounts. Special documentation may be required to redeem from certain types of accounts, such as trust, corporate, nonprofit, or retirement accounts. Please call us before attempting to redeem from these types of accounts.
74
Potentially disruptive redemptions. Vanguard reserves the right to pay all or part of a redemption in kind—that is, in the form of securities—if we reasonably believe that a cash redemption would negatively affect the fund’s operation or performance or that the shareholder may be engaged in market-timing or frequent trading. Under these circumstances, Vanguard also reserves the right to delay payment of the redemption proceeds for up to seven calendar days. By calling us before you attempt to redeem a large dollar amount, you may avoid in-kind or delayed payment of your redemption. Please see Frequent-Trading Limitations for information about Vanguard’s policies to limit frequent trading.
Recently purchased shares. Although you can redeem shares at any time, proceeds may not be made available to you until the fund collects payment for your purchase. This may take up to seven calendar days for shares purchased by check or by electronic bank transfer. If you have written a check on a fund in an account with checkwriting privileges, that check may be rejected if your fund account does not have a sufficient available balance.
Address change. If you change your address online or by telephone, there may be up to a 14-day restriction (starting on the business day after your address is changed) on your ability to request check redemptions online and by telephone. You can request a redemption in writing (using a form available online) at any time. Confirmations of address changes are sent to both the old and new addresses.
Payment to a different person or address. At your request, we can make your redemption check payable, or wire your redemption proceeds, to a different person or send it to a different address. However, this generally requires the written consent of all registered account owners and may require additional documentation, such as a signature guarantee or a notarized signature. You may obtain a signature guarantee from some commercial or savings banks, credit unions, trust companies, or member firms of a U.S. stock exchange.
No cancellations. Vanguard will not accept your request to cancel any redemption request once processing has begun. Please be careful when placing a redemption request.
Emergency circumstances. Vanguard funds can postpone payment of redemption proceeds for up to seven calendar days. In addition, Vanguard funds can suspend redemptions and/or postpone payments of redemption proceeds beyond seven calendar days at times when the NYSE is closed or during emergency circumstances, as determined by the SEC.
75
Exchanging Shares
An exchange occurs when you use the proceeds from the redemption of shares of one Vanguard fund to simultaneously purchase shares of a different Vanguard fund. You can make exchange requests online (if you are registered for online access), by telephone, or by mail. See Purchasing Shares and Redeeming Shares.
If the NYSE is open for regular trading (generally until 4 p.m., Eastern time, on a business day) at the time an exchange request is received in good order, the trade date generally will be the same day. See Other Rules You Should Know—Good Order for additional information on all transaction requests.
Vanguard will not accept your request to cancel any exchange request once processing has begun. Please be careful when placing an exchange request.
Call Vanguard before attempting to exchange a large dollar amount. By calling us before you attempt to exchange a large dollar amount, you may avoid delayed or rejected transactions.
Please note that Vanguard reserves the right, without notice, to revise or terminate the exchange privilege, limit the amount of any exchange, or reject an exchange, at any time, for any reason. See Frequent-Trading Limitations for additional restrictions on exchanges.
Frequent-Trading Limitations
Because excessive transactions can disrupt management of a fund and increase the fund’s costs for all shareholders, the board of trustees of each Vanguard fund places certain limits on frequent trading in the funds. Each Vanguard fund (other than money market funds and short-term bond funds, but including Vanguard Short-Term Inflation-Protected Securities Index Fund) limits an investor’s purchases or exchanges into a fund account for 30 calendar days after the investor has redeemed or exchanged out of that fund account. ETF Shares are not subject to these frequent-trading limits.
For Vanguard Retirement Investment Program pooled plans, the limitations apply to exchanges made online or by telephone.
76
These frequent-trading limitations do not apply to the following:
• Certain transactions below dollar value or other thresholds specified by Vanguard.
• In-kind transactions to a shareholder’s donor advised fund managed by Vanguard Charitable.
• Purchases of shares with reinvested dividend or capital gains distributions.
• Transactions through Vanguard’s Automatic Investment Plan, Automatic Exchange Service, Direct Deposit Service, Automatic Withdrawal Plan, Required Minimum Distribution Service, Vanguard Small Business Online®, and certain transactions through intermediaries relating to systematic trades and required minimum distributions.
• Discretionary transactions through Vanguard Personal Advisor Services®, Vanguard Institutional Advisory Services®, Vanguard Digital Advisor™, and discretionary (advisor-directed) transactions through certain intermediaries.
• Redemptions of shares to pay fund or account fees.
• Redemptions of shares to remove excess shareholder contributions to certain types of retirement accounts (including, but not limited to, IRAs and Vanguard Individual 401(k) Plans).
• Transfers and reregistrations of shares within the same fund.
• Purchases of shares by asset transfer or direct rollover.
• Conversions of shares from one share class to another in the same fund.
• Checkwriting redemptions.
• Section 529 college savings plans.
• Certain approved institutional portfolios and asset allocation programs, as well as trades made by funds or trusts managed by Vanguard or its affiliates that invest in other Vanguard funds. (Please note that shareholders of Vanguard’s funds of funds are subject to the limitations.)
For participants in employer-sponsored defined contribution plans,* the frequent-trading limitations do not apply to:
• Purchases of shares with participant payroll or employer contributions or loan repayments.
• Purchases of shares with reinvested dividend or capital gains distributions.
• Distributions, loans, and in-service withdrawals from a plan.
• Redemptions of shares as part of a plan termination or at the direction of the plan.
77
• Transactions executed through the Vanguard Managed Account Program.
• Redemptions of shares to pay fund or account fees.
• Share or asset transfers or rollovers.
• Reregistrations of shares.
• Conversions of shares from one share class to another in the same fund.
• Exchange requests submitted by written request to Vanguard. (Exchange requests submitted by fax, if otherwise permitted, are subject to the limitations.)
* The following Vanguard fund accounts are subject to the frequent-trading limitations: SEP-IRAs, SIMPLE IRAs, certain Individual 403(b)(7) Custodial Accounts, and Vanguard Individual 401(k) Plans.
Accounts Held by Institutions (Other Than Defined Contribution Plans)
Vanguard will systematically monitor for frequent trading in institutional clients’ accounts. If we detect suspicious trading activity, we will investigate and take appropriate action, which may include applying to a client’s accounts the 30-day policy previously described, prohibiting a client’s purchases of fund shares, and/or revoking the client’s exchange privilege.
Accounts Held by Intermediaries
When intermediaries establish accounts in Vanguard funds for the benefit of their clients, we cannot always monitor the trading activity of the individual clients. However, we review trading activity at the intermediary (omnibus) level, and if we detect suspicious activity, we will investigate and take appropriate action. If necessary, Vanguard may prohibit additional purchases of fund shares by an intermediary, including for the benefit of certain of the intermediary’s clients. Intermediaries also may monitor their clients’ trading activities with respect to Vanguard funds.
For those Vanguard funds that charge purchase and/or redemption fees, intermediaries will be asked to assess these fees on client accounts and remit these fees to the funds. The application of purchase and redemption fees and frequent-trading limitations may vary among intermediaries. There are no assurances that Vanguard will successfully identify all intermediaries or that intermediaries will properly assess purchase and redemption fees or administer frequent-trading limitations. If you invest with Vanguard through an intermediary, please read that firm’s materials carefully to learn of any other rules or fees that may apply.
78
Other Rules You Should Know
Prospectus and Shareholder Report Mailings
When two or more shareholders have the same last name and address, just one summary prospectus (or prospectus) and/or shareholder report may be sent in an attempt to eliminate the unnecessary expense of duplicate mailings. You may request individual prospectuses and reports by contacting our Client Services Department in writing, by telephone, or online. See Contacting Vanguard.
Vanguard.com
Registration. If you are a registered user of vanguard.com, you can review your account holdings; buy, sell, or exchange shares of most Vanguard funds; and perform most other transactions through our website. You must register for this service online.
Electronic delivery. Vanguard can deliver your account statements, transaction confirmations, prospectuses, certain tax forms, and shareholder reports electronically. If you are a registered user of vanguard.com, you can consent to the electronic delivery of these documents by logging on and changing your mailing preferences under “Account Maintenance.” You can revoke your electronic consent at any time through our website, and we will begin to send paper copies of these documents within 30 days of receiving your revocation.
Telephone Transactions
Automatic. When we set up your account, we will automatically enable you to do business with us by telephone, unless you instruct us otherwise in writing.
Proof of a caller’s authority. We reserve the right to refuse a telephone request if the caller is unable to provide the requested information or if we reasonably believe that the caller is not an individual authorized to act on the account. Before we allow a caller to act on an account, we may request the following information:
• Authorization to act on the account (as the account owner or by legal documentation or other means).
• Account registration and address.
• Fund name and account number, if applicable.
• Other information relating to the caller, the account owner, or the account.
79
Good Order
We reserve the right to reject any transaction instructions that are not in “good order.” Good order generally means that your instructions:
• Are provided by the person(s) authorized in accordance with Vanguard’s policies and procedures to access the account and request transactions.
• Include the fund name and account number.
• Include the amount of the transaction (stated in dollars, shares, or percentage).
Written instructions also must generally be provided on a Vanguard form and include:
• Signature(s) and date from the authorized person(s).
• Signature guarantees or notarized signatures, if required for the type of transaction. (Call Vanguard for specific requirements.)
• Any supporting documentation that may be required.
Good order requirements may vary among types of accounts and transactions. For more information, consult our website at vanguard.com or see Contacting Vanguard.
Vanguard reserves the right, without notice, to revise the requirements for good order.
Future Trade-Date Requests
Vanguard does not accept requests to hold a purchase, conversion, redemption, or exchange transaction for a future date. All such requests will receive trade dates as previously described in Purchasing Shares, Converting Shares, Redeeming Shares, and Exchanging Shares. Vanguard reserves the right to return future-dated purchase checks.
Accounts With More Than One Owner
If an account has more than one owner or authorized person, Vanguard generally will accept instructions from any one owner or authorized person.
Responsibility for Fraud
You should take precautions to protect yourself from fraud. Keep your account-related information private, and review any account confirmations, statements, or other information that we provide to you as soon as you receive them. Let us know immediately if you discover unauthorized activity or see something on your account that you do not understand or that looks unusual.
80
Vanguard will not be responsible for losses that result from transactions by a person who we reasonably believe is authorized to act on your account.
Uncashed Checks
Please cash your distribution or redemption checks promptly. Vanguard will not pay interest on uncashed checks. Vanguard may be required to transfer assets related to uncashed checks to a state under the state’s abandoned property law.
Dormant Accounts
If your account has no activity in it for a period of time, Vanguard may be required to transfer it to a state under the state’s abandoned property law, subject to potential federal or state withholding taxes.
Unusual Circumstances
If you experience difficulty contacting Vanguard online or by telephone, you can send us your transaction request on a Vanguard form by regular or express mail.
Investing With Vanguard Through Other Firms
You may purchase or sell shares of most Vanguard funds through a financial intermediary, such as a bank, a broker, or an investment advisor. Please consult your financial intermediary to determine which, if any, shares are available through that firm and to learn about other rules that may apply. Your financial intermediary can provide you with account information and any required tax forms. You may be required to pay a commission on purchases of mutual fund shares made through a financial intermediary.
Please see Frequent-Trading Limitations—Accounts Held by Intermediaries for information about the assessment of any purchase or redemption fees and the monitoring of frequent trading for accounts held by intermediaries.
Account Service Fee
Vanguard may charge a $25 account service fee on fund accounts that have a balance below $5,000,000 for any reason, including market fluctuation. The account service fee may be applied to both retirement and nonretirement fund accounts and may be assessed on fund accounts in all Vanguard funds, regardless of the account minimum. The fee, which will be collected by redeeming fund shares in the amount of $25, will be deducted from fund accounts subject to the fee once per calendar year.
Certain account types have alternative fee structures, including SIMPLE IRAs, Vanguard Retirement Investment Program pooled plans, and Vanguard Individual 401(k) Plans.
81
Low-Balance Accounts
Each Fund reserves the right to liquidate a fund account whose balance falls
below the account minimum for any reason, including market fluctuation. This
liquidation policy applies to nonretirement fund accounts and accounts that are held through intermediaries. Any such liquidation will be preceded by written notice to the investor.
below the account minimum for any reason, including market fluctuation. This
liquidation policy applies to nonretirement fund accounts and accounts that are held through intermediaries. Any such liquidation will be preceded by written notice to the investor.
Right to Change Policies
In addition to the rights expressly stated elsewhere in this prospectus, Vanguard reserves the right, without notice, to (1) alter, add, or discontinue any conditions of purchase (including eligibility requirements), redemption, exchange, conversion, service, or privilege at any time and (2) alter, impose, discontinue, or waive any purchase fee, redemption fee, account service fee, or other fee charged to a shareholder or a group of shareholders. Changes may affect any or all investors. These actions will be taken when, at the sole discretion of Vanguard management, Vanguard believes they are in the best interest of a fund.
Account Restrictions
Vanguard reserves the right to: (1) redeem all or a portion of a fund/account to meet a legal obligation, including tax withholding, tax lien, garnishment order, or other obligation imposed on your account by a court or government agency; (2) redeem shares, close an account, or suspend account privileges, features, or options in the case of threatening conduct or activity; (3) redeem shares, close an account, or suspend account privileges, features, or options if Vanguard believes or suspects that not doing so could result in a suspicious, fraudulent, or illegal transaction; (4) place restrictions on the ability to redeem any or all shares in an account if it is required to do so by a court or government agency; (5) place restrictions on the ability to redeem any or all shares in an account if Vanguard believes that doing so will prevent fraud, financial exploitation or abuse, or to protect vulnerable investors; (6) freeze any account and/or suspend account services if Vanguard has received reasonable notice of a dispute regarding the assets in an account, including notice of a dispute between the registered or beneficial account owners; and (7) freeze any account and/or suspend account services upon initial notification to Vanguard of the death of an account owner.
Share Classes
Vanguard reserves the right, without notice, to change the eligibility requirements of its share classes, including the types of clients who are eligible to purchase each share class.
82
Shareholder Rights
Each Fund’s Agreement and Declaration of Trust, as amended, requires a shareholder bringing a derivative action on behalf of Vanguard Scottsdale Funds (the Trust) that is subject to a pre-suit demand to collectively hold at least 10% of the outstanding shares of a Trust or at least 10% of the outstanding shares of the series or class to which the demand relates and to undertake to reimburse the Trust for the expense of any counsel or advisors used when considering the merits of the demand in the event that the board of trustees determines not to bring such action. In each case, these requirements do not apply to claims arising under the federal securities laws to the extent that any such federal securities laws, rules, or regulations do not permit such application.
Fund and Account Updates
Confirmation Statements
We will send (or provide through our website, whichever you prefer) a confirmation of your trade date and the amount of your transaction when you buy, sell, exchange, or convert shares. However, we will not send confirmations reflecting only checkwriting redemptions or the reinvestment of dividend or capital gains distributions. For any month in which you had a checkwriting redemption, a Checkwriting Activity Statement will be sent to you itemizing the checkwriting redemptions for that month. Promptly review each confirmation statement that we provide to you. It is important that you contact Vanguard immediately with any questions you may have about any transaction reflected on a confirmation statement, or Vanguard will consider the transaction properly processed.
Portfolio Summaries
We will send (or provide through our website, whichever you prefer) quarterly portfolio summaries to help you keep track of your accounts throughout the year. Each summary shows the market value of your account at the close of the statement period, as well as all distributions, purchases, redemptions, exchanges, transfers, and conversions for the current calendar quarter (or month). Promptly review each summary that we provide to you. It is important that you contact Vanguard immediately with any questions you may have about any transaction reflected on the summary, or Vanguard will consider the transaction properly processed.
83
Tax Information Statements
For most accounts, Vanguard (or your intermediary) is required to provide annual tax forms to assist you in preparing your income tax returns. These forms are generally available for each calendar year early in the following year. Registered users of vanguard.com can also view certain forms through our website. Vanguard (or your intermediary) may also provide you with additional tax-related documentation. For more information, consult our website at vanguard.com or see Contacting Vanguard.
Annual and Semiannual Reports
We will send (or provide through our website, whichever you prefer) reports about Vanguard Sector Bond Index Funds twice a year, in April and October. These reports include overviews of the financial markets and provide the following specific Fund information:
• Performance assessments and comparisons with industry benchmarks.
• Financial statements with listings of Fund holdings.
Portfolio Holdings
Please consult the Funds' Statement of Additional Information or our website for a description of the policies and procedures that govern disclosure of a Fund’s portfolio holdings.
Employer-Sponsored Plans
Your plan administrator or your employee benefits office can provide you with detailed information on how to participate in your plan and how to elect a Fund as an investment option.
• If you have any questions about a Fund or Vanguard, including those about a Fund’s investment objective, strategies, or risks, contact Vanguard Participant Services toll-free at 800-523-1188 or visit our website at vanguard.com.
• If you have questions about your account, contact your plan administrator or the organization that provides recordkeeping services for your plan.
• Be sure to carefully read each topic that pertains to your transactions with Vanguard.
Vanguard reserves the right to change its policies without notice to shareholders.
84
Transactions
Processing times for your transaction requests may differ among recordkeepers or among transaction and funding types. Your plan’s recordkeeper (which may also be Vanguard) will determine the necessary processing time frames for your transaction requests prior to submission to a Fund. Consult your recordkeeper or plan administrator for more information.
If Vanguard is serving as your plan recordkeeper and if your transaction involves one or more investments with an early cut-off time for processing or another trading restriction, your entire transaction will be subject to the restriction when the trade date for your transaction is determined.
85
Contacting Vanguard
|
Web |
|
|
Vanguard.com |
For the most complete source of Vanguard news
For fund, account, and service information
For most account transactions
For literature requests
24 hours a day, 7 days a week |
|
Phone | |
|
Investor Information 800-662-7447
(Text telephone for people with
hearing impairment at 800-749-7273) |
For fund and service information
For literature requests |
|
Client Services 800-662-2739
(Text telephone for people with
hearing impairment at 800-749-7273) |
For account information
For most account transactions |
|
Participant Services 800-523-1188
(Text telephone for people with
hearing impairment at 800-749-7273) |
For information and services for participants in
employer-sponsored plans |
|
Institutional Division
888-809-8102 |
For information and services for large institutional
investors |
|
Financial Advisor and Intermediary
Sales Support 800-997-2798 |
For information and services for financial intermediaries
including financial advisors, broker-dealers, trust
institutions, and insurance companies |
|
Financial Advisory and Intermediary
Trading Support 800-669-0498 |
For account information and trading support for
financial intermediaries including financial advisors,
broker-dealers, trust institutions, and insurance
companies |
86
Additional Information
Each Fund’s Bylaws require, unless the Trust otherwise consents in writing, that the U.S. Federal District Courts be the sole and exclusive forum for the resolution of complaints under the Securities Act of 1933. This provision may limit a shareholder’s ability to bring a claim in a different forum and may result in increased shareholder costs in pursuing such a claim.
|
Vanguard Fund |
Inception
Date |
Newspaper
Abbreviation |
Vanguard
Fund Number |
CUSIP
Number |
|
Vanguard Short-Term Treasury Index Fund | ||||
|
Admiral Shares |
12/28/2009 |
STGovIxAdm |
1942 |
92206C300 |
|
Vanguard Intermediate-Term Treasury Index Fund | ||||
|
Admiral Shares |
8/4/2010 |
ITGovIxAdm |
1943 |
92206C888 |
|
Vanguard Long-Term Treasury Index Fund | ||||
|
Admiral Shares |
3/1/2010 |
LTGovIxAdm |
1944 |
92206C821 |
|
Vanguard Short-Term Corporate Bond Index Fund | ||||
|
Admiral Shares |
11/18/2010 |
STCorpIxAdm |
1945 |
92206C607 |
|
Vanguard Intermediate-Term Corporate Bond Index Fund | ||||
|
Admiral Shares |
3/2/2010 |
ITCorpIxAdm |
1946 |
92206C854 |
|
Vanguard Long-Term Corporate Bond Index Fund | ||||
|
Admiral Shares |
1/19/2010 |
LTCorpIxAdm |
1947 |
92206C789 |
|
Vanguard Mortgage-Backed Securities Index Fund | ||||
|
Admiral Shares |
12/3/2009 |
MrgBkdIxAdm |
1948 |
92206C755 |
CGS identifiers have been provided by CUSIP Global Services, managed on behalf of the American Bankers Association by Standard & Poor’s Financial Services, LLC, and are not for use or dissemination in a manner that would serve as a substitute for any CUSIP service. The CUSIP Database, © 2023 American Bankers Association. “CUSIP” is a registered trademark of the American Bankers Association.
87
CFA® is a registered trademark owned by CFA Institute.
”Bloomberg®” and Bloomberg U.S. Treasury 1–3 Year Index, Bloomberg U.S. Treasury 3–10 Year Index, Bloomberg U.S. Long Treasury Index, Bloomberg U.S. 1-5 Year Corporate Bond Index, Bloomberg U.S. 5–10 Year Corporate Bond Index, Bloomberg U.S. 10+ Year Corporate Bond Index, Bloomberg U.S. MBS Float Adjusted Index, and Bloomberg U.S. Aggregate Float Adjusted Index (“the Indices” or “Bloomberg Indices”) are service marks of Bloomberg Finance L.P. and its affiliates, including Bloomberg Index Services Limited (“BISL”), the administrator of the Indices (collectively, “Bloomberg”), and have been licensed for use for certain purposes by Vanguard.
Vanguard Sector Bond Index Funds are not sponsored, endorsed, sold or promoted by Bloomberg. Bloomberg does not make any representation or warranty, express or implied, to the owners of or counterparties to Vanguard Sector Bond Index Funds or any member of the public regarding the advisability of investing in securities generally or in Vanguard Sector Bond Index Funds particularly. The only relationship of Bloomberg to Vanguard is the licensing of certain trademarks, trade names and service marks and of the U.S. Treasury 1–3 Year Index, Bloomberg U.S. Treasury 3–10 Year Index, Bloomberg U.S. Long Treasury Index, Bloomberg U.S. 1-5 Year Corporate Bond Index, Bloomberg U.S. 5–10 Year Corporate Bond Index, Bloomberg U.S. 10+ Year Corporate Bond Index, Bloomberg U.S. MBS Float Adjusted Index, and Bloomberg U.S. Aggregate Float Adjusted Index, which is determined, composed and calculated by BISL without regard to Vanguard or Vanguard Sector Bond Index Funds. Bloomberg has no obligation to take the needs of Vanguard or the owners of Vanguard Sector Bond Index Funds into consideration in determining, composing or calculating the U.S. Treasury 1–3 Year Index, Bloomberg U.S. Treasury 3–10 Year Index, Bloomberg U.S. Long Treasury Index, Bloomberg U.S. 1-5 Year Corporate Bond Index, Bloomberg U.S. 5–10 Year Corporate Bond Index, Bloomberg U.S. 10+ Year Corporate Bond Index, Bloomberg U.S. MBS Float Adjusted Index, and Bloomberg U.S. Aggregate Float Adjusted Index. Bloomberg is not responsible for and has not participated in the determination of the timing of, prices at, or quantities of Vanguard Sector Bond Index Funds to be issued. Bloomberg shall not have any obligation or liability, including, without limitation, to Vanguard Sector Bond Index Funds customers, in connection with the administration, marketing or trading of Vanguard Sector Bond Index Funds.
BLOOMBERG DOES NOT GUARANTEE THE ACCURACY AND/OR THE COMPLETENESS OF THE U.S. TREASURY 1-3 YEAR INDEX, BLOOMBERG U.S. TREASURY 3-10 YEAR INDEX, BLOOMBERG U.S. LONG TREASURY INDEX, BLOOMBERG U.S. 1-5 YEAR CORPORATE BOND INDEX, BLOOMBERG U.S. 5-10 YEAR CORPORATE BOND INDEX, BLOOMBERG U.S. 10+ YEAR CORPORATE BOND INDEX, BLOOMBERG U.S. MBS FLOAT ADJUSTED INDEX, AND BLOOMBERG U.S. AGGREGATE FLOAT ADJUSTED INDEX OR ANY DATA RELATED THERETO AND SHALL HAVE NO LIABILITY FOR ANY ERRORS, OMISSIONS OR INTERRUPTIONS THEREIN. BLOOMBERG DOES NOT MAKE ANY WARRANTY, EXPRESS OR IMPLIED, AS TO RESULTS TO BE OBTAINED BY VANGUARD, OWNERS OF VANGUARD SECTOR BOND INDEX FUNDS OR ANY OTHER PERSON OR ENTITY FROM THE USE OF THE U.S. TREASURY 1-3 YEAR INDEX, BLOOMBERG U.S. TREASURY 3-10 YEAR INDEX, BLOOMBERG U.S. LONG TREASURY INDEX, BLOOMBERG U.S. 1-5 YEAR CORPORATE BOND INDEX, BLOOMBERG U.S. 5-10 YEAR CORPORATE BOND INDEX, BLOOMBERG U.S. 10+ YEAR CORPORATE BOND INDEX, BLOOMBERG U.S. MBS FLOAT ADJUSTED INDEX, AND BLOOMBERG U.S. AGGREGATE FLOAT ADJUSTED INDEX OR ANY DATA RELATED THERETO. BLOOMBERG DOES NOT MAKE ANY EXPRESS OR IMPLIED WARRANTIES AND EXPRESSLY DISCLAIMS ALL WARRANTIES OF MERCHANTABILITY OR FITNESS FOR A PARTICULAR PURPOSE OR USE WITH RESPECT TO THE U.S. TREASURY 1-3 YEAR INDEX, BLOOMBERG U.S. TREASURY 3-10 YEAR INDEX, BLOOMBERG U.S. LONG TREASURY INDEX, BLOOMBERG U.S. 1-5 YEAR CORPORATE BOND INDEX, BLOOMBERG U.S. 5-10 YEAR CORPORATE BOND INDEX, BLOOMBERG U.S. 10+ YEAR CORPORATE BOND INDEX, BLOOMBERG U.S. MBS FLOAT ADJUSTED INDEX, AND BLOOMBERG U.S. AGGREGATE FLOAT ADJUSTED INDEX OR ANY DATA RELATED THERETO. WITHOUT LIMITING ANY OF THE FOREGOING, TO THE MAXIMUM EXTENT ALLOWED BY LAW, BLOOMBERG, ITS LICENSORS, AND ITS AND THEIR RESPECTIVE EMPLOYEES, CONTRACTORS, AGENTS, SUPPLIERS, AND VENDORS SHALL HAVE NO LIABILITY OR RESPONSIBILITY WHATSOEVER FOR ANY INJURY OR DAMAGES—WHETHER DIRECT, INDIRECT,
88
CONSEQUENTIAL, INCIDENTAL, PUNITIVE OR OTHERWISE—ARISING IN CONNECTION WITH VANGUARD SECTOR BOND INDEX FUNDS OR U.S. TREASURY 1-3 YEAR INDEX, BLOOMBERG U.S. TREASURY 3-10 YEAR INDEX, BLOOMBERG U.S. LONG TREASURY INDEX, BLOOMBERG U.S. 1-5 YEAR CORPORATE BOND INDEX, BLOOMBERG U.S. 5-10 YEAR CORPORATE BOND INDEX, BLOOMBERG U.S. 10+ YEAR CORPORATE BOND INDEX, BLOOMBERG U.S. MBS FLOAT ADJUSTED INDEX, AND BLOOMBERG U.S. AGGREGATE FLOAT ADJUSTED INDEX OR ANY DATA OR VALUES RELATING THERETO—WHETHER ARISING FROM THEIR NEGLIGENCE OR OTHERWISE, EVEN IF NOTIFIED OF THE POSSIBILITY THEREOF.
89
Glossary of Investment Terms
Average Maturity. The average length of time until bonds held by a fund reach maturity and are repaid. In general, the longer the average maturity, the more a fund's share price fluctuates in response to changes in market interest rates. In calculating average maturity, a fund uses a bond’s maturity or, if applicable, an earlier date on which the advisor believes it is likely that a maturity-shortening device (such as a call, put, refunding, prepayment, or redemption provision or an adjustable coupon rate) will cause the bond to be repaid.
Bloomberg U.S. Aggregate Float Adjusted Index. An index that is the broadest representation of the taxable U.S. bond market, including most U.S. Treasury, agency, corporate, mortgage-backed, asset-backed, and international dollar-denominated issues, all with investment-grade ratings and maturities of 1 year or more. This Index weights its constituent securities based on the value of the constituent securities that are available for public trading, rather than the value of all constituent securities.
Bond. A debt security (IOU) issued by a corporation, a government, or a government agency in exchange for the money the bondholder lends it. In most instances, the issuer agrees to pay back the loan by a specific date and generally to make regular interest payments until that date.
Capital Gains Distributions. Payments to mutual fund shareholders of gains realized on securities that a fund has sold at a profit, minus any realized losses.
Corporate Bond. An IOU issued by a business that wants to borrow money. As with other types of bonds, the issuer promises to repay the borrowed money by a specific date and generally to make interest payments in the meantime.
Coupon Rate. The interest rate paid by the issuer of a debt security until its maturity. It is expressed as an annual percentage of the face value of the security.
Dividend Distributions. Payments to mutual fund shareholders of income from interest or dividends generated by a fund's investments.
Expense Ratio. A fund's total annual operating expenses expressed as a percentage of the fund's average net assets. The expense ratio includes management and administrative expenses, but it does not include the transaction costs of buying and selling portfolio securities.
Face Value. The amount to be paid at a bond’s maturity; also known as the par value or principal.
90
Fixed Income Security. An investment, such as a bond, representing a debt that must be repaid by a specified date, and on which the borrower may pay a fixed, variable, or floating rate of interest.
Float-Adjusted Index. An index that weights its constituent securities based on the value of the constituent securities that are available for public trading, rather than the value of all constituent securities. Some portion of an issuer’s securities may be unavailable for public trading because, for example, those securities are owned by company insiders on a restricted basis or by a government agency. By excluding unavailable securities, float-adjusted indexes can produce a more accurate picture of the returns actually experienced by investors in the measured market.
Government Bond. An IOU issued by the U.S. government or a government agency in exchange for the money you lend it. The issuer promises to repay the borrowed money by a specific date and generally to make regular interest payments until that date.
Inception Date. The date on which the assets of a fund (or one of its share classes) are first invested in accordance with the fund's investment objective. For funds with a subscription period, the inception date is the day after that period ends. Investment performance is generally measured from the inception date.
Indexing. A low-cost investment strategy in which a mutual fund attempts to track—rather than outperform—a specified market benchmark, or “index.”
Investment-Grade Bond. A debt security whose credit quality is considered by independent bond rating agencies, or through independent analysis conducted by a fund's advisor, to be sufficient to ensure timely payment of principal and interest under current economic circumstances. Debt securities rated in one of the four highest rating categories are considered investment-grade. Other debt securities may be considered by an advisor to be investment-grade.
Joint Committed Credit Facility. Each Fund participates, along with other funds managed by Vanguard, in a committed credit facility provided by a syndicate of lenders pursuant to a credit agreement that may be renewed annually; each Vanguard fund is individually liable for its borrowings, if any, under the credit facility. The amount and terms of the committed credit facility are subject to approval by the Funds' board of trustees and renegotiation with the lender syndicate on an annual basis.
91
Mutual Fund. An investment company that pools the money of many people and invests it in a variety of securities in an effort to achieve a specific objective over time.
New York Stock Exchange (NYSE). A stock exchange based in New York City that is open for regular trading on business days, Monday through Friday, from 9:30 a.m. to 4 p.m., Eastern time.
Principal. The face value of a debt instrument or the amount of money put into an investment.
Return of Capital. A return of capital occurs when a fund's distributions exceed its earnings in a fiscal year. A return of capital is a return of all or part of your original investment or amounts paid in excess of your original investment in a fund. In general, a return of capital reduces your cost basis in a fund's shares and is not taxable to you until your cost basis has been reduced to zero.
Securities. Stocks, bonds, money market instruments, and other investments.
Total Return. A percentage change, over a specified time period, in a mutual fund's net asset value, assuming the reinvestment of all distributions of dividends and capital gains.
Volatility. The fluctuations in value of a mutual fund or other security. The greater a fund's volatility, the wider the fluctuations in its returns.
Yield. Income (interest or dividends) earned by an investment, expressed as a percentage of the investment’s price.
92
Connect with Vanguard® ˃ vanguard.com
For More Information
If you would like more information about Vanguard Sector Bond Index Funds, the following documents are available free upon request:
Annual/Semiannual Reports to Shareholders
Additional information about the Funds' investments is available in the Funds' annual and semiannual reports to shareholders. In the annual report, you will find a discussion of the market conditions and investment strategies that significantly affected the Funds' performance during their last fiscal year.
Statement of Additional Information (SAI)
The SAI provides more detailed information about the Funds and is incorporated by reference into (and thus legally a part of) this prospectus.
To receive a free copy of the latest annual or semiannual report or the SAI, or to request additional information about the Funds or other Vanguard funds, please visit vanguard.com or contact us as follows:
If you are an individual investor:
Telephone: 800-662-7447; Text telephone for people with hearing impairment: 800-749-7273
Telephone: 800-662-7447; Text telephone for people with hearing impairment: 800-749-7273
If you are a participant in an employer-sponsored plan:
Telephone: 800-523-1188; Text telephone for people with hearing impairment: 800-749-7273
Telephone: 800-523-1188; Text telephone for people with hearing impairment: 800-749-7273
If you are a current Vanguard shareholder and would like information about your account, account transactions, and/or account statements, please call:
Client Services Department
Telephone: 800-662-2739; Text telephone for people with hearing impairment: 800-749-7273
Telephone: 800-662-2739; Text telephone for people with hearing impairment: 800-749-7273
Information Provided by the SEC
Reports and other information about the Funds are available in the EDGAR database on the SEC’s website at sec.gov, or you can receive copies of this information, for a fee, by electronic request at the following email address: publicinfo@sec.gov.
Funds' Investment Company Act file number: 811-07803
© 2023 The Vanguard Group, Inc. All rights reserved.
Vanguard Marketing Corporation, Distributor.
P 1942 122023
Vanguard Marketing Corporation, Distributor.
P 1942 122023
Vanguard Sector Bond Index Funds
Prospectus
December 22, 2023
Institutional Shares
Vanguard Short-Term Treasury Index Fund Institutional Shares (VSBIX)
Vanguard Intermediate-Term Treasury Index Fund Institutional Shares (VIIGX)
Vanguard Long-Term Treasury Index Fund Institutional Shares (VLGIX)
Vanguard Short-Term Corporate Bond Index Fund Institutional Shares (VSTBX)
Vanguard Intermediate-Term Corporate Bond Index Fund Institutional Shares (VICBX)
Vanguard Long-Term Corporate Bond Index Fund Institutional Shares (VLCIX)
Vanguard Mortgage-Backed Securities Index Fund Institutional Shares (VMBIX)
This prospectus contains financial data for the Funds through the fiscal year ended August 31, 2023.
The Securities and Exchange Commission (SEC) has not approved or disapproved these securities or passed upon the adequacy of this prospectus. Any representation to the contrary is a criminal offense.
(Fees paid directly from your investment)
|
| |
|
Sales Charge (Load) Imposed on Purchases |
|
|
Purchase Fee |
|
|
Sales Charge (Load) Imposed on Reinvested Dividends |
|
|
Redemption Fee |
|
(Expenses that you pay each year as a percentage of the value of your investment)
|
| |
|
Management Fees |
% |
|
12b-1 Distribution Fee |
|
|
Other Expenses |
% |
|
Total Annual Fund Operating Expenses |
% |
|
1 Year |
3 Years |
5 Years |
10 Years |
|
$ |
$ |
$ |
$ |
1
2

1 The year-to-date return as of the most recent calendar quarter, which ended on September 30, 2023, was 1.71%.
|
|
Total Return |
Quarter |
|
|
% |
|
|
|
-
% |
|
3
|
|
1 Year |
5 Years |
10 Years |
|
Vanguard Short-Term Treasury Index Fund
Institutional Shares |
|
|
|
|
Return Before Taxes |
-
% |
% |
% |
|
Return After Taxes on Distributions |
- |
|
|
|
Return After Taxes on Distributions and Sale of Fund Shares |
- |
|
|
|
Bloomberg U.S. Treasury 1-3 Year Index
(reflects no deduction for fees, expenses, or taxes) |
-
% |
% |
% |
|
Spliced Bloomberg U.S. Treasury 1-3 Year Index in USD
(reflects no deduction for fees, expenses, or taxes) |
- |
|
|
|
Bloomberg U.S. Aggregate Float Adjusted Index
(reflects no deduction for fees, expenses, or taxes) |
- |
|
|
Investment Advisor
The Vanguard Group, Inc. (Vanguard)
Portfolio Manager
Joshua C. Barrickman, CFA, Principal of Vanguard and co-head of Vanguard’s Fixed Income Indexing Americas. He has managed the Fund since 2013.
4
Purchase and Sale of Fund Shares
You may purchase or redeem shares online through our website (vanguard.com), by mail (The Vanguard Group, P.O. Box 982901, El Paso, TX 79998-2901), or by telephone (800-662-2739). The minimum investment amount required to open and maintain a Fund account for Institutional Shares is $5 million. The minimum investment amount required to add to an existing Fund account is generally $1. If you are investing through an employer-sponsored retirement or savings plan, your plan administrator or your benefits office can provide you with detailed information on how you can invest through your plan.
Tax Information
The Fund’s distributions may be taxable as ordinary income or capital gain. If you are investing through a tax-advantaged account, such as an IRA or an employer-sponsored retirement or savings plan, special tax rules apply.
Payments to Financial Intermediaries
The Fund and its investment advisor do not pay financial intermediaries for sales of Fund shares.
5
(Fees paid directly from your investment)
|
| |
|
Sales Charge (Load) Imposed on Purchases |
|
|
Purchase Fee |
|
|
Sales Charge (Load) Imposed on Reinvested Dividends |
|
|
Redemption Fee |
|
(Expenses that you pay each year as a percentage of the value of your investment)
|
| |
|
Management Fees |
% |
|
12b-1 Distribution Fee |
|
|
Other Expenses |
% |
|
Total Annual Fund Operating Expenses |
% |
|
1 Year |
3 Years |
5 Years |
10 Years |
|
$ |
$ |
$ |
$ |
6
7
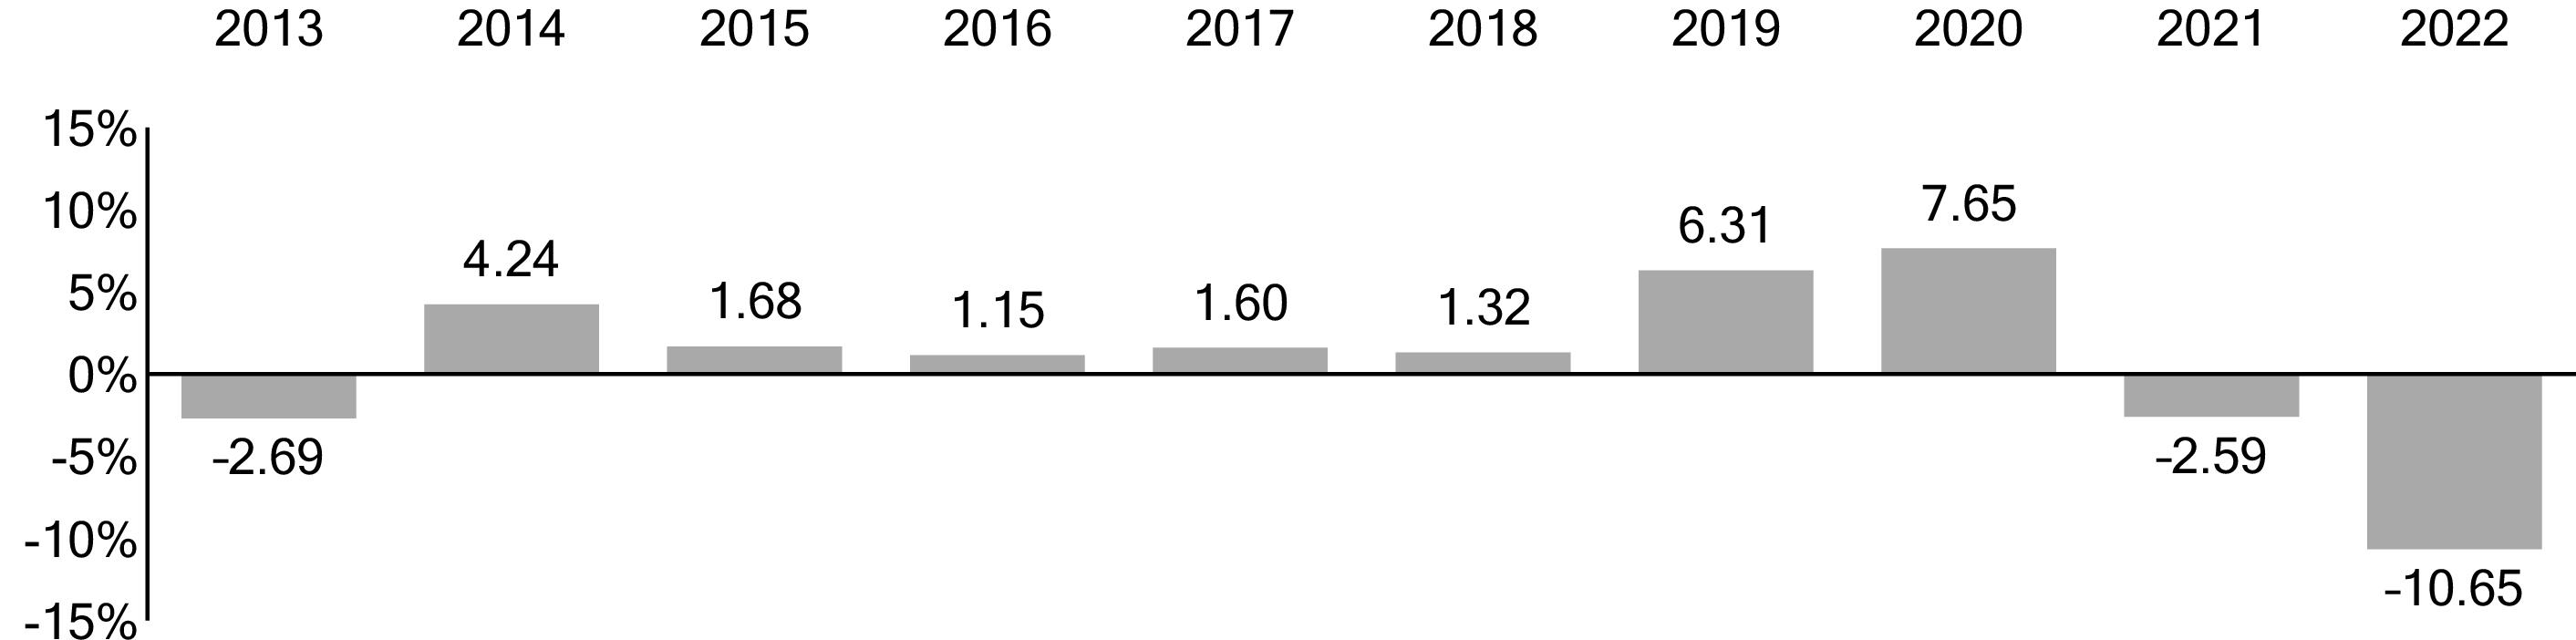
1 The year-to-date return as of the most recent calendar quarter, which ended on September 30, 2023, was -0.54%.
|
|
Total Return |
Quarter |
|
|
% |
|
|
|
-
% |
|
8
|
|
1 Year |
5 Years |
10 Years |
|
Vanguard Intermediate-Term Treasury Index Fund
Institutional Shares |
|
|
|
|
Return Before Taxes |
-
% |
% |
% |
|
Return After Taxes on Distributions |
- |
- |
- |
|
Return After Taxes on Distributions and Sale of Fund Shares |
- |
- |
|
|
Bloomberg U.S. Treasury 3-10 Year Index
(reflects no deduction for fees, expenses, or taxes) |
-
% |
% |
% |
|
Spliced Bloomberg U.S. Treasury 3-10 Year Index in USD
(reflects no deduction for fees, expenses, or taxes) |
- |
|
|
|
Bloomberg U.S. Aggregate Float Adjusted Index
(reflects no deduction for fees, expenses, or taxes) |
- |
|
|
9
Investment Advisor
The Vanguard Group, Inc. (Vanguard)
Portfolio Manager
Joshua C. Barrickman, CFA, Principal of Vanguard and co-head of Vanguard’s Fixed Income Indexing Americas. He has managed the Fund since 2013.
Purchase and Sale of Fund Shares
You may purchase or redeem shares online through our website (vanguard.com), by mail (The Vanguard Group, P.O. Box 982901, El Paso, TX 79998-2901), or by telephone (800-662-2739). The minimum investment amount required to open and maintain a Fund account for Institutional Shares is $5 million. The minimum investment amount required to add to an existing Fund account is generally $1. If you are investing through an employer-sponsored retirement or savings plan, your plan administrator or your benefits office can provide you with detailed information on how you can invest through your plan.
Tax Information
The Fund’s distributions may be taxable as ordinary income or capital gain. If you are investing through a tax-advantaged account, such as an IRA or an employer-sponsored retirement or savings plan, special tax rules apply.
Payments to Financial Intermediaries
The Fund and its investment advisor do not pay financial intermediaries for sales of Fund shares.
10
(Fees paid directly from your investment)
|
| |
|
Sales Charge (Load) Imposed on Purchases |
|
|
Purchase Fee |
|
|
Sales Charge (Load) Imposed on Reinvested Dividends |
|
|
Redemption Fee |
|
(Expenses that you pay each year as a percentage of the value of your investment)
|
| |
|
Management Fees |
% |
|
12b-1 Distribution Fee |
|
|
Other Expenses |
% |
|
Total Annual Fund Operating Expenses |
% |
|
1 Year |
3 Years |
5 Years |
10 Years |
|
$ |
$ |
$ |
$ |
11
12
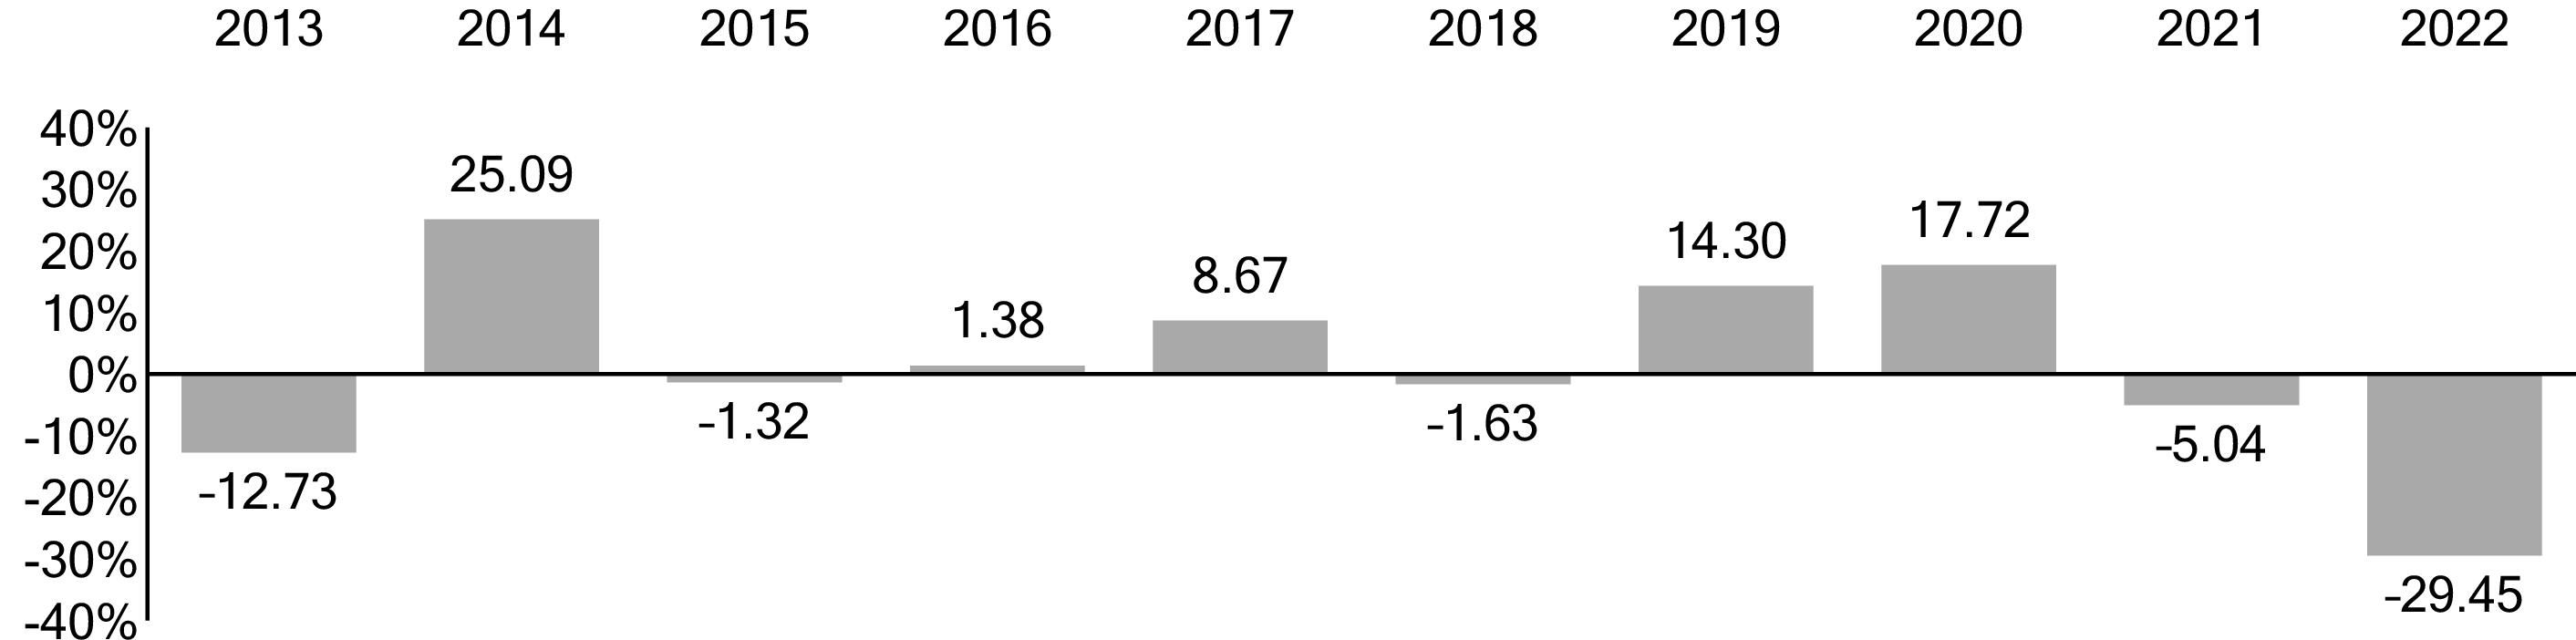
1 The year-to-date return as of the most recent calendar quarter, which ended on September 30, 2023, was -7.94%.
|
|
Total Return |
Quarter |
|
|
% |
|
|
|
-
% |
|
13
|
|
1 Year |
5 Years |
10 Years |
|
Vanguard Long-Term Treasury Index Fund
Institutional Shares |
|
|
|
|
Return Before Taxes |
-
% |
-
% |
% |
|
Return After Taxes on Distributions |
- |
- |
- |
|
Return After Taxes on Distributions and Sale of Fund Shares |
- |
- |
- |
|
Bloomberg U.S. Long Treasury Bond Index
(reflects no deduction for fees, expenses, or taxes) |
-
% |
-
% |
% |
|
Spliced Bloomberg U.S. Long Treasury Index in USD
(reflects no deduction for fees, expenses, or taxes) |
- |
- |
|
|
Bloomberg U.S. Aggregate Float Adjusted Index
(reflects no deduction for fees, expenses, or taxes) |
- |
|
|
Investment Advisor
The Vanguard Group, Inc. (Vanguard)
Portfolio Manager
Joshua C. Barrickman, CFA, Principal of Vanguard and co-head of Vanguard’s Fixed Income Indexing Americas. He has managed the Fund since 2013.
14
Purchase and Sale of Fund Shares
You may purchase or redeem shares online through our website (vanguard.com), by mail (The Vanguard Group, P.O. Box 982901, El Paso, TX 79998-2901), or by telephone (800-662-2739). The minimum investment amount required to open and maintain a Fund account for Institutional Shares is $5 million. The minimum investment amount required to add to an existing Fund account is generally $1. If you are investing through an employer-sponsored retirement or savings plan, your plan administrator or your benefits office can provide you with detailed information on how you can invest through your plan.
Tax Information
The Fund’s distributions may be taxable as ordinary income or capital gain. If you are investing through a tax-advantaged account, such as an IRA or an employer-sponsored retirement or savings plan, special tax rules apply.
Payments to Financial Intermediaries
The Fund and its investment advisor do not pay financial intermediaries for sales of Fund shares.
15
(Fees paid directly from your investment)
|
| |
|
Sales Charge (Load) Imposed on Purchases |
|
|
Purchase Fee |
|
|
Sales Charge (Load) Imposed on Reinvested Dividends |
|
|
Redemption Fee |
|
(Expenses that you pay each year as a percentage of the value of your investment)
|
| |
|
Management Fees |
% |
|
12b-1 Distribution Fee |
|
|
Other Expenses |
% |
|
Total Annual Fund Operating Expenses |
% |
|
1 Year |
3 Years |
5 Years |
10 Years |
|
$ |
$ |
$ |
$ |
16
17

1 The year-to-date return as of the most recent calendar quarter, which ended on September 30, 2023, was 2.04%.
18
|
|
Total Return |
Quarter |
|
|
% |
|
|
|
-
% |
|
|
|
1 Year |
5 Years |
10 Years |
|
Vanguard Short-Term Corporate Bond Index Fund
Institutional Shares |
|
|
|
|
Return Before Taxes |
-
% |
% |
% |
|
Return After Taxes on Distributions |
- |
|
|
|
Return After Taxes on Distributions and Sale of Fund Shares |
- |
|
|
|
Bloomberg U.S. 1-5 Year Corporate Bond Index
(reflects no deduction for fees, expenses, or taxes) |
-
% |
% |
% |
|
Bloomberg U.S. Aggregate Float Adjusted Index
(reflects no deduction for fees, expenses, or taxes) |
- |
|
|
Investment Advisor
The Vanguard Group, Inc. (Vanguard)
Portfolio Manager
Joshua C. Barrickman, CFA, Principal of Vanguard and co-head of Vanguard’s Fixed Income Indexing Americas. He has managed the Fund since its inception in 2009.
19
Purchase and Sale of Fund Shares
You may purchase or redeem shares online through our website (vanguard.com), by mail (The Vanguard Group, P.O. Box 982901, El Paso, TX 79998-2901), or by telephone (800-662-2739). The minimum investment amount required to open and maintain a Fund account for Institutional Shares is $5 million. The minimum investment amount required to add to an existing Fund account is generally $1. If you are investing through an employer-sponsored retirement or savings plan, your plan administrator or your benefits office can provide you with detailed information on how you can invest through your plan.
Tax Information
The Fund’s distributions may be taxable as ordinary income or capital gain. If you are investing through a tax-advantaged account, such as an IRA or an employer-sponsored retirement or savings plan, special tax rules apply.
Payments to Financial Intermediaries
The Fund and its investment advisor do not pay financial intermediaries for sales of Fund shares.
20
(Fees paid directly from your investment)
|
| |
|
Sales Charge (Load) Imposed on Purchases |
|
|
Purchase Fee |
% |
|
Sales Charge (Load) Imposed on Reinvested Dividends |
|
|
Redemption Fee |
|
(Expenses that you pay each year as a percentage of the value of your investment)
|
| |
|
Management Fees |
% |
|
12b-1 Distribution Fee |
|
|
Other Expenses |
% |
|
Total Annual Fund Operating Expenses |
% |
|
1 Year |
3 Years |
5 Years |
10 Years |
|
$ |
$ |
$ |
$ |
21
22

1 The year-to-date return as of the most recent calendar quarter, which ended on September 30, 2023, was 0.49%.
23
|
|
Total Return |
Quarter |
|
|
% |
|
|
|
-
% |
|
|
|
1 Year |
5 Years |
10 Years |
|
Vanguard Intermediate-Term Corporate Bond Index Fund
Institutional Shares |
|
|
|
|
Return Before Taxes |
-
% |
% |
% |
|
Return After Taxes on Distributions |
- |
- |
|
|
Return After Taxes on Distributions and Sale of Fund Shares |
- |
|
|
|
Bloomberg U.S. 5-10 Year Corporate Bond Index
(reflects no deduction for fees, expenses, or taxes) |
-
% |
% |
% |
|
Bloomberg U.S. Aggregate Float Adjusted Index
(reflects no deduction for fees, expenses, or taxes) |
- |
|
|
Investment Advisor
The Vanguard Group, Inc. (Vanguard)
Portfolio Manager
Joshua C. Barrickman, CFA, Principal of Vanguard and co-head of Vanguard’s Fixed Income Indexing Americas. He has managed the Fund since its inception in 2009.
24
Purchase and Sale of Fund Shares
You may purchase or redeem shares online through our website (vanguard.com), by mail (The Vanguard Group, P.O. Box 982901, El Paso, TX 79998-2901), or by telephone (800-662-2739). The minimum investment amount required to open and maintain a Fund account for Institutional Shares is $5 million. The minimum investment amount required to add to an existing Fund account is generally $1. If you are investing through an employer-sponsored retirement or savings plan, your plan administrator or your benefits office can provide you with detailed information on how you can invest through your plan.
Tax Information
The Fund’s distributions may be taxable as ordinary income or capital gain. If you are investing through a tax-advantaged account, such as an IRA or an employer-sponsored retirement or savings plan, special tax rules apply.
Payments to Financial Intermediaries
The Fund and its investment advisor do not pay financial intermediaries for sales of Fund shares.
25
(Fees paid directly from your investment)
|
| |
|
Sales Charge (Load) Imposed on Purchases |
|
|
Purchase Fee |
% |
|
Sales Charge (Load) Imposed on Reinvested Dividends |
|
|
Redemption Fee |
|
(Expenses that you pay each year as a percentage of the value of your investment)
|
| |
|
Management Fees |
% |
|
12b-1 Distribution Fee |
|
|
Other Expenses |
% |
|
Total Annual Fund Operating Expenses |
% |
|
1 Year |
3 Years |
5 Years |
10 Years |
|
$ |
$ |
$ |
$ |
26
27
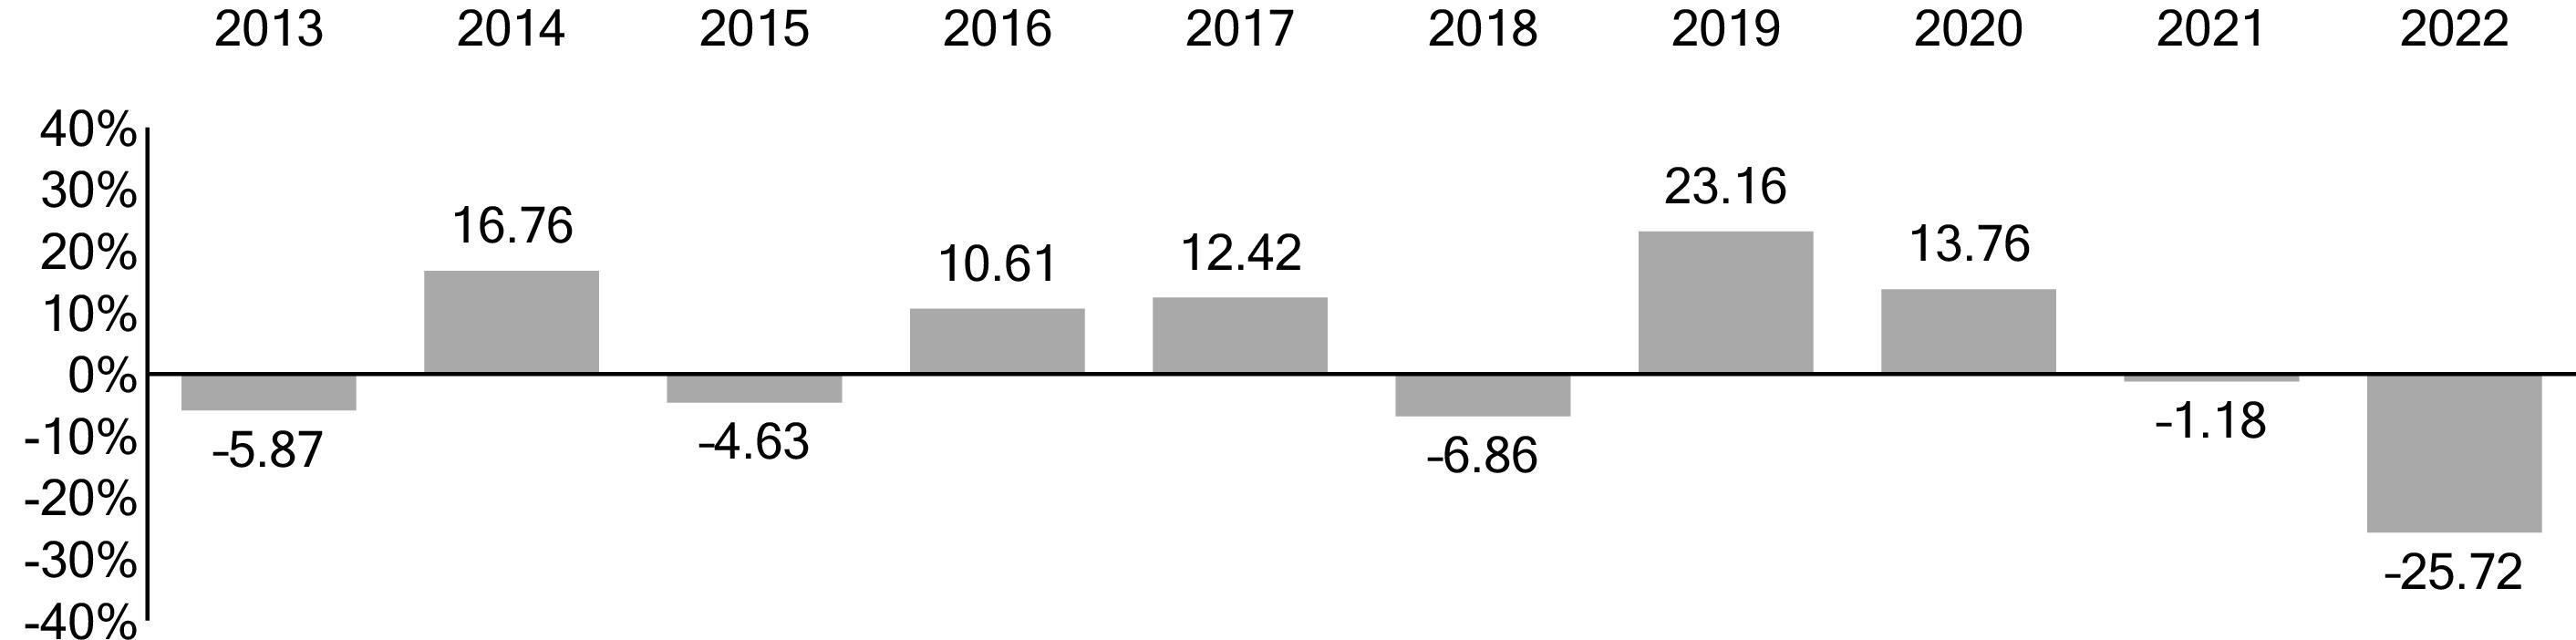
1 The year-to-date return as of the most recent calendar quarter, which ended on September 30, 2023, was -2.43%.
28
|
|
Total Return |
Quarter |
|
|
% |
|
|
|
-
% |
|
|
|
1 Year |
5 Years |
10 Years |
|
Vanguard Long-Term Corporate Bond Index Fund
Institutional Shares |
|
|
|
|
Return Before Taxes |
-
% |
-
% |
% |
|
Return After Taxes on Distributions |
- |
- |
|
|
Return After Taxes on Distributions and Sale of Fund Shares |
- |
- |
|
|
Bloomberg U.S. 10+ Year Corporate Bond Index
(reflects no deduction for fees, expenses, or taxes) |
-
% |
-
% |
% |
|
Bloomberg U.S. Aggregate Float Adjusted Index
(reflects no deduction for fees, expenses, or taxes) |
- |
|
|
Investment Advisor
The Vanguard Group, Inc. (Vanguard)
Portfolio Manager
Joshua C. Barrickman, CFA, Principal of Vanguard and co-head of Vanguard’s Fixed Income Indexing Americas. He has managed the Fund since its inception in 2009.
29
Purchase and Sale of Fund Shares
You may purchase or redeem shares online through our website (vanguard.com), by mail (The Vanguard Group, P.O. Box 982901, El Paso, TX 79998-2901), or by telephone (800-662-2739). The minimum investment amount required to open and maintain a Fund account for Institutional Shares is $5 million. The minimum investment amount required to add to an existing Fund account is generally $1. If you are investing through an employer-sponsored retirement or savings plan, your plan administrator or your benefits office can provide you with detailed information on how you can invest through your plan.
Tax Information
The Fund’s distributions may be taxable as ordinary income or capital gain. If you are investing through a tax-advantaged account, such as an IRA or an employer-sponsored retirement or savings plan, special tax rules apply.
Payments to Financial Intermediaries
The Fund and its investment advisor do not pay financial intermediaries for sales of Fund shares.
30
(Fees paid directly from your investment)
|
| |
|
Sales Charge (Load) Imposed on Purchases |
|
|
Purchase Fee |
|
|
Sales Charge (Load) Imposed on Reinvested Dividends |
|
|
Redemption Fee |
|
(Expenses that you pay each year as a percentage of the value of your investment)
|
| |
|
Management Fees |
% |
|
12b-1 Distribution Fee |
|
|
Other Expenses |
% |
|
Total Annual Fund Operating Expenses |
% |
|
1 Year |
3 Years |
5 Years |
10 Years |
|
$ |
$ |
$ |
$ |
31
32
33
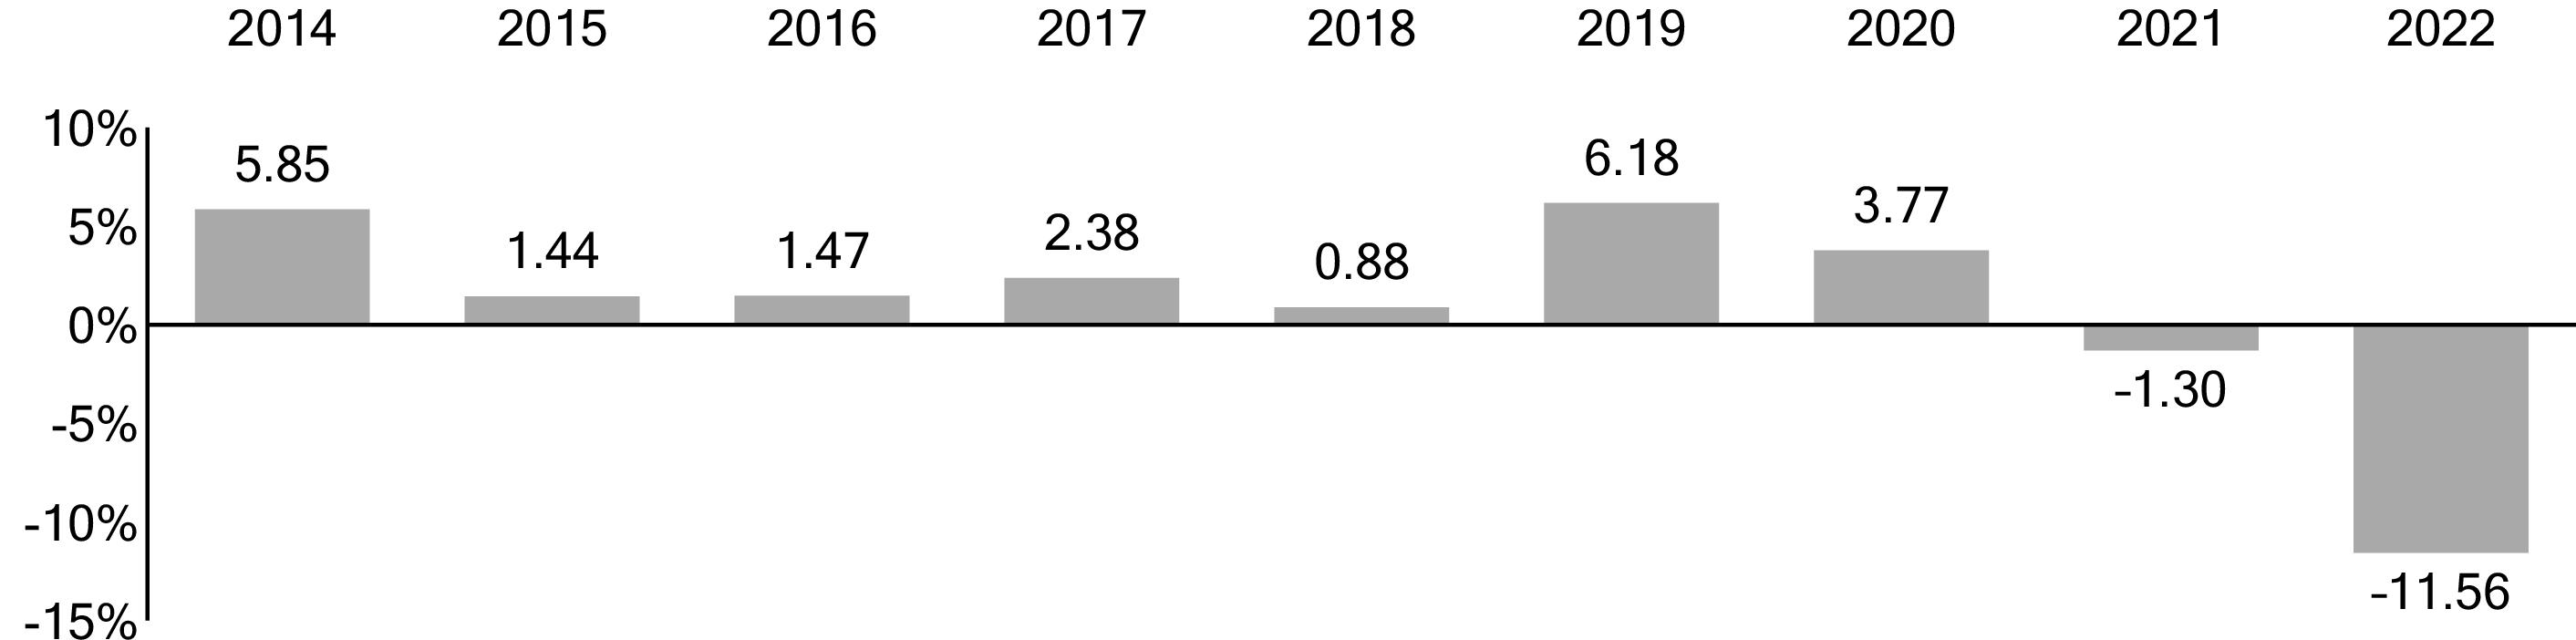
1 The year-to-date return as of the most recent calendar quarter, which ended on September 30, 2023, was -2.17%.
|
|
Total Return |
Quarter |
|
|
% |
|
|
|
-
% |
|
|
|
1 Year |
5 Years |
Since
Fund
Inception |
Fund
Inception
Date |
|
Vanguard Mortgage-Backed Securities
Index Fund Institutional Shares |
|
|
|
|
|
Return Before Taxes |
-
% |
-
% |
% |
|
|
Return After Taxes on Distributions |
- |
- |
- |
|
|
Return After Taxes on Distributions and Sale
of Fund Shares |
- |
- |
|
|
|
Bloomberg U.S. MBS Float Adjusted Index
(reflects no deduction for fees, expenses,
or taxes) |
-
% |
-
% |
% |
|
|
Bloomberg U.S. Aggregate Float Adjusted
Index
(reflects no deduction for fees, expenses,
or taxes) |
- |
|
|
|
34
Investment Advisor
The Vanguard Group, Inc. (Vanguard)
Portfolio Manager
Joshua C. Barrickman, CFA, Principal of Vanguard and co-head of Vanguard’s Fixed Income Indexing Americas. He has managed the Fund since 2013.
Purchase and Sale of Fund Shares
You may purchase or redeem shares online through our website (vanguard.com), by mail (The Vanguard Group, P.O. Box 982901, El Paso, TX 79998-2901), or by telephone (800-662-2739). The minimum investment amount required to open and maintain a Fund account for Institutional Shares is $5 million. The minimum investment amount required to add to an existing Fund account is generally $1. If you are investing through an employer-sponsored retirement or savings plan, your plan administrator or your benefits office can provide you with detailed information on how you can invest through your plan.
Tax Information
The Fund’s distributions may be taxable as ordinary income or capital gain. If you are investing through a tax-advantaged account, such as an IRA or an employer-sponsored retirement or savings plan, special tax rules apply.
Payments to Financial Intermediaries
The Fund and its investment advisor do not pay financial intermediaries for sales of Fund shares.
35
Investing in Index Funds
What Is Indexing?
Indexing is an investment strategy for tracking the performance of a specified market benchmark, or “index.” An index is a group of securities whose overall performance is used as a standard to measure the investment performance of a particular market. There are many types of indexes. Some represent entire markets—such as the U.S. stock market or the U.S. bond market. Other indexes cover market segments—such as small-capitalization stocks or short-term bonds. One cannot invest directly in an index.
The index provider determines the securities to include in the index and the weighting of each security in the index. Under normal circumstances, the index provider will rebalance an index on a regular schedule. An index provider may carry out additional ad hoc index rebalances or delay or cancel a scheduled rebalance. Generally, the index provider does not provide any warranty, or accept any liability, with respect to the quality, accuracy, or completeness of either the target index or its related data. Errors made by the index provider may occur from time to time and may not be identified by the index provider for a period of time or at all. Vanguard does not provide any warranty or guarantee against such errors. Therefore, the gains, losses, or costs associated with the index provider’s errors will generally be borne by the index fund and its shareholders.
An index fund seeks to hold all, or a representative sample, of the securities that make up its target index. Index funds attempt to mirror the performance of the target index, for better or worse. However, an index fund generally does not perform exactly like its target index. For example, index funds have operating expenses and transaction costs. Market indexes do not, and therefore they will usually have a slight performance advantage over funds that track them. The ability of an index fund to match its performance to that of its target index can also be impacted by, among other things, the timing and size of cash flows, asset valuation differences, and the size of the fund. Market disruptions could also have an adverse effect on a fund’s ability to adjust its exposure to the required levels in order to track the index. The risk that a fund may not track the performance of its target index may be heightened during times of increased market volatility or other unusual market conditions.
Index funds typically have the following characteristics:
• Variety of investments. Depending on a fund’s benchmark index, the fund may invest in the securities of a variety of companies, industries, and/or governments or government agencies.
• Relative performance consistency. Because they seek to track market benchmarks, index funds usually do not perform dramatically better or worse than their benchmarks.
• Low cost. Index funds are generally inexpensive to run compared with actively managed funds. They have low or no research costs and typically keep trading activity—and thus dealer markups and other transaction costs—to a minimum compared with actively managed funds.
36
More on the Funds
This prospectus describes the principal risks you would face as a Fund shareholder. It is important to keep in mind one of the main principles of investing: generally, the higher the risk of losing money, the higher the potential reward. The reverse, also, is generally true: the lower the risk, the lower the potential reward. As you consider an investment in any mutual fund, you should take into account your personal tolerance for fluctuations in the securities markets. Look for this
symbol throughout the prospectus. It is used to mark detailed information about the more significant risks that you would confront as a Fund shareholder. To highlight terms and concepts important to mutual fund investors, we have provided Plain Talk® explanations along the way. Reading the prospectus will help you decide whether a Fund is the right investment for you. We suggest that you keep this prospectus for future reference.
symbol throughout the prospectus. It is used to mark detailed information about the more significant risks that you would confront as a Fund shareholder. To highlight terms and concepts important to mutual fund investors, we have provided Plain Talk® explanations along the way. Reading the prospectus will help you decide whether a Fund is the right investment for you. We suggest that you keep this prospectus for future reference.Share Class Overview
This prospectus offers the Funds' Institutional Shares, which are generally for investors who invest a minimum of $5 million. A separate prospectus offers the Funds’ Admiral™ Shares, which generally have an investment minimum of $3,000. In addition, each Fund issues ETF Shares (an exchange-traded class of shares), which are also offered through a separate prospectus.
All share classes offered by a Fund have the same investment objective, strategies, and policies. However, different share classes may have different expenses; as a result, their investment returns may differ.
|
Plain Talk About Costs of Investing |
|
Costs are an important consideration in choosing a mutual fund. That is
because you, as a shareholder, pay a proportionate share of the costs of
operating a fund and any transaction costs incurred when the fund buys or
sells securities, including costs generated by shareholders of other share
classes offered by the fund. These costs can erode a substantial portion of
the gross income or the capital appreciation a fund achieves. Even
seemingly small differences in expenses can, over time, have a dramatic
effect on a fund’s performance. |
The following sections explain the principal investment strategies and policies that each Fund uses in pursuit of its investment objective. The Funds' board of trustees, which oversees each Fund's management, may change investment strategies or policies in the interest of shareholders without a shareholder vote, unless those strategies or policies are designated as fundamental. Note that each Fund’s investment objective is not fundamental and may be changed
37
without a shareholder vote. However, each Fund’s policy of investing at least 80% of its assets in bonds that are included in its target index may be changed only upon 60 days’ notice to shareholders.
Market Exposure
Each Fund is subject to interest rate risk, which is the chance that bond prices will decline because of rising interest rates. Interest rate risk should be low for short-term bond funds, moderate for intermediate-term bond funds, and high for long-term bond funds.
Although fixed income securities (commonly referred to as bonds) are often thought to be less risky than stocks, there have been periods when bond prices have fallen significantly because of rising interest rates. For instance, prices of long-term bonds fell by almost 48% between December 1976 and September 1981.
To illustrate the relationship between bond prices and interest rates, the following table shows the effect of a 1% and a 2% change (both up and down) in interest rates on the values of three noncallable bonds (i.e., bonds that cannot be redeemed by the issuer) of different maturities, each with a face value of $1,000.
How Interest Rate Changes Affect the Value of a $1,000 Bond1
|
Type of Bond (Maturity) |
After a 1%
Increase |
After a 1%
Decrease |
After a 2%
Increase |
After a 2%
Decrease |
|
Short-Term (2.5 years) |
$977 |
$1,024 |
$954 |
$1,049 |
|
Intermediate-Term (10 years) |
922 |
1,086 |
851 |
1,180 |
|
Long-Term (20 years) |
874 |
1,150 |
769 |
1,328 |
1 Assuming a 4% coupon rate.
These figures are for illustration only; you should not regard them as an indication of future performance of the bond market as a whole or the Funds in particular.
38
|
Plain Talk About Bonds and Interest Rates |
|
As a rule, when interest rates rise, bond prices fall. The opposite is also true:
Bond prices go up when interest rates fall. Why do bond prices and interest
rates move in opposite directions? Let’s assume that you hold a bond
offering a 4% yield. A year later, interest rates are on the rise and bonds of
comparable quality and maturity are offered with a 5% yield. With
higher-yielding bonds available, you would have trouble selling your 4% bond
for the price you paid—you would probably have to lower your asking price.
On the other hand, if interest rates were falling and 3% bonds were being
offered, you should be able to sell your 4% bond for more than you paid. |
|
How mortgage-backed securities are different: In general, declining interest
rates will not lift the prices of mortgage-backed securities—such as those
guaranteed by the Government National Mortgage Association—as much as
the prices of comparable bonds. Why? Because when interest rates fall, the
bond market tends to discount the prices of mortgage-backed securities for
prepayment risk—the possibility that homeowners will refinance their
mortgages at lower rates and cause the bonds to be paid off prior to maturity.
In part to compensate for this prepayment possibility, mortgage-backed
securities tend to offer higher yields than other bonds of comparable credit
quality and maturity. In contrast, when interest rates rise, prepayments tend
to slow down, subjecting mortgage-backed securities to extension risk—the
possibility that homeowners will repay their mortgages at slower rates. This
will lengthen the duration or average life of mortgage-backed securities held
by a fund and delay the fund’s ability to reinvest proceeds at higher interest
rates, making the fund more sensitive to changes in interest rates. |
Changes in interest rates can affect bond income as well as bond prices.
Each Fund is subject to income risk, which is the chance that the Fund's income will decline because of falling interest rates. A fund's income declines when interest rates fall because the fund then must invest new cash flow and cash from maturing bonds in lower-yielding bonds. Income risk is generally higher for short-term bond funds and lower for long-term bond funds.
39
|
Plain Talk About Bond Maturities |
|
A bond is issued with a specific maturity date—the date when the issuer must
pay back the bond’s principal (face value). Bond maturities range from less
than 1 year to more than 30 years. Typically, the longer a bond’s maturity, the
more price risk you, as a bond investor, will face as interest rates rise—but
also the higher the potential yield you could receive. Longer-term bonds are
generally more suitable for investors willing to take a greater risk of price
fluctuations to get higher and more stable interest income. Shorter-term bond
investors should be willing to accept lower yields and greater income
variability in return for less fluctuation in the value of their investment. The
stated maturity of a bond may differ from the effective maturity of a bond,
which takes into consideration that an action such as a call or refunding may
cause bonds to be repaid before their stated maturity dates. |
Although falling interest rates tend to strengthen bond prices, they can cause other problems for bond fund investors—bond calls and prepayments.
Each Fund (other than Vanguard Mortgage-Backed Securities Index Fund) is subject to call risk, which is the chance that during periods of falling interest rates, issuers of callable bonds may call (redeem) securities with higher coupon rates or interest rates before their maturity dates. The Fund would then lose any price appreciation above the bond’s call price and would be forced to reinvest the unanticipated proceeds at lower interest rates, resulting in a decline in the Fund’s income. Such redemptions and subsequent reinvestments would also increase the Fund’s portfolio turnover rate.
The indexes that Vanguard Treasury and Corporate Bond Index Funds seek to track include only a limited number of callable bonds. Thus, call risk for these Funds should be very low.
Vanguard Mortgage-Backed Securities Index Fund is subject to prepayment risk, which is the chance that during periods of falling interest rates, homeowners will refinance their mortgages before their maturity dates, resulting in prepayment of mortgage-backed securities held by the Fund. The Fund would then lose any price appreciation above the mortgage’s principal and would be forced to reinvest the unanticipated proceeds at lower interest rates, resulting in a decline in the Fund’s income. Such prepayments and subsequent reinvestments would also increase the Fund's portfolio turnover rate. Prepayment risk is high for the Fund.
40
Vanguard Mortgage-Backed Securities Index Fund is subject to extension risk, which is the chance that during periods of rising interest rates, homeowners will repay their mortgages at slower rates. This will lengthen the duration or average life of mortgage-backed securities held by the Fund and delay the Fund's ability to reinvest proceeds at higher interest rates. Extension risk is high for the Fund.
Each Fund (other than the three Vanguard Treasury Index Funds) is subject to credit risk, which is the chance that a bond issuer will fail to pay interest or principal in a timely manner or that negative perceptions of the issuer’s ability to make such payments will cause the price of that bond to decline.
|
Plain Talk About Credit Quality |
|
A bond’s credit quality rating is an assessment of the issuer’s ability to pay
interest on the bond and, ultimately, to repay the principal. The lower the
credit quality, the greater the perceived chance that the bond issuer will
default, or fail to meet its payment obligations. All things being equal, the
lower a bond’s credit quality, the higher its yield should be to compensate
investors for assuming additional risk. Mortgage-backed securities typically
have higher yields than comparable-quality corporate or government bonds
to make up for their higher prepayment risk. |
Vanguard Mortgage-Backed Securities Index Fund has low credit risk. The three Treasury Index Funds invest primarily in U.S. Treasury securities and have high credit quality and low credit risk. The three Corporate Bond Index Funds are expected to have moderate credit risk as a result of their investments in investment-grade bonds. Investment-grade bonds are those rated BBB/Baa or higher by a credit rating agency, and therefore investment-grade bonds are a mixture of high-and medium-quality bonds.
Vanguard Short-Term Corporate Bond Index, Intermediate-Term Corporate Bond Index, Long-Term Corporate Bond Index, and Mortgage-Backed Securities Index Funds are subject to liquidity risk, which is the chance that a Fund may not be able to sell a security in a timely manner at a desired price.
Corporate bonds are traded among dealers and brokers that connect buyers with sellers. Liquidity in the corporate bond market may be challenged depending on overall economic conditions and credit tightening. There may be little trading in the secondary market for particular bonds and other debt securities, which may make them more difficult to value or sell.
41
To a limited extent, Corporate Bond Index Funds are subject to event risk, which is the chance that corporate fixed income securities held by these Funds may suffer a substantial decline in credit quality and market value because of a restructuring of the companies that issued the securities or because of other factors negatively affecting issuers.
|
Plain Talk About Types of Bonds |
|
Bonds are issued (sold) by many sources: Corporations issue corporate
bonds; the federal government issues U.S. Treasury bonds; agencies of the
federal government issue agency bonds; financial institutions issue
asset-backed bonds; and mortgage holders issue “mortgage-backed”
pass-through certificates. Each issuer is responsible for paying back the
bond’s initial value as well as for making periodic interest payments. Many
bonds issued by government agencies and entities are neither guaranteed
nor insured by the U.S. government. |
Market disruptions can adversely affect local and global markets as well as normal market conditions and operations. Any such disruptions could have an adverse impact on the value of a Fund's investments and Fund performance.
Security Selection
Index sampling strategy. Because it would be very expensive and inefficient to buy and sell all bonds held in its target index—which is an indexing strategy called “replication”—each Fund uses index “sampling” techniques to select securities. Using computer programs, each Fund’s advisor generally selects a representative sample of securities that approximates the full target index in terms of key risk factors and other characteristics. These factors include duration, cash flow, quality, and callability of the underlying bonds. In addition, each Fund keeps sector and subsector exposure within tight boundaries relative to its target index. Because the Funds do not hold all of the securities included in their target indexes, some of the securities (and issuers) that are held will likely be overweighted (or underweighted) compared with the target indexes. The maximum overweight (or underweight) is constrained at the issuer level with the goal of producing well-diversified credit exposure in the portfolio.
The components of the target indices of each Fund are reconstituted and rebalanced on a monthly basis. Each index rebalances as a float-adjusted market-weighted index, and bonds may enter or fall out of the index on a monthly basis. New securities are added to and removed from an index in connection with the month-end index rebalancing process.
42
Each Fund is subject to index sampling risk, which is the chance that the securities selected for the Fund, in the aggregate, will not provide investment performance matching that of the Fund's target index. Index sampling risk is expected to be low for each Fund.
The following table shows the number of bonds held by each Fund, as well as the number of bonds in each Fund’s target index, as of August 31, 2023.
|
Vanguard Fund |
Number of
Bonds in Fund |
Number of Bonds
in Target Index |
|
Vanguard Short-Term Treasury Index Fund |
97 |
157 |
|
Vanguard Intermediate-Term Treasury
Index Fund |
109 |
109 |
|
Vanguard Long-Term Treasury Index Fund |
78 |
78 |
|
Vanguard Short-Term Corporate Bond
Index Fund |
2,498 |
2,704 |
|
Vanguard Intermediate-Term Corporate
Bond Index Fund |
2,085 |
2,090 |
|
Vanguard Long-Term Corporate Bond
Index Fund |
2,794 |
2,885 |
|
Vanguard Mortgage-Backed Securities
Index Fund |
1,1691 |
932 |
1 Issues are mortgage pools grouped by coupon.
Types of bonds. Each Fund seeks to track an index that is a subset of the Bloomberg U.S. Aggregate Float Adjusted Index (the Aggregate Index). The Aggregate Index measures the total universe of taxable fixed income securities in the United States—including government, corporate, and international dollar-denominated bonds, as well as mortgage-backed securities—all with maturities of at least 1 year. Taken together, the seven Funds cover approximately 97% of the Aggregate Index; the only sectors not covered are asset-backed bonds, bonds issued by foreign governments (unless guaranteed by the U.S. government), taxable state and municipal bonds, and commercial mortgage-backed securities.
43
The following grid shows, at a glance, the types of financial instruments that may be purchased by each Fund. An explanation of each type of financial instrument follows the grid.
|
|
Treasury Index
Funds |
Corporate Bond
Index Funds |
Mortgage-Backed
Securities
Index Fund |
|
Corporate Debt Obligations |
|
• |
|
|
U.S. Government and Agency
Bonds |
• |
• |
• |
|
Mortgage-Backed Securities |
|
|
• |
|
Mortgage Dollar Rolls |
|
|
• |
|
Cash Equivalent Investments,
Including Repurchase Agreements |
• |
• |
• |
|
Futures, Options, and Other
Derivatives |
• |
• |
• |
|
International Dollar-Denominated
Bonds |
|
• |
|
• Corporate debt obligations—usually called bonds—represent loans by an investor to a corporation.
• U.S. government and agency bonds represent loans by investors to the U.S. Treasury or a wide variety of government agencies and instrumentalities. Securities issued by most U.S. government entities are neither guaranteed by the U.S. Treasury nor backed by the full faith and credit of the U.S. government. These entities include, among others, the Federal Home Loan Banks (FHLBs), the Federal National Mortgage Association (FNMA), and the Federal Home Loan Mortgage Corporation (FHLMC). Securities issued by the U.S. Treasury and a small number of U.S. government agencies, such as the Government National Mortgage Association (GNMA), are backed by the full faith and credit of the U.S. government. The market values of U.S. government and agency securities and U.S. Treasury securities are subject to fluctuation.
• Mortgage-backed securities represent partial ownership interest in pools of commercial or residential mortgage loans made by financial institutions to finance a borrower’s real estate purchase. These loans are packaged by private or governmental issuers for sale to investors. As the underlying mortgage loans are paid by borrowers, the investors receive payments of interest and principal. To be announced (TBA) securities represent an agreement to buy or sell mortgage-backed securities with agreed-upon characteristics for a fixed unit price, with settlement on a scheduled future date beyond the typical settlement period for most other securities.
44
• Mortgage dollar rolls are transactions in which a fund sells mortgage-backed securities to a dealer and simultaneously agrees to purchase similar securities in the future at a predetermined price. These transactions simulate an investment in mortgage-backed securities and have the potential to enhance a fund’s returns and reduce its administrative burdens, compared with holding mortgage-backed securities directly. These transactions may increase a fund’s portfolio turnover rate. Mortgage dollar rolls will be used only if consistent with a fund's investment objective and risk profile.
• Cash equivalent investments is a blanket term that describes a variety of short-term fixed income investments, including money market instruments, commercial paper, bank certificates of deposit, banker’s acceptances, and repurchase agreements. Repurchase agreements represent short-term (normally overnight) loans by a fund to banks or large securities dealers. Vanguard Treasury Index Funds and Vanguard Mortgage-Backed Securities Index Fund may invest only in repurchase agreements that are collateralized by U.S. Treasury or U.S. government agency securities. Repurchase agreements can carry several risks. For instance, if the seller is unable to repurchase the securities as promised, a fund may experience a loss when trying to sell the securities to another buyer. Also, if the seller becomes insolvent, a bankruptcy court may determine that the securities do not belong to a fund and order that the securities be used to pay off the seller’s debts. The Funds‘ advisor believes that these risks can be controlled through careful security selection and monitoring.
• Futures, options, and other derivatives are described in detail under Other Investment Policies and Risks.
• International dollar-denominated bonds are bonds denominated in U.S. dollars and issued by foreign governments and companies. To the extent that a Fund owns foreign bonds, it is subject to country risk, which is the chance that world events—such as political upheaval, financial troubles, or natural disasters—will adversely affect the value and/or liquidity of securities issued by companies in foreign countries. In addition, the prices of foreign bonds and the prices of U.S. bonds have, at times, moved in opposite directions. Because the bond’s value is designated in dollars rather than in the currency of the issuer’s country, the investor is not exposed to currency risk; rather, the issuer assumes that risk, usually to attract U.S. investors. Although currency movements do not affect the value of international dollar-denominated bonds directly, they could affect the value indirectly by adversely affecting the issuer’s ability (or the market’s perception of the issuer’s ability) to pay interest or repay principal.
45
|
Plain Talk About U.S. Government-Sponsored Enterprises |
|
A variety of U.S. government-sponsored enterprises (GSEs), such as the
Federal Home Loan Mortgage Corporation (FHLMC), the Federal National
Mortgage Association (FNMA), and the Federal Home Loan Banks (FHLBs),
issue debt and mortgage-backed securities. Although GSEs may be chartered
or sponsored by acts of Congress, they are not funded by congressional
appropriations. In September of 2008, the U.S. Treasury placed FNMA and
FHLMC under conservatorship and appointed the Federal Housing Finance
Agency (FHFA) to manage their daily operations. In addition, the U.S. Treasury
entered into purchase agreements with FNMA and FHLMC to provide them
with capital in exchange for senior preferred stock. Generally, a GSE’s
securities are neither issued nor guaranteed by the U.S. Treasury and are not
backed by the full faith and credit of the U.S. government. In most cases, these
securities are supported only by the credit of the GSE, standing alone. In some
cases, a GSE’s securities may be supported by the ability of the GSE to
borrow from the U.S. Treasury or may be supported by the U.S. government in
some other way. Securities issued by the Government National Mortgage
Association (GNMA), however, are backed by the full faith and credit of the
U.S. government. |
46
Other Investment Policies and Risks
Under normal circumstances, each Fund will invest at least 80% of its assets in bonds held in its target index. Up to 20% of each Fund’s assets may be used to purchase nonpublic, investment-grade securities, generally referred to as 144A securities, as well as smaller public issues or medium-term notes not included in the index because of the small size of the issue. The vast majority of these securities will have characteristics and risks similar to those in the target index. Subject to the same 20% limit, each Fund may also purchase other investments that are outside of its target index or may hold bonds that, when acquired, were included in the index but subsequently were removed.
Each Fund reserves the right to substitute a different index for the index it currently tracks if the current index is discontinued, if the Fund's agreement with the provider of its target index is terminated, or for any other reason determined in good faith by the Fund’s board of trustees. In any such instance, the substitute index would represent the same market segment as the current index.
Each Fund may invest in derivatives. In general, investments in derivatives may involve risks different from, and possibly greater than, those of investments directly in the underlying securities or assets.
Generally speaking, a derivative is a financial contract whose value is based on the value of a financial asset (such as a stock, a bond, or a currency), a physical asset (such as gold, oil, or wheat), a market index, or a reference rate. Each Fund may invest in derivatives only if the expected risks and rewards of the derivatives are consistent with the investment objective, policies, strategies, and risks of the Fund as disclosed in this prospectus. In particular, derivatives will be used only when they may help the advisor to accomplish one or more of the following:
• Invest in eligible asset classes with greater efficiency and lower cost than is possible through direct investment.
• Add value when these instruments are attractively priced.
• Adjust sensitivity to changes in interest rates.
• Adjust overall credit risk of the portfolio.
The Funds' derivative investments may include fixed income futures contracts, fixed income options, interest rate swaps, total return swaps, credit default swaps, or other derivatives. Losses (or gains) involving futures contracts can sometimes be substantial—in part because a relatively small price movement in a futures contract may result in an immediate and substantial loss (or gain) for a fund. Similar risks exist for other types of derivatives.
The Funds' derivative investments may include fixed income futures contracts, fixed income options, interest rate swaps, total return swaps, credit default swaps, or other derivatives. Losses (or gains) involving futures contracts can sometimes be substantial—in part because a relatively small price movement in a futures contract may result in an immediate and substantial loss (or gain) for a fund. Similar risks exist for other types of derivatives.
47
|
Plain Talk About Derivatives |
|
Derivatives can take many forms. Some forms of derivatives—such as
exchange-traded futures and options on securities, commodities, or
indexes—have been trading on regulated exchanges for decades. These
types of derivatives are standardized contracts that can easily be bought and
sold and whose market values are determined and published daily. On the
other hand, non-exchange-traded derivatives—such as certain swap
agreements—tend to be more specialized or complex and may be more
difficult to accurately value. |
Each Fund may invest a small portion of its assets in fixed income futures, which are a type of derivative, and/or shares of exchange-traded funds (ETFs). These fixed income futures and ETFs typically provide returns similar to those of the bonds listed in the index, or in a subset of the index, the Fund seeks to track. A Fund may purchase futures or ETFs when doing so will reduce the Fund’s transaction costs, facilitate cash management, mitigate risk, or have the potential to add value because the instruments are favorably priced. Vanguard receives no additional revenue from Fund assets invested in ETF Shares of other Vanguard funds. Fund assets invested in ETF Shares of other Vanguard funds are excluded when allocating to the Fund its share of the costs of Vanguard operations.
Cash Management
Each Fund's daily cash balance may be invested in Vanguard Market Liquidity Fund and/or Vanguard Municipal Cash Management Fund (each, a CMT Fund), which are low-cost money market funds. When investing in a CMT Fund, each Fund bears its proportionate share of the expenses of the CMT Fund in which it invests. Vanguard receives no additional revenue from Fund assets invested in a CMT Fund.
Redemption Requests
Methods used to meet redemption requests. Under normal circumstances, each Fund typically expects to meet redemptions with positive cash flows. When this is not an option, each Fund seeks to maintain its risk exposure by selling a cross section of the Fund’s holdings to meet redemptions, while also factoring in transaction costs. Additionally, a Fund may work with larger clients to implement their redemptions in a manner that is least disruptive to the portfolio; see “Potentially disruptive redemptions” under Redeeming Shares in the Investing With Vanguard section.
48
Under certain circumstances, including under stressed market conditions, there are additional tools that each Fund may use in order to meet redemptions, including advancing the settlement of market trades with counterparties to match investor redemption payments or delaying settlement of an investor’s transaction to match trade settlement within regulatory requirements. A Fund may also suspend payment of redemption proceeds for up to seven days; see “Emergency circumstances” under Redeeming Shares in the Investing With Vanguard section. Additionally under these unusual circumstances, a Fund may borrow money (subject to certain regulatory conditions and if available under board-approved procedures) through an interfund lending facility; through a bank line-of-credit, including a joint committed credit facility; or through an uncommitted line-of-credit from Vanguard in order to meet redemption requests.
Potential redemption activity impacts. At times, a Fund may experience adverse effects when certain large shareholders, or multiple shareholders comprising significant ownership of the Fund or a share class of the Fund, redeem large amounts of shares of the Fund. Large redemptions may cause a Fund to sell portfolio securities at times when it would not otherwise do so. This may result in a Fund distributing capital gains or other taxable income to non-redeeming shareholders. Large redemptions may also increase a Fund's transaction costs. Redemption activity can occur for many reasons, including shareholder reactions to market movements or other events unrelated to Vanguard’s actions, or when Vanguard makes product changes that, for example, may result in a shareholder redeeming shares of a Fund to purchase shares of another similar fund or investment vehicle. When experiencing large redemptions, the Fund reserves the right to pay all or part of the redemption in-kind and/or delay payment of the redemption proceeds for up to seven calendar days; see “Potentially disruptive redemptions” under Redeeming Shares in the Investing With Vanguard section.
Temporary Investment Measures
Each Fund may temporarily depart from its normal investment policies and strategies when the advisor believes that doing so is in the Fund's best interest, so long as the strategy or policy employed is consistent with the Fund's investment objective. For instance, the Fund may invest beyond its normal limits in derivatives or exchange-traded funds that are consistent with the Fund's investment objective when those instruments are more favorably priced or provide needed liquidity, as might be the case when the Fund receives large cash flows that it cannot prudently invest immediately.
49
Purchase and Transaction Fees
Vanguard Intermediate-Term and Long-Term Corporate Bond Index Funds charge fees of 0.25% and 1.00%, respectively, on all purchases of shares, including shares that you purchase by exchange from another Vanguard fund. In addition, Vanguard Short-Term and Intermediate-Term Corporate Bond Index Funds each reserve the right to impose a transaction fee on any purchase that, in the opinion of the advisor, would disrupt efficient management of the Fund. The advisor believes that it may be necessary to impose a transaction fee of 0.25% for Vanguard Short-Term Corporate Bond Index Fund and a transaction fee of 0.50% for Vanguard Intermediate-Term Corporate Bond Index Fund. The advisor may impose this transaction fee if an investor’s aggregate purchases into a Fund over a 12-month period exceed, or are expected to exceed, $100 million for Vanguard Short-Term Corporate Bond Index Fund or $50 million for Vanguard Intermediate-Term Corporate Bond Index Fund.
Unlike a sales charge or load paid to a broker or a fund management company, purchase and transaction fees are paid directly to the Fund to offset the costs of buying securities.
See Investing With Vanguard for more information about fees.
Unlike a sales charge or load paid to a broker or a fund management company, purchase and transaction fees are paid directly to the Fund to offset the costs of buying securities.
See Investing With Vanguard for more information about fees.
Frequent Trading or Market-Timing
Background. Some investors try to profit from strategies involving frequent trading of mutual fund shares, such as market-timing. For funds holding foreign securities, investors may try to take advantage of an anticipated difference between the price of the fund’s shares and price movements in overseas markets, a practice also known as time-zone arbitrage. Investors also may try to engage in frequent trading of funds holding investments such as small-cap stocks and high-yield bonds. As money is shifted into and out of a fund by a shareholder engaging in frequent trading, the fund incurs costs for buying and selling securities, resulting in increased brokerage and administrative costs. These costs are borne by all fund shareholders, including the long-term investors who do not generate the costs. In addition, frequent trading may interfere with an advisor’s ability to efficiently manage the fund.
Policies to address frequent trading. The Vanguard funds (other than money market funds and short-term bond funds, but including Vanguard Short-Term Inflation-Protected Securities Index Fund) do not knowingly accommodate frequent trading. The board of trustees of each Vanguard fund (other than money market funds and short-term bond funds, but including Vanguard Short-Term Inflation-Protected Securities Index Fund) has adopted policies and procedures reasonably designed to detect and discourage frequent trading and, in some
50
cases, to compensate the fund for the costs associated with it. These policies and procedures do not apply to ETF Shares because frequent trading in ETF Shares generally does not disrupt portfolio management or otherwise harm fund shareholders. Although there is no assurance that Vanguard will be able to detect or prevent frequent trading or market-timing in all circumstances, the following policies have been adopted to address these issues:
• Each Vanguard fund reserves the right to reject any purchase request—including exchanges from other Vanguard funds—without notice and regardless of size. For example, a purchase request could be rejected because the investor has a history of frequent trading or if Vanguard determines that such purchase may negatively affect a fund’s operation or performance.
• Each Vanguard fund (other than money market funds and short-term bond funds, but including Vanguard Short-Term Inflation-Protected Securities Index Fund) generally prohibits, except as otherwise noted in the Investing With Vanguard section, an investor’s purchases or exchanges into a fund account for 30 calendar days after the investor has redeemed or exchanged out of that fund account.
• Certain Vanguard funds charge shareholders purchase and/or redemption fees on transactions.
See the Investing With Vanguard section of this prospectus for further details on Vanguard’s transaction policies.
Each Vanguard fund (other than retail and government money market funds), in determining its net asset value, will use fair-value pricing when appropriate, as described in the Share Price section. Fair-value pricing may reduce or eliminate the profitability of certain frequent-trading strategies.
Do not invest with Vanguard if you are a market-timer.
A precautionary note to investment companies: Each Fund's shares are issued by registered investment companies, and therefore the acquisition of such shares by other investment companies and private funds is subject to the restrictions of Section 12(d)(1) of the Investment Company Act of 1940 (the 1940 Act). SEC Rule 12d1-4 under the 1940 Act permits registered investment companies to invest in other registered investment companies beyond the limits in Section 12(d)(1), subject to certain conditions, including that funds with different investment advisors must enter into a fund of funds investment agreement.
51
Turnover Rate
Although the Funds generally seek to invest for the long term, each Fund may sell securities regardless of how long they have been held. Generally, an index fund sells securities in response to redemption requests from shareholders of conventional (i.e., not exchange-traded) shares or to changes in the composition of its target index or in an effort to manage the fund’s duration. The Financial Highlights section of this prospectus shows historical turnover rates for the Funds. A turnover rate of 100%, for example, would mean that a Fund had sold and replaced securities valued at 100% of its net assets within a one-year period. Shorter-term bonds will mature or be sold—and need to be replaced—more frequently than longer-term bonds. As a result, shorter-term bond funds tend to have higher turnover rates than longer-term bond funds. In general, the greater the turnover rate, the greater the impact transaction costs will have on a fund’s return. Also, funds with high turnover rates may be more likely to generate capital gains, including short-term capital gains, that must be distributed to shareholders and will be taxable to shareholders investing through a taxable account.
The Funds and Vanguard
Each Fund is a member of The Vanguard Group, Inc. (Vanguard), a family of over 200 funds. All of the funds that are members of Vanguard (other than funds of funds) share in the expenses associated with administrative services and business operations, such as personnel, office space, and equipment.
Vanguard Marketing Corporation provides marketing services to the funds. Although fund shareholders do not pay sales commissions or 12b-1 distribution fees, each fund (other than a fund of funds) or each share class of a fund (in the case of a fund with multiple share classes) pays its allocated share of the Vanguard funds’ marketing costs.
|
Plain Talk About Vanguard’s Unique Corporate Structure |
|
Vanguard is owned jointly by the funds it oversees and thus indirectly by the
shareholders in those funds. Most other mutual funds are operated by
management companies that are owned by third parties—either public or
private stockholders—and not by the funds they serve. |
52
Investment Advisor
The Vanguard Group, Inc., P.O. Box 2600, Valley Forge, PA 19482, which began operations in 1975, serves as advisor to the Funds through its Fixed Income Group. As of August 31, 2023, Vanguard served as advisor for approximately $6.8 trillion in assets. Vanguard provides investment advisory services to the Funds pursuant to the Funds’ Service Agreement and subject to the supervision and oversight of the trustees and officers of the Funds.
For the fiscal year ended August 31, 2023, the advisory expenses for each Fund represented an effective annual rate of less than 0.01% of the Fund’s average net assets.
Under the terms of an SEC exemption, the Funds' board of trustees may, without prior approval from shareholders, change the terms of an advisory agreement with a third-party investment advisor or hire a new third-party investment advisor—either as a replacement for an existing advisor or as an additional advisor. Any significant change in a Fund's advisory arrangements will be communicated to shareholders in writing. As the Funds' sponsor and overall manager, Vanguard may provide investment advisory services to a Fund at any time. Vanguard may also recommend to the board of trustees that an advisor be hired, terminated, or replaced or that the terms of an existing advisory agreement be revised. The Funds have filed an application seeking a similar SEC exemption with respect to investment advisors that are wholly owned subsidiaries of Vanguard. If the exemption is granted, the Funds may rely on the new SEC relief.
For a discussion of why the board of trustees approved each Fund's investment advisory arrangement, see the most recent annual report to shareholders covering the fiscal year ended August 31.
The manager primarily responsible for the day-to-day management of the Funds is:
Joshua C. Barrickman, CFA, Principal of Vanguard and co-head of Vanguard’s Fixed Income Indexing Americas. He has been with Vanguard since 1998; has worked in investment management since 1999; has managed investment portfolios since 2005; has managed Vanguard Short-Term, Intermediate-Term, and Long-Term Corporate Bond Index Funds since their inceptions in 2009; and has managed Vanguard Short-Term, Intermediate-Term, and Long-Term Treasury Index Funds and managed Vanguard Mortgage-Backed Securities Index Fund since 2013. Education: B.S., Ohio Northern University; M.B.A., Lehigh University.
53
The Funds' Statement of Additional Information provides information about the portfolio manager’s compensation, other accounts under management, and ownership of shares of the Funds.
Dividends, Capital Gains, and Taxes
Fund Distributions
Each Fund distributes to shareholders virtually all of its net income (interest less expenses) as well as any net short-term or long-term capital gains realized from the sale of its holdings. From time to time, each Fund may also make distributions that are treated as a return of capital. Income dividends generally are declared and distributed monthly; capital gains distributions, if any, generally occur annually in December. In addition, each Fund may occasionally make a supplemental distribution at some other time during the year.
You can receive distributions of income or capital gains in cash, or you can have them automatically reinvested in more shares of the Fund. However, if you are investing through an employer-sponsored retirement or savings plan, your distributions will be automatically reinvested in additional Fund shares.
|
Plain Talk About Distributions |
|
As a shareholder, you are entitled to your portion of a fund’s income from
interest as well as capital gains from the fund’s sale of investments. Income
consists of interest the fund earns from its money market and bond
investments. Capital gains are realized whenever the fund sells securities for
higher prices than it paid for them. These capital gains are either short-term
or long-term, depending on whether the fund held the securities for one year
or less or for more than one year. |
Basic Tax Points
Investors in taxable accounts should be aware of the following basic federal income tax points:
• Distributions are taxable to you whether or not you reinvest these amounts in additional Fund shares.
• Distributions declared in December—if paid to you by the end of January—are taxable as if received in December.
• Any income dividend distribution or short-term capital gains distribution that you receive is taxable to you as ordinary income.
54
• Any distribution of net long-term capital gains is taxable to you as long-term capital gains, no matter how long you have owned shares in the Fund.
• Capital gains distributions may vary considerably from year to year as a result of the Funds' normal investment activities and cash flows.
• Your cost basis in the Fund will be decreased by the amount of any return of capital that you receive. This, in turn, will affect the amount of any capital gain or loss that you realize when selling your Fund shares.
• Return of capital distributions generally are not taxable to you until your cost basis has been reduced to zero. If your cost basis is at zero, return of capital distributions will be treated as capital gains.
• A sale or exchange of Fund shares is a taxable event. This means that you may have a capital gain to report as income, or a capital loss to report as a deduction, when you complete your tax return.
• Any conversion between classes of shares of the same fund is a nontaxable event. By contrast, an exchange between classes of shares of different funds is a taxable event.
• Vanguard (or your intermediary) will send you a statement each year showing the tax status of all of your distributions.
Individuals, trusts, and estates whose income exceeds certain threshold amounts are subject to a 3.8% Medicare contribution tax on “net investment income.” Net investment income takes into account distributions paid by the Fund and capital gains from any sale or exchange of Fund shares.
Income dividends and capital gains distributions that you receive, as well as your gains or losses from any sale or exchange of Fund shares, may be subject to state and local income taxes. Depending on your state’s rules, however, any dividends attributable to interest earned on direct obligations of the U.S. government may be exempt from state and local taxes. Vanguard will notify you each year how much, if any, of your dividends may qualify for this exemption.
This prospectus provides general tax information only. If you are investing through a tax-advantaged account, such as an IRA or an employer-sponsored retirement or savings plan, special tax rules apply. Please consult your tax advisor for detailed information about any tax consequences for you.
55
General Information
Backup withholding. By law, Vanguard must withhold 24% of any taxable distributions or redemptions from your account if you do not:
• Provide your correct taxpayer identification number.
• Certify that the taxpayer identification number is correct.
• Confirm that you are not subject to backup withholding.
Similarly, Vanguard (or your intermediary) must withhold taxes from your account if the IRS instructs us to do so.
Foreign investors. Vanguard funds offered for sale in the United States (Vanguard U.S. funds), including the Funds offered in this prospectus, are not widely available outside the United States. Non-U.S. investors should be aware that U.S. withholding and estate taxes and certain U.S. tax reporting requirements may apply to any investments in Vanguard U.S. funds. Foreign investors should visit the non-U.S. investors page on our website at vanguard.com for information on Vanguard’s non-U.S. products.
Invalid addresses. If an income dividend distribution or capital gains distribution check mailed to your address of record is returned as undeliverable, Vanguard will automatically reinvest the distribution and all future distributions until you provide us with a valid mailing address. Reinvestments will receive the net asset value calculated on the date of the reinvestment.
Share Price
Share price, also known as net asset value (NAV), is calculated as of the close of regular trading on the New York Stock Exchange (NYSE), generally 4 p.m., Eastern time, on each day that the NYSE is open for business (a business day). In the rare event the NYSE experiences unanticipated disruptions and is unavailable at the close of the trading day, NAVs will be calculated as of the close of regular trading on the Nasdaq (or another alternate exchange if the Nasdaq is unavailable, as determined at Vanguard’s discretion), generally 4 p.m., Eastern time. Each share class has its own NAV, which is computed by dividing the total assets, minus liabilities, allocated to the share class by the number of Fund shares outstanding for that class. On U.S. holidays or other days when the NYSE is closed, the NAV is not calculated, and the Funds do not sell or redeem shares. However, on those days the value of a Fund’s assets may be affected to the extent that the Fund holds securities that change in value on those days (such as foreign securities that trade on foreign markets that are open).
56
Debt securities held by a Vanguard fund are valued based on information furnished by an independent pricing service or market quotations. When a fund determines that pricing-service information or market quotations either are not readily available or do not accurately reflect the value of a security, the security is priced at its fair value (the amount that the owner might reasonably expect to receive upon the current sale of the security).
The values of any foreign securities held by a fund are converted into U.S. dollars using an exchange rate obtained from an independent third party as of the close of regular trading on the NYSE. The values of any mutual fund shares, including institutional money market fund shares, held by a fund are based on the NAVs of the shares. The values of any ETF shares or closed-end fund shares held by a fund are based on the market value of the shares.
A fund also may use fair-value pricing on bond market holidays when the fund is open for business (such as Columbus Day and Veterans Day). Fair-value prices are determined by Vanguard according to procedures adopted by the board of trustees. When fair-value pricing is employed, the prices of securities used by a fund to calculate the NAV may differ from quoted or published prices for the same securities.
Each Fund has authorized certain financial intermediaries and their designees, and may, from time to time, authorize certain funds of funds for which Vanguard serves as the investment advisor (Vanguard Funds of Funds), to accept orders to buy or sell fund shares on their behalf. The Fund will be deemed to receive an order when accepted by the financial intermediary, its designee, or one of the Vanguard Funds of Funds, and the order will receive the NAV next computed by the Fund after such acceptance.
Vanguard fund share prices are published daily on our website at vanguard.com/prices.
57
Financial Highlights
Financial highlights information is intended to help you understand a fund’s performance for the past five years (or, if shorter, its period of operations). Certain information reflects financial results for a single fund share. Total return represents the rate that an investor would have earned or lost each period on an investment in a fund or share class (assuming reinvestment of all distributions). This information has been obtained from the financial statements audited by PricewaterhouseCoopers LLP, an independent registered public accounting firm, whose report, along with fund financial statements, is included in a fund’s most recent annual report to shareholders. You may obtain a free copy of a fund’s latest annual or semiannual report, which is available upon request.
Vanguard Short-Term Treasury Index Fund Institutional Shares
|
For a Share Outstanding Throughout Each Period |
Year Ended August 31, | ||||
|
2023 |
2022 |
2021 |
2020 |
2019 | |
|
Net Asset Value, Beginning of Period |
$24.50 |
$25.77 |
$26.02 |
$25.57 |
$25.06 |
|
Investment Operations |
|
|
|
|
|
|
Net Investment Income1 |
.680 |
.145 |
.120 |
.421 |
.598 |
|
Net Realized and Unrealized Gain (Loss) on Investments |
(.389) |
(1.191) |
(.092) |
.445 |
.490 |
|
Total from Investment Operations |
.291 |
(1.046) |
.028 |
.866 |
1.088 |
|
Distributions |
|
|
|
|
|
|
Dividends from Net Investment Income |
(.651) |
(.145) |
(.122) |
(.416) |
(.578) |
|
Distributions from Realized Capital Gains |
— |
(.079) |
(.156) |
— |
— |
|
Total Distributions |
(.651) |
(.224) |
(.278) |
(.416) |
(.578) |
|
Net Asset Value, End of Period |
$24.14 |
$24.50 |
$25.77 |
$26.02 |
$25.57 |
|
Total Return |
1.21% |
-4.08% |
0.11% |
3.42% |
4.40% |
|
Ratios/Supplemental Data |
|
|
|
|
|
|
Net Assets, End of Period (Millions) |
$1,586 |
$1,092 |
$1,138 |
$1,104 |
$974 |
|
Ratio of Total Expenses to Average Net Assets |
0.05%2 |
0.05%2 |
0.05% |
0.05% |
0.05% |
|
Ratio of Net Investment Income to Average Net Assets |
2.80% |
0.58% |
0.47% |
1.63% |
2.37% |
|
Portfolio Turnover Rate3 |
81% |
59% |
66% |
67% |
55% |
|
|
|
|
|
|
|
|
|
|
|
1 |
Calculated based on average shares outstanding. |
|
2 |
The ratio of expenses to average net assets for the period net of reduction from custody fee
offset arrangements was 0.05%. |
|
3 |
Excludes the value of portfolio securities received or delivered as a result of in-kind purchases
or redemptions of the fund’s capital shares, including ETF Creation Units. |
58
Vanguard Intermediate-Term Treasury Index Fund Institutional Shares
|
For a Share Outstanding Throughout Each Period |
Year Ended August 31, | ||||
|
2023 |
2022 |
2021 |
2020 |
2019 | |
|
Net Asset Value, Beginning of Period |
$25.26 |
$28.60 |
$29.51 |
$28.15 |
$26.23 |
|
Investment Operations |
|
|
|
|
|
|
Net Investment Income1 |
.615 |
.355 |
.337 |
.527 |
.634 |
|
Net Realized and Unrealized Gain (Loss) on Investments |
(.935) |
(3.195) |
(.709) |
1.355 |
1.908 |
|
Total from Investment Operations |
(.320) |
(2.840) |
(.372) |
1.882 |
2.542 |
|
Distributions |
|
|
|
|
|
|
Dividends from Net Investment Income |
(.600) |
(.346) |
(.334) |
(.522) |
(.622) |
|
Distributions from Realized Capital Gains |
— |
(.154) |
(.204) |
— |
— |
|
Total Distributions |
(.600) |
(.500) |
(.538) |
(.522) |
(.622) |
|
Net Asset Value, End of Period |
$24.34 |
$25.26 |
$28.60 |
$29.51 |
$28.15 |
|
Total Return |
-1.27% |
-10.03% |
-1.26% |
6.76% |
9.83% |
|
Ratios/Supplemental Data |
|
|
|
|
|
|
Net Assets, End of Period (Millions) |
$2,203 |
$1,700 |
$1,725 |
$1,558 |
$1,183 |
|
Ratio of Total Expenses to Average Net Assets |
0.05%2 |
0.05%2 |
0.05% |
0.05% |
0.05% |
|
Ratio of Net Investment Income to Average Net Assets |
2.49% |
1.32% |
1.17% |
1.83% |
2.36% |
|
Portfolio Turnover Rate3 |
36% |
36% |
33% |
28% |
29% |
|
|
|
|
|
|
|
|
|
|
|
1 |
Calculated based on average shares outstanding. |
|
2 |
The ratio of expenses to average net assets for the period net of reduction from custody fee
offset arrangements was 0.05%. |
|
3 |
Excludes the value of portfolio securities received or delivered as a result of in-kind purchases
or redemptions of the fund’s capital shares, including ETF Creation Units. |
59
Vanguard Long-Term Treasury Index Fund Institutional Shares
|
For a Share Outstanding Throughout Each Period |
Year Ended August 31, | ||||
|
2023 |
2022 |
2021 |
2020 |
2019 | |
|
Net Asset Value, Beginning of Period |
$29.16 |
$38.52 |
$42.19 |
$38.43 |
$31.66 |
|
Investment Operations |
|
|
|
|
|
|
Net Investment Income1 |
.847 |
.727 |
.699 |
.822 |
.902 |
|
Net Realized and Unrealized Gain (Loss) on Investments |
(3.641) |
(9.376) |
(3.554) |
3.748 |
6.753 |
|
Total from Investment Operations |
(2.794) |
(8.649) |
(2.855) |
4.570 |
7.655 |
|
Distributions |
|
|
|
|
|
|
Dividends from Net Investment Income |
(.826) |
(.711) |
(.691) |
(.810) |
(.885) |
|
Distributions from Realized Capital Gains |
— |
— |
(.124) |
— |
— |
|
Total Distributions |
(.826) |
(.711) |
(.815) |
(.810) |
(.885) |
|
Net Asset Value, End of Period |
$25.54 |
$29.16 |
$38.52 |
$42.19 |
$38.43 |
|
Total Return |
-9.68% |
-22.69% |
-6.77% |
12.03% |
24.71% |
|
Ratios/Supplemental Data |
|
|
|
|
|
|
Net Assets, End of Period (Millions) |
$3,026 |
$2,586 |
$2,038 |
$1,234 |
$1,054 |
|
Ratio of Total Expenses to Average Net Assets |
0.05%2 |
0.05%2 |
0.05% |
0.05% |
0.05% |
|
Ratio of Net Investment Income to Average Net Assets |
3.14% |
2.15% |
1.82% |
2.06% |
2.75% |
|
Portfolio Turnover Rate3 |
20% |
19% |
22% |
29% |
16% |
|
|
|
|
|
|
|
|
|
|
|
1 |
Calculated based on average shares outstanding. |
|
2 |
The ratio of expenses to average net assets for the period net of reduction from custody fee
offset arrangements was 0.05%. |
|
3 |
Excludes the value of portfolio securities received or delivered as a result of in-kind purchases
or redemptions of the fund’s capital shares, including ETF Creation Units. |
60
Vanguard Short-Term Corporate Bond Index Fund Institutional Shares
|
For a Share Outstanding Throughout Each Period |
Year Ended August 31, | ||||
|
2023 |
2022 |
2021 |
2020 |
2019 | |
|
Net Asset Value, Beginning of Period |
$25.34 |
$27.53 |
$27.61 |
$27.00 |
$26.06 |
|
Investment Operations |
|
|
|
|
|
|
Net Investment Income1 |
.702 |
.436 |
.473 |
.713 |
.768 |
|
Net Realized and Unrealized Gain (Loss) on Investments |
(.149) |
(2.131) |
(.080) |
.604 |
.939 |
|
Total from Investment Operations |
.553 |
(1.695) |
.393 |
1.317 |
1.707 |
|
Distributions |
|
|
|
|
|
|
Dividends from Net Investment Income |
(.703) |
(.434) |
(.473) |
(.707) |
(.767) |
|
Distributions from Realized Capital Gains |
— |
(.061) |
— |
— |
— |
|
Total Distributions |
(.703) |
(.495) |
(.473) |
(.707) |
(.767) |
|
Net Asset Value, End of Period |
$25.19 |
$25.34 |
$27.53 |
$27.61 |
$27.00 |
|
Total Return |
2.22% |
-6.21% |
1.44% |
4.96% |
6.66% |
|
Ratios/Supplemental Data |
|
|
|
|
|
|
Net Assets, End of Period (Millions) |
$2,444 |
$2,239 |
$2,258 |
$1,661 |
$1,633 |
|
Ratio of Total Expenses to Average Net Assets |
0.05%2 |
0.05%2 |
0.05% |
0.05% |
0.05% |
|
Ratio of Net Investment Income to Average Net Assets |
2.79% |
1.65% |
1.72% |
2.63% |
2.92% |
|
Portfolio Turnover Rate3 |
63% |
50% |
42% |
56% |
51% |
|
|
|
|
|
|
|
|
|
|
|
1 |
Calculated based on average shares outstanding. |
|
2 |
The ratio of expenses to average net assets for the period net of reduction from custody fee
offset arrangements was 0.05%. |
|
3 |
Excludes the value of portfolio securities received or delivered as a result of in-kind purchases
or redemptions of the fund’s capital shares, including ETF Creation Units. |
61
Vanguard Intermediate-Term Corporate Bond Index Fund Institutional Shares
|
For a Share Outstanding Throughout Each Period |
Year Ended August 31, | ||||
|
2023 |
2022 |
2021 |
2020 |
2019 | |
|
Net Asset Value, Beginning of Period |
$26.56 |
$31.82 |
$31.95 |
$30.53 |
$27.94 |
|
Investment Operations |
|
|
|
|
|
|
Net Investment Income1 |
.934 |
.720 |
.720 |
.940 |
1.044 |
|
Net Realized and Unrealized Gain (Loss) on Investments |
(.538) |
(5.061) |
(.070) |
1.394 |
2.584 |
|
Total from Investment Operations |
.396 |
(4.341) |
.650 |
2.334 |
3.628 |
|
Distributions |
|
|
|
|
|
|
Dividends from Net Investment Income |
(.936) |
(.721) |
(.714) |
(.914) |
(1.038) |
|
Distributions from Realized Capital Gains |
— |
(.198) |
(.066) |
— |
— |
|
Total Distributions |
(.936) |
(.919) |
(.780) |
(.914) |
(1.038) |
|
Net Asset Value, End of Period |
$26.02 |
$26.56 |
$31.82 |
$31.95 |
$30.53 |
|
Total Return2 |
1.54% |
-13.87% |
2.07% |
7.81% |
13.30% |
|
Ratios/Supplemental Data |
|
|
|
|
|
|
Net Assets, End of Period (Millions) |
$298 |
$338 |
$443 |
$357 |
$406 |
|
Ratio of Total Expenses to Average Net Assets |
0.05%3 |
0.05%3 |
0.05% |
0.05% |
0.05% |
|
Ratio of Net Investment Income to Average Net Assets |
3.57% |
2.46% |
2.27% |
3.07% |
3.65% |
|
Portfolio Turnover Rate4 |
76% |
58% |
53% |
72% |
59% |
|
|
|
|
|
|
|
|
|
|
|
1 |
Calculated based on average shares outstanding. |
|
2 |
Total returns do not include transaction fees that may have applied in the periods shown.
Fund prospectuses provide information about any applicable transaction fees. |
|
3 |
The ratio of expenses to average net assets for the period net of reduction from custody fee
offset arrangements was 0.05%. |
|
4 |
Excludes the value of portfolio securities received or delivered as a result of in-kind purchases
or redemptions of the fund’s capital shares, including ETF Creation Units. |
62
Vanguard Long-Term Corporate Bond Index Fund Institutional Shares
|
For a Share Outstanding Throughout Each Period |
Year Ended August 31, | ||||
|
2023 |
2022 |
2021 |
2020 |
2019 | |
|
Net Asset Value, Beginning of Period |
$26.76 |
$36.02 |
$35.59 |
$34.18 |
$29.36 |
|
Investment Operations |
|
|
|
|
|
|
Net Investment Income1 |
1.227 |
1.092 |
1.095 |
1.250 |
1.314 |
|
Net Realized and Unrealized Gain (Loss) on Investments2 |
(1.575) |
(9.264) |
.425 |
1.387 |
4.812 |
|
Total from Investment Operations |
(.348) |
(8.172) |
1.520 |
2.637 |
6.126 |
|
Distributions |
|
|
|
|
|
|
Dividends from Net Investment Income |
(1.202) |
(1.088) |
(1.090) |
(1.227) |
(1.306) |
|
Distributions from Realized Capital Gains |
— |
— |
— |
— |
— |
|
Total Distributions |
(1.202) |
(1.088) |
(1.090) |
(1.227) |
(1.306) |
|
Net Asset Value, End of Period |
$25.21 |
$26.76 |
$36.02 |
$35.59 |
$34.18 |
|
Total Return3 |
-1.28% |
-23.05% |
4.37% |
7.91% |
21.58% |
|
Ratios/Supplemental Data |
|
|
|
|
|
|
Net Assets, End of Period (Millions) |
$414 |
$264 |
$340 |
$268 |
$541 |
|
Ratio of Total Expenses to Average Net Assets |
0.05%4 |
0.05%4 |
0.05% |
0.05% |
0.05% |
|
Ratio of Net Investment Income to Average Net Assets |
4.78% |
3.46% |
3.09% |
3.68% |
4.36% |
|
Portfolio Turnover Rate5 |
33% |
31% |
36% |
62% |
47% |
|
|
|
|
|
|
|
|
|
|
|
1 |
Calculated based on average shares outstanding. |
|
2 |
Includes increases from purchase fees of $.02, $.00, $.01, $.00, and $.00. |
|
3 |
Total returns do not include transaction fees that may have applied in the periods shown.
Fund prospectuses provide information about any applicable transaction fees. |
|
4 |
The ratio of expenses to average net assets for the period net of reduction from custody fee
offset arrangements was 0.05%. |
|
5 |
Excludes the value of portfolio securities received or delivered as a result of in-kind purchases
or redemptions of the fund’s capital shares, including ETF Creation Units. |
63
Vanguard Mortgage-Backed Securities Index Fund Institutional Shares
|
For a Share Outstanding Throughout Each Period |
Year Ended August 31, | ||||
|
2023 |
2022 |
2021 |
2020 |
2019 | |
|
Net Asset Value, Beginning of Period |
$25.72 |
$28.96 |
$29.44 |
$28.81 |
$27.79 |
|
Investment Operations |
|
|
|
|
|
|
Net Investment Income1 |
.771 |
.467 |
.393 |
.641 |
.846 |
|
Net Realized and Unrealized Gain (Loss) on Investments |
(1.278) |
(3.258) |
(.503) |
.636 |
1.011 |
|
Total from Investment Operations |
(.507) |
(2.791) |
(.110) |
1.277 |
1.857 |
|
Distributions |
|
|
|
|
|
|
Dividends from Net Investment Income |
(.763) |
(.449) |
(.311) |
(.647) |
(.837) |
|
Distributions from Realized Capital Gains |
— |
— |
(.059) |
— |
— |
|
Total Distributions |
(.763) |
(.449) |
(.370) |
(.647) |
(.837) |
|
Net Asset Value, End of Period |
$24.45 |
$25.72 |
$28.96 |
$29.44 |
$28.81 |
|
Total Return |
-1.98% |
-9.70% |
-0.38% |
4.48% |
6.80% |
|
Ratios/Supplemental Data |
|
|
|
|
|
|
Net Assets, End of Period (Millions) |
$237 |
$179 |
$122 |
$171 |
$119 |
|
Ratio of Total Expenses to Average Net Assets |
0.05%2 |
0.05%2 |
0.05% |
0.05% |
0.05% |
|
Ratio of Net Investment Income to Average Net Assets |
3.10% |
1.71% |
1.35% |
2.20% |
3.01% |
|
Portfolio Turnover Rate3 |
101% |
170% |
316% |
218% |
190% |
|
|
|
|
|
|
|
|
|
|
|
1 |
Calculated based on average shares outstanding. |
|
2 |
The ratio of expenses to average net assets for the period net of reduction from custody fee
offset arrangements was 0.05%. |
|
3 |
Includes 80%, 113%, 237%, 11%, and 34%, respectively, attributable to mortgage-dollar-
roll activity. |
64
Investing With Vanguard
This section of the prospectus explains the basics of doing business with Vanguard. Vanguard fund shares can be held indirectly through an intermediary, such as a bank, a broker, or an investment advisor. If you hold Vanguard fund shares indirectly through an intermediary (including shares held in a brokerage account through Vanguard Brokerage Services®), please see Investing With Vanguard Through Other Firms, and also refer to your account agreement with the intermediary for information about transacting in that account. If you hold Vanguard fund shares through an employer-sponsored retirement or savings plan, please see Employer-Sponsored Plans. Vanguard reserves the right to change the policies in this section without notice. Please call or check online for current information. See Contacting Vanguard.
In certain circumstances, Vanguard fund shares can be held directly with Vanguard. If you hold Vanguard fund shares directly with Vanguard, you should carefully read each topic within this section that pertains to your relationship with Vanguard. Vanguard reserves the right, upon reasonable notice, to discontinue the ability to hold Vanguard fund shares directly with Vanguard for any or all investors and/or to transfer such shares to an affiliate or other financial institution.
In certain circumstances, Vanguard fund shares can be held directly with Vanguard. If you hold Vanguard fund shares directly with Vanguard, you should carefully read each topic within this section that pertains to your relationship with Vanguard. Vanguard reserves the right, upon reasonable notice, to discontinue the ability to hold Vanguard fund shares directly with Vanguard for any or all investors and/or to transfer such shares to an affiliate or other financial institution.
For Vanguard fund shares held directly with Vanguard, each fund you hold in an account is a separate “fund account.” For example, if you hold three funds in a nonretirement account titled in your own name, two funds in a nonretirement account titled jointly with your spouse, and one fund in an individual retirement account, you have six fund accounts—and this is true even if you hold the same fund in multiple accounts. Note that each reference to “you” in this prospectus applies to any one or more registered account owners or persons authorized to transact on your account.
Purchasing Shares
Vanguard reserves the right, without notice, to increase or decrease the minimum amount required to open, convert shares to, or maintain a fund account or to add to an existing fund account.
Investment minimums may differ for certain categories of investors.
Account Minimums for Institutional Shares
To open and maintain an account. $5 million. If you request Institutional Shares when you open a new account but the investment amount does not meet the account minimum for Institutional Shares, your investment will be placed in another share class of the Fund, as appropriate.
65
Certain Vanguard institutional clients may meet the minimum investment amount by aggregating separate accounts within the same fund. This aggregation policy does not apply to financial intermediaries.
Vanguard may charge additional recordkeeping fees for institutional clients whose accounts are recordkept by Vanguard. Please contact your Vanguard representative to determine whether additional recordkeeping fees apply to your account.
To add to an existing account. Generally $1.
How to Initiate a Purchase Request
Be sure to check Exchanging Shares, Frequent-Trading Limitations, and Other Rules You Should Know before placing your purchase request.
Online. You may open certain types of accounts, request a purchase of shares, and request an exchange through our website or our mobile application if your account is eligible and you are registered for online access.
By telephone. You may call Vanguard to begin the account registration process or request that the account-opening forms be sent to you. You may also call Vanguard to request a purchase of shares in your account or to request an exchange. See Contacting Vanguard.
By mail. You may send Vanguard your account registration form and check to open a new fund account. To add to an existing fund account, you may send your check with an Invest-by-Mail form (from a transaction confirmation or your account statement) or with a deposit slip (available online).
How to Pay for a Purchase
By electronic bank transfer. You may purchase shares of a Vanguard fund through an electronic transfer of money from a bank account. To establish the electronic bank transfer service on an account, you must designate the bank account online, complete a form, or fill out the appropriate section of your account registration form. After the service is set up on your account, you can purchase shares by electronic bank transfer on a regular schedule (Automatic Investment Plan), if eligible, or upon request. Your purchase request can be initiated online (if you are registered for online access), by telephone, or by mail.
By wire. Wiring instructions vary for different types of purchases. Please call Vanguard for instructions and policies on purchasing shares by wire. See Contacting Vanguard.
66
By check. You may make initial or additional purchases to your fund account by sending a check with a deposit slip or by utilizing our mobile application if your account is eligible and you are registered for online access. Also see How to Initiate a Purchase Request. Make your check payable to Vanguard and include the appropriate fund number (Vanguard—xx). For a list of Fund numbers (for Funds in this prospectus), see Additional Information.
By exchange. You may purchase shares of a Vanguard fund using the proceeds from the simultaneous redemption of shares of another Vanguard fund. You may initiate an exchange online (if you are registered for online access), by telephone, or by mail with an exchange form. See Exchanging Shares.
Trade Date
The trade date for any purchase request received in good order will depend on the day and time Vanguard receives your request, the manner in which you are paying, and the type of fund you are purchasing. Your purchase will be executed using the NAV as calculated on the trade date. NAVs are calculated only on days that the NYSE is open for trading (a business day). In the rare event the NYSE experiences unanticipated disruptions and is unavailable at the close of the trading day, NAVs will be calculated as of the close of regular trading on the Nasdaq (or another alternate exchange if the Nasdaq is unavailable, as determined at Vanguard’s discretion), generally 4 p.m., Eastern time. The time selected for NAV calculation in this rare event shall also serve as the conclusion of the trading day. See Share Price.
For purchases by check into all funds other than money market funds and for purchases by exchange, wire, or electronic bank transfer into all funds: If the purchase request is received by Vanguard on a business day before the close of regular trading on the NYSE (generally 4 p.m., Eastern time), the trade date for the purchase will be the same day. If the purchase request is received on a business day after the close of regular trading on the NYSE, or on a nonbusiness day, the trade date for the purchase will be the next business day.
For purchases by check into money market funds: If the purchase request is received by Vanguard on a business day before the close of regular trading on the NYSE (generally 4 p.m., Eastern time), the trade date for the purchase will be the next business day. If the purchase request is received on a business day after the close of regular trading on the NYSE, or on a nonbusiness day, the trade date for the purchase will be the second business day following the day Vanguard receives the purchase request. Because money market instruments must be purchased with federal funds and it takes a money market mutual fund one business day to convert check proceeds into federal funds, the trade date for the purchase will be one business day later than for other funds.
67
If applicable, orders by Vanguard Funds of Funds will be treated as received by a Fund at the same time that corresponding orders are received in proper form by the Vanguard Funds of Funds.
If your purchase request is not accurate and complete, it may be rejected. See Other Rules You Should Know—Good Order.
For further information about purchase transactions, consult our website at vanguard.com or see Contacting Vanguard.
Purchase and Transaction Fees
Vanguard Intermediate-Term and Long-Term Corporate Bond Index Funds charge fees of 0.25% and 1.00%, respectively, on all purchases of shares, including shares that you purchase by exchange from another Vanguard fund. In addition, Vanguard Short-Term and Intermediate-Term Corporate Bond Index Funds each reserve the right to impose a transaction fee on any purchase that, in the opinion of the advisor, would disrupt efficient management of the Fund. The advisor believes that it may be necessary to impose a transaction fee of 0.25% for Vanguard Short-Term Corporate Bond Index Fund and a transaction fee of 0.50% for Vanguard Intermediate-Term Corporate Bond Index Fund. The advisor may impose this transaction fee if an investor’s aggregate purchases into a Fund over a 12-month period exceed, or are expected to exceed, $100 million for Vanguard Short-Term Corporate Bond Index Fund or $50 million for Vanguard Intermediate-Term Corporate Bond Index Fund.
Purchase fees will not apply to Vanguard fund account purchases in the following circumstances: (1) purchases of shares through reinvested dividends or capital gains distributions; (2) share transfers, rollovers, or reregistrations within the same fund; (3) conversions of shares from one share class to another in the same fund; (4) purchases in kind; and (5) share rollovers in an IRA within the same Vanguard fund for plans in which Vanguard serves as a recordkeeper. Unlike a sales charge or load paid to a broker or a fund management company, purchase and transaction fees are paid directly to the Fund to offset the costs of buying securities.
Purchase fees will not apply to Vanguard fund account purchases in the following circumstances: (1) purchases of shares through reinvested dividends or capital gains distributions; (2) share transfers, rollovers, or reregistrations within the same fund; (3) conversions of shares from one share class to another in the same fund; (4) purchases in kind; and (5) share rollovers in an IRA within the same Vanguard fund for plans in which Vanguard serves as a recordkeeper. Unlike a sales charge or load paid to a broker or a fund management company, purchase and transaction fees are paid directly to the Fund to offset the costs of buying securities.
Other Purchase Rules You Should Know
Check purchases. All purchase checks must be written in U.S. dollars, be drawn on a U.S. bank, and be accompanied by good order instructions. Vanguard does not accept cash, traveler’s checks, starter checks, or money orders. In addition, Vanguard may refuse checks that are not made payable to Vanguard.
68
New accounts. We are required by law to obtain from you certain personal information that we will use to verify your identity. If you do not provide the information, we may not be able to open your account. If we are unable to verify your identity, Vanguard reserves the right, without notice, to close your account or take such other steps as we deem reasonable. Certain types of accounts may require additional documentation.
Refused or rejected purchase requests. Vanguard reserves the right to stop selling fund shares or to reject any purchase request at any time and without notice, including, but not limited to, purchases requested by exchange from another Vanguard fund. This also includes the right to reject any purchase request because the investor has a history of frequent trading or because the purchase may negatively affect a fund’s operation or performance.
Large purchases. Call Vanguard before attempting to invest a large dollar amount.
No cancellations. Vanguard will not accept your request to cancel any purchase request once processing has begun. Please be careful when placing a purchase request.
Converting Shares
When a conversion occurs, you receive shares of one class in place of shares of another class of the same fund. At the time of conversion, the dollar value of the “new” shares you receive equals the dollar value of the “old” shares that were converted. In other words, the conversion has no effect on the value of your investment in the fund at the time of the conversion. However, the number of shares you own after the conversion may be greater than or less than the number of shares you owned before the conversion, depending on the NAVs of the two share classes.
Vanguard will not accept your request to cancel any self-directed conversion request once processing has begun. Please be careful when placing a conversion request.
A conversion between share classes of the same fund is a nontaxable event.
Trade Date
The trade date for any conversion request received in good order will depend on the day and time Vanguard receives your request. Your conversion will be executed using the NAVs of the different share classes on the trade date. NAVs are calculated only on days that the NYSE is open for trading (a business day).
69
In the rare event the NYSE experiences unanticipated disruptions and is unavailable at the close of the trading day, NAVs will be calculated as of the close of regular trading on the Nasdaq (or another alternate exchange if the Nasdaq is unavailable, as determined at Vanguard’s discretion), generally 4 p.m., Eastern time. The time selected for NAV calculation in this rare event shall also serve as the conclusion of the trading day. See Share Price.
For a conversion request (other than a request to convert to ETF Shares) received by Vanguard on a business day before the close of regular trading on the NYSE (generally 4 p.m., Eastern time), the trade date will be the same day. For a conversion request received on a business day after the close of regular trading on the NYSE, or on a nonbusiness day, the trade date will be the next business day. See Other Rules You Should Know.
Conversions to Institutional Shares
You are eligible for a self-directed conversion from Admiral to Institutional Shares of the same Fund (if available), provided that your account meets all Institutional Shares eligibility requirements. You may request a conversion through our website (if you are registered for online access), or you may contact Vanguard by telephone or by mail to request this transaction. Accounts that qualify for Institutional Shares will not be automatically converted.
Conversions to ETF Shares
Owners of conventional (i.e., not exchange-traded) shares issued by a Fund may convert those shares to ETF Shares of equivalent value of the same fund. Please note that investors who own conventional shares through a 401(k) plan or other employer-sponsored retirement or benefit plan generally may not convert those shares to ETF Shares and should check with their plan sponsor or recordkeeper. ETF Shares, whether acquired through a conversion or purchased on the secondary market, cannot be converted to conventional shares by a shareholder. Also, ETF Shares of one fund cannot be exchanged for ETF Shares of another fund.
ETF Shares must be held in a brokerage account. Thus, before converting conventional shares to ETF Shares, you must have an existing, or open a new, brokerage account. This account may be with Vanguard Brokerage Services or with any other brokerage firm.
Vanguard Brokerage Services does not impose a fee on conversions from conventional shares to Vanguard ETF Shares. However, other brokerage firms may charge a fee to process a conversion. Vanguard reserves the right, in the future, to impose a transaction fee on conversions or to limit, temporarily
70
suspend, or terminate the conversion privilege. For additional information on converting conventional shares to ETF Shares, please contact Vanguard to obtain a prospectus for ETF Shares. See Contacting Vanguard.
Mandatory Conversions to Admiral Shares
If an account no longer meets the balance requirements for Institutional Shares, Vanguard may automatically convert the shares in the account to Admiral Shares. A decline in the account balance because of market movement may result in such a conversion. Vanguard will notify the investor in writing before any mandatory conversion occurs.
Redeeming Shares
How to Initiate a Redemption Request
Be sure to check Exchanging Shares, Frequent-Trading Limitations, and Other Rules You Should Know before placing your redemption request.
Online. You may request a redemption of shares or request an exchange through our website or our mobile application if your account is eligible and you are registered for online access.
By telephone. You may call Vanguard to request a redemption of shares or an exchange. See Contacting Vanguard.
By mail. You may send a form (available online) to Vanguard to redeem from a fund account or to make an exchange.
How to Receive Redemption Proceeds
By electronic bank transfer. You may have the proceeds of a fund redemption sent directly to a designated bank account. To establish the electronic bank transfer service on an account, you must designate a bank account online, complete a form, or fill out the appropriate section of your account registration form. After the service is set up on your account, you can redeem shares by electronic bank transfer on a regular schedule (Automatic Withdrawal Plan), if eligible, or upon request. Your redemption request can be initiated online (if you are registered for online access), by telephone, or by mail.
By wire. To receive your proceeds by wire, you may instruct Vanguard to wire your redemption proceeds ($100 minimum) to a previously designated bank account. To establish the wire redemption service, you generally must designate a bank account online, complete a form, or fill out the appropriate section of your account registration form.
71
Please note that Vanguard charges a $10 wire fee for outgoing wire redemptions. The fee is assessed in addition to, rather than being withheld from, redemption proceeds and is paid directly to the fund in which you invest. For example, if you redeem $100 via a wire, you will receive the full $100, and the $10 fee will be assessed to your fund account through an additional redemption of fund shares. If you redeem your entire fund account, your redemption proceeds will be reduced by the amount of the fee. The wire fee does not apply to accounts held by Flagship and Flagship Select clients; accounts held through intermediaries, including Vanguard Brokerage Services; or accounts held by institutional clients.
By exchange. You may have the proceeds of a Vanguard fund redemption invested directly in shares of another Vanguard fund. You may initiate an exchange online (if you are registered for online access), by telephone, or by mail. See Exchanging Shares.
By check. If you have not chosen another redemption method, Vanguard will mail you a redemption check, generally payable to all registered account owners, normally within two business days of your trade date, and generally to the address of record.
Trade Date
The trade date for any redemption request received in good order will depend on the day and time Vanguard receives your request and the manner in which you are redeeming. Your redemption will be executed using the NAV as calculated on the trade date. NAVs are calculated only on days that the NYSE is open for trading (a business day). In the rare event the NYSE experiences unanticipated disruptions and is unavailable at the close of the trading day, NAVs will be calculated as of the close of regular trading on the Nasdaq (or another alternate exchange if the Nasdaq is unavailable, as determined at Vanguard’s discretion), generally 4 p.m., Eastern time. The time selected for NAV calculation in this rare event shall also serve as the conclusion of the trading day. See Share Price.
For redemptions by check, exchange, or wire: If the redemption request is received by Vanguard on a business day before the close of regular trading on the NYSE (generally 4 p.m., Eastern time), the trade date will be the same day. If the redemption request is received on a business day after the close of regular trading on the NYSE, or on a nonbusiness day, the trade date will be the next business day.
• Note on timing of wire redemptions from money market funds: For telephone requests received by Vanguard on a business day before 10:45 a.m., Eastern time (2 p.m., Eastern time, for Vanguard Cash Reserves Federal Money Market Fund; 12:30 p.m., Eastern time, for Vanguard Federal Money Market Fund), the redemption proceeds generally will leave Vanguard
72
by the close of business the same day. For telephone requests received by Vanguard on a business day after those cut-off times, or on a nonbusiness day, and for all requests other than by telephone, the redemption proceeds generally will leave Vanguard by the close of business on the next business day.
• Note on timing of wire redemptions from all other funds: For requests received by Vanguard on a business day before the close of regular trading on the NYSE (generally 4 p.m., Eastern time), the redemption proceeds generally will leave Vanguard by the close of business on the next business day. For requests received by Vanguard on a business day after the close of regular trading on the NYSE, or on a nonbusiness day, the redemption proceeds generally will leave Vanguard by the close of business on the second business day after Vanguard receives the request.
For redemptions by electronic bank transfer: If the redemption request is received by Vanguard on a business day before the close of regular trading on the NYSE (generally 4 p.m., Eastern time), the trade date will be the same day. If the redemption request is received on a business day after the close of regular trading on the NYSE, or on a nonbusiness day, the trade date will be the next business day.
If your redemption request is not accurate and complete, it may be rejected. If we are unable to send your redemption proceeds by wire or electronic bank transfer because the receiving institution rejects the transfer, Vanguard will make additional efforts to complete your transaction. If Vanguard is still unable to complete the transaction, we may send the proceeds of the redemption to you by check, generally payable to all registered account owners, or use your proceeds to purchase new shares of the fund from which you sold shares for the purpose of the wire or electronic bank transfer transaction. See Other Rules You Should Know—Good Order.
If your redemption request is received in good order, we typically expect that redemption proceeds will be paid by a Fund within one business day of the trade date; however, in certain circumstances, investors may experience a longer settlement period at the time of the transaction. For further information, see “Potentially disruptive redemptions” and “Emergency circumstances.”
For further information about redemption transactions, consult our website at vanguard.com or see Contacting Vanguard.
73
Other Redemption Rules You Should Know
Documentation for certain accounts. Special documentation may be required to redeem from certain types of accounts, such as trust, corporate, nonprofit, or retirement accounts. Please call us before attempting to redeem from these types of accounts.
Potentially disruptive redemptions. Vanguard reserves the right to pay all or part of a redemption in kind—that is, in the form of securities—if we reasonably believe that a cash redemption would negatively affect the fund’s operation or performance or that the shareholder may be engaged in market-timing or frequent trading. Under these circumstances, Vanguard also reserves the right to delay payment of the redemption proceeds for up to seven calendar days. By calling us before you attempt to redeem a large dollar amount, you may avoid in-kind or delayed payment of your redemption. Please see Frequent-Trading Limitations for information about Vanguard's policies to limit frequent trading.
Recently purchased shares. Although you can redeem shares at any time, proceeds may not be made available to you until the fund collects payment for your purchase. This may take up to seven calendar days for shares purchased by check or by electronic bank transfer. If you have written a check on a fund in an account with checkwriting privileges, that check may be rejected if your fund account does not have a sufficient available balance.
Address change. If you change your address online or by telephone, there may be up to a 14-day restriction (starting on the business day after your address is changed) on your ability to request check redemptions online and by telephone. You can request a redemption in writing (using a form available online) at any time. Confirmations of address changes are sent to both the old and new addresses.
Payment to a different person or address. At your request, we can make your redemption check payable, or wire your redemption proceeds, to a different person or send it to a different address. However, this generally requires the written consent of all registered account owners and may require additional documentation, such as a signature guarantee or a notarized signature. You may obtain a signature guarantee from some commercial or savings banks, credit unions, trust companies, or member firms of a U.S. stock exchange.
No cancellations. Vanguard will not accept your request to cancel any redemption request once processing has begun. Please be careful when placing a redemption request.
74
Emergency circumstances. Vanguard funds can postpone payment of redemption proceeds for up to seven calendar days. In addition, Vanguard funds can suspend redemptions and/or postpone payments of redemption proceeds beyond seven calendar days at times when the NYSE is closed or during emergency circumstances, as determined by the SEC.
Exchanging Shares
An exchange occurs when you use the proceeds from the redemption of shares of one Vanguard fund to simultaneously purchase shares of a different Vanguard fund. You can make exchange requests online (if you are registered for online access), by telephone, or by mail. See Purchasing Shares and Redeeming Shares.
If the NYSE is open for regular trading (generally until 4 p.m., Eastern time, on a business day) at the time an exchange request is received in good order, the trade date generally will be the same day. See Other Rules You Should Know—Good Order for additional information on all transaction requests.
Vanguard will not accept your request to cancel any exchange request once processing has begun. Please be careful when placing an exchange request.
Call Vanguard before attempting to exchange a large dollar amount. By calling us before you attempt to exchange a large dollar amount, you may avoid delayed or rejected transactions.
Please note that Vanguard reserves the right, without notice, to revise or terminate the exchange privilege, limit the amount of any exchange, or reject an exchange, at any time, for any reason. See Frequent-Trading Limitations for additional restrictions on exchanges.
Frequent-Trading Limitations
Because excessive transactions can disrupt management of a fund and increase the fund’s costs for all shareholders, the board of trustees of each Vanguard fund places certain limits on frequent trading in the funds. Each Vanguard fund (other than money market funds and short-term bond funds, but including Vanguard Short-Term Inflation-Protected Securities Index Fund) limits an investor’s purchases or exchanges into a fund account for 30 calendar days after the investor has redeemed or exchanged out of that fund account. ETF Shares are not subject to these frequent-trading limits.
75
For Vanguard Retirement Investment Program pooled plans, the limitations apply to exchanges made online or by telephone.
These frequent-trading limitations do not apply to the following:
• Certain transactions below dollar value or other thresholds specified by Vanguard.
• In-kind transactions to a shareholder’s donor advised fund managed by Vanguard Charitable.
• Purchases of shares with reinvested dividend or capital gains distributions.
• Transactions through Vanguard’s Automatic Investment Plan, Automatic Exchange Service, Direct Deposit Service, Automatic Withdrawal Plan, Required Minimum Distribution Service, Vanguard Small Business Online®, and certain transactions through intermediaries relating to systematic trades and required minimum distributions.
• Discretionary transactions through Vanguard Personal Advisor Services®, Vanguard Institutional Advisory Services®, Vanguard Digital Advisor™, and discretionary (advisor-directed) transactions through certain intermediaries.
• Redemptions of shares to pay fund or account fees.
• Redemptions of shares to remove excess shareholder contributions to certain types of retirement accounts (including, but not limited to, IRAs and Vanguard Individual 401(k) Plans).
• Transfers and reregistrations of shares within the same fund.
• Purchases of shares by asset transfer or direct rollover.
• Conversions of shares from one share class to another in the same fund.
• Checkwriting redemptions.
• Section 529 college savings plans.
• Certain approved institutional portfolios and asset allocation programs, as well as trades made by funds or trusts managed by Vanguard or its affiliates that invest in other Vanguard funds. (Please note that shareholders of Vanguard’s funds of funds are subject to the limitations.)
For participants in employer-sponsored defined contribution plans,* the frequent-trading limitations do not apply to:
• Purchases of shares with participant payroll or employer contributions or loan repayments.
• Purchases of shares with reinvested dividend or capital gains distributions.
• Distributions, loans, and in-service withdrawals from a plan.
76
• Redemptions of shares as part of a plan termination or at the direction of the plan.
• Transactions executed through the Vanguard Managed Account Program.
• Redemptions of shares to pay fund or account fees.
• Share or asset transfers or rollovers.
• Reregistrations of shares.
• Conversions of shares from one share class to another in the same fund.
• Exchange requests submitted by written request to Vanguard. (Exchange requests submitted by fax, if otherwise permitted, are subject to the limitations.)
* The following Vanguard fund accounts are subject to the frequent-trading limitations: SEP-IRAs, SIMPLE IRAs, certain Individual 403(b)(7) Custodial Accounts, and Vanguard Individual 401(k) Plans.
Accounts Held by Institutions (Other Than Defined Contribution Plans)
Vanguard will systematically monitor for frequent trading in institutional clients’ accounts. If we detect suspicious trading activity, we will investigate and take appropriate action, which may include applying to a client’s accounts the 30-day policy previously described, prohibiting a client’s purchases of fund shares, and/or revoking the client’s exchange privilege.
Accounts Held by Intermediaries
When intermediaries establish accounts in Vanguard funds for the benefit of their clients, we cannot always monitor the trading activity of the individual clients. However, we review trading activity at the intermediary (omnibus) level, and if we detect suspicious activity, we will investigate and take appropriate action. If necessary, Vanguard may prohibit additional purchases of fund shares by an intermediary, including for the benefit of certain of the intermediary’s clients. Intermediaries also may monitor their clients’ trading activities with respect to Vanguard funds.
For those Vanguard funds that charge purchase and/or redemption fees, intermediaries will be asked to assess these fees on client accounts and remit these fees to the funds. The application of purchase and redemption fees and frequent-trading limitations may vary among intermediaries. There are no assurances that Vanguard will successfully identify all intermediaries or that intermediaries will properly assess purchase and redemption fees or administer frequent-trading limitations. If you invest with Vanguard through an intermediary, please read that firm’s materials carefully to learn of any other rules or fees that may apply.
77
Other Rules You Should Know
Prospectus and Shareholder Report Mailings
When two or more shareholders have the same last name and address, just one summary prospectus (or prospectus) and/or shareholder report may be sent in an attempt to eliminate the unnecessary expense of duplicate mailings. You may request individual prospectuses and reports by contacting our Client Services Department in writing, by telephone, or online. See Contacting Vanguard.
Vanguard.com
Registration. If you are a registered user of vanguard.com, you can review your account holdings; buy, sell, or exchange shares of most Vanguard funds; and perform most other transactions through our website. You must register for this service online.
Electronic delivery. Vanguard can deliver your account statements, transaction confirmations, prospectuses, certain tax forms, and shareholder reports electronically. If you are a registered user of vanguard.com, you can consent to the electronic delivery of these documents by logging on and changing your mailing preferences under “Account Maintenance.” You can revoke your electronic consent at any time through our website, and we will begin to send paper copies of these documents within 30 days of receiving your revocation.
Telephone Transactions
Automatic. When we set up your account, we will automatically enable you to do business with us by telephone, unless you instruct us otherwise in writing.
Proof of a caller’s authority. We reserve the right to refuse a telephone request if the caller is unable to provide the requested information or if we reasonably believe that the caller is not an individual authorized to act on the account. Before we allow a caller to act on an account, we may request the following information:
• Authorization to act on the account (as the account owner or by legal documentation or other means).
• Account registration and address.
• Fund name and account number, if applicable.
• Other information relating to the caller, the account owner, or the account.
78
Good Order
We reserve the right to reject any transaction instructions that are not in “good order.” Good order generally means that your instructions:
• Are provided by the person(s) authorized in accordance with Vanguard’s policies and procedures to access the account and request transactions.
• Include the fund name and account number.
• Include the amount of the transaction (stated in dollars, shares, or percentage).
Written instructions also must generally be provided on a Vanguard form and include:
• Signature(s) and date from the authorized person(s).
• Signature guarantees or notarized signatures, if required for the type of transaction. (Call Vanguard for specific requirements.)
• Any supporting documentation that may be required.
Good order requirements may vary among types of accounts and transactions. For more information, consult our website at vanguard.com or see Contacting Vanguard.
Vanguard reserves the right, without notice, to revise the requirements for good order.
Future Trade-Date Requests
Vanguard does not accept requests to hold a purchase, conversion, redemption, or exchange transaction for a future date. All such requests will receive trade dates as previously described in Purchasing Shares, Converting Shares, Redeeming Shares, and Exchanging Shares. Vanguard reserves the right to return future-dated purchase checks.
Accounts With More Than One Owner
If an account has more than one owner or authorized person, Vanguard generally will accept instructions from any one owner or authorized person.
Responsibility for Fraud
You should take precautions to protect yourself from fraud. Keep your account-related information private, and review any account confirmations, statements, or other information that we provide to you as soon as you receive them. Let us know immediately if you discover unauthorized activity or see something on your account that you do not understand or that looks unusual.
79
Vanguard will not be responsible for losses that result from transactions by a person who we reasonably believe is authorized to act on your account.
Uncashed Checks
Please cash your distribution or redemption checks promptly. Vanguard will not pay interest on uncashed checks. Vanguard may be required to transfer assets related to uncashed checks to a state under the state’s abandoned property law.
Dormant Accounts
If your account has no activity in it for a period of time, Vanguard may be required to transfer it to a state under the state’s abandoned property law, subject to potential federal or state withholding taxes.
Unusual Circumstances
If you experience difficulty contacting Vanguard online or by telephone, you can send us your transaction request on a Vanguard form by regular or express mail.
Investing With Vanguard Through Other Firms
You may purchase or sell shares of most Vanguard funds through a financial intermediary, such as a bank, a broker, or an investment advisor. Please consult your financial intermediary to determine which, if any, shares are available through that firm and to learn about other rules that may apply. Your financial intermediary can provide you with account information and any required tax forms. You may be required to pay a commission on purchases of mutual fund shares made through a financial intermediary.
Please see Frequent-Trading Limitations—Accounts Held by Intermediaries for information about the assessment of any purchase or redemption fees and the monitoring of frequent trading for accounts held by intermediaries.
Low-Balance Accounts
Each Fund reserves the right to convert an investor's Institutional Shares to Admiral Shares if the fund account balance falls below the account minimum for any reason, including market fluctuation. Any such conversion will be preceded by written notice to the investor.
Right to Change Policies
In addition to the rights expressly stated elsewhere in this prospectus, Vanguard reserves the right, without notice, to (1) alter, add, or discontinue any conditions of purchase (including eligibility requirements), redemption, exchange, conversion, service, or privilege at any time and (2) alter, impose, discontinue, or waive any purchase fee, redemption fee, account service fee, or other fee
80
charged to a shareholder or a group of shareholders. Changes may affect any or all investors. These actions will be taken when, at the sole discretion of Vanguard management, Vanguard believes they are in the best interest of a fund.
Account Restrictions
Vanguard reserves the right to: (1) redeem all or a portion of a fund/account to meet a legal obligation, including tax withholding, tax lien, garnishment order, or other obligation imposed on your account by a court or government agency; (2) redeem shares, close an account, or suspend account privileges, features, or options in the case of threatening conduct or activity; (3) redeem shares, close an account, or suspend account privileges, features, or options if Vanguard believes or suspects that not doing so could result in a suspicious, fraudulent, or illegal transaction; (4) place restrictions on the ability to redeem any or all shares in an account if it is required to do so by a court or government agency; (5) place restrictions on the ability to redeem any or all shares in an account if Vanguard believes that doing so will prevent fraud, financial exploitation or abuse, or to protect vulnerable investors; (6) freeze any account and/or suspend account services if Vanguard has received reasonable notice of a dispute regarding the assets in an account, including notice of a dispute between the registered or beneficial account owners; and (7) freeze any account and/or suspend account services upon initial notification to Vanguard of the death of an account owner.
Share Classes
Vanguard reserves the right, without notice, to change the eligibility requirements of its share classes, including the types of clients who are eligible to purchase each share class.
Shareholder Rights
Each Fund's Agreement and Declaration of Trust, as amended, requires a shareholder bringing a derivative action on behalf of Vanguard Scottsdale Funds (the Trust) that is subject to a pre-suit demand to collectively hold at least 10% of the outstanding shares of the Trust or at least 10% of the outstanding shares of the series or class to which the demand relates and to undertake to reimburse the Trust for the expense of any counsel or advisors used when considering the merits of the demand in the event that the board of trustees determines not to bring such action. In each case, these requirements do not apply to claims arising under the federal securities laws to the extent that any such federal securities laws, rules, or regulations do not permit such application.
81
Fund and Account Updates
Confirmation Statements
We will send (or provide through our website, whichever you prefer) a confirmation of your trade date and the amount of your transaction when you buy, sell, exchange, or convert shares. However, we will not send confirmations reflecting only checkwriting redemptions or the reinvestment of dividend or capital gains distributions. For any month in which you had a checkwriting redemption, a Checkwriting Activity Statement will be sent to you itemizing the checkwriting redemptions for that month. Promptly review each confirmation statement that we provide to you. It is important that you contact Vanguard immediately with any questions you may have about any transaction reflected on a confirmation statement, or Vanguard will consider the transaction properly processed.
Portfolio Summaries
We will send (or provide through our website, whichever you prefer) quarterly portfolio summaries to help you keep track of your accounts throughout the year. Each summary shows the market value of your account at the close of the statement period, as well as all distributions, purchases, redemptions, exchanges, transfers, and conversions for the current calendar quarter (or month). Promptly review each summary that we provide to you. It is important that you contact Vanguard immediately with any questions you may have about any transaction reflected on the summary, or Vanguard will consider the transaction properly processed.
Tax Information Statements
For most accounts, Vanguard (or your intermediary) is required to provide annual tax forms to assist you in preparing your income tax returns. These forms are generally available for each calendar year early in the following year. Registered users of vanguard.com can also view certain forms through our website. Vanguard (or your intermediary) may also provide you with additional tax-related documentation. For more information, consult our website at vanguard.com or see Contacting Vanguard.
82
Annual and Semiannual Reports
We will send (or provide through our website, whichever you prefer) reports about Vanguard Sector Bond Index Funds twice a year, in April and October. These reports include overviews of the financial markets and provide the following specific Fund information:
• Performance assessments and comparisons with industry benchmarks.
• Financial statements with listings of Fund holdings.
Portfolio Holdings
Please consult the Funds' Statement of Additional Information or our website for a description of the policies and procedures that govern disclosure of a Fund’s portfolio holdings.
Employer-Sponsored Plans
Your plan administrator or your employee benefits office can provide you with detailed information on how to participate in your plan and how to elect a Fund as an investment option.
• If you have any questions about a Fund or Vanguard, including those about a Fund’s investment objective, strategies, or risks, contact Vanguard Participant Services toll-free at 800-523-1188 or visit our website at vanguard.com.
• If you have questions about your account, contact your plan administrator or the organization that provides recordkeeping services for your plan.
• Be sure to carefully read each topic that pertains to your transactions with Vanguard.
Vanguard reserves the right to change its policies without notice to shareholders.
Transactions
Processing times for your transaction requests may differ among recordkeepers or among transaction and funding types. Your plan’s recordkeeper (which may also be Vanguard) will determine the necessary processing time frames for your transaction requests prior to submission to a Fund. Consult your recordkeeper or plan administrator for more information.
If Vanguard is serving as your plan recordkeeper and if your transaction involves one or more investments with an early cut-off time for processing or another trading restriction, your entire transaction will be subject to the restriction when the trade date for your transaction is determined.
83
Contacting Vanguard
|
Web |
|
|
Vanguard.com |
For the most complete source of Vanguard news
For fund, account, and service information
For most account transactions
For literature requests
24 hours a day, 7 days a week |
|
Phone | |
|
Investor Information 800-662-7447
(Text telephone for people with
hearing impairment at 800-749-7273) |
For fund and service information
For literature requests |
|
Client Services 800-662-2739
(Text telephone for people with
hearing impairment at 800-749-7273) |
For account information
For most account transactions |
|
Participant Services 800-523-1188
(Text telephone for people with
hearing impairment at 800-749-7273) |
For information and services for participants in
employer-sponsored plans |
|
Institutional Division
888-809-8102 |
For information and services for large institutional
investors |
|
Financial Advisor and Intermediary
Sales Support 800-997-2798 |
For information and services for financial intermediaries
including financial advisors, broker-dealers, trust
institutions, and insurance companies |
|
Financial Advisory and Intermediary
Trading Support 800-669-0498 |
For account information and trading support for
financial intermediaries including financial advisors,
broker-dealers, trust institutions, and insurance
companies |
84
Additional Information
Each Fund’s Bylaws require, unless the Trust otherwise consents in writing, that the U.S. Federal District Courts be the sole and exclusive forum for the resolution of complaints under the Securities Act of 1933. This provision may limit a shareholder’s ability to bring a claim in a different forum and may result in increased shareholder costs in pursuing such a claim.
|
Vanguard Fund |
Inception
Date |
Newspaper
Abbreviation |
Vanguard
Fund Number |
CUSIP
Number |
|
Vanguard Short-Term Treasury Index Fund | ||||
|
Institutional Shares |
8/23/2010 |
STGovIxInst |
1642 |
92206C201 |
|
Vanguard Intermediate-Term Treasury Index Fund | ||||
|
Institutional Shares |
3/19/2010 |
ITGovIxInst |
1643 |
92206C805 |
|
Vanguard Long-Term Treasury Index Fund | ||||
|
Institutional Shares |
7/30/2010 |
LTGovIxInst |
1644 |
92206C839 |
|
Vanguard Short-Term Corporate Bond Index Fund | ||||
|
Institutional Shares |
11/19/2009 |
STCorpIxInst |
1645 |
92206C508 |
|
Vanguard Intermediate-Term Corporate Bond Index Fund | ||||
|
Institutional Shares |
11/19/2009 |
ITCorpIxInst |
1646 |
92206C862 |
|
Vanguard Long-Term Corporate Bond Index Fund | ||||
|
Institutional Shares |
11/19/2009 |
LTCorpIxInst |
1647 |
92206C797 |
|
Vanguard Mortgage-Backed Securities Index Fund | ||||
|
Institutional Shares |
10/31/2013 |
MrgBkdIxInst |
1648 |
92206C763 |
CGS identifiers have been provided by CUSIP Global Services, managed on behalf of the American Bankers Association by Standard & Poor’s Financial Services, LLC, and are not for use or dissemination in a manner that would serve as a substitute for any CUSIP service. The CUSIP Database, © 2023 American Bankers Association. “CUSIP” is a registered trademark of the American Bankers Association.
CFA® is a registered trademark owned by CFA Institute.
”Bloomberg®” and Bloomberg U.S. Treasury 1–3 Year Index, Bloomberg U.S. Treasury 3–10 Year Index, Bloomberg U.S. Long Treasury Index, Bloomberg U.S. 1-5 Year Corporate Bond Index, Bloomberg U.S. 5–10 Year Corporate Bond Index, Bloomberg U.S. 10+ Year Corporate Bond Index, Bloomberg U.S. MBS Float Adjusted Index, and Bloomberg U.S. Aggregate Float Adjusted Index (“the Indices” or “Bloomberg Indices”) are service marks of Bloomberg Finance L.P. and its affiliates, including Bloomberg Index Services Limited (“BISL”), the administrator of the Indices (collectively, “Bloomberg”), and have been licensed for use for certain purposes by Vanguard.
Vanguard Sector Bond Index Funds are not sponsored, endorsed, sold or promoted by Bloomberg. Bloomberg does not make any representation or warranty, express or implied, to the owners of or counterparties to Vanguard Sector Bond Index Funds or any member of the public regarding the advisability of investing in securities generally or in Vanguard Sector Bond Index Funds particularly. The only relationship of Bloomberg to Vanguard is the licensing of certain trademarks, trade names and service marks and of the U.S. Treasury 1–3 Year Index, Bloomberg U.S. Treasury 3–10 Year Index, Bloomberg U.S. Long Treasury Index, Bloomberg
85
U.S. 1-5 Year Corporate Bond Index, Bloomberg U.S. 5–10 Year Corporate Bond Index, Bloomberg U.S. 10+ Year Corporate Bond Index, Bloomberg U.S. MBS Float Adjusted Index, and Bloomberg U.S. Aggregate Float Adjusted Index, which is determined, composed and calculated by BISL without regard to Vanguard or Vanguard Sector Bond Index Funds. Bloomberg has no obligation to take the needs of Vanguard or the owners of Vanguard Sector Bond Index Funds into consideration in determining, composing or calculating the U.S. Treasury 1–3 Year Index, Bloomberg U.S. Treasury 3–10 Year Index, Bloomberg U.S. Long Treasury Index, Bloomberg U.S. 1-5 Year Corporate Bond Index, Bloomberg U.S. 5–10 Year Corporate Bond Index, Bloomberg U.S. 10+ Year Corporate Bond Index, Bloomberg U.S. MBS Float Adjusted Index, and Bloomberg U.S. Aggregate Float Adjusted Index. Bloomberg is not responsible for and has not participated in the determination of the timing of, prices at, or quantities of Vanguard Sector Bond Index Funds to be issued. Bloomberg shall not have any obligation or liability, including, without limitation, to Vanguard Sector Bond Index Funds customers, in connection with the administration, marketing or trading of Vanguard Sector Bond Index Funds.
BLOOMBERG DOES NOT GUARANTEE THE ACCURACY AND/OR THE COMPLETENESS OF THE U.S. TREASURY 1-3 YEAR INDEX, BLOOMBERG U.S. TREASURY 3-10 YEAR INDEX, BLOOMBERG U.S. LONG TREASURY INDEX, BLOOMBERG U.S. 1-5 YEAR CORPORATE BOND INDEX, BLOOMBERG U.S. 5-10 YEAR CORPORATE BOND INDEX, BLOOMBERG U.S. 10+ YEAR CORPORATE BOND INDEX, BLOOMBERG U.S. MBS FLOAT ADJUSTED INDEX, AND BLOOMBERG U.S. AGGREGATE FLOAT ADJUSTED INDEX OR ANY DATA RELATED THERETO AND SHALL HAVE NO LIABILITY FOR ANY ERRORS, OMISSIONS OR INTERRUPTIONS THEREIN. BLOOMBERG DOES NOT MAKE ANY WARRANTY, EXPRESS OR IMPLIED, AS TO RESULTS TO BE OBTAINED BY VANGUARD, OWNERS OF VANGUARD SECTOR BOND INDEX FUNDS OR ANY OTHER PERSON OR ENTITY FROM THE USE OF THE U.S. TREASURY 1-3 YEAR INDEX, BLOOMBERG U.S. TREASURY 3-10 YEAR INDEX, BLOOMBERG U.S. LONG TREASURY INDEX, BLOOMBERG U.S. 1-5 YEAR CORPORATE BOND INDEX, BLOOMBERG U.S. 5-10 YEAR CORPORATE BOND INDEX, BLOOMBERG U.S. 10+ YEAR CORPORATE BOND INDEX, BLOOMBERG U.S. MBS FLOAT ADJUSTED INDEX, AND BLOOMBERG U.S. AGGREGATE FLOAT ADJUSTED INDEX OR ANY DATA RELATED THERETO. BLOOMBERG DOES NOT MAKE ANY EXPRESS OR IMPLIED WARRANTIES AND EXPRESSLY DISCLAIMS ALL WARRANTIES OF MERCHANTABILITY OR FITNESS FOR A PARTICULAR PURPOSE OR USE WITH RESPECT TO THE U.S. TREASURY 1-3 YEAR INDEX, BLOOMBERG U.S. TREASURY 3-10 YEAR INDEX, BLOOMBERG U.S. LONG TREASURY INDEX, BLOOMBERG U.S. 1-5 YEAR CORPORATE BOND INDEX, BLOOMBERG U.S. 5-10 YEAR CORPORATE BOND INDEX, BLOOMBERG U.S. 10+ YEAR CORPORATE BOND INDEX, BLOOMBERG U.S. MBS FLOAT ADJUSTED INDEX, AND BLOOMBERG U.S. AGGREGATE FLOAT ADJUSTED INDEX OR ANY DATA RELATED THERETO. WITHOUT LIMITING ANY OF THE FOREGOING, TO THE MAXIMUM EXTENT ALLOWED BY LAW, BLOOMBERG, ITS LICENSORS, AND ITS AND THEIR RESPECTIVE EMPLOYEES, CONTRACTORS, AGENTS, SUPPLIERS, AND VENDORS SHALL HAVE NO LIABILITY OR RESPONSIBILITY WHATSOEVER FOR ANY INJURY OR DAMAGES—WHETHER DIRECT, INDIRECT, CONSEQUENTIAL, INCIDENTAL, PUNITIVE OR OTHERWISE—ARISING IN CONNECTION WITH VANGUARD SECTOR BOND INDEX FUNDS OR U.S. TREASURY 1-3 YEAR INDEX, BLOOMBERG U.S. TREASURY 3-10 YEAR INDEX, BLOOMBERG U.S. LONG TREASURY INDEX, BLOOMBERG U.S. 1-5 YEAR CORPORATE BOND INDEX, BLOOMBERG U.S. 5-10 YEAR CORPORATE BOND INDEX, BLOOMBERG U.S. 10+ YEAR CORPORATE BOND
86
INDEX, BLOOMBERG U.S. MBS FLOAT ADJUSTED INDEX, AND BLOOMBERG U.S. AGGREGATE FLOAT ADJUSTED INDEX OR ANY DATA OR VALUES RELATING THERETO—WHETHER ARISING FROM THEIR NEGLIGENCE OR OTHERWISE, EVEN IF NOTIFIED OF THE POSSIBILITY THEREOF.
87
Glossary of Investment Terms
Average Maturity. The average length of time until bonds held by a fund reach maturity and are repaid. In general, the longer the average maturity, the more a fund's share price fluctuates in response to changes in market interest rates. In calculating average maturity, a fund uses a bond’s maturity or, if applicable, an earlier date on which the advisor believes it is likely that a maturity-shortening device (such as a call, put, refunding, prepayment, or redemption provision or an adjustable coupon rate) will cause the bond to be repaid.
Bloomberg U.S. Aggregate Float Adjusted Index. An index that is the broadest representation of the taxable U.S. bond market, including most U.S. Treasury, agency, corporate, mortgage-backed, asset-backed, and international dollar-denominated issues, all with investment-grade ratings and maturities of 1 year or more. This Index weights its constituent securities based on the value of the constituent securities that are available for public trading, rather than the value of all constituent securities.
Bond. A debt security (IOU) issued by a corporation, a government, or a government agency in exchange for the money the bondholder lends it. In most instances, the issuer agrees to pay back the loan by a specific date and generally to make regular interest payments until that date.
Capital Gains Distributions. Payments to mutual fund shareholders of gains realized on securities that a fund has sold at a profit, minus any realized losses.
Corporate Bond. An IOU issued by a business that wants to borrow money. As with other types of bonds, the issuer promises to repay the borrowed money by a specific date and generally to make interest payments in the meantime.
Coupon Rate. The interest rate paid by the issuer of a debt security until its maturity. It is expressed as an annual percentage of the face value of the security.
Dividend Distributions. Payments to mutual fund shareholders of income from interest or dividends generated by a fund's investments.
Expense Ratio. A fund's total annual operating expenses expressed as a percentage of the fund's average net assets. The expense ratio includes management and administrative expenses, but it does not include the transaction costs of buying and selling portfolio securities.
Face Value. The amount to be paid at a bond’s maturity; also known as the par value or principal.
88
Fixed Income Security. An investment, such as a bond, representing a debt that must be repaid by a specified date, and on which the borrower may pay a fixed, variable, or floating rate of interest.
Float-Adjusted Index. An index that weights its constituent securities based on the value of the constituent securities that are available for public trading, rather than the value of all constituent securities. Some portion of an issuer’s securities may be unavailable for public trading because, for example, those securities are owned by company insiders on a restricted basis or by a government agency. By excluding unavailable securities, float-adjusted indexes can produce a more accurate picture of the returns actually experienced by investors in the measured market.
Government Bond. An IOU issued by the U.S. government or a government agency in exchange for the money you lend it. The issuer promises to repay the borrowed money by a specific date and generally to make regular interest payments until that date.
Inception Date. The date on which the assets of a fund (or one of its share classes) are first invested in accordance with the fund's investment objective. For funds with a subscription period, the inception date is the day after that period ends. Investment performance is generally measured from the inception date.
Indexing. A low-cost investment strategy in which a mutual fund attempts to track—rather than outperform—a specified market benchmark, or “index.”
Investment-Grade Bond. A debt security whose credit quality is considered by independent bond rating agencies, or through independent analysis conducted by a fund's advisor, to be sufficient to ensure timely payment of principal and interest under current economic circumstances. Debt securities rated in one of the four highest rating categories are considered investment-grade. Other debt securities may be considered by an advisor to be investment-grade.
Joint Committed Credit Facility. Each Fund participates, along with other funds managed by Vanguard, in a committed credit facility provided by a syndicate of lenders pursuant to a credit agreement that may be renewed annually; each Vanguard fund is individually liable for its borrowings, if any, under the credit facility. The amount and terms of the committed credit facility are subject to approval by the Funds' board of trustees and renegotiation with the lender syndicate on an annual basis.
89
Mutual Fund. An investment company that pools the money of many people and invests it in a variety of securities in an effort to achieve a specific objective over time.
New York Stock Exchange (NYSE). A stock exchange based in New York City that is open for regular trading on business days, Monday through Friday, from 9:30 a.m. to 4 p.m., Eastern time.
Principal. The face value of a debt instrument or the amount of money put into an investment.
Return of Capital. A return of capital occurs when a fund's distributions exceed its earnings in a fiscal year. A return of capital is a return of all or part of your original investment or amounts paid in excess of your original investment in a fund. In general, a return of capital reduces your cost basis in a fund's shares and is not taxable to you until your cost basis has been reduced to zero.
Securities. Stocks, bonds, money market instruments, and other investments.
Total Return. A percentage change, over a specified time period, in a mutual fund's net asset value, assuming the reinvestment of all distributions of dividends and capital gains.
Volatility. The fluctuations in value of a mutual fund or other security. The greater a fund's volatility, the wider the fluctuations in its returns.
Yield. Income (interest or dividends) earned by an investment, expressed as a percentage of the investment’s price.
Connect with Vanguard® ˃ vanguard.com
For More Information
If you would like more information about Vanguard Sector Bond Index Funds, the following documents are available free upon request:
Annual/Semiannual Reports to Shareholders
Additional information about the Funds' investments is available in the Funds' annual and semiannual reports to shareholders. In the annual report, you will find a discussion of the market conditions and investment strategies that significantly affected the Funds' performance during their last fiscal year.
Statement of Additional Information (SAI)
The SAI provides more detailed information about the Funds and is incorporated by reference into (and thus legally a part of) this prospectus.
To receive a free copy of the latest annual or semiannual report or the SAI, or to request additional information about the Funds or other Vanguard funds, please visit vanguard.com or contact us as follows:
If you are an individual investor:
Telephone: 800-662-7447; Text telephone for people with hearing impairment: 800-749-7273
Telephone: 800-662-7447; Text telephone for people with hearing impairment: 800-749-7273
If you are a client of Vanguard’s Institutional Division:
Telephone: 888-809-8102; Text telephone for people with hearing impairment: 800-749-7273
Telephone: 888-809-8102; Text telephone for people with hearing impairment: 800-749-7273
If you are a current Vanguard shareholder and would like information about your account, account transactions, and/or account statements, please call:
Client Services Department
Telephone: 800-662-2739; Text telephone for people with hearing impairment: 800-749-7273
Telephone: 800-662-2739; Text telephone for people with hearing impairment: 800-749-7273
Information Provided by the SEC
Reports and other information about the Funds are available in the EDGAR database on the SEC’s website at sec.gov, or you can receive copies of this information, for a fee, by electronic request at the following email address: publicinfo@sec.gov.
Funds' Investment Company Act file number: 811-07803
© 2023 The Vanguard Group, Inc. All rights reserved.
Vanguard Marketing Corporation, Distributor.
I 1642 122023
Vanguard Marketing Corporation, Distributor.
I 1642 122023
Vanguard Sector Bond ETFs
Prospectus
December 22, 2023
Exchange-traded fund shares that are not individually redeemable and are listed on Nasdaq
Vanguard Short-Term Treasury Index Fund ETF Shares (VGSH)
Vanguard Intermediate-Term Treasury Index Fund ETF Shares (VGIT)
Vanguard Long-Term Treasury Index Fund ETF Shares (VGLT)
Vanguard Short-Term Corporate Bond Index Fund ETF Shares (VCSH)
Vanguard Intermediate-Term Corporate Bond Index Fund ETF Shares (VCIT)
Vanguard Long-Term Corporate Bond Index Fund ETF Shares (VCLT)
Vanguard Mortgage-Backed Securities Index Fund ETF Shares (VMBS)
This prospectus contains financial data for the Funds through the fiscal year ended August 31, 2023.
The Securities and Exchange Commission (SEC) has not approved or disapproved these securities or passed upon the adequacy of this prospectus. Any representation to the contrary is a criminal offense.
(Fees paid directly from your investment)
|
| |
|
Transaction Fee on Purchases and Sales |
|
|
Transaction Fee on Reinvested Dividends |
|
|
Transaction Fee on Conversion to ETF Shares |
|
*
(Expenses that you pay each year as a percentage of the value of your investment)
|
| |
|
Management Fees |
% |
|
12b-1 Distribution Fee |
|
|
Other Expenses |
% |
|
Total Annual Fund Operating Expenses |
% |
1
|
1 Year |
3 Years |
5 Years |
10 Years |
|
$ |
$ |
$ |
$ |
2
3
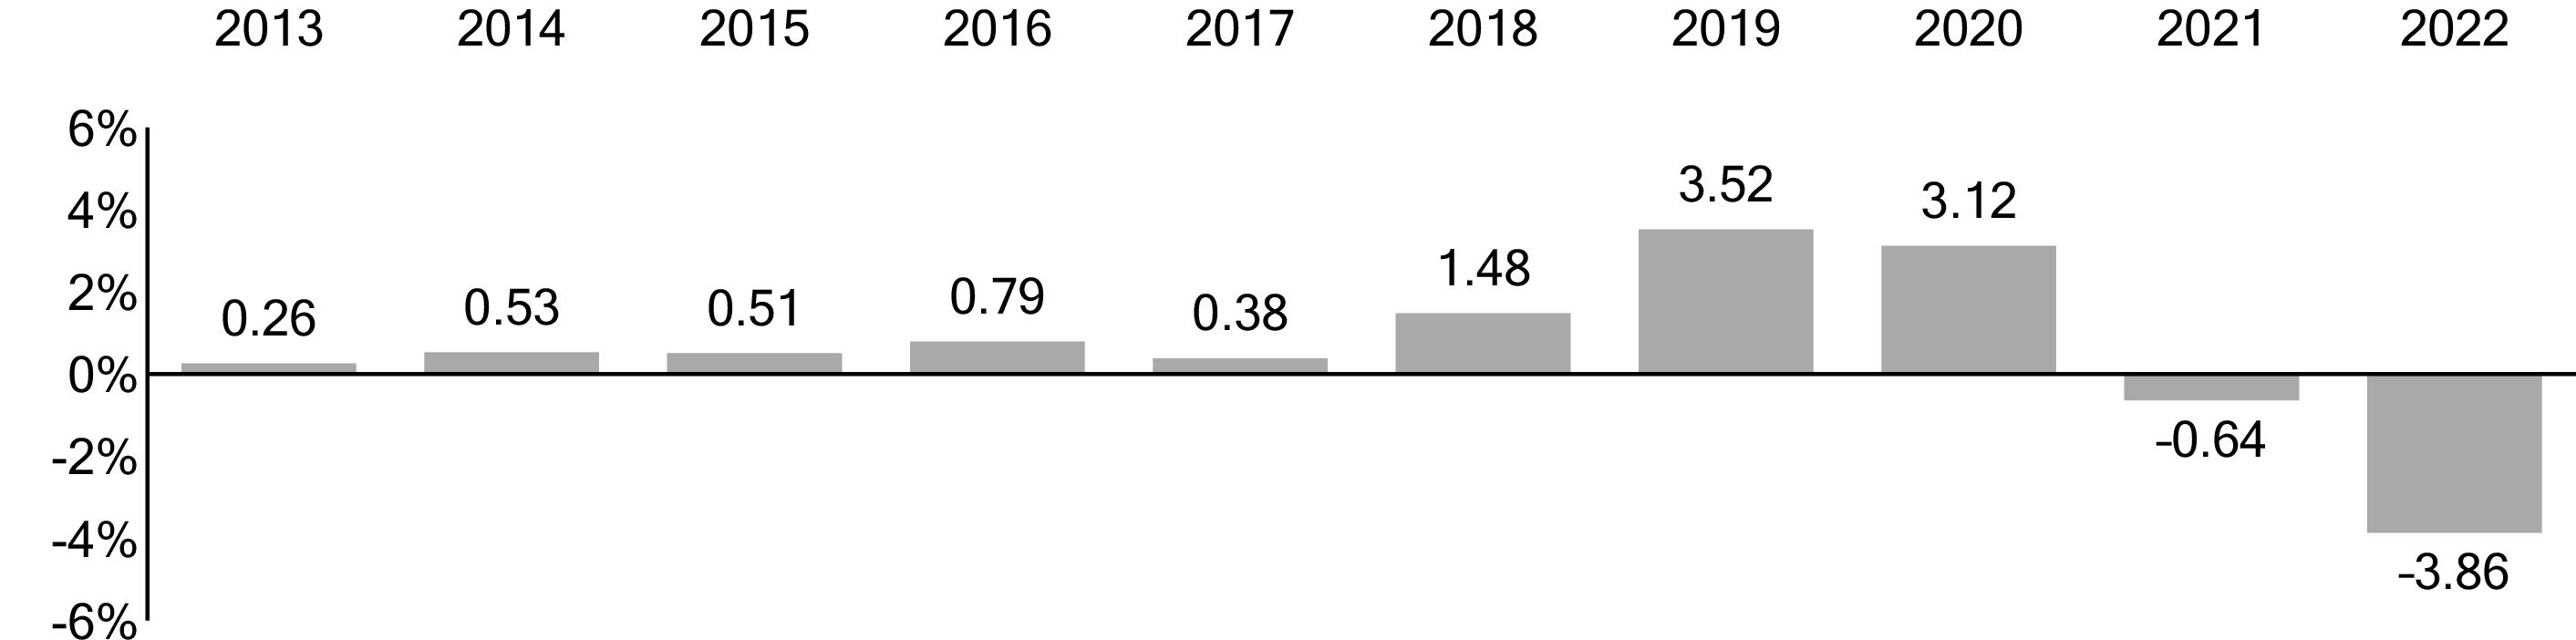
1 The year-to-date return as of the most recent calendar quarter, which ended on September 30, 2023, was 1.70%.
|
|
Total Return |
Quarter |
|
|
% |
|
|
|
-
% |
|
4
|
|
1 Year |
5 Years |
10 Years |
|
Vanguard Short-Term Treasury Index Fund ETF Shares |
|
|
|
|
Based on NAV |
|
|
|
|
Return Before Taxes |
-
% |
% |
% |
|
Return After Taxes on Distributions |
- |
|
|
|
Return After Taxes on Distributions and Sale of Fund Shares |
- |
|
|
|
Based on Market Price |
|
|
|
|
Return Before Taxes |
- |
|
|
|
Bloomberg U.S. Treasury 1-3 Year Index
(reflects no deduction for fees, expenses, or taxes) |
-
% |
% |
% |
|
Spliced Bloomberg U.S. Treasury 1-3 Year Index in USD
(reflects no deduction for fees, expenses, or taxes) |
- |
|
|
|
Bloomberg U.S. Aggregate Float Adjusted Index
(reflects no deduction for fees, expenses, or taxes) |
- |
|
|
Investment Advisor
The Vanguard Group, Inc. (Vanguard)
Portfolio Manager
Joshua C. Barrickman, CFA, Principal of Vanguard and co-head of Vanguard’s Fixed Income Indexing Americas. He has managed the Fund since 2013.
5
Purchase and Sale of Fund Shares
ETF Shares may only be bought and sold in the secondary market through a brokerage firm. The price you pay or receive for ETF Shares will be the prevailing market price, which may be more (premium) or less (discount) than the NAV of the shares. The brokerage firm may charge you a commission to execute the transaction. Unless imposed by your brokerage firm, there is no minimum dollar amount you must invest and no minimum number of shares you must buy. ETF Shares of the Fund cannot be directly purchased from or redeemed with the Fund, except by certain authorized broker-dealers. These broker-dealers may purchase and redeem ETF Shares only in large blocks (Creation Units), typically in exchange for baskets of securities.
An investor may incur costs attributable to the difference between the highest price a buyer is willing to pay to purchase ETF Shares (bid) and the lowest price a seller is willing to accept for ETF Shares (ask) when buying or selling shares in the secondary market (bid-ask spread). Recent information, including information on the Fund's NAV, market price, premiums and discounts, and bid-ask spreads, is available online at vanguard.com.
Tax Information
The Fund’s distributions may be taxable as ordinary income or capital gain. If you are investing through a tax-advantaged account, such as an IRA or an employer-sponsored retirement or savings plan, special tax rules apply.
Payments to Financial Intermediaries
The Fund and its investment advisor do not pay financial intermediaries for sales of Fund shares.
6
(Fees paid directly from your investment)
|
| |
|
Transaction Fee on Purchases and Sales |
|
|
Transaction Fee on Reinvested Dividends |
|
|
Transaction Fee on Conversion to ETF Shares |
|
*
(Expenses that you pay each year as a percentage of the value of your investment)
|
| |
|
Management Fees |
% |
|
12b-1 Distribution Fee |
|
|
Other Expenses |
% |
|
Total Annual Fund Operating Expenses |
% |
7
|
1 Year |
3 Years |
5 Years |
10 Years |
|
$ |
$ |
$ |
$ |
8
9

1 The year-to-date return as of the most recent calendar quarter, which ended on September 30, 2023, was -0.55%.
|
|
Total Return |
Quarter |
|
|
% |
|
|
|
-
% |
|
10
|
|
1 Year |
5 Years |
10 Years |
|
Vanguard Intermediate-Term Treasury Index Fund
ETF Shares |
|
|
|
|
Based on NAV |
|
|
|
|
Return Before Taxes |
-
% |
% |
% |
|
Return After Taxes on Distributions |
- |
- |
- |
|
Return After Taxes on Distributions and Sale of Fund Shares |
- |
- |
|
|
Based on Market Price |
|
|
|
|
Return Before Taxes |
- |
|
|
|
Bloomberg U.S. Treasury 3-10 Year Index
(reflects no deduction for fees, expenses, or taxes) |
-
% |
% |
% |
|
Spliced Bloomberg U.S. Treasury 3-10 Year Index in USD
(reflects no deduction for fees, expenses, or taxes) |
- |
|
|
|
Bloomberg U.S. Aggregate Float Adjusted Index
(reflects no deduction for fees, expenses, or taxes) |
- |
|
|
Investment Advisor
The Vanguard Group, Inc. (Vanguard)
Portfolio Manager
Joshua C. Barrickman, CFA, Principal of Vanguard and co-head of Vanguard’s Fixed Income Indexing Americas. He has managed the Fund since 2013.
11
Purchase and Sale of Fund Shares
ETF Shares may only be bought and sold in the secondary market through a brokerage firm. The price you pay or receive for ETF Shares will be the prevailing market price, which may be more (premium) or less (discount) than the NAV of the shares. The brokerage firm may charge you a commission to execute the transaction. Unless imposed by your brokerage firm, there is no minimum dollar amount you must invest and no minimum number of shares you must buy. ETF Shares of the Fund cannot be directly purchased from or redeemed with the Fund, except by certain authorized broker-dealers. These broker-dealers may purchase and redeem ETF Shares only in large blocks (Creation Units), typically in exchange for baskets of securities.
An investor may incur costs attributable to the difference between the highest price a buyer is willing to pay to purchase ETF Shares (bid) and the lowest price a seller is willing to accept for ETF Shares (ask) when buying or selling shares in the secondary market (bid-ask spread). Recent information, including information on the Fund's NAV, market price, premiums and discounts, and bid-ask spreads, is available online at vanguard.com.
12
Tax Information
The Fund’s distributions may be taxable as ordinary income or capital gain. If you are investing through a tax-advantaged account, such as an IRA or an employer-sponsored retirement or savings plan, special tax rules apply.
Payments to Financial Intermediaries
The Fund and its investment advisor do not pay financial intermediaries for sales of Fund shares.
13
(Fees paid directly from your investment)
|
| |
|
Transaction Fee on Purchases and Sales |
|
|
Transaction Fee on Reinvested Dividends |
|
|
Transaction Fee on Conversion to ETF Shares |
|
*
(Expenses that you pay each year as a percentage of the value of your investment)
|
| |
|
Management Fees |
% |
|
12b-1 Distribution Fee |
|
|
Other Expenses |
% |
|
Total Annual Fund Operating Expenses |
% |
14
|
1 Year |
3 Years |
5 Years |
10 Years |
|
$ |
$ |
$ |
$ |
15
16
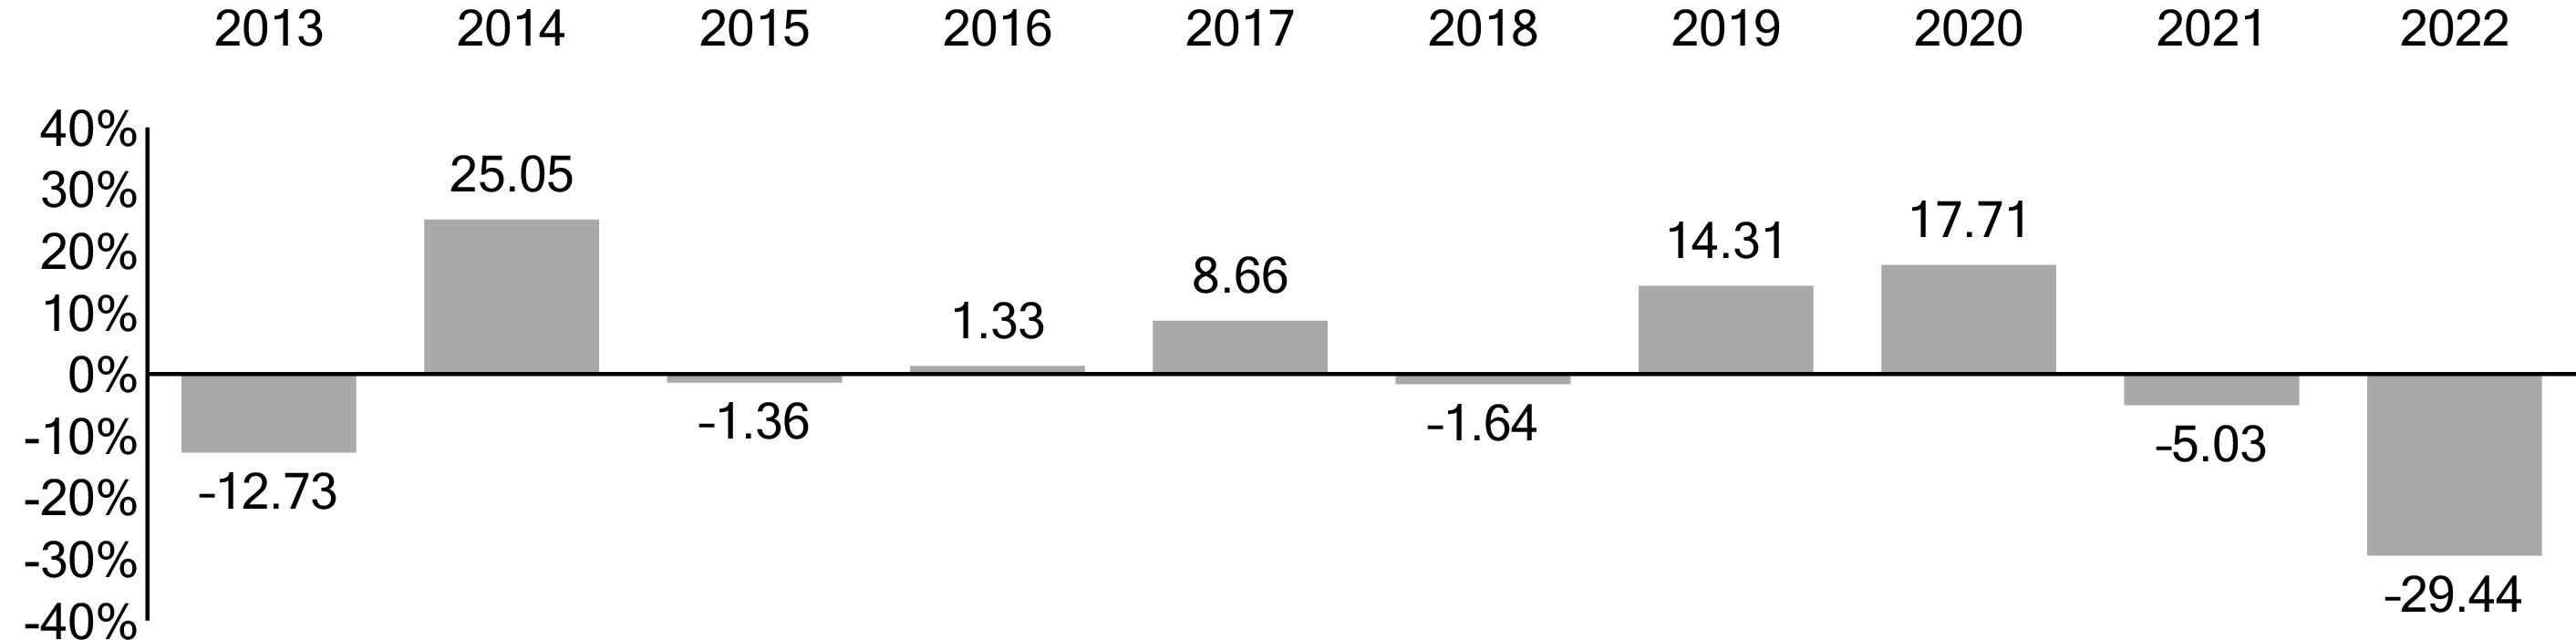
1 The year-to-date return as of the most recent calendar quarter, which ended on September 30, 2023, was -7.95%.
|
|
Total Return |
Quarter |
|
|
% |
|
|
|
-
% |
|
17
|
|
1 Year |
5 Years |
10 Years |
|
Vanguard Long-Term Treasury Index Fund ETF Shares |
|
|
|
|
Based on NAV |
|
|
|
|
Return Before Taxes |
-
% |
-
% |
% |
|
Return After Taxes on Distributions |
- |
- |
- |
|
Return After Taxes on Distributions and Sale of Fund Shares |
- |
- |
- |
|
Based on Market Price |
|
|
|
|
Return Before Taxes |
- |
- |
|
|
Bloomberg U.S. Long Treasury Bond Index
(reflects no deduction for fees, expenses, or taxes) |
-
% |
-
% |
% |
|
Spliced Bloomberg U.S. Long Treasury Index in USD
(reflects no deduction for fees, expenses, or taxes) |
- |
- |
|
|
Bloomberg U.S. Aggregate Float Adjusted Index
(reflects no deduction for fees, expenses, or taxes) |
- |
|
|
Investment Advisor
The Vanguard Group, Inc. (Vanguard)
Portfolio Manager
Joshua C. Barrickman, CFA, Principal of Vanguard and co-head of Vanguard’s Fixed Income Indexing Americas. He has managed the Fund since 2013.
18
Purchase and Sale of Fund Shares
ETF Shares may only be bought and sold in the secondary market through a brokerage firm. The price you pay or receive for ETF Shares will be the prevailing market price, which may be more (premium) or less (discount) than the NAV of the shares. The brokerage firm may charge you a commission to execute the transaction. Unless imposed by your brokerage firm, there is no minimum dollar amount you must invest and no minimum number of shares you must buy. ETF Shares of the Fund cannot be directly purchased from or redeemed with the Fund, except by certain authorized broker-dealers. These broker-dealers may purchase and redeem ETF Shares only in large blocks (Creation Units), typically in exchange for baskets of securities.
An investor may incur costs attributable to the difference between the highest price a buyer is willing to pay to purchase ETF Shares (bid) and the lowest price a seller is willing to accept for ETF Shares (ask) when buying or selling shares in the secondary market (bid-ask spread). Recent information, including information on the Fund's NAV, market price, premiums and discounts, and bid-ask spreads, is available online at vanguard.com.
Tax Information
The Fund’s distributions may be taxable as ordinary income or capital gain. If you are investing through a tax-advantaged account, such as an IRA or an employer-sponsored retirement or savings plan, special tax rules apply.
Payments to Financial Intermediaries
The Fund and its investment advisor do not pay financial intermediaries for sales of Fund shares.
19
(Fees paid directly from your investment)
|
| |
|
Transaction Fee on Purchases and Sales |
|
|
Transaction Fee on Reinvested Dividends |
|
|
Transaction Fee on Conversion to ETF Shares |
|
*
(Expenses that you pay each year as a percentage of the value of your investment)
|
| |
|
Management Fees |
% |
|
12b-1 Distribution Fee |
|
|
Other Expenses |
% |
|
Total Annual Fund Operating Expenses |
% |
20
|
1 Year |
3 Years |
5 Years |
10 Years |
|
$ |
$ |
$ |
$ |
21
22
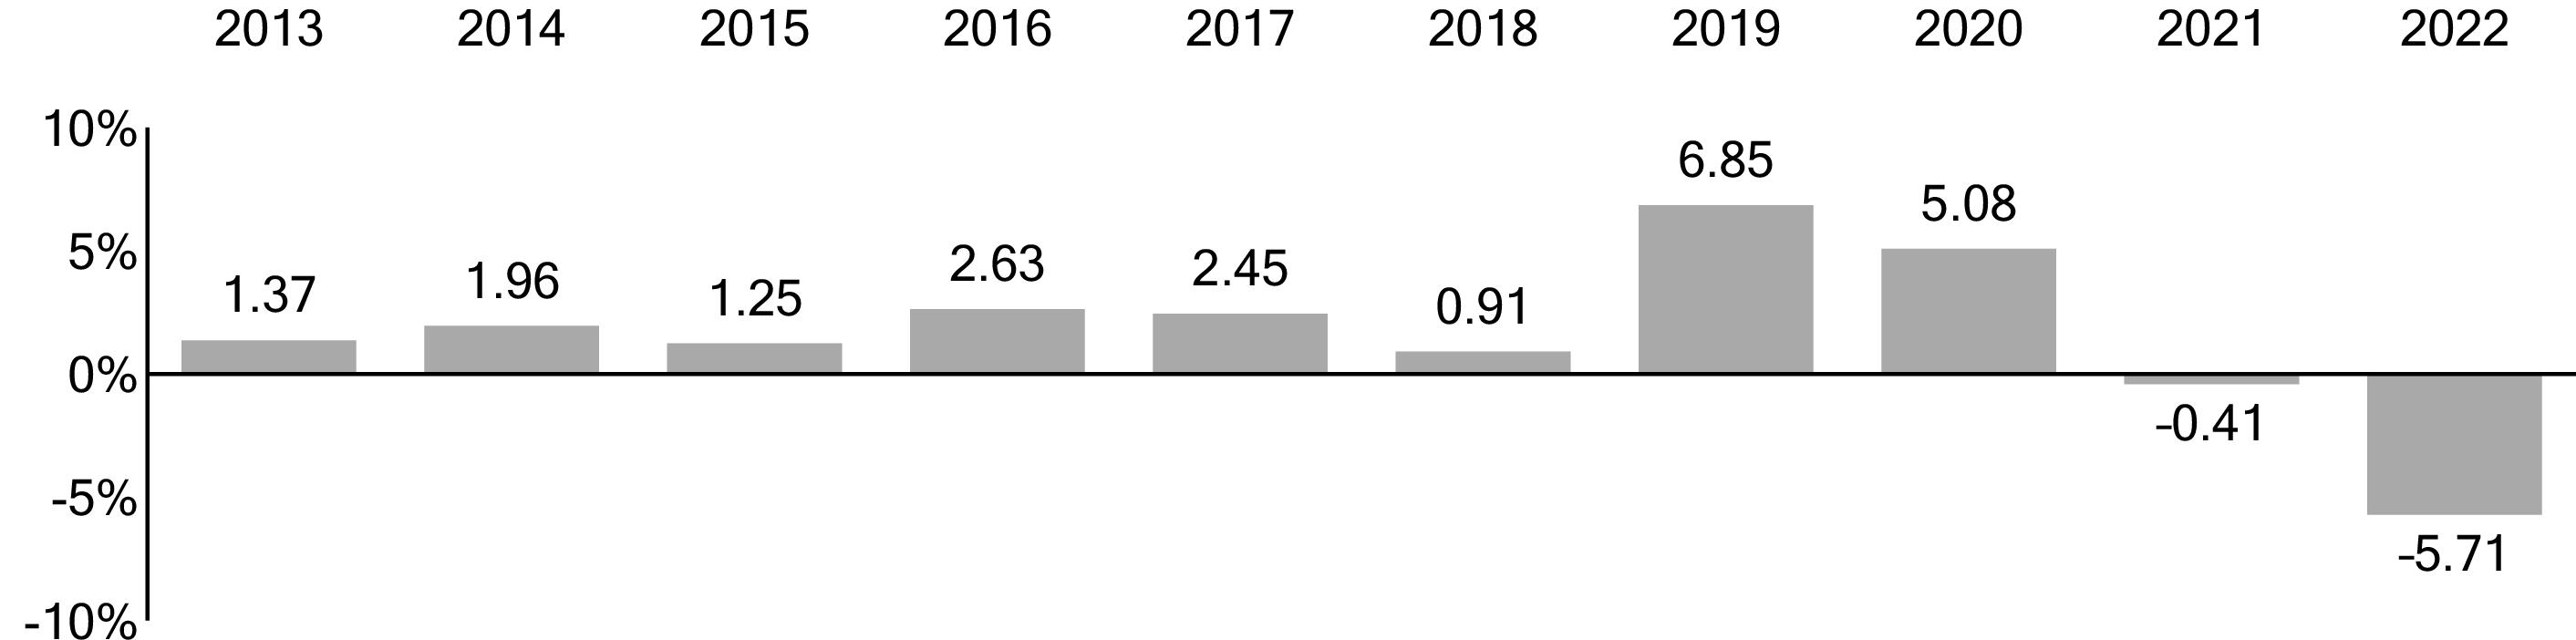
1 The year-to-date return as of the most recent calendar quarter, which ended on September 30, 2023, was 2.06%.
|
|
Total Return |
Quarter |
|
|
% |
|
|
|
-
% |
|
23
|
|
1 Year |
5 Years |
10 Years |
|
Vanguard Short-Term Corporate Bond Index Fund
ETF Shares |
|
|
|
|
Based on NAV |
|
|
|
|
Return Before Taxes |
-
% |
% |
% |
|
Return After Taxes on Distributions |
- |
|
|
|
Return After Taxes on Distributions and Sale of Fund Shares |
- |
|
|
|
Based on Market Price |
|
|
|
|
Return Before Taxes |
- |
|
|
|
Bloomberg U.S. 1-5 Year Corporate Bond Index
(reflects no deduction for fees, expenses, or taxes) |
-
% |
% |
% |
|
Bloomberg U.S. Aggregate Float Adjusted Index
(reflects no deduction for fees, expenses, or taxes) |
- |
|
|
Investment Advisor
The Vanguard Group, Inc. (Vanguard)
Portfolio Manager
Joshua C. Barrickman, CFA, Principal of Vanguard and co-head of Vanguard’s Fixed Income Indexing Americas. He has managed the Fund since its inception in 2009.
24
Purchase and Sale of Fund Shares
ETF Shares may only be bought and sold in the secondary market through a brokerage firm. The price you pay or receive for ETF Shares will be the prevailing market price, which may be more (premium) or less (discount) than the NAV of the shares. The brokerage firm may charge you a commission to execute the transaction. Unless imposed by your brokerage firm, there is no minimum dollar amount you must invest and no minimum number of shares you must buy. ETF Shares of the Fund cannot be directly purchased from or redeemed with the Fund, except by certain authorized broker-dealers. These broker-dealers may purchase and redeem ETF Shares only in large blocks (Creation Units), typically in exchange for baskets of securities.
An investor may incur costs attributable to the difference between the highest price a buyer is willing to pay to purchase ETF Shares (bid) and the lowest price a seller is willing to accept for ETF Shares (ask) when buying or selling shares in the secondary market (bid-ask spread). Recent information, including information on the Fund's NAV, market price, premiums and discounts, and bid-ask spreads, is available online at vanguard.com.
Tax Information
The Fund’s distributions may be taxable as ordinary income or capital gain. If you are investing through a tax-advantaged account, such as an IRA or an employer-sponsored retirement or savings plan, special tax rules apply.
Payments to Financial Intermediaries
The Fund and its investment advisor do not pay financial intermediaries for sales of Fund shares.
25
(Fees paid directly from your investment)
|
| |
|
Transaction Fee on Purchases and Sales |
|
|
Transaction Fee on Reinvested Dividends |
|
|
Transaction Fee on Conversion to ETF Shares |
|
*
(Expenses that you pay each year as a percentage of the value of your investment)
|
| |
|
Management Fees |
% |
|
12b-1 Distribution Fee |
|
|
Other Expenses |
% |
|
Total Annual Fund Operating Expenses |
% |
26
|
1 Year |
3 Years |
5 Years |
10 Years |
|
$ |
$ |
$ |
$ |
27
28

1 The year-to-date return as of the most recent calendar quarter, which ended on September 30, 2023, was 0.52%.
|
|
Total Return |
Quarter |
|
|
% |
|
|
|
-
% |
|
29
|
|
1 Year |
5 Years |
10 Years |
|
Vanguard Intermediate-Term Corporate Bond Index Fund
ETF Shares |
|
|
|
|
Based on NAV |
|
|
|
|
Return Before Taxes |
-
% |
% |
% |
|
Return After Taxes on Distributions |
- |
- |
|
|
Return After Taxes on Distributions and Sale of Fund Shares |
- |
|
|
|
Based on Market Price |
|
|
|
|
Return Before Taxes |
- |
|
|
|
Bloomberg U.S. 5-10 Year Corporate Bond Index
(reflects no deduction for fees, expenses, or taxes) |
-
% |
% |
% |
|
Bloomberg U.S. Aggregate Float Adjusted Index
(reflects no deduction for fees, expenses, or taxes) |
- |
|
|
Investment Advisor
The Vanguard Group, Inc. (Vanguard)
Portfolio Manager
Joshua C. Barrickman, CFA, Principal of Vanguard and co-head of Vanguard’s Fixed Income Indexing Americas. He has managed the Fund since its inception in 2009.
30
Purchase and Sale of Fund Shares
ETF Shares may only be bought and sold in the secondary market through a brokerage firm. The price you pay or receive for ETF Shares will be the prevailing market price, which may be more (premium) or less (discount) than the NAV of the shares. The brokerage firm may charge you a commission to execute the transaction. Unless imposed by your brokerage firm, there is no minimum dollar amount you must invest and no minimum number of shares you must buy. ETF Shares of the Fund cannot be directly purchased from or redeemed with the Fund, except by certain authorized broker-dealers. These broker-dealers may purchase and redeem ETF Shares only in large blocks (Creation Units), typically in exchange for baskets of securities.
An investor may incur costs attributable to the difference between the highest price a buyer is willing to pay to purchase ETF Shares (bid) and the lowest price a seller is willing to accept for ETF Shares (ask) when buying or selling shares in the secondary market (bid-ask spread). Recent information, including information on the Fund's NAV, market price, premiums and discounts, and bid-ask spreads, is available online at vanguard.com.
Tax Information
The Fund’s distributions may be taxable as ordinary income or capital gain. If you are investing through a tax-advantaged account, such as an IRA or an employer-sponsored retirement or savings plan, special tax rules apply.
Payments to Financial Intermediaries
The Fund and its investment advisor do not pay financial intermediaries for sales of Fund shares.
31
(Fees paid directly from your investment)
|
| |
|
Transaction Fee on Purchases and Sales |
|
|
Transaction Fee on Reinvested Dividends |
|
|
Transaction Fee on Conversion to ETF Shares |
|
*
(Expenses that you pay each year as a percentage of the value of your investment)
|
| |
|
Management Fees |
% |
|
12b-1 Distribution Fee |
|
|
Other Expenses |
% |
|
Total Annual Fund Operating Expenses |
% |
32
|
1 Year |
3 Years |
5 Years |
10 Years |
|
$ |
$ |
$ |
$ |
33
34
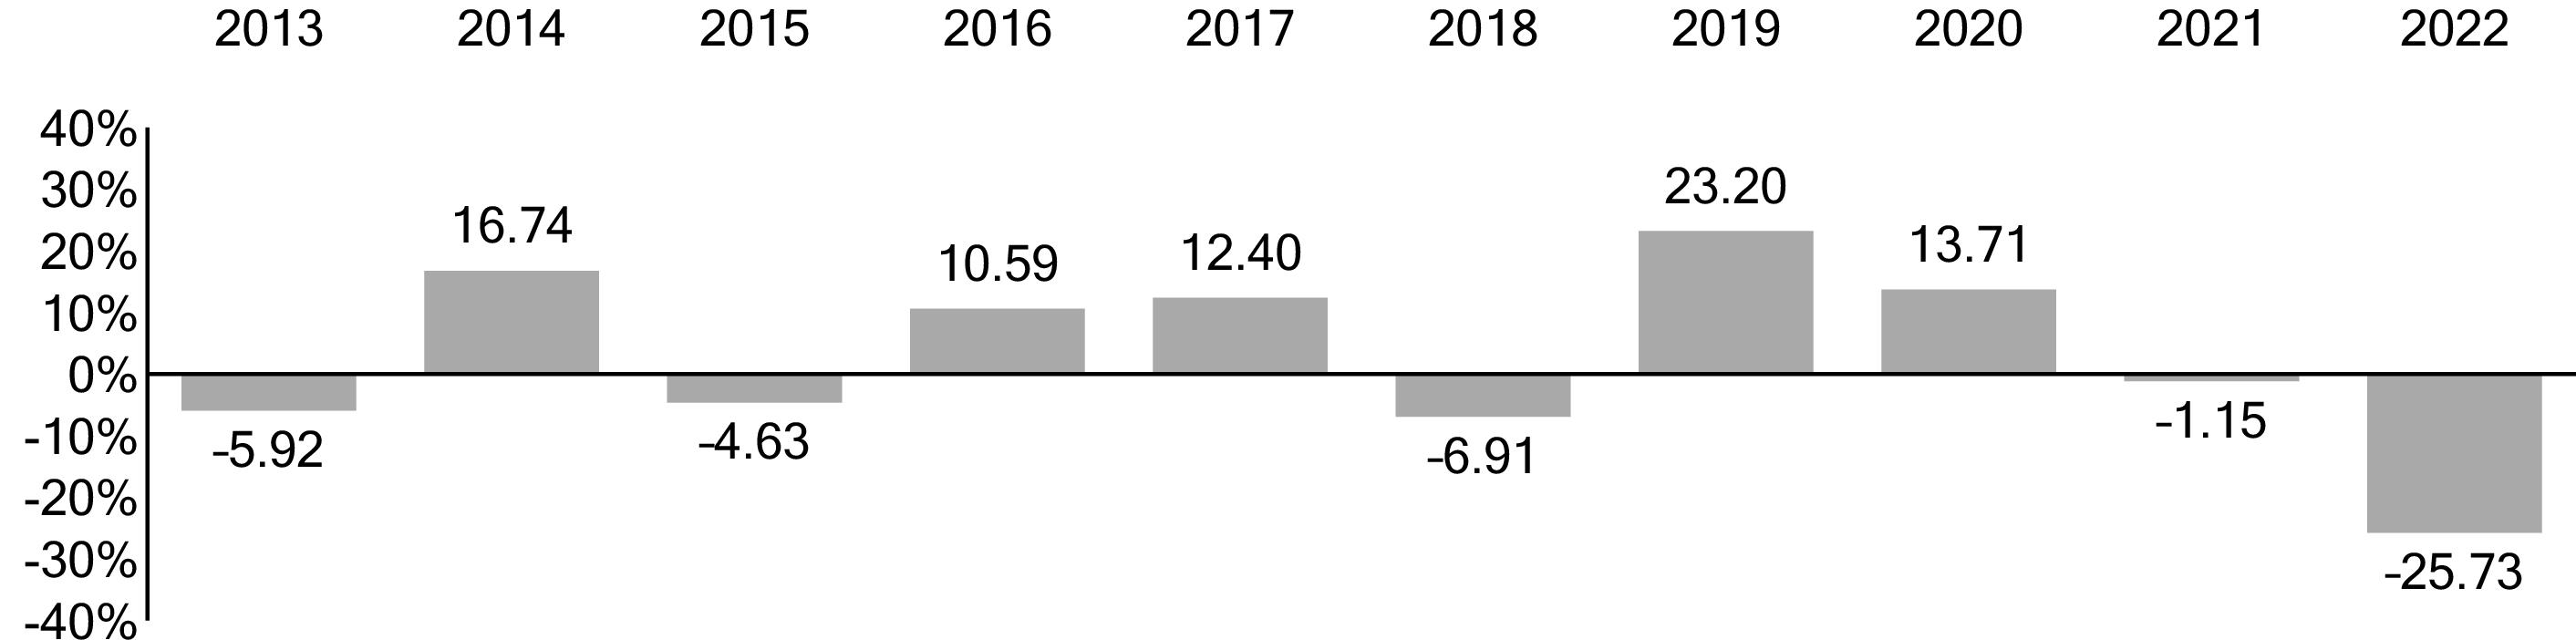
1 The year-to-date return as of the most recent calendar quarter, which ended on September 30, 2023, was -2.39%.
|
|
Total Return |
Quarter |
|
|
% |
|
|
|
-
% |
|
35
|
|
1 Year |
5 Years |
10 Years |
|
Vanguard Long-Term Corporate Bond Index Fund
ETF Shares |
|
|
|
|
Based on NAV |
|
|
|
|
Return Before Taxes |
-
% |
-
% |
% |
|
Return After Taxes on Distributions |
- |
- |
|
|
Return After Taxes on Distributions and Sale of Fund Shares |
- |
- |
|
|
Based on Market Price |
|
|
|
|
Return Before Taxes |
- |
- |
|
|
Bloomberg U.S. 10+ Year Corporate Bond Index
(reflects no deduction for fees, expenses, or taxes) |
-
% |
-
% |
% |
|
Bloomberg U.S. Aggregate Float Adjusted Index
(reflects no deduction for fees, expenses, or taxes) |
- |
|
|
Investment Advisor
The Vanguard Group, Inc. (Vanguard)
Portfolio Manager
Joshua C. Barrickman, CFA, Principal of Vanguard and co-head of Vanguard’s Fixed Income Indexing Americas. He has managed the Fund since its inception in 2009.
36
Purchase and Sale of Fund Shares
ETF Shares may only be bought and sold in the secondary market through a brokerage firm. The price you pay or receive for ETF Shares will be the prevailing market price, which may be more (premium) or less (discount) than the NAV of the shares. The brokerage firm may charge you a commission to execute the transaction. Unless imposed by your brokerage firm, there is no minimum dollar amount you must invest and no minimum number of shares you must buy. ETF Shares of the Fund cannot be directly purchased from or redeemed with the Fund, except by certain authorized broker-dealers. These broker-dealers may purchase and redeem ETF Shares only in large blocks (Creation Units), typically in exchange for baskets of securities.
An investor may incur costs attributable to the difference between the highest price a buyer is willing to pay to purchase ETF Shares (bid) and the lowest price a seller is willing to accept for ETF Shares (ask) when buying or selling shares in the secondary market (bid-ask spread). Recent information, including information on the Fund's NAV, market price, premiums and discounts, and bid-ask spreads, is available online at vanguard.com.
Tax Information
The Fund’s distributions may be taxable as ordinary income or capital gain. If you are investing through a tax-advantaged account, such as an IRA or an employer-sponsored retirement or savings plan, special tax rules apply.
Payments to Financial Intermediaries
The Fund and its investment advisor do not pay financial intermediaries for sales of Fund shares.
37
(Fees paid directly from your investment)
|
| |
|
Transaction Fee on Purchases and Sales |
|
|
Transaction Fee on Reinvested Dividends |
|
|
Transaction Fee on Conversion to ETF Shares |
|
*
(Expenses that you pay each year as a percentage of the value of your investment)
|
| |
|
Management Fees |
% |
|
12b-1 Distribution Fee |
|
|
Other Expenses |
% |
|
Total Annual Fund Operating Expenses |
% |
38
|
1 Year |
3 Years |
5 Years |
10 Years |
|
$ |
$ |
$ |
$ |
39
40
41
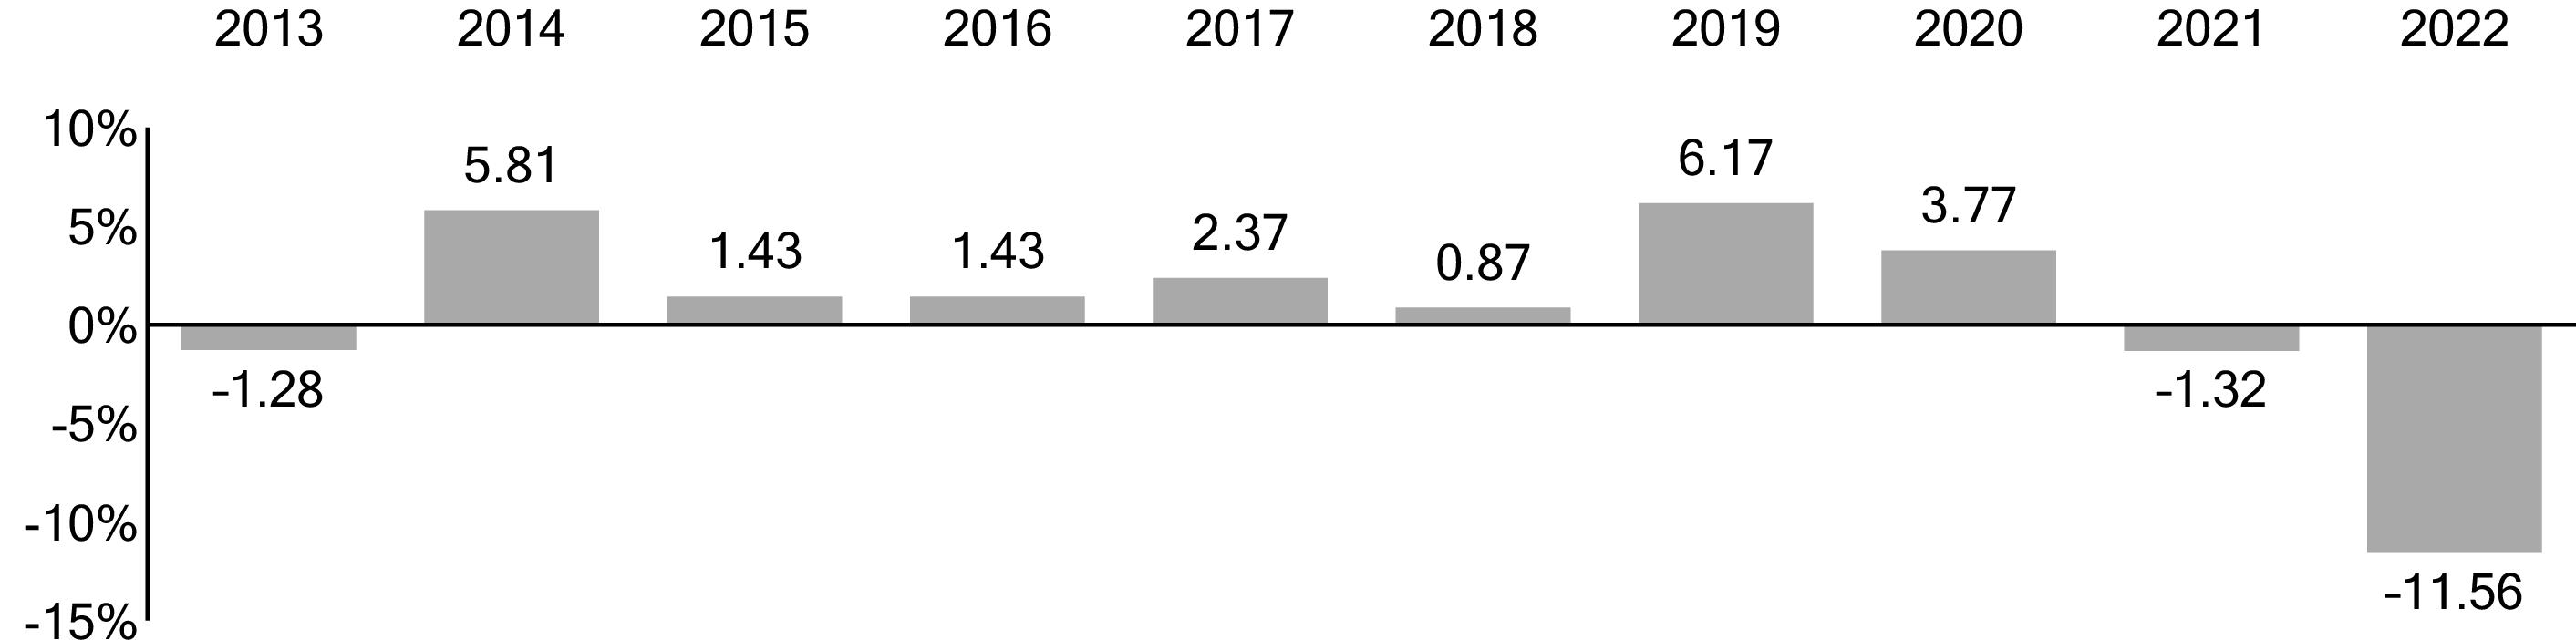
1 The year-to-date return as of the most recent calendar quarter, which ended on September 30, 2023, was -2.14%.
|
|
Total Return |
Quarter |
|
|
% |
|
|
|
-
% |
|
|
|
1 Year |
5 Years |
10 Years |
|
Vanguard Mortgage-Backed Securities Index Fund
ETF Shares |
|
|
|
|
Based on NAV |
|
|
|
|
Return Before Taxes |
-
% |
-
% |
% |
|
Return After Taxes on Distributions |
- |
- |
- |
|
Return After Taxes on Distributions and Sale of Fund Shares |
- |
- |
|
|
Based on Market Price |
|
|
|
|
Return Before Taxes |
- |
- |
|
|
Bloomberg U.S. MBS Float Adjusted Index
(reflects no deduction for fees, expenses, or taxes) |
-
% |
-
% |
% |
|
Bloomberg U.S. Aggregate Float Adjusted Index
(reflects no deduction for fees, expenses, or taxes) |
- |
|
|
42
Investment Advisor
The Vanguard Group, Inc. (Vanguard)
Portfolio Manager
Joshua C. Barrickman, CFA, Principal of Vanguard and co-head of Vanguard’s Fixed Income Indexing Americas. He has managed the Fund since 2013.
Purchase and Sale of Fund Shares
ETF Shares may only be bought and sold in the secondary market through a brokerage firm. The price you pay or receive for ETF Shares will be the prevailing market price, which may be more (premium) or less (discount) than the NAV of the shares. The brokerage firm may charge you a commission to execute the transaction. Unless imposed by your brokerage firm, there is no minimum dollar amount you must invest and no minimum number of shares you must buy. ETF Shares of the Fund cannot be directly purchased from or redeemed with the Fund, except by certain authorized broker-dealers. These broker-dealers may purchase and redeem ETF Shares only in large blocks (Creation Units), typically in exchange for cash.
An investor may incur costs attributable to the difference between the highest price a buyer is willing to pay to purchase ETF Shares (bid) and the lowest price a seller is willing to accept for ETF Shares (ask) when buying or selling shares in the secondary market (bid-ask spread). Recent information, including information on the Fund's NAV, market price, premiums and discounts, and bid-ask spreads, is available online at vanguard.com.
Tax Information
The Fund’s distributions may be taxable as ordinary income or capital gain. If you are investing through a tax-advantaged account, such as an IRA or an employer-sponsored retirement or savings plan, special tax rules apply.
Payments to Financial Intermediaries
The Fund and its investment advisor do not pay financial intermediaries for sales of Fund shares.
43
Investing in Vanguard ETF® Shares
What Are Vanguard ETF Shares?
Vanguard ETF Shares are an exchange-traded class of shares issued by certain Vanguard funds. ETF Shares represent an interest in the portfolio of stocks or bonds held by the issuing fund. The following ETF Shares are offered through this prospectus:
|
Vanguard Fund |
Vanguard ETF Shares |
|
Short-Term Treasury Index Fund |
Short-Term Treasury ETF |
|
Intermediate-Term Treasury Index Fund |
Intermediate-Term Treasury ETF |
|
Long-Term Treasury Index Fund |
Long-Term Treasury ETF |
|
Short-Term Corporate Bond Index Fund |
Short-Term Corporate Bond ETF |
|
Intermediate-Term Corporate Bond Index
Fund |
Intermediate-Term Corporate Bond ETF |
|
Long-Term Corporate Bond Index Fund |
Long-Term Corporate Bond ETF |
|
Mortgage-Backed Securities Index Fund |
Mortgage-Backed Securities ETF |
In addition to ETF Shares, each Fund offers two conventional (not exchange-traded) classes of shares. This prospectus, however, relates only to ETF Shares.
How Are Vanguard ETF Shares Different From Conventional Mutual Fund Shares?
Conventional mutual fund shares can be directly purchased from and redeemed with the issuing fund for cash at the net asset value (NAV), typically calculated once a day. ETF Shares, by contrast, cannot be purchased directly from or redeemed directly with the issuing fund by an individual investor. Rather, ETF Shares can only be purchased or redeemed directly from the issuing fund by certain authorized broker-dealers. These broker-dealers may purchase and redeem ETF Shares only in large blocks (Creation Units), usually in exchange for baskets of securities and not for cash (although some funds issue and redeem Creation Units in exchange for cash or a combination of cash and securities).
An organized secondary trading market is expected to exist for ETF Shares, unlike conventional mutual fund shares, because ETF Shares are listed for trading on a national securities exchange. Individual investors can purchase and sell ETF Shares on the secondary market through a broker. Secondary-market transactions occur not at NAV, but at market prices that are subject to change throughout the day based on the supply of and demand for ETF Shares, changes in the prices of the fund’s portfolio holdings, and other factors.
The market price of a fund's ETF Shares typically will differ somewhat from the NAV of those shares. The difference between market price and NAV is expected to be small most of the time, but in times of market disruption or extreme market volatility, the difference may become significant.
44
How Do I Buy and Sell Vanguard ETF Shares?
ETF Shares of the Funds are listed for trading on Nasdaq. You can buy and sell ETF Shares on the secondary market in the same way you buy and sell any other exchange-traded security—through a broker. Your broker may charge a commission to execute a transaction. You will also incur the cost of the “bid-ask spread,” which is the difference between the highest price a buyer is willing to pay to purchase ETF Shares (bid) and the lowest price a seller is willing to accept for ETF Shares (ask) when buying or selling shares in the secondary market. Because secondary-market transactions occur at market prices, you may pay more (premium) or less (discount) than NAV when you buy ETF Shares and receive more or less than NAV when you sell those shares. In times of severe market disruption, the bid-ask spread and premiums/discounts can increase significantly. Unless imposed by your broker, there is no minimum dollar amount you must invest and no minimum number of ETF Shares you must buy.
Your ownership of ETF Shares will be shown on the records of the broker through which you hold the shares. Vanguard will not have any record of your ownership. Your account information will be maintained by your broker, which will provide you with account statements, confirmations of your purchases and sales of ETF Shares, and tax information. Your broker also will be responsible for ensuring that you receive income and capital gains distributions, as well as shareholder reports and other communications from the fund whose ETF Shares you own. You will receive other services (e.g., dividend reinvestment and average cost information) only if your broker offers these services.
45
Investing in Index Funds
What Is Indexing?
Indexing is an investment strategy for tracking the performance of a specified market benchmark, or “index.” An index is a group of securities whose overall performance is used as a standard to measure the investment performance of a particular market. There are many types of indexes. Some represent entire markets—such as the U.S. stock market or the U.S. bond market. Other indexes cover market segments—such as small-capitalization stocks or short-term bonds. One cannot invest directly in an index.
The index provider determines the securities to include in the index and the weighting of each security in the index. Under normal circumstances, the index provider will rebalance an index on a regular schedule. An index provider may carry out additional ad hoc index rebalances or delay or cancel a scheduled rebalance. Generally, the index provider does not provide any warranty, or accept any liability, with respect to the quality, accuracy, or completeness of either the target index or its related data. Errors made by the index provider may occur from time to time and may not be identified by the index provider for a period of time or at all. Vanguard does not provide any warranty or guarantee against such errors. Therefore, the gains, losses, or costs associated with the index provider’s errors will generally be borne by the index fund and its shareholders.
An index fund seeks to hold all, or a representative sample, of the securities that make up its target index. Index funds attempt to mirror the performance of the target index, for better or worse. However, an index fund generally does not perform exactly like its target index. For example, index funds have operating expenses and transaction costs. Market indexes do not, and therefore they will usually have a slight performance advantage over funds that track them. The ability of an index fund to match its performance to that of its target index can also be impacted by, among other things, the timing and size of cash flows, asset valuation differences, and the size of the fund. Market disruptions could also have an adverse effect on a fund’s ability to adjust its exposure to the required levels in order to track the index. The risk that a fund may not track the performance of its target index may be heightened during times of increased market volatility or other unusual market conditions.
Index funds typically have the following characteristics:
• Variety of investments. Depending on a fund’s benchmark index, the fund may invest in the securities of a variety of companies, industries, and/or governments or government agencies.
• Relative performance consistency. Because they seek to track market benchmarks, index funds usually do not perform dramatically better or worse than their benchmarks.
• Low cost. Index funds are generally inexpensive to run compared with actively managed funds. They have low or no research costs and typically keep trading activity—and thus dealer markups and other transaction costs—to a minimum compared with actively managed funds.
46
More on the Funds and ETF Shares
This prospectus describes the principal risks you would face as a Fund shareholder. It is important to keep in mind one of the main principles of investing: generally, the higher the risk of losing money, the higher the potential reward. The reverse, also, is generally true: the lower the risk, the lower the potential reward. As you consider an investment in any fund, you should take into account your personal tolerance for fluctuations in the securities markets. Look for this
symbol throughout the prospectus. It is used to mark detailed information about the more significant risks that you would confront as a Fund shareholder. To highlight terms and concepts important to fund investors, we have provided Plain Talk® explanations along the way. Reading the prospectus will help you decide whether a Fund is the right investment for you. We suggest that you keep this prospectus for future reference.
symbol throughout the prospectus. It is used to mark detailed information about the more significant risks that you would confront as a Fund shareholder. To highlight terms and concepts important to fund investors, we have provided Plain Talk® explanations along the way. Reading the prospectus will help you decide whether a Fund is the right investment for you. We suggest that you keep this prospectus for future reference.Share Class Overview
This prospectus offers the Funds' ETF Shares, an exchange-traded class of shares. A separate prospectus offers the Funds' Admiral™ Shares, which generally have an investment minimum of $3,000. Another prospectus offers the Funds‘ Institutional Shares, which are generally for investors who invest a minimum of $5 million.
All share classes offered by a Fund have the same investment objective, strategies, and policies. However, different share classes may have different expenses; as a result, their investment returns may differ.
A Note to Investors
Vanguard ETF Shares can be purchased directly from the issuing Fund only by certain authorized broker-dealers in exchange for a basket of securities (or, in some cases, for cash or a combination of cash and securities). Individual investors generally will not be able to purchase ETF Shares directly from a Fund. Instead, these investors will purchase ETF Shares on the secondary market through a broker.
|
Plain Talk About Costs of Investing |
|
Costs are an important consideration in choosing an ETF. That is because
you, as a shareholder, pay a proportionate share of the costs of operating a
fund and any transaction costs incurred when the fund buys or sells
securities, including costs generated by shareholders of other share classes
offered by the fund. These costs can erode a substantial portion of the gross
income or the capital appreciation a fund achieves. Even seemingly small
differences in expenses can, over time, have a dramatic effect on a
fund’s performance. |
47
The following sections explain the principal investment strategies and policies that each Fund uses in pursuit of its investment objective. The Funds' board of trustees, which oversees each Fund's management, may change investment strategies or policies in the interest of shareholders without a shareholder vote, unless those strategies or policies are designated as fundamental. Note that each Fund’s investment objective is not fundamental and may be changed without a shareholder vote. However, each Fund’s policy of investing at least 80% of its assets in bonds that are included in its target index may be changed only upon 60 days’ notice to shareholders.
Market Exposure
Each Fund is subject to interest rate risk, which is the chance that bond prices will decline because of rising interest rates. Interest rate risk should be low for short-term bond funds, moderate for intermediate-term bond funds, and high for long-term bond funds.
Although fixed income securities (commonly referred to as bonds) are often thought to be less risky than stocks, there have been periods when bond prices have fallen significantly because of rising interest rates. For instance, prices of long-term bonds fell by almost 48% between December 1976 and September 1981.
To illustrate the relationship between bond prices and interest rates, the following table shows the effect of a 1% and a 2% change (both up and down) in interest rates on the values of three noncallable bonds (i.e., bonds that cannot be redeemed by the issuer) of different maturities, each with a face value of $1,000.
How Interest Rate Changes Affect the Value of a $1,000 Bond1
|
Type of Bond (Maturity) |
After a 1%
Increase |
After a 1%
Decrease |
After a 2%
Increase |
After a 2%
Decrease |
|
Short-Term (2.5 years) |
$977 |
$1,024 |
$954 |
$1,049 |
|
Intermediate-Term (10 years) |
922 |
1,086 |
851 |
1,180 |
|
Long-Term (20 years) |
874 |
1,150 |
769 |
1,328 |
1 Assuming a 4% coupon rate.
These figures are for illustration only; you should not regard them as an indication of future performance of the bond market as a whole or the Funds in particular.
48
|
Plain Talk About Bonds and Interest Rates |
|
As a rule, when interest rates rise, bond prices fall. The opposite is also true:
Bond prices go up when interest rates fall. Why do bond prices and interest
rates move in opposite directions? Let’s assume that you hold a bond
offering a 4% yield. A year later, interest rates are on the rise and bonds of
comparable quality and maturity are offered with a 5% yield. With
higher-yielding bonds available, you would have trouble selling your 4% bond
for the price you paid—you would probably have to lower your asking price.
On the other hand, if interest rates were falling and 3% bonds were being
offered, you should be able to sell your 4% bond for more than you paid. |
|
How mortgage-backed securities are different: In general, declining interest
rates will not lift the prices of mortgage-backed securities—such as those
guaranteed by the Government National Mortgage Association—as much as
the prices of comparable bonds. Why? Because when interest rates fall, the
bond market tends to discount the prices of mortgage-backed securities for
prepayment risk—the possibility that homeowners will refinance their
mortgages at lower rates and cause the bonds to be paid off prior to maturity.
In part to compensate for this prepayment possibility, mortgage-backed
securities tend to offer higher yields than other bonds of comparable credit
quality and maturity. In contrast, when interest rates rise, prepayments tend
to slow down, subjecting mortgage-backed securities to extension risk—the
possibility that homeowners will repay their mortgages at slower rates. This
will lengthen the duration or average life of mortgage-backed securities held
by a fund and delay the fund’s ability to reinvest proceeds at higher interest
rates, making the fund more sensitive to changes in interest rates. |
Changes in interest rates can affect bond income as well as bond prices.
Each Fund is subject to income risk, which is the chance that the Fund's income will decline because of falling interest rates. A fund's income declines when interest rates fall because the fund then must invest new cash flow and cash from maturing bonds in lower-yielding bonds. Income risk is generally higher for short-term bond funds and lower for long-term bond funds.
49
|
Plain Talk About Bond Maturities |
|
A bond is issued with a specific maturity date—the date when the issuer must
pay back the bond’s principal (face value). Bond maturities range from less
than 1 year to more than 30 years. Typically, the longer a bond’s maturity, the
more price risk you, as a bond investor, will face as interest rates rise—but
also the higher the potential yield you could receive. Longer-term bonds are
generally more suitable for investors willing to take a greater risk of price
fluctuations to get higher and more stable interest income. Shorter-term bond
investors should be willing to accept lower yields and greater income
variability in return for less fluctuation in the value of their investment. The
stated maturity of a bond may differ from the effective maturity of a bond,
which takes into consideration that an action such as a call or refunding may
cause bonds to be repaid before their stated maturity dates. |
Although falling interest rates tend to strengthen bond prices, they can cause other problems for bond fund investors—bond calls and prepayments.
Each Fund (other than Vanguard Mortgage-Backed Securities Index Fund) is subject to call risk, which is the chance that during periods of falling interest rates, issuers of callable bonds may call (redeem) securities with higher coupon rates or interest rates before their maturity dates. The Fund would then lose any price appreciation above the bond’s call price and would be forced to reinvest the unanticipated proceeds at lower interest rates, resulting in a decline in the Fund’s income. Such redemptions and subsequent reinvestments would also increase the Fund’s portfolio turnover rate.
The indexes that Vanguard Treasury and Corporate Bond Index Funds seek to track include only a limited number of callable bonds. Thus, call risk for these Funds should be very low.
Vanguard Mortgage-Backed Securities Index Fund is subject to prepayment risk, which is the chance that during periods of falling interest rates, homeowners will refinance their mortgages before their maturity dates, resulting in prepayment of mortgage-backed securities held by the Fund. The Fund would then lose any price appreciation above the mortgage’s principal and would be forced to reinvest the unanticipated proceeds at lower interest rates, resulting in a decline in the Fund’s income. Such prepayments and subsequent reinvestments would also increase the Fund's portfolio turnover rate. Prepayment risk is high for the Fund.
50
Vanguard Mortgage-Backed Securities Index Fund is subject to extension risk, which is the chance that during periods of rising interest rates, homeowners will repay their mortgages at slower rates. This will lengthen the duration or average life of mortgage-backed securities held by the Fund and delay the Fund's ability to reinvest proceeds at higher interest rates. Extension risk is high for the Fund.
Each Fund (other than the three Vanguard Treasury Index Funds) is subject to credit risk, which is the chance that a bond issuer will fail to pay interest or principal in a timely manner or that negative perceptions of the issuer’s ability to make such payments will cause the price of that bond to decline.
|
Plain Talk About Credit Quality |
|
A bond’s credit quality rating is an assessment of the issuer’s ability to pay
interest on the bond and, ultimately, to repay the principal. The lower the
credit quality, the greater the perceived chance that the bond issuer will
default, or fail to meet its payment obligations. All things being equal, the
lower a bond’s credit quality, the higher its yield should be to compensate
investors for assuming additional risk. Mortgage-backed securities typically
have higher yields than comparable-quality corporate or government bonds
to make up for their higher prepayment risk. |
Vanguard Mortgage-Backed Securities Index Fund has low credit risk. The three Treasury Index Funds invest primarily in U.S. Treasury securities and have high credit quality and low credit risk. The three Corporate Bond Index Funds are expected to have moderate credit risk as a result of their investments in investment-grade bonds. Investment-grade bonds are those rated BBB/Baa or higher by a credit rating agency, and therefore investment-grade bonds are a mixture of high-and medium-quality bonds.
Vanguard Short-Term Corporate Bond Index, Intermediate-Term Corporate Bond Index, Long-Term Corporate Bond Index, and Mortgage-Backed Securities Index Funds are subject to liquidity risk, which is the chance that a Fund may not be able to sell a security in a timely manner at a desired price.
Corporate bonds are traded among dealers and brokers that connect buyers with sellers. Liquidity in the corporate bond market may be challenged depending on overall economic conditions and credit tightening. There may be little trading in the secondary market for particular bonds and other debt securities, which may make them more difficult to value or sell.
51
To a limited extent, Corporate Bond Index Funds are subject to event risk, which is the chance that corporate fixed income securities held by these Funds may suffer a substantial decline in credit quality and market value because of a restructuring of the companies that issued the securities or because of other factors negatively affecting issuers.
|
Plain Talk About Types of Bonds |
|
Bonds are issued (sold) by many sources: Corporations issue corporate
bonds; the federal government issues U.S. Treasury bonds; agencies of the
federal government issue agency bonds; financial institutions issue
asset-backed bonds; and mortgage holders issue “mortgage-backed”
pass-through certificates. Each issuer is responsible for paying back the
bond’s initial value as well as for making periodic interest payments. Many
bonds issued by government agencies and entities are neither guaranteed
nor insured by the U.S. government. |
Market disruptions can adversely affect local and global markets as well as normal market conditions and operations. Any such disruptions could have an adverse impact on the value of a Fund's investments and Fund performance.
Security Selection
Index sampling strategy. Because it would be very expensive and inefficient to buy and sell all bonds held in its target index—which is an indexing strategy called “replication”—each Fund uses index “sampling” techniques to select securities. Using computer programs, each Fund’s advisor generally selects a representative sample of securities that approximates the full target index in terms of key risk factors and other characteristics. These factors include duration, cash flow, quality, and callability of the underlying bonds. In addition, each Fund keeps sector and subsector exposure within tight boundaries relative to its target index. Because the Funds do not hold all of the securities included in their target indexes, some of the securities (and issuers) that are held will likely be overweighted (or underweighted) compared with the target indexes. The maximum overweight (or underweight) is constrained at the issuer level with the goal of producing well-diversified credit exposure in the portfolio.
The components of the target indices of each Fund are reconstituted and rebalanced on a monthly basis. Each index rebalances as a float-adjusted market-weighted index, and bonds may enter or fall out of the index on a monthly basis. New securities are added to and removed from an index in connection with the month-end index rebalancing process.
52
Each Fund is subject to index sampling risk, which is the chance that the securities selected for the Fund, in the aggregate, will not provide investment performance matching that of the Fund's target index. Index sampling risk is expected to be low for each Fund.
The following table shows the number of bonds held by each Fund, as well as the number of bonds in each Fund’s target index, as of August 31, 2023.
|
Vanguard Fund |
Number of
Bonds in Fund |
Number of Bonds
in Target Index |
|
Vanguard Short-Term Treasury Index Fund |
97 |
157 |
|
Vanguard Intermediate-Term Treasury
Index Fund |
109 |
109 |
|
Vanguard Long-Term Treasury Index Fund |
78 |
78 |
|
Vanguard Short-Term Corporate Bond
Index Fund |
2,498 |
2,704 |
|
Vanguard Intermediate-Term Corporate
Bond Index Fund |
2,085 |
2,090 |
|
Vanguard Long-Term Corporate Bond
Index Fund |
2,794 |
2,885 |
|
Vanguard Mortgage-Backed Securities
Index Fund |
1,1691 |
932 |
1 Issues are mortgage pools grouped by coupon.
Types of bonds. Each Fund seeks to track an index that is a subset of the Bloomberg U.S. Aggregate Float Adjusted Index (the Aggregate Index). The Aggregate Index measures the total universe of taxable fixed income securities in the United States—including government, corporate, and international dollar-denominated bonds, as well as mortgage-backed securities—all with maturities of at least 1 year. Taken together, the seven Funds cover approximately 97% of the Aggregate Index; the only sectors not covered are asset-backed bonds, bonds issued by foreign governments (unless guaranteed by the U.S. government), taxable state and municipal bonds, and commercial mortgage-backed securities.
53
The following grid shows, at a glance, the types of financial instruments that may be purchased by each Fund. An explanation of each type of financial instrument follows the grid.
|
|
Treasury Index
Funds |
Corporate Bond
Index Funds |
Mortgage-Backed
Securities
Index Fund |
|
Corporate Debt Obligations |
|
• |
|
|
U.S. Government and Agency
Bonds |
• |
• |
• |
|
Mortgage-Backed Securities |
|
|
• |
|
Mortgage Dollar Rolls |
|
|
• |
|
Cash Equivalent Investments,
Including Repurchase Agreements |
• |
• |
• |
|
Futures, Options, and Other
Derivatives |
• |
• |
• |
|
International Dollar-Denominated
Bonds |
|
• |
|
• Corporate debt obligations—usually called bonds—represent loans by an investor to a corporation.
• U.S. government and agency bonds represent loans by investors to the U.S. Treasury or a wide variety of government agencies and instrumentalities. Securities issued by most U.S. government entities are neither guaranteed by the U.S. Treasury nor backed by the full faith and credit of the U.S. government. These entities include, among others, the Federal Home Loan Banks (FHLBs), the Federal National Mortgage Association (FNMA), and the Federal Home Loan Mortgage Corporation (FHLMC). Securities issued by the U.S. Treasury and a small number of U.S. government agencies, such as the Government National Mortgage Association (GNMA), are backed by the full faith and credit of the U.S. government. The market values of U.S. government and agency securities and U.S. Treasury securities are subject to fluctuation.
• Mortgage-backed securities represent partial ownership interest in pools of commercial or residential mortgage loans made by financial institutions to finance a borrower’s real estate purchase. These loans are packaged by private or governmental issuers for sale to investors. As the underlying mortgage loans are paid by borrowers, the investors receive payments of interest and principal. To be announced (TBA) securities represent an agreement to buy or sell mortgage-backed securities with agreed-upon characteristics for a fixed unit price, with settlement on a scheduled future date beyond the typical settlement period for most other securities.
54
• Mortgage dollar rolls are transactions in which a fund sells mortgage-backed securities to a dealer and simultaneously agrees to purchase similar securities in the future at a predetermined price. These transactions simulate an investment in mortgage-backed securities and have the potential to enhance a fund’s returns and reduce its administrative burdens, compared with holding mortgage-backed securities directly. These transactions may increase a fund’s portfolio turnover rate. Mortgage dollar rolls will be used only if consistent with a fund's investment objective and risk profile.
• Cash equivalent investments is a blanket term that describes a variety of short-term fixed income investments, including money market instruments, commercial paper, bank certificates of deposit, banker’s acceptances, and repurchase agreements. Repurchase agreements represent short-term (normally overnight) loans by a fund to banks or large securities dealers. Vanguard Treasury Index Funds and Vanguard Mortgage-Backed Securities Index Fund may invest only in repurchase agreements that are collateralized by U.S. Treasury or U.S. government agency securities. Repurchase agreements can carry several risks. For instance, if the seller is unable to repurchase the securities as promised, a fund may experience a loss when trying to sell the securities to another buyer. Also, if the seller becomes insolvent, a bankruptcy court may determine that the securities do not belong to a fund and order that the securities be used to pay off the seller’s debts. The Funds‘ advisor believes that these risks can be controlled through careful security selection and monitoring.
• Futures, options, and other derivatives are described in detail under Other Investment Policies and Risks.
• International dollar-denominated bonds are bonds denominated in U.S. dollars and issued by foreign governments and companies. To the extent that a Fund owns foreign bonds, it is subject to country risk, which is the chance that world events—such as political upheaval, financial troubles, or natural disasters—will adversely affect the value and/or liquidity of securities issued by companies in foreign countries. In addition, the prices of foreign bonds and the prices of U.S. bonds have, at times, moved in opposite directions. Because the bond’s value is designated in dollars rather than in the currency of the issuer’s country, the investor is not exposed to currency risk; rather, the issuer assumes that risk, usually to attract U.S. investors. Although currency movements do not affect the value of international dollar-denominated bonds directly, they could affect the value indirectly by adversely affecting the issuer’s ability (or the market’s perception of the issuer’s ability) to pay interest or repay principal.
55
|
Plain Talk About U.S. Government-Sponsored Enterprises |
|
A variety of U.S. government-sponsored enterprises (GSEs), such as the
Federal Home Loan Mortgage Corporation (FHLMC), the Federal National
Mortgage Association (FNMA), and the Federal Home Loan Banks (FHLBs),
issue debt and mortgage-backed securities. Although GSEs may be chartered
or sponsored by acts of Congress, they are not funded by congressional
appropriations. In September of 2008, the U.S. Treasury placed FNMA and
FHLMC under conservatorship and appointed the Federal Housing Finance
Agency (FHFA) to manage their daily operations. In addition, the U.S. Treasury
entered into purchase agreements with FNMA and FHLMC to provide them
with capital in exchange for senior preferred stock. Generally, a GSE’s
securities are neither issued nor guaranteed by the U.S. Treasury and are not
backed by the full faith and credit of the U.S. government. In most cases, these
securities are supported only by the credit of the GSE, standing alone. In some
cases, a GSE’s securities may be supported by the ability of the GSE to
borrow from the U.S. Treasury or may be supported by the U.S. government in
some other way. Securities issued by the Government National Mortgage
Association (GNMA), however, are backed by the full faith and credit of the
U.S. government. |
Other Investment Policies and Risks
Under normal circumstances, each Fund will invest at least 80% of its assets in bonds held in its target index. Up to 20% of each Fund’s assets may be used to purchase nonpublic, investment-grade securities, generally referred to as 144A securities, as well as smaller public issues or medium-term notes not included in the index because of the small size of the issue. The vast majority of these securities will have characteristics and risks similar to those in the target index. Subject to the same 20% limit, each Fund may also purchase other investments that are outside of its target index or may hold bonds that, when acquired, were included in the index but subsequently were removed.
Each Fund reserves the right to substitute a different index for the index it currently tracks if the current index is discontinued, if the Fund's agreement with the provider of its target index is terminated, or for any other reason determined in good faith by the Fund’s board of trustees. In any such instance, the substitute index would represent the same market segment as the current index.
Each Fund may invest in derivatives. In general, investments in derivatives may involve risks different from, and possibly greater than, those of investments directly in the underlying securities or assets.
56
Generally speaking, a derivative is a financial contract whose value is based on the value of a financial asset (such as a stock, a bond, or a currency), a physical asset (such as gold, oil, or wheat), a market index, or a reference rate. Each Fund may invest in derivatives only if the expected risks and rewards of the derivatives are consistent with the investment objective, policies, strategies, and risks of the Fund as disclosed in this prospectus. In particular, derivatives will be used only when they may help the advisor to accomplish one or more of the following:
• Invest in eligible asset classes with greater efficiency and lower cost than is possible through direct investment.
• Add value when these instruments are attractively priced.
• Adjust sensitivity to changes in interest rates.
• Adjust overall credit risk of the portfolio.
The Funds' derivative investments may include fixed income futures contracts, fixed income options, interest rate swaps, total return swaps, credit default swaps, or other derivatives. Losses (or gains) involving futures contracts can sometimes be substantial—in part because a relatively small price movement in a futures contract may result in an immediate and substantial loss (or gain) for a fund. Similar risks exist for other types of derivatives.
The Funds' derivative investments may include fixed income futures contracts, fixed income options, interest rate swaps, total return swaps, credit default swaps, or other derivatives. Losses (or gains) involving futures contracts can sometimes be substantial—in part because a relatively small price movement in a futures contract may result in an immediate and substantial loss (or gain) for a fund. Similar risks exist for other types of derivatives.
|
Plain Talk About Derivatives |
|
Derivatives can take many forms. Some forms of derivatives—such as
exchange-traded futures and options on securities, commodities, or
indexes—have been trading on regulated exchanges for decades. These
types of derivatives are standardized contracts that can easily be bought and
sold and whose market values are determined and published daily. On the
other hand, non-exchange-traded derivatives—such as certain swap
agreements—tend to be more specialized or complex and may be more
difficult to accurately value. |
Each Fund may invest a small portion of its assets in fixed income futures, which are a type of derivative, and/or shares of exchange-traded funds (ETFs). These fixed income futures and ETFs typically provide returns similar to those of the bonds listed in the index, or in a subset of the index, the Fund seeks to track. A Fund may purchase futures or ETFs when doing so will reduce the Fund’s transaction costs, facilitate cash management, mitigate risk, or have the potential to add value because the instruments are favorably priced. Vanguard receives no additional revenue from Fund assets invested in ETF Shares of other Vanguard
57
funds. Fund assets invested in ETF Shares of other Vanguard funds are excluded when allocating to the Fund its share of the costs of Vanguard operations.
Cash Management
Each Fund's daily cash balance may be invested in Vanguard Market Liquidity Fund and/or Vanguard Municipal Cash Management Fund (each, a CMT Fund), which are low-cost money market funds. When investing in a CMT Fund, each Fund bears its proportionate share of the expenses of the CMT Fund in which it invests. Vanguard receives no additional revenue from Fund assets invested in a CMT Fund.
Redemption Requests
Methods used to meet redemption requests. Redemptions of ETF Shares are typically met through a combination of cash and securities held by each Fund; see “How Are Vanguard ETF Shares Different From Conventional Mutual Fund Shares?” If cash is used to meet redemptions, the Fund typically obtains such cash through positive cash flows or the sale of Fund holdings consistent with the Fund’s investment objective and strategy. Please consult the Funds' Statement of Additional Information for further information on redemptions of ETF Shares.
Under certain circumstances, a Fund may borrow money (subject to certain regulatory conditions and if available under board-approved procedures) through an interfund lending facility; through a bank line-of-credit, including a joint committed credit facility; or through an uncommitted line-of-credit from Vanguard in order to meet redemption requests.
Potential redemption activity impacts. At times, a Fund may experience adverse effects when certain large shareholders, or multiple shareholders comprising significant ownership of the Fund or a share class of the Fund, redeem large amounts of shares of the Fund. Large redemptions may cause a Fund to sell portfolio securities at times when it would not otherwise do so. This may result in a Fund distributing capital gains or other taxable income to non-redeeming shareholders. Large redemptions may also increase a Fund’s transaction costs. Redemption activity can occur for many reasons, including shareholder reactions to market movements or other events unrelated to Vanguard’s actions, or when Vanguard makes product changes that, for example, may result in a shareholder redeeming shares of a Fund to purchase shares of another similar fund or investment vehicle.
58
Temporary Investment Measures
Each Fund may temporarily depart from its normal investment policies and strategies when the advisor believes that doing so is in the Fund's best interest, so long as the strategy or policy employed is consistent with the Fund's investment objective. For instance, the Fund may invest beyond its normal limits in derivatives or exchange-traded funds that are consistent with the Fund's investment objective when those instruments are more favorably priced or provide needed liquidity, as might be the case when the Fund receives large cash flows that it cannot prudently invest immediately.
Special Risks of Exchange-Traded Shares
ETF Shares are not individually redeemable. They can be redeemed with the issuing Fund at NAV only by certain authorized broker-dealers and only in large blocks known as Creation Units. Consequently, if you want to liquidate some or all of your ETF Shares, you must sell them on the secondary market at prevailing market prices.
The market price of ETF Shares may differ from NAV. Although it is expected that the market price of an ETF Share typically will approximate its NAV, there may be times when the market price and the NAV differ significantly. Thus, you may pay more (premium) or less (discount) than NAV when you buy ETF Shares on the secondary market, and you may receive more or less than NAV when you sell those shares. These discounts and premiums are likely to be greatest during times of market disruption or extreme market volatility.
Vanguard’s website at vanguard.com shows the previous day’s closing NAV and closing market price for each Fund's ETF Shares. The website also discloses, in the Premium/Discount Analysis section of the ETF Shares’ Price & Performance page, how frequently each Fund’s ETF Shares traded at a premium or discount to NAV (based on closing NAVs and market prices) and the magnitudes of such premiums and discounts.
An active trading market may not exist. Although Vanguard ETF Shares are listed on a national securities exchange, it is possible that an active trading market may not be maintained. Although this could happen at any time, it is more likely to occur during times of severe market disruption. If you attempt to sell your ETF Shares when an active trading market is not functioning, you may have to sell at a significant discount to NAV. In extreme cases, you may not be able to sell your shares at all.
59
Trading may be halted. Trading of Vanguard ETF Shares on an exchange may be halted by the activation of individual or marketwide trading halts (which halt trading for a specific period of time when the price of a particular security or overall market prices decline by a specified percentage). Trading of ETF Shares may also be halted if (1) the shares are delisted from the listing exchange without first being listed on another exchange or (2) exchange officials determine that such action is appropriate in the interest of a fair and orderly market or for the protection of investors.
Conversion Privilege
Owners of conventional shares issued by a Fund may convert those shares to ETF Shares of equivalent value of the same fund. Please note that investors who own conventional shares through a 401(k) plan or other employer-sponsored retirement or benefit plan generally may not convert those shares to ETF Shares and should check with their plan sponsor or recordkeeper. ETF Shares, whether acquired through a conversion or purchased on the secondary market, cannot be converted to conventional shares by a shareholder. Also, ETF Shares of one fund cannot be exchanged for ETF Shares of another fund.
You must hold ETF Shares in a brokerage account. Thus, before converting conventional shares to ETF Shares, you must have an existing, or open a new, brokerage account. This account may be with Vanguard Brokerage Services® or with any other brokerage firm. To initiate a conversion of conventional shares to ETF Shares, please contact your broker.
Vanguard Brokerage Services does not impose a fee on conversions from Vanguard conventional shares to Vanguard ETF Shares. However, other brokerage firms may charge a fee to process a conversion. Vanguard reserves the right, in the future, to impose a transaction fee on conversions or to limit, temporarily suspend, or terminate the conversion privilege.
Converting conventional shares to ETF Shares is generally accomplished as follows. First, after your broker notifies Vanguard of your request to convert, Vanguard will transfer your conventional shares from your account to the broker’s omnibus account with Vanguard (an account maintained by the broker on behalf of all its customers who hold conventional Vanguard fund shares through the broker). After the transfer, Vanguard’s records will reflect your broker, not you, as the owner of the shares. Next, your broker will instruct Vanguard to convert the appropriate number or dollar amount of conventional shares in its omnibus account to ETF Shares of equivalent value, based on the respective NAVs of the two share classes.
60
Your Fund’s transfer agent will reflect ownership of all ETF Shares in the name of the Depository Trust Company (DTC). The DTC will keep track of which ETF Shares belong to your broker, and your broker, in turn, will keep track of which ETF Shares belong to you.
Because the DTC is unable to handle fractional shares, only whole shares can be converted. For example, if you owned 300.25 conventional shares, and this was equivalent in value to 90.75 ETF Shares, the DTC account would receive 90 ETF Shares. Conventional shares with a value equal to 0.75 ETF Shares (in this example, that would be 2.481 conventional shares) would remain in the broker’s omnibus account with Vanguard. Your broker then could either (1) credit your account with 0.75 ETF Shares or (2) redeem the 2.481 conventional shares for cash at NAV and deliver that cash to your account. If your broker chose to redeem your conventional shares, you would realize a gain or loss on the redemption that must be reported on your tax return (unless you hold the shares in an IRA or other tax-deferred account). Please consult your broker for information on how it will handle the conversion process, including whether it will impose a fee to process a conversion.
If you convert your conventional shares to ETF Shares through Vanguard Brokerage Services, all conventional shares for which you request conversion will be converted to ETF Shares of equivalent value. Because no fractional shares will have to be sold, the transaction will not be taxable.
Here are some important points to keep in mind when converting conventional shares of a Vanguard fund to ETF Shares:
• The conversion process can take anywhere from several days to several weeks, depending on your broker. Vanguard generally will process conversion requests either on the day they are received or on the next business day. Vanguard imposes conversion blackout windows around the dates when a fund with ETF Shares declares dividends. This is necessary to prevent a shareholder from collecting a dividend from both the conventional share class currently held and also from the ETF share class to which the shares will be converted.
• Until the conversion process is complete, you will remain fully invested in a fund’s conventional shares, and your investment will increase or decrease in value in tandem with the NAV of those shares.
• The conversion transaction is nontaxable except, if applicable, to the very limited extent previously described.
A precautionary note to investment companies: Each Fund's ETF Shares are issued by registered investment companies, and therefore the acquisition of such shares by other investment companies and private funds is subject to the
61
restrictions of Section 12(d)(1) of the Investment Company Act of 1940 (the 1940 Act). SEC Rule 12d1-4 under the 1940 Act permits registered investment companies to invest in other registered investment companies beyond the limits in Section 12(d)(1), subject to certain conditions, including that the funds with different investment advisors must enter into a fund of funds investment agreement.
Shareholder Rights
Each Fund's Agreement and Declaration of Trust, as amended, requires a shareholder bringing a derivative action on behalf of Vanguard Scottsdale (the Trust) that is subject to a pre-suit demand to collectively hold at least 10% of the outstanding shares of the Trust or at least 10% of the outstanding shares of the series or class to which the demand relates and to undertake to reimburse the Trust for the expense of any counsel or advisors used when considering the merits of the demand in the event that the board of trustees determines not to bring such action. In each case, these requirements do not apply to claims arising under the federal securities laws to the extent that any such federal securities laws, rules, or regulations do not permit such application.
Frequent Trading and Market-Timing
Unlike frequent trading of a Vanguard fund’s conventional (i.e., not exchange-traded) classes of shares, frequent trading of ETF Shares does not disrupt portfolio management or otherwise harm fund shareholders. The vast majority of trading in ETF Shares occurs on the secondary market. Because these trades do not involve the issuing fund, they do not harm the fund or its shareholders. Certain broker-dealers are authorized to purchase and redeem ETF Shares directly with the issuing fund. Because these trades typically are effected in kind (i.e., for securities and not for cash), or are assessed a transaction fee when effected in cash, they do not cause any of the harmful effects to the issuing fund (as previously noted) that may result from frequent trading. For these reasons, the board of trustees of each fund that issues ETF Shares has determined that it is not necessary to adopt policies and procedures to detect and deter frequent trading and market-timing of ETF Shares.
Portfolio Holdings
Please consult the Funds' Statement of Additional Information or our website for a description of the policies and procedures that govern disclosure of a Fund’s portfolio holdings.
A precautionary note to investment companies: Each Fund's ETF Shares are issued by registered investment companies, and therefore the acquisition of such shares by other investment companies and private funds is subject to the
62
restrictions of Section 12(d)(1) of the Investment Company Act of 1940 (the 1940 Act). SEC Rule 12d1-4 under the 1940 Act permits registered investment companies to invest in other registered investment companies beyond the limits in Section 12(d)(1), subject to certain conditions, including that the funds with different investment advisors must enter into a fund of funds investment agreement.
Turnover Rate
Although the Funds generally seek to invest for the long term, each Fund may sell securities regardless of how long they have been held. Generally, an index fund sells securities in response to redemption requests from shareholders of conventional ( i.e., not exchange-traded) shares or to changes in the composition of its target index or in an effort to manage the fund’s duration. The Financial Highlights section of this prospectus shows historical turnover rates for the Funds. A turnover rate of 100%, for example, would mean that a Fund had sold and replaced securities valued at 100% of its net assets within a one-year period. Shorter-term bonds will mature or be sold—and need to be replaced—more frequently than longer-term bonds. As a result, shorter-term bond funds tend to have higher turnover rates than longer-term bond funds. In general, the greater the turnover rate, the greater the impact transaction costs will have on a fund’s return. Also, funds with high turnover rates may be more likely to generate capital gains, including short-term capital gains, that must be distributed to shareholders and will be taxable to shareholders investing through a taxable account.
The Funds and Vanguard
Each Fund is a member of The Vanguard Group, Inc. (Vanguard), a family of over 200 funds. All of the funds that are members of Vanguard (other than funds of funds) share in the expenses associated with administrative services and business operations, such as personnel, office space, and equipment.
Vanguard Marketing Corporation provides marketing services to the funds. Although fund shareholders do not pay sales commissions or 12b-1 distribution fees, each fund (other than a fund of funds) or each share class of a fund (in the case of a fund with multiple share classes) pays its allocated share of the Vanguard funds’ marketing costs.
63
|
Plain Talk About Vanguard’s Unique Corporate Structure |
|
Vanguard is owned jointly by the funds it oversees and thus indirectly by the
shareholders in those funds. Most other mutual funds are operated by
management companies that are owned by third parties—either public or
private stockholders—and not by the funds they serve. |
Investment Advisor
The Vanguard Group, Inc., P.O. Box 2600, Valley Forge, PA 19482, which began operations in 1975, serves as advisor to the Funds through its Fixed Income Group. As of August 31, 2023, Vanguard served as advisor for approximately $6.8 trillion in assets. Vanguard provides investment advisory services to the Funds pursuant to the Funds’ Service Agreement and subject to the supervision and oversight of the trustees and officers of the Funds.
For the fiscal year ended August 31, 2023, the advisory expenses for each Fund represented an effective annual rate of less than 0.01% of the Fund’s average net assets.
Under the terms of an SEC exemption, the Funds' board of trustees may, without prior approval from shareholders, change the terms of an advisory agreement with a third-party investment advisor or hire a new third-party investment advisor—either as a replacement for an existing advisor or as an additional advisor. Any significant change in a Fund's advisory arrangements will be communicated to shareholders in writing. As the Funds' sponsor and overall manager, Vanguard may provide investment advisory services to a Fund at any time. Vanguard may also recommend to the board of trustees that an advisor be hired, terminated, or replaced or that the terms of an existing advisory agreement be revised. The Funds have filed an application seeking a similar SEC exemption with respect to investment advisors that are wholly owned subsidiaries of Vanguard. If the exemption is granted, the Funds may rely on the new SEC relief.
For a discussion of why the board of trustees approved each Fund's investment advisory arrangement, see the most recent annual report to shareholders covering the fiscal year ended August 31.
64
The manager primarily responsible for the day-to-day management of the Funds is:
Joshua C. Barrickman, CFA, Principal of Vanguard and co-head of Vanguard’s Fixed Income Indexing Americas. He has been with Vanguard since 1998; has worked in investment management since 1999; has managed investment portfolios since 2005; has managed Vanguard Short-Term, Intermediate-Term, and Long-Term Corporate Bond Index Funds since their inceptions in 2009; and has managed Vanguard Short-Term, Intermediate-Term, and Long-Term Treasury Index Funds and managed Vanguard Mortgage-Backed Securities Index Fund since 2013. Education: B.S., Ohio Northern University; M.B.A., Lehigh University.
The Funds' Statement of Additional Information provides information about the portfolio manager’s compensation, other accounts under management, and ownership of shares of the Funds.
Dividends, Capital Gains, and Taxes
Fund Distributions
Each Fund distributes to shareholders virtually all of its net income (interest less expenses) as well as any net short-term or long-term capital gains realized from the sale of its holdings. From time to time, each Fund may also make distributions that are treated as a return of capital. Income dividends generally are declared and distributed monthly; capital gains distributions, if any, generally occur annually in December. In addition, each Fund may occasionally make a supplemental distribution at some other time during the year.
|
Plain Talk About Distributions |
|
As a shareholder, you are entitled to your portion of a fund’s income from
interest as well as capital gains from the fund’s sale of investments. Income
consists of interest the fund earns from its money market and bond
investments. Capital gains are realized whenever the fund sells securities for
higher prices than it paid for them. These capital gains are either short-term
or long-term, depending on whether the fund held the securities for one year
or less or for more than one year. |
65
Reinvestment of Distributions
In order to reinvest dividend and capital gains distributions, investors in a Fund's ETF Shares must hold their shares at a broker that offers a reinvestment service. This can be the broker’s own service or a service made available by a third party, such as the broker’s outside clearing firm or the Depository Trust Company (DTC). If a reinvestment service is available, distributions of income and capital gains can automatically be reinvested in additional whole and fractional ETF Shares of the Fund. If a reinvestment service is not available, investors will receive their distributions in cash. To determine whether a reinvestment service is available and whether there is a commission or other charge for using this service, consult your broker.
As with all exchange-traded funds, reinvestment of dividend and capital gains distributions in additional ETF Shares will occur four business days or more after the ex-dividend date (the date when a distribution of dividends or capital gains is deducted from the price of a Fund’s shares). The exact number of days depends on your broker. During that time, the amount of your distribution will not be invested in the Fund and therefore will not share in the Fund’s income, gains, and losses.
Basic Tax Points
Investors in taxable accounts should be aware of the following basic federal income tax points:
• Distributions are taxable to you whether or not you reinvest these amounts in additional ETF Shares.
• Distributions declared in December—if paid to you by the end of January—are taxable as if received in December.
• Any income dividend distribution or short-term capital gains distribution that you receive is taxable to you as ordinary income.
• Any distribution of net long-term capital gains is taxable to you as long-term capital gains, no matter how long you have owned ETF Shares.
• Capital gains distributions may vary considerably from year to year as a result of the Funds' normal investment activities and cash flows.
• Your cost basis in the Fund will be decreased by the amount of any return of capital that you receive. This, in turn, will affect the amount of any capital gain or loss that you realize when selling your ETF Shares.
• Return of capital distributions generally are not taxable to you until your cost basis has been reduced to zero. If your cost basis is at zero, return of capital distributions will be treated as capital gains.
66
• A sale of ETF Shares is a taxable event. This means that you may have a capital gain to report as income, or a capital loss to report as a deduction, when you complete your tax return.
Individuals, trusts, and estates whose income exceeds certain threshold amounts are subject to a 3.8% Medicare contribution tax on “net investment income.” Net investment income takes into account distributions paid by the Fund and capital gains from any sale of ETF Shares.
Income dividends and capital gains distributions that you receive, as well as your gains or losses from any sale of ETF Shares, may be subject to state and local income taxes. Depending on your state’s rules, however, any dividends attributable to interest earned on direct obligations of the U.S. government may be exempt from state and local taxes. Vanguard will notify you each year how much, if any, of your dividends may qualify for this exemption.
This prospectus provides general tax information only. If you are investing through a tax-advantaged account, such as an IRA or an employer-sponsored retirement or savings plan, special tax rules apply. Please consult your tax advisor for detailed information about any tax consequences for you.
Share Price and Market Price
Share price, also known as net asset value (NAV), is calculated as of the close of regular trading on the New York Stock Exchange (NYSE), generally 4 p.m., Eastern time, on each day that the NYSE is open for business (a business day). In the rare event the NYSE experiences unanticipated disruptions and is unavailable at the close of the trading day, NAVs will be calculated as of the close of regular trading on the Nasdaq (or another alternate exchange if the Nasdaq is unavailable, as determined at Vanguard’s discretion), generally 4 p.m., Eastern time. Each share class has its own NAV, which is computed by dividing the total assets, minus liabilities, allocated to the share class by the number of Fund shares outstanding for that class. On U.S. holidays or other days when the NYSE is closed, the NAV is not calculated, and the Funds do not sell or redeem shares. However, on those days the value of a Fund’s assets may be affected to the extent that the Fund holds securities that change in value on those days (such as foreign securities that trade on foreign markets that are open).
Remember: If you buy or sell ETF Shares on the secondary market, you will pay or receive the market price, which may be higher or lower than NAV. Your transaction will be priced at NAV only if you purchase or redeem your ETF Shares in Creation Unit blocks (an option available only to certain authorized broker-dealers) or if you convert your conventional fund shares to ETF Shares.
67
Debt securities held by a Vanguard fund are valued based on information furnished by an independent pricing service or market quotations. When a fund determines that pricing-service information or market quotations either are not readily available or do not accurately reflect the value of a security, the security is priced at its fair value (the amount that the owner might reasonably expect to receive upon the current sale of the security).
The values of any foreign securities held by a fund are converted into U.S. dollars using an exchange rate obtained from an independent third party as of the close of regular trading on the NYSE. The values of any mutual fund shares, including institutional money market fund shares, held by a fund are based on the NAVs of the shares. The values of any ETF shares or closed-end fund shares held by a fund are based on the market value of the shares.
A fund also may use fair-value pricing on bond market holidays when the fund is open for business (such as Columbus Day and Veterans Day). Fair-value prices are determined by Vanguard according to procedures adopted by the board of trustees. When fair-value pricing is employed, the prices of securities used by a fund to calculate the NAV may differ from quoted or published prices for the same securities.
Each Fund has authorized certain financial intermediaries and their designees, and may, from time to time, authorize certain funds of funds for which Vanguard serves as the investment advisor (Vanguard Funds of Funds), to accept orders to buy or sell fund shares on its behalf. The Fund will be deemed to receive an order when accepted by the financial intermediary, its designee, or one of the Vanguard Funds of Funds, and the order will receive the NAV next computed by the Fund after such acceptance.
Vanguard’s website will show the previous day’s closing NAV and closing market price for each Fund’s ETF Shares.
68
Additional Information
Each Fund’s Bylaws require, unless the Trust otherwise consents in writing, that the U.S. Federal District Courts be the sole and exclusive forum for the resolution of complaints under the Securities Act of 1933. This provision may limit a shareholder’s ability to bring a claim in a different forum and may result in increased shareholder costs in pursuing such a claim.
|
Vanguard Fund |
Inception Date |
Vanguard
Fund
Number |
CUSIP
Number |
|
Vanguard Short-Term Treasury Index Fund |
|
|
|
|
ETF Shares |
11/19/2009 |
3142 |
92206C102 |
|
Vanguard Intermediate-Term Treasury Index
Fund |
|
|
|
|
ETF Shares |
11/19/2009 |
3143 |
92206C706 |
|
Vanguard Long-Term Treasury Index Fund |
|
|
|
|
ETF Shares |
11/19/2009 |
3144 |
92206C847 |
|
Vanguard Short-Term Corporate Bond Index
Fund |
|
|
|
|
ETF Shares |
11/19/2009 |
3145 |
92206C409 |
|
Vanguard Intermediate-Term Corporate Bond
Index Fund |
|
|
|
|
ETF Shares |
11/19/2009 |
3146 |
92206C870 |
|
Vanguard Long-Term Corporate Bond Index
Fund |
|
|
|
|
ETF Shares |
11/19/2009 |
3147 |
92206C813 |
|
Vanguard Mortgage-Backed Securities Index
Fund |
|
|
|
|
ETF Shares |
11/19/2009 |
3148 |
92206C771 |
Certain affiliates of the Funds and the advisor may purchase and resell ETF Shares pursuant to the prospectus.
CGS identifiers have been provided by CUSIP Global Services, managed on behalf of the American Bankers Association by Standard & Poor’s Financial Services, LLC, and are not for use or dissemination in a manner that would serve as a substitute for any CUSIP service. The CUSIP Database, © 2023 American Bankers Association. “CUSIP” is a registered trademark of the American Bankers Association.
69
Financial Highlights
Financial highlights information is intended to help you understand a fund’s performance for the past five years (or, if shorter, its period of operations). Certain information reflects financial results for a single fund share. Total return represents the rate that an investor would have earned or lost each period on an investment in a fund or share class (assuming reinvestment of all distributions). This information has been obtained from the financial statements audited by PricewaterhouseCoopers LLP, an independent registered public accounting firm, whose report, along with fund financial statements, is included in a fund’s most recent annual report to shareholders. You may obtain a free copy of a fund’s latest annual or semiannual report, which is available upon request.
Vanguard Short-Term Treasury Index Fund ETF Shares
|
For a Share Outstanding
Throughout Each Period |
Year Ended August 31, | ||||
|
2023 |
2022 |
2021 |
2020 |
2019 | |
|
Net Asset Value, Beginning of Period |
$58.51 |
$61.50 |
$62.13 |
$61.12 |
$59.89 |
|
Investment Operations |
|
|
|
|
|
|
Net Investment Income1 |
1.625 |
.368 |
.288 |
.956 |
1.430 |
|
Net Realized and Unrealized Gain (Loss) on Investments |
(.919) |
(2.860) |
(.220) |
1.115 |
1.165 |
|
Total from Investment Operations |
.706 |
(2.492) |
.068 |
2.071 |
2.595 |
|
Distributions |
|
|
|
|
|
|
Dividends from Net Investment Income |
(1.446) |
(.310) |
(.325) |
(1.061) |
(1.365) |
|
Distributions from Realized Capital Gains |
— |
(.188) |
(.373) |
— |
— |
|
Total Distributions |
(1.446) |
(.498) |
(.698) |
(1.061) |
(1.365) |
|
Net Asset Value, End of Period |
$57.77 |
$58.51 |
$61.50 |
$62.13 |
$61.12 |
|
Total Return |
1.23% |
-4.07% |
0.11% |
3.43% |
4.39% |
|
Ratios/Supplemental Data |
|
|
|
|
|
|
Net Assets, End of Period (Millions) |
$22,488 |
$15,565 |
$13,394 |
$9,140 |
$5,334 |
|
Ratio of Total Expenses to Average Net Assets |
0.04%2 |
0.04%2 |
0.04% |
0.05% |
0.05% |
|
Ratio of Net Investment Income to Average Net Assets |
2.81% |
0.61% |
0.47% |
1.55% |
2.37% |
|
Portfolio Turnover Rate3 |
81% |
59% |
66% |
67% |
55% |
|
|
|
|
|
|
|
|
|
|
|
1 |
Calculated based on average shares outstanding. |
|
2 |
The ratio of expenses to average net assets for the period net of reduction from custody fee
offset arrangements was 0.04%. |
|
3 |
Excludes the value of portfolio securities received or delivered as a result of in-kind purchases
or redemptions of the fund’s capital shares, including ETF Creation Units. |
70
Vanguard Intermediate-Term Treasury Index Fund ETF Shares
|
For a Share Outstanding
Throughout Each Period |
Year Ended August 31, | ||||
|
2023 |
2022 |
2021 |
2020 |
2019 | |
|
Net Asset Value, Beginning of Period |
$60.34 |
$68.27 |
$70.46 |
$67.26 |
$62.67 |
|
Investment Operations |
|
|
|
|
|
|
Net Investment Income1 |
1.473 |
.858 |
.809 |
1.239 |
1.515 |
|
Net Realized and Unrealized Gain (Loss) on Investments |
(2.221) |
(7.617) |
(1.692) |
3.248 |
4.552 |
|
Total from Investment Operations |
(.748) |
(6.759) |
(.883) |
4.487 |
6.067 |
|
Distributions |
|
|
|
|
|
|
Dividends from Net Investment Income |
(1.392) |
(.805) |
(.820) |
(1.287) |
(1.477) |
|
Distributions from Realized Capital Gains |
— |
(.366) |
(.487) |
— |
— |
|
Total Distributions |
(1.392) |
(1.171) |
(1.307) |
(1.287) |
(1.477) |
|
Net Asset Value, End of Period |
$58.20 |
$60.34 |
$68.27 |
$70.46 |
$67.26 |
|
Total Return |
-1.25% |
-10.01% |
-1.26% |
6.76% |
9.84% |
|
Ratios/Supplemental Data |
|
|
|
|
|
|
Net Assets, End of Period (Millions) |
$16,995 |
$11,726 |
$8,147 |
$6,547 |
$4,353 |
|
Ratio of Total Expenses to Average Net Assets |
0.04%2 |
0.04%2 |
0.04% |
0.05% |
0.05% |
|
Ratio of Net Investment Income to Average Net Assets |
2.50% |
1.34% |
1.18% |
1.80% |
2.36% |
|
Portfolio Turnover Rate3 |
36% |
36% |
33% |
28% |
29% |
|
|
|
|
|
|
|
|
|
|
|
1 |
Calculated based on average shares outstanding. |
|
2 |
The ratio of expenses to average net assets for the period net of reduction from custody fee
offset arrangements was 0.04%. |
|
3 |
Excludes the value of portfolio securities received or delivered as a result of in-kind purchases
or redemptions of the fund’s capital shares, including ETF Creation Units. |
71
Vanguard Long-Term Treasury Index Fund ETF Shares
|
For a Share Outstanding
Throughout Each Period |
Year Ended August 31, | ||||
|
2023 |
2022 |
2021 |
2020 |
2019 | |
|
Net Asset Value, Beginning of Period |
$68.45 |
$90.37 |
$98.93 |
$90.17 |
$74.33 |
|
Investment Operations |
|
|
|
|
|
|
Net Investment Income1 |
2.008 |
1.718 |
1.645 |
1.915 |
2.115 |
|
Net Realized and Unrealized Gain (Loss) on Investments |
(8.567) |
(21.974) |
(8.289) |
8.772 |
15.798 |
|
Total from Investment Operations |
(6.559) |
(20.256) |
(6.644) |
10.687 |
17.913 |
|
Distributions |
|
|
|
|
|
|
Dividends from Net Investment Income |
(1.911) |
(1.664) |
(1.625) |
(1.927) |
(2.073) |
|
Distributions from Realized Capital Gains |
— |
— |
(.291) |
— |
— |
|
Total Distributions |
(1.911) |
(1.664) |
(1.916) |
(1.927) |
(2.073) |
|
Net Asset Value, End of Period |
$59.98 |
$68.45 |
$90.37 |
$98.93 |
$90.17 |
|
Total Return |
-9.70% |
-22.69% |
-6.73% |
12.02% |
24.69% |
|
Ratios/Supplemental Data |
|
|
|
|
|
|
Net Assets, End of Period (Millions) |
$7,322 |
$3,813 |
$2,366 |
$2,138 |
$1,282 |
|
Ratio of Total Expenses to Average Net Assets |
0.04%2 |
0.04%2 |
0.04% |
0.05% |
0.05% |
|
Ratio of Net Investment Income to Average Net Assets |
3.19% |
2.19% |
1.81% |
2.03% |
2.75% |
|
Portfolio Turnover Rate3 |
20% |
19% |
22% |
29% |
16% |
|
|
|
|
|
|
|
|
|
|
|
1 |
Calculated based on average shares outstanding. |
|
2 |
The ratio of expenses to average net assets for the period net of reduction from custody fee
offset arrangements was 0.04%. |
|
3 |
Excludes the value of portfolio securities received or delivered as a result of in-kind purchases
or redemptions of the fund’s capital shares, including ETF Creation Units. |
72
Vanguard Short-Term Corporate Bond Index Fund ETF Shares
|
Year Ended August 31, | |||||
|
2023 |
2022 |
2021 |
2020 |
2019 | |
|
Net Asset Value, Beginning of Period |
$76.14 |
$82.67 |
$82.95 |
$81.18 |
$78.32 |
|
Investment Operations |
|
|
|
|
|
|
Net Investment Income1 |
2.094 |
1.319 |
1.433 |
2.127 |
2.311 |
|
Net Realized and Unrealized Gain (Loss) on Investments |
(.441) |
(6.388) |
(.250) |
1.815 |
2.826 |
|
Total from Investment Operations |
1.653 |
(5.069) |
1.183 |
3.942 |
5.137 |
|
Distributions |
|
|
|
|
|
|
Dividends from Net Investment Income |
(2.043) |
(1.279) |
(1.463) |
(2.172) |
(2.277) |
|
Distributions from Realized Capital Gains |
— |
(.182) |
— |
— |
— |
|
Total Distributions |
(2.043) |
(1.461) |
(1.463) |
(2.172) |
(2.277) |
|
Net Asset Value, End of Period |
$75.75 |
$76.14 |
$82.67 |
$82.95 |
$81.18 |
|
Total Return |
2.23% |
-6.19% |
1.44% |
4.95% |
6.68% |
|
Ratios/Supplemental Data |
|
|
|
|
|
|
Net Assets, End of Period (Millions) |
$36,793 |
$43,723 |
$41,569 |
$31,797 |
$24,537 |
|
Ratio of Total Expenses to Average Net Assets |
0.04%2 |
0.04%2 |
0.04% |
0.05% |
0.05% |
|
Ratio of Net Investment Income to Average Net Assets |
2.78% |
1.67% |
1.73% |
2.62% |
2.92% |
|
Portfolio Turnover Rate3 |
63% |
50% |
42% |
56% |
51% |
|
|
|
|
|
|
|
|
|
|
|
1 |
Calculated based on average shares outstanding. |
|
2 |
The ratio of expenses to average net assets for the period net of reduction from custody fee
offset arrangements was 0.04%. |
|
3 |
Excludes the value of portfolio securities received or delivered as a result of in-kind purchases
or redemptions of the fund’s capital shares, including ETF Creation Units. |
73
Vanguard Intermediate-Term Corporate Bond Index Fund ETF Shares
|
For a Share Outstanding
Throughout Each Period |
Year Ended August 31, | ||||
|
2023 |
2022 |
2021 |
2020 |
2019 | |
|
Net Asset Value, Beginning of Period |
$79.83 |
$95.57 |
$95.98 |
$91.82 |
$84.02 |
|
Investment Operations |
|
|
|
|
|
|
Net Investment Income1 |
2.808 |
2.171 |
2.163 |
2.761 |
3.132 |
|
Net Realized and Unrealized Gain (Loss) on Investments |
(1.605) |
(15.176) |
(.205) |
4.205 |
7.768 |
|
Total from Investment Operations |
1.203 |
(13.005) |
1.958 |
6.966 |
10.900 |
|
Distributions |
|
|
|
|
|
|
Dividends from Net Investment Income |
(2.763) |
(2.141) |
(2.169) |
(2.806) |
(3.100) |
|
Distributions from Realized Capital Gains |
— |
(.594) |
(.199) |
— |
— |
|
Total Distributions |
(2.763) |
(2.735) |
(2.368) |
(2.806) |
(3.100) |
|
Net Asset Value, End of Period |
$78.27 |
$79.83 |
$95.57 |
$95.98 |
$91.82 |
|
Total Return |
1.55% |
-13.86% |
2.08% |
7.78% |
13.33% |
|
Ratios/Supplemental Data |
|
|
|
|
|
|
Net Assets, End of Period (Millions) |
$40,262 |
$41,058 |
$46,873 |
$38,944 |
$24,080 |
|
Ratio of Total Expenses to Average Net Assets |
0.04%2 |
0.04%2 |
0.04% |
0.05% |
0.05% |
|
Ratio of Net Investment Income to Average Net Assets |
3.58% |
2.48% |
2.27% |
2.99% |
3.65% |
|
Portfolio Turnover Rate3 |
76% |
58% |
53% |
72% |
59% |
|
|
|
|
|
|
|
|
|
|
|
1 |
Calculated based on average shares outstanding. |
|
2 |
The ratio of expenses to average net assets for the period net of reduction from custody fee
offset arrangements was 0.04%. |
|
3 |
Excludes the value of portfolio securities received or delivered as a result of in-kind purchases
or redemptions of the fund’s capital shares, including ETF Creation Units. |
74
Vanguard Long-Term Corporate Bond Index Fund ETF Shares
|
For a Share Outstanding
Throughout Each Period |
Year Ended August 31, | ||||
|
2023 |
2022 |
2021 |
2020 |
2019 | |
|
Net Asset Value, Beginning of Period |
$80.54 |
$108.31 |
$107.01 |
$102.86 |
$88.35 |
|
Investment Operations |
|
|
|
|
|
|
Net Investment Income1 |
3.692 |
3.286 |
3.294 |
3.701 |
3.936 |
|
Net Realized and Unrealized Gain (Loss) on
Investments2 |
(4.727) |
(27.794) |
1.288 |
4.189 |
14.458 |
|
Total from Investment Operations |
(1.035) |
(24.508) |
4.582 |
7.890 |
18.394 |
|
Distributions |
|
|
|
|
|
|
Dividends from Net Investment Income |
(3.595) |
(3.262) |
(3.282) |
(3.740) |
(3.884) |
|
Distributions from Realized Capital Gains |
— |
— |
— |
— |
— |
|
Total Distributions |
(3.595) |
(3.262) |
(3.282) |
(3.740) |
(3.884) |
|
Net Asset Value, End of Period |
$75.91 |
$80.54 |
$108.31 |
$107.01 |
$102.86 |
|
Total Return |
-1.27% |
-23.06% |
4.39% |
7.90% |
21.60% |
|
Ratios/Supplemental Data |
|
|
|
|
|
|
Net Assets, End of Period (Millions) |
$6,252 |
$4,545 |
$5,517 |
$5,214 |
$4,074 |
|
Ratio of Total Expenses to Average Net Assets |
0.04%3 |
0.04%3 |
0.04% |
0.05% |
0.05% |
|
Ratio of Net Investment Income to Average Net Assets |
4.79% |
3.47% |
3.10% |
3.60% |
4.36% |
|
Portfolio Turnover Rate4 |
33% |
31% |
36% |
62% |
47% |
|
|
|
|
|
|
|
|
|
|
|
1 |
Calculated based on average shares outstanding. |
|
2 |
Includes increases from purchase fees of $.05, $.01, $.03, $.00, and $.00. |
|
3 |
The ratio of expenses to average net assets for the period net of reduction from custody fee
offset arrangements was 0.04%. |
|
4 |
Excludes the value of portfolio securities received or delivered as a result of in-kind purchases
or redemptions of the fund’s capital shares, including ETF Creation Units. |
75
Vanguard Mortgage-Backed Securities Index Fund ETF Shares
|
For a Share Outstanding
Throughout Each Period |
Year Ended August 31, | ||||
|
2023 |
2022 |
2021 |
2020 |
2019 | |
|
Net Asset Value, Beginning of Period |
$47.53 |
$53.47 |
$54.36 |
$53.26 |
$51.38 |
|
Investment Operations |
|
|
|
|
|
|
Net Investment Income1 |
1.424 |
.842 |
.581 |
1.197 |
1.564 |
|
Net Realized and Unrealized Gain (Loss) on Investments |
(2.344) |
(5.995) |
(.768) |
1.146 |
1.859 |
|
Total from Investment Operations |
(.920) |
(5.153) |
(.187) |
2.343 |
3.423 |
|
Distributions |
|
|
|
|
|
|
Dividends from Net Investment Income |
(1.380) |
(.787) |
(.594) |
(1.243) |
(1.543) |
|
Distributions from Realized Capital Gains |
— |
— |
(.109) |
— |
— |
|
Total Distributions |
(1.380) |
(.787) |
(.703) |
(1.243) |
(1.543) |
|
Net Asset Value, End of Period |
$45.23 |
$47.53 |
$53.47 |
$54.36 |
$53.26 |
|
Total Return |
-1.94% |
-9.71% |
-0.35% |
4.45% |
6.80% |
|
Ratios/Supplemental Data |
|
|
|
|
|
|
Net Assets, End of Period (Millions) |
$16,343 |
$14,405 |
$15,055 |
$11,643 |
$10,316 |
|
Ratio of Total Expenses to Average Net Assets |
0.04%2 |
0.04%2 |
0.04% |
0.05% |
0.05% |
|
Ratio of Net Investment Income to Average Net Assets |
3.10% |
1.67% |
1.08% |
2.22% |
3.01% |
|
Portfolio Turnover Rate3 |
101% |
170% |
316% |
218% |
190% |
|
|
|
|
|
|
|
|
|
|
|
1 |
Calculated based on average shares outstanding. |
|
2 |
The ratio of expenses to average net assets for the period net of reduction from custody fee
offset arrangements was 0.04%. |
|
3 |
Includes 80%, 113%, 237%, 11%, and 34%, respectively, attributable to mortgage-dollar-
roll activity. |
76
CFA® is a registered trademark owned by CFA Institute.
”Bloomberg®” and Bloomberg US Treasury 1–3 Year Index, Bloomberg U.S. Treasury 3–10 Year Index, Bloomberg U.S. Long Treasury Index, Bloomberg U.S. 1-5 Year Corporate Bond Index, Bloomberg U.S. 5–10 Year Corporate Bond Index, Bloomberg U.S. 10+ Year Corporate Bond Index, and Bloomberg U.S. MBS Float Adjusted Index (“the Indices” or “Bloomberg Indices”) are service marks of Bloomberg Finance L.P. and its affiliates, including Bloomberg Index Services Limited (“BISL”), the administrator of the Indices (collectively, “Bloomberg”), and have been licensed for use for certain purposes by Vanguard.
Vanguard Sector Bond ETFs are not sponsored, endorsed, sold or promoted by Bloomberg. Bloomberg does not make any representation or warranty, express or implied, to the owners of or counterparties to Vanguard Sector Bond ETFs or any member of the public regarding the advisability of investing in securities generally or in Vanguard Sector Bond ETFs particularly. The only relationship of Bloomberg to Vanguard is the licensing of certain trademarks, trade names and service marks and of the U.S. Treasury 1–3 Year Index, Bloomberg U.S. Treasury 3–10 Year Index, Bloomberg U.S. Long Treasury Index, Bloomberg U.S. 1-5 Year Corporate Bond Index, Bloomberg U.S. 5–10 Year Corporate Bond Index, Bloomberg U.S. 10+ Year Corporate Bond Index, Bloomberg U.S. MBS Float Adjusted Index, and Bloomberg U.S. Aggregate Float Adjusted Index, which is determined, composed and calculated by BISL without regard to Vanguard or Vanguard Sector Bond ETFs. Bloomberg has no obligation to take the needs of Vanguard or the owners of Vanguard Sector Bond ETFs into consideration in determining, composing or calculating the U.S. Treasury 1–3 Year Index, Bloomberg U.S. Treasury 3–10 Year Index, Bloomberg U.S. Long Treasury Index, Bloomberg U.S. 1-5 Year Corporate Bond Index, Bloomberg U.S. 5–10 Year Corporate Bond Index, Bloomberg U.S. 10+ Year Corporate Bond Index, Bloomberg U.S. MBS Float Adjusted Index, and Bloomberg U.S. Aggregate Float Adjusted Index. Bloomberg is not responsible for and has not participated in the determination of the timing of, prices at, or quantities of Vanguard Sector Bond ETFs to be issued. Bloomberg shall not have any obligation or liability, including, without limitation, to Vanguard Sector Bond ETFs customers, in connection with the administration, marketing or trading of Vanguard Sector Bond ETFs.
BLOOMBERG DOES NOT GUARANTEE THE ACCURACY AND/OR THE COMPLETENESS OF THE U.S. TREASURY 1-3 YEAR INDEX, BLOOMBERG U.S. TREASURY 3-10 YEAR INDEX, BLOOMBERG U.S. LONG TREASURY INDEX, BLOOMBERG U.S. 1-5 YEAR CORPORATE BOND INDEX, BLOOMBERG U.S. 5-10 YEAR CORPORATE BOND INDEX, BLOOMBERG U.S. 10+ YEAR CORPORATE BOND INDEX, BLOOMBERG U.S. MBS FLOAT ADJUSTED INDEX, AND BLOOMBERG U.S. AGGREGATE FLOAT ADJUSTED INDEX OR ANY DATA RELATED THERETO AND SHALL HAVE NO LIABILITY FOR ANY ERRORS, OMISSIONS OR INTERRUPTIONS THEREIN. BLOOMBERG DOES NOT MAKE ANY WARRANTY, EXPRESS OR IMPLIED, AS TO RESULTS TO BE OBTAINED BY VANGUARD, OWNERS OF VANGUARD SECTOR BOND ETFS OR ANY OTHER PERSON OR ENTITY FROM THE USE OF THE U.S. TREASURY 1-3 YEAR INDEX, BLOOMBERG U.S. TREASURY 3-10 YEAR INDEX, BLOOMBERG U.S. LONG TREASURY INDEX, BLOOMBERG U.S. 1-5 YEAR CORPORATE BOND INDEX, BLOOMBERG U.S. 5-10 YEAR CORPORATE BOND INDEX, BLOOMBERG U.S. 10+ YEAR CORPORATE BOND INDEX, BLOOMBERG U.S. MBS FLOAT ADJUSTED INDEX, AND BLOOMBERG U.S. AGGREGATE FLOAT ADJUSTED INDEX OR ANY DATA RELATED THERETO. BLOOMBERG DOES NOT MAKE ANY EXPRESS OR IMPLIED WARRANTIES AND EXPRESSLY DISCLAIMS ALL WARRANTIES OF MERCHANTABILITY OR FITNESS FOR A PARTICULAR PURPOSE OR USE WITH RESPECT TO THE U.S. TREASURY 1-3 YEAR INDEX, BLOOMBERG U.S. TREASURY 3-10 YEAR INDEX, BLOOMBERG U.S. LONG TREASURY INDEX, BLOOMBERG U.S. 1-5 YEAR CORPORATE BOND INDEX, BLOOMBERG U.S. 5-10 YEAR CORPORATE BOND INDEX, BLOOMBERG U.S. 10+ YEAR CORPORATE BOND INDEX, BLOOMBERG U.S. MBS FLOAT ADJUSTED INDEX, AND BLOOMBERG U.S. AGGREGATE FLOAT ADJUSTED INDEX OR ANY DATA RELATED THERETO. WITHOUT LIMITING ANY OF THE FOREGOING, TO THE MAXIMUM EXTENT ALLOWED BY LAW, BLOOMBERG, ITS LICENSORS, AND ITS AND THEIR RESPECTIVE EMPLOYEES, CONTRACTORS, AGENTS, SUPPLIERS, AND VENDORS SHALL HAVE NO LIABILITY OR RESPONSIBILITY WHATSOEVER FOR ANY INJURY OR DAMAGES—WHETHER DIRECT, INDIRECT, CONSEQUENTIAL, INCIDENTAL, PUNITIVE OR OTHERWISE—ARISING IN CONNECTION WITH VANGUARD SECTOR BOND ETFS OR U.S. TREASURY 1-3 YEAR INDEX, BLOOMBERG U.S. TREASURY 3-10 YEAR
77
INDEX, BLOOMBERG U.S. LONG TREASURY INDEX, BLOOMBERG U.S. 1-5 YEAR CORPORATE BOND INDEX, BLOOMBERG U.S. 5-10 YEAR CORPORATE BOND INDEX, BLOOMBERG U.S. 10+ YEAR CORPORATE BOND INDEX, BLOOMBERG U.S. MBS FLOAT ADJUSTED INDEX, AND BLOOMBERG U.S. AGGREGATE FLOAT ADJUSTED INDEX OR ANY DATA OR VALUES RELATING THERETO—WHETHER ARISING FROM THEIR NEGLIGENCE OR OTHERWISE, EVEN IF NOTIFIED OF THE POSSIBILITY THEREOF.
78
Glossary of Investment Terms
Authorized Participant. Institutional investors that are permitted to purchase Creation Units directly from, and redeem Creation Units directly with, the issuing fund. To be an Authorized Participant, an entity must be a participant in the Depository Trust Company and must enter into an agreement with the fund’s Distributor.
Average Maturity. The average length of time until bonds held by a fund reach maturity and are repaid. In general, the longer the average maturity, the more a fund's share price fluctuates in response to changes in market interest rates. In calculating average maturity, a fund uses a bond’s maturity or, if applicable, an earlier date on which the advisor believes it is likely that a maturity-shortening device (such as a call, put, refunding, prepayment, or redemption provision or an adjustable coupon rate) will cause the bond to be repaid.
Bid-Ask Spread. The difference between the highest price a buyer is willing to pay to purchase ETF Shares (bid) and the lowest price a seller is willing to accept for ETF Shares (ask) when buying or selling shares in the secondary market.
Bloomberg U.S. Aggregate Float Adjusted Index. An index that is the broadest representation of the taxable U.S. bond market, including most U.S. Treasury, agency, corporate, mortgage-backed, asset-backed, and international dollar-denominated issues, all with investment-grade ratings and maturities of 1 year or more. This Index weights its constituent securities based on the value of the constituent securities that are available for public trading, rather than the value of all constituent securities.
Bond. A debt security (IOU) issued by a corporation, a government, or a government agency in exchange for the money the bondholder lends it. In most instances, the issuer agrees to pay back the loan by a specific date and generally to make regular interest payments until that date.
Capital Gains Distributions. Payments to fund shareholders of gains realized on securities that a fund has sold at a profit, minus any realized losses.
Corporate Bond. An IOU issued by a business that wants to borrow money. As with other types of bonds, the issuer promises to repay the borrowed money by a specific date and generally to make interest payments in the meantime.
Coupon Rate. The interest rate paid by the issuer of a debt security until its maturity. It is expressed as an annual percentage of the face value of the security.
79
Creation Unit. A large block of a specified number of ETF Shares. Certain broker-dealers known as “Authorized Participants” may purchase and redeem ETF Shares from the issuing fund in Creation Unit size blocks.
Dividend Distributions. Payments to fund shareholders of income from interest or dividends generated by a fund's investments.
Ex-Dividend Date. The date when a distribution of dividends and/or capital gains is deducted from the share price of a mutual fund, ETF, or stock. On the ex-dividend date, the share price drops by the amount of the distribution per share (plus or minus any market activity).
Expense Ratio. A fund's total annual operating expenses expressed as a percentage of the fund's average net assets. The expense ratio includes management and administrative expenses, but it does not include the transaction costs of buying and selling portfolio securities.
Face Value. The amount to be paid at a bond’s maturity; also known as the par value or principal.
Fixed Income Security. An investment, such as a bond, representing a debt that must be repaid by a specified date, and on which the borrower may pay a fixed, variable, or floating rate of interest.
Float-Adjusted Index. An index that weights its constituent securities based on the value of the constituent securities that are available for public trading, rather than the value of all constituent securities. Some portion of an issuer’s securities may be unavailable for public trading because, for example, those securities are owned by company insiders on a restricted basis or by a government agency. By excluding unavailable securities, float-adjusted indexes can produce a more accurate picture of the returns actually experienced by investors in the measured market.
Government Bond. An IOU issued by the U.S. government or a government agency in exchange for the money you lend it. The issuer promises to repay the borrowed money by a specific date and generally to make regular interest payments until that date.
Inception Date. The date on which the assets of a fund (or one of its share classes) are first invested in accordance with the fund's investment objective. For funds with a subscription period, the inception date is the day after that period ends. Investment performance is generally measured from the inception date.
80
Indexing. A low-cost investment strategy in which a fund attempts to track—rather than outperform—a specified market benchmark, or “index.”
Investment-Grade Bond. A debt security whose credit quality is considered by independent bond rating agencies, or through independent analysis conducted by a fund's advisor, to be sufficient to ensure timely payment of principal and interest under current economic circumstances. Debt securities rated in one of the four highest rating categories are considered investment-grade. Other debt securities may be considered by an advisor to be investment-grade.
Joint Committed Credit Facility. Each Fund participates, along with other funds managed by Vanguard, in a committed credit facility provided by a syndicate of lenders pursuant to a credit agreement that may be renewed annually; each Vanguard fund is individually liable for its borrowings, if any, under the credit facility. The amount and terms of the committed credit facility are subject to approval by the Funds' board of trustees and renegotiation with the lender syndicate on an annual basis.
Mutual Fund. An investment company that pools the money of many people and invests it in a variety of securities in an effort to achieve a specific objective over time.
New York Stock Exchange (NYSE). A stock exchange based in New York City that is open for regular trading on business days, Monday through Friday, from 9:30 a.m. to 4 p.m., Eastern time.
Principal. The face value of a debt instrument or the amount of money put into an investment.
Return of Capital. A return of capital occurs when a fund's distributions exceed its earnings in a fiscal year. A return of capital is a return of all or part of your original investment or amounts paid in excess of your original investment in a fund. In general, a return of capital reduces your cost basis in a fund's shares and is not taxable to you until your cost basis has been reduced to zero.
Securities. Stocks, bonds, money market instruments, and other investments.
Total Return. A percentage change, over a specified time period, in a fund's net asset value, assuming the reinvestment of all distributions of dividends and capital gains.
81
Volatility. The fluctuations in value of a mutual fund or other security. The greater a fund's volatility, the wider the fluctuations in its returns.
Yield. Income (interest or dividends) earned by an investment, expressed as a percentage of the investment’s price.
82
Connect with Vanguard® ˃ vanguard.com
For More Information
If you would like more information about Vanguard Sector Bond ETFs, the following documents are available free upon request:
Annual/Semiannual Reports to Shareholders
Additional information about the Funds' investments is available in the Funds' annual and semiannual reports to shareholders. In the annual report, you will find a discussion of the market conditions and investment strategies that significantly affected the Funds' performance during their last fiscal year.
Statement of Additional Information (SAI)
The SAI provides more detailed information about the Funds' ETF Shares and is incorporated by reference into (and thus legally a part of) this prospectus.
To receive a free copy of the latest annual or semiannual reportor the SAI, or to request additional information about Vanguard ETF Shares, please visit vanguard.com or contact us as follows:
Telephone: 866-499-8473; Text telephone for people with hearing impairment: 800-749-7273
Information Provided by the SEC
Reports and other information about the Funds are available in the EDGAR database on the SEC’s website at sec.gov, or you can receive copies of this information, for a fee, by electronic request at the following email address: publicinfo@sec.gov.
Funds' Investment Company Act file number: 811-07803
© 2023 The Vanguard Group, Inc. All rights reserved.
Vanguard Marketing Corporation, Distributor.
P 3142 122023
Vanguard Marketing Corporation, Distributor.
P 3142 122023
Vanguard Total Corporate Bond ETF
Prospectus
December 22, 2023
Exchange-traded fund shares that are not individually redeemable and are listed on Nasdaq
Vanguard Total Corporate Bond ETF Shares (VTC)
This prospectus contains financial data for the Fund through the fiscal year ended August 31, 2023.
The Securities and Exchange Commission (SEC) has not approved or disapproved these securities or passed upon the adequacy of this prospectus. Any representation to the contrary is a criminal offense.
(Fees paid directly from your investment)
|
| |
|
Transaction Fee on Purchases and Sales |
|
|
Transaction Fee on Reinvested Dividends |
|
*
(Expenses that you pay each year as a percentage of the value of your investment)
|
| |
|
Management Fees |
% |
|
12b-1 Distribution Fee |
|
|
Other Expenses |
% |
|
Acquired Fund Fees and Expenses |
% |
|
Total Annual Fund Operating Expenses |
% |
1
|
1 Year |
3 Years |
5 Years |
10 Years |
|
$ |
$ |
$ |
$ |
2
3
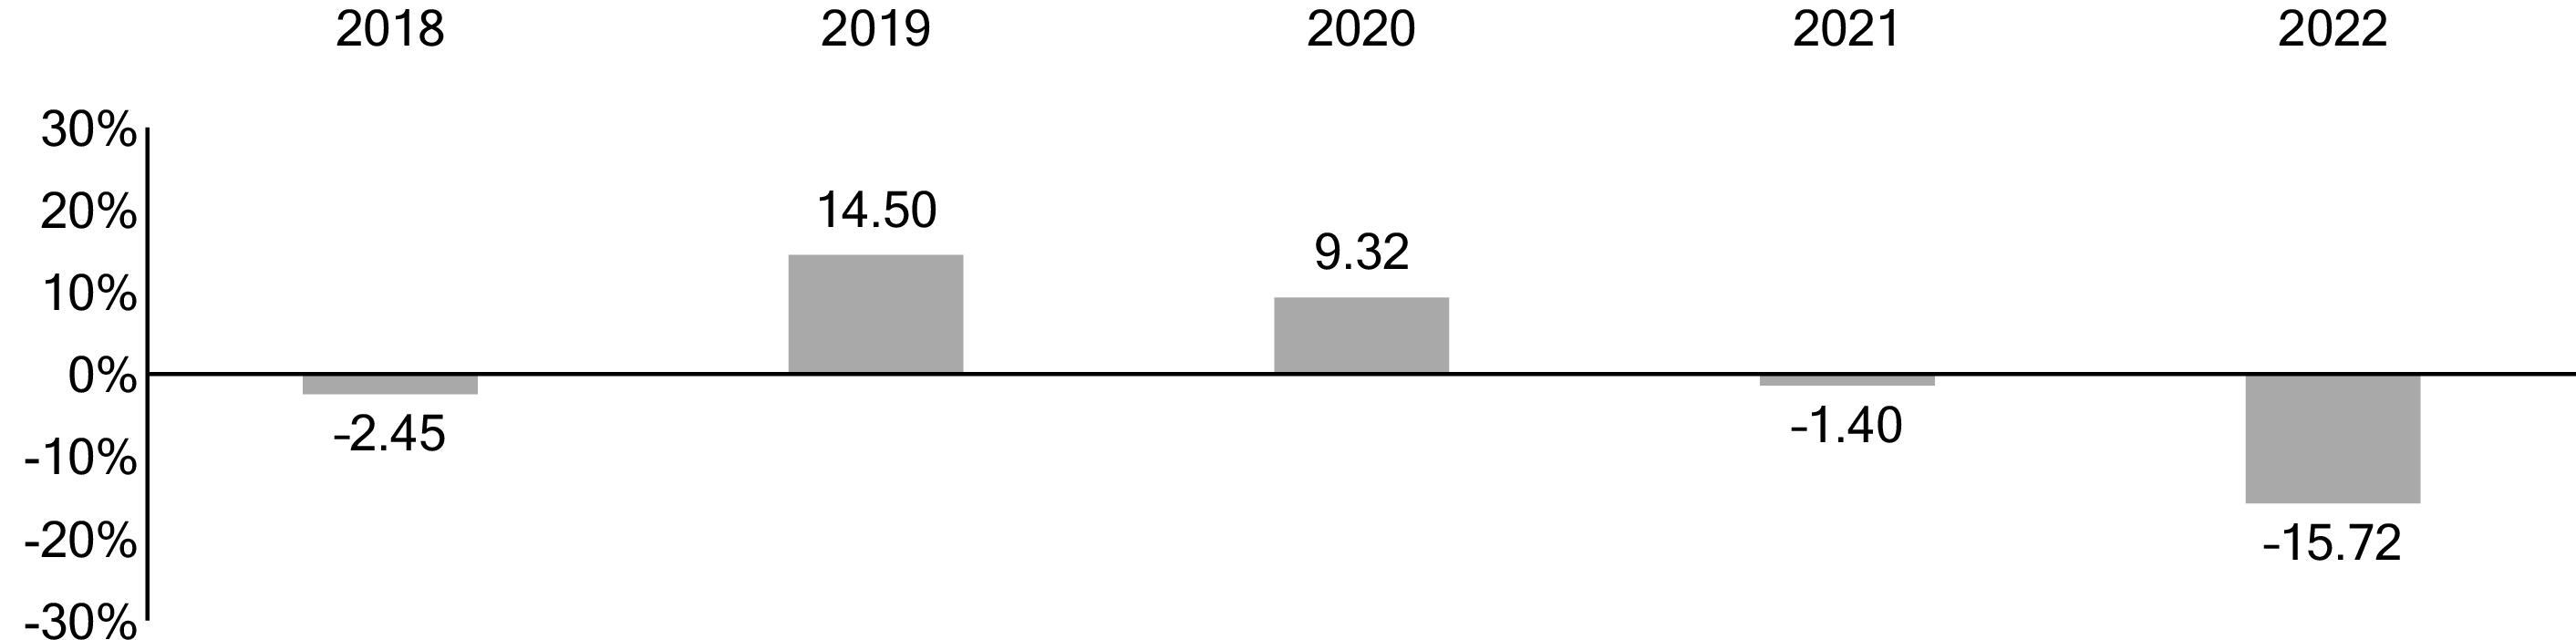
1 The year-to-date return as of the most recent calendar quarter, which ended on September 30, 2023, was 0.13%.
|
|
Total Return |
Quarter |
|
|
% |
|
|
|
-
% |
|
4
|
|
1 Year |
5 Years |
Since
Fund
Inception |
Fund
Inception
Date |
|
Vanguard Total Corporate Bond ETF Shares |
|
|
|
|
|
Based on NAV |
|
|
|
|
|
Return Before Taxes |
-
% |
% |
% |
|
|
Return After Taxes on Distributions |
- |
- |
- |
|
|
Return After Taxes on Distributions and Sale of
Fund Shares |
- |
- |
- |
|
|
Based on Market Price |
|
|
|
|
|
Return Before Taxes |
- |
|
|
|
|
Bloomberg U.S. Corporate Bond Index
(reflects no deduction for fees, expenses,
or taxes) |
-
% |
% |
% |
|
|
Bloomberg U.S. Aggregate Float Adjusted
Index
(reflects no deduction for fees, expenses,
or taxes) |
- |
|
|
|
Investment Advisor
The Vanguard Group, Inc. (Vanguard)
Portfolio Manager
Joshua C. Barrickman, CFA, Principal of Vanguard and co-head of Vanguard’s Fixed Income Indexing Americas. He has managed the Fund since its inception in 2017.
5
Purchase and Sale of Fund Shares
ETF Shares may only be bought and sold in the secondary market through a brokerage firm. The price you pay or receive for ETF Shares will be the prevailing market price, which may be more (premium) or less (discount) than the NAV of the shares. The brokerage firm may charge you a commission to execute the transaction. Unless imposed by your brokerage firm, there is no minimum dollar amount you must invest and no minimum number of shares you must buy. ETF Shares cannot be directly purchased from or redeemed with the Fund, except by certain authorized broker-dealers. These broker-dealers may purchase and redeem ETF Shares only in large blocks (Creation Units), typically in exchange for baskets of securities.
An investor may incur costs attributable to the difference between the highest price a buyer is willing to pay to purchase ETF Shares (bid) and the lowest price a seller is willing to accept for ETF Shares (ask) when buying or selling shares in the secondary market (bid-ask spread). Recent information, including information on the Fund's NAV, market price, premiums and discounts, and bid-ask spreads, is available online at vanguard.com.
Tax Information
The Fund’s distributions may be taxable as ordinary income or capital gain. If you are investing through a tax-advantaged account, such as an IRA or an employer-sponsored retirement or savings plan, special tax rules apply.
Payments to Financial Intermediaries
The Fund and its investment advisor do not pay financial intermediaries for sales of Fund shares.
6
Investing in Vanguard ETF® Shares
What Are Vanguard ETF Shares?
Vanguard ETF Shares are an exchange-traded class of shares issued by certain Vanguard funds. ETF Shares represent an interest in the portfolio of stocks, bonds, or underlying ETFs held by the issuing fund.
How Are Vanguard ETF Shares Different From Conventional Mutual Fund Shares?
Conventional mutual fund shares can be directly purchased from and redeemed with the issuing fund for cash at the net asset value (NAV), typically calculated once a day. ETF Shares, by contrast, cannot be purchased directly from or redeemed directly with the issuing fund by an individual investor. Rather, ETF Shares can only be purchased or redeemed directly from the issuing fund by certain authorized broker-dealers. These broker-dealers may purchase and redeem ETF Shares only in large blocks (Creation Units), usually in exchange for baskets of securities and not for cash (although some funds issue and redeem Creation Units in exchange for cash or a combination of cash and securities).
An organized secondary trading market is expected to exist for ETF Shares, unlike conventional mutual fund shares, because ETF Shares are listed for trading on a national securities exchange. Individual investors can purchase and sell ETF Shares on the secondary market through a broker. Secondary-market transactions occur not at NAV, but at market prices that are subject to change throughout the day based on the supply of and demand for ETF Shares, changes in the prices of the fund’s portfolio holdings, and other factors.
The market price of ETF Shares typically will differ somewhat from the NAV of those shares. The difference between market price and NAV is expected to be small most of the time, but in times of market disruption or extreme market volatility, the difference may become significant.
7
How Do I Buy and Sell Vanguard ETF Shares?
ETF Shares of the Fund are listed for trading on Nasdaq. You can buy and sell ETF Shares on the secondary market in the same way you buy and sell any other exchange-traded security—through a broker. Your broker may charge a commission to execute a transaction. You will also incur the cost of the “bid-ask spread,” which is the difference between the highest price a buyer is willing to pay to purchase ETF Shares (bid) and the lowest price a seller is willing to accept for ETF Shares (ask) when buying or selling shares in the secondary market. Because secondary-market transactions occur at market prices, you may pay more (premium) or less (discount) than NAV when you buy ETF Shares and receive more or less than NAV when you sell those shares. In times of severe market disruption, the bid-ask spread and premiums/discounts can increase significantly. Unless imposed by your broker, there is no minimum dollar amount you must invest and no minimum number of ETF Shares you must buy.
Your ownership of ETF Shares will be shown on the records of the broker through which you hold the shares. Vanguard will not have any record of your ownership. Your account information will be maintained by your broker, which will provide you with account statements, confirmations of your purchases and sales of ETF Shares, and tax information. Your broker also will be responsible for ensuring that you receive income and capital gains distributions, as well as shareholder reports and other communications from the fund whose ETF Shares you own. You will receive other services (e.g., dividend reinvestment and average cost information) only if your broker offers these services.
8
Investing in Index Funds
What Is Indexing?
Indexing is an investment strategy for tracking the performance of a specified market benchmark, or “index.” An index is a group of securities whose overall performance is used as a standard to measure the investment performance of a particular market. There are many types of indexes. Some represent entire markets—such as the U.S. stock market or the U.S. bond market. Other indexes cover market segments—such as small-capitalization stocks or short-term bonds. One cannot invest directly in an index.
The index provider determines the securities to include in the index and the weighting of each security in the index. Under normal circumstances, the index provider will rebalance an index on a regular schedule. An index provider may carry out additional ad hoc index rebalances or delay or cancel a scheduled rebalance. Generally, the index provider does not provide any warranty, or accept any liability, with respect to the quality, accuracy, or completeness of either the target index or its related data. Errors made by the index provider may occur from time to time and may not be identified by the index provider for a period of time or at all. Vanguard does not provide any warranty or guarantee against such errors. Therefore, the gains, losses, or costs associated with the index provider’s errors will generally be borne by the index fund and its shareholders.
An index fund seeks to hold all, or a representative sample, of the securities that make up its target index. Index funds attempt to mirror the performance of the target index, for better or worse. However, an index fund generally does not perform exactly like its target index. For example, index funds have operating expenses and transaction costs. Market indexes do not, and therefore they will usually have a slight performance advantage over funds that track them. The ability of an index fund to match its performance to that of its target index can also be impacted by, among other things, the timing and size of cash flows, asset valuation differences, and the size of the fund. Market disruptions could also have an adverse effect on a fund’s ability to adjust its exposure to the required levels in order to track the index. The risk that a fund may not track the performance of its target index may be heightened during times of increased market volatility or other unusual market conditions.
Index funds typically have the following characteristics:
• Variety of investments. Depending on a fund’s benchmark index, the fund may invest in the securities of a variety of companies, industries, and/or governments or government agencies.
• Relative performance consistency. Because they seek to track market benchmarks, index funds usually do not perform dramatically better or worse than their benchmarks.
• Low cost. Index funds are generally inexpensive to run compared with actively managed funds. They have low or no research costs and typically keep trading activity—and thus dealer markups and other transaction costs—to a minimum compared with actively managed funds.
9
More on the Fund and ETF Shares
This prospectus describes the principal risks you would face as a Fund shareholder. It is important to keep in mind one of the main principles of investing: generally, the higher the risk of losing money, the higher the potential reward. The reverse, also, is generally true: the lower the risk, the lower the potential reward. As you consider an investment in any fund, you should take into account your personal tolerance for fluctuations in the securities markets. Look for this
symbol throughout the prospectus. It is used to mark detailed information about the more significant risks that you would confront as a Fund shareholder. To highlight terms and concepts important to fund investors, we have provided Plain Talk® explanations along the way. Reading the prospectus will help you decide whether the Fund is the right investment for you. We suggest that you keep this prospectus for future reference.
symbol throughout the prospectus. It is used to mark detailed information about the more significant risks that you would confront as a Fund shareholder. To highlight terms and concepts important to fund investors, we have provided Plain Talk® explanations along the way. Reading the prospectus will help you decide whether the Fund is the right investment for you. We suggest that you keep this prospectus for future reference.A Note to Investors
Vanguard ETF Shares can be purchased directly from the issuing Fund only by certain authorized broker-dealers in exchange for a basket of securities (or, in some cases, for cash or a combination of cash and securities). Individual investors generally will not be able to purchase ETF Shares directly from the Fund. Instead, these investors will purchase ETF Shares on the secondary market through a broker.
|
Plain Talk About Fund Expenses |
|
All funds have operating expenses. These expenses, which are deducted
from a fund’s gross income, are expressed as a percentage of the net assets
of the fund. Assuming that operating expenses remain as stated in the Fees
and Expenses section, Vanguard Total Corporate Bond ETF Shares’ expense
ratio would be 0.04%, or $0.40 per $1,000 of average net assets. The
average expense ratio for core bond funds in 2022 was 0.66%, or $6.60 per
$1,000 of average net assets (derived from data provided by Lipper, a
Thomson Reuters Company, which reports on the fund industry). |
|
Plain Talk About Costs of Investing |
|
Costs are an important consideration in choosing an ETF. That is because
you, as a shareholder, pay a proportionate share of the costs of operating a
fund and any transaction costs incurred when the fund buys or sells
securities. These costs can erode a substantial portion of the gross income
or the capital appreciation a fund achieves. Even seemingly small differences
in expenses can, over time, have a dramatic effect on a fund’s performance. |
10
The following sections explain the principal investment strategies and policies that the Fund uses in pursuit of its investment objective. The Fund's board of trustees, which oversees the Fund's management, may change investment strategies or policies in the interest of shareholders without a shareholder vote, unless those strategies or policies are designated as fundamental. Note that the Fund‘s investment objective is not fundamental and may be changed without a shareholder vote. As a fund of funds, the Fund seeks to achieve its investment objective by primarily investing in underlying funds. Through its investments in underlying funds, the Fund indirectly owns a diversified portfolio of fixed income securities. Under normal circumstances, at least 80% of the Fund‘s assets will be indirectly invested in corporate bonds. The Fund may change its 80% policy only upon 60 days‘ notice to shareholders.
Market Exposure
Through the underlying funds, the Fund indirectly invests its assets in investment-grade U.S. corporate bonds.
The Fund is subject to interest rate risk, which is the chance that bond prices overall will decline because of rising interest rates. Interest rate risk should be moderate for the Fund.
Although fixed income securities (commonly referred to as bonds) are often thought to be less risky than stocks, there have been periods when bond prices have fallen significantly because of rising interest rates. For instance, prices of U.S. long-term bonds fell by almost 48% between December 1976 and September 1981.
To illustrate the relationship between bond prices and interest rates, the following table shows the effect of a 1% and a 2% change (both up and down) in interest rates on the values of three noncallable bonds (i.e., bonds that cannot be redeemed by the issuer) of different maturities, each with a face value of $1,000.
How Interest Rate Changes Affect the Value of a $1,000 Bond1
|
Type of Bond (Maturity) |
After a 1%
Increase |
After a 1%
Decrease |
After a 2%
Increase |
After a 2%
Decrease |
|
Short-Term (2.5 years) |
$977 |
$1,024 |
$954 |
$1,049 |
|
Intermediate-Term (10 years) |
922 |
1,086 |
851 |
1,180 |
|
Long-Term (20 years) |
874 |
1,150 |
769 |
1,328 |
1 Assuming a 4% coupon rate.
11
These figures are for illustration only; you should not regard them as an indication of future performance of the bond market as a whole or the Fund in particular.
|
Plain Talk About Bonds and Interest Rates |
|
As a rule, when interest rates rise, bond prices fall. The opposite is also true:
Bond prices go up when interest rates fall. Why do bond prices and interest
rates move in opposite directions? Let’s assume that you hold a bond
offering a 4% yield. A year later, interest rates are on the rise and bonds of
comparable quality and maturity are offered with a 5% yield. With
higher-yielding bonds available, you would have trouble selling your 4% bond
for the price you paid—you would probably have to lower your asking price.
On the other hand, if interest rates were falling and 3% bonds were being
offered, you should be able to sell your 4% bond for more than you paid. |
Changes in interest rates can affect bond income as well as bond prices.
The Fund is subject to income risk, which is the chance that a fund's income will decline because of falling interest rates. A fund holding bonds will experience a decline when interest rates fall because the fund then must invest new cash flow and cash from maturing bonds in lower-yielding bonds.
|
Plain Talk About Bond Maturities |
|
A bond is issued with a specific maturity date—the date when the issuer must
pay back the bond’s principal (face value). Bond maturities range from less
than 1 year to more than 30 years. Typically, the longer a bond’s maturity, the
more price risk you, as a bond investor, will face as interest rates rise—but
also the higher the potential yield you could receive. Longer-term bonds are
generally more suitable for investors willing to take a greater risk of price
fluctuations to get higher and more stable interest income. Shorter-term bond
investors should be willing to accept lower yields and greater income
variability in return for less fluctuation in the value of their investment. The
stated maturity of a bond may differ from the effective maturity of a bond,
which takes into consideration that an action such as a call or refunding may
cause bonds to be repaid before their stated maturity dates. |
Although falling interest rates tend to strengthen bond prices, they can cause other problems for bond fund investors—bond calls and prepayments.
12
The Fund is subject to call risk, which is the chance that during periods of falling interest rates, issuers of callable bonds may call (redeem) securities with higher coupon rates or interest rates before their maturity dates. A fund would then lose any price appreciation above the bond's call price and would be forced to reinvest the unanticipated proceeds at lower interest rates, resulting in a decline in income.
The Index that the Fund seeks to track includes only a limited number of callable bonds. Thus, call risk for the Fund should be low.
The Fund is subject to credit risk, which is the chance that a bond issuer will fail to pay interest or principal in a timely manner or that negative perceptions of the issuer's ability to make such payments will cause the price of that bond to decline, thus reducing a fund's return. Credit risk should be moderate for the Fund.
|
Plain Talk About Credit Quality |
|
A bond’s credit quality rating is an assessment of the issuer’s ability to pay
interest on the bond and, ultimately, to repay the principal. The lower the
credit quality, the greater the perceived chance that the bond issuer will
default, or fail to meet its payment obligations. All things being equal, the
lower a bond’s credit quality, the higher its yield should be to compensate
investors for assuming additional risk. |
The underlying funds are expected to have moderate credit risk as a result of their investments in investment-grade bonds. Investment-grade bonds are those rated BBB/Baa or higher by a credit rating agency, and therefore are a mixture of high- and medium-quality bonds.
The Fund is subject to liquidity risk, which is the chance that a security may not be sold in a timely manner at a desired price.
To a limited extent, the Fund is also indirectly subject to event risk, which is the chance that corporate fixed income securities held by the underlying funds may suffer a substantial decline in credit quality and market value because of a restructuring of the companies that issued the securities or because of other factors negatively affecting the issuers.
Market disruptions can adversely affect local and global markets as well as normal market conditions and operations. Any such disruptions could have an adverse impact on the value of the Fund's investments and Fund performance.
13
Security Selection
Vanguard Total Corporate Bond ETF is a fund of funds, which means that it seeks to achieve its investment objective by investing primarily in a combination of other funds rather than in individual securities. The Fund invests in three Vanguard ETFs, which are briefly described in the following paragraphs.
• Vanguard Short-Term Corporate Bond ETF seeks to track the performance of the Bloomberg U.S. 1–5 Year Corporate Bond Index, which includes U.S. dollar-denominated, investment-grade, fixed-rate, taxable securities issued by industrial, utility, and financial companies, with maturities between 1 and 5 years. The fund invests by sampling the index, meaning that it holds a range of securities that, in the aggregate, approximates the full index in terms of key risk factors and other characteristics.
• Vanguard Intermediate-Term Corporate Bond ETF seeks to track the performance of the Bloomberg U.S. 5–10 Year Corporate Bond Index, which includes U.S. dollar-denominated, investment-grade, fixed-rate, taxable securities issued by industrial, utility, and financial companies, with maturities between 5 and 10 years. The fund invests by sampling the index, meaning that it holds a range of securities that, in the aggregate, approximates the full index in terms of key risk factors and other characteristics.
• Vanguard Long-Term Corporate Bond ETF seeks to track the performance of the Bloomberg U.S. 10+ Year Corporate Bond Index, which includes U.S. dollar-denominated, investment-grade, fixed-rate, taxable securities issued by industrial, utility, and financial companies, with maturities greater than 10 years. The fund invests by sampling the index, meaning that it holds a range of securities that, in the aggregate, approximates the full index in terms of key risk factors and other characteristics.
Each of the underlying funds seeks to track the performance of an index that represents a subset of the Bloomberg U.S. Corporate Bond Index. Together, these three indexes comprise the Fund’s target index. As of August 31, 2023, there were 7,679 bonds in the Bloomberg U.S. Corporate Bond Index.
Types of bonds. The Fund’s target index is the Bloomberg U.S. Corporate Bond Index. This Index measures the investment-grade, fixed-rate, taxable corporate bond market and includes U.S. dollar-denominated securities that are publicly issued by industrial, utility, and financial issuers.
Corporate debt obligations – usually called bonds – represent loans by an investor to a corporation. Through its investment in the underlying funds, the Fund also has the ability to invest in other types of financial instruments, including U.S. government and agency bonds; cash equivalent instruments,
14
including repurchase agreements; futures, options, and other derivatives; and international dollar-denominated bonds. An explanation of each type of financial instrument follows.
• U.S. government and agency bonds represent loans by investors to the U.S. Treasury or a wide variety of government agencies and instrumentalities. Securities issued by most U.S. government entities are neither guaranteed by the U.S. Treasury nor backed by the full faith and credit of the U.S. government. These entities include, among others, the Federal Home Loan Banks (FHLBs), the Federal National Mortgage Association (FNMA), and the Federal Home Loan Mortgage Corporation (FHLMC). Securities issued by the U.S. Treasury and a small number of U.S. government agencies, such as the Government National Mortgage Association (GNMA), are backed by the full faith and credit of the U.S. government. The market values of U.S. government and agency securities and U.S. Treasury securities are subject to fluctuation.
• Cash equivalent investments is a blanket term that describes a variety of short-term, fixed income investments, including money market instruments, commercial paper, bank certificates of deposit, banker’s acceptances, and repurchase agreements. Repurchase agreements represent short-term (normally overnight) loans by a fund to banks or large securities dealers. Repurchase agreements can carry several risks. For instance, if the seller in unable to repurchase the securities as promised, a fund may experience a loss when trying to sell the securities to another buyer. Also, if the seller becomes insolvent, a bankruptcy court may determine that the securities do not belong to a fund and order that the securities be used to pay off the seller’s debts. The Fund’s advisor believes that these risks can be controlled through careful security selection and monitoring.
• Futures, options, and other derivatives are described in detail under Other Investment Policies and Risks.
• International dollar-denominated bonds are bonds denominated in U.S. dollars and issued by foreign governments and companies. To the extent that the Fund indirectly owns foreign bonds, it is subject to country risk, which is the chance that world events—such as political upheaval, financial troubles, or natural disasters—will adversely affect the value and/or liquidity of securities issued by companies in foreign countries. In addition, the prices of foreign bonds and the prices of U.S. bonds have, at times, moved in opposite directions. Because the bond’s value is designated in dollars rather than in the currency of the issuer’s country, the investor is not exposed to currency risk; rather, the issuer assumes that risk, usually to attract U.S. investors. Although currency movements do not affect the value of international dollar-denominated bonds directly, they could affect the value indirectly by adversely affecting the issuer’s ability (or the market’s perception of the issuer’s ability) to pay interest or repay principal.
15
Other Investment Policies and Risks
The Fund reserves the right to substitute a different index for the index it currently tracks if the current index is discontinued, if the Fund's agreement with the provider of its target index is terminated, or for any other reason determined in good faith by the Fund’s board of trustees. In any such instance, the substitute index would represent the same market segment as the current index.
The Fund and the underlying funds may invest in derivatives. In general, investments in derivatives may involve risks different from, and possibly greater than, those of investments directly in the underlying securities or assets.
Generally speaking, a derivative is a financial contract whose value is based on the value of a financial asset (such as a stock, a bond, or a currency), a physical asset (such as gold, oil, or wheat), a market index, or a reference rate. The Fund may invest in derivatives only if the expected risks and rewards of the derivatives are consistent with the investment objective, policies, strategies, and risks of a Fund as disclosed in this prospectus. In particular, derivatives will be used only when they may help the advisor to accomplish one or more of the following:
• Invest in eligible asset classes with greater efficiency and lower cost than is possible through direct investment.
• Add value when these instruments are attractively priced.
• Adjust sensitivity to changes in interest rates.
|
Plain Talk About Derivatives |
|
Derivatives can take many forms. Some forms of derivatives—such as
exchange-traded futures and options on securities, commodities, or
indexes—have been trading on regulated exchanges for decades. These
types of derivatives are standardized contracts that can easily be bought and
sold and whose market values are determined and published daily. On the
other hand, non-exchange-traded derivatives—such as certain swap
agreementsand foreign currency exchange forward contracts—tend to be
more specialized or complex and may be more difficult to accurately value. |
The Fund may invest a small portion of its assets in fixed income futures and/or credit default swaps, which are types of derivatives, and/or shares of certain exchange-traded funds (ETFs) in addition to those described above. Fixed income futures and ETFs typically provide returns similar to those of the bonds
16
listed in the index, or in a subset of the index, the Fund seeks to track. The Fund may purchase these types of derivatives or ETFs when doing so will reduce the Fund’s transaction costs, facilitate cash management, mitigate risk, or have the potential to add value because the instruments are favorably priced. Vanguard receives no additional revenue from Fund assets invested in ETF Shares of other Vanguard funds. Fund assets invested in ETF Shares of other Vanguard funds are excluded when allocating to the Fund its share of the costs of Vanguard operations.
Cash Management
The Fund's daily cash balance may be invested in Vanguard Market Liquidity Fund and/or Vanguard Municipal Cash Management Fund (each, a CMT Fund), which are low-cost money market funds. When investing in a CMT Fund, the Fund bears its proportionate share of the expenses of the CMT Fund in which it invests. Vanguard receives no additional revenue from Fund assets invested in a CMT Fund.
Redemption Requests
Methods used to meet redemption requests. Redemptions of ETF Shares are typically met through a combination of cash and securities held by the Fund; see “How Are Vanguard ETF Shares Different From Conventional Mutual Fund Shares?” If cash is used to meet redemptions, the Fund typically obtains such cash through positive cash flows or the sale of Fund holdings consistent with the Fund’s investment objective and strategy. Please consult the Fund's Statement of Additional Information for further information on redemptions of ETF Shares.
Under certain circumstances, the Fund may borrow money (subject to certain regulatory conditions and if available under board-approved procedures) through an interfund lending facility; through a bank line-of-credit, including a joint committed credit facility; or through an uncommitted line-of-credit from Vanguard in order to meet redemption requests.
Potential redemption activity impacts. At times, the Fund may experience adverse effects when certain large shareholders, or multiple shareholders comprising significant ownership of the Fund, redeem large amounts of shares of the Fund. Large redemptions may cause the Fund to sell portfolio securities at times when it would not otherwise do so. This may result in the Fund distributing capital gains or other taxable income to non-redeeming shareholders. Large redemptions may also increase the Fund’s transaction costs. Redemption activity can occur for many reasons, including shareholder reactions to market movements or other events unrelated to Vanguard’s actions, or when Vanguard
17
makes product changes that, for example, may result in a shareholder redeeming shares of the Fund to purchase shares of another similar fund or investment vehicle.
Temporary Investment Measures
The Fund may temporarily depart from its normal investment policies and strategies when the advisor believes that doing so is in the Fund's best interest, so long as the strategy or policy employed is consistent with the Fund's investment objective. For instance, the Fund may invest beyond its normal limits in derivatives or exchange-traded funds that are consistent with the Fund's investment objective when those instruments are more favorably priced or provide needed liquidity, as might be the case when the Fund receives large cash flows that it cannot prudently invest immediately.
Special Risks of Exchange-Traded Shares
ETF Shares are not individually redeemable. They can be redeemed with the issuing Fund at NAV only by certain authorized broker-dealers and only in large blocks known as Creation Units. Consequently, if you want to liquidate some or all of your ETF Shares, you must sell them on the secondary market at prevailing market prices.
The market price of ETF Shares may differ from NAV. Although it is expected that the market price of an ETF Share typically will approximate its NAV, there may be times when the market price and the NAV differ significantly. Thus, you may pay more (premium) or less (discount) than NAV when you buy ETF Shares on the secondary market, and you may receive more or less than NAV when you sell those shares. These discounts and premiums are likely to be greatest during times of market disruption or extreme market volatility.
Vanguard’s website at vanguard.com shows the previous day’s closing NAV and closing market price for the Fund. The website also discloses, in the Premium/Discount Analysis section of the Fund’s Price & Performance page, how frequently the Fund traded at a premium or discount to NAV and the magnitudes of such premiums and discounts.
An active trading market may not exist. Although Vanguard ETF Shares are listed on a national securities exchange, it is possible that an active trading market may not be maintained. Although this could happen at any time, it is more likely to occur during times of severe market disruption. If you attempt to sell your ETF Shares when an active trading market is not functioning, you may have to sell at a significant discount to NAV. In extreme cases, you may not be able to sell your shares at all.
18
Trading may be halted. Trading of Vanguard ETF Shares on an exchange may be halted by the activation of individual or marketwide trading halts (which halt trading for a specific period of time when the price of a particular security or overall market prices decline by a specified percentage). Trading of ETF Shares may also be halted if (1) the shares are delisted from the listing exchange without first being listed on another exchange or (2) exchange officials determine that such action is appropriate in the interest of a fair and orderly market or for the protection of investors.
A precautionary note to investment companies: The Fund's ETF Shares are issued by a registered investment company, and therefore the acquisition of such shares by other investment companies and private funds is subject to the restrictions of Section 12(d)(1) of the Investment Company Act of 1940 (the 1940 Act). SEC Rule 12d1-4 under the 1940 Act permits registered investment companies to invest in other registered investment companies beyond the limits in Section 12(d)(1), subject to certain conditions, including that funds with different investment advisors must enter into a fund of funds investment agreement.
Shareholder Rights
The Fund's Agreement and Declaration of Trust, as amended, requires a shareholder bringing a derivative action on behalf of Vanguard Scottsdale Funds (the Trust) that is subject to a pre-suit demand to collectively hold at least 10% of the outstanding shares of the Trust or at least 10% of the outstanding shares of the series or class to which the demand relates and to undertake to reimburse the Trust for the expense of any counsel or advisors used when considering the merits of the demand in the event that the board of trustees determines not to bring such action. In each case, these requirements do not apply to claims arising under the federal securities laws to the extent that any such federal securities laws, rules, or regulations do not permit such application.
Frequent Trading and Market-Timing
Unlike frequent trading of a Vanguard fund’s conventional (i.e., not exchange-traded) classes of shares, frequent trading of ETF Shares does not disrupt portfolio management or otherwise harm fund shareholders. The vast majority of trading in ETF Shares occurs on the secondary market. Because these trades do not involve the issuing fund, they do not harm the fund or its shareholders. Certain broker-dealers are authorized to purchase and redeem ETF Shares directly with the issuing fund. Because these trades typically are effected in kind (i.e., for securities and not for cash), or are assessed a transaction fee when effected in cash, they do not cause any of the harmful effects to the issuing fund (as previously noted) that may result from frequent
19
trading. For these reasons, the board of trustees of each fund that issues ETF Shares has determined that it is not necessary to adopt policies and procedures to detect and deter frequent trading and market-timing of ETF Shares.
Portfolio Holdings
Please consult the Fund's Statement of Additional Information or our website for a description of the policies and procedures that govern disclosure of the Fund’s portfolio holdings.
Turnover Rate
Although the Fund generally seeks to invest for the long term, it may sell shares of the underlying funds regardless of how long they have been held. The Financial Highlights section of this prospectus shows historical turnover rates for the Fund. A turnover rate of 100%, for example, would mean that the Fund had sold and replaced shares of the underlying funds valued at 100% of its net assets within a one-year period. In general, the greater the turnover rate, the greater the impact transaction costs will have on a fund’s return. Also, funds with high turnover rates may be more likely to generate capital gains, including short-term capital gains, that must be distributed to shareholders and will be taxable to shareholders investing through a taxable account.
The Fund and Vanguard
The Fund is a member of The Vanguard Group, Inc. (Vanguard), a family of over 200 funds. All of the funds that are members of Vanguard (other than funds of funds) share in the expenses associated with administrative services and business operations, such as personnel, office space, and equipment.
Vanguard Marketing Corporation provides marketing services to the funds. Although fund shareholders do not pay sales commissions or 12b-1 distribution fees, each fund (other than a fund of funds) or each share class of a fund (in the case of a fund with multiple share classes) pays its allocated share of the Vanguard funds’ marketing costs.
According to an agreement applicable to Vanguard Total Corporate Bond ETF and Vanguard, the Fund’s direct expenses may be reduced or eliminated by savings accruing to the benefit of the Vanguard funds that Vanguard expects to derive from the Fund’s operation.
20
Accordingly, all expenses for services provided by Vanguard to the Fund and all other expenses incurred by the Fund are expected to be borne by the underlying funds. The Fund's shareholders bear the fees and expenses associated with the Fund's investments in the underlying funds.
|
Plain Talk About Vanguard’s Unique Corporate Structure |
|
Vanguard is owned jointly by the funds it oversees and thus indirectly by the
shareholders in those funds. Most other mutual funds are operated by
management companies that are owned by third parties—either public or
private stockholders—and not by the funds they serve. |
Investment Advisor
The Vanguard Group, Inc., P.O. Box 2600, Valley Forge, PA 19482, which began operations in 1975, serves as advisor to the Fund through its Fixed Income Group. Vanguard also serves as investment advisor to each of the underlying funds. As of August 31, 2023, Vanguard served as advisor for approximately $6.8 trillion in assets. Vanguard provides investment advisory services to the Fund and each of the underlying funds pursuant to the Funds’ Service Agreement and subject to the supervision and oversight of the trustees and officers of the Fund and each of the underlying funds.
Under the terms of an SEC exemption, the Fund's board of trustees may, without prior approval from shareholders, change the terms of an advisory agreement with a third-party investment advisor or hire a new third-party investment advisor—either as a replacement for an existing advisor or as an additional advisor. Any significant change in the Fund's advisory arrangements will be communicated to shareholders in writing. As the Fund's sponsor and overall manager, Vanguard may provide investment advisory services to the Fund at any time. Vanguard may also recommend to the board of trustees that an advisor be hired, terminated, or replaced or that the terms of an existing advisory agreement be revised. The Fund has filed an application seeking a similar SEC exemption with respect to investment advisors that are wholly owned subsidiaries of Vanguard. If the exemption is granted, the Fund may rely on the new SEC relief.
For a discussion of why the board of trustees approved the Fund's investment advisory arrangement, see the most recent annual report to shareholders covering the fiscal year ended August 31.
21
The manager primarily responsible for the day-to-day management of the Fund is:
Joshua C. Barrickman, CFA, Principal of Vanguard and co-head of Vanguard’s Fixed Income Indexing Americas. He has been with Vanguard since 1998, has worked in investment management since 1999, has managed investment portfolios since 2005, and has managed the Fund since its inception in 2017. Education: B.S., Ohio Northern University; M.B.A., Lehigh University.
The Fund's Statement of Additional Information provides information about the portfolio manager’s compensation, other accounts under management, and ownership of shares of the Fund.
Dividends, Capital Gains, and Taxes
Fund Distributions
The Fund distributes to shareholders virtually all of its net income (interest less expenses) as well as any net short-term or long-term capital gains realized from the sale of its holdings or received as dividend or capital gains distributions from the underlying funds. From time to time, the Fund may also make distributions that are treated as a return of capital. Income dividends generally are declared monthly and distributed monthly; capital gains distributions, if any, generally occur annually in December. In addition, the Fund may occasionally make a supplemental distribution at some other time during the year.
|
Plain Talk About Distributions |
|
As a shareholder, you are entitled to your portion of a fund’s income from
interest as well as capital gains from the fund’s sale of investments. Income
consists of interest the fund earns from its money market and bond
investments. Capital gains are realized whenever the fund sells securities for
higher prices than it paid for them. These capital gains are either short-term
or long-term, depending on whether the fund held the securities for one year
or less or for more than one year. |
Reinvestment of Distributions
In order to reinvest dividend and capital gains distributions, investors in the Fund must hold their shares at a broker that offers a reinvestment service. This can be the broker’s own service or a service made available by a third party, such as the broker’s outside clearing firm or the Depository Trust Company (DTC). If a
22
reinvestment service is available, distributions of income and capital gains can automatically be reinvested in additional whole and fractional ETF Shares of the Fund. If a reinvestment service is not available, investors will receive their distributions in cash. To determine whether a reinvestment service is available and whether there is a commission or other charge for using this service, consult your broker.
As with all exchange-traded funds, reinvestment of dividend and capital gains distributions in additional ETF Shares will occur four business days or more after the ex-dividend date (the date when a distribution of dividends or capital gains is deducted from the price of the Fund’s shares). The exact number of days depends on your broker. During that time, the amount of your distribution will not be invested in the Fund and therefore will not share in the Fund’s income, gains, and losses.
Basic Tax Points
Investors in taxable accounts should be aware of the following basic federal income tax points:
• Distributions are taxable to you whether or not you reinvest these amounts in additional ETF Shares.
• Distributions declared in December—if paid to you by the end of January—are taxable as if received in December.
• Any income dividend distribution or short-term capital gains distribution that you receive is taxable to you as ordinary income.
• Any distribution of net long-term capital gains is taxable to you as long-term capital gains, no matter how long you have owned ETF Shares.
• Income and capital gains distributions may vary considerably from month to month or year to year, as applicable, as a result of the Fund’s (and underlying funds’) normal investment activities and cash flows.
• Your cost basis in the Fund will be decreased by the amount of any return of capital that you receive. This, in turn, will affect the amount of any capital gain or loss that you realize when selling your ETF Shares.
• Return of capital distributions generally are not taxable to you until your cost basis has been reduced to zero. If your cost basis is at zero, return of capital distributions will be treated as capital gains.
• A sale of ETF Shares is a taxable event. This means that you may have a capital gain to report as income, or a capital loss to report as a deduction, when you complete your tax return.
23
Individuals, trusts, and estates whose income exceeds certain threshold amounts are subject to a 3.8% Medicare contribution tax on “net investment income.” Net investment income takes into account distributions paid by the Fund and capital gains from any sale of ETF Shares.
Income dividends and capital gains distributions that you receive, as well as your gains or losses from any sale of ETF Shares, may be subject to state and local income taxes.
This prospectus provides general tax information only. If you are investing through a tax-advantaged account, such as an IRA or an employer-sponsored retirement or savings plan, special tax rules apply. Please consult your tax advisor for detailed information about any tax consequences for you.
Share Price and Market Price
Share price, also known as net asset value (NAV), is calculated as of the close of regular trading on the New York Stock Exchange (NYSE), generally 4 p.m., Eastern time, on each day that the NYSE is open for business (a business day). In the rare event the NYSE experiences unanticipated disruptions and is unavailable at the close of the trading day, NAVs will be calculated as of the close of regular trading on the Nasdaq (or another alternate exchange if the Nasdaq is unavailable, as determined at Vanguard’s discretion), generally 4 p.m., Eastern time. The NAV per share is computed by dividing the total assets, minus liabilities, of the Fund by the number of Fund shares outstanding. On U.S. holidays or other days when the NYSE is closed, the NAV is not calculated, and the Fund does not sell or redeem shares.
Remember: If you buy or sell ETF Shares on the secondary market, you will pay or receive the market price, which may be higher or lower than NAV. Your transaction will be priced at NAV only if you purchase or redeem your ETF Shares in Creation Unit blocks (an option available only to certain authorized broker-dealers).
Debt securities held by a Vanguard fund are valued based on information furnished by an independent pricing service or market quotations. When a fund determines that pricing-service information or market quotations either are not readily available or do not accurately reflect the value of a security, the security is priced at its fair value (the amount that the owner might reasonably expect to receive upon the current sale of the security).
24
The values of any foreign securities held by a fund are converted into U.S. dollars using an exchange rate obtained from an independent third party as of the close of regular trading on the NYSE. The values of any mutual fund shares, including institutional money market fund shares, held by a fund are based on the NAVs of the shares. The values of any ETF shares or closed-end fund shares held by a fund are based on the market value of the shares.
The Fund’s NAV is calculated based upon the values of the underlying funds in which the Fund invests. The value of the underlying funds’ ETF Shares held by the Fund are based on the market value of the shares. The prospectuses for the underlying funds explain the circumstances under which those funds will use fair-value pricing and the effects of doing so.
Vanguard’s website will show the previous day’s closing NAV and closing market price for the Fund’s ETF Shares.
25
Additional Information
The Fund's Bylaws require, unless the Trust otherwise consents in writing, that the U.S. Federal District Courts be the sole and exclusive forum for the resolution of complaints under the Securities Act of 1933. This provision may limit a shareholder’s ability to bring a claim in a different forum and may result in increased shareholder costs in pursuing such a claim.
|
Vanguard Fund |
Inception Date |
Vanguard Fund Number |
CUSIP Number |
|
Vanguard Total Corporate
Bond ETF |
11/7/2017 |
985 |
92206C573 |
Certain affiliates of the Fund and the advisor may purchase and resell ETF Shares pursuant to the prospectus.
CGS identifiers have been provided by CUSIP Global Services, managed on behalf of the American Bankers Association by Standard & Poor’s Financial Services, LLC, and are not for use or dissemination in a manner that would serve as a substitute for any CUSIP service. The CUSIP Database, © 2023 American Bankers Association. “CUSIP” is a registered trademark of the American Bankers Association.
26
Financial Highlights
Financial highlights information is intended to help you understand a fund’s performance for the past five years (or, if shorter, its period of operations). Certain information reflects financial results for a single fund share. Total return represents the rate that an investor would have earned or lost each period on an investment in a fund or share class (assuming reinvestment of all distributions). This information has been obtained from the financial statements audited by PricewaterhouseCoopers LLP, an independent registered public accounting firm, whose report, along with fund financial statements, is included in a fund’s most recent annual report to shareholders. You may obtain a free copy of a fund’s latest annual or semiannual report, which is available upon request.
Vanguard Total Corporate Bond ETF
|
|
Year Ended August 31, | ||||
|
2023 |
2022 |
2021 |
2020 |
2019 | |
|
Net Asset Value, Beginning of Period |
$76.60 |
$92.55 |
$92.62 |
$89.19 |
$81.59 |
|
Investment Operations |
|
|
|
|
|
|
Net Investment Income1 |
2.644 |
2.141 |
2.229 |
2.638 |
2.825 |
|
Capital Gain Distributions Received1 |
— |
.237 |
.053 |
— |
— |
|
Net Realized and Unrealized Gain (Loss) on Investments |
(1.806) |
(16.168) |
(.131) |
3.614 |
7.717 |
|
Total from Investment Operations |
.838 |
(13.790) |
2.151 |
6.252 |
10.542 |
|
Distributions |
|
|
|
|
|
|
Dividends from Net Investment Income |
(2.698) |
(2.148) |
(2.221) |
(2.822) |
(2.942) |
|
Distributions from Realized Capital Gains |
— |
(.012) |
— |
— |
— |
|
Total Distributions |
(2.698) |
(2.160) |
(2.221) |
(2.822) |
(2.942) |
|
Net Asset Value, End of Period |
$74.74 |
$76.60 |
$92.55 |
$92.62 |
$89.19 |
|
Total Return |
1.13% |
-15.11% |
2.37% |
7.18% |
13.29% |
|
Ratios/Supplemental Data |
|
|
|
|
|
|
Net Assets, End of Period (Millions) |
$1,183 |
$579 |
$695 |
$619 |
$203 |
|
Ratio of Total Expenses to Average Net Assets |
— |
— |
— |
— |
— |
|
Acquired Fund Fees and Expenses |
0.04% |
0.04% |
0.04% |
0.05% |
0.05% |
|
Ratio of Net Investment Income to Average Net Assets |
3.52% |
2.52% |
2.43% |
2.94% |
3.38% |
|
Portfolio Turnover Rate2 |
10% |
14% |
10% |
40% |
12% |
|
|
|
|
|
|
|
|
|
|
|
1 |
Calculated based on average shares outstanding. |
|
2 |
Excludes the value of portfolio securities received or delivered as a result of in-kind purchases
or redemptions of the fund’s capital shares, including ETF Creation Units. |
27
CFA® is a registered trademark owned by CFA Institute.
”Bloomberg®” and the Bloomberg U.S. Corporate Bond Index and Bloomberg U.S. Aggregate Float Adjusted Index (“the Indices” or “Bloomberg Indices”) are service marks of Bloomberg Finance L.P. and its affiliates, including Bloomberg Index Services Limited (“BISL”), the administrator of the Indices (collectively, “Bloomberg”), and have been licensed for use for certain purposes by Vanguard.
Vanguard Total Corporate Bond ETF is not sponsored, endorsed, sold or promoted by Bloomberg. Bloomberg does not make any representation or warranty, express or implied, to the owners of or counterparties to Vanguard Total Corporate Bond ETF or any member of the public regarding the advisability of investing in securities generally or in Vanguard Total Corporate Bond ETF particularly. The only relationship of Bloomberg to Vanguard is the licensing of certain trademarks, trade names and service marks and of the Bloomberg U.S. Corporate Bond Index and Bloomberg U.S. Aggregate Float Adjusted Index, which is determined, composed and calculated by BISL without regard to Vanguard or Vanguard Total Corporate Bond ETF. Bloomberg has no obligation to take the needs of Vanguard or the owners of Vanguard Total Corporate Bond ETF into consideration in determining, composing or calculating the Bloomberg U.S. Corporate Bond Index and Bloomberg U.S. Aggregate Float Adjusted Index. Bloomberg is not responsible for and has not participated in the determination of the timing of, prices at, or quantities of Vanguard Total Corporate Bond ETF to be issued. Bloomberg shall not have any obligation or liability, including, without limitation, to Vanguard Total Corporate Bond ETF customers, in connection with the administration, marketing or trading of Vanguard Total Corporate Bond ETF.
BLOOMBERG DOES NOT GUARANTEE THE ACCURACY AND/OR THE COMPLETENESS OF THE BLOOMBERG U.S. CORPORATE BOND INDEX AND BLOOMBERG U.S. AGGREGATE FLOAT ADJUSTED INDEX OR ANY DATA RELATED THERETO AND SHALL HAVE NO LIABILITY FOR ANY ERRORS, OMISSIONS OR INTERRUPTIONS THEREIN. BLOOMBERG DOES NOT MAKE ANY WARRANTY, EXPRESS OR IMPLIED, AS TO RESULTS TO BE OBTAINED BY VANGUARD, OWNERS OF VANGUARD TOTAL CORPORATE BOND ETF OR ANY OTHER PERSON OR ENTITY FROM THE USE OF THE BLOOMBERG U.S. CORPORATE BOND INDEX AND BLOOMBERG U.S. AGGREGATE FLOAT ADJUSTED INDEX OR ANY DATA RELATED THERETO. BLOOMBERG DOES NOT MAKE ANY EXPRESS OR IMPLIED WARRANTIES AND EXPRESSLY DISCLAIMS ALL WARRANTIES OF MERCHANTABILITY OR FITNESS FOR A PARTICULAR PURPOSE OR USE WITH RESPECT TO THE BLOOMBERG U.S. CORPORATE BOND INDEX AND BLOOMBERG U.S. AGGREGATE FLOAT ADJUSTED INDEX OR ANY DATA RELATED THERETO. WITHOUT LIMITING ANY OF THE FOREGOING, TO THE MAXIMUM EXTENT ALLOWED BY LAW, BLOOMBERG, ITS LICENSORS, AND ITS AND THEIR RESPECTIVE EMPLOYEES, CONTRACTORS, AGENTS, SUPPLIERS, AND VENDORS SHALL HAVE NO LIABILITY OR RESPONSIBILITY WHATSOEVER FOR ANY INJURY OR DAMAGES—WHETHER DIRECT, INDIRECT, CONSEQUENTIAL, INCIDENTAL, PUNITIVE OR OTHERWISE—ARISING IN CONNECTION WITH VANGUARD TOTAL CORPORATE BOND ETF OR BLOOMBERG U.S. CORPORATE BOND INDEX AND BLOOMBERG U.S. AGGREGATE FLOAT ADJUSTED INDEX OR ANY DATA OR VALUES RELATING THERETO—WHETHER ARISING FROM THEIR NEGLIGENCE OR OTHERWISE, EVEN IF NOTIFIED OF THE POSSIBILITY THEREOF.
28
Glossary of Investment Terms
Authorized Participant. Institutional investors that are permitted to purchase Creation Units directly from, and redeem Creation Units directly with, the issuing fund. To be an Authorized Participant, an entity must be a participant in the Depository Trust Company and must enter into an agreement with the fund’s Distributor.
Average Maturity. The average length of time until bonds held by a fund reach maturity and are repaid. In general, the longer the average maturity, the more a fund's share price fluctuates in response to changes in market interest rates. In calculating average maturity, a fund uses a bond’s maturity or, if applicable, an earlier date on which the advisor believes it is likely that a maturity-shortening device (such as a call, put, refunding, prepayment, or redemption provision or an adjustable coupon rate) will cause the bond to be repaid.
Bid-Ask Spread. The difference between the highest price a buyer is willing to pay to purchase ETF Shares (bid) and the lowest price a seller is willing to accept for ETF Shares (ask) when buying or selling shares in the secondary market.
Bloomberg U.S. Aggregate Float Adjusted Index. An index that is the broadest representation of the taxable U.S. bond market, including most U.S. Treasury, agency, corporate, mortgage-backed, asset-backed, and international dollar-denominated issues, all with investment-grade ratings and maturities of 1 year or more. This Index weights its constituent securities based on the value of the constituent securities that are available for public trading, rather than the value of all constituent securities.
Bond. A debt security (IOU) issued by a corporation, a government, or a government agency in exchange for the money the bondholder lends it. In most instances, the issuer agrees to pay back the loan by a specific date and generally to make regular interest payments until that date.
Capital Gains Distributions. Payments to fund shareholders of gains realized on securities that a fund has sold at a profit, minus any realized losses.
Corporate Bond. An IOU issued by a business that wants to borrow money. As with other types of bonds, the issuer promises to repay the borrowed money by a specific date and generally to make interest payments in the meantime.
Coupon Rate. The interest rate paid by the issuer of a debt security until its maturity. It is expressed as an annual percentage of the face value of the security.
29
Creation Unit. A large block of a specified number of ETF Shares. Certain broker-dealers known as “Authorized Participants” may purchase and redeem ETF Shares from the issuing fund in Creation Unit size blocks.
Dividend Distributions. Payments to fund shareholders of income from interest or dividends generated by a fund's investments.
Ex-Dividend Date. The date when a distribution of dividends and/or capital gains is deducted from the share price of a mutual fund, ETF, or stock. On the ex-dividend date, the share price drops by the amount of the distribution per share (plus or minus any market activity).
Expense Ratio. A fund's total annual operating expenses expressed as a percentage of the fund's average net assets. The expense ratio includes management and administrative expenses, but it does not include the transaction costs of buying and selling portfolio securities.
Face Value. The amount to be paid at a bond’s maturity; also known as the par value or principal.
Fixed Income Security. An investment, such as a bond, representing a debt that must be repaid by a specified date, and on which the borrower may pay a fixed, variable, or floating rate of interest.
Inception Date. The date on which the assets of a fund are first invested in accordance with the fund's investment objective. For funds with a subscription period, the inception date is the day after that period ends. Investment performance is generally measured from the inception date.
Indexing. A low-cost investment strategy in which a fund attempts to track—rather than outperform—a specified market benchmark, or “index.”
Investment-Grade Bond. A debt security whose credit quality is considered by independent bond rating agencies, or through independent analysis conducted by a fund's advisor, to be sufficient to ensure timely payment of principal and interest under current economic circumstances. Debt securities rated in one of the four highest rating categories are considered investment-grade. Other debt securities may be considered by an advisor to be investment-grade.
30
Joint Committed Credit Facility. The Fund participates, along with other funds managed by Vanguard, in a committed credit facility provided by a syndicate of lenders pursuant to a credit agreement that may be renewed annually; each Vanguard fund is individually liable for its borrowings, if any, under the credit facility. The amount and terms of the committed credit facility are subject to approval by the Fund's board of trustees and renegotiation with the lender syndicate on an annual basis.
Mutual Fund. An investment company that pools the money of many people and invests it in a variety of securities in an effort to achieve a specific objective over time.
New York Stock Exchange (NYSE). A stock exchange based in New York City that is open for regular trading on business days, Monday through Friday, from 9:30 a.m. to 4 p.m., Eastern time.
Principal. The face value of a debt instrument or the amount of money put into an investment.
Return of Capital. A return of capital occurs when a fund's distributions exceed its earnings in a fiscal year. A return of capital is a return of all or part of your original investment or amounts paid in excess of your original investment in a fund. In general, a return of capital reduces your cost basis in a fund's shares and is not taxable to you until your cost basis has been reduced to zero.
Securities. Stocks, bonds, money market instruments, and other investments.
Total Return. A percentage change, over a specified time period, in a fund's net asset value, assuming the reinvestment of all distributions of dividends and capital gains.
Volatility. The fluctuations in value of a mutual fund or other security. The greater a fund's volatility, the wider the fluctuations in its returns.
Yield. Income (interest or dividends) earned by an investment, expressed as a percentage of the investment’s price.
31
Connect with Vanguard® ˃ vanguard.com
For More Information
If you would like more information about Vanguard Total Corporate Bond ETF, the following documents are available free upon request:
Annual/Semiannual Reports to Shareholders
Additional information about the Fund's investments is available in the Fund's annual and semiannual reports to shareholders. In the annual report, you will find a discussion of the market conditions and investment strategies that significantly affected the Fund's performance during its last fiscal year.
Statement of Additional Information (SAI)
The SAI provides more detailed information about the Fund's ETF Shares and is incorporated by reference into (and thus legally a part of) this prospectus.
To receive a free copy of the latest annual or semiannual report or the SAI, or to request additional information about Vanguard ETF Shares, please visit vanguard.com or contact us as follows:
Telephone: 866-499-8473; Text telephone for people with hearing impairment: 800-749-7273
Information Provided by the SEC
Reports and other information about the Fund are available in the EDGAR database on the SEC’s website at sec.gov, or you can receive copies of this information, for a fee, by electronic request at the following email address: publicinfo@sec.gov.
Fund's Investment Company Act file number: 811-07803
© 2023 The Vanguard Group, Inc. All rights reserved.
Vanguard Marketing Corporation, Distributor.
P985 122023
Vanguard Marketing Corporation, Distributor.
P985 122023
Vanguard Russell 1000 Index Funds
Prospectus
December 22, 2023
Institutional Shares
Vanguard Russell 1000 Index Fund Institutional Shares (VRNIX)
Vanguard Russell 1000 Value Index Fund Institutional Shares (VRVIX)
Vanguard Russell 1000 Growth Index Fund Institutional Shares (VRGWX)
Vanguard Russell 1000 Value Index Fund Institutional Shares (VRVIX)
Vanguard Russell 1000 Growth Index Fund Institutional Shares (VRGWX)
This prospectus contains financial data for the Funds through the fiscal year ended August 31, 2023.
The Securities and Exchange Commission (SEC) has not approved or disapproved these securities or passed upon the adequacy of this prospectus. Any representation to the contrary is a criminal offense.
(Fees paid directly from your investment)
|
| |
|
Sales Charge (Load) Imposed on Purchases |
|
|
Purchase Fee |
|
|
Sales Charge (Load) Imposed on Reinvested Dividends |
|
|
Redemption Fee |
|
(Expenses that you pay each year as a percentage of the value of your investment)
|
| |
|
Management Fees |
% |
|
12b-1 Distribution Fee |
|
|
Other Expenses |
% |
|
Total Annual Fund Operating Expenses |
% |
|
1 Year |
3 Years |
5 Years |
10 Years |
|
$ |
$ |
$ |
$ |
1
2
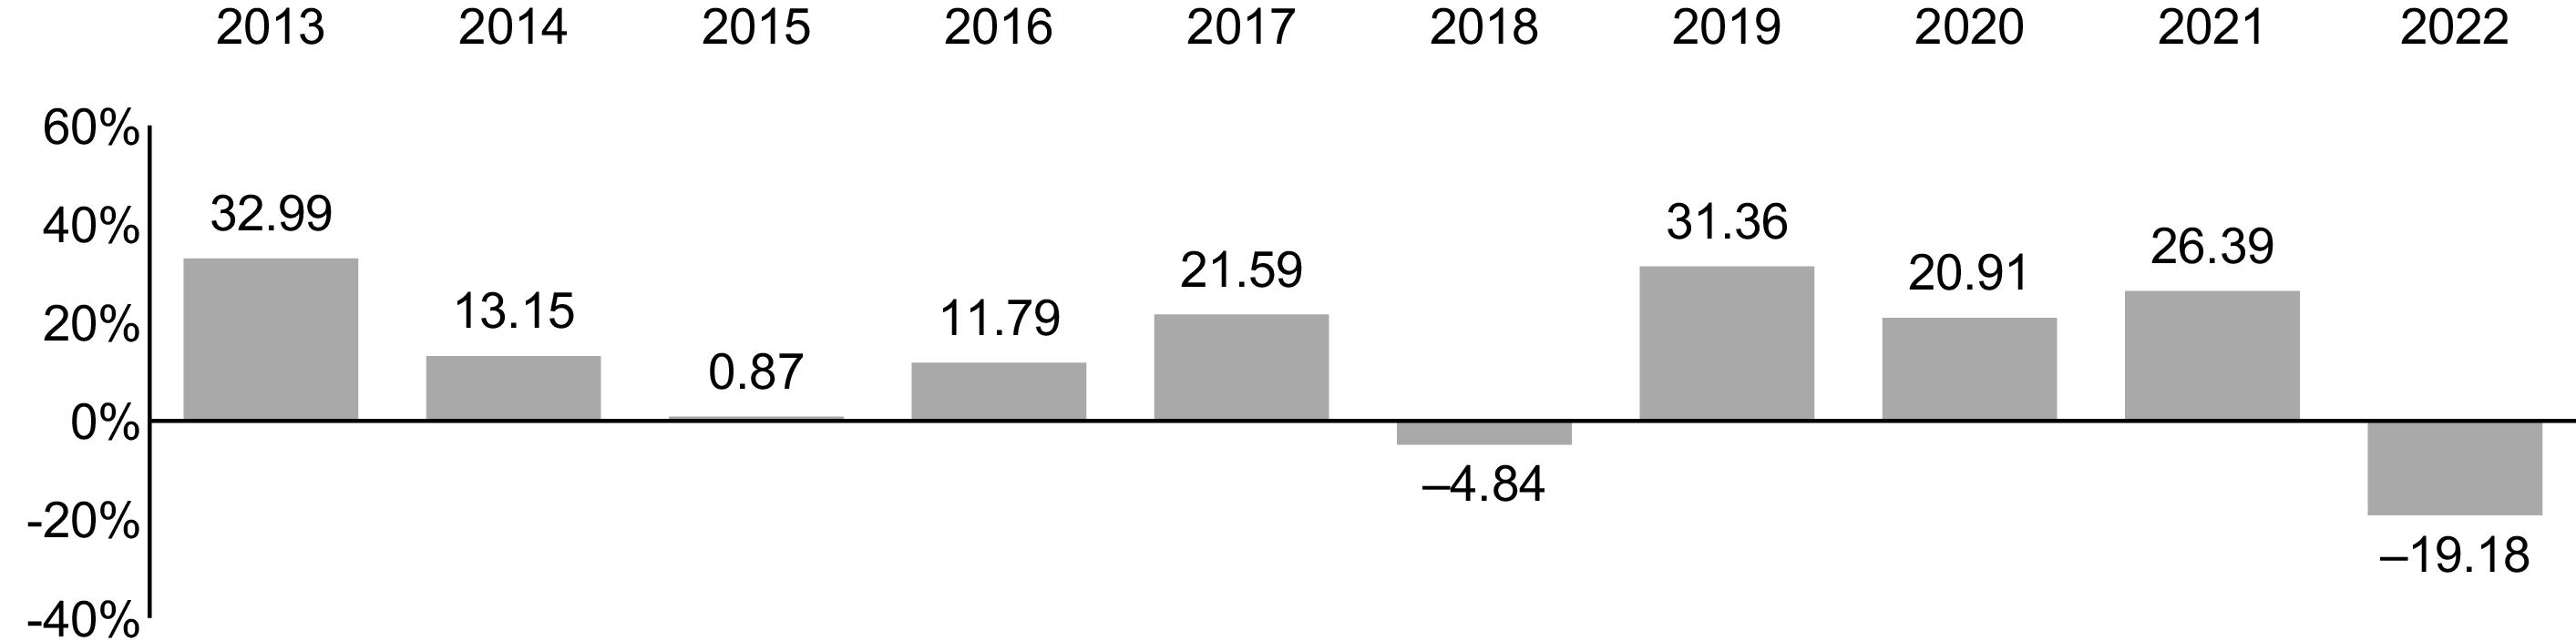
1 The year-to-date return as of the most recent calendar quarter, which ended on September 30, 2023, was 12.97%.
|
|
Total Return |
Quarter |
|
|
% |
|
|
|
-
% |
|
|
|
1 Year |
5 Years |
10 Years |
|
Vanguard Russell 1000 Index Fund Institutional Shares |
|
|
|
|
Return Before Taxes |
-
% |
% |
% |
|
Return After Taxes on Distributions |
- |
|
|
|
Return After Taxes on Distributions and Sale of Fund Shares |
- |
|
|
|
Russell 1000 Index
(reflects no deduction for fees, expenses, or taxes) |
-
% |
% |
% |
|
Dow Jones U.S. Total Stock Market Float Adjusted Index
(reflects no deduction for fees, expenses, or taxes) |
- |
|
|
3
Investment Advisor
The Vanguard Group, Inc. (Vanguard)
Portfolio Managers
Nick Birkett, CFA, Portfolio Manager at Vanguard. He has co-managed the Fund since 2021.
Aurélie Denis, CFA, Portfolio Manager at Vanguard. She has co-managed the Fund since February 2023.
4
Purchase and Sale of Fund Shares
You may purchase or redeem shares online through our website (vanguard.com), by mail (The Vanguard Group, P.O. Box 982901, El Paso, TX 79998-2901), or by telephone (800-662-2739). The minimum investment amount required to open and maintain a Fund account for Institutional Shares is $5 million. The minimum investment amount required to add to an existing Fund account is generally $1. If you are investing through an employer-sponsored retirement or savings plan, your plan administrator or your benefits office can provide you with detailed information on how you can invest through your plan.
Tax Information
The Fund’s distributions may be taxable as ordinary income or capital gain. If you are investing through a tax-advantaged account, such as an IRA or an employer-sponsored retirement or savings plan, special tax rules apply.
Payments to Financial Intermediaries
The Fund and its investment advisor do not pay financial intermediaries for sales of Fund shares.
5
(Fees paid directly from your investment)
|
| |
|
Sales Charge (Load) Imposed on Purchases |
|
|
Purchase Fee |
|
|
Sales Charge (Load) Imposed on Reinvested Dividends |
|
|
Redemption Fee |
|
(Expenses that you pay each year as a percentage of the value of your investment)
|
| |
|
Management Fees |
% |
|
12b-1 Distribution Fee |
|
|
Other Expenses |
% |
|
Total Annual Fund Operating Expenses |
% |
|
1 Year |
3 Years |
5 Years |
10 Years |
|
$ |
$ |
$ |
$ |
6
7

1 The year-to-date return as of the most recent calendar quarter, which ended on September 30, 2023, was 1.77%.
|
|
Total Return |
Quarter |
|
|
% |
|
|
|
-
% |
|
8
|
|
1 Year |
5 Years |
10 Years |
|
Vanguard Russell 1000 Value Index Fund
Institutional Shares |
|
|
|
|
Return Before Taxes |
-
% |
% |
% |
|
Return After Taxes on Distributions |
- |
|
|
|
Return After Taxes on Distributions and Sale of Fund Shares |
- |
|
|
|
Russell 1000 Value Index
(reflects no deduction for fees, expenses, or taxes) |
-
% |
% |
% |
|
Dow Jones U.S. Total Stock Market Float Adjusted Index
(reflects no deduction for fees, expenses, or taxes) |
- |
|
|
Investment Advisor
The Vanguard Group, Inc. (Vanguard)
Portfolio Managers
Nick Birkett, CFA, Portfolio Manager at Vanguard. He has co-managed the Fund since 2021.
Aurélie Denis, CFA, Portfolio Manager at Vanguard. She has co-managed the Fund since February 2023.
9
Purchase and Sale of Fund Shares
You may purchase or redeem shares online through our website (vanguard.com), by mail (The Vanguard Group, P.O. Box 982901, El Paso, TX 79998-2901), or by telephone (800-662-2739). The minimum investment amount required to open and maintain a Fund account for Institutional Shares is $5 million. The minimum investment amount required to add to an existing Fund account is generally $1. If you are investing through an employer-sponsored retirement or savings plan, your plan administrator or your benefits office can provide you with detailed information on how you can invest through your plan.
Tax Information
The Fund’s distributions may be taxable as ordinary income or capital gain. If you are investing through a tax-advantaged account, such as an IRA or an employer-sponsored retirement or savings plan, special tax rules apply.
Payments to Financial Intermediaries
The Fund and its investment advisor do not pay financial intermediaries for sales of Fund shares.
10
(Fees paid directly from your investment)
|
| |
|
Sales Charge (Load) Imposed on Purchases |
|
|
Purchase Fee |
|
|
Sales Charge (Load) Imposed on Reinvested Dividends |
|
|
Redemption Fee |
|
(Expenses that you pay each year as a percentage of the value of your investment)
|
| |
|
Management Fees |
% |
|
12b-1 Distribution Fee |
|
|
Other Expenses |
% |
|
Total Annual Fund Operating Expenses |
% |
|
1 Year |
3 Years |
5 Years |
10 Years |
|
$ |
$ |
$ |
$ |
11
12
13
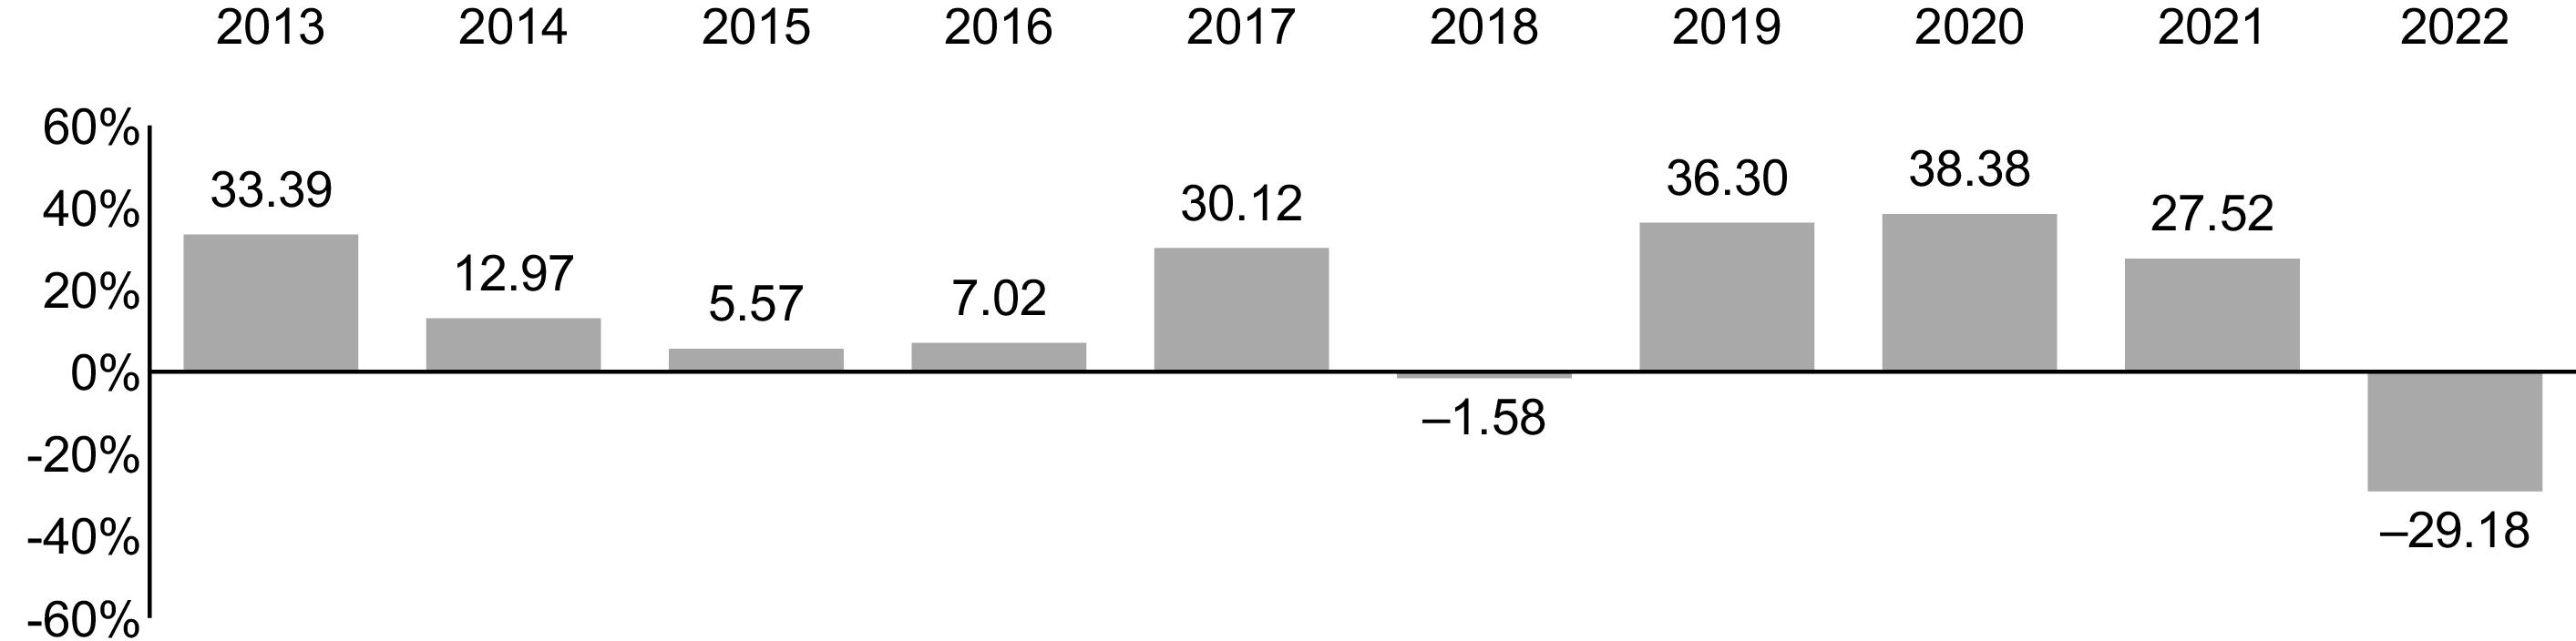
1 The year-to-date return as of the most recent calendar quarter, which ended on September 30, 2023, was 24.92%.
|
|
Total Return |
Quarter |
|
|
% |
|
|
|
-
% |
|
|
|
1 Year |
5 Years |
10 Years |
|
Vanguard Russell 1000 Growth Index Fund
Institutional Shares |
|
|
|
|
Return Before Taxes |
-
% |
% |
% |
|
Return After Taxes on Distributions |
- |
|
|
|
Return After Taxes on Distributions and Sale of Fund Shares |
- |
|
|
|
Russell 1000 Growth Index
(reflects no deduction for fees, expenses, or taxes) |
-
% |
% |
% |
|
Dow Jones U.S. Total Stock Market Float Adjusted Index
(reflects no deduction for fees, expenses, or taxes) |
- |
|
|
14
Investment Advisor
The Vanguard Group, Inc. (Vanguard)
Portfolio Managers
Nick Birkett, CFA, Portfolio Manager at Vanguard. He has co-managed the Fund since 2021.
Aurélie Denis, CFA, Portfolio Manager at Vanguard. She has co-managed the Fund since February 2023.
Purchase and Sale of Fund Shares
You may purchase or redeem shares online through our website (vanguard.com), by mail (The Vanguard Group, P.O. Box 982901, El Paso, TX 79998-2901), or by telephone (800-662-2739). The minimum investment amount required to open and maintain a Fund account for Institutional Shares is $5 million. The minimum investment amount required to add to an existing Fund account is generally $1. If you are investing through an employer-sponsored retirement or savings plan, your plan administrator or your benefits office can provide you with detailed information on how you can invest through your plan.
Tax Information
The Fund’s distributions may be taxable as ordinary income or capital gain. If you are investing through a tax-advantaged account, such as an IRA or an employer-sponsored retirement or savings plan, special tax rules apply.
Payments to Financial Intermediaries
The Fund and its investment advisor do not pay financial intermediaries for sales of Fund shares.
15
Investing in Index Funds
What Is Indexing?
Indexing is an investment strategy for tracking the performance of a specified market benchmark, or “index.” An index is a group of securities whose overall performance is used as a standard to measure the investment performance of a particular market. There are many types of indexes. Some represent entire markets—such as the U.S. stock market or the U.S. bond market. Other indexes cover market segments—such as small-capitalization stocks or short-term bonds. One cannot invest directly in an index.
The index provider determines the securities to include in the index and the weighting of each security in the index. Under normal circumstances, the index provider will rebalance an index on a regular schedule. An index provider may carry out additional ad hoc index rebalances or delay or cancel a scheduled rebalance. Generally, the index provider does not provide any warranty, or accept any liability, with respect to the quality, accuracy, or completeness of either the target index or its related data. Errors made by the index provider may occur from time to time and may not be identified by the index provider for a period of time or at all. Vanguard does not provide any warranty or guarantee against such errors. Therefore, the gains, losses, or costs associated with the index provider’s errors will generally be borne by the index fund and its shareholders.
An index fund seeks to hold all, or a representative sample, of the securities that make up its target index. Index funds attempt to mirror the performance of the target index, for better or worse. However, an index fund generally does not perform exactly like its target index. For example, index funds have operating expenses and transaction costs. Market indexes do not, and therefore they will usually have a slight performance advantage over funds that track them. The ability of an index fund to match its performance to that of its target index can also be impacted by, among other things, the timing and size of cash flows, asset valuation differences, and the size of the fund. Market disruptions could also have an adverse effect on a fund’s ability to adjust its exposure to the required levels in order to track the index. The risk that a fund may not track the performance of its target index may be heightened during times of increased market volatility or other unusual market conditions.
Index funds typically have the following characteristics:
• Variety of investments. Depending on a fund’s benchmark index, the fund may invest in the securities of a variety of companies, industries, and/or governments or government agencies.
• Relative performance consistency. Because they seek to track market benchmarks, index funds usually do not perform dramatically better or worse than their benchmarks.
• Low cost. Index funds are generally inexpensive to run compared with actively managed funds. They have low or no research costs and typically keep trading activity—and thus brokerage commissions and other transaction costs—to a minimum compared with actively managed funds.
16
More on the Funds
This prospectus describes the principal risks you would face as a Fund shareholder. It is important to keep in mind one of the main principles of investing: generally, the higher the risk of losing money, the higher the potential reward. The reverse, also, is generally true: the lower the risk, the lower the potential reward. As you consider an investment in any mutual fund, you should take into account your personal tolerance for fluctuations in the securities markets. Look for this
symbol throughout the prospectus. It is used to mark detailed information about the more significant risks that you would confront as a Fund shareholder. To highlight terms and concepts important to mutual fund investors, we have provided Plain Talk® explanations along the way. Reading the prospectus will help you decide whether a Fund is the right investment for you. We suggest that you keep this prospectus for future reference.
symbol throughout the prospectus. It is used to mark detailed information about the more significant risks that you would confront as a Fund shareholder. To highlight terms and concepts important to mutual fund investors, we have provided Plain Talk® explanations along the way. Reading the prospectus will help you decide whether a Fund is the right investment for you. We suggest that you keep this prospectus for future reference.Share Class Overview
This prospectus offers the Funds‘ Institutional Shares, which are generally for investors who invest a minimum of $5 million. Each Fund also issues ETF Shares (an exchange-traded class of shares), which are offered through a separate prospectus.
Both share classes offered by a Fund have the same investment objective, strategies, and policies. However, different share classes may have different expenses; as a result, their investment returns may differ.
|
Plain Talk About Costs of Investing |
|
Costs are an important consideration in choosing a mutual fund. That is
because you, as a shareholder, pay a proportionate share of the costs of
operating a fund and any transaction costs incurred when the fund buys or
sells securities. These costs can erode a substantial portion of the gross
income or the capital appreciation a fund achieves. Even seemingly small
differences in expenses can, over time, have a dramatic effect on a
fund’s performance. |
The following sections explain the principal investment strategies and policies that each Fund uses in pursuit of its investment objective. The Funds' board of trustees, which oversees each Fund's management, may change investment strategies or policies in the interest of shareholders without a shareholder vote, unless those strategies or policies are designated as fundamental. Note that each Fund's investment objective is not fundamental and may be changed without a shareholder vote. Under normal circumstances, each Fund will invest at least 80% of its assets in the stocks that make up its target index. A Fund may change its 80% policy only upon 60 days‘ notice to shareholders.
17
Market Exposure
Each Fund is subject to stock market risk, which is the chance that stock prices overall will decline. Stock markets tend to move in cycles, with periods of rising prices and periods of falling prices. Each Fund‘s target index tracks a subset of the U.S. stock market, which could cause the Fund to perform differently from the overall stock market. In addition, each Fund‘s target index may, at times, become focused in stocks of a particular market sector, which would subject the Fund to proportionately higher exposure to the risks of that sector.
Stocks of publicly traded companies are often classified according to market capitalization, which is the market value of a company's outstanding shares. These classifications typically include small-cap, mid-cap, and large-cap. It is important to understand that there are no “official” definitions of small-, mid-, and large-cap, even among Vanguard fund advisors, and that market capitalization ranges can change over time. The asset-weighted median market capitalization of each Fund's stock holdings as of August 31, 2023, was:
|
Vanguard Fund |
Asset-Weighted Median
Market Capitalization |
|
Vanguard Russell 1000 Index Fund |
$149 billion |
|
Vanguard Russell 1000 Value Index Fund |
75 |
|
Vanguard Russell 1000 Growth Index
Fund |
500 |
Each Fund is subject to investment style risk, which is the chance that returns from the types of stocks in which the Fund invests will trail returns from the overall stock market. Specific types of stocks tend to go through cycles of doing better or worse than other segments of the stock market or the stock market in general. These periods have, in the past, lasted for as long as several years.
18
|
Plain Talk About Growth Funds and Value Funds |
|
Growth investing and value investing are two styles employed by stock-fund
managers. Growth funds generally invest in stocks of companies believed to
have above-average potential for growth in revenue, earnings, cash flow, or
other similar criteria. These stocks typically have low dividend yields, if any,
and above-average prices in relation to measures such as earnings and book
value. Value funds typically invest in stocks whose prices are below average
in relation to those measures; these stocks often have above-average
dividend yields. Value stocks also may remain undervalued by the market for
long periods of time. Growth and value stocks have historically produced
similar long-term returns, though each category has periods when it
outperforms the other. |
Market disruptions can adversely affect local and global markets as well as normal market conditions and operations. Any such disruptions could have an adverse impact on the value of a Fund's investments and Fund performance.
Security Selection
Each Fund attempts to track the investment performance of a benchmark index that measures the return of a particular market segment. Each Fund uses the replication method of indexing, meaning that each Fund generally holds the same stocks as its target index and in approximately the same proportions.
Vanguard Russell 1000 Growth Index Fund is subject to nondiversification risk. In order to closely track the composition of the Fund’s target index, the Fund’s total assets are invested in multiple issuers representing more than 5% of the Fund’s total assets. As a result, the Fund may become nondiversified under the Investment Company Act of 1940, although it continues to hold multiple stocks across a number of sectors. The Fund’s performance may be hurt disproportionately by the poor performance of relatively few stocks, or even a single stock, and the Fund’s shares may experience significant fluctuations in value.
19
Vanguard Russell 1000 Growth Index Fund is subject to sector risk, which is the chance that significant problems will affect a particular sector, or that returns from that sector will trail returns from the overall stock market. Daily fluctuations in specific market sectors are often more extreme or volatile than fluctuations in the overall market. Because a significant portion of the Fund’s assets are invested in the information technology sector, the Fund’s performance is impacted by the general condition of that sector. Companies in the information technology sector could be affected by, among other things, overall economic conditions, short product cycles, rapid obsolescence of products, competition, and government regulation. Sector risk is expected to be high for the Fund.
Each Fund is subject to index replicating risk, which is the chance that each Fund may be prevented from holding one or more securities in the same proportion as in its target index.
The ability of the advisor to purchase or dispose of certain Fund investments is or may be restricted or impaired because of limitations imposed by law, regulation, or by certain regulators or issuers. As a result, the advisor may be required to limit purchases or sell existing investments. If a Fund is required to limit its investment in a particular issuer, then the Fund may seek to obtain regulatory relief or special permission from an issuer to exceed a certain percentage ownership in that issuer's shares. Other options a Fund may pursue include seeking to obtain economic exposure to that issuer through alternative means, such as through a derivative or through investment in a wholly owned subsidiary, both of which may be more costly than owning securities of the issuer directly. Ownership restrictions and limitations could result in unanticipated tax consequences to a Fund that may affect the amount, timing, and character of distributions to shareholders. See Other Investment Policies and Risks for further information related to derivatives.
Other Investment Policies and Risks
Each Fund reserves the right to substitute a different index for the index it currently tracks if the current index is discontinued, if the Fund's agreement with the provider of its target index is terminated, or for any other reason determined in good faith by the Fund’s board of trustees. In any such instance, the substitute index would represent the same market segment as the current index.
Each Fund has the ability to invest in foreign securities to the extent necessary to carry out its investment strategy of holding all, or substantially all of the stocks that make up the index it tracks. It is not expected that any Fund will invest more than 5% of its assets in foreign securities.
20
To track their target indexes as closely as possible, the Funds attempt to remain fully invested in stocks. To help stay fully invested and to reduce transaction costs, the Funds may invest, to a limited extent, in derivatives, including equity futures. The Funds may also use derivatives such as total return swaps to obtain exposure to a stock, a basket of stocks, or an index. Generally speaking, a derivative is a financial contract whose value is based on the value of a financial asset (such as a stock, a bond, or a currency), a physical asset (such as gold, oil, or wheat), a market index, or a reference rate. Investments in derivatives may subject the Funds to risks different from, and possibly greater than, those of investments directly in the underlying securities or assets. The Funds will not use derivatives for speculation or for the purpose of leveraging (magnifying) investment returns.
Cash Management
Each Fund's daily cash balance may be invested in Vanguard Market Liquidity Fund and/or Vanguard Municipal Cash Management Fund (each, a CMT Fund), which are low-cost money market funds. When investing in a CMT Fund, each Fund bears its proportionate share of the expenses of the CMT Fund in which it invests. Vanguard receives no additional revenue from Fund assets invested in a CMT Fund.
Redemption Requests
Methods used to meet redemption requests. Under normal circumstances, each Fund typically expects to meet redemptions with positive cash flows. When this is not an option, each Fund seeks to maintain its risk exposure by selling a cross section of the Fund’s holdings to meet redemptions, while also factoring in transaction costs. Additionally, a Fund may work with larger clients to implement their redemptions in a manner that is least disruptive to the portfolio; see “Potentially disruptive redemptions” under Redeeming Shares in the Investing With Vanguard section.
Under certain circumstances, including under stressed market conditions, there are additional tools that each Fund may use in order to meet redemptions, including advancing the settlement of market trades with counterparties to match investor redemption payments or delaying settlement of an investor’s transaction to match trade settlement within regulatory requirements. A Fund may also suspend payment of redemption proceeds for up to seven days; see “Emergency circumstances” under Redeeming Shares in the Investing With Vanguard section. Additionally under these unusual circumstances, a Fund may borrow money (subject to certain regulatory conditions and if available under
21
board-approved procedures) through an interfund lending facility; through a bank line-of-credit, including a joint committed credit facility; or through an uncommitted line-of-credit from Vanguard in order to meet redemption requests.
Potential redemption activity impacts. At times, a Fund may experience adverse effects when certain large shareholders, or multiple shareholders comprising significant ownership of the Fund, redeem large amounts of shares of the Fund. Large redemptions may cause a Fund to sell portfolio securities at times when it would not otherwise do so. This may result in a Fund distributing capital gains or other taxable income to non-redeeming shareholders. Large redemptions may also increase a Fund's transaction costs. Redemption activity can occur for many reasons, including shareholder reactions to market movements or other events unrelated to Vanguard’s actions, or when Vanguard makes product changes that, for example, may result in a shareholder redeeming shares of a Fund to purchase shares of another similar fund or investment vehicle. When experiencing large redemptions, the Fund reserves the right to pay all or part of the redemption in-kind and/or delay payment of the redemption proceeds for up to seven calendar days; see “Potentially disruptive redemptions” under Redeeming Shares in the Investing With Vanguard section.
Temporary Investment Measures
Each Fund may temporarily depart from its normal investment policies and strategies when the advisor believes that doing so is in the Fund's best interest, so long as the strategy or policy employed is consistent with the Fund's investment objective. For instance, the Fund may invest beyond its normal limits in derivatives or exchange-traded funds that are consistent with the Fund's investment objective when those instruments are more favorably priced or provide needed liquidity, as might be the case when the Fund receives large cash flows that it cannot prudently invest immediately.
Frequent Trading or Market-Timing
Background. Some investors try to profit from strategies involving frequent trading of mutual fund shares, such as market-timing. For funds holding foreign securities, investors may try to take advantage of an anticipated difference between the price of the fund’s shares and price movements in overseas markets, a practice also known as time-zone arbitrage. Investors also may try to engage in frequent trading of funds holding investments such as small-cap stocks and high-yield bonds. As money is shifted into and out of a fund by a shareholder engaging in frequent trading, the fund incurs costs for buying and selling securities, resulting in increased brokerage and administrative costs.
22
These costs are borne by all fund shareholders, including the long-term investors who do not generate the costs. In addition, frequent trading may interfere with an advisor’s ability to efficiently manage the fund.
Policies to address frequent trading. The Vanguard funds (other than money market funds and short-term bond funds, but including Vanguard Short-Term Inflation-Protected Securities Index Fund) do not knowingly accommodate frequent trading. The board of trustees of each Vanguard fund (other than money market funds and short-term bond funds, but including Vanguard Short-Term Inflation-Protected Securities Index Fund) has adopted policies and procedures reasonably designed to detect and discourage frequent trading and, in some cases, to compensate the fund for the costs associated with it. These policies and procedures do not apply to ETF Shares because frequent trading in ETF Shares generally does not disrupt portfolio management or otherwise harm fund shareholders. Although there is no assurance that Vanguard will be able to detect or prevent frequent trading or market-timing in all circumstances, the following policies have been adopted to address these issues:
• Each Vanguard fund reserves the right to reject any purchase request—including exchanges from other Vanguard funds—without notice and regardless of size. For example, a purchase request could be rejected because the investor has a history of frequent trading or if Vanguard determines that such purchase may negatively affect a fund’s operation or performance.
• Each Vanguard fund (other than money market funds and short-term bond funds, but including Vanguard Short-Term Inflation-Protected Securities Index Fund) generally prohibits, except as otherwise noted in the Investing With Vanguard section, an investor’s purchases or exchanges into a fund account for 30 calendar days after the investor has redeemed or exchanged out of that fund account.
• Certain Vanguard funds charge shareholders purchase and/or redemption fees on transactions.
See the Investing With Vanguard section of this prospectus for further details on Vanguard’s transaction policies.
Each Vanguard fund (other than retail and government money market funds), in determining its net asset value, will use fair-value pricing when appropriate, as described in the Share Price section. Fair-value pricing may reduce or eliminate the profitability of certain frequent-trading strategies.
Do not invest with Vanguard if you are a market-timer.
23
A precautionary note to investment companies: Each Fund's shares are issued by registered investment companies, and therefore the acquisition of such shares by other investment companies and private funds is subject to the restrictions of Section 12(d)(1) of the Investment Company Act of 1940 (the 1940 Act). SEC Rule 12d1-4 under the 1940 Act permits registered investment companies to invest in other registered investment companies beyond the limits in Section 12(d)(1), subject to certain conditions, including that funds with different investment advisors must enter into a fund of funds investment agreement.
Turnover Rate
Although the Funds generally seek to invest for the long term, each Fund may sell securities regardless of how long they have been held. Generally, an index fund sells securities in response to redemption requests from shareholders of conventional (i.e., not exchange-traded) shares or to changes in the composition of its target index. Turnover rates for large-cap stock index funds tend to be low because large-cap indexes typically do not change significantly from year to year. The Financial Highlights section of this prospectus shows historical turnover rates for each Fund. A turnover rate of 100%, for example, would mean that a Fund had sold and replaced securities valued at 100% of its net assets within a one-year period. In general, the greater the turnover rate, the greater the impact transaction costs will have on a fund’s return. Also, funds with high turnover rates may be more likely to generate capital gains, including short-term capital gains, that must be distributed to shareholders and will be taxable to shareholders investing through a taxable account.
The Funds and Vanguard
Each Fund is a member of The Vanguard Group, Inc. (Vanguard), a family of over 200 funds. All of the funds that are members of Vanguard (other than funds of funds) share in the expenses associated with administrative services and business operations, such as personnel, office space, and equipment.
Vanguard Marketing Corporation provides marketing services to the funds. Although fund shareholders do not pay sales commissions or 12b-1 distribution fees, each fund (other than a fund of funds) or each share class of a fund (in the case of a fund with multiple share classes) pays its allocated share of the Vanguard funds’ marketing costs.
24
|
Plain Talk About Vanguard’s Unique Corporate Structure |
|
Vanguard is owned jointly by the funds it oversees and thus indirectly by the
shareholders in those funds. Most other mutual funds are operated by
management companies that are owned by third parties—either public or
private stockholders—and not by the funds they serve. |
Investment Advisor
The Vanguard Group, Inc., P.O. Box 2600, Valley Forge, PA 19482, which began operations in 1975, serves as advisor to the Funds through its Equity Index Group. As of August 31, 2023, Vanguard served as advisor for approximately $6.8 trillion in assets. Vanguard provides investment advisory services to the Funds pursuant to the Funds’ Service Agreement and subject to the supervision and oversight of the trustees and officers of the Funds.
For the fiscal year ended August 31, 2023, the advisory expenses represented an effective annual rate of less than 0.01% of each Fund's average net assets.
Under the terms of an SEC exemption, the Funds' board of trustees may, without prior approval from shareholders, change the terms of an advisory agreement with a third-party investment advisor or hire a new third-party investment advisor—either as a replacement for an existing advisor or as an additional advisor. Any significant change in a Fund's advisory arrangements will be communicated to shareholders in writing. As the Funds' sponsor and overall manager, Vanguard may provide investment advisory services to a Fund at any time. Vanguard may also recommend to the board of trustees that an advisor be hired, terminated, or replaced or that the terms of an existing advisory agreement be revised. The Funds have filed an application seeking a similar SEC exemption with respect to investment advisors that are wholly owned subsidiaries of Vanguard. If the exemption is granted, the Funds may rely on the new SEC relief.
For a discussion of why the board of trustees approved each Fund's investment advisory arrangement, see the most recent annual report to shareholders covering the fiscal year ended August 31.
25
The managers primarily responsible for the day-to-day management of the Funds are:
Nick Birkett, CFA, Portfolio Manager at Vanguard. He has worked in investment management since 2006, has been with Vanguard since 2017, and has co-managed the Funds since 2021. Education: B.S., University of Bath.
Aurélie Denis, CFA, Portfolio Manager at Vanguard. She has been with Vanguard since 2016, has worked in investment management since 2017, has managed investment portfolios since 2023, and has co-managed the Funds since February 2023. Education: B.S., Pennsylvania State University.
The Funds' Statement of Additional Information provides information about each portfolio manager’s compensation, other accounts under management, and ownership of shares of the Funds.
Dividends, Capital Gains, and Taxes
Fund Distributions
Each Fund distributes to shareholders virtually all of its net income (interest and dividends, less expenses) as well as any net short-term or long-term capital gains realized from the sale of its holdings. From time to time, each Fund may also make distributions that are treated as a return of capital. Income dividends generally are distributed quarterly in March, June, September and December; capital gains distributions, if any, generally occur annually in December. In addition, each Fund may occasionally make a supplemental distribution at some other time during the year.
You can receive distributions of income or capital gains in cash, or you can have them automatically reinvested in more shares of the Fund. However, if you are investing through an employer-sponsored retirement or savings plan, your distributions will be automatically reinvested in additional Fund shares.
26
|
Plain Talk About Distributions |
|
As a shareholder, you are entitled to your portion of a fund’s income from
interest and dividends as well as capital gains from the fund’s sale of
investments. Income consists of both the dividends that the fund earns from
any stock holdings and the interest it receives from any money market and
bond investments. Capital gains are realized whenever the fund sells
securities for higher prices than it paid for them. These capital gains are
either short-term or long-term, depending on whether the fund held the
securities for one year or less or for more than one year. |
Basic Tax Points
Investors in taxable accounts should be aware of the following basic federal income tax points:
• Distributions are taxable to you whether or not you reinvest these amounts in additional Fund shares.
• Distributions declared in December—if paid to you by the end of January—are taxable as if received in December.
• Any dividend distribution or short-term capital gains distribution that you receive is taxable to you as ordinary income. If you are an individual and meet certain holding period requirements with respect to your Fund shares, you may be eligible for reduced tax rates on “qualified dividend income,” if any, or a special tax deduction on “qualified REIT dividends,” if any, distributed by the Fund.
• Any distribution of net long-term capital gains is taxable to you as long-term capital gains, no matter how long you have owned shares in the Fund.
• Capital gains distributions may vary considerably from year to year as a result of the Funds' normal investment activities and cash flows.
• Your cost basis in the Fund will be decreased by the amount of any return of capital that you receive. This, in turn, will affect the amount of any capital gain or loss that you realize when selling or exchanging your Fund shares.
• Return of capital distributions generally are not taxable to you until your cost basis has been reduced to zero. If your cost basis is at zero, return of capital distributions will be treated as capital gains.
• A sale or exchange of Fund shares is a taxable event. This means that you may have a capital gain to report as income, or a capital loss to report as a deduction, when you complete your tax return.
27
• Any conversion between classes of shares of the same fund is a nontaxable event. By contrast, an exchange between classes of shares of different funds is a taxable event.
• Vanguard (or your intermediary) will send you a statement each year showing the tax status of all of your distributions.
Individuals, trusts, and estates whose income exceeds certain threshold amounts are subject to a 3.8% Medicare contribution tax on “net investment income.” Net investment income takes into account distributions paid by the Fund and capital gains from any sale or exchange of Fund shares.
Dividend distributions and capital gains distributions that you receive, as well as your gains or losses from any sale or exchange of Fund shares, may be subject to state and local income taxes.
This prospectus provides general tax information only. If you are investing through a tax-advantaged account, such as an IRA or an employer-sponsored retirement or savings plan, special tax rules apply. Please consult your tax advisor for detailed information about any tax consequences for you.
|
Plain Talk About Buying a Dividend |
|
Unless you are a tax-exempt investor or investing through a tax-advantaged
account (such as an IRA or an employer-sponsored retirement or savings
plan), you should consider avoiding a purchase of fund shares shortly before
the fund makes a distribution, because doing so can cost you money in
taxes. This is known as “buying a dividend.” For example: On December 15,
you invest $5,000, buying 250 shares for $20 each. If the fund pays a
distribution of $1 per share on December 16, its share price will drop to $19
(not counting market change). You still have only $5,000 (250 shares x $19 =
$4,750 in share value, plus 250 shares x $1 = $250 in distributions), but you
owe tax on the $250 distribution you received—even if you reinvest it in more
shares. To avoid buying a dividend, check a fund’s distribution schedule
before you invest. |
General Information
Backup withholding. By law, Vanguard must withhold 24% of any taxable distributions or redemptions from your account if you do not:
• Provide your correct taxpayer identification number.
• Certify that the taxpayer identification number is correct.
• Confirm that you are not subject to backup withholding.
28
Similarly, Vanguard (or your intermediary) must withhold taxes from your account if the IRS instructs us to do so.
Foreign investors. Vanguard funds offered for sale in the United States (Vanguard U.S. funds), including the Funds offered in this prospectus, are not widely available outside the United States. Non-U.S. investors should be aware that U.S. withholding and estate taxes and certain U.S. tax reporting requirements may apply to any investments in Vanguard U.S. funds. Foreign investors should visit the non-U.S. investors page on our website at vanguard.com for information on Vanguard’s non-U.S. products.
Invalid addresses. If a dividend distribution or capital gains distribution check mailed to your address of record is returned as undeliverable, Vanguard will automatically reinvest the distribution and all future distributions until you provide us with a valid mailing address. Reinvestments will receive the net asset value calculated on the date of the reinvestment.
Share Price
Share price, also known as net asset value (NAV), is calculated as of the close of regular trading on the New York Stock Exchange (NYSE), generally 4 p.m., Eastern time, on each day that the NYSE is open for business (a business day). In the rare event the NYSE experiences unanticipated disruptions and is unavailable at the close of the trading day, NAVs will be calculated as of the close of regular trading on the Nasdaq (or another alternate exchange if the Nasdaq is unavailable, as determined at Vanguard’s discretion), generally 4 p.m., Eastern time. Each share class has its own NAV, which is computed by dividing the total assets, minus liabilities, allocated to the share class by the number of Fund shares outstanding for that class. On U.S. holidays or other days when the NYSE is closed, the NAV is not calculated, and the Funds do not sell or redeem shares. However, on those days the value of a Fund’s assets may be affected to the extent that the Fund holds securities that change in value on those days (such as foreign securities that trade on foreign markets that are open).
Stocks held by a Vanguard fund are valued at their market value when reliable market quotations are readily available from the principal exchange or market on which they are traded. Such securities are generally valued at their official closing price, the last reported sales price, or if there were no sales that day, the mean between the closing bid and asking prices. When a fund determines that market quotations either are not readily available or do not accurately reflect the value of a security, the security is priced at its fair value (the amount that the owner might reasonably expect to receive upon the current sale of the security).
29
The values of any foreign securities held by a fund are converted into U.S. dollars using an exchange rate obtained from an independent third party as of the close of regular trading on the NYSE. The values of any mutual fund shares, including institutional money market fund shares, held by a fund are based on the NAVs of the shares. The values of any ETF shares or closed-end fund shares held by a fund are based on the market value of the shares.
A fund also will use fair-value pricing if the value of a security it holds has been materially affected by events occurring before the fund's pricing time but after the close of the principal exchange or market on which the security is traded. This most commonly occurs with foreign securities, which may trade on foreign exchanges that close many hours before the fund's pricing time. Intervening events might be company-specific (e.g., earnings report, merger announcement) or country-specific or regional/global (e.g., natural disaster, economic or political news, interest rate change, act of terrorism). Intervening events include price movements in U.S. markets that exceed a specified threshold or that are otherwise deemed to affect the value of foreign securities.
Fair-value pricing may be used for domestic securities—for example, if (1) trading in a security is halted and does not resume before the fund's pricing time or a security does not trade in the course of a day and (2) the fund holds enough of the security that its price could affect the NAV.
Fair-value prices are determined by Vanguard according to procedures adopted by the board of trustees. When fair-value pricing is employed, the prices of securities used by a fund to calculate the NAV may differ from quoted or published prices for the same securities.
Each Fund has authorized certain financial intermediaries and their designees, and may, from time to time, authorize certain funds of funds for which Vanguard serves as the investment advisor (Vanguard Funds of Funds), to accept orders to buy or sell fund shares on its behalf. The Fund will be deemed to receive an order when accepted by the financial intermediary, its designee, or one of the Vanguard Funds of Funds, and the order will receive the NAV next computed by the Fund after such acceptance.
Vanguard fund share prices are published daily on our website at vanguard.com/prices.
Vanguard fund share prices are published daily on our website at vanguard.com/prices.
30
Financial Highlights
Financial highlights information is intended to help you understand a fund’s performance for the past five years (or, if shorter, its period of operations). Certain information reflects financial results for a single fund share. Total return represents the rate that an investor would have earned or lost each period on an investment in a fund or share class (assuming reinvestment of all distributions). This information has been obtained from the financial statements audited by PricewaterhouseCoopers LLP, an independent registered public accounting firm, whose report, along with fund financial statements, is included in a fund’s most recent annual report to shareholders. You may obtain a free copy of a fund’s latest annual or semiannual report, which is available upon request.
Vanguard Russell 1000 Index Fund Institutional Shares
|
For a Share Outstanding
Throughout Each Period |
Year Ended August 31, | ||||
|
2023 |
2022 |
2021 |
2020 |
2019 | |
|
Net Asset Value, Beginning of Period |
$349.62 |
$407.44 |
$312.59 |
$260.26 |
$258.75 |
|
Investment Operations |
|
|
|
|
|
|
Net Investment Income1 |
5.737 |
5.354 |
4.807 |
4.927 |
4.645 |
|
Net Realized and Unrealized Gain (Loss) on
Investments |
47.099 |
(57.922) |
94.766 |
52.362 |
1.483 |
|
Total from Investment Operations |
52.836 |
(52.568) |
99.573 |
57.289 |
6.128 |
|
Distributions |
|
|
|
|
|
|
Dividends from Net Investment Income |
(5.576) |
(5.252) |
(4.723) |
(4.959) |
(4.618) |
|
Distributions from Realized Capital Gains |
— |
— |
— |
— |
— |
|
Total Distributions |
(5.576) |
(5.252) |
(4.723) |
(4.959) |
(4.618) |
|
Net Asset Value, End of Period |
$396.88 |
$349.62 |
$407.44 |
$312.59 |
$260.26 |
|
Total Return |
15.35% |
-13.01% |
32.16% |
22.45% |
2.45% |
|
Ratios/Supplemental Data |
|
|
|
|
|
|
Net Assets, End of Period (Millions) |
$2,029 |
$2,174 |
$2,822 |
$2,523 |
$2,323 |
|
Ratio of Total Expenses to Average Net Assets |
0.07% |
0.07% |
0.07% |
0.07% |
0.07% |
|
Ratio of Net Investment Income to Average Net
Assets |
1.60% |
1.39% |
1.36% |
1.81% |
1.86% |
|
Portfolio Turnover Rate2 |
8% |
10% |
6% |
9% |
6% |
|
|
|
|
1 |
Calculated based on average shares outstanding. |
|
2 |
Excludes the value of portfolio securities received or delivered as a result of in-kind purchases
or redemptions of the fund’s capital shares, including ETF Creation Units. |
31
Vanguard Russell 1000 Value Index Fund Institutional Shares
|
For a Share Outstanding
Throughout Each Period |
Year Ended August 31, | ||||
|
2023 |
2022 |
2021 |
2020 |
2019 | |
|
Net Asset Value, Beginning of Period |
$256.61 |
$279.40 |
$209.00 |
$213.25 |
$217.14 |
|
Investment Operations |
|
|
|
|
|
|
Net Investment Income1 |
5.952 |
5.555 |
5.002 |
5.594 |
5.294 |
|
Net Realized and Unrealized Gain (Loss) on
Investments |
15.489 |
(22.930) |
70.071 |
(4.226) |
(4.087) |
|
Total from Investment Operations |
21.441 |
(17.375) |
75.073 |
1.368 |
1.207 |
|
Distributions |
|
|
|
|
|
|
Dividends from Net Investment Income |
(5.791) |
(5.415) |
(4.673) |
(5.618) |
(5.097) |
|
Distributions from Realized Capital Gains |
— |
— |
— |
— |
— |
|
Total Distributions |
(5.791) |
(5.415) |
(4.673) |
(5.618) |
(5.097) |
|
Net Asset Value, End of Period |
$272.26 |
$256.61 |
$279.40 |
$209.00 |
$213.25 |
|
Total Return |
8.55% |
-6.30% |
36.35% |
0.81% |
0.61% |
|
Ratios/Supplemental Data |
|
|
|
|
|
|
Net Assets, End of Period (Millions) |
$1,405 |
$1,608 |
$1,773 |
$1,207 |
$1,889 |
|
Ratio of Total Expenses to Average Net Assets |
0.07% |
0.07% |
0.07% |
0.07% |
0.07% |
|
Ratio of Net Investment Income to Average Net
Assets |
2.27% |
2.03% |
2.01% |
2.64% |
2.52% |
|
Portfolio Turnover Rate2 |
15% |
14% |
19% |
24% |
17% |
|
|
|
|
1 |
Calculated based on average shares outstanding. |
|
2 |
Excludes the value of portfolio securities received or delivered as a result of in-kind purchases
or redemptions of the fund’s capital shares, including ETF Creation Units. |
32
Vanguard Russell 1000 Growth Index Fund Institutional Shares
|
For a Share Outstanding
Throughout Each Period |
Year Ended August 31, | ||||
|
2023 |
2022 |
2021 |
2020 |
2019 | |
|
Net Asset Value, Beginning of Period |
$461.93 |
$575.10 |
$451.15 |
$316.39 |
$306.82 |
|
Investment Operations |
|
|
|
|
|
|
Net Investment Income1 |
4.482 |
4.036 |
3.573 |
3.695 |
3.711 |
|
Net Realized and Unrealized Gain (Loss) on
Investments |
95.622 |
(113.399) |
123.861 |
134.792 |
9.061 |
|
Total from Investment Operations |
100.104 |
(109.363) |
127.434 |
138.487 |
12.772 |
|
Distributions |
|
|
|
|
|
|
Dividends from Net Investment Income |
(4.304) |
(3.807) |
(3.484) |
(3.727) |
(3.202) |
|
Distributions from Realized Capital Gains |
— |
— |
— |
— |
— |
|
Total Distributions |
(4.304) |
(3.807) |
(3.484) |
(3.727) |
(3.202) |
|
Net Asset Value, End of Period |
$557.73 |
$461.93 |
$575.10 |
$451.15 |
$316.39 |
|
Total Return |
21.86% |
-19.09% |
28.42% |
44.24% |
4.21% |
|
Ratios/Supplemental Data |
|
|
|
|
|
|
Net Assets, End of Period (Millions) |
$3,713 |
$2,754 |
$3,573 |
$3,542 |
$3,076 |
|
Ratio of Total Expenses to Average Net Assets |
0.07% |
0.07% |
0.07% |
0.07% |
0.07% |
|
Ratio of Net Investment Income to Average Net
Assets |
0.94% |
0.77% |
0.74% |
1.06% |
1.26% |
|
Portfolio Turnover Rate2 |
14% |
13% |
14% |
14% |
17% |
|
|
|
|
1 |
Calculated based on average shares outstanding. |
|
2 |
Excludes the value of portfolio securities received or delivered as a result of in-kind purchases
or redemptions of the fund’s capital shares, including ETF Creation Units. |
33
Investing With Vanguard
This section of the prospectus explains the basics of doing business with Vanguard. Vanguard fund shares can be held indirectly through an intermediary, such as a bank, a broker, or an investment advisor. If you hold Vanguard fund shares indirectly through an intermediary (including shares held in a brokerage account through Vanguard Brokerage Services®), please see Investing With Vanguard Through Other Firms, and also refer to your account agreement with the intermediary for information about transacting in that account. If you hold Vanguard fund shares through an employer-sponsored retirement or savings plan, please see Employer-Sponsored Plans. Vanguard reserves the right to change the policies in this section without notice. Please call or check online for current information. See Contacting Vanguard.
In certain circumstances, Vanguard fund shares can be held directly with Vanguard. If you hold Vanguard fund shares directly with Vanguard, you should carefully read each topic within this section that pertains to your relationship with Vanguard. Vanguard reserves the right, upon reasonable notice, to discontinue the ability to hold Vanguard fund shares directly with Vanguard for any or all investors and/or to transfer such shares to an affiliate or other financial institution.
In certain circumstances, Vanguard fund shares can be held directly with Vanguard. If you hold Vanguard fund shares directly with Vanguard, you should carefully read each topic within this section that pertains to your relationship with Vanguard. Vanguard reserves the right, upon reasonable notice, to discontinue the ability to hold Vanguard fund shares directly with Vanguard for any or all investors and/or to transfer such shares to an affiliate or other financial institution.
For Vanguard fund shares held directly with Vanguard, each fund you hold in an account is a separate “fund account.” For example, if you hold three funds in a nonretirement account titled in your own name, two funds in a nonretirement account titled jointly with your spouse, and one fund in an individual retirement account, you have six fund accounts—and this is true even if you hold the same fund in multiple accounts. Note that each reference to “you” in this prospectus applies to any one or more registered account owners or persons authorized to transact on your account.
Purchasing Shares
Vanguard reserves the right, without notice, to increase or decrease the minimum amount required to open, convert shares to, or maintain a fund account or to add to an existing fund account.
Investment minimums may differ for certain categories of investors.
Account Minimums for Institutional Shares
To open and maintain an account. $5 million.
Certain Vanguard institutional clients may meet the minimum investment amount by aggregating separate accounts within the same Fund. This aggregation policy does not apply to financial intermediaries.
34
Vanguard may charge additional recordkeeping fees for institutional clients whose accounts are recordkept by Vanguard. Please contact your Vanguard representative to determine whether additional recordkeeping fees apply to your account.
To add to an existing account. Generally $1.
How to Initiate a Purchase Request
Be sure to check Exchanging Shares, Frequent-Trading Limitations, and Other Rules You Should Know before placing your purchase request.
Online. You may open certain types of accounts, request a purchase of shares, and request an exchange through our website or our mobile application if your account is eligible and you are registered for online access.
By telephone. You may call Vanguard to begin the account registration process or request that the account-opening forms be sent to you. You may also call Vanguard to request a purchase of shares in your account or to request an exchange. See Contacting Vanguard.
By mail. You may send Vanguard your account registration form and check to open a new fund account. To add to an existing fund account, you may send your check with an Invest-by-Mail form (from a transaction confirmation or your account statement) or with a deposit slip (available online).
How to Pay for a Purchase
By electronic bank transfer. You may purchase shares of a Vanguard fund through an electronic transfer of money from a bank account. To establish the electronic bank transfer service on an account, you must designate the bank account online, complete a form, or fill out the appropriate section of your account registration form. After the service is set up on your account, you can purchase shares by electronic bank transfer on a regular schedule (Automatic Investment Plan), if eligible, or upon request. Your purchase request can be initiated online (if you are registered for online access), by telephone, or by mail.
By wire. Wiring instructions vary for different types of purchases. Please call Vanguard for instructions and policies on purchasing shares by wire. See Contacting Vanguard.
By check. You may make initial or additional purchases to your fund account by sending a check with a deposit slip or by utilizing our mobile application if your account is eligible and you are registered for online access. Also see How to
35
Initiate a Purchase Request. Make your check payable to Vanguard and include the appropriate fund number (e.g., Vanguard—xx). For a list of Fund numbers (for Funds in this prospectus), see Additional Information.
By exchange. You may purchase shares of a Vanguard fund using the proceeds from the simultaneous redemption of shares of another Vanguard fund. You may initiate an exchange online (if you are registered for online access), by telephone, or by mail with an exchange form. See Exchanging Shares.
Trade Date
The trade date for any purchase request received in good order will depend on the day and time Vanguard receives your request, the manner in which you are paying, and the type of fund you are purchasing. Your purchase will be executed using the NAV as calculated on the trade date. NAVs are calculated only on days that the NYSE is open for trading (a business day). In the rare event the NYSE experiences unanticipated disruptions and is unavailable at the close of the trading day, NAVs will be calculated as of the close of regular trading on the Nasdaq (or another alternate exchange if the Nasdaq is unavailable, as determined at Vanguard’s discretion), generally 4 p.m., Eastern time. The time selected for NAV calculation in this rare event shall also serve as the conclusion of the trading day. See Share Price.
For purchases by check into all funds other than money market funds and for purchases by exchange, wire, or electronic bank transfer into all funds: If the purchase request is received by Vanguard on a business day before the close of regular trading on the NYSE (generally 4 p.m., Eastern time), the trade date for the purchase will be the same day. If the purchase request is received on a business day after the close of regular trading on the NYSE, or on a nonbusiness day, the trade date for the purchase will be the next business day.
For purchases by check into money market funds: If the purchase request is received by Vanguard on a business day before the close of regular trading on the NYSE (generally 4 p.m., Eastern time), the trade date for the purchase will be the next business day. If the purchase request is received on a business day after the close of regular trading on the NYSE, or on a nonbusiness day, the trade date for the purchase will be the second business day following the day Vanguard receives the purchase request. Because money market instruments must be purchased with federal funds and it takes a money market mutual fund one business day to convert check proceeds into federal funds, the trade date for the purchase will be one business day later than for other funds.
36
If applicable, orders by Vanguard Funds of Funds will be treated as received by a Fund at the same time that corresponding orders are received in proper form by the Vanguard Funds of Funds.
If your purchase request is not accurate and complete, it may be rejected. See Other Rules You Should Know—Good Order.
For further information about purchase transactions, consult our website at vanguard.com or see Contacting Vanguard.
Other Purchase Rules You Should Know
Check purchases. All purchase checks must be written in U.S. dollars, be drawn on a U.S. bank, and be accompanied by good order instructions. Vanguard does not accept cash, traveler’s checks, starter checks, or money orders. In addition, Vanguard may refuse checks that are not made payable to Vanguard.
New accounts. We are required by law to obtain from you certain personal information that we will use to verify your identity. If you do not provide the information, we may not be able to open your account. If we are unable to verify your identity, Vanguard reserves the right, without notice, to close your account or take such other steps as we deem reasonable. Certain types of accounts may require additional documentation.
Refused or rejected purchase requests. Vanguard reserves the right to stop selling fund shares or to reject any purchase request at any time and without notice, including, but not limited to, purchases requested by exchange from another Vanguard fund. This also includes the right to reject any purchase request because the investor has a history of frequent trading or because the purchase may negatively affect a fund’s operation or performance.
Large purchases. Call Vanguard before attempting to invest a large dollar amount.
No cancellations. Vanguard will not accept your request to cancel any purchase request once processing has begun. Please be careful when placing a purchase request.
Converting Shares
If you convert from Institutional Shares to ETF Shares, the transaction will be based on the respective NAVs of the separate share classes on the trade date of the conversion.
37
Vanguard will not accept your request to cancel any self-directed conversion request once processing has begun. Please be careful when placing a conversion request.
A conversion between share classes of the same fund is a nontaxable event.
Conversions to ETF Shares
Owners of conventional (i.e., not exchange-traded) shares issued by a Fund may convert those shares to ETF Shares of equivalent value of the same fund. Please note that investors who own conventional shares through a 401(k) plan or other employer-sponsored retirement or benefit plan generally may not convert those shares to ETF Shares and should check with their plan sponsor or recordkeeper. ETF Shares, whether acquired through a conversion or purchased on the secondary market, cannot be converted to conventional shares by a shareholder. Also, ETF Shares of one fund cannot be exchanged for ETF Shares of another fund.
ETF Shares must be held in a brokerage account. Thus, before converting conventional shares to ETF Shares, you must have an existing, or open a new, brokerage account. This account may be with Vanguard Brokerage Services or with any other brokerage firm.
Vanguard Brokerage Services does not impose a fee on conversions from conventional shares to Vanguard ETF Shares. However, other brokerage firms may charge a fee to process a conversion. Vanguard reserves the right, in the future, to impose a transaction fee on conversions or to limit, temporarily suspend, or terminate the conversion privilege. For additional information on converting conventional shares to ETF Shares, please contact Vanguard to obtain a prospectus for ETF Shares. See Contacting Vanguard.
Redeeming Shares
How to Initiate a Redemption Request
Be sure to check Exchanging Shares, Frequent-Trading Limitations, and Other Rules You Should Know before placing your redemption request.
Online. You may request a redemption of shares or request an exchange through our website or our mobile application if your account is eligible and you are registered for online access.
By telephone. You may call Vanguard to request a redemption of shares or an exchange. See Contacting Vanguard.
38
By mail. You may send a form (available online) to Vanguard to redeem from a fund account or to make an exchange.
How to Receive Redemption Proceeds
By electronic bank transfer. You may have the proceeds of a fund redemption sent directly to a designated bank account. To establish the electronic bank transfer service on an account, you must designate a bank account online, complete a form, or fill out the appropriate section of your account registration form. After the service is set up on your account, you can redeem shares by electronic bank transfer on a regular schedule (Automatic Withdrawal Plan), if eligible, or upon request. Your redemption request can be initiated online (if you are registered for online access), by telephone, or by mail.
By wire. To receive your proceeds by wire, you may instruct Vanguard to wire your redemption proceeds ($100 minimum) to a previously designated bank account. To establish the wire redemption service, you generally must designate a bank account online, complete a form, or fill out the appropriate section of your account registration form.
Please note that Vanguard charges a $10 wire fee for outgoing wire redemptions. The fee is assessed in addition to, rather than being withheld from, redemption proceeds and is paid directly to the fund in which you invest. For example, if you redeem $100 via a wire, you will receive the full $100, and the $10 fee will be assessed to your fund account through an additional redemption of fund shares. If you redeem your entire fund account, your redemption proceeds will be reduced by the amount of the fee. The wire fee does not apply to accounts held by Flagship and Flagship Select clients; accounts held through intermediaries, including Vanguard Brokerage Services; or accounts held by institutional clients.
By exchange. You may have the proceeds of a Vanguard fund redemption invested directly in shares of another Vanguard fund. You may initiate an exchange online (if you are registered for online access), by telephone, or by mail. See Exchanging Shares.
By check. If you have not chosen another redemption method, Vanguard will mail you a redemption check, generally payable to all registered account owners, normally within two business days of your trade date, and generally to the address of record.
Trade Date
The trade date for any redemption request received in good order will depend on the day and time Vanguard receives your request and the manner in which you are redeeming. Your redemption will be executed using the NAV as calculated on
39
the trade date. NAVs are calculated only on days that the NYSE is open for trading (a business day). In the rare event the NYSE experiences unanticipated disruptions and is unavailable at the close of the trading day, NAVs will be calculated as of the close of regular trading on the Nasdaq (or another alternate exchange if the Nasdaq is unavailable, as determined at Vanguard’s discretion), generally 4 p.m., Eastern time. The time selected for NAV calculation in this rare event shall also serve as the conclusion of the trading day. See Share Price.
For redemptions by check, exchange, or wire: If the redemption request is received by Vanguard on a business day before the close of regular trading on the NYSE (generally 4 p.m., Eastern time), the trade date will be the same day. If the redemption request is received on a business day after the close of regular trading on the NYSE, or on a nonbusiness day, the trade date will be the next business day.
• Note on timing of wire redemptions from money market funds: For telephone requests received by Vanguard on a business day before 10:45 a.m., Eastern time (2 p.m., Eastern time, for Vanguard Cash Reserves Federal Money Market Fund; 12:30 p.m., Eastern time, for Vanguard Federal Money Market Fund), the redemption proceeds generally will leave Vanguard by the close of business the same day. For telephone requests received by Vanguard on a business day after those cut-off times, or on a nonbusiness day, and for all requests other than by telephone, the redemption proceeds generally will leave Vanguard by the close of business on the next business day.
• Note on timing of wire redemptions from all other funds: For requests received by Vanguard on a business day before the close of regular trading on the NYSE (generally 4 p.m., Eastern time), the redemption proceeds generally will leave Vanguard by the close of business on the next business day. For requests received by Vanguard on a business day after the close of regular trading on the NYSE, or on a nonbusiness day, the redemption proceeds generally will leave Vanguard by the close of business on the second business day after Vanguard receives the request.
For redemptions by electronic bank transfer: If the redemption request is received by Vanguard on a business day before the close of regular trading on the NYSE (generally 4 p.m., Eastern time), the trade date will be the same day. If the redemption request is received on a business day after the close of regular trading on the NYSE, or on a nonbusiness day, the trade date will be the next business day.
40
If your redemption request is not accurate and complete, it may be rejected. If we are unable to send your redemption proceeds by wire or electronic bank transfer because the receiving institution rejects the transfer, Vanguard will make additional efforts to complete your transaction. If Vanguard is still unable to complete the transaction, we may send the proceeds of the redemption to you by check, generally payable to all registered account owners, or use your proceeds to purchase new shares of the fund from which you sold shares for the purpose of the wire or electronic bank transfer transaction. See Other Rules You Should Know—Good Order.
If your redemption request is received in good order, we typically expect that redemption proceeds will be paid by a Fund within one business day of the trade date; however, in certain circumstances, investors may experience a longer settlement period at the time of the transaction. For further information, see “Potentially disruptive redemptions” and “Emergency circumstances.”
For further information about redemption transactions, consult our website at vanguard.com or see Contacting Vanguard.
Other Redemption Rules You Should Know
Documentation for certain accounts. Special documentation may be required to redeem from certain types of accounts, such as trust, corporate, nonprofit, or retirement accounts. Please call us before attempting to redeem from these types of accounts.
Potentially disruptive redemptions. Vanguard reserves the right to pay all or part of a redemption in kind—that is, in the form of securities—if we reasonably believe that a cash redemption would negatively affect the fund’s operation or performance or that the shareholder may be engaged in market-timing or frequent trading. Under these circumstances, Vanguard also reserves the right to delay payment of the redemption proceeds for up to seven calendar days. By calling us before you attempt to redeem a large dollar amount, you may avoid in-kind or delayed payment of your redemption. Please see Frequent-Trading Limitations for information about Vanguard’s policies to limit frequent trading.
Recently purchased shares. Although you can redeem shares at any time, proceeds may not be made available to you until the fund collects payment for your purchase. This may take up to seven calendar days for shares purchased by check or by electronic bank transfer. If you have written a check on a fund in an account with checkwriting privileges, that check may be rejected if your fund account does not have a sufficient available balance.
41
Address change. If you change your address online or by telephone, there may be up to a 14-day restriction (starting on the business day after your address is changed) on your ability to request check redemptions online and by telephone. You can request a redemption in writing (using a form available online) at any time. Confirmations of address changes are sent to both the old and new addresses.
Payment to a different person or address. At your request, we can make your redemption check payable, or wire your redemption proceeds, to a different person or send it to a different address. However, this generally requires the written consent of all registered account owners and may require additional documentation, such as a signature guarantee or a notarized signature. You may obtain a signature guarantee from some commercial or savings banks, credit unions, trust companies, or member firms of a U.S. stock exchange.
No cancellations. Vanguard will not accept your request to cancel any redemption request once processing has begun. Please be careful when placing a redemption request.
Emergency circumstances. Vanguard funds can postpone payment of redemption proceeds for up to seven calendar days. In addition, Vanguard funds can suspend redemptions and/or postpone payments of redemption proceeds beyond seven calendar days at times when the NYSE is closed or during emergency circumstances, as determined by the SEC.
Exchanging Shares
An exchange occurs when you use the proceeds from the redemption of shares of one Vanguard fund to simultaneously purchase shares of a different Vanguard fund. You can make exchange requests online (if you are registered for online access), by telephone, or by mail. See Purchasing Shares and Redeeming Shares.
If the NYSE is open for regular trading (generally until 4 p.m., Eastern time, on a business day) at the time an exchange request is received in good order, the trade date generally will be the same day. See Other Rules You Should Know—Good Order for additional information on all transaction requests.
Vanguard will not accept your request to cancel any exchange request once processing has begun. Please be careful when placing an exchange request.
Call Vanguard before attempting to exchange a large dollar amount. By calling us before you attempt to exchange a large dollar amount, you may avoid delayed or rejected transactions.
42
Please note that Vanguard reserves the right, without notice, to revise or terminate the exchange privilege, limit the amount of any exchange, or reject an exchange, at any time, for any reason. See Frequent-Trading Limitations for additional restrictions on exchanges.
Frequent-Trading Limitations
Because excessive transactions can disrupt management of a fund and increase the fund’s costs for all shareholders, the board of trustees of each Vanguard fund places certain limits on frequent trading in the funds. Each Vanguard fund (other than money market funds and short-term bond funds, but including Vanguard Short-Term Inflation-Protected Securities Index Fund) limits an investor’s purchases or exchanges into a fund account for 30 calendar days after the investor has redeemed or exchanged out of that fund account. ETF Shares are not subject to these frequent-trading limits.
For Vanguard Retirement Investment Program pooled plans, the limitations apply to exchanges made online or by telephone.
These frequent-trading limitations do not apply to the following:
• Certain transactions below dollar value or other thresholds specified by Vanguard.
• In-kind transactions to a shareholder’s donor advised fund managed by Vanguard Charitable.
• Purchases of shares with reinvested dividend or capital gains distributions.
• Transactions through Vanguard’s Automatic Investment Plan, Automatic Exchange Service, Direct Deposit Service, Automatic Withdrawal Plan, Required Minimum Distribution Service, Vanguard Small Business Online®, and certain transactions through intermediaries relating to systematic trades and required minimum distributions.
• Discretionary transactions through Vanguard Personal Advisor Services®, Vanguard Institutional Advisory Services®, Vanguard Digital Advisor™, and discretionary (advisor-directed) transactions through certain intermediaries.
• Redemptions of shares to pay fund or account fees.
• Redemptions of shares to remove excess shareholder contributions to certain types of retirement accounts (including, but not limited to, IRAs and Vanguard Individual 401(k) Plans).
• Transfers and reregistrations of shares within the same fund.
• Purchases of shares by asset transfer or direct rollover.
43
• Conversions of shares from one share class to another in the same fund.
• Checkwriting redemptions.
• Section 529 college savings plans.
• Certain approved institutional portfolios and asset allocation programs, as well as trades made by funds or trusts managed by Vanguard or its affiliates that invest in other Vanguard funds. (Please note that shareholders of Vanguard’s funds of funds are subject to the limitations.)
For participants in employer-sponsored defined contribution plans,* the frequent-trading limitations do not apply to:
• Purchases of shares with participant payroll or employer contributions or loan repayments.
• Purchases of shares with reinvested dividend or capital gains distributions.
• Distributions, loans, and in-service withdrawals from a plan.
• Redemptions of shares as part of a plan termination or at the direction of the plan.
• Transactions executed through the Vanguard Managed Account Program.
• Redemptions of shares to pay fund or account fees.
• Share or asset transfers or rollovers.
• Reregistrations of shares.
• Conversions of shares from one share class to another in the same fund.
• Exchange requests submitted by written request to Vanguard. (Exchange requests submitted by fax, if otherwise permitted, are subject to the limitations.)
* The following Vanguard fund accounts are also subject to the frequent-trading limitations: SEP-IRAs, SIMPLE IRAs, certain Individual 403(b)(7) Custodial Accounts, and Vanguard Individual 401(k) Plans.
Accounts Held by Institutions (Other Than Defined Contribution Plans)
Vanguard will systematically monitor for frequent trading in institutional clients’ accounts. If we detect suspicious trading activity, we will investigate and take appropriate action, which may include applying to a client’s accounts the 30-day policy previously described, prohibiting a client’s purchases of fund shares, and/or revoking the client’s exchange privilege.
44
Accounts Held by Intermediaries
When intermediaries establish accounts in Vanguard funds for the benefit of their clients, we cannot always monitor the trading activity of the individual clients. However, we review trading activity at the intermediary (omnibus) level, and if we detect suspicious activity, we will investigate and take appropriate action. If necessary, Vanguard may prohibit additional purchases of fund shares by an intermediary, including for the benefit of certain of the intermediary’s clients. Intermediaries also may monitor their clients’ trading activities with respect to Vanguard funds.
For those Vanguard funds that charge purchase and/or redemption fees, intermediaries will be asked to assess these fees on client accounts and remit these fees to the funds. The application of purchase and redemption fees and frequent-trading limitations may vary among intermediaries. There are no assurances that Vanguard will successfully identify all intermediaries or that intermediaries will properly assess purchase and redemption fees or administer frequent-trading limitations. If you invest with Vanguard through an intermediary, please read that firm’s materials carefully to learn of any other rules or fees that may apply.
Other Rules You Should Know
Prospectus and Shareholder Report Mailings
When two or more shareholders have the same last name and address, just one summary prospectus (or prospectus) and/or shareholder report may be sent in an attempt to eliminate the unnecessary expense of duplicate mailings. You may request individual prospectuses and reports by contacting our Client Services Department in writing, by telephone, or online. See Contacting Vanguard.
Vanguard.com
Registration. If you are a registered user of vanguard.com, you can review your account holdings; buy, sell, or exchange shares of most Vanguard funds; and perform most other transactions through our website. You must register for this service online.
Electronic delivery. Vanguard can deliver your account statements, transaction confirmations, prospectuses, certain tax forms, and shareholder reports electronically. If you are a registered user of vanguard.com, you can consent to the electronic delivery of these documents by logging on and changing your mailing preferences under “Account Maintenance.” You can revoke your electronic consent at any time through our website, and we will begin to send paper copies of these documents within 30 days of receiving your revocation.
45
Telephone Transactions
Automatic. When we set up your account, we will automatically enable you to do business with us by telephone, unless you instruct us otherwise in writing.
Proof of a caller’s authority. We reserve the right to refuse a telephone request if the caller is unable to provide the requested information or if we reasonably believe that the caller is not an individual authorized to act on the account. Before we allow a caller to act on an account, we may request the following information:
• Authorization to act on the account (as the account owner or by legal documentation or other means).
• Account registration and address.
• Fund name and account number, if applicable.
• Other information relating to the caller, the account owner, or the account.
Good Order
We reserve the right to reject any transaction instructions that are not in “good order.” Good order generally means that your instructions:
• Are provided by the person(s) authorized in accordance with Vanguard’s policies and procedures to access the account and request transactions.
• Include the fund name and account number.
• Include the amount of the transaction (stated in dollars, shares, or percentage).
Written instructions also must generally be provided on a Vanguard form and include:
• Signature(s) and date from the authorized person(s).
• Signature guarantees or notarized signatures, if required for the type of transaction. (Call Vanguard for specific requirements.)
• Any supporting documentation that may be required.
Good order requirements may vary among types of accounts and transactions. For more information, consult our website at vanguard.com or see Contacting Vanguard.
Vanguard reserves the right, without notice, to revise the requirements for good order.
46
Future Trade-Date Requests
Vanguard does not accept requests to hold a purchase, conversion, redemption, or exchange transaction for a future date. All such requests will receive trade dates as previously described in Purchasing Shares, Converting Shares, Redeeming Shares, and Exchanging Shares. Vanguard reserves the right to return future-dated purchase checks.
Accounts With More Than One Owner
If an account has more than one owner or authorized person, Vanguard generally will accept instructions from any one owner or authorized person.
Responsibility for Fraud
You should take precautions to protect yourself from fraud. Keep your account-related information private, and review any account confirmations, statements, or other information that we provide to you as soon as you receive them. Let us know immediately if you discover unauthorized activity or see something on your account that you do not understand or that looks unusual.
Vanguard will not be responsible for losses that result from transactions by a person who we reasonably believe is authorized to act on your account.
Uncashed Checks
Please cash your distribution or redemption checks promptly. Vanguard will not pay interest on uncashed checks. Vanguard may be required to transfer assets related to uncashed checks to a state under the state’s abandoned property law.
Dormant Accounts
If your account has no activity in it for a period of time, Vanguard may be required to transfer it to a state under the state’s abandoned property law, subject to potential federal or state withholding taxes.
Unusual Circumstances
If you experience difficulty contacting Vanguard online or by telephone, you can send us your transaction request on a Vanguard form by regular or express mail.
Investing With Vanguard Through Other Firms
You may purchase or sell shares of most Vanguard funds through a financial intermediary, such as a bank, a broker, or an investment advisor. Please consult your financial intermediary to determine which, if any, shares are available through that firm and to learn about other rules that may apply. Your financial
47
intermediary can provide you with account information and any required tax forms. You may be required to pay a commission on purchases of mutual fund shares made through a financial intermediary.
Please see Frequent-Trading Limitations—Accounts Held by Intermediaries for information about the assessment of any purchase or redemption fees and the monitoring of frequent trading for accounts held by intermediaries.
Low-Balance Accounts
Each Fund reserves the right to liquidate a fund account whose balance falls below the account minimum for any reason, including market fluctuation. This liquidation policy applies to nonretirement fund accounts and accounts that are held through intermediaries. Any such liquidation will be preceded by written notice to the investor.
Right to Change Policies
In addition to the rights expressly stated elsewhere in this prospectus, Vanguard reserves the right, without notice, to (1) alter, add, or discontinue any conditions of purchase (including eligibility requirements), redemption, exchange, conversion, service, or privilege at any time and (2) alter, impose, discontinue, or waive any purchase fee, redemption fee, account service fee, or other fee charged to a shareholder or a group of shareholders. Changes may affect any or all investors. These actions will be taken when, at the sole discretion of Vanguard management, Vanguard believes they are in the best interest of a fund.
Account Restrictions
Vanguard reserves the right to: (1) redeem all or a portion of a fund/account to meet a legal obligation, including tax withholding, tax lien, garnishment order, or other obligation imposed on your account by a court or government agency; (2) redeem shares, close an account, or suspend account privileges, features, or options in the case of threatening conduct or activity; (3) redeem shares, close an account, or suspend account privileges, features, or options if Vanguard believes or suspects that not doing so could result in a suspicious, fraudulent, or illegal transaction; (4) place restrictions on the ability to redeem any or all shares in an account if it is required to do so by a court or government agency; (5) place restrictions on the ability to redeem any or all shares in an account if Vanguard believes that doing so will prevent fraud, financial exploitation or abuse, or to protect vulnerable investors; (6) freeze any account and/or suspend account services if Vanguard has received reasonable notice of a dispute regarding the assets in an account, including notice of a dispute between the registered or beneficial account owners; and (7) freeze any account and/or suspend account services upon initial notification to Vanguard of the death of an account owner.
48
Share Classes
Vanguard reserves the right, without notice, to change the eligibility requirements of its share classes, including the types of clients who are eligible to purchase each share class.
Shareholder Rights
Each Fund's Agreement and Declaration of Trust, as amended, requires a shareholder bringing a derivative action on behalf of Vanguard Scottsdale Funds (the Trust) that is subject to a pre-suit demand to collectively hold at least 10% of the outstanding shares of the Trust or at least 10% of the outstanding shares of the series or class to which the demand relates and to undertake to reimburse the Trust for the expense of any counsel or advisors used when considering the merits of the demand in the event that the board of trustees determines not to bring such action. In each case, these requirements do not apply to claims arising under the federal securities laws to the extent that any such federal securities laws, rules, or regulations do not permit such application.
Fund and Account Updates
Confirmation Statements
We will send (or provide through our website, whichever you prefer) a confirmation of your trade date and the amount of your transaction when you buy, sell, exchange, or convert shares. However, we will not send confirmations reflecting only checkwriting redemptions or the reinvestment of dividend or capital gains distributions. For any month in which you had a checkwriting redemption, a Checkwriting Activity Statement will be sent to you itemizing the checkwriting redemptions for that month. Promptly review each confirmation statement that we provide to you. It is important that you contact Vanguard immediately with any questions you may have about any transaction reflected on a confirmation statement, or Vanguard will consider the transaction properly processed.
Portfolio Summaries
We will send (or provide through our website, whichever you prefer) quarterly portfolio summaries to help you keep track of your accounts throughout the year. Each summary shows the market value of your account at the close of the statement period, as well as all distributions, purchases, redemptions, exchanges, transfers, and conversions for the current calendar quarter (or month). Promptly review each summary that we provide to you. It is important
49
that you contact Vanguard immediately with any questions you may have about any transaction reflected on the summary, or Vanguard will consider the transaction properly processed.
Tax Information Statements
For most accounts, Vanguard (or your intermediary) is required to provide annual tax forms to assist you in preparing your income tax returns. These forms are generally available for each calendar year early in the following year. Registered users of vanguard.com can also view certain forms through our website. Vanguard (or your intermediary) may also provide you with additional tax-related documentation. For more information, consult our website at vanguard.com or see Contacting Vanguard.
Annual and Semiannual Reports
We will send (or provide through our website, whichever you prefer) reports about Vanguard Russell 1000 Index Funds twice a year, in April and October. These reports include overviews of the financial markets and provide the following specific Fund information:
• Performance assessments and comparisons with industry benchmarks.
• Financial statements with listings of Fund holdings.
Portfolio Holdings
Please consult the Funds' Statement of Additional Information or our website for a description of the policies and procedures that govern disclosure of a Fund’s portfolio holdings.
Employer-Sponsored Plans
Your plan administrator or your employee benefits office can provide you with detailed information on how to participate in your plan and how to elect a Fund as an investment option.
• If you have any questions about a Fund or Vanguard, including those about a Fund’s investment objective, strategies, or risks, contact Vanguard Participant Services toll-free at 800-523-1188 or visit our website at vanguard.com.
• If you have questions about your account, contact your plan administrator or the organization that provides recordkeeping services for your plan.
• Be sure to carefully read each topic that pertains to your transactions with Vanguard.
Vanguard reserves the right to change its policies without notice to shareholders.
50
Transactions
Processing times for your transaction requests may differ among recordkeepers or among transaction and funding types. Your plan’s recordkeeper (which may also be Vanguard) will determine the necessary processing time frames for your transaction requests prior to submission to a Fund. Consult your recordkeeper or plan administrator for more information.
If Vanguard is serving as your plan recordkeeper and if your transaction involves one or more investments with an early cut-off time for processing or another trading restriction, your entire transaction will be subject to the restriction when the trade date for your transaction is determined.
51
Contacting Vanguard
|
Web |
|
|
Vanguard.com |
For the most complete source of Vanguard news
For fund, account, and service information
For most account transactions
For literature requests
24 hours a day, 7 days a week |
|
Phone | |
|
Investor Information 800-662-7447
(Text telephone for people with
hearing impairment at 800-749-7273) |
For fund and service information
For literature requests |
|
Client Services 800-662-2739
(Text telephone for people with
hearing impairment at 800-749-7273) |
For account information
For most account transactions |
|
Participant Services 800-523-1188
(Text telephone for people with
hearing impairment at 800-749-7273) |
For information and services for participants in
employer-sponsored plans |
|
Institutional Division
888-809-8102 |
For information and services for large institutional
investors |
|
Financial Advisor and Intermediary
Sales Support 800-997-2798 |
For information and services for financial intermediaries
including financial advisors, broker-dealers, trust
institutions, and insurance companies |
|
Financial Advisory and Intermediary
Trading Support 800-669-0498 |
For account information and trading support for
financial intermediaries including financial advisors,
broker-dealers, trust institutions, and insurance
companies |
52
Additional Information
Each Fund's Bylaws require, unless the Trust otherwise consents in writing, that the U.S. Federal District Courts be the sole and exclusive forum for the resolution of complaints under the Securities Act of 1933. This provision may limit a shareholder’s ability to bring a claim in a different forum and may result in increased shareholder costs in pursuing such a claim.
|
Vanguard Fund |
Inception
Date |
Newspaper
Abbreviation |
Vanguard
Fund
Number |
CUSIP
Number |
|
Vanguard Russell 1000 Index Fund |
|
|
| |
|
Institutional Shares |
10/15/2010 |
Russ1000IdxInst |
1848 |
92206C722 |
|
Vanguard Russell 1000 Value Index Fund |
|
|
| |
|
Institutional Shares |
12/10/2010 |
Russ1000ValIdxInst |
1849 |
92206C698 |
|
Vanguard Russell 1000 Growth Index Fund |
|
|
| |
|
Institutional Shares |
12/6/2010 |
Russ1000GwthIdxInst |
1850 |
92206C672 |
CGS identifiers have been provided by CUSIP Global Services, managed on behalf of the American Bankers Association by Standard & Poor’s Financial Services, LLC, and are not for use or dissemination in a manner that would serve as a substitute for any CUSIP service. The CUSIP Database, © 2023 American Bankers Association. “CUSIP” is a registered trademark of the American Bankers Association.
53
CFA® is a registered trademark owned by CFA Institute.
The Products are not sponsored, endorsed, sold or promoted by Frank Russell Company (“Russell”). Russell makes no representation or warranty, express or implied, to the owners of the Products or any member of the public regarding the advisability of investing in securities generally or in the Products particularly or the ability of the Russell 1000, Russell 1000 Value, and Russell 1000 Growth Indexes to track general stock market performance or a segment of the same. Russell’s publication of the Russell 1000, Russell 1000 Value, and Russell 1000 Growth Indexes in no way suggests or implies an opinion by Russell as to the advisability of investment in any or all of the securities upon which the Russell 1000, Russell 1000 Value, and Russell 1000 Growth Indexes are based. Russell’s only relationship to The Vanguard Group, Inc. is the licensing of certain trademarks and trade names of Russell and of the Russell 1000, Russell 1000 Value, and Russell 1000 Growth Indexes which are determined, composed and calculated by Russell without regard to The Vanguard Group, Inc. or the Products. Russell is not responsible for and has not reviewed the Products nor any associated literature or publications and Russell makes no representation or warranty express or implied as to their accuracy or completeness, or otherwise. Russell has no obligation or liability in connection with the administration, marketing or trading of the Products.
Russell makes no representation, warranty or guarantee as to the accuracy, completeness, reliability or otherwise of the Russell Indexes or any data included in the Russell Indexes. Russell does not guarantee the accuracy and/or the completeness of the Russell 1000, Russell 1000 Value, and Russell 1000 Growth Indexes or any data included therein and Russell shall have no liability for any errors, omissions, or interruptions therein. Russell makes no warranty, express or implied, as to the use of or results to be obtained by The Vanguard Group, Inc., investors, owners of the Products, or any other person or entity from the use of the Russell 1000, Russell 1000 Value, and Russell 1000 Growth Indexes or any data included therein. Russell makes no express or implied warranties, and expressly disclaims all warranties of merchantability or fitness for a particular purpose or use with respect to the Russell 1000, Russell 1000 Value, and Russell 1000 Growth Indexes or any data included therein. Without limiting any of the foregoing, in no event shall Russell have any liability for any special, punitive, indirect, or consequential damages (including lost profits), even if notified of the possibility of such damages.
Russell reserves the right, at any time and without notice, to alter, amend, terminate or in any way change the Russell Indexes. Russell has no obligation to take the needs of any particular fund or its participants or any other product or person into consideration in determining, composing or calculating any of the Russell Indexes.
54
Glossary of Investment Terms
Capital Gains Distributions. Payments to mutual fund shareholders of gains realized on securities that a fund has sold at a profit, minus any realized losses.
Common Stock. A security representing ownership rights in a corporation.
Dividend Distributions. Payments to mutual fund shareholders of income from interest or dividends generated by a fund's investments.
Dow Jones U.S. Total Stock Market Float Adjusted Index. An index that represents the entire U.S. stock market and tracks more than 5,000 stocks, excluding shares of securities not available for public trading.
Expense Ratio. A fund's total annual operating expenses expressed as a percentage of the fund's average net assets. The expense ratio includes management and administrative expenses, but it does not include the transaction costs of buying and selling portfolio securities.
Inception Date. The date on which the assets of a fund (or one of its share classes) are first invested in accordance with the fund's investment objective. For funds with a subscription period, the inception date is the day after that period ends. Investment performance is generally measured from the inception date.
Indexing. A low-cost investment strategy in which a mutual fund attempts to track—rather than outperform—a specified market benchmark, or “index.”
Joint Committed Credit Facility. Each Fund participates, along with other funds managed by Vanguard, in a committed credit facility provided by a syndicate of lenders pursuant to a credit agreement that may be renewed annually; each Vanguard fund is individually liable for its borrowings, if any, under the credit facility. The amount and terms of the committed credit facility are subject to approval by the Funds' board of trustees and renegotiation with the lender syndicate on an annual basis.
Median Market Capitalization. An indicator of the size of companies in which a fund invests; the midpoint of market capitalization (market price x shares outstanding) of a fund's stocks, weighted by the proportion of the fund's assets invested in each stock. Stocks representing half of the fund's assets have market capitalizations above the median, and the rest are below it.
Mutual Fund. An investment company that pools the money of many people and invests it in a variety of securities in an effort to achieve a specific objective over time.
55
New York Stock Exchange (NYSE). A stock exchange based in New York City that is open for regular trading on business days, Monday through Friday, from 9:30 a.m. to 4 p.m., Eastern time.
Return of Capital. A return of capital occurs when a fund's distributions exceed its earnings in a fiscal year. A return of capital is a return of all or part of your original investment or amounts paid in excess of your original investment in a fund. In general, a return of capital reduces your cost basis in a fund's shares and is not taxable to you until your cost basis has been reduced to zero.
Securities. Stocks, bonds, money market instruments, and other investments.
Total Return. A percentage change, over a specified time period, in a mutual fund's net asset value, assuming the reinvestment of all distributions of dividends and capital gains.
Volatility. The fluctuations in value of a mutual fund or other security. The greater a fund's volatility, the wider the fluctuations in its returns.
Yield. Income (interest or dividends) earned by an investment, expressed as a percentage of the investment’s price.
56
Connect with Vanguard® ˃ vanguard.com
For More Information
If you would like more information about Vanguard Russell 1000 Index Funds, the following documents are available free upon request:
Annual/Semiannual Reports to Shareholders
Additional information about the Funds' investments is available in the Funds' annual and semiannual reports to shareholders. In the annual report, you will find a discussion of the market conditions and investment strategies that significantly affected the Funds' performance during their last fiscal year.
Statement of Additional Information (SAI)
The SAI provides more detailed information about the Funds and is incorporated by reference into (and thus legally a part of) this prospectus.
To receive a free copy of the latest annual or semiannual report or the SAI, or to request additional information about the Funds or other Vanguard funds, please visit vanguard.com or contact us as follows:
If you are an individual investor:
Telephone: 800-662-7447; Text telephone for people with hearing impairment: 800-749-7273
Telephone: 800-662-7447; Text telephone for people with hearing impairment: 800-749-7273
If you are a client of Vanguard’s Institutional Division:
Telephone: 888-809-8102; Text telephone for people
with hearing impairment: 800-749-7273
Telephone: 888-809-8102; Text telephone for people
with hearing impairment: 800-749-7273
If you are a current Vanguard shareholder and would like information about your account, account transactions, and/or account statements, please call:
Client Services Department
Telephone: 800-662-2739; Text telephone for people with hearing impairment: 800-749-7273
Telephone: 800-662-2739; Text telephone for people with hearing impairment: 800-749-7273
Information Provided by the SEC
Reports and other information about the Funds are available in the EDGAR database on the SEC’s website at sec.gov, or you can receive copies of this information, for a fee, by electronic request at the following email address: publicinfo@sec.gov.
Funds' Investment Company Act file number: 811-07803
© 2023 The Vanguard Group, Inc. All rights reserved.
Vanguard Marketing Corporation, Distributor.
Vanguard Marketing Corporation, Distributor.
I 1848 122023
Vanguard Russell 2000 Index Funds
Prospectus
December 22, 2023
Institutional Shares
Vanguard Russell 2000 Index Fund Institutional Shares (VRTIX)
Vanguard Russell 2000 Value Index Fund Institutional Shares (VRTVX)
Vanguard Russell 2000 Growth Index Fund Institutional Shares (VRTGX)
Vanguard Russell 2000 Value Index Fund Institutional Shares (VRTVX)
Vanguard Russell 2000 Growth Index Fund Institutional Shares (VRTGX)
This prospectus contains financial data for the Funds through the fiscal year ended August 31, 2023.
The Securities and Exchange Commission (SEC) has not approved or disapproved these securities or passed upon the adequacy of this prospectus. Any representation to the contrary is a criminal offense.
(Fees paid directly from your investment)
|
| |
|
Sales Charge (Load) Imposed on Purchases |
|
|
Purchase Fee |
|
|
Sales Charge (Load) Imposed on Reinvested Dividends |
|
|
Redemption Fee |
|
(Expenses that you pay each year as a percentage of the value of your investment)
|
| |
|
Management Fees |
% |
|
12b-1 Distribution Fee |
|
|
Other Expenses |
% |
|
Total Annual Fund Operating Expenses |
% |
|
1 Year |
3 Years |
5 Years |
10 Years |
|
$ |
$ |
$ |
$ |
1
2
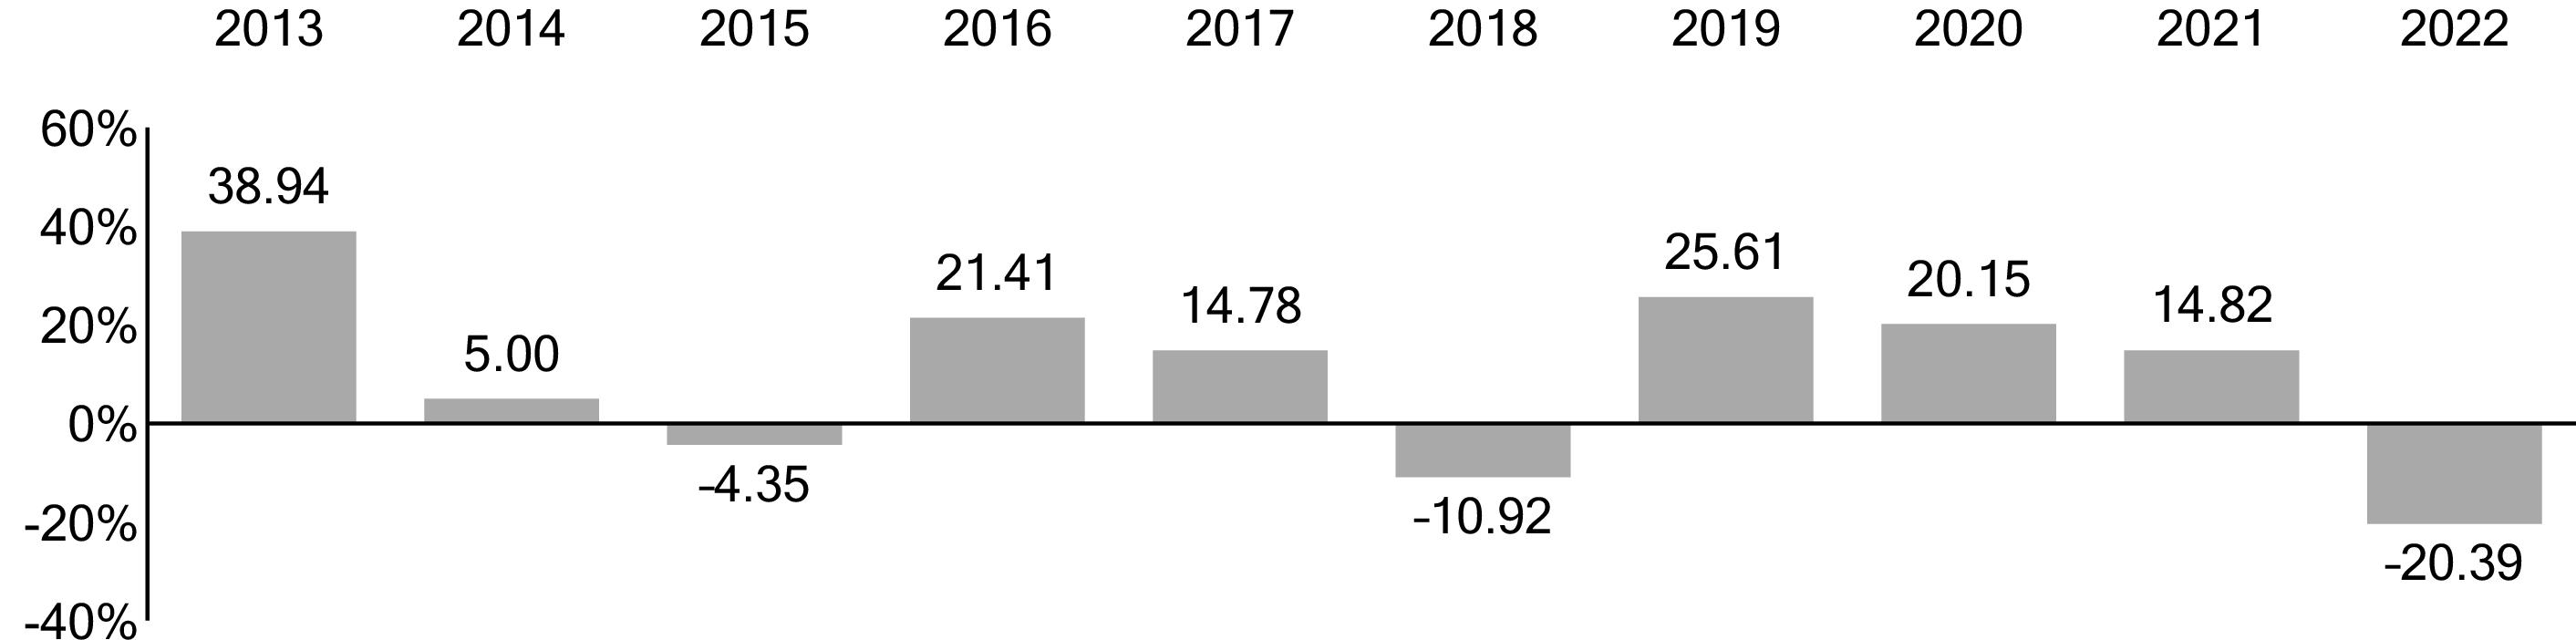
1 The year-to-date return as of the most recent calendar quarter, which ended on September 30, 2023, was 2.62%.
|
|
Total Return |
Quarter |
|
|
% |
|
|
|
-
% |
|
3
|
|
1 Year |
5 Years |
10 Years |
|
Vanguard Russell 2000 Index Fund Institutional Shares |
|
|
|
|
Return Before Taxes |
-
% |
% |
% |
|
Return After Taxes on Distributions |
- |
|
|
|
Return After Taxes on Distributions and Sale of Fund Shares |
- |
|
|
|
Russell 2000 Index
(reflects no deduction for fees, expenses, or taxes) |
-
% |
% |
% |
|
Dow Jones U.S. Total Stock Market Float Adjusted Index
(reflects no deduction for fees, expenses, or taxes) |
- |
|
|
Investment Advisor
The Vanguard Group, Inc. (Vanguard)
Portfolio Managers
Nick Birkett, CFA, Portfolio Manager at Vanguard. He has co-managed the Fund since 2021.
Kenny Narzikul, CFA, Portfolio Manager at Vanguard. He has co-managed the Fund since February 2023.
Purchase and Sale of Fund Shares
You may purchase or redeem shares online through our website (vanguard.com), by mail (The Vanguard Group, P.O. Box 982901, El Paso, TX 79998-2901), or by telephone (800-662-2739). The minimum investment amount required to open and maintain a Fund account for Institutional Shares is $5 million. The minimum investment amount required to add to an existing Fund account is generally $1. If you are investing through an employer-sponsored retirement or savings plan, your plan administrator or your benefits office can provide you with detailed information on how you can invest through your plan.
4
Tax Information
The Fund’s distributions may be taxable as ordinary income or capital gain. If you are investing through a tax-advantaged account, such as an IRA or an employer-sponsored retirement or savings plan, special tax rules apply.
Payments to Financial Intermediaries
The Fund and its investment advisor do not pay financial intermediaries for sales of Fund shares.
5
(Fees paid directly from your investment)
|
| |
|
Sales Charge (Load) Imposed on Purchases |
|
|
Purchase Fee |
|
|
Sales Charge (Load) Imposed on Reinvested Dividends |
|
|
Redemption Fee |
|
(Expenses that you pay each year as a percentage of the value of your investment)
|
| |
|
Management Fees |
% |
|
12b-1 Distribution Fee |
|
|
Other Expenses |
% |
|
Total Annual Fund Operating Expenses |
% |
|
1 Year |
3 Years |
5 Years |
10 Years |
|
$ |
$ |
$ |
$ |
6
7
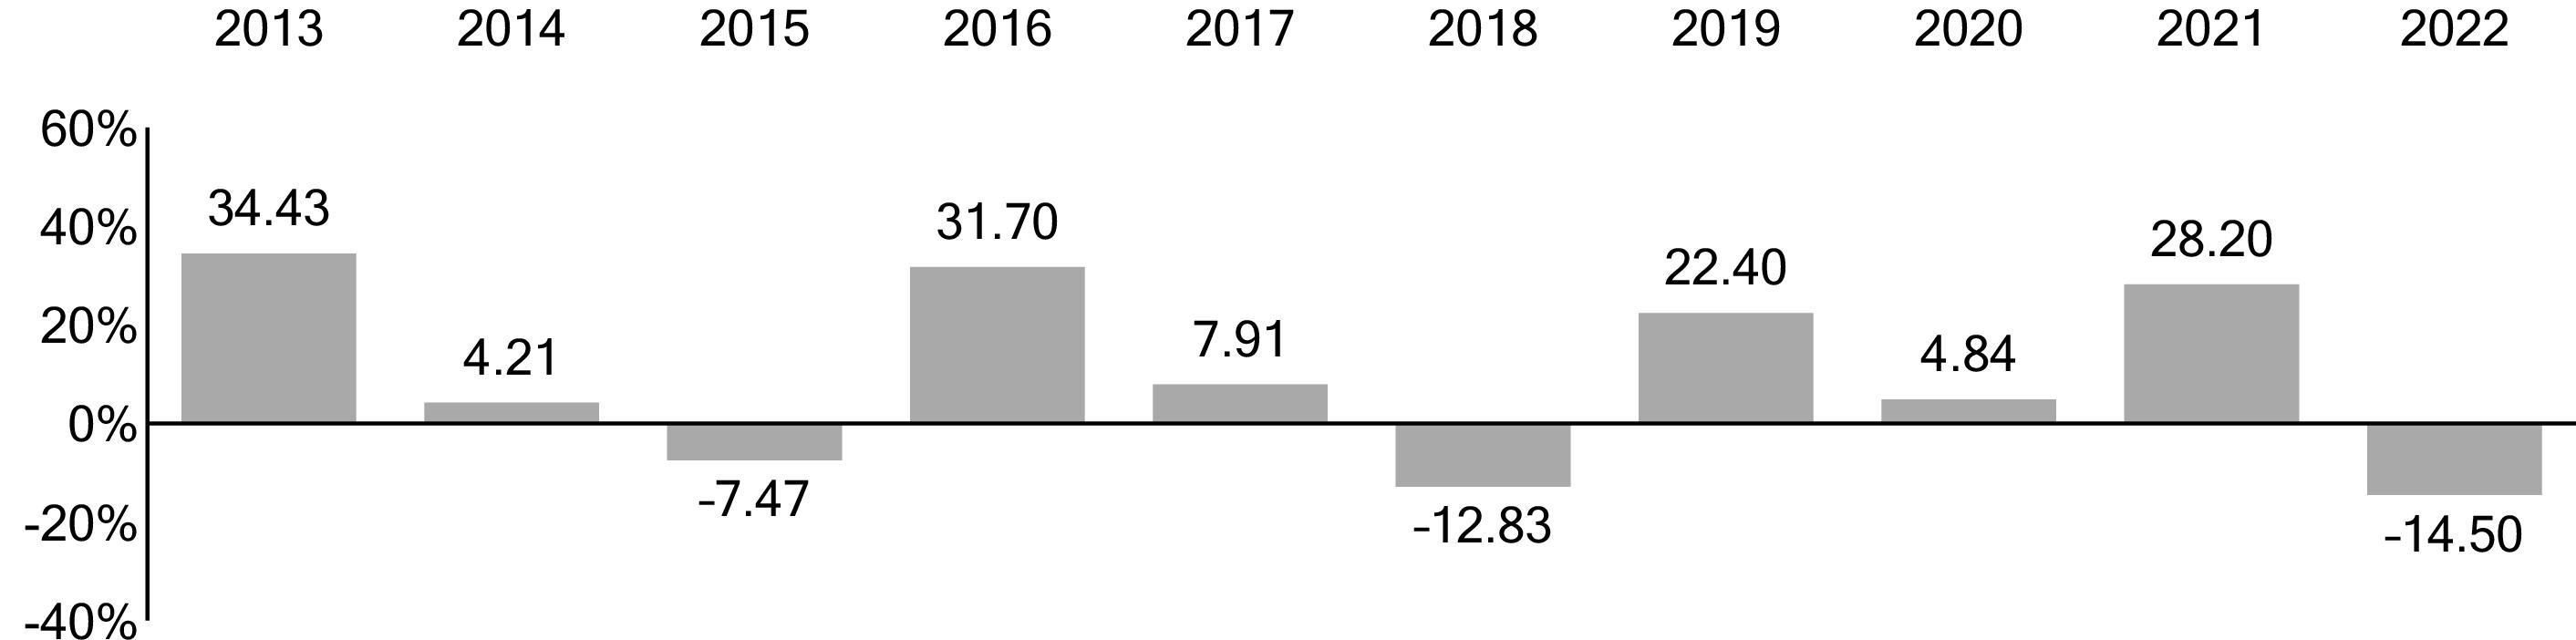
1 The year-to-date return as of the most recent calendar quarter, which ended on September 30, 2023, was -0.46%.
|
|
Total Return |
Quarter |
|
|
% |
|
|
|
-
% |
|
8
|
|
1 Year |
5 Years |
10 Years |
|
Vanguard Russell 2000 Value Index Fund
Institutional Shares |
|
|
|
|
Return Before Taxes |
-
% |
% |
% |
|
Return After Taxes on Distributions |
- |
|
|
|
Return After Taxes on Distributions and Sale of Fund Shares |
- |
|
|
|
Russell 2000 Value Index
(reflects no deduction for fees, expenses, or taxes) |
-
% |
% |
% |
|
Dow Jones U.S. Total Stock Market Float Adjusted Index
(reflects no deduction for fees, expenses, or taxes) |
- |
|
|
Investment Advisor
The Vanguard Group, Inc. (Vanguard)
Portfolio Managers
Nick Birkett, CFA, Portfolio Manager at Vanguard. He has co-managed the Fund since 2021.
Kenny Narzikul, CFA, Portfolio Manager at Vanguard. He has co-managed the Fund since February 2023.
Purchase and Sale of Fund Shares
You may purchase or redeem shares online through our website (vanguard.com), by mail (The Vanguard Group, P.O. Box 982901, El Paso, TX 79998-2901), or by telephone (800-662-2739). The minimum investment amount required to open and maintain a Fund account for Institutional Shares is $5 million. The minimum investment amount required to add to an existing Fund
9
account is generally $1. If you are investing through an employer-sponsored retirement or savings plan, your plan administrator or your benefits office can provide you with detailed information on how you can invest through your plan.
Tax Information
The Fund’s distributions may be taxable as ordinary income or capital gain. If you are investing through a tax-advantaged account, such as an IRA or an employer-sponsored retirement or savings plan, special tax rules apply.
Payments to Financial Intermediaries
The Fund and its investment advisor do not pay financial intermediaries for sales of Fund shares.
10
(Fees paid directly from your investment)
|
| |
|
Sales Charge (Load) Imposed on Purchases |
|
|
Purchase Fee |
|
|
Sales Charge (Load) Imposed on Reinvested Dividends |
|
|
Redemption Fee |
|
(Expenses that you pay each year as a percentage of the value of your investment)
|
| |
|
Management Fees |
% |
|
12b-1 Distribution Fee |
|
|
Other Expenses |
% |
|
Total Annual Fund Operating Expenses |
% |
|
1 Year |
3 Years |
5 Years |
10 Years |
|
$ |
$ |
$ |
$ |
11
12
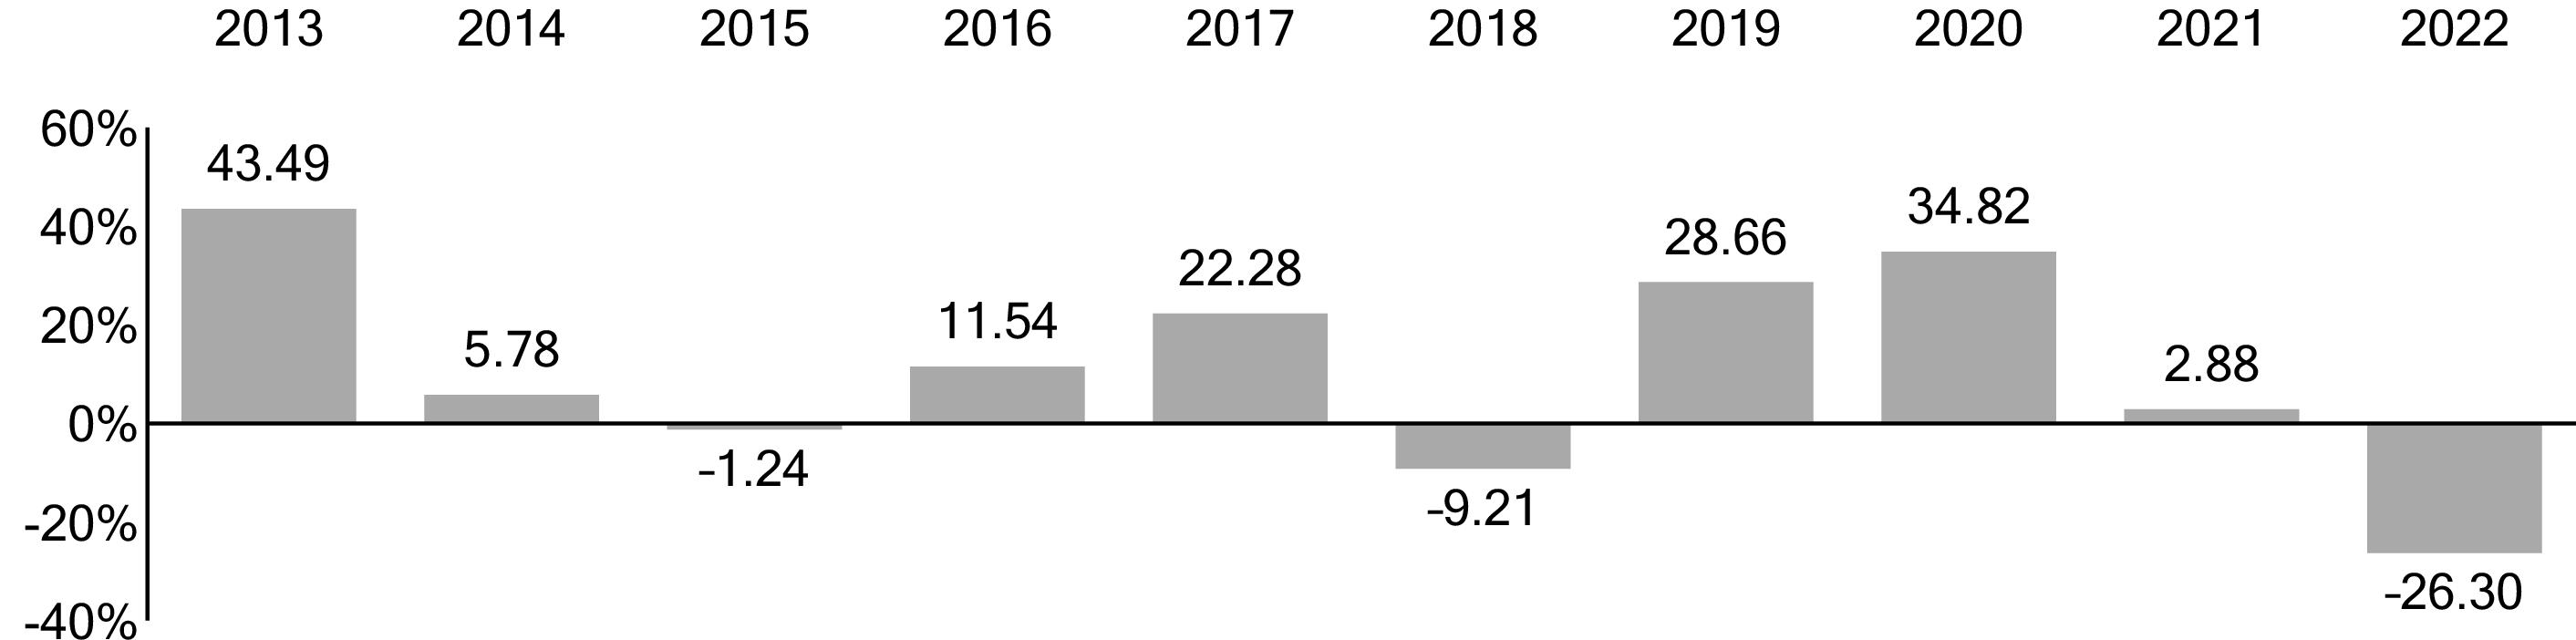
1 The year-to-date return as of the most recent calendar quarter, which ended on September 30, 2023, was 5.36%.
|
|
Total Return |
Quarter |
|
|
% |
|
|
|
-
% |
|
13
|
|
1 Year |
5 Years |
10 Years |
|
Vanguard Russell 2000 Growth Index Fund
Institutional Shares |
|
|
|
|
Return Before Taxes |
-
% |
% |
% |
|
Return After Taxes on Distributions |
- |
|
|
|
Return After Taxes on Distributions and Sale of Fund Shares |
- |
|
|
|
Russell 2000 Growth Index
(reflects no deduction for fees, expenses, or taxes) |
-
% |
% |
% |
|
Dow Jones U.S. Total Stock Market Float Adjusted Index
(reflects no deduction for fees, expenses, or taxes) |
- |
|
|
Investment Advisor
The Vanguard Group, Inc. (Vanguard)
Portfolio Managers
Nick Birkett, CFA, Portfolio Manager at Vanguard. He has co-managed the Fund since 2021.
Kenny Narzikul, CFA, Portfolio Manager at Vanguard. He has co-managed the Fund since February 2023.
Purchase and Sale of Fund Shares
You may purchase or redeem shares online through our website (vanguard.com), by mail (The Vanguard Group, P.O. Box 982901, El Paso, TX 79998-2901), or by telephone (800-662-2739). The minimum investment amount required to open and maintain a Fund account for Institutional Shares is $5 million. The minimum investment amount required to add to an existing Fund
14
account is generally $1. If you are investing through an employer-sponsored retirement or savings plan, your plan administrator or your benefits office can provide you with detailed information on how you can invest through your plan.
Tax Information
The Fund’s distributions may be taxable as ordinary income or capital gain. If you are investing through a tax-advantaged account, such as an IRA or an employer-sponsored retirement or savings plan, special tax rules apply.
Payments to Financial Intermediaries
The Fund and its investment advisor do not pay financial intermediaries for sales of Fund shares.
15
Investing in Index Funds
What Is Indexing?
Indexing is an investment strategy for tracking the performance of a specified market benchmark, or “index.” An index is a group of securities whose overall performance is used as a standard to measure the investment performance of a particular market. There are many types of indexes. Some represent entire markets—such as the U.S. stock market or the U.S. bond market. Other indexes cover market segments—such as small-capitalization stocks or short-term bonds. One cannot invest directly in an index.
The index provider determines the securities to include in the index and the weighting of each security in the index. Under normal circumstances, the index provider will rebalance an index on a regular schedule. An index provider may carry out additional ad hoc index rebalances or delay or cancel a scheduled rebalance. Generally, the index provider does not provide any warranty, or accept any liability, with respect to the quality, accuracy, or completeness of either the target index or its related data. Errors made by the index provider may occur from time to time and may not be identified by the index provider for a period of time or at all. Vanguard does not provide any warranty or guarantee against such errors. Therefore, the gains, losses, or costs associated with the index provider’s errors will generally be borne by the index fund and its shareholders.
An index fund seeks to hold all, or a representative sample, of the securities that make up its target index. Index funds attempt to mirror the performance of the target index, for better or worse. However, an index fund generally does not perform exactly like its target index. For example, index funds have operating expenses and transaction costs. Market indexes do not, and therefore they will usually have a slight performance advantage over funds that track them. The ability of an index fund to match its performance to that of its target index can also be impacted by, among other things, the timing and size of cash flows, asset valuation differences, and the size of the fund. Market disruptions could also have an adverse effect on a fund’s ability to adjust its exposure to the required levels in order to track the index. The risk that a fund may not track the performance of its target index may be heightened during times of increased market volatility or other unusual market conditions.
Index funds typically have the following characteristics:
• Variety of investments. Depending on a fund’s benchmark index, the fund may invest in the securities of a variety of companies, industries, and/or governments or government agencies.
• Relative performance consistency. Because they seek to track market benchmarks, index funds usually do not perform dramatically better or worse than their benchmarks.
• Low cost. Index funds are generally inexpensive to run compared with actively managed funds. They have low or no research costs and typically keep trading activity—and thus brokerage commissions and other transaction costs—to a minimum compared with actively managed funds.
16
More on the Funds
This prospectus describes the principal risks you would face as a Fund shareholder. It is important to keep in mind one of the main principles of investing: generally, the higher the risk of losing money, the higher the potential reward. The reverse, also, is generally true: the lower the risk, the lower the potential reward. As you consider an investment in any mutual fund, you should take into account your personal tolerance for fluctuations in the securities markets. Look for this
symbol throughout the prospectus. It is used to mark detailed information about the more significant risks that you would confront as a Fund shareholder. To highlight terms and concepts important to mutual fund investors, we have provided Plain Talk® explanations along the way. Reading the prospectus will help you decide whether a Fund is the right investment for you. We suggest that you keep this prospectus for future reference.
symbol throughout the prospectus. It is used to mark detailed information about the more significant risks that you would confront as a Fund shareholder. To highlight terms and concepts important to mutual fund investors, we have provided Plain Talk® explanations along the way. Reading the prospectus will help you decide whether a Fund is the right investment for you. We suggest that you keep this prospectus for future reference.Share Class Overview
This prospectus offers the Funds’ Institutional Shares, which are generally for investors who invest a minimum of $5 million. Each Fund also issues ETF Shares (an exchange-traded class of shares), which are offered through a separate prospectus.
Both share classes offered by a Fund have the same investment objective, strategies, and policies. However, different share classes may have different expenses; as a result, their investment returns may differ.
|
Plain Talk About Costs of Investing |
|
Costs are an important consideration in choosing a mutual fund. That is
because you, as a shareholder, pay a proportionate share of the costs of
operating a fund and any transaction costs incurred when the fund buys or
sells securities. These costs can erode a substantial portion of the gross
income or the capital appreciation a fund achieves. Even seemingly small
differences in expenses can, over time, have a dramatic effect on a
fund’s performance. |
The following sections explain the principal investment strategies and policies that each Fund uses in pursuit of its investment objective. The Funds' board of trustees, which oversees each Fund's management, may change investment strategies or policies in the interest of shareholders without a shareholder vote, unless those strategies or policies are designated as fundamental. Note that each Fund’s investment objective is not fundamental and may be changed without a shareholder vote. Under normal circumstances, each Fund will invest at least 80% of its assets in the stocks that make up its target index. A Fund may change its 80% policy only upon 60 days‘ notice to shareholders.
17
Market Exposure
Each Fund is subject to stock market risk, which is the chance that stock prices overall will decline. Stock markets tend to move in cycles, with periods of rising prices and periods of falling prices. Each Fund‘s target index tracks a subset of the U.S. stock market, which could cause the Fund to perform differently from the overall stock market. In addition, each Fund‘s target index may, at times, become focused in stocks of a particular market sector, which would subject the Fund to proportionately higher exposure to the risks of that sector.
Stocks of publicly traded companies are often classified according to market capitalization, which is the market value of a company's outstanding shares. These classifications typically include small-cap, mid-cap, and large-cap. It is important to understand that there are no “official” definitions of small-, mid-, and large-cap, even among Vanguard fund advisors, and that market capitalization ranges can change over time. The asset-weighted median market capitalization of each Fund's stock holdings as of August 31, 2023, was:
|
Vanguard Fund |
Asset-Weighted Median
Market Capitalization |
|
Vanguard Russell 2000 Index Fund |
$2.7 billion |
|
Vanguard Russell 2000 Value Index Fund |
2.2 |
|
Vanguard Russell 2000 Growth Index
Fund |
3.1 |
Each Fund is subject to investment style risk, which is the chance that returns from the types of stocks in which the Fund invests will trail returns from the overall stock market. Historically, small-cap stocks have been more volatile in price than the large-cap stocks that dominate the overall market, and they often perform quite differently. The stock prices of small companies tend to experience greater volatility because, among other things, these companies tend to be more sensitive to changing economic conditions. Specific types of stocks tend to go through cycles of doing better or worse than other segments of the U.S. stock market or the stock market in general. These periods have, in the past, lasted for as long as several years.
18
|
Plain Talk About Growth Funds and Value Funds |
|
Growth investing and value investing are two styles employed by stock-fund
managers. Growth funds generally invest in stocks of companies believed to
have above-average potential for growth in revenue, earnings, cash flow, or
other similar criteria. These stocks typically have low dividend yields, if any,
and above-average prices in relation to measures such as earnings and book
value. Value funds typically invest in stocks whose prices are below average
in relation to those measures; these stocks often have above-average
dividend yields. Value stocks also may remain undervalued by the market for
long periods of time. Growth and value stocks have historically produced
similar long-term returns, though each category has periods when it
outperforms the other. |
Market disruptions can adversely affect local and global markets as well as normal market conditions and operations. Any such disruptions could have an adverse impact on the value of a Fund's investments and Fund performance.
Security Selection
Each Fund attempts to track the investment performance of a benchmark index that measures the return of a particular market segment. Each Fund uses the replication method of indexing, meaning that each Fund generally holds the same stocks as its target index and in approximately the same proportions.
Each Fund is subject to index replicating risk, which is the chance that each Fund may be prevented from holding one or more securities in the same proportion as in its target index.
The ability of the advisor to purchase or dispose of certain Fund investments is or may be restricted or impaired because of limitations imposed by law, regulation, or by certain regulators or issuers. As a result, the advisor may be required to limit purchases or sell existing investments. If a Fund is required to limit its investment in a particular issuer, then the Fund may seek to obtain regulatory relief or special permission from an issuer to exceed a certain percentage ownership in that issuer's shares. Other options a Fund may pursue include seeking to obtain economic exposure to that issuer through alternative means, such as through a derivative or through investment in a wholly owned subsidiary, both of which may be more costly than owning securities of the issuer directly. Ownership restrictions and limitations could result in unanticipated tax consequences to a Fund that may affect the amount, timing, and character of distributions to shareholders. See Other Investment Policies and Risks for further information related to derivatives.
19
Other Investment Policies and Risks
Each Fund reserves the right to substitute a different index for the index it currently tracks if the current index is discontinued, if the Fund's agreement with the provider of its target index is terminated, or for any other reason determined in good faith by the Fund’s board of trustees. In any such instance, the substitute index would represent the same market segment as the current index.
Each Fund has the ability to invest in foreign securities to the extent necessary to carry out its investment strategy of holding all, or substantially all, of the stocks that make up the index it tracks. It is not expected that any Fund will invest more than 5% of its assets in foreign securities.
To track their target indexes as closely as possible, the Funds attempt to remain fully invested in stocks. To help stay fully invested and to reduce transaction costs, the Funds may invest, to a limited extent, in derivatives, including equity futures. The Funds may also use derivatives such as total return swaps to obtain exposure to a stock, a basket of stocks, or an index. Generally speaking, a derivative is a financial contract whose value is based on the value of a financial asset (such as a stock, a bond, or a currency), a physical asset (such as gold, oil, or wheat), a market index, or a reference rate. Investments in derivatives may subject the Funds to risks different from, and possibly greater than, those of investments directly in the underlying securities or assets. The Funds will not use derivatives for speculation or for the purpose of leveraging (magnifying) investment returns.
Cash Management
Each Fund's daily cash balance may be invested in Vanguard Market Liquidity Fund and/or Vanguard Municipal Cash Management Fund (each, a CMT Fund), which are low-cost money market funds. When investing in a CMT Fund, each Fund bears its proportionate share of the expenses of the CMT Fund in which it invests. Vanguard receives no additional revenue from Fund assets invested in a CMT Fund.
Redemption Requests
Methods used to meet redemption requests. Under normal circumstances, each Fund typically expects to meet redemptions with positive cash flows. When this is not an option, each Fund seeks to maintain its risk exposure by selling a cross section of the Fund’s holdings to meet redemptions, while also factoring in transaction costs. Additionally, a Fund may work with larger clients to implement their redemptions in a manner that is least disruptive to the portfolio; see “Potentially disruptive redemptions” under Redeeming Shares in the Investing With Vanguard section.
20
Under certain circumstances, including under stressed market conditions, there are additional tools that each Fund may use in order to meet redemptions, including advancing the settlement of market trades with counterparties to match investor redemption payments or delaying settlement of an investor’s transaction to match trade settlement within regulatory requirements. A Fund may also suspend payment of redemption proceeds for up to seven days; see “Emergency circumstances” under Redeeming Shares in the Investing With Vanguard section. Additionally under these unusual circumstances, a Fund may borrow money (subject to certain regulatory conditions and if available under board-approved procedures) through an interfund lending facility; through a bank line-of-credit, including a joint committed credit facility; or through an uncommitted line-of-credit from Vanguard in order to meet redemption requests.
Potential redemption activity impacts. At times, a Fund may experience adverse effects when certain large shareholders, or multiple shareholders comprising significant ownership of the Fund, redeem large amounts of shares of the Fund. Large redemptions may cause a Fund to sell portfolio securities at times when it would not otherwise do so. This may result in a Fund distributing capital gains or other taxable income to non-redeeming shareholders. Large redemptions may also increase a Fund's transaction costs. Redemption activity can occur for many reasons, including shareholder reactions to market movements or other events unrelated to Vanguard’s actions, or when Vanguard makes product changes that, for example, may result in a shareholder redeeming shares of a Fund to purchase shares of another similar fund or investment vehicle. When experiencing large redemptions, the Fund reserves the right to pay all or part of the redemption in-kind and/or delay payment of the redemption proceeds for up to seven calendar days; see “Potentially disruptive redemptions” under Redeeming Shares in the Investing With Vanguard section.
Temporary Investment Measures
Each Fund may temporarily depart from its normal investment policies and strategies when the advisor believes that doing so is in the Fund's best interest, so long as the strategy or policy employed is consistent with the Fund's investment objective. For instance, the Fund may invest beyond its normal limits in derivatives or exchange-traded funds that are consistent with the Fund's investment objective when those instruments are more favorably priced or provide needed liquidity, as might be the case when the Fund receives large cash flows that it cannot prudently invest immediately.
21
Frequent Trading or Market-Timing
Background. Some investors try to profit from strategies involving frequent trading of mutual fund shares, such as market-timing. For funds holding foreign securities, investors may try to take advantage of an anticipated difference between the price of the fund’s shares and price movements in overseas markets, a practice also known as time-zone arbitrage. Investors also may try to engage in frequent trading of funds holding investments such as small-cap stocks and high-yield bonds. As money is shifted into and out of a fund by a shareholder engaging in frequent trading, the fund incurs costs for buying and selling securities, resulting in increased brokerage and administrative costs. These costs are borne by all fund shareholders, including the long-term investors who do not generate the costs. In addition, frequent trading may interfere with an advisor’s ability to efficiently manage the fund.
Policies to address frequent trading. The Vanguard funds (other than money market funds and short-term bond funds, but including Vanguard Short-Term Inflation-Protected Securities Index Fund) do not knowingly accommodate frequent trading. The board of trustees of each Vanguard fund (other than money market funds and short-term bond funds, but including Vanguard Short-Term Inflation-Protected Securities Index Fund) has adopted policies and procedures reasonably designed to detect and discourage frequent trading and, in some cases, to compensate the fund for the costs associated with it. These policies and procedures do not apply to ETF Shares because frequent trading in ETF Shares generally does not disrupt portfolio management or otherwise harm fund shareholders. Although there is no assurance that Vanguard will be able to detect or prevent frequent trading or market-timing in all circumstances, the following policies have been adopted to address these issues:
• Each Vanguard fund reserves the right to reject any purchase request—including exchanges from other Vanguard funds—without notice and regardless of size. For example, a purchase request could be rejected because the investor has a history of frequent trading or if Vanguard determines that such purchase may negatively affect a fund’s operation or performance.
• Each Vanguard fund (other than money market funds and short-term bond funds, but including Vanguard Short-Term Inflation-Protected Securities Index Fund) generally prohibits, except as otherwise noted in the Investing With Vanguard section, an investor’s purchases or exchanges into a fund account for 30 calendar days after the investor has redeemed or exchanged out of that fund account.
• Certain Vanguard funds charge shareholders purchase and/or redemption fees on transactions.
22
See the Investing With Vanguard section of this prospectus for further details on Vanguard’s transaction policies.
Each Vanguard fund (other than retail and government money market funds), in determining its net asset value, will use fair-value pricing when appropriate, as described in the Share Price section. Fair-value pricing may reduce or eliminate the profitability of certain frequent-trading strategies.
Do not invest with Vanguard if you are a market-timer.
A precautionary note to investment companies: Each Fund's shares are issued by registered investment companies, and therefore the acquisition of such shares by other investment companies and private funds is subject to the restrictions of Section 12(d)(1) of the Investment Company Act of 1940 (the 1940 Act). SEC Rule 12d1-4 under the 1940 Act permits registered investment companies to invest in other registered investment companies beyond the limits in Section 12(d)(1), subject to certain conditions, including that funds with different investment advisors must enter into a fund of funds investment agreement.
Turnover Rate
Although the Funds generally seek to invest for the long term, each Fund may sell securities regardless of how long they have been held. Generally, an index fund sells securities in response to redemption requests from shareholders of conventional (i.e., not exchange-traded) shares or to changes in the composition of its target index. Turnover rates for mid-cap and small-cap stock index funds tend to be higher than those for large-cap stock index funds (although still relatively low, compared with actively managed stock funds) because the indexes they track are more likely to change as a result of companies merging, growing, or failing. The Financial Highlights section of this prospectus shows historical turnover rates for each Fund. A turnover rate of 100%, for example, would mean that a Fund had sold and replaced securities valued at 100% of its net assets within a one-year period. In general, the greater the turnover rate, the greater the impact transaction costs will have on a fund’s return. Also, funds with high turnover rates may be more likely to generate capital gains, including short-term capital gains, that must be distributed to shareholders and will be taxable to shareholders investing through a taxable account.
23
The Funds and Vanguard
Each Fund is a member of The Vanguard Group, Inc. (Vanguard), a family of over 200 funds. All of the funds that are members of Vanguard (other than funds of funds) share in the expenses associated with administrative services and business operations, such as personnel, office space, and equipment.
Vanguard Marketing Corporation provides marketing services to the funds. Although fund shareholders do not pay sales commissions or 12b-1 distribution fees, each fund (other than a fund of funds) or each share class of a fund (in the case of a fund with multiple share classes) pays its allocated share of the Vanguard funds’ marketing costs.
|
Plain Talk About Vanguard’s Unique Corporate Structure |
|
Vanguard is owned jointly by the funds it oversees and thus indirectly by the
shareholders in those funds. Most other mutual funds are operated by
management companies that are owned by third parties—either public or
private stockholders—and not by the funds they serve. |
Investment Advisor
The Vanguard Group, Inc., P.O. Box 2600, Valley Forge, PA 19482, which began operations in 1975, serves as advisor to the Funds through its Equity Index Group. As of August 31, 2023, Vanguard served as advisor for approximately $6.8 trillion in assets. Vanguard provides investment advisory services to the Funds pursuant to the Funds’ Service Agreement and subject to the supervision and oversight of the trustees and officers of the Funds.
For the fiscal year ended August 31, 2023, the advisory expenses represented an effective annual rate of less than 0.01% of each Fund's average net assets.
Under the terms of an SEC exemption, the Funds' board of trustees may, without prior approval from shareholders, change the terms of an advisory agreement with a third-party investment advisor or hire a new third-party investment advisor—either as a replacement for an existing advisor or as an additional advisor. Any significant change in a Fund's advisory arrangements will be communicated to shareholders in writing. As the Funds' sponsor and overall manager, Vanguard may provide investment advisory services to a Fund at any time. Vanguard may also recommend to the board of trustees that an advisor be hired, terminated, or replaced or that the terms of an existing advisory agreement
24
be revised. The Funds have filed an application seeking a similar SEC exemption with respect to investment advisors that are wholly owned subsidiaries of Vanguard. If the exemption is granted, the Funds may rely on the new SEC relief.
For a discussion of why the board of trustees approved each Fund's investment advisory arrangement, see the most recent annual report to shareholders covering the fiscal year ended August 31.
The managers primarily responsible for the day-to-day management of the Funds are:
Nick Birkett, CFA, Portfolio Manager at Vanguard. He has worked in investment management since 2006, has been with Vanguard since 2017, and has co-managed the Funds since 2021. Education: B.S., University of Bath.
Kenny Narzikul, CFA, Portfolio Manager at Vanguard. He has been with Vanguard since 2012, has worked in investment management since 2016, has managed investment portfolios since 2023, and has co-managed the Funds since February 2023. Education: B.B.A., James Madison University.
The Funds' Statement of Additional Information provides information about each portfolio manager’s compensation, other accounts under management, and ownership of shares of the Funds.
Dividends, Capital Gains, and Taxes
Fund Distributions
Each Fund distributes to shareholders virtually all of its net income (interest and dividends, less expenses) as well as any net short-term or long-term capital gains realized from the sale of its holdings. From time to time, each Fund may also make distributions that are treated as a return of capital. Income dividends generally are distributed quarterly in March, June, September, and December; capital gains distributions, if any, generally occur annually in December. In addition, each Fund may occasionally make a supplemental distribution at some other time during the year.
You can receive distributions of income or capital gains in cash, or you can have them automatically reinvested in more shares of the Fund. However, if you are investing through an employer-sponsored retirement or savings plan, your distributions will be automatically reinvested in additional Fund shares.
25
|
Plain Talk About Distributions |
|
As a shareholder, you are entitled to your portion of a fund’s income from
interest and dividends as well as capital gains from the fund’s sale of
investments. Income consists of both the dividends that the fund earns from
any stock holdings and the interest it receives from any money market and
bond investments. Capital gains are realized whenever the fund sells
securities for higher prices than it paid for them. These capital gains are
either short-term or long-term, depending on whether the fund held the
securities for one year or less or for more than one year. |
Basic Tax Points
Investors in taxable accounts should be aware of the following basic federal income tax points:
• Distributions are taxable to you whether or not you reinvest these amounts in additional Fund shares.
• Distributions declared in December—if paid to you by the end of January—are taxable as if received in December.
• Any dividend distribution or short-term capital gains distribution that you receive is taxable to you as ordinary income. If you are an individual and meet certain holding period requirements with respect to your Fund shares, you may be eligible for reduced tax rates on “qualified dividend income,” if any, or a special tax deduction on “qualified REIT dividends,” if any, distributed by the Fund.
• Any distribution of net long-term capital gains is taxable to you as long-term capital gains, no matter how long you have owned shares in the Fund.
• Capital gains distributions may vary considerably from year to year as a result of the Funds' normal investment activities and cash flows.
• Your cost basis in the Fund will be decreased by the amount of any return of capital that you receive. This, in turn, will affect the amount of any capital gain or loss that you realize when selling or exchanging your Fund shares.
• Return of capital distributions generally are not taxable to you until your cost basis has been reduced to zero. If your cost basis is at zero, return of capital distributions will be treated as capital gains.
• A sale or exchange of Fund shares is a taxable event. This means that you may have a capital gain to report as income, or a capital loss to report as a deduction, when you complete your tax return.
26
• Any conversion between classes of shares of the same fund is a nontaxable event. By contrast, an exchange between classes of shares of different funds is a taxable event.
• Vanguard (or your intermediary) will send you a statement each year showing the tax status of all of your distributions.
Individuals, trusts, and estates whose income exceeds certain threshold amounts are subject to a 3.8% Medicare contribution tax on “net investment income.” Net investment income takes into account distributions paid by the Fund and capital gains from any sale or exchange of Fund shares.
Dividend distributions and capital gains distributions that you receive, as well as your gains or losses from any sale or exchange of Fund shares, may be subject to state and local income taxes.
This prospectus provides general tax information only. If you are investing through a tax-advantaged account, such as an IRA or an employer-sponsored retirement or savings plan, special tax rules apply. Please consult your tax advisor for detailed information about any tax consequences for you.
|
Plain Talk About Buying a Dividend |
|
Unless you are a tax-exempt investor or investing through a tax-advantaged
account (such as an IRA or an employer-sponsored retirement or savings
plan), you should consider avoiding a purchase of fund shares shortly before
the fund makes a distribution, because doing so can cost you money in
taxes. This is known as “buying a dividend.” For example: On December 15,
you invest $5,000, buying 250 shares for $20 each. If the fund pays a
distribution of $1 per share on December 16, its share price will drop to $19
(not counting market change). You still have only $5,000 (250 shares x $19 =
$4,750 in share value, plus 250 shares x $1 = $250 in distributions), but you
owe tax on the $250 distribution you received—even if you reinvest it in more
shares. To avoid buying a dividend, check a fund’s distribution schedule
before you invest. |
27
General Information
Backup withholding. By law, Vanguard must withhold 24% of any taxable distributions or redemptions from your account if you do not:
• Provide your correct taxpayer identification number.
• Certify that the taxpayer identification number is correct.
• Confirm that you are not subject to backup withholding.
Similarly, Vanguard (or your intermediary) must withhold taxes from your account if the IRS instructs us to do so.
Foreign investors. Vanguard funds offered for sale in the United States (Vanguard U.S. funds), including the Funds offered in this prospectus, are not widely available outside the United States. Non-U.S. investors should be aware that U.S. withholding and estate taxes and certain U.S. tax reporting requirements may apply to any investments in Vanguard U.S. funds. Foreign investors should visit the non-U.S. investors page on our website at vanguard.com for information on Vanguard’s non-U.S. products.
Invalid addresses. If a dividend distribution or capital gains distribution check mailed to your address of record is returned as undeliverable, Vanguard will automatically reinvest the distribution and all future distributions until you provide us with a valid mailing address. Reinvestments will receive the net asset value calculated on the date of the reinvestment.
Share Price
Share price, also known as net asset value (NAV), is calculated as of the close of regular trading on the New York Stock Exchange (NYSE), generally 4 p.m., Eastern time, on each day that the NYSE is open for business (a business day). In the rare event the NYSE experiences unanticipated disruptions and is unavailable at the close of the trading day, NAVs will be calculated as of the close of regular trading on the Nasdaq (or another alternate exchange if the Nasdaq is unavailable, as determined at Vanguard’s discretion), generally 4 p.m., Eastern time. Each share class has its own NAV, which is computed by dividing the total assets, minus liabilities, allocated to the share class by the number of Fund shares outstanding for that class. On U.S. holidays or other days when the NYSE is closed, the NAV is not calculated, and the Funds do not sell or redeem shares. However, on those days the value of a Fund’s assets may be affected to the extent that the Fund holds securities that change in value on those days (such as foreign securities that trade on foreign markets that are open).
28
Stocks held by a Vanguard fund are valued at their market value when reliable market quotations are readily available from the principal exchange or market on which they are traded. Such securities are generally valued at their official closing price, the last reported sales price, or if there were no sales that day, the mean between the closing bid and asking prices. When a fund determines that market quotations either are not readily available or do not accurately reflect the value of a security, the security is priced at its fair value (the amount that the owner might reasonably expect to receive upon the current sale of the security).
The values of any foreign securities held by a fund are converted into U.S. dollars using an exchange rate obtained from an independent third party as of the close of regular trading on the NYSE. The values of any mutual fund shares, including institutional money market fund shares, held by a fund are based on the NAVs of the shares. The values of any ETF shares or closed-end fund shares held by a fund are based on the market value of the shares.
A fund also will use fair-value pricing if the value of a security it holds has been materially affected by events occurring before the fund's pricing time but after the close of the principal exchange or market on which the security is traded. This most commonly occurs with foreign securities, which may trade on foreign exchanges that close many hours before the fund's pricing time. Intervening events might be company-specific (e.g., earnings report, merger announcement) or country-specific or regional/global (e.g., natural disaster, economic or political news, interest rate change, act of terrorism). Intervening events include price movements in U.S. markets that exceed a specified threshold or that are otherwise deemed to affect the value of foreign securities.
Fair-value pricing may be used for domestic securities—for example, if (1) trading in a security is halted and does not resume before the fund's pricing time or a security does not trade in the course of a day and (2) the fund holds enough of the security that its price could affect the NAV.
Fair-value prices are determined by Vanguard according to procedures adopted by the board of trustees. When fair-value pricing is employed, the prices of securities used by a fund to calculate the NAV may differ from quoted or published prices for the same securities.
29
Each Fund has authorized certain financial intermediaries and their designees, and may, from time to time, authorize certain funds of funds for which Vanguard serves as the investment advisor (Vanguard Funds of Funds), to accept orders to buy or sell fund shares on its behalf. The Fund will be deemed to receive an order when accepted by the financial intermediary, its designee, or one of the Vanguard Funds of Funds, and the order will receive the NAV next computed by the Fund after such acceptance.
Vanguard fund share prices are published daily on our website at vanguard.com/prices.
Vanguard fund share prices are published daily on our website at vanguard.com/prices.
30
Financial Highlights
Financial highlights information is intended to help you understand a fund’s performance for the past five years (or, if shorter, its period of operations). Certain information reflects financial results for a single fund share. Total return represents the rate that an investor would have earned or lost each period on an investment in a fund or share class (assuming reinvestment of all distributions). This information has been obtained from the financial statements audited by PricewaterhouseCoopers LLP, an independent registered public accounting firm, whose report, along with fund financial statements, is included in a fund’s most recent annual report to shareholders. You may obtain a free copy of a fund’s latest annual or semiannual report, which is available upon request.
Vanguard Russell 2000 Index Fund Institutional Shares
|
For a Share Outstanding
Throughout Each Period |
Year Ended August 31, | ||||
|
2023 |
2022 |
2021 |
2020 |
2019 | |
|
Net Asset Value, Beginning of Period |
$283.22 |
$349.26 |
$239.84 |
$229.03 |
$266.12 |
|
Investment Operations |
|
|
|
|
|
|
Net Investment Income1 |
4.671 |
4.063 |
3.360 |
3.208 |
3.078 |
|
Net Realized and Unrealized Gain (Loss) on
Investments |
8.434 |
(66.085) |
109.242 |
10.710 |
(37.106) |
|
Total from Investment Operations |
13.105 |
(62.022) |
112.602 |
13.918 |
(34.028) |
|
Distributions |
|
|
|
|
|
|
Dividends from Net Investment Income |
(4.465) |
(4.018) |
(3.182) |
(3.108) |
(3.062) |
|
Distributions from Realized Capital Gains |
— |
— |
— |
— |
— |
|
Total Distributions |
(4.465) |
(4.018) |
(3.182) |
(3.108) |
(3.062) |
|
Net Asset Value, End of Period |
$291.86 |
$283.22 |
$349.26 |
$239.84 |
$229.03 |
|
Total Return |
4.76% |
-17.88% |
47.19% |
6.15% |
-12.83% |
|
Ratios/Supplemental Data |
|
|
|
|
|
|
Net Assets, End of Period (Millions) |
$474 |
$487 |
$619 |
$630 |
$859 |
|
Ratio of Total Expenses to Average Net Assets |
0.08%2 |
0.08%2 |
0.08% |
0.08% |
0.08% |
|
Ratio of Net Investment Income to Average Net
Assets |
1.67% |
1.29% |
1.08% |
1.41% |
1.32% |
|
Portfolio Turnover Rate3 |
15% |
19% |
23% |
19% |
16% |
|
|
|
|
1 |
Calculated based on average shares outstanding. |
|
2 |
The ratio of expenses to average net assets for the period net of reduction from custody fee
offset arrangements was 0.08%. |
|
3 |
Excludes the value of portfolio securities received or delivered as a result of in-kind purchases
or redemptions of the fund’s capital shares, including ETF Creation Units. |
31
Vanguard Russell 2000 Value Index Fund Institutional Shares
|
For a Share Outstanding
Throughout Each Period |
Year Ended August 31, | ||||
|
2023 |
2022 |
2021 |
2020 |
2019 | |
|
Net Asset Value, Beginning of Period |
$250.04 |
$283.82 |
$180.98 |
$196.24 |
$234.81 |
|
Investment Operations |
|
|
|
|
|
|
Net Investment Income1 |
5.717 |
4.918 |
4.212 |
3.783 |
3.966 |
|
Net Realized and Unrealized Gain (Loss) on
Investments |
(.456) |
(33.609) |
102.428 |
(15.303) |
(38.670) |
|
Total from Investment Operations |
5.261 |
(28.691) |
106.640 |
(11.520) |
(34.704) |
|
Distributions |
|
|
|
|
|
|
Dividends from Net Investment Income |
(5.471) |
(5.089) |
(3.800) |
(3.740) |
(3.866) |
|
Distributions from Realized Capital Gains |
— |
— |
— |
— |
— |
|
Total Distributions |
(5.471) |
(5.089) |
(3.800) |
(3.740) |
(3.866) |
|
Net Asset Value, End of Period |
$249.83 |
$250.04 |
$283.82 |
$180.98 |
$196.24 |
|
Total Return |
2.26% |
-10.23% |
59.46% |
-5.97% |
-14.88% |
|
Ratios/Supplemental Data |
|
|
|
|
|
|
Net Assets, End of Period (Millions) |
$177 |
$184 |
$202 |
$88 |
$140 |
|
Ratio of Total Expenses to Average Net Assets |
0.08%2 |
0.08% |
0.08% |
0.08% |
0.08% |
|
Ratio of Net Investment Income to Average Net
Assets |
2.34% |
1.82% |
1.67% |
2.04% |
1.90% |
|
Portfolio Turnover Rate3 |
27% |
28% |
45% |
38% |
27% |
|
|
|
|
1 |
Calculated based on average shares outstanding. |
|
2 |
The ratio of expenses to average net assets for the period net of reduction from custody fee
offset arrangements was 0.08%. |
|
3 |
Excludes the value of portfolio securities received or delivered as a result of in-kind purchases
or redemptions of the fund’s capital shares, including ETF Creation Units. |
32
Vanguard Russell 2000 Growth Index Fund Institutional Shares
|
For a Share Outstanding
Throughout Each Period |
Year Ended August 31, | ||||
|
2023 |
2022 |
2021 |
2020 |
2019 | |
|
Net Asset Value, Beginning of Period |
$315.20 |
$424.16 |
$314.01 |
$269.76 |
$305.04 |
|
Investment Operations |
|
|
|
|
|
|
Net Investment Income1 |
3.090 |
2.706 |
1.912 |
2.275 |
2.021 |
|
Net Realized and Unrealized Gain (Loss) on
Investments |
18.463 |
(109.390) |
110.162 |
44.269 |
(35.267) |
|
Total from Investment Operations |
21.553 |
(106.684) |
112.074 |
46.544 |
(33.246) |
|
Distributions |
|
|
|
|
|
|
Dividends from Net Investment Income |
(3.053) |
(2.276) |
(1.924) |
(2.294) |
(2.034) |
|
Distributions from Realized Capital Gains |
— |
— |
— |
— |
— |
|
Total Distributions |
(3.053) |
(2.276) |
(1.924) |
(2.294) |
(2.034) |
|
Net Asset Value, End of Period |
$333.70 |
$315.20 |
$424.16 |
$314.01 |
$269.76 |
|
Total Return |
6.94% |
-25.24% |
35.77% |
17.42% |
-10.91% |
|
Ratios/Supplemental Data |
|
|
|
|
|
|
Net Assets, End of Period (Millions) |
$235 |
$255 |
$752 |
$500 |
$472 |
|
Ratio of Total Expenses to Average Net Assets |
0.08%2 |
0.08% |
0.08% |
0.08% |
0.08% |
|
Ratio of Net Investment Income to Average Net
Assets |
0.98% |
0.72% |
0.48% |
0.82% |
0.75% |
|
Portfolio Turnover Rate3 |
32% |
33% |
47% |
38% |
28% |
|
|
|
|
1 |
Calculated based on average shares outstanding. |
|
2 |
The ratio of expenses to average net assets for the period net of reduction from custody fee
offset arrangements was 0.08%. |
|
3 |
Excludes the value of portfolio securities received or delivered as a result of in-kind purchases
or redemptions of the fund’s capital shares, including ETF Creation Units. |
33
Investing With Vanguard
This section of the prospectus explains the basics of doing business with Vanguard. Vanguard fund shares can be held indirectly through an intermediary, such as a bank, a broker, or an investment advisor. If you hold Vanguard fund shares indirectly through an intermediary (including shares held in a brokerage account through Vanguard Brokerage Services®), please see Investing With Vanguard Through Other Firms, and also refer to your account agreement with the intermediary for information about transacting in that account. If you hold Vanguard fund shares through an employer-sponsored retirement or savings plan, please see Employer-Sponsored Plans. Vanguard reserves the right to change the policies in this section without notice. Please call or check online for current information. See Contacting Vanguard.
In certain circumstances, Vanguard fund shares can be held directly with Vanguard. If you hold Vanguard fund shares directly with Vanguard, you should carefully read each topic within this section that pertains to your relationship with Vanguard. Vanguard reserves the right, upon reasonable notice, to discontinue the ability to hold Vanguard fund shares directly with Vanguard for any or all investors and/or to transfer such shares to an affiliate or other financial institution.
In certain circumstances, Vanguard fund shares can be held directly with Vanguard. If you hold Vanguard fund shares directly with Vanguard, you should carefully read each topic within this section that pertains to your relationship with Vanguard. Vanguard reserves the right, upon reasonable notice, to discontinue the ability to hold Vanguard fund shares directly with Vanguard for any or all investors and/or to transfer such shares to an affiliate or other financial institution.
For Vanguard fund shares held directly with Vanguard, each fund you hold in an account is a separate “fund account.” For example, if you hold three funds in a nonretirement account titled in your own name, two funds in a nonretirement account titled jointly with your spouse, and one fund in an individual retirement account, you have six fund accounts—and this is true even if you hold the same fund in multiple accounts. Note that each reference to “you” in this prospectus applies to any one or more registered account owners or persons authorized to transact on your account.
Purchasing Shares
Vanguard reserves the right, without notice, to increase or decrease the minimum amount required to open, convert shares to, or maintain a fund account or to add to an existing fund account.
Investment minimums may differ for certain categories of investors.
Account Minimums for Institutional Shares
To open and maintain an account. $5 million.
Certain Vanguard institutional clients may meet the minimum investment amount by aggregating separate accounts within the same Fund. This aggregation policy does not apply to financial intermediaries.
34
Vanguard may charge additional recordkeeping fees for institutional clients whose accounts are recordkept by Vanguard. Please contact your Vanguard representative to determine whether additional recordkeeping fees apply to your account.
To add to an existing account. Generally $1.
How to Initiate a Purchase Request
Be sure to check Exchanging Shares, Frequent-Trading Limitations, and Other Rules You Should Know before placing your purchase request.
Online. You may open certain types of accounts, request a purchase of shares, and request an exchange through our website or our mobile application if your account is eligible and you are registered for online access.
By telephone. You may call Vanguard to begin the account registration process or request that the account-opening forms be sent to you. You may also call Vanguard to request a purchase of shares in your account or to request an exchange. See Contacting Vanguard.
By mail. You may send Vanguard your account registration form and check to open a new fund account. To add to an existing fund account, you may send your check with an Invest-by-Mail form (from a transaction confirmation or your account statement) or with a deposit slip (available online).
How to Pay for a Purchase
By electronic bank transfer. You may purchase shares of a Vanguard fund through an electronic transfer of money from a bank account. To establish the electronic bank transfer service on an account, you must designate the bank account online, complete a form, or fill out the appropriate section of your account registration form. After the service is set up on your account, you can purchase shares by electronic bank transfer on a regular schedule (Automatic Investment Plan), if eligible, or upon request. Your purchase request can be initiated online (if you are registered for online access), by telephone, or by mail.
By wire. Wiring instructions vary for different types of purchases. Please call Vanguard for instructions and policies on purchasing shares by wire. See Contacting Vanguard.
By check. You may make initial or additional purchases to your fund account by sending a check with a deposit slip or by utilizing our mobile application if your account is eligible and you are registered for online access. Also see How to
35
Initiate a Purchase Request. Make your check payable to Vanguard and include the appropriate fund number (e.g., Vanguard—xx). For a list of Fund numbers (for Funds in this prospectus), see Additional Information.
By exchange. You may purchase shares of a Vanguard fund using the proceeds from the simultaneous redemption of shares of another Vanguard fund. You may initiate an exchange online (if you are registered for online access), by telephone, or by mail with an exchange form. See Exchanging Shares.
Trade Date
The trade date for any purchase request received in good order will depend on the day and time Vanguard receives your request, the manner in which you are paying, and the type of fund you are purchasing. Your purchase will be executed using the NAV as calculated on the trade date. NAVs are calculated only on days that the NYSE is open for trading (a business day). In the rare event the NYSE experiences unanticipated disruptions and is unavailable at the close of the trading day, NAVs will be calculated as of the close of regular trading on the Nasdaq (or another alternate exchange if the Nasdaq is unavailable, as determined at Vanguard’s discretion), generally 4 p.m., Eastern time. The time selected for NAV calculation in this rare event shall also serve as the conclusion of the trading day. See Share Price.
For purchases by check into all funds other than money market funds and for purchases by exchange, wire, or electronic bank transfer into all funds: If the purchase request is received by Vanguard on a business day before the close of regular trading on the NYSE (generally 4 p.m., Eastern time), the trade date for the purchase will be the same day. If the purchase request is received on a business day after the close of regular trading on the NYSE, or on a nonbusiness day, the trade date for the purchase will be the next business day.
For purchases by check into money market funds: If the purchase request is received by Vanguard on a business day before the close of regular trading on the NYSE (generally 4 p.m., Eastern time), the trade date for the purchase will be the next business day. If the purchase request is received on a business day after the close of regular trading on the NYSE, or on a nonbusiness day, the trade date for the purchase will be the second business day following the day Vanguard receives the purchase request. Because money market instruments must be purchased with federal funds and it takes a money market mutual fund one business day to convert check proceeds into federal funds, the trade date for the purchase will be one business day later than for other funds.
36
If applicable, orders by Vanguard Funds of Funds will be treated as received by a Fund at the same time that corresponding orders are received in proper form by the Vanguard Funds of Funds.
If your purchase request is not accurate and complete, it may be rejected. See Other Rules You Should Know—Good Order.
For further information about purchase transactions, consult our website at vanguard.com or see Contacting Vanguard.
Other Purchase Rules You Should Know
Check purchases. All purchase checks must be written in U.S. dollars, be drawn on a U.S. bank, and be accompanied by good order instructions. Vanguard does not accept cash, traveler’s checks, starter checks, or money orders. In addition, Vanguard may refuse checks that are not made payable to Vanguard.
New accounts. We are required by law to obtain from you certain personal information that we will use to verify your identity. If you do not provide the information, we may not be able to open your account. If we are unable to verify your identity, Vanguard reserves the right, without notice, to close your account or take such other steps as we deem reasonable. Certain types of accounts may require additional documentation.
Refused or rejected purchase requests. Vanguard reserves the right to stop selling fund shares or to reject any purchase request at any time and without notice, including, but not limited to, purchases requested by exchange from another Vanguard fund. This also includes the right to reject any purchase request because the investor has a history of frequent trading or because the purchase may negatively affect a fund’s operation or performance.
Large purchases. Call Vanguard before attempting to invest a large dollar amount.
No cancellations. Vanguard will not accept your request to cancel any purchase request once processing has begun. Please be careful when placing a purchase request.
Converting Shares
If you convert from Institutional Shares to ETF Shares, the transaction will be based on the respective NAVs of the separate share classes on the trade date of the conversion.
37
Vanguard will not accept your request to cancel any self-directed conversion request once processing has begun. Please be careful when placing a conversion request.
A conversion between share classes of the same fund is a nontaxable event.
Conversions to ETF Shares
Owners of conventional (i.e., not exchange-traded) shares issued by a Fund may convert those shares to ETF Shares of equivalent value of the same fund. Please note that investors who own conventional shares through a 401(k) plan or other employer-sponsored retirement or benefit plan generally may not convert those shares to ETF Shares and should check with their plan sponsor or recordkeeper. ETF Shares, whether acquired through a conversion or purchased on the secondary market, cannot be converted to conventional shares by a shareholder. Also, ETF Shares of one fund cannot be exchanged for ETF Shares of another fund.
ETF Shares must be held in a brokerage account. Thus, before converting conventional shares to ETF Shares, you must have an existing, or open a new, brokerage account. This account may be with Vanguard Brokerage Services or with any other brokerage firm.
Vanguard Brokerage Services does not impose a fee on conversions from conventional shares to Vanguard ETF Shares. However, other brokerage firms may charge a fee to process a conversion. Vanguard reserves the right, in the future, to impose a transaction fee on conversions or to limit, temporarily suspend, or terminate the conversion privilege. For additional information on converting conventional shares to ETF Shares, please contact Vanguard to obtain a prospectus for ETF Shares. See Contacting Vanguard.
Redeeming Shares
How to Initiate a Redemption Request
Be sure to check Exchanging Shares, Frequent-Trading Limitations, and Other Rules You Should Know before placing your redemption request.
Online. You may request a redemption of shares or request an exchange through our website or our mobile application if your account is eligible and you are registered for online access.
By telephone. You may call Vanguard to request a redemption of shares or an exchange. See Contacting Vanguard.
38
By mail. You may send a form (available online) to Vanguard to redeem from a fund account or to make an exchange.
How to Receive Redemption Proceeds
By electronic bank transfer. You may have the proceeds of a fund redemption sent directly to a designated bank account. To establish the electronic bank transfer service on an account, you must designate a bank account online, complete a form, or fill out the appropriate section of your account registration form. After the service is set up on your account, you can redeem shares by electronic bank transfer on a regular schedule (Automatic Withdrawal Plan), if eligible, or upon request. Your redemption request can be initiated online (if you are registered for online access), by telephone, or by mail.
By wire. To receive your proceeds by wire, you may instruct Vanguard to wire your redemption proceeds ($100 minimum) to a previously designated bank account. To establish the wire redemption service, you generally must designate a bank account online, complete a form, or fill out the appropriate section of your account registration form.
Please note that Vanguard charges a $10 wire fee for outgoing wire redemptions. The fee is assessed in addition to, rather than being withheld from, redemption proceeds and is paid directly to the fund in which you invest. For example, if you redeem $100 via a wire, you will receive the full $100, and the $10 fee will be assessed to your fund account through an additional redemption of fund shares. If you redeem your entire fund account, your redemption proceeds will be reduced by the amount of the fee. The wire fee does not apply to accounts held by Flagship and Flagship Select clients; accounts held through intermediaries, including Vanguard Brokerage Services; or accounts held by institutional clients.
By exchange. You may have the proceeds of a Vanguard fund redemption invested directly in shares of another Vanguard fund. You may initiate an exchange online (if you are registered for online access), by telephone, or by mail. See Exchanging Shares.
By check. If you have not chosen another redemption method, Vanguard will mail you a redemption check, generally payable to all registered account owners, normally within two business days of your trade date, and generally to the address of record.
Trade Date
The trade date for any redemption request received in good order will depend on the day and time Vanguard receives your request and the manner in which you are redeeming. Your redemption will be executed using the NAV as calculated on
39
the trade date. NAVs are calculated only on days that the NYSE is open for trading (a business day). In the rare event the NYSE experiences unanticipated disruptions and is unavailable at the close of the trading day, NAVs will be calculated as of the close of regular trading on the Nasdaq (or another alternate exchange if the Nasdaq is unavailable, as determined at Vanguard’s discretion), generally 4 p.m., Eastern time. The time selected for NAV calculation in this rare event shall also serve as the conclusion of the trading day. See Share Price.
For redemptions by check, exchange, or wire: If the redemption request is received by Vanguard on a business day before the close of regular trading on the NYSE (generally 4 p.m., Eastern time), the trade date will be the same day. If the redemption request is received on a business day after the close of regular trading on the NYSE, or on a nonbusiness day, the trade date will be the next business day.
• Note on timing of wire redemptions from money market funds: For telephone requests received by Vanguard on a business day before 10:45 a.m., Eastern time (2 p.m., Eastern time, for Vanguard Cash Reserves Federal Money Market Fund; 12:30 p.m., Eastern time, for Vanguard Federal Money Market Fund), the redemption proceeds generally will leave Vanguard by the close of business the same day. For telephone requests received by Vanguard on a business day after those cut-off times, or on a nonbusiness day, and for all requests other than by telephone, the redemption proceeds generally will leave Vanguard by the close of business on the next business day.
• Note on timing of wire redemptions from all other funds: For requests received by Vanguard on a business day before the close of regular trading on the NYSE (generally 4 p.m., Eastern time), the redemption proceeds generally will leave Vanguard by the close of business on the next business day. For requests received by Vanguard on a business day after the close of regular trading on the NYSE, or on a nonbusiness day, the redemption proceeds generally will leave Vanguard by the close of business on the second business day after Vanguard receives the request.
For redemptions by electronic bank transfer: If the redemption request is received by Vanguard on a business day before the close of regular trading on the NYSE (generally 4 p.m., Eastern time), the trade date will be the same day. If the redemption request is received on a business day after the close of regular trading on the NYSE, or on a nonbusiness day, the trade date will be the next business day.
40
If your redemption request is not accurate and complete, it may be rejected. If we are unable to send your redemption proceeds by wire or electronic bank transfer because the receiving institution rejects the transfer, Vanguard will make additional efforts to complete your transaction. If Vanguard is still unable to complete the transaction, we may send the proceeds of the redemption to you by check, generally payable to all registered account owners, or use your proceeds to purchase new shares of the fund from which you sold shares for the purpose of the wire or electronic bank transfer transaction. See Other Rules You Should Know—Good Order.
If your redemption request is received in good order, we typically expect that redemption proceeds will be paid by a Fund within one business day of the trade date; however, in certain circumstances, investors may experience a longer settlement period at the time of the transaction. For further information, see “Potentially disruptive redemptions” and “Emergency circumstances.”
For further information about redemption transactions, consult our website at vanguard.com or see Contacting Vanguard.
Other Redemption Rules You Should Know
Documentation for certain accounts. Special documentation may be required to redeem from certain types of accounts, such as trust, corporate, nonprofit, or retirement accounts. Please call us before attempting to redeem from these types of accounts.
Potentially disruptive redemptions. Vanguard reserves the right to pay all or part of a redemption in kind—that is, in the form of securities—if we reasonably believe that a cash redemption would negatively affect the fund’s operation or performance or that the shareholder may be engaged in market-timing or frequent trading. Under these circumstances, Vanguard also reserves the right to delay payment of the redemption proceeds for up to seven calendar days. By calling us before you attempt to redeem a large dollar amount, you may avoid in-kind or delayed payment of your redemption. Please see Frequent-Trading Limitations for information about Vanguard’s policies to limit frequent trading.
Recently purchased shares. Although you can redeem shares at any time, proceeds may not be made available to you until the fund collects payment for your purchase. This may take up to seven calendar days for shares purchased by check or by electronic bank transfer. If you have written a check on a fund in an account with checkwriting privileges, that check may be rejected if your fund account does not have a sufficient available balance.
41
Address change. If you change your address online or by telephone, there may be up to a 14-day restriction (starting on the business day after your address is changed) on your ability to request check redemptions online and by telephone. You can request a redemption in writing (using a form available online) at any time. Confirmations of address changes are sent to both the old and new addresses.
Payment to a different person or address. At your request, we can make your redemption check payable, or wire your redemption proceeds, to a different person or send it to a different address. However, this generally requires the written consent of all registered account owners and may require additional documentation, such as a signature guarantee or a notarized signature. You may obtain a signature guarantee from some commercial or savings banks, credit unions, trust companies, or member firms of a U.S. stock exchange.
No cancellations. Vanguard will not accept your request to cancel any redemption request once processing has begun. Please be careful when placing a redemption request.
Emergency circumstances. Vanguard funds can postpone payment of redemption proceeds for up to seven calendar days. In addition, Vanguard funds can suspend redemptions and/or postpone payments of redemption proceeds beyond seven calendar days at times when the NYSE is closed or during emergency circumstances, as determined by the SEC.
Exchanging Shares
An exchange occurs when you use the proceeds from the redemption of shares of one Vanguard fund to simultaneously purchase shares of a different Vanguard fund. You can make exchange requests online (if you are registered for online access), by telephone, or by mail. See Purchasing Shares and Redeeming Shares.
If the NYSE is open for regular trading (generally until 4 p.m., Eastern time, on a business day) at the time an exchange request is received in good order, the trade date generally will be the same day. See Other Rules You Should Know—Good Order for additional information on all transaction requests.
Vanguard will not accept your request to cancel any exchange request once processing has begun. Please be careful when placing an exchange request.
Call Vanguard before attempting to exchange a large dollar amount. By calling us before you attempt to exchange a large dollar amount, you may avoid delayed or rejected transactions.
42
Please note that Vanguard reserves the right, without notice, to revise or terminate the exchange privilege, limit the amount of any exchange, or reject an exchange, at any time, for any reason. See Frequent-Trading Limitations for additional restrictions on exchanges.
Frequent-Trading Limitations
Because excessive transactions can disrupt management of a fund and increase the fund’s costs for all shareholders, the board of trustees of each Vanguard fund places certain limits on frequent trading in the funds. Each Vanguard fund (other than money market funds and short-term bond funds, but including Vanguard Short-Term Inflation-Protected Securities Index Fund) limits an investor’s purchases or exchanges into a fund account for 30 calendar days after the investor has redeemed or exchanged out of that fund account. ETF Shares are not subject to these frequent-trading limits.
For Vanguard Retirement Investment Program pooled plans, the limitations apply to exchanges made online or by telephone.
These frequent-trading limitations do not apply to the following:
• Certain transactions below dollar value or other thresholds specified by Vanguard.
• In-kind transactions to a shareholder’s donor advised fund managed by Vanguard Charitable.
• Purchases of shares with reinvested dividend or capital gains distributions.
• Transactions through Vanguard’s Automatic Investment Plan, Automatic Exchange Service, Direct Deposit Service, Automatic Withdrawal Plan, Required Minimum Distribution Service, Vanguard Small Business Online®, and certain transactions through intermediaries relating to systematic trades and required minimum distributions.
• Discretionary transactions through Vanguard Personal Advisor Services®, Vanguard Institutional Advisory Services®, Vanguard Digital Advisor™, and discretionary (advisor-directed) transactions through certain intermediaries.
• Redemptions of shares to pay fund or account fees.
• Redemptions of shares to remove excess shareholder contributions to certain types of retirement accounts (including, but not limited to, IRAs and Vanguard Individual 401(k) Plans).
• Transfers and reregistrations of shares within the same fund.
• Purchases of shares by asset transfer or direct rollover.
43
• Conversions of shares from one share class to another in the same fund.
• Checkwriting redemptions.
• Section 529 college savings plans.
• Certain approved institutional portfolios and asset allocation programs, as well as trades made by funds or trusts managed by Vanguard or its affiliates that invest in other Vanguard funds. (Please note that shareholders of Vanguard’s funds of funds are subject to the limitations.)
For participants in employer-sponsored defined contribution plans,* the frequent-trading limitations do not apply to:
• Purchases of shares with participant payroll or employer contributions or loan repayments.
• Purchases of shares with reinvested dividend or capital gains distributions.
• Distributions, loans, and in-service withdrawals from a plan.
• Redemptions of shares as part of a plan termination or at the direction of the plan.
• Transactions executed through the Vanguard Managed Account Program.
• Redemptions of shares to pay fund or account fees.
• Share or asset transfers or rollovers.
• Reregistrations of shares.
• Conversions of shares from one share class to another in the same fund.
• Exchange requests submitted by written request to Vanguard. (Exchange requests submitted by fax, if otherwise permitted, are subject to the limitations.)
* The following Vanguard fund accounts are also subject to the frequent-trading limitations: SEP-IRAs, SIMPLE IRAs, certain Individual 403(b)(7) Custodial Accounts, and Vanguard Individual 401(k) Plans.
Accounts Held by Institutions (Other Than Defined Contribution Plans)
Vanguard will systematically monitor for frequent trading in institutional clients’ accounts. If we detect suspicious trading activity, we will investigate and take appropriate action, which may include applying to a client’s accounts the 30-day policy previously described, prohibiting a client’s purchases of fund shares, and/or revoking the client’s exchange privilege.
44
Accounts Held by Intermediaries
When intermediaries establish accounts in Vanguard funds for the benefit of their clients, we cannot always monitor the trading activity of the individual clients. However, we review trading activity at the intermediary (omnibus) level, and if we detect suspicious activity, we will investigate and take appropriate action. If necessary, Vanguard may prohibit additional purchases of fund shares by an intermediary, including for the benefit of certain of the intermediary’s clients. Intermediaries also may monitor their clients’ trading activities with respect to Vanguard funds.
For those Vanguard funds that charge purchase and/or redemption fees, intermediaries will be asked to assess these fees on client accounts and remit these fees to the funds. The application of purchase and redemption fees and frequent-trading limitations may vary among intermediaries. There are no assurances that Vanguard will successfully identify all intermediaries or that intermediaries will properly assess purchase and redemption fees or administer frequent-trading limitations. If you invest with Vanguard through an intermediary, please read that firm’s materials carefully to learn of any other rules or fees that may apply.
Other Rules You Should Know
Prospectus and Shareholder Report Mailings
When two or more shareholders have the same last name and address, just one summary prospectus (or prospectus) and/or shareholder report may be sent in an attempt to eliminate the unnecessary expense of duplicate mailings. You may request individual prospectuses and reports by contacting our Client Services Department in writing, by telephone, or online. See Contacting Vanguard.
Vanguard.com
Registration. If you are a registered user of vanguard.com, you can review your account holdings; buy, sell, or exchange shares of most Vanguard funds; and perform most other transactions through our website. You must register for this service online.
Electronic delivery. Vanguard can deliver your account statements, transaction confirmations, prospectuses, certain tax forms, and shareholder reports electronically. If you are a registered user of vanguard.com, you can consent to the electronic delivery of these documents by logging on and changing your mailing preferences under “Account Maintenance.” You can revoke your electronic consent at any time through our website, and we will begin to send paper copies of these documents within 30 days of receiving your revocation.
45
Telephone Transactions
Automatic. When we set up your account, we will automatically enable you to do business with us by telephone, unless you instruct us otherwise in writing.
Proof of a caller’s authority. We reserve the right to refuse a telephone request if the caller is unable to provide the requested information or if we reasonably believe that the caller is not an individual authorized to act on the account. Before we allow a caller to act on an account, we may request the following information:
• Authorization to act on the account (as the account owner or by legal documentation or other means).
• Account registration and address.
• Fund name and account number, if applicable.
• Other information relating to the caller, the account owner, or the account.
Good Order
We reserve the right to reject any transaction instructions that are not in “good order.” Good order generally means that your instructions:
• Are provided by the person(s) authorized in accordance with Vanguard’s policies and procedures to access the account and request transactions.
• Include the fund name and account number.
• Include the amount of the transaction (stated in dollars, shares, or percentage).
Written instructions also must generally be provided on a Vanguard form and include:
• Signature(s) and date from the authorized person(s).
• Signature guarantees or notarized signatures, if required for the type of transaction. (Call Vanguard for specific requirements.)
• Any supporting documentation that may be required.
Good order requirements may vary among types of accounts and transactions. For more information, consult our website at vanguard.com or see Contacting Vanguard.
Vanguard reserves the right, without notice, to revise the requirements for good order.
46
Future Trade-Date Requests
Vanguard does not accept requests to hold a purchase, conversion, redemption, or exchange transaction for a future date. All such requests will receive trade dates as previously described in Purchasing Shares, Converting Shares, Redeeming Shares, and Exchanging Shares. Vanguard reserves the right to return future-dated purchase checks.
Accounts With More Than One Owner
If an account has more than one owner or authorized person, Vanguard generally will accept instructions from any one owner or authorized person.
Responsibility for Fraud
You should take precautions to protect yourself from fraud. Keep your account-related information private, and review any account confirmations, statements, or other information that we provide to you as soon as you receive them. Let us know immediately if you discover unauthorized activity or see something on your account that you do not understand or that looks unusual.
Vanguard will not be responsible for losses that result from transactions by a person who we reasonably believe is authorized to act on your account.
Uncashed Checks
Please cash your distribution or redemption checks promptly. Vanguard will not pay interest on uncashed checks. Vanguard may be required to transfer assets related to uncashed checks to a state under the state’s abandoned property law.
Dormant Accounts
If your account has no activity in it for a period of time, Vanguard may be required to transfer it to a state under the state’s abandoned property law, subject to potential federal or state withholding taxes.
Unusual Circumstances
If you experience difficulty contacting Vanguard online or by telephone, you can send us your transaction request on a Vanguard form by regular or express mail.
Investing With Vanguard Through Other Firms
You may purchase or sell shares of most Vanguard funds through a financial intermediary, such as a bank, a broker, or an investment advisor. Please consult your financial intermediary to determine which, if any, shares are available through that firm and to learn about other rules that may apply. Your financial
47
intermediary can provide you with account information and any required tax forms. You may be required to pay a commission on purchases of mutual fund shares made through a financial intermediary.
Please see Frequent-Trading Limitations—Accounts Held by Intermediaries for information about the assessment of any purchase or redemption fees and the monitoring of frequent trading for accounts held by intermediaries.
Low-Balance Accounts
Each Fund reserves the right to liquidate a fund account whose balance falls below the account minimum for any reason, including market fluctuation. This liquidation policy applies to nonretirement fund accounts and accounts that are held through intermediaries. Any such liquidation will be preceded by written notice to the investor.
Right to Change Policies
In addition to the rights expressly stated elsewhere in this prospectus, Vanguard reserves the right, without notice, to (1) alter, add, or discontinue any conditions of purchase (including eligibility requirements), redemption, exchange, conversion, service, or privilege at any time and (2) alter, impose, discontinue, or waive any purchase fee, redemption fee, account service fee, or other fee charged to a shareholder or a group of shareholders. Changes may affect any or all investors. These actions will be taken when, at the sole discretion of Vanguard management, Vanguard believes they are in the best interest of a fund.
Account Restrictions
Vanguard reserves the right to: (1) redeem all or a portion of a fund/account to meet a legal obligation, including tax withholding, tax lien, garnishment order, or other obligation imposed on your account by a court or government agency; (2) redeem shares, close an account, or suspend account privileges, features, or options in the case of threatening conduct or activity; (3) redeem shares, close an account, or suspend account privileges, features, or options if Vanguard believes or suspects that not doing so could result in a suspicious, fraudulent, or illegal transaction; (4) place restrictions on the ability to redeem any or all shares in an account if it is required to do so by a court or government agency; (5) place restrictions on the ability to redeem any or all shares in an account if Vanguard believes that doing so will prevent fraud, financial exploitation or abuse, or to protect vulnerable investors; (6) freeze any account and/or suspend account services if Vanguard has received reasonable notice of a dispute regarding the assets in an account, including notice of a dispute between the registered or beneficial account owners; and (7) freeze any account and/or suspend account services upon initial notification to Vanguard of the death of an account owner.
48
Share Classes
Vanguard reserves the right, without notice, to change the eligibility requirements of its share classes, including the types of clients who are eligible to purchase each share class.
Shareholder Rights
Each Fund's Agreement and Declaration of Trust, as amended, requires a shareholder bringing a derivative action on behalf of Vanguard Scottsdale Funds (the Trust) that is subject to a pre-suit demand to collectively hold at least 10% of the outstanding shares of the Trust or at least 10% of the outstanding shares of the series or class to which the demand relates and to undertake to reimburse the Trust for the expense of any counsel or advisors used when considering the merits of the demand in the event that the board of trustees determines not to bring such action. In each case, these requirements do not apply to claims arising under the federal securities laws to the extent that any such federal securities laws, rules, or regulations do not permit such application.
Fund and Account Updates
Confirmation Statements
We will send (or provide through our website, whichever you prefer) a confirmation of your trade date and the amount of your transaction when you buy, sell, exchange, or convert shares. However, we will not send confirmations reflecting only checkwriting redemptions or the reinvestment of dividend or capital gains distributions. For any month in which you had a checkwriting redemption, a Checkwriting Activity Statement will be sent to you itemizing the checkwriting redemptions for that month. Promptly review each confirmation statement that we provide to you. It is important that you contact Vanguard immediately with any questions you may have about any transaction reflected on a confirmation statement, or Vanguard will consider the transaction properly processed.
Portfolio Summaries
We will send (or provide through our website, whichever you prefer) quarterly portfolio summaries to help you keep track of your accounts throughout the year. Each summary shows the market value of your account at the close of the statement period, as well as all distributions, purchases, redemptions, exchanges, transfers, and conversions for the current calendar quarter (or month). Promptly review each summary that we provide to you. It is important
49
that you contact Vanguard immediately with any questions you may have about any transaction reflected on the summary, or Vanguard will consider the transaction properly processed.
Tax Information Statements
For most accounts, Vanguard (or your intermediary) is required to provide annual tax forms to assist you in preparing your income tax returns. These forms are generally available for each calendar year early in the following year. Registered users of vanguard.com can also view certain forms through our website. Vanguard (or your intermediary) may also provide you with additional tax-related documentation. For more information, consult our website at vanguard.com or see Contacting Vanguard.
Annual and Semiannual Reports
We will send (or provide through our website, whichever you prefer) reports about Vanguard Russell 2000 Index Funds twice a year, in April and October. These reports include overviews of the financial markets and provide the following specific Fund information:
• Performance assessments and comparisons with industry benchmarks.
• Financial statements with listings of Fund holdings.
Portfolio Holdings
Please consult the Funds' Statement of Additional Information or our website for a description of the policies and procedures that govern disclosure of a Fund’s portfolio holdings.
Employer-Sponsored Plans
Your plan administrator or your employee benefits office can provide you with detailed information on how to participate in your plan and how to elect a Fund as an investment option.
• If you have any questions about a Fund or Vanguard, including those about a Fund’s investment objective, strategies, or risks, contact Vanguard Participant Services toll-free at 800-523-1188 or visit our website at vanguard.com.
• If you have questions about your account, contact your plan administrator or the organization that provides recordkeeping services for your plan.
• Be sure to carefully read each topic that pertains to your transactions with Vanguard.
Vanguard reserves the right to change its policies without notice to shareholders.
50
Transactions
Processing times for your transaction requests may differ among recordkeepers or among transaction and funding types. Your plan’s recordkeeper (which may also be Vanguard) will determine the necessary processing time frames for your transaction requests prior to submission to a Fund. Consult your recordkeeper or plan administrator for more information.
If Vanguard is serving as your plan recordkeeper and if your transaction involves one or more investments with an early cut-off time for processing or another trading restriction, your entire transaction will be subject to the restriction when the trade date for your transaction is determined.
51
Contacting Vanguard
|
Web |
|
|
Vanguard.com |
For the most complete source of Vanguard news
For fund, account, and service information
For most account transactions
For literature requests
24 hours a day, 7 days a week |
|
Phone | |
|
Investor Information 800-662-7447
(Text telephone for people with
hearing impairment at 800-749-7273) |
For fund and service information
For literature requests |
|
Client Services 800-662-2739
(Text telephone for people with
hearing impairment at 800-749-7273) |
For account information
For most account transactions |
|
Participant Services 800-523-1188
(Text telephone for people with
hearing impairment at 800-749-7273) |
For information and services for participants in
employer-sponsored plans |
|
Institutional Division
888-809-8102 |
For information and services for large institutional
investors |
|
Financial Advisor and Intermediary
Sales Support 800-997-2798 |
For information and services for financial intermediaries
including financial advisors, broker-dealers, trust
institutions, and insurance companies |
|
Financial Advisory and Intermediary
Trading Support 800-669-0498 |
For account information and trading support for
financial intermediaries including financial advisors,
broker-dealers, trust institutions, and insurance
companies |
52
Additional Information
Each Fund's Bylaws require, unless the Trust otherwise consents in writing, that the U.S. Federal District Courts be the sole and exclusive forum for the resolution of complaints under the Securities Act of 1933. This provision may limit a shareholder’s ability to bring a claim in a different forum and may result in increased shareholder costs in pursuing such a claim.
|
Vanguard Fund |
Inception
Date |
Newspaper
Abbreviation |
Vanguard
Fund
Number |
CUSIP
Number |
|
Vanguard Russell 2000 Index Fund |
|
|
| |
|
Institutional Shares |
12/22/2010 |
Russ2000IdxInst |
1851 |
92206C656 |
|
Vanguard Russell 2000 Value Index Fund |
|
|
| |
|
Institutional Shares |
7/13/2012 |
Russ2000ValIdxInst |
1852 |
92206C631 |
|
Vanguard Russell 2000 Growth Index Fund |
|
|
| |
|
Institutional Shares |
5/25/2011 |
Russ2000GwthIdxInst |
1853 |
92206C615 |
CGS identifiers have been provided by CUSIP Global Services, managed on behalf of the American Bankers Association by Standard & Poor’s Financial Services, LLC, and are not for use or dissemination in a manner that would serve as a substitute for any CUSIP service. The CUSIP Database, © 2023 American Bankers Association. “CUSIP” is a registered trademark of the American Bankers Association.
53
CFA® is a registered trademark owned by CFA Institute.
The Products are not sponsored, endorsed, sold or promoted by Frank Russell Company (“Russell”). Russell makes no representation or warranty, express or implied, to the owners of the Products or any member of the public regarding the advisability of investing in securities generally or in the Products particularly or the ability of the Russell 2000, Russell 2000 Value, and Russell 2000 Growth Indexes to track general stock market performance or a segment of the same. Russell’s publication of the Russell 2000, Russell 2000 Value, and Russell 2000 Growth Indexes in no way suggests or implies an opinion by Russell as to the advisability of investment in any or all of the securities upon which the Russell 2000, Russell 2000 Value, and Russell 2000 Growth Indexes are based. Russell’s only relationship to The Vanguard Group, Inc. is the licensing of certain trademarks and trade names of Russell and of the Russell 2000, Russell 2000 Value, and Russell 2000 Growth Indexes which are determined, composed and calculated by Russell without regard to The Vanguard Group, Inc. or the Products. Russell is not responsible for and has not reviewed the Products nor any associated literature or publications and Russell makes no representation or warranty express or implied as to their accuracy or completeness, or otherwise. Russell has no obligation or liability in connection with the administration, marketing or trading of the Products.
Russell makes no representation, warranty or guarantee as to the accuracy, completeness, reliability or otherwise of the Russell Indexes or any data included in the Russell Indexes. Russell does not guarantee the accuracy and/or the completeness of the Russell 2000, Russell 2000 Value, and Russell 2000 Growth Indexes or any data included therein and Russell shall have no liability for any errors, omissions, or interruptions therein. Russell makes no warranty, express or implied, as to the use of or results to be obtained by The Vanguard Group, Inc., investors, owners of the Products, or any other person or entity from the use of the Russell 2000, Russell 2000 Value, and Russell 2000 Growth Indexes or any data included therein. Russell makes no express or implied warranties, and expressly disclaims all warranties of merchantability or fitness for a particular purpose or use with respect to the Russell 2000, Russell 2000 Value, and Russell 2000 Growth Indexes or any data included therein. Without limiting any of the foregoing, in no event shall Russell have any liability for any special, punitive, indirect, or consequential damages (including lost profits), even if notified of the possibility of such damages.
Russell reserves the right, at any time and without notice, to alter, amend, terminate or in any way change the Russell Indexes. Russell has no obligation to take the needs of any particular fund or its participants or any other product or person into consideration in determining, composing or calculating any of the Russell Indexes.
54
Glossary of Investment Terms
Capital Gains Distributions. Payments to mutual fund shareholders of gains realized on securities that a fund has sold at a profit, minus any realized losses.
Common Stock. A security representing ownership rights in a corporation.
Dividend Distributions. Payments to mutual fund shareholders of income from interest or dividends generated by a fund's investments.
Dow Jones U.S. Total Stock Market Float Adjusted Index. An index that represents the entire U.S. stock market and tracks more than 5,000 stocks, excluding shares of securities not available for public trading.
Expense Ratio. A fund's total annual operating expenses expressed as a percentage of the fund's average net assets. The expense ratio includes management and administrative expenses, but it does not include the transaction costs of buying and selling portfolio securities.
Inception Date. The date on which the assets of a fund (or one of its share classes) are first invested in accordance with the fund's investment objective. For funds with a subscription period, the inception date is the day after that period ends. Investment performance is generally measured from the inception date.
Indexing. A low-cost investment strategy in which a mutual fund attempts to track—rather than outperform—a specified market benchmark, or “index.”
Joint Committed Credit Facility. Each Fund participates, along with other funds managed by Vanguard, in a committed credit facility provided by a syndicate of lenders pursuant to a credit agreement that may be renewed annually; each Vanguard fund is individually liable for its borrowings, if any, under the credit facility. The amount and terms of the committed credit facility are subject to approval by the Funds' board of trustees and renegotiation with the lender syndicate on an annual basis.
Median Market Capitalization. An indicator of the size of companies in which a fund invests; the midpoint of market capitalization (market price x shares outstanding) of a fund's stocks, weighted by the proportion of the fund's assets invested in each stock. Stocks representing half of the fund's assets have market capitalizations above the median, and the rest are below it.
Mutual Fund. An investment company that pools the money of many people and invests it in a variety of securities in an effort to achieve a specific objective over time.
55
New York Stock Exchange (NYSE). A stock exchange based in New York City that is open for regular trading on business days, Monday through Friday, from 9:30 a.m. to 4 p.m., Eastern time.
Return of Capital. A return of capital occurs when a fund's distributions exceed its earnings in a fiscal year. A return of capital is a return of all or part of your original investment or amounts paid in excess of your original investment in a fund. In general, a return of capital reduces your cost basis in a fund's shares and is not taxable to you until your cost basis has been reduced to zero.
Securities. Stocks, bonds, money market instruments, and other investments.
Total Return. A percentage change, over a specified time period, in a mutual fund's net asset value, assuming the reinvestment of all distributions of dividends and capital gains.
Volatility. The fluctuations in value of a mutual fund or other security. The greater a fund's volatility, the wider the fluctuations in its returns.
Yield. Income (interest or dividends) earned by an investment, expressed as a percentage of the investment’s price.
56
Connect with Vanguard® ˃ vanguard.com
For More Information
If you would like more information about Vanguard Russell 2000 Index Funds, the following documents are available free upon request:
Annual/Semiannual Reports to Shareholders
Additional information about the Funds' investments is available in the Funds' annual and semiannual reports to shareholders. In the annual report, you will find a discussion of the market conditions and investment strategies that significantly affected the Funds' performance during their last fiscal year.
Statement of Additional Information (SAI)
The SAI provides more detailed information about the Funds and is incorporated by reference into (and thus legally a part of) this prospectus.
To receive a free copy of the latest annual or semiannual report or the SAI, or to request additional information about the Funds or other Vanguard funds, please visit vanguard.com or contact us as follows:
If you are an individual investor:
Telephone: 800-662-7447; Text telephone for people with hearing impairment: 800-749-7273
Telephone: 800-662-7447; Text telephone for people with hearing impairment: 800-749-7273
If you are a client of Vanguard’s Institutional Division:
Telephone: 888-809-8102; Text telephone for people
with hearing impairment: 800-749-7273
Telephone: 888-809-8102; Text telephone for people
with hearing impairment: 800-749-7273
If you are a current Vanguard shareholder and would like information about your account, account transactions, and/or account statements, please call:
Client Services Department
Telephone: 800-662-2739; Text telephone for people with hearing impairment: 800-749-7273
Telephone: 800-662-2739; Text telephone for people with hearing impairment: 800-749-7273
Information Provided by the SEC
Reports and other information about the Funds are available in the EDGAR database on the SEC’s website at sec.gov, or you can receive copies of this information, for a fee, by electronic request at the following email address: publicinfo@sec.gov.
Funds' Investment Company Act file number: 811-07803
© 2023 The Vanguard Group, Inc. All rights reserved.
Vanguard Marketing Corporation, Distributor.
I 1851 122023
Vanguard Marketing Corporation, Distributor.
I 1851 122023
Vanguard Russell 3000 Index Fund
Prospectus
December 22, 2023
Institutional Shares
Vanguard Russell 3000 Index Fund Institutional Shares (VRTTX)
This prospectus contains financial data for the Fund through the fiscal year ended August 31, 2023.
The Securities and Exchange Commission (SEC) has not approved or disapproved these securities or passed upon the adequacy of this prospectus. Any representation to the contrary is a criminal offense.
(Fees paid directly from your investment)
|
| |
|
Sales Charge (Load) Imposed on Purchases |
|
|
Purchase Fee |
|
|
Sales Charge (Load) Imposed on Reinvested Dividends |
|
|
Redemption Fee |
|
(Expenses that you pay each year as a percentage of the value of your investment)
|
| |
|
Management Fees |
% |
|
12b-1 Distribution Fee |
|
|
Other Expenses |
% |
|
Total Annual Fund Operating Expenses |
% |
|
1 Year |
3 Years |
5 Years |
10 Years |
|
$ |
$ |
$ |
$ |
1
2

1 The year-to-date return as of the most recent calendar quarter, which ended on September 30, 2023, was 12.35%.
|
|
Total Return |
Quarter |
|
|
% |
|
|
|
-
% |
|
|
|
1 Year |
5 Years |
10 Years |
|
Vanguard Russell 3000 Index Fund Institutional Shares |
|
|
|
|
Return Before Taxes |
-
% |
% |
% |
|
Return After Taxes on Distributions |
- |
|
|
|
Return After Taxes on Distributions and Sale of Fund Shares |
- |
|
|
|
Russell 3000 Index
(reflects no deduction for fees, expenses, or taxes) |
-
% |
% |
% |
|
Dow Jones U.S. Total Stock Market Float Adjusted Index
(reflects no deduction for fees, expenses, or taxes) |
- |
|
|
3
Investment Advisor
The Vanguard Group, Inc. (Vanguard)
Portfolio Managers
Nick Birkett, CFA, Portfolio Manager at Vanguard. He has co-managed the Fund since 2021.
Walter Nejman, Portfolio Manager at Vanguard. He has co-managed the Fund since 2015.
Purchase and Sale of Fund Shares
You may purchase or redeem shares online through our website (vanguard.com), by mail (The Vanguard Group, P.O. Box 982901, El Paso, TX 79998-2901), or by telephone (800-662-2739). The minimum investment amount required to open and maintain a Fund account for Institutional Shares is $5 million. The minimum investment amount required to add to an existing Fund account is generally $1. If you are investing through an employer-sponsored retirement or savings plan, your plan administrator or your benefits office can provide you with detailed information on how you can invest through your plan.
Tax Information
The Fund’s distributions may be taxable as ordinary income or capital gain. If you are investing through a tax-advantaged account, such as an IRA or an employer-sponsored retirement or savings plan, special tax rules apply.
Payments to Financial Intermediaries
The Fund and its investment advisor do not pay financial intermediaries for sales of Fund shares.
4
Investing in Index Funds
What Is Indexing?
Indexing is an investment strategy for tracking the performance of a specified market benchmark, or “index.” An index is a group of securities whose overall performance is used as a standard to measure the investment performance of a particular market. There are many types of indexes. Some represent entire markets—such as the U.S. stock market or the U.S. bond market. Other indexes cover market segments—such as small-capitalization stocks or short-term bonds. One cannot invest directly in an index.
The index provider determines the securities to include in the index and the weighting of each security in the index. Under normal circumstances, the index provider will rebalance an index on a regular schedule. An index provider may carry out additional ad hoc index rebalances or delay or cancel a scheduled rebalance. Generally, the index provider does not provide any warranty, or accept any liability, with respect to the quality, accuracy, or completeness of either the target index or its related data. Errors made by the index provider may occur from time to time and may not be identified by the index provider for a period of time or at all. Vanguard does not provide any warranty or guarantee against such errors. Therefore, the gains, losses, or costs associated with the index provider’s errors will generally be borne by the index fund and its shareholders.
An index fund seeks to hold all, or a representative sample, of the securities that make up its target index. Index funds attempt to mirror the performance of the target index, for better or worse. However, an index fund generally does not perform exactly like its target index. For example, index funds have operating expenses and transaction costs. Market indexes do not, and therefore they will usually have a slight performance advantage over funds that track them. The ability of an index fund to match its performance to that of its target index can also be impacted by, among other things, the timing and size of cash flows, asset valuation differences, and the size of the fund. Market disruptions could also have an adverse effect on a fund’s ability to adjust its exposure to the required levels in order to track the index. The risk that a fund may not track the performance of its target index may be heightened during times of increased market volatility or other unusual market conditions.
Index funds typically have the following characteristics:
• Variety of investments. Depending on a fund’s benchmark index, the fund may invest in the securities of a variety of companies, industries, and/or governments or government agencies.
• Relative performance consistency. Because they seek to track market benchmarks, index funds usually do not perform dramatically better or worse than their benchmarks.
• Low cost. Index funds are generally inexpensive to run compared with actively managed funds. They have low or no research costs and typically keep trading activity—and thus brokerage commissions and other transaction costs—to a minimum compared with actively managed funds.
5
More on the Fund
This prospectus describes the principal risks you would face as a Fund shareholder. It is important to keep in mind one of the main principles of investing: generally, the higher the risk of losing money, the higher the potential reward. The reverse, also, is generally true: the lower the risk, the lower the potential reward. As you consider an investment in any mutual fund, you should take into account your personal tolerance for fluctuations in the securities markets. Look for this
symbol throughout the prospectus. It is used to mark detailed information about the more significant risks that you would confront as a Fund shareholder. To highlight terms and concepts important to mutual fund investors, we have provided Plain Talk® explanations along the way. Reading the prospectus will help you decide whether the Fund is the right investment for you. We suggest that you keep this prospectus for future reference.
symbol throughout the prospectus. It is used to mark detailed information about the more significant risks that you would confront as a Fund shareholder. To highlight terms and concepts important to mutual fund investors, we have provided Plain Talk® explanations along the way. Reading the prospectus will help you decide whether the Fund is the right investment for you. We suggest that you keep this prospectus for future reference.Share Class Overview
This prospectus offers the Fund's Institutional Shares, which are generally for investors who invest a minimum of $5 million. The Fund also issues ETF Shares (an exchange-traded class of shares), which are offered through a separate prospectus.
Both share classes offered by the Fund have the same investment objective, strategies, and policies. However, different share classes may have different expenses; as a result, their investment returns may differ.
|
Plain Talk About Costs of Investing |
|
Costs are an important consideration in choosing a mutual fund. That is
because you, as a shareholder, pay a proportionate share of the costs of
operating a fund and any transaction costs incurred when the fund buys or
sells securities. These costs can erode a substantial portion of the gross
income or the capital appreciation a fund achieves. Even seemingly small
differences in expenses can, over time, have a dramatic effect on a
fund’s performance. |
The following sections explain the principal investment strategies and policies that the Fund uses in pursuit of its investment objective. The Fund's board of trustees, which oversees the Fund's management, may change investment strategies or policies in the interest of shareholders without a shareholder vote, unless those strategies or policies are designated as fundamental. Note that the Fund’s investment objective is not fundamental and may be changed without a shareholder vote. Under normal circumstances, the Fund will invest at least 80% of its assets in the stocks that make up its target index. The Fund may change its 80% policy only upon 60 days‘ notice to shareholders.
6
Market Exposure
The Fund is subject to stock market risk, which is the chance that stock prices overall will decline. Stock markets tend to move in cycles, with periods of rising prices and periods of falling prices. In addition, the Fund‘s target index may, at times, become focused in stocks of a particular market sector, which would subject the Fund to proportionately higher exposure to the risks of that sector.
Stocks of publicly traded companies are often classified according to market capitalization, which is the market value of a company's outstanding shares. These classifications typically include small-cap, mid-cap, and large-cap. It is important to understand that there are no “official” definitions of small-, mid-, and large-cap, even among Vanguard fund advisors, and that market capitalization ranges can change over time. The asset-weighted median market capitalization of the Fund's stock holdings as of August 31, 2023, was $135 billion.
Market disruptions can adversely affect local and global markets as well as normal market conditions and operations. Any such disruptions could have an adverse impact on the value of the Fund's investments and Fund performance.
Security Selection
The Fund attempts to track the investment performance of a benchmark index that measures the return of the overall stock market. The Fund uses the replication method of indexing, meaning that it generally holds the same stocks as its target index and in approximately the same proportions.
The Fund is subject to index replicating risk, which is the change that the Fund may be prevented from holding one or more securities in the same proportion as in its target index.
The ability of the advisor to purchase or dispose of certain Fund investments is or may be restricted or impaired because of limitations imposed by law, regulation, or by certain regulators or issuers. As a result, the advisor may be required to limit purchases or sell existing investments. If the Fund is required to limit its investment in a particular issuer, then the Fund may seek to obtain regulatory relief or special permission from an issuer to exceed a certain percentage ownership in that issuer's shares. Other options the Fund may pursue include seeking to obtain economic exposure to that issuer through alternative means, such as through a derivative or through investment in a wholly owned subsidiary, both of which may be more costly than owning securities of the issuer directly. Ownership restrictions and limitations could result in
7
unanticipated tax consequences to the Fund that may affect the amount, timing, and character of distributions to shareholders. See Other Investment Policies and Risks for further information related to derivatives.
Other Investment Policies and Risks
The Fund reserves the right to substitute a different index for the index it currently tracks if the current index is discontinued, if the Fund's agreement with the provider of its target index is terminated, or for any other reason determined in good faith by the Fund’s board of trustees. In any such instance, the substitute index would represent the same market segment as the current index.
The Fund has the ability to invest in foreign securities to the extent necessary to carry out its investment strategy of holding all, or substantially all, of the stocks that make up the index it tracks. It is not expected that the Fund will invest more than 5% of its assets in foreign securities.
To track its target index as closely as possible, the Fund attempts to remain fully invested in stocks. To help stay fully invested and to reduce transaction costs, the Fund may invest, to a limited extent, in derivatives, including equity futures. The Fund may also use derivatives such as total return swaps to obtain exposure to a stock, a basket of stocks, or an index. Generally speaking, a derivative is a financial contract whose value is based on the value of a financial asset (such as a stock, a bond, or a currency), a physical asset (such as gold, oil, or wheat), a market index, or a reference rate. Investments in derivatives may subject the Fund to risks different from, and possibly greater than, those of investments directly in the underlying securities or assets. The Fund will not use derivatives for speculation or for the purpose of leveraging (magnifying) investment returns.
Cash Management
The Fund's daily cash balance may be invested in Vanguard Market Liquidity Fund and/or Vanguard Municipal Cash Management Fund (each, a CMT Fund), which are low-cost money market funds. When investing in a CMT Fund, the Fund bears its proportionate share of the expenses of the CMT Fund in which it invests. Vanguard receives no additional revenue from Fund assets invested in a CMT Fund.
Redemption Requests
Methods used to meet redemption requests. Under normal circumstances, the Fund typically expects to meet redemptions with positive cash flows. When this is not an option, the Fund seeks to maintain its risk exposure by selling a cross section of the Fund’s holdings to meet redemptions, while also factoring in transaction costs. Additionally, the Fund may work with larger clients to
8
implement their redemptions in a manner that is least disruptive to the portfolio; see “Potentially disruptive redemptions” under Redeeming Shares in the Investing With Vanguard section.
Under certain circumstances, including under stressed market conditions, there are additional tools that the Fund may use in order to meet redemptions, including advancing the settlement of market trades with counterparties to match investor redemption payments or delaying settlement of an investor’s transaction to match trade settlement within regulatory requirements. The Fund may also suspend payment of redemption proceeds for up to seven days; see “Emergency circumstances” under Redeeming Shares in the Investing With Vanguard section. Additionally under these unusual circumstances, the Fund may borrow money (subject to certain regulatory conditions and if available under board-approved procedures) through an interfund lending facility; through a bank line-of-credit, including a joint committed credit facility; or through an uncommitted line-of-credit from Vanguard in order to meet redemption requests.
Potential redemption activity impacts. At times, the Fund may experience adverse effects when certain large shareholders, or multiple shareholders comprising significant ownership of the Fund, redeem large amounts of shares of the Fund. Large redemptions may cause the Fund to sell portfolio securities at times when it would not otherwise do so. This may result in the Fund distributing capital gains or other taxable income to non-redeeming shareholders. Large redemptions may also increase the Fund's transaction costs. Redemption activity can occur for many reasons, including shareholder reactions to market movements or other events unrelated to Vanguard’s actions, or when Vanguard makes product changes that, for example, may result in a shareholder redeeming shares of the Fund to purchase shares of another similar fund or investment vehicle. When experiencing large redemptions, the Fund reserves the right to pay all or part of the redemption in-kind and/or delay payment of the redemption proceeds for up to seven calendar days; see “Potentially disruptive redemptions” under Redeeming Shares in the Investing With Vanguard section.
Temporary Investment Measures
The Fund may temporarily depart from its normal investment policies and strategies when the advisor believes that doing so is in the Fund's best interest, so long as the strategy or policy employed is consistent with the Fund's investment objective. For instance, the Fund may invest beyond its normal limits in derivatives or exchange-traded funds that are consistent with the Fund's investment objective when those instruments are more favorably priced or provide needed liquidity, as might be the case when the Fund receives large cash flows that it cannot prudently invest immediately.
9
Frequent Trading or Market-Timing
Background. Some investors try to profit from strategies involving frequent trading of mutual fund shares, such as market-timing. For funds holding foreign securities, investors may try to take advantage of an anticipated difference between the price of the fund’s shares and price movements in overseas markets, a practice also known as time-zone arbitrage. Investors also may try to engage in frequent trading of funds holding investments such as small-cap stocks and high-yield bonds. As money is shifted into and out of a fund by a shareholder engaging in frequent trading, the fund incurs costs for buying and selling securities, resulting in increased brokerage and administrative costs. These costs are borne by all fund shareholders, including the long-term investors who do not generate the costs. In addition, frequent trading may interfere with an advisor’s ability to efficiently manage the fund.
Policies to address frequent trading. The Vanguard funds (other than money market funds and short-term bond funds, but including Vanguard Short-Term Inflation-Protected Securities Index Fund) do not knowingly accommodate frequent trading. The board of trustees of each Vanguard fund (other than money market funds and short-term bond funds, but including Vanguard Short-Term Inflation-Protected Securities Index Fund) has adopted policies and procedures reasonably designed to detect and discourage frequent trading and, in some cases, to compensate the fund for the costs associated with it. These policies and procedures do not apply to ETF Shares because frequent trading in ETF Shares generally does not disrupt portfolio management or otherwise harm fund shareholders. Although there is no assurance that Vanguard will be able to detect or prevent frequent trading or market-timing in all circumstances, the following policies have been adopted to address these issues:
• Each Vanguard fund reserves the right to reject any purchase request—including exchanges from other Vanguard funds—without notice and regardless of size. For example, a purchase request could be rejected because the investor has a history of frequent trading or if Vanguard determines that such purchase may negatively affect a fund’s operation or performance.
• Each Vanguard fund (other than money market funds and short-term bond funds, but including Vanguard Short-Term Inflation-Protected Securities Index Fund) generally prohibits, except as otherwise noted in the Investing With Vanguard section, an investor’s purchases or exchanges into a fund account for 30 calendar days after the investor has redeemed or exchanged out of that fund account.
• Certain Vanguard funds charge shareholders purchase and/or redemption fees on transactions.
10
See the Investing With Vanguard section of this prospectus for further details on Vanguard’s transaction policies.
Each Vanguard fund (other than retail and government money market funds), in determining its net asset value, will use fair-value pricing when appropriate, as described in the Share Price section. Fair-value pricing may reduce or eliminate the profitability of certain frequent-trading strategies.
Do not invest with Vanguard if you are a market-timer.
A precautionary note to investment companies: The Fund's shares are issued by a registered investment company, and therefore the acquisition of such shares by other investment companies and private funds is subject to the restrictions of Section 12(d)(1) of the Investment Company Act of 1940 (the 1940 Act). SEC Rule 12d1-4 under the 1940 Act permits registered investment companies to invest in other registered investment companies beyond the limits in Section 12(d)(1), subject to certain conditions, including that funds with different investment advisors must enter into a fund of funds investment agreement.
Turnover Rate
Although the Fund generally seeks to invest for the long term, it may sell securities regardless of how long they have been held. Generally, an index fund sells securities in response to redemption requests from shareholders of conventional (i.e., not exchange-traded) shares or to changes in the composition of its target index. Turnover rates for large-cap stock index funds tend to be low because large-cap indexes typically do not change significantly from year to year. Turnover rates for mid-cap and small-cap stock index funds tend to be higher than those for large-cap stock index funds (although still relatively low, compared with actively managed stock funds) because the indexes they track are more likely to change as a result of companies merging, growing, or failing. The Financial Highlights section of this prospectus shows historical turnover rates for the Fund. A turnover rate of 100%, for example, would mean that the Fund had sold and replaced securities valued at 100% of its net assets within a one-year period. In general, the greater the turnover rate, the greater the impact transaction costs will have on a fund’s return. Also, funds with high turnover rates may be more likely to generate capital gains, including short-term capital gains, that must be distributed to shareholders and will be taxable to shareholders investing through a taxable account.
11
The Fund and Vanguard
The Fund is a member of The Vanguard Group, Inc. (Vanguard), a family of over 200 funds. All of the funds that are members of Vanguard (other than funds of funds) share in the expenses associated with administrative services and business operations, such as personnel, office space, and equipment.
Vanguard Marketing Corporation provides marketing services to the funds. Although fund shareholders do not pay sales commissions or 12b-1 distribution fees, each fund (other than a fund of funds) or each share class of a fund (in the case of a fund with multiple share classes) pays its allocated share of the Vanguard funds’ marketing costs.
|
Plain Talk About Vanguard’s Unique Corporate Structure |
|
Vanguard is owned jointly by the funds it oversees and thus indirectly by the
shareholders in those funds. Most other mutual funds are operated by
management companies that are owned by third parties—either public or
private stockholders—and not by the funds they serve. |
Investment Advisor
The Vanguard Group, Inc., P.O. Box 2600, Valley Forge, PA 19482, which began operations in 1975, serves as advisor to the Fund through its Equity Index Group. As of August 31, 2023, Vanguard served as advisor for approximately $6.8 trillion in assets. Vanguard provides investment advisory services to the Fund pursuant to the Funds’ Service Agreement and subject to the supervision and oversight of the trustees and officers of the Fund.
For the fiscal year ended August 31, 2023, the advisory expenses represented an effective annual rate of less than 0.01% of the Fund’s average net assets.
Under the terms of an SEC exemption, the Fund's board of trustees may, without prior approval from shareholders, change the terms of an advisory agreement with a third-party investment advisor or hire a new third-party investment advisor—either as a replacement for an existing advisor or as an additional advisor. Any significant change in the Fund's advisory arrangements will be communicated to shareholders in writing. As the Fund's sponsor and overall manager, Vanguard may provide investment advisory services to the Fund at any time. Vanguard may also recommend to the board of trustees that an advisor be hired, terminated, or replaced or that the terms of an existing advisory agreement
12
be revised. The Fund has filed an application seeking a similar SEC exemption with respect to investment advisors that are wholly owned subsidiaries of Vanguard. If the exemption is granted, the Fund may rely on the new SEC relief.
For a discussion of why the board of trustees approved the Fund's investment advisory arrangement, see the most recent annual report to shareholders covering the fiscal year ended August 31.
The managers primarily responsible for the day-to-day management of the Fund are:
Nick Birkett, CFA, Portfolio Manager at Vanguard. He has worked in investment management since 2006, has been with Vanguard since 2017, and has co-managed the Fund since 2021. Education: B.S., University of Bath.
Walter Nejman, Portfolio Manager at Vanguard. He has been with Vanguard since 2005; has worked in investment management since 2008; and has co-managed the Fund since 2015. Education: B.A., Arcadia University; M.B.A., Villanova University.
The Fund's Statement of Additional Information provides information about each portfolio manager’s compensation, other accounts under management, and ownership of shares of the Fund.
Dividends, Capital Gains, and Taxes
Fund Distributions
The Fund distributes to shareholders virtually all of its net income (interest and dividends, less expenses) as well as any net short-term or long-term capital gains realized from the sale of its holdings. From time to time, the Fund may also make distributions that are treated as a return of capital. Income dividends generally are distributed quarterly in March, June, September, and December; capital gains distributions, if any, generally occur annually in December. In addition, the Fund may occasionally make a supplemental distribution at some other time during the year.
You can receive distributions of income or capital gains in cash, or you can have them automatically reinvested in more shares of the Fund. However, if you are investing through an employer-sponsored retirement or savings plan, your distributions will be automatically reinvested in additional Fund shares.
13
|
Plain Talk About Distributions |
|
As a shareholder, you are entitled to your portion of a fund’s income from
interest and dividends as well as capital gains from the fund’s sale of
investments. Income consists of both the dividends that the fund earns from
any stock holdings and the interest it receives from any money market and
bond investments. Capital gains are realized whenever the fund sells
securities for higher prices than it paid for them. These capital gains are
either short-term or long-term, depending on whether the fund held the
securities for one year or less or for more than one year. |
Basic Tax Points
Investors in taxable accounts should be aware of the following basic federal income tax points:
• Distributions are taxable to you whether or not you reinvest these amounts in additional Fund shares.
• Distributions declared in December—if paid to you by the end of January—are taxable as if received in December.
• Any dividend distribution or short-term capital gains distribution that you receive is taxable to you as ordinary income. If you are an individual and meet certain holding period requirements with respect to your Fund shares, you may be eligible for reduced tax rates on “qualified dividend income,” if any, or a special tax deduction on “qualified REIT dividends,” if any, distributed by the Fund.
• Any distribution of net long-term capital gains is taxable to you as long-term capital gains, no matter how long you have owned shares in the Fund.
• Capital gains distributions may vary considerably from year to year as a result of the Fund's normal investment activities and cash flows.
• Your cost basis in the Fund will be decreased by the amount of any return of capital that you receive. This, in turn, will affect the amount of any capital gain or loss that you realize when selling or exchanging your Fund shares.
• Return of capital distributions generally are not taxable to you until your cost basis has been reduced to zero. If your cost basis is at zero, return of capital distributions will be treated as capital gains.
• A sale or exchange of Fund shares is a taxable event. This means that you may have a capital gain to report as income, or a capital loss to report as a deduction, when you complete your tax return.
14
• Any conversion between classes of shares of the same fund is a nontaxable event. By contrast, an exchange between classes of shares of different funds is a taxable event.
• Vanguard (or your intermediary) will send you a statement each year showing the tax status of all of your distributions.
Individuals, trusts, and estates whose income exceeds certain threshold amounts are subject to a 3.8% Medicare contribution tax on “net investment income.” Net investment income takes into account distributions paid by the Fund and capital gains from any sale or exchange of Fund shares.
Dividend distributions and capital gains distributions that you receive, as well as your gains or losses from any sale or exchange of Fund shares, may be subject to state and local income taxes.
This prospectus provides general tax information only. If you are investing through a tax-advantaged account, such as an IRA or an employer-sponsored retirement or savings plan, special tax rules apply. Please consult your tax advisor for detailed information about any tax consequences for you.
|
Plain Talk About Buying a Dividend |
|
Unless you are a tax-exempt investor or investing through a tax-advantaged
account (such as an IRA or an employer-sponsored retirement or savings
plan), you should consider avoiding a purchase of fund shares shortly before
the fund makes a distribution, because doing so can cost you money in
taxes. This is known as “buying a dividend.” For example: On December 15,
you invest $5,000, buying 250 shares for $20 each. If the fund pays a
distribution of $1 per share on December 16, its share price will drop to $19
(not counting market change). You still have only $5,000 (250 shares x $19 =
$4,750 in share value, plus 250 shares x $1 = $250 in distributions), but you
owe tax on the $250 distribution you received—even if you reinvest it in more
shares. To avoid buying a dividend, check a fund’s distribution schedule
before you invest. |
General Information
Backup withholding. By law, Vanguard must withhold 24% of any taxable distributions or redemptions from your account if you do not:
• Provide your correct taxpayer identification number.
• Certify that the taxpayer identification number is correct.
• Confirm that you are not subject to backup withholding.
15
Similarly, Vanguard (or your intermediary) must withhold taxes from your account if the IRS instructs us to do so.
Foreign investors. Vanguard funds offered for sale in the United States (Vanguard U.S. funds), including the Fund offered in this prospectus, are not widely available outside the United States. Non-U.S. investors should be aware that U.S. withholding and estate taxes and certain U.S. tax reporting requirements may apply to any investments in Vanguard U.S. funds. Foreign investors should visit the non-U.S. investors page on our website at vanguard.com for information on Vanguard’s non-U.S. products.
Invalid addresses. If a dividend distribution or capital gains distribution check mailed to your address of record is returned as undeliverable, Vanguard will automatically reinvest the distribution and all future distributions until you provide us with a valid mailing address. Reinvestments will receive the net asset value calculated on the date of the reinvestment.
Share Price
Share price, also known as net asset value (NAV), is calculated as of the close of regular trading on the New York Stock Exchange (NYSE), generally 4 p.m., Eastern time, on each day that the NYSE is open for business (a business day). In the rare event the NYSE experiences unanticipated disruptions and is unavailable at the close of the trading day, NAVs will be calculated as of the close of regular trading on the Nasdaq (or another alternate exchange if the Nasdaq is unavailable, as determined at Vanguard’s discretion), generally 4 p.m., Eastern time. Each share class has its own NAV, which is computed by dividing the total assets, minus liabilities, allocated to the share class by the number of Fund shares outstanding for that class. On U.S. holidays or other days when the NYSE is closed, the NAV is not calculated, and the Fund does not sell or redeem shares. However, on those days the value of the Fund’s assets may be affected to the extent that the Fund holds securities that change in value on those days (such as foreign securities that trade on foreign markets that are open).
Stocks held by a Vanguard fund are valued at their market value when reliable market quotations are readily available from the principal exchange or market on which they are traded. Such securities are generally valued at their official closing price, the last reported sales price, or if there were no sales that day, the mean between the closing bid and asking prices. When a fund determines that market quotations either are not readily available or do not accurately reflect the value of a security, the security is priced at its fair value (the amount that the owner might reasonably expect to receive upon the current sale of the security).
16
The values of any foreign securities held by a fund are converted into U.S. dollars using an exchange rate obtained from an independent third party as of the close of regular trading on the NYSE. The values of any mutual fund shares, including institutional money market fund shares, held by a fund are based on the NAVs of the shares. The values of any ETF shares or closed-end fund shares held by a fund are based on the market value of the shares.
A fund also will use fair-value pricing if the value of a security it holds has been materially affected by events occurring before the fund's pricing time but after the close of the principal exchange or market on which the security is traded. This most commonly occurs with foreign securities, which may trade on foreign exchanges that close many hours before the fund's pricing time. Intervening events might be company-specific (e.g., earnings report, merger announcement) or country-specific or regional/global (e.g., natural disaster, economic or political news, interest rate change, act of terrorism). Intervening events include price movements in U.S. markets that exceed a specified threshold or that are otherwise deemed to affect the value of foreign securities.
Fair-value pricing may be used for domestic securities—for example, if (1) trading in a security is halted and does not resume before the fund's pricing time or a security does not trade in the course of a day and (2) the fund holds enough of the security that its price could affect the NAV.
Fair-value prices are determined by Vanguard according to procedures adopted by the board of trustees. When fair-value pricing is employed, the prices of securities used by a fund to calculate the NAV may differ from quoted or published prices for the same securities.
The Fund has authorized certain financial intermediaries and their designees, and may, from time to time, authorize certain funds of funds for which Vanguard serves as the investment advisor (Vanguard Funds of Funds), to accept orders to buy or sell fund shares on its behalf. The Fund will be deemed to receive an order when accepted by the financial intermediary, its designee, or one of the Vanguard Funds of Funds, and the order will receive the NAV next computed by the Fund after such acceptance.
Vanguard fund share prices are published daily on our website at vanguard.com/prices.
Vanguard fund share prices are published daily on our website at vanguard.com/prices.
17
Financial Highlights
Financial highlights information is intended to help you understand a fund’s performance for the past five years (or, if shorter, its period of operations). Certain information reflects financial results for a single fund share. Total return represents the rate that an investor would have earned or lost each period on an investment in a fund or share class (assuming reinvestment of all distributions). This information has been obtained from the financial statements audited by PricewaterhouseCoopers LLP, an independent registered public accounting firm, whose report, along with fund financial statements, is included in the fund’s most recent annual report to shareholders. You may obtain a free copy of the fund’s latest annual or semiannual report, which is available upon request.
Vanguard Russell 3000 Index Fund Institutional Shares
|
For a Share Outstanding
Throughout Each Period |
Year Ended August 31, | ||||
|
2023 |
2022 |
2021 |
2020 |
2019 | |
|
Net Asset Value, Beginning of Period |
$344.48 |
$402.86 |
$307.19 |
$257.87 |
$259.33 |
|
Investment Operations |
|
|
|
|
|
|
Net Investment Income1 |
5.690 |
5.323 |
4.689 |
4.739 |
4.499 |
|
Net Realized and Unrealized Gain (Loss) on
Investments |
44.177 |
(58.648) |
95.580 |
49.347 |
(1.394) |
|
Total from Investment Operations |
49.867 |
(53.325) |
100.269 |
54.086 |
3.105 |
|
Distributions |
|
|
|
|
|
|
Dividends from Net Investment Income |
(5.717) |
(5.055) |
(4.599) |
(4.766) |
(4.565) |
|
Distributions from Realized Capital Gains |
— |
— |
— |
— |
— |
|
Total Distributions |
(5.717) |
(5.055) |
(4.599) |
(4.766) |
(4.565) |
|
Net Asset Value, End of Period |
$388.63 |
$344.48 |
$402.86 |
$307.19 |
$257.87 |
|
Total Return |
14.70% |
-13.34% |
32.94% |
21.38% |
1.27% |
|
Ratios/Supplemental Data |
|
|
|
|
|
|
Net Assets, End of Period (Millions) |
$1,061 |
$1,445 |
$1,154 |
$1,018 |
$871 |
|
Ratio of Total Expenses to Average Net Assets |
0.08%2 |
0.08% |
0.08% |
0.08% |
0.08% |
|
Ratio of Net Investment Income to Average Net
Assets |
1.62% |
1.40% |
1.34% |
1.76% |
1.81% |
|
Portfolio Turnover Rate3 |
11% |
8% |
10% |
8% |
10% |
|
|
|
|
1 |
Calculated based on average shares outstanding. |
|
2 |
The ratio of expenses to average net assets for the period net of reduction from custody fee
offset arrangements was 0.08%. |
|
3 |
Excludes the value of portfolio securities received or delivered as a result of in-kind purchases
or redemptions of the fund’s capital shares, including ETF Creation Units. |
18
Investing With Vanguard
This section of the prospectus explains the basics of doing business with Vanguard. Vanguard fund shares can be held indirectly through an intermediary, such as a bank, a broker, or an investment advisor. If you hold Vanguard fund shares indirectly through an intermediary (including shares held in a brokerage account through Vanguard Brokerage Services®), please see Investing With Vanguard Through Other Firms, and also refer to your account agreement with the intermediary for information about transacting in that account. If you hold Vanguard fund shares through an employer-sponsored retirement or savings plan, please see Employer-Sponsored Plans. Vanguard reserves the right to change the policies in this section without notice. Please call or check online for current information. See Contacting Vanguard.
In certain circumstances, Vanguard fund shares can be held directly with Vanguard. If you hold Vanguard fund shares directly with Vanguard, you should carefully read each topic within this section that pertains to your relationship with Vanguard. Vanguard reserves the right, upon reasonable notice, to discontinue the ability to hold Vanguard fund shares directly with Vanguard for any or all investors and/or to transfer such shares to an affiliate or other financial institution.
In certain circumstances, Vanguard fund shares can be held directly with Vanguard. If you hold Vanguard fund shares directly with Vanguard, you should carefully read each topic within this section that pertains to your relationship with Vanguard. Vanguard reserves the right, upon reasonable notice, to discontinue the ability to hold Vanguard fund shares directly with Vanguard for any or all investors and/or to transfer such shares to an affiliate or other financial institution.
For Vanguard fund shares held directly with Vanguard, each fund you hold in an account is a separate “fund account.” For example, if you hold three funds in a nonretirement account titled in your own name, two funds in a nonretirement account titled jointly with your spouse, and one fund in an individual retirement account, you have six fund accounts—and this is true even if you hold the same fund in multiple accounts. Note that each reference to “you” in this prospectus applies to any one or more registered account owners or persons authorized to transact on your account.
Purchasing Shares
Vanguard reserves the right, without notice, to increase or decrease the minimum amount required to open, convert shares to, or maintain a fund account or to add to an existing fund account.
Investment minimums may differ for certain categories of investors.
Account Minimums for Institutional Shares
To open and maintain an account. $5 million.
Certain Vanguard institutional clients may meet the minimum investment amount by aggregating separate accounts within the same Fund. This aggregation policy does not apply to financial intermediaries.
19
Vanguard may charge additional recordkeeping fees for institutional clients whose accounts are recordkept by Vanguard. Please contact your Vanguard representative to determine whether additional recordkeeping fees apply to your account.
To add to an existing account. Generally $1.
How to Initiate a Purchase Request
Be sure to check Exchanging Shares, Frequent-Trading Limitations, and Other Rules You Should Know before placing your purchase request.
Online. You may open certain types of accounts, request a purchase of shares, and request an exchange through our website or our mobile application if your account is eligible and you are registered for online access.
By telephone. You may call Vanguard to begin the account registration process or request that the account-opening forms be sent to you. You may also call Vanguard to request a purchase of shares in your account or to request an exchange. See Contacting Vanguard.
By mail. You may send Vanguard your account registration form and check to open a new fund account. To add to an existing fund account, you may send your check with an Invest-by-Mail form (from a transaction confirmation or your account statement) or with a deposit slip (available online).
How to Pay for a Purchase
By electronic bank transfer. You may purchase shares of a Vanguard fund through an electronic transfer of money from a bank account. To establish the electronic bank transfer service on an account, you must designate the bank account online, complete a form, or fill out the appropriate section of your account registration form. After the service is set up on your account, you can purchase shares by electronic bank transfer on a regular schedule (Automatic Investment Plan), if eligible, or upon request. Your purchase request can be initiated online (if you are registered for online access), by telephone, or by mail.
By wire. Wiring instructions vary for different types of purchases. Please call Vanguard for instructions and policies on purchasing shares by wire. See Contacting Vanguard.
20
By check. You may make initial or additional purchases to your fund account by sending a check with a deposit slip or by utilizing our mobile application if your account is eligible and you are registered for online access. Also see How to Initiate a Purchase Request. Make your check payable to Vanguard and include the appropriate fund number (Vanguard—1854).
By exchange. You may purchase shares of a Vanguard fund using the proceeds from the simultaneous redemption of shares of another Vanguard fund. You may initiate an exchange online (if you are registered for online access), by telephone, or by mail with an exchange form. See Exchanging Shares.
Trade Date
The trade date for any purchase request received in good order will depend on the day and time Vanguard receives your request, the manner in which you are paying, and the type of fund you are purchasing. Your purchase will be executed using the NAV as calculated on the trade date. NAVs are calculated only on days that the NYSE is open for trading (a business day). In the rare event the NYSE experiences unanticipated disruptions and is unavailable at the close of the trading day, NAVs will be calculated as of the close of regular trading on the Nasdaq (or another alternate exchange if the Nasdaq is unavailable, as determined at Vanguard’s discretion), generally 4 p.m., Eastern time. The time selected for NAV calculation in this rare event shall also serve as the conclusion of the trading day. See Share Price.
For purchases by check into all funds other than money market funds and for purchases by exchange, wire, or electronic bank transfer into all funds: If the purchase request is received by Vanguard on a business day before the close of regular trading on the NYSE (generally 4 p.m., Eastern time), the trade date for the purchase will be the same day. If the purchase request is received on a business day after the close of regular trading on the NYSE, or on a nonbusiness day, the trade date for the purchase will be the next business day.
For purchases by check into money market funds: If the purchase request is received by Vanguard on a business day before the close of regular trading on the NYSE (generally 4 p.m., Eastern time), the trade date for the purchase will be the next business day. If the purchase request is received on a business day after the close of regular trading on the NYSE, or on a nonbusiness day, the trade date for the purchase will be the second business day following the day Vanguard receives the purchase request. Because money market instruments must be purchased with federal funds and it takes a money market mutual fund one business day to convert check proceeds into federal funds, the trade date for the purchase will be one business day later than for other funds.
21
If applicable, orders by Vanguard Funds of Funds will be treated as received by the Fund at the same time that corresponding orders are received in proper form by the Vanguard Funds of Funds.
If your purchase request is not accurate and complete, it may be rejected. See Other Rules You Should Know—Good Order.
For further information about purchase transactions, consult our website at vanguard.com or see Contacting Vanguard.
Other Purchase Rules You Should Know
Check purchases. All purchase checks must be written in U.S. dollars, be drawn on a U.S. bank, and be accompanied by good order instructions. Vanguard does not accept cash, traveler’s checks, starter checks, or money orders. In addition, Vanguard may refuse checks that are not made payable to Vanguard.
New accounts. We are required by law to obtain from you certain personal information that we will use to verify your identity. If you do not provide the information, we may not be able to open your account. If we are unable to verify your identity, Vanguard reserves the right, without notice, to close your account or take such other steps as we deem reasonable. Certain types of accounts may require additional documentation.
Refused or rejected purchase requests. Vanguard reserves the right to stop selling fund shares or to reject any purchase request at any time and without notice, including, but not limited to, purchases requested by exchange from another Vanguard fund. This also includes the right to reject any purchase request because the investor has a history of frequent trading or because the purchase may negatively affect a fund’s operation or performance.
Large purchases. Call Vanguard before attempting to invest a large dollar amount.
No cancellations. Vanguard will not accept your request to cancel any purchase request once processing has begun. Please be careful when placing a purchase request.
Converting Shares
If you convert from Institutional Shares to ETF Shares, the transaction will be based on the respective NAVs of the separate share classes on the trade date of the conversion.
22
Vanguard will not accept your request to cancel any self-directed conversion request once processing has begun. Please be careful when placing a conversion request.
A conversion between share classes of the same fund is a nontaxable event.
Conversions to ETF Shares
Owners of conventional (i.e., not exchange-traded) shares issued by the Fund may convert those shares to ETF Shares of equivalent value of the same fund. Please note that investors who own conventional shares through a 401(k) plan or other employer-sponsored retirement or benefit plan generally may not convert those shares to ETF Shares and should check with their plan sponsor or recordkeeper. ETF Shares, whether acquired through a conversion or purchased on the secondary market, cannot be converted to conventional shares by a shareholder. Also, ETF Shares of one fund cannot be exchanged for ETF Shares of another fund.
ETF Shares must be held in a brokerage account. Thus, before converting conventional shares to ETF Shares, you must have an existing, or open a new, brokerage account. This account may be with Vanguard Brokerage Services or with any other brokerage firm.
Vanguard Brokerage Services does not impose a fee on conversions from conventional shares to Vanguard ETF Shares. However, other brokerage firms may charge a fee to process a conversion. Vanguard reserves the right, in the future, to impose a transaction fee on conversions or to limit, temporarily suspend, or terminate the conversion privilege. For additional information on converting conventional shares to ETF Shares, please contact Vanguard to obtain a prospectus for ETF Shares. See Contacting Vanguard.
Redeeming Shares
How to Initiate a Redemption Request
Be sure to check Exchanging Shares, Frequent-Trading Limitations, and Other Rules You Should Know before placing your redemption request.
Online. You may request a redemption of shares or request an exchange through our website or our mobile application if your account is eligible and you are registered for online access.
By telephone. You may call Vanguard to request a redemption of shares or an exchange. See Contacting Vanguard.
23
By mail. You may send a form (available online) to Vanguard to redeem from a fund account or to make an exchange.
How to Receive Redemption Proceeds
By electronic bank transfer. You may have the proceeds of a fund redemption sent directly to a designated bank account. To establish the electronic bank transfer service on an account, you must designate a bank account online, complete a form, or fill out the appropriate section of your account registration form. After the service is set up on your account, you can redeem shares by electronic bank transfer on a regular schedule (Automatic Withdrawal Plan), if eligible, or upon request. Your redemption request can be initiated online (if you are registered for online access), by telephone, or by mail.
By wire. To receive your proceeds by wire, you may instruct Vanguard to wire your redemption proceeds ($100 minimum) to a previously designated bank account. To establish the wire redemption service, you generally must designate a bank account online, complete a form, or fill out the appropriate section of your account registration form.
Please note that Vanguard charges a $10 wire fee for outgoing wire redemptions. The fee is assessed in addition to, rather than being withheld from, redemption proceeds and is paid directly to the fund in which you invest. For example, if you redeem $100 via a wire, you will receive the full $100, and the $10 fee will be assessed to your fund account through an additional redemption of fund shares. If you redeem your entire fund account, your redemption proceeds will be reduced by the amount of the fee. The wire fee does not apply to accounts held by Flagship and Flagship Select clients; accounts held through intermediaries, including Vanguard Brokerage Services; or accounts held by institutional clients.
By exchange. You may have the proceeds of a Vanguard fund redemption invested directly in shares of another Vanguard fund. You may initiate an exchange online (if you are registered for online access), by telephone, or by mail. See Exchanging Shares.
By check. If you have not chosen another redemption method, Vanguard will mail you a redemption check, generally payable to all registered account owners, normally within two business days of your trade date, and generally to the address of record.
Trade Date
The trade date for any redemption request received in good order will depend on the day and time Vanguard receives your request and the manner in which you are redeeming. Your redemption will be executed using the NAV as calculated on
24
the trade date. NAVs are calculated only on days that the NYSE is open for trading (a business day). In the rare event the NYSE experiences unanticipated disruptions and is unavailable at the close of the trading day, NAVs will be calculated as of the close of regular trading on the Nasdaq (or another alternate exchange if the Nasdaq is unavailable, as determined at Vanguard’s discretion), generally 4 p.m., Eastern time. The time selected for NAV calculation in this rare event shall also serve as the conclusion of the trading day. See Share Price.
For redemptions by check, exchange, or wire: If the redemption request is received by Vanguard on a business day before the close of regular trading on the NYSE (generally 4 p.m., Eastern time), the trade date will be the same day. If the redemption request is received on a business day after the close of regular trading on the NYSE, or on a nonbusiness day, the trade date will be the next business day.
• Note on timing of wire redemptions from money market funds: For telephone requests received by Vanguard on a business day before 10:45 a.m., Eastern time (2 p.m., Eastern time, for Vanguard Cash Reserves Federal Money Market Fund; 12:30 p.m., Eastern time, for Vanguard Federal Money Market Fund), the redemption proceeds generally will leave Vanguard by the close of business the same day. For telephone requests received by Vanguard on a business day after those cut-off times, or on a nonbusiness day, and for all requests other than by telephone, the redemption proceeds generally will leave Vanguard by the close of business on the next business day.
• Note on timing of wire redemptions from all other funds: For requests received by Vanguard on a business day before the close of regular trading on the NYSE (generally 4 p.m., Eastern time), the redemption proceeds generally will leave Vanguard by the close of business on the next business day. For requests received by Vanguard on a business day after the close of regular trading on the NYSE, or on a nonbusiness day, the redemption proceeds generally will leave Vanguard by the close of business on the second business day after Vanguard receives the request.
For redemptions by electronic bank transfer: If the redemption request is received by Vanguard on a business day before the close of regular trading on the NYSE (generally 4 p.m., Eastern time), the trade date will be the same day. If the redemption request is received on a business day after the close of regular trading on the NYSE, or on a nonbusiness day, the trade date will be the next business day.
25
If your redemption request is not accurate and complete, it may be rejected. If we are unable to send your redemption proceeds by wire or electronic bank transfer because the receiving institution rejects the transfer, Vanguard will make additional efforts to complete your transaction. If Vanguard is still unable to complete the transaction, we may send the proceeds of the redemption to you by check, generally payable to all registered account owners, or use your proceeds to purchase new shares of the fund from which you sold shares for the purpose of the wire or electronic bank transfer transaction. See Other Rules You Should Know—Good Order.
If your redemption request is received in good order, we typically expect that redemption proceeds will be paid by the Fund within one business day of the trade date; however, in certain circumstances, investors may experience a longer settlement period at the time of the transaction. For further information, see “Potentially disruptive redemptions” and “Emergency circumstances.”
For further information about redemption transactions, consult our website at vanguard.com or see Contacting Vanguard.
Other Redemption Rules You Should Know
Documentation for certain accounts. Special documentation may be required to redeem from certain types of accounts, such as trust, corporate, nonprofit, or retirement accounts. Please call us before attempting to redeem from these types of accounts.
Potentially disruptive redemptions. Vanguard reserves the right to pay all or part of a redemption in kind—that is, in the form of securities—if we reasonably believe that a cash redemption would negatively affect the fund’s operation or performance or that the shareholder may be engaged in market-timing or frequent trading. Under these circumstances, Vanguard also reserves the right to delay payment of the redemption proceeds for up to seven calendar days. By calling us before you attempt to redeem a large dollar amount, you may avoid in-kind or delayed payment of your redemption. Please see Frequent-Trading Limitations for information about Vanguard’s policies to limit frequent trading.
Recently purchased shares. Although you can redeem shares at any time, proceeds may not be made available to you until the fund collects payment for your purchase. This may take up to seven calendar days for shares purchased by check or by electronic bank transfer. If you have written a check on a fund in an account with checkwriting privileges, that check may be rejected if your fund account does not have a sufficient available balance.
26
Address change. If you change your address online or by telephone, there may be up to a 14-day restriction (starting on the business day after your address is changed) on your ability to request check redemptions online and by telephone. You can request a redemption in writing (using a form available online) at any time. Confirmations of address changes are sent to both the old and new addresses.
Payment to a different person or address. At your request, we can make your redemption check payable, or wire your redemption proceeds, to a different person or send it to a different address. However, this generally requires the written consent of all registered account owners and may require additional documentation, such as a signature guarantee or a notarized signature. You may obtain a signature guarantee from some commercial or savings banks, credit unions, trust companies, or member firms of a U.S. stock exchange.
No cancellations. Vanguard will not accept your request to cancel any redemption request once processing has begun. Please be careful when placing a redemption request.
Emergency circumstances. Vanguard funds can postpone payment of redemption proceeds for up to seven calendar days. In addition, Vanguard funds can suspend redemptions and/or postpone payments of redemption proceeds beyond seven calendar days at times when the NYSE is closed or during emergency circumstances, as determined by the SEC.
Exchanging Shares
An exchange occurs when you use the proceeds from the redemption of shares of one Vanguard fund to simultaneously purchase shares of a different Vanguard fund. You can make exchange requests online (if you are registered for online access), by telephone, or by mail. See Purchasing Shares and Redeeming Shares.
If the NYSE is open for regular trading (generally until 4 p.m., Eastern time, on a business day) at the time an exchange request is received in good order, the trade date generally will be the same day. See Other Rules You Should Know—Good Order for additional information on all transaction requests.
Vanguard will not accept your request to cancel any exchange request once processing has begun. Please be careful when placing an exchange request.
Call Vanguard before attempting to exchange a large dollar amount. By calling us before you attempt to exchange a large dollar amount, you may avoid delayed or rejected transactions.
27
Please note that Vanguard reserves the right, without notice, to revise or terminate the exchange privilege, limit the amount of any exchange, or reject an exchange, at any time, for any reason. See Frequent-Trading Limitations for additional restrictions on exchanges.
28
Frequent-Trading Limitations
Because excessive transactions can disrupt management of a fund and increase the fund’s costs for all shareholders, the board of trustees of each Vanguard fund places certain limits on frequent trading in the funds. Each Vanguard fund (other than money market funds and short-term bond funds, but including Vanguard Short-Term Inflation-Protected Securities Index Fund) limits an investor’s purchases or exchanges into a fund account for 30 calendar days after the investor has redeemed or exchanged out of that fund account. ETF Shares are not subject to these frequent-trading limits.
For Vanguard Retirement Investment Program pooled plans, the limitations apply to exchanges made online or by telephone.
These frequent-trading limitations do not apply to the following:
• Certain transactions below dollar value or other thresholds specified by Vanguard.
• In-kind transactions to a shareholder’s donor advised fund managed by Vanguard Charitable.
• Purchases of shares with reinvested dividend or capital gains distributions.
• Transactions through Vanguard’s Automatic Investment Plan, Automatic Exchange Service, Direct Deposit Service, Automatic Withdrawal Plan, Required Minimum Distribution Service, Vanguard Small Business Online®, and certain transactions through intermediaries relating to systematic trades and required minimum distributions.
• Discretionary transactions through Vanguard Personal Advisor Services®, Vanguard Institutional Advisory Services®, Vanguard Digital Advisor™, and discretionary (advisor-directed) transactions through certain intermediaries.
• Redemptions of shares to pay fund or account fees.
• Redemptions of shares to remove excess shareholder contributions to certain types of retirement accounts (including, but not limited to, IRAs and Vanguard Individual 401(k) Plans).
• Transfers and reregistrations of shares within the same fund.
• Purchases of shares by asset transfer or direct rollover.
• Conversions of shares from one share class to another in the same fund.
• Checkwriting redemptions.
• Section 529 college savings plans.
• Certain approved institutional portfolios and asset allocation programs, as well as trades made by funds or trusts managed by Vanguard or its affiliates that
29
invest in other Vanguard funds. (Please note that shareholders of Vanguard’s funds of funds are subject to the limitations.)
For participants in employer-sponsored defined contribution plans,* the frequent-trading limitations do not apply to:
• Purchases of shares with participant payroll or employer contributions or loan repayments.
• Purchases of shares with reinvested dividend or capital gains distributions.
• Distributions, loans, and in-service withdrawals from a plan.
• Redemptions of shares as part of a plan termination or at the direction of the plan.
• Transactions executed through the Vanguard Managed Account Program.
• Redemptions of shares to pay fund or account fees.
• Share or asset transfers or rollovers.
• Reregistrations of shares.
• Conversions of shares from one share class to another in the same fund.
• Exchange requests submitted by written request to Vanguard. (Exchange requests submitted by fax, if otherwise permitted, are subject to the limitations.)
* The following Vanguard fund accounts are also subject to the frequent-trading limitations: SEP-IRAs, SIMPLE IRAs, certain Individual 403(b)(7) Custodial Accounts, and Vanguard Individual 401(k) Plans.
Accounts Held by Institutions (Other Than Defined Contribution Plans)
Vanguard will systematically monitor for frequent trading in institutional clients’ accounts. If we detect suspicious trading activity, we will investigate and take appropriate action, which may include applying to a client’s accounts the 30-day policy previously described, prohibiting a client’s purchases of fund shares, and/or revoking the client’s exchange privilege.
Accounts Held by Intermediaries
When intermediaries establish accounts in Vanguard funds for the benefit of their clients, we cannot always monitor the trading activity of the individual clients. However, we review trading activity at the intermediary (omnibus) level, and if we detect suspicious activity, we will investigate and take appropriate action. If necessary, Vanguard may prohibit additional purchases of fund shares by an intermediary, including for the benefit of certain of the intermediary’s clients. Intermediaries also may monitor their clients’ trading activities with respect to Vanguard funds.
30
For those Vanguard funds that charge purchase and/or redemption fees, intermediaries will be asked to assess these fees on client accounts and remit these fees to the funds. The application of purchase and redemption fees and frequent-trading limitations may vary among intermediaries. There are no assurances that Vanguard will successfully identify all intermediaries or that intermediaries will properly assess purchase and redemption fees or administer frequent-trading limitations. If you invest with Vanguard through an intermediary, please read that firm’s materials carefully to learn of any other rules or fees that may apply.
Other Rules You Should Know
Prospectus and Shareholder Report Mailings
When two or more shareholders have the same last name and address, just one summary prospectus (or prospectus) and/or shareholder report may be sent in an attempt to eliminate the unnecessary expense of duplicate mailings. You may request individual prospectuses and reports by contacting our Client Services Department in writing, by telephone, or online. See Contacting Vanguard.
Vanguard.com
Registration. If you are a registered user of vanguard.com, you can review your account holdings; buy, sell, or exchange shares of most Vanguard funds; and perform most other transactions through our website. You must register for this service online.
Electronic delivery. Vanguard can deliver your account statements, transaction confirmations, prospectuses, certain tax forms, and shareholder reports electronically. If you are a registered user of vanguard.com, you can consent to the electronic delivery of these documents by logging on and changing your mailing preferences under “Account Maintenance.” You can revoke your electronic consent at any time through our website, and we will begin to send paper copies of these documents within 30 days of receiving your revocation.
Telephone Transactions
Automatic. When we set up your account, we will automatically enable you to do business with us by telephone, unless you instruct us otherwise in writing.
31
Proof of a caller’s authority. We reserve the right to refuse a telephone request if the caller is unable to provide the requested information or if we reasonably believe that the caller is not an individual authorized to act on the account. Before we allow a caller to act on an account, we may request the following information:
• Authorization to act on the account (as the account owner or by legal documentation or other means).
• Account registration and address.
• Fund name and account number, if applicable.
• Other information relating to the caller, the account owner, or the account.
Good Order
We reserve the right to reject any transaction instructions that are not in “good order.” Good order generally means that your instructions:
• Are provided by the person(s) authorized in accordance with Vanguard’s policies and procedures to access the account and request transactions.
• Include the fund name and account number.
• Include the amount of the transaction (stated in dollars, shares, or percentage).
Written instructions also must generally be provided on a Vanguard form and include:
• Signature(s) and date from the authorized person(s).
• Signature guarantees or notarized signatures, if required for the type of transaction. (Call Vanguard for specific requirements.)
• Any supporting documentation that may be required.
Good order requirements may vary among types of accounts and transactions. For more information, consult our website at vanguard.com or see Contacting Vanguard.
Vanguard reserves the right, without notice, to revise the requirements for good order.
Future Trade-Date Requests
Vanguard does not accept requests to hold a purchase, conversion, redemption, or exchange transaction for a future date. All such requests will receive trade dates as previously described in Purchasing Shares, Converting Shares, Redeeming Shares, and Exchanging Shares. Vanguard reserves the right to return future-dated purchase checks.
32
Accounts With More Than One Owner
If an account has more than one owner or authorized person, Vanguard generally will accept instructions from any one owner or authorized person.
Responsibility for Fraud
You should take precautions to protect yourself from fraud. Keep your account-related information private, and review any account confirmations, statements, or other information that we provide to you as soon as you receive them. Let us know immediately if you discover unauthorized activity or see something on your account that you do not understand or that looks unusual.
Vanguard will not be responsible for losses that result from transactions by a person who we reasonably believe is authorized to act on your account.
Uncashed Checks
Please cash your distribution or redemption checks promptly. Vanguard will not pay interest on uncashed checks. Vanguard may be required to transfer assets related to uncashed checks to a state under the state’s abandoned property law.
Dormant Accounts
If your account has no activity in it for a period of time, Vanguard may be required to transfer it to a state under the state’s abandoned property law, subject to potential federal or state withholding taxes.
Unusual Circumstances
If you experience difficulty contacting Vanguard online or by telephone, you can send us your transaction request on a Vanguard form by regular or express mail.
Investing With Vanguard Through Other Firms
You may purchase or sell shares of most Vanguard funds through a financial intermediary, such as a bank, a broker, or an investment advisor. Please consult your financial intermediary to determine which, if any, shares are available through that firm and to learn about other rules that may apply. Your financial intermediary can provide you with account information and any required tax forms. You may be required to pay a commission on purchases of mutual fund shares made through a financial intermediary.
Please see Frequent-Trading Limitations—Accounts Held by Intermediaries for information about the assessment of any purchase or redemption fees and the monitoring of frequent trading for accounts held by intermediaries.
33
Low-Balance Accounts
The Fund reserves the right to liquidate a fund account whose balance falls below the account minimum for any reason, including market fluctuation. This liquidation policy applies to nonretirement fund accounts and accounts that are held through intermediaries. Any such liquidation will be preceded by written notice to the investor.
Right to Change Policies
In addition to the rights expressly stated elsewhere in this prospectus, Vanguard reserves the right, without notice, to (1) alter, add, or discontinue any conditions of purchase (including eligibility requirements), redemption, exchange, conversion, service, or privilege at any time and (2) alter, impose, discontinue, or waive any purchase fee, redemption fee, account service fee, or other fee charged to a shareholder or a group of shareholders. Changes may affect any or all investors. These actions will be taken when, at the sole discretion of Vanguard management, Vanguard believes they are in the best interest of a fund.
Account Restrictions
Vanguard reserves the right to: (1) redeem all or a portion of a fund/account to meet a legal obligation, including tax withholding, tax lien, garnishment order, or other obligation imposed on your account by a court or government agency; (2) redeem shares, close an account, or suspend account privileges, features, or options in the case of threatening conduct or activity; (3) redeem shares, close an account, or suspend account privileges, features, or options if Vanguard believes or suspects that not doing so could result in a suspicious, fraudulent, or illegal transaction; (4) place restrictions on the ability to redeem any or all shares in an account if it is required to do so by a court or government agency; (5) place restrictions on the ability to redeem any or all shares in an account if Vanguard believes that doing so will prevent fraud, financial exploitation or abuse, or to protect vulnerable investors; (6) freeze any account and/or suspend account services if Vanguard has received reasonable notice of a dispute regarding the assets in an account, including notice of a dispute between the registered or beneficial account owners; and (7) freeze any account and/or suspend account services upon initial notification to Vanguard of the death of an account owner.
Share Classes
Vanguard reserves the right, without notice, to change the eligibility requirements of its share classes, including the types of clients who are eligible to purchase each share class.
34
Shareholder Rights
The Fund's Agreement and Declaration of Trust, as amended, requires a shareholder bringing a derivative action on behalf of Vanguard Scottsdale Funds (the Trust) that is subject to a pre-suit demand to collectively hold at least 10% of the outstanding shares of the Trust or at least 10% of the outstanding shares of the series or class to which the demand relates and to undertake to reimburse the Trust for the expense of any counsel or advisors used when considering the merits of the demand in the event that the board of trustees determines not to bring such action. In each case, these requirements do not apply to claims arising under the federal securities laws to the extent that any such federal securities laws, rules, or regulations do not permit such application.
Fund and Account Updates
Confirmation Statements
We will send (or provide through our website, whichever you prefer) a confirmation of your trade date and the amount of your transaction when you buy, sell, exchange, or convert shares. However, we will not send confirmations reflecting only checkwriting redemptions or the reinvestment of dividend or capital gains distributions. For any month in which you had a checkwriting redemption, a Checkwriting Activity Statement will be sent to you itemizing the checkwriting redemptions for that month. Promptly review each confirmation statement that we provide to you. It is important that you contact Vanguard immediately with any questions you may have about any transaction reflected on a confirmation statement, or Vanguard will consider the transaction properly processed.
Portfolio Summaries
We will send (or provide through our website, whichever you prefer) quarterly portfolio summaries to help you keep track of your accounts throughout the year. Each summary shows the market value of your account at the close of the statement period, as well as all distributions, purchases, redemptions, exchanges, transfers, and conversions for the current calendar quarter (or month). Promptly review each summary that we provide to you. It is important that you contact Vanguard immediately with any questions you may have about any transaction reflected on the summary, or Vanguard will consider the transaction properly processed.
35
Tax Information Statements
For most accounts, Vanguard (or your intermediary) is required to provide annual tax forms to assist you in preparing your income tax returns. These forms are generally available for each calendar year early in the following year. Registered users of vanguard.com can also view certain forms through our website. Vanguard (or your intermediary) may also provide you with additional tax-related documentation. For more information, consult our website at vanguard.com or see Contacting Vanguard.
Annual and Semiannual Reports
We will send (or provide through our website, whichever you prefer) reports about Vanguard Russell 3000 Index Fund twice a year, in April and October. These reports include overviews of the financial markets and provide the following specific Fund information:
• Performance assessments and comparisons with industry benchmarks.
• Financial statements with listings of Fund holdings.
Portfolio Holdings
Please consult the Fund's Statement of Additional Information or our website for a description of the policies and procedures that govern disclosure of the Fund’s portfolio holdings.
Employer-Sponsored Plans
Your plan administrator or your employee benefits office can provide you with detailed information on how to participate in your plan and how to elect the Fund as an investment option.
• If you have any questions about the Fund or Vanguard, including those about the Fund’s investment objective, strategies, or risks, contact Vanguard Participant Services toll-free at 800-523-1188 or visit our website at vanguard.com.
• If you have questions about your account, contact your plan administrator or the organization that provides recordkeeping services for your plan.
• Be sure to carefully read each topic that pertains to your transactions with Vanguard.
Vanguard reserves the right to change its policies without notice to shareholders.
36
Transactions
Processing times for your transaction requests may differ among recordkeepers or among transaction and funding types. Your plan’s recordkeeper (which may also be Vanguard) will determine the necessary processing time frames for your transaction requests prior to submission to the Fund. Consult your recordkeeper or plan administrator for more information.
If Vanguard is serving as your plan recordkeeper and if your transaction involves one or more investments with an early cut-off time for processing or another trading restriction, your entire transaction will be subject to the restriction when the trade date for your transaction is determined.
Contacting Vanguard
|
Web |
|
|
Vanguard.com |
For the most complete source of Vanguard news
For fund, account, and service information
For most account transactions
For literature requests
24 hours a day, 7 days a week |
|
Phone | |
|
Investor Information 800-662-7447
(Text telephone for people with
hearing impairment at 800-749-7273) |
For fund and service information
For literature requests |
|
Client Services 800-662-2739
(Text telephone for people with
hearing impairment at 800-749-7273) |
For account information
For most account transactions |
|
Participant Services 800-523-1188
(Text telephone for people with
hearing impairment at 800-749-7273) |
For information and services for participants in
employer-sponsored plans |
|
Institutional Division
888-809-8102 |
For information and services for large institutional
investors |
|
Financial Advisor and Intermediary
Sales Support 800-997-2798 |
For information and services for financial intermediaries
including financial advisors, broker-dealers, trust
institutions, and insurance companies |
|
Financial Advisory and Intermediary
Trading Support 800-669-0498 |
For account information and trading support for
financial intermediaries including financial advisors,
broker-dealers, trust institutions, and insurance
companies |
37
Additional Information
The Fund's Bylaws require, unless the Trust otherwise consents in writing, that the U.S. Federal District Courts be the sole and exclusive forum for the resolution of complaints under the Securities Act of 1933. This provision may limit a shareholder’s ability to bring a claim in a different forum and may result in increased shareholder costs in pursuing such a claim.
|
Vanguard Fund |
Inception
Date |
Newspaper
Abbreviation |
Vanguard
Fund
Number |
CUSIP
Number |
|
Vanguard Russell 3000 Index
Fund |
|
|
|
|
|
Institutional Shares |
11/1/2010 |
Russ3000IdxInst |
1854 |
92206C581 |
CGS identifiers have been provided by CUSIP Global Services, managed on behalf of the American Bankers Association by Standard & Poor’s Financial Services, LLC, and are not for use or dissemination in a manner that would serve as a substitute for any CUSIP service. The CUSIP Database, © 2023 American Bankers Association. “CUSIP” is a registered trademark of the American Bankers Association.
38
CFA® is a registered trademark owned by CFA Institute.
The Product is not sponsored, endorsed, sold or promoted by Frank Russell Company (“Russell”). Russell makes no representation or warranty, express or implied, to the owners of the Product or any member of the public regarding the advisability of investing in securities generally or in the Product particularly or the ability of the Russell 3000 Index to track general stock market performance or a segment of the same. Russell’s publication of the Russell 3000 Index in no way suggests or implies an opinion by Russell as to the advisability of investment in any or all of the securities upon which the Russell 3000 Index is based. Russell’s only relationship to The Vanguard Group, Inc. is the licensing of certain trademarks and trade names of Russell and of the Russell 3000 Index which is determined, composed and calculated by Russell without regard to The Vanguard Group, Inc. or the Product. Russell is not responsible for and has not reviewed the Product nor any associated literature or publications and Russell makes no representation or warranty express or implied as to their accuracy or completeness, or otherwise. Russell has no obligation or liability in connection with the administration, marketing or trading of the Product.
Russell makes no representation, warranty or guarantee as to the accuracy, completeness, reliability or otherwise of the Russell Indexes or any data included in the Russell Indexes. Russell does not guarantee the accuracy and/or the completeness of the Russell 3000 Index or any data included therein and Russell shall have no liability for any errors, omissions, or interruptions therein. Russell makes no warranty, express or implied, as to the use of or results to be obtained by The Vanguard Group, Inc., investors, owners of the Product, or any other person or entity from the use of the Russell 3000 Index or any data included therein. Russell makes no express or implied warranties, and expressly disclaims all warranties of merchantability or fitness for a particular purpose or use with respect to the Russell 3000 Index or any data included therein. Without limiting any of the foregoing, in no event shall Russell have any liability for any special, punitive, indirect, or consequential damages (including lost profits), even if notified of the possibility of such damages.
Russell reserves the right, at any time and without notice, to alter, amend, terminate or in any way change the Russell Indexes. Russell has no obligation to take the needs of any particular fund or its participants or any other product or person into consideration in determining, composing or calculating any of the Russell Indexes.
39
Glossary of Investment Terms
Capital Gains Distributions. Payments to mutual fund shareholders of gains realized on securities that a fund has sold at a profit, minus any realized losses.
Common Stock. A security representing ownership rights in a corporation.
Dividend Distributions. Payments to mutual fund shareholders of income from interest or dividends generated by a fund's investments.
Dow Jones U.S. Total Stock Market Float Adjusted Index. An index that represents the entire U.S. stock market and tracks more than 5,000 stocks, excluding shares of securities not available for public trading.
Expense Ratio. A fund's total annual operating expenses expressed as a percentage of the fund's average net assets. The expense ratio includes management and administrative expenses, but it does not include the transaction costs of buying and selling portfolio securities.
Inception Date. The date on which the assets of a fund (or one of its share classes) are first invested in accordance with the fund's investment objective. For funds with a subscription period, the inception date is the day after that period ends. Investment performance is generally measured from the inception date.
Indexing. A low-cost investment strategy in which a mutual fund attempts to track—rather than outperform—a specified market benchmark, or “index.”
Joint Committed Credit Facility. The Fund participates, along with other funds managed by Vanguard, in a committed credit facility provided by a syndicate of lenders pursuant to a credit agreement that may be renewed annually; each Vanguard fund is individually liable for its borrowings, if any, under the credit facility. The amount and terms of the committed credit facility are subject to approval by the Fund's board of trustees and renegotiation with the lender syndicate on an annual basis.
Median Market Capitalization. An indicator of the size of companies in which a fund invests; the midpoint of market capitalization (market price x shares outstanding) of a fund's stocks, weighted by the proportion of the fund's assets invested in each stock. Stocks representing half of the fund's assets have market capitalizations above the median, and the rest are below it.
Mutual Fund. An investment company that pools the money of many people and invests it in a variety of securities in an effort to achieve a specific objective over time.
40
New York Stock Exchange (NYSE). A stock exchange based in New York City that is open for regular trading on business days, Monday through Friday, from 9:30 a.m. to 4 p.m., Eastern time.
Return of Capital. A return of capital occurs when a fund's distributions exceed its earnings in a fiscal year. A return of capital is a return of all or part of your original investment or amounts paid in excess of your original investment in a fund. In general, a return of capital reduces your cost basis in a fund's shares and is not taxable to you until your cost basis has been reduced to zero.
Securities. Stocks, bonds, money market instruments, and other investments.
Total Return. A percentage change, over a specified time period, in a mutual fund's net asset value, assuming the reinvestment of all distributions of dividends and capital gains.
Volatility. The fluctuations in value of a mutual fund or other security. The greater a fund's volatility, the wider the fluctuations in its returns.
Yield. Income (interest or dividends) earned by an investment, expressed as a percentage of the investment’s price.
Connect with Vanguard® ˃ vanguard.com
For More Information
If you would like more information about Vanguard Russell 3000 Index Fund, the following documents are available free upon request:
Annual/Semiannual Reports to Shareholders
Additional information about the Fund's investments is available in the Fund's annual and semiannual reports to shareholders. In the annual report, you will find a discussion of the market conditions and investment strategies that significantly affected the Fund's performance during its last fiscal year.
Statement of Additional Information (SAI)
The SAI provides more detailed information about the Fund and is incorporated by reference into (and thus legally a part of) this prospectus.
To receive a free copy of the latest annual or semiannual report or the SAI, or to request additional information about the Fund or other Vanguard funds, please visit vanguard.com or contact us as follows:
If you are an individual investor:
Telephone: 800-662-7447; Text telephone for people with hearing impairment: 800-749-7273
Telephone: 800-662-7447; Text telephone for people with hearing impairment: 800-749-7273
If you are a client of Vanguard’s Institutional Division:
Telephone: 888-809-8102; Text telephone for people
with hearing impairment: 800-749-7273
Telephone: 888-809-8102; Text telephone for people
with hearing impairment: 800-749-7273
If you are a current Vanguard shareholder and would like information about your account, account transactions, and/or account statements, please call:
Client Services Department
Telephone: 800-662-2739; Text telephone for people with hearing impairment: 800-749-7273
Telephone: 800-662-2739; Text telephone for people with hearing impairment: 800-749-7273
Information Provided by the SEC
Reports and other information about the Fund are available in the EDGAR database on the SEC’s website at sec.gov, or you can receive copies of this information, for a fee, by electronic request at the following email address: publicinfo@sec.gov.
Fund's Investment Company Act file number: 811-07803
© 2023 The Vanguard Group, Inc. All rights reserved.
Vanguard Marketing Corporation, Distributor.
I 1854 122023
Vanguard Marketing Corporation, Distributor.
I 1854 122023
Vanguard Russell ETFs
Prospectus
December 22, 2023
Exchange-traded fund shares that are not individually redeemable and are listed on Nasdaq
Vanguard Russell 1000 Index Fund ETF Shares (VONE)
Vanguard Russell 1000 Value Index Fund ETF Shares (VONV)
Vanguard Russell 1000 Growth Index Fund ETF Shares (VONG)
Vanguard Russell 2000 Index Fund ETF Shares (VTWO)
Vanguard Russell 2000 Value Index Fund ETF Shares (VTWV)
Vanguard Russell 2000 Growth Index Fund ETF Shares (VTWG)
Vanguard Russell 3000 Index Fund ETF Shares (VTHR)
This prospectus contains financial data for the Funds through the fiscal year ended August 31, 2023.
The Securities and Exchange Commission (SEC) has not approved or disapproved these securities or passed upon the adequacy of this prospectus. Any representation to the contrary is a criminal offense.
(Fees paid directly from your investment)
|
| |
|
Transaction Fee on Purchases and Sales |
|
|
Transaction Fee on Reinvested Dividends |
|
|
Transaction Fee on Conversion to ETF Shares |
|
*
(Expenses that you pay each year as a percentage of the value of your investment)
|
| |
|
Management Fees |
% |
|
12b-1 Distribution Fee |
|
|
Other Expenses |
% |
|
Total Annual Fund Operating Expenses |
% |
1
|
1 Year |
3 Years |
5 Years |
10 Years |
|
$ |
$ |
$ |
$ |
2
3

1 The year-to-date return as of the most recent calendar quarter, which ended on September 30, 2023, was 12.97%.
|
|
Total Return |
Quarter |
|
|
% |
|
|
|
-
% |
|
|
|
1 Year |
5 Years |
10 Years |
|
Vanguard Russell 1000 Index Fund ETF Shares |
|
|
|
|
Based on NAV |
|
|
|
|
Return Before Taxes |
-
% |
% |
% |
|
Return After Taxes on Distributions |
- |
|
|
|
Return After Taxes on Distributions and Sale of Fund Shares |
- |
|
|
|
Based on Market Price |
|
|
|
|
Return Before Taxes |
- |
|
|
|
Russell 1000 Index
(reflects no deduction for fees, expenses, or taxes) |
-
% |
% |
% |
|
Dow Jones U.S. Total Stock Market Float Adjusted Index
(reflects no deduction for fees, expenses, or taxes) |
- |
|
|
4
Investment Advisor
The Vanguard Group, Inc. (Vanguard)
Portfolio Managers
Nick Birkett, CFA, Portfolio Manager at Vanguard. He has co-managed the Fund since 2021.
Aurélie Denis, CFA, Portfolio Manager at Vanguard. She has co-managed the Fund since February 2023.
Purchase and Sale of Fund Shares
ETF Shares may only be bought and sold in the secondary market through a brokerage firm. The price you pay or receive for ETF Shares will be the prevailing market price, which may be more (premium) or less (discount) than the NAV of the shares. The brokerage firm may charge you a commission to execute the transaction. Unless imposed by your brokerage firm, there is no minimum dollar amount you must invest and no minimum number of shares you must buy. ETF Shares of the Fund cannot be directly purchased from or redeemed with the Fund, except by certain authorized broker-dealers. These broker-dealers may purchase and redeem ETF Shares only in large blocks (Creation Units), typically in exchange for baskets of securities.
An investor may incur costs attributable to the difference between the highest price a buyer is willing to pay to purchase ETF Shares (bid) and the lowest price a seller is willing to accept for ETF Shares (ask) when buying or selling shares in the secondary market (bid-ask spread). Recent information, including information on the Fund's NAV, market price, premiums and discounts, and bid-ask spreads, is available online at vanguard.com.
5
Tax Information
The Fund’s distributions may be taxable as ordinary income or capital gain. If you are investing through a tax-advantaged account, such as an IRA or an employer-sponsored retirement or savings plan, special tax rules apply.
Payments to Financial Intermediaries
The Fund and its investment advisor do not pay financial intermediaries for sales of Fund shares.
6
(Fees paid directly from your investment)
|
| |
|
Transaction Fee on Purchases and Sales |
|
|
Transaction Fee on Reinvested Dividends |
|
|
Transaction Fee on Conversion to ETF Shares |
|
*
(Expenses that you pay each year as a percentage of the value of your investment)
|
| |
|
Management Fees |
% |
|
12b-1 Distribution Fee |
|
|
Other Expenses |
% |
|
Total Annual Fund Operating Expenses |
% |
7
|
1 Year |
3 Years |
5 Years |
10 Years |
|
$ |
$ |
$ |
$ |
8
9
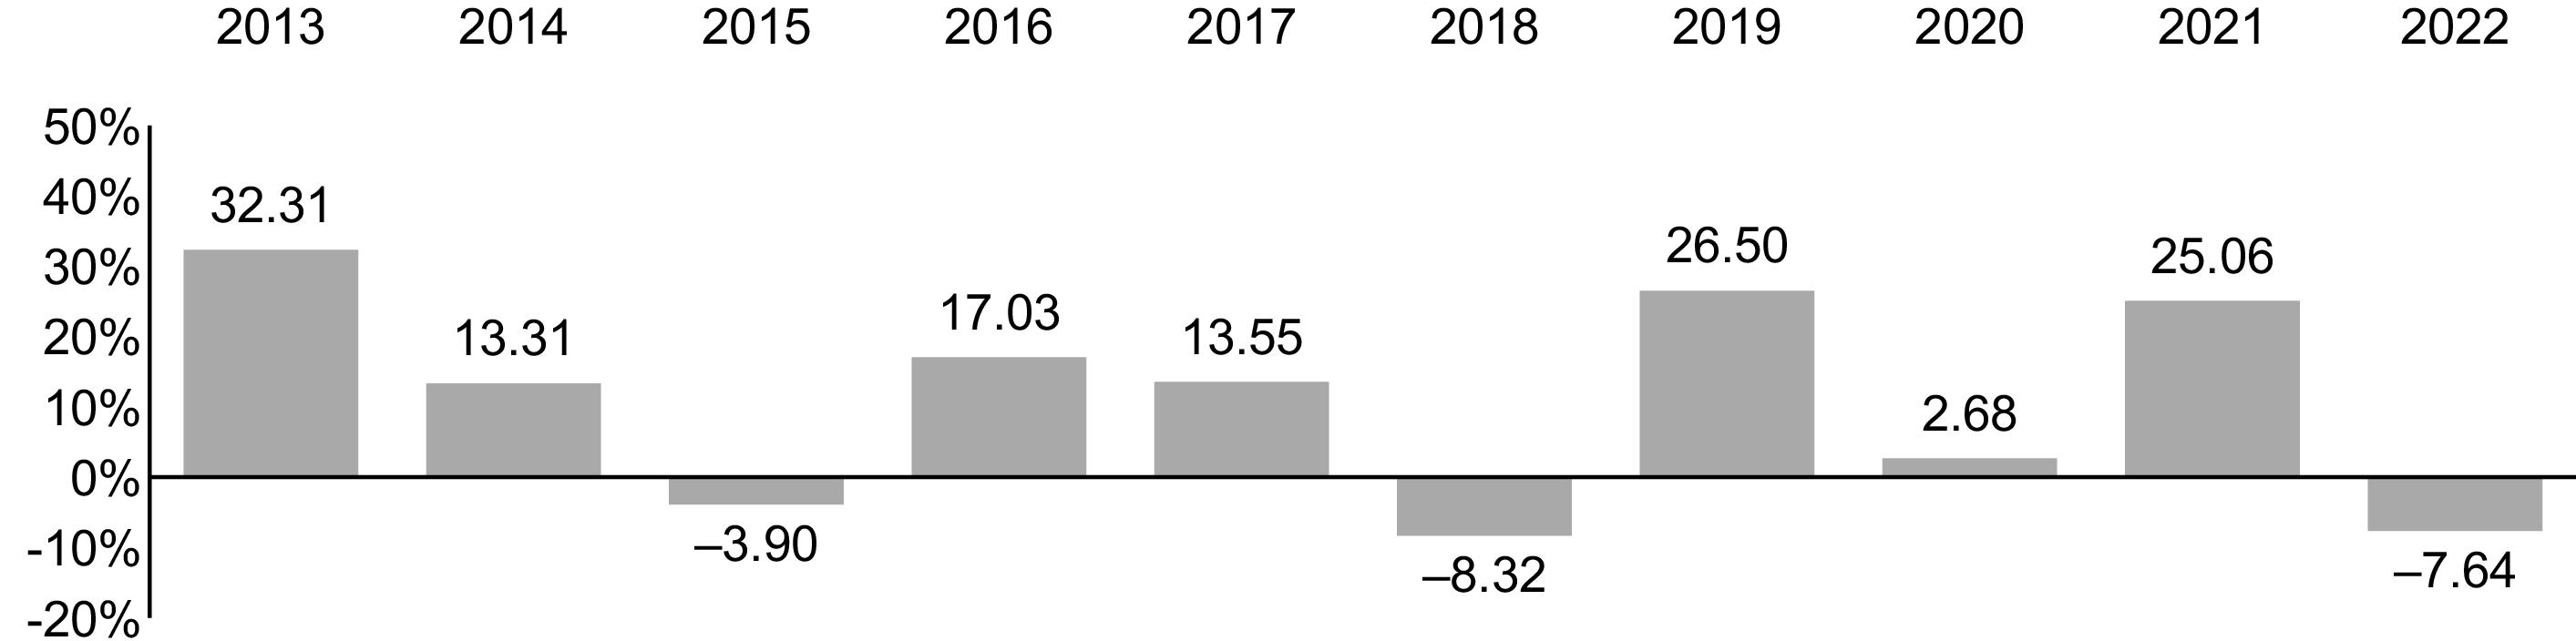
1 The year-to-date return as of the most recent calendar quarter, which ended on September 30, 2023, was 1.79%.
|
|
Total Return |
Quarter |
|
|
% |
|
|
|
-
% |
|
|
|
1 Year |
5 Years |
10 Years |
|
Vanguard Russell 1000 Value Index Fund ETF Shares |
|
|
|
|
Based on NAV |
|
|
|
|
Return Before Taxes |
-
% |
% |
% |
|
Return After Taxes on Distributions |
- |
|
|
|
Return After Taxes on Distributions and Sale of Fund Shares |
- |
|
|
|
Based on Market Price |
|
|
|
|
Return Before Taxes |
- |
|
|
|
Russell 1000 Value Index
(reflects no deduction for fees, expenses, or taxes) |
-
% |
% |
% |
|
Dow Jones U.S. Total Stock Market Float Adjusted Index
(reflects no deduction for fees, expenses, or taxes) |
- |
|
|
10
Investment Advisor
The Vanguard Group, Inc. (Vanguard)
Portfolio Managers
Nick Birkett, CFA, Portfolio Manager at Vanguard. He has co-managed the Fund since 2021.
Aurélie Denis, CFA, Portfolio Manager at Vanguard. She has co-managed the Fund since February 2023.
Purchase and Sale of Fund Shares
ETF Shares may only be bought and sold in the secondary market through a brokerage firm. The price you pay or receive for ETF Shares will be the prevailing market price, which may be more (premium) or less (discount) than the NAV of the shares. The brokerage firm may charge you a commission to execute the transaction. Unless imposed by your brokerage firm, there is no minimum dollar amount you must invest and no minimum number of shares you must buy. ETF Shares of the Fund cannot be directly purchased from or redeemed with the Fund, except by certain authorized broker-dealers. These broker-dealers may purchase and redeem ETF Shares only in large blocks (Creation Units), typically in exchange for baskets of securities.
An investor may incur costs attributable to the difference between the highest price a buyer is willing to pay to purchase ETF Shares (bid) and the lowest price a seller is willing to accept for ETF Shares (ask) when buying or selling shares in the secondary market (bid-ask spread). Recent information, including information on the Fund's NAV, market price, premiums and discounts, and bid-ask spreads, is available online at vanguard.com.
11
Tax Information
The Fund’s distributions may be taxable as ordinary income or capital gain. If you are investing through a tax-advantaged account, such as an IRA or an employer-sponsored retirement or savings plan, special tax rules apply.
Payments to Financial Intermediaries
The Fund and its investment advisor do not pay financial intermediaries for sales of Fund shares.
12
(Fees paid directly from your investment)
|
| |
|
Transaction Fee on Purchases and Sales |
|
|
Transaction Fee on Reinvested Dividends |
|
|
Transaction Fee on Conversion to ETF Shares |
|
*
(Expenses that you pay each year as a percentage of the value of your investment)
|
| |
|
Management Fees |
% |
|
12b-1 Distribution Fee |
|
|
Other Expenses |
% |
|
Total Annual Fund Operating Expenses |
% |
13
|
1 Year |
3 Years |
5 Years |
10 Years |
|
$ |
$ |
$ |
$ |
14
15
16

1 The year-to-date return as of the most recent calendar quarter, which ended on September 30, 2023, was 24.92%.
|
|
Total Return |
Quarter |
|
|
% |
|
|
|
-
% |
|
|
|
1 Year |
5 Years |
10 Years |
|
Vanguard Russell 1000 Growth Index Fund ETF Shares |
|
|
|
|
Based on NAV |
|
|
|
|
Return Before Taxes |
-
% |
% |
% |
|
Return After Taxes on Distributions |
- |
|
|
|
Return After Taxes on Distributions and Sale of Fund Shares |
- |
|
|
|
Based on Market Price |
|
|
|
|
Return Before Taxes |
- |
|
|
|
Russell 1000 Growth Index
(reflects no deduction for fees, expenses, or taxes) |
-
% |
% |
% |
|
Dow Jones U.S. Total Stock Market Float Adjusted Index
(reflects no deduction for fees, expenses, or taxes) |
- |
|
|
17
Investment Advisor
The Vanguard Group, Inc. (Vanguard)
Portfolio Managers
Nick Birkett, CFA, Portfolio Manager at Vanguard. He has co-managed the Fund since 2021.
Aurélie Denis, CFA, Portfolio Manager at Vanguard. She has co-managed the Fund since February 2023.
Purchase and Sale of Fund Shares
ETF Shares may only be bought and sold in the secondary market through a brokerage firm. The price you pay or receive for ETF Shares will be the prevailing market price, which may be more (premium) or less (discount) than the NAV of the shares. The brokerage firm may charge you a commission to execute the transaction. Unless imposed by your brokerage firm, there is no minimum dollar amount you must invest and no minimum number of shares you must buy. ETF Shares of the Fund cannot be directly purchased from or redeemed with the Fund, except by certain authorized broker-dealers. These broker-dealers may purchase and redeem ETF Shares only in large blocks (Creation Units), typically in exchange for baskets of securities.
An investor may incur costs attributable to the difference between the highest price a buyer is willing to pay to purchase ETF Shares (bid) and the lowest price a seller is willing to accept for ETF Shares (ask) when buying or selling shares in the secondary market (bid-ask spread). Recent information, including information on the Fund's NAV, market price, premiums and discounts, and bid-ask spreads, is available online at vanguard.com.
Tax Information
The Fund’s distributions may be taxable as ordinary income or capital gain. If you are investing through a tax-advantaged account, such as an IRA or an employer-sponsored retirement or savings plan, special tax rules apply.
Payments to Financial Intermediaries
The Fund and its investment advisor do not pay financial intermediaries for sales of Fund shares.
18
(Fees paid directly from your investment)
|
| |
|
Transaction Fee on Purchases and Sales |
|
|
Transaction Fee on Reinvested Dividends |
|
|
Transaction Fee on Conversion to ETF Shares |
|
*
(Expenses that you pay each year as a percentage of the value of your investment)
|
| |
|
Management Fees |
% |
|
12b-1 Distribution Fee |
|
|
Other Expenses |
% |
|
Total Annual Fund Operating Expenses |
% |
19
|
1 Year |
3 Years |
5 Years |
10 Years |
|
$ |
$ |
$ |
$ |
20
21
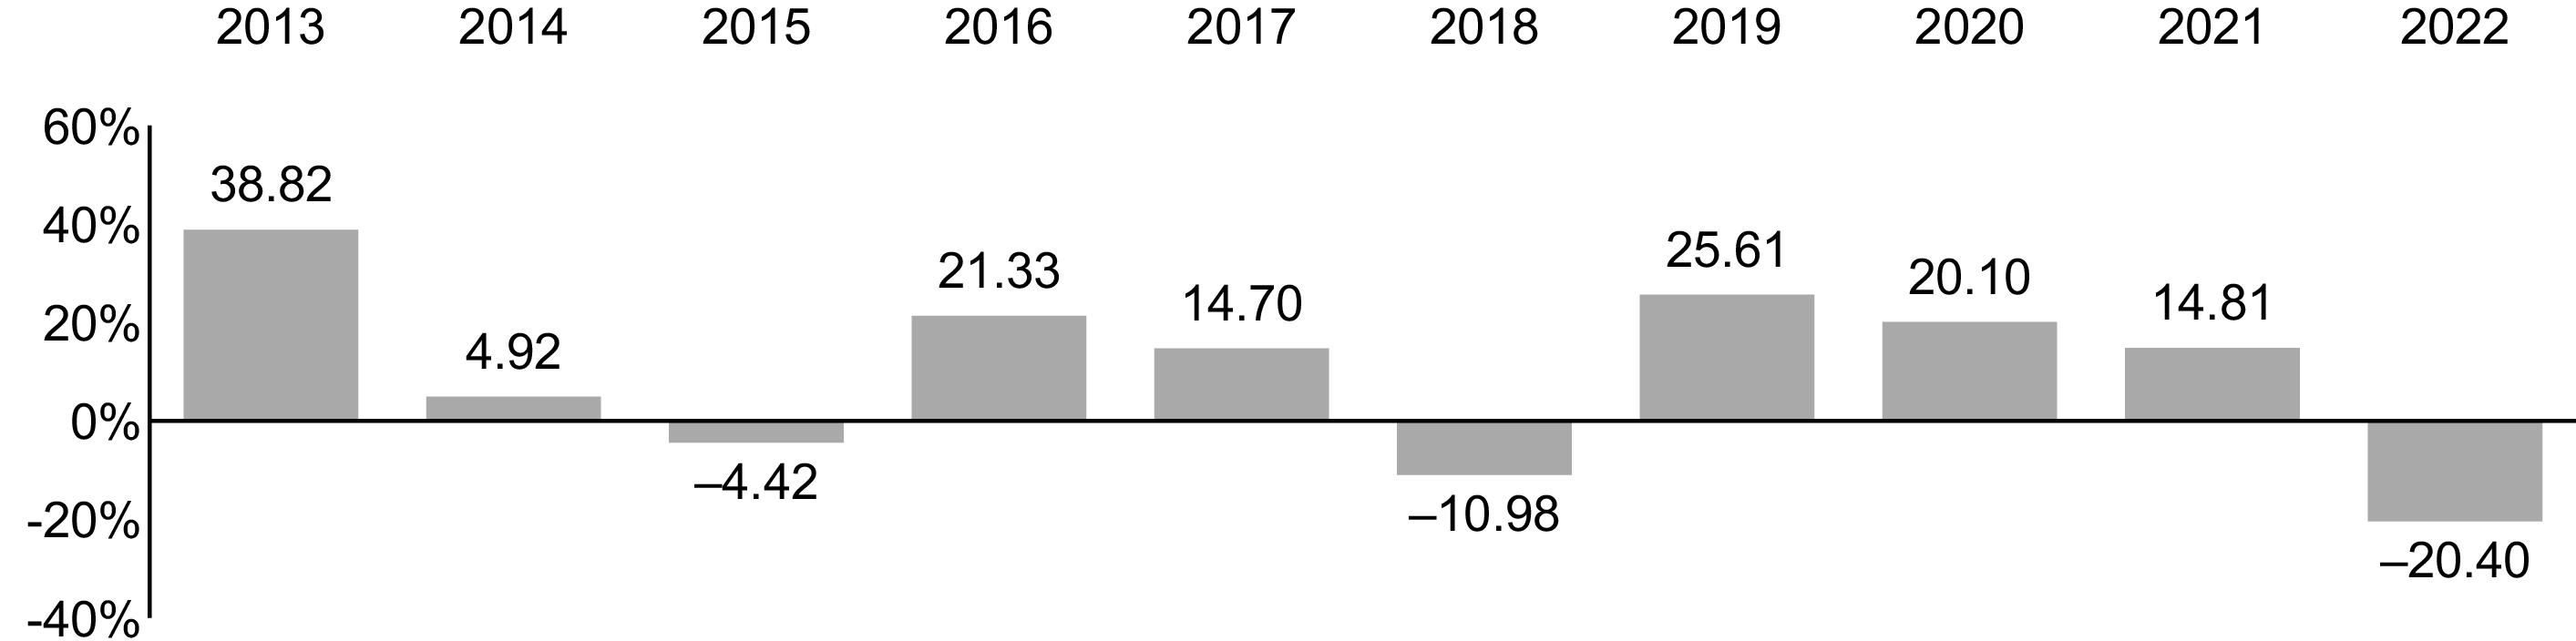
1 The year-to-date return as of the most recent calendar quarter, which ended on September 30, 2023, was 2.61%.
|
|
Total Return |
Quarter |
|
|
% |
|
|
|
-
% |
|
22
|
|
1 Year |
5 Years |
10 Years |
|
Vanguard Russell 2000 Index Fund ETF Shares |
|
|
|
|
Based on NAV |
|
|
|
|
Return Before Taxes |
-
% |
% |
% |
|
Return After Taxes on Distributions |
- |
|
|
|
Return After Taxes on Distributions and Sale of Fund Shares |
- |
|
|
|
Based on Market Price |
|
|
|
|
Return Before Taxes |
- |
|
|
|
Russell 2000 Index
(reflects no deduction for fees, expenses, or taxes) |
-
% |
% |
% |
|
Dow Jones U.S. Total Stock Market Float Adjusted Index
(reflects no deduction for fees, expenses, or taxes) |
- |
|
|
Investment Advisor
The Vanguard Group, Inc. (Vanguard)
Portfolio Managers
Nick Birkett, CFA, Portfolio Manager at Vanguard. He has co-managed the Fund since 2021.
Kenny Narzikul, CFA, Portfolio Manager at Vanguard. He has co-managed the Fund since February 2023.
Purchase and Sale of Fund Shares
ETF Shares may only be bought and sold in the secondary market through a brokerage firm. The price you pay or receive for ETF Shares will be the prevailing market price, which may be more (premium) or less (discount) than the NAV of the shares. The brokerage firm may charge you a commission to execute
23
the transaction. Unless imposed by your brokerage firm, there is no minimum dollar amount you must invest and no minimum number of shares you must buy. ETF Shares of the Fund cannot be directly purchased from or redeemed with the Fund, except by certain authorized broker-dealers. These broker-dealers may purchase and redeem ETF Shares only in large blocks (Creation Units), typically in exchange for baskets of securities.
An investor may incur costs attributable to the difference between the highest price a buyer is willing to pay to purchase ETF Shares (bid) and the lowest price a seller is willing to accept for ETF Shares (ask) when buying or selling shares in the secondary market (bid-ask spread). Recent information, including information on the Fund's NAV, market price, premiums and discounts, and bid-ask spreads, is available online at vanguard.com.
Tax Information
The Fund’s distributions may be taxable as ordinary income or capital gain. If you are investing through a tax-advantaged account, such as an IRA or an employer-sponsored retirement or savings plan, special tax rules apply.
Payments to Financial Intermediaries
The Fund and its investment advisor do not pay financial intermediaries for sales of Fund shares.
24
(Fees paid directly from your investment)
|
| |
|
Transaction Fee on Purchases and Sales |
|
|
Transaction Fee on Reinvested Dividends |
|
|
Transaction Fee on Conversion to ETF Shares |
|
*
(Expenses that you pay each year as a percentage of the value of your investment)
|
| |
|
Management Fees |
% |
|
12b-1 Distribution Fee |
|
|
Other Expenses |
% |
|
Total Annual Fund Operating Expenses |
% |
25
|
1 Year |
3 Years |
5 Years |
10 Years |
|
$ |
$ |
$ |
$ |
26
27
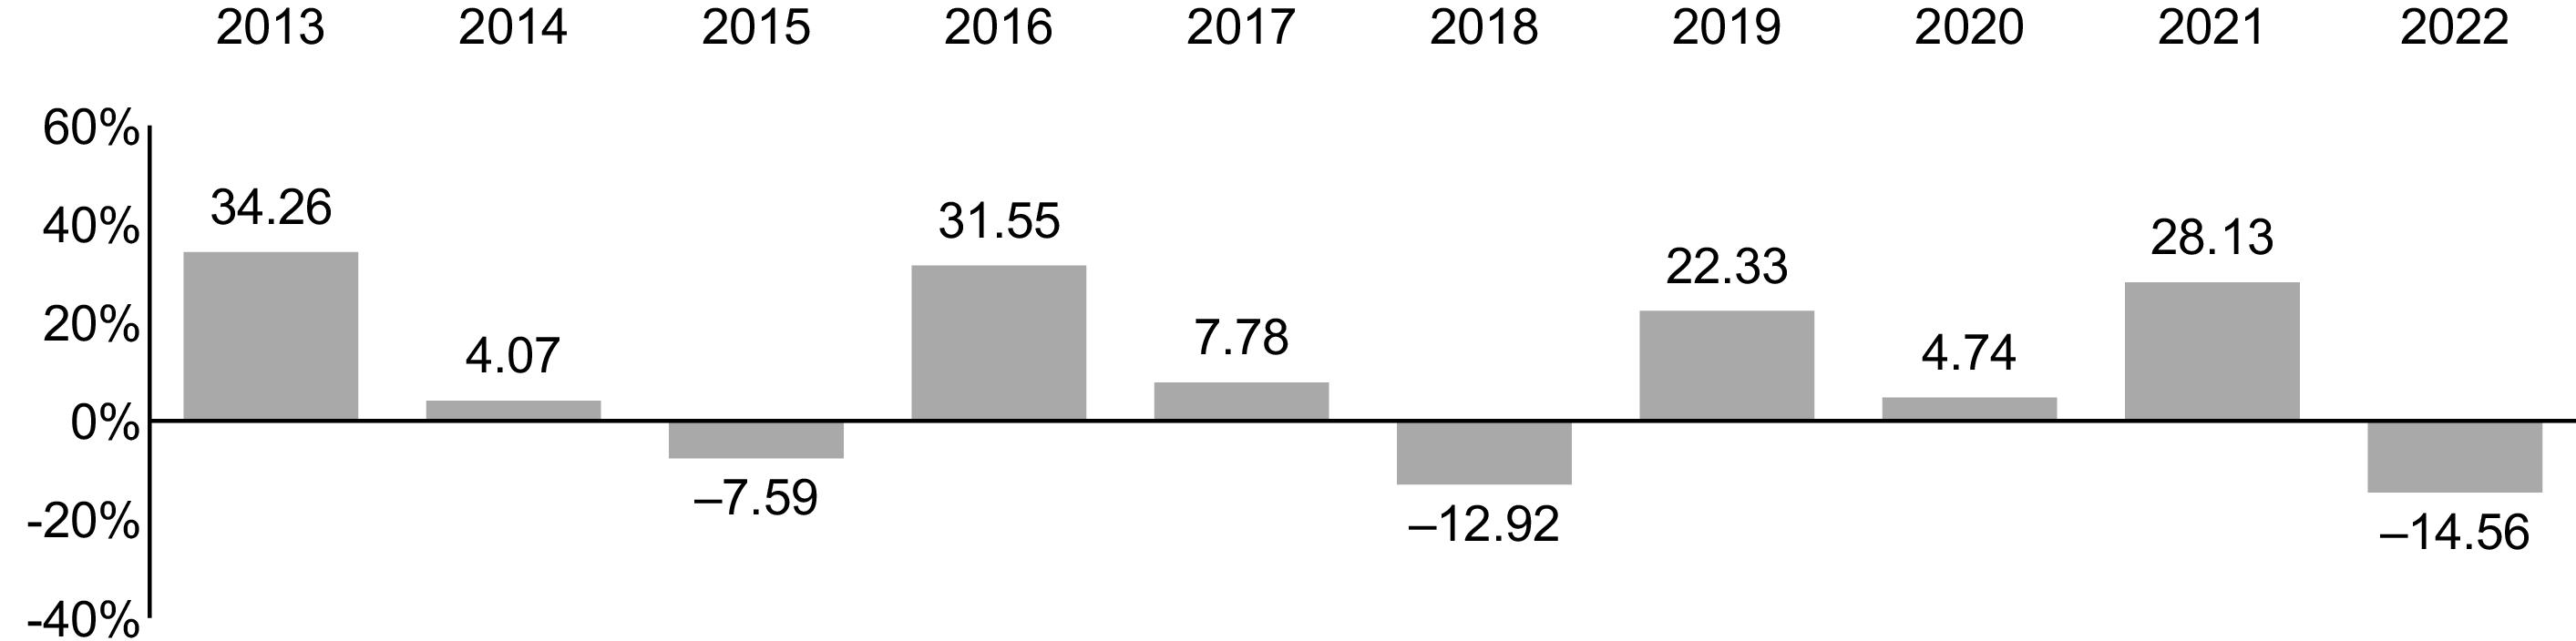
1 The year-to-date return as of the most recent calendar quarter, which ended on September 30, 2023, was -0.49%.
|
|
Total Return |
Quarter |
|
|
% |
|
|
|
-
% |
|
28
|
|
1 Year |
5 Years |
10 Years |
|
Vanguard Russell 2000 Value Index Fund ETF Shares |
|
|
|
|
Based on NAV |
|
|
|
|
Return Before Taxes |
-
% |
% |
% |
|
Return After Taxes on Distributions |
- |
|
|
|
Return After Taxes on Distributions and Sale of Fund Shares |
- |
|
|
|
Based on Market Price |
|
|
|
|
Return Before Taxes |
- |
|
|
|
Russell 2000 Value Index
(reflects no deduction for fees, expenses, or taxes) |
-
% |
% |
% |
|
Dow Jones U.S. Total Stock Market Float Adjusted Index
(reflects no deduction for fees, expenses, or taxes) |
- |
|
|
Investment Advisor
The Vanguard Group, Inc. (Vanguard)
Portfolio Managers
Nick Birkett, CFA, Portfolio Manager at Vanguard. He has co-managed the Fund since 2021.
Kenny Narzikul, CFA, Portfolio Manager at Vanguard. He has co-managed the Fund since February 2023.
Purchase and Sale of Fund Shares
ETF Shares may only be bought and sold in the secondary market through a brokerage firm. The price you pay or receive for ETF Shares will be the prevailing market price, which may be more (premium) or less (discount) than the NAV of the shares. The brokerage firm may charge you a commission to execute
29
the transaction. Unless imposed by your brokerage firm, there is no minimum dollar amount you must invest and no minimum number of shares you must buy. ETF Shares of the Fund cannot be directly purchased from or redeemed with the Fund, except by certain authorized broker-dealers. These broker-dealers may purchase and redeem ETF Shares only in large blocks (Creation Units), typically in exchange for baskets of securities.
An investor may incur costs attributable to the difference between the highest price a buyer is willing to pay to purchase ETF Shares (bid) and the lowest price a seller is willing to accept for ETF Shares (ask) when buying or selling shares in the secondary market (bid-ask spread). Recent information, including information on the Fund's NAV, market price, premiums and discounts, and bid-ask spreads, is available online at vanguard.com.
Tax Information
The Fund’s distributions may be taxable as ordinary income or capital gain. If you are investing through a tax-advantaged account, such as an IRA or an employer-sponsored retirement or savings plan, special tax rules apply.
Payments to Financial Intermediaries
The Fund and its investment advisor do not pay financial intermediaries for sales of Fund shares.
30
(Fees paid directly from your investment)
|
| |
|
Transaction Fee on Purchases and Sales |
|
|
Transaction Fee on Reinvested Dividends |
|
|
Transaction Fee on Conversion to ETF Shares |
|
*
(Expenses that you pay each year as a percentage of the value of your investment)
|
| |
|
Management Fees |
% |
|
12b-1 Distribution Fee |
|
|
Other Expenses |
% |
|
Total Annual Fund Operating Expenses |
% |
31
|
1 Year |
3 Years |
5 Years |
10 Years |
|
$ |
$ |
$ |
$ |
32
33
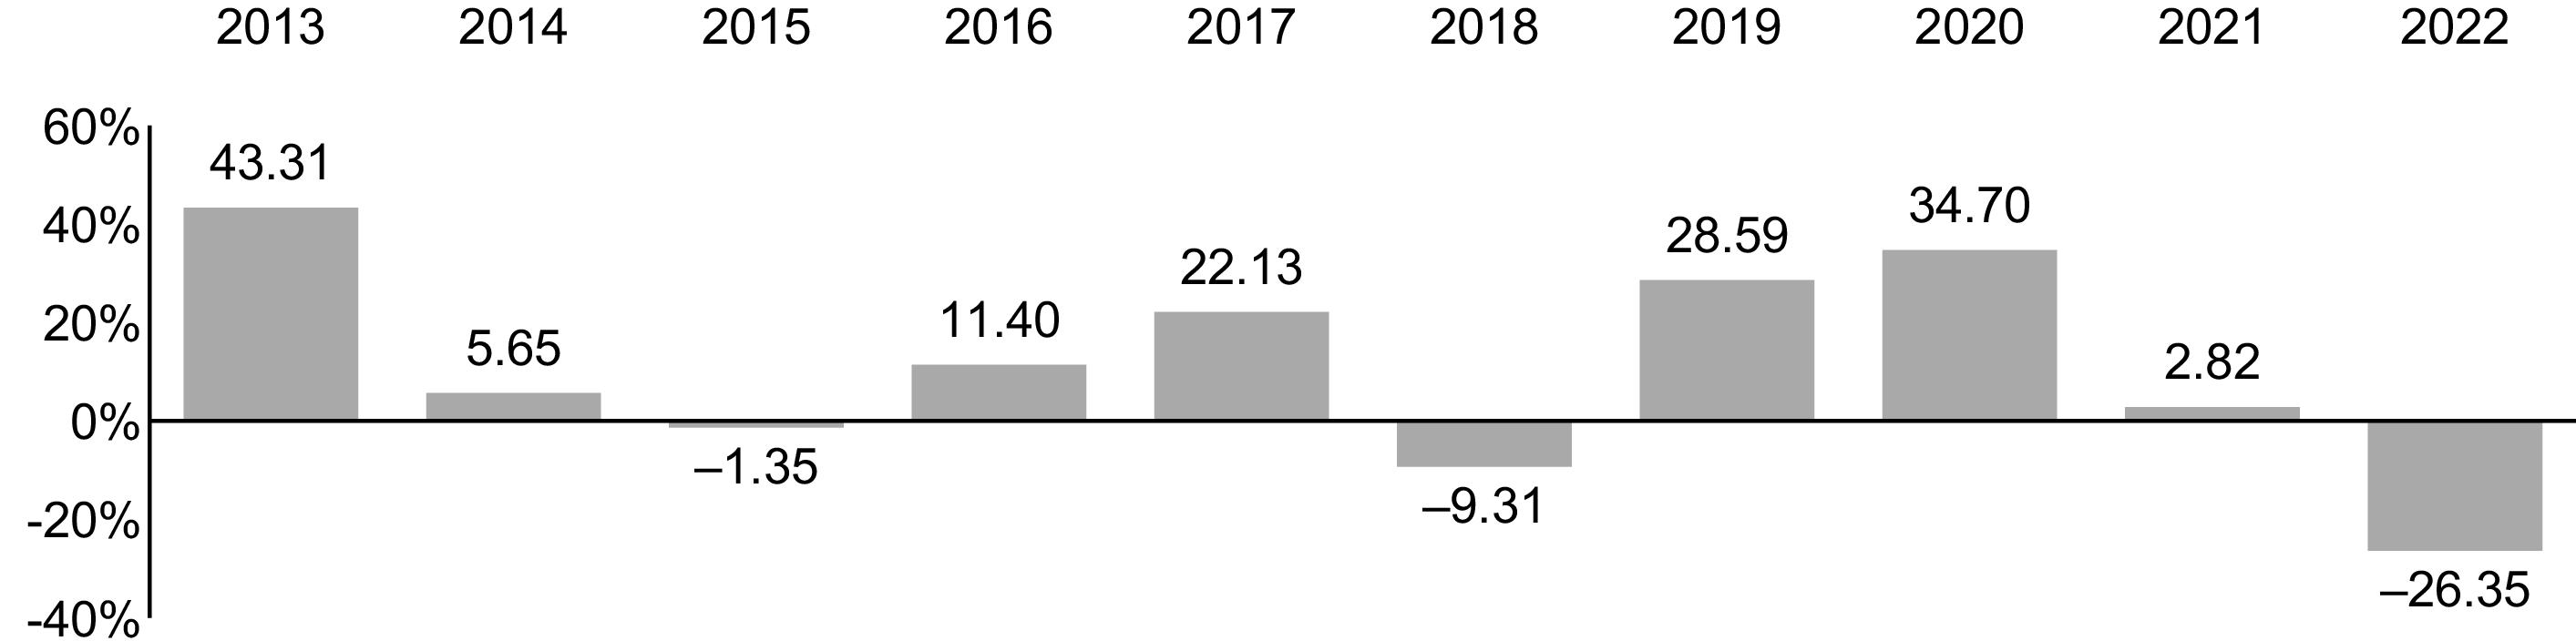
1 The year-to-date return as of the most recent calendar quarter, which ended on September 30, 2023, was 5.31%.
|
|
Total Return |
Quarter |
|
|
% |
|
|
|
-
% |
|
34
|
|
1 Year |
5 Years |
10 Years |
|
Vanguard Russell 2000 Growth Index Fund ETF Shares |
|
|
|
|
Based on NAV |
|
|
|
|
Return Before Taxes |
-
% |
% |
% |
|
Return After Taxes on Distributions |
- |
|
|
|
Return After Taxes on Distributions and Sale of Fund Shares |
- |
|
|
|
Based on Market Price |
|
|
|
|
Return Before Taxes |
- |
|
|
|
Russell 2000 Growth Index
(reflects no deduction for fees, expenses, or taxes) |
-
% |
% |
% |
|
Dow Jones U.S. Total Stock Market Float Adjusted Index
(reflects no deduction for fees, expenses, or taxes) |
- |
|
|
Investment Advisor
The Vanguard Group, Inc. (Vanguard)
Portfolio Managers
Nick Birkett, CFA, Portfolio Manager at Vanguard. He has co-managed the Fund since 2021.
Kenny Narzikul, CFA, Portfolio Manager at Vanguard. He has co-managed the Fund since February 2023.
Purchase and Sale of Fund Shares
ETF Shares may only be bought and sold in the secondary market through a brokerage firm. The price you pay or receive for ETF Shares will be the prevailing market price, which may be more (premium) or less (discount) than the NAV of the shares. The brokerage firm may charge you a commission to execute
35
the transaction. Unless imposed by your brokerage firm, there is no minimum dollar amount you must invest and no minimum number of shares you must buy. ETF Shares of the Fund cannot be directly purchased from or redeemed with the Fund, except by certain authorized broker-dealers. These broker-dealers may purchase and redeem ETF Shares only in large blocks (Creation Units), typically in exchange for baskets of securities.
An investor may incur costs attributable to the difference between the highest price a buyer is willing to pay to purchase ETF Shares (bid) and the lowest price a seller is willing to accept for ETF Shares (ask) when buying or selling shares in the secondary market (bid-ask spread). Recent information, including information on the Fund's NAV, market price, premiums and discounts, and bid-ask spreads, is available online at vanguard.com.
Tax Information
The Fund’s distributions may be taxable as ordinary income or capital gain. If you are investing through a tax-advantaged account, such as an IRA or an employer-sponsored retirement or savings plan, special tax rules apply.
Payments to Financial Intermediaries
The Fund and its investment advisor do not pay financial intermediaries for sales of Fund shares.
36
(Fees paid directly from your investment)
|
| |
|
Transaction Fee on Purchases and Sales |
|
|
Transaction Fee on Reinvested Dividends |
|
|
Transaction Fee on Conversion to ETF Shares |
|
*
(Expenses that you pay each year as a percentage of the value of your investment)
|
| |
|
Management Fees |
% |
|
12b-1 Distribution Fee |
|
|
Other Expenses |
% |
|
Total Annual Fund Operating Expenses |
% |
37
|
1 Year |
3 Years |
5 Years |
10 Years |
|
$ |
$ |
$ |
$ |
38
39

1 The year-to-date return as of the most recent calendar quarter, which ended on September 30, 2023, was 12.34%.
|
|
Total Return |
Quarter |
|
|
% |
|
|
|
-
% |
|
|
|
1 Year |
5 Years |
10 Years |
|
Vanguard Russell 3000 Index Fund ETF Shares |
|
|
|
|
Based on NAV |
|
|
|
|
Return Before Taxes |
-
% |
% |
% |
|
Return After Taxes on Distributions |
- |
|
|
|
Return After Taxes on Distributions and Sale of Fund Shares |
- |
|
|
|
Based on Market Price |
|
|
|
|
Return Before Taxes |
- |
|
|
|
Russell 3000 Index
(reflects no deduction for fees, expenses, or taxes) |
-
% |
% |
% |
|
Dow Jones U.S. Total Stock Market Float Adjusted Index
(reflects no deduction for fees, expenses, or taxes) |
- |
|
|
40
Investment Advisor
The Vanguard Group, Inc. (Vanguard)
Portfolio Managers
Nick Birkett, CFA, Portfolio Manager at Vanguard. He has co-managed the Fund since 2021.
Walter Nejman, Portfolio Manager at Vanguard. He has co-managed the Fund since 2015.
Purchase and Sale of Fund Shares
ETF Shares may only be bought and sold in the secondary market through a brokerage firm. The price you pay or receive for ETF Shares will be the prevailing market price, which may be more (premium) or less (discount) than the NAV of the shares. The brokerage firm may charge you a commission to execute the transaction. Unless imposed by your brokerage firm, there is no minimum dollar amount you must invest and no minimum number of shares you must buy. ETF Shares of the Fund cannot be directly purchased from or redeemed with the Fund, except by certain authorized broker-dealers. These broker-dealers may purchase and redeem ETF Shares only in large blocks (Creation Units), typically in exchange for baskets of securities.
An investor may incur costs attributable to the difference between the highest price a buyer is willing to pay to purchase ETF Shares (bid) and the lowest price a seller is willing to accept for ETF Shares (ask) when buying or selling shares in the secondary market (bid-ask spread). Recent information, including information on the Fund's NAV, market price, premiums and discounts, and bid-ask spreads, is available online at vanguard.com.
Tax Information
The Fund’s distributions may be taxable as ordinary income or capital gain. If you are investing through a tax-advantaged account, such as an IRA or an employer-sponsored retirement or savings plan, special tax rules apply.
Payments to Financial Intermediaries
The Fund and its investment advisor do not pay financial intermediaries for sales of Fund shares.
41
Investing in Vanguard ETF® Shares
What Are Vanguard ETF Shares?
Vanguard ETF Shares are an exchange-traded class of shares issued by certain Vanguard funds. ETF Shares represent an interest in the portfolio of stocks or bonds held by the issuing fund. The following ETF Shares are offered through this prospectus:
|
Vanguard Fund |
Vanguard ETF Shares |
Seeks to Track |
|
Vanguard Russell 1000 Index Fund |
Russell 1000 ETF |
Large-cap stocks |
|
Vanguard Russell 1000 Value Index Fund |
Russell 1000 Value ETF |
Large-cap value stocks |
|
Vanguard Russell 1000 Growth Index
Fund |
Russell 1000 Growth ETF |
Large-cap growth stocks |
|
Vanguard Russell 2000 Index Fund |
Russell 2000 ETF |
Small-cap stocks |
|
Vanguard Russell 2000 Value Index Fund |
Russell 2000 Value ETF |
Small-cap value stocks |
|
Vanguard Russell 2000 Growth Index
Fund |
Russell 2000 Growth ETF |
Small-cap growth stocks |
|
Vanguard Russell 3000 Index Fund |
Russell 3000 ETF |
The broad stock market |
In addition to ETF Shares, each Fund offers one conventional (i.e., not exchange-traded) class of shares. This prospectus, however, relates only to ETF Shares.
How Are Vanguard ETF Shares Different From Conventional Mutual Fund Shares?
Conventional mutual fund shares can be directly purchased from and redeemed with the issuing fund for cash at the net asset value (NAV), typically calculated once a day. ETF Shares, by contrast, cannot be purchased directly from or redeemed directly with the issuing fund by an individual investor. Rather, ETF Shares can only be purchased or redeemed directly from the issuing fund by certain authorized broker-dealers. These broker-dealers may purchase and redeem ETF Shares only in large blocks (Creation Units), usually in exchange for baskets of securities and not for cash (although some funds issue and redeem Creation Units in exchange for cash or a combination of cash and securities).
An organized secondary trading market is expected to exist for ETF Shares, unlike conventional mutual fund shares, because ETF Shares are listed for trading on a national securities exchange. Individual investors can purchase and sell ETF Shares on the secondary market through a broker. Secondary-market transactions occur not at NAV, but at market prices that are subject to change throughout the day based on the supply of and demand for ETF Shares, changes in the prices of the fund’s portfolio holdings, and other factors.
42
The market price of a fund's ETF Shares typically will differ somewhat from the NAV of those shares. The difference between market price and NAV is expected to be small most of the time, but in times of market disruption or extreme market volatility, the difference may become significant.
How Do I Buy and Sell Vanguard ETF Shares?
ETF Shares of the Funds are listed for trading on Nasdaq. You can buy and sell ETF Shares on the secondary market in the same way you buy and sell any other exchange-traded security—through a broker. Your broker may charge a commission to execute a transaction. You will also incur the cost of the “bid-ask spread,” which is the difference between the highest price a buyer is willing to pay to purchase ETF Shares (bid) and the lowest price a seller is willing to accept for ETF Shares (ask) when buying or selling shares in the secondary market. Because secondary-market transactions occur at market prices, you may pay more (premium) or less (discount) than NAV when you buy ETF Shares and receive more or less than NAV when you sell those shares. In times of severe market disruption, the bid-ask spread and premiums/discounts can increase significantly. Unless imposed by your broker, there is no minimum dollar amount you must invest and no minimum number of ETF Shares you must buy.
Your ownership of ETF Shares will be shown on the records of the broker through which you hold the shares. Vanguard will not have any record of your ownership. Your account information will be maintained by your broker, which will provide you with account statements, confirmations of your purchases and sales of ETF Shares, and tax information. Your broker also will be responsible for ensuring that you receive income and capital gains distributions, as well as shareholder reports and other communications from the fund whose ETF Shares you own. You will receive other services (e.g., dividend reinvestment and average cost information) only if your broker offers these services.
43
Investing in Index Funds
What Is Indexing?
Indexing is an investment strategy for tracking the performance of a specified market benchmark, or “index.” An index is a group of securities whose overall performance is used as a standard to measure the investment performance of a particular market. There are many types of indexes. Some represent entire markets—such as the U.S. stock market or the U.S. bond market. Other indexes cover market segments—such as small-capitalization stocks or short-term bonds. One cannot invest directly in an index.
The index provider determines the securities to include in the index and the weighting of each security in the index. Under normal circumstances, the index provider will rebalance an index on a regular schedule. An index provider may carry out additional ad hoc index rebalances or delay or cancel a scheduled rebalance. Generally, the index provider does not provide any warranty, or accept any liability, with respect to the quality, accuracy, or completeness of either the target index or its related data. Errors made by the index provider may occur from time to time and may not be identified by the index provider for a period of time or at all. Vanguard does not provide any warranty or guarantee against such errors. Therefore, the gains, losses, or costs associated with the index provider’s errors will generally be borne by the index fund and its shareholders.
An index fund seeks to hold all, or a representative sample, of the securities that make up its target index. Index funds attempt to mirror the performance of the target index, for better or worse. However, an index fund generally does not perform exactly like its target index. For example, index funds have operating expenses and transaction costs. Market indexes do not, and therefore they will usually have a slight performance advantage over funds that track them. The ability of an index fund to match its performance to that of its target index can also be impacted by, among other things, the timing and size of cash flows, asset valuation differences, and the size of the fund. Market disruptions could also have an adverse effect on a fund’s ability to adjust its exposure to the required levels in order to track the index. The risk that a fund may not track the performance of its target index may be heightened during times of increased market volatility or other unusual market conditions.
Index funds typically have the following characteristics:
• Variety of investments. Depending on a fund’s benchmark index, the fund may invest in the securities of a variety of companies, industries, and/or governments or government agencies.
• Relative performance consistency. Because they seek to track market benchmarks, index funds usually do not perform dramatically better or worse than their benchmarks.
• Low cost. Index funds are generally inexpensive to run compared with actively managed funds. They have low or no research costs and typically keep trading activity—and thus brokerage commissions and other transaction costs—to a minimum compared with actively managed funds.
44
More on the Funds and ETF Shares
This prospectus describes the principal risks you would face as a Fund shareholder. It is important to keep in mind one of the main principles of investing: generally, the higher the risk of losing money, the higher the potential reward. The reverse, also, is generally true: the lower the risk, the lower the potential reward. As you consider an investment in any fund, you should take into account your personal tolerance for fluctuations in the securities markets. Look for this
symbol throughout the prospectus. It is used to mark detailed information about the more significant risks that you would confront as a Fund shareholder. To highlight terms and concepts important to fund investors, we have provided Plain Talk® explanations along the way. Reading the prospectus will help you decide whether a Fund is the right investment for you. We suggest that you keep this prospectus for future reference.
symbol throughout the prospectus. It is used to mark detailed information about the more significant risks that you would confront as a Fund shareholder. To highlight terms and concepts important to fund investors, we have provided Plain Talk® explanations along the way. Reading the prospectus will help you decide whether a Fund is the right investment for you. We suggest that you keep this prospectus for future reference.Share Class Overview
This prospectus offers the Funds’ ETF Shares, an exchange-traded class of shares. Separate prospectuses offer the Funds’ Institutional Shares, which are generally for investors who invest a minimum of $5 million.
Both share classes offered by a Fund have the same investment objective, strategies, and policies. However, different share classes may have different expenses; as a result, their investment returns may differ.
A Note to Investors
Vanguard ETF Shares can be purchased directly from the issuing Fund only by certain authorized broker-dealers in exchange for a basket of securities (or, in some cases, for cash or a combination of cash and securities). Individual investors generally will not be able to purchase ETF Shares directly from a Fund. Instead, these investors will purchase ETF Shares on the secondary market through a broker.
|
Plain Talk About Costs of Investing |
|
Costs are an important consideration in choosing an ETF. That is because
you, as a shareholder, pay a proportionate share of the costs of operating a
fund and any transaction costs incurred when the fund buys or sells
securities. These costs can erode a substantial portion of the gross income
or the capital appreciation a fund achieves. Even seemingly small differences
in expenses can, over time, have a dramatic effect on a fund’s performance. |
The following sections explain the principal investment strategies and policies that each Fund uses in pursuit of its investment objective. The Funds' board of trustees, which oversees each Fund's management, may change investment
45
strategies or policies in the interest of shareholders without a shareholder vote, unless those strategies or policies are designated as fundamental. Note that each Fund‘s investment objective is not fundamental and may be changed without a shareholder vote. Under normal circumstances, each Fund will invest at least 80% of its assets in the stocks that make up its target index. A Fund may change its 80% policy only upon 60 days’ notice to shareholders.
Market Exposure
Each Fund is subject to stock market risk, which is the chance that stock prices overall will decline. Stock markets tend to move in cycles, with periods of rising prices and periods of falling prices. Excluding Vanguard Russell 3000 Index Fund (which seeks to track the broad stock market), each Fund’s target index tracks a subset of the U.S. stock market, which could cause the Fund to perform differently from the overall stock market. In addition, each Fund’s target index may, at times, become focused in stocks of a particular market sector, which would subject the Fund to proportionately higher exposure to the risks of that sector.
Stocks of publicly traded companies are often classified according to market capitalization, which is the market value of a company's outstanding shares. These classifications typically include small-cap, mid-cap, and large-cap. It is important to understand that there are no “official” definitions of small-, mid-, and large-cap, even among Vanguard fund advisors, and that market capitalization ranges can change over time. The asset-weighted median market capitalization of each Fund's stock holdings as of August 31, 2023, was:
|
Vanguard Fund |
Asset-Weighted Median
Market Capitalization |
|
Vanguard Russell 1000 Index Fund |
$149 billion |
|
Vanguard Russell 1000 Value Index Fund |
75 |
|
Vanguard Russell 1000 Growth Index
Fund |
500 |
|
Vanguard Russell 2000 Index Fund |
2.7 |
|
Vanguard Russell 2000 Value Index Fund |
2.2 |
|
Vanguard Russell 2000 Growth Index
Fund |
3.1 |
|
Vanguard Russell 3000 Index Fund |
135 |
46
Each Fund (other than Vanguard Russell 3000 Index Fund) is subject to investment style risk, which is the chance that returns from the types of stocks in which the Fund invests will trail returns from the overall stock market. Specific types of stocks tend to go through cycles of doing better or worse than other segments of the stock market or the stock market in general. These periods have, in the past, lasted for as long as several years.
|
Plain Talk About Growth Funds and Value Funds |
|
Growth investing and value investing are two styles employed by stock-fund
managers. Growth funds generally invest in stocks of companies believed to
have above-average potential for growth in revenue, earnings, cash flow, or
other similar criteria. These stocks typically have low dividend yields, if any,
and above-average prices in relation to measures such as earnings and book
value. Value funds typically invest in stocks whose prices are below average
in relation to those measures; these stocks often have above-average
dividend yields. Value stocks also may remain undervalued by the market for
long periods of time. Growth and value stocks have historically produced
similar long-term returns, though each category has periods when it
outperforms the other. |
Market disruptions can adversely affect local and global markets as well as normal market conditions and operations. Any such disruptions could have an adverse impact on the value of a Fund's investments and Fund performance.
Security Selection
Each Fund (other than Vanguard Russell 3000 Index Fund) attempts to track the investment performance of a benchmark index that measures the return of a particular market segment. Vanguard Russell 3000 Index Fund attempts to track the investment performance of a benchmark index that measures the return of the overall stock market. Each Fund uses the replication method of indexing, meaning that each Fund generally holds the same stocks as its target index and in approximately the same proportions.
47
Vanguard Russell 1000 Growth Index Fund is subject to nondiversification risk. In order to closely track the composition of the Fund’s target index, the Fund’s total assets are invested in multiple issuers representing more than 5% of the Fund’s total assets. As a result, the Fund may become nondiversified under the Investment Company Act of 1940, although it continues to hold multiple stocks across a number of sectors. The Fund’s performance may be hurt disproportionately by the poor performance of relatively few stocks, or even a single stock, and the Fund’s shares may experience significant fluctuations in value.
Vanguard Russell 1000 Growth Index Fund is subject to sector risk, which is the chance that significant problems will affect a particular sector, or that returns from that sector will trail returns from the overall stock market. Daily fluctuations in specific market sectors are often more extreme or volatile than fluctuations in the overall market. Because a significant portion of the Fund’s assets are invested in the information technology sector, the Fund’s performance is impacted by the general condition of that sector. Companies in the information technology sector could be affected by, among other things, overall economic conditions, short product cycles, rapid obsolescence of products, competition, and government regulation. Sector risk is expected to be high for the Fund.
Each Fund is subject to index replicating risk, which is the change that each Fund may be prevented from holding one or more securities in the same proportion as in its target index.
The ability of the advisor to purchase or dispose of certain Fund investments is or may be restricted or impaired because of limitations imposed by law, regulation, or by certain regulators or issuers. As a result, the advisor may be required to limit purchases or sell existing investments. If a Fund is required to limit its investment in a particular issuer, then the Fund may seek to obtain regulatory relief or special permission from an issuer to exceed a certain percentage ownership in that issuer's shares. Other options a Fund may pursue include seeking to obtain economic exposure to that issuer through alternative means, such as through a derivative or through investment in a wholly owned subsidiary, both of which may be more costly than owning securities of the issuer directly. Ownership restrictions and limitations could result in unanticipated tax consequences to a Fund that may affect the amount, timing, and character of distributions to shareholders. See Other Investment Policies and Risks for further information related to derivatives.
48
Other Investment Policies and Risks
Each Fund reserves the right to substitute a different index for the index it currently tracks if the current index is discontinued, if the Fund's agreement with the provider of its target index is terminated, or for any other reason determined in good faith by the Fund’s board of trustees. In any such instance, the substitute index would represent the same market segment as the current index.
Each Fund has the ability to invest in foreign securities to the extent necessary to carry out its investment strategy of holding all, or substantially all, of the stocks that make up the index it tracks. It is not expected that any Fund will invest more than 5% of its assets in foreign securities.
To track their target indexes as closely as possible, the Funds attempt to remain fully invested in stocks. To help stay fully invested and to reduce transaction costs, the Funds may invest, to a limited extent, in derivatives, including equity futures. The Funds may also use derivatives such as total return swaps to obtain exposure to a stock, a basket of stocks, or an index. Generally speaking, a derivative is a financial contract whose value is based on the value of a financial asset (such as a stock, a bond, or a currency), a physical asset (such as gold, oil, or wheat), a market index, or a reference rate. Investments in derivatives may subject the Funds to risks different from, and possibly greater than, those of investments directly in the underlying securities or assets. The Funds will not use derivatives for speculation or for the purpose of leveraging (magnifying) investment returns.
Cash Management
Each Fund's daily cash balance may be invested in Vanguard Market Liquidity Fund and/or Vanguard Municipal Cash Management Fund (each, a CMT Fund), which are low-cost money market funds. When investing in a CMT Fund, each Fund bears its proportionate share of the expenses of the CMT Fund in which it invests. Vanguard receives no additional revenue from Fund assets invested in a CMT Fund.
Redemption Requests
Methods used to meet redemption requests. Redemptions of ETF Shares are typically met through a combination of cash and securities held by each Fund; see “How Are Vanguard ETF Shares Different From Conventional Mutual Fund Shares?” If cash is used to meet redemptions, the Fund typically obtains such cash through positive cash flows or the sale of Fund holdings consistent with the Fund’s investment objective and strategy. Please consult the Funds' Statement of Additional Information for further information on redemptions of ETF Shares.
49
Under certain circumstances, a Fund may borrow money (subject to certain regulatory conditions and if available under board-approved procedures) through an interfund lending facility; through a bank line-of-credit, including a joint committed credit facility; or through an uncommitted line-of-credit from Vanguard in order to meet redemption requests.
Potential redemption activity impacts. At times, a Fund may experience adverse effects when certain large shareholders, or multiple shareholders comprising significant ownership of the Fund, redeem large amounts of shares of the Fund. Large redemptions may cause a Fund to sell portfolio securities at times when it would not otherwise do so. This may result in a Fund distributing capital gains or other taxable income to non-redeeming shareholders. Large redemptions may also increase a Fund’s transaction costs. Redemption activity can occur for many reasons, including shareholder reactions to market movements or other events unrelated to Vanguard’s actions, or when Vanguard makes product changes that, for example, may result in a shareholder redeeming shares of a Fund to purchase shares of another similar fund or investment vehicle.
Temporary Investment Measures
Each Fund may temporarily depart from its normal investment policies and strategies when the advisor believes that doing so is in the Fund's best interest, so long as the strategy or policy employed is consistent with the Fund's investment objective. For instance, the Fund may invest beyond its normal limits in derivatives or exchange-traded funds that are consistent with the Fund's investment objective when those instruments are more favorably priced or provide needed liquidity, as might be the case when the Fund receives large cash flows that it cannot prudently invest immediately.
Special Risks of Exchange-Traded Shares
ETF Shares are not individually redeemable. They can be redeemed with the issuing Fund at NAV only by certain authorized broker-dealers and only in large blocks known as Creation Units. Consequently, if you want to liquidate some or all of your ETF Shares, you must sell them on the secondary market at prevailing market prices.
50
The market price of ETF Shares may differ from NAV. Although it is expected that the market price of an ETF Share typically will approximate its NAV, there may be times when the market price and the NAV differ significantly. Thus, you may pay more (premium) or less (discount) than NAV when you buy ETF Shares on the secondary market, and you may receive more or less than NAV when you sell those shares. These discounts and premiums are likely to be greatest during times of market disruption or extreme market volatility.
Vanguard’s website at vanguard.com shows the previous day’s closing NAV and closing market price for each Fund’s ETF Shares. The website also discloses, in the Premium/Discount Analysis section of the ETF Shares’ Price & Performance page, how frequently each Fund’s ETF Shares traded at a premium or discount to NAV (based on closing NAVs and market prices) and the magnitudes of such premiums and discounts.
An active trading market may not exist. Although Vanguard ETF Shares are listed on a national securities exchange, it is possible that an active trading market may not be maintained. Although this could happen at any time, it is more likely to occur during times of severe market disruption. If you attempt to sell your ETF Shares when an active trading market is not functioning, you may have to sell at a significant discount to NAV. In extreme cases, you may not be able to sell your shares at all.
Trading may be halted. Trading of Vanguard ETF Shares on an exchange may be halted by the activation of individual or marketwide trading halts (which halt trading for a specific period of time when the price of a particular security or overall market prices decline by a specified percentage). Trading of ETF Shares may also be halted if (1) the shares are delisted from the listing exchange without first being listed on another exchange or (2) exchange officials determine that such action is appropriate in the interest of a fair and orderly market or for the protection of investors.
Conversion Privilege
Owners of conventional shares issued by a Fund may convert those shares to ETF Shares of equivalent value of the same fund. Please note that investors who own conventional shares through a 401(k) plan or other employer-sponsored retirement or benefit plan generally may not convert those shares to ETF Shares and should check with their plan sponsor or recordkeeper. ETF Shares, whether acquired through a conversion or purchased on the secondary market, cannot be converted to conventional shares by a shareholder. Also, ETF Shares of one fund cannot be exchanged for ETF Shares of another fund.
51
You must hold ETF Shares in a brokerage account. Thus, before converting conventional shares to ETF Shares, you must have an existing, or open a new, brokerage account. This account may be with Vanguard Brokerage Services® or with any other brokerage firm. To initiate a conversion of conventional shares to ETF Shares, please contact your broker.
Vanguard Brokerage Services does not impose a fee on conversions from Vanguard conventional shares to Vanguard ETF Shares. However, other brokerage firms may charge a fee to process a conversion. Vanguard reserves the right, in the future, to impose a transaction fee on conversions or to limit, temporarily suspend, or terminate the conversion privilege.
Converting conventional shares to ETF Shares is generally accomplished as follows. First, after your broker notifies Vanguard of your request to convert, Vanguard will transfer your conventional shares from your account to the broker’s omnibus account with Vanguard (an account maintained by the broker on behalf of all its customers who hold conventional Vanguard fund shares through the broker). After the transfer, Vanguard’s records will reflect your broker, not you, as the owner of the shares. Next, your broker will instruct Vanguard to convert the appropriate number or dollar amount of conventional shares in its omnibus account to ETF Shares of equivalent value, based on the respective NAVs of the two share classes.
Your Fund’s transfer agent will reflect ownership of all ETF Shares in the name of the Depository Trust Company (DTC). The DTC will keep track of which ETF Shares belong to your broker, and your broker, in turn, will keep track of which ETF Shares belong to you.
Because the DTC is unable to handle fractional shares, only whole shares can be converted. For example, if you owned 300.25 conventional shares, and this was equivalent in value to 90.75 ETF Shares, the DTC account would receive 90 ETF Shares. Conventional shares with a value equal to 0.75 ETF Shares (in this example, that would be 2.481 conventional shares) would remain in the broker’s omnibus account with Vanguard. Your broker then could either (1) credit your account with 0.75 ETF Shares or (2) redeem the 2.481 conventional shares for cash at NAV and deliver that cash to your account. If your broker chose to redeem your conventional shares, you would realize a gain or loss on the redemption that must be reported on your tax return (unless you hold the shares in an IRA or other tax-deferred account). Please consult your broker for information on how it will handle the conversion process, including whether it will impose a fee to process a conversion.
52
If you convert your conventional shares to ETF Shares through Vanguard Brokerage Services, all conventional shares for which you request conversion will be converted to ETF Shares of equivalent value. Because no fractional shares will have to be sold, the transaction will not be taxable.
Here are some important points to keep in mind when converting conventional shares of a Vanguard fund to ETF Shares:
• The conversion process can take anywhere from several days to several weeks, depending on your broker. Vanguard generally will process conversion requests either on the day they are received or on the next business day. Vanguard imposes conversion blackout windows around the dates when a fund with ETF Shares declares dividends. This is necessary to prevent a shareholder from collecting a dividend from both the conventional share class currently held and also from the ETF share class to which the shares will be converted.
• Until the conversion process is complete, you will remain fully invested in a fund’s conventional shares, and your investment will increase or decrease in value in tandem with the NAV of those shares.
• The conversion transaction is nontaxable except, if applicable, to the very limited extent previously described.
A precautionary note to investment companies: Each Fund's ETF Shares are issued by registered investment companies, and therefore the acquisition of such shares by other investment companies and private funds is subject to the restrictions of Section 12(d)(1) of the Investment Company Act of 1940 (the 1940 Act). SEC Rule 12d1-4 under the 1940 Act permits registered investment companies to invest in other registered investment companies beyond the limits in Section 12(d)(1), subject to certain conditions, including that funds with different investment advisors must enter into a fund of funds investment agreement.
Shareholder Rights
Each Fund's Agreement and Declaration of Trust, as amended, requires a shareholder bringing a derivative action on behalf of Vanguard Scottsdale Funds (the Trust) that is subject to a pre-suit demand to collectively hold at least 10% of the outstanding shares of the Trust or at least 10% of the outstanding shares of the series or class to which the demand relates and to undertake to reimburse the Trust for the expense of any counsel or advisors used when considering the merits of the demand in the event that the board of trustees determines not to bring such action. In each case, these requirements do not apply to claims arising under the federal securities laws to the extent that any such federal securities laws, rules, or regulations do not permit such application.
53
Frequent Trading and Market-Timing
Unlike frequent trading of a Vanguard fund’s conventional (i.e., not exchange-traded) classes of shares, frequent trading of ETF Shares does not disrupt portfolio management or otherwise harm fund shareholders. The vast majority of trading in ETF Shares occurs on the secondary market. Because these trades do not involve the issuing fund, they do not harm the fund or its shareholders. Certain broker-dealers are authorized to purchase and redeem ETF Shares directly with the issuing fund. Because these trades typically are effected in kind (i.e., for securities and not for cash), or are assessed a transaction fee when effected in cash, they do not cause any of the harmful effects to the issuing fund (as previously noted) that may result from frequent trading. For these reasons, the board of trustees of each fund that issues ETF Shares has determined that it is not necessary to adopt policies and procedures to detect and deter frequent trading and market-timing of ETF Shares.
Portfolio Holdings
Please consult the Funds' Statement of Additional Information or our website for a description of the policies and procedures that govern disclosure of a Fund’s portfolio holdings.
Turnover Rate
Although the Funds generally seek to invest for the long term, each Fund may sell securities regardless of how long they have been held. Generally, an index fund sells securities in response to redemption requests from shareholders of conventional (i.e., not exchange-traded) shares or to changes in the composition of its target index. Turnover rates for large-cap stock index funds tend to be low because large-cap indexes typically do not change significantly from year to year. Turnover rates for mid-cap and small-cap stock index funds tend to be higher than those for large-cap stock index funds (although still relatively low, compared with actively managed stock funds) because the indexes they track are more likely to change as a result of companies merging, growing, or failing. The Financial Highlights section of this prospectus shows historical turnover rates for each Fund. A turnover rate of 100%, for example, would mean that a Fund had sold and replaced securities valued at 100% of its net assets within a one-year period. In general, the greater the turnover rate, the greater the impact transaction costs will have on a fund’s return. Also, funds with high turnover rates may be more likely to generate capital gains, including short-term capital gains, that must be distributed to shareholders and will be taxable to shareholders investing through a taxable account.
54
The Funds and Vanguard
Each Fund is a member of The Vanguard Group, Inc. (Vanguard), a family of over 200 funds. All of the funds that are members of Vanguard (other than funds of funds) share in the expenses associated with administrative services and business operations, such as personnel, office space, and equipment.
Vanguard Marketing Corporation provides marketing services to the funds. Although fund shareholders do not pay sales commissions or 12b-1 distribution fees, each fund (other than a fund of funds) or each share class of a fund (in the case of a fund with multiple share classes) pays its allocated share of the Vanguard funds’ marketing costs.
|
Plain Talk About Vanguard’s Unique Corporate Structure |
|
Vanguard is owned jointly by the funds it oversees and thus indirectly by the
shareholders in those funds. Most other mutual funds are operated by
management companies that are owned by third parties—either public or
private stockholders—and not by the funds they serve. |
Investment Advisor
The Vanguard Group, Inc., P.O. Box 2600, Valley Forge, PA 19482, which began operations in 1975, serves as advisor to the Funds through its Equity Index Group. As of August 31, 2023, Vanguard served as advisor for approximately $6.8 trillion in assets. Vanguard provides investment advisory services to the Funds pursuant to the Funds’ Service Agreement and subject to the supervision and oversight of the trustees and officers of the Funds.
For the fiscal year ended August 31, 2023, the advisory expenses represented an effective annual rate of less than 0.01% of each Fund's average net assets.
Under the terms of an SEC exemption, the Funds' board of trustees may, without prior approval from shareholders, change the terms of an advisory agreement with a third-party investment advisor or hire a new third-party investment advisor—either as a replacement for an existing advisor or as an additional advisor. Any significant change in a Fund's advisory arrangements will be communicated to shareholders in writing. As the Funds' sponsor and overall manager, Vanguard may provide investment advisory services to a Fund at any time. Vanguard may also recommend to the board of trustees that an advisor be hired, terminated, or replaced or that the terms of an existing advisory agreement
55
be revised. The Funds have filed an application seeking a similar SEC exemption with respect to investment advisors that are wholly owned subsidiaries of Vanguard. If the exemption is granted, the Funds may rely on the new SEC relief.
For a discussion of why the board of trustees approved each Fund's investment advisory arrangement, see the most recent annual report to shareholders covering the fiscal year ended August 31.
The managers primarily responsible for the day-to-day management of the Funds are:
Nick Birkett, CFA, Portfolio Manager at Vanguard. He has worked in investment management since 2006, has been with Vanguard since 2017, and has co-managed the Funds since 2021. Education: B.S., University of Bath.
Aurélie Denis, CFA, Portfolio Manager at Vanguard. She has been with Vanguard since 2016, has worked in investment management since 2017, has managed investment portfolios since 2023, and has co-managed Vanguard Russell 1000 Fund, Vanguard Russell 1000 Value Fund, and Vanguard Russell 1000 Growth Fund since February 2023. Education: B.S., Pennsylvania State University.
Kenny Narzikul, CFA, Portfolio Manager at Vanguard. He has been with Vanguard since 2012, has worked in investment management since 2016, has managed investment portfolios since 2023, and has co-managed Vanguard Russell 2000 Fund, Vanguard Russell 2000 Value Fund, and Vanguard Russell 2000 Growth Fund since February 2023. Education: B.B.A., James Madison University.
Walter Nejman, Portfolio Manager at Vanguard. He has been with Vanguard since 2005, has worked in investment management since 2008, and has co- managed Vanguard Russell 3000 Index Fund since 2015. Education: B.A., Arcadia University; M.B.A., Villanova University.
The Funds' Statement of Additional Information provides information about each portfolio manager’s compensation, other accounts under management, and ownership of shares of the Funds.
56
Dividends, Capital Gains, and Taxes
Fund Distributions
Each Fund distributes to shareholders virtually all of its net income (interest and dividends, less expenses) as well as any net short-term or long-term capital gains realized from the sale of its holdings. From time to time, each Fund may also make distributions that are treated as a return of capital. Income dividends generally are distributed quarterly in March, June, September, and December; capital gains distributions, if any, generally occur annually in December. In addition, each Fund may occasionally make a supplemental distribution at some other time during the year.
|
Plain Talk About Distributions |
|
As a shareholder, you are entitled to your portion of a fund’s income from
interest and dividends as well as capital gains from the fund’s sale of
investments. Income consists of both the dividends that the fund earns from
any stock holdings and the interest it receives from any money market and
bond investments. Capital gains are realized whenever the fund sells
securities for higher prices than it paid for them. These capital gains are
either short-term or long-term, depending on whether the fund held the
securities for one year or less or for more than one year. |
Reinvestment of Distributions
In order to reinvest dividend and capital gains distributions, investors in a Fund's ETF Shares must hold their shares at a broker that offers a reinvestment service. This can be the broker’s own service or a service made available by a third party, such as the broker’s outside clearing firm or the DTC. If a reinvestment service is available, distributions of income and capital gains can automatically be reinvested in additional whole and fractional ETF Shares of the Fund. If a reinvestment service is not available, investors will receive their distributions in cash. To determine whether a reinvestment service is available and whether there is a commission or other charge for using this service, consult your broker.
As with all exchange-traded funds, reinvestment of dividend and capital gains distributions in additional ETF Shares will occur four business days or more after the ex-dividend date (the date when a distribution of dividends or capital gains is deducted from the price of a Fund’s shares). The exact number of days depends on your broker. During that time, the amount of your distribution will not be invested in the Fund and therefore will not share in the Fund’s income, gains, and losses.
57
Basic Tax Points
Investors in taxable accounts should be aware of the following basic federal income tax points:
• Distributions are taxable to you whether or not you reinvest these amounts in additional ETF Shares.
• Distributions declared in December—if paid to you by the end of January—are taxable as if received in December.
• Any dividend distribution or short-term capital gains distribution that you receive is taxable to you as ordinary income. If you are an individual and meet certain holding-period requirements with respect to your ETF Shares, you may be eligible for reduced tax rates on “qualified dividend income,” if any, or a special tax deduction on “qualified REIT dividends,” if any, distributed by the Fund.
• Any distribution of net long-term capital gains is taxable to you as long-term capital gains, no matter how long you have owned ETF Shares.
• Capital gains distributions may vary considerably from year to year as a result of the Funds' normal investment activities and cash flows.
• Your cost basis in the Fund will be decreased by the amount of any return of capital that you receive. This, in turn, will affect the amount of any capital gain or loss that you realize when selling your ETF Shares.
• Return of capital distributions generally are not taxable to you until your cost basis has been reduced to zero. If your cost basis is at zero, return of capital distributions will be treated as capital gains.
• A sale of ETF Shares is a taxable event. This means that you may have a capital gain to report as income, or a capital loss to report as a deduction, when you complete your tax return.
Individuals, trusts, and estates whose income exceeds certain threshold amounts are subject to a 3.8% Medicare contribution tax on “net investment income.” Net investment income takes into account distributions paid by the Fund and capital gains from any sale of ETF Shares.
Dividend distributions and capital gains distributions that you receive, as well as your gains or losses from any sale of ETF Shares, may be subject to state and local income taxes.
This prospectus provides general tax information only. If you are investing through a tax-advantaged account, such as an IRA or an employer-sponsored retirement or savings plan, special tax rules apply. Please consult your tax advisor for detailed information about any tax consequences for you.
58
Share Price and Market Price
Share price, also known as net asset value (NAV), is calculated as of the close of regular trading on the New York Stock Exchange (NYSE), generally 4 p.m., Eastern time, on each day that the NYSE is open for business (a business day). In the rare event the NYSE experiences unanticipated disruptions and is unavailable at the close of the trading day, NAVs will be calculated as of the close of regular trading on the Nasdaq (or another alternate exchange if the Nasdaq is unavailable, as determined at Vanguard’s discretion), generally 4 p.m., Eastern time. Each share class has its own NAV, which is computed by dividing the total assets, minus liabilities, allocated to the share class by the number of Fund shares outstanding for that class. On U.S. holidays or other days when the NYSE is closed, the NAV is not calculated, and the Funds do not sell or redeem shares. However, on those days the value of a Fund’s assets may be affected to the extent that the Fund holds securities that change in value on those days (such as foreign securities that trade on foreign markets that are open).
Remember: If you buy or sell ETF Shares on the secondary market, you will pay or receive the market price, which may be higher or lower than NAV. Your transaction will be priced at NAV only if you purchase or redeem your ETF Shares in Creation Unit blocks (an option available only to certain authorized broker-dealers) or if you convert your conventional fund shares to ETF Shares.
Stocks held by a Vanguard fund are valued at their market value when reliable market quotations are readily available from the principal exchange or market on which they are traded. Such securities are generally valued at their official closing price, the last reported sales price, or if there were no sales that day, the mean between the closing bid and asking prices. When a fund determines that market quotations either are not readily available or do not accurately reflect the value of a security, the security is priced at its fair value (the amount that the owner might reasonably expect to receive upon the current sale of the security).
The values of any foreign securities held by a fund are converted into U.S. dollars using an exchange rate obtained from an independent third party as of the close of regular trading on the NYSE. The values of any mutual fund shares, including institutional money market fund shares, held by a fund are based on the NAVs of the shares. The values of any ETF shares or closed-end fund shares held by a fund are based on the market value of the shares.
A fund also will use fair-value pricing if the value of a security it holds has been materially affected by events occurring before the fund's pricing time but after the close of the principal exchange or market on which the security is traded. This most commonly occurs with foreign securities, which may trade on foreign exchanges that close many hours before the fund's pricing time. Intervening
59
events might be company-specific (e.g., earnings report, merger announcement) or country-specific or regional/global (e.g., natural disaster, economic or political news, interest rate change, act of terrorism). Intervening events include price movements in U.S. markets that exceed a specified threshold or that are otherwise deemed to affect the value of foreign securities.
Fair-value pricing may be used for domestic securities—for example, if (1) trading in a security is halted and does not resume before the fund's pricing time or a security does not trade in the course of a day and (2) the fund holds enough of the security that its price could affect the NAV.
Fair-value prices are determined by Vanguard according to procedures adopted by the board of trustees. When fair-value pricing is employed, the prices of securities used by a fund to calculate the NAV may differ from quoted or published prices for the same securities.
Each Fund has authorized certain financial intermediaries and their designees, and may, from time to time, authorize certain funds of funds for which Vanguard serves as the investment advisor (Vanguard Funds of Funds), to accept orders to buy or sell fund shares on its behalf. The Fund will be deemed to receive an order when accepted by the financial intermediary, its designee, or one of the Vanguard Funds of Funds, and the order will receive the NAV next computed by the Fund after such acceptance.
Vanguard’s website will show the previous day’s closing NAV and closing market price for each Fund’s ETF Shares.
Vanguard’s website will show the previous day’s closing NAV and closing market price for each Fund’s ETF Shares.
60
Additional Information
Each Fund's Bylaws require, unless the Trust otherwise consents in writing, that the U.S. Federal District Courts be the sole and exclusive forum for the resolution of complaints under the Securities Act of 1933. This provision may limit a shareholder’s ability to bring a claim in a different forum and may result in increased shareholder costs in pursuing such a claim.
|
Vanguard Fund |
Inception
Date |
Vanguard
Fund
Number |
CUSIP
Number |
|
Vanguard Russell 1000 Index Fund |
|
|
|
|
ETF Shares |
9/20/2010 |
3348 |
92206C730 |
|
Vanguard Russell 1000 Value Index Fund |
|
|
|
|
ETF Shares |
9/20/2010 |
3349 |
92206C714 |
|
Vanguard Russell 1000 Growth Index Fund |
|
|
|
|
ETF Shares |
9/20/2010 |
3350 |
92206C680 |
|
Vanguard Russell 2000 Index Fund |
|
|
|
|
ETF Shares |
9/20/2010 |
3351 |
92206C664 |
|
Vanguard Russell 2000 Value Index Fund |
|
|
|
|
ETF Shares |
9/20/2010 |
3352 |
92206C649 |
|
Vanguard Russell 2000 Growth Index Fund |
|
|
|
|
ETF Shares |
9/20/2010 |
3353 |
92206C623 |
|
Vanguard Russell 3000 Index Fund |
|
|
|
|
ETF Shares |
9/20/2010 |
3354 |
92206C599 |
Certain affiliates of the Fund and the advisor may purchase and resell ETF Shares pursuant to the prospectus.
CGS identifiers have been provided by CUSIP Global Services, managed on behalf of the American Bankers Association by Standard & Poor’s Financial Services, LLC, and are not for use or dissemination in a manner that would serve as a substitute for any CUSIP service. The CUSIP Database, © 2023 American Bankers Association. “CUSIP” is a registered trademark of the American Bankers Association.
61
Financial Highlights
Financial highlights information is intended to help you understand a fund’s performance for the past five years (or, if shorter, its period of operations). Certain information reflects financial results for a single fund share. Total return represents the rate that an investor would have earned or lost each period on an investment in a fund or share class (assuming reinvestment of all distributions). This information has been obtained from the financial statements audited by PricewaterhouseCoopers LLP, an independent registered public accounting firm, whose report, along with fund financial statements, is included in a fund’s most recent annual report to shareholders. You may obtain a free copy of a fund’s latest annual or semiannual report, which is available upon request.
Vanguard Russell 1000 Index Fund ETF Shares
|
For a Share Outstanding
Throughout Each Period |
Year Ended August 31, | ||||
|
2023 |
2022 |
2021 |
2020 |
2019 | |
|
Net Asset Value, Beginning of Period |
$180.47 |
$210.32 |
$161.36 |
$134.37 |
$133.57 |
|
Investment Operations |
|
|
|
|
|
|
Net Investment Income1 |
2.956 |
2.757 |
2.459 |
2.525 |
2.395 |
|
Net Realized and Unrealized Gain (Loss) on
Investments |
24.306 |
(29.909) |
48.925 |
27.028 |
.759 |
|
Total from Investment Operations |
27.262 |
(27.152) |
51.384 |
29.553 |
3.154 |
|
Distributions |
|
|
|
|
|
|
Dividends from Net Investment Income |
(2.862) |
(2.698) |
(2.424) |
(2.563) |
(2.354) |
|
Distributions from Realized Capital Gains |
— |
— |
— |
— |
— |
|
Total Distributions |
(2.862) |
(2.698) |
(2.424) |
(2.563) |
(2.354) |
|
Net Asset Value, End of Period |
$204.87 |
$180.47 |
$210.32 |
$161.36 |
$134.37 |
|
Total Return |
15.34% |
-13.02% |
32.14% |
22.39% |
2.45% |
|
Ratios/Supplemental Data |
|
|
|
|
|
|
Net Assets, End of Period (Millions) |
$3,785 |
$2,721 |
$2,682 |
$1,678 |
$1,196 |
|
Ratio of Total Expenses to Average Net Assets |
0.08% |
0.08% |
0.08% |
0.08% |
0.08% |
|
Ratio of Net Investment Income to Average Net
Assets |
1.59% |
1.39% |
1.34% |
1.79% |
1.85% |
|
Portfolio Turnover Rate2 |
8% |
10% |
6% |
9% |
6% |
|
|
|
|
1 |
Calculated based on average shares outstanding. |
|
2 |
Excludes the value of portfolio securities received or delivered as a result of in-kind purchases
or redemptions of the fund’s capital shares, including ETF Creation Units. |
62
Vanguard Russell 1000 Value Index Fund ETF Shares
|
For a Share Outstanding
Throughout Each Period |
Year Ended August 31, | ||||
|
2023 |
2022 |
20211 |
20201 |
20191 | |
|
Net Asset Value, Beginning of Period |
$65.70 |
$71.54 |
$53.52 |
$54.61 |
$55.60 |
|
Investment Operations |
|
|
|
|
|
|
Net Investment Income2 |
1.523 |
1.415 |
1.282 |
1.408 |
1.357 |
|
Net Realized and Unrealized Gain (Loss) on Investments |
3.964 |
(5.875) |
17.932 |
(1.056) |
(1.054) |
|
Total from Investment Operations |
5.487 |
(4.460) |
19.214 |
.352 |
.303 |
|
Distributions |
|
|
|
|
|
|
Dividends from Net Investment Income |
(1.477) |
(1.380) |
(1.194) |
(1.442) |
(1.293) |
|
Distributions from Realized Capital Gains |
— |
— |
— |
— |
— |
|
Total Distributions |
(1.477) |
(1.380) |
(1.194) |
(1.442) |
(1.293) |
|
Net Asset Value, End of Period |
$69.71 |
$65.70 |
$71.54 |
$53.52 |
$54.61 |
|
Total Return |
8.55% |
-6.32% |
36.32% |
0.75% |
0.60% |
|
Ratios/Supplemental Data |
|
|
|
|
|
|
Net Assets, End of Period (Millions) |
$6,760 |
$5,980 |
$6,569 |
$2,646 |
$1,914 |
|
Ratio of Total Expenses to Average Net Assets |
0.08% |
0.08% |
0.08% |
0.08% |
0.08% |
|
Ratio of Net Investment Income to Average Net Assets |
2.27% |
2.02% |
1.99% |
2.65% |
2.51% |
|
Portfolio Turnover Rate3 |
15% |
14% |
19% |
24% |
17% |
|
|
|
|
1 |
Adjusted to reflect a 2-for-1 share split effective at the beginning of trading on April 20, 2021. |
|
2 |
Calculated based on average shares outstanding. |
|
3 |
Excludes the value of portfolio securities received or delivered as a result of in-kind purchases
or redemptions of the fund’s capital shares, including ETF Creation Units. |
63
Vanguard Russell 1000 Growth Index Fund ETF Shares
|
For a Share Outstanding
Throughout Each Period |
Year Ended August 31, | ||||
|
2023 |
2022 |
20211 |
20201 |
20191 | |
|
Net Asset Value, Beginning of Period |
$60.05 |
$74.77 |
$58.66 |
$41.14 |
$39.89 |
|
Investment Operations |
|
|
|
|
|
|
Net Investment Income2 |
.578 |
.523 |
.460 |
.475 |
.481 |
|
Net Realized and Unrealized Gain (Loss) on Investments |
12.437 |
(14.754) |
16.099 |
17.530 |
1.177 |
|
Total from Investment Operations |
13.015 |
(14.231) |
16.559 |
18.005 |
1.658 |
|
Distributions |
|
|
|
|
|
|
Dividends from Net Investment Income |
(.555) |
(.489) |
(.449) |
(.485) |
(.408) |
|
Distributions from Realized Capital Gains |
— |
— |
— |
— |
— |
|
Total Distributions |
(.555) |
(.489) |
(.449) |
(.485) |
(.408) |
|
Net Asset Value, End of Period |
$72.51 |
$60.05 |
$74.77 |
$58.66 |
$41.14 |
|
Total Return |
21.87% |
-19.11% |
28.40% |
44.18% |
4.20% |
|
Ratios/Supplemental Data |
|
|
|
|
|
|
Net Assets, End of Period (Millions) |
$13,652 |
$7,311 |
$7,455 |
$4,951 |
$2,872 |
|
Ratio of Total Expenses to Average Net Assets |
0.08% |
0.08% |
0.08% |
0.08% |
0.08% |
|
Ratio of Net Investment Income to Average Net Assets |
0.92% |
0.77% |
0.72% |
1.04% |
1.25% |
|
Portfolio Turnover Rate3 |
14% |
13% |
14% |
14% |
17% |
|
|
|
|
1 |
Adjusted to reflect a 4-for-1 share split effective at the beginning of trading on April 20, 2021. |
|
2 |
Calculated based on average shares outstanding. |
|
3 |
Excludes the value of portfolio securities received or delivered as a result of in-kind purchases
or redemptions of the fund’s capital shares, including ETF Creation Units. |
64
Vanguard Russell 2000 Index Fund ETF Shares
|
For a Share Outstanding
Throughout Each Period |
Year Ended August 31, | ||||
|
2023 |
2022 |
20211 |
20201 |
20191 | |
|
Net Asset Value, Beginning of Period |
$74.02 |
$91.28 |
$62.69 |
$59.88 |
$69.56 |
|
Investment Operations |
|
|
|
|
|
|
Net Investment Income2 |
1.207 |
1.030 |
.865 |
.810 |
.797 |
|
Net Realized and Unrealized Gain (Loss) on Investments |
2.207 |
(17.254) |
28.550 |
2.815 |
(9.704) |
|
Total from Investment Operations |
3.414 |
(16.224) |
29.415 |
3.625 |
(8.907) |
|
Distributions |
|
|
|
|
|
|
Dividends from Net Investment Income |
(1.154) |
(1.036) |
(.825) |
(.815) |
(.773) |
|
Distributions from Realized Capital Gains |
— |
— |
— |
— |
— |
|
Total Distributions |
(1.154) |
(1.036) |
(.825) |
(.815) |
(.773) |
|
Net Asset Value, End of Period |
$76.28 |
$74.02 |
$91.28 |
$62.69 |
$59.88 |
|
Total Return |
4.75% |
-17.88% |
47.15% |
6.12% |
-12.83% |
|
Ratios/Supplemental Data |
|
|
|
|
|
|
Net Assets, End of Period (Millions) |
$6,455 |
$5,255 |
$6,223 |
$1,802 |
$1,464 |
|
Ratio of Total Expenses to Average Net Assets |
0.10%3 |
0.10%3 |
0.10% |
0.10% |
0.10% |
|
Ratio of Net Investment Income to Average Net Assets |
1.64% |
1.26% |
1.02% |
1.37% |
1.30% |
|
Portfolio Turnover Rate4 |
15% |
19% |
23% |
19% |
16% |
|
|
|
|
1 |
Adjusted to reflect a 2-for-1 share split effective at the beginning of trading on April 20, 2021. |
|
2 |
Calculated based on average shares outstanding. |
|
3 |
The ratio of expenses to average net assets for the period net of reduction from custody fee
offset arrangements was 0.10%. |
|
4 |
Excludes the value of portfolio securities received or delivered as a result of in-kind purchases
or redemptions of the fund’s capital shares, including ETF Creation Units. |
65
Vanguard Russell 2000 Value Index Fund ETF Shares
|
For a Share Outstanding
Throughout Each Period |
Year Ended August 31, | ||||
|
2023 |
2022 |
2021 |
2020 |
2019 | |
|
Net Asset Value, Beginning of Period |
$126.77 |
$143.88 |
$91.76 |
$99.51 |
$119.05 |
|
Investment Operations |
|
|
|
|
|
|
Net Investment Income1 |
2.816 |
2.353 |
1.998 |
1.868 |
1.912 |
|
Net Realized and Unrealized Gain (Loss) on
Investments |
(.234) |
(16.986) |
51.982 |
(7.771) |
(19.589) |
|
Total from Investment Operations |
2.582 |
(14.633) |
53.980 |
(5.903) |
(17.677) |
|
Distributions |
|
|
|
|
|
|
Dividends from Net Investment Income |
(2.692) |
(2.477) |
(1.860) |
(1.847) |
(1.863) |
|
Distributions from Realized Capital Gains |
— |
— |
— |
— |
— |
|
Total Distributions |
(2.692) |
(2.477) |
(1.860) |
(1.847) |
(1.863) |
|
Net Asset Value, End of Period |
$126.66 |
$126.77 |
$143.88 |
$91.76 |
$99.51 |
|
Total Return |
2.19% |
-10.28% |
59.34% |
-6.05% |
-14.93% |
|
Ratios/Supplemental Data |
|
|
|
|
|
|
Net Assets, End of Period (Millions) |
$788 |
$837 |
$1,036 |
$303 |
$251 |
|
Ratio of Total Expenses to Average Net Assets |
0.15%2 |
0.15% |
0.15% |
0.15% |
0.15% |
|
Ratio of Net Investment Income to Average Net Assets |
2.27% |
1.71% |
1.52% |
1.99% |
1.83% |
|
Portfolio Turnover Rate3 |
27% |
28% |
45% |
38% |
27% |
|
|
|
|
1 |
Calculated based on average shares outstanding. |
|
2 |
The ratio of expenses to average net assets for the period net of reduction from custody fee
offset arrangements was 0.15%. |
|
3 |
Excludes the value of portfolio securities received or delivered as a result of in-kind purchases
or redemptions of the fund’s capital shares, including ETF Creation Units. |
66
Vanguard Russell 2000 Growth Index Fund ETF Shares
|
For a Share Outstanding
Throughout Each Period |
Year Ended August 31, | ||||
|
2023 |
2022 |
2021 |
2020 |
2019 | |
|
Net Asset Value, Beginning of Period |
$165.45 |
$222.64 |
$164.83 |
$141.63 |
$160.12 |
|
Investment Operations |
|
|
|
|
|
|
Net Investment Income1 |
1.499 |
1.137 |
.839 |
1.097 |
.971 |
|
Net Realized and Unrealized Gain (Loss) on
Investments |
9.702 |
(57.266) |
57.852 |
23.237 |
(18.527) |
|
Total from Investment Operations |
11.201 |
(56.129) |
58.691 |
24.334 |
(17.556) |
|
Distributions |
|
|
|
|
|
|
Dividends from Net Investment Income |
(1.501) |
(1.061) |
(.881) |
(1.134) |
(.934) |
|
Distributions from Realized Capital Gains |
— |
— |
— |
— |
— |
|
Total Distributions |
(1.501) |
(1.061) |
(.881) |
(1.134) |
(.934) |
|
Net Asset Value, End of Period |
$175.15 |
$165.45 |
$222.64 |
$164.83 |
$141.63 |
|
Total Return |
6.87% |
-25.28% |
35.67% |
17.32% |
-10.97% |
|
Ratios/Supplemental Data |
|
|
|
|
|
|
Net Assets, End of Period (Millions) |
$784 |
$658 |
$735 |
$371 |
$301 |
|
Ratio of Total Expenses to Average Net Assets |
0.15%2 |
0.15% |
0.15% |
0.15% |
0.15% |
|
Ratio of Net Investment Income to Average Net
Assets |
0.90% |
0.61% |
0.40% |
0.75% |
0.68% |
|
Portfolio Turnover Rate3 |
32% |
33% |
47% |
38% |
28% |
|
|
|
|
1 |
Calculated based on average shares outstanding. |
|
2 |
The ratio of expenses to average net assets for the period net of reduction from custody fee
offset arrangements was 0.15%. |
|
3 |
Excludes the value of portfolio securities received or delivered as a result of in-kind purchases
or redemptions of the fund’s capital shares, including ETF Creation Units. |
67
Vanguard Russell 3000 Index Fund ETF Shares
|
For a Share Outstanding
Throughout Each Period |
Year Ended August 31, | ||||
|
2023 |
2022 |
2021 |
2020 |
2019 | |
|
Net Asset Value, Beginning of Period |
$177.97 |
$208.13 |
$158.71 |
$133.26 |
$133.98 |
|
Investment Operations |
|
|
|
|
|
|
Net Investment Income1 |
2.897 |
2.662 |
2.385 |
2.416 |
2.312 |
|
Net Realized and Unrealized Gain (Loss) on
Investments |
22.832 |
(30.247) |
49.386 |
25.494 |
(.730) |
|
Total from Investment Operations |
25.729 |
(27.585) |
51.771 |
27.910 |
1.582 |
|
Distributions |
|
|
|
|
|
|
Dividends from Net Investment Income |
(2.929) |
(2.575) |
(2.351) |
(2.460) |
(2.302) |
|
Distributions from Realized Capital Gains |
— |
— |
— |
— |
— |
|
Total Distributions |
(2.929) |
(2.575) |
(2.351) |
(2.460) |
(2.302) |
|
Net Asset Value, End of Period |
$200.77 |
$177.97 |
$208.13 |
$158.71 |
$133.26 |
|
Total Return |
14.68% |
-13.36% |
32.90% |
21.31% |
1.25% |
|
Ratios/Supplemental Data |
|
|
|
|
|
|
Net Assets, End of Period (Millions) |
$1,802 |
$1,219 |
$1,124 |
$710 |
$463 |
|
Ratio of Total Expenses to Average Net Assets |
0.10%2 |
0.10% |
0.10% |
0.10% |
0.10% |
|
Ratio of Net Investment Income to Average Net
Assets |
1.58% |
1.36% |
1.31% |
1.74% |
1.79% |
|
Portfolio Turnover Rate3 |
11% |
8% |
10% |
8% |
10% |
|
|
|
|
1 |
Calculated based on average shares outstanding. |
|
2 |
The ratio of expenses to average net assets for the period net of reduction from custody fee
offset arrangements was 0.10%. |
|
3 |
Excludes the value of portfolio securities received or delivered as a result of in-kind purchases
or redemptions of the fund’s capital shares, including ETF Creation Units. |
68
CFA® is a registered trademark owned by CFA Institute.
The Products are not sponsored, endorsed, sold or promoted by Frank Russell Company (“Russell”). Russell makes no representation or warranty, express or implied, to the owners of the Products or any member of the public regarding the advisability of investing in securities generally or in the Products particularly or the ability of the Russell 1000, Russell 1000 Value, Russell 1000 Growth, Russell 2000, Russell 2000 Value, Russell 2000 Growth, and Russell 3000 Indexes to track general stock market performance or a segment of the same. Russell’s publication of the Russell 1000, Russell 1000 Value, Russell 1000 Growth, Russell 2000, Russell 2000 Value, Russell 2000 Growth, and Russell 3000 Indexes in no way suggests or implies an opinion by Russell as to the advisability of investment in any or all of the securities upon which the Russell 1000, Russell 1000 Value, Russell 1000 Growth, Russell 2000, Russell 2000 Value, Russell 2000 Growth, and Russell 3000 Indexes are based. Russell’s only relationship to The Vanguard Group, Inc. is the licensing of certain trademarks and trade names of Russell and of the Russell 1000, Russell 1000 Value, Russell 1000 Growth, Russell 2000, Russell 2000 Value, Russell 2000 Growth, and Russell 3000 Indexes which are determined, composed and calculated by Russell without regard to The Vanguard Group, Inc. or the Products. Russell is not responsible for and has not reviewed the Products nor any associated literature or publications and Russell makes no representation or warranty express or implied as to their accuracy or completeness, or otherwise. Russell has no obligation or liability in connection with the administration, marketing or trading of the Products.
Russell makes no representation, warranty or guarantee as to the accuracy, completeness, reliability or otherwise of the Russell Indexes or any data included in the Russell Indexes. Russell does not guarantee the accuracy and/or the completeness of the Russell 1000, Russell 1000 Value, Russell 1000 Growth, Russell 2000, Russell 2000 Value, Russell 2000 Growth, and Russell 3000 Indexes or any data included therein and Russell shall have no liability for any errors, omissions, or interruptions therein. Russell makes no warranty, express or implied, as to the use of or results to be obtained by The Vanguard Group, Inc., investors, owners of the Products, or any other person or entity from the use of the Russell 1000, Russell 1000 Value, Russell 1000 Growth, Russell 2000, Russell 2000 Value, Russell 2000 Growth, and Russell 3000 Indexes or any data included therein. Russell makes no express or implied warranties, and expressly disclaims all warranties of merchantability or fitness for a particular purpose or use with respect to the Russell 1000, Russell 1000 Value, Russell 1000 Growth, Russell 2000, Russell 2000 Value, Russell 2000 Growth, and Russell 3000 Indexes or any data included therein. Without limiting any of the foregoing, in no event shall Russell have any liability for any special, punitive, indirect, or consequential damages (including lost profits), even if notified of the possibility of such damages.
Russell reserves the right, at any time and without notice, to alter, amend, terminate or in any way change the Russell Indexes. Russell has no obligation to take the needs of any particular fund or its participants or any other product or person into consideration in determining, composing or calculating any of the Russell Indexes.
69
Glossary of Investment Terms
Authorized Participant. Institutional investors that are permitted to purchase Creation Units directly from, and redeem Creation Units directly with, the issuing fund. To be an Authorized Participant, an entity must be a participant in the Depository Trust Company and must enter into an agreement with the fund’s Distributor.
Bid-Ask Spread. The difference between the highest price a buyer is willing to pay to purchase ETF Shares (bid) and the lowest price a seller is willing to accept for ETF Shares (ask) when buying or selling shares in the secondary market.
Capital Gains Distributions. Payments to fund shareholders of gains realized on securities that a fund has sold at a profit, minus any realized losses.
Common Stock. A security representing ownership rights in a corporation.
Creation Unit. A large block of a specified number of ETF Shares. Certain broker-dealers known as “Authorized Participants” may purchase and redeem ETF Shares from the issuing fund in Creation Unit size blocks.
Dividend Distributions. Payments to fund shareholders of income from interest or dividends generated by a fund's investments.
Dow Jones U.S. Total Stock Market Float Adjusted Index. An index that represents the entire U.S. stock market and tracks more than 5,000 stocks, excluding shares of securities not available for public trading.
Ex-Dividend Date. The date when a distribution of dividends and/or capital gains is deducted from the share price of a mutual fund, ETF, or stock. On the ex-dividend date, the share price drops by the amount of the distribution per share (plus or minus any market activity).
Expense Ratio. A fund's total annual operating expenses expressed as a percentage of the fund's average net assets. The expense ratio includes management and administrative expenses, but it does not include the transaction costs of buying and selling portfolio securities.
Inception Date. The date on which the assets of a fund (or one of its share classes) are first invested in accordance with the fund's investment objective. For funds with a subscription period, the inception date is the day after that period ends. Investment performance is generally measured from the inception date.
70
Indexing. A low-cost investment strategy in which a fund attempts to track—rather than outperform—a specified market benchmark, or “index.”
Joint Committed Credit Facility. Each Fund participates, along with other funds managed by Vanguard, in a committed credit facility provided by a syndicate of lenders pursuant to a credit agreement that may be renewed annually; each Vanguard fund is individually liable for its borrowings, if any, under the credit facility. The amount and terms of the committed credit facility are subject to approval by the Funds' board of trustees and renegotiation with the lender syndicate on an annual basis.
Median Market Capitalization. An indicator of the size of companies in which a fund invests; the midpoint of market capitalization (market price x shares outstanding) of a fund's stocks, weighted by the proportion of the fund's assets invested in each stock. Stocks representing half of the fund's assets have market capitalizations above the median, and the rest are below it.
Mutual Fund. An investment company that pools the money of many people and invests it in a variety of securities in an effort to achieve a specific objective over time.
New York Stock Exchange (NYSE). A stock exchange based in New York City that is open for regular trading on business days, Monday through Friday, from 9:30 a.m. to 4 p.m., Eastern time.
Return of Capital. A return of capital occurs when a fund's distributions exceed its earnings in a fiscal year. A return of capital is a return of all or part of your original investment or amounts paid in excess of your original investment in a fund. In general, a return of capital reduces your cost basis in a fund's shares and is not taxable to you until your cost basis has been reduced to zero.
Securities. Stocks, bonds, money market instruments, and other investments.
Total Return. A percentage change, over a specified time period, in a fund's net asset value, assuming the reinvestment of all distributions of dividends and capital gains.
Volatility. The fluctuations in value of a mutual fund or other security. The greater a fund's volatility, the wider the fluctuations in its returns.
Yield. Income (interest or dividends) earned by an investment, expressed as a percentage of the investment’s price.
71
Connect with Vanguard® ˃ vanguard.com
For More Information
If you would like more information about Vanguard Russell ETFs, the following documents are available free upon request:
Annual/Semiannual Reports to Shareholders
Additional information about the Funds' investments is available in the Funds' annual and semiannual reports to shareholders. In the annual reports, you will find a discussion of the market conditions and investment strategies that significantly affected the Funds' performance during their last fiscal year.
Statement of Additional Information (SAI)
The SAI provides more detailed information about the Funds' ETF Shares and is incorporated by reference into (and thus legally a part of) this prospectus.
To receive a free copy of the latest annual or semiannual reports or the SAI, or to request additional information about Vanguard ETF Shares, please visit vanguard.com or contact us as follows:
Telephone: 866-499-8473; Text telephone for people with hearing impairment: 800-749-7273
Information Provided by the SEC
Reports and other information about the Funds are available in the EDGAR database on the SEC’s website at sec.gov, or you can receive copies of this information, for a fee, by electronic request at the following email address: publicinfo@sec.gov.
Funds' Investment Company Act file number: 811-07803
© 2023 The Vanguard Group, Inc. All rights reserved.
Vanguard Marketing Corporation, Distributor.
P 3348 122023
Vanguard Marketing Corporation, Distributor.
P 3348 122023
Vanguard Total World Bond ETF
Prospectus
December 22, 2023
Exchange-traded fund shares that are not individually redeemable and are listed on Nasdaq
Vanguard Total World Bond ETF Shares (BNDW)
This prospectus contains financial data for the Fund through the fiscal year ended August 31, 2023.
The Securities and Exchange Commission (SEC) has not approved or disapproved these securities or passed upon the adequacy of this prospectus. Any representation to the contrary is a criminal offense.
(Fees paid directly from your investment)
|
| |
|
Transaction Fee on Purchases and Sales |
|
|
Transaction Fee on Reinvested Dividends |
|
*
(Expenses that you pay each year as a percentage of the value of your investment)
|
| |
|
Management Fees |
% |
|
12b-1 Distribution Fee |
|
|
Other Expenses |
% |
|
Acquired Fund Fees and Expenses |
% |
|
Total Annual Fund Operating Expenses |
% |
1
|
1 Year |
3 Years |
5 Years |
10 Years |
|
$ |
$ |
$ |
$ |
2
3
4
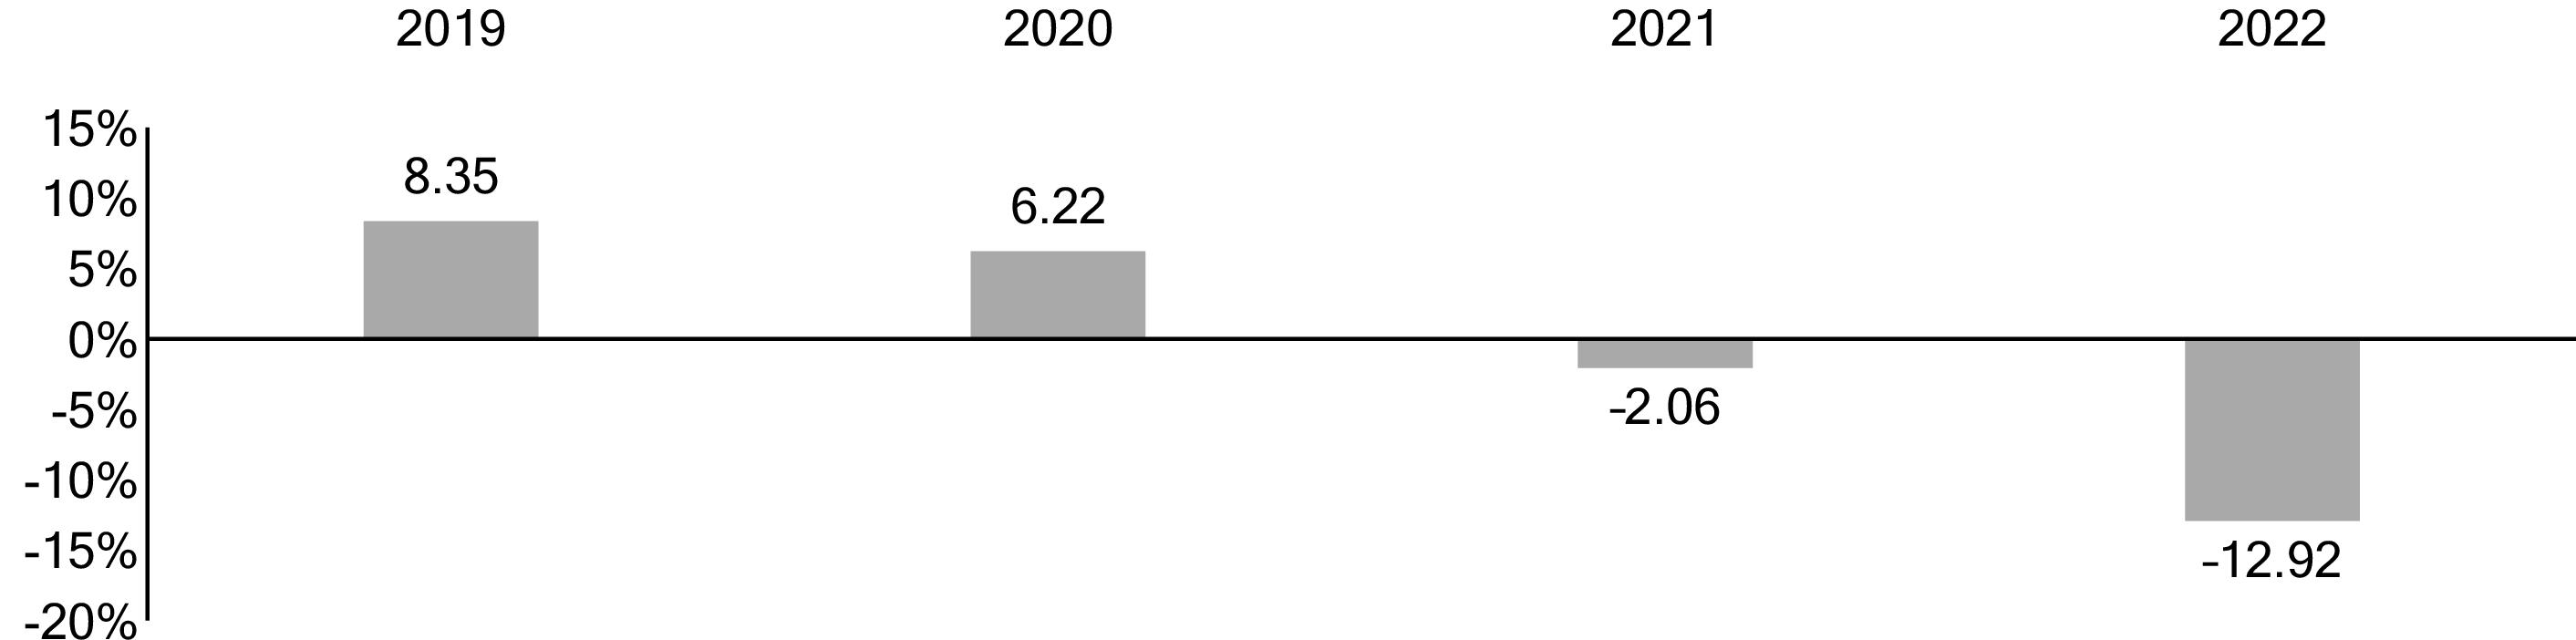
1 The year-to-date return as of the most recent calendar quarter, which ended on September 30, 2023, was 0.56%.
|
|
Total Return |
Quarter |
|
|
% |
|
|
|
-
% |
|
5
|
|
1 Year |
Since
Fund
Inception |
Fund
Inception
Date |
|
Vanguard Total World Bond ETF Shares |
|
|
|
|
Based on NAV |
|
|
|
|
Return Before Taxes |
-
% |
-
% |
|
|
Return After Taxes on Distributions |
- |
- |
|
|
Return After Taxes on Distributions and Sale of Fund
Shares |
- |
- |
|
|
Based on Market Price |
|
|
|
|
Return Before Taxes |
- |
- |
|
|
Bloomberg Global Aggregate Float Adjusted
Composite Index
(reflects no deduction for fees, expenses, or taxes) |
-
% |
-
% |
|
|
Bloomberg Global Aggregate Float Adjusted Index in
USD
(reflects no deduction for fees, expenses, or taxes) |
- |
- |
|
Investment Advisor
The Vanguard Group, Inc. (Vanguard)
Portfolio Manager
Joshua C. Barrickman, CFA, Principal of Vanguard and co-head of Vanguard’s Fixed Income Indexing Americas. He has managed the Fund since its inception in 2018.
6
Purchase and Sale of Fund Shares
ETF Shares may only be bought and sold in the secondary market through a brokerage firm. The price you pay or receive for ETF Shares will be the prevailing market price, which may be more (premium) or less (discount) than the NAV of the shares. The brokerage firm may charge you a commission to execute the transaction. Unless imposed by your brokerage firm, there is no minimum dollar amount you must invest and no minimum number of shares you must buy. ETF Shares cannot be directly purchased from or redeemed with the Fund, except by certain authorized broker-dealers. These broker-dealers may purchase and redeem ETF Shares only in large blocks (Creation Units), typically in exchange for baskets of securities.
An investor may incur costs attributable to the difference between the highest price a buyer is willing to pay to purchase ETF Shares (bid) and the lowest price a seller is willing to accept for ETF Shares (ask) when buying or selling shares in the secondary market (bid-ask spread). Recent information, including information on the Fund's NAV, market price, premiums and discounts, and bid-ask spreads, is available online at vanguard.com.
Tax Information
The Fund’s distributions may be taxable as ordinary income or capital gain. If you are investing through a tax-advantaged account, such as an IRA or an employer-sponsored retirement or savings plan, special tax rules apply.
Payments to Financial Intermediaries
The Fund and its investment advisor do not pay financial intermediaries for sales of Fund shares.
7
Investing in Vanguard ETF® Shares
What Are Vanguard ETF Shares?
Vanguard ETF Shares are an exchange-traded class of shares issued by certain Vanguard funds. ETF Shares represent an interest in the portfolio of stocks, bonds, or underlying ETFs held by the issuing fund.
How Are Vanguard ETF Shares Different From Conventional Mutual Fund Shares?
Conventional mutual fund shares can be directly purchased from and redeemed with the issuing fund for cash at the net asset value (NAV), typically calculated once a day. ETF Shares, by contrast, cannot be purchased directly from or redeemed directly with the issuing fund by an individual investor. Rather, ETF Shares can only be purchased or redeemed directly from the issuing fund by certain authorized broker-dealers. These broker-dealers may purchase and redeem ETF Shares only in large blocks (Creation Units), usually in exchange for baskets of securities and not for cash (although some funds issue and redeem Creation Units in exchange for cash or a combination of cash and securities).
An organized secondary trading market is expected to exist for ETF Shares, unlike conventional mutual fund shares, because ETF Shares are listed for trading on a national securities exchange. Individual investors can purchase and sell ETF Shares on the secondary market through a broker. Secondary-market transactions occur not at NAV, but at market prices that are subject to change throughout the day based on the supply of and demand for ETF Shares, changes in the prices of the fund’s portfolio holdings, and other factors.
The market price of ETF Shares typically will differ somewhat from the NAV of those shares. The difference between market price and NAV is expected to be small most of the time, but in times of market disruption or extreme market volatility, the difference may become significant.
8
How Do I Buy and Sell Vanguard ETF Shares?
ETF Shares of the Fund are listed for trading on Nasdaq. You can buy and sell ETF Shares on the secondary market in the same way you buy and sell any other exchange-traded security—through a broker. Your broker may charge a commission to execute a transaction. You will also incur the cost of the “bid-ask spread,” which is the difference between the highest price a buyer is willing to pay to purchase ETF Shares (bid) and the lowest price a seller is willing to accept for ETF Shares (ask) when buying or selling shares in the secondary market. Because secondary-market transactions occur at market prices, you may pay more (premium) or less (discount) than NAV when you buy ETF Shares and receive more or less than NAV when you sell those shares. In times of severe market disruption, the bid-ask spread and premiums/discounts can increase significantly. Unless imposed by your broker, there is no minimum dollar amount you must invest and no minimum number of ETF Shares you must buy.
Your ownership of ETF Shares will be shown on the records of the broker through which you hold the shares. Vanguard will not have any record of your ownership. Your account information will be maintained by your broker, which will provide you with account statements, confirmations of your purchases and sales of ETF Shares, and tax information. Your broker also will be responsible for ensuring that you receive income and capital gains distributions, as well as shareholder reports and other communications from the fund whose ETF Shares you own. You will receive other services (e.g., dividend reinvestment and average cost information) only if your broker offers these services.
9
Investing in Index Funds
What Is Indexing?
Indexing is an investment strategy for tracking the performance of a specified market benchmark, or “index.” An index is a group of securities whose overall performance is used as a standard to measure the investment performance of a particular market. There are many types of indexes. Some represent entire markets—such as the U.S. stock market or the U.S. bond market. Other indexes cover market segments—such as small-capitalization stocks or short-term bonds. One cannot invest directly in an index.
The index provider determines the securities to include in the index and the weighting of each security in the index. Under normal circumstances, the index provider will rebalance an index on a regular schedule. An index provider may carry out additional ad hoc index rebalances or delay or cancel a scheduled rebalance. Generally, the index provider does not provide any warranty, or accept any liability, with respect to the quality, accuracy, or completeness of either the target index or its related data. Errors made by the index provider may occur from time to time and may not be identified by the index provider for a period of time or at all. Vanguard does not provide any warranty or guarantee against such errors. Therefore, the gains, losses, or costs associated with the index provider’s errors will generally be borne by the index fund and its shareholders.
An index fund seeks to hold all, or a representative sample, of the securities that make up its target index. Index funds attempt to mirror the performance of the target index, for better or worse. However, an index fund generally does not perform exactly like its target index. For example, index funds have operating expenses and transaction costs. Market indexes do not, and therefore they will usually have a slight performance advantage over funds that track them. The ability of an index fund to match its performance to that of its target index can also be impacted by, among other things, the timing and size of cash flows, asset valuation differences, and the size of the fund. Market disruptions could also have an adverse effect on a fund’s ability to adjust its exposure to the required levels in order to track the index. The risk that a fund may not track the performance of its target index may be heightened during times of increased market volatility or other unusual market conditions.
Index funds typically have the following characteristics:
• Variety of investments. Depending on a fund’s benchmark index, the fund may invest in the securities of a variety of companies, industries, and/or governments or government agencies.
• Relative performance consistency. Because they seek to track market benchmarks, index funds usually do not perform dramatically better or worse than their benchmarks.
• Low cost. Index funds are generally inexpensive to run compared with actively managed funds. They have low or no research costs and typically keep trading activity—and thus dealer markups and other transaction costs—to a minimum compared with actively managed funds.
10
More on the Fund and ETF Shares
This prospectus describes the principal risks you would face as a Fund shareholder. It is important to keep in mind one of the main principles of investing: generally, the higher the risk of losing money, the higher the potential reward. The reverse, also, is generally true: the lower the risk, the lower the potential reward. As you consider an investment in any fund, you should take into account your personal tolerance for fluctuations in the securities markets. Look for this
symbol throughout the prospectus. It is used to mark detailed information about the more significant risks that you would confront as a Fund shareholder. To highlight terms and concepts important to fund investors, we have provided Plain Talk® explanations along the way. Reading the prospectus will help you decide whether the Fund is the right investment for you. We suggest that you keep this prospectus for future reference.
symbol throughout the prospectus. It is used to mark detailed information about the more significant risks that you would confront as a Fund shareholder. To highlight terms and concepts important to fund investors, we have provided Plain Talk® explanations along the way. Reading the prospectus will help you decide whether the Fund is the right investment for you. We suggest that you keep this prospectus for future reference.A Note to Investors
Vanguard ETF Shares can be purchased directly from the issuing Fund only by certain authorized broker-dealers in exchange for a basket of securities (or, in some cases, for cash or a combination of cash and securities). Individual investors generally will not be able to purchase ETF Shares directly from the Fund. Instead, these investors will purchase ETF Shares on the secondary market through a broker.
|
Plain Talk About Fund Expenses |
|
All funds have operating expenses. These expenses, which are deducted
from a fund’s gross income, are expressed as a percentage of the net assets
of the fund. Assuming that operating expenses remain as stated in the Fees
and Expenses section, Vanguard Total World Bond ETF Shares’ expense
ratio would be 0.05%, or $0.50 per $1,000 of average net assets. The
average expense ratio for global income funds in 2022 was 0.88%, or $8.80
per $1,000 of average net assets (derived from data provided by Lipper, a
Thomson Reuters Company, which reports on the fund industry). |
|
Plain Talk About Costs of Investing |
|
Costs are an important consideration in choosing an ETF. That is because
you, as a shareholder, pay a proportionate share of the costs of operating a
fund and any transaction costs incurred when the fund buys or sells
securities. These costs can erode a substantial portion of the gross income
or the capital appreciation a fund achieves. Even seemingly small differences
in expenses can, over time, have a dramatic effect on a fund’s performance. |
11
The following sections explain the principal investment strategies and policies that the Fund uses in pursuit of its investment objective. The Fund's board of trustees, which oversees the Fund's management, may change investment strategies or policies in the interest of shareholders without a shareholder vote, unless those strategies or policies are designated as fundamental. Note that the Fund‘s investment objective is not fundamental and may be changed without a shareholder vote. As a fund of funds, the Fund seeks to achieve its investment objective by primarily investing in underlying funds. Through its investments in underlying funds, the Fund indirectly owns a diversified portfolio of fixed income securities. Under normal circumstances, at least 80% of the Fund‘s assets will be indirectly invested in investment-grade U.S. bonds and investment-grade non-U.S. dollar-denominated bonds. The Fund may change its 80% policy only upon 60 days‘ notice to shareholders.
Market Exposure
Through the underlying funds, the Fund indirectly invests its assets in investment-grade U.S. bonds and investment-grade non-U.S.
dollar-denominated bonds.
dollar-denominated bonds.
The Fund is subject to interest rate risk, which is the chance that bond prices overall will decline because of rising interest rates. Interest rate risk should be moderate for the Fund.
Although fixed income securities (commonly referred to as bonds) are often thought to be less risky than stocks, there have been periods when bond prices have fallen significantly because of rising interest rates. For instance, prices of U.S. long-term bonds fell by almost 48% between December 1976 and September 1981. Note that over comparable periods of time, the prices of foreign bonds and U.S. bonds may increase or decrease by different amounts, and in some cases may move in opposite directions.
To illustrate the relationship between bond prices and interest rates, the following table shows the effect of a 1% and a 2% change (both up and down) in interest rates on the values of three noncallable bonds (i.e., bonds that cannot be redeemed by the issuer) of different maturities, each with a face value of $1,000.
12
How Interest Rate Changes Affect the Value of a $1,000 Bond1
|
Type of Bond (Maturity) |
After a 1%
Increase |
After a 1%
Decrease |
After a 2%
Increase |
After a 2%
Decrease |
|
Short-Term (2.5 years) |
$977 |
$1,024 |
$954 |
$1,049 |
|
Intermediate-Term (10 years) |
922 |
1,086 |
851 |
1,180 |
|
Long-Term (20 years) |
874 |
1,150 |
769 |
1,328 |
1 Assuming a 4% coupon rate.
These figures are for illustration only; you should not regard them as an indication of future performance of the bond market as a whole or the Fund in particular.
|
Plain Talk About Bonds and Interest Rates |
|
As a rule, when interest rates rise, bond prices fall. The opposite is also true:
Bond prices go up when interest rates fall. Why do bond prices and interest
rates move in opposite directions? Let’s assume that you hold a bond
offering a 4% yield. A year later, interest rates are on the rise and bonds of
comparable quality and maturity are offered with a 5% yield. With
higher-yielding bonds available, you would have trouble selling your 4% bond
for the price you paid—you would probably have to lower your asking price.
On the other hand, if interest rates were falling and 3% bonds were being
offered, you should be able to sell your 4% bond for more than you paid. |
|
How mortgage-backed securities are different: In general, declining interest
rates will not lift the prices of mortgage-backed securities—such as those
guaranteed by the Government National Mortgage Association—as much as
the prices of comparable bonds. Why? Because when interest rates fall, the
bond market tends to discount the prices of mortgage-backed securities for
prepayment risk—the possibility that homeowners will refinance their
mortgages at lower rates and cause the bonds to be paid off prior to maturity.
In part to compensate for this prepayment possibility, mortgage-backed
securities tend to offer higher yields than other bonds of comparable credit
quality and maturity. In contrast, when interest rates rise, prepayments tend
to slow down, subjecting mortgage-backed securities to extension risk—the
possibility that homeowners will repay their mortgages at slower rates. This
will lengthen the duration or average life of mortgage-backed securities held
by a fund and delay the fund’s ability to reinvest proceeds at higher interest
rates, making the fund more sensitive to changes in interest rates. |
Changes in interest rates can affect bond income as well as bond prices.
13
The Fund is subject to income risk, which is the chance that a fund's income will decline because of falling interest rates. A fund holding bonds will experience a decline when interest rates fall because the fund then must invest new cash flow and cash from maturing bonds in lower-yielding bonds.
|
Plain Talk About Bond Maturities |
|
A bond is issued with a specific maturity date—the date when the issuer must
pay back the bond’s principal (face value). Bond maturities range from less
than 1 year to more than 30 years. Typically, the longer a bond’s maturity, the
more price risk you, as a bond investor, will face as interest rates rise—but
also the higher the potential yield you could receive. Longer-term bonds are
generally more suitable for investors willing to take a greater risk of price
fluctuations to get higher and more stable interest income. Shorter-term bond
investors should be willing to accept lower yields and greater income
variability in return for less fluctuation in the value of their investment. The
stated maturity of a bond may differ from the effective maturity of a bond,
which takes into consideration that an action such as a call or refunding may
cause bonds to be repaid before their stated maturity dates. |
Although falling interest rates tend to strengthen bond prices, they can cause other problems for bond fund investors—bond calls and prepayments.
The Fund is subject to prepayment risk, which is the chance that during periods of falling interest rates, homeowners will refinance their mortgages before their maturity dates, resulting in prepayment of mortgage-backed securities held by a fund. A fund would then lose any price appreciation above the mortgage's principal and the underlying fund would be forced to reinvest the unanticipated proceeds at lower interest rates, resulting in a decline in the fund's income. Such prepayments and subsequent reinvestments would also increase a fund's portfolio turnover rate.
The Fund is subject to extension risk, which is the chance that during periods of rising interest rates, certain debt securities will be paid off substantially more slowly than originally anticipated, and the value of those securities may fall. This will lengthen the duration or average life of securities held by a fund and delay a fund's ability to reinvest proceeds at higher interest rates, making the fund more sensitive to changes in interest rates. For funds that invest in mortgage-backed securities, extension risk is the chance that during periods of rising interest rates, homeowners will repay their mortgages at slower rates.
14
The Fund is subject to call risk, which is the chance that during periods of falling interest rates, issuers of callable bonds may call (redeem) securities with higher coupon rates or interest rates before their maturity dates. A fund would then lose any price appreciation above the bond's call price and would be forced to reinvest the unanticipated proceeds at lower interest rates, resulting in a decline in income.
The Index that the Fund seeks to track includes only a limited number of callable bonds. Thus, call risk for the Fund should be low.
The Fund is subject to credit risk, which is the chance that a bond issuer will fail to pay interest or principal in a timely manner or that negative perceptions of the issuer's ability to make such payments will cause the price of that bond to decline, thus reducing a fund's return. Credit risk should be low for the Fund.
|
Plain Talk About Credit Quality |
|
A bond’s credit quality rating is an assessment of the issuer’s ability to pay
interest on the bond and, ultimately, to repay the principal. The lower the
credit quality, the greater the perceived chance that the bond issuer will
default, or fail to meet its payment obligations. All things being equal, the
lower a bond’s credit quality, the higher its yield should be to compensate
investors for assuming additional risk. |
The underlying funds are expected to have low credit risk as a result of their investments in investment-grade bonds. Investment-grade bonds are those rated BBB/Baa or higher by a credit rating agency, and therefore are a mixture of high- and medium-quality bonds.
The Fund is subject to liquidity risk, which is the chance that a security may not be sold in a timely manner at a desired price.
To a limited extent, the Fund is also indirectly subject to event risk, which is the chance that securities held by the underlying funds may suffer a substantial decline in credit quality and market value because of a restructuring of the companies that issued the securities or because of other factors negatively affecting the issuers.
15
The Fund is subject to country/regional risk, which is the chance that world events—such as political upheaval, financial troubles, or natural disasters—will adversely affect the value and/or liquidity of securities issued by foreign companies, governments, or government agencies. Because the Fund may indirectly invest a large portion of its assets in bonds of issuers located in a particular country or region, the Fund's performance may be hurt disproportionately by the poor performance of its investments in that area.
The Fund is subject to currency hedging risk, which is the chance that the currency hedging transactions entered into by an underlying fund may not perfectly offset the underlying fund’s foreign currency exposure. An underlying fund may seek to mimic the performance of foreign bonds without regard to currency exchange rate fluctuations. To accomplish this goal, an underlying fund may attempt to offset, or hedge, its foreign currency exposure by entering into currency hedging transactions, primarily through the use of foreign currency exchange forward contracts. However, it generally is not possible to perfectly hedge an underlying fund’s foreign currency exposure. An underlying fund will decline in value if it underhedges a currency that has weakened or overhedges a currency that has strengthened relative to the U.S. dollar. In addition, an underlying fund will incur expenses to hedge its foreign currency exposure. By entering into currency hedging transactions, an underlying fund may eliminate any chance to benefit from favorable fluctuations in relevant currency exchange rates. Currency hedging risk for the Fund is low.
|
Plain Talk About International Investing |
|
U.S. investors who invest in foreign securities will encounter risks not
typically associated with U.S. companies because foreign stock and bond
markets operate differently from the U.S. markets. For instance, foreign
companies and governments may not be subject to the same or similar
auditing, legal, tax, regulatory, financial reporting, accounting, and
recordkeeping standards and practices as U.S. companies and the U.S.
government, and their stocks and bonds may not be as liquid as those of
similar U.S. entities. In addition, foreign stock exchanges, brokers,
companies, bond markets, and dealers may be subject to less government
supervision and regulation than their counterparts in the United States.
Further, the imposition of economic or other sanctions on the United States
by a foreign country, or on a foreign country or issuer by the United States,
could impair a fund's ability to buy, sell, hold, receive, deliver, or otherwise
transact in certain investment securities or obtain exposure to foreign
securities and assets. These factors, among others, could negatively affect
the returns U.S. investors receive from foreign investments. |
16
Market disruptions can adversely affect local and global markets as well as normal market conditions and operations. Any such disruptions could have an adverse impact on the value of the Fund's investments and Fund performance.
Security Selection
Vanguard Total World Bond ETF is a fund of funds, which means that it seeks to achieve its investment objective by investing primarily in a combination of other funds rather than in individual securities. The Fund invests in two Vanguard bond ETFs, which are briefly described in the following paragraphs.
• Vanguard Total Bond Market ETF seeks to track the performance of the Bloomberg U.S. Aggregate Float Adjusted Index. This index measures the performance of a wide spectrum of public, investment-grade, taxable, fixed income securities in the United States—including government, corporate, and international dollar-denominated bonds, as well as mortgage-backed and asset-backed securities—all with maturities of more than 1 year. The Total Bond Market ETF invests by sampling the index, meaning that it holds a range of securities that, in the aggregate, approximates the full index in terms of key risk factors and other characteristics. As of August 31, 2023, there were 13,370 bonds in the Bloomberg U.S. Aggregate Float Adjusted Index.
• Vanguard Total International Bond ETF seeks to track the performance of the Bloomberg Global Aggregate ex-USD Float Adjusted RIC Capped Index (USD Hedged). This index provides a broad-based measure of the global, investment-grade, fixed-rate debt markets. The index includes government, government agency, corporate, and securitized non-U.S. investment-grade fixed income investments, all issued in currencies other than the U.S. dollar and with maturities of more than one year. The Total International Bond ETF invests by sampling the index, meaning that it holds a range of securities that, in the aggregate, approximates the full index in terms of key risk factors and other characteristics. The Bloomberg Global Aggregate ex-USD Float Adjusted RIC Capped Index (USD Hedged) is capped to comply with investment company diversification standards of the Internal Revenue Code, which state that, at the close of each fiscal quarter, a fund’s (1) exposure to any particular bond issuer may not exceed 25% of the fund’s assets, and (2) aggregate exposure to issuers that individually constitute 5% or more of the fund may not exceed 50% of the fund’s assets. To help enforce these limits, if the index, on the last business day of any month, were to have greater than 20% exposure to any particular bond issuer, or greater than 48% aggregate exposure to issuers that individually constitute 5% or more of the index, then the excess would be reallocated to bonds of other issuers represented in the index. Notwithstanding the fact that the index is capped, exposure of the index or Vanguard Total International Bond ETF to a particular bond issuer may exceed 25%, and issuers that individually
17
constitute 5% or more of the index or Vanguard Total International Bond ETF may, in the aggregate, constitute more than 50% of the index or Vanguard Total International Bond ETF on any day during the month because of currency and/or price movements. As of August 31, 2023, there were 12,843 bonds in the Bloomberg Global Aggregate ex-USD Float Adjusted RIC Capped Index (USD Hedged).
Each of the underlying funds seek to track the performance of an index that represents a subset of the Bloomberg Global Aggregate Float Adjusted Composite Index. Together, the two indexes comprise the Fund’s target index.
Types of bonds. The Fund’s target index is the Bloomberg Global Aggregate Float Adjusted Composite Index. This custom, USD-hedged Index is designed to track the market capitalized weights of the global investment-grade bond market and is comprised of the Bloomberg U.S. Aggregate Float Adjusted Index and the Bloomberg Global Aggregate ex-USD Float Adjusted RIC Capped Index.
Through its investment in Vanguard Total Bond Market ETF and Vanguard Total International Bond ETF, the Fund indirectly invests in the following types of bonds.
• U.S. government and agency bonds represent loans by investors to the U.S. Treasury or a wide variety of government agencies and instrumentalities. Securities issued by most U.S. government entities are neither guaranteed by the U.S. Treasury nor backed by the full faith and credit of the U.S. government. These entities include, among others, the Federal Home Loan Banks (FHLBs), the Federal National Mortgage Association (FNMA), and the Federal Home Loan Mortgage Corporation (FHLMC). Securities issued by the U.S. Treasury and a small number of U.S. government agencies, such as the Government National Mortgage Association (GNMA), are backed by the full faith and credit of the U.S. government. The market values of U.S. government and agency securities and U.S. Treasury securities are subject to fluctuation.
• Corporate bonds are IOUs issued by businesses that want to borrow money for some purpose—often to develop a new product or service, to expand into a new market, or to buy another company. As with other types of bonds, the issuer promises to repay the principal on a specific date and to make interest payments in the meantime. The amount of interest offered depends both on market conditions and on the financial health of the corporation issuing the bonds; a company whose credit rating is not strong will have to offer a higher interest rate to obtain buyers for its bonds. Corporate bonds include securities that are backed by a pool of underlying assets (asset-backed securities) or commercial mortgages (commercial mortgage-backed bonds). Vanguard Total Bond Market ETF expects to purchase only investment-grade corporate bonds.
18
• Mortgage-backed securities represent interests in underlying pools of mortgages. Unlike ordinary bonds, which generally pay a fixed rate of interest at regular intervals and then repay principal upon maturity, mortgage-backed securities pass through both interest and principal from underlying mortgages as part of their regular payments. Because the mortgages underlying the securities can be prepaid at any time by homeowners or by corporate borrowers, mortgage-backed securities are subject to prepayment risk. These types of securities are issued by a number of government agencies, including the GNMA, the FHLMC, and the FNMA. Mortgage-backed securities issued by the GNMA are guaranteed by the full faith and credit of the U.S. government as to the timely payment of principal and interest; those issued by other government agencies or private corporations are not. Vanguard Total Bond Market ETF may also invest in conventional mortgage-backed securities—which are packaged by private corporations and are not guaranteed by the U.S. government—and enter into mortgage-dollar-roll transactions. In a mortgage-dollar-roll transaction, a fund sells mortgage-backed securities to a dealer and simultaneously agrees to purchase similar securities in the future at a predetermined price. These transactions simulate an investment in mortgage-backed securities and have the potential to enhance a fund’s returns and reduce its administrative burdens, compared with holding mortgage-backed securities directly. These transactions may increase a fund’s portfolio turnover rate. Mortgage dollar rolls will be used only to the extent that they are consistent with the Fund’s investment objective and risk profile.
• International dollar-denominated bonds are bonds denominated in U.S. dollars and issued by foreign governments and companies. To the extent that the Fund indirectly owns foreign bonds, it is subject to country risk, which is the chance that world events—such as political upheaval, financial troubles, or natural disasters—will adversely affect the value and/or liquidity of securities issued by companies in foreign countries. In addition, the prices of foreign bonds and the prices of U.S. bonds have, at times, moved in opposite directions. Because the bond’s value is designated in dollars rather than in the currency of the issuer’s country, the investor is not exposed to currency risk; rather, the issuer assumes that risk, usually to attract U.S. investors. Although currency movements do not affect the value of international dollar-denominated bonds directly, they could affect the value indirectly by adversely affecting the issuer’s ability (or the market’s perception of the issuer’s ability) to pay interest or repay principal.
• Local currency bonds are government, government agency, corporate, and securitized non-U.S. investment-grade fixed income investments, issued in currencies other than the U.S. dollar.
19
|
Plain Talk About U.S. Government-Sponsored Enterprises |
|
A variety of U.S. government-sponsored enterprises (GSEs), such as the
Federal Home Loan Mortgage Corporation (FHLMC), the Federal National
Mortgage Association (FNMA), and the Federal Home Loan Banks (FHLBs),
issue debt and mortgage-backed securities. Although GSEs may be chartered
or sponsored by acts of Congress, they are not funded by congressional
appropriations. In September of 2008, the U.S. Treasury placed FNMA and
FHLMC under conservatorship and appointed the Federal Housing Finance
Agency (FHFA) to manage their daily operations. In addition, the U.S. Treasury
entered into purchase agreements with FNMA and FHLMC to provide them
with capital in exchange for senior preferred stock. Generally, a GSE’s
securities are neither issued nor guaranteed by the U.S. Treasury and are not
backed by the full faith and credit of the U.S. government. In most cases, these
securities are supported only by the credit of the GSE, standing alone. In some
cases, a GSE’s securities may be supported by the ability of the GSE to
borrow from the U.S. Treasury or may be supported by the U.S. government in
some other way. Securities issued by the Government National Mortgage
Association (GNMA), however, are backed by the full faith and credit of the
U.S. government. |
Other Investment Policies and Risks
The Fund reserves the right to substitute a different index for the index it currently tracks if the current index is discontinued, if the Fund's agreement with the provider of its target index is terminated, or for any other reason determined in good faith by the Fund’s board of trustees. In any such instance, the substitute index would represent the same market segment as the current index.
The Fund and the underlying funds may invest in derivatives. In general, investments in derivatives may involve risks different from, and possibly greater than, those of investments directly in the underlying securities or assets.
Generally speaking, a derivative is a financial contract whose value is based on the value of a financial asset (such as a stock, a bond, or a currency), a physical asset (such as gold, oil, or wheat), a market index, or a reference rate. The Fund may invest in derivatives only if the expected risks and rewards of the derivatives are consistent with the investment objective, policies, strategies, and risks of a Fund as disclosed in this prospectus. In particular, derivatives will be used only when they may help the advisor to accomplish one or more of the following:
• Invest in eligible asset classes with greater efficiency and lower cost than is possible through direct investment.
20
• Add value when these instruments are attractively priced.
• Adjust sensitivity to changes in interest rates.
• Hedge foreign currency exposure.
Each underlying fund's derivative investments may include fixed income futures contracts, fixed income options, interest rate swaps, total return swaps, credit default swaps, or other derivatives. Losses (or gains) involving futures contracts can sometimes be substantial—in part because a relatively small price movement in a futures contract may result in an immediate and substantial loss (or gain) for a fund. Similar risks exist for other types of derivatives.
An underlying fund may enter into foreign currency exchange forward contracts, which are a type of derivative, in order to hedge its foreign currency exposure. A foreign currency exchange forward contract is an agreement to buy or sell a currency at a specific price on a specific date, usually 30, 60, or 90 days in the future. These contracts will be used in an effort to offset any changes in the dollar value of foreign bonds attributable to changes in the value of the bonds’ local currencies relative to the U.S. dollar. Although such contracts can protect a fund from unfavorable fluctuations in currency exchange rates, they also reduce or eliminate any chance for the fund to benefit from favorable exchange rate fluctuations. Notably, foreign currency exchange forward contracts do not prevent a fund’s securities from falling in value for reasons unrelated to currency exchange rates, such as interest rate increases and credit downgrades.
To the extent that an underlying fund enters into currency hedging transactions, the Fund is exposed to counterparty risk. Counterparty risk is the chance that the counterparty to a currency forward contract with a fund is unable or unwilling to meet its financial obligations. Counterparty risk is low for the Fund.
21
|
Plain Talk About Derivatives |
|
Derivatives can take many forms. Some forms of derivatives—such as
exchange-traded futures and options on securities, commodities, or
indexes—have been trading on regulated exchanges for decades. These
types of derivatives are standardized contracts that can easily be bought and
sold and whose market values are determined and published daily. On the
other hand, non-exchange-traded derivatives—such as certain swap
agreements and foreign currency exchange forward contracts—tend to be
more specialized or complex and may be more difficult to accurately value. |
The Fund may invest a small portion of its assets in fixed income futures and/or credit default swaps, which are types of derivatives, and/or shares of certain other exchange-traded funds (ETFs) in addition to those described above. Fixed income futures and ETFs typically provide returns similar to those of the bonds listed in the index, or in a subset of the index, the Fund seeks to track. The Fund may purchase these types of derivatives or ETFs when doing so will reduce the Fund’s transaction costs, facilitate cash management, mitigate risk, or have the potential to add value because the instruments are favorably priced. Vanguard receives no additional revenue from Fund assets invested in ETF Shares of other Vanguard funds. Fund assets invested in ETF Shares of other Vanguard funds are excluded when allocating to the Fund its share of the costs of Vanguard operations.
The Fund may enter into foreign currency exchange forward contracts to hedge its foreign currency exposure. Such contracts can protect the Fund from unfavorable fluctuations in currency exchange rates, but they also reduce or eliminate any chance for the Fund to benefit from favorable exchange rate fluctuations.
Cash Management
The Fund's daily cash balance may be invested in Vanguard Market Liquidity Fund and/or Vanguard Municipal Cash Management Fund (each, a CMT Fund), which are low-cost money market funds. When investing in a CMT Fund, the Fund bears its proportionate share of the expenses of the CMT Fund in which it invests. Vanguard receives no additional revenue from Fund assets invested in a CMT Fund.
22
Redemption Requests
Methods used to meet redemption requests. Redemptions of ETF Shares are typically met through a combination of cash and securities held by the Fund; see “How Are Vanguard ETF Shares Different From Conventional Mutual Fund Shares?” If cash is used to meet redemptions, the Fund typically obtains such cash through positive cash flows or the sale of Fund holdings consistent with the Fund’s investment objective and strategy. Please consult the Fund's Statement of Additional Information for further information on redemptions of ETF Shares.
Under certain circumstances, the Fund may borrow money (subject to certain regulatory conditions and if available under board-approved procedures) through an interfund lending facility; through a bank line-of-credit, including a joint committed credit facility; or through an uncommitted line-of-credit from Vanguard in order to meet redemption requests.
Potential redemption activity impacts. At times, the Fund may experience adverse effects when certain large shareholders, or multiple shareholders comprising significant ownership of the Fund, redeem large amounts of shares of the Fund. Large redemptions may cause the Fund to sell portfolio securities at times when it would not otherwise do so. This may result in the Fund distributing capital gains or other taxable income to non-redeeming shareholders. Large redemptions may also increase the Fund’s transaction costs. Redemption activity can occur for many reasons, including shareholder reactions to market movements or other events unrelated to Vanguard’s actions, or when Vanguard makes product changes that, for example, may result in a shareholder redeeming shares of the Fund to purchase shares of another similar fund or investment vehicle.
Temporary Investment Measures
The Fund may temporarily depart from its normal investment policies and strategies when the advisor believes that doing so is in the Fund's best interest, so long as the strategy or policy employed is consistent with the Fund's investment objective. For instance, the Fund may invest beyond its normal limits in derivatives or exchange-traded funds that are consistent with the Fund's investment objective when those instruments are more favorably priced or provide needed liquidity, as might be the case when the Fund receives large cash flows that it cannot prudently invest immediately.
23
Special Risks of Exchange-Traded Shares
ETF Shares are not individually redeemable. They can be redeemed with the issuing Fund at NAV only by certain authorized broker-dealers and only in large blocks known as Creation Units. Consequently, if you want to liquidate some or all of your ETF Shares, you must sell them on the secondary market at prevailing market prices.
The market price of ETF Shares may differ from NAV. Although it is expected that the market price of an ETF Share typically will approximate its NAV, there may be times when the market price and the NAV differ significantly. Thus, you may pay more (premium) or less (discount) than NAV when you buy ETF Shares on the secondary market, and you may receive more or less than NAV when you sell those shares. These discounts and premiums are likely to be greatest during times of market disruption or extreme market volatility.
Vanguard’s website at vanguard.com shows the previous day’s closing NAV and closing market price for the Fund. The website also discloses, in the Premium/Discount Analysis section of the Fund’s Price & Performance page, how frequently the Fund traded at a premium or discount to NAV and the magnitudes of such premiums and discounts.
An active trading market may not exist. Although Vanguard ETF Shares are listed on a national securities exchange, it is possible that an active trading market may not be maintained. Although this could happen at any time, it is more likely to occur during times of severe market disruption. If you attempt to sell your ETF Shares when an active trading market is not functioning, you may have to sell at a significant discount to NAV. In extreme cases, you may not be able to sell your shares at all.
Trading may be halted. Trading of Vanguard ETF Shares on an exchange may be halted by the activation of individual or marketwide trading halts (which halt trading for a specific period of time when the price of a particular security or overall market prices decline by a specified percentage). Trading of ETF Shares may also be halted if (1) the shares are delisted from the listing exchange without first being listed on another exchange or (2) exchange officials determine that such action is appropriate in the interest of a fair and orderly market or for the protection of investors.
A precautionary note to investment companies: The Fund's ETF Shares are issued by a registered investment company, and therefore the acquisition of such shares by other investment companies and private funds is subject to the restrictions of Section 12(d)(1) of the Investment Company Act of 1940 (the 1940 Act). SEC Rule 12d1-4 under the 1940 Act permits registered investment companies to invest in other registered investment companies beyond the limits
24
in Section 12(d)(1), subject to certain conditions, including that funds with different investment advisors must enter into a fund of funds investment agreement.
Shareholder Rights
The Fund's Agreement and Declaration of Trust, as amended, requires a shareholder bringing a derivative action on behalf of Vanguard Scottsdale Funds (the Trust) that is subject to a pre-suit demand to collectively hold at least 10% of the outstanding shares of the Trust or at least 10% of the outstanding shares of the series or class to which the demand relates and to undertake to reimburse the Trust for the expense of any counsel or advisors used when considering the merits of the demand in the event that the board of trustees determines not to bring such action. In each case, these requirements do not apply to claims arising under the federal securities laws to the extent that any such federal securities laws, rules, or regulations do not permit such application.
Frequent Trading and Market-Timing
Unlike frequent trading of a Vanguard fund’s conventional (i.e., not exchange-traded) classes of shares, frequent trading of ETF Shares does not disrupt portfolio management or otherwise harm fund shareholders. The vast majority of trading in ETF Shares occurs on the secondary market. Because these trades do not involve the issuing fund, they do not harm the fund or its shareholders. Certain broker-dealers are authorized to purchase and redeem ETF Shares directly with the issuing fund. Because these trades typically are effected in kind (i.e., for securities and not for cash), or are assessed a transaction fee when effected in cash, they do not cause any of the harmful effects to the issuing fund (as previously noted) that may result from frequent trading. For these reasons, the board of trustees of each fund that issues ETF Shares has determined that it is not necessary to adopt policies and procedures to detect and deter frequent trading and market-timing of ETF Shares.
Portfolio Holdings
Please consult the Fund's Statement of Additional Information or our website for a description of the policies and procedures that govern disclosure of the Fund’s portfolio holdings.
Turnover Rate
Although the Fund generally seeks to invest for the long term, it may sell shares of the underlying funds regardless of how long they have been held. The Financial Highlights section of this prospectus shows historical turnover rates for the Fund. A turnover rate of 100%, for example, would mean that the Fund had sold and replaced shares of the underlying funds valued at 100% of its net
25
assets within a one-year period. In general, the greater the turnover rate, the greater the impact transaction costs will have on a fund’s return. Also, funds with high turnover rates may be more likely to generate capital gains, including short-term capital gains, that must be distributed to shareholders and will be taxable to shareholders investing through a taxable account.
The Fund and Vanguard
The Fund is a member of The Vanguard Group, Inc. (Vanguard), a family of over 200 funds. All of the funds that are members of Vanguard (other than funds of funds) share in the expenses associated with administrative services and business operations, such as personnel, office space, and equipment.
Vanguard Marketing Corporation provides marketing services to the funds. Although fund shareholders do not pay sales commissions or 12b-1 distribution fees, each fund (other than a fund of funds) or each share class of a fund (in the case of a fund with multiple share classes) pays its allocated share of the Vanguard funds’ marketing costs.
According to an agreement applicable to Vanguard Total World Bond ETF and Vanguard, the Fund’s direct expenses may be reduced or eliminated by savings accruing to the benefit of the Vanguard funds that Vanguard expects to derive from the Fund’s operation.
Accordingly, all expenses for services provided by Vanguard to the Fund and all other expenses incurred by the Fund are expected to be borne by the underlying funds. The Fund's shareholders bear the fees and expenses associated with the Fund's investments in the underlying funds.
|
Plain Talk About Vanguard’s Unique Corporate Structure |
|
Vanguard is owned jointly by the funds it oversees and thus indirectly by the
shareholders in those funds. Most other mutual funds are operated by
management companies that are owned by third parties—either public or
private stockholders—and not by the funds they serve. |
Investment Advisor
The Vanguard Group, Inc., P.O. Box 2600, Valley Forge, PA 19482, which began operations in 1975, serves as advisor to the Fund through its Fixed Income Group. Vanguard also serves as investment advisor for each of the underlying
26
funds. As of August 31, 2023, Vanguard served as advisor for approximately $6.8 trillion in assets. Vanguard provides investment advisory services to the Fund and each of the underlying funds pursuant to the Funds’ Service Agreement and subject to the supervision and oversight of the trustees and officers of the Fund and each of the underlying funds.
Under the terms of an SEC exemption, the Fund's board of trustees may, without prior approval from shareholders, change the terms of an advisory agreement with a third-party investment advisor or hire a new third-party investment advisor—either as a replacement for an existing advisor or as an additional advisor. Any significant change in the Fund's advisory arrangements will be communicated to shareholders in writing. As the Fund's sponsor and overall manager, Vanguard may provide investment advisory services to the Fund at any time. Vanguard may also recommend to the board of trustees that an advisor be hired, terminated, or replaced or that the terms of an existing advisory agreement be revised. The Fund has filed an application seeking a similar SEC exemption with respect to investment advisors that are wholly owned subsidiaries of Vanguard. If the exemption is granted, the Fund may rely on the new SEC relief.
For a discussion of why the board of trustees approved the Fund's investment advisory arrangement, see the most recent annual report to shareholders covering the fiscal year ended August 31.
The manager primarily responsible for the day-to-day management of the Fund is:
Joshua C. Barrickman, CFA, Principal of Vanguard and co-head of Vanguard’s Fixed Income Indexing Americas. He has been with Vanguard since 1998, has worked in investment management since 1999, has managed investment portfolios since 2005, and has managed the Fund since its inception in 2018. Education: B.S., Ohio Northern University; M.B.A., Lehigh University.
The Fund's Statement of Additional Information provides information about the portfolio manager’s compensation, other accounts under management, and ownership of shares of the Fund.
27
Dividends, Capital Gains, and Taxes
Fund Distributions
The Fund distributes to shareholders virtually all of its net income (interest less expenses) as well as any net short-term or long-term capital gains realized from the sale of its holdings or received as dividend or capital gains distributions from the underlying funds. From time to time, the Fund may also make distributions that are treated as a return of capital. Income dividends generally are declared monthly and distributed monthly; capital gains distributions, if any, generally occur annually in December. In addition, the Fund may occasionally make a supplemental distribution at some other time during the year.
|
Plain Talk About Distributions |
|
As a shareholder, you are entitled to your portion of a fund’s income from
interest as well as capital gains from the fund’s sale of investments. Income
consists of interest the fund earns from its money market and bond
investments. Capital gains are realized whenever the fund sells securities for
higher prices than it paid for them. These capital gains are either short-term
or long-term, depending on whether the fund held the securities for one year
or less or for more than one year. |
Reinvestment of Distributions
In order to reinvest dividend and capital gains distributions, investors in the Fund must hold their shares at a broker that offers a reinvestment service. This can be the broker’s own service or a service made available by a third party, such as the broker’s outside clearing firm or the Depository Trust Corporation (DTC). If a reinvestment service is available, distributions of income and capital gains can automatically be reinvested in additional whole and fractional ETF Shares of the Fund. If a reinvestment service is not available, investors will receive their distributions in cash. To determine whether a reinvestment service is available and whether there is a commission or other charge for using this service, consult your broker.
As with all exchange-traded funds, reinvestment of dividend and capital gains distributions in additional ETF Shares will occur four business days or more after the ex-dividend date (the date when a distribution of dividends or capital gains is deducted from the price of the Fund’s shares). The exact number of days depends on your broker. During that time, the amount of your distribution will not be invested in the Fund and therefore will not share in the Fund’s income, gains, and losses.
28
Basic Tax Points
Investors in taxable accounts should be aware of the following basic federal income tax points:
• Distributions are taxable to you whether or not you reinvest these amounts in additional ETF Shares.
• Distributions declared in December—if paid to you by the end of January—are taxable as if received in December.
• Any income dividend distribution or short-term capital gains distribution that you receive is taxable to you as ordinary income.
• Any distribution of net long-term capital gains is taxable to you as long-term capital gains, no matter how long you have owned ETF Shares.
• Income and capital gains distributions may vary considerably from month to month or year to year, as applicable, as a result of the Fund’s (and underlying funds') normal investment and currency hedging activities and cash flows.
• Your cost basis in the Fund will be decreased by the amount of any return of capital that you receive. This, in turn, will affect the amount of any capital gain or loss that you realize when selling your ETF Shares.
• Return of capital distributions generally are not taxable to you until your cost basis has been reduced to zero. If your cost basis is at zero, return of capital distributions will be treated as capital gains.
• A sale of ETF Shares is a taxable event. This means that you may have a capital gain to report as income, or a capital loss to report as a deduction, when you complete your tax return.
Individuals, trusts, and estates whose income exceeds certain threshold amounts are subject to a 3.8% Medicare contribution tax on “net investment income.” Net investment income takes into account distributions paid by the Fund and capital gains from any sale of ETF Shares.
Income dividends and capital gains distributions that you receive, as well as your gains or losses from any sale of ETF Shares, may be subject to state and local income taxes.
The Fund, directly or indirectly, may be subject to foreign taxes or foreign tax withholding on dividends, interest, and some capital gains that it receives on foreign securities. If at the end of the taxable year more than 50% of the value of the Fund’s assets consists of securities of foreign corporations, and the Fund makes a special election, you will generally be required to include in your income, for U.S. federal income tax purposes, your share of the qualifying foreign income taxes paid by the Fund in respect of its foreign portfolio securities. There
29
is no assurance that the Fund will make this election for a taxable year, even if it is eligible to do so. You may qualify for an offsetting credit or deduction under U.S. tax laws for any amount designated as your portion of the Fund’s foreign tax obligations, provided that you meet certain requirements. See your tax advisor or IRS publications for more information.
This prospectus provides general tax information only. If you are investing through a tax-advantaged account, such as an IRA or an employer-sponsored retirement or savings plan, special tax rules apply. Please consult your tax advisor for detailed information about any tax consequences for you.
Share Price and Market Price
Share price, also known as net asset value (NAV), is calculated as of the close of regular trading on the New York Stock Exchange (NYSE), generally 4 p.m., Eastern time, on each day that the NYSE is open for business (a business day). In the rare event the NYSE experiences unanticipated disruptions and is unavailable at the close of the trading day, NAVs will be calculated as of the close of regular trading on the Nasdaq (or another alternate exchange if the Nasdaq is unavailable, as determined at Vanguard’s discretion), generally 4 p.m., Eastern time. The NAV per share is computed by dividing the total assets, minus liabilities, of the Fund by the number of Fund shares outstanding. On U.S. holidays or other days when the NYSE is closed, the NAV is not calculated, and the Fund does not sell or redeem shares. However, on those days the value of the Fund’s assets may be affected to the extent that the Fund holds securities that change in value on those days (such as foreign securities that trade on foreign markets that are open).
Remember: If you buy or sell ETF Shares on the secondary market, you will pay or receive the market price, which may be higher or lower than NAV. Your transaction will be priced at NAV only if you purchase or redeem your ETF Shares in Creation Unit blocks (an option available only to certain authorized broker-dealers).
Debt securities held by a Vanguard fund are valued based on information furnished by an independent pricing service or market quotations. When a fund determines that pricing-service information or market quotations either are not readily available or do not accurately reflect the value of a security, the security is priced at its fair value (the amount that the owner might reasonably expect to receive upon the current sale of the security).
30
The values of any foreign securities held by a fund are converted into U.S. dollars using an exchange rate obtained from an independent third party as of the close of regular trading on the NYSE. The values of any mutual fund shares, including institutional money market fund shares, held by a fund are based on the NAVs of the shares. The values of any ETF shares or closed-end fund shares held by a fund are based on the market value of the shares.
The Fund’s NAV is calculated based upon the values of the underlying funds in which the Fund invests. The value of the underlying funds’ ETF Shares held by the Fund are based on the market value of the shares. The prospectuses for the underlying funds explain the circumstances under which those funds will use fair-value pricing and the effects of doing so.
Vanguard’s website will show the previous day’s closing NAV and closing market price for the Fund’s ETF Shares.
Additional Information
The Fund's Bylaws require, unless the Trust otherwise consents in writing, that the U.S. Federal District Courts be the sole and exclusive forum for the resolution of complaints under the Securities Act of 1933. This provision may limit a shareholder’s ability to bring a claim in a different forum and may result in increased shareholder costs in pursuing such a claim.
|
Vanguard Fund |
Inception Date |
Vanguard Fund Number |
CUSIP Number |
|
Vanguard Total World Bond
ETF |
9/4/2018 |
3061 |
92206C565 |
Certain affiliates of the Fund and the advisor may purchase and resell ETF Shares pursuant to the prospectus.
CGS identifiers have been provided by CUSIP Global Services, managed on behalf of the American Bankers Association by Standard & Poor’s Financial Services, LLC, and are not for use or dissemination in a manner that would serve as a substitute for any CUSIP service. The CUSIP Database, © 2023 American Bankers Association. “CUSIP” is a registered trademark of the American Bankers Association.
31
Financial Highlights
Financial highlights information is intended to help you understand a fund’s performance for the past five years (or, if shorter, its period of operations). Certain information reflects financial results for a single fund share. Total return represents the rate that an investor would have earned or lost each period on an investment in a fund or share class (assuming reinvestment of all distributions). This information has been obtained from the financial statements audited by PricewaterhouseCoopers LLP, an independent registered public accounting firm, whose report, along with fund financial statements, is included in a fund’s most recent annual report to shareholders. You may obtain a free copy of a fund’s latest annual or semiannual report, which is available upon request.
Vanguard Total World Bond ETF
|
|
Year Ended August 31, |
September 4,
20181 to
August 31,
2019 | |||
|
2023 |
2022 |
2021 |
2020 | ||
|
Net Asset Value, Beginning of Period |
$69.58 |
$80.76 |
$81.56 |
$80.97 |
$75.00 |
|
Investment Operations |
|
|
|
|
|
|
Net Investment Income2 |
1.623 |
1.912 |
1.108 |
2.125 |
2.004 |
|
Capital Gain Distributions Received2 |
— |
.327 |
.146 |
— |
— |
|
Net Realized and Unrealized Gain (Loss) on
Investments |
(1.668) |
(11.356) |
(.929) |
.782 |
6.071 |
|
Total from Investment Operations |
(.045) |
(9.117) |
.325 |
2.907 |
8.075 |
|
Distributions |
|
|
|
|
|
|
Dividends from Net Investment Income |
(1.635) |
(1.984) |
(1.125) |
(2.317) |
(2.105) |
|
Distributions from Realized Capital Gains |
— |
(.079) |
— |
— |
— |
|
Total Distributions |
(1.635) |
(2.063) |
(1.125) |
(2.317) |
(2.105) |
|
Net Asset Value, End of Period |
$67.90 |
$69.58 |
$80.76 |
$81.56 |
$80.97 |
|
Total Return |
-0.03% |
-11.51% |
0.40% |
3.69% |
11.00% |
|
Ratios/Supplemental Data |
|
|
|
|
|
|
Net Assets, End of Period (Millions) |
$678 |
$570 |
$581 |
$448 |
$160 |
|
Ratio of Total Expenses to Average Net Assets |
— |
— |
— |
— |
—3 |
|
Acquired Fund Fees and Expenses |
0.05% |
0.05% |
0.06% |
0.06% |
0.06%3 |
|
Ratio of Net Investment Income to Average Net
Assets |
2.38% |
2.55% |
1.37% |
2.64% |
2.62%3 |
|
Portfolio Turnover Rate4 |
14% |
13% |
10% |
19% |
8% |
|
|
|
|
|
|
|
|
|
|
|
1 |
Inception. |
|
2 |
Calculated based on average shares outstanding. |
|
3 |
Annualized. |
|
4 |
Excludes the value of portfolio securities received or delivered as a result of in-kind purchases
or redemptions of the fund’s capital shares, including ETF Creation Units. |
32
CFA® is a registered trademark owned by CFA Institute.
”Bloomberg®” and Bloomberg Global Aggregate Float Adjusted Composite Index and Bloomberg Global Aggregate Float Adjusted Index in USD (“the Indices” or “Bloomberg Indices”) are service marks of Bloomberg Finance L.P. and its affiliates, including Bloomberg Index Services Limited (“BISL”), the administrator of the Indices (collectively, “Bloomberg”), and have been licensed for use for certain purposes by Vanguard.
Vanguard Total World Bond ETF is not sponsored, endorsed, sold or promoted by Bloomberg. Bloomberg does not make any representation or warranty, express or implied, to the owners of or counterparties to Vanguard Total World Bond ETF or any member of the public regarding the advisability of investing in securities generally or in Vanguard Total World Bond ETF particularly. The only relationship of Bloomberg to Vanguard is the licensing of certain trademarks, trade names and service marks and of the Bloomberg Global Aggregate Float Adjusted Composite Index and Bloomberg Global Aggregate Float Adjusted Index in USD, which is determined, composed and calculated by BISL without regard to Vanguard or Vanguard Total World Bond ETF. Bloomberg has no obligation to take the needs of Vanguard or the owners of Vanguard Total World Bond ETF into consideration in determining, composing or calculating the Bloomberg Global Aggregate Float Adjusted Composite Index and Bloomberg Global Aggregate Float Adjusted Index in USD. Bloomberg is not responsible for and has not participated in the determination of the timing of, prices at, or quantities of Vanguard Total World Bond ETF to be issued. Bloomberg shall not have any obligation or liability, including, without limitation, to Vanguard Total World Bond ETF customers, in connection with the administration, marketing or trading of Vanguard Total World Bond ETF.
BLOOMBERG DOES NOT GUARANTEE THE ACCURACY AND/OR THE COMPLETENESS OF THE BLOOMBERG GLOBAL AGGREGATE FLOAT ADJUSTED COMPOSITE INDEX AND BLOOMBERG GLOBAL AGGREGATE FLOAT ADJUSTED INDEX OR ANY DATA RELATED THERETO AND SHALL HAVE NO LIABILITY FOR ANY ERRORS, OMISSIONS OR INTERRUPTIONS THEREIN. BLOOMBERG DOES NOT MAKE ANY WARRANTY, EXPRESS OR IMPLIED, AS TO RESULTS TO BE OBTAINED BY VANGUARD, OWNERS OF VANGUARD TOTAL WORLD BOND ETF OR ANY OTHER PERSON OR ENTITY FROM THE USE OF THE BLOOMBERG GLOBAL AGGREGATE FLOAT ADJUSTED COMPOSITE INDEX AND BLOOMBERG GLOBAL AGGREGATE FLOAT ADJUSTED INDEX OR ANY DATA RELATED THERETO. BLOOMBERG DOES NOT MAKE ANY EXPRESS OR IMPLIED WARRANTIES AND EXPRESSLY DISCLAIMS ALL WARRANTIES OF MERCHANTABILITY OR FITNESS FOR A PARTICULAR PURPOSE OR USE WITH RESPECT TO THE BLOOMBERG GLOBAL AGGREGATE FLOAT ADJUSTED COMPOSITE INDEX AND BLOOMBERG GLOBAL AGGREGATE FLOAT ADJUSTED INDEX OR ANY DATA RELATED THERETO. WITHOUT LIMITING ANY OF THE FOREGOING, TO THE MAXIMUM EXTENT ALLOWED BY LAW, BLOOMBERG, ITS LICENSORS, AND ITS AND THEIR RESPECTIVE EMPLOYEES, CONTRACTORS, AGENTS, SUPPLIERS, AND VENDORS SHALL HAVE NO LIABILITY OR RESPONSIBILITY WHATSOEVER FOR ANY INJURY OR DAMAGES—WHETHER DIRECT, INDIRECT, CONSEQUENTIAL, INCIDENTAL, PUNITIVE OR OTHERWISE—ARISING IN CONNECTION WITH VANGUARD TOTAL WORLD BOND ETF OR BLOOMBERG GLOBAL AGGREGATE FLOAT ADJUSTED COMPOSITE INDEX AND BLOOMBERG GLOBAL AGGREGATE FLOAT ADJUSTED INDEX OR ANY DATA OR VALUES RELATING THERETO—WHETHER ARISING FROM THEIR NEGLIGENCE OR OTHERWISE, EVEN IF NOTIFIED OF THE POSSIBILITY THEREOF.
33
Glossary of Investment Terms
Authorized Participant. Institutional investors that are permitted to purchase Creation Units directly from, and redeem Creation Units directly with, the issuing fund. To be an Authorized Participant, an entity must be a participant in the Depository Trust Company and must enter into an agreement with the fund’s Distributor.
Average Maturity. The average length of time until bonds held by a fund reach maturity and are repaid. In general, the longer the average maturity, the more a fund's share price fluctuates in response to changes in market interest rates. In calculating average maturity, a fund uses a bond’s maturity or, if applicable, an earlier date on which the advisor believes it is likely that a maturity-shortening device (such as a call, put, refunding, prepayment, or redemption provision or an adjustable coupon rate) will cause the bond to be repaid.
Bid-Ask Spread. The difference between the highest price a buyer is willing to pay to purchase ETF Shares (bid) and the lowest price a seller is willing to accept for ETF Shares (ask) when buying or selling shares in the secondary market.
Bloomberg Global Aggregate Float Adjusted Index in USD. A USD-hedged benchmark that includes fixed-rate treasury, government-related, corporate and securitized bonds from developed and emerging market issuers with maturities of more than one year.
Bond. A debt security (IOU) issued by a corporation, a government, or a government agency in exchange for the money the bondholder lends it. In most instances, the issuer agrees to pay back the loan by a specific date and generally to make regular interest payments until that date.
Capital Gains Distributions. Payments to fund shareholders of gains realized on securities that a fund has sold at a profit, minus any realized losses.
Corporate Bond. An IOU issued by a business that wants to borrow money. As with other types of bonds, the issuer promises to repay the borrowed money by a specific date and generally to make interest payments in the meantime.
Coupon Rate. The interest rate paid by the issuer of a debt security until its maturity. It is expressed as an annual percentage of the face value of the security.
Creation Unit. A large block of a specified number of ETF Shares. Certain broker-dealers known as “Authorized Participants” may purchase and redeem ETF Shares from the issuing fund in Creation Unit size blocks.
34
Dividend Distributions. Payments to fund shareholders of income from interest or dividends generated by a fund's investments.
Ex-Dividend Date. The date when a distribution of dividends and/or capital gains is deducted from the share price of a mutual fund, ETF, or stock. On the ex-dividend date, the share price drops by the amount of the distribution per share (plus or minus any market activity).
Expense Ratio. A fund's total annual operating expenses expressed as a percentage of the fund's average net assets. The expense ratio includes management and administrative expenses, but it does not include the transaction costs of buying and selling portfolio securities.
Face Value. The amount to be paid at a bond’s maturity; also known as the par value or principal.
Fixed Income Security. An investment, such as a bond, representing a debt that must be repaid by a specified date, and on which the borrower may pay a fixed, variable, or floating rate of interest.
Float-Adjusted Index. An index that weights its constituent securities based on the value of the constituent securities that are available for public trading, rather than the value of all constituent securities. Some portion of an issuer’s securities may be unavailable for public trading because, for example, those securities are owned by company insiders on a restricted basis or by a government agency. By excluding unavailable securities, float-adjusted indexes can produce a more accurate picture of the returns actually experienced by investors in the measured market.
Inception Date. The date on which the assets of a fund are first invested in accordance with the fund's investment objective. For funds with a subscription period, the inception date is the day after that period ends. Investment performance is generally measured from the inception date.
Indexing. A low-cost investment strategy in which a fund attempts to track—rather than outperform—a specified market benchmark, or “index.”
35
Investment-Grade Bond. A debt security whose credit quality is considered by independent bond rating agencies, or through independent analysis conducted by a fund's advisor, to be sufficient to ensure timely payment of principal and interest under current economic circumstances. Debt securities rated in one of the four highest rating categories are considered investment-grade. Other debt securities may be considered by an advisor to be investment-grade.
Joint Committed Credit Facility. The Fund participates, along with other funds managed by Vanguard, in a committed credit facility provided by a syndicate of lenders pursuant to a credit agreement that may be renewed annually; each Vanguard fund is individually liable for its borrowings, if any, under the credit facility. The amount and terms of the committed credit facility are subject to approval by the Fund's board of trustees and renegotiation with the lender syndicate on an annual basis.
Mutual Fund. An investment company that pools the money of many people and invests it in a variety of securities in an effort to achieve a specific objective over time.
New York Stock Exchange (NYSE). A stock exchange based in New York City that is open for regular trading on business days, Monday through Friday, from 9:30 a.m. to 4 p.m., Eastern time.
Principal. The face value of a debt instrument or the amount of money put into an investment.
Return of Capital. A return of capital occurs when a fund's distributions exceed its earnings in a fiscal year. A return of capital is a return of all or part of your original investment or amounts paid in excess of your original investment in a fund. In general, a return of capital reduces your cost basis in a fund's shares and is not taxable to you until your cost basis has been reduced to zero.
Securities. Stocks, bonds, money market instruments, and other investments.
Total Return. A percentage change, over a specified time period, in a fund's net asset value, assuming the reinvestment of all distributions of dividends and capital gains.
Volatility. The fluctuations in value of a mutual fund or other security. The greater a fund's volatility, the wider the fluctuations in its returns.
Yield. Income (interest or dividends) earned by an investment, expressed as a percentage of the investment’s price.
36
Connect with Vanguard® ˃ vanguard.com
For More Information
If you would like more information about Vanguard Total World Bond ETF, the following documents are available free upon request:
Annual/Semiannual Reports to Shareholders
Additional information about the Fund's investments is available in the Fund's annual and semiannual reports to shareholders. In the annual report, you will find a discussion of the market conditions and investment strategies that significantly affected the Fund's performance during its last fiscal year.
Statement of Additional Information (SAI)
The SAI provides more detailed information about the Fund's ETF Shares and is incorporated by reference into (and thus legally a part of) this prospectus.
To receive a free copy of the latest annual or semiannual report or the SAI, or to request additional information about Vanguard ETF Shares, please visit vanguard.com or contact us as follows:
Telephone: 866-499-8473; Text telephone for people with hearing impairment: 800-749-7273
Information Provided by the SEC
Reports and other information about the Fund are available in the EDGAR database on the SEC’s website at sec.gov, or you can receive copies of this information, for a fee, by electronic request at the following email address: publicinfo@sec.gov.
Fund's Investment Company Act file number: 811-07803
© 2023 The Vanguard Group, Inc. All rights reserved.
Vanguard Marketing Corporation, Distributor.
P3061 122023
Vanguard Marketing Corporation, Distributor.
P3061 122023
VANGUARD SCOTTSDALE FUNDS
STATEMENT OF ADDITIONAL INFORMATION
December 22, 2023
This Statement of Additional Information is not a prospectus but should be read in conjunction with a Fund’s current prospectus (dated December 22, 2023). To obtain, without charge, a prospectus or the most recent Annual Report to Shareholders, which contains the Fund’s financial statements as hereby incorporated by reference, please contact The Vanguard Group, Inc. (Vanguard).
Phone: Investor Information Department at 800-662-7447
Online: vanguard.com
Online: vanguard.com
|
B-1 | |
|
B-4 | |
|
B-5 | |
|
B-34 | |
|
B-35 | |
|
B-36 | |
|
B-62 | |
|
B-72 | |
|
B-74 | |
|
B-75 | |
|
B-97 | |
|
B-98 | |
|
B-100 | |
|
B-104 |
Description of the Trust
Vanguard Scottsdale Funds (the Trust) currently offers the following funds and share classes (identified by ticker symbol):
|
|
Share Classes1
| |||
|
Vanguard Fund2
|
Investor |
Admiral |
Institutional |
ETF |
|
Vanguard Explorer ValueTM Fund |
VEVFX |
— |
— |
— |
|
Vanguard Short-Term Treasury Index Fund |
— |
VSBSX |
VSBIX |
VGSH |
|
Vanguard Intermediate-Term Treasury Index Fund |
— |
VSIGX |
VIIGX |
VGIT |
|
Vanguard Long-Term Treasury Index Fund |
— |
VLGSX |
VLGIX |
VGLT |
|
Vanguard Short-Term Corporate Bond Index Fund |
— |
VSCSX |
VSTBX |
VCSH |
|
Vanguard Intermediate-Term Corporate Bond Index Fund |
— |
VICSX |
VICBX |
VCIT |
|
Vanguard Long-Term Corporate Bond Index Fund |
— |
VLTCX |
VLCIX |
VCLT |
|
Vanguard Mortgage-Backed Securities Index Fund |
— |
VMBSX |
VMBIX |
VMBS |
|
Vanguard Total Corporate Bond ETF |
— |
— |
— |
VTC |
|
Vanguard Russell 1000 Index Fund |
— |
— |
VRNIX |
VONE |
|
Vanguard Russell 1000 Value Index Fund |
— |
— |
VRVIX |
VONV |
|
Vanguard Russell 1000 Growth Index Fund |
— |
— |
VRGWX |
VONG |
|
Vanguard Russell 2000 Index Fund |
— |
— |
VRTIX |
VTWO |
|
Vanguard Russell 2000 Value Index Fund |
— |
— |
VRTVX |
VTWV |
|
Vanguard Russell 2000 Growth Index Fund |
— |
— |
VRTGX |
VTWG |
|
Vanguard Russell 3000 Index Fund |
— |
— |
VRTTX |
VTHR |
|
Vanguard Total World Bond ETF |
— |
— |
— |
BNDW |
1 Individually, a class; collectively, the classes.
2 Individually, a Fund; collectively, the Funds.
B-1
The Trust has the ability to offer additional funds or classes of shares. There is no limit on the number of full and fractional shares that may be issued for a single fund or class of shares.
Throughout this document, any references to “class” apply only to the extent a Fund issues multiple classes.
Organization
The Trust was organized as a Delaware statutory trust in 1996. Prior to 2009, the Trust was known as Vanguard Treasury Funds. The Trust is registered with the United States Securities and Exchange Commission (SEC) under the Investment Company Act of 1940 (the 1940 Act) as an open-end management investment company. All Funds within the Trust are classified as diversified within the meaning of the 1940 Act. Vanguard Russell 1000 Growth Index Fund may become nondiversified solely as a result of a change in relative market capitalization or index weightings of one or more constituents of its target index.
Service Providers
Custodians. Bank of New York Mellon, 240 Greenwich Street, New York, NY 10286, serves as custodian for the Russell 1000 Index, Russell 1000 Value Index, Russell 1000 Growth Index, Russell 2000 Index, Russell 2000 Value Index, and Russell 2000 Growth Index Funds (collectively, with the Russell 3000 Index Fund, the Russell Index Funds). State Street Bank and Trust Company, One Congress Street, Suite 1, Boston, MA 02114, serves as custodian for the Russell 3000 Index Fund and the Explorer Value Fund. JPMorgan Chase Bank, N.A., 383 Madison Avenue, New York, NY 10179, serves as custodian for the Total Corporate Bond ETF and the Total World Bond ETF, and for the Short-Term Treasury, Intermediate-Term Treasury, Long-Term Treasury, Short-Term Corporate Bond, Intermediate-Term Corporate Bond, Long-Term Corporate Bond, and Mortgage-Backed Securities Index Funds (collectively, the Vanguard Sector Bond Index Funds). The custodians are responsible for maintaining the Funds' assets, keeping all necessary accounts and records of Fund assets, and appointing any foreign subcustodians or foreign securities depositories.
Independent Registered Public Accounting Firm. PricewaterhouseCoopers LLP, Two Commerce Square, Suite 1800, 2001 Market Street, Philadelphia, PA 19103-7042, serves as the Funds' independent registered public accounting firm. The independent registered public accounting firm audits the Funds' annual financial statements and provides other related services.
Transfer and Dividend-Paying Agent. The Funds' transfer agent and dividend-paying agent is Vanguard, P.O. Box 2600, Valley Forge, PA 19482.
Characteristics of the Funds' Shares
Restrictions on Holding or Disposing of Shares. There are no restrictions on the right of shareholders to retain or dispose of a Fund’s shares, other than those described in the Fund’s current prospectus and elsewhere in this Statement of Additional Information. Each Fund or class may be terminated by reorganization into another mutual fund or class or by liquidation and distribution of the assets of the Fund or class. Unless terminated by reorganization or liquidation, each Fund and share class will continue indefinitely.
Shareholder Liability. The Trust is organized under Delaware law, which provides that shareholders of a statutory trust are entitled to the same limitations of personal liability as shareholders of a corporation organized under Delaware law. This means that a shareholder of a Fund generally will not be personally liable for payment of the Fund’s debts. Some state courts, however, may not apply Delaware law on this point. We believe that the possibility of such a situation arising is remote.
Dividend Rights. The shareholders of each class of a Fund are entitled to receive any dividends or other distributions declared by the Fund for each such class. No shares of a Fund have priority or preference over any other shares of the Fund with respect to distributions. Distributions will be made from the assets of the Fund and will be paid ratably to all shareholders of a particular class according to the number of shares of the class held by shareholders on the record date. The amount of dividends per share may vary between separate share classes of the Fund based upon differences in the net asset values of the different classes and differences in the way that expenses are allocated between share classes pursuant to a multiple class plan approved by the Fund's board of trustees.
Voting Rights. Shareholders are entitled to vote on a matter if (1) the matter concerns an amendment to the Declaration of Trust that would adversely affect to a material degree the rights and preferences of the shares of a Fund
B-2
or any class; (2) the trustees determine that it is necessary or desirable to obtain a shareholder vote; (3) a merger or consolidation, share conversion, share exchange, or sale of assets is proposed and a shareholder vote is required by the 1940 Act to approve the transaction; or (4) a shareholder vote is required under the 1940 Act. The 1940 Act requires a shareholder vote under various circumstances, including to elect or remove trustees upon the written request of shareholders representing 10% or more of a Fund’s net assets, to change any fundamental policy of a Fund (please see Fundamental Policies), and to enter into certain merger transactions. Unless otherwise required by applicable law, shareholders of a Fund receive one vote for each dollar of net asset value owned on the record date and a fractional vote for each fractional dollar of net asset value owned on the record date. However, only the shares of a Fund or the class affected by a particular matter are entitled to vote on that matter. In addition, each class has exclusive voting rights on any matter submitted to shareholders that relates solely to that class, and each class has separate voting rights on any matter submitted to shareholders in which the interests of one class differ from the interests of another. Voting rights are noncumulative and cannot be modified without a majority vote by the shareholders.
Liquidation Rights. In the event that a Fund is liquidated, shareholders will be entitled to receive a pro rata share of the Fund’s net assets. In the event that a class of shares is liquidated, shareholders of that class will be entitled to receive a pro rata share of the Fund’s net assets that are allocated to that class. Shareholders may receive cash, securities, or a combination of the two.
Preemptive Rights. There are no preemptive rights associated with the Funds' shares.
Conversion Rights. Shareholders of each Fund (except the Explorer Value Fund, Total Corporate Bond ETF, and Total World Bond ETF) may convert their shares to another class of shares of the same Fund upon the satisfaction of any then-applicable eligibility requirements, as described in the Fund’s current prospectus. ETF Shares cannot be converted into conventional shares of a fund by a shareholder. For additional information about the conversion rights applicable to ETF Shares, please see Information About the ETF Share Class. There are no conversion rights associated with Vanguard Explorer Value Fund, Vanguard Total Corporate Bond ETF, or Vanguard Total World Bond ETF.
Redemption Provisions. Each Fund's redemption provisions are described in its current prospectus and elsewhere in this Statement of Additional Information.
Sinking Fund Provisions. The Funds have no sinking fund provisions.
Calls or Assessment. Each Fund's shares, when issued, are fully paid and non-assessable.
Shareholder Rights. Any limitations on a shareholder’s right to bring an action do not apply to claims arising under the federal securities laws to the extent that any such federal securities laws, rules, or regulations do not permit such limitations.
Tax Status of the Funds
Each Fund expects to qualify each year for treatment as a “regulated investment company” under Subchapter M of the Internal Revenue Code of 1986, as amended (the IRC). This special tax status means that the Fund will not be liable for federal tax on income and capital gains distributed to shareholders. In order to preserve its tax status, each Fund must comply with certain requirements relating to the source of its income and the diversification of its assets. If a Fund fails to meet these requirements in any taxable year, the Fund will, in some cases, be able to cure such failure, including by paying a fund-level tax, paying interest, making additional distributions, and/or disposing of certain assets. If the Fund is ineligible to or otherwise does not cure such failure for any year, it will be subject to tax on its taxable income at corporate rates, and all distributions from earnings and profits, including any distributions of net tax-exempt income and net long-term capital gains, will be taxable to shareholders as ordinary income. In addition, a Fund could be required to recognize unrealized gains, pay substantial taxes and interest, and make substantial distributions before regaining its tax status as a regulated investment company.
Dividends received and distributed by each Fund on shares of stock of domestic corporations (excluding Real Estate Investment Trusts (REITs)) and certain foreign corporations generally may be eligible to be reported by the Fund, and treated by individual shareholders, as “qualified dividend income” taxed at long-term capital gain rates instead of at higher ordinary income tax rates. Individuals must satisfy holding period and other requirements in order to be eligible for such treatment. Also, distributions attributable to income earned on a Fund’s securities lending transactions, including substitute dividend payments received by a Fund with respect to a security out on loan, will not be eligible for treatment as qualified dividend income.
B-3
Taxable ordinary dividends received and distributed by each Fund on its REIT holdings may be eligible to be reported by a Fund, and treated by individual shareholders, as “qualified REIT dividends” that are eligible for a 20% deduction on their federal income tax returns. Individuals must satisfy holding period and other requirements in order to be eligible for this deduction. Without further legislation, the deduction would sunset after 2025. Shareholders should consult their own tax professionals concerning their eligibility for this deduction.
Dividends received and distributed by each Fund on shares of stock of domestic corporations (excluding REITs) may be eligible for the dividends-received deduction applicable to corporate shareholders. Corporations must satisfy certain requirements in order to claim the deduction. Also, distributions attributable to income earned on a Fund's securities lending transactions, including substitute dividend payments received by a Fund with respect to a security out on loan, will not be eligible for the dividends-received deduction.
Each Fund may declare a capital gain dividend consisting of the excess (if any) of net realized long-term capital gains over net realized short-term capital losses. Net capital gains for a fiscal year are computed by taking into account any capital loss carryforwards of the Fund. Capital losses may be carried forward indefinitely and retain their character as either short-term or long-term.
Fundamental Policies
Each Fund is subject to the following fundamental investment policies, which cannot be changed in any material way without the approval of the holders of a majority of the Fund’s shares. For these purposes, a “majority” of shares means shares representing the lesser of (1) 67% or more of the Fund's net assets voted, so long as shares representing more than 50% of the Fund’s net assets are present or represented by proxy or (2) more than 50% of the Fund's net assets.
Borrowing. Each Fund may borrow money only as permitted by the 1940 Act or other governing statute, by the Rules thereunder, or by the SEC or other regulatory agency with authority over the Fund.
Commodities. Each Fund may invest in commodities only as permitted by the 1940 Act or other governing statute, by the Rules thereunder, or by the SEC or other regulatory agency with authority over the Fund.
Diversification. For Vanguard Russell 1000 Growth Index Fund only, with respect to 75% of its total assets, the Fund may not: (1) purchase more than 10% of the outstanding voting securities of any one issuer or (2) purchase securities of any issuer if, as a result, more than 5% of the Fund’s total assets would be invested in that issuer’s securities; except as may be necessary to approximate the composition of its target index. This limitation does not apply to obligations of the U.S. government or its agencies or instrumentalities.
Industry Concentration. Each Fund (other than Vanguard Explorer Value Fund) will not concentrate its investments in the securities of issuers whose principal business activities are in the same industry or group of industries, except as may be necessary to approximate the composition of its target index.
Vanguard Explorer Value Fund will not concentrate its investments in the securities of issuers whose principal business activities are in the same industry.
Loans. Each Fund may make loans to another person only as permitted by the 1940 Act or other governing statute, by the Rules thereunder, or by the SEC or other regulatory agency with authority over the Fund.
Real Estate. Each Fund may not invest directly in real estate unless it is acquired as a result of ownership of securities or other instruments. This restriction shall not prevent a Fund from investing in securities or other instruments (1) issued by companies that invest, deal, or otherwise engage in transactions in real estate or (2) backed or secured by real estate or interests in real estate.
Senior Securities. Each Fund may not issue senior securities except as permitted by the 1940 Act or other governing statute, by the Rules thereunder, or by the SEC or other regulatory agency with authority over the Fund.
Underwriting. Each Fund may not act as an underwriter of another issuer’s securities, except to the extent that the Fund may be deemed to be an underwriter within the meaning of the Securities Act of 1933 (the 1933 Act), in connection with the purchase and sale of portfolio securities.
B-4
Compliance with the fundamental policies previously described is generally measured at the time the securities are purchased. Unless otherwise required by the 1940 Act (as is the case with borrowing), if a percentage restriction is adhered to at the time the investment is made, a later change in percentage resulting from a change in the market value of assets will not constitute a violation of such restriction. All fundamental policies must comply with applicable regulatory requirements. For more details, see Investment Strategies, Risks, and Nonfundamental Policies.
None of these policies prevents the Funds from having an ownership interest in Vanguard. As a part owner of Vanguard, each Fund may own securities issued by Vanguard, make loans to Vanguard, and contribute to Vanguard’s costs or other financial requirements. See Management of the Funds for more information.
Shareholder approval will not be sought if Vanguard Russell 1000 Growth Index Fund crosses from diversified to nondiversified status in order to approximate the composition of its target index.
Investment Strategies, Risks, and Nonfundamental Policies
Some of the investment strategies and policies described on the following pages and in each Fund's prospectus set forth percentage limitations on a Fund's investment in, or holdings of, certain securities or other assets. Unless otherwise required by law, compliance with these strategies and policies will be determined immediately after the acquisition of such securities or assets by the Fund. Subsequent changes in values, net assets, or other circumstances will not be considered when determining whether the investment complies with the Fund's investment strategies and policies.
The following investment strategies, risks, and policies supplement each Fund's investment strategies, risks, and policies set forth in the prospectus. With respect to the different investments discussed as follows, a Fund may acquire such investments to the extent consistent with its investment strategies and policies.
Asset-Backed Securities. Asset-backed securities represent a participation in, or are secured by and payable from, pools of underlying assets such as debt securities, bank loans, motor vehicle installment sales contracts, installment loan contracts, leases of various types of real and personal property, receivables from revolving credit (i.e., credit card) agreements, and other categories of receivables. These underlying assets are securitized through the use of trusts and special purpose entities. Payment of interest and repayment of principal on asset-backed securities may be largely dependent upon the cash flows generated by the underlying assets backing the securities and, in certain cases, may be supported by letters of credit, surety bonds, or other credit enhancements. The rate of principal payments on asset-backed securities is related to the rate of principal payments, including prepayments, on the underlying assets. The credit quality of asset-backed securities depends primarily on the quality of the underlying assets, the level of credit support, if any, provided for the securities, and the credit quality of the credit-support provider, if any. The value of asset-backed securities may be affected by the various factors described above and other factors, such as changes in interest rates, the availability of information concerning the pool and its structure, the creditworthiness of the servicing agent for the pool, the originator of the underlying assets, or the entities providing the credit enhancement.
Asset-backed securities are often subject to more rapid repayment than their stated maturity date would indicate, as a result of the pass-through of prepayments of principal on the underlying assets. Prepayments of principal by borrowers or foreclosure or other enforcement action by creditors shortens the term of the underlying assets. The occurrence of prepayments is a function of several factors, such as the level of interest rates, the general economic conditions, the location and age of the underlying obligations, and other social and demographic conditions. A fund’s ability to maintain positions in asset-backed securities is affected by the reductions in the principal amount of the underlying assets because of prepayments. A fund’s ability to reinvest such prepayments of principal (as well as interest and other distributions and sale proceeds) at a comparable yield is subject to generally prevailing interest rates at that time. The value of asset-backed securities varies with changes in market interest rates generally and the differentials in yields among various kinds of U.S. government securities, mortgage-backed securities, and asset-backed securities. In periods of rising interest rates, the rate of prepayment tends to decrease, thereby lengthening the average life of the underlying securities. Conversely, in periods of falling interest rates, the rate of prepayment tends to increase, thereby shortening the average life of such assets. Because prepayments of principal generally occur when interest rates are declining, an investor, such as a fund, generally has to reinvest the proceeds of such prepayments at lower interest rates than those at which the assets were previously invested. Therefore, asset-backed securities have less potential for capital appreciation in periods of falling interest rates than other income-bearing securities of comparable maturity.
Because asset-backed securities generally do not have the benefit of a security interest in the underlying assets that is comparable to a mortgage, asset-backed securities present certain additional risks that are not present with mortgage-backed securities. For example, revolving credit receivables are generally unsecured and the debtors on such
B-5
receivables are entitled to the protection of a number of state and federal consumer credit laws, many of which give debtors the right to set off certain amounts owed, thereby reducing the balance due. Automobile receivables generally are secured, but by automobiles rather than by real property. Most issuers of automobile receivables permit loan servicers to retain possession of the underlying assets. If the servicer of a pool of underlying assets sells them to another party, there is the risk that the purchaser could acquire an interest superior to that of holders of the asset-backed securities. In addition, because of the large number of vehicles involved in a typical issue of asset-backed securities and technical requirements under state law, the trustee for the holders of the automobile receivables may not have a proper security interest in the automobiles. Therefore, there is the possibility that recoveries on repossessed collateral may not be available to support payments on these securities. Asset-backed securities have been, and may continue to be, subject to greater liquidity risks when worldwide economic and liquidity conditions deteriorate. In addition, government actions and proposals that affect the terms of underlying home and consumer loans, thereby changing demand for products financed by those loans, as well as the inability of borrowers to refinance existing loans, have had and may continue to have a negative effect on the valuation and liquidity of asset-backed securities.
Bank Loans, Loan Interests, and Direct Debt Instruments. Loan interests and direct debt instruments are interests in amounts owed by a corporate, governmental, or other borrower to lenders or lending syndicates (in the case of loans and loan participations); to suppliers of goods or services (in the case of trade claims or other receivables); or to other parties. These investments involve a risk of loss in case of default, insolvency, or the bankruptcy of the borrower; may not be deemed to be securities under certain federal securities laws; and may offer less legal protection to the purchaser in the event of fraud or misrepresentation, or there may be a requirement that a purchaser supply additional cash to a borrower on demand.
Purchasers of loans and other forms of direct indebtedness depend primarily upon the creditworthiness of the borrower for payment of interest and repayment of principal. Direct debt instruments may not be rated by a rating agency. If scheduled interest or principal payments are not made, or are not made in a timely manner, the value of the instrument may be adversely affected. Loans that are fully secured provide more protections than unsecured loans in the event of failure to make scheduled interest or principal payments. However, there is no assurance that the liquidation of collateral from a secured loan would satisfy the borrower’s obligation or that the collateral could be liquidated. Indebtedness of borrowers whose creditworthiness is poor involves substantially greater risks and may be highly speculative. Borrowers that are in bankruptcy or restructuring may never pay off their indebtedness, or they may pay only a small fraction of the amount owed. Direct indebtedness of countries, particularly developing countries, also involves a risk that the governmental entities responsible for the repayment of the debt may be unable, or unwilling, to pay interest and repay principal when due.
Corporate loans and other forms of direct corporate indebtedness in which a fund may invest generally are made to finance internal growth, mergers, acquisitions, stock repurchases, refinancing of existing debt, leveraged buyouts, and other corporate activities. A significant portion of the corporate indebtedness purchased by a fund may represent interests in loans or debt made to finance highly leveraged corporate acquisitions (known as “leveraged buyout” transactions), leveraged recapitalization loans, and other types of acquisition financing. Another portion may also represent loans incurred in restructuring or “work-out” scenarios, including super-priority debtor-in-possession facilities in bankruptcy and acquisition of assets out of bankruptcy. Loans in restructuring or work-out scenarios may be especially vulnerable to the inherent uncertainties in restructuring processes. In addition, the highly leveraged capital structure of the borrowers in any such transactions, whether in acquisition financing or restructuring, may make such loans especially vulnerable to adverse or unusual economic or market conditions.
Loans and other forms of direct indebtedness generally are subject to restrictions on transfer, and only limited opportunities may exist to sell them in secondary markets. As a result, a fund may be unable to sell loans and other forms of direct indebtedness at a time when it may otherwise be desirable to do so or may be able to sell them only at a price that is less than their fair value.
Investments in loans through direct assignment of a financial institution’s interests with respect to a loan may involve additional risks. For example, if a loan is foreclosed, the purchaser could become part owner of any collateral and would bear the costs and liabilities associated with owning and disposing of the collateral. In addition, it is at least conceivable that, under emerging legal theories of lender liability, a purchaser could be held liable as a co-lender. Direct debt instruments may also involve a risk of insolvency of the lending bank or other intermediary.
A loan is often administered by a bank or other financial institution that acts as agent for all holders. The agent administers the terms of the loan, as specified in the loan agreement. Unless the purchaser has direct recourse against
B-6
the borrower, the purchaser may have to rely on the agent to apply appropriate credit remedies against a borrower under the terms of the loan or other indebtedness. If assets held by the agent for the benefit of a purchaser were determined to be subject to the claims of the agent’s general creditors, the purchaser might incur certain costs and delays in realizing payment on the loan or loan participation and could suffer a loss of principal and/or interest.
Direct indebtedness may include letters of credit, revolving credit facilities, or other standby financing commitments that obligate purchasers to make additional cash payments on demand. These commitments may have the effect of requiring a purchaser to increase its investment in a borrower when it would not otherwise have done so, even if the borrower’s condition makes it unlikely that the amount will ever be repaid.
A fund’s investment policies will govern the amount of total assets that it may invest in any one issuer or in issuers within the same industry. For purposes of these limitations, a fund generally will treat the borrower as the “issuer” of indebtedness held by the fund. In the case of loan participations in which a bank or other lending institution serves as financial intermediary between a fund and the borrower, if the participation does not shift to the fund the direct debtor-creditor relationship with the borrower, SEC interpretations require the fund, in some circumstances, to treat both the lending bank or other lending institution and the borrower as “issuers” for purposes of the fund’s investment policies. Treating a financial intermediary as an issuer of indebtedness may restrict a fund’s ability to invest in indebtedness related to a single financial intermediary, or a group of intermediaries engaged in the same industry, even if the underlying borrowers represent many different companies and industries.
Borrowing. A fund’s ability to borrow money is limited by its investment policies and limitations; by the 1940 Act; and by applicable exemptions, no-action letters, interpretations, and other pronouncements issued from time to time by the SEC and its staff or any other regulatory authority with jurisdiction. Under the 1940 Act, a fund is required to maintain continuous asset coverage (i.e., total assets including borrowings, less liabilities exclusive of borrowings) of 300% of the amount borrowed, with an exception for borrowings not in excess of 5% of the fund’s total assets (at the time of borrowing) made for temporary or emergency purposes. Any borrowings for temporary purposes in excess of 5% of the fund’s total assets must maintain continuous asset coverage. If the 300% asset coverage should decline as a result of market fluctuations or for other reasons, a fund may be required to sell some of its portfolio holdings within three days (excluding Sundays and holidays) to reduce the debt and restore the 300% asset coverage, even though it may be disadvantageous from an investment standpoint to sell securities at that time.
Borrowing will tend to exaggerate the effect on net asset value of any increase or decrease in the market value of a fund’s portfolio. Money borrowed will be subject to interest costs that may or may not be recovered by earnings on the securities purchased with the proceeds of such borrowing. A fund also may be required to maintain minimum average balances in connection with a borrowing or to pay a commitment or other fee to maintain a line of credit; either of these requirements would increase the cost of borrowing over the stated interest rate.
A borrowing transaction will not be considered to constitute the issuance, by a fund, of a “senior security,” as that term is defined in Section 18(g) of the 1940 Act, and therefore such transaction will not be subject to the 300% asset coverage requirement otherwise applicable to borrowings by a fund, if the fund complies with Rule 18f-4 under the 1940 Act.
Common Stock. Common stock represents an equity or ownership interest in an issuer. Common stock typically entitles the owner to vote on the election of directors and other important matters, as well as to receive dividends on such stock. In the event an issuer is liquidated or declares bankruptcy, the claims of owners of bonds, other debt holders, and owners of preferred stock take precedence over the claims of those who own common stock.
Convertible Securities. Convertible securities are hybrid securities that combine the investment characteristics of bonds and common stocks. Convertible securities typically consist of debt securities or preferred stock that may be converted (on a voluntary or mandatory basis) within a specified period of time (normally for the entire life of the security) into a certain amount of common stock or other equity security of the same or a different issuer at a predetermined price. Convertible securities also include debt securities with warrants or common stock attached and derivatives combining the features of debt securities and equity securities. Other convertible securities with features and risks not specifically referred to herein may become available in the future. Convertible securities involve risks similar to those of both fixed income and equity securities. In a corporation’s capital structure, convertible securities are senior to common stock but are usually subordinated to senior debt obligations of the issuer.
The market value of a convertible security is a function of its “investment value” and its “conversion value.” A security’s “investment value” represents the value of the security without its conversion feature (i.e., a nonconvertible debt security). The investment value may be determined by reference to its credit quality and the current value of its yield to maturity or probable call date. At any given time, investment value is dependent upon such factors as the general level
B-7
of interest rates, the yield of similar nonconvertible securities, the financial strength of the issuer, and the seniority of the security in the issuer’s capital structure. A security’s “conversion value” is determined by multiplying the number of shares the holder is entitled to receive upon conversion or exchange by the current price of the underlying security. If the conversion value of a convertible security is significantly below its investment value, the convertible security will trade like nonconvertible debt or preferred stock and its market value will not be influenced greatly by fluctuations in the market price of the underlying security. In that circumstance, the convertible security takes on the characteristics of a bond, and its price moves in the opposite direction from interest rates. Conversely, if the conversion value of a convertible security is near or above its investment value, the market value of the convertible security will be more heavily influenced by fluctuations in the market price of the underlying security. In that case, the convertible security’s price may be as volatile as that of common stock. Because both interest rates and market movements can influence its value, a convertible security generally is not as sensitive to interest rates as a similar debt security, nor is it as sensitive to changes in share price as its underlying equity security. Convertible securities are often rated below investment-grade or are not rated, and they are generally subject to a high degree of credit risk.
Although all markets are prone to change over time, the generally high rate at which convertible securities are retired (through mandatory or scheduled conversions by issuers or through voluntary redemptions by holders) and replaced with newly issued convertible securities may cause the convertible securities market to change more rapidly than other markets. For example, a concentration of available convertible securities in a few economic sectors could elevate the sensitivity of the convertible securities market to the volatility of the equity markets and to the specific risks of those sectors. Moreover, convertible securities with innovative structures, such as mandatory-conversion securities and equity-linked securities, have increased the sensitivity of the convertible securities market to the volatility of the equity markets and to the special risks of those innovations, which may include risks different from, and possibly greater than, those associated with traditional convertible securities. A convertible security may be subject to redemption at the option of the issuer at a price set in the governing instrument of the convertible security. If a convertible security held by a fund is subject to such redemption option and is called for redemption, the fund must allow the issuer to redeem the security, convert it into the underlying common stock, or sell the security to a third party.
Cybersecurity Risks. The increased use of technology to conduct business could subject a fund and its third-party service providers (including, but not limited to, investment advisors, transfer agents, and custodians) to risks associated with cybersecurity. In general, a cybersecurity incident can occur as a result of a deliberate attack designed to gain unauthorized access to digital systems. If the attack is successful, an unauthorized person or persons could misappropriate assets or sensitive information, corrupt data, or cause operational disruption. A cybersecurity incident could also occur unintentionally if, for example, an authorized person inadvertently released proprietary or confidential information. Vanguard has developed robust technological safeguards and business continuity plans to prevent, or reduce the impact of, potential cybersecurity incidents. Additionally, Vanguard has a process for assessing the information security and/or cybersecurity programs implemented by a fund’s third-party service providers, which helps minimize the risk of potential incidents that could impact a Vanguard fund or its shareholders. Despite these measures, a cybersecurity incident still has the potential to disrupt business operations, which could negatively impact a fund and/or its shareholders. Some examples of negative impacts that could occur as a result of a cybersecurity incident include, but are not limited to, the following: a fund may be unable to calculate its net asset value (NAV), a fund’s shareholders may be unable to transact business, a fund may be unable to process transactions, or a fund may be unable to safeguard its data or the personal information of its shareholders.
Debt Securities. A debt security, sometimes called a fixed income security, consists of a certificate or other evidence of a debt (secured or unsecured) upon which the issuer of the debt security promises to pay the holder a fixed, variable, or floating rate of interest for a specified length of time and to repay the debt on the specified maturity date. Some debt securities, such as zero-coupon bonds, do not make regular interest payments but are issued at a discount to their principal or maturity value. Debt securities include a variety of fixed income obligations, including, but not limited to, corporate bonds, government securities, municipal securities, convertible securities, mortgage-backed securities, and asset-backed securities. Debt securities include investment-grade securities, non-investment-grade securities, and unrated securities. Debt securities are subject to a variety of risks, such as interest rate risk, income risk, call risk, prepayment risk, extension risk, inflation risk, credit risk, liquidity risk, coupon deferral risk, lower recovery value risk, and (in the case of foreign securities) country risk and currency risk. The reorganization of an issuer under the federal bankruptcy laws or an out-of-court restructuring of an issuer’s capital structure may result in the issuer’s debt securities being cancelled without repayment, repaid only in part, or repaid in part or in whole through an exchange thereof for any combination of cash, debt securities, convertible securities, equity securities, or other instruments or rights in respect to the same issuer or a related entity.
B-8
Debt Securities—Bank Obligations. Time deposits are non-negotiable deposits maintained in a banking institution for a specified period of time at a stated interest rate. Certificates of deposit are negotiable short-term obligations of commercial banks. Variable rate certificates of deposit have an interest rate that is periodically adjusted prior to their stated maturity based upon a specified market rate. As a result of these adjustments, the interest rate on these obligations may be increased or decreased periodically. Frequently, dealers selling variable rate certificates of deposit to a fund will agree to repurchase such instruments, at the fund’s option, at par on or near the coupon dates. The dealers’ obligations to repurchase these instruments are subject to conditions imposed by various dealers; such conditions typically are the continued credit standing of the issuer and the existence of reasonably orderly market conditions. A fund is also able to sell variable rate certificates of deposit on the secondary market. Variable rate certificates of deposit normally carry a higher interest rate than comparable fixed-rate certificates of deposit. A banker’s acceptance is a time draft drawn on a commercial bank by a borrower usually in connection with an international commercial transaction (to finance the import, export, transfer, or storage of goods). The borrower is liable for payment, as is the bank, which unconditionally guarantees to pay the draft at its face amount on the maturity date. Most acceptances have maturities of 6 months or less and are traded in the secondary markets prior to maturity.
Debt Securities—Commercial Paper. Commercial paper refers to short-term, unsecured promissory notes issued by corporations to finance short-term credit needs. It is usually sold on a discount basis and has a maturity at the time of issuance not exceeding 9 months. High-quality commercial paper typically has the following characteristics: (1) liquidity ratios are adequate to meet cash requirements; (2) long-term senior debt is also high credit quality; (3) the issuer has access to at least two additional channels of borrowing; (4) basic earnings and cash flow have an upward trend with allowance made for unusual circumstances; (5) typically, the issuer’s industry is well established and the issuer has a strong position within the industry; and (6) the reliability and quality of management are unquestioned. In assessing the credit quality of commercial paper issuers, the following factors may be considered: (1) evaluation of the management of the issuer, (2) economic evaluation of the issuer’s industry or industries and the appraisal of speculative-type risks that may be inherent in certain areas, (3) evaluation of the issuer’s products in relation to competition and customer acceptance, (4) liquidity, (5) amount and quality of long-term debt, (6) trend of earnings over a period of ten years, (7) financial strength of a parent company and the relationships that exist with the issuer, and (8) recognition by the management of obligations that may be present or may arise as a result of public-interest questions and preparations to meet such obligations. The short-term nature of a commercial paper investment makes it less susceptible to interest rate risk than longer-term fixed income securities because interest rate risk typically increases as maturity lengths increase. Additionally, an issuer may expect to repay commercial paper obligations at maturity from the proceeds of the issuance of new commercial paper. As a result, investment in commercial paper is subject to the risk the issuer cannot issue enough new commercial paper to satisfy its outstanding commercial paper payment obligations, also known as rollover risk. Commercial paper may suffer from reduced liquidity due to certain circumstances, in particular, during stressed markets. In addition, as with all fixed income securities, an issuer may default on its commercial paper obligation.
Variable-amount master-demand notes are demand obligations that permit the investment of fluctuating amounts at varying market rates of interest pursuant to an arrangement between the issuer and a commercial bank acting as agent for the payees of such notes, whereby both parties have the right to vary the amount of the outstanding indebtedness on the notes. Because variable-amount master-demand notes are direct lending arrangements between a lender and a borrower, it is not generally contemplated that such instruments will be traded, and there is no secondary market for these notes, although they are redeemable (and thus immediately repayable by the borrower) at face value, plus accrued interest, at any time. In connection with a fund’s investment in variable-amount master-demand notes, Vanguard’s investment management staff will monitor, on an ongoing basis, the earning power, cash flow, and other liquidity ratios of the issuer, along with the borrower’s ability to pay principal and interest on demand.
Debt Securities—Emerging Market Risk. Investing in emerging market countries involves certain risks not typically associated with investing in the United States, and imposes risks greater than, or in addition to, risks of investing in more developed foreign countries. These risks may significantly affect the value of emerging market investments and include, but are not limited to, the following: (i) nationalization or expropriation of assets or confiscatory taxation; (ii) currency devaluations and other currency exchange rate fluctuations; (iii) greater social, economic, and political uncertainty and instability (including amplified risk of war and terrorism); (iv) more substantial government involvement in and control over the economy; (v) less government supervision and regulation of the securities markets and participants in those markets and possible arbitrary and unpredictable enforcement of securities regulations and other laws, which may increase the risk of market manipulation; (vi) controls on foreign investment and limitations on repatriation of invested capital and on a fund’s ability to exchange local currencies for U.S. dollars; (vii) unavailability of currency hedging techniques in certain emerging market countries; (viii); generally, smaller, less seasoned, or newly organized companies; (ix) the difference in, or lack of, corporate governance, accounting, auditing, recordkeeping, and financial
B-9
reporting standards, which may result in unavailability of material information about issuers and impede evaluation of such issuers; (x) difficulty in obtaining and/or enforcing a judgment in a court outside the United States; and (xi) greater price volatility, substantially less liquidity, and significantly smaller market capitalization of bond markets. Also, any change in the leadership or politics of emerging market countries, or the countries that exercise a significant influence over those countries, may halt the expansion of or reverse the liberalization of foreign investment policies now occurring and adversely affect existing investment opportunities. Furthermore, high rates of inflation and rapid fluctuations in inflation rates have had, and may continue to have, negative effects on the economies and bond markets of certain emerging market countries. Custodial expenses and other investment-related costs are often more expensive in emerging market countries, which can reduce a fund’s income from investments in securities or debt instruments of emerging market country issuers. Additionally, information regarding companies located in emerging markets may be less available and less reliable, which can impede the ability to evaluate such companies. There may also be limited regulatory oversight of certain foreign subcustodians that hold foreign securities subject to the supervision of a fund’s primary U.S.-based custodian. A fund may be limited in its ability to recover assets if a foreign subcustodian becomes bankrupt or otherwise unable or unwilling to return assets to the fund, which may expose the fund to risk, especially in circumstances where the fund’s primary custodian may not be contractually obligated to make the fund whole for the particular loss.
Emerging market investments also carry the risk that strained international relations may give rise to retaliatory actions, including actions through financial markets such as purchase and ownership restrictions, sanctions, tariffs, cyberattacks, and unpredictable enforcement of securities regulations and other laws. Such actual and/or threatened retaliatory actions may impact emerging market economies and issuers in which a fund invests.
Debt Securities—Foreign Securities. The Total World Bond ETF invests a substantial portion of its assets in foreign debt securities. Typically, foreign debt securities are issued by entities organized, domiciled, or with a principal executive office outside the United States, such as foreign corporations and governments. Foreign debt securities may trade in U.S. or foreign securities markets. Investing in foreign debt securities involves certain special risk considerations that are not typically associated with investing in debt securities of U.S. companies or governments.
Because foreign issuers are not generally subject to uniform accounting, auditing, and financial reporting standards and practices comparable to those applicable to U.S. issuers, there may be less publicly available information about certain foreign issuers than about U.S. issuers. Evidence of securities ownership may be uncertain in many foreign countries. As a result, there are risks that could result in a loss to the fund, including, but not limited to, the risk that a fund’s trade details could be incorrectly or fraudulently entered at the time of the transaction. Securities of foreign issuers are generally more volatile and less liquid than securities of comparable U.S. issuers, and foreign investments may be effected through structures that may be complex or confusing. In certain countries, there is less government supervision and regulation of bond markets, bond dealers, and bond issuers than in the United States. In addition, with respect to certain foreign countries, there is the possibility of expropriation or confiscatory taxation, political or social instability, war, terrorism, nationalization, limitations on the removal of funds or other assets, or diplomatic developments that could affect U.S. investments in those countries. Additionally, the imposition of economic or other sanctions on the United States by a foreign country, or on a foreign country or issuer by the United States, could impair a fund’s ability to buy, sell, hold, receive, deliver, or otherwise transact in certain investment securities or obtain exposure to foreign securities and assets. This may negatively impact the value and/or liquidity of a fund’s investments and could impair a fund’s ability to meet its investment objective or invest in accordance with its investment strategy. Sanctions could also result in the devaluation of a country’s currency, a downgrade in the credit ratings of a country or issuers in a country, or a decline in the value and/or liquidity of securities of issuers in that country.
Although an advisor will endeavor to achieve the most favorable execution costs for a fund’s portfolio transactions in foreign securities under the circumstances, mark-ups and other transaction costs are generally higher than those on U.S. securities. In addition, it is expected that the custodian arrangement expenses for a fund that invests primarily in foreign securities will be somewhat greater than the expenses for a fund that invests primarily in domestic securities. Certain foreign governments levy withholding or other taxes against dividend and interest income from or transactions in foreign securities. Although in some countries a portion of these taxes is recoverable by the fund, the nonrecovered portion of foreign withholding taxes will reduce the income received from such securities.
The value of the foreign securities held by a fund that are not U.S. dollar-denominated may be significantly affected by changes in currency exchange rates. The U.S. dollar value of a foreign security generally decreases when the value of the U.S. dollar rises against the foreign currency in which the security is denominated, and it tends to increase when the value of the U.S. dollar falls against such currency. The Total World Bond ETF will attempt to hedge local currency risk,
B-10
as discussed under the heading “Foreign Securities—Foreign Currency Transactions.” In addition, the value of fund assets may be affected by losses and other expenses incurred in converting between various currencies in order to purchase and sell foreign securities, as well as by currency restrictions, exchange control regulation, currency devaluations, and political and economic developments.
Debt Securities—Inflation-Indexed Securities. Inflation-indexed securities are debt securities, the principal value of which is periodically adjusted to reflect the rate of inflation as indicated by the Consumer Price Index (CPI). Inflation-indexed securities may be issued by the U.S. government, by agencies and instrumentalities of the U.S. government, and by corporations. Two structures are common. The U.S. Treasury and some other issuers use a structure that accrues inflation into the principal value of the bond. Most other issuers pay out the CPI accruals as part of a semiannual coupon payment.
The periodic adjustment of U.S. inflation-indexed securities is tied to the CPI, which is calculated monthly by the U.S. Bureau of Labor Statistics. The CPI is a measurement of changes in the cost of living, made up of components such as housing, food, transportation, and energy. Inflation-indexed securities issued by a foreign government are generally adjusted to reflect a comparable inflation index, calculated by that government. There can be no assurance that the CPI or any foreign inflation index will accurately measure the real rate of inflation in the prices of goods and services. Moreover, there can be no assurance that the rate of inflation in a foreign country will correlate to the rate of inflation in the United States.
Inflation—a general rise in prices of goods and services—erodes the purchasing power of an investor’s portfolio. For example, if an investment provides a “nominal” total return of 5% in a given year and inflation is 2% during that period, the inflation-adjusted, or real, return is 3%. Inflation, as measured by the CPI, has generally occurred during the past 50 years, so investors should be conscious of both the nominal and real returns of their investments. Investors in inflation-indexed securities funds who do not reinvest the portion of the income distribution that is attributable to inflation adjustments will not maintain the purchasing power of the investment over the long term. This is because interest earned depends on the amount of principal invested, and that principal will not grow with inflation if the investor fails to reinvest the principal adjustment paid out as part of a fund’s income distributions. Although inflation-indexed securities are expected to be protected from long-term inflationary trends, short-term increases in inflation may lead to a decline in value. If interest rates rise because of reasons other than inflation (e.g., changes in currency exchange rates), investors in these securities may not be protected to the extent that the increase is not reflected in the bond’s inflation measure.
If the periodic adjustment rate measuring inflation (i.e., the CPI) falls, the principal value of inflation-indexed securities will be adjusted downward, and consequently the interest payable on these securities (calculated with respect to a smaller principal amount) will be reduced. Repayment of the original bond principal upon maturity (as adjusted for inflation) is guaranteed in the case of U.S. Treasury inflation-indexed securities, even during a period of deflation. However, the current market value of the inflation-indexed securities is not guaranteed and will fluctuate. Other inflation-indexed securities include inflation-related bonds, which may or may not provide a similar guarantee. If a guarantee of principal is not provided, the adjusted principal value of the bond repaid at maturity may be less than the original principal.
The value of inflation-indexed securities should change in response to changes in real interest rates. Real interest rates, in turn, are tied to the relationship between nominal interest rates and the rate of inflation. Therefore, if inflation were to rise at a faster rate than nominal interest rates, real interest rates might decline, leading to an increase in value of inflation-indexed securities. In contrast, if nominal interest rates were to increase at a faster rate than inflation, real interest rates might rise, leading to a decrease in value of inflation-indexed securities.
Coupon payments that a fund receives from inflation-indexed securities are included in the fund’s gross income for the period during which they accrue. Any increase in principal for an inflation-indexed security resulting from inflation adjustments is considered by Internal Revenue Service (IRS) regulations to be taxable income in the year it occurs. For direct holders of an inflation-indexed security, this means that taxes must be paid on principal adjustments, even though these amounts are not received until the bond matures. By contrast, a fund holding these securities distributes both interest income and the income attributable to principal adjustments each quarter in the form of cash or reinvested shares (which, like principal adjustments, are taxable to shareholders). It may be necessary for the fund to liquidate portfolio positions, including when it is not advantageous to do so, in order to make required distributions.
Debt Securities—Non-Investment-Grade Securities. Non-investment-grade securities, also referred to as “high-yield securities” or “junk bonds,” are debt securities that are rated lower than the four highest rating categories by a nationally recognized statistical rating organization (e.g., lower than Baa3/P-2 by Moody’s Investors Service, Inc. (Moody’s) or below BBB–/A-2 by Standard & Poor’s Financial Services LLC (Standard & Poor’s)) or, if unrated, are determined to be
B-11
of comparable quality by the fund’s advisor. These securities are generally considered to be, on balance, predominantly speculative with respect to capacity to pay interest and repay principal in accordance with the terms of the obligation, and they will generally involve more credit risk than securities in the investment-grade categories. Non-investment-grade securities generally provide greater income and opportunity for capital appreciation than higher quality securities, but they also typically entail greater price volatility and principal and income risk.
Analysis of the creditworthiness of issuers of high-yield securities may be more complex than for issuers of investment-grade securities. Thus, reliance on credit ratings in making investment decisions entails greater risks for high-yield securities than for investment-grade securities. The success of a fund’s advisor in managing high-yield securities is more dependent upon its own credit analysis than is the case with investment-grade securities.
Some high-yield securities are issued by smaller, less-seasoned companies, while others are issued as part of a corporate restructuring such as an acquisition, a merger, or a leveraged buyout. Companies that issue high-yield securities are often highly leveraged and may not have more traditional methods of financing available to them. Therefore, the risk associated with acquiring the securities of such issuers generally is greater than is the case with investment-grade securities. Some high-yield securities were once rated as investment-grade but have been downgraded to junk bond status because of financial difficulties experienced by their issuers.
The market values of high-yield securities tend to reflect individual issuer developments to a greater extent than do investment-grade securities, which in general react to fluctuations in the general level of interest rates. High-yield securities also tend to be more sensitive to economic conditions than are investment-grade securities. An actual or anticipated economic downturn or sustained period of rising interest rates, for example, could cause a decline in junk bond prices because the advent of a recession could lessen the ability of a highly leveraged company to make principal and interest payments on its debt securities. If an issuer of high-yield securities defaults, in addition to risking payment of all or a portion of interest and principal, a fund investing in such securities may incur additional expenses to seek recovery.
The secondary market on which high-yield securities are traded may be less liquid than the market for investment-grade securities. Less liquidity in the secondary trading market could adversely affect the ability of a fund’s advisor to sell a high-yield security or the price at which a fund’s advisor could sell a high-yield security, and it could also adversely affect the daily net asset value of fund shares. When secondary markets for high-yield securities are less liquid than the market for investment-grade securities, it may be more difficult to value the securities because such valuation may require more research, and elements of judgment may play a greater role in the valuation of the securities.
Except as otherwise provided in a fund’s prospectus, if a credit rating agency changes the rating of a portfolio security held by a fund, the fund may retain the portfolio security if the advisor deems it in the best interests of shareholders.
Debt Securities—Structured and Indexed Securities. Structured securities (also called “structured notes”) and indexed securities are derivative debt securities, the interest rate or principal of which is determined by an unrelated indicator. Indexed securities include structured notes as well as securities other than debt securities. The value of the principal of and/or interest on structured and indexed securities is determined by reference to changes in the value of a specific asset, reference rate, or index (the reference) or the relative change in two or more references. The interest rate or the principal amount payable upon maturity or redemption may be increased or decreased, depending upon changes in the applicable reference. The terms of the structured and indexed securities may provide that, in certain circumstances, no principal is due at maturity and, therefore, may result in a loss of invested capital. Structured and indexed securities may be positively or negatively indexed, so that appreciation of the reference may produce an increase or a decrease in the interest rate or value of the security at maturity. In addition, changes in the interest rate or the value of the structured or indexed security at maturity may be calculated as a specified multiple of the change in the value of the reference; therefore, the value of such security may be very volatile. Structured and indexed securities may entail a greater degree of market risk than other types of debt securities because the investor bears the risk of the reference. Structured or indexed securities may also be more volatile, less liquid, and more difficult to accurately price than less complex securities or more traditional debt securities, which could lead to an overvaluation or an undervaluation of the securities.
Debt Securities—U.S. Government Securities. The term “U.S. government securities” refers to a variety of debt securities that are issued or guaranteed by the U.S. Treasury, by various agencies of the U.S. government, or by various instrumentalities that have been established or sponsored by the U.S. government. The term also refers to repurchase agreements collateralized by such securities.
B-12
U.S. Treasury securities are backed by the full faith and credit of the U.S. government, meaning that the U.S. government is required to repay the principal in the event of default. Other types of securities issued or guaranteed by federal agencies and U.S. government-sponsored instrumentalities may or may not be backed by the full faith and credit of the U.S. government. The U.S. government, however, does not guarantee the market price of any U.S. government securities. In the case of securities not backed by the full faith and credit of the U.S. government, the investor must look principally to the agency or instrumentality issuing or guaranteeing the obligation for ultimate repayment and may not be able to assert a claim against the United States itself in the event the agency or instrumentality does not meet its commitment.
Some of the U.S. government agencies that issue or guarantee securities include the Government National Mortgage Association, the Export-Import Bank of the United States, the Federal Housing Administration, the Maritime Administration, the Small Business Administration, and the Tennessee Valley Authority. An instrumentality of the U.S. government is a government agency organized under federal charter with government supervision. Instrumentalities issuing or guaranteeing securities include, among others, the Federal Deposit Insurance Corporation, the Federal Home Loan Banks, and the Federal National Mortgage Association. From time to time, uncertainty regarding the status of negotiations in the U.S. government to increase the statutory debt ceiling could increase the risk that the U.S. government may default on payments on certain U.S. government securities, cause the credit rating of the U.S. government to be downgraded, increase volatility in the stock and bond markets, result in higher interest rates, reduce prices of U.S. Treasury securities, and/or increase the costs of various kinds of debt. If a U.S. government-sponsored entity is negatively impacted by legislative or regulatory action, is unable to meet its obligations, or its creditworthiness declines, the performance of a fund that holds securities of the entity may be adversely impacted.
Debt Securities—Variable and Floating Rate Securities. Variable and floating rate securities are debt securities that provide for periodic adjustments in the interest rate paid on the security. Variable rate securities provide for a specified periodic adjustment in the interest rate, while floating rate securities have interest rates that change whenever there is a change in a designated benchmark or reference rate (such as the Secured Overnight Financing Rate (SOFR) or another reference rate) or the issuer’s credit quality. There is a risk that the current interest rate on variable and floating rate securities may not accurately reflect current market interest rates or adequately compensate the holder for the current creditworthiness of the issuer. Some variable or floating rate securities are structured with liquidity features such as (1) put options or tender options that permit holders (sometimes subject to conditions) to demand payment of the unpaid principal balance plus accrued interest from the issuers or certain financial intermediaries or (2) auction-rate features, remarketing provisions, or other maturity-shortening devices designed to enable the issuer to refinance or redeem outstanding debt securities (market-dependent liquidity features). Variable or floating rate securities that include market-dependent liquidity features may have greater liquidity risk than other securities. The greater liquidity risk may exist, for example, because of the failure of a market-dependent liquidity feature to operate as intended (as a result of the issuer’s declining creditworthiness, adverse market conditions, or other factors) or the inability or unwillingness of a participating broker-dealer to make a secondary market for such securities. As a result, variable or floating rate securities that include market-dependent liquidity features may lose value, and the holders of such securities may be required to retain them until the later of the repurchase date, the resale date, or the date of maturity. A demand instrument with a demand notice exceeding seven days may be considered illiquid if there is no secondary market for such security.
Debt Securities—Zero-Coupon and Pay-in-Kind Securities. Zero-coupon and pay-in-kind securities are debt securities that do not make regular cash interest payments. Zero-coupon securities generally do not pay interest. Zero-coupon Treasury bonds are U.S. Treasury notes and bonds that have been stripped of their unmatured interest coupons, or the coupons themselves, and also receipts or certificates representing an interest in such stripped debt obligations and coupons. The timely payment of coupon interest and principal on these instruments remains guaranteed by the full faith and credit of the U.S. government. Pay-in-kind securities pay interest through the issuance of additional securities. These securities are generally issued at a discount to their principal or maturity value. Because such securities do not pay current cash income, the price of these securities can be volatile when interest rates fluctuate. Although these securities do not pay current cash income, federal income tax law requires the holders of zero-coupon and pay-in-kind securities to include in income each year the portion of the original issue discount and other noncash income on such securities accrued during that year. Each fund that holds such securities intends to pass along such interest as a component of the fund’s distributions of net investment income. It may be necessary for the fund to liquidate portfolio positions, including when it is not advantageous to do so, in order to make required distributions.
Depositary Receipts. Depositary receipts (also sold as participatory notes) are securities that evidence ownership interests in a security or a pool of securities that have been deposited with a “depository.” Depositary receipts may be sponsored or unsponsored and include American Depositary Receipts (ADRs), European Depositary Receipts (EDRs),
B-13
and Global Depositary Receipts (GDRs). For ADRs, the depository is typically a U.S. financial institution, and the underlying securities are issued by a foreign issuer. For other depositary receipts, the depository may be a foreign or a U.S. entity, and the underlying securities may have a foreign or a U.S. issuer. Depositary receipts will not necessarily be denominated in the same currency as their underlying securities. Generally, ADRs are issued in registered form, denominated in U.S. dollars, and designed for use in the U.S. securities markets. Other depositary receipts, such as GDRs and EDRs, may be issued in bearer form and denominated in other currencies, and they are generally designed for use in securities markets outside the United States. Although the two types of depositary receipt facilities (sponsored and unsponsored) are similar, there are differences regarding a holder’s rights and obligations and the practices of market participants.
A depository may establish an unsponsored facility without participation by (or acquiescence of) the underlying issuer; typically, however, the depository requests a letter of nonobjection from the underlying issuer prior to establishing the facility. Holders of unsponsored depositary receipts generally bear all the costs of the facility. The depository usually charges fees upon the deposit and withdrawal of the underlying securities, the conversion of dividends into U.S. dollars or other currency, the disposition of noncash distributions, and the performance of other services. The depository of an unsponsored facility frequently is under no obligation to distribute shareholder communications received from the underlying issuer or to pass through voting rights to depositary receipt holders with respect to the underlying securities.
Sponsored depositary receipt facilities are created in generally the same manner as unsponsored facilities, except that sponsored depositary receipts are established jointly by a depository and the underlying issuer through a deposit agreement. The deposit agreement sets out the rights and responsibilities of the underlying issuer, the depository, and the depositary receipt holders. With sponsored facilities, the underlying issuer typically bears some of the costs of the depositary receipts (such as dividend payment fees of the depository), although most sponsored depositary receipt holders may bear costs such as deposit and withdrawal fees. Depositories of most sponsored depositary receipts agree to distribute notices of shareholder meetings, voting instructions, and other shareholder communications and information to the depositary receipt holders at the underlying issuer’s request.
For purposes of a fund’s investment policies, investments in depositary receipts will be deemed to be investments in the underlying securities. Thus, a depositary receipt representing ownership of common stock will be treated as common stock. Depositary receipts do not eliminate all of the risks associated with directly investing in the securities of foreign issuers.
Derivatives. A derivative is a financial instrument that has a value based on—or “derived from”—the values of other assets, reference rates, or indexes. Derivatives may relate to a wide variety of underlying references, such as commodities, stocks, bonds, interest rates, currency exchange rates, and related indexes. Derivatives include futures contracts and options on futures contracts, certain forward-commitment transactions, options on securities, caps, floors, collars, swap agreements, and certain other financial instruments. Some derivatives, such as futures contracts and certain options, are traded on U.S. commodity and securities exchanges, while other derivatives, such as swap agreements, may be privately negotiated and entered into in the over-the-counter market (OTC Derivatives) or may be cleared through a clearinghouse (Cleared Derivatives) and traded on an exchange or swap execution facility. As a result of the Dodd-Frank Wall Street Reform and Consumer Protection Act (the Dodd-Frank Act), certain swap agreements, such as certain standardized credit default and interest rate swap agreements, must be cleared through a clearinghouse and traded on an exchange or swap execution facility. This could result in an increase in the overall costs of such transactions. While the intent of derivatives regulatory reform is to mitigate risks associated with derivatives markets, the regulations could, among other things, increase liquidity and decrease pricing for more standardized products while decreasing liquidity and increasing pricing for less standardized products. The risks associated with the use of derivatives are different from, and possibly greater than, the risks associated with investing directly in the securities or assets on which the derivatives are based.
Derivatives may be used for a variety of purposes, including—but not limited to—hedging, managing risk, seeking to stay fully invested, seeking to reduce transaction costs, seeking to simulate an investment in equity or debt securities or other investments, and seeking to add value by using derivatives to more efficiently implement portfolio positions when derivatives are favorably priced relative to equity or debt securities or other investments. Some investors may use derivatives primarily for speculative purposes while other uses of derivatives may not constitute speculation. There is no assurance that any derivatives strategy used by a fund’s advisor will succeed. The other parties to a fund’s OTC Derivatives contracts (usually referred to as “counterparties”) will not be considered the issuers thereof for purposes of certain provisions of the 1940 Act and the IRC, although such OTC Derivatives may qualify as securities or investments under such laws. A fund’s advisor(s), however, will monitor and adjust, as appropriate, the fund’s credit risk exposure to OTC Derivative counterparties.
B-14
Derivative products are highly specialized instruments that require investment techniques and risk analyses different from those associated with stocks, bonds, and other traditional investments. The use of a derivative requires an understanding not only of the underlying instrument but also of the derivative itself, without the benefit of observing the performance of the derivative under all possible market conditions.
When a fund enters into a Cleared Derivative, an initial margin deposit with a Futures Commission Merchant (FCM) is required. Initial margin deposits are typically calculated as an amount equal to the volatility in market value of a Cleared Derivative over a fixed period. If the value of the fund’s Cleared Derivatives declines, the fund will be required to make additional “variation margin” payments to the FCM to settle the change in value. If the value of the fund’s Cleared Derivatives increases, the FCM will be required to make additional “variation margin” payments to the fund to settle the change in value. This process is known as “marking-to-market” and is calculated on a daily basis.
For OTC Derivatives, a fund is subject to the risk that a loss may be sustained as a result of the insolvency or bankruptcy of the counterparty or the failure of the counterparty to make required payments or otherwise comply with the terms of the contract. Additionally, the use of credit derivatives can result in losses if a fund’s advisor does not correctly evaluate the creditworthiness of the issuer on which the credit derivative is based.
Derivatives may be subject to liquidity risk, which exists when a particular derivative is difficult to purchase or sell. If a derivative transaction is particularly large or if the relevant market is illiquid (as is the case with certain OTC Derivatives), it may not be possible to initiate a transaction or liquidate a position at an advantageous time or price.
Derivatives may be subject to pricing or “basis” risk, which exists when a particular derivative becomes extraordinarily expensive relative to historical prices or the prices of corresponding cash market instruments. Under certain market conditions, it may not be economically feasible to initiate a transaction or liquidate a position in time to avoid a loss or take advantage of an opportunity.
Because certain derivatives have a leverage component, adverse changes in the value or level of the underlying asset, reference rate, or index can result in a loss substantially greater than the amount invested in the derivative itself. Certain derivatives have the potential for unlimited loss, regardless of the size of the initial investment. A derivative transaction will not be considered to constitute the issuance, by a fund, of a “senior security,” as that term is defined in Section 18(g) of the 1940 Act, and therefore such transaction will not be subject to the 300% asset coverage requirement otherwise applicable to borrowings by a fund, if the fund complies with Rule 18f-4.
Like most other investments, derivative instruments are subject to the risk that the market value of the instrument will change in a way detrimental to a fund’s interest. A fund bears the risk that its advisor will incorrectly forecast future market trends or the values of assets, reference rates, indexes, or other financial or economic factors in establishing derivative positions for the fund. If the advisor attempts to use a derivative as a hedge against, or as a substitute for, a portfolio investment, the fund will be exposed to the risk that the derivative will have or will develop imperfect or no correlation with the portfolio investment. This could cause substantial losses for the fund. Although hedging strategies involving derivative instruments can reduce the risk of loss, they can also reduce the opportunity for gain or even result in losses by offsetting favorable price movements in other fund investments. Many derivatives (in particular, OTC Derivatives) are complex and often valued subjectively. Improper valuations can result in increased cash payment requirements to counterparties or a loss of value to a fund.
On October 28, 2020, the Securities and Exchange Commission adopted new regulations governing the use of derivatives by registered investment companies (“Rule 18f-4”). The Funds were required to implement and comply with Rule18f-4 by August 19, 2022. Rule 18f-4 imposes limits on the amount of derivatives a fund can enter into, eliminates the asset segregation framework currently used by funds to comply with Section 18 of the Investment Company Act of 1940, as amended, treats derivatives as senior securities and requires funds whose use of derivatives is more than a limited specified exposure amount to establish and maintain a comprehensive derivatives risk management program and appoint a derivatives risk manager.
Each Fund intends to comply with Rule 4.5 under the Commodity Exchange Act (CEA), under which a fund may be excluded from the definition of the term Commodity Pool Operator (CPO) if the fund meets certain conditions such as limiting its investments in certain CEA-regulated instruments (e.g., futures, options, or swaps) and complying with certain marketing restrictions. Accordingly, Vanguard is not subject to registration or regulation as a CPO with respect to each Fund under the CEA. Each Fund will only enter into futures contracts and futures options that are traded on a U.S. or foreign exchange, board of trade, or similar entity or that are quoted on an automated quotation system.
Environmental, Social, and Governance (ESG) Considerations. ESG risk factors, either quantitative or qualitative, may be used as a component of certain funds’ investment processes as a means to assess long-term risk to
B-15
shareholder value (e.g., risk analysis, credit analysis, or investment opportunities) as the advisor deems appropriate. The weight given to ESG factors may vary across types of investments, industries, regions, and issuers; may change over time; and not every ESG factor may be identified or evaluated. Consideration of ESG factors may affect a fund’s exposure to certain issuers or industries. The advisor’s assessment of an issuer may differ from that of other funds or an investor’s assessment of such issuer. As a result, securities selected by the advisor may not reflect the beliefs and values of any particular investor. The advisor may be dependent on the availability of timely, complete, and accurate ESG data being reported by issuers and/or third-party research providers to evaluate ESG factors. ESG factors are often not uniformly measured or defined, which could impact an advisor’s ability to assess an issuer. Where ESG risk factor analysis is used as one part of an overall investment process (as may be the case for actively managed funds included in this Statement of Additional Information), such funds may still invest in securities of issuers that all market participants may not view as ESG-focused or that may be viewed as having a high ESG risk profile.
For funds advised by Vanguard, Vanguard’s Investment Stewardship Team, on behalf of the Board of Trustees of each Vanguard-advised U.S. fund, administers proxy voting for the equity holdings of the Vanguard-advised funds. The Investment Stewardship Team may engage with issuers to better understand how they are addressing material risks, including material environmental, social, or governance risks. Specifically, the Investment Stewardship Team may engage with company leaders and directors to understand how they oversee, mitigate, and disclose material risks to shareholders. With respect to material human-rights-related risks, where such matters are not addressed by applicable sanctions laws and regulations that restrict specific investments, the Investment Stewardship Team employs procedures to identify and monitor material human-rights-related risks to long-term shareholder returns at portfolio companies held by the Vanguard-advised funds and to understand how portfolio company boards are overseeing any such risks.
For funds advised by third-party advisory firms independent of Vanguard, such third-party advisory firms are responsible for administration of proxy voting and engagement with respect to the equity holdings they manage on behalf of the fund.
Exchange-Traded Funds. A fund may purchase shares of exchange-traded funds (ETFs). Typically, a fund would purchase ETF shares for the same reason it would purchase (and as an alternative to purchasing) futures contracts: to obtain exposure to all or a portion of the stock or bond market. ETF shares enjoy several advantages over futures. Depending on the market, the holding period, and other factors, ETF shares can be less costly and more tax-efficient than futures. In addition, ETF shares can be purchased for smaller sums, offer exposure to market sectors and styles for which there is no suitable or liquid futures contract, and do not involve leverage.
An investment in an ETF generally presents the same principal risks as an investment in a conventional fund (i.e., one that is not exchange-traded) that has the same investment objective, strategies, and policies. The price of an ETF can fluctuate within a wide range, and a fund could lose money investing in an ETF if the prices of the securities owned by the ETF go down. In addition, ETFs are subject to the following risks that do not apply to conventional funds: (1) the market price of an ETF’s shares may trade at a discount or a premium to their net asset value; (2) an active trading market for an ETF’s shares may not develop or be maintained; and (3) trading of an ETF’s shares may be halted by the activation of individual or marketwide trading halts (which halt trading for a specific period of time when the price of a particular security or overall market prices decline by a specified percentage). Trading of an ETF’s shares may also be halted if the shares are delisted from the exchange without first being listed on another exchange or if the listing exchange’s officials determine that such action is appropriate in the interest of a fair and orderly market or for the protection of investors.
Most ETFs are investment companies. Therefore, a fund’s purchases of ETF shares generally are subject to the limitations on, and the risks of, a fund’s investments in other investment companies, which are described under the heading “Other Investment Companies.”
Foreign Securities. Typically, foreign securities are considered to be equity or debt securities issued by entities organized, domiciled, or with a principal executive office outside the United States, such as foreign corporations and governments. Securities issued by certain companies organized outside the United States may not be deemed to be foreign securities if the company’s principal operations are conducted from the United States or when the company’s equity securities trade principally on a U.S. stock exchange. Foreign securities may trade in U.S. or foreign securities markets. A fund may make foreign investments either directly by purchasing foreign securities or indirectly by purchasing depositary receipts or depositary shares of similar instruments (depositary receipts) for foreign securities. Direct investments in foreign securities may be made either on foreign securities exchanges or in the over-the-counter (OTC) markets. Investing in foreign securities involves certain special risk considerations that are not typically associated with investing in securities of U.S. companies or governments.
B-16
Because foreign issuers are not generally subject to uniform accounting, auditing, and financial reporting standards and practices comparable to those applicable to U.S. issuers, there may be less publicly available information about certain foreign issuers than about U.S. issuers. Evidence of securities ownership may be uncertain in many foreign countries. As a result, there are risks that could result in a loss to the fund, including, but not limited to, the risk that a fund’s trade details could be incorrectly or fraudulently entered at the time of a transaction. Securities of foreign issuers are generally more volatile and less liquid than securities of comparable U.S. issuers, and foreign investments may be effected through structures that may be complex or confusing. In certain countries, there is less government supervision and regulation of stock exchanges, brokers, and listed companies than in the United States. The risk that securities traded on foreign exchanges may be suspended, either by the issuers themselves, by an exchange, or by government authorities, is also heightened. In addition, with respect to certain foreign countries, there is the possibility of expropriation or confiscatory taxation, political or social instability, war, terrorism, nationalization, limitations on the removal of funds or other assets, or diplomatic developments that could affect U.S. investments in those countries. Additionally, the imposition of economic or other sanctions on the United States by a foreign country, or on a foreign country or issuer by the United States, could impair a fund’s ability to buy, sell, hold, receive, deliver, or otherwise transact in certain investment securities or obtain exposure to foreign securities and assets. This may negatively impact the value and/or liquidity of a fund's investments and could impair a fund's ability to meet its investment objective or invest in accordance with its investment strategy. Sanctions could also result in the devaluation of a country's currency, a downgrade in the credit ratings of a country or issuers in a country, or a decline in the value and/or liquidity of securities of issuers in that country.
Although an advisor will endeavor to achieve the most favorable execution costs for a fund’s portfolio transactions in foreign securities under the circumstances, commissions and other transaction costs are generally higher than those on U.S. securities. In addition, it is expected that the custodian arrangement expenses for a fund that invests primarily in foreign securities will be somewhat greater than the expenses for a fund that invests primarily in domestic securities. Additionally, bankruptcy laws vary by jurisdiction and cash deposits may be subject to a custodian’s creditors. Certain foreign governments levy withholding or other taxes against dividend and interest income from, capital gains on the sale of, or transactions in foreign securities. Although in some countries a portion of these taxes is recoverable by the fund, the nonrecovered portion of foreign withholding taxes will reduce the income received from such securities.
The value of the foreign securities held by a fund that are not U.S. dollar-denominated may be significantly affected by changes in currency exchange rates. The U.S. dollar value of a foreign security generally decreases when the value of the U.S. dollar rises against the foreign currency in which the security is denominated, and it tends to increase when the value of the U.S. dollar falls against such currency (as discussed under the heading “Foreign Securities—Foreign Currency Transactions,” a fund may attempt to hedge its currency risks). In addition, the value of fund assets may be affected by losses and other expenses incurred from converting between various currencies in order to purchase and sell foreign securities, as well as by currency restrictions, exchange control regulations, currency devaluations, and political and economic developments.
Foreign Securities—China Bonds Risk. The People’s Republic of China (China) continues to limit direct foreign investments, generally in industries deemed important to national interests. Foreign investment in Chinese securities is also subject to substantial restrictions, although Chinese regulators have begun to introduce programs through which foreign investors can gain direct access to certain Chinese securities markets. The People’s Bank of China (PBoC) has established a program that permits eligible foreign investors to invest directly in securities traded on the Chinese Interbank Bond Market (CIBM). A fund may invest in the bonds available on the CIBM through Bond Connect and the Hong Kong Monetary Authority that allows investors from mainland China and overseas to trade in each other’s respective markets. Bond Connect provides a connection between mainland China- and Hong Kong-based financial institutions, permitting investors to trade between the mainland China and Hong Kong markets electronically, thus eliminating the stricter restrictions that were present under previous access models. While the CIBM is relatively large and trading volumes are generally high, the market remains subject to similar risks as bond markets in other emerging market countries.
Investing in securities traded on the CIBM through Bond Connect is also subject to regulatory risks. The relevant rules and regulations of, the structure and terms of, and a fund’s access to Bond Connect may be subject to change with minimal notice and have the potential to be applied retroactively. Additionally, as is the case with other emerging market economies, China’s ability to develop and sustain its legal, tax, regulatory, financial reporting, accounting, and recordkeeping systems could influence the course of foreign investment. In particular, the Chinese legal system constitutes a significant risk factor for investors. The interpretation and enforcement of Chinese laws and regulations are uncertain, and investments in China may not be subject to the same degree of legal protection as in other developed countries.
B-17
In the event account opening or trading is suspended on the CIBM, a fund’s ability to invest in securities traded on the CIBM will be adversely affected and may negatively affect the fund. Furthermore, if Bond Connect is not operating, a fund may not be able to acquire or dispose of bonds through Bond Connect in a timely manner, which could adversely affect the fund’s performance.
Market volatility and potential lack of liquidity due to low trading volume of certain bonds on the CIBM may result in significant fluctuations in the prices of certain bonds traded on the CIBM. The bid-ask spreads of the prices of such securities may be large, and a fund may therefore incur significant costs and may suffer losses when selling such investments. The bonds traded on the CIBM may be difficult or impossible to sell, which may impact a fund’s ability to acquire or dispose of such securities at their expected prices. A fund is also exposed to risks associated with settlement procedures and default of counterparties.
Bond Connect trades are settled in RMB, which is currently restricted and not freely convertible. As a result, a fund’s investments through Bond Connect will be exposed to currency risk and incur currency conversion costs, and it cannot be guaranteed that investors will have timely access to a reliable supply of RMB. RMB is the only currency of China. Although both onshore RMB (CNY) and offshore RMB (CNH) are the same currency, they are traded in different and separate markets. These markets operate separately and can be subject to different liquidity constraints and market forces, meaning their valuations can vary. As part of standard fund management practices, a fund may hedge the foreign exchange (FX) exposure that arises from the inclusion of Chinese RMB-denominated bonds into the base currency of the fund. FX hedging utilizing CNY would match the currency of the index. Conversely, FX hedging utilizing CNH would introduce incremental FX risk arising from any divergence between CNH and CNY.
Trading through Bond Connect is performed through newly developed trading platforms and operational systems. There is no assurance that such systems will function properly (in particular, under extreme market conditions) or will continue to be adapted to changes and developments in the market. In the event relevant systems fail to function properly, trading through Bond Connect may be disrupted. A fund’s ability to trade through Bond Connect may therefore be adversely affected. In addition, where a fund invests in securities traded on the CIBM through Bond Connect, it may be subject to risks of delays inherent in order placing and/or settlement.
Any changes in the application of tax law to China-sourced dividends and interest from non-government bonds paid to a fund, future clarifications thereof, and/or subsequent retroactive enforcement by Chinese tax authorities may result in a loss to a fund.
Foreign Securities—Emerging Market Risk. Investing in emerging market countries involves certain risks not typically associated with investing in the United States, and it imposes risks greater than, or in addition to, risks of investing in more developed foreign countries. These risks may significantly affect the value of emerging market investments and include: (i) nationalization or expropriation of assets or confiscatory taxation; (ii) currency devaluations and other currency exchange rate fluctuations; (iii) greater social, economic, and political uncertainty and instability (including amplified risk of war and terrorism); (iv) more substantial government involvement and control over the economy; (v) less government supervision and regulation of the securities markets and participants in those markets and possible arbitrary and unpredictable enforcement of securities regulations and other laws, which may increase the risk of market manipulation; (vi) controls on foreign investment and limitations on repatriation of invested capital and on the fund’s ability to exchange local currencies for U.S. dollars; (vii) unavailability of currency-hedging techniques in certain emerging market countries; (viii) generally smaller, less seasoned, or newly organized companies; (ix) differences in, or lack of, corporate governance, accounting, auditing, record keeping and financial reporting standards, which may result in unavailability of material information about issuers and impede evaluation of such issuers; (x) difficulty in obtaining and/or enforcing a judgment in a court outside the United States; and (xi) greater price volatility, substantially less liquidity, and significantly smaller market capitalization of securities markets. Also, any change in the leadership or politics of emerging market countries, or the countries that exercise a significant influence over those countries, may halt the expansion of or reverse the liberalization of foreign investment policies now occurring and adversely affect existing investment opportunities. Furthermore, high rates of inflation and rapid fluctuations in inflation rates have had, and may continue to have, negative effects on the economies and securities markets of certain emerging market countries. Custodial expenses and other investment-related costs are often more expensive in emerging market countries, which can reduce a fund’s income from investments in securities or debt instruments of emerging market country issuers. Additionally, information regarding companies located in emerging markets may be less available and less reliable, which can impede the ability to evaluate such companies. There may also be limited regulatory oversight of certain foreign sub-custodians that hold foreign securities subject to the supervision of the Fund’s primary U.S.-based custodian. The Fund may be limited in its ability to recover assets if a foreign sub-custodian becomes bankrupt or otherwise unable or unwilling to return assets to the Fund, which may expose the Fund to risk, especially in
B-18
circumstances where the Fund’s primary custodian may not be contractually obligated to make the Fund whole for the particular loss.
Emerging market investments also carry the risk that strained international relations may give rise to retaliatory actions, including actions through financial markets such as purchase and ownership restrictions, sanctions, tariffs, cyberattacks, and unpredictable enforcement of securities regulations and other laws. Such actual and/or threatened retaliatory actions may impact emerging market economies and issuers in which a Fund invests. For example, in China, ownership of companies in certain sectors by foreign individuals and entities is prohibited. In order to facilitate investment in these companies by foreign individuals, many Chinese companies have created variable interest entities (“VIEs”) that provide exposure to the Chinese company through contractual arrangements instead of equity ownership. VIE structures are subject to risks associated with breach of the contractual arrangements, including difficulty in enforcing any judgments outside of the United States, and do not offer the same level of investor protection as direct ownership. Additionally, while VIEs are a longstanding industry practice, they have not been approved by Chinese regulators. Chinese regulators could prohibit Chinese companies from accessing foreign investment through VIEs or sever their ability to transmit economic and governance rights to foreign individuals and entities. Such actions would significantly reduce, and possibly permanently eliminate, the market value of VIEs held by a Fund.
Emerging market investments also carry the risk that strained international relations may give rise to retaliatory actions, including actions through financial markets such as purchase and ownership restrictions, sanctions, tariffs, cyberattacks, and unpredictable enforcement of securities regulations and other laws. Such actual and/or threatened retaliatory actions may impact emerging market economies and issuers in which a Fund invests. For example, in China, ownership of companies in certain sectors by foreign individuals and entities is prohibited. In order to facilitate investment in these companies by foreign individuals, many Chinese companies have created variable interest entities (“VIEs”) that provide exposure to the Chinese company through contractual arrangements instead of equity ownership. VIE structures are subject to risks associated with breach of the contractual arrangements, including difficulty in enforcing any judgments outside of the United States, and do not offer the same level of investor protection as direct ownership. Additionally, while VIEs are a longstanding industry practice, they have not been approved by Chinese regulators. Chinese regulators could prohibit Chinese companies from accessing foreign investment through VIEs or sever their ability to transmit economic and governance rights to foreign individuals and entities. Such actions would significantly reduce, and possibly permanently eliminate, the market value of VIEs held by a Fund.
Foreign Securities—Foreign Currency Transactions. The value in U.S. dollars of a fund’s non-dollar-denominated foreign securities may be affected favorably or unfavorably by changes in foreign currency exchange rates and exchange control regulations, and the fund may incur costs in connection with conversions between various currencies. To seek to minimize the impact of such factors on net asset values, a fund may engage in foreign currency transactions in connection with its investments in foreign securities. A fund will enter into foreign currency transactions only to attempt to “hedge” the currency risk associated with investing in foreign securities. Although such transactions tend to minimize the risk of loss that would result from a decline in the value of the hedged currency, they also may limit any potential gain that might result should the value of such currency increase.
Currency exchange transactions may be conducted either on a spot (i.e., cash) basis at the rate prevailing in the currency exchange market or through forward contracts to purchase or sell foreign currencies. A forward currency contract involves an obligation to purchase or sell a specific currency at a future date, which may be any fixed number of days from the date of the contract agreed upon by the parties, at a price set at the time of the contract. These contracts are entered into with large commercial banks or other currency traders who are participants in the interbank market. Currency exchange transactions also may be effected through the use of swap agreements or other derivatives.
Currency exchange transactions may be considered borrowings. A currency exchange transaction will not be considered to constitute the issuance, by a fund, of a “senior security,” as that term is defined in Section 18(g) of the 1940 Act, and therefore such transaction will not be subject to the 300% asset coverage requirement otherwise applicable to borrowings by a fund, if the fund complies with Rule 18f-4.
By entering into a forward contract for the purchase or sale of foreign currency involved in underlying security transactions, a fund may be able to protect itself against part or all of the possible loss between trade and settlement dates for that purchase or sale resulting from an adverse change in the relationship between the U.S. dollar and such foreign currency. This practice is sometimes referred to as “transaction hedging.” In addition, when the advisor reasonably believes that a particular foreign currency may suffer a substantial decline against the U.S. dollar, a fund may enter into a forward contract to sell an amount of foreign currency approximating the value of some or all of its portfolio securities denominated in such foreign currency. This practice is sometimes referred to as “portfolio hedging.” Similarly, when the advisor reasonably believes that the U.S. dollar may suffer a substantial decline against a foreign currency, a fund may enter into a forward contract to buy that foreign currency for a fixed dollar amount.
A fund may also attempt to hedge its foreign currency exchange rate risk by engaging in currency futures, options, and “cross-hedge” transactions. In cross-hedge transactions, a fund holding securities denominated in one foreign currency will enter into a forward currency contract to buy or sell a different foreign currency (one that the advisor reasonably believes generally tracks the currency being hedged with regard to price movements). The advisor may select the tracking (or substitute) currency rather than the currency in which the security is denominated for various reasons, including in order to take advantage of pricing or other opportunities presented by the tracking currency or to take advantage of a more liquid or more efficient market for the tracking currency. Such cross-hedges are expected to help protect a fund against an increase or decrease in the value of the U.S. dollar against certain foreign currencies.
B-19
A fund may hold a portion of its assets in bank deposits denominated in foreign currencies so as to facilitate investment in foreign securities as well as protect against currency fluctuations and the need to convert such assets into U.S. dollars (thereby also reducing transaction costs). To the extent these assets are converted back into U.S. dollars, the value of the assets so maintained will be affected favorably or unfavorably by changes in foreign currency exchange rates and exchange control regulations.
Forecasting the movement of the currency market is extremely difficult. Whether any hedging strategy will be successful is highly uncertain. Moreover, it is impossible to forecast with precision the market value of portfolio securities at the expiration of a forward currency contract. Accordingly, a fund may be required to buy or sell additional currency on the spot market (and bear the expense of such transaction) if its advisor’s predictions regarding the movement of foreign currency or securities markets prove inaccurate. In addition, the use of cross-hedging transactions may involve special risks and may leave a fund in a less advantageous position than if such a hedge had not been established. Because forward currency contracts are privately negotiated transactions, there can be no assurance that a fund will have flexibility to roll over a forward currency contract upon its expiration if it desires to do so. Additionally, there can be no assurance that the other party to the contract will perform its services thereunder.
Foreign Securities—Foreign Investment Companies. Some of the countries in which a fund may invest may not permit, or may place economic restrictions on, direct investment by outside investors. Fund investments in such countries may be permitted only through foreign government-approved or authorized investment vehicles, which may include other investment companies. Such investments may be made through registered or unregistered closed-end investment companies that invest in foreign securities. Investing through such vehicles may involve layered fees or expenses and may also be subject to the limitations on, and the risks of, a fund’s investments in other investment companies, which are described under the heading “Other Investment Companies.”
Foreign Securities—Russian Market Risk. Russia’s large-scale invasion of Ukraine has resulted in sanctions against Russian governmental institutions, Russian entities, and Russian individuals that may result in the devaluation of Russian currency; a downgrade in the country’s credit rating; a freeze of Russian foreign assets; a decline in the value and liquidity of Russian securities, properties, or interests; and other adverse consequences to the Russian economy and Russian assets. In addition, a fund’s ability to price, buy, sell, receive, or deliver Russian investments has been and may continue to be impaired. These sanctions, and the resulting disruption of the Russian economy, may cause volatility in other regional and global markets and may negatively impact the performance of various sectors and industries, as well as companies in other countries, which could have a negative effect on the performance of a fund, even if the fund does not have direct exposure to securities of Russian issuers.
Futures Contracts and Options on Futures Contracts. Futures contracts and options on futures contracts are derivatives. A futures contract is a standardized agreement between two parties to buy or sell at a specific time in the future a specific quantity of a commodity at a specific price. The commodity may consist of an asset, a reference rate, or an index. A security futures contract relates to the sale of a specific quantity of shares of a single equity security or a narrow-based securities index. The value of a futures contract tends to increase and decrease in tandem with the value of the underlying commodity. The buyer of a futures contract enters into an agreement to purchase the underlying commodity on the settlement date and is said to be “long” the contract. The seller of a futures contract enters into an agreement to sell the underlying commodity on the settlement date and is said to be “short” the contract. The price at which a futures contract is entered into is established either in the electronic marketplace or by open outcry on the floor of an exchange between exchange members acting as traders or brokers. Open futures contracts can be liquidated or closed out by physical delivery of the underlying commodity or payment of the cash settlement amount on the settlement date, depending on the terms of the particular contract. Some financial futures contracts (such as security futures) provide for physical settlement at maturity. Other financial futures contracts (such as those relating to interest rates, foreign currencies, and broad-based securities indexes) generally provide for cash settlement at maturity. In the case of cash-settled futures contracts, the cash settlement amount is equal to the difference between the final settlement or market price for the relevant commodity on the last trading day of the contract and the price for the relevant commodity agreed upon at the outset of the contract. Most futures contracts, however, are not held until maturity but instead are “offset” before the settlement date through the establishment of an opposite and equal futures position.
The purchaser or seller of a futures contract is not required to deliver or pay for the underlying commodity unless the contract is held until the settlement date. However, both the purchaser and seller are required to deposit “initial margin” with a futures commission merchant (FCM) when the futures contract is entered into. Initial margin deposits are typically calculated as an amount equal to the volatility in market value of a contract over a fixed period. If the value of the fund’s position declines, the fund will be required to make additional “variation margin” payments to the FCM to settle the
B-20
change in value. If the value of the fund’s position increases, the FCM will be required to make additional “variation margin” payments to the fund to settle the change in value. This process is known as “marking-to-market” and is calculated on a daily basis. A futures transaction will not be considered to constitute the issuance, by a fund, of a “senior security,” as that term is defined in Section 18(g) of the 1940 Act, and therefore such transaction will not be subject to the 300% asset coverage requirement otherwise applicable to borrowings by a fund, if the fund complies with Rule 18f-4.
An option on a futures contract (or futures option) conveys the right, but not the obligation, to purchase (in the case of a call option) or sell (in the case of a put option) a specific futures contract at a specific price (called the “exercise” or “strike” price) any time before the option expires. The seller of an option is called an option writer. The purchase price of an option is called the premium. The potential loss to an option buyer is limited to the amount of the premium plus transaction costs. This will be the case, for example, if the option is held and not exercised prior to its expiration date. Generally, an option writer sells options with the goal of obtaining the premium paid by the option buyer. If an option sold by an option writer expires without being exercised, the writer retains the full amount of the premium. The option writer, however, has unlimited economic risk because its potential loss, except to the extent offset by the premium received when the option was written, is equal to the amount the option is “in-the-money” at the expiration date. A call option is in-the-money if the value of the underlying futures contract exceeds the exercise price of the option. A put option is in-the-money if the exercise price of the option exceeds the value of the underlying futures contract. Generally, any profit realized by an option buyer represents a loss for the option writer.
A fund that takes the position of a writer of a futures option is required to deposit and maintain initial and variation margin with respect to the option, as previously described in the case of futures contracts. A futures option transaction will not be considered to constitute the issuance, by a fund, of a “senior security,” as that term is defined in Section 18(g) of the 1940 Act, and therefore such transaction will not be subject to the 300% asset coverage requirement otherwise applicable to borrowings by a fund, if the fund complies with Rule 18f-4.
Futures Contracts and Options on Futures Contracts—Risks. The risk of loss in trading futures contracts and in writing futures options can be substantial because of the low margin deposits required, the extremely high degree of leverage involved in futures and options pricing, and the potential high volatility of the futures markets. As a result, a relatively small price movement in a futures position may result in immediate and substantial loss (or gain) for the investor. For example, if at the time of purchase, 10% of the value of the futures contract is deposited as margin, a subsequent 10% decrease in the value of the futures contract would result in a total loss of the margin deposit, before any deduction for the transaction costs, if the account were then closed out. A 15% decrease would result in a loss equal to 150% of the original margin deposit if the contract were closed out. Thus, a purchase or sale of a futures contract, and the writing of a futures option, may result in losses in excess of the amount invested in the position. In the event of adverse price movements, a fund would continue to be required to make daily cash payments to maintain its required margin. In such situations, if the fund has insufficient cash, it may have to sell portfolio securities to meet daily margin requirements (and segregation requirements, if applicable) at a time when it may be disadvantageous to do so. In addition, on the settlement date, a fund may be required to make delivery of the instruments underlying the futures positions it holds.
A fund could suffer losses if it is unable to close out a futures contract or a futures option because of an illiquid secondary market. Futures contracts and futures options may be closed out only on an exchange that provides a secondary market for such products. However, there can be no assurance that a liquid secondary market will exist for any particular futures product at any specific time. Thus, it may not be possible to close a futures or option position. Moreover, most futures exchanges limit the amount of fluctuation permitted in futures contract prices during a single trading day. The daily limit establishes the maximum amount that the price of a futures contract may vary either up or down from the previous day’s settlement price at the end of a trading session. Once the daily limit has been reached in a particular type of contract, no trades may be made on that day at a price beyond that limit. The daily limit governs only price movement during a particular trading day, and therefore does not limit potential losses because the limit may prevent the liquidation of unfavorable positions. Futures contract prices have occasionally moved to the daily limit for several consecutive trading days with little or no trading, thereby preventing prompt liquidation of future positions and subjecting some futures traders to substantial losses. The inability to close futures and options positions also could have an adverse impact on the ability to hedge a portfolio investment or to establish a substitute for a portfolio investment. U.S. Treasury futures are generally not subject to such daily limits.
A fund bears the risk that its advisor will incorrectly predict future market trends. If the advisor attempts to use a futures contract or a futures option as a hedge against, or as a substitute for, a portfolio investment, the fund will be exposed to
B-21
the risk that the futures position will have or will develop imperfect or no correlation with the portfolio investment. This could cause substantial losses for the fund. Although hedging strategies involving futures products can reduce the risk of loss, they can also reduce the opportunity for gain or even result in losses by offsetting favorable price movements in other fund investments.
A fund could lose margin payments it has deposited with its FCM if, for example, the FCM breaches its agreement with the fund or becomes insolvent or goes into bankruptcy. In that event, the fund may be entitled to return of margin owed to it only in proportion to the amount received by the FCM’s other customers, potentially resulting in losses to the fund.
Hybrid Instruments. A hybrid instrument, or hybrid, is an interest in an issuer that combines the characteristics of an equity security, a debt security, a commodity, and/or a derivative. A hybrid may have characteristics that, on the whole, more strongly suggest the existence of a bond, stock, or other traditional investment, but a hybrid may also have prominent features that are normally associated with a different type of investment. Moreover, hybrid instruments may be treated as a particular type of investment for one regulatory purpose (such as taxation) and may be simultaneously treated as a different type of investment for a different regulatory purpose (such as securities or commodity regulation). Hybrids can be used as an efficient means of pursuing a variety of investment goals, including increased total return, duration management, and currency hedging. Because hybrids combine features of two or more traditional investments and may involve the use of innovative structures, hybrids present risks that may be similar to, different from, or greater than those associated with traditional investments with similar characteristics.
Examples of hybrid instruments include convertible securities, which combine the investment characteristics of bonds and common stocks; perpetual bonds, which are structured like fixed income securities, have no maturity date, and may be characterized as debt or equity for certain regulatory purposes; contingent convertible securities, which are fixed income securities that, under certain circumstances, either convert into common stock of the issuer or undergo a principal write-down by a predetermined percentage if the issuer’s capital ratio falls below a predetermined trigger level; and trust-preferred securities, which are preferred stocks of a special-purpose trust that holds subordinated debt of the corporate parent. Another example of a hybrid is a commodity-linked bond, such as a bond issued by an oil company that pays a small base level of interest with additional interest that accrues in correlation to the extent to which oil prices exceed a certain predetermined level. Such a hybrid would be a combination of a bond and a call option on oil.
In the case of hybrids that are structured like fixed income securities (such as structured notes), the principal amount or the interest rate is generally tied (positively or negatively) to the price of some commodity, currency, securities index, interest rate, or other economic factor (each, a benchmark). For some hybrids, the principal amount payable at maturity or the interest rate may be increased or decreased, depending on changes in the value of the benchmark. Other hybrids do not bear interest or pay dividends. The value of a hybrid or its interest rate may be a multiple of a benchmark and, as a result, may be leveraged and move (up or down) more steeply and rapidly than the benchmark, thus magnifying movements within the benchmark. These benchmarks may be sensitive to economic and political events, such as commodity shortages and currency devaluations, which cannot be readily foreseen by the purchaser of a hybrid. Under certain conditions, the redemption value of a hybrid could be zero. Thus, an investment in a hybrid may entail significant market risks that are not associated with a similar investment in a traditional, U.S. dollar-denominated bond with a fixed principal amount that pays a fixed rate or floating rate of interest. The purchase of hybrids also exposes a fund to the credit risk of the issuer of the hybrids. Depending on the level of a fund’s investment in hybrids, these risks may cause significant fluctuations in the fund’s net asset value. Hybrid instruments may also carry liquidity risk since the instruments are often “customized” to meet the needs of an issuer or, sometimes, the portfolio needs of a particular investor, and therefore the number of investors that are willing and able to buy such instruments in the secondary market may be smaller than that for more traditional securities.
Certain issuers of hybrid instruments known as structured products may be deemed to be investment companies as defined in the 1940 Act. As a result, a fund’s investments in these products may be subject to the limitations described under the heading “Other Investment Companies.”
Interfund Borrowing and Lending. The SEC has granted an exemption permitting registered open-end Vanguard funds to participate in Vanguard’s interfund lending program. This program allows the Vanguard funds to borrow money from and lend money to each other for temporary or emergency purposes. The program is subject to a number of conditions, including, among other things, the requirements that (1) no fund may borrow or lend money through the program unless it receives a more favorable interest rate than is typically available from a bank for a comparable transaction, (2) no fund may lend money if the loan would cause its aggregate outstanding loans through the program to exceed 15% of its net assets at the time of the loan, and (3) a fund’s interfund loans to any one fund shall not exceed
B-22
5% of the lending fund’s net assets. In addition, a Vanguard fund may participate in the program only if and to the extent that such participation is consistent with the fund’s investment objective and investment policies. The boards of trustees of the Vanguard funds are responsible for overseeing the interfund lending program. Any delay in repayment to a lending fund could result in a lost investment opportunity or additional borrowing costs.
Investing for Control. Each Vanguard fund invests in securities and other instruments for the sole purpose of achieving a specific investment objective. As such, a Vanguard fund does not seek to acquire, individually or collectively with any other Vanguard fund, enough of a company’s outstanding voting stock to have control over management decisions. A Vanguard fund does not invest for the purpose of controlling a company’s management.
Market Disruption. Significant market disruptions, such as those caused by pandemics, natural or environmental disasters, war, acts of terrorism, or other events, can adversely affect local and global markets and normal market operations. Market disruptions may exacerbate political, social, and economic risks discussed above and in a fund’s prospectus. Additionally, market disruptions may result in increased market volatility; regulatory trading halts; closure of domestic or foreign exchanges, markets, or governments; or market participants operating pursuant to business continuity plans for indeterminate periods of time. Such events can be highly disruptive to economies and markets and significantly impact individual companies, sectors, industries, markets, currencies, interest and inflation rates, credit ratings, investor sentiment, and other factors affecting the value of a fund’s investments and operation of a fund. These events could also result in the closure of businesses that are integral to a fund’s operations or otherwise disrupt the ability of employees of fund service providers to perform essential tasks on behalf of a fund.
Mortgage-Backed Securities. Mortgage-backed securities represent direct or indirect participation in, or are collateralized by and payable from, mortgage loans secured by real property or instruments derived from such loans and may be based on different types of mortgages, including those on residential properties or commercial real estate. Mortgage-backed securities include various types of securities, such as government stripped mortgage-backed securities, adjustable rate mortgage-backed securities, and collateralized mortgage obligations.
Generally, mortgage-backed securities represent partial interests in pools of mortgage loans assembled for sale to investors by various governmental agencies, such as the Government National Mortgage Association (GNMA); by government-related organizations, such as the Federal National Mortgage Association (FNMA) and the Federal Home Loan Mortgage Corporation (FHLMC); and by private issuers, such as commercial banks, savings and loan institutions, and mortgage bankers. The average maturity of pass-through pools of mortgage-backed securities in which a fund may invest varies with the maturities of the underlying mortgage instruments. In addition, a pool’s average maturity may be shortened by unscheduled payments on the underlying mortgages. Factors affecting mortgage prepayments include the level of interest rates, the general economic and social conditions, the location of the mortgaged property, and the age of the mortgage. Because prepayment rates of individual mortgage pools vary widely, the average life of a particular pool cannot be predicted accurately.
Mortgage-backed securities may be classified as private, government, or government-related, depending on the issuer or guarantor. Private mortgage-backed securities represent interest in pass-through pools consisting principally of conventional residential or commercial mortgage loans created by nongovernment issuers, such as commercial banks, savings and loan associations, and private mortgage insurance companies. Private mortgage-backed securities may not be readily marketable. In addition, mortgage-backed securities have been subject to greater liquidity risk when worldwide economic and liquidity conditions deteriorate. U.S. government mortgage-backed securities are backed by the full faith and credit of the U.S. government. GNMA, the principal U.S. guarantor of these securities, is a wholly owned U.S. government corporation within the Department of Housing and Urban Development. Government-related mortgage-backed securities are not backed by the full faith and credit of the U.S. government. Issuers include FNMA and FHLMC, which are congressionally chartered corporations. In September 2008, the U.S. Treasury placed FNMA and FHLMC under conservatorship and appointed the Federal Housing Finance Agency (FHFA) to manage their daily operations. In addition, the U.S. Treasury entered into purchase agreements with FNMA and FHLMC to provide them with capital in exchange for senior preferred stock. Pass-through securities issued by FNMA are guaranteed as to timely payment of principal and interest by FNMA. Participation certificates representing interests in mortgages from FHLMC’s national portfolio are guaranteed as to the timely payment of interest and principal by FHLMC. Private, government, or government-related entities may create mortgage loan pools offering pass-through investments in addition to those described above. The mortgages underlying these securities may be alternative mortgage instruments (i.e., mortgage instruments whose principal or interest payments may vary or whose terms to maturity may be shorter than customary).
Mortgage-backed securities are often subject to more rapid repayment than their stated maturity date would indicate as a result of the pass-through of prepayments of principal on the underlying loans. Prepayments of principal by mortgagors or mortgage foreclosures shorten the term of the mortgage pool underlying the mortgage-backed security. A
B-23
fund’s ability to maintain positions in mortgage-backed securities is affected by the reductions in the principal amount of such securities resulting from prepayments. A fund’s ability to reinvest prepayments of principal at comparable yield is subject to generally prevailing interest rates at that time. The values of mortgage-backed securities vary with changes in market interest rates generally and the differentials in yields among various kinds of government securities, mortgage-backed securities, and asset-backed securities. In periods of rising interest rates, the rate of prepayment tends to decrease, thereby lengthening the average life of a pool of mortgages supporting a mortgage-backed security. Conversely, in periods of falling interest rates, the rate of prepayment tends to increase, thereby shortening the average life of such a pool. Because prepayments of principal generally occur when interest rates are declining, an investor, such as a fund, generally has to reinvest the proceeds of such prepayments at lower interest rates than those at which its assets were previously invested. Therefore, mortgage-backed securities have less potential for capital appreciation in periods of falling interest rates than other income-bearing securities of comparable maturity.
Mortgage-Backed Securities—Adjustable Rate Mortgage-Backed Securities. Adjustable rate mortgage-backed securities (ARMBSs) have interest rates that reset at periodic intervals. Acquiring ARMBSs permits a fund to participate in increases in prevailing current interest rates through periodic adjustments in the coupons of mortgages underlying the pool on which ARMBSs are based. Such ARMBSs generally have higher current yield and lower price fluctuations than is the case with more traditional fixed income debt securities of comparable rating and maturity. However, because the interest rates on ARMBSs are reset only periodically, changes in market interest rates or in the issuer’s creditworthiness may affect their value. In addition, when prepayments of principal are made on the underlying mortgages during periods of rising interest rates, a fund can reinvest the proceeds of such prepayments at rates higher than those at which they were previously invested. Mortgages underlying most ARMBSs, however, have limits on the allowable annual or lifetime increases that can be made in the interest rate that the mortgagor pays. Therefore, if current interest rates rise above such limits over the period of the limitation, a fund holding an ARMBS does not benefit from further increases in interest rates. Moreover, when interest rates are in excess of coupon rates (i.e., the rates being paid by mortgagors) of the mortgages, ARMBSs behave more like fixed income securities and less like adjustable rate securities and are thus subject to the risks associated with fixed income securities. In addition, during periods of rising interest rates, increases in the coupon rate of adjustable rate mortgages generally lag current market interest rates slightly, thereby creating the potential for capital depreciation on such securities.
Mortgage-Backed Securities—Collateralized Mortgage Obligations. Collateralized mortgage obligations (CMOs) are mortgage-backed securities that are collateralized by whole loan mortgages or mortgage pass-through securities. The bonds issued in a CMO transaction are divided into groups, and each group of bonds is referred to as a “tranche.” Under the traditional CMO structure, the cash flows generated by the mortgages or mortgage pass-through securities in the collateral pool are used to first pay interest and then pay principal to the CMO bondholders. The bonds issued under a traditional CMO structure are retired sequentially as opposed to the pro-rata return of principal found in traditional pass-through obligations. Subject to the various provisions of individual CMO issues, the cash flow generated by the underlying collateral (to the extent it exceeds the amount required to pay the stated interest) is used to retire the bonds. Under a CMO structure, the repayment of principal among the different tranches is prioritized in accordance with the terms of the particular CMO issuance. The “fastest-pay” tranches of bonds, as specified in the prospectus for the issuance, would initially receive all principal payments. When those tranches of bonds are retired, the next tranche (or tranches) in the sequence, as specified in the prospectus, receives all of the principal payments until that tranche is retired. The sequential retirement of bond groups continues until the last tranche is retired. Accordingly, the CMO structure allows the issuer to use cash flows of long-maturity, monthly pay collateral to formulate securities with short, intermediate, and long final maturities and expected average lives and risk characteristics.
In recent years, new types of CMO tranches have evolved. These include floating rate CMOs, planned amortization classes, accrual bonds, and CMO residuals. These newer structures affect the amount and timing of principal and interest received by each tranche from the underlying collateral. Under certain of these new structures, given classes of CMOs have priority over others with respect to the receipt of prepayments on the mortgages. Therefore, depending on the type of CMOs in which a fund invests, the investment may be subject to a greater or lesser risk of prepayment than other types of mortgage-backed securities.
CMOs may include real estate mortgage investment conduits (REMICs). REMICs, which were authorized under the Tax Reform Act of 1986, are private entities formed for the purpose of holding a fixed pool of mortgages secured by an interest in real property. A REMIC is a CMO that qualifies for special tax treatment under the IRC and invests in certain mortgages principally secured by interests in real property. Investors may purchase beneficial interests in REMICs, which are known as “regular” interests, or “residual” interests. Guaranteed REMIC pass-through certificates (REMIC Certificates) issued by FNMA or FHLMC represent beneficial ownership interests in a REMIC trust consisting principally
B-24
of mortgage loans or FNMA, FHLMC, or GNMA-guaranteed mortgage pass-through certificates. For FHLMC REMIC Certificates, FHLMC guarantees the timely payment of interest and also guarantees the payment of principal, as payments are required to be made on the underlying mortgage participation certificates. FNMA REMIC Certificates are issued and guaranteed as to timely distribution of principal and interest by FNMA.
The primary risk of CMOs is the uncertainty of the timing of cash flows that results from the rate of prepayments on the underlying mortgages serving as collateral and from the structure of the particular CMO transaction (i.e., the priority of the individual tranches). An increase or decrease in prepayment rates (resulting from a decrease or increase in mortgage interest rates) will affect the yield, the average life, and the price of CMOs. The prices of certain CMOs, depending on their structure and the rate of prepayments, can be volatile. Some CMOs may also not be as liquid as other securities.
Mortgage-Backed Securities—Hybrid ARMs. A hybrid adjustable rate mortgage (hybrid ARM) is a type of mortgage in which the interest rate is fixed for a specified period and then resets periodically, or floats, for the remaining mortgage term. Hybrid ARMs are usually referred to by their fixed and floating periods. For example, a 5/1 ARM refers to a mortgage with a 5-year fixed interest rate period, followed by a 1-year interest rate adjustment period. During the initial interest period (i.e., the initial five years for a 5/1 hybrid ARM), hybrid ARMs behave more like fixed income securities and are thus subject to the risks associated with fixed income securities. All hybrid ARMs have reset dates. A reset date is the date when a hybrid ARM changes from a fixed interest rate to a floating interest rate. At the reset date, a hybrid ARM can adjust by a maximum specified amount based on a margin over an identified index. Like ARMBSs, hybrid ARMs have periodic and lifetime limitations on the increases that can be made to the interest rates that mortgagors pay. Therefore, if during a floating rate period interest rates rise above the interest rate limits of the hybrid ARM, a fund holding the hybrid ARM does not benefit from further increases in interest rates.
Mortgage-Backed Securities—Mortgage Dollar Rolls. A mortgage dollar roll is a transaction in which a fund sells a mortgage-backed security to a dealer and simultaneously agrees to purchase a similar security (but not the same security) in the future at a predetermined price. A mortgage-dollar-roll program may be structured to simulate an investment in mortgage-backed securities at a potentially lower cost, or with potentially reduced administrative burdens, than directly holding mortgage-backed securities. For accounting purposes, each transaction in a mortgage dollar roll is viewed as a separate purchase and sale of a mortgage-backed security. These transactions may increase a fund’s portfolio turnover rate. The fund receives cash for a mortgage-backed security in the initial transaction and enters into an agreement that requires the fund to purchase a similar mortgage-backed security in the future.
The counterparty with which a fund enters into a mortgage-dollar-roll transaction is obligated to provide the fund with similar securities to purchase as those originally sold by the fund. These securities generally must (1) be issued by the same agency and be part of the same program; (2) have similar original stated maturities; (3) have identical net coupon rates; and (4) satisfy “good delivery” requirements, meaning that the aggregate principal amounts of the securities delivered and received back must be within a certain percentage of the initial amount delivered. Mortgage dollar rolls will be used only if consistent with a fund’s investment objective and strategies and will not be used to change a fund’s risk profile.
Mortgage-Backed Securities—Stripped Mortgage-Backed Securities. Stripped mortgage-backed securities (SMBSs) are derivative multiclass mortgage-backed securities. SMBSs may be issued by agencies or instrumentalities of the U.S. government or by private originators of, or investors in, mortgage loans, including savings and loan associations, mortgage banks, commercial banks, investment banks, and special purpose entities formed or sponsored by any of the foregoing.
SMBSs are usually structured with two classes that receive different proportions of the interest and principal distributions on a pool of mortgage assets. A common type of SMBS will have one class receiving some of the interest and most of the principal from the mortgage assets, while the other class will receive most of the interest and the remainder of the principal. In the most extreme case, one class will receive all of the interest (the “IO” class), while the other class will receive all of the principal (the principal-only or “PO” class). The price and yield to maturity on an IO class are extremely sensitive to the rate of principal payments (including prepayments) on the related underlying mortgage assets, and a rapid rate of principal payments may have a material adverse effect on a fund’s yield to maturity from these securities. If the underlying mortgage assets experience greater than anticipated prepayments of principal, a fund may fail to recoup some or all of its initial investment in these securities, even if the security is in one of the highest rating categories.
B-25
Although SMBSs are purchased and sold by institutional investors through several investment banking firms acting as brokers or dealers, these securities were only recently developed. As a result, established trading markets have not yet developed, and accordingly, these securities may be deemed “illiquid” and thus subject to a fund’s limitations on investment in illiquid securities.
Mortgage-Backed Securities— To Be Announced (TBA) Securities. A TBA securities transaction, which is a type of forward-commitment transaction, represents an agreement to buy or sell mortgage-backed securities with agreed-upon characteristics for a fixed unit price, with settlement on a scheduled future date, typically within 30 calendar days of the trade date. With TBA transactions, the particular securities (i.e., specified mortgage pools) to be delivered or received are not identified at the trade date; however, securities delivered to a purchaser must meet specified criteria, including face value, coupon rate, and maturity, and be within industry-accepted “good delivery” standards.
A fund may sell TBA securities to hedge its portfolio positions or to dispose of mortgage-backed securities it owns under delayed-delivery arrangements. Proceeds of TBA securities sold are not received until the contractual settlement date.
For TBA purchases, a fund will maintain sufficient liquid assets (e.g., cash or marketable securities) until settlement date in an amount sufficient to meet the purchase price. Unsettled TBA securities are valued by an independent pricing service based on the characteristics of the securities to be delivered or received. A risk associated with TBA transactions is that at settlement, either the buyer fails to pay the agreed price for the securities or the seller fails to deliver the agreed securities. As the value of such unsettled TBA securities is assessed on a daily basis, parties mitigate such risk by, among other things, exchanging collateral as security for performance, performing a credit analysis of the counterparty, allocating transactions among numerous counterparties, and monitoring its exposure to each counterparty.
Options. An option is a derivative. An option on a security (or index) is a contract that gives the holder of the option, in return for the payment of a “premium,” the right, but not the obligation, to buy from (in the case of a call option) or sell to (in the case of a put option) the writer of the option the security underlying the option (or the cash value of the index) at a specified exercise price prior to the expiration date of the option. The writer of an option on a security has the obligation upon exercise of the option to deliver the underlying security upon payment of the exercise price (in the case of a call option) or to pay the exercise price upon delivery of the underlying security (in the case of a put option). The writer of an option on an index has the obligation upon exercise of the option to pay an amount equal to the cash value of the index minus the exercise price, multiplied by the specified multiplier for the index option. The multiplier for an index option determines the size of the investment position the option represents. Unlike exchange-traded options, which are standardized with respect to the underlying instrument, expiration date, contract size, and strike price, the terms of over-the-counter (OTC) options (options not traded on exchanges) generally are established through negotiation with the other party to the option contract. Although this type of arrangement allows the purchaser or writer greater flexibility to tailor an option to its needs, OTC options generally involve credit risk to the counterparty, whereas for exchange-traded, centrally cleared options, credit risk is mutualized through the involvement of the applicable clearing house.
The buyer (or holder) of an option is said to be “long” the option, while the seller (or writer) of an option is said to be “short” the option. A call option grants to the holder the right to buy (and obligates the writer to sell) the underlying security at the strike price, which is the predetermined price at which the option may be exercised. A put option grants to the holder the right to sell (and obligates the writer to buy) the underlying security at the strike price. The purchase price of an option is called the “premium.” The potential loss to an option buyer is limited to the amount of the premium plus transaction costs. This will be the case if the option is held and not exercised prior to its expiration date. Generally, an option writer sells options with the goal of obtaining the premium paid by the option buyer, but that person could also seek to profit from an anticipated rise or decline in option prices. If an option sold by an option writer expires without being exercised, the writer retains the full amount of the premium. The option writer, however, has unlimited economic risk because its potential loss, except to the extent offset by the premium received when the option was written, is equal to the amount the option is “in-the-money” at the expiration date. A call option is in-the-money if the value of the underlying position exceeds the exercise price of the option. A put option is in-the-money if the exercise price of the option exceeds the value of the underlying position. Generally, any profit realized by an option buyer represents a loss for the option writer. The writing of an option will not be considered to constitute the issuance, by a fund, of a “senior security,” as that term is defined in Section 18(g) of the 1940 Act, and therefore such transaction will not be subject to the 300% asset coverage requirement otherwise applicable to borrowings by a fund, if the fund complies with Rule 18f-4.
If a trading market, in particular options, were to become unavailable, investors in those options (such as the funds) would be unable to close out their positions until trading resumes, and they may be faced with substantial losses if the
B-26
value of the underlying instrument moves adversely during that time. Even if the market were to remain available, there may be times when options prices will not maintain their customary or anticipated relationships to the prices of the underlying instruments and related instruments. Lack of investor interest, changes in volatility, or other factors or conditions might adversely affect the liquidity, efficiency, continuity, or even the orderliness of the market for particular options.
A fund bears the risk that its advisor will not accurately predict future market trends. If the advisor attempts to use an option as a hedge against, or as a substitute for, a portfolio investment, the fund will be exposed to the risk that the option will have or will develop imperfect or no correlation with the portfolio investment, which could cause substantial losses for the fund. Although hedging strategies involving options can reduce the risk of loss, they can also reduce the opportunity for gain or even result in losses by offsetting favorable price movements in other fund investments. Many options, in particular OTC options, are complex and often valued based on subjective factors. Improper valuations can result in increased cash payment requirements to counterparties or a loss of value to a fund.
OTC Swap Agreements. An over-the-counter (OTC) swap agreement, which is a type of derivative, is an agreement between two parties (counterparties) to exchange payments at specified dates (periodic payment dates) on the basis of a specified amount (notional amount) with the payments calculated with reference to a specified asset, reference rate, or index.
Examples of OTC swap agreements include, but are not limited to, interest rate swaps, credit default swaps, equity swaps, commodity swaps, foreign currency swaps, index swaps, excess return swaps, and total return swaps. Most OTC swap agreements provide that when the periodic payment dates for both parties are the same, payments are netted and only the net amount is paid to the counterparty entitled to receive the net payment. Consequently, a fund’s current obligations (or rights) under an OTC swap agreement will generally be equal only to the net amount to be paid or received under the agreement, based on the relative values of the positions held by each counterparty. OTC swap agreements allow for a wide variety of transactions. For example, fixed rate payments may be exchanged for floating rate payments; U.S. dollar-denominated payments may be exchanged for payments denominated in a different currency; and payments tied to the price of one asset, reference rate, or index may be exchanged for payments tied to the price of another asset, reference rate, or index.
An OTC option on an OTC swap agreement, also called a “swaption,” is an option that gives the buyer the right, but not the obligation, to enter into a swap on a future date in exchange for paying a market-based “premium.” A receiver swaption gives the owner the right to receive the total return of a specified asset, reference rate, or index. A payer swaption gives the owner the right to pay the total return of a specified asset, reference rate, or index. Swaptions also include options that allow an existing swap to be terminated or extended by one of the counterparties.
The use of OTC swap agreements by a fund entails certain risks, which may be different from, or possibly greater than, the risks associated with investing directly in the securities and other investments that are the referenced asset for the swap agreement. OTC swaps are highly specialized instruments that require investment techniques, risk analyses, and tax planning different from those associated with stocks, bonds, and other traditional investments. The use of an OTC swap requires an understanding not only of the referenced asset, reference rate, or index but also of the swap itself, without the benefit of observing the performance of the swap under all possible market conditions.
OTC swap agreements may be subject to liquidity risk, which exists when a particular swap is difficult to purchase or sell. If an OTC swap transaction is particularly large or if the relevant market is illiquid (as is the case with many OTC swaps), it may not be possible to initiate a transaction or liquidate a position at an advantageous time or price, which may result in significant losses. In addition, OTC swap transactions may be subject to a fund’s limitation on investments in illiquid securities.
OTC swap agreements may be subject to pricing risk, which exists when a particular swap becomes extraordinarily expensive or inexpensive relative to historical prices or the prices of corresponding cash market instruments. Under certain market conditions, it may not be economically feasible to initiate a transaction or liquidate a position in time to avoid a loss or take advantage of an opportunity or to realize the intrinsic value of the OTC swap agreement.
Because certain OTC swap agreements have a leverage component, adverse changes in the value or level of the underlying asset, reference rate, or index can result in a loss substantially greater than the amount invested in the swap itself. Certain OTC swaps have the potential for unlimited loss, regardless of the size of the initial investment. A leveraged OTC swap transaction will not be considered to constitute the issuance, by a fund, of a “senior security,” as that term is defined in Section 18(g) of the 1940 Act, and therefore such transaction will not be subject to the 300% asset coverage requirement otherwise applicable to borrowings by a fund, if the fund complies with Rule 18f-4.
B-27
Like most other investments, OTC swap agreements are subject to the risk that the market value of the instrument will change in a way detrimental to a fund’s interest. A fund bears the risk that its advisor will not accurately forecast future market trends or the values of assets, reference rates, indexes, or other economic factors in establishing OTC swap positions for the fund. If the advisor attempts to use an OTC swap as a hedge against, or as a substitute for, a portfolio investment, the fund will be exposed to the risk that the OTC swap will have or will develop imperfect or no correlation with the portfolio investment. This could cause substantial losses for the fund. Although hedging strategies involving OTC swap instruments can reduce the risk of loss, they can also reduce the opportunity for gain or even result in losses by offsetting favorable price movements in other fund investments. Many OTC swaps are complex and often valued subjectively. Improper valuations can result in increased cash payment requirements to counterparties or a loss of value to a fund.
The use of an OTC swap agreement also involves the risk that a loss may be sustained as a result of the insolvency or bankruptcy of the counterparty or the failure of the counterparty to make required payments or otherwise comply with the terms of the agreement. Additionally, the use of credit default swaps can result in losses if a fund’s advisor does not correctly evaluate the creditworthiness of the issuer on which the credit swap is based.
Other Investment Companies. A fund may invest in other investment companies, including ETFs, non-exchange traded U.S. registered open-end investment companies (mutual funds), and closed-end investment companies, to the extent permitted by applicable law or SEC exemption. Under Section 12(d)(1) of the 1940 Act, a fund may invest up to 10% of its assets in shares of investment companies generally and up to 5% of its assets in any one investment company, as long as no investment represents more than 3% of the voting stock of an acquired investment company. In addition, no funds for which Vanguard acts as an advisor may, in the aggregate, own more than 10% of the voting stock of a closed-end investment company. SEC Rule 12d1-4 under the 1940 Act permits registered investment companies to invest in other registered investment companies beyond the limits in Section 12(d)(1), subject to certain conditions, including that funds with different investment advisors enter into a fund of funds investment agreement. Rule 12d1-4 is also designed to limit the use of complex fund structures. Under Rule 12d1-4, an acquired fund is prohibited from purchasing or otherwise acquiring the securities of another investment company or private fund if, immediately after the purchase, the securities of investment companies and private funds owned by the acquired fund have an aggregate value in excess of 10% of the value of the acquired fund's total assets, subject to certain limited exceptions. Accordingly, to the extent a fund's shares are sold to other investment companies in reliance on Rule 12d1-4, the acquired fund will be limited in the amount it could invest in other investment companies and private funds. If a fund invests in other investment companies, shareholders will bear not only their proportionate share of the fund’s expenses (including operating expenses and the fees of the advisor), but they also may indirectly bear similar expenses of the underlying investment companies. Certain investment companies, such as business development companies (BDCs), are more akin to operating companies and, as such, their expenses are not direct expenses paid by fund shareholders and are not used to calculate the fund’s net asset value. SEC rules nevertheless require that any expenses incurred by a BDC be included in a fund’s expense ratio as “Acquired Fund Fees and Expenses.” The expense ratio of a fund that holds a BDC will thus overstate what the fund actually spends on portfolio management, administrative services, and other shareholder services by an amount equal to these Acquired Fund Fees and Expenses. The Acquired Fund Fees and Expenses are not included in a fund’s financial statements, which provide a clearer picture of a fund’s actual operating expenses. Shareholders would also be exposed to the risks associated not only with the investments of the fund but also with the portfolio investments of the underlying investment companies. Certain types of investment companies, such as closed-end investment companies, issue a fixed number of shares that typically trade on a stock exchange or over-the-counter at a premium or discount to their net asset value. Others are continuously offered at net asset value but also may be traded on the secondary market.
A fund may be limited to purchasing a particular share class of other investment companies (underlying funds). In certain cases, an investor may be able to purchase lower-cost shares of such underlying funds separately, and therefore be able to construct, and maintain over time, a similar portfolio of investments while incurring lower overall expenses.
Ownership Limitations and Regulatory Relief. The ability of Vanguard and external advisors to purchase or dispose of certain fund investments, or to exercise rights on behalf of a fund, is or may be restricted or impaired because of limitations imposed by law, regulation, or by certain regulators or issuers. As a result, Vanguard and external advisors, on behalf of certain funds currently and other funds potentially in the future, are required to limit purchases, sell existing investments, or otherwise limit the exercise of shareholder rights by the fund, including voting rights. These ownership restrictions and limitations can impact a fund’s performance. For index funds, this impact generally takes the form of tracking error, which can arise when a fund is not able to acquire its desired amount of a security. For actively managed funds, this impact can result, for example, in missed investment opportunities otherwise desired by a fund's investment
B-28
advisor. If a fund is required to limit its investment in a particular issuer, then the fund may seek to obtain regulatory or corporate consents or ownership waivers. Other options a fund may pursue include seeking to obtain economic exposure to that issuer through alternative means, such as through a derivative or through investment in a totally held subsidiary, both of which may be more costly than owning securities of the issuer directly. In the event a derivative, such as a swap, is used as an alternative means of exposure, Vanguard and external advisors on behalf of a fund are not able to guarantee the availability of derivatives necessary to allow economic exposure to the security, sector, or industry. This limited availability may have additional impacts to fund performance. Additionally, use of derivatives as an alternative means of exposure subjects a fund to derivatives-related risks. Ownership restrictions and limitations could result in unanticipated tax consequences to the fund that may affect the amount, timing, and character of distributions to shareholders.
Preferred Stock. Preferred stock represents an equity or ownership interest in an issuer. Preferred stock normally pays dividends at a specified rate and has precedence over common stock in the event the issuer is liquidated or declares bankruptcy. However, in the event an issuer is liquidated or declares bankruptcy, the claims of owners of bonds take precedence over the claims of those who own preferred and common stock. Preferred stock, unlike common stock, often has a stated dividend rate payable from the corporation’s earnings. Preferred stock dividends may be cumulative or noncumulative, participating, or auction rate. “Cumulative” dividend provisions require all or a portion of prior unpaid dividends to be paid before dividends can be paid to the issuer’s common stock. “Participating” preferred stock may be entitled to a dividend exceeding the stated dividend in certain cases. If interest rates rise, the fixed dividend on preferred stocks may be less attractive, causing the price of such stocks to decline. Preferred stock may have mandatory sinking fund provisions, as well as provisions allowing the stock to be called or redeemed, which can limit the benefit of a decline in interest rates. Preferred stock is subject to many of the risks to which common stock and debt securities are subject. In addition, preferred stock may be subject to more abrupt or erratic price movements than common stock or debt securities because preferred stock may trade with less frequency and in more limited volume.
Real Estate Investment Trusts (REITs). An equity REIT owns real estate properties directly and generates income from rental and lease payments. Equity REITs also have the potential to generate capital gains as properties are sold at a profit. A mortgage REIT makes construction, development, and long-term mortgage loans to commercial real estate developers and earns interest income on these loans. A hybrid REIT holds both properties and mortgages. To avoid taxation at the corporate level, REITs must distribute most of their earnings to shareholders.
Investments in REITs are subject to many of the same risks as direct investments in real estate. In general, real estate values can be affected by a variety of factors, including, but not limited to, supply and demand for properties, general or local economic conditions, and the strength of specific industries that rent properties. Ultimately, a REIT’s performance depends on the types and locations of the properties it owns and on how well the REIT manages its properties. For example, rental income could decline because of extended vacancies, increased competition from nearby properties, tenants’ failure to pay rent, regulatory limitations on rents, fluctuations in rental income, variations in market rental rates, or incompetent management. Property values could decrease because of overbuilding in the area, environmental liabilities, uninsured damages caused by natural disasters, a general decline in the neighborhood, losses because of casualty or condemnation, increases in property taxes, or changes in zoning laws.
The value of a REIT may also be affected by changes in interest rates. Rising interest rates generally increase the cost of financing for real estate projects, which could cause the value of an equity REIT to decline. During periods of declining interest rates, mortgagors may elect to prepay mortgages held by mortgage REITs, which could lower or diminish the yield on the REIT. REITs are also subject to heavy cash-flow dependency, default by borrowers, and changes in tax and regulatory requirements. In addition, a REIT may fail to meet the requirements for qualification and taxation as a REIT under the IRC and/or fail to maintain exemption from the 1940 Act.
Reliance on Service Providers, Data Providers, and Other Technology. Vanguard funds rely upon the performance of service providers to execute several key functions, which may include functions integral to a fund’s operations. Failure by any service provider to carry out its obligations to a fund could disrupt the business of the fund and could have an adverse effect on the fund’s performance. A fund’s service providers’ reliance on certain technology or information vendors (e.g., trading systems, investment analysis tools, benchmark analytics, and tax and accounting tools) could also adversely affect a fund and its shareholders. For example, a fund’s investment advisor may use models and/or data with respect to potential investments for the fund. When models or data prove to be incorrect or incomplete, any decisions made in reliance upon such models or data expose a fund to potential risks.
Repurchase Agreements. A repurchase agreement is an agreement under which a fund acquires a debt security (generally a security issued by the U.S. government or an agency thereof, a banker’s acceptance, or a certificate of deposit) from a bank, a broker, a dealer, or another counterparty that meets minimum credit requirements and
B-29
simultaneously agrees to resell such security to the seller at an agreed-upon price and date (normally, the next business day). Because the security purchased constitutes collateral for the repurchase obligation, a repurchase agreement may be considered a loan that is collateralized by the security purchased. The resale price reflects an agreed-upon interest rate effective for the period the instrument is held by a fund and is unrelated to the interest rate on the underlying instrument. In these transactions, the securities acquired by a fund (including accrued interest earned thereon) must have a total value in excess of the value of the repurchase agreement and be held by a custodian bank until repurchased. In addition, the investment advisor will monitor a fund’s repurchase agreement transactions generally and will evaluate the creditworthiness of any bank, broker, dealer, or other counterparty that meets minimum credit requirements to a repurchase agreement relating to a fund. The aggregate amount of any such agreements is not limited, except to the extent required by law.
The use of repurchase agreements involves certain risks. One risk is the seller’s ability to pay the agreed-upon repurchase price on the repurchase date. If the seller defaults, the fund may incur costs in disposing of the collateral, which would reduce the amount realized thereon. If the seller seeks relief under bankruptcy laws, the disposition of the collateral may be delayed or limited. For example, if the other party to the agreement becomes insolvent and subject to liquidation or reorganization under bankruptcy or other laws, a court may determine that the underlying security is collateral for a loan by the fund not within its control, and therefore the realization by the fund on such collateral may be automatically stayed. Finally, it is possible that the fund may not be able to substantiate its interest in the underlying security and may be deemed an unsecured creditor of the other party to the agreement.
Restricted and Illiquid Securities/Investments (including Private Placements). Illiquid securities/investments are investments that a fund reasonably expects cannot be sold or disposed of in current market conditions in seven calendar days or less without the sale or disposition significantly changing the market value of the investment. The SEC generally limits aggregate holdings of illiquid securities/investments by a mutual fund to 15% of its net assets (5% for money market funds). A fund may experience difficulty valuing and selling illiquid securities/investments and, in some cases, may be unable to value or sell certain illiquid securities for an indefinite period of time. Illiquid securities may include a wide variety of investments, such as (1) repurchase agreements maturing in more than seven days (unless the agreements have demand/redemption features), (2) OTC options contracts and certain other derivatives (including certain swap agreements), (3) fixed time deposits that are not subject to prepayment or do not provide for withdrawal penalties upon prepayment (other than overnight deposits), (4) certain loan interests and other direct debt instruments, (5) certain municipal lease obligations, (6) private equity investments, (7) commercial paper issued pursuant to Section 4(a)(2) of the 1933 Act, and (8) securities whose disposition is restricted under the federal securities laws. Illiquid securities/investments may include restricted, privately placed securities (such as private investments in public equity (PIPEs) or special purpose acquisition companies (SPACs)) that, under the federal securities laws, generally may be resold only to qualified institutional buyers. If a market develops for a restricted security held by a fund, it may be treated as a liquid security in accordance with guidelines approved by the board of trustees.
Reverse Repurchase Agreements. In a reverse repurchase agreement, a fund sells a security to another party, such as a bank or broker-dealer, in return for cash and agrees to repurchase that security at an agreed-upon price and time. Under a reverse repurchase agreement, the fund continues to receive any principal and interest payments on the underlying security during the term of the agreement. Reverse repurchase agreements involve the risk that the market value of securities retained by the fund may decline below the repurchase price of the securities sold by the fund that it is obligated to repurchase. In addition to the risk of such a loss, fees charged to the fund may exceed the return the fund earns from investing the proceeds received from the reverse repurchase agreement transaction. A reverse repurchase agreement may be considered a borrowing transaction for purposes of the 1940 Act. A reverse repurchase agreement transaction will not be considered to constitute the issuance, by a fund, of a “senior security,” as that term is defined in Section 18(g) of the 1940 Act, and therefore such transaction will not be subject to the 300% asset coverage requirement otherwise applicable to borrowings by a fund, if the fund complies with Rule 18f-4. A fund will enter into reverse repurchase agreements only with parties whose creditworthiness has been reviewed and found satisfactory by the advisor. If the buyer in a reverse repurchase agreement becomes insolvent or files for bankruptcy, a fund’s use of proceeds from the sale may be restricted while the other party or its trustee or receiver determines if it will honor the fund’s right to repurchase the securities. If the fund is unable to recover the securities it sold in a reverse repurchase agreement, it would realize a loss equal to the difference between the value of the securities and the payment it received for them.
Securities Lending. A fund may lend its securities to financial institutions (typically brokers, dealers, and banks) to generate income for the fund. There are certain risks associated with lending securities, including counterparty, credit, market, regulatory, and operational risks. Vanguard considers the creditworthiness of the borrower, among other factors, in making decisions with respect to the lending of securities, subject to oversight by the board of trustees. If the
B-30
borrower defaults on its obligation to return the securities lent because of insolvency or other reasons, a fund could experience delays and costs in recovering the securities lent or in gaining access to the collateral. These delays and costs could be greater for certain types of foreign securities, as well as certain types of borrowers that are subject to global regulatory regimes. If a fund is not able to recover the securities lent, the fund may sell the collateral and purchase a replacement security in the market. Collateral investments are subject to market appreciation or depreciation. The value of the collateral could decrease below the value of the replacement investment by the time the replacement investment is purchased. Currently, a fund invests cash collateral into Vanguard Market Liquidity Fund, an affiliated money market fund that invests in high-quality, short-term money market instruments.
The terms and the structure of the loan arrangements, as well as the aggregate amount of securities loans, must be consistent with the 1940 Act and the rules or interpretations of the SEC thereunder. These provisions limit the amount of securities a fund may lend to 33 1∕3% of the fund’s total assets and require that (1) the borrower pledge and maintain with the fund collateral consisting of cash, an irrevocable letter of credit, or securities issued or guaranteed by the U.S. government having at all times not less than 100% of the value of the securities lent; (2) the borrower add to such collateral whenever the price of the securities lent rises (i.e., the borrower “marks to market” on a daily basis); (3) the loan be made subject to termination by the fund at any time; and (4) the fund receives reasonable interest on the loan (which may include the fund investing any cash collateral in interest-bearing short-term investments), any distribution on the lent securities, and any increase in their market value. Loan arrangements made by a fund will comply with any other applicable regulatory requirements. At the present time, the SEC does not object if an investment company pays reasonable negotiated fees in connection with lent securities, so long as such fees are set forth in a written contract and approved by the investment company’s trustees. In addition, voting rights pass with the lent securities, but if a fund has knowledge that a material event will occur affecting securities on loan, and in respect to which the holder of the securities will be entitled to vote or consent, the lender must be entitled to call the loaned securities in time to vote or consent. A fund bears the risk that there may be a delay in the return of the securities, which may impair the fund’s ability to vote on such a matter. See Tax Status of the Funds for information about certain tax consequences related to a fund’s securities lending activities.
Pursuant to Vanguard’s securities lending policy, Vanguard’s fixed income and money market funds are not permitted to, and do not, lend their investment securities.
Tax Matters—Federal Tax Discussion. Discussion herein of U.S. federal income tax matters summarizes some of the important, generally applicable U.S. federal tax considerations relevant to investment in a fund based on the IRC, U.S. Treasury regulations, and other applicable authorities. These authorities are subject to change by legislative, administrative, or judicial action, possibly with retroactive effect. Each Fund has not requested and will not request an advance ruling from the Internal Revenue Service (IRS) as to the U.S. federal income tax matters discussed in this Statement of Additional Information. In some cases, a fund’s tax position may be uncertain under current tax law and an adverse determination or future guidance by the IRS with respect to such a position could adversely affect the fund and its shareholders, including the fund’s ability to continue to qualify as a regulated investment company or to continue to pursue its current investment strategy. A shareholder should consult his or her tax professional for information regarding the particular situation and the possible application of U.S. federal, state, local, foreign, and other taxes.
Tax Matters—Federal Tax Treatment of Derivatives, Hedging, and Related Transactions. A fund’s transactions in derivative instruments (including, but not limited to, options, futures, forward contracts, and swap agreements), as well as any of the fund’s hedging, short sale, securities loan, or similar transactions, may be subject to one or more special tax rules that accelerate income to the fund, defer losses to the fund, cause adjustments in the holding periods of the fund’s securities, convert long-term capital gains into short-term capital gains, or convert short-term capital losses into long-term capital losses. These rules could therefore affect the amount, timing, and character of distributions to shareholders.
Because these and other tax rules applicable to these types of transactions are in some cases uncertain under current law, an adverse determination or future guidance by the IRS with respect to these rules (which determination or guidance could be retroactive) may affect whether a fund has made sufficient distributions, and otherwise satisfied the relevant requirements, to maintain its qualification as a regulated investment company and avoid a fund-level tax.
Tax Matters—Federal Tax Treatment of Futures Contracts. For federal income tax purposes, a fund generally must recognize, as of the end of each taxable year, any net unrealized gains and losses on certain futures contracts, as well as any gains and losses actually realized during the year. In these cases, any gain or loss recognized with respect to a futures contract is considered to be 60% long-term capital gain or loss and 40% short-term capital gain or loss, without regard to the holding period of the contract. Gains and losses on certain other futures contracts (primarily non-U.S. futures contracts) are not recognized until the contracts are closed and are treated as long-term or short-term,
B-31
depending on the holding period of the contract. Sales of futures contracts that are intended to hedge against a change in the value of securities held by a fund may affect the holding period of such securities and, consequently, the nature of the gain or loss on such securities upon disposition. A fund may be required to defer the recognition of losses on one position, such as futures contracts, to the extent of any unrecognized gains on a related offsetting position held by the fund.
A fund will distribute to shareholders annually any net capital gains that have been recognized for federal income tax purposes on futures transactions. Such distributions will be combined with distributions of capital gains realized on the fund’s other investments, and shareholders will be advised on the nature of the distributions.
Tax Matters—Federal Tax Treatment of Non-U.S. Currency Transactions. Special rules generally govern the federal income tax treatment of a fund’s transactions in the following: non-U.S. currencies; non-U.S. currency-denominated debt obligations; and certain non-U.S. currency options, futures contracts, forward contracts, and similar instruments. Accordingly, if a fund engages in these types of transactions it may have ordinary income or loss to the extent that such income or loss results from fluctuations in the value of the non-U.S. currency concerned. Such ordinary income could accelerate fund distributions to shareholders and increase the distributions taxed to shareholders as ordinary income. Any ordinary loss so created will generally reduce ordinary income distributions and, in some cases, could require the recharacterization of prior ordinary income distributions. Net ordinary losses cannot be carried forward by the fund to offset income or gains realized in subsequent taxable years.
Any gain or loss attributable to the non-U.S. currency component of a transaction engaged in by a fund that is not subject to these special currency rules (such as foreign equity investments other than certain preferred stocks) will generally be treated as a capital gain or loss and will not be segregated from the gain or loss on the underlying transaction.
To the extent a fund engages in non-U.S. currency hedging, the fund may elect or be required to apply other rules that could affect the character, timing, or amount of the fund’s gains and losses. For more information, see “Tax Matters—Federal Tax Treatment of Derivatives, Hedging, and Related Transactions.”
Tax Matters—Foreign Tax Credit. Foreign governments may withhold taxes on dividends and interest paid with respect to foreign securities held by a fund. Foreign governments may also impose taxes on other payments or gains with respect to foreign securities. If, at the close of its fiscal year, more than 50% of a fund’s total assets are invested in securities of foreign issuers, the fund may elect to pass through to shareholders the ability to deduct or, if they meet certain holding period requirements, take a credit for foreign taxes paid by the fund. Similarly, if at the close of each quarter of a fund’s taxable year, at least 50% of its total assets consist of interests in other regulated investment companies, the fund is permitted to elect to pass through to its shareholders the foreign income taxes paid by the fund in connection with foreign securities held directly by the fund or held by a regulated investment company in which the fund invests that has elected to pass through such taxes to shareholders.
Tax Matters—Market Discount or Premium. The price of a bond purchased after its original issuance may reflect market discount or premium. Depending on the particular circumstances, market discount may affect the tax character and amount of income required to be recognized by a fund holding the bond. In determining whether a bond is purchased with market discount, certain de minimis rules apply. Premium is generally amortizable over the remaining term of the bond. Depending on the type of bond, premium may affect the amount of income required to be recognized by a fund holding the bond and the fund’s basis in the bond.
Tax Matters—Passive Foreign Investment Companies. To the extent that a fund invests in stock in a foreign company, such stock may constitute an equity investment in a passive foreign investment company (PFIC). A foreign company is generally a PFIC if 75% or more of its gross income is passive or if 50% or more of its assets produce passive income. Capital gains on the sale of an interest in a PFIC will be deemed ordinary income regardless of how long a fund held it. Also, a fund may be subject to corporate income tax and an interest charge on certain dividends and capital gains earned in respect to PFIC interests, whether or not such amounts are distributed to shareholders. To avoid such tax and interest, a fund may elect to “mark to market” its PFIC interests, that is, to treat such interests as sold on the last day of a fund’s fiscal year, and to recognize any unrealized gains (or losses, to the extent of previously recognized gains) as ordinary income (or loss) each year. Distributions from a fund that are attributable to income or gains earned in respect to PFIC interests are characterized as ordinary income.
Tax Matters—Real Estate Mortgage Investment Conduits. If a fund invests directly or indirectly, including through a REIT or other pass-through entity, in residual interests in real estate mortgage investment conduits (REMICs) or equity interests in taxable mortgage pools (TMPs), a portion of the fund’s income that is attributable to a residual interest in a
B-32
REMIC or an equity interest in a TMP (such portion referred to in the IRC as an “excess inclusion”) will be subject to U.S. federal income tax in all events—including potentially at the fund level—under a notice issued by the IRS in October 2006 and U.S. Treasury regulations that have yet to be issued but may apply retroactively. This notice also provides, and the regulations are expected to provide, that excess inclusion income of a regulated investment company will be allocated to shareholders of the regulated investment company in proportion to the dividends received by such shareholders, with the same consequences as if the shareholders held the related interest directly. In general, excess inclusion income allocated to shareholders (1) cannot be offset by net operating losses (subject to a limited exception for certain thrift institutions); (2) will constitute unrelated business taxable income (UBTI) to entities (including a qualified pension plan, an individual retirement account, a 401(k) plan, a Keogh plan, or other tax-exempt entity) subject to tax on UBTI, thereby potentially requiring such an entity, which otherwise might not be required, to file a tax return and pay tax on such income; and (3) in the case of a non-U.S. investor, will not qualify for any reduction in U.S. federal withholding tax. A shareholder will be subject to U.S. federal income tax on such inclusions notwithstanding any exemption from such income tax otherwise available under the IRC. As a result, a fund investing in such interests may not be suitable for charitable remainder trusts. See “Tax Matters—Tax-Exempt Investors.”
Tax Matters—Tax Considerations for Non-U.S. Investors. U.S. withholding and estate taxes and certain U.S. tax reporting requirements may apply to any investments made by non-U.S. investors in Vanguard funds. Certain properly reported distributions of qualifying interest income or short-term capital gain made by a fund to its non-U.S. investors are exempt from U.S. withholding taxes, provided the investors furnish valid tax documentation (i.e., IRS Form W-8) certifying as to their non-U.S. status.
A fund is permitted, but is not required, to report any of its distributions as eligible for such relief, and some distributions (e.g., distributions of interest a fund receives from non-U.S. issuers) are not eligible for this relief. For some funds, Vanguard has chosen to report qualifying distributions and apply the withholding exemption to those distributions when made to non-U.S. shareholders who invest directly with Vanguard. For other funds, Vanguard may choose not to apply the withholding exemption to qualifying fund distributions made to direct shareholders, but may provide the reporting to such shareholders. In these cases, a shareholder may be able to reclaim such withholding tax directly from the IRS.
If shareholders hold fund shares (including ETF shares) through a broker or intermediary, their broker or intermediary may apply this relief to properly reported qualifying distributions made to shareholders with respect to those shares. If a shareholder’s broker or intermediary instead collects withholding tax where the fund has provided the proper reporting, the shareholder may be able to reclaim such withholding tax from the IRS. Please consult your broker or intermediary regarding the application of these rules.
This relief does not apply to any withholding required under the Foreign Account Tax Compliance Act (FATCA), which generally requires a fund to obtain information sufficient to identify the status of each of its shareholders. If a shareholder fails to provide this information or otherwise fails to comply with FATCA, a fund may be required to withhold under FATCA at a rate of 30% with respect to that shareholder on fund distributions. Please consult your tax advisor for more information about these rules.
Tax Matters—Tax-Exempt Investors. Income of a fund that would be UBTI if earned directly by a tax-exempt entity will not generally be attributed as UBTI to a tax-exempt shareholder of the fund. Notwithstanding this “blocking” effect, a tax-exempt shareholder could realize UBTI by virtue of its investment in a fund if shares in the fund constitute debt-financed property in the hands of the tax-exempt shareholder within the meaning of IRC Section 514(b).
A tax-exempt shareholder may also recognize UBTI if a fund recognizes “excess inclusion income” derived from direct or indirect investments in residual interests in REMICs or equity interests in TMPs. See “Tax Matters—Real Estate Mortgage Investment Conduits.”
In addition, special tax consequences apply to charitable remainder trusts that invest in a fund that invests directly or indirectly in residual interests in REMICs or equity interests in TMPs. Charitable remainder trusts and other tax-exempt investors are urged to consult their tax advisors concerning the consequences of investing in a fund.
Time Deposits. Time deposits are subject to the same risks that pertain to domestic issuers of money market instruments, most notably credit risk (and, to a lesser extent, income risk, market risk, and liquidity risk). Additionally, time deposits of foreign branches of U.S. banks and foreign branches of foreign banks may be subject to certain sovereign risks. One such risk is the possibility that a sovereign country might prevent capital, in the form of U.S. dollars, from flowing across its borders. Other risks include adverse political and economic developments, the extent
B-33
and quality of government regulation of financial markets and institutions, the imposition of foreign withholding taxes, and expropriation or nationalization of foreign issuers. However, time deposits of such issuers will undergo the same type of credit analysis as domestic issuers in which a Vanguard fund invests and will have at least the same financial strength as the domestic issuers approved for the fund.
Warrants. Warrants are instruments that give the holder the right, but not the obligation, to buy an equity security at a specific price for a specific period of time. Changes in the value of a warrant do not necessarily correspond to changes in the value of its underlying security. The price of a warrant may be more volatile than the price of its underlying security, and a warrant may offer greater potential for capital appreciation as well as capital loss. Warrants do not entitle a holder to dividends or voting rights with respect to the underlying security and do not represent any rights in the assets of the issuing company. A warrant ceases to have value if it is not exercised prior to its expiration date. These factors can make warrants more speculative than other types of investments. Other kinds of warrants exist, including, but not limited to, warrants linked to countries’ economic performance or to commodity prices such as oil prices. These warrants may be subject to risk from fluctuation of underlying assets or indexes, as well as credit risk that the issuer does not pay on the obligations and risk that the data used for warrant payment calculation does not accurately reflect the true underlying commodity price or economic performance.
When-Issued, Delayed-Delivery, and Forward-Commitment Transactions. When-issued, delayed-delivery, and forward-commitment transactions involve a commitment to purchase or sell specific securities at a predetermined price or yield in which payment and delivery take place after the customary settlement period for that type of security. Typically, no interest accrues to the purchaser until the security is delivered. When purchasing securities pursuant to one of these transactions, payment for the securities is not required until the delivery date. However, the purchaser assumes the rights and risks of ownership, including the risks of price and yield fluctuations and the risk that the security will not be issued as anticipated. When a fund has sold a security pursuant to one of these transactions, the fund does not participate in further gains or losses with respect to the security. If the other party to a delayed-delivery transaction fails to deliver or pay for the securities, the fund could miss a favorable price or yield opportunity or suffer a loss. A fund may renegotiate a when-issued or forward-commitment transaction and may sell the underlying securities before delivery, which may result in capital gains or losses for the fund. When-issued, delayed-delivery, and forward-commitment transactions will not be considered to constitute the issuance, by a fund, of a “senior security,” as that term is defined in Section 18(g) of the 1940 Act, and therefore such transaction will not be subject to the 300% asset coverage requirement otherwise applicable to borrowings by the fund, if the fund complies with Rule 18f-4.
Share Price
Multiple-class funds do not have a single share price. Rather, each class has a share price, called its net asset value, or NAV, is calculated as of the close of regular trading on the New York Stock Exchange (NYSE), generally 4 p.m., Eastern time, on each day that the NYSE is open for business (a business day). In the rare event the NYSE experiences unanticipated disruptions and is unavailable at the close of the trading day, each Fund reserves the right to treat such day as a business day and calculate NAVs as of the close of regular trading on the Nasdaq (or another alternate exchange if the Nasdaq is unavailable, as determined at Vanguard’s discretion), generally 4 p.m., Eastern time. The NAV per share for the Funds (except Vanguard Explorer Value Fund, Vanguard Total Corporate Bond ETF, and Total World Bond ETF) is computed by dividing the total assets, minus liabilities, allocated to the share class by the number of Fund shares outstanding for that class. NAV per share for the Explorer Value Fund and the Total Corporate Bond ETF is computed by dividing the total assets, minus liabilities, of the Fund by the number of Fund shares outstanding. On U.S. holidays or other days when the NYSE is closed, the NAV is not calculated, and the Funds do not sell or redeem shares. However, on those days the value of a Fund’s assets may be affected to the extent that the Fund holds securities that change in value on those days (such as foreign securities that trade on foreign markets that are open).
The NYSE typically observes the following holidays: New Year’s Day; Martin Luther King, Jr., Day; Presidents’ Day (Washington’s Birthday); Good Friday; Memorial Day; Juneteenth National Independence Day; Independence Day; Labor Day; Thanksgiving Day; and Christmas Day. Although each Fund expects the same holidays to be observed in the future, the NYSE may modify its holiday schedule or hours of operation at any time.
B-34
Purchase and Redemption of Shares
Purchase of Shares (Other than ETF Shares)
The purchase price of shares of each Fund is the NAV per share next determined after the purchase request is received in good order, as defined in each Fund's prospectus.
The Intermediate-Term and Long-Term Corporate Bond Index Funds charge purchase fees of 0.25% and 1.00%, respectively. The purchase fee is paid to the Fund to reimburse it for the transaction costs incurred from purchasing securities. The fee is deducted from all purchases, including shares purchased by exchange from other Vanguard funds. Information regarding the application of purchase fees is described more fully in the Fund’s prospectus.
The Short-Term and Intermediate-Term Corporate Bond Index Funds each reserve the right to impose a transaction fee on any purchase that, in the opinion of the advisor, would disrupt efficient management of the Fund. The advisor believes that it may be necessary to impose a transaction fee of 0.25% for the Short-Term Corporate Bond Index Fund and a transaction fee of 0.50% for the Intermediate-Term Corporate Bond Index Fund. The advisor may impose this transaction fee if an investor’s aggregate purchases into a Fund over a 12-month period exceed, or are expected to exceed, $100 million for the Short-Term Corporate Bond Index Fund or $50 million for the Intermediate-Term Corporate Bond Index Fund.
When applicable, transaction fees may be imposed on the aggregate amount of an investor’s purchases. Fees are based on the advisor’s estimate of the transaction costs incurred by each Fund in accepting new investments, which depends on the types of securities in which each Fund invests. Fees may be waived or reduced, however, if an investor’s purchases can be offset by other shareholders’ redemptions from the same Fund. Prospective investors may determine whether the fee will be imposed on their investments by calling Vanguard.
Exchange of Securities for Shares of a Fund. Shares of a Fund may be purchased “in kind” (i.e., in exchange for securities, rather than for cash) at the discretion of each Fund’s portfolio manager. Such securities must not be restricted as to transfer and must have a value that is readily ascertainable. Securities accepted by each Fund will be valued, as set forth in the Fund’s prospectus, as of the time of the next determination of NAV after such acceptance. All dividend, subscription, or other rights that are reflected in the market price of accepted securities at the time of valuation become the property of each Fund and must be delivered to the Fund by the investor upon receipt from the issuer. A gain or loss for federal income tax purposes, depending upon the cost of the securities tendered, would be realized by the investor upon the exchange. Investors interested in purchasing fund shares in kind should contact Vanguard.
Redemption of Shares (Other than ETF Shares)
The redemption price of shares of each Fund is the NAV per share next determined after the redemption request is received in good order, as defined in each Fund’s prospectus.
Each Fund can postpone payment of redemption proceeds for up to seven calendar days. In addition, each Fund can suspend redemptions and/or postpone payments of redemption proceeds beyond seven calendar days (1) during any period that the NYSE is closed or trading on the NYSE is restricted as determined by the SEC; (2) during any period when an emergency exists, as defined by the SEC, as a result of which it is not reasonably practicable for the Fund to dispose of securities it owns or to fairly determine the value of its assets; or (3) for such other periods as the SEC may permit.
The Trust has filed a notice of election with the SEC to pay in cash all redemptions requested by any shareholder of record limited in amount during any 90-day period to the lesser of $250,000 or 1% of the net assets of a Fund at the beginning of such period.
If Vanguard determines that it would be detrimental to the best interests of the remaining shareholders of a Fund to make payment wholly or partly in cash, the Fund may pay the redemption price in whole or in part by a distribution in kind of readily marketable securities held by the Fund in lieu of cash in conformity with applicable rules of the SEC and in accordance with procedures adopted by the Fund's board of trustees. Investors may incur brokerage charges on the sale of such securities received in payment of redemptions.
The Funds do not charge redemption fees. Shares redeemed may be worth more or less than what was paid for them, depending on the market value of the securities held by the Fund.
B-35
Vanguard processes purchase and redemption requests through a pooled account. Pending investment direction or distribution of redemption proceeds, the assets in the pooled account are invested and any earnings (the “float”) are allocated proportionately among the Vanguard funds in order to offset fund expenses. Other than the float, Vanguard treats assets held in the pooled account as the assets of each shareholder making such purchase or redemption request.
Right to Change Policies
Vanguard reserves the right, without notice, to (1) alter, add, or discontinue any conditions of purchase (including eligibility requirements), redemption, exchange, conversion, service, or privilege at any time and (2) alter, impose, discontinue, or waive any purchase fee, redemption fee, account service fee, or other fee charged to a shareholder or a group of shareholders. Changes may affect any or all investors. These actions will be taken when, at the sole discretion of Vanguard management, Vanguard believes they are in the best interest of a fund.
Account Restrictions
Vanguard reserves the right to: (1) redeem all or a portion of a fund/account to meet a legal obligation, including tax withholding, tax lien, garnishment order, or other obligation imposed on your account by a court or government agency; (2) redeem shares, close an account, or suspend account privileges, features, or options in the case of threatening conduct or activity; (3) redeem shares, close an account, or suspend account privileges, features, or options if Vanguard believes or suspects that not doing so could result in a suspicious, fraudulent, or illegal transaction; (4) place restrictions on the ability to redeem any or all shares in an account if it is required to do so by a court or government agency; (5) place restrictions on the ability to redeem any or all shares in an account if Vanguard believes that doing so will prevent fraud or financial exploitation or abuse, or will protect vulnerable investors; (6) freeze any account and/or suspend account services if Vanguard has received reasonable notice of a dispute regarding the assets in an account, including notice of a dispute between the registered or beneficial account owners; and (7) freeze any account and/or suspend account services upon initial notification to Vanguard of the death of an account owner.
Investing With Vanguard Through Other Firms
Each Fund has authorized certain agents to accept on its behalf purchase and redemption orders, and those agents are authorized to designate other intermediaries to accept purchase and redemption orders on the Fund’s behalf (collectively, Authorized Agents). The Fund will be deemed to have received a purchase or redemption order when an Authorized Agent accepts the order in accordance with the Fund’s instructions. In most instances, a customer order that is properly transmitted to an Authorized Agent will be priced at the NAV per share next determined after the order is received by the Authorized Agent.
Management of the Funds
Vanguard
Each Fund is part of the Vanguard group of investment companies, which consists of over 200 funds. Each Fund is a series of a Delaware statutory trust. The funds obtain virtually all of their corporate management, administrative, and distribution services through the trusts’ jointly owned subsidiary, Vanguard. Vanguard may contract with certain third-party service providers to assist Vanguard in providing certain administrative and/or accounting services with respect to the funds, subject to Vanguard's oversight. Vanguard also provides investment advisory services to certain Vanguard funds. All of these services are provided at Vanguard’s total cost of operations pursuant to the Fifth Amended and Restated Funds’ Service Agreement (the Agreement).
Vanguard employs a supporting staff of management and administrative personnel needed to provide the requisite services to the funds and also furnishes the funds with necessary office space, furnishings, and equipment. Each fund (other than a fund of funds) pays its share of Vanguard’s total expenses, which are allocated among the funds under methods approved by the board of trustees of each fund. In addition, each fund bears its own direct expenses, such as legal, auditing, and custodial fees.
Pursuant to an agreement between Vanguard and JPMorgan Chase Bank N.A. (JPMorgan), JPMorgan provides services for Vanguard Sector Bond Index Funds, Vanguard Total Corporate Bond ETF, and Vanguard Total World Bond ETF. These services include, but are not limited to: (i) the calculation of such funds’ daily NAVs and (ii) the furnishing of financial reports. The fees paid to JPMorgan under this agreement are based on a combination of flat and asset based
Pursuant to an agreement between Vanguard and JPMorgan Chase Bank N.A. (JPMorgan), JPMorgan provides services for Vanguard Sector Bond Index Funds, Vanguard Total Corporate Bond ETF, and Vanguard Total World Bond ETF. These services include, but are not limited to: (i) the calculation of such funds’ daily NAVs and (ii) the furnishing of financial reports. The fees paid to JPMorgan under this agreement are based on a combination of flat and asset based
B-36
fees. As of the fiscal year ended August 31, 2023, JPMorgan had received fees from the Funds for administrative services rendered as shown in the table below.
Pursuant to an agreement between Vanguard and State Street Bank and Trust Company (State Street), State Street provides services for Vanguard Explore Value Fund and Vanguard Russell Index Funds. These services include, but are not limited to: (i) the calculation of such funds’ daily NAVs and (ii) the furnishing of financial reports. The fees paid to State Street under this agreement are based on a combination of flat and asset based fees. During the fiscal years ended August 31, 2021, 2022, and 2023, State Street had received fees from the Funds for administrative services rendered as shown in the table below.
Pursuant to an agreement between Vanguard and State Street Bank and Trust Company (State Street), State Street provides services for Vanguard Explore Value Fund and Vanguard Russell Index Funds. These services include, but are not limited to: (i) the calculation of such funds’ daily NAVs and (ii) the furnishing of financial reports. The fees paid to State Street under this agreement are based on a combination of flat and asset based fees. During the fiscal years ended August 31, 2021, 2022, and 2023, State Street had received fees from the Funds for administrative services rendered as shown in the table below.
|
Vanguard Fund |
2021 |
2022 |
2023 |
|
Vanguard Explorer Value Fund |
$16,125.03 |
$21,500.04 |
$21,500.04 |
|
Vanguard Intermediate-Term Corporate Bond Index Fund |
14,166.61 |
16,999.93 |
16,999.93 |
|
Vanguard Intermediate-Term Treasury Index Fund |
14,166.65 |
16,999.93 |
16,999.92 |
|
Vanguard Long-Term Corporate Bond Index Fund |
14,166.59 |
16,999.92 |
16,999.89 |
|
Vanguard Long-Term Treasury Index Fund |
14,166.60 |
16,999.91 |
16,999.90 |
|
Vanguard Mortgage-Backed Securities Index Fund |
14,166.61 |
16,999.95 |
16,999.99 |
|
Vanguard Russell 1000 Growth Index Fund |
16,125.03 |
21,500.04 |
21,500.04 |
|
Vanguard Russell 1000 Index Fund |
16,125.03 |
21,500.04 |
21,500.04 |
|
Vanguard Russell 1000 Value Index Fund |
16,125.03 |
21,500.04 |
21,500.04 |
|
Vanguard Russell 2000 Growth Index Fund |
16,125.03 |
21,500.04 |
21,500.04 |
|
Vanguard Russell 2000 Index Fund |
16,125.03 |
21,500.04 |
21,500.04 |
|
Vanguard Russell 2000 Value Index Fund |
16,125.03 |
21,500.04 |
21,500.04 |
|
Vanguard Russell 3000 Index Fund |
16,125.03 |
21,500.04 |
21,500.04 |
|
Vanguard Short-Term Corporate Bond Index Fund |
14,166.56 |
16,999.92 |
16,999.92 |
|
Vanguard Short-Term Treasury Index Fund |
14,166.62 |
16,999.92 |
16,999.92 |
|
Vanguard Total Corporate Bond ETF |
14,166.60 |
16,999.92 |
16,999.92 |
|
Vanguard Total World Bond ETF |
14,166.60 |
16,999.92 |
16,999.92 |
The funds’ officers are also employees of Vanguard.
Vanguard, Vanguard Marketing Corporation (VMC), the funds, and the funds’ advisors have adopted codes of ethics designed to prevent employees who may have access to nonpublic information about the trading activities of the funds (access persons) from profiting from that information. The codes of ethics permit access persons to invest in securities for their own accounts, including securities that may be held by a fund, but place substantive and procedural restrictions on the trading activities of access persons. For example, the codes of ethics require that access persons receive advance approval for most securities trades to ensure that there is no conflict with the trading activities of the funds.
Vanguard was established and operates under the Agreement. The Agreement provides that each Vanguard fund may be called upon to invest up to 0.40% of its net assets in Vanguard. The amounts that each fund has invested are adjusted from time to time in order to maintain the proportionate relationship between each fund’s relative net assets and its contribution to Vanguard’s capital.
B-37
As of August 31, 2023, each Fund had contributed capital to Vanguard as follows:
|
Vanguard Fund |
Capital
Contribution to
Vanguard |
Percentage of
Fund’s
Average
Net Assets |
Percent of
Vanguard Funds’
Contribution |
|
Vanguard Explorer Value Fund |
$33,000 |
Less than 0.01% |
0.01% |
|
Vanguard Short-Term Treasury Index Fund |
890,000 |
Less than 0.01 |
0.36 |
|
Vanguard Intermediate-Term Treasury Index Fund |
694,000 |
Less than 0.01 |
0.28 |
|
Vanguard Long-Term Treasury Index Fund |
382,000 |
Less than 0.01 |
0.15 |
|
Vanguard Short-Term Corporate Bond Index Fund |
1,417,000 |
Less than 0.01 |
0.57 |
|
Vanguard Intermediate-Term Corporate Bond Index Fund |
1,366,000 |
Less than 0.01 |
0.55 |
|
Vanguard Long-Term Corporate Bond Index Fund |
227,000 |
Less than 0.01 |
0.09 |
|
Vanguard Mortgage-Backed Securities Index Fund |
581,000 |
Less than 0.01 |
0.23 |
|
Vanguard Russell 1000 Index Fund |
195,000 |
Less than 0.01 |
0.08 |
|
Vanguard Russell 1000 Value Index Fund |
272,000 |
Less than 0.01 |
0.11 |
|
Vanguard Russell 1000 Growth Index Fund |
569,000 |
Less than 0.01 |
0.23 |
|
Vanguard Russell 2000 Index Fund |
236,000 |
Less than 0.01 |
0.09 |
|
Vanguard Russell 2000 Value Index Fund |
33,000 |
Less than 0.01 |
0.01 |
|
Vanguard Russell 2000 Growth Index Fund |
35,000 |
Less than 0.01 |
0.01 |
|
Vanguard Russell 3000 Index Fund |
94,000 |
Less than 0.01 |
0.04 |
Vanguard Total Corporate Bond ETF and Vanguard Total World Bond ETF Only. The Agreement provides that the Funds will not contribute to Vanguard’s capitalization or pay for corporate management, administrative, and distribution services provided by Vanguard. However, each Fund will bear its own direct expenses, such as legal, auditing, and custodial fees. In addition, the Agreement further provides that the Funds’ direct expenses may be offset, in whole or in part, by (1) the Funds’ contributions to the cost of operating the underlying Vanguard funds in which the Funds invest and (2) certain savings in administrative and marketing costs that Vanguard expects to derive from the Funds’ operations. Accordingly, all expenses for services provided by Vanguard to the Funds and all other expenses incurred by the Funds are expected to be borne by the underlying funds. The Funds' shareholders bear the fees and expenses associated with the Fund’s investments in the underlying funds.
As of August 31, 2023, the annualized Acquired Fund Fees and Expenses of the Total Corporate Bond ETF and Total World Bond ETF were 0.04% and 0.05%, respectively.
Management. Corporate management and administrative services include (1) executive staff, (2) accounting and financial, (3) legal and regulatory, (4) shareholder account maintenance, (5) monitoring and control of custodian relationships, (6) shareholder reporting, and (7) review and evaluation of advisory and other services provided to the funds by third parties.
Distribution. Vanguard Marketing Corporation, 100 Vanguard Boulevard, Malvern, PA 19355, a wholly owned subsidiary of Vanguard, is the principal underwriter for the funds and in that capacity performs and finances marketing, promotional, and distribution activities (collectively, marketing and distribution activities) that are primarily intended to result in the sale of the funds’ shares. VMC offers shares of each fund for sale on a continuous basis and will use all reasonable efforts in connection with the distribution of shares of the funds. VMC performs marketing and distribution activities in accordance with the conditions of a 1981 SEC exemptive order that permits the Vanguard funds to internalize and jointly finance the marketing, promotion, and distribution of their shares. The funds’ trustees review and approve the marketing and distribution expenses incurred by the funds, including the nature and cost of the activities and the desirability of each fund’s continued participation in the joint arrangement.
To ensure that each fund’s participation in the joint arrangement falls within a reasonable range of fairness, each fund contributes to VMC’s marketing and distribution expenses in accordance with an SEC-approved formula. Under that formula, one half of the marketing and distribution expenses are allocated among the funds based upon their relative net assets. The remaining half of those expenses is allocated among the funds based upon each fund’s sales for the preceding 24 months relative to the total sales of the funds as a group, provided, however, that no fund’s aggregate
B-38
quarterly rate of contribution for marketing and distribution expenses shall exceed 125% of the average marketing and distribution expense rate for Vanguard and that no fund shall incur annual marketing and distribution expenses in excess of 0.20% of its average month-end net assets. Each fund’s contribution to these marketing and distribution expenses helps to maintain and enhance the attractiveness and viability of the Vanguard complex as a whole, which benefits all of the funds and their shareholders.
VMC’s principal marketing and distribution expenses are for advertising, promotional materials, and marketing personnel. Other marketing and distribution activities of an administrative nature that VMC undertakes on behalf of the funds may include, but are not limited to:
◾ Conducting or publishing Vanguard-generated research and analysis concerning the funds, other investments, the financial markets, or the economy.
◾ Providing views, opinions, advice, or commentary concerning the funds, other investments, the financial markets, or the economy.
◾ Providing analytical, statistical, performance, or other information concerning the funds, other investments, the financial markets, or the economy.
◾ Providing administrative services in connection with investments in the funds or other investments, including, but not limited to, shareholder services, recordkeeping services, and educational services.
◾ Providing products or services that assist investors or financial service providers (as defined below) in the investment decision-making process.
VMC performs most marketing and distribution activities itself. Some activities may be conducted by third parties pursuant to shared marketing arrangements under which VMC agrees to share the costs and performance of marketing and distribution activities in concert with a financial service provider. Financial service providers include, but are not limited to, investment advisors, broker-dealers, financial planners, financial consultants, banks, and insurance companies. Under these cost- and performance-sharing arrangements, VMC may pay or reimburse a financial service provider (or a third party it retains) for marketing and distribution activities that VMC would otherwise perform. VMC’s cost- and performance-sharing arrangements may be established in connection with Vanguard investment products or services offered or provided to or through the financial service providers.
VMC’s arrangements for shared marketing and distribution activities may vary among financial service providers, and its payments or reimbursements to financial service providers in connection with shared marketing and distribution activities may be significant. VMC, as a matter of policy, does not pay asset-based fees, sales-based fees, or account-based fees to financial service providers in connection with its marketing and distribution activities for the Vanguard funds. VMC does make fixed dollar payments to financial service providers when sponsoring, jointly sponsoring, financially supporting, or participating in conferences, programs, seminars, presentations, meetings, or other events involving fund shareholders, financial service providers, or others concerning the funds, other investments, the financial markets, or the economy, such as industry conferences, prospecting trips, due diligence visits, training or education meetings, and sales presentations. VMC also makes fixed dollar payments to financial service providers for data regarding funds, such as statistical information regarding sales of fund shares. In addition, VMC makes fixed dollar payments for expenses associated with financial service providers’ use of Vanguard’s funds including, but not limited to, the use of funds in model portfolios. These payments may be used for services including, but not limited to, technology support and development; platform support and development; due diligence related to products used on a platform; legal, regulatory, and compliance expenses related to a platform; and other platform-related services.
In connection with its marketing and distribution activities, VMC may give financial service providers (or their representatives) (1) promotional items of nominal value that display Vanguard’s logo, such as golf balls, shirts, towels, pens, and mouse pads; (2) gifts that do not exceed $100 per person annually and are not preconditioned on achievement of a sales target; (3) an occasional meal, a ticket to a sporting event or the theater, or comparable entertainment that is neither so frequent nor so extensive as to raise any question of propriety and is not preconditioned on achievement of a sales target; and (4) reasonable travel and lodging accommodations to facilitate participation in marketing and distribution activities.
VMC policy prohibits marketing and distribution activities that are intended, designed, or likely to compromise suitability determinations by, or the fulfillment of any fiduciary duties or other obligations that apply to, financial service providers. Nonetheless, VMC’s marketing and distribution activities are primarily intended to result in the sale of the funds’ shares, and as such, its activities, including shared marketing and distribution activities and fixed dollar payments as described above, may influence applicable financial service providers (or their representatives) to recommend, promote, include, or invest in a Vanguard fund or share class. In addition, Vanguard or any of its subsidiaries may retain a financial
B-39
service provider to provide consulting or other services, and that financial service provider also may provide services to investors. Investors should consider the possibility that any of these activities, relationships, or payments may influence a financial service provider’s (or its representatives’) decision to recommend, promote, include, or invest in a Vanguard fund or share class. Each financial service provider should consider its suitability determinations, fiduciary duties, and other legal obligations (or those of its representatives) in connection with any decision to consider, recommend, promote, include, or invest in a Vanguard fund or share class.
The following table describes the expenses of Vanguard and VMC that are incurred by the Funds (other than Vanguard Total Corporate Bond ETF and Vanguard Total World Bond ETF). Amounts captioned “Management and Administrative Expenses” include a Fund's allocated share of expenses associated with the management, administrative, and transfer agency services Vanguard provides to the Vanguard funds. Amounts captioned “Marketing and Distribution Expenses” include a Fund's allocated share of expenses associated with the marketing and distribution activities that VMC conducts on behalf of the Vanguard funds.
As is the case with all mutual funds, transaction costs incurred by the Funds for buying and selling securities are not reflected in the table. Annual Shared Fund Operating Expenses are based on expenses incurred in the fiscal years ended August 31, 2021, 2022, and 2023, and are presented as a percentage of each Fund's average month-end net assets.
B-40
|
Annual Shared Fund Operating Expenses
(Shared Expenses Deducted From Fund Assets) | |||
|
Vanguard Fund |
2021 |
2022 |
2023 |
|
Vanguard Explorer Value Fund |
|
|
|
|
Management and Administrative Expenses |
0.21% |
0.20% |
0.20% |
|
Marketing and Distribution Expenses |
0.02 |
0.01 |
0.01 |
|
Vanguard Intermediate-Term Corporate Bond Index Fund |
|
|
|
|
Management and Administrative Expenses |
0.04% |
0.03% |
0.03% |
|
Marketing and Distribution Expenses |
0.01 |
0.01 |
0.01 |
|
Vanguard Intermediate-Term Treasury Index Fund |
|
|
|
|
Management and Administrative Expenses |
0.04% |
0.04% |
0.04% |
|
Marketing and Distribution Expenses |
0.01 |
0.01 |
0.01 |
|
Vanguard Long-Term Corporate Bond Index Fund |
|
|
|
|
Management and Administrative Expenses |
0.03% |
0.03% |
0.03% |
|
Marketing and Distribution Expenses |
0.01 |
0.01 |
0.01 |
|
Vanguard Long-Term Treasury Index Fund |
|
|
|
|
Management and Administrative Expenses |
0.05% |
0.04% |
0.04% |
|
Marketing and Distribution Expenses |
0.01 |
0.01 |
0.01 |
|
Vanguard Mortgage-Backed Securities Index Fund |
|
|
|
|
Management and Administrative Expenses |
0.03% |
0.03% |
0.03% |
|
Marketing and Distribution Expenses |
0.01 |
Less than 0.01 |
Less than 0.01 |
|
Vanguard Russell 1000 Growth Index Fund |
|
|
|
|
Management and Administrative Expenses |
0.07% |
0.06% |
0.07% |
|
Marketing and Distribution Expenses |
Less than 0.01 |
Less than 0.01 |
Less than 0.01 |
|
Vanguard Russell 1000 Index Fund |
|
|
|
|
Management and Administrative Expenses |
0.06% |
0.05% |
0.06% |
|
Marketing and Distribution Expenses |
Less than 0.01 |
Less than 0.01 |
Less than 0.01 |
|
Vanguard Russell 1000 Value Index Fund |
|
|
|
|
Management and Administrative Expenses |
0.06% |
0.05% |
0.06% |
|
Marketing and Distribution Expenses |
Less than 0.01 |
0.01 |
0.01 |
|
Vanguard Russell 2000 Growth Index Fund |
|
|
|
|
Management and Administrative Expenses |
0.10% |
0.10% |
0.10% |
|
Marketing and Distribution Expenses |
Less than 0.01 |
Less than 0.01 |
0.01 |
|
Vanguard Russell 2000 Index Fund |
|
|
|
|
Management and Administrative Expenses |
0.07% |
0.06% |
0.07% |
|
Marketing and Distribution Expenses |
Less than 0.01 |
0.01 |
0.01 |
|
Vanguard Russell 2000 Value Index Fund |
|
|
|
|
Management and Administrative Expenses |
0.11% |
0.10% |
0.11% |
|
Marketing and Distribution Expenses |
Less than 0.01 |
0.01 |
0.01 |
|
Vanguard Russell 3000 Index Fund |
|
|
|
|
Management and Administrative Expenses |
0.08% |
0.06% |
0.05% |
|
Marketing and Distribution Expenses |
Less than 0.01 |
Less than 0.01 |
Less than 0.01 |
|
Vanguard Short-Term Corporate Bond Index Fund |
|
|
|
|
Management and Administrative Expenses |
0.04% |
0.03% |
0.03% |
|
Marketing and Distribution Expenses |
0.01 |
0.01 |
0.01 |
|
Vanguard Short-Term Treasury Index Fund |
|
|
|
|
Management and Administrative Expenses |
0.04% |
0.04% |
0.03% |
|
Marketing and Distribution Expenses |
0.01 |
0.01 |
0.01 |
B-41
Officers and Trustees
Each Vanguard fund is governed by the board of trustees of its trust and a single set of officers. Consistent with the board’s corporate governance principles, the trustees believe that their primary responsibility is oversight of the management of each fund for the benefit of its shareholders, not day-to-day management. The trustees set broad policies for the funds; select investment advisors; monitor fund operations, regulatory compliance, performance, and costs; nominate and select new trustees; and elect fund officers. Vanguard manages the day-to-day operations of the funds under the direction of the board of trustees.
The trustees play an active role, as a full board and at the committee level, in overseeing risk management for the funds. The trustees delegate the day-to-day risk management of the funds to various groups, including portfolio review, investment management, risk management, compliance, legal, fund accounting, and fund services and oversight. These groups provide the trustees with regular reports regarding investment, valuation, liquidity, and compliance, as well as the risks associated with each. The trustees also oversee risk management for the funds through regular interactions with the funds’ internal and external auditors.
The full board participates in the funds’ risk oversight, in part, through the Vanguard funds’ compliance program, which covers the following broad areas of compliance: investment and other operations; recordkeeping; valuation and pricing; communications and disclosure; reporting and accounting; oversight of service providers; fund governance; and codes of ethics, insider trading controls, and protection of nonpublic information. The program seeks to identify and assess risk through various methods, including through regular interdisciplinary communications between compliance professionals and business personnel who participate on a daily basis in risk management on behalf of the funds. The funds’ chief compliance officer regularly provides reports to the board in writing and in person.
The audit committee of the board, which is composed of F. Joseph Loughrey, Mark Loughridge, Sarah Bloom Raskin, and Peter F. Volanakis, each of whom is an independent trustee, oversees management of financial risks and controls. The audit committee serves as the channel of communication between the independent auditors of the funds and the board with respect to financial statements and financial reporting processes, systems of internal control, and the audit process. Vanguard’s head of internal audit reports directly to the audit committee and provides reports to the committee in writing and in person on a regular basis. Although the audit committee is responsible for overseeing the management of financial risks, the entire board is regularly informed of these risks through committee reports.
All of the trustees bring to each fund’s board a wealth of executive leadership experience derived from their service as executives (in many cases chief executive officers), board members, and leaders of diverse public operating companies, academic institutions, and other organizations. In determining whether an individual is qualified to serve as a trustee of the funds, the board considers a wide variety of information about the trustee, and multiple factors contribute to the board’s decision. Each trustee is determined to have the experience, skills, and attributes necessary to serve the funds and their shareholders because each trustee demonstrates an exceptional ability to consider complex business and financial matters, evaluate the relative importance and priority of issues, make decisions, and contribute effectively to the deliberations of the board. The board also considers the individual experience of each trustee and determines that the trustee’s professional experience, education, and background contribute to the diversity of perspectives on the board. The business acumen, experience, and objective thinking of the trustees are considered invaluable assets for Vanguard management and, ultimately, the Vanguard funds’ shareholders. The specific roles and experience of each board member that factor into this determination are presented on the following pages. The mailing address of the trustees and officers is P.O. Box 876, Valley Forge, PA 19482.
B-42
|
Name, Year of Birth |
Position(s)
Held With
Funds |
Vanguard
Funds’ Trustee/
Officer Since |
Principal Occupation(s)
During the Past Five Years,
Outside Directorships,
and Other Experience |
Number of
Vanguard Funds
Overseen by
Trustee/Officer |
|
Interested Trustee1
|
|
|
|
|
|
Mortimer J. Buckley
(1969) |
Chairman of the
Board, Chief
Executive
Officer, and
President |
January 2018 |
Chairman of the board (2019–present) of Vanguard
and of each of the investment companies served by
Vanguard; chief executive officer (2018–present) of
Vanguard; chief executive officer, president, and
trustee (2018–present) of each of the investment
companies served by Vanguard; president and
director (2017–present) of Vanguard; and president
(2018–present) of Vanguard Marketing Corporation.
Chief investment officer (2013–2017), managing
director (2002–2017), head of the Retail Investor
Group (2006–2012), and chief information officer
(2001–2006) of Vanguard. Member of the board of
governors of the Investment Company Institute and of
FINRA. |
208 |
|
1 Mr. Buckley is considered an “interested person” as defined in the 1940 Act because he is an officer of the Trust. | ||||
|
Independent Trustees |
|
|
|
|
|
Tara Bunch
(1962) |
Trustee |
November 2021 |
Head of Global Operations at Airbnb (2020–present).
Vice President of AppleCare (2012–2020). Member of
the board of Out & Equal, the University of California,
Berkeley School of Engineering, and Santa Clara
University’s School of Business. |
208 |
|
Emerson U. Fullwood
(1948) |
Trustee |
January 2008 |
Executive chief staff and marketing officer for North
America and corporate vice president (retired 2008) of
Xerox Corporation (document management products
and services). Former president of the Worldwide
Channels Group, Latin America, and Worldwide
Customer Service and executive chief staff officer of
Developing Markets of Xerox. Executive in residence
and 2009–2010 Distinguished Minett Professor at the
Rochester Institute of Technology. Member of the
board of directors of the University of Rochester
Medical Center, the Monroe Community College
Foundation, the United Way of Rochester, North
Carolina A&T University, Roberts Wesleyan College,
and the Rochester Philharmonic Orchestra. Trustee of
the University of Rochester. |
208 |
|
F. Joseph Loughrey
(1949) |
Trustee |
October 2009 |
President and chief operating officer (retired 2009)
and vice chairman of the board (2008–2009) of
Cummins Inc. (industrial machinery). Director of the V
Foundation. Member of the advisory council for the
College of Arts and Letters at the University of Notre
Dame. Chairman of the board of Saint Anselm
College. |
208 |
|
Mark Loughridge
(1953) |
Lead
Independent
Trustee |
March 2012 |
Senior vice president and chief financial officer (retired
2013) of IBM (information technology services).
Fiduciary member of IBM’s Retirement Plan
Committee (2004–2013), senior vice president and
general manager (2002–2004) of IBM Global
Financing, vice president and controller (1998–2002)
of IBM, and a variety of other prior management roles
at IBM. Member of the Council on Chicago Booth. |
208 |
B-43
|
Name, Year of Birth |
Position(s)
Held With
Funds |
Vanguard
Funds’ Trustee/
Officer Since |
Principal Occupation(s)
During the Past Five Years,
Outside Directorships,
and Other Experience |
Number of
Vanguard Funds
Overseen by
Trustee/Officer |
|
Scott C. Malpass
(1962) |
Trustee |
March 2012 |
Co-founder and managing partner (2022-present) of
Grafton Street Partners (investment advisory firm).
Chief investment officer and vice president of the
University of Notre Dame (retired 2020). Chair of the
board of Catholic Investment Services, Inc.
(investment advisors). Member of the board of
superintendence of the Institute for the Works of
Religion. Member of the Notre Dame 403(b)
Investment Committee and the board of directors of
Paxos Trust Company (finance). |
208 |
|
Deanna Mulligan
(1963) |
Trustee |
January 2018 |
Chief executive officer of Purposeful (2021–present).
Board chair (2020), chief executive officer
(2011–2020), and president (2010–2019) of The
Guardian Life Insurance Company of America. Chief
operating officer (2010–2011) and executive vice
president (2008–2010) of Individual Life and Disability
of The Guardian Life Insurance Company of America.
Director of DuPont. Member of the board of the
Economic Club of New York. Trustee of the
Partnership for New York City (business leadership),
the Chief Executives for Corporate Purpose, and the
New York-Presbyterian Hospital. |
208 |
|
André F. Perold
(1952) |
Trustee |
December 2004 |
George Gund Professor of Finance and Banking,
Emeritus at the Harvard Business School (retired
2011). Chief investment officer and partner of
HighVista Strategies LLC (private investment firm).
Board member of RIT Capital Partners (investment
firm). |
208 |
|
Sarah Bloom Raskin
(1961) |
Trustee |
January 2018 |
Deputy secretary (2014–2017) of the United States
Department of the Treasury. Governor (2010–2014) of
the Federal Reserve Board. Commissioner
(2007–2010) of financial regulation for the State of
Maryland. Colin W. Brown Distinguished Professor of
the Practice, Duke Law School (2021–present);
Rubenstein Fellow, Duke University (2017–2020);
Distinguished Fellow of the Global Financial Markets
Center, Duke Law School (2020–2022); and Senior
Fellow, Duke Center on Risk (2020–present). Partner
of Kaya Partners (climate policy advisory services).
Member of the board of directors of Arcadia (energy
solution technology). |
208 |
|
Grant Reid
(1959) |
Trustee |
July 2023 |
Chief executive officer and president (2014–2022) and
member of the board of directors (2015–2022) of
Mars, Incorporated (multinational manufacturer).
Member of the board of directors of Marriott
International, Inc. Chair of Agribusiness Task Force,
Sustainable Markets Initiative. |
208 |
|
David Thomas
(1956) |
Trustee |
July 2021 |
President of Morehouse College (2018–present).
Professor of Business Administration Emeritus at
Harvard University (2017–2018) and Dean
(2011–2016) and Professor of Management at
Georgetown University, McDonough School of
Business (2016–2017). Director of DTE Energy
Company. Trustee of Common Fund. |
208 |
B-44
|
Name, Year of Birth |
Position(s)
Held With
Funds |
Vanguard
Funds’ Trustee/
Officer Since |
Principal Occupation(s)
During the Past Five Years,
Outside Directorships,
and Other Experience |
Number of
Vanguard Funds
Overseen by
Trustee/Officer |
|
Peter F. Volanakis
(1955) |
Trustee |
July 2009 |
President and chief operating officer (retired 2010) of
Corning Incorporated (communications equipment)
and director of Corning Incorporated (2000–2010) and
Dow Corning (2001–2010). Director (2012) of SPX
Corporation (multi-industry manufacturing). Overseer
of the Amos Tuck School of Business Administration,
Dartmouth College (2001–2013). Member of the BMW
Group Mobility Council. |
208 |
|
Executive Officers |
|
|
|
|
|
Jacqueline Angell
(1974) |
Chief
Compliance
Officer |
November 2022 |
Principal of Vanguard. Chief compliance officer
(2022–present) of Vanguard and of each of the
investment companies served by Vanguard. Chief
compliance officer (2018–2022) and deputy chief
compliance officer (2017–2019) of State Street. |
208 |
|
Christine Buchanan
(1970) |
Chief Financial
Officer |
November 2017 |
Principal of Vanguard. Chief financial officer
(2021–present) and treasurer (2017–2021) of each of
the investment companies served by Vanguard.
Partner (2005–2017) at KPMG (audit, tax, and
advisory services). |
208 |
|
John Galloway
(1973) |
Investment
Stewardship
Officer |
September 2020 |
Principal of Vanguard. Investment stewardship officer
(2020–present) of each of the investment companies
served by Vanguard. Head of Investor Advocacy
(2020–present) and head of Marketing Strategy and
Planning (2017–2020) at Vanguard. Special Assistant
to the President of the United States (2015). |
208 |
|
Ashley Grim
(1984) |
Treasurer |
February 2022 |
Treasurer (2022–present) of each of the investment
companies served by Vanguard. Fund transfer agent
controller (2019–2022) and director of Audit Services
(2017–2019) at Vanguard. Senior manager
(2015–2017) at PriceWaterhouseCoopers (audit and
assurance, consulting, and tax services). |
208 |
|
Jodi Miller
(1980) |
Finance Director |
September
2022 |
Principal of Vanguard. Finance director
(2022–present) of each of the investment companies
served by Vanguard. Head of Enterprise Investment
Services (2020–present), Head of Retail Client
Services & Operations (2020–2022), and Head of
Retail Strategic Support (2018–2020) at Vanguard. |
208 |
|
Anne E. Robinson
(1970) |
Secretary |
September 2016 |
General counsel (2016–present) of Vanguard.
Secretary (2016–present) of Vanguard and of each of
the investment companies served by Vanguard.
Managing director (2016–present) of Vanguard.
Managing director and general counsel of Global
Cards and Consumer Services (2014–2016) at
Citigroup. Counsel (2003–2014) at American Express.
Non-executive director of the board of National Grid
(energy). |
208 |
|
Michael Rollings
(1963) |
Finance Director |
February 2017 |
Finance director (2017–present) and treasurer (2017)
of each of the investment companies served by
Vanguard. Managing director (2016–present) of
Vanguard. Chief financial officer (2016–present) of
Vanguard. Director (2016–present) of Vanguard
Marketing Corporation. Executive vice president and
chief financial officer (2006–2016) of MassMutual
Financial Group. |
208 |
All but one of the trustees are independent. The independent trustees designate a lead independent trustee. The lead independent trustee is a spokesperson and principal point of contact for the independent trustees and is responsible for coordinating the activities of the independent trustees, including calling regular executive sessions of the independent
B-45
trustees; developing the agenda of each meeting together with the chairman; and chairing the meetings of the independent trustees. The lead independent trustee also chairs the meetings of the audit, compensation, and nominating committees. The board also has two investment committees, which consist of independent trustees and the sole interested trustee.
The independent trustees appoint the chairman of the board. The roles of chairman of the board and chief executive officer currently are held by the same person; as a result, the chairman of the board is an “interested” trustee. The independent trustees generally believe that the Vanguard funds’ chief executive officer is best qualified to serve as chairman and that fund shareholders benefit from this leadership structure through accountability and strong day-to-day leadership.
Board Committees: The Trust's board has the following committees:
◾ Audit Committee: This committee oversees the accounting and financial reporting policies, the systems of internal controls, and the independent audits of each fund. The following independent trustees serve as members of the committee: Mr. Loughrey, Mr. Loughridge, Ms. Raskin, and Mr. Volanakis. The committee held five meetings during the Trust's fiscal year ended August 31, 2023.
◾ Compensation Committee: This committee oversees the compensation programs established by each fund for the benefit of its trustees. All independent trustees serve as members of the committee. The committee held five meetings during the Trust's fiscal year ended August 31, 2023.
◾ Independent Governance Committee: This committee assists the board in fulfilling its responsibilities and is empowered to exercise board powers in the intervals between board meetings unless such action is prohibited by applicable law or Trust bylaws. The following independent trustees serve as members of the committee: Mr. Loughridge, Ms. Mulligan, Mr. Perold, Ms. Raskin, and Mr. Volanakis. The committee held five during the Trust's fiscal year ended August 31, 2023.
◾ Investment Committees: These committees assist the board in its oversight of investment advisors to the funds and in the review and evaluation of materials relating to the board’s consideration of investment advisory agreements with the funds. Each trustee serves on one of two investment committees. Each investment committee held three meetings during the Trust's fiscal year ended August 31, 2023.
◾ Nominating Committee: This committee nominates candidates for election to the board of trustees of each fund. The committee also has the authority to recommend the removal of any trustee. All independent trustees serve as members of the committee. The committee held seven meetings during the Trust's fiscal year ended August 31, 2023.
The Nominating Committee will consider shareholder recommendations for trustee nominees. Shareholders may send recommendations to Mr. Loughridge, chairman of the committee.
Trustees retire in accordance with the funds' governing documents and policies, and typically by age 75.
Trustee Compensation
The same individuals serve as trustees of all Vanguard funds and each fund pays a proportionate share of the trustees’ compensation. Vanguard funds also employ their officers on a shared basis; however, officers are compensated by Vanguard, not the funds.
Independent Trustees. The funds compensate their independent trustees (i.e., the ones who are not also officers of the funds) in two ways:
◾ The independent trustees receive an annual fee for their service to the funds, which is subject to reduction based on absences from scheduled board meetings.
◾ The independent trustees are reimbursed for the travel and other expenses that they incur in attending board meetings.
“Interested” Trustee. Mr. Buckley serves as a trustee, but is not paid in this capacity. He is, however, paid in his role as an officer of Vanguard.
Compensation Table. The following table provides compensation details for each of the trustees. We list the amounts paid as compensation by the Funds for each trustee. In addition, the table shows the total amount of compensation paid to each trustee by all Vanguard funds.
B-46
VANGUARD SCOTTSDALE FUNDS
TRUSTEES’ COMPENSATION TABLE
TRUSTEES’ COMPENSATION TABLE
|
Trustee |
Aggregate
Compensation From
the Funds1 |
Total Compensation
From All Vanguard
Funds Paid to Trustees2 |
|
Mortimer J. Buckley |
— |
— |
|
Tara Bunch |
$10,566 |
$330,000 |
|
Emerson U. Fullwood |
10,566 |
330,000 |
|
F. Joseph Loughrey |
11,207 |
350,000 |
|
Mark Loughridge |
12,810 |
400,000 |
|
Scott C. Malpass |
10,566 |
330,000 |
|
Deanna Mulligan |
10,566 |
330,000 |
|
André F. Perold |
10,566 |
330,000 |
|
Sarah Bloom Raskin |
11,207 |
350,000 |
|
Grant Reid3 |
1,006 |
188,571 |
|
David Thomas |
10,566 |
330,000 |
|
Peter F. Volanakis |
11,207 |
350,000 |
1
The amounts shown in this column are based on the Trust's fiscal year ended August 31, 2023. Each Fund within the Trust is responsible for a proportionate share of these amounts.
2
The amounts reported in this column reflect the total compensation paid to each trustee for his or her service as trustee of 206 Vanguard funds for the 2022 calendar year and include any amount a trustee has elected to defer. During the 2022 calendar year, the following trustees elected to defer all or a portion of their compensation as follows: Ms. Bunch, $330,000; Ms. Mulligan, $330,000; Mr. Perold, $330,000; Ms. Raskin, $245,000; and Dr. Thomas, $165,000.
3
Mr. Reid became a member of the Funds’ board effective July 20, 2023.
Ownership of Fund Shares
All current trustees allocate their investments among the various Vanguard funds based on their own investment needs. The following table shows each trustee’s ownership of shares of each Fund and of all Vanguard funds served by the trustee as of December 31, 2022. Mr. Reid began service as a trustee effective July 20, 2023.
VANGUARD SCOTTSDALE FUNDS
|
Vanguard Fund |
Trustee |
Dollar Range of
Fund Shares
Owned by Trustee |
Aggregate Dollar Range
of Vanguard Fund Shares
Owned by Trustee |
|
Vanguard Explorer Value Fund |
Mortimer J. Buckley |
— |
Over $100,000 |
|
|
Tara Bunch |
— |
Over $100,000 |
|
|
Emerson U. Fullwood |
— |
Over $100,000 |
|
|
F. Joseph Loughrey |
— |
Over $100,000 |
|
|
Mark Loughridge |
— |
Over $100,000 |
|
|
Scott C. Malpass |
— |
Over $100,000 |
|
|
Deanna Mulligan |
— |
Over $100,000 |
|
|
André F. Perold |
— |
Over $100,000 |
|
|
Sarah Bloom Raskin |
— |
Over $100,000 |
|
|
Grant Reid |
— |
Over $100,000 |
|
|
David Thomas |
— |
Over $100,000 |
|
|
Peter F. Volanakis |
— |
Over $100,000 |
|
|
|
|
|
B-47
|
Vanguard Fund |
Trustee |
Dollar Range of
Fund Shares
Owned by Trustee |
Aggregate Dollar Range
of Vanguard Fund Shares
Owned by Trustee |
|
Vanguard Intermediate-Term Corporate Bond Index Fund |
Mortimer J. Buckley |
— |
Over $100,000 |
|
|
Tara Bunch |
— |
Over $100,000 |
|
|
Emerson U. Fullwood |
— |
Over $100,000 |
|
|
F. Joseph Loughrey |
— |
Over $100,000 |
|
|
Mark Loughridge |
— |
Over $100,000 |
|
|
Scott C. Malpass |
— |
Over $100,000 |
|
|
Deanna Mulligan |
— |
Over $100,000 |
|
|
André F. Perold |
— |
Over $100,000 |
|
|
Sarah Bloom Raskin |
— |
Over $100,000 |
|
|
Grant Reid |
— |
Over $100,000 |
|
|
David Thomas |
— |
Over $100,000 |
|
|
Peter F. Volanakis |
— |
Over $100,000 |
|
|
|
|
|
|
Vanguard Intermediate-Term Treasury Index Fund |
Mortimer J. Buckley |
— |
Over $100,000 |
|
|
Tara Bunch |
— |
Over $100,000 |
|
|
Emerson U. Fullwood |
— |
Over $100,000 |
|
|
F. Joseph Loughrey |
— |
Over $100,000 |
|
|
Mark Loughridge |
— |
Over $100,000 |
|
|
Scott C. Malpass |
— |
Over $100,000 |
|
|
Deanna Mulligan |
— |
Over $100,000 |
|
|
André F. Perold |
— |
Over $100,000 |
|
|
Sarah Bloom Raskin |
— |
Over $100,000 |
|
|
Grant Reid |
— |
Over $100,000 |
|
|
David Thomas |
— |
Over $100,000 |
|
|
Peter F. Volanakis |
— |
Over $100,000 |
|
|
|
|
|
|
Vanguard Long-Term Corporate Bond Index Fund |
Mortimer J. Buckley |
— |
Over $100,000 |
|
|
Tara Bunch |
— |
Over $100,000 |
|
|
Emerson U. Fullwood |
— |
Over $100,000 |
|
|
F. Joseph Loughrey |
— |
Over $100,000 |
|
|
Mark Loughridge |
— |
Over $100,000 |
|
|
Scott C. Malpass |
— |
Over $100,000 |
|
|
Deanna Mulligan |
— |
Over $100,000 |
|
|
André F. Perold |
— |
Over $100,000 |
|
|
Sarah Bloom Raskin |
— |
Over $100,000 |
|
|
Grant Reid |
— |
Over $100,000 |
|
|
David Thomas |
— |
Over $100,000 |
|
|
Peter F. Volanakis |
— |
Over $100,000 |
|
|
|
|
|
|
Vanguard Long-Term Treasury Index Fund |
Mortimer J. Buckley |
— |
Over $100,000 |
|
|
Tara Bunch |
— |
Over $100,000 |
|
|
Emerson U. Fullwood |
— |
Over $100,000 |
|
|
F. Joseph Loughrey |
— |
Over $100,000 |
|
|
Mark Loughridge |
— |
Over $100,000 |
|
|
Scott C. Malpass |
— |
Over $100,000 |
|
|
Deanna Mulligan |
— |
Over $100,000 |
|
|
André F. Perold |
— |
Over $100,000 |
|
|
Sarah Bloom Raskin |
— |
Over $100,000 |
|
|
Grant Reid |
— |
Over $100,000 |
|
|
David Thomas |
— |
Over $100,000 |
|
|
Peter F. Volanakis |
$1,000 – $10,000 |
Over $100,000 |
|
|
|
|
|
B-48
|
Vanguard Fund |
Trustee |
Dollar Range of
Fund Shares
Owned by Trustee |
Aggregate Dollar Range
of Vanguard Fund Shares
Owned by Trustee |
|
Vanguard Mortgage-Backed Securities Index Fund |
Mortimer J. Buckley |
— |
Over $100,000 |
|
|
Tara Bunch |
— |
Over $100,000 |
|
|
Emerson U. Fullwood |
— |
Over $100,000 |
|
|
F. Joseph Loughrey |
— |
Over $100,000 |
|
|
Mark Loughridge |
— |
Over $100,000 |
|
|
Scott C. Malpass |
— |
Over $100,000 |
|
|
Deanna Mulligan |
— |
Over $100,000 |
|
|
André F. Perold |
— |
Over $100,000 |
|
|
Sarah Bloom Raskin |
— |
Over $100,000 |
|
|
Grant Reid |
— |
Over $100,000 |
|
|
David Thomas |
— |
Over $100,000 |
|
|
Peter F. Volanakis |
— |
Over $100,000 |
|
|
|
|
|
|
Vanguard Russell 1000 Growth Index Fund |
Mortimer J. Buckley |
— |
Over $100,000 |
|
|
Tara Bunch |
— |
Over $100,000 |
|
|
Emerson U. Fullwood |
— |
Over $100,000 |
|
|
F. Joseph Loughrey |
— |
Over $100,000 |
|
|
Mark Loughridge |
— |
Over $100,000 |
|
|
Scott C. Malpass |
— |
Over $100,000 |
|
|
Deanna Mulligan |
— |
Over $100,000 |
|
|
André F. Perold |
— |
Over $100,000 |
|
|
Sarah Bloom Raskin |
— |
Over $100,000 |
|
|
Grant Reid |
— |
Over $100,000 |
|
|
David Thomas |
— |
Over $100,000 |
|
|
Peter F. Volanakis |
— |
Over $100,000 |
|
|
|
|
|
|
Vanguard Russell 1000 Index Fund |
Mortimer J. Buckley |
— |
Over $100,000 |
|
|
Tara Bunch |
— |
Over $100,000 |
|
|
Emerson U. Fullwood |
— |
Over $100,000 |
|
|
F. Joseph Loughrey |
— |
Over $100,000 |
|
|
Mark Loughridge |
— |
Over $100,000 |
|
|
Scott C. Malpass |
— |
Over $100,000 |
|
|
Deanna Mulligan |
— |
Over $100,000 |
|
|
André F. Perold |
— |
Over $100,000 |
|
|
Sarah Bloom Raskin |
— |
Over $100,000 |
|
|
Grant Reid |
— |
Over $100,000 |
|
|
David Thomas |
— |
Over $100,000 |
|
|
Peter F. Volanakis |
— |
Over $100,000 |
|
|
|
|
|
|
Vanguard Russell 1000 Value Index Fund |
Mortimer J. Buckley |
— |
Over $100,000 |
|
|
Tara Bunch |
— |
Over $100,000 |
|
|
Emerson U. Fullwood |
— |
Over $100,000 |
|
|
F. Joseph Loughrey |
— |
Over $100,000 |
|
|
Mark Loughridge |
— |
Over $100,000 |
|
|
Scott C. Malpass |
— |
Over $100,000 |
|
|
Deanna Mulligan |
— |
Over $100,000 |
|
|
André F. Perold |
— |
Over $100,000 |
|
|
Sarah Bloom Raskin |
$1 – $10,000 |
Over $100,000 |
|
|
Grant Reid |
— |
Over $100,000 |
|
|
David Thomas |
— |
Over $100,000 |
|
|
Peter F. Volanakis |
— |
Over $100,000 |
|
|
|
|
|
B-49
|
Vanguard Fund |
Trustee |
Dollar Range of
Fund Shares
Owned by Trustee |
Aggregate Dollar Range
of Vanguard Fund Shares
Owned by Trustee |
|
Vanguard Russell 2000 Growth Index Fund |
Mortimer J. Buckley |
— |
Over $100,000 |
|
|
Tara Bunch |
— |
Over $100,000 |
|
|
Emerson U. Fullwood |
— |
Over $100,000 |
|
|
F. Joseph Loughrey |
— |
Over $100,000 |
|
|
Mark Loughridge |
— |
Over $100,000 |
|
|
Scott C. Malpass |
— |
Over $100,000 |
|
|
Deanna Mulligan |
— |
Over $100,000 |
|
|
André F. Perold |
— |
Over $100,000 |
|
|
Sarah Bloom Raskin |
— |
Over $100,000 |
|
|
Grant Reid |
— |
Over $100,000 |
|
|
David Thomas |
— |
Over $100,000 |
|
|
Peter F. Volanakis |
— |
Over $100,000 |
|
|
|
|
|
|
Vanguard Russell 2000 Index Fund |
Mortimer J. Buckley |
— |
Over $100,000 |
|
|
Tara Bunch |
— |
Over $100,000 |
|
|
Emerson U. Fullwood |
— |
Over $100,000 |
|
|
F. Joseph Loughrey |
— |
Over $100,000 |
|
|
Mark Loughridge |
— |
Over $100,000 |
|
|
Scott C. Malpass |
— |
Over $100,000 |
|
|
Deanna Mulligan |
— |
Over $100,000 |
|
|
André F. Perold |
— |
Over $100,000 |
|
|
Sarah Bloom Raskin |
— |
Over $100,000 |
|
|
Grant Reid |
— |
Over $100,000 |
|
|
David Thomas |
— |
Over $100,000 |
|
|
Peter F. Volanakis |
— |
Over $100,000 |
|
|
|
|
|
|
Vanguard Russell 2000 Value Index Fund |
Mortimer J. Buckley |
— |
Over $100,000 |
|
|
Tara Bunch |
— |
Over $100,000 |
|
|
Emerson U. Fullwood |
— |
Over $100,000 |
|
|
F. Joseph Loughrey |
— |
Over $100,000 |
|
|
Mark Loughridge |
— |
Over $100,000 |
|
|
Scott C. Malpass |
— |
Over $100,000 |
|
|
Deanna Mulligan |
— |
Over $100,000 |
|
|
André F. Perold |
— |
Over $100,000 |
|
|
Sarah Bloom Raskin |
— |
Over $100,000 |
|
|
Grant Reid |
— |
Over $100,000 |
|
|
David Thomas |
— |
Over $100,000 |
|
|
Peter F. Volanakis |
— |
Over $100,000 |
|
|
|
|
|
|
Vanguard Russell 3000 Index Fund |
Mortimer J. Buckley |
— |
Over $100,000 |
|
|
Tara Bunch |
— |
Over $100,000 |
|
|
Emerson U. Fullwood |
— |
Over $100,000 |
|
|
F. Joseph Loughrey |
— |
Over $100,000 |
|
|
Mark Loughridge |
— |
Over $100,000 |
|
|
Scott C. Malpass |
— |
Over $100,000 |
|
|
Deanna Mulligan |
— |
Over $100,000 |
|
|
André F. Perold |
— |
Over $100,000 |
|
|
Sarah Bloom Raskin |
— |
Over $100,000 |
|
|
Grant Reid |
— |
Over $100,000 |
|
|
David Thomas |
— |
Over $100,000 |
|
|
Peter F. Volanakis |
— |
Over $100,000 |
|
|
|
|
|
B-50
|
Vanguard Fund |
Trustee |
Dollar Range of
Fund Shares
Owned by Trustee |
Aggregate Dollar Range
of Vanguard Fund Shares
Owned by Trustee |
|
Vanguard Short-Term Corporate Bond Index Fund |
Mortimer J. Buckley |
— |
Over $100,000 |
|
|
Tara Bunch |
— |
Over $100,000 |
|
|
Emerson U. Fullwood |
— |
Over $100,000 |
|
|
F. Joseph Loughrey |
— |
Over $100,000 |
|
|
Mark Loughridge |
— |
Over $100,000 |
|
|
Scott C. Malpass |
— |
Over $100,000 |
|
|
Deanna Mulligan |
— |
Over $100,000 |
|
|
André F. Perold |
— |
Over $100,000 |
|
|
Sarah Bloom Raskin |
— |
Over $100,000 |
|
|
Grant Reid |
— |
Over $100,000 |
|
|
David Thomas |
— |
Over $100,000 |
|
|
Peter F. Volanakis |
— |
Over $100,000 |
|
|
|
|
|
|
Vanguard Short-Term Treasury Index Fund |
Mortimer J. Buckley |
— |
Over $100,000 |
|
|
Tara Bunch |
— |
Over $100,000 |
|
|
Emerson U. Fullwood |
— |
Over $100,000 |
|
|
F. Joseph Loughrey |
— |
Over $100,000 |
|
|
Mark Loughridge |
— |
Over $100,000 |
|
|
Scott C. Malpass |
— |
Over $100,000 |
|
|
Deanna Mulligan |
— |
Over $100,000 |
|
|
André F. Perold |
— |
Over $100,000 |
|
|
Sarah Bloom Raskin |
— |
Over $100,000 |
|
|
Grant Reid |
— |
Over $100,000 |
|
|
David Thomas |
— |
Over $100,000 |
|
|
Peter F. Volanakis |
— |
Over $100,000 |
|
|
|
|
|
|
Vanguard Total Corporate Bond ETF |
Mortimer J. Buckley |
— |
Over $100,000 |
|
|
Tara Bunch |
— |
Over $100,000 |
|
|
Emerson U. Fullwood |
— |
Over $100,000 |
|
|
F. Joseph Loughrey |
— |
Over $100,000 |
|
|
Mark Loughridge |
— |
Over $100,000 |
|
|
Scott C. Malpass |
— |
Over $100,000 |
|
|
Deanna Mulligan |
— |
Over $100,000 |
|
|
André F. Perold |
— |
Over $100,000 |
|
|
Sarah Bloom Raskin |
— |
Over $100,000 |
|
|
Grant Reid |
— |
Over $100,000 |
|
|
David Thomas |
— |
Over $100,000 |
|
|
Peter F. Volanakis |
— |
Over $100,000 |
|
|
|
|
|
|
Vanguard Total World Bond ETF |
Mortimer J. Buckley |
— |
Over $100,000 |
|
|
Tara Bunch |
— |
Over $100,000 |
|
|
Emerson U. Fullwood |
— |
Over $100,000 |
|
|
F. Joseph Loughrey |
— |
Over $100,000 |
|
|
Mark Loughridge |
— |
Over $100,000 |
|
|
Scott C. Malpass |
— |
Over $100,000 |
|
|
Deanna Mulligan |
— |
Over $100,000 |
|
|
André F. Perold |
— |
Over $100,000 |
|
|
Sarah Bloom Raskin |
— |
Over $100,000 |
|
|
Grant Reid |
— |
Over $100,000 |
|
|
David Thomas |
— |
Over $100,000 |
|
|
Peter F. Volanakis |
— |
Over $100,000 |
B-51
As of November 30, 2023, the trustees and officers of the funds owned, in the aggregate, less than 1% of each class of each fund’s outstanding shares.
As of November 30, 2023, the following owned of record 5% or more of the outstanding shares of each class (Other than ETF Shares):
|
Vanguard Fund |
Share Class |
Owner and Address |
Percentage
of Ownership |
|
Vanguard Explorer Value Fund |
Investor Shares |
FIDELITY INVESTMENTS
INSTITUTIONAL OPERATIONS CO
COVINGTON, KY |
29.89% |
|
|
|
GREAT WEST LIFE TEST ACCOUNT
EMPOWER TRUST FBO FBO
SKADDEN ARPS SLATE MEAGHER &
FLOM GREENWOOD VLG, CO |
5.97% |
|
Vanguard Intermediate-Term Corporate Bond Index
Fund |
Institutional Shares |
ASHLAND ASBESTOS DEFENSE
TRUST NEW YORK, NY |
20.89% |
|
|
|
ASHLAND EVIRONMENTAL ACCOUNT
NEW YORK, NY |
6.31% |
|
|
|
MUNICH REINSURANCE AMERICA,
INC. PENSION PLAN PRINCETON, NJ |
7.74% |
|
|
|
MUNICH REINSURANCE AMERICA,
INC. PENSION PLAN PRINCETON, NJ |
7.72% |
|
|
|
PACIFIC LIFE FOUNDATION
NEWPORT BEACH, CA |
8.82% |
|
|
|
SEI PRIVATE TRUST COMPANY C/O
PRINCIPAL FINANCIAL OAKS, PA |
22.86% |
|
|
|
US BANK NA MILWAUKEE, WI |
6.08% |
|
|
Admiral Shares |
CHARLES SCHWAB & CO INC SAN
FRANCISCO, CA |
9.24% |
|
Vanguard Intermediate-Term Treasury Index Fund |
Institutional Shares |
CHARLES SCHWAB & CO INC SAN
FRANCISCO, CA |
13.26% |
|
|
|
NATIONAL FINANCIAL SERVICES
CORPORATION JERSEY CITY, NJ |
27.80% |
|
|
Admiral Shares |
CHARLES SCHWAB & CO INC SAN
FRANCISCO, CA |
37.74% |
|
|
|
NATIONAL FINANCIAL SERVICES
CORPORATION JERSEY CITY, NJ |
9.79% |
|
Vanguard Long-Term Corporate Bond Index Fund |
Institutional Shares |
CHARLES SCHWAB & CO INC SAN
FRANCISCO, CA |
20.28% |
|
|
|
MAC & CO PITTSBURGH, PA |
10.38% |
|
|
|
NEW YORK UNIVERSITY STAFF
PENSION PLAN
(NON-CONTRIBUTORY) NEW YORK,
NY |
37.27% |
|
|
|
NEW YORK UNIVERSITY STAFF
PENSION PLAN
(NON-CONTRIBUTORY) NEW YORK,
NY |
37.42% |
|
|
|
THE NORTHERN TRUST COMPANY
FBO NEW YORK TIMES COMPANY -
GUILD FUND CHICAGO, IL |
17.89% |
|
|
|
THE NORTHERN TRUST COMPANY
FBO PPA - CASH 4492957 CHICAGO,
IL |
7.33% |
|
|
|
US BANK NA MILWAUKEE, WI |
5.46% |
|
|
Admiral Shares |
FIRST NATIONAL BANK OF
NEBRASKA MARIL & CO FBO NG
MILWAUKEE, WI |
15.94% |
B-52
|
Vanguard Fund |
Share Class |
Owner and Address |
Percentage
of Ownership |
|
Vanguard Long-Term Treasury Index Fund |
Institutional Shares |
BBH-CREDIT SUISSE & LOMBARD
ODIER ACCOUNTS NEW YORK, NY |
5.13% |
|
|
|
NATIONAL FINANCIAL SERVICES
CORPORATION JERSEY CITY, NJ |
44.82% |
|
|
|
THE NORTHERN TRUST FBO WILLIS
TOWERS WATSON SAVINGS PLAN
CHICAGO, IL |
5.52% |
|
|
Admiral Shares |
NATIONAL FINANCIAL SERVICES
CORPORATION JERSEY CITY, NJ |
7.28% |
|
Vanguard Mortgage-Backed Securities Index Fund |
Institutional Shares |
GOVERNMENT EMPLOYEES HEALTH
ASSOCIATION INC LEES SUMMIT, MO |
9.63% |
|
|
|
NATIONAL FINANCIAL SERVICES
CORPORATION JERSEY CITY, NJ |
33.39% |
|
|
|
PERSHING LLC JERSEY CITY, NJ |
10.18% |
|
|
|
PERSHING LLC JERSEY CITY, NJ |
31.84% |
|
|
Admiral Shares |
CHARLES SCHWAB & CO INC SAN
FRANCISCO, CA |
23.54% |
|
|
|
NATIONAL FINANCIAL SERVICES
CORPORATION JERSEY CITY, NJ |
39.79% |
|
|
|
SEI PRIVATE TRUST COMPANY C/O
TRUIST OAKS, PA |
10.51% |
|
Vanguard Russell 1000 Growth Index Fund |
Institutional Shares |
FIDELITY INVESTMENTS
INSTITUTIONAL OPERATIONS CO
COVINGTON, KY |
5.43% |
|
|
|
MAC & CO PITTSBURGH, PA |
8.48% |
|
|
|
MG TRUST LEGACY WTRISC FBO
PHX-ONEAMERICA (WI OFFICE)
PHOENIX, AZ |
9.38% |
|
|
|
NATIONAL FINANCIAL SERVICES
CORPORATION JERSEY CITY, NJ |
7.57% |
|
|
|
SEI PRIVATE TRUST COMPANY C/O
PRINCIPAL FINANCIAL OAKS, PA |
6.18% |
|
Vanguard Russell 1000 Index Fund |
Institutional Shares |
NATIONAL FINANCIAL SERVICES
CORPORATION JERSEY CITY, NJ |
29.35% |
|
|
|
SEI PRIVATE TRUST COMPANY C/O
PRINCIPAL FINANCIAL OAKS, PA |
14.57% |
|
|
|
THE NORTHERN TRUST COMPANY
FBO THE CONFEDERATE TRIBES OF
THE GRAND RONDE COMMUNITY OF
OREGON CHICAGO, IL |
6.40% |
|
|
|
US BANK, N.A. MILWAUKEE, WI |
6.75% |
|
Vanguard Russell 1000 Value Index Fund |
Institutional Shares |
FIDELITY INVESTMENTS
INSTITUTIONAL OPERATIONS CO
COVINGTON, KY |
6.80% |
|
|
|
NATIONAL FINANCIAL SERVICES
CORPORATION JERSEY CITY, NJ |
13.91% |
|
|
|
SAXON & CO CLEVELAND, OH |
5.27% |
|
|
|
SEI PRIVATE TRUST COMPANY C/O
PRINCIPAL FINANCIAL OAKS, PA |
13.23% |
|
|
|
SEI PRIVATE TRUST COMPANY C/O
TRUIST OAKS, PA |
6.32% |
|
|
|
TRANSAMERICA RETIREMENT
SOLUTIONS OMNIBUS ACCOUNT
HARRISON, NY |
5.26% |
|
|
|
US BANK, N.A. MILWAUKEE, WI |
5.03% |
B-53
|
Vanguard Fund |
Share Class |
Owner and Address |
Percentage
of Ownership |
|
Vanguard Russell 2000 Growth Index Fund |
Institutional Shares |
FIDELITY INVESTMENTS
INSTITUTIONAL OPERATIONS CO
COVINGTON, KY |
16.57% |
|
|
|
FIRST CITIZENS BANK MITRA & CO
FBO FCB MILWAUKEE, WI |
6.86% |
|
|
|
JOHN HANCOCK TRUST COMPANY
LLC BOSTON, MA |
17.26% |
|
|
|
SEI PRIVATE TRUST COMPANY C/O
M & T OAKS, PA |
14.44% |
|
|
|
SEI PRIVATE TRUST COMPANY C/O
REGIONS BANK OAKS, PA |
6.73% |
|
|
|
TRANSAMERICA RETIREMENT
SOLUTIONS OMNIBUS ACCOUNT
HARRISON, NY |
5.77% |
|
|
|
UBATCO & CO FBO NEBRASKA
EDUCATIONAL SAVINGS LINCOLN,
NE |
19.35% |
|
Vanguard Russell 2000 Index Fund |
Institutional Shares |
CROWE LLP RETIREMENT PLAN
SOUTH BEND, IN |
6.17% |
|
|
|
KEY TRUST COMPANY CLEVELAND,
OH |
6.40% |
|
|
|
NATIONAL FINANCIAL SERVICES
CORPORATION JERSEY CITY, NJ |
11.67% |
|
|
|
TRANSAMERICA RETIREMENT
SOLUTIONS OMNIBUS ACCOUNT
HARRISON, NY |
8.80% |
|
|
|
US BANK, N.A. MILWAUKEE, WI |
8.64% |
|
|
|
VOYA INSTITUTIONAL TRUST
COMPANY TTEE FOR CORE MARKET
BRAINTREE, MA |
6.92% |
|
Vanguard Russell 2000 Value Index Fund |
Institutional Shares |
BMO HARRIS BANK, N.A. MITRA & CO
FBO 98 DC MILWAUKEE, WI |
9.86% |
|
|
|
JOHN HANCOCK TRUST COMPANY
LLC WESTWOOD, MA |
17.33% |
|
|
|
KEY TRUST COMPANY CLEVELAND,
OH |
7.31% |
|
|
|
NATIONAL FINANCIAL SERVICES
CORPORATION JERSEY CITY, NJ |
32.75% |
|
|
|
TRANSAMERICA RETIREMENT
SOLUTIONS OMNIBUS ACCOUNT
HARRISON, NY |
6.84% |
|
|
|
US BANK, N.A. MILWAUKEE, WI |
22.95% |
|
Vanguard Russell 3000 Index Fund |
Institutional Shares |
COMMERCE BANK MORI & CO
KANSAS CITY, MO |
8.32% |
|
|
|
NATIONAL FINANCIAL SERVICES
CORPORATION JERSEY CITY, NJ |
38.46% |
|
|
|
SUTTER INSURANCE SERVICES
CORPORATION HONOLULU, HI |
7.91% |
B-54
|
Vanguard Fund |
Share Class |
Owner and Address |
Percentage
of Ownership |
|
Vanguard Short-Term Corporate Bond Index Fund |
Institutional Shares |
MAC & CO PITTSBURGH, PA |
5.73% |
|
|
|
NATIONAL FINANCIAL SERVICES
CORPORATION JERSEY CITY, NJ |
28.11% |
|
|
|
PERSHING LLC JERSEY CITY, NJ |
9.32% |
|
|
|
SEI PRIVATE TRUST COMPANY C/O
PRINCIPAL FINANCIAL OAKS, PA |
5.56% |
|
|
|
THE UNIVERSITY OF SOUTH
FLORIDA BOARD OF TRUSTEES
TAMPA, FL |
18.49% |
|
|
Admiral Shares |
CHARLES SCHWAB & CO INC SAN
FRANCISCO, CA |
17.56% |
|
|
|
NATIONAL FINANCIAL SERVICES
CORPORATION JERSEY CITY, NJ |
9.22% |
|
Vanguard Short-Term Treasury Index Fund |
Institutional Shares |
NATIONAL FINANCIAL SERVICES
CORPORATION JERSEY CITY, NJ |
9.04% |
|
|
|
US BANK, N.A. MILWAUKEE, WI |
23.06% |
|
|
Admiral Shares |
NATIONAL FINANCIAL SERVICES
CORPORATION JERSEY CITY, NJ |
12.57% |
Although the Funds do not have information concerning the beneficial ownership of shares held in the names of Depository Trust Company (DTC) participants, as of November 30, 2023, the name and percentage ownership of each DTC participant that owned of record 5% or more of the outstanding ETF Shares of a Fund were as follows:
|
Vanguard Fund |
Owner |
Percentage
of Ownership |
|
Vanguard Intermediate-Term Corporate Bond ETF |
Charles Schwab & Co., Inc. |
20.14% |
|
|
JPMorgan Chase Bank, N.A. |
11.53% |
|
|
Merrill Lynch, Pierce, Fenner & Smith Incorporated |
12.81% |
|
|
National Financial Services, LLC |
10.51% |
|
Vanguard Intermediate-Term Treasury ETF |
Charles Schwab & Co., Inc. |
20.29% |
|
|
JPMorgan Chase Bank, N.A. |
5.12% |
|
|
Merrill Lynch, Pierce, Fenner & Smith Incorporated |
12.62% |
|
|
National Financial Services, LLC |
21.06% |
|
|
Pershing, LLC |
5.47% |
|
|
UBS Financial Services, LLC |
5.61% |
|
Vanguard Long-Term Corporate Bond ETF |
Charles Schwab & Co., Inc. |
10.54% |
|
|
Citibank, N.A. |
5.07% |
|
|
JPMorgan Chase Bank, N.A. |
7.89% |
|
|
National Financial Services, LLC |
6.61% |
|
|
State Street Bank and Trust Company |
6.38% |
|
|
The Bank of New York Mellon |
8.26% |
|
|
The Northern Trust Company |
11.42% |
|
|
Vanguard Marketing Corporation |
8.19% |
|
Vanguard Long-Term Treasury ETF |
Ameriprise Advisor Services, Inc. |
14.71% |
|
|
Charles Schwab & Co., Inc. |
16.74% |
|
|
Merrill Lynch, Pierce, Fenner & Smith Incorporated |
14.69% |
|
|
Morgan Stanley DW Inc. |
5.56% |
|
|
National Financial Services, LLC |
9.47% |
|
|
Pershing, LLC |
8.13% |
|
Vanguard Mortgage-Backed Securities ETF |
Charles Schwab & Co., Inc. |
44.13% |
|
|
JPMorgan Chase Bank, N.A. |
5.00% |
|
|
Merrill Lynch, Pierce, Fenner & Smith Incorporated |
19.68% |
|
|
National Financial Services, LLC |
8.85% |
B-55
|
Vanguard Fund |
Owner |
Percentage
of Ownership |
|
Vanguard Russell 1000 ETF |
Charles Schwab & Co., Inc. |
24.97% |
|
|
National Financial Services, LLC |
8.87% |
|
|
State Street Bank and Trust Company |
6.36% |
|
|
UBS Financial Services, LLC |
6.45% |
|
|
Vanguard Marketing Corporation |
14.94% |
|
Vanguard Russell 1000 Growth ETF |
Charles Schwab & Co., Inc. |
14.86% |
|
|
JPMorgan Chase Bank, N.A. |
5.95% |
|
|
Merrill Lynch, Pierce, Fenner & Smith Incorporated |
14.16% |
|
|
National Financial Services, LLC |
14.87% |
|
|
UBS Financial Services, LLC |
9.35% |
|
|
Vanguard Marketing Corporation |
5.64% |
|
Vanguard Russell 1000 Value ETF |
Charles Schwab & Co., Inc. |
11.45% |
|
|
Merrill Lynch, Pierce, Fenner & Smith Incorporated |
21.41% |
|
|
Morgan Stanley DW Inc. |
6.23% |
|
|
National Financial Services, LLC |
10.20% |
|
|
UBS Financial Services, LLC |
18.47% |
|
Vanguard Russell 2000 ETF |
BROWN/ETF |
6.96% |
|
|
Charles Schwab & Co., Inc. |
11.93% |
|
|
Edward D. Jones & Co. |
6.46% |
|
|
Merrill Lynch, Pierce, Fenner & Smith Incorporated |
18.75% |
|
|
National Financial Services, LLC |
10.32% |
|
|
UBS Financial Services, LLC |
10.71% |
|
|
Vanguard Marketing Corporation |
5.40% |
|
Vanguard Russell 2000 Growth ETF |
Charles Schwab & Co., Inc. |
21.14% |
|
|
Merrill Lynch, Pierce, Fenner & Smith Incorporated |
7.70% |
|
|
Morgan Stanley DW Inc. |
5.69% |
|
|
National Financial Services, LLC |
12.37% |
|
|
Pershing, LLC |
9.10% |
|
|
The Bank of New York Mellon |
6.90% |
|
|
Vanguard Marketing Corporation |
13.61% |
|
Vanguard Russell 2000 Value ETF |
Ameriprise Advisor Services, Inc. |
6.17% |
|
|
Charles Schwab & Co., Inc. |
23.92% |
|
|
Merrill Lynch, Pierce, Fenner & Smith Incorporated |
8.76% |
|
|
Morgan Stanley DW Inc. |
7.60% |
|
|
National Financial Services, LLC |
14.38% |
|
|
Pershing, LLC |
5.16% |
|
|
Vanguard Marketing Corporation |
12.17% |
|
Vanguard Russell 3000 ETF |
Charles Schwab & Co., Inc. |
16.96% |
|
|
National Financial Services, LLC |
8.62% |
|
|
The Bank of New York Mellon |
17.19% |
|
|
The Northern Trust Company |
10.19% |
|
|
Vanguard Marketing Corporation |
5.80% |
|
Vanguard Short-Term Corporate Bond ETF |
Charles Schwab & Co., Inc. |
21.07% |
|
|
JPMorgan Chase Bank, N.A. |
10.77% |
|
|
Merrill Lynch, Pierce, Fenner & Smith Incorporated |
11.02% |
|
|
Morgan Stanley DW Inc. |
5.64% |
|
|
National Financial Services, LLC |
7.68% |
|
|
The Bank of New York Mellon |
7.99% |
B-56
|
Vanguard Fund |
Owner |
Percentage
of Ownership |
|
Vanguard Short-Term Treasury ETF |
Charles Schwab & Co., Inc. |
22.67% |
|
|
JPMorgan Chase Bank, N.A. |
5.39% |
|
|
JPMorgan Chase Bank, N.A. |
10.73% |
|
|
Morgan Stanley DW Inc. |
7.31% |
|
|
National Financial Services, LLC |
12.16% |
|
|
Pershing, LLC |
5.43% |
|
|
The Northern Trust Company |
7.19% |
|
Vanguard Total Corporate Bond ETF |
Charles Schwab & Co., Inc. |
19.91% |
|
|
LPL Financial Corporation |
6.54% |
|
|
National Financial Services, LLC |
12.60% |
|
|
The Northern Trust Company |
9.05% |
|
|
UBS Financial Services, LLC |
8.91% |
|
|
Vanguard Marketing Corporation |
14.69% |
|
Vanguard Total World Bond ETF |
Charles Schwab & Co., Inc. |
27.26% |
|
|
CITI/DECV |
6.49% |
|
|
JPMorgan Chase Bank, N.A. |
10.07% |
|
|
National Financial Services, LLC |
10.53% |
|
|
Vanguard Marketing Corporation |
13.50% |
A shareholder who owns more than 25% of a Fund’s voting shares may be considered a controlling person. As of November 30, 2023, the following held of record 25% or more of the voting shares:
|
Vanguard Fund |
Owner |
Percentage
of Ownership |
|
Vanguard Explorer Value Fund |
Fidelity Investments Institutional Operations Co |
29.89% |
|
Vanguard Mortgage-Backed Securities Index Fund |
Charles Schwab & Co., Inc. |
40.73% |
|
Vanguard Total World Bond ETF |
Charles Schwab & Co., Inc. |
27.26% |
Portfolio Holdings Disclosure Policies and Procedures
Introduction
Vanguard and the boards of trustees of the Vanguard funds (the Boards) have adopted Portfolio Holdings Disclosure Policies and Procedures (Policies and Procedures) to govern the disclosure of the portfolio holdings of each Vanguard fund. Vanguard and the Boards considered each of the circumstances under which Vanguard fund portfolio holdings may be disclosed to different categories of persons under the Policies and Procedures. Vanguard and the Boards also considered actual and potential material conflicts that could arise in such circumstances between the interests of Vanguard fund shareholders, on the one hand, and those of the fund’s investment advisor, sub-advisor, distributor, or any affiliated person of the fund, its investment advisor, sub-advisor, or its distributor, on the other. After giving due consideration to such matters and after the exercise of their fiduciary duties and reasonable business judgment, Vanguard and the Boards determined that the Vanguard funds have a legitimate business purpose for disclosing portfolio holdings to the persons described in each of the circumstances set forth in the Policies and Procedures and that the Policies and Procedures are reasonably designed to ensure that disclosure of portfolio holdings and information about portfolio holdings is in the best interests of fund shareholders and appropriately addresses the potential for material conflicts of interest.
The Boards exercise continuing oversight of the disclosure of Vanguard fund portfolio holdings by (1) overseeing the implementation and enforcement of the Policies and Procedures, the Code of Ethical Conduct, and the Policies and Procedures Designed to Prevent the Misuse of Inside Information (collectively, the portfolio holdings governing policies) by the chief compliance officer of Vanguard and the Vanguard funds; (2) considering reports and recommendations by the chief compliance officer concerning any material compliance matters (as defined in Rule 38a-1 under the 1940 Act and Rule 206(4)-7 under the Investment Advisers Act of 1940) that may arise in connection with any portfolio holdings governing policies; and (3) considering whether to approve or ratify any amendment to any portfolio holdings governing policies.
B-57
Vanguard and the Boards reserve the right to amend the Policies and Procedures at any time and from time to time without prior notice at their sole discretion. For purposes of the Policies and Procedures, the term “portfolio holdings” means the equity and debt securities (e.g., stocks and bonds) held by a Vanguard fund and does not mean the cash equivalent investments, derivatives, and other investment positions (collectively, other investment positions) held by the fund.
Online Disclosure of Complete Portfolio Holdings
Each actively managed Vanguard fund, unless otherwise stated, generally will seek to disclose the fund’s complete portfolio holdings as of the end of the most recent calendar quarter online at vanguard.com 30 calendar days after the end of the calendar quarter. Each Vanguard fund relying on Rule 6c-11 under the 1940 Act (e.g., standalone ETFs) generally will seek to disclose complete portfolio holdings, including other investment positions, at the beginning of each business day. These portfolio holdings, including other investment positions, will be disclosed online at vanguard.com. In accordance with Rule 2a-7 under the 1940 Act, each of the Vanguard money market funds will disclose the fund’s complete portfolio holdings as of the last business day of the prior month online at vanguard.com no later than the fifth business day of the current month. The complete portfolio holdings information for money market funds will remain available online for at least six months after the initial posting. Each Vanguard index fund, other than those Vanguard index funds relying on Rule 6c-11 under the 1940 Act (e.g., standalone ETFs), generally will seek to disclose the fund’s complete portfolio holdings as of the end of the most recent month online at vanguard.com, 15 calendar days after the end of the month. Online disclosure of complete portfolio holdings is made to all categories of persons, including individual investors, institutional investors, intermediaries, third-party service providers, rating and ranking organizations, affiliated persons of a Vanguard fund, and all other persons. Vanguard will review complete portfolio holdings before disclosure is made and, except with respect to the complete portfolio holdings of the Vanguard money market funds, may withhold any portion of the fund’s complete portfolio holdings from disclosure when deemed to be in the best interests of the fund after consultation with a Vanguard fund’s investment advisor.
Disclosure of Complete Portfolio Holdings to Service Providers Subject to Confidentiality and Trading Restrictions
Vanguard, for legitimate business purposes, may disclose Vanguard fund complete portfolio holdings at times it deems necessary and appropriate to rating and ranking organizations; financial printers; proxy voting service providers; pricing information vendors; issuers of guaranteed investment contracts for stable value portfolios; third parties that deliver analytical, statistical, or consulting services; and other third parties that provide services (collectively, Service Providers) to Vanguard, Vanguard subsidiaries, and/or the Vanguard funds. Disclosure of complete portfolio holdings to a Service Provider is conditioned on the Service Provider being subject to a written agreement imposing a duty of confidentiality, including a duty not to trade on the basis of any material nonpublic information.
The frequency with which complete portfolio holdings may be disclosed to a Service Provider, and the length of the lag, if any, between the date of the information and the date on which the information is disclosed to the Service Provider, is determined based on the facts and circumstances, including, without limitation, the nature of the portfolio holdings information to be disclosed, the risk of harm to the funds and their shareholders, and the legitimate business purposes served by such disclosure. The frequency of disclosure to a Service Provider varies and may be as frequent as daily, with no lag. Disclosure of Vanguard fund complete portfolio holdings by Vanguard to a Service Provider must be authorized by a Vanguard fund officer or a Principal in Vanguard’s Portfolio Review Department or Office of the General Counsel. Any disclosure of Vanguard fund complete portfolio holdings to a Service Provider as previously described may also include a list of the other investment positions that make up the fund, such as cash equivalent investments and derivatives.
Currently, Vanguard fund complete portfolio holdings are disclosed to the following Service Providers as part of ongoing arrangements that serve legitimate business purposes: Abel/Noser Corporation; Advisor Software, Inc.; Alcom Printing Group, Inc.; Apple Press, L.C.; Bloomberg L.P.; Brilliant Graphics, Inc.; Broadridge Financial Solutions, Inc.; Brown Brothers Harriman & Co.; Canon Business Process Services; Charles River Systems, Inc.; Eagle Investments; Equilend; FactSet Research Systems Inc.; Gresham Technologies, Plc.; Innovation Printing & Communications; Institutional Shareholder Services, Inc.; Intelligencer Printing Company; Investment Technology Group, Inc.; Lipper, Inc.; Markit WSO Corporation; McMunn Associates, Inc.; Morningstar; Pirium; Reuters America Inc.; R.R. Donnelley, Inc.; State Street Bank and Trust Company; Stonewain; and Trade Informatics LLC.
B-58
Disclosure of Complete Portfolio Holdings to Vanguard Affiliates and Certain Fiduciaries Subject to Confidentiality and Trading Restrictions
Vanguard fund complete portfolio holdings may be disclosed between and among the following persons (collectively, Affiliates and Fiduciaries) for legitimate business purposes within the scope of their official duties and responsibilities, subject to such persons’ continuing legal duty of confidentiality and legal duty not to trade on the basis of any material nonpublic information, as such duties are imposed under the Code of Ethical Conduct, the Policies and Procedures Designed to Prevent the Misuse of Inside Information, by agreement, or under applicable laws, rules, and regulations: (1) persons who are subject to the Code of Ethical Conduct or the Policies and Procedures Designed to Prevent the Misuse of Inside Information; (2) an investment advisor, sub-advisor, distributor, administrator, transfer agent, or custodian to a Vanguard fund; (3) an accounting firm, an auditing firm, or outside legal counsel retained by Vanguard, a Vanguard subsidiary, or a Vanguard fund; (4) an investment advisor to whom complete portfolio holdings are disclosed for due diligence purposes when the advisor is in merger or acquisition talks with a Vanguard fund’s current advisor; and (5) a newly hired investment advisor or sub-advisor to whom complete portfolio holdings are disclosed prior to the time it commences its duties.
The frequency with which complete portfolio holdings may be disclosed between and among Affiliates and Fiduciaries, and the length of the lag, if any, between the date of the information and the date on which the information is disclosed between and among the Affiliates and Fiduciaries, is determined by such Affiliates and Fiduciaries based on the facts and circumstances, including, without limitation, the nature of the portfolio holdings information to be disclosed, the risk of harm to the funds and their shareholders, and the legitimate business purposes served by such disclosure. The frequency of disclosure between and among Affiliates and Fiduciaries varies and may be as frequent as daily, with no lag. Any disclosure of Vanguard fund complete portfolio holdings to any Affiliates and Fiduciaries as previously described may also include a list of the other investment positions that make up the fund, such as cash equivalent investments and derivatives. Disclosure of Vanguard fund complete portfolio holdings or other investment positions by Vanguard, VMC, or a Vanguard fund to Affiliates and Fiduciaries must be authorized by a Vanguard fund officer or a Principal of Vanguard.
Currently, Vanguard discloses complete portfolio holdings to the following Affiliates and Fiduciaries as part of ongoing arrangements that serve legitimate business purposes: Vanguard and each investment advisor, sub-advisor, custodian, and independent registered public accounting firm identified in each fund’s Statement of Additional Information.
Disclosure of Portfolio Holdings to Trading Counterparties in the Normal Course of Managing a Fund’s Assets
An investment advisor, sub-advisor, administrator, or custodian for a Vanguard fund may, for legitimate business purposes within the scope of its official duties and responsibilities, disclose portfolio holdings (whether partial portfolio holdings or complete portfolio holdings) and other investment positions that make up the fund to any trading counterparty, including one or more broker-dealers or banks, during the course of, or in connection with, normal day-to-day securities and derivatives transactions with or through such trading counterparties subject to the counterparty’s legal obligation not to use or disclose material nonpublic information concerning the fund’s portfolio holdings, other investment positions, securities transactions, or derivatives transactions without the consent of the fund or its agents. The Vanguard funds have not given their consent to any such use or disclosure and no person or agent of Vanguard is authorized to give such consent except as approved in writing by the Boards of the Vanguard funds. Disclosure of portfolio holdings or other investment positions by Vanguard to trading counterparties must be authorized by a Vanguard fund officer or a Principal of Vanguard.
In addition to the disclosures described below to Authorized Participants, a Vanguard fund investment advisor or administrator may also disclose portfolio holdings information to other current or prospective fund shareholders in connection with the dissemination of information necessary for transactions in Creation Units (as defined below) or other large transactions with a Vanguard fund. Such shareholders are typically Authorized Participants or other financial institutions that have been authorized by VMC to purchase and redeem large blocks of shares, but may also include market makers and other institutional market participants and entities to whom a Vanguard fund advisor or administrator may provide information in connection with transactions in a Vanguard fund.
Disclosure of Nonmaterial Information
The Policies and Procedures permit Vanguard fund officers, Vanguard fund portfolio managers, and other Vanguard representatives (collectively, Approved Vanguard Representatives) to disclose any views, opinions, judgments, advice,
B-59
or commentary, or any analytical, statistical, performance, or other information, in connection with or relating to a Vanguard fund or its portfolio holdings and/or other investment positions (collectively, commentary and analysis) or any changes in the portfolio holdings of a Vanguard fund that occurred after the end of the most recent calendar quarter (recent portfolio changes) to any person if (1) such disclosure serves a legitimate business purpose, (2) such disclosure does not effectively result in the disclosure of the complete portfolio holdings of any Vanguard fund (which can be disclosed only in accordance with the Policies and Procedures), and (3) such information does not constitute material nonpublic information. Disclosure of commentary and analysis or recent portfolio changes by Vanguard, VMC, or a Vanguard fund must be authorized by a Vanguard fund officer or a Principal of Vanguard.
An Approved Vanguard Representative must make a good faith determination whether the information constitutes material nonpublic information, which involves an assessment of the particular facts and circumstances. Vanguard believes that in most cases recent portfolio changes that involve a few or even several securities in a diversified portfolio or commentary and analysis would be immaterial and would not convey any advantage to a recipient in making an investment decision concerning a Vanguard fund. Nonexclusive examples of commentary and analysis about a Vanguard fund include (1) the allocation of the fund’s portfolio holdings and other investment positions among various asset classes, sectors, industries, and countries; (2) the characteristics of the stock and bond components of the fund’s portfolio holdings and other investment positions; (3) the attribution of fund returns by asset class, sector, industry, and country; and (4) the volatility characteristics of the fund. Approved Vanguard Representatives may, at their sole discretion, deny any request for information made by any person, and may do so for any reason or for no reason. Approved Vanguard Representatives include, for purposes of the Policies and Procedures, persons employed by or associated with Vanguard or a subsidiary of Vanguard who have been authorized by Vanguard’s Portfolio Review Department to disclose recent portfolio changes and/or commentary and analysis in accordance with the Policies and Procedures.
Disclosure of Portfolio Holdings, Including Other Investment Positions, in Accordance with Securities and Exchange Commission (SEC) Exemptive Orders and Rule 6c-11
Vanguard’s Fund Services and Oversight unit may disclose to the National Securities Clearing Corporation (NSCC), Authorized Participants, and other market makers the daily portfolio composition files (PCFs) that identify a basket of specified securities that may overlap with the actual or expected portfolio holdings of the Vanguard funds that offer a class of shares known as Vanguard ETF Shares (ETF Funds). Each Vanguard fund relying on Rule 6c-11 under the 1940 Act generally will seek to disclose complete portfolio holdings, including other investment positions, at the beginning of each business day. These portfolio holdings, including other investment positions, will be disclosed online at vanguard.com. The disclosure of PCFs and portfolio holdings, including other investment positions, will be in accordance with the terms and conditions of related exemptive orders (Vanguard ETF Exemptive Orders) issued by the SEC or Rule 6c-11 under the 1940 Act, as described in this section. In addition to disclosing PCFs to the NSCC, as previously described, Vanguard’s Fund Services and Oversight unit will generally disclose the PCF for any ETF Fund online at vanguard.com.
Unlike the conventional classes of shares issued by ETF Funds, the ETF Shares are listed for trading on a national securities exchange. Each ETF Fund issues and redeems ETF Shares in large blocks, known as “Creation Units.” To purchase or redeem a Creation Unit, an investor must be an “Authorized Participant” or the investor must purchase or redeem through a broker-dealer that is an Authorized Participant. An Authorized Participant is a participant in the Depository Trust Company (DTC) that has executed a “Participant Agreement” with VMC. Each ETF Fund issues Creation Units in exchange for a “portfolio deposit” consisting of a basket of specified securities (Deposit Securities) and a cash payment (Balancing Amount). Each ETF Fund also generally redeems Creation Units in kind; an investor who tenders a Creation Unit will receive, as redemption proceeds, a basket of specified securities together with a Balancing Amount.
In connection with the creation and redemption process, and in accordance with the terms and conditions of the Vanguard ETF Exemptive Orders and Rule 6c-11, Vanguard makes available to the NSCC (a clearing agency registered with the SEC and affiliated with the DTC), for dissemination to NSCC participants on each business day prior to the opening of trading on the listing exchange, a PCF containing a list of the names and the required number of shares of each Deposit Security for each ETF Fund. In addition, the listing exchange disseminates (1) continuously throughout the trading day, through the facilities of the Consolidated Tape Association, the market value of an ETF Share; and (2) every 15 seconds throughout the trading day, a calculation of the estimated NAV of an ETF Share
B-60
(expected to be accurate to within a few basis points). Comparing these two figures allows an investor to determine whether, and to what extent, ETF Shares are selling at a premium or at a discount to NAV. ETF Shares are listed on the exchange and traded on the secondary market in the same manner as other equity securities. The price of ETF Shares trading on the secondary market is based on a current bid/offer market.
Disclosure of Portfolio Holdings Related Information to the Issuer of a Security for Legitimate Business Purposes
Vanguard, at its sole discretion, may disclose portfolio holdings information concerning a security held by one or more Vanguard funds to the issuer of such security if the issuer presents, to the satisfaction of Vanguard’s Fund Services and Oversight unit, convincing evidence that the issuer has a legitimate business purpose for such information. Disclosure of this information to an issuer is conditioned on the issuer being subject to a written agreement imposing a duty of confidentiality, including a duty not to trade on the basis of any material nonpublic information. The frequency with which portfolio holdings information concerning a security may be disclosed to the issuer of such security, and the length of the lag, if any, between the date of the information and the date on which the information is disclosed to the issuer, is determined based on the facts and circumstances, including, without limitation, the nature of the portfolio holdings information to be disclosed, the risk of harm to the funds and their shareholders, and the legitimate business purposes served by such disclosure. The frequency of disclosure to an issuer cannot be determined in advance of a specific request and will vary based upon the particular facts and circumstances and the legitimate business purposes, but in unusual situations could be as frequent as daily, with no lag. Disclosure of portfolio holdings information concerning a security held by one or more Vanguard funds to the issuer of such security must be authorized by a Vanguard fund officer or a Principal in Vanguard’s Equity Investment Group, Portfolio Review Department, or Office of the General Counsel.
Disclosure of Portfolio Holdings as Required by Applicable Law
Vanguard fund portfolio holdings (whether partial portfolio holdings or complete portfolio holdings) and other investment positions that make up a fund shall be disclosed to any person as required by applicable laws, rules, and regulations. Examples of such required disclosure include, but are not limited to, disclosure of Vanguard fund portfolio holdings (1) in a filing or submission with the SEC or another regulatory body, (2) in connection with seeking recovery on defaulted bonds in a federal bankruptcy case, (3) in connection with a lawsuit, or (4) as required by court order. Disclosure of portfolio holdings or other investment positions by Vanguard, VMC, or a Vanguard fund as required by applicable laws, rules, and regulations must be authorized by a Vanguard fund officer or a Principal of Vanguard.
Prohibitions on Disclosure of Portfolio Holdings
No person is authorized to disclose Vanguard fund portfolio holdings or other investment positions (whether online at vanguard.com, in writing, by fax, by email, orally, or by other means) except in accordance with the Policies and Procedures. In addition, no person is authorized to make disclosure pursuant to the Policies and Procedures if such disclosure is otherwise unlawful under the antifraud provisions of the federal securities laws (as defined in Rule 38a-1 under the 1940 Act). Furthermore, Vanguard’s management, at its sole discretion, may determine not to disclose portfolio holdings or other investment positions that make up a Vanguard fund to any person who would otherwise be eligible to receive such information under the Policies and Procedures, or may determine to make such disclosures publicly as provided by the Policies and Procedures.
Prohibitions on Receipt of Compensation or Other Consideration
The Policies and Procedures prohibit a Vanguard fund, its investment advisor, and any other person or entity from paying or receiving any compensation or other consideration of any type for the purpose of obtaining disclosure of Vanguard fund portfolio holdings or other investment positions. “Consideration” includes any agreement to maintain assets in the fund or in other investment companies or accounts managed by the investment advisor or sub-advisor or by any affiliated person of the investment advisor or sub-advisor.
B-61
Investment Advisory and Other Services
The Trust currently uses four investment advisors:
◾ Ariel Investments, LLC (Ariel) provides investment advisory services for a portion of Vanguard Explorer Value Fund.
◾ Cardinal Capital Management, L.L.C. (Cardinal Capital) provides investment advisory services for a portion of Vanguard Explorer Value Fund.
◾ Frontier Capital Management Co., LLC (Frontier Capital) provides investment advisory services for a portion of Vanguard Explorer Value Fund.
◾ Vanguard provides investment advisory services for Vanguard Russell Index Funds, Vanguard Sector Bond Index Funds, Vanguard Total Corporate Bond ETF and Vanguard Total World Bond ETF.
For funds that are advised by independent third-party advisory firms unaffiliated with Vanguard, the board of trustees of each fund hires investment advisory firms, not individual portfolio managers, to provide investment advisory services to such funds. Vanguard negotiates each advisory agreement, which contains advisory fee arrangements, on an arm’s length basis with the advisory firm. Each advisory agreement is reviewed annually by each fund’s board of trustees, taking into account numerous factors, which include, without limitation, the nature, extent, and quality of the services provided; investment performance; and the fair market value of the services provided. Each advisory agreement is between the Trust and the advisory firm, not between the Trust and the portfolio manager. The structure of the advisory fee paid to each unaffiliated investment advisory firm is described in the following sections. In addition, each firm has established policies and procedures designed to address the potential for conflicts of interest. Each firm’s compensation structure and management of potential conflicts of interest are summarized by the advisory firm in the following sections for the fiscal year ended August 31, 2023.
A fund is a party to an investment advisory agreement with each of its independent third-party advisors whereby the advisor manages the investment and reinvestment of the portion of the fund’s assets that the fund’s board of trustees determines to assign to the advisor. In this capacity, each advisor continuously reviews, supervises, and administers the investment program for its portion of the fund’s assets. Hereafter, each portion will be referred to as the advisor’s Portfolio. Each advisor discharges its responsibilities subject to the supervision and oversight of Vanguard’s Portfolio Review Department and the officers and trustees of the fund. Vanguard’s Portfolio Review Department is responsible for recommending changes in a fund’s advisory arrangements to the fund’s board of trustees, including changes in the amount of assets allocated to each advisor and recommendations to hire, terminate, or replace an advisor.
I. Vanguard Explorer Value Fund
The Fund pays each of its investment advisors a base fee plus or minus a performance adjustment. Each base fee, which is paid quarterly, is a percentage of average daily net assets managed by the advisor during the most recent fiscal quarter. The base fee has breakpoints, which means that the percentage declines as assets go up. The performance adjustment, also paid quarterly, is based on the cumulative total return of each advisor’s portion of the Fund relative to that of the Russell 2000 Value Index (for Frontier Capital) or the Russell 2500 Value Index (for Ariel and Cardinal Capital) over the preceding 36-month period.
During the fiscal years ended August 31, 2021, 2022, and 2023, the Explorer Value Fund incurred investment advisory fees of approximately $2,653,000 (before a performance-based increase of $54,000), $3,363,000 (before a performance-based increase of $246,000), and $3,094,000 (before a performance-based decrease of $388,000), respectively.
During the fiscal years ended August 31, 2021, 2022, and 2023, the Explorer Value Fund incurred investment advisory fees of approximately $2,653,000 (before a performance-based increase of $54,000), $3,363,000 (before a performance-based increase of $246,000), and $3,094,000 (before a performance-based decrease of $388,000), respectively.
A. Cardinal Capital Management, L.L.C. (Cardinal Capital)
Cardinal Capital, a registered investment advisor founded in 1995 and owned by investment professionals within the firm, provides investment management services to the Fund, public and private institutions, corporations, public and private pension plans, investment companies, foundations and endowments, mutual funds, collective investment trusts and high net worth individuals.
1. Other Accounts Managed
The following table provides information relating to the other accounts managed by the portfolio managers of the Fund as of the fiscal year ended August 31, 2023 (unless otherwise noted):
B-62
|
Portfolio Manager |
|
No. of
accounts |
Total assets |
No. of accounts with
performance-based
fees |
Total assets in
accounts with
performance-based
fees |
|
Eugene Fox III |
Registered investment companies1 |
5 |
$1.7B |
1 |
$959.4M |
|
|
Other pooled investment vehicles |
3 |
$313B |
0 |
$0 |
|
|
Other accounts |
34 |
$1.5T |
0 |
$0 |
|
Robert B. Kirkpatrick |
Registered investment companies1 |
5 |
$1.7B |
1 |
$959.4M |
|
|
Other pooled investment vehicles |
3 |
$313B |
0 |
$0 |
|
|
Other accounts |
34 |
$1.5T |
0 |
$0 |
|
Rachel D. Matthews |
Registered investment companies1 |
5 |
$1.7B |
1 |
$959.4M |
|
|
Other pooled investment vehicles |
3 |
$313B |
0 |
$0 |
|
|
Other accounts |
34 |
$1.5T |
0 |
$0 |
|
Robert F. Fields |
Registered investment companies1 |
5 |
$1.7B |
1 |
$959.4M |
|
|
Other pooled investment vehicles |
3 |
$313B |
0 |
$0 |
|
|
Other accounts |
34 |
$1.5T |
0 |
$0 |
1
Includes Vanguard Explorer Value Fund which held assets of $959.4 million as of August 31, 2023.
2. Material Conflicts of Interest
The portfolio managers for the Fund manage multiple accounts, including the Fund. The portfolio managers make decisions for each account based on the investment objectives, policies, practices, and other relevant investment considerations that the portfolio managers believe are applicable to that account. Consequently, the portfolio managers may purchase securities for one account and not another account, and the performance of securities purchased for one account may vary from the performance of securities purchased for other accounts. A portfolio manager may place transactions on behalf of other accounts that are contrary to investment decisions made on behalf of the Fund, or make investment decisions that are similar to those made for the Fund, both of which have the potential to adversely affect the price paid or received by the Fund or the size of the security position obtainable for the Fund. Cardinal Capital has adopted policies and procedures that it believes address the conflicts associated with managing multiple accounts for multiple clients, although there is no assurance that such policies and procedures will adequately address such conflicts.
3. Description of Compensation
The portfolio managers receive a fixed base salary, variable annual bonus, and partnership distributions. The annual bonus and partnership distributions are directly correlated to the net profits of the firm. Compensation is not based on Fund performance.
4. Ownership of Securities
As of August 31, 2023, the named portfolio managers did not own any shares of Vanguard Explorer Value Fund.
B. Frontier Capital Management Co., LLC (Frontier Capital)
Frontier Capital is a registered investment advisor founded in 1980. The Affiliated Managers Group, Inc., a publicly traded asset management company with equity investments in a diverse group of investment management firms, indirectly owns a controlling interest in Frontier Capital.
B-63
1. Other Accounts Managed
The following table provides information relating to the other accounts managed by the portfolio managers of the Fund as of the fiscal year ended August 31, 2023 (unless otherwise noted):
|
Portfolio Manager |
|
No. of
accounts |
Total assets |
No. of accounts with
performance-based
fees |
Total assets in
accounts with
performance-based
fees |
|
William A. Teichner |
Registered investment companies1 |
1 |
$959.4M |
1 |
$959.4M |
|
|
Other pooled investment vehicles |
1 |
$170.8M |
0 |
$0 |
|
|
Other accounts |
23 |
$1.8B |
0 |
$0 |
|
Rushan Jiang |
Registered investment companies1 |
1 |
$959.4M |
1 |
$959.4M |
|
|
Other pooled investment vehicles |
1 |
$170.8M |
0 |
$0 |
|
|
Other accounts |
23 |
$1.8B |
0 |
$0 |
1
Includes Vanguard Explorer Value Fund which held assets of $959.4 million as of August 31, 2023.
2. Material Conflicts of Interest
In connection with its management of clients’ accounts, Frontier is subject to a number of actual or apparent conflicts of interest. These conflicts may arise when a portfolio manager has day-to-day management responsibilities with respect to more than one fund or other account. A portfolio manager potentially could give favorable treatment to some accounts for a variety of reasons, including favoring larger accounts, accounts that have a different advisory fee arrangement (including any accounts that pay performance-based fees) or accounts in which the portfolio manager has a personal investment. In addition, conflicts may arise relating to the allocation of investments among accounts with similar investment objectives but managed by different portfolio managers.
Frontier Capital’s portfolio managers typically manage multiple accounts. Generally, however, accounts within a particular investment strategy (e.g., small cap value) with similar objectives are managed similarly. Accordingly, portfolio holdings and industry and sector exposure tend to be similar across a group of accounts in the same strategy with similar objectives, which tend to minimize the potential for conflicts of interest.
Frontier Capital has adopted trade allocation and aggregation policies that seek to treat all clients fairly and equitably. These policies address the allocation of limited investment opportunities, such as IPOs, and the allocation of transactions and aggregations of orders across multiple accounts. Investment personnel of the firm or its affiliates may be permitted to be commercially or professionally involved with an issuer of securities. Any potential conflicts of interest from such involvement would be monitored for compliance with the firm’s Code of Ethics.
3. Description of Compensation
Frontier Capital’s portfolio manager compensation structure is designed to align the interest of portfolio managers with those of the shareholders whose assets they manage. Frontier’s portfolio manager compensation program consists of a base salary, annual bonus, and participation in company-funded retirement plans. In addition, all of Frontier’s portfolio managers are partners at Frontier, which entitles them to share in the firm’s profits and the long-term growth of the firm. The annual bonus is variable and based partially or primarily upon management-fee revenues generated from client accounts.
4. Ownership of Securities
As of August 31, 2023, Mr. Teichner owned shares of Vanguard Explorer Value Fund within the $100,001-$500,000 range. As of August 31, 2023, Mr. Jiang did not own any shares of the Fund.
C. Ariel Investments, LLC (Ariel)
Founded in 1983 by Chairman, CIO and Co-CEO John W. Rogers, Jr., Ariel became an industry trailblazer by being the first black-owned mutual fund company in the United States. Under Ariel’s time-tested patient investing philosophy, the firm has managed small-cap value portfolios for over 38 years. Ariel launched international and global strategies in 2011, also with a long-term approach. Ariel is headquartered in Chicago, with offices in New York City, San Francisco, and Sydney.
B-64
1. Other Accounts Managed
The following table provides information relating to the other accounts managed by the portfolio managers of the Fund as of the fiscal year ended August 31, 2023 (unless otherwise noted):
|
Portfolio Manager |
|
No. of
accounts |
Total assets |
No. of accounts with
performance-based
fees |
Total assets in
accounts with
performance-based
fees |
|
John W. Rogers, Jr. |
Registered investment companies1 |
5 |
$4.9B |
1 |
$959.4M |
|
|
Other pooled investment vehicles |
0 |
$0 |
0 |
$0 |
|
|
Other accounts |
134 |
$4.3B |
1 |
$100M |
|
Kenneth E. Kuhrt |
Registered investment companies1 |
3 |
$3.7B |
1 |
$959.4M |
|
|
Other pooled investment vehicles |
0 |
$0 |
0 |
$0 |
|
|
Other accounts |
54 |
$2.2B |
0 |
$0 |
1
Includes Vanguard Explorer Value Fund which held assets of $959.4 million as of August 31, 2023.
2. Material Conflicts of Interest
Conflicts of interest can arise in connection with Ariel’s or its portfolio managers’ management of the Fund vis-à-vis its/their discretionary authority over other client accounts. These conflicts are described in Ariel’s Form ADV and/or otherwise disclosed. Examples of these conflicts include:
◾ Potential conflicts of interest arise from managing accounts with performance-based fees alongside accounts with asset-based fees, including the incentive to favor performance-based accounts to increase the manager’s own profits. Ariel does not manage performance-based fee accounts differently than asset-based fee accounts. Specifically, Ariel has in place various procedures to mitigate the conflicts, which include the use of a model portfolio for each strategy to construct individual client portfolios, regular reviews of accounts, performance dispersion reporting procedures, trade aggregation and allocation policies and a trade rotation policy.
◾ Ariel’s management of separately managed accounts for itself and its employees raises a potential conflict of interest because of the potential that Ariel would preferentially allocate trades for itself and its employees to the detriment of other clients. Ariel addresses this conflict by following procedures designed to prevent such preferential treatment, including its trade aggregation and allocation and trade rotation procedures. Ariel takes a number of factors into account when making allocation decisions including, but not limited to, client guidelines or investment restrictions, cash levels, size of account, weighting of securities in a portfolio, any client directed brokerage requirements, and other relevant investment factors.
◾ There may be a pending block order for a security specific to a strategy when a subsequent additional block order is placed for the same security for another strategy. If, upon receiving the second order, the security price has not materially changed and a significant amount of time has not lapsed since the first order was placed, Ariel’s traders may aggregate the first and subsequent orders. However, in cases where the first order has been substantially filled or the price has substantially changed, Ariel’s traders may allocate the existing order and then combine the unexecuted portion for a new block order.
◾ An instance could arise whereby Ariel may receive an investment opportunity of limited availability to allocate among its clients. Ariel’s policy is to allocate IPOs fairly and equitably among those clients eligible to receive IPOs. Portfolio managers will not give preferential treatment in its allocations to any Ariel proprietary account or any accounts in which Ariel’s affiliated persons may have an interest.
◾ Potential conflicts of interest arise when Ariel votes proxies of issuers that have or are seeking a material relationship with Ariel. For example, Ariel manages retirement plan assets and corporate assets for issuers whose securities are held by Ariel’s clients for whom Ariel votes proxies. Ariel also votes proxies of issuers that distribute Ariel’s Funds or that otherwise have a material business relationship with Ariel. Ariel mitigates these and other potential conflicts of interest that arise by following, among other things, a disciplined investment strategy and proxy voting procedures designed to detect and resolve potential conflicts of interest in the proxy voting process and to cast votes that are in the best interests of clients and not a product of a conflict.
B-65
3. Description of Compensation
Portfolio Manager Compensation – John W. Rogers, Jr. As of August 31, 2023, Mr. Rogers’ compensation is determined by Ariel’s Board of Directors and is composed of:
(1) Base Salary. Base salary is a fixed amount determined annually and is calculated based upon market factors for chief executive officers with portfolio management responsibilities.
(2) Discretionary Cash Bonus. Discretionary cash bonuses are related to the profitability of Ariel. In addition, deferred incentives may be awarded and are based on Mr. Rogers’ contribution to Ariel. Deferred incentives vest three years from the award date. Mr. Rogers may choose the form of deferred incentive, which include: (i) investment in the stock of Ariel (which may be elected to be paid out in cash upon vesting) or (ii) deferred cash payment based on the pre-tax performance of one or more of the Fund(s) from the grant date through the vest date. Mr. Rogers may be required to select a minimum percentage in one or more of the Funds.
Portfolio Manager Compensation – Kenneth E. Kuhrt. As of August 31, 2023, Mr. Kurht’s compensation is determined by Mr. Rogers, in consultation with Ariel’s Board. Their compensation consists of:
(1) Base Salary. Base salary is a fixed amount determined annually. Base salaries vary among the portfolio managers and may be based on factors such as level of experience, position responsibilities, and years of service.
(2) Discretionary Cash Bonus. Discretionary cash bonuses are related to the profitability of Ariel. In addition, deferred incentives may be awarded and are based on the portfolio manager’s contribution to Ariel. Deferred incentives vest three years from the award date. Each portfolio manager may choose the form of deferred incentive, which include: (i) investment in the stock of Ariel (which may be elected to be paid out in cash upon vesting) or (ii) deferred cash payment based on the pre-tax performance of one or more of the Fund(s) from the grant date through the vest date. Portfolio managers may be required to select a minimum percentage in one or more of the Funds.
Ariel attempts to align the interests of the portfolio managers and Fund shareholders in determining the portfolio managers’ compensation. Each portfolio manager is evaluated on qualitative factors, which may include, technical skills, productivity, communication skills, industry knowledge, contribution to long-term performance of the Funds (and other accounts) he manages, and consistent exhibition of Ariel’s firm values. There is no mathematical formula attributed to any of the factors considered in determining the value of each form of compensation; rather, each factor considered is a part of a comprehensive qualitative review.
4. Ownership of Securities
As of August 31, 2023, Mr. Rogers owned shares of Vanguard Explorer Value Fund in the $500,001-$1,000,000 range. As of the same date, Mr. Kuhrt owned shares of the Vanguard Explorer Value Fund in the $100,001-$500,000 range.
II. Vanguard Russell 1000 Index Fund, Vanguard Russell 1000 Value Index Fund, Vanguard Russell 1000 Growth Index Fund, Vanguard Russell 2000 Index Fund, Vanguard Russell 2000 Value Index Fund, Vanguard Russell 2000 Growth Index Fund, Vanguard Russell 3000 Index Fund, Vanguard Short-Term Corporate Bond Index Fund, Vanguard Short-Term Treasury Index Fund, Vanguard Intermediate-Term Corporate Bond Index Fund, Vanguard Intermediate-Term Treasury Index Fund, Vanguard Long-Term Corporate Bond Index Fund, Vanguard Long-Term Treasury Index Fund, Vanguard Mortgage-Backed Securities Index Fund, Vanguard Total Corporate Bond ETF, Vanguard Total World Bond ETF
Vanguard, through its Equity Index Group, provides investment advisory services to the Vanguard Russell Index Funds. Vanguard, through its Fixed Income Group, provides investment advisory services to the Vanguard Sector Bond Index Funds. The compensation and other expenses of Vanguard’s advisory staff are allocated among the funds utilizing these services.
Vanguard, through its Fixed Income Group, provides investment advisory services to Vanguard Total Corporate Bond ETF and Vanguard Total World Bond ETF. The Funds are fund of funds that invest in other Vanguard ETFs (underlying funds). The Funds benefit from the investment advisory services provided to the underlying funds and, as a shareholder of those funds, indirectly bear a proportionate share of those funds’ advisory fees and expenses. For more information about the investment advisory services provided to the underlying funds, please refer to each fund’s Statement of Additional Information.
B-66
During the fiscal years ended August 31, 2021, 2022, and 2023, the Funds (other than Vanguard Total World Bond ETF and Vanguard Total Corporate Bond ETF) incurred the following approximate investment advisory expenses:
|
Vanguard Fund |
2021 |
2022 |
2023 |
|
Vanguard Short-Term Treasury Index Fund |
$345,000 |
$331,000 |
$527,000 |
|
Vanguard Intermediate-Term Treasury Index Fund |
269,000 |
258,000 |
409,000 |
|
Vanguard Long-Term Treasury Index Fund |
136,000 |
140,000 |
194,000 |
|
Vanguard Short-Term Corporate Bond Index Fund |
1,035,000 |
925,000 |
1,006,000 |
|
Vanguard Intermediate-Term Corporate Bond Index Fund |
1,054,000 |
976,000 |
909,000 |
|
Vanguard Long-Term Corporate Bond Index Fund |
144,000 |
104,000 |
139,000 |
|
Vanguard Mortgage-Backed Securities Index Fund |
353,000 |
308,000 |
363,000 |
|
Vanguard Russell 1000 Index Fund |
693,000 |
636,000 |
125,000 |
|
Vanguard Russell 1000 Value Index Fund |
860,000 |
1,051,000 |
188,000 |
|
Vanguard Russell 1000 Growth Index Fund |
1,374,000 |
1,235,000 |
321,000 |
|
Vanguard Russell 2000 Index Fund |
711,000 |
828,000 |
148,000 |
|
Vanguard Russell 2000 Value Index Fund |
128,000 |
108,000 |
23,000 |
|
Vanguard Russell 2000 Growth Index Fund |
199,000 |
93,000 |
22,000 |
|
Vanguard Russell 3000 Index Fund |
301,000 |
223,000 |
67,000 |
B-67
1. Other Accounts Managed
The following table provides information relating to the other accounts managed by the portfolio managers of the Funds as of the fiscal year ended August 31, 2023 (unless otherwise noted):
|
Portfolio Manager |
|
No. of
accounts |
Total assets |
No. of accounts with
performance-based
fees |
Total assets in
accounts with
performance-based
fees |
|
Joshua C. Barrickman |
Registered investment companies1 |
23 |
$1.1T |
0 |
$0 |
|
|
Other pooled investment vehicles |
1 |
$822.8M |
0 |
$0 |
|
|
Other accounts |
7 |
$6.0B |
0 |
$0 |
|
Nick Birkett |
Registered investment companies2 |
22 |
$1.6T |
0 |
$0 |
|
|
Other pooled investment vehicles |
4 |
$10.0B |
0 |
$0 |
|
|
Other accounts |
0 |
$0 |
0 |
$0 |
|
Aurélie Denis3 |
Registered investment companies4 |
31 |
$970B |
0 |
$0 |
|
|
Other pooled investment vehicles |
14 |
$626B |
0 |
$0 |
|
|
Other accounts |
0 |
$0 |
0 |
$0 |
|
Kenny Narzikul5
|
Registered investment companies6
|
15 |
$179B |
0 |
$0 |
|
|
Other pooled investment vehicles |
2 |
$2.5B |
0 |
$0 |
|
|
Other accounts |
0 |
$0 |
0 |
$0 |
|
Walter Nejman |
Registered investment companies7 |
40 |
$2.7T |
0 |
$0 |
|
|
Other pooled investment vehicles |
12 |
$619B |
0 |
$0 |
|
|
Other accounts |
0 |
$0 |
0 |
$0 |
1
Includes Vanguard Short-Term, Intermediate-Term, and Long-Term Treasury Index Funds, Vanguard Short-Term, Intermediate-Term, and Long-Term Corporate Bond Index Funds, and Vanguard Total Corporate Bond ETF, Vanguard Mortgage-Backed Securities Index Fund, Vanguard Total Corporate Bond, and Vanguard Total World Bond ETF which collectively held assets of $172 billion as of August 31, 2023.
2
Includes Vanguard Russell 1000 Index Fund, Vanguard Russell 1000 Value Index Fund, Vanguard Russell 1000 Growth Index Fund, Vanguard Russell 2000 Index Fund, Vanguard Russell 2000 Value Index Fund, Vanguard Russell 2000 Growth Index Fund, and Vanguard Russell 3000 Index Fund which collectively held assets of $43 billion as of August 31, 2023.
3
Ms. Denis began co-managing Vanguard Russell 1000 Index Fund, Vanguard Russell 1000 Growth Index Fund, and Vanguard Russell 1000 Value Index Fund on February 17, 2023.
4
Includes Vanguard Russell 1000 Index Fund, Vanguard Russell 1000 Value Index Fund, and Vanguard Russell 1000 Growth Index Fund which collectively held assets of $31 billion as of August 31, 2023.
5
Mr. Narzikul began co-managing Vanguard Russell 2000 Index Fund, Vanguard Russell 2000 Growth Index Fund, and Vanguard Russell 2000 Value Index Fund on February 17, 2023.
6
Includes Vanguard Russell 2000 Index Fund, Vanguard Russell 2000 Value Index Fund, and Vanguard Russell 2000 Growth Index Fund which collectively held assets of $8.9 billion as of August 31, 2023.
7
Includes Vanguard Russell 3000 Index Fund which held assets of $2.9 billion as of August 31, 2023.
2. Material Conflicts of Interest
At Vanguard, individual portfolio managers may manage multiple accounts for multiple clients. In addition to mutual funds, these accounts may include separate accounts, collective trusts, and offshore funds. Managing multiple funds or accounts may give rise to potential conflicts of interest including, for example, conflicts among investment strategies and conflicts in the allocation of investment opportunities. Vanguard manages potential conflicts between funds or accounts through allocation policies and procedures, internal review processes, and oversight by trustees and independent third parties. Vanguard has developed trade allocation procedures and controls to ensure that no one client, regardless of type, is intentionally favored at the expense of another. Allocation policies are designed to address potential conflicts in situations in which two or more funds or accounts participate in investment decisions involving the same securities.
3. Description of Compensation
All Vanguard portfolio managers are Vanguard employees. This section describes the compensation of the Vanguard employees who manage Vanguard mutual funds. As of August 31, 2023, a Vanguard portfolio manager’s compensation generally consists of base salary, bonus, and payments under Vanguard’s long-term incentive compensation program. In addition, portfolio managers are eligible for the standard retirement benefits and health and welfare benefits available
B-68
to all Vanguard employees. Also, certain portfolio managers may be eligible for additional retirement benefits under several supplemental retirement plans that Vanguard adopted in the 1980s to restore dollar-for-dollar the benefits of management employees that had been cut back solely as a result of tax law changes. These plans are structured to provide the same retirement benefits as the standard retirement plans.
In the case of portfolio managers responsible for managing multiple Vanguard funds or accounts, the method used to determine their compensation is the same for all funds and investment accounts. A portfolio manager’s base salary is determined by the manager’s experience and performance in the role, taking into account the ongoing compensation benchmark analyses performed by Vanguard’s Human Resources Department. A portfolio manager’s base salary is generally a fixed amount that may change as a result of an annual review, upon assumption of new duties, or when a market adjustment of the position occurs.
A portfolio manager’s bonus is determined by a number of factors. One factor is gross, pre-tax performance of the fund relative to expectations for how the fund should have performed, given the fund’s investment objective, policies, strategies, and limitations, and the market environment during the measurement period. This performance factor is not based on the amount of assets held in any individual fund’s portfolio. For each Fund, the performance factor depends on how closely the portfolio manager tracks the Fund’s benchmark index over a one-year period. Additional factors include the portfolio manager’s contributions to the investment management functions within the sub-asset class, contributions to the development of other investment professionals and supporting staff, and overall contributions to strategic planning and decisions for the investment group. The target bonus is expressed as a percentage of base salary. The actual bonus paid may be more or less than the target bonus, based on how well the manager satisfies the objectives previously described. The bonus is paid on an annual basis.
Under the long-term incentive compensation program, all full-time employees receive a payment from Vanguard’s long-term incentive compensation plan based on their years of service, job level, and if applicable, management responsibilities. Each year, Vanguard’s independent directors determine the amount of the long-term incentive compensation award for that year based on the investment performance of the Vanguard funds relative to competitors and Vanguard’s operating efficiencies in providing services to the Vanguard funds.
4. Ownership of Securities
As of August 31, 2023, none of the managers owned any shares of the Funds they managed.
Duration and Termination of Investment Advisory Agreements
The current investment advisory agreements with the unaffiliated advisors are (other than Ariel) renewable for successive one-year periods, only if (1) each renewal is specifically approved by a vote of the Fund’s board of trustees, including the affirmative votes of a majority of the trustees who are not parties to the agreement or “interested persons” (as defined in the 1940 Act) of any such party, cast in person at a meeting called for the purpose of considering such approval, or (2) each renewal is specifically approved by a vote of a majority of the Fund’s outstanding voting securities. An agreement is automatically terminated if assigned and may be terminated without penalty at any time either (1) by vote of the board of trustees of the Fund upon thirty (30) days’ written notice to the advisor, (2) by a vote of a majority of the Fund’s outstanding voting securities upon 30 days’ written notice to the advisor, or (3) by the advisor upon ninety (90) days’ written notice to the Fund.
The initial investment advisory agreement with Ariel is binding for a two-year period. At the end of that time, the agreement will become renewable for successive one-year periods, subject to the above conditions. Vanguard provides investment advisory services to the Vanguard Russell Index Funds, the Vanguard Sector Bond Index Funds, Vanguard Total Corporate Bond ETF, and Vanguard Total World Bond ETF pursuant to the terms of the Fifth Amended and Restated Funds' Service Agreement. This agreement will continue in full force and effect until terminated or amended by mutual agreement of the Vanguard funds and Vanguard. Vanguard provides investment advisory services to the Vanguard Russell Index Funds, the Vanguard Sector Bond Index Funds, Vanguard Total Corporate Bond ETF, and Vanguard Total World Bond ETF pursuant to the terms of the Fifth Amended and Restated Funds' Service Agreement. This agreement will continue in full force and effect until terminated or amended by mutual agreement of the Vanguard funds and Vanguard.
B-69
Securities Lending
The following table describes the securities lending activities of each Fund during the fiscal year ended August 31, 2023. Pursuant to Vanguard’s securities lending policy, Vanguard Total Corporate Bond ETF, Vanguard Total World Bond ETF, and the Vanguard Sector Bond Index Funds are not permitted to, and do not, lend their investment securities.
|
Vanguard Fund |
Securities Lending Activities |
|
Vanguard Explorer Value Fund |
|
|
Gross income from securities lending activities |
$42,256 |
|
Fees paid to securities lending agent from a revenue split |
$0 |
|
Fees paid for any cash collateral management service (including fees deducted from a pooled cash
collateral reinvestment vehicle) that are not included in the revenue split |
$399 |
|
Administrative fees not included in revenue split |
$605 |
|
Indemnification fee not included in revenue split |
$0 |
|
Rebate (paid to borrower) |
$0 |
|
Other fees not included in revenue split (specify) |
$0 |
|
Aggregate fees/compensation for securities lending activities |
$1,004 |
|
Net income from securities lending activities |
$41,252 |
|
Vanguard Russell 1000 Growth Index Fund |
|
|
Gross income from securities lending activities |
$567,788 |
|
Fees paid to securities lending agent from a revenue split |
$0 |
|
Fees paid for any cash collateral management service (including fees deducted from a pooled cash
collateral reinvestment vehicle) that are not included in the revenue split |
$574 |
|
Administrative fees not included in revenue split |
$8,162 |
|
Indemnification fee not included in revenue split |
$0 |
|
Rebate (paid to borrower) |
$2,651 |
|
Other fees not included in revenue split (specify) |
$0 |
|
Aggregate fees/compensation for securities lending activities |
$11,387 |
|
Net income from securities lending activities |
$556,401 |
|
Vanguard Russell 1000 Index Fund |
|
|
Gross income from securities lending activities |
$665,151 |
|
Fees paid to securities lending agent from a revenue split |
$0 |
|
Fees paid for any cash collateral management service (including fees deducted from a pooled cash
collateral reinvestment vehicle) that are not included in the revenue split |
$457 |
|
Administrative fees not included in revenue split |
$9,797 |
|
Indemnification fee not included in revenue split |
$0 |
|
Rebate (paid to borrower) |
$5,172 |
|
Other fees not included in revenue split (specify) |
$0 |
|
Aggregate fees/compensation for securities lending activities |
$15,426 |
|
Net income from securities lending activities |
$649,725 |
|
Vanguard Russell 1000 Value Index Fund |
|
|
Gross income from securities lending activities |
$1,769,054 |
|
Fees paid to securities lending agent from a revenue split |
$0 |
|
Fees paid for any cash collateral management service (including fees deducted from a pooled cash
collateral reinvestment vehicle) that are not included in the revenue split |
$1,027 |
|
Administrative fees not included in revenue split |
$26,530 |
|
Indemnification fee not included in revenue split |
$0 |
|
Rebate (paid to borrower) |
$9,850 |
|
Other fees not included in revenue split (specify) |
$0 |
|
Aggregate fees/compensation for securities lending activities |
$37,407 |
|
Net income from securities lending activities |
$1,731,647 |
B-70
|
Vanguard Fund |
Securities Lending Activities |
|
Vanguard Russell 2000 Growth Index Fund |
|
|
Gross income from securities lending activities |
$2,057,474 |
|
Fees paid to securities lending agent from a revenue split |
$0 |
|
Fees paid for any cash collateral management service (including fees deducted from a pooled cash
collateral reinvestment vehicle) that are not included in the revenue split |
$1,365 |
|
Administrative fees not included in revenue split |
$30,343 |
|
Indemnification fee not included in revenue split |
$0 |
|
Rebate (paid to borrower) |
$6,198 |
|
Other fees not included in revenue split (specify) |
$0 |
|
Aggregate fees/compensation for securities lending activities |
$37,906 |
|
Net income from securities lending activities |
$2,019,568 |
|
Vanguard Russell 2000 Index Fund |
|
|
Gross income from securities lending activities |
$10,816,007 |
|
Fees paid to securities lending agent from a revenue split |
$0 |
|
Fees paid for any cash collateral management service (including fees deducted from a pooled cash
collateral reinvestment vehicle) that are not included in the revenue split |
$8,267 |
|
Administrative fees not included in revenue split |
$159,124 |
|
Indemnification fee not included in revenue split |
$0 |
|
Rebate (paid to borrower) |
$93,749 |
|
Other fees not included in revenue split (specify) |
$0 |
|
Aggregate fees/compensation for securities lending activities |
$261,140 |
|
Net income from securities lending activities |
$10,554,867 |
|
Vanguard Russell 2000 Value Index Fund |
|
|
Gross income from securities lending activities |
$1,286,175 |
|
Fees paid to securities lending agent from a revenue split |
$0 |
|
Fees paid for any cash collateral management service (including fees deducted from a pooled cash
collateral reinvestment vehicle) that are not included in the revenue split |
$1,177 |
|
Administrative fees not included in revenue split |
$18,980 |
|
Indemnification fee not included in revenue split |
$0 |
|
Rebate (paid to borrower) |
$4,536 |
|
Other fees not included in revenue split (specify) |
$0 |
|
Aggregate fees/compensation for securities lending activities |
$24,693 |
|
Net income from securities lending activities |
$1,261,482 |
|
Vanguard Russell 3000 Index Fund |
|
|
Gross income from securities lending activities |
$579,353 |
|
Fees paid to securities lending agent from a revenue split |
$0 |
|
Fees paid for any cash collateral management service (including fees deducted from a pooled cash
collateral reinvestment vehicle) that are not included in the revenue split |
$405 |
|
Administrative fees not included in revenue split |
$8,607 |
|
Indemnification fee not included in revenue split |
$0 |
|
Rebate (paid to borrower) |
$898 |
|
Other fees not included in revenue split (specify) |
$0 |
|
Aggregate fees/compensation for securities lending activities |
$9,910 |
|
Net income from securities lending activities |
$569,443 |
The services provided by Brown Brothers Harriman & Co. and Vanguard, each acting separately as securities lending agents for certain Vanguard funds, include coordinating the selection of securities to be loaned to approved borrowers; negotiating the terms of the loan; monitoring the value of the securities loaned and corresponding collateral, marking to market daily; coordinating the investment of cash collateral in the funds’ approved cash collateral reinvestment vehicle; monitoring dividends and coordinating material proxy votes relating to loaned securities; and transferring, recalling, and arranging the return of loaned securities to the funds upon termination of the loan.
B-71
Portfolio Transactions
The advisor decides which securities to buy and sell on behalf of a Fund and then selects the brokers or dealers that will execute the trades on an agency basis or the dealers with whom the trades will be effected on a principal basis. For each trade, the advisor must select a broker-dealer that it believes will provide “best execution.” Best execution does not necessarily mean paying the lowest spread or commission rate available. In seeking best execution, the SEC has said that an advisor should consider the full range of a broker-dealer’s services. The factors considered by the advisor in seeking best execution include, but are not limited to, the broker-dealer’s execution capability, clearance and settlement services, commission rate, trading expertise, willingness and ability to commit capital, ability to provide anonymity, financial responsibility, reputation and integrity, responsiveness, access to underwritten offerings and secondary markets, and access to company management, as well as the value of any research provided by the broker-dealer. In assessing which broker-dealer can provide best execution for a particular trade, the advisor also may consider the timing and size of the order and available liquidity and current market conditions. Subject to applicable legal requirements, the advisor may select a broker based partly on brokerage or research services provided to the advisor and its clients, including the Funds. The advisor may cause a Fund to pay a higher commission than other brokers would charge if the advisor determines in good faith that the amount of the commission is reasonable in relation to the value of services provided. The advisor also may receive brokerage or research services from broker-dealers that are provided at no charge in recognition of the volume of trades directed to the broker. To the extent research services or products may be a factor in selecting brokers, services and products may include written research reports analyzing performance or securities, discussions with research analysts, meetings with corporate executives to obtain oral reports on company performance, market data, and other products and services that will assist the advisor in its investment decision-making process. The research services provided by brokers through which a Fund effects securities transactions may be used by the advisor in servicing all of its accounts, and some of the services may not be used by the advisor in connection with the Fund.
The types of securities in which the Sector Bond Index Funds invest are generally purchased and sold through principal transactions, meaning that the Funds normally purchase securities directly from the issuer or a primary market-maker acting as principal for the securities on a net basis. Explicit brokerage commissions are not paid on these transactions, although purchases of new issues from underwriters of securities typically include a commission or concession paid by the issuer to the underwriter, and purchases from dealers serving as market-makers typically include a dealer’s markup (i.e., a spread between the bid and the asked prices). Brokerage commissions are paid, however, in connection with opening and closing out futures positions.
As previously explained, the types of securities that the Sector Bond Index Funds purchase do not normally involve the payment of explicit brokerage commissions. If any such brokerage commissions are paid, however, the advisor will evaluate their reasonableness by considering: (1) the historical commission rates; (2) the rates that other institutional investors are paying, based upon publicly available information; (3) the rates quoted by brokers and dealers; (4) the size of a particular transaction, in terms of the number of shares, the dollar amount, and the number of clients involved; (5) the complexity of a particular transaction in terms of both execution and settlement; (6) the level and type of business done with a particular firm over a period of time; and (7) the extent to which the broker or dealer has capital at risk in the transaction.
During the fiscal years ended August 31, 2021, 2022, and 2023, the Funds paid the following approximate amounts in brokerage commissions. Brokerage commissions paid by a fund may be substantially different from year to year for multiple reasons, such as market volatility, cash flows, or changes to the stocks that make up a fund's target index.
|
Vanguard Fund |
2021 |
2022 |
2023 |
|
Vanguard Explorer Value Fund1 |
$767,000 |
$466,000 |
$672,000 |
|
Vanguard Intermediate-Term Corporate Bond Index Fund2 |
78,000 |
128,000 |
183,000 |
|
Vanguard Intermediate-Term Treasury Index Fund |
— |
Less than 1,000 |
— |
|
Vanguard Long-Term Corporate Bond Index Fund2 |
9,000 |
4,000 |
8,000 |
|
Vanguard Long-Term Treasury Index Fund |
Less than 1,000 |
— |
— |
|
Vanguard Mortgage-Backed Securities Index Fund |
— |
1,000 |
3,000 |
|
Vanguard Russell 1000 Growth Index Fund |
32,000 |
33,000 |
93,000 |
|
Vanguard Russell 1000 Index Fund |
21,000 |
37,000 |
39,000 |
|
Vanguard Russell 1000 Value Index Fund |
54,000 |
59,000 |
110,000 |
|
Vanguard Russell 2000 Growth Index Fund |
63,000 |
70,000 |
57,000 |
|
Vanguard Russell 2000 Index Fund |
157,000 |
426,000 |
350,000 |
B-72
|
Vanguard Fund |
2021 |
2022 |
2023 |
|
Vanguard Russell 2000 Value Index Fund |
52,000 |
73,000 |
71,000 |
|
Vanguard Russell 3000 Index Fund |
17,000 |
26,000 |
33,000 |
|
Vanguard Short-Term Corporate Bond Index Fund2 |
75,000 |
77,000 |
120,000 |
|
Vanguard Short-Term Treasury Index Fund |
— |
— |
— |
|
Vanguard Total Corporate Bond ETF |
— |
— |
— |
Some securities that are considered for investment by a Fund may also be appropriate for other Vanguard funds or for other clients served by the advisors. If such securities are compatible with the investment policies of a Fund and one or more of an advisor’s other clients, and are considered for purchase or sale at or about the same time, then transactions in such securities may be aggregated by the advisor, and the purchased securities or sale proceeds may be allocated among the participating Vanguard funds and the other participating clients of the advisor in a manner deemed equitable by the advisor. Although there may be no specified formula for allocating such transactions, the allocation methods used, and the results of such allocations, will be subject to periodic review by the Funds' board of trustees.
As of August 31, 2023, each Fund (other than Vanguard Total Corporate Bond ETF and Vanguard Total World Bond ETF, which are fund of funds that do not directly hold such securities), held securities of its “regular brokers or dealers,” as that term is defined in Rule 10b-1 of the 1940 Act, as follows:
|
Vanguard Fund |
Regular Broker or Dealer (or Parent) |
Aggregate Holdings |
|
Vanguard Explorer Value Fund |
— |
— |
|
Vanguard Intermediate-Term Corporate Bond Index Fund |
— |
— |
|
Vanguard Intermediate-Term Treasury Index Fund |
— |
— |
|
Vanguard Long-Term Corporate Bond Index Fund |
— |
— |
|
Vanguard Long-Term Treasury Index Fund |
— |
— |
|
Vanguard Mortgage-Backed Securities Index Fund |
BofA Securities, Inc. |
$27,786,000 |
|
|
Citigroup Global Markets Inc. |
11,177,000 |
|
|
Goldman Sachs & Co. LLC |
14,724,000 |
|
|
J.P. Morgan Securities LLC |
59,524,000 |
|
|
Morgan Stanley & Co. LLC |
14,245,000 |
|
|
Wells Fargo Securities, LLC |
21,713,000 |
|
Vanguard Russell 1000 Growth Index Fund |
— |
— |
|
Vanguard Russell 1000 Index Fund |
BofA Securities, Inc. |
27,786,000 |
|
|
Citigroup Global Markets Inc. |
11,177,000 |
|
|
Goldman Sachs & Co. LLC |
14,724,000 |
|
|
J.P. Morgan Securities LLC |
59,524,000 |
|
|
Morgan Stanley & Co. LLC |
14,245,000 |
|
|
Wells Fargo Securities, LLC |
21,713,000 |
|
Vanguard Russell 1000 Value Index Fund |
BofA Securities, Inc. |
83,477,000 |
|
|
Citigroup Global Markets Inc. |
33,560,000 |
|
|
Goldman Sachs & Co. LLC |
44,203,000 |
|
|
J.P. Morgan Securities LLC |
178,937,000 |
|
|
Morgan Stanley & Co. LLC |
42,760,000 |
|
|
Wells Fargo Securities, LLC |
65,241,000 |
|
Vanguard Russell 2000 Growth Index Fund |
— |
— |
|
Vanguard Russell 2000 Index Fund |
— |
— |
|
Vanguard Russell 2000 Value Index Fund |
— |
— |
|
Vanguard Russell 3000 Index Fund |
BofA Securities, Inc. |
12,949,000 |
|
|
Citigroup Global Markets Inc. |
5,204,000 |
|
|
Goldman Sachs & Co. LLC |
6,868,000 |
|
|
J.P. Morgan Securities LLC |
27,756,000 |
|
|
Morgan Stanley & Co. LLC |
6,646,000 |
|
|
Virtu Americas LLC |
106,000 |
|
|
Wells Fargo Securities, LLC |
10,123,000 |
|
Vanguard Short-Term Corporate Bond Index Fund |
— |
— |
|
Vanguard Short-Term Treasury Index Fund |
— |
— |
B-73
|
Vanguard Fund |
Regular Broker or Dealer (or Parent) |
Aggregate Holdings |
|
Vanguard Total Corporate Bond ETF |
— |
— |
|
Vanguard Total World Bond ETF |
— |
— |
Portfolio turnover for Vanguard Mortgage-Backed Securities Index Fund. The Mortgage-Backed Securities Index Fund portfolio turnover rate was 170 % during its fiscal year ended August 31, 2022, and 101% during its fiscal year ended August 31, 2023. The lower portfolio turnover rate for the Fund in the fiscal year 2023 was due to a decline in refinancing activity and purchase loans.
Proxy Voting
I. Proxy Voting Policies
Each Vanguard fund advised by Vanguard retains the authority to vote proxies received with respect to the shares of equity securities held in a portfolio advised by Vanguard. The Board of Trustees of the Vanguard-advised funds (the Board) has adopted proxy voting procedures and guidelines to govern proxy voting for each portfolio retaining proxy voting authority, which are summarized in Appendix A. The Board of each Vanguard fund advised by a manager not affiliated with Vanguard has delegated the authority to vote proxies related to the portfolio securities held by each fund to its respective advisor(s). Each advisor will vote such proxies in accordance with its own proxy voting policies and procedures, which are summarized in Appendix B.
Vanguard has entered into agreements with various state, federal, and non-U.S. regulators and with certain issuers that limit the amount of shares that the funds may vote at their discretion for particular securities. For these securities, the funds are able to vote a limited portion of the shares at their discretion. Any additional shares generally are voted in the same proportion as votes cast by the issuer’s entire shareholder base (i.e., mirror voted), or the fund is not permitted to vote such shares. Further, the Board has adopted policies that will result in certain funds mirror voting a higher proportion of the shares they own in a regulated issuer in order to permit certain other funds (generally advised by managers not affiliated with Vanguard) to mirror vote none, or a lower proportion, of their shares in such regulated issuer.
II. Securities Lending
There may be occasions when Vanguard needs to restrict lending of and/or recall securities that are out on loan in order to vote the full position at a shareholder meeting. For the funds managed by Vanguard, Vanguard has processes to monitor securities on loan and to evaluate any circumstances that may require it to restrict and/or attempt to recall the security based on the criteria set forth in Appendix A. Additionally, Vanguard has processes in place for advisors unaffiliated with Vanguard who have been delegated authority to vote proxies on behalf of certain Vanguard funds to inform Vanguard of an upcoming vote the advisor deems to be material in accordance with such advisor's proxy voting policies and procedures in order for Vanguard to instruct the recall of the security.
To obtain a free copy of a report that details how the funds voted the proxies relating to the portfolio securities held by the funds for the prior 12-month period ended June 30, log on to vanguard.com or visit the SEC’s website at sec.gov.
B-74
Information About the ETF Share Class
Vanguard Russell Index Funds and Vanguard Sector Bond Index Funds each offer and issue an exchange-traded class of shares called ETF Shares. Throughout this section, we will collectively refer to the Russell Index Funds, Sector Bond Index Funds, Total Corporate Bond ETF, and Total World Bond ETF, as the ETF Funds. Each ETF Fund issues and redeems ETF Shares in large blocks, known as “Creation Units.”
To purchase or redeem a Creation Unit, you must be an Authorized Participant or you must transact through a broker that is an Authorized Participant. An Authorized Participant is a participant in the Depository Trust Company (DTC) that has executed a Participant Agreement with Vanguard Marketing Corporation, the ETF Funds' Distributor (the Distributor). For a current list of Authorized Participants, contact the Distributor.
Investors that are not Authorized Participants must hold ETF Shares in a brokerage account. As with any stock traded on an exchange through a broker, purchases and sales of ETF Shares will be subject to usual and customary brokerage commissions.
Each ETF Fund issues Creation Units in kind in exchange for a basket of securities that are part of—or soon to be part of—its target index (Deposit Securities). Each ETF Fund also redeems Creation Units in kind; an investor who tenders a Creation Unit will receive, as redemption proceeds, a basket of securities that are part of the Fund’s portfolio holdings (Redemption Securities). As part of any creation or redemption transaction, the investor will either pay or receive some cash in addition to the securities, as described more fully on the following pages. The ETF Fund reserves the right to issue Creation Units for cash, rather than in kind.
Exchange Listing and Trading
The ETF Shares have been approved for listing on a national securities exchange and will trade on the exchange at market prices that may differ from net asset value (NAV). There can be no assurance that, in the future, ETF Shares will continue to meet all of the exchange’s listing requirements. The exchange will institute procedures to delist a Fund’s ETF Shares if the Fund’s ETF Shares do not continuously comply with the exchange’s listing rules. The exchange will also delist a Fund’s ETF Shares upon termination of the ETF share class.
The exchange disseminates, through the facilities of the Consolidated Tape Association, an updated “indicative optimized portfolio value” (IOPV) for each ETF Fund as calculated by an information provider. The ETF Funds are not involved with or responsible for the calculation or dissemination of the IOPVs, and they make no warranty as to the accuracy of the IOPVs. An IOPV for a Fund’s ETF Shares is disseminated every 15 seconds during regular exchange trading hours. An IOPV has a securities value component and a cash component. The IOPV is designed as an estimate of an ETF Fund’s NAV at a particular point in time, but it is only an estimate and should not be viewed as the actual NAV, which is calculated once each day.
Conversions and Exchanges
Owners of conventional (i.e., not exchange-traded) shares issued by an ETF Fund may convert those shares to ETF Shares of equivalent value of the same Fund. Please note that investors who own conventional shares through a 401(k) plan or other employer-sponsored retirement or benefit plan generally may not convert those shares to ETF Shares and should check with their plan sponsor or recordkeeper. ETF Shares, whether acquired through a conversion or purchased on the secondary market, cannot be converted to conventional shares by a shareholder. Also, ETF Shares of one fund cannot be exchanged for ETF Shares of another fund.
Investors that are not Authorized Participants must hold ETF Shares in a brokerage account. Thus, before converting conventional shares to ETF Shares, an investor must have an existing, or open a new, brokerage account. This account may be with Vanguard Brokerage Services or with any other brokerage firm. To initiate a conversion of conventional shares to ETF Shares, an investor must contact his or her broker.
Vanguard Brokerage Services does not impose a fee on conversions from Vanguard conventional shares to Vanguard ETF Shares. However, other brokerage firms may charge a fee to process a conversion. Vanguard reserves the right, in the future, to impose a transaction fee on conversions or to limit or terminate the conversion privilege.
Converting conventional shares to ETF Shares is generally accomplished as follows. First, after the broker notifies Vanguard of an investor‘s request to convert, Vanguard will transfer conventional shares from the investor‘s account with Vanguard to the broker‘s omnibus account with Vanguard (an account maintained by the broker on behalf of all its customers who hold conventional Vanguard fund shares through the broker). After the transfer, Vanguard’s records will
B-75
reflect the broker, not the investor, as the owner of the shares. Next, the broker will instruct Vanguard to convert the appropriate number or dollar amount of conventional shares in its omnibus account to ETF Shares of equivalent value, based on the respective NAVs of the two share classes. The ETF Fund’s transfer agent will reflect ownership of all ETF Shares in the name of the DTC. The DTC will keep track of which ETF Shares belong to the broker, and the broker, in turn, will keep track of which ETF Shares belong to its customers.
Because the DTC is unable to handle fractional shares, only whole shares can be converted. For example, if the investor owned 300.25 conventional shares, and this was equivalent in value to 90.75 ETF Shares, the DTC account would receive 90 ETF Shares. Conventional shares with a value equal to 0.75 ETF Shares (in this example, that would be 2.481 conventional shares) would remain in the broker‘s omnibus account with Vanguard. The broker then could either (1) take certain internal actions necessary to credit the investor‘s account with 0.75 ETF Shares or (2) redeem the 2.481 conventional shares for cash at NAV and deliver that cash to the investor’s account. If the broker chose to redeem the conventional shares, the investor would realize a gain or loss on the redemption that must be reported on his or her tax return (unless the shares are held in an IRA or other tax-deferred account). An investor should consult his or her broker for information on how the broker will handle the conversion process, including whether the broker will impose a fee to process a conversion.
The conversion process works differently for investors who opt to hold ETF Shares through an account at Vanguard Brokerage Services. Investors who convert their conventional shares to ETF Shares through Vanguard Brokerage Services will have all conventional shares for which they request conversion converted to the equivalent dollar value of ETF Shares. Because no fractional shares will have to be sold, the transaction will not be taxable.
Here are some important points to keep in mind when converting conventional shares of an ETF Fund to ETF Shares:
◾ The conversion process can take anywhere from several days to several weeks, depending on the broker. Vanguard generally will process conversion requests either on the day they are received or on the next business day. Vanguard imposes conversion blackout windows around the dates when an ETF Fund declares dividends. This is necessary to prevent a shareholder from collecting a dividend from both the conventional share class currently held and also from the ETF share class to which the shares will be converted.
◾ During the conversion process, an investor will remain fully invested in the Fund‘s conventional shares, and the investment will increase or decrease in value in tandem with the NAV of those shares.
◾ The conversion transaction is nontaxable except, if applicable, to the very limited extent previously described.
◾ During the conversion process, an investor will be able to liquidate all or part of an investment by instructing Vanguard or the broker (depending on whether the shares are held in the investor’s account or the broker‘s omnibus account) to redeem the conventional shares. After the conversion process is complete, an investor will be able to liquidate all or part of an investment by instructing the broker to sell the ETF Shares.
Book Entry Only System
ETF Shares issued by the ETF Funds are registered in the name of the DTC or its nominee, Cede & Co., and are deposited with, or on behalf of, the DTC. The DTC is a limited-purpose trust company that was created to hold securities of its participants (DTC Participants) and to facilitate the clearance and settlement of transactions among them through electronic book-entry changes in their accounts, thereby eliminating the need for physical movement of securities certificates. DTC Participants include securities brokers and dealers, banks, trust companies, clearing corporations, and certain other organizations. The DTC is a subsidiary of the Depository Trust and Clearing Corporation (DTCC), which is owned by certain participants of the DTCC’s subsidiaries, including the DTC. Access to the DTC system is also available to others such as banks, brokers, dealers, and trust companies that clear through or maintain a custodial relationship with a DTC Participant, either directly or indirectly (Indirect Participants).
Beneficial ownership of ETF Shares is limited to DTC Participants, Indirect Participants, and persons holding interests through DTC Participants and Indirect Participants. Ownership of beneficial interests in ETF Shares (owners of such beneficial interests are referred to herein as Beneficial Owners) is shown on, and the transfer of ownership is effected only through, records maintained by the DTC (with respect to DTC Participants) and on the records of DTC Participants (with respect to Indirect Participants and Beneficial Owners that are not DTC Participants). Beneficial Owners will receive from, or through, the DTC Participant a written confirmation relating to their purchase of ETF Shares. The laws of some jurisdictions may require that certain purchasers of securities take physical delivery of such securities. Such laws may impair the ability of certain investors to acquire beneficial interests in ETF Shares.
B-76
The ETF Fund recognizes the DTC or its nominee as the record owner of all ETF Shares for all purposes. Beneficial Owners of ETF Shares are not entitled to have ETF Shares registered in their names and will not receive or be entitled to physical delivery of share certificates. Each Beneficial Owner must rely on the procedures of the DTC and any DTC Participant and/or Indirect Participant through which such Beneficial Owner holds its interests to exercise any rights of a holder of ETF Shares.
Conveyance of all notices, statements, and other communications to Beneficial Owners is effected as follows. The DTC will make available to each ETF Fund, upon request and for a fee, a listing of the ETF Shares of the Fund held by each DTC Participant. The ETF Fund shall obtain from each DTC Participant the number of Beneficial Owners holding ETF Shares, directly or indirectly, through the DTC Participant. The ETF Fund shall provide each DTC Participant with copies of such notice, statement, or other communication, in form, in number, and at such place as the DTC Participant may reasonably request, in order that these communications may be transmitted by the DTC Participant, directly or indirectly, to the Beneficial Owners. In addition, the ETF Fund shall pay to each DTC Participant a fair and reasonable amount as reimbursement for the expenses attendant to such transmittal, subject to applicable statutory and regulatory requirements.
Share distributions shall be made to the DTC or its nominee as the registered holder of all ETF Shares. The DTC or its nominee, upon receipt of any such distributions, shall immediately credit the DTC Participants’ accounts with payments in amounts proportionate to their respective beneficial interests in ETF Shares of the appropriate ETF Fund as shown on the records of the DTC or its nominee. Payments by DTC Participants to Indirect Participants and Beneficial Owners of ETF Shares held through such DTC Participants will be governed by standing instructions and customary practices, as is now the case with securities held for the accounts of customers in bearer form or registered in a “street name,” and will be the responsibility of such DTC Participants.
The ETF Funds have no responsibility or liability for any aspects of the records relating to or notices to Beneficial Owners; for payments made on account of beneficial ownership interests in such ETF Shares; for maintenance, supervision, or review of any records relating to such beneficial ownership interests; or for any other aspect of the relationship between the DTC and DTC Participants or the relationship between such DTC Participants and the Indirect Participants and Beneficial Owners owning through such DTC Participants.
The DTC may determine to discontinue providing its service with respect to ETF Shares at any time by giving reasonable notice to the ETF Funds and discharging its responsibilities with respect thereto under applicable law. Under such circumstances, the ETF Funds shall take action either to find a replacement for the DTC to perform its functions at a comparable cost or, if such replacement is unavailable, to issue and deliver printed certificates representing ownership of ETF Shares, unless the ETF Funds make other arrangements with respect thereto satisfactory to the exchange.
Purchase and Issuance of ETF Shares in Creation Units
Except for conversions to ETF Shares from conventional shares, the ETF Funds issue and sell ETF Shares only in Creation Units on a continuous basis through the Distributor, without a sales load, at their NAV next determined after receipt of an order in proper form on any business day. The ETF Funds do not issue fractional Creation Units. (Please see “Conversions and Exchanges” for the issuance of ETF Shares resulting from a conversion.)
A business day is any day on which the NYSE is open for business. As of the date of this Statement of Additional Information, the NYSE observes the following U.S. holidays: New Year’s Day; Martin Luther King, Jr., Day; Presidents’ Day (Washington’s Birthday); Good Friday; Memorial Day; Juneteenth National Independence Day; Independence Day; Labor Day; Thanksgiving Day; and Christmas Day.
Fund Deposit. The consideration for purchase of a Creation Unit from an ETF Fund generally consists of an in-kind deposit of a designated portfolio of securities (Deposit Securities) and an amount of cash (Cash Component) consisting of a purchase balancing amount and a transaction fee (both described in the following paragraphs). Together, the Deposit Securities and the Cash Component constitute the fund deposit.
The purchase balancing amount is an amount equal to the difference between the NAV of a Creation Unit and the market value of the Deposit Securities (Deposit Amount). It ensures that the NAV of a fund deposit (not including the transaction fee) is identical to the NAV of the Creation Unit it is used to purchase. If the purchase balancing amount is a positive number (i.e., the NAV per Creation Unit exceeds the market value of the Deposit Securities), then that amount will be paid by the purchaser to an ETF Fund in cash. If the purchase balancing amount is a negative number (i.e., the NAV per Creation Unit is less than the market value of the Deposit Securities), then that amount will be paid by an ETF Fund to the purchaser in cash (except as offset by the transaction fee).
B-77
Vanguard, through the National Securities Clearing Corporation (NSCC), makes available after the close of each business day a list of the names and the number of shares of each Deposit Security to be included in the next business day’s fund deposit for each ETF Fund (subject to possible amendment or correction). Each ETF Fund reserves the right to accept a nonconforming fund deposit.
The identity and number of shares of the Deposit Securities required for a fund deposit may change from one day to another to reflect rebalancing adjustments and corporate actions, to reflect interest payments on underlying bonds, or to respond to adjustments to the weighting or composition of the component securities of the relevant target index
Vanguard Mortgage-Backed Securities ETF intends to require an investor purchasing a Creation Unit to include in the fund deposit, in place of all Deposit Securities that are mortgage-TBA (to-be-announced) transactions, an amount of cash, to be added to the Cash Component, equal in value to the mortgage TBAs. Vanguard Mortgage-Backed Securities ETF reserves the right to require an investor purchasing a Creation Unit late in the day to include in the fund deposit, in place of all Deposit Securities that are mortgage-TBA transactions, U.S. Treasury securities of equivalent value and duration rather than cash.
In addition, each ETF Fund reserves the right to permit or require the substitution of an amount of cash—referred to as “cash in lieu”—to be added to the Cash Component to replace any Deposit Security. This might occur, for example, if a Deposit Security is not available in sufficient quantity for delivery, is not eligible for transfer through the applicable clearance and settlement system, or is not eligible for trading by an Authorized Participant or the investor for which an Authorized Participant is acting. Trading costs incurred by the ETF Fund in connection with the purchase of Deposit Securities with cash-in-lieu amounts will be an expense of the ETF Fund. However, Vanguard may adjust the transaction fee to protect existing shareholders from this expense.
In addition, each ETF Fund reserves the right to permit or require the substitution of an amount of cash—referred to as “cash in lieu”—to be added to the Cash Component to replace any Deposit Security. This might occur, for example, if a Deposit Security is not available in sufficient quantity for delivery, is not eligible for transfer through the applicable clearance and settlement system, or is not eligible for trading by an Authorized Participant or the investor for which an Authorized Participant is acting. Trading costs incurred by the ETF Fund in connection with the purchase of Deposit Securities with cash-in-lieu amounts will be an expense of the ETF Fund. However, Vanguard may adjust the transaction fee to protect existing shareholders from this expense.
All questions as to the number of shares of each security in the Deposit Securities and the validity, form, eligibility, and acceptance for deposit of any securities to be delivered shall be determined by the appropriate ETF Fund, and the ETF Fund’s determination shall be final and binding.
Procedures for Purchasing Creation Units. An Authorized Participant may place an order to purchase Creation Units from a stock ETF Fund either (1) through the Continuous Net Settlement (CNS) clearing processes of the NSCC as such processes have been enhanced to effect purchases of Creation Units, such processes being referred to herein as the Clearing Process, or (2) outside the Clearing Process. To purchase through the Clearing Process, an Authorized Participant must be a member of the NSCC that is eligible to use the CNS system. Purchases of Creation Units cleared through the Clearing Process will be subject to a lower transaction fee than those cleared outside the Clearing Process.
For all ETF Funds, to initiate a purchase order for a Creation Unit (either through the Clearing Process or outside the Clearing Process for stock ETF Funds), an Authorized Participant must submit an order in proper form to the Distributor and such order must be received by the Distributor prior to the closing time of regular trading on the NYSE (Closing Time) (ordinarily 4 p.m., Eastern time) to receive that day's NAV. The date on which an order to purchase (or redeem) Creation Units is placed is referred to as the transmittal date. Authorized Participants must transmit orders using a transmission method acceptable to the Distributor pursuant to procedures set forth in the Participant Agreement.
Purchase orders effected outside the Clearing Process are likely to require transmittal by the Authorized Participant earlier on the transmittal date than orders effected using the Clearing Process. Those persons placing orders outside the Clearing Process should ascertain the deadlines applicable to the DTC and the Federal Reserve Bank wire system by contacting the operations department of the broker or depository institution effectuating such transfer of Deposit Securities and Cash Component.
Neither the Trust, the ETF Funds, the Distributor, nor any affiliated party will be liable to an investor who is unable to submit a purchase order by Closing Time, even if the problem is the responsibility of one of those parties (e.g., the Distributor's phone or email systems were not operating properly).
If you are not an Authorized Participant, you must place your purchase order in an acceptable form with an Authorized Participant. The Authorized Participant may request that you make certain representations or enter into agreements with respect to the order (e.g., to provide for payments of cash when required).
Placement of Purchase Orders for Vanguard Russell ETFs
Purchase Orders Using the Clearing Process
B-78
For purchase orders placed through the Clearing Process, the Participant Agreement authorizes the Distributor to transmit through the transfer agent or index receipt agent to the NSCC, on behalf of an Authorized Participant, such trade instructions as are necessary to effect the Authorized Participant’s purchase order. Pursuant to such trade instructions to the NSCC, the Authorized Participant agrees to deliver the requisite Deposit Securities and the Cash Component to the appropriate ETF Fund, together with such additional information as may be required by the Distributor.
An order to purchase Creation Units through the Clearing Process is deemed received on the transmittal date if (1) such order is received by the ETF Fund’s designated agent before Closing Time on such transmittal date and (2) all other procedures set forth in the Participant Agreement are properly followed. Such order will be effected based on the NAV of the ETF Fund next determined on that day. An order to purchase Creation Units through the Clearing Process made in proper form but received after Closing Time on the transmittal date will be deemed received on the next business day immediately following the transmittal date and will be effected at the NAV next determined on that day. The Deposit Securities and the Cash Component will be transferred by the second NSCC business day following the date on which the purchase request is deemed received.
Purchase Orders Outside the Clearing Process
An Authorized Participant that wishes to place an order to purchase Creation Units outside the Clearing Process must state that it is not using the Clearing Process and that the purchase instead will be effected through a transfer of securities and cash directly through the DTC. An order to purchase Creation Units outside the Clearing Process is deemed received by the ETF Fund’s designated agent on the transmittal date if (1) such order is received by the Distributor before Closing Time on such transmittal date and (2) all other procedures set forth in the Participant Agreement are properly followed.
If a fund deposit is incomplete on the first business day after the trade date (the trade date, known as “T,” is the date on which the trade actually takes place; one business day after the trade date is known as “T+1”) because of the failed delivery of one or more of the Deposit Securities, an ETF Fund shall be entitled to cancel the purchase order. Alternatively, the ETF Fund may issue Creation Units in reliance on the Authorized Participant’s undertaking to deliver the missing Deposit Securities at a later date. Such undertaking shall be secured by the delivery and maintenance of cash collateral in an amount determined by the ETF Fund in accordance with the terms of the Participant Agreement.
Placement of Purchase Orders for Vanguard Total Corporate Bond ETF, Vanguard Total World Bond ETF, and Vanguard Sector Bond ETFs. An Authorized Participant must deliver the cash and government securities portion of a fund deposit through the Federal Reserve’s Fedwire System and the corporate securities portion of a fund deposit through the DTC. If a fund deposit is incomplete on the second business day after the trade date (the trade date is the date on which the trade actually takes place, or “T”; two business days after the trade date is known as “T+2”) because of the failed delivery of one or more of the Deposit Securities, the ETF Fund shall be entitled to cancel the purchase order.
The ETF Funds may issue Creation Units in reliance on the Authorized Participant’s undertaking to deliver the missing Deposit Securities at a later date. Such undertaking shall be secured by the delivery and maintenance of cash collateral in an amount determined by the ETF Fund in accordance with the terms of the Participant Agreement.
Rejection of Purchase Orders. The ETF Fund reserves the absolute right to reject a purchase order. By way of example, and not limitation, an ETF Fund will reject a purchase order if:
◾ The order is not in proper form.
◾ The Deposit Securities delivered are not the same (in name or amount) as the published basket.
◾ Acceptance of the Deposit Securities would have certain adverse tax consequences to the ETF Fund.
◾ Acceptance of the fund deposit would, in the opinion of counsel, be unlawful.
◾ Acceptance of the fund deposit would otherwise, at the discretion of the ETF Fund or Vanguard, have an adverse effect on the Fund or any of its shareholders.
◾ Circumstances outside the control of the ETF Fund, the Trust, the transfer agent, the custodian, the Distributor, and Vanguard make it for all practical purposes impossible to process the order. Examples include, but are not limited to, natural disasters, public service disruptions, or utility problems such as fires, floods, extreme weather conditions, and power outages resulting in telephone, telecopy, and computer failures; market conditions or activities causing trading halts; systems failures involving computer or other information systems affecting the aforementioned parties as well
B-79
as the DTC, the NSCC,the Federal Reserve, or any other participant in the purchase process; and similar extraordinary events.
If a purchase order is rejected, the Distributor shall notify the Authorized Participant that submitted the order. The ETF Funds, the Trust, the transfer agent, the custodian, the Distributor, and Vanguard are under no duty, however, to give notification of any defects or irregularities in the delivery of a fund deposit, nor shall any of them incur any liability for the failure to give any such notification.
Transaction Fee on Purchases of Creation Units of Vanguard Russell ETFs. Each ETF Fund may impose a transaction fee (payable to the Fund) to compensate the Fund for costs associated with the issuance of Creation Units. The amount of the fee, which may be changed by each ETF Fund from time to time at its sole discretion, is made available daily to Authorized Participants, market makers, and other interested parties through Vanguard’s proprietary portal system. An additional charge may be imposed for purchases of Creation Units effected outside the Clearing Process. When an ETF Fund permits (or requires) a purchaser to substitute cash in lieu of depositing one or more Deposit Securities, the purchaser may be assessed an additional charge on the cash-in-lieu portion of the investment. The amount of this charge will be disclosed to investors before they place their orders. The amount will be determined by the ETF Fund at its sole discretion. The maximum transaction fee on purchases of Creation Units, including any additional charges as described, shall be 2% of the value of the Creation Units.
Each ETF Fund reserves the right to not impose a transaction fee or to vary the amount of the transaction fee imposed, up to the maximum amount listed above. To the extent a creation transaction fee is not charged or does not cover the costs associated with the issuance of the Creation Units, certain costs may be borne by the Fund.
Transaction Fee on Purchases of Creation Units of Vanguard Total Corporate Bond ETF, Vanguard Total World Bond ETF, and Vanguard Sector Bond ETFs. The ETF Fund may impose a transaction fee (payable to the Fund) to compensate the Fund for costs associated with the issuance of Creation Units. The amount of the fee, which may be changed by each ETF Fund from time to time at its sole discretion, is made available daily to Authorized Participants, market makers, and other interested parties through Vanguard’s proprietary portal system. For Creation Units of Vanguard Mortgage-Backed Securities ETF purchased with a fund deposit that includes cash in lieu of mortgage-TBA securities, the transaction fee includes a variable charge in an amount approximately equal to the transaction costs the Fund expects to incur buying the mortgage TBAs that are part of the fund deposit. When an ETF Fund (except Vanguard Mortgage-Backed Securities ETF) permits (or requires) a purchaser to substitute cash in lieu of depositing one or more Deposit Securities, the purchaser may be assessed an additional charge on the cash-in-lieu portion of the investment. The amount of this charge will be disclosed to investors before they place their orders. The amount will be determined by the ETF Fund at its sole discretion. The maximum transaction fee on purchases of Creation Units, including any additional charges as described, shall be 2% of the value of the Creation Units.
Each ETF Fund reserves the right to not impose a transaction fee or to vary the amount of the transaction fee imposed, up to the maximum amount listed above. To the extent a creation transaction fee is not charged or does not cover the costs associated with the issuance of the Creation Units, certain costs may be borne by the Fund.
Redemption of ETF Shares in Creation Units
To be eligible to place a redemption order, you must be an Authorized Participant. Investors that are not Authorized Participants must make appropriate arrangements with an Authorized Participant in order to redeem a Creation Unit.
ETF Shares may be redeemed only in Creation Units. Investors should expect to incur brokerage and other transaction costs in connection with assembling a sufficient number of ETF Shares to constitute a redeemable Creation Unit. There can be no assurance, however, that there will be sufficient liquidity in the public trading market at any time to permit assembly of a Creation Unit. Redemption requests received on a business day in good order will receive the NAV next determined after the request is made.
Unless cash redemptions are available or specified for an ETF Fund, an investor tendering a Creation Unit generally will receive redemption proceeds consisting of (1) a basket of Redemption Securities; plus (2) a redemption balancing amount in cash equal to the difference between (x) the NAV of the Creation Unit being redeemed, as next determined after receipt of a request in proper form, and (y) the value of the Redemption Securities; less (3) a transaction fee. If the Redemption Securities have a value greater than the NAV of a Creation Unit, the redeeming investor will pay the redemption balancing amount in cash to the ETF Fund, rather than receive such amount from the Fund.
Vanguard, through the NSCC, makes available after the close of each business day a list of the names and the number of shares of each Redemption Security to be included in the next business day’s redemption basket for each ETF Fund
B-80
(subject to possible amendment or correction). The basket of Redemption Securities provided to an investor redeeming a Creation Unit may not be identical to the basket of Deposit Securities required of an investor purchasing a Creation Unit. An ETF Fund may provide a redeeming investor with a basket of Redemption Securities that differs from the composition of the redemption basket published through the NSCC.
The ETF Fund reserves the right to deliver cash in lieu of any Redemption Security for the same reason it might accept cash in lieu of a Deposit Security, as previously discussed, or if the ETF Fund could not lawfully deliver the security or could not do so without first registering such security under federal or state law.
When satisfying redemption requests, Vanguard Mortgage-Backed Securities ETF intends to deliver, in lieu of each mortgage-TBA transaction that is a Redemption Security, cash in an amount equal to the value of the mortgage TBA. Vanguard Mortgage-Backed Securities ETF reserves the right to deliver to a shareholder redeeming a Creation Unit late in the day, in place of all Redemption Securities that are mortgage-TBA transactions, U.S. Treasury securities of equivalent value and duration, rather than cash.
Neither the Trust, an ETF Funds, the Distributor, nor any affiliated party will be liable to an investor who is unable to submit a redemption order by Closing Time, even if the problem is the responsibility of one of those parties (e.g., the Distributor's phone or email systems were not operating properly).
Transaction Fee on Redemptions of Creation Units of Vanguard Russell ETFs. Each ETF Fund may impose a transaction fee (payable to the Fund) to compensate the ETF Fund for costs associated with the redemption of Creation Units. The amount of the fee, which may be changed by each ETF Fund from time to time at its sole discretion, is made available daily to Authorized Participants, market makers, and other interested parties through Vanguard’s proprietary portal system. An additional charge may be imposed for redemptions of Creation Units effected outside the Clearing Process. When an ETF Fund permits (or requires) a redeeming investor to receive cash in lieu of one or more Redemption Securities, each ETF Fund may assess an additional variable charge on the cash portion of the redemption. The amount will vary as determined by the ETF Fund at its sole discretion and is made available daily to Authorized Participants, market makers, and other interested parties through Vanguard’s proprietary portal system. The maximum transaction fee, including any variable charges, on redemptions of Creation Units, shall be 2% of the value of the Creation Units.
Each ETF Fund reserves the right to not impose a transaction fee or to vary the amount of the transaction fee imposed, up to the maximum amount listed above. To the extent a redemption transaction fee is not charged or does not cover the costs associated with the redemption of the Creation Units, certain costs may be borne by the Fund.
Transaction Fee on Redemptions of Creation Units of Vanguard Total Corporate Bond ETF, Vanguard Total World Bond ETF, and Vanguard Sector Bond ETFs. The ETF Fund may impose a transaction fee (payable to the Fund) to compensate the ETF Fund for costs associated with the redemption of Creation Units. The amount of the fee, which may be changed by each ETF Fund from time to time at its sole discretion, is made available daily to Authorized Participants, market makers, and other interested parties through Vanguard’s proprietary portal system. When an ETF Fund permits (or requires) a redeeming investor to receive cash in lieu of one or more Redemption Securities, each ETF Fund may assess an additional variable charge on the cash portion of the redemption. The amount will vary as determined by the ETF Fund at its sole discretion and is made available daily to Authorized Participants, market timers, and other interested parties through Vanguard's proprietary portal system. The maximum transaction fee, including any variable charges, on redemptions of Creation Units shall be 2% of the value of the Creation Units.
Each ETF Fund reserves the right to not impose a transaction fee or to vary the amount of the transaction fee imposed, up to the maximum amount listed above. To the extent a redemption transaction fee is not charged or does not cover the costs associated with the redemption of the Creation Units, certain costs may be borne by the Fund.
Placement of Redemption Orders for Vanguard Russell ETFs
Redemption Orders Using the Clearing Process
An Authorized Participant may place an order to redeem Creation Units of a stock ETF Fund either (1) through the CNS clearing processes of the NSCC as such processes have been enhanced to effect redemptions of Creation Units, such processes being referred to herein as the Clearing Process, or (2) outside the Clearing Process. To redeem through the Clearing Process, an Authorized Participant must be a member of the NSCC that is eligible to use the CNS system. Redemptions of Creation Units cleared through the Clearing Process will be subject to a lower transaction fee than those cleared outside the Clearing Process.
B-81
An order to redeem Creation Units through the Clearing Process is deemed received on the transmittal date if (1) such order is received by the ETF Fund's designated agent before Closing Time on such transmittal date and (2) all other procedures set forth in the Participant Agreement are properly followed. Such order will be effected based on the NAV of an ETF Fund next determined on that day. An order to redeem Creation Units through the Clearing Process made in proper form but received by an ETF Fund after Closing Time on the transmittal date will be deemed received on the next business day immediately following the transmittal date and will be effected at the NAV next determined on that day. The Redemption Securities and the Cash Redemption Amount will be transferred by the second NSCC business day following the date on which the redemption request is deemed received.
Redemption Orders Outside the Clearing Process
An Authorized Participant that wishes to place an order to redeem a Creation Unit outside the Clearing Process must state that it is not using the Clearing Process and that the redemption instead will be effected through a transfer of ETF Shares directly through the DTC. An order to redeem a Creation Unit of an ETF Fund outside the Clearing Process is deemed received on the transmittal date if (1) such order is received by the ETF Fund‘s designated agent before Closing Time on such transmittal date and (2) all other procedures set forth in the Participant Agreement are properly followed.
If a redemption order in proper form is submitted to the transfer agent by an Authorized Participant prior to Closing Time on the transmittal date, then the value of the Redemption Securities and the Cash Redemption Amount will be determined by the ETF Fund on such transmittal date.
After the transfer agent has deemed an order for redemption outside the Clearing Process received, the transfer agent will initiate procedures to transfer the Redemption Securities and the Cash Redemption Amount to the Authorized Participant on behalf of the redeeming Beneficial Owner by the second business day following the transmittal date on which such redemption order is deemed received by the transfer agent.
If on T+1 an Authorized Participant has failed to deliver all of the Vanguard ETF Shares it is seeking to redeem, the ETF Fund shall be entitled to cancel the redemption order. Alternatively, the ETF Fund may deliver to the Authorized Participant the full complement of Redemption Securities and cash in reliance on the Authorized Participant’s undertaking to deliver the missing ETF Shares at a later date. Such undertaking shall be secured by the Authorized Participant’s delivery and maintenance of cash collateral in accordance with collateral procedures that are part of the Participant Agreement. In all cases the ETF Fund shall be entitled to charge the Authorized Participant for any costs (including investment losses, attorney’s fees, and interest) incurred by the ETF Fund as a result of the late delivery or failure to deliver.
Each ETF Fund reserves the right, at its sole discretion, to require or permit a redeeming investor to receive the redemption proceeds in cash. In such cases, the investor would receive a cash payment equal to the NAV of its ETF Shares based on the NAV of those shares next determined after the redemption request is received in proper form (minus a transaction fee, including a charge for cash redemptions as previously discussed).
If an Authorized Participant, or a redeeming investor acting through an Authorized Participant, is subject to a legal restriction with respect to a particular security included in the basket of Redemption Securities, such investor may be paid an equivalent amount of cash in lieu of the security. In addition, each ETF Fund reserves the right to redeem Creation Units partially for cash to the extent that the Fund could not lawfully deliver one or more Redemption Securities or could not do so without first registering such securities under federal or state law.
Placement of Redemption Orders for Vanguard Total Corporate Bond ETF, Vanguard Total World Bond ETF, and Vanguard Sector Bond ETFs. To initiate a redemption order for a Creation Unit, an Authorized Participant must submit such order in proper form to the Distributor before Closing Time in order to receive that day’s NAV. Authorized Participants must transmit orders using a transmission method acceptable to the Distributor pursuant to procedures set forth in the Participant Agreement.
If on the settlement date (typically T+1) an Authorized Participant has failed to deliver all of the Vanguard ETF Shares it is seeking to redeem, the ETF Fund shall be entitled to cancel the redemption order. Alternatively, the ETF Fund may deliver to the Authorized Participant the full complement of Redemption Securities and cash in reliance on the Authorized Participant’s undertaking to deliver the missing ETF Shares at a later date. Such undertaking shall be secured by the Authorized Participant’s delivery and maintenance of cash collateral in accordance with collateral procedures that are part of the Participant Agreement. In all cases the ETF Fund shall be entitled to charge the Authorized Participant for any costs (including investment losses, attorney’s fees, and interest) incurred by the ETF Fund as a result of the late delivery or failure to deliver.
B-82
If an Authorized Participant, or a redeeming investor acting through an Authorized Participant, is subject to a legal restriction with respect to a particular security included in the basket of Redemption Securities, such investor may be paid an equivalent amount of cash in lieu of the security. In addition, each ETF Fund reserves the right to redeem Creation Units partially for cash to the extent that the Fund could not lawfully deliver one or more Redemption Securities or could not do so without first registering such securities under federal or state law.
Suspension of Redemption Rights. The right of redemption may be suspended or the date of payment postponed with respect to an ETF Fund (1) for any period during which the NYSE or listing exchange is closed (other than customary weekend and holiday closings), (2) for any period during which trading on the NYSE or listing exchange is suspended or restricted, (3) for any period during which an emergency exists as a result of which disposal of the Fund’s portfolio securities or determination of its NAV is not reasonably practicable, or (4) in such other circumstances as the SEC permits.
Precautionary Notes
A precautionary note to ETF investors: The DTC or its nominee will be the registered owner of all outstanding ETF Shares. Your ownership of ETF Shares will be shown on the records of the DTC and the DTC Participant broker through which you hold the shares. Vanguard will not have any record of your ownership. Your account information will be maintained by your broker, which will provide you with account statements, confirmations of your purchases and sales of ETF Shares, and tax information. Your broker also will be responsible for distributing income and capital gains distributions and for ensuring that you receive shareholder reports and other communications from the fund whose ETF Shares you own. You will receive other services (e.g., dividend reinvestment and average cost information) only if your broker offers these services.
You should also be aware that investments in ETF Shares may be subject to certain risks relating to having large shareholders. To the extent that a large number of the Fund's ETF Shares are held by a large shareholder (e.g., an institutional investor, an investment advisor or an affiliate of an investment advisor, an authorized participant, a lead market maker, or another entity), a large redemption by such a shareholder could result in an increase in the ETF's expense ratio, cause the ETF to incur higher transaction costs, cause the ETF to fail to comply with applicable listing standards of the listing exchange upon which it is listed, lead to the realization of taxable capital gains, or cause the remaining shareholders to receive distributions representing a disproportionate share of the ETF's ordinary income and long-term capital gains. In addition, transactions by large shareholders may account for a large percentage of the trading volume on an exchange and may, therefore, have a material upward or downward effect on the market price of the ETF Shares.
A precautionary note to purchasers of Creation Units: You should be aware of certain legal risks unique to investors purchasing Creation Units directly from the issuing fund.
Because new ETF Shares may be issued on an ongoing basis, a “distribution” of ETF Shares could be occurring at any time. Certain activities that you perform as a dealer could, depending on the circumstances, result in your being deemed a participant in the distribution in a manner that could render you a statutory underwriter and subject you to the prospectus delivery and liability provisions of the Securities Act of 1933 (the 1933 Act). For example, you could be deemed a statutory underwriter if you purchase Creation Units from the issuing fund, break them down into the constituent ETF Shares, and sell those shares directly to customers or if you choose to couple the creation of a supply of new ETF Shares with an active selling effort involving solicitation of secondary market demand for ETF Shares. Whether a person is an underwriter depends upon all of the facts and circumstances pertaining to that person’s activities, and the examples mentioned here should not be considered a complete description of all the activities that could cause you to be deemed an underwriter.
Dealers who are not “underwriters” but are participating in a distribution (as opposed to engaging in ordinary secondary-market transactions), and thus dealing with ETF Shares as part of an “unsold allotment” within the meaning of Section 4(3)(C) of the 1933 Act, will be unable to take advantage of the prospectus delivery exemption provided by Section 4(3) of the 1933 Act.
A precautionary note to shareholders redeeming Creation Units: An Authorized Participant that is not a “qualified institutional buyer” as defined in Rule 144A under the 1933 Act will not be able to receive, as part of the redemption basket, restricted securities eligible for resale under Rule 144A.
B-83
A precautionary note to investment companies: Vanguard ETF Shares are issued by registered investment companies, and therefore the acquisition of such shares by other investment companies and private funds is subject to the restrictions of Section 12(d)(1) of the 1940 Act. SEC Rule 12d1-4 under the 1940 Act permits investments in Vanguard ETF Shares beyond the limits of Section 12(d)(1), subject to the conditions of Rule 12d1-4, as described under the headings “Other Investment Companies”.
ETF Shares: Foreign Market Information
The security settlement cycles and local market holiday schedules in foreign markets, as well as unscheduled foreign market closings, may result in Vanguard Total World Bond ETF delivering redemption proceeds (either in kind or in cash) more than seven days after receipt of a redemption request in proper form. Below are the dates of regular holidays affecting the relevant markets in which the ETF Fund invests and the dates on which, if a redemption request is submitted, the settlement period in a given market will exceed seven days. The proclamation of new holidays, the treatment by market participants of certain days as “informal holidays,” the elimination of existing holidays, or changes in local securities delivery practices could affect the information set forth herein at some time in the future.
Regular Holidays. The calendar year 2023 local market holidays are as follows:
|
Country |
JAN |
FEB |
MAR |
APR |
MAY |
JUN |
JUL |
AUG |
SEP |
OCT |
NOV |
DEC |
|
Albania |
2 |
|
14, 22 |
10, 17,
21 |
1 |
28 |
|
|
5 |
|
28, 29 |
8, 25 |
|
Argentina |
|
20, 21 |
24 |
6, 7 |
1, 25,
26 |
19, 20 |
|
21 |
|
13, 16 |
20 |
8, 25 |
|
Australia |
2, 26 |
|
6, 13 |
7, 10,
11, 25 |
1, 29 |
5, 12 |
|
7, 16 |
25 |
2 |
7 |
25, 26 |
|
Austria |
|
|
|
7, 10 |
1, 29 |
|
|
|
|
26 |
|
25, 26 |
|
Bahrain** |
1 |
|
|
23 |
1 |
28, 29 |
19, 27 |
|
27 |
|
|
17 |
|
Bangladesh** |
|
21 |
8, 26 |
19, 23 |
1, 4 |
28, 29 |
|
15 |
6, 28 |
24 |
|
25, 31 |
|
Belgium |
|
|
|
7, 10 |
1 |
|
|
|
|
|
|
25, 26 |
|
Benin |
|
|
|
10, 19,
21 |
1, 18,
29 |
29 |
|
7, 15 |
27 |
|
1, 15 |
25 |
|
Bermuda |
2 |
|
|
7 |
26 |
19 |
|
3, 4 |
4 |
|
13 |
25, 26 |
|
Bosnia and
Herzegovina, Fed. of |
2, 3 |
|
1 |
10, 21 |
1, 2 |
28 |
|
|
|
|
|
25 |
|
Botswana |
2, 3 |
|
|
7, 10 |
1, 18 |
|
17, 18 |
|
|
2 |
|
25, 26 |
|
Brazil |
|
20-22 |
|
7, 21 |
|
8 |
|
|
7 |
12 |
2, 15 |
29 |
|
Bulgaria |
2 |
|
3 |
7, 10,
14, 17 |
1, 8,
24 |
|
|
|
6, 22 |
|
|
25-27 |
|
Burkina Faso |
|
|
|
10, 19,
21 |
1, 18,
29 |
29 |
|
7, 15 |
27 |
|
1, 15 |
25 |
|
Canada |
2, 3 |
20 |
|
7 |
22 |
26 |
3 |
7 |
4 |
2, 9 |
13 |
25, 26 |
|
Chile |
2 |
|
|
7 |
1 |
21, 26 |
|
15 |
18, 19 |
9, 27 |
1 |
8, 25 |
|
China |
2,
23-27 |
|
|
5 |
1-3 |
22, 23 |
|
|
29 |
2-6 |
|
|
|
China Connect - Bond
Connect |
2,
23-27 |
|
|
5-7, 10 |
1-3,
25, 26 |
22, 23 |
|
|
29 |
2-6,
20, 23 |
|
22, 25,
26 |
|
China Connect - Stock
Connect |
2,
23-27 |
|
|
5-7, 10 |
1-3,
25, 26 |
22, 23 |
|
|
29 |
2-6,
20, 23 |
|
22, 25,
26 |
|
Colombia |
9 |
|
20 |
6, 7 |
1, 22 |
12, 19 |
3, 20 |
7, 21 |
|
16 |
6, 13 |
8 |
|
Costa Rica |
|
|
|
6, 7,
10 |
1 |
|
24 |
2, 14 |
15 |
|
|
1, 25 |
|
Croatia |
6 |
|
|
7, 10 |
1, 30 |
8, 22 |
|
15 |
|
|
1 |
25, 26 |
|
CyprusT |
6 |
27 |
|
7, 10,
14, 17,
18 |
1 |
5 |
|
15 |
|
|
|
25, 26 |
|
Cyprus |
6 |
27 |
|
7, 10,
14, 17,
18 |
1 |
5 |
|
15 |
|
|
|
25, 26 |
B-84
|
Country |
JAN |
FEB |
MAR |
APR |
MAY |
JUN |
JUL |
AUG |
SEP |
OCT |
NOV |
DEC |
|
Czech Republic |
2, 16 |
20 |
|
7, 10 |
1, 8,
29 |
19 |
4, 5, 6 |
28 |
4, 28 |
9 |
17, 23 |
25, 26 |
|
Denmark |
|
|
|
6, 7,
10 |
5, 18,
19, 29 |
5 |
|
|
|
|
|
25, 26 |
|
Egypt** |
1, 8,
26 |
|
|
16, 17,
21, 22,
25 |
1 |
27-29 |
19, 23 |
|
27 |
|
|
|
|
Estonia |
|
24 |
|
7, 10 |
1, 18 |
23 |
|
|
|
|
|
25, 26 |
|
Finland |
6 |
|
|
7, 10 |
1, 18 |
23 |
|
|
|
|
|
6, 25,
26 |
|
France |
|
|
|
7, 10 |
1 |
|
|
|
|
|
|
25, 26 |
|
Georgia, Republic of |
2, 19 |
|
3, 8 |
14, 17 |
9, 12,
26 |
|
|
28 |
|
|
23 |
|
|
Germany |
|
|
|
7, 10 |
1 |
|
|
|
|
|
|
25, 26 |
|
Ghana |
2, 9 |
|
6 |
7, 10 |
1, 3 |
|
7 |
4 |
21 |
|
|
1, 25,
26 |
|
Greece |
6 |
27 |
|
7, 10,
14, 17 |
1 |
5 |
|
15 |
|
|
|
25, 26 |
|
Guinea-Bissau |
|
|
|
10, 19,
21 |
1, 18,
29 |
29 |
|
7, 15 |
27 |
|
1, 15 |
25 |
|
Hong Kong |
2,
23-25 |
|
|
5, 7,
10 |
1, 26 |
22 |
|
|
|
2, 23 |
|
25, 26 |
|
Hungary |
|
|
15 |
7, 10 |
1, 29 |
|
|
|
|
23 |
1 |
25, 26 |
|
Iceland |
|
|
|
6, 7,
10, 20 |
1, 18,
29 |
|
|
7 |
|
|
|
25, 26 |
|
India |
26 |
|
7, 22,
30 |
4, 7,
14 |
1, 5 |
28 |
|
15, 16 |
19, 28 |
2, 24 |
14, 27 |
25 |
|
Indonesia |
23 |
|
22, 23 |
7, 21,
24-26 |
1, 18 |
1, 2,
29 |
19 |
17 |
28 |
|
|
25, 26 |
|
Ireland |
2 |
|
|
7, 10 |
1 |
|
|
|
|
|
|
22, 25,
26, 29 |
|
Israel** |
|
|
7 |
5, 6,
9-12,
25, 26 |
25 |
|
27 |
|
17, 24,
25 |
1-5, 31 |
|
|
|
Italy |
|
|
|
7, 10 |
1 |
|
|
15 |
|
|
|
25, 26 |
|
Ivory Coast |
|
|
|
10, 19,
21 |
1, 18,
29 |
29 |
|
7, 15 |
27 |
|
1, 15 |
25 |
|
Japan |
2, 3, 9 |
23 |
21 |
|
3-5 |
|
17 |
11 |
18 |
9 |
3, 23 |
|
|
Jordan** |
1 |
|
|
23, 24 |
1, 25 |
27, 28,
29 |
19 |
|
27 |
|
|
25 |
|
Kazakhstan |
3 |
|
8,
21-23 |
|
1, 8, 9 |
28 |
6 |
30 |
|
25 |
|
18 |
|
Kenya |
2 |
|
|
7, 10,
21 |
1 |
1, 28,
29 |
|
|
|
10, 20 |
|
12, 25,
26 |
|
Korea, Republic of |
2, 23,
24 |
|
1 |
|
1, 5 |
6 |
|
15 |
28, 29 |
3, 9 |
|
25 |
|
Kuwait** |
1 |
19, 26,
27 |
|
23 |
|
28, 29 |
19 |
|
28 |
|
|
|
|
Latvia |
|
|
|
7, 10 |
1, 4, 5,
18 |
23 |
10 |
|
|
|
20 |
25, 26 |
|
Lithuania |
|
16 |
|
10 |
1, 18 |
|
6 |
15 |
|
|
1, 2 |
25, 26 |
|
Luxembourg |
|
|
|
7, 10 |
1 |
|
|
|
|
|
|
25, 26 |
|
Malawi |
2, 16 |
|
3 |
7, 10,
21 |
1, 15 |
|
6 |
|
|
16 |
|
25, 26 |
|
Malaysia |
23, 24 |
1 |
|
|
1, 4 |
6, 29 |
19 |
31 |
28 |
|
|
25 |
|
Mali |
|
|
|
10, 19,
21 |
1, 18,
29 |
29 |
|
7, 15 |
27 |
|
1, 15 |
25 |
|
Mauritius |
2, 3 |
1 |
22 |
|
1 |
|
|
|
20 |
|
1, 2 |
25 |
B-85
|
Country |
JAN |
FEB |
MAR |
APR |
MAY |
JUN |
JUL |
AUG |
SEP |
OCT |
NOV |
DEC |
|
Mexico |
|
6 |
20 |
6, 7 |
1 |
|
|
|
|
|
2, 20 |
12, 25 |
|
Morocco |
11 |
|
|
21 |
1 |
28, 29 |
19 |
14, 21 |
28, 29 |
|
6 |
|
|
Namibia |
2 |
|
21 |
7, 10 |
1, 4,
18, 25 |
|
|
|
|
|
|
11, 25,
26 |
|
Netherlands |
|
|
|
7, 10 |
1 |
|
|
|
|
|
|
25, 26 |
|
New Zealand |
2, 3 |
6 |
|
7, 10,
25 |
|
5 |
14 |
|
|
23 |
|
25, 26 |
|
Niger |
|
|
|
10, 19,
21 |
1, 18,
29 |
29 |
|
7, 15 |
27 |
|
1, 15 |
25 |
|
Nigeria |
2 |
|
|
7, 10,
21 |
1, 29 |
12, 28,
29 |
|
|
28 |
2 |
|
25, 26 |
|
Norway |
|
|
|
5, 6, 7,
10 |
1, 17,
18, 29 |
|
|
|
|
|
|
25, 26 |
|
Oman** |
1, 12 |
18 |
22 |
21 |
|
27 |
19 |
|
27 |
|
|
|
|
Pakistan |
2 |
|
23, 24 |
24, 25 |
1 |
29, 30 |
3, 27,
28 |
14 |
27 |
|
9 |
25 |
|
Panama |
9 |
20-22 |
|
6, 7 |
1 |
|
|
|
|
|
3, 6,
10, 27 |
8, 25 |
|
Peru |
|
|
|
6, 7 |
1 |
29 |
28 |
30 |
|
|
1 |
8, 25 |
|
Philippines |
2 |
|
|
6, 7,
10 |
1 |
12 |
|
21, 28 |
|
|
1, 2,
27 |
8, 25 |
|
Poland |
6 |
|
|
7, 10 |
1, 3 |
8 |
|
15 |
|
|
1 |
25, 26,
29 |
|
Portugal |
|
|
|
7, 10 |
1 |
|
|
|
|
|
|
25, 26 |
|
Qatar** |
1 |
14 |
5 |
23, 24 |
|
28, 29 |
|
|
|
|
|
18 |
|
Romania |
2, 24 |
|
|
14, 17 |
1 |
1, 5 |
|
15 |
|
|
30 |
1, 25,
26 |
|
Russia |
2-6 |
23, 24 |
8 |
|
1, 8, 9 |
12 |
|
|
|
|
6 |
|
|
Saudi Arabia** |
|
22 |
|
23-25 |
|
27-29 |
|
|
|
|
|
|
|
Senegal |
|
|
|
10, 19,
21 |
1, 18,
29 |
29 |
|
7, 15 |
27 |
|
1, 15 |
25 |
|
Serbia |
2, 3 |
15, 16 |
|
14, 17 |
1, 2 |
|
|
|
|
|
|
|
|
Singapore |
2, 23,
24 |
|
|
7 |
1 |
29 |
|
9 |
|
|
13 |
25 |
|
Slovak Republic |
6 |
|
|
7, 10 |
1, 8 |
|
5 |
29 |
1, 15 |
|
1, 17 |
25, 26 |
|
Slovenia |
2 |
8 |
|
7, 10,
27 |
1, 2 |
|
|
15 |
|
31 |
1 |
25, 26 |
|
South Africa |
2 |
|
21 |
7, 10,
27 |
1 |
16 |
|
9 |
25 |
|
|
25, 26 |
|
Spain |
|
|
|
7, 10 |
1 |
|
|
|
|
|
|
25, 26 |
|
Sri Lanka |
6, 16 |
3 |
6 |
5, 7,
13, 14 |
1, 4, 5 |
29 |
3 |
1, 30 |
28, 29 |
|
|
25, 26 |
|
Srpska, Republic of |
2, 3, 6,
9 |
|
|
14, 17 |
1, 2, 9 |
|
|
|
|
|
21 |
|
|
Sweden |
5, 6 |
|
|
6, 7,
10 |
1, 17,
18 |
6, 23 |
|
|
|
|
3 |
25, 26 |
|
Switzerland |
2 |
|
|
7, 10 |
1, 18,
29 |
|
|
1 |
|
|
|
25, 26 |
|
Taiwan |
2,
18-20,
23-27 |
27, 28 |
|
3-5 |
1 |
22, 23 |
|
|
29 |
9, 10 |
|
|
|
Tanzania |
12 |
|
|
7, 10,
21, 26 |
1 |
28 |
7 |
8 |
27 |
|
|
25, 26 |
|
Thailand |
2 |
|
6 |
6, 13,
14 |
1, 4, 5 |
5 |
28 |
1, 14 |
|
13, 23 |
|
5, 11 |
|
Togo |
|
|
|
10, 19,
21 |
1, 18,
29 |
29 |
|
7, 15 |
27 |
|
1, 15 |
25 |
|
Tunisia |
|
|
20 |
21 |
1 |
28, 29 |
19, 25 |
|
27 |
|
|
|
B-86
|
Country |
JAN |
FEB |
MAR |
APR |
MAY |
JUN |
JUL |
AUG |
SEP |
OCT |
NOV |
DEC |
|
Turkey |
|
|
|
20, 21 |
1, 19 |
27-30 |
30 |
|
|
|
|
|
|
Uganda |
26 |
16 |
8 |
7, 10,
21 |
1 |
9, 28 |
|
|
|
9 |
|
25, 26 |
|
Ukraine |
|
|
8 |
|
1, 9 |
5, 28 |
|
24 |
|
|
|
25 |
|
United Arab Emirates -
ADX** |
|
|
|
20, 21 |
|
27-29 |
19 |
|
27 |
|
|
1 |
|
United Arab Emirates -
DFM** |
|
|
|
20, 21 |
|
27-29 |
19 |
|
27 |
|
|
1 |
|
United Arab Emirates -
DIFC** |
|
|
|
20, 21 |
|
27-29 |
19 |
|
27 |
|
|
1 |
|
United Kingdom |
2 |
|
|
7, 10 |
1, 8,
29 |
|
|
28 |
|
|
|
22, 25,
26, 29 |
|
United States |
2, 16 |
20 |
|
7 |
29 |
19 |
3, 4 |
|
4 |
9 |
23, 24 |
25 |
|
Uruguay |
6 |
20, 21 |
|
6, 7,
17 |
1, 22 |
19 |
18 |
25 |
|
16 |
2 |
25 |
|
Vietnam |
2, 20,
23-26 |
|
|
|
1, 2, 3 |
|
|
|
1, 4 |
|
|
|
|
Zambia |
2 |
|
8, 13 |
7, 10,
28 |
1, 25 |
|
3, 4 |
7 |
|
18, 24 |
|
25 |
|
Zimbabwe |
2 |
21 |
|
7, 10,
18 |
1, 25 |
|
|
14, 15 |
|
|
|
22, 25,
26 |
** Market is closed every Friday
Redemption. A redemption request submitted on the following dates in the following foreign markets in calendar year 2023 will result in a settlement period that exceeds seven calendar days.
|
Argentina |
|
|
|
Redemption Date |
Redemption Settlement Date |
Settlement Period |
|
No settlement cycles (˃=): T+7 | ||
|
Australia |
|
|
|
Redemption Date |
Redemption Settlement Date |
Settlement Period |
|
No settlement cycles (˃=): T+7 | ||
|
Austria |
|
|
|
Redemption Date |
Redemption Settlement Date |
Settlement Period |
|
No settlement cycles (˃=): T+7 | ||
|
Bahrain |
|
|
|
Redemption Date |
Redemption Settlement Date |
Settlement Period |
|
No settlement cycles (˃=): T+7 | ||
|
Bangladesh |
|
|
|
Redemption Date |
Redemption Settlement Date |
Settlement Period |
|
No settlement cycles (˃=): T+7 | ||
|
Belgium |
|
|
|
Redemption Date |
Redemption Settlement Date |
Settlement Period |
|
No settlement cycles (˃=): T+7 | ||
|
Bermuda |
|
|
|
Redemption Date |
Redemption Settlement Date |
Settlement Period |
|
No settlement cycles (˃=): T+7 | ||
|
Botswana |
|
|
|
Redemption Date |
Redemption Settlement Date |
Settlement Period |
|
12/28/2022 |
01/04/2023 |
T+7 |
|
12/29/2022 |
01/05/2023 |
T+7 |
|
12/30/2022 |
01/06/2023 |
T+7 |
B-87
|
Botswana |
|
|
|
Redemption Date |
Redemption Settlement Date |
Settlement Period |
|
04/04/2023 |
04/11/2023 |
T+7 |
|
04/05/2023 |
04/12/2023 |
T+7 |
|
04/06/2023 |
04/13/2023 |
T+7 |
|
07/12/2023 |
07/19/2023 |
T+7 |
|
07/13/2023 |
07/20/2023 |
T+7 |
|
07/14/2023 |
07/21/2023 |
T+7 |
|
12/20/2023 |
12/27/2023 |
T+7 |
|
12/21/2023 |
12/28/2023 |
T+7 |
|
12/22/2023 |
12/29/2023 |
T+7 |
|
Brazil |
|
|
|
Redemption Date |
Redemption Settlement Date |
Settlement Period |
|
No settlement cycles (˃=): T+7 | ||
|
Bulgaria |
|
|
|
Redemption Date |
Redemption Settlement Date |
Settlement Period |
|
12/21/2023 |
12/28/2023 |
T+7 |
|
12/22/2023 |
12/29/2023 |
T+7 |
|
Canada |
|
|
|
Redemption Date |
Redemption Settlement Date |
Settlement Period |
|
No settlement cycles (˃=): T+7 | ||
|
Chile |
|
|
|
Redemption Date |
Redemption Settlement Date |
Settlement Period |
|
No settlement cycles (˃=): T+7 | ||
|
China A-Share |
|
|
|
Redemption Date |
Redemption Settlement Date |
Settlement Period |
|
No settlement cycles (˃=): T+7 | ||
|
China B-Share |
|
|
|
Redemption Date |
Redemption Settlement Date |
Settlement Period |
|
01/18/2023 |
01/30/2023 |
T+12 |
|
01/19/2023 |
01/31/2023 |
T+12 |
|
01/20/2023 |
02/01/2023 |
T+12 |
|
04/26/2023 |
05/04/2023 |
T+8 |
|
04/27/2023 |
05/05/2023 |
T+8 |
|
04/28/2023 |
05/08/2023 |
T+10 |
|
06/19/2023 |
06/26/2023 |
T+7 |
|
06/20/2023 |
06/27/2023 |
T+7 |
|
06/21/2023 |
06/28/2023 |
T+7 |
|
09/26/2023 |
10/10/2023 |
T+14 |
|
09/26/2023 |
10/09/2023 |
T+13 |
|
09/27/2023 |
10/11/2023 |
T+14 |
|
09/27/2023 |
10/10/2023 |
T+13 |
|
09/28/2023 |
10/12/2023 |
T+14 |
|
09/28/2023 |
10/11/2023 |
T+13 |
|
12/20/2023 |
12/27/2023 |
T+7 |
|
12/21/2023 |
12/28/2023 |
T+7 |
|
12/22/2023 |
12/29/2023 |
T+7 |
|
China Connect |
|
|
|
Redemption Date |
Redemption Settlement Date |
Settlement Period |
|
No settlement cycles (˃=): T+7 | ||
B-88
|
Colombia |
|
|
|
Redemption Date |
Redemption Settlement Date |
Settlement Period |
|
No settlement cycles (˃=): T+7 | ||
|
Costa Rica |
|
|
|
Redemption Date |
Redemption Settlement Date |
Settlement Period |
|
04/04/2023 |
04/11/2023 |
T+7 |
|
04/05/2023 |
04/12/2023 |
T+7 |
|
Croatia |
|
|
|
Redemption Date |
Redemption Settlement Date |
Settlement Period |
|
04/04/2023 |
04/11/2023 |
T+7 |
|
04/05/2023 |
04/12/2023 |
T+7 |
|
Cyprus |
|
|
|
Redemption Date |
Redemption Settlement Date |
Settlement Period |
|
04/12/2023 |
04/19/2023 |
T+7 |
|
04/13/2023 |
04/20/2023 |
T+7 |
|
Czech Republic |
|
|
|
Redemption Date |
Redemption Settlement Date |
Settlement Period |
|
No settlement cycles (˃=): T+7 | ||
|
Denmark |
|
|
|
Redemption Date |
Redemption Settlement Date |
Settlement Period |
|
04/04/2023 |
04/11/2023 |
T+7 |
|
04/05/2023 |
04/12/2023 |
T+7 |
|
Egypt |
|
|
|
Redemption Date |
Redemption Settlement Date |
Settlement Period |
|
06/23/2023 |
06/30/2023 |
T+7 |
|
06/26/2023 |
07/03/2023 |
T+7 |
|
Estonia |
|
|
|
Redemption Date |
Redemption Settlement Date |
Settlement Period |
|
No settlement cycles (˃=): T+7 | ||
|
Finland |
|
|
|
Redemption Date |
Redemption Settlement Date |
Settlement Period |
|
No settlement cycles (˃=): T+7 | ||
|
France |
|
|
|
Redemption Date |
Redemption Settlement Date |
Settlement Period |
|
No settlement cycles (˃=): T+7 | ||
|
Germany |
|
|
|
Redemption Date |
Redemption Settlement Date |
Settlement Period |
|
No settlement cycles (˃=): T+7 | ||
|
Ghana |
|
|
|
Redemption Date |
Redemption Settlement Date |
Settlement Period |
|
04/04/2023 |
04/11/2023 |
T+7 |
|
04/05/2023 |
04/12/2023 |
T+7 |
|
04/06/2023 |
04/13/2023 |
T+7 |
|
12/20/2023 |
12/27/2023 |
T+7 |
|
12/21/2023 |
12/28/2023 |
T+7 |
|
12/22/2023 |
12/29/2023 |
T+7 |
B-89
|
Greece |
|
|
|
Redemption Date |
Redemption Settlement Date |
Settlement Period |
|
No settlement cycles (˃=): T+7 | ||
|
Hong Kong |
|
|
|
Redemption Date |
Redemption Settlement Date |
Settlement Period |
|
01/19/2023 |
01/26/2023 |
T+7 |
|
01/20/2023 |
01/27/2023 |
T+7 |
|
Hungary |
|
|
|
Redemption Date |
Redemption Settlement Date |
Settlement Period |
|
No settlement cycles (˃=): T+7 | ||
|
Iceland |
|
|
|
Redemption Date |
Redemption Settlement Date |
Settlement Period |
|
04/04/2023 |
04/11/2023 |
T+7 |
|
04/05/2023 |
04/12/2023 |
T+7 |
|
India |
|
|
|
Redemption Date |
Redemption Settlement Date |
Settlement Period |
|
No settlement cycles (˃=): T+7 | ||
|
Indonesia |
|
|
|
Redemption Date |
Redemption Settlement Date |
Settlement Period |
|
04/19/2023 |
04/27/2023 |
T+8 |
|
04/20/2023 |
04/28/2023 |
T+8 |
|
Ireland |
|
|
|
Redemption Date |
Redemption Settlement Date |
Settlement Period |
|
No settlement cycles (˃=): T+7 | ||
|
Israel |
|
|
|
Redemption Date |
Redemption Settlement Date |
Settlement Period |
|
04/06/2023 |
04/13/2023 |
T+7 |
|
04/07/2023 |
04/14/2023 |
T+7 |
|
09/28/2023 |
10/06/2023 |
T+8 |
|
09/29/2023 |
10/09/2023 |
T+10 |
|
Italy |
|
|
|
Redemption Date |
Redemption Settlement Date |
Settlement Period |
|
No settlement cycles (˃=): T+7 | ||
|
Japan |
|
|
|
Redemption Date |
Redemption Settlement Date |
Settlement Period |
|
05/01/2023 |
05/08/2023 |
T+7 |
|
05/02/2023 |
05/09/2022 |
T+7 |
|
Jordan |
|
|
|
Redemption Date |
Redemption Settlement Date |
Settlement Period |
|
06/23/2023 |
06/30/2023 |
T+7 |
|
06/26/2023 |
07/03/2023 |
T+7 |
|
Kazakhstan |
|
|
|
Redemption Date |
Redemption Settlement Date |
Settlement Period |
|
12/28/2022 |
01/04/2023 |
T+7 |
|
12/29/2022 |
01/05/2023 |
T+7 |
|
12/30/2022 |
01/06/2023 |
T+7 |
|
03/16/2023 |
03/24/2023 |
T+8 |
|
03/17/2023 |
03/27/2023 |
T+10 |
|
03/20/2023 |
03/28/2023 |
T+8 |
B-90
|
Kazakhstan |
|
|
|
Redemption Date |
Redemption Settlement Date |
Settlement Period |
|
05/03/2023 |
05/10/2023 |
T+7 |
|
05/04/2023 |
05/11/2023 |
T+7 |
|
05/05/2023 |
05/12/2023 |
T+7 |
|
Kenya |
|
|
|
Redemption Date |
Redemption Settlement Date |
Settlement Period |
|
04/04/2023 |
04/11/2023 |
T+7 |
|
04/05/2023 |
04/12/2023 |
T+7 |
|
04/06/2023 |
04/13/2023 |
T+7 |
|
06/23/2023 |
06/30/2023 |
T+7 |
|
06/26/2023 |
07/03/2023 |
T+7 |
|
06/27/2023 |
07/04/2023 |
T+7 |
|
12/20/2023 |
12/27/2023 |
T+7 |
|
12/21/2023 |
12/28/2023 |
T+7 |
|
12/22/2023 |
12/29/2023 |
T+7 |
|
Kuwait |
|
|
|
Redemption Date |
Redemption Settlement Date |
Settlement Period |
|
06/22/2023 |
06/30/2023 |
T+8 |
|
06/23/2023 |
07/03/2023 |
T+8 |
|
06/26/2023 |
07/04/2023 |
T+8 |
|
Latvia |
|
|
|
Redemption Date |
Redemption Settlement Date |
Settlement Period |
|
No settlement cycles (˃=): T+7 | ||
|
Lithuania |
|
|
|
Redemption Date |
Redemption Settlement Date |
Settlement Period |
|
No settlement cycles (˃=): T+7 | ||
|
Luxembourg |
|
|
|
Redemption Date |
Redemption Settlement Date |
Settlement Period |
|
No settlement cycles (˃=): T+7 | ||
|
Malawi |
|
|
|
Redemption Date |
Redemption Settlement Date |
Settlement Period |
|
04/04/2023 |
04/11/2023 |
T+7 |
|
04/05/2023 |
04/12/2023 |
T+7 |
|
04/06/2023 |
04/13/2023 |
T+7 |
|
12/20/2023 |
12/27/2023 |
T+7 |
|
12/21/2023 |
12/28/2023 |
T+7 |
|
12/22/2023 |
12/29/2023 |
T+7 |
|
Malaysia |
|
|
|
Redemption Date |
Redemption Settlement Date |
Settlement Period |
|
No settlement cycles (˃=): T+7 | ||
|
Mauritius |
|
|
|
Redemption Date |
Redemption Settlement Date |
Settlement Period |
|
12/28/2022 |
01/04/2023 |
T+7 |
|
12/29/2022 |
01/05/2023 |
T+7 |
|
12/30/2022 |
01/06/2023 |
T+7 |
|
Mexico |
|
|
|
Redemption Date |
Redemption Settlement Date |
Settlement Period |
|
No settlement cycles (˃=): T+7 | ||
B-91
|
Morocco |
|
|
|
Redemption Date |
Redemption Settlement Date |
Settlement Period |
|
06/26/2023 |
07/03/2023 |
T+7 |
|
06/27/2023 |
07/04/2023 |
T+7 |
|
06/28/2023 |
07/05/2023 |
T+7 |
|
09/25/2023 |
10/02/2023 |
T+7 |
|
09/26/2023 |
10/03/2023 |
T+7 |
|
09/27/2023 |
10/04/2023 |
T+7 |
|
Namibia |
|
|
|
Redemption Date |
Redemption Settlement Date |
Settlement Period |
|
12/26/2022 |
01/03/2023 |
T+8 |
|
12/27/2022 |
01/04/2023 |
T+8 |
|
12/28/2022 |
01/05/2023 |
T+8 |
|
12/29/2022 |
01/06/2023 |
T+8 |
|
12/30/2022 |
01/09/2023 |
T+10 |
|
03/14/2023 |
03/22/2023 |
T+8 |
|
03/15/2023 |
03/23/2023 |
T+8 |
|
03/16/2023 |
03/24/2023 |
T+8 |
|
03/17/2023 |
03/27/2023 |
T+10 |
|
03/20/2023 |
03/28/2023 |
T+8 |
|
03/31/2023 |
04/11/2023 |
T+11 |
|
04/03/2023 |
04/12/2023 |
T+9 |
|
04/04/2023 |
04/13/2023 |
T+9 |
|
04/05/2023 |
04/14/2023 |
T+9 |
|
04/06/2023 |
04/17/2023 |
T+11 |
|
04/20/2023 |
04/28/2023 |
T+8 |
|
04/21/2023 |
05/02/2023 |
T+11 |
|
04/24/2023 |
05/03/2023 |
T+9 |
|
04/25/2023 |
05/05/2023 |
T+10 |
|
04/26/2023 |
05/08/2022 |
T+12 |
|
04/28/2023 |
05/09/2023 |
T+11 |
|
05/02/2023 |
05/10/2023 |
T+8 |
|
05/03/2023 |
05/11/2023 |
T+8 |
|
05/11/2023 |
05/19/2023 |
T+8 |
|
05/12/2023 |
05/22/2023 |
T+10 |
|
05/15/2023 |
05/23/2023 |
T+8 |
|
05/16/2023 |
05/24/2023 |
T+8 |
|
05/17/2023 |
05/26/2023 |
T+9 |
|
05/19/2023 |
05/29/2023 |
T+10 |
|
05/22/2023 |
05/30/2023 |
T+8 |
|
05/23/2023 |
05/31/2023 |
T+8 |
|
05/24/2023 |
06/01/2023 |
T+8 |
|
06/09/2023 |
06/19/2023 |
T+10 |
|
06/12/2023 |
06/20/2023 |
T+8 |
|
06/13/2023 |
06/21/2023 |
T+8 |
|
06/14/2023 |
06/22/2023 |
T+8 |
|
06/15/2023 |
06/23/2023 |
T+8 |
|
08/02/2023 |
08/10/2023 |
T+8 |
|
08/03/2023 |
08/11/2023 |
T+8 |
|
08/04/2023 |
08/14/2023 |
T+10 |
|
08/07/2023 |
08/15/2023 |
T+8 |
|
08/08/2023 |
08/16/2023 |
T+8 |
|
09/18/2023 |
09/26/2023 |
T+8 |
|
09/19/2023 |
09/27/2023 |
T+8 |
B-92
|
Namibia |
|
|
|
Redemption Date |
Redemption Settlement Date |
Settlement Period |
|
09/20/2023 |
09/28/2023 |
T+8 |
|
09/21/2023 |
09/29/2023 |
T+8 |
|
09/22/2023 |
10/02/2023 |
T+10 |
|
12/04/2023 |
12/12/2023 |
T+8 |
|
12/05/2023 |
12/13/2023 |
T+8 |
|
12/06/2023 |
12/14/2023 |
T+8 |
|
12/07/2023 |
12/15/2023 |
T+8 |
|
12/08/2023 |
12/18/2023 |
T+10 |
|
12/18/2023 |
12/27/2023 |
T+9 |
|
12/19/2023 |
12/28/2023 |
T+9 |
|
12/20/2023 |
12/29/2023 |
T+9 |
|
12/21/2023 |
01/02/2024 |
T+12 |
|
12/22/2023 |
01/03/2024 |
T+12 |
|
Netherlands |
|
|
|
Redemption Date |
Redemption Settlement Date |
Settlement Period |
|
No settlement cycles (˃=): T+7 | ||
|
New Zealand |
|
|
|
Redemption Date |
Redemption Settlement Date |
Settlement Period |
|
No settlement cycles (˃=): T+7 | ||
|
Nigeria |
|
|
|
Redemption Date |
Redemption Settlement Date |
Settlement Period |
|
04/04/2023 |
04/11/2023 |
T+7 |
|
04/05/2023 |
04/12/2023 |
T+7 |
|
04/06/2023 |
04/13/2023 |
T+7 |
|
06/23/2023 |
06/30/2023 |
T+7 |
|
06/26/2023 |
07/03/2023 |
T+7 |
|
06/27/2023 |
07/04/2023 |
T+7 |
|
12/20/2023 |
12/27/2023 |
T+7 |
|
12/21/2023 |
12/28/2023 |
T+7 |
|
12/22/2023 |
12/29/2023 |
T+7 |
|
Norway |
|
|
|
Redemption Date |
Redemption Settlement Date |
Settlement Period |
|
04/03/2023 |
04/11/2023 |
T+8 |
|
04/04/2023 |
04/12/2023 |
T+8 |
|
Oman |
|
|
|
Redemption Date |
Redemption Settlement Date |
Settlement Period |
|
04/19/2023 |
04/27/2023 |
T+8 |
|
04/20/2023 |
04/28/2023 |
T+8 |
|
04/21/2023 |
05/01/2023 |
T+10 |
|
Pakistan |
|
|
|
Redemption Date |
Redemption Settlement Date |
Settlement Period |
|
04/20/2023 |
04/27/2023 |
T+7 |
|
04/21/2023 |
04/28/2023 |
T+7 |
|
06/26/2023 |
07/03/2023 |
T+7 |
|
06/27/2023 |
07/04/2023 |
T+7 |
|
Panama |
|
|
|
Redemption Date |
Redemption Settlement Date |
Settlement Period |
|
No settlement cycles (˃=): T+7 | ||
B-93
|
Peru |
|
|
|
Redemption Date |
Redemption Settlement Date |
Settlement Period |
|
No settlement cycles (˃=): T+7 | ||
|
Philippines |
|
|
|
Redemption Date |
Redemption Settlement Date |
Settlement Period |
|
04/03/2023 |
04/11/2023 |
T+8 |
|
04/04/2023 |
04/12/2023 |
T+8 |
|
04/05/2023 |
04/13/2023 |
T+8 |
|
10/27/2023 |
11/03/2023 |
T+7 |
|
10/30/2023 |
11/06/2023 |
T+7 |
|
10/31/2023 |
11/07/2023 |
T+7 |
|
Poland |
|
|
|
Redemption Date |
Redemption Settlement Date |
Settlement Period |
|
No settlement cycles (˃=): T+7 | ||
|
Portugal |
|
|
|
Redemption Date |
Redemption Settlement Date |
Settlement Period |
|
No settlement cycles (˃=): T+7 | ||
|
Qatar |
|
|
|
Redemption Date |
Redemption Settlement Date |
Settlement Period |
|
06/23/2023 |
06/30/2023 |
T+7 |
|
06/26/2023 |
07/03/2023 |
T+7 |
|
06/27/2023 |
07/04/2023 |
T+7 |
|
Romania |
|
|
|
Redemption Date |
Redemption Settlement Date |
Settlement Period |
|
No settlement cycles (˃=): T+7 | ||
|
Russia |
|
|
|
Redemption Date |
Redemption Settlement Date |
Settlement Period |
|
12/28/2022 |
01/09/2023 |
T+12 |
|
12/29/2022 |
01/10/2023 |
T+12 |
|
12/30/2022 |
01/11/2023 |
T+12 |
|
02/20/2023 |
02/27/2023 |
T+7 |
|
02/21/2023 |
02/28/2023 |
T+7 |
|
02/22/2023 |
03/01/2023 |
T+7 |
|
05/03/2023 |
05/10/2023 |
T+7 |
|
05/04/2023 |
05/11/2023 |
T+7 |
|
05/05/2023 |
05/12/2023 |
T+7 |
|
Saudi Arabia |
|
|
|
Redemption Date |
Redemption Settlement Date |
Settlement Period |
|
04/20/2023 |
04/27/2023 |
T+7 |
|
04/21/2023 |
04/28/2023 |
T+7 |
|
06/23/2023 |
06/30/2023 |
T+7 |
|
06/26/2023 |
07/03/2023 |
T+7 |
|
Serbia |
|
|
|
Redemption Date |
Redemption Settlement Date |
Settlement Period |
|
No settlement cycles (˃=): T+7 | ||
|
Singapore |
|
|
|
Redemption Date |
Redemption Settlement Date |
Settlement Period |
|
No settlement cycles (˃=): T+7 | ||
B-94
|
Slovak Republic |
|
|
|
Redemption Date |
Redemption Settlement Date |
Settlement Period |
|
No settlement cycles (˃=): T+7 | ||
|
Slovenia |
|
|
|
Redemption Date |
Redemption Settlement Date |
Settlement Period |
|
No settlement cycles (˃=): T+7 | ||
|
South Africa |
|
|
|
Redemption Date |
Redemption Settlement Date |
Settlement Period |
|
04/04/2023 |
04/11/2023 |
T+7 |
|
04/05/2023 |
04/12/2023 |
T+7 |
|
04/06/2023 |
04/13/2023 |
T+7 |
|
12/20/2023 |
12/27/2023 |
T+7 |
|
12/21/2023 |
12/28/2023 |
T+7 |
|
12/22/2023 |
12/29/2023 |
T+7 |
|
South Korea |
|
|
|
Redemption Date |
Redemption Settlement Date |
Settlement Period |
|
No settlement cycles (˃=): T+7 | ||
|
Spain |
|
|
|
Redemption Date |
Redemption Settlement Date |
Settlement Period |
|
No settlement cycles (˃=): T+7 | ||
|
Sri Lanka |
|
|
|
Redemption Date |
Redemption Settlement Date |
Settlement Period |
|
04/10/2023 |
04/17/2023 |
T+7 |
|
04/11/2023 |
04/18/2023 |
T+7 |
|
04/12/2023 |
04/19/2023 |
T+7 |
|
05/01/2023 |
05/08/2023 |
T+7 |
|
05/02/2023 |
05/09/2023 |
T+7 |
|
05/03/2023 |
05/10/2023 |
T+7 |
|
09/25/2023 |
10/02/2023 |
T+7 |
|
09/26/2023 |
10/03/2023 |
T+7 |
|
09/27/2023 |
10/04/2023 |
T+7 |
|
12/20/2023 |
12/27/2023 |
T+7 |
|
12/21/2023 |
12/28/2023 |
T+7 |
|
12/22/2023 |
12/29/2023 |
T+7 |
|
Sweden |
|
|
|
Redemption Date |
Redemption Settlement Date |
Settlement Period |
|
04/03/2023 |
04/11/2023 |
T+8 |
|
04/04/2023 |
04/12/2023 |
T+8 |
|
Switzerland |
|
|
|
Redemption Date |
Redemption Settlement Date |
Settlement Period |
|
No settlement cycles (˃=): T+7 | ||
|
Taiwan |
|
|
|
Redemption Date |
Redemption Settlement Date |
Settlement Period |
|
01/18/2023 |
01/30/2023 |
T+12 |
|
01/19/2023 |
01/31/2023 |
T+12 |
|
03/30/2023 |
04/06/2023 |
T+7 |
|
03/31/2023 |
04/07/2023 |
T+7 |
|
Tanzania |
|
|
|
Redemption Date |
Redemption Settlement Date |
Settlement Period |
|
04/04/2023 |
04/11/2023 |
T+7 |
B-95
|
Tanzania |
|
|
|
Redemption Date |
Redemption Settlement Date |
Settlement Period |
|
04/05/2023 |
04/12/2023 |
T+7 |
|
04/06/2023 |
04/13/2023 |
T+7 |
|
12/20/2023 |
12/27/2023 |
T+7 |
|
12/21/2023 |
12/28/2023 |
T+7 |
|
12/22/2023 |
12/29/2023 |
T+7 |
|
Thailand |
|
|
|
Redemption Date |
Redemption Settlement Date |
Settlement Period |
|
No settlement cycles (˃=): T+7 | ||
|
Tunisia |
|
|
|
Redemption Date |
Redemption Settlement Date |
Settlement Period |
|
06/23/2023 |
06/30/2023 |
T+7 |
|
06/26/2023 |
07/03/2023 |
T+7 |
|
06/27/2023 |
07/04/2023 |
T+7 |
|
07/13/2023 |
07/20/2023 |
T+7 |
|
07/14/2023 |
07/21/2023 |
T+7 |
|
07/17/2023 |
07/24/2023 |
T+7 |
|
Turkey |
|
|
|
Redemption Date |
Redemption Settlement Date |
Settlement Period |
|
06/23/2023 |
07/03/2023 |
T+10 |
|
06/26/2023 |
07/04/2023 |
T+8 |
|
Uganda |
|
|
|
Redemption Date |
Redemption Settlement Date |
Settlement Period |
|
04/04/2023 |
04/11/2023 |
T+7 |
|
04/05/2023 |
04/12/2023 |
T+7 |
|
04/06/2023 |
04/13/2023 |
T+7 |
|
12/20/2023 |
12/27/2023 |
T+7 |
|
12/21/2023 |
12/28/2023 |
T+7 |
|
12/22/2023 |
12/29/2023 |
T+7 |
|
Ukraine |
|
|
|
Redemption Date |
Redemption Settlement Date |
Settlement Period |
|
No settlement cycles (˃=): T+7 | ||
|
United Arab Emirates |
|
|
|
Redemption Date |
Redemption Settlement Date |
Settlement Period |
|
04/18/2023 |
04/25/2023 |
T+7 |
|
04/19/2023 |
04/26/2023 |
T+7 |
|
06/26/2023 |
07/03/2023 |
T+7 |
|
06/27/2023 |
07/04/2023 |
T+7 |
|
United Kingdom |
|
|
|
Redemption Date |
Redemption Settlement Date |
Settlement Period |
|
No settlement cycles (˃=): T+7 | ||
|
United States |
|
|
|
Redemption Date |
Redemption Settlement Date |
Settlement Period |
|
No settlement cycles (˃=): T+7 | ||
|
Uruguay |
|
|
|
Redemption Date |
Redemption Settlement Date |
Settlement Period |
|
No settlement cycles (˃=): T+7 | ||
B-96
|
Vietnam |
|
|
|
Redemption Date |
Redemption Settlement Date |
Settlement Period |
|
01/18/2023 |
01/27/2023 |
T+9 |
|
01/19/2023 |
01/30/2023 |
T+11 |
|
04/27/2023 |
05/04/2023 |
T+7 |
|
04/28/2023 |
05/05/2023 |
T+7 |
|
WAEMU |
|
|
|
Redemption Date |
Redemption Settlement Date |
Settlement Period |
|
No settlement cycles (˃=): T+7 | ||
|
Zambia |
|
|
|
Redemption Date |
Redemption Settlement Date |
Settlement Period |
|
04/04/2023 |
04/11/2023 |
T+7 |
|
04/05/2023 |
04/12/2023 |
T+7 |
|
04/06/2023 |
04/13/2023 |
T+7 |
|
06/28/2023 |
07/05/2023 |
T+7 |
|
06/29/2023 |
07/06/2023 |
T+7 |
|
06/30/2023 |
07/07/2023 |
T+7 |
|
Zimbabwe |
|
|
|
Redemption Date |
Redemption Settlement Date |
Settlement Period |
|
04/04/2023 |
04/11/2023 |
T+7 |
|
04/05/2023 |
04/12/2023 |
T+7 |
|
04/06/2023 |
04/13/2023 |
T+7 |
|
08/09/2023 |
08/16/2023 |
T+7 |
|
08/10/2023 |
08/17/2023 |
T+7 |
|
08/11/2023 |
08/18/2023 |
T+7 |
|
12/19/2023 |
12/27/2023 |
T+8 |
|
12/20/2023 |
12/28/2023 |
T+8 |
|
12/21/2023 |
12/29/2023 |
T+8 |
In 2023, the maximum number of calendar days necessary to satisfy a redemption request would be 13 days.
Financial Statements
Each Fund’s Financial Statements for the fiscal year ended August 31, 2023, appearing in the Funds' 2023 Annual Reports to Shareholders, and the reports thereon of PricewaterhouseCoopers LLP, an independent registered public accounting firm, also appearing therein, are incorporated by reference into this Statement of Additional Information. For a more complete discussion of each Fund’s performance, please see the Funds' Annual and Semiannual Reports to Shareholders, which may be obtained without charge.
B-97
Description of Bond Ratings
Moody’s Rating Symbols
The following describe characteristics of the global long-term (original maturity of 1 year or more) bond ratings provided by Moody’s Investors Service, Inc. (Moody’s):
Aaa—Judged to be obligations of the highest quality, they are subject to the lowest level of credit risk.
Aa—Judged to be obligations of high quality, they are subject to very low credit risk. Together with the Aaa group, they make up what are generally known as high-grade bonds.
A—Judged to be upper-medium-grade obligations, they are subject to low credit risk.
Baa—Judged to be medium-grade obligations, subject to moderate credit risk, they may possess certain speculative characteristics.
Ba—Judged to be speculative obligations, they are subject to substantial credit risk.
B—Considered to be speculative obligations, they are subject to high credit risk.
Caa—Judged to be speculative obligations of poor standing, they are subject to very high credit risk.
Ca—Viewed as highly speculative obligations, they are likely in, or very near, default, with some prospect of recovery of principal and interest.
C—Viewed as the lowest rated obligations, they are typically in default, with little prospect for recovery of principal and interest.
Moody’s also supplies numerical indicators (1, 2, and 3) to rating categories. The modifier 1 indicates that the security is in the higher end of its rating category, the modifier 2 indicates a mid-range ranking, and the modifier 3 indicates a ranking toward the lower end of the category.
The following describe characteristics of the global short-term (original maturity of 13 months or less) bond ratings provided by Moody’s. This ratings scale also applies to U.S. municipal tax-exempt commercial paper.
Prime-1 (P-1)—Judged to have a superior ability to repay short-term debt obligations.
Prime-2 (P-2)—Judged to have a strong ability to repay short-term debt obligations.
Prime-3 (P-3)—Judged to have an acceptable ability to repay short-term debt obligations.
Not Prime (NP)—Cannot be judged to be in any of the prime rating categories.
The following describe characteristics of the U.S. municipal short-term bond ratings provided by Moody’s:
Moody’s ratings for state and municipal notes and other short-term (up to 3 years) obligations are designated Municipal Investment Grade (MIG).
MIG 1—Indicates superior quality, enjoying the excellent protection of established cash flows, liquidity support, and broad-based access to the market for refinancing.
MIG 2—Indicates strong credit quality with ample margins of protection, although not as large as in the preceding group.
MIG 3—Indicates acceptable credit quality, with narrow liquidity and cash-flow protection and less well-established market access for refinancing.
SG—Indicates speculative credit quality with questionable margins of protection.
Standard and Poor’s Rating Symbols
The following describe characteristics of the long-term (original maturity of 1 year or more) bond ratings provided by Standard and Poor’s:
AAA—These are the highest rated obligations. The capacity to pay interest and repay principal is extremely strong.
B-98
AA—These also qualify as high-grade obligations. They have a very strong capacity to pay interest and repay principal, and they differ from AAA issues only in small degree.
A—These are regarded as upper-medium-grade obligations. They have a strong capacity to pay interest and repay principal although they are somewhat more susceptible to the adverse effects of changes in circumstances and economic conditions than debt in higher-rated categories.
BBB—These are regarded as having an adequate capacity to pay interest and repay principal. However, adverse economic conditions or changing circumstances are more likely to lead to a weakened capacity in this regard. This group is the lowest that qualifies for commercial bank investment.
BB, B, CCC, CC, and C—These obligations range from speculative to significantly speculative with respect to the capacity to pay interest and repay principal. BB indicates the lowest degree of speculation and C the highest.
D—These obligations are in default, and payment of principal and/or interest is likely in arrears.
The ratings from AA to CCC may be modified by the addition of a plus (+) or minus (–) sign to show relative standing within the major rating categories.
The following describe characteristics of short-term (original maturity of 365 days or less) bond and commercial paper ratings designations provided by Standard and Poor’s:
A-1—These are the highest rated obligations. The capacity of the obligor to pay interest and repay principal is strong. The addition of a plus sign (+) would indicate a very strong capacity.
A-2—These obligations are somewhat susceptible to changing economic conditions. The obligor has a satisfactory capacity to pay interest and repay principal.
A-3—These obligations are more susceptible to the adverse effects of changing economic conditions, which could lead to a weakened capacity to pay interest and repay principal.
B—These obligations are vulnerable to nonpayment and are significantly speculative, but the obligor currently has the capacity to meet its financial commitments.
C—These obligations are vulnerable to nonpayment, but the obligor must rely on favorable economic conditions to meet its financial commitment.
D—These obligations are in default, and payment of principal and/or interest is likely in arrears.
The following describe characteristics of U.S. municipal short-term (original maturity of 3 years or less) note ratings provided by Standard and Poor’s:
SP-1—This designation indicates a strong capacity to pay principal and interest.
SP-2—This designation indicates a satisfactory capacity to pay principal and interest.
SP-3—This designation indicates a speculative capacity to pay principal and interest.
B-99
Appendix A
Summary of the Vanguard-Advised Funds Proxy Voting Policy
The funds for which Vanguard acts as investment advisor (Vanguard-advised funds) retain authority to vote proxies received for the shares of equity securities held in each fund. The Board of Trustees (the Board) for the Vanguard-advised funds has adopted proxy voting procedures and guidelines to govern proxy voting for each portfolio retaining proxy voting authority.
The Investment Stewardship Oversight Committee (the Committee), comprised primarily of fund officers and subject to the procedures described below, oversees the Vanguard-advised funds’ proxy voting. The Committee reports directly to the Board. Vanguard is subject to these procedures and the proxy voting policies to the extent that they call for Vanguard to administer the voting process and implement the resulting voting decisions, and for these purposes the voting policies have also been approved by the Board of Directors of Vanguard.
The voting principles and policies adopted by the Board provide a framework for assessing each proposal and seek to ensure that each vote is cast in the best interests of each fund. Under the voting policies, each proposal is evaluated on its merits, based on the particular facts and circumstances presented at the company in question. For more information on the funds’ proxy voting policies, please visit about.vanguard.com/investment-stewardship.
I. Investment Stewardship Team
The Investment Stewardship Team administers the day-to-day operation of the funds’ proxy voting process, overseen by the Committee. The Investment Stewardship Team performs the following functions: (1) managing and conducting due diligence of proxy voting vendors; (2) reconciling share positions; (3) analyzing proxy proposals using factors described in the voting policies; (4) determining and addressing potential or actual conflicts of interest that may be presented by a particular proxy; and (5) voting proxies. The Investment Stewardship Team also prepares periodic and special reports for the Board and proposes amendments to the procedures and voting policies.
II. Investment Stewardship Oversight Committee
The Board, including a majority of the independent trustees, appoints the members of the Committee (which is comprised primarily of fund officers). The Committee works with the Investment Stewardship Team to provide reports and other guidance to the Board regarding proxy voting by the funds. The Committee has an obligation to exercise its decision-making authority in accordance with the Board’s instructions as set forth in the funds’ proxy voting procedures and voting policies and subject to the fiduciary standards of good faith, fairness, and Vanguard’s Code of Ethical Conduct. The Committee may advise the Investment Stewardship Team on how to best apply the Board’s instructions as set forth in the voting policies or refer the matter to the Board, which has ultimate decision-making authority for the funds. The Board reviews the procedures and voting policies annually and modifies them from time to time upon the recommendation of the Committee and in consultation with the Investment Stewardship Team.
III. Proxy Voting Pillars
Vanguard's investment stewardship activities are grounded in four pillars of corporate governance:
1) Board composition and effectiveness: Good governance begins with a company’s board of directors. Our primary focus is on understanding to what extent the individuals who serve as board members are appropriately independent, capable, and experienced.
2) Board oversight of strategy and risk: Boards should be meaningfully involved in the formation and oversight of strategy and have ongoing oversight of material risks to their company. We work to understand how boards of directors are involved in strategy formation, oversee company strategy, and identify and govern material risks to long-term shareholder returns.
3) Executive pay (compensation or remuneration): Sound, performance-linked compensation programs drive long-term investment returns. We look for companies to provide clear disclosure about their compensation practices, the board’s oversight of those practices, and how said practices are aligned with long-term shareholder returns.
B-100
4) Shareholder rights: We believe governance structures should allow shareholders to effectively exercise their foundational rights. Shareholder rights enable a company’s owners to use their voice and their vote – ideally, consistent with their economic exposure – to effect and approve changes in corporate governance practices.
IV. Evaluation of Proxies
For ease of reference, the procedures and guidelines often refer to all Vanguard-advised funds. However, the processes and practices seek to ensure that proxy voting decisions are suitable for individual funds. For most proxy proposals, particularly those involving routine corporate governance matters, the evaluation could result in the funds having a common interest in the matter and, accordingly, each fund casting votes in the same manner. In other cases, however, a fund may vote differently from other funds, depending upon the nature and objective of each fund, if doing so is in the best interest of the individual fund.
The voting policies do not permit the Board to delegate voting discretion to a third party that does not serve as a fiduciary for all Vanguard-advised funds. Because many factors bear on each decision, the voting policies incorporate factors that should be considered in each voting decision. A fund may refrain from voting some or all of its shares or vote in a particular way if doing so would be in the fund’s and its shareholders’ best interests. These circumstances may arise, for example, if the expected cost of voting exceeds the expected benefits of voting, if exercising the vote would result in the imposition of trading or other restrictions, or if a fund (or all Vanguard funds in the aggregate) were to own more than the permissible maximum percentage of a company’s stock (as determined by the company’s governing documents or by applicable law, regulation, or regulatory agreement), or if voting would present a potential conflict of interest.
In evaluating proxy proposals, the Investment Stewardship Team considers information from many sources, which could include, but is not limited to, the perspectives of the company management or shareholders presenting a proposal, independent proxy research services, or proprietary research. Additionally, data and recommendations from proxy advisors serve as one of many inputs into our research process. The Vanguard-advised funds may utilize automated voting for matters that are clearly addressed by the funds’ proxy voting procedures and guidelines.
While serving as a framework, the voting policies cannot contemplate all possible proposals with which a fund may be presented. In the absence of a specific guideline for a particular proposal (e.g., in the case of a transactional issue or contested proxy), the Investment Stewardship Team, under the supervision of the Committee, will evaluate the matter and cast the fund’s vote in a manner that is in the fund’s best interest, subject to the individual circumstances of the fund.
V. Conflicts of Interest
Vanguard takes seriously its commitment to avoid potential conflicts of interest. Vanguard funds invest in thousands of publicly listed companies worldwide. Those companies may include clients, potential clients, vendors, or competitors. Some companies may employ Vanguard trustees, former Vanguard executives, or family members of Vanguard personnel who have direct involvement in Vanguard’s Investment Stewardship program.
Vanguard’s approach to mitigating conflicts of interest begins with the funds’ proxy voting procedures. The procedures require that voting personnel act as fiduciaries and must conduct their activities at all times in accordance with the following standards: (i) fund shareholders’ interests come first; (ii) conflicts of interest must be avoided and mitigated to the extent possible; and (iii) compromising situations must be avoided.
We maintain an important separation between Vanguard’s Investment Stewardship Team and other groups within Vanguard that are responsible for sales, marketing, client service, and vendor/partner relationships. Proxy voting personnel are required to disclose potential conflicts of interest and must recuse themselves from all voting decisions and engagement activities in such instances. In certain circumstances, Vanguard may refrain from voting shares of a company, or may engage an independent third-party fiduciary to vote proxies.
Each externally managed fund has adopted the proxy voting guidelines of its advisor(s) and votes in accordance with the external advisors’ guidelines and procedures. Each advisor has its own procedures for managing conflicts of interest in the best interests of fund shareholders.
VI. Shareholder Proposals
Shareholder proposals are evaluated in the context of the general corporate governance principle that a company’s board has ultimate responsibility for providing effective ongoing oversight of relevant sector and company-specific risks,
B-101
including risks related to environmental and social matters. Each proposal is evaluated on its merits and in the context of the particular facts and circumstances at the company in question and supported when there is a logically demonstrable linkage between the specific proposal and long-term shareholder value of the company. Some of the factors considered when evaluating shareholder proposals include the materiality of the risk addressed by the proposal, the quality of the current disclosures/business practices, and any progress by the company toward addressing and disclosing the relevant material risk.
VII. Voting in Markets Outside the United States
Corporate governance standards, disclosure requirements, and voting mechanics vary greatly among the markets outside the United States (U.S.) in which the funds may invest. Each fund’s votes will be used, where applicable, to support improvements in governance and disclosure by each fund’s portfolio companies. Matters presented by non-U.S. portfolio companies will be evaluated in the foregoing context, as well as in accordance with local market standards and best practices. Votes are cast for each fund in a manner philosophically consistent with the voting policies, taking into account differing practices by market.
In many other markets, voting proxies will result in a fund being prohibited from selling the shares for a period of time due to requirements known as “share-blocking” or reregistration. Generally, the value of voting is unlikely to outweigh the loss of liquidity imposed by these requirements on the funds. In such instances, the funds will generally abstain from voting.
The costs of voting (e.g., custodian fees, vote agency fees) in other markets may be substantially higher than for U.S. holdings. As such, the fund may limit its voting on foreign holdings in instances in which the issues presented are unlikely to have a material impact on shareholder value.
VIII. Voting Shares of a Company That Has an Ownership Limitation
Certain companies have provisions in their governing documents or other agreements that restrict stock ownership in excess of a specified limit. Typically, these ownership restrictions are included in the governing documents of real estate investment trusts but may be included in other companies’ governing documents. A company’s governing documents normally allow the company to grant a waiver of these ownership limits, which would allow a fund to exceed the stated ownership limit. Sometimes a company will grant a waiver without restriction. From time to time, a company may grant a waiver only if a fund (or funds) agrees to not vote the company’s shares in excess of the normal specified limit. In such a circumstance, a fund may refrain from voting shares if owning the shares beyond the company’s specified limit is in the best interests of the fund and its shareholders.
In addition, applicable law may require prior regulatory approval to permit ownership of certain regulated issuer’s voting securities above certain limits or may impose other restrictions on owners of more than a certain percentage of a regulated issuer’s voting shares. The Board has authorized the funds to vote shares above these limits in the same proportion as votes cast by the issuer’s entire shareholder base (i.e., mirror vote), or to refrain from voting excess shares. Further, the Board has adopted policies that will result in certain funds mirror voting a higher proportion of the shares they own in a regulated issuer in order to permit certain other funds (generally advised by managers not affiliated with Vanguard) to mirror vote none, or a lower proportion of, their shares in such regulated issuer.
IX. Voting on a Fund's Holdings of Other Vanguard Funds
Certain Vanguard funds (owner funds) may, from time to time, own shares of other Vanguard funds (underlying funds). If an underlying fund submits a matter to a vote of its shareholders, votes for and against such matters on behalf of the owner funds will be cast in the same proportion as the votes of the other shareholders in the underlying fund.
X. Securities Lending
There may be occasions when Vanguard needs to restrict lending of and/or recall securities that are out on loan in order to vote in a shareholder meeting. Vanguard has processes to monitor securities on loan and to evaluate any circumstances that may require us to restrict and/or recall the stock. In making this decision, we consider:
◾ The subject of the vote and whether, based on our knowledge and experience, we believe the topic is potentially material to the corporate governance and/or long-term performance of the company;
◾ The funds’ individual and/or aggregate equity investment in a company, and whether we estimate that voting funds’ shares would affect the shareholder meeting outcome; and
B-102
◾ The long-term impact to our fund shareholders, evaluating whether we believe the benefits of voting a company’s shares would outweigh the benefits of stock lending revenues in a particular instance.
B-103
Appendix B
Ariel Investments, LLC
Proxy Voting Policies and Procedures
Ariel Investments, LLC (Ariel) has established Proxy Voting Policies and Procedures (the Proxy Policies) concerning proxies voted by Ariel on behalf of each client who delegates proxy voting authority to Ariel and delivers the proxies to Ariel. A client may retain proxy voting powers, give particular proxy voting instructions to Ariel, or have a third-party fiduciary vote proxies. Ariel’s Proxy Policies are subject to change as necessary or appropriate to remain current with applicable rules and regulations and our internal policies and procedures.
Ariel’s Domestic Strategies
The “domestic strategies” consist of the traditional value and focused value strategies.
As part of our domestic strategies’ investment process, Ariel places emphasis on a company’s management, its board and its activities. Ariel looks for companies with high quality management teams, as represented by their individual industry experience and their management of material environmental, social and governance (ESG) issues. Furthermore, Ariel strives to invest with management teams who show integrity, candor, and foster open and honest communication with their shareholders. Accordingly, Ariel believes that the recommendation of a company’s management on any issue should be given considerable weight in determining how a proxy voting resolution is resolved. As a result, it is generally Ariel’s policy to vote in accordance with management.
Ariel has established general guidelines for voting clients’ proxies. While these generally guide Ariel’s decision-making, all issues are analyzed by the Ariel analyst who follows the company, the head of ESG, as well as Ariel’s Director of Research Operations. As a result, there may be cases in which particular circumstances lead Ariel to vote an individual proxy differently than otherwise stated within Ariel’s general proxy voting guidelines. In such cases, Ariel will document its reasoning.
Potential conflicts of interest arise when Ariel votes proxies of issuers that have or are seeking a material relationship with Ariel. For example, Ariel manages retirement plan assets and corporate assets for issuers whose securities are held by Ariel’s clients for whom Ariel votes proxies. Ariel also votes proxies of issuers that distribute Ariel’s Funds or that otherwise have a material business relationship with Ariel. Ariel mitigates these and other potential conflicts of interest that arise by following, among other things, a disciplined investment strategy and proxy voting procedures designed to detect and resolve potential conflicts of interest in the proxy voting process and to cast votes that are in the best interests of clients and not a product of a conflict.
If it is determined that a material conflict of interest may exist, such as a business relationship with a portfolio company, it is Ariel’s policy to generally vote in accordance with the recommendations of Institutional Shareholder Services, Inc. (ISS). If, in a conflict situation, Ariel decides to vote differently than ISS, the proxy will be referred to Ariel’s Domestic Proxy Resolution Committee, which is charged with determining whether the decision to vote differently than ISS is in the best interests of Ariel’s clients and is not the product of a conflict.
Voting Limitations
Ariel generally will not vote its clients’ proxies in the following circumstances:
• For securities Ariel did not acquire for a client’s account (e.g., if a new client transferred securities to Ariel and Ariel has not yet sold the securities through the account transition process, or if an Ariel client chooses to invest its cash in a money market fund).
• In those instances where Ariel receives a meeting notice without enough time to fully process the proxy.
• For those Ariel clients who engage in securities lending programs through their custodians, and the security is on loan at the record date.
• If a client’s custodian is unable to retrieve and deliver ballots to Ariel’s proxy voting service (ISS).
B-104
Ariel may be required to vote shares in securities of regulated companies (such as banks) in conformance with conditions specified by the industry’s regulator. Additionally, the issuer of a security may impose limitations upon Ariel’s ability to vote proxies for its clients. In these circumstances, Ariel will refrain from voting some or all of clients’ shares.
Some clients who delegate proxy voting authority to Ariel may give Ariel specific proxy voting instructions that could be contrary to Ariel’s guidelines. As a result, Ariel could vote differently for those clients than it votes for other clients in the same strategy.
For each proxy, Ariel maintains records as required by applicable law. Proxy voting information will be provided to clients in accordance with their agreement with us or upon request. You may request a copy of Ariel’s Proxy Voting Policies and Procedures, or a copy of the specific voting record for the Fund, by calling Ariel at (800) 725-0140, emailing ClientserviceIR@arielinvestments.com, or writing to Ariel Investments, LLC, Attention: Institutional Client & Investor Relations, at 200 East Randolph Street, Suite 2900, Chicago, IL 60601.
Cardinal Capital Management, L.L.C.
Proxy Voting Policies and Procedures
I. Policy
Proxy voting is an important right of shareholders and reasonable care and diligence must be undertaken to ensure that such rights are properly and timely exercised. When Cardinal Capital has discretion to vote the proxies of its clients, it will vote those proxies in the best interest of its clients and in accordance with these policies and procedures.
II. Proxy Voting Procedures
(a) All proxies received by Cardinal Capital will be sent to the CCO or his or her delegatee. The CCO or Compliance delegatee will:
(1) Keep a record of each proxy received;
(2) Forward the proxy to the appropriate investment team member with primary responsibility for company.
(3) Determine which accounts managed by Cardinal Capital hold the security to which the proxy relates;
(4) Provide the investment team member with a list of accounts that hold the security, together with the number of votes each account controls (reconciling any duplications), and the date by which Cardinal Capital must vote the proxy in order to allow enough time for the completed proxy to be returned to the issuer prior to the vote taking place.
(5) Absent material conflicts (see Section IV), the investment team member will determine how Cardinal Capital should vote the proxy. The investment team member will send its decision on how Cardinal Capital will vote a proxy to the CCO or delegatee. The CCO or delegatee is responsible for casting Cardinal’s votes in a timely and appropriate manner.
(6) Cardinal Capital may retain a third party to assist it in coordinating and voting proxies with respect to client securities. If so, the CCO shall monitor the third party to assure that all proxies are being properly voted and appropriate records are being retained.
III. Voting Guidelines
Cardinal Capital believes that voting proxies in accordance with the following guidelines is in the best interests of its clients.
Generally, Cardinal Capital will vote in favor of routine corporate housekeeping proposals, including election of directors (where no corporate governance issues are implicated), selection of auditors, and increases in or reclassification of common stock.
Generally, Cardinal Capital will vote against proposals that make it more difficult to replace members of the issuer’s board of directors, including proposals to stagger the board, cause management to be overrepresented on the board, introduce cumulative voting, introduce unequal voting rights, and create supermajority voting.
B-105
For other proposals, Cardinal Capital shall determine whether a proposal is in the best interests of its clients and may take into account the following factors, among others:
(1) Whether the proposal was recommended by management and Cardinal Capital’s opinion of management;
(2) Whether the proposal acts to entrench existing management; and
(3) Whether the proposal fairly compensates management for past and future performance.
Cardinal may receive occasional item specific voting guidelines from a client, which may result in different voting results for proxies for the same issuer.
IV. Conflicts of Interest
(1) The CCO or their delegatee will identify any conflicts that exist between the interests of Cardinal Capital and its clients. This examination will include a review of the relationship of Cardinal Capital and its affiliates with the issuer of each security and any of the issuer’s affiliates to determine if the issuer is a client of Cardinal Capital or an affiliate of Cardinal Capital or has some other relationship with Cardinal Capital or a client of Cardinal Capital.
(2) If a material conflict exists, the Adviser will determine whether voting in accordance with the voting guidelines and factors described above is in the best interests of the client. Cardinal Capital will also determine whether it is appropriate to disclose the conflict to the affected clients and, except in the case of clients that are subject to the Employee Retirement Income Security Act of 1974, as amended (“ERISA”), give the clients the opportunity to vote their proxies themselves. In the case of ERISA clients, if the Investment Management Agreement reserves to the ERISA client the authority to vote proxies when Cardinal Capital determines it has a material conflict that affects its best judgment as an ERISA fiduciary, Cardinal Capital will give the ERISA client the opportunity to vote the proxies themselves, or special ERISA proxy voting procedures must provide for a pre-determined voting policy that eliminates the discretion of the Adviser when voting proxies if such a conflict exists.
V. Disclosure
(a) Cardinal Capital will disclose in its Form ADV Part II that clients may contact the Compliance Officer, via e-mail or telephone at compliance@cardcap.com in order to obtain information on how Cardinal Capital voted such client’s proxies, and to request a copy of these policies and procedures. If a client requests this information, the Compliance Officer will prepare a written response to the client that lists, with respect to each voted proxy that the client has inquired about, (1) the name of the issuer; (2) the proposal voted upon and (3) how Cardinal Capital voted the client’s proxy.
(b) A concise summary of these Proxy Voting Policies and Procedures will be included in Cardinal Capital’s Form ADV Part II, and will be updated whenever these policies and procedures are updated. The Compliance Officer or their delegatee will arrange for a copy of this summary to be sent to all existing clients (who will already have been sent Cardinal Capital’s Form ADV Part II, which is required to be offered to clients annually) either as a separate mailing or along with a periodic account statement or other correspondence sent to clients.
VI. Recordkeeping
The Compliance Officer or their delegatee will maintain files relating to Cardinal Capital’s proxy voting procedures in an easily accessible place. Records will be maintained and preserved for five years from the end of the fiscal year during which the last entry was made on a record, with records for the first two years kept in the offices of Cardinal Capital. Records of the following will be included in the files:
(a) Copies of these proxy voting policies and procedures, and any amendments thereto.
(b) A copy of each proxy statement that Cardinal Capital receives, provided however that Cardinal Capital may rely on obtaining a copy of proxy statements from the SEC’s EDGAR system for those proxy statements that are so available.
(c) A record of each vote that Cardinal Capital casts.
(d) A copy of any document Cardinal Capital created that was material to making a decision how to vote proxies, or that memorializes that decision.
(e) A copy of each written client request for information on how Cardinal Capital voted such client’s proxies, and a copy of any written response to any (written or oral) client request for information on how Cardinal Capital voted its proxies.
B-106
Frontier Capital Management Company, LLC
Proxy Voting Statement and Guidelines
As an investment adviser and fiduciary of client assets, Frontier Capital utilizes proxy voting policies and procedures intended to pursue its clients’ best interest by protecting the value of clients’ investments. Frontier Capital recognizes that proxies have an economic value. In voting proxies, we seek to both maximize the long-term value of our clients’ assets and to cast votes that we believe to be fair and in the best interest of the affected client(s). Proxies are considered client assets and are managed with the same care, skill and diligence as all other client assets. These written proxy policies and procedures are designed to reasonably ensure that Frontier Capital votes proxies in the best interest of clients for whom Frontier Capital has voting authority.
Frontier Capital’s authority to vote proxies does not extend to taking any legal action with regard to class action suits relating to securities purchased by Frontier Capital for its clients. Frontier Capital provides instructions to custodians and brokers regarding tender offers and rights offerings for securities in client accounts. However, Frontier Capital does not provide legal advice to clients and, accordingly, does not determine whether a client should join, opt out of or otherwise submit a claim with respect to any legal proceedings, including bankruptcies or class actions, involving securities held or previously held by the client. Frontier Capital generally does not have authority to submit claims or elections on behalf of clients in legal proceedings. Should a client, however, wish to retain legal counsel and/or take action regarding any class action suit proceeding, Frontier Capital will provide the client or the client’s legal counsel with information that may be needed upon the client’s reasonable request.
Arrangements with Outside Firms
Frontier Capital has contracted with a third-party vendor (the “proxy vendor”) to provide vote recommendations according to a set of pre-determined proxy voting policy guidelines. Frontier Capital has also contracted with the proxy vendor to act as agent for the proxy voting process and to maintain records on proxy voting for our clients. The vendor has represented to Frontier Capital that it uses its best efforts to ensure that its proxy voting recommendations are in accordance with these policies as well as relevant requirements of the ERISA and the U.S. Department of Labor’s interpretations thereof.
There may be occasional circumstances in which Frontier Capital exercises its voting discretion to deviate from the proxy vendor’s recommendation. Frontier Capital’s action in these cases is described in the Conflicts of Interest section of these policies and procedures.
Proxy Voting Committee
Frontier Capital has a Proxy Voting Committee (the “Committee”) that is responsible for deciding what is in the best interest of clients when determining how proxies are voted. The Committee is comprised of the Chief Compliance Officer (“CCO”), the Operations Manager, and one or more Portfolio Managers. The Committee performs the following tasks in satisfying its responsibility:
◾ Reviews annually, and revises as necessary, this Proxy Voting Statement and Guidelines (the “Proxy Statement”);
◾ Reviews annually all proxy votes taken to determine if those votes were consistent with the Proxy Statement, including any votes where Frontier Capital determined it had a material conflict of interest;
◾ Reviews annually the proxy vendor’s proxy voting policies to determine that they continue to be consistent with the Proxy Statement and reasonably designed to be in the best interests of Frontier Capital’s clients; and
◾ Reviews and approves as necessary any changes to the proxy vendor’s proxy voting policies.
Determination and Execution of Discretionary Authority
Except where the contract is silent, each client will designate in its investment management contract whether it would like to retain proxy voting authority or delegate that authority to Frontier Capital. If a client contract is silent on whether the client delegates proxy voting authority to Frontier Capital, Frontier Capital will be implied to have proxy voting authority.
B-107
Frontier Capital will not neglect its proxy voting responsibilities, but Frontier Capital may abstain from voting if it deems that abstaining is in its Clients’ best interests. For example, Frontier Capital may be unable to vote securities that have been lent by the custodian or may choose not to vote where doing so would prevent transacting in those securities for a certain period of time (referred to as “share blocking”).
Proxy Voting Process
Frontier Capital’s Operations team (“Operations”) manages the proxy voting process. The proxy vendor provides an online portal that shows all ballots received, together with the company’s voting recommendation and the proxy vendor’s voting recommendation. Operations distributes this information, as well as any additional proxy soliciting materials (such as a company’s response to the proxy vendor’s recommendation) received by Frontier Capital at least three days prior to the voting date, to an investment professional for deliberation. Prior to the voting date, Operations submits Frontier Capital’s vote via the online portal, a record of which is maintained by the proxy vendor.
Investment professionals determine how Frontier Capital votes client proxies. Absent specific client instructions, or in the event that no determination is made by the investment professional, Frontier Capital generally votes client proxies according to recommendations made by the proxy vendor. Investment professionals wishing to deviate from these recommendations must provide the CCO with a written explanation of the reason for the deviation, and the CCO will consider potential conflicts of interest as described in greater detail below.
Any attempt to influence the proxy voting process by Issuers or others not identified in these policies and procedures must also be promptly reported to the CCO. Similarly, any Client’s attempt to influence proxy voting with respect to other Clients’ securities should be promptly reported to the CCO.
Conflicts of Interest
As noted, Frontier Capital has adopted the proxy vendor’s proxy voting guidelines. The adoption of these proxy voting guidelines provides pre-determined policies for voting proxies and is thus designed to remove conflicts of interest. Examples of such conflicts are when we vote a proxy solicited by an issuer who is a client of ours or with whom we have another business or personal relationship that may affect how we vote on the issuer’s proxy. The intent of this policy is to remove any discretion that Frontier Capital may have to interpret how to vote proxies in cases where Frontier Capital has a material conflict of interest or the appearance of a material conflict of interest.
Although under normal circumstances Frontier Capital is not expected to deviate from the proxy vendor’s recommendation, the CCO will monitor any situation where Frontier Capital wishes to do so. In these situations, the CCO will consider whether Frontier Capital has a material conflict of interest. If the CCO determines that a material conflict exists, Frontier Capital will vote the proxy using either of the following two methods: (a) we will follow the recommendations of the proxy vendor; or (b) we will not take into consideration the relationship that gave rise to the conflict and will vote the proxy in the best interest of our clients. If the CCO determines that a material conflict does not exist, then we may vote the proxy in our discretion. The Committee reviews annually all votes cast where Frontier Capital determined it had a material conflict of interest.
Proxy Vendor Oversight
Changes to Proxy Vendor Proxy Voting Policies and Guidelines
The proxy vendor notifies Frontier Capital of any material changes to its proxy voting policies and guidelines. On an annual basis, the proxy vendor distributes its updated guidelines to Frontier Capital.
New Account Setup
As part of the account setup process, Client Services will review a new investment advisory agreement to determine if Frontier Capital has voting authority. If voting authority has been granted, Operations will provide the proxy vendor with the required instructions to set up the new account. On the following business day, Operations will review the proxy vendor’s systems to confirm the account was setup in accordance with Frontier Capital’s instructions.
Account Reconciliations
B-108
On a periodic basis, the proxy vendor will provide Frontier Capital with a list of Frontier Capital clients for which the proxy vendor is voting. This is designed to ensure that the proxy vendor is voting for all clients for whom Frontier Capital retains voting authority. In that regard, Frontier Capital will conduct a periodic reconciliation between its records and the proxy vendor’s records.
Initial and Periodic Due Diligence of Proxy Vendors
When considering whether to retain or continue retaining Frontier Capital’s proxy vendor to provide research or voting recommendations, Frontier Capital will consider factors such as the following:
◾ The proxy vendor’s capacity and competency to adequately analyze the matters for which the investment adviser is responsible for voting;
◾ The adequacy and quality of the proxy vendor’s personnel, processes, and technology;
◾ The adequacy of the proxy vendor’s process for seeking timely input from issuers and proxy vendor clients with respect to proxy voting policies, methodologies, and peer group constructions, including for “say-on-pay” votes;
◾ The proxy vendor’s engagement with issuers, including the firm’s process for ensuring that it has complete and accurate information about the issuer and each particular matter, and the firm’s process, if any, for investment advisers to access the issuer’s views about the firm’s voting recommendations in a timely and efficient manner;
◾ The adequacy of the proxy vendor’s disclosures regarding its sources of information and methodologies for formulating voting recommendations and, in making such recommendations;
◾ The proxy vendor’s consideration of factors unique to a specific issuer or proposal when evaluating a matter subject to a shareholder vote;
◾ The proxy vendor’s policies and procedures for identifying and addressing conflicts of interest;
◾ The proxy vendor to update the investment adviser regarding business changes that may affect the proxy vendor’s capacity and competency to provide independent proxy voting advice or carry out voting instructions;
◾ Whether the proxy vendor appropriately updates its methodologies, guidelines, and voting recommendations on an ongoing basis, including in response to feedback from issuers and their shareholders; and
◾ The proxy voting vendor’s policies and procedures to keep confidential Frontier Capital’s non-public information, including Frontier Capital’s intention to proxy votes.
Votes Cast Other than According to the Proxy Vendor’s Pre-Determined Policies
Frontier Capital’s CCO, who is also the General Counsel, will periodically confirm that all documentation regarding any decisions to vote other than according to the proxy vendor’s pre-determined policies is accurate and complete.
Client Disclosure
Frontier Capital includes a description of its policies and procedures regarding proxy voting and class actions in Part 2 of Form ADV, along with a statement that Clients can contact Frontier Capital at 617-261-0777 to obtain a copy of these policies and procedures and information about how Frontier Capital voted with respect to the Client’s securities. Any request for information about proxy voting or class actions should be promptly forwarded to the CCO, who will respond to any such requests.
Upon a client’s request, the proxy agent will provide Frontier Capital with the following information:
◾ the name of the issuer of the portfolio security
◾ the ticker symbol of the security
◾ the CUSIP of the security
◾ the shareholder meeting date
◾ a description of the matter voted on
◾ whether the matter was proposed by the issuer or by a security holder
◾ whether the account voted on the matter
◾ how each proxy proposal was voted (e.g., for or against the proposal, abstain; for or withhold authority regarding election of directors)
◾ whether the vote that was cast was for or against management’s recommendation
B-109
As a matter of policy, Frontier Capital does not disclose to companies or clients how it expects to vote on upcoming proxies. Additionally, Frontier Capital does not disclose the way it voted proxies to unaffiliated third parties without a legitimate need to know such information.
Recordkeeping
Frontier Capital will maintain in an easily accessible place for a period of six years, the first two years in an appropriate Frontier Capital office, the following documents (except documents maintained on Frontier Capital’s behalf by the proxy agent as specifically noted below):
◾ Frontier Capital’s proxy voting policies and procedures and the proxy voting guidelines;
◾ Proxy statements received regarding client securities, which Frontier Capital may satisfy by relying on the proxy agent, on Frontier Capital’s behalf, to retain a copy of each proxy statement;
◾ Records of votes cast on behalf of its clients, which Frontier Capital may satisfy by relying on the proxy agent to retain, on Frontier Capital’s behalf, a record of the vote cast;
◾ A copy of any document created by Frontier Capital personnel that was material to making a decision on how to vote proxies on behalf of a client or that memorialized the basis for that decision; and
◾ A copy of each written client request for information on how Frontier Capital voted proxies on behalf of the client, and a copy of any written response by Frontier Capital to any written or oral client request for information on how Frontier Capital voted proxies on behalf of the requesting client.
SAI 1690 122023
PART C
VANGUARD SCOTTSDALE FUNDS
OTHER INFORMATION
VANGUARD SCOTTSDALE FUNDS
OTHER INFORMATION
Item 28. Exhibits
|
(a) |
Articles of Incorporation, Amended and Restated Agreement and Declaration of Trust, filed with Post-Effective
Amendment No. 56 dated September 4, 2018, is hereby incorporated by reference. |
|
(b) |
By-Laws, Amended and Restated By-Laws, filed with Post-Effective Amendment No. 63 dated December 17, 2021,
is hereby incorporated by reference. |
|
(c) |
Instruments Defining Rights of Security Holders, reference is made to Articles III and V of the Registrant’s Amended
and Restated Agreement and Declaration of Trust, refer to Exhibit (a) above. |
|
(d) |
Investment Advisory Contracts, for Frontier Capital Management Co., LLC (with respect to Vanguard Explorer Value
Fund), filed with Post-Effective Amendment No. 26 on August 18, 2010, is hereby incorporated by reference. For
Ariel Investments, LLC, (with respect to Vanguard Explorer Value Fund), filed with Post-Effective Amendment No. 65
on December 21, 2022, is hereby incorporated by reference. For Cardinal Capital Management, L.L.C., (with
respect to Vanguard Explorer Value Fund), is filed herewith. Amendment to the Investment Advisory Agreement for
Frontier Capital Management Co., LLC, is filed herewith. The Vanguard Group, Inc., provides investment advisory
services to Vanguard Sector Bond Index Funds, Vanguard Russell Index Funds, Vanguard Total Corporate Bond
ETF, and Vanguard Total World Bond ETF pursuant to the Fifth Amended and Restated Funds’ Service Agreement,
refer to Exhibit (h) below. |
|
(e) |
Underwriting Contracts, not applicable. |
|
(f) |
Bonus or Profit Sharing Contracts, reference is made to the section entitled “Management of the Funds” in Part B of
this Registration Statement. |
|
(g) |
Custodian Agreements, for The Bank of New York Mellon, JPMorgan Chase Bank, and State Street Bank and Trust
Company, are filed herewith. |
|
(h) |
Other Material Contracts, Fifth Amended and Restated Funds’ Service Agreement, filed with Post-Effective
Amendment No. 62 on December 22, 2020, is hereby incorporated by reference. Form of Authorized Participant
Agreement, filed with Post-Effective Amendment No. 26 on August 18, 2010, is hereby incorporated by reference.
Form of Fund of Funds Investment Agreement, filed with Post-Effective Amendment No. 65 on December 21, 2022,
is hereby incorporated by reference. |
|
(i) |
Legal Opinion, not applicable. |
|
(j) |
|
|
(k) |
Omitted Financial Statements, not applicable. |
|
(l) |
Initial Capital Agreements, not applicable. |
|
(m) |
Rule 12b-1 Plan, not applicable. |
|
(n) |
|
|
(o) |
Reserved. |
|
(p) |
Codes of Ethics, Frontier Capital Management Co., LLC, and The Vanguard Group, Inc., filed with Post-Effective
Amendment No. 65 on December 21, 2022, are hereby incorporated by reference. For Ariel Investments, LLC, and
Cardinal Capital Management, L.L.C., is filed herewith. |
Item 29. Persons Controlled by or under Common Control with Registrant
None.
Item 30. Indemnification
The Registrant’s organizational documents contain provisions indemnifying Trustees and officers against liability incurred in their official capacities. Article VII, Section 2 of the Amended and Restated Agreement and Declaration of Trust provides
C-1
that the Registrant may indemnify and hold harmless each and every Trustee and officer from and against any and all claims, demands, costs, losses, expenses, and damages whatsoever arising out of or related to the performance of his or her duties as a Trustee or officer. Article VI of the By-Laws generally provides that the Registrant shall indemnify its Trustees and officers from any liability arising out of their past or present service in that capacity. Among other things, this provision excludes any liability arising by reason of willful misfeasance, bad faith, gross negligence, or the reckless disregard of the duties involved in the conduct of the Trustee’s or officer’s office with the Registrant.
Insofar as indemnification for liabilities arising under the Securities Act of 1933 (the Securities Act) may be permitted for directors, officers, or persons controlling the Registrant pursuant to the foregoing provisions, the Registrant has been informed that in the opinion of the Securities and Exchange Commission, such indemnification is against public policy as expressed in the Securities Act and is therefore unenforceable.
Item 31. Business and Other Connections of Investment Advisers
Ariel Investments, LLC (Ariel), is an investment adviser registered under the Investment Advisers Act of 1940, as amended (the Advisers Act). The list required by this Item 31 of officers and directors of Ariel, together with any information as to any business, profession, vocation, or employment of a substantial nature engaged in by such officers and directors during the past two years, is incorporated herein by reference from Form ADV filed by Ariel pursuant to the Advisers Act (SEC File No. 801- 18767).
Cardinal Capital Management, L.L.C. (Cardinal) is an investment advisor registered under the Advisers Act. The list required by this Item 31 of officers and directors of Cardinal, together with any information as to any business, profession, vocation, or employment of a substantial nature engaged in by such officers and directors during the past two years, is incorporated herein by reference from Form ADV filed by Cardinal pursuant to the Advisers Act (SEC File No. 801-49090).
Frontier Capital Management Co., LLC (Frontier) is an investment adviser registered under the Investment Advisers Act of 1940, as amended (the Advisers Act). The list required by this Item 31 of officers and directors of Frontier, together with any information as to any business, profession, vocation, or employment of a substantial nature engaged in by such officers and directors during the past two years, is incorporated herein by reference from Form ADV filed by Frontier pursuant to the Advisers Act (SEC File No. 801-15724).
The Vanguard Group, Inc. (Vanguard), is an investment adviser registered under the Investment Advisers Act of 1940, as amended (the Advisers Act). The list required by this Item 31 of officers and directors of Vanguard, together with any information as to any business, profession, vocation, or employment of a substantial nature engaged in by such officers and directors during the past two years, is incorporated herein by reference from Form ADV filed by Vanguard pursuant to the Advisers Act (SEC File No. 801- 11953).
Item 32. Principal Underwriters
|
(a) |
Vanguard Marketing Corporation, a wholly owned subsidiary of The Vanguard Group, Inc., is the principal
underwriter of each fund within the Vanguard group of investment companies, a family of over 200 funds. |
|
(b) |
The principal business address of each named director and officer of Vanguard Marketing Corporation is 100
Vanguard Boulevard, Malvern, PA 19355. |
|
Name |
Positions and Office with Underwriter |
Positions and Office with Funds |
|
Matthew J. Benchener |
Vice President and Chief Executive Officer
Designee |
None |
|
Karin A. Risi |
Vice President |
None |
|
Thomas M. Rampulla |
Vice President |
None |
|
Michael Rollings |
Vice President |
Finance Director |
|
John E. Bisordi |
General Counsel and Vice President |
None |
|
Tara Buckley |
Vice President and Assistant Secretary |
None |
|
Matthew C. Brancato |
Vice President |
None |
|
Mortimer J. Buckley |
President |
Chief Executive Officer and President |
|
Beth Morales Singh |
Secretary |
None |
C-2
|
Name |
Positions and Office with Underwriter |
Positions and Office with Funds |
|
Erica Green |
Chief Compliance Officer |
None |
|
Sarah Green |
Anti-Money Laundering Officer |
None |
|
Nitin Tandon |
Chief Information Officer |
None |
|
Manish Nagar |
Chief Information Security Officer |
None |
|
Salvatore L. Pantalone |
Principal Financial Officer and Treasurer |
None |
|
Matthew Tretter |
Principal Operations Officer |
None |
|
Danielle Corey |
Annuity and Insurance Officer |
None |
|
Jeff Seglem |
Annuity and Insurance Officer |
None |
|
Barbara Bock |
Controller |
None |
|
Jason Botzler |
Vice President |
None |
|
Jon Cleborne |
Vice President |
None |
|
Kaitlyn Holmes |
Vice President |
None |
|
Andrew Kadjeski |
Vice President |
None |
|
Amy M. Laursen |
Vice President |
None |
|
Paul M. Jakubowski |
Vice President |
None |
|
John James |
Vice President |
None |
|
James D. Martielli |
Vice President |
None |
|
Armond E. Mosley |
Vice President |
None |
|
David Petty |
Vice President |
None |
|
David MacBride |
Vice President |
None |
|
Massy Williams |
Vice President |
None |
|
Jacob Buttery |
Assistant Secretary |
None |
|
Janelle McDonald |
Vice President |
None |
|
Parks Strobridge |
Vice President |
None |
|
(c) |
Not applicable. |
Item 33. Location of Accounts and Records
The books, accounts, and other documents required to be maintained by Section 31(a) of the Investment Company Act of 1940, as amended, and the rules promulgated thereunder will be maintained at the offices of the Registrant, 100 Vanguard Boulevard, Malvern, PA 19355; the Registrant’s Transfer Agent, The Vanguard Group, Inc., 100 Vanguard Boulevard, Malvern, PA 19355; and the Registrant’s Custodians, The Bank of New York Mellon, 240 Greenwich Street, New York, NY 10286, and JPMorgan Chase Bank, 383 Madison Avenue, New York, NY 10179, and State Street Bank and Trust Company, One Congress Street, Suite 1, Boston, MA 02114 identified in this Registration Statement.
Item 34. Management Services
Other than as set forth in the section entitled “Management of the Funds” in Part B of this Registration Statement, the Registrant is not a party to any management-related service contract.
Item 35. Undertakings
Not applicable.
C-3
SIGNATURES
Pursuant to the requirements of the Securities Act of 1933 and the Investment Company Act of 1940, the Registrant hereby certifies that it meets all requirements for effectiveness of this Registration Statement pursuant to Rule 485(b) under the Securities Act of 1933 and has duly caused this Registration Statement to be signed on its behalf by the undersigned, thereunto duly authorized, in the Town of Valley Forge and the Commonwealth of Pennsylvania, on the 21st day of December, 2023.
Vanguard Scottsdale Funds
BY:
/s/ Mortimer J. Buckley*
Mortimer J. Buckley
Chairman and Chief Executive Officer
Chairman and Chief Executive Officer
Pursuant to the requirements of the Securities Act of 1933, this Post-Effective Amendment to the Registration Statement has been signed below by the following persons in the capacities and on the date indicated:
|
Signature |
Title |
Date |
|
/s/ Mortimer J. Buckley*
Mortimer J. Buckley |
Chairman and Chief Executive Officer |
December 21, 2023 |
|
/s/ Tara Bunch*
Tara Bunch |
Trustee |
December 21, 2023 |
|
/s/ Emerson U. Fullwood*
Emerson U. Fullwood |
Trustee |
December 21, 2023 |
|
/s/ F. Joseph Loughrey*
F. Joseph Loughrey |
Trustee |
December 21, 2023 |
|
/s/ Mark Loughridge*
Mark Loughridge |
Trustee |
December 21, 2023 |
|
/s/ Scott C. Malpass*
Scott C. Malpass |
Trustee |
December 21, 2023 |
|
/s/ Deanna Mulligan*
Deanna Mulligan |
Trustee |
December 21, 2023 |
|
/s/ André F. Perold*
André F. Perold |
Trustee |
December 21, 2023 |
|
/s/ Sarah Bloom Raskin*
Sarah Bloom Raskin |
Trustee |
December 21, 2023 |
|
/s/ Grant Reid*
Grant Reid |
Trustee |
December 21, 2023 |
|
/s/ David Thomas*
David Thomas |
Trustee |
December 21, 2023 |
|
/s/ Peter F. Volanakis*
Peter F. Volanakis |
Trustee |
December 21, 2023 |
|
Signature |
Title |
Date |
|
/s/ Christine Buchanan*
Christine Buchanan |
Chief Financial Officer |
December 21, 2023 |
*By: /s/ Anne E. Robinson
Anne E. Robinson, pursuant to a Power of Attorney filed on July 21, 2023 (see File Number 33-53683) and to a Power of Attorney filed on March 29, 2023 (see File Number 2-11444), Incorporated by Reference.
Anne E. Robinson, pursuant to a Power of Attorney filed on July 21, 2023 (see File Number 33-53683) and to a Power of Attorney filed on March 29, 2023 (see File Number 2-11444), Incorporated by Reference.