UNITED STATES
SECURITIES AND EXCHANGE COMMISSION
Washington, D.C. 20549
FORM N-CSR
CERTIFIED SHAREHOLDER REPORT
OF
REGISTERED MANAGEMENT INVESTMENT COMPANIES
| Investment Company Act file number: | 811-07803 | |
|
Name of Registrant: |
Vanguard Scottsdale Funds | |
|
Address of Registrant: |
P.O. Box 2600 | |
| Valley Forge, PA 19482 | ||
|
Name and address of agent for service: |
Anne E. Robinson, Esquire | |
| P.O. Box 876 | ||
| Valley Forge, PA 19482 | ||
|
Registrant’s telephone number, including area code: (610) 669-1000 | ||
|
Date of fiscal year end: August 31 |
||
|
Date of reporting period: September 1, 2017 – August 31, 2018 | ||
|
Item 1: Reports to Shareholders |
||
![]()
Vanguard’s Principles for Investing Success
We want to give you the best chance of investment success. These principles, grounded in Vanguard’s research and experience, can put you on the right path.
Goals. Create clear, appropriate investment goals.
Balance. Develop a suitable asset allocation using broadly diversified funds. Cost. Minimize cost.
Discipline. Maintain perspective and long-term discipline.
A single theme unites these principles: Focus on the things you can control.
We believe there is no wiser course for any investor.
| Contents | |
| Your Fund’s Performance at a Glance. | 1 |
| CEO’s Perspective. | 3 |
| Advisors’ Report. | 5 |
| Fund Profile. | 9 |
| Performance Summary. | 10 |
| Financial Statements. | 12 |
| Your Fund’s After-Tax Returns. | 26 |
| About Your Fund’s Expenses. | 27 |
| Glossary. | 29 |
Please note: The opinions expressed in this report are just that—informed opinions. They should not be considered promises
or advice. Also, please keep in mind that the information and opinions cover the period through the date on the front of this
report. Of course, the risks of investing in your fund are spelled out in the prospectus.
See the Glossary for definitions of investment terms used in this report.
Your Fund’s Performance at a Glance
• Amid a strong labor market and improving corporate profits, Vanguard Explorer Value Fund returned more than 22% for the 12 months ended August 31, 2018. The fund finished ahead of its benchmark, the Russell 2500 Value Index, and the average return of its peer small-capitalization value funds.
• Small-cap stocks outperformed their mid- and large-cap counterparts for the period, and growth stocks fared better than value stocks. All of the fund’s industry sectors recorded gains, seven of them in double digits.
• Based on relative performance, information technology, industrials, and real estate were the fund’s strongest sectors. Financials and materials detracted most from fund performance.
• Since its inception in 2010, the fund has posted an average annual return of more than 13%, outperforming both its benchmark and the average return of its peer funds.
| Total Returns: Fiscal Year Ended August 31, 2018 | |
| Total | |
| Returns | |
| Vanguard Explorer Value Fund | 22.10% |
| Russell 2500 Value Index | 17.43 |
| Small-Cap Value Funds Average | 19.05 |
| Small-Cap Value Funds Average: Derived from data provided by Lipper, a Thomson Reuters Company. |
| Total Returns: Inception Through August 31, 2018 | |
| Average | |
| Annual Return | |
| Explorer Value Fund (Returns since inception: 3/30/2010) | 13.38% |
| Russell 2500 Value Index | 12.09 |
| Small-Cap Value Funds Average | 11.24 |
| Small-Cap Value Funds Average: Derived from data provided by Lipper, a Thomson Reuters Company. |
The figures shown represent past performance, which is not a guarantee of future results. (Current
performance may be lower or higher than the performance data cited. For performance data current to the
most recent month-end, visit our website at vanguard.com/performance.) Note, too, that both investment
returns and principal value can fluctuate widely, so an investor’s shares, when sold, could be worth more
or less than their original cost.
1
| Expense Ratios | ||
| Your Fund Compared With Its Peer Group | ||
| Peer Group | ||
| Fund | Average | |
| Explorer Value Fund | 0.55% | 1.30% |
The fund expense ratio shown is from the prospectus dated December 21, 2017, and represents estimated costs for the current fiscal year.
For the fiscal year ended August 31, 2018, the fund’s expense ratio was 0.56%. The peer-group expense ratio is derived from data
provided by Lipper, a Thomson Reuters Company, and captures information through year-end 2017.
Peer group: Small-Cap Value Funds.
2
CEO’s Perspective

Tim Buckley
President and Chief Executive Officer
Dear Shareholder,
Over the years, I’ve found that prudent investors exhibit a common trait: discipline. No matter how the markets move or what new investing fad hits the headlines, those who stay focused on their goals and tune out the noise are set up for long-term success.
The prime gateway to investing is saving, and you don’t usually become a saver without a healthy dose of discipline. Savers make the decision to sock away part of their income, which means spending less and delaying gratification, no matter how difficult that may be.
Of course, disciplined investing extends beyond diligent saving. The financial markets, in the short term especially, are unpredictable; I have yet to meet the investor who can time them perfectly. It takes discipline to resist the urge to go all-in when markets are frothy or to retreat when things look bleak.
Staying put with your investments is one strategy for handling volatility. Another, rebalancing, requires even more discipline because it means steering your money away from strong performers and toward poorer performers.
Patience—a form of discipline—is also the friend of long-term investors. Higher returns are the potential reward for weathering the market’s turbulence and uncertainty.
3
We have been enjoying one of the longest bull markets in history, but it won’t continue forever. Prepare yourself now for how you will react when volatility comes back. Don’t panic. Don’t chase returns or look for answers outside the asset classes you trust. And be sure to rebalance periodically, even when there’s turmoil.
Whether you’re a master of self-control, get a boost from technology, or work with a professional advisor, know that discipline is necessary to get the most out of your investment portfolio. And know that Vanguard is with you for the entire ride.
Thank you for your continued loyalty.
Sincerely,

Mortimer J. Buckley
President and Chief Executive Officer
September 13, 2018
| Market Barometer | |||
| Average Annual Total Returns | |||
| Periods Ended August 31, 2018 | |||
| One Year | Three Years | Five Years | |
| Stocks | |||
| Russell 1000 Index (Large-caps) | 19.82% | 15.84% | 14.36% |
| Russell 2000 Index (Small-caps) | 25.45 | 16.11 | 13.00 |
| Russell 3000 Index (Broad U.S. market) | 20.25 | 15.86 | 14.25 |
| FTSE All-World ex US Index (International) | 3.51 | 8.31 | 5.82 |
| Bonds | |||
| Bloomberg Barclays U.S. Aggregate Bond Index | |||
| (Broad taxable market) | -1.05% | 1.76% | 2.49% |
| Bloomberg Barclays Municipal Bond Index | |||
| (Broad tax-exempt market) | 0.49 | 2.71 | 4.12 |
| FTSE Three-Month U. S. Treasury Bill Index | 1.49 | 0.74 | 0.44 |
| CPI | |||
| Consumer Price Index | 2.70% | 1.90% | 1.52% |
4
Advisors’ Report
For the fiscal year ended August 31, 2018, Vanguard Explorer Value Fund returned 22.10%, ahead of its benchmark, the Russell 2500 Value Index, and the average return of its small-capitalization value peers. Your fund is managed by two independent advisors, a strategy that enhances the fund’s diversification by providing exposure to distinct yet complementary investment approaches. It is not uncommon for different advisors to have different views about individual securities or the broader investment environment.
The advisors, the amount and percentage of fund assets each manages, and brief descriptions of their investment strategies are presented in the table below. The advisors have also prepared a discussion of the investment environment that existed during the 12 months and of how their portfolio positioning reflects this assessment. (Please note that the Frontier discussion refers to industry sectors as defined by Russell classifications, rather than by the Global Industry Classification Standard used elsewhere in this report.) These comments were prepared on September 21, 2018.
| Vanguard Explorer Value Fund Investment Advisors | |||
| Fund Assets Managed | |||
| Investment Advisor | % | $ Million | Investment Strategy |
| Frontier Capital Management | 48 | 370 | The advisor selects stocks by identifying |
| Co., LLC | companies it believes are underpriced relative | ||
| to their long-term value. These companies are | |||
| generally inexpensive and have low | |||
| price-to-book and price-to-earnings ratios. | |||
| Cardinal Capital Management, | 48 | 367 | The advisor seeks stocks that are able to |
| L.L.C. | generate excess cash flow and reinvest the | ||
| cash to increase shareholder value. | |||
| Cash Investments | 4 | 31 | These short-term reserves are invested by |
| Vanguard in equity index products to simulate | |||
| investment in stocks. Each advisor may also | |||
| maintain a modest cash position. | |||
5
Frontier Capital Management Co., LLC
Portfolio Managers:
Thomas W. Duncan, Jr.,
Executive Vice President
William A. Teichner, CFA,
Executive Vice President
Strong stock selection, which more than offset slightly negative sector selection, boosted returns for our portfolio during the 12-month period ended August 31, 2018. Returns relative to the benchmark were driven by holdings in consumer discretionary, technology, and energy.
The portfolio’s ten biggest contributors added, on average, approximately 105 basis points each to absolute performance. (A basis point is one one-hundredth of a percentage point.) These stocks were spread over six sectors and represented three consumer discretionary firms, two holdings each from financial services and producer durables, and one position each from energy, health care, and technology. The consumer discretionary stocks were a clothing retailer, an entry-level home builder, and a provider of online education.
The top contributor was Boot Barn, a retailer with more than 230 stores in 31 states that focuses on Western and work-related footwear and apparel. The stock added approximately 150 basis points to performance. Boot Barn met or exceeded consensus revenue and earnings expectations in each quarter during the period. Store openings, along with sales growth from existing stores and the firm’s e-commerce sites, drove overall revenues. The company was also helped by improved market conditions in Texas and other oil- and gas-producing states where it sells work boots and apparel. Operating profitability expanded from improved merchandise margins and the leveraging of the firm’s fixed expenses. In August, management raised its earnings outlook for the company’s fiscal year ending March 2019.
The portfolio’s ten largest detractors trimmed, on average, approximately 20 basis points each from performance. These stocks were spread over six sectors and represented three technology companies, two holdings each from financial services and producer durables, and one position each from health care, materials and processing, and consumer discretionary. The technology companies were a firm that delivers internet connectivity to airline passengers, a manufacturer of equipment used to produce semiconductors,
6
and a provider of outsourced manufacturing services used to make a wide variety of products, such as smartphones, wearable electronics, and medical devices.
The largest detractor was Lannett, a marketer of generic pharmaceuticals. The stock hindered performance by approximately 40 basis points despite the company’s reporting better-than-expected earnings during the period we owned the stock. The shares declined after Lannett lost a major contract to market Levothyroxine sodium tablets, which are widely used to treat thyroid hormone deficiency. This was Lannett’s top-selling drug, accounting for 37% of total company sales in fiscal 2018. We sold the stock given our concerns about the company’s significantly reduced expected profitability without this drug.
On a positive note, the drug’s manufacturer chose Amneal Pharmaceuticals, another holding of ours, to market the drug under a ten-year agreement.
During the period, we bought eight new stocks and exited 14 positions. The purchases were spread across seven sectors; the sales were across six. The net effect was an increase in energy and a reduction in technology, financial services, materials and processing, consumer discretionary, health care, and producer durables. As is usual for the portfolio, the changes were related to company-specific reasons rather than sector positioning.
Cardinal Capital Management, L.L.C.
Portfolio Managers:
Eugene Fox III, Managing Partner
Robert B. Kirkpatrick, CFA,
Managing Partner
Rachel D. Matthews, Partner
Robert Fields, Partner
During the 12-month period ended August 31, 2018, investor behavior was generally consistent with an optimistic view of the U.S. economy, primarily in response to the passage of the Tax Cut and Jobs Act. Small-cap stocks were in favor as investors sought to reduce risk from the Trump administration’s imposition of tariffs on imported goods, which tend to affect larger companies that have more operations outside the United States.
Investments in the information technology, industrial, and health care sectors contributed most to Cardinal’s relative performance during the period. In the information technology sector, shares of IAC/InterActiveCorp rose on strong results and price appreciation from the company’s publicly traded subsidiaries, Match Group and ANGI Homeservices. In industrials, shares of KAR Auction Services benefited from solid results and the company’s unexpected decision to spin off its very attractive salvage auction business.
7
In the health care sector, shares of Ligand Pharmaceuticals rose on strong results as its high-margin royalty revenues continued to ramp up with increasing sales of key licensed products. Management also raised fiscal year 2018 guidance materially after a licensee of Ligand’s OmniAb products prepaid $47 million in milestone payments to restructure its agreement.
The primary detractors from relative performance were Cardinal’s investments in the materials and energy sectors.
Cardinal’s near-term outlook for equities is cautious as valuations are full, the economic cycle is extended, monetary policy is tightening, and the imposition of tariffs could slow the economy and boost inflation. Nonetheless, the U.S. economy is growing at a solid pace and the U.S. corporate tax cut’s benefit is only beginning to be felt.
The prospects for domestic small-cap stocks appear better than for large-caps as the stronger U.S. dollar is less of a headwind for small-caps and the impact of tariffs is less consequential. However, if trade issues are favorably resolved or if the U.S. economy starts to slow, small-cap stocks would likely underperform. In an environment of heightened uncertainty, Cardinal continues to prefer stocks for which investment success is based on company-specific prospects and depends less on the macroeconomic outlook.
The strong mergers and acquisitions market, increased share repurchases from repatriated cash, and the lower corporate tax rate all support equity valuations. Private equity and activist funds continue to unlock value by improving operational performance, divesting noncore assets, and selling companies. These activities have been, and should remain, a source of alpha in the portfolio. Cardinal is optimistic that portfolio companies will continue to redeploy free cash flow through share repurchases, dividends, and opportunistic acquisitions, which should bode well for future value creation.
8
Explorer Value Fund
Fund Profile
As of August 31, 2018
| Portfolio Characteristics | |||
| Russell | DJ | ||
| 2500 | U.S. Total | ||
| Value | Market | ||
| Fund | Index | FA Index | |
| Number of Stocks | 111 | 1,708 | 3,745 |
| Median Market Cap | $3.5B | $4.5B | $71.0B |
| Price/Earnings Ratio | 16.4x | 16.7x | 21.0x |
| Price/Book Ratio | 2.0x | 1.7x | 3.1x |
| Return on Equity | 8.4% | 8.3% | 15.0% |
| Earnings Growth | |||
| Rate | 10.6% | 5.6% | 8.4% |
| Dividend Yield | 1.6% | 2.0% | 1.7% |
| Foreign Holdings | 1.4% | 0% | 0% |
| Turnover Rate | 31% | — | — |
| Ticker Symbol | VEVFX | — | — |
| Expense Ratio1 | 0.55% | — | — |
| 30-Day SEC Yield | 1.18% | — | — |
| Short-Term Reserves | 3.8% | — | — |
| Sector Diversification (% of equity exposure) | |||
| Russell | DJ | ||
| 2500 | U.S. Total | ||
| Value | Market | ||
| Fund | Index | FA Index | |
| Consumer Discretionary | 9.7% | 10.8% | 13.1% |
| Consumer Staples | 3.9 | 3.3 | 6.0 |
| Energy | 6.1 | 6.9 | 5.6 |
| Financials | 21.3 | 22.9 | 14.2 |
| Health Care | 4.3 | 5.4 | 14.3 |
| Industrials | 17.7 | 13.8 | 10.3 |
| Information Technology | 15.3 | 9.4 | 25.3 |
| Materials | 9.4 | 6.1 | 2.9 |
| Real Estate | 9.5 | 15.0 | 3.7 |
| Telecommunication | |||
| Services | 0.0 | 0.4 | 1.8 |
| Utilities | 2.8 | 6.0 | 2.8 |
Sector categories are based on the Global Industry Classification
Standard (“GICS”), except for the “Other” category (if applicable),
which includes securities that have not been provided a GICS
classification as of the effective reporting period.
| Volatility Measures | ||
| Russell | DJ | |
| 2500 | U.S. Total | |
| Value | Market | |
| Index | FA Index | |
| R-Squared | 0.94 | 0.69 |
| Beta | 1.00 | 1.03 |
| These measures show the degree and timing of the fund’s | ||
| fluctuations compared with the indexes over 36 months. | ||
| Ten Largest Holdings (% of total net assets) | ||
| IAC/InterActiveCorp | Internet Software & | |
| Services | 2.7% | |
| KAR Auction Services | Diversified Support | |
| Inc. | Services | 2.6 |
| PacWest Bancorp | Regional Banks | 2.4 |
| Genesee & Wyoming | ||
| Inc. | Railroads | 1.9 |
| FMC Corp. | Fertilizers & | |
| Agricultural | ||
| Chemicals | 1.9 | |
| ACI Worldwide Inc. | Application Software | 1.8 |
| Six Flags Entertainment | ||
| Corp. | Leisure Facilities | 1.7 |
| Columbia Banking | ||
| System Inc. | Regional Banks | 1.6 |
| Silicon Motion | ||
| Technology Corp. | Semiconductors | 1.4 |
| Argo Group International Property & Casualty | ||
| Holdings Ltd. | Insurance | 1.4 |
| Top Ten | 19.4% | |
| The holdings listed exclude any temporary cash investments and | ||
| equity index products. | ||
Investment Focus
1 The expense ratio shown is from the prospectus dated December 21, 2017, and represents estimated costs for the current fiscal year. For the
fiscal year ended August 31, 2018, the expense ratio was 0.56%.
9
Explorer Value Fund
Performance Summary
All of the returns in this report represent past performance, which is not a guarantee of future results that may be achieved by the fund. (Current performance may be lower or higher than the performance data cited. For performance data current to the most recent month-end, visit our website at vanguard.com/performance.) Note, too, that both investment returns and principal value can fluctuate widely, so an investor’s shares, when sold, could be worth more or less than their original cost. The returns shown do not reflect taxes that a shareholder would pay on fund distributions or on the sale of fund shares.
Cumulative Performance: March 30, 2010, Through August 31, 2018
Initial Investment of $10,000
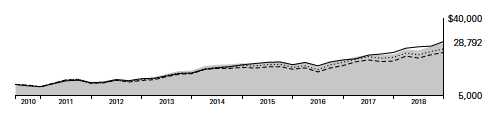
| Average Annual Total Returns | |||||
| Periods Ended August 31, 2018 | |||||
| Since | Final Value | ||||
| One | Five | Inception of a $10,000 | |||
| Year | Years | (3/30/2010) | Investment | ||
| Explorer Value Fund | 22.10% | 12.10% | 13.38% | $28,792 | |
| • • • • • • • • | Russell 2500 Value Index | 17.43 | 11.44 | 12.09 | 26,141 |
| – – – – | Small-Cap Value Funds Average | 19.05 | 10.46 | 11.24 | 24,526 |
| Dow Jones U.S. Total Stock Market | |||||
| Float Adjusted Index | 20.26 | 14.21 | 13.69 | 29,465 | |
| Small-Cap Value Funds Average: Derived from data provided by Lipper, a Thomson Reuters Company. | |||||
| "Since Inception" performance is calculated from the inception date for both the fund and its comparative standards. | |||||
See Financial Highlights for dividend and capital gains information.
10
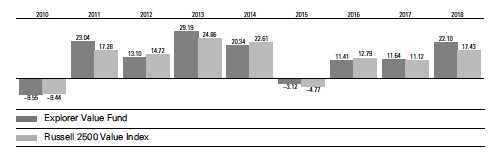
Explorer Value Fund
Fiscal-Year Total Returns (%): March 30, 2010, Through August 31, 2018
Average Annual Total Returns: Periods Ended June 30, 2018
This table presents returns through the latest calendar quarter—rather than through the end of the fiscal period.
Securities and Exchange Commission rules require that we provide this information.
| Inception | One | Five | Since | |
| Date | Year | Years | Inception | |
| Explorer Value Fund | 3/30/2010 | 15.51% | 11.52% | 12.94% |
| 11 |
Explorer Value Fund
Financial Statements
Statement of Net Assets
As of August 31, 2018
The fund reports a complete list of its holdings in regulatory filings four times in each fiscal year, at the quarter-ends. For the second and fourth fiscal quarters, the lists appear in the fund’s semiannual and annual reports to shareholders. For the first and third fiscal quarters, the fund files the lists with the Securities and Exchange Commission on Form N-Q. Shareholders can look up the fund’s Forms N-Q on the SEC’s website at sec.gov. Forms N-Q may also be reviewed and copied at the SEC’s Public Reference Room (see the back cover of this report for further information).
| Market | |||
| Value• | |||
| Shares | ($000) | ||
| Common Stocks (92.2%)1 | |||
| Consumer Discretionary (8.9%) | |||
| Six Flags Entertainment | |||
| Corp. | 187,739 | 12,682 | |
| * | Career Education Corp. | 555,408 | 8,859 |
| * | Modine Manufacturing | ||
| Co. | 400,560 | 6,749 | |
| * | Boot Barn Holdings Inc. | 209,882 | 6,282 |
| Lithia Motors Inc. | |||
| Class A | 72,346 | 6,251 | |
| *,^ | LGI Homes Inc. | 92,587 | 5,333 |
| Wendy’s Co. | 273,386 | 4,825 | |
| * | Vista Outdoor Inc. | 246,435 | 4,552 |
| Cooper Tire & Rubber | |||
| Co. | 100,898 | 2,911 | |
| * | Del Taco Restaurants | ||
| Inc. | 218,043 | 2,819 | |
| Nexstar Media Group | |||
| Inc. Class A | 32,586 | 2,672 | |
| *,^ | Lands’ End Inc. | 100,144 | 2,574 |
| Libbey Inc. | 211,949 | 2,083 | |
| 68,592 | |||
| Consumer Staples (3.6%) | |||
| Pinnacle Foods Inc. | 151,133 | 10,038 | |
| Spectrum Brands | |||
| Holdings Inc. | 99,795 | 8,667 | |
| * | Hostess Brands Inc. | ||
| Class A | 573,679 | 6,746 | |
| * | Central Garden & Pet | ||
| Co. Class A | 53,606 | 1,948 | |
| 27,399 | |||
| Energy (5.7%) | |||
| * | Parsley Energy Inc. | ||
| Class A | 321,868 | 8,938 | |
| SM Energy Co. | 194,170 | 5,842 | |
| * | Carrizo Oil & Gas Inc. | 195,211 | 4,728 |
| * | PDC Energy Inc. | 89,371 | 4,709 |
| * | Callon Petroleum Co. | 381,754 | 4,314 |
| * | Centennial Resource | ||
| Development Inc. | |||
| Class A | 214,794 | 4,139 | |
| * | QEP Resources Inc. | 349,208 | 3,482 |
| * | International Seaways | ||
| Inc. | 98,300 | 2,017 | |
| Viper Energy Partners | |||
| LP | 47,520 | 1,849 | |
| * | WPX Energy Inc. | 96,205 | 1,835 |
| * | Apergy Corp. | 35,335 | 1,598 |
| 43,451 | |||
| Financials (19.6%) | |||
| PacWest Bancorp | 365,229 | 18,440 | |
| Columbia Banking | |||
| System Inc. | 282,622 | 11,941 | |
| Argo Group International | |||
| Holdings Ltd. | 170,023 | 10,830 | |
| Popular Inc. | 207,029 | 10,422 | |
| BGC Partners Inc. | |||
| Class A | 814,547 | 10,117 | |
| * | First BanCorp | 1,087,451 | 9,515 |
| Starwood Property | |||
| Trust Inc. | 410,464 | 9,043 | |
| First Horizon National | |||
| Corp. | 471,445 | 8,684 | |
| Flushing Financial Corp. | 294,467 | 7,633 | |
| Washington Federal Inc. | 221,507 | 7,553 | |
| South State Corp. | 82,412 | 6,795 | |
| Renasant Corp. | 143,844 | 6,716 | |
| Affiliated Managers | |||
| Group Inc. | 39,626 | 5,789 | |
| First Merchants Corp. | 114,412 | 5,505 | |
| James River Group | |||
| Holdings Ltd. | 127,821 | 5,234 | |
| * | Bancorp Inc. | 465,227 | 4,666 |
| MB Financial Inc. | 93,178 | 4,515 | |
12
Explorer Value Fund
| Market | |||
| Value• | |||
| Shares | ($000) | ||
| * | Texas Capital | ||
| Bancshares Inc. | 45,530 | 4,048 | |
| WSFS Financial Corp. | 47,581 | 2,322 | |
| Aspen Insurance | |||
| Holdings Ltd. | 23,760 | 978 | |
| 150,746 | |||
| Health Care (4.0%) | |||
| * | Ligand | ||
| Pharmaceuticals Inc. | 35,615 | 9,249 | |
| * | Syneos Health Inc. | 148,251 | 7,390 |
| * | Myriad Genetics Inc. | 141,532 | 7,047 |
| * | Amneal | ||
| Pharmaceuticals Inc. | 176,546 | 4,078 | |
| * | Diplomat Pharmacy Inc. | 131,415 | 2,715 |
| 30,479 | |||
| Industrials (16.3%) | |||
| KAR Auction Services | |||
| Inc. | 313,111 | 19,629 | |
| * | Genesee & Wyoming | ||
| Inc. Class A | 168,767 | 14,833 | |
| * | Teledyne Technologies | ||
| Inc. | 41,686 | 9,890 | |
| * | Wesco Aircraft | ||
| Holdings Inc. | 603,228 | 7,329 | |
| Trinity Industries Inc. | 177,266 | 6,353 | |
| * | Beacon Roofing | ||
| Supply Inc. | 170,740 | 6,331 | |
| * | BMC Stock Holdings | ||
| Inc. | 242,735 | 5,462 | |
| Kaman Corp. | 83,677 | 5,457 | |
| Actuant Corp. Class A | 179,851 | 5,297 | |
| Interface Inc. Class A | 221,571 | 5,218 | |
| HNI Corp. | 117,511 | 5,182 | |
| BWX Technologies Inc. | 80,862 | 4,958 | |
| EnerSys | 58,625 | 4,865 | |
| Encore Wire Corp. | 91,809 | 4,613 | |
| * | MRC Global Inc. | 212,411 | 4,378 |
| * | Saia Inc. | 49,762 | 3,944 |
| * | WESCO International | ||
| Inc. | 59,814 | 3,658 | |
| ^ | Altra Industrial Motion | ||
| Corp. | 86,864 | 3,392 | |
| Briggs & Stratton Corp. | 123,055 | 2,481 | |
| * | DXP Enterprises Inc. | 39,735 | 1,823 |
| Steelcase Inc. Class A | 32,299 | 472 | |
| 125,565 | |||
| Information Technology (14.1%) | |||
| * | IAC/InterActiveCorp | 105,596 | 20,823 |
| * | ACI Worldwide Inc. | 475,986 | 13,523 |
| Silicon Motion | |||
| Technology Corp. ADR | 187,244 | 11,029 | |
| * | Conduent Inc. | 455,352 | 10,555 |
| * | Fabrinet | 145,992 | 6,989 |
| Cypress Semiconductor | |||
| Corp. | 404,579 | 6,963 | |
| * | Virtusa Corp. | 114,747 | 6,685 |
| * | Insight Enterprises Inc. | 108,549 | 5,985 |
| * | Semtech Corp. | 97,945 | 5,852 |
| Jabil Inc. | 179,319 | 5,301 | |
| * | Integrated Device | ||
| Technology Inc. | 122,045 | 5,186 | |
| j2 Global Inc. | 57,121 | 4,716 | |
| * | Itron Inc. | 36,538 | 2,426 |
| * | Infinera Corp. | 264,652 | 2,369 |
| 108,402 | |||
| Materials (8.6%) | |||
| FMC Corp. | 173,322 | 14,810 | |
| Silgan Holdings Inc. | 315,552 | 8,599 | |
| * | Kraton Corp. | 173,018 | 8,137 |
| Valvoline Inc. | 364,569 | 7,846 | |
| Ashland Global | |||
| Holdings Inc. | 76,641 | 6,453 | |
| * | Allegheny | ||
| Technologies Inc. | 222,097 | 6,003 | |
| Carpenter Technology | |||
| Corp. | 93,960 | 5,607 | |
| Innophos Holdings Inc. | 81,554 | 3,565 | |
| Bemis Co. Inc. | 64,020 | 3,155 | |
| Eagle Materials Inc. | 23,905 | 2,207 | |
| 66,382 | |||
| Real Estate (8.8%) | |||
| Medical Properties | |||
| Trust Inc. | 671,807 | 10,111 | |
| Gaming and Leisure | |||
| Properties Inc. | 261,664 | 9,365 | |
| Sunstone Hotel | |||
| Investors Inc. | 475,807 | 7,984 | |
| STAG Industrial Inc. | 233,056 | 6,728 | |
| Corporate Office | |||
| Properties Trust | 218,184 | 6,716 | |
| * | Howard Hughes Corp. | 47,926 | 6,248 |
| Cousins Properties Inc. | 660,958 | 6,180 | |
| Mack-Cali Realty Corp. | 280,497 | 6,126 | |
| Invitation Homes Inc. | 201,988 | 4,720 | |
| National Retail | |||
| Properties Inc. | 66,867 | 3,082 | |
| 67,260 | |||
| Utilities (2.6%) | |||
| Portland General | |||
| Electric Co. | 180,576 | 8,379 | |
| MDU Resources | |||
| Group Inc. | 209,848 | 5,853 | |
| Unitil Corp. | 110,216 | 5,571 | |
| 19,803 | |||
| Total Common Stocks | |||
| (Cost $542,216) | 708,079 | ||
13
Explorer Value Fund
| Market | |
| Value• | |
| Shares | ($000) |
| Temporary Cash Investments (8.0%)1 | |
| Money Market Fund (7.8%) | |
| 2,3 Vanguard Market | |
| Liquidity Fund, 2.153% 598,712 | 59,883 |
| Face | |
| Amount | |
| ($000) | |
| U. S. Government and Agency Obligations (0.2%) | |
| 4 United States | |
| Treasury Bill, | |
| 2.034%–2.078%, 11/15/18 1,600 | 1,594 |
| Total Temporary Cash Investments | |
| (Cost $61,461) | 61,477 |
| Total Investments (100.2%) | |
| (Cost $603,677) | 769,556 |
| Other Assets and Liabilities (-0.2%) | |
| Other Assets | 7,499 |
| Liabilities 3 | (9,173) |
| (1,674) | |
| Net Assets (100%) | |
| Applicable to 18,947,964 outstanding | |
| $.001 par value shares of beneficial | |
| interest (unlimited authorization) | 767,882 |
| Net Asset Value Per Share | $40.53 |
| Amount | |
| ($000) | |
| Statement of Assets and Liabilities | |
| Assets | |
| Investments in Securities, at Value | |
| Unaffiliated Issuers | 709,673 |
| Affiliated Issuers | 59,883 |
| Total Investments in Securities | 769,556 |
| Investment in Vanguard | 38 |
| Receivables for Investment | |
| Securities Sold | 4,535 |
| Receivables for Accrued Income | 867 |
| Receivables for Capital Shares Issued | 1,967 |
| Variation Margin Receivable— | |
| Futures Contracts | 92 |
| Total Assets | 777,055 |
| Liabilities | |
| Payables for Investment | |
| Securities Purchased | 4,940 |
| Collateral for Securities on Loan | 2,844 |
| Payables to Investment Advisor | 606 |
| Payables for Capital Shares | |
| Redeemed | 398 |
| Payables to Vanguard | 384 |
| Other Liabilities | 1 |
| Total Liabilities | 9,173 |
| Net Assets | 767,882 |
14
Explorer Value Fund
| At August 31, 2018, net assets consisted of: | |
| Amount | |
| ($000) | |
| Paid-in Capital | 561,490 |
| Undistributed Net Investment Income | 2,833 |
| Accumulated Net Realized Gains | 36,651 |
| Unrealized Appreciation (Depreciation) | |
| Investment Securities | 165,879 |
| Futures Contracts | 1,029 |
| Net Assets | 767,882 |
• See Note A in Notes to Financial Statements.
* Non-income-producing security.
^ Includes partial security positions on loan to broker-dealers.
The total value of securities on loan is $2,757,000.
1 The fund invests a portion of its cash reserves in equity
markets through the use of index futures contracts. After
giving effect to futures investments, the fund’s effective
common stock and temporary cash investment positions
represent 96.0% and 4.2%, respectively, of net assets.
2 Affiliated money market fund available only to Vanguard funds
and certain trusts and accounts managed by Vanguard. Rate
shown is the 7-day yield.
3 Includes $2,844,000 of collateral received for securities
on loan.
4 Securities with a value of $1,344,000 have been segregated
as initial margin for open futures contracts.
ADR—American Depositary Receipt.
| Derivative Financial Instruments Outstanding as of Period End | ||||
| Futures Contracts | ||||
| ($000) | ||||
| Value and | ||||
| Number of | Unrealized | |||
| Long (Short) | Notional | Appreciation | ||
| Expiration | Contracts | Amount | (Depreciation) | |
| Long Futures Contracts | ||||
| E-mini Russell 2000 Index | September 2018 | 338 | 29,416 | 1,029 |
See accompanying Notes, which are an integral part of the Financial Statements.
15
Explorer Value Fund
Statement of Operations
| Year Ended | |
| August31,2018 | |
| ($000) | |
| Investment Income | |
| Income | |
| Dividends | 9,569 |
| Interest1 | 827 |
| Securities Lending—Net | 91 |
| Total Income | 10,487 |
| Expenses | |
| Investment Advisory Fees—Note B | |
| Basic Fee | 2,198 |
| Performance Adjustment | 179 |
| The Vanguard Group—Note C | |
| Management and Administrative | 1,310 |
| Marketing and Distribution | 137 |
| Custodian Fees | 19 |
| Auditing Fees | 45 |
| Shareholders’ Reports and Proxy | 20 |
| Trustees’ Fees and Expenses | 1 |
| Total Expenses | 3,909 |
| Net Investment Income | 6,578 |
| Realized Net Gain (Loss) | |
| Investment Securities Sold1 | 40,521 |
| Futures Contracts | 3,898 |
| Realized Net Gain (Loss) | 44,419 |
| Change in Unrealized Appreciation (Depreciation) | |
| Investment Securities1 | 84,486 |
| Futures Contracts | 1,148 |
| Change in Unrealized Appreciation (Depreciation) | 85,634 |
| Net Increase (Decrease) in Net Assets Resulting from Operations | 136,631 |
1 Interest income, realized net gain (loss), and change in unrealized appreciation (depreciation) from an affiliated company of the fund
were $801,000, ($5,000), and $8,000, respectively. Purchases and sales are for temporary cash investment purposes.
See accompanying Notes, which are an integral part of the Financial Statements.
16
Explorer Value Fund
Statement of Changes in Net Assets
| Year Ended August 31, | ||
| 2018 | 2017 | |
| ($000) | ($000) | |
| Increase (Decrease) in Net Assets | ||
| Operations | ||
| Net Investment Income | 6,578 | 5,213 |
| Realized Net Gain (Loss) | 44,419 | 17,669 |
| Change in Unrealized Appreciation (Depreciation) | 85,634 | 27,148 |
| Net Increase (Decrease) in Net Assets Resulting from Operations | 136,631 | 50,030 |
| Distributions | ||
| Net Investment Income | (5,243) | (4,203) |
| Realized Capital Gain1 | (20,022) | (6,166) |
| Total Distributions | (25,265) | (10,369) |
| Capital Share Transactions | ||
| Issued | 149,222 | 295,734 |
| Issued in Lieu of Cash Distributions | 24,128 | 9,836 |
| Redeemed | (123,774) | (115,593) |
| Net Increase (Decrease) from Capital Share Transactions | 49,576 | 189,977 |
| Total Increase (Decrease) | 160,942 | 229,638 |
| Net Assets | ||
| Beginning of Period | 606,940 | 377,302 |
| End of Period2 | 767,882 | 606,940 |
1 Includes fiscal 2018 and 2017 short-term gain distributions totaling $7,489,000 and $345,000, respectively. Short-term gain
distributions are treated as ordinary income dividends for tax purposes.
2 Net Assets—End of Period includes undistributed (overdistributed) net investment income of $2,833,000 and $1,859,000.
See accompanying Notes, which are an integral part of the Financial Statements.
17
Explorer Value Fund
Financial Highlights
| For a Share Outstanding | Year Ended August 31, | ||||
| Throughout Each Period | 2018 | 2017 | 2016 | 2015 | 2014 |
| Net Asset Value, Beginning of Period | $34.45 | $31.55 | $30.09 | $32.97 | $29.39 |
| Investment Operations | |||||
| Net Investment Income | . 3551 | .3291 | .293 | .259 | .251 |
| Net Realized and Unrealized Gain (Loss) | |||||
| on Investments | 7.112 | 3.331 | 2.964 | (1.284) | 5.539 |
| Total from Investment Operations | 7.467 | 3.660 | 3.257 | (1.025) | 5.790 |
| Distributions | |||||
| Dividends from Net Investment Income | (. 288) | (. 308) | (. 237) | (. 272) | (.168) |
| Distributions from Realized Capital Gains | (1.099) | (.452) | (1.560) | (1.583) | (2.042) |
| Total Distributions | (1.387) | (.760) | (1.797) | (1.855) | (2.210) |
| Net Asset Value, End of Period | $40.53 | $34.45 | $31.55 | $30.09 | $32.97 |
| Total Return2 | 22.10% | 11.64% | 11.41% | -3.12% | 20.34% |
| Ratios/Supplemental Data | |||||
| Net Assets, End of Period (Millions) | $768 | $607 | $377 | $291 | $323 |
| Ratio of Total Expenses to Average Net Assets3 | 0.56% | 0.55% | 0.57% | 0.56% | 0.57% |
| Ratio of Net Investment Income to | |||||
| Average Net Assets | 0.95% | 0.98% | 1.03% | 0.78% | 0.83% |
| Portfolio Turnover Rate | 31% | 33% | 61% | 35% | 36% |
1 Calculated based on average shares outstanding.
2 Total returns do not include account service fees that may have applied in the periods shown. Fund prospectuses provide
information about any applicable account service fees.
3 Includes performance-based investment advisory fee increases (decreases) of 0.03%, (0.01%), (0.01%), (0.02%), and (0.02%).
See accompanying Notes, which are an integral part of the Financial Statements.
18
Explorer Value Fund
Notes to Financial Statements
Vanguard Explorer Value Fund is registered under the Investment Company Act of 1940 as an open-end investment company, or mutual fund.
A. The following significant accounting policies conform to generally accepted accounting principles for U.S. investment companies. The fund consistently follows such policies in preparing its financial statements.
1. Security Valuation: Securities are valued as of the close of trading on the New York Stock Exchange (generally 4 p.m., Eastern time) on the valuation date. Equity securities are valued at the latest quoted sales prices or official closing prices taken from the primary market in which each security trades; such securities not traded on the valuation date are valued at the mean of the latest quoted bid and asked prices. Securities for which market quotations are not readily available, or whose values have been materially affected by events occurring before the fund’s pricing time but after the close of the securities’ primary markets, are valued by methods deemed by the board of trustees to represent fair value. Investments in Vanguard Market Liquidity Fund are valued at that fund’s net asset value. Temporary cash investments are valued using the latest bid prices or using valuations based on a matrix system (which considers such factors as security prices, yields, maturities, and ratings), both as furnished by independent pricing services.
2. Futures Contracts: The fund uses index futures contracts to a limited extent, with the objective of maintaining full exposure to the stock market while maintaining liquidity. The fund may purchase or sell futures contracts to achieve a desired level of investment, whether to accommodate portfolio turnover or cash flows from capital share transactions. The primary risks associated with the use of futures contracts are imperfect correlation between changes in market values of stocks held by the fund and the prices of futures contracts, and the possibility of an illiquid market. Counterparty risk involving futures is mitigated because a regulated clearinghouse is the counterparty instead of the clearing broker. To further mitigate counterparty risk, the fund trades futures contracts on an exchange, monitors the financial strength of its clearing brokers and clearinghouse, and has entered into clearing agreements with its clearing brokers. The clearinghouse imposes initial margin requirements to secure the fund’s performance and requires daily settlement of variation margin representing changes in the market value of each contract. Any assets pledged as initial margin for open contracts are noted in the Statement of Net Assets.
Futures contracts are valued at their quoted daily settlement prices. The notional amounts of the contracts are not recorded in the Statement of Net Assets. Fluctuations in the value of the contracts are recorded in the Statement of Assets and Liabilities as an asset (liability) and in the Statement of Operations as unrealized appreciation (depreciation) until the contracts are closed, when they are recorded as realized futures gains (losses).
During the year ended August 31, 2018, the fund’s average investments in long and short futures contracts represented 3% and 0% of net assets, respectively, based on the average of the notional amounts at each quarter-end during the period.
3. Federal Income Taxes: The fund intends to continue to qualify as a regulated investment company and distribute all of its taxable income. Management has analyzed the fund’s tax positions taken for all open federal income tax years (August 31, 2015–2018), and has concluded that no provision for federal income tax is required in the fund’s financial statements.
4. Distributions: Distributions to shareholders are recorded on the ex-dividend date. Distributions are determined on a tax basis and may differ from net investment income and realized capital gains for financial reporting purposes.
19
Explorer Value Fund
5. Securities Lending: To earn additional income, the fund lends its securities to qualified institutional borrowers. Security loans are subject to termination by the fund at any time, and are required to be secured at all times by collateral in an amount at least equal to the market value of securities loaned. Daily market fluctuations could cause the value of loaned securities to be more or less than the value of the collateral received. When this occurs, the collateral is adjusted and settled before the opening of the market on the next business day. The fund further mitigates its counterparty risk by entering into securities lending transactions only with a diverse group of prequalified counterparties, monitoring their financial strength, and entering into master securities lending agreements with its counterparties. The master securities lending agreements provide that, in the event of a counterparty’s default (including bankruptcy), the fund may terminate any loans with that borrower, determine the net amount owed, and sell or retain the collateral up to the net amount owed to the fund; however, such actions may be subject to legal proceedings. While collateral mitigates counterparty risk, in the event of a default, the fund may experience delays and costs in recovering the securities loaned. The fund invests cash collateral received in Vanguard Market Liquidity Fund, and records a liability in the Statement of Assets and Liabilities for the return of the collateral, during the period the securities are on loan. Securities lending income represents fees charged to borrowers plus income earned on invested cash collateral, less expenses associated with the loan. During the term of the loan, the fund is entitled to all distributions made on or in respect of the loaned securities.
6. Credit Facility: The fund and certain other funds managed by The Vanguard Group (“Vanguard”) participate in a $3.1 billion committed credit facility provided by a syndicate of lenders pursuant to a credit agreement that may be renewed annually; each fund is individually liable for its borrowings, if any, under the credit facility. Borrowings may be utilized for temporary and emergency purposes, and are subject to the fund’s regulatory and contractual borrowing restrictions. The participating funds are charged administrative fees and an annual commitment fee of 0.10% of the undrawn amount of the facility; these fees are allocated to the funds based on a method approved by the fund’s board of trustees and included in Management and Administrative expenses on the fund’s Statement of Operations. Any borrowings under this facility bear interest at a rate based upon the higher of the one-month London Interbank Offered Rate, federal funds effective rate, or overnight bank funding rate plus an agreed-upon spread.
The fund had no borrowings outstanding at August 31, 2018, or at any time during the period then ended.
7. Other: Dividend income is recorded on the ex-dividend date. Interest income includes income distributions received from Vanguard Market Liquidity Fund and is accrued daily. Premiums and discounts on debt securities purchased are amortized and accreted, respectively, to interest income over the lives of the respective securities. Security transactions are accounted for on the date securities are bought or sold. Costs used to determine realized gains (losses) on the sale of investment securities are those of the specific securities sold.
B. The investment advisory firms Frontier Capital Management Co., LLC, and Cardinal Capital Management, LLC, each provide investment advisory services to a portion of the fund for a fee calculated at an annual percentage rate of average net assets managed by the advisor. The basic fee of Frontier Capital Management Co., LLC, is subject to quarterly adjustments based on performance relative to the Russell 2000 Value Index for the preceding three years. The basic fee of Cardinal Capital Management, L.L.C., is subject to quarterly adjustments based on performance relative to the Russell 3000 Value Custom Index for the preceding three years.
20
Explorer Value Fund
Vanguard manages the cash reserves of the fund as described below.
For the year ended August 31, 2018, the aggregate investment advisory fee represented an effective annual basic rate of 0.32% of the fund’s average net assets, before an increase of $179,000 (0.03%) based on performance.
C. In accordance with the terms of a Funds’ Service Agreement (the “FSA”) between Vanguard and the fund, Vanguard furnishes to the fund corporate management, administrative, marketing, distribution, and cash management services at Vanguard’s cost of operations (as defined by the FSA). These costs of operations are allocated to the fund based on methods and guidelines approved by the board of trustees. Vanguard does not require reimbursement in the current period for certain costs of operations (such as deferred compensation/benefits and risk/insurance costs); the fund’s liability for these costs of operations is included in Payables to Vanguard on the Statement of Assets and Liabilities. All other costs of operations payable to Vanguard are generally settled twice a month.
Upon the request of Vanguard, the fund may invest up to 0.40% of its net assets as capital in Vanguard. At August 31, 2018, the fund had contributed to Vanguard capital in the amount of $38,000, representing 0.01% of the fund’s net assets and 0.02% of Vanguard’s capitalization. The fund’s trustees and officers are also directors and employees, respectively, of Vanguard.
D. Various inputs may be used to determine the value of the fund’s investments. These inputs are summarized in three broad levels for financial statement purposes. The inputs or methodologies used to value securities are not necessarily an indication of the risk associated with investing in those securities.
Level 1—Quoted prices in active markets for identical securities.
Level 2—Other significant observable inputs (including quoted prices for similar securities, interest rates, prepayment speeds, credit risk, etc.).
Level 3—Significant unobservable inputs (including the fund’s own assumptions used to determine
the fair value of investments). Any investments valued with significant unobservable inputs are noted
on the Statement of Net Assets.
The following table summarizes the market value of the fund’s investments as of August 31, 2018, based on the inputs used to value them:
| Level 1 | Level 2 | Level 3 | |
| Investments | ($000) | ($000) | ($000) |
| Common Stocks | 708,079 | — | — |
| Temporary Cash Investments | 59,883 | 1,594 | — |
| Futures Contracts—Assets1 | 92 | — | — |
| Total | 768,054 | 1,594 | — |
| 1 Represents variation margin on the last day of the reporting period. |
21
Explorer Value Fund
E. Permanent differences are reclassified among capital accounts in the financial statements to reflect their tax character. These reclassifications have no effect on net assets or net asset value per share. As of period end, the following permanent differences primarily attributable to the accounting for distributions in connection with fund share redemptions were reclassified to the following accounts:
| Amount | |
| ($000) | |
| Paid-in capital | 2,898 |
| Undistributed (Overdistributed) net investment income | (361) |
| Accumulated net realized gains (losses) | (2,537) |
Temporary differences between book-basis and tax-basis components of accumulated net earnings (losses) arise when certain items of income, gain, or loss are recognized in different periods for financial statement and tax purposes; these differences will reverse at some time in the future. The differences are primarily related to the tax deferral of losses on wash sales and the realization of unrealized gains or losses on certain futures contracts. As of period end, the tax components of accumulated net earnings (losses) are detailed in the table as follows:
| Amount | |
| ($000) | |
| Undistributed ordinary income | 12,621 |
| Undistributed long-term gains | 28,205 |
| Capital Loss Carryforwards (Non-Expiring) | — |
| Net unrealized gains (losses) | 165,879 |
As of August 31, 2018, gross unrealized appreciation and depreciation for investments and derivatives based on cost for U.S. federal income tax purposes were as follows:
| Amount | |
| ($000) | |
| Tax cost | 603,677 |
| Gross unrealized appreciation | 177,398 |
| Gross unrealized depreciation | (11,519) |
| Net unrealized appreciation (depreciation) | 165,879 |
22
Explorer Value Fund
F. During the year ended August 31, 2018, the fund purchased $210,873,000 of investment securities and sold $198,210,000 of investment securities, other than temporary cash investments.
G. Capital shares issued and redeemed were:
| Year Ended August 31, | ||
| 2018 | 2017 | |
| Shares | Shares | |
| (000) | (000) | |
| Issued | 3,985 | 8,790 |
| Issued in Lieu of Cash Distributions | 659 | 290 |
| Redeemed | (3,313) | (3,422) |
| Net Increase (Decrease) in Shares Outstanding | 1,331 | 5,658 |
H. Management has determined that no events or transactions occurred subsequent to August 31, 2018, that would require recognition or disclosure in these financial statements.
23
Report of Independent Registered
Public Accounting Firm
To the Board of Trustees of Vanguard Scottsdale Funds and Shareholders of Vanguard Explorer Value Fund
Opinion on the Financial Statements
We have audited the accompanying statement of net assets and statement of assets and liabilities of Vanguard Explorer Value Fund (one of the funds constituting Vanguard Scottsdale Funds, referred to hereafter as the “Fund”) as of August 31, 2018, the related statement of operations for the year ended August 31, 2018, the statement of changes in net assets for each of the two years in the period ended August 31, 2018, including the related notes, and the financial highlights for each of the five years in the period ended August 31, 2018 (collectively referred to as the “financial statements”). In our opinion, the financial statements present fairly, in all material respects, the financial position of the Fund as of August 31, 2018, the results of its operations for the year then ended, the changes in its net assets for each of the two years in the period ended August 31, 2018 and the financial highlights for each of the five years in the period ended August 31, 2018 in conformity with accounting principles generally accepted in the United States of America.
Basis for Opinion
These financial statements are the responsibility of the Fund’s management. Our responsibility is to express an opinion on the Fund’s financial statements based on our audits. We are a public accounting firm registered with the Public Company Accounting Oversight Board (United States) (“PCAOB”) and are required to be independent with respect to the Fund in accordance with the U.S. federal securities laws and the applicable rules and regulations of the Securities and Exchange Commission and the PCAOB.
We conducted our audits of these financial statements in accordance with the standards of the PCAOB. Those standards require that we plan and perform the audit to obtain reasonable assurance about whether the financial statements are free of material misstatement, whether due to error or fraud.
Our audits included performing procedures to assess the risks of material misstatement of the financial statements, whether due to error or fraud, and performing procedures that respond to those risks. Such procedures included examining, on a test basis, evidence regarding the amounts and disclosures in the financial statements. Our audits also included evaluating the accounting principles used and significant estimates made by management, as well as evaluating the overall presentation of the financial statements. Our procedures included confirmation of securities owned as of August 31, 2018 by correspondence with the custodians and brokers and by agreement to the underlying ownership records of the transfer agent; when replies were not received from brokers, we performed other auditing procedures. We believe that our audits provide a reasonable basis for our opinion.
/s/PricewaterhouseCoopers LLP
Philadelphia, Pennsylvania
October 18, 2018
We have served as the auditor of one or more investment companies in The Vanguard Group of
Funds since 1975.
24

Special 2018 tax information (unaudited) for Vanguard Explorer Value Fund
This information for the fiscal year ended August 31, 2018, is included pursuant to provisions of the
Internal Revenue Code.
The fund distributed $14,428,000 as capital gain dividends (20% rate gain distributions) to shareholders
during the fiscal year.
For nonresident alien shareholders, 100% of short-term capital gain dividends distributed by the fund
are qualified short-term capital gains.
The fund distributed $12,732,000 of qualified dividend income to shareholders during the fiscal year.
For corporate shareholders, 34.9% of investment income (dividend income plus short-term gains,
if any) qualifies for the dividends-received deduction.
25
Your Fund’s After-Tax Returns
This table presents returns for your fund both before and after taxes. The after-tax returns are shown in two ways: (1) assuming that an investor owned the fund during the entire period and paid taxes on the fund’s distributions, and (2) assuming that an investor paid taxes on the fund’s distributions and sold all shares at the end of each period.
Calculations are based on the highest individual federal income tax and capital gains tax rates in effect at the times of the distributions and the hypothetical sales. State and local taxes were not considered. After-tax returns reflect any qualified dividend income, using actual prior-year figures and estimates for 2018. (In the example, returns after the sale of fund shares may be higher than those assuming no sale. This occurs when the sale would have produced a capital loss. The calculation assumes that the investor received a tax deduction for the loss.)
Please note that your actual after-tax returns will depend on your tax situation and may differ from those shown. Also note that if you own the fund in a tax-deferred account, such as an individual retirement account or a 401(k) plan, this information does not apply to you. Such accounts are not subject to current taxes.
Finally, keep in mind that a fund’s performance—whether before or after taxes—does not guarantee future results.
| Average Annual Total Returns: Explorer Value Fund | |||
| Periods Ended August 31, 2018 | |||
| Since | |||
| One | Five | Inception | |
| Year | Years | (3/30/2010) | |
| Returns Before Taxes | 22.10% | 12.10% | 13.38% |
| Returns After Taxes on Distributions | 20.79 | 10.59 | 12.15 |
| Returns After Taxes on Distributions and Sale of Fund Shares | 13.46 | 9.14 | 10.62 |
26
About Your Fund’s Expenses
As a shareholder of the fund, you incur ongoing costs, which include costs for portfolio management, administrative services, and shareholder reports (like this one), among others. Operating expenses, which are deducted from a fund’s gross income, directly reduce the investment return of the fund.
A fund’s expenses are expressed as a percentage of its average net assets. This figure is known as the expense ratio. The following examples are intended to help you understand the ongoing costs (in dollars) of investing in your fund and to compare these costs with those of other mutual funds. The examples are based on an investment of $1,000 made at the beginning of the period shown and held for the entire period.
The accompanying table illustrates your fund’s costs in two ways:
• Based on actual fund return. This section helps you to estimate the actual expenses that you paid over the period. The ”Ending Account Value“ shown is derived from the fund‘s actual return, and the third column shows the dollar amount that would have been paid by an investor who started with $1,000 in the fund. You may use the information here, together with the amount you invested, to estimate the expenses that you paid over the period.
To do so, simply divide your account value by $1,000 (for example, an $8,600 account value divided by $1,000 = 8.6), then multiply the result by the number given for your fund under the heading ”Expenses Paid During Period.“
• Based on hypothetical 5% yearly return. This section is intended to help you compare your fund‘s costs with those of other mutual funds. It assumes that the fund had a yearly return of 5% before expenses, but that the expense ratio is unchanged. In this case—because the return used is not the fund’s actual return—the results do not apply to your investment. The example is useful in making comparisons because the Securities and Exchange Commission requires all mutual funds to calculate expenses based on a 5% return. You can assess your fund’s costs by comparing this hypothetical example with the hypothetical examples that appear in shareholder reports of other funds.
Note that the expenses shown in the table are meant to highlight and help you compare ongoing costs only and do not reflect transaction costs incurred by the fund for buying and selling securities. Further, the expenses do not include any purchase, redemption, or account service fees described in the fund prospectus. If such fees were applied to your account, your costs would be higher. Your fund does not carry a “sales load.”
The calculations assume no shares were bought or sold during the period. Your actual costs may have been higher or lower, depending on the amount of your investment and the timing of any purchases or redemptions.
You can find more information about the fund’s expenses, including annual expense ratios, in the Financial Statements section of this report. For additional information on operating expenses and other shareholder costs, please refer to your fund’s current prospectus.
27
| Six Months Ended August 31, 2018 | |||
| Beginning | Ending | Expenses | |
| Account Value | Account Value | Paid During | |
| Explorer Value Fund | 2/28/2018 | 8/31/2018 | Period |
| Based on Actual Fund Return | $1,000.00 | $1,134.66 | $2.91 |
| Based on Hypothetical 5% Yearly Return | 1,000.00 | 1,022.48 | 2.75 |
The calculations are based on expenses incurred in the most recent six-month period. The fund’s annualized six-month expense ratio for
that period is 0.54%. The dollar amounts shown as “Expenses Paid” are equal to the annualized expense ratio multiplied by the average
account value over the period, multiplied by the number of days in the most recent six-month period, then divided by the number of days in
the most recent 12-month period (184/365).
28
Glossary
30-Day SEC Yield. A fund’s 30-day SEC yield is derived using a formula specified by the U.S. Securities and Exchange Commission. Under the formula, data related to the fund’s security holdings in the previous 30 days are used to calculate the fund’s hypothetical net income for that period, which is then annualized and divided by the fund’s estimated average net assets over the calculation period. For the purposes of this calculation, a security’s income is based on its current market yield to maturity (for bonds), its actual income (for asset-backed securities), or its projected dividend yield (for stocks). Because the SEC yield represents hypothetical annualized income, it will differ—at times significantly—from the fund’s actual experience. As a result, the fund’s income distributions may be higher or lower than implied by the SEC yield.
Beta. A measure of the magnitude of a fund’s past share-price fluctuations in relation to the ups and downs of a given market index. The index is assigned a beta of 1.00. Compared with a given index, a fund with a beta of 1.20 typically would have seen its share price rise or fall by 12% when the index rose or fell by 10%. For this report, beta is based on returns over the past 36 months for both the fund and the index. Note that a fund’s beta should be reviewed in conjunction with its R-squared (see definition). The lower the R-squared, the less correlation there is between the fund and the index, and the less reliable beta is as an indicator of volatility.
Dividend Yield. Dividend income earned by stocks, expressed as a percentage of the aggregate market value (or of net asset value, for a fund). The yield is determined by dividing the amount of the annual dividends by the aggregate value (or net asset value) at the end of the period. For a fund, the dividend yield is based solely on stock holdings and does not include any income produced by other investments.
Earnings Growth Rate. The average annual rate of growth in earnings over the past five years for the stocks now in a fund.
Equity Exposure. A measure that reflects a fund’s investments in stocks and stock futures. Any holdings in short-term reserves are excluded.
Expense Ratio. A fund’s total annual operating expenses expressed as a percentage of the fund’s average net assets. The expense ratio includes management and administrative expenses, but does not include the transaction costs of buying and selling portfolio securities.
Foreign Holdings. The percentage of a fund represented by securities or depositary receipts of companies based outside the United States.
Inception Date. The date on which the assets of a fund (or one of its share classes) are first invested in accordance with the fund’s investment objective. For funds with a subscription period, the inception date is the day after that period ends. Investment performance is measured from the inception date.
Median Market Cap. An indicator of the size of companies in which a fund invests; the midpoint of market capitalization (market price x shares outstanding) of a fund’s stocks, weighted by the proportion of the fund’s assets invested in each stock. Stocks representing half of the fund’s assets have market capitalizations above the median, and the rest are below it.
Price/Book Ratio. The share price of a stock divided by its net worth, or book value, per share.
For a fund, the weighted average price/book ratio of the stocks it holds.
29
Price/Earnings Ratio. The ratio of a stock’s current price to its per-share earnings over the past year. For a fund, the weighted average P/E of the stocks it holds. P/E is an indicator of market expectations about corporate prospects; the higher the P/E, the greater the expectations for a company’s future growth.
R-Squared. A measure of how much of a fund’s past returns can be explained by the returns from the market in general, as measured by a given index. If a fund’s total returns were precisely synchronized with an index’s returns, its R-squared would be 1.00. If the fund’s returns bore no relationship to the index’s returns, its R-squared would be 0. For this report, R-squared is based on returns over the past 36 months for both the fund and the index.
Return on Equity. The annual average rate of return generated by a company during the past five years for each dollar of shareholder’s equity (net income divided by shareholder’s equity). For a fund, the weighted average return on equity for the companies whose stocks it holds.
Short-Term Reserves. The percentage of a fund invested in highly liquid, short-term securities that can be readily converted to cash.
Turnover Rate. An indication of the fund’s trading activity. Funds with high turnover rates incur higher transaction costs and may be more likely to distribute capital gains (which may be taxable to investors). The turnover rate excludes in-kind transactions, which have minimal impact on costs.
30
The Global Industry Classification Standard (“GICS”) was developed by and is the exclusive property and a service mark
of MSCI Inc. (“MSCI”) and Standard and Poor’s, a division of McGraw-Hill Companies, Inc. (“S&P”), and is licensed for use
by Vanguard. Neither MSCI, S&P nor any third party involved in making or compiling the GICS or any GICS classification
makes any express or implied warranties or representations with respect to such standard or classification (or the results
to be obtained by the use thereof), and all such parties hereby expressly disclaim all warranties of originality, accuracy,
completeness, merchantability or fitness for a particular purpose with respect to any such standard or classification.
Without limiting any of the foregoing, in no event shall MSCI, S&P, any of its affiliates or any third party involved in
making or compiling the GICS or any GICS classification have any liability for any direct, indirect, special, punitive,
consequential or any other damages (including lost profits) even if notified of the possibility of such damages.
31
This page intentionally left blank.
This page intentionally left blank.
This page intentionally left blank.
The People Who Govern Your Fund
The trustees of your mutual fund are there to see that the fund is operated and managed in your best interests since, as a shareholder, you are a part owner of the fund. Your fund’s trustees also serve on the board of directors of The Vanguard Group, Inc., which is owned by the Vanguard funds and provides services to them on an at-cost basis.
A majority of Vanguard’s board members are independent, meaning that they have no affiliation with Vanguard or the funds they oversee, apart from the sizable personal investments they have made as private individuals. The independent board members have distinguished backgrounds in business, academia, and public service. Each of the trustees and executive officers oversees 208 Vanguard funds.
Information for each trustee and executive officer of the fund appears below. The mailing address of the trustees and officers is P.O. Box 876, Valley Forge, PA 19482. More information about the trustees is in the Statement of Additional Information, which can be obtained, without charge, by contacting Vanguard at 800-662-7447, or online at vanguard.com.
Interested Trustees1
F. William McNabb III
Born in 1957. Trustee since July 2009. Principal occupation(s) during the past five years and other experience: chairman of the board (January 2010–present) of Vanguard and of each of the investment companies served by Vanguard, trustee (2009–present) of each of the investment companies served by Vanguard, and director (2008–present) of Vanguard. Chief executive officer and president (2008–2017) of Vanguard and each of the investment companies served by Vanguard, managing director (1995–2008) of Vanguard, and director (1997–2018) of Vanguard Marketing Corporation. Director (2018–present) of UnitedHealth Group.
Mortimer J. Buckley
Born in 1969. Trustee since January 2018. Principal occupation(s) during the past five years and other experience: chief executive officer (January 2018–present) of Vanguard; chief executive officer, president, and trustee (January 2018–present) of each of the investment companies served by Vanguard; president and director (2017–present) of Vanguard; and president (February 2018–present) of Vanguard Marketing Corporation. Chief investment officer (2013–2017), managing director (2002–2017), head of the Retail Investor Group (2006–2012), and chief information officer (2001–2006) of Vanguard. Chairman of the board (2011–2017) of the Children’s Hospital of Philadelphia.
Independent Trustees
Emerson U. Fullwood
Born in 1948. Trustee since January 2008. Principal occupation(s) during the past five years and other experience: executive chief staff and marketing officer for North America and corporate vice president (retired 2008) of Xerox Corporation (document management products and services). Former president of the Worldwide Channels Group, Latin America, and Worldwide Customer Service and executive chief staff officer of Developing Markets of Xerox. Executive in residence and 2009–2010 Distinguished Minett Professor at the Rochester Institute of Technology. Lead director of SPX FLOW, Inc. (multi-industry manufacturing). Director of the University of Rochester Medical Center, the Monroe Community College Foundation, the United Way of Rochester, North Carolina A&T University, and Roberts Wesleyan College. Trustee of the University of Rochester.
Amy Gutmann
Born in 1949. Trustee since June 2006. Principal occupation(s) during the past five years and other experience: president (2004–present) of the University of Pennsylvania. Christopher H. Browne Distinguished Professor of Political Science, School of Arts and Sciences, and professor of communication, Annenberg School for Communication, with secondary faculty appointments in the Department of Philosophy, School of Arts and Sciences, and at the Graduate School of Education, University of Pennsylvania. Trustee of the National Constitution Center.
1 Mr. McNabb and Mr. Buckley are considered “interested persons,” as defined in the Investment Company Act of 1940, because
they are officers of the Vanguard funds.
JoAnn Heffernan Heisen
Born in 1950. Trustee since July 1998. Principal occupation(s) during the past five years and other experience: corporate vice president of Johnson & Johnson (pharmaceuticals/medical devices/consumer products) and member of its executive committee (1997–2008). Chief global diversity officer (retired 2008), vice president and chief information officer (1997–2006), controller (1995–1997), treasurer (1991–1995), and assistant treasurer (1989–1991) of Johnson & Johnson. Director of Skytop Lodge Corporation (hotels) and the Robert Wood Johnson Foundation. Member of the advisory board of the Institute for Women’s Leadership at Rutgers University.
F. Joseph Loughrey
Born in 1949. Trustee since October 2009. Principal occupation(s) during the past five years and other experience: president and chief operating officer (retired 2009) and vice chairman of the board (2008–2009) of Cummins Inc. (industrial machinery). Chairman of the board of Hillenbrand, Inc. (specialized consumer services), Oxfam America, and the Lumina Foundation for Education. Director of the V Foundation for Cancer Research. Member of the advisory council for the College of Arts and Letters and chair of the advisory board to the Kellogg Institute for International Studies, both at the University of Notre Dame.
Mark Loughridge
Born in 1953. Trustee since March 2012. Principal occupation(s) during the past five years and other experience: senior vice president and chief financial officer (retired 2013) of IBM (information technology services). Fiduciary member of IBM’s Retirement Plan Committee (2004–2013), senior vice president and general manager (2002–2004) of IBM Global Financing, vice president and controller (1998–2002) of IBM, and a variety of other prior management roles at IBM. Member of the Council on Chicago Booth.
Scott C. Malpass
Born in 1962. Trustee since March 2012. Principal occupation(s) during the past five years and other experience: chief investment officer (1989–present) and vice president (1996–present) of the University of Notre Dame. Assistant professor of finance at the Mendoza College of Business, University of Notre Dame, and member of the Notre Dame 403(b) Investment Committee. Chairman of the board of TIFF Advisory Services, Inc. Member of the board of Catholic Investment Services, Inc. (investment advisors), the board of advisors for Spruceview Capital Partners, and the board of superintendence of the Institute for the Works of Religion.
Deanna Mulligan
Born in 1963. Trustee since January 2018. Principal occupation(s) during the past five years and other experience: president (2010–present) and chief executive officer (2011–present) of The Guardian Life Insurance Company of America. Chief operating officer (2010–2011) and executive vice president (2008–2010) of Individual Life and Disability of The Guardian Life Insurance Company of America. Member of the board of The Guardian Life Insurance Company of America, the American Council of Life Insurers, the Partnership for New York City (business leadership), and the Committee Encouraging Corporate Philanthropy. Trustee of the Economic Club of New York and the Bruce Museum (arts and science). Member of the Advisory Council for the Stanford Graduate School of Business.
André F. Perold
Born in 1952. Trustee since December 2004. Principal occupation(s) during the past five years and other experience: George Gund Professor of Finance and Banking, Emeritus at the Harvard Business School (retired 2011). Chief investment officer and co-managing partner of HighVista Strategies LLC (private investment firm). Overseer of the Museum of Fine Arts Boston.
Sarah Bloom Raskin
Born in 1961. Trustee since January 2018. Principal occupation(s) during the past five years and other experience: deputy secretary (2014–2017) of the United States Department of the Treasury. Governor (2010–2014) of the Federal Reserve Board. Commissioner (2007–2010) of financial regulation for the State of Maryland. Member of the board of directors (2012–2014) of Neighborhood Reinvestment Corporation. Director of i(x) Investments, LLC.
Peter F. Volanakis
Born in 1955. Trustee since July 2009. Principal occupation(s) during the past five years and other experience: president and chief operating officer (retired 2010) of Corning Incorporated (communications equipment) and director of Corning Incorporated (2000–2010) and Dow Corning (2001–2010). Director (2012) of SPX Corporation (multi-industry manufacturing). Overseer of the Amos Tuck School of Business Administration, Dartmouth College (2001–2013). Chairman of the board of trustees of Colby-Sawyer College. Member of the Board of Hypertherm Inc. (industrial cutting systems, software, and consumables).
Executive Officers
Glenn Booraem
Born in 1967. Principal occupation(s) during the past five years and other experience: principal of Vanguard. Investment stewardship officer (2017–present), treasurer (2015–2017), controller (2010–2015), and assistant controller (2001–2010) of each of the investment companies served by Vanguard.
Christine M. Buchanan
Born in 1970. Principal occupation(s) during the past five years and other experience: principal of Vanguard and global head of Fund Administration at Vanguard. Treasurer (2017–present) of each of the investment companies served by Vanguard. Partner (2005–2017) at KPMG LLP (audit, tax, and advisory services).
Brian Dvorak
Born in 1973. Principal occupation(s) during the past five years and other experience: principal of Vanguard. Chief compliance officer (2017–present) of Vanguard and each of the investment companies served by Vanguard. Assistant vice president (2017–present) of Vanguard Marketing Corporation. Vice president and director of Enterprise Risk Management (2011–2013) at Oppenheimer Funds, Inc.
Thomas J. Higgins
Born in 1957. Principal occupation(s) during the past five years and other experience: principal of Vanguard. Chief financial officer (2008–present) and treasurer (1998–2008) of each of the investment companies served by Vanguard.
Peter Mahoney
Born in 1974. Principal occupation(s) during the past five years and other experience: principal of Vanguard. Controller (2015–present) of each of the investment companies served by Vanguard. Head of International Fund Services (2008–2014) at Vanguard.
Anne E. Robinson
Born in 1970. Principal occupation(s) during the past five years and other experience: general counsel (2016–present) of Vanguard. Secretary (2016–present) of Vanguard and of each of the investment companies served by Vanguard. Managing director (2016–present) of Vanguard. Director and senior vice president (2016–2018) of Vanguard Marketing Corporation. Managing director and general counsel of Global Cards and Consumer Services (2014–2016) at Citigroup. Counsel (2003–2014) at American Express.
Michael Rollings
Born in 1963. Principal occupation(s) during the past five years and other experience: finance director (2017–present) and treasurer (2017) of each of the investment companies served by Vanguard. Managing director (2016–present) of Vanguard. Chief financial officer (2016–present) of Vanguard. Director (2016–present) of Vanguard Marketing Corporation. Executive vice president and chief financial officer (2006–2016) of MassMutual Financial Group.
| Vanguard Senior Management Team | |
| Mortimer J. Buckley | James M. Norris |
| Gregory Davis | Thomas M. Rampulla |
| John James | Karin A. Risi |
| Martha G. King | Anne E. Robinson |
| John T. Marcante | Michael Rollings |
| Chris D. McIsaac | |
| Chairman Emeritus and Senior Advisor | |
| John J. Brennan | |
| Chairman, 1996–2009 | |
| Chief Executive Officer and President, 1996–2008 | |
| Founder | |
| John C. Bogle | |
| Chairman and Chief Executive Officer, 1974–1996 | |
 | |
| P.O. Box 2600 | |
| Valley Forge, PA 19482-2600 | |
| Connect with Vanguard® > vanguard.com | |
| Fund Information > 800-662-7447 | Source for Bloomberg Barclays indexes: Bloomberg |
| Direct Investor Account Services > 800-662-2739 | Index Services Limited. Copyright 2018, Bloomberg. All |
| rights reserved. | |
| Institutional Investor Services > 800-523-1036 | |
| CFA® is a registered trademark owned by CFA Institute. | |
| Text Telephone for People | |
| Who Are Deaf or Hard of Hearing > 800-749-7273 | |
| This material may be used in conjunction | |
| with the offering of shares of any Vanguard | |
| fund only if preceded or accompanied by | |
| the fund’s current prospectus. | |
| All comparative mutual fund data are from Lipper, a | |
| Thomson Reuters Company, or Morningstar, Inc., unless | |
| otherwise noted. | |
| You can obtain a free copy of Vanguard’s proxy voting | |
| guidelines by visiting vanguard.com/proxyreporting or by | |
| calling Vanguard at 800-662-2739. The guidelines are | |
| also available from the SEC’s website, sec.gov. In | |
| addition, you may obtain a free report on how your fund | |
| voted the proxies for securities it owned during the 12 | |
| months ended June 30. To get the report, visit either | |
| vanguard.com/proxyreporting or sec.gov. | |
| You can review and copy information about your fund at | |
| the SEC’s Public Reference Room in Washington, D.C. To | |
| find out more about this public service, call the SEC at | |
| 202-551-8090. Information about your fund is also | |
| available on the SEC’s website, and you can receive | |
| copies of this information, for a fee, by sending a | |
| request in either of two ways: via email addressed to | |
| publicinfo@sec.gov or via regular mail addressed to the | |
| Public Reference Section, Securities and Exchange | |
| Commission, Washington, DC 20549-1520. | |
| © 2018 The Vanguard Group, Inc. | |
| All rights reserved. | |
| Vanguard Marketing Corporation, Distributor. | |
| Q16900 102018 | |
Vanguard’s Principles for Investing Success
We want to give you the best chance of investment success. These principles, grounded in Vanguard’s research and experience, can put you on the right path.
Goals. Create clear, appropriate investment goals.
Balance. Develop a suitable asset allocation using broadly diversified funds. Cost. Minimize cost.
Discipline. Maintain perspective and long-term discipline.
A single theme unites these principles: Focus on the things you can control.
We believe there is no wiser course for any investor.
| Contents | |
| Your Fund’s Performance at a Glance. | 1 |
| CEO’s Perspective. | 4 |
| Russell 1000 Index Fund. | 6 |
| Russell 1000 Value Index Fund. | 22 |
| Russell 1000 Growth Index Fund. | 38 |
| Your Fund’s After-Tax Returns. | 58 |
| About Your Fund’s Expenses. | 59 |
| Trustees Approve Advisory Arrangements. | 61 |
| Glossary. | 63 |
Please note: The opinions expressed in this report are just that—informed opinions. They should not be considered promises
or advice. Also, please keep in mind that the information and opinions cover the period through the date on the front of this
report. Of course, the risks of investing in your fund are spelled out in the prospectus.
See the Glossary for definitions of investment terms used in this report.
Your Fund’s Performance at a Glance
• Growth stocks generally outpaced value stocks over the 12 months ended August 31, 2018, a trend reflected in the performance of the Vanguard Russell 1000 Index Funds.
• Returns exceeded 12% for Vanguard Russell 1000 Value Index Fund and 27% for Vanguard Russell 1000 Growth Index Fund. Vanguard Russell 1000 Index Fund, which holds both value and growth stocks, returned nearly 20%.
• Each fund closely tracked its target index. The Index Fund and the Growth Index Fund outpaced the average returns of their large-capitalization fund peers; the Value Index Fund lagged its large-cap value fund peer average.
• Technology holdings contributed the most to the Index Fund and the Growth Index Fund. Financial services led for the Value Index Fund.
• Consumer staples was the lowest-performing sector for all three funds.
| Total Returns: Fiscal Year Ended August 31, 2018 | |
| Total | |
| Returns | |
| Vanguard Russell 1000 Index Fund | |
| ETF Shares | |
| Market Price | 19.70% |
| Net Asset Value | 19.68 |
| Institutional Shares | 19.72 |
| Russell 1000 Index | 19.82 |
| Large-Cap Core Funds Average | 17.58 |
| Large-Cap Core Funds Average: Derived from data provided by Lipper, a Thomson Reuters Company. | |
| Vanguard Russell 1000 Value Index Fund | |
| ETF Shares | |
| Market Price | 12.38% |
| Net Asset Value | 12.36 |
| Institutional Shares | 12.39 |
| Russell 1000 Value Index | 12.47 |
| Large-Cap Value Funds Average | 14.09 |
| Large-Cap Value Funds Average: Derived from data provided by Lipper, a Thomson Reuters Company. | |
1
| Total | |
| Returns | |
| Vanguard Russell 1000 Growth Index Fund | |
| ETF Shares | |
| Market Price | 27.13% |
| Net Asset Value | 27.09 |
| Institutional Shares | 27.14 |
| Russell 1000 Growth Index | 27.23 |
| Large-Cap Growth Funds Average | 25.16 |
Large-Cap Growth Funds Average: Derived from data provided by Lipper, a Thomson Reuters Company.
Institutional Shares are available to certain institutional investors who meet specific administrative, service, and account-size criteria. The
Vanguard ETF® Shares shown are traded on the Nasdaq exchange and are available only through brokers. The table provides ETF returns
based on both the Nasdaq market price and the net asset value for a share. U.S. Pat. Nos. 6,879,964; 7,337,138; 7,720,749; 7,925,573;
8,090,646; and 8,417,623.
For the ETF Shares, the market price is determined by the midpoint of the bid-offer spread as of the closing time of the New York Stock
Exchange (generally 4 p.m., Eastern time). The net asset value is also determined as of the NYSE closing time. For more information about
how the ETF Shares' market prices have compared with their net asset value, visit vanguard.com, select your ETF, and then select the
Price and Performance tab. The ETF premium/discount analysis there shows the percentages of days on which the ETF Shares' market
price was above or below the NAV.
| Total Returns: Inception Through August 31, 2018 | |
| Average | |
| Annual Return | |
| Russell 1000 Index Fund ETF Shares Net Asset Value (Returns since inception: 9/20/2010) | 14.68% |
| Russell 1000 Index | 14.84 |
| Large-Cap Core Funds Average | 12.93 |
| Large-Cap Core Funds Average: Derived from data provided by Lipper, a Thomson Reuters Company. | |
| Russell 1000 Value Index Fund ETF Shares Net Asset Value (Returns since inception: 9/20/2010) | 12.57% |
| Russell 1000 Value Index | 12.73 |
| Large-Cap Value Funds Average | 11.78 |
| Large-Cap Value Funds Average: Derived from data provided by Lipper, a Thomson Reuters Company. | |
| Russell 1000 Growth Index Fund ETF Shares Net Asset Value (Returns since inception: 9/20/2010) | 16.72% |
| Russell 1000 Growth Index | 16.88 |
| Large-Cap Growth Funds Average | 14.90 |
| Large-Cap Growth Funds Average: Derived from data provided by Lipper, a Thomson Reuters Company. | |
The figures shown represent past performance, which is not a guarantee of future results. (Current performance may be lower or higher than the performance data cited. For performance data current to the most recent month-end, visit our website at vanguard.com/performance.) Note, too, that both investment returns and principal value can fluctuate widely, so an investor’s shares, when sold, could be worth more or less than their original cost.
2
| Expense Ratios | |||
| Your Fund Compared With Its Peer Group | |||
| ETF | Institutional | Peer Group | |
| Shares | Shares | Average | |
| Russell 1000 Index Fund | 0.12% | 0.08% | 1.03% |
| Russell 1000 Value Index Fund | 0.12 | 0.08 | 1.04 |
| Russell 1000 Growth Index Fund | 0.12 | 0.08 | 1.10 |
The fund expense ratios shown are from the prospectus dated December 21, 2017, and represent estimated costs for the current fiscal
year. For the fiscal year ended August 31, 2018, the funds’ expense ratios were: for the Russell 1000 Index Fund, 0.12% for ETF Shares
and 0.08% for Institutional Shares; for the Russell 1000 Value Index Fund, 0.12% for ETF Shares and 0.08% for Institutional Shares; and
for the Russell 1000 Growth Index Fund, 0.12% for ETF Shares and 0.08% for Institutional Shares. Peer-group expense ratios are derived
from data provided by Lipper, a Thomson Reuters Company, and capture information through year-end 2017.
Peer groups: For the Russell 1000 Index Fund, Large-Cap Core Funds; for the Russell 1000 Value Index Fund, Large-Cap Value Funds; and
for the Russell 1000 Growth Index Fund, Large-Cap Growth Funds.
3
CEO’s Perspective

Tim Buckley
President and Chief Executive Officer
Dear Shareholder,
Over the years, I’ve found that prudent investors exhibit a common trait: discipline. No matter how the markets move or what new investing fad hits the headlines, those who stay focused on their goals and tune out the noise are set up for long-term success.
The prime gateway to investing is saving, and you don’t usually become a saver without a healthy dose of discipline. Savers make the decision to sock away part of their income, which means spending less and delaying gratification, no matter how difficult that may be.
Of course, disciplined investing extends beyond diligent saving. The financial markets, in the short term especially, are unpredictable; I have yet to meet the investor who can time them perfectly. It takes discipline to resist the urge to go all-in when markets are frothy or to retreat when things look bleak.
Staying put with your investments is one strategy for handling volatility. Another, rebalancing, requires even more discipline because it means steering your money away from strong performers and toward poorer performers.
Patience—a form of discipline—is also the friend of long-term investors. Higher returns are the potential reward for weathering the market’s turbulence and uncertainty.
4
We have been enjoying one of the longest bull markets in history, but it won’t continue forever. Prepare yourself now for how you will react when volatility comes back. Don’t panic. Don’t chase returns or look for answers outside the asset classes you trust. And be sure to rebalance periodically, even when there’s turmoil.
Whether you’re a master of self-control, get a boost from technology, or work with a professional advisor, know that discipline
is necessary to get the most out of your investment portfolio. And know that Vanguard is with you for the entire ride.
Thank you for your continued loyalty.
Sincerely,

Mortimer J. Buckley
President and Chief Executive Officer
September 13, 2018
| Market Barometer | |||
| Average Annual Total Returns | |||
| Periods Ended August 31, 2018 | |||
| One Year | Three Years | Five Years | |
| Stocks | |||
| Russell 1000 Index (Large-caps) | 19.82% | 15.84% | 14.36% |
| Russell 2000 Index (Small-caps) | 25.45 | 16.11 | 13.00 |
| Russell 3000 Index (Broad U.S. market) | 20.25 | 15.86 | 14.25 |
| FTSE All-World ex US Index (International) | 3.51 | 8.31 | 5.82 |
| Bonds | |||
| Bloomberg Barclays U.S. Aggregate Bond Index | |||
| (Broad taxable market) | -1.05% | 1.76% | 2.49% |
| Bloomberg Barclays Municipal Bond Index | |||
| (Broad tax-exempt market) | 0.49 | 2.71 | 4.12 |
| FTSE Three-Month U. S. Treasury Bill Index | 1.49 | 0.74 | 0.44 |
| CPI | |||
| Consumer Price Index | 2.70% | 1.90% | 1.52% |
5
Russell 1000 Index Fund
Fund Profile
As of August 31, 2018
| Share-Class Characteristics | ||
| ETF | Institutional | |
| Shares | Shares | |
| Ticker Symbol | VONE | VRNIX |
| Expense Ratio1 | 0.12% | 0.08% |
| 30-Day SEC Yield | 1.75% | 1.79% |
| Portfolio Characteristics | |||
| DJ | |||
| Russell | U.S. Total | ||
| 1000 | Market | ||
| Fund | Index | FA Index | |
| Number of Stocks | 987 | 984 | 3,745 |
| Median Market Cap | $91.3B | $91.3B | $71.0B |
| Price/Earnings Ratio | 21.2x | 21.2x | 21.0x |
| Price/Book Ratio | 3.3x | 3.3x | 3.2x |
| Return on Equity | 15.6% | 15.6% | 15.0% |
| Earnings Growth | |||
| Rate | 8.4% | 8.4% | 8.4% |
| Dividend Yield | 1.7% | 1.7% | 1.7% |
| Foreign Holdings | 0.0% | 0.0% | 0.0% |
| Turnover Rate | 9% | — | — |
| Short-Term Reserves | -0.1% | — | — |
| Sector Diversification (% of equity exposure) | |||
| DJ | |||
| Russell | U.S. Total | ||
| 1000 | Market | ||
| Fund | Index | FA Index | |
| Consumer Discretionary | 14.2% | 14.2% | 14.4% |
| Consumer Staples | 5.6 | 5.6 | 5.3 |
| Energy | 5.7 | 5.7 | 5.6 |
| Financial Services | 20.5 | 20.5 | 20.8 |
| Health Care | 13.8 | 13.8 | 13.9 |
| Materials & Processing | 3.2 | 3.2 | 3.5 |
| Producer Durables | 10.2 | 10.2 | 10.5 |
| Technology | 22.2 | 22.2 | 21.4 |
| Utilities | 4.6 | 4.6 | 4.6 |
Sector categories are based on the Russell Global Sectors (“RGS”),
except for the “Other” category (if applicable), which includes
securities that have not been provided a RGS classification as of
the effective reporting period.
| Volatility Measures | ||
| DJ | ||
| Russell | U.S. Total | |
| 1000 | Market | |
| Index | FA Index | |
| R-Squared | 1.00 | 1.00 |
| Beta | 1.00 | 0.99 |
| These measures show the degree and timing of the fund’s | ||
| fluctuations compared with the indexes over 36 months. | ||
| Ten Largest Holdings (% of total net assets) | ||
| Apple Inc. | Computer | |
| Technology | 4.1% | |
| Microsoft Corp. | Computer Services | |
| Software & Systems | 3.1 | |
| Amazon.com Inc. | Diversified Retail | 3.0 |
| Alphabet Inc. | Computer Services | |
| Software & Systems | 2.6 | |
| Facebook Inc. | Computer Services | |
| Software & Systems | 1.5 | |
| Berkshire Hathaway Inc. Insurance: Multi-Line | 1.5 | |
| JPMorgan Chase & Co. | Diversified Financial | |
| Services | 1.4 | |
| Johnson & Johnson | Pharmaceuticals | 1.3 |
| Exxon Mobil Corp. | Oil: Integrated | 1.3 |
| Bank of America Corp. | Banks: Diversified | 1.1 |
| Top Ten | 20.9% | |
| The holdings listed exclude any temporary cash investments and | ||
| equity index products. | ||
Investment Focus

1 The expense ratios shown are from the prospectus dated December 21, 2017, and represent estimated costs for the current fiscal year. For the
fiscal year ended August 31, 2018, the expense ratios were 0.12% for ETF Shares and 0.08% for Institutional Shares.
6
Russell 1000 Index Fund
Performance Summary
All of the returns in this report represent past performance, which is not a guarantee of future results that may be achieved by the fund. (Current performance may be lower or higher than the performance data cited. For performance data current to the most recent month-end, visit our website at vanguard.com/performance.) Note, too, that both investment returns and principal value can fluctuate widely, so an investor’s shares, when sold, could be worth more or less than their original cost. The returns shown do not reflect taxes that a shareholder would pay on fund distributions or on the sale of fund shares.
Cumulative Performance: September 20, 2010, Through August 31, 2018
Initial Investment of $10,000

| Average Annual Total Returns | |||||
| Periods Ended August 31, 2018 | |||||
| Since | Final Value | ||||
| One | Five | Inception | of a $10,000 | ||
| Year | Years | (9/20/2010) | Investment | ||
| Russell 1000 Index Fund*ETF Shares | |||||
| Net Asset Value | 19.68% | 14.20% | 14.68% | $29,698 | |
| Russell 1000 Index Fund*ETF Shares | |||||
| Market Price | 19.70 | 14.21 | 14.68 | 29,698 | |
| • • • • • • • • | Russell 1000 Index | 19.82 | 14.36 | 14.84 | 30,022 |
| – – – – | Large-Cap Core Funds Average | 17.58 | 12.49 | 12.93 | 26,283 |
| Dow Jones U.S. Total Stock Market | |||||
| Float Adjusted Index | 20.26 | 14.21 | 14.77 | 29,886 | |
Large-Cap Core Funds Average: Derived from data provided by Lipper, a Thomson Reuters Company.
"Since Inception" performance is calculated from the ETF Shares’ inception date for both the fund and its comparative standards.
| Since | Final Value | |||
| One | Five | Inception | of a $5,000,000 | |
| Year | Years | (10/15/2010) | Investment | |
| Russell 1000 Index Fund Institutional Shares | 19.72% | 14.24% | 14.41% | $14,434,322 |
| Russell 1000 Index | 19.82 | 14.36 | 14.52 | 14,544,129 |
| Dow Jones U.S. Total Stock Market Float | ||||
| Adjusted Index | 20.26 | 14.21 | 14.43 | 14,456,245 |
"Since Inception" performance is calculated from the Institutional Shares’ inception date for both the fund and its comparative standards.
See Financial Highlights for dividend and capital gains information.
7
Russell 1000 Index Fund
| Cumulative Returns of ETF Shares: September 20, 2010, Through August 31, 2018 | |||
| Since | |||
| One | Five | Inception | |
| Year | Years | (9/20/2010) | |
| Russell 1000 Index Fund ETF Shares Market Price | 19.70% | 94.30% | 196.98% |
| Russell 1000 Index Fund ETF Shares Net Asset | |||
| Value | 19.68 | 94.20 | 196.98 |
| Russell 1000 Index | 19.82 | 95.64 | 200.22 |
| "Since Inception" performance is calculated from the ETF Shares’ inception date for both the fund and its comparative standards. | |||
Fiscal-Year Total Returns (%): September 20, 2010, Through August 31, 2018

Average Annual Total Returns: Periods Ended June 30, 2018
This table presents returns through the latest calendar quarter—rather than through the end of the fiscal period.
Securities and Exchange Commission rules require that we provide this information.
| Inception | One | Five | Since | |
| Date | Year | Years | Inception | |
| ETF Shares | 9/20/2010 | |||
| Market Price | 14.43% | 13.24% | 14.03% | |
| Net Asset Value | 14.41 | 13.20 | 14.03 | |
| Institutional Shares | 10/15/2010 | 14.45 | 13.25 | 13.74 |
8
Russell 1000 Index Fund
Financial Statements
Statement of Net Assets—Investments Summary
As of August 31, 2018
This Statement summarizes the fund’s holdings by asset type. Details are reported for each of the fund’s 50 largest individual holdings and for investments that, in total for any issuer, represent more than 1% of the fund’s net assets. The total value of smaller holdings is reported as a single amount within each category.
The fund reports a complete list of its holdings in regulatory filings four times in each fiscal year, at the quarter-ends. For the second and fourth fiscal quarters, the complete listing of the fund’s holdings is available electronically on vanguard.com and on the Securities and Exchange Commission’s website (sec.gov), or you can have it mailed to you without charge by calling 800-662-7447. For the first and third fiscal quarters, the fund files the lists with the SEC on Form N-Q. Shareholders can look up the fund’s Forms N-Q on the SEC’s website. Forms N-Q may also be reviewed and copied at the SEC’s Public Reference Room (see the back cover of this report for further information).
| Market | Percentage | |||
| Value• | of Net | |||
| Shares | ($000) | Assets | ||
| Common Stocks | ||||
| Consumer Discretionary | ||||
| * Amazon.com Inc. | 46,375 | 93,339 | 3.0% | |
| Home Depot Inc. | 131,379 | 26,377 | 0.8% | |
| Comcast Corp. Class A | 520,763 | 19,263 | 0.6% | |
| Walt Disney Co. | 170,121 | 19,057 | 0.6% | |
| * Netflix Inc. | 47,516 | 17,471 | 0.5% | |
| Walmart Inc. | 162,862 | 15,612 | 0.5% | |
| McDonald’s Corp. | 89,598 | 14,536 | 0.5% | |
| Consumer Discretionary—Other † | 241,842 | 7.7% | ||
| 447,497 | 14.2% | |||
| Consumer Staples | ||||
| Procter & Gamble Co. | 287,243 | 23,827 | 0.8% | |
| Coca-Cola Co. | 435,681 | 19,418 | 0.6% | |
| PepsiCo Inc. | 161,595 | 18,100 | 0.6% | |
| Philip Morris International Inc. | 177,261 | 13,807 | 0.4% | |
| Altria Group Inc. | 215,637 | 12,619 | 0.4% | |
| Consumer Staples—Other † | 86,856 | 2.8% | ||
| 174,627 | 5.6% | |||
| Energy | ||||
| Exxon Mobil Corp. | 483,179 | 38,736 | 1.3% | |
| Chevron Corp. | 217,389 | 25,752 | 0.8% | |
| Energy—Other † | 113,547 | 3.6% | ||
| 178,035 | 5.7% | |||
| Financial Services | ||||
| * Berkshire Hathaway Inc. Class B | 220,955 | 46,118 | 1.5% | |
| JPMorgan Chase & Co. | 386,790 | 44,318 | 1.4% | |
| Bank of America Corp. | 1,079,239 | 33,381 | 1.1% | |
| Visa Inc. Class A | 203,983 | 29,963 | 1.0% | |
| Wells Fargo & Co. | 501,193 | 29,310 | 0.9% | |
| 9 | ||||
| Russell 1000 Index Fund | |||||
| Market | Percentage | ||||
| Value• | of Net | ||||
| Shares | ($000) | Assets | |||
| Mastercard Inc. Class A | 104,908 | 22,614 | 0.7% | ||
| Citigroup Inc. | 291,486 | 20,765 | 0.7% | ||
| * | PayPal Holdings Inc. | 135,413 | 12,503 | 0.4% | |
| Financial Services—Other † | 403,832 | 12.8% | |||
| 642,804 | 20.5% | ||||
| Health Care | |||||
| Johnson & Johnson | 306,192 | 41,241 | 1.3% | ||
| UnitedHealth Group Inc. | 109,162 | 29,306 | 0.9% | ||
| Pfizer Inc. | 662,377 | 27,502 | 0.9% | ||
| Merck & Co. Inc. | 307,369 | 21,082 | 0.7% | ||
| AbbVie Inc. | 181,103 | 17,382 | 0.5% | ||
| Amgen Inc. | 75,433 | 15,072 | 0.5% | ||
| Medtronic plc | 154,260 | 14,872 | 0.5% | ||
| Abbott Laboratories | 195,387 | 13,060 | 0.4% | ||
| Health Care—Other † | 253,597 | 8.1% | |||
| 433,114 | 13.8% | ||||
| Materials & Processing | |||||
| DowDuPont Inc. | 265,142 | 18,594 | 0.6% | ||
| Materials & Processing—Other † | 81,102 | 2.6% | |||
| 99,696 | 3.2% | ||||
| 1,§Other † | 13 | 0.0% | |||
| Producer Durables | |||||
| Boeing Co. | 62,711 | 21,497 | 0.7% | ||
| 3M Co. | 65,729 | 13,864 | 0.4% | ||
| Honeywell International Inc. | 85,087 | 13,534 | 0.4% | ||
| Union Pacific Corp. | 87,791 | 13,223 | 0.4% | ||
| General Electric Co. | 982,384 | 12,712 | 0.4% | ||
| Producer Durables—Other † | 247,217 | 7.9% | |||
| 322,047 | 10.2% | ||||
| Technology | |||||
| Apple Inc. | 561,031 | 127,707 | 4.1% | ||
| Microsoft Corp. | 864,538 | 97,114 | 3.1% | ||
| * | Facebook Inc. Class A | 271,247 | 47,666 | 1.5% | |
| * | Alphabet Inc. Class A | 34,537 | 42,543 | 1.3% | |
| * | Alphabet Inc. Class C | 34,280 | 41,760 | 1.3% | |
| Cisco Systems Inc. | 550,654 | 26,305 | 0.8% | ||
| Intel Corp. | 532,469 | 25,787 | 0.8% | ||
| NVIDIA Corp. | 66,476 | 18,658 | 0.6% | ||
| Oracle Corp. | 327,526 | 15,911 | 0.5% | ||
| International Business Machines Corp. | 104,677 | 15,333 | 0.5% | ||
| * | Adobe Systems Inc. | 56,084 | 14,779 | 0.5% | |
| Texas Instruments Inc. | 112,049 | 12,594 | 0.4% | ||
| Technology—Other † | 209,443 | 6.7% | |||
| 695,600 | 22.1% | ||||
| Utilities | |||||
| AT&T Inc. | 829,159 | 26,483 | 0.8% | ||
| Verizon Communications Inc. | 472,019 | 25,664 | 0.8% | ||
| Utilities—Other † | 93,176 | 3.0% | |||
| 145,323 | 4.6% | ||||
| Total Common Stocks (Cost $2,204,331) | 3,138,756 | 99.9%2 | |||
| 10 | |||||
| Russell 1000 Index Fund | |||||
| Market | Percentage | ||||
| Value• | of Net | ||||
| Coupon | Shares | ($000) | Assets | ||
| Temporary Cash Investments | |||||
| Money Market Fund | |||||
| 3,4 Vanguard Market Liquidity Fund | 2.153% | 27,434 | 2,744 | 0.1% | |
| 5U.S. Government and Agency Obligations † | 398 | 0.0% | |||
| Total Temporary Cash Investments (Cost $3,142) | 3,142 | 0.1%2 | |||
| 6Total Investments (Cost $2,207,473) | 3,141,898 | 100.0% | |||
| Amount | |||||
| ($000) | |||||
| Other Assets and Liabilities | |||||
| Other Assets | |||||
| Investment in Vanguard | 157 | ||||
| Receivables for Investment Securities Sold | 2,987 | ||||
| Receivables for Accrued Income | 5,436 | ||||
| Receivables for Capital Shares Issued | 6,820 | ||||
| Variation Margin Receivable—Futures Contracts | — | ||||
| Total Other Assets | 15,400 | 0.5% | |||
| Liabilities | |||||
| Payables for Investment Securities Purchased | (1) | ||||
| Collateral for Securities on Loan | (2,741) | ||||
| Payables for Capital Shares Redeemed | (6,611) | ||||
| Payables to Vanguard | (561) | ||||
| Other Liabilities | (4,906) | ||||
| Total Liabilities | (14,820) | (0.5%) | |||
| Net Assets | 3,142,478 | 100.0% | |||
| At August 31, 2018, net assets consisted of: | |||||
| Amount | |||||
| ($000) | |||||
| Paid-in Capital | 2,243,028 | ||||
| Undistributed Net Investment Income | 11,890 | ||||
| Accumulated Net Realized Losses | (46,990) | ||||
| Unrealized Appreciation (Depreciation) | |||||
| Investment Securities | 934,425 | ||||
| Futures Contracts | 125 | ||||
| Net Assets | 3,142,478 | ||||
| 11 | |||||
Russell 1000 Index Fund
| Amount | |
| ($000) | |
| ETF Shares—Net Assets | |
| Applicable to 7,550,000 outstanding $.001 par value shares of | |
| beneficial interest (unlimited authorization) | 1,008,425 |
| Net Asset Value Per Share—ETF Shares | $133.57 |
| Institutional Shares—Net Assets | |
| Applicable to 8,247,660 outstanding $.001 par value shares of | |
| beneficial interest (unlimited authorization) | 2,134,053 |
| Net Asset Value Per Share—Institutional Shares | $258.75 |
• See Note A in Notes to Financial Statements.
* Non-income-producing security.
† Represents the aggregate value, by category, of securities that are not among the 50 largest holdings and, in total for any issuer,
represent 1% or less of net assets.
§ Certain of the fund’s securities are valued using significant unobservable inputs.
1 “Other” represents securities that are not classified by the fund’s benchmark index.
2 The fund invests a portion of its cash reserves in equity markets through the use of index futures contracts. After giving effect to
futures investments, the fund’s effective common stock and temporary cash investment positions represent 100.0% and 0.0%,
respectively, of net assets.
3 Affiliated money market fund available only to Vanguard funds and certain trusts and accounts managed by Vanguard. Rate shown
is the 7-day yield.
4 Includes $2,741,000 of collateral received for securities on loan.
5 Securities with a value of $398,000 have been segregated as initial margin for open futures contracts.
6 The total value of securities on loan is $2,587,000.
| Derivative Financial Instruments Outstanding as of Period End | ||||
| Futures Contracts | ||||
| ($000) | ||||
| Value and | ||||
| Number of | Unrealized | |||
| Long (Short) | Notional | Appreciation | ||
| Expiration | Contracts | Amount | (Depreciation) | |
| Long Futures Contracts | ||||
| E-mini S&P 500 Index | September 2018 | 21 | 3,047 | 125 |
See accompanying Notes, which are an integral part of the Financial Statements.
12
| Russell 1000 Index Fund | |
| Statement of Operations | |
| Year Ended | |
| August31,2018 | |
| ($000) | |
| Investment Income | |
| Income | |
| Dividends | 55,079 |
| Interest1 | 53 |
| Securities Lending—Net | 81 |
| Total Income | 55,213 |
| Expenses | |
| The Vanguard Group—Note B | |
| Investment Advisory Services | 435 |
| Management and Administrative—ETF Shares | 749 |
| Management and Administrative—Institutional Shares | 1,149 |
| Marketing and Distribution—ETF Shares | 50 |
| Marketing and Distribution—Institutional Shares | 50 |
| Custodian Fees | 160 |
| Auditing Fees | 33 |
| Shareholders’ Reports and Proxy—ETF Shares | 26 |
| Shareholders’ Reports and Proxy—Institutional Shares | 4 |
| Trustees’ Fees and Expenses | 2 |
| Total Expenses | 2,658 |
| Net Investment Income | 52,555 |
| Realized Net Gain (Loss) | |
| Investment Securities Sold1,2 | 114,178 |
| Futures Contracts | 601 |
| Realized Net Gain (Loss) | 114,779 |
| Change in Unrealized Appreciation (Depreciation) | |
| Investment Securities1 | 359,396 |
| Futures Contracts | 39 |
| Change in Unrealized Appreciation (Depreciation) | 359,435 |
| Net Increase (Decrease) in Net Assets Resulting from Operations | 526,769 |
1 Interest income, realized net gain (loss), and change in unrealized appreciation (depreciation) from an affiliated company of the fund
were $45,000, $3,000, and $1,000, respectively. Purchases and sales are for temporary cash investment purposes.
2 Includes $120,317,000 of net gain (loss) resulting from in-kind redemptions; such gain (loss) is not taxable to the fund.
See accompanying Notes, which are an integral part of the Financial Statements.
13
| Russell 1000 Index Fund | ||
| Statement of Changes in Net Assets | ||
| Year Ended August 31, | ||
| 2018 | 2017 | |
| ($000) | ($000) | |
| Increase (Decrease) in Net Assets | ||
| Operations | ||
| Net Investment Income | 52,555 | 49,543 |
| Realized Net Gain (Loss) | 114,779 | 72,664 |
| Change in Unrealized Appreciation (Depreciation) | 359,435 | 254,042 |
| Net Increase (Decrease) in Net Assets Resulting from Operations | 526,769 | 376,249 |
| Distributions | ||
| Net Investment Income | ||
| ETF Shares | (14,394) | (13,358) |
| Institutional Shares | (37,058) | (34,418) |
| Realized Capital Gain | ||
| ETF Shares | — | — |
| Institutional Shares | — | — |
| Total Distributions | (51,452) | (47,776) |
| Capital Share Transactions | ||
| ETF Shares | 146,208 | (45,968) |
| Institutional Shares | (217,061) | 227,507 |
| Net Increase (Decrease) from Capital Share Transactions | (70,853) | 181,539 |
| Total Increase (Decrease) | 404,464 | 510,012 |
| Net Assets | ||
| Beginning of Period | 2,738,014 | 2,228,002 |
| End of Period1 | 3,142,478 | 2,738,014 |
| 1 Net Assets—End of Period includes undistributed (overdistributed) net investment income of $11,890,000 and $10,787,000. | ||
See accompanying Notes, which are an integral part of the Financial Statements.
14
Russell 1000 Index Fund
Financial Highlights
| ETF Shares | |||||
| For a Share Outstanding | Year Ended August 31, | ||||
| Throughout Each Period | 2018 | 2017 | 2016 | 2015 | 2014 |
| Net Asset Value, Beginning of Period | $113.60 | $99.81 | $91.37 | $92.70 | $75.40 |
| Investment Operations | |||||
| Net Investment Income | 2.2091 | 2.0541 | 1.892 | 1.679 | 1.553 |
| Net Realized and Unrealized Gain (Loss) | |||||
| on Investments | 19.896 | 13.753 | 8.383 | (1.355) | 17.272 |
| Total from Investment Operations | 22.105 | 15.807 | 10.275 | . 324 | 18.825 |
| Distributions | |||||
| Dividends from Net Investment Income | (2.135) | (2.017) | (1.835) | (1.654) | (1.525) |
| Distributions from Realized Capital Gains | — | — | — | — | — |
| Total Distributions | (2.135) | (2.017) | (1.835) | (1.654) | (1.525) |
| Net Asset Value, End of Period | $133.57 | $113.60 | $99.81 | $91.37 | $92.70 |
| Total Return | 19.68% | 16.02% | 11.41% | 0.29% | 25.18% |
| Ratios/Supplemental Data | |||||
| Net Assets, End of Period (Millions) | $1,008 | $724 | $679 | $514 | $380 |
| Ratio of Total Expenses to | |||||
| Average Net Assets | 0.12% | 0.12% | 0.12% | 0.12% | 0.12% |
| Ratio of Net Investment Income to | |||||
| Average Net Assets | 1.78% | 1.94% | 2.05% | 1.84% | 1.85% |
| Portfolio Turnover Rate2 | 9% | 11% | 9% | 4% | 7% |
| 1 Calculated based on average shares outstanding. | |||||
| 2 Excludes the value of portfolio securities received or delivered as a result of in-kind purchases or redemptions of the fund’s capital | |||||
| shares, including ETF Creation Units. | |||||
See accompanying Notes, which are an integral part of the Financial Statements.
15
Russell 1000 Index Fund
Financial Highlights
| Institutional Shares | |||||
| For a Share Outstanding | Year Ended August 31, | ||||
| Throughout Each Period | 2018 | 2017 | 2016 | 2015 | 2014 |
| Net Asset Value, Beginning of Period | $220.06 | $193.36 | $176.99 | $179.58 | $146.04 |
| Investment Operations | |||||
| Net Investment Income | 4.3451 | 4.0801 | 3.732 | 3.329 | 3.060 |
| Net Realized and Unrealized Gain (Loss) | |||||
| on Investments | 38.573 | 26.609 | 16.259 | (2.641) | 33.485 |
| Total from Investment Operations | 42.918 | 30.689 | 19.991 | .688 | 36.545 |
| Distributions | |||||
| Dividends from Net Investment Income | (4.228) | (3.989) | (3.621) | (3.278) | (3.005) |
| Distributions from Realized Capital Gains | — | — | — | — | — |
| Total Distributions | (4.228) | (3.989) | (3.621) | (3.278) | (3.005) |
| Net Asset Value, End of Period | $258.75 | $220.06 | $193.36 | $176.99 | $179.58 |
| Total Return | 19.72% | 16.06% | 11.47% | 0.33% | 25.24% |
| Ratios/Supplemental Data | |||||
| Net Assets, End of Period (Millions) | $2,134 | $2,014 | $1,549 | $1,251 | $944 |
| Ratio of Total Expenses to | |||||
| Average Net Assets | 0.08% | 0.08% | 0.08% | 0.08% | 0.08% |
| Ratio of Net Investment Income to | |||||
| Average Net Assets | 1.82% | 1.98% | 2.09% | 1.88% | 1.89% |
| Portfolio Turnover Rate2 | 9% | 11% | 9% | 4% | 7% |
1 Calculated based on average shares outstanding.
2 Excludes the value of portfolio securities received or delivered as a result of in-kind purchases or redemptions of the fund’s capital
shares, including ETF Creation Units.
See accompanying Notes, which are an integral part of the Financial Statements.
16
Russell 1000 Index Fund
Notes to Financial Statements
Vanguard Russell 1000 Index Fund is registered under the Investment Company Act of 1940 as an open-end investment company, or mutual fund. The fund offers two classes of shares: ETF Shares and Institutional Shares. ETF Shares are listed for trading on Nasdaq; they can be purchased and sold through a broker. Institutional Shares are designed for investors who meet certain administrative, service, and account-size criteria.
A. The following significant accounting policies conform to generally accepted accounting principles for U.S. investment companies. The fund consistently follows such policies in preparing its financial statements.
1. Security Valuation: Securities are valued as of the close of trading on the New York Stock Exchange (generally 4 p.m., Eastern time) on the valuation date. Equity securities are valued at the latest quoted sales prices or official closing prices taken from the primary market in which each security trades; such securities not traded on the valuation date are valued at the mean of the latest quoted bid and asked prices. Securities for which market quotations are not readily available, or whose values have been materially affected by events occurring before the fund’s pricing time but after the close of the securities’ primary markets, are valued by methods deemed by the board of trustees to represent fair value. Investments in Vanguard Market Liquidity Fund are valued at that fund’s net asset value. Temporary cash investments are valued using the latest bid prices or using valuations based on a matrix system (which considers such factors as security prices, yields, maturities, and ratings), both as furnished by independent pricing services.
2. Futures Contracts: The fund uses index futures contracts to a limited extent, with the objectives of maintaining full exposure to the stock market, maintaining liquidity, and minimizing transaction costs. The fund may purchase futures contracts to immediately invest incoming cash in the market, or sell futures in response to cash outflows, thereby simulating a fully invested position in the underlying index while maintaining a cash balance for liquidity. The primary risks associated with the use of futures contracts are imperfect correlation between changes in market values of stocks held by the fund and the prices of futures contracts, and the possibility of an illiquid market. Counterparty risk involving futures is mitigated because a regulated clearinghouse is the counterparty instead of the clearing broker. To further mitigate counterparty risk, the fund trades futures contracts on an exchange, monitors the financial strength of its clearing brokers and clearinghouse, and has entered into clearing agreements with its clearing brokers. The clearinghouse imposes initial margin requirements to secure the fund’s performance and requires daily settlement of variation margin representing changes in the market value of each contract. Any assets pledged as initial margin for open contracts are noted in the Statement of Net Assets.
Futures contracts are valued at their quoted daily settlement prices. The notional amounts of the contracts are not recorded in the Statement of Net Assets. Fluctuations in the value of the contracts are recorded in the Statement of Net Assets as an asset (liability) and in the Statement of Operations as unrealized appreciation (depreciation) until the contracts are closed, when they are recorded as realized futures gains (losses).
During the year ended August 31, 2018, the fund’s average investments in long and short futures contracts represented less than 1% and 0% of net assets, respectively, based on the average of the notional amounts at each quarter-end during the period.
17
Russell 1000 Index Fund
3. Federal Income Taxes: The fund intends to continue to qualify as a regulated investment company and distribute all of its taxable income. Management has analyzed the fund’s tax positions taken for all open federal income tax years (August 31, 2015–2018), and has concluded that no provision for federal income tax is required in the fund’s financial statements.
4. Distributions: Distributions to shareholders are recorded on the ex-dividend date. Distributions are determined on a tax basis and may differ from net investment income and realized capital gains for financial reporting purposes.
5. Securities Lending: To earn additional income, the fund lends its securities to qualified institutional borrowers. Security loans are subject to termination by the fund at any time, and are required to be secured at all times by collateral in an amount at least equal to the market value of securities loaned. Daily market fluctuations could cause the value of loaned securities to be more or less than the value of the collateral received. When this occurs, the collateral is adjusted and settled before the opening of the market on the next business day. The fund further mitigates its counterparty risk by entering into securities lending transactions only with a diverse group of prequalified counterparties, monitoring their financial strength, and entering into master securities lending agreements with its counterparties. The master securities lending agreements provide that, in the event of a counterparty’s default (including bankruptcy), the fund may terminate any loans with that borrower, determine the net amount owed, and sell or retain the collateral up to the net amount owed to the fund; however, such actions may be subject to legal proceedings. While collateral mitigates counterparty risk, in the event of a default, the fund may experience delays and costs in recovering the securities loaned. The fund invests cash collateral received in Vanguard Market Liquidity Fund, and records a liability in the Statement of Net Assets for the return of the collateral, during the period the securities are on loan. Securities lending income represents fees charged to borrowers plus income earned on invested cash collateral, less expenses associated with the loan. During the term of the loan, the fund is entitled to all distributions made on or in respect of the loaned securities.
6. Credit Facility: The fund and certain other funds managed by The Vanguard Group (“Vanguard”) participate in a $3.1 billion committed credit facility provided by a syndicate of lenders pursuant to a credit agreement that may be renewed annually; each fund is individually liable for its borrowings, if any, under the credit facility. Borrowings may be utilized for temporary and emergency purposes, and are subject to the fund’s regulatory and contractual borrowing restrictions. The participating funds are charged administrative fees and an annual commitment fee of 0.10% of the undrawn amount of the facility; these fees are allocated to the funds based on a method approved by the fund’s board of trustees and included in Management and Administrative expenses on the fund’s Statement of Operations. Any borrowings under this facility bear interest at a rate based upon the higher of the one-month London Interbank Offered Rate, federal funds effective rate, or overnight bank funding rate plus an agreed-upon spread.
The fund had no borrowings outstanding at August 31, 2018, or at any time during the period then ended.
7. Other: Dividend income is recorded on the ex-dividend date. Interest income includes income distributions received from Vanguard Market Liquidity Fund and is accrued daily. Premiums and discounts on debt securities purchased are amortized and accreted, respectively, to interest income over the lives of the respective securities. Security transactions are accounted for on the date securities are bought or sold. Costs used to determine realized gains (losses) on the sale of investment securities are those of the specific securities sold.
18
Russell 1000 Index Fund
Each class of shares has equal rights as to assets and earnings, except that each class separately bears certain class-specific expenses related to maintenance of shareholder accounts (included in Management and Administrative expenses), shareholder reporting, and the proxy. Marketing and distribution expenses are allocated to each class of shares based on a method approved by the board of trustees. Income, other non-class-specific expenses, and gains and losses on investments are allocated to each class of shares based on its relative net assets.
B. In accordance with the terms of a Funds’ Service Agreement (the “FSA”) between Vanguard and the fund, Vanguard furnishes to the fund investment advisory, corporate management, administrative, marketing, and distribution services at Vanguard’s cost of operations (as defined by the FSA). These costs of operations are allocated to the fund based on methods and guidelines approved by the board of trustees. Vanguard does not require reimbursement in the current period for certain costs of operations (such as deferred compensation/benefits and risk/insurance costs); the fund’s liability for these costs of operations is included in Payables to Vanguard on the Statement of Net Assets. All other costs of operations payable to Vanguard are generally settled twice a month.
Upon the request of Vanguard, the fund may invest up to 0.40% of its net assets as capital in Vanguard. At August 31, 2018, the fund had contributed to Vanguard capital in the amount of $157,000, representing 0.00% of the fund’s net assets and 0.06% of Vanguard’s capitalization. The fund’s trustees and officers are also directors and employees, respectively, of Vanguard.
C. Various inputs may be used to determine the value of the fund’s investments. These inputs are summarized in three broad levels for financial statement purposes. The inputs or methodologies used to value securities are not necessarily an indication of the risk associated with investing in those securities.
Level 1—Quoted prices in active markets for identical securities.
Level 2—Other significant observable inputs (including quoted prices for similar securities, interest rates, prepayment speeds, credit risk, etc.).
Level 3—Significant unobservable inputs (including the fund’s own assumptions used to determine
the fair value of investments). Any investments valued with significant unobservable inputs are
noted on the Statement of Net Assets.
The following table summarizes the market value of the fund’s investments as of August 31, 2018, based on the inputs used to value them:
| Level 1 | Level 2 | Level 3 | |
| Investments | ($000) | ($000) | ($000) |
| Common Stocks | 3,138,743 | — | 13 |
| Temporary Cash Investments | 2,744 | 398 | — |
| Futures Contracts—Assets1 | — | — | — |
| Total | 3,141,487 | 398 | 13 |
| 1 Represents variation margin on the last day of the reporting period. | |||
19
Russell 1000 Index Fund
D. Permanent differences are reclassified among capital accounts in the financial statements to reflect their tax character. These reclassifications have no effect on net assets or net asset value per share. As of period end, the following permanent differences primarily attributable to the accounting for in-kind redemptions were reclassified to the following accounts:
| Amount | |
| ($000) | |
| Paid-in capital | 120,317 |
| Undistributed (Overdistributed) net investment income | — |
| Accumulated net realized gains (losses) | (120,317) |
Temporary differences between book-basis and tax-basis components of accumulated net earnings (losses) arise when certain items of income, gain, or loss are recognized in different periods for financial statement and tax purposes; these differences will reverse at some time in the future.
The differences are primarily related to the tax deferral of losses on wash sales and the realization of unrealized gains or losses on certain futures contracts. As of period end, the tax components of accumulated net earnings (losses) are detailed in the table as follows:
| Amount | |
| ($000) | |
| Undistributed ordinary income | 12,310 |
| Undistributed long-term gains | — |
| Capital loss carryforwards (non-expiring) | (46,865) |
| Net unrealized gains (losses) | 934,425 |
As of August 31, 2018, gross unrealized appreciation and depreciation for investments and derivatives based on cost for U.S. federal income tax purposes were as follows:
| Amount | |
| ($000) | |
| Tax cost | 2,207,473 |
| Gross unrealized appreciation | 1,002,733 |
| Gross unrealized depreciation | (68,308) |
| Net unrealized appreciation (depreciation) | 934,425 |
E. During the year ended August 31, 2018, the fund purchased $477,981,000 of investment securities and sold $541,177,000 of investment securities, other than temporary cash investments. Purchases and sales include $164,139,000 and $292,790,000, respectively, in connection with in-kind purchases and redemptions of the fund’s capital shares.
The fund purchased securities from and sold securities to other Vanguard funds or accounts managed by Vanguard or its affiliates, in accordance with procedures adopted by the board of trustees in compliance with Rule 17a-7 of the Investment Company Act of 1940. For the year ended August 31, 2018, such purchases and sales were $74,585,000 and $38,409,000, respectively; these amounts are included in the purchases and sales of investment securities noted above.
20
Russell 1000 Index Fund
F. Capital share transactions for each class of shares were:
| Year Ended August 31, | ||||
| 2018 | 2017 | |||
| Amount | Shares | Amount | Shares | |
| ($000) | (000) | ($000) | (000) | |
| ETF Shares | ||||
| Issued | 446,703 | 3,625 | 120,235 | 1,150 |
| Issued in Lieu of Cash Distributions | — | — | — | — |
| Redeemed | (300,495) | (2,450) | (166,203) | (1,575) |
| Net Increase (Decrease)—ETF Shares | 146,208 | 1,175 | (45,968) | (425) |
| Institutional Shares | ||||
| Issued | 192,313 | 815 | 492,249 | 2,424 |
| Issued in Lieu of Cash Distributions | 34,748 | 149 | 31,880 | 157 |
| Redeemed | (444,122) | (1,868) | (296,622) | (1,442) |
| Net Increase (Decrease)—Institutional Shares | (217,061) | (904) | 227,507 | 1,139 |
G. Management has determined that no events or transactions occurred subsequent to August 31, 2018, that would require recognition or disclosure in these financial statements.
21
Russell 1000 Value Index Fund
Fund Profile
As of August 31, 2018
| Share-Class Characteristics | ||
| ETF | Institutional | |
| Shares | Shares | |
| Ticker Symbol | VONV | VRVIX |
| Expense Ratio1 | 0.12% | 0.08% |
| 30-Day SEC Yield | 2.39% | 2.43% |
| Portfolio Characteristics | |||
| Russell | DJ | ||
| 1000 | U.S. Total | ||
| Value | Market | ||
| Fund | Index | FA Index | |
| Number of Stocks | 752 | 727 | 3,745 |
| Median Market Cap | $68.0B | $68.0B | $71.0B |
| Price/Earnings Ratio | 16.5x | 16.5x | 21.0x |
| Price/Book Ratio | 2.1x | 2.1x | 3.1x |
| Return on Equity | 12.1% | 12.1% | 15.0% |
| Earnings Growth | |||
| Rate | 5.7% | 5.8% | 8.4% |
| Dividend Yield | 2.4% | 2.4% | 1.7% |
| Foreign Holdings | 0.0% | 0.0% | 0.0% |
| Turnover Rate | 16% | — | — |
| Short-Term Reserves | -0.2% | — | — |
| Sector Diversification (% of equity exposure) | |||
| Russell | DJ | ||
| 1000 | U.S. Total | ||
| Value | Market | ||
| Fund | Index | FA Index | |
| Consumer Discretionary | 9.5% | 9.4% | 14.4% |
| Consumer Staples | 6.7 | 6.7 | 5.3 |
| Energy | 10.5 | 10.5 | 5.6 |
| Financial Services | 29.0 | 29.0 | 20.8 |
| Health Care | 14.1 | 14.1 | 13.9 |
| Materials & Processing | 4.3 | 4.3 | 3.5 |
| Producer Durables | 7.7 | 7.7 | 10.5 |
| Technology | 9.1 | 9.1 | 21.4 |
| Utilities | 9.1 | 9.2 | 4.6 |
Sector categories are based on the Russell Global Sectors (“RGS”),
except for the “Other” category (if applicable), which includes
securities that have not been provided a RGS classification as of
the effective reporting period.
| Volatility Measures | ||
| Russell | DJ | |
| 1000 | U.S. Total | |
| Value | Market | |
| Index | FA Index | |
| R-Squared | 1.00 | 0.90 |
| Beta | 1.00 | 0.95 |
| These measures show the degree and timing of the fund’s | ||
| fluctuations compared with the indexes over 36 months. | ||
| Ten Largest Holdings (% of total net assets) | ||
| JPMorgan Chase & Co. | Diversified Financial | |
| Services | 2.8% | |
| Berkshire Hathaway Inc. Insurance: Multi-Line | 2.6 | |
| Exxon Mobil Corp. | Oil: Integrated | 2.5 |
| Johnson & Johnson | Pharmaceuticals | 2.2 |
| Bank of America Corp. | Banks: Diversified | 2.1 |
| Wells Fargo & Co. | Banks: Diversified | 1.9 |
| Pfizer Inc. | Pharmaceuticals | 1.8 |
| AT&T Inc. | Utilities: | |
| Telecommunications | 1.7 | |
| Cisco Systems Inc. | Communications | |
| Technology | 1.7 | |
| Intel Corp. | Semiconductors & | |
| Components | 1.6 | |
| Top Ten | 20.9% | |
| The holdings listed exclude any temporary cash investments and | ||
| equity index products. | ||
Investment Focus
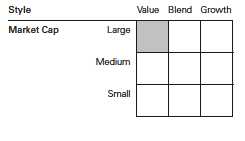
1 The expense ratios shown are from the prospectus dated December 21, 2017, and represent estimated costs for the current fiscal year. For the
fiscal year ended August 31, 2018, the expense ratios were 0.12% for ETF Shares and 0.08% for Institutional Shares.
22
Russell 1000 Value Index Fund
Performance Summary
All of the returns in this report represent past performance, which is not a guarantee of future results that may be achieved by the fund. (Current performance may be lower or higher than the performance data cited. For performance data current to the most recent month-end, visit our website at vanguard.com/performance.) Note, too, that both investment returns and principal value can fluctuate widely, so an investor’s shares, when sold, could be worth more or less than their original cost. The returns shown do not reflect taxes that a shareholder would pay on fund distributions or on the sale of fund shares.
Cumulative Performance: September 20, 2010, Through August 31, 2018
Initial Investment of $10,000
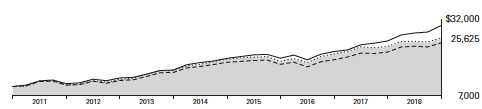
| Average Annual Total Returns | |||||
| Periods Ended August 31, 2018 | |||||
| Since | Final Value | ||||
| One | Five | Inception | of a $10,000 | ||
| Year | Years | (9/20/2010) | Investment | ||
| Russell 1000 Value Index Fund*ETF | |||||
| Shares Net Asset Value | 12.36% | 11.07% | 12.57% | $25,625 | |
| Russell 1000 Value Index Fund*ETF | |||||
| Shares Market Price | 12.38 | 11.08 | 12.58 | 25,630 | |
| • • • • • • • • | Russell 1000 Value Index | 12.47 | 11.22 | 12.73 | 25,918 |
| – – – – | Large-Cap Value Funds Average | 14.09 | 10.66 | 11.78 | 24,225 |
| Dow Jones U.S. Total Stock Market | |||||
| Float Adjusted Index | 20.26 | 14.21 | 14.77 | 29,886 | |
Large-Cap Value Funds Average: Derived from data provided by Lipper, a Thomson Reuters Company.
"Since Inception" performance is calculated from the ETF Shares’ inception date for both the fund and its comparative standards.
| Since | Final Value | |||
| One | Five | Inception | of a $5,000,000 | |
| Year | Years | (12/10/2010) | Investment | |
| Russell 1000 Value Index Fund Institutional | ||||
| Shares | 12.39% | 11.12% | 11.95% | $11,959,383 |
| Russell 1000 Value Index | 12.47 | 11.22 | 12.06 | 12,044,015 |
| Dow Jones U.S. Total Stock Market Float | ||||
| Adjusted Index | 20.26 | 14.21 | 13.79 | 13,563,444 |
"Since Inception" performance is calculated from the Institutional Shares’ inception date for both the fund and its comparative standards.
See Financial Highlights for dividend and capital gains information.
23
Russell 1000 Value Index Fund
| Cumulative Returns of ETF Shares: September 20, 2010, Through August 31, 2018 | |||
| Since | |||
| One | Five | Inception | |
| Year | Years | (9/20/2010) | |
| Russell 1000 Value Index Fund ETF Shares Market | |||
| Price | 12.38% | 69.09% | 156.30% |
| Russell 1000 Value Index Fund ETF Shares Net | |||
| Asset Value | 12.36 | 69.03 | 156.25 |
| Russell 1000 Value Index | 12.47 | 70.19 | 159.18 |
| "Since Inception" performance is calculated from the ETF Shares’ inception date for both the fund and its comparative standards. | |||
Fiscal-Year Total Returns (%): September 20, 2010, Through August 31, 2018
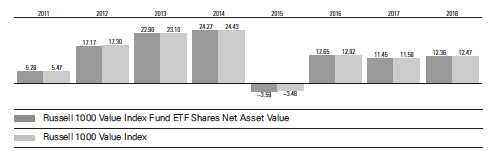
Average Annual Total Returns: Periods Ended June 30, 2018
This table presents returns through the latest calendar quarter—rather than through the end of the fiscal period.
Securities and Exchange Commission rules require that we provide this information.
| Inception | One | Five | Since | |
| Date | Year | Years | Inception | |
| ETF Shares | 9/20/2010 | |||
| Market Price | 6.67% | 10.20% | 12.10% | |
| Net Asset Value | 6.67 | 10.19 | 12.09 | |
| Institutional Shares | 12/10/2010 | 6.70 | 10.24 | 11.45 |
24
Russell 1000 Value Index Fund
Financial Statements
Statement of Net Assets—Investments Summary
As of August 31, 2018
This Statement summarizes the fund’s holdings by asset type. Details are reported for each of the fund’s 50 largest individual holdings and for investments that, in total for any issuer, represent more than 1% of the fund’s net assets. The total value of smaller holdings is reported as a single amount within each category.
The fund reports a complete list of its holdings in regulatory filings four times in each fiscal year, at the quarter-ends. For the second and fourth fiscal quarters, the complete listing of the fund’s holdings is available electronically on vanguard.com and on the Securities and Exchange Commission’s website (sec.gov), or you can have it mailed to you without charge by calling 800-662-7447. For the first and third fiscal quarters, the fund files the lists with the SEC on Form N-Q. Shareholders can look up the fund’s Forms N-Q on the SEC’s website. Forms N-Q may also be reviewed and copied at the SEC’s Public Reference Room (see the back cover of this report for further information).
| Market | Percentage | |||
| Value• | of Net | |||
| Shares | ($000) | Assets | ||
| Common Stocks | ||||
| Consumer Discretionary | ||||
| Comcast Corp. Class A | 1,030,844 | 38,131 | 1.2% | |
| Walmart Inc. | 321,936 | 30,861 | 1.0% | |
| McDonald’s Corp. | 142,935 | 23,188 | 0.7% | |
| Consumer Discretionary—Other † | 199,522 | 6.5% | ||
| 291,702 | 9.4% | |||
| Consumer Staples | ||||
| Procter & Gamble Co. | 567,762 | 47,096 | 1.5% | |
| Philip Morris International Inc. | 350,423 | 27,294 | 0.9% | |
| CVS Health Corp. | 229,046 | 17,233 | 0.6% | |
| Mondelez International Inc. Class A | 326,735 | 13,958 | 0.4% | |
| Walgreens Boots Alliance Inc. | 190,741 | 13,077 | 0.4% | |
| Consumer Staples—Other † | 88,143 | 2.9% | ||
| 206,801 | 6.7% | |||
| Energy | ||||
| Exxon Mobil Corp. | 955,827 | 76,629 | 2.5% | |
| Chevron Corp. | 429,797 | 50,914 | 1.7% | |
| Schlumberger Ltd. | 312,641 | 19,746 | 0.6% | |
| ConocoPhillips | 264,345 | 19,411 | 0.6% | |
| Occidental Petroleum Corp. | 172,705 | 13,794 | 0.4% | |
| EOG Resources Inc. | 115,610 | 13,669 | 0.4% | |
| Valero Energy Corp. | 97,037 | 11,439 | 0.4% | |
| Phillips 66 | 94,788 | 11,233 | 0.4% | |
| Energy—Other † | 108,249 | 3.5% | ||
| 325,084 | 10.5% | |||
| Financial Services | ||||
| JPMorgan Chase & Co. | 764,147 | 87,556 | 2.8% | |
| * Berkshire Hathaway Inc. Class B | 381,843 | 79,698 | 2.6% | |
| Bank of America Corp. | 2,131,689 | 65,933 | 2.1% | |
| 25 | ||||
| Russell 1000 Value Index Fund | ||||
| Market | Percentage | |||
| Value• | of Net | |||
| Shares | ($000) | Assets | ||
| Wells Fargo & Co. | 990,793 | 57,942 | 1.9% | |
| Citigroup Inc. | 575,515 | 41,000 | 1.3% | |
| Goldman Sachs Group Inc. | 79,752 | 18,966 | 0.6% | |
| US Bancorp | 346,968 | 18,774 | 0.6% | |
| PNC Financial Services Group Inc. | 105,928 | 15,205 | 0.5% | |
| Chubb Ltd. | 104,456 | 14,127 | 0.5% | |
| Morgan Stanley | 281,242 | 13,733 | 0.4% | |
| BlackRock Inc. | 27,748 | 13,293 | 0.4% | |
| CME Group Inc. | 69,641 | 12,168 | 0.4% | |
| Financial Services—Other † | 455,835 | 14.8% | ||
| 894,230 | 28.9% | |||
| Health Care | ||||
| Johnson & Johnson | 496,725 | 66,904 | 2.2% | |
| Pfizer Inc. | 1,309,128 | 54,355 | 1.8% | |
| Merck & Co. Inc. | 566,946 | 38,887 | 1.2% | |
| Medtronic plc | 305,317 | 29,436 | 0.9% | |
| Abbott Laboratories | 386,148 | 25,810 | 0.8% | |
| Thermo Fisher Scientific Inc. | 85,141 | 20,357 | 0.6% | |
| Anthem Inc. | 57,568 | 15,240 | 0.5% | |
| Allergan plc | 76,363 | 14,640 | 0.5% | |
| Danaher Corp. | 139,373 | 14,431 | 0.5% | |
| Becton Dickinson and Co. | 54,278 | 14,214 | 0.5% | |
| Health Care—Other † | 140,886 | 4.6% | ||
| 435,160 | 14.1% | |||
| Materials & Processing | ||||
| DowDuPont Inc. | 524,007 | 36,749 | 1.2% | |
| Materials & Processing—Other † | 96,611 | 3.1% | ||
| 133,360 | 4.3% | |||
| Producer Durables | ||||
| General Electric Co. | 1,945,083 | 25,169 | 0.8% | |
| United Technologies Corp. | 168,930 | 22,248 | 0.7% | |
| Norfolk Southern Corp. | 63,640 | 11,063 | 0.4% | |
| Producer Durables—Other † | 178,093 | 5.8% | ||
| 236,573 | 7.7% | |||
| Technology | ||||
| Cisco Systems Inc. | 1,087,719 | 51,960 | 1.7% | |
| Intel Corp. | 1,052,174 | 50,957 | 1.7% | |
| Oracle Corp. | 585,137 | 28,426 | 0.9% | |
| QUALCOMM Inc. | 317,819 | 21,837 | 0.7% | |
| Technology—Other † | 126,291 | 4.1% | ||
| 279,471 | 9.1% | |||
| Utilities | ||||
| AT&T Inc. | 1,640,124 | 52,386 | 1.7% | |
| Verizon Communications Inc. | 933,326 | 50,745 | 1.7% | |
| NextEra Energy Inc. | 106,232 | 18,070 | 0.6% | |
| Duke Energy Corp. | 158,237 | 12,855 | 0.4% | |
| Utilities—Other † | 148,820 | 4.8% | ||
| 282,876 | 9.2% | |||
| Total Common Stocks (Cost $2,663,402) | 3,085,257 | 99.9%1 | ||
| 26 | ||||
| Russell 1000 Value Index Fund | |||||
| Market | Percentage | ||||
| Value• | of Net | ||||
| Coupon | Shares | ($000) | Assets | ||
| Temporary Cash Investments | |||||
| Money Market Fund | |||||
| 2,3 Vanguard Market Liquidity Fund | 2.153% | 4,571 | 457 | 0.0% | |
| 4U.S. Government and Agency Obligations † | 399 | 0.0% | |||
| Total Temporary Cash Investments (Cost $856) | 856 | 0.0%1 | |||
| 5Total Investments (Cost $2,664,258) | 3,086,113 | 99.9% | |||
| Amount | |||||
| ($000) | |||||
| Other Assets and Liabilities | |||||
| Other Assets | |||||
| Investment in Vanguard | 157 | ||||
| Receivables for Accrued Income | 7,297 | ||||
| Receivables for Capital Shares Issued | 3,792 | ||||
| Variation Margin Receivable—Futures Contracts | — | ||||
| Total Other Assets | 11,246 | 0.4% | |||
| Liabilities | |||||
| Payables for Investment Securities Purchased | (4,504) | ||||
| Collateral for Securities on Loan | (453) | ||||
| Payables for Capital Shares Redeemed | (459) | ||||
| Payables to Vanguard | (572) | ||||
| Other Liabilities | (1,327) | ||||
| Total Liabilities | (7,315) | (0.3%) | |||
| Net Assets | 3,090,044 | 100.0% | |||
| 27 | |||||
Russell 1000 Value Index Fund
At August 31, 2018, net assets consisted of:
| Amount | |
| ($000) | |
| Paid-in Capital | 2,734,050 |
| Undistributed Net Investment Income | 16,033 |
| Accumulated Net Realized Losses | (82,109) |
| Unrealized Appreciation (Depreciation) | |
| Investment Securities | 421,855 |
| Futures Contracts | 215 |
| Net Assets | 3,090,044 |
| ETF Shares—Net Assets | |
| Applicable to 13,375,000 outstanding $.001 par value shares of | |
| beneficial interest (unlimited authorization) | 1,487,262 |
| Net Asset Value Per Share—ETF Shares | $111.20 |
| Institutional Shares—Net Assets | |
| Applicable to 7,381,490 outstanding $.001 par value shares of | |
| beneficial interest (unlimited authorization) | 1,602,782 |
| Net Asset Value Per Share—Institutional Shares | $217.14 |
• See Note A in Notes to Financial Statements.
* Non-income-producing security.
† Represents the aggregate value, by category, of securities that are not among the 50 largest holdings and, in total for any issuer,
represent 1% or less of net assets.
1 The fund invests a portion of its cash reserves in equity markets through the use of index futures contracts. After giving effect to
futures investments, the fund’s effective common stock and temporary cash investment positions represent 100.0% and -0.1%,
respectively, of net assets.
2 Affiliated money market fund available only to Vanguard funds and certain trusts and accounts managed by Vanguard. Rate shown
is the 7-day yield.
3 Includes $453,000 of collateral received for securities on loan.
4 Securities with a value of $399,000 have been segregated as initial margin for open futures contracts.
5 The total value of securities on loan is $421,000.
| Derivative Financial Instruments Outstanding as of Period End | ||||
| Futures Contracts | ||||
| ($000) | ||||
| Value and | ||||
| Number of | Unrealized | |||
| Long (Short) | Notional | Appreciation | ||
| Expiration | Contracts | Amount | (Depreciation) | |
| Long Futures Contracts | ||||
| E-mini S&P 500 Index | September 2018 | 36 | 5,224 | 215 |
See accompanying Notes, which are an integral part of the Financial Statements.
28
Russell 1000 Value Index Fund
Statement of Operations
| Year Ended | |
| August31,2018 | |
| ($000) | |
| Investment Income | |
| Income | |
| Dividends | 71,428 |
| Interest1 | 48 |
| Securities Lending—Net | 16 |
| Total Income | 71,492 |
| Expenses | |
| The Vanguard Group—Note B | |
| Investment Advisory Services | 434 |
| Management and Administrative—ETF Shares | 1,169 |
| Management and Administrative—Institutional Shares | 855 |
| Marketing and Distribution—ETF Shares | 80 |
| Marketing and Distribution—Institutional Shares | 41 |
| Custodian Fees | 184 |
| Auditing Fees | 33 |
| Shareholders’ Reports and Proxy—ETF Shares | 41 |
| Shareholders’ Reports and Proxy—Institutional Shares | 7 |
| Trustees’ Fees and Expenses | 2 |
| Total Expenses | 2,846 |
| Net Investment Income | 68,646 |
| Realized Net Gain (Loss) | |
| Investment Securities Sold1,2 | 104,371 |
| Futures Contracts | 998 |
| Realized Net Gain (Loss) | 105,369 |
| Change in Unrealized Appreciation (Depreciation) | |
| Investment Securities1 | 163,770 |
| Futures Contracts | 101 |
| Change in Unrealized Appreciation (Depreciation) | 163,871 |
| Net Increase (Decrease) in Net Assets Resulting from Operations | 337,886 |
1 Interest income, realized net gain (loss), and change in unrealized appreciation (depreciation) from an affiliated company of the fund
were $38,000, ($3,000), and $1,000, respectively. Purchases and sales are for temporary cash investment purposes.
2 Includes $138,367,000 of net gain (loss) resulting from in-kind redemptions; such gain (loss) is not taxable to the fund.
See accompanying Notes, which are an integral part of the Financial Statements.
| Russell 1000 Value Index Fund | ||
| Statement of Changes in Net Assets | ||
| Year Ended August 31, | ||
| 2018 | 2017 | |
| ($000) | ($000) | |
| Increase (Decrease) in Net Assets | ||
| Operations | ||
| Net Investment Income | 68,646 | 62,216 |
| Realized Net Gain (Loss) | 105,369 | 93,658 |
| Change in Unrealized Appreciation (Depreciation) | 163,871 | 106,805 |
| Net Increase (Decrease) in Net Assets Resulting from Operations | 337,886 | 262,679 |
| Distributions | ||
| Net Investment Income | ||
| ETF Shares | (30,349) | (21,356) |
| Institutional Shares | (36,994) | (37,526) |
| Realized Capital Gain | ||
| ETF Shares | — | — |
| Institutional Shares | — | — |
| Total Distributions | (67,343) | (58,882) |
| Capital Share Transactions | ||
| ETF Shares | 213,539 | 411,800 |
| Institutional Shares | (87,648) | (74,873) |
| Net Increase (Decrease) from Capital Share Transactions | 125,891 | 336,927 |
| Total Increase (Decrease) | 396,434 | 540,724 |
| Net Assets | ||
| Beginning of Period | 2,693,610 | 2,152,886 |
| End of Period1 | 3,090,044 | 2,693,610 |
1 Net Assets—End of Period includes undistributed (overdistributed) net investment income of $16,033,000 and $14,724,000.
See accompanying Notes, which are an integral part of the Financial Statements.
30
Russell 1000 Value Index Fund
Financial Highlights
| ETF Shares | |||||
| For a Share Outstanding | Year Ended August 31, | ||||
| Throughout Each Period | 2018 | 2017 | 2016 | 2015 | 2014 |
| Net Asset Value, Beginning of Period | $101.32 | $93.14 | $84.77 | $89.83 | $73.82 |
| Investment Operations | |||||
| Net Investment Income | 2.5221 | 2.4371 | 2.205 | 1.990 | 1.774 |
| Net Realized and Unrealized Gain (Loss) | |||||
| on Investments | 9.836 | 8.109 | 8.312 | (5.097) | 15.967 |
| Total from Investment Operations | 12.358 | 10.546 | 10.517 | (3.107) | 17.741 |
| Distributions | |||||
| Dividends from Net Investment Income | (2.478) | (2.366) | (2.147) | (1.953) | (1.731) |
| Distributions from Realized Capital Gains | — | — | — | — | — |
| Total Distributions | (2.478) | (2.366) | (2.147) | (1.953) | (1.731) |
| Net Asset Value, End of Period | $111.20 | $101.32 | $93.14 | $84.77 | $89.83 |
| Total Return | 12.36% | 11.45% | 12.65% | -3.59% | 24.27% |
| Ratios/Supplemental Data | |||||
| Net Assets, End of Period (Millions) | $1,487 | $1,153 | $668 | $407 | $283 |
| Ratio of Total Expenses to Average Net Assets | 0.12% | 0.12% | 0.12% | 0.12% | 0.12% |
| Ratio of Net Investment Income to | |||||
| Average Net Assets | 2.35% | 2.48% | 2.58% | 2.26% | 2.22% |
| Portfolio Turnover Rate2 | 16% | 22% | 18% | 18% | 16% |
1 Calculated based on average shares outstanding.
2 Excludes the value of portfolio securities received or delivered as a result of in-kind purchases or redemptions of the fund’s capital
shares, including ETF Creation Units.
See accompanying Notes, which are an integral part of the Financial Statements.
31
Russell 1000 Value Index Fund
Financial Highlights
| Institutional Shares | |||||
| For a Share Outstanding | Year Ended August 31, | ||||
| Throughout Each Period | 2018 | 2017 | 2016 | 2015 | 2014 |
| Net Asset Value, Beginning of Period | $197.85 | $181.86 | $165.50 | $175.38 | $144.13 |
| Investment Operations | |||||
| Net Investment Income | 4.9781 | 4.8501 | 4.359 | 3.946 | 3.528 |
| Net Realized and Unrealized Gain (Loss) | |||||
| on Investments | 19.227 | 15.821 | 16.249 | (9.955) | 31.182 |
| Total from Investment Operations | 24.205 | 20.671 | 20.608 | (6.009) | 34.710 |
| Distributions | |||||
| Dividends from Net Investment Income | (4.915) | (4.681) | (4.248) | (3.871) | (3.460) |
| Distributions from Realized Capital Gains | — | — | — | — | — |
| Total Distributions | (4.915) | (4.681) | (4.248) | (3.871) | (3.460) |
| Net Asset Value, End of Period | $217.14 | $197.85 | $181.86 | $165.50 | $175.38 |
| Total Return | 12.39% | 11.49% | 12.72% | -3.55% | 24.33% |
| Ratios/Supplemental Data | |||||
| Net Assets, End of Period (Millions) | $1,603 | $1,541 | $1,485 | $1,283 | $1,222 |
| Ratio of Total Expenses to Average Net Assets | 0.08% | 0.08% | 0.08% | 0.08% | 0.08% |
| Ratio of Net Investment Income to | |||||
| Average Net Assets | 2.39% | 2.52% | 2.62% | 2.30% | 2.26% |
| Portfolio Turnover Rate2 | 16% | 22% | 18% | 18% | 16% |
| 1 Calculated based on average shares outstanding. | |||||
| 2 Excludes the value of portfolio securities received or delivered as a result of in-kind purchases or redemptions of the fund’s capital | |||||
| shares, including ETF Creation Units. | |||||
See accompanying Notes, which are an integral part of the Financial Statements.
32
Russell 1000 Value Index Fund
Notes to Financial Statements
Vanguard Russell 1000 Value Index Fund is registered under the Investment Company Act of 1940 as an open-end investment company, or mutual fund. The fund offers two classes of shares: ETF Shares and Institutional Shares. ETF Shares are listed for trading on Nasdaq; they can be purchased and sold through a broker. Institutional Shares are designed for investors who meet certain administrative, service, and account-size criteria.
A. The following significant accounting policies conform to generally accepted accounting principles for U.S. investment companies. The fund consistently follows such policies in preparing its financial statements.
1. Security Valuation: Securities are valued as of the close of trading on the New York Stock Exchange (generally 4 p.m., Eastern time) on the valuation date. Equity securities are valued at the latest quoted sales prices or official closing prices taken from the primary market in which each security trades; such securities not traded on the valuation date are valued at the mean of the latest quoted bid and asked prices. Securities for which market quotations are not readily available, or whose values have been materially affected by events occurring before the fund’s pricing time but after the close of the securities’ primary markets, are valued by methods deemed by the board of trustees to represent fair value. Investments in Vanguard Market Liquidity Fund are valued at that fund’s net asset value. Temporary cash investments are valued using the latest bid prices or using valuations based on a matrix system (which considers such factors as security prices, yields, maturities, and ratings), both as furnished by independent pricing services.
2. Futures Contracts: The fund uses index futures contracts to a limited extent, with the objectives of maintaining full exposure to the stock market, maintaining liquidity, and minimizing transaction costs. The fund may purchase futures contracts to immediately invest incoming cash in the market, or sell futures in response to cash outflows, thereby simulating a fully invested position in the underlying index while maintaining a cash balance for liquidity. The primary risks associated with the use of futures contracts are imperfect correlation between changes in market values of stocks held by the fund and the prices of futures contracts, and the possibility of an illiquid market. Counterparty risk involving futures is mitigated because a regulated clearinghouse is the counterparty instead of the clearing broker. To further mitigate counterparty risk, the fund trades futures contracts on an exchange, monitors the financial strength of its clearing brokers and clearinghouse, and has entered into clearing agreements with its clearing brokers. The clearinghouse imposes initial margin requirements to secure the fund’s performance and requires daily settlement of variation margin representing changes in the market value of each contract. Any assets pledged as initial margin for open contracts are noted in the Statement of Net Assets.
Futures contracts are valued at their quoted daily settlement prices. The notional amounts of the contracts are not recorded in the Statement of Net Assets. Fluctuations in the value of the contracts are recorded in the Statement of Net Assets as an asset (liability) and in the Statement of Operations as unrealized appreciation (depreciation) until the contracts are closed, when they are recorded as realized futures gains (losses).
During the year ended August 31, 2018, the fund’s average investments in long and short futures contracts represented less than 1% and 0% of net assets, respectively, based on the average of the notional amounts at each quarter-end during the period.
33
Russell 1000 Value Index Fund
3. Federal Income Taxes: The fund intends to continue to qualify as a regulated investment company and distribute all of its taxable income. Management has analyzed the fund’s tax positions taken for all open federal income tax years (August 31, 2015–2018), and has concluded that no provision for federal income tax is required in the fund’s financial statements.
4. Distributions: Distributions to shareholders are recorded on the ex-dividend date. Distributions are determined on a tax basis and may differ from net investment income and realized capital gains for financial reporting purposes.
5. Securities Lending: To earn additional income, the fund lends its securities to qualified institutional borrowers. Security loans are subject to termination by the fund at any time, and are required to be secured at all times by collateral in an amount at least equal to the market value of securities loaned. Daily market fluctuations could cause the value of loaned securities to be more or less than the value of the collateral received. When this occurs, the collateral is adjusted and settled before the opening of the market on the next business day. The fund further mitigates its counterparty risk by entering into securities lending transactions only with a diverse group of prequalified counterparties, monitoring their financial strength, and entering into master securities lending agreements with its counterparties. The master securities lending agreements provide that, in the event of a counterparty’s default (including bankruptcy), the fund may terminate any loans with that borrower, determine the net amount owed, and sell or retain the collateral up to the net amount owed to the fund; however, such actions may be subject to legal proceedings. While collateral mitigates counterparty risk, in the event of a default, the fund may experience delays and costs in recovering the securities loaned. The fund invests cash collateral received in Vanguard Market Liquidity Fund, and records a liability in the Statement of Net Assets for the return of the collateral, during the period the securities are on loan. Securities lending income represents fees charged to borrowers plus income earned on invested cash collateral, less expenses associated with the loan. During the term of the loan, the fund is entitled to all distributions made on or in respect of the loaned securities.
6. Credit Facility: The fund and certain other funds managed by The Vanguard Group (“Vanguard”) participate in a $3.1 billion committed credit facility provided by a syndicate of lenders pursuant to a credit agreement that may be renewed annually; each fund is individually liable for its borrowings, if any, under the credit facility. Borrowings may be utilized for temporary and emergency purposes, and are subject to the fund’s regulatory and contractual borrowing restrictions. The participating funds are charged administrative fees and an annual commitment fee of 0.10% of the undrawn amount of the facility; these fees are allocated to the funds based on a method approved by the fund’s board of trustees and included in Management and Administrative expenses on the fund’s Statement of Operations. Any borrowings under this facility bear interest at a rate based upon the higher of the one-month London Interbank Offered Rate, federal funds effective rate, or overnight bank funding rate plus an agreed-upon spread.
The fund had no borrowings outstanding at August 31, 2018, or at any time during the period then ended.
7. Other: Dividend income is recorded on the ex-dividend date. Interest income includes income distributions received from Vanguard Market Liquidity Fund and is accrued daily. Premiums and discounts on debt securities purchased are amortized and accreted, respectively, to interest income over the lives of the respective securities. Security transactions are accounted for on the date securities are bought or sold. Costs used to determine realized gains (losses) on the sale of investment securities are those of the specific securities sold.
34
Russell 1000 Value Index Fund
Each class of shares has equal rights as to assets and earnings, except that each class separately bears certain class-specific expenses related to maintenance of shareholder accounts (included in Management and Administrative expenses), shareholder reporting, and the proxy. Marketing and distribution expenses are allocated to each class of shares based on a method approved by the board of trustees. Income, other non-class-specific expenses, and gains and losses on investments are allocated to each class of shares based on its relative net assets.
B. In accordance with the terms of a Funds’ Service Agreement (the “FSA”) between Vanguard and the fund, Vanguard furnishes to the fund investment advisory, corporate management, administrative, marketing, and distribution services at Vanguard’s cost of operations (as defined by the FSA). These costs of operations are allocated to the fund based on methods and guidelines approved by the board of trustees. Vanguard does not require reimbursement in the current period for certain costs of operations (such as deferred compensation/benefits and risk/insurance costs); the fund’s liability for these costs of operations is included in Payables to Vanguard on the Statement of Net Assets. All other costs of operations payable to Vanguard are generally settled twice a month.
Upon the request of Vanguard, the fund may invest up to 0.40% of its net assets as capital in Vanguard. At August 31, 2018, the fund had contributed to Vanguard capital in the amount of $157,000, representing 0.01% of the fund’s net assets and 0.06% of Vanguard’s capitalization. The fund’s trustees and officers are also directors and employees, respectively, of Vanguard.
C. Various inputs may be used to determine the value of the fund’s investments. These inputs are summarized in three broad levels for financial statement purposes. The inputs or methodologies used to value securities are not necessarily an indication of the risk associated with investing in those securities.
Level 1—Quoted prices in active markets for identical securities.
Level 2—Other significant observable inputs (including quoted prices for similar securities, interest rates, prepayment speeds, credit risk, etc.).
Level 3—Significant unobservable inputs (including the fund’s own assumptions used to determine
the fair value of investments). Any investments valued with significant unobservable inputs are
noted on the Statement of Net Assets.
The following table summarizes the market value of the fund’s investments as of August 31, 2018, based on the inputs used to value them:
| Level 1 | Level 2 | Level 3 | |
| Investments | ($000) | ($000) | ($000) |
| Common Stocks | 3,085,257 | — | — |
| Temporary Cash Investments | 457 | 399 | — |
| Futures Contracts—Assets1 | — | — | — |
| Total | 3,085,714 | 399 | — |
| 1 Represents variation margin on the last day of the reporting period. | |||
35
Russell 1000 Value Index Fund
D. Permanent differences are reclassified among capital accounts in the financial statements to reflect their tax character. These reclassifications have no effect on net assets or net asset value per share. As of period end, the following permanent differences primarily attributable to the accounting for in-kind redemptions and passive foreign investment companies were reclassified to the following accounts:
| Amount | |
| ($000) | |
| Paid-in capital | 138,367 |
| Undistributed (Overdistributed) net investment income | 6 |
| Accumulated net realized gains (losses) | (138,373) |
Temporary differences between book-basis and tax-basis components of accumulated net earnings (losses) arise when certain items of income, gain, or loss are recognized in different periods for financial statement and tax purposes; these differences will reverse at some time in the future. The differences are primarily related to the tax deferral of losses on wash sales and the realization of unrealized gains or losses on certain futures contracts. As of period end, the tax components of accumulated net earnings (losses) are detailed in the table as follows:
| Amount | |
| ($000) | |
| Undistributed ordinary income | 16,456 |
| Undistributed long-term gains | — |
| Capital loss carryforwards (non-expiring) | (81,894) |
| Net unrealized gains (losses) | 421,855 |
As of August 31, 2018, gross unrealized appreciation and depreciation for investments and derivatives based on cost for U.S. federal income tax purposes were as follows:
| Amount | |
| ($000) | |
| Tax cost | 2,664,258 |
| Gross unrealized appreciation | 534,441 |
| Gross unrealized depreciation | (112,586) |
| Net unrealized appreciation (depreciation) | 421,855 |
E. During the year ended August 31, 2018, the fund purchased $1,103,834,000 of investment securities and sold $971,496,000 of investment securities, other than temporary cash investments. Purchases and sales include $550,670,000 and $500,425,000, respectively, in connection with in-kind purchases and redemptions of the fund’s capital shares.
The fund purchased securities from and sold securities to other Vanguard funds or accounts managed by Vanguard or its affiliates, in accordance with procedures adopted by the board of trustees in compliance with Rule 17a-7 of the Investment Company Act of 1940. For the year ended August 31, 2018, such purchases and sales were $173,372,000 and $80,116,000, respectively; these amounts are included in the purchases and sales of investment securities noted above.
36
Russell 1000 Value Index Fund
F. Capital share transactions for each class of shares were:
| Year Ended August 31, | ||||
| 2018 | 2017 | |||
| Amount | Shares | Amount | Shares | |
| ($000) | (000) | ($000) | (000) | |
| ETF Shares | ||||
| Issued | 723,035 | 6,725 | 731,025 | 7,400 |
| Issued in Lieu of Cash Distributions | — | — | — | — |
| Redeemed | (509,496) | (4,725) | (319,225) | (3,200) |
| Net Increase (Decrease)—ETF Shares | 213,539 | 2,000 | 411,800 | 4,200 |
| Institutional Shares | ||||
| Issued | 245,835 | 1,180 | 399,585 | 2,102 |
| Issued in Lieu of Cash Distributions | 34,133 | 166 | 35,304 | 186 |
| Redeemed | (367,616) | (1,753) | (509,762) | (2,663) |
| Net Increase (Decrease)—Institutional Shares | (87,648) | (407) | (74,873) | (375) |
G. Management has determined that no events or transactions occurred subsequent to August 31, 2018, that would require recognition or disclosure in these financial statements.
37
Russell 1000 Growth Index Fund
Fund Profile
As of August 31, 2018
| Share-Class Characteristics | ||
| ETF | Institutional | |
| Shares | Shares | |
| Ticker Symbol | VONG | VRGWX |
| Expense Ratio1 | 0.12% | 0.08% |
| 30-Day SEC Yield | 1.14% | 1.18% |
| Portfolio Characteristics | |||
| Russell | DJ | ||
| 1000 | U.S. Total | ||
| Growth | Market | ||
| Fund | Index | FA Index | |
| Number of Stocks | 545 | 542 | 3,745 |
| Median Market Cap | $110.4B | $111.4B | $71.0B |
| Price/Earnings Ratio | 28.9x | 29.1x | 21.0x |
| Price/Book Ratio | 7.4x | 7.5x | 3.1x |
| Return on Equity | 22.0% | 21.5% | 15.0% |
| Earnings Growth | |||
| Rate | 11.2% | 11.2% | 8.4% |
| Dividend Yield | 1.1% | 1.1% | 1.7% |
| Foreign Holdings | 0.0% | 0.0% | 0.0% |
| Turnover Rate | 15% | — | — |
| Short-Term Reserves | 0.8% | — | — |
| Sector Diversification (% of equity exposure) | |||
| Russell | DJ | ||
| 1000 | U.S. Total | ||
| Growth | Market | ||
| Fund | Index | FA Index | |
| Consumer Discretionary | 18.2% | 19.0% | 14.4% |
| Consumer Staples | 4.5 | 4.4 | 5.3 |
| Energy | 0.9 | 0.9 | 5.6 |
| Financial Services | 12.2 | 12.1 | 20.8 |
| Health Care | 13.6 | 13.5 | 13.9 |
| Materials & Processing | 2.1 | 2.0 | 3.5 |
| Producer Durables | 12.9 | 12.8 | 10.5 |
| Technology | 35.4 | 35.1 | 21.4 |
| Utilities | 0.2 | 0.2 | 4.6 |
Sector categories are based on the Russell Global Sectors (“RGS”),
except for the “Other” category (if applicable), which includes
securities that have not been provided a RGS classification as of
the effective reporting period.
| Volatility Measures | ||
| DJ | ||
| U.S. Total | ||
| Russell 1000 | Market | |
| Growth Index | FA Index | |
| R-Squared | 1.00 | 0.89 |
| Beta | 1.00 | 1.02 |
| These measures show the degree and timing of the fund’s | ||
| fluctuations compared with the indexes over 36 months. | ||
| Ten Largest Holdings (% of total net assets) | ||
| Apple Inc. | Computer | |
| Technology | 8.1% | |
| Microsoft Corp. | Computer Services | |
| Software & Systems | 5.8 | |
| Alphabet Inc. | Computer Services | |
| Software & Systems | 5.4 | |
| Amazon.com Inc. | Diversified Retail | 4.9 |
| Facebook Inc. | Computer Services | |
| Software & Systems | 3.0 | |
| Visa Inc. | Financial Data & | |
| Systems | 1.9 | |
| UnitedHealth Group Inc. | Health Care | |
| Management | ||
| Services | 1.8 | |
| Home Depot Inc. | Specialty Retail | 1.7 |
| Mastercard Inc. | Financial Data & | |
| Systems | 1.4 | |
| Boeing Co. | Aerospace | 1.4 |
| Top Ten | 35.4% | |
| The holdings listed exclude any temporary cash investments and | ||
| equity index products. | ||
Investment Focus
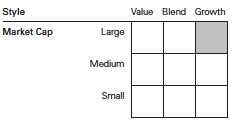
1 The expense ratios shown are from the prospectus dated December 21, 2017, and represent estimated costs for the current fiscal year. For
fiscal year ended August 31, 2018, the expense ratios were 0.12% for ETF Shares and 0.08% for Institutional Shares.
Russell 1000 Growth Index Fund
Performance Summary
All of the returns in this report represent past performance, which is not a guarantee of future results that may be achieved by the fund. (Current performance may be lower or higher than the performance data cited. For performance data current to the most recent month-end, visit our website at vanguard.com/performance.) Note, too, that both investment returns and principal value can fluctuate widely, so an investor’s shares, when sold, could be worth more or less than their original cost. The returns shown do not reflect taxes that a shareholder would pay on fund distributions or on the sale of fund shares.
Cumulative Performance: September 20, 2010, Through August 31, 2018
Initial Investment of $10,000
| Average Annual Total Returns | |||||
| Periods Ended August 31, 2018 | |||||
| Since | Final Value | ||||
| One | Five | Inception | of a $10,000 | ||
| Year | Years | (9/20/2010) | Investment | ||
| Russell 1000 Growth Index Fund*ETF | |||||
| Shares Net Asset Value | 27.09% | 17.34% | 16.72% | $34,146 | |
| Russell 1000 Growth Index Fund*ETF | |||||
| Shares Market Price | 27.13 | 17.34 | 16.72 | 34,156 | |
| • • • • • • • • | Russell 1000 Growth Index | 27.23 | 17.47 | 16.88 | 34,523 |
| – – – – | Large-Cap Growth Funds Average | 25.16 | 15.69 | 14.90 | 30,157 |
| Dow Jones U.S. Total Stock Market | |||||
| Float Adjusted Index | 20.26 | 14.21 | 14.77 | 29,886 | |
| Large-Cap Growth Funds Average: Derived from data provided by Lipper, a Thomson Reuters Company. | |||||
| "Since Inception" performance is calculated from the ETF Shares’ inception date for both the fund and its comparative standards. | |||||
| Since | Final Value | |||
| One | Five | Inception | of a $5,000,000 | |
| Year | Years | (12/6/2010) | Investment | |
| Russell 1000 Growth Index Fund | ||||
| Institutional Shares | 27.14% | 17.39% | 15.75% | $15,496,789 |
| Russell 1000 Growth Index | 27.23 | 17.47 | 15.85 | 15,597,992 |
| Dow Jones U.S. Total Stock Market Float | ||||
| Adjusted Index | 20.26 | 14.21 | 13.98 | 13,755,508 |
| "Since Inception" performance is calculated from the Institutional Shares’ inception date for both the fund and its comparative standards. | ||||
| See Financial Highlights for dividend and capital gains information. | ||||
39
Russell 1000 Growth Index Fund
Cumulative Returns of ETF Shares: September 20, 2010, Through August 31, 2018
| Since | |||
| One | Five | Inception | |
| Year | Years | (9/20/2010) | |
| Russell 1000 Growth Index Fund ETF Shares Market | |||
| Price | 27.13% | 122.46% | 241.56% |
| Russell 1000 Growth Index Fund ETF Shares Net | |||
| Asset Value | 27.09 | 122.41 | 241.46 |
| Russell 1000 Growth Index | 27.23 | 123.72 | 245.23 |
| "Since Inception" performance is calculated from the ETF Shares’ inception date for both the fund and its comparative standards. | |||
Fiscal-Year Total Returns (%): September 20, 2010, Through August 31, 2018
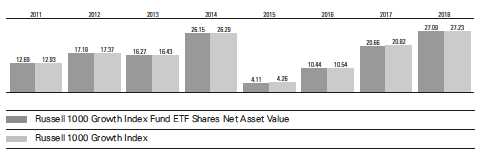
Average Annual Total Returns: Periods Ended June 30, 2018
This table presents returns through the latest calendar quarter—rather than through the end of the fiscal period.
Securities and Exchange Commission rules require that we provide this information.
| Inception | One | Five | Since | |
| Date | Year | Years | Inception | |
| ETF Shares | 9/20/2010 | |||
| Market Price | 22.44% | 16.23% | 15.89% | |
| Net Asset Value | 22.38 | 16.22 | 15.88 | |
| Institutional Shares | 12/6/2010 | 22.42 | 16.27 | 14.88 |
40
Russell 1000 Growth Index Fund
Financial Statements
Statement of Net Assets—Investments Summary
As of August 31, 2018
This Statement summarizes the fund’s holdings by asset type. Details are reported for each of the fund’s 50 largest individual holdings and for investments that, in total for any issuer, represent more than 1% of the fund’s net assets. The total value of smaller holdings is reported as a single amount within each category.
The fund reports a complete list of its holdings in regulatory filings four times in each fiscal year, at the quarter-ends. For the second and fourth fiscal quarters, the complete listing of the fund’s holdings is available electronically on vanguard.com and on the Securities and Exchange Commission’s website (sec.gov), or you can have it mailed to you without charge by calling 800-662-7447. For the first and third fiscal quarters, the fund files the lists with the SEC on Form N-Q. Shareholders can look up the fund’s Forms N-Q on the SEC’s website. Forms N-Q may also be reviewed and copied at the SEC’s Public Reference Room (see the back cover of this report for further information).
| Market | Percentage | |||
| Value• | of Net | |||
| Shares | ($000) | Assets | ||
| Common Stocks | ||||
| Consumer Discretionary | ||||
| * Amazon.com Inc. | 129,356 | 260,356 | 4.9% | |
| Home Depot Inc. | 437,946 | 87,926 | 1.7% | |
| * Netflix Inc. | 158,319 | 58,211 | 1.1% | |
| Walt Disney Co. | 405,658 | 45,442 | 0.9% | |
| NIKE Inc. Class B | 476,899 | 39,201 | 0.7% | |
| Costco Wholesale Corp. | 165,981 | 38,695 | 0.7% | |
| * Booking Holdings Inc. | 18,279 | 35,672 | 0.7% | |
| Lowe’s Cos. Inc. | 313,886 | 34,135 | 0.7% | |
| Starbucks Corp. | 510,522 | 27,287 | 0.5% | |
| TJX Cos. Inc. | 238,275 | 26,203 | 0.5% | |
| Consumer Discretionary—Other † | 296,044 | 5.6% | ||
| 949,172 | 18.0% | |||
| Consumer Staples | ||||
| PepsiCo Inc. | 477,439 | 53,478 | 1.0% | |
| Coca-Cola Co. | 1,127,602 | 50,257 | 0.9% | |
| Altria Group Inc. | 719,342 | 42,096 | 0.8% | |
| Consumer Staples—Other † | 87,686 | 1.7% | ||
| 233,517 | 4.4% | |||
| Energy † | 45,620 | 0.9% | ||
| Financial Services | ||||
| Visa Inc. Class A | 679,163 | 99,762 | 1.9% | |
| Mastercard Inc. Class A | 349,022 | 75,235 | 1.4% | |
| * PayPal Holdings Inc. | 451,380 | 41,676 | 0.8% | |
| American Tower Corp. | 166,600 | 24,843 | 0.5% | |
| Charles Schwab Corp. | 456,450 | 23,183 | 0.4% | |
| Financial Services—Other † | 371,556 | 7.1% | ||
| 636,255 | 12.1% | |||
| 41 | ||||
| Russell 1000 Growth Index Fund | |||||
| Market | Percentage | ||||
| Value• | of Net | ||||
| Shares | ($000) | Assets | |||
| Health Care | |||||
| UnitedHealth Group Inc. | 363,169 | 97,496 | 1.8% | ||
| AbbVie Inc. | 603,371 | 57,912 | 1.1% | ||
| Amgen Inc. | 236,665 | 47,288 | 0.9% | ||
| Gilead Sciences Inc. | 366,381 | 27,746 | 0.5% | ||
| * | Biogen Inc. | 75,909 | 26,833 | 0.5% | |
| * | Celgene Corp. | 274,752 | 25,950 | 0.5% | |
| Johnson & Johnson | 183,569 | 24,725 | 0.5% | ||
| * | Intuitive Surgical Inc. | 42,685 | 23,904 | 0.5% | |
| Eli Lilly & Co. | 225,469 | 23,821 | 0.5% | ||
| Stryker Corp. | 129,777 | 21,988 | 0.4% | ||
| Health Care—Other † | 332,563 | 6.3% | |||
| 710,226 | 13.5% | ||||
| Materials & Processing † | 106,646 | 2.0% | |||
| 1,§Other † | 32 | 0.0% | |||
| Producer Durables | |||||
| Boeing Co. | 208,710 | 71,544 | 1.4% | ||
| Accenture plc Class A | 244,278 | 41,300 | 0.8% | ||
| Union Pacific Corp. | 269,038 | 40,522 | 0.8% | ||
| 3M Co. | 182,996 | 38,597 | 0.7% | ||
| United Parcel Service Inc. Class B | 262,399 | 32,244 | 0.6% | ||
| Caterpillar Inc. | 202,710 | 28,146 | 0.5% | ||
| Honeywell International Inc. | 175,823 | 27,966 | 0.5% | ||
| Lockheed Martin Corp. | 86,036 | 27,567 | 0.5% | ||
| Automatic Data Processing Inc. | 167,356 | 24,559 | 0.5% | ||
| FedEx Corp. | 94,070 | 22,948 | 0.4% | ||
| Raytheon Co. | 109,116 | 21,762 | 0.4% | ||
| Producer Durables—Other † | 297,512 | 5.7% | |||
| 674,667 | 12.8% | ||||
| Technology | |||||
| Apple Inc. | 1,869,115 | 425,467 | 8.1% | ||
| Microsoft Corp. | 2,727,127 | 306,338 | 5.8% | ||
| * | Facebook Inc. Class A | 903,567 | 158,784 | 3.0% | |
| * | Alphabet Inc. Class C | 115,703 | 140,948 | 2.7% | |
| * | Alphabet Inc. Class A | 113,504 | 139,814 | 2.7% | |
| NVIDIA Corp. | 221,153 | 62,073 | 1.2% | ||
| * | Adobe Systems Inc. | 186,804 | 49,225 | 0.9% | |
| Texas Instruments Inc. | 372,237 | 41,839 | 0.8% | ||
| * | salesforce.com Inc. | 268,152 | 40,941 | 0.8% | |
| International Business Machines Corp. | 251,001 | 36,767 | 0.7% | ||
| Broadcom Inc. | 98,140 | 21,496 | 0.4% | ||
| Technology—Other † | 423,634 | 8.0% | |||
| 1,847,326 | 35.1% | ||||
| Utilities † | 7,634 | 0.2% | |||
| Total Common Stocks (Cost $3,542,732) | 5,211,095 | 99.0%2 | |||
| 42 | |||||
| Russell 1000 Growth Index Fund | |||||
| Market | Percentage | ||||
| Value• | of Net | ||||
| Coupon | Shares | ($000) | Assets | ||
| Temporary Cash Investments | |||||
| Money Market Fund | |||||
| 3,4 Vanguard Market Liquidity Fund | 2.153% | 584,403 | 58,452 | 1.1% | |
| 5U.S. Government and Agency Obligations † | 629 | 0.0% | |||
| Total Temporary Cash Investments (Cost $59,074) | 59,081 | 1.1%2 | |||
| 6Total Investments (Cost $3,601,806) | 5,270,176 | 100.1% | |||
| Amount | |||||
| ($000) | |||||
| Other Assets and Liabilities | |||||
| Other Assets | |||||
| Investment in Vanguard | 255 | ||||
| Receivables for Accrued Income | 5,852 | ||||
| Receivables for Capital Shares Issued | 6,912 | ||||
| Variation Margin Receivable—Futures Contracts | — | ||||
| Unrealized Appreciation—Swap Contracts | 3,211 | ||||
| Other Assets 5 | 31 | ||||
| Total Other Assets | 16,261 | 0.3% | |||
| Liabilities | |||||
| Payables for Investment Securities Purchased | (8,082) | ||||
| Collateral for Securities on Loan | (10,185) | ||||
| Payables for Capital Shares Redeemed | (3,225) | ||||
| Payables to Vanguard | (740) | ||||
| Other Liabilities | (2) | ||||
| Total Liabilities | (22,234) | (0.4%) | |||
| Net Assets | 5,264,203 | 100.0% | |||
| 43 | |||||
Russell 1000 Growth Index Fund
| At August 31, 2018, net assets consisted of: | |
| Amount | |
| ($000) | |
| Paid-in Capital | 3,663,976 |
| Undistributed Net Investment Income | 14,100 |
| Accumulated Net Realized Losses | (85,823) |
| Unrealized Appreciation (Depreciation) | |
| Investment Securities | 1,668,370 |
| Futures Contracts | 369 |
| Swap Contracts | 3,211 |
| Net Assets | 5,264,203 |
| ETF Shares—Net Assets | |
| Applicable to 13,051,711 outstanding $.001 par value shares of | |
| beneficial interest (unlimited authorization) | 2,082,575 |
| Net Asset Value Per Share—ETF Shares | $159.56 |
| Institutional Shares—Net Assets | |
| Applicable to 10,369,765 outstanding $.001 par value shares of | |
| beneficial interest (unlimited authorization) | 3,181,628 |
| Net Asset Value Per Share—Institutional Shares | $306.82 |
• See Note A in Notes to Financial Statements.
* Non-income-producing security.
§ Security value determined using significant unobservable inputs.
† Represents the aggregate value, by category, of securities that are not among the 50 largest holdings and, in total for any issuer,
represent 1% or less of net assets.
1 “Other” represents securities that are not classified by the fund’s benchmark index.
2 The fund invests a portion of its cash reserves in equity markets through the use of index futures contracts and swap contracts.
After giving effect to futures and swap investments, the fund’s effective common stock and temporary cash investment positions
represent 100.0% and 0.1%, respectively, of net assets.
3 Affiliated money market fund available only to Vanguard funds and certain trusts and accounts managed by Vanguard. Rate shown
is the 7-day yield.
4 Includes $10,185,000 of collateral received for securities on loan.
5 Securities with a value of $299,000 and cash of $30,000 have been segregated as initial margin for open futures contracts.
6 The total value of securities on loan is $9,594,000.
44
Russell 1000 Growth Index Fund
| Derivative Financial Instruments Outstanding as of Period End | |||||
| Futures Contracts | |||||
| ($000) | |||||
| Value and | |||||
| Number of | Unrealized | ||||
| Long (Short) | Notional | Appreciation | |||
| Expiration | Contracts | Amount | (Depreciation) | ||
| Long Futures Contracts | |||||
| E-mini S&P 500 Index | September 2018 | 55 | 7,981 | 369 | |
| Total Return Swaps | |||||
| Value and | |||||
| Fixed/Floating | Unrealized | ||||
| Notional | Net Rate | Appreciation | |||
| Termination | Amount | Received | (Depreciation) | ||
| Reference Entity | Date | Counterparty | ($000) | (Paid)1 | ($000) |
| Amazon.com Inc. | 11/8/18 | GSI | 47,066 | (2.260%) | 3,211 |
| GSI—Goldman Sachs International. | |||||
| 1 Payment received/paid monthly. | |||||
At August 31, 2018, a counterparty had deposited in a segregated account cash of $2,850,000 in connection with open swap contracts.
See accompanying Notes, which are an integral part of the Financial Statements.
45
Russell 1000 Growth Index Fund
Statement of Operations
| Year Ended | |
| August31,2018 | |
| ($000) | |
| Investment Income | |
| Income | |
| Dividends | 60,250 |
| Interest1 | 156 |
| Securities Lending—Net | 239 |
| Total Income | 60,645 |
| Expenses | |
| The Vanguard Group—Note B | |
| Investment Advisory Services | 669 |
| Management and Administrative—ETF Shares | 1,511 |
| Management and Administrative—Institutional Shares | 1,628 |
| Marketing and Distribution—ETF Shares | 100 |
| Marketing and Distribution—Institutional Shares | 75 |
| Custodian Fees | 156 |
| Auditing Fees | 33 |
| Shareholders’ Reports and Proxy—ETF Shares | 56 |
| Shareholders’ Reports and Proxy—Institutional Shares | 7 |
| Trustees’ Fees and Expenses | 2 |
| Total Expenses | 4,237 |
| Net Investment Income | 56,408 |
| Realized Net Gain (Loss) | |
| Investment Securities Sold1,2 | 294,162 |
| Futures Contracts | 596 |
| Swap Contracts | 1,283 |
| Realized Net Gain (Loss) | 296,041 |
| Change in Unrealized Appreciation (Depreciation) | |
| Investment Securities1 | 722,716 |
| Futures Contracts | 270 |
| Swap Contracts | 3,211 |
| Change in Unrealized Appreciation (Depreciation) | 726,197 |
| Net Increase (Decrease) in Net Assets Resulting from Operations | 1,078,646 |
1 Interest income, realized net gain (loss), and change in unrealized appreciation (depreciation) from an affiliated company of the fund
were $138,000, ($3,000), and $6,000, respectively. Purchases and sales are for temporary cash investment purposes.
2 Includes $286,387,000 of net gain (loss) resulting from in-kind redemptions; such gain (loss) is not taxable to the fund.
See accompanying Notes, which are an integral part of the Financial Statements.
46
Russell 1000 Growth Index Fund
Statement of Changes in Net Assets
| Year Ended August 31, | ||
| 2018 | 2017 | |
| ($000) | ($000) | |
| Increase (Decrease) in Net Assets | ||
| Operations | ||
| Net Investment Income | 56,408 | 48,004 |
| Realized Net Gain (Loss) | 296,041 | 82,617 |
| Change in Unrealized Appreciation (Depreciation) | 726,197 | 499,028 |
| Net Increase (Decrease) in Net Assets Resulting from Operations | 1,078,646 | 629,649 |
| Distributions | ||
| Net Investment Income | ||
| ETF Shares | (19,358) | (13,968) |
| Institutional Shares | (33,606) | (33,764) |
| Realized Capital Gain | ||
| ETF Shares | — | — |
| Institutional Shares | — | — |
| Total Distributions | (52,964) | (47,732) |
| Capital Share Transactions | ||
| ETF Shares | 387,413 | 400,801 |
| Institutional Shares | 56,452 | 85,007 |
| Net Increase (Decrease) from Capital Share Transactions | 443,865 | 485,808 |
| Total Increase (Decrease) | 1,469,547 | 1,067,725 |
| Net Assets | ||
| Beginning of Period | 3,794,656 | 2,726,931 |
| End of Period1 | 5,264,203 | 3,794,656 |
| 1 Net Assets—End of Period includes undistributed (overdistributed) net investment income of $14,100,000 and $9,373,000. | ||
See accompanying Notes, which are an integral part of the Financial Statements.
47
Russell 1000 Growth Index Fund
Financial Highlights
| ETF Shares | |||||
| For a Share Outstanding | Year Ended August 31, | ||||
| Throughout Each Period | 2018 | 2017 | 2016 | 2015 | 2014 |
| Net Asset Value, Beginning of Period | $127.08 | $106.90 | $98.24 | $95.74 | $77.02 |
| Investment Operations | |||||
| Net Investment Income | 1.7621 | 1.6841 | 1.602 | 1.466 | 1.293 |
| Net Realized and Unrealized Gain (Loss) | |||||
| on Investments | 32.386 | 20.177 | 8.556 | 2.481 | 18.713 |
| Total from Investment Operations | 34.148 | 21.861 | 10.158 | 3.947 | 20.006 |
| Distributions | |||||
| Dividends from Net Investment Income | (1.668) | (1.681) | (1.498) | (1.447) | (1.286) |
| Distributions from Realized Capital Gains | — | — | — | — | — |
| Total Distributions | (1.668) | (1.681) | (1.498) | (1.447) | (1.286) |
| Net Asset Value, End of Period | $159.56 | $127.08 | $106.90 | $98.24 | $95.74 |
| Total Return | 27.09% | 20.66% | 10.44% | 4.11% | 26.15% |
| Ratios/Supplemental Data | |||||
| Net Assets, End of Period (Millions) | $2,083 | $1,319 | $738 | $452 | $295 |
| Ratio of Total Expenses to Average Net Assets | 0.12% | 0.12% | 0.12% | 0.12% | 0.12% |
| Ratio of Net Investment Income to | |||||
| Average Net Assets | 1.24% | 1.45% | 1.60% | 1.47% | 1.51% |
| Portfolio Turnover Rate2 | 15% | 21% | 15% | 20% | 18% |
1 Calculated based on average shares outstanding.
2 Excludes the value of portfolio securities received or delivered as a result of in-kind purchases or redemptions of the fund’s capital
shares, including ETF Creation Units.
See accompanying Notes, which are an integral part of the Financial Statements.
48
Russell 1000 Growth Index Fund
Financial Highlights
| Institutional Shares | |||||
| For a Share Outstanding | Year Ended August 31, | ||||
| Throughout Each Period | 2018 | 2017 | 2016 | 2015 | 2014 |
| Net Asset Value, Beginning of Period | $244.34 | $205.53 | $188.88 | $184.06 | $148.07 |
| Investment Operations | |||||
| Net Investment Income | 3.4851 | 3.2911 | 3.147 | 2.882 | 2.544 |
| Net Realized and Unrealized Gain (Loss) | |||||
| on Investments | 62.293 | 38.832 | 16.449 | 4.782 | 35.986 |
| Total from Investment Operations | 65.778 | 42.123 | 19.596 | 7.664 | 38.530 |
| Distributions | |||||
| Dividends from Net Investment Income | (3.298) | (3.313) | (2.946) | (2.844) | (2.540) |
| Distributions from Realized Capital Gains | — | — | — | — | — |
| Total Distributions | (3.298) | (3.313) | (2.946) | (2.844) | (2.540) |
| Net Asset Value, End of Period | $306.82 | $244.34 | $205.53 | $188.88 | $184.06 |
| Total Return | 27.14% | 20.72% | 10.48% | 4.15% | 26.20% |
| Ratios/Supplemental Data | |||||
| Net Assets, End of Period (Millions) | $3,182 | $2,476 | $1,989 | $1,560 | $1,460 |
| Ratio of Total Expenses to Average Net Assets | 0.08% | 0.08% | 0.08% | 0.08% | 0.08% |
| Ratio of Net Investment Income to | |||||
| Average Net Assets | 1.28% | 1.49% | 1.64% | 1.51% | 1.55% |
| Portfolio Turnover Rate2 | 15% | 21% | 15% | 20% | 18% |
1 Calculated based on average shares outstanding.
2 Excludes the value of portfolio securities received or delivered as a result of in-kind purchases or redemptions of the fund’s capital
shares, including ETF Creation Units.
See accompanying Notes, which are an integral part of the Financial Statements.
49
Russell 1000 Growth Index Fund
Notes to Financial Statements
Vanguard Russell 1000 Growth Index Fund is registered under the Investment Company Act of 1940 as an open-end investment company, or mutual fund. The fund offers two classes of shares: ETF Shares and Institutional Shares. ETF Shares are listed for trading on Nasdaq; they can be purchased and sold through a broker. Institutional Shares are designed for investors who meet certain administrative, service, and account-size criteria.
A. The following significant accounting policies conform to generally accepted accounting principles for U.S. investment companies. The fund consistently follows such policies in preparing its financial statements.
1. Security Valuation: Securities are valued as of the close of trading on the New York Stock Exchange (generally 4 p.m., Eastern time) on the valuation date. Equity securities are valued at the latest quoted sales prices or official closing prices taken from the primary market in which each security trades; such securities not traded on the valuation date are valued at the mean of the latest quoted bid and asked prices. Securities for which market quotations are not readily available, or whose values have been materially affected by events occurring before the fund’s pricing time but after the close of the securities’ primary markets, are valued by methods deemed by the board of trustees to represent fair value. Investments in Vanguard Market Liquidity Fund are valued at that fund’s net asset value. Temporary cash investments are valued using the latest bid prices or using valuations based on a matrix system (which considers such factors as security prices, yields, maturities, and ratings), both as furnished by independent pricing services.
2. Futures Contracts: The fund uses index futures contracts to a limited extent, with the objectives of maintaining full exposure to the stock market, maintaining liquidity, and minimizing transaction costs. The fund may purchase futures contracts to immediately invest incoming cash in the market, or sell futures in response to cash outflows, thereby simulating a fully invested position in the underlying index while maintaining a cash balance for liquidity. The primary risks associated with the use of futures contracts are imperfect correlation between changes in market values of stocks held by the fund and the prices of futures contracts, and the possibility of an illiquid market. Counterparty risk involving futures is mitigated because a regulated clearinghouse is the counterparty instead of the clearing broker. To further mitigate counterparty risk, the fund trades futures contracts on an exchange, monitors the financial strength of its clearing brokers and clearinghouse, and has entered into clearing agreements with its clearing brokers. The clearinghouse imposes initial margin requirements to secure the fund’s performance and requires daily settlement of variation margin representing changes in the market value of each contract. Any assets pledged as initial margin for open contracts are noted in the Statement of Net Assets.
Futures contracts are valued at their quoted daily settlement prices. The notional amounts of the contracts are not recorded in the Statement of Net Assets. Fluctuations in the value of the contracts are recorded in the Statement of Net Assets as an asset (liability) and in the Statement of Operations as unrealized appreciation (depreciation) until the contracts are closed, when they are recorded as realized futures gains (losses).
During the year ended August 31, 2018, the fund’s average investments in long and short futures contracts represented less than 1% and 0% of net assets, respectively, based on the average of the notional amounts at each quarter-end during the period.
3. Swap Contracts: The fund has entered into equity swap contracts to earn the total return on selected reference stocks in the fund’s target index. Under the terms of the swaps, the fund receives the total return on the referenced stock (i.e., receiving the increase or paying the decrease
50
Russell 1000 Growth Index Fund
in value of the selected reference stock and receiving the equivalent of any dividends in respect of the selected referenced stock) over a specified period of time, applied to a notional amount that represents the value of a designated number of shares of the selected reference stock at the beginning of the equity swap contract. The fund also pays a floating rate that is based on short-term interest rates, applied to the notional amount. At the same time, the fund invests an amount approximating the notional amount of the swap in high-quality temporary cash investments.
The notional amounts of swap contracts are not recorded in the Statement of Net Assets. Swaps are valued daily based on market quotations received from independent pricing services or recognized dealers and the change in value is recorded in the Statement of Net Assets as an asset (liability) and in the Statement of Operations as unrealized appreciation (depreciation) until termination of the swap, at which time realized gain (loss) is recorded.
A risk associated with all types of swaps is the possibility that a counterparty may default on its obligation to pay net amounts due to the fund. The fund’s maximum amount subject to counterparty risk is the unrealized appreciation on the swap contract. The fund mitigates its counterparty risk by entering into swaps only with a diverse group of prequalified counterparties, monitoring their financial strength, entering into master netting arrangements with its counterparties, and requiring its counterparties to transfer collateral as security for their performance. In the absence of a default, the collateral pledged or received by the fund cannot be repledged, resold, or rehypothecated.
In the event of a counterparty’s default (including bankruptcy), the fund may terminate any swap contracts with that counterparty, determine the net amount owed by either party in accordance with its master netting arrangements, and sell or retain any collateral held up to the net amount owed to the fund under the master netting arrangements. The swap contracts contain provisions whereby a counterparty may terminate open contracts if the fund net assets decline below a certain level, triggering a payment by the fund if the fund is in a net liability position at the time of the termination. The payment amount would be reduced by any collateral the fund has pledged. Any securities pledged as collateral for open contracts are noted in the Statement of Net Assets. The value of collateral received or pledged is compared daily to the value of the swap contracts exposure with each counterparty, and any difference, if in excess of a specified minimum transfer amount, is adjusted and settled within two business days.
During the year ended August 31, 2018, the fund’s average amounts of investments in total return swaps represented less than 1% of net assets, based on the average of notional amounts at each quarter-end during the period.
4. Federal Income Taxes: The fund intends to continue to qualify as a regulated investment company and distribute all of its taxable income. Management has analyzed the fund’s tax positions taken for all open federal income tax years (August 31, 2015–2018), and has concluded that no provision for federal income tax is required in the fund’s financial statements.
5. Distributions: Distributions to shareholders are recorded on the ex-dividend date. Distributions are determined on a tax basis and may differ from net investment income and realized capital gains for financial reporting purposes.
6. Securities Lending: To earn additional income, the fund lends its securities to qualified institutional borrowers. Security loans are subject to termination by the fund at any time, and are required to be secured at all times by collateral in an amount at least equal to the market value of securities loaned. Daily market fluctuations could cause the value of loaned securities to be more or less than the value of the collateral received. When this occurs, the collateral is adjusted and settled before the
51
Russell 1000 Growth Index Fund
opening of the market on the next business day. The fund further mitigates its counterparty risk by entering into securities lending transactions only with a diverse group of prequalified counterparties, monitoring their financial strength, and entering into master securities lending agreements with its counterparties. The master securities lending agreements provide that, in the event of a counterparty’s default (including bankruptcy), the fund may terminate any loans with that borrower, determine the net amount owed, and sell or retain the collateral up to the net amount owed to the fund; however, such actions may be subject to legal proceedings. While collateral mitigates counterparty risk, in the event of a default, the fund may experience delays and costs in recovering the securities loaned. The fund invests cash collateral received in Vanguard Market Liquidity Fund, and records a liability in the Statement of Net Assets for the return of the collateral, during the period the securities are on loan. Securities lending income represents fees charged to borrowers plus income earned on invested cash collateral, less expenses associated with the loan. During the term of the loan, the fund is entitled to all distributions made on or in respect of the loaned securities.
7. Credit Facility: The fund and certain other funds managed by The Vanguard Group (“Vanguard”) participate in a $3.1 billion committed credit facility provided by a syndicate of lenders pursuant to a credit agreement that may be renewed annually; each fund is individually liable for its borrowings, if any, under the credit facility. Borrowings may be utilized for temporary and emergency purposes, and are subject to the fund’s regulatory and contractual borrowing restrictions. The participating funds are charged administrative fees and an annual commitment fee of 0.10% of the undrawn amount of the facility; these fees are allocated to the funds based on a method approved by the fund’s board of trustees and included in Management and Administrative expenses on the fund’s Statement of Operations. Any borrowings under this facility bear interest at a rate based upon the higher of the one-month London Interbank Offered Rate, federal funds effective rate, or overnight bank funding rate plus an agreed-upon spread.
The fund had no borrowings outstanding at August 31, 2018, or at any time during the period then ended.
8. Other: Dividend income is recorded on the ex-dividend date. Interest income includes income distributions received from Vanguard Market Liquidity Fund and is accrued daily. Premiums and discounts on debt securities purchased are amortized and accreted, respectively, to interest income over the lives of the respective securities. Security transactions are accounted for on the date securities are bought or sold. Costs used to determine realized gains (losses) on the sale of investment securities are those of the specific securities sold.
Each class of shares has equal rights as to assets and earnings, except that each class separately bears certain class-specific expenses related to maintenance of shareholder accounts (included in Management and Administrative expenses), shareholder reporting, and the proxy. Marketing and distribution expenses are allocated to each class of shares based on a method approved by the board of trustees. Income, other non-class-specific expenses, and gains and losses on investments are allocated to each class of shares based on its relative net assets.
B. In accordance with the terms of a Funds’ Service Agreement (the “FSA”) between Vanguard and the fund, Vanguard furnishes to the fund investment advisory, corporate management, administrative, marketing, and distribution services at Vanguard’s cost of operations (as defined by the FSA). These costs of operations are allocated to the fund based on methods and guidelines approved by the board of trustees. Vanguard does not require reimbursement in the current period for certain costs of operations (such as deferred compensation/benefits and risk/insurance costs);
52
Russell 1000 Growth Index Fund
the fund’s liability for these costs of operations is included in Payables to Vanguard on the Statement of Net Assets. All other costs of operations payable to Vanguard are generally settled twice a month.
Upon the request of Vanguard, the fund may invest up to 0.40% of its net assets as capital in Vanguard. At August 31, 2018, the fund had contributed to Vanguard capital in the amount of $255,000, representing 0.00% of the fund’s net assets and 0.10% of Vanguard’s capitalization. The fund’s trustees and officers are also directors and employees, respectively, of Vanguard.
C. Various inputs may be used to determine the value of the fund’s investments. These inputs are summarized in three broad levels for financial statement purposes. The inputs or methodologies used to value securities are not necessarily an indication of the risk associated with investing in those securities.
Level 1—Quoted prices in active markets for identical securities.
Level 2—Other significant observable inputs (including quoted prices for similar securities, interest rates, prepayment speeds, credit risk, etc.).
Level 3—Significant unobservable inputs (including the fund’s own assumptions used to determine
the fair value of investments). Any investments valued with significant unobservable inputs are
noted on the Statement of Net Assets.
The following table summarizes the market value of the fund’s investments as of August 31, 2018, based on the inputs used to value them:
| Level 1 | Level 2 | Level 3 | |
| Investments | ($000) | ($000) | ($000) |
| Common Stocks | 5,211,063 | — | 32 |
| Temporary Cash Investments | 58,452 | 629 | — |
| Futures Contracts—Assets1 | — | — | — |
| Swap Contracts—Assets | — | 3,211 | — |
| Total | 5,269,515 | 3,840 | 32 |
| 1 Represents variation margin on the last day of the reporting period. | |||
D. Permanent differences are reclassified among capital accounts in the financial statements to reflect their tax character. These reclassifications have no effect on net assets or net asset value per share. As of period end, the following permanent differences primarily attributable to the accounting for in-kind redemptions and swap agreements were reclassified to the following accounts:
| Amount | |
| ($000) | |
| Paid-in capital | 286,387 |
| Undistributed (Overdistributed) net investment income | 1,283 |
| Accumulated net realized gains (losses) | (287,670) |
53
Russell 1000 Growth Index Fund
Temporary differences between book-basis and tax-basis components of accumulated net earnings (losses) arise when certain items of income, gain, or loss are recognized in different periods for financial statement and tax purposes; these differences will reverse at some time in the future. The differences are primarily related to the tax deferral of losses on wash sales and the realization of unrealized gains or losses on certain futures contracts and swap agreements. As of period end, the tax components of accumulated net earnings (losses) are detailed in the table as follows:
| Amount | |
| ($000) | |
| Undistributed ordinary income | 17,811 |
| Undistributed long-term gains | — |
| Capital loss carryforwards (non-expiring)* | (85,454) |
| Net unrealized gains (losses) | 1,668,370 |
* The fund used capital loss carryforwards of $8,641,000 to offset taxable capital gains realized during the year ended August 31,
2018, reducing the amount of capital gains that would otherwise be available to distribute to shareholders.
As of August 31, 2018, gross unrealized appreciation and depreciation for investments and derivatives based on cost for U.S. federal income tax purposes were as follows:
| Amount | |
| ($000) | |
| Tax cost | 3,601,806 |
| Gross unrealized appreciation | 1,691,279 |
| Gross unrealized depreciation | (22,909) |
| Net unrealized appreciation (depreciation) | 1,668,370 |
E. During the year ended August 31, 2018, the fund purchased $1,845,672,000 of investment securities and sold $1,432,629,000 of investment securities, other than temporary cash investments. Purchases and sales include $886,781,000 and $786,155,000, respectively, in connection with in-kind purchases and redemptions of the fund’s capital shares.
The fund purchased securities from and sold securities to other Vanguard funds or accounts managed by Vanguard or its affiliates, in accordance with procedures adopted by the board of trustees in compliance with Rule 17a-7 of the Investment Company Act of 1940. For the year ended August 31, 2018, such purchases and sales were $113,088,000 and $161,417,000, respectively; these amounts are included in the purchases and sales of investment securities noted above.
54
Russell 1000 Growth Index Fund
F. Capital share transactions for each class of shares were:
| Year Ended August 31, | ||||
| 2018 | 2017 | |||
| Amount | Shares | Amount | Shares | |
| ($000) | (000) | ($000) | (000) | |
| ETF Shares | ||||
| Issued | 1,187,329 | 8,125 | 601,764 | 5,200 |
| Issued in Lieu of Cash Distributions | — | — | — | — |
| Redeemed | (799,916) | (5,450) | (200,963) | (1,725) |
| Net Increase (Decrease)—ETF Shares | 387,413 | 2,675 | 400,801 | 3,475 |
| Institutional Shares | ||||
| Issued | 705,146 | 2,597 | 575,144 | 2,636 |
| Issued in Lieu of Cash Distributions | 30,158 | 114 | 30,714 | 142 |
| Redeemed | (678,852) | (2,475) | (520,851) | (2,323) |
| Net Increase (Decrease)—Institutional Shares | 56,452 | 236 | 85,007 | 455 |
G. Management has determined that no events or transactions occurred subsequent to August 31, 2018, that would require recognition or disclosure in these financial statements.
55
Report of Independent Registered
Public Accounting Firm
To the Board of Trustees of Vanguard Scottsdale Funds and Shareholders of Vanguard Russell 1000 Index Fund, Vanguard Russell 1000 Value Index Fund and Vanguard Russell 1000 Growth Index Fund
Opinions on the Financial Statements
We have audited the accompanying statements of net assets—investments summary of Vanguard Russell 1000 Index Fund, Vanguard Russell 1000 Value Index Fund and Vanguard Russell 1000 Growth Index Fund (three of the funds constituting Vanguard Scottsdale Funds, hereafter collectively referred to as the “Funds”) as of August 31, 2018, the related statements of operations for the year ended August 31, 2018, the statements of changes in net assets for each of the two years in the period ended August 31, 2018, including the related notes, and the financial highlights for each of the five years in the period ended August 31, 2018 (collectively referred to as the “financial statements”). In our opinion, the financial statements present fairly, in all material respects, the financial position of each of the Funds as of August 31, 2018, the results of each of their operations for the year then ended, the changes in each of their net assets for each of the two years in the period ended August 31, 2018 and each of the financial highlights for each of the five years in the period ended August 31, 2018 in conformity with accounting principles generally accepted in the United States of America.
Basis for Opinions
These financial statements are the responsibility of the Funds’ management. Our responsibility is to express an opinion on the Funds’ financial statements based on our audits. We are a public accounting firm registered with the Public Company Accounting Oversight Board (United States) (“PCAOB”) and are required to be independent with respect to the Funds in accordance with the U.S. federal securities laws and the applicable rules and regulations of the Securities and Exchange Commission and the PCAOB.
We conducted our audits of these financial statements in accordance with the standards of the PCAOB. Those standards require that we plan and perform the audit to obtain reasonable assurance about whether the financial statements are free of material misstatement, whether due to error or fraud.
Our audits included performing procedures to assess the risks of material misstatement of the financial statements, whether due to error or fraud, and performing procedures that respond to those risks. Such procedures included examining, on a test basis, evidence regarding the amounts and disclosures in the financial statements. Our audits also included evaluating the accounting principles used and significant estimates made by management, as well as evaluating the overall presentation of the financial statements. Our procedures included confirmation of securities owned as of August 31, 2018 by correspondence with the custodian and brokers and by agreement to the underlying ownership records of the transfer agent; when replies were not received from brokers, we performed other auditing procedures. We believe that our audits provide a reasonable basis for our opinions.
/s/PricewaterhouseCoopers LLP
Philadelphia, Pennsylvania
October 18, 2018
We have served as the auditor of one or more investment companies in The Vanguard Group of Funds since 1975.
56

Special 2018 tax information (unaudited) for Vanguard Russell 1000 Index Funds
This information for the fiscal year ended August 31, 2018, is included pursuant to provisions of the Internal Revenue Code.
The funds distributed qualified dividend income to shareholders during the fiscal year as follows:
| Fund | ($000) |
| Russell 1000 Index Fund | 51,452 |
| Russell 1000 Value Index Fund | 67,343 |
| Russell 1000 Growth Index Fund | 52,964 |
For corporate shareholders, the percentage of investment income (dividend income plus short-term gains, if any) that qualifies for the dividends-received deduction is as follows:
| Fund | Percentage |
| Russell 1000 Index Fund | 91.9% |
| Russell 1000 Value Index Fund | 88.9 |
| Russell 1000 Growth Index Fund | 90.8 |
57
Your Fund’s After-Tax Returns
This table presents returns for your fund both before and after taxes. The after-tax returns are shown in two ways: (1) assuming that an investor owned the fund during the entire period and paid taxes on the fund’s distributions, and (2) assuming that an investor paid taxes on the fund’s distributions and sold all shares at the end of each period.
Calculations are based on the highest individual federal income tax and capital gains tax rates in effect at the times of the distributions and the hypothetical sales. State and local taxes were not considered. After-tax returns reflect any qualified dividend income, using actual prior-year figures and estimates for 2018. (In the example, returns after the sale of fund shares may be higher than those assuming no sale. This occurs when the sale would have produced a capital loss. The calculation assumes that the investor received a tax deduction for the loss.)
The table shows returns for ETF Shares only; returns for other share classes will differ. Please note that your actual after-tax returns will depend on your tax situation and may differ from those shown. Also note that if you own the fund in a tax-deferred account, such as an individual retirement account or a 401(k) plan, this information does not apply to you. Such accounts are not subject to current taxes.
Finally, keep in mind that a fund’s performance—whether before or after taxes—does not guarantee future results.
| Average Annual Total Returns: Russell 1000 Index Funds | |||
| Periods Ended August 31, 2018 | |||
| Since | |||
| One | Five | Inception | |
| Year | Years | (9/20/2010) | |
| Russell 1000 Index Fund ETF Shares | |||
| Returns Before Taxes | 19.68% | 14.20% | 14.68% |
| Returns After Taxes on Distributions | 19.18 | 13.70 | 14.25 |
| Returns After Taxes on Distributions and Sale of | |||
| Fund Shares | 11.94 | 11.30 | 12.11 |
| Since | |||
| One | Five | Inception | |
| Year | Years | (9/20/2010) | |
| Russell 1000 Value Index Fund ETF Shares | |||
| Returns Before Taxes | 12.36% | 11.07% | 12.57% |
| Returns After Taxes on Distributions | 11.74 | 10.45 | 12.05 |
| Returns After Taxes on Distributions and Sale of | |||
| Fund Shares | 7.71 | 8.70 | 10.26 |
| Since | |||
| One | Five | Inception | |
| Year | Years | (9/20/2010) | |
| Russell 1000 Growth Index Fund ETF Shares | |||
| Returns Before Taxes | 27.09% | 17.34% | 16.72% |
| Returns After Taxes on Distributions | 26.72 | 16.94 | 16.37 |
| Returns After Taxes on Distributions and Sale of | |||
| Fund Shares | 16.23 | 13.96 | 13.92 |
58
About Your Fund’s Expenses
As a shareholder of the fund, you incur ongoing costs, which include costs for portfolio management, administrative services, and shareholder reports (like this one), among others. Operating expenses, which are deducted from a fund’s gross income, directly reduce the investment return of the fund.
A fund’s expenses are expressed as a percentage of its average net assets. This figure is known as the expense ratio. The following examples are intended to help you understand the ongoing costs (in dollars) of investing in your fund and to compare these costs with those of other mutual funds. The examples are based on an investment of $1,000 made at the beginning of the period shown and held for the entire period.
The accompanying table illustrates your fund’s costs in two ways:
• Based on actual fund return. This section helps you to estimate the actual expenses that you paid over the period. The ”Ending Account Value“ shown is derived from the fund‘s actual return, and the third column shows the dollar amount that would have been paid by an investor who started with $1,000 in the fund. You may use the information here, together with the amount you invested, to estimate the expenses that you paid over the period.
To do so, simply divide your account value by $1,000 (for example, an $8,600 account value divided by $1,000 = 8.6), then multiply the result by the number given for your fund under the heading ”Expenses Paid During Period.“
• Based on hypothetical 5% yearly return. This section is intended to help you compare your fund‘s costs with those of other mutual funds. It assumes that the fund had a yearly return of 5% before expenses, but that the expense ratio is unchanged. In this case—because the return used is not the fund’s actual return—the results do not apply to your investment. The example is useful in making comparisons because the Securities and Exchange Commission requires all mutual funds to calculate expenses based on a 5% return. You can assess your fund’s costs by comparing this hypothetical example with the hypothetical examples that appear in shareholder reports of other funds.
Note that the expenses shown in the table are meant to highlight and help you compare ongoing costs only and do not reflect transaction costs incurred by the fund for buying and selling securities. Further, the expenses do not include any purchase, redemption, or account service fees described in the fund prospectus. If such fees were applied to your account, your costs would be higher. Your fund does not carry a “sales load.”
The calculations assume no shares were bought or sold during the period. Your actual costs may have been higher or lower, depending on the amount of your investment and the timing of any purchases or redemptions.
You can find more information about the fund’s expenses, including annual expense ratios, in the Financial Statements section of this report. For additional information on operating expenses and other shareholder costs, please refer to your fund’s current prospectus.
59
| Six Months Ended August 31, 2018 | |||
| Beginning | Ending | Expenses | |
| Account Value | Account Value | Paid During | |
| 2/28/2018 | 8/31/2018 | Period | |
| Based on Actual Fund Return | |||
| Russell 1000 Index Fund | |||
| ETF Shares | $1,000.00 | $1,082.60 | $0.63 |
| Institutional Shares | 1,000.00 | 1,082.74 | 0.42 |
| Russell 1000 Value Index Fund | |||
| ETF Shares | $1,000.00 | $1,048.13 | $0.62 |
| Institutional Shares | 1,000.00 | 1,048.20 | 0.41 |
| Russell 1000 Growth Index Fund | |||
| ETF Shares | $1,000.00 | $1,116.01 | $0.64 |
| Institutional Shares | 1,000.00 | 1,116.24 | 0.43 |
| Based on Hypothetical 5% Yearly Return | |||
| Russell 1000 Index Fund | |||
| ETF Shares | $1,000.00 | $1,024.60 | $0.61 |
| Institutional Shares | 1,000.00 | 1,024.80 | 0.41 |
| Russell 1000 Value Index Fund | |||
| ETF Shares | $1,000.00 | $1,024.60 | $0.61 |
| Institutional Shares | 1,000.00 | 1,024.80 | 0.41 |
| Russell 1000 Growth Index Fund | |||
| ETF Shares | $1,000.00 | $1,024.60 | $0.61 |
| Institutional Shares | 1,000.00 | 1,024.80 | 0.41 |
The calculations are based on expenses incurred in the most recent six-month period. The funds’ annualized six-month expense ratios for
that period are: for the Russell 1000 Index Fund, 0.12% for ETF Shares and 0.08% for Institutional Shares; for the Russell 1000 Value Index
Fund, 0.12% for ETF Shares and 0.08% for Institutional Shares; and for the Russell 1000 Growth Index Fund, 0.12% for ETF Shares and
0.08% for Institutional Shares. The dollar amounts shown as ”Expenses Paid” are equal to the annualized expense ratio multiplied by the
average account value over the period, multiplied by the number of days in the most recent six-month period, then divided by the number
of days in the most recent 12-month period (184/365).
60
Trustees Approve Advisory Arrangements
The board of trustees of Vanguard Russell 1000 Index Fund, Vanguard Russell 1000 Value Index Fund, and Vanguard Russell 1000 Growth Index Fund has renewed each fund’s investment advisory arrangement with The Vanguard Group, Inc. (Vanguard), through its Equity Index Group. The board determined that continuing each fund’s internalized management structure was in the best interests of the fund and its shareholders.
The board based its decision upon an evaluation of the advisor’s investment staff, portfolio management process, and performance. This evaluation included information provided to the board by Vanguard’s Portfolio Review Department, which is responsible for fund and advisor oversight and product management. The Portfolio Review Department met regularly with the advisor and made monthly presentations to the board during the fiscal year that directed the board’s focus to relevant information and topics.
The board, or an investment committee made up of board members, also received information throughout the year through advisor presentations. For each advisor presentation, the board was provided with letters and reports that included information about, among other things, the advisory firm and the advisor’s assessment of the investment environment, portfolio performance, and portfolio characteristics.
In addition, the board received monthly reports, which included a Market and Economic Report, a Fund Dashboard Monthly Summary, and a Fund Performance Report.
Prior to their meeting, the trustees were provided with a memo and materials that summarized the information they had received over the course of the year. They also considered the factors discussed below, among others. However, no single factor determined whether the board approved the arrangements. Rather, it was the totality of the circumstances that drove the board’s decision.
Nature, extent, and quality of services
The board reviewed the quality of the investment management services provided to the funds since their inception in 2010, and took into account the organizational depth and stability of the advisor. The board considered that Vanguard has been managing investments for more than four decades. The Equity Index Group adheres to a sound, disciplined investment management process; the team has considerable experience, stability, and depth.
The board concluded that Vanguard’s experience, stability, depth, and performance, among other factors, warranted continuation of each advisory arrangement.
Investment performance
The board considered each fund’s performance since its inception, including any periods of outperformance or underperformance compared with its target index and peer group. The board concluded that the performance was such that each advisory arrangement should continue. Information about each fund’s most recent performance can be found on the Performance Summary pages of this report.
61
Cost
The board concluded that each fund’s expense ratio was well below the average expense ratio charged by funds in its peer group and that each fund’s advisory expenses were also well below its peer-group average. Information about the funds’ expenses appears in the About Your Fund’s Expenses section of this report as well as in the Financial Statements sections.
The board does not conduct a profitability analysis of Vanguard because of Vanguard’s unique “at-cost” structure. Unlike most other mutual fund management companies, Vanguard is owned by the funds it oversees and produces “profits” only in the form of reduced expenses for fund shareholders.
The benefit of economies of scale
The board concluded that each fund’s at-cost arrangement with Vanguard ensures that the funds will realize economies of scale as they grow, with the cost to shareholders declining as fund assets increase.
The board will consider whether to renew the advisory arrangements again after a one-year period.
62
Glossary
30-Day SEC Yield. A fund’s 30-day SEC yield is derived using a formula specified by the U.S. Securities and Exchange Commission. Under the formula, data related to the fund’s security holdings in the previous 30 days are used to calculate the fund’s hypothetical net income for that period, which is then annualized and divided by the fund’s estimated average net assets over the calculation period. For the purposes of this calculation, a security’s income is based on its current market yield to maturity (for bonds), its actual income (for asset-backed securities), or its projected dividend yield (for stocks). Because the SEC yield represents hypothetical annualized income, it will differ—at times significantly—from the fund’s actual experience. As a result, the fund’s income distributions may be higher or lower than implied by the SEC yield.
Beta. A measure of the magnitude of a fund’s past share-price fluctuations in relation to the ups and downs of a given market index. The index is assigned a beta of 1.00. Compared with a given index, a fund with a beta of 1.20 typically would have seen its share price rise or fall by 12% when the index rose or fell by 10%. For this report, beta is based on returns over the past 36 months for both the fund and the index. Note that a fund’s beta should be reviewed in conjunction with its R-squared (see definition). The lower the R-squared, the less correlation there is between the fund and the index, and the less reliable beta is as an indicator of volatility.
Dividend Yield. Dividend income earned by stocks, expressed as a percentage of the aggregate market value (or of net asset value, for a fund). The yield is determined by dividing the amount of the annual dividends by the aggregate value (or net asset value) at the end of the period. For a fund, the dividend yield is based solely on stock holdings and does not include any income produced by other investments.
Earnings Growth Rate. The average annual rate of growth in earnings over the past five years for the stocks now in a fund.
Equity Exposure. A measure that reflects a fund’s investments in stocks and stock futures. Any holdings in short-term reserves are excluded.
Expense Ratio. A fund’s total annual operating expenses expressed as a percentage of the fund’s average net assets. The expense ratio includes management and administrative expenses, but does not include the transaction costs of buying and selling portfolio securities.
Foreign Holdings. The percentage of a fund represented by securities or depositary receipts of companies based outside the United States.
Inception Date. The date on which the assets of a fund (or one of its share classes) are first invested in accordance with the fund’s investment objective. For funds with a subscription period, the inception date is the day after that period ends. Investment performance is measured from the inception date.
Median Market Cap. An indicator of the size of companies in which a fund invests; the midpoint of market capitalization (market price x shares outstanding) of a fund’s stocks, weighted by the proportion of the fund’s assets invested in each stock. Stocks representing half of the fund’s assets have market capitalizations above the median, and the rest are below it.
Price/Book Ratio. The share price of a stock divided by its net worth, or book value, per share.
For a fund, the weighted average price/book ratio of the stocks it holds.
63
Price/Earnings Ratio. The ratio of a stock’s current price to its per-share earnings over the past year. For a fund, the weighted average P/E of the stocks it holds. P/E is an indicator of market expectations about corporate prospects; the higher the P/E, the greater the expectations for a company’s future growth.
R-Squared. A measure of how much of a fund’s past returns can be explained by the returns from the market in general, as measured by a given index. If a fund’s total returns were precisely synchronized with an index’s returns, its R-squared would be 1.00. If the fund’s returns bore no relationship to the index’s returns, its R-squared would be 0. For this report, R-squared is based on returns over the past 36 months for both the fund and the index.
Return on Equity. The annual average rate of return generated by a company during the past five years for each dollar of shareholder’s equity (net income divided by shareholder’s equity). For a fund, the weighted average return on equity for the companies whose stocks it holds.
Short-Term Reserves. The percentage of a fund invested in highly liquid, short-term securities that can be readily converted to cash.
Turnover Rate. An indication of the fund’s trading activity. Funds with high turnover rates incur higher transaction costs and may be more likely to distribute capital gains (which may be taxable to investors). The turnover rate excludes in-kind transactions, which have minimal impact on costs.
64
This page intentionally left blank.
This page intentionally left blank.
The People Who Govern Your Fund
The trustees of your mutual fund are there to see that the fund is operated and managed in your best interests since, as a shareholder, you are a part owner of the fund. Your fund’s trustees also serve on the board of directors of The Vanguard Group, Inc., which is owned by the Vanguard funds and provides services to them on an at-cost basis.
A majority of Vanguard’s board members are independent, meaning that they have no affiliation with Vanguard or the funds they oversee, apart from the sizable personal investments they have made as private individuals. The independent board members have distinguished backgrounds in business, academia, and public service. Each of the trustees and executive officers oversees 208 Vanguard funds.
Information for each trustee and executive officer of the fund appears below. The mailing address of the trustees and officers is P.O. Box 876, Valley Forge, PA 19482. More information about the trustees is in the Statement of Additional Information, which can be obtained, without charge, by contacting Vanguard at 800-662-7447, or online at vanguard.com.
Interested Trustees1
F. William McNabb III
Born in 1957. Trustee since July 2009. Principal occupation(s) during the past five years and other experience: chairman of the board (January 2010–present) of Vanguard and of each of the investment companies served by Vanguard, trustee (2009–present) of each of the investment companies served by Vanguard, and director (2008–present) of Vanguard. Chief executive officer and president (2008–2017) of Vanguard and each of the investment companies served by Vanguard, managing director (1995–2008) of Vanguard, and director (1997–2018) of Vanguard Marketing Corporation. Director (2018–present) of UnitedHealth Group.
Mortimer J. Buckley
Born in 1969. Trustee since January 2018. Principal occupation(s) during the past five years and other experience: chief executive officer (January 2018–present) of Vanguard; chief executive officer, president, and trustee (January 2018–present) of each of the investment companies served by Vanguard; president and director (2017–present) of Vanguard; and president (February 2018–present) of Vanguard Marketing Corporation. Chief investment officer (2013–2017), managing director (2002–2017), head of the Retail Investor Group (2006–2012), and chief information officer (2001–2006) of Vanguard. Chairman of the board (2011–2017) of the Children’s Hospital of Philadelphia.
Independent Trustees
Emerson U. Fullwood
Born in 1948. Trustee since January 2008. Principal occupation(s) during the past five years and other experience: executive chief staff and marketing officer for North America and corporate vice president (retired 2008) of Xerox Corporation (document management products and services). Former president of the Worldwide Channels Group, Latin America, and Worldwide Customer Service and executive chief staff officer of Developing Markets of Xerox. Executive in residence and 2009–2010 Distinguished Minett Professor at the Rochester Institute of Technology. Lead director of SPX FLOW, Inc. (multi-industry manufacturing). Director of the University of Rochester Medical Center, the Monroe Community College Foundation, the United Way of Rochester, North Carolina A&T University, and Roberts Wesleyan College. Trustee of the University of Rochester.
Amy Gutmann
Born in 1949. Trustee since June 2006. Principal occupation(s) during the past five years and other experience: president (2004–present) of the University of Pennsylvania. Christopher H. Browne Distinguished Professor of Political Science, School of Arts and Sciences, and professor of communication, Annenberg School for Communication, with secondary faculty appointments in the Department of Philosophy, School of Arts and Sciences, and at the Graduate School of Education, University of Pennsylvania. Trustee of the National Constitution Center.
1 Mr. McNabb and Mr. Buckley are considered “interested persons,” as defined in the Investment Company Act of 1940, because
they are officers of the Vanguard funds.
JoAnn Heffernan Heisen
Born in 1950. Trustee since July 1998. Principal occupation(s) during the past five years and other experience: corporate vice president of Johnson & Johnson (pharmaceuticals/medical devices/consumer products) and member of its executive committee (1997–2008). Chief global diversity officer (retired 2008), vice president and chief information officer (1997–2006), controller (1995–1997), treasurer (1991–1995), and assistant treasurer (1989–1991) of Johnson & Johnson. Director of Skytop Lodge Corporation (hotels) and the Robert Wood Johnson Foundation. Member of the advisory board of the Institute for Women’s Leadership at Rutgers University.
F. Joseph Loughrey
Born in 1949. Trustee since October 2009. Principal occupation(s) during the past five years and other experience: president and chief operating officer (retired 2009) and vice chairman of the board (2008–2009) of Cummins Inc. (industrial machinery). Chairman of the board of Hillenbrand, Inc. (specialized consumer services), Oxfam America, and the Lumina Foundation for Education. Director of the V Foundation for Cancer Research. Member of the advisory council for the College of Arts and Letters and chair of the advisory board to the Kellogg Institute for International Studies, both at the University of Notre Dame.
Mark Loughridge
Born in 1953. Trustee since March 2012. Principal occupation(s) during the past five years and other experience: senior vice president and chief financial officer (retired 2013) of IBM (information technology services). Fiduciary member of IBM’s Retirement Plan Committee (2004–2013), senior vice president and general manager (2002–2004) of IBM Global Financing, vice president and controller (1998–2002) of IBM, and a variety of other prior management roles at IBM. Member of the Council on Chicago Booth.
Scott C. Malpass
Born in 1962. Trustee since March 2012. Principal occupation(s) during the past five years and other experience: chief investment officer (1989–present) and vice president (1996–present) of the University of Notre Dame. Assistant professor of finance at the Mendoza College of Business, University of Notre Dame, and member of the Notre Dame 403(b) Investment Committee. Chairman of the board of TIFF Advisory Services, Inc. Member of the board of Catholic Investment Services, Inc. (investment advisors), the board of advisors for Spruceview Capital Partners, and the board of superintendence of the Institute for the Works of Religion.
Deanna Mulligan
Born in 1963. Trustee since January 2018. Principal occupation(s) during the past five years and other experience: president (2010–present) and chief executive officer (2011–present) of The Guardian Life Insurance Company of America. Chief operating officer (2010–2011) and executive vice president (2008–2010) of Individual Life and Disability of The Guardian Life Insurance Company of America. Member of the board of The Guardian Life Insurance Company of America, the American Council of Life Insurers, the Partnership for New York City (business leadership), and the Committee Encouraging Corporate Philanthropy. Trustee of the Economic Club of New York and the Bruce Museum (arts and science). Member of the Advisory Council for the Stanford Graduate School of Business.
André F. Perold
Born in 1952. Trustee since December 2004. Principal occupation(s) during the past five years and other experience: George Gund Professor of Finance and Banking, Emeritus at the Harvard Business School (retired 2011). Chief investment officer and co-managing partner of HighVista Strategies LLC (private investment firm). Overseer of the Museum of Fine Arts Boston.
Sarah Bloom Raskin
Born in 1961. Trustee since January 2018. Principal occupation(s) during the past five years and other experience: deputy secretary (2014–2017) of the United States Department of the Treasury. Governor (2010–2014) of the Federal Reserve Board. Commissioner (2007–2010) of financial regulation for the State of Maryland. Member of the board of directors (2012–2014) of Neighborhood Reinvestment Corporation. Director of i(x) Investments, LLC.
Peter F. Volanakis
Born in 1955. Trustee since July 2009. Principal occupation(s) during the past five years and other experience: president and chief operating officer (retired 2010) of Corning Incorporated (communications equipment) and director of Corning Incorporated (2000–2010) and Dow Corning (2001–2010). Director (2012) of SPX Corporation (multi-industry manufacturing). Overseer of the Amos Tuck School of Business Administration, Dartmouth College (2001–2013). Chairman of the board of trustees of Colby-Sawyer College. Member of the Board of Hypertherm Inc. (industrial cutting systems, software, and consumables).
Executive Officers
Glenn Booraem
Born in 1967. Principal occupation(s) during the past five years and other experience: principal of Vanguard. Investment stewardship officer (2017–present), treasurer (2015–2017), controller (2010–2015), and assistant controller (2001–2010) of each of the investment companies served by Vanguard.
Christine M. Buchanan
Born in 1970. Principal occupation(s) during the past five years and other experience: principal of Vanguard and global head of Fund Administration at Vanguard. Treasurer (2017–present) of each of the investment companies served by Vanguard. Partner (2005–2017) at KPMG LLP (audit, tax, and advisory services).
Brian Dvorak
Born in 1973. Principal occupation(s) during the past five years and other experience: principal of Vanguard. Chief compliance officer (2017–present) of Vanguard and each of the investment companies served by Vanguard. Assistant vice president (2017–present) of Vanguard Marketing Corporation. Vice president and director of Enterprise Risk Management (2011–2013) at Oppenheimer Funds, Inc.
Thomas J. Higgins
Born in 1957. Principal occupation(s) during the past five years and other experience: principal of Vanguard. Chief financial officer (2008–present) and treasurer (1998–2008) of each of the investment companies served by Vanguard.
Peter Mahoney
Born in 1974. Principal occupation(s) during the past five years and other experience: principal of Vanguard. Controller (2015–present) of each of the investment companies served by Vanguard. Head of International Fund Services (2008–2014) at Vanguard.
Anne E. Robinson
Born in 1970. Principal occupation(s) during the past five years and other experience: general counsel (2016–present) of Vanguard. Secretary (2016–present) of Vanguard and of each of the investment companies served by Vanguard. Managing director (2016–present) of Vanguard. Director and senior vice president (2016–2018) of Vanguard Marketing Corporation. Managing director and general counsel of Global Cards and Consumer Services (2014–2016) at Citigroup. Counsel (2003–2014) at American Express.
Michael Rollings
Born in 1963. Principal occupation(s) during the past five years and other experience: finance director (2017–present) and treasurer (2017) of each of the investment companies served by Vanguard. Managing director (2016–present) of Vanguard. Chief financial officer (2016–present) of Vanguard. Director (2016–present) of Vanguard Marketing Corporation. Executive vice president and chief financial officer (2006–2016) of MassMutual Financial Group.
| Vanguard Senior Management Team | |
| Mortimer J. Buckley | James M. Norris |
| Gregory Davis | Thomas M. Rampulla |
| John James | Karin A. Risi |
| Martha G. King | Anne E. Robinson |
| John T. Marcante | Michael Rollings |
| Chris D. McIsaac | |
| Chairman Emeritus and Senior Advisor | |
| John J. Brennan | |
| Chairman, 1996–2009 | |
| Chief Executive Officer and President, 1996–2008 | |
| Founder | |
| John C. Bogle | |
| Chairman and Chief Executive Officer, 1974–1996 | |
 | |
| P.O. Box 2600 | |
| Valley Forge, PA 19482-2600 | |
| Connect with Vanguard® > vanguard.com | |
| Fund Information > 800-662-7447 | Source for Bloomberg Barclays indexes: Bloomberg |
| Direct Investor Account Services > 800-662-2739 | Index Services Limited. Copyright 2018, Bloomberg. All |
| rights reserved. | |
| Institutional Investor Services > 800-523-1036 | |
| The Russell Indexes and Russell® are registered | |
| Text Telephone for People | trademarks of Russell Investments and have been |
| Who Are Deaf or Hard of Hearing > 800-749-7273 | licensed for use by The Vanguard Group, Inc. The |
| This material may be used in conjunction | products are not sponsored, endorsed, sold, or |
| promoted by Russell Investments and Russell | |
| with the offering of shares of any Vanguard | Investments makes no representation regarding the |
| fund only if preceded or accompanied by | advisability of investing in the products. |
| the fund’s current prospectus. | |
| All comparative mutual fund data are from Lipper, a | |
| Thomson Reuters Company, or Morningstar, Inc., unless | |
| otherwise noted. | |
| You can obtain a free copy of Vanguard’s proxy voting | |
| guidelines by visiting vanguard.com/proxyreporting or by | |
| calling Vanguard at 800-662-2739. The guidelines are | |
| also available from the SEC’s website, sec.gov. In | |
| addition, you may obtain a free report on how your fund | |
| voted the proxies for securities it owned during the 12 | |
| months ended June 30. To get the report, visit either | |
| vanguard.com/proxyreporting or sec.gov. | |
| You can review and copy information about your fund at | |
| the SEC’s Public Reference Room in Washington, D.C. To | |
| find out more about this public service, call the SEC at | |
| 202-551-8090. Information about your fund is also | |
| available on the SEC’s website, and you can receive | |
| copies of this information, for a fee, by sending a | |
| request in either of two ways: via email addressed to | |
| publicinfo@sec.gov or via regular mail addressed to the | |
| Public Reference Section, Securities and Exchange | |
| Commission, Washington, DC 20549-1520. | |
| © 2018 The Vanguard Group, Inc. | |
| All rights reserved. | |
| Vanguard Marketing Corporation, Distributor. | |
| Q18480 102018 | |
Vanguard’s Principles for Investing Success
We want to give you the best chance of investment success. These principles, grounded in Vanguard’s research and experience, can put you on the right path.
Goals. Create clear, appropriate investment goals.
Balance. Develop a suitable asset allocation using broadly diversified funds. Cost. Minimize cost.
Discipline. Maintain perspective and long-term discipline.
A single theme unites these principles: Focus on the things you can control.
We believe there is no wiser course for any investor.
| Contents | |
| Your Fund’s Performance at a Glance. | 1 |
| CEO’s Perspective. | 4 |
| Russell 2000 Index Fund. | 6 |
| Russell 2000 Value Index Fund. | 23 |
| Russell 2000 Growth Index Fund. | 40 |
| Your Fund’s After-Tax Returns. | 59 |
| About Your Fund’s Expenses. | 60 |
| Trustees Approve Advisory Arrangements. | 62 |
| Glossary. | 64 |
Please note: The opinions expressed in this report are just that—informed opinions. They should not be considered promises
or advice. Also, please keep in mind that the information and opinions cover the period through the date on the front of this
report. Of course, the risks of investing in your fund are spelled out in the prospectus.
See the Glossary for definitions of investment terms used in this report.
Your Fund’s Performance at a Glance
• Growth stocks outpaced their value-oriented counterparts and small-capitalization stocks generally outperformed mid- and large-caps for the 12 months ended August 31, 2018. These broad trends were reflected in the performance of the three Vanguard Russell 2000 Index Funds.
• Results ranged from about 20% for Vanguard Russell 2000 Value Index Fund to more than 30% for Vanguard Russell 2000 Growth Index Fund. Vanguard Russell 2000 Index Fund, which includes both growth and value stocks, returned more than 25%.
• Each fund closely tracked its target index. The Growth Index Fund trailed the average returns of its small-cap peers; the Index Fund and Value Index Fund both outpaced their peer-group averages.
• All nine industry sectors produced positive returns for all three funds, with health care and consumer discretionary among the top performers. Utilities and, for the Value Index Fund, consumer staples were among the poorest performers.
| Total Returns: Fiscal Year Ended August 31, 2018 | |
| Total | |
| Returns | |
| Vanguard Russell 2000 Index Fund | |
| ETF Shares | |
| Market Price | 25.48% |
| Net Asset Value | 25.49 |
| Institutional Shares | 25.58 |
| Russell 2000 Index | 25.45 |
| Small-Cap Core Funds Average | 21.09 |
| Small-Cap Core Funds Average: Derived from data provided by Lipper, a Thomson Reuters Company. | |
| Vanguard Russell 2000 Value Index Fund | |
| ETF Shares | |
| Market Price | 20.01% |
| Net Asset Value | 19.96 |
| Institutional Shares | 20.10 |
| Russell 2000 Value Index | 20.05 |
| Small-Cap Value Funds Average | 19.05 |
| Small-Cap Value Funds Average: Derived from data provided by Lipper, a Thomson Reuters Company. | |
1
| Total | |
| Returns | |
| Vanguard Russell 2000 Growth Index Fund | |
| ETF Shares | |
| Market Price | 30.66% |
| Net Asset Value | 30.69 |
| Institutional Shares | 30.85 |
| Russell 2000 Growth Index | 30.72 |
| Small-Cap Growth Funds Average | 34.70 |
Small-Cap Growth Funds Average: Derived from data provided by Lipper, a Thomson Reuters Company.
Institutional Shares are available to certain institutional investors who meet specific administrative, service, and account-size criteria. The
Vanguard ETF® Shares shown are traded on the Nasdaq exchange and are available only through brokers. The table provides ETF returns
based on both the Nasdaq market price and the net asset value for a share. U.S. Pat. Nos. 6,879,964; 7,337,138; 7,720,749; 7,925,573;
8,090,646; and 8,417,623.
For the ETF Shares, the market price is determined by the midpoint of the bid-offer spread as of the closing time of the New York Stock
Exchange (generally 4 p.m., Eastern time). The net asset value is also determined as of the NYSE closing time. For more information about
how the ETF Shares' market prices have compared with their net asset value, visit vanguard.com, select your ETF, and then select the
Price and Performance tab. The ETF premium/discount analysis there shows the percentages of days on which the ETF Shares' market
price was above or below the NAV.
| Total Returns: Inception Through August 31, 2018 | |
| Average | |
| Annual Return | |
| Russell 2000 Index Fund ETF Shares Net Asset Value (Returns since inception: 9/20/2010) | 14.30% |
| Russell 2000 Index | 14.32 |
| Small-Cap Core Funds Average | 12.77 |
| Small-Cap Core Funds Average: Derived from data provided by Lipper, a Thomson Reuters Company. | |
| Russell 2000 Value Index Fund ETF Shares Net Asset Value (Returns since inception: 9/20/2010) | 12.73% |
| Russell 2000 Value Index | 12.88 |
| Small-Cap Value Funds Average | 12.20 |
| Small-Cap Value Funds Average: Derived from data provided by Lipper, a Thomson Reuters Company. | |
| Russell 2000 Growth Index Fund ETF Shares Net Asset Value (Returns since inception: 9/20/2010) | 15.64% |
| Russell 2000 Growth Index | 15.67 |
| Small-Cap Growth Funds Average | 14.88 |
| Small-Cap Growth Funds Average: Derived from data provided by Lipper, a Thomson Reuters Company. | |
The figures shown represent past performance, which is not a guarantee of future results. (Current performance may be
lower or higher than the performance data cited. For performance data current to the most recent month-end, visit our
website at vanguard.com/performance.) Note, too, that both investment returns and principal value can fluctuate widely,
so an investor’s shares, when sold, could be worth more or less than their original cost.
2
| Expense Ratios | |||
| Your Fund Compared With Its Peer Group | |||
| ETF | Institutional | Peer Group | |
| Shares | Shares | Average | |
| Russell 2000 Index Fund | 0.15% | 0.08% | 1.20% |
| Russell 2000 Value Index Fund | 0.20 | 0.08 | 1.30 |
| Russell 2000 Growth Index Fund | 0.20 | 0.08 | 1.31 |
The fund expense ratios shown are from the prospectus dated December 21, 2017, and represent estimated costs for the current fiscal
year. For the fiscal year ended August 31, 2018, the funds’ expense ratios were: for the Russell 2000 Index Fund, 0.15% for ETF Shares
and 0.08% for Institutional Shares; for the Russell 2000 Value Index Fund, 0.20% for ETF Shares and 0.08% for Institutional Shares; and
for the Russell 2000 Growth Index Fund, 0.20% for ETF Shares and 0.08% for Institutional Shares. The peer-group expense ratios are
derived from data provided by Lipper, a Thomson Reuters Company, and capture information through year-end 2017.
Peer groups: For the Russell 2000 Index Fund, Small-Cap Core Funds; for the Russell 2000 Value Index Fund, Small-Cap Value Funds; and
for the Russell 2000 Growth Index Fund, Small-Cap Growth Funds.
| 3 |
CEO’s Perspective

Tim Buckley
President and Chief Executive Officer
Dear Shareholder,
Over the years, I’ve found that prudent investors exhibit a common trait: discipline. No matter how the markets move or what new investing fad hits the headlines, those who stay focused on their goals and tune out the noise are set up for long-term success.
The prime gateway to investing is saving, and you don’t usually become a saver without a healthy dose of discipline. Savers make the decision to sock away part of their income, which means spending less and delaying gratification, no matter how difficult that may be.
Of course, disciplined investing extends beyond diligent saving. The financial markets, in the short term especially, are unpredictable; I have yet to meet the investor who can time them perfectly. It takes discipline to resist the urge to go all-in when markets are frothy or to retreat when things look bleak.
Staying put with your investments is one strategy for handling volatility. Another, rebalancing, requires even more discipline because it means steering your money away from strong performers and toward poorer performers.
Patience—a form of discipline—is also the friend of long-term investors. Higher returns are the potential reward for weathering the market’s turbulence and uncertainty.
4
We have been enjoying one of the longest bull markets in history, but it won’t continue forever. Prepare yourself now for how you will react when volatility comes back. Don’t panic. Don’t chase returns or look for answers outside the asset classes you trust. And be sure to rebalance periodically, even when there’s turmoil.
Whether you’re a master of self-control, get a boost from technology, or work with a professional advisor, know that discipline
is necessary to get the most out of your investment portfolio. And know that Vanguard is with you for the entire ride.
Thank you for your continued loyalty.
Sincerely,

Mortimer J. Buckley
President and Chief Executive Officer
September 13, 2018
| Market Barometer | |||
| Average Annual Total Returns | |||
| Periods Ended August 31, 2018 | |||
| One Year | Three Years | Five Years | |
| Stocks | |||
| Russell 1000 Index (Large-caps) | 19.82% | 15.84% | 14.36% |
| Russell 2000 Index (Small-caps) | 25.45 | 16.11 | 13.00 |
| Russell 3000 Index (Broad U.S. market) | 20.25 | 15.86 | 14.25 |
| FTSE All-World ex US Index (International) | 3.51 | 8.31 | 5.82 |
| Bonds | |||
| Bloomberg Barclays U.S. Aggregate Bond Index | |||
| (Broad taxable market) | -1.05% | 1.76% | 2.49% |
| Bloomberg Barclays Municipal Bond Index | |||
| (Broad tax-exempt market) | 0.49 | 2.71 | 4.12 |
| FTSE Three-Month U. S. Treasury Bill Index | 1.49 | 0.74 | 0.44 |
| CPI | |||
| Consumer Price Index | 2.70% | 1.90% | 1.52% |
5
Russell 2000 Index Fund
Fund Profile
As of August 31, 2018
| Share-Class Characteristics | ||
| ETF | Institutional | |
| Shares | Shares | |
| Ticker Symbol | VTWO | VRTIX |
| Expense Ratio1 | 0.15% | 0.08% |
| 30-Day SEC Yield | 1.12% | 1.19% |
| Portfolio Characteristics | |||
| DJ | |||
| Russell | U.S. Total | ||
| 2000 | Market | ||
| Fund | Index | FA Index | |
| Number of Stocks | 2,052 | 2,000 | 3,745 |
| Median Market Cap | $2.3B | $2.3B | $71.0B |
| Price/Earnings Ratio | 19.1x | 19.1x | 21.0x |
| Price/Book Ratio | 2.3x | 2.3x | 3.2x |
| Return on Equity | 7.7% | 7.7% | 15.0% |
| Earnings Growth | |||
| Rate | 8.5% | 8.4% | 8.4% |
| Dividend Yield | 1.2% | 1.2% | 1.7% |
| Foreign Holdings | 0.0% | 0.0% | 0.0% |
| Turnover Rate | 19% | — | — |
| Short-Term Reserves | 0.0% | — | — |
| Sector Diversification (% of equity exposure) | |||
| DJ | |||
| Russell | U.S. Total | ||
| 2000 | Market | ||
| Fund | Index | FA Index | |
| Consumer Discretionary | 14.9% | 14.9% | 14.4% |
| Consumer Staples | 2.4 | 2.4 | 5.3 |
| Energy | 4.6 | 4.6 | 5.6 |
| Financial Services | 24.9 | 24.9 | 20.8 |
| Health Care | 16.0 | 16.0 | 13.9 |
| Materials & Processing | 6.8 | 6.8 | 3.5 |
| Producer Durables | 13.5 | 13.5 | 10.5 |
| Technology | 13.0 | 13.0 | 21.4 |
| Utilities | 3.9 | 3.9 | 4.6 |
Sector categories are based on the Russell Global Sectors (“RGS”),
except for the “Other” category (if applicable), which includes
securities that have not been provided a RGS classification as of
the effective reporting period.
| Volatility Measures | ||
| DJ | ||
| Russell | U.S. Total | |
| 2000 | Market | |
| Index | FA Index | |
| R-Squared | 1.00 | 0.69 |
| Beta | 1.00 | 1.16 |
| These measures show the degree and timing of the fund’s | ||
| fluctuations compared with the indexes over 36 months. | ||
| Ten Largest Holdings (% of total net assets) | ||
| Five Below Inc. | Specialty Retail | 0.3% |
| LivaNova plc | Medical Equipment | 0.3 |
| Haemonetics Corp. | Medical Equipment | 0.3 |
| Etsy Inc. | Diversified Retail | 0.3 |
| Integrated Device | Semiconductors & | |
| Technology Inc. | Components | 0.2 |
| Ligand Pharmaceuticals | ||
| Inc. | Biotechnology | 0.2 |
| Primerica Inc. | Insurance: Life | 0.2 |
| HubSpot Inc. | Computer Services | |
| Software & Systems | 0.2 | |
| Teladoc Health Inc. | Health Care Services | 0.2 |
| HealthEquity Inc. | Health Care | |
| Management | ||
| Services | 0.2 | |
| Top Ten | 2.4% | |
| The holdings listed exclude any temporary cash investments and | ||
| equity index products. | ||
Investment Focus

1 The expense ratios shown are from the prospectus dated December 21, 2017, and represent estimated costs for the current fiscal year. For the fiscal year ended August 31, 2018, the expense ratios were 0.15% for ETF Shares and 0.08% for Institutional Shares.
6
Russell 2000 Index Fund
Performance Summary
All of the returns in this report represent past performance, which is not a guarantee of future results that may be achieved by the fund. (Current performance may be lower or higher than the performance data cited. For performance data current to the most recent month-end, visit our website at vanguard.com/performance.) Note, too, that both investment returns and principal value can fluctuate widely, so an investor’s shares, when sold, could be worth more or less than their original cost. The returns shown do not reflect taxes that a shareholder would pay on fund distributions or on the sale of fund shares.
Cumulative Performance: September 20, 2010, Through August 31, 2018
Initial Investment of $10,000
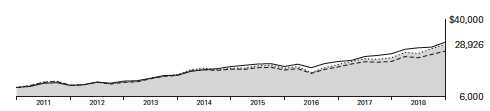
| Average Annual Total Returns | |||||
| Periods Ended August 31, 2018 | |||||
| Since | Final Value | ||||
| One | Five | Inception | of a $10,000 | ||
| Year | Years | (9/20/2010) | Investment | ||
| Russell 2000 Index Fund*ETF Shares | |||||
| Net Asset Value | 25.49% | 13.03% | 14.30% | $28,926 | |
| Russell 2000 Index Fund*ETF Shares | |||||
| Market Price | 25.48 | 13.02 | 14.30 | 28,923 | |
| • • • • • • • • | Russell 2000 Index | 25.45 | 13.00 | 14.32 | 28,951 |
| – – – – | Small-Cap Core Funds Average | 21.09 | 11.19 | 12.77 | 25,983 |
| Dow Jones U.S. Total Stock Market | |||||
| Float Adjusted Index | 20.26 | 14.21 | 14.77 | 29,886 | |
Small-Cap Core Funds Average: Derived from data provided by Lipper, a Thomson Reuters Company.
"Since Inception" performance is calculated from the ETF Shares’ inception date for both the fund and its comparative standards.
See Financial Highlights for dividend and capital gains information.
7
Russell 2000 Index Fund
| Average Annual Total Returns | ||||
| Periods Ended August 31, 2018 | ||||
| Since | Final Value | |||
| One | Five | Inception | of a $5,000,000 | |
| Year | Years | (12/22/2010) | Investment | |
| Russell 2000 Index Fund Institutional Shares | 25.58% | 13.11% | 12.40% | $12,288,554 |
| Russell 2000 Index | 25.45 | 13.00 | 12.33 | 12,228,884 |
| Dow Jones U.S. Total Stock Market Float | ||||
| Adjusted Index | 20.26 | 14.21 | 13.62 | 13,346,409 |
| "Since Inception" performance is calculated from the Institutional Shares’ inception date for both the fund and its comparative standards. | ||||
| Cumulative Returns of ETF Shares: September 20, 2010, Through August 31, 2018 | |||
| Since | |||
| One | Five | Inception | |
| Year | Years | (9/20/2010) | |
| Russell 2000 Index Fund ETF Shares Market Price | 25.48% | 84.44% | 189.23% |
| Russell 2000 Index Fund ETF Shares Net Asset | |||
| Value | 25.49 | 84.46 | 189.26 |
| Russell 2000 Index | 25.45 | 84.28 | 189.51 |
| "Since Inception" performance is calculated from the ETF Shares’ inception date for both the fund and its comparative standards. | |||
Fiscal-Year Total Returns (%): September 20, 2010, Through August 31, 2018
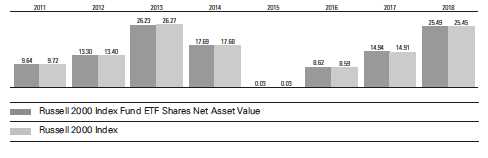
8
Russell 2000 Index Fund
Average Annual Total Returns: Periods Ended June 30, 2018
This table presents returns through the latest calendar quarter—rather than through the end of the fiscal period.
Securities and Exchange Commission rules require that we provide this information.
| Inception | One | Five | Since | |
| Date | Year | Years | Inception | |
| ETF Shares | 9/20/2010 | |||
| Market Price | 17.70% | 12.55% | 13.76% | |
| Net Asset Value | 17.60 | 12.48 | 13.76 | |
| Institutional Shares | 12/22/2010 | 17.69 | 12.56 | 11.81 |
9
Russell 2000 Index Fund
Financial Statements
Statement of Net Assets—Investments Summary
As of August 31, 2018
This Statement summarizes the fund’s holdings by asset type. Details are reported for each of the fund’s 50 largest individual holdings and for investments that, in total for any issuer, represent more than 1% of the fund’s net assets. The total value of smaller holdings is reported as a single amount within each category.
The fund reports a complete list of its holdings in regulatory filings four times in each fiscal year, at the quarter-ends. For the second and fourth fiscal quarters, the complete listing of the fund’s holdings is available electronically on vanguard.com and on the Securities and Exchange Commission’s website (sec.gov), or you can have it mailed to you without charge by calling 800-662-7447. For the first and third fiscal quarters, the fund files the lists with the SEC on Form N-Q. Shareholders can look up the fund’s Forms N-Q on the SEC’s website. Forms N-Q may also be reviewed and copied at the SEC’s Public Reference Room (see the back cover of this report for further information).
| Market | Percentage | |||
| Value• | of Net | |||
| Shares | ($000) | Assets | ||
| Common Stocks | ||||
| Consumer Discretionary | ||||
| * Five Below Inc. | 63,777 | 7,428 | 0.3% | |
| * Etsy Inc. | 139,455 | 6,790 | 0.2% | |
| Texas Roadhouse Inc. Class A | 79,155 | 5,458 | 0.2% | |
| * Planet Fitness Inc. Class A | 103,236 | 5,303 | 0.2% | |
| * Trade Desk Inc. Class A | 36,767 | 5,216 | 0.2% | |
| * Ollie’s Bargain Outlet Holdings Inc. | 58,029 | 5,054 | 0.2% | |
| * Stamps.com Inc. | 20,254 | 5,032 | 0.2% | |
| American Eagle Outfitters Inc. | 188,251 | 4,887 | 0.2% | |
| Consumer Discretionary—Other † | 357,922 | 13.2% | ||
| 403,090 | 14.9% | |||
| Consumer Staples † | 65,550 | 2.4% | ||
| Energy | ||||
| Delek US Holdings Inc. | 97,490 | 5,313 | 0.2% | |
| Energy—Other † | 117,574 | 4.4% | ||
| 122,887 | 4.6% | |||
| Financial Services | ||||
| Primerica Inc. | 51,076 | 6,244 | 0.2% | |
| IBERIABANK Corp. | 65,523 | 5,678 | 0.2% | |
| * MGIC Investment Corp. | 432,992 | 5,508 | 0.2% | |
| Radian Group Inc. | 252,204 | 5,127 | 0.2% | |
| Gramercy Property Trust | 187,295 | 5,123 | 0.2% | |
| Hancock Whitney Corp. | 99,306 | 5,119 | 0.2% | |
| Kemper Corp. | 61,557 | 5,008 | 0.2% | |
| Sabra Health Care REIT Inc. | 207,447 | 4,892 | 0.2% | |
| * Essent Group Ltd. | 112,100 | 4,861 | 0.2% | |
| * Green Dot Corp. Class A | 55,663 | 4,769 | 0.2% | |
| Financial Services—Other † | 617,858 | 22.9% | ||
| 670,187 | 24.9% | |||
| 10 | ||||
| Russell 2000 Index Fund | |||||
| Market | Percentage | ||||
| Value• | of Net | ||||
| Shares | ($000) | Assets | |||
| Health Care | |||||
| * | LivaNova plc | 56,815 | 7,133 | 0.3% | |
| * | Haemonetics Corp. | 62,689 | 6,999 | 0.3% | |
| * | Ligand Pharmaceuticals Inc. | 24,410 | 6,339 | 0.2% | |
| *,^ | Teladoc Health Inc. | 77,943 | 6,044 | 0.2% | |
| * | HealthEquity Inc. | 63,176 | 5,952 | 0.2% | |
| * | Medidata Solutions Inc. | 67,828 | 5,764 | 0.2% | |
| * | Neogen Corp. | 58,610 | 5,477 | 0.2% | |
| * | Inogen Inc. | 20,574 | 5,450 | 0.2% | |
| * | FibroGen Inc. | 87,156 | 5,330 | 0.2% | |
| * | Loxo Oncology Inc. | 30,963 | 5,232 | 0.2% | |
| Health Care—Other † | 371,024 | 13.8% | |||
| 430,744 | 16.0% | ||||
| Materials & Processing | |||||
| * | Trex Co. Inc. | 68,964 | 5,841 | 0.2% | |
| * | Ingevity Corp. | 49,474 | 4,997 | 0.2% | |
| Louisiana-Pacific Corp. | 170,369 | 4,968 | 0.2% | ||
| § | Materials & Processing—Other † | 168,211 | 6.2% | ||
| 184,017 | 6.8% | ||||
| §,1Other † | 480 | 0.0% | |||
| Producer Durables | |||||
| * | ASGN Inc. | 59,200 | 5,481 | 0.2% | |
| EMCOR Group Inc. | 67,898 | 5,439 | 0.2% | ||
| Insperity Inc. | 44,718 | 5,359 | 0.2% | ||
| Woodward Inc. | 62,562 | 5,040 | 0.2% | ||
| MAXIMUS Inc. | 75,775 | 5,039 | 0.2% | ||
| * | Proto Labs Inc. | 31,618 | 4,915 | 0.2% | |
| Producer Durables—Other † | 332,255 | 12.3% | |||
| 363,528 | 13.5% | ||||
| Technology | |||||
| * | Integrated Device Technology Inc. | 154,790 | 6,577 | 0.3% | |
| * | HubSpot Inc. | 42,295 | 6,078 | 0.2% | |
| Blackbaud Inc. | 56,310 | 5,888 | 0.2% | ||
| * | Cree Inc. | 117,531 | 5,654 | 0.2% | |
| Entegris Inc. | 165,673 | 5,616 | 0.2% | ||
| * | CACI International Inc. Class A | 28,678 | 5,592 | 0.2% | |
| * | New Relic Inc. | 51,718 | 5,315 | 0.2% | |
| * | Ciena Corp. | 167,323 | 5,284 | 0.2% | |
| * | Lumentum Holdings Inc. | 73,179 | 4,969 | 0.2% | |
| * | Silicon Laboratories Inc. | 50,075 | 4,907 | 0.2% | |
| Technology—Other † | 293,766 | 10.9% | |||
| 349,646 | 13.0% | ||||
| Utilities | |||||
| IDACORP Inc. | 58,920 | 5,765 | 0.2% | ||
| Portland General Electric Co. | 104,371 | 4,843 | 0.2% | ||
| Utilities—Other † | 95,488 | 3.5% | |||
| 106,096 | 3.9% | ||||
| Total Common Stocks (Cost $2,273,490) | 2,696,225 | 100.0%2 | |||
| 11 | |||||
| Russell 2000 Index Fund | |||||
| Market | Percentage | ||||
| Value• | of Net | ||||
| Coupon | Shares | ($000) | Assets | ||
| Temporary Cash Investments | |||||
| Money Market Fund | |||||
| 3,4 Vanguard Market Liquidity Fund | 2.153% | 416,156 | 41,624 | 1.6% | |
| 5U.S. Government and Agency Obligations † | 598 | 0.0% | |||
| Total Temporary Cash Investments (Cost $42,211) | 42,222 | 1.6%2 | |||
| Total Investments (Cost $2,315,701) | 2,738,447 | 101.6% | |||
| Amount | |||||
| ($000) | |||||
| Other Assets and Liabilities | |||||
| Other Assets | |||||
| Investment in Vanguard | 131 | ||||
| Receivables for Accrued Income | 1,674 | ||||
| Receivables for Capital Shares Issued | 10,572 | ||||
| Variation Margin Receivable—Futures Contracts | 7 | ||||
| Other Assets | 103 | ||||
| Total Other Assets | 12,487 | 0.4% | |||
| Liabilities | |||||
| Payables for Investment Securities Purchased | (321) | ||||
| Collateral for Securities on Loan | (40,831) | ||||
| Payables for Capital Shares Redeemed | (12,973) | ||||
| Payables to Vanguard | (393) | ||||
| Total Liabilities | (54,518) | (2.0%) | |||
| Net Assets | 2,696,416 | 100.0% | |||
| At August 31, 2018, net assets consisted of: | |||||
| Amount | |||||
| ($000) | |||||
| Paid-in Capital | 2,337,978 | ||||
| Undistributed Net Investment Income | 6,218 | ||||
| Accumulated Net Realized Losses | (70,610) | ||||
| Unrealized Appreciation (Depreciation) | |||||
| Investment Securities | 422,746 | ||||
| Futures Contracts | 84 | ||||
| Net Assets | 2,696,416 | ||||
| 12 | |||||
Russell 2000 Index Fund
| Amount | |
| ($000) | |
| ETF Shares—Net Assets | |
| Applicable to 12,325,000 outstanding $.001 par value shares of | |
| beneficial interest (unlimited authorization) | 1,714,588 |
| Net Asset Value Per Share—ETF Shares | $139.11 |
| Institutional Shares—Net Assets | |
| Applicable to 3,689,454 outstanding $.001 par value shares of | |
| beneficial interest (unlimited authorization) | 981,828 |
| Net Asset Value Per Share—Institutional Shares | $266.12 |
• See Note A in Notes to Financial Statements.
* Non-income-producing security.
^ Includes partial security positions on loan to broker-dealers. The total value of securities on loan is $37,466,000.
† Represents the aggregate value, by category, of securities that are not among the 50 largest holdings and, in total for any issuer,
represent 1% or less of net assets.
§ Certain of the fund’s securities are valued using significant unobservable inputs.
1 “Other” represents securities that are not classified by the fund’s benchmark index.
2 The fund invests a portion of its cash reserves in equity markets through the use of index futures contracts. After giving effect to
futures investments, the fund’s effective common stock and temporary cash investment positions represent 100.1% and 1.5%,
respectively, of net assets.
3 Affiliated money market fund available only to Vanguard funds and certain trusts and accounts managed by Vanguard. Rate shown
is the 7-day yield.
4 Includes $40,831,000 of collateral received for securities on loan.
5 Securities with a value of $100,000 have been segregated as initial margin for open futures contracts.
REIT—Real Estate Investment Trust.
| Derivative Financial Instruments Outstanding as of Period End | ||||
| Futures Contracts | ||||
| ($000) | ||||
| Value and | ||||
| Number of | Unrealized | |||
| Long (Short) | Notional | Appreciation | ||
| Expiration | Contracts | Amount | (Depreciation) | |
| Long Futures Contracts | ||||
| E-mini Russell 2000 Index | September 2018 | 26 | 2,263 | 84 |
See accompanying Notes, which are an integral part of the Financial Statements.
13
Russell 2000 Index Fund
Statement of Operations
| Year Ended | |
| August31,2018 | |
| ($000) | |
| Investment Income | |
| Income | |
| Dividends | 27,140 |
| Interest1 | 108 |
| Securities Lending—Net | 2,424 |
| Total Income | 29,672 |
| Expenses | |
| The Vanguard Group—Note B | |
| Investment Advisory Services | 322 |
| Management and Administrative—ETF Shares | 1,442 |
| Management and Administrative—Institutional Shares | 342 |
| Marketing and Distribution—ETF Shares | 82 |
| Marketing and Distribution—Institutional Shares | 23 |
| Custodian Fees | 343 |
| Auditing Fees | 33 |
| Shareholders’ Reports and Proxy—ETF Shares | 68 |
| Shareholders’ Reports and Proxy—Institutional Shares | 9 |
| Trustees’ Fees and Expenses | 1 |
| Total Expenses | 2,665 |
| Net Investment Income | 27,007 |
| Realized Net Gain (Loss) | |
| Investment Securities Sold1,2 | 157,790 |
| Futures Contracts | 1,874 |
| Realized Net Gain (Loss) | 159,664 |
| Change in Unrealized Appreciation (Depreciation) | |
| Investment Securities1 | 298,941 |
| Futures Contracts | 76 |
| Change in Unrealized Appreciation (Depreciation) | 299,017 |
| Net Increase (Decrease) in Net Assets Resulting from Operations | 485,688 |
1 Interest income, realized net gain (loss), and change in unrealized appreciation (depreciation) from an affiliated company of the fund
were $98,000, ($3,000), and $6,000, respectively. Purchases and sales are for temporary cash investment purposes.
2 Includes $187,469,000 of net gain (loss) resulting from in-kind redemptions; such gain (loss) is not taxable to the fund.
See accompanying Notes, which are an integral part of the Financial Statements.
14
Russell 2000 Index Fund
Statement of Changes in Net Assets
| Year Ended August 31, | ||
| 2018 | 2017 | |
| ($000) | ($000) | |
| Increase (Decrease) in Net Assets | ||
| Operations | ||
| Net Investment Income | 27,007 | 20,174 |
| Realized Net Gain (Loss) | 159,664 | 44,973 |
| Change in Unrealized Appreciation (Depreciation) | 299,017 | 126,697 |
| Net Increase (Decrease) in Net Assets Resulting from Operations | 485,688 | 191,844 |
| Distributions | ||
| Net Investment Income | ||
| ETF Shares | (15,782) | (12,026) |
| Institutional Shares | (9,362) | (7,759) |
| Realized Capital Gain | ||
| ETF Shares | — | — |
| Institutional Shares | — | — |
| Total Distributions | (25,144) | (19,785) |
| Capital Share Transactions | ||
| ETF Shares | 342,765 | 282,534 |
| Institutional Shares | 233,779 | 27,481 |
| Net Increase (Decrease) from Capital Share Transactions | 576,544 | 310,015 |
| Total Increase (Decrease) | 1,037,088 | 482,074 |
| Net Assets | ||
| Beginning of Period | 1,659,328 | 1,177,254 |
| End of Period1 | 2,696,416 | 1,659,328 |
| 1 Net Assets—End of Period includes undistributed (overdistributed) net investment income of $6,218,000 and $4,232,000. | ||
See accompanying Notes, which are an integral part of the Financial Statements.
15
Russell 2000 Index Fund
Financial Highlights
| ETF Shares | |||||
| For a Share Outstanding | Year Ended August 31, | ||||
| Throughout Each Period | 2018 | 2017 | 2016 | 2015 | 2014 |
| Net Asset Value, Beginning of Period | $112.21 | $98.98 | $92.71 | $93.72 | $80.46 |
| Investment Operations | |||||
| Net Investment Income | 1.5541 | 1.4431 | 1.302 | 1.2241 | 1.054 |
| Net Realized and Unrealized Gain (Loss) | |||||
| on Investments | 26.846 | 13.255 | 6.537 | (1.163) | 13.163 |
| Total from Investment Operations | 28.400 | 14.698 | 7.839 | .061 | 14.217 |
| Distributions | |||||
| Dividends from Net Investment Income | (1.500) | (1.468) | (1.569) | (1.071) | (.957) |
| Distributions from Realized Capital Gains | — | — | — | — | — |
| Total Distributions | (1.500) | (1.468) | (1.569) | (1.071) | (.957) |
| Net Asset Value, End of Period | $139.11 | $112.21 | $98.98 | $92.71 | $93.72 |
| Total Return | 25.49% | 14.94% | 8.62% | 0.03% | 17.69% |
| Ratios/Supplemental Data | |||||
| Net Assets, End of Period (Millions) | $1,715 | $1,083 | $698 | $554 | $375 |
| Ratio of Total Expenses to Average Net Assets | 0.15% | 0.15% | 0.15% | 0.15% | 0.15% |
| Ratio of Net Investment Income to | |||||
| Average Net Assets | 1.23% | 1.34% | 1.52% | 1.28% | 1.23% |
| Portfolio Turnover Rate2 | 19% | 23% | 19% | 17% | 16% |
1 Calculated based on average shares outstanding.
2 Excludes the value of portfolio securities received or delivered as a result of in-kind purchases or redemptions of the fund’s capital
shares, including ETF Creation Units.
See accompanying Notes, which are an integral part of the Financial Statements.
16
Russell 2000 Index Fund
Financial Highlights
| Institutional Shares | |||||
| For a Share Outstanding | Year Ended August 31, | ||||
| Throughout Each Period | 2018 | 2017 | 2016 | 2015 | 2014 |
| Net Asset Value, Beginning of Period | $214.65 | $189.31 | $177.40 | $179.29 | $153.88 |
| Investment Operations | |||||
| Net Investment Income | 3.1291 | 2.9561 | 2.606 | 2.4531 | 2.110 |
| Net Realized and Unrealized Gain (Loss) | |||||
| on Investments | 51.369 | 25.315 | 12.503 | (2.212) | 25.206 |
| Total from Investment Operations | 54.498 | 28.271 | 15.109 | .241 | 27.316 |
| Distributions | |||||
| Dividends from Net Investment Income | (3.028) | (2.931) | (3.199) | (2.131) | (1.906) |
| Distributions from Realized Capital Gains | — | — | — | — | — |
| Total Distributions | (3.028) | (2.931) | (3.199) | (2.131) | (1.906) |
| Net Asset Value, End of Period | $266.12 | $214.65 | $189.31 | $177.40 | $179.29 |
| Total Return | 25.58% | 15.03% | 8.69% | 0.11% | 17.78% |
| Ratios/Supplemental Data | |||||
| Net Assets, End of Period (Millions) | $982 | $576 | $479 | $528 | $320 |
| Ratio of Total Expenses to Average Net Assets | 0.08% | 0.08% | 0.08% | 0.08% | 0.08% |
| Ratio of Net Investment Income to | |||||
| Average Net Assets | 1.30% | 1.41% | 1.59% | 1.35% | 1.30% |
| Portfolio Turnover Rate2 | 19% | 23% | 19% | 17% | 16% |
1 Calculated based on average shares outstanding.
2 Excludes the value of portfolio securities received or delivered as a result of in-kind purchases or redemptions of the fund’s capital
shares, including ETF Creation Units.
See accompanying Notes, which are an integral part of the Financial Statements.
17
Russell 2000 Index Fund
Notes to Financial Statements
Vanguard Russell 2000 Index Fund is registered under the Investment Company Act of 1940 as an open-end investment company, or mutual fund. The fund offers two classes of shares: ETF Shares and Institutional Shares. ETF Shares are listed for trading on Nasdaq; they can be purchased and sold through a broker. Institutional Shares are designed for investors who meet certain administrative, service, and account-size criteria.
A. The following significant accounting policies conform to generally accepted accounting principles for U.S. investment companies. The fund consistently follows such policies in preparing its financial statements.
1. Security Valuation: Securities are valued as of the close of trading on the New York Stock Exchange (generally 4 p.m., Eastern time) on the valuation date. Equity securities are valued at the latest quoted sales prices or official closing prices taken from the primary market in which each security trades; such securities not traded on the valuation date are valued at the mean of the latest quoted bid and asked prices. Securities for which market quotations are not readily available, or whose values have been materially affected by events occurring before the fund’s pricing time but after the close of the securities’ primary markets, are valued by methods deemed by the board of trustees to represent fair value. Investments in Vanguard Market Liquidity Fund are valued at that fund’s net asset value. Temporary cash investments are valued using the latest bid prices or using valuations based on a matrix system (which considers such factors as security prices, yields, maturities, and ratings), both as furnished by independent pricing services.
2. Futures Contracts: The fund uses index futures contracts to a limited extent, with the objectives of maintaining full exposure to the stock market, maintaining liquidity, and minimizing transaction costs. The fund may purchase futures contracts to immediately invest incoming cash in the market, or sell futures in response to cash outflows, thereby simulating a fully invested position in the underlying index while maintaining a cash balance for liquidity. The primary risks associated with the use of futures contracts are imperfect correlation between changes in market values of stocks held by the fund and the prices of futures contracts, and the possibility of an illiquid market. Counterparty risk involving futures is mitigated because a regulated clearinghouse is the counterparty instead of the clearing broker. To further mitigate counterparty risk, the fund trades futures contracts on an exchange, monitors the financial strength of its clearing brokers and clearinghouse, and has entered into clearing agreements with its clearing brokers. The clearinghouse imposes initial margin requirements to secure the fund’s performance and requires daily settlement of variation margin representing changes in the market value of each contract. Any assets pledged as initial margin for open contracts are noted in the Statement of Net Assets.
Futures contracts are valued at their quoted daily settlement prices. The notional amounts of the contracts are not recorded in the Statement of Net Assets. Fluctuations in the value of the contracts are recorded in the Statement of Net Assets as an asset (liability) and in the Statement of Operations as unrealized appreciation (depreciation) until the contracts are closed, when they are recorded as realized futures gains (losses).
During the year ended August 31, 2018, the fund’s average investments in long and short futures contracts represented less than 1% and 0% of net assets, respectively, based on the average of the notional amounts at each quarter-end during the period.
18
Russell 2000 Index Fund
3. Federal Income Taxes: The fund intends to continue to qualify as a regulated investment company and distribute all of its taxable income. Management has analyzed the fund’s tax positions taken for all open federal income tax years (August 31, 2015–2018), and has concluded that no provision for federal income tax is required in the fund’s financial statements.
4. Distributions: Distributions to shareholders are recorded on the ex-dividend date. Distributions are determined on a tax basis and may differ from net investment income and realized capital gains for financial reporting purposes.
5. Securities Lending: To earn additional income, the fund lends its securities to qualified institutional borrowers. Security loans are subject to termination by the fund at any time, and are required to be secured at all times by collateral in an amount at least equal to the market value of securities loaned. Daily market fluctuations could cause the value of loaned securities to be more or less than the value of the collateral received. When this occurs, the collateral is adjusted and settled before the opening of the market on the next business day. The fund further mitigates its counterparty risk by entering into securities lending transactions only with a diverse group of prequalified counterparties, monitoring their financial strength, and entering into master securities lending agreements with its counterparties. The master securities lending agreements provide that, in the event of a counterparty’s default (including bankruptcy), the fund may terminate any loans with that borrower, determine the net amount owed, and sell or retain the collateral up to the net amount owed to the fund; however, such actions may be subject to legal proceedings. While collateral mitigates counterparty risk, in the event of a default, the fund may experience delays and costs in recovering the securities loaned. The fund invests cash collateral received in Vanguard Market Liquidity Fund, and records a liability in the Statement of Net Assets for the return of the collateral, during the period the securities are on loan. Securities lending income represents fees charged to borrowers plus income earned on invested cash collateral, less expenses associated with the loan. During the term of the loan, the fund is entitled to all distributions made on or in respect of the loaned securities.
6. Credit Facility: The fund and certain other funds managed by The Vanguard Group (“Vanguard”) participate in a $3.1 billion committed credit facility provided by a syndicate of lenders pursuant to a credit agreement that may be renewed annually; each fund is individually liable for its borrowings, if any, under the credit facility. Borrowings may be utilized for temporary and emergency purposes, and are subject to the fund’s regulatory and contractual borrowing restrictions. The participating funds are charged administrative fees and an annual commitment fee of 0.10% of the undrawn amount of the facility; these fees are allocated to the funds based on a method approved by the fund’s board of trustees and included in Management and Administrative expenses on the fund’s Statement of Operations. Any borrowings under this facility bear interest at a rate based upon the higher of the one-month London Interbank Offered Rate, federal funds effective rate, or overnight bank funding rate plus an agreed-upon spread.
The fund had no borrowings outstanding at August 31, 2018, or at any time during the period then ended.
7. Other: Dividend income is recorded on the ex-dividend date. Interest income includes income distributions received from Vanguard Market Liquidity Fund and is accrued daily. Premiums and discounts on debt securities purchased are amortized and accreted, respectively, to interest income over the lives of the respective securities. Security transactions are accounted for on the date securities are bought or sold. Costs used to determine realized gains (losses) on the sale of investment securities are those of the specific securities sold.
19
Russell 2000 Index Fund
Each class of shares has equal rights as to assets and earnings, except that each class separately bears certain class-specific expenses related to maintenance of shareholder accounts (included in Management and Administrative expenses), shareholder reporting, and the proxy. Marketing and distribution expenses are allocated to each class of shares based on a method approved by the board of trustees. Income, other non-class-specific expenses, and gains and losses on investments are allocated to each class of shares based on its relative net assets.
B. In accordance with the terms of a Funds’ Service Agreement (the “FSA”) between Vanguard and the fund, Vanguard furnishes to the fund investment advisory, corporate management, administrative, marketing, and distribution services at Vanguard’s cost of operations (as defined by the FSA). These costs of operations are allocated to the fund based on methods and guidelines approved by the board of trustees. Vanguard does not require reimbursement in the current period for certain costs of operations (such as deferred compensation/benefits and risk/insurance costs); the fund’s liability for these costs of operations is included in Payables to Vanguard on the Statement of Net Assets. All other costs of operations payable to Vanguard are generally settled twice a month.
Upon the request of Vanguard, the fund may invest up to 0.40% of its net assets as capital in Vanguard. At August 31, 2018, the fund had contributed to Vanguard capital in the amount of $131,000, representing 0.01% of the fund’s net assets and 0.05% of Vanguard’s capitalization. The fund’s trustees and officers are also directors and employees, respectively, of Vanguard.
C. Various inputs may be used to determine the value of the fund’s investments. These inputs are summarized in three broad levels for financial statement purposes. The inputs or methodologies used to value securities are not necessarily an indication of the risk associated with investing in those securities.
Level 1—Quoted prices in active markets for identical securities.
Level 2—Other significant observable inputs (including quoted prices for similar securities, interest rates, prepayment speeds, credit risk, etc.).
Level 3—Significant unobservable inputs (including the fund’s own assumptions used to determine
the fair value of investments). Any investments valued with significant unobservable inputs are
noted on the Statement of Net Assets.
The following table summarizes the market value of the fund’s investments as of August 31, 2018, based on the inputs used to value them:
| Level 1 | Level 2 | Level 3 | |
| Investments | ($000) | ($000) | ($000) |
| Common Stocks | 2,695,794 | — | 431 |
| Temporary Cash Investments | 41,624 | 598 | — |
| Futures Contracts—Assets1 | 7 | — | — |
| Total | 2,737,425 | 598 | 431 |
| 1 Represents variation margin on the last day of the reporting period. | |||
20
Russell 2000 Index Fund
D. Permanent differences are reclassified among capital accounts in the financial statements to reflect their tax character. These reclassifications have no effect on net assets or net asset value per share. As of period end, the following permanent differences primarily attributable to the accounting for in-kind redemptions and passive foreign investment companies were reclassified to the following accounts:
| Amount | |
| ($000) | |
| Paid-in capital | 187,418 |
| Undistributed (Overdistributed) net investment income | 123 |
| Accumulated net realized gains (losses) | (187,541) |
Temporary differences between book-basis and tax-basis components of accumulated net earnings (losses) arise when certain items of income, gain, or loss are recognized in different periods for financial statement and tax purposes; these differences will reverse at some time in the future. The differences are primarily related to the tax deferral of losses on wash sales, the realization of unrealized gains or losses on certain future contracts, and unrealized gains on passive foreign investment companies. As of period end, the tax components of accumulated net earnings (losses) are detailed in the table as follows:
| Amount | |
| ($000) | |
| Undistributed ordinary income | 6,487 |
| Undistributed long-term gains | — |
| Capital loss carryforwards (non-expiring) | (70,527) |
| Net unrealized gains (losses) | 422,710 |
As of August 31, 2018, gross unrealized appreciation and depreciation for investments and derivatives based on cost for U.S. federal income tax purposes were as follows:
| Amount | |
| ($000) | |
| Tax cost | 2,315,737 |
| Gross unrealized appreciation | 546,715 |
| Gross unrealized depreciation | (124,005) |
| Net unrealized appreciation (depreciation) | 422,710 |
21
Russell 2000 Index Fund
E. During the year ended August 31, 2018, the fund purchased $1,494,422,000 of investment securities and sold $907,964,000 of investment securities, other than temporary cash investments. Purchases and sales include $808,989,000 and $494,554,000, respectively, in connection with in-kind purchases and redemptions of the fund’s capital shares.
F. Capital share transactions for each class of shares were:
| Year Ended August 31, | ||||
| 2018 | 2017 | |||
| Amount | Shares | Amount | Shares | |
| ($000) | (000) | ($000) | (000) | |
| ETF Shares | ||||
| Issued | 847,293 | 6,625 | 413,730 | 3,800 |
| Issued in Lieu of Cash Distributions | — | — | — | — |
| Redeemed | (504,528) | (3,950) | (131,196) | (1,200) |
| Net Increase (Decrease) —ETF Shares | 342,765 | 2,675 | 282,534 | 2,600 |
| Institutional Shares | ||||
| Issued | 361,277 | 1,523 | 162,735 | 807 |
| Issued in Lieu of Cash Distributions | 9,197 | 39 | 7,230 | 35 |
| Redeemed | (136,695) | (558) | (142,484) | (689) |
| Net Increase (Decrease)—Institutional Shares | 233,779 | 1,004 | 27,481 | 153 |
G. Management has determined that no events or transactions occurred subsequent to August 31, 2018, that would require recognition or disclosure in these financial statements.
22
Russell 2000 Value Index Fund
Fund Profile
As of August 31, 2018
| Share-Class Characteristics | ||
| ETF | Institutional | |
| Shares | Shares | |
| Ticker Symbol | VTWV | VRTVX |
| Expense Ratio1 | 0.20% | 0.08% |
| 30-Day SEC Yield | 1.69% | 1.81% |
| Portfolio Characteristics | |||
| Russell | DJ | ||
| 2000 | U.S. Total | ||
| Value | Market | ||
| Fund | Index | FA Index | |
| Number of Stocks | 1,440 | 1,347 | 3,745 |
| Median Market Cap | $2.1B | $2.1B | $71.0B |
| Price/Earnings Ratio | 15.5x | 15.5x | 21.0x |
| Price/Book Ratio | 1.5x | 1.5x | 3.2x |
| Return on Equity | 7.5% | 7.5% | 15.0% |
| Earnings Growth | |||
| Rate | 5.6% | 5.5% | 8.4% |
| Dividend Yield | 1.9% | 1.9% | 1.7% |
| Foreign Holdings | 0.0% | 0.0% | 0.0% |
| Turnover Rate | 30% | — | — |
| Short-Term Reserves | 0.1% | — | — |
| Sector Diversification (% of equity exposure) | |||
| Russell | DJ | ||
| 2000 | U.S. Total | ||
| Value | Market | ||
| Fund | Index | FA Index | |
| Consumer Discretionary | 11.9% | 11.9% | 14.4% |
| Consumer Staples | 2.4 | 2.4 | 5.3 |
| Energy | 7.0 | 7.0 | 5.6 |
| Financial Services | 40.3 | 40.3 | 20.8 |
| Health Care | 4.9 | 4.9 | 13.9 |
| Materials & Processing | 5.8 | 5.8 | 3.5 |
| Producer Durables | 11.5 | 11.5 | 10.5 |
| Technology | 9.9 | 9.9 | 21.4 |
| Utilities | 6.3 | 6.3 | 4.6 |
Sector categories are based on the Russell Global Sectors (“RGS”),
except for the “Other” category (if applicable), which includes
securities that have not been provided a RGS classification as of
the effective reporting period.
| Volatility Measures | ||
| Russell | DJ | |
| 2000 | U.S. Total | |
| Value | Market | |
| Index | FA Index | |
| R-Squared | 1.00 | 0.57 |
| Beta | 1.00 | 1.08 |
| These measures show the degree and timing of the fund’s | ||
| fluctuations compared with the indexes over 36 months. | ||
| Ten Largest Holdings (% of total net assets) | ||
| IDACORP Inc. | Utilities: Electrical | 0.4% |
| IBERIABANK Corp. | Banks: Diversified | 0.4 |
| Cree Inc. | Semiconductors & | |
| Components | 0.4 | |
| CACI International Inc. | Computer Services | |
| Software & Systems | 0.4 | |
| MGIC Investment Corp. | Consumer Lending | 0.4 |
| Ciena Corp. | Communications | |
| Technology | 0.4 | |
| Hancock Whitney Corp. | Banks: Diversified | 0.4 |
| Gramercy Property Trust Diversified REITs | 0.4 | |
| Radian Group Inc. | Insurance: | |
| Property-Casualty | 0.4 | |
| Sabra Health Care REIT | Real Estate | |
| Inc. | Investment Trusts | |
| (REITs) | 0.4 | |
| Top Ten | 4.0% | |
| The holdings listed exclude any temporary cash investments and | ||
| equity index products. | ||
Investment Focus
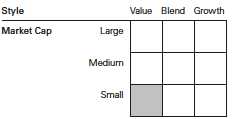
1 The expense ratios shown are from the prospectus dated December 21, 2017, and represent estimated costs for the current fiscal year. For the
fiscal year ended August 31, 2018, the expense ratios were 0.20% for ETF Shares and 0.08% for Institutional Shares.
23
Russell 2000 Value Index Fund
Performance Summary
All of the returns in this report represent past performance, which is not a guarantee of future results that may be achieved by the fund. (Current performance may be lower or higher than the performance data cited. For performance data current to the most recent month-end, visit our website at vanguard.com/performance.) Note, too, that both investment returns and principal value can fluctuate widely, so an investor’s shares, when sold, could be worth more or less than their original cost. The returns shown do not reflect taxes that a shareholder would pay on fund distributions or on the sale of fund shares.
Cumulative Performance: September 20, 2010, Through August 31, 2018
Initial Investment of $10,000
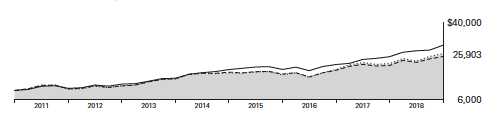
| Average Annual Total Returns | |||||
| Periods Ended August 31, 2018 | |||||
| Since | Final Value | ||||
| One | Five | Inception | of a $10,000 | ||
| Year | Years | (9/20/2010) | Investment | ||
| Russell 2000 Value Index Fund*ETF | |||||
| Shares Net Asset Value | 19.96% | 11.59% | 12.73% | $25,903 | |
| Russell 2000 Value Index Fund*ETF | |||||
| Shares Market Price | 20.01 | 11.58 | 12.73 | 25,908 | |
| • • • • • • • • | Russell 2000 Value Index | 20.05 | 11.72 | 12.88 | 26,191 |
| – – – – | Small-Cap Value Funds Average | 19.05 | 10.46 | 12.20 | 24,949 |
| Dow Jones U.S. Total Stock Market | |||||
| Float Adjusted Index | 20.26 | 14.21 | 14.77 | 29,886 | |
| Small-Cap Value Funds Average: Derived from data provided by Lipper, a Thomson Reuters Company. | |||||
| "Since Inception" performance is calculated from the ETF Shares’ inception date for both the fund and its comparative standards. | |||||
See Financial Highlights for dividend and capital gains information.
24
Russell 2000 Value Index Fund
| Average Annual Total Returns | ||||
| Periods Ended August 31, 2018 | ||||
| Since | Final Value | |||
| One | Five | Inception | of a $5,000,000 | |
| Year | Years | (7/13/2012) | Investment | |
| Russell 2000 Value Index Fund Institutional | ||||
| Shares | 20.10% | 11.72% | 13.67% | $10,971,611 |
| Russell 2000 Value Index | 20.05 | 11.72 | 13.68 | 10,977,382 |
| Dow Jones U.S. Total Stock Market Float | ||||
| Adjusted Index | 20.26 | 14.21 | 15.52 | 12,112,461 |
| "Since Inception" performance is calculated from the Institutional Shares’ inception date for both the fund and its comparative standards. | ||||
| Cumulative Returns of ETF Shares: September 20, 2010, Through August 31, 2018 | |||
| Since | |||
| One | Five | Inception | |
| Year | Years | (9/20/2010) | |
| Russell 2000 Value Index Fund ETF Shares Market | |||
| Price | 20.01% | 72.93% | 159.08% |
| Russell 2000 Value Index Fund ETF Shares Net | |||
| Asset Value | 19.96 | 73.00 | 159.03 |
| Russell 2000 Value Index | 20.05 | 74.01 | 161.91 |
| "Since Inception" performance is calculated from the ETF Shares’ inception date for both the fund and its comparative standards. | |||
Fiscal-Year Total Returns (%): September 20, 2010, Through August 31, 2018
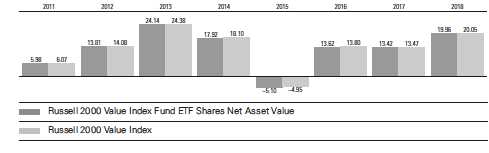
25
Russell 2000 Value Index Fund
Average Annual Total Returns: Periods Ended June 30, 2018
This table presents returns through the latest calendar quarter—rather than through the end of the fiscal period.
Securities and Exchange Commission rules require that we provide this information.
| Inception | One | Five | Since | |
| Date | Year | Years | Inception | |
| ETF Shares | 9/20/2010 | |||
| Market Price | 13.18% | 11.10% | 12.43% | |
| Net Asset Value | 13.02 | 11.05 | 12.43 | |
| Institutional Shares | 7/13/2012 | 13.16 | 11.18 | 13.30 |
26
Russell 2000 Value Index Fund
Financial Statements
Statement of Net Assets—Investments Summary
As of August 31, 2018
This Statement summarizes the fund’s holdings by asset type. Details are reported for each of the fund’s 50 largest individual holdings and for investments that, in total for any issuer, represent more than 1% of the fund’s net assets. The total value of smaller holdings is reported as a single amount within each category.
The fund reports a complete list of its holdings in regulatory filings four times in each fiscal year, at the quarter-ends. For the second and fourth fiscal quarters, the complete listing of the fund’s holdings is available electronically on vanguard.com and on the Securities and Exchange Commission’s website (sec.gov), or you can have it mailed to you without charge by calling 800-662-7447. For the first and third fiscal quarters, the fund files the lists with the SEC on Form N-Q. Shareholders can look up the fund’s Forms N-Q on the SEC’s website. Forms N-Q may also be reviewed and copied at the SEC’s Public Reference Room (see the back cover of this report for further information).
| Market | Percentage | |||
| Value• | of Net | |||
| Shares | ($000) | Assets | ||
| Common Stocks | ||||
| Consumer Discretionary | ||||
| Signet Jewelers Ltd. | 19,447 | 1,248 | 0.3% | |
| Aaron’s Inc. | 23,257 | 1,156 | 0.3% | |
| Consumer Discretionary—Other † | 41,954 | 11.2% | ||
| 44,358 | 11.8% | |||
| Consumer Staples † | 8,869 | 2.4% | ||
| Energy | ||||
| * Oasis Petroleum Inc. | 89,339 | 1,203 | 0.3% | |
| * PDC Energy Inc. | 21,991 | 1,159 | 0.3% | |
| McDermott International Inc. | 59,559 | 1,152 | 0.3% | |
| * Southwestern Energy Co. | 195,718 | 1,100 | 0.3% | |
| Peabody Energy Corp. | 26,484 | 1,094 | 0.3% | |
| Energy—Other † | 20,437 | 5.5% | ||
| 26,145 | 7.0% | |||
| Financial Services | ||||
| IBERIABANK Corp. | 18,533 | 1,606 | 0.4% | |
| * MGIC Investment Corp. | 121,903 | 1,551 | 0.4% | |
| Hancock Whitney Corp. | 28,014 | 1,444 | 0.4% | |
| Gramercy Property Trust | 52,784 | 1,444 | 0.4% | |
| Radian Group Inc. | 70,992 | 1,443 | 0.4% | |
| Sabra Health Care REIT Inc. | 58,652 | 1,383 | 0.4% | |
| Chemical Financial Corp. | 23,499 | 1,342 | 0.4% | |
| United Bankshares Inc. | 33,468 | 1,319 | 0.4% | |
| Cousins Properties Inc. | 138,634 | 1,296 | 0.4% | |
| Stifel Financial Corp. | 23,005 | 1,285 | 0.4% | |
| LaSalle Hotel Properties | 36,474 | 1,281 | 0.3% | |
| Valley National Bancorp | 106,162 | 1,279 | 0.3% | |
| 27 | ||||
| Russell 2000 Value Index Fund | |||||
| Market | Percentage | ||||
| Value• | of Net | ||||
| Shares | ($000) | Assets | |||
| Healthcare Realty Trust Inc. | 41,137 | 1,274 | 0.3% | ||
| RLJ Lodging Trust | 56,800 | 1,244 | 0.3% | ||
| Sunstone Hotel Investors Inc. | 73,690 | 1,237 | 0.3% | ||
| Selective Insurance Group Inc. | 19,043 | 1,223 | 0.3% | ||
| MB Financial Inc. | 25,100 | 1,216 | 0.3% | ||
| CNO Financial Group Inc. | 54,847 | 1,185 | 0.3% | ||
| Blackstone Mortgage Trust Inc. Class A | 33,540 | 1,142 | 0.3% | ||
| UMB Financial Corp. | 14,813 | 1,115 | 0.3% | ||
| Glacier Bancorp Inc. | 24,044 | 1,098 | 0.3% | ||
| BancorpSouth Bank | 31,515 | 1,097 | 0.3% | ||
| Cathay General Bancorp | 25,845 | 1,093 | 0.3% | ||
| American Equity Investment Life Holding Co. | 29,396 | 1,090 | 0.3% | ||
| Financial Services—Other † | 119,219 | 31.8% | |||
| 149,906 | 40.0% | ||||
| Health Care | |||||
| * | Endo International plc | 69,579 | 1,193 | 0.3% | |
| * | Avanos Medical Inc. | 15,506 | 1,118 | 0.3% | |
| Health Care—Other † | 15,980 | 4.3% | |||
| 18,291 | 4.9% | ||||
| Materials & Processing | |||||
| Louisiana-Pacific Corp. | 41,052 | 1,197 | 0.3% | ||
| * | Allegheny Technologies Inc. | 41,561 | 1,123 | 0.3% | |
| § | Materials & Processing—Other † | 19,093 | 5.1% | ||
| 21,413 | 5.7% | ||||
| §,1Other † | 10 | 0.0% | |||
| Producer Durables | |||||
| * | KLX Inc. | 16,540 | 1,221 | 0.3% | |
| SkyWest Inc. | 16,762 | 1,095 | 0.3% | ||
| Producer Durables—Other † | 40,358 | 10.8% | |||
| 42,674 | 11.4% | ||||
| Technology | |||||
| * | Cree Inc. | 33,277 | 1,601 | 0.4% | |
| * | CACI International Inc. Class A | 8,093 | 1,578 | 0.4% | |
| * | Ciena Corp. | 47,317 | 1,494 | 0.4% | |
| *,^ | ViaSat Inc. | 18,077 | 1,136 | 0.3% | |
| Perspecta Inc. | 47,339 | 1,101 | 0.3% | ||
| Technology—Other † | 29,736 | 8.0% | |||
| 36,646 | 9.8% | ||||
| Utilities | |||||
| IDACORP Inc. | 16,521 | 1,617 | 0.4% | ||
| Portland General Electric Co. | 29,529 | 1,370 | 0.4% | ||
| ONE Gas Inc. | 17,028 | 1,337 | 0.4% | ||
| ALLETE Inc. | 16,880 | 1,267 | 0.3% | ||
| Southwest Gas Holdings Inc. | 15,773 | 1,220 | 0.3% | ||
| New Jersey Resources Corp. | 26,397 | 1,204 | 0.3% | ||
| Spire Inc. | 16,101 | 1,200 | 0.3% | ||
| Avista Corp. | 21,507 | 1,104 | 0.3% | ||
| Utilities—Other † | 12,994 | 3.5% | |||
| 23,313 | 6.2% | ||||
| Total Common Stocks (Cost $312,004) | 371,625 | 99.2%2 | |||
| 28 | |||||
| Russell 2000 Value Index Fund | |||||
| Market | Percentage | ||||
| Value• | of Net | ||||
| Coupon | Shares | ($000) | Assets | ||
| Temporary Cash Investments | |||||
| Money Market Fund | |||||
| 3,4 Vanguard Market Liquidity Fund | 2.153% | 56,401 | 5,642 | 1.4% | |
| 5U.S. Government and Agency Obligations † | 199 | 0.1% | |||
| Total Temporary Cash Investments (Cost $5,839) | 5,841 | 1.5%2 | |||
| Total Investments (Cost $317,843) | 377,466 | 100.7% | |||
| Amount | |||||
| ($000) | |||||
| Other Assets and Liabilities | |||||
| Other Assets | |||||
| Investment in Vanguard | 19 | ||||
| Receivables for Accrued Income | 311 | ||||
| Receivables for Capital Shares Issued | 7 | ||||
| Variation Margin Receivable—Futures Contracts | 11 | ||||
| Total Other Assets | 348 | 0.1% | |||
| Liabilities | |||||
| Payables for Investment Securities Purchased | (606) | ||||
| Collateral for Securities on Loan | (2,409) | ||||
| Payables for Capital Shares Redeemed | (37) | ||||
| Payables to Vanguard | (70) | ||||
| Other Liabilities | (19) | ||||
| Total Liabilities | (3,141) | (0.8%) | |||
| Net Assets | 374,673 | 100.0% | |||
| At August 31, 2018, net assets consisted of: | |||||
| Amount | |||||
| ($000) | |||||
| Paid-in Capital | 335,036 | ||||
| Undistributed Net Investment Income | 1,314 | ||||
| Accumulated Net Realized Losses | (21,384) | ||||
| Unrealized Appreciation (Depreciation) | |||||
| Investment Securities | 59,623 | ||||
| Futures Contracts | 84 | ||||
| Net Assets | 374,673 | ||||
| 29 | |||||
Russell 2000 Value Index Fund
| Amount | |
| ($000) | |
| ETF Shares—Net Assets | |
| Applicable to 1,875,000 outstanding $.001 par value shares of | |
| beneficial interest (unlimited authorization) | 223,211 |
| Net Asset Value Per Share—ETF Shares | $119.05 |
| Institutional Shares—Net Assets | |
| Applicable to 645,044 outstanding $.001 par value shares of | |
| beneficial interest (unlimited authorization) | 151,462 |
| Net Asset Value Per Share—Institutional Shares | $234.81 |
• See Note A in Notes to Financial Statements.
* Non-income-producing security.
^ Includes partial security positions on loan to broker-dealers. The total value of securities on loan is $2,205,000.
† Represents the aggregate value, by category, of securities that are not among the 50 largest holdings and, in total for any issuer,
represent 1% or less of net assets.
§ Certain of the fund’s securities are valued using significant unobservable inputs.
1 “Other” represents securities that are not classified by the fund’s benchmark index.
2 The fund invests a portion of its cash reserves in equity markets through the use of index futures contracts. After giving effect to
futures investments, the fund’s effective common stock and temporary cash investment positions represent 100.0% and 0.7%,
respectively, of net assets.
3 Affiliated money market fund available only to Vanguard funds and certain trusts and accounts managed by Vanguard. Rate shown
is the 7-day yield.
4 Includes $2,409,000 of collateral received for securities on loan.
5 Securities with a value of $199,000 have been segregated as initial margin for open futures contracts.
REIT—Real Estate Investment Trust.
| Derivative Financial Instruments Outstanding as of Period End | ||||
| Futures Contracts | ||||
| ($000) | ||||
| Value and | ||||
| Number of | Unrealized | |||
| Long (Short) | Notional | Appreciation | ||
| Expiration | Contracts | Amount | (Depreciation) | |
| Long Futures Contracts | ||||
| E-mini Russell 2000 Index | September 2018 | 37 | 3,220 | 84 |
See accompanying Notes, which are an integral part of the Financial Statements.
30
Russell 2000 Value Index Fund
Statement of Operations
| Year Ended | |
| August31,2018 | |
| ($000) | |
| Investment Income | |
| Income | |
| Dividends | 6,489 |
| Interest1 | 32 |
| Securities Lending—Net | 236 |
| Total Income | 6,757 |
| Expenses | |
| The Vanguard Group—Note B | |
| Investment Advisory Services | 53 |
| Management and Administrative—ETF Shares | 242 |
| Management and Administrative—Institutional Shares | 24 |
| Marketing and Distribution—ETF Shares | 10 |
| Marketing and Distribution—Institutional Shares | 4 |
| Custodian Fees | 130 |
| Auditing Fees | 33 |
| Shareholders’ Reports and Proxy—ETF Shares | 18 |
| Shareholders’ Reports and Proxy—Institutional Shares | — |
| Total Expenses | 514 |
| Net Investment Income | 6,243 |
| Realized Net Gain (Loss) | |
| Investment Securities Sold1,2 | 17,857 |
| Futures Contracts | 252 |
| Realized Net Gain (Loss) | 18,109 |
| Change in Unrealized Appreciation (Depreciation) | |
| Investment Securities1 | 38,873 |
| Futures Contracts | 49 |
| Change in Unrealized Appreciation (Depreciation) | 38,922 |
| Net Increase (Decrease) in Net Assets Resulting from Operations | 63,274 |
1 Interest income, realized net gain (loss), and change in unrealized appreciation (depreciation) from an affiliated company of the fund
were $29,000, ($1,000), and $1,000, respectively. Purchases and sales are for temporary cash investment purposes.
2 Includes $24,004,000 of net gain (loss) resulting from in-kind redemptions; such gain (loss) is not taxable to the fund.
See accompanying Notes, which are an integral part of the Financial Statements.
31
Russell 2000 Value Index Fund
Statement of Changes in Net Assets
| Year Ended August 31, | ||
| 2018 | 2017 | |
| ($000) | ($000) | |
| Increase (Decrease) in Net Assets | ||
| Operations | ||
| Net Investment Income | 6,243 | 5,564 |
| Realized Net Gain (Loss) | 18,109 | 16,665 |
| Change in Unrealized Appreciation (Depreciation) | 38,922 | 13,434 |
| Net Increase (Decrease) in Net Assets Resulting from Operations | 63,274 | 35,663 |
| Distributions | ||
| Net Investment Income | ||
| ETF Shares | (3,273) | (2,681) |
| Institutional Shares | (2,871) | (2,873) |
| Realized Capital Gain | ||
| ETF Shares | — | — |
| Institutional Shares | — | — |
| Total Distributions | (6,144) | (5,554) |
| Capital Share Transactions | ||
| ETF Shares | 19,909 | 36,580 |
| Institutional Shares | (19,999) | 1,757 |
| Net Increase (Decrease) from Capital Share Transactions | (90) | 38,337 |
| Total Increase (Decrease) | 57,040 | 68,446 |
| Net Assets | ||
| Beginning of Period | 317,633 | 249,187 |
| End of Period1 | 374,673 | 317,633 |
| 1 Net Assets—End of Period includes undistributed (overdistributed) net investment income of $1,314,000 and $1,146,000. | ||
See accompanying Notes, which are an integral part of the Financial Statements.
32
Russell 2000 Value Index Fund
Financial Highlights
| ETF Shares | |||||
| For a Share Outstanding | Year Ended August 31, | ||||
| Throughout Each Period | 2018 | 2017 | 2016 | 2015 | 2014 |
| Net Asset Value, Beginning of Period | $100.96 | $90.64 | $81.88 | $87.76 | $75.48 |
| Investment Operations | |||||
| Net Investment Income | 1.9051 | 1.7361 | 1.561 | 1.530 | 1.284 |
| Net Realized and Unrealized Gain (Loss) | |||||
| on Investments | 18.070 | 10.358 | 9.305 | (5.907) | 12.219 |
| Total from Investment Operations | 19.975 | 12.094 | 10.866 | (4.377) | 13.503 |
| Distributions | |||||
| Dividends from Net Investment Income | (1.885) | (1.774) | (2.106) | (1.503) | (1.223) |
| Distributions from Realized Capital Gains | — | — | — | — | — |
| Total Distributions | (1.885) | (1.774) | (2.106) | (1.503) | (1.223) |
| Net Asset Value, End of Period | $119.05 | $100.96 | $90.64 | $81.88 | $87.76 |
| Total Return | 19.96% | 13.42% | 13.62% | -5.10% | 17.92% |
| Ratios/Supplemental Data | |||||
| Net Assets, End of Period (Millions) | $223 | $172 | $120 | $74 | $70 |
| Ratio of Total Expenses to Average Net Assets | 0.20% | 0.20% | 0.20% | 0.20% | 0.20% |
| Ratio of Net Investment Income to | |||||
| Average Net Assets | 1.73% | 1.76% | 2.02% | 1.80% | 1.83% |
| Portfolio Turnover Rate2 | 30% | 36% | 31% | 28% | 36% |
1 Calculated based on average shares outstanding.
2 Excludes the value of portfolio securities received or delivered as a result of in-kind purchases or redemptions of the fund’s capital
shares, including ETF Creation Units.
See accompanying Notes, which are an integral part of the Financial Statements.
33
Russell 2000 Value Index Fund
Financial Highlights
| Institutional Shares | |||||
| For a Share Outstanding | Year Ended August 31, | ||||
| Throughout Each Period | 2018 | 2017 | 2016 | 2015 | 2014 |
| Net Asset Value, Beginning of Period | $199.13 | $178.76 | $161.59 | $173.15 | $148.87 |
| Investment Operations | |||||
| Net Investment Income | 4.0291 | 3.7371 | 3.265 | 3.195 | 2.724 |
| Net Realized and Unrealized Gain (Loss) | |||||
| on Investments | 35.618 | 20.356 | 18.355 | (11.619) | 24.103 |
| Total from Investment Operations | 39.647 | 24.093 | 21.620 | (8.424) | 26.827 |
| Distributions | |||||
| Dividends from Net Investment Income | (3.967) | (3.723) | (4.450) | (3.136) | (2.547) |
| Distributions from Realized Capital Gains | — | — | — | — | — |
| Total Distributions | (3.967) | (3.723) | (4.450) | (3.136) | (2.547) |
| Net Asset Value, End of Period | $234.81 | $199.13 | $178.76 | $161.59 | $173.15 |
| Total Return | 20.10% | 13.55% | 13.76% | -4.97% | 18.07% |
| Ratios/Supplemental Data | |||||
| Net Assets, End of Period (Millions) | $151 | $146 | $129 | $71 | $82 |
| Ratio of Total Expenses to Average Net Assets | 0.08% | 0.08% | 0.08% | 0.08% | 0.08% |
| Ratio of Net Investment Income to | |||||
| Average Net Assets | 1.85% | 1.88% | 2.14% | 1.92% | 1.95% |
| Portfolio Turnover Rate2 | 30% | 36% | 31% | 28% | 36% |
1 Calculated based on average shares outstanding.
2 Excludes the value of portfolio securities received or delivered as a result of in-kind purchases or redemptions of the fund’s capital
shares, including ETF Creation Units.
See accompanying Notes, which are an integral part of the Financial Statements.
34
Russell 2000 Value Index Fund
Notes to Financial Statements
Vanguard Russell 2000 Value Index Fund is registered under the Investment Company Act of 1940 as an open-end investment company, or mutual fund. The fund offers two classes of shares: ETF Shares and Institutional Shares. ETF Shares are listed for trading on Nasdaq; they can be purchased and sold through a broker. Institutional Shares are designed for investors who meet certain administrative, service, and account-size criteria.
A. The following significant accounting policies conform to generally accepted accounting principles for U.S. investment companies. The fund consistently follows such policies in preparing its financial statements.
1. Security Valuation: Securities are valued as of the close of trading on the New York Stock Exchange (generally 4 p.m., Eastern time) on the valuation date. Equity securities are valued at the latest quoted sales prices or official closing prices taken from the primary market in which each security trades; such securities not traded on the valuation date are valued at the mean of the latest quoted bid and asked prices. Securities for which market quotations are not readily available, or whose values have been materially affected by events occurring before the fund’s pricing time but after the close of the securities’ primary markets, are valued by methods deemed by the board of trustees to represent fair value. Investments in Vanguard Market Liquidity Fund are valued at that fund’s net asset value. Temporary cash investments are valued using the latest bid prices or using valuations based on a matrix system (which considers such factors as security prices, yields, maturities, and ratings), both as furnished by independent pricing services.
2. Futures Contracts: The fund uses index futures contracts to a limited extent, with the objectives of maintaining full exposure to the stock market, maintaining liquidity, and minimizing transaction costs. The fund may purchase futures contracts to immediately invest incoming cash in the market, or sell futures in response to cash outflows, thereby simulating a fully invested position in the underlying index while maintaining a cash balance for liquidity. The primary risks associated with the use of futures contracts are imperfect correlation between changes in market values of stocks held by the fund and the prices of futures contracts, and the possibility of an illiquid market. Counterparty risk involving futures is mitigated because a regulated clearinghouse is the counterparty instead of the clearing broker. To further mitigate counterparty risk, the fund trades futures contracts on an exchange, monitors the financial strength of its clearing brokers and clearinghouse, and has entered into clearing agreements with its clearing brokers. The clearinghouse imposes initial margin requirements to secure the fund’s performance and requires daily settlement of variation margin representing changes in the market value of each contract. Any assets pledged as initial margin for open contracts are noted in the Statement of Net Assets.
Futures contracts are valued at their quoted daily settlement prices. The notional amounts of the contracts are not recorded in the Statement of Net Assets. Fluctuations in the value of the contracts are recorded in the Statement of Net Assets as an asset (liability) and in the Statement of Operations as unrealized appreciation (depreciation) until the contracts are closed, when they are recorded as realized futures gains (losses).
During the year ended August 31, 2018, the fund’s average investments in long and short futures contracts represented less than 1% and 0% of net assets, respectively, based on the average of the notional amounts at each quarter-end during the period.
35
Russell 2000 Value Index Fund
3. Federal Income Taxes: The fund intends to continue to qualify as a regulated investment company and distribute all of its taxable income. Management has analyzed the fund’s tax positions taken for all open federal income tax years (August 31, 2015–2018), and has concluded that no provision for federal income tax is required in the fund’s financial statements.
4. Distributions: Distributions to shareholders are recorded on the ex-dividend date. Distributions are determined on a tax basis and may differ from net investment income and realized capital gains for financial reporting purposes.
5. Securities Lending: To earn additional income, the fund lends its securities to qualified institutional borrowers. Security loans are subject to termination by the fund at any time, and are required to be secured at all times by collateral in an amount at least equal to the market value of securities loaned. Daily market fluctuations could cause the value of loaned securities to be more or less than the value of the collateral received. When this occurs, the collateral is adjusted and settled before the opening of the market on the next business day. The fund further mitigates its counterparty risk by entering into securities lending transactions only with a diverse group of prequalified counterparties, monitoring their financial strength, and entering into master securities lending agreements with its counterparties. The master securities lending agreements provide that, in the event of a counterparty’s default (including bankruptcy), the fund may terminate any loans with that borrower, determine the net amount owed, and sell or retain the collateral up to the net amount owed to the fund; however, such actions may be subject to legal proceedings. While collateral mitigates counterparty risk, in the event of a default, the fund may experience delays and costs in recovering the securities loaned. The fund invests cash collateral received in Vanguard Market Liquidity Fund, and records a liability in the Statement of Net Assets for the return of the collateral, during the period the securities are on loan. Securities lending income represents fees charged to borrowers plus income earned on invested cash collateral, less expenses associated with the loan. During the term of the loan, the fund is entitled to all distributions made on or in respect of the loaned securities.
6. Credit Facility: The fund and certain other funds managed by The Vanguard Group (“Vanguard”) participate in a $3.1 billion committed credit facility provided by a syndicate of lenders pursuant to a credit agreement that may be renewed annually; each fund is individually liable for its borrowings, if any, under the credit facility. Borrowings may be utilized for temporary and emergency purposes, and are subject to the fund’s regulatory and contractual borrowing restrictions. The participating funds are charged administrative fees and an annual commitment fee of 0.10% of the undrawn amount of the facility; these fees are allocated to the funds based on a method approved by the fund’s board of trustees and included in Management and Administrative expenses on the fund’s Statement of Operations. Any borrowings under this facility bear interest at a rate based upon the higher of the one-month London Interbank Offered Rate, federal funds effective rate, or overnight bank funding rate plus an agreed-upon spread.
The fund had no borrowings outstanding at August 31, 2018, or at any time during the period then ended.
7. Other: Dividend income is recorded on the ex-dividend date. Interest income includes income distributions received from Vanguard Market Liquidity Fund and is accrued daily. Premiums and discounts on debt securities purchased are amortized and accreted, respectively, to interest income over the lives of the respective securities. Security transactions are accounted for on the date securities are bought or sold. Costs used to determine realized gains (losses) on the sale of investment securities are those of the specific securities sold.
36
Russell 2000 Value Index Fund
Each class of shares has equal rights as to assets and earnings, except that each class separately bears certain class-specific expenses related to maintenance of shareholder accounts (included in Management and Administrative expenses), shareholder reporting, and the proxy. Marketing and distribution expenses are allocated to each class of shares based on a method approved by the board of trustees. Income, other non-class-specific expenses, and gains and losses on investments are allocated to each class of shares based on its relative net assets.
B. In accordance with the terms of a Funds’ Service Agreement (the “FSA”) between Vanguard and the fund, Vanguard furnishes to the fund investment advisory, corporate management, administrative, marketing, and distribution services at Vanguard’s cost of operations (as defined by the FSA). These costs of operations are allocated to the fund based on methods and guidelines approved by the board of trustees. Vanguard does not require reimbursement in the current period for certain costs of operations (such as deferred compensation/benefits and risk/insurance costs); the fund’s liability for these costs of operations is included in Payables to Vanguard on the Statement of Net Assets. All other costs of operations payable to Vanguard are generally settled twice a month.
Upon the request of Vanguard, the fund may invest up to 0.40% of its net assets as capital in Vanguard. At August 31, 2018, the fund had contributed to Vanguard capital in the amount of $19,000, representing 0.01% of the fund’s net assets and 0.01% of Vanguard’s capitalization. The fund’s trustees and officers are also directors and employees, respectively, of Vanguard.
C. Various inputs may be used to determine the value of the fund’s investments. These inputs are summarized in three broad levels for financial statement purposes. The inputs or methodologies used to value securities are not necessarily an indication of the risk associated with investing in those securities.
Level 1—Quoted prices in active markets for identical securities.
Level 2—Other significant observable inputs (including quoted prices for similar securities, interest rates, prepayment speeds, credit risk, etc.).
Level 3—Significant unobservable inputs (including the fund’s own assumptions used to determine
the fair value of investments). Any investments valued with significant unobservable inputs are noted
on the Statement of Net Assets.
The following table summarizes the market value of the fund’s investments as of August 31, 2018, based on the inputs used to value them:
| Level 1 | Level 2 | Level 3 | |
| Investments | ($000) | ($000) | ($000) |
| Common Stocks | 371,621 | — | 4 |
| Temporary Cash Investments | 5,642 | 199 | — |
| Futures Contracts—Assets1 | 11 | — | — |
| Total | 377,274 | 199 | 4 |
| 1 Represents variation margin on the last day of the reporting period. |
37
Russell 2000 Value Index Fund
D. Permanent differences are reclassified among capital accounts in the financial statements to reflect their tax character. These reclassifications have no effect on net assets or net asset value per share. As of period end, the following permanent differences primarily attributable to the accounting for in-kind redemptions and passive foreign investment companies were reclassified to the following accounts:
| Amount | |
| ($000) | |
| Paid-in capital | 23,997 |
| Undistributed (Overdistributed) net investment income | 69 |
| Accumulated net realized gains (losses) | (24,066) |
Temporary differences between book-basis and tax-basis components of accumulated net earnings (losses) arise when certain items of income, gain, or loss are recognized in different periods for financial statement and tax purposes; these differences will reverse at some time in the future. The differences are primarily related to the tax deferral of losses on wash sales, the realization of unrealized gains or losses on certain futures contracts, and unrealized gains on passive foreign investment companies. As of period end, the tax components of accumulated net earnings (losses) are detailed in the table as follows:
| Amount | |
| ($000) | |
| Undistributed ordinary income | 1,368 |
| Undistributed long-term gains | — |
| Capital loss carryforwards (non-expiring) | (21,300) |
| Net unrealized gains (losses) | 59,612 |
As of August 31, 2018, gross unrealized appreciation and depreciation for investments and derivatives based on cost for U.S. federal income tax purposes were as follows:
| Amount | |
| ($000) | |
| Tax cost | 317,854 |
| Gross unrealized appreciation | 72,265 |
| Gross unrealized depreciation | (12,653) |
| Net unrealized appreciation (depreciation) | 59,612 |
38
Russell 2000 Value Index Fund
E. During the year ended August 31, 2018, the fund purchased $177,567,000 of investment securities and sold $176,666,000 of investment securities, other than temporary cash investments. Purchases and sales include $72,595,000 and $66,633,000, respectively, in connection with in-kind purchases and redemptions of the fund’s capital shares.
The fund purchased securities from and sold securities to other Vanguard funds or accounts managed by Vanguard or its affiliates, in accordance with procedures adopted by the board of trustees in compliance with Rule 17a-7 of the Investment Company Act of 1940. For the year ended August 31, 2018, such purchases and sales were $45,497,000 and $31,004,000, respectively; these amounts are included in the purchases and sales of investment securities noted above.
F. Capital share transactions for each class of shares were:
| Year Ended August 31, | ||||
| 2018 | 2017 | |||
| Amount | Shares | Amount | Shares | |
| ($000) | (000) | ($000) | (000) | |
| ETF Shares | ||||
| Issued | 87,282 | 750 | 95,420 | 950 |
| Issued in Lieu of Cash Distributions | — | — | — | — |
| Redeemed | (67,373) | (575) | (58,840) | (575) |
| Net Increase (Decrease)—ETF Shares | 19,909 | 175 | 36,580 | 375 |
| Institutional Shares | ||||
| Issued | 24,366 | 112 | 39,675 | 198 |
| Issued in Lieu of Cash Distributions | 2,753 | 13 | 2,511 | 13 |
| Redeemed | (47,118) | (213) | (40,429) | (200) |
| Net Increase (Decrease)—Institutional Shares | (19,999) | (88) | 1,757 | 11 |
G. Management has determined that no events or transactions occurred subsequent to August 31, 2018, that would require recognition or disclosure in these financial statements.
39
Russell 2000 Growth Index Fund
Fund Profile
As of August 31, 2018
| Share-Class Characteristics | ||
| ETF | Institutional | |
| Shares | Shares | |
| Ticker Symbol | VTWG | VRTGX |
| Expense Ratio1 | 0.20% | 0.08% |
| 30-Day SEC Yield | 0.48% | 0.60% |
| Portfolio Characteristics | |||
| Russell | DJ | ||
| 2000 | U.S. Total | ||
| Growth | Market | ||
| Fund | Index | FA Index | |
| Number of Stocks | 1,370 | 1,212 | 3,745 |
| Median Market Cap | $2.5B | $2.5B | $71.0B |
| Price/Earnings Ratio | 25.9x | 25.9x | 21.0x |
| Price/Book Ratio | 4.5x | 4.5x | 3.2x |
| Return on Equity | 8.3% | 8.3% | 15.0% |
| Earnings Growth | |||
| Rate | 12.4% | 12.2% | 8.4% |
| Dividend Yield | 0.6% | 0.6% | 1.7% |
| Foreign Holdings | 0.0% | 0.0% | 0.0% |
| Turnover Rate | 35% | — | — |
| Short-Term Reserves | 0.1% | — | — |
| Sector Diversification (% of equity exposure) | |||
| Russell | DJ | ||
| 2000 | U.S. Total | ||
| Growth | Market | ||
| Fund | Index | FA Index | |
| Consumer Discretionary | 17.8% | 17.8% | 14.4% |
| Consumer Staples | 2.5 | 2.5 | 5.3 |
| Energy | 2.2 | 2.2 | 5.6 |
| Financial Services | 10.1 | 10.1 | 20.8 |
| Health Care | 26.5 | 26.5 | 13.9 |
| Materials & Processing | 7.9 | 7.9 | 3.5 |
| Producer Durables | 15.4 | 15.4 | 10.5 |
| Technology | 15.9 | 15.9 | 21.4 |
| Utilities | 1.7 | 1.7 | 4.6 |
Sector categories are based on the Russell Global Sectors (“RGS”),
except for the “Other” category (if applicable), which includes
securities that have not been provided a RGS classification as of
the effective reporting period.
| Volatility Measures | ||
| DJ | ||
| U.S. Total | ||
| Russell 2000 | Market | |
| Growth Index | FA Index | |
| R-Squared | 1.00 | 0.73 |
| Beta | 1.00 | 1.24 |
| These measures show the degree and timing of the fund’s | ||
| fluctuations compared with the indexes over 36 months. | ||
| Ten Largest Holdings (% of total net assets) | ||
| Five Below Inc. | Specialty Retail | 0.5% |
| Haemonetics Corp. | Medical Equipment | 0.5 |
| Etsy Inc. | Diversified Retail | 0.5 |
| Integrated Device | Semiconductors & | |
| Technology Inc. | Components | 0.5 |
| Ligand Pharmaceuticals | ||
| Inc. | Biotechnology | 0.5 |
| Primerica Inc. | Insurance: Life | 0.5 |
| HubSpot Inc. | Computer Services | |
| Software & Systems | 0.4 | |
| Teladoc Health Inc. | Health Care Services | 0.4 |
| HealthEquity Inc. | Health Care | |
| Management | ||
| Services | 0.4 | |
| Blackbaud Inc. | Computer Services | |
| Software & Systems | 0.4 | |
| Top Ten | 4.6% | |
| The holdings listed exclude any temporary cash investments and | ||
| equity index products. | ||
Investment Focus
1 The expense ratios shown are from the prospectus dated December 21, 2017, and represent estimated costs for the current fiscal year. For the fiscal year ended August 31, 2018, the expense ratios were 0.20% for ETF Shares and 0.08% for Institutional Shares.
40
Russell 2000 Growth Index Fund
Performance Summary
All of the returns in this report represent past performance, which is not a guarantee of future results that may be achieved by the fund. (Current performance may be lower or higher than the performance data cited. For performance data current to the most recent month-end, visit our website at vanguard.com/performance.) Note, too, that both investment returns and principal value can fluctuate widely, so an investor’s shares, when sold, could be worth more or less than their original cost. The returns shown do not reflect taxes that a shareholder would pay on fund distributions or on the sale of fund shares.
Cumulative Performance: September 20, 2010, Through August 31, 2018
Initial Investment of $10,000
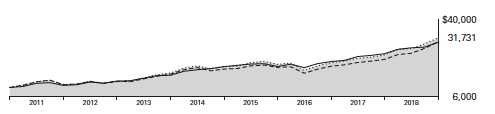
| Average Annual Total Returns | |||||
| Periods Ended August 31, 2018 | |||||
| Since | Final Value | ||||
| One | Five | Inception | of a $10,000 | ||
| Year | Years | (9/20/2010) | Investment | ||
| Russell 2000 Growth Index Fund*ETF | |||||
| Shares Net Asset Value | 30.69% | 14.22% | 15.64% | $31,731 | |
| Russell 2000 Growth Index Fund*ETF | |||||
| Shares Market Price | 30.66 | 14.23 | 15.64 | 31,730 | |
| • • • • • • • • | Russell 2000 Growth Index | 30.72 | 14.20 | 15.67 | 31,795 |
| – – – – | Small-Cap Growth Funds Average | 34.70 | 13.68 | 14.88 | 30,108 |
| Dow Jones U.S. Total Stock Market | |||||
| Float Adjusted Index | 20.26 | 14.21 | 14.77 | 29,886 | |
Small-Cap Growth Funds Average: Derived from data provided by Lipper, a Thomson Reuters Company.
"Since Inception" performance is calculated from the ETF Shares’ inception date for both the fund and its comparative standards.
See Financial Highlights for dividend and capital gains information.
41
Russell 2000 Growth Index Fund
| Average Annual Total Returns | ||||
| Periods Ended August 31, 2018 | ||||
| Since | Final Value | |||
| One | Five | Inception | of a $5,000,000 | |
| Year | Years | (5/25/2011) | Investment | |
| Russell 2000 Growth Index Fund | ||||
| Institutional Shares | 30.85% | 14.36% | 13.51% | $12,559,398 |
| Russell 2000 Growth Index | 30.72 | 14.20 | 13.40 | 12,469,457 |
| Dow Jones U.S. Total Stock Market Float | ||||
| Adjusted Index | 20.26 | 14.21 | 13.56 | 12,596,493 |
| "Since Inception" performance is calculated from the Institutional Shares’ inception date for both the fund and its comparative standards. | ||||
| Cumulative Returns of ETF Shares: September 20, 2010, Through August 31, 2018 | |||
| Since | |||
| One | Five | Inception | |
| Year | Years | (9/20/2010) | |
| Russell 2000 Growth Index Fund ETF Shares Market | |||
| Price | 30.66% | 94.45% | 217.30% |
| Russell 2000 Growth Index Fund ETF Shares Net | |||
| Asset Value | 30.69 | 94.43 | 217.31 |
| Russell 2000 Growth Index | 30.72 | 94.23 | 217.95 |
| "Since Inception" performance is calculated from the ETF Shares’ inception date for both the fund and its comparative standards. | |||
Fiscal-Year Total Returns (%): September 20, 2010, Through August 31, 2018
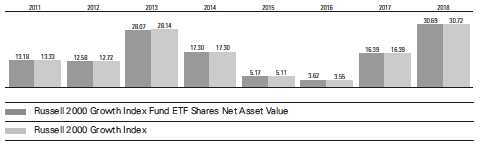
42
Russell 2000 Growth Index Fund
Average Annual Total Returns: Periods Ended June 30, 2018
This table presents returns through the latest calendar quarter—rather than through the end of the fiscal period.
Securities and Exchange Commission rules require that we provide this information.
| Inception | One | Five | Since | |
| Date | Year | Years | Inception | |
| ETF Shares | 9/20/2010 | |||
| Market Price | 21.84% | 13.69% | 14.86% | |
| Net Asset Value | 21.82 | 13.67 | 14.86 | |
| Institutional Shares | 5/25/2011 | 21.96 | 13.80 | 12.61 |
43
Russell 2000 Growth Index Fund
Financial Statements
Statement of Net Assets—Investments Summary
As of August 31, 2018
This Statement summarizes the fund’s holdings by asset type. Details are reported for each of the fund’s 50 largest individual holdings and for investments that, in total for any issuer, represent more than 1% of the fund’s net assets. The total value of smaller holdings is reported as a single amount within each category.
The fund reports a complete list of its holdings in regulatory filings four times in each fiscal year, at the quarter-ends. For the second and fourth fiscal quarters, the complete listing of the fund’s holdings is available electronically on vanguard.com and on the Securities and Exchange Commission’s website (sec.gov), or you can have it mailed to you without charge by calling 800-662-7447. For the first and third fiscal quarters, the fund files the lists with the SEC on Form N-Q. Shareholders can look up the fund’s Forms N-Q on the SEC’s website. Forms N-Q may also be reviewed and copied at the SEC’s Public Reference Room (see the back cover of this report for further information).
| Market | Percentage | |||
| Value• | of Net | |||
| Shares | ($000) | Assets | ||
| Common Stocks | ||||
| Consumer Discretionary | ||||
| * Five Below Inc. | 40,354 | 4,700 | 0.5% | |
| * Etsy Inc. | 88,053 | 4,287 | 0.5% | |
| Texas Roadhouse Inc. Class A | 50,100 | 3,454 | 0.4% | |
| * Planet Fitness Inc. Class A | 65,357 | 3,357 | 0.4% | |
| * Trade Desk Inc. Class A | 23,290 | 3,304 | 0.4% | |
| * Ollie’s Bargain Outlet Holdings Inc. | 36,628 | 3,190 | 0.4% | |
| * Stamps.com Inc. | 12,828 | 3,187 | 0.4% | |
| * Deckers Outdoor Corp. | 23,561 | 2,871 | 0.3% | |
| American Eagle Outfitters Inc. | 107,151 | 2,782 | 0.3% | |
| World Wrestling Entertainment Inc. Class A | 31,201 | 2,727 | 0.3% | |
| Nexstar Media Group Inc. Class A | 33,124 | 2,716 | 0.3% | |
| Consumer Discretionary—Other † | 118,732 | 13.6% | ||
| 155,307 | 17.8% | |||
| Consumer Staples † | 21,601 | 2.5% | ||
| Energy | ||||
| Delek US Holdings Inc. | 56,872 | 3,099 | 0.4% | |
| Energy—Other † | 15,969 | 1.8% | ||
| 19,068 | 2.2% | |||
| Financial Services | ||||
| Primerica Inc. | 32,307 | 3,950 | 0.5% | |
| * Green Dot Corp. Class A | 35,308 | 3,025 | 0.3% | |
| Ryman Hospitality Properties Inc. | 33,039 | 2,932 | 0.3% | |
| First Financial Bankshares Inc. | 48,069 | 2,903 | 0.3% | |
| Financial Services—Other † | 74,847 | 8.6% | ||
| 87,657 | 10.0% | |||
| 44 | ||||
| Russell 2000 Growth Index Fund | |||||
| Market | Percentage | ||||
| Value• | of Net | ||||
| Shares | ($000) | Assets | |||
| Health Care | |||||
| * | Haemonetics Corp. | 39,691 | 4,431 | 0.5% | |
| * | Ligand Pharmaceuticals Inc. | 15,424 | 4,005 | 0.5% | |
| *,^ | Teladoc Health Inc. | 49,540 | 3,842 | 0.5% | |
| * | HealthEquity Inc. | 40,021 | 3,770 | 0.4% | |
| * | Medidata Solutions Inc. | 42,545 | 3,615 | 0.4% | |
| * | LivaNova plc | 28,463 | 3,574 | 0.4% | |
| * | Neogen Corp. | 37,216 | 3,477 | 0.4% | |
| * | Inogen Inc. | 12,988 | 3,441 | 0.4% | |
| * | FibroGen Inc. | 55,394 | 3,387 | 0.4% | |
| * | Loxo Oncology Inc. | 19,639 | 3,319 | 0.4% | |
| * | Ultragenyx Pharmaceutical Inc. | 34,816 | 2,950 | 0.3% | |
| * | Globus Medical Inc. | 52,989 | 2,823 | 0.3% | |
| Health Care—Other † | 188,562 | 21.6% | |||
| 231,196 | 26.5% | ||||
| Materials & Processing | |||||
| * | Trex Co. Inc. | 43,668 | 3,699 | 0.4% | |
| * | Ingevity Corp. | 31,315 | 3,163 | 0.4% | |
| Materials & Processing—Other † | 61,608 | 7.0% | |||
| 68,470 | 7.8% | ||||
| §,1Other † | 372 | 0.0% | |||
| Producer Durables | |||||
| * | ASGN Inc. | 37,489 | 3,471 | 0.4% | |
| Insperity Inc. | 28,248 | 3,386 | 0.4% | ||
| Woodward Inc. | 39,613 | 3,191 | 0.4% | ||
| MAXIMUS Inc. | 47,865 | 3,183 | 0.4% | ||
| * | Proto Labs Inc. | 20,027 | 3,113 | 0.4% | |
| Korn/Ferry International | 41,773 | 2,804 | 0.3% | ||
| Brink’s Co. | 37,065 | 2,784 | 0.3% | ||
| John Bean Technologies Corp. | 23,075 | 2,730 | 0.3% | ||
| Tetra Tech Inc. | 38,385 | 2,679 | 0.3% | ||
| Producer Durables—Other † | 106,889 | 12.2% | |||
| 134,230 | 15.4% | ||||
| Technology | |||||
| * | Integrated Device Technology Inc. | 98,092 | 4,168 | 0.5% | |
| * | HubSpot Inc. | 26,744 | 3,843 | 0.4% | |
| Blackbaud Inc. | 35,675 | 3,731 | 0.4% | ||
| Entegris Inc. | 104,976 | 3,559 | 0.4% | ||
| * | New Relic Inc. | 32,791 | 3,370 | 0.4% | |
| * | Lumentum Holdings Inc. | 46,322 | 3,145 | 0.4% | |
| * | Silicon Laboratories Inc. | 31,627 | 3,099 | 0.4% | |
| Science Applications International Corp. | 31,315 | 2,825 | 0.3% | ||
| * | Yelp Inc. Class A | 59,757 | 2,816 | 0.3% | |
| * | Coupa Software Inc. | 39,183 | 2,810 | 0.3% | |
| Technology—Other † | 105,541 | 12.1% | |||
| 138,907 | 15.9% | ||||
| Utilities | |||||
| j2 Global Inc. | 34,520 | 2,850 | 0.3% | ||
| Utilities—Other † | 11,904 | 1.4% | |||
| 14,754 | 1.7% | ||||
| Total Common Stocks (Cost $683,188) | 871,562 | 99.8%2 | |||
| 45 | |||||
| Russell 2000 Growth Index Fund | |||||
| Market | Percentage | ||||
| Value• | of Net | ||||
| Coupon | Shares | ($000) | Assets | ||
| Temporary Cash Investments | |||||
| Money Market Fund | |||||
| 3,4 Vanguard Market Liquidity Fund | 2.153% | 170,119 | 17,015 | 2.0% | |
| 5U.S. Government and Agency Obligations † | 250 | 0.0% | |||
| Total Temporary Cash Investments (Cost $17,261) | 17,265 | 2.0%2 | |||
| Total Investments (Cost $700,449) | 888,827 | 101.8% | |||
| Amount | |||||
| ($000) | |||||
| Other Assets and Liabilities | |||||
| Other Assets | |||||
| Investment in Vanguard | 42 | ||||
| Receivables for Investment Securities Sold | 46 | ||||
| Receivables for Accrued Income | 375 | ||||
| Receivables for Capital Shares Issued | 143 | ||||
| Variation Margin Receivable—Futures Contracts | 10 | ||||
| Total Other Assets | 616 | 0.1% | |||
| Liabilities | |||||
| Payables for Investment Securities Purchased | (1,911) | ||||
| Collateral for Securities on Loan | (13,514) | ||||
| Payables for Capital Shares Redeemed | (358) | ||||
| Payables to Vanguard | (133) | ||||
| Other Liabilities | (5) | ||||
| Total Liabilities | (15,921) | (1.9%) | |||
| Net Assets | 873,522 | 100.0% | |||
| At August 31, 2018, net assets consisted of: | |||||
| Amount | |||||
| ($000) | |||||
| Paid-in Capital | 737,876 | ||||
| Undistributed Net Investment Income | 1,229 | ||||
| Accumulated Net Realized Losses | (54,024) | ||||
| Unrealized Appreciation (Depreciation) | |||||
| Investment Securities | 188,378 | ||||
| Futures Contracts | 63 | ||||
| Net Assets | 873,522 | ||||
| 46 | |||||
Russell 2000 Growth Index Fund
| Amount | |
| ($000) | |
| ETF Shares—Net Assets | |
| Applicable to 2,050,000 outstanding $.001 par value shares of | |
| beneficial interest (unlimited authorization) | 328,246 |
| Net Asset Value Per Share—ETF Shares | $160.12 |
| Institutional Shares—Net Assets | |
| Applicable to 1,787,577 outstanding $.001 par value shares of | |
| beneficial interest (unlimited authorization) | 545,276 |
| Net Asset Value Per Share—Institutional Shares | $305.04 |
• See Note A in Notes to Financial Statements.
* Non-income-producing security.
^ Includes partial security positions on loan to broker-dealers. The total value of securities on loan is $12,608,000.
† Represents the aggregate value, by category, of securities that are not among the 50 largest holdings and, in total for any issuer,
represent 1% or less of net assets.
§ Certain of the fund’s securities are valued using significant unobservable inputs.
1 “Other” represents securities that are not classified by the fund’s benchmark index.
2 The fund invests a portion of its cash reserves in equity markets through the use of index futures contracts. After giving effect to
futures investments, the fund’s effective common stock and temporary cash investment positions represent 100.2% and 1.6%,
respectively, of net assets.
3 Affiliated money market fund available only to Vanguard funds and certain trusts and accounts managed by Vanguard. Rate shown
is the 7-day yield.
4 Includes $13,514,000 of collateral received for securities on loan.
5 Securities with a value of $149,000 have been segregated as initial margin for open futures contracts.
| Derivative Financial Instruments Outstanding as of Period End | ||||
| Futures Contracts | ||||
| ($000) | ||||
| Value and | ||||
| Number of | Unrealized | |||
| Long (Short) | Notional | Appreciation | ||
| Expiration | Contracts | Amount | (Depreciation) | |
| Long Futures Contracts | ||||
| E-mini Russell 2000 Index | September 2018 | 36 | 3,133 | 63 |
See accompanying Notes, which are an integral part of the Financial Statements.
47
Russell 2000 Growth Index Fund
Statement of Operations
| Year Ended | |
| August31,2018 | |
| ($000) | |
| Investment Income | |
| Income | |
| Dividends | 4,835 |
| Interest1 | 56 |
| Securities Lending—Net | 992 |
| Total Income | 5,883 |
| Expenses | |
| The Vanguard Group—Note B | |
| Investment Advisory Services | 106 |
| Management and Administrative—ETF Shares | 399 |
| Management and Administrative—Institutional Shares | 208 |
| Marketing and Distribution—ETF Shares | 14 |
| Marketing and Distribution—Institutional Shares | 13 |
| Custodian Fees | 63 |
| Auditing Fees | 33 |
| Shareholders’ Reports and Proxy—ETF Shares | 18 |
| Shareholders’ Reports and Proxy—Institutional Shares | 11 |
| Total Expenses | 865 |
| Net Investment Income | 5,018 |
| Realized Net Gain (Loss) | |
| Investment Securities Sold1,2 | 58,116 |
| Futures Contracts | 498 |
| Realized Net Gain (Loss) | 58,614 |
| Change in Unrealized Appreciation (Depreciation) | |
| Investment Securities1 | 122,921 |
| Futures Contracts | 97 |
| Change in Unrealized Appreciation (Depreciation) | 123,018 |
| Net Increase (Decrease) in Net Assets Resulting from Operations | 186,650 |
1 Interest income, realized net gain (loss), and change in unrealized appreciation (depreciation) from an affiliated company of the fund
were $49,000, ($2,000), and $2,000, respectively. Purchases and sales are for temporary cash investment purposes.
2 Includes $67,540,000 of net gain (loss) resulting from in-kind redemptions; such gain (loss) is not taxable to the fund.
See accompanying Notes, which are an integral part of the Financial Statements.
48
Russell 2000 Growth Index Fund
Statement of Changes in Net Assets
| Year Ended August 31, | ||
| 2018 | 2017 | |
| ($000) | ($000) | |
| Increase (Decrease) in Net Assets | ||
| Operations | ||
| Net Investment Income | 5,018 | 4,195 |
| Realized Net Gain (Loss) | 58,614 | 11,911 |
| Change in Unrealized Appreciation (Depreciation) | 123,018 | 53,655 |
| Net Increase (Decrease) in Net Assets Resulting from Operations | 186,650 | 69,761 |
| Distributions | ||
| Net Investment Income | ||
| ETF Shares | (1,438) | (1,648) |
| Institutional Shares | (3,131) | (2,980) |
| Realized Capital Gain | ||
| ETF Shares | — | — |
| Institutional Shares | — | — |
| Total Distributions | (4,569) | (4,628) |
| Capital Share Transactions | ||
| ETF Shares | 71,455 | 25,090 |
| Institutional Shares | 56,059 | 110,695 |
| Net Increase (Decrease) from Capital Share Transactions | 127,514 | 135,785 |
| Total Increase (Decrease) | 309,595 | 200,918 |
| Net Assets | ||
| Beginning of Period | 563,927 | 363,009 |
| End of Period1 | 873,522 | 563,927 |
| 1 Net Assets—End of Period includes undistributed (overdistributed) net investment income of $1,229,000 and $775,000. | ||
See accompanying Notes, which are an integral part of the Financial Statements.
49
Russell 2000 Growth Index Fund
Financial Highlights
| ETF Shares | |||||
| For a Share Outstanding | Year Ended August 31, | ||||
| Throughout Each Period | 2018 | 2017 | 2016 | 2015 | 2014 |
| Net Asset Value, Beginning of Period | $123.26 | $106.98 | $104.34 | $99.83 | $85.58 |
| Investment Operations | |||||
| Net Investment Income | . 8951 | .9611 | . 989 | .680 | .646 |
| Net Realized and Unrealized Gain (Loss) | |||||
| on Investments | 36.791 | 16.455 | 2.721 | 4.471 | 14.153 |
| Total from Investment Operations | 37.686 | 17.416 | 3.710 | 5.151 | 14.799 |
| Distributions | |||||
| Dividends from Net Investment Income | (.826) | (1.136) | (1.070) | (.641) | (.549) |
| Distributions from Realized Capital Gains | — | — | — | — | — |
| Total Distributions | (.826) | (1.136) | (1.070) | (.641) | (.549) |
| Net Asset Value, End of Period | $160.12 | $123.26 | $106.98 | $104.34 | $99.83 |
| Total Return | 30.69% | 16.39% | 3.62% | 5.17% | 17.30% |
| Ratios/Supplemental Data | |||||
| Net Assets, End of Period (Millions) | $328 | $194 | $144 | $149 | $100 |
| Ratio of Total Expenses to Average Net Assets | 0.20% | 0.20% | 0.20% | 0.20% | 0.20% |
| Ratio of Net Investment Income to | |||||
| Average Net Assets | 0.64% | 0.83% | 0.99% | 0.67% | 0.60% |
| Portfolio Turnover Rate2 | 35% | 34% | 33% | 34% | 35% |
1 Calculated based on average shares outstanding.
2 Excludes the value of portfolio securities received or delivered as a result of in-kind purchases or redemptions of the fund’s capital
shares, including ETF Creation Units.
See accompanying Notes, which are an integral part of the Financial Statements.
50
Russell 2000 Growth Index Fund
Financial Highlights
| Institutional Shares | |||||
| For a Share Outstanding | Year Ended August 31, | ||||
| Throughout Each Period | 2018 | 2017 | 2016 | 2015 | 2014 |
| Net Asset Value, Beginning of Period | $234.80 | $203.79 | $198.85 | $190.26 | $162.99 |
| Investment Operations | |||||
| Net Investment Income | 2.026 1 | 2.1021 | 2.121 | 1.478 | 1.412 |
| Net Realized and Unrealized Gain (Loss) | |||||
| on Investments | 70.080 | 31.338 | 5.185 | 8.565 | 26.992 |
| Total from Investment Operations | 72.106 | 33.440 | 7.306 | 10.043 | 28.404 |
| Distributions | |||||
| Dividends from Net Investment Income | (1.866) | (2.430) | (2.366) | (1.453) | (1.134) |
| Distributions from Realized Capital Gains | — | — | — | — | — |
| Total Distributions | (1.866) | (2.430) | (2.366) | (1.453) | (1.134) |
| Net Asset Value, End of Period | $305.04 | $234.80 | $203.79 | $198.85 | $190.26 |
| Total Return | 30.85% | 16.53% | 3.74% | 5.29% | 17.44% |
| Ratios/Supplemental Data | |||||
| Net Assets, End of Period (Millions) | $545 | $370 | $219 | $187 | $171 |
| Ratio of Total Expenses to Average Net Assets | 0.08% | 0.08% | 0.08% | 0.08% | 0.08% |
| Ratio of Net Investment Income to | |||||
| Average Net Assets | 0.76% | 0.95% | 1.11% | 0.79% | 0.72% |
| Portfolio Turnover Rate2 | 35% | 34% | 33% | 34% | 35% |
1 Calculated based on average shares outstanding.
2 Excludes the value of portfolio securities received or delivered as a result of in-kind purchases or redemptions of the fund’s capital
shares, including ETF Creation Units.
See accompanying Notes, which are an integral part of the Financial Statements.
51
Russell 2000 Growth Index Fund
Notes to Financial Statements
Vanguard Russell 2000 Growth Index Fund is registered under the Investment Company Act of 1940 as an open-end investment company, or mutual fund. The fund offers two classes of shares: ETF Shares and Institutional Shares. ETF Shares are listed for trading on Nasdaq; they can be purchased and sold through a broker. Institutional Shares are designed for investors who meet certain administrative, service, and account-size criteria.
A. The following significant accounting policies conform to generally accepted accounting principles for U.S. investment companies. The fund consistently follows such policies in preparing its financial statements.
1. Security Valuation: Securities are valued as of the close of trading on the New York Stock Exchange (generally 4 p.m., Eastern time) on the valuation date. Equity securities are valued at the latest quoted sales prices or official closing prices taken from the primary market in which each security trades; such securities not traded on the valuation date are valued at the mean of the latest quoted bid and asked prices. Securities for which market quotations are not readily available, or whose values have been materially affected by events occurring before the fund’s pricing time but after the close of the securities’ primary markets, are valued by methods deemed by the board of trustees to represent fair value. Investments in Vanguard Market Liquidity Fund are valued at that fund’s net asset value. Temporary cash investments are valued using the latest bid prices or using valuations based on a matrix system (which considers such factors as security prices, yields, maturities, and ratings), both as furnished by independent pricing services.
2. Futures Contracts: The fund uses index futures contracts to a limited extent, with the objectives of maintaining full exposure to the stock market, maintaining liquidity, and minimizing transaction costs. The fund may purchase futures contracts to immediately invest incoming cash in the market, or sell futures in response to cash outflows, thereby simulating a fully invested position in the underlying index while maintaining a cash balance for liquidity. The primary risks associated with the use of futures contracts are imperfect correlation between changes in market values of stocks held by the fund and the prices of futures contracts, and the possibility of an illiquid market. Counterparty risk involving futures is mitigated because a regulated clearinghouse is the counterparty instead of the clearing broker. To further mitigate counterparty risk, the fund trades futures contracts on an exchange, monitors the financial strength of its clearing brokers and clearinghouse, and has entered into clearing agreements with its clearing brokers. The clearinghouse imposes initial margin requirements to secure the fund’s performance and requires daily settlement of variation margin representing changes in the market value of each contract. Any assets pledged as initial margin for open contracts are noted in the Statement of Net Assets.
Futures contracts are valued at their quoted daily settlement prices. The notional amounts of the contracts are not recorded in the Statement of Net Assets. Fluctuations in the value of the contracts are recorded in the Statement of Net Assets as an asset (liability) and in the Statement of Operations as unrealized appreciation (depreciation) until the contracts are closed, when they are recorded as realized futures gains (losses).
During the year ended August 31, 2018, the fund’s average investments in long and short futures contracts represented less than 1% and 0% of net assets, respectively, based on the average of the notional amounts at each quarter-end during the period.
52
Russell 2000 Growth Index Fund
3. Federal Income Taxes: The fund intends to continue to qualify as a regulated investment company and distribute all of its taxable income. Management has analyzed the fund’s tax positions taken for all open federal income tax years (August 31, 2015–2018), and has concluded that no provision for federal income tax is required in the fund’s financial statements.
4. Distributions: Distributions to shareholders are recorded on the ex-dividend date. Distributions are determined on a tax basis and may differ from net investment income and realized capital gains for financial reporting purposes.
5. Securities Lending: To earn additional income, the fund lends its securities to qualified institutional borrowers. Security loans are subject to termination by the fund at any time, and are required to be secured at all times by collateral in an amount at least equal to the market value of securities loaned. Daily market fluctuations could cause the value of loaned securities to be more or less than the value of the collateral received. When this occurs, the collateral is adjusted and settled before the opening of the market on the next business day. The fund further mitigates its counterparty risk by entering into securities lending transactions only with a diverse group of prequalified counterparties, monitoring their financial strength, and entering into master securities lending agreements with its counterparties. The master securities lending agreements provide that, in the event of a counterparty’s default (including bankruptcy), the fund may terminate any loans with that borrower, determine the net amount owed, and sell or retain the collateral up to the net amount owed to the fund; however, such actions may be subject to legal proceedings. While collateral mitigates counterparty risk, in the event of a default, the fund may experience delays and costs in recovering the securities loaned. The fund invests cash collateral received in Vanguard Market Liquidity Fund, and records a liability in the Statement of Net Assets for the return of the collateral, during the period the securities are on loan. Securities lending income represents fees charged to borrowers plus income earned on invested cash collateral, less expenses associated with the loan. During the term of the loan, the fund is entitled to all distributions made on or in respect of the loaned securities.
6. Credit Facility: The fund and certain other funds managed by The Vanguard Group (“Vanguard”) participate in a $3.1 billion committed credit facility provided by a syndicate of lenders pursuant to a credit agreement that may be renewed annually; each fund is individually liable for its borrowings, if any, under the credit facility. Borrowings may be utilized for temporary and emergency purposes, and are subject to the fund’s regulatory and contractual borrowing restrictions. The participating funds are charged administrative fees and an annual commitment fee of 0.10% of the undrawn amount of the facility; these fees are allocated to the funds based on a method approved by the fund’s board of trustees and included in Management and Administrative expenses on the fund’s Statement of Operations. Any borrowings under this facility bear interest at a rate based upon the higher of the one-month London Interbank Offered Rate, federal funds effective rate, or overnight bank funding rate plus an agreed-upon spread.
The fund had no borrowings outstanding at August 31, 2018, or at any time during the period then ended.
7. Other: Dividend income is recorded on the ex-dividend date. Interest income includes income distributions received from Vanguard Market Liquidity Fund and is accrued daily. Premiums and discounts on debt securities purchased are amortized and accreted, respectively, to interest income over the lives of the respective securities. Security transactions are accounted for on the date securities are bought or sold. Costs used to determine realized gains (losses) on the sale of investment securities are those of the specific securities sold.
53
Russell 2000 Growth Index Fund
Each class of shares has equal rights as to assets and earnings, except that each class separately bears certain class-specific expenses related to maintenance of shareholder accounts (included in Management and Administrative expenses), shareholder reporting, and the proxy. Marketing and distribution expenses are allocated to each class of shares based on a method approved by the board of trustees. Income, other non-class-specific expenses, and gains and losses on investments are allocated to each class of shares based on its relative net assets.
B. In accordance with the terms of a Funds’ Service Agreement (the “FSA”) between Vanguard and the fund, Vanguard furnishes to the fund investment advisory, corporate management, administrative, marketing, and distribution services at Vanguard’s cost of operations (as defined by the FSA). These costs of operations are allocated to the fund based on methods and guidelines approved by the board of trustees. Vanguard does not require reimbursement in the current period for certain costs of operations (such as deferred compensation/benefits and risk/insurance costs); the fund’s liability for these costs of operations is included in Payables to Vanguard on the Statement of Net Assets. All other costs of operations payable to Vanguard are generally settled twice a month.
Upon the request of Vanguard, the fund may invest up to 0.40% of its net assets as capital in Vanguard. At August 31, 2018, the fund had contributed to Vanguard capital in the amount of $42,000, representing 0.01% of the fund’s net assets and 0.02% of Vanguard’s capitalization. The fund’s trustees and officers are also directors and employees, respectively, of Vanguard.
C. Various inputs may be used to determine the value of the fund’s investments. These inputs are summarized in three broad levels for financial statement purposes. The inputs or methodologies used to value securities are not necessarily an indication of the risk associated with investing in those securities.
Level 1—Quoted prices in active markets for identical securities.
Level 2—Other significant observable inputs (including quoted prices for similar securities, interest rates, prepayment speeds, credit risk, etc.).
Level 3—Significant unobservable inputs (including the fund’s own assumptions used to determine
the fair value of investments). Any investments valued with significant unobservable inputs are noted
on the Statement of Net Assets.
The following table summarizes the market value of the fund’s investments as of August 31, 2018, based on the inputs used to value them:
| Level 1 | Level 2 | Level 3 | |
| Investments | ($000) | ($000) | ($000) |
| Common Stocks | 871,212 | — | 350 |
| Temporary Cash Investments | 17,015 | 250 | — |
| Futures Contracts—Assets1 | 10 | — | — |
| Total | 888,237 | 250 | 350 |
| 1 Represents variation margin on the last day of the reporting period. | |||
54
Russell 2000 Growth Index Fund
D. Permanent differences are reclassified among capital accounts in the financial statements to reflect their tax character. These reclassifications have no effect on net assets or net asset value per share. As of period end, the following permanent differences primarily attributable to the accounting for in-kind redemptions and passive foreign investment companies were reclassified to the following accounts:
| Amount | |
| ($000) | |
| Paid-in capital | 67,539 |
| Undistributed (Overdistributed) net investment income | 5 |
| Accumulated net realized gains (losses) | (67,544) |
Temporary differences between book-basis and tax-basis components of accumulated net earnings (losses) arise when certain items of income, gain, or loss are recognized in different periods for financial statement and tax purposes; these differences will reverse at some time in the future. The differences are primarily related to the tax deferral of losses on wash sales, the realization of unrealized gains or losses on certain futures contracts, and unrealized gains on passive foreign investment companies. As of period end, the tax components of accumulated net earnings (losses) are detailed in the table as follows:
| Amount | |
| ($000) | |
| Undistributed ordinary income | 1,316 |
| Undistributed long-term gains | — |
| Capital loss carryforwards (non-expiring) | (53,961) |
| Net unrealized gains (losses) | 188,372 |
As of August 31, 2018, gross unrealized appreciation and depreciation for investments and derivatives based on cost for U.S. federal income tax purposes were as follows:
| Amount | |
| ($000) | |
| Tax cost | 700,455 |
| Gross unrealized appreciation | 213,568 |
| Gross unrealized depreciation | (25,196) |
| Net unrealized appreciation (depreciation) | 188,372 |
55
Russell 2000 Growth Index Fund
E. During the year ended August 31, 2018, the fund purchased $530,332,000 of investment securities and sold $400,882,000 of investment securities, other than temporary cash investments. Purchases and sales include $233,321,000 and $158,642,000, respectively, in connection with in-kind purchases and redemptions of the fund’s capital shares.
The fund purchased securities from and sold securities to other Vanguard funds or accounts managed by Vanguard or its affiliates, in accordance with procedures adopted by the board of trustees in compliance with Rule 17a-7 of the Investment Company Act of 1940. For the year ended August 31, 2018, such purchases and sales were $45,013,000 and $72,024,000, respectively; these amounts are included in the purchases and sales of investment security note above.
F. Capital share transactions for each class of shares were:
| Year Ended August 31, | ||||
| 2018 | 2017 | |||
| Amount | Shares | Amount | Shares | |
| ($000) | (000) | ($000) | (000) | |
| ETF Shares | ||||
| Issued | 234,403 | 1,550 | 48,370 | 425 |
| Issued in Lieu of Cash Distributions | — | — | — | — |
| Redeemed | (162,948) | (1,075) | (23,280) | (200) |
| Net Increase (Decrease)—ETF Shares | 71,455 | 475 | 25,090 | 225 |
| Institutional Shares | ||||
| Issued | 91,649 | 347 | 142,467 | 647 |
| Issued in Lieu of Cash Distributions | 3,131 | 12 | 2,980 | 14 |
| Redeemed | (38,721) | (146) | (34,752) | (159) |
| Net Increase (Decrease)—Institutional Shares | 56,059 | 213 | 110,695 | 502 |
G. Management has determined that no events or transactions occurred subsequent to August 31, 2018, that would require recognition or disclosure in these financial statements.
56
Report of Independent Registered
Public Accounting Firm
To the Board of Trustees of Vanguard Scottsdale Funds and Shareholders of Vanguard Russell 2000 Index Fund, Vanguard Russell 2000 Value Index Fund and Vanguard Russell 2000 Growth Index Fund
Opinions on the Financial Statements
We have audited the accompanying statements of net assets—investments summary of Vanguard Russell 2000 Index Fund, Vanguard Russell 2000 Value Index Fund and Vanguard Russell 2000 Growth Index Fund (three of the funds constituting Vanguard Scottsdale Funds, hereafter collectively referred to as the “Funds”) as of August 31, 2018, the related statements of operations for the year ended August 31, 2018, the statements of changes in net assets for each of the two years in the period ended August 31, 2018, including the related notes, and the financial highlights for each of the five years in the period ended August 31, 2018 (collectively referred to as the “financial statements”). In our opinion, the financial statements present fairly, in all material respects, the financial position of each of the Funds as of August 31, 2018, the results of each of their operations for the year then ended, the changes in each of their net assets for each of the two years in the period ended August 31, 2018 and each of the financial highlights for each of the five years in the period ended August 31, 2018 in conformity with accounting principles generally accepted in the United States of America.
Basis for Opinions
These financial statements are the responsibility of the Funds’ management. Our responsibility is to express an opinion on the Funds’ financial statements based on our audits. We are a public accounting firm registered with the Public Company Accounting Oversight Board (United States) (“PCAOB”) and are required to be independent with respect to the Funds in accordance with the U.S. federal securities laws and the applicable rules and regulations of the Securities and Exchange Commission and the PCAOB.
We conducted our audits of these financial statements in accordance with the standards of the PCAOB. Those standards require that we plan and perform the audit to obtain reasonable assurance about whether the financial statements are free of material misstatement, whether due to error or fraud.
Our audits included performing procedures to assess the risks of material misstatement of the financial statements, whether due to error or fraud, and performing procedures that respond to those risks. Such procedures included examining, on a test basis, evidence regarding the amounts and disclosures in the financial statements. Our audits also included evaluating the accounting principles used and significant estimates made by management, as well as evaluating the overall presentation of the financial statements. Our procedures included confirmation of securities owned as of August 31, 2018 by correspondence with the custodian and brokers and by agreement to the underlying ownership records of the transfer agent; when replies were not received from brokers, we performed other auditing procedures. We believe that our audits provide a reasonable basis for our opinions.
/s/PricewaterhouseCoopers LLP
Philadelphia, Pennsylvania
October 18, 2018
We have served as the auditor of one or more investment companies in The Vanguard Group of Funds since 1975.
57

Special 2018 tax information (unaudited) for Vanguard Russell 2000 Index Funds
This information for the fiscal year ended August 31, 2018, is included pursuant to provisions of the
Internal Revenue Code.
The funds distributed qualified dividend income to shareholders during the fiscal year as follows:
| Fund | ($000) |
| Russell 2000 Index Fund | 18,750 |
| Russell 2000 Value Index Fund | 4,506 |
| Russell 2000 Growth Index Fund | 3,818 |
For corporate shareholders, the percentage of investment income (dividend income plus short-term gains, if any) that qualifies for the dividends-received deduction is as follows:
| Fund | Percentage |
| Russell 2000 Index Fund | 73.1% |
| Russell 2000 Value Index Fund | 69.3 |
| Russell 2000 Growth Index Fund | 84.0 |
| 58 |
Your Fund’s After-Tax Returns
This table presents returns for your fund both before and after taxes. The after-tax returns are shown in two ways: (1) assuming that an investor owned the fund during the entire period and paid taxes on the fund’s distributions, and (2) assuming that an investor paid taxes on the fund’s distributions and sold all shares at the end of each period.
Calculations are based on the highest individual federal income tax and capital gains tax rates in effect at the times of the distributions and the hypothetical sales. State and local taxes were not considered. After-tax returns reflect any qualified dividend income, using actual prior-year figures and estimates for 2018. (In the example, returns after the sale of fund shares may be higher than those assuming no sale. This occurs when the sale would have produced a capital loss. The calculation assumes that the investor received a tax deduction for the loss.)
The table shows returns for ETF Shares only; returns for other share classes will differ. Please note that your actual after-tax returns will depend on your tax situation and may differ from those shown. Also note that if you own the fund in a tax-deferred account, such as an individual retirement account or a 401(k) plan, this information does not apply to you. Such accounts are not subject to current taxes.
Finally, keep in mind that a fund’s performance—whether before or after taxes—does not guarantee future results.
| Average Annual Total Returns: Russell 2000 Index Funds | |||
| Periods Ended August 31, 2018 | |||
| Since | |||
| One | Five | Inception | |
| Year | Years | (9/20/2010) | |
| Russell 2000 Index Fund ETF Shares | |||
| Returns Before Taxes | 25.49% | 13.03% | 14.30% |
| Returns After Taxes on Distributions | 25.05 | 12.59 | 13.94 |
| Returns After Taxes on Distributions and Sale of | |||
| Fund Shares | 15.22 | 10.26 | 11.73 |
| Since | |||
| One | Five | Inception | |
| Year | Years | (9/20/2010) | |
| Russell 2000 Value Index Fund ETF Shares | |||
| Returns Before Taxes | 19.96% | 11.59% | 12.73% |
| Returns After Taxes on Distributions | 19.37 | 10.95 | 12.20 |
| Returns After Taxes on Distributions and Sale of | |||
| Fund Shares | 12.01 | 8.99 | 10.28 |
| Since | |||
| One | Five | Inception | |
| Year | Years | (9/20/2010) | |
| Russell 2000 Growth Index Fund ETF Shares | |||
| Returns Before Taxes | 30.69% | 14.22% | 15.64% |
| Returns After Taxes on Distributions | 30.48 | 13.98 | 15.45 |
| Returns After Taxes on Distributions and Sale of | |||
| Fund Shares | 18.24 | 11.35 | 13.00 |
59
About Your Fund’s Expenses
As a shareholder of the fund, you incur ongoing costs, which include costs for portfolio management, administrative services, and shareholder reports (like this one), among others. Operating expenses, which are deducted from a fund’s gross income, directly reduce the investment return of the fund.
A fund’s expenses are expressed as a percentage of its average net assets. This figure is known as the expense ratio. The following examples are intended to help you understand the ongoing costs (in dollars) of investing in your fund and to compare these costs with those of other mutual funds. The examples are based on an investment of $1,000 made at the beginning of the period shown and held for the entire period.
The accompanying table illustrates your fund’s costs in two ways:
• Based on actual fund return. This section helps you to estimate the actual expenses that you paid over the period. The ”Ending Account Value“ shown is derived from the fund‘s actual return, and the third column shows the dollar amount that would have been paid by an investor who started with $1,000 in the fund. You may use the information here, together with the amount you invested, to estimate the expenses that you paid over the period.
To do so, simply divide your account value by $1,000 (for example, an $8,600 account value divided by $1,000 = 8.6), then multiply the result by the number given for your fund under the heading ”Expenses Paid During Period.“
• Based on hypothetical 5% yearly return. This section is intended to help you compare your fund‘s costs with those of other mutual funds. It assumes that the fund had a yearly return of 5% before expenses, but that the expense ratio is unchanged. In this case—because the return used is not the fund’s actual return—the results do not apply to your investment. The example is useful in making comparisons because the Securities and Exchange Commission requires all mutual funds to calculate expenses based on a 5% return. You can assess your fund’s costs by comparing this hypothetical example with the hypothetical examples that appear in shareholder reports of other funds.
Note that the expenses shown in the table are meant to highlight and help you compare ongoing costs only and do not reflect transaction costs incurred by the fund for buying and selling securities. Further, the expenses do not include any purchase, redemption, or account service fees described in the fund prospectus. If such fees were applied to your account, your costs would be higher. Your fund does not carry a “sales load.”
The calculations assume no shares were bought or sold during the period. Your actual costs may have been higher or lower, depending on the amount of your investment and the timing of any purchases or redemptions.
You can find more information about the fund’s expenses, including annual expense ratios, in the Financial Statements section of this report. For additional information on operating expenses and other shareholder costs, please refer to your fund’s current prospectus.
60
| Six Months Ended August 31, 2018 | |||
| Beginning | Ending | Expenses | |
| Account Value | Account Value | Paid During | |
| 2/28/2018 | 8/31/2018 | Period | |
| Based on Actual Fund Return | |||
| Russell 2000 Index Fund | |||
| ETF Shares | $1,000.00 | $1,254.93 | $0.85 |
| Institutional Shares | 1,000.00 | 1,255.82 | 0.45 |
| Russell 2000 Value Index Fund | |||
| ETF Shares | $1,000.00 | $1,199.64 | $1.11 |
| Institutional Shares | 1,000.00 | 1,200.98 | 0.44 |
| Russell 2000 Growth Index Fund | |||
| ETF Shares | $1,000.00 | $1,306.92 | $1.16 |
| Institutional Shares | 1,000.00 | 1,308.49 | 0.47 |
| Based on Hypothetical 5% Yearly Return | |||
| Russell 2000 Index Fund | |||
| ETF Shares | $1,000.00 | $1,024.45 | $0.77 |
| Institutional Shares | 1,000.00 | 1,024.80 | 0.41 |
| Russell 2000 Value Index Fund | |||
| ETF Shares | $1,000.00 | $1,024.20 | $1.02 |
| Institutional Shares | 1,000.00 | 1,024.80 | 0.41 |
| Russell 2000 Growth Index Fund | |||
| ETF Shares | $1,000.00 | $1,024.20 | $1.02 |
| Institutional Shares | 1,000.00 | 1,024.80 | 0.41 |
The calculations are based on expenses incurred in the most recent six-month period. The funds’ annualized six-month expense ratios for
that period are: for the Russell 2000 Index Fund, 0.15% for ETF Shares and 0.08% for Institutional Shares; for the Russell 2000 Value Index
Fund, 0.20% for ETF Shares and 0.08% for Institutional Shares; and for the Russell 2000 Growth Index Fund, 0.20% for ETF Shares and
0.08% for Institutional Shares. The dollar amounts shown as “Expenses Paid” are equal to the annualized expense ratio multiplied by the
average account value over the period, multiplied by the number of days in the most recent six-month period, then divided by the number
of days in the most recent 12-month period (184/365).
61
Trustees Approve Advisory Arrangements
The board of trustees of Vanguard Russell 2000 Index Fund, Vanguard Russell 2000 Value Index Fund, and Vanguard Russell 2000 Growth Index Fund has renewed each fund’s investment advisory arrangement with The Vanguard Group, Inc. (Vanguard), through its Equity Index Group. The board determined that continuing each fund’s internalized management structure was in the best interests of the fund and its shareholders.
The board based its decision upon an evaluation of the advisor’s investment staff, portfolio management process, and performance. This evaluation included information provided to the board by Vanguard’s Portfolio Review Department, which is responsible for fund and advisor oversight and product management. The Portfolio Review Department met regularly with the advisor and made monthly presentations to the board during the fiscal year that directed the board’s focus to relevant information and topics.
The board, or an investment committee made up of board members, also received information throughout the year through advisor presentations. For each advisor presentation, the board was provided with letters and reports that included information about, among other things, the advisory firm and the advisor’s assessment of the investment environment, portfolio performance, and portfolio characteristics.
In addition, the board received monthly reports, which included a Market and Economic Report, a Fund Dashboard Monthly Summary, and a Fund Performance Report.
Prior to their meeting, the trustees were provided with a memo and materials that summarized the information they had received over the course of the year. They also considered the factors discussed below, among others. However, no single factor determined whether the board approved the arrangements. Rather, it was the totality of the circumstances that drove the board’s decision.
Nature, extent, and quality of services
The board reviewed the quality of the investment management services provided to the funds since their inception in 2010, and took into account the organizational depth and stability of the advisor. The board considered that Vanguard has been managing investments for more than four decades. The Equity Index Group adheres to a sound, disciplined investment management process; the team has considerable experience, stability, and depth.
The board concluded that Vanguard’s experience, stability, depth, and performance, among other factors, warranted continuation of each advisory arrangement.
Investment performance
The board considered each fund’s performance since its inception, including any periods of outperformance or underperformance compared with its target index and peer group. The board concluded that the performance was such that each advisory arrangement should continue. Information about each fund’s most recent performance can be found on the Performance Summary pages of this report.
62
Cost
The board concluded that each fund’s expense ratio was well below the average expense ratio charged by funds in its peer group and that each fund’s advisory expenses were also well below its peer-group average. Information about the funds’ expenses appears in the About Your Fund’s Expenses section of this report as well as in the Financial Statements sections.
The board does not conduct a profitability analysis of Vanguard because of Vanguard’s unique “at-cost” structure. Unlike most other mutual fund management companies, Vanguard is owned by the funds it oversees and produces “profits” only in the form of reduced expenses for fund shareholders.
The benefit of economies of scale
The board concluded that each fund’s at-cost arrangement with Vanguard ensures that the funds will realize economies of scale as they grow, with the cost to shareholders declining as fund assets increase.
The board will consider whether to renew the advisory arrangements again after a one-year period.
63
Glossary
30-Day SEC Yield. A fund’s 30-day SEC yield is derived using a formula specified by the U.S. Securities and Exchange Commission. Under the formula, data related to the fund’s security holdings in the previous 30 days are used to calculate the fund’s hypothetical net income for that period, which is then annualized and divided by the fund’s estimated average net assets over the calculation period. For the purposes of this calculation, a security’s income is based on its current market yield to maturity (for bonds), its actual income (for asset-backed securities), or its projected dividend yield (for stocks). Because the SEC yield represents hypothetical annualized income, it will differ—at times significantly—from the fund’s actual experience. As a result, the fund’s income distributions may be higher or lower than implied by the SEC yield.
Beta. A measure of the magnitude of a fund’s past share-price fluctuations in relation to the ups and downs of a given market index. The index is assigned a beta of 1.00. Compared with a given index, a fund with a beta of 1.20 typically would have seen its share price rise or fall by 12% when the index rose or fell by 10%. For this report, beta is based on returns over the past 36 months for both the fund and the index. Note that a fund’s beta should be reviewed in conjunction with its R-squared (see definition). The lower the R-squared, the less correlation there is between the fund and the index, and the less reliable beta is as an indicator of volatility.
Dividend Yield. Dividend income earned by stocks, expressed as a percentage of the aggregate market value (or of net asset value, for a fund). The yield is determined by dividing the amount of the annual dividends by the aggregate value (or net asset value) at the end of the period. For a fund, the dividend yield is based solely on stock holdings and does not include any income produced by other investments.
Earnings Growth Rate. The average annual rate of growth in earnings over the past five years for the stocks now in a fund.
Equity Exposure. A measure that reflects a fund’s investments in stocks and stock futures. Any holdings in short-term reserves are excluded.
Expense Ratio. A fund’s total annual operating expenses expressed as a percentage of the fund’s average net assets. The expense ratio includes management and administrative expenses, but does not include the transaction costs of buying and selling portfolio securities.
Foreign Holdings. The percentage of a fund represented by securities or depositary receipts of companies based outside the United States.
Inception Date. The date on which the assets of a fund (or one of its share classes) are first invested in accordance with the fund’s investment objective. For funds with a subscription period, the inception date is the day after that period ends. Investment performance is measured from the inception date.
Median Market Cap. An indicator of the size of companies in which a fund invests; the midpoint of market capitalization (market price x shares outstanding) of a fund’s stocks, weighted by the proportion of the fund’s assets invested in each stock. Stocks representing half of the fund’s assets have market capitalizations above the median, and the rest are below it.
Price/Book Ratio. The share price of a stock divided by its net worth, or book value, per share.
For a fund, the weighted average price/book ratio of the stocks it holds.
64
Price/Earnings Ratio. The ratio of a stock’s current price to its per-share earnings over the past year. For a fund, the weighted average P/E of the stocks it holds. P/E is an indicator of market expectations about corporate prospects; the higher the P/E, the greater the expectations for a company’s future growth.
R-Squared. A measure of how much of a fund’s past returns can be explained by the returns from the market in general, as measured by a given index. If a fund’s total returns were precisely synchronized with an index’s returns, its R-squared would be 1.00. If the fund’s returns bore no relationship to the index’s returns, its R-squared would be 0. For this report, R-squared is based on returns over the past 36 months for both the fund and the index.
Return on Equity. The annual average rate of return generated by a company during the past five years for each dollar of shareholder’s equity (net income divided by shareholder’s equity). For a fund, the weighted average return on equity for the companies whose stocks it holds.
Short-Term Reserves. The percentage of a fund invested in highly liquid, short-term securities that can be readily converted to cash.
Turnover Rate. An indication of the fund’s trading activity. Funds with high turnover rates incur higher transaction costs and may be more likely to distribute capital gains (which may be taxable to investors). The turnover rate excludes in-kind transactions, which have minimal impact on costs.
65
This page intentionally left blank.
The People Who Govern Your Fund
The trustees of your mutual fund are there to see that the fund is operated and managed in your best interests since, as a shareholder, you are a part owner of the fund. Your fund’s trustees also serve on the board of directors of The Vanguard Group, Inc., which is owned by the Vanguard funds and provides services to them on an at-cost basis.
A majority of Vanguard’s board members are independent, meaning that they have no affiliation with Vanguard or the funds they oversee, apart from the sizable personal investments they have made as private individuals. The independent board members have distinguished backgrounds in business, academia, and public service. Each of the trustees and executive officers oversees 208 Vanguard funds.
Information for each trustee and executive officer of the fund appears below. The mailing address of the trustees and officers is P.O. Box 876, Valley Forge, PA 19482. More information about the trustees is in the Statement of Additional Information, which can be obtained, without charge, by contacting Vanguard at 800-662-7447, or online at vanguard.com.
Interested Trustees1
F. William McNabb III
Born in 1957. Trustee since July 2009. Principal occupation(s) during the past five years and other experience: chairman of the board (January 2010–present) of Vanguard and of each of the investment companies served by Vanguard, trustee (2009–present) of each of the investment companies served by Vanguard, and director (2008–present) of Vanguard. Chief executive officer and president (2008–2017) of Vanguard and each of the investment companies served by Vanguard, managing director (1995–2008) of Vanguard, and director (1997–2018) of Vanguard Marketing Corporation. Director (2018–present) of UnitedHealth Group.
Mortimer J. Buckley
Born in 1969. Trustee since January 2018. Principal occupation(s) during the past five years and other experience: chief executive officer (January 2018–present) of Vanguard; chief executive officer, president, and trustee (January 2018–present) of each of the investment companies served by Vanguard; president and director (2017–present) of Vanguard; and president (February 2018–present) of Vanguard Marketing Corporation. Chief investment officer (2013–2017), managing director (2002–2017), head of the Retail Investor Group (2006–2012), and chief information officer (2001–2006) of Vanguard. Chairman of the board (2011–2017) of the Children’s Hospital of Philadelphia.
Independent Trustees
Emerson U. Fullwood
Born in 1948. Trustee since January 2008. Principal occupation(s) during the past five years and other experience: executive chief staff and marketing officer for North America and corporate vice president (retired 2008) of Xerox Corporation (document management products and services). Former president of the Worldwide Channels Group, Latin America, and Worldwide Customer Service and executive chief staff officer of Developing Markets of Xerox. Executive in residence and 2009–2010 Distinguished Minett Professor at the Rochester Institute of Technology. Lead director of SPX FLOW, Inc. (multi-industry manufacturing). Director of the University of Rochester Medical Center, the Monroe Community College Foundation, the United Way of Rochester, North Carolina A&T University, and Roberts Wesleyan College. Trustee of the University of Rochester.
Amy Gutmann
Born in 1949. Trustee since June 2006. Principal occupation(s) during the past five years and other experience: president (2004–present) of the University of Pennsylvania. Christopher H. Browne Distinguished Professor of Political Science, School of Arts and Sciences, and professor of communication, Annenberg School for Communication, with secondary faculty appointments in the Department of Philosophy, School of Arts and Sciences, and at the Graduate School of Education, University of Pennsylvania. Trustee of the National Constitution Center.
1 Mr. McNabb and Mr. Buckley are considered “interested persons,” as defined in the Investment Company Act of 1940, because
they are officers of the Vanguard funds.
JoAnn Heffernan Heisen
Born in 1950. Trustee since July 1998. Principal occupation(s) during the past five years and other experience: corporate vice president of Johnson & Johnson (pharmaceuticals/medical devices/consumer products) and member of its executive committee (1997–2008). Chief global diversity officer (retired 2008), vice president and chief information officer (1997–2006), controller (1995–1997), treasurer (1991–1995), and assistant treasurer (1989–1991) of Johnson & Johnson. Director of Skytop Lodge Corporation (hotels) and the Robert Wood Johnson Foundation. Member of the advisory board of the Institute for Women’s Leadership at Rutgers University.
F. Joseph Loughrey
Born in 1949. Trustee since October 2009. Principal occupation(s) during the past five years and other experience: president and chief operating officer (retired 2009) and vice chairman of the board (2008–2009) of Cummins Inc. (industrial machinery). Chairman of the board of Hillenbrand, Inc. (specialized consumer services), Oxfam America, and the Lumina Foundation for Education. Director of the V Foundation for Cancer Research. Member of the advisory council for the College of Arts and Letters and chair of the advisory board to the Kellogg Institute for International Studies, both at the University of Notre Dame.
Mark Loughridge
Born in 1953. Trustee since March 2012. Principal occupation(s) during the past five years and other experience: senior vice president and chief financial officer (retired 2013) of IBM (information technology services). Fiduciary member of IBM’s Retirement Plan Committee (2004–2013), senior vice president and general manager (2002–2004) of IBM Global Financing, vice president and controller (1998–2002) of IBM, and a variety of other prior management roles at IBM. Member of the Council on Chicago Booth.
Scott C. Malpass
Born in 1962. Trustee since March 2012. Principal occupation(s) during the past five years and other experience: chief investment officer (1989–present) and vice president (1996–present) of the University of Notre Dame. Assistant professor of finance at the Mendoza College of Business, University of Notre Dame, and member of the Notre Dame 403(b) Investment Committee. Chairman of the board of TIFF Advisory Services, Inc. Member of the board of Catholic Investment Services, Inc. (investment advisors), the board of advisors for Spruceview Capital Partners, and the board of superintendence of the Institute for the Works of Religion.
Deanna Mulligan
Born in 1963. Trustee since January 2018. Principal occupation(s) during the past five years and other experience: president (2010–present) and chief executive officer (2011–present) of The Guardian Life Insurance Company of America. Chief operating officer (2010–2011) and executive vice president (2008–2010) of Individual Life and Disability of The Guardian Life Insurance Company of America. Member of the board of The Guardian Life Insurance Company of America, the American Council of Life Insurers, the Partnership for New York City (business leadership), and the Committee Encouraging Corporate Philanthropy. Trustee of the Economic Club of New York and the Bruce Museum (arts and science). Member of the Advisory Council for the Stanford Graduate School of Business.
André F. Perold
Born in 1952. Trustee since December 2004. Principal occupation(s) during the past five years and other experience: George Gund Professor of Finance and Banking, Emeritus at the Harvard Business School (retired 2011). Chief investment officer and co-managing partner of HighVista Strategies LLC (private investment firm). Overseer of the Museum of Fine Arts Boston.
Sarah Bloom Raskin
Born in 1961. Trustee since January 2018. Principal occupation(s) during the past five years and other experience: deputy secretary (2014–2017) of the United States Department of the Treasury. Governor (2010–2014) of the Federal Reserve Board. Commissioner (2007–2010) of financial regulation for the State of Maryland. Member of the board of directors (2012–2014) of Neighborhood Reinvestment Corporation. Director of i(x) Investments, LLC.
Peter F. Volanakis
Born in 1955. Trustee since July 2009. Principal occupation(s) during the past five years and other experience: president and chief operating officer (retired 2010) of Corning Incorporated (communications equipment) and director of Corning Incorporated (2000–2010) and Dow Corning (2001–2010). Director (2012) of SPX Corporation (multi-industry manufacturing). Overseer of the Amos Tuck School of Business Administration, Dartmouth College (2001–2013). Chairman of the board of trustees of Colby-Sawyer College. Member of the Board of Hypertherm Inc. (industrial cutting systems, software, and consumables).
Executive Officers
Glenn Booraem
Born in 1967. Principal occupation(s) during the past five years and other experience: principal of Vanguard. Investment stewardship officer (2017–present), treasurer (2015–2017), controller (2010–2015), and assistant controller (2001–2010) of each of the investment companies served by Vanguard.
Christine M. Buchanan
Born in 1970. Principal occupation(s) during the past five years and other experience: principal of Vanguard and global head of Fund Administration at Vanguard. Treasurer (2017–present) of each of the investment companies served by Vanguard. Partner (2005–2017) at KPMG LLP (audit, tax, and advisory services).
Brian Dvorak
Born in 1973. Principal occupation(s) during the past five years and other experience: principal of Vanguard. Chief compliance officer (2017–present) of Vanguard and each of the investment companies served by Vanguard. Assistant vice president (2017–present) of Vanguard Marketing Corporation. Vice president and director of Enterprise Risk Management (2011–2013) at Oppenheimer Funds, Inc.
Thomas J. Higgins
Born in 1957. Principal occupation(s) during the past five years and other experience: principal of Vanguard. Chief financial officer (2008–present) and treasurer (1998–2008) of each of the investment companies served by Vanguard.
Peter Mahoney
Born in 1974. Principal occupation(s) during the past five years and other experience: principal of Vanguard. Controller (2015–present) of each of the investment companies served by Vanguard. Head of International Fund Services (2008–2014) at Vanguard.
Anne E. Robinson
Born in 1970. Principal occupation(s) during the past five years and other experience: general counsel (2016–present) of Vanguard. Secretary (2016–present) of Vanguard and of each of the investment companies served by Vanguard. Managing director (2016–present) of Vanguard. Director and senior vice president (2016–2018) of Vanguard Marketing Corporation. Managing director and general counsel of Global Cards and Consumer Services (2014–2016) at Citigroup. Counsel (2003–2014) at American Express.
Michael Rollings
Born in 1963. Principal occupation(s) during the past five years and other experience: finance director (2017–present) and treasurer (2017) of each of the investment companies served by Vanguard. Managing director (2016–present) of Vanguard. Chief financial officer (2016–present) of Vanguard. Director (2016–present) of Vanguard Marketing Corporation. Executive vice president and chief financial officer (2006–2016) of MassMutual Financial Group.
| Vanguard Senior Management Team | |
| Mortimer J. Buckley | James M. Norris |
| Gregory Davis | Thomas M. Rampulla |
| John James | Karin A. Risi |
| Martha G. King | Anne E. Robinson |
| John T. Marcante | Michael Rollings |
| Chris D. McIsaac | |
| Chairman Emeritus and Senior Advisor | |
| John J. Brennan | |
| Chairman, 1996–2009 | |
| Chief Executive Officer and President, 1996–2008 | |
| Founder | |
| John C. Bogle | |
| Chairman and Chief Executive Officer, 1974–1996 | |
 | |
| P.O. Box 2600 | |
| Valley Forge, PA 19482-2600 | |
| Connect with Vanguard® > vanguard.com | |
| Fund Information > 800-662-7447 | Source for Bloomberg Barclays indexes: Bloomberg |
| Direct Investor Account Services > 800-662-2739 | Index Services Limited. Copyright 2018, Bloomberg. All |
| rights reserved. | |
| Institutional Investor Services > 800-523-1036 | |
| The Russell Indexes and Russell® are registered | |
| Text Telephone for People | trademarks of Russell Investments and have been |
| Who Are Deaf or Hard of Hearing > 800-749-7273 | licensed for use by The Vanguard Group, Inc. The |
| This material may be used in conjunction | products are not sponsored, endorsed, sold, or |
| promoted by Russell Investments and Russell | |
| with the offering of shares of any Vanguard | Investments makes no representation regarding the |
| fund only if preceded or accompanied by | advisability of investing in the products. |
| the fund’s current prospectus. | |
| All comparative mutual fund data are from Lipper, a | |
| Thomson Reuters Company, or Morningstar, Inc., unless | |
| otherwise noted. | |
| You can obtain a free copy of Vanguard’s proxy voting | |
| guidelines by visiting vanguard.com/proxyreporting or by | |
| calling Vanguard at 800-662-2739. The guidelines are | |
| also available from the SEC’s website, sec.gov. In | |
| addition, you may obtain a free report on how your fund | |
| voted the proxies for securities it owned during the 12 | |
| months ended June 30. To get the report, visit either | |
| vanguard.com/proxyreporting or sec.gov. | |
| You can review and copy information about your fund at | |
| the SEC’s Public Reference Room in Washington, D.C. To | |
| find out more about this public service, call the SEC at | |
| 202-551-8090. Information about your fund is also | |
| available on the SEC’s website, and you can receive | |
| copies of this information, for a fee, by sending a | |
| request in either of two ways: via email addressed to | |
| publicinfo@sec.gov or via regular mail addressed to the | |
| Public Reference Section, Securities and Exchange | |
| Commission, Washington, DC 20549-1520. | |
| © 2018 The Vanguard Group, Inc. | |
| All rights reserved. | |
| Vanguard Marketing Corporation, Distributor. | |
| Q18510 102018 | |

Vanguard’s Principles for Investing Success
We want to give you the best chance of investment success. These principles, grounded in Vanguard’s research and experience, can put you on the right path.
Goals. Create clear, appropriate investment goals.
Balance. Develop a suitable asset allocation using broadly diversified funds. Cost. Minimize cost.
Discipline. Maintain perspective and long-term discipline.
A single theme unites these principles: Focus on the things you can control.
We believe there is no wiser course for any investor.
| Contents | |
| Your Fund’s Performance at a Glance. | 1 |
| CEO’s Perspective. | 3 |
| Fund Profile. | 5 |
| Performance Summary. | 6 |
| Financial Statements. | 8 |
| Your Fund’s After-Tax Returns. | 23 |
| About Your Fund’s Expenses. | 24 |
| Trustees Approve Advisory Arrangement. | 26 |
| Glossary. | 28 |
Please note: The opinions expressed in this report are just that—informed opinions. They should not be considered promises
or advice. Also, please keep in mind that the information and opinions cover the period through the date on the front of this
report. Of course, the risks of investing in your fund are spelled out in the prospectus.
See the Glossary for definitions of investment terms used in this report.
Your Fund’s Performance at a Glance
• Vanguard Russell 3000 Index Fund, which represents the broad U.S. stock market, returned more than 20% for the 12 months ended August 31, 2018. The fund’s return was in line with that of its target index and exceeded the average return of its multicapitalization core fund peers.
• Despite bouts of volatility, the stock market generally rose during the fiscal year.
Small-cap stocks outperformed large-caps, and growth stocks outmuscled their value counterparts.
• Eight of the fund’s nine industry sectors advanced, with technology, financial services, and consumer discretionary stocks contributing the most to returns.
• The consumer staples sector slightly dampened returns.
| Total Returns: Fiscal Year Ended August 31, 2018 | |
| Total | |
| Returns | |
| Vanguard Russell 3000 Index Fund | |
| ETF Shares | |
| Market Price | 20.15% |
| Net Asset Value | 20.07 |
| Institutional Shares | 20.15 |
| Russell 3000 Index | 20.25 |
| Multi-Cap Core Funds Average | 16.79 |
Multi-Cap Core Funds Average: Derived from data provided by Lipper, a Thomson Reuters Company.
Institutional Shares are available to certain institutional investors who meet specific administrative, service, and account-size criteria. The
Vanguard ETF® Shares shown are traded on the Nasdaq exchange and are available only through brokers. The table provides ETF returns
based on both the Nasdaq market price and the net asset value for a share. U.S. Pat. Nos. 6,879,964; 7,337,138; 7,720,749; 7,925,573;
8,090,646; and 8,417,623.
For the ETF Shares, the market price is determined by the midpoint of the bid-offer spread as of the closing time of the New York Stock
Exchange (generally 4 p.m., Eastern time). The net asset value is also determined as of the NYSE closing time. For more information about
how the ETF Shares' market prices have compared with their net asset value, visit vanguard.com, select your ETF, and then select the
Price and Performance tab. The ETF premium/discount analysis there shows the percentages of days on which the ETF Shares' market
price was above or below the NAV.
1
| Total Returns: Inception Through August 31, 2018 | |
| Average | |
| Annual Return | |
| Russell 3000 Index Fund ETF Shares Net Asset Value (Returns since inception: 9/20/2010) | 14.63% |
| Russell 3000 Index | 14.79 |
| Multi-Cap Core Funds Average | 12.13 |
| Multi-Cap Core Funds Average: Derived from data provided by Lipper, a Thomson Reuters Company. |
The figures shown represent past performance, which is not a guarantee of future results. (Current performance may be lower or higher than the performance data cited. For performance data current to the most recent month-end, visit our website at vanguard.com/performance.) Note, too, that both investment returns and principal value can fluctuate widely, so an investor’s shares, when sold, could be worth more or less than their original cost.
| Expense Ratios | |||
| Your Fund Compared With Its Peer Group | |||
| ETF | Institutional | Peer Group | |
| Shares | Shares | Average | |
| Russell 3000 Index Fund | 0.15% | 0.08% | 1.11% |
The fund expense ratios shown are from the prospectus dated December 21, 2017, and represent estimated costs for the current fiscal year. For the fiscal year ended August 31, 2018, the fund’s expense ratios were 0.15% for ETF Shares and 0.08% for Institutional Shares. The peer-group expense ratio is derived from data provided by Lipper, a Thomson Reuters Company, and captures information through year-end 2017.
Peer group: Multi-Cap Core Funds.
2
CEO’s Perspective

Tim Buckley
President and Chief Executive Officer
Dear Shareholder,
Over the years, I’ve found that prudent investors exhibit a common trait: discipline. No matter how the markets move or what new investing fad hits the headlines, those who stay focused on their goals and tune out the noise are set up for long-term success.
The prime gateway to investing is saving, and you don’t usually become a saver without a healthy dose of discipline. Savers make the decision to sock away part of their income, which means spending less and delaying gratification, no matter how difficult that may be.
Of course, disciplined investing extends beyond diligent saving. The financial markets, in the short term especially, are unpredictable; I have yet to meet the investor who can time them perfectly. It takes discipline to resist the urge to go all-in when markets are frothy or to retreat when things look bleak.
Staying put with your investments is one strategy for handling volatility. Another, rebalancing, requires even more discipline because it means steering your money away from strong performers and toward poorer performers.
Patience—a form of discipline—is also the friend of long-term investors. Higher returns are the potential reward for weathering the market’s turbulence and uncertainty.
3
We have been enjoying one of the longest bull markets in history, but it won’t continue forever. Prepare yourself now for how you will react when volatility comes back. Don’t panic. Don’t chase returns or look for answers outside the asset classes you trust. And be sure to rebalance periodically, even when there’s turmoil.
Whether you’re a master of self-control, get a boost from technology, or work with a professional advisor, know that discipline is necessary to get the most out of your investment portfolio. And know that Vanguard is with you for the entire ride.
Thank you for your continued loyalty.
Sincerely,

Mortimer J. Buckley
President and Chief Executive Officer
September 13, 2018
| Market Barometer | |||
| Average Annual Total Returns | |||
| Periods Ended August 31, 2018 | |||
| One Year | Three Years | Five Years | |
| Stocks | |||
| Russell 1000 Index (Large-caps) | 19.82% | 15.84% | 14.36% |
| Russell 2000 Index (Small-caps) | 25.45 | 16.11 | 13.00 |
| Russell 3000 Index (Broad U.S. market) | 20.25 | 15.86 | 14.25 |
| FTSE All-World ex US Index (International) | 3.51 | 8.31 | 5.82 |
| Bonds | |||
| Bloomberg Barclays U.S. Aggregate Bond Index | |||
| (Broad taxable market) | -1.05% | 1.76% | 2.49% |
| Bloomberg Barclays Municipal Bond Index | |||
| (Broad tax-exempt market) | 0.49 | 2.71 | 4.12 |
| FTSE Three-Month U. S. Treasury Bill Index | 1.49 | 0.74 | 0.44 |
| CPI | |||
| Consumer Price Index | 2.70% | 1.90% | 1.52% |
4
Russell 3000 Index Fund
Fund Profile
As of August 31, 2018
| Share-Class Characteristics | ||
| ETF | Institutional | |
| Shares | Shares | |
| Ticker Symbol | VTHR | VRTTX |
| Expense Ratio1 | 0.15% | 0.08% |
| 30-Day SEC Yield | 1.70% | 1.77% |
| Portfolio Characteristics | |||
| DJ | |||
| Russell | U.S. Total | ||
| 3000 | Market | ||
| Fund | Index | FA Index | |
| Number of Stocks | 2,820 | 2,984 | 3,745 |
| Median Market Cap | $71.2B | $71.2B | $71.0B |
| Price/Earnings Ratio | 21.1x | 21.1x | 21.0x |
| Price/Book Ratio | 3.2x | 3.2x | 3.2x |
| Return on Equity | 15.0% | 15.0% | 15.0% |
| Earnings Growth | |||
| Rate | 8.3% | 8.4% | 8.4% |
| Dividend Yield | 1.7% | 1.7% | 1.7% |
| Foreign Holdings | 0.0% | 0.0% | 0.0% |
| Turnover Rate | 14% | — | — |
| Short-Term Reserves | -0.2% | — | — |
| Sector Diversification (% of equity exposure) | |||
| DJ | |||
| Russell U.S. Total | |||
| 3000 | Market | ||
| Fund | Index FA Index | ||
| Consumer Discretionary | 14.3% | 14.3% | 14.4% |
| Consumer Staples | 5.3 | 5.3 | 5.3 |
| Energy | 5.6 | 5.6 | 5.6 |
| Financial Services | 20.8 | 20.8 | 20.8 |
| Health Care | 14.0 | 14.0 | 13.9 |
| Materials & Processing | 3.4 | 3.4 | 3.5 |
| Producer Durables | 10.5 | 10.5 | 10.5 |
| Technology | 21.5 | 21.5 | 21.4 |
| Utilities | 4.6 | 4.6 | 4.6 |
Sector categories are based on the Russell Global Sectors (“RGS”),
except for the “Other” category (if applicable), which includes
securities that have not been provided a RGS classification as of
the effective reporting period.
| Volatility Measures | ||
| DJ | ||
| Russell | U.S. Total | |
| 3000 | Market | |
| Index | FA Index | |
| R-Squared | 1.00 | 1.00 |
| Beta | 1.00 | 1.00 |
| These measures show the degree and timing of the fund’s | ||
| fluctuations compared with the indexes over 36 months. | ||
| Ten Largest Holdings (% of total net assets) | ||
| Apple Inc. | Computer | |
| Technology | 3.7% | |
| Microsoft Corp. | Computer Services | |
| Software & Systems | 2.8 | |
| Amazon.com Inc. | Diversified Retail | 2.7 |
| Alphabet Inc. | Computer Services | |
| Software & Systems | 2.5 | |
| Facebook Inc. | Computer Services | |
| Software & Systems | 1.4 | |
| Berkshire Hathaway Inc. Insurance: Multi-Line | 1.3 | |
| JPMorgan Chase & Co. | Diversified Financial | |
| Services | 1.3 | |
| Johnson & Johnson | Pharmaceuticals | 1.2 |
| Exxon Mobil Corp. | Oil: Integrated | 1.1 |
| Bank of America Corp. | Banks: Diversified | 1.0 |
| Top Ten | 19.0% | |
| The holdings listed exclude any temporary cash investments and | ||
| equity index products. | ||
Investment Focus
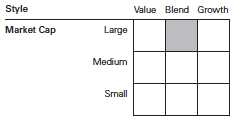
1 The expense ratios shown are from the prospectus dated December 21, 2017, and represent estimated costs for the current fiscal year. For the
fiscal year ended August 31, 2018, the expense ratios were 0.15% for ETF Shares and 0.08% for Institutional Shares.
5
Russell 3000 Index Fund
Performance Summary
All of the returns in this report represent past performance, which is not a guarantee of future results that may be achieved by the fund. (Current performance may be lower or higher than the performance data cited. For performance data current to the most recent month-end, visit our website at vanguard.com/performance.) Note, too, that both investment returns and principal value can fluctuate widely, so an investor’s shares, when sold, could be worth more or less than their original cost. The returns shown do not reflect taxes that a shareholder would pay on fund distributions or on the sale of fund shares.
Cumulative Performance: September 20, 2010, Through August 31, 2018
Initial Investment of $10,000
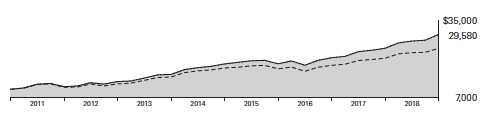
| Average Annual Total Returns | |||||
| Periods Ended August 31, 2018 | |||||
| Since | Final Value | ||||
| One | Five | Inception | of a $10,000 | ||
| Year | Years | (9/20/2010) | Investment | ||
| Russell 3000 Index Fund*ETF Shares | |||||
| Net Asset Value | 20.07% | 14.08% | 14.63% | $29,580 | |
| Russell 3000 Index Fund*ETF Shares | |||||
| Market Price | 20.15 | 14.09 | 14.63 | 29,595 | |
| • • • • • • • • | Russell 3000 Index | 20.25 | 14.25 | 14.79 | 29,929 |
| – – – – | Multi-Cap Core Funds Average | 16.79 | 11.44 | 12.13 | 24,842 |
| Dow Jones U.S. Total Stock Market | |||||
| Float Adjusted Index | 20.26 | 14.21 | 14.77 | 29,886 | |
Multi-Cap Core Funds Average: Derived from data provided by Lipper, a Thomson Reuters Company.
"Since Inception" performance is calculated from the ETF Shares’ inception date for both the fund and its comparative standards.
| Since | Final Value | |||
| One | Five | Inception | of a $5,000,000 | |
| Year | Years | (11/1/2010) | Investment | |
| Russell 3000 Index Fund Institutional Shares | 20.15% | 14.16% | 14.35% | $14,287,772 |
| Russell 3000 Index | 20.25 | 14.25 | 14.44 | 14,373,987 |
| Dow Jones U.S. Total Stock Market Float | ||||
| Adjusted Index | 20.26 | 14.21 | 14.41 | 14,350,724 |
| "Since Inception" performance is calculated from the Institutional Shares’ inception date for both the fund and its comparative standards. | ||||
See Financial Highlights for dividend and capital gains information.
6
Russell 3000 Index Fund
Cumulative Returns of ETF Shares: September 20, 2010, Through August 31, 2018
| Since | |||
| One | Five | Inception | |
| Year | Years | (9/20/2010) | |
| Russell 3000 Index Fund ETF Shares Market Price | 20.15% | 93.32% | 195.95% |
| Russell 3000 Index Fund ETF Shares Net Asset | |||
| Value | 20.07 | 93.23 | 195.80 |
| Russell 3000 Index | 20.25 | 94.69 | 199.29 |
| "Since Inception" performance is calculated from the ETF Shares’ inception date for both the fund and its comparative standards. | |||
Fiscal-Year Total Returns (%): September 20, 2010, Through August 31, 2018
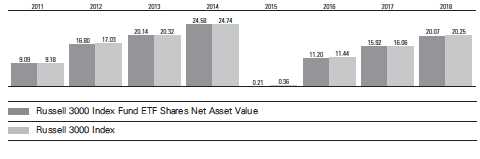
Average Annual Total Returns: Periods Ended June 30, 2018
This table presents returns through the latest calendar quarter—rather than through the end of the fiscal period.
Securities and Exchange Commission rules require that we provide this information.
| Inception | One | Five | Since | |
| Date | Year | Years | Inception | |
| ETF Shares | 9/20/2010 | |||
| Market Price | 14.71% | 13.14% | 14.00% | |
| Net Asset Value | 14.63 | 13.12 | 13.98 | |
| Institutional Shares | 11/1/2010 | 14.70 | 13.21 | 13.69 |
7
Russell 3000 Index Fund
Financial Statements
Statement of Net Assets—Investments Summary
As of August 31, 2018
This Statement summarizes the fund’s holdings by asset type. Details are reported for each of the fund’s 50 largest individual holdings and for investments that, in total for any issuer, represent more than 1% of the fund’s net assets. The total value of smaller holdings is reported as a single amount within each category.
The fund reports a complete list of its holdings in regulatory filings four times in each fiscal year, at the quarter-ends. For the second and fourth fiscal quarters, the complete listing of the fund’s holdings is available electronically on vanguard.com and on the Securities and Exchange Commission’s website (sec.gov), or you can have it mailed to you without charge by calling 800-662-7447. For the first and third fiscal quarters, the fund files the lists with the SEC on Form N-Q. Shareholders can look up the fund’s Forms N-Q on the SEC’s website. Forms N-Q may also be reviewed and copied at the SEC’s Public Reference Room (see the back cover of this report for further information).
| Market | Percentage | ||
| Value• | of Net | ||
| Shares | ($000) | Assets | |
| Common Stocks | |||
| Consumer Discretionary | |||
| * Amazon.com Inc. | 17,536 | 35,295 | 2.7% |
| Home Depot Inc. | 49,648 | 9,968 | 0.8% |
| Comcast Corp. Class A | 197,174 | 7,293 | 0.6% |
| Walt Disney Co. | 64,328 | 7,206 | 0.6% |
| * Netflix Inc. | 17,990 | 6,615 | 0.5% |
| Walmart Inc. | 61,511 | 5,896 | 0.5% |
| McDonald’s Corp. | 33,944 | 5,507 | 0.4% |
| Consumer Discretionary—Other † | 106,221 | 8.2% | |
| 184,001 | 14.3% | ||
| Consumer Staples | |||
| Procter & Gamble Co. | 108,361 | 8,989 | 0.7% |
| Coca-Cola Co. | 164,805 | 7,345 | 0.6% |
| PepsiCo Inc. | 61,138 | 6,848 | 0.5% |
| Philip Morris International Inc. | 66,978 | 5,217 | 0.4% |
| Altria Group Inc. | 81,420 | 4,765 | 0.4% |
| Consumer Staples—Other † | 35,299 | 2.7% | |
| 68,463 | 5.3% | ||
| Energy | |||
| Exxon Mobil Corp. | 182,900 | 14,663 | 1.1% |
| Chevron Corp. | 82,245 | 9,743 | 0.8% |
| Energy—Other † | 47,390 | 3.7% | |
| 71,796 | 5.6% | ||
| Financial Services | |||
| * Berkshire Hathaway Inc. Class B | 83,413 | 17,410 | 1.3% |
| JPMorgan Chase & Co. | 146,126 | 16,743 | 1.3% |
| Bank of America Corp. | 407,914 | 12,617 | 1.0% |
| Visa Inc. Class A | 77,007 | 11,312 | 0.9% |
| Wells Fargo & Co. | 189,511 | 11,083 | 0.8% |
8
| Russell 3000 Index Fund | |||||
| Market | Percentage | ||||
| Value• | of Net | ||||
| Shares | ($000) | Assets | |||
| Mastercard Inc. Class A | 39,641 | 8,545 | 0.7% | ||
| Citigroup Inc. | 110,231 | 7,853 | 0.6% | ||
| * | PayPal Holdings Inc. | 51,283 | 4,735 | 0.4% | |
| Financial Services—Other † | 177,430 | 13.7% | |||
| 267,728 | 20.7% | ||||
| Health Care | |||||
| Johnson & Johnson | 115,959 | 15,619 | 1.2% | ||
| UnitedHealth Group Inc. | 41,252 | 11,074 | 0.9% | ||
| Pfizer Inc. | 250,514 | 10,401 | 0.8% | ||
| Merck & Co. Inc. | 116,229 | 7,972 | 0.6% | ||
| AbbVie Inc. | 68,545 | 6,579 | 0.5% | ||
| Amgen Inc. | 28,551 | 5,705 | 0.5% | ||
| Medtronic plc | 58,480 | 5,638 | 0.4% | ||
| Abbott Laboratories | 73,913 | 4,940 | 0.4% | ||
| Health Care—Other † | 111,539 | 8.6% | |||
| 179,467 | 13.9% | ||||
| Materials & Processing | |||||
| DowDuPont Inc. | 100,308 | 7,035 | 0.5% | ||
| § | Materials & Processing—Other † | 37,218 | 2.9% | ||
| 44,253 | 3.4% | ||||
| §,1Other † | 37 | 0.0% | |||
| Producer Durables | |||||
| Boeing Co. | 23,708 | 8,127 | 0.6% | ||
| 3M Co. | 24,923 | 5,257 | 0.4% | ||
| Honeywell International Inc. | 32,191 | 5,120 | 0.4% | ||
| Union Pacific Corp. | 33,187 | 4,999 | 0.4% | ||
| General Electric Co. | 372,120 | 4,815 | 0.4% | ||
| Producer Durables—Other † | 107,042 | 8.3% | |||
| 135,360 | 10.5% | ||||
| Technology | |||||
| Apple Inc. | 212,151 | 48,292 | 3.7% | ||
| Microsoft Corp. | 326,788 | 36,708 | 2.8% | ||
| * | Facebook Inc. Class A | 102,571 | 18,025 | 1.4% | |
| * | Alphabet Inc. Class C | 13,122 | 15,985 | 1.2% | |
| * | Alphabet Inc. Class A | 12,929 | 15,926 | 1.2% | |
| Cisco Systems Inc. | 208,248 | 9,948 | 0.8% | ||
| Intel Corp. | 201,328 | 9,750 | 0.8% | ||
| NVIDIA Corp. | 25,149 | 7,059 | 0.6% | ||
| Oracle Corp. | 124,001 | 6,024 | 0.5% | ||
| International Business Machines Corp. | 39,640 | 5,806 | 0.5% | ||
| * | Adobe Systems Inc. | 21,190 | 5,584 | 0.4% | |
| Texas Instruments Inc. | 42,349 | 4,760 | 0.4% | ||
| Technology—Other † | 92,248 | 7.1% | |||
| 276,115 | 21.4% | ||||
| Utilities | |||||
| AT&T Inc. | 313,591 | 10,016 | 0.8% | ||
| Verizon Communications Inc. | 178,455 | 9,703 | 0.8% | ||
| Utilities—Other † | 39,122 | 3.0% | |||
| 58,841 | 4.6% | ||||
| Total Common Stocks (Cost $956,771) | 1,286,061 | 99.7%2 | |||
| 9 | |||||
| Russell 3000 Index Fund | ||||
| Market | Percentage | |||
| Value• | of Net | |||
| Coupon | Shares | ($000) | Assets | |
| Temporary Cash Investments | ||||
| Money Market Fund | ||||
| 3,4 Vanguard Market Liquidity Fund | 2.153% | 25,239 | 2,524 | 0.2% |
| U.S. Government and Agency Obligations † | 300 | 0.0% | ||
| Total Temporary Cash Investments (Cost $2,824) | 2,824 | 0.2%2 | ||
| 5Total Investments (Cost $959,595) | 1,288,885 | 99.9% | ||
| Amount | ||||
| ($000) | ||||
| Other Assets and Liabilities | ||||
| Other Assets | ||||
| Investment in Vanguard | 64 | |||
| Receivables for Accrued Income | 2,501 | |||
| Receivables for Capital Shares Issued | 95 | |||
| Variation Margin Receivable—Futures Contracts | — | |||
| Other Assets 6 | 310 | |||
| Total Other Assets | 2,970 | 0.2% | ||
| Liabilities | ||||
| Payables for Investment Securities Purchased | (6) | |||
| Collateral for Securities on Loan | (265) | |||
| Payables for Capital Shares Redeemed | (438) | |||
| Payables to Vanguard | (260) | |||
| Other Liabilities | (100) | |||
| Total Liabilities | (1,069) | (0.1%) | ||
| Net Assets | 1,290,786 | 100.0% | ||
| At August 31, 2018, net assets consisted of: | ||||
| Amount | ||||
| ($000) | ||||
| Paid-in Capital | 983,208 | |||
| Undistributed Net Investment Income | 4,656 | |||
| Accumulated Net Realized Losses | (26,566) | |||
| Unrealized Appreciation (Depreciation) | ||||
| Investment Securities | 329,290 | |||
| Futures Contracts | 198 | |||
| Net Assets | 1,290,786 | |||
| ETF Shares—Net Assets | ||||
| Applicable to 3,075,000 outstanding $.001 par value shares of | ||||
| beneficial interest (unlimited authorization) | 411,993 | |||
| Net Asset Value Per Share—ETF Shares | $133.98 | |||
| 10 | ||||
Russell 3000 Index Fund
| Amount | |
| ($000) | |
| Institutional Shares—Net Assets | |
| Applicable to 3,388,640 outstanding $.001 par value shares of | |
| beneficial interest (unlimited authorization) | 878,793 |
| Net Asset Value Per Share—Institutional Shares | $259.33 |
• See Note A in Notes to Financial Statements.
* Non-income-producing security.
† Represents the aggregate value, by category, of securities that are not among the 50 largest holdings and, in total for any issuer,
represent 1% or less of net assets.
§ Certain of the fund’s securities are valued using significant unobservable inputs.
1 “Other” represents securities that are not classified by the fund’s benchmark index.
2 The fund invests a portion of its cash reserves in equity markets through the use of index futures contracts. After giving effect to
futures investments, the fund’s effective common stock and temporary cash investment positions represent 100.0% and -0.1%,
respectively, of net assets.
3 Affiliated money market fund available only to Vanguard funds and certain trusts and accounts managed by Vanguard. Rate shown
is the 7-day yield.
4 Includes $265,000 of collateral received for securities on loan.
5 The total value of securities on loan is $247,000.
6 Cash of $300,000 has been segregated as initial margin for open futures contracts.
| Derivative Financial Instruments Outstanding as of Period End | ||||
| Futures Contracts | ||||
| ($000) | ||||
| Value and | ||||
| Number of | Unrealized | |||
| Long (Short) | Notional | Appreciation | ||
| Expiration | Contracts | Amount | (Depreciation) | |
| Long Futures Contracts | ||||
| E-mini S&P 500 Index | September 2018 | 32 | 4,643 | 198 |
See accompanying Notes, which are an integral part of the Financial Statements.
11
Russell 3000 Index Fund
Statement of Operations
| Year Ended | |
| August31,2018 | |
| ($000) | |
| Investment Income | |
| Income | |
| Dividends | 21,802 |
| Interest1 | 43 |
| Securities Lending—Net | 51 |
| Total Income | 21,896 |
| Expenses | |
| The Vanguard Group—Note B | |
| Investment Advisory Services | 178 |
| Management and Administrative—ETF Shares | 427 |
| Management and Administrative—Institutional Shares | 416 |
| Marketing and Distribution—ETF Shares | 22 |
| Marketing and Distribution—Institutional Shares | 18 |
| Custodian Fees | 101 |
| Auditing Fees | 33 |
| Shareholders’ Reports and Proxy—ETF Shares | 11 |
| Shareholders’ Reports and Proxy—Institutional Shares | — |
| Trustees’ Fees and Expenses | 1 |
| Total Expenses | 1,207 |
| Net Investment Income | 20,689 |
| Realized Net Gain (Loss) | |
| Investment Securities Sold1,2 | 29,938 |
| Futures Contracts | 464 |
| Realized Net Gain (Loss) | 30,402 |
| Change in Unrealized Appreciation (Depreciation) | |
| Investment Securities1 | 166,076 |
| Futures Contracts | 128 |
| Change in Unrealized Appreciation (Depreciation) | 166,204 |
| Net Increase (Decrease) in Net Assets Resulting from Operations | 217,295 |
1 Interest income, realized net gain (loss), and change in unrealized appreciation (depreciation) from an affiliated company of the
fund were $40,000, ($1,000), and $1,000, respectively. Purchases and sales are for temporary cash investment purposes.
2 Includes $32,032,000 of net gain (loss) resulting from in-kind redemptions; such gain (loss) is not taxable to the fund.
See accompanying Notes, which are an integral part of the Financial Statements.
12
Russell 3000 Index Fund
Statement of Changes in Net Assets
| Year Ended August 31, | ||
| 2018 | 2017 | |
| ($000) | ($000) | |
| Increase (Decrease) in Net Assets | ||
| Operations | ||
| Net Investment Income | 20,689 | 22,270 |
| Realized Net Gain (Loss) | 30,402 | 52,614 |
| Change in Unrealized Appreciation (Depreciation) | 166,204 | 96,914 |
| Net Increase (Decrease) in Net Assets Resulting from Operations | 217,295 | 171,798 |
| Distributions | ||
| Net Investment Income | ||
| ETF Shares | (6,199) | (5,670) |
| Institutional Shares | (14,177) | (16,819) |
| Realized Capital Gain | ||
| ETF Shares | — | — |
| Institutional Shares | — | — |
| Total Distributions | (20,376) | (22,489) |
| Capital Share Transactions | ||
| ETF Shares | 6,041 | 21,046 |
| Institutional Shares | (10,897) | (200,208) |
| Net Increase (Decrease) from Capital Share Transactions | (4,856) | (179,162) |
| Total Increase (Decrease) | 192,063 | (29,853) |
| Net Assets | ||
| Beginning of Period | 1,098,723 | 1,128,576 |
| End of Period1 | 1,290,786 | 1,098,723 |
| 1 Net Assets—End of Period includes undistributed (overdistributed) net investment income of $4,656,000 and $4,336,000. | ||
See accompanying Notes, which are an integral part of the Financial Statements.
13
Russell 3000 Index Fund
Financial Highlights
| ETF Shares | |||||
| For a Share Outstanding | Year Ended August 31, | ||||
| Throughout Each Period | 2018 | 2017 | 2016 | 2015 | 2014 |
| Net Asset Value, Beginning of Period | $113.52 | $99.77 | $91.43 | $92.82 | $75.79 |
| Investment Operations | |||||
| Net Investment Income | 2.0991 | 1.9801 | 1.850 | 1.649 | 1.485 |
| Net Realized and Unrealized Gain (Loss) | |||||
| on Investments | 20.442 | 13.722 | 8.248 | (1.396) | 17.004 |
| Total from Investment Operations | 22.541 | 15.702 | 10.098 | .253 | 18.489 |
| Distributions | |||||
| Dividends from Net Investment Income | (2.081) | (1.952) | (1.758) | (1.643) | (1.459) |
| Distributions from Realized Capital Gains | — | — | — | — | — |
| Total Distributions | (2.081) | (1.952) | (1.758) | (1.643) | (1.459) |
| Net Asset Value, End of Period | $133.98 | $113.52 | $99.77 | $91.43 | $92.82 |
| Total Return | 20.07% | 15.92% | 11.20% | 0.21% | 24.58% |
| Ratios/Supplemental Data | |||||
| Net Assets, End of Period (Millions) | $412 | $343 | $282 | $169 | $121 |
| Ratio of Total Expenses to Average Net Assets | 0.15% | 0.15% | 0.15% | 0.15% | 0.15% |
| Ratio of Net Investment Income to | |||||
| Average Net Assets | 1.70% | 1.85% | 1.98% | 1.76% | 1.77% |
| Portfolio Turnover Rate2 | 14% | 16% | 8% | 4% | 8% |
| 1 Calculated based on average shares outstanding. | |||||
| 2 Excludes the value of portfolio securities received or delivered as a result of in-kind purchases or redemptions of the fund’s capital | |||||
| shares, including ETF Creation Units. | |||||
See accompanying Notes, which are an integral part of the Financial Statements.
14
Russell 3000 Index Fund
Financial Highlights
| Institutional Shares | |||||
| For a Share Outstanding | Year Ended August 31, | ||||
| Throughout Each Period | 2018 | 2017 | 2016 | 2015 | 2014 |
| Net Asset Value, Beginning of Period | $219.72 | $193.10 | $176.98 | $179.64 | $146.68 |
| Investment Operations | |||||
| Net Investment Income | 4.2201 | 3.9521 | 3.689 | 3.318 | 2.986 |
| Net Realized and Unrealized Gain (Loss) | |||||
| on Investments | 39.578 | 26.583 | 15.965 | (2.689) | 32.903 |
| Total from Investment Operations | 43.798 | 30.535 | 19.654 | .629 | 35.889 |
| Distributions | |||||
| Dividends from Net Investment Income | (4.188) | (3.915) | (3.534) | (3.289) | (2.929) |
| Distributions from Realized Capital Gains | — | — | — | — | — |
| Total Distributions | (4.188) | (3.915) | (3.534) | (3.289) | (2.929) |
| Net Asset Value, End of Period | $259.33 | $219.72 | $193.10 | $176.98 | $179.64 |
| Total Return | 20.15% | 16.00% | 11.28% | 0.30% | 24.66% |
| Ratios/Supplemental Data | |||||
| Net Assets, End of Period (Millions) | $879 | $755 | $847 | $788 | $600 |
| Ratio of Total Expenses to Average Net Assets | 0.08% | 0.08% | 0.08% | 0.08% | 0.08% |
| Ratio of Net Investment Income to | |||||
| Average Net Assets | 1.77% | 1.92% | 2.05% | 1.83% | 1.84% |
| Portfolio Turnover Rate2 | 14% | 16% | 8% | 4% | 8% |
| 1 Calculated based on average shares outstanding. | |||||
| 2 Excludes the value of portfolio securities received or delivered as a result of in-kind purchases or redemptions of the fund’s capital | |||||
| shares, including ETF Creation Units. | |||||
See accompanying Notes, which are an integral part of the Financial Statements.
15
Russell 3000 Index Fund
Notes to Financial Statements
Vanguard Russell 3000 Index Fund is registered under the Investment Company Act of 1940 as an open-end investment company, or mutual fund. The fund offers two classes of shares: ETF Shares and Institutional Shares. ETF Shares are listed for trading on Nasdaq; they can be purchased and sold through a broker. Institutional Shares are designed for investors who meet certain administrative, service, and account-size criteria.
A. The following significant accounting policies conform to generally accepted accounting principles for U.S. investment companies. The fund consistently follows such policies in preparing its financial statements.
1. Security Valuation: Securities are valued as of the close of trading on the New York Stock Exchange (generally 4 p.m., Eastern time) on the valuation date. Equity securities are valued at the latest quoted sales prices or official closing prices taken from the primary market in which each security trades; such securities not traded on the valuation date are valued at the mean of the latest quoted bid and asked prices. Securities for which market quotations are not readily available, or whose values have been materially affected by events occurring before the fund’s pricing time but after the close of the securities’ primary markets, are valued by methods deemed by the board of trustees to represent fair value. Investments in Vanguard Market Liquidity Fund are valued at that fund’s net asset value. Temporary cash investments are valued using the latest bid prices or using valuations based on a matrix system (which considers such factors as security prices, yields, maturities, and ratings), both as furnished by independent pricing services.
2. Futures Contracts: The fund uses index futures contracts to a limited extent, with the objectives of maintaining full exposure to the stock market, maintaining liquidity, and minimizing transaction costs. The fund may purchase futures contracts to immediately invest incoming cash in the market, or sell futures in response to cash outflows, thereby simulating a fully invested position in the underlying index while maintaining a cash balance for liquidity. The primary risks associated with the use of futures contracts are imperfect correlation between changes in market values of stocks held by the fund and the prices of futures contracts, and the possibility of an illiquid market. Counterparty risk involving futures is mitigated because a regulated clearinghouse is the counterparty instead of the clearing broker. To further mitigate counterparty risk, the fund trades futures contracts on an exchange, monitors the financial strength of its clearing brokers and clearinghouse, and has entered into clearing agreements with its clearing brokers. The clearinghouse imposes initial margin requirements to secure the fund’s performance and requires daily settlement of variation margin representing changes in the market value of each contract. Any assets pledged as initial margin for open contracts are noted in the Statement of Net Assets.
Futures contracts are valued at their quoted daily settlement prices. The notional amounts of the contracts are not recorded in the Statement of Net Assets. Fluctuations in the value of the contracts are recorded in the Statement of Net Assets as an asset (liability) and in the Statement of Operations as unrealized appreciation (depreciation) until the contracts are closed, when they are recorded as realized futures gains (losses).
During the year ended August 31, 2018, the fund’s average investments in long and short futures contracts represented less than 1% and 0% of net assets, respectively, based on the average of the notional amounts at each quarter-end during the period.
16
Russell 3000 Index Fund
3. Federal Income Taxes: The fund intends to continue to qualify as a regulated investment company and distribute all of its taxable income. Management has analyzed the fund’s tax positions taken for all open federal income tax years (August 31, 2015–2018), and has concluded that no provision for federal income tax is required in the fund’s financial statements.
4. Distributions: Distributions to shareholders are recorded on the ex-dividend date. Distributions are determined on a tax basis and may differ from net investment income and realized capital gains for financial reporting purposes.
5. Securities Lending: To earn additional income, the fund lends its securities to qualified institutional borrowers. Security loans are subject to termination by the fund at any time, and are required to be secured at all times by collateral in an amount at least equal to the market value of securities loaned. Daily market fluctuations could cause the value of loaned securities to be more or less than the value of the collateral received. When this occurs, the collateral is adjusted and settled before the opening of the market on the next business day. The fund further mitigates its counterparty risk by entering into securities lending transactions only with a diverse group of prequalified counterparties, monitoring their financial strength, and entering into master securities lending agreements with its counterparties. The master securities lending agreements provide that, in the event of a counterparty’s default (including bankruptcy), the fund may terminate any loans with that borrower, determine the net amount owed, and sell or retain the collateral up to the net amount owed to the fund; however, such actions may be subject to legal proceedings. While collateral mitigates counterparty risk, in the event of a default, the fund may experience delays and costs in recovering the securities loaned. The fund invests cash collateral received in Vanguard Market Liquidity Fund, and records a liability in the Statement of Net Assets for the return of the collateral, during the period the securities are on loan. Securities lending income represents fees charged to borrowers plus income earned on invested cash collateral, less expenses associated with the loan. During the term of the loan, the fund is entitled to all distributions made on or in respect of the loaned securities.
6. Credit Facility: The fund and certain other funds managed by The Vanguard Group (“Vanguard”) participate in a $3.1 billion committed credit facility provided by a syndicate of lenders pursuant to a credit agreement that may be renewed annually; each fund is individually liable for its borrowings, if any, under the credit facility. Borrowings may be utilized for temporary and emergency purposes, and are subject to the fund’s regulatory and contractual borrowing restrictions. The participating funds are charged administrative fees and an annual commitment fee of 0.10% of the undrawn amount of the facility; these fees are allocated to the funds based on a method approved by the fund’s board of trustees and included in Management and Administrative expenses on the fund’s Statement of Operations. Any borrowings under this facility bear interest at a rate based upon the higher of the one-month London Interbank Offered Rate, federal funds effective rate, or overnight bank funding rate plus an agreed-upon spread.
The fund had no borrowings outstanding at August 31, 2018, or at any time during the period then ended.
7. Other: Dividend income is recorded on the ex-dividend date. Interest income includes income distributions received from Vanguard Market Liquidity Fund and is accrued daily. Premiums and discounts on debt securities purchased are amortized and accreted, respectively, to interest income
17
Russell 3000 Index Fund
over the lives of the respective securities. Security transactions are accounted for on the date securities are bought or sold. Costs used to determine realized gains (losses) on the sale of investment securities are those of the specific securities sold.
Each class of shares has equal rights as to assets and earnings, except that each class separately bears certain class-specific expenses related to maintenance of shareholder accounts (included in Management and Administrative expenses), shareholder reporting, and the proxy. Marketing and distribution expenses are allocated to each class of shares based on a method approved by the board of trustees. Income, other non-class-specific expenses, and gains and losses on investments are allocated to each class of shares based on its relative net assets.
B. In accordance with the terms of a Funds’ Service Agreement (the “FSA”) between Vanguard and the fund, Vanguard furnishes to the fund investment advisory, corporate management, administrative, marketing, and distribution services at Vanguard’s cost of operations (as defined by the FSA). These costs of operations are allocated to the fund based on methods and guidelines approved by the board of trustees. Vanguard does not require reimbursement in the current period for certain costs of operations (such as deferred compensation/benefits and risk/insurance costs); the fund’s liability for these costs of operations is included in Payables to Vanguard on the Statement of Net Assets. All other costs of operations payable to Vanguard are generally settled twice a month.
Upon the request of Vanguard, the fund may invest up to 0.40% of its net assets as capital in Vanguard. At August 31, 2018, the fund had contributed to Vanguard capital in the amount of $64,000, representing 0.01% of the fund’s net assets and 0.03% of Vanguard’s capitalization. The fund’s trustees and officers are also directors and employees, respectively, of Vanguard.
C. Various inputs may be used to determine the value of the fund’s investments. These inputs are summarized in three broad levels for financial statement purposes. The inputs or methodologies used to value securities are not necessarily an indication of the risk associated with investing in those securities.
Level 1—Quoted prices in active markets for identical securities.
Level 2—Other significant observable inputs (including quoted prices for similar securities, interest rates, prepayment speeds, credit risk, etc.).
Level 3—Significant unobservable inputs (including the fund’s own assumptions used to determine
the fair value of investments). Any investments valued with significant unobservable inputs are
noted on the Statement of Net Assets.
The following table summarizes the market value of the fund’s investments as of August 31, 2018, based on the inputs used to value them:
| Level 1 | Level 2 | Level 3 | |
| Investments | ($000) | ($000) | ($000) |
| Common Stocks | 1,286,025 | — | 36 |
| Temporary Cash Investments | 2,524 | 300 | — |
| Futures Contracts—Assets1 | — | — | — |
| Total | 1,288,549 | 300 | 36 |
| 1 Represents variation margin on the last day of the reporting period. | |||
18
Russell 3000 Index Fund
D. Permanent differences are reclassified among capital accounts in the financial statements to reflect their tax character. These reclassifications have no effect on net assets or net asset value per share. As of period end, the following permanent differences primarily attributable to the accounting for in-kind redemptions and passive foreign investment companies were reclassified to the following accounts:
| Amount | |
| ($000) | |
| Paid-in capital | 32,032 |
| Undistributed (Overdistributed) net investment income | 7 |
| Accumulated net realized gains (losses) | (32,039) |
Temporary differences between book-basis and tax-basis components of accumulated net earnings (losses) arise when certain items of income, gain, or loss are recognized in different periods for financial statement and tax purposes; these differences will reverse at some time in the future. The differences are primarily related to the tax deferral of losses on wash sales, the realization of unrealized gains or losses on certain futures contracts, and unrealized gains on passive foreign investment companies. As of period end, the tax components of accumulated net earnings (losses) are detailed in the table as follows:
| Amount | |
| ($000) | |
| Undistributed ordinary income | 4,854 |
| Undistributed long-term gains | — |
| Capital loss carryforwards (non-expiring) | (26,368) |
| Net unrealized gains (losses) | 329,289 |
As of August 31, 2018, gross unrealized appreciation and depreciation for investments and derivatives based on cost for U.S. federal income tax purposes were as follows:
| Amount | |
| ($000) | |
| Tax cost | 959,596 |
| Gross unrealized appreciation | 373,971 |
| Gross unrealized depreciation | (44,682) |
| Net unrealized appreciation (depreciation) | 329,289 |
E. During the year ended August 31, 2018, the fund purchased $257,990,000 of investment securities and sold $261,182,000 of investment securities, other than temporary cash investments. Purchases and sales include $74,158,000 and $91,778,000, respectively, in connection with in-kind purchases and redemptions of the fund’s capital shares.
19
Russell 3000 Index Fund
F. Capital share transactions for each class of shares were:
| Year Ended August 31, | ||||
| 2018 | 2017 | |||
| Amount | Shares | Amount | Shares | |
| ($000) | (000) | ($000) | (000) | |
| ETF Shares | ||||
| Issued | 102,932 | 825 | 212,775 | 1,925 |
| Issued in Lieu of Cash Distributions | — | — | — | — |
| Redeemed | (96,891) | (775) | (191,729) | (1,725) |
| Net Increase (Decrease)—ETF Shares | 6,041 | 50 | 21,046 | 200 |
| Institutional Shares | ||||
| Issued | 134,022 | 562 | 100,395 | 493 |
| Issued in Lieu of Cash Distributions | 13,860 | 59 | 16,428 | 81 |
| Redeemed | (158,779) | (670) | (317,031) | (1,521) |
| Net Increase (Decrease)—Institutional Shares | (10,897) | (49) | (200,208) | (947) |
G. Management has determined that no events or transactions occurred subsequent to August 31, 2018, that would require recognition or disclosure in these financial statements.
20
Report of Independent Registered
Public Accounting Firm
To the Board of Trustees of Vanguard Scottsdale Funds and Shareholders of Vanguard Russell 3000 Index Fund
Opinion on the Financial Statements
We have audited the accompanying statement of net assets—investments summary of Vanguard Russell 3000 Index Fund (one of the funds constituting Vanguard Scottsdale Funds, referred to hereafter as the “Fund”) as of August 31, 2018, the related statement of operations for the year ended August 31, 2018, the statement of changes in net assets for each of the two years in the period ended August 31, 2018, including the related notes, and the financial highlights for each of the five years in the period ended August 31, 2018 (collectively referred to as the “financial statements”). In our opinion, the financial statements present fairly, in all material respects, the financial position of the Fund as of August 31, 2018, the results of its operations for the year then ended, the changes in its net assets for each of the two years in the period ended August 31, 2018 and the financial highlights for each of the five years in the period ended August 31, 2018 in conformity with accounting principles generally accepted in the United States of America.
Basis for Opinion
These financial statements are the responsibility of the Fund’s management. Our responsibility is to express an opinion on the Fund’s financial statements based on our audits. We are a public accounting firm registered with the Public Company Accounting Oversight Board (United States) (“PCAOB”) and are required to be independent with respect to the Fund in accordance with the U.S. federal securities laws and the applicable rules and regulations of the Securities and Exchange Commission and the PCAOB.
We conducted our audits of these financial statements in accordance with the standards of the PCAOB. Those standards require that we plan and perform the audit to obtain reasonable assurance about whether the financial statements are free of material misstatement, whether due to error or fraud.
Our audits included performing procedures to assess the risks of material misstatement of the financial statements, whether due to error or fraud, and performing procedures that respond to those risks. Such procedures included examining, on a test basis, evidence regarding the amounts and disclosures in the financial statements. Our audits also included evaluating the accounting principles used and significant estimates made by management, as well as evaluating the overall presentation of the financial statements. Our procedures included confirmation of securities owned as of August 31, 2018 by correspondence with the custodians and brokers and by agreement to the underlying ownership records of the transfer agent; when replies were not received from brokers, we performed other auditing procedures. We believe that our audits provide a reasonable basis for our opinion.
/s/PricewaterhouseCoopers LLP
Philadelphia, Pennsylvania
October 18, 2018
We have served as the auditor of one or more investment companies in The Vanguard Group of Funds since 1975.
21

Special 2018 tax information (unaudited) for Vanguard Russell 3000 Index Fund
This information for the fiscal year ended August 31, 2018, is included pursuant to provisions of
the Internal Revenue Code.
The fund distributed $20,376,000 of qualified dividend income to shareholders during the fiscal year.
For corporate shareholders, 91.7% of investment income (dividend income plus short-term gains,
if any) qualifies for the dividends-received deduction.
22
Your Fund’s After-Tax Returns
This table presents returns for your fund both before and after taxes. The after-tax returns are shown in two ways: (1) assuming that an investor owned the fund during the entire period and paid taxes on the fund’s distributions, and (2) assuming that an investor paid taxes on the fund’s distributions and sold all shares at the end of each period.
Calculations are based on the highest individual federal income tax and capital gains tax rates in effect at the times of the distributions and the hypothetical sales. State and local taxes were not considered. After-tax returns reflect any qualified dividend income, using actual prior-year figures and estimates for 2018. (In the example, returns after the sale of fund shares may be higher than those assuming no sale. This occurs when the sale would have produced a capital loss. The calculation assumes that the investor received a tax deduction for the loss.)
The table shows returns for ETF Shares only; returns for other share classes will differ. Please note that your actual after-tax returns will depend on your tax situation and may differ from those shown. Also note that if you own the fund in a tax-deferred account, such as an individual retirement account or a 401(k) plan, this information does not apply to you. Such accounts are not subject to current taxes.
Finally, keep in mind that a fund’s performance—whether before or after taxes—does not guarantee future results.
| Average Annual Total Returns: Russell 3000 Index Fund ETF Shares | |||
| Periods Ended August 31, 2018 | |||
| Since | |||
| One | Five | Inception | |
| Year | Years | (9/20/2010) | |
| Returns Before Taxes | 20.07% | 14.08% | 14.63% |
| Returns After Taxes on Distributions | 19.58 | 13.60 | 14.21 |
| Returns After Taxes on Distributions and Sale of | |||
| Fund Shares | 12.17 | 11.21 | 12.06 |
23
About Your Fund’s Expenses
As a shareholder of the fund, you incur ongoing costs, which include costs for portfolio management, administrative services, and shareholder reports (like this one), among others. Operating expenses, which are deducted from a fund’s gross income, directly reduce the investment return of the fund.
A fund’s expenses are expressed as a percentage of its average net assets. This figure is known as the expense ratio. The following examples are intended to help you understand the ongoing costs (in dollars) of investing in your fund and to compare these costs with those of other mutual funds. The examples are based on an investment of $1,000 made at the beginning of the period shown and held for the entire period.
The accompanying table illustrates your fund’s costs in two ways:
• Based on actual fund return. This section helps you to estimate the actual expenses that you paid over the period. The ”Ending Account Value“ shown is derived from the fund‘s actual return, and the third column shows the dollar amount that would have been paid by an investor who started with $1,000 in the fund. You may use the information here, together with the amount you invested, to estimate the expenses that you paid over the period.
To do so, simply divide your account value by $1,000 (for example, an $8,600 account value divided by $1,000 = 8.6), then multiply the result by the number given for your fund under the heading ”Expenses Paid During Period.“
• Based on hypothetical 5% yearly return. This section is intended to help you compare your fund‘s costs with those of other mutual funds. It assumes that the fund had a yearly return of 5% before expenses, but that the expense ratio is unchanged. In this case—because the return used is not the fund’s actual return—the results do not apply to your investment. The example is useful in making comparisons because the Securities and Exchange Commission requires all mutual funds to calculate expenses based on a 5% return. You can assess your fund’s costs by comparing this hypothetical example with the hypothetical examples that appear in shareholder reports of other funds.
Note that the expenses shown in the table are meant to highlight and help you compare ongoing costs only and do not reflect transaction costs incurred by the fund for buying and selling securities. Further, the expenses do not include any purchase, redemption, or account service fees described in the fund prospectus. If such fees were applied to your account, your costs would be higher. Your fund does not carry a “sales load.”
The calculations assume no shares were bought or sold during the period. Your actual costs may have been higher or lower, depending on the amount of your investment and the timing of any purchases or redemptions.
You can find more information about the fund’s expenses, including annual expense ratios, in the Financial Statements section of this report. For additional information on operating expenses and other shareholder costs, please refer to your fund’s current prospectus.
24
| Six Months Ended August 31, 2018 | |||
| Beginning | Ending | Expenses | |
| Account Value | Account Value | Paid During | |
| Russell 3000 Index Fund | 2/28/2018 | 8/31/2018 | Period |
| Based on Actual Fund Return | |||
| ETF Shares | $1,000.00 | $1,200.74 | $0.83 |
| Institutional Shares | 1,000.00 | 1,201.54 | 0.44 |
| Based on Hypothetical 5% Yearly Return | |||
| ETF Shares | $1,000.00 | $1,024.45 | $0.77 |
| Institutional Shares | 1,000.00 | 1,024.80 | 0.41 |
The calculations are based on expenses incurred in the most recent six-month period. The fund’s annualized six-month expense ratios for
that period are 0.15% for ETF Shares and 0.08% for Institutional Shares. The dollar amounts shown as ”Expenses Paid” are equal to the
annualized expense ratio multiplied by the average account value over the period, multiplied by the number of days in the most recent
six-month period, then divided by the number of days in the most recent 12-month period (184/365).
25
Trustees Approve Advisory Arrangement
The board of trustees of Vanguard Russell 3000 Index Fund has renewed the fund’s investment advisory arrangement with The Vanguard Group, Inc. (Vanguard), through its Equity Index Group. The board determined that continuing the fund’s internalized management structure was in the best interests of the fund and its shareholders.
The board based its decision upon an evaluation of the advisor’s investment staff, portfolio management process, and performance. This evaluation included information provided to the board by Vanguard’s Portfolio Review Department, which is responsible for fund and advisor oversight and product management. The Portfolio Review Department met regularly with the advisor and made monthly presentations to the board during the fiscal year that directed the board’s focus to relevant information and topics.
The board, or an investment committee made up of board members, also received information throughout the year through advisor presentations. For each advisor presentation, the board was provided with letters and reports that included information about, among other things, the advisory firm and the advisor’s assessment of the investment environment, portfolio performance, and portfolio characteristics.
In addition, the board received monthly reports, which included a Market and Economic Report, a Fund Dashboard Monthly Summary, and a Fund Performance Report.
Prior to their meeting, the trustees were provided with a memo and materials that summarized the information they had received over the course of the year. They also considered the factors discussed below, among others. However, no single factor determined whether the board approved the arrangement. Rather, it was the totality of the circumstances that drove the board’s decision.
Nature, extent, and quality of services
The board reviewed the quality of the investment management services provided to the fund since its inception in 2010, and took into account the organizational depth and stability of the advisor. The board considered that Vanguard has been managing investments for more than four decades. The Equity Index Group adheres to a sound, disciplined investment management process; the team has considerable experience, stability, and depth.
The board concluded that Vanguard’s experience, stability, depth, and performance, among other factors, warranted continuation of the advisory arrangement.
Investment performance
The board considered the fund’s performance since its inception, including any periods of outperformance or underperformance compared with its target index and peer group. The board concluded that the performance was such that the advisory arrangement should continue. Information about the fund’s most recent performance can be found in the Performance Summary section of this report.
Cost
The board concluded that the fund’s expense ratio was well below the average expense ratio charged by funds in its peer group and that the fund’s advisory expenses were also well below the peer-group average. Information about the fund’s expenses appears in the About Your Fund’s Expenses section of the report as well as in the Financial Statements section.
26
The board does not conduct a profitability analysis of Vanguard because of Vanguard’s unique “at-cost” structure. Unlike most other mutual fund management companies, Vanguard is owned by the funds it oversees and produces “profits” only in the form of reduced expenses for fund shareholders.
The benefit of economies of scale
The board concluded that the fund’s at-cost arrangement with Vanguard ensures that the fund will realize economies of scale as it grows, with the cost to shareholders declining as fund assets increase.
The board will consider whether to renew the advisory arrangement again after a one-year period.
27
Glossary
30-Day SEC Yield. A fund’s 30-day SEC yield is derived using a formula specified by the U.S. Securities and Exchange Commission. Under the formula, data related to the fund’s security holdings in the previous 30 days are used to calculate the fund’s hypothetical net income for that period, which is then annualized and divided by the fund’s estimated average net assets over the calculation period. For the purposes of this calculation, a security’s income is based on its current market yield to maturity (for bonds), its actual income (for asset-backed securities), or its projected dividend yield (for stocks). Because the SEC yield represents hypothetical annualized income, it will differ—at times significantly—from the fund’s actual experience. As a result, the fund’s income distributions may be higher or lower than implied by the SEC yield.
Beta. A measure of the magnitude of a fund’s past share-price fluctuations in relation to the ups and downs of a given market index. The index is assigned a beta of 1.00. Compared with a given index, a fund with a beta of 1.20 typically would have seen its share price rise or fall by 12% when the index rose or fell by 10%. For this report, beta is based on returns over the past 36 months for both the fund and the index. Note that a fund’s beta should be reviewed in conjunction with its R-squared (see definition). The lower the R-squared, the less correlation there is between the fund and the index, and the less reliable beta is as an indicator of volatility.
Dividend Yield. Dividend income earned by stocks, expressed as a percentage of the aggregate market value (or of net asset value, for a fund). The yield is determined by dividing the amount of the annual dividends by the aggregate value (or net asset value) at the end of the period. For a fund, the dividend yield is based solely on stock holdings and does not include any income produced by other investments.
Earnings Growth Rate. The average annual rate of growth in earnings over the past five years for the stocks now in a fund.
Equity Exposure. A measure that reflects a fund’s investments in stocks and stock futures. Any holdings in short-term reserves are excluded.
Expense Ratio. A fund’s total annual operating expenses expressed as a percentage of the fund’s average net assets. The expense ratio includes management and administrative expenses, but does not include the transaction costs of buying and selling portfolio securities.
Foreign Holdings. The percentage of a fund represented by securities or depositary receipts of companies based outside the United States.
Inception Date. The date on which the assets of a fund (or one of its share classes) are first invested in accordance with the fund’s investment objective. For funds with a subscription period, the inception date is the day after that period ends. Investment performance is measured from the inception date.
Median Market Cap. An indicator of the size of companies in which a fund invests; the midpoint of market capitalization (market price x shares outstanding) of a fund’s stocks, weighted by the proportion of the fund’s assets invested in each stock. Stocks representing half of the fund’s assets have market capitalizations above the median, and the rest are below it.
Price/Book Ratio. The share price of a stock divided by its net worth, or book value, per share.
For a fund, the weighted average price/book ratio of the stocks it holds.
28
Price/Earnings Ratio. The ratio of a stock’s current price to its per-share earnings over the past year. For a fund, the weighted average P/E of the stocks it holds. P/E is an indicator of market expectations about corporate prospects; the higher the P/E, the greater the expectations for a company’s future growth.
R-Squared. A measure of how much of a fund’s past returns can be explained by the returns from the market in general, as measured by a given index. If a fund’s total returns were precisely synchronized with an index’s returns, its R-squared would be 1.00. If the fund’s returns bore no relationship to the index’s returns, its R-squared would be 0. For this report, R-squared is based on returns over the past 36 months for both the fund and the index.
Return on Equity. The annual average rate of return generated by a company during the past five years for each dollar of shareholder’s equity (net income divided by shareholder’s equity). For a fund, the weighted average return on equity for the companies whose stocks it holds.
Short-Term Reserves. The percentage of a fund invested in highly liquid, short-term securities that can be readily converted to cash.
Turnover Rate. An indication of the fund’s trading activity. Funds with high turnover rates incur higher transaction costs and may be more likely to distribute capital gains (which may be taxable to investors). The turnover rate excludes in-kind transactions, which have minimal impact on costs.
29
This page intentionally left blank.
The People Who Govern Your Fund
The trustees of your mutual fund are there to see that the fund is operated and managed in your best interests since, as a shareholder, you are a part owner of the fund. Your fund’s trustees also serve on the board of directors of The Vanguard Group, Inc., which is owned by the Vanguard funds and provides services to them on an at-cost basis.
A majority of Vanguard’s board members are independent, meaning that they have no affiliation with Vanguard or the funds they oversee, apart from the sizable personal investments they have made as private individuals. The independent board members have distinguished backgrounds in business, academia, and public service. Each of the trustees and executive officers oversees 208 Vanguard funds.
Information for each trustee and executive officer of the fund appears below. The mailing address of the trustees and officers is P.O. Box 876, Valley Forge, PA 19482. More information about the trustees is in the Statement of Additional Information, which can be obtained, without charge, by contacting Vanguard at 800-662-7447, or online at vanguard.com.
Interested Trustees1
F. William McNabb III
Born in 1957. Trustee since July 2009. Principal occupation(s) during the past five years and other experience: chairman of the board (January 2010–present) of Vanguard and of each of the investment companies served by Vanguard, trustee (2009–present) of each of the investment companies served by Vanguard, and director (2008–present) of Vanguard. Chief executive officer and president (2008–2017) of Vanguard and each of the investment companies served by Vanguard, managing director (1995–2008) of Vanguard, and director (1997–2018) of Vanguard Marketing Corporation. Director (2018–present) of UnitedHealth Group.
Mortimer J. Buckley
Born in 1969. Trustee since January 2018. Principal occupation(s) during the past five years and other experience: chief executive officer (January 2018–present) of Vanguard; chief executive officer, president, and trustee (January 2018–present) of each of the investment companies served by Vanguard; president and director (2017–present) of Vanguard; and president (February 2018–present) of Vanguard Marketing Corporation. Chief investment officer (2013–2017), managing director (2002–2017), head of the Retail Investor Group (2006–2012), and chief information officer (2001–2006) of Vanguard. Chairman of the board (2011–2017) of the Children’s Hospital of Philadelphia.
Independent Trustees
Emerson U. Fullwood
Born in 1948. Trustee since January 2008. Principal occupation(s) during the past five years and other experience: executive chief staff and marketing officer for North America and corporate vice president (retired 2008) of Xerox Corporation (document management products and services). Former president of the Worldwide Channels Group, Latin America, and Worldwide Customer Service and executive chief staff officer of Developing Markets of Xerox. Executive in residence and 2009–2010 Distinguished Minett Professor at the Rochester Institute of Technology. Lead director of SPX FLOW, Inc. (multi-industry manufacturing). Director of the University of Rochester Medical Center, the Monroe Community College Foundation, the United Way of Rochester, North Carolina A&T University, and Roberts Wesleyan College. Trustee of the University of Rochester.
Amy Gutmann
Born in 1949. Trustee since June 2006. Principal occupation(s) during the past five years and other experience: president (2004–present) of the University of Pennsylvania. Christopher H. Browne Distinguished Professor of Political Science, School of Arts and Sciences, and professor of communication, Annenberg School for Communication, with secondary faculty appointments in the Department of Philosophy, School of Arts and Sciences, and at the Graduate School of Education, University of Pennsylvania. Trustee of the National Constitution Center.
1 Mr. McNabb and Mr. Buckley are considered “interested persons,” as defined in the Investment Company Act of 1940, because
they are officers of the Vanguard funds.
JoAnn Heffernan Heisen
Born in 1950. Trustee since July 1998. Principal occupation(s) during the past five years and other experience: corporate vice president of Johnson & Johnson (pharmaceuticals/medical devices/consumer products) and member of its executive committee (1997–2008). Chief global diversity officer (retired 2008), vice president and chief information officer (1997–2006), controller (1995–1997), treasurer (1991–1995), and assistant treasurer (1989–1991) of Johnson & Johnson. Director of Skytop Lodge Corporation (hotels) and the Robert Wood Johnson Foundation. Member of the advisory board of the Institute for Women’s Leadership at Rutgers University.
F. Joseph Loughrey
Born in 1949. Trustee since October 2009. Principal occupation(s) during the past five years and other experience: president and chief operating officer (retired 2009) and vice chairman of the board (2008–2009) of Cummins Inc. (industrial machinery). Chairman of the board of Hillenbrand, Inc. (specialized consumer services), Oxfam America, and the Lumina Foundation for Education. Director of the V Foundation for Cancer Research. Member of the advisory council for the College of Arts and Letters and chair of the advisory board to the Kellogg Institute for International Studies, both at the University of Notre Dame.
Mark Loughridge
Born in 1953. Trustee since March 2012. Principal occupation(s) during the past five years and other experience: senior vice president and chief financial officer (retired 2013) of IBM (information technology services). Fiduciary member of IBM’s Retirement Plan Committee (2004–2013), senior vice president and general manager (2002–2004) of IBM Global Financing, vice president and controller (1998–2002) of IBM, and a variety of other prior management roles at IBM. Member of the Council on Chicago Booth.
Scott C. Malpass
Born in 1962. Trustee since March 2012. Principal occupation(s) during the past five years and other experience: chief investment officer (1989–present) and vice president (1996–present) of the University of Notre Dame. Assistant professor of finance at the Mendoza College of Business, University of Notre Dame, and member of the Notre Dame 403(b) Investment Committee. Chairman of the board of TIFF Advisory Services, Inc. Member of the board of Catholic Investment Services, Inc. (investment advisors), the board of advisors for Spruceview Capital Partners, and the board of superintendence of the Institute for the Works of Religion.
Deanna Mulligan
Born in 1963. Trustee since January 2018. Principal occupation(s) during the past five years and other experience: president (2010–present) and chief executive officer (2011–present) of The Guardian Life Insurance Company of America. Chief operating officer (2010–2011) and executive vice president (2008–2010) of Individual Life and Disability of The Guardian Life Insurance Company of America. Member of the board of The Guardian Life Insurance Company of America, the American Council of Life Insurers, the Partnership for New York City (business leadership), and the Committee Encouraging Corporate Philanthropy. Trustee of the Economic Club of New York and the Bruce Museum (arts and science). Member of the Advisory Council for the Stanford Graduate School of Business.
André F. Perold
Born in 1952. Trustee since December 2004. Principal occupation(s) during the past five years and other experience: George Gund Professor of Finance and Banking, Emeritus at the Harvard Business School (retired 2011). Chief investment officer and co-managing partner of HighVista Strategies LLC (private investment firm). Overseer of the Museum of Fine Arts Boston.
Sarah Bloom Raskin
Born in 1961. Trustee since January 2018. Principal occupation(s) during the past five years and other experience: deputy secretary (2014–2017) of the United States Department of the Treasury. Governor (2010–2014) of the Federal Reserve Board. Commissioner (2007–2010) of financial regulation for the State of Maryland. Member of the board of directors (2012–2014) of Neighborhood Reinvestment Corporation. Director of i(x) Investments, LLC.
Peter F. Volanakis
Born in 1955. Trustee since July 2009. Principal occupation(s) during the past five years and other experience: president and chief operating officer (retired 2010) of Corning Incorporated (communications equipment) and director of Corning Incorporated (2000–2010) and Dow Corning (2001–2010). Director (2012) of SPX Corporation (multi-industry manufacturing). Overseer of the Amos Tuck School of Business Administration, Dartmouth College (2001–2013). Chairman of the board of trustees of Colby-Sawyer College. Member of the Board of Hypertherm Inc. (industrial cutting systems, software, and consumables).
Executive Officers
Glenn Booraem
Born in 1967. Principal occupation(s) during the past five years and other experience: principal of Vanguard. Investment stewardship officer (2017–present), treasurer (2015–2017), controller (2010–2015), and assistant controller (2001–2010) of each of the investment companies served by Vanguard.
Christine M. Buchanan
Born in 1970. Principal occupation(s) during the past five years and other experience: principal of Vanguard and global head of Fund Administration at Vanguard. Treasurer (2017–present) of each of the investment companies served by Vanguard. Partner (2005–2017) at KPMG LLP (audit, tax, and advisory services).
Brian Dvorak
Born in 1973. Principal occupation(s) during the past five years and other experience: principal of Vanguard. Chief compliance officer (2017–present) of Vanguard and each of the investment companies served by Vanguard. Assistant vice president (2017–present) of Vanguard Marketing Corporation. Vice president and director of Enterprise Risk Management (2011–2013) at Oppenheimer Funds, Inc.
Thomas J. Higgins
Born in 1957. Principal occupation(s) during the past five years and other experience: principal of Vanguard. Chief financial officer (2008–present) and treasurer (1998–2008) of each of the investment companies served by Vanguard.
Peter Mahoney
Born in 1974. Principal occupation(s) during the past five years and other experience: principal of Vanguard. Controller (2015–present) of each of the investment companies served by Vanguard. Head of International Fund Services (2008–2014) at Vanguard.
Anne E. Robinson
Born in 1970. Principal occupation(s) during the past five years and other experience: general counsel (2016–present) of Vanguard. Secretary (2016–present) of Vanguard and of each of the investment companies served by Vanguard. Managing director (2016–present) of Vanguard. Director and senior vice president (2016–2018) of Vanguard Marketing Corporation. Managing director and general counsel of Global Cards and Consumer Services (2014–2016) at Citigroup. Counsel (2003–2014) at American Express.
Michael Rollings
Born in 1963. Principal occupation(s) during the past five years and other experience: finance director (2017–present) and treasurer (2017) of each of the investment companies served by Vanguard. Managing director (2016–present) of Vanguard. Chief financial officer (2016–present) of Vanguard. Director (2016–present) of Vanguard Marketing Corporation. Executive vice president and chief financial officer (2006–2016) of MassMutual Financial Group.
| Vanguard Senior Management Team | |
| Mortimer J. Buckley | James M. Norris |
| Gregory Davis | Thomas M. Rampulla |
| John James | Karin A. Risi |
| Martha G. King | Anne E. Robinson |
| John T. Marcante | Michael Rollings |
| Chris D. McIsaac | |
| Chairman Emeritus and Senior Advisor | |
| John J. Brennan | |
| Chairman, 1996–2009 | |
| Chief Executive Officer and President, 1996–2008 | |
| Founder | |
| John C. Bogle | |
| Chairman and Chief Executive Officer, 1974–1996 | |
 | |
| P.O. Box 2600 | |
| Valley Forge, PA 19482-2600 | |
| Connect with Vanguard® > vanguard.com | |
| Fund Information > 800-662-7447 | Source for Bloomberg Barclays indexes: Bloomberg |
| Direct Investor Account Services > 800-662-2739 | Index Services Limited. Copyright 2018, Bloomberg. All |
| rights reserved. | |
| Institutional Investor Services > 800-523-1036 | |
| The Russell Indexes and Russell® are registered | |
| Text Telephone for People | trademarks of Russell Investments and have been |
| Who Are Deaf or Hard of Hearing > 800-749-7273 | licensed for use by The Vanguard Group, Inc. The |
| This material may be used in conjunction | products are not sponsored, endorsed, sold, or |
| promoted by Russell Investments and Russell | |
| with the offering of shares of any Vanguard | Investments makes no representation regarding the |
| fund only if preceded or accompanied by | advisability of investing in the products. |
| the fund’s current prospectus. | |
| All comparative mutual fund data are from Lipper, a | |
| Thomson Reuters Company, or Morningstar, Inc., unless | |
| otherwise noted. | |
| You can obtain a free copy of Vanguard’s proxy voting | |
| guidelines by visiting vanguard.com/proxyreporting or by | |
| calling Vanguard at 800-662-2739. The guidelines are | |
| also available from the SEC’s website, sec.gov. In | |
| addition, you may obtain a free report on how your fund | |
| voted the proxies for securities it owned during the 12 | |
| months ended June 30. To get the report, visit either | |
| vanguard.com/proxyreporting or sec.gov. | |
| You can review and copy information about your fund at | |
| the SEC’s Public Reference Room in Washington, D.C. To | |
| find out more about this public service, call the SEC at | |
| 202-551-8090. Information about your fund is also | |
| available on the SEC’s website, and you can receive | |
| copies of this information, for a fee, by sending a | |
| request in either of two ways: via email addressed to | |
| publicinfo@sec.gov or via regular mail addressed to the | |
| Public Reference Section, Securities and Exchange | |
| Commission, Washington, DC 20549-1520. | |
| © 2018 The Vanguard Group, Inc. | |
| All rights reserved. | |
| Vanguard Marketing Corporation, Distributor. | |
| Q18540 102018 | |
Vanguard’s Principles for Investing Success
We want to give you the best chance of investment success. These principles, grounded in Vanguard’s research and experience, can put you on the right path.
Goals. Create clear, appropriate investment goals.
Balance. Develop a suitable asset allocation using broadly diversified funds.
Cost. Minimize cost.
Discipline. Maintain perspective and long-term discipline.
A single theme unites these principles: Focus on the things you can control.
We believe there is no wiser course for any investor.
| Contents | |
| Your Fund’s Performance at a Glance. | 1 |
| CEO’s Perspective. | 6 |
| Short-Term Treasury Index Fund. | 8 |
| Intermediate-Term Treasury Index Fund. | 25 |
| Long-Term Treasury Index Fund. | 42 |
| Short-Term Corporate Bond Index Fund. | 58 |
| Intermediate-Term Corporate Bond Index Fund. | 77 |
| Long-Term Corporate Bond Index Fund. | 96 |
| Mortgage-Backed Securities Index Fund. | 116 |
| About Your Fund’s Expenses. | 138 |
| Trustees Approve Advisory Arrangements. | 141 |
| Glossary. | 143 |
Please note: The opinions expressed in this report are just that—informed opinions. They should not be considered promises
or advice. Also, please keep in mind that the information and opinions cover the period through the date on the front of this
report. Of course, the risks of investing in your fund are spelled out in the prospectus.
See the Glossary for definitions of investment terms used in this report.
• Bond yields overall rose for the 12 months ended August 31, 2018, resulting in price declines. Returns of the funds in this report ranged from about –3% for Vanguard Long-Term Treasury Index Fund to just above zero for Vanguard Short-Term Corporate Bond Index Fund. (For the ETF share class, we look at the net asset value return.) The funds mostly performed in line with their benchmarks after taking expenses into account. The Long-Term Treasury Index Fund, though, underperformed its benchmark, largely because of security pricing differences that are expected to be temporary.
A majority of the funds lagged their peer-group average returns.
• Although demand for longer-term bonds picked up at times, their yields finished higher on expectations for continued growth and rising inflation. Shorter-term bond yields also rose as the Federal Reserve further raised rates.
• Corporate fundamentals and quarterly earnings remained robust—helped by recent tax cuts—but corporate bond prices declined as issuance ran high and demand softened.
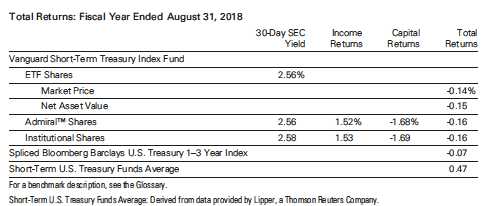
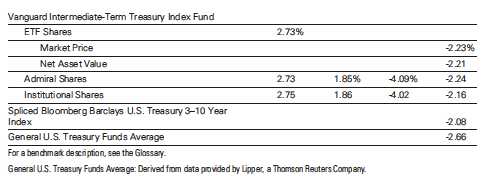
| 30-Day SEC | Income | Capital | Total | |
| Yield | Returns | Returns | Returns | |
| Vanguard Long-Term Treasury Index Fund | ||||
| ETF Shares | 2.95% | |||
| Market Price | -3.05% | |||
| Net Asset Value | -3.07 | |||
| Admiral Shares | 2.95 | 2.58% | -5.64% | -3.06 |
| Institutional Shares | 2.97 | 2.59 | -5.66 | -3.07 |
| Spliced Bloomberg Barclays U.S. Long Treasury Index | -2.75 | |||
| General U.S. Treasury Funds Average | -2.66 | |||
| For a benchmark description, see the Glossary. | ||||
| General U.S. Treasury Funds Average: Derived from data provided by Lipper, a Thomson Reuters Company. | ||||
| Vanguard Short-Term Corporate Bond Index Fund | ||||
| ETF Shares | 3.32% | |||
| Market Price | -0.03% | |||
| Net Asset Value | 0.01 | |||
| Admiral Shares | 3.32 | 2.45% | -2.43% | 0.02 |
| Institutional Shares | 3.34 | 2.47 | -2.40 | 0.07 |
| Bloomberg Barclays U.S. 1–5 Year Corporate Bond Index | 0.08 | |||
| Short-Intermediate Investment-Grade Debt Funds | ||||
| Average | -0.25 | |||
| Short-Intermediate Investment-Grade Debt Funds Average: Derived from data provided by Lipper, a Thomson Reuters Company. | ||||
| Vanguard Intermediate-Term Corporate Bond Index Fund | ||||
| ETF Shares | 3.98% | |||
| Market Price | -1.71% | |||
| Net Asset Value | -1.62 | |||
| Admiral Shares | 3.98 | 3.31% | -4.92% | -1.61 |
| Institutional Shares | 4.00 | 3.33 | -4.90 | -1.57 |
| Bloomberg Barclays U.S. 5–10 Year Corporate Bond Index | -1.49 | |||
| Core Bond Funds Average | -1.12 | |||
| Core Bond Funds Average: Derived from data provided by Lipper, a Thomson Reuters Company. | ||||
| Vanguard Long-Term Corporate Bond Index Fund | ||||
| ETF Shares | 4.56% | |||
| Market Price | -2.22% | |||
| Net Asset Value | -2.01 | |||
| Admiral Shares | 4.56 | 4.08% | -6.08% | -2.00 |
| Institutional Shares | 4.58 | 4.10 | -6.05 | -1.95 |
| Bloomberg Barclays U.S. 10+ Year Corporate Bond Index | -1.85 | |||
| Corporate Debt Funds BBB-Rated Average | -1.16 | |||
| Corporate Debt Funds BBB-Rated Average: Derived from data provided by Lipper, a Thomson Reuters Company. | ||||
2
| 30-Day SEC | Income | Capital | Total | |
| Yield | Returns | Returns | Returns | |
| vanguard mortgage-backed securities index fund | ||||
| etf shares | 2.86% | |||
| market price | -0.65% | |||
| net asset value | -0.67 | |||
| Admiral Shares | 2.86 | 2.44% | -3.12% | -0.68 |
| Institutional Shares | 2.88 | 2.46 | -3.14 | -0.68 |
| Bloomberg Barclays U.S. MBS Float Adjusted Index | -0.48 | |||
| U.S. Mortgage Funds Average | -0.47 |
U.S. Mortgage Funds Average: Derived from data provided by Lipper, a Thomson Reuters Company.
Admiral Shares carry lower expenses and are available to investors who meet certain account-balance requirements. Institutional Shares
are available to certain institutional investors who meet specific administrative, service, and account-size criteria. The Vanguard ETF®
Shares shown are traded on the Nasdaq exchange and are available only through brokers. The table provides ETF returns based on both
the Nasdaq market price and the net asset value for a share. U.S. Pat. Nos. 6,879,964; 7,337,138; 7,720,749; 7,925,573; 8,090,646; and
8,417,623.
For the ETF Shares, the market price is determined by the midpoint of the bid-offer spread as of the closing time of the New York Stock
Exchange (generally 4 p.m., Eastern time). The net asset value is also determined as of the NYSE closing time. For more information about
how the ETF Shares' market prices have compared with their net asset value, visit vanguard.com, select your ETF, and then select the
Price and Performance tab. The ETF premium/discount analysis there shows the percentages of days on which the ETF Shares' market
price was above or below the NAV.
| Total Returns: Inception Through August 31, 2018 | |
| Average | |
| Annual Return | |
| Short-Term Treasury Index Fund ETF Shares Net Asset Value (Returns since inception: 11/19/2009) | 0.71% |
| Spliced Bloomberg Barclays U.S. Treasury 1–3 Year Index | 0.82 |
| Short-Term U.S. Treasury Funds Average | 0.77 |
| For a benchmark description, see the Glossary. | |
| Short-Term U.S. Treasury Funds Average: Derived from data provided by Lipper, a Thomson Reuters Company. | |
| Intermediate-Term Treasury Index Fund ETF Shares Net Asset Value (Returns since inception: | |
| 11/19/2009) | 2.50% |
| Spliced Bloomberg Barclays U.S. Treasury 3–10 Year Index | 2.60 |
| General U.S. Treasury Funds Average | 3.34 |
| For a benchmark description, see the Glossary. | |
| General U.S. Treasury Funds Average: Derived from data provided by Lipper, a Thomson Reuters Company. |
| Long-Term Treasury Index Fund ETF Shares Net Asset Value (Returns since inception: 11/19/2009) | 5.58% |
| Spliced Bloomberg Barclays U.S. Long Treasury Index | 5.70 |
| General U.S. Treasury Funds Average | 3.42 |
| For a benchmark description, see the Glossary. | |
| General U.S. Treasury Funds Average: Derived from data provided by Lipper, a Thomson Reuters Company. |
3
| Average | |
| Annual Return | |
| Short-Term Corporate Bond Index Fund ETF Shares Net Asset Value (Returns since inception: | |
| 11/19/2009) | 2.72% |
| Bloomberg Barclays U.S. 1–5 Year Corporate Bond Index | 2.92 |
| Short-Intermediate Investment-Grade Debt Funds Average | 2.19 |
| Short-Intermediate Investment-Grade Debt Funds Average: Derived from data provided by Lipper, a Thomson Reuters Company. | |
| Intermediate-Term Corporate Bond Index Fund ETF Shares Net Asset Value (Returns since inception: | |
| 11/19/2009) | 5.07% |
| Bloomberg Barclays U.S. 5–10 Year Corporate Bond Index | 5.19 |
| Spliced Core Bond Funds Average | 3.32 |
| For a benchmark description, see the Glossary. | |
| Spliced Core Bond Funds Average: Derived from data provided by Lipper, a Thomson Reuters Company. | |
| Long-Term Corporate Bond Index Fund ETF Shares Net Asset Value (Returns since inception: | |
| 11/19/2009) | 6.76% |
| Bloomberg Barclays U.S. 10+ Year Corporate Bond Index | 6.78 |
| Corporate Debt Funds BBB-Rated Average | 4.82 |
| Corporate Debt Funds BBB-Rated Average: Derived from data provided by Lipper, a Thomson Reuters Company. | |
| Mortgage-Backed Securities Index Fund ETF Shares Net Asset Value (Returns since inception: | |
| 11/19/2009) | 2.50% |
| Bloomberg Barclays U.S. MBS Float Adjusted Index | 2.55 |
| U.S. Mortgage Funds Average | 2.93 |
| U.S. Mortgage Funds Average: Derived from data provided by Lipper, a Thomson Reuters Company. | |
The figures shown represent past performance, which is not a guarantee of future results. (Current performance may be
lower or higher than the performance data cited. For performance data current to the most recent month-end, visit our
website at vanguard.com/performance.) Note, too, that both investment returns and principal value can fluctuate widely,
so an investor’s shares, when sold, could be worth more or less than their original cost.
4
| Expense Ratios | ||||
| Your Fund Compared With Its Peer Group | ||||
| ETF | Admiral | Institutional | Peer Group | |
| Shares | Shares | Shares | Average | |
| Short-Term Treasury Index Fund | 0.07% | 0.07% | 0.05% | 0.47% |
| Intermediate-Term Treasury Index Fund | 0.07 | 0.07 | 0.05 | 0.37 |
| Long-Term Treasury Index Fund | 0.07 | 0.07 | 0.05 | 0.37 |
| Short-Term Corporate Bond Index Fund | 0.07 | 0.07 | 0.05 | 0.73 |
| Intermediate-Term Corporate Bond | ||||
| Index Fund | 0.07 | 0.07 | 0.05 | 0.74 |
| Long-Term Corporate Bond Index Fund | 0.07 | 0.07 | 0.05 | 0.87 |
| Mortgage-Backed Securities Index | ||||
| Fund | 0.07 | 0.07 | 0.05 | 0.85 |
The fund expense ratios shown are from the prospectus dated December 21, 2017, and represent estimated costs for the current fiscal
year. For the fiscal year ended August 31, 2018, the funds’ expense ratios were: for the Short-Term Treasury Index Fund, 0.07% for ETF
Shares, 0.07% for Admiral Shares, and 0.05% for Institutional Shares; for the Intermediate-Term Treasury Index Fund, 0.07% for ETF
Shares, 0.07% for Admiral Shares, and 0.05% for Institutional Shares; for the Long-Term Treasury Index Fund, 0.07% for ETF Shares,
0.07% for Admiral Shares, and 0.05% for Institutional Shares; for the Short-Term Corporate Bond Index Fund, 0.07% for ETF Shares,
0.07% for Admiral Shares, and 0.05% for Institutional Shares; for the Intermediate-Term Corporate Bond Index Fund, 0.07% for ETF
Shares, 0.07% for Admiral Shares, and 0.05% for Institutional Shares; for the Long-Term Corporate Bond Index Fund, 0.07% for ETF
Shares, 0.07% for Admiral Shares, and 0.05% for Institutional Shares; and for the Mortgage-Backed Securities Index Fund, 0.07% for ETF
Shares, 0.07% for Admiral Shares, and 0.05% for Institutional Shares. Peer-group expense ratios are derived from data provided by Lipper,
a Thomson Reuters Company, and capture information through year-end 2017.
Peer groups: For the Short-Term Treasury Index Fund, Short-Term U.S. Treasury Funds; for the Intermediate-Term Treasury Index Fund,
General U.S. Treasury Funds; for the Long-Term Treasury Index Fund, General U.S. Treasury Funds; for the Short-Term Corporate Bond
Index Fund, Short-Intermediate Investment-Grade Debt Funds; for the Intermediate-Term Corporate Bond Index Fund, Core Bond Funds; for
the Long-Term Corporate Bond Index Fund, Corporate Debt Funds BBB-Rated; and for the Mortgage-Backed Securities Index Fund, U.S.
Mortgage Funds.
5
CEO’s Perspective

Tim Buckley
President and Chief Executive Officer
Dear Shareholder,
Over the years, I’ve found that prudent investors exhibit a common trait: discipline. No matter how the markets move or what new investing fad hits the headlines, those who stay focused on their goals and tune out the noise are set up for long-term success.
The prime gateway to investing is saving, and you don’t usually become a saver without a healthy dose of discipline. Savers make the decision to sock away part of their income, which means spending less and delaying gratification, no matter how difficult that may be.
Of course, disciplined investing extends beyond diligent saving. The financial markets, in the short term especially, are unpredictable; I have yet to meet the investor who can time them perfectly. It takes discipline to resist the urge to go all-in when markets are frothy or to retreat when things look bleak.
Staying put with your investments is one strategy for handling volatility. Another, rebalancing, requires even more discipline because it means steering your money away from strong performers and toward poorer performers.
Patience—a form of discipline—is also the friend of long-term investors. Higher returns are the potential reward for weathering the market’s turbulence and uncertainty.
…
We have been enjoying one of the longest bull markets in history, but it won’t continue forever. Prepare yourself now for how you will react when volatility comes back. Don’t panic. Don’t chase returns or look for answers outside the asset classes you trust. And be sure to rebalance periodically, even when there’s turmoil.
Whether you’re a master of self-control, get a boost from technology, or work with a professional advisor, know that discipline
is necessary to get the most out of your investment portfolio. And know that Vanguard is with you for the entire ride.
Thank you for your continued loyalty.
Sincerely,

Mortimer J. Buckley
President and Chief Executive Officer
September 13, 2018
| Market Barometer | |||
| Average Annual Total Returns | |||
| Periods Ended August 31, 2018 | |||
| One Year | Three Years | Five Years | |
| Stocks | |||
| Russell 1000 Index (Large-caps) | 19.82% | 15.84% | 14.36% |
| Russell 2000 Index (Small-caps) | 25.45 | 16.11 | 13.00 |
| Russell 3000 Index (Broad U. S. market) | 20.25 | 15.86 | 14.25 |
| FTSE All-World ex US Index (International) | 3.51 | 8.31 | 5.82 |
| Bonds | |||
| Bloomberg Barclays U. S. Aggregate Bond Index | |||
| (Broad taxable market) | -1.05% | 1.76% | 2.49% |
| Bloomberg Barclays Municipal Bond Index | |||
| (Broad tax-exempt market) | 0.49 | 2.71 | 4.12 |
| FTSE Three-Month U. S. Treasury Bill Index | 1.49 | 0.74 | 0.44 |
| CPI | |||
| Consumer Price Index | 2.70% | 1.90% | 1.52% |
š
Short-Term Treasury Index Fund
Fund Profile
As of August 31, 2018
| Share-Class Characteristics | |||
| ETF | Admiral | Institutional | |
| Shares | Shares | Shares | |
| Ticker Symbol | VGSH | VSBSX | VSBIX |
| Expense Ratio1 | 0.07% | 0.07% | 0.05% |
| 30-Day SEC Yield | 2.56% | 2.56% | 2.58% |
| Financial Attributes | |||
| Bloomberg | |||
| Barclays | Bloomberg | ||
| U.S. | Barclays | ||
| Treasury | U.S. | ||
| 1–3 Year | Aggregate | ||
| Fund | Bond Index | FA Index | |
| Number of Bonds | 93 | 97 | 10,038 |
| Yield to Maturity | |||
| (before expenses) | 2.6% | 2.6% | 3.3% |
| Average Coupon | 1.9% | 1.9% | 3.1% |
| Average Duration | 1.9 years | 1.9 years | 6.1 years |
| Average Effective | |||
| Maturity | 2.0 years | 2.0 years | 8.4 years |
| Short-Term | |||
| Reserves | 0.5% | — | — |
| Sector Diversification (% of portfolio) | |
| U.S. Treasury | 100.0% |
The agency and mortgage-backed securities sectors may include
issues from government-sponsored enterprises; such issues are
generally not backed by the full faith and credit of the U.S.
government.
| Volatility Measures | ||
| Spliced | ||
| Bloomberg | Bloomberg | |
| Barclays U.S. | Barclays U.S. | |
| Treasury 1–3 | Aggregate | |
| Year Index | FA Index | |
| R-Squared | 0.99 | 0.70 |
| Beta | 1.02 | 0.24 |
| These measures show the degree and timing of the fund’s | ||
| fluctuations compared with the indexes over 36 months. | ||
| Distribution by Effective Maturity | |
| (% of portfolio) | |
| Under 1 Year | 0.3% |
| 1 - 3 Years | 99.7 |
| Distribution by Credit Quality (% of portfolio) | |
| U.S. Government | 100.0% |
Credit-quality ratings are obtained from Barclays and are from Moody's, Fitch, and S&P. When ratings from all three agencies are used, the median rating is shown. When ratings from two of the agencies are used, the lower rating for each issue is shown. "Not Rated" is used to classify securities for which a rating is not available. For more information about these ratings, see the Glossary entry for Credit Quality.
Investment Focus
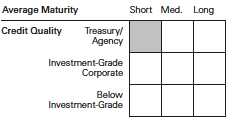
1 The expense ratios shown are from the prospectus dated December 21, 2017, and represent estimated costs for the current fiscal year. For the
fiscal year ended August 31, 2018, the expense ratios were 0.07% for ETF Shares, 0.07% for Admiral Shares, and 0.05% for Institutional Shares.
8
Short-Term Treasury Index Fund
Performance Summary
All of the returns in this report represent past performance, which is not a guarantee of future results that may be achieved by the fund. (Current performance may be lower or higher than the performance data cited. For performance data current to the most recent month-end, visit our website at vanguard.com/performance.) Note, too, that both investment returns and principal value can fluctuate widely, so an investor’s shares, when sold, could be worth more or less than their original cost. The returns shown do not reflect taxes that a shareholder would pay on fund distributions or on the sale of fund shares.
Cumulative Performance: November 19, 2009, Through August 31, 2018
Initial Investment of $10,000
| Average Annual Total Returns | |||||
| Periods Ended August 31, 2018 | |||||
| Since | Final Value | ||||
| One | Five | Inception | of a $10,000 | ||
| Year | Years (11/19/2009) | Investment | |||
| Short-Term Treasury Index FundETF | |||||
| Shares Net Asset Value | -0.15% | 0.55% | 0.71% | $10,645 | |
| Short-Term Treasury Index FundETF | |||||
| Shares Market Price | -0.14 | 0.56 | 0.72 | 10,651 | |
| Spliced Bloomberg Barclays U.S. | |||||
| • • • • • • •• | Treasury 1–3 Year Index | -0.07 | 0.64 | 0.82 | 10,743 |
| – – – – | Short-Term U.S. Treasury Funds | ||||
| Average | 0.47 | 0.71 | 0.77 | 10,695 | |
| Spliced Bloomberg Barclays U.S. | |||||
| Aggregate Float Adjusted Index | -1.09 | 2.47 | 3.09 | 13,062 | |
For a benchmark description, see the Glossary.
Short-Term U.S. Treasury Funds Average: Derived from data provided by Lipper, a Thomson Reuters Company.
"Since Inception" performance is calculated from the ETF Shares’ inception date for both the fund and its comparative standards.
See Financial Highlights for dividend and capital gains information.
9
Short-Term Treasury Index Fund
| Average Annual Total Returns | ||||
| Periods Ended August 31, 2018 | ||||
| Since | Final Value | |||
| One | Five | Inception | of a $10,000 | |
| Year | Years | (12/28/2009) | Investment | |
| Short-Term Treasury Index Fund Admiral | ||||
| Shares | -0.16% | 0.55% | 0.78% | $10,695 |
| Spliced Bloomberg Barclays U.S. Treasury | ||||
| 1–3 Year Index | -0.07 | 0.64 | 0.88 | 10,788 |
| Spliced Bloomberg Barclays U.S. Aggregate | ||||
| Float Adjusted Index | -1.09 | 2.47 | 3.25 | 13,198 |
| "Since Inception" performance is calculated from the Admiral Shares’ inception date for both the fund and its comparative standards. | ||||
| Since | Final Value | |||
| One | Five | Inception | of a $5,000,000 | |
| Year | Years | (8/23/2010) | Investment | |
| Short-Term Treasury Index Fund | ||||
| Institutional Shares | -0.16% | 0.58% | 0.60% | $5,247,770 |
| Spliced Bloomberg Barclays U.S. Treasury | ||||
| 1–3 Year Index | -0.07 | 0.64 | 0.67 | 5,277,241 |
| Spliced Bloomberg Barclays U.S. Aggregate | ||||
| Float Adjusted Index | -1.09 | 2.47 | 2.58 | 6,132,523 |
| "Since Inception" performance is calculated from the Institutional Shares’ inception date for both the fund and its comparative standards. | ||||
| Cumulative Returns of ETF Shares: November 19, 2009, Through August 31, 2018 | |||
| Since | |||
| One | Five | Inception | |
| Year | Years | (11/19/2009) | |
| Short-Term Treasury Index Fund ETF Shares Market | |||
| Price | -0.14% | 2.82% | 6.51% |
| Short-Term Treasury Index Fund ETF Shares Net | |||
| Asset Value | -0.15 | 2.80 | 6.45 |
| Spliced Bloomberg Barclays U.S. Treasury 1–3 Year | |||
| Index | -0.07 | 3.23 | 7.43 |
| "Since Inception" performance is calculated from the ETF Shares’ inception date for both the fund and its comparative standards. | |||
10
Short-Term Treasury Index Fund
| Fiscal-Year Total Returns (%): November 19, 2009, Through August 31, 2018 | ||
| Spliced | ||
| Bloomberg | ||
| Barclays U.S. | ||
| Treasury 1–3 Year | ||
| ETF Shares Net Asset Value | Index | |
| Fiscal Year | Total Returns | Total Returns |
| 2010 | 1.69% | 1.83% |
| 2011 | 1.39 | 1.53 |
| 2012 | 0.40 | 0.50 |
| 2013 | 0.04 | 0.16 |
| 2014 | 0.70 | 0.80 |
| 2015 | 0.75 | 0.84 |
| 2016 | 0.98 | 1.06 |
| 2017 | 0.50 | 0.56 |
| 2018 | -0.15 | -0.07 |
| For a benchmark description, see the Glossary. | ||
Average Annual Total Returns: Periods Ended June 30, 2018
This table presents returns through the latest calendar quarter—rather than through the end of the fiscal period.
Securities and Exchange Commission rules require that we provide this information.
| Since Inception | ||||||
| Inception Date | One Year | Five Years | Income | Capital | Total | |
| ETF Shares | 11/19/2009 | |||||
| Market Price | -0.08% | 0.50% | 0.70% | |||
| Net Asset Value | -0.05 | 0.50 | 0.69 | |||
| Admiral Shares | 12/28/2009 | -0.06 | 0.50 | 0.67% | 0.08% | 0.75 |
| Institutional Shares | 8/23/2010 | -0.02 | 0.53 | 0.71 | -0.13 | 0.58 |
11
Short-Term Treasury Index Fund
Financial Statements
Statement of Net Assets
As of August 31, 2018
The fund reports a complete list of its holdings in regulatory filings four times in each fiscal year, at the quarter-ends. For the second and fourth fiscal quarters, the lists appear in the fund’s semiannual and annual reports to shareholders. For the first and third fiscal quarters, the fund files the lists with the Securities and Exchange Commission on Form N-Q. Shareholders can look up the fund’s Forms N-Q on the SEC’s website at sec.gov. Forms N-Q may also be reviewed and copied at the SEC’s Public Reference Room (see the back cover of this report for further information).
| Face | Market | |||
| Maturity | Amount | Value • | ||
| Coupon | Date | ($000) | ($000) | |
| U.S. Government and Agency Obligations (99.3%) | ||||
| U.S. Government Securities (99.3%) | ||||
| United States Treasury Note/Bond | 0.875% | 9/15/19 | 36,955 | 36,349 |
| United States Treasury Note/Bond | 1.000% | 9/30/19 | 12,033 | 11,843 |
| United States Treasury Note/Bond | 1.375% | 9/30/19 | 50,165 | 49,569 |
| United States Treasury Note/Bond | 1.750% | 9/30/19 | 37,426 | 37,128 |
| United States Treasury Note/Bond | 1.000% | 10/15/19 | 38,312 | 37,678 |
| United States Treasury Note/Bond | 1.250% | 10/31/19 | 12,090 | 11,916 |
| United States Treasury Note/Bond | 1.500% | 10/31/19 | 101,700 | 100,508 |
| United States Treasury Note/Bond | 1.000% | 11/15/19 | 37,366 | 36,694 |
| United States Treasury Note/Bond | 3.375% | 11/15/19 | 30,856 | 31,160 |
| United States Treasury Note/Bond | 1.000% | 11/30/19 | 70,660 | 69,346 |
| United States Treasury Note/Bond | 1.500% | 11/30/19 | 56,703 | 55,985 |
| United States Treasury Note/Bond | 1.750% | 11/30/19 | 21,590 | 21,384 |
| United States Treasury Note/Bond | 1.375% | 12/15/19 | 82,405 | 81,194 |
| United States Treasury Note/Bond | 1.125% | 12/31/19 | 28,040 | 27,523 |
| United States Treasury Note/Bond | 1.625% | 12/31/19 | 45,008 | 44,467 |
| United States Treasury Note/Bond | 1.875% | 12/31/19 | 30,000 | 29,737 |
| United States Treasury Note/Bond | 1.375% | 1/15/20 | 104,644 | 102,993 |
| United States Treasury Note/Bond | 1.250% | 1/31/20 | 38,125 | 37,440 |
| United States Treasury Note/Bond | 1.375% | 1/31/20 | 28,545 | 28,081 |
| United States Treasury Note/Bond | 2.000% | 1/31/20 | 55,275 | 54,852 |
| United States Treasury Note/Bond | 1.375% | 2/15/20 | 50,617 | 49,763 |
| United States Treasury Note/Bond | 3.625% | 2/15/20 | 57,096 | 57,926 |
| United States Treasury Note/Bond | 1.250% | 2/29/20 | 15,429 | 15,132 |
| United States Treasury Note/Bond | 1.375% | 2/29/20 | 80,964 | 79,547 |
| United States Treasury Note/Bond | 2.250% | 2/29/20 | 95,550 | 95,102 |
| United States Treasury Note/Bond | 1.625% | 3/15/20 | 21,863 | 21,549 |
| United States Treasury Note/Bond | 1.125% | 3/31/20 | 8,132 | 7,949 |
| United States Treasury Note/Bond | 1.375% | 3/31/20 | 86,056 | 84,442 |
| United States Treasury Note/Bond | 2.250% | 3/31/20 | 28,690 | 28,538 |
| United States Treasury Note/Bond | 1.500% | 4/15/20 | 65,363 | 64,230 |
| United States Treasury Note/Bond | 1.125% | 4/30/20 | 13,817 | 13,487 |
| United States Treasury Note/Bond | 1.375% | 4/30/20 | 48,641 | 47,676 |
| United States Treasury Note/Bond | 2.375% | 4/30/20 | 41,995 | 41,831 |
| United States Treasury Note/Bond | 1.500% | 5/15/20 | 56,265 | 55,227 |
| United States Treasury Note/Bond | 3.500% | 5/15/20 | 43,388 | 44,012 |
| United States Treasury Note/Bond | 1.375% | 5/31/20 | 38,415 | 37,605 |
™š
| Short-Term Treasury Index Fund | ||||
| Face | Market | |||
| Maturity | Amount | Value • | ||
| Coupon | Date | ($000) | ($000) | |
| United States Treasury Note/Bond | 1.500% | 5/31/20 | 110,825 | 108,729 |
| United States Treasury Note/Bond | 2.500% | 5/31/20 | 29,000 | 28,941 |
| United States Treasury Note/Bond | 1.500% | 6/15/20 | 59,000 | 57,857 |
| United States Treasury Note/Bond | 1.625% | 6/30/20 | 58,480 | 57,438 |
| United States Treasury Note/Bond | 1.875% | 6/30/20 | 39,000 | 38,488 |
| United States Treasury Note/Bond | 2.500% | 6/30/20 | 34,000 | 33,920 |
| United States Treasury Note/Bond | 1.500% | 7/15/20 | 90,189 | 88,357 |
| United States Treasury Note/Bond | 1.625% | 7/31/20 | 62,119 | 60,964 |
| United States Treasury Note/Bond | 2.000% | 7/31/20 | 48,619 | 48,057 |
| United States Treasury Note/Bond | 2.625% | 7/31/20 | 71,600 | 71,589 |
| United States Treasury Note/Bond | 1.500% | 8/15/20 | 25,261 | 24,720 |
| United States Treasury Note/Bond | 2.625% | 8/15/20 | 55,304 | 55,295 |
| United States Treasury Note/Bond | 8.750% | 8/15/20 | 16,124 | 17,978 |
| United States Treasury Note/Bond | 1.375% | 8/31/20 | 62,467 | 60,944 |
| United States Treasury Note/Bond | 2.125% | 8/31/20 | 35,642 | 35,297 |
| United States Treasury Note/Bond | 2.625% | 8/31/20 | 40,000 | 39,994 |
| United States Treasury Note/Bond | 1.375% | 9/15/20 | 18,652 | 18,189 |
| United States Treasury Note/Bond | 1.375% | 9/30/20 | 56,751 | 55,306 |
| United States Treasury Note/Bond | 2.000% | 9/30/20 | 17,904 | 17,675 |
| United States Treasury Note/Bond | 1.625% | 10/15/20 | 44,883 | 43,943 |
| United States Treasury Note/Bond | 1.375% | 10/31/20 | 38,908 | 37,868 |
| United States Treasury Note/Bond | 1.750% | 10/31/20 | 28,495 | 27,961 |
| United States Treasury Note/Bond | 1.750% | 11/15/20 | 56,000 | 54,915 |
| United States Treasury Note/Bond | 2.625% | 11/15/20 | 60,228 | 60,162 |
| United States Treasury Note/Bond | 1.625% | 11/30/20 | 49,950 | 48,834 |
| United States Treasury Note/Bond | 2.000% | 11/30/20 | 54,623 | 53,837 |
| United States Treasury Note/Bond | 1.875% | 12/15/20 | 71,473 | 70,234 |
| United States Treasury Note/Bond | 1.750% | 12/31/20 | 46,756 | 45,806 |
| United States Treasury Note/Bond | 2.375% | 12/31/20 | 38,773 | 38,524 |
| United States Treasury Note/Bond | 2.000% | 1/15/21 | 93,363 | 91,934 |
| United States Treasury Note/Bond | 1.375% | 1/31/21 | 50,871 | 49,345 |
| United States Treasury Note/Bond | 2.125% | 1/31/21 | 34,346 | 33,906 |
| United States Treasury Note/Bond | 2.250% | 2/15/21 | 66,911 | 66,242 |
| United States Treasury Note/Bond | 3.625% | 2/15/21 | 45,541 | 46,552 |
| United States Treasury Note/Bond | 1.125% | 2/28/21 | 48,036 | 46,250 |
| United States Treasury Note/Bond | 2.000% | 2/28/21 | 31,617 | 31,103 |
| United States Treasury Note/Bond | 2.375% | 3/15/21 | 76,273 | 75,701 |
| United States Treasury Note/Bond | 1.250% | 3/31/21 | 85,022 | 82,020 |
| United States Treasury Note/Bond | 2.250% | 3/31/21 | 19,060 | 18,858 |
| United States Treasury Note/Bond | 2.375% | 4/15/21 | 69,240 | 68,699 |
| United States Treasury Note/Bond | 1.375% | 4/30/21 | 46,431 | 44,878 |
| United States Treasury Note/Bond | 2.250% | 4/30/21 | 37,274 | 36,861 |
| United States Treasury Note/Bond | 2.625% | 5/15/21 | 115,725 | 115,507 |
| United States Treasury Note/Bond | 3.125% | 5/15/21 | 39,192 | 39,627 |
| United States Treasury Note/Bond | 1.375% | 5/31/21 | 36,203 | 34,953 |
| United States Treasury Note/Bond | 2.000% | 5/31/21 | 29,251 | 28,716 |
| United States Treasury Note/Bond | 2.625% | 6/15/21 | 66,250 | 66,125 |
| United States Treasury Note/Bond | 1.125% | 6/30/21 | 22,335 | 21,386 |
| United States Treasury Note/Bond | 2.125% | 6/30/21 | 52,076 | 51,270 |
| United States Treasury Note/Bond | 2.625% | 7/15/21 | 60,000 | 59,878 |
| United States Treasury Note/Bond | 1.125% | 7/31/21 | 25,000 | 23,906 |
| United States Treasury Note/Bond | 2.250% | 7/31/21 | 18,678 | 18,447 |
| United States Treasury Note/Bond | 2.125% | 8/15/21 | 89,119 | 87,657 |
| United States Treasury Note/Bond | 2.750% | 8/15/21 | 75,000 | 75,106 |
ˆ‰
Short-Term Treasury Index Fund
| Face | Market | |||
| Maturity | Amount | Value • | ||
| Coupon | Date | ($000) | ($000) | |
| United States Treasury Note/Bond | 1.125% | 8/31/21 | 64,163 | 61,265 |
| United States Treasury Note/Bond | 2.000% | 8/31/21 | 58,694 | 57,511 |
| Total U. S. Government and Agency Obligations (Cost $4,519,684) | 4,485,388 | |||
| Shares | ||||
| Temporary Cash Investment (0.5%) | ||||
| Money Market Fund (0.5%) | ||||
| 1 Vanguard Market Liquidity Fund | ||||
| (Cost $24,433) | 2.153% | 244,314 | 24,436 | |
| Total Investments (99.8%) (Cost $4,544,117) | 4,509,824 | |||
| Other Assets and Liabilities (0.2%) | ||||
| Other Assets | 264,120 | |||
| Liabilities | (257,102) | |||
| 7,018 | ||||
| Net Assets (100%) | 4,516,842 | |||
| Amount | ||||
| ($000) | ||||
| Statement of Assets and Liabilities | ||||
| Assets | ||||
| Investments in Securities, at Value | ||||
| Unaffiliated Issuers | 4,485,388 | |||
| Affiliated Issuers | 24,436 | |||
| Total Investments in Securities | 4,509,824 | |||
| Investment in Vanguard | 221 | |||
| Receivables for Investment Securities Sold | 244,642 | |||
| Receivables for Accrued Income | 17,077 | |||
| Receivables for Capital Shares Issued | 2,180 | |||
| Total Assets | 4,773,944 | |||
| Liabilities | ||||
| Payables for Investment Securities Purchased | 255,286 | |||
| Payables for Capital Shares Redeemed | 858 | |||
| Payables for Distributions | 558 | |||
| Payables to Vanguard | 400 | |||
| Total Liabilities | 257,102 | |||
| Net Assets | 4,516,842 | |||
–—
Short-Term Treasury Index Fund
| At August 31, 2018, net assets consisted of: | |
| Amount | |
| ($000) | |
| Paid-in Capital | 4,562,542 |
| Undistributed Net Investment Income | 5,133 |
| Accumulated Net Realized Losses | (16,540) |
| Unrealized Appreciation (Depreciation) | (34,293) |
| Net Assets | 4,516,842 |
| ETF Shares—Net Assets | |
| Applicable to 51,423,793 outstanding $.001 par value shares of | |
| beneficial interest (unlimited authorization) | 3,079,921 |
| Net Asset Value Per Share—ETF Shares | $59.89 |
| Admiral Shares—Net Assets | |
| Applicable to 46,551,676 outstanding $.001 par value shares of | |
| beneficial interest (unlimited authorization) | 928,610 |
| Net Asset Value Per Share—Admiral Shares | $19.95 |
| Institutional Shares—Net Assets | |
| Applicable to 20,282,543 outstanding $.001 par value shares of | |
| beneficial interest (unlimited authorization) | 508,311 |
| Net Asset Value Per Share—Institutional Shares | $25.06 |
• See Note A in Notes to Financial Statements.
1 Affiliated money market fund available only to Vanguard funds and certain trusts and accounts managed by Vanguard. Rate shown
is the 7-day yield.
See accompanying Notes, which are an integral part of the Financial Statements.
‚ƒ
Short-Term Treasury Index Fund
Statement of Operations
| Year Ended | |
| August 31, 2018 | |
| ($000) | |
| Investment Income | |
| Income | |
| Interest1 | 53,644 |
| Total Income | 53,644 |
| Expenses | |
| The Vanguard Group—Note B | |
| Investment Advisory Services | 99 |
| Management and Administrative—ETF Shares | 1,204 |
| Management and Administrative—Admiral Shares | 370 |
| Management and Administrative—Institutional Shares | 130 |
| Marketing and Distribution—ETF Shares | 135 |
| Marketing and Distribution—Admiral Shares | 55 |
| Marketing and Distribution—Institutional Shares | 10 |
| Custodian Fees | 19 |
| Auditing Fees | 50 |
| Shareholders’ Reports and Proxy—ETF Shares | 79 |
| Shareholders’ Reports and Proxy—Admiral Shares | 14 |
| Shareholders’ Reports and Proxy—Institutional Shares | — |
| Trustees’ Fees and Expenses | 2 |
| Total Expenses | 2,167 |
| Net Investment Income | 51,477 |
| Realized Net Gain (Loss) on Investment Securities Sold1,2 | (15,243) |
| Change in Unrealized Appreciation (Depreciation) of Investment Securities1 | (31,545) |
| Net Increase (Decrease) in Net Assets Resulting from Operations | 4,689 |
1 Interest income, realized net gain (loss), and change in unrealized appreciation (depreciation) from an affiliated company of the fund
were $182,000, ($3,000), and $3,000, respectively. Purchases and sales are for temporary cash investment purposes.
2 Includes ($390,000) of net gain (loss) resulting from in-kind redemptions; such gain (loss) are not taxable to the fund.
See accompanying Notes, which are an integral part of the Financial Statements.
“”
Short-Term Treasury Index Fund
Statement of Changes in Net Assets
| Year Ended August 31, | ||
| 2018 | 2017 | |
| ($000) | ($000) | |
| Increase (Decrease) in Net Assets | ||
| Operations | ||
| Net Investment Income | 51,477 | 19,015 |
| Realized Net Gain (Loss) | (15,243) | (1,507) |
| Change in Unrealized Appreciation (Depreciation) | (31,545) | (4,467) |
| Net Increase (Decrease) in Net Assets Resulting from Operations | 4,689 | 13,041 |
| Distributions | ||
| Net Investment Income | ||
| ETF Shares | (31,980) | (11,818) |
| Admiral Shares | (10,944) | (4,153) |
| Institutional Shares | (5,259) | (1,921) |
| Realized Capital Gain1 | ||
| ETF Shares | — | (153) |
| Admiral Shares | — | (62) |
| Institutional Shares | — | (28) |
| Total Distributions | (48,183) | (18,135) |
| Capital Share Transactions | ||
| ETF Shares | 1,277,956 | 926,710 |
| Admiral Shares | 431,785 | 144,213 |
| Institutional Shares | 304,396 | 116,737 |
| Net Increase (Decrease) from Capital Share Transactions | 2,014,137 | 1,187,660 |
| Total Increase (Decrease) | 1,970,643 | 1,182,566 |
| Net Assets | ||
| Beginning of Period | 2,546,199 | 1,363,633 |
| End of Period2 | 4,516,842 | 2,546,199 |
1 Includes fiscal 2018 and 2017 short-term gain distributions totaling $0 and $36,000, respectively. Short-term gain distributions are
treated as ordinary income dividends for tax purposes.
2 Net Assets—End of Period includes undistributed (overdistributed) net investment income of $5,133,000 and $1,839,000.
See accompanying Notes, which are an integral part of the Financial Statements.
}‘
Short-Term Treasury Index Fund
Financial Highlights
| ETF Shares | |||||
| For a Share Outstanding | Year Ended August 31, | ||||
| Throughout Each Period | 2018 | 2017 | 2016 | 2015 | 2014 |
| Net Asset Value, Beginning of Period | $60.86 | $61.14 | $61.03 | $60.95 | $60.75 |
| Investment Operations | |||||
| Net Investment Income | .9651 | .6141 | .478 | .351 | .198 |
| Net Realized and Unrealized Gain (Loss) | |||||
| on Investments | (1.062) | (.311) | .118 | .102 | .227 |
| Total from Investment Operations | (.097) | .303 | .596 | .453 | .425 |
| Distributions | |||||
| Dividends from Net Investment Income | (.873) | (.573) | (.462) | (.340) | (.177) |
| Distributions from Realized Capital Gains | — | (.010) | (.024) | (.033) | (.048) |
| Total Distributions | (.873) | (.583) | (.486) | (.373) | (.225) |
| Net Asset Value, End of Period | $59.89 | $60.86 | $61.14 | $61.03 | $60.95 |
| Total Return | -0.15% | 0.50% | 0.98% | 0.75% | 0.70% |
| Ratios/Supplemental Data | |||||
| Net Assets, End of Period (Millions) | $3,080 | $1,832 | $908 | $635 | $497 |
| Ratio of Total Expenses to Average Net Assets | 0.07% | 0.07% | 0.07% | 0.10% | 0.12% |
| Ratio of Net Investment Income to | |||||
| Average Net Assets | 1.61% | 1.01% | 0.80% | 0.59% | 0.34% |
| Portfolio Turnover Rate2 | 67% | 60% | 73% | 64% | 64% |
1 Calculated based on average shares outstanding.
2 Excludes the value of portfolio securities received or delivered as a result of in-kind purchases or redemptions of the fund’s capital
shares, including ETF Creation Units.
See accompanying Notes, which are an integral part of the Financial Statements.
•–
Short-Term Treasury Index Fund
Financial Highlights
| Admiral Shares | |||||
| For a Share Outstanding | Year Ended August 31, | ||||
| Throughout Each Period | 2018 | 2017 | 2016 | 2015 | 2014 |
| Net Asset Value, Beginning of Period | $20.29 | $20.38 | $20.35 | $20.33 | $20.27 |
| Investment Operations | |||||
| Net Investment Income | . 3241 | . 2021 | .158 | .116 | .068 |
| Net Realized and Unrealized Gain (Loss) | |||||
| on Investments | (.358) | (.096) | .040 | .031 | .074 |
| Total from Investment Operations | (.034) | .106 | .198 | .147 | .142 |
| Distributions | |||||
| Dividends from Net Investment Income | (.306) | (.193) | (.160) | (.116) | (.066) |
| Distributions from Realized Capital Gains | — | (. 003) | (. 008) | (. 011) | (. 016) |
| Total Distributions | (.306) | (.196) | (.168) | (.127) | (.082) |
| Net Asset Value, End of Period | $19.95 | $20.29 | $20.38 | $20.35 | $20.33 |
| Total Return2 | -0.16% | 0.53% | 0.98% | 0.72% | 0.70% |
| Ratios/Supplemental Data | |||||
| Net Assets, End of Period (Millions) | $929 | $507 | $364 | $221 | $126 |
| Ratio of Total Expenses to Average Net Assets | 0.07% | 0.07% | 0.07% | 0.10% | 0.12% |
| Ratio of Net Investment Income to | |||||
| Average Net Assets | 1.61% | 1.01% | 0.80% | 0.59% | 0.34% |
| Portfolio Turnover Rate 3 | 67% | 60% | 73% | 64% | 64% |
Signal Shares were renamed Admiral Shares in October 2013.
1 Calculated based on average shares outstanding.
2 Total returns do not include account service fees that may have applied in the periods shown. Fund prospectuses provide information
about any applicable account service fees.
3 Excludes the value of portfolio securities received or delivered as a result of in-kind purchases or redemptions of the fund’s capital
shares, including ETF Creation Units.
See accompanying Notes, which are an integral part of the Financial Statements.
•–
Short-Term Treasury Index Fund
Financial Highlights
| Institutional Shares | |||||
| For a Share Outstanding | Year Ended August 31, | ||||
| Throughout Each Period | 2018 | 2017 | 2016 | 2015 | 2014 |
| Net Asset Value, Beginning of Period | $25.49 | $25.60 | $25.57 | $25.54 | $25.47 |
| Investment Operations | |||||
| Net Investment Income | . 4251 | . 2601 | .207 | .156 | .095 |
| Net Realized and Unrealized Gain (Loss) | |||||
| on Investments | (.467) | (.117) | .042 | .043 | .088 |
| Total from Investment Operations | (.042) | .143 | .249 | .199 | .183 |
| Distributions | |||||
| Dividends from Net Investment Income | (. 388) | (. 249) | (. 209) | (.155) | (. 093) |
| Distributions from Realized Capital Gains | — | (. 004) | (. 010) | (. 014) | (. 020) |
| Total Distributions | (.388) | (.253) | (.219) | (.169) | (.113) |
| Net Asset Value, End of Period | $25.06 | $25.49 | $25.60 | $25.57 | $25.54 |
| Total Return | -0.16% | 0.56% | 0.98% | 0.78% | 0.72% |
| Ratios/Supplemental Data | |||||
| Net Assets, End of Period (Millions) | $508 | $208 | $92 | $67 | $49 |
| Ratio of Total Expenses to Average Net Assets | 0.05% | 0.05% | 0.05% | 0.07% | 0.09% |
| Ratio of Net Investment Income to | |||||
| Average Net Assets | 1.63% | 1.03% | 0.82% | 0.62% | 0.37% |
| Portfolio Turnover Rate2 | 67% | 60% | 73% | 64% | 64% |
1 Calculated based on average shares outstanding.
2 Excludes the value of portfolio securities received or delivered as a result of in-kind purchases or redemptions of the fund’s capital
shares, including ETF Creation Units.
See accompanying Notes, which are an integral part of the Financial Statements.
•–
Short-Term Treasury Index Fund
Notes to Financial Statements
Vanguard Short-Term Treasury Index Fund is registered under the Investment Company Act of 1940 as an open-end investment company, or mutual fund. The fund offers three classes of shares: ETF Shares, Admiral Shares, and Institutional Shares. ETF Shares are listed for trading on Nasdaq; they can be purchased and sold through a broker. Admiral Shares and Institutional Shares are designed for investors who meet certain administrative, service, and account-size criteria. The fund changed its name from Vanguard Short-Term Government Bond Index Fund to Vanguard Short-Term Treasury Index Fund in December 2017.
A. The following significant accounting policies conform to generally accepted accounting principles for U.S. investment companies. The fund consistently follows such policies in preparing its financial statements.
1. Security Valuation: Securities are valued as of the close of trading on the New York Stock Exchange (generally 4 p.m., Eastern time) on the valuation date. Bonds and temporary cash investments are valued using the latest bid prices or using valuations based on a matrix system (which considers such factors as security prices, yields, maturities, and ratings), both as furnished by independent pricing services. Investments in Vanguard Market Liquidity Fund are valued at that fund’s net asset value. Securities for which market quotations are not readily available, or whose values have been affected by events occurring before the fund’s pricing time but after the close of the securities’ primary markets, are valued by methods deemed by the board of trustees to represent fair value.
2. Federal Income Taxes: The fund intends to continue to qualify as a regulated investment company and distribute all of its taxable income. Management has analyzed the fund’s tax positions taken for all open federal income tax years (August 31, 2015–2018), and has concluded that no provision for federal income tax is required in the fund’s financial statements.
3. Distributions: Distributions to shareholders are recorded on the ex-dividend date. Distributions are determined on a tax basis and may differ from net investment income and realized capital gains for financial reporting purposes.
4. Credit Facility: The fund and certain other funds managed by The Vanguard Group (“Vanguard”) participate in a $3.1 billion committed credit facility provided by a syndicate of lenders pursuant to a credit agreement that may be renewed annually; each fund is individually liable for its borrowings, if any, under the credit facility. Borrowings may be utilized for temporary and emergency purposes, and are subject to the fund’s regulatory and contractual borrowing restrictions. The participating funds are charged administrative fees and an annual commitment fee of 0.10% of the undrawn amount of the facility; these fees are allocated to the funds based on a method approved by the fund’s board of trustees and included in Management and Administrative expenses on the fund’s Statement of Operations. Any borrowings under this facility bear interest at a rate based upon the higher of the one-month London Interbank Offered Rate, federal funds effective rate, or overnight bank funding rate plus an agreed-upon spread.
The fund had no borrowings outstanding at August 31, 2018, or at any time during the period then ended.
5. Other: Interest income includes income distributions received from Vanguard Market Liquidity Fund and is accrued daily. Premiums and discounts on debt securities purchased are amortized and accreted, respectively, to interest income over the lives of the respective securities. Security transactions are accounted for on the date securities are bought or sold. Costs used to determine realized gains (losses) on the sale of investment securities are those of the specific securities sold.
£¤
Short-Term Treasury Index Fund
Each class of shares has equal rights as to assets and earnings, except that each class separately bears certain class-specific expenses related to maintenance of shareholder accounts (included in Management and Administrative expenses), shareholder reporting, and the proxy. Marketing and distribution expenses are allocated to each class of shares based on a method approved by the board of trustees. Income, other non-class-specific expenses, and gains and losses on investments are allocated to each class of shares based on its relative net assets.
B. In accordance with the terms of a Funds’ Service Agreement (the “FSA”) between Vanguard and the fund, Vanguard furnishes to the fund investment advisory, corporate management, administrative, marketing, and distribution services at Vanguard’s cost of operations (as defined by the FSA). These costs of operations are allocated to the fund based on methods and guidelines approved by the board of trustees. Vanguard does not require reimbursement in the current period for certain costs of operations (such as deferred compensation/benefits and risk/insurance costs); the fund’s liability for these costs of operations is included in Payables to Vanguard on the Statement of Assets and Liabilities. All other costs of operations payable to Vanguard are generally settled twice a month.
Upon the request of Vanguard, the fund may invest up to 0.40% of its net assets as capital in Vanguard. At August 31, 2018, the fund had contributed to Vanguard capital in the amount of $221,000, representing 0.00% of the fund’s net assets and 0.09% of Vanguard’s capitalization. The fund’s trustees and officers are also directors and employees, respectively, of Vanguard.
C. Various inputs may be used to determine the value of the fund’s investments. These inputs are summarized in three broad levels for financial statement purposes. The inputs or methodologies used to value securities are not necessarily an indication of the risk associated with investing in those securities.
Level 1—Quoted prices in active markets for identical securities.
Level 2—Other significant observable inputs (including quoted prices for similar securities, interest rates, prepayment speeds, credit risk, etc.).
Level 3—Significant unobservable inputs (including the fund’s own assumptions used to determine
the fair value of investments). Any investments valued with significant unobservable inputs are
noted on the Statement of Net Assets.
The following table summarizes the market value of the fund’s investments as of August 31, 2018, based on the inputs used to value them:
| Level 1 | Level 2 | Level 3 | |
| Investments | ($000) | ($000) | ($000) |
| U.S. Government and Agency Obligations | — | 4,485,388 | — |
| Temporary Cash Investments | 24,436 | — | — |
| Total | 24,436 | 4,485,388 | — |
ŸŸ
Short-Term Treasury Index Fund
D. Permanent differences are reclassified among capital accounts in the financial statements to reflect their tax character. These reclassifications have no effect on net assets or net asset value per share. As of period end, the following permanent differences primarily attributable to the accounting for in-kind redemptions were reclassified to the following accounts:
| Amount | |
| ($000) | |
| Paid-in capital | (390) |
| Undistributed (Overdistributed) net investment income | — |
| Accumulated net realized gains (losses) | 390 |
Temporary differences between book-basis and tax-basis components of accumulated net earnings (losses) arise when certain items of income, gain, or loss are recognized in different periods for financial statement and tax purposes; these differences will reverse at some time in the future. The differences are primarily related to the tax deferral of losses on wash sales and payables for distributions. As of period end, the tax components of accumulated net earnings (losses) are detailed in the table as follows:
| Amount | |
| ($000) | |
| Undistributed ordinary income | 5,944 |
| Undistributed long-term gains | — |
| Capital loss carryforwards (non-expiring) | (16,540) |
| Net unrealized gains (losses) | (34,293) |
As of August 31, 2018, gross unrealized appreciation and depreciation for investments and derivatives based on cost for U.S. federal income tax purposes were as follows:
| Amount | |
| ($000) | |
| Tax cost | 4,544,117 |
| Gross unrealized appreciation | 255 |
| Gross unrealized depreciation | (34,548) |
| Net unrealized appreciation (depreciation) | (34,293) |
E. During the year ended August 31, 2018, the fund purchased $4,583,796,000 of investment securities and sold $2,586,192,000 of investment securities, other than temporary cash investments. Purchases and sales include $1,695,195,000 and $428,762,000, respectively, in connection with in-kind purchases and redemptions of the fund’s capital shares.
Short-Term Treasury Index Fund
F. Capital share transactions for each class of shares were:
| Year Ended August 31, | ||||
| 2018 | 2017 | |||
| Amount | Shares | Amount | Shares | |
| ($000) | (000) | ($000) | (000) | |
| ETF Shares | ||||
| Issued | 1,710,741 | 28,551 | 969,314 | 15,950 |
| Issued in Lieu of Cash Distributions | — | — | — | — |
| Redeemed | (432,785) | (7,225) | (42,604) | (700) |
| Net Increase (Decrease)—ETF Shares | 1,277,956 | 21,326 | 926,710 | 15,250 |
| Admiral Shares | ||||
| Issued | 715,770 | 35,747 | 338,355 | 16,679 |
| Issued in Lieu of Cash Distributions | 8,265 | 413 | 3,318 | 164 |
| Redeemed | (292,250) | (14,587) | (197,460) | (9,736) |
| Net Increase (Decrease)—Admiral Shares | 431,785 | 21,573 | 144,213 | 7,107 |
| Institutional Shares | ||||
| Issued | 377,989 | 15,046 | 149,457 | 5,851 |
| Issued in Lieu of Cash Distributions | 4,231 | 169 | 1,182 | 46 |
| Redeemed | (77,824) | (3,081) | (33,902) | (1,331) |
| Net Increase (Decrease)—Institutional Shares | 304,396 | 12,134 | 116,737 | 4,566 |
G. Management has determined that no events or transactions occurred subsequent to August 31, 2018, that would require recognition or disclosure in these financial statements.
‘’
Intermediate-Term Treasury Index Fund
Fund Profile
As of August 31, 2018
| Share-Class Characteristics | |||
| ETF | Admiral Institutional | ||
| Shares | Shares | Shares | |
| Ticker Symbol | VGIT | VSIGX | VIIGX |
| Expense Ratio1 | 0.07% | 0.07% | 0.05% |
| 30-Day SEC Yield | 2.73% | 2.73% | 2.75% |
| Financial Attributes | |||
| Bloomberg | |||
| Barclays | Bloomberg | ||
| U.S. | Barclays | ||
| Treasury | U.S. | ||
| 3–10 Year | Aggregate | ||
| Fund | Bond Index | FA Index | |
| Number of Bonds | 115 | 113 | 10,038 |
| Yield to Maturity | |||
| (before expenses) | 2.8% | 2.8% | 3.3% |
| Average Coupon | 2.2% | 2.2% | 3.1% |
| Average Duration | 5.2 years | 5.2 years | 6.1 years |
| Average Effective | |||
| Maturity | 5.6 years | 5.6 years | 8.4 years |
| Short-Term | |||
| Reserves | 0.5% | — | — |
| Sector Diversification (% of portfolio) | |
| U.S. Treasury | 100.0% |
The agency and mortgage-backed securities sectors may include
issues from government-sponsored enterprises; such issues are
generally not backed by the full faith and credit of the U.S.
government.
| Volatility Measures | ||
| Spliced | ||
| Bloomberg | Bloomberg | |
| Barclays U.S. | Barclays U.S. | |
| Treasury 3–10 | Aggregate | |
| Year Index | FA Index | |
| R-Squared | 1.00 | 0.85 |
| Beta | 1.02 | 1.06 |
These measures show the degree and timing of the fund’s
fluctuations compared with the indexes over 36 months.
| Distribution by Effective Maturity | |
| (% of portfolio) | |
| 1 - 3 Years | 0.1% |
| 3 - 5 Years | 48.1 |
| 5 - 10 Years | 51.8 |
| Distribution by Credit Quality (% of portfolio) | |
| U.S. Government | 100.0% |
Credit-quality ratings are obtained from Barclays and are from
Moody's, Fitch, and S&P. When ratings from all three agencies are
used, the median rating is shown. When ratings from two of the
agencies are used, the lower rating for each issue is shown. "Not
Rated" is used to classify securities for which a rating is not
available. For more information about these ratings, see the
Glossary entry for Credit Quality.
Investment Focus
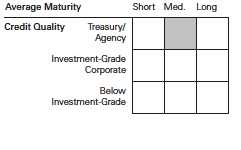
1 The expense ratios shown are from the prospectus dated December 21, 2017, and represent estimated costs for the current fiscal year. For the
fiscal year ended August 31, 2018, the expense ratios were 0.07% for ETF Shares, 0.07% for Admiral Shares, and 0.05% for Institutional Shares.
25
Intermediate-Term Treasury Index Fund
Performance Summary
All of the returns in this report represent past performance, which is not a guarantee of future results that may be achieved by the fund. (Current performance may be lower or higher than the performance data cited. For performance data current to the most recent month-end, visit our website at vanguard.com/performance.) Note, too, that both investment returns and principal value can fluctuate widely, so an investor’s shares, when sold, could be worth more or less than their original cost. The returns shown do not reflect taxes that a shareholder would pay on fund distributions or on the sale of fund shares.
Cumulative Performance: November 19, 2009, Through August 31, 2018
Initial Investment of $10,000
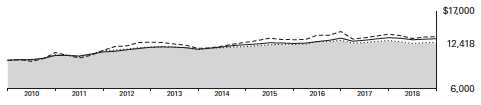
| Average Annual Total Returns | |||||
| Periods Ended August 31, 2018 | |||||
| Since | Final Value | ||||
| One | Five | Inception | of a $10,000 | ||
| Year | Years | (11/19/2009) | Investment | ||
| Intermediate-Term Treasury Index Fund | |||||
| ETF Shares Net Asset Value | -2.21% | 1.60% | 2.50% | $12,418 | |
| Intermediate-Term Treasury Index Fund | |||||
| ETF Shares Market Price | -2.23 | 1.60 | 2.50 | 12,420 | |
| Spliced Bloomberg Barclays U.S. | |||||
| • • • • • • •• | Treasury 3–10 Year Index | -2.08 | 1.68 | 2.60 | 12,532 |
| – – – – | General U.S. Treasury Funds Average | -2.66 | 2.69 | 3.34 | 13,346 |
| Spliced Bloomberg Barclays U.S. | |||||
| Aggregate Float Adjusted Index | -1.09 | 2.47 | 3.09 | 13,062 | |
For a benchmark description, see the Glossary.
General U.S. Treasury Funds Average: Derived from data provided by Lipper, a Thomson Reuters Company.
"Since Inception" performance is calculated from the ETF Shares’ inception date for both the fund and its comparative standards.
See Financial Highlights for dividend and capital gains information.
26
Intermediate-Term Treasury Index Fund
| Average Annual Total Returns | ||||
| Periods Ended August 31, 2018 | ||||
| Since | Final Value | |||
| One | Five | Inception | of a $10,000 | |
| Year | Years | (8/4/2010) | Investment | |
| Intermediate-Term Treasury Index Fund | ||||
| Admiral Shares | -2.24% | 1.60% | 2.03% | $11,759 |
| Spliced Bloomberg Barclays U.S. Treasury | ||||
| 3–10 Year Index | -2.08 | 1.68 | 2.13 | 11,857 |
| Bloomberg Barclays U.S. Aggregate Float | ||||
| Adjusted Index | -1.09 | 2.47 | 2.70 | 12,395 |
| "Since Inception" performance is calculated from the Admiral Shares’ inception date for both the fund and its comparative standards. | ||||
| Since | Final Value | |||
| One | Five | Inception | of a $5,000,000 | |
| Year | Years | (3/19/2010) | Investment | |
| Intermediate-Term Treasury Index Fund | ||||
| Institutional Shares | -2.16% | 1.63% | 2.63% | $6,226,670 |
| Spliced Bloomberg Barclays U.S. Treasury | ||||
| 3–10 Year Index | -2.08 | 1.68 | 2.71 | 6,267,482 |
| Bloomberg Barclays U.S. Aggregate Float | ||||
| Adjusted Index | -1.09 | 2.47 | 3.06 | 6,452,884 |
| "Since Inception" performance is calculated from the Institutional Shares’ inception date for both the fund and its comparative standards. | ||||
| Cumulative Returns of ETF Shares: November 19, 2009, Through August 31, 2018 | |||
| Since | |||
| One | Five | Inception | |
| Year | Years | (11/19/2009) | |
| Intermediate-Term Treasury Index Fund ETF Shares | |||
| Market Price | -2.23% | 8.25% | 24.20% |
| Intermediate-Term Treasury Index Fund ETF Shares | |||
| Net Asset Value | -2.21 | 8.28 | 24.18 |
| Spliced Bloomberg Barclays U.S. Treasury 3–10 Year | |||
| Index | -2.08 | 8.70 | 25.32 |
| "Since Inception" performance is calculated from the ETF Shares’ inception date for both the fund and its comparative standards. | |||
27
Intermediate-Term Treasury Index Fund
| Fiscal-Year Total Returns (%): November 19, 2009, Through August 31, 2018 | ||
| Spliced | ||
| Bloomberg | ||
| Barclays U.S. | ||
| Treasury 3–10 Year | ||
| ETF Shares Net Asset Value | Index | |
| Fiscal Year | Total Returns | Total Returns |
| 2010 | 7.65% | 7.76% |
| 2011 | 5.30 | 5.53 |
| 2012 | 4.50 | 4.51 |
| 2013 | -3.18 | -2.99 |
| 2014 | 3.54 | 3.54 |
| 2015 | 2.67 | 2.86 |
| 2016 | 4.37 | 4.47 |
| 2017 | -0.21 | -0.22 |
| 2018 | -2.21 | -2.08 |
Average Annual Total Returns: Periods Ended June 30, 2018
This table presents returns through the latest calendar quarter—rather than through the end of the fiscal period.
Securities and Exchange Commission rules require that we provide this information.
| Since Inception | ||||||
| Inception Date | One Year | Five Years | Income | Capital | Total | |
| ETF Shares | 11/19/2009 | |||||
| Market Price | -1.36% | 1.37% | 2.50% | |||
| Net Asset Value | -1.35 | 1.36 | 2.50 | |||
| Admiral Shares | 8/4/2010 | -1.34 | 1.37 | 1.67% | 0.35% | 2.02 |
| Institutional Shares | 3/19/2010 | -1.35 | 1.39 | 1.73 | 0.90 | 2.63 |
28
Intermediate-Term Treasury Index Fund
Financial Statements
Statement of Net Assets
As of August 31, 2018
The fund reports a complete list of its holdings in regulatory filings four times in each fiscal year, at the quarter-ends. For the second and fourth fiscal quarters, the lists appear in the fund’s semiannual and annual reports to shareholders. For the first and third fiscal quarters, the fund files the lists with the Securities and Exchange Commission on Form N-Q. Shareholders can look up the fund’s Forms N-Q on the SEC’s website at sec.gov. Forms N-Q may also be reviewed and copied at the SEC’s Public Reference Room (see the back cover of this report for further information).
| Face | Market | |||
| Maturity | Amount | Value • | ||
| Coupon | Date | ($000) | ($000) | |
| U.S. Government and Agency Obligations (99.5%) | ||||
| U.S. Government Securities (99.5%) | ||||
| United States Treasury Note/Bond | 8.125% | 5/15/21 | 1,340 | 1,528 |
| United States Treasury Note/Bond | 8.125% | 8/15/21 | 2,945 | 3,395 |
| United States Treasury Note/Bond | 1.125% | 9/30/21 | 38,184 | 36,418 |
| United States Treasury Note/Bond | 2.125% | 9/30/21 | 77,770 | 76,433 |
| United States Treasury Note/Bond | 1.250% | 10/31/21 | 10,205 | 9,755 |
| United States Treasury Note/Bond | 2.000% | 10/31/21 | 94,535 | 92,497 |
| United States Treasury Note/Bond | 2.000% | 11/15/21 | 21,608 | 21,139 |
| United States Treasury Note/Bond | 8.000% | 11/15/21 | 9,340 | 10,843 |
| United States Treasury Note/Bond | 1.750% | 11/30/21 | 38,147 | 37,014 |
| United States Treasury Note/Bond | 1.875% | 11/30/21 | 26,960 | 26,261 |
| United States Treasury Note/Bond | 2.000% | 12/31/21 | 35,385 | 34,578 |
| United States Treasury Note/Bond | 2.125% | 12/31/21 | 47,300 | 46,413 |
| United States Treasury Note/Bond | 1.500% | 1/31/22 | 27,525 | 26,433 |
| United States Treasury Note/Bond | 1.875% | 1/31/22 | 20,787 | 20,215 |
| United States Treasury Note/Bond | 2.000% | 2/15/22 | 31,394 | 30,648 |
| United States Treasury Note/Bond | 1.750% | 2/28/22 | 16,748 | 16,206 |
| United States Treasury Note/Bond | 1.875% | 2/28/22 | 28,224 | 27,426 |
| United States Treasury Note/Bond | 1.750% | 3/31/22 | 19,037 | 18,406 |
| United States Treasury Note/Bond | 1.875% | 3/31/22 | 75,663 | 73,464 |
| United States Treasury Note/Bond | 1.750% | 4/30/22 | 11,267 | 10,885 |
| United States Treasury Note/Bond | 1.875% | 4/30/22 | 44,274 | 42,960 |
| United States Treasury Note/Bond | 1.750% | 5/15/22 | 5,000 | 4,828 |
| United States Treasury Note/Bond | 1.750% | 5/31/22 | 75,831 | 73,177 |
| United States Treasury Note/Bond | 1.875% | 5/31/22 | 11,375 | 11,030 |
| United States Treasury Note/Bond | 1.750% | 6/30/22 | 21,964 | 21,182 |
| United States Treasury Note/Bond | 2.125% | 6/30/22 | 17,359 | 16,974 |
| United States Treasury Note/Bond | 1.875% | 7/31/22 | 28,225 | 27,325 |
| United States Treasury Note/Bond | 2.000% | 7/31/22 | 72,665 | 70,689 |
| United States Treasury Note/Bond | 1.625% | 8/15/22 | 7,552 | 7,239 |
| United States Treasury Note/Bond | 7.250% | 8/15/22 | 975 | 1,139 |
| United States Treasury Note/Bond | 1.625% | 8/31/22 | 30,990 | 29,692 |
| United States Treasury Note/Bond | 1.875% | 8/31/22 | 18,582 | 17,975 |
| United States Treasury Note/Bond | 1.750% | 9/30/22 | 22,750 | 21,883 |
| United States Treasury Note/Bond | 1.875% | 9/30/22 | 29,652 | 28,665 |
| United States Treasury Note/Bond | 1.875% | 10/31/22 | 9,810 | 9,476 |
| United States Treasury Note/Bond | 2.000% | 10/31/22 | 30,070 | 29,196 |
™š
| Intermediate-Term Treasury Index Fund | ||||
| Face | Market | |||
| Maturity | Amount | Value • | ||
| Coupon | Date | ($000) | ($000) | |
| United States Treasury Note/Bond | 1.625% | 11/15/22 | 79,856 | 76,312 |
| United States Treasury Note/Bond | 7.625% | 11/15/22 | 2,075 | 2,475 |
| United States Treasury Note/Bond | 2.000% | 11/30/22 | 102,504 | 99,461 |
| United States Treasury Note/Bond | 2.125% | 12/31/22 | 46,348 | 45,175 |
| United States Treasury Note/Bond | 1.750% | 1/31/23 | 53,066 | 50,886 |
| United States Treasury Note/Bond | 2.375% | 1/31/23 | 33,680 | 33,164 |
| United States Treasury Note/Bond | 2.000% | 2/15/23 | 40,368 | 39,113 |
| United States Treasury Note/Bond | 7.125% | 2/15/23 | 2,968 | 3,509 |
| United States Treasury Note/Bond | 1.500% | 2/28/23 | 67,853 | 64,302 |
| United States Treasury Note/Bond | 2.625% | 2/28/23 | 48,500 | 48,265 |
| United States Treasury Note/Bond | 1.500% | 3/31/23 | 39,620 | 37,509 |
| United States Treasury Note/Bond | 2.500% | 3/31/23 | 24,000 | 23,745 |
| United States Treasury Note/Bond | 1.625% | 4/30/23 | 41,430 | 39,410 |
| United States Treasury Note/Bond | 2.750% | 4/30/23 | 20,000 | 20,000 |
| United States Treasury Note/Bond | 1.750% | 5/15/23 | 66,015 | 63,127 |
| United States Treasury Note/Bond | 1.625% | 5/31/23 | 27,205 | 25,853 |
| United States Treasury Note/Bond | 2.750% | 5/31/23 | 33,685 | 33,695 |
| United States Treasury Note/Bond | 1.375% | 6/30/23 | 80,975 | 75,977 |
| United States Treasury Note/Bond | 2.625% | 6/30/23 | 25,960 | 25,814 |
| United States Treasury Note/Bond | 1.250% | 7/31/23 | 16,725 | 15,578 |
| United States Treasury Note/Bond | 2.750% | 7/31/23 | 38,575 | 38,575 |
| United States Treasury Note/Bond | 2.500% | 8/15/23 | 24,120 | 23,841 |
| United States Treasury Note/Bond | 6.250% | 8/15/23 | 5,625 | 6,532 |
| United States Treasury Note/Bond | 1.375% | 8/31/23 | 26,475 | 24,779 |
| United States Treasury Note/Bond | 2.750% | 8/31/23 | 45,000 | 45,007 |
| United States Treasury Note/Bond | 1.375% | 9/30/23 | 20,600 | 19,258 |
| United States Treasury Note/Bond | 1.625% | 10/31/23 | 55,095 | 52,099 |
| United States Treasury Note/Bond | 2.750% | 11/15/23 | 40,765 | 40,746 |
| United States Treasury Note/Bond | 2.125% | 11/30/23 | 23,600 | 22,866 |
| United States Treasury Note/Bond | 2.250% | 12/31/23 | 22,329 | 21,757 |
| United States Treasury Note/Bond | 2.250% | 1/31/24 | 11,598 | 11,294 |
| United States Treasury Note/Bond | 2.750% | 2/15/24 | 114,115 | 113,991 |
| United States Treasury Note/Bond | 2.125% | 2/29/24 | 43,199 | 41,782 |
| United States Treasury Note/Bond | 2.125% | 3/31/24 | 20,113 | 19,434 |
| United States Treasury Note/Bond | 2.000% | 4/30/24 | 10,515 | 10,085 |
| United States Treasury Note/Bond | 2.500% | 5/15/24 | 92,257 | 90,873 |
| United States Treasury Note/Bond | 2.000% | 5/31/24 | 30,709 | 29,433 |
| United States Treasury Note/Bond | 2.000% | 6/30/24 | 30,122 | 28,851 |
| United States Treasury Note/Bond | 2.125% | 7/31/24 | 41,248 | 39,753 |
| United States Treasury Note/Bond | 2.375% | 8/15/24 | 90,612 | 88,531 |
| United States Treasury Note/Bond | 1.875% | 8/31/24 | 28,985 | 27,527 |
| United States Treasury Note/Bond | 2.125% | 9/30/24 | 22,926 | 22,070 |
| United States Treasury Note/Bond | 2.250% | 10/31/24 | 30,430 | 29,493 |
| United States Treasury Note/Bond | 2.250% | 11/15/24 | 47,776 | 46,283 |
| United States Treasury Note/Bond | 7.500% | 11/15/24 | 340 | 431 |
| United States Treasury Note/Bond | 2.125% | 11/30/24 | 75,275 | 72,370 |
| United States Treasury Note/Bond | 2.250% | 12/31/24 | 29,130 | 28,201 |
| United States Treasury Note/Bond | 2.500% | 1/31/25 | 26,550 | 26,077 |
| United States Treasury Note/Bond | 2.000% | 2/15/25 | 97,383 | 92,727 |
| United States Treasury Note/Bond | 7.625% | 2/15/25 | 300 | 385 |
| United States Treasury Note/Bond | 2.750% | 2/28/25 | 28,333 | 28,245 |
| United States Treasury Note/Bond | 2.625% | 3/31/25 | 21,850 | 21,608 |
| United States Treasury Note/Bond | 2.875% | 4/30/25 | 22,000 | 22,086 |
| United States Treasury Note/Bond | 2.125% | 5/15/25 | 83,360 | 79,856 |
ˆ‰
| Intermediate-Term Treasury Index Fund | ||||
| Face | Market | |||
| Maturity | Amount | Value • | ||
| Coupon | Date | ($000) | ($000) | |
| United States Treasury Note/Bond | 2.875% | 5/31/25 | 29,500 | 29,601 |
| United States Treasury Note/Bond | 2.750% | 6/30/25 | 25,000 | 24,894 |
| United States Treasury Note/Bond | 2.875% | 7/31/25 | 30,625 | 30,735 |
| United States Treasury Note/Bond | 2.000% | 8/15/25 | 45,450 | 43,092 |
| United States Treasury Note/Bond | 6.875% | 8/15/25 | 4,248 | 5,334 |
| United States Treasury Note/Bond | 2.750% | 8/31/25 | 40,000 | 39,825 |
| United States Treasury Note/Bond | 2.250% | 11/15/25 | 80,520 | 77,513 |
| United States Treasury Note/Bond | 1.625% | 2/15/26 | 79,870 | 73,418 |
| United States Treasury Note/Bond | 6.000% | 2/15/26 | 1,295 | 1,572 |
| United States Treasury Note/Bond | 1.625% | 5/15/26 | 86,295 | 79,108 |
| United States Treasury Note/Bond | 1.500% | 8/15/26 | 68,392 | 61,906 |
| United States Treasury Note/Bond | 2.000% | 11/15/26 | 83,410 | 78,275 |
| United States Treasury Note/Bond | 6.500% | 11/15/26 | 4,000 | 5,070 |
| United States Treasury Note/Bond | 2.250% | 2/15/27 | 67,335 | 64,316 |
| United States Treasury Note/Bond | 6.625% | 2/15/27 | 3,015 | 3,871 |
| United States Treasury Note/Bond | 2.375% | 5/15/27 | 86,960 | 83,781 |
| United States Treasury Note/Bond | 2.250% | 8/15/27 | 67,920 | 64,641 |
| United States Treasury Note/Bond | 6.375% | 8/15/27 | 3,000 | 3,831 |
| United States Treasury Note/Bond | 2.250% | 11/15/27 | 73,465 | 69,826 |
| United States Treasury Note/Bond | 6.125% | 11/15/27 | 7,000 | 8,835 |
| United States Treasury Note/Bond | 2.750% | 2/15/28 | 66,230 | 65,568 |
| United States Treasury Note/Bond | 2.875% | 5/15/28 | 71,157 | 71,157 |
| United States Treasury Note/Bond | 2.875% | 8/15/28 | 40,000 | 40,031 |
| United States Treasury Note/Bond | 5.500% | 8/15/28 | 672 | 824 |
| Total U.S. Government and Agency Obligations (Cost $4,243,991) | 4,150,627 | |||
| Shares | ||||
| Temporary Cash Investment (0.5%) | ||||
| Money Market Fund (0.5%) | ||||
| 1 Vanguard Market Liquidity Fund | ||||
| (Cost $20,358) | 2.153% | 203,565 | 20,360 | |
| Total Investments (100.0%) (Cost $4,264,349) | 4,170,987 | |||
| Amount | ||||
| ($000) | ||||
| Other Assets and Liabilities (0.0%) | ||||
| Other Assets | ||||
| Investment in Vanguard | 211 | |||
| Receivables for Investment Securities Sold | 111,089 | |||
| Receivables for Accrued Income | 17,901 | |||
| Receivables for Capital Shares Issued | 1,055 | |||
| Other Assets | 1 | |||
| Total Other Assets | 130,257 | |||
| Liabilities | ||||
| Payables for Investment Securities Purchased | (125,113) | |||
| Payables for Capital Shares Redeemed | (2,288) | |||
| Payables for Distributions | (417) | |||
| Payables to Vanguard | (419) | |||
| Total Liabilities | (128,237) | |||
| Net Assets (100%) | 4,173,007 | |||
–—
Intermediate-Term Treasury Index Fund
| At August 31, 2018, net assets consisted of: | |
| Amount | |
| ($000) | |
| Paid-in Capital | 4,284,853 |
| Undistributed Net Investment Income | 5,130 |
| Accumulated Net Realized Losses | (23,614) |
| Unrealized Appreciation (Depreciation) | (93,362) |
| Net Assets | 4,173,007 |
| ETF Shares—Net Assets | |
| Applicable to 42,758,077 outstanding $.001 par value shares of | |
| beneficial interest (unlimited authorization) | 2,679,624 |
| Net Asset Value Per Share—ETF Shares | $62.67 |
| Admiral Shares—Net Assets | |
| Applicable to 52,230,952 outstanding $.001 par value shares of | |
| beneficial interest (unlimited authorization) | 1,103,745 |
| Net Asset Value Per Share—Admiral Shares | $21.13 |
| Institutional Shares—Net Assets | |
| Applicable to 14,857,290 outstanding $.001 par value shares of | |
| beneficial interest (unlimited authorization) | 389,638 |
| Net Asset Value Per Share—Institutional Shares | $26.23 |
• See Note A in Notes to Financial Statements.
1 Affiliated money market fund available only to Vanguard funds and certain trusts and accounts managed by Vanguard. Rate shown
is the 7-day yield.
See accompanying Notes, which are an integral part of the Financial Statements.
ƒ„
Intermediate-Term Treasury Index Fund
Statement of Operations
| Year Ended | |
| August 31, 2018 | |
| ($000) | |
| Investment Income | |
| Income | |
| Interest1 | 62,859 |
| Total Income | 62,859 |
| Expenses | |
| The Vanguard Group—Note B | |
| Investment Advisory Services | 97 |
| Management and Administrative—ETF Shares | 831 |
| Management and Administrative—Admiral Shares | 532 |
| Management and Administrative—Institutional Shares | 131 |
| Marketing and Distribution—ETF Shares | 113 |
| Marketing and Distribution—Admiral Shares | 78 |
| Marketing and Distribution—Institutional Shares | 10 |
| Custodian Fees | 11 |
| Auditing Fees | 50 |
| Shareholders’ Reports and Proxy—ETF Shares | 215 |
| Shareholders’ Reports and Proxy—Admiral Shares | 21 |
| Shareholders’ Reports and Proxy—Institutional Shares | 1 |
| Trustees’ Fees and Expenses | 2 |
| Total Expenses | 2,092 |
| Net Investment Income | 60,767 |
| Realized Net Gain (Loss) on Investment Securities Sold1,2 | (20,311) |
| Change in Unrealized Appreciation (Depreciation) of Investment Securities1 | (92,277) |
| Net Increase (Decrease) in Net Assets Resulting from Operations | (51,821) |
1 Interest income, realized net gain (loss), and change in unrealized appreciation (depreciation) from an affiliated company of the fund
were $83,000, $1,000, and $2,000, respectively. Purchases and sales are for temporary cash investment purposes.
2 Includes $347,000 of net gain (loss) resulting from in-kind redemptions; such gain (loss) is not taxable to the fund.
See accompanying Notes, which are an integral part of the Financial Statements.
’’
Intermediate-Term Treasury Index Fund
Statement of Changes in Net Assets
| Year Ended August 31, | ||
| 2018 | 2017 | |
| ($000) | ($000) | |
| Increase (Decrease) in Net Assets | ||
| Operations | ||
| Net Investment Income | 60,767 | 34,849 |
| Realized Net Gain (Loss) | (20,311) | (148) |
| Change in Unrealized Appreciation (Depreciation) | (92,277) | (32,895) |
| Net Increase (Decrease) in Net Assets Resulting from Operations | (51,821) | 1,806 |
| Distributions | ||
| Net Investment Income | ||
| ETF Shares | (32,737) | (16,506) |
| Admiral Shares | (18,863) | (11,627) |
| Institutional Shares | (6,253) | (5,744) |
| Realized Capital Gain1 | ||
| ETF Shares | — | (1,196) |
| Admiral Shares | — | (889) |
| Institutional Shares | — | (450) |
| Total Distributions | (57,853) | (36,412) |
| Capital Share Transactions | ||
| ETF Shares | 1,410,372 | 435,675 |
| Admiral Shares | 267,460 | 176,741 |
| Institutional Shares | 66,033 | 70,683 |
| Net Increase (Decrease) from Capital Share Transactions | 1,743,865 | 683,099 |
| Total Increase (Decrease) | 1,634,191 | 648,493 |
| Net Assets | ||
| Beginning of Period | 2,538,816 | 1,890,323 |
| End of Period2 | 4,173,007 | 2,538,816 |
1 Includes fiscal 2018 and 2017 short-term gain distributions totaling $0 and $418,000, respectively. Short-term gain distributions are
treated as ordinary income dividends for tax purposes.
2 Net Assets—End of Period includes undistributed (overdistributed) net investment income of $5,130,000 and $2,216,000.
See accompanying Notes, which are an integral part of the Financial Statements.
}‘
Intermediate-Term Treasury Index Fund
Financial Highlights
| ETF Shares | |||||
| For a Share Outstanding | Year Ended August 31, | ||||
| Throughout Each Period | 2018 | 2017 | 2016 | 2015 | 2014 |
| Net Asset Value, Beginning of Period | $65.29 | $66.54 | $64.80 | $64.14 | $62.96 |
| Investment Operations | |||||
| Net Investment Income | 1.2501 | 1.0431 | 1.035 | 1.054 | .920 |
| Net Realized and Unrealized Gain (Loss) | |||||
| on Investments | (2.691) | (1.201) | 1.770 | .649 | 1.292 |
| Total from Investment Operations | (1.441) | (.158) | 2.805 | 1.703 | 2.212 |
| Distributions | |||||
| Dividends from Net Investment Income | (1.179) | (1.011) | (1.038) | (1.043) | (.843) |
| Distributions from Realized Capital Gains | — | (.081) | (.027) | — | (.189) |
| Total Distributions | (1.179) | (1.092) | (1.065) | (1.043) | (1.032) |
| Net Asset Value, End of Period | $62.67 | $65.29 | $66.54 | $64.80 | $64.14 |
| Total Return | -2.21% | -0.21% | 4.37% | 2.67% | 3.54% |
| Ratios/Supplemental Data | |||||
| Net Assets, End of Period (Millions) | $2,680 | $1,329 | $908 | $360 | $164 |
| Ratio of Total Expenses to Average Net Assets | 0.07% | 0.07% | 0.07% | 0.10% | 0.12% |
| Ratio of Net Investment Income to | |||||
| Average Net Assets | 1.97% | 1.61% | 1.61% | 1.67% | 1.50% |
| Portfolio Turnover Rate2 | 31% | 32% | 37% | 35% | 43% |
1 Calculated based on average shares outstanding.
2 Excludes the value of portfolio securities received or delivered as a result of in-kind purchases or redemptions of the fund’s capital
shares, including ETF Creation Units.
See accompanying Notes, which are an integral part of the Financial Statements.
•–
Intermediate-Term Treasury Index Fund
Financial Highlights
| Admiral Shares | |||||
| For a Share Outstanding | Year Ended August 31, | ||||
| Throughout Each Period | 2018 | 2017 | 2016 | 2015 | 2014 |
| Net Asset Value, Beginning of Period | $22.03 | $22.45 | $21.86 | $21.64 | $21.27 |
| Investment Operations | |||||
| Net Investment Income | .4181 | .3511 | .349 | .355 | .317 |
| Net Realized and Unrealized Gain (Loss) | |||||
| on Investments | (.911) | (.400) | .601 | .220 | .432 |
| Total from Investment Operations | (.493) | (.049) | .950 | .575 | .749 |
| Distributions | |||||
| Dividends from Net Investment Income | (.407) | (.344) | (.351) | (.355) | (.315) |
| Distributions from Realized Capital Gains | — | (.027) | (.009) | — | (.064) |
| Total Distributions | (.407) | (.371) | (.360) | (.355) | (.379) |
| Net Asset Value, End of Period | $21.13 | $22.03 | $22.45 | $21.86 | $21.64 |
| Total Return2 | -2.24% | -0.19% | 4.38% | 2.67% | 3.55% |
| Ratios/Supplemental Data | |||||
| Net Assets, End of Period (Millions) | $1,104 | $874 | $710 | $358 | $232 |
| Ratio of Total Expenses to Average Net Assets | 0.07% | 0.07% | 0.07% | 0.10% | 0.12% |
| Ratio of Net Investment Income to | |||||
| Average Net Assets | 1.97% | 1.61% | 1.61% | 1.67% | 1.50% |
| Portfolio Turnover Rate 3 | 31% | 32% | 37% | 35% | 43% |
Signal Shares were renamed Admiral Shares in October 2013.
1 Calculated based on average shares outstanding.
2 Total returns do not include account service fees that may have applied in the periods shown. Fund prospectuses provide information
about any applicable account service fees.
3 Excludes the value of portfolio securities received or delivered as a result of in-kind purchases or redemptions of the fund’s capital
shares, including ETF Creation Units.
See accompanying Notes, which are an integral part of the Financial Statements.
•–
Intermediate-Term Treasury Index Fund
Financial Highlights
| Institutional Shares | |||||
| For a Share Outstanding | Year Ended August 31, | ||||
| Throughout Each Period | 2018 | 2017 | 2016 | 2015 | 2014 |
| Net Asset Value, Beginning of Period | $27.33 | $27.86 | $27.12 | $26.85 | $26.39 |
| Investment Operations | |||||
| Net Investment Income | . 5241 | .4411 | .437 | .447 | .400 |
| Net Realized and Unrealized Gain (Loss) | |||||
| on Investments | (1.114) | (.507) | .752 | .271 | .536 |
| Total from Investment Operations | (.590) | (.066) | 1.189 | .718 | .936 |
| Distributions | |||||
| Dividends from Net Investment Income | (.510) | (.430) | (.438) | (.448) | (.397) |
| Distributions from Realized Capital Gains | — | (.034) | (.011) | — | (.079) |
| Total Distributions | (.510) | (.464) | (.449) | (.448) | (.476) |
| Net Asset Value, End of Period | $26.23 | $27.33 | $27.86 | $27.12 | $26.85 |
| Total Return | -2.16% | -0.21% | 4.42% | 2.69% | 3.58% |
| Ratios/Supplemental Data | |||||
| Net Assets, End of Period (Millions) | $390 | $336 | $272 | $208 | $54 |
| Ratio of Total Expenses to Average Net Assets | 0.05% | 0.05% | 0.05% | 0.07% | 0.09% |
| Ratio of Net Investment Income to | |||||
| Average Net Assets | 1.99% | 1.63% | 1.63% | 1.70% | 1.53% |
| Portfolio Turnover Rate2 | 31% | 32% | 37% | 35% | 43% |
1 Calculated based on average shares outstanding.
2 Excludes the value of portfolio securities received or delivered as a result of in-kind purchases or redemptions of the fund’s capital
shares, including ETF Creation Units.
See accompanying Notes, which are an integral part of the Financial Statements.
•–
Intermediate-Term Treasury Index Fund
Notes to Financial Statements
Vanguard Intermediate-Term Treasury Index Fund is registered under the Investment Company Act of 1940 as an open-end investment company, or mutual fund. The fund offers three classes of shares: ETF Shares, Admiral Shares, and Institutional Shares. ETF Shares are listed for trading on Nasdaq; they can be purchased and sold through a broker. Admiral Shares and Institutional Shares are designed for investors who meet certain administrative, service, and account-size criteria.
The fund changed its name from Vanguard Intermediate-Term Government Bond Index Fund to Vanguard Intermediate-Term Treasury Index Fund in December 2017.
A. The following significant accounting policies conform to generally accepted accounting principles for U.S. investment companies. The fund consistently follows such policies in preparing its financial statements.
1. Security Valuation: Securities are valued as of the close of trading on the New York Stock Exchange (generally 4 p.m., Eastern time) on the valuation date. Bonds and temporary cash investments are valued using the latest bid prices or using valuations based on a matrix system (which considers such factors as security prices, yields, maturities, and ratings), both as furnished by independent pricing services. Investments in Vanguard Market Liquidity Fund are valued at that fund’s net asset value. Securities for which market quotations are not readily available, or whose values have been affected by events occurring before the fund’s pricing time but after the close of the securities’ primary markets, are valued by methods deemed by the board of trustees to represent fair value.
2. Federal Income Taxes: The fund intends to continue to qualify as a regulated investment company and distribute all of its taxable income. Management has analyzed the fund’s tax positions taken for all open federal income tax years (August 31, 2015–2018), and has concluded that no provision for federal income tax is required in the fund’s financial statements.
3. Distributions: Distributions to shareholders are recorded on the ex-dividend date. Distributions are determined on a tax basis and may differ from net investment income and realized capital gains for financial reporting purposes.
4. Credit Facility: The fund and certain other funds managed by The Vanguard Group (“Vanguard”) participate in a $3.1 billion committed credit facility provided by a syndicate of lenders pursuant to a credit agreement that may be renewed annually; each fund is individually liable for its borrowings, if any, under the credit facility. Borrowings may be utilized for temporary and emergency purposes, and are subject to the fund’s regulatory and contractual borrowing restrictions. The participating funds are charged administrative fees and an annual commitment fee of 0.10% of the undrawn amount of the facility; these fees are allocated to the funds based on a method approved by the fund’s board of trustees and included in Management and Administrative expenses on the fund’s Statement of Operations. Any borrowings under this facility bear interest at a rate based upon the higher of the one-month London Interbank Offered Rate, federal funds effective rate, or overnight bank funding rate plus an agreed-upon spread.
The fund had no borrowings outstanding at August 31, 2018, or at any time during the period then ended.
¢£
Intermediate-Term Treasury Index Fund
5. Other: Interest income includes income distributions received from Vanguard Market Liquidity Fund and is accrued daily. Premiums and discounts on debt securities purchased are amortized and accreted, respectively, to interest income over the lives of the respective securities. Security transactions are accounted for on the date securities are bought or sold. Costs used to determine realized gains (losses) on the sale of investment securities are those of the specific securities sold.
Each class of shares has equal rights as to assets and earnings, except that each class separately bears certain class-specific expenses related to maintenance of shareholder accounts (included in Management and Administrative expenses), shareholder reporting, and the proxy. Marketing and distribution expenses are allocated to each class of shares based on a method approved by the board of trustees. Income, other non-class-specific expenses, and gains and losses on investments are allocated to each class of shares based on its relative net assets.
B. In accordance with the terms of a Funds’ Service Agreement (the “FSA”) between Vanguard and the fund, Vanguard furnishes to the fund investment advisory, corporate management, administrative, marketing, and distribution services at Vanguard’s cost of operations (as defined by the FSA). These costs of operations are allocated to the fund based on methods and guidelines approved by the board of trustees. Vanguard does not require reimbursement in the current period for certain costs of operations (such as deferred compensation/benefits and risk/insurance costs); the fund’s liability for these costs of operations is included in Payables to Vanguard on the Statement of Net Assets. All other costs of operations payable to Vanguard are generally settled twice a month.
Upon the request of Vanguard, the fund may invest up to 0.40% of its net assets as capital in Vanguard. At August 31, 2018, the fund had contributed to Vanguard capital in the amount of $211,000, representing 0.01% of the fund’s net assets and 0.08% of Vanguard’s capitalization. The fund’s trustees and officers are also directors and employees, respectively, of Vanguard.
C. Various inputs may be used to determine the value of the fund’s investments. These inputs are summarized in three broad levels for financial statement purposes. The inputs or methodologies used to value securities are not necessarily an indication of the risk associated with investing in those securities.
Level 1—Quoted prices in active markets for identical securities.
Level 2—Other significant observable inputs (including quoted prices for similar securities, interest rates, prepayment speeds, credit risk, etc.).
Level 3—Significant unobservable inputs (including the fund’s own assumptions used to determine
the fair value of investments). Any investments valued with significant unobservable inputs are
noted on the Statement of Net Assets.
The following table summarizes the market value of the fund’s investments as of August 31, 2018, based on the inputs used to value them:
| Level 1 | Level 2 | Level 3 | |
| Investments | ($000) | ($000) | ($000) |
| U.S. Government and Agency Obligations | — | 4,150,627 | — |
| Temporary Cash Investments | 20,360 | — | — |
| Total | 20,360 | 4,150,627 | — |
Ÿ¡
Intermediate-Term Treasury Index Fund
D. Permanent differences are reclassified among capital accounts in the financial statements to reflect their tax character. These reclassifications have no effect on net assets or net asset value per share. As of period end, the following permanent differences primarily attributable to the accounting for in-kind redemptions were reclassified to the following accounts:
| Amount | |
| ($000) | |
| Paid-in capital | 347 |
| Undistributed (Overdistributed) net investment income | — |
| Accumulated net realized gains (losses) | (347) |
Temporary differences between book-basis and tax-basis components of accumulated net earnings (losses) arise when certain items of income, gain, or loss are recognized in different periods for financial statement and tax purposes; these differences will reverse at some time in the future. The differences are primarily related to the tax deferral of losses on wash sales and payables for distributions. As of period end, the tax components of accumulated net earnings (losses) are detailed in the table as follows:
| Amount | |
| ($000) | |
| Undistributed ordinary income | 5,812 |
| Undistributed long-term gains | — |
| Capital loss carryforwards (non-expiring) | (23,601) |
| Net unrealized gains (losses) | (93,362) |
As of August 31, 2018, gross unrealized appreciation and depreciation for investments and derivatives based on cost for U.S. federal income tax purposes were as follows:
| Amount | |
| ($000) | |
| Tax cost | 4,264,349 |
| Gross unrealized appreciation | 557 |
| Gross unrealized depreciation | (93,919) |
| Net unrealized appreciation (depreciation) | (93,362) |
Intermediate-Term Treasury Index Fund
E. During the year ended August 31, 2018, the fund purchased $2,921,870,000 of investment securities and sold $1,182,180,000 of investment securities, other than temporary cash investments. Purchases and sales include $1,613,929,000 and $217,271,000, respectively, in connection with in-kind purchases and redemptions of the fund’s capital shares.
F. Capital share transactions for each class of shares were:
| Year Ended August 31, | ||||
| 2018 | 2017 | |||
| Amount | Shares | Amount | Shares | |
| ($000) | (000) | ($000) | (000) | |
| ETF Shares | ||||
| Issued | 1,630,128 | 25,907 | 610,836 | 9,400 |
| Issued in Lieu of Cash Distributions | — | — | — | — |
| Redeemed | (219,756) | (3,500) | (175,161) | (2,700) |
| Net Increase (Decrease)—ETF Shares | 1,410,372 | 22,407 | 435,675 | 6,700 |
| Admiral Shares | ||||
| Issued | 535,999 | 25,121 | 453,636 | 20,733 |
| Issued in Lieu of Cash Distributions | 16,263 | 764 | 10,936 | 501 |
| Redeemed | (284,802) | (13,350) | (287,831) | (13,186) |
| Net Increase (Decrease)—Admiral Shares | 267,460 | 12,535 | 176,741 | 8,048 |
| Institutional Shares | ||||
| Issued | 169,266 | 6,444 | 200,088 | 7,293 |
| Issued in Lieu of Cash Distributions | 5,651 | 214 | 5,268 | 194 |
| Redeemed | (108,884) | (4,081) | (134,673) | (4,958) |
| Net Increase (Decrease)—Institutional Shares | 66,033 | 2,577 | 70,683 | 2,529 |
G. Management has determined that no events or transactions occurred subsequent to August 31, 2018, that would require recognition or disclosure in these financial statements.
–—
Long-Term Treasury Index Fund
Fund Profile
As of August 31, 2018
| Share-Class Characteristics | |||
| ETF | Admiral Institutional | ||
| Shares | Shares | Shares | |
| Ticker Symbol | VGLT | VLGSX | VLGIX |
| Expense Ratio1 | 0.07% | 0.07% | 0.05% |
| 30-Day SEC Yield | 2.95% | 2.95% | 2.97% |
| Financial Attributes | |||
| Bloomberg | Bloomberg | ||
| Barclays | Barclays | ||
| U.S. Long | U.S. | ||
| Treasury | Aggregate | ||
| Fund | Bond Index | FA Index | |
| Number of Bonds | 50 | 49 | 10,038 |
| Yield to Maturity | |||
| (before expenses) | 3.0% | 3.0% | 3.3% |
| Average Coupon | 3.3% | 3.3% | 3.1% |
| Average Duration | 17.3 years | 17.3 years | 6.1 years |
| Average Effective | |||
| Maturity | 25.1 years | 25.1 years | 8.4 years |
| Short-Term | |||
| Reserves | 0.8% | — | — |
| Sector Diversification (% of portfolio) | |
| U.S. Treasury | 100.0% |
The agency and mortgage-backed securities sectors may include
issues from government-sponsored enterprises; such issues are
generally not backed by the full faith and credit of the U.S.
government.
| Volatility Measures | ||
| Spliced | ||
| Bloomberg | Bloomberg | |
| Barclays U.S. | Barclays U.S. | |
| Long Treasury | Aggregate | |
| Index | FA Index | |
| R-Squared | 0.99 | 0.87 |
| Beta | 1.02 | 3.08 |
These measures show the degree and timing of the fund’s
fluctuations compared with the indexes over 36 months.
| Distribution by Effective Maturity | |
| (% of portfolio) | |
| 10 - 20 Years | 7.7% |
| 20 - 30 Years | 92.3 |
| Distribution by Credit Quality (% of portfolio) | |
| U.S. Government | 100.0% |
Credit-quality ratings are obtained from Barclays and are from
Moody's, Fitch, and S&P. When ratings from all three agencies are
used, the median rating is shown. When ratings from two of the
agencies are used, the lower rating for each issue is shown. "Not
Rated" is used to classify securities for which a rating is not
available. For more information about these ratings, see the
Glossary entry for Credit Quality.
Investment Focus
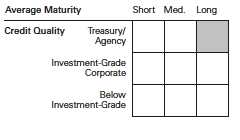
1 The expense ratios shown are from the prospectus dated December 21, 2017, and represent estimated costs for the current fiscal year. For the
fiscal year ended August 31, 2018, the expense ratios were 0.07% for ETF Shares, 0.07% for Admiral Shares, and 0.05% for Institutional Shares.
42
Long-Term Treasury Index Fund
Performance Summary
All of the returns in this report represent past performance, which is not a guarantee of future results that may be achieved by the fund. (Current performance may be lower or higher than the performance data cited. For performance data current to the most recent month-end, visit our website at vanguard.com/performance.) Note, too, that both investment returns and principal value can fluctuate widely, so an investor’s shares, when sold, could be worth more or less than their original cost. The returns shown do not reflect taxes that a shareholder would pay on fund distributions or on the sale of fund shares.
Cumulative Performance: November 19, 2009, Through August 31, 2018
Initial Investment of $10,000
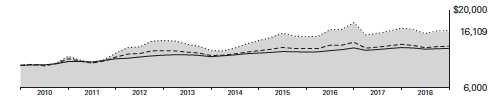
| Average Annual Total Returns | |||||
| Periods Ended August 31, 2018 | |||||
| Since | Final Value | ||||
| One | Five | Inception | of a $10,000 | ||
| Year | Years | (11/19/2009) | Investment | ||
| Long-Term Treasury Index FundETF | |||||
| Shares Net Asset Value | -3.07% | 5.08% | 5.58% | $16,109 | |
| Long-Term Treasury Index FundETF | |||||
| Shares Market Price | -3.05 | 5.07 | 5.59 | 16,121 | |
| Spliced Bloomberg Barclays U.S. Long | |||||
| • • • • • • •• | Treasury Index | -2.75 | 5.11 | 5.70 | 16,271 |
| – – – – | General U.S. Treasury Funds Average | -2.66 | 2.69 | 3.42 | 13,432 |
| Spliced Bloomberg Barclays U.S. | |||||
| Aggregate Float Adjusted Index | -1.09 | 2.47 | 3.09 | 13,062 | |
For a benchmark description, see the Glossary.
General U.S. Treasury Funds Average: Derived from data provided by Lipper, a Thomson Reuters Company.
"Since Inception" performance is calculated from the ETF Shares’ inception date for both the fund and its comparative standards.
See Financial Highlights for dividend and capital gains information.
43
Long-Term Treasury Index Fund
| Average Annual Total Returns | ||||
| Periods Ended August 31, 2018 | ||||
| Since | Final Value | |||
| One | Five | Inception | of a $10,000 | |
| Year | Years | (3/1/2010) | Investment | |
| Long-Term Treasury Index Fund Admiral | ||||
| Shares | -3.06% | 5.07% | 5.93% | $163,246 |
| Spliced Bloomberg Barclays U.S. Long | ||||
| Treasury Index | -2.75 | 5.11 | 6.06 | 164,858 |
| Bloomberg Barclays U.S. Aggregate Float | ||||
| Adjusted Index | -1.09 | 2.47 | 3.08 | 129,384 |
| "Since Inception" performance is calculated from the Admiral Shares’ inception date for both the fund and its comparative standards. | ||||
| Since | Final Value | |||
| One | Five | Inception | of a $5,000,000 | |
| Year | Years | (7/30/2010) | Investment | |
| Long-Term Treasury Index Fund Institutional | ||||
| Shares | -3.07% | 5.10% | 5.01% | $7,427,169 |
| Spliced Bloomberg Barclays U.S. Long | ||||
| Treasury Index | -2.75 | 5.11 | 5.09 | 7,470,649 |
| Bloomberg Barclays U.S. Aggregate Float | ||||
| Adjusted Index | -1.09 | 2.47 | 2.68 | 6,192,445 |
| "Since Inception" performance is calculated from the Institutional Shares’ inception date for both the fund and its comparative standards. | ||||
| Cumulative Returns of ETF Shares: November 19, 2009, Through August 31, 2018 | |||
| Since | |||
| One | Five | Inception | |
| Year | Years | (11/19/2009) | |
| Long-Term Treasury Index Fund ETF Shares Market | |||
| Price | -3.05% | 28.07% | 61.21% |
| Long-Term Treasury Index Fund ETF Shares Net | |||
| Asset Value | -3.07 | 28.10 | 61.09 |
| Spliced Bloomberg Barclays U.S. Long Treasury | |||
| Index | -2.75 | 28.32 | 62.71 |
| "Since Inception" performance is calculated from the ETF Shares’ inception date for both the fund and its comparative standards. | |||
44
Long-Term Treasury Index Fund
| Fiscal-Year Total Returns (%): November 19, 2009, Through August 31, 2018 | ||
| Spliced | ||
| Bloomberg | ||
| Barclays U.S. | ||
| Long Treasury | ||
| ETF Shares Net Asset Value | Index | |
| Fiscal Year | Total Returns | Total Returns |
| 2010 | 16.21% | 16.12% |
| 2011 | 4.63 | 5.11 |
| 2012 | 19.06 | 18.68 |
| 2013 | -13.13 | -12.46 |
| 2014 | 14.65 | 14.15 |
| 2015 | 4.44 | 5.05 |
| 2016 | 16.96 | 16.59 |
| 2017 | -5.63 | -5.61 |
| 2018 | -3.07 | -2.75 |
| For a benchmark description, see the Glossary. | ||
Average Annual Total Returns: Periods Ended June 30, 2018
This table presents returns through the latest calendar quarter—rather than through the end of the fiscal period.
Securities and Exchange Commission rules require that we provide this information.
| Since Inception | ||||||
| Inception Date | One Year | Five Years | Income | Capital | Total | |
| ETF Shares | 11/19/2009 | |||||
| Market Price | -0.40% | 4.46% | 5.72% | |||
| Net Asset Value | -0.38 | 4.45 | 5.71 | |||
| Admiral Shares | 3/1/2010 | -0.36 | 4.45 | 3.06% | 3.01% | 6.07 |
| Institutional Shares | 7/30/2010 | -0.39 | 4.47 | 3.03 | 2.11 | 5.14 |
45
Long-Term Treasury Index Fund
Financial Statements
Statement of Net Assets
As of August 31, 2018
The fund reports a complete list of its holdings in regulatory filings four times in each fiscal year, at the quarter-ends. For the second and fourth fiscal quarters, the lists appear in the fund’s semiannual and annual reports to shareholders. For the first and third fiscal quarters, the fund files the lists with the Securities and Exchange Commission on Form N-Q. Shareholders can look up the fund’s Forms N-Q on the SEC’s website at sec.gov. Forms N-Q may also be reviewed and copied at the SEC’s Public Reference Room (see the back cover of this report for further information).
| Face | Market | |||
| Maturity | Amount | Value • | ||
| Coupon | Date | ($000) | ($000) | |
| U.S. Government and Agency Obligations (99.4%) | ||||
| U.S. Government Securities (99.4%) | ||||
| United States Treasury Note/Bond | 5.250% | 11/15/28 | 9,764 | 11,801 |
| United States Treasury Note/Bond | 5.250% | 2/15/29 | 8,112 | 9,841 |
| United States Treasury Note/Bond | 6.125% | 8/15/29 | 6,397 | 8,335 |
| United States Treasury Note/Bond | 6.250% | 5/15/30 | 11,373 | 15,149 |
| United States Treasury Note/Bond | 5.375% | 2/15/31 | 17,850 | 22,457 |
| United States Treasury Note/Bond | 4.500% | 2/15/36 | 18,957 | 23,071 |
| United States Treasury Note/Bond | 4.750% | 2/15/37 | 5,901 | 7,437 |
| United States Treasury Note/Bond | 5.000% | 5/15/37 | 6,520 | 8,463 |
| United States Treasury Note/Bond | 4.375% | 2/15/38 | 9,244 | 11,203 |
| United States Treasury Note/Bond | 4.500% | 5/15/38 | 10,515 | 12,952 |
| United States Treasury Note/Bond | 3.500% | 2/15/39 | 16,426 | 17,789 |
| United States Treasury Note/Bond | 4.250% | 5/15/39 | 20,492 | 24,552 |
| United States Treasury Note/Bond | 4.500% | 8/15/39 | 16,614 | 20,565 |
| United States Treasury Note/Bond | 4.375% | 11/15/39 | 19,456 | 23,727 |
| United States Treasury Note/Bond | 4.625% | 2/15/40 | 25,895 | 32,632 |
| United States Treasury Note/Bond | 4.375% | 5/15/40 | 22,836 | 27,888 |
| United States Treasury Note/Bond | 3.875% | 8/15/40 | 17,018 | 19,438 |
| United States Treasury Note/Bond | 4.250% | 11/15/40 | 20,330 | 24,459 |
| United States Treasury Note/Bond | 4.750% | 2/15/41 | 23,233 | 29,876 |
| United States Treasury Note/Bond | 4.375% | 5/15/41 | 18,530 | 22,711 |
| United States Treasury Note/Bond | 3.750% | 8/15/41 | 20,988 | 23,575 |
| United States Treasury Note/Bond | 3.125% | 11/15/41 | 20,056 | 20,451 |
| United States Treasury Note/Bond | 3.125% | 2/15/42 | 25,606 | 26,102 |
| United States Treasury Note/Bond | 3.000% | 5/15/42 | 20,057 | 20,013 |
| United States Treasury Note/Bond | 2.750% | 8/15/42 | 29,664 | 28,311 |
| United States Treasury Note/Bond | 2.750% | 11/15/42 | 37,064 | 35,344 |
| United States Treasury Note/Bond | 3.125% | 2/15/43 | 37,704 | 38,375 |
| United States Treasury Note/Bond | 2.875% | 5/15/43 | 52,896 | 51,532 |
| United States Treasury Note/Bond | 3.625% | 8/15/43 | 44,157 | 48,786 |
| United States Treasury Note/Bond | 3.750% | 11/15/43 | 53,248 | 60,046 |
| United States Treasury Note/Bond | 3.625% | 2/15/44 | 53,271 | 58,948 |
| United States Treasury Note/Bond | 3.375% | 5/15/44 | 50,233 | 53,381 |
| United States Treasury Note/Bond | 3.125% | 8/15/44 | 54,948 | 55,944 |
| United States Treasury Note/Bond | 3.000% | 11/15/44 | 54,650 | 54,419 |
| United States Treasury Note/Bond | 2.500% | 2/15/45 | 52,914 | 47,846 |
| United States Treasury Note/Bond | 3.000% | 5/15/45 | 53,808 | 53,581 |
™š
Long-Term Treasury Index Fund
| Face | Market | |||
| Maturity | Amount | Value • | ||
| Coupon | Date | ($000) | ($000) | |
| United States Treasury Note/Bond | 2.875% | 8/15/45 | 58,495 | 56,868 |
| United States Treasury Note/Bond | 3.000% | 11/15/45 | 59,226 | 58,957 |
| United States Treasury Note/Bond | 2.500% | 2/15/46 | 53,892 | 48,587 |
| United States Treasury Note/Bond | 2.500% | 5/15/46 | 51,792 | 46,669 |
| United States Treasury Note/Bond | 2.250% | 8/15/46 | 46,261 | 39,495 |
| United States Treasury Note/Bond | 2.875% | 11/15/46 | 51,467 | 49,996 |
| United States Treasury Note/Bond | 3.000% | 2/15/47 | 47,378 | 47,178 |
| United States Treasury Note/Bond | 3.000% | 5/15/47 | 50,860 | 50,606 |
| United States Treasury Note/Bond | 2.750% | 8/15/47 | 50,249 | 47,572 |
| United States Treasury Note/Bond | 2.750% | 11/15/47 | 49,563 | 46,907 |
| United States Treasury Note/Bond | 3.000% | 2/15/48 | 54,515 | 54,225 |
| United States Treasury Note/Bond | 3.125% | 5/15/48 | 55,340 | 56,447 |
| United States Treasury Note/Bond | 3.000% | 8/15/48 | 23,200 | 23,088 |
| Total U.S. Government and Agency Obligations (Cost $1,746,036) | 1,677,595 | |||
| Shares | ||||
| Temporary Cash Investment (0.9%) | ||||
| Money Market Fund (0.9%) | ||||
| 1 Vanguard Market Liquidity Fund | ||||
| (Cost $14,358) | 2.153% | 143,566 | 14,360 | |
| Total Investments (100.3%) (Cost $1,760,394) | 1,691,955 | |||
| Amount | ||||
| ($000) | ||||
| Other Assets and Liabilities (-0.3%) | ||||
| Other Assets | ||||
| Investment in Vanguard | 86 | |||
| Receivables for Investment Securities Sold | 10,958 | |||
| Receivables for Accrued Income | 9,102 | |||
| Receivables for Capital Shares Issued | 930 | |||
| Total Other Assets | 21,076 | |||
| Liabilities | ||||
| Payables for Investment Securities Purchased | (24,084) | |||
| Payables for Capital Shares Redeemed | (1,161) | |||
| Payables for Distributions | (257) | |||
| Payables to Vanguard | (236) | |||
| Total Liabilities | (25,738) | |||
| Net Assets (100%) | 1,687,293 | |||
•–
Long-Term Treasury Index Fund
| At August 31, 2018, net assets consisted of: | |
| Amount | |
| ($000) | |
| Paid-in Capital | 1,786,048 |
| Undistributed Net Investment Income | 1,622 |
| Accumulated Net Realized Losses | (31,938) |
| Unrealized Appreciation (Depreciation) | (68,439) |
| Net Assets | 1,687,293 |
| ETF Shares—Net Assets | |
| Applicable to 9,092,292 outstanding $.001 par value shares of | |
| beneficial interest (unlimited authorization) | 675,808 |
| Net Asset Value Per Share—ETF Shares | $74.33 |
| Admiral Shares—Net Assets | |
| Applicable to 22,424,406 outstanding $.001 par value shares of | |
| beneficial interest (unlimited authorization) | 559,434 |
| Net Asset Value Per Share—Admiral Shares | $24.95 |
| Institutional Shares—Net Assets | |
| Applicable to 14,276,190 outstanding $.001 par value shares of | |
| beneficial interest (unlimited authorization) | 452,051 |
| Net Asset Value Per Share—Institutional Shares | $31.66 |
• See Note A in Notes to Financial Statements.
1 Affiliated money market fund available only to Vanguard funds and certain trusts and accounts managed by Vanguard. Rate shown
is the 7-day yield.
See accompanying Notes, which are an integral part of the Financial Statements.
ƒ„
Long-Term Treasury Index Fund
Statement of Operations
| Year Ended | |
| August 31, 2018 | |
| ($000) | |
| Investment Income | |
| Income | |
| Interest1 | 41,694 |
| Total Income | 41,694 |
| Expenses | |
| The Vanguard Group—Note B | |
| Investment Advisory Services | 47 |
| Management and Administrative—ETF Shares | 301 |
| Management and Administrative—Admiral Shares | 257 |
| Management and Administrative—Institutional Shares | 139 |
| Marketing and Distribution—ETF Shares | 38 |
| Marketing and Distribution—Admiral Shares | 41 |
| Marketing and Distribution—Institutional Shares | 11 |
| Custodian Fees | 18 |
| Auditing Fees | 50 |
| Shareholders’ Reports and Proxy—ETF Shares | 46 |
| Shareholders’ Reports and Proxy—Admiral Shares | 21 |
| Shareholders’ Reports and Proxy—Institutional Shares | — |
| Trustees’ Fees and Expenses | 1 |
| Total Expenses | 970 |
| Net Investment Income | 40,724 |
| Realized Net Gain (Loss) on Investment Securities Sold1,2 | (5,090) |
| Change in Unrealized Appreciation (Depreciation) of Investment Securities1 | (69,891) |
| Net Increase (Decrease) in Net Assets Resulting from Operations | (34,257) |
1 Interest income, realized net gain (loss), and change in unrealized appreciation (depreciation) from an affiliated company of the fund
were $55,000, $6,000, and $2,000, respectively. Purchases and sales are for temporary cash investment purposes.
2 Includes $4,056,000 of net gain (loss) resulting from in-kind redemptions; such gain (loss) is not taxable to the fund.
See accompanying Notes, which are an integral part of the Financial Statements.
Long-Term Treasury Index Fund
Statement of Changes in Net Assets
| Year Ended August 31, | ||
| 2018 | 2017 | |
| ($000) | ($000) | |
| Increase (Decrease) in Net Assets | ||
| Operations | ||
| Net Investment Income | 40,724 | 27,249 |
| Realized Net Gain (Loss) | (5,090) | (564) |
| Change in Unrealized Appreciation (Depreciation) | (69,891) | (82,295) |
| Net Increase (Decrease) in Net Assets Resulting from Operations | (34,257) | (55,610) |
| Distributions | ||
| Net Investment Income | ||
| ETF Shares | (16,498) | (13,190) |
| Admiral Shares | (13,942) | (9,591) |
| Institutional Shares | (9,959) | (4,367) |
| Realized Capital Gain | ||
| ETF Shares | — | — |
| Admiral Shares | — | — |
| Institutional Shares | — | — |
| Total Distributions | (40,399) | (27,148) |
| Capital Share Transactions | ||
| ETF Shares | 161,471 | 20,982 |
| Admiral Shares | 120,197 | 118,161 |
| Institutional Shares | 250,354 | 83,424 |
| Net Increase (Decrease) from Capital Share Transactions | 532,022 | 222,567 |
| Total Increase (Decrease) | 457,366 | 139,809 |
| Net Assets | ||
| Beginning of Period | 1,229,927 | 1,090,118 |
| End of Period1 | 1,687,293 | 1,229,927 |
| 1 Net Assets—End of Period includes undistributed (overdistributed) net investment income of $1,622,000 and $1,297,000. | ||
See accompanying Notes, which are an integral part of the Financial Statements.
}‘
Long-Term Treasury Index Fund
Financial Highlights
| ETF Shares | |||||
| For a Share Outstanding | Year Ended August 31, | ||||
| Throughout Each Period | 2018 | 2017 | 2016 | 2015 | 2014 |
| Net Asset Value, Beginning of Period | $78.76 | $85.64 | $75.13 | $73.93 | $66.33 |
| Investment Operations | |||||
| Net Investment Income | 2.0501 | 2.0061 | 2.021 | 2.073 | 2.100 |
| Net Realized and Unrealized Gain (Loss) | |||||
| on Investments | (4.469) | (6.905) | 10.511 | 1.206 | 7.429 |
| Total from Investment Operations | (2.419) | (4.899) | 12.532 | 3.279 | 9.529 |
| Distributions | |||||
| Dividends from Net Investment Income | (2.011) | (1.981) | (2.022) | (2.079) | (1.929) |
| Distributions from Realized Capital Gains | — | — | — | — | — |
| Total Distributions | (2.011) | (1.981) | (2.022) | (2.079) | (1.929) |
| Net Asset Value, End of Period | $74.33 | $78.76 | $85.64 | $75.13 | $73.93 |
| Total Return | -3.07% | -5.63% | 16.96% | 4.44% | 14.65% |
| Ratios/Supplemental Data | |||||
| Net Assets, End of Period (Millions) | $676 | $549 | $578 | $252 | $107 |
| Ratio of Total Expenses to Average Net Assets | 0.07% | 0.07% | 0.07% | 0.10% | 0.12% |
| Ratio of Net Investment Income to | |||||
| Average Net Assets | 2.73% | 2.62% | 2.58% | 2.76% | 3.17% |
| Portfolio Turnover Rate2 | 19% | 19% | 18% | 24% | 23% |
1 Calculated based on average shares outstanding.
2 Excludes the value of portfolio securities received or delivered as a result of in-kind purchases or redemptions of the fund’s capital
shares, including ETF Creation Units.
See accompanying Notes, which are an integral part of the Financial Statements.
•–
Long-Term Treasury Index Fund
Financial Highlights
| Admiral Shares | |||||
| For a Share Outstanding | Year Ended August 31, | ||||
| Throughout Each Period | 2018 | 2017 | 2016 | 2015 | 2014 |
| Net Asset Value, Beginning of Period | $26.44 | $28.75 | $25.21 | $24.81 | $22.32 |
| Investment Operations | |||||
| Net Investment Income | .6901 | . 6761 | .679 | .698 | .711 |
| Net Realized and Unrealized Gain (Loss) | |||||
| on Investments | (1.501) | (2.319) | 3.540 | .399 | 2.491 |
| Total from Investment Operations | (.811) | (1.643) | 4.219 | 1.097 | 3.202 |
| Distributions | |||||
| Dividends from Net Investment Income | (.679) | (.667) | (.679) | (.697) | (.712) |
| Distributions from Realized Capital Gains | — | — | — | — | — |
| Total Distributions | (.679) | (.667) | (.679) | (.697) | (.712) |
| Net Asset Value, End of Period | $24.95 | $26.44 | $28.75 | $25.21 | $24.81 |
| Total Return2 | -3.06% | -5.62% | 16.97% | 4.40% | 14.63% |
| Ratios/Supplemental Data | |||||
| Net Assets, End of Period (Millions) | $559 | $468 | $374 | $130 | $44 |
| Ratio of Total Expenses to Average Net Assets | 0.07% | 0.07% | 0.07% | 0.10% | 0.12% |
| Ratio of Net Investment Income to | |||||
| Average Net Assets | 2.73% | 2.62% | 2.58% | 2.76% | 3.17% |
| Portfolio Turnover Rate 3 | 19% | 19% | 18% | 24% | 23% |
Signal Shares were renamed Admiral Shares in October 2013.
1 Calculated based on average shares outstanding.
2 Total returns do not include account service fees that may have applied in the periods shown. Fund prospectuses provide information
about any applicable account service fees.
3 Excludes the value of portfolio securities received or delivered as a result of in-kind purchases or redemptions of the fund’s capital
shares, including ETF Creation Units.
See accompanying Notes, which are an integral part of the Financial Statements.
•–
Long-Term Treasury Index Fund
Financial Highlights
| Institutional Shares | |||||
| For a Share Outstanding | Year Ended August 31, | ||||
| Throughout Each Period | 2018 | 2017 | 2016 | 2015 | 2014 |
| Net Asset Value, Beginning of Period | $33.56 | $36.49 | $32.00 | $31.48 | $28.32 |
| Investment Operations | |||||
| Net Investment Income | .8831 | .8651 | .868 | .896 | .910 |
| Net Realized and Unrealized Gain (Loss) | |||||
| on Investments | (1.915) | (2.942) | 4.492 | .517 | 3.161 |
| Total from Investment Operations | (1.032) | (2.077) | 5.360 | 1.413 | 4.071 |
| Distributions | |||||
| Dividends from Net Investment Income | (. 868) | (. 853) | (. 870) | (. 893) | (. 911) |
| Distributions from Realized Capital Gains | — | — | — | — | — |
| Total Distributions | (. 868) | (. 853) | (. 870) | (. 893) | (. 911) |
| Net Asset Value, End of Period | $31.66 | $33.56 | $36.49 | $32.00 | $31.48 |
| Total Return | -3.07% | -5.60% | 16.99% | 4.47% | 14.66% |
| Ratios/Supplemental Data | |||||
| Net Assets, End of Period (Millions) | $452 | $213 | $138 | $154 | $95 |
| Ratio of Total Expenses to Average Net Assets | 0.05% | 0.05% | 0.05% | 0.07% | 0.09% |
| Ratio of Net Investment Income to | |||||
| Average Net Assets | 2.75% | 2.64% | 2.60% | 2.79% | 3.20% |
| Portfolio Turnover Rate2 | 19% | 19% | 18% | 24% | 23% |
1 Calculated based on average shares outstanding.
2 Excludes the value of portfolio securities received or delivered as a result of in-kind purchases or redemptions of the fund’s capital
shares, including ETF Creation Units.
See accompanying Notes, which are an integral part of the Financial Statements.
•–
Long-Term Treasury Index Fund
Notes to Financial Statements
Vanguard Long-Term Treasury Index Fund is registered under the Investment Company Act of 1940 as an open-end investment company, or mutual fund. The fund offers three classes of shares: ETF Shares, Admiral Shares, and Institutional Shares. ETF Shares are listed for trading on Nasdaq; they can be purchased and sold through a broker. Admiral Shares and Institutional Shares are designed for investors who meet certain administrative, service, and account-size criteria. The fund changed its name from Vanguard Long-Term Government Bond Index Fund to Vanguard Long-Term Treasury Index Fund in December 2017.
A. The following significant accounting policies conform to generally accepted accounting principles for U.S. investment companies. The fund consistently follows such policies in preparing its financial statements.
1. Security Valuation: Securities are valued as of the close of trading on the New York Stock Exchange (generally 4 p.m., Eastern time) on the valuation date. Bonds and temporary cash investments are valued using the latest bid prices or using valuations based on a matrix system (which considers such factors as security prices, yields, maturities, and ratings), both as furnished by independent pricing services. Investments in Vanguard Market Liquidity Fund are valued at that fund’s net asset value. Securities for which market quotations are not readily available, or whose values have been affected by events occurring before the fund’s pricing time but after the close of the securities’ primary markets, are valued by methods deemed by the board of trustees to represent fair value.
2. Federal Income Taxes: The fund intends to continue to qualify as a regulated investment company and distribute all of its taxable income. Management has analyzed the fund’s tax positions taken for all open federal income tax years (August 31, 2015–2018), and has concluded that no provision for federal income tax is required in the fund’s financial statements.
3. Distributions: Distributions to shareholders are recorded on the ex-dividend date. Distributions are determined on a tax basis and may differ from net investment income and realized capital gains for financial reporting purposes.
4. Credit Facility: The fund and certain other funds managed by The Vanguard Group (“Vanguard”) participate in a $3.1 billion committed credit facility provided by a syndicate of lenders pursuant to a credit agreement that may be renewed annually; each fund is individually liable for its borrowings, if any, under the credit facility. Borrowings may be utilized for temporary and emergency purposes, and are subject to the fund’s regulatory and contractual borrowing restrictions. The participating funds are charged administrative fees and an annual commitment fee of 0.10% of the undrawn amount of the facility; these fees are allocated to the funds based on a method approved by the fund’s board of trustees and included in Management and Administrative expenses on the fund’s Statement of Operations. Any borrowings under this facility bear interest at a rate based upon the higher of the one-month London Interbank Offered Rate, federal funds effective rate, or overnight bank funding rate plus an agreed-upon spread.
The fund had no borrowings outstanding at August 31, 2018, or at any time during the period then ended.
¢£
Long-Term Treasury Index Fund
5. Other: Interest income includes income distributions received from Vanguard Market Liquidity Fund and is accrued daily. Premiums and discounts on debt securities purchased are amortized and accreted, respectively, to interest income over the lives of the respective securities. Security transactions are accounted for on the date securities are bought or sold. Costs used to determine realized gains (losses) on the sale of investment securities are those of the specific securities sold.
Each class of shares has equal rights as to assets and earnings, except that each class separately bears certain class-specific expenses related to maintenance of shareholder accounts (included in Management and Administrative expenses), shareholder reporting, and the proxy. Marketing and distribution expenses are allocated to each class of shares based on a method approved by the board of trustees. Income, other non-class-specific expenses, and gains and losses on investments are allocated to each class of shares based on its relative net assets.
B. In accordance with the terms of a Funds’ Service Agreement (the “FSA”) between Vanguard and the fund, Vanguard furnishes to the fund investment advisory, corporate management, administrative, marketing, and distribution services at Vanguard’s cost of operations (as defined by the FSA). These costs of operations are allocated to the fund based on methods and guidelines approved by the board of trustees. Vanguard does not require reimbursement in the current period for certain costs of operations (such as deferred compensation/benefits and risk/insurance costs); the fund’s liability for these costs of operations is included in Payables to Vanguard on the Statement of Net Assets. All other costs of operations payable to Vanguard are generally settled twice a month.
Upon the request of Vanguard, the fund may invest up to 0.40% of its net assets as capital in Vanguard. At August 31, 2018, the fund had contributed to Vanguard capital in the amount of $86,000, representing 0.01% of the fund’s net assets and 0.03% of Vanguard’s capitalization. The fund’s trustees and officers are also directors and employees, respectively, of Vanguard.
C. Various inputs may be used to determine the value of the fund’s investments. These inputs are summarized in three broad levels for financial statement purposes. The inputs or methodologies used to value securities are not necessarily an indication of the risk associated with investing in those securities.
Level 1—Quoted prices in active markets for identical securities.
Level 2—Other significant observable inputs (including quoted prices for similar securities, interest rates, prepayment speeds, credit risk, etc.).
Level 3—Significant unobservable inputs (including the fund’s own assumptions used to determine
the fair value of investments). Any investments valued with significant unobservable inputs are
noted on the Statement of Net Assets.
The following table summarizes the market value of the fund’s investments as of August 31, 2018, based on the inputs used to value them:
| Level 1 | Level 2 | Level 3 | |
| Investments | ($000) | ($000) | ($000) |
| U.S. Government and Agency Obligations | — | 1,677,595 | — |
| Temporary Cash Investments | 14,360 | — | — |
| Total | 14,360 | 1,677,595 | — |
¡¡
Long-Term Treasury Index Fund
D. Permanent differences are reclassified among capital accounts in the financial statements to reflect their tax character. These reclassifications have no effect on net assets or net asset value per share. As of period end, the following permanent difference primarily attributable to the accounting for in-kind redemptions was reclassified to the following accounts:
| Amount | |
| ($000) | |
| Paid-in capital | 4,056 |
| Undistributed (Overdistributed) net investment income | — |
| Accumulated net realized gains (losses) | (4,056) |
Temporary differences between book-basis and tax-basis components of accumulated net earnings (losses) arise when certain items of income, gain, or loss are recognized in different periods for financial statement and tax purposes; these differences will reverse at some time in the future. The differences are primarily related to the tax deferral of losses on wash sales and payables for distributions. As of period end, the tax components of accumulated net earnings (losses) are detailed in the table as follows:
| Amount | |
| ($000) | |
| Undistributed ordinary income | 2,061 |
| Undistributed long-term gains | — |
| Capital loss carryforwards (non-expiring) | (31,938) |
| Net unrealized gains (losses) | (68,439) |
As of August 31, 2018, gross unrealized appreciation and depreciation for investments and
derivatives based on cost for U.S. federal income tax purposes were as follows:
| Amount | |
| ($000) | |
| Tax cost | 1,760,394 |
| Gross unrealized appreciation | 688 |
| Gross unrealized depreciation | (69,127) |
| Net unrealized appreciation (depreciation) | (68,439) |
Long-Term Treasury Index Fund
E. During the year ended August 31, 2018, the fund purchased $1,150,300,000 of investment securities and sold $615,605,000 of investment securities, other than temporary cash investments. Purchases and sales include $499,608,000 and $340,236,000, respectively, in connection with in-kind purchases and redemptions of the fund’s capital shares.
F. Capital share transactions for each class of shares were:
| Year Ended August 31, | ||||
| 2018 | 2017 | |||
| Amount | Shares | Amount | Shares | |
| ($000) | (000) | ($000) | (000) | |
| ETF Shares | ||||
| Issued | 505,399 | 6,751 | 494,338 | 6,411 |
| Issued in Lieu of Cash Distributions | — | — | — | — |
| Redeemed | (343,928) | (4,625) | (473,356) | (6,200) |
| Net Increase (Decrease)—ETF Shares | 161,471 | 2,126 | 20,982 | 211 |
| Admiral Shares | ||||
| Issued | 257,934 | 10,193 | 322,560 | 12,713 |
| Issued in Lieu of Cash Distributions | 11,605 | 461 | 8,434 | 327 |
| Redeemed | (149,342) | (5,928) | (212,833) | (8,355) |
| Net Increase (Decrease)—Admiral Shares | 120,197 | 4,726 | 118,161 | 4,685 |
| Institutional Shares | ||||
| Issued | 325,625 | 10,272 | 96,263 | 2,986 |
| Issued in Lieu of Cash Distributions | 9,959 | 312 | 4,367 | 134 |
| Redeemed | (85,230) | (2,666) | (17,206) | (530) |
| Net Increase (Decrease)—Institutional Shares | 250,354 | 7,918 | 83,424 | 2,590 |
G. Management has determined that no events or transactions occurred subsequent to August 31, 2018, that would require recognition or disclosure in these financial statements.
–—
Short-Term Corporate Bond Index Fund
Fund Profile
As of August 31, 2018
| Share-Class Characteristics | |||
| ETF | Admiral Institutional | ||
| Shares | Shares | Shares | |
| Ticker Symbol | VCSH | VSCSX | VSTBX |
| Expense Ratio1 | 0.07% | 0.07% | 0.05% |
| 30-Day SEC Yield | 3.32% | 3.32% | 3.34% |
| Financial Attributes | |||
| Bloomberg | |||
| Barclays | Bloomberg | ||
| U.S. 1–5 | Barclays | ||
| Year | U.S. | ||
| Corporate | Aggregate | ||
| Fund | Bond Index | FA Index | |
| Number of Bonds | 2,214 | 2,185 | 10,038 |
| Yield to Maturity | |||
| (before expenses) | 3.4% | 3.4% | 3.3% |
| Average Coupon | 3.2% | 3.3% | 3.1% |
| Average Duration | 2.8 years | 2.8 years | 6.1 years |
| Average Effective | |||
| Maturity | 3.0 years | 3.0 years | 8.4 years |
| Short-Term | |||
| Reserves | 0.2% | — | — |
| Sector Diversification (% of portfolio) | |
| Finance | 42.0% |
| Industrial | 53.7 |
| Utilities | 4.2 |
| Other | 0.1 |
The agency and mortgage-backed securities sectors may include
issues from government-sponsored enterprises; such issues are
generally not backed by the full faith and credit of the U.S.
government.
| Volatility Measures | ||
| Bloomberg | ||
| Barclays U.S. | Bloomberg | |
| 1–5 Year | Barclays U.S. | |
| Corporate | Aggregate | |
| Bond Index | FA Index | |
| R-Squared | 0.99 | 0.73 |
| Beta | 1.00 | 0.45 |
| These measures show the degree and timing of the fund’s | ||
| fluctuations compared with the indexes over 36 months. | ||
| Distribution by Effective Maturity | |
| (% of portfolio) | |
| Under 1 Year | 0.2% |
| 1 - 3 Years | 52.5 |
| 3 - 5 Years | 47.2 |
| 5 - 10 Years | 0.1 |
| Distribution by Credit Quality (% of portfolio) | |
| Aaa | 1.2% |
| Aa | 12.8 |
| A | 42.9 |
| Baa | 43.1 |
Credit-quality ratings are obtained from Barclays and are from Moody's, Fitch, and S&P. When ratings from all three agencies are used, the median rating is shown. When ratings from two of the agencies are used, the lower rating for each issue is shown. "Not Rated" is used to classify securities for which a rating is not available. For more information about these ratings, see the Glossary entry for Credit Quality.
Investment Focus
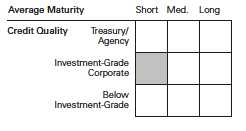
1 The expense ratios shown are from the prospectus dated December 21, 2017, and represent estimated costs for the current fiscal year. For the fiscal year ended August 31, 2018, the expense ratios were 0.07% for ETF Shares, 0.07% for Admiral Shares, and 0.05% for Institutional Shares.
58
Short-Term Corporate Bond Index Fund
Performance Summary
All of the returns in this report represent past performance, which is not a guarantee of future results that may be achieved by the fund. (Current performance may be lower or higher than the performance data cited. For performance data current to the most recent month-end, visit our website at vanguard.com/performance.) Note, too, that both investment returns and principal value can fluctuate widely, so an investor’s shares, when sold, could be worth more or less than their original cost. The returns shown do not reflect taxes that a shareholder would pay on fund distributions or on the sale of fund shares.
Cumulative Performance: November 19, 2009, Through August 31, 2018
Initial Investment of $10,000
![]()
| Average Annual Total Returns | |||||
| Periods Ended August 31, 2018 | |||||
| Since | Final Value | ||||
| One | Five | Inception | of a $10,000 | ||
| Year | Years | (11/19/2009) | Investment | ||
| Short-Term Corporate Bond Index Fund | |||||
| ETF Shares Net Asset Value | 0.01% | 1.99% | 2.72% | $12,657 | |
| Short-Term Corporate Bond Index Fund | |||||
| ETF Shares Market Price | -0.03 | 1.95 | 2.73 | 12,665 | |
| Bloomberg Barclays U.S. 1–5 Year | |||||
| • • • • • • •• | Corporate Bond Index | 0.08 | 2.11 | 2.92 | 12,874 |
| – – – – | Short-Intermediate Investment-Grade | ||||
| Debt Funds Average | -0.25 | 1.38 | 2.19 | 12,100 | |
| Spliced Bloomberg Barclays U.S. | |||||
| Aggregate Float Adjusted Index | -1.09 | 2.47 | 3.09 | 13,062 | |
For a benchmark description, see the Glossary.
Short-Intermediate Investment-Grade Debt Funds Average: Derived from data provided by Lipper, a Thomson Reuters Company.
"Since Inception" performance is calculated from the ETF Shares’ inception date for both the fund and its comparative standards.
See Financial Highlights for dividend and capital gains information.
59
Short-Term Corporate Bond Index Fund
| Average Annual Total Returns | ||||
| Periods Ended August 31, 2018 | ||||
| Since | Final Value | |||
| One | Five | Inception | of a $10,000 | |
| Year | Years | (11/18/2010) | Investment | |
| Short-Term Corporate Bond Index Fund | ||||
| Admiral Shares | 0.02% | 1.99% | 2.30% | $11,937 |
| Bloomberg Barclays U.S. 1–5 Year | ||||
| Corporate Bond Index | 0.08 | 2.11 | 2.46 | 12,083 |
| Bloomberg Barclays U.S. Aggregate Float | ||||
| Adjusted Index | -1.09 | 2.47 | 2.66 | 12,269 |
| "Since Inception" performance is calculated from the Admiral Shares’ inception date for both the fund and its comparative standards. | ||||
| Since | Final Value | |||
| One | Five | Inception | of a $5,000,000 | |
| Year | Years | (11/19/2009) | Investment | |
| Short-Term Corporate Bond Index Fund | ||||
| Institutional Shares | 0.07% | 2.02% | 2.76% | $6,347,771 |
| Bloomberg Barclays U.S. 1–5 Year | ||||
| Corporate Bond Index | 0.08 | 2.11 | 2.92 | 6,436,863 |
| Spliced Bloomberg Barclays U.S. Aggregate | ||||
| Float Adjusted Index | -1.09 | 2.47 | 3.09 | 6,530,959 |
| "Since Inception" performance is calculated from the Institutional Shares’ inception date for both the fund and its comparative standards. | ||||
| Cumulative Returns of ETF Shares: November 19, 2009, Through August 31, 2018 | |||
| Since | |||
| One | Five | Inception | |
| Year | Years | (11/19/2009) | |
| Short-Term Corporate Bond Index Fund ETF Shares | |||
| Market Price | -0.03% | 10.15% | 26.65% |
| Short-Term Corporate Bond Index Fund ETF Shares | |||
| Net Asset Value | 0.01 | 10.36 | 26.57 |
| Bloomberg Barclays U.S. 1–5 Year Corporate Bond | |||
| Index | 0.08 | 10.99 | 28.74 |
| "Since Inception" performance is calculated from the ETF Shares’ inception date for both the fund and its comparative standards. | |||
60
Short-Term Corporate Bond Index Fund
| Fiscal-Year Total Returns (%): November 19, 2009, Through August 31, 2018 | ||
| Bloomberg | ||
| Barclays U.S. | ||
| 1–5 Year | ||
| Corporate Bond | ||
| ETF Shares Net Asset Value | Index | |
| Fiscal Year | Total Returns | Total Returns |
| 2010 | 5.34% | 5.61% |
| 2011 | 2.94 | 3.45 |
| 2012 | 4.68 | 4.81 |
| 2013 | 1.03 | 1.29 |
| 2014 | 3.50 | 3.67 |
| 2015 | 0.96 | 1.03 |
| 2016 | 3.71 | 3.78 |
| 2017 | 1.84 | 2.03 |
| 2018 | 0.01 | 0.08 |
Average Annual Total Returns: Periods Ended June 30, 2018
This table presents returns through the latest calendar quarter—rather than through the end of the fiscal period.
Securities and Exchange Commission rules require that we provide this information.
| Since Inception | ||||||
| Inception Date | One Year | Five Years | Income | Capital | Total | |
| ETF Shares | 11/19/2009 | |||||
| Market Price | -0.08% | 1.87% | 2.68% | |||
| Net Asset Value | 0.09 | 1.93 | 2.68 | |||
| Admiral Shares | 11/18/2010 | 0.07 | 1.93 | 2.13% | 0.12% | 2.25 |
| Institutional Shares | 11/19/2009 | 0.13 | 1.95 | 2.18 | 0.54 | 2.72 |
61
Short-Term Corporate Bond Index Fund
Financial Statements
Statement of Net Assets—Investments Summary
As of August 31, 2018
This Statement summarizes the fund’s holdings by asset type. Details are reported for each of the fund’s 50 largest individual holdings and for investments that, in total for any issuer, represent more than 1% of the fund’s net assets. The total value of smaller holdings is reported as a single amount within each category.
The fund reports a complete list of its holdings in regulatory filings four times in each fiscal year, at the quarter-ends. For the second and fourth fiscal quarters, the complete listing of the fund’s holdings is available electronically on vanguard.com and on the Securities and Exchange Commission’s website (sec.gov), or you can have it mailed to you without charge by calling 800-662-7447. For the first and third fiscal quarters, the fund files the lists with the SEC on Form N-Q. Shareholders can look up the fund’s Forms N-Q on the SEC’s website. Forms N-Q may also be reviewed and copied at the SEC’s Public Reference Room (see the back cover of this report for further information).
| Face | Market | Percentage | |||||
| Maturity | Amount | Value • | of Net | ||||
| Coupon | Date | ($000) | ($000) | Assets | |||
| U.S. Government and Agency Obligations | |||||||
| U.S. Government Securities | |||||||
| United States Treasury | |||||||
| Note/Bond | 2.750% | 8/31/23 | 40,000 | 40,007 | 0.2% | ||
| U.S. Government | |||||||
| Securities—Other † | 35,004 | 0.1% | |||||
| Total U. S. Government and Agency Obligations (Cost $75,008) | 75,011 | 0.3% | |||||
| Corporate Bonds | |||||||
| Finance | |||||||
| Banking | |||||||
| Bank of America Corp. | 3.004% | 12/20/23 | 87,793 | 85,462 | 0.3% | ||
| Bank of America Corp. | 3.300% | 1/11/23 | 58,376 | 57,814 | 0.2% | ||
| 1 | Bank of America Corp. | 2.369% | 7/21/21 | 43,554 | 42,790 | 0.2% | |
| 1 | Bank of America Corp. | 3.550% | 3/5/24 | 41,500 | 41,228 | 0.1% | |
| 1 | Bank of America Corp. | 2.151%–5.875% | 4/21/20–7/23/24 | 361,671 | 356,491 | 1.3% | |
| Citibank NA | 1.850%–3.400% | 9/18/19–7/23/21 | 145,105 | 143,574 | 0.5% | ||
| Citigroup Inc. | 2.900% | 12/8/21 | 42,187 | 41,553 | 0.1% | ||
| 1 | Citigroup Inc. | 2.350%–5.375% | 1/10/20– 6/1/24 | 340,078 | 336,492 | 1.3% | |
| Deutsche Bank AG | 4.250% | 10/14/21 | 45,470 | 45,312 | 0.2% | ||
| Goldman Sachs Bank USA | 3.200% | 6/5/20 | 13,650 | 13,684 | 0.1% | ||
| Goldman Sachs Group Inc. | 5.750% | 1/24/22 | 67,388 | 71,988 | 0.3% | ||
| Goldman Sachs Group Inc. | 3.000% | 4/26/22 | 58,450 | 57,399 | 0.2% | ||
| Goldman Sachs Group Inc. | 5.250% | 7/27/21 | 47,872 | 50,292 | 0.2% | ||
| Goldman Sachs Group Inc. | 2.300% | 12/13/19 | 39,760 | 39,452 | 0.1% | ||
| 1 | Goldman Sachs | ||||||
| Group Inc. | 2.350%– 6.000% | 10/23/19–7/24/23 | 376,818 | 373,955 | 1.4% | ||
| HSBC Bank USA NA | 4.875% | 8/24/20 | 12,601 | 12,937 | 0.0% | ||
| HSBC Holdings plc | 2.650% | 1/5/22 | 50,435 | 49,039 | 0.2% | ||
| HSBC Holdings plc | 3.400% | 3/8/21 | 48,535 | 48,535 | 0.2% | ||
| 1 | HSBC Holdings plc | 3.262% | 3/13/23 | 45,912 | 45,157 | 0.2% | |
£¤
| Short-Term Corporate Bond Index Fund | ||||||
| Face | Market | Percentage | ||||
| Maturity | Amount | Value • | of Net | |||
| Coupon | Date | ($000) | ($000) | Assets | ||
| 1 HSBC Holdings plc | 2.950%–5.100% | 4/5/21–5/18/24 | 167,062 | 168,126 | 0.6% | |
| HSBC USA Inc. | 2.350%–5.000% | 11/13/19–9/27/20 | 65,766 | 65,514 | 0.2% | |
| JPMorgan Chase & Co. | 2.250% | 1/23/20 | 56,970 | 56,400 | 0.2% | |
| JPMorgan Chase & Co. | 2.295% | 8/15/21 | 49,711 | 48,443 | 0.2% | |
| JPMorgan Chase & Co. | 4.250% | 10/15/20 | 43,672 | 44,660 | 0.2% | |
| JPMorgan Chase & Co. | 2.550% | 3/1/21 | 44,521 | 43,806 | 0.2% | |
| 1 JPMorgan Chase & Co. | 2.200%–4.950% | 10/22/19–7/23/24 | 477,475 | 477,569 | 1.8% | |
| 1 JPMorgan Chase | ||||||
| Bank NA | 1.650%–3.086% | 9/23/19–4/26/21 | 67,573 | 67,230 | 0.2% | |
| Morgan Stanley | 2.750% | 5/19/22 | 59,100 | 57,611 | 0.2% | |
| Morgan Stanley | 2.625% | 11/17/21 | 51,056 | 49,819 | 0.2% | |
| Morgan Stanley | 2.650% | 1/27/20 | 46,836 | 46,555 | 0.2% | |
| Morgan Stanley | 5.625% | 9/23/19 | 44,908 | 46,181 | 0.2% | |
| Morgan Stanley | 2.500% | 4/21/21 | 44,245 | 43,078 | 0.2% | |
| 1 Morgan Stanley | 3.737% | 4/24/24 | 41,300 | 41,224 | 0.1% | |
| Morgan Stanley | 2.800%–5.750% | 1/26/20–5/22/23 | 235,452 | 240,502 | 0.9% | |
| Toronto-Dominion Bank | 2.500% | 12/14/20 | 49,419 | 48,757 | 0.2% | |
| Wells Fargo & Co. | 3.069% | 1/24/23 | 55,857 | 54,707 | 0.2% | |
| Wells Fargo & Co. | 2.625% | 7/22/22 | 47,250 | 45,762 | 0.2% | |
| Wells Fargo & Co. | 2.100% | 7/26/21 | 44,276 | 42,798 | 0.2% | |
| Wells Fargo & Co. | 2.150%–4.600% | 1/30/20–8/15/23 | 256,120 | 255,279 | 0.9% | |
| 1 Wells Fargo Bank NA | 2.150%–3.550% | 12/6/19–8/14/23 | 146,962 | 145,971 | 0.5% | |
| 2 Banking—Other † | 5,049,593 | 18.9% | ||||
| 2 Brokerage † | 217,147 | 0.8% | ||||
| Finance Companies | ||||||
| GE Capital International | ||||||
| Funding Co. Unlimited Co. | 2.342% | 11/15/20 | 79,990 | 78,291 | 0.3% | |
| Finance Companies—Other † | 271,730 | 1.0% | ||||
| 2 Insurance † | 895,752 | 3.4% | ||||
| Other Finance † | 9,895 | 0.0% | ||||
| Real Estate Investment Trusts † | 586,466 | 2.2% | ||||
| 11,112,020 | 41.5% | |||||
| Industrial | ||||||
| Basic Industry † | 623,530 | 2.3% | ||||
| Capital Goods | ||||||
| General Electric Co. | 2.700% | 10/9/22 | 43,463 | 42,233 | 0.2% | |
| General Electric Co. | 2.100%–5.550% | 12/11/19–1/9/23 | 146,070 | 148,427 | 0.5% | |
| 2 Capital Goods—Other † | 1,258,185 | 4.7% | ||||
| Communication | ||||||
| AT&T Inc. | 2.450%–5.875% | 10/1/19–2/17/23 | 254,492 | 254,383 | 0.9% | |
| Charter Communications | ||||||
| Operating LLC / Charter | ||||||
| Communications | ||||||
| Operating Capital | 4.464% | 7/23/22 | 40,342 | 41,129 | 0.2% | |
| Time Warner Inc. | 3.400%–4.875% | 3/15/20– 6/15/22 | 59,610 | 60,823 | 0.2% | |
| 2 Communication—Other † | 1,113,574 | 4.2% | ||||
| Consumer Cyclical | ||||||
| Ford Motor Credit | ||||||
| Co. LLC | 2.343%–8.125% | 11/4/19–8/6/23 | 284,170 | 281,071 | 1.1% | |
| General Motors | ||||||
| Financial Co. Inc. | 2.350%–4.375% | 10/4/19– 6/19/23 | 276,855 | 274,953 | 1.0% | |
| Visa Inc. | 2.200% | 12/14/20 | 46,270 | 45,564 | 0.2% | |
| 2 Consumer Cyclical—Other † | 1,526,764 | 5.7% | ||||
œ~
| Short-Term Corporate Bond Index Fund | |||||||
| Face | Market | Percentage | |||||
| Maturity | Amount | Value • | of Net | ||||
| Coupon | Date | ($000) | ($000) | Assets | |||
| Consumer Noncyclical | |||||||
| AbbVie Inc. | 2.500% | 5/14/20 | 58,585 | 58,044 | 0.2% | ||
| Allergan Funding SCS | 3.000% | 3/12/20 | 47,193 | 47,080 | 0.2% | ||
| Anheuser-Busch InBev | |||||||
| Finance Inc. | 2.650% | 2/1/21 | 109,000 | 107,646 | 0.4% | ||
| Anheuser-Busch InBev | |||||||
| Finance Inc. | 3.300% | 2/1/23 | 93,749 | 92,887 | 0.3% | ||
| Anheuser-Busch InBev | |||||||
| Finance Inc. | 2.625% | 1/17/23 | 9,505 | 9,179 | 0.0% | ||
| Anheuser-Busch InBev | |||||||
| Worldwide Inc. | 2.500% | 7/15/22 | 45,735 | 44,342 | 0.2% | ||
| Anheuser-Busch InBev | |||||||
| Worldwide Inc. | 3.750%– 6.875% | 11/15/19–1/15/22 | 46,643 | 47,632 | 0.2% | ||
| 2 | Anheuser-Busch North | ||||||
| American Holding Corp. | 3.750% | 1/15/22 | 750 | 762 | 0.0% | ||
| CVS Health Corp. | 3.700% | 3/9/23 | 81,215 | 80,759 | 0.3% | ||
| CVS Health Corp. | 2.800% | 7/20/20 | 41,064 | 40,779 | 0.1% | ||
| Medtronic Inc. | 3.150% | 3/15/22 | 41,186 | 41,068 | 0.2% | ||
| Medtronic Inc. | 2.500% | 3/15/20 | 40,347 | 40,105 | 0.1% | ||
| Shire Acquisitions | |||||||
| Investments Ireland DAC | 1.900% | 9/23/19 | 44,691 | 44,131 | 0.2% | ||
| Shire Acquisitions | |||||||
| Investments Ireland DAC | 2.400% | 9/23/21 | 44,237 | 42,733 | 0.2% | ||
| 2,3 | Consumer Noncyclical—Other † | 3,294,008 | 12.3% | ||||
| Energy | |||||||
| Baker Hughes a GE Co. LLC | 3.200% | 8/15/21 | 7,983 | 7,972 | 0.0% | ||
| Baker Hughes a GE Co. LLC / | |||||||
| Baker Hughes Co-Obligor Inc. | 2.773% | 12/15/22 | 18,950 | 18,369 | 0.1% | ||
| Energy—Other † | 1,876,289 | 7.0% | |||||
| Other Industrial † | 17,507 | 0.1% | |||||
| Technology | |||||||
| Apple Inc. | 2.400% | 5/3/23 | 76,345 | 73,826 | 0.3% | ||
| Apple Inc. | 1.500%–2.850% | 9/12/19–2/23/23 | 319,777 | 314,712 | 1.2% | ||
| Broadcom Corp. / | |||||||
| Broadcom Cayman | |||||||
| Finance Ltd. | 3.000% | 1/15/22 | 47,517 | 46,332 | 0.2% | ||
| Broadcom Corp. / | |||||||
| Broadcom Cayman | |||||||
| Finance Ltd. | 2.375% | 1/15/20 | 43,115 | 42,654 | 0.2% | ||
| 2 | Dell International LLC / | ||||||
| EMC Corp. | 5.450% | 6/15/23 | 49,995 | 52,514 | 0.2% | ||
| 2 | Diamond 1 Finance Corp. / | ||||||
| Diamond 2 Finance Corp. | 4.420% | 6/15/21 | 67,981 | 69,133 | 0.2% | ||
| Hewlett Packard Enterprise Co. | 3.600% | 10/15/20 | 50,981 | 51,317 | 0.2% | ||
| Oracle Corp. | 1.900% | 9/15/21 | 64,534 | 62,440 | 0.2% | ||
| Technology—Other † | 1,552,699 | 5.8% | |||||
| Transportation † | 384,026 | 1.4% | |||||
| 14,231,581 | 53.2% | ||||||
| Utilities | |||||||
| 2 | Electric † | 1,050,761 | 3.9% | ||||
| 2 | Natural Gas † | 73,435 | 0.3% | ||||
| 1,124,196 | 4.2% | ||||||
| Total Corporate Bonds (Cost $26,872,622) | 26,467,797 | 98.9% | |||||
~Ÿ
| Short-Term Corporate Bond Index Fund | ||||
| Market | Percentage | |||
| Value• | of Net | |||
| ($000) | Assets | |||
| Taxable Municipal Bonds (Cost $2,054) † | 2,029 | 0.0% | ||
| Coupon | Shares | |||
| Temporary Cash Investment | ||||
| Money Market Fund | ||||
| 4 Vanguard Market Liquidity Fund | ||||
| (Cost $42,716) | 2.153% | 427,159 | 42,725 | 0.2% |
| Total Investments (Cost $26,992,400) | 26,587,562 | 99.4% | ||
| Amount | ||||
| ($000) | ||||
| Other Assets and Liabilities | ||||
| Other Assets | ||||
| Investment in Vanguard | 1,361 | |||
| Receivables for Investment Securities Sold | 80,026 | |||
| Receivables for Accrued Income | 223,268 | |||
| Receivables for Capital Shares Issued | 3,854 | |||
| Other Assets | 3,543 | |||
| Total Other Assets | 312,052 | 1.2% | ||
| Liabilities | ||||
| Payables for Investment Securities Purchased | (135,825) | |||
| Payables for Capital Shares Redeemed | (6,352) | |||
| Payables for Distributions | (2,268) | |||
| Payables to Vanguard | (4,140) | |||
| Variation Margin Payable—Futures Contracts | (746) | |||
| Total Liabilities | (149,331) | (0.6%) | ||
| Net Assets | 26,750,283 | 100.0% | ||
| At August 31, 2018, net assets consisted of: | ||||
| Amount | ||||
| ($000) | ||||
| Paid-in Capital | 27,168,329 | |||
| Undistributed Net Investment Income | 45,842 | |||
| Accumulated Net Realized Losses | (59,047) | |||
| Unrealized Appreciation (Depreciation) | ||||
| Investment Securities | (404,838) | |||
| Futures Contracts | (3) | |||
| Net Assets | 26,750,283 | |||
| ETF Shares—Net Assets | ||||
| Applicable to 274,646,883 outstanding $.001 par value shares of | ||||
| beneficial interest (unlimited authorization) | 21,511,487 | |||
| Net Asset Value Per Share—ETF Shares | $78.32 | |||
–—
Short-Term Corporate Bond Index Fund
| Amount | |
| ($000) | |
| Admiral Shares—Net Assets | |
| Applicable to 165,971,140 outstanding $.001 par value shares of | |
| beneficial interest (unlimited authorization) | 3,532,599 |
| Net Asset Value Per Share—Admiral Shares | $21.28 |
| Institutional Shares—Net Assets | |
| Applicable to 65,483,918 outstanding $.001 par value shares of | |
| beneficial interest (unlimited authorization) | 1,706,197 |
| Net Asset Value Per Share—Institutional Shares | $26.06 |
• See Note A in Notes to Financial Statements.
† Represents the aggregate value, by category, of securities that are not among the 50 largest holdings and, in total for any issuer,
represent 1% or less of net assets.
1 The average or expected maturity is shorter than the final maturity shown because of the possibility of interim principal payments
and prepayments or the possibility of the issue being called.
2 Certain of the fund’s securities are exempt from registration under Rule 144A of the Securities Act of 1933. Such securities may be
sold in transactions exempt from registration, normally to qualified institutional buyers. At August 31, 2018, the aggregate value of
these securities was $360,386,000, representing 1.3% of net assets.
3 Securities with a value of $4,065,000 have been segregated as initial margin for open futures contracts.
4 Affiliated money market fund available only to Vanguard funds and certain trusts and accounts managed by Vanguard. Rate shown
is the 7-day yield.
| Derivative Financial Instruments Outstanding as of Period End | ||||
| Futures Contracts | ||||
| ($000) | ||||
| Value and | ||||
| Number of | Unrealized | |||
| Long (Short) | Notional | Appreciation | ||
| Expiration | Contracts | Amount | (Depreciation) | |
| Short Futures Contracts | ||||
| 2-Year U.S. Treasury Note | December 2018 | (210) | (44,385) | (3) |
See accompanying Notes, which are an integral part of the Financial Statements.
‰‰
Short-Term Corporate Bond Index Fund
Statement of Operations
| Year Ended | |
| August 31, 2018 | |
| ($000) | |
| Investment Income | |
| Income | |
| Interest1 | 669,783 |
| Total Income | 669,783 |
| Expenses | |
| The Vanguard Group—Note B | |
| Investment Advisory Services | 816 |
| Management and Administrative—ETF Shares | 11,878 |
| Management and Administrative—Admiral Shares | 1,956 |
| Management and Administrative—Institutional Shares | 692 |
| Marketing and Distribution—ETF Shares | 1,179 |
| Marketing and Distribution—Admiral Shares | 274 |
| Marketing and Distribution—Institutional Shares | 47 |
| Custodian Fees | 86 |
| Auditing Fees | 54 |
| Shareholders’ Reports and Proxy—ETF Shares | 1,048 |
| Shareholders’ Reports and Proxy—Admiral Shares | 54 |
| Shareholders’ Reports and Proxy—Institutional Shares | 1 |
| Trustees’ Fees and Expenses | 15 |
| Total Expenses | 18,100 |
| Net Investment Income | 651,683 |
| Realized Net Gain (Loss) | |
| Investment Securities Sold1,2 | (73,540) |
| Futures Contracts | 2,179 |
| Realized Net Gain (Loss) | (71,361) |
| Change in Unrealized Appreciation (Depreciation) | |
| Investment Securities1 | (578,477) |
| Futures Contracts | (3) |
| Change in Unrealized Appreciation (Depreciation) | (578,480) |
| Net Increase (Decrease) in Net Assets Resulting from Operations | 1,842 |
1 Interest income, realized net gain (loss), and change in unrealized appreciation (depreciation) from an affiliated company of the fund
were $1,373,000, $30,000, and $5,000, respectively. Purchases and sales are for temporary cash investment purposes.
2 Includes ($25,532,000) of net gain (loss) resulting from in-kind redemptions; such gain (loss) is not taxable to the fund.
See accompanying Notes, which are an integral part of the Financial Statements.
“”
Short-Term Corporate Bond Index Fund
Statement of Changes in Net Assets
| Year Ended August 31, | ||
| 2018 | 2017 | |
| ($000) | ($000) | |
| Increase (Decrease) in Net Assets | ||
| Operations | ||
| Net Investment Income | 651,683 | 463,976 |
| Realized Net Gain (Loss) | (71,361) | 13,416 |
| Change in Unrealized Appreciation (Depreciation) | (578,480) | (39,014) |
| Net Increase (Decrease) in Net Assets Resulting from Operations | 1,842 | 438,378 |
| Distributions | ||
| Net Investment Income | ||
| ETF Shares | (518,779) | (368,312) |
| Admiral Shares | (85,686) | (53,903) |
| Institutional Shares | (40,252) | (27,080) |
| Realized Capital Gain | ||
| ETF Shares | — | — |
| Admiral Shares | — | — |
| Institutional Shares | — | — |
| Total Distributions | (644,717) | (449,295) |
| Capital Share Transactions | ||
| ETF Shares | 1,169,464 | 6,749,919 |
| Admiral Shares | 437,240 | 1,222,309 |
| Institutional Shares | 230,307 | 495,280 |
| Net Increase (Decrease) from Capital Share Transactions | 1,837,011 | 8,467,508 |
| Total Increase (Decrease) | 1,194,136 | 8,456,591 |
| Net Assets | ||
| Beginning of Period | 25,556,147 | 17,099,556 |
| End of Period1 | 26,750,283 | 25,556,147 |
| 1 Net Assets—End of Period includes undistributed (overdistributed) net investment income of $45,842,000 and $38,876,000. | ||
See accompanying Notes, which are an integral part of the Financial Statements.
}‘
Short-Term Corporate Bond Index Fund
Financial Highlights
| ETF Shares | |||||
| For a Share Outstanding | Year Ended August 31, | ||||
| Throughout Each Period | 2018 | 2017 | 2016 | 2015 | 2014 |
| Net Asset Value, Beginning of Period | $80.25 | $80.52 | $79.33 | $80.21 | $78.97 |
| Investment Operations | |||||
| Net Investment Income | 1.9501 | 1.7681 | 1.661 | 1.504 | 1.436 |
| Net Realized and Unrealized Gain (Loss) | |||||
| on Investments | (1.953) | (.317) | 1.240 | (.743) | 1.305 |
| Total from Investment Operations | (.003) | 1.451 | 2.901 | .761 | 2.741 |
| Distributions | |||||
| Dividends from Net Investment Income | (1.927) | (1.721) | (1.648) | (1.492) | (1.321) |
| Distributions from Realized Capital Gains | — | — | (.063) | (.149) | (.180) |
| Total Distributions | (1.927) | (1.721) | (1.711) | (1.641) | (1.501) |
| Net Asset Value, End of Period | $78.32 | $80.25 | $80.52 | $79.33 | $80.21 |
| Total Return | 0.01% | 1.84% | 3.71% | 0.96% | 3.50% |
| Ratios/Supplemental Data | |||||
| Net Assets, End of Period (Millions) | $21,511 | $20,862 | $14,121 | $10,377 | $8,430 |
| Ratio of Total Expenses to Average Net Assets | 0.07% | 0.07% | 0.07% | 0.10% | 0.12% |
| Ratio of Net Investment Income to | |||||
| Average Net Assets | 2.48% | 2.21% | 2.11% | 1.90% | 1.82% |
| Portfolio Turnover Rate2 | 56% | 66% | 57% | 62% | 56% |
1 Calculated based on average shares outstanding.
2 Excludes the value of portfolio securities received or delivered as a result of in-kind purchases or redemptions of the fund’s capital
shares, including ETF Creation Units.
See accompanying Notes, which are an integral part of the Financial Statements.
•–
Short-Term Corporate Bond Index Fund
Financial Highlights
| Admiral Shares | |||||
| For a Share Outstanding | Year Ended August 31, | ||||
| Throughout Each Period | 2018 | 2017 | 2016 | 2015 | 2014 |
| Net Asset Value, Beginning of Period | $21.81 | $21.89 | $21.57 | $21.81 | $21.51 |
| Investment Operations | |||||
| Net Investment Income | .5321 | . 4811 | .451 | .409 | .395 |
| Net Realized and Unrealized Gain (Loss) | |||||
| on Investments | (.531) | (.088) | .337 | (.199) | .347 |
| Total from Investment Operations | .001 | .393 | .788 | .210 | .742 |
| Distributions | |||||
| Dividends from Net Investment Income | (.531) | (.473) | (.451) | (.410) | (.393) |
| Distributions from Realized Capital Gains | — | — | (.017) | (.040) | (.049) |
| Total Distributions | (.531) | (.473) | (.468) | (.450) | (.442) |
| Net Asset Value, End of Period | $21.28 | $21.81 | $21.89 | $21.57 | $21.81 |
| Total Return2 | 0.02% | 1.83% | 3.70% | 0.97% | 3.47% |
| Ratios/Supplemental Data | |||||
| Net Assets, End of Period (Millions) | $3,533 | $3,180 | $1,959 | $1,222 | $821 |
| Ratio of Total Expenses to Average Net Assets | 0.07% | 0.07% | 0.07% | 0.10% | 0.12% |
| Ratio of Net Investment Income to | |||||
| Average Net Assets | 2.48% | 2.21% | 2.11% | 1.90% | 1.82% |
| Portfolio Turnover Rate 3 | 56% | 66% | 57% | 62% | 56% |
Signal Shares were renamed Admiral Shares in October 2013.
1 Calculated based on average shares outstanding.
2 Total returns do not include transaction or account service fees that may have applied in the periods shown. Fund prospectuses provide
information about any applicable transaction and account service fees.
3 Excludes the value of portfolio securities received or delivered as a result of in-kind purchases or redemptions of the fund’s capital
shares, including ETF Creation Units.
See accompanying Notes, which are an integral part of the Financial Statements.
•–
Short-Term Corporate Bond Index Fund
Financial Highlights
| Institutional Shares | |||||
| For a Share Outstanding | Year Ended August 31, | ||||
| Throughout Each Period | 2018 | 2017 | 2016 | 2015 | 2014 |
| Net Asset Value, Beginning of Period | $26.70 | $26.80 | $26.41 | $26.71 | $26.33 |
| Investment Operations | |||||
| Net Investment Income | .6561 | .5941 | .558 | .509 | .491 |
| Net Realized and Unrealized Gain (Loss) | |||||
| on Investments | (.641) | (.111) | .413 | (.249) | .437 |
| Total from Investment Operations | .015 | .483 | .971 | .260 | .928 |
| Distributions | |||||
| Dividends from Net Investment Income | (.655) | (.583) | (.560) | (.510) | (.488) |
| Distributions from Realized Capital Gains | — | — | (.021) | (.050) | (.060) |
| Total Distributions | (.655) | (.583) | (.581) | (.560) | (.548) |
| Net Asset Value, End of Period | $26.06 | $26.70 | $26.80 | $26.41 | $26.71 |
| Total Return2 | 0.07% | 1.84% | 3.72% | 0.98% | 3.55% |
| Ratios/Supplemental Data | |||||
| Net Assets, End of Period (Millions) | $1,706 | $1,515 | $1,020 | $745 | $634 |
| Ratio of Total Expenses to Average Net Assets | 0.05% | 0.05% | 0.05% | 0.07% | 0.09% |
| Ratio of Net Investment Income to | |||||
| Average Net Assets | 2.50% | 2.23% | 2.13% | 1.93% | 1.85% |
| Portfolio Turnover Rate 3 | 56% | 66% | 57% | 62% | 56% |
1 Calculated based on average shares outstanding.
2 Total returns do not include transaction fees that may have applied in the periods shown. Fund prospectuses provide information about
any applicable transaction fees.
3 Excludes the value of portfolio securities received or delivered as a result of in-kind purchases or redemptions of the fund’s capital
shares, including ETF Creation Units.
See accompanying Notes, which are an integral part of the Financial Statements.
•–
Short-Term Corporate Bond Index Fund
Notes to Financial Statements
Vanguard Short-Term Corporate Bond Index Fund is registered under the Investment Company Act of 1940 as an open-end investment company, or mutual fund. Certain of the fund’s investments are in corporate debt instruments; the issuers’ abilities to meet their obligations may be affected by economic developments in their respective industries. The fund offers three classes of shares: ETF Shares, Admiral Shares, and Institutional Shares. ETF Shares are listed for trading on Nasdaq; they can be purchased and sold through a broker. Admiral Shares and Institutional Shares are designed for investors who meet certain administrative, service, and account-size criteria.
A. The following significant accounting policies conform to generally accepted accounting principles for U.S. investment companies. The fund consistently follows such policies in preparing its financial statements.
1. Security Valuation: Securities are valued as of the close of trading on the New York Stock Exchange (generally 4 p.m., Eastern time) on the valuation date. Bonds and temporary cash investments are valued using the latest bid prices or using valuations based on a matrix system (which considers such factors as security prices, yields, maturities, and ratings), both as furnished by independent pricing services. Investments in Vanguard Market Liquidity Fund are valued at that fund’s net asset value. Securities for which market quotations are not readily available, or whose values have been affected by events occurring before the fund’s pricing time but after the close of the securities’ primary markets, are valued by methods deemed by the board of trustees to represent fair value.
2. Futures Contracts: The fund uses futures contracts to invest in fixed income asset classes with greater efficiency and lower cost than is possible through direct investment, to add value when these instruments are attractively priced, or to adjust sensitivity to changes in interest rates. The primary risks associated with the use of futures contracts are imperfect correlation between changes in market values of bonds held by the fund and the prices of futures contracts, and the possibility of an illiquid market. Counterparty risk involving futures is mitigated because a regulated clearinghouse is the counterparty instead of the clearing broker. To further mitigate counterparty risk, the fund trades futures contracts on an exchange, monitors the financial strength of its clearing brokers and clearinghouse, and has entered into clearing agreements with its clearing brokers. The clearinghouse imposes initial margin requirements to secure the fund’s performance and requires daily settlement of variation margin representing changes in the market value of each contract.
Any assets pledged as initial margin for open contracts are noted in the Statement of Net Assets.
Futures contracts are valued at their quoted daily settlement prices. The notional amounts of the contracts are not recorded in the Statement of Net Assets. Fluctuations in the value of the contracts are recorded in the Statement of Net Assets as an asset (liability) and in the Statement of Operations as unrealized appreciation (depreciation) until the contracts are closed, when they are recorded as realized futures gains (losses).
During the year ended August 31, 2018, the fund’s average investments in long and short futures contracts each represented less than 1% of net assets, based on the average of the notional amounts at each quarter-end during the period.
3. Federal Income Taxes: The fund intends to continue to qualify as a regulated investment company and distribute all of its taxable income. Management has analyzed the fund’s tax positions taken for all open federal income tax years (August 31, 2015–2018), and has concluded that no provision for federal income tax is required in the fund’s financial statements.
š›
Short-Term Corporate Bond Index Fund
4. Distributions: Distributions to shareholders are recorded on the ex-dividend date. Distributions are determined on a tax basis and may differ from net investment income and realized capital gains for financial reporting purposes.
5. Credit Facility: The fund and certain other funds managed by The Vanguard Group (“Vanguard”) participate in a $3.1 billion committed credit facility provided by a syndicate of lenders pursuant to a credit agreement that may be renewed annually; each fund is individually liable for its borrowings, if any, under the credit facility. Borrowings may be utilized for temporary and emergency purposes, and are subject to the fund’s regulatory and contractual borrowing restrictions. The participating funds are charged administrative fees and an annual commitment fee of 0.10% of the undrawn amount of the facility; these fees are allocated to the funds based on a method approved by the fund’s board of trustees and included in Management and Administrative expenses on the fund’s Statement of Operations. Any borrowings under this facility bear interest at a rate based upon the higher of the one-month London Interbank Offered Rate, federal funds effective rate, or overnight bank funding rate plus an agreed-upon spread.
The fund had no borrowings outstanding at August 31, 2018, or at any time during the period then ended.
6. Other: Interest income includes income distributions received from Vanguard Market Liquidity Fund and is accrued daily. Premiums and discounts on debt securities purchased are amortized and accreted, respectively, to interest income over the lives of the respective securities. Security transactions are accounted for on the date securities are bought or sold. Costs used to determine realized gains (losses) on the sale of investment securities are those of the specific securities sold.
Each class of shares has equal rights as to assets and earnings, except that each class separately bears certain class-specific expenses related to maintenance of shareholder accounts (included in Management and Administrative expenses), shareholder reporting, and the proxy. Marketing and distribution expenses are allocated to each class of shares based on a method approved by the board of trustees. Income, other non-class-specific expenses, and gains and losses on investments are allocated to each class of shares based on its relative net assets.
B. In accordance with the terms of a Funds’ Service Agreement (the “FSA”) between Vanguard and the fund, Vanguard furnishes to the fund investment advisory, corporate management, administrative, marketing, and distribution services at Vanguard’s cost of operations (as defined by the FSA). These costs of operations are allocated to the fund based on methods and guidelines approved by the board of trustees. Vanguard does not require reimbursement in the current period for certain costs of operations (such as deferred compensation/benefits and risk/insurance costs); the fund’s liability for these costs of operations is included in Payables to Vanguard on the Statement of Net Assets. All other costs of operations payable to Vanguard are generally settled twice a month.
Upon the request of Vanguard, the fund may invest up to 0.40% of its net assets as capital in Vanguard. At August 31, 2018, the fund had contributed to Vanguard capital in the amount of $1,361,000, representing 0.01% of the fund’s net assets and 0.54% of Vanguard’s capitalization. The fund’s trustees and officers are also directors and employees, respectively, of Vanguard.
¡¢
Short-Term Corporate Bond Index Fund
C. Various inputs may be used to determine the value of the fund’s investments. These inputs are summarized in three broad levels for financial statement purposes. The inputs or methodologies used to value securities are not necessarily an indication of the risk associated with investing in those securities.
Level 1—Quoted prices in active markets for identical securities.
Level 2—Other significant observable inputs (including quoted prices for similar securities, interest rates, prepayment speeds, credit risk, etc.).
Level 3—Significant unobservable inputs (including the fund’s own assumptions used to determine
the fair value of investments). Any investments valued with significant unobservable inputs are
noted on the Statement of Net Assets.
The following table summarizes the market value of the fund’s investments as of August 31, 2018, based on the inputs used to value them:
| Level 1 | Level 2 | Level 3 | |
| Investments | ($000) | ($000) | ($000) |
| U.S. Government and Agency Obligations | — | 75,011 | — |
| Corporate Bonds | — | 26,467,797 | — |
| Taxable Municipal Bonds | — | 2,029 | — |
| Temporary Cash Investments | 42,725 | — | — |
| Futures Contracts—Liabilities1 | (746) | — | — |
| Total | 41,979 | 26,544,837 | — |
| 1 Represents variation margin on the last day of the reporting period. |
D. Permanent differences are reclassified among capital accounts in the financial statements to reflect their tax character. These reclassifications have no effect on net assets or net asset value per share. As of period end, the following permanent differences primarily attributable to the accounting for in-kind redemptions were reclassified to the following accounts:
| Amount | |
| ($000) | |
| Paid-in capital | (25,532) |
| Undistributed (Overdistributed) net investment income | — |
| Accumulated net realized gains (losses) | 25,532 |
š›
Short-Term Corporate Bond Index Fund
Temporary differences between book-basis and tax-basis components of accumulated net earnings (losses) arise when certain items of income, gain, or loss are recognized in different periods for financial statement and tax purposes; these differences will reverse at some time in the future. The differences are primarily related to the tax deferral of losses on wash sales, the realization of unrealized gains or losses on certain futures contracts, and payables for distributions. As of period end, the tax components of accumulated net earnings (losses) are detailed in the table as follows:
| Amount | |
| ($000) | |
| Undistributed ordinary income | 51,303 |
| Undistributed long-term gains | — |
| Capital loss carryforwards (non-expiring) | (59,005) |
| Net unrealized gains (losses) | (404,838) |
As of August 31, 2018, gross unrealized appreciation and depreciation for investments and derivatives based on cost for U.S. federal income tax purposes were as follows:
| Amount | |
| ($000) | |
| Tax cost | 26,992,400 |
| Gross unrealized appreciation | 10,746 |
| Gross unrealized depreciation | (415,584) |
| Net unrealized appreciation (depreciation) | (404,838) |
E. During the year ended August 31, 2018, the fund purchased $12,802,910,000 of investment securities and sold $10,756,912,000 of investment securities, other than U.S. government securities and temporary cash investments. Purchases and sales of U.S. government securities were $5,954,127,000 and $6,023,778,000, respectively. Total purchases and sales include $3,415,901,000 and $2,272,692,000, respectively, in connection with in-kind purchases and redemptions of the fund’s capital shares.
The fund purchased securities from and sold securities to other Vanguard funds or accounts managed by Vanguard or its affiliates, in accordance with procedures adopted by the board of trustees in compliance with Rule 17a-7 of the Investment Company Act of 1940. For the year ended August 31, 2018, such purchases and sales were $4,919,208,000 and $844,043,000, respectively; these amounts are included in the purchases and sales of investment securities noted above.
Short-Term Corporate Bond Index Fund
F. Capital share transactions for each class of shares were:
| Year Ended August 31, | ||||
| 2018 | 2017 | |||
| Amount | Shares | Amount | Shares | |
| ($000) | (000) | ($000) | (000) | |
| ETF Shares | ||||
| Issued | 3,483,918 | 44,176 | 6,885,407 | 86,293 |
| Issued in Lieu of Cash Distributions | — | — | — | — |
| Redeemed | (2,314,454) | (29,500) | (135,488) | (1,700) |
| Net Increase (Decrease)—ETF Shares | 1,169,464 | 14,676 | 6,749,919 | 84,593 |
| Admiral Shares | ||||
| Issued | 2,006,001 | 93,348 | 2,266,859 | 104,397 |
| Issued in Lieu of Cash Distributions | 69,123 | 3,230 | 43,547 | 2,006 |
| Redeemed | (1,637,884) | (76,367) | (1,088,097) | (50,134) |
| Net Increase (Decrease) —Admiral Shares | 437,240 | 20,211 | 1,222,309 | 56,269 |
| Institutional Shares | ||||
| Issued | 506,657 | 19,295 | 622,558 | 23,451 |
| Issued in Lieu of Cash Distributions | 31,448 | 1,200 | 20,932 | 788 |
| Redeemed | (307,798) | (11,728) | (148,210) | (5,579) |
| Net Increase (Decrease)—Institutional Shares | 230,307 | 8,767 | 495,280 | 18,660 |
G. Management has determined that no events or transactions occurred subsequent to August 31, 2018, that would require recognition or disclosure in these financial statements.
‘’
Intermediate-Term Corporate Bond Index Fund
Fund Profile
As of August 31, 2018
| Share-Class Characteristics | |||
| ETF | Admiral Institutional | ||
| Shares | Shares | Shares | |
| Ticker Symbol | VCIT | VICSX | VICBX |
| Expense Ratio1 | 0.07% | 0.07% | 0.05% |
| 30-Day SEC Yield | 3.98% | 3.98% | 4.00% |
| Financial Attributes | |||
| Bloomberg | |||
| Barclays | Bloomberg | ||
| U.S. 5–10 | Barclays | ||
| Year | U.S. | ||
| Corporate | Aggregate | ||
| Fund | Bond Index | FA Index | |
| Number of Bonds | 1,736 | 1,705 | 10,038 |
| Yield to Maturity | |||
| (before expenses) | 4.0% | 4.0% | 3.3% |
| Average Coupon | 3.7% | 3.8% | 3.1% |
| Average Duration | 6.3 years | 6.3 years | 6.1 years |
| Average Effective | |||
| Maturity | 7.5 years | 7.4 years | 8.4 years |
| Short-Term | |||
| Reserves | 0.4% | — | — |
| Sector Diversification (% of portfolio) | |
| Finance | 36.5% |
| Industrial | 57.9 |
| Treasury/Agency | 0.2 |
| Utilities | 5.4 |
The agency and mortgage-backed securities sectors may include
issues from government-sponsored enterprises; such issues are
generally not backed by the full faith and credit of the U.S.
government.
| Volatility Measures | ||
| Bloomberg | ||
| Barclays U.S. | Bloomberg | |
| 5–10 Year | Barclays U.S. | |
| Corporate | Aggregate | |
| Bond Index | FA Index | |
| R-Squared | 0.99 | 0.84 |
| Beta | 1.02 | 1.20 |
| These measures show the degree and timing of the fund’s | ||
| fluctuations compared with the indexes over 36 months. | ||
| Distribution by Effective Maturity | |
| (% of portfolio) | |
| Under 1 Year | 0.1% |
| 1 - 3 Years | 0.1 |
| 3 - 5 Years | 1.7 |
| 5 - 10 Years | 98.1 |
| Distribution by Credit Quality (% of portfolio) | |
| U.S. Government | 0.1% |
| Aaa | 1.6 |
| Aa | 5.7 |
| A | 37.9 |
| Baa | 54.7 |
Credit-quality ratings are obtained from Barclays and are from
Moody's, Fitch, and S&P. When ratings from all three agencies are
used, the median rating is shown. When ratings from two of the
agencies are used, the lower rating for each issue is shown. "Not
Rated" is used to classify securities for which a rating is not
available. For more information about these ratings, see the
Glossary entry for Credit Quality.
Investment Focus
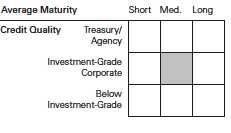
1 The expense ratios shown are from the prospectus dated December 21, 2017, and represent estimated costs for the current fiscal year. For the
fiscal year ended August 31, 2018, the expense ratios were 0.07% for ETF Shares, 0.07% for Admiral Shares, and 0.05% for Institutional Shares.
77
Intermediate-Term Corporate Bond Index Fund
Performance Summary
All of the returns in this report represent past performance, which is not a guarantee of future results that may be achieved by the fund. (Current performance may be lower or higher than the performance data cited. For performance data current to the most recent month-end, visit our website at vanguard.com/performance.) Note, too, that both investment returns and principal value can fluctuate widely, so an investor’s shares, when sold, could be worth more or less than their original cost. The returns shown do not reflect taxes that a shareholder would pay on fund distributions or on the sale of fund shares.
Cumulative Performance: November 19, 2009, Through August 31, 2018
Initial Investment of $10,000
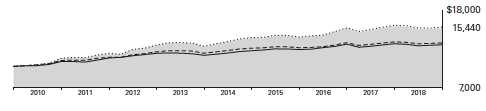
| Average Annual Total Returns | |||||
| Periods Ended August 31, 2018 | |||||
| Since | Final Value | ||||
| One | Five | Inception | of a $10,000 | ||
| Year | Years | (11/19/2009) | Investment | ||
| Intermediate-Term Corporate Bond | |||||
| Index Fund ETF Shares Net Asset Value | -1.62% | 3.87% | 5.07% | $15,440 | |
| Intermediate-Term Corporate Bond | |||||
| Index Fund ETF Shares Market Price | -1.71 | 3.85 | 5.08 | 15,446 | |
| Bloomberg Barclays U.S. 5–10 Year | |||||
| • • • • • • •• | Corporate Bond Index | -1.49 | 3.93 | 5.19 | 15,591 |
| – – – – | Spliced Core Bond Funds Average | -1.12 | 2.35 | 3.32 | 13,318 |
| Spliced Bloomberg Barclays U.S. | |||||
| Aggregate Float Adjusted Index | -1.09 | 2.47 | 3.09 | 13,062 | |
For a benchmark description, see the Glossary.
Spliced Core Bond Funds Average: Derived from data provided by Lipper, a Thomson Reuters Company.
"Since Inception" performance is calculated from the ETF Shares’ inception date for both the fund and its comparative standards.
Vanguard fund returns are adjusted to reflect the 0.25% fee on purchases of fund shares. The fee does not apply to the ETF Shares. The
Fiscal-Year Total Returns table is not adjusted for fees.
See Financial Highlights for dividend and capital gains information.
78
Intermediate-Term Corporate Bond Index Fund
| Average Annual Total Returns | ||||
| Periods Ended August 31, 2018 | ||||
| Since | Final Value | |||
| One | Five | Inception | of a $10,000 | |
| Year | Years | (3/2/2010) | Investment | |
| Intermediate-Term Corporate Bond Index | ||||
| Fund Admiral Shares | -1.85% | 3.83% | 4.95% | $15,071 |
| Bloomberg Barclays U.S. 5–10 Year | ||||
| Corporate Bond Index | -1.49 | 3.93 | 5.06 | 15,207 |
| Bloomberg Barclays U.S. Aggregate Float | ||||
| Adjusted Index | -1.09 | 2.47 | 3.07 | 12,929 |
| "Since Inception" performance is calculated from the Admiral Shares’ inception date for both the fund and its comparative standards. | ||||
| Since | Final Value | |||
| One | Five | Inception | of a $5,000,000 | |
| Year | Years | (11/19/2009) | Investment | |
| Intermediate-Term Corporate Bond Index | ||||
| Fund Institutional Shares | -1.82% | 3.84% | 5.08% | $7,725,058 |
| Bloomberg Barclays U.S. 5–10 Year | ||||
| Corporate Bond Index | -1.49 | 3.93 | 5.19 | 7,795,427 |
| Spliced Bloomberg Barclays U.S. Aggregate | ||||
| Float Adjusted Index | -1.09 | 2.47 | 3.09 | 6,530,959 |
| "Since Inception" performance is calculated from the Institutional Shares’ inception date for both the fund and its comparative standards. | ||||
| Cumulative Returns of ETF Shares: November 19, 2009, Through August 31, 2018 | |||
| Since | |||
| One | Five | Inception | |
| Year | Years | (11/19/2009) | |
| Intermediate-Term Corporate Bond Index Fund ETF | |||
| Shares Market Price | -1.71% | 20.80% | 54.46% |
| Intermediate-Term Corporate Bond Index Fund ETF | |||
| Shares Net Asset Value | -1.62 | 20.88 | 54.40 |
| Bloomberg Barclays U.S. 5–10 Year Corporate Bond | |||
| Index | -1.49 | 21.27 | 55.91 |
| "Since Inception" performance is calculated from the ETF Shares’ inception date for both the fund and its comparative standards. | |||
Vanguard fund returns are adjusted to reflect the 0.25% fee on purchases of fund shares. The fee does not apply to the ETF Shares. The
Fiscal-Year Total Returns table is not adjusted for fees.
79
Intermediate-Term Corporate Bond Index Fund
| Fiscal-Year Total Returns (%): November 19, 2009, Through August 31, 2018 | ||
| Bloomberg | ||
| Barclays U.S. | ||
| 5–10 Year | ||
| Corporate Bond | ||
| ETF Shares Net Asset Value | Index | |
| Fiscal Year | Total Returns | Total Returns |
| 2010 | 11.30% | 11.41% |
| 2011 | 5.65 | 6.19 |
| 2012 | 10.43 | 10.07 |
| 2013 | -1.64 | -1.27 |
| 2014 | 9.60 | 9.51 |
| 2015 | 0.32 | 0.39 |
| 2016 | 9.58 | 9.46 |
| 2017 | 1.98 | 2.30 |
| 2018 | -1.62 | -1.49 |
Average Annual Total Returns: Periods Ended June 30, 2018
This table presents returns through the latest calendar quarter—rather than through the end of the fiscal period.
Securities and Exchange Commission rules require that we provide this information.
| Since Inception | ||||||
| Inception Date | One Year | Five Years | Income | Capital | Total | |
| ETF Shares | 11/19/2009 | |||||
| Market Price | -1.40% | 3.53% | 5.01% | |||
| Net Asset Value | -1.27 | 3.52 | 5.01 | |||
| Admiral Shares | 3/2/2010 | -1.30 | 3.53 | 3.55% | 1.36% | 4.91 |
| Fee-Adjusted Returns | -1.54 | 3.48 | 4.88 | |||
| Institutional Shares | 11/19/2009 | -1.27 | 3.55 | 3.61 | 1.44 | 5.05 |
| Fee-Adjusted Returns | -1.52 | 3.49 | 5.02 | |||
Vanguard fund returns are adjusted to reflect the 0.25% fee on purchases of fund shares. The fee does not apply to the ETF Shares. The
Fiscal-Year Total Returns table is not adjusted for fees.
80
Intermediate-Term Corporate Bond Index Fund
Financial Statements
Statement of Net Assets—Investments Summary
As of August 31, 2018
This Statement summarizes the fund’s holdings by asset type. Details are reported for each of the fund’s 50 largest individual holdings and for investments that, in total for any issuer, represent more than 1% of the fund’s net assets. The total value of smaller holdings is reported as a single amount within each category.
The fund reports a complete list of its holdings in regulatory filings four times in each fiscal year, at the quarter-ends. For the second and fourth fiscal quarters, the complete listing of the fund’s holdings is available electronically on vanguard.com and on the Securities and Exchange Commission’s website (sec.gov), or you can have it mailed to you without charge by calling 800-662-7447. For the first and third fiscal quarters, the fund files the lists with the SEC on Form N-Q. Shareholders can look up the fund’s Forms N-Q on the SEC’s website. Forms N-Q may also be reviewed and copied at the SEC’s Public Reference Room (see the back cover of this report for further information).
| Face | Market | Percentage | |||||
| Maturity | Amount | Value • | of Net | ||||
| Coupon | Date | ($000) | ($000) | Assets | |||
| U.S. Government and Agency Obligations | |||||||
| U.S. Government Securities | |||||||
| United States Treasury | |||||||
| Note/Bond | 2.875% | 8/15/28 | 56,985 | 57,029 | 0.3% | ||
| U.S. Government | |||||||
| Securities—Other † | 4,515 | 0.0% | |||||
| Total U.S. Government and Agency Obligations (Cost $61,635) | 61,544 | 0.3% | |||||
| Corporate Bonds | |||||||
| Finance | |||||||
| Banking | |||||||
| Bank of America Corp. | 3.419% | 12/20/28 | 96,994 | 91,671 | 0.4% | ||
| Bank of America Corp. | 3.950% | 4/21/25 | 41,007 | 40,264 | 0.2% | ||
| Bank of America Corp. | 3.500% | 4/19/26 | 40,729 | 39,621 | 0.2% | ||
| 1 | Bank of America Corp. | 3.093%– 6.220% | 1/22/24–7/23/29 | 479,154 | 471,722 | 2.3% | |
| Bank One Corp. | 7.625%–8.000% | 10/15/26–4/29/27 | 15,830 | 19,651 | 0.1% | ||
| Citigroup Inc. | 4.450% | 9/29/27 | 70,850 | 70,244 | 0.3% | ||
| 1 | Citigroup Inc. | 3.200%– 6.625% | 10/25/23–4/23/29 | 393,593 | 384,601 | 1.8% | |
| Credit Suisse AG | 3.625% | 9/9/24 | 46,209 | 45,656 | 0.2% | ||
| 1 | Goldman Sachs Group Inc. | 3.814% | 4/23/29 | 44,975 | 43,104 | 0.2% | |
| Goldman Sachs Group Inc. | 3.850% | 1/26/27 | 43,852 | 42,818 | 0.2% | ||
| 1 | Goldman Sachs Group Inc. | 4.223% | 5/1/29 | 43,125 | 42,776 | 0.2% | |
| Goldman Sachs Group Inc. | 3.500% | 1/23/25 | 40,911 | 39,867 | 0.2% | ||
| 1 | Goldman Sachs | ||||||
| Group Inc. | 3.272%–5.950% | 3/3/24– 6/5/28 | 265,864 | 262,393 | 1.3% | ||
| HSBC Holdings plc | 4.300% | 3/8/26 | 44,460 | 44,984 | 0.2% | ||
| 1 | HSBC Holdings plc | 4.583% | 6/19/29 | 42,825 | 43,489 | 0.2% | |
| 1 | HSBC Holdings plc | 3.900%–4.375% | 3/14/24–3/13/28 | 143,498 | 141,973 | 0.7% | |
| HSBC USA Inc. | 3.500% | 6/23/24 | 10,071 | 9,941 | 0.1% | ||
| JPMorgan Chase & Co. | 3.875% | 9/10/24 | 51,491 | 51,151 | 0.3% | ||
| 1 | JPMorgan Chase & Co. | 4.005% | 4/23/29 | 51,500 | 51,048 | 0.2% | |
¥¦
| Intermediate-Term Corporate Bond Index Fund | ||||||
| Face | Market | Percentage | ||||
| Maturity | Amount | Value • | of Net | |||
| Coupon | Date | ($000) | ($000) | Assets | ||
| JPMorgan Chase & Co. | 2.950% | 10/1/26 | 47,715 | 44,426 | 0.2% | |
| 1 JPMorgan Chase & Co. | 3.782% | 2/1/28 | 44,961 | 43,965 | 0.2% | |
| JPMorgan Chase & Co. | 3.900% | 7/15/25 | 41,904 | 42,013 | 0.2% | |
| JPMorgan Chase & Co. | 3.300% | 4/1/26 | 41,880 | 40,310 | 0.2% | |
| 1 JPMorgan Chase & Co. | 3.125%–4.250% | 2/1/24–7/23/29 | 255,943 | 251,163 | 1.2% | |
| 1 Morgan Stanley | 3.591% | 7/22/28 | 46,980 | 44,722 | 0.2% | |
| Morgan Stanley | 3.625% | 1/20/27 | 44,900 | 43,289 | 0.2% | |
| Morgan Stanley | 3.875% | 4/29/24 | 42,647 | 42,829 | 0.2% | |
| Morgan Stanley | 3.125% | 7/27/26 | 43,170 | 40,449 | 0.2% | |
| Morgan Stanley | 3.875% | 1/27/26 | 39,568 | 39,114 | 0.2% | |
| 1 Morgan Stanley | 3.700%– 6.250% | 10/23/24–1/24/29 | 221,079 | 221,051 | 1.1% | |
| Wachovia Corp. | 6.605%–7.574% | 10/1/25–8/1/26 | 2,459 | 2,896 | 0.0% | |
| Wells Fargo & Co. | 3.000% | 4/22/26 | 51,774 | 48,605 | 0.2% | |
| Wells Fargo & Co. | 4.100% | 6/3/26 | 43,199 | 43,180 | 0.2% | |
| Wells Fargo & Co. | 3.000% | 10/23/26 | 45,285 | 42,298 | 0.2% | |
| 1 Wells Fargo & Co. | 3.000%–4.480% | 1/16/24–5/22/28 | 178,305 | 174,280 | 0.8% | |
| 2 Banking—Other † | 2,140,045 | 10.3% | ||||
| Brokerage † | 327,285 | 1.6% | ||||
| Finance Companies † | 130,901 | 0.6% | ||||
| 2 Insurance † | 854,986 | 4.1% | ||||
| Other Finance † | 15,182 | 0.1% | ||||
| Real Estate Investment Trusts † | 987,900 | 4.7% | ||||
| 7,557,863 | 36.2% | |||||
| Industrial | ||||||
| 2 Basic Industry † | 504,392 | 2.4% | ||||
| 2 Capital Goods † | 970,514 | 4.7% | ||||
| Communication | ||||||
| AT&T Inc. | 3.400% | 5/15/25 | 71,857 | 68,143 | 0.3% | |
| 2 AT&T Inc. | 3.800%–4.450% | 3/1/24–2/15/28 | 152,587 | 150,681 | 0.7% | |
| Charter Communications | ||||||
| Operating LLC / Charter | ||||||
| Communications | ||||||
| Operating Capital | 4.908% | 7/23/25 | 63,446 | 64,750 | 0.3% | |
| Time Warner Inc. | 2.950%–4.050% | 12/15/23–2/15/27 | 73,662 | 70,994 | 0.4% | |
| Verizon | ||||||
| Communications Inc. | 5.150% | 9/15/23 | 57,026 | 61,148 | 0.3% | |
| Verizon Communications Inc. | 3.376% | 2/15/25 | 55,059 | 53,683 | 0.3% | |
| Verizon Communications Inc. | 4.125% | 3/16/27 | 44,855 | 45,077 | 0.2% | |
| 2 Verizon | ||||||
| Communications Inc. | 2.625%–4.329% | 3/15/24–9/21/28 | 82,318 | 78,681 | 0.4% | |
| Vodafone Group plc | 4.375% | 5/30/28 | 42,092 | 41,725 | 0.2% | |
| 2 Communication—Other † | 821,417 | 3.9% | ||||
| Consumer Cyclical | ||||||
| Amazon.com Inc. | 3.150% | 8/22/27 | 43,245 | 41,779 | 0.2% | |
| Visa Inc. | 3.150% | 12/14/25 | 62,847 | 61,591 | 0.3% | |
| Walmart Inc. | 3.700% | 6/26/28 | 39,870 | 40,374 | 0.2% | |
| 2 Consumer Cyclical—Other † | 1,415,743 | 6.8% | ||||
| Consumer Noncyclical | ||||||
| Abbott Laboratories | 3.750% | 11/30/26 | 44,116 | 43,726 | 0.2% | |
| AbbVie Inc. | 3.600% | 5/14/25 | 51,793 | 50,478 | 0.2% | |
| Allergan Funding SCS | 3.800% | 3/15/25 | 58,075 | 57,439 | 0.3% | |
| Anheuser-Busch InBev | ||||||
| Finance Inc. | 3.650% | 2/1/26 | 158,630 | 155,139 | 0.7% | |
| Intermediate-Term Corporate Bond Index Fund | |||||
| Face | Market | Percentage | |||
| Maturity | Amount | Value • | of Net | ||
| Coupon | Date | ($000) | ($000) | Assets | |
| Anheuser-Busch InBev | |||||
| Finance Inc. | 3.700% | 2/1/24 | 19,936 | 20,026 | 0.1% |
| Anheuser-Busch InBev | |||||
| Worldwide Inc. | 3.500%–4.000% | 1/12/24–4/13/28 | 51,056 | 50,848 | 0.3% |
| 2 BAT Capital Corp. | 3.557% | 8/15/27 | 50,235 | 47,043 | 0.2% |
| CVS Health Corp. | 4.300% | 3/25/28 | 129,091 | 128,230 | 0.6% |
| CVS Health Corp. | 4.100% | 3/25/25 | 68,820 | 68,913 | 0.3% |
| CVS Health Corp. | 3.875% | 7/20/25 | 43,121 | 42,478 | 0.2% |
| CVS Health Corp. | 2.875%–4.000% | 12/5/23– 6/1/26 | 57,915 | 55,316 | 0.3% |
| Medtronic Inc. | 3.500% | 3/15/25 | 56,426 | 56,407 | 0.3% |
| 2 Consumer Noncyclical—Other † | 2,457,051 | 11.8% | |||
| 2 Energy † | 1,875,774 | 9.0% | |||
| Other Industrial † | 50,488 | 0.2% | |||
| Technology | |||||
| Apple Inc. | 3.250% | 2/23/26 | 43,597 | 42,813 | 0.2% |
| Apple Inc. | 2.450%–3.450% | 2/9/24–11/13/27 | 311,998 | 302,291 | 1.5% |
| Broadcom Corp. / | |||||
| Broadcom Cayman | |||||
| Finance Ltd. | 3.875% | 1/15/27 | 83,743 | 78,260 | 0.4% |
| 2 Diamond 1 Finance | |||||
| Corp. / Diamond 2 | |||||
| Finance Corp. | 6.020% | 6/15/26 | 63,426 | 67,187 | 0.3% |
| Microsoft Corp. | 2.400% | 8/8/26 | 55,259 | 51,317 | 0.2% |
| Microsoft Corp. | 3.300% | 2/6/27 | 48,706 | 48,155 | 0.2% |
| Microsoft Corp. | 2.700%–3.625% | 12/15/23–11/3/25 | 130,258 | 128,207 | 0.6% |
| Oracle Corp. | 2.650% | 7/15/26 | 42,853 | 39,902 | 0.2% |
| 3 Technology—Other † | 1,087,989 | 5.2% | |||
| Transportation † | 453,432 | 2.2% | |||
| 11,949,601 | 57.3% | ||||
| Utilities | |||||
| 2 Electric † | 975,043 | 4.7% | |||
| Natural Gas † | 102,847 | 0.5% | |||
| Other Utility † | 25,302 | 0.1% | |||
| 1,103,192 | 5.3% | ||||
| Total Corporate Bonds (Cost $21,156,289) | 20,610,656 | 98.8% | |||
| Shares | |||||
| Temporary Cash Investment | |||||
| Money Market Fund | |||||
| 4 Vanguard Market Liquidity Fund | |||||
| (Cost $83,780) | 2.153% | 837,734 | 83,790 | 0.4% | |
| Total Investments (Cost $21,301,704) | 20,755,990 | 99.5% | |||
š›
| Intermediate-Term Corporate Bond Index Fund | ||
| Percentage | ||
| Amount | of Net | |
| ($000) | Assets | |
| Other Assets and Liabilities | ||
| Other Assets | ||
| Investment in Vanguard | 1,061 | |
| Receivables for Investment Securities Sold | 40,254 | |
| Receivables for Accrued Income | 214,982 | |
| Receivables for Capital Shares Issued | 2,199 | |
| Other Assets | 247 | |
| Total Other Assets | 258,743 | 1.2% |
| Liabilities | ||
| Payables for Investment Securities Purchased | (140,741) | |
| Payables for Capital Shares Redeemed | (905) | |
| Payables for Distributions | (1,179) | |
| Payables to Vanguard | (2,614) | |
| Variation Margin Payable—Futures Contracts | (96) | |
| Total Liabilities | (145,535) | (0.7%) |
| Net Assets | 20,869,198 | 100.0% |
| At August 31, 2018, net assets consisted of: | ||
| Amount | ||
| ($000) | ||
| Paid-in Capital | 21,472,696 | |
| Undistributed Net Investment Income | 55,372 | |
| Accumulated Net Realized Losses | (113,156) | |
| Unrealized Appreciation (Depreciation) | (545,714) | |
| Net Assets | 20,869,198 | |
| ETF Shares—Net Assets | ||
| Applicable to 229,737,465 outstanding $.001 par value shares of | ||
| beneficial interest (unlimited authorization) | 19,301,891 | |
| Net Asset Value Per Share—ETF Shares | $84.02 | |
| Admiral Shares—Net Assets | ||
| Applicable to 47,570,999 outstanding $.001 par value shares of | ||
| beneficial interest (unlimited authorization) | 1,075,500 | |
| Net Asset Value Per Share—Admiral Shares | $22.61 | |
Intermediate-Term Corporate Bond Index Fund
| Amount | |
| ($000) | |
| Institutional Shares—Net Assets | |
| Applicable to 17,604,135 outstanding $.001 par value shares of | |
| beneficial interest (unlimited authorization) | 491,807 |
| Net Asset Value Per Share—Institutional Shares | $27.94 |
• See Note A in Notes to Financial Statements.
† Represents the aggregate value, by category, of securities that are not among the 50 largest holdings and, in total for any issuer,
represent 1% or less of net assets.
1 The average or expected maturity is shorter than the final maturity shown because of the possibility of interim principal payments
and prepayments or the possibility of the issue being called.
2 Certain of the fund’s securities are exempt from registration under Rule 144A of the Securities Act of 1933. Such securities may be
sold in transactions exempt from registration, normally to qualified institutional buyers. At August 31, 2018, the aggregate value of
these securities was $420,027,000, representing 2.0% of net assets.
3 Securities with a value of $1,154,000 have been segregated as initial margin for recently closed futures contracts.
4 Affiliated money market fund available only to Vanguard funds and certain trusts and accounts managed by Vanguard. Rate shown
is the 7-day yield.
See accompanying Notes, which are an integral part of the Financial Statements.
Intermediate-Term Corporate Bond Index Fund
Statement of Operations
| Year Ended | |
| August 31, 2018 | |
| ($000) | |
| Investment Income | |
| Income | |
| Interest1 | 703,356 |
| Total Income | 703,356 |
| Expenses | |
| The Vanguard Group—Note B | |
| Investment Advisory Services | 625 |
| Management and Administrative—ETF Shares | 10,221 |
| Management and Administrative—Admiral Shares | 613 |
| Management and Administrative—Institutional Shares | 252 |
| Marketing and Distribution—ETF Shares | 1,108 |
| Marketing and Distribution—Admiral Shares | 86 |
| Marketing and Distribution—Institutional Shares | 17 |
| Custodian Fees | 45 |
| Auditing Fees | 52 |
| Shareholders’ Reports and Proxy—ETF Shares | 867 |
| Shareholders’ Reports and Proxy—Admiral Shares | 18 |
| Shareholders’ Reports and Proxy—Institutional Shares | 1 |
| Trustees’ Fees and Expenses | 11 |
| Total Expenses | 13,916 |
| Net Investment Income | 689,440 |
| Realized Net Gain (Loss) | |
| Investment Securities Sold1,2 | (98,458) |
| Futures Contracts | (632) |
| Realized Net Gain (Loss) | (99,090) |
| Change in Unrealized Appreciation (Depreciation) of Investment Securities1 | (927,990) |
| Net Increase (Decrease) in Net Assets Resulting from Operations | (337,640) |
1 Interest income, realized net gain (loss), and change in unrealized appreciation (depreciation) from an affiliated company of the fund
were $1,172,000, $35,000, and $9,000, respectively. Purchases and sales are for temporary cash investment purposes.
2 Includes ($2,494,000) of net gain (loss) resulting from in-kind redemptions; such gain (loss) is not taxable to the fund.
See accompanying Notes, which are an integral part of the Financial Statements.
“”
Intermediate-Term Corporate Bond Index Fund
Statement of Changes in Net Assets
| Year Ended August 31, | ||
| 2018 | 2017 | |
| ($000) | ($000) | |
| Increase (Decrease) in Net Assets | ||
| Operations | ||
| Net Investment Income | 689,440 | 456,587 |
| Realized Net Gain (Loss) | (99,090) | 27,719 |
| Change in Unrealized Appreciation (Depreciation) | (927,990) | (65,344) |
| Net Increase (Decrease) in Net Assets Resulting from Operations | (337,640) | 418,962 |
| Distributions | ||
| Net Investment Income | ||
| ETF Shares | (621,479) | (397,564) |
| Admiral Shares | (36,906) | (26,554) |
| Institutional Shares | (20,134) | (14,578) |
| Realized Capital Gain | ||
| ETF Shares | — | — |
| Admiral Shares | — | — |
| Institutional Shares | — | — |
| Total Distributions | (678,519) | (438,696) |
| Capital Share Transactions | ||
| ETF Shares | 3,530,037 | 6,663,645 |
| Admiral Shares | 117,812 | 318,614 |
| Institutional Shares | (47,827) | 187,545 |
| Net Increase (Decrease) from Capital Share Transactions | 3,600,022 | 7,169,804 |
| Total Increase (Decrease) | 2,583,863 | 7,150,070 |
| Net Assets | ||
| Beginning of Period | 18,285,335 | 11,135,265 |
| End of Period1 | 20,869,198 | 18,285,335 |
| 1 Net Assets—End of Period includes undistributed (overdistributed) net investment income of $55,372,000 and $44,451,000. | ||
See accompanying Notes, which are an integral part of the Financial Statements.
}‘
Intermediate-Term Corporate Bond Index Fund
Financial Highlights
| ETF Shares | |||||
| For a Share Outstanding | Year Ended August 31, | ||||
| Throughout Each Period | 2018 | 2017 | 2016 | 2015 | 2014 |
| Net Asset Value, Beginning of Period | $88.35 | $89.47 | $84.39 | $86.98 | $82.31 |
| Investment Operations | |||||
| Net Investment Income | 2.9351 | 2.8691 | 2.831 | 2.767 | 2.724 |
| Net Realized and Unrealized Gain (Loss) | |||||
| on Investments1 | (4.362) | (1.184) | 5.083 | (2.473) | 5.024 |
| Total from Investment Operations | (1.427) | 1.685 | 7.914 | .294 | 7.748 |
| Distributions | |||||
| Dividends from Net Investment Income | (2.903) | (2.805) | (2.834) | (2.754) | (2.496) |
| Distributions from Realized Capital Gains | — | — | — | (.130) | (.582) |
| Total Distributions | (2.903) | (2.805) | (2.834) | (2.884) | (3.078) |
| Net Asset Value, End of Period | $84.02 | $88.35 | $89.47 | $84.39 | $86.98 |
| Total Return | -1.62% | 1.98% | 9.58% | 0.32% | 9.60% |
| Ratios/Supplemental Data | |||||
| Net Assets, End of Period (Millions) | $19,302 | $16,699 | $10,048 | $5,393 | $4,010 |
| Ratio of Total Expenses to Average Net Assets | 0.07% | 0.07% | 0.07% | 0.10% | 0.12% |
| Ratio of Net Investment Income to | |||||
| Average Net Assets | 3.44% | 3.30% | 3.34% | 3.25% | 3.25% |
| Portfolio Turnover Rate2 | 65% | 65% | 71% | 56% | 65% |
1 Calculated based on average shares outstanding.
2 Excludes the value of portfolio securities received or delivered as a result of in-kind purchases or redemptions of the fund’s capital
shares, including ETF Creation Units.
See accompanying Notes, which are an integral part of the Financial Statements.
••
Intermediate-Term Corporate Bond Index Fund
Financial Highlights
| Admiral Shares | |||||
| For a Share Outstanding | Year Ended August 31, | ||||
| Throughout Each Period | 2018 | 2017 | 2016 | 2015 | 2014 |
| Net Asset Value, Beginning of Period | $23.78 | $24.08 | $22.71 | $23.40 | $22.20 |
| Investment Operations | |||||
| Net Investment Income | .7921 | .7741 | .764 | .745 | .736 |
| Net Realized and Unrealized Gain (Loss) | |||||
| on Investments | (1.175) | (.318) | 1.371 | (.654) | 1.355 |
| Total from Investment Operations | (.383) | .456 | 2.135 | .091 | 2.091 |
| Distributions | |||||
| Dividends from Net Investment Income | (.787) | (.756) | (.765) | (.746) | (.734) |
| Distributions from Realized Capital Gains | — | — | — | (.035) | (.157) |
| Total Distributions | (.787) | (.756) | (.765) | (.781) | (. 891) |
| Net Asset Value, End of Period | $22.61 | $23.78 | $24.08 | $22.71 | $23.40 |
| Total Return2 | -1.61% | 1.99% | 9.57% | 0.37% | 9.60% |
| Ratios/Supplemental Data | |||||
| Net Assets, End of Period (Millions) | $1,076 | $1,014 | $700 | $423 | $239 |
| Ratio of Total Expenses to Average Net Assets | 0.07% | 0.07% | 0.07% | 0.10% | 0.12% |
| Ratio of Net Investment Income to | |||||
| Average Net Assets | 3.44% | 3.30% | 3.34% | 3.25% | 3.25% |
| Portfolio Turnover Rate 3 | 65% | 65% | 71% | 56% | 65% |
Signal Shares were renamed Admiral shares in October 2013.
1 Calculated based on average shares outstanding.
2 Total returns do not include transaction or account service fees that may have applied in the periods shown. Fund prospectuses provide
information about any applicable transaction and account service fees.
3 Excludes the value of portfolio securities received or delivered as a result of in-kind purchases or redemptions of the fund’s capital
shares, including ETF Creation Units.
See accompanying Notes, which are an integral part of the Financial Statements.
•–
Intermediate-Term Corporate Bond Index Fund
Financial Highlights
| Institutional Shares | |||||
| For a Share Outstanding | Year Ended August 31, | ||||
| Throughout Each Period | 2018 | 2017 | 2016 | 2015 | 2014 |
| Net Asset Value, Beginning of Period | $29.38 | $29.75 | $28.06 | $28.92 | $27.44 |
| Investment Operations | |||||
| Net Investment Income | .9831 | .9621 | .949 | .931 | .919 |
| Net Realized and Unrealized Gain (Loss) | |||||
| on Investments | (1.446) | (.392) | 1.690 | (.816) | 1.671 |
| Total from Investment Operations | (.463) | .570 | 2.639 | .115 | 2.590 |
| Distributions | |||||
| Dividends from Net Investment Income | (. 977) | (. 940) | (. 949) | (. 932) | (. 916) |
| Distributions from Realized Capital Gains | — | — | — | (.043) | (.194) |
| Total Distributions | (.977) | (.940) | (.949) | (.975) | (1.110) |
| Net Asset Value, End of Period | $27.94 | $29.38 | $29.75 | $28.06 | $28.92 |
| Total Return2 | -1.57% | 2.01% | 9.58% | 0.37% | 9.62% |
| Ratios/Supplemental Data | |||||
| Net Assets, End of Period (Millions) | $492 | $572 | $387 | $338 | $307 |
| Ratio of Total Expenses to Average Net Assets | 0.05% | 0.05% | 0.05% | 0.07% | 0.09% |
| Ratio of Net Investment Income to | |||||
| Average Net Assets | 3.46% | 3.32% | 3.36% | 3.28% | 3.28% |
| Portfolio Turnover Rate 3 | 65% | 65% | 71% | 56% | 65% |
1 Calculated based on average shares outstanding.
2 Total returns do not include transaction fees that may have applied in the periods shown. Fund prospectuses provide information about
any applicable transaction fees.
3 Excludes the value of portfolio securities received or delivered as a result of in-kind purchases or redemptions of the fund’s capital
shares, including ETF Creation Units.
See accompanying Notes, which are an integral part of the Financial Statements.
•–
Intermediate-Term Corporate Bond Index Fund
Notes to Financial Statements
Vanguard Intermediate-Term Corporate Bond Index Fund is registered under the Investment Company Act of 1940 as an open-end investment company, or mutual fund. Certain of the fund’s investments are in corporate debt instruments; the issuers’ abilities to meet their obligations may be affected by economic developments in their respective industries. The fund offers three classes of shares: ETF Shares, Admiral Shares, and Institutional Shares. ETF Shares are listed for trading on Nasdaq; they can be purchased and sold through a broker. Admiral Shares and Institutional Shares are designed for investors who meet certain administrative, service, and account-size criteria.
A. The following significant accounting policies conform to generally accepted accounting principles for U.S. investment companies. The fund consistently follows such policies in preparing its financial statements.
1. Security Valuation: Securities are valued as of the close of trading on the New York Stock Exchange (generally 4 p.m., Eastern time) on the valuation date. Bonds and temporary cash investments are valued using the latest bid prices or using valuations based on a matrix system (which considers such factors as security prices, yields, maturities, and ratings), both as furnished by independent pricing services. Investments in Vanguard Market Liquidity Fund are valued at that fund’s net asset value. Securities for which market quotations are not readily available, or whose values have been affected by events occurring before the fund’s pricing time but after the close of the securities’ primary markets, are valued by methods deemed by the board of trustees to represent fair value.
2. Futures Contracts: The fund uses futures contracts to invest in fixed income asset classes with greater efficiency and lower cost than is possible through direct investment, to add value when these instruments are attractively priced, or to adjust sensitivity to changes in interest rates.
The primary risks associated with the use of futures contracts are imperfect correlation between changes in market values of bonds held by the fund and the prices of futures contracts, and the possibility of an illiquid market. Counterparty risk involving futures is mitigated because a regulated clearinghouse is the counterparty instead of the clearing broker. To further mitigate counterparty risk, the fund trades futures contracts on an exchange, monitors the financial strength of its clearing brokers and clearinghouse, and has entered into clearing agreements with its clearing brokers. The clearinghouse imposes initial margin requirements to secure the fund’s performance and requires daily settlement of variation margin representing changes in the market value of each contract.
Any assets pledged as initial margin for open contracts are noted in the Statement of Net Assets.
Futures contracts are valued at their quoted daily settlement prices. The notional amounts of the contracts are not recorded in the Statement of Net Assets. Fluctuations in the value of the contracts are recorded in the Statement of Net Assets as an asset (liability) and in the Statement of Operations as unrealized appreciation (depreciation) until the contracts are closed, when they are recorded as realized futures gains (losses).
During the year ended August 31, 2018, the fund’s average investments in long and short futures contracts each represented less than 1% of net assets, based on the average of the notional amounts at each quarter-end during the period. The fund had no open futures contracts at August 31, 2018.
˜™
Intermediate-Term Corporate Bond Index Fund
3. Federal Income Taxes: The fund intends to continue to qualify as a regulated investment company and distribute all of its taxable income. Management has analyzed the fund’s tax positions taken for all open federal income tax years (August 31, 2015–2018), and has concluded that no provision for federal income tax is required in the fund’s financial statements.
4. Distributions: Distributions to shareholders are recorded on the ex-dividend date. Distributions are determined on a tax basis and may differ from net investment income and realized capital gains for financial reporting purposes.
5. Credit Facility: The fund and certain other funds managed by The Vanguard Group (“Vanguard”) participate in a $3.1 billion committed credit facility provided by a syndicate of lenders pursuant to a credit agreement that may be renewed annually; each fund is individually liable for its borrowings, if any, under the credit facility. Borrowings may be utilized for temporary and emergency purposes, and are subject to the fund’s regulatory and contractual borrowing restrictions. The participating funds are charged administrative fees and an annual commitment fee of 0.10% of the undrawn amount of the facility; these fees are allocated to the funds based on a method approved by the fund’s board of trustees and included in Management and Administrative expenses on the fund’s Statement of Operations. Any borrowings under this facility bear interest at a rate based upon the higher of the one-month London Interbank Offered Rate, federal funds effective rate, or overnight bank funding rate plus an agreed-upon spread.
The fund had no borrowings outstanding at August 31, 2018, or at any time during the period then ended.
6. Other: Interest income includes income distributions received from Vanguard Market Liquidity Fund and is accrued daily. Premiums and discounts on debt securities purchased are amortized and accreted, respectively, to interest income over the lives of the respective securities. Security transactions are accounted for on the date securities are bought or sold. Costs used to determine realized gains (losses) on the sale of investment securities are those of the specific securities sold. Fees assessed on capital share transactions are credited to paid-in capital.
Each class of shares has equal rights as to assets and earnings, except that each class separately bears certain class-specific expenses related to maintenance of shareholder accounts (included in Management and Administrative expenses), shareholder reporting, and the proxy. Marketing and distribution expenses are allocated to each class of shares based on a method approved by the board of trustees. Income, other non-class-specific expenses, and gains and losses on investments are allocated to each class of shares based on its relative net assets.
B. In accordance with the terms of a Funds’ Service Agreement (the “FSA”) between Vanguard and the fund, Vanguard furnishes to the fund investment advisory, corporate management, administrative, marketing, and distribution services at Vanguard’s cost of operations (as defined by the FSA). These costs of operations are allocated to the fund based on methods and guidelines approved by the board of trustees. Vanguard does not require reimbursement in the current period for certain costs of operations (such as deferred compensation/benefits and risk/insurance costs); the fund’s liability for these costs of operations is included in Payables to Vanguard on the Statement of Net Assets. All other costs of operations payable to Vanguard are generally settled twice a month.
¡¢
Intermediate-Term Corporate Bond Index Fund
Upon the request of Vanguard, the fund may invest up to 0.40% of its net assets as capital in Vanguard. At August 31, 2018, the fund had contributed to Vanguard capital in the amount of $1,061,000, representing 0.01% of the fund’s net assets and 0.42% of Vanguard’s capitalization. The fund’s trustees and officers are also directors and employees, respectively, of Vanguard.
C. Various inputs may be used to determine the value of the fund’s investments. These inputs are summarized in three broad levels for financial statement purposes. The inputs or methodologies used to value securities are not necessarily an indication of the risk associated with investing in those securities.
Level 1—Quoted prices in active markets for identical securities.
Level 2—Other significant observable inputs (including quoted prices for similar securities, interest rates, prepayment speeds, credit risk, etc.).
Level 3—Significant unobservable inputs (including the fund’s own assumptions used to determine
the fair value of investments). Any investments valued with significant unobservable inputs are
noted on the Statement of Net Assets.
The following table summarizes the market value of the fund’s investments as of August 31, 2018, based on the inputs used to value them:
| Level 1 | Level 2 | Level 3 | |
| Investments | ($000) | ($000) | ($000) |
| U.S. Government and Agency Obligations | — | 61,544 | — |
| Corporate Bonds | — | 20,610,656 | — |
| Temporary Cash Investments | 83,790 | — | — |
| Futures Contracts—Liabilities1 | (96) | — | — |
| Total | 83,694 | 20,672,200 | — |
| 1 Represents variation margin on the last day of the reporting period for recently closed futures contracts. | |||
D. Permanent differences are reclassified among capital accounts in the financial statements to reflect their tax character. These reclassifications have no effect on net assets or net asset value per share. As of period end, the following permanent differences primarily attributable to the accounting for in-kind redemptions were reclassified to the following accounts:
| Amount | |
| ($000) | |
| Paid-in capital | (2,494) |
| Undistributed (Overdistributed) net investment income | — |
| Accumulated net realized gains (losses) | 2,494 |
š›
Intermediate-Term Corporate Bond Index Fund
Temporary differences between book-basis and tax-basis components of accumulated net earnings (losses) arise when certain items of income, gain, or loss are recognized in different periods for financial statement and tax purposes; these differences will reverse at some time in the future. The differences are primarily related to the tax deferral of losses on wash sales, straddles, and payables for distributions. As of period end, the tax components of accumulated net earnings (losses) are detailed in the table as follows:
| Amount | |
| ($000) | |
| Undistributed ordinary income | 58,404 |
| Undistributed long-term gains | — |
| Capital loss carryforwards (non-expiring) | (112,542) |
| Net unrealized gains (losses) | (546,282) |
As of August 31, 2018, gross unrealized appreciation and depreciation for investments and derivatives based on cost for U.S. federal income tax purposes were as follows:
| Amount | |
| ($000) | |
| Tax cost | 21,302,272 |
| Gross unrealized appreciation | 18,423 |
| Gross unrealized depreciation | (564,705) |
| Net unrealized appreciation (depreciation) | (546,282) |
E. During the year ended August 31, 2018, the fund purchased $11,290,848,000 of investment securities and sold $7,540,983,000 of investment securities, other than U.S. government securities and temporary cash investments. Purchases and sales of U.S. government securities were $6,649,797,000 and $6,631,277,000, respectively. Total purchases and sales include $4,844,630,000 and $1,405,426,000, respectively, in connection with in-kind purchases and redemptions of the fund’s capital shares.
The fund purchased securities from and sold securities to other Vanguard funds or accounts managed by Vanguard or its affiliates, in accordance with procedures adopted by the board of trustees in compliance with Rule 17a-7 of the Investment Company Act of 1940. For the year ended August 31, 2018, such purchases and sales were $1,279,666,000 and $5,025,388,000 respectively; these amounts are included in the purchases and sales of investment securities noted above.
Intermediate-Term Corporate Bond Index Fund
F. Capital share transactions for each class of shares were:
| Year Ended August 31, | ||||
| 2018 | 2017 | |||
| Amount | Shares | Amount | Shares | |
| ($000) | (000) | ($000) | (000) | |
| ETF Shares | ||||
| Issued1 | 4,970,461 | 57,724 | 6,950,937 | 80,003 |
| Issued in Lieu of Cash Distributions | — | — | — | — |
| Redeemed | (1,440,424) | (17,000) | (287,292) | (3,300) |
| Net Increase (Decrease)—ETF Shares | 3,530,037 | 40,724 | 6,663,645 | 76,703 |
| Admiral Shares | ||||
| Issued1 | 438,358 | 18,901 | 526,063 | 22,458 |
| Issued in Lieu of Cash Distributions | 30,536 | 1,331 | 22,355 | 953 |
| Redeemed | (351,082) | (15,292) | (229,804) | (9,850) |
| Net Increase (Decrease)—Admiral Shares | 117,812 | 4,940 | 318,614 | 13,561 |
| Institutional Shares | ||||
| Issued1 | 170,333 | 5,907 | 224,066 | 7,736 |
| Issued in Lieu of Cash Distributions | 12,904 | 454 | 8,685 | 300 |
| Redeemed | (231,064) | (8,230) | (45,206) | (1,569) |
| Net Increase (Decrease)—Institutional Shares | (47,827) | (1,869) | 187,545 | 6,467 |
| 1 Includes purchase fees for fiscal 2018 and 2017 of $1,706,000 and $1,802,000, respectively (fund totals). | ||||
G. Management has determined that no events or transactions occurred subsequent to August 31, 2018, that would require recognition or disclosure in these financial statements.
‘’
Long-Term Corporate Bond Index Fund
Fund Profile
As of August 31, 2018
| Share-Class Characteristics | |||
| ETF | Admiral | Institutional | |
| Shares | Shares | Shares | |
| Ticker Symbol | VCLT | VLTCX | VLCIX |
| Expense Ratio1 | 0.07% | 0.07% | 0.05% |
| 30-Day SEC Yield | 4.56% | 4.56% | 4.58% |
| Financial Attributes | |||
| Bloomberg | |||
| Barclays | Bloomberg | ||
| U.S. 10+ | Barclays | ||
| Year | U.S. | ||
| Corporate | Aggregate | ||
| Fund | Bond Index | FA Index | |
| Number of Bonds | 1,851 | 1,829 | 10,038 |
| Yield to Maturity | |||
| (before expenses) | 4.6% | 4.6% | 3.3% |
| Average Coupon | 5.0% | 5.1% | 3.1% |
| Average Duration | 13.6 years | 13.7 years | 6.1 years |
| Average Effective | |||
| Maturity | 23.6 years | 23.5 years | 8.4 years |
| Short-Term | |||
| Reserves | 0.6% | — | — |
| Sector Diversification (% of portfolio) | |
| Finance | 16.8% |
| Industrial | 70.5 |
| Treasury/Agency | 0.1 |
| Utilities | 12.4 |
| Other | 0.2 |
The agency and mortgage-backed securities sectors may include
issues from government-sponsored enterprises; such issues are
generally not backed by the full faith and credit of the U.S.
government.
| Volatility Measures | ||
| Bloomberg | ||
| Barclays U.S. | Bloomberg | |
| 10+ Year | Barclays U.S. | |
| Corporate | Aggregate | |
| Bond Index | FA Index | |
| R-Squared | 0.99 | 0.68 |
| Beta | 1.02 | 2.07 |
| These measures show the degree and timing of the fund’s | ||
| fluctuations compared with the indexes over 36 months. | ||
| Distribution by Effective Maturity | |
| (% of portfolio) | |
| Under 1 Year | 0.2% |
| 5 - 10 Years | 0.6 |
| 10 - 20 Years | 31.0 |
| 20 - 30 Years | 63.4 |
| Over 30 Years | 4.8 |
| Distribution by Credit Quality (% of portfolio) | |
| U.S. Government | 0.1% |
| Aaa | 3.5 |
| Aa | 6.1 |
| A | 41.3 |
| Baa | 49.0 |
Credit-quality ratings are obtained from Barclays and are from
Moody's, Fitch, and S&P. When ratings from all three agencies are
used, the median rating is shown. When ratings from two of the
agencies are used, the lower rating for each issue is shown. "Not
Rated" is used to classify securities for which a rating is not
available. For more information about these ratings, see the
Glossary entry for Credit Quality.
Investment Focus

1 The expense ratios shown are from the prospectus dated December 21, 2017, and represent estimated costs for the current fiscal year. For the
fiscal year ended August 31, 2018, the expense ratios were 0.07% for ETF Shares, 0.07% for Admiral Shares, and 0.05% for Institutional Shares.
96
Long-Term Corporate Bond Index Fund
Performance Summary
All of the returns in this report represent past performance, which is not a guarantee of future results that may be achieved by the fund. (Current performance may be lower or higher than the performance data cited. For performance data current to the most recent month-end, visit our website at vanguard.com/performance.) Note, too, that both investment returns and principal value can fluctuate widely, so an investor’s shares, when sold, could be worth more or less than their original cost. The returns shown do not reflect taxes that a shareholder would pay on fund distributions or on the sale of fund shares.
Cumulative Performance: November 19, 2009, Through August 31, 2018
Initial Investment of $10,000
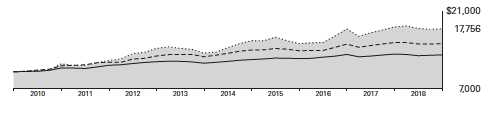
| Average Annual Total Returns | |||||
| Periods Ended August 31, 2018 | |||||
| Since | Final Value | ||||
| One | Five | Inception | of a $10,000 | ||
| Year | Years | (11/19/2009) | Investment | ||
| Long-Term Corporate Bond Index Fund | |||||
| ETF Shares Net Asset Value | -2.01% | 5.93% | 6.76% | $17,756 | |
| Long-Term Corporate Bond Index Fund | |||||
| ETF Shares Market Price | -2.22 | 6.01 | 6.76 | 17,765 | |
| Bloomberg Barclays U.S. 10+ Year | |||||
| • • • • • • •• | Corporate Bond Index | -1.85 | 5.86 | 6.78 | 17,787 |
| – – – – | Corporate Debt Funds BBB-Rated | ||||
| Average | -1.16 | 3.51 | 4.82 | 15,120 | |
| Spliced Bloomberg Barclays U.S. | |||||
| Aggregate Float Adjusted Index | -1.09 | 2.47 | 3.09 | 13,062 | |
For a benchmark description, see the Glossary.
Corporate Debt Funds BBB-Rated Average: Derived from data provided by Lipper, a Thomson Reuters Company.
"Since Inception" performance is calculated from the ETF Shares’ inception date for both the fund and its comparative standards.
Vanguard fund returns are adjusted to reflect the 1.00% fee on purchases of fund shares. The fee does not apply to the ETF Shares. The
Fiscal-Year Total Returns table is not adjusted for fees.
See Financial Highlights for dividend and capital gains information.
97
Long-Term Corporate Bond Index Fund
| Average Annual Total Returns | ||||
| Periods Ended August 31, 2018 | ||||
| Since | Final Value | |||
| One | Five | Inception | of a $10,000 | |
| Year | Years | (1/19/2010) | Investment | |
| Long-Term Corporate Bond Index Fund | ||||
| Admiral Shares | -2.98% | 5.72% | 6.65% | $17,410 |
| Bloomberg Barclays U.S. 10+ Year | ||||
| Corporate Bond Index | -1.85 | 5.86 | 6.81 | 17,633 |
| Bloomberg Barclays U.S. Aggregate Float | ||||
| Adjusted Index | -1.09 | 2.47 | 3.13 | 13,039 |
| "Since Inception" performance is calculated from the Admiral Shares’ inception date for both the fund and its comparative standards. | ||||
| Since | Final Value | |||
| One | Five | Inception | of a $5,000,000 | |
| Year | Years | (11/19/2009) | Investment | |
| Long-Term Corporate Bond Index Fund | ||||
| Institutional Shares | -2.93% | 5.74% | 6.67% | $8,818,137 |
| Bloomberg Barclays U.S. 10+ Year | ||||
| Corporate Bond Index | -1.85 | 5.86 | 6.78 | 8,893,642 |
| Spliced Bloomberg Barclays U.S. Aggregate | ||||
| Float Adjusted Index | -1.09 | 2.47 | 3.09 | 6,530,959 |
| "Since Inception" performance is calculated from the Institutional Shares’ inception date for both the fund and its comparative standards. | ||||
| Cumulative Returns of ETF Shares: November 19, 2009, Through August 31, 2018 | |||
| Since | |||
| One | Five | Inception | |
| Year | Years | (11/19/2009) | |
| Long-Term Corporate Bond Index Fund ETF Shares | |||
| Market Price | -2.22% | 33.91% | 77.65% |
| Long-Term Corporate Bond Index Fund ETF Shares | |||
| Net Asset Value | -2.01 | 33.35 | 77.56 |
| Bloomberg Barclays U.S. 10+ Year Corporate Bond | |||
| Index | -1.85 | 32.96 | 77.87 |
| "Since Inception" performance is calculated from the ETF Shares’ inception date for both the fund and its comparative standards. | |||
Vanguard fund returns are adjusted to reflect the 1.00% fee on purchases of fund shares. The fee does not apply to the ETF Shares. The
Fiscal-Year Total Returns table is not adjusted for fees.
98
Long-Term Corporate Bond Index Fund
| Fiscal-Year Total Returns (%): November 19, 2009, Through August 31, 2018 | ||
| Bloomberg | ||
| Barclays U.S. | ||
| 10+ Year | ||
| Corporate Bond | ||
| ETF Shares Net Asset Value | Index | |
| Fiscal Year | Total Returns | Total Returns |
| 2010 | 14.54% | 14.46% |
| 2011 | 4.19 | 5.18 |
| 2012 | 19.40 | 18.33 |
| 2013 | -6.55 | -6.09 |
| 2014 | 17.35 | 16.80 |
| 2015 | -3.64 | -3.48 |
| 2016 | 18.21 | 17.71 |
| 2017 | 1.81 | 2.08 |
| 2018 | -2.01 | -1.85 |
Average Annual Total Returns: Periods Ended June 30, 2018
This table presents returns through the latest calendar quarter—rather than through the end of the fiscal period.
Securities and Exchange Commission rules require that we provide this information.
| Since Inception | ||||||
| Inception Date | One Year | Five Years | Income | Capital | Total | |
| ETF Shares | 11/19/2009 | |||||
| Market Price | -2.24% | 5.49% | 6.66% | |||
| Net Asset Value | -1.97 | 5.46 | 6.67 | |||
| Admiral Shares | 1/19/2010 | -1.95 | 5.47 | 4.82% | 1.87% | 6.69 |
| Fee-Adjusted Returns | -2.93 | 5.26 | 6.56 | |||
| Institutional Shares | 11/19/2009 | -1.93 | 5.49 | 4.84 | 1.87 | 6.71 |
| Fee-Adjusted Returns | -2.91 | 5.28 | 6.58 | |||
Vanguard fund returns are adjusted to reflect the 1.00% fee on purchases of fund shares. The fee does not apply to the ETF Shares. The
Fiscal-Year Total Returns table is not adjusted for fees.
99
Long-Term Corporate Bond Index Fund
Financial Statements
Statement of Net Assets—Investments Summary
As of August 31, 2018
This Statement summarizes the fund’s holdings by asset type. Details are reported for each of the fund’s 50 largest individual holdings and for investments that, in total for any issuer, represent more than 1% of the fund’s net assets. The total value of smaller holdings is reported as a single amount within each category.
The fund reports a complete list of its holdings in regulatory filings four times in each fiscal year, at the quarter-ends. For the second and fourth fiscal quarters, the complete listing of the fund’s holdings is available electronically on vanguard.com and on the Securities and Exchange Commission’s website (sec.gov), or you can have it mailed to you without charge by calling 800-662-7447. For the first and third fiscal quarters, the fund files the lists with the SEC on Form N-Q. Shareholders can look up the fund’s Forms N-Q on the SEC’s website. Forms N-Q may also be reviewed and copied at the SEC’s Public Reference Room (see the back cover of this report for further information).
| Face | Market | Percentage | |||||
| Maturity | Amount | Value • | of Net | ||||
| Coupon | Date | ($000) | ($000) | Assets | |||
| U.S. Government and Agency Obligations | |||||||
| U.S. Government Securities | |||||||
| United States Treasury | |||||||
| Note/Bond | 2.875% | 8/15/28 | 11,880 | 11,889 | 0.3% | ||
| U.S. Government | |||||||
| Securities—Other † | 2,754 | 0.1% | |||||
| Total U.S. Government and Agency Obligations (Cost $14,679) | 14,643 | 0.4% | |||||
| Corporate Bonds | |||||||
| Finance | |||||||
| Banking | |||||||
| 1 | Bank of America Corp. | 3.946%–7.750% | 1/29/37–1/23/49 | 29,186 | 32,141 | 0.9% | |
| Bank of America NA | 6.000% | 10/15/36 | 2,592 | 3,098 | 0.1% | ||
| Bank One Capital III | 8.750% | 9/1/30 | 453 | 622 | 0.0% | ||
| 1 | Citigroup Inc. | 3.878%–8.125% | 6/15/32–7/23/48 | 31,957 | 35,469 | 1.0% | |
| Goldman Sachs Capital I | 6.345% | 2/15/34 | 2,422 | 2,849 | 0.1% | ||
| Goldman Sachs Group Inc. | 6.750% | 10/1/37 | 12,019 | 14,564 | 0.4% | ||
| 1 | Goldman Sachs | ||||||
| Group Inc. | 4.017%– 6.450% | 2/15/33–10/21/45 | 32,722 | 34,550 | 1.0% | ||
| HSBC Holdings plc | 6.500% | 9/15/37 | 5,610 | 6,701 | 0.2% | ||
| 1 | JPMorgan Chase & Co. | 3.882%– 6.400% | 5/15/38–1/23/49 | 45,607 | 47,241 | 1.4% | |
| Wachovia Corp. | 5.500%–7.500% | 4/15/35–10/15/35 | 2,083 | 2,442 | 0.1% | ||
| Wells Fargo & Co. | 3.900%–5.606% | 2/7/35–12/7/46 | 32,171 | 32,784 | 0.9% | ||
| Wells Fargo Bank NA | 5.850%– 6.600% | 8/26/36–1/15/38 | 7,496 | 9,108 | 0.3% | ||
| 1 | Wells Fargo Capital X | 5.950% | 2/15/36 | 1,650 | 1,782 | 0.1% | |
| Banking—Other † | 85,001 | 2.4% | |||||
| Brokerage † | 16,903 | 0.5% | |||||
| Finance Companies | |||||||
| GE Capital International | |||||||
| Funding Co. Unlimited Co. | 4.418% | 11/15/35 | 24,687 | 23,680 | 0.7% | ||
| Finance Companies—Other † | 1,370 | 0.0% | |||||
§¨¨
| Long-Term Corporate Bond Index Fund | |||||||
| Face | Market | Percentage | |||||
| Maturity | Amount | Value • | of Net | ||||
| Coupon | Date | ($000) | ($000) | Assets | |||
| Insurance | |||||||
| Berkshire Hathaway | |||||||
| Finance Corp. | 4.200%–5.750% | 1/15/40–8/15/48 | 9,931 | 10,434 | 0.3% | ||
| Berkshire Hathaway Inc. | 4.500% | 2/11/43 | 1,881 | 1,980 | 0.1% | ||
| 2 | Insurance—Other † | 190,505 | 5.4% | ||||
| Real Estate Investment Trusts † | 26,499 | 0.8% | |||||
| 579,723 | 16.7% | ||||||
| Industrial | |||||||
| Basic Industry | |||||||
| Lubrizol Corp. | 6.500% | 10/1/34 | 528 | 681 | 0.0% | ||
| Vale Overseas Ltd. | 6.875% | 11/21/36 | 6,103 | 7,026 | 0.2% | ||
| Basic Industry—Other † | 128,784 | 3.7% | |||||
| Capital Goods | |||||||
| General Electric Co. | 6.750% | 3/15/32 | 6,634 | 8,221 | 0.2% | ||
| General Electric Co. | 5.875% | 1/14/38 | 6,649 | 7,573 | 0.2% | ||
| General Electric Co. | 4.125%– 6.875% | 8/7/37–3/11/44 | 15,915 | 16,734 | 0.5% | ||
| Precision Castparts | |||||||
| Corp. | 3.900%–4.375% | 1/15/43– 6/15/45 | 1,630 | 1,638 | 0.1% | ||
| United Technologies | |||||||
| Corp. | 4.500% | 6/1/42 | 7,955 | 7,900 | 0.2% | ||
| 2,3 | Capital Goods—Other † | 139,631 | 4.0% | ||||
| Communication | |||||||
| AT&T Corp. | 8.250% | 11/15/31 | 822 | 1,082 | 0.0% | ||
| AT&T Inc. | 4.500% | 3/9/48 | 9,533 | 8,214 | 0.2% | ||
| AT&T Inc. | 5.250% | 3/1/37 | 7,489 | 7,412 | 0.2% | ||
| 2 | AT&T Inc. | 4.300% | 2/15/30 | 7,725 | 7,384 | 0.2% | |
| AT&T Inc. | 4.750% | 5/15/46 | 7,549 | 6,810 | 0.2% | ||
| 2 | AT&T Inc. | 4.300%– 6.550% | 5/15/35–8/15/58 | 66,945 | 62,985 | 1.8% | |
| British | |||||||
| Telecommunications plc | 9.625% | 12/15/30 | 5,785 | 8,233 | 0.2% | ||
| Charter Communications | |||||||
| Operating LLC / Charter | |||||||
| Communications | |||||||
| Operating Capital | 6.484% | 10/23/45 | 7,370 | 7,867 | 0.2% | ||
| Charter Communications | |||||||
| Operating LLC / Charter | |||||||
| Communications | |||||||
| Operating Capital | 5.375%– 6.834% | 10/23/35–10/23/55 | 16,660 | 16,594 | 0.5% | ||
| Comcast Corp. | 3.200%–7.050% | 1/15/33–11/1/52 | 52,742 | 52,354 | 1.5% | ||
| Deutsche Telekom | |||||||
| International Finance BV | 8.750% | 6/15/30 | 8,875 | 11,985 | 0.4% | ||
| NBCUniversal Media | |||||||
| LLC | 4.450%– 6.400% | 4/30/40–1/15/43 | 6,107 | 6,701 | 0.2% | ||
| Orange SA | 9.000% | 3/1/31 | 5,155 | 7,228 | 0.2% | ||
| Time Warner Cable LLC | 4.500%–7.300% | 5/1/37–9/15/42 | 17,983 | 18,459 | 0.5% | ||
| Time Warner | |||||||
| Entertainment Co. LP | 8.375% | 7/15/33 | 1,748 | 2,199 | 0.1% | ||
| Time Warner Inc. | 3.800%– 6.200% | 2/15/27– 6/1/44 | 10,477 | 10,128 | 0.3% | ||
| Verizon Communications | |||||||
| Inc. | 5.012% | 8/21/54 | 11,889 | 11,588 | 0.3% | ||
| Verizon Communications Inc. | 4.672% | 3/15/55 | 11,369 | 10,378 | 0.3% | ||
| 2 | Verizon Communications Inc. | 4.329% | 9/21/28 | 10,100 | 10,174 | 0.3% | |
| Verizon Communications Inc. | 4.862% | 8/21/46 | 10,179 | 10,002 | 0.3% | ||
| Verizon Communications Inc. | 4.522% | 9/15/48 | 9,919 | 9,351 | 0.3% | ||
Ÿ¡Ÿ
| Long-Term Corporate Bond Index Fund | ||||||
| Face | Market | Percentage | ||||
| Maturity | Amount | Value • | of Net | |||
| Coupon | Date | ($000) | ($000) | Assets | ||
| Verizon Communications Inc. | 5.012% | 4/15/49 | 8,594 | 8,626 | 0.3% | |
| Verizon Communications Inc. | 4.500% | 8/10/33 | 7,541 | 7,431 | 0.2% | |
| Verizon Communications Inc. | 5.250% | 3/16/37 | 7,058 | 7,420 | 0.2% | |
| Verizon Communications | ||||||
| Inc. | 3.850%–5.850% | 11/1/34–3/16/47 | 29,485 | 28,238 | 0.8% | |
| Warner Media LLC | 4.850%–7.625% | 4/15/31–7/15/45 | 2,820 | 3,577 | 0.1% | |
| Communication—Other † | 142,169 | 4.1% | ||||
| Consumer Cyclical | ||||||
| Amazon.com Inc. | 4.050% | 8/22/47 | 7,320 | 7,164 | 0.2% | |
| Home Depot Inc. | 5.875% | 12/16/36 | 6,326 | 7,756 | 0.2% | |
| Visa Inc. | 4.300% | 12/14/45 | 7,232 | 7,580 | 0.2% | |
| Walmart Inc. | 4.050% | 6/29/48 | 6,625 | 6,685 | 0.2% | |
| Consumer Cyclical—Other † | 183,677 | 5.3% | ||||
| Consumer Noncyclical | ||||||
| Abbott Laboratories | 4.900% | 11/30/46 | 7,475 | 8,078 | 0.2% | |
| Amgen Inc. | 4.663% | 6/15/51 | 7,982 | 7,949 | 0.2% | |
| Anheuser-Busch InBev | ||||||
| Finance Inc. | 4.900% | 2/1/46 | 25,458 | 25,948 | 0.8% | |
| Anheuser-Busch InBev | ||||||
| Finance Inc. | 4.700% | 2/1/36 | 14,542 | 14,736 | 0.4% | |
| Anheuser-Busch InBev | ||||||
| Finance Inc. | 4.000%–4.625% | 1/17/43–2/1/44 | 3,015 | 2,835 | 0.1% | |
| Anheuser-Busch InBev | ||||||
| Worldwide Inc. | 4.600% | 4/15/48 | 6,655 | 6,541 | 0.2% | |
| Anheuser-Busch InBev | ||||||
| Worldwide Inc. | 3.750%–8.200% | 6/15/35–4/15/58 | 17,312 | 18,143 | 0.5% | |
| AstraZeneca plc | 6.450% | 9/15/37 | 5,553 | 6,924 | 0.2% | |
| 2 BAT Capital Corp. | 4.390% | 8/15/37 | 7,225 | 6,719 | 0.2% | |
| CVS Health Corp. | 5.050% | 3/25/48 | 17,470 | 17,781 | 0.5% | |
| CVS Health Corp. | 5.125% | 7/20/45 | 7,385 | 7,549 | 0.2% | |
| CVS Health Corp. | 4.780% | 3/25/38 | 6,750 | 6,687 | 0.2% | |
| CVS Health Corp. | 4.875%– 6.125% | 7/20/35–12/5/43 | 8,713 | 9,372 | 0.3% | |
| GlaxoSmithKline | ||||||
| Capital Inc. | 6.375% | 5/15/38 | 6,420 | 8,203 | 0.3% | |
| Medtronic Inc. | 4.625% | 3/15/45 | 10,193 | 10,886 | 0.3% | |
| Pfizer Inc. | 7.200% | 3/15/39 | 5,372 | 7,503 | 0.2% | |
| 2 Consumer Noncyclical—Other † | 452,885 | 13.0% | ||||
| Energy | ||||||
| Baker Hughes a GE Co. LLC | 5.125% | 9/15/40 | 2,300 | 2,436 | 0.1% | |
| Baker Hughes a GE Co. LLC / | ||||||
| Baker Hughes Co-Obligor Inc. | 4.080% | 12/15/47 | 3,195 | 2,905 | 0.1% | |
| ConocoPhillips | 6.500% | 2/1/39 | 5,400 | 7,025 | 0.2% | |
| Kinder Morgan Energy | ||||||
| Partners LP | 4.700%–7.750% | 3/15/31–9/1/44 | 18,120 | 19,698 | 0.6% | |
| Kinder Morgan Inc. | 5.050%–7.800% | 8/1/31–3/1/48 | 12,785 | 13,758 | 0.4% | |
| Shell International | ||||||
| Finance BV | 6.375% | 12/15/38 | 5,730 | 7,439 | 0.2% | |
| Tennessee Gas Pipeline | ||||||
| Co. LLC | 7.000%–7.625% | 10/15/28–4/1/37 | 1,234 | 1,485 | 0.0% | |
| 2 Energy—Other † | 342,616 | 9.8% | ||||
| Other Industrial † | 18,801 | 0.6% | ||||
| Technology | ||||||
| Apple Inc. | 4.650% | 2/23/46 | 8,898 | 9,657 | 0.3% | |
| Apple Inc. | 3.450%–4.500% | 2/23/36–11/13/47 | 31,302 | 30,795 | 0.9% | |
¢£¤
| Long-Term Corporate Bond Index Fund | |||||
| Face | Market | Percentage | |||
| Maturity | Amount | Value • | of Net | ||
| Coupon | Date | ($000) | ($000) | Assets | |
| Microsoft Corp. | 3.700% | 8/8/46 | 9,196 | 8,858 | 0.3% |
| Microsoft Corp. | 4.250% | 2/6/47 | 7,532 | 7,945 | 0.2% |
| Microsoft Corp. | 4.450% | 11/3/45 | 7,125 | 7,718 | 0.2% |
| Microsoft Corp. | 4.000% | 2/12/55 | 6,834 | 6,759 | 0.2% |
| Microsoft Corp. | 4.100% | 2/6/37 | 6,291 | 6,550 | 0.2% |
| Microsoft Corp. | 3.450%–5.300% | 2/12/35–2/6/57 | 31,503 | 32,041 | 0.9% |
| Oracle Corp. | 3.250%– 6.500% | 5/15/30–5/15/55 | 45,579 | 46,857 | 1.3% |
| 2 Technology—Other † | 79,535 | 2.3% | |||
| Transportation | |||||
| Burlington Northern | |||||
| Santa Fe LLC | 3.900%– 6.200% | 8/15/36–12/15/48 | 26,638 | 28,129 | 0.8% |
| Transportation—Other † | 97,872 | 2.8% | |||
| 2,413,257 | 69.3% | ||||
| Utilities | |||||
| Electric | |||||
| 2 Berkshire Hathaway | |||||
| Energy Co. | 3.800%– 6.125% | 4/1/36–1/15/49 | 11,909 | 13,087 | 0.4% |
| Duke Energy Carolinas | |||||
| LLC | 3.700%– 6.450% | 12/1/28–3/15/48 | 13,067 | 14,097 | 0.4% |
| Duke Energy Corp. | 3.750%–4.800% | 12/15/45–9/1/46 | 5,565 | 5,222 | 0.2% |
| Duke Energy Florida | |||||
| LLC | 3.400%– 6.400% | 9/15/37–7/15/48 | 6,809 | 7,736 | 0.2% |
| 1 Duke Energy Florida | |||||
| Project Finance LLC | 2.538%–3.112% | 9/1/29–9/1/36 | 1,725 | 1,585 | 0.0% |
| Duke Energy Indiana | |||||
| LLC | 3.750%– 6.450% | 10/15/35–5/15/46 | 4,757 | 5,408 | 0.2% |
| Duke Energy Ohio Inc. | 3.700% | 6/15/46 | 645 | 595 | 0.0% |
| Duke Energy Progress | |||||
| LLC | 3.600%– 6.300% | 9/1/28–9/15/47 | 10,352 | 10,360 | 0.3% |
| MidAmerican Energy | |||||
| Co. | 3.650%– 6.750% | 12/30/31–8/1/48 | 7,455 | 8,066 | 0.2% |
| Nevada Power Co. | 6.650%– 6.750% | 4/1/36–7/1/37 | 1,549 | 2,010 | 0.1% |
| Pacific Gas & Electric Co. | 6.050% | 3/1/34 | 6,194 | 6,927 | 0.2% |
| PacifiCorp | 4.100%–7.700% | 11/15/31–1/15/49 | 8,801 | 10,338 | 0.3% |
| Progress Energy Inc. | 6.000%–7.750% | 3/1/31–12/1/39 | 3,206 | 4,078 | 0.1% |
| 2 Electric—Other † | 292,892 | 8.4% | |||
| Natural Gas | |||||
| Piedmont Natural Gas | |||||
| Co. Inc. | 3.640%–4.650% | 8/1/43–11/1/46 | 1,250 | 1,194 | 0.0% |
| Natural Gas—Other † | 31,326 | 0.9% | |||
| Other Utility † | 8,923 | 0.3% | |||
| 423,844 | 12.2% | ||||
| Total Corporate Bonds (Cost $3,516,059) | 3,416,824 | 98.2% | |||
| Taxable Municipal Bonds (Cost $8,079) † | 7,994 | 0.2% | |||
| Shares | |||||
| Temporary Cash Investment | |||||
| Money Market Fund | |||||
| 4 Vanguard Market Liquidity Fund | |||||
| (Cost $19,766) | 2.153% | 197,644 | 19,769 | 0.6% | |
| Total Investments (Cost $3,558,583) | 3,459,230 | 99.4% | |||
œ~Ÿ
| Long-Term Corporate Bond Index Fund | ||
| Percentage | ||
| Amount | of Net | |
| ($000) | Assets | |
| Other Assets and Liabilities | ||
| Other Assets | ||
| Investment in Vanguard | 166 | |
| Receivables for Investment Securities Sold | 15,119 | |
| Receivables for Accrued Income | 44,788 | |
| Receivables for Capital Shares Issued | 59 | |
| Variation Margin Receivable—Futures Contracts | 17 | |
| Other Assets | 3 | |
| Total Other Assets | 60,152 | 1.7% |
| Liabilities | ||
| Payables for Investment Securities Purchased | (37,617) | |
| Payables for Capital Shares Redeemed | (141) | |
| Payables for Distributions | (284) | |
| Payables to Vanguard | (537) | |
| Variation Margin Payable—Futures Contracts | (5) | |
| Total Liabilities | (38,584) | (1.1%) |
| Net Assets | 3,480,798 | 100.0% |
| At August 31, 2018, net assets consisted of: | ||
| Amount | ||
| ($000) | ||
| Paid-in Capital | 3,623,185 | |
| Undistributed Net Investment Income | 8,359 | |
| Accumulated Net Realized Losses | (51,401) | |
| Unrealized Appreciation (Depreciation) | ||
| Investment Securities | (99,353) | |
| Futures Contracts | 8 | |
| Net Assets | 3,480,798 | |
| ETF Shares—Net Assets | ||
| Applicable to 28,404,289 outstanding $.001 par value shares of | ||
| beneficial interest (unlimited authorization) | 2,509,480 | |
| Net Asset Value Per Share—ETF Shares | $88.35 | |
| Admiral Shares—Net Assets | ||
| Applicable to 7,853,229 outstanding $.001 par value shares of | ||
| beneficial interest (unlimited authorization) | 185,760 | |
| Net Asset Value Per Share—Admiral Shares | $23.65 | |
‘’“
| Long-Term Corporate Bond Index Fund | |
| Amount | |
| ($000) | |
| Institutional Shares—Net Assets | |
| Applicable to 26,760,338 outstanding $.001 par value shares of | |
| beneficial interest (unlimited authorization) | 785,558 |
| Net Asset Value Per Share—Institutional Shares | $29.36 |
• See Note A in Notes to Financial Statements.
† Represents the aggregate value, by category, of securities that are not among the 50 largest holdings and, in total for any issuer,
represent 1% or less of net assets.
1 The average or expected maturity is shorter than the final maturity shown because of the possibility of interim principal payments
and prepayments or the possibility of the issue being called.
2 Certain of the fund’s securities are exempt from registration under Rule 144A of the Securities Act of 1933. Such securities may be
sold in transactions exempt from registration, normally to qualified institutional buyers. At August 31, 2018, the aggregate value of
these securities was $68,413,000, representing 2.0% of net assets.
3 Certain of the fund’s securities with a value of $681,000 have been segregated as initial margin for open futures contracts.
4 Affiliated money market fund available only to Vanguard funds and certain trusts and accounts managed by Vanguard. Rate shown
is the 7-day yield.
| Derivative Financial Instruments Outstanding as of Period End | ||||
| Futures Contracts | ||||
| ($000) | ||||
| Value and | ||||
| Number of | Unrealized | |||
| Long (Short) | Notional | Appreciation | ||
| Expiration | Contracts | Amount | (Depreciation) | |
| Long Futures Contracts | ||||
| Ultra 10-Year U.S. Treasury Note | December 2018 | 25 | 3,201 | 9 |
| Short Futures Contracts | ||||
| Ultra Long U.S. Treasury Bond | December 2018 | (28) | (4,461) | (1) |
| 8 | ||||
See accompanying Notes, which are an integral part of the Financial Statements.
Œ}‘
Long-Term Corporate Bond Index Fund
Statement of Operations
| Year Ended | |
| August 31, 2018 | |
| ($000) | |
| Investment Income | |
| Income | |
| Interest1 | 132,316 |
| Total Income | 132,316 |
| Expenses | |
| The Vanguard Group—Note B | |
| Investment Advisory Services | 96 |
| Management and Administrative—ETF Shares | 1,159 |
| Management and Administrative—Admiral Shares | 101 |
| Management and Administrative—Institutional Shares | 258 |
| Marketing and Distribution—ETF Shares | 136 |
| Marketing and Distribution—Admiral Shares | 15 |
| Marketing and Distribution—Institutional Shares | 17 |
| Custodian Fees | 36 |
| Auditing Fees | 52 |
| Shareholders’ Reports and Proxy—ETF Shares | 142 |
| Shareholders’ Reports and Proxy—Admiral Shares | 3 |
| Shareholders’ Reports and Proxy—Institutional Shares | — |
| Trustees’ Fees and Expenses | 2 |
| Total Expenses | 2,017 |
| Net Investment Income | 130,299 |
| Realized Net Gain (Loss) | |
| Investment Securities Sold1,2 | 8,723 |
| Futures Contracts | (1,922) |
| Realized Net Gain (Loss) | 6,801 |
| Change in Unrealized Appreciation (Depreciation) | |
| Investment Securities1 | (204,019) |
| Futures Contracts | (38) |
| Change in Unrealized Appreciation (Depreciation) | (204,057) |
| Net Increase (Decrease) in Net Assets Resulting from Operations | (66,957) |
1 Interest income, realized net gain (loss), and change in unrealized appreciation (depreciation) from an affiliated company of the fund
were $236,000, ($4,000), and $2,000, respectively. Purchases and sales are for temporary cash investment purposes.
2 Includes $20,995,000 of net gain (loss) resulting from in-kind redemptions; such gain (loss) is not taxable to the fund.
See accompanying Notes, which are an integral part of the Financial Statements.
“”•
Long-Term Corporate Bond Index Fund
Statement of Changes in Net Assets
| Year Ended August 31, | ||
| 2018 | 2017 | |
| ($000) | ($000) | |
| Increase (Decrease) in Net Assets | ||
| Operations | ||
| Net Investment Income | 130,299 | 95,044 |
| Realized Net Gain (Loss) | 6,801 | 8,603 |
| Change in Unrealized Appreciation (Depreciation) | (204,057) | (37,094) |
| Net Increase (Decrease) in Net Assets Resulting from Operations | (66,957) | 66,553 |
| Distributions | ||
| Net Investment Income | ||
| ETF Shares | (94,437) | (68,989) |
| Admiral Shares | (7,913) | (4,937) |
| Institutional Shares | (26,788) | (18,938) |
| Realized Capital Gain | ||
| ETF Shares | — | — |
| Admiral Shares | — | — |
| Institutional Shares | — | — |
| Total Distributions | (129,138) | (92,864) |
| Capital Share Transactions | ||
| ETF Shares | 553,331 | 623,715 |
| Admiral Shares | 37,881 | 70,782 |
| Institutional Shares | 299,185 | 150,313 |
| Net Increase (Decrease) from Capital Share Transactions | 890,397 | 844,810 |
| Total Increase (Decrease) | 694,302 | 818,499 |
| Net Assets | ||
| Beginning of Period | 2,786,496 | 1,967,997 |
| End of Period1 | 3,480,798 | 2,786,496 |
| 1 Net Assets—End of Period includes undistributed (overdistributed) net investment income of $8,359,000 and $7,198,000. | ||
See accompanying Notes, which are an integral part of the Financial Statements.
}‘’
Long-Term Corporate Bond Index Fund
Financial Highlights
| ETF Shares | |||||
| For a Share Outstanding | Year Ended August 31, | ||||
| Throughout Each Period | 2018 | 2017 | 2016 | 2015 | 2014 |
| Net Asset Value, Beginning of Period | $94.07 | $96.37 | $85.25 | $92.38 | $82.11 |
| Investment Operations | |||||
| Net Investment Income | 3.8801 | 3.8971 | 3.905 | 3.910 | 3.964 |
| Net Realized and Unrealized Gain (Loss) | |||||
| on Investments 2 | (5.722) | (2.356) | 11.127 | (7.127) | 9.937 |
| Total from Investment Operations | (1.842) | 1.541 | 15.032 | (3.217) | 13.901 |
| Distributions | |||||
| Dividends from Net Investment Income | (3.878) | (3.841) | (3.912) | (3.913) | (3.631) |
| Distributions from Realized Capital Gains | — | — | — | — | — |
| Total Distributions | (3.878) | (3.841) | (3.912) | (3.913) | (3.631) |
| Net Asset Value, End of Period | $88.35 | $94.07 | $96.37 | $85.25 | $92.38 |
| Total Return | -2.01% | 1.81% | 18.21% | -3.64% | 17.35% |
| Ratios/Supplemental Data | |||||
| Net Assets, End of Period (Millions) | $2,509 | $2,098 | $1,494 | $972 | $878 |
| Ratio of Total Expenses to Average Net Assets | 0.07% | 0.07% | 0.07% | 0.10% | 0.12% |
| Ratio of Net Investment Income to | |||||
| Average Net Assets | 4.26% | 4.27% | 4.46% | 4.37% | 4.63% |
| Portfolio Turnover Rate 3 | 48% | 56% | 59% | 64% | 54% |
1 Calculated based on average shares outstanding.
2 Includes increases from purchase fees of $.09, $.09, $.03, $.11, and $.05.
3 Excludes the value of portfolio securities received or delivered as a result of in-kind purchases or redemptions of the fund’s capital
shares, including ETF Creation Units.
See accompanying Notes, which are an integral part of the Financial Statements.
•–—
Long-Term Corporate Bond Index Fund
Financial Highlights
| Admiral Shares | |||||
| For a Share Outstanding | Year Ended August 31, | ||||
| Throughout Each Period | 2018 | 2017 | 2016 | 2015 | 2014 |
| Net Asset Value, Beginning of Period | $25.18 | $25.79 | $22.80 | $24.71 | $22.04 |
| Investment Operations | |||||
| Net Investment Income | 1.0431 | 1.0471 | 1.047 | 1.048 | 1.066 |
| Net Realized and Unrealized Gain (Loss) | |||||
| on Investments 2 | (1.536) | (.625) | 2.991 | (1.911) | 2.669 |
| Total from Investment Operations | (.493) | .422 | 4.038 | (.863) | 3.735 |
| Distributions | |||||
| Dividends from Net Investment Income | (1.037) | (1.032) | (1.048) | (1.047) | (1.065) |
| Distributions from Realized Capital Gains | — | — | — | — | — |
| Total Distributions | (1.037) | (1.032) | (1.048) | (1.047) | (1.065) |
| Net Asset Value, End of Period | $23.65 | $25.18 | $25.79 | $22.80 | $24.71 |
| Total Return 3 | -2.00% | 1.84% | 18.21% | -3.66% | 17.37% |
| Ratios/Supplemental Data | |||||
| Net Assets, End of Period (Millions) | $186 | $161 | $90 | $67 | $44 |
| Ratio of Total Expenses to Average Net Assets | 0.07% | 0.07% | 0.07% | 0.10% | 0.12% |
| Ratio of Net Investment Income to | |||||
| Average Net Assets | 4.26% | 4.27% | 4.46% | 4.37% | 4.63% |
| Portfolio Turnover Rate 4 | 48% | 56% | 59% | 64% | 54% |
Signal Shares were renamed Admiral Shares in October 2013.
1 Calculated based on average shares outstanding.
2 Includes increases from purchase fees of $.03, $.02, $.01, $.02, and $.01.
3 Total returns do not include transaction or account service fees that may have applied in the periods shown. Fund prospectuses provide
information about any applicable transaction and account service fees.
4 Excludes the value of portfolio securities received or delivered as a result of in-kind purchases or redemptions of the fund’s capital
shares, including ETF Creation Units.
See accompanying Notes, which are an integral part of the Financial Statements.
•–—
Long-Term Corporate Bond Index Fund
Financial Highlights
| Institutional Shares | |||||
| For a Share Outstanding | Year Ended August 31, | ||||
| Throughout Each Period | 2018 | 2017 | 2016 | 2015 | 2014 |
| Net Asset Value, Beginning of Period | $31.25 | $32.02 | $28.31 | $30.68 | $27.37 |
| Investment Operations | |||||
| Net Investment Income | 1.2991 | 1.3061 | 1.306 | 1.310 | 1.331 |
| Net Realized and Unrealized Gain (Loss) | |||||
| on Investments 2 | (1.895) | (.790) | 3.710 | (2.370) | 3.308 |
| Total from Investment Operations | (.596) | .516 | 5.016 | (1.060) | 4.639 |
| Distributions | |||||
| Dividends from Net Investment Income | (1.294) | (1.286) | (1.306) | (1.310) | (1.329) |
| Distributions from Realized Capital Gains | — | — | — | — | — |
| Total Distributions | (1.294) | (1.286) | (1.306) | (1.310) | (1.329) |
| Net Asset Value, End of Period | $29.36 | $31.25 | $32.02 | $28.31 | $30.68 |
| Total Return 3 | -1.95% | 1.81% | 18.22% | -3.62% | 17.38% |
| Ratios/Supplemental Data | |||||
| Net Assets, End of Period (Millions) | $786 | $528 | $384 | $296 | $250 |
| Ratio of Total Expenses to Average Net Assets | 0.05% | 0.05% | 0.05% | 0.07% | 0.09% |
| Ratio of Net Investment Income to | |||||
| Average Net Assets | 4.28% | 4.29% | 4.48% | 4.40% | 4.66% |
| Portfolio Turnover Rate 4 | 48% | 56% | 59% | 64% | 54% |
1 Calculated based on average shares outstanding.
2 Includes increases from purchase fees of $.03, $.03, $.01, $.03, and $.02.
3 Total returns do not include transaction fees that may have applied in the periods shown. Fund prospectuses provide information about
any applicable transaction fees.
4 Excludes the value of portfolio securities received or delivered as a result of in-kind purchases or redemptions of the fund’s capital
shares, including ETF Creation Units.
See accompanying Notes, which are an integral part of the Financial Statements.
••–
Long-Term Corporate Bond Index Fund
Notes to Financial Statements
Vanguard Long-Term Corporate Bond Index Fund is registered under the Investment Company Act of 1940 as an open-end investment company, or mutual fund. Certain of the fund’s investments are in corporate debt instruments; the issuers’ abilities to meet their obligations may be affected by economic developments in their respective industries. The fund offers three classes of shares: ETF Shares, Admiral Shares, and Institutional Shares. ETF Shares are listed for trading on Nasdaq; they can be purchased and sold through a broker. Admiral Shares and Institutional Shares are designed for investors who meet certain administrative, service, and account-size criteria.
A. The following significant accounting policies conform to generally accepted accounting principles for U.S. investment companies. The fund consistently follows such policies in preparing its financial statements.
1. Security Valuation: Securities are valued as of the close of trading on the New York Stock Exchange (generally 4 p.m., Eastern time) on the valuation date. Bonds and temporary cash investments are valued using the latest bid prices or using valuations based on a matrix system (which considers such factors as security prices, yields, maturities, and ratings), both as furnished by independent pricing services. Investments in Vanguard Market Liquidity Fund are valued at that fund’s net asset value. Securities for which market quotations are not readily available, or whose values have been affected by events occurring before the fund’s pricing time but after the close of the securities’ primary markets, are valued by methods deemed by the board of trustees to represent fair value.
2. Futures Contracts: The fund uses futures contracts to invest in fixed income asset classes with greater efficiency and lower cost than is possible through direct investment, to add value when these instruments are attractively priced, or to adjust sensitivity to changes in interest rates. The primary risks associated with the use of futures contracts are imperfect correlation between changes in market values of bonds held by the fund and the prices of futures contracts, and the possibility of an illiquid market. Counterparty risk involving futures is mitigated because a regulated clearinghouse is the counterparty instead of the clearing broker. To further mitigate counterparty risk, the fund trades futures contracts on an exchange, monitors the financial strength of its clearing brokers and clearinghouse, and has entered into clearing agreements with its clearing brokers. The clearinghouse imposes initial margin requirements to secure the fund’s performance and requires daily settlement of variation margin representing changes in the market value of each contract.
Any assets pledged as initial margin for open contracts are noted in the Statement of Net Assets.
Futures contracts are valued at their quoted daily settlement prices. The notional amounts of the contracts are not recorded in the Statement of Net Assets. Fluctuations in the value of the contracts are recorded in the Statement of Net Assets as an asset (liability) and in the Statement of Operations as unrealized appreciation (depreciation) until the contracts are closed, when they are recorded as realized futures gains (losses).
During the year ended August 31, 2018, the fund’s average investments in long and short futures contracts each represented less than 1% of net assets, based on the average of the notional amounts at each quarter-end during the period.
˜˜˜
Long-Term Corporate Bond Index Fund
3. Federal Income Taxes: The fund intends to continue to qualify as a regulated investment company and distribute all of its taxable income. Management has analyzed the fund’s tax positions taken for all open federal income tax years (August 31, 2015–2018), and has concluded that no provision for federal income tax is required in the fund’s financial statements.
4. Distributions: Distributions to shareholders are recorded on the ex-dividend date. Distributions are determined on a tax basis and may differ from net investment income and realized capital gains for financial reporting purposes.
5. Credit Facility: The fund and certain other funds managed by The Vanguard Group (“Vanguard”) participate in a $3.1 billion committed credit facility provided by a syndicate of lenders pursuant to a credit agreement that may be renewed annually; each fund is individually liable for its borrowings, if any, under the credit facility. Borrowings may be utilized for temporary and emergency purposes, and are subject to the fund’s regulatory and contractual borrowing restrictions. The participating funds are charged administrative fees and an annual commitment fee of 0.10% of the undrawn amount of the facility; these fees are allocated to the funds based on a method approved by the fund’s board of trustees and included in Management and Administrative expenses on the fund’s Statement of Operations. Any borrowings under this facility bear interest at a rate based upon the higher of the one-month London Interbank Offered Rate, federal funds effective rate, or overnight bank funding rate plus an agreed-upon spread.
The fund had no borrowings outstanding at August 31, 2018, or at any time during the period then ended.
6. Other: Interest income includes income distributions received from Vanguard Market Liquidity Fund and is accrued daily. Premiums and discounts on debt securities purchased are amortized and accreted, respectively, to interest income over the lives of the respective securities. Security transactions are accounted for on the date securities are bought or sold. Costs used to determine realized gains (losses) on the sale of investment securities are those of the specific securities sold. Fees assessed on capital share transactions are credited to paid-in capital.
Each class of shares has equal rights as to assets and earnings, except that each class separately bears certain class-specific expenses related to maintenance of shareholder accounts (included in Management and Administrative expenses), shareholder reporting, and the proxy. Marketing and distribution expenses are allocated to each class of shares based on a method approved by the board of trustees. Income, other non-class-specific expenses, and gains and losses on investments are allocated to each class of shares based on its relative net assets.
B. In accordance with the terms of a Funds’ Service Agreement (the “FSA”) between Vanguard and the fund, Vanguard furnishes to the fund investment advisory, corporate management, administrative, marketing, and distribution services at Vanguard’s cost of operations (as defined by the FSA). These costs of operations are allocated to the fund based on methods and guidelines approved by the board of trustees. Vanguard does not require reimbursement in the current period for certain costs of operations (such as deferred compensation/benefits and risk/insurance costs); the fund’s liability for these costs of operations is included in Payables to Vanguard on the Statement of Net Assets. All other costs of operations payable to Vanguard are generally settled twice a month.
¡¡¢
Long-Term Corporate Bond Index Fund
Upon the request of Vanguard, the fund may invest up to 0.40% of its net assets as capital in Vanguard. At August 31, 2018, the fund had contributed to Vanguard capital in the amount of $166,000, representing 0.00% of the fund’s net assets and 0.07% of Vanguard’s capitalization. The fund’s trustees and officers are also directors and employees, respectively, of Vanguard.
C. Various inputs may be used to determine the value of the fund’s investments. These inputs are summarized in three broad levels for financial statement purposes. The inputs or methodologies used to value securities are not necessarily an indication of the risk associated with investing in those securities.
Level 1—Quoted prices in active markets for identical securities.
Level 2—Other significant observable inputs (including quoted prices for similar securities, interest rates, prepayment speeds, credit risk, etc.).
Level 3—Significant unobservable inputs (including the fund’s own assumptions used to determine
the fair value of investments). Any investments valued with significant unobservable inputs are
noted on the Statement of Net Assets.
The following table summarizes the market value of the fund’s investments as of August 31, 2018, based on the inputs used to value them:
| Level 1 | Level 2 | Level 3 | |
| Investments | ($000) | ($000) | ($000) |
| U.S. Government and Agency Obligations | 14,643 | ||
| Corporate Bonds | — | 3,416,824 | — |
| Taxable Municipal Bonds | — | 7,994 | — |
| Temporary Cash Investments | 19,769 | — | — |
| Futures Contracts—Assets1 | 17 | — | — |
| Futures Contracts—Liabilities1 | (5) | — | — |
| Total | 19,781 | 3,439,461 | — |
| 1 Represents variation margin on the last day of the reporting period. |
D. Permanent differences are reclassified among capital accounts in the financial statements to reflect their tax character. These reclassifications have no effect on net assets or net asset value per share. As of period end, the following permanent differences primarily attributable to the accounting for in-kind redemptions were reclassified to the following accounts:
| Amount | |
| ($000) | |
| Paid-in capital | 20,995 |
| Undistributed (Overdistributed) net investment income | — |
| Accumulated net realized gains (losses) | (20,995) |
››œ
Long-Term Corporate Bond Index Fund
Temporary differences between book-basis and tax-basis components of accumulated net earnings (losses) arise when certain items of income, gain, or loss are recognized in different periods for financial statement and tax purposes; these differences will reverse at some time in the future.
The differences are primarily related to the tax deferral of losses on wash sales and straddles. As of period end, the tax components of accumulated net earnings (losses) are detailed in the table as follows:
| Amount | |
| ($000) | |
| Undistributed ordinary income | 9,069 |
| Undistributed long-term gains | — |
| Capital loss carryforwards (non-expiring) | (51,355) |
| Net unrealized gains (losses) | (99,392) |
As of August 31, 2018, gross unrealized appreciation and depreciation for investments and derivatives based on cost for U.S. federal income tax purposes were as follows:
| Amount | |
| ($000) | |
| Tax cost | 3,558,622 |
| Gross unrealized appreciation | 13,526 |
| Gross unrealized depreciation | (112,918) |
| Net unrealized appreciation (depreciation) | (99,392) |
E. During the year ended August 31, 2018, the fund purchased $2,250,250,000 of investment securities and sold $1,350,711,000 of investment securities, other than U.S. government securities and temporary cash investments. Purchases and sales of U.S. government securities were $669,211,000 and $654,340,000, respectively. Total purchases and sales include $1,109,602,000 and $568,691,000, respectively, in connection with in-kind purchases and redemptions of the fund’s capital shares.
The fund purchased securities from and sold securities to other Vanguard funds or accounts managed by Vanguard or its affiliates, in accordance with procedures adopted by the board of trustees in compliance with Rule 17a-7 of the Investment Company Act of 1940. For the year ended August 31, 2018, such purchases and sales were $377,221,000 and $566,707,000, respectively; these amounts are included in the purchases and sales of investment securities noted above.
——˜
Long-Term Corporate Bond Index Fund
F. Capital share transactions for each class of shares were:
| Year Ended August 31, | ||||
| 2018 | 2017 | |||
| Amount | Shares | Amount | Shares | |
| ($000) | (000) | ($000) | (000) | |
| ETF Shares | ||||
| Issued1 | 1,140,046 | 12,500 | 1,037,964 | 11,403 |
| Issued in Lieu of Cash Distributions | — | — | — | — |
| Redeemed | (586,715) | (6,400) | (414,249) | (4,600) |
| Net Increase (Decrease)—ETF Shares | 553,331 | 6,100 | 623,715 | 6,803 |
| Admiral Shares | ||||
| Issued1 | 93,287 | 3,743 | 97,733 | 4,001 |
| Issued in Lieu of Cash Distributions | 6,178 | 253 | 3,760 | 154 |
| Redeemed | (61,584) | (2,519) | (30,711) | (1,269) |
| Net Increase (Decrease)—Admiral Shares | 37,881 | 1,477 | 70,782 | 2,886 |
| Institutional Shares | ||||
| Issued1 | 329,774 | 10,870 | 163,296 | 5,330 |
| Issued in Lieu of Cash Distributions | 24,989 | 828 | 18,070 | 595 |
| Redeemed | (55,578) | (1,824) | (31,053) | (1,034) |
| Net Increase (Decrease)—Institutional Shares | 299,185 | 9,874 | 150,313 | 4,891 |
| 1 Includes purchase fees for fiscal 2018 and 2017 of $3,520,000 and $2,617,000, respectively (fund totals). | ||||
G. Management has determined that no events or transactions occurred subsequent to August 31, 2018, that would require recognition or disclosure in these financial statements.
‘‘’
Mortgage-Backed Securities Index Fund
Fund Profile
As of August 31, 2018
| Share-Class Characteristics | |||
| ETF | Admiral Institutional | ||
| Shares | Shares | Shares | |
| Ticker Symbol | VMBS | VMBSX | VMBIX |
| Expense Ratio1 | 0.07% | 0.07% | 0.05% |
| 30-Day SEC Yield | 2.86% | 2.86% | 2.88% |
| Financial Attributes | |||
| Bloomberg | Bloomberg | ||
| Barclays | Barclays | ||
| U.S. MBS | U.S. | ||
| Float Adj | Aggregate | ||
| Fund | Index | FA Index | |
| Number of Bonds | 5702 | 329 | 10,038 |
| Yield to Maturity | |||
| (before expenses) | 3.4% | 3.4% | 3.3% |
| Average Coupon | 3.6% | 3.6% | 3.1% |
| Average Duration | 4.9 years | 4.9 years | 6.1 years |
| Average Effective | |||
| Maturity | 7.4 years | 7.4 years | 8.4 years |
| Short-Term | |||
| Reserves | 8.9% | — | — |
| Sector Diversification (% of portfolio) | |
| Government Mortgage-Backed | 100.0% |
The agency and mortgage-backed securities sectors may include
issues from government-sponsored enterprises; such issues are
generally not backed by the full faith and credit of the U.S.
government.
| Volatility Measures | ||
| Bloomberg | Bloomberg | |
| Barclays U.S. | Barclays U.S. | |
| MBS Float Adj | Aggregate | |
| Index | FA Index | |
| R-Squared | 0.99 | 0.87 |
| Beta | 1.03 | 0.66 |
| These measures show the degree and timing of the fund’s | ||
| fluctuations compared with the indexes over 36 months. | ||
| Distribution by Effective Maturity | |
| (% of portfolio) | |
| Under 1 Year | 0.3% |
| 1 - 3 Years | 1.9 |
| 3 - 5 Years | 9.3 |
| 5 - 10 Years | 87.3 |
| 10 - 20 Years | 1.2 |
| Distribution by Credit Quality (% of portfolio) | |
| U.S. Government | 100.0% |
Credit-quality ratings are obtained from Barclays and are from
Moody's, Fitch, and S&P. When ratings from all three agencies are
used, the median rating is shown. When ratings from two of the
agencies are used, the lower rating for each issue is shown. "Not
Rated" is used to classify securities for which a rating is not
available. For more information about these ratings, see the
Glossary entry for Credit Quality.
| Distribution by Coupon (% of portfolio) | |
| 0% - 5.0% | 97.4% |
| More Than 5.0% - 5.5% | 1.5 |
| More Than 5.5% - 6.0% | 0.9 |
| More Than 6.0% - 6.5% | 0.2 |
1 The expense ratios shown are from the prospectus dated December 21, 2017, and represent estimated costs for the current fiscal year.
For the fiscal year ended August 31, 2018, the expense ratios were 0.07% for ETF Shares, 0.07% for Admiral Shares, and 0.05% for
Institutional Shares.
2 Issues are mortgage pools grouped by coupon.
116
Mortgage-Backed Securities Index Fund
Investment Focus
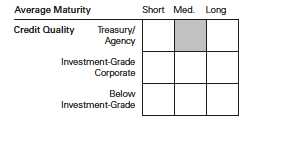
117
Mortgage-Backed Securities Index Fund
Performance Summary
All of the returns in this report represent past performance, which is not a guarantee of future results that may be achieved by the fund. (Current performance may be lower or higher than the performance data cited. For performance data current to the most recent month-end, visit our website at vanguard.com/performance.) Note, too, that both investment returns and principal value can fluctuate widely, so an investor’s shares, when sold, could be worth more or less than their original cost. The returns shown do not reflect taxes that a shareholder would pay on fund distributions or on the sale of fund shares.
Cumulative Performance: November 19, 2009, Through August 31, 2018
Initial Investment of $10,000

| Average Annual Total Returns | |||||
| Periods Ended August 31, 2018 | |||||
| Since | Final Value | ||||
| One | Five | Inception | of a $10,000 | ||
| Year | Years | (11/19/2009) | Investment | ||
| Mortgage-Backed Securities Index Fund | |||||
| ETF Shares Net Asset Value | -0.67% | 2.27% | 2.50% | $12,423 | |
| Mortgage-Backed Securities Index Fund | |||||
| ETF Shares Market Price | -0.65 | 2.31 | 2.51 | 12,433 | |
| Bloomberg Barclays U.S. MBS Float Adj | |||||
| • • • • • • •• | Index | -0.48 | 2.33 | 2.55 | 12,479 |
| – – – – | U.S. Mortgage Funds Average | -0.47 | 2.39 | 2.93 | 12,883 |
| Spliced Bloomberg Barclays U.S. | |||||
| Aggregate Float Adjusted Index | -1.09 | 2.47 | 3.09 | 13,062 | |
For a benchmark description, see the Glossary.
U.S. Mortgage Funds Average: Derived from data provided by Lipper, a Thomson Reuters Company.
"Since Inception" performance is calculated from the ETF Shares’ inception date for both the fund and its comparative standards.
See Financial Highlights for dividend and capital gains information.
118
Mortgage-Backed Securities Index Fund
| Average Annual Total Returns | ||||
| Periods Ended August 31, 2018 | ||||
| Since | Final Value | |||
| One | Five | Inception | of a $10,000 | |
| Year | Years | (12/3/2009) | Investment | |
| Mortgage-Backed Securities Index Fund | ||||
| Admiral Shares | -0.68% | 2.27% | 2.49% | $12,396 |
| Bloomberg Barclays U.S. MBS Float Adj | ||||
| Index | -0.48 | 2.33 | 2.55 | 12,468 |
| Spliced Bloomberg Barclays U.S. Aggregate | ||||
| Float Adjusted Index | -1.09 | 2.47 | 3.09 | 13,046 |
| "Since Inception" performance is calculated from the Admiral Shares’ inception date for both the fund and its comparative standards. | ||||
| Since | Final Value | ||
| One | Inception | of a $5,000,000 | |
| Year | (10/31/2013) | Investment | |
| Mortgage-Backed Securities Index Fund | |||
| Institutional Shares | -0.68% | 1.96% | $5,491,326 |
| Bloomberg Barclays U.S. MBS Float Adj | |||
| Index | -0.48 | 2.01 | 5,504,785 |
| Bloomberg Barclays U.S. Aggregate Float | |||
| Adjusted Index | -1.09 | 2.20 | 5,555,506 |
| "Since Inception" performance is calculated from the Institutional Shares’ inception date for both the fund and its comparative standards. | |||
| Cumulative Returns of ETF Shares: November 19, 2009, Through August 31, 2018 | |||
| Since | |||
| One | Five | Inception | |
| Year | Years | (11/19/2009) | |
| Mortgage-Backed Securities Index Fund ETF Shares | |||
| Market Price | -0.65% | 12.12% | 24.33% |
| Mortgage-Backed Securities Index Fund ETF Shares | |||
| Net Asset Value | -0.67 | 11.88 | 24.23 |
| Bloomberg Barclays U.S. MBS Float Adj Index | -0.48 | 12.20 | 24.79 |
119
Mortgage-Backed Securities Index Fund
| Fiscal-Year Total Returns (%): November 19, 2009, Through August 31, 2018 | ||
| Bloomberg | ||
| Barclays U.S. | ||
| MBS Float Adj | ||
| ETF Shares Net Asset Value | Index | |
| Fiscal Year | Total Returns | Total Returns |
| 2010 | 4.39% | 4.23% |
| 2011 | 5.14 | 5.11 |
| 2012 | 3.62 | 3.62 |
| 2013 | -2.36 | -2.03 |
| 2014 | 5.21 | 5.15 |
| 2015 | 2.49 | 2.51 |
| 2016 | 3.70 | 3.76 |
| 2017 | 0.74 | 0.81 |
| 2018 | -0.67 | -0.48 |
Average Annual Total Returns: Periods Ended June 30, 2018
This table presents returns through the latest calendar quarter—rather than through the end of the fiscal period.
Securities and Exchange Commission rules require that we provide this information.
| Since Inception | ||||||
| Inception Date | One Year | Five Years | Income | Capital | Total | |
| ETF Shares | 11/19/2009 | |||||
| Market Price | -0.02% | 2.14% | 2.51% | |||
| Net Asset Value | 0.01 | 2.11 | 2.50 | |||
| Admiral Shares | 12/3/2009 | -0.03 | 2.10 | 1.78% | 0.70% | 2.48 |
| Institutional Shares | 10/31/2013 | 0.02 | — | 1.89 | 0.05 | 1.94 |
120
Mortgage-Backed Securities Index Fund
Financial Statements
Statement of Net Assets
As of August 31, 2018
The fund reports a complete list of its holdings in regulatory filings four times in each fiscal year, at the quarter-ends. For the second and fourth fiscal quarters, the lists appear in the fund’s semiannual and annual reports to shareholders. For the first and third fiscal quarters, the fund files the lists with the Securities and Exchange Commission on Form N-Q. Shareholders can look up the fund’s Forms N-Q on the SEC’s website at sec.gov. Forms N-Q may also be reviewed and copied at the SEC’s Public Reference Room (see the back cover of this report for further information).
| Face | Market | ||||
| Maturity | Amount | Value • | |||
| Coupon | Date | ($000) | ($000) | ||
| U. S. Government and Agency Obligations (99.9%) | |||||
| Conventional Mortgage-Backed Securities (99.8%) | |||||
| 1,2 | Fannie Mae Pool | 2.000% | 11/1/27–11/1/31 | 13,368 | 12,638 |
| 1,2,3 Fannie Mae Pool | 2.500% | 11/1/26–10/1/46 | 222,285 | 216,138 | |
| 1,2,3 Fannie Mae Pool | 3.000% | 11/1/25–10/1/48 | 790,227 | 772,018 | |
| 1,2,3 Fannie Mae Pool | 3.500% | 10/1/20–10/1/48 | 1,014,332 | 1,012,041 | |
| 1,2,3 Fannie Mae Pool | 4.000% | 9/1/18–10/1/48 | 783,010 | 798,907 | |
| 1,2,3 Fannie Mae Pool | 4.500% | 9/1/18–9/1/48 | 286,917 | 299,069 | |
| 1,2,3 Fannie Mae Pool | 5.000% | 10/1/18–9/1/48 | 92,408 | 98,366 | |
| 1,2 | Fannie Mae Pool | 5.500% | 12/1/18–2/1/42 | 59,437 | 64,601 |
| 1,2 | Fannie Mae Pool | 6.000% | 12/1/20–5/1/41 | 40,458 | 44,252 |
| 1,2 | Fannie Mae Pool | 6.500% | 10/1/21–10/1/39 | 10,543 | 11,582 |
| 1,2 | Fannie Mae Pool | 7.000% | 12/1/22–10/1/37 | 601 | 683 |
| 1,2 | Fannie Mae Pool | 7.500% | 11/1/22 | 3 | 4 |
| 1,2 | Freddie Mac Gold Pool | 2.000% | 1/1/28–12/1/31 | 7,608 | 7,194 |
| 1,2,3 Freddie Mac Gold Pool | 2.500% | 8/1/22–10/1/46 | 163,236 | 158,901 | |
| 1,2,3 Freddie Mac Gold Pool | 3.000% | 1/1/26–9/1/48 | 584,943 | 571,394 | |
| 1,2,3 Freddie Mac Gold Pool | 3.500% | 9/1/25–9/1/48 | 663,545 | 662,459 | |
| 1,2,3 Freddie Mac Gold Pool | 4.000% | 9/1/18–9/1/48 | 426,088 | 434,990 | |
| 1,2,3 Freddie Mac Gold Pool | 4.500% | 10/1/18–9/1/48 | 167,764 | 174,937 | |
| 1,2 | Freddie Mac Gold Pool | 5.000% | 9/1/18–3/1/42 | 46,025 | 49,137 |
| 1,2 | Freddie Mac Gold Pool | 5.500% | 4/1/21– 6/1/41 | 39,680 | 43,098 |
| 1,2 | Freddie Mac Gold Pool | 6.000% | 1/1/24–5/1/40 | 20,895 | 22,876 |
| 1,2 | Freddie Mac Gold Pool | 6.500% | 10/1/28–9/1/39 | 5,181 | 5,754 |
| 1,2 | Freddie Mac Gold Pool | 7.000% | 7/1/28–12/1/38 | 249 | 280 |
| 2 | Ginnie Mae I Pool | 3.000% | 1/15/26–3/15/45 | 28,877 | 28,302 |
| 2,3 | Ginnie Mae I Pool | 3.500% | 2/15/26–10/1/48 | 33,372 | 33,502 |
| 2,3 | Ginnie Mae I Pool | 4.000% | 7/15/24–10/1/47 | 41,722 | 42,862 |
| 2,3 | Ginnie Mae I Pool | 4.500% | 9/15/18–9/1/47 | 46,856 | 49,082 |
| 2 | Ginnie Mae I Pool | 5.000% | 1/15/19–4/15/41 | 27,463 | 29,325 |
| 2 | Ginnie Mae I Pool | 5.500% | 10/15/32–3/15/40 | 9,300 | 10,030 |
| 2 | Ginnie Mae I Pool | 6.000% | 4/15/28–5/15/41 | 3,575 | 3,886 |
| 2 | Ginnie Mae I Pool | 6.500% | 5/15/24–1/15/39 | 153 | 173 |
| 2 | Ginnie Mae I Pool | 7.000% | 10/15/27 | 4 | 5 |
| 2 | Ginnie Mae II Pool | 2.500% | 6/20/27–12/20/46 | 28,512 | 27,283 |
| 2,3 | Ginnie Mae II Pool | 3.000% | 10/20/26–8/20/48 | 549,839 | 539,338 |
| 2,3 | Ginnie Mae II Pool | 3.500% | 12/20/25–10/1/48 | 903,482 | 909,042 |
| 2,3 | Ginnie Mae II Pool | 4.000% | 9/20/25–9/1/48 | 536,570 | 550,924 |
š›š
| Mortgage-Backed Securities Index Fund | |||||
| Face | Market | ||||
| Maturity | Amount | Value • | |||
| Coupon | Date | ($000) | ($000) | ||
| 2,3 Ginnie Mae II Pool | 4.500% | 2/20/39–10/1/48 | 189,649 | 198,077 | |
| 2,3 Ginnie Mae II Pool | 5.000% | 6/20/33–9/1/48 | 59,147 | 62,908 | |
| 2 | Ginnie Mae II Pool | 5.500% | 11/20/33–5/20/45 | 15,478 | 16,529 |
| 2 | Ginnie Mae II Pool | 6.000% | 3/20/31–9/20/41 | 6,822 | 7,370 |
| 2 | Ginnie Mae II Pool | 6.500% | 10/20/28–9/20/40 | 741 | 824 |
| 2 | Ginnie Mae II Pool | 7.000% | 4/20/38–11/20/38 | 78 | 90 |
| 7,970,871 | |||||
| Nonconventional Mortgage-Backed Securities (0.1%) | |||||
| 1,2 Fannie Mae Pool | 2.127% | 3/1/43 | 463 | 458 | |
| 1,2 Fannie Mae Pool | 2.182% | 6/1/43 | 257 | 256 | |
| 1,2 Fannie Mae Pool | 2.278% | 7/1/43 | 805 | 780 | |
| 1,2 Fannie Mae Pool | 2.387% | 10/1/42 | 274 | 273 | |
| 1,2,4 Fannie Mae Pool | 3.330% | 12/1/41 | 80 | 82 | |
| 1,2 Fannie Mae Pool | 3.362% | 8/1/42 | 114 | 114 | |
| 1,2,4 Fannie Mae Pool | 3.481% | 10/1/39 | 18 | 19 | |
| 1,2,4 Fannie Mae Pool | 3.482% | 12/1/40 | 149 | 156 | |
| 1,2 Fannie Mae Pool | 3.493% | 4/1/41 | 37 | 37 | |
| 1,2,4 Fannie Mae Pool | 3.555% | 11/1/41 | 75 | 80 | |
| 1,2,4 Fannie Mae Pool | 3.560% | 10/1/40–12/1/40 | 15 | 16 | |
| 1,2,4 Fannie Mae Pool | 3.563% | 11/1/41 | 20 | 21 | |
| 1,2,4 Fannie Mae Pool | 3.565% | 11/1/40–12/1/40 | 16 | 17 | |
| 1,2,4 Fannie Mae Pool | 3.575% | 12/1/41 | 79 | 83 | |
| 1,2,4 Fannie Mae Pool | 3.606% | 1/1/42 | 154 | 161 | |
| 1,2,4 Fannie Mae Pool | 3.614% | 9/1/37 | 26 | 27 | |
| 1,2,4 Fannie Mae Pool | 3.627% | 3/1/38 | 3 | 3 | |
| 1,2,4 Fannie Mae Pool | 3.645% | 1/1/40 | 3 | 3 | |
| 1,2,4 Fannie Mae Pool | 3.685% | 2/1/41 | 4 | 4 | |
| 1,2,4 Fannie Mae Pool | 3.716% | 3/1/41 | 114 | 119 | |
| 1,2,5 Fannie Mae Pool | 3.724% | 8/1/39 | 44 | 45 | |
| 1,2,4 Fannie Mae Pool | 3.747% | 12/1/39 | 146 | 151 | |
| 1,2,4 Fannie Mae Pool | 3.849% | 5/1/42 | 29 | 30 | |
| 1,2,4 Fannie Mae Pool | 3.851% | 11/1/39 | 19 | 20 | |
| 1,2,5 Fannie Mae Pool | 3.888% | 5/1/42 | 69 | 71 | |
| 1,2,4 Fannie Mae Pool | 3.955% | 10/1/37 | 84 | 86 | |
| 1,2,4 Fannie Mae Pool | 4.187% | 3/1/42 | 62 | 66 | |
| 1,2,5 Fannie Mae Pool | 4.192% | 2/1/42 | 127 | 135 | |
| 1,2,4 Fannie Mae Pool | 4.234% | 5/1/40 | 2 | 3 | |
| 1,2,4 Fannie Mae Pool | 4.284% | 4/1/37 | 5 | 6 | |
| 1,2,4 Fannie Mae Pool | 4.313% | 5/1/41 | 35 | 37 | |
| 1,2,4 Fannie Mae Pool | 4.330% | 6/1/42 | 760 | 789 | |
| 1,2,4 Fannie Mae Pool | 4.385% | 9/1/40 | 146 | 154 | |
| 1,2,4 Fannie Mae Pool | 4.440% | 9/1/42 | 393 | 409 | |
| 1,2 Freddie Mac Non Gold Pool | 2.456% | 11/1/43 | 276 | 284 | |
| 1,2,4 Freddie Mac Non Gold Pool | 3.410% | 10/1/37 | 11 | 11 | |
| 1,2,4 Freddie Mac Non Gold Pool | 3.495% | 12/1/40 | 22 | 23 | |
| 1,2,4 Freddie Mac Non Gold Pool | 3.577% | 2/1/37 | 11 | 11 | |
| 1,2,4 Freddie Mac Non Gold Pool | 3.666% | 2/1/42 | 27 | 28 | |
| 1,2,4 Freddie Mac Non Gold Pool | 3.826% | 12/1/39 | 15 | 16 | |
| 1,2,4 Freddie Mac Non Gold Pool | 3.900% | 2/1/41 | 104 | 110 | |
| 1,2,4 Freddie Mac Non Gold Pool | 3.910% | 2/1/41 | 5 | 5 | |
| 1,2,4 Freddie Mac Non Gold Pool | 4.060% | 9/1/40 | 42 | 44 | |
| 1,2,4 Freddie Mac Non Gold Pool | 4.145% | 3/1/38 | 11 | 11 | |
| 1,2,4 Freddie Mac Non Gold Pool | 4.445% | 5/1/40 | 1 | 1 | |
| 1,2,4 Freddie Mac Non Gold Pool | 4.483% | 6/1/40 | 38 | 39 | |
‡ˆˆ
| Mortgage-Backed Securities Index Fund | ||||
| Face | Market | |||
| Maturity | Amount | Value• | ||
| Coupon | Date | ($000) | ($000) | |
| 1,2,4 Freddie Mac Non Gold Pool | 4.517% | 6/1/40 | 34 | 36 |
| 1,2,4 Freddie Mac Non Gold Pool | 4.544% | 6/1/41 | 50 | 52 |
| 1,2,4 Freddie Mac Non Gold Pool | 4.647% | 6/1/37 | 94 | 99 |
| 2,6 Ginnie Mae II Pool | 2.750% | 7/20/41–8/20/41 | 107 | 110 |
| 2,6 Ginnie Mae II Pool | 3.125% | 11/20/40–12/20/42 | 411 | 422 |
| 2,6 Ginnie Mae II Pool | 3.375% | 1/20/41–2/20/41 | 413 | 427 |
| 2,6 Ginnie Mae II Pool | 3.625% | 11/20/40–4/20/41 | 14 | 14 |
| 2,6 Ginnie Mae II Pool | 4.125% | 5/20/41 | 7 | 8 |
| 6,462 | ||||
| Total U.S. Government and Agency Obligations (Cost $8,143,919) | 7,977,333 | |||
| Shares | ||||
| Temporary Cash Investment (9.7%) | ||||
| Money Market Fund (9.7%) | ||||
| 7 Vanguard Market Liquidity Fund | ||||
| (Cost $775,692) | 2.153% | 7,757,012 | 775,856 | |
| Total Investments (109.6%) (Cost $8,919,611) | 8,753,189 | |||
| Other Assets and Liabilities (-9.6%) | ||||
| Other Assets | 192,064 | |||
| Liabilities | (957,070) | |||
| (765,006) | ||||
| Net Assets (100%) | 7,988,183 | |||
| Amount | ||||
| ($000) | ||||
| Statement of Assets and Liabilities | ||||
| Assets | ||||
| Investments in Securities, at Value | ||||
| Unaffiliated Issuers | 7,977,333 | |||
| Affiliated Issuers | 775,856 | |||
| Total Investments in Securities | 8,753,189 | |||
| Investment in Vanguard | 398 | |||
| Receivables for Investment Securities Sold | 162,905 | |||
| Receivables for Accrued Income | 24,769 | |||
| Receivables for Capital Shares Issued | 3,905 | |||
| Other Assets | 87 | |||
| Total Assets | 8,945,253 | |||
| Liabilities | ||||
| Payables for Investment Securities Purchased | 954,591 | |||
| Payables for Capital Shares Redeemed | 914 | |||
| Payables for Distributions | 785 | |||
| Payables to Vanguard | 780 | |||
| Total Liabilities | 957,070 | |||
| Net Assets | 7,988,183 | |||
Mortgage-Backed Securities Index Fund
| At August 31, 2018, net assets consisted of: | |
| Amount | |
| ($000) | |
| Paid-in Capital | 8,154,540 |
| Undistributed Net Investment Income | 16,204 |
| Accumulated Net Realized Losses | (16,139) |
| Unrealized Appreciation (Depreciation) | (166,422) |
| Net Assets | 7,988,183 |
| ETF Shares—Net Assets | |
| Applicable to 140,001,386 outstanding $.001 par value shares of | |
| beneficial interest (unlimited authorization) | 7,193,279 |
| Net Asset Value Per Share—ETF Shares | $51.38 |
| Admiral Shares—Net Assets | |
| Applicable to 35,351,875 outstanding $.001 par value shares of | |
| beneficial interest (unlimited authorization) | 725,057 |
| Net Asset Value Per Share—Admiral Shares | $20.51 |
| Institutional Shares—Net Assets | |
| Applicable to 2,513,209 outstanding $.001 par value shares of | |
| beneficial interest (unlimited authorization) | 69,847 |
| Net Asset Value Per Share—Institutional Shares | $27.79 |
• See Note A in Notes to Financial Statements.
1 The issuer was placed under federal conservatorship in September 2008; since that time, its daily operations have been managed
by the Federal Housing Finance Agency and it receives capital from the U.S. Treasury, as needed to maintain a positive net worth,
in exchange for senior preferred stock.
2 The average or expected maturity is shorter than the final maturity shown because of the possibility of interim principal payments
and prepayments or the possibility of the issue being called.
3 Includes securities purchased on a when-issued or delayed-delivery basis for which the fund has not taken delivery as of
August 31, 2018.
4 Adjustable-rate security based upon 12-month USD LIBOR plus spread.
5 Adjustable-rate security based upon 6-month USD LIBOR plus spread.
6 Adjustable-rate security based upon one-year Constant Maturity Treasury yield plus spread.
7 Affiliated money market fund available only to Vanguard funds and certain trusts and accounts managed by Vanguard. Rate shown
is the 7-day yield.
See accompanying Notes, which are an integral part of the Financial Statements.
ƒ„…
Mortgage-Backed Securities Index Fund
Statement of Operations
| Year Ended | |
| August 31, 2018 | |
| ($000) | |
| Investment Income | |
| Income | |
| Interest1 | 156,408 |
| Total Income | 156,408 |
| Expenses | |
| The Vanguard Group—Note B | |
| Investment Advisory Services | 188 |
| Management and Administrative—ETF Shares | 2,401 |
| Management and Administrative—Admiral Shares | 288 |
| Management and Administrative—Institutional Shares | 24 |
| Marketing and Distribution—ETF Shares | 327 |
| Marketing and Distribution—Admiral Shares | 48 |
| Marketing and Distribution—Institutional Shares | 1 |
| Custodian Fees | 120 |
| Auditing Fees | 42 |
| Shareholders’ Reports and Proxy—ETF Shares | 664 |
| Shareholders’ Reports and Proxy—Admiral Shares | 44 |
| Shareholders’ Reports and Proxy—Institutional Shares | — |
| Trustees’ Fees and Expenses | 4 |
| Total Expenses | 4,151 |
| Net Investment Income | 152,257 |
| Realized Net Gain (Loss) on Investment Securities Sold1 | (12,797) |
| Change in Unrealized Appreciation (Depreciation) of Investment Securities1 | (161,675) |
| Net Increase (Decrease) in Net Assets Resulting from Operations | (22,215) |
1 Interest income, realized net gain (loss), and change in unrealized appreciation (depreciation) from an affiliated company of the fund
were $12,096,000, ($98,000), and $67,000, respectively. Purchases and sales are for temporary cash investment purposes.
See accompanying Notes, which are an integral part of the Financial Statements.
’“”
Mortgage-Backed Securities Index Fund
Statement of Changes in Net Assets
| Year Ended August 31, | ||
| 2018 | 2017 | |
| ($000) | ($000) | |
| Increase (Decrease) in Net Assets | ||
| Operations | ||
| Net Investment Income | 152,257 | 81,386 |
| Realized Net Gain (Loss) | (12,797) | (3,034) |
| Change in Unrealized Appreciation (Depreciation) | (161,675) | (33,643) |
| Net Increase (Decrease) in Net Assets Resulting from Operations | (22,215) | 44,709 |
| Distributions | ||
| Net Investment Income | ||
| ETF Shares | (127,410) | (66,407) |
| Admiral Shares | (15,137) | (10,261) |
| Institutional Shares | (1,461) | (951) |
| Realized Capital Gain1 | ||
| ETF Shares | — | (9,143) |
| Admiral Shares | — | (1,699) |
| Institutional Shares | — | (139) |
| Total Distributions | (144,008) | (88,600) |
| Capital Share Transactions | ||
| ETF Shares | 3,087,309 | 1,449,272 |
| Admiral Shares | 216,671 | (18,274) |
| Institutional Shares | 19,589 | 6,068 |
| Net Increase (Decrease) from Capital Share Transactions | 3,323,569 | 1,437,066 |
| Total Increase (Decrease) | 3,157,346 | 1,393,175 |
| Net Assets | ||
| Beginning of Period | 4,830,837 | 3,437,662 |
| End of Period2 | 7,988,183 | 4,830,837 |
1 Includes fiscal 2018 and 2017 short-term gain distributions totaling $0 and $10,882,000, respectively. Short-term gain distributions
are treated as ordinary income dividends for tax purposes.
2 Net Assets—End of Period includes undistributed (overdistributed) net investment income of $16,204,000 and $7,955,000.
See accompanying Notes, which are an integral part of the Financial Statements.
}‘’
Mortgage-Backed Securities Index Fund
Financial Highlights
| ETF Shares | |||||
| For a Share Outstanding | Year Ended August 31, | ||||
| Throughout Each Period | 2018 | 2017 | 2016 | 2015 | 2014 |
| Net Asset Value, Beginning of Period | $53.00 | $53.79 | $53.05 | $52.65 | $50.85 |
| Investment Operations | |||||
| Net Investment Income | 1.3251 | 1.0591 | .967 | .748 | .887 |
| Net Realized and Unrealized Gain (Loss) | |||||
| on Investments | (1.683) | (.682) | .968 | .554 | 1.741 |
| Total from Investment Operations | (.358) | .377 | 1.935 | 1.302 | 2.628 |
| Distributions | |||||
| Dividends from Net Investment Income | (1.262) | (1.004) | (.955) | (.741) | (.828) |
| Distributions from Realized Capital Gains | — | (.163) | (.240) | (.161) | — |
| Total Distributions | (1.262) | (1.167) | (1.195) | (.902) | (.828) |
| Net Asset Value, End of Period | $51.38 | $53.00 | $53.79 | $53.05 | $52.65 |
| Total Return | -0.67% | 0.74% | 3.70% | 2.49% | 5.21% |
| Ratios/Supplemental Data | |||||
| Net Assets, End of Period (Millions) | $7,193 | $4,252 | $2,837 | $1,451 | $542 |
| Ratio of Total Expenses to Average Net Assets | 0.07% | 0.07% | 0.07% | 0.10% | 0.12% |
| Ratio of Net Investment Income to | |||||
| Average Net Assets | 2.56% | 2.00% | 1.85% | 1.43% | 1.72% |
| Portfolio Turnover Rate2 | 279% | 339% | 380% | 713% | 514% |
1 Calculated based on average shares outstanding.
2 Includes 78%, 133%, 175%, 331%, and 294% attributable to mortgage-dollar-roll activity.
See accompanying Notes, which are an integral part of the Financial Statements.
•–—
Mortgage-Backed Securities Index Fund
Financial Highlights
| Admiral Shares | |||||
| For a Share Outstanding | Year Ended August 31, | ||||
| Throughout Each Period | 2018 | 2017 | 2016 | 2015 | 2014 |
| Net Asset Value, Beginning of Period | $21.17 | $21.49 | $21.20 | $21.05 | $20.35 |
| Investment Operations | |||||
| Net Investment Income | . 5281 | .4131 | .388 | .298 | .356 |
| Net Realized and Unrealized Gain (Loss) | |||||
| on Investments | (.674) | (.258) | .387 | .214 | .699 |
| Total from Investment Operations | (.146) | .155 | .775 | .512 | 1.055 |
| Distributions | |||||
| Dividends from Net Investment Income | (.514) | (.410) | (.389) | (.297) | (.355) |
| Distributions from Realized Capital Gains | — | (.065) | (.096) | (.065) | — |
| Total Distributions | (.514) | (.475) | (.485) | (.362) | (.355) |
| Net Asset Value, End of Period | $20.51 | $21.17 | $21.49 | $21.20 | $21.05 |
| Total Return2 | -0.68% | 0.76% | 3.70% | 2.44% | 5.22% |
| Ratios/Supplemental Data | |||||
| Net Assets, End of Period (Millions) | $725 | $527 | $554 | $424 | $305 |
| Ratio of Total Expenses to Average Net Assets | 0.07% | 0.07% | 0.07% | 0.10% | 0.12% |
| Ratio of Net Investment Income to | |||||
| Average Net Assets | 2.56% | 2.00% | 1.85% | 1.43% | 1.72% |
| Portfolio Turnover Rate 3 | 279% | 339% | 380% | 713% | 514% |
Signal Shares were renamed Admiral Shares in October 2013.
1 Calculated based on average shares outstanding.
2 Total returns do not include account service fees that may have applied in the periods shown. Fund prospectuses provide information
about any applicable account service fees.
3 Includes 78%, 133%, 175%, 331%, and 294% attributable to mortgage-dollar-roll activity.
See accompanying Notes, which are an integral part of the Financial Statements.
•–—
Mortgage-Backed Securities Index Fund
Financial Highlights
| Institutional Shares | |||||
| Oct. 31, | |||||
| 20131 to | |||||
| For a Share Outstanding | Year Ended August 31, | Aug. 31, | |||
| Throughout Each Period | 2018 | 2017 | 2016 | 2015 | 2014 |
| Net Asset Value, Beginning of Period | $28.69 | $29.12 | $28.73 | $28.52 | $28.04 |
| Investment Operations | |||||
| Net Investment Income | .7212 | .5712 | .532 | .412 | .390 |
| Net Realized and Unrealized Gain (Loss) | |||||
| on Investments | (.920) | (.353) | .522 | .295 | .504 |
| Total from Investment Operations | (.199) | .218 | 1.054 | .707 | .894 |
| Distributions | |||||
| Dividends from Net Investment Income | (.701) | (. 560) | (. 534) | (. 410) | (. 414) |
| Distributions from Realized Capital Gains | — | (.088) | (.130) | (.087) | — |
| Total Distributions | (.701) | (. 648) | (. 664) | (. 497) | (. 414) |
| Net Asset Value, End of Period | $27.79 | $28.69 | $29.12 | $28.73 | $28.52 |
| Total Return | -0.68% | 0.79% | 3.72% | 2.49% | 3.22% |
| Ratios/Supplemental Data | |||||
| Net Assets, End of Period (Millions) | $70 | $52 | $47 | $44 | $109 |
| Ratio of Total Expenses to Average Net Assets | 0.05% | 0.05% | 0.05% | 0.07% | 0.09%3 |
| Ratio of Net Investment Income to | |||||
| Average Net Assets | 2.58% | 2.02% | 1.87% | 1.46% | 1.75%3 |
| Portfolio Turnover Rate 4 | 279% | 339% | 380% | 713% | 514% |
1 Recommencement of operations.
2 Calculated based on average shares outstanding.
3 Annualized.
4 Includes 78%, 133%, 175%, 331%, and 294% attributable to mortgage-dollar-roll activity.
See accompanying Notes, which are an integral part of the Financial Statements.
•–—
Mortgage-Backed Securities Index Fund
Notes to Financial Statements
Vanguard Mortgage-Backed Securities Index Fund is registered under the Investment Company Act of 1940 as an open-end investment company, or mutual fund. The fund offers three classes of shares: ETF Shares, Admiral Shares, and Institutional Shares. ETF Shares are listed for trading on Nasdaq; they can be purchased and sold through a broker. Admiral Shares and Institutional Shares are designed for investors who meet certain administrative, service, and account-size criteria.
A. The following significant accounting policies conform to generally accepted accounting principles for U.S. investment companies. The fund consistently follows such policies in preparing its financial statements.
1. Security Valuation: Securities are valued as of the close of trading on the New York Stock Exchange (generally 4 p.m., Eastern time) on the valuation date. Bonds and temporary cash investments are valued using the latest bid prices or using valuations based on a matrix system (which considers such factors as security prices, yields, maturities, and ratings), both as furnished by independent pricing services. Structured debt securities, including mortgages and asset-backed securities, are valued using the latest bid prices or using valuations based on a matrix system that considers such factors as issuer, tranche, nominal or option-adjusted spreads, weighted average coupon, weighted average maturity, credit enhancements, and collateral. Investments in Vanguard Market Liquidity Fund are valued at that fund’s net asset value. Securities for which market quotations are not readily available, or whose values have been affected by events occurring before the fund’s pricing time but after the close of the securities’ primary markets, are valued by methods deemed by the board of trustees to represent fair value.
2. To Be Announced (TBA) Transactions: A TBA transaction is an agreement to buy or sell mortgage-backed securities with agreed-upon characteristics (face amount, coupon, maturity) for settlement at a future date. The fund may be a seller of TBA transactions to reduce its exposure to the mortgage-backed securities market or in order to sell mortgage-backed securities it owns under delayed-delivery arrangements. When the fund is a buyer of TBA transactions, it maintains cash or short-term investments in an amount sufficient to meet the purchase price at the settlement date of the TBA transaction. The primary risk associated with TBA transactions is that a counterparty may default on its obligations. The fund mitigates its counterparty risk by, among other things, performing a credit analysis of counterparties, allocating transactions among numerous counterparties, and monitoring its exposure to each counterparty. The fund may also enter into a Master Securities Forward Transaction Agreement (MSFTA) with certain counterparties and require them to transfer collateral as security for their performance. In the absence of a default, the collateral pledged or received by the fund cannot be repledged, resold, or rehypothecated. Under an MSFTA, upon a counterparty default (including bankruptcy), the fund may terminate any TBA transactions with that counterparty, determine the net amount owed by either party in accordance with its master netting arrangements, and sell or retain any collateral held up to the net amount owed to the fund under the master netting arrangements.
At August 31, 2018, the counterparty had deposited in a segregated account securities with a value of $494,000 and cash with a value of $230,000 in connection with TBA transactions.
—˜™
Mortgage-Backed Securities Index Fund
3. Mortgage Dollar Rolls: The fund enters into mortgage-dollar-roll transactions, in which the fund sells mortgage-backed securities to a dealer and simultaneously agrees to purchase similar securities in the future at a predetermined price. The proceeds of the securities sold in mortgage-dollar-roll transactions are typically invested in high-quality short-term fixed income securities. The fund forgoes principal and interest paid on the securities sold, and is compensated by interest earned on the proceeds of the sale and by a lower price on the securities to be repurchased. The fund has also entered into mortgage-dollar-roll transactions in which the fund buys mortgage-backed securities from a dealer pursuant to a TBA transaction and simultaneously agrees to sell similar securities in the future at a predetermined price. The securities bought in mortgage-dollar-roll transactions are used to cover an open TBA sell position. The fund continues to earn interest on mortgage-backed security pools already held and receives a lower price on the securities to be sold in the future. The fund accounts for mortgage-dollar-roll transactions as purchases and sales; as such, these transactions may increase the fund’s portfolio turnover rate. Amounts to be received or paid in connection with open mortgage dollar rolls are included in Receivables for Investment Securities Sold or Payables for Investment Securities Purchased in the Statement of Assets and Liabilities.
4. Federal Income Taxes: The fund intends to continue to qualify as a regulated investment company and distribute all of its taxable income. Management has analyzed the fund’s tax positions taken for all open federal income tax years (August 31, 2015–2018), and has concluded that no provision for federal income tax is required in the fund’s financial statements.
5. Distributions: Distributions to shareholders are recorded on the ex-dividend date. Distributions are determined on a tax basis and may differ from net investment income and realized capital gains for financial reporting purposes.
6. Credit Facility: The fund and certain other funds managed by The Vanguard Group (“Vanguard”) participate in a $3.1 billion committed credit facility provided by a syndicate of lenders pursuant to a credit agreement that may be renewed annually; each fund is individually liable for its borrowings, if any, under the credit facility. Borrowings may be utilized for temporary and emergency purposes, and are subject to the fund’s regulatory and contractual borrowing restrictions. The participating funds are charged administrative fees and an annual commitment fee of 0.10% of the undrawn amount of the facility; these fees are allocated to the funds based on a method approved by the fund’s board of trustees and included in Management and Administrative expenses on the fund’s Statement of Operations. Any borrowings under this facility bear interest at a rate based upon the higher of the one-month London Interbank Offered Rate, federal funds effective rate, or overnight bank funding rate plus an agreed-upon spread.
The fund had no borrowings outstanding at August 31, 2018, or at any time during the period then ended.
7. Other: Interest income includes income distributions received from Vanguard Market Liquidity Fund and is accrued daily. Premiums and discounts on debt securities purchased are amortized and accreted, respectively, to interest income over the lives of the respective securities. Security transactions are accounted for on the date securities are bought or sold. Costs used to determine realized gains (losses) on the sale of investment securities are those of the specific securities sold.
~Ÿ~
Mortgage-Backed Securities Index Fund
Each class of shares has equal rights as to assets and earnings, except that each class separately bears certain class-specific expenses related to maintenance of shareholder accounts (included in Management and Administrative expenses), shareholder reporting, and the proxy. Marketing and distribution expenses are allocated to each class of shares based on a method approved by the board of trustees. Income, other non-class-specific expenses, and gains and losses on investments are allocated to each class of shares based on its relative net assets.
B. In accordance with the terms of a Funds’ Service Agreement (the “FSA”) between Vanguard and the fund, Vanguard furnishes to the fund investment advisory, corporate management, administrative, marketing, and distribution services at Vanguard’s cost of operations (as defined by the FSA). These costs of operations are allocated to the fund based on methods and guidelines approved by the board of trustees. Vanguard does not require reimbursement in the current period for certain costs of operations (such as deferred compensation/benefits and risk/insurance costs); the fund’s liability for these costs of operations is included in Payables to Vanguard on the Statement of Assets and Liabilities. All other costs of operations payable to Vanguard are generally settled twice a month.
Upon the request of Vanguard, the fund may invest up to 0.40% of its net assets as capital in Vanguard. At August 31, 2018, the fund had contributed to Vanguard capital in the amount of $398,000, representing 0.00% of the fund’s net assets and 0.16% of Vanguard’s capitalization. The fund’s trustees and officers are also directors and employees, respectively, of Vanguard.
C. Various inputs may be used to determine the value of the fund’s investments. These inputs are summarized in three broad levels for financial statement purposes. The inputs or methodologies used to value securities are not necessarily an indication of the risk associated with investing in those securities.
Level 1—Quoted prices in active markets for identical securities.
Level 2—Other significant observable inputs (including quoted prices for similar securities, interest rates, prepayment speeds, credit risk, etc.).
Level 3—Significant unobservable inputs (including the fund’s own assumptions used to determine
the fair value of investments). Any investments valued with significant unobservable inputs are
noted on the Statement of Net Assets.
The following table summarizes the market value of the fund’s investments as of August 31, 2018, based on the inputs used to value them:
| Level 1 | Level 2 | Level 3 | |
| Investments | ($000) | ($000) | ($000) |
| U.S. Government and Agency Obligations | — | 7,977,333 | — |
| Temporary Cash Investments | 775,856 | — | — |
| Total | 775,856 | 7,977,333 | — |
¡¢£
Mortgage-Backed Securities Index Fund
D. Permanent differences, if any, are reclassified among capital accounts in the financial statements to reflect their tax character. These reclassifications have no effect on net assets or net asset value per share.
Temporary differences between book-basis and tax-basis components of accumulated net earnings (losses) arise when certain items of income, gain, or loss are recognized in different periods for financial statement and tax purposes; these differences will reverse at some time in the future. The differences are primarily related to the tax deferral of losses on wash sales and payables for distribution. As of period end, the tax components of accumulated net earnings (losses) are detailed in the table as follows:
| Amount | |
| ($000) | |
| Undistributed ordinary income | 17,494 |
| Undistributed long-term gains | — |
| Capital loss carryforwards (non-expiring) | (16,139) |
| Net unrealized gains (losses) | (166,422) |
As of August 31, 2018, gross unrealized appreciation and depreciation for investments and derivatives based on cost for U.S. federal income tax purposes were as follows:
| Amount | |
| ($000) | |
| Tax cost | 8,919,611 |
| Gross unrealized appreciation | 2,647 |
| Gross unrealized depreciation | (169,069) |
| Net unrealized appreciation (depreciation) | (166,422) |
E. During the year ended August 31, 2018, the fund purchased $18,533,016,000 of investment securities and sold $16,728,383,000 of investment securities, other than temporary cash investments. Purchases include $1,565,244,000 in connection with in-kind purchases of the fund’s capital shares.
Mortgage-Backed Securities Index Fund
F. Capital share transactions for each class of shares were:
| Year Ended August 31, | ||||
| 2018 | 2017 | |||
| Amount | Shares | Amount | Shares | |
| ($000) | (000) | ($000) | (000) | |
| ETF Shares | ||||
| Issued | 3,261,856 | 63,125 | 1,746,074 | 33,125 |
| Issued in Lieu of Cash Distributions | — | — | — | — |
| Redeemed | (174,547) | (3,350) | (296,802) | (5,650) |
| Net Increase (Decrease) —ETF Shares | 3,087,309 | 59,775 | 1,449,272 | 27,475 |
| Admiral Shares | ||||
| Issued | 344,126 | 16,640 | 194,551 | 9,213 |
| Issued in Lieu of Cash Distributions | 8,268 | 400 | 6,385 | 304 |
| Redeemed | (135,723) | (6,563) | (219,210) | (10,403) |
| Net Increase (Decrease)—Admiral Shares | 216,671 | 10,477 | (18,274) | (886) |
| Institutional Shares | ||||
| Issued | 21,125 | 754 | 6,657 | 234 |
| Issued in Lieu of Cash Distributions | 1,431 | 51 | 1,090 | 38 |
| Redeemed | (2,967) | (105) | (1,679) | (59) |
| Net Increase (Decrease)—Institutional Shares | 19,589 | 700 | 6,068 | 213 |
At August 31, 2018, one shareholder was the record or beneficial owner of 31% of the fund’s net assets. If the shareholder were to redeem its investment in the fund, the redemption might result in an increase in the fund’s expense ratio.
G. Management has determined that no events or transactions occurred subsequent to August 31, 2018, that would require recognition or disclosure in these financial statements.
”•–
Report of Independent Registered
Public Accounting Firm
To the Board of Trustees of Vanguard Scottsdale Funds and Shareholders of Vanguard Short-Term Treasury Index Fund (formerly known as Vanguard Short-Term Government Bond Index Fund), Vanguard Intermediate-Term Treasury Index Fund (formerly known as Vanguard Intermediate-Term Government Bond Index Fund), Vanguard Long-Term Treasury Index Fund (formerly known as Vanguard Long-Term Government Bond Index Fund), Vanguard Short-Term Corporate Bond Index Fund, Vanguard Intermediate-Term Corporate Bond Index Fund, Vanguard Long-Term Corporate Bond Index Fund and Vanguard Mortgage-Backed Securities Index Fund
Opinions on the Financial Statements
We have audited the accompanying statements of assets and liabilities of Vanguard Short-Term Treasury Index Fund and Vanguard Mortgage-Backed Securities Index Fund, statements of net assets-investments summary of Vanguard Short-Term Corporate Bond Index Fund, Vanguard Intermediate-Term Corporate Bond Index Fund and Vanguard Long-Term Corporate Bond Index Fund, and statements of net assets of Vanguard Short-Term Treasury Index Fund, Vanguard Intermediate-Term Treasury Index Fund, Vanguard Long-Term Treasury Index Fund and Vanguard Mortgage-Backed Securities Index Fund (seven of the funds constituting Vanguard Scottsdale Funds, hereafter collectively referred to as the “Funds”) as of August 31, 2018, the related statements of operations for the year ended August 31, 2018, the statements of changes in net assets for each of the two years in the period ended August 31, 2018, including the related notes, and the financial highlights for each of the periods indicated therein (collectively referred to as the “financial statements”). In our opinion, the financial statements present fairly, in all material respects, the financial position of each of the Funds as of August 31, 2018, the results of each of their operations for the year then ended, the changes in each of their net assets for each of the two years in the period ended August 31, 2018 and each of the financial highlights for each of the periods indicated therein in conformity with accounting principles generally accepted in the United States of America.
Basis for Opinions
These financial statements are the responsibility of the Funds’ management. Our responsibility is to express an opinion on the Funds’ financial statements based on our audits. We are a public accounting firm registered with the Public Company Accounting Oversight Board (United States) (“PCAOB”) and are required to be independent with respect to the Funds in accordance with the U.S. federal securities laws and the applicable rules and regulations of the Securities and Exchange Commission and the PCAOB.
We conducted our audits of these financial statements in accordance with the standards of the PCAOB. Those standards require that we plan and perform the audit to obtain reasonable assurance about whether the financial statements are free of material misstatement, whether due to error or fraud.
Our audits included performing procedures to assess the risks of material misstatement of the financial statements, whether due to error or fraud, and performing procedures that respond to those risks. Such procedures included examining, on a test basis, evidence regarding the amounts and disclosures in the financial statements. Our audits also included evaluating the accounting principles used and significant estimates made by management, as well as evaluating the overall presentation of the financial statements. Our procedures included confirmation of securities owned as of August 31, 2018 by correspondence with the custodian and brokers and by agreement to the underlying ownership records of the transfer agent; when replies were not received from brokers, we performed other auditing procedures. We believe that our audits provide a reasonable basis for our opinions.
/s/PricewaterhouseCoopers LLP
Philadelphia, Pennsylvania
October 18, 2018
We have served as the auditor of one or more investment companies in The Vanguard Group of Funds since 1975.

Special 2018 tax information (unaudited) for Vanguard Short-Term Treasury Index Fund
This information for the fiscal year ended August 31, 2018, is included pursuant to provisions of the Internal Revenue Code.
For nonresident alien shareholders, 99.4% of income dividends are interest-related dividends.

Special 2018 tax information (unaudited) for Vanguard Intermediate-Term Treasury Index Fund
This information for the fiscal year ended August 31, 2018, is included pursuant to provisions of the Internal Revenue Code.
For nonresident alien shareholders, 99.7% of income dividends are interest-related dividends.
‘’“

Special 2018 tax information (unaudited) for Vanguard Long-Term Treasury Bond Index Fund
This information for the fiscal year ended August 31, 2018, is included pursuant to provisions of
the Internal Revenue Code.
For nonresident alien shareholders, 99.6% of income dividends are interest-related dividends.

Special 2018 tax information (unaudited) for Vanguard Short-Term Corporate Bond Index Fund
This information for the fiscal year ended August 31, 2018, is included pursuant to provisions of
the Internal Revenue Code.
For nonresident alien shareholders, 79.1% of income dividends are interest-related dividends.

Special 2018 tax information (unaudited) for Vanguard Intermediate-Term Corporate Bond
Index Fund
This information for the fiscal year ended August 31, 2018, is included pursuant to provisions of
the Internal Revenue Code.
For nonresident alien shareholders, 84.3% of income dividends are interest-related dividends.

Special 2018 tax information (unaudited) for Vanguard Long-Term Corporate Bond Index Fund
This information for the fiscal year ended August 31, 2018, is included pursuant to provisions of
the Internal Revenue Code.
For nonresident alien shareholders, 87.0% of income dividends are interest-related dividends.

Special 2018 tax information (unaudited) for Vanguard Mortgage-Backed Securities Index Fund
This information for the fiscal year ended August 31, 2018, is included pursuant to provisions of
the Internal Revenue Code.
For nonresident alien shareholders, 91.7% of income dividends are interest-related dividends.
€‚ƒ
About Your Fund’s Expenses
As a shareholder of the fund, you incur ongoing costs, which include costs for portfolio management, administrative services, and shareholder reports (like this one), among others. Operating expenses, which are deducted from a fund’s gross income, directly reduce the investment return of the fund.
A fund’s expenses are expressed as a percentage of its average net assets. This figure is known as the expense ratio. The following examples are intended to help you understand the ongoing costs (in dollars) of investing in your fund and to compare these costs with those of other mutual funds. The examples are based on an investment of $1,000 made at the beginning of the period shown and held for the entire period.
The accompanying table illustrates your fund’s costs in two ways:
• Based on actual fund return. This section helps you to estimate the actual expenses that you paid over the period. The ”Ending Account Value“ shown is derived from the fund‘s actual return, and the third column shows the dollar amount that would have been paid by an investor who started with $1,000 in the fund. You may use the information here, together with the amount you invested, to estimate the expenses that you paid over the period.
To do so, simply divide your account value by $1,000 (for example, an $8,600 account value divided by $1,000 = 8.6), then multiply the result by the number given for your fund under the heading ”Expenses Paid During Period.“
• Based on hypothetical 5% yearly return. This section is intended to help you compare your fund‘s costs with those of other mutual funds. It assumes that the fund had a yearly return of 5% before expenses, but that the expense ratio is unchanged. In this case—because the return used is not the fund’s actual return—the results do not apply to your investment. The example is useful in making comparisons because the Securities and Exchange Commission requires all mutual funds to calculate expenses based on a 5% return. You can assess your fund’s costs by comparing this hypothetical example with the hypothetical examples that appear in shareholder reports of other funds.
Note that the expenses shown in the table are meant to highlight and help you compare ongoing costs only and do not reflect transaction costs incurred by the fund for buying and selling securities. Further, the expenses do not include any purchase, redemption, or account service fees described in the fund prospectus. If such fees were applied to your account, your costs would be higher. Your fund does not carry a “sales load.”
The calculations assume no shares were bought or sold during the period. Your actual costs may have been higher or lower, depending on the amount of your investment and the timing of any purchases or redemptions.
You can find more information about the fund’s expenses, including annual expense ratios, in the Financial Statements section of this report. For additional information on operating expenses and other shareholder costs, please refer to your fund’s current prospectus.
138
| Six Months Ended August 31, 2018 | |||
| Beginning | Ending | Expenses | |
| Account Value | Account Value | Paid During | |
| 2/28/2018 | 8/31/2018 | Period | |
| Based on Actual Fund Return | |||
| Short-Term Treasury Index Fund | |||
| ETF Shares | $1,000.00 | $1,006.75 | $0.35 |
| Admiral Shares | 1,000.00 | 1,006.82 | 0.35 |
| Institutional Shares | 1,000.00 | 1,006.94 | 0.25 |
| Intermediate-Term Treasury Index Fund | |||
| ETF Shares | $1,000.00 | $1,010.76 | $0.35 |
| Admiral Shares | 1,000.00 | 1,010.69 | 0.35 |
| Institutional Shares | 1,000.00 | 1,011.09 | 0.25 |
| Long-Term Treasury Index Fund | |||
| ETF Shares | $1,000.00 | $1,030.91 | $0.36 |
| Admiral Shares | 1,000.00 | 1,030.96 | 0.36 |
| Institutional Shares | 1,000.00 | 1,030.72 | 0.26 |
| Short-Term Corporate Bond Index Fund | |||
| ETF Shares | $1,000.00 | $1,010.45 | $0.35 |
| Admiral Shares | 1,000.00 | 1,010.47 | 0.35 |
| Institutional Shares | 1,000.00 | 1,010.71 | 0.25 |
| Intermediate-Term Corporate Bond Index Fund | |||
| ETF Shares | $1,000.00 | $1,007.80 | $0.35 |
| Admiral Shares | 1,000.00 | 1,007.91 | 0.35 |
| Institutional Shares | 1,000.00 | 1,008.15 | 0.25 |
| Long-Term Corporate Bond Index Fund | |||
| ETF Shares | $1,000.00 | $994.58 | $0.35 |
| Admiral Shares | 1,000.00 | 994.52 | 0.35 |
| Institutional Shares | 1,000.00 | 994.94 | 0.25 |
| Mortgage-Backed Securities Index Fund | |||
| ETF Shares | $1,000.00 | $1,012.30 | $0.36 |
| Admiral Shares | 1,000.00 | 1,012.57 | 0.36 |
| Institutional Shares | 1,000.00 | 1,012.20 | 0.25 |
139
| Six Months Ended August 31, 2018 | |||
| Beginning | Ending | Expenses | |
| Account Value | Account Value | Paid During | |
| 2/28/2018 | 8/31/2018 | Period | |
| Based on Hypothetical 5% Yearly Return | |||
| Short-Term Treasury Index Fund | |||
| ETF Shares | $1,000.00 | $1,024.85 | $0.36 |
| Admiral Shares | 1,000.00 | 1,024.85 | 0.36 |
| Institutional Shares | 1,000.00 | 1,024.95 | 0.26 |
| Intermediate-Term Treasury Index Fund | |||
| ETF Shares | $1,000.00 | $1,024.85 | $0.36 |
| Admiral Shares | 1,000.00 | 1,024.85 | 0.36 |
| Institutional Shares | 1,000.00 | 1,024.95 | 0.26 |
| Long-Term Treasury Index Fund | |||
| ETF Shares | $1,000.00 | $1,024.85 | $0.36 |
| Admiral Shares | 1,000.00 | 1,024.85 | 0.36 |
| Institutional Shares | 1,000.00 | 1,024.95 | 0.26 |
| Short-Term Corporate Bond Index Fund | |||
| ETF Shares | $1,000.00 | $1,024.85 | $0.36 |
| Admiral Shares | 1,000.00 | 1,024.85 | 0.36 |
| Institutional Shares | 1,000.00 | 1,024.95 | 0.26 |
| Intermediate-Term Corporate Bond Index Fund | |||
| ETF Shares | $1,000.00 | $1,024.85 | $0.36 |
| Admiral Shares | 1,000.00 | 1,024.85 | 0.36 |
| Institutional Shares | 1,000.00 | 1,024.95 | 0.26 |
| Long-Term Corporate Bond Index Fund | |||
| ETF Shares | $1,000.00 | $1,024.85 | $0.36 |
| Admiral Shares | 1,000.00 | 1,024.85 | 0.36 |
| Institutional Shares | 1,000.00 | 1,024.95 | 0.26 |
| Mortgage-Backed Securities Index Fund | |||
| ETF Shares | $1,000.00 | $1,024.85 | $0.36 |
| Admiral Shares | 1,000.00 | 1,024.85 | 0.36 |
| Institutional Shares | 1,000.00 | 1,024.95 | 0.26 |
The calculations are based on expenses incurred in the most recent six-month period. The funds’ annualized six-month expense ratios for
that period are: for the Short-Term Treasury Index Fund, 0.07% for ETF Shares, 0.07% for Admiral Shares, and 0.05% for Institutional
Shares; for the Intermediate-Term Treasury Index Fund, 0.07% for ETF Shares, 0.07% for Admiral Shares, and 0.05% for Institutional
Shares; for the Long-Term Treasury Index Fund, 0.07% for ETF Shares, 0.07% for Admiral Shares, and 0.05% for Institutional Shares; for
the Short-Term Corporate Bond Index Fund, 0.07% for ETF Shares, 0.07% for Admiral Shares, and 0.05% for Institutional Shares; for the
Intermediate-Term Corporate Bond Index Fund, 0.07% for ETF Shares, 0.07% for Admiral Shares, and 0.05% for Institutional Shares; for
the Long-Term Corporate Bond Index Fund, 0.07% for ETF Shares, 0.07% for Admiral Shares, and 0.05% for Institutional Shares; and for
the Mortgage-Backed Securities Index Fund, 0.07% for ETF Shares, 0.07% for Admiral Shares, and 0.05% for Institutional Shares. The
dollar amounts shown as ”Expenses Paid” are equal to the annualized expense ratio multiplied by the average account value over the
period, multiplied by the number of days in the most recent six-month period, then divided by the number of days in the most recent
12-month period (184/365).
140
Trustees Approve Advisory Arrangements
The board of trustees of Vanguard Short-Term Treasury Index Fund, Vanguard Intermediate-Term Treasury Index Fund, Vanguard Long-Term Treasury Index Fund, Vanguard Short-Term Corporate Bond Index Fund, Vanguard Intermediate-Term Corporate Bond Index Fund, Vanguard Long-Term Corporate Bond Index Fund, and Vanguard Mortgage-Backed Securities Index Fund has renewed each fund’s investment advisory arrangement with The Vanguard Group, Inc. (Vanguard), through its Fixed Income Group. The board determined that continuing each fund’s internalized management structure was in the best interests of the fund and its shareholders.
The board based its decision upon an evaluation of the advisor’s investment staff, portfolio management process, and performance. This evaluation included information provided to the board by Vanguard’s Portfolio Review Department, which is responsible for fund and advisor oversight and product management. The Portfolio Review Department met regularly with the advisor and made monthly presentations to the board during the fiscal year that directed the board’s focus to relevant information and topics.
The board, or an investment committee made up of board members, also received information throughout the year through advisor presentations. For each advisor presentation, the board was provided with letters and reports that included information about, among other things, the advisory firm and the advisor’s assessment of the investment environment, portfolio performance, and portfolio characteristics.
In addition, the board received monthly reports, which included a Market and Economic Report, a Fund Dashboard Monthly Summary, and a Fund Performance Report.
Prior to their meeting, the trustees were provided with a memo and materials that summarized the information they had received over the course of the year. They also considered the factors discussed below, among others. However, no single factor determined whether the board approved the arrangements. Rather, it was the totality of the circumstances that drove the board’s decision.
Nature, extent, and quality of services
The board reviewed the quality of the investment management services provided to the funds since their inception in 2009, and took into account the organizational depth and stability of the advisor. The board considered that Vanguard has been managing investments for more than four decades. The Fixed Income Group adheres to a sound, disciplined investment management process; the team has considerable experience, stability, and depth.
The board concluded that Vanguard’s experience, stability, depth, and performance, among other factors, warranted continuation of each advisory arrangement.
Investment performance
The board considered each fund’s performance since its inception, including any periods of outperformance or underperformance compared with its target index and peer group. The board concluded that the performance was such that each advisory arrangement should continue. Information about each fund’s most recent performance can be found on the Performance Summary pages of this report.
}‘}
Cost
The board concluded that each fund’s expense ratio was well below the average expense ratio charged by funds in its peer group and that each fund’s advisory expenses were also well below its peer-group average. Information about the funds’ expenses appears in the About Your Fund’s Expenses section of this report as well as in the Financial Statements sections.
The board does not conduct a profitability analysis of Vanguard because of Vanguard’s unique “at-cost” structure. Unlike most other mutual fund management companies, Vanguard is owned by the funds it oversees and produces “profits” only in the form of reduced expenses for fund shareholders.
The benefit of economies of scale
The board concluded that each fund’s at-cost arrangement with Vanguard ensures that the funds will realize economies of scale as they grow, with the cost to shareholders declining as fund assets increase.
The board will consider whether to renew the advisory arrangements again after a one-year period.
ƒ„…
Glossary
30-Day SEC Yield. A fund’s 30-day SEC yield is derived using a formula specified by the U.S. Securities and Exchange Commission. Under the formula, data related to the fund’s security holdings in the previous 30 days are used to calculate the fund’s hypothetical net income for that period, which is then annualized and divided by the fund’s estimated average net assets over the calculation period. For the purposes of this calculation, a security’s income is based on its current market yield to maturity (for bonds), its actual income (for asset-backed securities), or its projected dividend yield (for stocks). Because the SEC yield represents hypothetical annualized income, it will differ—at times significantly—from the fund’s actual experience. As a result, the fund’s income distributions may be higher or lower than implied by the SEC yield.
Average Coupon. The average interest rate paid on the fixed income securities held by a fund. It is expressed as a percentage of face value.
Average Duration. An estimate of how much the value of the bonds held by a fund will fluctuate in response to a change in interest rates. To see how the value could change, multiply the average duration by the change in rates. If interest rates rise by 1 percentage point, the value of the bonds in a fund with an average duration of five years would decline by about 5%. If rates decrease by a percentage point, the value would rise by 5%.
Average Effective Maturity. The average length of time until fixed income securities held by a fund reach maturity and are repaid, taking into consideration the possibility that the issuer may call the bond before its maturity date. The figure reflects the proportion of fund assets represented by each security; it also reflects any futures contracts held. In general, the longer the average effective maturity, the more a fund’s share price will fluctuate in response to changes in market interest rates.
Beta. A measure of the magnitude of a fund’s past share-price fluctuations in relation to the ups and downs of a given market index. The index is assigned a beta of 1.00. Compared with a given index, a fund with a beta of 1.20 typically would have seen its share price rise or fall by 12% when the index rose or fell by 10%. For this report, beta is based on returns over the past 36 months for both the fund and the index. Note that a fund’s beta should be reviewed in conjunction with its R-squared (see definition). The lower the R-squared, the less correlation there is between the fund and the index, and the less reliable beta is as an indicator of volatility.
Credit Quality. Credit-quality ratings are measured on a scale that generally ranges from AAA (highest) to D (lowest). U.S. Treasury, U.S. Agency, and U.S. Agency mortgage-backed securities appear under “U.S. Government.” Credit-quality ratings are obtained from Barclays and are from Moody’s, Fitch, and S&P. When ratings from all three agencies are used, the median rating is shown. When ratings from two of the agencies are used, the lower rating for each issue is shown. “Not Rated” is used to classify securities for which a rating is not available.
Expense Ratio. A fund’s total annual operating expenses expressed as a percentage of the fund’s average net assets. The expense ratio includes management and administrative expenses, but does not include the transaction costs of buying and selling portfolio securities.
Inception Date. The date on which the assets of a fund (or one of its share classes) are first invested in accordance with the fund’s investment objective. For funds with a subscription period, the inception date is the day after that period ends. Investment performance is measured from the inception date.
143
R-Squared. A measure of how much of a fund’s past returns can be explained by the returns from the market in general, as measured by a given index. If a fund’s total returns were precisely synchronized with an index’s returns, its R-squared would be 1.00. If the fund’s returns bore no relationship to the index’s returns, its R-squared would be 0. For this report, R-squared is based on returns over the past 36 months for both the fund and the index.
Short-Term Reserves. The percentage of a fund invested in highly liquid, short-term securities that can be readily converted to cash.
Yield to Maturity. The rate of return an investor would receive if the fixed income securities held by a fund were held to their maturity dates.
Benchmark Information
Spliced Bloomberg Barclays U.S. Aggregate Float Adjusted Index: Bloomberg Barclays U.S.
Aggregate Bond Index through December 31, 2009; Bloomberg Barclays U.S. Aggregate Float Adjusted Index thereafter.
Spliced Bloomberg Barclays U.S. Long Treasury Index: Bloomberg Barclays U.S. Long Government Float Adjusted Index through December 11, 2017; Bloomberg Barclays U.S. Long Treasury Bond Index thereafter.
Spliced Bloomberg Barclays U.S. Treasury 1–3 Year Index: Bloomberg Barclays U.S. 1–3 Year Government Float Adjusted Index through December 11, 2017; Bloomberg Barclays U.S. Treasury 1–3 Year Bond Index thereafter.
Spliced Bloomberg Barclays U.S. Treasury 3–10 Year Index: Bloomberg Barclays U.S. 3–10 Year Government Float Adjusted Index through December 11, 2017; Bloomberg Barclays U.S. Treasury 3–10 Year Bond Index thereafter.
Spliced Core Bond Funds Average: Intermediate Investment-Grade Debt Funds Average through August 31, 2013; Core Bond Funds Average thereafter.
144
BLOOMBERG is a trademark and service mark of Bloomberg Finance L.P. BARCLAYS is a trademark and service mark of
Barclays Bank Plc, used under license. Bloomberg Finance L.P. and its affiliates, including Bloomberg Index Services Limited
(BISL) (collectively, Bloomberg), or Bloomberg’s licensors, own all proprietary rights in the Bloomberg Barclays U.S. Treasury
1–3 Year Bond Index, Bloomberg Barclays U.S. Treasury 3–10 Year Bond Index, Bloomberg Barclays U.S. Long Treasury
Bond Index, Bloomberg Barclays U.S. 1–5 Year Corporate Bond Index, Bloomberg Barclays U.S. 5–10 Year Corporate Bond
Index, Bloomberg Barclays U.S. 10+ Year Corporate Bond Index, and Bloomberg Barclays U.S. MBS Float Adjusted Index
(the Indices or Bloomberg Barclays Indices).
Neither Barclays Bank Plc, Barclays Capital Inc., or any affiliate (collectively Barclays) or Bloomberg is the issuer or
producer of the Sector Bond Index Funds and neither Bloomberg nor Barclays has any responsibilities, obligations or duties
to investors in the Sector Bond Index Funds. The Indices are licensed for use by The Vanguard Group, Inc. (Vanguard) as the
sponsor of the Sector Bond Index Funds. Bloomberg and Barclays’ only relationship with Vanguard in respect to the Indices
is the licensing of the Indices, which is determined, composed and calculated by BISL, or any successor thereto, without
regard to the Issuer or the Sector Bond Index Funds or the owners of the Sector Bond Index Funds.
Additionally, Vanguard may for itself execute transaction(s) with Barclays in or relating to the Indices in connection with
the Sector Bond Index Funds. Investors acquire the Sector Bond Index Funds from Vanguard and investors neither acquire
any interest in the Indices nor enter into any relationship of any kind whatsoever with Bloomberg or Barclays upon making
an investment in the Sector Bond Index Funds. The Sector Bond Index Funds are not sponsored, endorsed, sold or promoted
by Bloomberg or Barclays. Neither Bloomberg nor Barclays makes any representation or warranty, express or implied
regarding the advisability of investing in the Sector Bond Index Funds or the advisability of investing in securities generally
or the ability of the Indices to track corresponding or relative market performance. Neither Bloomberg nor Barclays has
passed on the legality or suitability of the Sector Bond Index Funds with respect to any person or entity. Neither Bloomberg
nor Barclays is responsible for and has not participated in the determination of the timing of, prices at, or quantities of the
Sector Bond Index Funds to be issued. Neither Bloomberg nor Barclays has any obligation to take the needs of the Issuer
or the owners of the Sector Bond Index Funds or any other third party into consideration in determining, composing or
calculating the Indices. Neither Bloomberg nor Barclays has any obligation or liability in connection with administration,
marketing or trading of the Sector Bond Index Funds.
The licensing agreement between Bloomberg and Barclays is solely for the benefit of Bloomberg and Barclays and not
for the benefit of the owners of the Sector Bond Index Funds, investors or other third parties. In addition, the licensing
agreement between Vanguard and Bloomberg is solely for the benefit of Vanguard and Bloomberg and not for the benefit
of the owners of the Sector Bond Index Funds, investors or other third parties.
NEITHER BLOOMBERG NOR BARCLAYS SHALL HAVE ANY LIABILITY TO THE ISSUER, INVESTORS OR TO OTHER THIRD
PARTIES FOR THE QUALITY, ACCURACY AND/OR COMPLETENESS OF THE BLOOMBERG BARCLAYS INDICES OR ANY
DATA INCLUDED THEREIN OR FOR INTERRUPTIONS IN THE DELIVERY OF THE BLOOMBERG BARCLAYS INDICES.
NEITHER BLOOMBERG NOR BARCLAYS MAKES ANY WARRANTY, EXPRESS OR IMPLIED, AS TO RESULTS TO BE
OBTAINED BY THE ISSUER, THE INVESTORS OR ANY OTHER PERSON OR ENTITY FROM THE USE OF THE BLOOMBERG
BARCLAYS INDICES OR ANY DATA INCLUDED THEREIN. NEITHER BLOOMBERG NOR BARCLAYS MAKES ANY EXPRESS
OR IMPLIED WARRANTIES, AND EACH HEREBY EXPRESSLY DISCLAIMS ALL WARRANTIES OF MERCHANTABILITY
OR FITNESS FOR A PARTICULAR PURPOSE OR USE WITH RESPECT TO THE BLOOMBERG BARCLAYS INDICES OR
ANY DATA INCLUDED THEREIN. BLOOMBERG RESERVES THE RIGHT TO CHANGE THE METHODS OF CALCULATION
OR PUBLICATION, OR TO CEASE THE CALCULATION OR PUBLICATION OF THE BLOOMBERG BARCLAYS INDICES,
AND NEITHER BLOOMBERG NOR BARCLAYS SHALL BE LIABLE FOR ANY MISCALCULATION OF OR ANY INCORRECT,
DELAYED OR INTERRUPTED PUBLICATION WITH RESPECT TO ANY OF THE BLOOMBERG BARCLAYS INDICES. NEITHER
BLOOMBERG NOR BARCLAYS SHALL BE LIABLE FOR ANY DAMAGES, INCLUDING, WITHOUT LIMITATION, ANY
SPECIAL, INDIRECT OR CONSEQUENTIAL DAMAGES, OR ANY LOST PROFITS AND EVEN IF ADVISED OF THE
POSSIBILITY OF SUCH, RESULTING FROM THE USE OF BLOOMBERG BARCLAYS INDICES OR ANY DATA INCLUDED
THEREIN OR WITH RESPECT TO THE SECTOR BOND INDEX FUNDS.
None of the information supplied by Bloomberg or Barclays and used in this publication may be reproduced in any manner
without the prior written permission of both Bloomberg and Barclays Capital, the investment banking division of Barclays
Bank Plc. Barclays Bank Plc is registered in England No. 1026167. Registered office 1 Churchill Place London E14 5HP.
© 2018 Bloomberg. Used with Permission.
Source: Bloomberg Index Services Limited. Copyright 2018, Bloomberg. All rights reserved.
The People Who Govern Your Fund
The trustees of your mutual fund are there to see that the fund is operated and managed in your best interests since, as a shareholder, you are a part owner of the fund. Your fund’s trustees also serve on the board of directors of The Vanguard Group, Inc., which is owned by the Vanguard funds and provides services to them on an at-cost basis.
A majority of Vanguard’s board members are independent, meaning that they have no affiliation with Vanguard or the funds they oversee, apart from the sizable personal investments they have made as private individuals. The independent board members have distinguished backgrounds in business, academia, and public service. Each of the trustees and executive officers oversees 208 Vanguard funds.
Information for each trustee and executive officer of the fund appears below. The mailing address of the trustees and officers is P.O. Box 876, Valley Forge, PA 19482. More information about the trustees is in the Statement of Additional Information, which can be obtained, without charge, by contacting Vanguard at 800-662-7447, or online at vanguard.com.
Interested Trustees1
F. William McNabb III
Born in 1957. Trustee since July 2009. Principal occupation(s) during the past five years and other experience: chairman of the board (January 2010–present) of Vanguard and of each of the investment companies served by Vanguard, trustee (2009–present) of each of the investment companies served by Vanguard, and director (2008–present) of Vanguard. Chief executive officer and president (2008–2017) of Vanguard and each of the investment companies served by Vanguard, managing director (1995–2008) of Vanguard, and director (1997–2018) of Vanguard Marketing Corporation. Director (2018–present) of UnitedHealth Group.
Mortimer J. Buckley
Born in 1969. Trustee since January 2018. Principal occupation(s) during the past five years and other experience: chief executive officer (January 2018–present) of Vanguard; chief executive officer, president, and trustee (January 2018–present) of each of the investment companies served by Vanguard; president and director (2017–present) of Vanguard; and president (February 2018–present) of Vanguard Marketing Corporation. Chief investment officer (2013–2017), managing director (2002–2017), head of the Retail Investor Group (2006–2012), and chief information officer (2001–2006) of Vanguard. Chairman of the board (2011–2017) of the Children’s Hospital of Philadelphia.
Independent Trustees
Emerson U. Fullwood
Born in 1948. Trustee since January 2008. Principal occupation(s) during the past five years and other experience: executive chief staff and marketing officer for North America and corporate vice president (retired 2008) of Xerox Corporation (document management products and services). Former president of the Worldwide Channels Group, Latin America, and Worldwide Customer Service and executive chief staff officer of Developing Markets of Xerox. Executive in residence and 2009–2010 Distinguished Minett Professor at the Rochester Institute of Technology. Lead director of SPX FLOW, Inc. (multi-industry manufacturing). Director of the University of Rochester Medical Center, the Monroe Community College Foundation, the United Way of Rochester, North Carolina A&T University, and Roberts Wesleyan College. Trustee of the University of Rochester.
Amy Gutmann
Born in 1949. Trustee since June 2006. Principal occupation(s) during the past five years and other experience: president (2004–present) of the University of Pennsylvania. Christopher H. Browne Distinguished Professor of Political Science, School of Arts and Sciences, and professor of communication, Annenberg School for Communication, with secondary faculty appointments in the Department of Philosophy, School of Arts and Sciences, and at the Graduate School of Education, University of Pennsylvania. Trustee of the National Constitution Center.
1 Mr. McNabb and Mr. Buckley are considered “interested persons,” as defined in the Investment Company Act of 1940, because
they are officers of the Vanguard funds.
JoAnn Heffernan Heisen
Born in 1950. Trustee since July 1998. Principal occupation(s) during the past five years and other experience: corporate vice president of Johnson & Johnson (pharmaceuticals/medical devices/consumer products) and member of its executive committee (1997–2008). Chief global diversity officer (retired 2008), vice president and chief information officer (1997–2006), controller (1995–1997), treasurer (1991–1995), and assistant treasurer (1989–1991) of Johnson & Johnson. Director of Skytop Lodge Corporation (hotels) and the Robert Wood Johnson Foundation. Member of the advisory board of the Institute for Women’s Leadership at Rutgers University
F. Joseph Loughrey
Born in 1949. Trustee since October 2009. Principal occupation(s) during the past five years and other experience: president and chief operating officer (retired 2009) and vice chairman of the board (2008–2009) of Cummins Inc. (industrial machinery). Chairman of the board of Hillenbrand, Inc. (specialized consumer services), Oxfam America, and the Lumina Foundation for Education. Director of the V Foundation for Cancer Research. Member of the advisory council for the College of Arts and Letters and chair of the advisory board to the Kellogg Institute for International Studies, both at the University of Notre Dame.
Mark Loughridge
Born in 1953. Trustee since March 2012. Principal occupation(s) during the past five years and other experience: senior vice president and chief financial officer (retired 2013) of IBM (information technology services). Fiduciary member of IBM’s Retirement Plan Committee (2004–2013), senior vice president and general manager (2002–2004) of IBM Global Financing, vice president and controller (1998–2002) of IBM, and a variety of other prior management roles at IBM. Member of the Council on Chicago Booth.
Scott C. Malpass
Born in 1962. Trustee since March 2012. Principal occupation(s) during the past five years and other experience: chief investment officer (1989–present) and vice president (1996–present) of the University of Notre Dame. Assistant professor of finance at the Mendoza College of Business, University of Notre Dame, and member of the Notre Dame 403(b) Investment Committee. Chairman of the board of TIFF Advisory Services, Inc. Member of the board of Catholic Investment Services, Inc. (investment advisors), the board of advisors for Spruceview Capital Partners, and the board of superintendence of the Institute for the Works of Religion.
Deanna Mulligan
Born in 1963. Trustee since January 2018. Principal occupation(s) during the past five years and other experience: president (2010–present) and chief executive officer (2011–present) of The Guardian Life Insurance Company of America. Chief operating officer (2010–2011) and executive vice president (2008–2010) of Individual Life and Disability of The Guardian Life Insurance Company of America. Member of the board of The Guardian Life Insurance Company of America, the American Council of Life Insurers, the Partnership for New York City (business leadership), and the Committee Encouraging Corporate Philanthropy. Trustee of the Economic Club of New York and the Bruce Museum (arts and science). Member of the Advisory Council for the Stanford Graduate School of Business.
André F. Perold
Born in 1952. Trustee since December 2004. Principal occupation(s) during the past five years and other experience: George Gund Professor of Finance and Banking, Emeritus at the Harvard Business School (retired 2011). Chief investment officer and co-managing partner of HighVista Strategies LLC (private investment firm). Overseer of the Museum of Fine Arts Boston.
Sarah Bloom Raskin
Born in 1961. Trustee since January 2018. Principal occupation(s) during the past five years and other experience: deputy secretary (2014–2017) of the United States Department of the Treasury. Governor (2010–2014) of the Federal Reserve Board. Commissioner (2007–2010) of financial regulation for the State of Maryland. Member of the board of directors (2012–2014) of Neighborhood Reinvestment Corporation. Director of i(x) Investments, LLC.
Peter F. Volanakis
Born in 1955. Trustee since July 2009. Principal occupation(s) during the past five years and other experience: president and chief operating officer (retired 2010) of Corning Incorporated (communications equipment) and director of Corning Incorporated (2000–2010) and Dow Corning (2001–2010). Director (2012) of SPX Corporation (multi-industry manufacturing). Overseer of the Amos Tuck School of Business Administration, Dartmouth College (2001–2013). Chairman of the board of trustees of Colby-Sawyer College. Member of the Board of Hypertherm Inc. (industrial cutting systems, software, and consumables).
Executive Officers
Glenn Booraem
Born in 1967. Principal occupation(s) during the past five years and other experience: principal of Vanguard. Investment stewardship officer (2017–present), treasurer (2015–2017), controller (2010–2015), and assistant controller (2001–2010) of each of the investment companies served by Vanguard.
Christine M. Buchanan
Born in 1970. Principal occupation(s) during the past five years and other experience: principal of Vanguard and global head of Fund Administration at Vanguard. Treasurer (2017–present) of each of the investment companies served by Vanguard. Partner (2005–2017) at KPMG LLP (audit, tax, and advisory services).
Brian Dvorak
Born in 1973. Principal occupation(s) during the past five years and other experience: principal of Vanguard. Chief compliance officer (2017–present) of Vanguard and each of the investment companies served by Vanguard. Assistant vice president (2017–present) of Vanguard Marketing Corporation. Vice president and director of Enterprise Risk Management (2011–2013) at Oppenheimer Funds, Inc.
Thomas J. Higgins
Born in 1957. Principal occupation(s) during the past five years and other experience: principal of Vanguard. Chief financial officer (2008–present) and treasurer (1998–2008) of each of the investment companies served by Vanguard.
Peter Mahoney
Born in 1974. Principal occupation(s) during the past five years and other experience: principal of Vanguard. Controller (2015–present) of each of the investment companies served by Vanguard. Head of International Fund Services (2008–2014) at Vanguard.
Anne E. Robinson
Born in 1970. Principal occupation(s) during the past five years and other experience: general counsel (2016–present) of Vanguard. Secretary (2016–present) of Vanguard and of each of the investment companies served by Vanguard. Managing director (2016–present) of Vanguard. Director and senior vice president (2016–2018) of Vanguard Marketing Corporation. Managing director and general counsel of Global Cards and Consumer Services (2014–2016) at Citigroup. Counsel (2003–2014) at American Express.
Michael Rollings
Born in 1963. Principal occupation(s) during the past five years and other experience: finance director (2017–present) and treasurer (2017) of each of the investment companies served by Vanguard. Managing director (2016–present) of Vanguard. Chief financial officer (2016–present) of Vanguard. Director (2016–present) of Vanguard Marketing Corporation. Executive vice president and chief financial officer (2006–2016) of MassMutual Financial Group.
| Vanguard Senior Management Team | |
| Mortimer J. Buckley | James M. Norris |
| Gregory Davis | Thomas M. Rampulla |
| John James | Karin A. Risi |
| Martha G. King | Anne E. Robinson |
| John T. Marcante | Michael Rollings |
| Chris D. McIsaac | |
| Chairman Emeritus and Senior Advisor | |
| John J. Brennan | |
| Chairman, 1996–2009 | |
| Chief Executive Officer and President, 1996–2008 | |
| Founder | |
| John C. Bogle | |
| Chairman and Chief Executive Officer, 1974–1996 | |
 | |
| P.O. Box 2600 | |
| Valley Forge, PA 19482-2600 | |
| Connect with Vanguard® > vanguard.com | |
| Fund Information > 800-662-7447 | |
| Direct Investor Account Services > 800-662-2739 | |
| Institutional Investor Services > 800-523-1036 | |
| Text Telephone for People | |
| Who Are Deaf or Hard of Hearing > 800-749-7273 | |
| This material may be used in conjunction | |
| with the offering of shares of any Vanguard | |
| fund only if preceded or accompanied by | |
| the fund’s current prospectus. | |
| All comparative mutual fund data are from Lipper, a | |
| Thomson Reuters Company, or Morningstar, Inc., unless | |
| otherwise noted. | |
| You can obtain a free copy of Vanguard’s proxy voting | |
| guidelines by visiting vanguard.com/proxyreporting or by | |
| calling Vanguard at 800-662-2739. The guidelines are | |
| also available from the SEC’s website, sec.gov. In | |
| addition, you may obtain a free report on how your fund | |
| voted the proxies for securities it owned during the 12 | |
| months ended June 30. To get the report, visit either | |
| vanguard.com/proxyreporting or sec.gov. | |
| You can review and copy information about your fund at | |
| the SEC’s Public Reference Room in Washington, D.C. To | |
| find out more about this public service, call the SEC at | |
| 202-551-8090. Information about your fund is also | |
| available on the SEC’s website, and you can receive | |
| copies of this information, for a fee, by sending a | |
| request in either of two ways: via email addressed to | |
| publicinfo@sec.gov or via regular mail addressed to the | |
| Public Reference Section, Securities and Exchange | |
| Commission, Washington, DC 20549-1520. | |
| © 2018 The Vanguard Group, Inc. | |
| All rights reserved. | |
| Vanguard Marketing Corporation, Distributor. | |
| Q16420 102018 | |
![]()
Vanguard’s Principles for Investing Success
We want to give you the best chance of investment success. These principles, grounded in Vanguard’s research and experience, can put you on the right path.
Goals. Create clear, appropriate investment goals.
Balance. Develop a suitable asset allocation using broadly diversified funds.
Cost. Minimize cost.
Discipline. Maintain perspective and long-term discipline.
A single theme unites these principles: Focus on the things you can control.
We believe there is no wiser course for any investor.
| Contents | |
| Your Fund’s Performance at a Glance. | 1 |
| CEO’s Perspective. | 3 |
| Fund Profile. | 5 |
| Performance Summary. | 6 |
| Financial Statements. | 7 |
| About Your Fund’s Expenses. | 17 |
| Trustees Approve Advisory Arrangement. | 19 |
| Glossary. | 21 |
Please note: The opinions expressed in this report are just that—informed opinions. They should not be considered promises
or advice. Also, please keep in mind that the information and opinions cover the period through the date on the front of this
report. Of course, the risks of investing in your fund are spelled out in the prospectus.
See the Glossary for definitions of investment terms used in this report.
Your Fund’s Performance at a Glance
• From its inception on November 7, 2017, through August 31, 2018, Vanguard Total Corporate Bond ETF returned –1.60%. Its benchmark returned –1.48% and the average return of its peer group was –0.97%.
• Overall during the period, bond yields rose as prices declined. While demand for longer-term Treasuries was supported at times by escalating trade tensions, political uncertainty in Europe, and geopolitical flare-ups, their yields finished higher on an outlook of continued growth and rising inflation expectations. Shorter-term U.S. Treasury yields also rose as the Federal Reserve raised the federal funds target rate three times.
• While corporate fundamentals remained strong and quarterly earnings reports were robust—helped by federal tax cuts—corporate bond prices declined as issuance ran high and demand softened. By maturity, shorter-term corporates held up significantly better than their longer-term counterparts. By quality, results were more nuanced.
| Total Returns: Fiscal Period Ended August 31, 2018 | ||||
| 30-Day SEC | Income | Capital | Since | |
| Yield | Return | Return | Inception | |
| Vanguard Total Corporate Bond ETF | ||||
| ETF Shares | 3.36% | |||
| Market Price (Inception: 11/7/2017) | -1.60% | |||
| Net Asset Value (Inception:11/7/2017) | 2.40% | -4.00% | -1.60 | |
| Bloomberg Barclays U.S. Corporate Bond Index | -1.48 | |||
| Core Bond Funds Average | -0.97 | |||
| Core Bond Funds Average: Derived from data provided by Lipper, a Thomson Reuters Company. | ||||
| Benchmark returns are calculated since the inception of the fund. | ||||
ETF Shares shown are traded on the Nasdaq exchange and are available only through brokers. The table provides ETF returns based on both the Nasdaq market price and the net asset value for a share. The market price is determined by the midpoint of the bid-offer spread as of the closing time of the New York Stock Exchange (generally 4 p.m., Eastern time). The net asset value is also determined as of the NYSE closing time. For more information about how the ETF Shares' market prices have compared with their net asset value, visit vanguard.com, select your ETF, and then select the Price and Performance tab. The ETF premium/discount analysis there shows the percentages of days on which the ETF Shares' market price was above or below the NAV.
1
| Expense Ratios | ||
| Your Fund Compared With Its Peer Group | ||
| Acquired Fund Fees | Peer Group | |
| and Expenses | Average | |
| Total Corporate Bond ETF | 0.07% | 0.21% |
The acquired fund fees and expenses—drawn from the prospectus dated November 7, 2017—represent an estimate of the weighted
average of the expense ratios and any transaction fees charged by the underlying mutual funds (the “acquired” funds) in which the Total
Corporate Bond ETF invests. The Total Corporate Bond ETF does not charge any expenses or fees of its own. For the fiscal period ended
August 31, 2018, the annualized acquired fund fees and expenses were 0.07%. The peer-group expense ratio is derived from data
provided by Lipper, a Thomson Reuters Company, and captures information through year-end 2017.
Peer group: Core Bond Funds.
| Underlying Funds: Allocations and Returns | ||
| Fiscal Period Ended August 31, 2018 | ||
| Percentage of | Returns | |
| Total Corporate Bond ETF | Since Inception1 | |
| Vanguard Fund | Assets | (11/7/2017) |
| Vanguard Short-Term Corporate Bond ETF | 38.6% | -0.19% |
| Vanguard Long-Term Corporate Bond ETF | 31.8 | -1.73 |
| Vanguard Intermediate-Term Corporate | ||
| Bond ETF | 29.6 | -2.96 |
| Combined | 100.0% | -1.60% |
| 1 The table provides returns based on the net asset value for a share. | ||
2
CEO’s Perspective

Tim Buckley
President and Chief Executive Officer
Dear Shareholder,
Over the years, I’ve found that prudent investors exhibit a common trait: discipline. No matter how the markets move or what new investing fad hits the headlines, those who stay focused on their goals and tune out the noise are set up for long-term success.
The prime gateway to investing is saving, and you don’t usually become a saver without a healthy dose of discipline. Savers make the decision to sock away part of their income, which means spending less and delaying gratification, no matter how difficult that may be.
Of course, disciplined investing extends beyond diligent saving. The financial markets, in the short term especially, are unpredictable; I have yet to meet the investor who can time them perfectly. It takes discipline to resist the urge to go all-in when markets are frothy or to retreat when things look bleak.
Staying put with your investments is one strategy for handling volatility. Another, rebalancing, requires even more discipline because it means steering your money away from strong performers and toward poorer performers.
Patience—a form of discipline—is also the friend of long-term investors. Higher returns are the potential reward for weathering the market’s turbulence and uncertainty.
3
We have been enjoying one of the longest bull markets in history, but it won’t continue forever. Prepare yourself now for how you will react when volatility comes back. Don’t panic. Don’t chase returns or look for answers outside the asset classes you trust. And be sure to rebalance periodically, even when there’s turmoil.
Whether you’re a master of self-control, get a boost from technology, or work with a professional advisor, know that discipline is necessary to get the most out of your investment portfolio. And know that Vanguard is with you for the entire ride.
Thank you for your continued loyalty.
Sincerely,

Mortimer J. Buckley
President and Chief Executive Officer
September 13, 2018
| Market Barometer | |||
| Average Annual Total Returns | |||
| Periods Ended August 31, 2018 | |||
| One Year | Three Years | Five Years | |
| Stocks | |||
| Russell 1000 Index (Large-caps) | 19.82% | 15.84% | 14.36% |
| Russell 2000 Index (Small-caps) | 25.45 | 16.11 | 13.00 |
| Russell 3000 Index (Broad U.S. market) | 20.25 | 15.86 | 14.25 |
| FTSE All-World ex US Index (International) | 3.51 | 8.31 | 5.82 |
| Bonds | |||
| Bloomberg Barclays U.S. Aggregate Bond Index | |||
| (Broad taxable market) | -1.05% | 1.76% | 2.49% |
| Bloomberg Barclays Municipal Bond Index | |||
| (Broad tax-exempt market) | 0.49 | 2.71 | 4.12 |
| FTSE Three-Month U. S. Treasury Bill Index | 1.49 | 0.74 | 0.44 |
| CPI | |||
| Consumer Price Index | 2.70% | 1.90% | 1.52% |
4
Total Corporate Bond ETF
Fund Profile
As of August 31, 2018
| Total Fund Characteristics | |
| Ticker Symbol | VTC |
| 30-Day SEC Yield | 3.36% |
| Acquired Fund Fees and Expenses1 | 0.07% |
| Allocation to Underlying Vanguard Funds | |
| Vanguard Short-Term Corporate | |
| Bond ETF | 38.6% |
| Vanguard Long-Term Corporate | |
| Bond ETF | 31.8% |
| Vanguard Intermediate-Term | |
| Corporate Bond ETF | 29.6% |
1 This figure—drawn from the prospectus dated November 7, 2017—represents an estimate of the weighted average of the expense ratios and any transaction fees charged by the underlying mutual funds (the ”acquired” funds) in which the Total Corporate Bond ETF invests. The Total Corporate Bond ETF does not charge any expenses or fees of its own. For the fiscal period ended August 31, 2018, the annualized acquired fund fees and expenses were 0.07%.
5
Total Corporate Bond ETF
Performance Summary
All of the returns in this report represent past performance, which is not a guarantee of future results that may be achieved by the fund. (Current performance may be lower or higher than the performance data cited. For performance data current to the most recent month-end, visit our website at vanguard.com/performance.) Note, too, that both investment returns and principal value can fluctuate widely, so an investor’s shares, when sold, could be worth more or less than their original cost. The returns shown do not reflect taxes that a shareholder would pay on fund distributions or on the sale of fund shares.
Fiscal-Period Total Returns (%): November 7, 2017, Through August 31, 2018
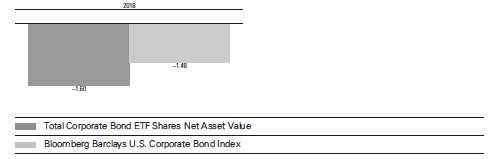
Total Returns: Period Ended June 30, 2018
This table presents returns through the latest calendar quarter—rather than through the end of the fiscal period.
Securities and Exchange Commission rules require that we provide this information.
| Inception Date | Since Inception | |
| ETF Shares | 11/7/2017 | |
| Market Price | -2.87% | |
| Net Asset Value | -2.87 |
See Financial Highlights for dividend and capital gains information.
6
Total Corporate Bond ETF
Financial Statements
Statement of Net Assets
As of August 31, 2018
The fund reports a complete list of its holdings in regulatory filings four times in each fiscal year, at the quarter-ends. For the second and fourth fiscal quarters, the lists appear in the fund’s semiannual and annual reports to shareholders. For the first and third fiscal quarters, the fund files the lists with the Securities and Exchange Commission on Form N-Q. Shareholders can look up the fund’s Forms N-Q on the SEC’s website at sec.gov. Forms N-Q may also be reviewed and copied at the SEC’s Public Reference Room (see the back cover of this report for further information).
| Market | ||
| Value• | ||
| Shares | ($000) | |
| Investment Companies (100.0%) | ||
| U.S. Bond Funds (100.0%) | ||
| Vanguard Short-Term Corporate Bond ETF | 271,076 | 21,252 |
| Vanguard Long-Term Corporate Bond ETF | 197,773 | 17,511 |
| Vanguard Intermediate-Term Corporate Bond ETF | 193,642 | 16,299 |
| Total Investment Companies (Cost $56,440) | 55,062 | |
| Temporary Cash Investment (0.0%) | ||
| Money Market Fund (0.0%) | ||
| 1 Vanguard Market Liquidity Fund, 2.153% (Cost $26) | 260 | 26 |
| Total Investments (100.0%) (Cost $56,466) | 55,088 | |
| Other Assets and Liabilities (0.0%) | ||
| Other Assets | 120 | |
| Liabilities | (135) | |
| (15) | ||
| Net Assets (100%) | ||
| Applicable to 675,000 outstanding $.001 par value shares of | ||
| beneficial interest (unlimited authorization) | 55,073 | |
| Net Asset Value Per Share | $81.59 | |
| Amount | ||
| ($000) | ||
| Statement of Assets and Liabilities | ||
| Assets | ||
| Investments in Securities, at Value—Affiliated Vanguard Funds | 55,088 | |
| Receivables for Investment Securities Sold | 120 | |
| Total Assets | 55,208 | |
| Liabilities | ||
| Payables for Investment Securities Purchased | 135 | |
| Total Liabilities | 135 | |
| Net Assets | 55,073 | |
7
Total Corporate Bond ETF
| At August 31, 2018, net assets consisted of: | |
| Amount | |
| ($000) | |
| Paid-in Capital | 56,473 |
| Undistributed Net Investment Income | 16 |
| Accumulated Net Realized Losses | (38) |
| Unrealized Appreciation (Depreciation) | (1,378) |
| Net Assets | 55,073 |
| • See Note A in Notes to Financial Statements. | |
| 1 Affiliated money market fund available only to Vanguard funds and certain trusts and accounts managed by Vanguard. Rate shown | |
| is the 7-day yield. | |
See accompanying Notes, which are an integral part of the Financial Statements.
8
Total Corporate Bond ETF
Statement of Operations
| November7,20171 to | |
| August31,2018 | |
| ($000) | |
| Investment Income | |
| Income | |
| Income Distributions Received from Affiliated Funds | 1,089 |
| Net Investment Income—Note B | 1,089 |
| Realized Net Gain (Loss) on Affiliated Investment Securities Sold2 | (281) |
| Change in Unrealized Appreciation (Depreciation) of Affiliated Investment Securities | (1,378) |
| Net Increase (Decrease) in Net Assets Resulting from Operations | (570) |
| 1 Inception. | |
| 2 Includes ($243,000) of net gain (loss) resulting from in-kind redemptions; such gain (loss) is not taxable to the fund. | |
See accompanying Notes, which are an integral part of the Financial Statements.
9
Total Corporate Bond ETF
Statement of Changes in Net Assets
| November 7, 20171 to | |
| August 31, 2018 | |
| ($000) | |
| Increase (Decrease) in Net Assets | |
| Operations | |
| Net Investment Income | 1,089 |
| Realized Net Gain (Loss) | (281) |
| Change in Unrealized Appreciation (Depreciation) | (1,378) |
| Net Increase (Decrease) in Net Assets Resulting from Operations | (570) |
| Distributions | |
| Net Investment Income | (1,073) |
| Realized Capital Gain | — |
| Total Distributions | (1,073) |
| Capital Share Transactions | |
| Issued | 81,134 |
| Issued in Lieu of Cash Distributions | — |
| Redeemed | (24,418) |
| Net Increase (Decrease) from Capital Share Transactions | 56,716 |
| Total Increase (Decrease) | 55,073 |
| Net Assets | |
| Beginning of Period | — |
| End of Period2 | 55,073 |
| 1 Inception. | |
| 2 Net Assets—End of Period includes undistributed (overdistributed) net investment income of $16,000. |
See accompanying Notes, which are an integral part of the Financial Statements.
10
Total Corporate Bond ETF
Financial Highlights
| November 7, 20171 to | |
| For a Share Outstanding Throughout the Period | August 31, 2018 |
| Net Asset Value, Beginning of Period | $85.00 |
| Investment Operations | |
| Net Investment Income2 | 2.081 |
| Capital Gain Distributions Received | — |
| Net Realized and Unrealized Gain (Loss) on Investments | (3.445) |
| Total from Investment Operations | (1.364) |
| Distributions | |
| Dividends from Net Investment Income | (2.046) |
| Distributions from Realized Capital Gains | — |
| Total Distributions | (2.046) |
| Net Asset Value, End of Period | $81.59 |
| Total Return | -1.60% |
| Ratios/Supplemental Data | |
| Net Assets, End of Period (Millions) | $55 |
| Ratio of Total Expenses to Average Net Assets | —* |
| Acquired Fund Fees and Expenses | 0.07%* |
| Ratio of Net Investment Income to Average Net Assets | 3.10%* |
| Portfolio Turnover Rate 3 | 4% |
| * Annualized. | |
| 1 Inception. | |
| 2 Calculated based on average shares outstanding. | |
| 3 Excludes the value of portfolio securities received or delivered as a result of in-kind purchases or redemptions of the fund’s capital | |
| shares, including ETF Creation Units. | |
See accompanying Notes, which are an integral part of the Financial Statements.
11
Total Corporate Bond ETF
Notes to Financial Statements
Vanguard Total Corporate Bond ETF is registered under the Investment Company Act of 1940 as an open-end investment company, or mutual fund. The fund seeks to match the performance of its target index by investing in select Vanguard bond index ETFs. ETF Shares are listed for trading on Nasdaq; they can be purchased and sold through a broker. Financial statements and other information about each underlying fund are available on vanguard.com.
A. The following significant accounting policies conform to generally accepted accounting principles for U.S. investment companies. The fund consistently follows such policies in preparing its financial statements.
1. Security Valuation: Underlying ETFs are valued at the latest quoted sales prices or official closing prices taken from their primary market or, if not traded on the valuation date, at the mean of the latest quoted bid and asked prices. Investments in Vanguard Market Liquidity Fund are valued at that fund’s net asset value.
2. Federal Income Taxes: The fund intends to qualify as a regulated investment company and distribute all of its taxable income. Management has analyzed the fund’s tax positions taken for the period ended August 31, 2018, and has concluded that no provision for federal income tax is required in the fund’s financial statements.
3. Distributions: Distributions to shareholders are recorded on the ex-dividend date. Annual distributions from realized capital gains, if any, are recorded on the ex-dividend date. Distributions are determined on a tax basis and may differ from net investment income and realized capital gains for financial reporting purposes.
4. Other: Income and capital gain distributions received are recorded on the ex-dividend date. Security transactions are accounted for on the date securities are bought or sold. Costs used to determine realized gains (losses) on the sale of investment securities are those of the specific securities sold.
B. In accordance with the terms of a Funds’ Service Agreement (the “FSA”) between Vanguard and the fund, Vanguard furnishes to the fund investment advisory, corporate management, administrative, marketing, and distribution services at Vanguard’s cost of operations (as defined by the FSA). These costs of operations are allocated to the fund based on methods and guidelines approved by the board of trustees. The FSA provides that expenses otherwise allocable to Vanguard funds-of-funds may be reduced or eliminated to the extent of savings realized by the underlying Vanguard funds by virtue of being part of a fund-of-funds. Accordingly, all expenses for services provided by Vanguard to the fund and all other expenses incurred by the fund during the period ended August 31, 2018, were borne by the underlying Vanguard funds in which the fund invests. The fund’s trustees and officers are also trustees and officers, respectively, of the underlying Vanguard funds, as well as directors and employees, respectively, of Vanguard.
C. Various inputs may be used to determine the value of the fund’s investments. These inputs are summarized in three broad levels for financial statement purposes. The inputs or methodologies used to value securities are not necessarily an indication of the risk associated with investing in those securities.
Level 1—Quoted prices in active markets for identical securities.
Level 2—Other significant observable inputs (including quoted prices for similar securities, interest rates, prepayment speeds, credit risk, etc.).
Level 3—Significant unobservable inputs (including the fund’s own assumptions used to determine
the fair value of investments). Any investments valued with significant unobservable inputs are
noted on the Statement of Net Assets.
12
Total Corporate Bond ETF
At August 31, 2018, 100% of the market value of the fund’s investments was determined based on Level 1 inputs.
D. Permanent differences are reclassified among capital accounts in the financial statements to reflect their tax character. These reclassifications have no effect on net assets or net asset value per share. As of period end, the following permanent differences primarily attributable to the accounting for in-kind redemptions were reclassified to the following accounts:
| Amount | |
| ($000) | |
| Paid-in capital | (243) |
| Undistributed (Overdistributed) net investment income | — |
| Accumulated net realized gains (losses) | 243 |
Temporary differences between book-basis and tax-basis components of accumulated net earnings (losses) arise when certain items of income, gain, or loss are recognized in different periods for financial statement and tax purposes; these differences will reverse at some time in the future. The differences are primarily related to the tax deferral of losses on wash sales. As of period end, the tax components of accumulated net earnings (losses) are detailed in the table as follows:
| Amount | |
| ($000) | |
| Undistributed ordinary income | 16 |
| Undistributed long-term gains | — |
| Capital loss carryforwards (non-expiring) | (38) |
| Net unrealized gains (losses) | (1,378) |
As of August 31, 2018, gross unrealized appreciation and depreciation for investments and derivatives based on cost for U.S. federal income tax purposes were as follows:
| Amount | |
| ($000) | |
| Tax cost | 56,466 |
| Gross unrealized appreciation | — |
| Gross unrealized depreciation | (1,378) |
| Net unrealized appreciation (depreciation) | (1,378) |
13
Total Corporate Bond ETF
E. Transactions during the period in affiliated underlying Vanguard funds were as follows:
| Current Period Transactions | ||||||||
| Nov. 7, | Proceeds | Realized | Aug. 31, | |||||
| 20171 | from | Net | Change in | Capital Gain | 2018 | |||
| Market | Purchases | Securities | Gain | Unrealized | Distributions | Market | ||
| Value | at Cost2 | Sold 3 | (Loss) | App. (Dep.) | Income | Received | Value | |
| ($000) | ($000) | ($000) | ($000) | ($000) | ($000) | ($000) | ($000) | |
| Vanguard Market | ||||||||
| Liquidity Fund | — | NA 4 | NA 4 | — | 1 | — | — | 26 |
| Vanguard | ||||||||
| Intermediate-Term | ||||||||
| Corporate Bond ETF | — | 24,743 | 7,963 | (190) | (291) | 335 | — | 16,299 |
| Vanguard Long-Term | ||||||||
| Corporate Bond ETF | — | 26,806 | 8,337 | (1) | (957) | 442 | — | 17,511 |
| Vanguard Short-Term | ||||||||
| Corporate Bond ETF | — | 31,343 | 9,870 | (90) | (131) | 312 | — | 21,252 |
| Total | — | 82,892 | 26,170 | (281) | (1,378) | 1,089 | — | 55,088 |
1 Inception.
2 Includes $81,113,000 of portfolio securities received as a result of in-kind purchases of the fund’s capital shares.
3 Includes $24,410,000 of portfolio securities delivered as a result of in-kind redemptions of the fund’s capital shares.
4 Not applicable—purchases and sales are for temporary cash investment purposes.
F. Capital shares issued and redeemed were:
| November 7, 20171 to | |
| August 31, 2018 | |
| Shares | |
| (000) | |
| Issued | 975 |
| Redeemed | (300) |
| Net Increase (Decrease) in Shares Outstanding | 675 |
| 1 Inception. |
G. Management has determined that no events or transactions occurred subsequent to
August 31, 2018, that would require recognition or disclosure in these financial statements.
14
Report of Independent Registered
Public Accounting Firm
To the Board of Trustees of Vanguard Scottsdale Funds and Shareholders of Vanguard Total Corporate Bond ETF
Opinion on the Financial Statements
We have audited the accompanying statement of net assets and statement of assets and liabilities of Vanguard Total Corporate Bond ETF (one of the funds constituting Vanguard Scottsdale Funds, referred to hereafter as the “Fund”) as of August 31, 2018, and the related statements of operations and changes in net assets, including the related notes, and the financial highlights for the period November 7, 2017 (commencement of operations) through August 31, 2018 (collectively referred to as the “financial statements”). In our opinion, the financial statements present fairly, in all material respects, the financial position of the Fund as of August 31, 2018, and the results of its operations, changes in its net assets, and the financial highlights for the period November 7, 2017 (commencement of operations) through August 31, 2018 in conformity with accounting principles generally accepted in the United States of America.
Basis for Opinion
These financial statements are the responsibility of the Fund’s management. Our responsibility is to express an opinion on the Fund’s financial statements based on our audit. We are a public accounting firm registered with the Public Company Accounting Oversight Board (United States) (“PCAOB”) and are required to be independent with respect to the Fund in accordance with the U.S. federal securities laws and the applicable rules and regulations of the Securities and Exchange Commission and the PCAOB.
We conducted our audit of these financial statements in accordance with the standards of the PCAOB. Those standards require that we plan and perform the audit to obtain reasonable assurance about whether the financial statements are free of material misstatement, whether due to error or fraud.
Our audit included performing procedures to assess the risks of material misstatement of the financial statements, whether due to error or fraud, and performing procedures that respond to those risks. Such procedures included examining, on a test basis, evidence regarding the amounts and disclosures in the financial statements. Our audit also included evaluating the accounting principles used and significant estimates made by management, as well as evaluating the overall presentation of the financial statements. Our procedures included confirmation of securities owned as of August 31, 2018 by correspondence with the custodian and brokers and by agreement to the underlying ownership records of the transfer agent; when replies were not received from brokers, we performed other auditing procedures. We believe that our audit provides a reasonable basis for our opinion.
/s/PricewaterhouseCoopers LLP
Philadelphia, Pennsylvania
October 16, 2018
We have served as the auditor of one or more investment companies in The Vanguard Group of Funds since 1975.
15

Special 2018 tax information (unaudited) for Vanguard Total Corporate Bond ETF
This information for the fiscal period ended August 31, 2018, is included pursuant to provisions of
the Internal Revenue Code.
For nonresident alien shareholders, 83.9% of income dividends are interest-related dividends.
16
About Your Fund’s Expenses
As a shareholder of the fund, you incur ongoing costs, which include costs for portfolio management, administrative services, and shareholder reports (like this one), among others. Operating expenses, which are deducted from a fund’s gross income, directly reduce the investment return of the fund.
A typical fund’s expenses are expressed as a percentage of its average net assets. The Total Corporate Bond ETF has no direct expenses, but bears its proportionate share of the costs for the underlying funds in which it invests. These indirect expenses make up the acquired fund fees and expenses, also expressed as a percentage of average net assets.
The following examples are intended to help you understand the ongoing cost (in dollars) of investing in your fund and to compare these costs with those of other mutual funds. The examples are based on an investment of $1,000 made at the beginning of the period shown and held for the entire period. The costs were calculated using the acquired fund fees and expenses for the Total Corporate Bond ETF.
The accompanying table illustrates your fund’s costs in two ways:
• Based on actual fund return. This section helps you to estimate the actual expenses that you paid over the period. The ”Ending Account Value“ shown is derived from the fund‘s actual return, and the third column shows the dollar amount that would have been paid by an investor who started with $1,000 in the fund. You may use the information here, together with the amount you invested, to estimate the expenses that you paid over the period.
To do so, simply divide your account value by $1,000 (for example, an $8,600 account value divided by $1,000 = 8.6), then multiply the result by the number given for your fund under the heading ”Expenses Paid During Period.“
• Based on hypothetical 5% yearly return. This section is intended to help you compare your fund‘s costs with those of other mutual funds. It assumes that the fund had a yearly return of 5% before expenses, but that the expense ratio is unchanged. In this case—because the return used is not the fund’s actual return—the results do not apply to your investment. The example is useful in making comparisons because the Securities and Exchange Commission requires all mutual funds to calculate expenses based on a 5% return. You can assess your fund’s costs by comparing this hypothetical example with the hypothetical examples that appear in shareholder reports of other funds.
Note that the expenses shown in the table are meant to highlight and help you compare ongoing costs only and do not reflect transaction costs incurred by the fund for buying and selling securities. Further, the expenses do not include any purchase, redemption, or account service fees described in the fund prospectus. If such fees were applied to your account, your costs would be higher. Your fund does not carry a “sales load.”
The calculations assume no shares were bought or sold during the period. Your actual costs may have been higher or lower, depending on the amount of your investment and the timing of any purchases or redemptions.
You can find more information about the fund’s expenses, including annual expense ratios, in the Financial Statements section of this report. For additional information on operating expenses and other shareholder costs, please refer to your fund’s current prospectus.
17
| Six Months Ended August 31, 2018 | |||
| Beginning | Ending | Expenses | |
| Account Value | Account Value | Paid During | |
| Total Corporate Bond ETF | 2/28/2018 | 8/31/2018 | Period |
| Based on Actual Fund Return | $1,000.00 | $1,006.42 | $0.35 |
| Based on Hypothetical 5% Yearly Return | 1,000.00 | 1,024.85 | 0.36 |
The calculations are based on acquired fund fees and expenses charged by the underlying funds in which the Total Corporate Bond ETF
invests. The Total Corporate Bond ETF’s annualized expense figure for the period is 0.07%. The dollar amounts shown as “Expenses Paid”
are equal to the annualized average weighted expense ratio for the underlying funds multiplied by the average account value over the
period, multiplied by the number of days in the most recent six-month period, then divided by the number of days in the most recent
12-month period (184/365).
18
Trustees Approve Advisory Arrangement
The board of trustees of Vanguard Total Corporate Bond ETF has renewed the fund’s investment advisory arrangement with The Vanguard Group, Inc. (Vanguard), through its Fixed Income Group. The board determined that continuing the fund’s internalized management structure was in the best interests of the fund and its shareholders.
The board based its decision upon an evaluation of the advisor’s investment staff, portfolio management process, and performance. This evaluation included information provided to the board by Vanguard’s Portfolio Review Department, which is responsible for fund and advisor oversight and product management. The Portfolio Review Department met regularly with the advisor and made monthly presentations to the board during the fiscal year that directed the board’s focus to relevant information and topics.
The board, or an investment committee made up of board members, also received information throughout the year during advisor presentations. For each advisor presentation, the board was provided with letters and reports that included information about, among other things, the advisory firm and the advisor’s assessment of the investment environment, portfolio performance, and portfolio characteristics.
In addition, the board received monthly reports, which included a Market and Economic Report, a Fund Dashboard Monthly Summary, and a Fund Performance Report.
Prior to their meeting, the trustees were provided with a memo and materials that summarized the information they received over the course of the year. They also considered the factors discussed below, among others. However, no single factor determined whether the board approved the arrangement. Rather, it was the totality of the circumstances that drove the board’s decision.
Nature, extent, and quality of services
The board considered the quality of the investment management services provided to the fund since its inception in 2017 and took into account the organizational depth and stability of the advisor. The board noted that Vanguard has been managing investments for more than four decades. The Fixed Income Group adheres to a sound, disciplined investment management process; the team has considerable experience, stability, and depth.
The board concluded that Vanguard’s experience, stability, depth, and performance, among other factors, warranted continuation of the advisory arrangement.
Investment performance
The board considered the fund’s performance since its inception, including any periods of outperformance or underperformance compared with its target index and peer group. The board concluded that the performance was such that the advisory arrangement should continue. Information about the fund’s performance since inception can be found in the Performance Summary section of this report.
19
Cost
The board concluded that, while the fund had not yet been in existence for a full fiscal year, the fund’s estimated acquired fund fees and expenses were well below the average expense ratio charged by funds in its peer group. The fund does not incur fees directly; however, the board noted that each of the underlying funds in which the fund invests has advisory expenses well below the relevant peer-group average. Information about the fund’s acquired fund fees and expenses appears in the About Your Fund’s Expenses section as well as in the Financial Statements section.
The board does not conduct a profitability analysis of Vanguard because of Vanguard’s unique “at-cost” structure. Unlike most other mutual fund management companies, Vanguard is owned by the funds it oversees and produces “profits” only in the form of reduced expenses for fund shareholders.
The benefit of economies of scale
The board concluded that Vanguard’s at-cost arrangement with the fund ensures that the fund will realize economies of scale as it grows, with the cost to shareholders declining as fund assets increase.
The board will consider whether to renew the advisory arrangement again after a one-year period.
20
Glossary
30-Day SEC Yield. A fund’s 30-day SEC yield is derived using a formula specified by the U.S. Securities and Exchange Commission. Under the formula, data related to the fund’s security holdings in the previous 30 days are used to calculate the fund’s hypothetical net income for that period, which is then annualized and divided by the fund’s estimated average net assets over the calculation period. For the purposes of this calculation, a security’s income is based on its current market yield to maturity (for bonds), its actual income (for asset-backed securities), or its projected dividend yield (for stocks). Because the SEC yield represents hypothetical annualized income, it will differ—at times significantly—from the fund’s actual experience. As a result, the fund’s income distributions may be higher or lower than implied by the SEC yield.
Acquired Fund Fees and Expenses. Funds that invest in other Vanguard funds incur no direct expenses, but they do bear proportionate shares of the operating, administrative, and advisory expenses of the underlying funds, and they must pay any fees charged by those funds. The figure for acquired fund fees and expenses represents a weighted average of these underlying costs. Acquired is a term that the Securities and Exchange Commission applies to any mutual fund whose shares are owned by another fund.
Expense Ratio. A fund’s total annual operating expenses expressed as a percentage of the fund’s average net assets. The expense ratio includes management and administrative expenses, but does not include the transaction costs of buying and selling portfolio securities.
Inception Date. The date on which the assets of a fund (or one of its share classes) are first invested in accordance with the fund’s investment objective. For funds with a subscription period, the inception date is the day after that period ends. Investment performance is measured from the inception date.
21
BLOOMBERG is a trademark and service mark of Bloomberg Finance L.P. BARCLAYS is a trademark and service mark
of Barclays Bank Plc, used under license. Bloomberg Finance L.P. and its affiliates, including Bloomberg Index Services
Limited (BISL) (collectively, Bloomberg), or Bloomberg’s licensors, own all proprietary rights in the Bloomberg Barclays
U.S. Corporate Bond Index, including its component Bloomberg Barclays U.S. 1–5 Year Corporate Bond Index, Bloomberg
Barclays U.S. 5–10 Year Corporate Bond Index, and Bloomberg Barclays U.S. 10+ Year Corporate Bond Index (the Indices
or Bloomberg Barclays Indices).
Neither Barclays Bank Plc, Barclays Capital Inc., or any affiliate (collectively Barclays) or Bloomberg is the issuer
or producer of Vanguard Total Corporate Bond ETF, including Vanguard Short-Term Corporate Bond ETF, Vanguard
Intermediate-Term Corporate Bond ETF, and Vanguard Long-Term Corporate Bond ETF (collectively, ETFs), and neither
Bloomberg nor Barclays has any responsibilities, obligations or duties to investors in the ETFs. The Indices are licensed
for use by The Vanguard Group, Inc. (Vanguard) as the sponsor of the ETFs. Bloomberg and Barclays only relationship
with Vanguard in respect of the Indices is the licensing of the Indices, which are determined, composed and calculated
by BISL, or any successor thereto, without regard to the Issuer or the ETFs or the owners of the ETFs.
Additionally, Vanguard may for itself execute transaction(s) with Barclays in or relating to the Indices in connection with
the ETFs. Investors acquire the ETFs from Vanguard and investors neither acquire any interest in the Indices nor enter
into any relationship of any kind whatsoever with Bloomberg or Barclays upon making an investment in the ETFs. The
ETFs are not sponsored, endorsed, sold or promoted by Bloomberg or Barclays. Neither Bloomberg nor Barclays makes
any representation or warranty, express or implied regarding the advisability of investing in the ETFs or the advisability
of investing in securities generally or the ability of the Indices to track corresponding or relative market performance.
Neither Bloomberg nor Barclays has passed on the legality or suitability of the ETFs with respect to any person or entity.
Neither Bloomberg nor Barclays is responsible for and has not participated in the determination of the timing of, prices at,
or quantities of the ETFs to be issued. Neither Bloomberg nor Barclays has any obligation to take the needs of the Issuer
or the owners of the ETFs or any other third party into consideration in determining, composing or calculating the Indices.
Neither Bloomberg nor Barclays has any obligation or liability in connection with administration, marketing or trading of
the ETFs.
22
The licensing agreement between Bloomberg and Barclays is solely for the benefit of Bloomberg and Barclays and not
for the benefit of the owners of the ETFs, investors or other third parties. In addition, the licensing agreement between
Vanguard and Bloomberg is solely for the benefit of Vanguard and Bloomberg and not for the benefit of the owners of
the ETFs, investors or other third parties.
NEITHER BLOOMBERG NOR BARCLAYS SHALL HAVE ANY LIABILITY TO THE ISSUER, INVESTORS OR TO OTHER
THIRD PARTIES FOR THE QUALITY, ACCURACY AND/OR COMPLETENESS OF THE INDICES OR ANY DATA INCLUDED
THEREIN OR FOR INTERRUPTIONS IN THE DELIVERY OF THE INDICES. NEITHER BLOOMBERG NOR BARCLAYS MAKES
ANY WARRANTY, EXPRESS OR IMPLIED, AS TO RESULTS TO BE OBTAINED BY THE ISSUER, THE INVESTORS OR ANY
OTHER PERSON OR ENTITY FROM THE USE OF THE INDICES OR ANY DATA INCLUDED THEREIN. NEITHER BLOOMBERG
NOR BARCLAYS MAKES ANY EXPRESS OR IMPLIED WARRANTIES, AND EACH HEREBY EXPRESSLY DISCLAIMS ALL
WARRANTIES OF MERCHANTABILITY OR FITNESS FOR A PARTICULAR PURPOSE OR USE WITH RESPECT TO THE
INDICES OR ANY DATA INCLUDED THEREIN. BLOOMBERG RESERVES THE RIGHT TO CHANGE THE METHODS OF
CALCULATION OR PUBLICATION, OR TO CEASE THE CALCULATION OR PUBLICATION OF THE INDICES, AND NEITHER
BLOOMBERG NOR BARCLAYS SHALL BE LIABLE FOR ANY MISCALCULATION OF OR ANY INCORRECT, DELAYED OR
INTERRUPTED PUBLICATION WITH RESPECT TO ANY OF THE INDICES. NEITHER BLOOMBERG NOR BARCLAYS SHALL
BE LIABLE FOR ANY DAMAGES, INCLUDING, WITHOUT LIMITATION, ANY SPECIAL, INDIRECT OR CONSEQUENTIAL
DAMAGES, OR ANY LOST PROFITS AND EVEN IF ADVISED OF THE POSSIBILITY OF SUCH, RESULTING FROM THE USE
OF THE INDICES OR ANY DATA INCLUDED THEREIN OR WITH RESPECT TO THE ETFS.
None of the information supplied by Bloomberg or Barclays and used in this publication may be reproduced in any manner
without the prior written permission of both Bloomberg and Barclays Capital, the investment banking division of Barclays
Bank Plc. Barclays Bank Plc is registered in England No. 1026167. Registered office 1 Churchill Place London E14 5HP.
© 2018 Bloomberg. Used with Permission.
Source: Bloomberg Index Services Limited. Copyright 2018, Bloomberg. All rights reserved.
23
This page intentionally left blank.
This page intentionally left blank.
This page intentionally left blank.
The People Who Govern Your Fund
The trustees of your mutual fund are there to see that the fund is operated and managed in your best interests since, as a shareholder, you are a part owner of the fund. Your fund’s trustees also serve on the board of directors of The Vanguard Group, Inc., which is owned by the Vanguard funds and provides services to them on an at-cost basis.
A majority of Vanguard’s board members are independent, meaning that they have no affiliation with Vanguard or the funds they oversee, apart from the sizable personal investments they have made as private individuals. The independent board members have distinguished backgrounds in business, academia, and public service. Each of the trustees and executive officers oversees 208 Vanguard funds.
Information for each trustee and executive officer of the fund appears below. The mailing address of the trustees and officers is P.O. Box 876, Valley Forge, PA 19482. More information about the trustees is in the Statement of Additional Information, which can be obtained, without charge, by contacting Vanguard at 800-662-7447, or online at vanguard.com.
Interested Trustees1
F. William McNabb III
Born in 1957. Trustee since July 2009. Principal occupation(s) during the past five years and other experience: chairman of the board (January 2010–present) of Vanguard and of each of the investment companies served by Vanguard, trustee (2009–present) of each of the investment companies served by Vanguard, and director (2008–present) of Vanguard. Chief executive officer and president (2008–2017) of Vanguard and each of the investment companies served by Vanguard, managing director (1995–2008) of Vanguard, and director (1997–2018) of Vanguard Marketing Corporation. Director (2018–present) of UnitedHealth Group.
Mortimer J. Buckley
Born in 1969. Trustee since January 2018. Principal occupation(s) during the past five years and other experience: chief executive officer (January 2018–present) of Vanguard; chief executive officer, president, and trustee (January 2018–present) of each of the investment companies served by Vanguard; president and director (2017–present) of Vanguard; and president (February 2018–present) of Vanguard Marketing Corporation. Chief investment officer (2013–2017), managing director (2002–2017), head of the Retail Investor Group (2006–2012), and chief information officer (2001–2006) of Vanguard. Chairman of the board (2011–2017) of the Children’s Hospital of Philadelphia.
Independent Trustees
Emerson U. Fullwood
Born in 1948. Trustee since January 2008. Principal occupation(s) during the past five years and other experience: executive chief staff and marketing officer for North America and corporate vice president (retired 2008) of Xerox Corporation (document management products and services). Former president of the Worldwide Channels Group, Latin America, and Worldwide Customer Service and executive chief staff officer of Developing Markets of Xerox. Executive in residence and 2009–2010 Distinguished Minett Professor at the Rochester Institute of Technology. Lead director of SPX FLOW, Inc. (multi-industry manufacturing). Director of the University of Rochester Medical Center, the Monroe Community College Foundation, the United Way of Rochester, North Carolina A&T University, and Roberts Wesleyan College. Trustee of the University of Rochester.
Amy Gutmann
Born in 1949. Trustee since June 2006. Principal occupation(s) during the past five years and other experience: president (2004–present) of the University of Pennsylvania. Christopher H. Browne Distinguished Professor of Political Science, School of Arts and Sciences, and professor of communication, Annenberg School for Communication, with secondary faculty appointments in the Department of Philosophy, School of Arts and Sciences, and at the Graduate School of Education, University of Pennsylvania. Trustee of the National Constitution Center.
1 Mr. McNabb and Mr. Buckley are considered “interested persons,” as defined in the Investment Company Act of 1940, because
they are officers of the Vanguard funds.
JoAnn Heffernan Heisen
Born in 1950. Trustee since July 1998. Principal occupation(s) during the past five years and other experience: corporate vice president of Johnson & Johnson (pharmaceuticals/medical devices/consumer products) and member of its executive committee (1997–2008). Chief global diversity officer (retired 2008), vice president and chief information officer (1997–2006), controller (1995–1997), treasurer (1991–1995), and assistant treasurer (1989–1991) of Johnson & Johnson. Director of Skytop Lodge Corporation (hotels) and the Robert Wood Johnson Foundation. Member of the advisory board of the Institute for Women’s Leadership at Rutgers University.
F. Joseph Loughrey
Born in 1949. Trustee since October 2009. Principal occupation(s) during the past five years and other experience: president and chief operating officer (retired 2009) and vice chairman of the board (2008–2009) of Cummins Inc. (industrial machinery). Chairman of the board of Hillenbrand, Inc. (specialized consumer services), Oxfam America, and the Lumina Foundation for Education. Director of the V Foundation for Cancer Research. Member of the advisory council for the College of Arts and Letters and chair of the advisory board to the Kellogg Institute for International Studies, both at the University of Notre Dame.
Mark Loughridge
Born in 1953. Trustee since March 2012. Principal occupation(s) during the past five years and other experience: senior vice president and chief financial officer (retired 2013) of IBM (information technology services). Fiduciary member of IBM’s Retirement Plan Committee (2004–2013), senior vice president and general manager (2002–2004) of IBM Global Financing, vice president and controller (1998–2002) of IBM, and a variety of other prior management roles at IBM. Member of the Council on Chicago Booth.
Scott C. Malpass
Born in 1962. Trustee since March 2012. Principal occupation(s) during the past five years and other experience: chief investment officer (1989–present) and vice president (1996–present) of the University of Notre Dame. Assistant professor of finance at the Mendoza College of Business, University of Notre Dame, and member of the Notre Dame 403(b) Investment Committee. Chairman of the board of TIFF Advisory Services, Inc. Member of the board of Catholic Investment Services, Inc. (investment advisors), the board of advisors for Spruceview Capital Partners, and the board of superintendence of the Institute for the Works of Religion.
Deanna Mulligan
Born in 1963. Trustee since January 2018. Principal occupation(s) during the past five years and other experience: president (2010–present) and chief executive officer (2011–present) of The Guardian Life Insurance Company of America. Chief operating officer (2010–2011) and executive vice president (2008–2010) of Individual Life and Disability of The Guardian Life Insurance Company of America. Member of the board of The Guardian Life Insurance Company of America, the American Council of Life Insurers, the Partnership for New York City (business leadership), and the Committee Encouraging Corporate Philanthropy. Trustee of the Economic Club of New York and the Bruce Museum (arts and science). Member of the Advisory Council for the Stanford Graduate School of Business.
André F. Perold
Born in 1952. Trustee since December 2004. Principal occupation(s) during the past five years and other experience: George Gund Professor of Finance and Banking, Emeritus at the Harvard Business School (retired 2011). Chief investment officer and co-managing partner of HighVista Strategies LLC (private investment firm). Overseer of the Museum of Fine Arts Boston.
Sarah Bloom Raskin
Born in 1961. Trustee since January 2018. Principal occupation(s) during the past five years and other experience: deputy secretary (2014–2017) of the United States Department of the Treasury. Governor (2010–2014) of the Federal Reserve Board. Commissioner (2007–2010) of financial regulation for the State of Maryland. Member of the board of directors (2012–2014) of Neighborhood Reinvestment Corporation. Director of i(x) Investments, LLC.
Peter F. Volanakis
Born in 1955. Trustee since July 2009. Principal occupation(s) during the past five years and other experience: president and chief operating officer (retired 2010) of Corning Incorporated (communications equipment) and director of Corning Incorporated (2000–2010) and Dow Corning (2001–2010). Director (2012) of SPX Corporation (multi-industry manufacturing). Overseer of the Amos Tuck School of Business Administration, Dartmouth College (2001–2013). Chairman of the board of trustees of Colby-Sawyer College. Member of the Board of Hypertherm Inc. (industrial cutting systems, software, and consumables).
Executive Officers
Glenn Booraem
Born in 1967. Principal occupation(s) during the past five years and other experience: principal of Vanguard. Investment stewardship officer (2017–present), treasurer (2015–2017), controller (2010–2015), and assistant controller (2001–2010) of each of the investment companies served by Vanguard.
Christine M. Buchanan
Born in 1970. Principal occupation(s) during the past five years and other experience: principal of Vanguard and global head of Fund Administration at Vanguard. Treasurer (2017–present) of each of the investment companies served by Vanguard. Partner (2005–2017) at KPMG LLP (audit, tax, and advisory services).
Brian Dvorak
Born in 1973. Principal occupation(s) during the past five years and other experience: principal of Vanguard. Chief compliance officer (2017–present) of Vanguard and each of the investment companies served by Vanguard. Assistant vice president (2017–present) of Vanguard Marketing Corporation. Vice president and director of Enterprise Risk Management (2011–2013) at Oppenheimer Funds, Inc.
Thomas J. Higgins
Born in 1957. Principal occupation(s) during the past five years and other experience: principal of Vanguard. Chief financial officer (2008–present) and treasurer (1998–2008) of each of the investment companies served by Vanguard.
Peter Mahoney
Born in 1974. Principal occupation(s) during the past five years and other experience: principal of Vanguard. Controller (2015–present) of each of the investment companies served by Vanguard. Head of International Fund Services (2008–2014) at Vanguard.
Anne E. Robinson
Born in 1970. Principal occupation(s) during the past five years and other experience: general counsel (2016–present) of Vanguard. Secretary (2016–present) of Vanguard and of each of the investment companies served by Vanguard. Managing director (2016–present) of Vanguard. Director and senior vice president (2016–2018) of Vanguard Marketing Corporation. Managing director and general counsel of Global Cards and Consumer Services (2014–2016) at Citigroup. Counsel (2003–2014) at American Express.
Michael Rollings
Born in 1963. Principal occupation(s) during the past five years and other experience: finance director (2017–present) and treasurer (2017) of each of the investment companies served by Vanguard. Managing director (2016–present) of Vanguard. Chief financial officer (2016–present) of Vanguard. Director (2016–present) of Vanguard Marketing Corporation. Executive vice president and chief financial officer (2006–2016) of MassMutual Financial Group.
| Vanguard Senior Management Team | |
| Mortimer J. Buckley | James M. Norris |
| Gregory Davis | Thomas M. Rampulla |
| John James | Karin A. Risi |
| Martha G. King | Anne E. Robinson |
| John T. Marcante | Michael Rollings |
| Chris D. McIsaac | |
| Chairman Emeritus and Senior Advisor | |
| John J. Brennan | |
| Chairman, 1996–2009 | |
| Chief Executive Officer and President, 1996–2008 | |
| Founder | |
| John C. Bogle | |
| Chairman and Chief Executive Officer, 1974–1996 | |
 | |
| P.O. Box 2600 | |
| Valley Forge, PA 19482-2600 | |
| Connect with Vanguard® > vanguard.com | |
| Fund Information > 800-662-7447 | |
| Direct Investor Account Services > 800-662-2739 | |
| Institutional Investor Services > 800-523-1036 | |
| Text Telephone for People | |
| Who Are Deaf or Hard of Hearing > 800-749-7273 | |
| This material may be used in conjunction | |
| with the offering of shares of any Vanguard | |
| fund only if preceded or accompanied by | |
| the fund’s current prospectus. | |
| All comparative mutual fund data are from Lipper, a | |
| Thomson Reuters Company, or Morningstar, Inc., unless | |
| otherwise noted. | |
| You can obtain a free copy of Vanguard’s proxy voting | |
| guidelines by visiting vanguard.com/proxyreporting or by | |
| calling Vanguard at 800-662-2739. The guidelines are | |
| also available from the SEC’s website, sec.gov. In | |
| addition, you may obtain a free report on how your fund | |
| voted the proxies for securities it owned during the 12 | |
| months ended June 30. To get the report, visit either | |
| vanguard.com/proxyreporting or sec.gov. | |
| You can review and copy information about your fund at | |
| the SEC’s Public Reference Room in Washington, D.C. To | |
| find out more about this public service, call the SEC at | |
| 202-551-8090. Information about your fund is also | |
| available on the SEC’s website, and you can receive | |
| copies of this information, for a fee, by sending a | |
| request in either of two ways: via email addressed to | |
| publicinfo@sec.gov or via regular mail addressed to the | |
| Public Reference Section, Securities and Exchange | |
| Commission, Washington, DC 20549-1520. | |
| © 2018 The Vanguard Group, Inc. | |
| All rights reserved. | |
| Vanguard Marketing Corporation, Distributor. | |
| Q9850 102018 | |
Item 2: Code of Ethics. The Registrant has adopted a code of ethics that applies to the Registrant’s principal executive officer, principal financial officer, principal accounting officer or controller or persons performing similar functions. The Code of Ethics was amended during the reporting period covered by this report to make certain technical, non-material changes.
Item 3: Audit Committee Financial Expert. All members of the Audit Committee have been determined by the Registrant’s Board of Trustees to be Audit Committee Financial Experts and to be independent: JoAnn Heffernan Heisen, F. Joseph Loughrey, Mark Loughridge, Sarah Bloom Raskin, and Peter F. Volanakis.
Item 4: Principal Accountant Fees and Services.
(a) Audit Fees.
Audit Fees of the Registrant
Fiscal Year Ended August 31, 2018: $626,000
Fiscal Year Ended August 31, 2017: $596,000
Aggregate Audit Fees of Registered Investment Companies in the Vanguard Group.
Fiscal Year Ended August 31, 2018: $9,734,277
Fiscal Year Ended August 31, 2017: $8,424,459
Includes fees billed in connection with audits of the Registrant, other registered investment companies in the Vanguard complex, The Vanguard Group, Inc. and Vanguard Marketing Corporation.
(b) Audit-Related Fees.
Fiscal Year Ended August 31, 2018: $5,581,366 Fiscal Year Ended August 31, 2017: $3,194,093
Includes fees billed in connection with assurance and related services provided to the Registrant, other registered investment companies in the Vanguard complex, The Vanguard Group, Inc., and Vanguard Marketing Corporation.
(c) Tax Fees.
Fiscal Year Ended August 31, 2018: $347,985
Fiscal Year Ended August 31, 2017: $274,313
Includes fees billed in connection with tax compliance, planning, and advice services provided to the Registrant, other registered investment companies in the Vanguard complex, The Vanguard Group, Inc., and Vanguard Marketing Corporation.
(d) All Other Fees.
Fiscal Year Ended August 31, 2018: $0
Fiscal Year Ended August 31, 2017: $0
Includes fees billed for services related to tax reported information provided to the Registrant, other registered investment companies in the Vanguard complex, The Vanguard Group, Inc., and Vanguard Marketing Corporation.
(e) (1) Pre-Approval Policies. The policy of the Registrant’s Audit Committee is to consider and, if appropriate, approve before the principal accountant is engaged for such services, all specific audit and non-audit services provided to: the Registrant, other registered investment companies in the Vanguard complex, The Vanguard Group, Inc., and entities controlled by The Vanguard Group, Inc. that provide ongoing services to the Registrant. In making a determination, the Audit Committee considers whether the services are consistent with maintaining the principal accountant’s independence.
In the event of a contingency situation in which the principal accountant is needed to provide services in between scheduled Audit Committee meetings, the Chairman of the Audit Committee would be called on to consider and, if appropriate, pre-approve audit or permitted non-audit services in an amount sufficient to complete services through the next Audit Committee meeting, and to determine if such services would be consistent with maintaining the accountant’s independence. At the next scheduled Audit Committee meeting, services and fees would be presented to the Audit Committee for formal consideration, and, if appropriate, approval by the entire Audit Committee. The Audit Committee would again consider whether such services and fees are consistent with maintaining the principal accountant’s independence.
The Registrant’s Audit Committee is informed at least annually of all audit and non-audit services provided by the principal accountant to the Vanguard complex, whether such services are provided to: the Registrant, other registered investment companies in the Vanguard complex, The Vanguard Group, Inc., or other entities controlled by The Vanguard Group, Inc. that provide ongoing services to the Registrant.
(2) No percentage of the principal accountant’s fees or services were approved pursuant to the waiver provision of paragraph (c)(7)(i)(C) of Rule 2-01 of Regulation S-X.
(f) For the most recent fiscal year, over 50% of the hours worked under the principal accountant’s engagement were not performed by persons other than full-time, permanent employees of the principal accountant.
(g) Aggregate Non-Audit Fees.
Fiscal Year Ended August 31, 2018: $347,985
Fiscal Year Ended August 31, 2017: $274,313
Includes fees billed for non-audit services provided to the Registrant, other registered investment companies in the Vanguard complex, The Vanguard Group, Inc., and Vanguard Marketing Corporation.
(h) For the most recent fiscal year, the Audit Committee has determined that the provision of all non-audit services was consistent with maintaining the principal accountant’s independence.
Item 5: Audit Committee of Listed Registrants.
The Registrant is a listed issuer as defined in rule 10A-3 under the Securities Exchange Act of 1934 (“Exchange Act”). The Registrant has a separately-designated standing audit committee established in accordance with Section 3(a)(58)(A) of the Exchange Act. The Registrant’s audit committee members are: JoAnn Heffernan Heisen, F. Joseph Loughrey, Mark Loughridge, Sarah Bloom Raskin, and Peter F. Volanakis.
Item 6: Investments.
| Vanguard® Russell 1000 Index Fund | |||
| Schedule of Investments | |||
| August 31, 2018 | |||
| Market | |||
| Value | |||
| Shares | ($000) | ||
| Common Stocks (99.9%)1 | |||
| Consumer Discretionary (14.2%) | |||
| * | Amazon.com Inc. | 46,375 | 93,339 |
| Home Depot Inc. | 131,379 | 26,377 | |
| Comcast Corp. Class A | 520,763 | 19,263 | |
| Walt Disney Co. | 170,121 | 19,057 | |
| * | Netflix Inc. | 47,516 | 17,471 |
| Walmart Inc. | 162,862 | 15,612 | |
| McDonald's Corp. | 89,598 | 14,536 | |
| NIKE Inc. Class B | 143,347 | 11,783 | |
| Costco Wholesale Corp. | 49,793 | 11,608 | |
| * | Booking Holdings Inc. | 5,481 | 10,696 |
| Lowe's Cos. Inc. | 94,006 | 10,223 | |
| Starbucks Corp. | 153,253 | 8,191 | |
| TJX Cos. Inc. | 71,490 | 7,862 | |
| * | Charter Communications Inc. Class A | 20,318 | 6,307 |
| Twenty-First Century Fox Inc. Class A | 120,874 | 5,488 | |
| General Motors Co. | 149,080 | 5,374 | |
| Target Corp. | 61,194 | 5,354 | |
| *,^ | Tesla Inc. | 15,383 | 4,640 |
| Marriott International Inc. Class A | 33,426 | 4,227 | |
| Ford Motor Co. | 440,573 | 4,177 | |
| Ross Stores Inc. | 42,197 | 4,042 | |
| * | eBay Inc. | 106,202 | 3,676 |
| Estee Lauder Cos. Inc. Class A | 24,917 | 3,491 | |
| VF Corp. | 36,691 | 3,380 | |
| Dollar General Corp. | 30,294 | 3,264 | |
| Yum! Brands Inc. | 36,654 | 3,185 | |
| * | O'Reilly Automotive Inc. | 9,148 | 3,068 |
| Carnival Corp. | 46,313 | 2,848 | |
| Las Vegas Sands Corp. | 40,586 | 2,655 | |
| Aptiv plc | 29,864 | 2,628 | |
| Hilton Worldwide Holdings Inc. | 32,076 | 2,490 | |
| Twenty-First Century Fox Inc. | 53,645 | 2,409 | |
| Royal Caribbean Cruises Ltd. | 19,257 | 2,361 | |
| * | AutoZone Inc. | 3,046 | 2,336 |
| Best Buy Co. Inc. | 27,823 | 2,214 | |
| * | Dollar Tree Inc. | 26,982 | 2,172 |
| CBS Corp. Class B | 37,297 | 1,978 | |
| Omnicom Group Inc. | 25,438 | 1,763 | |
| Expedia Group Inc. | 13,466 | 1,757 | |
| * | Lululemon Athletica Inc. | 11,261 | 1,745 |
| Wynn Resorts Ltd. | 11,663 | 1,730 | |
| Tiffany & Co. | 14,076 | 1,726 | |
| MGM Resorts International | 58,893 | 1,707 | |
| DR Horton Inc. | 37,998 | 1,691 | |
| Tapestry Inc. | 33,156 | 1,681 | |
| * | Ulta Beauty Inc. | 6,443 | 1,675 |
| Genuine Parts Co. | 16,701 | 1,668 | |
| Yum China Holdings Inc. | 42,451 | 1,642 | |
| Darden Restaurants Inc. | 13,884 | 1,611 | |
| Lennar Corp. Class A | 30,393 | 1,570 | |
| * | CarMax Inc. | 19,953 | 1,557 |
| Kohl's Corp. | 19,243 | 1,522 | |
| Domino's Pizza Inc. | 4,841 | 1,445 | |
| * | Mohawk Industries Inc. | 7,246 | 1,388 |
| Vail Resorts Inc. | 4,606 | 1,373 | |
| Advance Auto Parts Inc. | 8,215 | 1,348 | |
| * | Chipotle Mexican Grill Inc. Class A | 2,744 | 1,304 |
| Hasbro Inc. | 13,036 | 1,295 | |
| Macy's Inc. | 35,282 | 1,290 | |
| * | Norwegian Cruise Line Holdings Ltd. | 23,851 | 1,279 |
| * | Burlington Stores Inc. | 7,573 | 1,274 |
1
| Vanguard® Russell 1000 Index Fund | |||
| Schedule of Investments | |||
| August 31, 2018 | |||
| Market | |||
| Value | |||
| Shares | ($000) | ||
| PVH Corp. | 8,875 | 1,271 | |
| Tractor Supply Co. | 13,854 | 1,223 | |
| Lear Corp. | 7,445 | 1,208 | |
| Aramark | 28,527 | 1,172 | |
| * | LKQ Corp. | 33,944 | 1,172 |
| * | Michael Kors Holdings Ltd. | 15,884 | 1,154 |
| Newell Brands Inc. | 50,682 | 1,101 | |
| BorgWarner Inc. | 24,790 | 1,085 | |
| Viacom Inc. Class B | 36,905 | 1,081 | |
| Nielsen Holdings plc | 41,016 | 1,066 | |
| ^ | Sirius XM Holdings Inc. | 148,031 | 1,051 |
| Interpublic Group of Cos. Inc. | 44,713 | 1,044 | |
| * | Qurate Retail Group Inc. QVC Group Class A | 48,198 | 1,002 |
| Whirlpool Corp. | 7,921 | 990 | |
| KAR Auction Services Inc. | 15,695 | 984 | |
| *,^ | Discovery Communications Inc. Class A | 34,890 | 971 |
| * | ServiceMaster Global Holdings Inc. | 15,641 | 943 |
| * | NVR Inc. | 351 | 937 |
| * | DISH Network Corp. Class A | 25,513 | 902 |
| * | Liberty Broadband Corp. | 11,111 | 901 |
| * | Liberty Media Corp-Liberty SiriusXM Class C | 18,962 | 892 |
| Service Corp. International | 20,822 | 874 | |
| PulteGroup Inc. | 31,093 | 869 | |
| Garmin Ltd. | 12,731 | 868 | |
| Ralph Lauren Corp. Class A | 6,444 | 856 | |
| * | Wayfair Inc. | 6,267 | 847 |
| Harley-Davidson Inc. | 19,510 | 832 | |
| Nordstrom Inc. | 13,086 | 822 | |
| * | Live Nation Entertainment Inc. | 16,005 | 795 |
| Fortune Brands Home & Security Inc. | 14,821 | 785 | |
| * | Liberty Media Corp-Liberty Formula One | 20,909 | 773 |
| Gap Inc. | 24,840 | 754 | |
| Pool Corp. | 4,587 | 753 | |
| Polaris Industries Inc. | 6,927 | 751 | |
| * | WABCO Holdings Inc. | 6,085 | 749 |
| * | Bright Horizons Family Solutions Inc. | 6,167 | 737 |
| Hanesbrands Inc. | 41,898 | 735 | |
| Leggett & Platt Inc. | 15,620 | 710 | |
| Gentex Corp. | 29,726 | 695 | |
| * | Caesars Entertainment Corp. | 67,467 | 688 |
| L Brands Inc. | 25,752 | 681 | |
| Brunswick Corp. | 10,233 | 680 | |
| Dunkin' Brands Group Inc. | 9,280 | 676 | |
| Foot Locker Inc. | 13,653 | 673 | |
| Williams-Sonoma Inc. | 9,497 | 667 | |
| H&R Block Inc. | 24,233 | 656 | |
| Coty Inc. Class A | 53,038 | 656 | |
| * | Madison Square Garden Co. Class A | 2,160 | 652 |
| Wyndham Hotels & Resorts Inc. | 11,320 | 642 | |
| * | TripAdvisor Inc. | 11,553 | 627 |
| * | Grand Canyon Education Inc. | 5,255 | 626 |
| Goodyear Tire & Rubber Co. | 27,537 | 625 | |
| *,^ | Mattel Inc. | 39,663 | 612 |
| Thor Industries Inc. | 5,950 | 568 | |
| * | GCI Liberty Inc. - Class A | 11,488 | 564 |
| Six Flags Entertainment Corp. | 8,207 | 554 | |
| Toll Brothers Inc. | 15,151 | 549 | |
| News Corp. Class A | 41,774 | 546 | |
| * | 2U Inc. | 6,091 | 544 |
| Carter's Inc. | 5,059 | 536 | |
| * | Discovery Communications Inc. | 20,058 | 514 |
| Adient plc | 11,164 | 483 | |
| Cinemark Holdings Inc. | 12,652 | 472 | |
| * | Under Armour Inc. Class A | 22,770 | 466 |
2
| Vanguard® Russell 1000 Index Fund | |||
| Schedule of Investments | |||
| August 31, 2018 | |||
| Market | |||
| Value | |||
| Shares | ($000) | ||
| * | Liberty Media Corp-Liberty SiriusXM Class A | 9,874 | 462 |
| * | Skechers U.S.A. Inc. Class A | 15,614 | 460 |
| Extended Stay America Inc. | 21,725 | 438 | |
| Hyatt Hotels Corp. Class A | 5,459 | 422 | |
| * | Urban Outfitters Inc. | 8,440 | 392 |
| Wendy's Co. | 22,066 | 389 | |
| * | Under Armour Inc. | 20,055 | 380 |
| Cable One Inc. | 451 | 378 | |
| Tribune Media Co. Class A | 9,904 | 365 | |
| * | Hilton Grand Vacations Inc. | 11,172 | 365 |
| * | Visteon Corp. | 3,283 | 362 |
| John Wiley & Sons Inc. Class A | 5,389 | 348 | |
| Dick's Sporting Goods Inc. | 9,227 | 345 | |
| *,^ | Tempur Sealy International Inc. | 5,744 | 318 |
| * | Liberty Broadband Corp. Class A | 3,866 | 313 |
| * | AMC Networks Inc. Class A | 4,889 | 307 |
| Graham Holdings Co. Class B | 530 | 298 | |
| Lions Gate Entertainment Corp. Class B | 13,254 | 298 | |
| * | AutoNation Inc. | 6,387 | 290 |
| Choice Hotels International Inc. | 3,560 | 278 | |
| AMERCO | 733 | 275 | |
| Columbia Sportswear Co. | 2,931 | 266 | |
| International Game Technology plc | 11,769 | 248 | |
| Penske Automotive Group Inc. | 4,563 | 240 | |
| News Corp. Class B | 15,629 | 213 | |
| * | Michaels Cos. Inc. | 12,328 | 209 |
| * | Floor & Decor Holdings Inc. Class A | 4,414 | 162 |
| Lennar Corp. Class B | 3,777 | 159 | |
| * | Liberty Media Corp-Liberty Formula One Class A | 3,958 | 138 |
| Viacom Inc. Class A | 4,043 | 136 | |
| Lions Gate Entertainment Corp. Class A | 3,445 | 81 | |
| * | Liberty Expedia Holdings Inc. Class A | 590 | 27 |
| 447,497 | |||
| Consumer Staples (5.6%) | |||
| Procter & Gamble Co. | 287,243 | 23,827 | |
| Coca-Cola Co. | 435,681 | 19,418 | |
| PepsiCo Inc. | 161,595 | 18,100 | |
| Philip Morris International Inc. | 177,261 | 13,807 | |
| Altria Group Inc. | 215,637 | 12,619 | |
| CVS Health Corp. | 115,677 | 8,704 | |
| Mondelez International Inc. Class A | 165,101 | 7,053 | |
| Walgreens Boots Alliance Inc. | 96,438 | 6,612 | |
| Colgate-Palmolive Co. | 97,053 | 6,445 | |
| Kimberly-Clark Corp. | 39,556 | 4,570 | |
| Sysco Corp. | 53,786 | 4,024 | |
| Kraft Heinz Co. | 68,150 | 3,971 | |
| Constellation Brands Inc. Class A | 18,009 | 3,750 | |
| Archer-Daniels-Midland Co. | 63,922 | 3,222 | |
| General Mills Inc. | 66,646 | 3,066 | |
| Kroger Co. | 97,047 | 3,057 | |
| * | Monster Beverage Corp. | 45,941 | 2,797 |
| Clorox Co. | 14,680 | 2,128 | |
| Tyson Foods Inc. Class A | 32,808 | 2,061 | |
| Kellogg Co. | 28,392 | 2,038 | |
| McCormick & Co. Inc. | 13,562 | 1,694 | |
| Brown-Forman Corp. Class B | 30,870 | 1,612 | |
| Conagra Brands Inc. | 43,736 | 1,607 | |
| Church & Dwight Co. Inc. | 27,644 | 1,564 | |
| Hershey Co. | 15,392 | 1,547 | |
| Molson Coors Brewing Co. Class B | 20,189 | 1,348 | |
| JM Smucker Co. | 12,863 | 1,330 | |
| Hormel Foods Corp. | 31,263 | 1,224 | |
| Lamb Weston Holdings Inc. | 16,976 | 1,148 | |
| Bunge Ltd. | 16,187 | 1,052 | |
3
| Vanguard® Russell 1000 Index Fund | ||
| Schedule of Investments | ||
| August 31, 2018 | ||
| Market | ||
| Value | ||
| Shares | ($000) | |
| Pinnacle Foods Inc. | 13,837 | 919 |
| Campbell Soup Co. | 20,609 | 813 |
| * US Foods Holding Corp. | 24,682 | 804 |
| Ingredion Inc. | 7,855 | 794 |
| * Herbalife Nutrition Ltd. | 13,446 | 761 |
| * Post Holdings Inc. | 7,607 | 740 |
| Casey's General Stores Inc. | 4,512 | 515 |
| Nu Skin Enterprises Inc. Class A | 6,141 | 489 |
| * Keurig Dr Pepper Inc. | 20,399 | 465 |
| Flowers Foods Inc. | 21,302 | 429 |
| Energizer Holdings Inc. | 6,698 | 426 |
| Spectrum Brands Holdings Inc. | 4,773 | 415 |
| * Sprouts Farmers Market Inc. | 15,127 | 401 |
| Brown-Forman Corp. Class A | 6,762 | 356 |
| * TreeHouse Foods Inc. | 6,704 | 349 |
| * Hain Celestial Group Inc. | 11,428 | 326 |
| * Pilgrim's Pride Corp. | 6,282 | 116 |
| Seaboard Corp. | 31 | 114 |
| 174,627 | ||
| Energy (5.7%) | ||
| Exxon Mobil Corp. | 483,179 | 38,736 |
| Chevron Corp. | 217,389 | 25,752 |
| Schlumberger Ltd. | 157,913 | 9,974 |
| ConocoPhillips | 133,232 | 9,783 |
| EOG Resources Inc. | 65,737 | 7,772 |
| Occidental Petroleum Corp. | 87,459 | 6,985 |
| Valero Energy Corp. | 49,186 | 5,798 |
| Phillips 66 | 47,728 | 5,656 |
| Marathon Petroleum Corp. | 52,244 | 4,299 |
| Williams Cos. Inc. | 138,424 | 4,096 |
| Halliburton Co. | 98,372 | 3,924 |
| Kinder Morgan Inc. | 216,008 | 3,823 |
| Anadarko Petroleum Corp. | 58,382 | 3,760 |
| Pioneer Natural Resources Co. | 19,236 | 3,361 |
| ONEOK Inc. | 46,278 | 3,050 |
| * Concho Resources Inc. | 21,921 | 3,006 |
| Devon Energy Corp. | 59,155 | 2,540 |
| Andeavor | 16,224 | 2,479 |
| Marathon Oil Corp. | 98,212 | 2,113 |
| National Oilwell Varco Inc. | 43,630 | 2,054 |
| Hess Corp. | 29,799 | 2,007 |
| Apache Corp. | 43,304 | 1,898 |
| Noble Energy Inc. | 54,138 | 1,609 |
| * Cheniere Energy Inc. | 23,764 | 1,591 |
| EQT Corp. | 29,981 | 1,530 |
| Baker Hughes a GE Co. | 46,346 | 1,528 |
| HollyFrontier Corp. | 18,416 | 1,372 |
| Targa Resources Corp. | 24,846 | 1,368 |
| Diamondback Energy Inc. | 11,224 | 1,359 |
| Cabot Oil & Gas Corp. | 50,252 | 1,198 |
| Cimarex Energy Co. | 11,074 | 936 |
| * WPX Energy Inc. | 46,295 | 883 |
| * Parsley Energy Inc. Class A | 29,443 | 818 |
| Helmerich & Payne Inc. | 12,328 | 808 |
| * Energen Corp. | 9,742 | 756 |
| PBF Energy Inc. Class A | 13,337 | 692 |
| * Continental Resources Inc. | 10,398 | 686 |
| * Newfield Exploration Co. | 23,434 | 639 |
| * Transocean Ltd. | 50,240 | 608 |
| Murphy Oil Corp. | 19,372 | 597 |
| Whiting Petroleum Corp. | 10,093 | 514 |
| Valvoline Inc. | 23,401 | 504 |
| * Antero Resources Corp. | 27,194 | 503 |
| * First Solar Inc. | 9,340 | 486 |
4
| Vanguard® Russell 1000 Index Fund | ||
| Schedule of Investments | ||
| August 31, 2018 | ||
| Market | ||
| Value | ||
| Shares | ($000) | |
| * Chesapeake Energy Corp. | 107,043 | 474 |
| Patterson-UTI Energy Inc. | 24,990 | 428 |
| Range Resources Corp. | 25,348 | 416 |
| * Apergy Corp. | 8,938 | 404 |
| CNX Resources Corp. | 25,351 | 404 |
| * Centennial Resource Development Inc. Class A | 20,397 | 393 |
| SM Energy Co. | 12,505 | 376 |
| * QEP Resources Inc. | 28,094 | 280 |
| * Kosmos Energy Ltd. | 29,473 | 266 |
| * Weatherford International plc | 108,184 | 262 |
| Nabors Industries Ltd. | 38,545 | 238 |
| * Extraction Oil & Gas Inc. | 13,494 | 156 |
| RPC Inc. | 6,365 | 87 |
| 178,035 | ||
| Financial Services (20.5%) | ||
| * Berkshire Hathaway Inc. Class B | 220,955 | 46,118 |
| JPMorgan Chase & Co. | 386,790 | 44,318 |
| Bank of America Corp. | 1,079,239 | 33,381 |
| Visa Inc. Class A | 203,983 | 29,963 |
| Wells Fargo & Co. | 501,193 | 29,310 |
| Mastercard Inc. Class A | 104,908 | 22,614 |
| Citigroup Inc. | 291,486 | 20,765 |
| * PayPal Holdings Inc. | 135,413 | 12,503 |
| Goldman Sachs Group Inc. | 40,468 | 9,624 |
| US Bancorp | 176,215 | 9,535 |
| American Express Co. | 81,063 | 8,591 |
| PNC Financial Services Group Inc. | 53,695 | 7,707 |
| American Tower Corp. | 50,067 | 7,466 |
| Chubb Ltd. | 52,800 | 7,141 |
| Charles Schwab Corp. | 137,066 | 6,962 |
| Morgan Stanley | 142,039 | 6,936 |
| CME Group Inc. | 38,797 | 6,779 |
| BlackRock Inc. | 14,032 | 6,722 |
| Simon Property Group Inc. | 35,209 | 6,444 |
| S&P Global Inc. | 28,736 | 5,950 |
| Bank of New York Mellon Corp. | 106,384 | 5,548 |
| American International Group Inc. | 102,365 | 5,443 |
| Capital One Financial Corp. | 54,686 | 5,419 |
| Crown Castle International Corp. | 47,217 | 5,384 |
| Intercontinental Exchange Inc. | 65,002 | 4,955 |
| Marsh & McLennan Cos. Inc. | 57,968 | 4,906 |
| Prologis Inc. | 71,840 | 4,826 |
| Prudential Financial Inc. | 47,535 | 4,670 |
| BB&T Corp. | 89,017 | 4,599 |
| MetLife Inc. | 98,205 | 4,507 |
| Progressive Corp. | 66,273 | 4,475 |
| Aon plc | 27,758 | 4,040 |
| Aflac Inc. | 87,157 | 4,030 |
| Travelers Cos. Inc. | 30,588 | 4,025 |
| Allstate Corp. | 39,974 | 4,020 |
| Fidelity National Information Services Inc. | 37,160 | 4,020 |
| Equinix Inc. | 9,027 | 3,937 |
| SunTrust Banks Inc. | 52,752 | 3,880 |
| * Fiserv Inc. | 46,852 | 3,751 |
| State Street Corp. | 42,860 | 3,725 |
| Public Storage | 16,948 | 3,603 |
| Moody's Corp. | 19,053 | 3,392 |
| * Worldpay Inc. Class A | 33,484 | 3,261 |
| T. Rowe Price Group Inc. | 27,163 | 3,148 |
| Discover Financial Services | 39,116 | 3,056 |
| Weyerhaeuser Co. | 86,817 | 3,013 |
| M&T Bank Corp. | 16,814 | 2,979 |
| Digital Realty Trust Inc. | 23,601 | 2,933 |
| * Square Inc. | 32,385 | 2,871 |
5
| Vanguard® Russell 1000 Index Fund | ||
| Schedule of Investments | ||
| August 31, 2018 | ||
| Market | ||
| Value | ||
| Shares | ($000) | |
| AvalonBay Communities Inc. | 15,407 | 2,824 |
| Welltower Inc. | 42,181 | 2,814 |
| Equity Residential | 41,371 | 2,803 |
| Synchrony Financial | 86,438 | 2,737 |
| Northern Trust Corp. | 23,511 | 2,526 |
| KeyCorp | 118,712 | 2,501 |
| Regions Financial Corp. | 126,320 | 2,458 |
| Ventas Inc. | 40,545 | 2,427 |
| Boston Properties Inc. | 17,972 | 2,344 |
| Ameriprise Financial Inc. | 16,486 | 2,340 |
| Fifth Third Bancorp | 77,095 | 2,269 |
| Global Payments Inc. | 17,963 | 2,238 |
| Citizens Financial Group Inc. | 54,330 | 2,236 |
| Willis Towers Watson plc | 14,799 | 2,179 |
| * FleetCor Technologies Inc. | 10,044 | 2,147 |
| Hartford Financial Services Group Inc. | 40,584 | 2,044 |
| Huntington Bancshares Inc. | 123,760 | 2,006 |
| * SBA Communications Corp. Class A | 12,910 | 2,004 |
| Total System Services Inc. | 20,547 | 1,996 |
| * SVB Financial Group | 6,166 | 1,990 |
| Comerica Inc. | 20,147 | 1,964 |
| Realty Income Corp. | 33,106 | 1,939 |
| First Republic Bank | 18,666 | 1,896 |
| Essex Property Trust Inc. | 7,604 | 1,873 |
| TD Ameritrade Holding Corp. | 31,913 | 1,869 |
| * Markel Corp. | 1,531 | 1,851 |
| Broadridge Financial Solutions Inc. | 13,622 | 1,841 |
| Equifax Inc. | 13,649 | 1,829 |
| MSCI Inc. Class A | 9,965 | 1,796 |
| * E*TRADE Financial Corp. | 30,502 | 1,795 |
| Host Hotels & Resorts Inc. | 82,369 | 1,773 |
| Principal Financial Group Inc. | 31,608 | 1,744 |
| * CBRE Group Inc. Class A | 35,360 | 1,726 |
| XL Group Ltd. | 28,924 | 1,660 |
| Lincoln National Corp. | 24,654 | 1,617 |
| Loews Corp. | 32,117 | 1,616 |
| TransUnion | 21,094 | 1,588 |
| * First Data Corp. Class A | 61,149 | 1,573 |
| Vornado Realty Trust | 20,148 | 1,551 |
| Arthur J Gallagher & Co. | 20,878 | 1,506 |
| HCP Inc. | 54,659 | 1,477 |
| Alexandria Real Estate Equities Inc. | 11,195 | 1,437 |
| Raymond James Financial Inc. | 15,158 | 1,410 |
| Mid-America Apartment Communities Inc. | 13,340 | 1,381 |
| Annaly Capital Management Inc. | 129,377 | 1,374 |
| Jack Henry & Associates Inc. | 8,499 | 1,347 |
| * Arch Capital Group Ltd. | 43,886 | 1,342 |
| Cincinnati Financial Corp. | 17,070 | 1,309 |
| Extra Space Storage Inc. | 14,145 | 1,304 |
| Nasdaq Inc. | 13,649 | 1,303 |
| Ally Financial Inc. | 48,028 | 1,291 |
| Cboe Global Markets Inc. | 12,784 | 1,289 |
| Alliance Data Systems Corp. | 5,336 | 1,273 |
| Zions Bancorporation | 22,682 | 1,209 |
| Duke Realty Corp. | 41,639 | 1,186 |
| Fidelity National Financial Inc. | 29,466 | 1,182 |
| Iron Mountain Inc. | 32,689 | 1,180 |
| UDR Inc. | 29,492 | 1,179 |
| Regency Centers Corp. | 17,245 | 1,139 |
| Invesco Ltd. | 47,067 | 1,134 |
| Franklin Resources Inc. | 35,208 | 1,118 |
| Federal Realty Investment Trust | 8,543 | 1,116 |
| Alleghany Corp. | 1,723 | 1,089 |
| Reinsurance Group of America Inc. Class A | 7,597 | 1,085 |
6
| Vanguard® Russell 1000 Index Fund | ||
| Schedule of Investments | ||
| August 31, 2018 | ||
| Market | ||
| Value | ||
| Shares | ($000) | |
| East West Bancorp Inc. | 16,947 | 1,074 |
| FactSet Research Systems Inc. | 4,448 | 1,020 |
| Everest Re Group Ltd. | 4,530 | 1,010 |
| Western Union Co. | 53,093 | 1,005 |
| Torchmark Corp. | 11,409 | 1,003 |
| SEI Investments Co. | 15,496 | 977 |
| SL Green Realty Corp. | 9,233 | 964 |
| Equity LifeStyle Properties Inc. | 9,903 | 959 |
| Voya Financial Inc. | 18,987 | 951 |
| AGNC Investment Corp. | 49,762 | 946 |
| American Financial Group Inc. | 8,447 | 941 |
| Macerich Co. | 15,662 | 920 |
| Sun Communities Inc. | 8,908 | 919 |
| * VEREIT Inc. | 116,919 | 914 |
| * WEX Inc. | 4,717 | 897 |
| Camden Property Trust | 9,417 | 895 |
| WR Berkley Corp. | 11,137 | 872 |
| * Athene Holding Ltd. Class A | 17,546 | 871 |
| Affiliated Managers Group Inc. | 5,944 | 868 |
| Gaming and Leisure Properties Inc. | 24,136 | 864 |
| Unum Group | 23,343 | 861 |
| Brown & Brown Inc. | 27,377 | 834 |
| Kilroy Realty Corp. | 11,209 | 820 |
| Invitation Homes Inc. | 34,859 | 815 |
| MarketAxess Holdings Inc. | 4,254 | 807 |
| Commerce Bancshares Inc. | 11,327 | 805 |
| Apartment Investment & Management Co. | 18,209 | 798 |
| Jefferies Financial Group Inc. | 33,519 | 778 |
| PacWest Bancorp | 15,190 | 767 |
| * Omega Healthcare Investors Inc. | 23,196 | 767 |
| * Fair Isaac Corp. | 3,318 | 766 |
| Kimco Realty Corp. | 44,493 | 761 |
| Jones Lang LaSalle Inc. | 4,970 | 758 |
| Liberty Property Trust | 17,208 | 753 |
| Lamar Advertising Co. Class A | 9,735 | 750 |
| Signature Bank | 6,468 | 749 |
| CyrusOne Inc. | 11,161 | 747 |
| New Residential Investment Corp. | 40,162 | 746 |
| CIT Group Inc. | 13,654 | 741 |
| Park Hotels & Resorts Inc. | 22,000 | 736 |
| Cullen/Frost Bankers Inc. | 6,550 | 726 |
| Douglas Emmett Inc. | 18,589 | 726 |
| First American Financial Corp. | 12,549 | 714 |
| National Retail Properties Inc. | 15,346 | 707 |
| People's United Financial Inc. | 37,643 | 697 |
| WP Carey Inc. | 10,380 | 691 |
| Healthcare Trust of America Inc. Class A | 23,865 | 682 |
| LPL Financial Holdings Inc. | 10,207 | 676 |
| American Campus Communities Inc. | 15,958 | 669 |
| Old Republic International Corp. | 30,076 | 667 |
| VICI Properties Inc. | 31,839 | 666 |
| Brixmor Property Group Inc. | 36,497 | 665 |
| CubeSmart | 21,584 | 659 |
| Lazard Ltd. Class A | 13,672 | 658 |
| * Western Alliance Bancorp | 11,368 | 655 |
| American Homes 4 Rent Class A | 28,135 | 653 |
| First Horizon National Corp. | 35,024 | 645 |
| Medical Properties Trust Inc. | 42,606 | 641 |
| Eaton Vance Corp. | 12,137 | 640 |
| RenaissanceRe Holdings Ltd. | 4,721 | 628 |
| Starwood Property Trust Inc. | 28,351 | 625 |
| Assurant Inc. | 6,034 | 620 |
| Dun & Bradstreet Corp. | 4,340 | 620 |
| Webster Financial Corp. | 9,482 | 620 |
7
| Vanguard® Russell 1000 Index Fund | ||
| Schedule of Investments | ||
| August 31, 2018 | ||
| Market | ||
| Value | ||
| Shares | ($000) | |
| Hudson Pacific Properties Inc. | 18,292 | 619 |
| Hanover Insurance Group Inc. | 5,008 | 613 |
| New York Community Bancorp Inc. | 56,207 | 605 |
| * SLM Corp. | 51,388 | 602 |
| Popular Inc. | 11,924 | 600 |
| * Credit Acceptance Corp. | 1,304 | 596 |
| * Zillow Group Inc. | 12,058 | 587 |
| Prosperity Bancshares Inc. | 7,835 | 586 |
| * Brighthouse Financial Inc. | 14,122 | 586 |
| STORE Capital Corp. | 20,114 | 579 |
| * Howard Hughes Corp. | 4,352 | 567 |
| Forest City Realty Trust Inc. Class A | 22,409 | 564 |
| Synovus Financial Corp. | 11,197 | 561 |
| Hospitality Properties Trust | 19,270 | 559 |
| Associated Banc-Corp | 20,472 | 558 |
| Axis Capital Holdings Ltd. | 9,685 | 557 |
| * Euronet Worldwide Inc. | 5,619 | 550 |
| Pinnacle Financial Partners Inc. | 8,351 | 539 |
| Senior Housing Properties Trust | 28,096 | 537 |
| Life Storage Inc. | 5,487 | 536 |
| Rayonier Inc. | 15,240 | 531 |
| Sterling Bancorp | 23,125 | 528 |
| EPR Properties | 7,480 | 525 |
| Interactive Brokers Group Inc. | 8,191 | 509 |
| * Bank OZK | 12,505 | 506 |
| Assured Guaranty Ltd. | 12,264 | 500 |
| * CoreLogic Inc. | 9,733 | 495 |
| Wintrust Financial Corp. | 5,509 | 488 |
| Umpqua Holdings Corp. | 22,551 | 483 |
| TCF Financial Corp. | 18,924 | 480 |
| BankUnited Inc. | 12,341 | 479 |
| Wyndham Destinations Inc. | 10,800 | 477 |
| CoreSite Realty Corp. | 4,082 | 475 |
| * Texas Capital Bancshares Inc. | 5,217 | 464 |
| Highwoods Properties Inc. | 9,300 | 463 |
| * Equity Commonwealth | 14,288 | 458 |
| Evercore Inc. Class A | 4,304 | 457 |
| Apple Hospitality REIT Inc. | 25,216 | 445 |
| Weingarten Realty Investors | 14,367 | 444 |
| Bank of Hawaii Corp. | 5,283 | 439 |
| Two Harbors Investment Corp. | 27,982 | 437 |
| Navient Corp. | 31,577 | 431 |
| Chimera Investment Corp. | 22,636 | 422 |
| Uniti Group Inc. | 19,835 | 413 |
| Taubman Centers Inc. | 6,265 | 405 |
| JBG SMITH Properties | 10,554 | 395 |
| FNB Corp. | 28,649 | 385 |
| MFA Financial Inc. | 48,290 | 370 |
| Spirit Realty Capital Inc. | 43,929 | 368 |
| * Zillow Group Inc. Class A | 7,598 | 365 |
| Columbia Property Trust Inc. | 14,817 | 357 |
| Brookfield Property REIT Inc. Class A | 17,821 | 357 |
| First Citizens BancShares Inc. Class A | 751 | 357 |
| BGC Partners Inc. Class A | 28,238 | 351 |
| Retail Properties of America Inc. | 27,525 | 350 |
| * OneMain Holdings Inc. | 9,428 | 346 |
| Erie Indemnity Co. Class A | 2,774 | 343 |
| Outfront Media Inc. | 16,959 | 337 |
| AXA Equitable Holdings Inc. | 14,512 | 333 |
| Legg Mason Inc. | 10,617 | 331 |
| BOK Financial Corp. | 3,124 | 320 |
| Realogy Holdings Corp. | 14,659 | 314 |
| Colony Capital Inc. | 49,877 | 306 |
| Morningstar Inc. | 2,134 | 304 |
8
| Vanguard® Russell 1000 Index Fund | ||
| Schedule of Investments | ||
| August 31, 2018 | ||
| Market | ||
| Value | ||
| Shares | ($000) | |
| Corporate Office Properties Trust | 9,844 | 303 |
| Aspen Insurance Holdings Ltd. | 7,354 | 303 |
| White Mountains Insurance Group Ltd. | 321 | 298 |
| Paramount Group Inc. | 18,272 | 290 |
| Santander Consumer USA Holdings Inc. | 13,384 | 289 |
| First Hawaiian Inc. | 9,922 | 288 |
| Brandywine Realty Trust | 16,280 | 273 |
| DDR Corp. | 18,723 | 262 |
| Empire State Realty Trust Inc. | 11,810 | 208 |
| Mercury General Corp. | 3,675 | 198 |
| CNA Financial Corp. | 3,704 | 166 |
| American National Insurance Co. | 1,095 | 141 |
| TFS Financial Corp. | 7,318 | 113 |
| Virtu Financial Inc. Class A | 4,247 | 93 |
| * Retail Value Inc. | 1,872 | 67 |
| 642,804 | ||
| Health Care (13.8%) | ||
| Johnson & Johnson | 306,192 | 41,241 |
| UnitedHealth Group Inc. | 109,162 | 29,306 |
| Pfizer Inc. | 662,377 | 27,502 |
| Merck & Co. Inc. | 307,369 | 21,082 |
| AbbVie Inc. | 181,103 | 17,382 |
| Amgen Inc. | 75,433 | 15,072 |
| Medtronic plc | 154,260 | 14,872 |
| Abbott Laboratories | 195,387 | 13,060 |
| Eli Lilly & Co. | 109,956 | 11,617 |
| Bristol-Myers Squibb Co. | 186,413 | 11,287 |
| Gilead Sciences Inc. | 147,438 | 11,165 |
| Thermo Fisher Scientific Inc. | 45,779 | 10,946 |
| * Biogen Inc. | 24,058 | 8,504 |
| Becton Dickinson and Co. | 30,175 | 7,902 |
| * Celgene Corp. | 82,548 | 7,797 |
| Anthem Inc. | 29,085 | 7,700 |
| Allergan plc | 38,540 | 7,388 |
| Aetna Inc. | 36,577 | 7,325 |
| Danaher Corp. | 70,515 | 7,301 |
| * Intuitive Surgical Inc. | 12,812 | 7,175 |
| Stryker Corp. | 38,849 | 6,582 |
| * Illumina Inc. | 16,806 | 5,963 |
| * Express Scripts Holding Co. | 63,860 | 5,621 |
| * Boston Scientific Corp. | 157,252 | 5,592 |
| * Vertex Pharmaceuticals Inc. | 29,062 | 5,359 |
| Humana Inc. | 15,653 | 5,216 |
| Cigna Corp. | 26,808 | 5,049 |
| Zoetis Inc. | 55,228 | 5,004 |
| HCA Healthcare Inc. | 31,762 | 4,260 |
| Baxter International Inc. | 57,098 | 4,246 |
| * Regeneron Pharmaceuticals Inc. | 9,088 | 3,697 |
| * Align Technology Inc. | 8,993 | 3,476 |
| * Edwards Lifesciences Corp. | 24,054 | 3,470 |
| * Centene Corp. | 23,039 | 3,375 |
| McKesson Corp. | 23,321 | 3,003 |
| * Alexion Pharmaceuticals Inc. | 24,386 | 2,981 |
| Zimmer Biomet Holdings Inc. | 23,256 | 2,875 |
| * IDEXX Laboratories Inc. | 9,779 | 2,484 |
| Agilent Technologies Inc. | 36,488 | 2,464 |
| * IQVIA Holdings Inc. | 18,726 | 2,380 |
| * Cerner Corp. | 35,714 | 2,325 |
| * Mylan NV | 58,012 | 2,270 |
| * Laboratory Corp. of America Holdings | 11,689 | 2,021 |
| * BioMarin Pharmaceutical Inc. | 20,166 | 2,016 |
| * ABIOMED Inc. | 4,801 | 1,952 |
| Cardinal Health Inc. | 35,356 | 1,845 |
| ResMed Inc. | 15,996 | 1,782 |
9
| Vanguard® Russell 1000 Index Fund | ||
| Schedule of Investments | ||
| August 31, 2018 | ||
| Market | ||
| Value | ||
| Shares | ($000) | |
| Quest Diagnostics Inc. | 15,678 | 1,724 |
| * WellCare Health Plans Inc. | 5,628 | 1,703 |
| AmerisourceBergen Corp. Class A | 18,482 | 1,663 |
| * Incyte Corp. | 20,250 | 1,497 |
| * DexCom Inc. | 9,886 | 1,427 |
| Cooper Cos. Inc. | 5,458 | 1,396 |
| * Veeva Systems Inc. Class A | 13,352 | 1,393 |
| * Henry Schein Inc. | 17,459 | 1,356 |
| Teleflex Inc. | 5,274 | 1,305 |
| * Hologic Inc. | 31,644 | 1,258 |
| * Alnylam Pharmaceuticals Inc. | 10,235 | 1,256 |
| * Neurocrine Biosciences Inc. | 10,117 | 1,244 |
| Universal Health Services Inc. Class B | 9,379 | 1,221 |
| * Nektar Therapeutics Class A | 17,679 | 1,175 |
| * Varian Medical Systems Inc. | 10,260 | 1,149 |
| STERIS plc | 9,855 | 1,128 |
| PerkinElmer Inc. | 12,173 | 1,125 |
| * Jazz Pharmaceuticals plc | 6,539 | 1,118 |
| Perrigo Co. plc | 14,344 | 1,097 |
| * DaVita Inc. | 15,105 | 1,047 |
| Dentsply Sirona Inc. | 25,830 | 1,031 |
| * Bluebird Bio Inc. | 6,111 | 1,028 |
| * Exact Sciences Corp. | 13,395 | 1,003 |
| West Pharmaceutical Services Inc. | 8,377 | 981 |
| * QIAGEN NV | 25,136 | 980 |
| * Sarepta Therapeutics Inc. | 6,970 | 962 |
| * Seattle Genetics Inc. | 12,289 | 943 |
| * Molina Healthcare Inc. | 6,807 | 939 |
| Encompass Health Corp. | 10,769 | 879 |
| * Sage Therapeutics Inc. | 5,103 | 838 |
| Bio-Techne Corp. | 4,324 | 831 |
| * Bio-Rad Laboratories Inc. Class A | 2,445 | 795 |
| * Alkermes plc | 17,332 | 777 |
| Hill-Rom Holdings Inc. | 7,987 | 777 |
| * athenahealth Inc. | 4,735 | 729 |
| * PRA Health Sciences Inc. | 6,455 | 682 |
| * Charles River Laboratories International Inc. | 5,512 | 681 |
| * Insulet Corp. | 6,418 | 669 |
| * Ionis Pharmaceuticals Inc. | 14,613 | 668 |
| * Catalent Inc. | 15,710 | 657 |
| * United Therapeutics Corp. | 5,066 | 623 |
| * Exelixis Inc. | 33,065 | 621 |
| * Envision Healthcare Corp. | 13,682 | 621 |
| * Masimo Corp. | 5,002 | 590 |
| Chemed Corp. | 1,666 | 539 |
| * ICU Medical Inc. | 1,690 | 517 |
| * MEDNAX Inc. | 10,617 | 503 |
| * Integra LifeSciences Holdings Corp. | 8,220 | 489 |
| * Penumbra Inc. | 3,378 | 469 |
| * Agios Pharmaceuticals Inc. | 5,682 | 459 |
| Bruker Corp. | 11,470 | 408 |
| * Acadia Healthcare Co. Inc. | 9,453 | 393 |
| Cantel Medical Corp. | 3,982 | 386 |
| * Premier Inc. Class A | 6,247 | 276 |
| * TESARO Inc. | 4,817 | 156 |
| * Quorum Health Corp. | 35 | — |
| 433,114 | ||
| Materials & Processing (3.2%) | ||
| DowDuPont Inc. | 265,142 | 18,594 |
| Praxair Inc. | 32,714 | 5,175 |
| Sherwin-Williams Co. | 9,541 | 4,347 |
| Ecolab Inc. | 28,842 | 4,340 |
| Air Products & Chemicals Inc. | 24,973 | 4,153 |
| LyondellBasell Industries NV Class A | 36,442 | 4,110 |
10
| Vanguard® Russell 1000 Index Fund | ||
| Schedule of Investments | ||
| August 31, 2018 | ||
| Market | ||
| Value | ||
| Shares | ($000) | |
| PPG Industries Inc. | 28,145 | 3,111 |
| Ingersoll-Rand plc | 27,783 | 2,814 |
| International Paper Co. | 47,407 | 2,424 |
| Freeport-McMoRan Inc. | 165,228 | 2,321 |
| Nucor Corp. | 36,953 | 2,310 |
| Fastenal Co. | 33,055 | 1,929 |
| Newmont Mining Corp. | 61,317 | 1,903 |
| Celanese Corp. Class A | 15,347 | 1,793 |
| Vulcan Materials Co. | 14,749 | 1,634 |
| Ball Corp. | 39,004 | 1,634 |
| WestRock Co. | 29,205 | 1,609 |
| Eastman Chemical Co. | 15,744 | 1,528 |
| Martin Marietta Materials Inc. | 7,168 | 1,424 |
| CF Industries Holdings Inc. | 26,927 | 1,399 |
| Masco Corp. | 36,778 | 1,396 |
| FMC Corp. | 15,574 | 1,331 |
| Mosaic Co. | 40,640 | 1,271 |
| International Flavors & Fragrances Inc. | 9,310 | 1,213 |
| Albemarle Corp. | 12,556 | 1,199 |
| Packaging Corp. of America | 10,884 | 1,196 |
| Steel Dynamics Inc. | 25,082 | 1,147 |
| RPM International Inc. | 14,253 | 962 |
| * Alcoa Corp. | 21,339 | 953 |
| Lennox International Inc. | 4,084 | 910 |
| Chemours Co. | 19,515 | 851 |
| * Axalta Coating Systems Ltd. | 25,349 | 773 |
| Huntsman Corp. | 24,402 | 744 |
| * Berry Global Group Inc. | 15,479 | 739 |
| Owens Corning | 12,810 | 725 |
| Acuity Brands Inc. | 4,699 | 718 |
| Sealed Air Corp. | 17,850 | 716 |
| Hexcel Corp. | 10,582 | 700 |
| AptarGroup Inc. | 6,563 | 687 |
| Watsco Inc. | 3,789 | 663 |
| Reliance Steel & Aluminum Co. | 7,301 | 642 |
| Ashland Global Holdings Inc. | 7,344 | 618 |
| * Crown Holdings Inc. | 14,343 | 614 |
| Sonoco Products Co. | 10,853 | 608 |
| United States Steel Corp. | 20,325 | 603 |
| Olin Corp. | 18,949 | 582 |
| Royal Gold Inc. | 7,601 | 580 |
| Graphic Packaging Holding Co. | 36,796 | 523 |
| Eagle Materials Inc. | 5,576 | 515 |
| Versum Materials Inc. | 12,933 | 515 |
| WR Grace & Co. | 7,264 | 513 |
| Bemis Co. Inc. | 10,210 | 503 |
| Cabot Corp. | 7,317 | 475 |
| Southern Copper Corp. | 9,644 | 421 |
| Westlake Chemical Corp. | 4,402 | 416 |
| * USG Corp. | 9,515 | 410 |
| Timken Co. | 8,385 | 408 |
| Domtar Corp. | 7,632 | 389 |
| * Univar Inc. | 13,932 | 388 |
| * Armstrong World Industries Inc. | 5,406 | 377 |
| NewMarket Corp. | 902 | 362 |
| * Platform Specialty Products Corp. | 27,106 | 359 |
| * Owens-Illinois Inc. | 19,899 | 352 |
| Scotts Miracle-Gro Co. | 4,480 | 335 |
| Valmont Industries Inc. | 2,354 | 331 |
| Silgan Holdings Inc. | 9,407 | 256 |
| GrafTech International Ltd. | 6,944 | 128 |
| Ardagh Group SA | 1,656 | 27 |
| 99,696 | ||
11
| Vanguard® Russell 1000 Index Fund | |||
| Schedule of Investments | |||
| August 31, 2018 | |||
| Market | |||
| Value | |||
| Shares | ($000) | ||
| Other (0.0%)2 | |||
| *,§ | Herbalife Ltd. CVR | 1,316 | 13 |
| Producer Durables (10.2%) | |||
| Boeing Co. | 62,711 | 21,497 | |
| 3M Co. | 65,729 | 13,864 | |
| Honeywell International Inc. | 85,087 | 13,534 | |
| Union Pacific Corp. | 87,791 | 13,223 | |
| General Electric Co. | 982,384 | 12,712 | |
| Accenture plc Class A | 73,461 | 12,420 | |
| United Technologies Corp. | 85,347 | 11,240 | |
| United Parcel Service Inc. Class B | 78,837 | 9,687 | |
| Caterpillar Inc. | 66,101 | 9,178 | |
| Lockheed Martin Corp. | 28,280 | 9,061 | |
| Automatic Data Processing Inc. | 50,162 | 7,361 | |
| CSX Corp. | 95,182 | 7,059 | |
| FedEx Corp. | 28,323 | 6,909 | |
| Raytheon Co. | 32,668 | 6,515 | |
| General Dynamics Corp. | 29,538 | 5,713 | |
| Norfolk Southern Corp. | 32,068 | 5,575 | |
| Northrop Grumman Corp. | 18,507 | 5,524 | |
| Emerson Electric Co. | 71,095 | 5,455 | |
| Illinois Tool Works Inc. | 38,228 | 5,309 | |
| Deere & Co. | 36,713 | 5,279 | |
| Waste Management Inc. | 48,344 | 4,394 | |
| Delta Air Lines Inc. | 72,979 | 4,268 | |
| Eaton Corp. plc | 49,415 | 4,108 | |
| Johnson Controls International plc | 104,305 | 3,940 | |
| Southwest Airlines Co. | 60,006 | 3,678 | |
| Roper Technologies Inc. | 11,645 | 3,475 | |
| Fortive Corp. | 34,680 | 2,912 | |
| Paychex Inc. | 36,830 | 2,698 | |
| Parker-Hannifin Corp. | 15,337 | 2,693 | |
| PACCAR Inc. | 38,324 | 2,622 | |
| Rockwell Automation Inc. | 14,103 | 2,552 | |
| Rockwell Collins Inc. | 18,719 | 2,545 | |
| * | United Continental Holdings Inc. | 28,601 | 2,500 |
| Stanley Black & Decker Inc. | 17,513 | 2,461 | |
| Cummins Inc. | 17,142 | 2,431 | |
| Cintas Corp. | 10,087 | 2,152 | |
| * | Verisk Analytics Inc. Class A | 17,886 | 2,130 |
| AMETEK Inc. | 26,486 | 2,038 | |
| Textron Inc. | 29,150 | 2,012 | |
| L3 Technologies Inc. | 9,098 | 1,944 | |
| American Airlines Group Inc. | 47,772 | 1,934 | |
| * | TransDigm Group Inc. | 5,434 | 1,902 |
| WW Grainger Inc. | 5,151 | 1,824 | |
| * | CoStar Group Inc. | 4,090 | 1,808 |
| Republic Services Inc. Class A | 24,362 | 1,787 | |
| * | Waters Corp. | 8,886 | 1,684 |
| * | Mettler-Toledo International Inc. | 2,821 | 1,649 |
| Xylem Inc. | 20,612 | 1,565 | |
| * | Copart Inc. | 23,327 | 1,500 |
| CH Robinson Worldwide Inc. | 15,526 | 1,492 | |
| * | United Rentals Inc. | 9,444 | 1,472 |
| Expeditors International of Washington Inc. | 19,932 | 1,461 | |
| * | XPO Logistics Inc. | 13,697 | 1,459 |
| Dover Corp. | 16,905 | 1,452 | |
| * | Keysight Technologies Inc. | 21,852 | 1,418 |
| Kansas City Southern | 11,895 | 1,379 | |
| IDEX Corp. | 8,997 | 1,378 | |
| Huntington Ingalls Industries Inc. | 4,905 | 1,199 | |
| JB Hunt Transport Services Inc. | 9,702 | 1,172 | |
| * | Trimble Inc. | 27,645 | 1,164 |
12
| Vanguard® Russell 1000 Index Fund | ||
| Schedule of Investments | ||
| August 31, 2018 | ||
| Market | ||
| Value | ||
| Shares | ($000) | |
| Snap-on Inc. | 6,336 | 1,120 |
| Old Dominion Freight Line Inc. | 7,303 | 1,113 |
| Arconic Inc. | 49,293 | 1,103 |
| Jacobs Engineering Group Inc. | 14,784 | 1,075 |
| Spirit AeroSystems Holdings Inc. Class A | 12,555 | 1,073 |
| Wabtec Corp. | 9,822 | 1,064 |
| Robert Half International Inc. | 13,334 | 1,042 |
| * Zebra Technologies Corp. | 6,048 | 1,039 |
| * Sensata Technologies Holding plc | 19,485 | 1,032 |
| Avery Dennison Corp. | 9,621 | 1,012 |
| AO Smith Corp. | 16,797 | 976 |
| * Teledyne Technologies Inc. | 4,054 | 962 |
| Allegion plc | 10,972 | 957 |
| Alaska Air Group Inc. | 13,937 | 941 |
| * HD Supply Holdings Inc. | 20,498 | 935 |
| Nordson Corp. | 6,659 | 926 |
| FLIR Systems Inc. | 14,640 | 919 |
| Fluor Corp. | 15,525 | 891 |
| Carlisle Cos. Inc. | 6,913 | 877 |
| Booz Allen Hamilton Holding Corp. Class A | 16,786 | 859 |
| Graco Inc. | 17,272 | 812 |
| Hubbell Inc. Class B | 6,369 | 805 |
| Flowserve Corp. | 15,306 | 798 |
| * Middleby Corp. | 6,383 | 776 |
| Donaldson Co. Inc. | 15,295 | 774 |
| Pentair plc | 17,246 | 750 |
| ManpowerGroup Inc. | 7,853 | 736 |
| * JetBlue Airways Corp. | 37,270 | 711 |
| Toro Co. | 11,601 | 705 |
| BWX Technologies Inc. | 11,467 | 703 |
| HEICO Corp. Class A | 9,122 | 680 |
| Rollins Inc. | 11,308 | 679 |
| Xerox Corp. | 24,305 | 677 |
| Lincoln Electric Holdings Inc. | 6,937 | 653 |
| Allison Transmission Holdings Inc. | 13,090 | 650 |
| Curtiss-Wright Corp. | 4,805 | 644 |
| * AECOM | 18,923 | 637 |
| * Genesee & Wyoming Inc. Class A | 7,215 | 634 |
| National Instruments Corp. | 13,086 | 625 |
| ITT Inc. | 10,488 | 620 |
| Oshkosh Corp. | 8,735 | 614 |
| * Quanta Services Inc. | 17,643 | 610 |
| * Stericycle Inc. | 9,890 | 610 |
| Trinity Industries Inc. | 16,623 | 596 |
| Littelfuse Inc. | 2,589 | 579 |
| Landstar System Inc. | 4,948 | 573 |
| * Kirby Corp. | 6,485 | 566 |
| Crane Co. | 5,962 | 544 |
| Air Lease Corp. Class A | 11,506 | 532 |
| Genpact Ltd. | 17,331 | 531 |
| nVent Electric plc | 18,706 | 525 |
| * Conduent Inc. | 22,664 | 525 |
| Ryder System Inc. | 6,306 | 485 |
| AGCO Corp. | 8,033 | 479 |
| Knight-Swift Transportation Holdings Inc. | 14,017 | 478 |
| Macquarie Infrastructure Corp. | 9,660 | 454 |
| MSC Industrial Direct Co. Inc. Class A | 5,150 | 440 |
| * Clean Harbors Inc. | 5,943 | 408 |
| Regal Beloit Corp. | 4,590 | 384 |
| * Colfax Corp. | 10,859 | 379 |
| HEICO Corp. | 4,091 | 371 |
| * Gardner Denver Holdings Inc. | 12,713 | 355 |
| * WESCO International Inc. | 5,755 | 352 |
| * Welbilt Inc. | 15,788 | 349 |
13
| Vanguard® Russell 1000 Index Fund | ||
| Schedule of Investments | ||
| August 31, 2018 | ||
| Market | ||
| Value | ||
| Shares | ($000) | |
| Copa Holdings SA Class A | 3,788 | 303 |
| Terex Corp. | 7,366 | 285 |
| Schneider National Inc. Class B | 5,161 | 140 |
| ^ ADT Inc. | 13,071 | 117 |
| * Gates Industrial Corp. plc | 6,063 | 111 |
| 322,047 | ||
| Technology (22.1%) | ||
| Apple Inc. | 561,031 | 127,707 |
| Microsoft Corp. | 864,538 | 97,114 |
| * Facebook Inc. Class A | 271,247 | 47,666 |
| * Alphabet Inc. Class A | 34,537 | 42,543 |
| * Alphabet Inc. Class C | 34,280 | 41,760 |
| Cisco Systems Inc. | 550,654 | 26,305 |
| Intel Corp. | 532,469 | 25,787 |
| NVIDIA Corp. | 66,476 | 18,658 |
| Oracle Corp. | 327,526 | 15,911 |
| International Business Machines Corp. | 104,677 | 15,333 |
| * Adobe Systems Inc. | 56,084 | 14,779 |
| Texas Instruments Inc. | 112,049 | 12,594 |
| * salesforce.com Inc. | 80,387 | 12,273 |
| QUALCOMM Inc. | 160,618 | 11,036 |
| Broadcom Inc. | 49,140 | 10,763 |
| * Micron Technology Inc. | 132,005 | 6,933 |
| Activision Blizzard Inc. | 86,017 | 6,202 |
| Intuit Inc. | 27,967 | 6,138 |
| Cognizant Technology Solutions Corp. Class A | 66,663 | 5,228 |
| Applied Materials Inc. | 119,284 | 5,132 |
| HP Inc. | 186,702 | 4,602 |
| Analog Devices Inc. | 41,777 | 4,130 |
| * ServiceNow Inc. | 20,050 | 3,937 |
| * Electronic Arts Inc. | 34,448 | 3,907 |
| * Autodesk Inc. | 24,917 | 3,846 |
| * NXP Semiconductors NV | 39,192 | 3,650 |
| Lam Research Corp. | 18,751 | 3,246 |
| Corning Inc. | 92,618 | 3,104 |
| Amphenol Corp. Class A | 32,744 | 3,097 |
| * Red Hat Inc. | 20,517 | 3,031 |
| DXC Technology Co. | 32,726 | 2,981 |
| Hewlett Packard Enterprise Co. | 175,258 | 2,897 |
| * Twitter Inc. | 80,463 | 2,831 |
| NetApp Inc. | 30,953 | 2,687 |
| * Advanced Micro Devices Inc. | 102,630 | 2,583 |
| * Workday Inc. Class A | 16,501 | 2,550 |
| * IHS Markit Ltd. | 44,542 | 2,450 |
| Motorola Solutions Inc. | 18,194 | 2,335 |
| * Palo Alto Networks Inc. | 9,998 | 2,311 |
| Xilinx Inc. | 29,158 | 2,269 |
| Microchip Technology Inc. | 25,844 | 2,223 |
| * Dell Technologies Inc. Class V | 23,018 | 2,214 |
| Western Digital Corp. | 34,267 | 2,167 |
| Harris Corp. | 13,301 | 2,162 |
| * Splunk Inc. | 16,469 | 2,110 |
| KLA-Tencor Corp. | 17,409 | 2,023 |
| Maxim Integrated Products Inc. | 32,159 | 1,945 |
| * Arista Networks Inc. | 6,428 | 1,922 |
| * VeriSign Inc. | 12,051 | 1,911 |
| Skyworks Solutions Inc. | 20,745 | 1,894 |
| * Citrix Systems Inc. | 15,497 | 1,767 |
| * ANSYS Inc. | 9,475 | 1,762 |
| * Take-Two Interactive Software Inc. | 13,063 | 1,745 |
| * Synopsys Inc. | 16,543 | 1,690 |
| * IAC/InterActiveCorp | 8,390 | 1,654 |
| CA Inc. | 36,316 | 1,591 |
| * Gartner Inc. | 10,272 | 1,538 |
14
| Vanguard® Russell 1000 Index Fund | |||
| Schedule of Investments | |||
| August 31, 2018 | |||
| Market | |||
| Value | |||
| Shares | ($000) | ||
| * | Cadence Design Systems Inc. | 32,249 | 1,517 |
| CDW Corp. | 17,151 | 1,502 | |
| * | GoDaddy Inc. Class A | 18,217 | 1,484 |
| * | Akamai Technologies Inc. | 19,332 | 1,453 |
| * | GrubHub Inc. | 10,079 | 1,452 |
| Symantec Corp. | 70,995 | 1,431 | |
| SS&C Technologies Holdings Inc. | 22,993 | 1,364 | |
| * | F5 Networks Inc. | 7,119 | 1,346 |
| * | Fortinet Inc. | 15,955 | 1,336 |
| Marvell Technology Group Ltd. | 63,218 | 1,307 | |
| * | PTC Inc. | 12,673 | 1,267 |
| * | VMware Inc. Class A | 7,905 | 1,212 |
| * | Qorvo Inc. | 14,428 | 1,156 |
| Leidos Holdings Inc. | 15,917 | 1,126 | |
| Juniper Networks Inc. | 39,116 | 1,112 | |
| * | ON Semiconductor Corp. | 49,220 | 1,050 |
| * | Ultimate Software Group Inc. | 3,330 | 1,031 |
| Cognex Corp. | 19,079 | 1,026 | |
| * | Tyler Technologies Inc. | 4,152 | 1,025 |
| Amdocs Ltd. | 15,346 | 1,002 | |
| * | Atlassian Corp. plc Class A | 10,668 | 960 |
| CDK Global Inc. | 14,813 | 923 | |
| * | Aspen Technology Inc. | 7,998 | 923 |
| * | Guidewire Software Inc. | 9,110 | 916 |
| Teradyne Inc. | 22,240 | 916 | |
| * | Black Knight Inc. | 16,406 | 876 |
| * | Paycom Software Inc. | 5,606 | 870 |
| * | Tableau Software Inc. Class A | 7,756 | 868 |
| * | EPAM Systems Inc. | 5,689 | 813 |
| * | Zendesk Inc. | 11,186 | 771 |
| * | IPG Photonics Corp. | 4,237 | 743 |
| Sabre Corp. | 28,249 | 738 | |
| * | CommScope Holding Co. Inc. | 22,744 | 721 |
| * | Arrow Electronics Inc. | 9,079 | 704 |
| Cypress Semiconductor Corp. | 40,456 | 696 | |
| Avnet Inc. | 14,166 | 686 | |
| Monolithic Power Systems Inc. | 4,503 | 675 | |
| * | RingCentral Inc. Class A | 7,228 | 673 |
| * | Nutanix Inc. | 11,864 | 668 |
| * | Proofpoint Inc. | 5,562 | 660 |
| * | Twilio Inc. Class A | 7,755 | 626 |
| Jabil Inc. | 20,043 | 592 | |
| Universal Display Corp. | 4,810 | 589 | |
| * | Teradata Corp. | 14,192 | 589 |
| * | Okta Inc. | 9,309 | 576 |
| * | Nuance Communications Inc. | 34,075 | 556 |
| MKS Instruments Inc. | 5,936 | 551 | |
| * | Coherent Inc. | 2,818 | 537 |
| LogMeIn Inc. | 5,933 | 510 | |
| Dolby Laboratories Inc. Class A | 7,223 | 507 | |
| * | ARRIS International plc | 19,439 | 504 |
| * | Pure Storage Inc. Class A | 17,911 | 481 |
| * | RealPage Inc. | 7,461 | 466 |
| * | Manhattan Associates Inc. | 7,981 | 463 |
| * | Zynga Inc. Class A | 94,028 | 391 |
| * | FireEye Inc. | 23,292 | 387 |
| * | NCR Corp. | 13,140 | 373 |
| * | EchoStar Corp. Class A | 5,919 | 284 |
| *,^ | Match Group Inc. | 5,439 | 272 |
| Pegasystems Inc. | 3,690 | 235 | |
| ^ | Ubiquiti Networks Inc. | 2,038 | 183 |
| *,^ | DocuSign Inc. | 2,842 | 177 |
| Ceridian HCM Holding Inc. | 2,145 | 83 | |
15
| Vanguard® Russell 1000 Index Fund | ||
| Schedule of Investments | ||
| August 31, 2018 | ||
| Market | ||
| Value | ||
| Shares | ($000) | |
| Switch Inc. | 3,873 | 45 |
| 695,600 | ||
| Utilities (4.6%) | ||
| AT&T Inc. | 829,159 | 26,483 |
| Verizon Communications Inc. | 472,019 | 25,664 |
| NextEra Energy Inc. | 53,810 | 9,153 |
| Duke Energy Corp. | 80,228 | 6,518 |
| Dominion Energy Inc. | 74,236 | 5,254 |
| Southern Co. | 115,916 | 5,075 |
| Exelon Corp. | 110,169 | 4,816 |
| American Electric Power Co. Inc. | 55,916 | 4,011 |
| Sempra Energy | 30,207 | 3,506 |
| Public Service Enterprise Group Inc. | 57,393 | 3,005 |
| Consolidated Edison Inc. | 34,927 | 2,757 |
| Xcel Energy Inc. | 56,998 | 2,739 |
| PG&E Corp. | 58,946 | 2,722 |
| WEC Energy Group Inc. | 36,551 | 2,470 |
| PPL Corp. | 80,425 | 2,392 |
| Edison International | 35,746 | 2,350 |
| DTE Energy Co. | 21,017 | 2,336 |
| CenturyLink Inc. | 108,739 | 2,323 |
| * T-Mobile US Inc. | 35,150 | 2,321 |
| Eversource Energy | 35,526 | 2,218 |
| FirstEnergy Corp. | 53,564 | 2,002 |
| Ameren Corp. | 28,125 | 1,778 |
| American Water Works Co. Inc. | 20,163 | 1,765 |
| Evergy Inc. | 30,618 | 1,747 |
| Entergy Corp. | 20,233 | 1,691 |
| CMS Energy Corp. | 32,543 | 1,602 |
| CenterPoint Energy Inc. | 49,578 | 1,378 |
| NRG Energy Inc. | 35,540 | 1,258 |
| Alliant Energy Corp. | 27,624 | 1,183 |
| Atmos Energy Corp. | 12,432 | 1,147 |
| * Vistra Energy Corp. | 46,904 | 1,104 |
| UGI Corp. | 20,367 | 1,101 |
| NiSource Inc. | 40,160 | 1,087 |
| AES Corp. | 76,676 | 1,032 |
| Pinnacle West Capital Corp. | 11,894 | 934 |
| OGE Energy Corp. | 23,272 | 857 |
| Aqua America Inc. | 20,995 | 781 |
| * Zayo Group Holdings Inc. | 22,055 | 764 |
| Vectren Corp. | 9,708 | 691 |
| SCANA Corp. | 15,585 | 598 |
| MDU Resources Group Inc. | 20,843 | 581 |
| National Fuel Gas Co. | 9,189 | 510 |
| Hawaiian Electric Industries Inc. | 13,110 | 462 |
| * Sprint Corp. | 71,422 | 436 |
| Telephone & Data Systems Inc. | 11,460 | 344 |
| Avangrid Inc. | 6,371 | 314 |
| * United States Cellular Corp. | 1,463 | 63 |
| 145,323 | ||
| Total Common Stocks (Cost $2,204,331) | 3,138,756 | |
16
Vanguard® Russell 1000 Index Fund
Schedule of Investments
August 31, 2018
| Market | ||||
| Value | ||||
| Coupon | Shares | ($000) | ||
| Temporary Cash Investments (0.1%)1 | ||||
| Money Market Fund (0.1%) | ||||
| 3,4 Vanguard Market Liquidity Fund | 2.153% | 27,434 | 2,744 | |
| Face | ||||
| Maturity | Amount | |||
| Date | ($000) | |||
| U.S. Government and Agency Obligations (0.0%) | ||||
| 5 United States Treasury Bill | 2.034% | 11/15/18 | 400 | 398 |
| Total Temporary Cash Investments (Cost $3,142) | 3,142 | |||
| Total Investments (100.0%) (Cost $2,207,473) | 3,141,898 | |||
| Other Assets and Liabilities—Net (0.0%)4 | 580 | |||
| Net Assets (100%) | 3,142,478 | |||
* Non-income-producing security.
^ Includes partial security positions on loan to broker-dealers. The total value of securities on loan is $2,587,000.
§ Security value determined using significant unobservable inputs.
1 The fund invests a portion of its cash reserves in equity markets through the use of index futures contracts. After giving effect to futures
investments, the fund's effective common stock and temporary cash investment positions represent 100.0% and 0.0%, respectively, of net
assets.
2 “Other” represents securities that are not classified by the fund’s benchmark index.
3 Affiliated money market fund available only to Vanguard funds and certain trusts and accounts managed by Vanguard. Rate shown is the 7-day
yield.
4 Includes $2,741,000 of collateral received for securities on loan.
5 Securities with a value of $398,000 have been segregated as initial margin for open futures contracts.
CVR—Contingent Value Rights.
REIT—Real Estate Investment Trust.
17
| Vanguard® Russell 1000 Value Index Fund | ||
| Schedule of Investments | ||
| August 31, 2018 | ||
| Market | ||
| Value | ||
| Shares | ($000) | |
| Common Stocks (99.9%)1 | ||
| Consumer Discretionary (9.4%) | ||
| Comcast Corp. Class A | 1,030,844 | 38,131 |
| Walmart Inc. | 321,936 | 30,861 |
| McDonald's Corp. | 142,935 | 23,188 |
| Twenty-First Century Fox Inc. Class A | 235,831 | 10,707 |
| Walt Disney Co. | 95,549 | 10,703 |
| General Motors Co. | 295,256 | 10,644 |
| Target Corp. | 120,912 | 10,580 |
| Ford Motor Co. | 882,447 | 8,366 |
| * eBay Inc. | 165,272 | 5,720 |
| Carnival Corp. | 91,667 | 5,637 |
| Twenty-First Century Fox Inc. | 109,956 | 4,937 |
| Royal Caribbean Cruises Ltd. | 37,915 | 4,648 |
| Yum! Brands Inc. | 51,445 | 4,470 |
| * Charter Communications Inc. Class A | 11,837 | 3,674 |
| * Dollar Tree Inc. | 43,775 | 3,524 |
| Genuine Parts Co. | 32,675 | 3,263 |
| Best Buy Co. Inc. | 40,647 | 3,234 |
| MGM Resorts International | 106,239 | 3,080 |
| Kohl's Corp. | 37,540 | 2,970 |
| Yum China Holdings Inc. | 76,729 | 2,968 |
| Tiffany & Co. | 22,951 | 2,815 |
| * Mohawk Industries Inc. | 13,967 | 2,676 |
| Tapestry Inc. | 51,992 | 2,635 |
| Macy's Inc. | 68,709 | 2,511 |
| * Norwegian Cruise Line Holdings Ltd. | 46,056 | 2,469 |
| PVH Corp. | 17,197 | 2,462 |
| Viacom Inc. Class B | 79,561 | 2,330 |
| Aramark | 55,253 | 2,270 |
| Newell Brands Inc. | 101,459 | 2,204 |
| Lear Corp. | 13,333 | 2,163 |
| Nielsen Holdings plc | 80,074 | 2,082 |
| BorgWarner Inc. | 46,890 | 2,052 |
| Las Vegas Sands Corp. | 31,209 | 2,042 |
| * Qurate Retail Group Inc. QVC Group Class A | 98,164 | 2,041 |
| * Discovery Communications Inc. | 78,896 | 2,023 |
| * LKQ Corp. | 57,753 | 1,994 |
| Whirlpool Corp. | 15,547 | 1,943 |
| * Liberty Broadband Corp. | 23,238 | 1,884 |
| Advance Auto Parts Inc. | 11,090 | 1,819 |
| Interpublic Group of Cos. Inc. | 77,809 | 1,817 |
| * Liberty Media Corp-Liberty SiriusXM C | 37,896 | 1,783 |
| * DISH Network Corp. Class A | 50,215 | 1,775 |
| Garmin Ltd. | 25,590 | 1,744 |
| Ralph Lauren Corp. Class A | 12,334 | 1,638 |
| Darden Restaurants Inc. | 13,869 | 1,609 |
| Harley-Davidson Inc. | 37,677 | 1,606 |
| * Liberty Media Corp-Liberty Formula One | 41,807 | 1,545 |
| Lennar Corp. Class A | 29,904 | 1,545 |
| VF Corp. | 16,743 | 1,543 |
| DR Horton Inc. | 32,016 | 1,425 |
| Gap Inc. | 46,093 | 1,399 |
| * Caesars Entertainment Corp. | 133,921 | 1,366 |
| Leggett & Platt Inc. | 29,713 | 1,350 |
| Foot Locker Inc. | 26,360 | 1,300 |
| Coty Inc. Class A | 104,591 | 1,293 |
| * CarMax Inc. | 15,911 | 1,242 |
| Goodyear Tire & Rubber Co. | 53,986 | 1,225 |
| Omnicom Group Inc. | 17,375 | 1,204 |
| News Corp. Class A | 91,770 | 1,199 |
| Brunswick Corp. | 17,823 | 1,184 |
| * Madison Square Garden Co. Class A | 3,729 | 1,126 |
18
| Vanguard® Russell 1000 Value Index Fund | |||
| Schedule of Investments | |||
| August 31, 2018 | |||
| Market | |||
| Value | |||
| Shares | ($000) | ||
| L Brands Inc. | 42,356 | 1,119 | |
| PulteGroup Inc. | 39,763 | 1,111 | |
| * | GCI Liberty Inc. Class A | 22,575 | 1,108 |
| * | Michael Kors Holdings Ltd. | 15,037 | 1,092 |
| H&R Block Inc. | 38,505 | 1,042 | |
| Fortune Brands Home & Security Inc. | 19,562 | 1,036 | |
| Williams-Sonoma Inc. | 14,425 | 1,013 | |
| *,^ | Discovery Communications Inc. Class A | 34,035 | 947 |
| *,^ | Mattel Inc. | 60,231 | 929 |
| Adient plc | 21,014 | 910 | |
| * | Liberty Media Corp-Liberty SiriusXM A | 19,266 | 901 |
| Service Corp. International | 21,432 | 899 | |
| Cinemark Holdings Inc. | 24,043 | 897 | |
| Hyatt Hotels Corp. Class A | 10,360 | 801 | |
| Tribune Media Co. Class A | 20,308 | 749 | |
| Aptiv plc | 8,049 | 708 | |
| John Wiley & Sons Inc. Class A | 9,964 | 643 | |
| Dick's Sporting Goods Inc. | 17,176 | 643 | |
| * | AutoZone Inc. | 764 | 586 |
| AMERCO | 1,560 | 585 | |
| * | AutoNation Inc. | 12,466 | 565 |
| Toll Brothers Inc. | 15,586 | 565 | |
| Hasbro Inc. | 5,504 | 547 | |
| Columbia Sportswear Co. | 5,926 | 537 | |
| Graham Holdings Co. Class B | 945 | 532 | |
| * | Liberty Broadband Corp. Class A | 5,878 | 476 |
| * | Skechers U.S.A. Inc. Class A | 15,748 | 464 |
| Gentex Corp. | 19,820 | 463 | |
| International Game Technology plc | 20,940 | 441 | |
| Lions Gate Entertainment Corp. Class B | 19,248 | 432 | |
| Penske Automotive Group Inc. | 7,969 | 419 | |
| * | Michaels Cos. Inc. | 20,309 | 345 |
| Extended Stay America Inc. | 17,018 | 343 | |
| News Corp. Class B | 21,299 | 290 | |
| * | Liberty Media Corp-Liberty Formula One Class A | 8,139 | 285 |
| * | Visteon Corp. | 2,400 | 265 |
| Lions Gate Entertainment Corp. Class A | 10,702 | 252 | |
| * | Bright Horizons Family Solutions Inc. | 1,965 | 235 |
| * | Under Armour Inc. Class A | 10,173 | 208 |
| * | Under Armour Inc. | 10,170 | 193 |
| Thor Industries Inc. | 1,930 | 184 | |
| KAR Auction Services Inc. | 1,915 | 120 | |
| Lennar Corp. Class B | 2,173 | 92 | |
| Viacom Inc. Class A | 2,061 | 69 | |
| Hilton Worldwide Holdings Inc. | 112 | 9 | |
| * | Liberty Expedia Holdings Inc. Class A | 167 | 8 |
| * | Sally Beauty Holdings Inc. | 290 | 4 |
| Sirius XM Holdings Inc. | 319 | 2 | |
| 291,702 | |||
| Consumer Staples (6.7%) | |||
| Procter & Gamble Co. | 567,762 | 47,096 | |
| Philip Morris International Inc. | 350,423 | 27,294 | |
| CVS Health Corp. | 229,046 | 17,233 | |
| Mondelez International Inc. Class A | 326,735 | 13,958 | |
| Walgreens Boots Alliance Inc. | 190,741 | 13,077 | |
| Colgate-Palmolive Co. | 156,617 | 10,401 | |
| Coca-Cola Co. | 193,035 | 8,604 | |
| Kraft Heinz Co. | 136,004 | 7,925 | |
| Archer-Daniels-Midland Co. | 126,103 | 6,356 | |
| Kroger Co. | 192,127 | 6,052 | |
| General Mills Inc. | 127,171 | 5,851 | |
| Tyson Foods Inc. Class A | 65,773 | 4,131 | |
| PepsiCo Inc. | 36,084 | 4,042 | |
| McCormick & Co. Inc. | 25,727 | 3,213 | |
19
| Vanguard® Russell 1000 Value Index Fund | ||
| Schedule of Investments | ||
| August 31, 2018 | ||
| Market | ||
| Value | ||
| Shares | ($000) | |
| Conagra Brands Inc. | 84,709 | 3,113 |
| Molson Coors Brewing Co. Class B | 38,975 | 2,601 |
| JM Smucker Co. | 24,714 | 2,555 |
| Hormel Foods Corp. | 61,010 | 2,388 |
| Lamb Weston Holdings Inc. | 33,225 | 2,246 |
| Bunge Ltd. | 31,619 | 2,055 |
| Kellogg Co. | 27,941 | 2,006 |
| Pinnacle Foods Inc. | 26,598 | 1,767 |
| Ingredion Inc. | 16,165 | 1,634 |
| * US Foods Holding Corp. | 45,519 | 1,483 |
| * Herbalife Nutrition Ltd. | 21,386 | 1,210 |
| Kimberly-Clark Corp. | 10,194 | 1,178 |
| Casey's General Stores Inc. | 8,366 | 955 |
| Flowers Foods Inc. | 40,257 | 811 |
| Nu Skin Enterprises Inc. Class A | 8,536 | 679 |
| * TreeHouse Foods Inc. | 12,162 | 634 |
| * Post Holdings Inc. | 6,332 | 616 |
| * Hain Celestial Group Inc. | 21,413 | 611 |
| Clorox Co. | 3,792 | 550 |
| Campbell Soup Co. | 12,352 | 487 |
| Church & Dwight Co. Inc. | 8,214 | 465 |
| Spectrum Brands Holdings Inc. | 5,202 | 452 |
| Energizer Holdings Inc. | 5,538 | 352 |
| Hershey Co. | 2,843 | 286 |
| * Pilgrim's Pride Corp. | 11,719 | 217 |
| Seaboard Corp. | 58 | 214 |
| Brown-Forman Corp. Class B | 48 | 2 |
| Brown-Forman Corp. Class A | 16 | 1 |
| 206,801 | ||
| Energy (10.5%) | ||
| Exxon Mobil Corp. | 955,827 | 76,629 |
| Chevron Corp. | 429,797 | 50,914 |
| Schlumberger Ltd. | 312,641 | 19,746 |
| ConocoPhillips | 264,345 | 19,411 |
| Occidental Petroleum Corp. | 172,705 | 13,794 |
| EOG Resources Inc. | 115,610 | 13,669 |
| Valero Energy Corp. | 97,037 | 11,439 |
| Phillips 66 | 94,788 | 11,233 |
| Marathon Petroleum Corp. | 103,293 | 8,500 |
| Williams Cos. Inc. | 273,945 | 8,106 |
| Kinder Morgan Inc. | 428,897 | 7,591 |
| * Concho Resources Inc. | 38,212 | 5,241 |
| Devon Energy Corp. | 118,112 | 5,071 |
| Anadarko Petroleum Corp. | 77,287 | 4,977 |
| Andeavor | 31,672 | 4,839 |
| Marathon Oil Corp. | 191,345 | 4,116 |
| National Oilwell Varco Inc. | 86,471 | 4,070 |
| Hess Corp. | 59,611 | 4,014 |
| ONEOK Inc. | 54,189 | 3,572 |
| Apache Corp. | 80,437 | 3,526 |
| Noble Energy Inc. | 107,803 | 3,204 |
| Baker Hughes a GE Co. | 93,551 | 3,084 |
| EQT Corp. | 59,907 | 3,056 |
| Pioneer Natural Resources Co. | 17,101 | 2,988 |
| HollyFrontier Corp. | 36,422 | 2,714 |
| Targa Resources Corp. | 48,545 | 2,673 |
| Diamondback Energy Inc. | 16,336 | 1,978 |
| * WPX Energy Inc. | 89,122 | 1,700 |
| Cimarex Energy Co. | 18,524 | 1,565 |
| Helmerich & Payne Inc. | 23,805 | 1,561 |
| * Energen Corp. | 19,654 | 1,524 |
| PBF Energy Inc. Class A | 26,337 | 1,367 |
| * Transocean Ltd. | 96,227 | 1,165 |
| Murphy Oil Corp. | 36,838 | 1,136 |
20
| Vanguard® Russell 1000 Value Index Fund | ||
| Schedule of Investments | ||
| August 31, 2018 | ||
| Market | ||
| Value | ||
| Shares | ($000) | |
| Whiting Petroleum Corp. | 20,137 | 1,025 |
| * Cheniere Energy Inc. | 14,338 | 960 |
| * First Solar Inc. | 18,402 | 958 |
| Valvoline Inc. | 43,979 | 946 |
| * Chesapeake Energy Corp. | 201,663 | 893 |
| Patterson-UTI Energy Inc. | 49,005 | 839 |
| * Centennial Resource Development Inc. Class A | 41,976 | 809 |
| * Newfield Exploration Co. | 29,089 | 794 |
| * Apergy Corp. | 17,398 | 787 |
| Range Resources Corp. | 47,407 | 778 |
| CNX Resources Corp. | 48,162 | 768 |
| SM Energy Co. | 24,911 | 750 |
| * Continental Resources Inc. | 10,184 | 672 |
| Cabot Oil & Gas Corp. | 26,502 | 632 |
| * Weatherford International plc | 227,168 | 550 |
| * QEP Resources Inc. | 53,050 | 529 |
| * Parsley Energy Inc. Class A | 17,843 | 495 |
| Nabors Industries Ltd. | 76,510 | 472 |
| * Antero Resources Corp. | 25,341 | 469 |
| * Kosmos Energy Ltd. | 43,164 | 390 |
| * Extraction Oil & Gas Inc. | 24,863 | 287 |
| RPC Inc. | 7,926 | 108 |
| 325,084 | ||
| Financial Services (28.9%) | ||
| JPMorgan Chase & Co. | 764,147 | 87,556 |
| * Berkshire Hathaway Inc. Class B | 381,843 | 79,698 |
| Bank of America Corp. | 2,131,689 | 65,933 |
| Wells Fargo & Co. | 990,793 | 57,942 |
| Citigroup Inc. | 575,515 | 41,000 |
| Goldman Sachs Group Inc. | 79,752 | 18,966 |
| US Bancorp | 346,968 | 18,774 |
| PNC Financial Services Group Inc. | 105,928 | 15,205 |
| Chubb Ltd. | 104,456 | 14,127 |
| Morgan Stanley | 281,242 | 13,733 |
| BlackRock Inc. | 27,748 | 13,293 |
| CME Group Inc. | 69,641 | 12,168 |
| Bank of New York Mellon Corp. | 211,067 | 11,007 |
| Capital One Financial Corp. | 100,828 | 9,991 |
| Prologis Inc. | 141,139 | 9,482 |
| Prudential Financial Inc. | 94,714 | 9,306 |
| American International Group Inc. | 173,581 | 9,229 |
| BB&T Corp. | 175,685 | 9,076 |
| MetLife Inc. | 194,745 | 8,937 |
| Aflac Inc. | 172,430 | 7,973 |
| Allstate Corp. | 79,228 | 7,968 |
| SunTrust Banks Inc. | 105,045 | 7,727 |
| Fidelity National Information Services Inc. | 68,018 | 7,357 |
| State Street Corp. | 79,547 | 6,913 |
| Travelers Cos. Inc. | 49,142 | 6,467 |
| Weyerhaeuser Co. | 171,030 | 5,936 |
| * Worldpay Inc. Class A | 60,064 | 5,850 |
| M&T Bank Corp. | 32,798 | 5,810 |
| Digital Realty Trust Inc. | 46,408 | 5,768 |
| AvalonBay Communities Inc. | 31,239 | 5,726 |
| Welltower Inc. | 84,132 | 5,612 |
| Equity Residential | 81,185 | 5,500 |
| American Express Co. | 50,764 | 5,380 |
| Marsh & McLennan Cos. Inc. | 61,152 | 5,175 |
| KeyCorp | 237,533 | 5,005 |
| Regions Financial Corp. | 252,382 | 4,911 |
| Ventas Inc. | 79,989 | 4,789 |
| Intercontinental Exchange Inc. | 62,093 | 4,733 |
| Boston Properties Inc. | 34,903 | 4,553 |
| Fifth Third Bancorp | 154,070 | 4,534 |
21
| Vanguard® Russell 1000 Value Index Fund | ||
| Schedule of Investments | ||
| August 31, 2018 | ||
| Market | ||
| Value | ||
| Shares | ($000) | |
| Citizens Financial Group Inc. | 109,421 | 4,504 |
| Willis Towers Watson plc | 29,750 | 4,381 |
| Hartford Financial Services Group Inc. | 80,913 | 4,076 |
| Huntington Bancshares Inc. | 245,966 | 3,987 |
| Ameriprise Financial Inc. | 27,216 | 3,864 |
| Realty Income Corp. | 64,633 | 3,786 |
| First Republic Bank | 36,217 | 3,679 |
| Essex Property Trust Inc. | 14,882 | 3,665 |
| Northern Trust Corp. | 33,600 | 3,611 |
| Synchrony Financial | 112,309 | 3,557 |
| Host Hotels & Resorts Inc. | 164,510 | 3,542 |
| Comerica Inc. | 36,303 | 3,539 |
| Principal Financial Group Inc. | 64,054 | 3,535 |
| * Markel Corp. | 2,790 | 3,373 |
| Discover Financial Services | 42,344 | 3,308 |
| Lincoln National Corp. | 49,053 | 3,217 |
| Loews Corp. | 63,150 | 3,177 |
| Vornado Realty Trust | 38,716 | 2,981 |
| Arthur J Gallagher & Co. | 40,565 | 2,926 |
| HCP Inc. | 105,556 | 2,853 |
| Annaly Capital Management Inc. | 263,582 | 2,799 |
| * E*TRADE Financial Corp. | 46,173 | 2,718 |
| Alexandria Real Estate Equities Inc. | 21,079 | 2,705 |
| Cincinnati Financial Corp. | 34,512 | 2,646 |
| Equifax Inc. | 19,725 | 2,643 |
| Mid-America Apartment Communities Inc. | 25,468 | 2,637 |
| Crown Castle International Corp. | 23,069 | 2,631 |
| Ally Financial Inc. | 96,762 | 2,601 |
| Nasdaq Inc. | 26,323 | 2,512 |
| UDR Inc. | 59,581 | 2,381 |
| Fidelity National Financial Inc. | 59,294 | 2,378 |
| Zions Bancorporation | 43,685 | 2,328 |
| Iron Mountain Inc. | 63,761 | 2,302 |
| Duke Realty Corp. | 80,103 | 2,282 |
| Franklin Resources Inc. | 71,027 | 2,254 |
| Regency Centers Corp. | 34,105 | 2,252 |
| * Arch Capital Group Ltd. | 73,121 | 2,235 |
| Invesco Ltd. | 90,877 | 2,190 |
| Federal Realty Investment Trust | 16,524 | 2,158 |
| XL Group Ltd. | 36,510 | 2,095 |
| Torchmark Corp. | 23,711 | 2,085 |
| Reinsurance Group of America Inc. Class A | 14,481 | 2,069 |
| SL Green Realty Corp. | 19,158 | 2,000 |
| AGNC Investment Corp. | 103,034 | 1,960 |
| Raymond James Financial Inc. | 20,794 | 1,935 |
| East West Bancorp Inc. | 29,997 | 1,902 |
| Camden Property Trust | 19,941 | 1,896 |
| Alleghany Corp. | 2,928 | 1,850 |
| * CBRE Group Inc. Class A | 37,037 | 1,808 |
| Sun Communities Inc. | 17,503 | 1,806 |
| American Financial Group Inc. | 16,124 | 1,796 |
| * Athene Holding Ltd. Class A | 36,126 | 1,794 |
| Macerich Co. | 30,534 | 1,794 |
| Affiliated Managers Group Inc. | 12,160 | 1,776 |
| Voya Financial Inc. | 35,243 | 1,765 |
| Unum Group | 47,109 | 1,737 |
| * VEREIT Inc. | 217,782 | 1,703 |
| WR Berkley Corp. | 21,345 | 1,670 |
| Jefferies Financial Group Inc. | 69,456 | 1,613 |
| Kilroy Realty Corp. | 21,754 | 1,591 |
| Invitation Homes Inc. | 67,801 | 1,585 |
| National Retail Properties Inc. | 34,367 | 1,584 |
| WP Carey Inc. | 23,772 | 1,583 |
| Kimco Realty Corp. | 91,303 | 1,562 |
22
| Vanguard® Russell 1000 Value Index Fund | ||
| Schedule of Investments | ||
| August 31, 2018 | ||
| Market | ||
| Value | ||
| Shares | ($000) | |
| Jones Lang LaSalle Inc. | 10,181 | 1,553 |
| CIT Group Inc. | 28,610 | 1,552 |
| Apartment Investment & Management Co. | 35,045 | 1,535 |
| Park Hotels & Resorts Inc. | 45,429 | 1,520 |
| Commerce Bancshares Inc. | 21,311 | 1,514 |
| CyrusOne Inc. | 22,192 | 1,486 |
| Brown & Brown Inc. | 48,679 | 1,484 |
| Douglas Emmett Inc. | 37,230 | 1,454 |
| Liberty Property Trust | 33,098 | 1,448 |
| People's United Financial Inc. | 77,981 | 1,443 |
| Western Union Co. | 75,230 | 1,423 |
| Cullen/Frost Bankers Inc. | 12,826 | 1,422 |
| PacWest Bancorp | 28,151 | 1,421 |
| Old Republic International Corp. | 63,471 | 1,408 |
| New Residential Investment Corp. | 75,019 | 1,393 |
| First Horizon National Corp. | 75,466 | 1,390 |
| First American Financial Corp. | 24,353 | 1,385 |
| American Homes 4 Rent Class A | 57,963 | 1,345 |
| Webster Financial Corp. | 20,523 | 1,342 |
| * Omega Healthcare Investors Inc. | 40,391 | 1,335 |
| Healthcare Trust of America Inc. Class A | 45,759 | 1,307 |
| American Campus Communities Inc. | 30,586 | 1,282 |
| VICI Properties Inc. | 61,145 | 1,279 |
| Starwood Property Trust Inc. | 57,599 | 1,269 |
| CubeSmart | 41,452 | 1,266 |
| Everest Re Group Ltd. | 5,564 | 1,241 |
| Brixmor Property Group Inc. | 67,733 | 1,234 |
| Medical Properties Trust Inc. | 81,497 | 1,227 |
| Synovus Financial Corp. | 24,310 | 1,217 |
| Assurant Inc. | 11,742 | 1,207 |
| Forest City Realty Trust Inc. Class A | 47,931 | 1,205 |
| Sterling Bancorp | 51,940 | 1,187 |
| Hanover Insurance Group Inc. | 9,514 | 1,165 |
| EPR Properties | 16,521 | 1,159 |
| New York Community Bancorp Inc. | 107,000 | 1,152 |
| STORE Capital Corp. | 39,991 | 1,152 |
| * SLM Corp. | 97,625 | 1,144 |
| Popular Inc. | 22,619 | 1,139 |
| Highwoods Properties Inc. | 22,813 | 1,135 |
| Prosperity Bancshares Inc. | 15,069 | 1,128 |
| Wintrust Financial Corp. | 12,678 | 1,123 |
| * Brighthouse Financial Inc. | 26,919 | 1,117 |
| * Bank OZK | 27,053 | 1,095 |
| RenaissanceRe Holdings Ltd. | 8,150 | 1,084 |
| Umpqua Holdings Corp. | 49,853 | 1,067 |
| Hospitality Properties Trust | 36,535 | 1,059 |
| Simon Property Group Inc. | 5,683 | 1,040 |
| Gaming and Leisure Properties Inc. | 29,000 | 1,038 |
| Associated Banc-Corp | 37,979 | 1,035 |
| Hudson Pacific Properties Inc. | 30,369 | 1,028 |
| Assured Guaranty Ltd. | 24,808 | 1,011 |
| Senior Housing Properties Trust | 52,816 | 1,009 |
| Rayonier Inc. | 28,946 | 1,008 |
| FNB Corp. | 72,557 | 976 |
| Life Storage Inc. | 9,720 | 949 |
| Axis Capital Holdings Ltd. | 16,472 | 947 |
| TCF Financial Corp. | 36,982 | 937 |
| BankUnited Inc. | 23,356 | 906 |
| * SVB Financial Group | 2,745 | 886 |
| First Citizens BancShares Inc. Class A | 1,813 | 861 |
| JBG SMITH Properties | 22,966 | 860 |
| Apple Hospitality REIT Inc. | 48,632 | 858 |
| Two Harbors Investment Corp. | 54,868 | 857 |
| * Equity Commonwealth | 26,364 | 845 |
23
| Vanguard® Russell 1000 Value Index Fund | ||
| Schedule of Investments | ||
| August 31, 2018 | ||
| Market | ||
| Value | ||
| Shares | ($000) | |
| Weingarten Realty Investors | 26,819 | 830 |
| Spirit Realty Capital Inc. | 96,145 | 805 |
| Navient Corp. | 58,662 | 800 |
| Chimera Investment Corp. | 41,871 | 780 |
| Bank of Hawaii Corp. | 9,375 | 779 |
| Uniti Group Inc. | 37,011 | 771 |
| MFA Financial Inc. | 100,325 | 768 |
| Paramount Group Inc. | 46,547 | 739 |
| BGC Partners Inc. Class A | 58,489 | 726 |
| AXA Equitable Holdings Inc. | 30,990 | 711 |
| Corporate Office Properties Trust | 22,910 | 705 |
| Brookfield Property REIT Inc. Class A | 35,020 | 701 |
| * Howard Hughes Corp. | 5,233 | 682 |
| Dun & Bradstreet Corp. | 4,708 | 673 |
| Brandywine Realty Trust | 39,416 | 661 |
| White Mountains Insurance Group Ltd. | 696 | 646 |
| Columbia Property Trust Inc. | 26,429 | 636 |
| Colony Capital Inc. | 103,703 | 636 |
| Retail Properties of America Inc. | 49,200 | 626 |
| Pinnacle Financial Partners Inc. | 9,591 | 619 |
| Outfront Media Inc. | 30,784 | 612 |
| Realogy Holdings Corp. | 28,517 | 610 |
| BOK Financial Corp. | 5,818 | 597 |
| Legg Mason Inc. | 18,738 | 585 |
| * OneMain Holdings Inc. | 15,914 | 584 |
| First Hawaiian Inc. | 19,426 | 563 |
| Aspen Insurance Holdings Ltd. | 13,199 | 543 |
| Empire State Realty Trust Inc. | 30,219 | 532 |
| * Euronet Worldwide Inc. | 5,407 | 529 |
| Signature Bank | 4,541 | 526 |
| * Western Alliance Bancorp | 8,775 | 506 |
| Santander Consumer USA Holdings Inc. | 22,737 | 491 |
| DDR Corp. | 34,269 | 479 |
| T. Rowe Price Group Inc. | 3,725 | 432 |
| * Texas Capital Bancshares Inc. | 4,003 | 356 |
| * CoreLogic Inc. | 6,842 | 348 |
| * Zillow Group Inc. | 6,949 | 338 |
| Extra Space Storage Inc. | 3,646 | 336 |
| Mercury General Corp. | 6,143 | 331 |
| CNA Financial Corp. | 6,840 | 307 |
| American National Insurance Co. | 1,620 | 208 |
| Cboe Global Markets Inc. | 1,805 | 182 |
| * Zillow Group Inc. Class A | 3,576 | 172 |
| TFS Financial Corp. | 10,633 | 164 |
| Erie Indemnity Co. Class A | 1,313 | 162 |
| Lamar Advertising Co. Class A | 1,746 | 135 |
| * Retail Value Inc. | 3,426 | 122 |
| Lazard Ltd. Class A | 2,287 | 110 |
| * Credit Acceptance Corp. | 239 | 109 |
| Interactive Brokers Group Inc. | 1,634 | 102 |
| Charles Schwab Corp. | 274 | 14 |
| TD Ameritrade Holding Corp. | 112 | 7 |
| Taubman Centers Inc. | 96 | 6 |
| * WEX Inc. | 32 | 6 |
| Federated Investors Inc. Class B | 248 | 6 |
| Morningstar Inc. | 3 | — |
| 894,230 | ||
| Health Care (14.1%) | ||
| Johnson & Johnson | 496,725 | 66,904 |
| Pfizer Inc. | 1,309,128 | 54,355 |
| Merck & Co. Inc. | 566,946 | 38,887 |
| Medtronic plc | 305,317 | 29,436 |
| Abbott Laboratories | 386,148 | 25,810 |
| Thermo Fisher Scientific Inc. | 85,141 | 20,357 |
24
| Vanguard® Russell 1000 Value Index Fund | ||
| Schedule of Investments | ||
| August 31, 2018 | ||
| Market | ||
| Value | ||
| Shares | ($000) | |
| Anthem Inc. | 57,568 | 15,240 |
| Allergan plc | 76,363 | 14,640 |
| Danaher Corp. | 139,373 | 14,431 |
| Becton Dickinson and Co. | 54,278 | 14,214 |
| Bristol-Myers Squibb Co. | 172,691 | 10,456 |
| * Express Scripts Holding Co. | 116,375 | 10,243 |
| Aetna Inc. | 46,146 | 9,242 |
| Eli Lilly & Co. | 83,597 | 8,832 |
| Baxter International Inc. | 100,436 | 7,469 |
| Cigna Corp. | 32,154 | 6,056 |
| Zimmer Biomet Holdings Inc. | 46,001 | 5,687 |
| Gilead Sciences Inc. | 74,331 | 5,629 |
| McKesson Corp. | 40,605 | 5,228 |
| Agilent Technologies Inc. | 72,600 | 4,903 |
| * IQVIA Holdings Inc. | 36,619 | 4,654 |
| * Mylan NV | 115,386 | 4,515 |
| * Laboratory Corp. of America Holdings | 21,580 | 3,731 |
| Cardinal Health Inc. | 69,834 | 3,645 |
| Quest Diagnostics Inc. | 30,488 | 3,353 |
| * Cerner Corp. | 39,424 | 2,567 |
| * Boston Scientific Corp. | 71,604 | 2,546 |
| Universal Health Services Inc. Class B | 19,019 | 2,475 |
| * Hologic Inc. | 61,106 | 2,430 |
| HCA Healthcare Inc. | 17,970 | 2,410 |
| Cooper Cos. Inc. | 9,150 | 2,340 |
| * Henry Schein Inc. | 29,409 | 2,284 |
| PerkinElmer Inc. | 24,616 | 2,275 |
| Perrigo Co. plc | 29,033 | 2,221 |
| STERIS plc | 18,796 | 2,151 |
| Teleflex Inc. | 8,275 | 2,047 |
| Dentsply Sirona Inc. | 50,231 | 2,005 |
| * QIAGEN NV | 50,295 | 1,960 |
| Amgen Inc. | 8,731 | 1,745 |
| * Bio-Rad Laboratories Inc. Class A | 4,753 | 1,546 |
| West Pharmaceutical Services Inc. | 12,702 | 1,487 |
| * United Therapeutics Corp. | 9,636 | 1,185 |
| * Catalent Inc. | 24,638 | 1,030 |
| * DaVita Inc. | 14,472 | 1,003 |
| * Alexion Pharmaceuticals Inc. | 8,193 | 1,001 |
| * Envision Healthcare Corp. | 21,723 | 985 |
| * MEDNAX Inc. | 20,752 | 983 |
| * Biogen Inc. | 2,474 | 875 |
| * Acadia Healthcare Co. Inc. | 19,280 | 801 |
| * Centene Corp. | 5,329 | 781 |
| * Bluebird Bio Inc. | 3,707 | 624 |
| Humana Inc. | 1,584 | 528 |
| Hill-Rom Holdings Inc. | 5,149 | 501 |
| Bruker Corp. | 13,456 | 479 |
| * Charles River Laboratories International Inc. | 2,958 | 365 |
| * Premier Inc. Class A | 7,898 | 349 |
| * Molina Healthcare Inc. | 2,106 | 291 |
| * Alnylam Pharmaceuticals Inc. | 2,318 | 284 |
| * WellCare Health Plans Inc. | 789 | 239 |
| * Integra LifeSciences Holdings Corp. | 3,617 | 215 |
| * Jazz Pharmaceuticals plc | 1,053 | 180 |
| * Agios Pharmaceuticals Inc. | 684 | 55 |
| 435,160 | ||
| Materials & Processing (4.3%) | ||
| DowDuPont Inc. | 524,007 | 36,749 |
| Air Products & Chemicals Inc. | 49,448 | 8,223 |
| PPG Industries Inc. | 52,434 | 5,796 |
| Ecolab Inc. | 31,433 | 4,730 |
| Freeport-McMoRan Inc. | 325,671 | 4,576 |
| Nucor Corp. | 72,397 | 4,525 |
25
| Vanguard® Russell 1000 Value Index Fund | ||
| Schedule of Investments | ||
| August 31, 2018 | ||
| Market | ||
| Value | ||
| Shares | ($000) | |
| LyondellBasell Industries NV Class A | 37,725 | 4,255 |
| International Paper Co. | 82,617 | 4,225 |
| Newmont Mining Corp. | 119,794 | 3,717 |
| Ball Corp. | 77,460 | 3,244 |
| WestRock Co. | 57,064 | 3,143 |
| Eastman Chemical Co. | 32,016 | 3,106 |
| CF Industries Holdings Inc. | 52,369 | 2,721 |
| Ingersoll-Rand plc | 25,564 | 2,589 |
| Mosaic Co. | 78,857 | 2,466 |
| Albemarle Corp. | 24,678 | 2,357 |
| Steel Dynamics Inc. | 43,043 | 1,968 |
| * Alcoa Corp. | 41,941 | 1,873 |
| RPM International Inc. | 23,648 | 1,596 |
| FMC Corp. | 17,912 | 1,531 |
| Huntsman Corp. | 49,514 | 1,510 |
| AptarGroup Inc. | 13,902 | 1,456 |
| Acuity Brands Inc. | 9,233 | 1,411 |
| Owens Corning | 24,602 | 1,393 |
| Reliance Steel & Aluminum Co. | 15,748 | 1,384 |
| International Flavors & Fragrances Inc. | 10,301 | 1,342 |
| Celanese Corp. Class A | 11,179 | 1,306 |
| Sonoco Products Co. | 22,065 | 1,236 |
| Ashland Global Holdings Inc. | 14,003 | 1,179 |
| United States Steel Corp. | 39,572 | 1,174 |
| Olin Corp. | 37,461 | 1,151 |
| Praxair Inc. | 6,869 | 1,087 |
| Hexcel Corp. | 16,151 | 1,068 |
| Bemis Co. Inc. | 20,328 | 1,002 |
| * Axalta Coating Systems Ltd. | 29,622 | 903 |
| Cabot Corp. | 13,619 | 884 |
| Masco Corp. | 22,063 | 838 |
| Graphic Packaging Holding Co. | 57,043 | 811 |
| * USG Corp. | 18,314 | 789 |
| Timken Co. | 15,396 | 749 |
| * Berry Global Group Inc. | 15,149 | 723 |
| Domtar Corp. | 14,023 | 714 |
| Valmont Industries Inc. | 4,959 | 696 |
| Royal Gold Inc. | 8,612 | 657 |
| Sealed Air Corp. | 16,270 | 653 |
| * Owens-Illinois Inc. | 35,861 | 634 |
| * Univar Inc. | 21,654 | 602 |
| Scotts Miracle-Gro Co. | 4,532 | 339 |
| * Platform Specialty Products Corp. | 24,958 | 331 |
| Silgan Holdings Inc. | 11,339 | 309 |
| WR Grace & Co. | 3,760 | 266 |
| GrafTech International Ltd. | 13,774 | 255 |
| Watsco Inc. | 1,388 | 243 |
| Martin Marietta Materials Inc. | 1,169 | 232 |
| Vulcan Materials Co. | 1,778 | 197 |
| Lennox International Inc. | 525 | 117 |
| Eagle Materials Inc. | 1,264 | 117 |
| Ardagh Group SA | 4,327 | 69 |
| Westlake Chemical Corp. | 641 | 61 |
| NewMarket Corp. | 150 | 60 |
| Versum Materials Inc. | 362 | 14 |
| * Crown Holdings Inc. | 144 | 6 |
| Southern Copper Corp. | 36 | 2 |
| 133,360 | ||
| Producer Durables (7.7%) | ||
| General Electric Co. | 1,945,083 | 25,169 |
| United Technologies Corp. | 168,930 | 22,248 |
| Norfolk Southern Corp. | 63,640 | 11,063 |
| Honeywell International Inc. | 63,798 | 10,148 |
| Eaton Corp. plc | 98,719 | 8,207 |
26
| Vanguard® Russell 1000 Value Index Fund | ||
| Schedule of Investments | ||
| August 31, 2018 | ||
| Market | ||
| Value | ||
| Shares | ($000) | |
| Johnson Controls International plc | 208,713 | 7,883 |
| CSX Corp. | 99,852 | 7,405 |
| Delta Air Lines Inc. | 109,621 | 6,411 |
| General Dynamics Corp. | 32,232 | 6,234 |
| Roper Technologies Inc. | 18,558 | 5,537 |
| PACCAR Inc. | 77,764 | 5,321 |
| Stanley Black & Decker Inc. | 34,913 | 4,906 |
| * United Continental Holdings Inc. | 55,959 | 4,892 |
| 3M Co. | 21,431 | 4,520 |
| Rockwell Collins Inc. | 31,903 | 4,337 |
| Parker-Hannifin Corp. | 24,491 | 4,301 |
| American Airlines Group Inc. | 94,478 | 3,824 |
| L3 Technologies Inc. | 17,579 | 3,757 |
| Republic Services Inc. Class A | 46,244 | 3,392 |
| Textron Inc. | 48,201 | 3,327 |
| AMETEK Inc. | 41,467 | 3,191 |
| Emerson Electric Co. | 41,120 | 3,155 |
| Cummins Inc. | 21,948 | 3,112 |
| Dover Corp. | 34,462 | 2,959 |
| * Keysight Technologies Inc. | 42,038 | 2,728 |
| Kansas City Southern | 22,998 | 2,667 |
| * Trimble Inc. | 56,189 | 2,366 |
| Snap-on Inc. | 12,618 | 2,231 |
| Arconic Inc. | 97,134 | 2,174 |
| Union Pacific Corp. | 14,071 | 2,119 |
| Southwest Airlines Co. | 34,541 | 2,117 |
| Jacobs Engineering Group Inc. | 28,624 | 2,081 |
| * Teledyne Technologies Inc. | 7,934 | 1,882 |
| Alaska Air Group Inc. | 27,125 | 1,831 |
| Fluor Corp. | 31,500 | 1,808 |
| FLIR Systems Inc. | 27,752 | 1,741 |
| Carlisle Cos. Inc. | 13,374 | 1,696 |
| Pentair plc | 36,146 | 1,572 |
| Lockheed Martin Corp. | 4,855 | 1,556 |
| Flowserve Corp. | 29,374 | 1,531 |
| Caterpillar Inc. | 10,597 | 1,471 |
| Xerox Corp. | 50,121 | 1,396 |
| ManpowerGroup Inc. | 14,729 | 1,381 |
| * JetBlue Airways Corp. | 71,051 | 1,356 |
| Xylem Inc. | 17,775 | 1,349 |
| Waste Management Inc. | 14,780 | 1,343 |
| * HD Supply Holdings Inc. | 29,417 | 1,341 |
| Wabtec Corp. | 12,360 | 1,339 |
| Curtiss-Wright Corp. | 9,212 | 1,234 |
| * AECOM | 35,864 | 1,206 |
| Trinity Industries Inc. | 33,027 | 1,184 |
| Oshkosh Corp. | 16,513 | 1,160 |
| ITT Inc. | 19,620 | 1,160 |
| * Kirby Corp. | 13,200 | 1,152 |
| * Stericycle Inc. | 18,604 | 1,148 |
| Crane Co. | 11,224 | 1,025 |
| nVent Electric plc | 36,138 | 1,015 |
| Knight-Swift Transportation Holdings Inc. | 29,368 | 1,002 |
| * Conduent Inc. | 42,751 | 991 |
| Air Lease Corp. Class A | 20,179 | 932 |
| * Genesee & Wyoming Inc. Class A | 10,585 | 930 |
| * Sensata Technologies Holding plc | 17,318 | 917 |
| Ryder System Inc. | 11,684 | 898 |
| AGCO Corp. | 14,952 | 892 |
| Macquarie Infrastructure Corp. | 17,850 | 840 |
| * Quanta Services Inc. | 23,855 | 825 |
| Regal Beloit Corp. | 9,829 | 823 |
| * Clean Harbors Inc. | 11,428 | 784 |
| * Colfax Corp. | 20,007 | 699 |
27
| Vanguard® Russell 1000 Value Index Fund | ||
| Schedule of Investments | ||
| August 31, 2018 | ||
| Market | ||
| Value | ||
| Shares | ($000) | |
| * WESCO International Inc. | 10,535 | 644 |
| Genpact Ltd. | 21,008 | 644 |
| * Middleby Corp. | 5,000 | 608 |
| Terex Corp. | 15,296 | 593 |
| Copa Holdings SA Class A | 6,976 | 558 |
| Hubbell Inc. Class B | 3,967 | 501 |
| Fortive Corp. | 5,670 | 476 |
| MSC Industrial Direct Co. Inc. Class A | 5,524 | 472 |
| * Gardner Denver Holdings Inc. | 15,761 | 441 |
| Huntington Ingalls Industries Inc. | 1,421 | 347 |
| Allegion plc | 3,608 | 315 |
| Schneider National Inc. Class B | 8,774 | 237 |
| * Waters Corp. | 1,237 | 234 |
| National Instruments Corp. | 4,675 | 223 |
| ^ ADT Inc. | 23,460 | 210 |
| Littelfuse Inc. | 900 | 201 |
| * Gates Industrial Corp. plc | 9,863 | 180 |
| IDEX Corp. | 1,035 | 159 |
| Nordson Corp. | 846 | 118 |
| Donaldson Co. Inc. | 1,951 | 99 |
| Booz Allen Hamilton Holding Corp. Class A | 1,632 | 83 |
| Expeditors International of Washington Inc. | 177 | 13 |
| * XPO Logistics Inc. | 112 | 12 |
| WW Grainger Inc. | 16 | 6 |
| Spirit AeroSystems Holdings Inc. Class A | 55 | 5 |
| Avery Dennison Corp. | 16 | 2 |
| 236,573 | ||
| Technology (9.1%) | ||
| Cisco Systems Inc. | 1,087,719 | 51,960 |
| Intel Corp. | 1,052,174 | 50,957 |
| Oracle Corp. | 585,137 | 28,426 |
| QUALCOMM Inc. | 317,819 | 21,837 |
| Microsoft Corp. | 90,484 | 10,164 |
| HP Inc. | 370,724 | 9,138 |
| Broadcom Inc. | 39,009 | 8,544 |
| International Business Machines Corp. | 58,278 | 8,537 |
| Analog Devices Inc. | 70,080 | 6,927 |
| * NXP Semiconductors NV | 73,539 | 6,849 |
| Corning Inc. | 184,535 | 6,184 |
| DXC Technology Co. | 64,442 | 5,870 |
| Hewlett Packard Enterprise Co. | 350,754 | 5,798 |
| * IHS Markit Ltd. | 87,533 | 4,814 |
| Western Digital Corp. | 67,640 | 4,278 |
| Motorola Solutions Inc. | 32,300 | 4,146 |
| * Dell Technologies Inc. Class V | 41,675 | 4,008 |
| CA Inc. | 70,501 | 3,088 |
| * Synopsys Inc. | 30,122 | 3,077 |
| * Micron Technology Inc. | 56,508 | 2,968 |
| Symantec Corp. | 139,776 | 2,818 |
| * Qorvo Inc. | 28,498 | 2,282 |
| Leidos Holdings Inc. | 32,119 | 2,273 |
| Juniper Networks Inc. | 77,663 | 2,208 |
| Amdocs Ltd. | 32,088 | 2,095 |
| Marvell Technology Group Ltd. | 89,468 | 1,850 |
| * Arrow Electronics Inc. | 19,538 | 1,515 |
| Teradyne Inc. | 36,234 | 1,492 |
| * Take-Two Interactive Software Inc. | 10,423 | 1,392 |
| * CommScope Holding Co. Inc. | 43,228 | 1,370 |
| Avnet Inc. | 26,310 | 1,273 |
| * Autodesk Inc. | 7,886 | 1,217 |
| Jabil Inc. | 37,615 | 1,112 |
| Skyworks Solutions Inc. | 12,055 | 1,101 |
| * Nuance Communications Inc. | 66,004 | 1,077 |
| Cognizant Technology Solutions Corp. Class A | 13,022 | 1,021 |
28
| Vanguard® Russell 1000 Value Index Fund | ||
| Schedule of Investments | ||
| August 31, 2018 | ||
| Market | ||
| Value | ||
| Shares | ($000) | |
| * ARRIS International plc | 39,191 | 1,015 |
| Dolby Laboratories Inc. Class A | 13,563 | 952 |
| * Zynga Inc. Class A | 171,759 | 714 |
| * EchoStar Corp. Class A | 10,727 | 515 |
| Cypress Semiconductor Corp. | 25,631 | 441 |
| * Teradata Corp. | 8,187 | 339 |
| LogMeIn Inc. | 3,918 | 337 |
| Sabre Corp. | 11,512 | 301 |
| * Coherent Inc. | 1,546 | 295 |
| * FireEye Inc. | 14,625 | 243 |
| SS&C Technologies Holdings Inc. | 3,194 | 190 |
| * Akamai Technologies Inc. | 2,457 | 185 |
| * NCR Corp. | 4,644 | 132 |
| * Aspen Technology Inc. | 855 | 99 |
| * Guidewire Software Inc. | 161 | 16 |
| Harris Corp. | 85 | 14 |
| NetApp Inc. | 128 | 11 |
| Xilinx Inc. | 49 | 4 |
| * ON Semiconductor Corp. | 84 | 2 |
| 279,471 | ||
| Utilities (9.2%) | ||
| AT&T Inc. | 1,640,124 | 52,386 |
| Verizon Communications Inc. | 933,326 | 50,745 |
| NextEra Energy Inc. | 106,232 | 18,070 |
| Duke Energy Corp. | 158,237 | 12,855 |
| Dominion Energy Inc. | 146,850 | 10,393 |
| Southern Co. | 228,228 | 9,992 |
| Exelon Corp. | 217,536 | 9,508 |
| American Electric Power Co. Inc. | 111,501 | 7,998 |
| Sempra Energy | 59,679 | 6,928 |
| Public Service Enterprise Group Inc. | 113,971 | 5,966 |
| Consolidated Edison Inc. | 70,615 | 5,574 |
| Xcel Energy Inc. | 115,206 | 5,536 |
| PG&E Corp. | 116,220 | 5,367 |
| WEC Energy Group Inc. | 70,937 | 4,794 |
| Edison International | 71,890 | 4,725 |
| PPL Corp. | 158,583 | 4,716 |
| CenturyLink Inc. | 214,966 | 4,592 |
| DTE Energy Co. | 40,637 | 4,516 |
| Eversource Energy | 71,179 | 4,444 |
| FirstEnergy Corp. | 107,842 | 4,031 |
| American Water Works Co. Inc. | 40,055 | 3,506 |
| Evergy Inc. | 60,835 | 3,471 |
| Ameren Corp. | 54,636 | 3,455 |
| Entergy Corp. | 40,616 | 3,395 |
| CMS Energy Corp. | 63,261 | 3,115 |
| CenterPoint Energy Inc. | 96,968 | 2,695 |
| NRG Energy Inc. | 71,252 | 2,522 |
| Atmos Energy Corp. | 24,648 | 2,273 |
| Alliant Energy Corp. | 52,026 | 2,229 |
| NiSource Inc. | 81,337 | 2,202 |
| * Vistra Energy Corp. | 91,736 | 2,159 |
| UGI Corp. | 38,984 | 2,107 |
| AES Corp. | 148,485 | 1,999 |
| Pinnacle West Capital Corp. | 25,080 | 1,970 |
| OGE Energy Corp. | 44,863 | 1,652 |
| * T-Mobile US Inc. | 23,990 | 1,584 |
| Aqua America Inc. | 40,029 | 1,488 |
| Vectren Corp. | 18,680 | 1,330 |
| SCANA Corp. | 31,968 | 1,226 |
| MDU Resources Group Inc. | 43,575 | 1,215 |
| National Fuel Gas Co. | 18,091 | 1,005 |
| * Sprint Corp. | 144,648 | 884 |
| Hawaiian Electric Industries Inc. | 24,307 | 857 |
29
Vanguard® Russell 1000 Value Index Fund
Schedule of Investments
August 31, 2018
| Market | ||||
| Value | ||||
| Shares | ($000) | |||
| Telephone & Data Systems Inc. | 21,944 | 659 | ||
| Avangrid Inc. | 12,616 | 622 | ||
| * United States Cellular Corp. | 2,813 | 120 | ||
| 282,876 | ||||
| Total Common Stocks (Cost $2,663,402) | 3,085,257 | |||
| Coupon | ||||
| Temporary Cash Investments (0.0%)1 | ||||
| Money Market Fund (0.0%) | ||||
| 2,3 Vanguard Market Liquidity Fund | 2.153% | 4,571 | 457 | |
| Face | ||||
| Maturity | Amount | |||
| Date | ($000) | |||
| U.S. Government and Agency Obligations (0.0%) | ||||
| 4 United States Treasury Bill | 1.934% | 10/11/18 | 400 | 399 |
| Total Temporary Cash Investments (Cost $856) | 856 | |||
| Total Investments (99.9%) (Cost $2,664,258) | 3,086,113 | |||
| Other Assets and Liabilities—Net (0.1%)3 | 3,931 | |||
| Net Assets (100%) | 3,090,044 | |||
* Non-income-producing security.
^ Includes partial security positions on loan to broker-dealers. The total value of securities on loan is $421,000.
1 The fund invests a portion of its cash reserves in equity markets through the use of index futures contracts. After giving effect to futures
investments, the fund's effective common stock and temporary cash investment positions represent 100.0% and -0.1%, respectively, of net
assets.
2 Affiliated money market fund available only to Vanguard funds and certain trusts and accounts managed by Vanguard. Rate shown is the 7-day
yield.
3 Includes $453,000 of collateral received for securities on loan.
4 Securities with a value of $399,000 have been segregated as initial margin for open futures contracts.
REIT—Real Estate Investment Trust.
30
| Vanguard® Russell 1000 Growth Index Fund | |||
| Schedule of Investments | |||
| August 31, 2018 | |||
| Market | |||
| Value | |||
| Shares | ($000) | ||
| Common Stocks (99.0%)1 | |||
| Consumer Discretionary (18.0%) | |||
| * | Amazon.com Inc. | 129,356 | 260,356 |
| Home Depot Inc. | 437,946 | 87,926 | |
| * | Netflix Inc. | 158,319 | 58,211 |
| Walt Disney Co. | 405,658 | 45,442 | |
| NIKE Inc. Class B | 476,899 | 39,201 | |
| Costco Wholesale Corp. | 165,981 | 38,695 | |
| * | Booking Holdings Inc. | 18,279 | 35,672 |
| Lowe's Cos. Inc. | 313,886 | 34,135 | |
| Starbucks Corp. | 510,522 | 27,287 | |
| TJX Cos. Inc. | 238,275 | 26,203 | |
| *,^ | Tesla Inc. | 51,457 | 15,523 |
| * | Charter Communications Inc. Class A | 47,948 | 14,883 |
| Marriott International Inc. Class A | 111,305 | 14,077 | |
| Ross Stores Inc. | 140,773 | 13,483 | |
| Estee Lauder Cos. Inc. Class A | 82,800 | 11,602 | |
| Dollar General Corp. | 102,221 | 11,012 | |
| * | O'Reilly Automotive Inc. | 30,543 | 10,245 |
| McDonald's Corp. | 58,016 | 9,412 | |
| VF Corp. | 94,469 | 8,703 | |
| Hilton Worldwide Holdings Inc. | 106,190 | 8,243 | |
| Aptiv plc | 87,373 | 7,690 | |
| * | AutoZone Inc. | 8,883 | 6,812 |
| CBS Corp. Class B | 124,907 | 6,623 | |
| Expedia Group Inc. | 45,681 | 5,961 | |
| Wynn Resorts Ltd. | 38,990 | 5,784 | |
| * | Lululemon Athletica Inc. | 37,173 | 5,759 |
| * | Ulta Beauty Inc. | 21,720 | 5,647 |
| Las Vegas Sands Corp. | 82,825 | 5,418 | |
| Domino's Pizza Inc. | 15,979 | 4,771 | |
| Vail Resorts Inc. | 15,202 | 4,531 | |
| * | Chipotle Mexican Grill Inc. Class A | 9,235 | 4,388 |
| * | Burlington Stores Inc. | 25,283 | 4,252 |
| Tractor Supply Co. | 46,286 | 4,086 | |
| Omnicom Group Inc. | 56,556 | 3,920 | |
| ^ | Sirius XM Holdings Inc. | 487,520 | 3,461 |
| DR Horton Inc. | 76,790 | 3,418 | |
| Hasbro Inc. | 33,973 | 3,374 | |
| * | NVR Inc. | 1,200 | 3,202 |
| * | CarMax Inc. | 40,809 | 3,185 |
| Yum! Brands Inc. | 35,799 | 3,111 | |
| * | ServiceMaster Global Holdings Inc. | 51,513 | 3,105 |
| KAR Auction Services Inc. | 47,782 | 2,995 | |
| Lennar Corp. Class A | 57,929 | 2,993 | |
| * | Wayfair Inc. | 21,230 | 2,870 |
| Nordstrom Inc. | 44,616 | 2,804 | |
| Darden Restaurants Inc. | 23,638 | 2,743 | |
| * | eBay Inc. | 76,987 | 2,665 |
| * | Live Nation Entertainment Inc. | 52,590 | 2,613 |
| * | WABCO Holdings Inc. | 20,309 | 2,500 |
| Pool Corp. | 15,032 | 2,469 | |
| Polaris Industries Inc. | 22,712 | 2,463 | |
| Hanesbrands Inc. | 135,980 | 2,385 | |
| Dunkin' Brands Group Inc. | 31,397 | 2,289 | |
| * | Bright Horizons Family Solutions Inc. | 18,273 | 2,182 |
| * | TripAdvisor Inc. | 39,375 | 2,138 |
| * | Grand Canyon Education Inc. | 17,845 | 2,126 |
| * | Michael Kors Holdings Ltd. | 29,089 | 2,112 |
| Wyndham Hotels & Resorts Inc. | 37,120 | 2,107 | |
| Best Buy Co. Inc. | 23,334 | 1,856 | |
| Carter's Inc. | 17,480 | 1,852 | |
| Six Flags Entertainment Corp. | 26,994 | 1,823 | |
31
| Vanguard® Russell 1000 Growth Index Fund | |||
| Schedule of Investments | |||
| August 31, 2018 | |||
| Market | |||
| Value | |||
| Shares | ($000) | ||
| * | 2U Inc. | 20,401 | 1,823 |
| Gentex Corp. | 70,651 | 1,652 | |
| Thor Industries Inc. | 15,672 | 1,496 | |
| Cable One Inc. | 1,614 | 1,352 | |
| Advance Auto Parts Inc. | 8,158 | 1,338 | |
| Service Corp. International | 31,421 | 1,318 | |
| * | Urban Outfitters Inc. | 27,925 | 1,298 |
| Wendy's Co. | 71,114 | 1,255 | |
| * | Dollar Tree Inc. | 15,102 | 1,216 |
| Fortune Brands Home & Security Inc. | 22,841 | 1,210 | |
| * | Hilton Grand Vacations Inc. | 36,573 | 1,195 |
| * | Under Armour Inc. Class A | 54,288 | 1,110 |
| Tapestry Inc. | 21,459 | 1,088 | |
| * | AMC Networks Inc. Class A | 16,743 | 1,052 |
| Choice Hotels International Inc. | 13,102 | 1,023 | |
| * | Under Armour Inc. | 53,399 | 1,013 |
| Tiffany & Co. | 8,192 | 1,005 | |
| Toll Brothers Inc. | 27,053 | 980 | |
| *,^ | Tempur Sealy International Inc. | 17,524 | 971 |
| PulteGroup Inc. | 31,198 | 872 | |
| Extended Stay America Inc. | 42,911 | 866 | |
| * | Visteon Corp. | 7,053 | 779 |
| * | Skechers U.S.A. Inc. Class A | 23,682 | 698 |
| * | LKQ Corp. | 19,489 | 673 |
| * | Floor & Decor Holdings Inc. Class A | 14,401 | 529 |
| MGM Resorts International | 17,484 | 507 | |
| Williams-Sonoma Inc. | 7,128 | 501 | |
| Yum China Holdings Inc. | 11,760 | 455 | |
| * | Mattel Inc. | 28,733 | 443 |
| L Brands Inc. | 16,490 | 436 | |
| Lear Corp. | 2,624 | 426 | |
| H&R Block Inc. | 14,315 | 387 | |
| Interpublic Group of Cos. Inc. | 14,795 | 346 | |
| Brunswick Corp. | 3,158 | 210 | |
| * | Madison Square Garden Co. Class A | 692 | 209 |
| Gap Inc. | 5,121 | 155 | |
| Columbia Sportswear Co. | 1,415 | 128 | |
| Lennar Corp. Class B | 2,825 | 119 | |
| * | Michaels Cos. Inc. | 6,427 | 109 |
| Lions Gate Entertainment Corp. Class B | 3,471 | 78 | |
| International Game Technology plc | 2,076 | 44 | |
| Lions Gate Entertainment Corp. Class A | 554 | 13 | |
| 949,172 | |||
| Consumer Staples (4.4%) | |||
| PepsiCo Inc. | 477,439 | 53,478 | |
| Coca-Cola Co. | 1,127,602 | 50,257 | |
| Altria Group Inc. | 719,342 | 42,096 | |
| Sysco Corp. | 181,008 | 13,543 | |
| Kimberly-Clark Corp. | 115,149 | 13,304 | |
| Constellation Brands Inc. Class A | 59,645 | 12,418 | |
| * | Monster Beverage Corp. | 154,617 | 9,415 |
| Clorox Co. | 42,779 | 6,202 | |
| Brown-Forman Corp. Class B | 107,161 | 5,596 | |
| Hershey Co. | 48,417 | 4,867 | |
| Church & Dwight Co. Inc. | 78,607 | 4,448 | |
| Colgate-Palmolive Co. | 60,288 | 4,004 | |
| Kellogg Co. | 47,057 | 3,378 | |
| Campbell Soup Co. | 46,253 | 1,825 | |
| * | Keurig Dr Pepper Inc. | 68,731 | 1,567 |
| * | Post Holdings Inc. | 14,304 | 1,391 |
| * | Sprouts Farmers Market Inc. | 49,231 | 1,303 |
| Brown-Forman Corp. Class A | 19,391 | 1,021 | |
| Energizer Holdings Inc. | 12,824 | 816 | |
| Spectrum Brands Holdings Inc. | 7,155 | 621 | |
32
| Vanguard® Russell 1000 Growth Index Fund | ||
| Schedule of Investments | ||
| August 31, 2018 | ||
| Market | ||
| Value | ||
| Shares | ($000) | |
| General Mills Inc. | 11,439 | 526 |
| Nu Skin Enterprises Inc. Class A | 6,400 | 510 |
| * Herbalife Nutrition Ltd. | 7,817 | 442 |
| McCormick & Co. Inc. | 2,669 | 333 |
| * US Foods Holding Corp. | 4,791 | 156 |
| Lamb Weston Holdings Inc. | 1 | — |
| 233,517 | ||
| Energy (0.9%) | ||
| Halliburton Co. | 331,839 | 13,237 |
| Pioneer Natural Resources Co. | 35,524 | 6,206 |
| ONEOK Inc. | 64,397 | 4,244 |
| Anadarko Petroleum Corp. | 65,726 | 4,233 |
| * Cheniere Energy Inc. | 55,159 | 3,692 |
| Cabot Oil & Gas Corp. | 124,584 | 2,969 |
| EOG Resources Inc. | 24,741 | 2,925 |
| * Parsley Energy Inc. Class A | 67,853 | 1,884 |
| * Concho Resources Inc. | 9,598 | 1,316 |
| Diamondback Energy Inc. | 9,709 | 1,176 |
| * Continental Resources Inc. | 15,936 | 1,051 |
| * Antero Resources Corp. | 48,633 | 900 |
| * Newfield Exploration Co. | 27,410 | 748 |
| Apache Corp. | 9,102 | 399 |
| Cimarex Energy Co. | 4,448 | 376 |
| * Kosmos Energy Ltd. | 17,296 | 156 |
| RPC Inc. | 7,901 | 108 |
| 45,620 | ||
| Financial Services (12.1%) | ||
| Visa Inc. Class A | 679,163 | 99,762 |
| Mastercard Inc. Class A | 349,022 | 75,235 |
| * PayPal Holdings Inc. | 451,380 | 41,676 |
| American Tower Corp. | 166,600 | 24,843 |
| Charles Schwab Corp. | 456,450 | 23,183 |
| S&P Global Inc. | 95,442 | 19,761 |
| Simon Property Group Inc. | 107,428 | 19,663 |
| American Express Co. | 183,803 | 19,479 |
| * Berkshire Hathaway Inc. Class B | 92,555 | 19,318 |
| Progressive Corp. | 220,266 | 14,875 |
| Crown Castle International Corp. | 118,655 | 13,530 |
| Aon plc | 92,720 | 13,496 |
| Equinix Inc. | 30,108 | 13,131 |
| * Fiserv Inc. | 155,599 | 12,459 |
| Public Storage | 56,404 | 11,990 |
| Moody's Corp. | 63,338 | 11,275 |
| T. Rowe Price Group Inc. | 83,504 | 9,677 |
| * Square Inc. | 108,741 | 9,639 |
| Intercontinental Exchange Inc. | 112,350 | 8,564 |
| Marsh & McLennan Cos. Inc. | 89,835 | 7,603 |
| Global Payments Inc. | 60,454 | 7,531 |
| * FleetCor Technologies Inc. | 33,730 | 7,209 |
| * SBA Communications Corp. Class A | 43,158 | 6,699 |
| Total System Services Inc. | 68,213 | 6,626 |
| TD Ameritrade Holding Corp. | 106,794 | 6,255 |
| MSCI Inc. Class A | 33,387 | 6,018 |
| Broadridge Financial Solutions Inc. | 44,477 | 6,011 |
| * First Data Corp. Class A | 206,524 | 5,312 |
| TransUnion | 69,712 | 5,249 |
| * SVB Financial Group | 15,425 | 4,978 |
| Discover Financial Services | 60,544 | 4,730 |
| Jack Henry & Associates Inc. | 29,200 | 4,626 |
| Alliance Data Systems Corp. | 18,289 | 4,363 |
| Cboe Global Markets Inc. | 39,345 | 3,966 |
| Extra Space Storage Inc. | 40,099 | 3,698 |
| FactSet Research Systems Inc. | 14,376 | 3,298 |
| SEI Investments Co. | 50,600 | 3,192 |
33
| Vanguard® Russell 1000 Growth Index Fund | ||
| Schedule of Investments | ||
| August 31, 2018 | ||
| Market | ||
| Value | ||
| Shares | ($000) | |
| Synchrony Financial | 100,133 | 3,171 |
| Equity LifeStyle Properties Inc. | 32,075 | 3,107 |
| * WEX Inc. | 15,635 | 2,974 |
| * CBRE Group Inc. Class A | 57,849 | 2,824 |
| MarketAxess Holdings Inc. | 13,889 | 2,636 |
| Travelers Cos. Inc. | 19,923 | 2,622 |
| American International Group Inc. | 49,098 | 2,611 |
| * Fair Isaac Corp. | 11,108 | 2,566 |
| Northern Trust Corp. | 22,057 | 2,370 |
| Eaton Vance Corp. | 43,753 | 2,307 |
| Lamar Advertising Co. Class A | 28,873 | 2,225 |
| LPL Financial Holdings Inc. | 33,420 | 2,214 |
| CME Group Inc. | 11,581 | 2,024 |
| XL Group Ltd. | 34,109 | 1,958 |
| Lazard Ltd. Class A | 40,133 | 1,932 |
| * Credit Acceptance Corp. | 3,910 | 1,786 |
| Equifax Inc. | 12,259 | 1,642 |
| Wyndham Destinations Inc. | 37,018 | 1,636 |
| Evercore Inc. Class A | 15,187 | 1,612 |
| CoreSite Realty Corp. | 13,808 | 1,608 |
| Signature Bank | 13,087 | 1,515 |
| * Zillow Group Inc. | 31,107 | 1,513 |
| Interactive Brokers Group Inc. | 24,194 | 1,504 |
| Taubman Centers Inc. | 22,407 | 1,448 |
| Capital One Financial Corp. | 14,115 | 1,399 |
| Raymond James Financial Inc. | 14,650 | 1,363 |
| Everest Re Group Ltd. | 6,041 | 1,347 |
| * E*TRADE Financial Corp. | 22,612 | 1,331 |
| * Western Alliance Bancorp | 22,405 | 1,292 |
| Ameriprise Financial Inc. | 8,858 | 1,258 |
| Fidelity National Information Services Inc. | 10,613 | 1,148 |
| * Texas Capital Bancshares Inc. | 11,910 | 1,059 |
| Gaming and Leisure Properties Inc. | 27,467 | 983 |
| * CoreLogic Inc. | 19,264 | 979 |
| Morningstar Inc. | 6,852 | 975 |
| * Worldpay Inc. Class A | 9,839 | 958 |
| * Euronet Worldwide Inc. | 9,363 | 916 |
| Western Union Co. | 48,072 | 910 |
| Erie Indemnity Co. Class A | 7,284 | 900 |
| Dun & Bradstreet Corp. | 6,124 | 875 |
| Pinnacle Financial Partners Inc. | 12,242 | 790 |
| State Street Corp. | 8,993 | 782 |
| * Howard Hughes Corp. | 5,942 | 775 |
| * Zillow Group Inc. Class A | 15,531 | 747 |
| * Arch Capital Group Ltd. | 23,268 | 711 |
| * Markel Corp. | 454 | 549 |
| Alleghany Corp. | 642 | 406 |
| Alexandria Real Estate Equities Inc. | 3,056 | 392 |
| Comerica Inc. | 3,762 | 367 |
| Virtu Financial Inc. Class A | 14,774 | 322 |
| East West Bancorp Inc. | 4,094 | 260 |
| Voya Financial Inc. | 4,941 | 247 |
| Hudson Pacific Properties Inc. | 7,200 | 244 |
| * Omega Healthcare Investors Inc. | 6,149 | 203 |
| Axis Capital Holdings Ltd. | 3,340 | 192 |
| RenaissanceRe Holdings Ltd. | 1,303 | 173 |
| Synovus Financial Corp. | 3,450 | 173 |
| Brown & Brown Inc. | 4,936 | 150 |
| Santander Consumer USA Holdings Inc. | 5,642 | 122 |
| Life Storage Inc. | 978 | 96 |
| * OneMain Holdings Inc. | 2,040 | 75 |
| Colony Capital Inc. | 9,896 | 61 |
| 636,255 | ||
34
| Vanguard® Russell 1000 Growth Index Fund | ||
| Schedule of Investments | ||
| August 31, 2018 | ||
| Market | ||
| Value | ||
| Shares | ($000) | |
| Health Care (13.5%) | ||
| UnitedHealth Group Inc. | 363,169 | 97,496 |
| AbbVie Inc. | 603,371 | 57,912 |
| Amgen Inc. | 236,665 | 47,288 |
| Gilead Sciences Inc. | 366,381 | 27,746 |
| * Biogen Inc. | 75,909 | 26,833 |
| * Celgene Corp. | 274,752 | 25,950 |
| Johnson & Johnson | 183,569 | 24,725 |
| * Intuitive Surgical Inc. | 42,685 | 23,904 |
| Eli Lilly & Co. | 225,469 | 23,821 |
| Stryker Corp. | 129,777 | 21,988 |
| Bristol-Myers Squibb Co. | 330,587 | 20,017 |
| * Illumina Inc. | 55,720 | 19,771 |
| * Vertex Pharmaceuticals Inc. | 96,888 | 17,866 |
| Zoetis Inc. | 184,024 | 16,673 |
| Humana Inc. | 49,605 | 16,531 |
| * Boston Scientific Corp. | 402,696 | 14,320 |
| * Regeneron Pharmaceuticals Inc. | 30,285 | 12,318 |
| * Align Technology Inc. | 30,119 | 11,641 |
| * Edwards Lifesciences Corp. | 79,796 | 11,510 |
| HCA Healthcare Inc. | 75,113 | 10,073 |
| * Centene Corp. | 68,185 | 9,988 |
| Aetna Inc. | 44,053 | 8,822 |
| * IDEXX Laboratories Inc. | 32,542 | 8,267 |
| * Alexion Pharmaceuticals Inc. | 67,359 | 8,234 |
| Cigna Corp. | 35,622 | 6,709 |
| * BioMarin Pharmaceutical Inc. | 66,903 | 6,689 |
| * ABIOMED Inc. | 15,991 | 6,502 |
| ResMed Inc. | 53,304 | 5,939 |
| AmerisourceBergen Corp. Class A | 60,706 | 5,462 |
| * WellCare Health Plans Inc. | 17,395 | 5,263 |
| * Incyte Corp. | 66,528 | 4,917 |
| * DexCom Inc. | 33,113 | 4,781 |
| * Veeva Systems Inc. Class A | 45,515 | 4,750 |
| Merck & Co. Inc. | 68,494 | 4,698 |
| * Neurocrine Biosciences Inc. | 33,877 | 4,165 |
| * Nektar Therapeutics Class A | 59,466 | 3,954 |
| * Varian Medical Systems Inc. | 34,708 | 3,888 |
| * Alnylam Pharmaceuticals Inc. | 29,951 | 3,674 |
| * Cerner Corp. | 54,037 | 3,518 |
| * Jazz Pharmaceuticals plc | 20,477 | 3,500 |
| * Exact Sciences Corp. | 45,411 | 3,401 |
| * Sarepta Therapeutics Inc. | 23,447 | 3,237 |
| * Seattle Genetics Inc. | 40,835 | 3,134 |
| Encompass Health Corp. | 37,356 | 3,048 |
| * Sage Therapeutics Inc. | 17,208 | 2,827 |
| * Molina Healthcare Inc. | 19,640 | 2,710 |
| Bio-Techne Corp. | 14,053 | 2,701 |
| * Alkermes plc | 58,176 | 2,609 |
| Becton Dickinson and Co. | 9,126 | 2,390 |
| * Bluebird Bio Inc. | 14,023 | 2,360 |
| * athenahealth Inc. | 15,266 | 2,349 |
| * Insulet Corp. | 22,078 | 2,302 |
| * PRA Health Sciences Inc. | 21,674 | 2,289 |
| * Ionis Pharmaceuticals Inc. | 47,680 | 2,178 |
| Thermo Fisher Scientific Inc. | 8,959 | 2,142 |
| * Exelixis Inc. | 110,602 | 2,078 |
| * Masimo Corp. | 17,043 | 2,009 |
| Chemed Corp. | 5,878 | 1,902 |
| * DaVita Inc. | 26,662 | 1,847 |
| * ICU Medical Inc. | 5,911 | 1,809 |
| * Penumbra Inc. | 11,579 | 1,608 |
| * Charles River Laboratories International Inc. | 12,814 | 1,583 |
| Hill-Rom Holdings Inc. | 16,227 | 1,578 |
35
| Vanguard® Russell 1000 Growth Index Fund | |||
| Schedule of Investments | |||
| August 31, 2018 | |||
| Market | |||
| Value | |||
| Shares | ($000) | ||
| Baxter International Inc. | 21,207 | 1,577 | |
| * | Express Scripts Holding Co. | 17,430 | 1,534 |
| * | Agios Pharmaceuticals Inc. | 17,897 | 1,445 |
| Cantel Medical Corp. | 13,914 | 1,350 | |
| * | Integra LifeSciences Holdings Corp. | 21,197 | 1,261 |
| McKesson Corp. | 9,671 | 1,245 | |
| Teleflex Inc. | 3,287 | 813 | |
| West Pharmaceutical Services Inc. | 6,382 | 747 | |
| Cooper Cos. Inc. | 2,909 | 744 | |
| * | Henry Schein Inc. | 8,522 | 662 |
| Bruker Corp. | 15,329 | 545 | |
| * | Catalent Inc. | 12,940 | 541 |
| *,^ | TESARO Inc. | 14,702 | 477 |
| * | Envision Healthcare Corp. | 8,881 | 403 |
| * | Laboratory Corp. of America Holdings | 2,271 | 393 |
| * | Premier Inc. Class A | 6,681 | 295 |
| 710,226 | |||
| Materials & Processing (2.0%) | |||
| Praxair Inc. | 97,616 | 15,442 | |
| Sherwin-Williams Co. | 31,656 | 14,422 | |
| LyondellBasell Industries NV Class A | 58,467 | 6,594 | |
| Ecolab Inc. | 43,679 | 6,573 | |
| Fastenal Co. | 108,927 | 6,357 | |
| Vulcan Materials Co. | 46,833 | 5,189 | |
| Ingersoll-Rand plc | 50,807 | 5,146 | |
| Martin Marietta Materials Inc. | 21,876 | 4,347 | |
| Packaging Corp. of America | 35,458 | 3,898 | |
| Celanese Corp. Class A | 32,641 | 3,813 | |
| Masco Corp. | 80,235 | 3,046 | |
| Chemours Co. | 67,487 | 2,942 | |
| Lennox International Inc. | 13,011 | 2,899 | |
| * | Crown Holdings Inc. | 48,878 | 2,092 |
| FMC Corp. | 20,634 | 1,763 | |
| Watsco Inc. | 9,680 | 1,694 | |
| International Flavors & Fragrances Inc. | 12,627 | 1,645 | |
| Versum Materials Inc. | 41,094 | 1,635 | |
| Eagle Materials Inc. | 15,689 | 1,449 | |
| Southern Copper Corp. | 31,164 | 1,360 | |
| Sealed Air Corp. | 33,410 | 1,340 | |
| WR Grace & Co. | 18,678 | 1,320 | |
| * | Armstrong World Industries Inc. | 17,324 | 1,209 |
| Westlake Chemical Corp. | 12,699 | 1,201 | |
| * | Berry Global Group Inc. | 24,955 | 1,191 |
| NewMarket Corp. | 2,827 | 1,134 | |
| * | Axalta Coating Systems Ltd. | 32,508 | 991 |
| International Paper Co. | 17,708 | 906 | |
| Royal Gold Inc. | 10,148 | 774 | |
| RPM International Inc. | 10,068 | 680 | |
| PPG Industries Inc. | 6,126 | 677 | |
| Steel Dynamics Inc. | 13,090 | 599 | |
| Scotts Miracle-Gro Co. | 7,473 | 558 | |
| * | Platform Specialty Products Corp. | 41,934 | 556 |
| Hexcel Corp. | 7,121 | 471 | |
| Graphic Packaging Holding Co. | 19,887 | 283 | |
| Silgan Holdings Inc. | 9,860 | 269 | |
| * | Univar Inc. | 6,504 | 181 |
| 106,646 | |||
| Other (0.0%)2 | |||
| *,§ | Herbalife Ltd. CVR | 3,325 | 32 |
| Producer Durables (12.8%) | |||
| Boeing Co. | 208,710 | 71,544 | |
| Accenture plc Class A | 244,278 | 41,300 | |
| Union Pacific Corp. | 269,038 | 40,522 | |
36
| Vanguard® Russell 1000 Growth Index Fund | ||
| Schedule of Investments | ||
| August 31, 2018 | ||
| Market | ||
| Value | ||
| Shares | ($000) | |
| 3M Co. | 182,996 | 38,597 |
| United Parcel Service Inc. Class B | 262,399 | 32,244 |
| Caterpillar Inc. | 202,710 | 28,146 |
| Honeywell International Inc. | 175,823 | 27,966 |
| Lockheed Martin Corp. | 86,036 | 27,567 |
| Automatic Data Processing Inc. | 167,356 | 24,559 |
| FedEx Corp. | 94,070 | 22,948 |
| Raytheon Co. | 109,116 | 21,762 |
| Northrop Grumman Corp. | 61,458 | 18,345 |
| Illinois Tool Works Inc. | 128,245 | 17,811 |
| Deere & Co. | 122,962 | 17,682 |
| Emerson Electric Co. | 169,402 | 12,998 |
| Waste Management Inc. | 138,991 | 12,634 |
| CSX Corp. | 148,496 | 11,012 |
| Fortive Corp. | 107,208 | 9,003 |
| Paychex Inc. | 122,103 | 8,944 |
| Southwest Airlines Co. | 143,484 | 8,796 |
| Rockwell Automation Inc. | 47,450 | 8,587 |
| General Dynamics Corp. | 44,397 | 8,586 |
| * Verisk Analytics Inc. Class A | 60,801 | 7,241 |
| Cintas Corp. | 33,099 | 7,062 |
| * TransDigm Group Inc. | 18,376 | 6,432 |
| WW Grainger Inc. | 17,220 | 6,097 |
| * CoStar Group Inc. | 13,558 | 5,995 |
| * Mettler-Toledo International Inc. | 9,435 | 5,514 |
| * Waters Corp. | 27,370 | 5,186 |
| CH Robinson Worldwide Inc. | 52,395 | 5,034 |
| * Copart Inc. | 76,820 | 4,940 |
| * United Rentals Inc. | 31,655 | 4,934 |
| Expeditors International of Washington Inc. | 66,023 | 4,838 |
| * XPO Logistics Inc. | 45,125 | 4,806 |
| IDEX Corp. | 27,435 | 4,203 |
| JB Hunt Transport Services Inc. | 33,048 | 3,991 |
| Old Dominion Freight Line Inc. | 24,994 | 3,809 |
| Spirit AeroSystems Holdings Inc. Class A | 42,907 | 3,669 |
| Delta Air Lines Inc. | 61,278 | 3,584 |
| Robert Half International Inc. | 45,599 | 3,565 |
| Avery Dennison Corp. | 33,273 | 3,500 |
| Huntington Ingalls Industries Inc. | 14,172 | 3,465 |
| * Zebra Technologies Corp. | 20,061 | 3,445 |
| AO Smith Corp. | 53,975 | 3,135 |
| Cummins Inc. | 21,067 | 2,987 |
| Graco Inc. | 63,173 | 2,970 |
| Xylem Inc. | 37,888 | 2,876 |
| Nordson Corp. | 20,658 | 2,872 |
| Booz Allen Hamilton Holding Corp. Class A | 51,331 | 2,626 |
| Allegion plc | 29,733 | 2,593 |
| Toro Co. | 40,212 | 2,444 |
| Donaldson Co. Inc. | 46,110 | 2,333 |
| BWX Technologies Inc. | 37,619 | 2,307 |
| Allison Transmission Holdings Inc. | 45,651 | 2,267 |
| Lincoln Electric Holdings Inc. | 23,791 | 2,240 |
| Rollins Inc. | 36,960 | 2,221 |
| HEICO Corp. Class A | 28,847 | 2,149 |
| Roper Technologies Inc. | 7,131 | 2,128 |
| * Sensata Technologies Holding plc | 34,880 | 1,847 |
| Landstar System Inc. | 15,825 | 1,833 |
| Hubbell Inc. Class B | 13,979 | 1,766 |
| Littelfuse Inc. | 7,568 | 1,692 |
| National Instruments Corp. | 33,886 | 1,618 |
| Parker-Hannifin Corp. | 9,025 | 1,585 |
| * Middleby Corp. | 12,157 | 1,478 |
| HEICO Corp. | 14,632 | 1,327 |
| AMETEK Inc. | 16,578 | 1,276 |
37
| Vanguard® Russell 1000 Growth Index Fund | ||
| Schedule of Investments | ||
| August 31, 2018 | ||
| Market | ||
| Value | ||
| Shares | ($000) | |
| Wabtec Corp. | 11,693 | 1,267 |
| Rockwell Collins Inc. | 8,316 | 1,131 |
| Textron Inc. | 16,182 | 1,117 |
| * Welbilt Inc. | 49,311 | 1,091 |
| * HD Supply Holdings Inc. | 20,966 | 956 |
| MSC Industrial Direct Co. Inc. Class A | 7,621 | 651 |
| Genpact Ltd. | 19,569 | 600 |
| * Quanta Services Inc. | 16,398 | 567 |
| * Genesee & Wyoming Inc. Class A | 4,750 | 417 |
| Republic Services Inc. Class A | 5,409 | 397 |
| * Gardner Denver Holdings Inc. | 13,137 | 367 |
| FLIR Systems Inc. | 4,575 | 287 |
| Curtiss-Wright Corp. | 1,289 | 173 |
| Air Lease Corp. Class A | 2,889 | 133 |
| Schneider National Inc. Class B | 2,954 | 80 |
| 674,667 | ||
| Technology (35.1%) | ||
| Apple Inc. | 1,869,115 | 425,467 |
| Microsoft Corp. | 2,727,127 | 306,338 |
| * Facebook Inc. Class A | 903,567 | 158,784 |
| * Alphabet Inc. Class C | 115,703 | 140,948 |
| * Alphabet Inc. Class A | 113,504 | 139,814 |
| NVIDIA Corp. | 221,153 | 62,073 |
| * Adobe Systems Inc. | 186,804 | 49,225 |
| Texas Instruments Inc. | 372,237 | 41,839 |
| * salesforce.com Inc. | 268,152 | 40,941 |
| International Business Machines Corp. | 251,001 | 36,767 |
| Broadcom Inc. | 98,140 | 21,496 |
| Activision Blizzard Inc. | 286,166 | 20,633 |
| Intuit Inc. | 92,665 | 20,337 |
| * Micron Technology Inc. | 344,299 | 18,083 |
| Applied Materials Inc. | 399,027 | 17,166 |
| Cognizant Technology Solutions Corp. Class A | 200,033 | 15,689 |
| * ServiceNow Inc. | 66,561 | 13,070 |
| * Electronic Arts Inc. | 114,426 | 12,977 |
| * Autodesk Inc. | 70,039 | 10,811 |
| Lam Research Corp. | 62,329 | 10,789 |
| Amphenol Corp. Class A | 112,199 | 10,612 |
| * Red Hat Inc. | 67,325 | 9,946 |
| * Twitter Inc. | 269,042 | 9,465 |
| NetApp Inc. | 102,086 | 8,862 |
| * Advanced Micro Devices Inc. | 344,225 | 8,664 |
| * Workday Inc. Class A | 55,033 | 8,505 |
| * Palo Alto Networks Inc. | 33,706 | 7,791 |
| Xilinx Inc. | 96,940 | 7,545 |
| Microchip Technology Inc. | 87,538 | 7,531 |
| Harris Corp. | 44,952 | 7,305 |
| * Splunk Inc. | 54,907 | 7,036 |
| KLA-Tencor Corp. | 59,127 | 6,871 |
| * Arista Networks Inc. | 21,564 | 6,447 |
| Maxim Integrated Products Inc. | 105,492 | 6,379 |
| * VeriSign Inc. | 39,909 | 6,330 |
| * ANSYS Inc. | 31,593 | 5,876 |
| * Citrix Systems Inc. | 51,279 | 5,847 |
| * IAC/InterActiveCorp | 28,225 | 5,566 |
| Oracle Corp. | 105,768 | 5,138 |
| * Gartner Inc. | 33,558 | 5,026 |
| * Cadence Design Systems Inc. | 105,891 | 4,981 |
| * GoDaddy Inc. Class A | 60,726 | 4,947 |
| * GrubHub Inc. | 34,196 | 4,928 |
| CDW Corp. | 56,158 | 4,917 |
| Skyworks Solutions Inc. | 48,821 | 4,457 |
| * Akamai Technologies Inc. | 58,967 | 4,431 |
| * Fortinet Inc. | 52,715 | 4,415 |
38
| Vanguard® Russell 1000 Growth Index Fund | |||
| Schedule of Investments | |||
| August 31, 2018 | |||
| Market | |||
| Value | |||
| Shares | ($000) | ||
| * | F5 Networks Inc. | 23,177 | 4,383 |
| * | PTC Inc. | 43,376 | 4,335 |
| SS&C Technologies Holdings Inc. | 72,796 | 4,320 | |
| * | VMware Inc. Class A | 26,168 | 4,011 |
| * | Tyler Technologies Inc. | 14,360 | 3,546 |
| * | Ultimate Software Group Inc. | 11,307 | 3,501 |
| * | ON Semiconductor Corp. | 160,549 | 3,426 |
| * | Take-Two Interactive Software Inc. | 25,379 | 3,390 |
| Cognex Corp. | 62,670 | 3,372 | |
| * | Atlassian Corp. plc Class A | 34,723 | 3,125 |
| CDK Global Inc. | 49,906 | 3,110 | |
| * | Guidewire Software Inc. | 30,238 | 3,041 |
| * | Aspen Technology Inc. | 25,563 | 2,949 |
| * | Paycom Software Inc. | 18,767 | 2,911 |
| * | Black Knight Inc. | 53,824 | 2,874 |
| * | Tableau Software Inc. Class A | 25,676 | 2,872 |
| * | EPAM Systems Inc. | 19,232 | 2,749 |
| * | Zendesk Inc. | 38,841 | 2,676 |
| * | IPG Photonics Corp. | 13,690 | 2,402 |
| * | RingCentral Inc. Class A | 25,135 | 2,341 |
| Monolithic Power Systems Inc. | 15,378 | 2,305 | |
| * | Nutanix Inc. | 40,244 | 2,267 |
| * | Proofpoint Inc. | 19,015 | 2,256 |
| * | Twilio Inc. Class A | 27,067 | 2,183 |
| Analog Devices Inc. | 22,082 | 2,183 | |
| Sabre Corp. | 78,340 | 2,045 | |
| * | Okta Inc. | 32,404 | 2,004 |
| Universal Display Corp. | 16,038 | 1,963 | |
| MKS Instruments Inc. | 20,461 | 1,901 | |
| * | Pure Storage Inc. Class A | 62,173 | 1,669 |
| * | RealPage Inc. | 26,545 | 1,656 |
| Cypress Semiconductor Corp. | 93,469 | 1,609 | |
| * | Manhattan Associates Inc. | 25,456 | 1,476 |
| * | Teradata Corp. | 32,396 | 1,343 |
| * | Coherent Inc. | 6,708 | 1,279 |
| Marvell Technology Group Ltd. | 56,043 | 1,159 | |
| LogMeIn Inc. | 12,850 | 1,104 | |
| * | NCR Corp. | 36,658 | 1,041 |
| *,^ | Match Group Inc. | 19,530 | 977 |
| Pegasystems Inc. | 14,219 | 906 | |
| Motorola Solutions Inc. | 6,929 | 889 | |
| * | FireEye Inc. | 47,277 | 785 |
| ^ | Ubiquiti Networks Inc. | 7,270 | 652 |
| * | NXP Semiconductors NV | 6,904 | 643 |
| *,^ | DocuSign Inc. | 9,466 | 591 |
| * | Synopsys Inc. | 5,260 | 537 |
| * | Dell Technologies Inc. Class V | 5,493 | 528 |
| Teradyne Inc. | 11,561 | 476 | |
| Ceridian HCM Holding Inc. | 8,923 | 344 | |
| Switch Inc. | 13,492 | 156 | |
| 1,847,326 | |||
| Utilities (0.2%) | |||
| * | T-Mobile US Inc. | 76,050 | 5,022 |
| * | Zayo Group Holdings Inc. | 75,347 | 2,612 |
| Verizon Communications Inc. | 1 | — | |
| 7,634 | |||
| Total Common Stocks (Cost $3,542,732) | 5,211,095 | ||
39
Vanguard® Russell 1000 Growth Index Fund
Schedule of Investments
August 31, 2018
| Market | ||||
| Value | ||||
| Coupon | Shares | ($000) | ||
| Temporary Cash Investments (1.1%)1 | ||||
| Money Market Fund (1.1%) | ||||
| 3,4 Vanguard Market Liquidity Fund | 2.153% | 584,403 | 58,452 | |
| Face | ||||
| Maturity | Amount | |||
| Date | ($000) | |||
| U.S. Government and Agency Obligations (0.0%) | ||||
| 5 United States Treasury Bill | 1.934%—1.962% | 10/11/18 | 630 | 629 |
| Total Temporary Cash Investments (Cost $59,074) | 59,081 | |||
| Total Investments (100.1%) (Cost $3,601,806) | 5,270,176 | |||
| Other Assets and Liabilities—Net (-0.1%)4,5 | (5,973) | |||
| Net Assets (100%) | 5,264,203 | |||
* Non-income-producing security.
^ Includes partial security positions on loan to broker-dealers. The total value of securities on loan is $9,594,000.
§ Security value determined using significant unobservable inputs.
1 The fund invests a portion of its cash reserves in equity markets through the use of index futures contracts and swap contracts. After giving
effect to futures and swap investments, the fund's effective common stock and temporary cash investment positions represent 100.0% and
0.1%, respectively, of net assets.
2 “Other” represents securities that are not classified by the fund’s benchmark index.
3 Affiliated money market fund available only to Vanguard funds and certain trusts and accounts managed by Vanguard. Rate shown is the 7-day
yield.
4 Includes $10,185,000 of collateral received for securities on loan.
5 Securities with a value of $299,000 and cash of $30,000 have been segregated as collateral for open futures contracts.
CVR—Contingent Value Rights.
40
This page intentionally left blank.
41
© 2018 The Vanguard Group, Inc.
All rights reserved.
Vanguard Marketing Corporation, Distributor.
SNA18480 102018
| Vanguard® Russell 2000 Index Fund | |||
| Schedule of Investments | |||
| August 31, 2018 | |||
| Market | |||
| Value | |||
| Shares | ($000) | ||
| Common Stocks (100.0%)1 | |||
| Consumer Discretionary (14.9%) | |||
| * | Five Below Inc. | 63,777 | 7,428 |
| * | Etsy Inc. | 139,455 | 6,790 |
| Texas Roadhouse Inc. Class A | 79,155 | 5,458 | |
| * | Planet Fitness Inc. Class A | 103,236 | 5,303 |
| * | Trade Desk Inc. Class A | 36,767 | 5,216 |
| * | Ollie's Bargain Outlet Holdings Inc. | 58,029 | 5,054 |
| * | Stamps.com Inc. | 20,254 | 5,032 |
| American Eagle Outfitters Inc. | 188,251 | 4,887 | |
| * | Deckers Outdoor Corp. | 37,219 | 4,535 |
| Signet Jewelers Ltd. | 68,888 | 4,423 | |
| World Wrestling Entertainment Inc. Class A | 49,262 | 4,306 | |
| Nexstar Media Group Inc. Class A | 52,220 | 4,282 | |
| Wolverine World Wide Inc. | 107,775 | 4,223 | |
| * | SiteOne Landscape Supply Inc. | 46,619 | 4,213 |
| ILG Inc. | 123,375 | 4,211 | |
| Aaron's Inc. | 82,152 | 4,085 | |
| * | Chegg Inc. | 124,231 | 4,023 |
| Steven Madden Ltd. | 67,802 | 3,943 | |
| Churchill Downs Inc. | 13,742 | 3,883 | |
| * | Helen of Troy Ltd. | 31,231 | 3,715 |
| * | Eldorado Resorts Inc. | 76,846 | 3,692 |
| * | Cimpress NV | 25,703 | 3,598 |
| * | RH | 22,507 | 3,579 |
| New York Times Co. Class A | 153,339 | 3,573 | |
| Boyd Gaming Corp. | 96,095 | 3,500 | |
| * | Penn National Gaming Inc. | 99,840 | 3,440 |
| Strategic Education Inc. | 24,363 | 3,381 | |
| * | Weight Watchers International Inc. | 44,980 | 3,369 |
| Cracker Barrel Old Country Store Inc. | 22,460 | 3,349 | |
| Dana Inc. | 170,875 | 3,344 | |
| * | Adtalem Global Education Inc. | 69,842 | 3,342 |
| Jack in the Box Inc. | 34,400 | 3,118 | |
| * | Murphy USA Inc. | 36,268 | 3,009 |
| Roku Inc. | 50,588 | 3,009 | |
| * | Shutterfly Inc. | 38,582 | 2,997 |
| Marriott Vacations Worldwide Corp. | 25,057 | 2,982 | |
| TEGNA Inc. | 253,025 | 2,945 | |
| * | Liberty Expedia Holdings Inc. Class A | 63,470 | 2,929 |
| * | Cooper-Standard Holdings Inc. | 20,975 | 2,904 |
| Bed Bath & Beyond Inc. | 156,687 | 2,811 | |
| * | Fox Factory Holding Corp. | 42,132 | 2,783 |
| *,^ | Pandora Media Inc. | 298,926 | 2,762 |
| Travelport Worldwide Ltd. | 146,462 | 2,720 | |
| * | Dave & Buster's Entertainment Inc. | 46,440 | 2,701 |
| DSW Inc. Class A | 80,147 | 2,666 | |
| * | Liberty Latin America Ltd. | 135,647 | 2,663 |
| Cheesecake Factory Inc. | 49,970 | 2,657 | |
| LCI Industries | 28,520 | 2,651 | |
| Red Rock Resorts Inc. Class A | 81,133 | 2,648 | |
| Monro Inc. | 37,167 | 2,637 | |
| Children's Place Inc. | 18,680 | 2,629 | |
| * | TRI Pointe Group Inc. | 176,461 | 2,557 |
| * | Taylor Morrison Home Corp. Class A | 130,681 | 2,543 |
| Tenneco Inc. | 59,359 | 2,540 | |
| * | Dorman Products Inc. | 31,361 | 2,540 |
| National Vision Holdings Inc. | 56,650 | 2,507 | |
| Callaway Golf Co. | 109,585 | 2,500 | |
| KB Home | 100,270 | 2,492 | |
| * | Avis Budget Group Inc. | 80,023 | 2,489 |
| * | Cavco Industries Inc. | 9,988 | 2,451 |
| Sinclair Broadcast Group Inc. Class A | 84,012 | 2,432 | |
1
| Vanguard® Russell 2000 Index Fund | |||
| Schedule of Investments | |||
| August 31, 2018 | |||
| Market | |||
| Value | |||
| Shares | ($000) | ||
| Lithia Motors Inc. Class A | 27,603 | 2,385 | |
| Meredith Corp. | 45,967 | 2,374 | |
| * | G-III Apparel Group Ltd. | 50,727 | 2,307 |
| * | American Axle & Manufacturing Holdings Inc. | 130,080 | 2,304 |
| * | Cars.com Inc. | 84,638 | 2,278 |
| Wingstop Inc. | 33,980 | 2,275 | |
| Brinker International Inc. | 51,195 | 2,267 | |
| PriceSmart Inc. | 25,812 | 2,242 | |
| * | Sally Beauty Holdings Inc. | 142,918 | 2,201 |
| Office Depot Inc. | 647,827 | 2,170 | |
| * | Carvana Co. Class A | 33,231 | 2,151 |
| * | Meritor Inc. | 98,359 | 2,130 |
| * | Gentherm Inc. | 42,908 | 2,111 |
| Big Lots Inc. | 48,960 | 2,108 | |
| * | Pinnacle Entertainment Inc. | 61,013 | 2,089 |
| * | Sotheby's | 43,446 | 2,086 |
| Caleres Inc. | 49,255 | 1,994 | |
| * | Meritage Homes Corp. | 45,291 | 1,954 |
| Tupperware Brands Corp. | 60,013 | 1,952 | |
| * | Scientific Games Corp. | 64,208 | 1,945 |
| Bloomin' Brands Inc. | 98,047 | 1,892 | |
| Matthews International Corp. Class A | 36,434 | 1,891 | |
| * | SeaWorld Entertainment Inc. | 64,175 | 1,882 |
| Group 1 Automotive Inc. | 23,589 | 1,818 | |
| Oxford Industries Inc. | 19,509 | 1,816 | |
| La-Z-Boy Inc. | 54,411 | 1,809 | |
| BJ's Restaurants Inc. | 23,886 | 1,808 | |
| * | Asbury Automotive Group Inc. | 23,856 | 1,777 |
| * | Belmond Ltd. Class A | 104,381 | 1,748 |
| * | Shake Shack Inc. Class A | 28,848 | 1,744 |
| Abercrombie & Fitch Co. | 79,437 | 1,721 | |
| Cooper Tire & Rubber Co. | 59,454 | 1,715 | |
| * | MSG Networks Inc. | 70,139 | 1,704 |
| MDC Holdings Inc. | 52,940 | 1,678 | |
| Guess? Inc. | 67,167 | 1,646 | |
| * | Crocs Inc. | 79,122 | 1,635 |
| * | Gray Television Inc. | 93,648 | 1,634 |
| Dine Brands Global Inc. | 19,540 | 1,630 | |
| GameStop Corp. Class A | 117,307 | 1,557 | |
| * | Central Garden & Pet Co. Class A | 41,819 | 1,519 |
| * | IMAX Corp. | 64,354 | 1,512 |
| * | Instructure Inc. | 36,463 | 1,493 |
| Sonic Corp. | 41,496 | 1,488 | |
| * | Fitbit Inc. Class A | 241,928 | 1,456 |
| Viad Corp. | 23,631 | 1,456 | |
| * | Sleep Number Corp. | 42,579 | 1,435 |
| * | American Woodmark Corp. | 16,551 | 1,406 |
| * | Quotient Technology Inc. | 93,622 | 1,400 |
| Scholastic Corp. | 32,763 | 1,377 | |
| Tailored Brands Inc. | 58,244 | 1,371 | |
| Chico's FAS Inc. | 149,605 | 1,364 | |
| Gannett Co. Inc. | 132,320 | 1,360 | |
| * | Liberty TripAdvisor Holdings Inc. Class A | 85,209 | 1,351 |
| Winnebago Industries Inc. | 36,091 | 1,334 | |
| Inter Parfums Inc. | 20,406 | 1,332 | |
| Sturm Ruger & Co. Inc. | 19,722 | 1,291 | |
| Nutrisystem Inc. | 34,368 | 1,272 | |
| Standard Motor Products Inc. | 24,868 | 1,263 | |
| * | Career Education Corp. | 79,141 | 1,262 |
| *,^ | LGI Homes Inc. | 21,758 | 1,253 |
| International Speedway Corp. Class A | 28,380 | 1,253 | |
| * | Vista Outdoor Inc. | 66,522 | 1,229 |
| Papa John's International Inc. | 26,356 | 1,215 | |
| Shutterstock Inc. | 22,083 | 1,215 | |
2
| Vanguard® Russell 2000 Index Fund | |||
| Schedule of Investments | |||
| August 31, 2018 | |||
| Market | |||
| Value | |||
| Shares | ($000) | ||
| * | Fossil Group Inc. | 53,230 | 1,207 |
| Entercom Communications Corp. Class A | 149,100 | 1,170 | |
| * | Genesco Inc. | 22,794 | 1,159 |
| AMC Entertainment Holdings Inc. Class A | 60,532 | 1,153 | |
| * | Malibu Boats Inc. Class A | 23,810 | 1,148 |
| * | Hertz Global Holdings Inc. | 64,417 | 1,134 |
| New Media Investment Group Inc. | 69,360 | 1,103 | |
| * | Denny's Corp. | 72,880 | 1,098 |
| ^ | Dillard's Inc. Class A | 13,874 | 1,090 |
| Acushnet Holdings Corp. | 40,182 | 1,087 | |
| * | At Home Group Inc. | 31,115 | 1,071 |
| * | Liberty Media Corp-Liberty Braves Class C | 40,230 | 1,069 |
| Ruth's Hospitality Group Inc. | 33,954 | 1,046 | |
| HealthStream Inc. | 32,586 | 1,034 | |
| * | Express Inc. | 86,586 | 971 |
| * | Stoneridge Inc. | 32,304 | 967 |
| * | Hudson Ltd. Class A | 46,740 | 963 |
| * | Laureate Education Inc. Class A | 59,304 | 947 |
| * | Liberty Latin America Ltd. Class A | 47,914 | 944 |
| * | Conn's Inc. | 22,897 | 939 |
| * | Ascena Retail Group Inc. | 204,077 | 935 |
| Marcus Corp. | 22,141 | 899 | |
| * | Regis Corp. | 41,181 | 881 |
| * | American Outdoor Brands Corp. | 62,477 | 877 |
| * | Century Communities Inc. | 29,927 | 875 |
| Buckle Inc. | 33,848 | 872 | |
| * | M/I Homes Inc. | 32,680 | 847 |
| *,^ | GoPro Inc. Class A | 131,980 | 846 |
| * | XO Group Inc. | 28,099 | 845 |
| National CineMedia Inc. | 91,080 | 829 | |
| * | Fiesta Restaurant Group Inc. | 28,027 | 806 |
| ^ | Camping World Holdings Inc. Class A | 38,339 | 794 |
| EW Scripps Co. Class A | 53,891 | 791 | |
| * | Houghton Mifflin Harcourt Co. | 122,037 | 787 |
| Movado Group Inc. | 18,362 | 782 | |
| Tower International Inc. | 23,089 | 780 | |
| * | Rent-A-Center Inc. | 51,692 | 762 |
| National Presto Industries Inc. | 5,739 | 761 | |
| * | K12 Inc. | 45,031 | 746 |
| * | William Lyon Homes Class A | 37,101 | 726 |
| * | Universal Electronics Inc. | 16,334 | 706 |
| *,^ | Overstock.com Inc. | 24,149 | 705 |
| * | Zumiez Inc. | 21,649 | 674 |
| * | Boot Barn Holdings Inc. | 22,514 | 674 |
| * | American Public Education Inc. | 19,012 | 661 |
| * | QuinStreet Inc. | 43,547 | 661 |
| *,^ | JC Penney Co. Inc. | 365,878 | 648 |
| Ethan Allen Interiors Inc. | 29,022 | 646 | |
| * | Carrols Restaurant Group Inc. | 40,490 | 640 |
| Superior Industries International Inc. | 28,770 | 624 | |
| * | Red Robin Gourmet Burgers Inc. | 15,108 | 624 |
| * | Monarch Casino & Resort Inc. | 13,137 | 618 |
| * | Party City Holdco Inc. | 40,117 | 616 |
| * | Golden Entertainment Inc. | 21,184 | 615 |
| Sonic Automotive Inc. Class A | 28,450 | 612 | |
| * | Motorcar Parts of America Inc. | 22,277 | 591 |
| * | MCBC Holdings Inc. | 21,355 | 589 |
| * | America's Car-Mart Inc. | 6,985 | 583 |
| * | Chuy's Holdings Inc. | 19,983 | 578 |
| Hooker Furniture Corp. | 13,752 | 578 | |
| * | Lumber Liquidators Holdings Inc. | 33,080 | 577 |
| Johnson Outdoors Inc. Class A | 5,651 | 572 | |
| * | MarineMax Inc. | 25,056 | 564 |
| Cato Corp. Class A | 26,025 | 558 | |
3
| Vanguard® Russell 2000 Index Fund | |||
| Schedule of Investments | |||
| August 31, 2018 | |||
| Market | |||
| Value | |||
| Shares | ($000) | ||
| Shoe Carnival Inc. | 12,328 | 548 | |
| * | ZAGG Inc. | 31,811 | 515 |
| * | Nautilus Inc. | 34,511 | 506 |
| Haverty Furniture Cos. Inc. | 22,093 | 488 | |
| * | Central Garden & Pet Co. | 11,946 | 474 |
| * | Beazer Homes USA Inc. | 36,189 | 464 |
| * | Del Taco Restaurants Inc. | 35,773 | 462 |
| Citi Trends Inc. | 14,704 | 455 | |
| * | Hibbett Sports Inc. | 22,067 | 453 |
| Emerald Expositions Events Inc. | 28,695 | 448 | |
| * | Care.com Inc. | 22,564 | 438 |
| * | Drive Shack Inc. | 70,324 | 436 |
| Winmark Corp. | 2,896 | 432 | |
| *,^ | Eros International plc | 36,620 | 414 |
| *,^ | WideOpenWest Inc. | 35,432 | 413 |
| * | Perry Ellis International Inc. | 14,936 | 411 |
| Carriage Services Inc. Class A | 17,421 | 397 | |
| * | Central European Media Enterprises Ltd. Class A | 104,291 | 396 |
| Entravision Communications Corp. Class A | 75,198 | 395 | |
| * | Habit Restaurants Inc. Class A | 23,760 | 393 |
| Tilly's Inc. Class A | 16,591 | 390 | |
| * | Vera Bradley Inc. | 26,531 | 389 |
| * | 1-800-Flowers.com Inc. Class A | 31,279 | 377 |
| * | Lindblad Expeditions Holdings Inc. | 24,524 | 372 |
| * | Rosetta Stone Inc. | 23,094 | 365 |
| * | Potbelly Corp. | 26,893 | 364 |
| Barnes & Noble Inc. | 69,252 | 364 | |
| * | elf Beauty Inc. | 25,981 | 361 |
| Tile Shop Holdings Inc. | 46,623 | 357 | |
| * | Liberty Media Corp-Liberty Braves Class A | 12,769 | 341 |
| RCI Hospitality Holdings Inc. | 10,503 | 341 | |
| * | tronc Inc. | 20,050 | 331 |
| * | MDC Partners Inc. Class A | 67,521 | 327 |
| * | Lands' End Inc. | 12,254 | 315 |
| * | Reading International Inc. Class A | 19,440 | 313 |
| * | Funko Inc. Class A | 12,295 | 312 |
| *,^ | Daily Journal Corp. | 1,296 | 309 |
| Flexsteel Industries Inc. | 8,525 | 304 | |
| *,^ | Zoe's Kitchen Inc. | 22,116 | 303 |
| * | Bojangles' Inc. | 20,317 | 297 |
| * | El Pollo Loco Holdings Inc. | 24,819 | 295 |
| Nathan's Famous Inc. | 3,322 | 295 | |
| * | Green Brick Partners Inc. | 28,196 | 295 |
| Bassett Furniture Industries Inc. | 12,534 | 293 | |
| * | Franklin Covey Co. | 11,287 | 289 |
| * | Hemisphere Media Group Inc. Class A | 20,516 | 281 |
| * | Duluth Holdings Inc. | 9,410 | 272 |
| * | Barnes & Noble Education Inc. | 44,758 | 268 |
| * | Francesca's Holdings Corp. | 40,413 | 254 |
| * | Red Lion Hotels Corp. | 18,508 | 253 |
| Clarus Corp. | 24,227 | 251 | |
| * | Century Casinos Inc. | 31,254 | 250 |
| Weyco Group Inc. | 7,017 | 249 | |
| * | Sportsman's Warehouse Holdings Inc. | 43,276 | 247 |
| Rocky Brands Inc. | 8,014 | 242 | |
| Speedway Motorsports Inc. | 13,233 | 237 | |
| Skyline Champion Corp. | 8,108 | 234 | |
| * | Gaia Inc. Class A | 13,174 | 231 |
| * | Cambium Learning Group Inc. | 17,227 | 230 |
| * | Del Frisco's Restaurant Group Inc. | 23,526 | 222 |
| * | Hovnanian Enterprises Inc. Class A | 140,195 | 219 |
| * | Container Store Group Inc. | 18,165 | 205 |
| *,^ | Revlon Inc. Class A | 9,280 | 202 |
| * | Biglari Holdings Inc. Class B | 1,007 | 199 |
4
| Vanguard® Russell 2000 Index Fund | |||
| Schedule of Investments | |||
| August 31, 2018 | |||
| Market | |||
| Value | |||
| Shares | ($000) | ||
| Clear Channel Outdoor Holdings Inc. Class A | 42,844 | 195 | |
| Superior Group of Cos. Inc. | 10,101 | 191 | |
| * | J Alexander's Holdings Inc. | 14,647 | 182 |
| * | Noodles & Co. Class A | 14,507 | 178 |
| Escalade Inc. | 13,218 | 176 | |
| Marine Products Corp. | 8,938 | 175 | |
| *,^ | Vuzix Corp. | 26,884 | 175 |
| Hamilton Beach Brands Holding Co. Class A | 7,345 | 170 | |
| Pier 1 Imports Inc. | 91,966 | 169 | |
| * | Kirkland's Inc. | 18,448 | 168 |
| Saga Communications Inc. Class A | 4,393 | 167 | |
| ^ | Bluegreen Vacations Corp. | 8,777 | 164 |
| Lifetime Brands Inc. | 13,202 | 154 | |
| * | Town Sports International Holdings Inc. | 16,538 | 151 |
| *,^ | Boston Omaha Corp. Class A | 5,768 | 150 |
| * | New York & Co. Inc. | 32,848 | 149 |
| Big 5 Sporting Goods Corp. | 23,440 | 134 | |
| * | New Home Co. Inc. | 15,037 | 132 |
| BJ's Wholesale Club Holdings Inc. | 4,452 | 131 | |
| * | Cardlytics Inc. | 6,402 | 130 |
| * | Biglari Holdings Inc. | 129 | 124 |
| * | J. Jill Inc. | 18,951 | 114 |
| Fluent Inc. | 40,883 | 98 | |
| *,^ | Eastman Kodak Co. | 19,990 | 65 |
| *,^ | Sears Holdings Corp. | 46,159 | 62 |
| * | Empire Resorts Inc. | 4,482 | 56 |
| Beasley Broadcast Group Inc. Class A | 6,432 | 49 | |
| * | Purple Innovation Inc. | 5,605 | 31 |
| LiveXLive Media Inc. | 5,504 | 28 | |
| 403,090 | |||
| Consumer Staples (2.4%) | |||
| * | Performance Food Group Co. | 118,752 | 3,931 |
| * | Edgewell Personal Care Co. | 62,959 | 3,555 |
| Lancaster Colony Corp. | 22,043 | 3,445 | |
| Medifast Inc. | 13,640 | 3,120 | |
| * | Boston Beer Co. Inc. Class A | 9,810 | 2,974 |
| WD-40 Co. | 15,921 | 2,825 | |
| J&J Snack Foods Corp. | 17,561 | 2,555 | |
| Sanderson Farms Inc. | 23,786 | 2,516 | |
| B&G Foods Inc. | 76,549 | 2,446 | |
| * | United Natural Foods Inc. | 58,931 | 2,093 |
| Calavo Growers Inc. | 18,539 | 1,962 | |
| * | USANA Health Sciences Inc. | 14,826 | 1,956 |
| Core-Mark Holding Co. Inc. | 53,449 | 1,912 | |
| Cal-Maine Foods Inc. | 36,357 | 1,798 | |
| Vector Group Ltd. | 113,875 | 1,768 | |
| Universal Corp. | 28,928 | 1,730 | |
| *,^ | Rite Aid Corp. | 1,231,128 | 1,687 |
| *,^ | National Beverage Corp. | 13,752 | 1,621 |
| * | SUPERVALU Inc. | 44,433 | 1,435 |
| * | Diplomat Pharmacy Inc. | 66,119 | 1,366 |
| * | Hostess Brands Inc. Class A | 114,958 | 1,352 |
| Fresh Del Monte Produce Inc. | 35,428 | 1,326 | |
| Andersons Inc. | 31,613 | 1,291 | |
| * | Simply Good Foods Co. | 70,267 | 1,265 |
| MGP Ingredients Inc. | 15,562 | 1,200 | |
| * | Freshpet Inc. | 30,577 | 1,136 |
| Coca-Cola Bottling Co. Consolidated | 5,451 | 924 | |
| SpartanNash Co. | 41,395 | 884 | |
| PetMed Express Inc. | 23,227 | 852 | |
| Dean Foods Co. | 106,219 | 809 | |
| * | Chefs' Warehouse Inc. | 25,128 | 739 |
| John B Sanfilippo & Son Inc. | 9,904 | 724 | |
| * | Primo Water Corp. | 31,524 | 630 |
5
| Vanguard® Russell 2000 Index Fund | |||
| Schedule of Investments | |||
| August 31, 2018 | |||
| Market | |||
| Value | |||
| Shares | ($000) | ||
| Ingles Markets Inc. Class A | 16,363 | 588 | |
| Tootsie Roll Industries Inc. | 18,889 | 544 | |
| Weis Markets Inc. | 11,065 | 515 | |
| Limoneira Co. | 14,250 | 440 | |
| *,^ | 22nd Century Group Inc. | 135,577 | 367 |
| * | Farmer Brothers Co. | 11,849 | 344 |
| Turning Point Brands Inc. | 9,231 | 311 | |
| *,^ | GNC Holdings Inc. Class A | 94,952 | 294 |
| * | Craft Brew Alliance Inc. | 14,966 | 284 |
| Village Super Market Inc. Class A | 9,670 | 282 | |
| * | Seneca Foods Corp. Class A | 8,102 | 262 |
| *,^ | Cadiz Inc. | 25,493 | 245 |
| Natural Health Trends Corp. | 8,501 | 225 | |
| * | Natural Grocers by Vitamin Cottage Inc. | 10,366 | 201 |
| * | Smart & Final Stores Inc. | 26,899 | 188 |
| * | Alliance One International Inc. | 9,602 | 170 |
| Alico Inc. | 4,032 | 130 | |
| * | Castle Brands Inc. | 110,411 | 127 |
| *,^ | Celsius Holdings Inc. | 25,643 | 117 |
| * | Nature's Sunshine Products Inc. | 9,913 | 89 |
| 65,550 | |||
| Energy (4.6%) | |||
| Delek US Holdings Inc. | 97,490 | 5,313 | |
| * | Oasis Petroleum Inc. | 314,580 | 4,234 |
| * | PDC Energy Inc. | 77,280 | 4,072 |
| McDermott International Inc. | 209,288 | 4,048 | |
| Peabody Energy Corp. | 94,212 | 3,892 | |
| * | Southwestern Energy Co. | 687,956 | 3,866 |
| * | Matador Resources Co. | 115,548 | 3,783 |
| * | Oceaneering International Inc. | 115,464 | 3,264 |
| * | Callon Petroleum Co. | 262,246 | 2,963 |
| * | Denbury Resources Inc. | 512,610 | 2,855 |
| Golar LNG Ltd. | 110,420 | 2,822 | |
| * | SRC Energy Inc. | 282,074 | 2,626 |
| * | Gulfport Energy Corp. | 203,517 | 2,393 |
| * | Oil States International Inc. | 69,495 | 2,352 |
| * | Dril-Quip Inc. | 44,340 | 2,335 |
| SemGroup Corp. Class A | 92,067 | 2,228 | |
| * | Carrizo Oil & Gas Inc. | 91,311 | 2,212 |
| * | California Resources Corp. | 52,848 | 2,195 |
| World Fuel Services Corp. | 78,216 | 2,192 | |
| * | NOW Inc. | 125,970 | 2,165 |
| * | Rowan Cos. plc Class A | 148,452 | 2,084 |
| Arch Coal Inc. Class A | 22,431 | 1,989 | |
| Archrock Inc. | 148,468 | 1,878 | |
| * | Noble Corp. plc | 288,713 | 1,761 |
| Ocean Rig UDW Inc. | 63,894 | 1,730 | |
| * | Superior Energy Services Inc. | 179,228 | 1,613 |
| * | Unit Corp. | 61,312 | 1,612 |
| * | C&J Energy Services Inc. | 75,249 | 1,577 |
| * | Helix Energy Solutions Group Inc. | 164,969 | 1,544 |
| * | Laredo Petroleum Inc. | 181,162 | 1,502 |
| * | Cactus Inc. Class A | 43,140 | 1,475 |
| *,^ | Sunrun Inc. | 111,226 | 1,459 |
| * | CONSOL Energy Inc. | 32,936 | 1,413 |
| *,^ | Diamond Offshore Drilling Inc. | 75,391 | 1,313 |
| * | Penn Virginia Corp. | 14,532 | 1,293 |
| * | ProPetro Holding Corp. | 82,337 | 1,253 |
| * | Renewable Energy Group Inc. | 43,418 | 1,170 |
| * | Forum Energy Technologies Inc. | 94,655 | 1,131 |
| * | Newpark Resources Inc. | 102,155 | 1,073 |
| * | Exterran Corp. | 37,626 | 1,031 |
| Warrior Met Coal Inc. | 42,343 | 1,018 | |
| * | Jagged Peak Energy Inc. | 75,511 | 998 |
6
| Vanguard® Russell 2000 Index Fund | |||
| Schedule of Investments | |||
| August 31, 2018 | |||
| Market | |||
| Value | |||
| Shares | ($000) | ||
| TerraForm Power Inc. Class A | 85,150 | 952 | |
| *,^ | Tellurian Inc. | 95,311 | 922 |
| * | SunCoke Energy Inc. | 76,577 | 855 |
| *,^ | Resolute Energy Corp. | 25,379 | 837 |
| Green Plains Inc. | 46,458 | 825 | |
| * | Talos Energy Inc. | 23,431 | 809 |
| * | Ring Energy Inc. | 67,561 | 797 |
| * | Keane Group Inc. | 63,915 | 785 |
| * | Frank's International NV | 86,075 | 760 |
| * | Par Pacific Holdings Inc. | 36,842 | 748 |
| * | W&T Offshore Inc. | 108,459 | 734 |
| * | Select Energy Services Inc. Class A | 53,477 | 730 |
| *,^ | Halcon Resources Corp. | 158,220 | 725 |
| * | HighPoint Resources Corp. | 126,593 | 698 |
| ^ | CVR Energy Inc. | 18,315 | 697 |
| * | Bonanza Creek Energy Inc. | 22,308 | 692 |
| * | WildHorse Resource Development Corp. | 31,726 | 690 |
| * | TETRA Technologies Inc. | 141,531 | 650 |
| * | Matrix Service Co. | 30,730 | 642 |
| * | SandRidge Energy Inc. | 36,427 | 578 |
| * | REX American Resources Corp. | 6,586 | 531 |
| * | Alta Mesa Resources Inc. | 111,168 | 527 |
| * | Solaris Oilfield Infrastructure Inc. Class A | 30,185 | 520 |
| *,^ | Enphase Energy Inc. | 100,904 | 493 |
| *,^ | SunPower Corp. Class A | 71,871 | 483 |
| * | TPI Composites Inc. | 16,946 | 475 |
| * | Clean Energy Fuels Corp. | 159,386 | 438 |
| * | Northern Oil and Gas Inc. | 125,736 | 434 |
| * | Abraxas Petroleum Corp. | 184,456 | 415 |
| * | Covia Holdings Corp. | 36,220 | 410 |
| * | SEACOR Marine Holdings Inc. | 18,809 | 385 |
| * | Energy XXI Gulf Coast Inc. | 38,846 | 352 |
| * | Liberty Oilfield Services Inc. Class A | 17,537 | 344 |
| Panhandle Oil and Gas Inc. Class A | 18,102 | 338 | |
| * | Trecora Resources | 24,024 | 336 |
| * | Natural Gas Services Group Inc. | 14,835 | 328 |
| * | Ameresco Inc. Class A | 22,051 | 316 |
| Evolution Petroleum Corp. | 29,739 | 299 | |
| FTS International Inc. | 26,328 | 290 | |
| * | Pioneer Energy Services Corp. | 88,185 | 282 |
| * | Era Group Inc. | 23,527 | 281 |
| * | Nine Energy Service Inc. | 9,148 | 274 |
| Mammoth Energy Services Inc. | 9,912 | 272 | |
| *,^ | Lilis Energy Inc. | 51,176 | 272 |
| * | RigNet Inc. | 16,438 | 268 |
| * | SilverBow Resources Inc. | 8,262 | 255 |
| * | Ultra Petroleum Corp. | 187,149 | 245 |
| *,^ | Sanchez Energy Corp. | 87,460 | 230 |
| * | ION Geophysical Corp. | 12,535 | 225 |
| * | Infrastructure and Energy Alternatives Inc. | 21,106 | 224 |
| * | Midstates Petroleum Co. Inc. | 17,991 | 209 |
| * | CARBO Ceramics Inc. | 23,813 | 206 |
| * | Cloud Peak Energy Inc. | 86,006 | 203 |
| * | Basic Energy Services Inc. | 21,910 | 194 |
| * | Vivint Solar Inc. | 36,526 | 192 |
| * | NCS Multistage Holdings Inc. | 11,664 | 190 |
| * | Earthstone Energy Inc. Class A | 21,970 | 184 |
| * | Independence Contract Drilling Inc. | 41,255 | 180 |
| * | Key Energy Services Inc. | 12,125 | 162 |
| * | Flotek Industries Inc. | 62,255 | 155 |
| *,^ | Eclipse Resources Corp. | 104,444 | 149 |
| * | Dawson Geophysical Co. | 23,687 | 147 |
| * | Goodrich Petroleum Corp. | 9,634 | 135 |
| *,^ | Smart Sand Inc. | 25,956 | 129 |
7
| Vanguard® Russell 2000 Index Fund | |||
| Schedule of Investments | |||
| August 31, 2018 | |||
| Market | |||
| Value | |||
| Shares | ($000) | ||
| Hallador Energy Co. | 20,146 | 123 | |
| Adams Resources & Energy Inc. | 2,553 | 117 | |
| *,^ | Zion Oil & Gas Inc. | 60,861 | 113 |
| *,^ | Approach Resources Inc. | 51,157 | 111 |
| *,^ | FuelCell Energy Inc. | 92,603 | 108 |
| * | Isramco Inc. | 809 | 94 |
| * | EP Energy Corp. Class A | 48,257 | 85 |
| * | Profire Energy Inc. | 26,716 | 76 |
| * | Ramaco Resources Inc. | 7,732 | 62 |
| * | NextDecade Corp. | 8,466 | 58 |
| Quintana Energy Services Inc. | 7,126 | 56 | |
| * | Berry Petroleum Corp. | 1,415 | 23 |
| * | Nuverra Environmental Solutions Inc. | 1,458 | 17 |
| * | Rosehill Resources Inc. | 1,796 | 14 |
| Noble Energy Inc. | 8 | — | |
| 122,887 | |||
| Financial Services (24.9%) | |||
| Primerica Inc. | 51,076 | 6,244 | |
| IBERIABANK Corp. | 65,523 | 5,678 | |
| * | MGIC Investment Corp. | 432,992 | 5,508 |
| Radian Group Inc. | 252,204 | 5,127 | |
| Gramercy Property Trust | 187,295 | 5,123 | |
| Hancock Whitney Corp. | 99,306 | 5,119 | |
| Kemper Corp. | 61,557 | 5,008 | |
| Sabra Health Care REIT Inc. | 207,447 | 4,892 | |
| * | Essent Group Ltd. | 112,100 | 4,861 |
| * | Green Dot Corp. Class A | 55,663 | 4,769 |
| Chemical Financial Corp. | 83,219 | 4,753 | |
| First Industrial Realty Trust Inc. | 145,383 | 4,719 | |
| MB Financial Inc. | 96,883 | 4,695 | |
| United Bankshares Inc. | 118,064 | 4,652 | |
| Ryman Hospitality Properties Inc. | 52,195 | 4,631 | |
| Cousins Properties Inc. | 490,747 | 4,588 | |
| First Financial Bankshares Inc. | 75,825 | 4,580 | |
| LaSalle Hotel Properties | 129,341 | 4,541 | |
| Valley National Bancorp | 376,593 | 4,538 | |
| Glacier Bancorp Inc. | 99,057 | 4,525 | |
| Stifel Financial Corp. | 80,984 | 4,525 | |
| Healthcare Realty Trust Inc. | 144,705 | 4,480 | |
| RLJ Lodging Trust | 202,866 | 4,445 | |
| Sunstone Hotel Investors Inc. | 263,226 | 4,417 | |
| Home BancShares Inc. | 185,952 | 4,353 | |
| Selective Insurance Group Inc. | 67,771 | 4,351 | |
| FirstCash Inc. | 51,882 | 4,218 | |
| CNO Financial Group Inc. | 195,047 | 4,215 | |
| Blackstone Mortgage Trust Inc. Class A | 119,527 | 4,071 | |
| UMB Financial Corp. | 52,916 | 3,981 | |
| EastGroup Properties Inc. | 40,138 | 3,904 | |
| BancorpSouth Bank | 111,572 | 3,883 | |
| American Equity Investment Life Holding Co. | 104,535 | 3,877 | |
| Community Bank System Inc. | 58,581 | 3,874 | |
| Cathay General Bancorp | 90,142 | 3,813 | |
| Investors Bancorp Inc. | 292,482 | 3,744 | |
| Physicians Realty Trust | 213,028 | 3,726 | |
| National Health Investors Inc. | 46,946 | 3,720 | |
| Education Realty Trust Inc. | 88,792 | 3,674 | |
| Fulton Financial Corp. | 201,085 | 3,660 | |
| Columbia Banking System Inc. | 85,259 | 3,602 | |
| GEO Group Inc. | 141,721 | 3,595 | |
| CoreCivic Inc. | 138,637 | 3,589 | |
| Old National Bancorp | 176,231 | 3,577 | |
| RLI Corp. | 45,807 | 3,526 | |
| South State Corp. | 42,634 | 3,515 | |
| First Financial Bancorp | 111,336 | 3,496 | |
8
| Vanguard® Russell 2000 Index Fund | |||
| Schedule of Investments | |||
| August 31, 2018 | |||
| Market | |||
| Value | |||
| Shares | ($000) | ||
| PotlatchDeltic Corp. | 71,869 | 3,471 | |
| Bank of NT Butterfield & Son Ltd. | 63,699 | 3,366 | |
| Washington Federal Inc. | 98,570 | 3,361 | |
| Simmons First National Corp. Class A | 105,519 | 3,334 | |
| STAG Industrial Inc. | 113,993 | 3,291 | |
| First Midwest Bancorp Inc. | 119,739 | 3,254 | |
| Union Bankshares Corp. | 76,491 | 3,182 | |
| Kennedy-Wilson Holdings Inc. | 146,386 | 3,140 | |
| Pebblebrook Hotel Trust | 79,527 | 3,071 | |
| Rexford Industrial Realty Inc. | 94,019 | 3,056 | |
| Xenia Hotels & Resorts Inc. | 125,424 | 3,043 | |
| PS Business Parks Inc. | 23,233 | 3,030 | |
| International Bancshares Corp. | 64,313 | 3,013 | |
| Great Western Bancorp Inc. | 69,022 | 3,005 | |
| WesBanco Inc. | 60,859 | 3,003 | |
| * | Enstar Group Ltd. | 14,063 | 3,002 |
| ProAssurance Corp. | 61,996 | 2,997 | |
| Moelis & Co. Class A | 51,312 | 2,979 | |
| Piedmont Office Realty Trust Inc. Class A | 149,226 | 2,961 | |
| CenterState Bank Corp. | 96,429 | 2,953 | |
| Urban Edge Properties | 127,665 | 2,918 | |
| CVB Financial Corp. | 120,691 | 2,903 | |
| Washington REIT | 91,782 | 2,897 | |
| Independent Bank Corp. | 31,711 | 2,889 | |
| Apollo Commercial Real Estate Finance Inc. | 143,973 | 2,797 | |
| Trustmark Corp. | 78,734 | 2,793 | |
| DiamondRock Hospitality Co. | 233,547 | 2,793 | |
| First Merchants Corp. | 57,552 | 2,769 | |
| United Community Banks Inc. | 91,265 | 2,769 | |
| * | Genworth Financial Inc. Class A | 588,249 | 2,735 |
| QTS Realty Trust Inc. Class A | 59,482 | 2,720 | |
| Acadia Realty Trust | 93,899 | 2,678 | |
| Hope Bancorp Inc. | 151,276 | 2,649 | |
| Federated Investors Inc. Class B | 113,253 | 2,623 | |
| Renasant Corp. | 56,053 | 2,617 | |
| Tanger Factory Outlet Centers Inc. | 107,240 | 2,580 | |
| LegacyTexas Financial Group Inc. | 55,644 | 2,575 | |
| * | BofI Holding Inc. | 68,976 | 2,569 |
| * | FCB Financial Holdings Inc. Class A | 49,473 | 2,563 |
| Retail Opportunity Investments Corp. | 129,546 | 2,557 | |
| Towne Bank | 76,769 | 2,503 | |
| Terreno Realty Corp. | 64,180 | 2,465 | |
| Argo Group International Holdings Ltd. | 37,785 | 2,407 | |
| Banner Corp. | 37,352 | 2,403 | |
| Lexington Realty Trust | 251,735 | 2,351 | |
| ServisFirst Bancshares Inc. | 54,291 | 2,340 | |
| Ameris Bancorp | 46,470 | 2,307 | |
| Mack-Cali Realty Corp. | 105,527 | 2,305 | |
| *,^ | LendingTree Inc. | 9,054 | 2,294 |
| Chesapeake Lodging Trust | 69,307 | 2,281 | |
| Horace Mann Educators Corp. | 48,025 | 2,224 | |
| * | First BanCorp | 249,757 | 2,185 |
| LTC Properties Inc. | 45,950 | 2,134 | |
| Invesco Mortgage Capital Inc. | 130,968 | 2,126 | |
| * | Pacific Premier Bancorp Inc. | 53,181 | 2,103 |
| Heartland Financial USA Inc. | 34,256 | 2,083 | |
| Northwest Bancshares Inc. | 111,411 | 2,030 | |
| NBT Bancorp Inc. | 49,784 | 2,015 | |
| Agree Realty Corp. | 35,142 | 2,006 | |
| * | Eagle Bancorp Inc. | 37,205 | 2,003 |
| Berkshire Hills Bancorp Inc. | 47,405 | 2,003 | |
| HFF Inc. Class A | 43,910 | 1,994 | |
| Capitol Federal Financial Inc. | 150,081 | 1,983 | |
| Cadence BanCorp Class A | 69,657 | 1,968 | |
9
| Vanguard® Russell 2000 Index Fund | |||
| Schedule of Investments | |||
| August 31, 2018 | |||
| Market | |||
| Value | |||
| Shares | ($000) | ||
| Colony Credit Real Estate Inc. | 97,977 | 1,967 | |
| National General Holdings Corp. | 72,028 | 1,967 | |
| Government Properties Income Trust | 115,487 | 1,953 | |
| First Commonwealth Financial Corp. | 116,218 | 1,947 | |
| Four Corners Property Trust Inc. | 72,176 | 1,944 | |
| Seritage Growth Properties Class A | 37,740 | 1,943 | |
| Westamerica Bancorporation | 30,191 | 1,933 | |
| * | PRA Group Inc. | 52,235 | 1,909 |
| AmTrust Financial Services Inc. | 129,658 | 1,885 | |
| S&T Bancorp Inc. | 40,272 | 1,879 | |
| Alexander & Baldwin Inc. | 79,827 | 1,874 | |
| Waddell & Reed Financial Inc. Class A | 93,226 | 1,866 | |
| Artisan Partners Asset Management Inc. Class A | 56,188 | 1,863 | |
| Provident Financial Services Inc. | 72,239 | 1,823 | |
| American Assets Trust Inc. | 45,124 | 1,782 | |
| First Interstate BancSystem Inc. Class A | 38,267 | 1,777 | |
| Hilltop Holdings Inc. | 85,597 | 1,776 | |
| Ladder Capital Corp. Class A | 101,823 | 1,769 | |
| Walker & Dunlop Inc. | 32,361 | 1,764 | |
| Park National Corp. | 15,695 | 1,729 | |
| Employers Holdings Inc. | 37,666 | 1,727 | |
| WSFS Financial Corp. | 35,246 | 1,720 | |
| Global Net Lease Inc. | 79,242 | 1,719 | |
| *,^ | Redfin Corp. | 86,726 | 1,718 |
| EVERTEC Inc. | 71,388 | 1,717 | |
| Independent Bank Group Inc. | 24,716 | 1,712 | |
| * | Seacoast Banking Corp. of Florida | 53,746 | 1,699 |
| Navigators Group Inc. | 24,274 | 1,699 | |
| Washington Prime Group Inc. | 217,765 | 1,685 | |
| Kite Realty Group Trust | 95,986 | 1,678 | |
| Brookline Bancorp Inc. | 92,268 | 1,675 | |
| National Storage Affiliates Trust | 58,908 | 1,671 | |
| Summit Hotel Properties Inc. | 121,321 | 1,666 | |
| Safety Insurance Group Inc. | 17,175 | 1,661 | |
| Universal Insurance Holdings Inc. | 37,064 | 1,653 | |
| Houlihan Lokey Inc. Class A | 34,841 | 1,639 | |
| First Busey Corp. | 50,904 | 1,631 | |
| * | Cardtronics plc Class A | 46,327 | 1,626 |
| CareTrust REIT Inc. | 87,819 | 1,620 | |
| OceanFirst Financial Corp. | 55,269 | 1,614 | |
| Sandy Spring Bancorp Inc. | 40,461 | 1,578 | |
| * | NMI Holdings Inc. Class A | 72,805 | 1,573 |
| Kearny Financial Corp. | 113,767 | 1,559 | |
| * | Cannae Holdings Inc. | 79,527 | 1,546 |
| Monmouth Real Estate Investment Corp. | 88,581 | 1,540 | |
| Americold Realty Trust | 61,558 | 1,533 | |
| Select Income REIT | 74,188 | 1,525 | |
| Tompkins Financial Corp. | 17,295 | 1,520 | |
| Enterprise Financial Services Corp. | 26,506 | 1,492 | |
| Redwood Trust Inc. | 87,412 | 1,484 | |
| * | FGL Holdings | 165,463 | 1,441 |
| Heritage Financial Corp. | 39,593 | 1,437 | |
| State Bank Financial Corp. | 44,068 | 1,436 | |
| City Holding Co. | 17,630 | 1,429 | |
| First Bancorp | 34,008 | 1,419 | |
| AMERISAFE Inc. | 22,235 | 1,419 | |
| Boston Private Financial Holdings Inc. | 97,888 | 1,414 | |
| Beneficial Bancorp Inc. | 79,917 | 1,407 | |
| Lakeland Financial Corp. | 28,330 | 1,396 | |
| PennyMac Mortgage Investment Trust | 69,720 | 1,393 | |
| Kinsale Capital Group Inc. | 22,888 | 1,391 | |
| Southside Bancshares Inc. | 38,924 | 1,386 | |
| PJT Partners Inc. | 23,420 | 1,356 | |
| National Bank Holdings Corp. Class A | 33,725 | 1,354 | |
10
| Vanguard® Russell 2000 Index Fund | |||
| Schedule of Investments | |||
| August 31, 2018 | |||
| Market | |||
| Value | |||
| Shares | ($000) | ||
| BancFirst Corp. | 21,141 | 1,349 | |
| * | LendingClub Corp. | 370,795 | 1,339 |
| Tier REIT Inc. | 55,989 | 1,335 | |
| Piper Jaffray Cos. | 17,219 | 1,326 | |
| * | Enova International Inc. | 39,024 | 1,296 |
| Hannon Armstrong Sustainable Infrastructure Capital Inc. | 59,708 | 1,287 | |
| Ramco-Gershenson Properties Trust | 92,168 | 1,287 | |
| * | Third Point Reinsurance Ltd. | 94,054 | 1,260 |
| James River Group Holdings Ltd. | 30,520 | 1,250 | |
| Nelnet Inc. Class A | 21,593 | 1,245 | |
| Stewart Information Services Corp. | 27,282 | 1,222 | |
| United Fire Group Inc. | 24,590 | 1,218 | |
| BrightSphere Investment Group plc | 95,949 | 1,218 | |
| * | Triumph Bancorp Inc. | 27,949 | 1,186 |
| * | Encore Capital Group Inc. | 30,248 | 1,172 |
| TriCo Bancshares | 29,587 | 1,150 | |
| Bryn Mawr Bank Corp. | 23,491 | 1,146 | |
| ARMOUR Residential REIT Inc. | 48,423 | 1,139 | |
| * | Flagstar Bancorp Inc. | 34,447 | 1,138 |
| Chatham Lodging Trust | 53,052 | 1,138 | |
| Universal Health Realty Income Trust | 14,860 | 1,133 | |
| WisdomTree Investments Inc. | 137,461 | 1,130 | |
| * | Ambac Financial Group Inc. | 52,806 | 1,116 |
| Getty Realty Corp. | 37,471 | 1,091 | |
| Cohen & Steers Inc. | 26,155 | 1,087 | |
| InfraREIT Inc. | 51,988 | 1,086 | |
| *,^ | Trupanion Inc. | 28,208 | 1,077 |
| Easterly Government Properties Inc. | 53,124 | 1,076 | |
| Washington Trust Bancorp Inc. | 17,843 | 1,071 | |
| *,^ | MBIA Inc. | 103,786 | 1,066 |
| Independence Realty Trust Inc. | 102,624 | 1,060 | |
| CoBiz Financial Inc. | 45,332 | 1,045 | |
| United Financial Bancorp Inc. | 58,762 | 1,044 | |
| Virtus Investment Partners Inc. | 8,076 | 1,042 | |
| 1st Source Corp. | 18,580 | 1,040 | |
| Franklin Street Properties Corp. | 120,702 | 1,034 | |
| RE/MAX Holdings Inc. Class A | 20,961 | 1,032 | |
| Lakeland Bancorp Inc. | 53,114 | 1,025 | |
| Banc of California Inc. | 50,021 | 1,008 | |
| Meridian Bancorp Inc. | 56,261 | 1,007 | |
| TrustCo Bank Corp. NY | 108,498 | 1,004 | |
| MTGE Investment Corp. | 50,853 | 997 | |
| * | INTL. FCStone Inc. | 17,861 | 996 |
| Cass Information Systems Inc. | 13,891 | 994 | |
| Preferred Bank | 16,200 | 992 | |
| Hersha Hospitality Trust Class A | 41,902 | 989 | |
| CorePoint Lodging Inc. | 47,420 | 989 | |
| Stock Yards Bancorp Inc. | 25,533 | 988 | |
| *,^ | Columbia Financial Inc. | 58,219 | 986 |
| Hanmi Financial Corp. | 37,733 | 985 | |
| Granite Point Mortgage Trust Inc. | 49,876 | 955 | |
| Meta Financial Group Inc. | 10,986 | 951 | |
| Univest Corp. of Pennsylvania | 33,345 | 950 | |
| FBL Financial Group Inc. Class A | 11,612 | 945 | |
| Central Pacific Financial Corp. | 33,071 | 937 | |
| Carolina Financial Corp. | 22,765 | 937 | |
| Guaranty Bancorp | 29,623 | 926 | |
| German American Bancorp Inc. | 24,397 | 917 | |
| Capstead Mortgage Corp. | 108,174 | 909 | |
| Community Trust Bancorp Inc. | 18,320 | 905 | |
| Live Oak Bancshares Inc. | 29,637 | 897 | |
| Alexander's Inc. | 2,478 | 894 | |
| CBL & Associates Properties Inc. | 199,957 | 892 | |
| Horizon Bancorp Inc. | 43,028 | 879 | |
11
| Vanguard® Russell 2000 Index Fund | ||
| Schedule of Investments | ||
| August 31, 2018 | ||
| Market | ||
| Value | ||
| Shares | ($000) | |
| ConnectOne Bancorp Inc. | 35,603 | 878 |
| National Western Life Group Inc. Class A | 2,657 | 866 |
| * HomeStreet Inc. | 29,331 | 864 |
| Midland States Bancorp Inc. | 24,842 | 855 |
| Hamilton Lane Inc. Class A | 17,395 | 849 |
| iStar Inc. | 75,805 | 848 |
| ^ New York Mortgage Trust Inc. | 132,488 | 848 |
| Camden National Corp. | 18,486 | 846 |
| * World Acceptance Corp. | 7,108 | 843 |
| * Customers Bancorp Inc. | 34,069 | 841 |
| Investment Technology Group Inc. | 38,412 | 840 |
| Armada Hoffler Properties Inc. | 53,656 | 836 |
| * Marcus & Millichap Inc. | 22,914 | 834 |
| Pennsylvania REIT | 81,391 | 830 |
| OFG Bancorp | 51,133 | 828 |
| * Veritex Holdings Inc. | 26,958 | 825 |
| Preferred Apartment Communities Inc. Class A | 46,250 | 824 |
| * Donnelley Financial Solutions Inc. | 39,234 | 820 |
| Flushing Financial Corp. | 31,509 | 817 |
| Northfield Bancorp Inc. | 49,718 | 809 |
| Federal Agricultural Mortgage Corp. | 10,438 | 804 |
| Saul Centers Inc. | 13,376 | 803 |
| Urstadt Biddle Properties Inc. Class A | 35,140 | 799 |
| CBTX Inc. | 21,758 | 796 |
| RMR Group Inc. Class A | 8,332 | 787 |
| Investors Real Estate Trust | 143,253 | 781 |
| Origin Bancorp Inc. | 19,253 | 780 |
| Arbor Realty Trust Inc. | 63,137 | 774 |
| * TriState Capital Holdings Inc. | 25,835 | 769 |
| * National Commerce Corp. | 17,311 | 762 |
| NorthStar Realty Europe Corp. | 55,358 | 760 |
| Oritani Financial Corp. | 46,677 | 756 |
| TPG RE Finance Trust Inc. | 36,519 | 754 |
| Great Southern Bancorp Inc. | 12,657 | 751 |
| * St. Joe Co. | 43,468 | 748 |
| Banco Latinoamericano de Comercio Exterior SA | 36,167 | 748 |
| First Defiance Financial Corp. | 23,130 | 740 |
| Heritage Commerce Corp. | 46,348 | 734 |
| CatchMark Timber Trust Inc. Class A | 58,392 | 732 |
| Peoples Bancorp Inc. | 20,263 | 727 |
| * Health Insurance Innovations Inc. Class A | 13,513 | 715 |
| Peapack Gladstone Financial Corp. | 21,325 | 712 |
| Diamond Hill Investment Group Inc. | 3,810 | 711 |
| First Financial Corp. | 13,781 | 709 |
| Front Yard Residential Corp. | 57,312 | 700 |
| Bank of Marin Bancorp | 7,933 | 699 |
| Bridge Bancorp Inc. | 19,737 | 691 |
| Greenhill & Co. Inc. | 25,099 | 690 |
| Gladstone Commercial Corp. | 34,224 | 681 |
| Dime Community Bancshares Inc. | 37,422 | 679 |
| * Everi Holdings Inc. | 77,311 | 670 |
| FB Financial Corp. | 15,222 | 669 |
| Mercantile Bank Corp. | 18,658 | 661 |
| QCR Holdings Inc. | 15,179 | 660 |
| People's Utah Bancorp | 18,239 | 659 |
| Ashford Hospitality Trust Inc. | 100,903 | 655 |
| First Community Bancshares Inc. | 19,499 | 655 |
| * EZCORP Inc. Class A | 58,302 | 647 |
| Opus Bank | 22,810 | 647 |
| * eHealth Inc. | 21,866 | 638 |
| First of Long Island Corp. | 29,199 | 637 |
| Independent Bank Corp. | 25,372 | 633 |
| Fidelity Southern Corp. | 26,023 | 632 |
| NexPoint Residential Trust Inc. | 19,561 | 632 |
12
| Vanguard® Russell 2000 Index Fund | |||
| Schedule of Investments | |||
| August 31, 2018 | |||
| Market | |||
| Value | |||
| Shares | ($000) | ||
| * | Equity Bancshares Inc. Class A | 15,526 | 630 |
| * | First Foundation Inc. | 38,899 | 629 |
| Green Bancorp Inc. | 26,059 | 625 | |
| AG Mortgage Investment Trust Inc. | 33,189 | 624 | |
| Community Healthcare Trust Inc. | 20,087 | 623 | |
| * | Allegiance Bancshares Inc. | 13,986 | 623 |
| State Auto Financial Corp. | 19,814 | 622 | |
| Old Line Bancshares Inc. | 18,146 | 621 | |
| Blue Hills Bancorp Inc. | 26,592 | 612 | |
| UMH Properties Inc. | 37,871 | 604 | |
| United Community Financial Corp. | 57,911 | 599 | |
| Whitestone REIT | 43,792 | 597 | |
| First Bancshares Inc. | 14,388 | 591 | |
| * | Bancorp Inc. | 58,395 | 586 |
| * | HomeTrust Bancshares Inc. | 20,237 | 583 |
| Financial Institutions Inc. | 17,927 | 579 | |
| Industrial Logistics Properties Trust | 23,956 | 577 | |
| * | Franklin Financial Network Inc. | 14,827 | 573 |
| * | Ocwen Financial Corp. | 136,540 | 571 |
| BBX Capital Corp. Class A | 76,645 | 569 | |
| First Mid-Illinois Bancshares Inc. | 13,754 | 565 | |
| Westwood Holdings Group Inc. | 9,650 | 555 | |
| B. Riley Financial Inc. | 23,995 | 549 | |
| Anworth Mortgage Asset Corp. | 112,467 | 549 | |
| * | WMIH Corp. | 362,854 | 548 |
| New Senior Investment Group Inc. | 86,308 | 547 | |
| * | Tejon Ranch Co. | 24,506 | 545 |
| CNB Financial Corp. | 17,670 | 545 | |
| Republic Bancorp Inc. Class A | 11,185 | 544 | |
| * | Atlantic Capital Bancshares Inc. | 29,635 | 541 |
| * | Spirit MTA REIT | 50,215 | 538 |
| * | FRP Holdings Inc. | 8,238 | 538 |
| Arrow Financial Corp. | 13,645 | 537 | |
| Western Asset Mortgage Capital Corp. | 48,165 | 536 | |
| * | Nicolet Bankshares Inc. | 9,582 | 530 |
| City Office REIT Inc. | 40,756 | 526 | |
| Old Second Bancorp Inc. | 33,526 | 518 | |
| First Connecticut Bancorp Inc. | 16,236 | 515 | |
| CorEnergy Infrastructure Trust Inc. | 13,710 | 513 | |
| Bar Harbor Bankshares | 17,421 | 513 | |
| Merchants Bancorp | 19,256 | 503 | |
| Waterstone Financial Inc. | 29,737 | 503 | |
| United Insurance Holdings Corp. | 23,988 | 500 | |
| *,^ | Cowen Inc. Class A | 32,582 | 495 |
| One Liberty Properties Inc. | 17,110 | 493 | |
| * | On Deck Capital Inc. | 59,404 | 488 |
| ^ | Orchid Island Capital Inc. | 61,232 | 486 |
| PennyMac Financial Services Inc. Class A | 22,960 | 486 | |
| *,^ | Citizens Inc. Class A | 57,586 | 484 |
| Sierra Bancorp | 16,293 | 483 | |
| Access National Corp. | 17,383 | 472 | |
| Farmers & Merchants Bancorp Inc. | 10,365 | 471 | |
| RBB Bancorp | 16,322 | 468 | |
| Farmers National Banc Corp. | 29,296 | 464 | |
| Cedar Realty Trust Inc. | 103,206 | 461 | |
| West Bancorporation Inc. | 18,684 | 451 | |
| Ares Commercial Real Estate Corp. | 30,806 | 450 | |
| * | Greenlight Capital Re Ltd. Class A | 34,832 | 448 |
| MidWestOne Financial Group Inc. | 13,159 | 441 | |
| * | Byline Bancorp Inc. | 18,871 | 431 |
| Ladenburg Thalmann Financial Services Inc. | 122,610 | 423 | |
| Home Bancorp Inc. | 9,239 | 423 | |
| * | Altisource Portfolio Solutions SA | 11,579 | 419 |
| Exantas Capital Corp. | 35,104 | 416 | |
13
| Vanguard® Russell 2000 Index Fund | ||
| Schedule of Investments | ||
| August 31, 2018 | ||
| Market | ||
| Value | ||
| Shares | ($000) | |
| Southern National Bancorp of Virginia Inc. | 23,599 | 414 |
| Enterprise Bancorp Inc. | 11,318 | 407 |
| Dynex Capital Inc. | 63,168 | 405 |
| Cambridge Bancorp | 4,459 | 399 |
| American National Bankshares Inc. | 9,689 | 399 |
| * Republic First Bancorp Inc. | 50,744 | 396 |
| KKR Real Estate Finance Trust Inc. | 18,556 | 393 |
| PCSB Financial Corp. | 19,139 | 393 |
| Braemar Hotels & Resorts Inc. | 33,876 | 391 |
| Citizens & Northern Corp. | 13,797 | 386 |
| Global Indemnity Ltd. | 9,801 | 386 |
| Macatawa Bank Corp. | 30,620 | 382 |
| Peoples Financial Services Corp. | 7,972 | 367 |
| * Regional Management Corp. | 10,831 | 361 |
| National Bankshares Inc. | 7,835 | 360 |
| Northrim BanCorp Inc. | 8,023 | 357 |
| Sutherland Asset Management Corp. | 20,818 | 357 |
| FedNat Holding Co. | 13,537 | 356 |
| Charter Financial Corp. | 14,215 | 354 |
| Oppenheimer Holdings Inc. Class A | 11,311 | 353 |
| First Bancorp Inc. | 12,030 | 352 |
| MedEquities Realty Trust Inc. | 32,887 | 352 |
| Newmark Group Inc. Class A | 27,210 | 350 |
| * HarborOne Bancorp Inc. | 17,660 | 348 |
| * Goosehead Insurance Inc. Class A | 11,219 | 348 |
| Heritage Insurance Holdings Inc. | 23,315 | 342 |
| HCI Group Inc. | 8,431 | 341 |
| ^ Innovative Industrial Properties Inc. | 7,508 | 341 |
| Reliant Bancorp Inc. | 12,214 | 336 |
| Western New England Bancorp Inc. | 31,064 | 331 |
| * Southern First Bancshares Inc. | 7,947 | 331 |
| * BSB Bancorp Inc. | 9,924 | 330 |
| Arlington Asset Investment Corp. Class A | 32,472 | 330 |
| Capital City Bank Group Inc. | 13,437 | 329 |
| Hingham Institution for Savings | 1,518 | 329 |
| Summit Financial Group Inc. | 12,943 | 326 |
| Southern Missouri Bancorp Inc. | 8,048 | 322 |
| * SmartFinancial Inc. | 13,015 | 320 |
| Codorus Valley Bancorp Inc. | 10,138 | 317 |
| * Forestar Group Inc. | 12,187 | 313 |
| * Metropolitan Bank Holding Corp. | 7,590 | 313 |
| Jernigan Capital Inc. | 15,422 | 309 |
| Investors Title Co. | 1,588 | 308 |
| * Baycom Corp. | 11,730 | 307 |
| Ames National Corp. | 10,118 | 306 |
| Maiden Holdings Ltd. | 79,587 | 302 |
| First Internet Bancorp | 9,571 | 301 |
| * AV Homes Inc. | 13,965 | 300 |
| PICO Holdings Inc. | 24,360 | 291 |
| Consolidated-Tomoka Land Co. | 4,593 | 288 |
| ^ Business First Bancshares Inc. | 11,081 | 287 |
| Central Valley Community Bancorp | 13,252 | 286 |
| Investar Holding Corp. | 10,410 | 286 |
| Guaranty Bancshares Inc. | 9,021 | 284 |
| Civista Bancshares Inc. | 11,745 | 280 |
| ACNB Corp. | 7,778 | 278 |
| * Curo Group Holdings Corp. | 8,945 | 276 |
| Cherry Hill Mortgage Investment Corp. | 14,766 | 275 |
| Premier Financial Bancorp Inc. | 14,065 | 274 |
| Shore Bancshares Inc. | 14,569 | 274 |
| EMC Insurance Group Inc. | 10,643 | 273 |
| Bluerock Residential Growth REIT Inc. Class A | 27,609 | 273 |
| First Bank | 19,068 | 273 |
| MidSouth Bancorp Inc. | 17,706 | 272 |
14
| Vanguard® Russell 2000 Index Fund | ||
| Schedule of Investments | ||
| August 31, 2018 | ||
| Market | ||
| Value | ||
| Shares | ($000) | |
| Territorial Bancorp Inc. | 9,040 | 270 |
| ^ Farmland Partners Inc. | 37,714 | 266 |
| * Howard Bancorp Inc. | 15,144 | 264 |
| Timberland Bancorp Inc. | 7,427 | 264 |
| Norwood Financial Corp. | 6,721 | 264 |
| Evans Bancorp Inc. | 5,507 | 262 |
| MutualFirst Financial Inc. | 6,888 | 262 |
| Protective Insurance Corp. Class B | 11,067 | 260 |
| BankFinancial Corp. | 16,147 | 258 |
| Great Ajax Corp. | 18,678 | 255 |
| BCB Bancorp Inc. | 16,967 | 252 |
| Penns Woods Bancorp Inc. | 5,522 | 250 |
| Riverview Bancorp Inc. | 24,941 | 246 |
| C&F Financial Corp. | 3,941 | 246 |
| Union Bankshares Inc. | 4,666 | 245 |
| Sterling Bancorp Inc. | 19,659 | 241 |
| Century Bancorp Inc. Class A | 3,330 | 237 |
| Bank of Commerce Holdings | 18,169 | 234 |
| * MoneyGram International Inc. | 35,882 | 234 |
| * Safeguard Scientifics Inc. | 22,646 | 233 |
| SB One Bancorp | 8,323 | 231 |
| Orrstown Financial Services Inc. | 8,861 | 231 |
| GAIN Capital Holdings Inc. | 31,273 | 230 |
| MBT Financial Corp. | 20,859 | 228 |
| * Community Bankers Trust Corp. | 25,199 | 228 |
| Bankwell Financial Group Inc. | 7,233 | 228 |
| * Bank of Princeton | 6,725 | 221 |
| Unity Bancorp Inc. | 9,050 | 221 |
| * Elevate Credit Inc. | 23,575 | 221 |
| * Entegra Financial Corp. | 7,997 | 220 |
| First Business Financial Services Inc. | 9,760 | 216 |
| * Stratus Properties Inc. | 7,108 | 216 |
| FS Bancorp Inc. | 3,649 | 213 |
| Tiptree Inc. | 32,430 | 211 |
| Global Medical REIT Inc. | 22,008 | 211 |
| Clipper Realty Inc. | 17,129 | 209 |
| First Community Corp. | 8,218 | 207 |
| Ohio Valley Banc Corp. | 4,867 | 205 |
| Kingstone Cos. Inc. | 10,894 | 202 |
| Gladstone Land Corp. | 14,617 | 200 |
| LCNB Corp. | 10,635 | 198 |
| ^ Fidelity D&D Bancorp Inc. | 3,279 | 195 |
| Luther Burbank Corp. | 17,012 | 194 |
| * First Northwest Bancorp | 11,496 | 192 |
| Independence Holding Co. | 5,439 | 192 |
| Parke Bancorp Inc. | 8,304 | 191 |
| Northeast Bancorp | 8,740 | 191 |
| * Pacific Mercantile Bancorp | 18,685 | 189 |
| * NI Holdings Inc. | 11,156 | 188 |
| First Choice Bancorp | 6,893 | 187 |
| Prudential Bancorp Inc. | 10,158 | 187 |
| Community Financial Corp. | 5,582 | 186 |
| * Malvern Bancorp Inc. | 7,454 | 183 |
| Pzena Investment Management Inc. Class A | 20,161 | 183 |
| 1st Constitution Bancorp | 8,645 | 183 |
| SI Financial Group Inc. | 13,091 | 181 |
| * Esquire Financial Holdings Inc. | 6,957 | 181 |
| MVB Financial Corp. | 9,618 | 175 |
| ESSA Bancorp Inc. | 10,865 | 175 |
| Peoples Bancorp of North Carolina Inc. | 5,724 | 175 |
| Middlefield Banc Corp. | 3,486 | 173 |
| Oak Valley Bancorp | 8,245 | 173 |
| United Security Bancshares | 15,547 | 173 |
| CB Financial Services Inc. | 5,349 | 172 |
15
| Vanguard® Russell 2000 Index Fund | |||
| Schedule of Investments | |||
| August 31, 2018 | |||
| Market | |||
| Value | |||
| Shares | ($000) | ||
| * | PDL Community Bancorp | 11,473 | 170 |
| * | Hallmark Financial Services Inc. | 15,066 | 169 |
| First Financial Northwest Inc. | 9,667 | 169 | |
| * | OP Bancorp | 13,872 | 168 |
| First Savings Financial Group Inc. | 2,359 | 168 | |
| Mid Penn Bancorp Inc. | 5,429 | 165 | |
| * | Select Bancorp Inc. | 12,861 | 165 |
| Chemung Financial Corp. | 3,744 | 157 | |
| First United Corp. | 7,705 | 155 | |
| Capstar Financial Holdings Inc. | 8,853 | 155 | |
| Donegal Group Inc. Class A | 10,666 | 154 | |
| Silvercrest Asset Management Group Inc. Class A | 9,556 | 151 | |
| * | Provident Bancorp Inc. | 5,263 | 149 |
| Safety Income & Growth Inc. | 8,785 | 145 | |
| First Guaranty Bancshares Inc. | 5,787 | 145 | |
| County Bancorp Inc. | 5,775 | 144 | |
| GAMCO Investors Inc. Class A | 5,292 | 137 | |
| *,^ | Siebert Financial Corp. | 8,452 | 134 |
| * | Trinity Place Holdings Inc. | 21,684 | 132 |
| * | GreenSky Inc. Class A | 6,278 | 127 |
| Auburn National Bancorporation Inc. | 2,638 | 122 | |
| Greene County Bancorp Inc. | 3,455 | 121 | |
| BRT Apartments Corp. | 9,241 | 119 | |
| Associated Capital Group Inc. Class A | 3,106 | 116 | |
| Crawford & Co. Class B | 13,307 | 116 | |
| * | Maui Land & Pineapple Co. Inc. | 7,916 | 101 |
| * | Focus Financial Partners Inc. Class A | 2,232 | 94 |
| * | Essential Properties Realty Trust Inc. | 6,270 | 89 |
| * | Impac Mortgage Holdings Inc. | 11,947 | 89 |
| * | Ashford Inc. | 873 | 80 |
| * | Bridgewater Bancshares Inc. | 5,480 | 70 |
| * | Transcontinental Realty Investors Inc. | 2,103 | 64 |
| * | Spirit of Texas Bancshares Inc. | 2,343 | 51 |
| Level One Bancorp Inc. | 1,794 | 50 | |
| * | American Realty Investors Inc. | 2,723 | 46 |
| * | Evo Payments Inc. Class A | 1,472 | 35 |
| Value Line Inc. | 1,405 | 34 | |
| Oconee Federal Financial Corp. | 1,253 | 33 | |
| Griffin Industrial Realty Inc. | 771 | 31 | |
| Coastal Financial Corp. | 427 | 7 | |
| 670,187 | |||
| Health Care (16.0%) | |||
| * | LivaNova plc | 56,815 | 7,133 |
| * | Haemonetics Corp. | 62,689 | 6,999 |
| * | Ligand Pharmaceuticals Inc. | 24,410 | 6,339 |
| *,^ | Teladoc Health Inc. | 77,943 | 6,044 |
| * | HealthEquity Inc. | 63,176 | 5,952 |
| * | Medidata Solutions Inc. | 67,828 | 5,764 |
| * | Neogen Corp. | 58,610 | 5,477 |
| * | Inogen Inc. | 20,574 | 5,450 |
| * | FibroGen Inc. | 87,156 | 5,330 |
| * | Loxo Oncology Inc. | 30,963 | 5,232 |
| * | Ultragenyx Pharmaceutical Inc. | 54,907 | 4,652 |
| * | Endo International plc | 261,586 | 4,486 |
| * | Globus Medical Inc. | 83,556 | 4,451 |
| * | NuVasive Inc. | 59,976 | 4,210 |
| * | Wright Medical Group NV | 145,156 | 4,207 |
| * | Amedisys Inc. | 33,374 | 4,172 |
| *,^ | Immunomedics Inc. | 153,739 | 4,114 |
| * | Horizon Pharma plc | 192,861 | 4,077 |
| * | Avanos Medical Inc. | 54,703 | 3,944 |
| * | Myriad Genetics Inc. | 76,555 | 3,812 |
| * | Novocure Ltd. | 83,760 | 3,773 |
| * | Array BioPharma Inc. | 238,168 | 3,708 |
16
| Vanguard® Russell 2000 Index Fund | |||
| Schedule of Investments | |||
| August 31, 2018 | |||
| Market | |||
| Value | |||
| Shares | ($000) | ||
| * | Blueprint Medicines Corp. | 48,257 | 3,700 |
| * | Syneos Health Inc. | 72,375 | 3,608 |
| * | LHC Group Inc. | 35,995 | 3,561 |
| * | Merit Medical Systems Inc. | 57,214 | 3,367 |
| * | Mallinckrodt plc | 96,032 | 3,309 |
| * | Tenet Healthcare Corp. | 97,577 | 3,290 |
| * | Emergent BioSolutions Inc. | 52,076 | 3,229 |
| * | AMN Healthcare Services Inc. | 55,014 | 3,207 |
| * | Medicines Co. | 80,391 | 3,184 |
| * | HMS Holdings Corp. | 98,651 | 3,162 |
| * | Omnicell Inc. | 45,417 | 3,122 |
| * | Ironwood Pharmaceuticals Inc. Class A | 162,063 | 3,118 |
| * | Allscripts Healthcare Solutions Inc. | 210,912 | 3,081 |
| * | Amicus Therapeutics Inc. | 221,297 | 2,983 |
| * | Quidel Corp. | 38,268 | 2,942 |
| * | Integer Holdings Corp. | 36,251 | 2,896 |
| * | Heron Therapeutics Inc. | 74,553 | 2,874 |
| * | Intercept Pharmaceuticals Inc. | 25,573 | 2,859 |
| * | Global Blood Therapeutics Inc. | 58,299 | 2,854 |
| * | Halozyme Therapeutics Inc. | 145,915 | 2,686 |
| * | LifePoint Health Inc. | 41,489 | 2,672 |
| *,^ | Glaukos Corp. | 38,485 | 2,631 |
| * | Cambrex Corp. | 38,443 | 2,591 |
| * | iRhythm Technologies Inc. | 27,742 | 2,582 |
| * | Aerie Pharmaceuticals Inc. | 41,547 | 2,549 |
| * | Supernus Pharmaceuticals Inc. | 57,141 | 2,531 |
| * | Repligen Corp. | 45,807 | 2,514 |
| * | Select Medical Holdings Corp. | 126,642 | 2,507 |
| * | Spectrum Pharmaceuticals Inc. | 115,540 | 2,488 |
| * | Acceleron Pharma Inc. | 45,346 | 2,450 |
| * | Prestige Consumer Healthcare Inc. | 62,262 | 2,397 |
| Tandem Diabetes Care Inc. | 52,095 | 2,380 | |
| * | Momenta Pharmaceuticals Inc. | 89,597 | 2,374 |
| CONMED Corp. | 29,393 | 2,364 | |
| * | REGENXBIO Inc. | 33,349 | 2,349 |
| * | Amneal Pharmaceuticals Inc. | 101,474 | 2,344 |
| * | BioTelemetry Inc. | 37,875 | 2,341 |
| * | Zogenix Inc. | 48,247 | 2,330 |
| * | STAAR Surgical Co. | 48,582 | 2,317 |
| * | Nevro Corp. | 33,975 | 2,291 |
| * | Portola Pharmaceuticals Inc. | 76,085 | 2,271 |
| * | Xencor Inc. | 54,123 | 2,262 |
| *,^ | Spark Therapeutics Inc. | 36,638 | 2,257 |
| * | Arena Pharmaceuticals Inc. | 58,051 | 2,255 |
| Ensign Group Inc. | 57,414 | 2,243 | |
| *,^ | OPKO Health Inc. | 375,560 | 2,223 |
| * | PTC Therapeutics Inc. | 52,886 | 2,207 |
| * | MyoKardia Inc. | 35,638 | 2,197 |
| * | Pacira Pharmaceuticals Inc. | 46,557 | 2,195 |
| * | NxStage Medical Inc. | 76,691 | 2,173 |
| * | Brookdale Senior Living Inc. | 218,405 | 2,167 |
| * | Sangamo Therapeutics Inc. | 118,698 | 2,166 |
| Patterson Cos. Inc. | 95,540 | 2,154 | |
| * | Magellan Health Inc. | 28,739 | 2,112 |
| * | Clovis Oncology Inc. | 55,718 | 1,992 |
| * | Atara Biotherapeutics Inc. | 47,640 | 1,951 |
| * | AnaptysBio Inc. | 21,711 | 1,924 |
| US Physical Therapy Inc. | 14,497 | 1,816 | |
| * | Insmed Inc. | 89,618 | 1,786 |
| * | Enanta Pharmaceuticals Inc. | 19,590 | 1,781 |
| * | Tabula Rasa HealthCare Inc. | 20,305 | 1,780 |
| * | Editas Medicine Inc. | 53,164 | 1,745 |
| * | Akorn Inc. | 109,428 | 1,717 |
| * | Corcept Therapeutics Inc. | 114,200 | 1,715 |
17
| Vanguard® Russell 2000 Index Fund | |||
| Schedule of Investments | |||
| August 31, 2018 | |||
| Market | |||
| Value | |||
| Shares | ($000) | ||
| * | AxoGen Inc. | 39,048 | 1,712 |
| * | Iovance Biotherapeutics Inc. | 96,154 | 1,702 |
| * | ACADIA Pharmaceuticals Inc. | 115,236 | 1,639 |
| * | Madrigal Pharmaceuticals Inc. | 6,797 | 1,626 |
| * | Tivity Health Inc. | 46,613 | 1,603 |
| * | Reata Pharmaceuticals Inc. Class A | 18,536 | 1,601 |
| * | ImmunoGen Inc. | 149,354 | 1,522 |
| * | Arrowhead Pharmaceuticals Inc. | 101,996 | 1,505 |
| * | Endocyte Inc. | 76,203 | 1,503 |
| * | Puma Biotechnology Inc. | 33,919 | 1,491 |
| * | Retrophin Inc. | 47,030 | 1,490 |
| * | Quality Systems Inc. | 64,587 | 1,478 |
| * | Acorda Therapeutics Inc. | 51,098 | 1,472 |
| * | Genomic Health Inc. | 24,050 | 1,471 |
| *,^ | Theravance Biopharma Inc. | 50,272 | 1,456 |
| * | Cardiovascular Systems Inc. | 37,786 | 1,456 |
| * | G1 Therapeutics Inc. | 23,922 | 1,452 |
| * | CryoLife Inc. | 41,631 | 1,445 |
| * | Aimmune Therapeutics Inc. | 50,880 | 1,420 |
| * | Natus Medical Inc. | 37,523 | 1,400 |
| * | Omeros Corp. | 53,903 | 1,395 |
| * | Varex Imaging Corp. | 44,354 | 1,393 |
| * | Tactile Systems Technology Inc. | 20,313 | 1,375 |
| * | Audentes Therapeutics Inc. | 37,530 | 1,366 |
| Luminex Corp. | 48,326 | 1,363 | |
| * | AtriCure Inc. | 39,007 | 1,348 |
| *,^ | Esperion Therapeutics Inc. | 26,865 | 1,330 |
| * | K2M Group Holdings Inc. | 47,838 | 1,308 |
| *,^ | TherapeuticsMD Inc. | 195,744 | 1,268 |
| *,^ | Intrexon Corp. | 81,626 | 1,255 |
| * | Alder Biopharmaceuticals Inc. | 68,490 | 1,240 |
| *,^ | Intellia Therapeutics Inc. | 39,084 | 1,209 |
| Owens & Minor Inc. | 71,063 | 1,207 | |
| * | Biohaven Pharmaceutical Holding Co. Ltd. | 31,833 | 1,205 |
| * | Mirati Therapeutics Inc. | 21,290 | 1,204 |
| * | R1 RCM Inc. | 119,923 | 1,196 |
| * | Medpace Holdings Inc. | 19,986 | 1,195 |
| * | Surmodics Inc. | 15,085 | 1,188 |
| * | Karyopharm Therapeutics Inc. | 56,356 | 1,186 |
| * | Cerus Corp. | 150,431 | 1,170 |
| * | Innoviva Inc. | 80,284 | 1,166 |
| * | Intra-Cellular Therapies Inc. | 52,695 | 1,156 |
| * | Vanda Pharmaceuticals Inc. | 59,704 | 1,154 |
| * | OraSure Technologies Inc. | 69,978 | 1,120 |
| * | Invitae Corp. | 74,357 | 1,101 |
| * | Coherus Biosciences Inc. | 54,534 | 1,099 |
| Phibro Animal Health Corp. Class A | 23,199 | 1,095 | |
| * | WaVe Life Sciences Ltd. | 20,537 | 1,095 |
| * | Orthofix Medical Inc. | 20,340 | 1,089 |
| Atrion Corp. | 1,657 | 1,085 | |
| National HealthCare Corp. | 14,025 | 1,081 | |
| *,^ | Geron Corp. | 185,654 | 1,064 |
| * | Revance Therapeutics Inc. | 38,604 | 1,058 |
| *,^ | TransEnterix Inc. | 181,905 | 1,055 |
| * | Codexis Inc. | 59,829 | 1,029 |
| * | MacroGenics Inc. | 47,014 | 1,028 |
| * | Intersect ENT Inc. | 34,459 | 1,010 |
| * | CytomX Therapeutics Inc. | 44,850 | 1,009 |
| *,^ | Dynavax Technologies Corp. | 72,541 | 1,005 |
| * | AMAG Pharmaceuticals Inc. | 39,919 | 974 |
| * | Radius Health Inc. | 47,048 | 968 |
| * | Natera Inc. | 34,701 | 959 |
| * | AngioDynamics Inc. | 42,276 | 948 |
| * | Cymabay Therapeutics Inc. | 68,535 | 934 |
18
| Vanguard® Russell 2000 Index Fund | |||
| Schedule of Investments | |||
| August 31, 2018 | |||
| Market | |||
| Value | |||
| Shares | ($000) | ||
| * | CareDx Inc. | 37,660 | 915 |
| * | NeoGenomics Inc. | 65,250 | 904 |
| *,^ | Flexion Therapeutics Inc. | 39,044 | 894 |
| * | Providence Service Corp. | 13,102 | 880 |
| * | TG Therapeutics Inc. | 68,836 | 874 |
| * | Eagle Pharmaceuticals Inc. | 12,109 | 837 |
| Apellis Pharmaceuticals Inc. | 42,705 | 827 | |
| * | Heska Corp. | 7,709 | 825 |
| * | BioCryst Pharmaceuticals Inc. | 114,503 | 820 |
| * | Dicerna Pharmaceuticals Inc. | 51,710 | 820 |
| *,^ | Athenex Inc. | 48,936 | 804 |
| * | Assembly Biosciences Inc. | 19,738 | 790 |
| * | Amphastar Pharmaceuticals Inc. | 41,464 | 787 |
| Meridian Bioscience Inc. | 47,925 | 752 | |
| *,^ | Accelerate Diagnostics Inc. | 30,353 | 747 |
| * | Fate Therapeutics Inc. | 57,728 | 744 |
| * | Epizyme Inc. | 60,885 | 718 |
| * | Prothena Corp. plc | 46,698 | 711 |
| * | Pacific Biosciences of California Inc. | 141,805 | 708 |
| * | Novavax Inc. | 443,606 | 692 |
| * | Anika Therapeutics Inc. | 16,710 | 692 |
| * | Lantheus Holdings Inc. | 42,929 | 691 |
| LeMaitre Vascular Inc. | 18,229 | 684 | |
| * | Sientra Inc. | 26,987 | 678 |
| * | Progenics Pharmaceuticals Inc. | 86,267 | 675 |
| * | ArQule Inc. | 101,104 | 670 |
| * | Viking Therapeutics Inc. | 50,719 | 663 |
| * | Rigel Pharmaceuticals Inc. | 191,772 | 654 |
| *,^ | MiMedx Group Inc. | 120,625 | 639 |
| * | RadNet Inc. | 45,928 | 636 |
| * | Cara Therapeutics Inc. | 31,536 | 636 |
| * | CorVel Corp. | 10,443 | 621 |
| * | Verastem Inc. | 61,522 | 613 |
| * | Antares Pharma Inc. | 167,704 | 594 |
| * | Kura Oncology Inc. | 28,847 | 591 |
| * | Adamas Pharmaceuticals Inc. | 25,504 | 587 |
| * | ViewRay Inc. | 57,912 | 584 |
| * | Collegium Pharmaceutical Inc. | 33,960 | 581 |
| * | Lexicon Pharmaceuticals Inc. | 50,139 | 580 |
| Invacare Corp. | 38,157 | 580 | |
| Rocket Pharmaceuticals Inc. | 24,261 | 579 | |
| * | GlycoMimetics Inc. | 39,075 | 575 |
| * | Addus HomeCare Corp. | 8,860 | 575 |
| *,^ | La Jolla Pharmaceutical Co. | 24,798 | 571 |
| *,^ | Synergy Pharmaceuticals Inc. | 288,671 | 563 |
| *,^ | Sorrento Therapeutics Inc. | 101,247 | 562 |
| * | Triple-S Management Corp. Class B | 25,613 | 558 |
| * | MediciNova Inc. | 45,755 | 557 |
| *,^ | Abeona Therapeutics Inc. | 35,784 | 551 |
| * | Aduro Biotech Inc. | 74,415 | 551 |
| * | Stemline Therapeutics Inc. | 32,078 | 549 |
| * | Voyager Therapeutics Inc. | 24,969 | 543 |
| * | Achillion Pharmaceuticals Inc. | 156,744 | 541 |
| * | ANI Pharmaceuticals Inc. | 9,266 | 539 |
| * | Five Prime Therapeutics Inc. | 38,512 | 539 |
| * | Cutera Inc. | 15,639 | 532 |
| * | IntriCon Corp. | 7,101 | 525 |
| * | Vericel Corp. | 42,873 | 523 |
| ^ | Inspire Medical Systems Inc. | 9,495 | 522 |
| * | GenMark Diagnostics Inc. | 60,493 | 518 |
| *,^ | Inovio Pharmaceuticals Inc. | 95,423 | 502 |
| National Research Corp. | 12,797 | 501 | |
| *,^ | SIGA Technologies Inc. | 59,981 | 494 |
| * | Aclaris Therapeutics Inc. | 30,950 | 493 |
19
| Vanguard® Russell 2000 Index Fund | |||
| Schedule of Investments | |||
| August 31, 2018 | |||
| Market | |||
| Value | |||
| Shares | ($000) | ||
| * | CytoSorbents Corp. | 32,991 | 483 |
| * | Adverum Biotechnologies Inc. | 63,350 | 481 |
| * | Akebia Therapeutics Inc. | 58,068 | 477 |
| * | Solid Biosciences Inc. | 10,984 | 469 |
| *,^ | PetIQ Inc. | 11,764 | 461 |
| Computer Programs & Systems Inc. | 16,812 | 459 | |
| ^ | Eloxx Pharmaceuticals Inc. | 25,045 | 459 |
| * | Rhythm Pharmaceuticals Inc. | 14,239 | 449 |
| * | Kindred Biosciences Inc. | 29,918 | 446 |
| *,^ | ZIOPHARM Oncology Inc. | 151,566 | 443 |
| * | Assertio Therapeutics Inc. | 68,760 | 439 |
| *,^ | Apollo Medical Holdings Inc. | 28,710 | 438 |
| * | Avid Bioservices Inc. | 58,843 | 431 |
| * | Oxford Immunotec Global plc | 29,222 | 430 |
| * | BioScrip Inc. | 147,085 | 427 |
| * | Cytokinetics Inc. | 52,890 | 418 |
| * | PDL BioPharma Inc. | 172,095 | 416 |
| * | NanoString Technologies Inc. | 25,601 | 414 |
| * | Cross Country Healthcare Inc. | 41,047 | 411 |
| * | CASI Pharmaceuticals Inc. | 58,134 | 404 |
| *,^ | Akcea Therapeutics Inc. | 14,851 | 392 |
| Denali Therapeutics Inc. | 19,756 | 388 | |
| * | Community Health Systems Inc. | 99,730 | 387 |
| * | Accuray Inc. | 96,636 | 387 |
| * | BioSpecifics Technologies Corp. | 7,197 | 386 |
| * | Concert Pharmaceuticals Inc. | 24,407 | 385 |
| * | Dermira Inc. | 40,359 | 384 |
| * | Catalyst Pharmaceuticals Inc. | 112,095 | 378 |
| * | Nuvectra Corp. | 16,181 | 378 |
| *,^ | Keryx Biopharmaceuticals Inc. | 109,555 | 374 |
| * | Arbutus Biopharma Corp. | 41,031 | 373 |
| * | Paratek Pharmaceuticals Inc. | 36,339 | 372 |
| * | Surgery Partners Inc. | 21,448 | 372 |
| * | Minerva Neurosciences Inc. | 35,384 | 368 |
| * | Albireo Pharma Inc. | 10,611 | 367 |
| Utah Medical Products Inc. | 3,934 | 357 | |
| *,^ | AVEO Pharmaceuticals Inc. | 118,389 | 354 |
| * | Veracyte Inc. | 27,791 | 351 |
| * | Syros Pharmaceuticals Inc. | 28,471 | 350 |
| *,^ | Dova Pharmaceuticals Inc. | 13,723 | 349 |
| * | Kadmon Holdings Inc. | 80,864 | 349 |
| *,^ | Savara Inc. | 29,127 | 343 |
| * | Bellicum Pharmaceuticals Inc. | 46,474 | 336 |
| * | Corbus Pharmaceuticals Holdings Inc. | 57,381 | 336 |
| * | American Renal Associates Holdings Inc. | 15,277 | 335 |
| * | Pieris Pharmaceuticals Inc. | 60,382 | 334 |
| *,^ | BioTime Inc. | 120,929 | 333 |
| * | ChemoCentryx Inc. | 25,197 | 332 |
| * | Deciphera Pharmaceuticals Inc. | 8,862 | 328 |
| * | Senseonics Holdings Inc. | 77,861 | 318 |
| * | Corium International Inc. | 31,708 | 309 |
| * | Marinus Pharmaceuticals Inc. | 42,687 | 305 |
| * | Civitas Solutions Inc. | 18,667 | 299 |
| * | RTI Surgical Inc. | 66,576 | 298 |
| * | Sienna Biopharmaceuticals Inc. | 17,823 | 297 |
| *,^ | Insys Therapeutics Inc. | 31,210 | 292 |
| * | Capital Senior Living Corp. | 32,842 | 291 |
| * | Cellular Biomedicine Group Inc. | 13,537 | 288 |
| *,^ | Vital Therapies Inc. | 35,434 | 285 |
| OrthoPediatrics Corp. | 8,185 | 285 | |
| * | Castlight Health Inc. Class B | 94,366 | 283 |
| *,^ | Selecta Biosciences Inc. | 20,786 | 282 |
| * | Aratana Therapeutics Inc. | 53,160 | 282 |
| ^ | Optinose Inc. | 18,729 | 278 |
20
| Vanguard® Russell 2000 Index Fund | |||
| Schedule of Investments | |||
| August 31, 2018 | |||
| Market | |||
| Value | |||
| Shares | ($000) | ||
| *,^ | Rockwell Medical Inc. | 55,149 | 271 |
| * | Athersys Inc. | 129,952 | 268 |
| * | Zafgen Inc. | 26,551 | 253 |
| *,^ | Ocular Therapeutix Inc. | 36,669 | 247 |
| * | Harvard Bioscience Inc. | 40,932 | 244 |
| * | Fluidigm Corp. | 30,651 | 243 |
| * | Durect Corp. | 178,498 | 234 |
| * | Enzo Biochem Inc. | 50,938 | 234 |
| Idera Pharmaceuticals Inc. | 22,105 | 231 | |
| * | Palatin Technologies Inc. | 223,993 | 226 |
| * | Endologix Inc. | 97,045 | 223 |
| * | Clearside Biomedical Inc. | 31,929 | 217 |
| * | Seres Therapeutics Inc. | 24,309 | 213 |
| * | Tetraphase Pharmaceuticals Inc. | 59,900 | 212 |
| * | SeaSpine Holdings Corp. | 13,468 | 207 |
| * | Chimerix Inc. | 51,563 | 206 |
| * | Tocagen Inc. | 20,965 | 204 |
| * | Ra Pharmaceuticals Inc. | 16,753 | 204 |
| * | Mersana Therapeutics Inc. | 14,621 | 204 |
| * | Aeglea BioTherapeutics Inc. | 18,621 | 204 |
| * | Agenus Inc. | 91,260 | 202 |
| Homology Medicines Inc. | 11,864 | 198 | |
| * | Calithera Biosciences Inc. | 35,698 | 195 |
| * | Cue Biopharma Inc. | 20,061 | 193 |
| * | T2 Biosystems Inc. | 29,253 | 191 |
| *,^ | Achaogen Inc. | 35,838 | 190 |
| *,^ | Teligent Inc. | 46,638 | 188 |
| * | FONAR Corp. | 7,109 | 186 |
| * | Miragen Therapeutics Inc. | 29,973 | 186 |
| * | Synlogic Inc. | 17,511 | 185 |
| * | Spring Bank Pharmaceuticals Inc. | 12,988 | 184 |
| * | Kala Pharmaceuticals Inc. | 13,595 | 184 |
| ^ | Helius Medical Technologies Inc. Class A | 18,199 | 182 |
| *,^ | Neos Therapeutics Inc. | 31,363 | 180 |
| *,^ | Lannett Co. Inc. | 33,400 | 179 |
| * | MannKind Corp. | 160,357 | 176 |
| *,^ | Pulse Biosciences Inc. | 12,249 | 176 |
| * | Corvus Pharmaceuticals Inc. | 15,710 | 172 |
| * | Ardelyx Inc. | 39,440 | 170 |
| * | Celcuity Inc. | 6,790 | 168 |
| *,^ | Organovo Holdings Inc. | 121,355 | 157 |
| Odonate Therapeutics Inc. | 8,110 | 156 | |
| ^ | Evolus Inc. | 6,058 | 155 |
| * | Aldeyra Therapeutics Inc. | 18,051 | 153 |
| ^ | Innovate Biopharmaceuticals Inc. | 21,175 | 151 |
| * | Immune Design Corp. | 39,534 | 150 |
| * | Catalyst Biosciences Inc. | 13,585 | 148 |
| * | Quorum Health Corp. | 32,435 | 148 |
| Allena Pharmaceuticals Inc. | 13,203 | 144 | |
| * | Jounce Therapeutics Inc. | 18,116 | 142 |
| * | ADMA Biologics Inc. | 21,364 | 136 |
| *,^ | Cohbar Inc. | 25,447 | 133 |
| * | AAC Holdings Inc. | 14,859 | 132 |
| * | Mustang Bio Inc. | 18,696 | 129 |
| * | Syndax Pharmaceuticals Inc. | 16,569 | 129 |
| * | Pfenex Inc. | 24,243 | 128 |
| *,^ | GTx Inc. | 5,243 | 125 |
| *,^ | XOMA Corp. | 6,522 | 122 |
| * | Fennec Pharmaceuticals Inc. | 12,827 | 122 |
| * | Recro Pharma Inc. | 19,085 | 122 |
| * | Genesis Healthcare Inc. | 64,663 | 114 |
| * | iRadimed Corp. | 4,098 | 113 |
| Melinta Therapeutics Inc. | 23,648 | 111 | |
| * | NewLink Genetics Corp. | 35,189 | 109 |
21
| Vanguard® Russell 2000 Index Fund | |||
| Schedule of Investments | |||
| August 31, 2018 | |||
| Market | |||
| Value | |||
| Shares | ($000) | ||
| *,^ | CTI BioPharma Corp. | 57,993 | 109 |
| * | Tyme Technologies Inc. | 47,901 | 107 |
| ^ | UNITY Biotechnology Inc. | 5,515 | 105 |
| * | NantKwest Inc. | 30,834 | 105 |
| *,^ | Nymox Pharmaceutical Corp. | 38,196 | 100 |
| ^ | Quanterix Corp. | 5,921 | 99 |
| * | Ovid therapeutics Inc. | 14,758 | 98 |
| * | Calyxt Inc. | 5,763 | 98 |
| *,^ | Zomedica Pharmaceuticals Corp. | 44,488 | 95 |
| * | resTORbio Inc. | 7,814 | 92 |
| * | Spero Therapeutics Inc. | 7,899 | 90 |
| Arcus Biosciences Inc. | 5,977 | 86 | |
| Evelo Biosciences Inc. | 6,034 | 81 | |
| Surface Oncology Inc. | 8,278 | 80 | |
| * | Fortress Biotech Inc. | 39,641 | 78 |
| * | Proteostasis Therapeutics Inc. | 28,705 | 77 |
| * | Kiniksa Pharmaceuticals Ltd. Class A | 3,150 | 69 |
| * | Molecular Templates Inc. | 11,837 | 68 |
| Unum Therapeutics Inc. | 4,003 | 65 | |
| Tricida Inc. | 2,100 | 65 | |
| *,^ | NantHealth Inc. | 28,946 | 64 |
| Menlo Therapeutics Inc. | 8,018 | 62 | |
| *,^ | Ampio Pharmaceuticals Inc. | 90,483 | 57 |
| scPharmaceuticals Inc. | 8,851 | 45 | |
| ^ | Crinetics Pharmaceuticals Inc. | 1,240 | 37 |
| Avrobio Inc. | 1,075 | 37 | |
| Aptinyx Inc. | 1,302 | 31 | |
| * | Aquestive Therapeutics Inc. | 1,562 | 28 |
| ^ | Magenta Therapeutics Inc. | 1,575 | 23 |
| Forty Seven Inc. | 1,470 | 22 | |
| Replimune Group Inc. | 1,051 | 20 | |
| * | Arsanis Inc. | 6,826 | 16 |
| * | Neon Therapeutics Inc. | 1,318 | 16 |
| Kezar Life Sciences Inc. | 828 | 14 | |
| Scholar Rock Holding Corp. | 836 | 14 | |
| Xeris Pharmaceuticals Inc. | 517 | 13 | |
| *,^ | Eidos Therapeutics Inc. | 1,058 | 13 |
| Liquidia Technologies Inc. | 728 | 11 | |
| Neuronetics Inc. | 311 | 10 | |
| Constellation Pharmaceuticals Inc. | 826 | 9 | |
| Translate Bio Inc. | 736 | 8 | |
| * | Sarepta Therapeutics Inc. | 12 | 2 |
| * | Exact Sciences Corp. | 14 | 1 |
| * | Rubius Therapeutics Inc. | 41 | 1 |
| * | Bluebird Bio Inc. | 5 | 1 |
| * | Penumbra Inc. | 4 | 1 |
| * | Sage Therapeutics Inc. | 3 | — |
| 430,744 | |||
| Materials & Processing (6.8%) | |||
| * | Trex Co. Inc. | 68,964 | 5,841 |
| * | Ingevity Corp. | 49,474 | 4,997 |
| Louisiana-Pacific Corp. | 170,369 | 4,968 | |
| Balchem Corp. | 37,404 | 4,148 | |
| * | RBC Bearings Inc. | 27,515 | 4,122 |
| * | Allegheny Technologies Inc. | 146,408 | 3,957 |
| PolyOne Corp. | 93,125 | 3,935 | |
| Trinseo SA | 50,645 | 3,907 | |
| Simpson Manufacturing Co. Inc. | 48,363 | 3,713 | |
| * | Rexnord Corp. | 121,898 | 3,539 |
| KapStone Paper and Packaging Corp. | 102,619 | 3,525 | |
| Sensient Technologies Corp. | 49,621 | 3,524 | |
| * | Cleveland-Cliffs Inc. | 347,483 | 3,492 |
| Belden Inc. | 47,174 | 3,431 | |
| HB Fuller Co. | 59,039 | 3,365 | |
22
| Vanguard® Russell 2000 Index Fund | |||
| Schedule of Investments | |||
| August 31, 2018 | |||
| Market | |||
| Value | |||
| Shares | ($000) | ||
| Cabot Microelectronics Corp. | 29,693 | 3,347 | |
| Carpenter Technology Corp. | 54,350 | 3,243 | |
| * | Beacon Roofing Supply Inc. | 79,641 | 2,953 |
| Commercial Metals Co. | 135,808 | 2,933 | |
| * | Summit Materials Inc. Class A | 130,852 | 2,783 |
| Minerals Technologies Inc. | 41,234 | 2,769 | |
| Quaker Chemical Corp. | 15,206 | 2,739 | |
| Universal Forest Products Inc. | 69,774 | 2,614 | |
| Compass Minerals International Inc. | 39,765 | 2,487 | |
| Comfort Systems USA Inc. | 42,830 | 2,458 | |
| Worthington Industries Inc. | 50,060 | 2,332 | |
| Innospec Inc. | 28,265 | 2,193 | |
| * | Ferro Corp. | 98,434 | 2,161 |
| * | Masonite International Corp. | 31,857 | 2,133 |
| * | GCP Applied Technologies Inc. | 83,991 | 2,117 |
| Stepan Co. | 23,721 | 2,116 | |
| Mueller Industries Inc. | 66,142 | 2,115 | |
| Kaiser Aluminum Corp. | 19,071 | 2,090 | |
| Mueller Water Products Inc. Class A | 180,534 | 2,089 | |
| * | Builders FirstSource Inc. | 131,880 | 2,060 |
| * | MRC Global Inc. | 97,953 | 2,019 |
| * | JELD-WEN Holding Inc. | 81,876 | 1,991 |
| Boise Cascade Co. | 45,388 | 1,983 | |
| AAON Inc. | 48,234 | 1,949 | |
| US Silica Holdings Inc. | 91,306 | 1,935 | |
| * | Patrick Industries Inc. | 27,828 | 1,781 |
| Tronox Ltd. Class A | 109,649 | 1,775 | |
| Neenah Inc. | 19,449 | 1,775 | |
| * | BMC Stock Holdings Inc. | 78,781 | 1,773 |
| * | Kraton Corp. | 36,152 | 1,700 |
| * | Gibraltar Industries Inc. | 37,126 | 1,686 |
| Greif Inc. Class A | 29,732 | 1,641 | |
| * | AK Steel Holding Corp. | 367,370 | 1,631 |
| Advanced Drainage Systems Inc. | 51,718 | 1,621 | |
| Interface Inc. Class A | 68,717 | 1,618 | |
| * | Continental Building Products Inc. | 43,191 | 1,611 |
| Apogee Enterprises Inc. | 32,160 | 1,583 | |
| Hecla Mining Co. | 529,566 | 1,504 | |
| Materion Corp. | 23,496 | 1,499 | |
| Schweitzer-Mauduit International Inc. | 36,006 | 1,465 | |
| * | PGT Innovations Inc. | 56,822 | 1,381 |
| KMG Chemicals Inc. | 17,120 | 1,326 | |
| * | Verso Corp. | 40,574 | 1,274 |
| Rayonier Advanced Materials Inc. | 60,222 | 1,259 | |
| * | Tahoe Resources Inc. | 362,184 | 1,246 |
| * | Coeur Mining Inc. | 216,885 | 1,232 |
| * | AdvanSix Inc. | 36,037 | 1,219 |
| * | Installed Building Products Inc. | 25,770 | 1,200 |
| Chase Corp. | 8,506 | 1,054 | |
| Innophos Holdings Inc. | 22,809 | 997 | |
| Global Brass & Copper Holdings Inc. | 25,493 | 983 | |
| PH Glatfelter Co. | 50,504 | 971 | |
| * | GMS Inc. | 37,883 | 941 |
| *,^ | US Concrete Inc. | 18,731 | 903 |
| * | Koppers Holdings Inc. | 24,293 | 861 |
| * | NCI Building Systems Inc. | 49,536 | 837 |
| Schnitzer Steel Industries Inc. | 30,925 | 815 | |
| Insteel Industries Inc. | 21,146 | 811 | |
| Myers Industries Inc. | 36,084 | 803 | |
| * | PQ Group Holdings Inc. | 42,466 | 756 |
| * | Century Aluminum Co. | 59,192 | 747 |
| American Vanguard Corp. | 33,251 | 728 | |
| Quanex Building Products Corp. | 41,346 | 678 | |
| Tredegar Corp. | 29,990 | 658 | |
23
| Vanguard® Russell 2000 Index Fund | |||
| Schedule of Investments | |||
| August 31, 2018 | |||
| Market | |||
| Value | |||
| Shares | ($000) | ||
| * | Veritiv Corp. | 13,664 | 652 |
| DMC Global Inc. | 16,623 | 652 | |
| * | TimkenSteel Corp. | 46,528 | 652 |
| NN Inc. | 32,103 | 642 | |
| Griffon Corp. | 33,654 | 614 | |
| * | Unifi Inc. | 18,039 | 574 |
| Haynes International Inc. | 14,445 | 569 | |
| * | Clearwater Paper Corp. | 18,690 | 543 |
| Kronos Worldwide Inc. | 26,300 | 529 | |
| ^ | Caesarstone Ltd. | 26,636 | 505 |
| Hawkins Inc. | 11,186 | 462 | |
| * | OMNOVA Solutions Inc. | 50,952 | 461 |
| * | Armstrong Flooring Inc. | 25,562 | 448 |
| FutureFuel Corp. | 29,793 | 442 | |
| * | Landec Corp. | 31,520 | 424 |
| * | Nexeo Solutions Inc. | 37,828 | 379 |
| * | Intrepid Potash Inc. | 110,924 | 377 |
| Greif Inc. Class B | 6,593 | 375 | |
| * | BlueLinx Holdings Inc. | 10,368 | 373 |
| Culp Inc. | 13,197 | 335 | |
| Gold Resource Corp. | 60,562 | 313 | |
| * | Uranium Energy Corp. | 180,577 | 309 |
| Omega Flex Inc. | 3,413 | 303 | |
| * | UFP Technologies Inc. | 7,725 | 272 |
| * | Energy Fuels Inc. | 84,902 | 271 |
| * | Lawson Products Inc. | 7,853 | 265 |
| * | Amyris Inc. | 28,531 | 256 |
| * | LB Foster Co. Class A | 11,194 | 255 |
| * | Universal Stainless & Alloy Products Inc. | 8,178 | 248 |
| * | AgroFresh Solutions Inc. | 36,661 | 244 |
| * | Foundation Building Materials Inc. | 17,533 | 242 |
| Olympic Steel Inc. | 10,924 | 241 | |
| Oil-Dri Corp. of America | 5,855 | 238 | |
| Synalloy Corp. | 9,605 | 220 | |
| * | LSB Industries Inc. | 24,958 | 218 |
| * | Northwest Pipe Co. | 11,415 | 206 |
| *,^ | ChromaDex Corp. | 45,129 | 204 |
| Eastern Co. | 6,557 | 193 | |
| * | Ryerson Holding Corp. | 18,566 | 193 |
| *,^ | Forterra Inc. | 21,769 | 184 |
| United States Lime & Minerals Inc. | 2,412 | 183 | |
| * | Shiloh Industries Inc. | 17,753 | 159 |
| * | Marrone Bio Innovations Inc. | 62,021 | 129 |
| Valhi Inc. | 29,748 | 98 | |
| * | NL Industries Inc. | 10,543 | 83 |
| Bloom Energy Corp. Class A | 1,388 | 42 | |
| CompX International Inc. | 1,774 | 24 | |
| *,§ | Ferroglobe R&W Trust | 46,440 | — |
| 184,017 | |||
| Other (0.0%)2 | |||
| *,§ | Dyax Corp. CVR Exp. 12/31/2019 | 83,094 | 332 |
| *,§ | A Schulman Inc. CVR | 30,360 | 58 |
| *,^,§ | Tobira Therapeutics CVR Exp. 12/31/2028 | 6,201 | 28 |
| * | Sonos Inc. | 1,336 | 26 |
| * | Arlo Technologies Inc. | 1,100 | 22 |
| *,§ | NewStar Financial Inc. | 18,788 | 9 |
| *,§ | Media General Inc. CVR | 85,418 | 3 |
| *,§ | Omthera Pharmaceuticals Inc. CVR | 2,012 | 1 |
| * | Euronav NV | 100 | 1 |
| *,§ | Clinical Data CVR | 913 | — |
| 480 | |||
| Producer Durables (13.5%) | |||
| * | ASGN Inc. | 59,200 | 5,481 |
| EMCOR Group Inc. | 67,898 | 5,439 | |
24
| Vanguard® Russell 2000 Index Fund | ||
| Schedule of Investments | ||
| August 31, 2018 | ||
| Market | ||
| Value | ||
| Shares | ($000) | |
| Insperity Inc. | 44,718 | 5,359 |
| Woodward Inc. | 62,562 | 5,040 |
| MAXIMUS Inc. | 75,775 | 5,039 |
| * Proto Labs Inc. | 31,618 | 4,915 |
| Tetra Tech Inc. | 64,623 | 4,511 |
| Korn/Ferry International | 65,924 | 4,425 |
| Brink's Co. | 58,679 | 4,407 |
| * KLX Inc. | 58,679 | 4,333 |
| John Bean Technologies Corp. | 36,525 | 4,321 |
| * Axon Enterprise Inc. | 61,337 | 4,187 |
| EnerSys | 49,132 | 4,077 |
| MSA Safety Inc. | 39,754 | 4,019 |
| * Generac Holdings Inc. | 70,785 | 3,928 |
| Barnes Group Inc. | 57,264 | 3,897 |
| Kennametal Inc. | 94,979 | 3,879 |
| SkyWest Inc. | 59,397 | 3,879 |
| * Spirit Airlines Inc. | 80,046 | 3,804 |
| * Darling Ingredients Inc. | 191,234 | 3,783 |
| Hillenbrand Inc. | 73,232 | 3,746 |
| GATX Corp. | 43,851 | 3,703 |
| Healthcare Services Group Inc. | 86,329 | 3,558 |
| KBR Inc. | 164,664 | 3,455 |
| Applied Industrial Technologies Inc. | 44,491 | 3,428 |
| * FTI Consulting Inc. | 43,817 | 3,340 |
| * MasTec Inc. | 75,693 | 3,315 |
| Deluxe Corp. | 55,675 | 3,297 |
| UniFirst Corp. | 17,758 | 3,289 |
| Exponent Inc. | 60,143 | 3,148 |
| * TriNet Group Inc. | 50,902 | 3,007 |
| * Dycom Industries Inc. | 35,230 | 2,956 |
| Moog Inc. Class A | 37,447 | 2,955 |
| * Aerojet Rocketdyne Holdings Inc. | 81,551 | 2,863 |
| * Advanced Energy Industries Inc. | 45,712 | 2,724 |
| * Chart Industries Inc. | 35,963 | 2,717 |
| * Paylocity Holding Corp. | 33,824 | 2,687 |
| Watts Water Technologies Inc. Class A | 32,400 | 2,671 |
| Herman Miller Inc. | 69,316 | 2,655 |
| * Harsco Corp. | 93,757 | 2,649 |
| Franklin Electric Co. Inc. | 54,053 | 2,643 |
| Convergys Corp. | 106,459 | 2,633 |
| * Itron Inc. | 39,644 | 2,632 |
| * Esterline Technologies Corp. | 30,500 | 2,621 |
| Albany International Corp. | 33,497 | 2,584 |
| * TopBuild Corp. | 41,391 | 2,578 |
| * Navistar International Corp. | 57,381 | 2,500 |
| * ExlService Holdings Inc. | 38,937 | 2,495 |
| * WageWorks Inc. | 46,368 | 2,481 |
| ABM Industries Inc. | 77,156 | 2,447 |
| Hawaiian Holdings Inc. | 58,836 | 2,442 |
| Covanta Holding Corp. | 137,118 | 2,420 |
| * Saia Inc. | 29,919 | 2,371 |
| * SPX FLOW Inc. | 49,186 | 2,358 |
| Granite Construction Inc. | 51,298 | 2,343 |
| Triton International Ltd. | 60,905 | 2,301 |
| * Advanced Disposal Services Inc. | 84,550 | 2,256 |
| Cubic Corp. | 29,528 | 2,235 |
| HNI Corp. | 50,668 | 2,234 |
| Mobile Mini Inc. | 51,847 | 2,224 |
| Brady Corp. Class A | 54,734 | 2,214 |
| Forward Air Corp. | 34,167 | 2,196 |
| * Aerovironment Inc. | 24,716 | 2,174 |
| Greenbrier Cos. Inc. | 36,991 | 2,145 |
| Kaman Corp. | 32,233 | 2,102 |
| Actuant Corp. Class A | 71,191 | 2,097 |
25
| Vanguard® Russell 2000 Index Fund | ||
| Schedule of Investments | ||
| August 31, 2018 | ||
| Market | ||
| Value | ||
| Shares | ($000) | |
| Werner Enterprises Inc. | 55,778 | 2,067 |
| Allegiant Travel Co. Class A | 15,066 | 2,053 |
| Raven Industries Inc. | 41,909 | 2,028 |
| * Hub Group Inc. Class A | 38,091 | 2,013 |
| ESCO Technologies Inc. | 29,689 | 2,008 |
| US Ecology Inc. | 25,644 | 1,866 |
| Matson Inc. | 49,554 | 1,851 |
| Badger Meter Inc. | 33,437 | 1,837 |
| EnPro Industries Inc. | 24,216 | 1,818 |
| Federal Signal Corp. | 69,588 | 1,811 |
| * Electronics For Imaging Inc. | 51,793 | 1,802 |
| AAR Corp. | 37,827 | 1,765 |
| ICF International Inc. | 21,210 | 1,732 |
| * SPX Corp. | 50,423 | 1,714 |
| * Milacron Holdings Corp. | 80,736 | 1,712 |
| * Evoqua Water Technologies Corp. | 88,251 | 1,710 |
| * Atlas Air Worldwide Holdings Inc. | 27,591 | 1,680 |
| Sun Hydraulics Corp. | 33,371 | 1,680 |
| * TriMas Corp. | 53,347 | 1,638 |
| AZZ Inc. | 30,330 | 1,630 |
| McGrath RentCorp | 28,055 | 1,627 |
| Standex International Corp. | 14,899 | 1,608 |
| Pitney Bowes Inc. | 220,347 | 1,600 |
| Tennant Co. | 20,797 | 1,592 |
| Rush Enterprises Inc. Class A | 36,144 | 1,553 |
| ACCO Brands Corp. | 123,557 | 1,532 |
| * OSI Systems Inc. | 19,581 | 1,525 |
| * Herc Holdings Inc. | 28,063 | 1,476 |
| Steelcase Inc. Class A | 99,263 | 1,449 |
| ArcBest Corp. | 30,112 | 1,448 |
| * CBIZ Inc. | 60,048 | 1,435 |
| * TrueBlue Inc. | 47,686 | 1,397 |
| * Sykes Enterprises Inc. | 46,026 | 1,392 |
| Ship Finance International Ltd. | 97,857 | 1,390 |
| * Air Transport Services Group Inc. | 68,015 | 1,384 |
| * Kratos Defense & Security Solutions Inc. | 103,267 | 1,380 |
| * FARO Technologies Inc. | 19,686 | 1,343 |
| Knoll Inc. | 56,263 | 1,324 |
| * Casella Waste Systems Inc. Class A | 46,398 | 1,317 |
| ^ Altra Industrial Motion Corp. | 33,667 | 1,315 |
| Astec Industries Inc. | 26,831 | 1,305 |
| H&E Equipment Services Inc. | 37,256 | 1,297 |
| Kadant Inc. | 12,794 | 1,293 |
| * Huron Consulting Group Inc. | 25,744 | 1,274 |
| * Atkore International Group Inc. | 46,200 | 1,265 |
| * Vicor Corp. | 20,142 | 1,258 |
| * Navigant Consulting Inc. | 52,525 | 1,255 |
| Primoris Services Corp. | 48,984 | 1,228 |
| Wabash National Corp. | 67,019 | 1,222 |
| Lindsay Corp. | 12,571 | 1,204 |
| Douglas Dynamics Inc. | 26,050 | 1,193 |
| Encore Wire Corp. | 23,711 | 1,191 |
| Triumph Group Inc. | 57,126 | 1,188 |
| Aircastle Ltd. | 55,923 | 1,170 |
| Kforce Inc. | 26,827 | 1,128 |
| MTS Systems Corp. | 20,823 | 1,127 |
| Heartland Express Inc. | 55,033 | 1,125 |
| Columbus McKinnon Corp. | 25,940 | 1,103 |
| * Astronics Corp. | 24,888 | 1,083 |
| * Echo Global Logistics Inc. | 32,577 | 1,082 |
| Alamo Group Inc. | 11,296 | 1,077 |
| * CSW Industrials Inc. | 18,296 | 1,025 |
| * SEACOR Holdings Inc. | 19,875 | 1,023 |
| * SP Plus Corp. | 26,276 | 1,022 |
26
| Vanguard® Russell 2000 Index Fund | |||
| Schedule of Investments | |||
| August 31, 2018 | |||
| Market | |||
| Value | |||
| Shares | ($000) | ||
| * | Thermon Group Holdings Inc. | 37,734 | 1,011 |
| Marten Transport Ltd. | 45,508 | 1,003 | |
| Multi-Color Corp. | 16,120 | 995 | |
| * | Control4 Corp. | 30,434 | 986 |
| * | Modine Manufacturing Co. | 58,059 | 978 |
| Briggs & Stratton Corp. | 48,263 | 973 | |
| Heidrick & Struggles International Inc. | 21,983 | 972 | |
| Manitowoc Co. Inc. | 41,087 | 953 | |
| * | Aegion Corp. Class A | 37,312 | 931 |
| Kelly Services Inc. Class A | 36,623 | 923 | |
| * | Tidewater Inc. | 28,168 | 901 |
| * | Tutor Perini Corp. | 43,811 | 892 |
| CIRCOR International Inc. | 19,158 | 869 | |
| Quad/Graphics Inc. | 38,139 | 868 | |
| * | NV5 Global Inc. | 9,753 | 863 |
| * | DXP Enterprises Inc. | 18,689 | 858 |
| * | Lydall Inc. | 19,623 | 840 |
| *,^ | Team Inc. | 34,932 | 814 |
| GasLog Ltd. | 48,047 | 807 | |
| Mesa Laboratories Inc. | 3,849 | 773 | |
| * | Wesco Aircraft Holdings Inc. | 63,089 | 767 |
| Gorman-Rupp Co. | 20,737 | 760 | |
| Hyster-Yale Materials Handling Inc. | 12,219 | 754 | |
| * | Engility Holdings Inc. | 21,390 | 742 |
| Kimball International Inc. Class B | 41,735 | 729 | |
| Argan Inc. | 16,969 | 675 | |
| *,^ | Willscot Corp. Class A | 38,129 | 665 |
| Scorpio Tankers Inc. | 340,995 | 655 | |
| * | MYR Group Inc. | 18,604 | 647 |
| Barrett Business Services Inc. | 8,441 | 633 | |
| Ennis Inc. | 28,756 | 627 | |
| Essendant Inc. | 43,368 | 626 | |
| REV Group Inc. | 34,850 | 593 | |
| Forrester Research Inc. | 11,867 | 584 | |
| Hackett Group Inc. | 28,129 | 576 | |
| Spartan Motors Inc. | 39,694 | 574 | |
| * | CAI International Inc. | 21,217 | 573 |
| Resources Connection Inc. | 34,346 | 568 | |
| ^ | Teekay Corp. | 78,933 | 535 |
| Systemax Inc. | 14,580 | 532 | |
| * | International Seaways Inc. | 25,925 | 532 |
| * | Vishay Precision Group Inc. | 12,085 | 523 |
| CRA International Inc. | 9,063 | 518 | |
| * | Ducommun Inc. | 12,346 | 502 |
| DHT Holdings Inc. | 106,350 | 498 | |
| *,^ | Plug Power Inc. | 248,112 | 489 |
| LSC Communications Inc. | 39,930 | 488 | |
| *,^ | Frontline Ltd. | 89,103 | 485 |
| * | Textainer Group Holdings Ltd. | 31,930 | 482 |
| * | Mistras Group Inc. | 21,057 | 480 |
| Scorpio Bulkers Inc. | 67,419 | 458 | |
| * | Sterling Construction Co. Inc. | 30,935 | 450 |
| Titan International Inc. | 58,117 | 435 | |
| Park-Ohio Holdings Corp. | 10,379 | 430 | |
| * | Covenant Transportation Group Inc. Class A | 14,387 | 430 |
| TTEC Holdings Inc. | 16,371 | 429 | |
| * | Daseke Inc. | 47,319 | 425 |
| * | Vectrus Inc. | 12,937 | 425 |
| RR Donnelley & Sons Co. | 82,182 | 416 | |
| * | PHH Corp. | 38,270 | 415 |
| *,^ | CryoPort Inc. | 29,061 | 413 |
| * | Bristow Group Inc. | 37,593 | 412 |
| Allied Motion Technologies Inc. | 8,407 | 411 | |
| Powell Industries Inc. | 10,375 | 406 | |
27
| Vanguard® Russell 2000 Index Fund | |||
| Schedule of Investments | |||
| August 31, 2018 | |||
| Market | |||
| Value | |||
| Shares | ($000) | ||
| *,^ | Energy Recovery Inc. | 41,772 | 405 |
| * | InnerWorkings Inc. | 51,270 | 401 |
| * | Heritage-Crystal Clean Inc. | 17,166 | 400 |
| * | Titan Machinery Inc. | 21,815 | 394 |
| Costamare Inc. | 55,703 | 392 | |
| * | Blue Bird Corp. | 16,982 | 390 |
| VSE Corp. | 10,044 | 387 | |
| American Railcar Industries Inc. | 8,378 | 384 | |
| * | YRC Worldwide Inc. | 38,470 | 368 |
| * | Great Lakes Dredge & Dock Corp. | 66,761 | 366 |
| ^ | Nordic American Tankers Ltd. | 163,875 | 365 |
| Miller Industries Inc. | 12,615 | 363 | |
| Universal Logistics Holdings Inc. | 9,606 | 352 | |
| *,^ | Energous Corp. | 27,118 | 348 |
| * | Commercial Vehicle Group Inc. | 35,052 | 342 |
| * | Exela Technologies Inc. | 55,098 | 329 |
| Graham Corp. | 11,360 | 316 | |
| * | HC2 Holdings Inc. | 50,084 | 314 |
| Hurco Cos. Inc. | 7,091 | 304 | |
| CECO Environmental Corp. | 35,050 | 296 | |
| Marlin Business Services Corp. | 10,158 | 291 | |
| Preformed Line Products Co. | 3,549 | 290 | |
| * | ServiceSource International Inc. | 90,094 | 287 |
| * | Willdan Group Inc. | 9,082 | 285 |
| * | Eagle Bulk Shipping Inc. | 55,442 | 278 |
| * | Orion Group Holdings Inc. | 32,201 | 278 |
| * | Ardmore Shipping Corp. | 38,495 | 269 |
| * | GP Strategies Corp. | 14,136 | 269 |
| ConvergeOne Holdings Inc. | 28,652 | 262 | |
| Advanced Emissions Solutions Inc. | 22,261 | 254 | |
| * | Twin Disc Inc. | 9,659 | 247 |
| * | Dorian LPG Ltd. | 32,343 | 246 |
| Teekay Tankers Ltd. Class A | 223,446 | 241 | |
| * | Overseas Shipholding Group Inc. Class A | 67,743 | 232 |
| * | FreightCar America Inc. | 13,639 | 231 |
| * | PRGX Global Inc. | 23,928 | 229 |
| * | Liquidity Services Inc. | 30,382 | 219 |
| ^ | EnviroStar Inc. | 4,477 | 212 |
| * | Napco Security Technologies Inc. | 13,913 | 210 |
| * | USA Truck Inc. | 9,276 | 203 |
| * | Radiant Logistics Inc. | 45,035 | 196 |
| BG Staffing Inc. | 7,969 | 194 | |
| Rush Enterprises Inc. Class B | 4,230 | 187 | |
| * | Information Services Group Inc. | 37,746 | 187 |
| * | IES Holdings Inc. | 9,443 | 181 |
| * | Manitex International Inc. | 17,025 | 180 |
| * | Safe Bulkers Inc. | 57,200 | 160 |
| BrightView Holdings Inc. | 8,922 | 158 | |
| * | Gulfmark Offshore Inc. | 4,337 | 158 |
| NACCO Industries Inc. Class A | 4,461 | 157 | |
| * | General Finance Corp. | 11,393 | 156 |
| * | Hill International Inc. | 35,290 | 150 |
| * | PAM Transportation Services Inc. | 2,559 | 149 |
| * | PFSweb Inc. | 17,089 | 147 |
| * | Maxwell Technologies Inc. | 39,522 | 141 |
| * | Genco Shipping & Trading Ltd. | 9,729 | 134 |
| * | Gencor Industries Inc. | 9,956 | 128 |
| * | Willis Lease Finance Corp. | 3,566 | 122 |
| * | PHI Inc. | 14,017 | 114 |
| * | Babcock & Wilcox Enterprises Inc. | 36,419 | 51 |
| 363,528 | |||
| Technology (13.0%) | |||
| * | Integrated Device Technology Inc. | 154,790 | 6,577 |
| * | HubSpot Inc. | 42,295 | 6,078 |
28
| Vanguard® Russell 2000 Index Fund | |||
| Schedule of Investments | |||
| August 31, 2018 | |||
| Market | |||
| Value | |||
| Shares | ($000) | ||
| Blackbaud Inc. | 56,310 | 5,888 | |
| * | Cree Inc. | 117,531 | 5,654 |
| Entegris Inc. | 165,673 | 5,616 | |
| * | CACI International Inc. Class A | 28,678 | 5,592 |
| * | New Relic Inc. | 51,718 | 5,315 |
| * | Ciena Corp. | 167,323 | 5,284 |
| * | Lumentum Holdings Inc. | 73,179 | 4,969 |
| * | Silicon Laboratories Inc. | 50,075 | 4,907 |
| * | Semtech Corp. | 75,991 | 4,540 |
| Science Applications International Corp. | 49,460 | 4,462 | |
| * | Yelp Inc. Class A | 94,654 | 4,460 |
| * | Coupa Software Inc. | 62,014 | 4,447 |
| * | Ellie Mae Inc. | 39,875 | 4,202 |
| * | Acxiom Corp. | 91,774 | 4,193 |
| *,^ | ViaSat Inc. | 63,896 | 4,014 |
| Perspecta Inc. | 167,690 | 3,901 | |
| * | ACI Worldwide Inc. | 133,804 | 3,801 |
| Vishay Intertechnology Inc. | 154,552 | 3,678 | |
| * | Box Inc. | 148,499 | 3,647 |
| * | Verint Systems Inc. | 74,256 | 3,605 |
| * | II-VI Inc. | 72,174 | 3,591 |
| *,^ | iRobot Corp. | 31,605 | 3,587 |
| * | Qualys Inc. | 39,311 | 3,579 |
| * | Cornerstone OnDemand Inc. | 62,329 | 3,525 |
| SYNNEX Corp. | 35,432 | 3,436 | |
| InterDigital Inc. | 40,356 | 3,333 | |
| * | Cirrus Logic Inc. | 74,305 | 3,266 |
| * | Envestnet Inc. | 51,480 | 3,254 |
| * | Tech Data Corp. | 44,580 | 3,243 |
| Brooks Automation Inc. | 81,183 | 3,199 | |
| * | CommVault Systems Inc. | 45,845 | 3,193 |
| * | Five9 Inc. | 66,192 | 3,181 |
| * | Bottomline Technologies DE Inc. | 46,918 | 3,095 |
| * | Mercury Systems Inc. | 54,738 | 2,984 |
| * | Viavi Solutions Inc. | 265,380 | 2,972 |
| * | Rogers Corp. | 21,408 | 2,956 |
| * | Novanta Inc. | 38,187 | 2,925 |
| * | Avaya Holdings Corp. | 122,185 | 2,854 |
| * | Cargurus Inc. | 57,428 | 2,832 |
| * | Finisar Corp. | 133,978 | 2,733 |
| * | Q2 Holdings Inc. | 42,668 | 2,658 |
| Plantronics Inc. | 38,642 | 2,598 | |
| *,^ | 3D Systems Corp. | 127,412 | 2,593 |
| * | NETGEAR Inc. | 36,433 | 2,581 |
| * | Anixter International Inc. | 34,368 | 2,478 |
| * | NetScout Systems Inc. | 98,151 | 2,454 |
| Power Integrations Inc. | 33,413 | 2,451 | |
| * | Sanmina Corp. | 79,005 | 2,433 |
| * | Plexus Corp. | 38,187 | 2,417 |
| * | Varonis Systems Inc. | 32,443 | 2,398 |
| * | Yext Inc. | 94,747 | 2,355 |
| * | Insight Enterprises Inc. | 41,005 | 2,261 |
| Ebix Inc. | 28,050 | 2,234 | |
| * | Groupon Inc. Class A | 514,317 | 2,196 |
| Progress Software Corp. | 52,957 | 2,168 | |
| Maxar Technologies Ltd. | 66,021 | 2,050 | |
| ManTech International Corp. Class A | 30,859 | 2,047 | |
| * | TTM Technologies Inc. | 109,381 | 2,045 |
| * | Alarm.com Holdings Inc. | 36,022 | 2,028 |
| * | Evolent Health Inc. Class A | 79,331 | 2,023 |
| * | Fabrinet | 42,199 | 2,020 |
| * | Blackline Inc. | 37,789 | 1,994 |
| * | Blucora Inc. | 54,691 | 1,980 |
| * | Synaptics Inc. | 40,536 | 1,956 |
29
| Vanguard® Russell 2000 Index Fund | |||
| Schedule of Investments | |||
| August 31, 2018 | |||
| Market | |||
| Value | |||
| Shares | ($000) | ||
| * | SPS Commerce Inc. | 19,674 | 1,933 |
| TiVo Corp. | 141,309 | 1,929 | |
| * | Virtusa Corp. | 32,880 | 1,916 |
| * | Imperva Inc. | 40,610 | 1,915 |
| * | Alteryx Inc. Class A | 32,755 | 1,901 |
| * | SailPoint Technologies Holding Inc. | 61,242 | 1,894 |
| * | Inphi Corp. | 50,716 | 1,880 |
| * | Oclaro Inc. | 196,505 | 1,875 |
| * | MINDBODY Inc. Class A | 50,297 | 1,866 |
| * | Knowles Corp. | 102,329 | 1,855 |
| * | Everbridge Inc. | 30,725 | 1,850 |
| * | Cloudera Inc. | 120,450 | 1,808 |
| * | Hortonworks Inc. | 80,397 | 1,794 |
| * | LivePerson Inc. | 65,719 | 1,768 |
| * | Diodes Inc. | 46,604 | 1,767 |
| *,^ | GTT Communications Inc. | 40,961 | 1,763 |
| * | Syntel Inc. | 41,676 | 1,698 |
| * | KEMET Corp. | 65,056 | 1,681 |
| Methode Electronics Inc. | 42,216 | 1,674 | |
| * | MicroStrategy Inc. Class A | 11,049 | 1,646 |
| * | ePlus Inc. | 15,883 | 1,646 |
| * | Rapid7 Inc. | 42,320 | 1,615 |
| * | Infinera Corp. | 174,559 | 1,562 |
| * | Apptio Inc. Class A | 39,258 | 1,523 |
| * | Rambus Inc. | 124,266 | 1,519 |
| * | Stratasys Ltd. | 59,146 | 1,476 |
| * | Appfolio Inc. | 17,174 | 1,467 |
| * | Ambarella Inc. | 37,884 | 1,451 |
| CSG Systems International Inc. | 38,743 | 1,447 | |
| Benchmark Electronics Inc. | 55,939 | 1,446 | |
| * | MaxLinear Inc. | 73,200 | 1,411 |
| CTS Corp. | 38,102 | 1,408 | |
| * | TrueCar Inc. | 106,512 | 1,370 |
| * | FormFactor Inc. | 85,582 | 1,322 |
| * | Web.com Group Inc. | 47,084 | 1,316 |
| * | Acacia Communications Inc. | 32,100 | 1,309 |
| * | Carbonite Inc. | 31,047 | 1,290 |
| NIC Inc. | 74,991 | 1,260 | |
| *,^ | MACOM Technology Solutions Holdings Inc. | 53,199 | 1,226 |
| Altair Engineering Inc. Class A | 29,079 | 1,215 | |
| * | ForeScout Technologies Inc. | 33,629 | 1,213 |
| * | Vocera Communications Inc. | 36,037 | 1,195 |
| * | PROS Holdings Inc. | 32,375 | 1,194 |
| * | ScanSource Inc. | 29,357 | 1,193 |
| * | Workiva Inc. | 32,236 | 1,188 |
| AVX Corp. | 54,701 | 1,157 | |
| * | Nanometrics Inc. | 26,384 | 1,156 |
| * | Perficient Inc. | 39,758 | 1,142 |
| * | Lattice Semiconductor Corp. | 136,468 | 1,118 |
| *,^ | Unisys Corp. | 58,834 | 1,094 |
| * | Amkor Technology Inc. | 120,488 | 1,052 |
| * | Rudolph Technologies Inc. | 36,966 | 1,028 |
| * | Benefitfocus Inc. | 23,161 | 1,021 |
| * | Cray Inc. | 47,009 | 1,020 |
| Monotype Imaging Holdings Inc. | 48,302 | 995 | |
| * | Glu Mobile Inc. | 128,007 | 986 |
| * | USA Technologies Inc. | 60,284 | 980 |
| ADTRAN Inc. | 56,463 | 971 | |
| Comtech Telecommunications Corp. | 26,677 | 956 | |
| * | CalAmp Corp. | 40,517 | 952 |
| *,^ | Inovalon Holdings Inc. Class A | 82,918 | 912 |
| * | Xcerra Corp. | 62,537 | 906 |
| * | Applied Optoelectronics Inc. | 21,884 | 905 |
| Xperi Corp. | 57,581 | 904 | |
30
| Vanguard® Russell 2000 Index Fund | |||
| Schedule of Investments | |||
| August 31, 2018 | |||
| Market | |||
| Value | |||
| Shares | ($000) | ||
| Cohu Inc. | 33,274 | 878 | |
| * | Extreme Networks Inc. | 135,153 | 847 |
| * | Photronics Inc. | 78,967 | 845 |
| * | Cision Ltd. | 45,699 | 828 |
| * | Electro Scientific Industries Inc. | 37,014 | 812 |
| * | CEVA Inc. | 25,986 | 795 |
| * | Endurance International Group Holdings Inc. | 81,675 | 788 |
| *,^ | Ichor Holdings Ltd. | 29,478 | 764 |
| * | Axcelis Technologies Inc. | 37,810 | 764 |
| QAD Inc. Class A | 11,883 | 721 | |
| * | Quantenna Communications Inc. | 38,582 | 705 |
| ^ | Zscaler Inc. | 16,219 | 694 |
| * | OneSpan Inc. | 36,709 | 688 |
| * | Ultra Clean Holdings Inc. | 44,736 | 683 |
| * | Upland Software Inc. | 18,232 | 679 |
| * | Veeco Instruments Inc. | 56,441 | 677 |
| * | Loral Space & Communications Inc. | 14,961 | 664 |
| *,^ | Tucows Inc. Class A | 11,110 | 651 |
| NVE Corp. | 5,545 | 630 | |
| * | Limelight Networks Inc. | 124,105 | 629 |
| * | Kimball Electronics Inc. | 30,817 | 610 |
| * | PlayAGS Inc. | 18,579 | 595 |
| American Software Inc. Class A | 32,392 | 582 | |
| * | TechTarget Inc. | 23,473 | 563 |
| * | Presidio Inc. | 36,893 | 558 |
| PC Connection Inc. | 13,345 | 530 | |
| * | Harmonic Inc. | 96,713 | 527 |
| * | Model N Inc. | 29,082 | 494 |
| * | ShotSpotter Inc. | 8,423 | 480 |
| * | KeyW Holding Corp. | 56,219 | 478 |
| Park Electrochemical Corp. | 22,259 | 476 | |
| *,^ | Impinj Inc. | 21,850 | 469 |
| * | Digi International Inc. | 32,371 | 435 |
| * | Ribbon Communications Inc. | 61,229 | 424 |
| ^ | Diebold Nixdorf Inc. | 88,716 | 421 |
| * | Meet Group Inc. | 81,415 | 415 |
| * | A10 Networks Inc. | 58,399 | 407 |
| * | Immersion Corp. | 35,008 | 407 |
| * | Calix Inc. | 51,455 | 401 |
| * | MobileIron Inc. | 81,745 | 401 |
| * | ChannelAdvisor Corp. | 30,166 | 394 |
| *,^ | Digimarc Corp. | 13,104 | 387 |
| * | SMART Global Holdings Inc. | 11,585 | 382 |
| * | SendGrid Inc. | 10,508 | 381 |
| *,^ | NeoPhotonics Corp. | 40,221 | 354 |
| * | AXT Inc. | 44,101 | 348 |
| * | Ooma Inc. | 21,378 | 342 |
| * | PAR Technology Corp. | 13,242 | 340 |
| Daktronics Inc. | 41,794 | 339 | |
| * | Zix Corp. | 60,873 | 338 |
| * | Brightcove Inc. | 40,586 | 333 |
| * | pdvWireless Inc. | 10,926 | 328 |
| Bel Fuse Inc. Class B | 11,397 | 327 | |
| * | Alpha & Omega Semiconductor Ltd. | 22,816 | 324 |
| Internap Corp. | 23,308 | 313 | |
| Simulations Plus Inc. | 14,980 | 312 | |
| *,^ | Aquantia Corp. | 24,687 | 312 |
| * | eGain Corp. | 20,676 | 296 |
| *,^ | PolarityTE Inc. | 10,150 | 290 |
| * | Agilysys Inc. | 17,958 | 289 |
| * | PDF Solutions Inc. | 32,489 | 283 |
| * | Mitek Systems Inc. | 37,969 | 275 |
| ^ | nLight Inc. | 8,164 | 252 |
| Reis Inc. | 10,830 | 250 | |
31
| Vanguard® Russell 2000 Index Fund | |||
| Schedule of Investments | |||
| August 31, 2018 | |||
| Market | |||
| Value | |||
| Shares | ($000) | ||
| * | Casa Systems Inc. | 16,676 | 245 |
| * | Amber Road Inc. | 27,059 | 236 |
| ^ | Carbon Black Inc. | 9,233 | 234 |
| * | KVH Industries Inc. | 18,766 | 234 |
| * | Acacia Research Corp. | 57,130 | 223 |
| *,^ | VirnetX Holding Corp. | 62,877 | 211 |
| ^ | Turtle Beach Corp. | 9,022 | 207 |
| * | Leaf Group Ltd. | 18,594 | 206 |
| * | Telenav Inc. | 36,552 | 205 |
| * | Telaria Inc. | 49,783 | 205 |
| * | Clearfield Inc. | 13,618 | 186 |
| * | Avid Technology Inc. | 31,040 | 184 |
| * | Kopin Corp. | 73,553 | 171 |
| * | Asure Software Inc. | 11,242 | 169 |
| * | Aerohive Networks Inc. | 38,974 | 165 |
| * | Iteris Inc. | 29,742 | 153 |
| * | Sparton Corp. | 10,990 | 140 |
| * | SecureWorks Corp. Class A | 10,223 | 136 |
| ACM Research Inc. Class A | 9,232 | 130 | |
| * | Park City Group Inc. | 15,260 | 129 |
| * | Adesto Technologies Corp. | 20,578 | 125 |
| * | Remark Holdings Inc. | 31,164 | 110 |
| *,^ | Veritone Inc. | 8,184 | 85 |
| * | Pluralsight Inc. Class A | 2,299 | 79 |
| * | DASAN Zhone Solutions Inc. | 6,629 | 72 |
| * | Travelzoo | 5,393 | 67 |
| Domo Inc. | 2,600 | 61 | |
| * | Rimini Street Inc. | 10,696 | 54 |
| * | Majesco | 5,980 | 43 |
| * | Tenable Holdings Inc. | 775 | 26 |
| * | I3 Verticals Inc. Class A | 1,035 | 19 |
| EverQuote Inc. Class A | 1,033 | 14 | |
| * | Super Micro Computer Inc. | 118 | 2 |
| 349,646 | |||
| Utilities (3.9%) | |||
| IDACORP Inc. | 58,920 | 5,765 | |
| Portland General Electric Co. | 104,371 | 4,843 | |
| ONE Gas Inc. | 60,719 | 4,768 | |
| New Jersey Resources Corp. | 101,606 | 4,633 | |
| ALLETE Inc. | 60,108 | 4,513 | |
| j2 Global Inc. | 54,620 | 4,510 | |
| Southwest Gas Holdings Inc. | 56,248 | 4,349 | |
| Spire Inc. | 57,452 | 4,283 | |
| Avista Corp. | 76,679 | 3,935 | |
| Black Hills Corp. | 62,612 | 3,685 | |
| * | Vonage Holdings Corp. | 257,945 | 3,658 |
| PNM Resources Inc. | 92,841 | 3,616 | |
| NorthWestern Corp. | 58,155 | 3,487 | |
| South Jersey Industries Inc. | 99,831 | 3,312 | |
| El Paso Electric Co. | 47,216 | 2,894 | |
| Cogent Communications Holdings Inc. | 48,884 | 2,674 | |
| MGE Energy Inc. | 40,752 | 2,667 | |
| American States Water Co. | 42,626 | 2,576 | |
| Ormat Technologies Inc. | 46,373 | 2,442 | |
| * | 8x8 Inc. | 106,115 | 2,409 |
| California Water Service Group | 56,021 | 2,305 | |
| * | Iridium Communications Inc. | 111,946 | 2,267 |
| Otter Tail Corp. | 46,042 | 2,206 | |
| Northwest Natural Gas Co. | 33,422 | 2,169 | |
| Shenandoah Telecommunications Co. | 54,584 | 2,082 | |
| Pattern Energy Group Inc. Class A | 94,725 | 1,931 | |
| Chesapeake Utilities Corp. | 18,379 | 1,581 | |
| * | Boingo Wireless Inc. | 47,485 | 1,571 |
| NRG Yield Inc. | 77,743 | 1,543 | |
32
| Vanguard® Russell 2000 Index Fund | |||||
| Schedule of Investments | |||||
| August 31, 2018 | |||||
| Market | |||||
| Value | |||||
| Shares | ($000) | ||||
| SJW Group | 20,248 | 1,173 | |||
| * | Intelsat SA | 46,878 | 1,030 | ||
| Connecticut Water Service Inc. | 14,131 | 968 | |||
| Consolidated Communications Holdings Inc. | 81,386 | 961 | |||
| * | ORBCOMM Inc. | 84,820 | 915 | ||
| ATN International Inc. | 12,157 | 890 | |||
| Unitil Corp. | 17,323 | 876 | |||
| Middlesex Water Co. | 18,824 | 862 | |||
| NRG Yield Inc. Class A | 39,532 | 778 | |||
| * | Cincinnati Bell Inc. | 53,252 | 692 | ||
| * | NII Holdings Inc. | 103,546 | 594 | ||
| Frontier Communications Corp. | 91,863 | 478 | |||
| York Water Co. | 15,751 | 474 | |||
| Spok Holdings Inc. | 21,726 | 334 | |||
| Artesian Resources Corp. Class A | 9,129 | 328 | |||
| * | Gogo Inc. | 67,302 | 302 | ||
| * | Atlantic Power Corp. | 126,943 | 279 | ||
| * | Pure Cycle Corp. | 21,355 | 240 | ||
| Consolidated Water Co. Ltd. | 17,419 | 235 | |||
| * | AquaVenture Holdings Ltd. | 12,851 | 234 | ||
| RGC Resources Inc. | 8,583 | 231 | |||
| ^ | Windstream Holdings Inc. | 47,731 | 225 | ||
| Spark Energy Inc. Class A | 13,659 | 120 | |||
| Global Water Resources Inc. | 11,682 | 115 | |||
| Fusion Connect Inc. | 23,754 | 88 | |||
| 106,096 | |||||
| Total Common Stocks (Cost $2,273,490) | 2,696,225 | ||||
| Coupon | |||||
| Temporary Cash Investments (1.6%)1 | |||||
| Money Market Fund (1.6%) | |||||
| 3,4 | Vanguard Market Liquidity Fund | 2.153% | 416,156 | 41,624 | |
| Face | |||||
| Maturity | Amount | ||||
| Date | ($000) | ||||
| U.S. Government and Agency Obligations (0.0%) | |||||
| United States Treasury Bill | 1.986% | 10/18/18 | 150 | 150 | |
| 5 | United States Treasury Bill | 2.078% | 11/15/18 | 450 | 448 |
| 598 | |||||
| Total Temporary Cash Investments (Cost $42,211) | 42,222 | ||||
| Total Investments (101.6%) (Cost $2,315,701) | 2,738,447 | ||||
| Other Assets and Liabilities—Net (-1.6%)4 | (42,031) | ||||
| Net Assets (100%) | 2,696,416 | ||||
__________________________________________________________________________________________________________________________________________________________________________________________________________________________________________________________________________________________________________________________________________________________________________________________________________________________________________________________________________________________________________________________________________________________________________________________________________________________________________________________________________________________
__________________________________________________________________________________________________________________________________________________________________________________________________________________________________________________________________________________________________________________________________________________________________________________________________________________________________________________________________________________________________________________________________________________________________________________________________________________________________________________________________________________________
* Non-income-producing security.
^ Includes partial security positions on loan to broker-dealers. The total value of securities on loan is $37,466,000.
§ Security value determined using significant unobservable inputs.
1 The fund invests a portion of its cash reserves in equity markets through the use of index futures contracts. After giving effect to futures
investments, the fund's effective common stock and temporary cash investment positions represent 100.1% and 1.5%, respectively, of net
assets.
2 “Other” represents securities that are not classified by the fund’s benchmark index.
3 Affiliated money market fund available only to Vanguard funds and certain trusts and accounts managed by Vanguard. Rate shown is the 7-day
yield.
4 Includes $40,831,000 of collateral received for securities on loan.
5 Securities with a value of $100,000 have been segregated as initial margin for open futures contracts.
CVR—Contingent Value Rights.
REIT—Real Estate Investment Trust.
33
| Vanguard® Russell 2000 Value Index Fund | ||
| Schedule of Investments | ||
| August 31, 2018 | ||
| Market | ||
| Value | ||
| Shares | ($000) | |
| Common Stocks (99.2%)1 | ||
| Consumer Discretionary (11.8%) | ||
| Signet Jewelers Ltd. | 19,447 | 1,248 |
| Aaron's Inc. | 23,257 | 1,156 |
| * Helen of Troy Ltd. | 8,104 | 964 |
| * Adtalem Global Education Inc. | 19,841 | 949 |
| * Penn National Gaming Inc. | 24,802 | 855 |
| * Cooper-Standard Holdings Inc. | 5,993 | 830 |
| TEGNA Inc. | 71,114 | 828 |
| Bed Bath & Beyond Inc. | 44,702 | 802 |
| * Liberty Expedia Holdings Inc. Class A | 16,909 | 780 |
| DSW Inc. Class A | 22,589 | 751 |
| * Liberty Latin America Ltd. | 37,724 | 740 |
| Jack in the Box Inc. | 8,084 | 733 |
| * TRI Pointe Group Inc. | 47,705 | 691 |
| * Murphy USA Inc. | 8,269 | 686 |
| Meredith Corp. | 12,827 | 662 |
| * American Axle & Manufacturing Holdings Inc. | 36,256 | 642 |
| * Cars.com Inc. | 23,778 | 640 |
| * Taylor Morrison Home Corp. Class A | 32,234 | 627 |
| Travelport Worldwide Ltd. | 33,157 | 616 |
| Office Depot Inc. | 182,829 | 612 |
| * Gentherm Inc. | 11,953 | 588 |
| Caleres Inc. | 13,691 | 554 |
| KB Home | 22,053 | 548 |
| Tupperware Brands Corp. | 16,691 | 543 |
| Matthews International Corp. Class A | 10,435 | 542 |
| Group 1 Automotive Inc. | 6,625 | 511 |
| * Meritage Homes Corp. | 11,801 | 509 |
| MDC Holdings Inc. | 15,534 | 492 |
| Abercrombie & Fitch Co. | 22,405 | 485 |
| Cooper Tire & Rubber Co. | 16,506 | 476 |
| * MSG Networks Inc. | 19,476 | 473 |
| * G-III Apparel Group Ltd. | 10,257 | 466 |
| Guess? Inc. | 18,986 | 465 |
| * Gray Television Inc. | 26,282 | 459 |
| * Sally Beauty Holdings Inc. | 29,291 | 451 |
| Big Lots Inc. | 10,463 | 450 |
| GameStop Corp. Class A | 33,028 | 438 |
| * Belmond Ltd. Class A | 25,385 | 425 |
| Scholastic Corp. | 9,436 | 397 |
| Chico's FAS Inc. | 42,172 | 385 |
| Gannett Co. Inc. | 36,849 | 379 |
| Sinclair Broadcast Group Inc. Class A | 12,523 | 362 |
| Standard Motor Products Inc. | 6,908 | 351 |
| * Vista Outdoor Inc. | 18,846 | 348 |
| International Speedway Corp. Class A | 7,878 | 348 |
| Entercom Communications Corp. Class A | 41,643 | 327 |
| New Media Investment Group Inc. | 20,350 | 324 |
| AMC Entertainment Holdings Inc. Class A | 16,906 | 322 |
| * Genesco Inc. | 6,324 | 322 |
| * Hertz Global Holdings Inc. | 18,090 | 319 |
| * Fitbit Inc. Class A | 52,468 | 316 |
| Acushnet Holdings Corp. | 11,259 | 305 |
| Dillard's Inc. Class A | 3,838 | 302 |
| La-Z-Boy Inc. | 8,702 | 289 |
| ILG Inc. | 8,458 | 289 |
| Marcus Corp. | 6,839 | 278 |
| * Liberty Latin America Ltd. Class A | 14,082 | 278 |
| Lithia Motors Inc. Class A | 3,148 | 272 |
| * Express Inc. | 23,938 | 269 |
| * Fossil Group Inc. | 11,726 | 266 |
| * Laureate Education Inc. Class A | 16,399 | 262 |
34
| Vanguard® Russell 2000 Value Index Fund | |||
| Schedule of Investments | |||
| August 31, 2018 | |||
| Market | |||
| Value | |||
| Shares | ($000) | ||
| * | Ascena Retail Group Inc. | 56,967 | 261 |
| * | Regis Corp. | 11,513 | 246 |
| * | American Outdoor Brands Corp. | 17,478 | 245 |
| EW Scripps Co. Class A | 15,938 | 234 | |
| Callaway Golf Co. | 10,083 | 230 | |
| National CineMedia Inc. | 25,091 | 228 | |
| * | Century Communities Inc. | 7,746 | 227 |
| Tower International Inc. | 6,451 | 218 | |
| * | Rent-A-Center Inc. | 14,431 | 213 |
| * | K12 Inc. | 12,454 | 206 |
| Movado Group Inc. | 4,814 | 205 | |
| * | M/I Homes Inc. | 7,873 | 204 |
| * | Houghton Mifflin Harcourt Co. | 30,938 | 200 |
| New York Times Co. Class A | 8,493 | 198 | |
| National Presto Industries Inc. | 1,462 | 194 | |
| * | Universal Electronics Inc. | 4,476 | 193 |
| Buckle Inc. | 7,477 | 192 | |
| Viad Corp. | 3,022 | 186 | |
| Dine Brands Global Inc. | 2,212 | 184 | |
| Sonic Corp. | 5,132 | 184 | |
| Papa John's International Inc. | 3,987 | 184 | |
| *,^ | JC Penney Co. Inc. | 102,139 | 181 |
| Ethan Allen Interiors Inc. | 7,972 | 177 | |
| * | Red Robin Gourmet Burgers Inc. | 4,224 | 174 |
| Superior Industries International Inc. | 7,994 | 173 | |
| * | American Public Education Inc. | 4,924 | 171 |
| Sonic Automotive Inc. Class A | 7,801 | 168 | |
| * | William Lyon Homes Class A | 8,530 | 167 |
| * | Motorcar Parts of America Inc. | 6,191 | 164 |
| * | Party City Holdco Inc. | 10,553 | 162 |
| Cato Corp. Class A | 7,279 | 156 | |
| Shoe Carnival Inc. | 3,453 | 153 | |
| Brinker International Inc. | 3,454 | 153 | |
| American Eagle Outfitters Inc. | 5,623 | 146 | |
| Tenneco Inc. | 3,397 | 145 | |
| Haverty Furniture Cos. Inc. | 6,146 | 136 | |
| * | Conn's Inc. | 3,285 | 135 |
| * | Zumiez Inc. | 4,233 | 132 |
| * | Beazer Homes USA Inc. | 10,221 | 131 |
| * | Del Taco Restaurants Inc. | 10,103 | 131 |
| Citi Trends Inc. | 4,135 | 128 | |
| * | Hibbett Sports Inc. | 6,170 | 127 |
| Emerald Expositions Events Inc. | 8,066 | 126 | |
| * | America's Car-Mart Inc. | 1,494 | 125 |
| * | Vera Bradley Inc. | 8,171 | 120 |
| *,^ | WideOpenWest Inc. | 9,942 | 116 |
| * | Perry Ellis International Inc. | 4,191 | 115 |
| * | Habit Restaurants Inc. Class A | 6,631 | 110 |
| * | Central Garden & Pet Co. Class A | 2,914 | 106 |
| Barnes & Noble Inc. | 19,388 | 102 | |
| Tilly's Inc. Class A | 3,978 | 94 | |
| Marriott Vacations Worldwide Corp. | 761 | 91 | |
| Entravision Communications Corp. Class A | 17,073 | 90 | |
| * | Reading International Inc. Class A | 5,459 | 88 |
| Hooker Furniture Corp. | 2,088 | 88 | |
| Boyd Gaming Corp. | 2,410 | 88 | |
| * | Lands' End Inc. | 3,415 | 88 |
| *,^ | Daily Journal Corp. | 364 | 87 |
| *,^ | Zoe's Kitchen Inc. | 6,249 | 86 |
| Dana Inc. | 4,360 | 85 | |
| Flexsteel Industries Inc. | 2,385 | 85 | |
| * | Rosetta Stone Inc. | 5,311 | 84 |
| * | El Pollo Loco Holdings Inc. | 6,971 | 83 |
| * | Bojangles' Inc. | 5,662 | 83 |
35
| Vanguard® Russell 2000 Value Index Fund | |||
| Schedule of Investments | |||
| August 31, 2018 | |||
| Market | |||
| Value | |||
| Shares | ($000) | ||
| * | Green Brick Partners Inc. | 7,496 | 78 |
| Bassett Furniture Industries Inc. | 3,321 | 78 | |
| * | Denny's Corp. | 5,039 | 76 |
| * | Barnes & Noble Education Inc. | 12,490 | 75 |
| * | 1-800-Flowers.com Inc. Class A | 6,190 | 75 |
| Clarus Corp. | 6,889 | 71 | |
| Weyco Group Inc. | 2,010 | 71 | |
| * | Francesca's Holdings Corp. | 11,328 | 71 |
| * | Red Lion Hotels Corp. | 5,167 | 70 |
| * | Century Casinos Inc. | 8,785 | 70 |
| Carriage Services Inc. Class A | 3,013 | 69 | |
| Rocky Brands Inc. | 2,220 | 67 | |
| Speedway Motorsports Inc. | 3,724 | 67 | |
| * | MarineMax Inc. | 2,958 | 67 |
| * | Biglari Holdings Inc. Class B | 318 | 63 |
| * | Del Frisco's Restaurant Group Inc. | 6,579 | 62 |
| Johnson Outdoors Inc. Class A | 599 | 61 | |
| * | Eros International plc | 5,262 | 59 |
| * | Container Store Group Inc. | 5,132 | 58 |
| Clear Channel Outdoor Holdings Inc. Class A | 12,059 | 55 | |
| * | Weight Watchers International Inc. | 714 | 53 |
| * | J Alexander's Holdings Inc. | 4,175 | 52 |
| * | Cambium Learning Group Inc. | 3,644 | 49 |
| * | Hovnanian Enterprises Inc. Class A | 30,894 | 48 |
| Tile Shop Holdings Inc. | 6,226 | 48 | |
| Pier 1 Imports Inc. | 25,747 | 47 | |
| Wingstop Inc. | 707 | 47 | |
| Saga Communications Inc. Class A | 1,241 | 47 | |
| Escalade Inc. | 3,466 | 46 | |
| Lifetime Brands Inc. | 3,923 | 46 | |
| * | Fiesta Restaurant Group Inc. | 1,569 | 45 |
| * | Boston Omaha Corp. Class A | 1,641 | 43 |
| * | Hemisphere Media Group Inc. Class A | 2,947 | 40 |
| * | Lumber Liquidators Holdings Inc. | 2,286 | 40 |
| * | Town Sports International Holdings Inc. | 4,274 | 39 |
| Big 5 Sporting Goods Corp. | 6,529 | 37 | |
| * | New Home Co. Inc. | 4,207 | 37 |
| * | Monarch Casino & Resort Inc. | 748 | 35 |
| * | Kirkland's Inc. | 3,771 | 34 |
| * | J. Jill Inc. | 5,346 | 32 |
| * | Chuy's Holdings Inc. | 1,087 | 31 |
| * | Stoneridge Inc. | 955 | 29 |
| * | Biglari Holdings Inc. | 29 | 28 |
| * | Central Garden & Pet Co. | 683 | 27 |
| Fluent Inc. | 11,153 | 27 | |
| Inter Parfums Inc. | 404 | 26 | |
| * | Carrols Restaurant Group Inc. | 1,601 | 25 |
| RCI Hospitality Holdings Inc. | 739 | 24 | |
| * | Gaia Inc. Class A | 1,336 | 23 |
| * | New York & Co. Inc. | 3,546 | 16 |
| BJ's Wholesale Club Holdings Inc. | 510 | 15 | |
| *,^ | Sears Holdings Corp. | 10,706 | 14 |
| * | Nautilus Inc. | 931 | 14 |
| * | Drive Shack Inc. | 1,708 | 11 |
| Hamilton Beach Brands Holding Co. Class A | 457 | 11 | |
| Beasley Broadcast Group Inc. Class A | 1,338 | 10 | |
| * | Revlon Inc. Class A | 366 | 8 |
| *,^ | Empire Resorts Inc. | 593 | 7 |
| * | Vuzix Corp. | 756 | 5 |
| Strategic Education Inc. | 3 | — | |
| * | Franklin Covey Co. | 2 | — |
| * | XO Group Inc. | 1 | — |
| * | Vitamin Shoppe Inc. | 2 | — |
| * | Hudson Ltd. Class A | 1 | — |
36
| Vanguard® Russell 2000 Value Index Fund | |||
| Schedule of Investments | |||
| August 31, 2018 | |||
| Market | |||
| Value | |||
| Shares | ($000) | ||
| * | Cardlytics Inc. | 1 | — |
| * | VOXX International Corp. Class A | 3 | — |
| * | Eastman Kodak Co. | 2 | — |
| 44,358 | |||
| Consumer Staples (2.4%) | |||
| * | Edgewell Personal Care Co. | 17,669 | 998 |
| Sanderson Farms Inc. | 6,787 | 718 | |
| B&G Foods Inc. | 19,519 | 624 | |
| * | United Natural Foods Inc. | 16,703 | 593 |
| Core-Mark Holding Co. Inc. | 13,779 | 493 | |
| Universal Corp. | 8,119 | 486 | |
| * | Rite Aid Corp. | 348,428 | 477 |
| * | SUPERVALU Inc. | 12,557 | 405 |
| * | Hostess Brands Inc. Class A | 32,108 | 378 |
| Fresh Del Monte Produce Inc. | 9,900 | 371 | |
| Andersons Inc. | 8,850 | 362 | |
| * | Simply Good Foods Co. | 19,610 | 353 |
| Cal-Maine Foods Inc. | 6,048 | 299 | |
| Vector Group Ltd. | 17,671 | 274 | |
| Lancaster Colony Corp. | 1,684 | 263 | |
| SpartanNash Co. | 11,584 | 247 | |
| Dean Foods Co. | 29,674 | 226 | |
| Ingles Markets Inc. Class A | 5,020 | 180 | |
| Weis Markets Inc. | 3,359 | 156 | |
| Tootsie Roll Industries Inc. | 4,515 | 130 | |
| * | Farmer Brothers Co. | 3,308 | 96 |
| Village Super Market Inc. Class A | 3,178 | 93 | |
| Limoneira Co. | 2,758 | 85 | |
| *,^ | GNC Holdings Inc. Class A | 26,359 | 82 |
| * | Diplomat Pharmacy Inc. | 3,674 | 76 |
| * | Seneca Foods Corp. Class A | 2,260 | 73 |
| *,^ | Cadiz Inc. | 7,044 | 68 |
| * | Natural Grocers by Vitamin Cottage Inc. | 2,935 | 57 |
| * | Smart & Final Stores Inc. | 7,354 | 51 |
| * | Alliance One International Inc. | 2,729 | 48 |
| Alico Inc. | 1,184 | 38 | |
| MGP Ingredients Inc. | 490 | 38 | |
| * | Nature's Sunshine Products Inc. | 2,767 | 25 |
| Natural Health Trends Corp. | 210 | 6 | |
| 8,869 | |||
| Energy (7.0%) | |||
| * | Oasis Petroleum Inc. | 89,339 | 1,203 |
| * | PDC Energy Inc. | 21,991 | 1,159 |
| McDermott International Inc. | 59,559 | 1,152 | |
| * | Southwestern Energy Co. | 195,718 | 1,100 |
| Peabody Energy Corp. | 26,484 | 1,094 | |
| * | Oceaneering International Inc. | 33,426 | 945 |
| * | Callon Petroleum Co. | 74,220 | 839 |
| Golar LNG Ltd. | 31,178 | 797 | |
| * | Gulfport Energy Corp. | 57,348 | 674 |
| * | Oil States International Inc. | 19,392 | 656 |
| * | Dril-Quip Inc. | 12,385 | 652 |
| SemGroup Corp. Class A | 26,337 | 637 | |
| * | California Resources Corp. | 14,869 | 618 |
| World Fuel Services Corp. | 22,003 | 617 | |
| * | NOW Inc. | 35,505 | 610 |
| * | Rowan Cos. plc Class A | 42,186 | 592 |
| Arch Coal Inc. Class A | 6,240 | 553 | |
| Archrock Inc. | 41,369 | 523 | |
| * | Noble Corp. plc | 81,764 | 499 |
| Ocean Rig UDW Inc. | 17,976 | 487 | |
| * | Superior Energy Services Inc. | 49,892 | 449 |
| * | Unit Corp. | 17,023 | 448 |
| * | C&J Energy Services Inc. | 20,978 | 439 |
37
| Vanguard® Russell 2000 Value Index Fund | |||
| Schedule of Investments | |||
| August 31, 2018 | |||
| Market | |||
| Value | |||
| Shares | ($000) | ||
| * | Denbury Resources Inc. | 77,313 | 431 |
| * | Helix Energy Solutions Group Inc. | 45,769 | 428 |
| *,^ | Sunrun Inc. | 31,280 | 410 |
| *,^ | Diamond Offshore Drilling Inc. | 21,080 | 367 |
| * | Forum Energy Technologies Inc. | 26,356 | 315 |
| * | Newpark Resources Inc. | 28,593 | 300 |
| * | Renewable Energy Group Inc. | 11,021 | 297 |
| * | Laredo Petroleum Inc. | 35,272 | 292 |
| * | Exterran Corp. | 10,539 | 289 |
| Warrior Met Coal Inc. | 11,683 | 281 | |
| * | SunCoke Energy Inc. | 21,140 | 236 |
| Green Plains Inc. | 12,815 | 227 | |
| * | CONSOL Energy Inc. | 5,280 | 227 |
| * | Talos Energy Inc. | 6,555 | 226 |
| *,^ | Resolute Energy Corp. | 6,714 | 221 |
| TerraForm Power Inc. Class A | 19,535 | 218 | |
| * | Frank's International NV | 23,814 | 210 |
| * | Par Pacific Holdings Inc. | 10,337 | 210 |
| * | W&T Offshore Inc. | 30,249 | 205 |
| *,^ | Halcon Resources Corp. | 43,409 | 199 |
| * | HighPoint Resources Corp. | 35,371 | 195 |
| * | Bonanza Creek Energy Inc. | 6,127 | 190 |
| * | Matrix Service Co. | 8,604 | 180 |
| * | SandRidge Energy Inc. | 9,968 | 158 |
| * | Select Energy Services Inc. Class A | 11,378 | 155 |
| * | REX American Resources Corp. | 1,851 | 149 |
| * | Alta Mesa Resources Inc. | 31,197 | 148 |
| * | Enphase Energy Inc. | 28,138 | 138 |
| Delek US Holdings Inc. | 2,337 | 127 | |
| * | Clean Energy Fuels Corp. | 44,625 | 123 |
| * | SEACOR Marine Holdings Inc. | 5,256 | 108 |
| * | Matador Resources Co. | 3,100 | 101 |
| * | Trecora Resources | 6,742 | 94 |
| * | Northern Oil and Gas Inc. | 26,415 | 91 |
| FTS International Inc. | 8,255 | 91 | |
| * | Natural Gas Services Group Inc. | 4,058 | 90 |
| *,^ | SunPower Corp. Class A | 13,184 | 89 |
| * | Ameresco Inc. Class A | 6,151 | 88 |
| * | Nine Energy Service Inc. | 2,924 | 88 |
| * | Energy XXI Gulf Coast Inc. | 9,136 | 83 |
| * | SilverBow Resources Inc. | 2,640 | 81 |
| * | Era Group Inc. | 6,561 | 78 |
| * | Pioneer Energy Services Corp. | 22,775 | 73 |
| * | RigNet Inc. | 4,264 | 70 |
| * | Ultra Petroleum Corp. | 51,791 | 68 |
| * | Infrastructure and Energy Alternatives Inc. | 5,565 | 59 |
| * | CARBO Ceramics Inc. | 6,617 | 57 |
| * | Cloud Peak Energy Inc. | 24,089 | 57 |
| * | Midstates Petroleum Co. Inc. | 4,874 | 57 |
| * | Basic Energy Services Inc. | 6,240 | 55 |
| * | NCS Multistage Holdings Inc. | 3,179 | 52 |
| * | Earthstone Energy Inc. Class A | 6,137 | 51 |
| Panhandle Oil and Gas Inc. Class A | 2,457 | 46 | |
| * | Flotek Industries Inc. | 17,903 | 45 |
| * | Dawson Geophysical Co. | 6,860 | 43 |
| * | Vivint Solar Inc. | 7,288 | 38 |
| * | Smart Sand Inc. | 7,231 | 36 |
| Hallador Energy Co. | 5,401 | 33 | |
| *,^ | Approach Resources Inc. | 14,653 | 32 |
| Adams Resources & Energy Inc. | 687 | 32 | |
| * | FuelCell Energy Inc. | 26,507 | 31 |
| * | Independence Contract Drilling Inc. | 6,982 | 31 |
| * | Isramco Inc. | 233 | 27 |
| * | TETRA Technologies Inc. | 5,179 | 24 |
38
| Vanguard® Russell 2000 Value Index Fund | |||
| Schedule of Investments | |||
| August 31, 2018 | |||
| Market | |||
| Value | |||
| Shares | ($000) | ||
| * | EP Energy Corp. Class A | 13,157 | 23 |
| *,^ | Eclipse Resources Corp. | 14,798 | 21 |
| * | Abraxas Petroleum Corp. | 8,258 | 19 |
| Quintana Energy Services Inc. | 2,060 | 16 | |
| * | WildHorse Resource Development Corp. | 664 | 14 |
| * | Goodrich Petroleum Corp. | 946 | 13 |
| * | Ring Energy Inc. | 1,072 | 13 |
| * | Keane Group Inc. | 991 | 12 |
| CVR Energy Inc. | 282 | 11 | |
| * | Nuverra Environmental Solutions Inc. | 441 | 5 |
| * | Berry Petroleum Corp. | 200 | 3 |
| * | Ramaco Resources Inc. | 150 | 1 |
| Nordic American Offshore Ltd. | 72 | — | |
| * | Pacific Ethanol Inc. | 1 | — |
| * | Jones Energy Inc. Class A | 3 | — |
| 26,145 | |||
| Financial Services (40.0%) | |||
| IBERIABANK Corp. | 18,533 | 1,606 | |
| * | MGIC Investment Corp. | 121,903 | 1,551 |
| Hancock Whitney Corp. | 28,014 | 1,444 | |
| Gramercy Property Trust | 52,784 | 1,444 | |
| Radian Group Inc. | 70,992 | 1,443 | |
| Sabra Health Care REIT Inc. | 58,652 | 1,383 | |
| Chemical Financial Corp. | 23,499 | 1,342 | |
| United Bankshares Inc. | 33,468 | 1,319 | |
| Cousins Properties Inc. | 138,634 | 1,296 | |
| Stifel Financial Corp. | 23,005 | 1,285 | |
| LaSalle Hotel Properties | 36,474 | 1,281 | |
| Valley National Bancorp | 106,162 | 1,279 | |
| Healthcare Realty Trust Inc. | 41,137 | 1,274 | |
| RLJ Lodging Trust | 56,800 | 1,244 | |
| Sunstone Hotel Investors Inc. | 73,690 | 1,237 | |
| Selective Insurance Group Inc. | 19,043 | 1,223 | |
| MB Financial Inc. | 25,100 | 1,216 | |
| CNO Financial Group Inc. | 54,847 | 1,185 | |
| Blackstone Mortgage Trust Inc. Class A | 33,540 | 1,142 | |
| UMB Financial Corp. | 14,813 | 1,115 | |
| Glacier Bancorp Inc. | 24,044 | 1,098 | |
| BancorpSouth Bank | 31,515 | 1,097 | |
| Cathay General Bancorp | 25,845 | 1,093 | |
| American Equity Investment Life Holding Co. | 29,396 | 1,090 | |
| Community Bank System Inc. | 16,420 | 1,086 | |
| Physicians Realty Trust | 61,396 | 1,074 | |
| Investors Bancorp Inc. | 82,162 | 1,052 | |
| Education Realty Trust Inc. | 25,314 | 1,047 | |
| Fulton Financial Corp. | 57,303 | 1,043 | |
| First Industrial Realty Trust Inc. | 31,859 | 1,034 | |
| Columbia Banking System Inc. | 24,058 | 1,016 | |
| Old National Bancorp | 50,004 | 1,015 | |
| CoreCivic Inc. | 39,161 | 1,014 | |
| First Financial Bancorp | 31,456 | 988 | |
| South State Corp. | 11,945 | 985 | |
| PotlatchDeltic Corp. | 20,219 | 977 | |
| Washington Federal Inc. | 28,272 | 964 | |
| STAG Industrial Inc. | 33,085 | 955 | |
| Home BancShares Inc. | 40,491 | 948 | |
| Simmons First National Corp. Class A | 29,750 | 940 | |
| First Midwest Bancorp Inc. | 34,232 | 930 | |
| Union Bankshares Corp. | 21,567 | 897 | |
| Rexford Industrial Realty Inc. | 26,753 | 869 | |
| Pebblebrook Hotel Trust | 22,409 | 865 | |
| Xenia Hotels & Resorts Inc. | 35,193 | 854 | |
| CenterState Bank Corp. | 27,882 | 854 | |
39
| Vanguard® Russell 2000 Value Index Fund | ||
| Schedule of Investments | ||
| August 31, 2018 | ||
| Market | ||
| Value | ||
| Shares | ($000) | |
| Great Western Bancorp Inc. | 19,554 | 851 |
| * Enstar Group Ltd. | 3,961 | 846 |
| ProAssurance Corp. | 17,490 | 846 |
| CVB Financial Corp. | 35,054 | 843 |
| International Bancshares Corp. | 17,994 | 843 |
| Piedmont Office Realty Trust Inc. Class A | 42,388 | 841 |
| WesBanco Inc. | 17,001 | 839 |
| Washington REIT | 26,141 | 825 |
| Trustmark Corp. | 22,908 | 813 |
| GEO Group Inc. | 31,577 | 801 |
| DiamondRock Hospitality Co. | 66,613 | 797 |
| Apollo Commercial Real Estate Finance Inc. | 40,607 | 789 |
| First Merchants Corp. | 16,286 | 784 |
| * Genworth Financial Inc. Class A | 166,471 | 774 |
| Acadia Realty Trust | 26,945 | 768 |
| Hope Bancorp Inc. | 43,706 | 765 |
| Independent Bank Corp. | 8,124 | 740 |
| Renasant Corp. | 15,783 | 737 |
| United Community Banks Inc. | 23,859 | 724 |
| Retail Opportunity Investments Corp. | 36,145 | 713 |
| Towne Bank | 21,587 | 704 |
| Terreno Realty Corp. | 17,898 | 687 |
| Argo Group International Holdings Ltd. | 10,700 | 682 |
| Urban Edge Properties | 29,793 | 681 |
| * Essent Group Ltd. | 15,498 | 672 |
| Banner Corp. | 10,426 | 671 |
| Lexington Realty Trust | 71,451 | 667 |
| Mack-Cali Realty Corp. | 30,404 | 664 |
| Chesapeake Lodging Trust | 19,581 | 644 |
| Horace Mann Educators Corp. | 13,586 | 629 |
| * First BanCorp | 70,500 | 617 |
| National Health Investors Inc. | 7,546 | 598 |
| LTC Properties Inc. | 12,801 | 595 |
| Invesco Mortgage Capital Inc. | 36,555 | 593 |
| Kemper Corp. | 7,226 | 588 |
| Heartland Financial USA Inc. | 9,621 | 585 |
| Northwest Bancshares Inc. | 31,539 | 575 |
| Berkshire Hills Bancorp Inc. | 13,566 | 573 |
| Colony Credit Real Estate Inc. | 28,409 | 570 |
| Westamerica Bancorporation | 8,900 | 570 |
| Capitol Federal Financial Inc. | 43,037 | 569 |
| NBT Bancorp Inc. | 14,041 | 568 |
| First Commonwealth Financial Corp. | 33,889 | 568 |
| Agree Realty Corp. | 9,813 | 560 |
| Government Properties Income Trust | 32,789 | 554 |
| S&T Bancorp Inc. | 11,819 | 551 |
| Seritage Growth Properties Class A | 10,666 | 549 |
| * PRA Group Inc. | 14,762 | 540 |
| Waddell & Reed Financial Inc. Class A | 26,934 | 539 |
| Alexander & Baldwin Inc. | 22,854 | 536 |
| American Assets Trust Inc. | 13,128 | 519 |
| Provident Financial Services Inc. | 20,178 | 509 |
| First Interstate BancSystem Inc. Class A | 10,698 | 497 |
| Global Net Lease Inc. | 22,857 | 496 |
| Hilltop Holdings Inc. | 23,786 | 494 |
| Ladder Capital Corp. Class A | 28,288 | 491 |
| Employers Holdings Inc. | 10,711 | 491 |
| Kite Realty Group Trust | 27,541 | 481 |
| Park National Corp. | 4,358 | 480 |
| Washington Prime Group Inc. | 61,661 | 477 |
| Safety Insurance Group Inc. | 4,874 | 471 |
| CareTrust REIT Inc. | 25,290 | 467 |
| Brookline Bancorp Inc. | 25,701 | 466 |
| First Busey Corp. | 14,472 | 464 |
40
| Vanguard® Russell 2000 Value Index Fund | |||
| Schedule of Investments | |||
| August 31, 2018 | |||
| Market | |||
| Value | |||
| Shares | ($000) | ||
| Summit Hotel Properties Inc. | 33,644 | 462 | |
| OceanFirst Financial Corp. | 15,502 | 453 | |
| AmTrust Financial Services Inc. | 30,936 | 450 | |
| Sandy Spring Bancorp Inc. | 11,270 | 440 | |
| Walker & Dunlop Inc. | 7,988 | 435 | |
| * | Cannae Holdings Inc. | 22,114 | 430 |
| LegacyTexas Financial Group Inc. | 9,284 | 430 | |
| National Storage Affiliates Trust | 15,112 | 429 | |
| Kennedy-Wilson Holdings Inc. | 19,967 | 428 | |
| Select Income REIT | 20,591 | 423 | |
| Navigators Group Inc. | 6,044 | 423 | |
| Redwood Trust Inc. | 24,410 | 414 | |
| Heritage Financial Corp. | 11,279 | 409 | |
| QTS Realty Trust Inc. Class A | 8,918 | 408 | |
| AMERISAFE Inc. | 6,373 | 407 | |
| * | FGL Holdings | 46,126 | 402 |
| Tompkins Financial Corp. | 4,556 | 400 | |
| PennyMac Mortgage Investment Trust | 19,962 | 399 | |
| First Bancorp | 9,518 | 397 | |
| * | Pacific Premier Bancorp Inc. | 9,923 | 392 |
| Boston Private Financial Holdings Inc. | 27,106 | 392 | |
| Beneficial Bancorp Inc. | 22,195 | 391 | |
| * | Seacoast Banking Corp. of Florida | 12,310 | 389 |
| Southside Bancshares Inc. | 10,855 | 386 | |
| City Holding Co. | 4,751 | 385 | |
| Tier REIT Inc. | 15,906 | 379 | |
| * | LendingClub Corp. | 104,216 | 376 |
| Cadence BanCorp Class A | 13,006 | 367 | |
| Monmouth Real Estate Investment Corp. | 20,773 | 361 | |
| Ramco-Gershenson Properties Trust | 25,807 | 360 | |
| WSFS Financial Corp. | 7,319 | 357 | |
| Hannon Armstrong Sustainable Infrastructure Capital Inc. | 16,553 | 357 | |
| Independent Bank Group Inc. | 5,132 | 355 | |
| * | Third Point Reinsurance Ltd. | 26,249 | 352 |
| Piper Jaffray Cos. | 4,539 | 349 | |
| Nelnet Inc. Class A | 6,054 | 349 | |
| * | Encore Capital Group Inc. | 8,461 | 328 |
| Stewart Information Services Corp. | 7,225 | 324 | |
| ARMOUR Residential REIT Inc. | 13,535 | 318 | |
| * | Flagstar Bancorp Inc. | 9,613 | 318 |
| Bryn Mawr Bank Corp. | 6,486 | 317 | |
| Chatham Lodging Trust | 14,717 | 316 | |
| United Fire Group Inc. | 6,172 | 306 | |
| Getty Realty Corp. | 10,497 | 306 | |
| 1st Source Corp. | 5,431 | 304 | |
| TriCo Bancshares | 7,812 | 304 | |
| InfraREIT Inc. | 14,384 | 300 | |
| Independence Realty Trust Inc. | 28,377 | 293 | |
| United Financial Bancorp Inc. | 16,494 | 293 | |
| Kearny Financial Corp. | 21,333 | 292 | |
| * | Ambac Financial Group Inc. | 13,796 | 291 |
| Franklin Street Properties Corp. | 33,920 | 291 | |
| BancFirst Corp. | 4,481 | 286 | |
| RE/MAX Holdings Inc. Class A | 5,799 | 286 | |
| Lakeland Bancorp Inc. | 14,639 | 283 | |
| Banc of California Inc. | 13,997 | 282 | |
| TrustCo Bank Corp. NY | 30,452 | 282 | |
| * | INTL. FCStone Inc. | 4,991 | 278 |
| CorePoint Lodging Inc. | 13,236 | 276 | |
| Enterprise Financial Services Corp. | 4,897 | 276 | |
| MTGE Investment Corp. | 14,008 | 275 | |
| *,^ | Columbia Financial Inc. | 16,162 | 274 |
| Hersha Hospitality Trust Class A | 11,581 | 273 | |
| *,^ | MBIA Inc. | 26,427 | 271 |
41
| Vanguard® Russell 2000 Value Index Fund | ||
| Schedule of Investments | ||
| August 31, 2018 | ||
| Market | ||
| Value | ||
| Shares | ($000) | |
| Central Pacific Financial Corp. | 9,569 | 271 |
| Univest Corp. of Pennsylvania | 9,379 | 267 |
| PS Business Parks Inc. | 2,022 | 264 |
| FBL Financial Group Inc. Class A | 3,218 | 262 |
| State Bank Financial Corp. | 8,034 | 262 |
| National Bank Holdings Corp. Class A | 6,279 | 252 |
| Virtus Investment Partners Inc. | 1,953 | 252 |
| Capstead Mortgage Corp. | 29,934 | 251 |
| Community Trust Bancorp Inc. | 5,041 | 249 |
| Horizon Bancorp Inc. | 12,042 | 246 |
| CBL & Associates Properties Inc. | 55,094 | 246 |
| National Western Life Group Inc. Class A | 742 | 242 |
| * HomeStreet Inc. | 8,104 | 239 |
| Hanmi Financial Corp. | 9,135 | 238 |
| Meridian Bancorp Inc. | 13,273 | 238 |
| * World Acceptance Corp. | 1,998 | 237 |
| iStar Inc. | 21,177 | 237 |
| ^ New York Mortgage Trust Inc. | 36,448 | 233 |
| Flushing Financial Corp. | 8,921 | 231 |
| Easterly Government Properties Inc. | 11,362 | 230 |
| Northfield Bancorp Inc. | 14,129 | 230 |
| Camden National Corp. | 5,006 | 229 |
| OFG Bancorp | 14,089 | 228 |
| Preferred Apartment Communities Inc. Class A | 12,728 | 227 |
| CBTX Inc. | 6,062 | 222 |
| National General Holdings Corp. | 8,018 | 219 |
| Urstadt Biddle Properties Inc. Class A | 9,617 | 219 |
| Granite Point Mortgage Trust Inc. | 11,347 | 217 |
| Arbor Realty Trust Inc. | 17,683 | 217 |
| Stock Yards Bancorp Inc. | 5,535 | 214 |
| Great Southern Bancorp Inc. | 3,593 | 213 |
| Federated Investors Inc. Class B | 9,197 | 213 |
| Investors Real Estate Trust | 39,023 | 213 |
| Oritani Financial Corp. | 13,045 | 211 |
| TPG RE Finance Trust Inc. | 10,219 | 211 |
| Washington Trust Bancorp Inc. | 3,483 | 209 |
| NorthStar Realty Europe Corp. | 15,223 | 209 |
| * St. Joe Co. | 12,077 | 208 |
| First Defiance Financial Corp. | 6,488 | 208 |
| Peoples Bancorp Inc. | 5,748 | 206 |
| Banco Latinoamericano de Comercio Exterior SA | 9,957 | 206 |
| Investment Technology Group Inc. | 9,192 | 201 |
| CatchMark Timber Trust Inc. Class A | 15,978 | 200 |
| First Financial Corp. | 3,876 | 199 |
| Peapack Gladstone Financial Corp. | 5,959 | 199 |
| Front Yard Residential Corp. | 16,045 | 196 |
| Bank of Marin Bancorp | 2,212 | 195 |
| German American Bancorp Inc. | 5,167 | 194 |
| Dime Community Bancshares Inc. | 10,554 | 192 |
| Bridge Bancorp Inc. | 5,395 | 189 |
| Mercantile Bank Corp. | 5,278 | 187 |
| QCR Holdings Inc. | 4,252 | 185 |
| Gladstone Commercial Corp. | 9,145 | 182 |
| Opus Bank | 6,411 | 182 |
| * EZCORP Inc. Class A | 16,284 | 181 |
| James River Group Holdings Ltd. | 4,388 | 180 |
| Ashford Hospitality Trust Inc. | 27,648 | 179 |
| ConnectOne Bancorp Inc. | 7,259 | 179 |
| Armada Hoffler Properties Inc. | 11,458 | 179 |
| First Community Bancshares Inc. | 5,316 | 178 |
| * eHealth Inc. | 6,102 | 178 |
| Community Healthcare Trust Inc. | 5,663 | 176 |
| First of Long Island Corp. | 7,980 | 174 |
| Fidelity Southern Corp. | 7,130 | 173 |
42
| Vanguard® Russell 2000 Value Index Fund | |||
| Schedule of Investments | |||
| August 31, 2018 | |||
| Market | |||
| Value | |||
| Shares | ($000) | ||
| AG Mortgage Investment Trust Inc. | 9,138 | 172 | |
| State Auto Financial Corp. | 5,434 | 171 | |
| Whitestone REIT | 12,414 | 169 | |
| Four Corners Property Trust Inc. | 6,283 | 169 | |
| First Bancshares Inc. | 4,082 | 168 | |
| * | Bancorp Inc. | 16,392 | 164 |
| NexPoint Residential Trust Inc. | 5,087 | 164 | |
| * | Ocwen Financial Corp. | 39,210 | 164 |
| United Community Financial Corp. | 15,767 | 163 | |
| First Mid-Illinois Bancshares Inc. | 3,962 | 163 | |
| Financial Institutions Inc. | 4,995 | 161 | |
| * | Veritex Holdings Inc. | 5,251 | 161 |
| * | Franklin Financial Network Inc. | 4,158 | 161 |
| * | TriState Capital Holdings Inc. | 5,349 | 159 |
| BBX Capital Corp. Class A | 21,339 | 159 | |
| Industrial Logistics Properties Trust | 6,567 | 158 | |
| * | Customers Bancorp Inc. | 6,394 | 158 |
| RLI Corp. | 2,029 | 156 | |
| Federal Agricultural Mortgage Corp. | 2,018 | 156 | |
| Anworth Mortgage Asset Corp. | 31,678 | 155 | |
| * | WMIH Corp. | 102,300 | 154 |
| Old Line Bancshares Inc. | 4,509 | 154 | |
| New Senior Investment Group Inc. | 24,281 | 154 | |
| * | Tejon Ranch Co. | 6,837 | 152 |
| Republic Bancorp Inc. Class A | 3,125 | 152 | |
| Arrow Financial Corp. | 3,856 | 152 | |
| B. Riley Financial Inc. | 6,555 | 150 | |
| * | Spirit MTA REIT | 13,998 | 150 |
| * | Nicolet Bankshares Inc. | 2,705 | 150 |
| CorEnergy Infrastructure Trust Inc. | 3,919 | 147 | |
| Western Asset Mortgage Capital Corp. | 13,159 | 146 | |
| Bar Harbor Bankshares | 4,961 | 146 | |
| Old Second Bancorp Inc. | 9,447 | 146 | |
| CNB Financial Corp. | 4,713 | 145 | |
| Green Bancorp Inc. | 5,916 | 142 | |
| One Liberty Properties Inc. | 4,870 | 140 | |
| Origin Bancorp Inc. | 3,455 | 140 | |
| * | Allegiance Bancshares Inc. | 3,128 | 139 |
| Orchid Island Capital Inc. | 17,367 | 138 | |
| PennyMac Financial Services Inc. Class A | 6,450 | 136 | |
| Sierra Bancorp | 4,587 | 136 | |
| *,^ | Citizens Inc. Class A | 16,096 | 135 |
| Access National Corp. | 4,949 | 134 | |
| Farmers National Banc Corp. | 8,240 | 131 | |
| Independent Bank Corp. | 5,179 | 129 | |
| Cedar Realty Trust Inc. | 28,774 | 129 | |
| Waterstone Financial Inc. | 7,604 | 128 | |
| Ares Commercial Real Estate Corp. | 8,715 | 127 | |
| RBB Bancorp | 4,446 | 127 | |
| * | FRP Holdings Inc. | 1,941 | 127 |
| * | Greenlight Capital Re Ltd. Class A | 9,710 | 125 |
| City Office REIT Inc. | 9,516 | 123 | |
| MidWestOne Financial Group Inc. | 3,629 | 122 | |
| * | First Foundation Inc. | 7,521 | 122 |
| * | Byline Bancorp Inc. | 5,300 | 121 |
| * | Donnelley Financial Solutions Inc. | 5,776 | 121 |
| Live Oak Bancshares Inc. | 3,974 | 120 | |
| * | Equity Bancshares Inc. Class A | 2,957 | 120 |
| * | National Commerce Corp. | 2,697 | 119 |
| Pennsylvania REIT | 11,594 | 118 | |
| Home Bancorp Inc. | 2,576 | 118 | |
| Exantas Capital Corp. | 9,881 | 117 | |
| Midland States Bancorp Inc. | 3,362 | 116 | |
| First Connecticut Bancorp Inc. | 3,647 | 116 | |
43
| Vanguard® Russell 2000 Value Index Fund | ||
| Schedule of Investments | ||
| August 31, 2018 | ||
| Market | ||
| Value | ||
| Shares | ($000) | |
| * HomeTrust Bancshares Inc. | 3,983 | 115 |
| Dynex Capital Inc. | 17,652 | 113 |
| Southern National Bancorp of Virginia Inc. | 6,354 | 112 |
| * Altisource Portfolio Solutions SA | 3,058 | 111 |
| American National Bankshares Inc. | 2,683 | 110 |
| KKR Real Estate Finance Trust Inc. | 5,188 | 110 |
| Braemar Hotels & Resorts Inc. | 9,515 | 110 |
| * Eagle Bancorp Inc. | 2,024 | 109 |
| Arlington Asset Investment Corp. Class A | 10,634 | 108 |
| Citizens & Northern Corp. | 3,857 | 108 |
| West Bancorporation Inc. | 4,456 | 108 |
| Enterprise Bancorp Inc. | 2,917 | 105 |
| Lakeland Financial Corp. | 2,112 | 104 |
| Peoples Financial Services Corp. | 2,241 | 103 |
| * FCB Financial Holdings Inc. Class A | 1,979 | 103 |
| National Bankshares Inc. | 2,199 | 101 |
| MedEquities Realty Trust Inc. | 9,304 | 100 |
| Sutherland Asset Management Corp. | 5,745 | 99 |
| * Goosehead Insurance Inc. Class A | 3,174 | 98 |
| Northrim BanCorp Inc. | 2,207 | 98 |
| Macatawa Bank Corp. | 7,867 | 98 |
| Oppenheimer Holdings Inc. Class A | 3,144 | 98 |
| PCSB Financial Corp. | 4,776 | 98 |
| FB Financial Corp. | 2,222 | 98 |
| First Bancorp Inc. | 3,303 | 97 |
| HCI Group Inc. | 2,381 | 96 |
| Merchants Bancorp | 3,684 | 96 |
| Innovative Industrial Properties Inc. | 2,087 | 95 |
| Western New England Bancorp Inc. | 8,758 | 93 |
| Capital City Bank Group Inc. | 3,716 | 91 |
| * SmartFinancial Inc. | 3,695 | 91 |
| Blue Hills Bancorp Inc. | 3,938 | 91 |
| Ames National Corp. | 2,982 | 90 |
| Summit Financial Group Inc. | 3,563 | 90 |
| Codorus Valley Bancorp Inc. | 2,821 | 88 |
| * Forestar Group Inc. | 3,428 | 88 |
| * Cardtronics plc Class A | 2,506 | 88 |
| * Republic First Bancorp Inc. | 11,272 | 88 |
| Jernigan Capital Inc. | 4,391 | 88 |
| Global Indemnity Ltd. | 2,226 | 88 |
| * Metropolitan Bank Holding Corp. | 2,120 | 87 |
| * Baycom Corp. | 3,327 | 87 |
| Southern Missouri Bancorp Inc. | 2,170 | 87 |
| Heritage Insurance Holdings Inc. | 5,753 | 84 |
| Maiden Holdings Ltd. | 22,166 | 84 |
| Reliant Bancorp Inc. | 3,029 | 83 |
| * Southern First Bancshares Inc. | 2,002 | 83 |
| First Internet Bancorp | 2,635 | 83 |
| Central Valley Community Bancorp | 3,812 | 82 |
| Carolina Financial Corp. | 1,970 | 81 |
| PICO Holdings Inc. | 6,742 | 81 |
| Business First Bancshares Inc. | 3,086 | 80 |
| ACNB Corp. | 2,221 | 79 |
| Penns Woods Bancorp Inc. | 1,746 | 79 |
| Guaranty Bancshares Inc. | 2,503 | 79 |
| Charter Financial Corp. | 3,155 | 79 |
| Cambridge Bancorp | 873 | 78 |
| Civista Bancshares Inc. | 3,270 | 78 |
| EVERTEC Inc. | 3,235 | 78 |
| EMC Insurance Group Inc. | 3,007 | 77 |
| Cherry Hill Mortgage Investment Corp. | 4,139 | 77 |
| Shore Bancshares Inc. | 4,097 | 77 |
| Bluerock Residential Growth REIT Inc. Class A | 7,771 | 77 |
| First Bank | 5,306 | 76 |
44
| Vanguard® Russell 2000 Value Index Fund | ||
| Schedule of Investments | ||
| August 31, 2018 | ||
| Market | ||
| Value | ||
| Shares | ($000) | |
| Territorial Bancorp Inc. | 2,530 | 76 |
| Timberland Bancorp Inc. | 2,121 | 75 |
| Premier Financial Bancorp Inc. | 3,854 | 75 |
| MidSouth Bancorp Inc. | 4,866 | 75 |
| * Cowen Inc. Class A | 4,874 | 74 |
| * NMI Holdings Inc. Class A | 3,400 | 73 |
| Norwood Financial Corp. | 1,870 | 73 |
| Protective Insurance Corp. Class B | 3,117 | 73 |
| MBT Financial Corp. | 6,678 | 73 |
| ^ Farmland Partners Inc. | 10,315 | 73 |
| MutualFirst Financial Inc. | 1,901 | 72 |
| Evans Bancorp Inc. | 1,518 | 72 |
| Investors Title Co. | 370 | 72 |
| BankFinancial Corp. | 4,472 | 71 |
| Great Ajax Corp. | 5,226 | 71 |
| * BSB Bancorp Inc. | 2,045 | 68 |
| Riverview Bancorp Inc. | 6,894 | 68 |
| C&F Financial Corp. | 1,077 | 67 |
| Century Bancorp Inc. Class A | 931 | 66 |
| GAIN Capital Holdings Inc. | 8,897 | 66 |
| BCB Bancorp Inc. | 4,403 | 65 |
| Bank of Commerce Holdings | 5,044 | 65 |
| SB One Bancorp | 2,323 | 65 |
| * Community Bankers Trust Corp. | 6,984 | 63 |
| Orrstown Financial Services Inc. | 2,416 | 63 |
| * Bank of Princeton | 1,879 | 62 |
| * AV Homes Inc. | 2,868 | 62 |
| Global Medical REIT Inc. | 6,391 | 61 |
| Prudential Bancorp Inc. | 3,322 | 61 |
| Tiptree Inc. | 9,239 | 60 |
| First Business Financial Services Inc. | 2,698 | 60 |
| BrightSphere Investment Group plc | 4,711 | 60 |
| * Howard Bancorp Inc. | 3,421 | 60 |
| ESSA Bancorp Inc. | 3,699 | 59 |
| First Community Corp. | 2,331 | 59 |
| * MoneyGram International Inc. | 8,951 | 58 |
| Gladstone Land Corp. | 4,249 | 58 |
| * Stratus Properties Inc. | 1,907 | 58 |
| SI Financial Group Inc. | 4,179 | 58 |
| * OP Bancorp | 4,693 | 57 |
| Ohio Valley Banc Corp. | 1,334 | 56 |
| Luther Burbank Corp. | 4,913 | 56 |
| Unity Bancorp Inc. | 2,288 | 56 |
| Consolidated-Tomoka Land Co. | 889 | 56 |
| Investar Holding Corp. | 1,994 | 55 |
| LCNB Corp. | 2,923 | 54 |
| Independence Holding Co. | 1,518 | 53 |
| * HarborOne Bancorp Inc. | 2,709 | 53 |
| * NI Holdings Inc. | 3,156 | 53 |
| Bankwell Financial Group Inc. | 1,687 | 53 |
| Community Financial Corp. | 1,591 | 53 |
| * Entegra Financial Corp. | 1,926 | 53 |
| United Security Bancshares | 4,718 | 52 |
| * First Northwest Bancorp | 3,101 | 52 |
| Parke Bancorp Inc. | 2,251 | 52 |
| Middlefield Banc Corp. | 1,045 | 52 |
| First Choice Bancorp | 1,908 | 52 |
| * Pacific Mercantile Bancorp | 5,054 | 51 |
| Fidelity D&D Bancorp Inc. | 858 | 51 |
| * Regional Management Corp. | 1,519 | 51 |
| 1st Constitution Bancorp | 2,384 | 50 |
| MVB Financial Corp. | 2,735 | 50 |
| Hingham Institution for Savings | 229 | 50 |
| CB Financial Services Inc. | 1,519 | 49 |
45
| Vanguard® Russell 2000 Value Index Fund | ||
| Schedule of Investments | ||
| August 31, 2018 | ||
| Market | ||
| Value | ||
| Shares | ($000) | |
| * Hallmark Financial Services Inc. | 4,241 | 48 |
| Guaranty Bancorp | 1,516 | 47 |
| Northeast Bancorp | 2,151 | 47 |
| * Select Bancorp Inc. | 3,655 | 47 |
| Mid Penn Bancorp Inc. | 1,529 | 47 |
| Peoples Bancorp of North Carolina Inc. | 1,511 | 46 |
| FedNat Holding Co. | 1,745 | 46 |
| * Atlantic Capital Bancshares Inc. | 2,513 | 46 |
| Saul Centers Inc. | 763 | 46 |
| First United Corp. | 2,223 | 45 |
| Chemung Financial Corp. | 1,065 | 45 |
| Oak Valley Bancorp | 2,124 | 45 |
| County Bancorp Inc. | 1,769 | 44 |
| Donegal Group Inc. Class A | 3,047 | 44 |
| Safety Income & Growth Inc. | 2,572 | 42 |
| * PDL Community Bancorp | 2,858 | 42 |
| First Guaranty Bancshares Inc. | 1,691 | 42 |
| UMH Properties Inc. | 2,644 | 42 |
| First Savings Financial Group Inc. | 592 | 42 |
| * Malvern Bancorp Inc. | 1,680 | 41 |
| First Financial Northwest Inc. | 2,358 | 41 |
| Kingstone Cos. Inc. | 2,205 | 41 |
| * Provident Bancorp Inc. | 1,288 | 36 |
| Auburn National Bancorporation Inc. | 769 | 36 |
| BRT Apartments Corp. | 2,685 | 35 |
| United Insurance Holdings Corp. | 1,623 | 34 |
| Crawford & Co. Class B | 3,800 | 33 |
| Associated Capital Group Inc. Class A | 866 | 32 |
| Capstar Financial Holdings Inc. | 1,812 | 32 |
| * Esquire Financial Holdings Inc. | 1,174 | 31 |
| Universal Health Realty Income Trust | 389 | 30 |
| GAMCO Investors Inc. Class A | 1,132 | 29 |
| PJT Partners Inc. | 422 | 24 |
| FS Bancorp Inc. | 419 | 24 |
| Sterling Bancorp Inc. | 1,989 | 24 |
| * Impac Mortgage Holdings Inc. | 3,193 | 24 |
| Heritage Commerce Corp. | 1,372 | 22 |
| Greenhill & Co. Inc. | 765 | 21 |
| * Bridgewater Bancshares Inc. | 1,605 | 21 |
| * On Deck Capital Inc. | 2,194 | 18 |
| * Transcontinental Realty Investors Inc. | 545 | 17 |
| CoBiz Financial Inc. | 654 | 15 |
| * GreenSky Inc. Class A | 729 | 15 |
| * Spirit of Texas Bancshares Inc. | 640 | 14 |
| Level One Bancorp Inc. | 454 | 13 |
| Farmers & Merchants Bancorp Inc. | 276 | 13 |
| Griffin Industrial Realty Inc. | 291 | 12 |
| * American Realty Investors Inc. | 672 | 11 |
| * Focus Financial Partners Inc. Class A | 264 | 11 |
| * Essential Properties Realty Trust Inc. | 720 | 10 |
| Oconee Federal Financial Corp. | 379 | 10 |
| Ladenburg Thalmann Financial Services Inc. | 2,744 | 9 |
| ^ Union Bankshares Inc. | 155 | 8 |
| Greene County Bancorp Inc. | 199 | 7 |
| * Evo Payments Inc. Class A | 175 | 4 |
| Value Line Inc. | 29 | 1 |
| Clipper Realty Inc. | 4 | — |
| Hamilton Lane Inc. Class A | 1 | — |
| Pzena Investment Management Inc. Class A | 3 | — |
| Old Point Financial Corp. | 1 | — |
| 149,906 | ||
| Health Care (4.9%) | ||
| * Endo International plc | 69,579 | 1,193 |
| * Avanos Medical Inc. | 15,506 | 1,118 |
46
| Vanguard® Russell 2000 Value Index Fund | |||
| Schedule of Investments | |||
| August 31, 2018 | |||
| Market | |||
| Value | |||
| Shares | ($000) | ||
| * | Mallinckrodt plc | 27,377 | 943 |
| * | Syneos Health Inc. | 18,705 | 932 |
| * | LifePoint Health Inc. | 11,859 | 764 |
| * | Allscripts Healthcare Solutions Inc. | 50,736 | 741 |
| * | Prestige Consumer Healthcare Inc. | 17,842 | 687 |
| *,^ | OPKO Health Inc. | 106,704 | 632 |
| * | Brookdale Senior Living Inc. | 62,272 | 618 |
| Patterson Cos. Inc. | 26,941 | 608 | |
| * | Magellan Health Inc. | 8,148 | 599 |
| * | Akorn Inc. | 26,760 | 420 |
| CONMED Corp. | 5,170 | 416 | |
| * | LivaNova plc | 3,311 | 416 |
| * | Cambrex Corp. | 6,071 | 409 |
| * | Acorda Therapeutics Inc. | 12,469 | 359 |
| Owens & Minor Inc. | 19,869 | 337 | |
| National HealthCare Corp. | 3,948 | 304 | |
| * | AMAG Pharmaceuticals Inc. | 11,158 | 272 |
| * | AngioDynamics Inc. | 11,857 | 266 |
| Luminex Corp. | 7,768 | 219 | |
| * | Integer Holdings Corp. | 2,694 | 215 |
| * | Prothena Corp. plc | 13,062 | 199 |
| * | Anika Therapeutics Inc. | 4,689 | 194 |
| * | Zogenix Inc. | 3,445 | 166 |
| Invacare Corp. | 10,716 | 163 | |
| * | Intra-Cellular Therapies Inc. | 7,343 | 161 |
| * | Triple-S Management Corp. Class B | 7,185 | 156 |
| * | Achillion Pharmaceuticals Inc. | 44,187 | 152 |
| * | Five Prime Therapeutics Inc. | 10,790 | 151 |
| * | Quality Systems Inc. | 6,368 | 146 |
| * | Amphastar Pharmaceuticals Inc. | 7,142 | 136 |
| * | HMS Holdings Corp. | 4,085 | 131 |
| * | CryoLife Inc. | 3,665 | 127 |
| * | Myriad Genetics Inc. | 2,514 | 125 |
| * | Adverum Biotechnologies Inc. | 16,332 | 124 |
| * | Arena Pharmaceuticals Inc. | 3,194 | 124 |
| * | Novavax Inc. | 78,873 | 123 |
| * | PDL BioPharma Inc. | 48,248 | 117 |
| * | Acceleron Pharma Inc. | 2,146 | 116 |
| * | Cross Country Healthcare Inc. | 11,548 | 116 |
| * | Concert Pharmaceuticals Inc. | 6,920 | 109 |
| * | Community Health Systems Inc. | 27,872 | 108 |
| * | Immunomedics Inc. | 3,984 | 107 |
| * | BioScrip Inc. | 36,308 | 105 |
| * | Surgery Partners Inc. | 5,451 | 95 |
| * | Adamas Pharmaceuticals Inc. | 3,498 | 81 |
| * | Albireo Pharma Inc. | 2,285 | 79 |
| * | Arbutus Biopharma Corp. | 8,382 | 76 |
| * | Orthofix Medical Inc. | 1,379 | 74 |
| * | RTI Surgical Inc. | 15,350 | 69 |
| * | Alder Biopharmaceuticals Inc. | 3,597 | 65 |
| * | Medicines Co. | 1,634 | 65 |
| * | Harvard Bioscience Inc. | 10,821 | 64 |
| * | Cymabay Therapeutics Inc. | 4,482 | 61 |
| * | Tetraphase Pharmaceuticals Inc. | 16,770 | 59 |
| * | BioTime Inc. | 21,231 | 58 |
| * | SeaSpine Holdings Corp. | 3,779 | 58 |
| * | Chimerix Inc. | 14,278 | 57 |
| * | Spectrum Pharmaceuticals Inc. | 2,572 | 55 |
| * | Calithera Biosciences Inc. | 10,090 | 55 |
| * | Ra Pharmaceuticals Inc. | 4,429 | 54 |
| * | Epizyme Inc. | 4,537 | 54 |
| * | Synlogic Inc. | 5,004 | 53 |
| Computer Programs & Systems Inc. | 1,863 | 51 | |
| *,^ | Lannett Co. Inc. | 9,443 | 51 |
47
| Vanguard® Russell 2000 Value Index Fund | |||
| Schedule of Investments | |||
| August 31, 2018 | |||
| Market | |||
| Value | |||
| Shares | ($000) | ||
| * | Ardelyx Inc. | 10,894 | 47 |
| Meridian Bioscience Inc. | 2,894 | 45 | |
| * | Portola Pharmaceuticals Inc. | 1,488 | 44 |
| * | FONAR Corp. | 1,671 | 44 |
| * | Catalyst Biosciences Inc. | 3,861 | 42 |
| * | AVEO Pharmaceuticals Inc. | 13,583 | 41 |
| * | Aratana Therapeutics Inc. | 7,429 | 39 |
| * | Cerus Corp. | 4,845 | 38 |
| * | Immune Design Corp. | 9,722 | 37 |
| * | Endocyte Inc. | 1,816 | 36 |
| * | BioCryst Pharmaceuticals Inc. | 4,816 | 35 |
| * | Karyopharm Therapeutics Inc. | 1,523 | 32 |
| * | Dynavax Technologies Corp. | 2,225 | 31 |
| * | NantKwest Inc. | 9,018 | 31 |
| Melinta Therapeutics Inc. | 6,323 | 30 | |
| * | Audentes Therapeutics Inc. | 810 | 30 |
| * | Bellicum Pharmaceuticals Inc. | 4,063 | 29 |
| * | R1 RCM Inc. | 2,813 | 28 |
| * | NewLink Genetics Corp. | 8,937 | 28 |
| *,^ | Nymox Pharmaceutical Corp. | 9,700 | 25 |
| * | Civitas Solutions Inc. | 1,527 | 24 |
| * | Cara Therapeutics Inc. | 1,171 | 24 |
| * | resTORbio Inc. | 1,976 | 23 |
| * | Spero Therapeutics Inc. | 2,038 | 23 |
| * | Aclaris Therapeutics Inc. | 1,449 | 23 |
| * | Syndax Pharmaceuticals Inc. | 2,891 | 22 |
| * | Cellular Biomedicine Group Inc. | 993 | 21 |
| Utah Medical Products Inc. | 208 | 19 | |
| * | XOMA Corp. | 966 | 18 |
| * | Akebia Therapeutics Inc. | 2,196 | 18 |
| * | ArQule Inc. | 2,615 | 17 |
| * | Rigel Pharmaceuticals Inc. | 5,074 | 17 |
| * | AAC Holdings Inc. | 1,916 | 17 |
| * | Molecular Templates Inc. | 2,929 | 17 |
| Phibro Animal Health Corp. Class A | 348 | 16 | |
| * | Assertio Therapeutics Inc. | 2,543 | 16 |
| * | Minerva Neurosciences Inc. | 1,548 | 16 |
| Menlo Therapeutics Inc. | 2,087 | 16 | |
| * | OraSure Technologies Inc. | 931 | 15 |
| * | CareDx Inc. | 595 | 15 |
| * | Abeona Therapeutics Inc. | 939 | 14 |
| * | Lantheus Holdings Inc. | 887 | 14 |
| scPharmaceuticals Inc. | 2,210 | 11 | |
| * | NanoString Technologies Inc. | 673 | 11 |
| * | CASI Pharmaceuticals Inc. | 1,537 | 11 |
| National Research Corp. | 266 | 10 | |
| * | Cytokinetics Inc. | 1,288 | 10 |
| * | Miragen Therapeutics Inc. | 1,629 | 10 |
| * | American Renal Associates Holdings Inc. | 441 | 10 |
| * | NantHealth Inc. | 4,008 | 9 |
| * | Corium International Inc. | 857 | 8 |
| * | Kiniksa Pharmaceuticals Ltd. Class A | 350 | 8 |
| * | Ovid therapeutics Inc. | 1,092 | 7 |
| Arcus Biosciences Inc. | 505 | 7 | |
| Tricida Inc. | 233 | 7 | |
| * | Zafgen Inc. | 741 | 7 |
| * | PetIQ Inc. | 173 | 7 |
| * | Rockwell Medical Inc. | 1,347 | 7 |
| * | Achaogen Inc. | 1,176 | 6 |
| * | Pfenex Inc. | 939 | 5 |
| Crinetics Pharmaceuticals Inc. | 160 | 5 | |
| Avrobio Inc. | 139 | 5 | |
| * | Corvus Pharmaceuticals Inc. | 417 | 5 |
| * | Athersys Inc. | 2,215 | 5 |
48
| Vanguard® Russell 2000 Value Index Fund | ||
| Schedule of Investments | ||
| August 31, 2018 | ||
| Market | ||
| Value | ||
| Shares | ($000) | |
| * Proteostasis Therapeutics Inc. | 1,693 | 5 |
| Aptinyx Inc. | 168 | 4 |
| * Castlight Health Inc. Class B | 1,310 | 4 |
| * Tocagen Inc. | 364 | 4 |
| * Aquestive Therapeutics Inc. | 187 | 3 |
| * Rubius Therapeutics Inc. | 132 | 3 |
| * Neos Therapeutics Inc. | 541 | 3 |
| Magenta Therapeutics Inc. | 187 | 3 |
| Forty Seven Inc. | 175 | 3 |
| Replimune Group Inc. | 125 | 2 |
| Kezar Life Sciences Inc. | 107 | 2 |
| Xeris Pharmaceuticals Inc. | 67 | 2 |
| * Neon Therapeutics Inc. | 135 | 2 |
| Scholar Rock Holding Corp. | 89 | 2 |
| * Eidos Therapeutics Inc. | 114 | 1 |
| Constellation Pharmaceuticals Inc. | 100 | 1 |
| Translate Bio Inc. | 87 | 1 |
| * Haemonetics Corp. | 1 | — |
| * LHC Group Inc. | 1 | — |
| * Tivity Health Inc. | 2 | — |
| * Providence Service Corp. | 1 | — |
| Ensign Group Inc. | 1 | — |
| OrthoPediatrics Corp. | 1 | — |
| * Sientra Inc. | 1 | — |
| * Conformis Inc. | 14 | — |
| Quanterix Corp. | 1 | — |
| * Enzo Biochem Inc. | 3 | — |
| * Quotient Ltd. | 1 | — |
| 18,291 | ||
| Materials & Processing (5.7%) | ||
| Louisiana-Pacific Corp. | 41,052 | 1,197 |
| * Allegheny Technologies Inc. | 41,561 | 1,123 |
| Belden Inc. | 13,395 | 974 |
| Carpenter Technology Corp. | 15,494 | 925 |
| * Rexnord Corp. | 30,903 | 897 |
| Commercial Metals Co. | 38,828 | 839 |
| * Cleveland-Cliffs Inc. | 83,077 | 835 |
| Minerals Technologies Inc. | 11,804 | 793 |
| Innospec Inc. | 7,884 | 612 |
| Stepan Co. | 6,790 | 606 |
| Sensient Technologies Corp. | 6,650 | 472 |
| * Gibraltar Industries Inc. | 10,388 | 472 |
| * BMC Stock Holdings Inc. | 20,809 | 468 |
| * AK Steel Holding Corp. | 102,485 | 455 |
| Greif Inc. Class A | 7,628 | 421 |
| Materion Corp. | 6,543 | 417 |
| Hecla Mining Co. | 135,698 | 385 |
| Rayonier Advanced Materials Inc. | 16,693 | 349 |
| Trinseo SA | 4,415 | 341 |
| * Verso Corp. | 10,605 | 333 |
| Schweitzer-Mauduit International Inc. | 8,145 | 331 |
| * Coeur Mining Inc. | 51,109 | 290 |
| Kaiser Aluminum Corp. | 2,566 | 281 |
| PH Glatfelter Co. | 14,138 | 272 |
| Tronox Ltd. Class A | 16,388 | 265 |
| * MRC Global Inc. | 12,633 | 260 |
| HB Fuller Co. | 4,501 | 257 |
| Innophos Holdings Inc. | 5,422 | 237 |
| Mueller Water Products Inc. Class A | 20,288 | 235 |
| Schnitzer Steel Industries Inc. | 8,520 | 224 |
| * AdvanSix Inc. | 6,497 | 220 |
| US Silica Holdings Inc. | 10,163 | 215 |
| * Beacon Roofing Supply Inc. | 5,723 | 212 |
| * PQ Group Holdings Inc. | 11,904 | 212 |
49
| Vanguard® Russell 2000 Value Index Fund | ||
| Schedule of Investments | ||
| August 31, 2018 | ||
| Market | ||
| Value | ||
| Shares | ($000) | |
| American Vanguard Corp. | 9,335 | 204 |
| * Century Aluminum Co. | 15,304 | 193 |
| Quanex Building Products Corp. | 11,356 | 186 |
| Tredegar Corp. | 8,420 | 185 |
| * Tahoe Resources Inc. | 53,550 | 184 |
| * TimkenSteel Corp. | 13,011 | 182 |
| NN Inc. | 9,002 | 180 |
| * Veritiv Corp. | 3,743 | 179 |
| Griffon Corp. | 8,954 | 163 |
| * Unifi Inc. | 5,078 | 162 |
| Haynes International Inc. | 4,036 | 159 |
| * Clearwater Paper Corp. | 5,257 | 153 |
| ^ Caesarstone Ltd. | 7,457 | 141 |
| Hawkins Inc. | 3,152 | 130 |
| FutureFuel Corp. | 8,403 | 125 |
| * Landec Corp. | 8,819 | 119 |
| * Armstrong Flooring Inc. | 6,324 | 111 |
| * Nexeo Solutions Inc. | 10,802 | 108 |
| * Intrepid Potash Inc. | 31,072 | 106 |
| Universal Forest Products Inc. | 2,538 | 95 |
| Greif Inc. Class B | 1,664 | 95 |
| Neenah Inc. | 1,036 | 95 |
| Culp Inc. | 3,627 | 92 |
| Olympic Steel Inc. | 3,744 | 83 |
| PolyOne Corp. | 1,867 | 79 |
| * LB Foster Co. Class A | 3,373 | 77 |
| * UFP Technologies Inc. | 2,155 | 76 |
| * Energy Fuels Inc. | 23,807 | 76 |
| * Universal Stainless & Alloy Products Inc. | 2,282 | 69 |
| * AgroFresh Solutions Inc. | 10,259 | 68 |
| * Koppers Holdings Inc. | 1,912 | 68 |
| Apogee Enterprises Inc. | 1,369 | 67 |
| Oil-Dri Corp. of America | 1,632 | 66 |
| Synalloy Corp. | 2,688 | 62 |
| * LSB Industries Inc. | 7,026 | 61 |
| * Amyris Inc. | 6,795 | 61 |
| Compass Minerals International Inc. | 921 | 58 |
| * Lawson Products Inc. | 1,670 | 56 |
| * Northwest Pipe Co. | 3,106 | 56 |
| Worthington Industries Inc. | 1,130 | 53 |
| Eastern Co. | 1,776 | 52 |
| * Foundation Building Materials Inc. | 3,358 | 46 |
| United States Lime & Minerals Inc. | 600 | 46 |
| Interface Inc. Class A | 1,903 | 45 |
| * Masonite International Corp. | 596 | 40 |
| * Kraton Corp. | 817 | 38 |
| * Shiloh Industries Inc. | 4,093 | 37 |
| KMG Chemicals Inc. | 459 | 36 |
| Boise Cascade Co. | 797 | 35 |
| Valhi Inc. | 7,730 | 25 |
| Insteel Industries Inc. | 610 | 23 |
| * NL Industries Inc. | 2,717 | 21 |
| Global Brass & Copper Holdings Inc. | 524 | 20 |
| * GMS Inc. | 667 | 17 |
| Gold Resource Corp. | 2,104 | 11 |
| CompX International Inc. | 628 | 8 |
| Bloom Energy Corp. Class A | 157 | 5 |
| * GCP Applied Technologies Inc. | 3 | — |
| Aceto Corp. | 6 | — |
| * Huttig Building Products Inc. | 3 | — |
| * Ryerson Holding Corp. | 1 | — |
| * OMNOVA Solutions Inc. | 1 | — |
| * Ampco-Pittsburgh Corp. | 1 | — |
50
| Vanguard® Russell 2000 Value Index Fund | |||
| Schedule of Investments | |||
| August 31, 2018 | |||
| Market | |||
| Value | |||
| Shares | ($000) | ||
| *,§ | Ferroglobe R&W Trust | 19,424 | — |
| 21,413 | |||
| Other (0.0%)2 | |||
| *,§ | NewStar Financial Inc. | 6,148 | 3 |
| * | Sonos Inc. | 152 | 3 |
| * | Arlo Technologies Inc. | 133 | 3 |
| *,§ | Media General Inc. CVR | 35,434 | 1 |
| 10 | |||
| Producer Durables (11.4%) | |||
| * | KLX Inc. | 16,540 | 1,221 |
| SkyWest Inc. | 16,762 | 1,095 | |
| * | Spirit Airlines Inc. | 22,620 | 1,075 |
| * | Darling Ingredients Inc. | 53,821 | 1,065 |
| GATX Corp. | 12,481 | 1,054 | |
| KBR Inc. | 46,440 | 974 | |
| Barnes Group Inc. | 14,117 | 961 | |
| * | FTI Consulting Inc. | 12,366 | 943 |
| UniFirst Corp. | 4,387 | 812 | |
| Moog Inc. Class A | 9,657 | 762 | |
| * | Esterline Technologies Corp. | 8,640 | 743 |
| Convergys Corp. | 29,684 | 734 | |
| ABM Industries Inc. | 21,928 | 696 | |
| Hawaiian Holdings Inc. | 16,733 | 694 | |
| * | Navistar International Corp. | 15,389 | 670 |
| * | SPX FLOW Inc. | 13,949 | 669 |
| Triton International Ltd. | 17,510 | 662 | |
| Brady Corp. Class A | 15,604 | 631 | |
| Greenbrier Cos. Inc. | 10,469 | 607 | |
| ESCO Technologies Inc. | 8,441 | 571 | |
| * | Electronics For Imaging Inc. | 14,492 | 504 |
| AAR Corp. | 10,765 | 502 | |
| * | Atlas Air Worldwide Holdings Inc. | 7,704 | 469 |
| * | TriMas Corp. | 15,219 | 467 |
| EnPro Industries Inc. | 6,077 | 456 | |
| * | Chart Industries Inc. | 5,672 | 428 |
| ACCO Brands Corp. | 34,550 | 428 | |
| * | Milacron Holdings Corp. | 20,148 | 427 |
| ICF International Inc. | 5,219 | 426 | |
| Kennametal Inc. | 10,233 | 418 | |
| * | CBIZ Inc. | 17,183 | 411 |
| * | Sykes Enterprises Inc. | 13,500 | 408 |
| Steelcase Inc. Class A | 27,604 | 403 | |
| Ship Finance International Ltd. | 28,168 | 400 | |
| EMCOR Group Inc. | 4,928 | 395 | |
| EnerSys | 4,742 | 394 | |
| * | TrueBlue Inc. | 12,603 | 369 |
| * | Huron Consulting Group Inc. | 7,195 | 356 |
| ArcBest Corp. | 7,315 | 352 | |
| * | Navigant Consulting Inc. | 14,596 | 349 |
| Watts Water Technologies Inc. Class A | 4,107 | 339 | |
| Triumph Group Inc. | 16,114 | 335 | |
| Encore Wire Corp. | 6,622 | 333 | |
| Aircastle Ltd. | 15,597 | 326 | |
| Werner Enterprises Inc. | 8,629 | 320 | |
| MTS Systems Corp. | 5,814 | 315 | |
| AZZ Inc. | 5,769 | 310 | |
| * | SEACOR Holdings Inc. | 5,819 | 299 |
| * | Casella Waste Systems Inc. Class A | 10,529 | 299 |
| Actuant Corp. Class A | 10,115 | 298 | |
| Matson Inc. | 7,526 | 281 | |
| Multi-Color Corp. | 4,514 | 279 | |
| Briggs & Stratton Corp. | 13,504 | 272 | |
| * | Aegion Corp. Class A | 10,869 | 271 |
| * | OSI Systems Inc. | 3,434 | 267 |
51
| Vanguard® Russell 2000 Value Index Fund | |||
| Schedule of Investments | |||
| August 31, 2018 | |||
| Market | |||
| Value | |||
| Shares | ($000) | ||
| Manitowoc Co. Inc. | 11,493 | 267 | |
| Kelly Services Inc. Class A | 10,175 | 256 | |
| Wabash National Corp. | 13,720 | 250 | |
| * | Tidewater Inc. | 7,788 | 249 |
| * | Tutor Perini Corp. | 12,174 | 248 |
| Quad/Graphics Inc. | 10,680 | 243 | |
| * | Kratos Defense & Security Solutions Inc. | 18,079 | 242 |
| CIRCOR International Inc. | 5,288 | 240 | |
| * | Modine Manufacturing Co. | 13,697 | 231 |
| Rush Enterprises Inc. Class A | 5,271 | 226 | |
| GasLog Ltd. | 13,252 | 223 | |
| Pitney Bowes Inc. | 30,547 | 222 | |
| *,^ | Team Inc. | 9,088 | 212 |
| Hyster-Yale Materials Handling Inc. | 3,374 | 208 | |
| * | Engility Holdings Inc. | 5,901 | 205 |
| * | Hub Group Inc. Class A | 3,849 | 203 |
| * | SP Plus Corp. | 5,214 | 203 |
| * | Thermon Group Holdings Inc. | 7,517 | 201 |
| * | Lydall Inc. | 4,685 | 200 |
| Argan Inc. | 4,763 | 190 | |
| Astec Industries Inc. | 3,877 | 189 | |
| Scorpio Tankers Inc. | 95,521 | 183 | |
| ^ | Altra Industrial Motion Corp. | 4,660 | 182 |
| Ennis Inc. | 8,085 | 176 | |
| Essendant Inc. | 12,134 | 175 | |
| Gorman-Rupp Co. | 4,513 | 165 | |
| Cubic Corp. | 2,180 | 165 | |
| * | Control4 Corp. | 4,935 | 160 |
| * | Wesco Aircraft Holdings Inc. | 12,807 | 156 |
| Marten Transport Ltd. | 6,943 | 153 | |
| Granite Construction Inc. | 3,345 | 153 | |
| Teekay Corp. | 22,289 | 151 | |
| * | International Seaways Inc. | 7,076 | 145 |
| * | Ducommun Inc. | 3,459 | 141 |
| DHT Holdings Inc. | 29,891 | 140 | |
| LSC Communications Inc. | 11,174 | 137 | |
| REV Group Inc. | 8,031 | 137 | |
| * | Frontline Ltd. | 25,023 | 136 |
| * | Textainer Group Holdings Ltd. | 8,869 | 134 |
| Scorpio Bulkers Inc. | 18,927 | 129 | |
| Titan International Inc. | 16,346 | 122 | |
| * | Vectrus Inc. | 3,688 | 121 |
| * | Daseke Inc. | 13,336 | 120 |
| * | Covenant Transportation Group Inc. Class A | 4,011 | 120 |
| Columbus McKinnon Corp. | 2,781 | 118 | |
| Park-Ohio Holdings Corp. | 2,834 | 117 | |
| Standex International Corp. | 1,088 | 117 | |
| RR Donnelley & Sons Co. | 22,977 | 116 | |
| * | Bristow Group Inc. | 10,580 | 116 |
| * | PHH Corp. | 10,578 | 115 |
| Powell Industries Inc. | 2,877 | 113 | |
| Costamare Inc. | 15,868 | 112 | |
| * | Titan Machinery Inc. | 6,128 | 111 |
| Resources Connection Inc. | 6,619 | 110 | |
| Primoris Services Corp. | 4,336 | 109 | |
| American Railcar Industries Inc. | 2,361 | 108 | |
| Herman Miller Inc. | 2,805 | 107 | |
| * | Heritage-Crystal Clean Inc. | 4,572 | 107 |
| CRA International Inc. | 1,851 | 106 | |
| * | InnerWorkings Inc. | 13,297 | 104 |
| Nordic American Tankers Ltd. | 45,629 | 102 | |
| * | Great Lakes Dredge & Dock Corp. | 18,565 | 102 |
| VSE Corp. | 2,612 | 101 | |
| * | SPX Corp. | 2,961 | 101 |
52
| Vanguard® Russell 2000 Value Index Fund | ||
| Schedule of Investments | ||
| August 31, 2018 | ||
| Market | ||
| Value | ||
| Shares | ($000) | |
| * Sterling Construction Co. Inc. | 6,687 | 97 |
| Tetra Tech Inc. | 1,391 | 97 |
| Miller Industries Inc. | 3,348 | 96 |
| * CAI International Inc. | 3,251 | 88 |
| Hurco Cos. Inc. | 2,023 | 87 |
| CECO Environmental Corp. | 9,869 | 83 |
| * YRC Worldwide Inc. | 8,555 | 82 |
| Graham Corp. | 2,929 | 81 |
| Preformed Line Products Co. | 996 | 81 |
| H&E Equipment Services Inc. | 2,278 | 79 |
| * Eagle Bulk Shipping Inc. | 15,516 | 78 |
| * GP Strategies Corp. | 4,037 | 77 |
| * Ardmore Shipping Corp. | 10,650 | 75 |
| Mobile Mini Inc. | 1,618 | 69 |
| * Dorian LPG Ltd. | 8,963 | 68 |
| Teekay Tankers Ltd. Class A | 62,177 | 67 |
| * FreightCar America Inc. | 3,886 | 66 |
| * Twin Disc Inc. | 2,528 | 65 |
| * Overseas Shipholding Group Inc. Class A | 18,551 | 64 |
| * Liquidity Services Inc. | 8,489 | 61 |
| * Willscot Corp. Class A | 3,434 | 60 |
| * Blue Bird Corp. | 2,490 | 57 |
| Marlin Business Services Corp. | 1,928 | 55 |
| * Radiant Logistics Inc. | 12,657 | 55 |
| * DXP Enterprises Inc. | 1,196 | 55 |
| * IES Holdings Inc. | 2,711 | 52 |
| * Safe Bulkers Inc. | 16,546 | 46 |
| * Gulfmark Offshore Inc. | 1,205 | 44 |
| NACCO Industries Inc. Class A | 1,225 | 43 |
| * Orion Group Holdings Inc. | 4,787 | 41 |
| Alamo Group Inc. | 421 | 40 |
| * Maxwell Technologies Inc. | 11,070 | 39 |
| Federal Signal Corp. | 1,495 | 39 |
| Franklin Electric Co. Inc. | 787 | 38 |
| * Vishay Precision Group Inc. | 847 | 37 |
| * Advanced Disposal Services Inc. | 1,368 | 36 |
| * Genco Shipping & Trading Ltd. | 2,639 | 36 |
| * Information Services Group Inc. | 7,252 | 36 |
| Rush Enterprises Inc. Class B | 790 | 35 |
| Systemax Inc. | 938 | 34 |
| * Willis Lease Finance Corp. | 935 | 32 |
| * Gencor Industries Inc. | 2,406 | 31 |
| * PHI Inc. | 3,807 | 31 |
| * Vicor Corp. | 493 | 31 |
| * Mistras Group Inc. | 1,304 | 30 |
| Kimball International Inc. Class B | 1,600 | 28 |
| * General Finance Corp. | 1,749 | 24 |
| Knoll Inc. | 901 | 21 |
| * FARO Technologies Inc. | 301 | 21 |
| * Exela Technologies Inc. | 3,178 | 19 |
| BrightView Holdings Inc. | 1,039 | 18 |
| * Echo Global Logistics Inc. | 490 | 16 |
| ConvergeOne Holdings Inc. | 1,663 | 15 |
| Hackett Group Inc. | 728 | 15 |
| * Babcock & Wilcox Enterprises Inc. | 10,597 | 15 |
| * PAM Transportation Services Inc. | 213 | 12 |
| * Manitex International Inc. | 1,011 | 11 |
| Advanced Emissions Solutions Inc. | 666 | 8 |
| * Hill International Inc. | 1,318 | 6 |
| * USA Truck Inc. | 223 | 5 |
| Korn/Ferry International | 2 | — |
| Albany International Corp. | 1 | — |
| * Evoqua Water Technologies Corp. | 3 | — |
| * ServiceSource International Inc. | 17 | — |
53
| Vanguard® Russell 2000 Value Index Fund | |||
| Schedule of Investments | |||
| August 31, 2018 | |||
| Market | |||
| Value | |||
| Shares | ($000) | ||
| * | DHI Group Inc. | 4 | — |
| * | Navios Maritime Holdings Inc. | 6 | — |
| * | Ascent Capital Group Inc. Class A | 1 | — |
| 42,674 | |||
| Technology (9.8%) | |||
| * | Cree Inc. | 33,277 | 1,601 |
| * | CACI International Inc. Class A | 8,093 | 1,578 |
| * | Ciena Corp. | 47,317 | 1,494 |
| *,^ | ViaSat Inc. | 18,077 | 1,136 |
| Perspecta Inc. | 47,339 | 1,101 | |
| Vishay Intertechnology Inc. | 43,675 | 1,039 | |
| * | Verint Systems Inc. | 21,136 | 1,026 |
| SYNNEX Corp. | 10,086 | 978 | |
| * | Tech Data Corp. | 12,670 | 922 |
| * | Cirrus Logic Inc. | 20,160 | 886 |
| * | Avaya Holdings Corp. | 34,300 | 801 |
| * | Finisar Corp. | 38,339 | 782 |
| * | Anixter International Inc. | 9,758 | 704 |
| * | NetScout Systems Inc. | 27,843 | 696 |
| *,^ | 3D Systems Corp. | 34,121 | 694 |
| * | Sanmina Corp. | 22,479 | 692 |
| * | Plexus Corp. | 10,923 | 691 |
| * | Acxiom Corp. | 12,790 | 584 |
| Maxar Technologies Ltd. | 18,683 | 580 | |
| ManTech International Corp. Class A | 8,607 | 571 | |
| * | TTM Technologies Inc. | 30,519 | 571 |
| * | Fabrinet | 11,863 | 568 |
| * | NETGEAR Inc. | 7,949 | 563 |
| TiVo Corp. | 39,656 | 541 | |
| * | Viavi Solutions Inc. | 47,484 | 532 |
| * | Oclaro Inc. | 55,421 | 529 |
| InterDigital Inc. | 6,282 | 519 | |
| * | Knowles Corp. | 28,423 | 515 |
| * | Synaptics Inc. | 10,334 | 499 |
| * | MicroStrategy Inc. Class A | 3,238 | 482 |
| * | KEMET Corp. | 18,330 | 474 |
| * | Infinera Corp. | 49,180 | 440 |
| * | Evolent Health Inc. Class A | 16,852 | 430 |
| * | Rambus Inc. | 34,671 | 424 |
| * | Mercury Systems Inc. | 7,634 | 416 |
| *,^ | Stratasys Ltd. | 16,484 | 411 |
| CTS Corp. | 10,906 | 403 | |
| Benchmark Electronics Inc. | 15,520 | 401 | |
| * | Insight Enterprises Inc. | 7,155 | 395 |
| * | Rogers Corp. | 2,831 | 391 |
| * | Diodes Inc. | 9,714 | 368 |
| * | MACOM Technology Solutions Holdings Inc. | 14,742 | 340 |
| * | FormFactor Inc. | 21,881 | 338 |
| * | ScanSource Inc. | 8,195 | 333 |
| AVX Corp. | 15,182 | 321 | |
| * | Acacia Communications Inc. | 7,788 | 317 |
| * | Amkor Technology Inc. | 33,296 | 291 |
| Comtech Telecommunications Corp. | 7,480 | 268 | |
| ADTRAN Inc. | 15,581 | 268 | |
| Methode Electronics Inc. | 6,260 | 248 | |
| * | Ambarella Inc. | 6,246 | 239 |
| * | Cray Inc. | 10,902 | 237 |
| * | Photronics Inc. | 22,082 | 236 |
| * | Electro Scientific Industries Inc. | 10,330 | 227 |
| * | Axcelis Technologies Inc. | 10,426 | 211 |
| * | Perficient Inc. | 7,262 | 209 |
| Cohu Inc. | 7,694 | 203 | |
| Xperi Corp. | 12,557 | 197 | |
| * | Ultra Clean Holdings Inc. | 12,502 | 191 |
54
| Vanguard® Russell 2000 Value Index Fund | ||
| Schedule of Investments | ||
| August 31, 2018 | ||
| Market | ||
| Value | ||
| Shares | ($000) | |
| * Veeco Instruments Inc. | 15,729 | 189 |
| * Kimball Electronics Inc. | 8,428 | 167 |
| * Presidio Inc. | 10,324 | 156 |
| * Blucora Inc. | 4,230 | 153 |
| PC Connection Inc. | 3,755 | 149 |
| Monotype Imaging Holdings Inc. | 7,233 | 149 |
| * Harmonic Inc. | 27,071 | 148 |
| * KeyW Holding Corp. | 15,825 | 135 |
| * Meet Group Inc. | 23,289 | 119 |
| * Ribbon Communications Inc. | 17,140 | 119 |
| ^ Diebold Nixdorf Inc. | 24,810 | 118 |
| * Digi International Inc. | 8,734 | 117 |
| * Semtech Corp. | 1,715 | 102 |
| * NeoPhotonics Corp. | 11,243 | 99 |
| * AXT Inc. | 12,372 | 98 |
| Daktronics Inc. | 11,693 | 95 |
| * Unisys Corp. | 5,094 | 95 |
| * Alpha & Omega Semiconductor Ltd. | 6,452 | 92 |
| * pdvWireless Inc. | 3,044 | 91 |
| Bel Fuse Inc. Class B | 3,162 | 91 |
| CSG Systems International Inc. | 2,247 | 84 |
| * ACI Worldwide Inc. | 2,789 | 79 |
| * PDF Solutions Inc. | 8,222 | 72 |
| American Software Inc. Class A | 3,868 | 70 |
| * KVH Industries Inc. | 5,263 | 65 |
| * Acacia Research Corp. | 16,121 | 63 |
| * Applied Optoelectronics Inc. | 1,446 | 60 |
| Park Electrochemical Corp. | 2,602 | 56 |
| * Calix Inc. | 6,894 | 54 |
| * Xcerra Corp. | 3,395 | 49 |
| * Agilysys Inc. | 2,683 | 43 |
| * Syntel Inc. | 997 | 41 |
| * Telaria Inc. | 9,456 | 39 |
| * SecureWorks Corp. Class A | 2,505 | 33 |
| * Web.com Group Inc. | 1,118 | 31 |
| * Telenav Inc. | 4,893 | 27 |
| * DASAN Zhone Solutions Inc. | 1,911 | 21 |
| * Sparton Corp. | 1,607 | 20 |
| * Clearfield Inc. | 1,330 | 18 |
| * CEVA Inc. | 580 | 18 |
| * PAR Technology Corp. | 662 | 17 |
| * Avid Technology Inc. | 2,748 | 16 |
| * Leaf Group Ltd. | 1,316 | 15 |
| * eGain Corp. | 834 | 12 |
| NVE Corp. | 93 | 11 |
| * Pluralsight Inc. Class A | 264 | 9 |
| * ChannelAdvisor Corp. | 617 | 8 |
| Domo Inc. | 300 | 7 |
| * Casa Systems Inc. | 442 | 6 |
| * Kopin Corp. | 2,553 | 6 |
| * Digimarc Corp. | 138 | 4 |
| * Tenable Holdings Inc. | 86 | 3 |
| * I3 Verticals Inc. Class A | 133 | 2 |
| EverQuote Inc. Class A | 133 | 2 |
| * EMCORE Corp. | 218 | 1 |
| Progress Software Corp. | 5 | — |
| * Bottomline Technologies DE Inc. | 3 | — |
| QAD Inc. Class A | 3 | — |
| * RealNetworks Inc. | 21 | — |
| * Virtusa Corp. | 1 | — |
| * OneSpan Inc. | 3 | — |
| * Glu Mobile Inc. | 5 | — |
| * ForeScout Technologies Inc. | 1 | — |
| * Rubicon Project Inc. | 9 | — |
55
| Vanguard® Russell 2000 Value Index Fund | ||
| Schedule of Investments | ||
| August 31, 2018 | ||
| Market | ||
| Value | ||
| Shares | ($000) | |
| * SailPoint Technologies Holding Inc. | 1 | — |
| * ARC Document Solutions Inc. | 7 | — |
| * Quantum Corp. | 9 | — |
| * GSI Technology Inc. | 1 | — |
| * Limelight Networks Inc. | 1 | — |
| * Radisys Corp. | 1 | — |
| 36,646 | ||
| Utilities (6.2%) | ||
| IDACORP Inc. | 16,521 | 1,617 |
| Portland General Electric Co. | 29,529 | 1,370 |
| ONE Gas Inc. | 17,028 | 1,337 |
| ALLETE Inc. | 16,880 | 1,267 |
| Southwest Gas Holdings Inc. | 15,773 | 1,220 |
| New Jersey Resources Corp. | 26,397 | 1,204 |
| Spire Inc. | 16,101 | 1,200 |
| Avista Corp. | 21,507 | 1,104 |
| Black Hills Corp. | 17,775 | 1,046 |
| PNM Resources Inc. | 26,216 | 1,021 |
| NorthWestern Corp. | 16,249 | 974 |
| El Paso Electric Co. | 13,324 | 817 |
| South Jersey Industries Inc. | 24,243 | 804 |
| MGE Energy Inc. | 11,501 | 753 |
| Ormat Technologies Inc. | 13,081 | 689 |
| * Iridium Communications Inc. | 31,593 | 640 |
| Northwest Natural Gas Co. | 9,598 | 623 |
| Otter Tail Corp. | 13,004 | 623 |
| California Water Service Group | 14,505 | 597 |
| Pattern Energy Group Inc. Class A | 26,631 | 543 |
| NRG Yield Inc. | 21,483 | 426 |
| Chesapeake Utilities Corp. | 4,690 | 403 |
| * Intelsat SA | 13,207 | 290 |
| Connecticut Water Service Inc. | 3,992 | 274 |
| Consolidated Communications Holdings Inc. | 22,829 | 270 |
| Unitil Corp. | 5,021 | 254 |
| ATN International Inc. | 3,398 | 249 |
| American States Water Co. | 3,797 | 229 |
| NRG Yield Inc. Class A | 11,552 | 227 |
| * Cincinnati Bell Inc. | 15,151 | 197 |
| * NII Holdings Inc. | 28,885 | 166 |
| Frontier Communications Corp. | 25,701 | 134 |
| SJW Group | 1,956 | 113 |
| Artesian Resources Corp. Class A | 2,730 | 98 |
| Spok Holdings Inc. | 6,079 | 93 |
| * Atlantic Power Corp. | 36,100 | 79 |
| RGC Resources Inc. | 2,406 | 65 |
| Consolidated Water Co. Ltd. | 4,785 | 65 |
| * AquaVenture Holdings Ltd. | 3,547 | 64 |
| ^ Windstream Holdings Inc. | 13,270 | 63 |
| Middlesex Water Co. | 720 | 33 |
| * Pure Cycle Corp. | 2,709 | 30 |
| Fusion Connect Inc. | 5,904 | 22 |
| York Water Co. | 666 | 20 |
| * ORBCOMM Inc. | 3 | — |
| * Globalstar Inc. | 13 | — |
| 23,313 | ||
| Total Common Stocks (Cost $312,004) | 371,625 | |
56
| Vanguard® Russell 2000 Value Index Fund | ||||
| Schedule of Investments | ||||
| August 31, 2018 | ||||
| Market | ||||
| Value | ||||
| Coupon | Shares | ($000) | ||
| Temporary Cash Investments (1.5%)1 | ||||
| Money Market Fund (1.4%) | ||||
| 3,4 Vanguard Market Liquidity Fund | 2.153% | 56,401 | 5,642 | |
| Face | ||||
| Maturity | Amount | |||
| Date | ($000) | |||
| U.S. Government and Agency Obligations (0.1%) | ||||
| 5 United States Treasury Bill | 2.034% | 11/15/18 | 200 | 199 |
| Total Temporary Cash Investments (Cost $5,839) | 5,841 | |||
| Total Investments (100.7%) (Cost $317,843) | 377,466 | |||
| Other Assets and Liabilities—Net (-0.7%)4 | (2,793) | |||
| Net Assets (100%) | 374,673 | |||
__________________________________________________________________________________________________________________________________________________________________________________________________________________________________________________________________________________________________________________________________________________________________________________________________________________________________________________________________________________________________________________________________________________________________________________________________________________________________________________________________________________________
__________________________________________________________________________________________________________________________________________________________________________________________________________________________________________________________________________________________________________________________________________________________________________________________________________________________________________________________________________________________________________________________________________________________________________________________________________________________________________________________________________________________
* Non-income-producing security.
^ Includes partial security positions on loan to broker-dealers. The total value of securities on loan is $2,205,000.
§ Security value determined using significant unobservable inputs.
1 The fund invests a portion of its cash reserves in equity markets through the use of index futures contracts. After giving effect to futures
investments, the fund's effective common stock and temporary cash investment positions represent 100.0% and 0.7%, respectively, of net
assets.
2 “Other” represents securities that are not classified by the fund’s benchmark index.
3 Affiliated money market fund available only to Vanguard funds and certain trusts and accounts managed by Vanguard. Rate shown is the 7-day
yield.
4 Includes $2,409,000 of collateral received for securities on loan.
5 Securities with a value of $199,000 have been segregated as initial margin for open futures contracts.
CVR—Contingent Value Rights.
REIT—Real Estate Investment Trust.
57
| Vanguard® Russell 2000 Growth Index Fund | |||
| Schedule of Investments | |||
| August 31, 2018 | |||
| Market | |||
| Value | |||
| Shares | ($000) | ||
| Common Stocks (99.8%)1 | |||
| Consumer Discretionary (17.8%) | |||
| * | Five Below Inc. | 40,354 | 4,700 |
| * | Etsy Inc. | 88,053 | 4,287 |
| Texas Roadhouse Inc. Class A | 50,100 | 3,454 | |
| * | Planet Fitness Inc. Class A | 65,357 | 3,357 |
| * | Trade Desk Inc. Class A | 23,290 | 3,304 |
| * | Ollie's Bargain Outlet Holdings Inc. | 36,628 | 3,190 |
| * | Stamps.com Inc. | 12,828 | 3,187 |
| * | Deckers Outdoor Corp. | 23,561 | 2,871 |
| American Eagle Outfitters Inc. | 107,151 | 2,782 | |
| World Wrestling Entertainment Inc. Class A | 31,201 | 2,727 | |
| Nexstar Media Group Inc. Class A | 33,124 | 2,716 | |
| Wolverine World Wide Inc. | 68,326 | 2,677 | |
| * | SiteOne Landscape Supply Inc. | 29,453 | 2,662 |
| * | Chegg Inc. | 78,415 | 2,539 |
| Steven Madden Ltd. | 42,980 | 2,499 | |
| Churchill Downs Inc. | 8,707 | 2,461 | |
| * | Eldorado Resorts Inc. | 48,536 | 2,332 |
| * | Cimpress NV | 16,237 | 2,273 |
| * | RH | 14,209 | 2,259 |
| Strategic Education Inc. | 15,480 | 2,148 | |
| Cracker Barrel Old Country Store Inc. | 14,180 | 2,114 | |
| Boyd Gaming Corp. | 55,245 | 2,012 | |
| * | Weight Watchers International Inc. | 26,787 | 2,006 |
| ILG Inc. | 58,760 | 2,006 | |
| Dana Inc. | 99,751 | 1,952 | |
| Roku Inc. | 32,061 | 1,907 | |
| * | Shutterfly Inc. | 24,333 | 1,890 |
| New York Times Co. Class A | 78,856 | 1,837 | |
| * | Fox Factory Holding Corp. | 26,580 | 1,756 |
| *,^ | Pandora Media Inc. | 189,490 | 1,751 |
| * | Dave & Buster's Entertainment Inc. | 29,393 | 1,710 |
| Cheesecake Factory Inc. | 31,653 | 1,683 | |
| Marriott Vacations Worldwide Corp. | 14,104 | 1,678 | |
| Monro Inc. | 23,603 | 1,675 | |
| Red Rock Resorts Inc. Class A | 51,268 | 1,673 | |
| LCI Industries | 17,999 | 1,673 | |
| Children's Place Inc. | 11,870 | 1,671 | |
| * | Dorman Products Inc. | 19,818 | 1,605 |
| National Vision Holdings Inc. | 35,753 | 1,582 | |
| * | Avis Budget Group Inc. | 50,455 | 1,570 |
| * | Cavco Industries Inc. | 6,302 | 1,547 |
| PriceSmart Inc. | 16,397 | 1,424 | |
| * | Carvana Co. Class A | 20,992 | 1,359 |
| * | Meritor Inc. | 62,181 | 1,347 |
| Wingstop Inc. | 19,819 | 1,327 | |
| * | Pinnacle Entertainment Inc. | 38,495 | 1,318 |
| * | Sotheby's | 27,424 | 1,317 |
| Tenneco Inc. | 30,712 | 1,314 | |
| * | Scientific Games Corp. | 40,702 | 1,233 |
| Bloomin' Brands Inc. | 62,052 | 1,198 | |
| * | SeaWorld Entertainment Inc. | 40,502 | 1,188 |
| Oxford Industries Inc. | 12,322 | 1,147 | |
| BJ's Restaurants Inc. | 15,068 | 1,141 | |
| * | Asbury Automotive Group Inc. | 15,105 | 1,125 |
| * | Shake Shack Inc. Class A | 18,135 | 1,096 |
| Brinker International Inc. | 24,466 | 1,083 | |
| Callaway Golf Co. | 46,524 | 1,061 | |
| * | Crocs Inc. | 50,014 | 1,033 |
| * | Instructure Inc. | 23,307 | 954 |
| * | IMAX Corp. | 40,578 | 954 |
| Lithia Motors Inc. Class A | 10,767 | 930 | |
58
| Vanguard® Russell 2000 Growth Index Fund | |||
| Schedule of Investments | |||
| August 31, 2018 | |||
| Market | |||
| Value | |||
| Shares | ($000) | ||
| * | Sleep Number Corp. | 27,062 | 912 |
| * | American Woodmark Corp. | 10,375 | 881 |
| * | Quotient Technology Inc. | 58,545 | 875 |
| Tailored Brands Inc. | 36,783 | 866 | |
| * | Liberty TripAdvisor Holdings Inc. Class A | 53,682 | 851 |
| Winnebago Industries Inc. | 22,849 | 844 | |
| Nutrisystem Inc. | 21,849 | 808 | |
| Sturm Ruger & Co. Inc. | 12,336 | 807 | |
| * | Career Education Corp. | 50,183 | 800 |
| *,^ | LGI Homes Inc. | 13,698 | 789 |
| Inter Parfums Inc. | 11,939 | 780 | |
| Shutterstock Inc. | 13,810 | 760 | |
| * | Central Garden & Pet Co. Class A | 20,019 | 727 |
| * | Malibu Boats Inc. Class A | 15,036 | 725 |
| Sinclair Broadcast Group Inc. Class A | 24,738 | 716 | |
| * | Liberty Media Corp-Liberty Braves Class C | 25,862 | 687 |
| * | At Home Group Inc. | 19,634 | 676 |
| Ruth's Hospitality Group Inc. | 21,214 | 653 | |
| Dine Brands Global Inc. | 7,362 | 614 | |
| * | Hudson Ltd. Class A | 29,506 | 608 |
| HealthStream Inc. | 19,111 | 606 | |
| Viad Corp. | 8,789 | 541 | |
| * | Stoneridge Inc. | 18,072 | 541 |
| * | XO Group Inc. | 17,963 | 540 |
| *,^ | GoPro Inc. Class A | 83,215 | 533 |
| Sonic Corp. | 14,586 | 523 | |
| * | Denny's Corp. | 34,208 | 516 |
| Camping World Holdings Inc. Class A | 23,900 | 495 | |
| La-Z-Boy Inc. | 14,718 | 489 | |
| *,^ | Overstock.com Inc. | 15,231 | 445 |
| * | Boot Barn Holdings Inc. | 14,318 | 429 |
| * | QuinStreet Inc. | 27,673 | 420 |
| * | G-III Apparel Group Ltd. | 9,097 | 414 |
| * | Fiesta Restaurant Group Inc. | 14,047 | 404 |
| * | Golden Entertainment Inc. | 13,435 | 390 |
| * | MCBC Holdings Inc. | 13,607 | 375 |
| * | Sally Beauty Holdings Inc. | 24,013 | 370 |
| Papa John's International Inc. | 7,709 | 356 | |
| * | Murphy USA Inc. | 4,194 | 348 |
| * | Carrols Restaurant Group Inc. | 21,781 | 344 |
| KB Home | 13,492 | 335 | |
| * | ZAGG Inc. | 20,357 | 330 |
| Jack in the Box Inc. | 3,606 | 327 | |
| Travelport Worldwide Ltd. | 17,554 | 326 | |
| Big Lots Inc. | 7,301 | 314 | |
| * | Monarch Casino & Resort Inc. | 6,649 | 313 |
| * | Nautilus Inc. | 20,400 | 299 |
| * | Lumber Liquidators Holdings Inc. | 16,870 | 294 |
| * | Conn's Inc. | 7,092 | 291 |
| * | Chuy's Holdings Inc. | 9,956 | 288 |
| * | Care.com Inc. | 14,538 | 283 |
| Winmark Corp. | 1,854 | 277 | |
| * | Penn National Gaming Inc. | 7,701 | 265 |
| * | Drive Shack Inc. | 41,090 | 255 |
| * | Central European Media Enterprises Ltd. Class A | 64,407 | 245 |
| * | Lindblad Expeditions Holdings Inc. | 15,922 | 242 |
| * | Taylor Morrison Home Corp. Class A | 11,970 | 233 |
| * | Central Garden & Pet Co. | 5,745 | 228 |
| * | Potbelly Corp. | 16,608 | 225 |
| * | elf Beauty Inc. | 16,151 | 224 |
| Johnson Outdoors Inc. Class A | 2,200 | 223 | |
| * | tronc Inc. | 12,488 | 206 |
| * | Liberty Media Corp-Liberty Braves Class A | 7,707 | 206 |
| * | MDC Partners Inc. Class A | 42,144 | 204 |
59
| Vanguard® Russell 2000 Growth Index Fund | |||
| Schedule of Investments | |||
| August 31, 2018 | |||
| Market | |||
| Value | |||
| Shares | ($000) | ||
| * | MarineMax Inc. | 8,953 | 201 |
| * | Fitbit Inc. Class A | 33,023 | 199 |
| * | Funko Inc. Class A | 7,610 | 193 |
| * | Franklin Covey Co. | 7,324 | 188 |
| Nathan's Famous Inc. | 2,070 | 184 | |
| * | Duluth Holdings Inc. | 5,986 | 173 |
| * | Helen of Troy Ltd. | 1,453 | 173 |
| * | Fossil Group Inc. | 7,443 | 169 |
| RCI Hospitality Holdings Inc. | 4,920 | 160 | |
| Hooker Furniture Corp. | 3,734 | 157 | |
| * | Sportsman's Warehouse Holdings Inc. | 26,908 | 154 |
| Skyline Champion Corp. | 4,984 | 144 | |
| * | Belmond Ltd. Class A | 8,358 | 140 |
| * | Zumiez Inc. | 4,021 | 125 |
| * | Eros International plc | 10,960 | 124 |
| Superior Group of Cos. Inc. | 6,489 | 123 | |
| * | Liberty Expedia Holdings Inc. Class A | 2,643 | 122 |
| * | America's Car-Mart Inc. | 1,417 | 118 |
| Tile Shop Holdings Inc. | 15,282 | 117 | |
| * | Noodles & Co. Class A | 9,343 | 115 |
| *,^ | Revlon Inc. Class A | 5,054 | 110 |
| Buckle Inc. | 4,211 | 108 | |
| Hamilton Beach Brands Holding Co. Class A | 4,660 | 108 | |
| Marine Products Corp. | 5,444 | 107 | |
| ^ | Bluegreen Vacations Corp. | 5,364 | 100 |
| *,^ | Vuzix Corp. | 15,403 | 100 |
| * | M/I Homes Inc. | 3,763 | 98 |
| Carriage Services Inc. Class A | 4,134 | 94 | |
| * | Gaia Inc. Class A | 5,174 | 91 |
| * | Hemisphere Media Group Inc. Class A | 6,557 | 90 |
| * | TRI Pointe Group Inc. | 5,827 | 84 |
| * | Cardlytics Inc. | 4,102 | 84 |
| * | William Lyon Homes Class A | 4,159 | 81 |
| * | Meritage Homes Corp. | 1,798 | 78 |
| * | 1-800-Flowers.com Inc. Class A | 5,637 | 68 |
| BJ's Wholesale Club Holdings Inc. | 2,052 | 61 | |
| * | New York & Co. Inc. | 13,045 | 59 |
| Entravision Communications Corp. Class A | 8,652 | 45 | |
| National Presto Industries Inc. | 341 | 45 | |
| * | Century Communities Inc. | 1,467 | 43 |
| *,^ | Eastman Kodak Co. | 12,773 | 42 |
| * | Rosetta Stone Inc. | 2,483 | 39 |
| * | Houghton Mifflin Harcourt Co. | 6,077 | 39 |
| Tilly's Inc. Class A | 1,640 | 39 | |
| * | Cambium Learning Group Inc. | 2,416 | 32 |
| * | Hovnanian Enterprises Inc. Class A | 19,071 | 30 |
| Movado Group Inc. | 672 | 29 | |
| * | Kirkland's Inc. | 3,022 | 28 |
| * | Party City Holdco Inc. | 1,463 | 22 |
| * | American Public Education Inc. | 635 | 22 |
| * | Empire Resorts Inc. | 1,423 | 18 |
| LiveXLive Media Inc. | 3,482 | 18 | |
| * | Purple Innovation Inc. | 3,165 | 18 |
| * | Green Brick Partners Inc. | 1,042 | 11 |
| * | Town Sports International Holdings Inc. | 966 | 9 |
| *,^ | Sears Holdings Corp. | 5,620 | 8 |
| Beasley Broadcast Group Inc. Class A | 480 | 4 | |
| * | American Outdoor Brands Corp. | 43 | 1 |
| * | Zoe's Kitchen Inc. | 41 | 1 |
| * | Habit Restaurants Inc. Class A | 30 | 1 |
| * | Gray Television Inc. | 24 | — |
| MDC Holdings Inc. | 13 | — | |
| * | Universal Electronics Inc. | 9 | — |
| Collectors Universe Inc. | 19 | — | |
60
| Vanguard® Russell 2000 Growth Index Fund | |||
| Schedule of Investments | |||
| August 31, 2018 | |||
| Market | |||
| Value | |||
| Shares | ($000) | ||
| Entercom Communications Corp. Class A | 32 | — | |
| * | Red Robin Gourmet Burgers Inc. | 6 | — |
| * | Caesars Entertainment Corp. | 18 | — |
| * | Inspired Entertainment Inc. | 24 | — |
| * | Francesca's Holdings Corp. | 23 | — |
| * | Bridgepoint Education Inc. Class A | 7 | — |
| Marcus Corp. | 2 | — | |
| * | Horizon Global Corp. | 10 | — |
| * | WideOpenWest Inc. | 5 | — |
| * | J. Jill Inc. | 5 | — |
| 155,307 | |||
| Consumer Staples (2.5%) | |||
| * | Performance Food Group Co. | 75,344 | 2,494 |
| Medifast Inc. | 8,617 | 1,971 | |
| * | Boston Beer Co. Inc. Class A | 6,212 | 1,883 |
| WD-40 Co. | 10,069 | 1,787 | |
| J&J Snack Foods Corp. | 11,069 | 1,611 | |
| Lancaster Colony Corp. | 10,134 | 1,584 | |
| * | USANA Health Sciences Inc. | 9,386 | 1,239 |
| Calavo Growers Inc. | 11,667 | 1,235 | |
| * | National Beverage Corp. | 8,674 | 1,022 |
| * | Freshpet Inc. | 19,309 | 717 |
| * | Diplomat Pharmacy Inc. | 33,309 | 688 |
| MGP Ingredients Inc. | 8,718 | 672 | |
| Coca-Cola Bottling Co. Consolidated | 3,466 | 588 | |
| PetMed Express Inc. | 14,691 | 539 | |
| Vector Group Ltd. | 31,750 | 493 | |
| * | Chefs' Warehouse Inc. | 16,045 | 472 |
| John B Sanfilippo & Son Inc. | 6,329 | 463 | |
| Cal-Maine Foods Inc. | 9,316 | 461 | |
| * | Primo Water Corp. | 19,972 | 399 |
| *,^ | 22nd Century Group Inc. | 84,266 | 228 |
| Turning Point Brands Inc. | 5,915 | 199 | |
| * | Craft Brew Alliance Inc. | 9,242 | 175 |
| B&G Foods Inc. | 5,108 | 163 | |
| Natural Health Trends Corp. | 5,056 | 134 | |
| Core-Mark Holding Co. Inc. | 2,719 | 97 | |
| Limoneira Co. | 2,726 | 84 | |
| * | Castle Brands Inc. | 66,066 | 76 |
| *,^ | Celsius Holdings Inc. | 16,574 | 76 |
| Tootsie Roll Industries Inc. | 1,782 | 51 | |
| Dean Foods Co. | 44 | — | |
| * | Lifeway Foods Inc. | 4 | — |
| 21,601 | |||
| Energy (2.2%) | |||
| Delek US Holdings Inc. | 56,872 | 3,099 | |
| * | Matador Resources Co. | 67,630 | 2,214 |
| * | SRC Energy Inc. | 177,873 | 1,656 |
| * | Carrizo Oil & Gas Inc. | 57,544 | 1,394 |
| * | Cactus Inc. Class A | 27,233 | 931 |
| * | Denbury Resources Inc. | 150,398 | 838 |
| * | Penn Virginia Corp. | 9,191 | 817 |
| * | ProPetro Holding Corp. | 52,003 | 791 |
| *,^ | Jagged Peak Energy Inc. | 47,129 | 623 |
| *,^ | Tellurian Inc. | 59,976 | 580 |
| * | Ring Energy Inc. | 40,088 | 473 |
| * | Keane Group Inc. | 38,081 | 468 |
| CVR Energy Inc. | 11,008 | 419 | |
| * | WildHorse Resource Development Corp. | 18,688 | 406 |
| * | CONSOL Energy Inc. | 8,782 | 377 |
| * | TETRA Technologies Inc. | 78,620 | 361 |
| * | Solaris Oilfield Infrastructure Inc. Class A | 19,489 | 336 |
| * | TPI Composites Inc. | 10,831 | 304 |
| * | Laredo Petroleum Inc. | 35,480 | 294 |
61
| Vanguard® Russell 2000 Growth Index Fund | |||
| Schedule of Investments | |||
| August 31, 2018 | |||
| Market | |||
| Value | |||
| Shares | ($000) | ||
| * | Covia Holdings Corp. | 22,946 | 260 |
| * | Abraxas Petroleum Corp. | 111,931 | 252 |
| * | Liberty Oilfield Services Inc. Class A | 10,732 | 211 |
| Evolution Petroleum Corp. | 18,449 | 185 | |
| * | Lilis Energy Inc. | 32,259 | 172 |
| Mammoth Energy Services Inc. | 6,143 | 169 | |
| *,^ | Sanchez Energy Corp. | 55,423 | 146 |
| * | ION Geophysical Corp. | 7,703 | 138 |
| Panhandle Oil and Gas Inc. Class A | 5,926 | 110 | |
| TerraForm Power Inc. Class A | 9,507 | 106 | |
| * | SunPower Corp. Class A | 15,282 | 103 |
| * | Select Energy Services Inc. Class A | 7,382 | 101 |
| * | Key Energy Services Inc. | 7,412 | 99 |
| *,^ | Zion Oil & Gas Inc. | 38,634 | 71 |
| * | Northern Oil and Gas Inc. | 19,406 | 67 |
| * | Renewable Energy Group Inc. | 2,194 | 59 |
| * | Goodrich Petroleum Corp. | 4,163 | 58 |
| * | Profire Energy Inc. | 17,127 | 49 |
| *,^ | Eclipse Resources Corp. | 30,806 | 44 |
| * | Independence Contract Drilling Inc. | 9,288 | 41 |
| * | NextDecade Corp. | 5,511 | 37 |
| * | Energy XXI Gulf Coast Inc. | 3,613 | 33 |
| * | Par Pacific Holdings Inc. | 1,599 | 32 |
| * | Ramaco Resources Inc. | 4,007 | 32 |
| * | Vivint Solar Inc. | 5,980 | 31 |
| * | Resolute Energy Corp. | 842 | 28 |
| * | Pioneer Energy Services Corp. | 4,533 | 14 |
| * | Berry Petroleum Corp. | 666 | 11 |
| * | RigNet Inc. | 664 | 11 |
| * | Isramco Inc. | 76 | 9 |
| * | Rosehill Resources Inc. | 949 | 8 |
| * | Flotek Industries Inc. | 81 | — |
| * | Smart Sand Inc. | 29 | — |
| * | Ranger Energy Services Inc. | 16 | — |
| Quintana Energy Services Inc. | 8 | — | |
| * | Ultra Petroleum Corp. | 42 | — |
| * | W&T Offshore Inc. | 4 | — |
| 19,068 | |||
| Financial Services (10.0%) | |||
| Primerica Inc. | 32,307 | 3,950 | |
| * | Green Dot Corp. Class A | 35,308 | 3,025 |
| Ryman Hospitality Properties Inc. | 33,039 | 2,932 | |
| First Financial Bankshares Inc. | 48,069 | 2,903 | |
| FirstCash Inc. | 32,815 | 2,668 | |
| EastGroup Properties Inc. | 25,476 | 2,478 | |
| Bank of NT Butterfield & Son Ltd. | 40,205 | 2,124 | |
| Moelis & Co. Class A | 32,511 | 1,887 | |
| RLI Corp. | 24,320 | 1,872 | |
| Kemper Corp. | 22,536 | 1,833 | |
| Tanger Factory Outlet Centers Inc. | 67,940 | 1,635 | |
| * | BofI Holding Inc. | 43,812 | 1,632 |
| * | Essent Group Ltd. | 36,172 | 1,568 |
| ServisFirst Bancshares Inc. | 34,235 | 1,476 | |
| Ameris Bancorp | 29,668 | 1,473 | |
| *,^ | LendingTree Inc. | 5,729 | 1,451 |
| * | FCB Financial Holdings Inc. Class A | 27,464 | 1,423 |
| PS Business Parks Inc. | 10,078 | 1,314 | |
| HFF Inc. Class A | 27,825 | 1,264 | |
| Federated Investors Inc. Class B | 52,503 | 1,216 | |
| Artisan Partners Asset Management Inc. Class A | 35,628 | 1,181 | |
| *,^ | Redfin Corp. | 54,661 | 1,083 |
| Universal Insurance Holdings Inc. | 23,333 | 1,041 | |
| Houlihan Lokey Inc. Class A | 22,059 | 1,037 | |
| * | Eagle Bancorp Inc. | 18,970 | 1,022 |
62
| Vanguard® Russell 2000 Growth Index Fund | |||
| Schedule of Investments | |||
| August 31, 2018 | |||
| Market | |||
| Value | |||
| Shares | ($000) | ||
| National Health Investors Inc. | 12,858 | 1,019 | |
| Kennedy-Wilson Holdings Inc. | 47,125 | 1,011 | |
| Americold Realty Trust | 38,610 | 961 | |
| EVERTEC Inc. | 37,661 | 906 | |
| Kinsale Capital Group Inc. | 14,426 | 877 | |
| Four Corners Property Trust Inc. | 31,277 | 843 | |
| * | NMI Holdings Inc. Class A | 38,273 | 827 |
| * | Cardtronics plc Class A | 23,486 | 824 |
| * | Enova International Inc. | 24,574 | 816 |
| PJT Partners Inc. | 13,784 | 798 | |
| QTS Realty Trust Inc. Class A | 17,385 | 795 | |
| * | Triumph Bancorp Inc. | 17,846 | 758 |
| National General Holdings Corp. | 27,319 | 746 | |
| WisdomTree Investments Inc. | 85,948 | 706 | |
| Cohen & Steers Inc. | 16,361 | 680 | |
| *,^ | Trupanion Inc. | 17,568 | 671 |
| Universal Health Realty Income Trust | 8,756 | 668 | |
| Lakeland Financial Corp. | 13,506 | 665 | |
| BrightSphere Investment Group plc | 51,652 | 655 | |
| LegacyTexas Financial Group Inc. | 14,017 | 649 | |
| First Industrial Realty Trust Inc. | 19,823 | 643 | |
| Cass Information Systems Inc. | 8,832 | 632 | |
| Preferred Bank | 10,273 | 629 | |
| CoBiz Financial Inc. | 27,270 | 629 | |
| Home BancShares Inc. | 26,673 | 624 | |
| Meta Financial Group Inc. | 6,836 | 592 | |
| Alexander's Inc. | 1,568 | 566 | |
| Hamilton Lane Inc. Class A | 10,955 | 534 | |
| * | Marcus & Millichap Inc. | 14,314 | 521 |
| RMR Group Inc. Class A | 5,209 | 492 | |
| Guaranty Bancorp | 15,491 | 484 | |
| GEO Group Inc. | 18,832 | 478 | |
| Saul Centers Inc. | 7,650 | 459 | |
| * | Health Insurance Innovations Inc. Class A | 8,586 | 454 |
| Diamond Hill Investment Group Inc. | 2,413 | 450 | |
| * | Pacific Premier Bancorp Inc. | 11,299 | 447 |
| Glacier Bancorp Inc. | 9,713 | 444 | |
| Heritage Commerce Corp. | 26,734 | 423 | |
| * | Everi Holdings Inc. | 48,396 | 420 |
| Cadence BanCorp Class A | 14,786 | 418 | |
| Carolina Financial Corp. | 10,113 | 416 | |
| People's Utah Bancorp | 11,381 | 411 | |
| Greenhill & Co. Inc. | 14,181 | 390 | |
| James River Group Holdings Ltd. | 9,227 | 378 | |
| Westwood Holdings Group Inc. | 6,226 | 358 | |
| Kearny Financial Corp. | 23,568 | 323 | |
| UMH Properties Inc. | 20,142 | 321 | |
| Enterprise Financial Services Corp. | 5,579 | 314 | |
| State Bank Financial Corp. | 9,480 | 309 | |
| Urban Edge Properties | 13,417 | 307 | |
| Live Oak Bancshares Inc. | 9,868 | 299 | |
| National Bank Holdings Corp. Class A | 7,135 | 286 | |
| Midland States Bancorp Inc. | 8,130 | 280 | |
| Farmers & Merchants Bancorp Inc. | 6,031 | 274 | |
| * | On Deck Capital Inc. | 33,068 | 272 |
| WSFS Financial Corp. | 5,546 | 271 | |
| Independent Bank Group Inc. | 3,882 | 269 | |
| * | Donnelley Financial Solutions Inc. | 11,906 | 249 |
| Pennsylvania REIT | 24,124 | 246 | |
| MB Financial Inc. | 5,052 | 245 | |
| United Insurance Holdings Corp. | 11,659 | 243 | |
| * | Atlantic Capital Bancshares Inc. | 12,911 | 236 |
| Ladenburg Thalmann Financial Services Inc. | 67,663 | 233 | |
| Newmark Group Inc. Class A | 17,436 | 224 | |
63
| Vanguard® Russell 2000 Growth Index Fund | |||
| Schedule of Investments | |||
| August 31, 2018 | |||
| Market | |||
| Value | |||
| Shares | ($000) | ||
| * | National Commerce Corp. | 4,786 | 211 |
| BancFirst Corp. | 3,286 | 210 | |
| FB Financial Corp. | 4,561 | 201 | |
| Washington Trust Bancorp Inc. | 3,135 | 188 | |
| * | Seacoast Banking Corp. of Florida | 5,927 | 187 |
| Independent Bank Corp. | 2,001 | 182 | |
| Blue Hills Bancorp Inc. | 7,888 | 181 | |
| * | Curo Group Holdings Corp. | 5,806 | 179 |
| Armada Hoffler Properties Inc. | 11,326 | 177 | |
| * | Customers Bancorp Inc. | 7,027 | 174 |
| Origin Bancorp Inc. | 4,134 | 168 | |
| AmTrust Financial Services Inc. | 11,324 | 165 | |
| United Community Banks Inc. | 5,348 | 162 | |
| Easterly Government Properties Inc. | 7,874 | 159 | |
| Monmouth Real Estate Investment Corp. | 9,149 | 159 | |
| * | Veritex Holdings Inc. | 5,182 | 159 |
| Federal Agricultural Mortgage Corp. | 2,008 | 155 | |
| * | Cowen Inc. Class A | 9,512 | 145 |
| * | Safeguard Scientifics Inc. | 14,011 | 144 |
| Union Bankshares Inc. | 2,726 | 143 | |
| ConnectOne Bancorp Inc. | 5,735 | 141 | |
| Walker & Dunlop Inc. | 2,570 | 140 | |
| German American Bancorp Inc. | 3,724 | 140 | |
| * | Elevate Credit Inc. | 14,649 | 137 |
| Clipper Realty Inc. | 10,837 | 132 | |
| * | First Foundation Inc. | 7,938 | 128 |
| * | Equity Bancshares Inc. Class A | 3,153 | 128 |
| * | TriState Capital Holdings Inc. | 4,270 | 127 |
| Stock Yards Bancorp Inc. | 3,278 | 127 | |
| FedNat Holding Co. | 4,447 | 117 | |
| Pzena Investment Management Inc. Class A | 12,872 | 117 | |
| Granite Point Mortgage Trust Inc. | 6,028 | 115 | |
| * | Regional Management Corp. | 3,374 | 112 |
| Independent Bank Corp. | 4,399 | 110 | |
| * | HomeTrust Bancshares Inc. | 3,802 | 110 |
| Navigators Group Inc. | 1,545 | 108 | |
| National Storage Affiliates Trust | 3,756 | 107 | |
| Hingham Institution for Savings | 449 | 97 | |
| Sterling Bancorp Inc. | 7,943 | 97 | |
| * | HarborOne Bancorp Inc. | 4,890 | 96 |
| Silvercrest Asset Management Group Inc. Class A | 6,028 | 96 | |
| Meridian Bancorp Inc. | 5,284 | 95 | |
| Merchants Bancorp | 3,455 | 90 | |
| City Holding Co. | 1,088 | 88 | |
| Virtus Investment Partners Inc. | 675 | 87 | |
| FS Bancorp Inc. | 1,365 | 80 | |
| *,^ | Siebert Financial Corp. | 5,006 | 79 |
| * | Trinity Place Holdings Inc. | 12,739 | 78 |
| Green Bancorp Inc. | 3,087 | 74 | |
| United Fire Group Inc. | 1,490 | 74 | |
| Hanmi Financial Corp. | 2,807 | 73 | |
| City Office REIT Inc. | 5,444 | 70 | |
| * | Allegiance Bancshares Inc. | 1,558 | 69 |
| Investment Technology Group Inc. | 3,155 | 69 | |
| First Connecticut Bancorp Inc. | 2,152 | 68 | |
| * | MBIA Inc. | 6,428 | 66 |
| Cambridge Bancorp | 728 | 65 | |
| Greene County Bancorp Inc. | 1,818 | 64 | |
| * | Maui Land & Pineapple Co. Inc. | 4,929 | 63 |
| West Bancorporation Inc. | 2,462 | 59 | |
| * | GreenSky Inc. Class A | 2,893 | 59 |
| Investar Holding Corp. | 1,960 | 54 | |
| * | Republic First Bancorp Inc. | 6,845 | 53 |
| Consolidated-Tomoka Land Co. | 849 | 53 | |
64
| Vanguard® Russell 2000 Growth Index Fund | |||
| Schedule of Investments | |||
| August 31, 2018 | |||
| Market | |||
| Value | |||
| Shares | ($000) | ||
| * | FRP Holdings Inc. | 806 | 53 |
| * | Ashford Inc. | 559 | 51 |
| * | BSB Bancorp Inc. | 1,528 | 51 |
| Central Pacific Financial Corp. | 1,780 | 50 | |
| * | AV Homes Inc. | 2,334 | 50 |
| Tompkins Financial Corp. | 526 | 46 | |
| Old Line Bancshares Inc. | 1,325 | 45 | |
| * | Ambac Financial Group Inc. | 2,111 | 45 |
| * | Esquire Financial Holdings Inc. | 1,709 | 44 |
| Global Indemnity Ltd. | 1,124 | 44 | |
| Piper Jaffray Cos. | 566 | 44 | |
| * | Focus Financial Partners Inc. Class A | 1,023 | 43 |
| TriCo Bancshares | 1,074 | 42 | |
| * | Essential Properties Realty Trust Inc. | 2,910 | 41 |
| Stewart Information Services Corp. | 839 | 38 | |
| Waterstone Financial Inc. | 2,198 | 37 | |
| Kingstone Cos. Inc. | 1,816 | 34 | |
| Investors Title Co. | 173 | 34 | |
| * | Howard Bancorp Inc. | 1,872 | 33 |
| PCSB Financial Corp. | 1,373 | 28 | |
| Capstar Financial Holdings Inc. | 1,586 | 28 | |
| Heritage Insurance Holdings Inc. | 1,639 | 24 | |
| NexPoint Residential Trust Inc. | 697 | 23 | |
| * | Malvern Bancorp Inc. | 888 | 22 |
| Bankwell Financial Group Inc. | 690 | 22 | |
| * | Southern First Bancshares Inc. | 510 | 21 |
| Southern Missouri Bancorp Inc. | 476 | 19 | |
| CNB Financial Corp. | 615 | 19 | |
| Enterprise Bancorp Inc. | 469 | 17 | |
| * | Evo Payments Inc. Class A | 677 | 16 |
| Value Line Inc. | 648 | 16 | |
| Macatawa Bank Corp. | 1,259 | 16 | |
| * | Entegra Financial Corp. | 569 | 16 |
| Reliant Bancorp Inc. | 561 | 15 | |
| * | Altisource Portfolio Solutions SA | 417 | 15 |
| GAMCO Investors Inc. Class A | 558 | 14 | |
| First Financial Northwest Inc. | 763 | 13 | |
| * | MoneyGram International Inc. | 2,037 | 13 |
| Northeast Bancorp | 561 | 12 | |
| Unity Bancorp Inc. | 466 | 11 | |
| Oconee Federal Financial Corp. | 310 | 8 | |
| * | Provident Bancorp Inc. | 232 | 7 |
| Fidelity D&D Bancorp Inc. | 108 | 6 | |
| Oak Valley Bancorp | 286 | 6 | |
| Griffin Industrial Realty Inc. | 116 | 5 | |
| * | Franklin Financial Network Inc. | 25 | 1 |
| * | Atlas Financial Holdings Inc. | 64 | 1 |
| Medley Management Inc. Class A | 120 | 1 | |
| * | Rafael Holdings Inc. Class B | 46 | — |
| HCI Group Inc. | 8 | — | |
| * | Metropolitan Bank Holding Corp. | 6 | — |
| * | eHealth Inc. | 7 | — |
| First of Long Island Corp. | 9 | — | |
| Access National Corp. | 7 | — | |
| CPI Card Group Inc. | 51 | — | |
| * | LendingClub Corp. | 41 | — |
| Maiden Holdings Ltd. | 31 | — | |
| * | Ocwen Financial Corp. | 24 | — |
| Western New England Bancorp Inc. | 1 | — | |
| 87,657 | |||
| Health Care (26.5%) | |||
| * | Haemonetics Corp. | 39,691 | 4,431 |
| * | Ligand Pharmaceuticals Inc. | 15,424 | 4,005 |
| *,^ | Teladoc Health Inc. | 49,540 | 3,842 |
65
| Vanguard® Russell 2000 Growth Index Fund | |||
| Schedule of Investments | |||
| August 31, 2018 | |||
| Market | |||
| Value | |||
| Shares | ($000) | ||
| * | HealthEquity Inc. | 40,021 | 3,770 |
| * | Medidata Solutions Inc. | 42,545 | 3,615 |
| * | LivaNova plc | 28,463 | 3,574 |
| * | Neogen Corp. | 37,216 | 3,477 |
| * | Inogen Inc. | 12,988 | 3,441 |
| * | FibroGen Inc. | 55,394 | 3,387 |
| * | Loxo Oncology Inc. | 19,639 | 3,319 |
| * | Ultragenyx Pharmaceutical Inc. | 34,816 | 2,950 |
| * | Globus Medical Inc. | 52,989 | 2,823 |
| * | NuVasive Inc. | 37,876 | 2,659 |
| * | Wright Medical Group NV | 91,575 | 2,654 |
| * | Amedisys Inc. | 21,152 | 2,644 |
| * | Horizon Pharma plc | 121,758 | 2,574 |
| * | Novocure Ltd. | 52,951 | 2,385 |
| *,^ | Immunomedics Inc. | 88,419 | 2,366 |
| * | Array BioPharma Inc. | 151,048 | 2,352 |
| * | Blueprint Medicines Corp. | 30,481 | 2,337 |
| * | LHC Group Inc. | 22,788 | 2,254 |
| * | Merit Medical Systems Inc. | 36,210 | 2,131 |
| * | Myriad Genetics Inc. | 42,679 | 2,125 |
| * | Tenet Healthcare Corp. | 61,717 | 2,081 |
| * | Emergent BioSolutions Inc. | 32,906 | 2,040 |
| * | AMN Healthcare Services Inc. | 34,806 | 2,029 |
| * | Ironwood Pharmaceuticals Inc. Class A | 102,294 | 1,968 |
| * | Omnicell Inc. | 28,217 | 1,940 |
| * | Amicus Therapeutics Inc. | 139,802 | 1,885 |
| * | Medicines Co. | 47,334 | 1,875 |
| * | Quidel Corp. | 24,271 | 1,866 |
| * | Heron Therapeutics Inc. | 47,286 | 1,823 |
| * | Intercept Pharmaceuticals Inc. | 16,223 | 1,814 |
| * | Global Blood Therapeutics Inc. | 36,838 | 1,803 |
| * | HMS Holdings Corp. | 53,390 | 1,711 |
| * | Halozyme Therapeutics Inc. | 92,633 | 1,705 |
| *,^ | Glaukos Corp. | 24,414 | 1,669 |
| * | iRhythm Technologies Inc. | 17,619 | 1,640 |
| * | Aerie Pharmaceuticals Inc. | 26,392 | 1,619 |
| * | Supernus Pharmaceuticals Inc. | 36,108 | 1,600 |
| * | Repligen Corp. | 28,806 | 1,581 |
| * | Select Medical Holdings Corp. | 79,751 | 1,579 |
| * | Momenta Pharmaceuticals Inc. | 56,836 | 1,506 |
| Tandem Diabetes Care Inc. | 32,884 | 1,502 | |
| * | REGENXBIO Inc. | 21,064 | 1,484 |
| * | Amneal Pharmaceuticals Inc. | 64,113 | 1,481 |
| * | BioTelemetry Inc. | 23,874 | 1,475 |
| * | STAAR Surgical Co. | 30,806 | 1,469 |
| * | Spectrum Pharmaceuticals Inc. | 67,442 | 1,452 |
| * | Nevro Corp. | 21,395 | 1,442 |
| Ensign Group Inc. | 36,572 | 1,429 | |
| * | Spark Therapeutics Inc. | 23,135 | 1,425 |
| * | Xencor Inc. | 33,997 | 1,421 |
| * | PTC Therapeutics Inc. | 33,276 | 1,389 |
| * | Pacira Pharmaceuticals Inc. | 29,336 | 1,383 |
| * | MyoKardia Inc. | 22,416 | 1,382 |
| * | NxStage Medical Inc. | 48,674 | 1,379 |
| * | Sangamo Therapeutics Inc. | 74,669 | 1,363 |
| * | Integer Holdings Corp. | 16,944 | 1,354 |
| * | Portola Pharmaceuticals Inc. | 44,467 | 1,327 |
| * | Acceleron Pharma Inc. | 23,792 | 1,285 |
| * | Clovis Oncology Inc. | 35,000 | 1,251 |
| * | Atara Biotherapeutics Inc. | 29,894 | 1,224 |
| * | AnaptysBio Inc. | 13,655 | 1,210 |
| US Physical Therapy Inc. | 9,220 | 1,155 | |
| * | Arena Pharmaceuticals Inc. | 29,267 | 1,137 |
| * | Insmed Inc. | 56,310 | 1,122 |
66
| Vanguard® Russell 2000 Growth Index Fund | |||
| Schedule of Investments | |||
| August 31, 2018 | |||
| Market | |||
| Value | |||
| Shares | ($000) | ||
| * | Enanta Pharmaceuticals Inc. | 12,315 | 1,120 |
| * | Tabula Rasa HealthCare Inc. | 12,706 | 1,114 |
| * | Editas Medicine Inc. | 33,586 | 1,103 |
| * | Zogenix Inc. | 22,778 | 1,100 |
| * | Corcept Therapeutics Inc. | 72,148 | 1,084 |
| * | AxoGen Inc. | 24,517 | 1,075 |
| * | Iovance Biotherapeutics Inc. | 60,649 | 1,073 |
| * | ACADIA Pharmaceuticals Inc. | 72,409 | 1,030 |
| * | Madrigal Pharmaceuticals Inc. | 4,270 | 1,021 |
| * | Tivity Health Inc. | 29,578 | 1,017 |
| * | Reata Pharmaceuticals Inc. Class A | 11,684 | 1,009 |
| * | ImmunoGen Inc. | 94,908 | 967 |
| * | Arrowhead Pharmaceuticals Inc. | 64,342 | 950 |
| * | Genomic Health Inc. | 15,443 | 945 |
| * | Puma Biotechnology Inc. | 21,422 | 942 |
| * | Retrophin Inc. | 29,358 | 930 |
| * | Cardiovascular Systems Inc. | 23,850 | 919 |
| * | Theravance Biopharma Inc. | 31,699 | 918 |
| * | G1 Therapeutics Inc. | 15,065 | 914 |
| * | Aimmune Therapeutics Inc. | 31,777 | 887 |
| * | Varex Imaging Corp. | 28,131 | 883 |
| * | Natus Medical Inc. | 23,660 | 883 |
| * | Omeros Corp. | 33,613 | 870 |
| * | Endocyte Inc. | 43,875 | 865 |
| * | Tactile Systems Technology Inc. | 12,710 | 860 |
| * | AtriCure Inc. | 24,647 | 852 |
| *,^ | Esperion Therapeutics Inc. | 16,801 | 831 |
| * | K2M Group Holdings Inc. | 30,330 | 829 |
| * | TherapeuticsMD Inc. | 123,269 | 799 |
| * | Audentes Therapeutics Inc. | 21,631 | 787 |
| *,^ | Intrexon Corp. | 51,039 | 785 |
| * | Biohaven Pharmaceutical Holding Co. Ltd. | 20,039 | 759 |
| * | Surmodics Inc. | 9,587 | 755 |
| * | Medpace Holdings Inc. | 12,608 | 754 |
| * | Intellia Therapeutics Inc. | 24,357 | 753 |
| * | Mirati Therapeutics Inc. | 13,284 | 751 |
| * | Innoviva Inc. | 51,082 | 742 |
| * | Vanda Pharmaceuticals Inc. | 38,126 | 737 |
| * | Cambrex Corp. | 10,476 | 706 |
| * | Invitae Corp. | 47,230 | 699 |
| * | Coherus Biosciences Inc. | 34,383 | 693 |
| * | WaVe Life Sciences Ltd. | 12,978 | 692 |
| * | R1 RCM Inc. | 69,258 | 691 |
| * | Karyopharm Therapeutics Inc. | 32,742 | 689 |
| Atrion Corp. | 1,048 | 687 | |
| *,^ | Geron Corp. | 117,791 | 675 |
| * | OraSure Technologies Inc. | 41,934 | 671 |
| * | TransEnterix Inc. | 114,607 | 665 |
| * | Revance Therapeutics Inc. | 24,180 | 663 |
| Phibro Animal Health Corp. Class A | 13,950 | 658 | |
| * | Cerus Corp. | 84,540 | 658 |
| * | Codexis Inc. | 37,576 | 646 |
| * | CytomX Therapeutics Inc. | 28,347 | 638 |
| * | Intersect ENT Inc. | 21,744 | 637 |
| * | MacroGenics Inc. | 28,845 | 631 |
| * | Alder Biopharmaceuticals Inc. | 34,672 | 628 |
| * | CryoLife Inc. | 17,841 | 619 |
| * | Radius Health Inc. | 29,732 | 612 |
| * | Natera Inc. | 21,694 | 600 |
| *,^ | Flexion Therapeutics Inc. | 25,286 | 579 |
| * | NeoGenomics Inc. | 41,293 | 572 |
| * | Quality Systems Inc. | 24,763 | 567 |
| * | Dynavax Technologies Corp. | 40,758 | 565 |
| * | Providence Service Corp. | 8,341 | 560 |
67
| Vanguard® Russell 2000 Growth Index Fund | |||
| Schedule of Investments | |||
| August 31, 2018 | |||
| Market | |||
| Value | |||
| Shares | ($000) | ||
| * | TG Therapeutics Inc. | 43,632 | 554 |
| CONMED Corp. | 6,862 | 552 | |
| * | CareDx Inc. | 22,574 | 549 |
| * | Orthofix Medical Inc. | 10,013 | 536 |
| * | Eagle Pharmaceuticals Inc. | 7,679 | 531 |
| * | Heska Corp. | 4,917 | 526 |
| * | Dicerna Pharmaceuticals Inc. | 32,819 | 520 |
| Apellis Pharmaceuticals Inc. | 26,619 | 515 | |
| *,^ | Athenex Inc. | 31,067 | 510 |
| * | Assembly Biosciences Inc. | 12,526 | 501 |
| * | Fate Therapeutics Inc. | 37,011 | 477 |
| * | Accelerate Diagnostics Inc. | 19,272 | 474 |
| * | Cymabay Therapeutics Inc. | 33,444 | 456 |
| * | Pacific Biosciences of California Inc. | 90,603 | 452 |
| * | BioCryst Pharmaceuticals Inc. | 61,963 | 444 |
| LeMaitre Vascular Inc. | 11,648 | 437 | |
| Meridian Bioscience Inc. | 27,787 | 436 | |
| * | Sientra Inc. | 17,237 | 433 |
| * | Progenics Pharmaceuticals Inc. | 54,804 | 429 |
| * | Viking Therapeutics Inc. | 32,329 | 423 |
| *,^ | MiMedx Group Inc. | 77,229 | 409 |
| * | Lantheus Holdings Inc. | 25,394 | 409 |
| * | RadNet Inc. | 29,313 | 406 |
| * | CorVel Corp. | 6,740 | 401 |
| * | Verastem Inc. | 39,282 | 391 |
| * | ArQule Inc. | 58,364 | 387 |
| * | Antares Pharma Inc. | 107,589 | 381 |
| * | Rigel Pharmaceuticals Inc. | 110,996 | 379 |
| * | Kura Oncology Inc. | 18,410 | 377 |
| * | Collegium Pharmaceutical Inc. | 21,694 | 371 |
| Rocket Pharmaceuticals Inc. | 15,532 | 370 | |
| * | Lexicon Pharmaceuticals Inc. | 32,008 | 370 |
| *,^ | ViewRay Inc. | 36,608 | 369 |
| * | GlycoMimetics Inc. | 24,944 | 367 |
| * | Addus HomeCare Corp. | 5,647 | 367 |
| Luminex Corp. | 12,971 | 366 | |
| *,^ | La Jolla Pharmaceutical Co. | 15,816 | 364 |
| *,^ | Synergy Pharmaceuticals Inc. | 185,812 | 362 |
| * | Intra-Cellular Therapies Inc. | 16,497 | 362 |
| *,^ | Sorrento Therapeutics Inc. | 64,570 | 358 |
| * | Cara Therapeutics Inc. | 17,614 | 355 |
| * | Stemline Therapeutics Inc. | 20,771 | 355 |
| * | Aduro Biotech Inc. | 47,737 | 353 |
| * | MediciNova Inc. | 29,020 | 353 |
| * | Voyager Therapeutics Inc. | 15,967 | 347 |
| * | ANI Pharmaceuticals Inc. | 5,916 | 344 |
| * | Cutera Inc. | 9,909 | 337 |
| * | IntriCon Corp. | 4,556 | 337 |
| * | Epizyme Inc. | 28,432 | 336 |
| * | Vericel Corp. | 27,447 | 335 |
| * | GenMark Diagnostics Inc. | 38,714 | 331 |
| * | Inovio Pharmaceuticals Inc. | 61,960 | 326 |
| ^ | Inspire Medical Systems Inc. | 5,814 | 320 |
| *,^ | Abeona Therapeutics Inc. | 20,695 | 319 |
| *,^ | SIGA Technologies Inc. | 38,630 | 318 |
| * | CytoSorbents Corp. | 21,126 | 310 |
| National Research Corp. | 7,595 | 297 | |
| ^ | Eloxx Pharmaceuticals Inc. | 16,003 | 293 |
| * | Solid Biosciences Inc. | 6,763 | 289 |
| * | Rhythm Pharmaceuticals Inc. | 9,093 | 286 |
| *,^ | ZIOPHARM Oncology Inc. | 97,824 | 286 |
| * | PetIQ Inc. | 7,176 | 281 |
| * | Kindred Biosciences Inc. | 18,745 | 279 |
| * | Oxford Immunotec Global plc | 18,953 | 279 |
68
| Vanguard® Russell 2000 Growth Index Fund | |||
| Schedule of Investments | |||
| August 31, 2018 | |||
| Market | |||
| Value | |||
| Shares | ($000) | ||
| *,^ | Apollo Medical Holdings Inc. | 18,256 | 278 |
| * | Avid Bioservices Inc. | 36,734 | 269 |
| * | Akebia Therapeutics Inc. | 31,623 | 260 |
| * | Aclaris Therapeutics Inc. | 16,143 | 257 |
| *,^ | Akcea Therapeutics Inc. | 9,468 | 250 |
| * | Dermira Inc. | 25,988 | 247 |
| * | Catalyst Pharmaceuticals Inc. | 71,998 | 243 |
| * | Accuray Inc. | 60,630 | 243 |
| * | Assertio Therapeutics Inc. | 37,920 | 242 |
| * | Cytokinetics Inc. | 30,418 | 240 |
| Denali Therapeutics Inc. | 12,240 | 240 | |
| * | Nuvectra Corp. | 10,085 | 235 |
| * | CASI Pharmaceuticals Inc. | 33,753 | 235 |
| *,^ | Paratek Pharmaceuticals Inc. | 22,853 | 234 |
| * | BioSpecifics Technologies Corp. | 4,356 | 234 |
| *,^ | Keryx Biopharmaceuticals Inc. | 68,506 | 234 |
| * | Allscripts Healthcare Solutions Inc. | 15,794 | 231 |
| * | NanoString Technologies Inc. | 14,262 | 231 |
| * | Veracyte Inc. | 17,524 | 222 |
| * | Syros Pharmaceuticals Inc. | 17,750 | 218 |
| *,^ | Dova Pharmaceuticals Inc. | 8,535 | 217 |
| * | Kadmon Holdings Inc. | 50,317 | 217 |
| *,^ | Savara Inc. | 18,110 | 213 |
| * | Corbus Pharmaceuticals Holdings Inc. | 36,165 | 212 |
| * | ChemoCentryx Inc. | 15,878 | 209 |
| * | Pieris Pharmaceuticals Inc. | 37,637 | 209 |
| * | Deciphera Pharmaceuticals Inc. | 5,511 | 204 |
| * | Senseonics Holdings Inc. | 48,212 | 197 |
| * | Minerva Neurosciences Inc. | 18,873 | 196 |
| Utah Medical Products Inc. | 2,109 | 192 | |
| * | Marinus Pharmaceuticals Inc. | 26,380 | 188 |
| * | Adamas Pharmaceuticals Inc. | 8,118 | 187 |
| * | Amphastar Pharmaceuticals Inc. | 9,828 | 187 |
| * | American Renal Associates Holdings Inc. | 8,479 | 186 |
| * | Sienna Biopharmaceuticals Inc. | 11,171 | 186 |
| * | Syneos Health Inc. | 3,687 | 184 |
| *,^ | Insys Therapeutics Inc. | 19,432 | 182 |
| *,^ | Vital Therapies Inc. | 22,030 | 177 |
| *,^ | Selecta Biosciences Inc. | 13,046 | 177 |
| * | Endo International plc | 10,249 | 176 |
| OrthoPediatrics Corp. | 5,020 | 175 | |
| Optinose Inc. | 11,643 | 173 | |
| * | Corium International Inc. | 17,469 | 171 |
| * | Athersys Inc. | 78,571 | 162 |
| * | Novavax Inc. | 102,214 | 159 |
| *,^ | Ocular Therapeutix Inc. | 23,572 | 159 |
| * | Castlight Health Inc. Class B | 52,948 | 159 |
| * | Capital Senior Living Corp. | 17,858 | 158 |
| *,^ | Rockwell Medical Inc. | 31,804 | 156 |
| * | Fluidigm Corp. | 19,026 | 151 |
| * | Durect Corp. | 114,717 | 150 |
| * | Zafgen Inc. | 15,393 | 147 |
| * | Enzo Biochem Inc. | 31,904 | 146 |
| Idera Pharmaceuticals Inc. | 13,833 | 145 | |
| * | Palatin Technologies Inc. | 142,190 | 144 |
| * | Bellicum Pharmaceuticals Inc. | 19,810 | 143 |
| * | Endologix Inc. | 60,259 | 139 |
| * | Akorn Inc. | 8,803 | 138 |
| * | Clearside Biomedical Inc. | 20,261 | 138 |
| * | Seres Therapeutics Inc. | 15,659 | 137 |
| * | Civitas Solutions Inc. | 8,391 | 134 |
| * | Cellular Biomedicine Group Inc. | 6,184 | 131 |
| * | AVEO Pharmaceuticals Inc. | 43,327 | 130 |
| * | Aeglea BioTherapeutics Inc. | 11,812 | 129 |
69
| Vanguard® Russell 2000 Growth Index Fund | |||
| Schedule of Investments | |||
| August 31, 2018 | |||
| Market | |||
| Value | |||
| Shares | ($000) | ||
| * | Agenus Inc. | 57,999 | 128 |
| Homology Medicines Inc. | 7,563 | 126 | |
| * | Mersana Therapeutics Inc. | 9,019 | 126 |
| * | Cue Biopharma Inc. | 12,705 | 122 |
| Computer Programs & Systems Inc. | 4,459 | 122 | |
| * | T2 Biosystems Inc. | 18,529 | 121 |
| * | Acorda Therapeutics Inc. | 4,199 | 121 |
| *,^ | Teligent Inc. | 29,831 | 121 |
| ^ | Helius Medical Technologies Inc. Class A | 11,809 | 118 |
| * | Spring Bank Pharmaceuticals Inc. | 8,035 | 114 |
| * | Kala Pharmaceuticals Inc. | 8,433 | 114 |
| * | Tocagen Inc. | 11,564 | 113 |
| *,^ | MannKind Corp. | 101,514 | 112 |
| *,^ | Pulse Biosciences Inc. | 7,704 | 111 |
| * | Neos Therapeutics Inc. | 19,026 | 109 |
| *,^ | Achaogen Inc. | 20,116 | 106 |
| * | Celcuity Inc. | 4,207 | 104 |
| * | Corvus Pharmaceuticals Inc. | 9,098 | 100 |
| *,^ | Organovo Holdings Inc. | 75,968 | 98 |
| * | Aldeyra Therapeutics Inc. | 11,531 | 97 |
| *,^ | Miragen Therapeutics Inc. | 15,486 | 96 |
| ^ | Innovate Biopharmaceuticals Inc. | 13,407 | 95 |
| Odonate Therapeutics Inc. | 4,913 | 94 | |
| * | Quorum Health Corp. | 20,673 | 94 |
| Evolus Inc. | 3,664 | 94 | |
| Allena Pharmaceuticals Inc. | 8,398 | 92 | |
| * | Recro Pharma Inc. | 14,303 | 91 |
| * | Jounce Therapeutics Inc. | 11,395 | 89 |
| * | ADMA Biologics Inc. | 13,699 | 88 |
| *,^ | Cohbar Inc. | 16,158 | 85 |
| * | Aratana Therapeutics Inc. | 15,845 | 84 |
| * | Mustang Bio Inc. | 12,070 | 84 |
| * | GTx Inc. | 3,335 | 80 |
| * | Fennec Pharmaceuticals Inc. | 8,200 | 78 |
| * | Pfenex Inc. | 14,397 | 76 |
| * | Genesis Healthcare Inc. | 40,533 | 72 |
| ^ | UNITY Biotechnology Inc. | 3,650 | 70 |
| * | CTI BioPharma Corp. | 36,986 | 70 |
| * | iRadimed Corp. | 2,528 | 70 |
| * | Tyme Technologies Inc. | 30,429 | 68 |
| * | Calyxt Inc. | 3,732 | 63 |
| * | Arbutus Biopharma Corp. | 6,867 | 63 |
| Quanterix Corp. | 3,681 | 62 | |
| *,^ | Zomedica Pharmaceuticals Corp. | 28,242 | 60 |
| * | BioTime Inc. | 19,459 | 54 |
| Evelo Biosciences Inc. | 3,881 | 52 | |
| * | Albireo Pharma Inc. | 1,505 | 52 |
| Surface Oncology Inc. | 5,261 | 51 | |
| * | Fortress Biotech Inc. | 24,069 | 47 |
| * | Ovid therapeutics Inc. | 7,105 | 47 |
| Arcus Biosciences Inc. | 3,277 | 47 | |
| * | AAC Holdings Inc. | 5,272 | 47 |
| Unum Therapeutics Inc. | 2,562 | 42 | |
| * | Proteostasis Therapeutics Inc. | 15,059 | 41 |
| * | XOMA Corp. | 1,977 | 37 |
| *,^ | Ampio Pharmaceuticals Inc. | 57,484 | 36 |
| * | Syndax Pharmaceuticals Inc. | 4,302 | 33 |
| * | Kiniksa Pharmaceuticals Ltd. Class A | 1,450 | 32 |
| * | RTI Surgical Inc. | 7,013 | 31 |
| * | BioScrip Inc. | 10,286 | 30 |
| Tricida Inc. | 967 | 30 | |
| * | Surgery Partners Inc. | 1,355 | 24 |
| * | Adverum Biotechnologies Inc. | 3,035 | 23 |
| * | Nymox Pharmaceutical Corp. | 8,499 | 22 |
70
| Vanguard® Russell 2000 Growth Index Fund | ||
| Schedule of Investments | ||
| August 31, 2018 | ||
| Market | ||
| Value | ||
| Shares | ($000) | |
| * FONAR Corp. | 736 | 19 |
| Crinetics Pharmaceuticals Inc. | 560 | 17 |
| Avrobio Inc. | 485 | 17 |
| Aptinyx Inc. | 630 | 15 |
| * Aquestive Therapeutics Inc. | 750 | 14 |
| * Immune Design Corp. | 3,139 | 12 |
| * NantHealth Inc. | 4,970 | 11 |
| Magenta Therapeutics Inc. | 713 | 10 |
| Forty Seven Inc. | 665 | 10 |
| Replimune Group Inc. | 476 | 9 |
| * Harvard Bioscience Inc. | 1,336 | 8 |
| * Arsanis Inc. | 3,363 | 8 |
| * Ra Pharmaceuticals Inc. | 589 | 7 |
| Scholar Rock Holding Corp. | 391 | 7 |
| Kezar Life Sciences Inc. | 374 | 6 |
| Xeris Pharmaceuticals Inc. | 250 | 6 |
| * Eidos Therapeutics Inc. | 486 | 6 |
| Liquidia Technologies Inc. | 338 | 5 |
| Neuronetics Inc. | 151 | 5 |
| * resTORbio Inc. | 366 | 4 |
| Constellation Pharmaceuticals Inc. | 376 | 4 |
| * NewLink Genetics Corp. | 1,184 | 4 |
| Translate Bio Inc. | 333 | 4 |
| * Spero Therapeutics Inc. | 278 | 3 |
| * Rubius Therapeutics Inc. | 76 | 2 |
| * Anika Therapeutics Inc. | 8 | — |
| * Conatus Pharmaceuticals Inc. | 48 | — |
| * Protagonist Therapeutics Inc. | 24 | — |
| * Edge Therapeutics Inc. | 238 | — |
| * Prothena Corp. plc | 11 | — |
| * Conformis Inc. | 135 | — |
| * Corindus Vascular Robotics Inc. | 145 | — |
| * Advaxis Inc. | 108 | — |
| * Calithera Biosciences Inc. | 26 | — |
| * Obalon Therapeutics Inc. | 48 | — |
| * Viveve Medical Inc. | 44 | — |
| * Cross Country Healthcare Inc. | 13 | — |
| * Versartis Inc. | 60 | — |
| * Axovant Sciences Ltd. | 41 | — |
| Menlo Therapeutics Inc. | 13 | — |
| Curis Inc. | 55 | — |
| * Strongbridge Biopharma plc | 17 | — |
| * vTv Therapeutics Inc. Class A | 57 | — |
| * Matinas BioPharma Holdings Inc. | 125 | — |
| * Asterias Biotherapeutics Inc. Class A | 37 | — |
| * Genocea Biosciences Inc. | 84 | — |
| * Anavex Life Sciences Corp. | 20 | — |
| Merrimack Pharmaceuticals Inc. | 9 | — |
| Restoration Robotics Inc. | 21 | — |
| * Zynerba Pharmaceuticals Inc. | 6 | — |
| scPharmaceuticals Inc. | 8 | — |
| * Quotient Ltd. | 5 | — |
| * Aileron Therapeutics Inc. | 8 | — |
| * Oncocyte Corp. | 7 | — |
| * VBI Vaccines Inc. | 5 | — |
| 231,196 | ||
| Materials & Processing (7.8%) | ||
| * Trex Co. Inc. | 43,668 | 3,699 |
| * Ingevity Corp. | 31,315 | 3,163 |
| Balchem Corp. | 23,692 | 2,627 |
| * RBC Bearings Inc. | 17,402 | 2,607 |
| PolyOne Corp. | 55,628 | 2,351 |
| Simpson Manufacturing Co. Inc. | 30,579 | 2,348 |
| KapStone Paper and Packaging Corp. | 64,564 | 2,218 |
71
| Vanguard® Russell 2000 Growth Index Fund | |||
| Schedule of Investments | |||
| August 31, 2018 | |||
| Market | |||
| Value | |||
| Shares | ($000) | ||
| Cabot Microelectronics Corp. | 18,809 | 2,120 | |
| * | Summit Materials Inc. Class A | 83,190 | 1,769 |
| Quaker Chemical Corp. | 9,680 | 1,744 | |
| Trinseo SA | 22,261 | 1,717 | |
| HB Fuller Co. | 27,967 | 1,594 | |
| Comfort Systems USA Inc. | 27,130 | 1,557 | |
| Universal Forest Products Inc. | 39,251 | 1,470 | |
| Compass Minerals International Inc. | 23,152 | 1,448 | |
| * | Beacon Roofing Supply Inc. | 37,479 | 1,390 |
| * | Ferro Corp. | 62,558 | 1,373 |
| Worthington Industries Inc. | 29,135 | 1,357 | |
| * | GCP Applied Technologies Inc. | 53,148 | 1,339 |
| Mueller Industries Inc. | 41,687 | 1,333 | |
| * | Builders FirstSource Inc. | 83,101 | 1,298 |
| * | Masonite International Corp. | 19,268 | 1,290 |
| * | JELD-WEN Holding Inc. | 52,074 | 1,266 |
| AAON Inc. | 30,601 | 1,236 | |
| Sensient Technologies Corp. | 16,612 | 1,180 | |
| Boise Cascade Co. | 26,836 | 1,173 | |
| * | Patrick Industries Inc. | 17,602 | 1,127 |
| Advanced Drainage Systems Inc. | 32,766 | 1,027 | |
| * | Continental Building Products Inc. | 27,386 | 1,022 |
| * | Kraton Corp. | 21,077 | 991 |
| Neenah Inc. | 10,234 | 934 | |
| Interface Inc. Class A | 39,179 | 923 | |
| * | PGT Innovations Inc. | 36,093 | 877 |
| Apogee Enterprises Inc. | 17,236 | 848 | |
| Mueller Water Products Inc. Class A | 67,728 | 784 | |
| * | Installed Building Products Inc. | 16,251 | 757 |
| KMG Chemicals Inc. | 9,748 | 755 | |
| US Silica Holdings Inc. | 34,917 | 740 | |
| Kaiser Aluminum Corp. | 6,277 | 688 | |
| * | MRC Global Inc. | 33,170 | 684 |
| Chase Corp. | 5,322 | 660 | |
| Global Brass & Copper Holdings Inc. | 14,949 | 576 | |
| *,^ | US Concrete Inc. | 11,904 | 574 |
| * | GMS Inc. | 22,445 | 558 |
| * | NCI Building Systems Inc. | 31,267 | 528 |
| Tronox Ltd. Class A | 32,039 | 519 | |
| Myers Industries Inc. | 22,612 | 503 | |
| Louisiana-Pacific Corp. | 16,059 | 468 | |
| Insteel Industries Inc. | 12,071 | 463 | |
| DMC Global Inc. | 10,512 | 413 | |
| * | Koppers Holdings Inc. | 10,892 | 386 |
| * | Tahoe Resources Inc. | 107,576 | 370 |
| * | Cleveland-Cliffs Inc. | 35,041 | 352 |
| Kronos Worldwide Inc. | 16,772 | 338 | |
| * | OMNOVA Solutions Inc. | 32,617 | 295 |
| * | AdvanSix Inc. | 8,035 | 272 |
| * | Rexnord Corp. | 8,626 | 250 |
| * | BlueLinx Holdings Inc. | 6,631 | 238 |
| ^ | Omega Flex Inc. | 2,202 | 195 |
| * | Uranium Energy Corp. | 112,937 | 193 |
| Gold Resource Corp. | 33,470 | 173 | |
| Schweitzer-Mauduit International Inc. | 4,094 | 167 | |
| * | ChromaDex Corp. | 27,895 | 126 |
| * | Ryerson Holding Corp. | 11,548 | 120 |
| * | Coeur Mining Inc. | 20,606 | 117 |
| *,^ | Forterra Inc. | 13,675 | 116 |
| Innophos Holdings Inc. | 2,034 | 89 | |
| Greif Inc. Class A | 1,544 | 85 | |
| * | Marrone Bio Innovations Inc. | 37,444 | 78 |
| Hecla Mining Co. | 25,067 | 71 | |
| * | BMC Stock Holdings Inc. | 2,512 | 57 |
72
| Vanguard® Russell 2000 Growth Index Fund | |||
| Schedule of Investments | |||
| August 31, 2018 | |||
| Market | |||
| Value | |||
| Shares | ($000) | ||
| * | Verso Corp. | 1,767 | 56 |
| * | Foundation Building Materials Inc. | 3,219 | 45 |
| * | Lawson Products Inc. | 1,117 | 38 |
| * | Century Aluminum Co. | 2,107 | 27 |
| * | Armstrong Flooring Inc. | 1,321 | 23 |
| * | Amyris Inc. | 2,444 | 22 |
| Griffon Corp. | 1,115 | 20 | |
| Bloom Energy Corp. Class A | 646 | 19 | |
| Greif Inc. Class B | 322 | 18 | |
| * | Shiloh Industries Inc. | 1,547 | 14 |
| United States Lime & Minerals Inc. | 130 | 10 | |
| Valhi Inc. | 1,265 | 4 | |
| Hawkins Inc. | 10 | — | |
| NN Inc. | 9 | — | |
| Stepan Co. | 2 | — | |
| Caesarstone Ltd. | 8 | — | |
| Quanex Building Products Corp. | 9 | — | |
| * | Huttig Building Products Inc. | 28 | — |
| Rayonier Advanced Materials Inc. | 4 | — | |
| 68,470 | |||
| Other (0.0%)2 | |||
| *,§ | Dyax Corp. CVR Exp. 12/31/2019 | 73,258 | 293 |
| *,§ | A Schulman Inc. CVR | 19,599 | 37 |
| *,^,§ | Tobira Therapeutics CVR Exp. 12/31/2028 | 3,989 | 18 |
| * | Sonos Inc. | 619 | 12 |
| * | Arlo Technologies Inc. | 500 | 10 |
| *,§ | Omthera Pharmaceuticals Inc. CVR | 2,001 | 1 |
| *,§ | NewStar Financial Inc. | 2,203 | 1 |
| *,§ | Clinical Data CVR | 367 | — |
| 372 | |||
| Producer Durables (15.4%) | |||
| * | ASGN Inc. | 37,489 | 3,471 |
| Insperity Inc. | 28,248 | 3,386 | |
| Woodward Inc. | 39,613 | 3,191 | |
| MAXIMUS Inc. | 47,865 | 3,183 | |
| * | Proto Labs Inc. | 20,027 | 3,113 |
| Korn/Ferry International | 41,773 | 2,804 | |
| Brink's Co. | 37,065 | 2,784 | |
| John Bean Technologies Corp. | 23,075 | 2,730 | |
| Tetra Tech Inc. | 38,385 | 2,679 | |
| * | Axon Enterprise Inc. | 38,716 | 2,643 |
| EMCOR Group Inc. | 32,210 | 2,580 | |
| MSA Safety Inc. | 25,117 | 2,539 | |
| * | Generac Holdings Inc. | 44,804 | 2,486 |
| Hillenbrand Inc. | 46,397 | 2,373 | |
| Healthcare Services Group Inc. | 54,636 | 2,252 | |
| Applied Industrial Technologies Inc. | 28,270 | 2,178 | |
| * | MasTec Inc. | 47,815 | 2,094 |
| Deluxe Corp. | 35,175 | 2,083 | |
| Exponent Inc. | 38,016 | 1,990 | |
| * | TriNet Group Inc. | 32,168 | 1,900 |
| * | Dycom Industries Inc. | 22,378 | 1,878 |
| * | Aerojet Rocketdyne Holdings Inc. | 51,563 | 1,810 |
| * | Advanced Energy Industries Inc. | 29,061 | 1,731 |
| * | Paylocity Holding Corp. | 21,381 | 1,699 |
| EnerSys | 20,316 | 1,686 | |
| * | Harsco Corp. | 59,563 | 1,683 |
| * | Itron Inc. | 24,951 | 1,657 |
| Albany International Corp. | 21,267 | 1,641 | |
| * | TopBuild Corp. | 26,158 | 1,629 |
| * | ExlService Holdings Inc. | 24,774 | 1,588 |
| Franklin Electric Co. Inc. | 32,357 | 1,582 | |
| * | WageWorks Inc. | 29,418 | 1,574 |
| Covanta Holding Corp. | 87,066 | 1,537 | |
73
| Vanguard® Russell 2000 Growth Index Fund | ||
| Schedule of Investments | ||
| August 31, 2018 | ||
| Market | ||
| Value | ||
| Shares | ($000) | |
| Kennametal Inc. | 37,151 | 1,517 |
| * Saia Inc. | 18,867 | 1,495 |
| Herman Miller Inc. | 37,765 | 1,446 |
| HNI Corp. | 32,100 | 1,416 |
| Forward Air Corp. | 21,654 | 1,391 |
| * Aerovironment Inc. | 15,592 | 1,371 |
| * Advanced Disposal Services Inc. | 50,640 | 1,351 |
| Kaman Corp. | 20,292 | 1,323 |
| Allegiant Travel Co. Class A | 9,521 | 1,297 |
| Raven Industries Inc. | 26,512 | 1,283 |
| Mobile Mini Inc. | 29,130 | 1,250 |
| US Ecology Inc. | 16,186 | 1,178 |
| Granite Construction Inc. | 25,772 | 1,177 |
| Badger Meter Inc. | 21,027 | 1,155 |
| * Evoqua Water Technologies Corp. | 55,634 | 1,078 |
| Federal Signal Corp. | 41,395 | 1,078 |
| Sun Hydraulics Corp. | 21,209 | 1,068 |
| Cubic Corp. | 13,809 | 1,045 |
| McGrath RentCorp | 17,730 | 1,028 |
| Tennant Co. | 13,141 | 1,006 |
| Watts Water Technologies Inc. Class A | 11,603 | 957 |
| * Herc Holdings Inc. | 17,777 | 935 |
| * Air Transport Services Group Inc. | 43,348 | 882 |
| * SPX Corp. | 25,920 | 881 |
| Kadant Inc. | 8,087 | 817 |
| * Hub Group Inc. Class A | 15,400 | 814 |
| Standex International Corp. | 7,425 | 801 |
| * FARO Technologies Inc. | 11,684 | 797 |
| * Atkore International Group Inc. | 28,991 | 794 |
| Knoll Inc. | 33,635 | 792 |
| Lindsay Corp. | 7,870 | 754 |
| Douglas Dynamics Inc. | 16,282 | 746 |
| * Chart Industries Inc. | 9,808 | 741 |
| * Vicor Corp. | 11,591 | 724 |
| Kforce Inc. | 16,931 | 712 |
| Heartland Express Inc. | 34,419 | 704 |
| * Astronics Corp. | 15,541 | 676 |
| * CSW Industrials Inc. | 11,647 | 652 |
| * Echo Global Logistics Inc. | 19,484 | 647 |
| Actuant Corp. Class A | 21,941 | 646 |
| H&E Equipment Services Inc. | 18,230 | 635 |
| Heidrick & Struggles International Inc. | 13,817 | 611 |
| Alamo Group Inc. | 6,189 | 590 |
| Werner Enterprises Inc. | 15,683 | 581 |
| * NV5 Global Inc. | 6,140 | 543 |
| Matson Inc. | 14,170 | 529 |
| Primoris Services Corp. | 21,075 | 528 |
| Pitney Bowes Inc. | 69,306 | 503 |
| Mesa Laboratories Inc. | 2,437 | 489 |
| Rush Enterprises Inc. Class A | 10,038 | 431 |
| Columbus McKinnon Corp. | 10,013 | 426 |
| ^ Altra Industrial Motion Corp. | 10,805 | 422 |
| * DXP Enterprises Inc. | 9,079 | 417 |
| * MYR Group Inc. | 11,910 | 414 |
| Kimball International Inc. Class B | 23,180 | 405 |
| Astec Industries Inc. | 8,152 | 397 |
| Barrett Business Services Inc. | 5,232 | 393 |
| Forrester Research Inc. | 7,601 | 374 |
| Spartan Motors Inc. | 25,278 | 365 |
| * OSI Systems Inc. | 4,675 | 364 |
| Hackett Group Inc. | 16,342 | 335 |
| AZZ Inc. | 6,086 | 327 |
| * Kratos Defense & Security Solutions Inc. | 24,266 | 324 |
| Barnes Group Inc. | 4,746 | 323 |
74
| Vanguard® Russell 2000 Growth Index Fund | |||
| Schedule of Investments | |||
| August 31, 2018 | |||
| Market | |||
| Value | |||
| Shares | ($000) | ||
| *,^ | Plug Power Inc. | 160,418 | 316 |
| Marten Transport Ltd. | 13,343 | 294 | |
| * | Willscot Corp. Class A | 15,991 | 279 |
| TTEC Holdings Inc. | 10,536 | 276 | |
| UniFirst Corp. | 1,483 | 275 | |
| *,^ | CryoPort Inc. | 18,582 | 264 |
| * | Control4 Corp. | 8,073 | 262 |
| * | Energy Recovery Inc. | 26,831 | 260 |
| Allied Motion Technologies Inc. | 5,245 | 256 | |
| Systemax Inc. | 6,961 | 254 | |
| * | Vishay Precision Group Inc. | 5,751 | 249 |
| * | Mistras Group Inc. | 10,255 | 234 |
| Universal Logistics Holdings Inc. | 6,210 | 227 | |
| *,^ | Energous Corp. | 17,377 | 223 |
| * | Commercial Vehicle Group Inc. | 21,938 | 214 |
| Wabash National Corp. | 11,022 | 201 | |
| * | HC2 Holdings Inc. | 30,876 | 194 |
| * | SP Plus Corp. | 4,780 | 186 |
| * | Thermon Group Holdings Inc. | 6,709 | 180 |
| * | ServiceSource International Inc. | 56,108 | 179 |
| * | Willdan Group Inc. | 5,702 | 179 |
| * | CAI International Inc. | 6,119 | 165 |
| * | Exela Technologies Inc. | 27,298 | 163 |
| Moog Inc. Class A | 2,038 | 161 | |
| * | Casella Waste Systems Inc. Class A | 5,432 | 154 |
| * | PRGX Global Inc. | 14,942 | 143 |
| Advanced Emissions Solutions Inc. | 12,200 | 139 | |
| * | Wesco Aircraft Holdings Inc. | 10,728 | 130 |
| ConvergeOne Holdings Inc. | 14,202 | 130 | |
| * | Napco Security Technologies Inc. | 8,593 | 130 |
| ^ | EnviroStar Inc. | 2,715 | 128 |
| BG Staffing Inc. | 5,007 | 122 | |
| * | Blue Bird Corp. | 5,311 | 122 |
| ICF International Inc. | 1,477 | 121 | |
| * | USA Truck Inc. | 5,338 | 117 |
| * | Milacron Holdings Corp. | 5,380 | 114 |
| Resources Connection Inc. | 6,861 | 114 | |
| ArcBest Corp. | 2,307 | 111 | |
| EnPro Industries Inc. | 1,464 | 110 | |
| Gorman-Rupp Co. | 2,724 | 100 | |
| * | PFSweb Inc. | 11,020 | 95 |
| * | Modine Manufacturing Co. | 5,360 | 90 |
| CRA International Inc. | 1,572 | 90 | |
| * | Hill International Inc. | 20,963 | 89 |
| * | Manitex International Inc. | 8,275 | 88 |
| * | Navistar International Corp. | 1,965 | 86 |
| * | Orion Group Holdings Inc. | 9,316 | 80 |
| Rush Enterprises Inc. Class B | 1,802 | 80 | |
| * | Lydall Inc. | 1,829 | 78 |
| * | Information Services Group Inc. | 14,770 | 73 |
| BrightView Holdings Inc. | 4,107 | 73 | |
| * | PAM Transportation Services Inc. | 1,122 | 65 |
| REV Group Inc. | 3,843 | 65 | |
| * | Sterling Construction Co. Inc. | 4,439 | 65 |
| Marlin Business Services Corp. | 1,979 | 57 | |
| * | YRC Worldwide Inc. | 5,044 | 48 |
| * | TrueBlue Inc. | 1,631 | 48 |
| * | General Finance Corp. | 3,148 | 43 |
| * | Team Inc. | 1,211 | 28 |
| * | InnerWorkings Inc. | 2,365 | 18 |
| Miller Industries Inc. | 627 | 18 | |
| VSE Corp. | 462 | 18 | |
| * | Gencor Industries Inc. | 1,006 | 13 |
| * | Twin Disc Inc. | 499 | 13 |
75
| Vanguard® Russell 2000 Growth Index Fund | ||
| Schedule of Investments | ||
| August 31, 2018 | ||
| Market | ||
| Value | ||
| Shares | ($000) | |
| * Heritage-Crystal Clean Inc. | 547 | 13 |
| Graham Corp. | 412 | 11 |
| * Willis Lease Finance Corp. | 90 | 3 |
| ABM Industries Inc. | 18 | 1 |
| * Electronics For Imaging Inc. | 14 | — |
| * ExOne Co. | 45 | — |
| * StarTek Inc. | 57 | — |
| CIRCOR International Inc. | 6 | — |
| RR Donnelley & Sons Co. | 51 | — |
| * Hudson Technologies Inc. | 79 | — |
| * Vectrus Inc. | 4 | — |
| Quad/Graphics Inc. | 5 | — |
| * Aqua Metals Inc. | 32 | — |
| Multi-Color Corp. | 1 | — |
| * Radiant Logistics Inc. | 10 | — |
| 134,230 | ||
| Technology (15.9%) | ||
| * Integrated Device Technology Inc. | 98,092 | 4,168 |
| * HubSpot Inc. | 26,744 | 3,843 |
| Blackbaud Inc. | 35,675 | 3,731 |
| Entegris Inc. | 104,976 | 3,559 |
| * New Relic Inc. | 32,791 | 3,370 |
| * Lumentum Holdings Inc. | 46,322 | 3,145 |
| * Silicon Laboratories Inc. | 31,627 | 3,099 |
| Science Applications International Corp. | 31,315 | 2,825 |
| * Yelp Inc. Class A | 59,757 | 2,816 |
| * Coupa Software Inc. | 39,183 | 2,810 |
| * Ellie Mae Inc. | 25,283 | 2,664 |
| * Semtech Corp. | 44,069 | 2,633 |
| * Box Inc. | 93,859 | 2,305 |
| * ACI Worldwide Inc. | 80,307 | 2,282 |
| * Qualys Inc. | 24,964 | 2,273 |
| * II-VI Inc. | 45,540 | 2,266 |
| * iRobot Corp. | 19,959 | 2,265 |
| * Cornerstone OnDemand Inc. | 39,643 | 2,242 |
| * Envestnet Inc. | 32,669 | 2,065 |
| Brooks Automation Inc. | 51,438 | 2,027 |
| * Five9 Inc. | 42,028 | 2,019 |
| * CommVault Systems Inc. | 28,978 | 2,018 |
| * Bottomline Technologies DE Inc. | 29,617 | 1,954 |
| * Novanta Inc. | 24,169 | 1,851 |
| * Cargurus Inc. | 36,256 | 1,788 |
| * Q2 Holdings Inc. | 27,091 | 1,688 |
| Plantronics Inc. | 24,393 | 1,640 |
| Power Integrations Inc. | 21,251 | 1,559 |
| * Varonis Systems Inc. | 20,604 | 1,523 |
| * Yext Inc. | 60,113 | 1,494 |
| Ebix Inc. | 17,849 | 1,422 |
| * Groupon Inc. Class A | 326,673 | 1,395 |
| Progress Software Corp. | 33,484 | 1,371 |
| * Acxiom Corp. | 28,907 | 1,321 |
| * Alarm.com Holdings Inc. | 22,722 | 1,279 |
| * Blackline Inc. | 24,013 | 1,267 |
| * SPS Commerce Inc. | 12,449 | 1,223 |
| * Imperva Inc. | 25,640 | 1,209 |
| * Virtusa Corp. | 20,688 | 1,205 |
| * SailPoint Technologies Holding Inc. | 38,627 | 1,195 |
| * Alteryx Inc. Class A | 20,550 | 1,193 |
| * Inphi Corp. | 32,071 | 1,189 |
| * MINDBODY Inc. Class A | 31,567 | 1,171 |
| * Everbridge Inc. | 19,432 | 1,170 |
| * Cloudera Inc. | 76,106 | 1,142 |
| * Hortonworks Inc. | 50,693 | 1,132 |
| * LivePerson Inc. | 41,514 | 1,117 |
76
| Vanguard® Russell 2000 Growth Index Fund | |||
| Schedule of Investments | |||
| August 31, 2018 | |||
| Market | |||
| Value | |||
| Shares | ($000) | ||
| * | GTT Communications Inc. | 25,708 | 1,107 |
| * | ePlus Inc. | 10,054 | 1,042 |
| * | Rapid7 Inc. | 26,470 | 1,010 |
| * | Rogers Corp. | 7,095 | 980 |
| * | Syntel Inc. | 23,980 | 977 |
| * | Mercury Systems Inc. | 17,710 | 965 |
| * | Apptio Inc. Class A | 24,842 | 964 |
| InterDigital Inc. | 11,241 | 929 | |
| * | Appfolio Inc. | 10,824 | 924 |
| * | Blucora Inc. | 25,053 | 907 |
| * | MaxLinear Inc. | 45,864 | 884 |
| * | TrueCar Inc. | 67,502 | 868 |
| * | Carbonite Inc. | 19,739 | 820 |
| NIC Inc. | 47,248 | 794 | |
| Altair Engineering Inc. Class A | 18,331 | 766 | |
| * | Web.com Group Inc. | 27,287 | 763 |
| * | ForeScout Technologies Inc. | 21,137 | 762 |
| CSG Systems International Inc. | 20,296 | 758 | |
| * | Workiva Inc. | 20,507 | 756 |
| * | PROS Holdings Inc. | 20,364 | 751 |
| * | Nanometrics Inc. | 16,604 | 727 |
| * | Vocera Communications Inc. | 21,744 | 721 |
| * | Lattice Semiconductor Corp. | 86,522 | 709 |
| * | Viavi Solutions Inc. | 59,634 | 668 |
| *,^ | Benefitfocus Inc. | 14,618 | 645 |
| * | Rudolph Technologies Inc. | 23,181 | 644 |
| * | Glu Mobile Inc. | 81,207 | 625 |
| * | USA Technologies Inc. | 38,091 | 619 |
| * | CalAmp Corp. | 25,763 | 605 |
| *,^ | Inovalon Holdings Inc. Class A | 50,727 | 558 |
| * | Extreme Networks Inc. | 85,255 | 535 |
| * | Insight Enterprises Inc. | 9,688 | 534 |
| * | Cision Ltd. | 28,914 | 524 |
| * | Endurance International Group Holdings Inc. | 51,882 | 501 |
| * | Xcerra Corp. | 34,213 | 495 |
| Methode Electronics Inc. | 12,384 | 491 | |
| *,^ | Ichor Holdings Ltd. | 18,765 | 487 |
| * | Unisys Corp. | 25,889 | 482 |
| QAD Inc. Class A | 7,604 | 461 | |
| * | CEVA Inc. | 15,022 | 460 |
| * | Quantenna Communications Inc. | 24,236 | 443 |
| ^ | Zscaler Inc. | 10,319 | 442 |
| * | Applied Optoelectronics Inc. | 10,600 | 438 |
| * | OneSpan Inc. | 23,316 | 437 |
| * | Upland Software Inc. | 11,672 | 434 |
| * | Loral Space & Communications Inc. | 9,433 | 418 |
| * | Tucows Inc. Class A | 7,027 | 411 |
| * | Limelight Networks Inc. | 79,614 | 404 |
| * | PlayAGS Inc. | 11,896 | 381 |
| NVE Corp. | 3,302 | 375 | |
| * | Ambarella Inc. | 9,764 | 374 |
| * | NETGEAR Inc. | 5,181 | 367 |
| * | TechTarget Inc. | 15,018 | 360 |
| * | Model N Inc. | 18,891 | 321 |
| * | ShotSpotter Inc. | 5,383 | 307 |
| *,^ | Impinj Inc. | 13,873 | 298 |
| * | Evolent Health Inc. Class A | 11,643 | 297 |
| Monotype Imaging Holdings Inc. | 14,379 | 296 | |
| * | Diodes Inc. | 7,392 | 280 |
| * | Perficient Inc. | 9,621 | 276 |
| * | Immersion Corp. | 22,549 | 262 |
| * | A10 Networks Inc. | 36,312 | 253 |
| * | MobileIron Inc. | 51,505 | 252 |
| * | SMART Global Holdings Inc. | 7,413 | 245 |
77
| Vanguard® Russell 2000 Growth Index Fund | |||
| Schedule of Investments | |||
| August 31, 2018 | |||
| Market | |||
| Value | |||
| Shares | ($000) | ||
| * | SendGrid Inc. | 6,513 | 236 |
| * | ChannelAdvisor Corp. | 17,959 | 234 |
| *,^ | Digimarc Corp. | 7,921 | 234 |
| * | Ooma Inc. | 13,255 | 212 |
| * | Zix Corp. | 37,966 | 211 |
| * | Brightcove Inc. | 25,357 | 208 |
| American Software Inc. Class A | 11,552 | 208 | |
| Internap Corp. | 14,565 | 196 | |
| *,^ | Aquantia Corp. | 15,357 | 194 |
| *,^ | PolarityTE Inc. | 6,284 | 180 |
| Park Electrochemical Corp. | 8,175 | 175 | |
| * | PAR Technology Corp. | 6,779 | 174 |
| Simulations Plus Inc. | 8,338 | 174 | |
| * | Mitek Systems Inc. | 23,750 | 172 |
| * | eGain Corp. | 10,949 | 157 |
| ^ | nLight Inc. | 5,054 | 156 |
| Reis Inc. | 6,583 | 152 | |
| ^ | Carbon Black Inc. | 5,864 | 149 |
| * | Amber Road Inc. | 16,987 | 148 |
| * | Casa Systems Inc. | 9,585 | 141 |
| *,^ | VirnetX Holding Corp. | 39,157 | 131 |
| ^ | Turtle Beach Corp. | 5,698 | 131 |
| * | Calix Inc. | 16,640 | 130 |
| Xperi Corp. | 7,531 | 118 | |
| * | Acacia Communications Inc. | 2,802 | 114 |
| * | Synaptics Inc. | 2,364 | 114 |
| * | Cray Inc. | 5,016 | 109 |
| * | Asure Software Inc. | 7,183 | 108 |
| * | Cirrus Logic Inc. | 2,367 | 104 |
| * | Aerohive Networks Inc. | 24,331 | 103 |
| * | Leaf Group Ltd. | 8,919 | 99 |
| * | Iteris Inc. | 18,484 | 95 |
| * | Kopin Corp. | 40,443 | 94 |
| Cohu Inc. | 3,376 | 89 | |
| * | Agilysys Inc. | 5,278 | 85 |
| * | Park City Group Inc. | 9,837 | 83 |
| ACM Research Inc. Class A | 5,876 | 83 | |
| * | Avid Technology Inc. | 13,831 | 82 |
| * | 3D Systems Corp. | 3,971 | 81 |
| * | Adesto Technologies Corp. | 13,125 | 79 |
| * | Clearfield Inc. | 5,417 | 74 |
| * | Remark Holdings Inc. | 19,772 | 70 |
| * | FormFactor Inc. | 4,257 | 66 |
| * | Telenav Inc. | 10,984 | 62 |
| * | Veritone Inc. | 5,181 | 54 |
| * | Telaria Inc. | 10,746 | 44 |
| * | Sparton Corp. | 3,379 | 43 |
| * | Travelzoo | 3,472 | 43 |
| * | Pluralsight Inc. Class A | 1,067 | 36 |
| * | Rimini Street Inc. | 7,087 | 36 |
| * | Majesco | 4,509 | 32 |
| Domo Inc. | 1,200 | 28 | |
| * | PDF Solutions Inc. | 1,747 | 15 |
| * | Tenable Holdings Inc. | 364 | 12 |
| * | I3 Verticals Inc. Class A | 501 | 9 |
| * | SecureWorks Corp. Class A | 660 | 9 |
| EverQuote Inc. Class A | 467 | 6 | |
| * | Finisar Corp. | 119 | 2 |
| * | Oclaro Inc. | 228 | 2 |
| * | EMCORE Corp. | 280 | 1 |
| * | Proofpoint Inc. | 11 | 1 |
| * | Paycom Software Inc. | 8 | 1 |
| * | TTM Technologies Inc. | 29 | 1 |
| * | Stratasys Ltd. | 21 | 1 |
78
| Vanguard® Russell 2000 Growth Index Fund | ||
| Schedule of Investments | ||
| August 31, 2018 | ||
| Market | ||
| Value | ||
| Shares | ($000) | |
| * Tech Data Corp. | 7 | 1 |
| * Intevac Inc. | 87 | 1 |
| Daktronics Inc. | 59 | 1 |
| * CyberOptics Corp. | 21 | 1 |
| * Pixelworks Inc. | 74 | — |
| SYNNEX Corp. | 4 | — |
| * Alpha & Omega Semiconductor Ltd. | 27 | — |
| * Fabrinet | 8 | — |
| * PCM Inc. | 15 | — |
| Bel Fuse Inc. Class B | 11 | — |
| * Quantum Corp. | 129 | — |
| * KEMET Corp. | 10 | — |
| * Ultra Clean Holdings Inc. | 16 | — |
| * MicroVision Inc. | 212 | — |
| * Akoustis Technologies Inc. | 27 | — |
| * Meet Group Inc. | 41 | — |
| * Axcelis Technologies Inc. | 10 | — |
| Diebold Nixdorf Inc. | 41 | — |
| * MACOM Technology Solutions Holdings Inc. | 7 | — |
| * Global Eagle Entertainment Inc. | 31 | — |
| * Nutanix Inc. | 1 | — |
| 138,907 | ||
| Utilities (1.7%) | ||
| j2 Global Inc. | 34,520 | 2,850 |
| * Vonage Holdings Corp. | 162,967 | 2,311 |
| Cogent Communications Holdings Inc. | 31,051 | 1,699 |
| * 8x8 Inc. | 67,369 | 1,529 |
| Shenandoah Telecommunications Co. | 34,639 | 1,321 |
| American States Water Co. | 18,331 | 1,108 |
| * Boingo Wireless Inc. | 29,795 | 986 |
| * ORBCOMM Inc. | 54,006 | 583 |
| SJW Group | 8,259 | 478 |
| Middlesex Water Co. | 10,116 | 463 |
| South Jersey Industries Inc. | 9,244 | 307 |
| York Water Co. | 8,651 | 260 |
| New Jersey Resources Corp. | 4,666 | 213 |
| * Gogo Inc. | 41,860 | 188 |
| California Water Service Group | 2,889 | 119 |
| Chesapeake Utilities Corp. | 1,262 | 109 |
| Global Water Resources Inc. | 7,988 | 79 |
| Spark Energy Inc. Class A | 8,190 | 72 |
| * Pure Cycle Corp. | 6,338 | 71 |
| Fusion Connect Inc. | 1,972 | 7 |
| Consolidated Communications Holdings Inc. | 43 | 1 |
| * Atlantic Power Corp. | 178 | — |
| IDT Corp. Class B | 53 | — |
| * Globalstar Inc. | 222 | — |
| 14,754 | ||
| Total Common Stocks (Cost $683,188) | 871,562 | |
79
| Vanguard® Russell 2000 Growth Index Fund | ||||
| Schedule of Investments | ||||
| August 31, 2018 | ||||
| Market | ||||
| Value | ||||
| Coupon | Shares | ($000 | ||
| Temporary Cash Investments (2.0%)1 | ||||
| Money Market Fund (2.0%) | ||||
| 3,4 Vanguard Market Liquidity Fund | 2.153% | 170,119 | 17,015 | |
| Face | ||||
| Maturity | Amount | |||
| Date | ($000) | |||
| U.S. Government and Agency Obligations (0.0%) | ||||
| United States Treasury Bill | 1.916% | 9/6/18 | 100 | 100 |
| 5 United States Treasury Bill | 2.078% | 11/15/18 | 150 | 150 |
| 250 | ||||
| Total Temporary Cash Investments (Cost $17,261) | 17,265 | |||
| Total Investments (101.8%) (Cost $700,449) | 888,827 | |||
| Other Assets and Liabilities—Net (-1.8%)4 | (15,305) | |||
| Net Assets (100%) | 873,522 | |||
* Non-income-producing security.
^ Includes partial security positions on loan to broker-dealers. The total value of securities on loan is $12,608,000.
§ Security value determined using significant unobservable inputs.
1 The fund invests a portion of its cash reserves in equity markets through the use of index futures contracts. After giving effect to futures
investments, the fund's effective common stock and temporary cash investment positions represent 100.2% and 1.6%, respectively, of net
assets.
2 “Other” represents securities that are not classified by the fund’s benchmark index.
3 Affiliated money market fund available only to Vanguard funds and certain trusts and accounts managed by Vanguard. Rate shown is the 7-day
yield.
4 Includes $13,514,000 of collateral received for securities on loan.
5 Securities with a value of $149,000 have been segregated as initial margin for open futures contracts.
CVR—Contingent Value Rights.
REIT—Real Estate Investment Trust.
80
This page intentionally left blank.
© 2018 The Vanguard Group, Inc.
All rights reserved.
Vanguard Marketing Corporation, Distributor.
SNA18510 102018
| Vanguard® Russell 3000 Index Fund | ||
| Schedule of Investments | ||
| August 31, 2018 | ||
| Market | ||
| Value | ||
| Shares | ($000) | |
| Common Stocks (99.7%)1 | ||
| Consumer Discretionary (14.3%) | ||
| * Amazon.com Inc. | 17,536 | 35,295 |
| Home Depot Inc. | 49,648 | 9,968 |
| Comcast Corp. Class A | 197,174 | 7,293 |
| Walt Disney Co. | 64,328 | 7,206 |
| * Netflix Inc. | 17,990 | 6,615 |
| Walmart Inc. | 61,511 | 5,896 |
| McDonald's Corp. | 33,944 | 5,507 |
| NIKE Inc. Class B | 54,222 | 4,457 |
| Costco Wholesale Corp. | 18,854 | 4,395 |
| * Booking Holdings Inc. | 2,079 | 4,057 |
| Lowe's Cos. Inc. | 35,650 | 3,877 |
| Starbucks Corp. | 58,120 | 3,107 |
| TJX Cos. Inc. | 27,012 | 2,971 |
| * Charter Communications Inc. Class A | 7,725 | 2,398 |
| Twenty-First Century Fox Inc. Class A | 45,120 | 2,048 |
| General Motors Co. | 56,403 | 2,033 |
| Target Corp. | 23,052 | 2,017 |
| * Tesla Inc. | 5,853 | 1,766 |
| Marriott International Inc. Class A | 12,621 | 1,596 |
| Ford Motor Co. | 167,985 | 1,592 |
| Ross Stores Inc. | 15,889 | 1,522 |
| * eBay Inc. | 40,312 | 1,395 |
| Estee Lauder Cos. Inc. Class A | 9,418 | 1,320 |
| VF Corp. | 13,989 | 1,289 |
| Dollar General Corp. | 11,556 | 1,245 |
| Yum! Brands Inc. | 14,047 | 1,221 |
| * O'Reilly Automotive Inc. | 3,452 | 1,158 |
| Carnival Corp. | 17,513 | 1,077 |
| Las Vegas Sands Corp. | 15,355 | 1,005 |
| Aptiv plc | 11,335 | 998 |
| Twenty-First Century Fox Inc. | 20,960 | 941 |
| Hilton Worldwide Holdings Inc. | 12,002 | 932 |
| Royal Caribbean Cruises Ltd. | 7,263 | 890 |
| * AutoZone Inc. | 1,149 | 881 |
| Best Buy Co. Inc. | 10,406 | 828 |
| * Dollar Tree Inc. | 10,086 | 812 |
| CBS Corp. Class B | 14,212 | 754 |
| Expedia Group Inc. | 5,228 | 682 |
| Omnicom Group Inc. | 9,621 | 667 |
| * Lululemon Athletica Inc. | 4,282 | 663 |
| Wynn Resorts Ltd. | 4,392 | 652 |
| Tiffany & Co. | 5,305 | 651 |
| MGM Resorts International | 22,387 | 649 |
| DR Horton Inc. | 14,523 | 646 |
| * Ulta Beauty Inc. | 2,482 | 645 |
| Tapestry Inc. | 12,452 | 631 |
| Yum China Holdings Inc. | 16,097 | 623 |
| Darden Restaurants Inc. | 5,308 | 616 |
| Genuine Parts Co. | 6,079 | 607 |
| * CarMax Inc. | 7,587 | 592 |
| Lennar Corp. Class A | 11,044 | 571 |
| Kohl's Corp. | 7,207 | 570 |
| Domino's Pizza Inc. | 1,806 | 539 |
| Vail Resorts Inc. | 1,724 | 514 |
| Advance Auto Parts Inc. | 3,082 | 506 |
| * Mohawk Industries Inc. | 2,627 | 503 |
| * Chipotle Mexican Grill Inc. Class A | 1,049 | 498 |
| Hasbro Inc. | 4,955 | 492 |
| Macy's Inc. | 13,347 | 488 |
| * Burlington Stores Inc. | 2,857 | 480 |
| * Norwegian Cruise Line Holdings Ltd. | 8,792 | 471 |
1
| Vanguard® Russell 3000 Index Fund | ||
| Schedule of Investments | ||
| August 31, 2018 | ||
| Market | ||
| Value | ||
| Shares | ($000) | |
| Tractor Supply Co. | 5,321 | 470 |
| PVH Corp. | 3,254 | 466 |
| Lear Corp. | 2,822 | 458 |
| * LKQ Corp. | 13,100 | 452 |
| * Michael Kors Holdings Ltd. | 6,144 | 446 |
| Viacom Inc. Class B | 14,599 | 427 |
| Aramark | 10,396 | 427 |
| * Liberty Media Corp-Liberty SiriusXM Class C | 8,894 | 418 |
| Newell Brands Inc. | 19,146 | 416 |
| BorgWarner Inc. | 9,046 | 396 |
| * Qurate Retail Group Inc. QVC Group Class A | 18,982 | 395 |
| Nielsen Holdings plc | 15,138 | 394 |
| Sirius XM Holdings Inc. | 55,263 | 392 |
| Interpublic Group of Cos. Inc. | 16,398 | 383 |
| Whirlpool Corp. | 2,974 | 372 |
| * Discovery Communications Inc. | 14,295 | 367 |
| KAR Auction Services Inc. | 5,827 | 365 |
| * NVR Inc. | 136 | 363 |
| Garmin Ltd. | 5,197 | 354 |
| * ServiceMaster Global Holdings Inc. | 5,697 | 343 |
| Fortune Brands Home & Security Inc. | 6,411 | 340 |
| * DISH Network Corp. Class A | 9,389 | 332 |
| * Liberty Broadband Corp. | 4,071 | 330 |
| * Wayfair Inc. | 2,426 | 328 |
| Service Corp. International | 7,615 | 320 |
| PulteGroup Inc. | 11,415 | 319 |
| Nordstrom Inc. | 5,073 | 319 |
| Ralph Lauren Corp. Class A | 2,314 | 307 |
| Harley-Davidson Inc. | 7,134 | 304 |
| * Live Nation Entertainment Inc. | 5,888 | 293 |
| * Liberty Media Corp-Liberty Formula One | 7,912 | 292 |
| * WABCO Holdings Inc. | 2,370 | 292 |
| * Bright Horizons Family Solutions Inc. | 2,376 | 284 |
| Pool Corp. | 1,721 | 283 |
| Gentex Corp. | 12,051 | 282 |
| Polaris Industries Inc. | 2,575 | 279 |
| * Five Below Inc. | 2,383 | 278 |
| Hanesbrands Inc. | 15,747 | 276 |
| Gap Inc. | 9,084 | 276 |
| L Brands Inc. | 10,199 | 270 |
| * Caesars Entertainment Corp. | 26,077 | 266 |
| News Corp. Class A | 20,265 | 265 |
| Dunkin' Brands Group Inc. | 3,538 | 258 |
| Leggett & Platt Inc. | 5,634 | 256 |
| Foot Locker Inc. | 5,180 | 255 |
| Williams-Sonoma Inc. | 3,532 | 248 |
| H&R Block Inc. | 9,037 | 245 |
| Coty Inc. Class A | 19,753 | 244 |
| * TripAdvisor Inc. | 4,484 | 244 |
| * Etsy Inc. | 4,970 | 242 |
| Brunswick Corp. | 3,637 | 242 |
| * Grand Canyon Education Inc. | 2,011 | 240 |
| Goodyear Tire & Rubber Co. | 10,521 | 239 |
| Wyndham Hotels & Resorts Inc. | 4,188 | 238 |
| * Mattel Inc. | 14,959 | 231 |
| * Madison Square Garden Co. Class A | 762 | 230 |
| Toll Brothers Inc. | 6,173 | 224 |
| * 2U Inc. | 2,447 | 219 |
| Six Flags Entertainment Corp. | 3,174 | 214 |
| * GCI Liberty Inc. - Class A | 4,299 | 211 |
| Carter's Inc. | 1,958 | 207 |
| * Planet Fitness Inc. Class A | 3,937 | 202 |
| Texas Roadhouse Inc. Class A | 2,932 | 202 |
| Thor Industries Inc. | 2,098 | 200 |
2
| Vanguard® Russell 3000 Index Fund | |||
| Schedule of Investments | |||
| August 31, 2018 | |||
| Market | |||
| Value | |||
| Shares | ($000) | ||
| * | Trade Desk Inc. Class A | 1,396 | 198 |
| *,^ | Discovery Communications Inc. Class A | 7,112 | 198 |
| * | Stamps.com Inc. | 745 | 185 |
| * | Under Armour Inc. | 9,660 | 183 |
| American Eagle Outfitters Inc. | 6,888 | 179 | |
| Adient plc | 4,006 | 173 | |
| Cinemark Holdings Inc. | 4,587 | 171 | |
| Signet Jewelers Ltd. | 2,633 | 169 | |
| * | Ollie's Bargain Outlet Holdings Inc. | 1,914 | 167 |
| World Wrestling Entertainment Inc. Class A | 1,895 | 166 | |
| * | Deckers Outdoor Corp. | 1,355 | 165 |
| * | SiteOne Landscape Supply Inc. | 1,807 | 163 |
| ILG Inc. | 4,784 | 163 | |
| * | Skechers U.S.A. Inc. Class A | 5,488 | 162 |
| Extended Stay America Inc. | 7,924 | 160 | |
| Wolverine World Wide Inc. | 4,032 | 158 | |
| Nexstar Media Group Inc. Class A | 1,902 | 156 | |
| * | Urban Outfitters Inc. | 3,292 | 153 |
| Aaron's Inc. | 3,054 | 152 | |
| Hyatt Hotels Corp. Class A | 1,929 | 149 | |
| * | Helen of Troy Ltd. | 1,227 | 146 |
| Wendy's Co. | 8,249 | 146 | |
| * | Hilton Grand Vacations Inc. | 4,454 | 145 |
| * | Chegg Inc. | 4,469 | 145 |
| * | Eldorado Resorts Inc. | 3,002 | 144 |
| * | Visteon Corp. | 1,286 | 142 |
| Cable One Inc. | 165 | 138 | |
| Lions Gate Entertainment Corp. Class B | 6,154 | 138 | |
| Steven Madden Ltd. | 2,344 | 136 | |
| * | Under Armour Inc. Class A | 6,561 | 134 |
| Churchill Downs Inc. | 472 | 133 | |
| Strategic Education Inc. | 952 | 132 | |
| * | RH | 829 | 132 |
| Tribune Media Co. Class A | 3,540 | 131 | |
| * | Cimpress NV | 928 | 130 |
| John Wiley & Sons Inc. Class A | 1,981 | 128 | |
| * | AMC Networks Inc. Class A | 2,016 | 127 |
| Boyd Gaming Corp. | 3,465 | 126 | |
| Dick's Sporting Goods Inc. | 3,316 | 124 | |
| Dana Inc. | 6,319 | 124 | |
| * | Weight Watchers International Inc. | 1,640 | 123 |
| New York Times Co. Class A | 5,255 | 122 | |
| * | Penn National Gaming Inc. | 3,458 | 119 |
| * | Liberty Expedia Holdings Inc. Class A | 2,576 | 119 |
| * | Adtalem Global Education Inc. | 2,425 | 116 |
| * | Tempur Sealy International Inc. | 2,053 | 114 |
| * | Liberty Broadband Corp. Class A | 1,403 | 114 |
| Marriott Vacations Worldwide Corp. | 950 | 113 | |
| Cracker Barrel Old Country Store Inc. | 755 | 113 | |
| Columbia Sportswear Co. | 1,238 | 112 | |
| Roku Inc. | 1,885 | 112 | |
| AMERCO | 297 | 111 | |
| * | Liberty Latin America Ltd. Class A | 5,644 | 111 |
| TEGNA Inc. | 9,267 | 108 | |
| Bed Bath & Beyond Inc. | 6,011 | 108 | |
| Children's Place Inc. | 765 | 108 | |
| * | AutoNation Inc. | 2,372 | 108 |
| * | Murphy USA Inc. | 1,287 | 107 |
| * | Fox Factory Holding Corp. | 1,608 | 106 |
| * | Cooper-Standard Holdings Inc. | 762 | 105 |
| * | Pandora Media Inc. | 11,398 | 105 |
| Jack in the Box Inc. | 1,159 | 105 | |
| * | Shutterfly Inc. | 1,349 | 105 |
| Red Rock Resorts Inc. Class A | 3,169 | 103 | |
3
| Vanguard® Russell 3000 Index Fund | ||
| Schedule of Investments | ||
| August 31, 2018 | ||
| Market | ||
| Value | ||
| Shares | ($000) | |
| Choice Hotels International Inc. | 1,318 | 103 |
| * Dave & Buster's Entertainment Inc. | 1,757 | 102 |
| Cheesecake Factory Inc. | 1,875 | 100 |
| Monro Inc. | 1,403 | 100 |
| * Dorman Products Inc. | 1,214 | 98 |
| Graham Holdings Co. Class B | 174 | 98 |
| * Avis Budget Group Inc. | 3,106 | 97 |
| * Taylor Morrison Home Corp. Class A | 4,930 | 96 |
| * Cavco Industries Inc. | 388 | 95 |
| Travelport Worldwide Ltd. | 5,120 | 95 |
| International Game Technology plc | 4,518 | 95 |
| * Liberty Media Corp-Liberty SiriusXM Class A | 2,026 | 95 |
| LCI Industries | 1,008 | 94 |
| * American Axle & Manufacturing Holdings Inc. | 5,209 | 92 |
| Brinker International Inc. | 2,079 | 92 |
| DSW Inc. Class A | 2,701 | 90 |
| Callaway Golf Co. | 3,936 | 90 |
| National Vision Holdings Inc. | 2,026 | 90 |
| Tenneco Inc. | 2,078 | 89 |
| Wingstop Inc. | 1,324 | 89 |
| KB Home | 3,495 | 87 |
| Sinclair Broadcast Group Inc. Class A | 2,984 | 86 |
| * TRI Pointe Group Inc. | 5,916 | 86 |
| PriceSmart Inc. | 965 | 84 |
| Meredith Corp. | 1,619 | 84 |
| * G-III Apparel Group Ltd. | 1,833 | 83 |
| * Michaels Cos. Inc. | 4,793 | 81 |
| Penske Automotive Group Inc. | 1,543 | 81 |
| Lithia Motors Inc. Class A | 933 | 81 |
| * Sotheby's | 1,667 | 80 |
| * Sally Beauty Holdings Inc. | 5,161 | 79 |
| * Carvana Co. Class A | 1,216 | 79 |
| Lennar Corp. Class B | 1,864 | 79 |
| * Cars.com Inc. | 2,887 | 78 |
| Office Depot Inc. | 22,515 | 75 |
| Big Lots Inc. | 1,705 | 73 |
| * Meritage Homes Corp. | 1,693 | 73 |
| La-Z-Boy Inc. | 2,178 | 72 |
| Tupperware Brands Corp. | 2,213 | 72 |
| * Meritor Inc. | 3,303 | 72 |
| Group 1 Automotive Inc. | 928 | 72 |
| Matthews International Corp. Class A | 1,371 | 71 |
| Caleres Inc. | 1,739 | 70 |
| Bloomin' Brands Inc. | 3,642 | 70 |
| * Liberty Media Corp-Liberty Formula One Class A | 2,009 | 70 |
| * Gentherm Inc. | 1,411 | 69 |
| * SeaWorld Entertainment Inc. | 2,367 | 69 |
| * Crocs Inc. | 3,320 | 69 |
| Sonic Corp. | 1,904 | 68 |
| * MSG Networks Inc. | 2,770 | 67 |
| * Scientific Games Corp. | 2,214 | 67 |
| Oxford Industries Inc. | 720 | 67 |
| Guess? Inc. | 2,718 | 67 |
| Dine Brands Global Inc. | 797 | 66 |
| * Pinnacle Entertainment Inc. | 1,932 | 66 |
| MDC Holdings Inc. | 2,074 | 66 |
| Abercrombie & Fitch Co. | 3,000 | 65 |
| Cooper Tire & Rubber Co. | 2,237 | 65 |
| * Asbury Automotive Group Inc. | 851 | 63 |
| * IMAX Corp. | 2,604 | 61 |
| * Shake Shack Inc. Class A | 1,008 | 61 |
| * Gray Television Inc. | 3,489 | 61 |
| * Sleep Number Corp. | 1,798 | 61 |
| * Floor & Decor Holdings Inc. Class A | 1,644 | 60 |
4
| Vanguard® Russell 3000 Index Fund | ||
| Schedule of Investments | ||
| August 31, 2018 | ||
| Market | ||
| Value | ||
| Shares | ($000) | |
| * Belmond Ltd. Class A | 3,530 | 59 |
| GameStop Corp. Class A | 4,388 | 58 |
| BJ's Restaurants Inc. | 760 | 58 |
| * Career Education Corp. | 3,397 | 54 |
| Papa John's International Inc. | 1,152 | 53 |
| * Quotient Technology Inc. | 3,513 | 53 |
| Inter Parfums Inc. | 790 | 52 |
| Gannett Co. Inc. | 4,990 | 51 |
| Sturm Ruger & Co. Inc. | 780 | 51 |
| * Liberty TripAdvisor Holdings Inc. Class A | 3,138 | 50 |
| * Central Garden & Pet Co. Class A | 1,363 | 50 |
| Standard Motor Products Inc. | 970 | 49 |
| * Liberty Media Corp-Liberty Braves | 1,816 | 48 |
| * Fossil Group Inc. | 2,115 | 48 |
| * Vista Outdoor Inc. | 2,584 | 48 |
| Tailored Brands Inc. | 2,017 | 47 |
| Chico's FAS Inc. | 5,174 | 47 |
| * LGI Homes Inc. | 813 | 47 |
| AMC Entertainment Holdings Inc. Class A | 2,456 | 47 |
| * American Woodmark Corp. | 548 | 47 |
| Winnebago Industries Inc. | 1,257 | 46 |
| Viad Corp. | 736 | 45 |
| Scholastic Corp. | 1,074 | 45 |
| * Genesco Inc. | 880 | 45 |
| Entercom Communications Corp. Class A | 5,652 | 44 |
| * Fitbit Inc. Class A | 7,297 | 44 |
| Marcus Corp. | 1,074 | 44 |
| * Express Inc. | 3,852 | 43 |
| * Instructure Inc. | 1,051 | 43 |
| Acushnet Holdings Corp. | 1,550 | 42 |
| * At Home Group Inc. | 1,217 | 42 |
| Viacom Inc. Class A | 1,217 | 41 |
| * Hertz Global Holdings Inc. | 2,320 | 41 |
| International Speedway Corp. Class A | 920 | 41 |
| Nutrisystem Inc. | 1,091 | 40 |
| HealthStream Inc. | 1,270 | 40 |
| Ruth's Hospitality Group Inc. | 1,298 | 40 |
| Shutterstock Inc. | 722 | 40 |
| Buckle Inc. | 1,543 | 40 |
| Dillard's Inc. Class A | 496 | 39 |
| * Malibu Boats Inc. Class A | 796 | 38 |
| EW Scripps Co. Class A | 2,555 | 37 |
| National Presto Industries Inc. | 273 | 36 |
| * Ascena Retail Group Inc. | 7,864 | 36 |
| * Hudson Ltd. Class A | 1,743 | 36 |
| * American Outdoor Brands Corp. | 2,536 | 36 |
| * Denny's Corp. | 2,355 | 35 |
| * Fiesta Restaurant Group Inc. | 1,232 | 35 |
| * Stoneridge Inc. | 1,183 | 35 |
| * Laureate Education Inc. Class A | 2,117 | 34 |
| New Media Investment Group Inc. | 2,079 | 33 |
| * M/I Homes Inc. | 1,266 | 33 |
| * Regis Corp. | 1,530 | 33 |
| * Universal Electronics Inc. | 754 | 33 |
| * Carrols Restaurant Group Inc. | 2,006 | 32 |
| * Rent-A-Center Inc. | 2,116 | 31 |
| National CineMedia Inc. | 3,417 | 31 |
| Camping World Holdings Inc. Class A | 1,468 | 30 |
| News Corp. Class B | 2,227 | 30 |
| * Liberty Latin America Ltd. | 1,541 | 30 |
| Ethan Allen Interiors Inc. | 1,344 | 30 |
| Superior Industries International Inc. | 1,377 | 30 |
| Tower International Inc. | 877 | 30 |
| Movado Group Inc. | 690 | 29 |
5
| Vanguard® Russell 3000 Index Fund | |||
| Schedule of Investments | |||
| August 31, 2018 | |||
| Market | |||
| Value | |||
| Shares | ($000) | ||
| * | Conn's Inc. | 712 | 29 |
| * | K12 Inc. | 1,749 | 29 |
| * | Houghton Mifflin Harcourt Co. | 4,490 | 29 |
| * | Red Robin Gourmet Burgers Inc. | 687 | 28 |
| * | QuinStreet Inc. | 1,860 | 28 |
| * | GoPro Inc. Class A | 4,381 | 28 |
| * | America's Car-Mart Inc. | 329 | 27 |
| * | Zumiez Inc. | 877 | 27 |
| Hooker Furniture Corp. | 649 | 27 | |
| Emerald Expositions Events Inc. | 1,739 | 27 | |
| Winmark Corp. | 172 | 26 | |
| * | William Lyon Homes Class A | 1,311 | 26 |
| Shoe Carnival Inc. | 560 | 25 | |
| Cato Corp. Class A | 1,134 | 24 | |
| * | American Public Education Inc. | 693 | 24 |
| *,^ | JC Penney Co. Inc. | 13,594 | 24 |
| Haverty Furniture Cos. Inc. | 1,083 | 24 | |
| * | MarineMax Inc. | 1,052 | 24 |
| * | Lumber Liquidators Holdings Inc. | 1,340 | 23 |
| * | Monarch Casino & Resort Inc. | 486 | 23 |
| * | Century Communities Inc. | 749 | 22 |
| * | Motorcar Parts of America Inc. | 823 | 22 |
| * | Overstock.com Inc. | 742 | 22 |
| Johnson Outdoors Inc. Class A | 212 | 21 | |
| * | Habit Restaurants Inc. Class A | 1,257 | 21 |
| * | ZAGG Inc. | 1,275 | 21 |
| * | Chuy's Holdings Inc. | 709 | 21 |
| * | Nautilus Inc. | 1,379 | 20 |
| * | MCBC Holdings Inc. | 727 | 20 |
| * | Boot Barn Holdings Inc. | 669 | 20 |
| * | Central European Media Enterprises Ltd. Class A | 5,175 | 20 |
| Citi Trends Inc. | 617 | 19 | |
| * | XO Group Inc. | 629 | 19 |
| * | Hibbett Sports Inc. | 915 | 19 |
| * | Del Taco Restaurants Inc. | 1,417 | 18 |
| * | Beazer Homes USA Inc. | 1,425 | 18 |
| * | tronc Inc. | 1,092 | 18 |
| * | Care.com Inc. | 924 | 18 |
| * | Central Garden & Pet Co. | 445 | 18 |
| * | Party City Holdco Inc. | 1,124 | 17 |
| Barnes & Noble Inc. | 3,208 | 17 | |
| Entravision Communications Corp. Class A | 3,094 | 16 | |
| * | WideOpenWest Inc. | 1,379 | 16 |
| * | El Pollo Loco Holdings Inc. | 1,330 | 16 |
| Sonic Automotive Inc. Class A | 722 | 16 | |
| * | Vera Bradley Inc. | 1,033 | 15 |
| * | Perry Ellis International Inc. | 548 | 15 |
| * | Golden Entertainment Inc. | 519 | 15 |
| * | Rosetta Stone Inc. | 913 | 14 |
| RCI Hospitality Holdings Inc. | 442 | 14 | |
| * | 1-800-Flowers.com Inc. Class A | 1,174 | 14 |
| * | Lindblad Expeditions Holdings Inc. | 930 | 14 |
| * | Drive Shack Inc. | 2,271 | 14 |
| * | Daily Journal Corp. | 59 | 14 |
| * | Eros International plc | 1,238 | 14 |
| * | Lands' End Inc. | 541 | 14 |
| * | Franklin Covey Co. | 540 | 14 |
| Carriage Services Inc. Class A | 605 | 14 | |
| * | Reading International Inc. Class A | 835 | 13 |
| Tilly's Inc. Class A | 561 | 13 | |
| Tile Shop Holdings Inc. | 1,724 | 13 | |
| * | MDC Partners Inc. Class A | 2,668 | 13 |
| * | elf Beauty Inc. | 926 | 13 |
| * | Barnes & Noble Education Inc. | 2,104 | 13 |
6
| Vanguard® Russell 3000 Index Fund | ||
| Schedule of Investments | ||
| August 31, 2018 | ||
| Market | ||
| Value | ||
| Shares | ($000) | |
| Nathan's Famous Inc. | 141 | 13 |
| * Biglari Holdings Inc. | 13 | 12 |
| * Duluth Holdings Inc. | 427 | 12 |
| * Sportsman's Warehouse Holdings Inc. | 2,115 | 12 |
| Flexsteel Industries Inc. | 338 | 12 |
| Weyco Group Inc. | 338 | 12 |
| * Zoe's Kitchen Inc. | 860 | 12 |
| Bassett Furniture Industries Inc. | 497 | 12 |
| * Francesca's Holdings Corp. | 1,745 | 11 |
| * Container Store Group Inc. | 915 | 10 |
| Clear Channel Outdoor Holdings Inc. Class A | 2,248 | 10 |
| Speedway Motorsports Inc. | 556 | 10 |
| Clarus Corp. | 887 | 9 |
| * Hovnanian Enterprises Inc. Class A | 5,863 | 9 |
| * Funko Inc. Class A | 350 | 9 |
| * Century Casinos Inc. | 1,006 | 8 |
| * Potbelly Corp. | 526 | 7 |
| * J. Jill Inc. | 1,165 | 7 |
| Pier 1 Imports Inc. | 3,612 | 7 |
| BJ's Wholesale Club Holdings Inc. | 215 | 6 |
| * Kirkland's Inc. | 599 | 5 |
| * Del Frisco's Restaurant Group Inc. | 557 | 5 |
| Big 5 Sporting Goods Corp. | 902 | 5 |
| Lions Gate Entertainment Corp. Class A | 126 | 3 |
| * Eastman Kodak Co. | 773 | 3 |
| Fluent Inc. | 942 | 2 |
| Lifetime Brands Inc. | 92 | 1 |
| 184,001 | ||
| Consumer Staples (5.3%) | ||
| Procter & Gamble Co. | 108,361 | 8,989 |
| Coca-Cola Co. | 164,805 | 7,345 |
| PepsiCo Inc. | 61,138 | 6,848 |
| Philip Morris International Inc. | 66,978 | 5,217 |
| Altria Group Inc. | 81,420 | 4,765 |
| CVS Health Corp. | 43,923 | 3,305 |
| Mondelez International Inc. Class A | 62,555 | 2,672 |
| Walgreens Boots Alliance Inc. | 36,505 | 2,503 |
| Colgate-Palmolive Co. | 36,721 | 2,439 |
| Kimberly-Clark Corp. | 15,024 | 1,736 |
| Sysco Corp. | 20,691 | 1,548 |
| Kraft Heinz Co. | 26,065 | 1,519 |
| Constellation Brands Inc. Class A | 6,776 | 1,411 |
| Archer-Daniels-Midland Co. | 24,137 | 1,216 |
| General Mills Inc. | 25,445 | 1,171 |
| Kroger Co. | 36,636 | 1,154 |
| * Monster Beverage Corp. | 17,497 | 1,065 |
| Clorox Co. | 5,567 | 807 |
| Tyson Foods Inc. Class A | 12,615 | 792 |
| Kellogg Co. | 10,732 | 770 |
| McCormick & Co. Inc. | 5,239 | 654 |
| Brown-Forman Corp. Class B | 12,385 | 647 |
| Hershey Co. | 6,143 | 617 |
| Church & Dwight Co. Inc. | 10,556 | 597 |
| Conagra Brands Inc. | 16,213 | 596 |
| Molson Coors Brewing Co. Class B | 7,458 | 498 |
| JM Smucker Co. | 4,761 | 492 |
| Hormel Foods Corp. | 11,779 | 461 |
| Lamb Weston Holdings Inc. | 6,130 | 414 |
| Bunge Ltd. | 5,977 | 388 |
| Pinnacle Foods Inc. | 5,105 | 339 |
| Ingredion Inc. | 3,034 | 307 |
| Campbell Soup Co. | 7,468 | 295 |
| * US Foods Holding Corp. | 8,960 | 292 |
| * Herbalife Nutrition Ltd. | 4,862 | 275 |
7
| Vanguard® Russell 3000 Index Fund | |||
| Schedule of Investments | |||
| August 31, 2018 | |||
| Market | |||
| Value | |||
| Shares | ($000) | ||
| * | Post Holdings Inc. | 2,802 | 272 |
| Casey's General Stores Inc. | 1,593 | 182 | |
| Nu Skin Enterprises Inc. Class A | 2,258 | 180 | |
| * | Keurig Dr Pepper Inc. | 7,666 | 175 |
| Energizer Holdings Inc. | 2,607 | 166 | |
| Spectrum Brands Holdings Inc. | 1,838 | 160 | |
| * | Performance Food Group Co. | 4,627 | 153 |
| Flowers Foods Inc. | 7,427 | 150 | |
| * | Sprouts Farmers Market Inc. | 5,385 | 143 |
| * | Edgewell Personal Care Co. | 2,500 | 141 |
| Lancaster Colony Corp. | 826 | 129 | |
| * | Hain Celestial Group Inc. | 4,487 | 128 |
| Medifast Inc. | 521 | 119 | |
| * | TreeHouse Foods Inc. | 2,192 | 114 |
| Brown-Forman Corp. Class A | 2,082 | 110 | |
| WD-40 Co. | 609 | 108 | |
| * | Boston Beer Co. Inc. Class A | 345 | 105 |
| Sanderson Farms Inc. | 895 | 95 | |
| B&G Foods Inc. | 2,796 | 89 | |
| J&J Snack Foods Corp. | 597 | 87 | |
| * | United Natural Foods Inc. | 2,179 | 77 |
| Calavo Growers Inc. | 700 | 74 | |
| Core-Mark Holding Co. Inc. | 2,028 | 73 | |
| * | USANA Health Sciences Inc. | 549 | 72 |
| Vector Group Ltd. | 4,163 | 65 | |
| * | National Beverage Corp. | 547 | 64 |
| Universal Corp. | 1,073 | 64 | |
| * | Rite Aid Corp. | 45,344 | 62 |
| Cal-Maine Foods Inc. | 1,205 | 60 | |
| * | Simply Good Foods Co. | 3,224 | 58 |
| * | SUPERVALU Inc. | 1,748 | 56 |
| Fresh Del Monte Produce Inc. | 1,325 | 50 | |
| MGP Ingredients Inc. | 602 | 46 | |
| Andersons Inc. | 1,132 | 46 | |
| * | Pilgrim's Pride Corp. | 2,400 | 44 |
| * | Freshpet Inc. | 1,175 | 44 |
| * | Hostess Brands Inc. Class A | 3,676 | 43 |
| * | Diplomat Pharmacy Inc. | 1,996 | 41 |
| Seaboard Corp. | 11 | 41 | |
| PetMed Express Inc. | 948 | 35 | |
| Coca-Cola Bottling Co. Consolidated | 201 | 34 | |
| SpartanNash Co. | 1,582 | 34 | |
| John B Sanfilippo & Son Inc. | 461 | 34 | |
| * | Chefs' Warehouse Inc. | 1,051 | 31 |
| Dean Foods Co. | 4,026 | 31 | |
| Ingles Markets Inc. Class A | 792 | 28 | |
| Weis Markets Inc. | 553 | 26 | |
| Tootsie Roll Industries Inc. | 812 | 23 | |
| * | Primo Water Corp. | 1,149 | 23 |
| Limoneira Co. | 518 | 16 | |
| *,^ | 22nd Century Group Inc. | 5,198 | 14 |
| * | Craft Brew Alliance Inc. | 706 | 13 |
| * | Seneca Foods Corp. Class A | 391 | 13 |
| * | Farmer Brothers Co. | 383 | 11 |
| Natural Health Trends Corp. | 417 | 11 | |
| * | Natural Grocers by Vitamin Cottage Inc. | 516 | 10 |
| * | Cadiz Inc. | 998 | 10 |
| * | GNC Holdings Inc. Class A | 2,838 | 9 |
| * | Smart & Final Stores Inc. | 1,163 | 8 |
| Turning Point Brands Inc. | 231 | 8 | |
| * | Castle Brands Inc. | 4,435 | 5 |
| * | Nature's Sunshine Products Inc. | 472 | 4 |
| Village Super Market Inc. Class A | 74 | 2 | |
| 68,463 | |||
8
| Vanguard® Russell 3000 Index Fund | ||
| Schedule of Investments | ||
| August 31, 2018 | ||
| Market | ||
| Value | ||
| Shares | ($000) | |
| Energy (5.6%) | ||
| Exxon Mobil Corp. | 182,900 | 14,663 |
| Chevron Corp. | 82,245 | 9,743 |
| Schlumberger Ltd. | 59,878 | 3,782 |
| ConocoPhillips | 50,373 | 3,699 |
| EOG Resources Inc. | 25,218 | 2,982 |
| Occidental Petroleum Corp. | 33,385 | 2,666 |
| Valero Energy Corp. | 18,535 | 2,185 |
| Phillips 66 | 18,101 | 2,145 |
| Marathon Petroleum Corp. | 19,709 | 1,622 |
| Williams Cos. Inc. | 52,385 | 1,550 |
| Halliburton Co. | 37,664 | 1,502 |
| Kinder Morgan Inc. | 81,507 | 1,443 |
| Anadarko Petroleum Corp. | 22,363 | 1,440 |
| Pioneer Natural Resources Co. | 7,251 | 1,267 |
| ONEOK Inc. | 17,592 | 1,159 |
| * Concho Resources Inc. | 8,333 | 1,143 |
| Devon Energy Corp. | 22,309 | 958 |
| Andeavor | 6,072 | 928 |
| Marathon Oil Corp. | 35,979 | 774 |
| Hess Corp. | 11,489 | 774 |
| National Oilwell Varco Inc. | 16,209 | 763 |
| Apache Corp. | 16,426 | 720 |
| Noble Energy Inc. | 20,326 | 604 |
| * Cheniere Energy Inc. | 8,908 | 596 |
| Baker Hughes a GE Co. | 17,950 | 592 |
| EQT Corp. | 11,431 | 583 |
| HollyFrontier Corp. | 7,037 | 524 |
| Targa Resources Corp. | 9,177 | 505 |
| Diamondback Energy Inc. | 4,160 | 504 |
| Cabot Oil & Gas Corp. | 19,025 | 453 |
| Cimarex Energy Co. | 4,030 | 340 |
| * WPX Energy Inc. | 16,567 | 316 |
| * Parsley Energy Inc. Class A | 11,350 | 315 |
| Helmerich & Payne Inc. | 4,648 | 305 |
| * Energen Corp. | 3,740 | 290 |
| * Continental Resources Inc. | 3,836 | 253 |
| PBF Energy Inc. Class A | 4,704 | 244 |
| * Newfield Exploration Co. | 8,336 | 227 |
| * Transocean Ltd. | 18,312 | 222 |
| Murphy Oil Corp. | 7,056 | 218 |
| Whiting Petroleum Corp. | 4,059 | 207 |
| Delek US Holdings Inc. | 3,663 | 200 |
| * Antero Resources Corp. | 10,143 | 188 |
| Valvoline Inc. | 8,636 | 186 |
| * First Solar Inc. | 3,513 | 183 |
| * Chesapeake Energy Corp. | 40,609 | 180 |
| Patterson-UTI Energy Inc. | 9,090 | 156 |
| * Apergy Corp. | 3,305 | 149 |
| McDermott International Inc. | 7,690 | 149 |
| Peabody Energy Corp. | 3,581 | 148 |
| * Oasis Petroleum Inc. | 10,917 | 147 |
| * Centennial Resource Development Inc. Class A | 7,613 | 147 |
| SM Energy Co. | 4,870 | 147 |
| Range Resources Corp. | 8,864 | 146 |
| CNX Resources Corp. | 9,068 | 145 |
| * PDC Energy Inc. | 2,724 | 144 |
| * Southwestern Energy Co. | 24,717 | 139 |
| * Matador Resources Co. | 3,947 | 129 |
| * Oceaneering International Inc. | 4,108 | 116 |
| * Callon Petroleum Co. | 9,641 | 109 |
| * QEP Resources Inc. | 10,657 | 106 |
| Golar LNG Ltd. | 4,101 | 105 |
| * Denbury Resources Inc. | 18,736 | 104 |
9
| Vanguard® Russell 3000 Index Fund | ||
| Schedule of Investments | ||
| August 31, 2018 | ||
| Market | ||
| Value | ||
| Shares | ($000) | |
| * Weatherford International plc | 42,397 | 103 |
| * Dril-Quip Inc. | 1,785 | 94 |
| * Kosmos Energy Ltd. | 9,892 | 89 |
| * Gulfport Energy Corp. | 7,588 | 89 |
| * SRC Energy Inc. | 9,573 | 89 |
| Nabors Industries Ltd. | 13,790 | 85 |
| * California Resources Corp. | 2,041 | 85 |
| World Fuel Services Corp. | 2,933 | 82 |
| SemGroup Corp. Class A | 3,344 | 81 |
| * NOW Inc. | 4,689 | 81 |
| * Oil States International Inc. | 2,237 | 76 |
| * Rowan Cos. plc Class A | 5,281 | 74 |
| * Carrizo Oil & Gas Inc. | 3,039 | 74 |
| Arch Coal Inc. Class A | 767 | 68 |
| * Noble Corp. plc | 11,107 | 68 |
| Ocean Rig UDW Inc. | 2,487 | 67 |
| Archrock Inc. | 5,242 | 66 |
| * Penn Virginia Corp. | 674 | 60 |
| * C&J Energy Services Inc. | 2,777 | 58 |
| * Cactus Inc. Class A | 1,687 | 58 |
| * Laredo Petroleum Inc. | 6,955 | 58 |
| * Unit Corp. | 2,190 | 58 |
| * Helix Energy Solutions Group Inc. | 5,750 | 54 |
| * CONSOL Energy Inc. | 1,242 | 53 |
| * Extraction Oil & Gas Inc. | 4,581 | 53 |
| * Superior Energy Services Inc. | 5,853 | 53 |
| * Sunrun Inc. | 3,993 | 52 |
| * Renewable Energy Group Inc. | 1,800 | 48 |
| * Diamond Offshore Drilling Inc. | 2,769 | 48 |
| * Newpark Resources Inc. | 4,535 | 48 |
| * Frank's International NV | 4,825 | 43 |
| * ProPetro Holding Corp. | 2,701 | 41 |
| * SunCoke Energy Inc. | 3,444 | 38 |
| * Resolute Energy Corp. | 1,073 | 35 |
| * Forum Energy Technologies Inc. | 2,920 | 35 |
| * WildHorse Resource Development Corp. | 1,583 | 34 |
| * Talos Energy Inc. | 956 | 33 |
| RPC Inc. | 2,317 | 32 |
| * W&T Offshore Inc. | 4,671 | 32 |
| * Bonanza Creek Energy Inc. | 1,003 | 31 |
| * Par Pacific Holdings Inc. | 1,435 | 29 |
| * Jagged Peak Energy Inc. | 2,180 | 29 |
| Warrior Met Coal Inc. | 1,178 | 28 |
| * TETRA Technologies Inc. | 6,171 | 28 |
| TerraForm Power Inc. Class A | 2,532 | 28 |
| ^ CVR Energy Inc. | 742 | 28 |
| * Exterran Corp. | 1,022 | 28 |
| * Alta Mesa Resources Inc. | 5,725 | 27 |
| * Ring Energy Inc. | 2,284 | 27 |
| * Tellurian Inc. | 2,755 | 27 |
| Green Plains Inc. | 1,454 | 26 |
| * Halcon Resources Corp. | 5,612 | 26 |
| * SandRidge Energy Inc. | 1,585 | 25 |
| * Keane Group Inc. | 1,960 | 24 |
| * Matrix Service Co. | 1,151 | 24 |
| * REX American Resources Corp. | 280 | 23 |
| * Select Energy Services Inc. Class A | 1,632 | 22 |
| * Clean Energy Fuels Corp. | 8,091 | 22 |
| * Solaris Oilfield Infrastructure Inc. Class A | 1,164 | 20 |
| * Enphase Energy Inc. | 4,092 | 20 |
| * SunPower Corp. Class A | 2,976 | 20 |
| * HighPoint Resources Corp. | 3,629 | 20 |
| * Abraxas Petroleum Corp. | 7,765 | 17 |
| * Northern Oil and Gas Inc. | 4,646 | 16 |
10
| Vanguard® Russell 3000 Index Fund | |||
| Schedule of Investments | |||
| August 31, 2018 | |||
| Market | |||
| Value | |||
| Shares | ($000) | ||
| * | SEACOR Marine Holdings Inc. | 760 | 16 |
| * | TPI Composites Inc. | 551 | 15 |
| Panhandle Oil and Gas Inc. Class A | 769 | 14 | |
| * | Covia Holdings Corp. | 1,236 | 14 |
| * | RigNet Inc. | 859 | 14 |
| Evolution Petroleum Corp. | 1,359 | 14 | |
| * | Energy XXI Gulf Coast Inc. | 1,505 | 14 |
| * | Liberty Oilfield Services Inc. Class A | 657 | 13 |
| * | Natural Gas Services Group Inc. | 575 | 13 |
| * | Era Group Inc. | 1,047 | 12 |
| * | Trecora Resources | 867 | 12 |
| * | Lilis Energy Inc. | 2,212 | 12 |
| *,^ | Sanchez Energy Corp. | 4,418 | 12 |
| * | Pioneer Energy Services Corp. | 3,526 | 11 |
| Mammoth Energy Services Inc. | 410 | 11 | |
| * | CARBO Ceramics Inc. | 1,298 | 11 |
| * | Ameresco Inc. Class A | 746 | 11 |
| * | Ultra Petroleum Corp. | 7,639 | 10 |
| * | SilverBow Resources Inc. | 323 | 10 |
| * | ION Geophysical Corp. | 482 | 9 |
| * | Cloud Peak Energy Inc. | 3,576 | 8 |
| * | Nine Energy Service Inc. | 270 | 8 |
| * | NCS Multistage Holdings Inc. | 493 | 8 |
| Ensco plc Class A | 1,110 | 8 | |
| * | Key Energy Services Inc. | 555 | 7 |
| * | Basic Energy Services Inc. | 834 | 7 |
| * | Flotek Industries Inc. | 2,909 | 7 |
| * | Independence Contract Drilling Inc. | 1,655 | 7 |
| * | Midstates Petroleum Co. Inc. | 561 | 7 |
| * | Eclipse Resources Corp. | 4,453 | 6 |
| * | Vivint Solar Inc. | 1,189 | 6 |
| * | Smart Sand Inc. | 1,083 | 5 |
| Hallador Energy Co. | 840 | 5 | |
| Adams Resources & Energy Inc. | 102 | 5 | |
| * | Isramco Inc. | 38 | 4 |
| * | Approach Resources Inc. | 2,034 | 4 |
| FTS International Inc. | 398 | 4 | |
| * | Berry Petroleum Corp. | 100 | 2 |
| Quintana Energy Services Inc. | 125 | 1 | |
| 71,796 | |||
| Financial Services (20.7%) | |||
| * | Berkshire Hathaway Inc. Class B | 83,413 | 17,410 |
| JPMorgan Chase & Co. | 146,126 | 16,743 | |
| Bank of America Corp. | 407,914 | 12,617 | |
| Visa Inc. Class A | 77,007 | 11,312 | |
| Wells Fargo & Co. | 189,511 | 11,083 | |
| Mastercard Inc. Class A | 39,641 | 8,545 | |
| Citigroup Inc. | 110,231 | 7,853 | |
| * | PayPal Holdings Inc. | 51,283 | 4,735 |
| Goldman Sachs Group Inc. | 15,287 | 3,635 | |
| US Bancorp | 66,660 | 3,607 | |
| American Express Co. | 30,699 | 3,253 | |
| PNC Financial Services Group Inc. | 20,206 | 2,900 | |
| American Tower Corp. | 18,955 | 2,827 | |
| Chubb Ltd. | 19,989 | 2,703 | |
| Morgan Stanley | 54,058 | 2,640 | |
| Charles Schwab Corp. | 51,877 | 2,635 | |
| CME Group Inc. | 14,681 | 2,565 | |
| BlackRock Inc. | 5,325 | 2,551 | |
| Simon Property Group Inc. | 13,323 | 2,439 | |
| S&P Global Inc. | 10,873 | 2,251 | |
| Bank of New York Mellon Corp. | 40,477 | 2,111 | |
| Capital One Financial Corp. | 20,949 | 2,076 | |
| American International Group Inc. | 38,779 | 2,062 | |
11
| Vanguard® Russell 3000 Index Fund | ||
| Schedule of Investments | ||
| August 31, 2018 | ||
| Market | ||
| Value | ||
| Shares | ($000) | |
| Crown Castle International Corp. | 17,883 | 2,039 |
| Intercontinental Exchange Inc. | 24,691 | 1,882 |
| Marsh & McLennan Cos. Inc. | 21,928 | 1,856 |
| Prologis Inc. | 26,849 | 1,804 |
| Prudential Financial Inc. | 18,095 | 1,778 |
| BB&T Corp. | 33,629 | 1,737 |
| MetLife Inc. | 37,253 | 1,710 |
| Progressive Corp. | 25,033 | 1,690 |
| Fidelity National Information Services Inc. | 14,352 | 1,552 |
| Aon plc | 10,555 | 1,536 |
| Travelers Cos. Inc. | 11,657 | 1,534 |
| Allstate Corp. | 15,140 | 1,523 |
| Aflac Inc. | 32,801 | 1,517 |
| Equinix Inc. | 3,420 | 1,492 |
| SunTrust Banks Inc. | 19,992 | 1,471 |
| * Fiserv Inc. | 17,677 | 1,415 |
| State Street Corp. | 16,211 | 1,409 |
| Public Storage | 6,412 | 1,363 |
| Moody's Corp. | 7,191 | 1,280 |
| * Worldpay Inc. Class A | 12,631 | 1,230 |
| T. Rowe Price Group Inc. | 10,182 | 1,180 |
| Discover Financial Services | 14,912 | 1,165 |
| Weyerhaeuser Co. | 32,590 | 1,131 |
| M&T Bank Corp. | 6,259 | 1,109 |
| Digital Realty Trust Inc. | 8,855 | 1,100 |
| AvalonBay Communities Inc. | 5,957 | 1,092 |
| * Square Inc. | 12,275 | 1,088 |
| Welltower Inc. | 16,059 | 1,071 |
| Equity Residential | 15,377 | 1,042 |
| Synchrony Financial | 32,315 | 1,023 |
| Northern Trust Corp. | 8,937 | 960 |
| KeyCorp | 45,064 | 949 |
| Regions Financial Corp. | 48,039 | 935 |
| Ventas Inc. | 15,220 | 911 |
| Ameriprise Financial Inc. | 6,253 | 888 |
| Fifth Third Bancorp | 29,364 | 864 |
| Boston Properties Inc. | 6,606 | 862 |
| Citizens Financial Group Inc. | 20,822 | 857 |
| Global Payments Inc. | 6,783 | 845 |
| Willis Towers Watson plc | 5,703 | 840 |
| * FleetCor Technologies Inc. | 3,831 | 819 |
| Hartford Financial Services Group Inc. | 15,331 | 772 |
| * SBA Communications Corp. Class A | 4,925 | 765 |
| Huntington Bancshares Inc. | 46,837 | 759 |
| Total System Services Inc. | 7,699 | 748 |
| * SVB Financial Group | 2,254 | 727 |
| Comerica Inc. | 7,366 | 718 |
| TD Ameritrade Holding Corp. | 12,155 | 712 |
| First Republic Bank | 6,968 | 708 |
| * Markel Corp. | 585 | 707 |
| Realty Income Corp. | 12,004 | 703 |
| Essex Property Trust Inc. | 2,848 | 701 |
| Equifax Inc. | 5,162 | 692 |
| MSCI Inc. Class A | 3,793 | 684 |
| Broadridge Financial Solutions Inc. | 4,991 | 674 |
| Host Hotels & Resorts Inc. | 31,087 | 669 |
| Principal Financial Group Inc. | 12,050 | 665 |
| * E*TRADE Financial Corp. | 11,298 | 665 |
| * CBRE Group Inc. Class A | 13,473 | 658 |
| XL Group Ltd. | 10,885 | 625 |
| Lincoln National Corp. | 9,404 | 617 |
| Loews Corp. | 12,074 | 607 |
| TransUnion | 7,884 | 594 |
| * First Data Corp. Class A | 22,973 | 591 |
12
| Vanguard® Russell 3000 Index Fund | ||
| Schedule of Investments | ||
| August 31, 2018 | ||
| Market | ||
| Value | ||
| Shares | ($000) | |
| Vornado Realty Trust | 7,344 | 565 |
| Arthur J Gallagher & Co. | 7,764 | 560 |
| Alexandria Real Estate Equities Inc. | 4,328 | 555 |
| HCP Inc. | 19,804 | 535 |
| Annaly Capital Management Inc. | 50,077 | 532 |
| Jack Henry & Associates Inc. | 3,289 | 521 |
| Raymond James Financial Inc. | 5,599 | 521 |
| * Arch Capital Group Ltd. | 16,854 | 515 |
| Cincinnati Financial Corp. | 6,531 | 501 |
| Mid-America Apartment Communities Inc. | 4,827 | 500 |
| Ally Financial Inc. | 18,453 | 496 |
| Alliance Data Systems Corp. | 2,062 | 492 |
| Cboe Global Markets Inc. | 4,834 | 487 |
| Nasdaq Inc. | 5,080 | 485 |
| Extra Space Storage Inc. | 5,188 | 478 |
| UDR Inc. | 11,422 | 457 |
| Fidelity National Financial Inc. | 11,378 | 456 |
| Zions Bancorporation | 8,362 | 446 |
| Iron Mountain Inc. | 12,091 | 436 |
| Franklin Resources Inc. | 13,599 | 432 |
| Regency Centers Corp. | 6,532 | 431 |
| Duke Realty Corp. | 15,115 | 431 |
| Torchmark Corp. | 4,868 | 428 |
| SL Green Realty Corp. | 4,072 | 425 |
| Invesco Ltd. | 17,512 | 422 |
| Federal Realty Investment Trust | 3,187 | 416 |
| Alleghany Corp. | 631 | 399 |
| East West Bancorp Inc. | 6,273 | 398 |
| Reinsurance Group of America Inc. Class A | 2,743 | 392 |
| Everest Re Group Ltd. | 1,729 | 386 |
| FactSet Research Systems Inc. | 1,645 | 377 |
| AGNC Investment Corp. | 19,641 | 374 |
| Western Union Co. | 19,436 | 368 |
| Camden Property Trust | 3,856 | 367 |
| SEI Investments Co. | 5,788 | 365 |
| Sun Communities Inc. | 3,457 | 357 |
| Equity LifeStyle Properties Inc. | 3,639 | 353 |
| Voya Financial Inc. | 6,963 | 349 |
| * WEX Inc. | 1,819 | 346 |
| Affiliated Managers Group Inc. | 2,354 | 344 |
| * Athene Holding Ltd. Class A | 6,909 | 343 |
| Macerich Co. | 5,799 | 341 |
| American Financial Group Inc. | 3,037 | 338 |
| Unum Group | 9,081 | 335 |
| WR Berkley Corp. | 4,155 | 325 |
| * VEREIT Inc. | 40,677 | 318 |
| Jefferies Financial Group Inc. | 13,527 | 314 |
| WP Carey Inc. | 4,632 | 308 |
| Kilroy Realty Corp. | 4,172 | 305 |
| Brown & Brown Inc. | 10,002 | 305 |
| Gaming and Leisure Properties Inc. | 8,517 | 305 |
| Jones Lang LaSalle Inc. | 1,998 | 305 |
| Kimco Realty Corp. | 17,650 | 302 |
| Invitation Homes Inc. | 12,915 | 302 |
| Apartment Investment & Management Co. | 6,828 | 299 |
| MarketAxess Holdings Inc. | 1,562 | 296 |
| CIT Group Inc. | 5,402 | 293 |
| National Retail Properties Inc. | 6,333 | 292 |
| CyrusOne Inc. | 4,316 | 289 |
| * Fair Isaac Corp. | 1,244 | 287 |
| People's United Financial Inc. | 15,377 | 285 |
| Park Hotels & Resorts Inc. | 8,412 | 281 |
| Commerce Bancshares Inc. | 3,938 | 280 |
| * Omega Healthcare Investors Inc. | 8,365 | 276 |
13
| Vanguard® Russell 3000 Index Fund | ||
| Schedule of Investments | ||
| August 31, 2018 | ||
| Market | ||
| Value | ||
| Shares | ($000) | |
| Liberty Property Trust | 6,205 | 271 |
| Lamar Advertising Co. Class A | 3,509 | 270 |
| PacWest Bancorp | 5,288 | 267 |
| American Homes 4 Rent Class A | 11,478 | 266 |
| Douglas Emmett Inc. | 6,785 | 265 |
| Signature Bank | 2,289 | 265 |
| Old Republic International Corp. | 11,909 | 264 |
| Cullen/Frost Bankers Inc. | 2,345 | 260 |
| First American Financial Corp. | 4,569 | 260 |
| New Residential Investment Corp. | 13,872 | 258 |
| First Horizon National Corp. | 13,948 | 257 |
| Eaton Vance Corp. | 4,850 | 256 |
| VICI Properties Inc. | 12,181 | 255 |
| Healthcare Trust of America Inc. Class A | 8,774 | 251 |
| LPL Financial Holdings Inc. | 3,752 | 249 |
| Webster Financial Corp. | 3,768 | 246 |
| Starwood Property Trust Inc. | 11,085 | 244 |
| American Campus Communities Inc. | 5,761 | 242 |
| * Zillow Group Inc. | 4,902 | 238 |
| Lazard Ltd. Class A | 4,930 | 237 |
| CubeSmart | 7,741 | 236 |
| Synovus Financial Corp. | 4,714 | 236 |
| Brixmor Property Group Inc. | 12,925 | 235 |
| * Western Alliance Bancorp | 4,072 | 235 |
| Forest City Realty Trust Inc. Class A | 9,208 | 232 |
| Assurant Inc. | 2,225 | 229 |
| Medical Properties Trust Inc. | 15,014 | 226 |
| RenaissanceRe Holdings Ltd. | 1,691 | 225 |
| IBERIABANK Corp. | 2,588 | 224 |
| Hanover Insurance Group Inc. | 1,828 | 224 |
| Hudson Pacific Properties Inc. | 6,579 | 223 |
| Prosperity Bancshares Inc. | 2,949 | 221 |
| Highwoods Properties Inc. | 4,432 | 220 |
| * SLM Corp. | 18,781 | 220 |
| Dun & Bradstreet Corp. | 1,538 | 220 |
| New York Community Bancorp Inc. | 20,380 | 219 |
| EPR Properties | 3,121 | 219 |
| * Credit Acceptance Corp. | 477 | 218 |
| Popular Inc. | 4,318 | 217 |
| * Brighthouse Financial Inc. | 5,206 | 216 |
| Primerica Inc. | 1,764 | 216 |
| * Howard Hughes Corp. | 1,652 | 215 |
| STORE Capital Corp. | 7,379 | 213 |
| Glacier Bancorp Inc. | 4,586 | 209 |
| Sterling Bancorp | 9,130 | 209 |
| * Euronet Worldwide Inc. | 2,109 | 206 |
| Pinnacle Financial Partners Inc. | 3,178 | 205 |
| Umpqua Holdings Corp. | 9,485 | 203 |
| Wintrust Financial Corp. | 2,279 | 202 |
| * Bank OZK | 4,960 | 201 |
| Assured Guaranty Ltd. | 4,924 | 201 |
| Senior Housing Properties Trust | 10,416 | 199 |
| Hospitality Properties Trust | 6,817 | 198 |
| Axis Capital Holdings Ltd. | 3,427 | 197 |
| * MGIC Investment Corp. | 15,353 | 195 |
| FNB Corp. | 14,112 | 190 |
| Rayonier Inc. | 5,422 | 189 |
| Hancock Whitney Corp. | 3,627 | 187 |
| Wyndham Destinations Inc. | 4,221 | 187 |
| * Texas Capital Bancshares Inc. | 2,092 | 186 |
| Life Storage Inc. | 1,902 | 186 |
| * CoreLogic Inc. | 3,637 | 185 |
| Associated Banc-Corp | 6,782 | 185 |
| Kemper Corp. | 2,269 | 185 |
14
| Vanguard® Russell 3000 Index Fund | ||
| Schedule of Investments | ||
| August 31, 2018 | ||
| Market | ||
| Value | ||
| Shares | ($000) | |
| First Industrial Realty Trust Inc. | 5,676 | 184 |
| Radian Group Inc. | 9,043 | 184 |
| Valley National Bancorp | 15,118 | 182 |
| * Essent Group Ltd. | 4,185 | 181 |
| Evercore Inc. Class A | 1,693 | 180 |
| Interactive Brokers Group Inc. | 2,891 | 180 |
| Gramercy Property Trust | 6,511 | 178 |
| BankUnited Inc. | 4,491 | 174 |
| TCF Financial Corp. | 6,858 | 174 |
| JBG SMITH Properties | 4,543 | 170 |
| Sabra Health Care REIT Inc. | 7,171 | 169 |
| CoreSite Realty Corp. | 1,448 | 169 |
| Blackstone Mortgage Trust Inc. Class A | 4,946 | 168 |
| First Financial Bankshares Inc. | 2,785 | 168 |
| MB Financial Inc. | 3,460 | 168 |
| Chemical Financial Corp. | 2,925 | 167 |
| United Bankshares Inc. | 4,226 | 167 |
| * Green Dot Corp. Class A | 1,943 | 166 |
| * Equity Commonwealth | 5,145 | 165 |
| Cousins Properties Inc. | 17,603 | 165 |
| BancorpSouth Bank | 4,725 | 164 |
| LaSalle Hotel Properties | 4,666 | 164 |
| Ryman Hospitality Properties Inc. | 1,845 | 164 |
| RLJ Lodging Trust | 7,445 | 163 |
| Selective Insurance Group Inc. | 2,527 | 162 |
| Healthcare Realty Trust Inc. | 5,211 | 161 |
| CNO Financial Group Inc. | 7,423 | 160 |
| Taubman Centers Inc. | 2,476 | 160 |
| Apple Hospitality REIT Inc. | 9,027 | 159 |
| Home BancShares Inc. | 6,799 | 159 |
| Stifel Financial Corp. | 2,837 | 159 |
| Sunstone Hotel Investors Inc. | 9,422 | 158 |
| Two Harbors Investment Corp. | 10,012 | 156 |
| Spirit Realty Capital Inc. | 18,644 | 156 |
| FirstCash Inc. | 1,915 | 156 |
| Weingarten Realty Investors | 5,003 | 155 |
| Old National Bancorp | 7,617 | 155 |
| Bank of Hawaii Corp. | 1,858 | 154 |
| First Citizens BancShares Inc. Class A | 324 | 154 |
| Uniti Group Inc. | 7,323 | 152 |
| BGC Partners Inc. Class A | 12,254 | 152 |
| PS Business Parks Inc. | 1,166 | 152 |
| EastGroup Properties Inc. | 1,563 | 152 |
| Simmons First National Corp. Class A | 4,809 | 152 |
| Chimera Investment Corp. | 8,091 | 151 |
| Paramount Group Inc. | 9,260 | 147 |
| Navient Corp. | 10,737 | 146 |
| AXA Equitable Holdings Inc. | 6,289 | 144 |
| MFA Financial Inc. | 18,683 | 143 |
| UMB Financial Corp. | 1,880 | 141 |
| Community Bank System Inc. | 2,127 | 141 |
| American Equity Investment Life Holding Co. | 3,780 | 140 |
| Erie Indemnity Co. Class A | 1,120 | 138 |
| Colony Capital Inc. | 22,237 | 136 |
| Brookfield Property REIT Inc. Class A | 6,741 | 135 |
| GEO Group Inc. | 5,311 | 135 |
| National Health Investors Inc. | 1,678 | 133 |
| Cathay General Bancorp | 3,135 | 133 |
| * OneMain Holdings Inc. | 3,611 | 133 |
| Investors Bancorp Inc. | 10,350 | 132 |
| CoreCivic Inc. | 5,108 | 132 |
| Education Realty Trust Inc. | 3,134 | 130 |
| Physicians Realty Trust | 7,392 | 129 |
| Fulton Financial Corp. | 7,099 | 129 |
15
| Vanguard® Russell 3000 Index Fund | ||
| Schedule of Investments | ||
| August 31, 2018 | ||
| Market | ||
| Value | ||
| Shares | ($000) | |
| Columbia Banking System Inc. | 3,050 | 129 |
| Columbia Property Trust Inc. | 5,297 | 128 |
| CenterState Bank Corp. | 4,163 | 127 |
| Brandywine Realty Trust | 7,599 | 127 |
| Apollo Commercial Real Estate Finance Inc. | 6,449 | 125 |
| First Financial Bancorp | 3,971 | 125 |
| First Midwest Bancorp Inc. | 4,585 | 125 |
| RLI Corp. | 1,618 | 125 |
| PotlatchDeltic Corp. | 2,565 | 124 |
| South State Corp. | 1,495 | 123 |
| Bank of NT Butterfield & Son Ltd. | 2,326 | 123 |
| Corporate Office Properties Trust | 3,992 | 123 |
| White Mountains Insurance Group Ltd. | 131 | 122 |
| WesBanco Inc. | 2,442 | 121 |
| Outfront Media Inc. | 5,950 | 118 |
| Retail Properties of America Inc. | 9,163 | 117 |
| Realogy Holdings Corp. | 5,433 | 116 |
| * Zillow Group Inc. Class A | 2,415 | 116 |
| Union Bankshares Corp. | 2,782 | 116 |
| * FCB Financial Holdings Inc. Class A | 2,168 | 112 |
| Washington Federal Inc. | 3,278 | 112 |
| Independent Bank Corp. | 1,221 | 111 |
| Aspen Insurance Holdings Ltd. | 2,695 | 111 |
| International Bancshares Corp. | 2,356 | 110 |
| Moelis & Co. Class A | 1,899 | 110 |
| Xenia Hotels & Resorts Inc. | 4,520 | 110 |
| BOK Financial Corp. | 1,065 | 109 |
| CVB Financial Corp. | 4,526 | 109 |
| Great Western Bancorp Inc. | 2,480 | 108 |
| Kennedy-Wilson Holdings Inc. | 5,033 | 108 |
| Pebblebrook Hotel Trust | 2,764 | 107 |
| ProAssurance Corp. | 2,203 | 107 |
| First Hawaiian Inc. | 3,673 | 106 |
| * Genworth Financial Inc. Class A | 22,724 | 106 |
| STAG Industrial Inc. | 3,640 | 105 |
| Legg Mason Inc. | 3,344 | 104 |
| DiamondRock Hospitality Co. | 8,693 | 104 |
| Acadia Realty Trust | 3,630 | 104 |
| Towne Bank | 3,168 | 103 |
| * Enstar Group Ltd. | 482 | 103 |
| Morningstar Inc. | 708 | 101 |
| Tanger Factory Outlet Centers Inc. | 4,148 | 100 |
| BancFirst Corp. | 1,548 | 99 |
| Federated Investors Inc. Class B | 4,201 | 97 |
| * BofI Holding Inc. | 2,605 | 97 |
| Santander Consumer USA Holdings Inc. | 4,487 | 97 |
| Rexford Industrial Realty Inc. | 2,960 | 96 |
| Lexington Realty Trust | 10,241 | 96 |
| Berkshire Hills Bancorp Inc. | 2,262 | 96 |
| Hope Bancorp Inc. | 5,432 | 95 |
| Retail Opportunity Investments Corp. | 4,807 | 95 |
| DDR Corp. | 6,724 | 94 |
| * First BanCorp | 10,748 | 94 |
| ServisFirst Bancshares Inc. | 2,164 | 93 |
| Renasant Corp. | 1,981 | 92 |
| Urban Edge Properties | 4,022 | 92 |
| QTS Realty Trust Inc. Class A | 1,992 | 91 |
| * LendingTree Inc. | 358 | 91 |
| LTC Properties Inc. | 1,952 | 91 |
| United Community Banks Inc. | 2,970 | 90 |
| Empire State Realty Trust Inc. | 5,102 | 90 |
| Washington REIT | 2,833 | 89 |
| First Merchants Corp. | 1,831 | 88 |
| Trustmark Corp. | 2,476 | 88 |
16
| Vanguard® Russell 3000 Index Fund | ||
| Schedule of Investments | ||
| August 31, 2018 | ||
| Market | ||
| Value | ||
| Shares | ($000) | |
| Argo Group International Holdings Ltd. | 1,378 | 88 |
| LegacyTexas Financial Group Inc. | 1,890 | 87 |
| Piedmont Office Realty Trust Inc. Class A | 4,378 | 87 |
| National General Holdings Corp. | 3,144 | 86 |
| Mack-Cali Realty Corp. | 3,903 | 85 |
| Terreno Realty Corp. | 2,148 | 83 |
| Banner Corp. | 1,274 | 82 |
| First Commonwealth Financial Corp. | 4,694 | 79 |
| Chesapeake Lodging Trust | 2,384 | 78 |
| Colony Credit Real Estate Inc. | 3,893 | 78 |
| NBT Bancorp Inc. | 1,908 | 77 |
| * PRA Group Inc. | 2,076 | 76 |
| Park National Corp. | 687 | 76 |
| HFF Inc. Class A | 1,653 | 75 |
| Heartland Financial USA Inc. | 1,230 | 75 |
| AmTrust Financial Services Inc. | 5,134 | 75 |
| Four Corners Property Trust Inc. | 2,755 | 74 |
| Invesco Mortgage Capital Inc. | 4,514 | 73 |
| Horace Mann Educators Corp. | 1,576 | 73 |
| Government Properties Income Trust | 4,302 | 73 |
| * Eagle Bancorp Inc. | 1,350 | 73 |
| Northwest Bancshares Inc. | 3,948 | 72 |
| Provident Financial Services Inc. | 2,829 | 71 |
| Ameris Bancorp | 1,430 | 71 |
| Kearny Financial Corp. | 5,110 | 70 |
| Cadence BanCorp Class A | 2,464 | 70 |
| Hilltop Holdings Inc. | 3,316 | 69 |
| Capitol Federal Financial Inc. | 5,167 | 68 |
| Washington Prime Group Inc. | 8,735 | 68 |
| * Redfin Corp. | 3,394 | 67 |
| Global Net Lease Inc. | 3,079 | 67 |
| Americold Realty Trust | 2,675 | 67 |
| CareTrust REIT Inc. | 3,599 | 66 |
| Brookline Bancorp Inc. | 3,622 | 66 |
| Alexander & Baldwin Inc. | 2,796 | 66 |
| S&T Bancorp Inc. | 1,405 | 66 |
| Employers Holdings Inc. | 1,428 | 65 |
| Sandy Spring Bancorp Inc. | 1,672 | 65 |
| Waddell & Reed Financial Inc. Class A | 3,240 | 65 |
| City Holding Co. | 798 | 65 |
| American Assets Trust Inc. | 1,638 | 65 |
| * Cardtronics plc Class A | 1,836 | 64 |
| Tompkins Financial Corp. | 731 | 64 |
| First Busey Corp. | 2,003 | 64 |
| Westamerica Bancorporation | 1,000 | 64 |
| Agree Realty Corp. | 1,120 | 64 |
| Kite Realty Group Trust | 3,641 | 64 |
| * Pacific Premier Bancorp Inc. | 1,582 | 63 |
| EVERTEC Inc. | 2,596 | 62 |
| First Interstate BancSystem Inc. Class A | 1,337 | 62 |
| Houlihan Lokey Inc. Class A | 1,302 | 61 |
| Mercury General Corp. | 1,134 | 61 |
| * NMI Holdings Inc. Class A | 2,817 | 61 |
| * FGL Holdings | 6,915 | 60 |
| * Triumph Bancorp Inc. | 1,413 | 60 |
| Seritage Growth Properties Class A | 1,164 | 60 |
| PennyMac Mortgage Investment Trust | 2,993 | 60 |
| Walker & Dunlop Inc. | 1,097 | 60 |
| Artisan Partners Asset Management Inc. Class A | 1,775 | 59 |
| Safety Insurance Group Inc. | 608 | 59 |
| Enterprise Financial Services Corp. | 1,042 | 59 |
| CNA Financial Corp. | 1,296 | 58 |
| Select Income REIT | 2,821 | 58 |
| Redwood Trust Inc. | 3,381 | 57 |
17
| Vanguard® Russell 3000 Index Fund | ||
| Schedule of Investments | ||
| August 31, 2018 | ||
| Market | ||
| Value | ||
| Shares | ($000) | |
| * Cannae Holdings Inc. | 2,933 | 57 |
| * Third Point Reinsurance Ltd. | 4,245 | 57 |
| Ladder Capital Corp. Class A | 3,249 | 56 |
| State Bank Financial Corp. | 1,728 | 56 |
| Beneficial Bancorp Inc. | 3,191 | 56 |
| Summit Hotel Properties Inc. | 4,046 | 56 |
| AMERISAFE Inc. | 862 | 55 |
| * Seacoast Banking Corp. of Florida | 1,739 | 55 |
| Boston Private Financial Holdings Inc. | 3,797 | 55 |
| Tier REIT Inc. | 2,301 | 55 |
| WSFS Financial Corp. | 1,120 | 55 |
| Nelnet Inc. Class A | 940 | 54 |
| Independent Bank Group Inc. | 782 | 54 |
| Lakeland Financial Corp. | 1,095 | 54 |
| First Bancorp | 1,288 | 54 |
| Navigators Group Inc. | 756 | 53 |
| OceanFirst Financial Corp. | 1,796 | 52 |
| Universal Insurance Holdings Inc. | 1,168 | 52 |
| * LendingClub Corp. | 14,394 | 52 |
| Monmouth Real Estate Investment Corp. | 2,972 | 52 |
| Piper Jaffray Cos. | 651 | 50 |
| CoBiz Financial Inc. | 2,119 | 49 |
| Washington Trust Bancorp Inc. | 811 | 49 |
| PJT Partners Inc. | 840 | 49 |
| Universal Health Realty Income Trust | 638 | 49 |
| Southside Bancshares Inc. | 1,365 | 49 |
| * Enova International Inc. | 1,455 | 48 |
| United Financial Bancorp Inc. | 2,704 | 48 |
| * Ambac Financial Group Inc. | 2,271 | 48 |
| CBTX Inc. | 1,298 | 47 |
| Hannon Armstrong Sustainable Infrastructure Capital Inc. | 2,190 | 47 |
| National Storage Affiliates Trust | 1,662 | 47 |
| Ramco-Gershenson Properties Trust | 3,242 | 45 |
| * INTL. FCStone Inc. | 811 | 45 |
| National Bank Holdings Corp. Class A | 1,105 | 44 |
| * MBIA Inc. | 4,319 | 44 |
| InfraREIT Inc. | 2,111 | 44 |
| Hersha Hospitality Trust Class A | 1,867 | 44 |
| TriCo Bancshares | 1,129 | 44 |
| Westwood Holdings Group Inc. | 745 | 43 |
| Hanmi Financial Corp. | 1,629 | 43 |
| Meridian Bancorp Inc. | 2,375 | 43 |
| Central Pacific Financial Corp. | 1,499 | 42 |
| * Columbia Financial Inc. | 2,452 | 42 |
| Banc of California Inc. | 2,051 | 41 |
| WisdomTree Investments Inc. | 5,027 | 41 |
| TFS Financial Corp. | 2,676 | 41 |
| Preferred Bank | 673 | 41 |
| Alexander's Inc. | 114 | 41 |
| MTGE Investment Corp. | 2,097 | 41 |
| Access National Corp. | 1,514 | 41 |
| ARMOUR Residential REIT Inc. | 1,747 | 41 |
| Virtu Financial Inc. Class A | 1,854 | 40 |
| Franklin Street Properties Corp. | 4,706 | 40 |
| Cohen & Steers Inc. | 970 | 40 |
| Heritage Financial Corp. | 1,109 | 40 |
| * Flagstar Bancorp Inc. | 1,210 | 40 |
| * Trupanion Inc. | 1,040 | 40 |
| * HomeStreet Inc. | 1,332 | 39 |
| State Auto Financial Corp. | 1,248 | 39 |
| ConnectOne Bancorp Inc. | 1,586 | 39 |
| Lakeland Bancorp Inc. | 2,022 | 39 |
| Investment Technology Group Inc. | 1,767 | 39 |
| * Encore Capital Group Inc. | 995 | 39 |
18
| Vanguard® Russell 3000 Index Fund | ||
| Schedule of Investments | ||
| August 31, 2018 | ||
| Market | ||
| Value | ||
| Shares | ($000) | |
| Kinsale Capital Group Inc. | 634 | 39 |
| * St. Joe Co. | 2,238 | 38 |
| * Atlantic Capital Bancshares Inc. | 2,107 | 38 |
| iStar Inc. | 3,388 | 38 |
| Virtus Investment Partners Inc. | 292 | 38 |
| ^ New York Mortgage Trust Inc. | 5,860 | 38 |
| Cass Information Systems Inc. | 523 | 37 |
| Bryn Mawr Bank Corp. | 766 | 37 |
| Meta Financial Group Inc. | 430 | 37 |
| • CorePoint Lodging Inc. | 1,773 | 37 |
| Old Second Bancorp Inc. | 2,390 | 37 |
| Univest Corp. of Pennsylvania | 1,295 | 37 |
| James River Group Holdings Ltd. | 901 | 37 |
| Arbor Realty Trust Inc. | 2,997 | 37 |
| Independence Realty Trust Inc. | 3,551 | 37 |
| Chatham Lodging Trust | 1,709 | 37 |
| TrustCo Bank Corp. NY | 3,927 | 36 |
| Urstadt Biddle Properties Inc. Class A | 1,593 | 36 |
| TPG RE Finance Trust Inc. | 1,751 | 36 |
| One Liberty Properties Inc. | 1,248 | 36 |
| CBL & Associates Properties Inc. | 8,003 | 36 |
| NorthStar Realty Europe Corp. | 2,600 | 36 |
| BrightSphere Investment Group plc | 2,797 | 35 |
| Capstead Mortgage Corp. | 4,223 | 35 |
| Stock Yards Bancorp Inc. | 916 | 35 |
| German American Bancorp Inc. | 940 | 35 |
| Federal Agricultural Mortgage Corp. | 458 | 35 |
| United Fire Group Inc. | 709 | 35 |
| FBL Financial Group Inc. Class A | 431 | 35 |
| RE/MAX Holdings Inc. Class A | 708 | 35 |
| Armada Hoffler Properties Inc. | 2,216 | 35 |
| Origin Bancorp Inc. | 847 | 34 |
| Getty Realty Corp. | 1,158 | 34 |
| Live Oak Bancshares Inc. | 1,092 | 33 |
| * World Acceptance Corp. | 277 | 33 |
| Horizon Bancorp Inc. | 1,599 | 33 |
| Guaranty Bancorp | 1,037 | 32 |
| Stewart Information Services Corp. | 721 | 32 |
| Easterly Government Properties Inc. | 1,592 | 32 |
| Industrial Logistics Properties Trust | 1,332 | 32 |
| Saul Centers Inc. | 532 | 32 |
| CatchMark Timber Trust Inc. Class A | 2,538 | 32 |
| American National Insurance Co. | 247 | 32 |
| Front Yard Residential Corp. | 2,592 | 32 |
| * Byline Bancorp Inc. | 1,387 | 32 |
| PennyMac Financial Services Inc. Class A | 1,488 | 31 |
| NexPoint Residential Trust Inc. | 970 | 31 |
| Granite Point Mortgage Trust Inc. | 1,631 | 31 |
| RBB Bancorp | 1,084 | 31 |
| Pennsylvania REIT | 3,024 | 31 |
| Northfield Bancorp Inc. | 1,841 | 30 |
| Oritani Financial Corp. | 1,849 | 30 |
| Banco Latinoamericano de Comercio Exterior SA | 1,448 | 30 |
| Dime Community Bancshares Inc. | 1,648 | 30 |
| * TriState Capital Holdings Inc. | 1,005 | 30 |
| Bridge Bancorp Inc. | 854 | 30 |
| * Health Insurance Innovations Inc. Class A | 555 | 29 |
| * Marcus & Millichap Inc. | 806 | 29 |
| Peapack Gladstone Financial Corp. | 872 | 29 |
| Great Southern Bancorp Inc. | 490 | 29 |
| Merchants Bancorp | 1,108 | 29 |
| * Customers Bancorp Inc. | 1,167 | 29 |
| BBX Capital Corp. Class A | 3,864 | 29 |
| Flushing Financial Corp. | 1,091 | 28 |
19
| Vanguard® Russell 3000 Index Fund | ||
| Schedule of Investments | ||
| August 31, 2018 | ||
| Market | ||
| Value | ||
| Shares | ($000) | |
| AG Mortgage Investment Trust Inc. | 1,464 | 28 |
| Investors Real Estate Trust | 5,008 | 27 |
| * Bancorp Inc. | 2,715 | 27 |
| * Everi Holdings Inc. | 3,124 | 27 |
| Fidelity Southern Corp. | 1,112 | 27 |
| People's Utah Bancorp | 744 | 27 |
| Blue Hills Bancorp Inc. | 1,167 | 27 |
| RMR Group Inc. Class A | 284 | 27 |
| Preferred Apartment Communities Inc. Class A | 1,498 | 27 |
| Green Bancorp Inc. | 1,093 | 26 |
| Bar Harbor Bankshares | 888 | 26 |
| Mercantile Bank Corp. | 728 | 26 |
| * Allegiance Bancshares Inc. | 573 | 26 |
| Carolina Financial Corp. | 618 | 25 |
| First of Long Island Corp. | 1,156 | 25 |
| Gladstone Commercial Corp. | 1,264 | 25 |
| Peoples Bancorp Inc. | 700 | 25 |
| First Defiance Financial Corp. | 784 | 25 |
| * Donnelley Financial Solutions Inc. | 1,200 | 25 |
| * eHealth Inc. | 857 | 25 |
| OFG Bancorp | 1,544 | 25 |
| Independent Bank Corp. | 1,000 | 25 |
| * Tejon Ranch Co. | 1,116 | 25 |
| First Connecticut Bancorp Inc. | 778 | 25 |
| Community Healthcare Trust Inc. | 794 | 25 |
| * EZCORP Inc. Class A | 2,205 | 24 |
| Whitestone REIT | 1,791 | 24 |
| * HomeTrust Bancshares Inc. | 848 | 24 |
| Ashford Hospitality Trust Inc. | 3,763 | 24 |
| First Community Bancshares Inc. | 718 | 24 |
| United Community Financial Corp. | 2,314 | 24 |
| * Retail Value Inc. | 670 | 24 |
| 1st Source Corp. | 425 | 24 |
| National Western Life Group Inc. Class A | 73 | 24 |
| Diamond Hill Investment Group Inc. | 126 | 24 |
| New Senior Investment Group Inc. | 3,706 | 23 |
| * Ocwen Financial Corp. | 5,607 | 23 |
| CorEnergy Infrastructure Trust Inc. | 626 | 23 |
| First Financial Corp. | 450 | 23 |
| UMH Properties Inc. | 1,445 | 23 |
| Midland States Bancorp Inc. | 666 | 23 |
| * Republic First Bancorp Inc. | 2,912 | 23 |
| Republic Bancorp Inc. Class A | 465 | 23 |
| * On Deck Capital Inc. | 2,730 | 22 |
| Waterstone Financial Inc. | 1,317 | 22 |
| Anworth Mortgage Asset Corp. | 4,522 | 22 |
| Bank of Marin Bancorp | 250 | 22 |
| Greenhill & Co. Inc. | 798 | 22 |
| City Office REIT Inc. | 1,694 | 22 |
| Western Asset Mortgage Capital Corp. | 1,947 | 22 |
| * National Commerce Corp. | 490 | 22 |
| * Altisource Portfolio Solutions SA | 595 | 22 |
| * FRP Holdings Inc. | 329 | 21 |
| Orchid Island Capital Inc. | 2,693 | 21 |
| Hamilton Lane Inc. Class A | 437 | 21 |
| * Franklin Financial Network Inc. | 547 | 21 |
| Arrow Financial Corp. | 523 | 21 |
| Investors Title Co. | 106 | 21 |
| QCR Holdings Inc. | 472 | 21 |
| Heritage Commerce Corp. | 1,289 | 20 |
| Sierra Bancorp | 684 | 20 |
| * First Foundation Inc. | 1,240 | 20 |
| * Veritex Holdings Inc. | 653 | 20 |
| * Spirit MTA REIT | 1,847 | 20 |
20
| Vanguard® Russell 3000 Index Fund | ||
| Schedule of Investments | ||
| August 31, 2018 | ||
| Market | ||
| Value | ||
| Shares | ($000) | |
| * Nicolet Bankshares Inc. | 357 | 20 |
| CNB Financial Corp. | 633 | 20 |
| Dynex Capital Inc. | 3,038 | 19 |
| FB Financial Corp. | 435 | 19 |
| * Greenlight Capital Re Ltd. Class A | 1,485 | 19 |
| Farmers National Banc Corp. | 1,180 | 19 |
| Opus Bank | 656 | 19 |
| Enterprise Bancorp Inc. | 515 | 19 |
| Cherry Hill Mortgage Investment Corp. | 989 | 18 |
| Community Trust Bancorp Inc. | 371 | 18 |
| Financial Institutions Inc. | 566 | 18 |
| * Cowen Inc. Class A | 1,190 | 18 |
| Ares Commercial Real Estate Corp. | 1,223 | 18 |
| American National Bankshares Inc. | 434 | 18 |
| * Citizens Inc. Class A | 2,096 | 18 |
| * Equity Bancshares Inc. Class A | 430 | 17 |
| Cedar Realty Trust Inc. | 3,901 | 17 |
| Cambridge Bancorp | 194 | 17 |
| Innovative Industrial Properties Inc. | 382 | 17 |
| * HarborOne Bancorp Inc. | 864 | 17 |
| First Bancshares Inc. | 411 | 17 |
| First Mid-Illinois Bancshares Inc. | 410 | 17 |
| Ladenburg Thalmann Financial Services Inc. | 4,872 | 17 |
| Citizens & Northern Corp. | 600 | 17 |
| GAIN Capital Holdings Inc. | 2,264 | 17 |
| Exantas Capital Corp. | 1,389 | 16 |
| Camden National Corp. | 357 | 16 |
| Hingham Institution for Savings | 74 | 16 |
| Global Indemnity Ltd. | 407 | 16 |
| National Bankshares Inc. | 348 | 16 |
| PCSB Financial Corp. | 778 | 16 |
| * Regional Management Corp. | 473 | 16 |
| First Bancorp Inc. | 536 | 16 |
| Macatawa Bank Corp. | 1,254 | 16 |
| United Insurance Holdings Corp. | 747 | 16 |
| * Baycom Corp. | 581 | 15 |
| Farmers & Merchants Bancorp Inc. | 334 | 15 |
| Braemar Hotels & Resorts Inc. | 1,291 | 15 |
| HCI Group Inc. | 368 | 15 |
| * Goosehead Insurance Inc. Class A | 477 | 15 |
| West Bancorporation Inc. | 611 | 15 |
| Oppenheimer Holdings Inc. Class A | 466 | 15 |
| B. Riley Financial Inc. | 634 | 15 |
| Peoples Financial Services Corp. | 314 | 14 |
| Heritage Insurance Holdings Inc. | 985 | 14 |
| MedEquities Realty Trust Inc. | 1,341 | 14 |
| MidWestOne Financial Group Inc. | 428 | 14 |
| Northrim BanCorp Inc. | 322 | 14 |
| Clipper Realty Inc. | 1,168 | 14 |
| * Metropolitan Bank Holding Corp. | 341 | 14 |
| Ames National Corp. | 461 | 14 |
| * AV Homes Inc. | 640 | 14 |
| Old Line Bancshares Inc. | 397 | 14 |
| Charter Financial Corp. | 543 | 14 |
| Maiden Holdings Ltd. | 3,499 | 13 |
| * WMIH Corp. | 8,617 | 13 |
| Home Bancorp Inc. | 277 | 13 |
| ACNB Corp. | 352 | 13 |
| Sutherland Asset Management Corp. | 724 | 12 |
| FedNat Holding Co. | 472 | 12 |
| PICO Holdings Inc. | 1,037 | 12 |
| Timberland Bancorp Inc. | 344 | 12 |
| Newmark Group Inc. Class A | 949 | 12 |
| Western New England Bancorp Inc. | 1,132 | 12 |
21
| Vanguard® Russell 3000 Index Fund | ||
| Schedule of Investments | ||
| August 31, 2018 | ||
| Market | ||
| Value | ||
| Shares | ($000) | |
| Farmland Partners Inc. | 1,706 | 12 |
| Jernigan Capital Inc. | 573 | 11 |
| Bluerock Residential Growth REIT Inc. Class A | 1,158 | 11 |
| Southern Missouri Bancorp Inc. | 281 | 11 |
| Civista Bancshares Inc. | 469 | 11 |
| Shore Bancshares Inc. | 590 | 11 |
| Protective Insurance Corp. Class B | 471 | 11 |
| Consolidated-Tomoka Land Co. | 175 | 11 |
| Global Medical REIT Inc. | 1,126 | 11 |
| Norwood Financial Corp. | 274 | 11 |
| * MoneyGram International Inc. | 1,621 | 11 |
| Evans Bancorp Inc. | 221 | 11 |
| Great Ajax Corp. | 759 | 10 |
| Penns Woods Bancorp Inc. | 228 | 10 |
| Arlington Asset Investment Corp. Class A | 966 | 10 |
| Central Valley Community Bancorp | 454 | 10 |
| * Hallmark Financial Services Inc. | 873 | 10 |
| First Business Financial Services Inc. | 437 | 10 |
| EMC Insurance Group Inc. | 376 | 10 |
| Union Bankshares Inc. | 183 | 10 |
| KKR Real Estate Finance Trust Inc. | 450 | 10 |
| Donegal Group Inc. Class A | 659 | 10 |
| Bank of Commerce Holdings | 731 | 9 |
| C&F Financial Corp. | 149 | 9 |
| Southern National Bancorp of Virginia Inc. | 528 | 9 |
| MBT Financial Corp. | 843 | 9 |
| Orrstown Financial Services Inc. | 353 | 9 |
| * Stratus Properties Inc. | 299 | 9 |
| Bankwell Financial Group Inc. | 288 | 9 |
| * SmartFinancial Inc. | 366 | 9 |
| * First Northwest Bancorp | 523 | 9 |
| Prudential Bancorp Inc. | 471 | 9 |
| Reliant Bancorp Inc. | 314 | 9 |
| Ohio Valley Banc Corp. | 205 | 9 |
| * Elevate Credit Inc. | 907 | 8 |
| * Community Bankers Trust Corp. | 914 | 8 |
| Unity Bancorp Inc. | 326 | 8 |
| * NI Holdings Inc. | 468 | 8 |
| First Internet Bancorp | 251 | 8 |
| * Howard Bancorp Inc. | 451 | 8 |
| Crawford & Co. Class B | 877 | 8 |
| United Security Bancshares | 683 | 8 |
| First Financial Northwest Inc. | 431 | 8 |
| Northeast Bancorp | 343 | 7 |
| Kingstone Cos. Inc. | 397 | 7 |
| ESSA Bancorp Inc. | 453 | 7 |
| SI Financial Group Inc. | 525 | 7 |
| * Southern First Bancshares Inc. | 169 | 7 |
| Tiptree Inc. | 1,080 | 7 |
| * Malvern Bancorp Inc. | 285 | 7 |
| Territorial Bancorp Inc. | 232 | 7 |
| Peoples Bancorp of North Carolina Inc. | 222 | 7 |
| Community Financial Corp. | 200 | 7 |
| * Trinity Place Holdings Inc. | 1,080 | 7 |
| Middlefield Banc Corp. | 132 | 7 |
| Independence Holding Co. | 184 | 6 |
| Chemung Financial Corp. | 145 | 6 |
| * GreenSky Inc. Class A | 300 | 6 |
| Investar Holding Corp. | 221 | 6 |
| County Bancorp Inc. | 233 | 6 |
| MidSouth Bancorp Inc. | 378 | 6 |
| * Forestar Group Inc. | 217 | 6 |
| Associated Capital Group Inc. Class A | 144 | 5 |
| Capstar Financial Holdings Inc. | 305 | 5 |
22
| Vanguard® Russell 3000 Index Fund | ||
| Schedule of Investments | ||
| August 31, 2018 | ||
| Market | ||
| Value | ||
| Shares | ($000) | |
| Silvercrest Asset Management Group Inc. Class A | 336 | 5 |
| First Guaranty Bancshares Inc. | 199 | 5 |
| * Focus Financial Partners Inc. Class A | 109 | 5 |
| * Maui Land & Pineapple Co. Inc. | 338 | 4 |
| * Essential Properties Realty Trust Inc. | 300 | 4 |
| GAMCO Investors Inc. Class A | 64 | 2 |
| 267,728 | ||
| Health Care (13.9%) | ||
| Johnson & Johnson | 115,959 | 15,619 |
| UnitedHealth Group Inc. | 41,252 | 11,074 |
| Pfizer Inc. | 250,514 | 10,401 |
| Merck & Co. Inc. | 116,229 | 7,972 |
| AbbVie Inc. | 68,545 | 6,579 |
| Amgen Inc. | 28,551 | 5,705 |
| Medtronic plc | 58,480 | 5,638 |
| Abbott Laboratories | 73,913 | 4,940 |
| Eli Lilly & Co. | 41,551 | 4,390 |
| Bristol-Myers Squibb Co. | 70,550 | 4,272 |
| Gilead Sciences Inc. | 56,079 | 4,247 |
| Thermo Fisher Scientific Inc. | 17,330 | 4,144 |
| * Biogen Inc. | 9,089 | 3,213 |
| Becton Dickinson and Co. | 11,515 | 3,015 |
| * Celgene Corp. | 31,225 | 2,949 |
| Anthem Inc. | 11,044 | 2,924 |
| Allergan plc | 14,608 | 2,800 |
| Aetna Inc. | 13,837 | 2,771 |
| Danaher Corp. | 26,658 | 2,760 |
| * Intuitive Surgical Inc. | 4,840 | 2,710 |
| Stryker Corp. | 14,737 | 2,497 |
| * Illumina Inc. | 6,326 | 2,245 |
| * Express Scripts Holding Co. | 24,216 | 2,131 |
| * Boston Scientific Corp. | 59,435 | 2,113 |
| * Vertex Pharmaceuticals Inc. | 10,964 | 2,022 |
| Humana Inc. | 5,939 | 1,979 |
| Cigna Corp. | 10,238 | 1,928 |
| Zoetis Inc. | 20,804 | 1,885 |
| HCA Healthcare Inc. | 11,969 | 1,605 |
| Baxter International Inc. | 21,534 | 1,601 |
| * Regeneron Pharmaceuticals Inc. | 3,425 | 1,393 |
| * Align Technology Inc. | 3,405 | 1,316 |
| * Edwards Lifesciences Corp. | 9,032 | 1,303 |
| * Centene Corp. | 8,693 | 1,273 |
| McKesson Corp. | 8,880 | 1,143 |
| * Alexion Pharmaceuticals Inc. | 9,168 | 1,121 |
| Zimmer Biomet Holdings Inc. | 8,791 | 1,087 |
| * IDEXX Laboratories Inc. | 3,698 | 939 |
| Agilent Technologies Inc. | 13,875 | 937 |
| * IQVIA Holdings Inc. | 7,024 | 893 |
| * Cerner Corp. | 13,539 | 882 |
| * Mylan NV | 22,058 | 863 |
| * Laboratory Corp. of America Holdings | 4,412 | 763 |
| * BioMarin Pharmaceutical Inc. | 7,460 | 746 |
| * ABIOMED Inc. | 1,827 | 743 |
| Cardinal Health Inc. | 13,336 | 696 |
| ResMed Inc. | 6,021 | 671 |
| Quest Diagnostics Inc. | 5,789 | 637 |
| * WellCare Health Plans Inc. | 2,086 | 631 |
| AmerisourceBergen Corp. Class A | 6,898 | 621 |
| * Incyte Corp. | 7,412 | 548 |
| * Veeva Systems Inc. Class A | 5,237 | 547 |
| * DexCom Inc. | 3,785 | 546 |
| Cooper Cos. Inc. | 2,091 | 535 |
| * Henry Schein Inc. | 6,689 | 520 |
| Teleflex Inc. | 1,955 | 484 |
23
| Vanguard® Russell 3000 Index Fund | ||
| Schedule of Investments | ||
| August 31, 2018 | ||
| Market | ||
| Value | ||
| Shares | ($000) | |
| Universal Health Services Inc. Class B | 3,635 | 473 |
| * Hologic Inc. | 11,787 | 469 |
| * Alnylam Pharmaceuticals Inc. | 3,796 | 466 |
| * Neurocrine Biosciences Inc. | 3,764 | 463 |
| * Nektar Therapeutics Class A | 6,818 | 453 |
| * Jazz Pharmaceuticals plc | 2,604 | 445 |
| * Varian Medical Systems Inc. | 3,883 | 435 |
| PerkinElmer Inc. | 4,690 | 433 |
| Perrigo Co. plc | 5,582 | 427 |
| STERIS plc | 3,521 | 403 |
| * DaVita Inc. | 5,792 | 401 |
| * Bluebird Bio Inc. | 2,374 | 400 |
| Dentsply Sirona Inc. | 9,558 | 382 |
| * QIAGEN NV | 9,602 | 374 |
| * Exact Sciences Corp. | 4,983 | 373 |
| * Molina Healthcare Inc. | 2,699 | 372 |
| West Pharmaceutical Services Inc. | 3,083 | 361 |
| * Sarepta Therapeutics Inc. | 2,569 | 355 |
| * Seattle Genetics Inc. | 4,564 | 350 |
| Encompass Health Corp. | 4,073 | 332 |
| * Sage Therapeutics Inc. | 1,939 | 318 |
| Bio-Techne Corp. | 1,600 | 307 |
| * Alkermes plc | 6,573 | 295 |
| * Bio-Rad Laboratories Inc. Class A | 900 | 293 |
| * Insulet Corp. | 2,570 | 268 |
| Hill-Rom Holdings Inc. | 2,740 | 267 |
| * Haemonetics Corp. | 2,382 | 266 |
| * athenahealth Inc. | 1,726 | 266 |
| * PRA Health Sciences Inc. | 2,465 | 260 |
| * LivaNova plc | 2,017 | 253 |
| * Catalent Inc. | 6,048 | 253 |
| * Charles River Laboratories International Inc. | 1,972 | 244 |
| * Ionis Pharmaceuticals Inc. | 5,284 | 241 |
| * United Therapeutics Corp. | 1,908 | 235 |
| * Envision Healthcare Corp. | 5,158 | 234 |
| * Masimo Corp. | 1,972 | 232 |
| * Exelixis Inc. | 12,305 | 231 |
| * Ligand Pharmaceuticals Inc. | 869 | 226 |
| Chemed Corp. | 693 | 224 |
| * HealthEquity Inc. | 2,289 | 216 |
| * Teladoc Health Inc. | 2,744 | 213 |
| * Loxo Oncology Inc. | 1,213 | 205 |
| * ICU Medical Inc. | 664 | 203 |
| * Inogen Inc. | 760 | 201 |
| * Medidata Solutions Inc. | 2,368 | 201 |
| * Integra LifeSciences Holdings Corp. | 3,267 | 194 |
| * FibroGen Inc. | 3,123 | 191 |
| * Ultragenyx Pharmaceutical Inc. | 2,220 | 188 |
| * Neogen Corp. | 2,008 | 188 |
| * MEDNAX Inc. | 3,906 | 185 |
| * Penumbra Inc. | 1,309 | 182 |
| * Agios Pharmaceuticals Inc. | 2,174 | 175 |
| * Globus Medical Inc. | 3,177 | 169 |
| * Endo International plc | 9,585 | 164 |
| * Immunomedics Inc. | 5,993 | 160 |
| * Acadia Healthcare Co. Inc. | 3,673 | 153 |
| Cantel Medical Corp. | 1,565 | 152 |
| * NuVasive Inc. | 2,160 | 152 |
| Bruker Corp. | 4,174 | 148 |
| * Horizon Pharma plc | 6,915 | 146 |
| * Emergent BioSolutions Inc. | 2,332 | 145 |
| * Avanos Medical Inc. | 2,001 | 144 |
| * Amedisys Inc. | 1,145 | 143 |
| * Blueprint Medicines Corp. | 1,752 | 134 |
24
| Vanguard® Russell 3000 Index Fund | ||
| Schedule of Investments | ||
| August 31, 2018 | ||
| Market | ||
| Value | ||
| Shares | ($000) | |
| * Myriad Genetics Inc. | 2,688 | 134 |
| * LHC Group Inc. | 1,350 | 134 |
| * Syneos Health Inc. | 2,657 | 132 |
| * Array BioPharma Inc. | 8,316 | 129 |
| * Novocure Ltd. | 2,799 | 126 |
| * Wright Medical Group NV | 4,349 | 126 |
| * HMS Holdings Corp. | 3,880 | 124 |
| * Amicus Therapeutics Inc. | 9,077 | 122 |
| * Medicines Co. | 3,034 | 120 |
| * AMN Healthcare Services Inc. | 2,042 | 119 |
| * Tenet Healthcare Corp. | 3,461 | 117 |
| * Merit Medical Systems Inc. | 1,961 | 115 |
| * Mallinckrodt plc | 3,254 | 112 |
| * Ironwood Pharmaceuticals Inc. Class A | 5,817 | 112 |
| * Global Blood Therapeutics Inc. | 2,275 | 111 |
| * Omnicell Inc. | 1,556 | 107 |
| * iRhythm Technologies Inc. | 1,144 | 106 |
| * Integer Holdings Corp. | 1,327 | 106 |
| * Intercept Pharmaceuticals Inc. | 933 | 104 |
| * Heron Therapeutics Inc. | 2,688 | 104 |
| * Madrigal Pharmaceuticals Inc. | 426 | 102 |
| * Allscripts Healthcare Solutions Inc. | 6,890 | 101 |
| CONMED Corp. | 1,251 | 101 |
| * LifePoint Health Inc. | 1,540 | 99 |
| * Spectrum Pharmaceuticals Inc. | 4,548 | 98 |
| * Quidel Corp. | 1,266 | 97 |
| * Glaukos Corp. | 1,383 | 95 |
| * Aerie Pharmaceuticals Inc. | 1,540 | 94 |
| * Premier Inc. Class A | 2,131 | 94 |
| * Supernus Pharmaceuticals Inc. | 2,119 | 94 |
| * Select Medical Holdings Corp. | 4,697 | 93 |
| * Portola Pharmaceuticals Inc. | 3,090 | 92 |
| * STAAR Surgical Co. | 1,922 | 92 |
| * Spark Therapeutics Inc. | 1,487 | 92 |
| * Prestige Consumer Healthcare Inc. | 2,373 | 91 |
| * REGENXBIO Inc. | 1,295 | 91 |
| * MyoKardia Inc. | 1,468 | 90 |
| * Arena Pharmaceuticals Inc. | 2,311 | 90 |
| Tandem Diabetes Care Inc. | 1,962 | 90 |
| * Cambrex Corp. | 1,318 | 89 |
| Ensign Group Inc. | 2,246 | 88 |
| * Acceleron Pharma Inc. | 1,621 | 88 |
| * Amneal Pharmaceuticals Inc. | 3,788 | 87 |
| * Halozyme Therapeutics Inc. | 4,701 | 87 |
| * BioTelemetry Inc. | 1,379 | 85 |
| * OPKO Health Inc. | 14,384 | 85 |
| * Repligen Corp. | 1,523 | 84 |
| Patterson Cos. Inc. | 3,671 | 83 |
| * NxStage Medical Inc. | 2,897 | 82 |
| * Pacira Pharmaceuticals Inc. | 1,736 | 82 |
| * PTC Therapeutics Inc. | 1,956 | 82 |
| * Brookdale Senior Living Inc. | 8,183 | 81 |
| * Sangamo Therapeutics Inc. | 4,431 | 81 |
| * Atara Biotherapeutics Inc. | 1,940 | 79 |
| * Momenta Pharmaceuticals Inc. | 2,988 | 79 |
| * Nevro Corp. | 1,132 | 76 |
| * Xencor Inc. | 1,781 | 74 |
| * Magellan Health Inc. | 967 | 71 |
| * Zogenix Inc. | 1,407 | 68 |
| US Physical Therapy Inc. | 540 | 68 |
| * Clovis Oncology Inc. | 1,839 | 66 |
| * Enanta Pharmaceuticals Inc. | 720 | 65 |
| * Insmed Inc. | 3,239 | 65 |
| * Genomic Health Inc. | 1,040 | 64 |
25
| Vanguard® Russell 3000 Index Fund | |||
| Schedule of Investments | |||
| August 31, 2018 | |||
| Market | |||
| Value | |||
| Shares | ($000) | ||
| * | Tabula Rasa HealthCare Inc. | 723 | 63 |
| * | Quality Systems Inc. | 2,756 | 63 |
| * | Arrowhead Pharmaceuticals Inc. | 4,216 | 62 |
| * | AnaptysBio Inc. | 696 | 62 |
| * | AxoGen Inc. | 1,387 | 61 |
| * | Akorn Inc. | 3,865 | 61 |
| * | Tivity Health Inc. | 1,753 | 60 |
| * | AtriCure Inc. | 1,730 | 60 |
| * | Endocyte Inc. | 3,025 | 60 |
| * | Audentes Therapeutics Inc. | 1,633 | 59 |
| * | Cardiovascular Systems Inc. | 1,538 | 59 |
| * | CryoLife Inc. | 1,707 | 59 |
| * | Karyopharm Therapeutics Inc. | 2,794 | 59 |
| * | Reata Pharmaceuticals Inc. Class A | 676 | 58 |
| * | Retrophin Inc. | 1,823 | 58 |
| * | Corcept Therapeutics Inc. | 3,800 | 57 |
| * | ACADIA Pharmaceuticals Inc. | 4,012 | 57 |
| * | ImmunoGen Inc. | 5,481 | 56 |
| * | Puma Biotechnology Inc. | 1,250 | 55 |
| Luminex Corp. | 1,946 | 55 | |
| * | Editas Medicine Inc. | 1,650 | 54 |
| * | TESARO Inc. | 1,659 | 54 |
| * | Natus Medical Inc. | 1,433 | 53 |
| * | Iovance Biotherapeutics Inc. | 2,964 | 52 |
| * | Intellia Therapeutics Inc. | 1,693 | 52 |
| * | Omeros Corp. | 2,020 | 52 |
| * | K2M Group Holdings Inc. | 1,900 | 52 |
| * | Theravance Biopharma Inc. | 1,784 | 52 |
| * | Esperion Therapeutics Inc. | 1,033 | 51 |
| * | Acorda Therapeutics Inc. | 1,757 | 51 |
| Phibro Animal Health Corp. Class A | 1,046 | 49 | |
| * | R1 RCM Inc. | 4,901 | 49 |
| * | Mirati Therapeutics Inc. | 853 | 48 |
| * | Tactile Systems Technology Inc. | 712 | 48 |
| * | Innoviva Inc. | 3,271 | 47 |
| * | Surmodics Inc. | 593 | 47 |
| * | Alder Biopharmaceuticals Inc. | 2,578 | 47 |
| * | Aimmune Therapeutics Inc. | 1,671 | 47 |
| * | G1 Therapeutics Inc. | 764 | 46 |
| Owens & Minor Inc. | 2,635 | 45 | |
| * | AMAG Pharmaceuticals Inc. | 1,831 | 45 |
| * | Cerus Corp. | 5,734 | 45 |
| * | Varex Imaging Corp. | 1,413 | 44 |
| * | Natera Inc. | 1,591 | 44 |
| * | Orthofix Medical Inc. | 805 | 43 |
| * | TherapeuticsMD Inc. | 6,614 | 43 |
| National HealthCare Corp. | 554 | 43 | |
| * | Cymabay Therapeutics Inc. | 3,091 | 42 |
| * | Athenex Inc. | 2,560 | 42 |
| Atrion Corp. | 64 | 42 | |
| * | Biohaven Pharmaceutical Holding Co. Ltd. | 1,099 | 42 |
| * | TransEnterix Inc. | 7,020 | 41 |
| * | Vanda Pharmaceuticals Inc. | 2,104 | 41 |
| * | Invitae Corp. | 2,738 | 41 |
| *,^ | Geron Corp. | 7,024 | 40 |
| * | CareDx Inc. | 1,640 | 40 |
| * | Providence Service Corp. | 572 | 38 |
| * | Intra-Cellular Therapies Inc. | 1,731 | 38 |
| * | Intrexon Corp. | 2,461 | 38 |
| * | Coherus Biosciences Inc. | 1,877 | 38 |
| Apellis Pharmaceuticals Inc. | 1,947 | 38 | |
| * | Intersect ENT Inc. | 1,265 | 37 |
| * | Amphastar Pharmaceuticals Inc. | 1,940 | 37 |
| * | Dicerna Pharmaceuticals Inc. | 2,292 | 36 |
26
| Vanguard® Russell 3000 Index Fund | |||
| Schedule of Investments | |||
| August 31, 2018 | |||
| Market | |||
| Value | |||
| Shares | ($000) | ||
| * | AngioDynamics Inc. | 1,562 | 35 |
| * | OraSure Technologies Inc. | 2,186 | 35 |
| * | NeoGenomics Inc. | 2,517 | 35 |
| * | Codexis Inc. | 2,014 | 35 |
| * | Heska Corp. | 321 | 34 |
| * | Radius Health Inc. | 1,621 | 33 |
| * | MacroGenics Inc. | 1,524 | 33 |
| * | Dynavax Technologies Corp. | 2,372 | 33 |
| * | CytomX Therapeutics Inc. | 1,451 | 33 |
| * | Flexion Therapeutics Inc. | 1,399 | 32 |
| * | TG Therapeutics Inc. | 2,499 | 32 |
| Meridian Bioscience Inc. | 2,011 | 32 | |
| Utah Medical Products Inc. | 345 | 31 | |
| * | Accelerate Diagnostics Inc. | 1,274 | 31 |
| LeMaitre Vascular Inc. | 819 | 31 | |
| * | Revance Therapeutics Inc. | 1,101 | 30 |
| * | Eagle Pharmaceuticals Inc. | 436 | 30 |
| * | WaVe Life Sciences Ltd. | 565 | 30 |
| * | BioCryst Pharmaceuticals Inc. | 4,179 | 30 |
| * | CorVel Corp. | 502 | 30 |
| * | ArQule Inc. | 4,493 | 30 |
| * | Progenics Pharmaceuticals Inc. | 3,730 | 29 |
| * | GlycoMimetics Inc. | 1,944 | 29 |
| Rocket Pharmaceuticals Inc. | 1,189 | 28 | |
| * | Viking Therapeutics Inc. | 2,169 | 28 |
| * | Anika Therapeutics Inc. | 684 | 28 |
| * | Verastem Inc. | 2,825 | 28 |
| * | Assembly Biosciences Inc. | 703 | 28 |
| * | Fate Therapeutics Inc. | 2,122 | 27 |
| * | Cara Therapeutics Inc. | 1,309 | 26 |
| * | Vericel Corp. | 2,106 | 26 |
| * | Antares Pharma Inc. | 7,242 | 26 |
| * | Rigel Pharmaceuticals Inc. | 7,335 | 25 |
| * | Prothena Corp. plc | 1,625 | 25 |
| * | Novavax Inc. | 15,469 | 24 |
| *,^ | Sorrento Therapeutics Inc. | 4,327 | 24 |
| *,^ | MiMedx Group Inc. | 4,505 | 24 |
| * | Epizyme Inc. | 2,014 | 24 |
| * | RadNet Inc. | 1,705 | 24 |
| * | Rhythm Pharmaceuticals Inc. | 736 | 23 |
| * | Addus HomeCare Corp. | 356 | 23 |
| * | Cutera Inc. | 661 | 22 |
| Invacare Corp. | 1,478 | 22 | |
| * | Lexicon Pharmaceuticals Inc. | 1,895 | 22 |
| * | Medpace Holdings Inc. | 357 | 21 |
| * | Achillion Pharmaceuticals Inc. | 6,155 | 21 |
| * | ANI Pharmaceuticals Inc. | 364 | 21 |
| * | Adamas Pharmaceuticals Inc. | 914 | 21 |
| * | Lantheus Holdings Inc. | 1,296 | 21 |
| Eloxx Pharmaceuticals Inc. | 1,114 | 20 | |
| * | Adverum Biotechnologies Inc. | 2,658 | 20 |
| * | La Jolla Pharmaceutical Co. | 866 | 20 |
| * | Pacific Biosciences of California Inc. | 3,926 | 20 |
| * | Stemline Therapeutics Inc. | 1,136 | 19 |
| *,^ | Apollo Medical Holdings Inc. | 1,265 | 19 |
| * | Collegium Pharmaceutical Inc. | 1,099 | 19 |
| * | GenMark Diagnostics Inc. | 2,174 | 19 |
| * | Abeona Therapeutics Inc. | 1,206 | 19 |
| * | ZIOPHARM Oncology Inc. | 6,351 | 19 |
| * | Synergy Pharmaceuticals Inc. | 9,420 | 18 |
| * | ChemoCentryx Inc. | 1,391 | 18 |
| * | IntriCon Corp. | 247 | 18 |
| * | Community Health Systems Inc. | 4,701 | 18 |
| Inspire Medical Systems Inc. | 322 | 18 | |
27
| Vanguard® Russell 3000 Index Fund | |||
| Schedule of Investments | |||
| August 31, 2018 | |||
| Market | |||
| Value | |||
| Shares | ($000) | ||
| * | PetIQ Inc. | 450 | 18 |
| * | Dermira Inc. | 1,849 | 18 |
| * | SIGA Technologies Inc. | 2,136 | 18 |
| * | CASI Pharmaceuticals Inc. | 2,498 | 17 |
| National Research Corp. | 443 | 17 | |
| * | PDL BioPharma Inc. | 7,082 | 17 |
| * | Akebia Therapeutics Inc. | 2,058 | 17 |
| * | AVEO Pharmaceuticals Inc. | 5,649 | 17 |
| * | Nuvectra Corp. | 721 | 17 |
| * | Inovio Pharmaceuticals Inc. | 3,192 | 17 |
| * | Triple-S Management Corp. Class B | 765 | 17 |
| * | Kadmon Holdings Inc. | 3,861 | 17 |
| * | Concert Pharmaceuticals Inc. | 1,051 | 17 |
| * | Cross Country Healthcare Inc. | 1,644 | 16 |
| Denali Therapeutics Inc. | 833 | 16 | |
| * | Sientra Inc. | 650 | 16 |
| * | Assertio Therapeutics Inc. | 2,554 | 16 |
| * | Avid Bioservices Inc. | 2,215 | 16 |
| * | Oxford Immunotec Global plc | 1,091 | 16 |
| * | CytoSorbents Corp. | 1,094 | 16 |
| * | Surgery Partners Inc. | 923 | 16 |
| * | Cytokinetics Inc. | 2,021 | 16 |
| * | Paratek Pharmaceuticals Inc. | 1,534 | 16 |
| * | Kindred Biosciences Inc. | 1,054 | 16 |
| * | RTI Surgical Inc. | 3,451 | 15 |
| * | Accuray Inc. | 3,840 | 15 |
| * | Kura Oncology Inc. | 744 | 15 |
| * | Five Prime Therapeutics Inc. | 1,089 | 15 |
| * | Aclaris Therapeutics Inc. | 956 | 15 |
| * | NanoString Technologies Inc. | 932 | 15 |
| Computer Programs & Systems Inc. | 548 | 15 | |
| Optinose Inc. | 1,002 | 15 | |
| * | Keryx Biopharmaceuticals Inc. | 4,369 | 15 |
| * | ViewRay Inc. | 1,474 | 15 |
| * | Albireo Pharma Inc. | 428 | 15 |
| * | Solid Biosciences Inc. | 344 | 15 |
| * | American Renal Associates Holdings Inc. | 630 | 14 |
| * | Aduro Biotech Inc. | 1,866 | 14 |
| * | Veracyte Inc. | 1,086 | 14 |
| * | Senseonics Holdings Inc. | 3,353 | 14 |
| * | Arbutus Biopharma Corp. | 1,481 | 13 |
| * | Deciphera Pharmaceuticals Inc. | 359 | 13 |
| * | Savara Inc. | 1,121 | 13 |
| * | BioScrip Inc. | 4,504 | 13 |
| * | Akcea Therapeutics Inc. | 491 | 13 |
| * | Voyager Therapeutics Inc. | 588 | 13 |
| * | Zafgen Inc. | 1,307 | 12 |
| * | Harvard Bioscience Inc. | 2,020 | 12 |
| * | Marinus Pharmaceuticals Inc. | 1,667 | 12 |
| *,^ | Vital Therapies Inc. | 1,477 | 12 |
| * | Cellular Biomedicine Group Inc. | 545 | 12 |
| * | Civitas Solutions Inc. | 720 | 12 |
| * | Rockwell Medical Inc. | 2,346 | 12 |
| * | MediciNova Inc. | 925 | 11 |
| * | Insys Therapeutics Inc. | 1,142 | 11 |
| * | Fluidigm Corp. | 1,334 | 11 |
| * | Capital Senior Living Corp. | 1,181 | 10 |
| * | Aratana Therapeutics Inc. | 1,951 | 10 |
| * | Castlight Health Inc. Class B | 3,285 | 10 |
| * | Pieris Pharmaceuticals Inc. | 1,739 | 10 |
| * | BioTime Inc. | 3,497 | 10 |
| * | Corium International Inc. | 985 | 10 |
| * | Enzo Biochem Inc. | 1,946 | 9 |
| * | MannKind Corp. | 8,012 | 9 |
28
| Vanguard® Russell 3000 Index Fund | ||
| Schedule of Investments | ||
| August 31, 2018 | ||
| Market | ||
| Value | ||
| Shares | ($000) | |
| * Durect Corp. | 6,522 | 9 |
| Idera Pharmaceuticals Inc. | 796 | 8 |
| * Calithera Biosciences Inc. | 1,525 | 8 |
| * Bellicum Pharmaceuticals Inc. | 1,143 | 8 |
| * Ra Pharmaceuticals Inc. | 670 | 8 |
| * Ardelyx Inc. | 1,842 | 8 |
| * Lannett Co. Inc. | 1,456 | 8 |
| * Teligent Inc. | 1,909 | 8 |
| * Sienna Biopharmaceuticals Inc. | 461 | 8 |
| * Selecta Biosciences Inc. | 565 | 8 |
| * Achaogen Inc. | 1,434 | 8 |
| * Syros Pharmaceuticals Inc. | 616 | 8 |
| * Ocular Therapeutix Inc. | 1,103 | 7 |
| * Organovo Holdings Inc. | 5,739 | 7 |
| * Corbus Pharmaceuticals Holdings Inc. | 1,186 | 7 |
| * Clearside Biomedical Inc. | 998 | 7 |
| * Tetraphase Pharmaceuticals Inc. | 1,892 | 7 |
| * Catalyst Pharmaceuticals Inc. | 1,977 | 7 |
| * Kala Pharmaceuticals Inc. | 485 | 7 |
| * Pulse Biosciences Inc. | 456 | 7 |
| * Endologix Inc. | 2,608 | 6 |
| * Athersys Inc. | 2,846 | 6 |
| * Neos Therapeutics Inc. | 936 | 5 |
| * NantKwest Inc. | 1,461 | 5 |
| * Mersana Therapeutics Inc. | 326 | 5 |
| ^ Innovate Biopharmaceuticals Inc. | 634 | 5 |
| * Dova Pharmaceuticals Inc. | 169 | 4 |
| * Nymox Pharmaceutical Corp. | 1,458 | 4 |
| * NewLink Genetics Corp. | 1,223 | 4 |
| * Flex Pharma Inc. | 7,510 | 4 |
| * Fortress Biotech Inc. | 1,698 | 3 |
| * Kiniksa Pharmaceuticals Ltd. Class A | 150 | 3 |
| Unum Therapeutics Inc. | 200 | 3 |
| Tricida Inc. | 100 | 3 |
| * Agenus Inc. | 1,289 | 3 |
| * Ampio Pharmaceuticals Inc. | 4,154 | 3 |
| Crinetics Pharmaceuticals Inc. | 80 | 2 |
| Avrobio Inc. | 69 | 2 |
| Evolus Inc. | 89 | 2 |
| Melinta Therapeutics Inc. | 476 | 2 |
| Aptinyx Inc. | 84 | 2 |
| UNITY Biotechnology Inc. | 100 | 2 |
| * Aquestive Therapeutics Inc. | 100 | 2 |
| * Rubius Therapeutics Inc. | 53 | 1 |
| Magenta Therapeutics Inc. | 75 | 1 |
| Forty Seven Inc. | 70 | 1 |
| * Neon Therapeutics Inc. | 68 | 1 |
| 179,467 | ||
| Materials & Processing (3.4%) | ||
| DowDuPont Inc. | 100,308 | 7,035 |
| Praxair Inc. | 12,378 | 1,958 |
| Ecolab Inc. | 11,042 | 1,662 |
| Sherwin-Williams Co. | 3,585 | 1,633 |
| Air Products & Chemicals Inc. | 9,565 | 1,591 |
| LyondellBasell Industries NV Class A | 13,845 | 1,561 |
| PPG Industries Inc. | 10,756 | 1,189 |
| Ingersoll-Rand plc | 10,703 | 1,084 |
| International Paper Co. | 17,868 | 914 |
| Freeport-McMoRan Inc. | 62,510 | 878 |
| Nucor Corp. | 13,774 | 861 |
| Fastenal Co. | 12,341 | 720 |
| Newmont Mining Corp. | 22,918 | 711 |
| Celanese Corp. Class A | 5,754 | 672 |
| Vulcan Materials Co. | 5,655 | 627 |
29
| Vanguard® Russell 3000 Index Fund | ||
| Schedule of Investments | ||
| August 31, 2018 | ||
| Market | ||
| Value | ||
| Shares | ($000) | |
| Ball Corp. | 14,824 | 621 |
| WestRock Co. | 10,978 | 605 |
| Eastman Chemical Co. | 6,067 | 589 |
| Martin Marietta Materials Inc. | 2,665 | 530 |
| CF Industries Holdings Inc. | 9,884 | 513 |
| Masco Corp. | 13,417 | 509 |
| FMC Corp. | 5,681 | 485 |
| Mosaic Co. | 15,016 | 470 |
| Albemarle Corp. | 4,693 | 448 |
| Steel Dynamics Inc. | 9,743 | 446 |
| International Flavors & Fragrances Inc. | 3,359 | 438 |
| Packaging Corp. of America | 3,980 | 437 |
| RPM International Inc. | 5,672 | 383 |
| * Alcoa Corp. | 8,120 | 363 |
| Chemours Co. | 7,820 | 341 |
| Lennox International Inc. | 1,487 | 331 |
| Huntsman Corp. | 9,513 | 290 |
| * Axalta Coating Systems Ltd. | 9,157 | 279 |
| * Berry Global Group Inc. | 5,800 | 277 |
| AptarGroup Inc. | 2,620 | 274 |
| Sealed Air Corp. | 6,759 | 271 |
| Owens Corning | 4,726 | 268 |
| Acuity Brands Inc. | 1,742 | 266 |
| Reliance Steel & Aluminum Co. | 2,916 | 256 |
| Hexcel Corp. | 3,714 | 246 |
| * Crown Holdings Inc. | 5,645 | 242 |
| Sonoco Products Co. | 4,297 | 241 |
| Watsco Inc. | 1,369 | 240 |
| United States Steel Corp. | 7,887 | 234 |
| Ashland Global Holdings Inc. | 2,717 | 229 |
| Olin Corp. | 7,183 | 221 |
| Royal Gold Inc. | 2,837 | 216 |
| * Trex Co. Inc. | 2,406 | 204 |
| WR Grace & Co. | 2,812 | 199 |
| Bemis Co. Inc. | 4,009 | 198 |
| Graphic Packaging Holding Co. | 13,654 | 194 |
| * Ingevity Corp. | 1,859 | 188 |
| Versum Materials Inc. | 4,605 | 183 |
| Eagle Materials Inc. | 1,967 | 182 |
| Louisiana-Pacific Corp. | 6,072 | 177 |
| Cabot Corp. | 2,506 | 163 |
| Southern Copper Corp. | 3,543 | 155 |
| PolyOne Corp. | 3,580 | 151 |
| * USG Corp. | 3,469 | 149 |
| Westlake Chemical Corp. | 1,571 | 149 |
| Trinseo SA | 1,919 | 148 |
| Timken Co. | 3,010 | 146 |
| Balchem Corp. | 1,313 | 146 |
| Simpson Manufacturing Co. Inc. | 1,832 | 141 |
| * RBC Bearings Inc. | 933 | 140 |
| * Allegheny Technologies Inc. | 5,164 | 140 |
| Valmont Industries Inc. | 978 | 137 |
| NewMarket Corp. | 340 | 136 |
| Belden Inc. | 1,855 | 135 |
| * Univar Inc. | 4,843 | 135 |
| Scotts Miracle-Gro Co. | 1,788 | 134 |
| Domtar Corp. | 2,621 | 133 |
| KapStone Paper and Packaging Corp. | 3,868 | 133 |
| Sensient Technologies Corp. | 1,862 | 132 |
| HB Fuller Co. | 2,227 | 127 |
| * Owens-Illinois Inc. | 7,175 | 127 |
| * Platform Specialty Products Corp. | 9,516 | 126 |
| Carpenter Technology Corp. | 2,114 | 126 |
| * Cleveland-Cliffs Inc. | 12,429 | 125 |
30
| Vanguard® Russell 3000 Index Fund | ||
| Schedule of Investments | ||
| August 31, 2018 | ||
| Market | ||
| Value | ||
| Shares | ($000) | |
| * Rexnord Corp. | 4,198 | 122 |
| * Armstrong World Industries Inc. | 1,737 | 121 |
| Cabot Microelectronics Corp. | 1,005 | 113 |
| Universal Forest Products Inc. | 2,795 | 105 |
| * Beacon Roofing Supply Inc. | 2,788 | 103 |
| Silgan Holdings Inc. | 3,708 | 101 |
| Commercial Metals Co. | 4,668 | 101 |
| Minerals Technologies Inc. | 1,497 | 101 |
| * Summit Materials Inc. Class A | 4,630 | 98 |
| Worthington Industries Inc. | 2,010 | 94 |
| Comfort Systems USA Inc. | 1,616 | 93 |
| Compass Minerals International Inc. | 1,426 | 89 |
| Quaker Chemical Corp. | 491 | 88 |
| * Ferro Corp. | 3,826 | 84 |
| Kaiser Aluminum Corp. | 759 | 83 |
| * MRC Global Inc. | 3,950 | 81 |
| * GCP Applied Technologies Inc. | 3,210 | 81 |
| Stepan Co. | 879 | 78 |
| AAON Inc. | 1,904 | 77 |
| Mueller Industries Inc. | 2,376 | 76 |
| * Masonite International Corp. | 1,132 | 76 |
| US Silica Holdings Inc. | 3,549 | 75 |
| * JELD-WEN Holding Inc. | 3,056 | 74 |
| * Builders FirstSource Inc. | 4,695 | 73 |
| Innospec Inc. | 926 | 72 |
| Greif Inc. Class A | 1,228 | 68 |
| Tronox Ltd. Class A | 4,181 | 68 |
| Mueller Water Products Inc. Class A | 5,826 | 67 |
| Boise Cascade Co. | 1,512 | 66 |
| * Gibraltar Industries Inc. | 1,401 | 64 |
| * Continental Building Products Inc. | 1,701 | 63 |
| * Kraton Corp. | 1,334 | 63 |
| Advanced Drainage Systems Inc. | 1,968 | 62 |
| Neenah Inc. | 673 | 61 |
| * BMC Stock Holdings Inc. | 2,716 | 61 |
| * Patrick Industries Inc. | 947 | 61 |
| * AK Steel Holding Corp. | 13,142 | 58 |
| Hecla Mining Co. | 20,421 | 58 |
| Materion Corp. | 872 | 56 |
| Schweitzer-Mauduit International Inc. | 1,360 | 55 |
| Interface Inc. Class A | 2,207 | 52 |
| Apogee Enterprises Inc. | 1,044 | 51 |
| * AdvanSix Inc. | 1,488 | 50 |
| KMG Chemicals Inc. | 628 | 49 |
| * Installed Building Products Inc. | 1,001 | 47 |
| * Tahoe Resources Inc. | 13,318 | 46 |
| Rayonier Advanced Materials Inc. | 2,192 | 46 |
| * Verso Corp. | 1,451 | 46 |
| Global Brass & Copper Holdings Inc. | 1,175 | 45 |
| * Coeur Mining Inc. | 7,856 | 45 |
| * PGT Innovations Inc. | 1,713 | 42 |
| GrafTech International Ltd. | 2,094 | 39 |
| Innophos Holdings Inc. | 880 | 38 |
| Insteel Industries Inc. | 986 | 38 |
| PH Glatfelter Co. | 1,961 | 38 |
| * Koppers Holdings Inc. | 1,019 | 36 |
| Tredegar Corp. | 1,644 | 36 |
| * US Concrete Inc. | 701 | 34 |
| FutureFuel Corp. | 2,116 | 31 |
| * GMS Inc. | 1,237 | 31 |
| Chase Corp. | 246 | 30 |
| * Century Aluminum Co. | 2,372 | 30 |
| * TimkenSteel Corp. | 2,083 | 29 |
| American Vanguard Corp. | 1,302 | 28 |
31
| Vanguard® Russell 3000 Index Fund | |||
| Schedule of Investments | |||
| August 31, 2018 | |||
| Market | |||
| Value | |||
| Shares | ($000) | ||
| * | NCI Building Systems Inc. | 1,671 | 28 |
| * | Unifi Inc. | 867 | 28 |
| Quanex Building Products Corp. | 1,669 | 27 | |
| DMC Global Inc. | 669 | 26 | |
| * | Veritiv Corp. | 533 | 25 |
| Schnitzer Steel Industries Inc. | 952 | 25 | |
| Griffon Corp. | 1,346 | 25 | |
| * | Armstrong Flooring Inc. | 1,340 | 23 |
| Myers Industries Inc. | 990 | 22 | |
| Kronos Worldwide Inc. | 1,086 | 22 | |
| * | Clearwater Paper Corp. | 748 | 22 |
| Haynes International Inc. | 543 | 21 | |
| Caesarstone Ltd. | 1,004 | 19 | |
| NN Inc. | 874 | 17 | |
| * | OMNOVA Solutions Inc. | 1,879 | 17 |
| * | Landec Corp. | 1,164 | 16 |
| * | Intrepid Potash Inc. | 4,576 | 16 |
| * | PQ Group Holdings Inc. | 825 | 15 |
| * | BlueLinx Holdings Inc. | 402 | 14 |
| * | Nexeo Solutions Inc. | 1,327 | 13 |
| Gold Resource Corp. | 2,491 | 13 | |
| * | Universal Stainless & Alloy Products Inc. | 423 | 13 |
| Hawkins Inc. | 306 | 13 | |
| * | Energy Fuels Inc. | 3,791 | 12 |
| Omega Flex Inc. | 136 | 12 | |
| * | Uranium Energy Corp. | 6,859 | 12 |
| Ardagh Group SA | 712 | 11 | |
| * | UFP Technologies Inc. | 307 | 11 |
| * | LB Foster Co. Class A | 401 | 9 |
| Culp Inc. | 357 | 9 | |
| * | LSB Industries Inc. | 1,010 | 9 |
| * | Forterra Inc. | 999 | 8 |
| * | Lawson Products Inc. | 219 | 7 |
| * | AgroFresh Solutions Inc. | 1,083 | 7 |
| * | Northwest Pipe Co. | 365 | 7 |
| Eastern Co. | 218 | 6 | |
| * | Shiloh Industries Inc. | 641 | 6 |
| United States Lime & Minerals Inc. | 59 | 4 | |
| Bloom Energy Corp. Class A | 70 | 2 | |
| *,§ | Ferroglobe R&W Trust | 4,465 | — |
| 44,253 | |||
| Other (0.0%)2 | |||
| *,§ | Dyax Corp. CVR Exp. 12/31/2019 | 6,727 | 27 |
| *,§ | Herbalife Ltd. CVR | 450 | 5 |
| *,§ | A Schulman Inc. CVR | 1,117 | 2 |
| * | Arlo Technologies Inc. | 67 | 1 |
| *,§ | Tobira Therapeutics CVR Exp. 12/31/2028 | 277 | 1 |
| *,§ | NewStar Financial Inc. | 943 | 1 |
| *,§ | Media General Inc. CVR | 5,133 | — |
| *,§ | Omthera Pharmaceuticals Inc. CVR | 152 | — |
| Brookfield Property Partners LP | 1 | — | |
| *,§ | Clinical Data CVR | 32 | — |
| 37 | |||
| Producer Durables (10.5%) | |||
| Boeing Co. | 23,708 | 8,127 | |
| 3M Co. | 24,923 | 5,257 | |
| Honeywell International Inc. | 32,191 | 5,120 | |
| Union Pacific Corp. | 33,187 | 4,999 | |
| General Electric Co. | 372,120 | 4,815 | |
| Accenture plc Class A | 27,775 | 4,696 | |
| United Technologies Corp. | 32,269 | 4,250 | |
| United Parcel Service Inc. Class B | 29,742 | 3,655 | |
| Caterpillar Inc. | 25,066 | 3,480 | |
| Lockheed Martin Corp. | 10,710 | 3,432 | |
32
| Vanguard® Russell 3000 Index Fund | ||
| Schedule of Investments | ||
| August 31, 2018 | ||
| Market | ||
| Value | ||
| Shares | ($000) | |
| Automatic Data Processing Inc. | 19,017 | 2,791 |
| CSX Corp. | 35,906 | 2,663 |
| FedEx Corp. | 10,700 | 2,610 |
| Raytheon Co. | 12,374 | 2,468 |
| General Dynamics Corp. | 11,196 | 2,165 |
| Norfolk Southern Corp. | 12,203 | 2,121 |
| Northrop Grumman Corp. | 6,983 | 2,084 |
| Emerson Electric Co. | 27,010 | 2,072 |
| Illinois Tool Works Inc. | 14,666 | 2,037 |
| Deere & Co. | 13,965 | 2,008 |
| Waste Management Inc. | 18,659 | 1,696 |
| Delta Air Lines Inc. | 27,993 | 1,637 |
| Eaton Corp. plc | 18,914 | 1,572 |
| Johnson Controls International plc | 39,888 | 1,507 |
| Southwest Airlines Co. | 22,986 | 1,409 |
| Roper Technologies Inc. | 4,316 | 1,288 |
| Fortive Corp. | 13,303 | 1,117 |
| Paychex Inc. | 14,126 | 1,035 |
| PACCAR Inc. | 14,678 | 1,004 |
| Parker-Hannifin Corp. | 5,718 | 1,004 |
| Rockwell Automation Inc. | 5,382 | 974 |
| Rockwell Collins Inc. | 7,063 | 960 |
| * United Continental Holdings Inc. | 10,769 | 941 |
| Cummins Inc. | 6,600 | 936 |
| Stanley Black & Decker Inc. | 6,614 | 929 |
| * Verisk Analytics Inc. Class A | 6,824 | 813 |
| Cintas Corp. | 3,709 | 791 |
| Textron Inc. | 10,970 | 757 |
| AMETEK Inc. | 9,818 | 756 |
| American Airlines Group Inc. | 18,129 | 734 |
| * TransDigm Group Inc. | 2,074 | 726 |
| Republic Services Inc. Class A | 9,781 | 718 |
| L3 Technologies Inc. | 3,353 | 717 |
| WW Grainger Inc. | 1,956 | 693 |
| * CoStar Group Inc. | 1,530 | 676 |
| * Mettler-Toledo International Inc. | 1,109 | 648 |
| * Waters Corp. | 3,340 | 633 |
| Xylem Inc. | 7,616 | 578 |
| CH Robinson Worldwide Inc. | 5,981 | 575 |
| Dover Corp. | 6,594 | 566 |
| * United Rentals Inc. | 3,596 | 560 |
| Expeditors International of Washington Inc. | 7,599 | 557 |
| * Copart Inc. | 8,655 | 557 |
| * XPO Logistics Inc. | 5,024 | 535 |
| * Keysight Technologies Inc. | 8,003 | 519 |
| Kansas City Southern | 4,478 | 519 |
| IDEX Corp. | 3,229 | 495 |
| Huntington Ingalls Industries Inc. | 1,885 | 461 |
| JB Hunt Transport Services Inc. | 3,720 | 449 |
| * Trimble Inc. | 10,589 | 446 |
| Old Dominion Freight Line Inc. | 2,858 | 436 |
| Snap-on Inc. | 2,423 | 428 |
| Spirit AeroSystems Holdings Inc. Class A | 4,890 | 418 |
| Arconic Inc. | 18,669 | 418 |
| Robert Half International Inc. | 5,194 | 406 |
| Wabtec Corp. | 3,737 | 405 |
| Avery Dennison Corp. | 3,776 | 397 |
| Jacobs Engineering Group Inc. | 5,425 | 394 |
| * Zebra Technologies Corp. | 2,285 | 392 |
| * Sensata Technologies Holding plc | 7,323 | 388 |
| FLIR Systems Inc. | 5,901 | 370 |
| * HD Supply Holdings Inc. | 7,946 | 362 |
| AO Smith Corp. | 6,162 | 358 |
| Allegion plc | 4,083 | 356 |
33
| Vanguard® Russell 3000 Index Fund | ||
| Schedule of Investments | ||
| August 31, 2018 | ||
| Market | ||
| Value | ||
| Shares | ($000) | |
| Nordson Corp. | 2,522 | 351 |
| Alaska Air Group Inc. | 5,122 | 346 |
| * Teledyne Technologies Inc. | 1,454 | 345 |
| Fluor Corp. | 5,934 | 341 |
| Graco Inc. | 6,935 | 326 |
| Carlisle Cos. Inc. | 2,534 | 321 |
| Booz Allen Hamilton Holding Corp. Class A | 6,182 | 316 |
| Pentair plc | 6,912 | 301 |
| Hubbell Inc. Class B | 2,350 | 297 |
| Flowserve Corp. | 5,627 | 293 |
| Donaldson Co. Inc. | 5,632 | 285 |
| * Middleby Corp. | 2,327 | 283 |
| Toro Co. | 4,589 | 279 |
| Xerox Corp. | 9,867 | 275 |
| BWX Technologies Inc. | 4,432 | 272 |
| ManpowerGroup Inc. | 2,870 | 269 |
| Lincoln Electric Holdings Inc. | 2,781 | 262 |
| Allison Transmission Holdings Inc. | 5,156 | 256 |
| * JetBlue Airways Corp. | 13,338 | 254 |
| Curtiss-Wright Corp. | 1,885 | 252 |
| Rollins Inc. | 3,956 | 238 |
| * Genesee & Wyoming Inc. Class A | 2,663 | 234 |
| Trinity Industries Inc. | 6,483 | 232 |
| * Kirby Corp. | 2,590 | 226 |
| * AECOM | 6,706 | 226 |
| National Instruments Corp. | 4,723 | 226 |
| Littelfuse Inc. | 1,004 | 224 |
| Oshkosh Corp. | 3,128 | 220 |
| * Quanta Services Inc. | 6,332 | 219 |
| ITT Inc. | 3,667 | 217 |
| HEICO Corp. Class A | 2,905 | 216 |
| Landstar System Inc. | 1,853 | 215 |
| * Stericycle Inc. | 3,468 | 214 |
| Insperity Inc. | 1,781 | 213 |
| EMCOR Group Inc. | 2,566 | 206 |
| * ASGN Inc. | 2,210 | 205 |
| Crane Co. | 2,191 | 200 |
| * Conduent Inc. | 8,586 | 199 |
| Air Lease Corp. Class A | 4,276 | 198 |
| Genpact Ltd. | 6,397 | 196 |
| nVent Electric plc | 6,874 | 193 |
| Knight-Swift Transportation Holdings Inc. | 5,583 | 191 |
| MAXIMUS Inc. | 2,679 | 178 |
| Ryder System Inc. | 2,317 | 178 |
| Woodward Inc. | 2,209 | 178 |
| Brink's Co. | 2,301 | 173 |
| Tetra Tech Inc. | 2,429 | 170 |
| HEICO Corp. | 1,863 | 169 |
| * Proto Labs Inc. | 1,086 | 169 |
| * KLX Inc. | 2,282 | 168 |
| AGCO Corp. | 2,736 | 163 |
| EnerSys | 1,915 | 159 |
| Macquarie Infrastructure Corp. | 3,360 | 158 |
| * Axon Enterprise Inc. | 2,295 | 157 |
| Regal Beloit Corp. | 1,870 | 157 |
| Korn/Ferry International | 2,309 | 155 |
| John Bean Technologies Corp. | 1,305 | 154 |
| * Clean Harbors Inc. | 2,242 | 154 |
| MSC Industrial Direct Co. Inc. Class A | 1,798 | 154 |
| * Generac Holdings Inc. | 2,703 | 150 |
| Barnes Group Inc. | 2,191 | 149 |
| * Spirit Airlines Inc. | 3,044 | 145 |
| Kennametal Inc. | 3,476 | 142 |
| * Darling Ingredients Inc. | 7,158 | 142 |
34
| Vanguard® Russell 3000 Index Fund | ||
| Schedule of Investments | ||
| August 31, 2018 | ||
| Market | ||
| Value | ||
| Shares | ($000) | |
| MSA Safety Inc. | 1,374 | 139 |
| SkyWest Inc. | 2,115 | 138 |
| Hillenbrand Inc. | 2,574 | 132 |
| * WESCO International Inc. | 2,119 | 130 |
| GATX Corp. | 1,514 | 128 |
| Deluxe Corp. | 2,136 | 126 |
| Terex Corp. | 3,194 | 124 |
| * Colfax Corp. | 3,536 | 123 |
| * MasTec Inc. | 2,810 | 123 |
| Healthcare Services Group Inc. | 2,960 | 122 |
| Exponent Inc. | 2,328 | 122 |
| * Gardner Denver Holdings Inc. | 4,251 | 119 |
| * Welbilt Inc. | 5,318 | 118 |
| Applied Industrial Technologies Inc. | 1,525 | 117 |
| KBR Inc. | 5,493 | 115 |
| UniFirst Corp. | 610 | 113 |
| * FTI Consulting Inc. | 1,445 | 110 |
| Copa Holdings SA Class A | 1,372 | 110 |
| Moog Inc. Class A | 1,378 | 109 |
| * Dycom Industries Inc. | 1,295 | 109 |
| * Harsco Corp. | 3,803 | 107 |
| ABM Industries Inc. | 3,285 | 104 |
| Herman Miller Inc. | 2,688 | 103 |
| * Chart Industries Inc. | 1,351 | 102 |
| * TriNet Group Inc. | 1,719 | 102 |
| * Esterline Technologies Corp. | 1,181 | 101 |
| Franklin Electric Co. Inc. | 2,066 | 101 |
| * TopBuild Corp. | 1,603 | 100 |
| Watts Water Technologies Inc. Class A | 1,194 | 98 |
| * Itron Inc. | 1,471 | 98 |
| * WageWorks Inc. | 1,817 | 97 |
| * Aerojet Rocketdyne Holdings Inc. | 2,758 | 97 |
| * Paylocity Holding Corp. | 1,207 | 96 |
| * Navistar International Corp. | 2,183 | 95 |
| * Advanced Energy Industries Inc. | 1,580 | 94 |
| Hawaiian Holdings Inc. | 2,240 | 93 |
| Albany International Corp. | 1,197 | 92 |
| Convergys Corp. | 3,701 | 92 |
| * Advanced Disposal Services Inc. | 3,425 | 91 |
| * ExlService Holdings Inc. | 1,419 | 91 |
| Granite Construction Inc. | 1,950 | 89 |
| Covanta Holding Corp. | 4,993 | 88 |
| HNI Corp. | 1,996 | 88 |
| Cubic Corp. | 1,144 | 87 |
| Forward Air Corp. | 1,341 | 86 |
| * Saia Inc. | 1,076 | 85 |
| Raven Industries Inc. | 1,674 | 81 |
| Greenbrier Cos. Inc. | 1,394 | 81 |
| Mobile Mini Inc. | 1,880 | 81 |
| Actuant Corp. Class A | 2,712 | 80 |
| Brady Corp. Class A | 1,965 | 79 |
| * SPX FLOW Inc. | 1,654 | 79 |
| Triton International Ltd. | 2,072 | 78 |
| * Hub Group Inc. Class A | 1,447 | 76 |
| * Aerovironment Inc. | 849 | 75 |
| Federal Signal Corp. | 2,842 | 74 |
| Matson Inc. | 1,943 | 73 |
| AAR Corp. | 1,517 | 71 |
| EnPro Industries Inc. | 942 | 71 |
| * Electronics For Imaging Inc. | 2,025 | 70 |
| * Evoqua Water Technologies Corp. | 3,584 | 69 |
| Kaman Corp. | 1,064 | 69 |
| US Ecology Inc. | 943 | 69 |
| Badger Meter Inc. | 1,235 | 68 |
35
| Vanguard® Russell 3000 Index Fund | ||
| Schedule of Investments | ||
| August 31, 2018 | ||
| Market | ||
| Value | ||
| Shares | ($000) | |
| * SPX Corp. | 1,992 | 68 |
| ESCO Technologies Inc. | 993 | 67 |
| Werner Enterprises Inc. | 1,807 | 67 |
| ICF International Inc. | 816 | 67 |
| Allegiant Travel Co. Class A | 488 | 66 |
| AZZ Inc. | 1,153 | 62 |
| * OSI Systems Inc. | 793 | 62 |
| * Atlas Air Worldwide Holdings Inc. | 1,007 | 61 |
| ArcBest Corp. | 1,273 | 61 |
| Tennant Co. | 794 | 61 |
| Pitney Bowes Inc. | 8,315 | 60 |
| Standex International Corp. | 558 | 60 |
| Rush Enterprises Inc. Class A | 1,350 | 58 |
| * Milacron Holdings Corp. | 2,733 | 58 |
| ACCO Brands Corp. | 4,518 | 56 |
| * Herc Holdings Inc. | 1,056 | 56 |
| Sun Hydraulics Corp. | 1,102 | 55 |
| * Casella Waste Systems Inc. Class A | 1,951 | 55 |
| Heartland Express Inc. | 2,697 | 55 |
| * Sykes Enterprises Inc. | 1,816 | 55 |
| * Navigant Consulting Inc. | 2,253 | 54 |
| * SP Plus Corp. | 1,355 | 53 |
| Knoll Inc. | 2,190 | 52 |
| * TriMas Corp. | 1,678 | 52 |
| * TrueBlue Inc. | 1,750 | 51 |
| McGrath RentCorp | 870 | 50 |
| * CBIZ Inc. | 2,102 | 50 |
| Ship Finance International Ltd. | 3,533 | 50 |
| ^ Altra Industrial Motion Corp. | 1,279 | 50 |
| H&E Equipment Services Inc. | 1,415 | 49 |
| Wabash National Corp. | 2,621 | 48 |
| Encore Wire Corp. | 949 | 48 |
| Steelcase Inc. Class A | 3,218 | 47 |
| Lindsay Corp. | 490 | 47 |
| * Air Transport Services Group Inc. | 2,284 | 46 |
| * Tidewater Inc. | 1,435 | 46 |
| * Kratos Defense & Security Solutions Inc. | 3,433 | 46 |
| * Gates Industrial Corp. plc | 2,483 | 45 |
| * Vicor Corp. | 721 | 45 |
| Columbus McKinnon Corp. | 1,056 | 45 |
| Heidrick & Struggles International Inc. | 1,014 | 45 |
| ^ ADT Inc. | 4,995 | 45 |
| Triumph Group Inc. | 2,140 | 44 |
| Schneider National Inc. Class B | 1,627 | 44 |
| Douglas Dynamics Inc. | 958 | 44 |
| * Echo Global Logistics Inc. | 1,313 | 44 |
| * Huron Consulting Group Inc. | 880 | 44 |
| * Willscot Corp. Class A | 2,486 | 43 |
| Kadant Inc. | 424 | 43 |
| Aircastle Ltd. | 2,042 | 43 |
| Astec Industries Inc. | 873 | 42 |
| MTS Systems Corp. | 780 | 42 |
| * Thermon Group Holdings Inc. | 1,542 | 41 |
| * Atkore International Group Inc. | 1,493 | 41 |
| * FARO Technologies Inc. | 599 | 41 |
| Primoris Services Corp. | 1,618 | 41 |
| Marten Transport Ltd. | 1,832 | 40 |
| Briggs & Stratton Corp. | 1,960 | 39 |
| * Aegion Corp. Class A | 1,561 | 39 |
| Forrester Research Inc. | 789 | 39 |
| * CSW Industrials Inc. | 688 | 39 |
| * Astronics Corp. | 870 | 38 |
| * Control4 Corp. | 1,155 | 37 |
| * DXP Enterprises Inc. | 803 | 37 |
36
| Vanguard® Russell 3000 Index Fund | |||
| Schedule of Investments | |||
| August 31, 2018 | |||
| Market | |||
| Value | |||
| Shares | ($000) | ||
| Quad/Graphics Inc. | 1,581 | 36 | |
| * | Lydall Inc. | 819 | 35 |
| * | Tutor Perini Corp. | 1,721 | 35 |
| Kelly Services Inc. Class A | 1,378 | 35 | |
| * | NV5 Global Inc. | 387 | 34 |
| * | SEACOR Holdings Inc. | 660 | 34 |
| * | Modine Manufacturing Co. | 1,946 | 33 |
| Hyster-Yale Materials Handling Inc. | 525 | 32 | |
| Alamo Group Inc. | 339 | 32 | |
| * | Wesco Aircraft Holdings Inc. | 2,561 | 31 |
| Kforce Inc. | 736 | 31 | |
| * | Team Inc. | 1,280 | 30 |
| CIRCOR International Inc. | 654 | 30 | |
| Multi-Color Corp. | 479 | 30 | |
| Gorman-Rupp Co. | 793 | 29 | |
| Essendant Inc. | 2,014 | 29 | |
| Mesa Laboratories Inc. | 143 | 29 | |
| * | International Seaways Inc. | 1,395 | 29 |
| Kimball International Inc. Class B | 1,634 | 29 | |
| * | MYR Group Inc. | 818 | 28 |
| Manitowoc Co. Inc. | 1,224 | 28 | |
| * | Engility Holdings Inc. | 778 | 27 |
| Teekay Corp. | 3,953 | 27 | |
| Scorpio Tankers Inc. | 13,945 | 27 | |
| Argan Inc. | 655 | 26 | |
| Resources Connection Inc. | 1,556 | 26 | |
| Miller Industries Inc. | 848 | 24 | |
| Spartan Motors Inc. | 1,625 | 23 | |
| GasLog Ltd. | 1,390 | 23 | |
| Barrett Business Services Inc. | 308 | 23 | |
| * | CAI International Inc. | 840 | 23 |
| CRA International Inc. | 380 | 22 | |
| * | InnerWorkings Inc. | 2,742 | 21 |
| Ennis Inc. | 983 | 21 | |
| DHT Holdings Inc. | 4,570 | 21 | |
| Hackett Group Inc. | 1,044 | 21 | |
| * | CryoPort Inc. | 1,471 | 21 |
| * | Daseke Inc. | 2,286 | 21 |
| * | Frontline Ltd. | 3,761 | 20 |
| * | Ducommun Inc. | 499 | 20 |
| American Railcar Industries Inc. | 425 | 19 | |
| Systemax Inc. | 528 | 19 | |
| LSC Communications Inc. | 1,573 | 19 | |
| * | Covenant Transportation Group Inc. Class A | 640 | 19 |
| * | Textainer Group Holdings Ltd. | 1,260 | 19 |
| REV Group Inc. | 1,089 | 19 | |
| TTEC Holdings Inc. | 697 | 18 | |
| VSE Corp. | 464 | 18 | |
| * | Sterling Construction Co. Inc. | 1,217 | 18 |
| Titan International Inc. | 2,357 | 18 | |
| * | PHH Corp. | 1,612 | 17 |
| * | Vectrus Inc. | 527 | 17 |
| * | Gencor Industries Inc. | 1,296 | 17 |
| * | Bristow Group Inc. | 1,522 | 17 |
| *,^ | Plug Power Inc. | 8,445 | 17 |
| * | Energy Recovery Inc. | 1,662 | 16 |
| * | Blue Bird Corp. | 694 | 16 |
| Park-Ohio Holdings Corp. | 382 | 16 | |
| Powell Industries Inc. | 401 | 16 | |
| * | Mistras Group Inc. | 664 | 15 |
| Scorpio Bulkers Inc. | 2,207 | 15 | |
| * | Titan Machinery Inc. | 818 | 15 |
| * | Exela Technologies Inc. | 2,463 | 15 |
| * | Heritage-Crystal Clean Inc. | 628 | 15 |
37
| Vanguard® Russell 3000 Index Fund | |||
| Schedule of Investments | |||
| August 31, 2018 | |||
| Market | |||
| Value | |||
| Shares | ($000) | ||
| * | YRC Worldwide Inc. | 1,491 | 14 |
| Allied Motion Technologies Inc. | 292 | 14 | |
| RR Donnelley & Sons Co. | 2,785 | 14 | |
| * | Great Lakes Dredge & Dock Corp. | 2,437 | 13 |
| * | HC2 Holdings Inc. | 2,122 | 13 |
| Hurco Cos. Inc. | 306 | 13 | |
| * | Ardmore Shipping Corp. | 1,859 | 13 |
| Universal Logistics Holdings Inc. | 355 | 13 | |
| ConvergeOne Holdings Inc. | 1,395 | 13 | |
| Graham Corp. | 452 | 13 | |
| * | Orion Group Holdings Inc. | 1,426 | 12 |
| * | Liquidity Services Inc. | 1,689 | 12 |
| *,^ | Energous Corp. | 946 | 12 |
| * | ServiceSource International Inc. | 3,785 | 12 |
| * | Willdan Group Inc. | 374 | 12 |
| * | Commercial Vehicle Group Inc. | 1,175 | 11 |
| CECO Environmental Corp. | 1,327 | 11 | |
| * | Vishay Precision Group Inc. | 258 | 11 |
| Preformed Line Products Co. | 136 | 11 | |
| Advanced Emissions Solutions Inc. | 933 | 11 | |
| * | GP Strategies Corp. | 548 | 10 |
| Nordic American Tankers Ltd. | 4,539 | 10 | |
| * | FreightCar America Inc. | 583 | 10 |
| * | Twin Disc Inc. | 381 | 10 |
| * | Dorian LPG Ltd. | 1,258 | 10 |
| * | Eagle Bulk Shipping Inc. | 1,821 | 9 |
| EnviroStar Inc. | 183 | 9 | |
| Teekay Tankers Ltd. Class A | 7,173 | 8 | |
| NACCO Industries Inc. Class A | 220 | 8 | |
| BrightView Holdings Inc. | 425 | 8 | |
| * | Radiant Logistics Inc. | 1,707 | 7 |
| * | Overseas Shipholding Group Inc. Class A | 2,128 | 7 |
| * | Information Services Group Inc. | 1,467 | 7 |
| * | IES Holdings Inc. | 373 | 7 |
| * | Hill International Inc. | 1,657 | 7 |
| Costamare Inc. | 952 | 7 | |
| Marlin Business Services Corp. | 219 | 6 | |
| * | PHI Inc. | 724 | 6 |
| * | Genco Shipping & Trading Ltd. | 354 | 5 |
| BG Staffing Inc. | 165 | 4 | |
| * | Safe Bulkers Inc. | 1,425 | 4 |
| 135,360 | |||
| Technology (21.4%) | |||
| Apple Inc. | 212,151 | 48,292 | |
| Microsoft Corp. | 326,788 | 36,708 | |
| * | Facebook Inc. Class A | 102,571 | 18,025 |
| * | Alphabet Inc. Class C | 13,122 | 15,985 |
| * | Alphabet Inc. Class A | 12,929 | 15,926 |
| Cisco Systems Inc. | 208,248 | 9,948 | |
| Intel Corp. | 201,328 | 9,750 | |
| NVIDIA Corp. | 25,149 | 7,059 | |
| Oracle Corp. | 124,001 | 6,024 | |
| International Business Machines Corp. | 39,640 | 5,806 | |
| * | Adobe Systems Inc. | 21,190 | 5,584 |
| Texas Instruments Inc. | 42,349 | 4,760 | |
| * | salesforce.com Inc. | 30,636 | 4,677 |
| QUALCOMM Inc. | 60,870 | 4,182 | |
| Broadcom Inc. | 18,635 | 4,082 | |
| * | Micron Technology Inc. | 49,956 | 2,624 |
| Activision Blizzard Inc. | 32,430 | 2,338 | |
| Intuit Inc. | 10,610 | 2,329 | |
| Cognizant Technology Solutions Corp. Class A | 25,180 | 1,975 | |
| Applied Materials Inc. | 45,587 | 1,961 | |
| HP Inc. | 70,543 | 1,739 | |
38
| Vanguard® Russell 3000 Index Fund | ||
| Schedule of Investments | ||
| August 31, 2018 | ||
| Market | ||
| Value | ||
| Shares | ($000) | |
| Analog Devices Inc. | 15,835 | 1,565 |
| * ServiceNow Inc. | 7,499 | 1,472 |
| * Electronic Arts Inc. | 12,959 | 1,470 |
| * Autodesk Inc. | 9,430 | 1,456 |
| * NXP Semiconductors NV | 14,865 | 1,385 |
| Lam Research Corp. | 7,086 | 1,226 |
| Amphenol Corp. Class A | 12,682 | 1,199 |
| Corning Inc. | 35,354 | 1,185 |
| DXC Technology Co. | 12,278 | 1,118 |
| * Red Hat Inc. | 7,527 | 1,112 |
| Hewlett Packard Enterprise Co. | 66,470 | 1,099 |
| * Twitter Inc. | 30,587 | 1,076 |
| NetApp Inc. | 11,522 | 1,000 |
| * Advanced Micro Devices Inc. | 38,799 | 977 |
| * Workday Inc. Class A | 6,273 | 969 |
| * IHS Markit Ltd. | 17,210 | 947 |
| Motorola Solutions Inc. | 7,038 | 903 |
| * Palo Alto Networks Inc. | 3,779 | 873 |
| Xilinx Inc. | 10,975 | 854 |
| Microchip Technology Inc. | 9,910 | 853 |
| Harris Corp. | 5,135 | 834 |
| * Dell Technologies Inc. Class V | 8,518 | 819 |
| Western Digital Corp. | 12,809 | 810 |
| * Splunk Inc. | 6,281 | 805 |
| KLA-Tencor Corp. | 6,733 | 782 |
| * Arista Networks Inc. | 2,459 | 735 |
| * VeriSign Inc. | 4,573 | 725 |
| Maxim Integrated Products Inc. | 11,979 | 724 |
| Skyworks Solutions Inc. | 7,792 | 711 |
| * ANSYS Inc. | 3,536 | 658 |
| * Synopsys Inc. | 6,404 | 654 |
| * Citrix Systems Inc. | 5,711 | 651 |
| * Take-Two Interactive Software Inc. | 4,856 | 649 |
| * IAC/InterActiveCorp | 3,230 | 637 |
| CA Inc. | 13,450 | 589 |
| * Gartner Inc. | 3,799 | 569 |
| * GrubHub Inc. | 3,853 | 555 |
| * Cadence Design Systems Inc. | 11,770 | 554 |
| CDW Corp. | 6,272 | 549 |
| * GoDaddy Inc. Class A | 6,597 | 537 |
| Symantec Corp. | 26,384 | 532 |
| SS&C Technologies Holdings Inc. | 8,878 | 527 |
| * Akamai Technologies Inc. | 6,990 | 525 |
| * F5 Networks Inc. | 2,620 | 495 |
| * PTC Inc. | 4,896 | 489 |
| * Fortinet Inc. | 5,783 | 484 |
| Marvell Technology Group Ltd. | 23,159 | 479 |
| * VMware Inc. Class A | 2,979 | 457 |
| Leidos Holdings Inc. | 6,172 | 437 |
| * Qorvo Inc. | 5,384 | 431 |
| Juniper Networks Inc. | 14,686 | 418 |
| * Ultimate Software Group Inc. | 1,315 | 407 |
| * Tyler Technologies Inc. | 1,633 | 403 |
| Amdocs Ltd. | 6,131 | 400 |
| Cognex Corp. | 7,156 | 385 |
| * ON Semiconductor Corp. | 17,884 | 382 |
| * Guidewire Software Inc. | 3,536 | 356 |
| * Aspen Technology Inc. | 3,054 | 352 |
| CDK Global Inc. | 5,623 | 350 |
| Teradyne Inc. | 8,405 | 346 |
| * Atlassian Corp. plc Class A | 3,845 | 346 |
| * Tableau Software Inc. Class A | 3,014 | 337 |
| * Black Knight Inc. | 6,124 | 327 |
| * Paycom Software Inc. | 2,100 | 326 |
39
| Vanguard® Russell 3000 Index Fund | ||
| Schedule of Investments | ||
| August 31, 2018 | ||
| Market | ||
| Value | ||
| Shares | ($000) | |
| * EPAM Systems Inc. | 2,115 | 302 |
| * Zendesk Inc. | 4,366 | 301 |
| * Arrow Electronics Inc. | 3,835 | 297 |
| Cypress Semiconductor Corp. | 16,306 | 281 |
| Sabre Corp. | 10,743 | 280 |
| * Proofpoint Inc. | 2,303 | 273 |
| * IPG Photonics Corp. | 1,548 | 272 |
| * RingCentral Inc. Class A | 2,798 | 261 |
| * Twilio Inc. Class A | 3,160 | 255 |
| * CommScope Holding Co. Inc. | 7,990 | 253 |
| * Nutanix Inc. | 4,391 | 247 |
| Monolithic Power Systems Inc. | 1,647 | 247 |
| * Integrated Device Technology Inc. | 5,675 | 241 |
| Avnet Inc. | 4,977 | 241 |
| * Okta Inc. | 3,839 | 237 |
| * HubSpot Inc. | 1,617 | 232 |
| Universal Display Corp. | 1,807 | 221 |
| MKS Instruments Inc. | 2,347 | 218 |
| Jabil Inc. | 7,213 | 213 |
| Blackbaud Inc. | 2,032 | 212 |
| Entegris Inc. | 6,265 | 212 |
| * Teradata Corp. | 5,070 | 210 |
| * New Relic Inc. | 2,013 | 207 |
| * Cree Inc. | 4,208 | 202 |
| * Nuance Communications Inc. | 12,388 | 202 |
| * Ciena Corp. | 6,363 | 201 |
| * Coherent Inc. | 1,051 | 200 |
| * RealPage Inc. | 3,205 | 200 |
| Dolby Laboratories Inc. Class A | 2,803 | 197 |
| * Pure Storage Inc. Class A | 7,327 | 197 |
| * CACI International Inc. Class A | 998 | 195 |
| * ARRIS International plc | 7,424 | 192 |
| LogMeIn Inc. | 2,225 | 191 |
| * Lumentum Holdings Inc. | 2,632 | 179 |
| * Silicon Laboratories Inc. | 1,816 | 178 |
| * Manhattan Associates Inc. | 3,055 | 177 |
| * Coupa Software Inc. | 2,433 | 174 |
| Science Applications International Corp. | 1,802 | 163 |
| * Semtech Corp. | 2,679 | 160 |
| * Acxiom Corp. | 3,455 | 158 |
| * Yelp Inc. Class A | 3,298 | 155 |
| * Ellie Mae Inc. | 1,473 | 155 |
| * ViaSat Inc. | 2,381 | 150 |
| * ACI Worldwide Inc. | 5,260 | 149 |
| * NCR Corp. | 5,259 | 149 |
| * Qualys Inc. | 1,566 | 143 |
| * Box Inc. | 5,711 | 140 |
| Perspecta Inc. | 6,008 | 140 |
| * iRobot Corp. | 1,217 | 138 |
| Vishay Intertechnology Inc. | 5,667 | 135 |
| * Verint Systems Inc. | 2,765 | 134 |
| * Zynga Inc. Class A | 31,440 | 131 |
| * II-VI Inc. | 2,576 | 128 |
| * FireEye Inc. | 7,588 | 126 |
| * Five9 Inc. | 2,553 | 123 |
| * Cornerstone OnDemand Inc. | 2,165 | 122 |
| * CommVault Systems Inc. | 1,751 | 122 |
| InterDigital Inc. | 1,476 | 122 |
| * Cirrus Logic Inc. | 2,704 | 119 |
| * Mercury Systems Inc. | 2,163 | 118 |
| SYNNEX Corp. | 1,191 | 115 |
| * Match Group Inc. | 2,307 | 115 |
| * Envestnet Inc. | 1,797 | 114 |
| * Q2 Holdings Inc. | 1,797 | 112 |
40
| Vanguard® Russell 3000 Index Fund | ||
| Schedule of Investments | ||
| August 31, 2018 | ||
| Market | ||
| Value | ||
| Shares | ($000) | |
| * Tech Data Corp. | 1,531 | 111 |
| * Avaya Holdings Corp. | 4,695 | 110 |
| * Rogers Corp. | 794 | 110 |
| * Cargurus Inc. | 2,201 | 109 |
| * Bottomline Technologies DE Inc. | 1,623 | 107 |
| * Viavi Solutions Inc. | 9,493 | 106 |
| Brooks Automation Inc. | 2,645 | 104 |
| Plantronics Inc. | 1,541 | 104 |
| * NETGEAR Inc. | 1,439 | 102 |
| Pegasystems Inc. | 1,600 | 102 |
| * Varonis Systems Inc. | 1,365 | 101 |
| * Sanmina Corp. | 3,237 | 100 |
| * Finisar Corp. | 4,782 | 98 |
| * Novanta Inc. | 1,250 | 96 |
| * Yext Inc. | 3,733 | 93 |
| * 3D Systems Corp. | 4,550 | 93 |
| * Anixter International Inc. | 1,274 | 92 |
| * EchoStar Corp. Class A | 1,908 | 92 |
| Ebix Inc. | 1,087 | 87 |
| * Plexus Corp. | 1,364 | 86 |
| * NetScout Systems Inc. | 3,452 | 86 |
| Power Integrations Inc. | 1,175 | 86 |
| * Groupon Inc. Class A | 20,153 | 86 |
| * Insight Enterprises Inc. | 1,558 | 86 |
| ManTech International Corp. Class A | 1,253 | 83 |
| * TTM Technologies Inc. | 4,370 | 82 |
| Progress Software Corp. | 1,913 | 78 |
| Ubiquiti Networks Inc. | 872 | 78 |
| * Rapid7 Inc. | 2,043 | 78 |
| Maxar Technologies Ltd. | 2,506 | 78 |
| * Evolent Health Inc. Class A | 3,025 | 77 |
| * Virtusa Corp. | 1,290 | 75 |
| * SPS Commerce Inc. | 761 | 75 |
| * DocuSign Inc. | 1,185 | 74 |
| * Fabrinet | 1,545 | 74 |
| * Knowles Corp. | 4,017 | 73 |
| * Synaptics Inc. | 1,506 | 73 |
| * Blucora Inc. | 2,005 | 73 |
| * Alarm.com Holdings Inc. | 1,266 | 71 |
| * LivePerson Inc. | 2,648 | 71 |
| * Apptio Inc. Class A | 1,832 | 71 |
| TiVo Corp. | 5,185 | 71 |
| * Oclaro Inc. | 7,408 | 71 |
| * Alteryx Inc. Class A | 1,214 | 70 |
| * Diodes Inc. | 1,781 | 68 |
| * Hortonworks Inc. | 2,989 | 67 |
| * MINDBODY Inc. Class A | 1,790 | 66 |
| * Imperva Inc. | 1,407 | 66 |
| * Blackline Inc. | 1,245 | 66 |
| * Everbridge Inc. | 1,062 | 64 |
| * GTT Communications Inc. | 1,482 | 64 |
| * Inphi Corp. | 1,719 | 64 |
| Methode Electronics Inc. | 1,595 | 63 |
| * ePlus Inc. | 586 | 61 |
| * Rambus Inc. | 4,960 | 61 |
| * Syntel Inc. | 1,447 | 59 |
| * KEMET Corp. | 2,213 | 57 |
| * Cloudera Inc. | 3,777 | 57 |
| * MicroStrategy Inc. Class A | 380 | 57 |
| * Ambarella Inc. | 1,446 | 55 |
| * Nanometrics Inc. | 1,261 | 55 |
| Benchmark Electronics Inc. | 2,132 | 55 |
| * Infinera Corp. | 6,009 | 54 |
| * FormFactor Inc. | 3,444 | 53 |
41
| Vanguard® Russell 3000 Index Fund | ||
| Schedule of Investments | ||
| August 31, 2018 | ||
| Market | ||
| Value | ||
| Shares | ($000) | |
| Altair Engineering Inc. Class A | 1,246 | 52 |
| * Carbonite Inc. | 1,247 | 52 |
| * Stratasys Ltd. | 2,070 | 52 |
| * Appfolio Inc. | 596 | 51 |
| * Acacia Communications Inc. | 1,220 | 50 |
| * SailPoint Technologies Holding Inc. | 1,600 | 49 |
| * Web.com Group Inc. | 1,761 | 49 |
| * ForeScout Technologies Inc. | 1,361 | 49 |
| * MaxLinear Inc. | 2,537 | 49 |
| * ScanSource Inc. | 1,200 | 49 |
| * Unisys Corp. | 2,621 | 49 |
| * Lattice Semiconductor Corp. | 5,942 | 49 |
| * Vocera Communications Inc. | 1,458 | 48 |
| * PROS Holdings Inc. | 1,298 | 48 |
| AVX Corp. | 2,259 | 48 |
| NIC Inc. | 2,825 | 47 |
| CSG Systems International Inc. | 1,263 | 47 |
| * Cision Ltd. | 2,494 | 45 |
| * Workiva Inc. | 1,221 | 45 |
| Comtech Telecommunications Corp. | 1,250 | 45 |
| * MACOM Technology Solutions Holdings Inc. | 1,933 | 45 |
| Ceridian HCM Holding Inc. | 1,157 | 45 |
| * USA Technologies Inc. | 2,645 | 43 |
| * Perficient Inc. | 1,491 | 43 |
| * Amkor Technology Inc. | 4,618 | 40 |
| * Cray Inc. | 1,815 | 39 |
| * Rudolph Technologies Inc. | 1,394 | 39 |
| * TrueCar Inc. | 3,013 | 39 |
| CTS Corp. | 1,037 | 38 |
| ADTRAN Inc. | 2,182 | 38 |
| * Glu Mobile Inc. | 4,834 | 37 |
| * Upland Software Inc. | 978 | 36 |
| American Software Inc. Class A | 2,022 | 36 |
| Monotype Imaging Holdings Inc. | 1,746 | 36 |
| * CalAmp Corp. | 1,466 | 34 |
| Xperi Corp. | 2,150 | 34 |
| * OneSpan Inc. | 1,772 | 33 |
| * Benefitfocus Inc. | 746 | 33 |
| * Extreme Networks Inc. | 5,184 | 32 |
| * Applied Optoelectronics Inc. | 785 | 32 |
| ^ Zscaler Inc. | 756 | 32 |
| Cohu Inc. | 1,178 | 31 |
| * Electro Scientific Industries Inc. | 1,385 | 30 |
| * CEVA Inc. | 992 | 30 |
| * Photronics Inc. | 2,835 | 30 |
| * Inovalon Holdings Inc. Class A | 2,717 | 30 |
| NVE Corp. | 254 | 29 |
| * Ichor Holdings Ltd. | 1,105 | 29 |
| * Endurance International Group Holdings Inc. | 2,810 | 27 |
| * Tucows Inc. Class A | 458 | 27 |
| QAD Inc. Class A | 430 | 26 |
| * Xcerra Corp. | 1,781 | 26 |
| * Ultra Clean Holdings Inc. | 1,613 | 25 |
| * Kimball Electronics Inc. | 1,243 | 25 |
| * Veeco Instruments Inc. | 1,975 | 24 |
| Switch Inc. | 2,009 | 23 |
| * TechTarget Inc. | 911 | 22 |
| * PlayAGS Inc. | 648 | 21 |
| * Loral Space & Communications Inc. | 467 | 21 |
| * Harmonic Inc. | 3,722 | 20 |
| * Axcelis Technologies Inc. | 981 | 20 |
| * Limelight Networks Inc. | 3,871 | 20 |
| * A10 Networks Inc. | 2,702 | 19 |
| * Quantenna Communications Inc. | 1,022 | 19 |
42
| Vanguard® Russell 3000 Index Fund | ||
| Schedule of Investments | ||
| August 31, 2018 | ||
| Market | ||
| Value | ||
| Shares | ($000) | |
| * Impinj Inc. | 868 | 19 |
| PC Connection Inc. | 468 | 19 |
| * Ribbon Communications Inc. | 2,678 | 19 |
| * KeyW Holding Corp. | 2,149 | 18 |
| * Model N Inc. | 1,067 | 18 |
| * PAR Technology Corp. | 691 | 18 |
| * pdvWireless Inc. | 566 | 17 |
| Park Electrochemical Corp. | 777 | 17 |
| * ShotSpotter Inc. | 290 | 17 |
| * Meet Group Inc. | 3,237 | 16 |
| * PolarityTE Inc. | 562 | 16 |
| * Digi International Inc. | 1,191 | 16 |
| * ChannelAdvisor Corp. | 1,206 | 16 |
| * Calix Inc. | 2,008 | 16 |
| * SendGrid Inc. | 417 | 15 |
| * Alpha & Omega Semiconductor Ltd. | 1,064 | 15 |
| * Immersion Corp. | 1,279 | 15 |
| * NeoPhotonics Corp. | 1,689 | 15 |
| Diebold Nixdorf Inc. | 3,110 | 15 |
| * Zix Corp. | 2,658 | 15 |
| Bel Fuse Inc. Class B | 501 | 14 |
| * Digimarc Corp. | 471 | 14 |
| * Ooma Inc. | 868 | 14 |
| * eGain Corp. | 949 | 14 |
| * Brightcove Inc. | 1,624 | 13 |
| * MobileIron Inc. | 2,704 | 13 |
| nLight Inc. | 419 | 13 |
| * Aquantia Corp. | 1,000 | 13 |
| Simulations Plus Inc. | 591 | 12 |
| Daktronics Inc. | 1,470 | 12 |
| * Casa Systems Inc. | 809 | 12 |
| * Telenav Inc. | 1,968 | 11 |
| * Mitek Systems Inc. | 1,508 | 11 |
| Turtle Beach Corp. | 454 | 10 |
| * Presidio Inc. | 683 | 10 |
| * KVH Industries Inc. | 798 | 10 |
| Reis Inc. | 424 | 10 |
| * AXT Inc. | 1,218 | 10 |
| * PDF Solutions Inc. | 1,086 | 9 |
| Internap Corp. | 700 | 9 |
| * Acacia Research Corp. | 2,241 | 9 |
| * Avid Technology Inc. | 1,471 | 9 |
| * Amber Road Inc. | 968 | 8 |
| * VirnetX Holding Corp. | 2,500 | 8 |
| * Kopin Corp. | 3,357 | 8 |
| * Leaf Group Ltd. | 607 | 7 |
| * SMART Global Holdings Inc. | 190 | 6 |
| * Iteris Inc. | 1,125 | 6 |
| * Aerohive Networks Inc. | 1,333 | 6 |
| * Pluralsight Inc. Class A | 110 | 4 |
| Domo Inc. | 150 | 4 |
| * Veritone Inc. | 151 | 2 |
| EverQuote Inc. Class A | 67 | 1 |
| 276,115 | ||
| Utilities (4.6%) | ||
| AT&T Inc. | 313,591 | 10,016 |
| Verizon Communications Inc. | 178,455 | 9,703 |
| NextEra Energy Inc. | 20,235 | 3,442 |
| Duke Energy Corp. | 30,062 | 2,442 |
| Dominion Energy Inc. | 28,103 | 1,989 |
| Southern Co. | 43,772 | 1,916 |
| Exelon Corp. | 41,616 | 1,819 |
| American Electric Power Co. Inc. | 21,359 | 1,532 |
| Sempra Energy | 11,444 | 1,328 |
43
| Vanguard® Russell 3000 Index Fund | ||
| Schedule of Investments | ||
| August 31, 2018 | ||
| Market | ||
| Value | ||
| Shares | ($000) | |
| Public Service Enterprise Group Inc. | 21,611 | 1,131 |
| Consolidated Edison Inc. | 13,576 | 1,072 |
| Xcel Energy Inc. | 21,801 | 1,048 |
| PG&E Corp. | 22,290 | 1,029 |
| WEC Energy Group Inc. | 13,725 | 928 |
| Edison International | 13,679 | 899 |
| PPL Corp. | 30,122 | 896 |
| DTE Energy Co. | 7,866 | 874 |
| CenturyLink Inc. | 40,776 | 871 |
| * T-Mobile US Inc. | 13,114 | 866 |
| Eversource Energy | 13,474 | 841 |
| FirstEnergy Corp. | 20,208 | 755 |
| American Water Works Co. Inc. | 7,659 | 670 |
| Evergy Inc. | 11,749 | 670 |
| Ameren Corp. | 10,439 | 660 |
| Entergy Corp. | 7,863 | 657 |
| CMS Energy Corp. | 12,285 | 605 |
| CenterPoint Energy Inc. | 18,735 | 521 |
| NRG Energy Inc. | 13,645 | 483 |
| Atmos Energy Corp. | 4,776 | 441 |
| Alliant Energy Corp. | 9,853 | 422 |
| NiSource Inc. | 15,454 | 418 |
| * Vistra Energy Corp. | 17,552 | 413 |
| UGI Corp. | 7,572 | 409 |
| AES Corp. | 28,226 | 380 |
| Pinnacle West Capital Corp. | 4,754 | 373 |
| OGE Energy Corp. | 8,382 | 309 |
| * Zayo Group Holdings Inc. | 8,508 | 295 |
| Aqua America Inc. | 7,447 | 277 |
| Vectren Corp. | 3,653 | 260 |
| MDU Resources Group Inc. | 8,456 | 236 |
| SCANA Corp. | 6,088 | 233 |
| IDACORP Inc. | 2,243 | 220 |
| Portland General Electric Co. | 3,979 | 185 |
| New Jersey Resources Corp. | 3,795 | 173 |
| National Fuel Gas Co. | 3,111 | 173 |
| ONE Gas Inc. | 2,194 | 172 |
| j2 Global Inc. | 2,056 | 170 |
| ALLETE Inc. | 2,237 | 168 |
| * Sprint Corp. | 27,137 | 166 |
| Hawaiian Electric Industries Inc. | 4,528 | 160 |
| Southwest Gas Holdings Inc. | 1,997 | 154 |
| Spire Inc. | 2,014 | 150 |
| Avista Corp. | 2,875 | 148 |
| NorthWestern Corp. | 2,287 | 137 |
| PNM Resources Inc. | 3,397 | 132 |
| Black Hills Corp. | 2,236 | 132 |
| Telephone & Data Systems Inc. | 4,128 | 124 |
| * Vonage Holdings Corp. | 8,687 | 123 |
| El Paso Electric Co. | 1,916 | 117 |
| South Jersey Industries Inc. | 3,399 | 113 |
| MGE Energy Inc. | 1,698 | 111 |
| Avangrid Inc. | 2,193 | 108 |
| * 8x8 Inc. | 4,029 | 92 |
| American States Water Co. | 1,508 | 91 |
| Cogent Communications Holdings Inc. | 1,636 | 90 |
| Ormat Technologies Inc. | 1,683 | 89 |
| Northwest Natural Gas Co. | 1,354 | 88 |
| Otter Tail Corp. | 1,832 | 88 |
| * Iridium Communications Inc. | 4,121 | 83 |
| California Water Service Group | 2,000 | 82 |
| Shenandoah Telecommunications Co. | 1,923 | 73 |
| Chesapeake Utilities Corp. | 782 | 67 |
| Pattern Energy Group Inc. Class A | 3,002 | 61 |
44
| Vanguard® Russell 3000 Index Fund | |||||
| Schedule of Investments | |||||
| August 31, 2018 | |||||
| Market | |||||
| Value | |||||
| Shares | ($000) | ||||
| * | Boingo Wireless Inc. | 1,763 | 58 | ||
| NRG Yield Inc. | 2,852 | 57 | |||
| ATN International Inc. | 589 | 43 | |||
| SJW Group | 721 | 42 | |||
| Connecticut Water Service Inc. | 577 | 40 | |||
| * | Intelsat SA | 1,795 | 39 | ||
| * | United States Cellular Corp. | 755 | 32 | ||
| Middlesex Water Co. | 694 | 32 | |||
| * | ORBCOMM Inc. | 2,930 | 32 | ||
| Consolidated Communications Holdings Inc. | 2,645 | 31 | |||
| NRG Yield Inc. Class A | 1,434 | 28 | |||
| Unitil Corp. | 537 | 27 | |||
| York Water Co. | 882 | 27 | |||
| * | Cincinnati Bell Inc. | 1,901 | 25 | ||
| * | NII Holdings Inc. | 4,043 | 23 | ||
| Frontier Communications Corp. | 4,080 | 21 | |||
| * | Atlantic Power Corp. | 9,065 | 20 | ||
| RGC Resources Inc. | 593 | 16 | |||
| Artesian Resources Corp. Class A | 437 | 16 | |||
| Spok Holdings Inc. | 888 | 14 | |||
| * | Gogo Inc. | 2,800 | 13 | ||
| * | AquaVenture Holdings Ltd. | 611 | 11 | ||
| * | Pure Cycle Corp. | 948 | 11 | ||
| Windstream Holdings Inc. | 1,935 | 9 | |||
| Spark Energy Inc. Class A | 617 | 5 | |||
| 58,841 | |||||
| Total Common Stocks (Cost $956,771) | 1,286,061 | ||||
| Coupon | |||||
| Temporary Cash Investments (0.2%)1 | |||||
| Money Market Fund (0.2%) | |||||
| 3,4 | Vanguard Market Liquidity Fund | 2.153% | 25,239 | 2,524 | |
| Face | |||||
| Maturity | Amount | ||||
| Date | ($000) | ||||
| U.S. Government and Agency Obligations (0.0%) | |||||
| United States Treasury Bill | 1.916% | 9/6/18 | 300 | 300 | |
| Total Temporary Cash Investments (Cost $2,824) | 2,824 | ||||
| Total Investments (99.9%) (Cost $959,595) | 1,288,885 | ||||
| Other Assets and Liabilities—Net (0.1%)4,5 | 1,901 | ||||
| Net Assets (100%) | 1,290,786 | ||||
* Non-income-producing security.
^ Includes partial security positions on loan to broker-dealers. The total value of securities on loan is $247,000.
§ Security value determined using significant unobservable inputs.
1 The fund invests a portion of its cash reserves in equity markets through the use of index futures contracts. After giving effect to futures
investments, the fund's effective common stock and temporary cash investment positions represent 100.0% and -0.1%, respectively, of net
assets.
2 “Other” represents securities that are not classified by the fund’s benchmark index.
3 Affiliated money market fund available only to Vanguard funds and certain trusts and accounts managed by Vanguard. Rate shown is the 7-day
yield.
4 Includes $265,000 of collateral received for securities on loan.
5 Cash with a value of $300,000 has been segregated as initial margin for open futures contracts.
CVR—Contingent Value Rights.
REIT—Real Estate Investment Trust.
45
© 2018 The Vanguard Group, Inc.
All rights reserved.
Vanguard Marketing Corporation, Distributor.
SNA18540 102018
| Vanguard® Short-Term Corporate Bond Index Fund | |||||
| Schedule of Investments | |||||
| August 31, 2018 | |||||
| Face | Market | ||||
| Maturity | Amount | Value | |||
| Coupon | Date | ($000) | ($000) | ||
| U.S. Government and Agency Obligations (0.3%) | |||||
| U.S. Government Securities (0.3%) | |||||
| United States Treasury Note/Bond | 2.625% | 8/31/20 | 35,010 | 35,004 | |
| United States Treasury Note/Bond | 2.750% | 8/31/23 | 40,000 | 40,007 | |
| Total U.S. Government and Agency Obligations (Cost $75,008) | 75,011 | ||||
| Corporate Bonds (98.9%) | |||||
| Finance (41.5%) | |||||
| Banking (33.8%) | |||||
| American Express Co. | 2.200% | 10/30/20 | 12,106 | 11,866 | |
| American Express Co. | 3.375% | 5/17/21 | 4,455 | 4,471 | |
| American Express Co. | 2.500% | 8/1/22 | 35,225 | 33,891 | |
| American Express Co. | 2.650% | 12/2/22 | 20,232 | 19,484 | |
| American Express Co. | 3.400% | 2/27/23 | 25,350 | 25,211 | |
| American Express Co. | 3.700% | 8/3/23 | 19,725 | 19,789 | |
| American Express Credit Corp. | 2.250% | 8/15/19 | 17,359 | 17,265 | |
| American Express Credit Corp. | 1.700% | 10/30/19 | 3,677 | 3,626 | |
| American Express Credit Corp. | 2.200% | 3/3/20 | 23,127 | 22,865 | |
| American Express Credit Corp. | 2.375% | 5/26/20 | 29,911 | 29,537 | |
| American Express Credit Corp. | 2.600% | 9/14/20 | 20,595 | 20,386 | |
| American Express Credit Corp. | 2.250% | 5/5/21 | 29,556 | 28,777 | |
| American Express Credit Corp. | 2.700% | 3/3/22 | 20,054 | 19,591 | |
| Associated Bank NA | 3.500% | 8/13/21 | 4,500 | 4,496 | |
| Australia & New Zealand Banking Group Ltd. | 2.050% | 9/23/19 | 3,220 | 3,194 | |
| Australia & New Zealand Banking Group Ltd. | 2.125% | 8/19/20 | 16,290 | 15,960 | |
| Australia & New Zealand Banking Group Ltd. | 2.250% | 11/9/20 | 16,700 | 16,360 | |
| Australia & New Zealand Banking Group Ltd. | 2.700% | 11/16/20 | 10,924 | 10,792 | |
| Australia & New Zealand Banking Group Ltd. | 2.300% | 6/1/21 | 13,284 | 12,918 | |
| Australia & New Zealand Banking Group Ltd. | 2.550% | 11/23/21 | 16,550 | 16,115 | |
| Australia & New Zealand Banking Group Ltd. | 2.625% | 5/19/22 | 16,090 | 15,584 | |
| Australia & New Zealand Banking Group Ltd. | 2.625% | 11/9/22 | 10,400 | 10,046 | |
| Banco Bilbao Vizcaya Argentaria SA | 3.000% | 10/20/20 | 7,080 | 7,025 | |
| Banco Santander SA | 3.500% | 4/11/22 | 13,000 | 12,785 | |
| Banco Santander SA | 3.125% | 2/23/23 | 8,615 | 8,246 | |
| Banco Santander SA | 3.848% | 4/12/23 | 20,950 | 20,629 | |
| Bancolombia SA | 5.950% | 6/3/21 | 8,500 | 8,904 | |
| Bank of America Corp. | 2.250% | 4/21/20 | 30,503 | 30,117 | |
| Bank of America Corp. | 5.625% | 7/1/20 | 810 | 847 | |
| Bank of America Corp. | 2.625% | 10/19/20 | 32,796 | 32,456 | |
| Bank of America Corp. | 2.151% | 11/9/20 | 25,968 | 25,424 | |
| Bank of America Corp. | 5.875% | 1/5/21 | 1,901 | 2,010 | |
| Bank of America Corp. | 2.625% | 4/19/21 | 29,439 | 28,914 | |
| Bank of America Corp. | 5.000% | 5/13/21 | 1 | 1 | |
| 1 | Bank of America Corp. | 2.369% | 7/21/21 | 43,554 | 42,790 |
| 1 | Bank of America Corp. | 2.328% | 10/1/21 | 29,400 | 28,786 |
| 1 | Bank of America Corp. | 2.738% | 1/23/22 | 31,395 | 30,880 |
| Bank of America Corp. | 5.700% | 1/24/22 | 1,175 | 1,267 | |
| 1 | Bank of America Corp. | 3.499% | 5/17/22 | 15,915 | 15,918 |
| Bank of America Corp. | 2.503% | 10/21/22 | 38,986 | 37,533 | |
| Bank of America Corp. | 3.300% | 1/11/23 | 58,376 | 57,814 | |
| 1 | Bank of America Corp. | 3.124% | 1/20/23 | 25,256 | 24,900 |
| 1 | Bank of America Corp. | 2.881% | 4/24/23 | 24,681 | 23,942 |
| 1 | Bank of America Corp. | 2.816% | 7/21/23 | 25,982 | 25,223 |
| Bank of America Corp. | 4.100% | 7/24/23 | 30,463 | 31,180 | |
| Bank of America Corp. | 3.004% | 12/20/23 | 87,793 | 85,462 | |
| 1 | Bank of America Corp. | 3.550% | 3/5/24 | 41,500 | 41,228 |
| 1 | Bank of America Corp. | 3.864% | 7/23/24 | 17,000 | 17,093 |
| Bank of Montreal | 1.750% | 9/11/19 | 1,740 | 1,722 | |
| Bank of Montreal | 2.100% | 12/12/19 | 16,630 | 16,489 | |
| Bank of Montreal | 2.100% | 6/15/20 | 14,127 | 13,900 | |
| Bank of Montreal | 3.100% | 7/13/20 | 22,750 | 22,797 | |
| Bank of Montreal | 3.100% | 4/13/21 | 17,759 | 17,704 | |
| Bank of Montreal | 1.900% | 8/27/21 | 30,972 | 29,811 | |
1
| Vanguard® Short-Term Corporate Bond Index Fund | ||||
| Schedule of Investments | ||||
| August 31, 2018 | ||||
| Face | Market | |||
| Maturity | Amount | Value | ||
| Coupon | Date | ($000) | ($000) | |
| Bank of Montreal | 2.350% | 9/11/22 | 8,054 | 7,763 |
| Bank of Montreal | 2.550% | 11/6/22 | 13,578 | 13,098 |
| Bank of New York Mellon Corp. | 2.300% | 9/11/19 | 11,728 | 11,687 |
| Bank of New York Mellon Corp. | 4.600% | 1/15/20 | 2,126 | 2,174 |
| Bank of New York Mellon Corp. | 2.150% | 2/24/20 | 18,966 | 18,759 |
| Bank of New York Mellon Corp. | 2.600% | 8/17/20 | 18,964 | 18,820 |
| Bank of New York Mellon Corp. | 2.450% | 11/27/20 | 18,046 | 17,786 |
| Bank of New York Mellon Corp. | 4.150% | 2/1/21 | 2,000 | 2,052 |
| Bank of New York Mellon Corp. | 2.500% | 4/15/21 | 7,263 | 7,153 |
| Bank of New York Mellon Corp. | 2.050% | 5/3/21 | 22,280 | 21,664 |
| Bank of New York Mellon Corp. | 3.550% | 9/23/21 | 14,290 | 14,435 |
| Bank of New York Mellon Corp. | 2.600% | 2/7/22 | 15,050 | 14,721 |
| Bank of New York Mellon Corp. | 2.950% | 1/29/23 | 18,340 | 18,020 |
| 1 Bank of New York Mellon Corp. | 2.661% | 5/16/23 | 20,080 | 19,534 |
| Bank of New York Mellon Corp. | 3.450% | 8/11/23 | 9,000 | 8,984 |
| Bank of New York Mellon Corp. | 2.200% | 8/16/23 | 11,552 | 10,906 |
| Bank of Nova Scotia | 2.150% | 7/14/20 | 15,810 | 15,557 |
| Bank of Nova Scotia | 2.350% | 10/21/20 | 23,448 | 23,073 |
| Bank of Nova Scotia | 2.500% | 1/8/21 | 13,700 | 13,480 |
| Bank of Nova Scotia | 4.375% | 1/13/21 | 10,139 | 10,405 |
| Bank of Nova Scotia | 2.450% | 3/22/21 | 15,121 | 14,820 |
| Bank of Nova Scotia | 3.125% | 4/20/21 | 735 | 732 |
| Bank of Nova Scotia | 2.800% | 7/21/21 | 14,564 | 14,389 |
| Bank of Nova Scotia | 2.700% | 3/7/22 | 33,672 | 32,990 |
| Bank of Nova Scotia | 2.450% | 9/19/22 | 5,500 | 5,313 |
| 1 Bank of Nova Scotia | 4.650% | 12/31/49 | 6,100 | 5,688 |
| Barclays Bank plc | 5.125% | 1/8/20 | 7,070 | 7,236 |
| Barclays Bank plc | 5.140% | 10/14/20 | 12,435 | 12,756 |
| Barclays Bank plc | 2.650% | 1/11/21 | 27,500 | 26,987 |
| Barclays plc | 2.750% | 11/8/19 | 29,126 | 28,951 |
| Barclays plc | 2.875% | 6/8/20 | 21,996 | 21,776 |
| Barclays plc | 3.250% | 1/12/21 | 20,315 | 20,088 |
| Barclays plc | 3.200% | 8/10/21 | 20,390 | 20,081 |
| Barclays plc | 3.684% | 1/10/23 | 11,220 | 10,950 |
| 1 Barclays plc | 4.338% | 5/16/24 | 20,000 | 19,841 |
| BB&T Corp. | 5.250% | 11/1/19 | 4,682 | 4,803 |
| BB&T Corp. | 2.450% | 1/15/20 | 22,213 | 22,062 |
| BB&T Corp. | 2.625% | 6/29/20 | 7,888 | 7,826 |
| BB&T Corp. | 2.150% | 2/1/21 | 15,620 | 15,243 |
| BB&T Corp. | 2.050% | 5/10/21 | 11,655 | 11,299 |
| BB&T Corp. | 3.200% | 9/3/21 | 8,000 | 7,976 |
| BB&T Corp. | 3.950% | 3/22/22 | 2,809 | 2,855 |
| BB&T Corp. | 2.750% | 4/1/22 | 20,855 | 20,471 |
| BNP Paribas SA | 2.375% | 5/21/20 | 25,873 | 25,531 |
| BNP Paribas SA | 5.000% | 1/15/21 | 30,810 | 31,925 |
| BNP Paribas SA | 3.250% | 3/3/23 | 23,320 | 23,054 |
| BPCE SA | 2.250% | 1/27/20 | 18,105 | 17,866 |
| BPCE SA | 2.650% | 2/3/21 | 7,120 | 6,988 |
| BPCE SA | 2.750% | 12/2/21 | 22,095 | 21,518 |
| 2 BPCE SA | 3.000% | 5/22/22 | 4,300 | 4,187 |
| Branch Banking & Trust Co. | 2.100% | 1/15/20 | 9,775 | 9,662 |
| Branch Banking & Trust Co. | 2.250% | 6/1/20 | 19,055 | 18,782 |
| Branch Banking & Trust Co. | 2.850% | 4/1/21 | 7,346 | 7,279 |
| Branch Banking & Trust Co. | 2.625% | 1/15/22 | 11,253 | 11,024 |
| Canadian Imperial Bank of Commerce | 1.600% | 9/6/19 | 22,967 | 22,705 |
| Canadian Imperial Bank of Commerce | 2.100% | 10/5/20 | 16,650 | 16,279 |
| Canadian Imperial Bank of Commerce | 2.700% | 2/2/21 | 3,775 | 3,714 |
| Canadian Imperial Bank of Commerce | 2.550% | 6/16/22 | 7,572 | 7,351 |
| Capital One Bank USA NA | 3.375% | 2/15/23 | 21,434 | 20,953 |
| Capital One Financial Corp. | 2.500% | 5/12/20 | 17,854 | 17,655 |
| Capital One Financial Corp. | 2.400% | 10/30/20 | 4,925 | 4,831 |
| Capital One Financial Corp. | 3.450% | 4/30/21 | 16,750 | 16,771 |
| Capital One Financial Corp. | 4.750% | 7/15/21 | 17,454 | 18,067 |
| Capital One Financial Corp. | 3.050% | 3/9/22 | 5,534 | 5,404 |
2
| Vanguard® Short-Term Corporate Bond Index Fund | ||||
| Schedule of Investments | ||||
| August 31, 2018 | ||||
| Face | Market | |||
| Maturity | Amount | Value | ||
| Coupon | Date | ($000) | ($000) | |
| Capital One Financial Corp. | 3.200% | 1/30/23 | 13,050 | 12,730 |
| Capital One Financial Corp. | 3.500% | 6/15/23 | 19,407 | 19,204 |
| Capital One NA | 2.400% | 9/5/19 | 10,096 | 10,035 |
| Capital One NA | 1.850% | 9/13/19 | 13,790 | 13,630 |
| Capital One NA | 2.350% | 1/31/20 | 11,610 | 11,493 |
| Capital One NA | 2.950% | 7/23/21 | 12,090 | 11,912 |
| Capital One NA | 2.250% | 9/13/21 | 22,378 | 21,576 |
| Capital One NA | 2.650% | 8/8/22 | 16,995 | 16,391 |
| Citibank NA | 1.850% | 9/18/19 | 27,830 | 27,527 |
| Citibank NA | 3.050% | 5/1/20 | 26,600 | 26,585 |
| Citibank NA | 2.100% | 6/12/20 | 15,450 | 15,180 |
| Citibank NA | 2.125% | 10/20/20 | 38,000 | 37,188 |
| Citibank NA | 2.850% | 2/12/21 | 16,225 | 16,037 |
| Citibank NA | 3.400% | 7/23/21 | 21,000 | 21,057 |
| Citigroup Inc. | 2.450% | 1/10/20 | 22,232 | 22,059 |
| Citigroup Inc. | 2.400% | 2/18/20 | 35,311 | 34,980 |
| Citigroup Inc. | 5.375% | 8/9/20 | 10,822 | 11,270 |
| Citigroup Inc. | 2.650% | 10/26/20 | 38,330 | 37,863 |
| Citigroup Inc. | 2.700% | 3/30/21 | 38,082 | 37,505 |
| Citigroup Inc. | 2.350% | 8/2/21 | 24,147 | 23,483 |
| Citigroup Inc. | 2.900% | 12/8/21 | 42,187 | 41,553 |
| Citigroup Inc. | 4.500% | 1/14/22 | 24,694 | 25,477 |
| Citigroup Inc. | 2.750% | 4/25/22 | 31,150 | 30,348 |
| Citigroup Inc. | 4.050% | 7/30/22 | 9,712 | 9,831 |
| Citigroup Inc. | 2.700% | 10/27/22 | 15,872 | 15,326 |
| 1 Citigroup Inc. | 3.142% | 1/24/23 | 29,450 | 28,986 |
| Citigroup Inc. | 3.375% | 3/1/23 | 3,650 | 3,609 |
| Citigroup Inc. | 3.500% | 5/15/23 | 7,100 | 6,991 |
| 1 Citigroup Inc. | 2.876% | 7/24/23 | 32,046 | 31,132 |
| 1 Citigroup Inc. | 4.044% | 6/1/24 | 17,480 | 17,632 |
| Citizens Bank NA | 2.450% | 12/4/19 | 4,939 | 4,894 |
| Citizens Bank NA | 2.250% | 3/2/20 | 10,385 | 10,233 |
| Citizens Bank NA | 2.200% | 5/26/20 | 10,000 | 9,813 |
| Citizens Bank NA | 2.250% | 10/30/20 | 13,570 | 13,248 |
| Citizens Bank NA | 2.550% | 5/13/21 | 19,730 | 19,257 |
| Citizens Bank NA | 2.650% | 5/26/22 | 9,300 | 8,995 |
| Citizens Bank NA | 3.700% | 3/29/23 | 6,800 | 6,808 |
| Citizens Financial Group Inc. | 2.375% | 7/28/21 | 2,000 | 1,934 |
| Comerica Inc. | 3.700% | 7/31/23 | 13,125 | 13,170 |
| Commonwealth Bank of Australia | 2.300% | 9/6/19 | 15,250 | 15,184 |
| Commonwealth Bank of Australia | 2.300% | 3/12/20 | 4,411 | 4,356 |
| Commonwealth Bank of Australia | 2.400% | 11/2/20 | 23,333 | 22,892 |
| Commonwealth Bank of Australia | 2.550% | 3/15/21 | 7,357 | 7,210 |
| 2 Commonwealth Bank of Australia | 2.750% | 3/10/22 | 12,000 | 11,710 |
| Compass Bank | 2.750% | 9/29/19 | 3,443 | 3,431 |
| Compass Bank | 3.500% | 6/11/21 | 12,000 | 11,984 |
| Compass Bank | 2.875% | 6/29/22 | 16,069 | 15,556 |
| Cooperatieve Rabobank UA | 2.250% | 1/14/20 | 26,825 | 26,515 |
| Cooperatieve Rabobank UA | 4.500% | 1/11/21 | 18,228 | 18,685 |
| Cooperatieve Rabobank UA | 2.500% | 1/19/21 | 34,405 | 33,759 |
| Cooperatieve Rabobank UA | 3.125% | 4/26/21 | 3,250 | 3,234 |
| Cooperatieve Rabobank UA | 2.750% | 1/10/22 | 27,050 | 26,500 |
| Cooperatieve Rabobank UA | 3.875% | 2/8/22 | 34,179 | 34,636 |
| Cooperatieve Rabobank UA | 3.950% | 11/9/22 | 18,620 | 18,636 |
| Cooperatieve Rabobank UA | 2.750% | 1/10/23 | 9,270 | 8,978 |
| Credit Suisse AG | 5.400% | 1/14/20 | 21,392 | 21,997 |
| Credit Suisse AG | 4.375% | 8/5/20 | 5,581 | 5,699 |
| Credit Suisse AG | 3.000% | 10/29/21 | 29,627 | 29,197 |
| 2 Credit Suisse Group AG | 3.574% | 1/9/23 | 12,250 | 12,079 |
| Credit Suisse Group Funding Guernsey Ltd. | 2.750% | 3/26/20 | 24,842 | 24,601 |
| Credit Suisse Group Funding Guernsey Ltd. | 3.125% | 12/10/20 | 27,398 | 27,179 |
| Credit Suisse Group Funding Guernsey Ltd. | 3.450% | 4/16/21 | 28,932 | 28,860 |
| Credit Suisse Group Funding Guernsey Ltd. | 3.800% | 9/15/22 | 15,130 | 15,126 |
| Credit Suisse Group Funding Guernsey Ltd. | 3.800% | 6/9/23 | 16,800 | 16,686 |
3
| Vanguard® Short-Term Corporate Bond Index Fund | ||||
| Schedule of Investments | ||||
| August 31, 2018 | ||||
| Face | Market | |||
| Maturity | Amount | Value | ||
| Coupon | Date | ($000) | ($000) | |
| Deutsche Bank AG | 2.700% | 7/13/20 | 29,312 | 28,722 |
| Deutsche Bank AG | 2.950% | 8/20/20 | 10,190 | 10,022 |
| Deutsche Bank AG | 3.125% | 1/13/21 | 6,673 | 6,531 |
| Deutsche Bank AG | 3.150% | 1/22/21 | 32,071 | 31,350 |
| Deutsche Bank AG | 3.375% | 5/12/21 | 14,530 | 14,257 |
| Deutsche Bank AG | 4.250% | 10/14/21 | 45,470 | 45,312 |
| Deutsche Bank AG | 3.300% | 11/16/22 | 6,500 | 6,172 |
| Deutsche Bank AG | 3.950% | 2/27/23 | 17,590 | 17,058 |
| Discover Bank | 7.000% | 4/15/20 | 3,900 | 4,099 |
| Discover Bank | 3.100% | 6/4/20 | 18,667 | 18,621 |
| Discover Bank | 3.200% | 8/9/21 | 9,105 | 9,022 |
| Discover Bank | 3.350% | 2/6/23 | 13,900 | 13,565 |
| Discover Bank | 4.200% | 8/8/23 | 13,750 | 13,890 |
| 1 Discover Bank | 4.682% | 8/9/28 | 4,875 | 4,871 |
| Discover Financial Services | 5.200% | 4/27/22 | 2,806 | 2,921 |
| Discover Financial Services | 3.850% | 11/21/22 | 9,268 | 9,225 |
| Fifth Third Bancorp | 2.875% | 7/27/20 | 19,229 | 19,128 |
| Fifth Third Bancorp | 3.500% | 3/15/22 | 8,449 | 8,463 |
| Fifth Third Bancorp | 2.600% | 6/15/22 | 8,170 | 7,873 |
| Fifth Third Bank | 1.625% | 9/27/19 | 8,755 | 8,650 |
| Fifth Third Bank | 2.200% | 10/30/20 | 2,927 | 2,866 |
| Fifth Third Bank | 2.250% | 6/14/21 | 17,593 | 17,116 |
| Fifth Third Bank | 3.350% | 7/26/21 | 7,000 | 7,000 |
| Fifth Third Bank | 2.875% | 10/1/21 | 20,291 | 19,896 |
| First Horizon National Corp. | 3.500% | 12/15/20 | 7,595 | 7,611 |
| First Niagara Financial Group Inc. | 6.750% | 3/19/20 | 3,200 | 3,360 |
| First Republic Bank | 2.500% | 6/6/22 | 12,900 | 12,467 |
| Goldman Sachs Bank USA | 3.200% | 6/5/20 | 13,650 | 13,684 |
| Goldman Sachs Group Inc. | 2.550% | 10/23/19 | 31,143 | 31,041 |
| Goldman Sachs Group Inc. | 2.300% | 12/13/19 | 39,760 | 39,452 |
| Goldman Sachs Group Inc. | 5.375% | 3/15/20 | 30,274 | 31,279 |
| Goldman Sachs Group Inc. | 2.600% | 4/23/20 | 23,823 | 23,626 |
| Goldman Sachs Group Inc. | 6.000% | 6/15/20 | 24,597 | 25,784 |
| Goldman Sachs Group Inc. | 2.750% | 9/15/20 | 32,167 | 31,877 |
| Goldman Sachs Group Inc. | 2.600% | 12/27/20 | 7,656 | 7,549 |
| Goldman Sachs Group Inc. | 2.875% | 2/25/21 | 33,344 | 33,026 |
| Goldman Sachs Group Inc. | 2.625% | 4/25/21 | 16,984 | 16,675 |
| Goldman Sachs Group Inc. | 5.250% | 7/27/21 | 47,872 | 50,292 |
| Goldman Sachs Group Inc. | 2.350% | 11/15/21 | 20,895 | 20,248 |
| Goldman Sachs Group Inc. | 5.750% | 1/24/22 | 67,388 | 71,988 |
| Goldman Sachs Group Inc. | 3.000% | 4/26/22 | 58,450 | 57,399 |
| 1 Goldman Sachs Group Inc. | 2.876% | 10/31/22 | 33,247 | 32,517 |
| Goldman Sachs Group Inc. | 3.625% | 1/22/23 | 37,454 | 37,386 |
| Goldman Sachs Group Inc. | 3.200% | 2/23/23 | 26,600 | 26,121 |
| 1 Goldman Sachs Group Inc. | 2.908% | 6/5/23 | 28,050 | 27,276 |
| 1 Goldman Sachs Group Inc. | 2.905% | 7/24/23 | 30,584 | 29,550 |
| HSBC Bank USA NA | 4.875% | 8/24/20 | 12,601 | 12,937 |
| HSBC Holdings plc | 3.400% | 3/8/21 | 48,535 | 48,535 |
| HSBC Holdings plc | 5.100% | 4/5/21 | 24,613 | 25,627 |
| HSBC Holdings plc | 2.950% | 5/25/21 | 37,879 | 37,409 |
| HSBC Holdings plc | 2.650% | 1/5/22 | 50,435 | 49,039 |
| HSBC Holdings plc | 4.875% | 1/14/22 | 7,615 | 7,937 |
| HSBC Holdings plc | 4.000% | 3/30/22 | 24,995 | 25,397 |
| 1 HSBC Holdings plc | 3.262% | 3/13/23 | 45,912 | 45,157 |
| HSBC Holdings plc | 3.600% | 5/25/23 | 29,156 | 28,996 |
| 1 HSBC Holdings plc | 3.033% | 11/22/23 | 4,250 | 4,110 |
| 1 HSBC Holdings plc | 3.950% | 5/18/24 | 38,554 | 38,650 |
| HSBC USA Inc. | 2.375% | 11/13/19 | 15,370 | 15,272 |
| HSBC USA Inc. | 2.350% | 3/5/20 | 27,945 | 27,631 |
| HSBC USA Inc. | 2.750% | 8/7/20 | 13,497 | 13,396 |
| HSBC USA Inc. | 5.000% | 9/27/20 | 8,954 | 9,215 |
| Huntington Bancshares Inc. | 7.000% | 12/15/20 | 4,075 | 4,389 |
| Huntington Bancshares Inc. | 3.150% | 3/14/21 | 12,171 | 12,116 |
| Huntington Bancshares Inc. | 2.300% | 1/14/22 | 15,133 | 14,539 |
4
| Vanguard® Short-Term Corporate Bond Index Fund | ||||
| Schedule of Investments | ||||
| August 31, 2018 | ||||
| Face | Market | |||
| Maturity | Amount | Value | ||
| Coupon | Date | ($000) | ($000) | |
| Huntington National Bank | 2.375% | 3/10/20 | 8,672 | 8,574 |
| Huntington National Bank | 2.400% | 4/1/20 | 11,575 | 11,430 |
| Huntington National Bank | 2.875% | 8/20/20 | 4,410 | 4,379 |
| Huntington National Bank | 3.250% | 5/14/21 | 15,650 | 15,594 |
| Huntington National Bank | 2.500% | 8/7/22 | 2,375 | 2,277 |
| Huntington National Bank | 3.550% | 10/6/23 | 4,000 | 3,984 |
| ING Groep NV | 3.150% | 3/29/22 | 26,701 | 26,296 |
| 2 Intesa Sanpaolo SPA | 3.375% | 1/12/23 | 2,800 | 2,582 |
| 2 Itau Corpbanca | 3.875% | 9/22/19 | 1,650 | 1,658 |
| JPMorgan Chase & Co. | 2.200% | 10/22/19 | 17,535 | 17,414 |
| JPMorgan Chase & Co. | 2.250% | 1/23/20 | 56,970 | 56,400 |
| JPMorgan Chase & Co. | 4.950% | 3/25/20 | 20,409 | 20,999 |
| JPMorgan Chase & Co. | 2.750% | 6/23/20 | 30,648 | 30,486 |
| JPMorgan Chase & Co. | 4.400% | 7/22/20 | 29,056 | 29,739 |
| JPMorgan Chase & Co. | 4.250% | 10/15/20 | 43,672 | 44,660 |
| JPMorgan Chase & Co. | 2.550% | 10/29/20 | 24,028 | 23,738 |
| JPMorgan Chase & Co. | 2.550% | 3/1/21 | 44,521 | 43,806 |
| JPMorgan Chase & Co. | 4.625% | 5/10/21 | 24,706 | 25,558 |
| JPMorgan Chase & Co. | 2.400% | 6/7/21 | 22,111 | 21,642 |
| JPMorgan Chase & Co. | 2.295% | 8/15/21 | 49,711 | 48,443 |
| JPMorgan Chase & Co. | 4.350% | 8/15/21 | 30,610 | 31,496 |
| JPMorgan Chase & Co. | 4.500% | 1/24/22 | 36,535 | 37,809 |
| 1 JPMorgan Chase & Co. | 3.514% | 6/18/22 | 15,300 | 15,346 |
| JPMorgan Chase & Co. | 3.250% | 9/23/22 | 34,640 | 34,458 |
| JPMorgan Chase & Co. | 2.972% | 1/15/23 | 23,002 | 22,496 |
| JPMorgan Chase & Co. | 3.200% | 1/25/23 | 34,072 | 33,686 |
| 1 JPMorgan Chase & Co. | 2.776% | 4/25/23 | 17,700 | 17,242 |
| JPMorgan Chase & Co. | 3.375% | 5/1/23 | 31,100 | 30,553 |
| JPMorgan Chase & Co. | 2.700% | 5/18/23 | 30,473 | 29,437 |
| 1 JPMorgan Chase & Co. | 3.559% | 4/23/24 | 35,550 | 35,420 |
| 1 JPMorgan Chase & Co. | 3.797% | 7/23/24 | 20,000 | 20,050 |
| JPMorgan Chase Bank NA | 1.650% | 9/23/19 | 12,123 | 11,973 |
| 1 JPMorgan Chase Bank NA | 2.604% | 2/1/21 | 19,700 | 19,552 |
| 1 JPMorgan Chase Bank NA | 3.086% | 4/26/21 | 35,750 | 35,705 |
| KeyBank NA | 1.600% | 8/22/19 | 6,890 | 6,815 |
| KeyBank NA | 2.500% | 12/15/19 | 10,075 | 10,017 |
| KeyBank NA | 2.250% | 3/16/20 | 18,028 | 17,800 |
| KeyBank NA | 3.350% | 6/15/21 | 4,500 | 4,508 |
| KeyBank NA | 2.500% | 11/22/21 | 14,250 | 13,888 |
| KeyBank NA | 2.400% | 6/9/22 | 5,250 | 5,061 |
| KeyBank NA | 2.300% | 9/14/22 | 12,570 | 12,027 |
| KeyBank NA | 3.375% | 3/7/23 | 8,250 | 8,207 |
| 1 KeyBank NA | 3.180% | 10/15/27 | 350 | 345 |
| KeyCorp | 2.900% | 9/15/20 | 12,373 | 12,298 |
| KeyCorp | 5.100% | 3/24/21 | 10,746 | 11,226 |
| Lloyds Bank plc | 2.700% | 8/17/20 | 16,675 | 16,549 |
| Lloyds Bank plc | 6.375% | 1/21/21 | 15,816 | 16,867 |
| Lloyds Bank plc | 3.300% | 5/7/21 | 10,950 | 10,936 |
| Lloyds Banking Group plc | 3.100% | 7/6/21 | 14,920 | 14,716 |
| Lloyds Banking Group plc | 3.000% | 1/11/22 | 34,055 | 33,282 |
| Lloyds Banking Group plc | 4.050% | 8/16/23 | 14,500 | 14,470 |
| 1 Lloyds Banking Group plc | 2.907% | 11/7/23 | 27,000 | 25,829 |
| M&T Bank Corp. | 3.550% | 7/26/23 | 10,100 | 10,100 |
| Manufacturers & Traders Trust Co. | 2.100% | 2/6/20 | 6,810 | 6,726 |
| Manufacturers & Traders Trust Co. | 2.050% | 8/17/20 | 7,650 | 7,486 |
| Manufacturers & Traders Trust Co. | 2.625% | 1/25/21 | 14,100 | 13,886 |
| Manufacturers & Traders Trust Co. | 2.500% | 5/18/22 | 1,490 | 1,444 |
| Mitsubishi UFJ Financial Group Inc. | 2.950% | 3/1/21 | 18,381 | 18,177 |
| Mitsubishi UFJ Financial Group Inc. | 3.535% | 7/26/21 | 10,090 | 10,124 |
| Mitsubishi UFJ Financial Group Inc. | 2.190% | 9/13/21 | 24,450 | 23,532 |
| Mitsubishi UFJ Financial Group Inc. | 2.998% | 2/22/22 | 16,476 | 16,184 |
| Mitsubishi UFJ Financial Group Inc. | 2.665% | 7/25/22 | 31,360 | 30,374 |
| Mitsubishi UFJ Financial Group Inc. | 3.455% | 3/2/23 | 24,400 | 24,238 |
| Mitsubishi UFJ Financial Group Inc. | 3.761% | 7/26/23 | 12,900 | 12,988 |
5
| Vanguard® Short-Term Corporate Bond Index Fund | ||||
| Schedule of Investments | ||||
| August 31, 2018 | ||||
| Face | Market | |||
| Maturity | Amount | Value | ||
| Coupon | Date | ($000) | ($000) | |
| Mizuho Financial Group Inc. | 2.273% | 9/13/21 | 16,705 | 16,099 |
| Mizuho Financial Group Inc. | 2.953% | 2/28/22 | 20,583 | 20,166 |
| Mizuho Financial Group Inc. | 2.601% | 9/11/22 | 4,650 | 4,468 |
| Mizuho Financial Group Inc. | 3.549% | 3/5/23 | 15,000 | 14,921 |
| Morgan Stanley | 5.625% | 9/23/19 | 44,908 | 46,181 |
| Morgan Stanley | 5.500% | 1/26/20 | 22,449 | 23,185 |
| Morgan Stanley | 2.650% | 1/27/20 | 46,836 | 46,555 |
| Morgan Stanley | 2.800% | 6/16/20 | 33,425 | 33,210 |
| Morgan Stanley | 5.500% | 7/24/20 | 23,811 | 24,790 |
| Morgan Stanley | 5.750% | 1/25/21 | 16,460 | 17,371 |
| Morgan Stanley | 2.500% | 4/21/21 | 44,245 | 43,078 |
| Morgan Stanley | 5.500% | 7/28/21 | 29,452 | 31,019 |
| Morgan Stanley | 2.625% | 11/17/21 | 51,056 | 49,819 |
| Morgan Stanley | 2.750% | 5/19/22 | 59,100 | 57,611 |
| Morgan Stanley | 4.875% | 11/1/22 | 27,980 | 29,103 |
| Morgan Stanley | 3.125% | 1/23/23 | 23,915 | 23,477 |
| Morgan Stanley | 3.750% | 2/25/23 | 29,482 | 29,651 |
| Morgan Stanley | 4.100% | 5/22/23 | 28,478 | 28,696 |
| 1 Morgan Stanley | 3.737% | 4/24/24 | 41,300 | 41,224 |
| MUFG Americas Holdings Corp. | 2.250% | 2/10/20 | 17,552 | 17,351 |
| MUFG Americas Holdings Corp. | 3.500% | 6/18/22 | 3,275 | 3,277 |
| National Australia Bank Ltd. | 2.250% | 1/10/20 | 3,925 | 3,886 |
| National Australia Bank Ltd. | 2.125% | 5/22/20 | 17,525 | 17,238 |
| National Australia Bank Ltd. | 2.625% | 7/23/20 | 18,075 | 17,908 |
| National Australia Bank Ltd. | 2.500% | 1/12/21 | 3,500 | 3,439 |
| National Australia Bank Ltd. | 2.625% | 1/14/21 | 18,730 | 18,428 |
| National Australia Bank Ltd. | 1.875% | 7/12/21 | 17,230 | 16,544 |
| National Australia Bank Ltd. | 3.375% | 9/20/21 | 5,000 | 4,988 |
| National Australia Bank Ltd. | 2.800% | 1/10/22 | 22,000 | 21,526 |
| National Australia Bank Ltd. | 2.500% | 5/22/22 | 12,280 | 11,832 |
| National Australia Bank Ltd. | 3.000% | 1/20/23 | 8,850 | 8,638 |
| National Australia Bank Ltd. | 2.875% | 4/12/23 | 5,000 | 4,842 |
| National Australia Bank Ltd. | 3.625% | 6/20/23 | 5,000 | 5,013 |
| National Bank of Canada | 2.150% | 6/12/20 | 14,029 | 13,767 |
| National Bank of Canada | 2.200% | 11/2/20 | 17,160 | 16,734 |
| NatWest Markets plc | 5.625% | 8/24/20 | 100 | 103 |
| Northern Trust Corp. | 3.450% | 11/4/20 | 9,925 | 10,013 |
| Northern Trust Corp. | 3.375% | 8/23/21 | 6,265 | 6,301 |
| Northern Trust Corp. | 2.375% | 8/2/22 | 3,963 | 3,834 |
| People's United Financial Inc. | 3.650% | 12/6/22 | 4,450 | 4,436 |
| PNC Bank NA | 2.400% | 10/18/19 | 11,757 | 11,679 |
| PNC Bank NA | 2.000% | 5/19/20 | 13,793 | 13,522 |
| PNC Bank NA | 2.300% | 6/1/20 | 10,165 | 10,024 |
| PNC Bank NA | 2.600% | 7/21/20 | 4,150 | 4,104 |
| PNC Bank NA | 2.450% | 11/5/20 | 27,718 | 27,324 |
| PNC Bank NA | 2.500% | 1/22/21 | 16,997 | 16,719 |
| PNC Bank NA | 2.150% | 4/29/21 | 17,060 | 16,604 |
| PNC Bank NA | 2.550% | 12/9/21 | 8,800 | 8,600 |
| PNC Bank NA | 2.625% | 2/17/22 | 18,432 | 18,029 |
| PNC Bank NA | 2.450% | 7/28/22 | 1,100 | 1,064 |
| PNC Bank NA | 2.700% | 11/1/22 | 8,325 | 8,044 |
| PNC Bank NA | 2.950% | 1/30/23 | 9,545 | 9,291 |
| PNC Bank NA | 3.800% | 7/25/23 | 23,233 | 23,385 |
| PNC Financial Services Group Inc. | 2.854% | 11/9/22 | 7,386 | 7,208 |
| PNC Funding Corp. | 5.125% | 2/8/20 | 17,018 | 17,515 |
| PNC Funding Corp. | 4.375% | 8/11/20 | 5,470 | 5,604 |
| PNC Funding Corp. | 3.300% | 3/8/22 | 21,871 | 21,850 |
| RBC USA Holdco Corp. | 5.250% | 9/15/20 | 2,050 | 2,130 |
| Regions Bank | 2.750% | 4/1/21 | 6,775 | 6,669 |
| 1 Regions Bank | 3.374% | 8/13/21 | 6,875 | 6,878 |
| Regions Financial Corp. | 3.200% | 2/8/21 | 13,598 | 13,519 |
| Regions Financial Corp. | 2.750% | 8/14/22 | 14,790 | 14,326 |
| Regions Financial Corp. | 3.800% | 8/14/23 | 7,000 | 7,006 |
| Royal Bank of Canada | 2.125% | 3/2/20 | 25,990 | 25,667 |
6
| Vanguard® Short-Term Corporate Bond Index Fund | ||||
| Schedule of Investments | ||||
| August 31, 2018 | ||||
| Face | Market | |||
| Maturity | Amount | Value | ||
| Coupon | Date | ($000) | ($000) | |
| Royal Bank of Canada | 2.150% | 3/6/20 | 11,654 | 11,509 |
| Royal Bank of Canada | 2.150% | 10/26/20 | 17,737 | 17,385 |
| Royal Bank of Canada | 2.350% | 10/30/20 | 32,140 | 31,626 |
| Royal Bank of Canada | 2.500% | 1/19/21 | 22,661 | 22,352 |
| Royal Bank of Canada | 3.200% | 4/30/21 | 16,839 | 16,857 |
| Royal Bank of Canada | 2.750% | 2/1/22 | 9,200 | 9,060 |
| Royal Bank of Scotland Group plc | 6.400% | 10/21/19 | 4,561 | 4,708 |
| Royal Bank of Scotland Group plc | 6.125% | 12/15/22 | 17,000 | 17,822 |
| 1 Royal Bank of Scotland Group plc | 3.498% | 5/15/23 | 28,301 | 27,541 |
| Royal Bank of Scotland Group plc | 6.100% | 6/10/23 | 26,005 | 27,217 |
| 1 Royal Bank of Scotland Group plc | 4.519% | 6/25/24 | 24,000 | 24,094 |
| Santander Holdings USA Inc. | 2.650% | 4/17/20 | 21,458 | 21,282 |
| Santander Holdings USA Inc. | 3.700% | 3/28/22 | 23,175 | 22,986 |
| Santander Holdings USA Inc. | 3.400% | 1/18/23 | 15,083 | 14,607 |
| Santander UK Group Holdings plc | 2.875% | 10/16/20 | 8,216 | 8,107 |
| Santander UK Group Holdings plc | 3.125% | 1/8/21 | 24,466 | 24,191 |
| Santander UK Group Holdings plc | 2.875% | 8/5/21 | 20,649 | 20,176 |
| Santander UK Group Holdings plc | 3.571% | 1/10/23 | 13,649 | 13,344 |
| 1 Santander UK Group Holdings plc | 3.373% | 1/5/24 | 20,330 | 19,610 |
| Santander UK plc | 2.350% | 9/10/19 | 14,910 | 14,836 |
| Santander UK plc | 2.375% | 3/16/20 | 4,148 | 4,098 |
| Santander UK plc | 2.125% | 11/3/20 | 15,950 | 15,567 |
| Santander UK plc | 2.500% | 1/5/21 | 975 | 954 |
| Santander UK plc | 3.400% | 6/1/21 | 21,150 | 21,144 |
| Skandinaviska Enskilda Banken AB | 1.500% | 9/13/19 | 1,250 | 1,231 |
| Skandinaviska Enskilda Banken AB | 2.300% | 3/11/20 | 12,920 | 12,743 |
| Skandinaviska Enskilda Banken AB | 2.625% | 3/15/21 | 16,863 | 16,569 |
| Skandinaviska Enskilda Banken AB | 1.875% | 9/13/21 | 23,990 | 22,941 |
| Skandinaviska Enskilda Banken AB | 2.800% | 3/11/22 | 9,850 | 9,650 |
| State Street Corp. | 2.550% | 8/18/20 | 23,016 | 22,833 |
| State Street Corp. | 4.375% | 3/7/21 | 7,069 | 7,276 |
| State Street Corp. | 1.950% | 5/19/21 | 4,157 | 4,030 |
| 1 State Street Corp. | 2.653% | 5/15/23 | 11,700 | 11,403 |
| State Street Corp. | 3.100% | 5/15/23 | 12,400 | 12,208 |
| Sumitomo Mitsui Banking Corp. | 2.092% | 10/18/19 | 18,300 | 18,102 |
| Sumitomo Mitsui Banking Corp. | 2.450% | 1/16/20 | 32,991 | 32,666 |
| Sumitomo Mitsui Banking Corp. | 2.514% | 1/17/20 | 20,375 | 20,191 |
| Sumitomo Mitsui Banking Corp. | 2.650% | 7/23/20 | 8,640 | 8,533 |
| Sumitomo Mitsui Banking Corp. | 2.450% | 10/20/20 | 4,275 | 4,194 |
| Sumitomo Mitsui Banking Corp. | 3.200% | 7/18/22 | 8,667 | 8,556 |
| Sumitomo Mitsui Banking Corp. | 3.000% | 1/18/23 | 2,750 | 2,684 |
| Sumitomo Mitsui Banking Corp. | 3.950% | 7/19/23 | 9,525 | 9,653 |
| Sumitomo Mitsui Financial Group Inc. | 2.934% | 3/9/21 | 21,307 | 21,070 |
| Sumitomo Mitsui Financial Group Inc. | 2.058% | 7/14/21 | 17,781 | 17,127 |
| Sumitomo Mitsui Financial Group Inc. | 2.442% | 10/19/21 | 27,350 | 26,480 |
| Sumitomo Mitsui Financial Group Inc. | 2.846% | 1/11/22 | 7,075 | 6,922 |
| Sumitomo Mitsui Financial Group Inc. | 2.784% | 7/12/22 | 32,900 | 31,945 |
| Sumitomo Mitsui Financial Group Inc. | 2.778% | 10/18/22 | 10,550 | 10,218 |
| Sumitomo Mitsui Financial Group Inc. | 3.102% | 1/17/23 | 17,250 | 16,901 |
| Sumitomo Mitsui Financial Group Inc. | 3.748% | 7/19/23 | 7,500 | 7,538 |
| SunTrust Bank | 2.250% | 1/31/20 | 14,425 | 14,270 |
| 1 SunTrust Bank | 2.590% | 1/29/21 | 10,900 | 10,806 |
| SunTrust Bank | 2.450% | 8/1/22 | 8,827 | 8,507 |
| 1 SunTrust Bank | 3.502% | 8/2/22 | 7,900 | 7,900 |
| SunTrust Bank | 3.000% | 2/2/23 | 8,797 | 8,626 |
| SunTrust Bank | 2.750% | 5/1/23 | 3,600 | 3,488 |
| 1 SunTrust Bank | 3.689% | 8/2/24 | 8,150 | 8,142 |
| SunTrust Banks Inc. | 2.900% | 3/3/21 | 11,879 | 11,786 |
| SunTrust Banks Inc. | 2.700% | 1/27/22 | 14,663 | 14,313 |
| Svenska Handelsbanken AB | 1.500% | 9/6/19 | 16,770 | 16,533 |
| Svenska Handelsbanken AB | 1.950% | 9/8/20 | 15,111 | 14,737 |
| Svenska Handelsbanken AB | 2.400% | 10/1/20 | 16,566 | 16,259 |
| Svenska Handelsbanken AB | 2.450% | 3/30/21 | 14,799 | 14,484 |
| Svenska Handelsbanken AB | 3.350% | 5/24/21 | 20,250 | 20,249 |
7
| Vanguard® Short-Term Corporate Bond Index Fund | ||||
| Schedule of Investments | ||||
| August 31, 2018 | ||||
| Face | Market | |||
| Maturity | Amount | Value | ||
| Coupon | Date | ($000) | ($000) | |
| Svenska Handelsbanken AB | 1.875% | 9/7/21 | 14,575 | 13,957 |
| Synchrony Bank | 3.650% | 5/24/21 | 8,500 | 8,443 |
| Synchrony Bank | 3.000% | 6/15/22 | 17,490 | 16,829 |
| Synchrony Financial | 2.700% | 2/3/20 | 11,947 | 11,832 |
| Synchrony Financial | 3.750% | 8/15/21 | 14,043 | 13,969 |
| Synovus Financial Corp. | 3.125% | 11/1/22 | 4,025 | 3,860 |
| Toronto-Dominion Bank | 2.250% | 11/5/19 | 24,257 | 24,087 |
| Toronto-Dominion Bank | 3.000% | 6/11/20 | 5,650 | 5,651 |
| Toronto-Dominion Bank | 1.850% | 9/11/20 | 1,800 | 1,758 |
| Toronto-Dominion Bank | 2.500% | 12/14/20 | 49,419 | 48,757 |
| Toronto-Dominion Bank | 2.550% | 1/25/21 | 7,885 | 7,777 |
| Toronto-Dominion Bank | 2.125% | 4/7/21 | 23,273 | 22,662 |
| Toronto-Dominion Bank | 3.250% | 6/11/21 | 7,947 | 7,966 |
| Toronto-Dominion Bank | 1.800% | 7/13/21 | 35,581 | 34,251 |
| Toronto-Dominion Bank | 3.500% | 7/19/23 | 25,000 | 25,122 |
| UBS AG | 2.350% | 3/26/20 | 21,135 | 20,816 |
| UBS AG | 4.875% | 8/4/20 | 8,963 | 9,225 |
| US Bancorp | 2.350% | 1/29/21 | 16,430 | 16,136 |
| US Bancorp | 4.125% | 5/24/21 | 13,243 | 13,573 |
| US Bancorp | 2.625% | 1/24/22 | 19,063 | 18,690 |
| US Bancorp | 3.000% | 3/15/22 | 14,547 | 14,369 |
| US Bancorp | 2.950% | 7/15/22 | 17,737 | 17,419 |
| US Bank NA | 2.125% | 10/28/19 | 20,800 | 20,618 |
| US Bank NA | 2.350% | 1/23/20 | 11,600 | 11,511 |
| US Bank NA | 2.000% | 1/24/20 | 16,750 | 16,543 |
| US Bank NA | 3.050% | 7/24/20 | 11,450 | 11,451 |
| US Bank NA | 2.050% | 10/23/20 | 19,015 | 18,608 |
| US Bank NA | 3.150% | 4/26/21 | 2,328 | 2,329 |
| 1 US Bank NA | 3.104% | 5/21/21 | 11,000 | 10,990 |
| US Bank NA | 2.850% | 1/23/23 | 11,600 | 11,374 |
| US Bank NA | 3.400% | 7/24/23 | 11,000 | 10,975 |
| Wells Fargo & Co. | 2.150% | 1/30/20 | 19,843 | 19,628 |
| Wells Fargo & Co. | 2.600% | 7/22/20 | 36,975 | 36,597 |
| Wells Fargo & Co. | 2.550% | 12/7/20 | 38,784 | 38,278 |
| Wells Fargo & Co. | 3.000% | 1/22/21 | 15,866 | 15,794 |
| Wells Fargo & Co. | 2.500% | 3/4/21 | 33,943 | 33,281 |
| Wells Fargo & Co. | 4.600% | 4/1/21 | 30,297 | 31,283 |
| Wells Fargo & Co. | 2.100% | 7/26/21 | 44,276 | 42,798 |
| Wells Fargo & Co. | 3.500% | 3/8/22 | 31,124 | 31,227 |
| Wells Fargo & Co. | 2.625% | 7/22/22 | 47,250 | 45,762 |
| Wells Fargo & Co. | 3.069% | 1/24/23 | 55,857 | 54,707 |
| Wells Fargo & Co. | 3.450% | 2/13/23 | 27,450 | 27,006 |
| Wells Fargo & Co. | 4.125% | 8/15/23 | 21,838 | 22,185 |
| Wells Fargo Bank NA | 2.150% | 12/6/19 | 31,406 | 31,075 |
| Wells Fargo Bank NA | 2.400% | 1/15/20 | 22,200 | 22,046 |
| Wells Fargo Bank NA | 2.600% | 1/15/21 | 39,181 | 38,597 |
| 1 Wells Fargo Bank NA | 3.325% | 7/23/21 | 26,175 | 26,228 |
| Wells Fargo Bank NA | 3.550% | 8/14/23 | 28,000 | 28,025 |
| Westpac Banking Corp. | 4.875% | 11/19/19 | 24,947 | 25,519 |
| Westpac Banking Corp. | 2.150% | 3/6/20 | 22,188 | 21,902 |
| Westpac Banking Corp. | 3.050% | 5/15/20 | 8,825 | 8,808 |
| Westpac Banking Corp. | 2.300% | 5/26/20 | 17,321 | 17,109 |
| Westpac Banking Corp. | 2.600% | 11/23/20 | 16,274 | 16,072 |
| Westpac Banking Corp. | 2.650% | 1/25/21 | 7,695 | 7,579 |
| Westpac Banking Corp. | 2.100% | 5/13/21 | 25,907 | 25,100 |
| Westpac Banking Corp. | 2.000% | 8/19/21 | 22,375 | 21,568 |
| Westpac Banking Corp. | 2.800% | 1/11/22 | 16,250 | 15,920 |
| Westpac Banking Corp. | 2.500% | 6/28/22 | 19,400 | 18,715 |
| Westpac Banking Corp. | 2.750% | 1/11/23 | 8,800 | 8,523 |
| Westpac Banking Corp. | 3.650% | 5/15/23 | 12,400 | 12,471 |
| ZB NA | 3.500% | 8/27/21 | 8,500 | 8,493 |
| Brokerage (0.8%) | ||||
| Ameriprise Financial Inc. | 5.300% | 3/15/20 | 10,490 | 10,830 |
8
| Vanguard® Short-Term Corporate Bond Index Fund | ||||
| Schedule of Investments | ||||
| August 31, 2018 | ||||
| Face | Market | |||
| Maturity | Amount | Value | ||
| Coupon | Date | ($000) | ($000) | |
| BGC Partners Inc. | 5.375% | 12/9/19 | 2,050 | 2,095 |
| BGC Partners Inc. | 5.125% | 5/27/21 | 2,250 | 2,309 |
| 2 BGC Partners Inc. | 5.375% | 7/24/23 | 4,925 | 4,932 |
| BlackRock Inc. | 5.000% | 12/10/19 | 21,921 | 22,464 |
| BlackRock Inc. | 4.250% | 5/24/21 | 9,411 | 9,683 |
| BlackRock Inc. | 3.375% | 6/1/22 | 5,775 | 5,796 |
| Charles Schwab Corp. | 4.450% | 7/22/20 | 6,468 | 6,633 |
| Charles Schwab Corp. | 3.250% | 5/21/21 | 9,400 | 9,419 |
| Charles Schwab Corp. | 3.225% | 9/1/22 | 1,500 | 1,495 |
| Charles Schwab Corp. | 2.650% | 1/25/23 | 10,405 | 10,114 |
| CME Group Inc. | 3.000% | 9/15/22 | 5,050 | 4,999 |
| E*TRADE Financial Corp. | 2.950% | 8/24/22 | 10,050 | 9,727 |
| Eaton Vance Corp. | 3.625% | 6/15/23 | 4,350 | 4,328 |
| Franklin Resources Inc. | 2.800% | 9/15/22 | 3,200 | 3,126 |
| Intercontinental Exchange Inc. | 2.750% | 12/1/20 | 16,036 | 15,914 |
| Intercontinental Exchange Inc. | 2.350% | 9/15/22 | 2,205 | 2,124 |
| Invesco Finance plc | 3.125% | 11/30/22 | 9,007 | 8,893 |
| Jefferies Group LLC | 6.875% | 4/15/21 | 10,443 | 11,261 |
| Jefferies Group LLC | 5.125% | 1/20/23 | 9,571 | 9,976 |
| Lazard Group LLC | 4.250% | 11/14/20 | 7,780 | 7,923 |
| Nasdaq Inc. | 5.550% | 1/15/20 | 9,612 | 9,921 |
| Nomura Holdings Inc. | 6.700% | 3/4/20 | 16,300 | 17,094 |
| Stifel Financial Corp. | 3.500% | 12/1/20 | 4,575 | 4,549 |
| TD Ameritrade Holding Corp. | 5.600% | 12/1/19 | 6,072 | 6,264 |
| TD Ameritrade Holding Corp. | 2.950% | 4/1/22 | 15,495 | 15,278 |
| Finance Companies (1.3%) | ||||
| AerCap Ireland Capital DAC / AerCap Global Aviation | ||||
| Trust | 4.250% | 7/1/20 | 8,310 | 8,414 |
| AerCap Ireland Capital DAC / AerCap Global Aviation | ||||
| Trust | 4.625% | 10/30/20 | 14,372 | 14,695 |
| AerCap Ireland Capital DAC / AerCap Global Aviation | ||||
| Trust | 4.500% | 5/15/21 | 15,686 | 15,941 |
| AerCap Ireland Capital DAC / AerCap Global Aviation | ||||
| Trust | 5.000% | 10/1/21 | 13,987 | 14,459 |
| AerCap Ireland Capital DAC / AerCap Global Aviation | ||||
| Trust | 3.950% | 2/1/22 | 14,833 | 14,833 |
| AerCap Ireland Capital DAC / AerCap Global Aviation | ||||
| Trust | 3.500% | 5/26/22 | 6,865 | 6,754 |
| AerCap Ireland Capital DAC / AerCap Global Aviation | ||||
| Trust | 4.625% | 7/1/22 | 7,914 | 8,092 |
| AerCap Ireland Capital DAC / AerCap Global Aviation | ||||
| Trust | 3.300% | 1/23/23 | 3,845 | 3,720 |
| AerCap Ireland Capital DAC / AerCap Global Aviation | ||||
| Trust | 4.125% | 7/3/23 | 6,325 | 6,309 |
| Air Lease Corp. | 2.125% | 1/15/20 | 6,550 | 6,444 |
| Air Lease Corp. | 4.750% | 3/1/20 | 6,019 | 6,137 |
| Air Lease Corp. | 2.500% | 3/1/21 | 4,750 | 4,631 |
| Air Lease Corp. | 3.875% | 4/1/21 | 7,861 | 7,910 |
| Air Lease Corp. | 3.375% | 6/1/21 | 14,555 | 14,462 |
| Air Lease Corp. | 3.750% | 2/1/22 | 4,745 | 4,754 |
| Air Lease Corp. | 2.625% | 7/1/22 | 9,580 | 9,217 |
| Air Lease Corp. | 2.750% | 1/15/23 | 7,415 | 7,052 |
| Air Lease Corp. | 3.875% | 7/3/23 | 7,400 | 7,360 |
| Aircastle Ltd. | 6.250% | 12/1/19 | 1,152 | 1,189 |
| Aircastle Ltd. | 5.125% | 3/15/21 | 3,500 | 3,605 |
| Aircastle Ltd. | 5.500% | 2/15/22 | 5,000 | 5,231 |
| Aircastle Ltd. | 5.000% | 4/1/23 | 6,675 | 6,917 |
| Ares Capital Corp. | 3.875% | 1/15/20 | 7,485 | 7,512 |
| Ares Capital Corp. | 3.625% | 1/19/22 | 10,625 | 10,415 |
| Ares Capital Corp. | 3.500% | 2/10/23 | 9,875 | 9,498 |
| FS Investment Corp. | 4.250% | 1/15/20 | 3,665 | 3,675 |
| FS Investment Corp. | 4.750% | 5/15/22 | 475 | 470 |
| GATX Corp. | 2.600% | 3/30/20 | 5,310 | 5,253 |
9
| Vanguard® Short-Term Corporate Bond Index Fund | ||||
| Schedule of Investments | ||||
| August 31, 2018 | ||||
| Face | Market | |||
| Maturity | Amount | Value | ||
| Coupon | Date | ($000) | ($000) | |
| GATX Corp. | 4.850% | 6/1/21 | 3,925 | 4,057 |
| GATX Corp. | 3.900% | 3/30/23 | 1,775 | 1,774 |
| GE Capital International Funding Co. Unlimited Co. | 2.342% | 11/15/20 | 79,990 | 78,291 |
| International Lease Finance Corp. | 8.250% | 12/15/20 | 21,049 | 23,095 |
| International Lease Finance Corp. | 4.625% | 4/15/21 | 5,921 | 6,054 |
| International Lease Finance Corp. | 8.625% | 1/15/22 | 7,490 | 8,585 |
| International Lease Finance Corp. | 5.875% | 8/15/22 | 10,744 | 11,456 |
| Prospect Capital Corp. | 5.875% | 3/15/23 | 1,725 | 1,760 |
| Insurance (3.4%) | ||||
| AEGON Funding Co. LLC | 5.750% | 12/15/20 | 6,851 | 7,167 |
| Aetna Inc. | 4.125% | 6/1/21 | 5,374 | 5,465 |
| Aetna Inc. | 2.750% | 11/15/22 | 8,711 | 8,413 |
| Aetna Inc. | 2.800% | 6/15/23 | 19,754 | 19,001 |
| Aflac Inc. | 2.400% | 3/16/20 | 7,216 | 7,153 |
| Aflac Inc. | 4.000% | 2/15/22 | 5,525 | 5,640 |
| Aflac Inc. | 3.625% | 6/15/23 | 1,805 | 1,817 |
| Alleghany Corp. | 5.625% | 9/15/20 | 1,400 | 1,461 |
| Alleghany Corp. | 4.950% | 6/27/22 | 7,000 | 7,337 |
| Allstate Corp. | 3.150% | 6/15/23 | 3,420 | 3,383 |
| 1 Allstate Corp. | 5.750% | 8/15/53 | 10,705 | 11,240 |
| Alterra Finance LLC | 6.250% | 9/30/20 | 5,940 | 6,266 |
| American International Group Inc. | 3.375% | 8/15/20 | 6,280 | 6,295 |
| American International Group Inc. | 6.400% | 12/15/20 | 12,672 | 13,511 |
| American International Group Inc. | 3.300% | 3/1/21 | 17,029 | 17,006 |
| American International Group Inc. | 4.875% | 6/1/22 | 22,278 | 23,297 |
| Anthem Inc. | 4.350% | 8/15/20 | 9,290 | 9,463 |
| Anthem Inc. | 2.500% | 11/21/20 | 14,721 | 14,499 |
| Anthem Inc. | 3.700% | 8/15/21 | 8,555 | 8,575 |
| Anthem Inc. | 3.125% | 5/15/22 | 14,120 | 13,867 |
| Anthem Inc. | 2.950% | 12/1/22 | 14,275 | 13,920 |
| Anthem Inc. | 3.300% | 1/15/23 | 9,275 | 9,143 |
| Aon Corp. | 5.000% | 9/30/20 | 8,956 | 9,245 |
| Aon plc | 2.800% | 3/15/21 | 5,707 | 5,601 |
| Assurant Inc. | 4.000% | 3/15/23 | 6,145 | 6,209 |
| 2 AXA Equitable Holdings Inc. | 3.900% | 4/20/23 | 15,325 | 15,275 |
| AXIS Specialty Finance LLC | 5.875% | 6/1/20 | 8,842 | 9,206 |
| Berkshire Hathaway Finance Corp. | 2.900% | 10/15/20 | 6,986 | 6,994 |
| Berkshire Hathaway Finance Corp. | 4.250% | 1/15/21 | 10,127 | 10,414 |
| Berkshire Hathaway Finance Corp. | 3.000% | 5/15/22 | 3,495 | 3,489 |
| Berkshire Hathaway Inc. | 2.200% | 3/15/21 | 14,477 | 14,204 |
| Berkshire Hathaway Inc. | 3.750% | 8/15/21 | 6,482 | 6,622 |
| Berkshire Hathaway Inc. | 3.400% | 1/31/22 | 5,534 | 5,580 |
| Berkshire Hathaway Inc. | 3.000% | 2/11/23 | 8,281 | 8,255 |
| Berkshire Hathaway Inc. | 2.750% | 3/15/23 | 35,931 | 35,274 |
| Chubb INA Holdings Inc. | 2.300% | 11/3/20 | 24,624 | 24,129 |
| Chubb INA Holdings Inc. | 2.875% | 11/3/22 | 8,350 | 8,183 |
| Chubb INA Holdings Inc. | 2.700% | 3/13/23 | 8,282 | 8,029 |
| Cigna Corp. | 5.125% | 6/15/20 | 3,780 | 3,903 |
| Cigna Corp. | 4.375% | 12/15/20 | 1,750 | 1,780 |
| Cigna Corp. | 4.500% | 3/15/21 | 3,074 | 3,153 |
| Cigna Corp. | 4.000% | 2/15/22 | 10,290 | 10,427 |
| CNA Financial Corp. | 5.875% | 8/15/20 | 9,838 | 10,304 |
| CNA Financial Corp. | 5.750% | 8/15/21 | 4,900 | 5,193 |
| Coventry Health Care Inc. | 5.450% | 6/15/21 | 10,729 | 11,266 |
| Enstar Group Ltd. | 4.500% | 3/10/22 | 4,100 | 4,126 |
| Fidelity National Financial Inc. | 5.500% | 9/1/22 | 3,550 | 3,777 |
| Hartford Financial Services Group Inc. | 5.500% | 3/30/20 | 8,929 | 9,219 |
| Hartford Financial Services Group Inc. | 5.125% | 4/15/22 | 13,644 | 14,372 |
| Humana Inc. | 2.625% | 10/1/19 | 5,995 | 5,961 |
| Humana Inc. | 2.500% | 12/15/20 | 1,900 | 1,862 |
| Humana Inc. | 3.150% | 12/1/22 | 9,641 | 9,465 |
| Humana Inc. | 2.900% | 12/15/22 | 7,436 | 7,216 |
| Lincoln National Corp. | 6.250% | 2/15/20 | 3,675 | 3,826 |
10
| Vanguard® Short-Term Corporate Bond Index Fund | ||||
| Schedule of Investments | ||||
| August 31, 2018 | ||||
| Face | Market | |||
| Maturity | Amount | Value | ||
| Coupon | Date | ($000) | ($000) | |
| Lincoln National Corp. | 4.850% | 6/24/21 | 3,625 | 3,751 |
| Lincoln National Corp. | 4.200% | 3/15/22 | 3,737 | 3,820 |
| Loews Corp. | 2.625% | 5/15/23 | 8,333 | 8,007 |
| Manulife Financial Corp. | 4.900% | 9/17/20 | 7,301 | 7,530 |
| Markel Corp. | 4.900% | 7/1/22 | 4,955 | 5,126 |
| Marsh & McLennan Cos. Inc. | 2.350% | 9/10/19 | 5,910 | 5,878 |
| Marsh & McLennan Cos. Inc. | 2.350% | 3/6/20 | 6,543 | 6,461 |
| Marsh & McLennan Cos. Inc. | 4.800% | 7/15/21 | 8,171 | 8,463 |
| Marsh & McLennan Cos. Inc. | 2.750% | 1/30/22 | 12,235 | 11,917 |
| Marsh & McLennan Cos. Inc. | 3.300% | 3/14/23 | 4,000 | 3,957 |
| MetLife Inc. | 4.750% | 2/8/21 | 16,056 | 16,583 |
| MetLife Inc. | 3.048% | 12/15/22 | 2,850 | 2,813 |
| PartnerRe Finance B LLC | 5.500% | 6/1/20 | 6,710 | 6,930 |
| Primerica Inc. | 4.750% | 7/15/22 | 4,944 | 5,128 |
| Principal Financial Group Inc. | 3.300% | 9/15/22 | 5,785 | 5,723 |
| Principal Financial Group Inc. | 3.125% | 5/15/23 | 3,917 | 3,836 |
| 1 Principal Financial Group Inc. | 4.700% | 5/15/55 | 3,800 | 3,819 |
| Progressive Corp. | 3.750% | 8/23/21 | 7,978 | 8,064 |
| Protective Life Corp. | 7.375% | 10/15/19 | 5,425 | 5,663 |
| Prudential Financial Inc. | 5.375% | 6/21/20 | 8,769 | 9,098 |
| Prudential Financial Inc. | 4.500% | 11/15/20 | 6,400 | 6,583 |
| Prudential Financial Inc. | 4.500% | 11/16/21 | 6,565 | 6,790 |
| 1 Prudential Financial Inc. | 5.875% | 9/15/42 | 11,500 | 12,239 |
| 1 Prudential Financial Inc. | 5.625% | 6/15/43 | 27,206 | 28,498 |
| Reinsurance Group of America Inc. | 6.450% | 11/15/19 | 6,911 | 7,163 |
| Reinsurance Group of America Inc. | 5.000% | 6/1/21 | 7,385 | 7,678 |
| Torchmark Corp. | 3.800% | 9/15/22 | 3,080 | 3,089 |
| Travelers Cos. Inc. | 3.900% | 11/1/20 | 4,265 | 4,339 |
| Trinity Acquisition plc | 3.500% | 9/15/21 | 5,454 | 5,390 |
| UnitedHealth Group Inc. | 2.300% | 12/15/19 | 9,043 | 8,982 |
| UnitedHealth Group Inc. | 2.700% | 7/15/20 | 28,781 | 28,641 |
| UnitedHealth Group Inc. | 1.950% | 10/15/20 | 17,518 | 17,178 |
| UnitedHealth Group Inc. | 3.875% | 10/15/20 | 7,329 | 7,444 |
| UnitedHealth Group Inc. | 4.700% | 2/15/21 | 5,692 | 5,888 |
| UnitedHealth Group Inc. | 2.125% | 3/15/21 | 13,682 | 13,367 |
| UnitedHealth Group Inc. | 3.150% | 6/15/21 | 8,360 | 8,371 |
| UnitedHealth Group Inc. | 3.375% | 11/15/21 | 7,700 | 7,746 |
| UnitedHealth Group Inc. | 2.875% | 12/15/21 | 18,700 | 18,543 |
| UnitedHealth Group Inc. | 2.875% | 3/15/22 | 9,838 | 9,733 |
| UnitedHealth Group Inc. | 3.350% | 7/15/22 | 5,646 | 5,681 |
| UnitedHealth Group Inc. | 2.375% | 10/15/22 | 11,525 | 11,111 |
| UnitedHealth Group Inc. | 2.750% | 2/15/23 | 4,250 | 4,149 |
| UnitedHealth Group Inc. | 2.875% | 3/15/23 | 7,391 | 7,258 |
| UnitedHealth Group Inc. | 3.500% | 6/15/23 | 3,110 | 3,128 |
| Unum Group | 5.625% | 9/15/20 | 2,458 | 2,553 |
| Unum Group | 3.000% | 5/15/21 | 4,650 | 4,591 |
| Willis Towers Watson plc | 5.750% | 3/15/21 | 4,175 | 4,377 |
| WR Berkley Corp. | 7.375% | 9/15/19 | 1,282 | 1,332 |
| WR Berkley Corp. | 5.375% | 9/15/20 | 3,175 | 3,282 |
| WR Berkley Corp. | 4.625% | 3/15/22 | 6,441 | 6,654 |
| XLIT Ltd. | 5.750% | 10/1/21 | 4,635 | 4,929 |
| Other Finance (0.0%) | ||||
| ORIX Corp. | 2.900% | 7/18/22 | 10,200 | 9,895 |
| Real Estate Investment Trusts (2.2%) | ||||
| Alexandria Real Estate Equities Inc. | 2.750% | 1/15/20 | 5,052 | 5,014 |
| Alexandria Real Estate Equities Inc. | 4.600% | 4/1/22 | 9,286 | 9,583 |
| Alexandria Real Estate Equities Inc. | 3.900% | 6/15/23 | 5,770 | 5,818 |
| American Campus Communities Operating Partnership | ||||
| LP | 3.350% | 10/1/20 | 5,520 | 5,508 |
| American Campus Communities Operating Partnership | ||||
| LP | 3.750% | 4/15/23 | 5,350 | 5,322 |
| AvalonBay Communities Inc. | 6.100% | 3/15/20 | 750 | 778 |
11
| Vanguard® Short-Term Corporate Bond Index Fund | ||||
| Schedule of Investments | ||||
| August 31, 2018 | ||||
| Face | Market | |||
| Maturity | Amount | Value | ||
| Coupon | Date | ($000) | ($000) | |
| AvalonBay Communities Inc. | 3.625% | 10/1/20 | 6,505 | 6,554 |
| AvalonBay Communities Inc. | 2.950% | 9/15/22 | 5,300 | 5,198 |
| Boston Properties LP | 5.875% | 10/15/19 | 8,177 | 8,381 |
| Boston Properties LP | 5.625% | 11/15/20 | 8,725 | 9,120 |
| Boston Properties LP | 4.125% | 5/15/21 | 9,885 | 10,096 |
| Boston Properties LP | 3.850% | 2/1/23 | 15,551 | 15,697 |
| Brandywine Operating Partnership LP | 3.950% | 2/15/23 | 4,740 | 4,725 |
| Brixmor Operating Partnership LP | 3.875% | 8/15/22 | 5,872 | 5,861 |
| Camden Property Trust | 4.625% | 6/15/21 | 1,100 | 1,135 |
| Camden Property Trust | 2.950% | 12/15/22 | 5,971 | 5,819 |
| Corporate Office Properties LP | 3.700% | 6/15/21 | 4,020 | 3,991 |
| Corporate Office Properties LP | 3.600% | 5/15/23 | 5,184 | 5,051 |
| DDR Corp. | 4.625% | 7/15/22 | 9,721 | 9,986 |
| Digital Realty Trust LP | 5.875% | 2/1/20 | 6,100 | 6,276 |
| Digital Realty Trust LP | 3.400% | 10/1/20 | 7,265 | 7,275 |
| Digital Realty Trust LP | 5.250% | 3/15/21 | 11,779 | 12,236 |
| Digital Realty Trust LP | 3.950% | 7/1/22 | 2,885 | 2,917 |
| Digital Realty Trust LP | 3.625% | 10/1/22 | 8,166 | 8,141 |
| Digital Realty Trust LP | 2.750% | 2/1/23 | 4,122 | 3,960 |
| Duke Realty LP | 3.875% | 2/15/21 | 3,050 | 3,084 |
| Duke Realty LP | 4.375% | 6/15/22 | 650 | 667 |
| Duke Realty LP | 3.875% | 10/15/22 | 4,144 | 4,194 |
| Duke Realty LP | 3.625% | 4/15/23 | 2,500 | 2,489 |
| EPR Properties | 5.750% | 8/15/22 | 5,145 | 5,419 |
| ERP Operating LP | 4.750% | 7/15/20 | 4,825 | 4,946 |
| ERP Operating LP | 4.625% | 12/15/21 | 13,546 | 14,039 |
| ERP Operating LP | 3.000% | 4/15/23 | 5,290 | 5,181 |
| Essex Portfolio LP | 5.200% | 3/15/21 | 2,700 | 2,798 |
| Essex Portfolio LP | 3.625% | 8/15/22 | 1,750 | 1,743 |
| Essex Portfolio LP | 3.375% | 1/15/23 | 2,000 | 1,951 |
| Essex Portfolio LP | 3.250% | 5/1/23 | 4,220 | 4,119 |
| Government Properties Income Trust | 4.000% | 7/15/22 | 6,500 | 6,448 |
| HCP Inc. | 2.625% | 2/1/20 | 16,958 | 16,833 |
| HCP Inc. | 3.150% | 8/1/22 | 3,944 | 3,849 |
| HCP Inc. | 4.000% | 12/1/22 | 11,927 | 11,983 |
| Healthcare Trust of America Holdings LP | 3.375% | 7/15/21 | 4,587 | 4,568 |
| Healthcare Trust of America Holdings LP | 2.950% | 7/1/22 | 5,128 | 4,959 |
| Healthcare Trust of America Holdings LP | 3.700% | 4/15/23 | 2,100 | 2,072 |
| Highwoods Realty LP | 3.200% | 6/15/21 | 3,041 | 3,004 |
| Highwoods Realty LP | 3.625% | 1/15/23 | 1,360 | 1,332 |
| Hospitality Properties Trust | 4.250% | 2/15/21 | 4,600 | 4,652 |
| Hospitality Properties Trust | 5.000% | 8/15/22 | 3,651 | 3,763 |
| Hospitality Properties Trust | 4.500% | 6/15/23 | 6,495 | 6,557 |
| Host Hotels & Resorts LP | 6.000% | 10/1/21 | 5,322 | 5,620 |
| Host Hotels & Resorts LP | 5.250% | 3/15/22 | 2,064 | 2,151 |
| Host Hotels & Resorts LP | 4.750% | 3/1/23 | 7,207 | 7,392 |
| Kimco Realty Corp. | 3.200% | 5/1/21 | 6,135 | 6,082 |
| Kimco Realty Corp. | 3.400% | 11/1/22 | 4,735 | 4,674 |
| Kimco Realty Corp. | 3.125% | 6/1/23 | 3,673 | 3,556 |
| Liberty Property LP | 4.750% | 10/1/20 | 8,460 | 8,662 |
| Liberty Property LP | 4.125% | 6/15/22 | 3,000 | 3,059 |
| Liberty Property LP | 3.375% | 6/15/23 | 2,900 | 2,848 |
| National Retail Properties Inc. | 5.500% | 7/15/21 | 300 | 314 |
| National Retail Properties Inc. | 3.800% | 10/15/22 | 4,952 | 4,969 |
| National Retail Properties Inc. | 3.300% | 4/15/23 | 9,125 | 8,950 |
| Piedmont Operating Partnership LP | 3.400% | 6/1/23 | 4,000 | 3,868 |
| ProLogis LP | 4.250% | 8/15/23 | 10,137 | 10,486 |
| Public Storage | 2.370% | 9/15/22 | 6,698 | 6,453 |
| Realty Income Corp. | 3.250% | 10/15/22 | 17,410 | 17,253 |
| Realty Income Corp. | 4.650% | 8/1/23 | 10,755 | 11,206 |
| Regency Centers Corp. | 3.750% | 11/15/22 | 4,105 | 4,104 |
| Regency Centers LP | 4.800% | 4/15/21 | 2,750 | 2,829 |
| Select Income REIT | 3.600% | 2/1/20 | 1,600 | 1,592 |
| Select Income REIT | 4.150% | 2/1/22 | 5,190 | 5,169 |
12
| Vanguard® Short-Term Corporate Bond Index Fund | ||||
| Schedule of Investments | ||||
| August 31, 2018 | ||||
| Face | Market | |||
| Maturity | Amount | Value | ||
| Coupon | Date | ($000) | ($000) | |
| Simon Property Group LP | 2.500% | 9/1/20 | 8,298 | 8,205 |
| Simon Property Group LP | 4.375% | 3/1/21 | 9,064 | 9,302 |
| Simon Property Group LP | 2.500% | 7/15/21 | 6,792 | 6,657 |
| Simon Property Group LP | 4.125% | 12/1/21 | 7,880 | 8,078 |
| Simon Property Group LP | 2.350% | 1/30/22 | 7,725 | 7,491 |
| Simon Property Group LP | 3.375% | 3/15/22 | 6,484 | 6,490 |
| Simon Property Group LP | 2.625% | 6/15/22 | 4,925 | 4,800 |
| Simon Property Group LP | 2.750% | 2/1/23 | 10,159 | 9,888 |
| Simon Property Group LP | 2.750% | 6/1/23 | 6,660 | 6,461 |
| SL Green Operating Partnership LP | 3.250% | 10/15/22 | 4,200 | 4,099 |
| SL Green Realty Corp. | 7.750% | 3/15/20 | 2,500 | 2,654 |
| SL Green Realty Corp. | 4.500% | 12/1/22 | 5,775 | 5,880 |
| UDR Inc. | 3.700% | 10/1/20 | 8,875 | 8,920 |
| UDR Inc. | 4.625% | 1/10/22 | 975 | 1,000 |
| Ventas Realty LP | 3.100% | 1/15/23 | 4,065 | 3,962 |
| Ventas Realty LP | 3.125% | 6/15/23 | 5,470 | 5,311 |
| Ventas Realty LP / Ventas Capital Corp. | 2.700% | 4/1/20 | 8,378 | 8,316 |
| Ventas Realty LP / Ventas Capital Corp. | 4.250% | 3/1/22 | 8,304 | 8,478 |
| Ventas Realty LP / Ventas Capital Corp. | 3.250% | 8/15/22 | 8,550 | 8,417 |
| VEREIT Operating Partnership LP | 4.125% | 6/1/21 | 10,055 | 10,181 |
| Vornado Realty LP | 5.000% | 1/15/22 | 4,350 | 4,522 |
| Washington REIT | 4.950% | 10/1/20 | 2,150 | 2,194 |
| Washington REIT | 3.950% | 10/15/22 | 2,300 | 2,311 |
| Weingarten Realty Investors | 3.500% | 4/15/23 | 3,170 | 3,131 |
| Welltower Inc. | 6.125% | 4/15/20 | 5,615 | 5,861 |
| Welltower Inc. | 4.950% | 1/15/21 | 6,986 | 7,188 |
| Welltower Inc. | 5.250% | 1/15/22 | 7,151 | 7,487 |
| Welltower Inc. | 3.750% | 3/15/23 | 6,300 | 6,283 |
| Welltower Inc. | 3.950% | 9/1/23 | 6,525 | 6,570 |
| 11,112,020 | ||||
| Industrial (53.2%) | ||||
| Basic Industry (2.3%) | ||||
| Air Products & Chemicals Inc. | 3.000% | 11/3/21 | 2,150 | 2,137 |
| Air Products & Chemicals Inc. | 2.750% | 2/3/23 | 5,099 | 4,981 |
| Airgas Inc. | 2.375% | 2/15/20 | 2,200 | 2,178 |
| ArcelorMittal | 5.125% | 6/1/20 | 4,500 | 4,619 |
| ArcelorMittal | 5.250% | 8/5/20 | 4,300 | 4,424 |
| ArcelorMittal | 5.500% | 3/1/21 | 10,916 | 11,312 |
| ArcelorMittal | 6.250% | 2/25/22 | 9,000 | 9,675 |
| Barrick Gold Corp. | 3.850% | 4/1/22 | 1,735 | 1,756 |
| BHP Billiton Finance USA Ltd. | 3.250% | 11/21/21 | 550 | 551 |
| BHP Billiton Finance USA Ltd. | 2.875% | 2/24/22 | 17,370 | 17,171 |
| Cabot Corp. | 3.700% | 7/15/22 | 5,145 | 5,131 |
| Celanese US Holdings LLC | 5.875% | 6/15/21 | 5,682 | 6,002 |
| Celanese US Holdings LLC | 4.625% | 11/15/22 | 6,373 | 6,539 |
| Celulosa Arauco y Constitucion SA | 7.250% | 7/29/19 | 3,580 | 3,704 |
| Celulosa Arauco y Constitucion SA | 5.000% | 1/21/21 | 2,625 | 2,691 |
| Celulosa Arauco y Constitucion SA | 4.750% | 1/11/22 | 2,625 | 2,676 |
| Domtar Corp. | 4.400% | 4/1/22 | 2,205 | 2,240 |
| Dow Chemical Co. | 4.250% | 11/15/20 | 23,005 | 23,471 |
| Dow Chemical Co. | 4.125% | 11/15/21 | 8,117 | 8,281 |
| Dow Chemical Co. | 3.000% | 11/15/22 | 22,789 | 22,298 |
| Eastman Chemical Co. | 2.700% | 1/15/20 | 15,916 | 15,837 |
| Eastman Chemical Co. | 4.500% | 1/15/21 | 51 | 52 |
| Eastman Chemical Co. | 3.600% | 8/15/22 | 7,800 | 7,807 |
| Ecolab Inc. | 2.250% | 1/12/20 | 4,795 | 4,742 |
| Ecolab Inc. | 4.350% | 12/8/21 | 15,106 | 15,615 |
| Ecolab Inc. | 2.375% | 8/10/22 | 7,000 | 6,751 |
| Ecolab Inc. | 3.250% | 1/14/23 | 2,655 | 2,647 |
| EI du Pont de Nemours & Co. | 4.625% | 1/15/20 | 14,272 | 14,595 |
| EI du Pont de Nemours & Co. | 2.200% | 5/1/20 | 22,188 | 21,912 |
| EI du Pont de Nemours & Co. | 3.625% | 1/15/21 | 8,525 | 8,622 |
| EI du Pont de Nemours & Co. | 4.250% | 4/1/21 | 6,295 | 6,460 |
13
| Vanguard® Short-Term Corporate Bond Index Fund | ||||
| Schedule of Investments | ||||
| August 31, 2018 | ||||
| Face | Market | |||
| Maturity | Amount | Value | ||
| Coupon | Date | ($000) | ($000) | |
| EI du Pont de Nemours & Co. | 2.800% | 2/15/23 | 17,245 | 16,831 |
| FMC Corp. | 5.200% | 12/15/19 | 3,350 | 3,428 |
| FMC Corp. | 3.950% | 2/1/22 | 1,775 | 1,785 |
| Goldcorp Inc. | 3.625% | 6/9/21 | 10,700 | 10,687 |
| Goldcorp Inc. | 3.700% | 3/15/23 | 13,039 | 12,949 |
| International Flavors & Fragrances Inc. | 3.200% | 5/1/23 | 1,075 | 1,048 |
| International Paper Co. | 7.500% | 8/15/21 | 4,380 | 4,867 |
| International Paper Co. | 4.750% | 2/15/22 | 16,075 | 16,692 |
| Kinross Gold Corp. | 5.125% | 9/1/21 | 8,700 | 8,950 |
| LYB International Finance BV | 4.000% | 7/15/23 | 10,995 | 11,045 |
| LyondellBasell Industries NV | 6.000% | 11/15/21 | 14,693 | 15,688 |
| Methanex Corp. | 3.250% | 12/15/19 | 3,450 | 3,436 |
| Mosaic Co. | 3.750% | 11/15/21 | 3,820 | 3,830 |
| Mosaic Co. | 3.250% | 11/15/22 | 9,055 | 8,882 |
| Newmont Mining Corp. | 5.125% | 10/1/19 | 7,336 | 7,473 |
| Newmont Mining Corp. | 3.500% | 3/15/22 | 15,711 | 15,589 |
| Nucor Corp. | 4.000% | 8/1/23 | 8,000 | 8,165 |
| Nutrien Ltd. | 4.875% | 3/30/20 | 5,325 | 5,438 |
| Nutrien Ltd. | 3.150% | 10/1/22 | 12,378 | 12,078 |
| Nutrien Ltd. | 3.500% | 6/1/23 | 6,989 | 6,864 |
| Packaging Corp. of America | 2.450% | 12/15/20 | 9,505 | 9,345 |
| Packaging Corp. of America | 3.900% | 6/15/22 | 5,366 | 5,430 |
| PPG Industries Inc. | 2.300% | 11/15/19 | 7,780 | 7,714 |
| PPG Industries Inc. | 3.600% | 11/15/20 | 4,075 | 4,112 |
| PPG Industries Inc. | 3.200% | 3/15/23 | 2,190 | 2,173 |
| Praxair Inc. | 2.250% | 9/24/20 | 4,000 | 3,946 |
| Praxair Inc. | 4.050% | 3/15/21 | 5,075 | 5,189 |
| Praxair Inc. | 3.000% | 9/1/21 | 6,507 | 6,509 |
| Praxair Inc. | 2.450% | 2/15/22 | 2,775 | 2,708 |
| Praxair Inc. | 2.200% | 8/15/22 | 9,035 | 8,704 |
| Praxair Inc. | 2.700% | 2/21/23 | 7,500 | 7,328 |
| Rayonier Inc. | 3.750% | 4/1/22 | 3,400 | 3,381 |
| Reliance Steel & Aluminum Co. | 4.500% | 4/15/23 | 1,065 | 1,084 |
| RPM International Inc. | 6.125% | 10/15/19 | 5,905 | 6,084 |
| RPM International Inc. | 3.450% | 11/15/22 | 5,883 | 5,834 |
| Sherwin-Williams Co. | 2.250% | 5/15/20 | 27,190 | 26,818 |
| Sherwin-Williams Co. | 4.200% | 1/15/22 | 3,990 | 4,063 |
| Sherwin-Williams Co. | 2.750% | 6/1/22 | 14,257 | 13,862 |
| Southern Copper Corp. | 5.375% | 4/16/20 | 5,100 | 5,279 |
| Southern Copper Corp. | 3.500% | 11/8/22 | 5,105 | 5,033 |
| Vale Overseas Ltd. | 5.875% | 6/10/21 | 7,253 | 7,616 |
| Vale Overseas Ltd. | 4.375% | 1/11/22 | 24,951 | 25,076 |
| WestRock MWV LLC | 7.375% | 9/1/19 | 950 | 986 |
| WestRock RKT Co. | 3.500% | 3/1/20 | 2,970 | 2,975 |
| WestRock RKT Co. | 4.900% | 3/1/22 | 2,506 | 2,611 |
| WestRock RKT Co. | 4.000% | 3/1/23 | 12,505 | 12,671 |
| Weyerhaeuser Co. | 7.375% | 10/1/19 | 6,815 | 7,116 |
| Weyerhaeuser Co. | 4.700% | 3/15/21 | 5,675 | 5,845 |
| Weyerhaeuser Co. | 3.250% | 3/15/23 | 1,470 | 1,436 |
| Capital Goods (5.4%) | ||||
| 3M Co. | 2.000% | 8/7/20 | 7,675 | 7,536 |
| 3M Co. | 1.625% | 9/19/21 | 8,500 | 8,149 |
| 3M Co. | 2.000% | 6/26/22 | 6,488 | 6,250 |
| 3M Co. | 2.250% | 3/15/23 | 9,355 | 9,017 |
| ABB Finance USA Inc. | 2.800% | 4/3/20 | 1,190 | 1,187 |
| ABB Finance USA Inc. | 2.875% | 5/8/22 | 15,495 | 15,233 |
| ABB Finance USA Inc. | 3.375% | 4/3/23 | 3,803 | 3,796 |
| Acuity Brands Lighting Inc. | 6.000% | 12/15/19 | 3,534 | 3,655 |
| Bemis Co. Inc. | 4.500% | 10/15/21 | 2,120 | 2,171 |
| Boeing Capital Corp. | 4.700% | 10/27/19 | 6,464 | 6,598 |
| Boeing Co. | 4.875% | 2/15/20 | 13,810 | 14,244 |
| Boeing Co. | 1.650% | 10/30/20 | 6,370 | 6,212 |
| Boeing Co. | 8.750% | 8/15/21 | 1,900 | 2,189 |
14
| Vanguard® Short-Term Corporate Bond Index Fund | ||||
| Schedule of Investments | ||||
| August 31, 2018 | ||||
| Face | Market | |||
| Maturity | Amount | Value | ||
| Coupon | Date | ($000) | ($000) | |
| Boeing Co. | 2.350% | 10/30/21 | 7,475 | 7,345 |
| Boeing Co. | 2.125% | 3/1/22 | 4,250 | 4,121 |
| Boeing Co. | 2.800% | 3/1/23 | 4,270 | 4,223 |
| Boeing Co. | 1.875% | 6/15/23 | 4,650 | 4,376 |
| Carlisle Cos. Inc. | 3.750% | 11/15/22 | 3,775 | 3,768 |
| Caterpillar Financial Services Corp. | 2.000% | 11/29/19 | 11,505 | 11,380 |
| Caterpillar Financial Services Corp. | 2.250% | 12/1/19 | 5,267 | 5,218 |
| Caterpillar Financial Services Corp. | 2.100% | 1/10/20 | 9,497 | 9,389 |
| Caterpillar Financial Services Corp. | 2.000% | 3/5/20 | 9,629 | 9,487 |
| Caterpillar Financial Services Corp. | 2.950% | 5/15/20 | 9,522 | 9,528 |
| Caterpillar Financial Services Corp. | 1.850% | 9/4/20 | 7,175 | 7,000 |
| Caterpillar Financial Services Corp. | 2.500% | 11/13/20 | 4,950 | 4,887 |
| Caterpillar Financial Services Corp. | 2.900% | 3/15/21 | 1,350 | 1,343 |
| Caterpillar Financial Services Corp. | 1.700% | 8/9/21 | 20,444 | 19,704 |
| Caterpillar Financial Services Corp. | 2.750% | 8/20/21 | 2,000 | 1,983 |
| Caterpillar Financial Services Corp. | 1.931% | 10/1/21 | 8,804 | 8,467 |
| Caterpillar Financial Services Corp. | 2.850% | 6/1/22 | 6,259 | 6,194 |
| Caterpillar Financial Services Corp. | 2.400% | 6/6/22 | 4,575 | 4,447 |
| Caterpillar Financial Services Corp. | 2.550% | 11/29/22 | 10,090 | 9,814 |
| Caterpillar Financial Services Corp. | 2.625% | 3/1/23 | 4,784 | 4,628 |
| Caterpillar Financial Services Corp. | 3.450% | 5/15/23 | 9,100 | 9,156 |
| Caterpillar Inc. | 3.900% | 5/27/21 | 13,607 | 13,947 |
| Caterpillar Inc. | 2.600% | 6/26/22 | 7,412 | 7,262 |
| CNH Industrial Capital LLC | 4.375% | 11/6/20 | 8,630 | 8,727 |
| CNH Industrial Capital LLC | 4.875% | 4/1/21 | 5,865 | 5,990 |
| CNH Industrial Capital LLC | 3.875% | 10/15/21 | 8,139 | 8,098 |
| CNH Industrial Capital LLC | 4.375% | 4/5/22 | 8,010 | 8,090 |
| CNH Industrial NV | 4.500% | 8/15/23 | 5,695 | 5,816 |
| CRH America Inc. | 5.750% | 1/15/21 | 7,859 | 8,238 |
| Deere & Co. | 4.375% | 10/16/19 | 8,872 | 9,018 |
| Deere & Co. | 2.600% | 6/8/22 | 24,167 | 23,702 |
| Dover Corp. | 4.300% | 3/1/21 | 5,150 | 5,280 |
| Eaton Corp. | 2.750% | 11/2/22 | 23,678 | 23,043 |
| Embraer SA | 5.150% | 6/15/22 | 7,743 | 7,933 |
| Emerson Electric Co. | 4.875% | 10/15/19 | 4,441 | 4,534 |
| Emerson Electric Co. | 4.250% | 11/15/20 | 5,150 | 5,266 |
| Emerson Electric Co. | 2.625% | 12/1/21 | 8,610 | 8,482 |
| Emerson Electric Co. | 2.625% | 2/15/23 | 6,800 | 6,618 |
| FLIR Systems Inc. | 3.125% | 6/15/21 | 5,418 | 5,356 |
| Flowserve Corp. | 3.500% | 9/15/22 | 7,130 | 7,002 |
| Fortive Corp. | 2.350% | 6/15/21 | 10,100 | 9,784 |
| Fortune Brands Home & Security Inc. | 3.000% | 6/15/20 | 4,990 | 4,953 |
| General Dynamics Corp. | 2.875% | 5/11/20 | 24,420 | 24,408 |
| General Dynamics Corp. | 3.000% | 5/11/21 | 32,546 | 32,470 |
| General Dynamics Corp. | 3.875% | 7/15/21 | 7,553 | 7,695 |
| General Dynamics Corp. | 2.250% | 11/15/22 | 13,257 | 12,737 |
| General Dynamics Corp. | 3.375% | 5/15/23 | 17,835 | 17,957 |
| General Dynamics Corp. | 1.875% | 8/15/23 | 3,615 | 3,384 |
| General Electric Co. | 2.100% | 12/11/19 | 4,866 | 4,818 |
| General Electric Co. | 5.500% | 1/8/20 | 17,908 | 18,448 |
| General Electric Co. | 2.200% | 1/9/20 | 16,426 | 16,228 |
| General Electric Co. | 5.550% | 5/4/20 | 7,186 | 7,449 |
| General Electric Co. | 4.375% | 9/16/20 | 18,947 | 19,380 |
| General Electric Co. | 4.625% | 1/7/21 | 10,360 | 10,683 |
| General Electric Co. | 5.300% | 2/11/21 | 18,497 | 19,337 |
| General Electric Co. | 4.650% | 10/17/21 | 15,232 | 15,845 |
| General Electric Co. | 3.150% | 9/7/22 | 14,657 | 14,528 |
| General Electric Co. | 2.700% | 10/9/22 | 43,463 | 42,233 |
| General Electric Co. | 3.100% | 1/9/23 | 21,991 | 21,711 |
| Harris Corp. | 2.700% | 4/27/20 | 4,950 | 4,906 |
| Honeywell International Inc. | 1.400% | 10/30/19 | 8,175 | 8,050 |
| Honeywell International Inc. | 1.800% | 10/30/19 | 10,780 | 10,664 |
| Honeywell International Inc. | 4.250% | 3/1/21 | 14,414 | 14,829 |
| Honeywell International Inc. | 1.850% | 11/1/21 | 22,337 | 21,471 |
15
| Vanguard® Short-Term Corporate Bond Index Fund | ||||
| Schedule of Investments | ||||
| August 31, 2018 | ||||
| Face | Market | |||
| Maturity | Amount | Value | ||
| Coupon | Date | ($000) | ($000) | |
| Hubbell Inc. | 3.625% | 11/15/22 | 5,500 | 5,504 |
| IDEX Corp. | 4.200% | 12/15/21 | 3,175 | 3,222 |
| Illinois Tool Works Inc. | 3.375% | 9/15/21 | 4,002 | 4,028 |
| Ingersoll-Rand Global Holding Co. Ltd. | 2.900% | 2/21/21 | 5,156 | 5,108 |
| Ingersoll-Rand Global Holding Co. Ltd. | 4.250% | 6/15/23 | 8,652 | 8,917 |
| Ingersoll-Rand Luxembourg Finance SA | 2.625% | 5/1/20 | 4,155 | 4,098 |
| John Deere Capital Corp. | 2.300% | 9/16/19 | 3,299 | 3,283 |
| John Deere Capital Corp. | 1.250% | 10/9/19 | 8,284 | 8,137 |
| John Deere Capital Corp. | 1.700% | 1/15/20 | 7,551 | 7,437 |
| John Deere Capital Corp. | 2.050% | 3/10/20 | 7,496 | 7,401 |
| John Deere Capital Corp. | 2.200% | 3/13/20 | 2,500 | 2,469 |
| John Deere Capital Corp. | 1.950% | 6/22/20 | 11,265 | 11,067 |
| John Deere Capital Corp. | 2.375% | 7/14/20 | 6,565 | 6,482 |
| John Deere Capital Corp. | 2.450% | 9/11/20 | 4,100 | 4,053 |
| John Deere Capital Corp. | 2.350% | 1/8/21 | 10,400 | 10,246 |
| John Deere Capital Corp. | 2.550% | 1/8/21 | 5,400 | 5,337 |
| John Deere Capital Corp. | 2.800% | 3/4/21 | 3,723 | 3,695 |
| John Deere Capital Corp. | 2.875% | 3/12/21 | 1,750 | 1,741 |
| John Deere Capital Corp. | 3.900% | 7/12/21 | 7,398 | 7,543 |
| John Deere Capital Corp. | 3.150% | 10/15/21 | 5,464 | 5,461 |
| John Deere Capital Corp. | 2.650% | 1/6/22 | 5,521 | 5,428 |
| John Deere Capital Corp. | 2.750% | 3/15/22 | 5,685 | 5,605 |
| John Deere Capital Corp. | 2.150% | 9/8/22 | 4,675 | 4,479 |
| John Deere Capital Corp. | 2.700% | 1/6/23 | 11,750 | 11,478 |
| John Deere Capital Corp. | 2.800% | 1/27/23 | 5,170 | 5,057 |
| John Deere Capital Corp. | 2.800% | 3/6/23 | 10,050 | 9,830 |
| John Deere Capital Corp. | 3.450% | 6/7/23 | 12,030 | 12,089 |
| Johnson Controls International plc | 5.000% | 3/30/20 | 6,700 | 6,862 |
| Johnson Controls International plc | 4.250% | 3/1/21 | 5,014 | 5,108 |
| Johnson Controls International plc | 3.750% | 12/1/21 | 6,151 | 6,198 |
| Kennametal Inc. | 3.875% | 2/15/22 | 3,450 | 3,431 |
| L3 Technologies Inc. | 4.950% | 2/15/21 | 10,100 | 10,414 |
| L3 Technologies Inc. | 3.850% | 6/15/23 | 9,900 | 9,952 |
| Leggett & Platt Inc. | 3.400% | 8/15/22 | 1,000 | 988 |
| Lockheed Martin Corp. | 4.250% | 11/15/19 | 2,927 | 2,975 |
| Lockheed Martin Corp. | 2.500% | 11/23/20 | 14,548 | 14,386 |
| Lockheed Martin Corp. | 3.350% | 9/15/21 | 13,715 | 13,766 |
| Lockheed Martin Corp. | 3.100% | 1/15/23 | 14,625 | 14,526 |
| Masco Corp. | 7.125% | 3/15/20 | 1,445 | 1,526 |
| Masco Corp. | 3.500% | 4/1/21 | 5,804 | 5,781 |
| Masco Corp. | 5.950% | 3/15/22 | 2,578 | 2,767 |
| Mohawk Industries Inc. | 3.850% | 2/1/23 | 8,114 | 8,162 |
| Northrop Grumman Corp. | 2.080% | 10/15/20 | 14,305 | 13,979 |
| Northrop Grumman Corp. | 3.500% | 3/15/21 | 17,105 | 17,233 |
| Northrop Grumman Corp. | 2.550% | 10/15/22 | 11,930 | 11,523 |
| Northrop Grumman Corp. | 3.250% | 8/1/23 | 13,901 | 13,754 |
| 2 Nvent Finance Sarl | 3.950% | 4/15/23 | 1,000 | 989 |
| Owens Corning | 4.200% | 12/15/22 | 2,992 | 3,020 |
| Parker-Hannifin Corp. | 3.500% | 9/15/22 | 8,650 | 8,700 |
| Pentair Finance SA | 2.650% | 12/1/19 | 750 | 742 |
| Precision Castparts Corp. | 2.250% | 6/15/20 | 8,395 | 8,280 |
| Precision Castparts Corp. | 2.500% | 1/15/23 | 14,797 | 14,275 |
| Raytheon Co. | 4.400% | 2/15/20 | 8,050 | 8,221 |
| Raytheon Co. | 3.125% | 10/15/20 | 8,087 | 8,102 |
| Raytheon Co. | 2.500% | 12/15/22 | 12,500 | 12,164 |
| Republic Services Inc. | 5.500% | 9/15/19 | 8,195 | 8,406 |
| Republic Services Inc. | 5.000% | 3/1/20 | 10,547 | 10,865 |
| Republic Services Inc. | 5.250% | 11/15/21 | 7,288 | 7,708 |
| Republic Services Inc. | 3.550% | 6/1/22 | 15,009 | 15,078 |
| Republic Services Inc. | 4.750% | 5/15/23 | 6,778 | 7,113 |
| Rockwell Automation Inc. | 2.050% | 3/1/20 | 5,725 | 5,627 |
| Rockwell Collins Inc. | 3.100% | 11/15/21 | 1,884 | 1,860 |
| Rockwell Collins Inc. | 2.800% | 3/15/22 | 8,921 | 8,705 |
| Roper Technologies Inc. | 6.250% | 9/1/19 | 6,169 | 6,369 |
16
| Vanguard® Short-Term Corporate Bond Index Fund | ||||
| Schedule of Investments | ||||
| August 31, 2018 | ||||
| Face | Market | |||
| Maturity | Amount | Value | ||
| Coupon | Date | ($000) | ($000) | |
| Roper Technologies Inc. | 3.000% | 12/15/20 | 9,087 | 9,043 |
| Roper Technologies Inc. | 2.800% | 12/15/21 | 9,845 | 9,648 |
| Roper Technologies Inc. | 3.125% | 11/15/22 | 2,500 | 2,458 |
| Snap-on Inc. | 6.125% | 9/1/21 | 3,000 | 3,236 |
| Spirit AeroSystems Inc. | 3.950% | 6/15/23 | 9,100 | 9,140 |
| Stanley Black & Decker Inc. | 3.400% | 12/1/21 | 7,280 | 7,335 |
| Stanley Black & Decker Inc. | 2.900% | 11/1/22 | 9,874 | 9,674 |
| United Technologies Corp. | 1.500% | 11/1/19 | 9,300 | 9,159 |
| United Technologies Corp. | 4.500% | 4/15/20 | 16,931 | 17,318 |
| United Technologies Corp. | 1.900% | 5/4/20 | 13,402 | 13,157 |
| United Technologies Corp. | 3.350% | 8/16/21 | 12,010 | 12,060 |
| United Technologies Corp. | 1.950% | 11/1/21 | 14,950 | 14,371 |
| United Technologies Corp. | 2.300% | 5/4/22 | 250 | 241 |
| United Technologies Corp. | 3.100% | 6/1/22 | 30,312 | 29,925 |
| United Technologies Corp. | 3.650% | 8/16/23 | 29,470 | 29,607 |
| Waste Management Inc. | 4.750% | 6/30/20 | 12,495 | 12,903 |
| Waste Management Inc. | 4.600% | 3/1/21 | 5,327 | 5,500 |
| Waste Management Inc. | 2.900% | 9/15/22 | 6,950 | 6,844 |
| Waste Management Inc. | 2.400% | 5/15/23 | 3,325 | 3,186 |
| Xylem Inc. | 4.875% | 10/1/21 | 5,970 | 6,225 |
| Communication (5.5%) | ||||
| 21st Century Fox America Inc. | 5.650% | 8/15/20 | 7,200 | 7,521 |
| 21st Century Fox America Inc. | 4.500% | 2/15/21 | 13,951 | 14,367 |
| 21st Century Fox America Inc. | 3.000% | 9/15/22 | 16,476 | 16,238 |
| Activision Blizzard Inc. | 2.300% | 9/15/21 | 3,373 | 3,268 |
| Activision Blizzard Inc. | 2.600% | 6/15/22 | 5,550 | 5,375 |
| America Movil SAB de CV | 5.000% | 10/16/19 | 10,110 | 10,294 |
| America Movil SAB de CV | 5.000% | 3/30/20 | 26,760 | 27,345 |
| America Movil SAB de CV | 3.125% | 7/16/22 | 22,772 | 22,419 |
| American Tower Corp. | 2.800% | 6/1/20 | 9,355 | 9,281 |
| American Tower Corp. | 5.050% | 9/1/20 | 9,794 | 10,107 |
| American Tower Corp. | 3.300% | 2/15/21 | 18,778 | 18,708 |
| American Tower Corp. | 3.450% | 9/15/21 | 9,036 | 9,036 |
| American Tower Corp. | 5.900% | 11/1/21 | 6,328 | 6,754 |
| American Tower Corp. | 2.250% | 1/15/22 | 6,405 | 6,138 |
| American Tower Corp. | 4.700% | 3/15/22 | 7,848 | 8,130 |
| American Tower Corp. | 3.500% | 1/31/23 | 18,771 | 18,500 |
| American Tower Corp. | 3.000% | 6/15/23 | 2,535 | 2,442 |
| AT&T Inc. | 5.875% | 10/1/19 | 11,393 | 11,742 |
| AT&T Inc. | 5.200% | 3/15/20 | 9,696 | 10,000 |
| AT&T Inc. | 2.450% | 6/30/20 | 36,183 | 35,704 |
| AT&T Inc. | 4.600% | 2/15/21 | 9,370 | 9,616 |
| AT&T Inc. | 2.800% | 2/17/21 | 29,822 | 29,481 |
| AT&T Inc. | 5.000% | 3/1/21 | 15,445 | 16,045 |
| AT&T Inc. | 4.450% | 5/15/21 | 13,628 | 13,986 |
| AT&T Inc. | 3.875% | 8/15/21 | 18,546 | 18,780 |
| AT&T Inc. | 3.000% | 2/15/22 | 9,661 | 9,500 |
| AT&T Inc. | 3.200% | 3/1/22 | 18,954 | 18,734 |
| AT&T Inc. | 3.800% | 3/15/22 | 15,174 | 15,265 |
| AT&T Inc. | 3.000% | 6/30/22 | 37,150 | 36,300 |
| AT&T Inc. | 2.625% | 12/1/22 | 2,500 | 2,399 |
| AT&T Inc. | 3.600% | 2/17/23 | 26,970 | 26,831 |
| CBS Corp. | 4.300% | 2/15/21 | 5,475 | 5,570 |
| CBS Corp. | 3.375% | 3/1/22 | 9,456 | 9,357 |
| CBS Corp. | 2.500% | 2/15/23 | 6,250 | 5,902 |
| 2 CBS Corp. | 2.900% | 6/1/23 | 5,422 | 5,174 |
| CC Holdings GS V LLC / Crown Castle GS III Corp. | 3.849% | 4/15/23 | 13,750 | 13,636 |
| Charter Communications Operating LLC / Charter | ||||
| Communications Operating Capital | 3.579% | 7/23/20 | 27,473 | 27,565 |
| Charter Communications Operating LLC / Charter | ||||
| Communications Operating Capital | 4.464% | 7/23/22 | 40,342 | 41,129 |
| Comcast Cable Communications Holdings Inc. | 9.455% | 11/15/22 | 12,392 | 15,156 |
| Comcast Corp. | 5.150% | 3/1/20 | 20,664 | 21,290 |
17
| Vanguard® Short-Term Corporate Bond Index Fund | ||||
| Schedule of Investments | ||||
| August 31, 2018 | ||||
| Face | Market | |||
| Maturity | Amount | Value | ||
| Coupon | Date | ($000) | ($000) | |
| Comcast Corp. | 1.625% | 1/15/22 | 10,240 | 9,684 |
| Comcast Corp. | 3.125% | 7/15/22 | 11,504 | 11,412 |
| Comcast Corp. | 2.850% | 1/15/23 | 4,647 | 4,539 |
| Comcast Corp. | 2.750% | 3/1/23 | 14,750 | 14,338 |
| Crown Castle International Corp. | 3.400% | 2/15/21 | 10,938 | 10,938 |
| Crown Castle International Corp. | 2.250% | 9/1/21 | 13,070 | 12,596 |
| Crown Castle International Corp. | 4.875% | 4/15/22 | 13,916 | 14,365 |
| Crown Castle International Corp. | 5.250% | 1/15/23 | 25,080 | 26,356 |
| Crown Castle International Corp. | 3.150% | 7/15/23 | 2,425 | 2,342 |
| Discovery Communications LLC | 2.200% | 9/20/19 | 8,760 | 8,678 |
| 2 Discovery Communications LLC | 2.750% | 11/15/19 | 8,198 | 8,147 |
| 2 Discovery Communications LLC | 2.800% | 6/15/20 | 6,854 | 6,778 |
| Discovery Communications LLC | 4.375% | 6/15/21 | 8,600 | 8,761 |
| Discovery Communications LLC | 3.300% | 5/15/22 | 9,074 | 8,935 |
| 2 Discovery Communications LLC | 3.500% | 6/15/22 | 7,663 | 7,583 |
| Discovery Communications LLC | 2.950% | 3/20/23 | 18,180 | 17,440 |
| Discovery Communications LLC | 3.250% | 4/1/23 | 5,653 | 5,487 |
| Electronic Arts Inc. | 3.700% | 3/1/21 | 8,262 | 8,366 |
| Interpublic Group of Cos. Inc. | 3.750% | 2/15/23 | 7,333 | 7,228 |
| Moody's Corp. | 5.500% | 9/1/20 | 6,365 | 6,644 |
| Moody's Corp. | 3.250% | 6/7/21 | 3,250 | 3,246 |
| Moody's Corp. | 2.750% | 12/15/21 | 8,675 | 8,501 |
| Moody's Corp. | 4.500% | 9/1/22 | 5,775 | 5,967 |
| Moody's Corp. | 2.625% | 1/15/23 | 6,308 | 6,070 |
| NBCUniversal Media LLC | 5.150% | 4/30/20 | 29,014 | 29,986 |
| NBCUniversal Media LLC | 4.375% | 4/1/21 | 24,539 | 25,276 |
| NBCUniversal Media LLC | 2.875% | 1/15/23 | 16,555 | 16,174 |
| Omnicom Group Inc. | 4.450% | 8/15/20 | 13,811 | 14,167 |
| Omnicom Group Inc. | 3.625% | 5/1/22 | 17,154 | 17,077 |
| Orange SA | 1.625% | 11/3/19 | 18,622 | 18,335 |
| Orange SA | 4.125% | 9/14/21 | 13,984 | 14,291 |
| RELX Capital Inc. | 3.125% | 10/15/22 | 13,469 | 13,193 |
| RELX Capital Inc. | 3.500% | 3/16/23 | 9,775 | 9,702 |
| Rogers Communications Inc. | 3.000% | 3/15/23 | 6,986 | 6,827 |
| S&P Global Inc. | 3.300% | 8/14/20 | 9,522 | 9,536 |
| Telefonica Emisiones SAU | 5.134% | 4/27/20 | 23,719 | 24,438 |
| Telefonica Emisiones SAU | 5.462% | 2/16/21 | 20,342 | 21,217 |
| Telefonica Emisiones SAU | 4.570% | 4/27/23 | 7,350 | 7,593 |
| Telefonos de Mexico SAB de CV | 5.500% | 11/15/19 | 1,750 | 1,789 |
| Thomson Reuters Corp. | 4.700% | 10/15/19 | 4,825 | 4,904 |
| Thomson Reuters Corp. | 3.950% | 9/30/21 | 6,732 | 6,767 |
| Time Warner Cable LLC | 5.000% | 2/1/20 | 21,525 | 21,942 |
| Time Warner Cable LLC | 4.125% | 2/15/21 | 12,006 | 12,111 |
| Time Warner Cable LLC | 4.000% | 9/1/21 | 12,349 | 12,442 |
| Time Warner Entertainment Co. LP | 8.375% | 3/15/23 | 14,686 | 17,081 |
| Time Warner Inc. | 4.875% | 3/15/20 | 21,027 | 21,448 |
| Time Warner Inc. | 4.700% | 1/15/21 | 3,850 | 3,963 |
| Time Warner Inc. | 4.750% | 3/29/21 | 21,182 | 21,828 |
| Time Warner Inc. | 4.000% | 1/15/22 | 5,325 | 5,401 |
| Time Warner Inc. | 3.400% | 6/15/22 | 8,226 | 8,183 |
| Verizon Communications Inc. | 2.625% | 2/21/20 | 12,160 | 12,086 |
| Verizon Communications Inc. | 3.450% | 3/15/21 | 12,967 | 13,064 |
| Verizon Communications Inc. | 4.600% | 4/1/21 | 9,454 | 9,785 |
| Verizon Communications Inc. | 1.750% | 8/15/21 | 9,245 | 8,876 |
| Verizon Communications Inc. | 3.000% | 11/1/21 | 23,337 | 23,191 |
| Verizon Communications Inc. | 3.500% | 11/1/21 | 18,523 | 18,638 |
| Verizon Communications Inc. | 3.125% | 3/16/22 | 17,269 | 17,131 |
| Verizon Communications Inc. | 2.450% | 11/1/22 | 14,252 | 13,711 |
| Verizon Communications Inc. | 5.150% | 9/15/23 | 10,000 | 10,723 |
| Viacom Inc. | 5.625% | 9/15/19 | 10,150 | 10,390 |
| Viacom Inc. | 2.750% | 12/15/19 | 1,323 | 1,311 |
| Viacom Inc. | 3.875% | 12/15/21 | 7,264 | 7,309 |
| Vodafone Group plc | 4.375% | 3/16/21 | 7,699 | 7,912 |
| Vodafone Group plc | 2.500% | 9/26/22 | 16,382 | 15,763 |
18
| Vanguard® Short-Term Corporate Bond Index Fund | ||||
| Schedule of Investments | ||||
| August 31, 2018 | ||||
| Face | Market | |||
| Maturity | Amount | Value | ||
| Coupon | Date | ($000) | ($000) | |
| Vodafone Group plc | 2.950% | 2/19/23 | 15,364 | 14,897 |
| Vodafone Group plc | 3.750% | 1/16/24 | 5,000 | 4,960 |
| Walt Disney Co. | 1.950% | 3/4/20 | 12,576 | 12,414 |
| Walt Disney Co. | 1.800% | 6/5/20 | 8,100 | 7,931 |
| Walt Disney Co. | 2.150% | 9/17/20 | 12,450 | 12,230 |
| Walt Disney Co. | 2.300% | 2/12/21 | 8,748 | 8,595 |
| Walt Disney Co. | 3.750% | 6/1/21 | 4,075 | 4,146 |
| Walt Disney Co. | 2.750% | 8/16/21 | 10,141 | 10,025 |
| Walt Disney Co. | 2.550% | 2/15/22 | 2,056 | 2,012 |
| Walt Disney Co. | 2.450% | 3/4/22 | 6,765 | 6,584 |
| Walt Disney Co. | 2.350% | 12/1/22 | 12,587 | 12,124 |
| WPP Finance 2010 | 4.750% | 11/21/21 | 12,048 | 12,358 |
| WPP Finance 2010 | 3.625% | 9/7/22 | 6,720 | 6,586 |
| Consumer Cyclical (8.0%) | ||||
| Advance Auto Parts Inc. | 5.750% | 5/1/20 | 2,175 | 2,260 |
| Advance Auto Parts Inc. | 4.500% | 1/15/22 | 5,050 | 5,167 |
| Alibaba Group Holding Ltd. | 2.500% | 11/28/19 | 27,550 | 27,376 |
| Alibaba Group Holding Ltd. | 3.125% | 11/28/21 | 20,300 | 20,098 |
| Alibaba Group Holding Ltd. | 2.800% | 6/6/23 | 9,475 | 9,164 |
| Amazon.com Inc. | 2.600% | 12/5/19 | 17,363 | 17,335 |
| Amazon.com Inc. | 1.900% | 8/21/20 | 12,500 | 12,279 |
| Amazon.com Inc. | 3.300% | 12/5/21 | 7,493 | 7,578 |
| Amazon.com Inc. | 2.500% | 11/29/22 | 18,575 | 18,102 |
| Amazon.com Inc. | 2.400% | 2/22/23 | 14,265 | 13,784 |
| American Honda Finance Corp. | 2.000% | 11/13/19 | 9,600 | 9,502 |
| American Honda Finance Corp. | 2.000% | 2/14/20 | 11,354 | 11,218 |
| American Honda Finance Corp. | 2.150% | 3/13/20 | 5,820 | 5,741 |
| American Honda Finance Corp. | 3.000% | 6/16/20 | 1,859 | 1,861 |
| American Honda Finance Corp. | 1.950% | 7/20/20 | 14,150 | 13,875 |
| American Honda Finance Corp. | 2.450% | 9/24/20 | 11,235 | 11,110 |
| American Honda Finance Corp. | 2.650% | 2/12/21 | 7,000 | 6,935 |
| American Honda Finance Corp. | 1.650% | 7/12/21 | 7,631 | 7,319 |
| American Honda Finance Corp. | 1.700% | 9/9/21 | 15,606 | 14,952 |
| American Honda Finance Corp. | 2.600% | 11/16/22 | 10,500 | 10,218 |
| American Honda Finance Corp. | 3.450% | 7/14/23 | 1,910 | 1,924 |
| Aptiv plc | 3.150% | 11/19/20 | 4,050 | 4,016 |
| Automatic Data Processing Inc. | 2.250% | 9/15/20 | 8,634 | 8,527 |
| AutoNation Inc. | 5.500% | 2/1/20 | 3,768 | 3,874 |
| AutoNation Inc. | 3.350% | 1/15/21 | 5,725 | 5,675 |
| AutoZone Inc. | 4.000% | 11/15/20 | 2,984 | 3,031 |
| AutoZone Inc. | 3.700% | 4/15/22 | 10,627 | 10,703 |
| AutoZone Inc. | 2.875% | 1/15/23 | 7,454 | 7,218 |
| AutoZone Inc. | 3.125% | 7/15/23 | 4,622 | 4,515 |
| Best Buy Co. Inc. | 5.500% | 3/15/21 | 9,060 | 9,505 |
| Block Financial LLC | 4.125% | 10/1/20 | 14,848 | 14,976 |
| Block Financial LLC | 5.500% | 11/1/22 | 1,175 | 1,221 |
| Booking Holdings Inc. | 2.750% | 3/15/23 | 7,750 | 7,466 |
| BorgWarner Inc. | 4.625% | 9/15/20 | 575 | 588 |
| Carnival Corp. | 3.950% | 10/15/20 | 7,870 | 7,999 |
| Costco Wholesale Corp. | 1.700% | 12/15/19 | 12,604 | 12,434 |
| Costco Wholesale Corp. | 1.750% | 2/15/20 | 5,935 | 5,846 |
| Costco Wholesale Corp. | 2.150% | 5/18/21 | 14,866 | 14,589 |
| Costco Wholesale Corp. | 2.250% | 2/15/22 | 8,335 | 8,122 |
| Costco Wholesale Corp. | 2.300% | 5/18/22 | 14,775 | 14,346 |
| Dollar General Corp. | 3.250% | 4/15/23 | 17,353 | 17,085 |
| Dollar Tree Inc. | 3.700% | 5/15/23 | 15,645 | 15,522 |
| DR Horton Inc. | 4.000% | 2/15/20 | 4,028 | 4,059 |
| DR Horton Inc. | 2.550% | 12/1/20 | 8,750 | 8,600 |
| DR Horton Inc. | 4.375% | 9/15/22 | 3,635 | 3,706 |
| DR Horton Inc. | 4.750% | 2/15/23 | 3,100 | 3,188 |
| DR Horton Inc. | 5.750% | 8/15/23 | 6,800 | 7,289 |
| eBay Inc. | 2.150% | 6/5/20 | 7,365 | 7,246 |
| eBay Inc. | 3.250% | 10/15/20 | 7,665 | 7,686 |
19
| Vanguard® Short-Term Corporate Bond Index Fund | ||||
| Schedule of Investments | ||||
| August 31, 2018 | ||||
| Face | Market | |||
| Maturity | Amount | Value | ||
| Coupon | Date | ($000) | ($000) | |
| eBay Inc. | 2.875% | 8/1/21 | 10,622 | 10,489 |
| eBay Inc. | 3.800% | 3/9/22 | 12,583 | 12,750 |
| eBay Inc. | 2.600% | 7/15/22 | 12,516 | 12,118 |
| eBay Inc. | 2.750% | 1/30/23 | 11,391 | 10,988 |
| Expedia Group Inc. | 5.950% | 8/15/20 | 9,438 | 9,899 |
| Ford Motor Credit Co. LLC | 2.597% | 11/4/19 | 19,627 | 19,439 |
| Ford Motor Credit Co. LLC | 2.681% | 1/9/20 | 17,650 | 17,456 |
| Ford Motor Credit Co. LLC | 8.125% | 1/15/20 | 13,475 | 14,291 |
| Ford Motor Credit Co. LLC | 2.459% | 3/27/20 | 13,218 | 12,986 |
| Ford Motor Credit Co. LLC | 2.425% | 6/12/20 | 225 | 220 |
| Ford Motor Credit Co. LLC | 3.157% | 8/4/20 | 22,557 | 22,282 |
| Ford Motor Credit Co. LLC | 2.343% | 11/2/20 | 14,600 | 14,144 |
| Ford Motor Credit Co. LLC | 3.200% | 1/15/21 | 22,508 | 22,145 |
| Ford Motor Credit Co. LLC | 5.750% | 2/1/21 | 13,710 | 14,235 |
| Ford Motor Credit Co. LLC | 3.336% | 3/18/21 | 27,346 | 26,893 |
| Ford Motor Credit Co. LLC | 5.875% | 8/2/21 | 21,167 | 22,098 |
| Ford Motor Credit Co. LLC | 3.813% | 10/12/21 | 9,500 | 9,370 |
| Ford Motor Credit Co. LLC | 3.219% | 1/9/22 | 22,040 | 21,351 |
| Ford Motor Credit Co. LLC | 3.339% | 3/28/22 | 14,640 | 14,147 |
| Ford Motor Credit Co. LLC | 2.979% | 8/3/22 | 11,600 | 11,025 |
| Ford Motor Credit Co. LLC | 4.250% | 9/20/22 | 8,075 | 8,007 |
| Ford Motor Credit Co. LLC | 4.140% | 2/15/23 | 1,200 | 1,181 |
| Ford Motor Credit Co. LLC | 3.096% | 5/4/23 | 18,068 | 16,931 |
| Ford Motor Credit Co. LLC | 4.375% | 8/6/23 | 12,964 | 12,870 |
| General Motors Financial Co. Inc. | 2.350% | 10/4/19 | 10,718 | 10,641 |
| General Motors Financial Co. Inc. | 3.150% | 1/15/20 | 15,309 | 15,312 |
| General Motors Financial Co. Inc. | 2.650% | 4/13/20 | 18,280 | 18,092 |
| General Motors Financial Co. Inc. | 3.200% | 7/13/20 | 30,108 | 29,998 |
| General Motors Financial Co. Inc. | 2.450% | 11/6/20 | 14,900 | 14,556 |
| General Motors Financial Co. Inc. | 3.700% | 11/24/20 | 15,981 | 16,071 |
| General Motors Financial Co. Inc. | 4.200% | 3/1/21 | 25,954 | 26,304 |
| General Motors Financial Co. Inc. | 3.550% | 4/9/21 | 9,250 | 9,223 |
| General Motors Financial Co. Inc. | 3.200% | 7/6/21 | 21,004 | 20,729 |
| General Motors Financial Co. Inc. | 4.375% | 9/25/21 | 15,350 | 15,633 |
| General Motors Financial Co. Inc. | 3.450% | 1/14/22 | 18,762 | 18,545 |
| General Motors Financial Co. Inc. | 3.450% | 4/10/22 | 21,149 | 20,790 |
| General Motors Financial Co. Inc. | 3.150% | 6/30/22 | 13,523 | 13,175 |
| General Motors Financial Co. Inc. | 3.250% | 1/5/23 | 8,500 | 8,235 |
| General Motors Financial Co. Inc. | 3.700% | 5/9/23 | 19,904 | 19,493 |
| General Motors Financial Co. Inc. | 4.250% | 5/15/23 | 8,563 | 8,581 |
| General Motors Financial Co. Inc. | 4.150% | 6/19/23 | 9,600 | 9,575 |
| GLP Capital LP / GLP Financing II Inc. | 4.875% | 11/1/20 | 12,632 | 12,932 |
| GLP Capital LP / GLP Financing II Inc. | 4.375% | 4/15/21 | 3,725 | 3,790 |
| Home Depot Inc. | 1.800% | 6/5/20 | 13,450 | 13,223 |
| Home Depot Inc. | 3.950% | 9/15/20 | 4,251 | 4,332 |
| Home Depot Inc. | 2.000% | 4/1/21 | 19,016 | 18,539 |
| Home Depot Inc. | 4.400% | 4/1/21 | 13,355 | 13,821 |
| Home Depot Inc. | 2.625% | 6/1/22 | 12,080 | 11,892 |
| Home Depot Inc. | 2.700% | 4/1/23 | 17,480 | 17,143 |
| Hyatt Hotels Corp. | 5.375% | 8/15/21 | 2,125 | 2,223 |
| Hyatt Hotels Corp. | 3.375% | 7/15/23 | 4,725 | 4,639 |
| IHS Markit Ltd. | 4.125% | 8/1/23 | 5,525 | 5,525 |
| JD.com Inc. | 3.125% | 4/29/21 | 6,700 | 6,531 |
| Kohl's Corp. | 4.000% | 11/1/21 | 3,850 | 3,893 |
| Kohl's Corp. | 3.250% | 2/1/23 | 6,425 | 6,213 |
| Lowe's Cos. Inc. | 4.625% | 4/15/20 | 8,295 | 8,464 |
| Lowe's Cos. Inc. | 3.750% | 4/15/21 | 4,293 | 4,362 |
| Lowe's Cos. Inc. | 3.800% | 11/15/21 | 9,663 | 9,867 |
| Lowe's Cos. Inc. | 3.120% | 4/15/22 | 10,062 | 10,046 |
| Macy's Retail Holdings Inc. | 3.450% | 1/15/21 | 5,200 | 5,180 |
| Macy's Retail Holdings Inc. | 3.875% | 1/15/22 | 7,950 | 7,917 |
| Macy's Retail Holdings Inc. | 2.875% | 2/15/23 | 12,806 | 12,096 |
| Marriott International Inc. | 3.375% | 10/15/20 | 5,925 | 5,936 |
| Marriott International Inc. | 2.875% | 3/1/21 | 4,140 | 4,093 |
20
| Vanguard® Short-Term Corporate Bond Index Fund | ||||
| Schedule of Investments | ||||
| August 31, 2018 | ||||
| Face | Market | |||
| Maturity | Amount | Value | ||
| Coupon | Date | ($000) | ($000) | |
| Marriott International Inc. | 3.125% | 10/15/21 | 3,150 | 3,118 |
| Marriott International Inc. | 2.300% | 1/15/22 | 14,021 | 13,489 |
| Marriott International Inc. | 3.250% | 9/15/22 | 3,190 | 3,149 |
| Mastercard Inc. | 2.000% | 11/21/21 | 9,488 | 9,191 |
| McDonald's Corp. | 2.200% | 5/26/20 | 11,303 | 11,163 |
| McDonald's Corp. | 3.500% | 7/15/20 | 5,825 | 5,862 |
| McDonald's Corp. | 2.750% | 12/9/20 | 20,367 | 20,268 |
| McDonald's Corp. | 3.625% | 5/20/21 | 5,246 | 5,318 |
| McDonald's Corp. | 2.625% | 1/15/22 | 15,111 | 14,804 |
| McDonald's Corp. | 3.350% | 4/1/23 | 8,350 | 8,330 |
| NIKE Inc. | 2.250% | 5/1/23 | 5,660 | 5,430 |
| Nordstrom Inc. | 4.750% | 5/1/20 | 5,695 | 5,824 |
| Nordstrom Inc. | 4.000% | 10/15/21 | 5,967 | 6,033 |
| NVR Inc. | 3.950% | 9/15/22 | 8,693 | 8,746 |
| O'Reilly Automotive Inc. | 4.875% | 1/14/21 | 5,715 | 5,900 |
| O'Reilly Automotive Inc. | 4.625% | 9/15/21 | 5,076 | 5,253 |
| O'Reilly Automotive Inc. | 3.800% | 9/1/22 | 6,050 | 6,107 |
| O'Reilly Automotive Inc. | 3.850% | 6/15/23 | 5,525 | 5,571 |
| PACCAR Financial Corp. | 2.200% | 9/15/19 | 1,850 | 1,838 |
| PACCAR Financial Corp. | 1.950% | 2/27/20 | 256 | 253 |
| PACCAR Financial Corp. | 2.500% | 8/14/20 | 3,000 | 2,970 |
| PACCAR Financial Corp. | 2.050% | 11/13/20 | 7,650 | 7,460 |
| PACCAR Financial Corp. | 2.250% | 2/25/21 | 2,680 | 2,622 |
| PACCAR Financial Corp. | 2.800% | 3/1/21 | 5,360 | 5,319 |
| PACCAR Financial Corp. | 3.150% | 8/9/21 | 10,500 | 10,509 |
| PACCAR Financial Corp. | 3.400% | 8/9/23 | 4,500 | 4,517 |
| QVC Inc. | 5.125% | 7/2/22 | 7,447 | 7,594 |
| QVC Inc. | 4.375% | 3/15/23 | 10,573 | 10,448 |
| Ralph Lauren Corp. | 2.625% | 8/18/20 | 3,850 | 3,814 |
| Royal Caribbean Cruises Ltd. | 2.650% | 11/28/20 | 7,535 | 7,394 |
| Royal Caribbean Cruises Ltd. | 5.250% | 11/15/22 | 8,225 | 8,677 |
| 2 Sands China Ltd. | 4.600% | 8/8/23 | 24,400 | 24,583 |
| Starbucks Corp. | 2.200% | 11/22/20 | 9,950 | 9,765 |
| Starbucks Corp. | 2.100% | 2/4/21 | 13,519 | 13,198 |
| Starbucks Corp. | 2.700% | 6/15/22 | 4,525 | 4,422 |
| Starbucks Corp. | 3.100% | 3/1/23 | 9,013 | 8,888 |
| Tapestry Inc. | 3.000% | 7/15/22 | 5,525 | 5,343 |
| Target Corp. | 3.875% | 7/15/20 | 13,434 | 13,676 |
| Target Corp. | 2.900% | 1/15/22 | 15,025 | 14,964 |
| TJX Cos. Inc. | 2.750% | 6/15/21 | 11,610 | 11,521 |
| TJX Cos. Inc. | 2.500% | 5/15/23 | 11,109 | 10,741 |
| Toyota Motor Corp. | 3.183% | 7/20/21 | 7,142 | 7,164 |
| Toyota Motor Corp. | 3.419% | 7/20/23 | 6,000 | 6,026 |
| Toyota Motor Credit Corp. | 1.550% | 10/18/19 | 12,194 | 12,027 |
| Toyota Motor Credit Corp. | 2.200% | 1/10/20 | 18,725 | 18,580 |
| Toyota Motor Credit Corp. | 2.150% | 3/12/20 | 18,879 | 18,691 |
| Toyota Motor Credit Corp. | 1.950% | 4/17/20 | 19,361 | 19,084 |
| Toyota Motor Credit Corp. | 4.500% | 6/17/20 | 4,250 | 4,363 |
| Toyota Motor Credit Corp. | 4.250% | 1/11/21 | 4,875 | 5,009 |
| Toyota Motor Credit Corp. | 1.900% | 4/8/21 | 16,572 | 16,096 |
| Toyota Motor Credit Corp. | 2.950% | 4/13/21 | 10,800 | 10,765 |
| Toyota Motor Credit Corp. | 2.750% | 5/17/21 | 6,023 | 5,969 |
| Toyota Motor Credit Corp. | 3.400% | 9/15/21 | 12,761 | 12,867 |
| Toyota Motor Credit Corp. | 2.600% | 1/11/22 | 15,383 | 15,101 |
| Toyota Motor Credit Corp. | 3.300% | 1/12/22 | 12,242 | 12,292 |
| Toyota Motor Credit Corp. | 2.800% | 7/13/22 | 10,050 | 9,894 |
| Toyota Motor Credit Corp. | 2.150% | 9/8/22 | 13,212 | 12,684 |
| Toyota Motor Credit Corp. | 2.625% | 1/10/23 | 10,429 | 10,142 |
| Toyota Motor Credit Corp. | 2.700% | 1/11/23 | 10,000 | 9,755 |
| VF Corp. | 3.500% | 9/1/21 | 5,370 | 5,407 |
| Visa Inc. | 2.200% | 12/14/20 | 46,270 | 45,564 |
| Visa Inc. | 2.150% | 9/15/22 | 12,200 | 11,721 |
| Visa Inc. | 2.800% | 12/14/22 | 28,893 | 28,438 |
| Walgreen Co. | 3.100% | 9/15/22 | 9,013 | 8,863 |
21
| Vanguard® Short-Term Corporate Bond Index Fund | ||||
| Schedule of Investments | ||||
| August 31, 2018 | ||||
| Face | Market | |||
| Maturity | Amount | Value | ||
| Coupon | Date | ($000) | ($000) | |
| Walgreens Boots Alliance Inc. | 2.700% | 11/18/19 | 20,227 | 20,162 |
| Walgreens Boots Alliance Inc. | 3.300% | 11/18/21 | 14,100 | 14,066 |
| Walmart Inc. | 1.750% | 10/9/19 | 3,067 | 3,038 |
| Walmart Inc. | 2.850% | 6/23/20 | 20,575 | 20,635 |
| Walmart Inc. | 3.625% | 7/8/20 | 1,500 | 1,521 |
| Walmart Inc. | 3.250% | 10/25/20 | 26,597 | 26,902 |
| Walmart Inc. | 1.900% | 12/15/20 | 30,620 | 30,047 |
| Walmart Inc. | 3.125% | 6/23/21 | 25,900 | 26,007 |
| Walmart Inc. | 2.350% | 12/15/22 | 17,350 | 16,828 |
| Walmart Inc. | 2.550% | 4/11/23 | 24,700 | 24,073 |
| Walmart Inc. | 3.400% | 6/26/23 | 36,775 | 37,170 |
| Western Union Co. | 5.253% | 4/1/20 | 2,825 | 2,903 |
| Western Union Co. | 3.600% | 3/15/22 | 12,770 | 12,671 |
| Consumer Noncyclical (14.9%) | ||||
| Abbott Laboratories | 2.350% | 11/22/19 | 4,524 | 4,524 |
| Abbott Laboratories | 2.000% | 3/15/20 | 10,650 | 10,492 |
| Abbott Laboratories | 4.125% | 5/27/20 | 7,440 | 7,572 |
| Abbott Laboratories | 2.800% | 9/15/20 | 6,445 | 6,406 |
| Abbott Laboratories | 2.900% | 11/30/21 | 37,903 | 37,486 |
| Abbott Laboratories | 2.550% | 3/15/22 | 10,179 | 9,895 |
| Abbott Laboratories | 3.250% | 4/15/23 | 10,935 | 10,848 |
| AbbVie Inc. | 2.500% | 5/14/20 | 58,585 | 58,044 |
| AbbVie Inc. | 2.300% | 5/14/21 | 21,611 | 21,069 |
| AbbVie Inc. | 2.900% | 11/6/22 | 29,237 | 28,532 |
| AbbVie Inc. | 3.200% | 11/6/22 | 15,909 | 15,703 |
| AbbVie Inc. | 2.850% | 5/14/23 | 20,773 | 20,117 |
| Actavis Inc. | 3.250% | 10/1/22 | 23,564 | 23,117 |
| Agilent Technologies Inc. | 5.000% | 7/15/20 | 5,975 | 6,165 |
| Agilent Technologies Inc. | 3.200% | 10/1/22 | 6,550 | 6,423 |
| Agilent Technologies Inc. | 3.875% | 7/15/23 | 8,125 | 8,142 |
| Allergan Funding SCS | 3.000% | 3/12/20 | 47,193 | 47,080 |
| Allergan Funding SCS | 3.450% | 3/15/22 | 38,982 | 38,679 |
| Allergan Inc. | 3.375% | 9/15/20 | 9,493 | 9,517 |
| Allergan Inc. | 2.800% | 3/15/23 | 3,130 | 2,984 |
| Altria Group Inc. | 2.625% | 1/14/20 | 12,845 | 12,797 |
| Altria Group Inc. | 4.750% | 5/5/21 | 24,806 | 25,800 |
| Altria Group Inc. | 2.850% | 8/9/22 | 26,753 | 26,239 |
| Altria Group Inc. | 2.950% | 5/2/23 | 5,572 | 5,437 |
| AmerisourceBergen Corp. | 3.500% | 11/15/21 | 9,805 | 9,831 |
| Amgen Inc. | 4.500% | 3/15/20 | 1,936 | 1,977 |
| Amgen Inc. | 2.125% | 5/1/20 | 10,238 | 10,086 |
| Amgen Inc. | 2.200% | 5/11/20 | 9,839 | 9,705 |
| Amgen Inc. | 3.450% | 10/1/20 | 12,247 | 12,327 |
| Amgen Inc. | 4.100% | 6/15/21 | 10,320 | 10,526 |
| Amgen Inc. | 1.850% | 8/19/21 | 10,678 | 10,272 |
| Amgen Inc. | 3.875% | 11/15/21 | 21,943 | 22,315 |
| Amgen Inc. | 2.700% | 5/1/22 | 5,172 | 5,047 |
| Amgen Inc. | 2.650% | 5/11/22 | 20,251 | 19,738 |
| Amgen Inc. | 3.625% | 5/15/22 | 17,375 | 17,523 |
| Amgen Inc. | 2.250% | 8/19/23 | 8,944 | 8,437 |
| Anheuser-Busch InBev Finance Inc. | 2.650% | 2/1/21 | 109,000 | 107,646 |
| Anheuser-Busch InBev Finance Inc. | 2.625% | 1/17/23 | 9,505 | 9,179 |
| Anheuser-Busch InBev Finance Inc. | 3.300% | 2/1/23 | 93,749 | 92,887 |
| Anheuser-Busch InBev Worldwide Inc. | 6.875% | 11/15/19 | 5,134 | 5,364 |
| Anheuser-Busch InBev Worldwide Inc. | 4.375% | 2/15/21 | 7,650 | 7,871 |
| Anheuser-Busch InBev Worldwide Inc. | 3.750% | 1/15/22 | 33,859 | 34,397 |
| Anheuser-Busch InBev Worldwide Inc. | 2.500% | 7/15/22 | 45,735 | 44,342 |
| 2 Anheuser-Busch North American Holding Corp. | 3.750% | 1/15/22 | 750 | 762 |
| Archer-Daniels-Midland Co. | 4.479% | 3/1/21 | 3,933 | 4,052 |
| AstraZeneca plc | 2.375% | 11/16/20 | 19,098 | 18,785 |
| AstraZeneca plc | 2.375% | 6/12/22 | 15,750 | 15,158 |
| AstraZeneca plc | 3.500% | 8/17/23 | 11,000 | 10,945 |
| 2 BAT Capital Corp. | 2.297% | 8/14/20 | 32,857 | 32,258 |
22
| Vanguard® Short-Term Corporate Bond Index Fund | ||||
| Schedule of Investments | ||||
| August 31, 2018 | ||||
| Face | Market | |||
| Maturity | Amount | Value | ||
| Coupon | Date | ($000) | ($000) | |
| 2 BAT Capital Corp. | 2.764% | 8/15/22 | 30,625 | 29,618 |
| Baxalta Inc. | 2.875% | 6/23/20 | 14,949 | 14,913 |
| Baxalta Inc. | 3.600% | 6/23/22 | 8,160 | 8,198 |
| Baxter International Inc. | 1.700% | 8/15/21 | 4,900 | 4,680 |
| Beam Suntory Inc. | 3.250% | 5/15/22 | 2,450 | 2,416 |
| Becton Dickinson & Co. | 2.675% | 12/15/19 | 16,484 | 16,386 |
| Becton Dickinson & Co. | 2.404% | 6/5/20 | 14,150 | 13,919 |
| Becton Dickinson & Co. | 3.250% | 11/12/20 | 10,832 | 10,806 |
| Becton Dickinson & Co. | 3.125% | 11/8/21 | 8,945 | 8,834 |
| Becton Dickinson & Co. | 2.894% | 6/6/22 | 24,775 | 24,117 |
| Becton Dickinson & Co. | 3.300% | 3/1/23 | 2,000 | 1,958 |
| Bio-Rad Laboratories Inc. | 4.875% | 12/15/20 | 5,800 | 5,975 |
| Biogen Inc. | 2.900% | 9/15/20 | 25,006 | 24,916 |
| Biogen Inc. | 3.625% | 9/15/22 | 12,785 | 12,875 |
| Boston Scientific Corp. | 6.000% | 1/15/20 | 10,934 | 11,358 |
| Boston Scientific Corp. | 2.850% | 5/15/20 | 4,586 | 4,552 |
| Boston Scientific Corp. | 3.375% | 5/15/22 | 7,525 | 7,465 |
| Bristol-Myers Squibb Co. | 2.000% | 8/1/22 | 11,393 | 10,904 |
| Bristol-Myers Squibb Co. | 7.150% | 6/15/23 | 1,325 | 1,517 |
| Bunge Ltd. Finance Corp. | 3.500% | 11/24/20 | 4,315 | 4,316 |
| Bunge Ltd. Finance Corp. | 3.000% | 9/25/22 | 10,724 | 10,370 |
| Campbell Soup Co. | 3.300% | 3/15/21 | 15,850 | 15,732 |
| Campbell Soup Co. | 4.250% | 4/15/21 | 2,912 | 2,956 |
| Campbell Soup Co. | 2.500% | 8/2/22 | 7,600 | 7,245 |
| Campbell Soup Co. | 3.650% | 3/15/23 | 18,900 | 18,478 |
| Cardinal Health Inc. | 2.400% | 11/15/19 | 3,802 | 3,776 |
| Cardinal Health Inc. | 4.625% | 12/15/20 | 6,950 | 7,142 |
| Cardinal Health Inc. | 2.616% | 6/15/22 | 20,448 | 19,612 |
| Cardinal Health Inc. | 3.200% | 3/15/23 | 3,600 | 3,504 |
| Catholic Health Initiatives Colorado GO | 2.950% | 11/1/22 | 6,290 | 6,092 |
| Celgene Corp. | 2.875% | 8/15/20 | 21,661 | 21,556 |
| Celgene Corp. | 3.950% | 10/15/20 | 6,030 | 6,145 |
| Celgene Corp. | 2.875% | 2/19/21 | 7,500 | 7,425 |
| Celgene Corp. | 2.250% | 8/15/21 | 400 | 388 |
| Celgene Corp. | 3.250% | 8/15/22 | 15,244 | 15,084 |
| Celgene Corp. | 3.550% | 8/15/22 | 13,721 | 13,707 |
| Celgene Corp. | 2.750% | 2/15/23 | 15,035 | 14,498 |
| Celgene Corp. | 3.250% | 2/20/23 | 12,000 | 11,801 |
| Celgene Corp. | 4.000% | 8/15/23 | 9,468 | 9,592 |
| Church & Dwight Co. Inc. | 2.450% | 12/15/19 | 3,325 | 3,305 |
| Church & Dwight Co. Inc. | 2.450% | 8/1/22 | 5,945 | 5,720 |
| Church & Dwight Co. Inc. | 2.875% | 10/1/22 | 2,875 | 2,809 |
| Clorox Co. | 3.800% | 11/15/21 | 2,900 | 2,947 |
| Clorox Co. | 3.050% | 9/15/22 | 9,315 | 9,243 |
| Coca-Cola Co. | 1.875% | 10/27/20 | 18,747 | 18,353 |
| Coca-Cola Co. | 2.450% | 11/1/20 | 18,394 | 18,236 |
| Coca-Cola Co. | 3.150% | 11/15/20 | 14,392 | 14,491 |
| Coca-Cola Co. | 1.550% | 9/1/21 | 14,275 | 13,703 |
| Coca-Cola Co. | 3.300% | 9/1/21 | 15,987 | 16,187 |
| Coca-Cola Co. | 2.200% | 5/25/22 | 10,879 | 10,561 |
| Coca-Cola Co. | 2.500% | 4/1/23 | 5,075 | 4,940 |
| Coca-Cola European Partners plc | 3.500% | 9/15/20 | 6,360 | 6,346 |
| Coca-Cola European Partners plc | 3.250% | 8/19/21 | 674 | 667 |
| Coca-Cola Femsa SAB de CV | 4.625% | 2/15/20 | 2,175 | 2,213 |
| Colgate-Palmolive Co. | 2.450% | 11/15/21 | 4,250 | 4,175 |
| Colgate-Palmolive Co. | 2.300% | 5/3/22 | 6,989 | 6,831 |
| Colgate-Palmolive Co. | 2.250% | 11/15/22 | 6,285 | 6,089 |
| Colgate-Palmolive Co. | 1.950% | 2/1/23 | 5,900 | 5,626 |
| Colgate-Palmolive Co. | 2.100% | 5/1/23 | 5,257 | 5,018 |
| Conagra Brands Inc. | 3.200% | 1/25/23 | 4,332 | 4,239 |
| Constellation Brands Inc. | 2.000% | 11/7/19 | 7,244 | 7,159 |
| Constellation Brands Inc. | 3.875% | 11/15/19 | 6,975 | 7,040 |
| Constellation Brands Inc. | 2.250% | 11/6/20 | 7,200 | 7,035 |
| Constellation Brands Inc. | 3.750% | 5/1/21 | 5,933 | 6,000 |
23
| Vanguard® Short-Term Corporate Bond Index Fund | ||||
| Schedule of Investments | ||||
| August 31, 2018 | ||||
| Face | Market | |||
| Maturity | Amount | Value | ||
| Coupon | Date | ($000) | ($000) | |
| Constellation Brands Inc. | 2.700% | 5/9/22 | 12,250 | 11,879 |
| Constellation Brands Inc. | 2.650% | 11/7/22 | 12,700 | 12,176 |
| Constellation Brands Inc. | 3.200% | 2/15/23 | 8,200 | 8,018 |
| Constellation Brands Inc. | 4.250% | 5/1/23 | 13,500 | 13,781 |
| Covidien International Finance SA | 4.200% | 6/15/20 | 12,235 | 12,447 |
| Covidien International Finance SA | 3.200% | 6/15/22 | 7,775 | 7,740 |
| CVS Health Corp. | 3.125% | 3/9/20 | 29,600 | 29,596 |
| CVS Health Corp. | 2.800% | 7/20/20 | 41,064 | 40,779 |
| CVS Health Corp. | 3.350% | 3/9/21 | 38,650 | 38,659 |
| CVS Health Corp. | 2.125% | 6/1/21 | 25,888 | 25,074 |
| CVS Health Corp. | 3.500% | 7/20/22 | 19,742 | 19,581 |
| CVS Health Corp. | 2.750% | 12/1/22 | 23,687 | 22,751 |
| CVS Health Corp. | 4.750% | 12/1/22 | 3,574 | 3,710 |
| CVS Health Corp. | 3.700% | 3/9/23 | 81,215 | 80,759 |
| Danaher Corp. | 2.400% | 9/15/20 | 7,773 | 7,677 |
| Diageo Capital plc | 3.000% | 5/18/20 | 5,909 | 5,910 |
| Diageo Capital plc | 4.828% | 7/15/20 | 7,166 | 7,391 |
| Diageo Capital plc | 2.625% | 4/29/23 | 17,334 | 16,835 |
| Diageo Investment Corp. | 2.875% | 5/11/22 | 16,500 | 16,271 |
| Dignity Health California GO | 2.637% | 11/1/19 | 2,450 | 2,440 |
| Dignity Health California GO | 3.125% | 11/1/22 | 2,908 | 2,851 |
| Eli Lilly & Co. | 2.350% | 5/15/22 | 8,305 | 8,104 |
| Estee Lauder Cos. Inc. | 1.800% | 2/7/20 | 7,975 | 7,856 |
| Estee Lauder Cos. Inc. | 1.700% | 5/10/21 | 7,959 | 7,661 |
| Express Scripts Holding Co. | 2.600% | 11/30/20 | 11,100 | 10,886 |
| Express Scripts Holding Co. | 3.300% | 2/25/21 | 15,500 | 15,391 |
| Express Scripts Holding Co. | 4.750% | 11/15/21 | 13,669 | 14,130 |
| Express Scripts Holding Co. | 3.900% | 2/15/22 | 12,708 | 12,766 |
| Express Scripts Holding Co. | 3.050% | 11/30/22 | 9,336 | 9,076 |
| Express Scripts Holding Co. | 3.000% | 7/15/23 | 15,972 | 15,309 |
| Flowers Foods Inc. | 4.375% | 4/1/22 | 4,895 | 4,992 |
| Fomento Economico Mexicano SAB de CV | 2.875% | 5/10/23 | 3,000 | 2,875 |
| General Mills Inc. | 2.200% | 10/21/19 | 5,580 | 5,533 |
| General Mills Inc. | 3.200% | 4/16/21 | 7,075 | 7,071 |
| General Mills Inc. | 3.150% | 12/15/21 | 12,375 | 12,299 |
| General Mills Inc. | 2.600% | 10/12/22 | 10,970 | 10,581 |
| Genzyme Corp. | 5.000% | 6/15/20 | 2,069 | 2,139 |
| Gilead Sciences Inc. | 2.350% | 2/1/20 | 7,294 | 7,240 |
| Gilead Sciences Inc. | 2.550% | 9/1/20 | 29,772 | 29,508 |
| Gilead Sciences Inc. | 4.500% | 4/1/21 | 12,996 | 13,403 |
| Gilead Sciences Inc. | 4.400% | 12/1/21 | 20,035 | 20,712 |
| Gilead Sciences Inc. | 1.950% | 3/1/22 | 7,400 | 7,084 |
| Gilead Sciences Inc. | 3.250% | 9/1/22 | 14,770 | 14,744 |
| GlaxoSmithKline Capital Inc. | 2.800% | 3/18/23 | 18,265 | 17,840 |
| GlaxoSmithKline Capital Inc. | 3.375% | 5/15/23 | 17,250 | 17,248 |
| GlaxoSmithKline Capital plc | 3.125% | 5/14/21 | 20,271 | 20,294 |
| GlaxoSmithKline Capital plc | 2.850% | 5/8/22 | 24,893 | 24,570 |
| Hasbro Inc. | 3.150% | 5/15/21 | 4,350 | 4,307 |
| Hershey Co. | 2.900% | 5/15/20 | 5,000 | 5,001 |
| Hershey Co. | 4.125% | 12/1/20 | 4,625 | 4,748 |
| Hershey Co. | 3.100% | 5/15/21 | 6,960 | 6,986 |
| Hershey Co. | 2.625% | 5/1/23 | 750 | 727 |
| Hershey Co. | 3.375% | 5/15/23 | 7,660 | 7,736 |
| Hillshire Brands Co. | 4.100% | 9/15/20 | 1,857 | 1,878 |
| Ingredion Inc. | 4.625% | 11/1/20 | 2,600 | 2,669 |
| JM Smucker Co. | 2.200% | 12/6/19 | 4,796 | 4,745 |
| JM Smucker Co. | 2.500% | 3/15/20 | 7,349 | 7,277 |
| JM Smucker Co. | 3.500% | 10/15/21 | 6,575 | 6,585 |
| JM Smucker Co. | 3.000% | 3/15/22 | 8,727 | 8,562 |
| Johnson & Johnson | 1.875% | 12/5/19 | 4,930 | 4,879 |
| Johnson & Johnson | 2.950% | 9/1/20 | 7,258 | 7,305 |
| Johnson & Johnson | 1.950% | 11/10/20 | 7,265 | 7,153 |
| 3 Johnson & Johnson | 1.650% | 3/1/21 | 13,322 | 12,941 |
| Johnson & Johnson | 3.550% | 5/15/21 | 3,400 | 3,459 |
24
| Vanguard® Short-Term Corporate Bond Index Fund | ||||
| Schedule of Investments | ||||
| August 31, 2018 | ||||
| Face | Market | |||
| Maturity | Amount | Value | ||
| Coupon | Date | ($000) | ($000) | |
| Johnson & Johnson | 2.450% | 12/5/21 | 5,550 | 5,488 |
| Johnson & Johnson | 2.250% | 3/3/22 | 13,816 | 13,517 |
| Johnson & Johnson | 2.050% | 3/1/23 | 9,140 | 8,783 |
| Kaiser Foundation Hospitals | 3.500% | 4/1/22 | 4,000 | 4,028 |
| Kellogg Co. | 4.150% | 11/15/19 | 8,725 | 8,841 |
| Kellogg Co. | 4.000% | 12/15/20 | 9,260 | 9,445 |
| Kellogg Co. | 3.250% | 5/14/21 | 7,700 | 7,700 |
| Kellogg Co. | 3.125% | 5/17/22 | 2,775 | 2,743 |
| 2 Keurig Dr Pepper Inc. | 3.551% | 5/25/21 | 23,185 | 23,233 |
| Keurig Dr Pepper Inc. | 2.530% | 11/15/21 | 1,000 | 969 |
| 2 Keurig Dr Pepper Inc. | 4.057% | 5/25/23 | 34,900 | 35,153 |
| Kimberly-Clark Corp. | 2.400% | 3/1/22 | 4,025 | 3,913 |
| Kimberly-Clark Corp. | 2.400% | 6/1/23 | 4,732 | 4,541 |
| Kraft Foods Group Inc. | 5.375% | 2/10/20 | 13,645 | 14,079 |
| Kraft Foods Group Inc. | 3.500% | 6/6/22 | 17,021 | 16,951 |
| Kraft Heinz Foods Co. | 2.800% | 7/2/20 | 24,830 | 24,610 |
| Kraft Heinz Foods Co. | 3.375% | 6/15/21 | 9,310 | 9,304 |
| Kraft Heinz Foods Co. | 3.500% | 7/15/22 | 12,435 | 12,352 |
| Kraft Heinz Foods Co. | 4.000% | 6/15/23 | 21,475 | 21,505 |
| Kroger Co. | 6.150% | 1/15/20 | 6,877 | 7,149 |
| Kroger Co. | 3.300% | 1/15/21 | 15,256 | 15,256 |
| Kroger Co. | 2.600% | 2/1/21 | 7,605 | 7,462 |
| Kroger Co. | 2.950% | 11/1/21 | 7,700 | 7,593 |
| Kroger Co. | 3.400% | 4/15/22 | 6,700 | 6,680 |
| Kroger Co. | 2.800% | 8/1/22 | 1,183 | 1,151 |
| Kroger Co. | 3.850% | 8/1/23 | 8,100 | 8,166 |
| Laboratory Corp. of America Holdings | 2.625% | 2/1/20 | 7,498 | 7,452 |
| Laboratory Corp. of America Holdings | 4.625% | 11/15/20 | 3,700 | 3,793 |
| Laboratory Corp. of America Holdings | 3.200% | 2/1/22 | 6,851 | 6,788 |
| Laboratory Corp. of America Holdings | 3.750% | 8/23/22 | 4,577 | 4,609 |
| Life Technologies Corp. | 6.000% | 3/1/20 | 6,654 | 6,913 |
| Life Technologies Corp. | 5.000% | 1/15/21 | 5,418 | 5,573 |
| McCormick & Co. Inc. | 3.900% | 7/15/21 | 2,755 | 2,787 |
| McCormick & Co. Inc. | 2.700% | 8/15/22 | 8,336 | 8,114 |
| McKesson Corp. | 2.700% | 12/15/22 | 2,525 | 2,423 |
| McKesson Corp. | 2.850% | 3/15/23 | 6,875 | 6,615 |
| Mead Johnson Nutrition Co. | 4.900% | 11/1/19 | 8,575 | 8,766 |
| Mead Johnson Nutrition Co. | 3.000% | 11/15/20 | 11,070 | 11,043 |
| Medco Health Solutions Inc. | 4.125% | 9/15/20 | 6,000 | 6,076 |
| Medtronic Inc. | 2.500% | 3/15/20 | 40,347 | 40,105 |
| Medtronic Inc. | 4.125% | 3/15/21 | 5,853 | 5,978 |
| Medtronic Inc. | 3.125% | 3/15/22 | 8,191 | 8,177 |
| Medtronic Inc. | 3.150% | 3/15/22 | 41,186 | 41,068 |
| Medtronic Inc. | 2.750% | 4/1/23 | 2,072 | 2,027 |
| Merck & Co. Inc. | 1.850% | 2/10/20 | 16,800 | 16,600 |
| Merck & Co. Inc. | 3.875% | 1/15/21 | 12,083 | 12,341 |
| Merck & Co. Inc. | 2.350% | 2/10/22 | 20,753 | 20,305 |
| Merck & Co. Inc. | 2.400% | 9/15/22 | 14,000 | 13,628 |
| Merck & Co. Inc. | 2.800% | 5/18/23 | 23,611 | 23,215 |
| Molson Coors Brewing Co. | 2.250% | 3/15/20 | 7,180 | 7,081 |
| Molson Coors Brewing Co. | 2.100% | 7/15/21 | 13,522 | 13,029 |
| Molson Coors Brewing Co. | 3.500% | 5/1/22 | 6,300 | 6,290 |
| Mondelez International Inc. | 3.000% | 5/7/20 | 2,075 | 2,073 |
| Mondelez International Inc. | 3.625% | 5/7/23 | 3,800 | 3,793 |
| Mylan NV | 3.750% | 12/15/20 | 10,400 | 10,449 |
| Mylan NV | 3.150% | 6/15/21 | 24,971 | 24,587 |
| Newell Brands Inc. | 2.875% | 12/1/19 | 5,400 | 5,369 |
| Newell Brands Inc. | 3.150% | 4/1/21 | 18,423 | 18,150 |
| Newell Brands Inc. | 3.850% | 4/1/23 | 23,800 | 23,343 |
| Novartis Capital Corp. | 1.800% | 2/14/20 | 13,770 | 13,579 |
| Novartis Capital Corp. | 4.400% | 4/24/20 | 14,072 | 14,404 |
| Novartis Capital Corp. | 2.400% | 5/17/22 | 14,025 | 13,666 |
| Novartis Capital Corp. | 2.400% | 9/21/22 | 19,055 | 18,469 |
| Pall Corp. | 5.000% | 6/15/20 | 1,900 | 1,962 |
25
| Vanguard® Short-Term Corporate Bond Index Fund | ||||
| Schedule of Investments | ||||
| August 31, 2018 | ||||
| Face | Market | |||
| Maturity | Amount | Value | ||
| Coupon | Date | ($000) | ($000) | |
| PepsiCo Inc. | 1.350% | 10/4/19 | 7,968 | 7,852 |
| PepsiCo Inc. | 4.500% | 1/15/20 | 10,535 | 10,786 |
| PepsiCo Inc. | 1.850% | 4/30/20 | 14,094 | 13,867 |
| PepsiCo Inc. | 2.150% | 10/14/20 | 17,858 | 17,592 |
| PepsiCo Inc. | 3.125% | 11/1/20 | 19,988 | 20,080 |
| PepsiCo Inc. | 2.000% | 4/15/21 | 13,322 | 13,013 |
| PepsiCo Inc. | 3.000% | 8/25/21 | 8,280 | 8,292 |
| PepsiCo Inc. | 1.700% | 10/6/21 | 10,610 | 10,212 |
| PepsiCo Inc. | 2.750% | 3/5/22 | 15,992 | 15,867 |
| PepsiCo Inc. | 2.250% | 5/2/22 | 8,125 | 7,900 |
| PepsiCo Inc. | 3.100% | 7/17/22 | 12,807 | 12,813 |
| PepsiCo Inc. | 2.750% | 3/1/23 | 17,427 | 17,111 |
| PerkinElmer Inc. | 5.000% | 11/15/21 | 5,310 | 5,496 |
| Perrigo Finance Unlimited Co. | 3.500% | 3/15/21 | 1,896 | 1,883 |
| Perrigo Finance Unlimited Co. | 3.500% | 12/15/21 | 7,144 | 7,051 |
| Pfizer Inc. | 1.700% | 12/15/19 | 15,753 | 15,548 |
| Pfizer Inc. | 5.200% | 8/12/20 | 3,450 | 3,615 |
| Pfizer Inc. | 1.950% | 6/3/21 | 19,221 | 18,742 |
| Pfizer Inc. | 2.200% | 12/15/21 | 15,811 | 15,457 |
| Pfizer Inc. | 3.000% | 6/15/23 | 7,396 | 7,345 |
| Pfizer Inc. | 5.800% | 8/12/23 | 366 | 407 |
| Philip Morris International Inc. | 2.000% | 2/21/20 | 14,159 | 13,965 |
| Philip Morris International Inc. | 4.500% | 3/26/20 | 13,692 | 14,010 |
| Philip Morris International Inc. | 1.875% | 2/25/21 | 14,323 | 13,892 |
| Philip Morris International Inc. | 4.125% | 5/17/21 | 6,650 | 6,808 |
| Philip Morris International Inc. | 2.900% | 11/15/21 | 4,525 | 4,491 |
| Philip Morris International Inc. | 2.625% | 2/18/22 | 8,420 | 8,226 |
| Philip Morris International Inc. | 2.375% | 8/17/22 | 8,916 | 8,588 |
| Philip Morris International Inc. | 2.500% | 8/22/22 | 8,595 | 8,311 |
| Philip Morris International Inc. | 2.500% | 11/2/22 | 10,459 | 10,066 |
| Philip Morris International Inc. | 2.625% | 3/6/23 | 13,160 | 12,691 |
| Philip Morris International Inc. | 2.125% | 5/10/23 | 8,519 | 8,025 |
| 1 Procter & Gamble - Esop | 9.360% | 1/1/21 | 724 | 780 |
| Procter & Gamble Co. | 1.750% | 10/25/19 | 8,875 | 8,784 |
| Procter & Gamble Co. | 1.900% | 11/1/19 | 11,810 | 11,707 |
| Procter & Gamble Co. | 1.900% | 10/23/20 | 11,550 | 11,328 |
| Procter & Gamble Co. | 1.850% | 2/2/21 | 16,905 | 16,503 |
| Procter & Gamble Co. | 1.700% | 11/3/21 | 9,500 | 9,144 |
| Procter & Gamble Co. | 2.300% | 2/6/22 | 15,738 | 15,359 |
| Procter & Gamble Co. | 2.150% | 8/11/22 | 1,476 | 1,429 |
| Procter & Gamble Co. | 3.100% | 8/15/23 | 13,086 | 13,082 |
| Quest Diagnostics Inc. | 4.750% | 1/30/20 | 3,671 | 3,754 |
| Quest Diagnostics Inc. | 2.500% | 3/30/20 | 5,805 | 5,740 |
| Quest Diagnostics Inc. | 4.700% | 4/1/21 | 3,125 | 3,215 |
| Reynolds American Inc. | 6.875% | 5/1/20 | 10,160 | 10,750 |
| Reynolds American Inc. | 3.250% | 6/12/20 | 14,398 | 14,399 |
| Reynolds American Inc. | 4.000% | 6/12/22 | 4,400 | 4,453 |
| Sanofi | 4.000% | 3/29/21 | 29,112 | 29,804 |
| Sanofi | 3.375% | 6/19/23 | 15,485 | 15,552 |
| Shire Acquisitions Investments Ireland DAC | 1.900% | 9/23/19 | 44,691 | 44,131 |
| Shire Acquisitions Investments Ireland DAC | 2.400% | 9/23/21 | 44,237 | 42,733 |
| SSM Health Care Corp. | 3.688% | 6/1/23 | 4,800 | 4,821 |
| Stryker Corp. | 4.375% | 1/15/20 | 4,200 | 4,274 |
| Stryker Corp. | 2.625% | 3/15/21 | 21,690 | 21,405 |
| Sysco Corp. | 2.600% | 10/1/20 | 8,164 | 8,084 |
| Sysco Corp. | 2.500% | 7/15/21 | 6,624 | 6,484 |
| Sysco Corp. | 2.600% | 6/12/22 | 5,875 | 5,688 |
| Thermo Fisher Scientific Inc. | 4.700% | 5/1/20 | 1,275 | 1,305 |
| Thermo Fisher Scientific Inc. | 4.500% | 3/1/21 | 17,528 | 18,010 |
| Thermo Fisher Scientific Inc. | 3.600% | 8/15/21 | 8,245 | 8,286 |
| Thermo Fisher Scientific Inc. | 3.300% | 2/15/22 | 14,205 | 14,147 |
| Thermo Fisher Scientific Inc. | 3.150% | 1/15/23 | 13,346 | 13,112 |
| Thermo Fisher Scientific Inc. | 3.000% | 4/15/23 | 12,375 | 12,048 |
| Tupperware Brands Corp. | 4.750% | 6/1/21 | 6,900 | 7,054 |
26
| Vanguard® Short-Term Corporate Bond Index Fund | ||||
| Schedule of Investments | ||||
| August 31, 2018 | ||||
| Face | Market | |||
| Maturity | Amount | Value | ||
| Coupon | Date | ($000) | ($000) | |
| Tyson Foods Inc. | 2.250% | 8/23/21 | 7,298 | 7,053 |
| Tyson Foods Inc. | 4.500% | 6/15/22 | 17,195 | 17,726 |
| Unilever Capital Corp. | 1.800% | 5/5/20 | 7,611 | 7,477 |
| Unilever Capital Corp. | 2.100% | 7/30/20 | 13,020 | 12,741 |
| Unilever Capital Corp. | 4.250% | 2/10/21 | 13,963 | 14,346 |
| Unilever Capital Corp. | 1.375% | 7/28/21 | 6,190 | 5,870 |
| Unilever Capital Corp. | 2.200% | 5/5/22 | 11,300 | 10,898 |
| Unilever Capital Corp. | 3.125% | 3/22/23 | 7,000 | 6,951 |
| Whirlpool Corp. | 4.850% | 6/15/21 | 4,223 | 4,370 |
| Whirlpool Corp. | 4.700% | 6/1/22 | 3,675 | 3,806 |
| Zimmer Biomet Holdings Inc. | 4.625% | 11/30/19 | 4,025 | 4,100 |
| Zimmer Biomet Holdings Inc. | 2.700% | 4/1/20 | 27,807 | 27,569 |
| Zimmer Biomet Holdings Inc. | 3.375% | 11/30/21 | 2,400 | 2,382 |
| Zimmer Biomet Holdings Inc. | 3.150% | 4/1/22 | 13,343 | 13,123 |
| Zimmer Biomet Holdings Inc. | 3.700% | 3/19/23 | 3,400 | 3,400 |
| Zoetis Inc. | 3.450% | 11/13/20 | 7,116 | 7,144 |
| Zoetis Inc. | 3.250% | 8/20/21 | 3,375 | 3,376 |
| Zoetis Inc. | 3.250% | 2/1/23 | 19,603 | 19,352 |
| Energy (7.1%) | ||||
| Anadarko Petroleum Corp. | 4.850% | 3/15/21 | 8,086 | 8,318 |
| Andeavor Logistics LP / Tesoro Logistics Finance Corp. | 5.500% | 10/15/19 | 3,600 | 3,676 |
| Andeavor Logistics LP / Tesoro Logistics Finance Corp. | 3.500% | 12/1/22 | 5,175 | 5,091 |
| Apache Corp. | 3.625% | 2/1/21 | 7,829 | 7,858 |
| Apache Corp. | 3.250% | 4/15/22 | 10,474 | 10,313 |
| Apache Corp. | 2.625% | 1/15/23 | 4,612 | 4,413 |
| Baker Hughes a GE Co. LLC | 3.200% | 8/15/21 | 7,983 | 7,972 |
| Baker Hughes a GE Co. LLC / Baker Hughes Co-Obligor | ||||
| Inc. | 2.773% | 12/15/22 | 18,950 | 18,369 |
| Boardwalk Pipelines LP | 5.750% | 9/15/19 | 3,660 | 3,749 |
| Boardwalk Pipelines LP | 3.375% | 2/1/23 | 5,525 | 5,348 |
| BP Capital Markets plc | 1.768% | 9/19/19 | 8,815 | 8,704 |
| BP Capital Markets plc | 2.521% | 1/15/20 | 18,741 | 18,647 |
| BP Capital Markets plc | 2.315% | 2/13/20 | 28,287 | 28,036 |
| BP Capital Markets plc | 4.500% | 10/1/20 | 10,254 | 10,548 |
| BP Capital Markets plc | 4.742% | 3/11/21 | 16,647 | 17,289 |
| BP Capital Markets plc | 2.112% | 9/16/21 | 3,439 | 3,330 |
| BP Capital Markets plc | 3.561% | 11/1/21 | 17,087 | 17,252 |
| BP Capital Markets plc | 3.062% | 3/17/22 | 8,726 | 8,655 |
| BP Capital Markets plc | 3.245% | 5/6/22 | 29,297 | 29,244 |
| BP Capital Markets plc | 2.520% | 9/19/22 | 9,610 | 9,316 |
| BP Capital Markets plc | 2.500% | 11/6/22 | 13,275 | 12,871 |
| BP Capital Markets plc | 2.750% | 5/10/23 | 30,391 | 29,534 |
| Buckeye Partners LP | 4.875% | 2/1/21 | 9,554 | 9,733 |
| Buckeye Partners LP | 4.150% | 7/1/23 | 6,075 | 6,002 |
| Canadian Natural Resources Ltd. | 3.450% | 11/15/21 | 5,575 | 5,561 |
| Canadian Natural Resources Ltd. | 2.950% | 1/15/23 | 17,529 | 16,978 |
| Cenovus Energy Inc. | 5.700% | 10/15/19 | 22,370 | 22,901 |
| Cenovus Energy Inc. | 3.000% | 8/15/22 | 6,200 | 5,967 |
| Chevron Corp. | 2.193% | 11/15/19 | 8,087 | 8,038 |
| Chevron Corp. | 1.961% | 3/3/20 | 29,156 | 28,816 |
| Chevron Corp. | 1.991% | 3/3/20 | 7,011 | 6,932 |
| Chevron Corp. | 2.427% | 6/24/20 | 4,225 | 4,195 |
| Chevron Corp. | 2.419% | 11/17/20 | 17,133 | 16,979 |
| Chevron Corp. | 2.100% | 5/16/21 | 25,605 | 25,025 |
| Chevron Corp. | 2.411% | 3/3/22 | 9,100 | 8,913 |
| Chevron Corp. | 2.498% | 3/3/22 | 6,655 | 6,520 |
| Chevron Corp. | 2.355% | 12/5/22 | 36,609 | 35,450 |
| Chevron Corp. | 2.566% | 5/16/23 | 6,013 | 5,836 |
| Chevron Corp. | 3.191% | 6/24/23 | 31,209 | 31,118 |
| Columbia Pipeline Group Inc. | 3.300% | 6/1/20 | 8,825 | 8,792 |
| ConocoPhillips Co. | 2.400% | 12/15/22 | 400 | 385 |
| Continental Resources Inc. | 4.500% | 4/15/23 | 23,600 | 24,072 |
| Devon Energy Corp. | 4.000% | 7/15/21 | 8,892 | 9,014 |
27
| Vanguard® Short-Term Corporate Bond Index Fund | ||||
| Schedule of Investments | ||||
| August 31, 2018 | ||||
| Face | Market | |||
| Maturity | Amount | Value | ||
| Coupon | Date | ($000) | ($000) | |
| Devon Energy Corp. | 3.250% | 5/15/22 | 13,912 | 13,699 |
| Dominion Energy Gas Holdings LLC | 2.500% | 12/15/19 | 10,300 | 10,228 |
| Dominion Energy Gas Holdings LLC | 2.800% | 11/15/20 | 8,057 | 7,936 |
| Enbridge Energy Partners LP | 5.200% | 3/15/20 | 7,942 | 8,161 |
| Enbridge Energy Partners LP | 4.375% | 10/15/20 | 8,410 | 8,495 |
| Enbridge Energy Partners LP | 4.200% | 9/15/21 | 7,875 | 7,978 |
| Enbridge Inc. | 2.900% | 7/15/22 | 11,950 | 11,648 |
| Encana Corp. | 3.900% | 11/15/21 | 7,614 | 7,682 |
| Energy Transfer Equity LP | 4.250% | 3/15/23 | 1,800 | 1,802 |
| Energy Transfer LP | 4.150% | 10/1/20 | 4,573 | 4,631 |
| Energy Transfer LP | 4.650% | 6/1/21 | 18,099 | 18,571 |
| Energy Transfer LP | 5.200% | 2/1/22 | 11,417 | 11,913 |
| Energy Transfer LP | 3.600% | 2/1/23 | 15,880 | 15,634 |
| Energy Transfer Partners LP | 4.200% | 9/15/23 | 1,800 | 1,817 |
| Enterprise Products Operating LLC | 2.550% | 10/15/19 | 15,798 | 15,718 |
| Enterprise Products Operating LLC | 5.250% | 1/31/20 | 8,149 | 8,388 |
| Enterprise Products Operating LLC | 5.200% | 9/1/20 | 9,005 | 9,354 |
| Enterprise Products Operating LLC | 2.800% | 2/15/21 | 8,275 | 8,188 |
| Enterprise Products Operating LLC | 2.850% | 4/15/21 | 9,622 | 9,525 |
| Enterprise Products Operating LLC | 4.050% | 2/15/22 | 7,068 | 7,205 |
| Enterprise Products Operating LLC | 3.350% | 3/15/23 | 25,010 | 24,847 |
| 1 Enterprise Products Operating LLC | 4.875% | 8/16/77 | 4,250 | 4,101 |
| EOG Resources Inc. | 2.450% | 4/1/20 | 7,665 | 7,579 |
| EOG Resources Inc. | 4.400% | 6/1/20 | 9,385 | 9,580 |
| EOG Resources Inc. | 4.100% | 2/1/21 | 7,925 | 8,074 |
| EOG Resources Inc. | 2.625% | 3/15/23 | 14,654 | 14,171 |
| EQT Corp. | 2.500% | 10/1/20 | 8,000 | 7,833 |
| EQT Corp. | 4.875% | 11/15/21 | 2,672 | 2,743 |
| EQT Corp. | 3.000% | 10/1/22 | 12,700 | 12,275 |
| EQT Midstream Partners LP | 4.750% | 7/15/23 | 2,000 | 2,021 |
| Exxon Mobil Corp. | 1.912% | 3/6/20 | 24,230 | 23,962 |
| Exxon Mobil Corp. | 2.222% | 3/1/21 | 29,352 | 28,873 |
| Exxon Mobil Corp. | 2.397% | 3/6/22 | 15,381 | 15,067 |
| Exxon Mobil Corp. | 2.726% | 3/1/23 | 17,205 | 16,915 |
| Halliburton Co. | 3.250% | 11/15/21 | 4,447 | 4,463 |
| Halliburton Co. | 3.500% | 8/1/23 | 17,204 | 17,237 |
| Husky Energy Inc. | 7.250% | 12/15/19 | 9,611 | 10,092 |
| Husky Energy Inc. | 3.950% | 4/15/22 | 8,039 | 8,116 |
| Kinder Morgan Energy Partners LP | 6.850% | 2/15/20 | 6,850 | 7,167 |
| Kinder Morgan Energy Partners LP | 6.500% | 4/1/20 | 8,270 | 8,664 |
| Kinder Morgan Energy Partners LP | 5.300% | 9/15/20 | 5,855 | 6,023 |
| Kinder Morgan Energy Partners LP | 3.500% | 3/1/21 | 13,351 | 13,348 |
| Kinder Morgan Energy Partners LP | 5.800% | 3/1/21 | 5,000 | 5,268 |
| Kinder Morgan Energy Partners LP | 5.000% | 10/1/21 | 13,287 | 13,819 |
| Kinder Morgan Energy Partners LP | 4.150% | 3/1/22 | 3,400 | 3,462 |
| Kinder Morgan Energy Partners LP | 3.950% | 9/1/22 | 11,800 | 11,923 |
| Kinder Morgan Energy Partners LP | 3.450% | 2/15/23 | 5,659 | 5,563 |
| Kinder Morgan Inc. | 3.050% | 12/1/19 | 27,187 | 27,208 |
| Kinder Morgan Inc. | 6.500% | 9/15/20 | 3,978 | 4,197 |
| Kinder Morgan Inc. | 3.150% | 1/15/23 | 11,160 | 10,885 |
| Magellan Midstream Partners LP | 4.250% | 2/1/21 | 4,056 | 4,132 |
| Marathon Oil Corp. | 2.700% | 6/1/20 | 6,160 | 6,088 |
| Marathon Oil Corp. | 2.800% | 11/1/22 | 16,789 | 16,239 |
| Marathon Petroleum Corp. | 3.400% | 12/15/20 | 13,492 | 13,511 |
| Marathon Petroleum Corp. | 5.125% | 3/1/21 | 11,358 | 11,811 |
| MPLX LP | 5.500% | 2/15/23 | 638 | 652 |
| MPLX LP | 3.375% | 3/15/23 | 4,853 | 4,778 |
| MPLX LP | 4.500% | 7/15/23 | 22,356 | 22,988 |
| National Fuel Gas Co. | 4.900% | 12/1/21 | 5,839 | 5,992 |
| National Fuel Gas Co. | 3.750% | 3/1/23 | 7,875 | 7,736 |
| National Oilwell Varco Inc. | 2.600% | 12/1/22 | 18,163 | 17,381 |
| Noble Energy Inc. | 4.150% | 12/15/21 | 15,054 | 15,298 |
| Occidental Petroleum Corp. | 4.100% | 2/1/21 | 16,048 | 16,367 |
| Occidental Petroleum Corp. | 3.125% | 2/15/22 | 11,185 | 11,087 |
28
| Vanguard® Short-Term Corporate Bond Index Fund | ||||
| Schedule of Investments | ||||
| August 31, 2018 | ||||
| Face | Market | |||
| Maturity | Amount | Value | ||
| Coupon | Date | ($000) | ($000) | |
| Occidental Petroleum Corp. | 2.600% | 4/15/22 | 10,420 | 10,182 |
| Occidental Petroleum Corp. | 2.700% | 2/15/23 | 14,627 | 14,233 |
| ONEOK Inc. | 4.250% | 2/1/22 | 10,733 | 10,914 |
| ONEOK Partners LP | 3.375% | 10/1/22 | 15,490 | 15,211 |
| Petro-Canada | 9.250% | 10/15/21 | 2,897 | 3,368 |
| Phillips 66 | 4.300% | 4/1/22 | 28,285 | 29,089 |
| Phillips 66 Partners LP | 2.646% | 2/15/20 | 4,075 | 4,039 |
| Pioneer Natural Resources Co. | 7.500% | 1/15/20 | 5,200 | 5,500 |
| Pioneer Natural Resources Co. | 3.450% | 1/15/21 | 9,550 | 9,573 |
| Pioneer Natural Resources Co. | 3.950% | 7/15/22 | 8,988 | 9,117 |
| Plains All American Pipeline LP / PAA Finance Corp. | 2.600% | 12/15/19 | 6,085 | 6,037 |
| Plains All American Pipeline LP / PAA Finance Corp. | 5.750% | 1/15/20 | 9,652 | 9,939 |
| Plains All American Pipeline LP / PAA Finance Corp. | 5.000% | 2/1/21 | 8,184 | 8,398 |
| Plains All American Pipeline LP / PAA Finance Corp. | 3.650% | 6/1/22 | 6,441 | 6,373 |
| Plains All American Pipeline LP / PAA Finance Corp. | 2.850% | 1/31/23 | 4,900 | 4,646 |
| Regency Energy Partners LP / Regency Energy Finance | ||||
| Corp. | 5.750% | 9/1/20 | 3,096 | 3,212 |
| Regency Energy Partners LP / Regency Energy Finance | ||||
| Corp. | 5.875% | 3/1/22 | 17,835 | 18,926 |
| Regency Energy Partners LP / Regency Energy Finance | ||||
| Corp. | 5.000% | 10/1/22 | 7,200 | 7,470 |
| Sabine Pass Liquefaction LLC | 5.625% | 2/1/21 | 28,675 | 29,930 |
| Sabine Pass Liquefaction LLC | 6.250% | 3/15/22 | 14,490 | 15,613 |
| Sabine Pass Liquefaction LLC | 5.625% | 4/15/23 | 19,975 | 21,323 |
| Shell International Finance BV | 1.375% | 9/12/19 | 18,900 | 18,640 |
| Shell International Finance BV | 4.300% | 9/22/19 | 23,873 | 24,278 |
| Shell International Finance BV | 4.375% | 3/25/20 | 11,005 | 11,254 |
| Shell International Finance BV | 2.125% | 5/11/20 | 34,152 | 33,746 |
| Shell International Finance BV | 2.250% | 11/10/20 | 17,918 | 17,654 |
| Shell International Finance BV | 1.875% | 5/10/21 | 20,033 | 19,456 |
| Shell International Finance BV | 1.750% | 9/12/21 | 11,118 | 10,717 |
| Shell International Finance BV | 2.375% | 8/21/22 | 16,212 | 15,779 |
| Shell International Finance BV | 2.250% | 1/6/23 | 12,801 | 12,314 |
| Shell International Finance BV | 3.400% | 8/12/23 | 15,200 | 15,285 |
| Southern Natural Gas Co. LLC / Southern Natural | ||||
| Issuing Corp. | 4.400% | 6/15/21 | 3,120 | 3,182 |
| Sunoco Logistics Partners Operations LP | 4.400% | 4/1/21 | 12,966 | 13,192 |
| Sunoco Logistics Partners Operations LP | 4.650% | 2/15/22 | 3,200 | 3,290 |
| TC Pipelines LP | 4.650% | 6/15/21 | 2,608 | 2,653 |
| Total Capital Canada Ltd. | 2.750% | 7/15/23 | 13,510 | 13,157 |
| Total Capital International SA | 2.750% | 6/19/21 | 15,881 | 15,760 |
| Total Capital International SA | 2.875% | 2/17/22 | 12,340 | 12,222 |
| Total Capital International SA | 2.700% | 1/25/23 | 16,409 | 15,999 |
| Total Capital SA | 4.450% | 6/24/20 | 17,580 | 18,037 |
| Total Capital SA | 4.125% | 1/28/21 | 10,330 | 10,583 |
| Total Capital SA | 4.250% | 12/15/21 | 1,950 | 2,015 |
| TransCanada PipeLines Ltd. | 2.125% | 11/15/19 | 4,356 | 4,313 |
| TransCanada PipeLines Ltd. | 3.800% | 10/1/20 | 16,805 | 17,018 |
| TransCanada PipeLines Ltd. | 2.500% | 8/1/22 | 24,970 | 24,060 |
| Valero Energy Corp. | 6.125% | 2/1/20 | 10,727 | 11,135 |
| Western Gas Partners LP | 5.375% | 6/1/21 | 5,652 | 5,848 |
| Western Gas Partners LP | 4.000% | 7/1/22 | 6,463 | 6,402 |
| Williams Cos. Inc. | 5.250% | 3/15/20 | 22,859 | 23,462 |
| Williams Cos. Inc. | 4.125% | 11/15/20 | 7,212 | 7,312 |
| Williams Cos. Inc. | 4.000% | 11/15/21 | 5,907 | 5,958 |
| Williams Cos. Inc. | 3.600% | 3/15/22 | 12,551 | 12,524 |
| Williams Cos. Inc. | 3.350% | 8/15/22 | 16,885 | 16,641 |
| Williams Cos. Inc. | 3.700% | 1/15/23 | 1,800 | 1,782 |
| Other Industrial (0.1%) | ||||
| Cintas Corp. No 2 | 4.300% | 6/1/21 | 2,015 | 2,043 |
| Cintas Corp. No 2 | 2.900% | 4/1/22 | 7,365 | 7,216 |
| Cintas Corp. No 2 | 3.250% | 6/1/22 | 3,225 | 3,198 |
| Fluor Corp. | 3.375% | 9/15/21 | 5,000 | 5,050 |
29
| Vanguard® Short-Term Corporate Bond Index Fund | ||||
| Schedule of Investments | ||||
| August 31, 2018 | ||||
| Face | Market | |||
| Maturity | Amount | Value | ||
| Coupon | Date | ($000) | ($000) | |
| Technology (8.5%) | ||||
| Adobe Systems Inc. | 4.750% | 2/1/20 | 4,585 | 4,700 |
| Alphabet Inc. | 3.625% | 5/19/21 | 6,130 | 6,261 |
| Amphenol Corp. | 2.200% | 4/1/20 | 10,178 | 10,020 |
| Amphenol Corp. | 3.125% | 9/15/21 | 470 | 466 |
| Amphenol Corp. | 4.000% | 2/1/22 | 5,494 | 5,594 |
| Analog Devices Inc. | 2.850% | 3/12/20 | 7,500 | 7,463 |
| Analog Devices Inc. | 2.950% | 1/12/21 | 25 | 25 |
| Analog Devices Inc. | 2.500% | 12/5/21 | 6,420 | 6,236 |
| Analog Devices Inc. | 2.875% | 6/1/23 | 9,875 | 9,550 |
| Apple Inc. | 1.500% | 9/12/19 | 6,800 | 6,724 |
| Apple Inc. | 1.800% | 11/13/19 | 15,400 | 15,265 |
| Apple Inc. | 1.550% | 2/7/20 | 24,902 | 24,501 |
| Apple Inc. | 1.900% | 2/7/20 | 17,976 | 17,781 |
| Apple Inc. | 2.000% | 5/6/20 | 23,791 | 23,496 |
| Apple Inc. | 1.800% | 5/11/20 | 17,800 | 17,514 |
| Apple Inc. | 2.000% | 11/13/20 | 7,000 | 6,884 |
| Apple Inc. | 2.250% | 2/23/21 | 32,633 | 32,147 |
| Apple Inc. | 2.850% | 5/6/21 | 34,025 | 33,981 |
| Apple Inc. | 1.550% | 8/4/21 | 9,025 | 8,685 |
| Apple Inc. | 2.150% | 2/9/22 | 27,429 | 26,634 |
| Apple Inc. | 2.500% | 2/9/22 | 20,371 | 20,031 |
| Apple Inc. | 2.300% | 5/11/22 | 21,090 | 20,552 |
| Apple Inc. | 2.700% | 5/13/22 | 19,462 | 19,235 |
| Apple Inc. | 2.100% | 9/12/22 | 6,300 | 6,064 |
| Apple Inc. | 2.400% | 1/13/23 | 12,125 | 11,802 |
| Apple Inc. | 2.850% | 2/23/23 | 23,648 | 23,416 |
| Apple Inc. | 2.400% | 5/3/23 | 76,345 | 73,826 |
| Applied Materials Inc. | 2.625% | 10/1/20 | 5,386 | 5,337 |
| Applied Materials Inc. | 4.300% | 6/15/21 | 12,140 | 12,534 |
| Arrow Electronics Inc. | 3.500% | 4/1/22 | 4,806 | 4,738 |
| Arrow Electronics Inc. | 4.500% | 3/1/23 | 4,000 | 4,052 |
| Autodesk Inc. | 3.125% | 6/15/20 | 5,000 | 4,982 |
| Autodesk Inc. | 3.600% | 12/15/22 | 3,043 | 3,027 |
| Avnet Inc. | 5.875% | 6/15/20 | 4,089 | 4,252 |
| Avnet Inc. | 3.750% | 12/1/21 | 5,175 | 5,155 |
| Avnet Inc. | 4.875% | 12/1/22 | 5,325 | 5,495 |
| Baidu Inc. | 3.000% | 6/30/20 | 6,550 | 6,502 |
| Baidu Inc. | 2.875% | 7/6/22 | 16,775 | 16,209 |
| Baidu Inc. | 3.500% | 11/28/22 | 10,199 | 10,070 |
| Broadcom Corp. | 2.500% | 8/15/22 | 500 | 474 |
| Broadcom Corp. / Broadcom Cayman Finance Ltd. | 2.375% | 1/15/20 | 43,115 | 42,654 |
| Broadcom Corp. / Broadcom Cayman Finance Ltd. | 2.200% | 1/15/21 | 11,500 | 11,151 |
| Broadcom Corp. / Broadcom Cayman Finance Ltd. | 3.000% | 1/15/22 | 47,517 | 46,332 |
| Broadcom Corp. / Broadcom Cayman Finance Ltd. | 2.650% | 1/15/23 | 12,725 | 12,040 |
| Broadridge Financial Solutions Inc. | 3.950% | 9/1/20 | 2,975 | 3,009 |
| CA Inc. | 5.375% | 12/1/19 | 9,525 | 9,754 |
| CA Inc. | 3.600% | 8/1/20 | 3,369 | 3,378 |
| CA Inc. | 3.600% | 8/15/22 | 7,150 | 7,086 |
| Cisco Systems Inc. | 1.400% | 9/20/19 | 12,858 | 12,697 |
| Cisco Systems Inc. | 4.450% | 1/15/20 | 37,884 | 38,731 |
| Cisco Systems Inc. | 2.450% | 6/15/20 | 20,254 | 20,130 |
| Cisco Systems Inc. | 2.200% | 2/28/21 | 32,812 | 32,243 |
| Cisco Systems Inc. | 2.900% | 3/4/21 | 8,950 | 8,939 |
| Cisco Systems Inc. | 1.850% | 9/20/21 | 33,450 | 32,368 |
| Cisco Systems Inc. | 3.000% | 6/15/22 | 2,930 | 2,922 |
| Cisco Systems Inc. | 2.600% | 2/28/23 | 7,390 | 7,228 |
| Corning Inc. | 4.250% | 8/15/20 | 2,000 | 2,032 |
| Corning Inc. | 2.900% | 5/15/22 | 4,150 | 4,076 |
| 2 Dell International LLC / EMC Corp. | 5.450% | 6/15/23 | 49,995 | 52,514 |
| 2 Diamond 1 Finance Corp. / Diamond 2 Finance Corp. | 4.420% | 6/15/21 | 67,981 | 69,133 |
| DXC Technology Co. | 2.875% | 3/27/20 | 9,945 | 9,872 |
| Equifax Inc. | 2.300% | 6/1/21 | 5,475 | 5,270 |
30
| Vanguard® Short-Term Corporate Bond Index Fund | ||||
| Schedule of Investments | ||||
| August 31, 2018 | ||||
| Face | Market | |||
| Maturity | Amount | Value | ||
| Coupon | Date | ($000) | ($000) | |
| Equifax Inc. | 3.600% | 8/15/21 | 4,000 | 3,994 |
| Equifax Inc. | 3.300% | 12/15/22 | 4,395 | 4,311 |
| Equifax Inc. | 3.950% | 6/15/23 | 4,875 | 4,880 |
| Fidelity National Information Services Inc. | 3.625% | 10/15/20 | 16,392 | 16,498 |
| Fidelity National Information Services Inc. | 2.250% | 8/15/21 | 7,983 | 7,715 |
| Fidelity National Information Services Inc. | 4.500% | 10/15/22 | 3,776 | 3,902 |
| Fidelity National Information Services Inc. | 3.500% | 4/15/23 | 10,126 | 10,072 |
| Fiserv Inc. | 2.700% | 6/1/20 | 17,202 | 17,056 |
| Fiserv Inc. | 4.625% | 10/1/20 | 2,615 | 2,681 |
| Fiserv Inc. | 4.750% | 6/15/21 | 1,075 | 1,113 |
| Fiserv Inc. | 3.500% | 10/1/22 | 12,804 | 12,753 |
| Flex Ltd. | 4.625% | 2/15/20 | 5,225 | 5,304 |
| Flex Ltd. | 5.000% | 2/15/23 | 8,193 | 8,407 |
| Hewlett Packard Enterprise Co. | 3.600% | 10/15/20 | 50,981 | 51,317 |
| Hewlett Packard Enterprise Co. | 4.400% | 10/15/22 | 19,837 | 20,372 |
| HP Inc. | 3.750% | 12/1/20 | 1,655 | 1,670 |
| HP Inc. | 4.300% | 6/1/21 | 1,412 | 1,448 |
| HP Inc. | 4.375% | 9/15/21 | 19,466 | 20,025 |
| HP Inc. | 4.650% | 12/9/21 | 5,000 | 5,188 |
| HP Inc. | 4.050% | 9/15/22 | 7,125 | 7,237 |
| IBM Credit LLC | 1.625% | 9/6/19 | 10,900 | 10,787 |
| IBM Credit LLC | 1.800% | 1/20/21 | 12,000 | 11,656 |
| IBM Credit LLC | 2.650% | 2/5/21 | 14,600 | 14,465 |
| IBM Credit LLC | 2.200% | 9/8/22 | 4,425 | 4,246 |
| IBM Credit LLC | 3.000% | 2/6/23 | 8,625 | 8,524 |
| Intel Corp. | 1.850% | 5/11/20 | 14,165 | 13,942 |
| Intel Corp. | 2.450% | 7/29/20 | 27,754 | 27,574 |
| Intel Corp. | 1.700% | 5/19/21 | 10,598 | 10,267 |
| Intel Corp. | 3.300% | 10/1/21 | 19,320 | 19,489 |
| Intel Corp. | 2.350% | 5/11/22 | 4,715 | 4,588 |
| Intel Corp. | 3.100% | 7/29/22 | 13,924 | 13,900 |
| Intel Corp. | 2.700% | 12/15/22 | 20,615 | 20,273 |
| International Business Machines Corp. | 8.375% | 11/1/19 | 5,256 | 5,587 |
| International Business Machines Corp. | 1.900% | 1/27/20 | 12,150 | 11,999 |
| International Business Machines Corp. | 1.625% | 5/15/20 | 23,408 | 22,913 |
| International Business Machines Corp. | 2.250% | 2/19/21 | 12,007 | 11,781 |
| International Business Machines Corp. | 2.900% | 11/1/21 | 6,605 | 6,556 |
| International Business Machines Corp. | 2.500% | 1/27/22 | 8,472 | 8,289 |
| International Business Machines Corp. | 1.875% | 8/1/22 | 7,333 | 6,964 |
| International Business Machines Corp. | 2.875% | 11/9/22 | 10,325 | 10,160 |
| International Business Machines Corp. | 3.375% | 8/1/23 | 21,052 | 21,097 |
| Jabil Inc. | 5.625% | 12/15/20 | 3,500 | 3,657 |
| Jabil Inc. | 4.700% | 9/15/22 | 5,125 | 5,250 |
| Juniper Networks Inc. | 3.300% | 6/15/20 | 3,175 | 3,167 |
| Juniper Networks Inc. | 4.600% | 3/15/21 | 2,155 | 2,204 |
| Keysight Technologies Inc. | 3.300% | 10/30/19 | 3,800 | 3,790 |
| KLA-Tencor Corp. | 4.125% | 11/1/21 | 7,221 | 7,346 |
| Lam Research Corp. | 2.750% | 3/15/20 | 6,130 | 6,092 |
| Lam Research Corp. | 2.800% | 6/15/21 | 12,038 | 11,857 |
| Marvell Technology Group Ltd. | 4.200% | 6/22/23 | 6,725 | 6,750 |
| Maxim Integrated Products Inc. | 3.375% | 3/15/23 | 6,712 | 6,609 |
| Microsoft Corp. | 1.850% | 2/6/20 | 24,270 | 24,000 |
| Microsoft Corp. | 1.850% | 2/12/20 | 21,685 | 21,444 |
| Microsoft Corp. | 3.000% | 10/1/20 | 18,603 | 18,747 |
| Microsoft Corp. | 2.000% | 11/3/20 | 22,868 | 22,528 |
| Microsoft Corp. | 4.000% | 2/8/21 | 753 | 776 |
| Microsoft Corp. | 1.550% | 8/8/21 | 37,067 | 35,714 |
| Microsoft Corp. | 2.400% | 2/6/22 | 25,940 | 25,498 |
| Microsoft Corp. | 2.375% | 2/12/22 | 25,959 | 25,461 |
| Microsoft Corp. | 2.650% | 11/3/22 | 15,807 | 15,563 |
| Microsoft Corp. | 2.125% | 11/15/22 | 6,631 | 6,405 |
| Microsoft Corp. | 2.375% | 5/1/23 | 13,500 | 13,086 |
| Microsoft Corp. | 2.000% | 8/8/23 | 20,300 | 19,272 |
| Motorola Solutions Inc. | 3.500% | 9/1/21 | 4,710 | 4,668 |
31
| Vanguard® Short-Term Corporate Bond Index Fund | ||||
| Schedule of Investments | ||||
| August 31, 2018 | ||||
| Face | Market | |||
| Maturity | Amount | Value | ||
| Coupon | Date | ($000) | ($000) | |
| Motorola Solutions Inc. | 3.750% | 5/15/22 | 11,363 | 11,329 |
| Motorola Solutions Inc. | 3.500% | 3/1/23 | 8,000 | 7,787 |
| NetApp Inc. | 2.000% | 9/27/19 | 7,150 | 7,073 |
| NetApp Inc. | 3.375% | 6/15/21 | 5,925 | 5,888 |
| NVIDIA Corp. | 2.200% | 9/16/21 | 14,860 | 14,451 |
| Oracle Corp. | 2.250% | 10/8/19 | 30,342 | 30,214 |
| Oracle Corp. | 3.875% | 7/15/20 | 15,128 | 15,414 |
| Oracle Corp. | 2.800% | 7/8/21 | 15,885 | 15,825 |
| Oracle Corp. | 1.900% | 9/15/21 | 64,534 | 62,440 |
| Oracle Corp. | 2.500% | 5/15/22 | 34,611 | 33,883 |
| Oracle Corp. | 2.500% | 10/15/22 | 36,429 | 35,417 |
| Oracle Corp. | 2.625% | 2/15/23 | 17,553 | 17,112 |
| Oracle Corp. | 3.625% | 7/15/23 | 9,125 | 9,258 |
| QUALCOMM Inc. | 2.250% | 5/20/20 | 26,060 | 25,739 |
| QUALCOMM Inc. | 3.000% | 5/20/22 | 20,421 | 20,161 |
| QUALCOMM Inc. | 2.600% | 1/30/23 | 20,287 | 19,438 |
| salesforce.com Inc. | 3.250% | 4/11/23 | 13,670 | 13,643 |
| Seagate HDD Cayman | 4.250% | 3/1/22 | 10,150 | 10,201 |
| Seagate HDD Cayman | 4.750% | 6/1/23 | 13,182 | 13,198 |
| Tech Data Corp. | 3.700% | 2/15/22 | 7,405 | 7,300 |
| Texas Instruments Inc. | 1.750% | 5/1/20 | 3,158 | 3,099 |
| Texas Instruments Inc. | 2.750% | 3/12/21 | 17,420 | 17,332 |
| Texas Instruments Inc. | 1.850% | 5/15/22 | 4,717 | 4,515 |
| Texas Instruments Inc. | 2.250% | 5/1/23 | 4,710 | 4,524 |
| Total System Services Inc. | 3.800% | 4/1/21 | 10,326 | 10,352 |
| Total System Services Inc. | 3.750% | 6/1/23 | 8,826 | 8,755 |
| Total System Services Inc. | 4.000% | 6/1/23 | 7,500 | 7,555 |
| Trimble Inc. | 4.150% | 6/15/23 | 3,300 | 3,310 |
| Tyco Electronics Group SA | 4.875% | 1/15/21 | 180 | 186 |
| Tyco Electronics Group SA | 3.500% | 2/3/22 | 9,368 | 9,423 |
| Verisk Analytics Inc. | 5.800% | 5/1/21 | 6,278 | 6,639 |
| Verisk Analytics Inc. | 4.125% | 9/12/22 | 5,988 | 6,083 |
| VMware Inc. | 2.300% | 8/21/20 | 16,880 | 16,545 |
| VMware Inc. | 2.950% | 8/21/22 | 23,222 | 22,488 |
| Xerox Corp. | 5.625% | 12/15/19 | 6,875 | 7,048 |
| Xerox Corp. | 2.800% | 5/15/20 | 3,100 | 3,059 |
| Xerox Corp. | 3.500% | 8/20/20 | 300 | 300 |
| Xerox Corp. | 2.750% | 9/1/20 | 4,865 | 4,764 |
| Xerox Corp. | 4.500% | 5/15/21 | 17,488 | 17,642 |
| Xerox Corp. | 3.625% | 3/15/23 | 13,540 | 12,736 |
| Xilinx Inc. | 3.000% | 3/15/21 | 7,416 | 7,378 |
| Transportation (1.4%) | ||||
| 1 American Airlines 2013-2 Class A Pass Through Trust | 4.950% | 7/15/24 | 9,846 | 10,119 |
| Burlington Northern Santa Fe LLC | 4.700% | 10/1/19 | 3,884 | 3,960 |
| Burlington Northern Santa Fe LLC | 3.450% | 9/15/21 | 7,034 | 7,078 |
| Burlington Northern Santa Fe LLC | 3.050% | 3/15/22 | 10,233 | 10,163 |
| Burlington Northern Santa Fe LLC | 3.050% | 9/1/22 | 11,450 | 11,358 |
| Burlington Northern Santa Fe LLC | 3.000% | 3/15/23 | 10,035 | 9,890 |
| Canadian National Railway Co. | 2.400% | 2/3/20 | 4,000 | 3,971 |
| Canadian National Railway Co. | 2.850% | 12/15/21 | 5,125 | 5,068 |
| Canadian Pacific Railway Co. | 9.450% | 8/1/21 | 2,250 | 2,609 |
| Canadian Pacific Railway Co. | 4.450% | 3/15/23 | 4,350 | 4,511 |
| 1 Continental Airlines 2007-1 Class A Pass Through Trust | 5.983% | 10/19/23 | 4,997 | 5,286 |
| 1 Continental Airlines 2009-2 Class A Pass Through Trust | 7.250% | 5/10/21 | 2,306 | 2,399 |
| 1 Continental Airlines 2010-1 Class A Pass Through Trust | 4.750% | 7/12/22 | 1,604 | 1,636 |
| CSX Corp. | 3.700% | 10/30/20 | 4,632 | 4,664 |
| CSX Corp. | 4.250% | 6/1/21 | 6,115 | 6,253 |
| 1 Delta Air Lines 2007-1 Class A Pass Through Trust | 6.821% | 2/10/24 | 4,084 | 4,465 |
| 1 Delta Air Lines 2009-1 Class A Pass Through Trust | 7.750% | 6/17/21 | 1,307 | 1,368 |
| 1 Delta Air Lines 2010-2 Class A Pass Through Trust | 4.950% | 11/23/20 | 1,066 | 1,071 |
32
| Vanguard® Short-Term Corporate Bond Index Fund | ||||
| Schedule of Investments | ||||
| August 31, 2018 | ||||
| Face | Market | |||
| Maturity | Amount | Value | ||
| Coupon | Date | ($000) | ($000) | |
| 1 Delta Air Lines 2012-1 Class A Pass Through Trust | 4.750% | 11/7/21 | 1,164 | 1,184 |
| Delta Air Lines Inc. | 2.875% | 3/13/20 | 5,150 | 5,113 |
| Delta Air Lines Inc. | 2.600% | 12/4/20 | 14,900 | 14,599 |
| Delta Air Lines Inc. | 3.400% | 4/19/21 | 8,200 | 8,151 |
| Delta Air Lines Inc. | 3.625% | 3/15/22 | 13,900 | 13,754 |
| Delta Air Lines Inc. | 3.800% | 4/19/23 | 8,000 | 7,917 |
| FedEx Corp. | 2.300% | 2/1/20 | 3,415 | 3,390 |
| FedEx Corp. | 2.625% | 8/1/22 | 8,830 | 8,583 |
| JB Hunt Transport Services Inc. | 3.300% | 8/15/22 | 4,900 | 4,867 |
| Norfolk Southern Corp. | 3.250% | 12/1/21 | 10,374 | 10,348 |
| Norfolk Southern Corp. | 3.000% | 4/1/22 | 6,275 | 6,208 |
| Norfolk Southern Corp. | 2.903% | 2/15/23 | 11,438 | 11,202 |
| Norfolk Southern Railway Co. | 9.750% | 6/15/20 | 1,980 | 2,205 |
| 1 Northwest Airlines 2007-1 Class A Pass Through Trust | 7.027% | 5/1/21 | 1,415 | 1,468 |
| Ryder System Inc. | 2.450% | 9/3/19 | 4,840 | 4,807 |
| Ryder System Inc. | 2.650% | 3/2/20 | 7,500 | 7,436 |
| Ryder System Inc. | 2.500% | 5/11/20 | 5,100 | 5,037 |
| Ryder System Inc. | 2.875% | 9/1/20 | 4,896 | 4,860 |
| Ryder System Inc. | 3.500% | 6/1/21 | 1,000 | 1,003 |
| Ryder System Inc. | 2.250% | 9/1/21 | 4,490 | 4,327 |
| Ryder System Inc. | 3.450% | 11/15/21 | 250 | 249 |
| Ryder System Inc. | 2.800% | 3/1/22 | 8,475 | 8,283 |
| Ryder System Inc. | 2.500% | 9/1/22 | 2,435 | 2,340 |
| Ryder System Inc. | 3.400% | 3/1/23 | 4,750 | 4,713 |
| Ryder System Inc. | 3.750% | 6/9/23 | 7,150 | 7,213 |
| Southwest Airlines Co. | 2.750% | 11/6/19 | 4,040 | 4,027 |
| Southwest Airlines Co. | 2.650% | 11/5/20 | 5,609 | 5,541 |
| Southwest Airlines Co. | 2.750% | 11/16/22 | 5,700 | 5,550 |
| Union Pacific Corp. | 2.250% | 6/19/20 | 3,400 | 3,354 |
| Union Pacific Corp. | 4.000% | 2/1/21 | 3,904 | 3,977 |
| Union Pacific Corp. | 3.200% | 6/8/21 | 13,220 | 13,234 |
| Union Pacific Corp. | 4.163% | 7/15/22 | 9,655 | 9,963 |
| Union Pacific Corp. | 2.950% | 1/15/23 | 6,387 | 6,280 |
| Union Pacific Corp. | 2.750% | 4/15/23 | 2,125 | 2,062 |
| Union Pacific Corp. | 3.500% | 6/8/23 | 10,300 | 10,350 |
| United Parcel Service Inc. | 3.125% | 1/15/21 | 16,391 | 16,452 |
| United Parcel Service Inc. | 2.050% | 4/1/21 | 10,325 | 10,079 |
| United Parcel Service Inc. | 2.350% | 5/16/22 | 14,662 | 14,232 |
| United Parcel Service Inc. | 2.450% | 10/1/22 | 12,869 | 12,490 |
| United Parcel Service Inc. | 2.500% | 4/1/23 | 19,200 | 18,590 |
| United Parcel Service of America Inc. | 8.375% | 4/1/20 | 2,515 | 2,719 |
| 14,231,581 | ||||
| Utilities (4.2%) | ||||
| Electric (3.9%) | ||||
| AEP Texas Inc. | 2.400% | 10/1/22 | 5,375 | 5,157 |
| Alabama Power Co. | 2.450% | 3/30/22 | 8,425 | 8,164 |
| Ameren Corp. | 2.700% | 11/15/20 | 4,852 | 4,779 |
| Ameren Illinois Co. | 2.700% | 9/1/22 | 6,835 | 6,689 |
| American Electric Power Co. Inc. | 2.150% | 11/13/20 | 6,990 | 6,834 |
| American Electric Power Co. Inc. | 2.950% | 12/15/22 | 7,151 | 6,980 |
| Appalachian Power Co. | 4.600% | 3/30/21 | 4,500 | 4,614 |
| Baltimore Gas & Electric Co. | 3.500% | 11/15/21 | 5,447 | 5,480 |
| Baltimore Gas & Electric Co. | 3.350% | 7/1/23 | 4,800 | 4,784 |
| Berkshire Hathaway Energy Co. | 2.400% | 2/1/20 | 5,030 | 4,980 |
| Berkshire Hathaway Energy Co. | 2.375% | 1/15/21 | 6,630 | 6,512 |
| Berkshire Hathaway Energy Co. | 2.800% | 1/15/23 | 5,900 | 5,749 |
| CenterPoint Energy Houston Electric LLC | 1.850% | 6/1/21 | 8,000 | 7,709 |
| CenterPoint Energy Houston Electric LLC | 2.250% | 8/1/22 | 2,987 | 2,869 |
| CenterPoint Energy Inc. | 2.500% | 9/1/22 | 7,675 | 7,373 |
| CMS Energy Corp. | 6.250% | 2/1/20 | 2,859 | 2,967 |
| CMS Energy Corp. | 5.050% | 3/15/22 | 4,290 | 4,496 |
| Commonwealth Edison Co. | 4.000% | 8/1/20 | 2,625 | 2,663 |
| Commonwealth Edison Co. | 3.400% | 9/1/21 | 7,100 | 7,134 |
33
| Vanguard® Short-Term Corporate Bond Index Fund | ||||
| Schedule of Investments | ||||
| August 31, 2018 | ||||
| Face | Market | |||
| Maturity | Amount | Value | ||
| Coupon | Date | ($000) | ($000) | |
| Connecticut Light & Power Co. | 2.500% | 1/15/23 | 5,000 | 4,833 |
| Consolidated Edison Co. of New York Inc. | 4.450% | 6/15/20 | 2,750 | 2,809 |
| Consolidated Edison Inc. | 2.000% | 3/15/20 | 8,834 | 8,691 |
| Consolidated Edison Inc. | 2.000% | 5/15/21 | 6,750 | 6,542 |
| Constellation Energy Group Inc. | 5.150% | 12/1/20 | 7,082 | 7,277 |
| Consumers Energy Co. | 6.700% | 9/15/19 | 5,313 | 5,511 |
| Consumers Energy Co. | 5.650% | 4/15/20 | 2,875 | 2,994 |
| Consumers Energy Co. | 2.850% | 5/15/22 | 8,444 | 8,345 |
| Consumers Energy Co. | 3.375% | 8/15/23 | 3,795 | 3,808 |
| Dominion Energy Inc. | 2.500% | 12/1/19 | 8,421 | 8,369 |
| Dominion Energy Inc. | 2.579% | 7/1/20 | 13,801 | 13,594 |
| Dominion Energy Inc. | 4.450% | 3/15/21 | 8,809 | 8,995 |
| Dominion Energy Inc. | 4.104% | 4/1/21 | 5,350 | 5,403 |
| Dominion Energy Inc. | 2.000% | 8/15/21 | 7,610 | 7,293 |
| Dominion Energy Inc. | 2.750% | 1/15/22 | 4,400 | 4,294 |
| Dominion Energy Inc. | 2.750% | 9/15/22 | 750 | 723 |
| DTE Electric Co. | 3.450% | 10/1/20 | 5,365 | 5,388 |
| DTE Energy Co. | 1.500% | 10/1/19 | 5,120 | 5,036 |
| DTE Energy Co. | 2.400% | 12/1/19 | 7,920 | 7,846 |
| DTE Energy Co. | 3.300% | 6/15/22 | 4,470 | 4,420 |
| DTE Energy Co. | 3.700% | 8/1/23 | 8,200 | 8,238 |
| Duke Energy Carolinas LLC | 4.300% | 6/15/20 | 3,325 | 3,387 |
| Duke Energy Carolinas LLC | 3.900% | 6/15/21 | 5,725 | 5,824 |
| Duke Energy Carolinas LLC | 2.500% | 3/15/23 | 7,229 | 6,995 |
| Duke Energy Carolinas LLC | 3.050% | 3/15/23 | 7,100 | 7,036 |
| Duke Energy Corp. | 5.050% | 9/15/19 | 7,970 | 8,128 |
| Duke Energy Corp. | 1.800% | 9/1/21 | 19,370 | 18,518 |
| Duke Energy Corp. | 3.550% | 9/15/21 | 8,055 | 8,115 |
| Duke Energy Corp. | 2.400% | 8/15/22 | 7,950 | 7,648 |
| Duke Energy Corp. | 3.050% | 8/15/22 | 3,728 | 3,681 |
| 1 Duke Energy Florida LLC | 2.100% | 12/15/19 | 2,813 | 2,798 |
| Duke Energy Florida LLC | 3.100% | 8/15/21 | 3,485 | 3,476 |
| Duke Energy Indiana LLC | 3.750% | 7/15/20 | 2,418 | 2,446 |
| Duke Energy Progress LLC | 3.000% | 9/15/21 | 2,950 | 2,935 |
| Duke Energy Progress LLC | 2.800% | 5/15/22 | 7,920 | 7,817 |
| Duke Energy Progress LLC | 3.375% | 9/1/23 | 3,500 | 3,512 |
| Edison International | 2.125% | 4/15/20 | 7,550 | 7,400 |
| Edison International | 2.400% | 9/15/22 | 5,375 | 5,101 |
| Edison International | 2.950% | 3/15/23 | 3,500 | 3,354 |
| Emera US Finance LP | 2.700% | 6/15/21 | 5,529 | 5,375 |
| Entergy Arkansas Inc. | 3.750% | 2/15/21 | 4,567 | 4,618 |
| Entergy Corp. | 5.125% | 9/15/20 | 3,825 | 3,935 |
| Entergy Corp. | 4.000% | 7/15/22 | 8,974 | 9,106 |
| Eversource Energy | 4.500% | 11/15/19 | 2,932 | 2,976 |
| Eversource Energy | 2.500% | 3/15/21 | 7,425 | 7,282 |
| Eversource Energy | 2.750% | 3/15/22 | 8,550 | 8,320 |
| Eversource Energy | 2.800% | 5/1/23 | 7,525 | 7,229 |
| Exelon Corp. | 2.850% | 6/15/20 | 14,295 | 14,176 |
| Exelon Corp. | 2.450% | 4/15/21 | 4,075 | 3,962 |
| Exelon Corp. | 3.497% | 6/1/22 | 12,345 | 12,183 |
| Exelon Generation Co. LLC | 5.200% | 10/1/19 | 8,110 | 8,286 |
| Exelon Generation Co. LLC | 2.950% | 1/15/20 | 17,479 | 17,305 |
| Exelon Generation Co. LLC | 4.000% | 10/1/20 | 10,521 | 10,614 |
| Exelon Generation Co. LLC | 3.400% | 3/15/22 | 6,640 | 6,586 |
| Exelon Generation Co. LLC | 4.250% | 6/15/22 | 7,699 | 7,848 |
| FirstEnergy Corp. | 2.850% | 7/15/22 | 9,375 | 9,101 |
| FirstEnergy Corp. | 4.250% | 3/15/23 | 12,250 | 12,494 |
| Florida Power & Light Co. | 2.750% | 6/1/23 | 7,585 | 7,408 |
| Fortis Inc. | 2.100% | 10/4/21 | 11,618 | 11,111 |
| Georgia Power Co. | 4.250% | 12/1/19 | 8,775 | 8,894 |
| Georgia Power Co. | 2.000% | 3/30/20 | 9,830 | 9,548 |
| Georgia Power Co. | 2.000% | 9/8/20 | 4,020 | 3,925 |
| Georgia Power Co. | 2.400% | 4/1/21 | 5,578 | 5,448 |
| Georgia Power Co. | 2.850% | 5/15/22 | 3,800 | 3,708 |
34
| Vanguard® Short-Term Corporate Bond Index Fund | ||||
| Schedule of Investments | ||||
| August 31, 2018 | ||||
| Face | Market | |||
| Maturity | Amount | Value | ||
| Coupon | Date | ($000) | ($000) | |
| Great Plains Energy Inc. | 4.850% | 6/1/21 | 4,630 | 4,733 |
| ITC Holdings Corp. | 2.700% | 11/15/22 | 8,175 | 7,879 |
| Kansas City Power & Light Co. | 3.150% | 3/15/23 | 4,225 | 4,149 |
| Kentucky Utilities Co. | 3.250% | 11/1/20 | 3,925 | 3,925 |
| LG&E & KU Energy LLC | 3.750% | 11/15/20 | 6,400 | 6,433 |
| National Rural Utilities Cooperative Finance Corp. | 1.500% | 11/1/19 | 6,960 | 6,850 |
| National Rural Utilities Cooperative Finance Corp. | 2.300% | 11/15/19 | 2,415 | 2,395 |
| National Rural Utilities Cooperative Finance Corp. | 2.000% | 1/27/20 | 7,620 | 7,519 |
| National Rural Utilities Cooperative Finance Corp. | 2.350% | 6/15/20 | 4,950 | 4,886 |
| National Rural Utilities Cooperative Finance Corp. | 2.300% | 11/1/20 | 2,859 | 2,805 |
| National Rural Utilities Cooperative Finance Corp. | 2.900% | 3/15/21 | 6,675 | 6,640 |
| National Rural Utilities Cooperative Finance Corp. | 3.050% | 2/15/22 | 8,292 | 8,258 |
| National Rural Utilities Cooperative Finance Corp. | 2.400% | 4/25/22 | 6,930 | 6,703 |
| National Rural Utilities Cooperative Finance Corp. | 2.300% | 9/15/22 | 1,150 | 1,108 |
| National Rural Utilities Cooperative Finance Corp. | 2.700% | 2/15/23 | 7,770 | 7,580 |
| 1 National Rural Utilities Cooperative Finance Corp. | 4.750% | 4/30/43 | 4,025 | 4,054 |
| Nevada Power Co. | 2.750% | 4/15/20 | 11,000 | 10,946 |
| NextEra Energy Capital Holdings Inc. | 2.400% | 9/15/19 | 7,800 | 7,753 |
| NextEra Energy Capital Holdings Inc. | 2.700% | 9/15/19 | 5,909 | 5,890 |
| NextEra Energy Capital Holdings Inc. | 4.500% | 6/1/21 | 4,065 | 4,166 |
| NextEra Energy Capital Holdings Inc. | 2.800% | 1/15/23 | 3,705 | 3,591 |
| Northern States Power Co. | 2.200% | 8/15/20 | 3,200 | 3,152 |
| Northern States Power Co. | 2.150% | 8/15/22 | 2,875 | 2,755 |
| Northern States Power Co. | 2.600% | 5/15/23 | 6,440 | 6,243 |
| NV Energy Inc. | 6.250% | 11/15/20 | 3,150 | 3,336 |
| Ohio Power Co. | 5.375% | 10/1/21 | 6,015 | 6,382 |
| Oncor Electric Delivery Co. LLC | 4.100% | 6/1/22 | 5,093 | 5,225 |
| Oncor Electric Delivery Co. LLC | 7.000% | 9/1/22 | 9,161 | 10,368 |
| Pacific Gas & Electric Co. | 3.500% | 10/1/20 | 9,259 | 9,247 |
| Pacific Gas & Electric Co. | 4.250% | 5/15/21 | 4,362 | 4,432 |
| Pacific Gas & Electric Co. | 2.450% | 8/15/22 | 6,235 | 5,915 |
| Pacific Gas & Electric Co. | 3.250% | 6/15/23 | 6,025 | 5,833 |
| 2 Pacific Gas & Electric Co. | 4.250% | 8/1/23 | 6,000 | 6,035 |
| PacifiCorp | 3.850% | 6/15/21 | 4,502 | 4,580 |
| PacifiCorp | 2.950% | 2/1/22 | 6,387 | 6,330 |
| PacifiCorp | 2.950% | 6/1/23 | 3,500 | 3,432 |
| PECO Energy Co. | 1.700% | 9/15/21 | 4,225 | 4,029 |
| PECO Energy Co. | 2.375% | 9/15/22 | 1,875 | 1,810 |
| Pinnacle West Capital Corp. | 2.250% | 11/30/20 | 4,825 | 4,711 |
| PNM Resources Inc. | 3.250% | 3/9/21 | 4,400 | 4,372 |
| PPL Capital Funding Inc. | 4.200% | 6/15/22 | 7,855 | 7,998 |
| PPL Capital Funding Inc. | 3.500% | 12/1/22 | 4,220 | 4,202 |
| PPL Capital Funding Inc. | 3.400% | 6/1/23 | 8,150 | 8,021 |
| PPL Electric Utilities Corp. | 3.000% | 9/15/21 | 4,400 | 4,366 |
| Progress Energy Inc. | 4.875% | 12/1/19 | 6,171 | 6,301 |
| Progress Energy Inc. | 4.400% | 1/15/21 | 4,625 | 4,717 |
| Progress Energy Inc. | 3.150% | 4/1/22 | 6,087 | 6,007 |
| PSEG Power LLC | 5.125% | 4/15/20 | 4,280 | 4,398 |
| PSEG Power LLC | 3.000% | 6/15/21 | 6,977 | 6,898 |
| PSEG Power LLC | 3.850% | 6/1/23 | 10,550 | 10,556 |
| Public Service Co. of Colorado | 3.200% | 11/15/20 | 3,175 | 3,175 |
| Public Service Co. of Colorado | 2.250% | 9/15/22 | 5,835 | 5,613 |
| Public Service Co. of Oklahoma | 5.150% | 12/1/19 | 1,372 | 1,405 |
| Public Service Electric & Gas Co. | 1.900% | 3/15/21 | 8,350 | 8,108 |
| Public Service Electric & Gas Co. | 2.375% | 5/15/23 | 7,320 | 7,022 |
| Public Service Enterprise Group Inc. | 1.600% | 11/15/19 | 7,617 | 7,490 |
| Public Service Enterprise Group Inc. | 2.000% | 11/15/21 | 3,450 | 3,286 |
| Public Service Enterprise Group Inc. | 2.650% | 11/15/22 | 4,570 | 4,408 |
| Puget Energy Inc. | 6.500% | 12/15/20 | 6,400 | 6,813 |
| Puget Energy Inc. | 6.000% | 9/1/21 | 6,776 | 7,211 |
| Puget Energy Inc. | 5.625% | 7/15/22 | 7,975 | 8,483 |
| San Diego Gas & Electric Co. | 3.000% | 8/15/21 | 3,431 | 3,418 |
| South Carolina Electric & Gas Co. | 3.500% | 8/15/21 | 3,000 | 2,996 |
| Southern California Edison Co. | 2.900% | 3/1/21 | 2,600 | 2,574 |
35
| Vanguard® Short-Term Corporate Bond Index Fund | |||||
| Schedule of Investments | |||||
| August 31, 2018 | |||||
| Face | Market | ||||
| Maturity | Amount | Value | |||
| Coupon | Date | ($000) | ($000) | ||
| Southern California Edison Co. | 3.875% | 6/1/21 | 4,660 | 4,728 | |
| 1 | Southern California Edison Co. | 1.845% | 2/1/22 | 1,387 | 1,350 |
| Southern California Edison Co. | 2.400% | 2/1/22 | 4,350 | 4,206 | |
| Southern California Edison Co. | 3.400% | 6/1/23 | 7,250 | 7,235 | |
| Southern Co. | 2.150% | 9/1/19 | 5,875 | 5,829 | |
| Southern Co. | 2.750% | 6/15/20 | 9,796 | 9,711 | |
| Southern Co. | 2.350% | 7/1/21 | 18,599 | 18,029 | |
| Southern Co. | 2.950% | 7/1/23 | 15,771 | 15,208 | |
| 1 | Southern Co. | 5.500% | 3/15/57 | 5,925 | 6,036 |
| Southern Power Co. | 1.950% | 12/15/19 | 8,625 | 8,500 | |
| Southern Power Co. | 2.375% | 6/1/20 | 2,460 | 2,426 | |
| Southern Power Co. | 2.500% | 12/15/21 | 5,450 | 5,273 | |
| TECO Finance Inc. | 5.150% | 3/15/20 | 4,825 | 4,946 | |
| TransAlta Corp. | 4.500% | 11/15/22 | 4,544 | 4,496 | |
| UIL Holdings Corp. | 4.625% | 10/1/20 | 1,220 | 1,243 | |
| Virginia Electric & Power Co. | 2.950% | 1/15/22 | 4,520 | 4,461 | |
| Virginia Electric & Power Co. | 3.450% | 9/1/22 | 4,895 | 4,904 | |
| Virginia Electric & Power Co. | 2.750% | 3/15/23 | 11,617 | 11,333 | |
| WEC Energy Group Inc. | 2.450% | 6/15/20 | 4,613 | 4,567 | |
| WEC Energy Group Inc. | 3.375% | 6/15/21 | 7,250 | 7,283 | |
| Wisconsin Electric Power Co. | 2.950% | 9/15/21 | 2,870 | 2,849 | |
| Xcel Energy Inc. | 4.700% | 5/15/20 | 4,640 | 4,733 | |
| Xcel Energy Inc. | 2.400% | 3/15/21 | 9,995 | 9,743 | |
| Xcel Energy Inc. | 2.600% | 3/15/22 | 3,900 | 3,805 | |
| Natural Gas (0.3%) | |||||
| CenterPoint Energy Resources Corp. | 4.500% | 1/15/21 | 5,251 | 5,356 | |
| CenterPoint Energy Resources Corp. | 3.550% | 4/1/23 | 3,850 | 3,829 | |
| NiSource Finance Corp. | 2.650% | 11/17/22 | 5,400 | 5,194 | |
| 2 | NiSource Inc. | 3.650% | 6/15/23 | 6,000 | 6,003 |
| Sempra Energy | 1.625% | 10/7/19 | 6,918 | 6,814 | |
| Sempra Energy | 2.400% | 2/1/20 | 11,450 | 11,307 | |
| Sempra Energy | 2.400% | 3/15/20 | 9,969 | 9,833 | |
| Sempra Energy | 2.850% | 11/15/20 | 5,572 | 5,496 | |
| Sempra Energy | 2.875% | 10/1/22 | 9,331 | 9,092 | |
| Sempra Energy | 2.900% | 2/1/23 | 5,075 | 4,932 | |
| Sempra Energy | 4.050% | 12/1/23 | 300 | 303 | |
| Southern Co. Gas Capital Corp. | 3.500% | 9/15/21 | 5,300 | 5,276 | |
| 1,124,196 | |||||
| Total Corporate Bonds (Cost $26,872,622) | 26,467,797 | ||||
| Taxable Municipal Bonds (0.0%) | |||||
| Emory University Georgia GO | 5.625% | 9/1/19 | 1,980 | 2,029 | |
| Total Taxable Municipal Bonds (Cost $2,054) | 2,029 | ||||
| Shares | |||||
| Temporary Cash Investment (0.2%) | |||||
| Money Market Fund (0.2%) | |||||
| 4 | Vanguard Market Liquidity Fund (Cost | ||||
| $42,716) | 2.153% | 427,159 | 42,725 | ||
| Total Investments (99.4%) (Cost $26,992,400) | 26,587,562 | ||||
| Other Assets and Liabilities—Net (0.6%) | 162,721 | ||||
| Net Assets (100%) | 26,750,283 | ||||
1 The average or expected maturity is shorter than the final maturity shown because of the possibility of interim principal payments and
prepayments or the possibility of the issue being called.
2 Security exempt from registration under Rule 144A of the Securities Act of 1933. Such securities may be sold in transactions exempt from
registration, normally to qualified institutional buyers. At August 31, 2018, the aggregate value of these securities was $360,386,000,
representing 1.3% of net assets.
3 Securities with a value of $4,065,000 have been segregated as initial margin for open futures contracts.
36
Vanguard® Short-Term Corporate Bond Index Fund
Schedule of Investments
August 31, 2018
4 Affiliated money market fund available only to Vanguard funds and certain trusts and accounts managed by Vanguard. Rate shown is the 7-day
yield.
GO—General Obligation Bond.
REIT—Real Estate Investment Trust.
37
| Vanguard® Intermediate-Term Corporate Bond Index Fund | |||||
| Schedule of Investments | |||||
| August 31, 2018 | |||||
| Face | Market | ||||
| Maturity | Amount | Value | |||
| Coupon | Date | ($000) | ($000) | ||
| U.S. Government and Agency Obligations (0.3%) | |||||
| U.S. Government Securities (0.3%) | |||||
| United States Treasury Note/Bond | 2.750% | 7/31/23 | 4,515 | 4,515 | |
| United States Treasury Note/Bond | 2.875% | 8/15/28 | 56,985 | 57,029 | |
| Total U.S. Government and Agency Obligations (Cost $61,635) | 61,544 | ||||
| Corporate Bonds (98.8%) | |||||
| Finance (36.2%) | |||||
| Banking (25.1%) | |||||
| American Express Co. | 3.000% | 10/30/24 | 30,694 | 29,489 | |
| American Express Co. | 3.625% | 12/5/24 | 10,652 | 10,547 | |
| American Express Credit Corp. | 3.300% | 5/3/27 | 20,936 | 20,407 | |
| Associated Banc-Corp | 4.250% | 1/15/25 | 500 | 502 | |
| Australia & New Zealand Banking Group Ltd. | 3.700% | 11/16/25 | 7,350 | 7,310 | |
| Banco Santander SA | 5.179% | 11/19/25 | 16,510 | 16,800 | |
| Banco Santander SA | 4.250% | 4/11/27 | 19,152 | 18,409 | |
| Banco Santander SA | 3.800% | 2/23/28 | 9,865 | 9,096 | |
| Banco Santander SA | 4.379% | 4/12/28 | 20,260 | 19,540 | |
| Bank of America Corp. | 4.125% | 1/22/24 | 31,612 | 32,262 | |
| Bank of America Corp. | 4.000% | 4/1/24 | 33,099 | 33,561 | |
| Bank of America Corp. | 4.200% | 8/26/24 | 35,987 | 36,214 | |
| Bank of America Corp. | 4.000% | 1/22/25 | 33,726 | 33,284 | |
| Bank of America Corp. | 3.950% | 4/21/25 | 41,007 | 40,264 | |
| Bank of America Corp. | 3.875% | 8/1/25 | 9,401 | 9,406 | |
| 1 | Bank of America Corp. | 3.093% | 10/1/25 | 27,858 | 26,628 |
| 1 | Bank of America Corp. | 3.366% | 1/23/26 | 25,750 | 24,870 |
| Bank of America Corp. | 4.450% | 3/3/26 | 30,356 | 30,441 | |
| Bank of America Corp. | 3.500% | 4/19/26 | 40,729 | 39,621 | |
| Bank of America Corp. | 6.220% | 9/15/26 | 750 | 836 | |
| Bank of America Corp. | 4.250% | 10/22/26 | 33,369 | 33,060 | |
| Bank of America Corp. | 3.248% | 10/21/27 | 39,614 | 37,105 | |
| Bank of America Corp. | 4.183% | 11/25/27 | 26,345 | 25,805 | |
| 1 | Bank of America Corp. | 3.824% | 1/20/28 | 31,025 | 30,366 |
| 1 | Bank of America Corp. | 3.705% | 4/24/28 | 26,350 | 25,513 |
| 1 | Bank of America Corp. | 3.593% | 7/21/28 | 33,612 | 32,194 |
| Bank of America Corp. | 3.419% | 12/20/28 | 96,994 | 91,671 | |
| 1 | Bank of America Corp. | 3.970% | 3/5/29 | 23,400 | 23,026 |
| 1 | Bank of America Corp. | 4.271% | 7/23/29 | 36,900 | 37,151 |
| 1 | Bank of Montreal | 3.803% | 12/15/32 | 9,350 | 8,768 |
| Bank of New York Mellon Corp. | 3.650% | 2/4/24 | 11,608 | 11,692 | |
| Bank of New York Mellon Corp. | 3.400% | 5/15/24 | 6,368 | 6,326 | |
| Bank of New York Mellon Corp. | 3.250% | 9/11/24 | 9,028 | 8,902 | |
| Bank of New York Mellon Corp. | 3.000% | 2/24/25 | 10,704 | 10,345 | |
| Bank of New York Mellon Corp. | 3.950% | 11/18/25 | 5,052 | 5,164 | |
| Bank of New York Mellon Corp. | 2.800% | 5/4/26 | 7,817 | 7,403 | |
| Bank of New York Mellon Corp. | 2.450% | 8/17/26 | 12,033 | 11,048 | |
| Bank of New York Mellon Corp. | 3.250% | 5/16/27 | 15,028 | 14,566 | |
| Bank of New York Mellon Corp. | 3.400% | 1/29/28 | 17,830 | 17,483 | |
| 1 | Bank of New York Mellon Corp. | 3.442% | 2/7/28 | 12,020 | 11,733 |
| Bank of Nova Scotia | 4.500% | 12/16/25 | 18,715 | 18,869 | |
| Bank One Corp. | 7.625% | 10/15/26 | 7,020 | 8,563 | |
| Bank One Corp. | 8.000% | 4/29/27 | 8,810 | 11,088 | |
| Barclays Bank plc | 3.750% | 5/15/24 | 1,600 | 1,586 | |
| Barclays plc | 3.650% | 3/16/25 | 31,677 | 29,969 | |
| Barclays plc | 4.375% | 1/12/26 | 29,358 | 28,616 | |
| Barclays plc | 4.337% | 1/10/28 | 12,300 | 11,727 | |
| 1 | Barclays plc | 4.972% | 5/16/29 | 26,900 | 26,808 |
| BB&T Corp. | 2.850% | 10/26/24 | 17,233 | 16,563 | |
| BB&T Corp. | 3.700% | 6/5/25 | 13,275 | 13,300 | |
| BNP Paribas SA | 4.250% | 10/15/24 | 10,718 | 10,691 | |
| BPCE SA | 4.000% | 4/15/24 | 20,036 | 20,280 | |
| BPCE SA | 3.375% | 12/2/26 | 4,995 | 4,732 | |
| 2 | BPCE SA | 3.250% | 1/11/28 | 3,975 | 3,684 |
38
Vanguard® Intermediate-Term Corporate Bond Index Fund
Schedule of Investments
August 31, 2018
| Face | Market | |||
| Maturity | Amount | Value | ||
| Coupon | Date | ($000) | ($000) | |
| Branch Banking & Trust Co. | 3.625% | 9/16/25 | 20,044 | 19,822 |
| Branch Banking & Trust Co. | 3.800% | 10/30/26 | 10,082 | 10,078 |
| Capital One Financial Corp. | 3.750% | 4/24/24 | 11,066 | 10,867 |
| Capital One Financial Corp. | 3.300% | 10/30/24 | 21,547 | 20,686 |
| Capital One Financial Corp. | 3.200% | 2/5/25 | 12,470 | 11,838 |
| Capital One Financial Corp. | 4.250% | 4/30/25 | 10,900 | 10,951 |
| Capital One Financial Corp. | 4.200% | 10/29/25 | 21,325 | 21,044 |
| Capital One Financial Corp. | 3.750% | 7/28/26 | 21,538 | 20,247 |
| Capital One Financial Corp. | 3.750% | 3/9/27 | 20,997 | 20,000 |
| Capital One Financial Corp. | 3.800% | 1/31/28 | 14,730 | 14,014 |
| Citigroup Inc. | 3.875% | 10/25/23 | 15,184 | 15,314 |
| Citigroup Inc. | 3.750% | 6/16/24 | 10,477 | 10,450 |
| Citigroup Inc. | 4.000% | 8/5/24 | 7,196 | 7,173 |
| Citigroup Inc. | 3.875% | 3/26/25 | 18,933 | 18,481 |
| Citigroup Inc. | 3.300% | 4/27/25 | 11,498 | 11,087 |
| Citigroup Inc. | 4.400% | 6/10/25 | 28,822 | 28,911 |
| Citigroup Inc. | 5.500% | 9/13/25 | 22,513 | 23,973 |
| Citigroup Inc. | 3.700% | 1/12/26 | 34,491 | 33,566 |
| Citigroup Inc. | 4.600% | 3/9/26 | 19,863 | 20,031 |
| Citigroup Inc. | 3.400% | 5/1/26 | 27,828 | 26,530 |
| Citigroup Inc. | 3.200% | 10/21/26 | 38,707 | 36,329 |
| Citigroup Inc. | 4.300% | 11/20/26 | 14,476 | 14,302 |
| Citigroup Inc. | 4.450% | 9/29/27 | 70,850 | 70,244 |
| 1 Citigroup Inc. | 3.887% | 1/10/28 | 40,205 | 39,006 |
| Citigroup Inc. | 6.625% | 1/15/28 | 1,075 | 1,241 |
| 1 Citigroup Inc. | 3.668% | 7/24/28 | 31,650 | 30,284 |
| Citigroup Inc. | 4.125% | 7/25/28 | 11,622 | 11,244 |
| 1 Citigroup Inc. | 3.520% | 10/27/28 | 39,548 | 37,390 |
| 1 Citigroup Inc. | 4.075% | 4/23/29 | 19,505 | 19,289 |
| Citizens Financial Group Inc. | 4.300% | 12/3/25 | 9,199 | 9,139 |
| Comerica Bank | 4.000% | 7/27/25 | 3,900 | 3,864 |
| Comerica Inc. | 3.800% | 7/22/26 | 159 | 155 |
| Compass Bank | 3.875% | 4/10/25 | 9,573 | 9,274 |
| Cooperatieve Rabobank UA | 4.625% | 12/1/23 | 27,656 | 28,128 |
| Cooperatieve Rabobank UA | 3.375% | 5/21/25 | 11,320 | 11,079 |
| Cooperatieve Rabobank UA | 4.375% | 8/4/25 | 15,933 | 15,828 |
| Cooperatieve Rabobank UA | 3.750% | 7/21/26 | 22,806 | 21,746 |
| Credit Suisse AG | 3.625% | 9/9/24 | 46,209 | 45,656 |
| 2 Credit Suisse Group AG | 3.574% | 1/9/23 | 3,250 | 3,205 |
| 2 Credit Suisse Group AG | 4.282% | 1/9/28 | 5,300 | 5,226 |
| Credit Suisse Group Funding Guernsey Ltd. | 3.750% | 3/26/25 | 24,292 | 23,527 |
| Credit Suisse Group Funding Guernsey Ltd. | 4.550% | 4/17/26 | 26,935 | 27,270 |
| Deutsche Bank AG | 3.700% | 5/30/24 | 26,719 | 25,238 |
| Deutsche Bank AG | 4.100% | 1/13/26 | 3,928 | 3,755 |
| Deutsche Bank AG/London | 3.700% | 5/30/24 | 900 | 850 |
| Discover Bank | 4.250% | 3/13/26 | 3,918 | 3,877 |
| Discover Bank | 3.450% | 7/27/26 | 19,128 | 17,968 |
| Discover Financial Services | 3.950% | 11/6/24 | 5,478 | 5,369 |
| Discover Financial Services | 3.750% | 3/4/25 | 9,949 | 9,551 |
| Discover Financial Services | 4.100% | 2/9/27 | 10,918 | 10,565 |
| Fifth Third Bancorp | 4.300% | 1/16/24 | 14,063 | 14,329 |
| Fifth Third Bancorp | 3.950% | 3/14/28 | 8,230 | 8,149 |
| Fifth Third Bank | 3.950% | 7/28/25 | 5,700 | 5,738 |
| Fifth Third Bank | 3.850% | 3/15/26 | 12,852 | 12,576 |
| FirstMerit Bank NA | 4.270% | 11/25/26 | 450 | 447 |
| Goldman Sachs Group Inc. | 4.000% | 3/3/24 | 37,291 | 37,621 |
| Goldman Sachs Group Inc. | 3.850% | 7/8/24 | 37,477 | 37,379 |
| Goldman Sachs Group Inc. | 3.500% | 1/23/25 | 40,911 | 39,867 |
| Goldman Sachs Group Inc. | 3.750% | 5/22/25 | 31,746 | 31,215 |
| 1 Goldman Sachs Group Inc. | 3.272% | 9/29/25 | 34,410 | 33,054 |
| Goldman Sachs Group Inc. | 4.250% | 10/21/25 | 31,870 | 31,780 |
| Goldman Sachs Group Inc. | 3.750% | 2/25/26 | 25,751 | 25,150 |
| Goldman Sachs Group Inc. | 3.500% | 11/16/26 | 29,267 | 27,905 |
| Goldman Sachs Group Inc. | 5.950% | 1/15/27 | 12,877 | 14,216 |
39
| Vanguard® Intermediate-Term Corporate Bond Index Fund | ||||
| Schedule of Investments | ||||
| August 31, 2018 | ||||
| Face | Market | |||
| Maturity | Amount | Value | ||
| Coupon | Date | ($000) | ($000) | |
| Goldman Sachs Group Inc. | 3.850% | 1/26/27 | 43,852 | 42,818 |
| 1 Goldman Sachs Group Inc. | 3.691% | 6/5/28 | 25,175 | 24,073 |
| 1 Goldman Sachs Group Inc. | 3.814% | 4/23/29 | 44,975 | 43,104 |
| 1 Goldman Sachs Group Inc. | 4.223% | 5/1/29 | 43,125 | 42,776 |
| HSBC Holdings plc | 4.250% | 3/14/24 | 30,562 | 30,552 |
| HSBC Holdings plc | 4.250% | 8/18/25 | 27,299 | 27,159 |
| HSBC Holdings plc | 4.300% | 3/8/26 | 44,460 | 44,984 |
| HSBC Holdings plc | 3.900% | 5/25/26 | 35,939 | 35,382 |
| HSBC Holdings plc | 4.375% | 11/23/26 | 18,888 | 18,757 |
| 1 HSBC Holdings plc | 4.041% | 3/13/28 | 30,810 | 30,123 |
| 1 HSBC Holdings plc | 4.583% | 6/19/29 | 42,825 | 43,489 |
| HSBC USA Inc. | 3.500% | 6/23/24 | 10,071 | 9,941 |
| Huntington Bancshares Inc. | 4.000% | 5/15/25 | 6,725 | 6,761 |
| Huntington National Bank | 3.550% | 10/6/23 | 3,000 | 2,988 |
| ING Groep NV | 3.950% | 3/29/27 | 22,160 | 21,740 |
| Intesa Sanpaolo SPA | 5.250% | 1/12/24 | 9,487 | 9,366 |
| 2 Intesa Sanpaolo SPA | 3.875% | 1/12/28 | 2,700 | 2,291 |
| JPMorgan Chase & Co. | 3.875% | 2/1/24 | 25,680 | 26,011 |
| JPMorgan Chase & Co. | 3.625% | 5/13/24 | 35,955 | 35,963 |
| JPMorgan Chase & Co. | 3.875% | 9/10/24 | 51,491 | 51,151 |
| JPMorgan Chase & Co. | 3.125% | 1/23/25 | 26,855 | 25,841 |
| 1 JPMorgan Chase & Co. | 3.220% | 3/1/25 | 20,565 | 20,012 |
| JPMorgan Chase & Co. | 3.900% | 7/15/25 | 41,904 | 42,013 |
| JPMorgan Chase & Co. | 3.300% | 4/1/26 | 41,880 | 40,310 |
| JPMorgan Chase & Co. | 3.200% | 6/15/26 | 29,790 | 28,467 |
| JPMorgan Chase & Co. | 2.950% | 10/1/26 | 47,715 | 44,426 |
| JPMorgan Chase & Co. | 4.125% | 12/15/26 | 32,832 | 32,760 |
| JPMorgan Chase & Co. | 4.250% | 10/1/27 | 19,111 | 19,102 |
| JPMorgan Chase & Co. | 3.625% | 12/1/27 | 5,605 | 5,329 |
| 1 JPMorgan Chase & Co. | 3.782% | 2/1/28 | 44,961 | 43,965 |
| 1 JPMorgan Chase & Co. | 3.540% | 5/1/28 | 19,775 | 18,966 |
| 1 JPMorgan Chase & Co. | 3.509% | 1/23/29 | 23,600 | 22,476 |
| 1 JPMorgan Chase & Co. | 4.005% | 4/23/29 | 51,500 | 51,048 |
| 1 JPMorgan Chase & Co. | 4.203% | 7/23/29 | 16,175 | 16,236 |
| KeyBank NA | 3.300% | 6/1/25 | 6,900 | 6,714 |
| KeyBank NA | 3.400% | 5/20/26 | 10,836 | 10,348 |
| KeyBank NA | 6.950% | 2/1/28 | 2,864 | 3,454 |
| KeyCorp | 4.100% | 4/30/28 | 8,150 | 8,178 |
| Lloyds Banking Group plc | 4.500% | 11/4/24 | 15,464 | 15,343 |
| Lloyds Banking Group plc | 4.450% | 5/8/25 | 17,350 | 17,437 |
| Lloyds Banking Group plc | 4.582% | 12/10/25 | 19,826 | 19,555 |
| Lloyds Banking Group plc | 4.650% | 3/24/26 | 10,411 | 10,264 |
| Lloyds Banking Group plc | 3.750% | 1/11/27 | 18,716 | 17,752 |
| Lloyds Banking Group plc | 4.375% | 3/22/28 | 23,680 | 23,279 |
| Lloyds Banking Group plc | 4.550% | 8/16/28 | 17,000 | 16,911 |
| 1 Lloyds Banking Group plc | 3.574% | 11/7/28 | 29,000 | 26,760 |
| Manufacturers & Traders Trust Co. | 2.900% | 2/6/25 | 12,400 | 11,923 |
| Manufacturers & Traders Trust Co. | 3.400% | 8/17/27 | 5,315 | 5,153 |
| Mitsubishi UFJ Financial Group Inc. | 2.527% | 9/13/23 | 8,300 | 7,851 |
| Mitsubishi UFJ Financial Group Inc. | 3.777% | 3/2/25 | 16,989 | 16,929 |
| Mitsubishi UFJ Financial Group Inc. | 3.850% | 3/1/26 | 31,315 | 31,042 |
| Mitsubishi UFJ Financial Group Inc. | 2.757% | 9/13/26 | 7,550 | 6,943 |
| Mitsubishi UFJ Financial Group Inc. | 3.677% | 2/22/27 | 14,140 | 13,869 |
| Mitsubishi UFJ Financial Group Inc. | 3.287% | 7/25/27 | 20,300 | 19,305 |
| Mitsubishi UFJ Financial Group Inc. | 3.961% | 3/2/28 | 22,284 | 22,188 |
| Mizuho Financial Group Inc. | 2.839% | 9/13/26 | 6,375 | 5,885 |
| Mizuho Financial Group Inc. | 3.663% | 2/28/27 | 3,400 | 3,322 |
| Mizuho Financial Group Inc. | 3.170% | 9/11/27 | 20,560 | 19,240 |
| Mizuho Financial Group Inc. | 4.018% | 3/5/28 | 16,200 | 16,190 |
| Morgan Stanley | 3.875% | 4/29/24 | 42,647 | 42,829 |
| Morgan Stanley | 3.700% | 10/23/24 | 37,231 | 36,948 |
| Morgan Stanley | 4.000% | 7/23/25 | 36,066 | 36,181 |
| Morgan Stanley | 5.000% | 11/24/25 | 34,518 | 35,880 |
| Morgan Stanley | 3.875% | 1/27/26 | 39,568 | 39,114 |
40
| Vanguard® Intermediate-Term Corporate Bond Index Fund | ||||
| Schedule of Investments | ||||
| August 31, 2018 | ||||
| Face | Market | |||
| Maturity | Amount | Value | ||
| Coupon | Date | ($000) | ($000) | |
| Morgan Stanley | 3.125% | 7/27/26 | 43,170 | 40,449 |
| Morgan Stanley | 6.250% | 8/9/26 | 10,950 | 12,398 |
| Morgan Stanley | 4.350% | 9/8/26 | 33,619 | 33,426 |
| Morgan Stanley | 3.625% | 1/20/27 | 44,900 | 43,289 |
| Morgan Stanley | 3.950% | 4/23/27 | 32,395 | 31,185 |
| 1 Morgan Stanley | 3.591% | 7/22/28 | 46,980 | 44,722 |
| 1 Morgan Stanley | 3.772% | 1/24/29 | 36,300 | 35,033 |
| MUFG Americas Holdings Corp. | 3.000% | 2/10/25 | 5,894 | 5,635 |
| National Australia Bank Ltd. | 3.375% | 1/14/26 | 9,935 | 9,625 |
| National Australia Bank Ltd. | 2.500% | 7/12/26 | 17,057 | 15,492 |
| Northern Trust Corp. | 3.950% | 10/30/25 | 11,036 | 11,245 |
| Northern Trust Corp. | 3.650% | 8/3/28 | 3,325 | 3,337 |
| 1 Northern Trust Corp. | 3.375% | 5/8/32 | 3,175 | 2,991 |
| People's United Bank NA | 4.000% | 7/15/24 | 3,287 | 3,272 |
| PNC Bank NA | 3.300% | 10/30/24 | 8,260 | 8,129 |
| PNC Bank NA | 2.950% | 2/23/25 | 9,616 | 9,239 |
| PNC Bank NA | 3.250% | 6/1/25 | 13,444 | 13,136 |
| PNC Bank NA | 4.200% | 11/1/25 | 7,267 | 7,452 |
| PNC Bank NA | 3.100% | 10/25/27 | 14,450 | 13,776 |
| PNC Bank NA | 3.250% | 1/22/28 | 10,060 | 9,668 |
| PNC Bank NA | 4.050% | 7/26/28 | 3,250 | 3,291 |
| PNC Financial Services Group Inc. | 3.900% | 4/29/24 | 17,815 | 17,859 |
| PNC Financial Services Group Inc. | 3.150% | 5/19/27 | 8,870 | 8,493 |
| Royal Bank of Canada | 4.650% | 1/27/26 | 24,711 | 25,354 |
| Royal Bank of Scotland Group plc | 3.875% | 9/12/23 | 37,868 | 36,904 |
| Royal Bank of Scotland Group plc | 6.000% | 12/19/23 | 25,750 | 26,899 |
| Royal Bank of Scotland Group plc | 5.125% | 5/28/24 | 36,400 | 36,430 |
| Royal Bank of Scotland Group plc | 4.800% | 4/5/26 | 14,900 | 15,083 |
| 1 Royal Bank of Scotland Group plc | 4.892% | 5/18/29 | 29,000 | 28,993 |
| Santander Holdings USA Inc. | 4.500% | 7/17/25 | 21,833 | 21,799 |
| Santander Holdings USA Inc. | 4.400% | 7/13/27 | 14,644 | 14,015 |
| 1 Santander UK Group Holdings plc | 3.823% | 11/3/28 | 13,223 | 12,278 |
| Santander UK plc | 4.000% | 3/13/24 | 16,391 | 16,588 |
| State Street Corp. | 3.700% | 11/20/23 | 13,800 | 14,016 |
| State Street Corp. | 3.300% | 12/16/24 | 12,300 | 12,155 |
| State Street Corp. | 3.550% | 8/18/25 | 17,303 | 17,328 |
| State Street Corp. | 2.650% | 5/19/26 | 11,121 | 10,433 |
| Sumitomo Mitsui Banking Corp. | 3.950% | 1/10/24 | 3,180 | 3,199 |
| Sumitomo Mitsui Banking Corp. | 3.400% | 7/11/24 | 11,450 | 11,213 |
| Sumitomo Mitsui Banking Corp. | 3.650% | 7/23/25 | 2,500 | 2,468 |
| Sumitomo Mitsui Financial Group Inc. | 3.784% | 3/9/26 | 20,394 | 20,155 |
| Sumitomo Mitsui Financial Group Inc. | 2.632% | 7/14/26 | 36,722 | 33,442 |
| Sumitomo Mitsui Financial Group Inc. | 3.010% | 10/19/26 | 29,145 | 27,187 |
| Sumitomo Mitsui Financial Group Inc. | 3.446% | 1/11/27 | 15,140 | 14,585 |
| Sumitomo Mitsui Financial Group Inc. | 3.364% | 7/12/27 | 13,285 | 12,683 |
| Sumitomo Mitsui Financial Group Inc. | 3.352% | 10/18/27 | 11,275 | 10,791 |
| Sumitomo Mitsui Financial Group Inc. | 3.544% | 1/17/28 | 12,700 | 12,332 |
| Sumitomo Mitsui Financial Group Inc. | 3.944% | 7/19/28 | 18,800 | 18,800 |
| SunTrust Bank | 3.300% | 5/15/26 | 10,397 | 9,868 |
| SunTrust Banks Inc. | 4.000% | 5/1/25 | 8,350 | 8,424 |
| SVB Financial Group | 3.500% | 1/29/25 | 3,590 | 3,492 |
| Synchrony Financial | 4.250% | 8/15/24 | 22,323 | 21,627 |
| Synchrony Financial | 4.500% | 7/23/25 | 16,733 | 16,301 |
| Synchrony Financial | 3.700% | 8/4/26 | 11,324 | 10,270 |
| Synchrony Financial | 3.950% | 12/1/27 | 11,235 | 10,202 |
| 1 Toronto-Dominion Bank | 3.625% | 9/15/31 | 21,125 | 19,993 |
| US Bancorp | 3.700% | 1/30/24 | 16,652 | 16,847 |
| US Bancorp | 3.600% | 9/11/24 | 10,144 | 10,112 |
| US Bancorp | 3.100% | 4/27/26 | 14,216 | 13,510 |
| US Bancorp | 2.375% | 7/22/26 | 17,136 | 15,678 |
| US Bancorp | 3.150% | 4/27/27 | 16,003 | 15,430 |
| US Bancorp | 3.900% | 4/26/28 | 7,600 | 7,712 |
| US Bank NA | 2.800% | 1/27/25 | 18,513 | 17,688 |
41
| Vanguard® Intermediate-Term Corporate Bond Index Fund | ||||
| Schedule of Investments | ||||
| August 31, 2018 | ||||
| Face | Market | |||
| Maturity | Amount | Value | ||
| Coupon | Date | ($000) | ($000) | |
| Wachovia Corp. | 6.605% | 10/1/25 | 475 | 534 |
| Wachovia Corp. | 7.574% | 8/1/26 | 1,984 | 2,362 |
| Wells Fargo & Co. | 4.480% | 1/16/24 | 9,870 | 10,150 |
| Wells Fargo & Co. | 3.300% | 9/9/24 | 34,601 | 33,862 |
| Wells Fargo & Co. | 3.000% | 2/19/25 | 35,286 | 33,672 |
| Wells Fargo & Co. | 3.550% | 9/29/25 | 35,057 | 34,377 |
| Wells Fargo & Co. | 3.000% | 4/22/26 | 51,774 | 48,605 |
| Wells Fargo & Co. | 4.100% | 6/3/26 | 43,199 | 43,180 |
| Wells Fargo & Co. | 3.000% | 10/23/26 | 45,285 | 42,298 |
| Wells Fargo & Co. | 4.300% | 7/22/27 | 27,070 | 27,077 |
| 1 Wells Fargo & Co. | 3.584% | 5/22/28 | 36,421 | 35,142 |
| Westpac Banking Corp. | 2.850% | 5/13/26 | 23,370 | 21,818 |
| Westpac Banking Corp. | 2.700% | 8/19/26 | 10,594 | 9,755 |
| Westpac Banking Corp. | 3.350% | 3/8/27 | 13,416 | 12,909 |
| Westpac Banking Corp. | 3.400% | 1/25/28 | 16,600 | 15,983 |
| 1 Westpac Banking Corp. | 4.322% | 11/23/31 | 17,500 | 16,920 |
| Brokerage (1.6%) | ||||
| Affiliated Managers Group Inc. | 4.250% | 2/15/24 | 5,727 | 5,774 |
| Affiliated Managers Group Inc. | 3.500% | 8/1/25 | 4,291 | 4,171 |
| Ameriprise Financial Inc. | 4.000% | 10/15/23 | 11,049 | 11,291 |
| Ameriprise Financial Inc. | 3.700% | 10/15/24 | 8,330 | 8,323 |
| Ameriprise Financial Inc. | 2.875% | 9/15/26 | 6,280 | 5,866 |
| Apollo Investment Corp. | 5.250% | 3/3/25 | 500 | 484 |
| BlackRock Inc. | 3.500% | 3/18/24 | 13,917 | 14,010 |
| BlackRock Inc. | 3.200% | 3/15/27 | 9,406 | 9,162 |
| Brookfield Asset Management Inc. | 4.000% | 1/15/25 | 4,678 | 4,614 |
| Brookfield Finance Inc. | 4.250% | 6/2/26 | 4,910 | 4,866 |
| Brookfield Finance Inc. | 3.900% | 1/25/28 | 11,260 | 10,750 |
| Brookfield Finance LLC | 4.000% | 4/1/24 | 10,144 | 10,061 |
| Cboe Global Markets Inc. | 3.650% | 1/12/27 | 9,428 | 9,159 |
| Charles Schwab Corp. | 3.000% | 3/10/25 | 2,995 | 2,901 |
| Charles Schwab Corp. | 3.850% | 5/21/25 | 8,650 | 8,787 |
| Charles Schwab Corp. | 3.450% | 2/13/26 | 3,945 | 3,898 |
| Charles Schwab Corp. | 3.200% | 3/2/27 | 12,798 | 12,348 |
| Charles Schwab Corp. | 3.200% | 1/25/28 | 10,670 | 10,253 |
| CME Group Inc. | 3.000% | 3/15/25 | 12,100 | 11,753 |
| CME Group Inc. | 3.750% | 6/15/28 | 5,725 | 5,777 |
| E*TRADE Financial Corp. | 3.800% | 8/24/27 | 5,300 | 5,087 |
| E*TRADE Financial Corp. | 4.500% | 6/20/28 | 5,554 | 5,607 |
| Eaton Vance Corp. | 3.500% | 4/6/27 | 5,575 | 5,419 |
| Franklin Resources Inc. | 2.850% | 3/30/25 | 5,602 | 5,337 |
| Intercontinental Exchange Inc. | 3.450% | 9/21/23 | 6,000 | 6,016 |
| Intercontinental Exchange Inc. | 4.000% | 10/15/23 | 10,493 | 10,756 |
| Intercontinental Exchange Inc. | 3.750% | 12/1/25 | 18,336 | 18,464 |
| Intercontinental Exchange Inc. | 3.100% | 9/15/27 | 4,365 | 4,141 |
| Invesco Finance plc | 4.000% | 1/30/24 | 7,838 | 7,903 |
| Invesco Finance plc | 3.750% | 1/15/26 | 7,490 | 7,444 |
| Janus Capital Group Inc. | 4.875% | 8/1/25 | 3,710 | 3,827 |
| Jefferies Financial Group Inc. | 5.500% | 10/18/23 | 9,566 | 9,894 |
| Jefferies Group LLC | 4.850% | 1/15/27 | 10,953 | 10,881 |
| Jefferies Group LLC | 6.450% | 6/8/27 | 4,749 | 5,156 |
| Lazard Group LLC | 3.750% | 2/13/25 | 3,425 | 3,334 |
| Lazard Group LLC | 3.625% | 3/1/27 | 6,850 | 6,484 |
| Legg Mason Inc. | 3.950% | 7/15/24 | 1,265 | 1,254 |
| Legg Mason Inc. | 4.750% | 3/15/26 | 5,300 | 5,447 |
| Nasdaq Inc. | 4.250% | 6/1/24 | 5,738 | 5,839 |
| Nasdaq Inc. | 3.850% | 6/30/26 | 9,127 | 8,912 |
| Raymond James Financial Inc. | 3.625% | 9/15/26 | 5,992 | 5,789 |
| Stifel Financial Corp. | 4.250% | 7/18/24 | 6,995 | 7,049 |
| TD Ameritrade Holding Corp. | 3.625% | 4/1/25 | 7,326 | 7,270 |
| TD Ameritrade Holding Corp. | 3.300% | 4/1/27 | 16,314 | 15,727 |
42
| Vanguard® Intermediate-Term Corporate Bond Index Fund | ||||
| Schedule of Investments | ||||
| August 31, 2018 | ||||
| Face | Market | |||
| Maturity | Amount | Value | ||
| Coupon | Date | ($000) | ($000) | |
| Finance Companies (0.6%) | ||||
| AerCap Ireland Capital DAC / AerCap Global Aviation | ||||
| Trust | 3.500% | 1/15/25 | 8,806 | 8,399 |
| AerCap Ireland Capital DAC / AerCap Global Aviation | ||||
| Trust | 4.450% | 10/1/25 | 6,575 | 6,583 |
| AerCap Ireland Capital DAC / AerCap Global Aviation | ||||
| Trust | 3.650% | 7/21/27 | 19,289 | 17,891 |
| AerCap Ireland Capital DAC / AerCap Global Aviation | ||||
| Trust | 3.875% | 1/23/28 | 5,810 | 5,454 |
| Air Lease Corp. | 3.000% | 9/15/23 | 10,197 | 9,720 |
| Air Lease Corp. | 4.250% | 9/15/24 | 7,668 | 7,681 |
| Air Lease Corp. | 3.250% | 3/1/25 | 11,993 | 11,257 |
| Air Lease Corp. | 3.625% | 4/1/27 | 9,226 | 8,647 |
| Air Lease Corp. | 3.625% | 12/1/27 | 6,050 | 5,629 |
| Aircastle Ltd. | 4.125% | 5/1/24 | 1,110 | 1,100 |
| Ares Capital Corp. | 4.250% | 3/1/25 | 8,340 | 8,061 |
| GATX Corp. | 3.250% | 3/30/25 | 2,815 | 2,668 |
| GATX Corp. | 3.250% | 9/15/26 | 4,360 | 4,039 |
| GATX Corp. | 3.850% | 3/30/27 | 4,750 | 4,563 |
| GATX Corp. | 3.500% | 3/15/28 | 5,254 | 4,860 |
| GE Capital International Funding Co. Unlimited Co. | 3.373% | 11/15/25 | 25,232 | 24,349 |
| Insurance (4.1%) | ||||
| 1 Aegon NV | 5.500% | 4/11/48 | 10,550 | 10,194 |
| Aetna Inc. | 3.500% | 11/15/24 | 11,290 | 11,027 |
| Aflac Inc. | 3.625% | 11/15/24 | 12,751 | 12,771 |
| Aflac Inc. | 3.250% | 3/17/25 | 3,775 | 3,682 |
| Aflac Inc. | 2.875% | 10/15/26 | 4,168 | 3,908 |
| Allied World Assurance Co. Holdings Ltd. | 4.350% | 10/29/25 | 5,373 | 5,212 |
| Allstate Corp. | 3.280% | 12/15/26 | 7,719 | 7,476 |
| American Financial Group Inc. | 3.500% | 8/15/26 | 5,945 | 5,618 |
| American International Group Inc. | 4.125% | 2/15/24 | 13,915 | 14,043 |
| American International Group Inc. | 3.750% | 7/10/25 | 12,657 | 12,358 |
| American International Group Inc. | 3.900% | 4/1/26 | 21,743 | 21,314 |
| American International Group Inc. | 4.200% | 4/1/28 | 11,593 | 11,553 |
| 1 American International Group Inc. | 5.750% | 4/1/48 | 10,275 | 10,092 |
| Anthem Inc. | 3.500% | 8/15/24 | 12,495 | 12,248 |
| Anthem Inc. | 3.350% | 12/1/24 | 17,330 | 16,912 |
| Anthem Inc. | 3.650% | 12/1/27 | 16,165 | 15,446 |
| Anthem Inc. | 4.101% | 3/1/28 | 19,600 | 19,268 |
| Aon Corp. | 8.205% | 1/1/27 | 4,306 | 5,280 |
| Aon plc | 4.000% | 11/27/23 | 7,255 | 7,366 |
| Aon plc | 3.500% | 6/14/24 | 10,315 | 10,124 |
| Aon plc | 3.875% | 12/15/25 | 12,385 | 12,353 |
| Arch Capital Finance LLC | 4.011% | 12/15/26 | 6,687 | 6,680 |
| Aspen Insurance Holdings Ltd. | 4.650% | 11/15/23 | 4,740 | 4,852 |
| Assurant Inc. | 4.200% | 9/27/23 | 1,500 | 1,504 |
| Assurant Inc. | 4.900% | 3/27/28 | 5,900 | 5,920 |
| Assured Guaranty US Holdings Inc. | 5.000% | 7/1/24 | 7,096 | 7,384 |
| Athene Holding Ltd. | 4.125% | 1/12/28 | 13,880 | 13,015 |
| 2 AXA Equitable Holdings Inc. | 4.350% | 4/20/28 | 24,885 | 24,186 |
| AXA Financial Inc. | 7.000% | 4/1/28 | 1,300 | 1,490 |
| AXIS Specialty Finance plc | 4.000% | 12/6/27 | 7,470 | 7,143 |
| Berkshire Hathaway Inc. | 3.125% | 3/15/26 | 36,544 | 35,488 |
| Brighthouse Financial Inc. | 3.700% | 6/22/27 | 22,179 | 19,801 |
| Brown & Brown Inc. | 4.200% | 9/15/24 | 8,785 | 8,764 |
| Chubb INA Holdings Inc. | 3.350% | 5/15/24 | 5,343 | 5,270 |
| Chubb INA Holdings Inc. | 3.150% | 3/15/25 | 12,013 | 11,704 |
| Chubb INA Holdings Inc. | 3.350% | 5/3/26 | 25,807 | 25,232 |
| Cigna Corp. | 3.250% | 4/15/25 | 12,335 | 11,660 |
| Cigna Corp. | 7.875% | 5/15/27 | 836 | 1,047 |
| Cigna Corp. | 3.050% | 10/15/27 | 2,850 | 2,572 |
| Cincinnati Financial Corp. | 6.920% | 5/15/28 | 4,800 | 5,854 |
| CNA Financial Corp. | 3.950% | 5/15/24 | 7,695 | 7,697 |
43
| Vanguard® Intermediate-Term Corporate Bond Index Fund | ||||
| Schedule of Investments | ||||
| August 31, 2018 | ||||
| Face | Market | |||
| Maturity | Amount | Value | ||
| Coupon | Date | ($000) | ($000) | |
| CNA Financial Corp. | 4.500% | 3/1/26 | 7,640 | 7,785 |
| CNA Financial Corp. | 3.450% | 8/15/27 | 7,550 | 7,049 |
| 2 Fairfax Financial Holdings Ltd. | 4.850% | 4/17/28 | 7,870 | 7,826 |
| First American Financial Corp. | 4.600% | 11/15/24 | 2,850 | 2,850 |
| Hanover Insurance Group Inc. | 4.500% | 4/15/26 | 4,850 | 4,826 |
| Humana Inc. | 3.850% | 10/1/24 | 11,623 | 11,627 |
| Humana Inc. | 3.950% | 3/15/27 | 8,455 | 8,379 |
| Kemper Corp. | 4.350% | 2/15/25 | 5,737 | 5,703 |
| Lincoln National Corp. | 4.000% | 9/1/23 | 5,282 | 5,364 |
| Lincoln National Corp. | 3.350% | 3/9/25 | 4,335 | 4,164 |
| Lincoln National Corp. | 3.625% | 12/12/26 | 6,680 | 6,429 |
| Lincoln National Corp. | 3.800% | 3/1/28 | 6,060 | 5,897 |
| Loews Corp. | 3.750% | 4/1/26 | 6,387 | 6,389 |
| Manulife Financial Corp. | 4.150% | 3/4/26 | 15,331 | 15,532 |
| 1 Manulife Financial Corp. | 4.061% | 2/24/32 | 10,550 | 10,072 |
| Markel Corp. | 3.500% | 11/1/27 | 4,350 | 4,093 |
| Marsh & McLennan Cos. Inc. | 4.050% | 10/15/23 | 925 | 943 |
| Marsh & McLennan Cos. Inc. | 3.500% | 6/3/24 | 7,002 | 6,932 |
| Marsh & McLennan Cos. Inc. | 3.500% | 3/10/25 | 12,610 | 12,454 |
| Marsh & McLennan Cos. Inc. | 3.750% | 3/14/26 | 4,547 | 4,542 |
| Mercury General Corp. | 4.400% | 3/15/27 | 5,200 | 5,050 |
| MetLife Inc. | 4.368% | 9/15/23 | 10,251 | 10,666 |
| MetLife Inc. | 3.600% | 4/10/24 | 15,224 | 15,288 |
| MetLife Inc. | 3.000% | 3/1/25 | 6,160 | 5,908 |
| MetLife Inc. | 3.600% | 11/13/25 | 7,335 | 7,283 |
| Munich Re America Corp. | 7.450% | 12/15/26 | 1,400 | 1,698 |
| Old Republic International Corp. | 4.875% | 10/1/24 | 3,725 | 3,851 |
| Old Republic International Corp. | 3.875% | 8/26/26 | 9,490 | 9,144 |
| Principal Financial Group Inc. | 3.400% | 5/15/25 | 5,058 | 4,940 |
| Principal Financial Group Inc. | 3.100% | 11/15/26 | 5,358 | 4,997 |
| Progressive Corp. | 2.450% | 1/15/27 | 5,647 | 5,145 |
| Prudential Financial Inc. | 3.500% | 5/15/24 | 13,588 | 13,667 |
| Prudential Financial Inc. | 3.878% | 3/27/28 | 3,200 | 3,203 |
| 1 Prudential Financial Inc. | 5.200% | 3/15/44 | 6,665 | 6,707 |
| 1 Prudential Financial Inc. | 5.375% | 5/15/45 | 13,448 | 13,559 |
| 1 Prudential Financial Inc. | 4.500% | 9/15/47 | 11,075 | 10,277 |
| Reinsurance Group of America Inc. | 4.700% | 9/15/23 | 3,520 | 3,645 |
| Reinsurance Group of America Inc. | 3.950% | 9/15/26 | 4,100 | 4,013 |
| RenaissanceRe Finance Inc. | 3.700% | 4/1/25 | 3,000 | 2,950 |
| RenaissanceRe Finance Inc. | 3.450% | 7/1/27 | 5,280 | 4,986 |
| Swiss Re Solutions Holding Corp. | 7.000% | 2/15/26 | 2,848 | 3,318 |
| Trinity Acquisition plc | 4.400% | 3/15/26 | 7,964 | 7,946 |
| UnitedHealth Group Inc. | 3.750% | 7/15/25 | 27,591 | 27,869 |
| UnitedHealth Group Inc. | 3.100% | 3/15/26 | 15,704 | 15,275 |
| UnitedHealth Group Inc. | 3.450% | 1/15/27 | 13,927 | 13,705 |
| UnitedHealth Group Inc. | 3.375% | 4/15/27 | 6,816 | 6,671 |
| UnitedHealth Group Inc. | 2.950% | 10/15/27 | 11,385 | 10,724 |
| UnitedHealth Group Inc. | 3.850% | 6/15/28 | 13,540 | 13,665 |
| Unum Group | 4.000% | 3/15/24 | 6,377 | 6,314 |
| Voya Financial Inc. | 3.125% | 7/15/24 | 5,950 | 5,654 |
| Voya Financial Inc. | 3.650% | 6/15/26 | 6,466 | 6,192 |
| Willis North America Inc. | 3.600% | 5/15/24 | 8,640 | 8,450 |
| XLIT Ltd. | 6.375% | 11/15/24 | 5,954 | 6,668 |
| XLIT Ltd. | 4.450% | 3/31/25 | 7,641 | 7,561 |
| XLIT Ltd. | 6.250% | 5/15/27 | 3,216 | 3,633 |
| Other Finance (0.1%) | ||||
| ORIX Corp. | 3.250% | 12/4/24 | 9,170 | 8,780 |
| ORIX Corp. | 3.700% | 7/18/27 | 6,634 | 6,402 |
| Real Estate Investment Trusts (4.7%) | ||||
| Alexandria Real Estate Equities Inc. | 4.000% | 1/15/24 | 4,650 | 4,695 |
| Alexandria Real Estate Equities Inc. | 3.450% | 4/30/25 | 9,030 | 8,683 |
| Alexandria Real Estate Equities Inc. | 4.300% | 1/15/26 | 4,631 | 4,641 |
| Alexandria Real Estate Equities Inc. | 3.950% | 1/15/27 | 4,941 | 4,798 |
44
| Vanguard® Intermediate-Term Corporate Bond Index Fund | ||||
| Schedule of Investments | ||||
| August 31, 2018 | ||||
| Face | Market | |||
| Maturity | Amount | Value | ||
| Coupon | Date | ($000) | ($000) | |
| Alexandria Real Estate Equities Inc. | 3.950% | 1/15/28 | 5,900 | 5,722 |
| American Campus Communities Operating Partnership | ||||
| LP | 4.125% | 7/1/24 | 3,499 | 3,497 |
| American Campus Communities Operating Partnership | ||||
| LP | 3.625% | 11/15/27 | 7,113 | 6,748 |
| American Homes 4 Rent LP | 4.250% | 2/15/28 | 6,990 | 6,775 |
| AvalonBay Communities Inc. | 4.200% | 12/15/23 | 5,900 | 6,058 |
| AvalonBay Communities Inc. | 3.500% | 11/15/24 | 4,183 | 4,161 |
| AvalonBay Communities Inc. | 3.450% | 6/1/25 | 5,666 | 5,573 |
| AvalonBay Communities Inc. | 3.500% | 11/15/25 | 3,710 | 3,657 |
| AvalonBay Communities Inc. | 2.950% | 5/11/26 | 7,821 | 7,388 |
| AvalonBay Communities Inc. | 2.900% | 10/15/26 | 4,571 | 4,300 |
| AvalonBay Communities Inc. | 3.350% | 5/15/27 | 5,200 | 5,048 |
| AvalonBay Communities Inc. | 3.200% | 1/15/28 | 9,561 | 9,210 |
| Boston Properties LP | 3.125% | 9/1/23 | 6,649 | 6,513 |
| Boston Properties LP | 3.800% | 2/1/24 | 6,836 | 6,840 |
| Boston Properties LP | 3.200% | 1/15/25 | 12,150 | 11,671 |
| Boston Properties LP | 3.650% | 2/1/26 | 15,536 | 15,165 |
| Boston Properties LP | 2.750% | 10/1/26 | 14,943 | 13,650 |
| Brandywine Operating Partnership LP | 3.950% | 11/15/27 | 5,996 | 5,734 |
| Brixmor Operating Partnership LP | 3.250% | 9/15/23 | 6,894 | 6,631 |
| Brixmor Operating Partnership LP | 3.650% | 6/15/24 | 3,300 | 3,200 |
| Brixmor Operating Partnership LP | 3.850% | 2/1/25 | 9,442 | 9,157 |
| Brixmor Operating Partnership LP | 4.125% | 6/15/26 | 9,730 | 9,482 |
| Brixmor Operating Partnership LP | 3.900% | 3/15/27 | 6,945 | 6,640 |
| Columbia Property Trust Operating Partnership LP | 4.150% | 4/1/25 | 5,118 | 5,015 |
| Columbia Property Trust Operating Partnership LP | 3.650% | 8/15/26 | 5,128 | 4,763 |
| Corporate Office Properties LP | 5.250% | 2/15/24 | 3,075 | 3,162 |
| Corporate Office Properties LP | 5.000% | 7/1/25 | 1,000 | 1,023 |
| CubeSmart LP | 4.375% | 12/15/23 | 3,467 | 3,544 |
| CubeSmart LP | 4.000% | 11/15/25 | 3,525 | 3,476 |
| CubeSmart LP | 3.125% | 9/1/26 | 6,295 | 5,813 |
| DCT Industrial Operating Partnership LP | 4.500% | 10/15/23 | 2,300 | 2,449 |
| DDR Corp. | 3.900% | 8/15/24 | 6,830 | 6,647 |
| DDR Corp. | 3.625% | 2/1/25 | 6,952 | 6,655 |
| DDR Corp. | 4.250% | 2/1/26 | 4,291 | 4,220 |
| DDR Corp. | 4.700% | 6/1/27 | 6,498 | 6,579 |
| Digital Realty Trust LP | 4.750% | 10/1/25 | 5,748 | 5,941 |
| Digital Realty Trust LP | 3.700% | 8/15/27 | 13,525 | 12,990 |
| Digital Realty Trust LP | 4.450% | 7/15/28 | 12,900 | 13,068 |
| Duke Realty LP | 3.750% | 12/1/24 | 6,772 | 6,699 |
| Duke Realty LP | 3.250% | 6/30/26 | 2,300 | 2,166 |
| Duke Realty LP | 3.375% | 12/15/27 | 4,300 | 4,059 |
| EPR Properties | 4.500% | 4/1/25 | 4,293 | 4,234 |
| EPR Properties | 4.750% | 12/15/26 | 5,930 | 5,883 |
| EPR Properties | 4.500% | 6/1/27 | 6,482 | 6,238 |
| EPR Properties | 4.950% | 4/15/28 | 5,325 | 5,286 |
| ERP Operating LP | 3.375% | 6/1/25 | 2,950 | 2,897 |
| ERP Operating LP | 2.850% | 11/1/26 | 8,190 | 7,667 |
| ERP Operating LP | 3.250% | 8/1/27 | 4,477 | 4,297 |
| ERP Operating LP | 3.500% | 3/1/28 | 7,260 | 7,090 |
| Essex Portfolio LP | 3.875% | 5/1/24 | 7,206 | 7,176 |
| Essex Portfolio LP | 3.500% | 4/1/25 | 5,894 | 5,723 |
| Essex Portfolio LP | 3.375% | 4/15/26 | 6,756 | 6,423 |
| Essex Portfolio LP | 3.625% | 5/1/27 | 4,450 | 4,292 |
| Federal Realty Investment Trust | 3.250% | 7/15/27 | 10,464 | 9,894 |
| HCP Inc. | 4.250% | 11/15/23 | 14,356 | 14,477 |
| HCP Inc. | 4.200% | 3/1/24 | 3,657 | 3,650 |
| HCP Inc. | 3.875% | 8/15/24 | 7,799 | 7,676 |
| HCP Inc. | 3.400% | 2/1/25 | 11,143 | 10,613 |
| HCP Inc. | 4.000% | 6/1/25 | 10,679 | 10,569 |
| Healthcare Realty Trust Inc. | 3.625% | 1/15/28 | 3,840 | 3,618 |
| Healthcare Trust of America Holdings LP | 3.500% | 8/1/26 | 3,775 | 3,605 |
| Healthcare Trust of America Holdings LP | 3.750% | 7/1/27 | 12,032 | 11,416 |
45
| Vanguard® Intermediate-Term Corporate Bond Index Fund | ||||
| Schedule of Investments | ||||
| August 31, 2018 | ||||
| Face | Market | |||
| Maturity | Amount | Value | ||
| Coupon | Date | ($000) | ($000) | |
| Highwoods Realty LP | 3.875% | 3/1/27 | 4,600 | 4,444 |
| Highwoods Realty LP | 4.125% | 3/15/28 | 4,300 | 4,246 |
| Hospitality Properties Trust | 4.650% | 3/15/24 | 3,540 | 3,547 |
| Hospitality Properties Trust | 4.500% | 3/15/25 | 3,580 | 3,513 |
| Hospitality Properties Trust | 5.250% | 2/15/26 | 7,242 | 7,360 |
| Hospitality Properties Trust | 4.950% | 2/15/27 | 6,350 | 6,308 |
| Hospitality Properties Trust | 3.950% | 1/15/28 | 5,075 | 4,639 |
| Hospitality Properties Trust | 4.375% | 2/15/30 | 2,500 | 2,320 |
| Host Hotels & Resorts LP | 3.750% | 10/15/23 | 10,405 | 10,231 |
| Host Hotels & Resorts LP | 3.875% | 4/1/24 | 8,758 | 8,598 |
| Host Hotels & Resorts LP | 4.000% | 6/15/25 | 7,110 | 6,967 |
| Host Hotels & Resorts LP | 4.500% | 2/1/26 | 300 | 301 |
| Hudson Pacific Properties LP | 3.950% | 11/1/27 | 2,923 | 2,758 |
| Kilroy Realty LP | 3.450% | 12/15/24 | 6,170 | 5,957 |
| Kilroy Realty LP | 4.375% | 10/1/25 | 7,597 | 7,574 |
| Kimco Realty Corp. | 2.700% | 3/1/24 | 3,440 | 3,201 |
| Kimco Realty Corp. | 3.300% | 2/1/25 | 6,065 | 5,776 |
| Kimco Realty Corp. | 2.800% | 10/1/26 | 9,818 | 8,819 |
| Kimco Realty Corp. | 3.800% | 4/1/27 | 6,077 | 5,854 |
| Kite Realty Group LP | 4.000% | 10/1/26 | 2,925 | 2,650 |
| Liberty Property LP | 4.400% | 2/15/24 | 3,874 | 3,916 |
| Liberty Property LP | 3.750% | 4/1/25 | 5,370 | 5,261 |
| Liberty Property LP | 3.250% | 10/1/26 | 5,224 | 4,902 |
| Life Storage LP | 3.500% | 7/1/26 | 7,956 | 7,468 |
| Life Storage LP | 3.875% | 12/15/27 | 6,281 | 5,983 |
| Mid-America Apartments LP | 4.300% | 10/15/23 | 3,024 | 3,076 |
| Mid-America Apartments LP | 3.750% | 6/15/24 | 3,440 | 3,374 |
| Mid-America Apartments LP | 4.000% | 11/15/25 | 6,690 | 6,613 |
| Mid-America Apartments LP | 3.600% | 6/1/27 | 9,725 | 9,394 |
| National Retail Properties Inc. | 3.900% | 6/15/24 | 4,991 | 4,938 |
| National Retail Properties Inc. | 4.000% | 11/15/25 | 3,976 | 3,935 |
| National Retail Properties Inc. | 3.600% | 12/15/26 | 7,249 | 6,920 |
| National Retail Properties Inc. | 3.500% | 10/15/27 | 4,450 | 4,204 |
| Omega Healthcare Investors Inc. | 4.375% | 8/1/23 | 12,570 | 12,554 |
| Omega Healthcare Investors Inc. | 4.950% | 4/1/24 | 5,580 | 5,699 |
| Omega Healthcare Investors Inc. | 4.500% | 1/15/25 | 5,350 | 5,303 |
| Omega Healthcare Investors Inc. | 5.250% | 1/15/26 | 9,530 | 9,721 |
| Omega Healthcare Investors Inc. | 4.500% | 4/1/27 | 11,010 | 10,693 |
| Omega Healthcare Investors Inc. | 4.750% | 1/15/28 | 5,050 | 4,974 |
| Physicians Realty LP | 4.300% | 3/15/27 | 5,400 | 5,262 |
| Physicians Realty LP | 3.950% | 1/15/28 | 4,200 | 3,989 |
| Piedmont Operating Partnership LP | 4.450% | 3/15/24 | 4,525 | 4,550 |
| Prologis LP | 3.750% | 11/1/25 | 11,515 | 11,611 |
| Prologis LP | 3.875% | 9/15/28 | 2,500 | 2,541 |
| Public Storage | 3.094% | 9/15/27 | 5,470 | 5,179 |
| Realty Income Corp. | 3.875% | 7/15/24 | 2,779 | 2,782 |
| Realty Income Corp. | 3.875% | 4/15/25 | 12,525 | 12,509 |
| Realty Income Corp. | 4.125% | 10/15/26 | 13,708 | 13,839 |
| Realty Income Corp. | 3.000% | 1/15/27 | 5,015 | 4,670 |
| Realty Income Corp. | 3.650% | 1/15/28 | 10,695 | 10,400 |
| Regency Centers LP | 3.600% | 2/1/27 | 7,058 | 6,792 |
| Regency Centers LP | 4.125% | 3/15/28 | 5,000 | 4,988 |
| Sabra Health Care LP | 5.125% | 8/15/26 | 5,605 | 5,427 |
| Select Income REIT | 4.250% | 5/15/24 | 5,853 | 5,647 |
| Select Income REIT | 4.500% | 2/1/25 | 4,812 | 4,662 |
| Senior Housing Properties Trust | 4.750% | 2/15/28 | 705 | 691 |
| Simon Property Group LP | 3.750% | 2/1/24 | 5,286 | 5,336 |
| Simon Property Group LP | 3.375% | 10/1/24 | 5,847 | 5,771 |
| Simon Property Group LP | 3.500% | 9/1/25 | 7,833 | 7,716 |
| Simon Property Group LP | 3.300% | 1/15/26 | 16,875 | 16,384 |
| Simon Property Group LP | 3.250% | 11/30/26 | 6,625 | 6,376 |
| Simon Property Group LP | 3.375% | 6/15/27 | 12,100 | 11,758 |
| Simon Property Group LP | 3.375% | 12/1/27 | 13,117 | 12,680 |
| STORE Capital Corp. | 4.500% | 3/15/28 | 3,300 | 3,258 |
46
| Vanguard® Intermediate-Term Corporate Bond Index Fund | ||||
| Schedule of Investments | ||||
| August 31, 2018 | ||||
| Face | Market | |||
| Maturity | Amount | Value | ||
| Coupon | Date | ($000) | ($000) | |
| Tanger Properties LP | 3.750% | 12/1/24 | 1,100 | 1,065 |
| Tanger Properties LP | 3.125% | 9/1/26 | 3,905 | 3,520 |
| Tanger Properties LP | 3.875% | 7/15/27 | 4,150 | 3,928 |
| UDR Inc. | 3.750% | 7/1/24 | 5,036 | 4,964 |
| UDR Inc. | 4.000% | 10/1/25 | 3,690 | 3,675 |
| UDR Inc. | 2.950% | 9/1/26 | 4,431 | 4,091 |
| UDR Inc. | 3.500% | 7/1/27 | 3,994 | 3,816 |
| UDR Inc. | 3.500% | 1/15/28 | 3,800 | 3,663 |
| Ventas Realty LP | 3.750% | 5/1/24 | 4,190 | 4,146 |
| Ventas Realty LP | 3.500% | 2/1/25 | 7,117 | 6,861 |
| Ventas Realty LP | 4.125% | 1/15/26 | 3,476 | 3,454 |
| Ventas Realty LP | 3.250% | 10/15/26 | 8,407 | 7,815 |
| Ventas Realty LP | 3.850% | 4/1/27 | 5,989 | 5,799 |
| Ventas Realty LP | 4.000% | 3/1/28 | 14,750 | 14,435 |
| VEREIT Operating Partnership LP | 4.600% | 2/6/24 | 9,321 | 9,398 |
| VEREIT Operating Partnership LP | 4.875% | 6/1/26 | 4,840 | 4,919 |
| VEREIT Operating Partnership LP | 3.950% | 8/15/27 | 8,666 | 8,253 |
| Vornado Realty LP | 3.500% | 1/15/25 | 6,094 | 5,869 |
| Washington Prime Group LP | 5.950% | 8/15/24 | 9,875 | 9,588 |
| Welltower Inc. | 4.500% | 1/15/24 | 3,794 | 3,849 |
| Welltower Inc. | 4.000% | 6/1/25 | 15,456 | 15,342 |
| Welltower Inc. | 4.250% | 4/1/26 | 11,297 | 11,322 |
| Welltower Inc. | 4.250% | 4/15/28 | 10,125 | 10,065 |
| WP Carey Inc. | 4.600% | 4/1/24 | 6,398 | 6,490 |
| WP Carey Inc. | 4.000% | 2/1/25 | 3,669 | 3,591 |
| WP Carey Inc. | 4.250% | 10/1/26 | 2,575 | 2,543 |
| 7,557,863 | ||||
| Industrial (57.3%) | ||||
| Basic Industry (2.4%) | ||||
| Air Products & Chemicals Inc. | 3.350% | 7/31/24 | 8,695 | 8,613 |
| Airgas Inc. | 3.650% | 7/15/24 | 3,444 | 3,434 |
| Albemarle Corp. | 4.150% | 12/1/24 | 6,424 | 6,499 |
| ArcelorMittal | 6.125% | 6/1/25 | 5,995 | 6,527 |
| BHP Billiton Finance USA Ltd. | 3.850% | 9/30/23 | 10,840 | 11,057 |
| BHP Billiton Finance USA Ltd. | 6.420% | 3/1/26 | 470 | 546 |
| Braskem Finance Ltd. | 6.450% | 2/3/24 | 10,813 | 11,218 |
| Celulosa Arauco y Constitucion SA | 4.500% | 8/1/24 | 6,250 | 6,290 |
| Celulosa Arauco y Constitucion SA | 3.875% | 11/2/27 | 14,600 | 13,788 |
| Dow Chemical Co. | 3.500% | 10/1/24 | 14,530 | 14,252 |
| Eastman Chemical Co. | 3.800% | 3/15/25 | 12,789 | 12,704 |
| Ecolab Inc. | 2.700% | 11/1/26 | 9,935 | 9,264 |
| Ecolab Inc. | 3.250% | 12/1/27 | 7,525 | 7,224 |
| EI du Pont de Nemours & Co. | 6.500% | 1/15/28 | 1,200 | 1,431 |
| Fibria Overseas Finance Ltd. | 5.250% | 5/12/24 | 8,588 | 8,609 |
| Fibria Overseas Finance Ltd. | 4.000% | 1/14/25 | 6,300 | 5,758 |
| Fibria Overseas Finance Ltd. | 5.500% | 1/17/27 | 11,138 | 10,958 |
| FMC Corp. | 4.100% | 2/1/24 | 4,150 | 4,159 |
| Georgia-Pacific LLC | 8.000% | 1/15/24 | 3,434 | 4,132 |
| Georgia-Pacific LLC | 7.375% | 12/1/25 | 2,427 | 2,936 |
| International Paper Co. | 3.650% | 6/15/24 | 9,519 | 9,442 |
| International Paper Co. | 3.800% | 1/15/26 | 12,875 | 12,683 |
| International Paper Co. | 3.000% | 2/15/27 | 15,688 | 14,492 |
| Kinross Gold Corp. | 5.950% | 3/15/24 | 7,050 | 7,244 |
| Kinross Gold Corp. | 4.500% | 7/15/27 | 7,200 | 6,543 |
| LYB International Finance II BV | 3.500% | 3/2/27 | 13,800 | 13,127 |
| LyondellBasell Industries NV | 5.750% | 4/15/24 | 16,350 | 17,760 |
| Methanex Corp. | 4.250% | 12/1/24 | 4,040 | 3,965 |
| Mosaic Co. | 4.250% | 11/15/23 | 16,012 | 16,222 |
| Mosaic Co. | 4.050% | 11/15/27 | 8,079 | 7,828 |
| Nucor Corp. | 3.950% | 5/1/28 | 7,930 | 8,015 |
| Nutrien Ltd. | 3.625% | 3/15/24 | 5,395 | 5,283 |
| Nutrien Ltd. | 3.375% | 3/15/25 | 8,388 | 7,957 |
| Nutrien Ltd. | 3.000% | 4/1/25 | 5,950 | 5,496 |
47
| Vanguard® Intermediate-Term Corporate Bond Index Fund | ||||
| Schedule of Investments | ||||
| August 31, 2018 | ||||
| Face | Market | |||
| Maturity | Amount | Value | ||
| Coupon | Date | ($000) | ($000) | |
| Nutrien Ltd. | 4.000% | 12/15/26 | 11,575 | 11,262 |
| Packaging Corp. of America | 4.500% | 11/1/23 | 6,872 | 7,119 |
| Packaging Corp. of America | 3.650% | 9/15/24 | 6,030 | 5,951 |
| Packaging Corp. of America | 3.400% | 12/15/27 | 8,745 | 8,311 |
| Potash Corp. of Saskatchewan Inc. | 3.625% | 3/15/24 | 100 | 98 |
| PPG Industries Inc. | 3.750% | 3/15/28 | 5,970 | 6,010 |
| Praxair Inc. | 2.650% | 2/5/25 | 5,269 | 5,024 |
| Praxair Inc. | 3.200% | 1/30/26 | 10,985 | 10,774 |
| Rio Tinto Finance USA Ltd. | 3.750% | 6/15/25 | 16,185 | 16,294 |
| Rio Tinto Finance USA Ltd. | 7.125% | 7/15/28 | 5,010 | 6,305 |
| RPM International Inc. | 3.750% | 3/15/27 | 7,192 | 6,865 |
| Sherwin-Williams Co. | 3.125% | 6/1/24 | 11,804 | 11,398 |
| Sherwin-Williams Co. | 3.450% | 8/1/25 | 5,100 | 4,915 |
| Sherwin-Williams Co. | 3.950% | 1/15/26 | 3,200 | 3,179 |
| Sherwin-Williams Co. | 3.450% | 6/1/27 | 20,670 | 19,682 |
| Southern Copper Corp. | 3.875% | 4/23/25 | 7,736 | 7,549 |
| Vale Overseas Ltd. | 6.250% | 8/10/26 | 26,165 | 28,749 |
| Westlake Chemical Corp. | 3.600% | 8/15/26 | 13,869 | 13,135 |
| 2 WestRock Co. | 3.000% | 9/15/24 | 7,785 | 7,401 |
| 2 WestRock Co. | 3.750% | 3/15/25 | 8,700 | 8,549 |
| 2 WestRock Co. | 3.375% | 9/15/27 | 7,046 | 6,640 |
| 2 WestRock Co. | 4.000% | 3/15/28 | 8,350 | 8,232 |
| Weyerhaeuser Co. | 4.625% | 9/15/23 | 6,270 | 6,485 |
| Weyerhaeuser Co. | 8.500% | 1/15/25 | 1,375 | 1,691 |
| Weyerhaeuser Co. | 6.950% | 10/1/27 | 375 | 445 |
| Yamana Gold Inc. | 4.950% | 7/15/24 | 3,085 | 3,066 |
| Yamana Gold Inc. | 4.625% | 12/15/27 | 4,008 | 3,807 |
| Capital Goods (4.7%) | ||||
| 3M Co. | 3.000% | 8/7/25 | 6,024 | 5,896 |
| 3M Co. | 2.250% | 9/19/26 | 9,292 | 8,474 |
| 3M Co. | 2.875% | 10/15/27 | 12,933 | 12,345 |
| ABB Finance USA Inc. | 3.800% | 4/3/28 | 5,210 | 5,281 |
| Allegion US Holding Co. Inc. | 3.200% | 10/1/24 | 5,111 | 4,834 |
| Allegion US Holding Co. Inc. | 3.550% | 10/1/27 | 6,000 | 5,513 |
| Bemis Co. Inc. | 3.100% | 9/15/26 | 3,500 | 3,218 |
| Boeing Co. | 2.850% | 10/30/24 | 8,108 | 7,859 |
| Boeing Co. | 2.500% | 3/1/25 | 220 | 207 |
| Boeing Co. | 2.600% | 10/30/25 | 3,150 | 2,980 |
| Boeing Co. | 2.250% | 6/15/26 | 8,081 | 7,390 |
| Boeing Co. | 2.800% | 3/1/27 | 4,727 | 4,470 |
| Boeing Co. | 3.250% | 3/1/28 | 5,185 | 5,054 |
| Carlisle Cos. Inc. | 3.500% | 12/1/24 | 7,527 | 7,265 |
| Carlisle Cos. Inc. | 3.750% | 12/1/27 | 6,300 | 6,040 |
| Caterpillar Financial Services Corp. | 3.750% | 11/24/23 | 8,498 | 8,673 |
| Caterpillar Financial Services Corp. | 3.300% | 6/9/24 | 7,260 | 7,235 |
| Caterpillar Financial Services Corp. | 3.250% | 12/1/24 | 8,944 | 8,890 |
| Caterpillar Financial Services Corp. | 2.400% | 8/9/26 | 3,850 | 3,532 |
| Caterpillar Inc. | 3.400% | 5/15/24 | 13,136 | 13,172 |
| CNH Industrial Capital LLC | 4.200% | 1/15/24 | 6,000 | 6,012 |
| CNH Industrial NV | 3.850% | 11/15/27 | 11,640 | 11,189 |
| Crane Co. | 4.450% | 12/15/23 | 4,050 | 4,179 |
| Dover Corp. | 3.150% | 11/15/25 | 6,500 | 6,261 |
| Eagle Materials Inc. | 4.500% | 8/1/26 | 3,847 | 3,842 |
| Eaton Corp. | 3.103% | 9/15/27 | 9,725 | 9,136 |
| Embraer Netherlands Finance BV | 5.050% | 6/15/25 | 18,016 | 17,999 |
| Embraer Netherlands Finance BV | 5.400% | 2/1/27 | 8,685 | 8,828 |
| 2 Embraer Overseas Ltd. | 5.696% | 9/16/23 | 2,725 | 2,809 |
| Emerson Electric Co. | 3.150% | 6/1/25 | 5,553 | 5,399 |
| Flowserve Corp. | 4.000% | 11/15/23 | 4,400 | 4,366 |
| Fortive Corp. | 3.150% | 6/15/26 | 8,987 | 8,414 |
| Fortune Brands Home & Security Inc. | 4.000% | 6/15/25 | 6,575 | 6,557 |
| General Dynamics Corp. | 2.375% | 11/15/24 | 9,922 | 9,360 |
| General Dynamics Corp. | 3.500% | 5/15/25 | 12,050 | 12,175 |
48
| Vanguard® Intermediate-Term Corporate Bond Index Fund | ||||
| Schedule of Investments | ||||
| August 31, 2018 | ||||
| Face | Market | |||
| Maturity | Amount | Value | ||
| Coupon | Date | ($000) | ($000) | |
| General Dynamics Corp. | 2.125% | 8/15/26 | 12,578 | 11,350 |
| General Dynamics Corp. | 2.625% | 11/15/27 | 11,000 | 10,211 |
| General Dynamics Corp. | 3.750% | 5/15/28 | 11,030 | 11,168 |
| General Electric Co. | 3.375% | 3/11/24 | 17,900 | 17,756 |
| General Electric Co. | 3.450% | 5/15/24 | 14,235 | 14,013 |
| Harris Corp. | 3.832% | 4/27/25 | 7,401 | 7,301 |
| Harris Corp. | 4.400% | 6/15/28 | 7,590 | 7,688 |
| Hexcel Corp. | 4.700% | 8/15/25 | 500 | 514 |
| Hexcel Corp. | 3.950% | 2/15/27 | 7,355 | 7,222 |
| Honeywell International Inc. | 3.350% | 12/1/23 | 4,775 | 4,808 |
| Honeywell International Inc. | 2.500% | 11/1/26 | 17,235 | 15,956 |
| Hubbell Inc. | 3.350% | 3/1/26 | 3,979 | 3,804 |
| Hubbell Inc. | 3.150% | 8/15/27 | 5,578 | 5,194 |
| Hubbell Inc. | 3.500% | 2/15/28 | 6,400 | 6,094 |
| Huntington Ingalls Industries Inc. | 3.483% | 12/1/27 | 12,300 | 11,670 |
| Illinois Tool Works Inc. | 3.500% | 3/1/24 | 11,164 | 11,255 |
| Illinois Tool Works Inc. | 2.650% | 11/15/26 | 15,035 | 14,013 |
| Ingersoll-Rand Luxembourg Finance SA | 3.550% | 11/1/24 | 7,115 | 6,990 |
| John Deere Capital Corp. | 3.350% | 6/12/24 | 7,145 | 7,094 |
| John Deere Capital Corp. | 2.650% | 6/24/24 | 14,361 | 13,771 |
| John Deere Capital Corp. | 3.450% | 3/13/25 | 3,025 | 3,027 |
| John Deere Capital Corp. | 3.400% | 9/11/25 | 2,175 | 2,149 |
| John Deere Capital Corp. | 2.650% | 6/10/26 | 5,812 | 5,435 |
| John Deere Capital Corp. | 2.800% | 9/8/27 | 11,032 | 10,370 |
| John Deere Capital Corp. | 3.050% | 1/6/28 | 7,925 | 7,603 |
| Johnson Controls International plc | 3.625% | 7/2/24 | 4,949 | 4,907 |
| Johnson Controls International plc | 3.900% | 2/14/26 | 11,564 | 11,464 |
| Kennametal Inc. | 4.625% | 6/15/28 | 4,200 | 4,186 |
| L3 Technologies Inc. | 3.950% | 5/28/24 | 5,178 | 5,136 |
| L3 Technologies Inc. | 3.850% | 12/15/26 | 10,322 | 10,039 |
| L3 Technologies Inc. | 4.400% | 6/15/28 | 9,600 | 9,656 |
| Leggett & Platt Inc. | 3.800% | 11/15/24 | 2,700 | 2,654 |
| Leggett & Platt Inc. | 3.500% | 11/15/27 | 8,099 | 7,672 |
| Legrand France SA | 8.500% | 2/15/25 | 3,535 | 4,366 |
| Lennox International Inc. | 3.000% | 11/15/23 | 3,575 | 3,408 |
| Lockheed Martin Corp. | 2.900% | 3/1/25 | 13,549 | 12,970 |
| Lockheed Martin Corp. | 3.550% | 1/15/26 | 22,301 | 22,121 |
| Martin Marietta Materials Inc. | 4.250% | 7/2/24 | 2,250 | 2,285 |
| Martin Marietta Materials Inc. | 3.450% | 6/1/27 | 3,875 | 3,611 |
| Martin Marietta Materials Inc. | 3.500% | 12/15/27 | 10,975 | 10,187 |
| Masco Corp. | 4.450% | 4/1/25 | 7,622 | 7,716 |
| Masco Corp. | 4.375% | 4/1/26 | 9,916 | 9,915 |
| Northrop Grumman Corp. | 2.930% | 1/15/25 | 23,739 | 22,612 |
| Northrop Grumman Corp. | 3.200% | 2/1/27 | 13,930 | 13,173 |
| Northrop Grumman Corp. | 3.250% | 1/15/28 | 31,145 | 29,462 |
| 2 Nvent Finance Sarl | 4.550% | 4/15/28 | 5,400 | 5,332 |
| Oshkosh Corp. | 4.600% | 5/15/28 | 2,700 | 2,717 |
| Owens Corning | 4.200% | 12/1/24 | 3,600 | 3,583 |
| Owens Corning | 3.400% | 8/15/26 | 8,470 | 7,866 |
| Parker-Hannifin Corp. | 3.300% | 11/21/24 | 5,214 | 5,151 |
| Parker-Hannifin Corp. | 3.250% | 3/1/27 | 18,969 | 18,425 |
| Precision Castparts Corp. | 3.250% | 6/15/25 | 11,668 | 11,435 |
| Raytheon Co. | 3.150% | 12/15/24 | 2,375 | 2,338 |
| Raytheon Co. | 7.200% | 8/15/27 | 4,705 | 5,926 |
| Republic Services Inc. | 3.200% | 3/15/25 | 9,974 | 9,672 |
| Republic Services Inc. | 2.900% | 7/1/26 | 6,833 | 6,373 |
| Republic Services Inc. | 3.375% | 11/15/27 | 14,595 | 14,012 |
| Rockwell Automation Inc. | 2.875% | 3/1/25 | 1,504 | 1,434 |
| Rockwell Collins Inc. | 3.700% | 12/15/23 | 4,465 | 4,461 |
| Rockwell Collins Inc. | 3.200% | 3/15/24 | 17,897 | 17,274 |
| Rockwell Collins Inc. | 3.500% | 3/15/27 | 11,333 | 10,859 |
| Roper Technologies Inc. | 3.850% | 12/15/25 | 6,500 | 6,408 |
| Roper Technologies Inc. | 3.800% | 12/15/26 | 12,207 | 11,930 |
| Snap-on Inc. | 3.250% | 3/1/27 | 4,010 | 3,892 |
49
| Vanguard® Intermediate-Term Corporate Bond Index Fund | ||||
| Schedule of Investments | ||||
| August 31, 2018 | ||||
| Face | Market | |||
| Maturity | Amount | Value | ||
| Coupon | Date | ($000) | ($000) | |
| Spirit AeroSystems Inc. | 3.850% | 6/15/26 | 4,017 | 3,865 |
| Spirit AeroSystems Inc. | 4.600% | 6/15/28 | 15,200 | 15,274 |
| Textron Inc. | 4.300% | 3/1/24 | 2,740 | 2,783 |
| Textron Inc. | 3.875% | 3/1/25 | 3,300 | 3,263 |
| Textron Inc. | 4.000% | 3/15/26 | 5,650 | 5,594 |
| Textron Inc. | 3.650% | 3/15/27 | 12,005 | 11,523 |
| Textron Inc. | 3.375% | 3/1/28 | 4,258 | 3,974 |
| Timken Co. | 3.875% | 9/1/24 | 2,685 | 2,637 |
| United Technologies Corp. | 2.800% | 5/4/24 | 10,003 | 9,548 |
| United Technologies Corp. | 3.950% | 8/16/25 | 28,000 | 28,142 |
| United Technologies Corp. | 2.650% | 11/1/26 | 12,475 | 11,332 |
| United Technologies Corp. | 3.125% | 5/4/27 | 5,520 | 5,186 |
| United Technologies Corp. | 6.700% | 8/1/28 | 1,775 | 2,135 |
| Vulcan Materials Co. | 4.500% | 4/1/25 | 5,032 | 5,105 |
| Vulcan Materials Co. | 3.900% | 4/1/27 | 7,233 | 6,959 |
| Wabtec Corp. | 3.450% | 11/15/26 | 10,212 | 9,480 |
| Waste Management Inc. | 3.500% | 5/15/24 | 7,864 | 7,829 |
| Waste Management Inc. | 3.125% | 3/1/25 | 8,012 | 7,773 |
| Waste Management Inc. | 7.100% | 8/1/26 | 2,750 | 3,315 |
| Waste Management Inc. | 3.150% | 11/15/27 | 6,700 | 6,382 |
| Waste Management Inc. | 7.000% | 7/15/28 | 230 | 285 |
| Xylem Inc. | 3.250% | 11/1/26 | 10,791 | 10,192 |
| Communication (7.0%) | ||||
| 21st Century Fox America Inc. | 4.000% | 10/1/23 | 2,900 | 2,956 |
| 21st Century Fox America Inc. | 3.700% | 9/15/24 | 7,377 | 7,382 |
| 21st Century Fox America Inc. | 3.700% | 10/15/25 | 5,207 | 5,173 |
| 21st Century Fox America Inc. | 3.375% | 11/15/26 | 8,253 | 7,993 |
| Activision Blizzard Inc. | 3.400% | 9/15/26 | 12,055 | 11,550 |
| Activision Blizzard Inc. | 3.400% | 6/15/27 | 5,950 | 5,672 |
| American Tower Corp. | 5.000% | 2/15/24 | 13,869 | 14,516 |
| American Tower Corp. | 4.000% | 6/1/25 | 12,456 | 12,319 |
| American Tower Corp. | 4.400% | 2/15/26 | 7,708 | 7,738 |
| American Tower Corp. | 3.375% | 10/15/26 | 13,917 | 13,056 |
| American Tower Corp. | 3.125% | 1/15/27 | 4,384 | 4,006 |
| American Tower Corp. | 3.550% | 7/15/27 | 10,411 | 9,843 |
| American Tower Corp. | 3.600% | 1/15/28 | 9,480 | 8,891 |
| AT&T Inc. | 3.800% | 3/1/24 | 14,433 | 14,336 |
| AT&T Inc. | 3.900% | 3/11/24 | 12,113 | 12,079 |
| AT&T Inc. | 4.450% | 4/1/24 | 17,852 | 18,270 |
| AT&T Inc. | 3.950% | 1/15/25 | 15,760 | 15,519 |
| AT&T Inc. | 3.400% | 5/15/25 | 71,857 | 68,143 |
| AT&T Inc. | 4.125% | 2/17/26 | 35,761 | 35,263 |
| AT&T Inc. | 4.250% | 3/1/27 | 21,193 | 20,917 |
| 2 AT&T Inc. | 4.100% | 2/15/28 | 35,475 | 34,297 |
| CBS Corp. | 2.500% | 2/15/23 | 2,050 | 1,936 |
| CBS Corp. | 3.700% | 8/15/24 | 9,052 | 8,808 |
| CBS Corp. | 3.500% | 1/15/25 | 6,925 | 6,639 |
| CBS Corp. | 4.000% | 1/15/26 | 12,964 | 12,652 |
| CBS Corp. | 2.900% | 1/15/27 | 7,105 | 6,359 |
| CBS Corp. | 3.375% | 2/15/28 | 6,920 | 6,353 |
| 2 CBS Corp. | 3.700% | 6/1/28 | 6,775 | 6,389 |
| Charter Communications Operating LLC / Charter | ||||
| Communications Operating Capital | 4.500% | 2/1/24 | 12,700 | 12,847 |
| Charter Communications Operating LLC / Charter | ||||
| Communications Operating Capital | 4.908% | 7/23/25 | 63,446 | 64,750 |
| Charter Communications Operating LLC / Charter | ||||
| Communications Operating Capital | 3.750% | 2/15/28 | 22,901 | 21,089 |
| Charter Communications Operating LLC / Charter | ||||
| Communications Operating Capital | 4.200% | 3/15/28 | 10,796 | 10,304 |
| Comcast Corp. | 3.000% | 2/1/24 | 17,205 | 16,721 |
| Comcast Corp. | 3.600% | 3/1/24 | 15,446 | 15,433 |
| Comcast Corp. | 3.375% | 2/15/25 | 12,578 | 12,264 |
| Comcast Corp. | 3.375% | 8/15/25 | 20,826 | 20,283 |
50
| Vanguard® Intermediate-Term Corporate Bond Index Fund | ||||
| Schedule of Investments | ||||
| August 31, 2018 | ||||
| Face | Market | |||
| Maturity | Amount | Value | ||
| Coupon | Date | ($000) | ($000) | |
| Comcast Corp. | 3.150% | 3/1/26 | 30,330 | 28,854 |
| Comcast Corp. | 2.350% | 1/15/27 | 26,420 | 23,476 |
| Comcast Corp. | 3.300% | 2/1/27 | 20,531 | 19,547 |
| Comcast Corp. | 3.150% | 2/15/28 | 27,519 | 25,824 |
| Comcast Corp. | 3.550% | 5/1/28 | 9,500 | 9,193 |
| Crown Castle International Corp. | 3.200% | 9/1/24 | 10,435 | 9,959 |
| Crown Castle International Corp. | 4.450% | 2/15/26 | 10,678 | 10,755 |
| Crown Castle International Corp. | 3.700% | 6/15/26 | 10,091 | 9,664 |
| Crown Castle International Corp. | 4.000% | 3/1/27 | 7,684 | 7,492 |
| Crown Castle International Corp. | 3.650% | 9/1/27 | 13,875 | 13,103 |
| Crown Castle International Corp. | 3.800% | 2/15/28 | 14,700 | 14,029 |
| Discovery Communications LLC | 3.800% | 3/13/24 | 6,425 | 6,332 |
| 2 Discovery Communications LLC | 3.900% | 11/15/24 | 7,732 | 7,628 |
| Discovery Communications LLC | 3.450% | 3/15/25 | 3,951 | 3,763 |
| 2 Discovery Communications LLC | 3.950% | 6/15/25 | 8,200 | 8,058 |
| Discovery Communications LLC | 4.900% | 3/11/26 | 11,070 | 11,374 |
| Discovery Communications LLC | 3.950% | 3/20/28 | 23,564 | 22,416 |
| Electronic Arts Inc. | 4.800% | 3/1/26 | 5,596 | 5,922 |
| Grupo Televisa SAB | 6.625% | 3/18/25 | 8,800 | 9,936 |
| Grupo Televisa SAB | 4.625% | 1/30/26 | 4,115 | 4,179 |
| Interpublic Group of Cos. Inc. | 4.200% | 4/15/24 | 8,177 | 8,182 |
| Moody's Corp. | 4.875% | 2/15/24 | 9,340 | 9,812 |
| Moody's Corp. | 3.250% | 1/15/28 | 2,718 | 2,579 |
| Omnicom Group Inc. | 3.650% | 11/1/24 | 14,310 | 13,942 |
| Omnicom Group Inc. | 3.600% | 4/15/26 | 18,994 | 18,275 |
| Rogers Communications Inc. | 4.100% | 10/1/23 | 11,410 | 11,674 |
| Rogers Communications Inc. | 3.625% | 12/15/25 | 9,295 | 9,119 |
| Rogers Communications Inc. | 2.900% | 11/15/26 | 6,970 | 6,436 |
| S&P Global Inc. | 4.000% | 6/15/25 | 11,091 | 11,198 |
| S&P Global Inc. | 4.400% | 2/15/26 | 10,977 | 11,360 |
| S&P Global Inc. | 2.950% | 1/22/27 | 6,800 | 6,358 |
| TCI Communications Inc. | 7.875% | 2/15/26 | 1,457 | 1,788 |
| TCI Communications Inc. | 7.125% | 2/15/28 | 1,796 | 2,176 |
| Telefonica Emisiones SAU | 4.103% | 3/8/27 | 18,965 | 18,443 |
| TELUS Corp. | 2.800% | 2/16/27 | 12,360 | 11,334 |
| Thomson Reuters Corp. | 4.300% | 11/23/23 | 4,370 | 4,467 |
| Thomson Reuters Corp. | 3.850% | 9/29/24 | 6,533 | 6,457 |
| Thomson Reuters Corp. | 3.350% | 5/15/26 | 11,060 | 10,284 |
| Time Warner Inc. | 4.050% | 12/15/23 | 5,378 | 5,440 |
| Time Warner Inc. | 3.550% | 6/1/24 | 7,445 | 7,268 |
| Time Warner Inc. | 3.600% | 7/15/25 | 21,811 | 20,954 |
| Time Warner Inc. | 3.875% | 1/15/26 | 8,740 | 8,499 |
| Time Warner Inc. | 2.950% | 7/15/26 | 7,878 | 7,157 |
| Time Warner Inc. | 3.800% | 2/15/27 | 22,410 | 21,676 |
| Verizon Communications Inc. | 5.150% | 9/15/23 | 57,026 | 61,148 |
| Verizon Communications Inc. | 4.150% | 3/15/24 | 11,587 | 11,842 |
| Verizon Communications Inc. | 3.500% | 11/1/24 | 34,960 | 34,508 |
| Verizon Communications Inc. | 3.376% | 2/15/25 | 55,059 | 53,683 |
| Verizon Communications Inc. | 2.625% | 8/15/26 | 34,441 | 30,991 |
| Verizon Communications Inc. | 4.125% | 3/16/27 | 44,855 | 45,077 |
| 2 Verizon Communications Inc. | 4.329% | 9/21/28 | 1,330 | 1,340 |
| Viacom Inc. | 4.250% | 9/1/23 | 12,140 | 12,194 |
| Viacom Inc. | 3.875% | 4/1/24 | 6,839 | 6,716 |
| Viacom Inc. | 3.450% | 10/4/26 | 10,160 | 9,525 |
| Vodafone Group plc | 3.750% | 1/16/24 | 29,150 | 28,914 |
| Vodafone Group plc | 4.125% | 5/30/25 | 23,920 | 23,862 |
| Vodafone Group plc | 4.375% | 5/30/28 | 42,092 | 41,725 |
| Walt Disney Co. | 3.150% | 9/17/25 | 13,618 | 13,343 |
| Walt Disney Co. | 3.000% | 2/13/26 | 9,669 | 9,314 |
| Walt Disney Co. | 1.850% | 7/30/26 | 24,181 | 21,330 |
| Walt Disney Co. | 2.950% | 6/15/27 | 450 | 430 |
| WPP Finance 2010 | 3.750% | 9/19/24 | 11,686 | 11,229 |
51
| Vanguard® Intermediate-Term Corporate Bond Index Fund | ||||
| Schedule of Investments | ||||
| August 31, 2018 | ||||
| Face | Market | |||
| Maturity | Amount | Value | ||
| Coupon | Date | ($000) | ($000) | |
| Consumer Cyclical (7.5%) | ||||
| Advance Auto Parts Inc. | 4.500% | 12/1/23 | 6,059 | 6,190 |
| Alibaba Group Holding Ltd. | 3.600% | 11/28/24 | 30,670 | 30,313 |
| Alibaba Group Holding Ltd. | 3.400% | 12/6/27 | 33,220 | 31,184 |
| Amazon.com Inc. | 2.800% | 8/22/24 | 26,710 | 25,898 |
| Amazon.com Inc. | 3.800% | 12/5/24 | 13,374 | 13,736 |
| Amazon.com Inc. | 5.200% | 12/3/25 | 17,893 | 19,772 |
| Amazon.com Inc. | 3.150% | 8/22/27 | 43,245 | 41,779 |
| American Honda Finance Corp. | 2.900% | 2/16/24 | 11,690 | 11,368 |
| American Honda Finance Corp. | 2.300% | 9/9/26 | 2,938 | 2,671 |
| American Honda Finance Corp. | 3.500% | 2/15/28 | 8,100 | 8,000 |
| Aptiv plc | 4.250% | 1/15/26 | 7,600 | 7,540 |
| Automatic Data Processing Inc. | 3.375% | 9/15/25 | 10,421 | 10,401 |
| AutoNation Inc. | 3.500% | 11/15/24 | 6,457 | 6,147 |
| AutoNation Inc. | 4.500% | 10/1/25 | 6,330 | 6,331 |
| AutoNation Inc. | 3.800% | 11/15/27 | 5,005 | 4,667 |
| AutoZone Inc. | 3.250% | 4/15/25 | 9,676 | 9,195 |
| AutoZone Inc. | 3.125% | 4/21/26 | 7,613 | 7,118 |
| AutoZone Inc. | 3.750% | 6/1/27 | 8,463 | 8,183 |
| Bed Bath & Beyond Inc. | 3.749% | 8/1/24 | 4,111 | 3,759 |
| Block Financial LLC | 5.250% | 10/1/25 | 5,050 | 5,101 |
| Booking Holdings Inc. | 3.650% | 3/15/25 | 8,440 | 8,336 |
| Booking Holdings Inc. | 3.600% | 6/1/26 | 17,733 | 17,303 |
| Booking Holdings Inc. | 3.550% | 3/15/28 | 3,312 | 3,173 |
| BorgWarner Inc. | 3.375% | 3/15/25 | 4,675 | 4,552 |
| Costco Wholesale Corp. | 2.750% | 5/18/24 | 15,575 | 15,159 |
| Costco Wholesale Corp. | 3.000% | 5/18/27 | 10,610 | 10,179 |
| Cummins Inc. | 3.650% | 10/1/23 | 6,827 | 6,926 |
| Darden Restaurants Inc. | 3.850% | 5/1/27 | 6,300 | 6,147 |
| Delphi Corp. | 4.150% | 3/15/24 | 10,524 | 10,598 |
| Dollar General Corp. | 4.150% | 11/1/25 | 6,748 | 6,808 |
| Dollar General Corp. | 3.875% | 4/15/27 | 8,732 | 8,556 |
| Dollar General Corp. | 4.125% | 5/1/28 | 7,275 | 7,240 |
| Dollar Tree Inc. | 4.000% | 5/15/25 | 13,350 | 13,179 |
| Dollar Tree Inc. | 4.200% | 5/15/28 | 17,800 | 17,532 |
| eBay Inc. | 3.450% | 8/1/24 | 9,440 | 9,234 |
| eBay Inc. | 3.600% | 6/5/27 | 12,744 | 12,129 |
| Expedia Group Inc. | 4.500% | 8/15/24 | 6,872 | 6,962 |
| Expedia Group Inc. | 5.000% | 2/15/26 | 10,341 | 10,701 |
| Expedia Group Inc. | 3.800% | 2/15/28 | 13,925 | 13,053 |
| Ford Motor Co. | 4.346% | 12/8/26 | 15,788 | 14,936 |
| Ford Motor Credit Co. LLC | 3.810% | 1/9/24 | 10,594 | 10,177 |
| Ford Motor Credit Co. LLC | 3.664% | 9/8/24 | 11,702 | 11,056 |
| Ford Motor Credit Co. LLC | 4.687% | 6/9/25 | 8,500 | 8,293 |
| Ford Motor Credit Co. LLC | 4.134% | 8/4/25 | 19,572 | 18,662 |
| Ford Motor Credit Co. LLC | 4.389% | 1/8/26 | 16,419 | 15,570 |
| Ford Motor Credit Co. LLC | 3.815% | 11/2/27 | 11,987 | 10,760 |
| General Motors Co. | 4.875% | 10/2/23 | 22,879 | 23,420 |
| General Motors Co. | 4.000% | 4/1/25 | 4,846 | 4,710 |
| General Motors Co. | 4.200% | 10/1/27 | 10,297 | 9,879 |
| General Motors Financial Co. Inc. | 3.950% | 4/13/24 | 17,595 | 17,171 |
| General Motors Financial Co. Inc. | 3.500% | 11/7/24 | 11,527 | 10,947 |
| General Motors Financial Co. Inc. | 4.000% | 1/15/25 | 18,253 | 17,697 |
| General Motors Financial Co. Inc. | 4.350% | 4/9/25 | 9,471 | 9,355 |
| General Motors Financial Co. Inc. | 4.300% | 7/13/25 | 13,431 | 13,199 |
| General Motors Financial Co. Inc. | 5.250% | 3/1/26 | 19,346 | 19,967 |
| General Motors Financial Co. Inc. | 4.000% | 10/6/26 | 14,065 | 13,376 |
| General Motors Financial Co. Inc. | 4.350% | 1/17/27 | 18,358 | 17,835 |
| General Motors Financial Co. Inc. | 3.850% | 1/5/28 | 2,505 | 2,323 |
| GLP Capital LP / GLP Financing II Inc. | 5.375% | 11/1/23 | 5,056 | 5,315 |
| GLP Capital LP / GLP Financing II Inc. | 5.250% | 6/1/25 | 7,570 | 7,873 |
| GLP Capital LP / GLP Financing II Inc. | 5.375% | 4/15/26 | 14,049 | 14,576 |
| GLP Capital LP / GLP Financing II Inc. | 5.750% | 6/1/28 | 7,000 | 7,411 |
52
| Vanguard® Intermediate-Term Corporate Bond Index Fund | ||||
| Schedule of Investments | ||||
| August 31, 2018 | ||||
| Face | Market | |||
| Maturity | Amount | Value | ||
| Coupon | Date | ($000) | ($000) | |
| Harley-Davidson Inc. | 3.500% | 7/28/25 | 6,550 | 6,333 |
| Harman International Industries Inc. | 4.150% | 5/15/25 | 4,495 | 4,556 |
| Home Depot Inc. | 3.750% | 2/15/24 | 15,371 | 15,708 |
| Home Depot Inc. | 3.350% | 9/15/25 | 14,608 | 14,512 |
| Home Depot Inc. | 3.000% | 4/1/26 | 11,868 | 11,433 |
| Home Depot Inc. | 2.125% | 9/15/26 | 16,309 | 14,692 |
| Home Depot Inc. | 2.800% | 9/14/27 | 13,285 | 12,482 |
| Hyatt Hotels Corp. | 4.850% | 3/15/26 | 4,912 | 5,101 |
| IHS Markit Ltd. | 4.750% | 8/1/28 | 6,950 | 6,967 |
| JD.com Inc. | 3.875% | 4/29/26 | 6,425 | 6,065 |
| Kohl's Corp. | 4.750% | 12/15/23 | 836 | 856 |
| Kohl's Corp. | 4.250% | 7/17/25 | 8,724 | 8,726 |
| Lear Corp. | 5.375% | 3/15/24 | 5,259 | 5,450 |
| Lear Corp. | 5.250% | 1/15/25 | 7,087 | 7,353 |
| Lear Corp. | 3.800% | 9/15/27 | 9,910 | 9,358 |
| Lowe's Cos. Inc. | 3.875% | 9/15/23 | 7,716 | 7,925 |
| Lowe's Cos. Inc. | 3.125% | 9/15/24 | 4,279 | 4,196 |
| Lowe's Cos. Inc. | 3.375% | 9/15/25 | 10,491 | 10,361 |
| Lowe's Cos. Inc. | 2.500% | 4/15/26 | 19,925 | 18,432 |
| Lowe's Cos. Inc. | 3.100% | 5/3/27 | 22,444 | 21,508 |
| Macy's Retail Holdings Inc. | 4.375% | 9/1/23 | 4,935 | 4,939 |
| Macy's Retail Holdings Inc. | 3.625% | 6/1/24 | 3,343 | 3,223 |
| Macy's Retail Holdings Inc. | 6.650% | 7/15/24 | 991 | 1,074 |
| Magna International Inc. | 3.625% | 6/15/24 | 10,433 | 10,368 |
| Magna International Inc. | 4.150% | 10/1/25 | 8,662 | 8,791 |
| Marriott International Inc. | 3.750% | 3/15/25 | 7,265 | 7,130 |
| Marriott International Inc. | 3.750% | 10/1/25 | 2,510 | 2,463 |
| Marriott International Inc. | 3.125% | 6/15/26 | 11,423 | 10,705 |
| Marriott International Inc. | 4.000% | 4/15/28 | 5,975 | 5,911 |
| Mastercard Inc. | 3.375% | 4/1/24 | 12,118 | 12,179 |
| Mastercard Inc. | 2.950% | 11/21/26 | 10,760 | 10,329 |
| Mastercard Inc. | 3.500% | 2/26/28 | 6,900 | 6,892 |
| McDonald's Corp. | 3.250% | 6/10/24 | 2,323 | 2,308 |
| McDonald's Corp. | 3.375% | 5/26/25 | 14,029 | 13,795 |
| McDonald's Corp. | 3.700% | 1/30/26 | 16,644 | 16,595 |
| McDonald's Corp. | 3.500% | 3/1/27 | 16,339 | 15,945 |
| McDonald's Corp. | 3.800% | 4/1/28 | 15,450 | 15,357 |
| NIKE Inc. | 2.375% | 11/1/26 | 17,564 | 16,095 |
| Nordstrom Inc. | 4.000% | 3/15/27 | 5,600 | 5,467 |
| Nordstrom Inc. | 6.950% | 3/15/28 | 1,980 | 2,242 |
| O'Reilly Automotive Inc. | 3.550% | 3/15/26 | 4,699 | 4,528 |
| O'Reilly Automotive Inc. | 3.600% | 9/1/27 | 10,650 | 10,163 |
| O'Reilly Automotive Inc. | 4.350% | 6/1/28 | 6,500 | 6,558 |
| QVC Inc. | 4.850% | 4/1/24 | 9,216 | 9,208 |
| QVC Inc. | 4.450% | 2/15/25 | 7,365 | 7,063 |
| Ralph Lauren Corp. | 3.750% | 9/15/25 | 5,500 | 5,494 |
| Royal Caribbean Cruises Ltd. | 7.500% | 10/15/27 | 2,177 | 2,602 |
| Royal Caribbean Cruises Ltd. | 3.700% | 3/15/28 | 9,425 | 8,812 |
| 2 Sands China Ltd. | 5.125% | 8/8/25 | 23,000 | 23,086 |
| 2 Sands China Ltd. | 5.400% | 8/8/28 | 26,290 | 26,487 |
| Starbucks Corp. | 3.850% | 10/1/23 | 9,048 | 9,191 |
| Starbucks Corp. | 3.800% | 8/15/25 | 18,000 | 17,982 |
| Starbucks Corp. | 2.450% | 6/15/26 | 6,655 | 6,040 |
| Starbucks Corp. | 3.500% | 3/1/28 | 6,503 | 6,331 |
| Tapestry Inc. | 4.250% | 4/1/25 | 8,200 | 8,137 |
| Tapestry Inc. | 4.125% | 7/15/27 | 8,290 | 7,932 |
| Target Corp. | 3.500% | 7/1/24 | 11,950 | 12,103 |
| Target Corp. | 2.500% | 4/15/26 | 15,602 | 14,512 |
| TJX Cos. Inc. | 2.250% | 9/15/26 | 16,248 | 14,778 |
| Toyota Motor Corp. | 3.669% | 7/20/28 | 7,000 | 7,042 |
| Toyota Motor Credit Corp. | 2.250% | 10/18/23 | 7,082 | 6,699 |
| Toyota Motor Credit Corp. | 2.900% | 4/17/24 | 11,055 | 10,758 |
| Toyota Motor Credit Corp. | 3.400% | 4/14/25 | 4,500 | 4,464 |
| Toyota Motor Credit Corp. | 3.200% | 1/11/27 | 7,333 | 7,135 |
53
| Vanguard® Intermediate-Term Corporate Bond Index Fund | ||||
| Schedule of Investments | ||||
| August 31, 2018 | ||||
| Face | Market | |||
| Maturity | Amount | Value | ||
| Coupon | Date | ($000) | ($000) | |
| Toyota Motor Credit Corp. | 3.050% | 1/11/28 | 7,200 | 6,923 |
| Visa Inc. | 3.150% | 12/14/25 | 62,847 | 61,591 |
| Visa Inc. | 2.750% | 9/15/27 | 7,951 | 7,483 |
| Walgreens Boots Alliance Inc. | 3.800% | 11/18/24 | 25,273 | 24,974 |
| Walgreens Boots Alliance Inc. | 3.450% | 6/1/26 | 25,282 | 24,078 |
| Walmart Inc. | 3.300% | 4/22/24 | 20,475 | 20,520 |
| Walmart Inc. | 2.650% | 12/15/24 | 14,975 | 14,397 |
| Walmart Inc. | 3.550% | 6/26/25 | 20,830 | 21,036 |
| Walmart Inc. | 5.875% | 4/5/27 | 4,751 | 5,556 |
| Walmart Inc. | 3.700% | 6/26/28 | 39,870 | 40,374 |
| Consumer Noncyclical (15.5%) | ||||
| Abbott Laboratories | 3.400% | 11/30/23 | 22,769 | 22,642 |
| Abbott Laboratories | 2.950% | 3/15/25 | 14,352 | 13,744 |
| Abbott Laboratories | 3.875% | 9/15/25 | 4,058 | 4,098 |
| Abbott Laboratories | 3.750% | 11/30/26 | 44,116 | 43,726 |
| AbbVie Inc. | 3.600% | 5/14/25 | 51,793 | 50,478 |
| AbbVie Inc. | 3.200% | 5/14/26 | 29,958 | 28,202 |
| Advocate Health & Hospitals Corp. | 3.829% | 8/15/28 | 3,925 | 3,981 |
| Agilent Technologies Inc. | 3.050% | 9/22/26 | 5,354 | 5,005 |
| Allergan Funding SCS | 3.850% | 6/15/24 | 13,087 | 13,013 |
| Allergan Funding SCS | 3.800% | 3/15/25 | 58,075 | 57,439 |
| Altria Group Inc. | 4.000% | 1/31/24 | 18,682 | 19,065 |
| Altria Group Inc. | 2.625% | 9/16/26 | 5,110 | 4,699 |
| AmerisourceBergen Corp. | 3.400% | 5/15/24 | 5,097 | 4,999 |
| AmerisourceBergen Corp. | 3.250% | 3/1/25 | 5,675 | 5,426 |
| AmerisourceBergen Corp. | 3.450% | 12/15/27 | 13,500 | 12,633 |
| Amgen Inc. | 3.625% | 5/22/24 | 21,092 | 21,209 |
| Amgen Inc. | 3.125% | 5/1/25 | 11,836 | 11,379 |
| Amgen Inc. | 2.600% | 8/19/26 | 18,782 | 17,155 |
| Amgen Inc. | 3.200% | 11/2/27 | 12,740 | 12,062 |
| Anheuser-Busch InBev Finance Inc. | 3.700% | 2/1/24 | 19,936 | 20,026 |
| Anheuser-Busch InBev Finance Inc. | 3.650% | 2/1/26 | 158,630 | 155,139 |
| Anheuser-Busch InBev Worldwide Inc. | 3.500% | 1/12/24 | 25,978 | 25,881 |
| Anheuser-Busch InBev Worldwide Inc. | 4.000% | 4/13/28 | 25,078 | 24,967 |
| Archer-Daniels-Midland Co. | 2.500% | 8/11/26 | 13,595 | 12,557 |
| AstraZeneca plc | 3.375% | 11/16/25 | 27,081 | 26,302 |
| AstraZeneca plc | 3.125% | 6/12/27 | 8,898 | 8,361 |
| 2 BAT Capital Corp. | 3.222% | 8/15/24 | 31,367 | 30,040 |
| 2 BAT Capital Corp. | 3.557% | 8/15/27 | 50,235 | 47,043 |
| Baxalta Inc. | 4.000% | 6/23/25 | 28,754 | 29,033 |
| Baxter International Inc. | 2.600% | 8/15/26 | 4,340 | 3,976 |
| Becton Dickinson & Co. | 3.875% | 5/15/24 | 3,500 | 3,461 |
| Becton Dickinson & Co. | 3.363% | 6/6/24 | 24,587 | 23,768 |
| Becton Dickinson & Co. | 3.734% | 12/15/24 | 15,787 | 15,541 |
| Becton Dickinson & Co. | 3.700% | 6/6/27 | 30,466 | 29,173 |
| Bestfoods | 7.250% | 12/15/26 | 519 | 635 |
| Biogen Inc. | 4.050% | 9/15/25 | 27,298 | 27,571 |
| Boston Scientific Corp. | 4.125% | 10/1/23 | 5,960 | 6,069 |
| Boston Scientific Corp. | 3.850% | 5/15/25 | 10,866 | 10,906 |
| Boston Scientific Corp. | 4.000% | 3/1/28 | 12,025 | 11,954 |
| Bristol-Myers Squibb Co. | 3.250% | 11/1/23 | 7,121 | 7,119 |
| Bristol-Myers Squibb Co. | 3.250% | 2/27/27 | 10,455 | 10,238 |
| Brown-Forman Corp. | 3.500% | 4/15/25 | 4,025 | 3,977 |
| Bunge Ltd. Finance Corp. | 3.250% | 8/15/26 | 9,685 | 8,801 |
| Bunge Ltd. Finance Corp. | 3.750% | 9/25/27 | 9,145 | 8,515 |
| Campbell Soup Co. | 3.950% | 3/15/25 | 16,985 | 16,456 |
| Campbell Soup Co. | 3.300% | 3/19/25 | 2,981 | 2,773 |
| Campbell Soup Co. | 4.150% | 3/15/28 | 14,900 | 14,347 |
| Cardinal Health Inc. | 3.079% | 6/15/24 | 21,168 | 20,100 |
| Cardinal Health Inc. | 3.500% | 11/15/24 | 2,668 | 2,576 |
| Cardinal Health Inc. | 3.750% | 9/15/25 | 2,930 | 2,830 |
| Cardinal Health Inc. | 3.410% | 6/15/27 | 12,719 | 11,708 |
| Celgene Corp. | 3.625% | 5/15/24 | 14,546 | 14,375 |
54
| Vanguard® Intermediate-Term Corporate Bond Index Fund | ||||
| Schedule of Investments | ||||
| August 31, 2018 | ||||
| Face | Market | |||
| Maturity | Amount | Value | ||
| Coupon | Date | ($000) | ($000) | |
| Celgene Corp. | 3.875% | 8/15/25 | 30,901 | 30,437 |
| Celgene Corp. | 3.450% | 11/15/27 | 13,204 | 12,372 |
| Celgene Corp. | 3.900% | 2/20/28 | 30,664 | 29,915 |
| Church & Dwight Co. Inc. | 3.150% | 8/1/27 | 5,785 | 5,405 |
| Clorox Co. | 3.500% | 12/15/24 | 7,228 | 7,205 |
| Clorox Co. | 3.100% | 10/1/27 | 5,631 | 5,324 |
| Clorox Co. | 3.900% | 5/15/28 | 6,450 | 6,483 |
| Coca-Cola Bottling Co. Consolidated | 3.800% | 11/25/25 | 4,950 | 4,850 |
| Coca-Cola Co. | 3.200% | 11/1/23 | 19,424 | 19,390 |
| Coca-Cola Co. | 2.875% | 10/27/25 | 25,517 | 24,680 |
| Coca-Cola Co. | 2.550% | 6/1/26 | 7,170 | 6,704 |
| Coca-Cola Co. | 2.250% | 9/1/26 | 14,118 | 12,883 |
| Coca-Cola Co. | 2.900% | 5/25/27 | 5,944 | 5,667 |
| Coca-Cola Femsa SAB de CV | 3.875% | 11/26/23 | 12,305 | 12,361 |
| Colgate-Palmolive Co. | 3.250% | 3/15/24 | 7,859 | 7,856 |
| Constellation Brands Inc. | 4.750% | 11/15/24 | 10,659 | 11,095 |
| Constellation Brands Inc. | 3.700% | 12/6/26 | 11,025 | 10,594 |
| Constellation Brands Inc. | 3.500% | 5/9/27 | 7,430 | 7,010 |
| Constellation Brands Inc. | 3.600% | 2/15/28 | 11,735 | 11,115 |
| CVS Health Corp. | 4.000% | 12/5/23 | 19,256 | 19,340 |
| CVS Health Corp. | 3.375% | 8/12/24 | 9,030 | 8,764 |
| CVS Health Corp. | 4.100% | 3/25/25 | 68,820 | 68,913 |
| CVS Health Corp. | 3.875% | 7/20/25 | 43,121 | 42,478 |
| CVS Health Corp. | 2.875% | 6/1/26 | 29,629 | 27,212 |
| CVS Health Corp. | 4.300% | 3/25/28 | 129,091 | 128,230 |
| Danaher Corp. | 3.350% | 9/15/25 | 6,580 | 6,496 |
| Diageo Capital plc | 3.500% | 9/18/23 | 1,200 | 1,207 |
| Diageo Capital plc | 3.875% | 5/18/28 | 6,800 | 6,932 |
| Edwards Lifesciences Corp. | 4.300% | 6/15/28 | 8,000 | 8,124 |
| Eli Lilly & Co. | 2.750% | 6/1/25 | 16,018 | 15,352 |
| Eli Lilly & Co. | 5.500% | 3/15/27 | 559 | 634 |
| Eli Lilly & Co. | 3.100% | 5/15/27 | 10,275 | 9,964 |
| Estee Lauder Cos. Inc. | 3.150% | 3/15/27 | 7,597 | 7,345 |
| Express Scripts Holding Co. | 3.500% | 6/15/24 | 14,116 | 13,686 |
| Express Scripts Holding Co. | 4.500% | 2/25/26 | 21,782 | 21,939 |
| Express Scripts Holding Co. | 3.400% | 3/1/27 | 21,307 | 19,731 |
| Flowers Foods Inc. | 3.500% | 10/1/26 | 4,685 | 4,396 |
| General Mills Inc. | 3.700% | 10/17/23 | 18,675 | 18,669 |
| General Mills Inc. | 3.650% | 2/15/24 | 4,551 | 4,514 |
| General Mills Inc. | 4.000% | 4/17/25 | 7,131 | 7,104 |
| General Mills Inc. | 3.200% | 2/10/27 | 11,050 | 10,298 |
| General Mills Inc. | 4.200% | 4/17/28 | 22,125 | 21,941 |
| Gilead Sciences Inc. | 2.500% | 9/1/23 | 12,427 | 11,892 |
| Gilead Sciences Inc. | 3.700% | 4/1/24 | 26,380 | 26,569 |
| Gilead Sciences Inc. | 3.500% | 2/1/25 | 21,808 | 21,529 |
| Gilead Sciences Inc. | 3.650% | 3/1/26 | 39,359 | 38,963 |
| Gilead Sciences Inc. | 2.950% | 3/1/27 | 18,952 | 17,732 |
| GlaxoSmithKline Capital Inc. | 3.625% | 5/15/25 | 24,400 | 24,537 |
| GlaxoSmithKline Capital Inc. | 3.875% | 5/15/28 | 15,804 | 16,019 |
| Hasbro Inc. | 3.500% | 9/15/27 | 6,753 | 6,335 |
| Hershey Co. | 3.200% | 8/21/25 | 1,560 | 1,529 |
| Hershey Co. | 2.300% | 8/15/26 | 6,447 | 5,878 |
| Hershey Co. | 7.200% | 8/15/27 | 146 | 182 |
| Ingredion Inc. | 3.200% | 10/1/26 | 6,815 | 6,385 |
| JM Smucker Co. | 3.500% | 3/15/25 | 13,732 | 13,321 |
| JM Smucker Co. | 3.375% | 12/15/27 | 8,450 | 7,946 |
| Johnson & Johnson | 6.730% | 11/15/23 | 50 | 58 |
| Johnson & Johnson | 3.375% | 12/5/23 | 9,512 | 9,648 |
| Johnson & Johnson | 2.625% | 1/15/25 | 11,856 | 11,542 |
| Johnson & Johnson | 2.450% | 3/1/26 | 27,259 | 25,722 |
55
| Vanguard® Intermediate-Term Corporate Bond Index Fund | ||||
| Schedule of Investments | ||||
| August 31, 2018 | ||||
| Face | Market | |||
| Maturity | Amount | Value | ||
| Coupon | Date | ($000) | ($000) | |
| Johnson & Johnson | 2.950% | 3/3/27 | 16,509 | 16,005 |
| Johnson & Johnson | 2.900% | 1/15/28 | 18,463 | 17,734 |
| Kaiser Foundation Hospitals | 3.150% | 5/1/27 | 7,925 | 7,635 |
| Kellogg Co. | 2.650% | 12/1/23 | 9,645 | 9,243 |
| Kellogg Co. | 3.250% | 4/1/26 | 7,306 | 6,921 |
| Kellogg Co. | 3.400% | 11/15/27 | 10,943 | 10,308 |
| Keurig Dr Pepper Inc. | 3.130% | 12/15/23 | 8,656 | 8,306 |
| 2 Keurig Dr Pepper Inc. | 4.417% | 5/25/25 | 15,357 | 15,553 |
| Keurig Dr Pepper Inc. | 3.400% | 11/15/25 | 2,764 | 2,619 |
| Keurig Dr Pepper Inc. | 2.550% | 9/15/26 | 8,390 | 7,394 |
| Keurig Dr Pepper Inc. | 3.430% | 6/15/27 | 5,423 | 5,060 |
| 2 Keurig Dr Pepper Inc. | 4.597% | 5/25/28 | 37,100 | 37,683 |
| Kimberly-Clark Corp. | 3.050% | 8/15/25 | 4,090 | 3,947 |
| Kimberly-Clark Corp. | 2.750% | 2/15/26 | 6,367 | 6,006 |
| Kraft Heinz Foods Co. | 3.950% | 7/15/25 | 25,066 | 24,628 |
| Kraft Heinz Foods Co. | 3.000% | 6/1/26 | 26,286 | 23,981 |
| Kroger Co. | 4.000% | 2/1/24 | 6,210 | 6,244 |
| Kroger Co. | 3.500% | 2/1/26 | 6,674 | 6,405 |
| Kroger Co. | 2.650% | 10/15/26 | 13,434 | 12,053 |
| Kroger Co. | 3.700% | 8/1/27 | 5,827 | 5,614 |
| Laboratory Corp. of America Holdings | 4.000% | 11/1/23 | 3,546 | 3,589 |
| Laboratory Corp. of America Holdings | 3.250% | 9/1/24 | 8,680 | 8,369 |
| Laboratory Corp. of America Holdings | 3.600% | 2/1/25 | 14,780 | 14,468 |
| Laboratory Corp. of America Holdings | 3.600% | 9/1/27 | 8,125 | 7,807 |
| McCormick & Co. Inc. | 3.150% | 8/15/24 | 9,848 | 9,522 |
| McCormick & Co. Inc. | 3.400% | 8/15/27 | 12,013 | 11,470 |
| McKesson Corp. | 3.796% | 3/15/24 | 16,155 | 16,059 |
| McKesson Corp. | 3.950% | 2/16/28 | 7,228 | 6,981 |
| Mead Johnson Nutrition Co. | 4.125% | 11/15/25 | 10,062 | 10,287 |
| Medtronic Global Holdings SCA | 3.350% | 4/1/27 | 13,023 | 12,798 |
| Medtronic Inc. | 3.625% | 3/15/24 | 14,023 | 14,176 |
| Medtronic Inc. | 3.500% | 3/15/25 | 56,426 | 56,407 |
| Merck & Co. Inc. | 2.750% | 2/10/25 | 33,001 | 31,890 |
| Molson Coors Brewing Co. | 3.000% | 7/15/26 | 28,647 | 26,210 |
| Mylan Inc. | 4.200% | 11/29/23 | 6,595 | 6,568 |
| 2 Mylan Inc. | 4.550% | 4/15/28 | 9,000 | 8,797 |
| Mylan NV | 3.950% | 6/15/26 | 29,840 | 28,253 |
| Newell Brands Inc. | 4.000% | 12/1/24 | 6,827 | 6,644 |
| Newell Brands Inc. | 3.900% | 11/1/25 | 5,735 | 5,433 |
| Newell Brands Inc. | 4.200% | 4/1/26 | 26,051 | 25,106 |
| Novartis Capital Corp. | 3.400% | 5/6/24 | 27,317 | 27,364 |
| Novartis Capital Corp. | 3.000% | 11/20/25 | 27,869 | 26,960 |
| Novartis Capital Corp. | 3.100% | 5/17/27 | 13,154 | 12,692 |
| PepsiCo Inc. | 3.600% | 3/1/24 | 18,002 | 18,356 |
| PepsiCo Inc. | 2.750% | 4/30/25 | 16,617 | 16,011 |
| PepsiCo Inc. | 3.500% | 7/17/25 | 6,960 | 7,004 |
| PepsiCo Inc. | 2.850% | 2/24/26 | 9,903 | 9,442 |
| PepsiCo Inc. | 2.375% | 10/6/26 | 14,326 | 13,156 |
| PepsiCo Inc. | 3.000% | 10/15/27 | 22,270 | 21,347 |
| Perrigo Finance Unlimited Co. | 3.900% | 12/15/24 | 10,747 | 10,457 |
| Perrigo Finance Unlimited Co. | 4.375% | 3/15/26 | 12,332 | 12,106 |
| Pfizer Inc. | 3.400% | 5/15/24 | 14,326 | 14,461 |
| Pfizer Inc. | 2.750% | 6/3/26 | 23,275 | 22,197 |
| Pfizer Inc. | 3.000% | 12/15/26 | 19,159 | 18,575 |
| Philip Morris International Inc. | 3.600% | 11/15/23 | 7,409 | 7,431 |
| Philip Morris International Inc. | 3.250% | 11/10/24 | 7,668 | 7,517 |
| Philip Morris International Inc. | 3.375% | 8/11/25 | 11,646 | 11,398 |
| Philip Morris International Inc. | 2.750% | 2/25/26 | 12,750 | 11,953 |
| Philip Morris International Inc. | 3.125% | 8/17/27 | 6,550 | 6,222 |
| Philip Morris International Inc. | 3.125% | 3/2/28 | 7,170 | 6,834 |
| Procter & Gamble Co. | 2.700% | 2/2/26 | 6,902 | 6,590 |
| Procter & Gamble Co. | 2.450% | 11/3/26 | 12,840 | 11,954 |
| Procter & Gamble Co. | 2.850% | 8/11/27 | 11,580 | 11,079 |
| Providence St. Joseph Health Obligated Group | 2.746% | 10/1/26 | 2,225 | 2,059 |
56
| Vanguard® Intermediate-Term Corporate Bond Index Fund | ||||
| Schedule of Investments | ||||
| August 31, 2018 | ||||
| Face | Market | |||
| Maturity | Amount | Value | ||
| Coupon | Date | ($000) | ($000) | |
| Quest Diagnostics Inc. | 4.250% | 4/1/24 | 2,878 | 2,923 |
| Quest Diagnostics Inc. | 3.500% | 3/30/25 | 3,880 | 3,759 |
| Quest Diagnostics Inc. | 3.450% | 6/1/26 | 12,728 | 12,171 |
| Reynolds American Inc. | 4.850% | 9/15/23 | 8,218 | 8,561 |
| Reynolds American Inc. | 4.450% | 6/12/25 | 35,111 | 35,589 |
| Sanofi | 3.625% | 6/19/28 | 13,254 | 13,318 |
| Shire Acquisitions Investments Ireland DAC | 2.875% | 9/23/23 | 37,176 | 35,374 |
| Shire Acquisitions Investments Ireland DAC | 3.200% | 9/23/26 | 36,692 | 34,005 |
| SSM Health Care Corp. | 3.823% | 6/1/27 | 4,879 | 4,872 |
| Stryker Corp. | 3.375% | 5/15/24 | 8,968 | 8,862 |
| Stryker Corp. | 3.375% | 11/1/25 | 7,780 | 7,586 |
| Stryker Corp. | 3.500% | 3/15/26 | 10,566 | 10,349 |
| Stryker Corp. | 3.650% | 3/7/28 | 8,650 | 8,537 |
| Sutter Health | 3.695% | 8/15/28 | 4,725 | 4,697 |
| Sysco Corp. | 3.550% | 3/15/25 | 6,260 | 6,150 |
| Sysco Corp. | 3.750% | 10/1/25 | 10,678 | 10,582 |
| Sysco Corp. | 3.300% | 7/15/26 | 8,983 | 8,629 |
| Sysco Corp. | 3.250% | 7/15/27 | 15,640 | 14,855 |
| Thermo Fisher Scientific Inc. | 4.150% | 2/1/24 | 12,531 | 12,813 |
| Thermo Fisher Scientific Inc. | 3.650% | 12/15/25 | 4,155 | 4,111 |
| Thermo Fisher Scientific Inc. | 2.950% | 9/19/26 | 18,341 | 17,069 |
| Thermo Fisher Scientific Inc. | 3.200% | 8/15/27 | 10,726 | 10,120 |
| Tyson Foods Inc. | 3.950% | 8/15/24 | 20,176 | 20,243 |
| Tyson Foods Inc. | 3.550% | 6/2/27 | 19,872 | 18,856 |
| Unilever Capital Corp. | 2.600% | 5/5/24 | 13,165 | 12,659 |
| Unilever Capital Corp. | 3.375% | 3/22/25 | 6,150 | 6,131 |
| Unilever Capital Corp. | 3.100% | 7/30/25 | 4,725 | 4,614 |
| Unilever Capital Corp. | 2.000% | 7/28/26 | 13,650 | 12,216 |
| Unilever Capital Corp. | 2.900% | 5/5/27 | 11,635 | 11,092 |
| Unilever Capital Corp. | 3.500% | 3/22/28 | 6,100 | 6,102 |
| Whirlpool Corp. | 4.000% | 3/1/24 | 4,270 | 4,273 |
| Whirlpool Corp. | 3.700% | 5/1/25 | 4,650 | 4,522 |
| Whole Foods Market Inc. | 5.200% | 12/3/25 | 180 | 199 |
| Wyeth LLC | 6.450% | 2/1/24 | 11,314 | 13,031 |
| Zimmer Biomet Holdings Inc. | 3.550% | 4/1/25 | 25,436 | 24,444 |
| Zoetis Inc. | 4.500% | 11/13/25 | 8,903 | 9,265 |
| Zoetis Inc. | 3.000% | 9/12/27 | 11,360 | 10,617 |
| Zoetis Inc. | 3.900% | 8/20/28 | 5,000 | 4,985 |
| Energy (9.0%) | ||||
| Anadarko Petroleum Corp. | 3.450% | 7/15/24 | 8,883 | 8,600 |
| Anadarko Petroleum Corp. | 5.550% | 3/15/26 | 17,370 | 18,620 |
| Andeavor | 4.750% | 12/15/23 | 15,159 | 15,796 |
| Andeavor | 5.125% | 4/1/24 | 2,000 | 2,052 |
| Andeavor | 5.125% | 12/15/26 | 11,780 | 12,481 |
| Andeavor | 3.800% | 4/1/28 | 5,450 | 5,248 |
| Andeavor Logistics LP / Tesoro Logistics Finance Corp. | 6.375% | 5/1/24 | 550 | 584 |
| Andeavor Logistics LP / Tesoro Logistics Finance Corp. | 5.250% | 1/15/25 | 16,220 | 16,646 |
| Andeavor Logistics LP / Tesoro Logistics Finance Corp. | 4.250% | 12/1/27 | 10,165 | 10,007 |
| Baker Hughes a GE Co. LLC / Baker Hughes Co-Obligor | ||||
| Inc. | 3.337% | 12/15/27 | 19,180 | 18,094 |
| Boardwalk Pipelines LP | 4.950% | 12/15/24 | 9,225 | 9,390 |
| Boardwalk Pipelines LP | 5.950% | 6/1/26 | 7,080 | 7,541 |
| Boardwalk Pipelines LP | 4.450% | 7/15/27 | 8,512 | 8,265 |
| BP Capital Markets plc | 3.994% | 9/26/23 | 5,940 | 6,076 |
| BP Capital Markets plc | 3.216% | 11/28/23 | 19,832 | 19,614 |
| BP Capital Markets plc | 3.814% | 2/10/24 | 12,474 | 12,650 |
| BP Capital Markets plc | 3.224% | 4/14/24 | 10,006 | 9,862 |
| BP Capital Markets plc | 3.535% | 11/4/24 | 16,080 | 16,061 |
| BP Capital Markets plc | 3.506% | 3/17/25 | 11,410 | 11,357 |
| BP Capital Markets plc | 3.119% | 5/4/26 | 19,680 | 18,945 |
| BP Capital Markets plc | 3.017% | 1/16/27 | 12,750 | 12,132 |
| BP Capital Markets plc | 3.588% | 4/14/27 | 17,175 | 17,018 |
| BP Capital Markets plc | 3.279% | 9/19/27 | 22,800 | 22,007 |
57
| Vanguard® Intermediate-Term Corporate Bond Index Fund | ||||
| Schedule of Investments | ||||
| August 31, 2018 | ||||
| Face | Market | |||
| Maturity | Amount | Value | ||
| Coupon | Date | ($000) | ($000) | |
| Buckeye Partners LP | 4.350% | 10/15/24 | 682 | 671 |
| Buckeye Partners LP | 3.950% | 12/1/26 | 17,828 | 16,399 |
| Buckeye Partners LP | 4.125% | 12/1/27 | 1,700 | 1,574 |
| Canadian Natural Resources Ltd. | 3.800% | 4/15/24 | 9,204 | 9,164 |
| Canadian Natural Resources Ltd. | 3.900% | 2/1/25 | 3,917 | 3,852 |
| Canadian Natural Resources Ltd. | 3.850% | 6/1/27 | 21,171 | 20,669 |
| Cenovus Energy Inc. | 3.800% | 9/15/23 | 7,890 | 7,742 |
| Cenovus Energy Inc. | 4.250% | 4/15/27 | 14,584 | 14,201 |
| Chevron Corp. | 2.895% | 3/3/24 | 16,051 | 15,698 |
| Chevron Corp. | 3.326% | 11/17/25 | 11,390 | 11,275 |
| Chevron Corp. | 2.954% | 5/16/26 | 29,365 | 28,222 |
| Cimarex Energy Co. | 4.375% | 6/1/24 | 13,103 | 13,260 |
| Cimarex Energy Co. | 3.900% | 5/15/27 | 9,350 | 8,962 |
| Columbia Pipeline Group Inc. | 4.500% | 6/1/25 | 13,379 | 13,451 |
| Concho Resources Inc. | 4.375% | 1/15/25 | 3,819 | 3,848 |
| Concho Resources Inc. | 3.750% | 10/1/27 | 17,980 | 17,238 |
| Concho Resources Inc. | 4.300% | 8/15/28 | 4,775 | 4,775 |
| ConocoPhillips Co. | 3.350% | 11/15/24 | 5,773 | 5,720 |
| ConocoPhillips Co. | 3.350% | 5/15/25 | 1,388 | 1,367 |
| ConocoPhillips Co. | 4.950% | 3/15/26 | 18,666 | 20,179 |
| Continental Resources Inc. | 3.800% | 6/1/24 | 13,200 | 12,989 |
| Continental Resources Inc. | 4.375% | 1/15/28 | 14,100 | 14,047 |
| Devon Energy Corp. | 5.850% | 12/15/25 | 8,525 | 9,365 |
| Dominion Energy Gas Holdings LLC | 3.550% | 11/1/23 | 3,175 | 3,144 |
| Dominion Energy Gas Holdings LLC | 3.600% | 12/15/24 | 5,775 | 5,706 |
| Enable Midstream Partners LP | 3.900% | 5/15/24 | 4,300 | 4,151 |
| Enable Midstream Partners LP | 4.400% | 3/15/27 | 11,620 | 11,136 |
| Enable Midstream Partners LP | 4.950% | 5/15/28 | 12,850 | 12,736 |
| Enbridge Energy Partners LP | 5.875% | 10/15/25 | 6,598 | 7,226 |
| Enbridge Inc. | 4.000% | 10/1/23 | 5,005 | 5,065 |
| Enbridge Inc. | 3.500% | 6/10/24 | 7,084 | 6,922 |
| Enbridge Inc. | 4.250% | 12/1/26 | 15,375 | 15,432 |
| Enbridge Inc. | 3.700% | 7/15/27 | 11,887 | 11,480 |
| Energy Transfer LP | 4.900% | 2/1/24 | 4,020 | 4,154 |
| Energy Transfer LP | 4.050% | 3/15/25 | 12,231 | 11,986 |
| Energy Transfer LP | 4.750% | 1/15/26 | 19,430 | 19,675 |
| Energy Transfer LP | 4.200% | 4/15/27 | 7,139 | 6,930 |
| Energy Transfer Partners LP | 4.200% | 9/15/23 | 5,000 | 5,048 |
| Energy Transfer Partners LP | 4.950% | 6/15/28 | 10,900 | 11,178 |
| Enterprise Products Operating LLC | 3.900% | 2/15/24 | 9,522 | 9,622 |
| Enterprise Products Operating LLC | 3.750% | 2/15/25 | 17,503 | 17,567 |
| Enterprise Products Operating LLC | 3.700% | 2/15/26 | 19,978 | 19,752 |
| Enterprise Products Operating LLC | 3.950% | 2/15/27 | 4,846 | 4,851 |
| 1 Enterprise Products Operating LLC | 5.250% | 8/16/77 | 10,500 | 9,847 |
| 1 Enterprise Products Operating LLC | 5.375% | 2/15/78 | 8,750 | 8,165 |
| EOG Resources Inc. | 3.150% | 4/1/25 | 4,491 | 4,357 |
| EOG Resources Inc. | 4.150% | 1/15/26 | 13,279 | 13,647 |
| EQT Corp. | 3.900% | 10/1/27 | 18,595 | 17,485 |
| EQT Midstream Partners LP | 4.000% | 8/1/24 | 7,240 | 6,946 |
| EQT Midstream Partners LP | 4.125% | 12/1/26 | 8,180 | 7,630 |
| EQT Midstream Partners LP | 5.500% | 7/15/28 | 10,300 | 10,562 |
| Exxon Mobil Corp. | 3.176% | 3/15/24 | 8,362 | 8,346 |
| Exxon Mobil Corp. | 2.709% | 3/6/25 | 28,365 | 27,308 |
| Exxon Mobil Corp. | 3.043% | 3/1/26 | 36,970 | 36,070 |
| Halliburton Co. | 3.800% | 11/15/25 | 32,332 | 32,258 |
| Helmerich & Payne International Drilling Co. | 4.650% | 3/15/25 | 6,050 | 6,201 |
| Hess Corp. | 3.500% | 7/15/24 | 3,450 | 3,280 |
| Hess Corp. | 4.300% | 4/1/27 | 13,117 | 12,700 |
| HollyFrontier Corp. | 5.875% | 4/1/26 | 12,401 | 13,356 |
| Husky Energy Inc. | 4.000% | 4/15/24 | 11,239 | 11,262 |
| Kerr-McGee Corp. | 6.950% | 7/1/24 | 8,056 | 9,168 |
| Kinder Morgan Energy Partners LP | 3.500% | 9/1/23 | 11,160 | 10,926 |
| Kinder Morgan Energy Partners LP | 4.150% | 2/1/24 | 8,973 | 9,022 |
| Kinder Morgan Energy Partners LP | 4.300% | 5/1/24 | 11,223 | 11,354 |
58
| Vanguard® Intermediate-Term Corporate Bond Index Fund | ||||
| Schedule of Investments | ||||
| August 31, 2018 | ||||
| Face | Market | |||
| Maturity | Amount | Value | ||
| Coupon | Date | ($000) | ($000) | |
| Kinder Morgan Energy Partners LP | 4.250% | 9/1/24 | 7,257 | 7,296 |
| Kinder Morgan Inc. | 4.300% | 6/1/25 | 15,847 | 15,951 |
| Kinder Morgan Inc. | 4.300% | 3/1/28 | 21,585 | 21,360 |
| Magellan Midstream Partners LP | 5.000% | 3/1/26 | 8,827 | 9,366 |
| Marathon Oil Corp. | 3.850% | 6/1/25 | 16,639 | 16,351 |
| Marathon Oil Corp. | 4.400% | 7/15/27 | 11,510 | 11,513 |
| Marathon Petroleum Corp. | 3.625% | 9/15/24 | 9,823 | 9,743 |
| MPLX LP | 4.875% | 12/1/24 | 24,233 | 25,122 |
| MPLX LP | 4.000% | 2/15/25 | 8,030 | 7,941 |
| MPLX LP | 4.875% | 6/1/25 | 20,570 | 21,369 |
| MPLX LP | 4.125% | 3/1/27 | 11,456 | 11,206 |
| MPLX LP | 4.000% | 3/15/28 | 10,950 | 10,541 |
| National Fuel Gas Co. | 5.200% | 7/15/25 | 6,000 | 6,165 |
| National Fuel Gas Co. | 3.950% | 9/15/27 | 5,430 | 5,066 |
| National Fuel Gas Co. | 4.750% | 9/1/28 | 675 | 664 |
| Noble Energy Inc. | 3.900% | 11/15/24 | 8,491 | 8,409 |
| Noble Energy Inc. | 3.850% | 1/15/28 | 10,225 | 9,755 |
| Occidental Petroleum Corp. | 3.500% | 6/15/25 | 4,861 | 4,842 |
| Occidental Petroleum Corp. | 3.400% | 4/15/26 | 19,435 | 19,183 |
| Occidental Petroleum Corp. | 3.000% | 2/15/27 | 8,624 | 8,265 |
| ONEOK Inc. | 7.500% | 9/1/23 | 10,615 | 12,199 |
| ONEOK Inc. | 4.000% | 7/13/27 | 4,730 | 4,607 |
| ONEOK Inc. | 4.550% | 7/15/28 | 6,150 | 6,205 |
| ONEOK Partners LP | 5.000% | 9/15/23 | 4,955 | 5,219 |
| ONEOK Partners LP | 4.900% | 3/15/25 | 6,334 | 6,600 |
| 2 Patterson-UTI Energy Inc. | 3.950% | 2/1/28 | 5,300 | 4,975 |
| Phillips 66 | 3.900% | 3/15/28 | 9,496 | 9,395 |
| Phillips 66 Partners LP | 3.605% | 2/15/25 | 6,795 | 6,574 |
| Phillips 66 Partners LP | 3.550% | 10/1/26 | 5,750 | 5,449 |
| Phillips 66 Partners LP | 3.750% | 3/1/28 | 7,925 | 7,537 |
| Pioneer Natural Resources Co. | 4.450% | 1/15/26 | 6,196 | 6,374 |
| Plains All American Pipeline LP / PAA Finance Corp. | 3.850% | 10/15/23 | 8,253 | 8,125 |
| Plains All American Pipeline LP / PAA Finance Corp. | 3.600% | 11/1/24 | 7,884 | 7,581 |
| Plains All American Pipeline LP / PAA Finance Corp. | 4.650% | 10/15/25 | 17,336 | 17,549 |
| Plains All American Pipeline LP / PAA Finance Corp. | 4.500% | 12/15/26 | 11,842 | 11,796 |
| Regency Energy Partners LP / Regency Energy Finance | ||||
| Corp. | 4.500% | 11/1/23 | 10,740 | 10,941 |
| Sabine Pass Liquefaction LLC | 5.750% | 5/15/24 | 31,494 | 33,895 |
| Sabine Pass Liquefaction LLC | 5.625% | 3/1/25 | 29,876 | 31,893 |
| Sabine Pass Liquefaction LLC | 5.875% | 6/30/26 | 17,553 | 18,996 |
| Sabine Pass Liquefaction LLC | 5.000% | 3/15/27 | 18,090 | 18,610 |
| Sabine Pass Liquefaction LLC | 4.200% | 3/15/28 | 20,423 | 19,861 |
| Schlumberger Investment SA | 3.650% | 12/1/23 | 20,610 | 20,848 |
| Shell International Finance BV | 3.250% | 5/11/25 | 34,762 | 34,215 |
| Shell International Finance BV | 2.875% | 5/10/26 | 22,419 | 21,405 |
| Shell International Finance BV | 2.500% | 9/12/26 | 18,282 | 16,957 |
| Spectra Energy Partners LP | 4.750% | 3/15/24 | 14,267 | 14,752 |
| Spectra Energy Partners LP | 3.500% | 3/15/25 | 7,240 | 6,983 |
| Spectra Energy Partners LP | 3.375% | 10/15/26 | 7,518 | 7,072 |
| Suncor Energy Inc. | 3.600% | 12/1/24 | 9,920 | 9,843 |
| Sunoco Logistics Partners Operations LP | 4.250% | 4/1/24 | 6,698 | 6,702 |
| Sunoco Logistics Partners Operations LP | 5.950% | 12/1/25 | 7,755 | 8,386 |
| Sunoco Logistics Partners Operations LP | 3.900% | 7/15/26 | 2,690 | 2,576 |
| Sunoco Logistics Partners Operations LP | 4.000% | 10/1/27 | 14,420 | 13,752 |
| TC PipeLines LP | 4.375% | 3/13/25 | 1,275 | 1,271 |
| TC PipeLines LP | 3.900% | 5/25/27 | 8,116 | 7,702 |
| Tennessee Gas Pipeline Co. LLC | 7.000% | 3/15/27 | 950 | 1,089 |
| Total Capital International SA | 3.700% | 1/15/24 | 14,327 | 14,545 |
| Total Capital International SA | 3.750% | 4/10/24 | 12,404 | 12,569 |
| TransCanada PipeLines Ltd. | 3.750% | 10/16/23 | 12,024 | 12,109 |
| TransCanada PipeLines Ltd. | 4.875% | 1/15/26 | 10,794 | 11,330 |
| TransCanada PipeLines Ltd. | 4.250% | 5/15/28 | 10,970 | 11,055 |
| Transcontinental Gas Pipe Line Co. LLC | 7.850% | 2/1/26 | 8,160 | 10,006 |
| 2 Transcontinental Gas Pipe Line Co. LLC | 4.000% | 3/15/28 | 3,100 | 3,050 |
59
| Vanguard® Intermediate-Term Corporate Bond Index Fund | ||||
| Schedule of Investments | ||||
| August 31, 2018 | ||||
| Face | Market | |||
| Maturity | Amount | Value | ||
| Coupon | Date | ($000) | ($000) | |
| Valero Energy Corp. | 3.650% | 3/15/25 | 7,921 | 7,792 |
| Valero Energy Corp. | 3.400% | 9/15/26 | 17,536 | 16,720 |
| Valero Energy Corp. | 4.350% | 6/1/28 | 8,400 | 8,516 |
| Valero Energy Partners LP | 4.375% | 12/15/26 | 7,770 | 7,732 |
| Valero Energy Partners LP | 4.500% | 3/15/28 | 5,885 | 5,887 |
| Western Gas Partners LP | 3.950% | 6/1/25 | 9,931 | 9,529 |
| Western Gas Partners LP | 4.650% | 7/1/26 | 5,917 | 5,903 |
| Western Gas Partners LP | 4.500% | 3/1/28 | 3,900 | 3,819 |
| Williams Cos. Inc. | 4.500% | 11/15/23 | 7,641 | 7,809 |
| Williams Cos. Inc. | 4.300% | 3/4/24 | 12,687 | 12,838 |
| Williams Cos. Inc. | 4.550% | 6/24/24 | 12,375 | 12,622 |
| Williams Cos. Inc. | 3.900% | 1/15/25 | 13,914 | 13,732 |
| Williams Cos. Inc. | 4.000% | 9/15/25 | 16,617 | 16,411 |
| Williams Cos. Inc. | 3.750% | 6/15/27 | 17,145 | 16,393 |
| Other Industrial (0.2%) | ||||
| CBRE Services Inc. | 5.250% | 3/15/25 | 5,895 | 6,195 |
| CBRE Services Inc. | 4.875% | 3/1/26 | 9,595 | 9,966 |
| Cintas Corp. No 2 | 3.700% | 4/1/27 | 11,800 | 11,667 |
| Fluor Corp. | 3.500% | 12/15/24 | 7,525 | 7,397 |
| Fluor Corp. | 4.250% | 9/15/28 | 3,675 | 3,641 |
| Howard Hughes Medical Institute Revenue | 3.500% | 9/1/23 | 11,427 | 11,622 |
| Technology (8.8%) | ||||
| 3 Adobe Systems Inc. | 3.250% | 2/1/25 | 13,709 | 13,517 |
| Alphabet Inc. | 3.375% | 2/25/24 | 18,444 | 18,691 |
| Alphabet Inc. | 1.998% | 8/15/26 | 17,909 | 16,284 |
| Altera Corp. | 4.100% | 11/15/23 | 5,600 | 5,813 |
| Amphenol Corp. | 3.200% | 4/1/24 | 3,760 | 3,630 |
| Analog Devices Inc. | 3.125% | 12/5/23 | 9,407 | 9,157 |
| Analog Devices Inc. | 3.900% | 12/15/25 | 10,318 | 10,236 |
| Analog Devices Inc. | 3.500% | 12/5/26 | 11,928 | 11,491 |
| Apple Inc. | 3.000% | 2/9/24 | 19,180 | 18,927 |
| Apple Inc. | 3.450% | 5/6/24 | 30,005 | 30,210 |
| Apple Inc. | 2.850% | 5/11/24 | 28,427 | 27,701 |
| Apple Inc. | 2.750% | 1/13/25 | 24,948 | 24,075 |
| Apple Inc. | 2.500% | 2/9/25 | 20,648 | 19,565 |
| Apple Inc. | 3.200% | 5/13/25 | 28,366 | 28,002 |
| Apple Inc. | 3.250% | 2/23/26 | 43,597 | 42,813 |
| Apple Inc. | 2.450% | 8/4/26 | 31,962 | 29,605 |
| Apple Inc. | 3.350% | 2/9/27 | 34,480 | 33,942 |
| Apple Inc. | 3.200% | 5/11/27 | 29,597 | 28,772 |
| Apple Inc. | 3.000% | 6/20/27 | 13,060 | 12,525 |
| Apple Inc. | 2.900% | 9/12/27 | 32,253 | 30,633 |
| Apple Inc. | 3.000% | 11/13/27 | 19,072 | 18,334 |
| Applied Materials Inc. | 3.900% | 10/1/25 | 9,237 | 9,422 |
| Applied Materials Inc. | 3.300% | 4/1/27 | 17,128 | 16,695 |
| Arrow Electronics Inc. | 3.250% | 9/8/24 | 6,969 | 6,579 |
| Arrow Electronics Inc. | 4.000% | 4/1/25 | 7,470 | 7,304 |
| Arrow Electronics Inc. | 3.875% | 1/12/28 | 4,515 | 4,260 |
| Autodesk Inc. | 4.375% | 6/15/25 | 4,085 | 4,125 |
| Autodesk Inc. | 3.500% | 6/15/27 | 5,800 | 5,429 |
| Avnet Inc. | 4.625% | 4/15/26 | 7,450 | 7,430 |
| Baidu Inc. | 3.875% | 9/29/23 | 12,000 | 11,966 |
| Baidu Inc. | 4.125% | 6/30/25 | 4,585 | 4,563 |
| Baidu Inc. | 3.625% | 7/6/27 | 9,775 | 9,262 |
| Baidu Inc. | 4.375% | 3/29/28 | 6,200 | 6,195 |
| Broadcom Corp. / Broadcom Cayman Finance Ltd. | 3.625% | 1/15/24 | 35,328 | 34,185 |
| Broadcom Corp. / Broadcom Cayman Finance Ltd. | 3.125% | 1/15/25 | 16,250 | 15,037 |
| Broadcom Corp. / Broadcom Cayman Finance Ltd. | 3.875% | 1/15/27 | 83,743 | 78,260 |
| Broadcom Corp. / Broadcom Cayman Finance Ltd. | 3.500% | 1/15/28 | 2,810 | 2,536 |
| Broadridge Financial Solutions Inc. | 3.400% | 6/27/26 | 4,998 | 4,761 |
| CA Inc. | 4.700% | 3/15/27 | 4,550 | 4,532 |
| Cadence Design Systems Inc. | 4.375% | 10/15/24 | 4,775 | 4,843 |
| Cisco Systems Inc. | 2.200% | 9/20/23 | 5,634 | 5,372 |
60
| Vanguard® Intermediate-Term Corporate Bond Index Fund | ||||
| Schedule of Investments | ||||
| August 31, 2018 | ||||
| Face | Market | |||
| Maturity | Amount | Value | ||
| Coupon | Date | ($000) | ($000) | |
| Cisco Systems Inc. | 3.625% | 3/4/24 | 22,025 | 22,486 |
| Cisco Systems Inc. | 2.950% | 2/28/26 | 12,840 | 12,407 |
| Cisco Systems Inc. | 2.500% | 9/20/26 | 20,091 | 18,699 |
| Citrix Systems Inc. | 4.500% | 12/1/27 | 10,360 | 10,075 |
| 2 Diamond 1 Finance Corp. / Diamond 2 Finance Corp. | 6.020% | 6/15/26 | 63,426 | 67,187 |
| DXC Technology Co. | 4.250% | 4/15/24 | 7,673 | 7,708 |
| DXC Technology Co. | 4.750% | 4/15/27 | 9,650 | 9,837 |
| Fidelity National Information Services Inc. | 3.875% | 6/5/24 | 3,364 | 3,376 |
| Fidelity National Information Services Inc. | 5.000% | 10/15/25 | 9,784 | 10,355 |
| Fidelity National Information Services Inc. | 3.000% | 8/15/26 | 20,831 | 19,363 |
| Fidelity National Information Services Inc. | 4.250% | 5/15/28 | 5,950 | 6,013 |
| Fiserv Inc. | 3.850% | 6/1/25 | 12,875 | 12,870 |
| Flex Ltd. | 4.750% | 6/15/25 | 7,395 | 7,477 |
| Hewlett Packard Enterprise Co. | 4.900% | 10/15/25 | 36,030 | 37,061 |
| Intel Corp. | 2.875% | 5/11/24 | 18,907 | 18,343 |
| Intel Corp. | 3.700% | 7/29/25 | 36,979 | 37,438 |
| Intel Corp. | 2.600% | 5/19/26 | 27,287 | 25,577 |
| Intel Corp. | 3.150% | 5/11/27 | 640 | 622 |
| International Business Machines Corp. | 3.375% | 8/1/23 | 10,000 | 10,022 |
| International Business Machines Corp. | 3.625% | 2/12/24 | 22,595 | 22,804 |
| International Business Machines Corp. | 7.000% | 10/30/25 | 8,348 | 10,085 |
| International Business Machines Corp. | 3.450% | 2/19/26 | 19,674 | 19,538 |
| International Business Machines Corp. | 3.300% | 1/27/27 | 6,240 | 6,138 |
| International Business Machines Corp. | 6.220% | 8/1/27 | 3,709 | 4,389 |
| International Business Machines Corp. | 6.500% | 1/15/28 | 2,075 | 2,510 |
| Jabil Inc. | 3.950% | 1/12/28 | 6,700 | 6,379 |
| Juniper Networks Inc. | 4.500% | 3/15/24 | 6,212 | 6,332 |
| Juniper Networks Inc. | 4.350% | 6/15/25 | 4,670 | 4,676 |
| Keysight Technologies Inc. | 4.550% | 10/30/24 | 8,200 | 8,346 |
| Keysight Technologies Inc. | 4.600% | 4/6/27 | 9,525 | 9,704 |
| KLA-Tencor Corp. | 4.650% | 11/1/24 | 17,230 | 17,867 |
| Lam Research Corp. | 3.800% | 3/15/25 | 6,968 | 6,958 |
| Marvell Technology Group Ltd. | 4.875% | 6/22/28 | 6,750 | 6,868 |
| Maxim Integrated Products Inc. | 3.450% | 6/15/27 | 6,875 | 6,521 |
| Microsoft Corp. | 3.625% | 12/15/23 | 21,153 | 21,589 |
| Microsoft Corp. | 2.875% | 2/6/24 | 38,953 | 38,257 |
| Microsoft Corp. | 2.700% | 2/12/25 | 31,923 | 30,810 |
| Microsoft Corp. | 3.125% | 11/3/25 | 38,229 | 37,551 |
| Microsoft Corp. | 2.400% | 8/8/26 | 55,259 | 51,317 |
| Microsoft Corp. | 3.300% | 2/6/27 | 48,706 | 48,155 |
| Motorola Solutions Inc. | 4.000% | 9/1/24 | 10,343 | 10,204 |
| Motorola Solutions Inc. | 4.600% | 2/23/28 | 9,625 | 9,540 |
| NetApp Inc. | 3.300% | 9/29/24 | 5,410 | 5,178 |
| NVIDIA Corp. | 3.200% | 9/16/26 | 14,237 | 13,818 |
| Oracle Corp. | 2.400% | 9/15/23 | 35,408 | 33,884 |
| Oracle Corp. | 3.400% | 7/8/24 | 33,032 | 32,985 |
| Oracle Corp. | 2.950% | 11/15/24 | 29,532 | 28,719 |
| Oracle Corp. | 2.950% | 5/15/25 | 32,607 | 31,495 |
| Oracle Corp. | 2.650% | 7/15/26 | 42,853 | 39,902 |
| Oracle Corp. | 3.250% | 11/15/27 | 35,545 | 34,426 |
| QUALCOMM Inc. | 2.900% | 5/20/24 | 19,343 | 18,508 |
| QUALCOMM Inc. | 3.450% | 5/20/25 | 27,107 | 26,352 |
| QUALCOMM Inc. | 3.250% | 5/20/27 | 27,800 | 26,189 |
| salesforce.com Inc. | 3.700% | 4/11/28 | 20,575 | 20,532 |
| Seagate HDD | 4.875% | 3/1/24 | 7,769 | 7,643 |
| Seagate HDD | 4.750% | 1/1/25 | 9,681 | 9,245 |
| Seagate HDD | 4.875% | 6/1/27 | 9,872 | 9,181 |
| Tech Data Corp. | 4.950% | 2/15/27 | 9,864 | 9,700 |
| Texas Instruments Inc. | 2.625% | 5/15/24 | 4,421 | 4,257 |
| Texas Instruments Inc. | 2.900% | 11/3/27 | 2,835 | 2,699 |
| Total System Services Inc. | 4.800% | 4/1/26 | 11,846 | 12,259 |
| Total System Services Inc. | 4.450% | 6/1/28 | 6,750 | 6,825 |
| Trimble Inc. | 4.750% | 12/1/24 | 6,021 | 6,139 |
| Trimble Inc. | 4.900% | 6/15/28 | 7,665 | 7,816 |
61
| Vanguard® Intermediate-Term Corporate Bond Index Fund | ||||
| Schedule of Investments | ||||
| August 31, 2018 | ||||
| Face | Market | |||
| Maturity | Amount | Value | ||
| Coupon | Date | ($000) | ($000) | |
| Tyco Electronics Group SA | 3.450% | 8/1/24 | 5,521 | 5,415 |
| Tyco Electronics Group SA | 3.700% | 2/15/26 | 4,265 | 4,209 |
| Tyco Electronics Group SA | 3.125% | 8/15/27 | 6,960 | 6,543 |
| Verisk Analytics Inc. | 4.000% | 6/15/25 | 12,349 | 12,221 |
| VMware Inc. | 3.900% | 8/21/27 | 17,314 | 16,327 |
| Xerox Corp. | 3.625% | 3/15/23 | 4,000 | 3,762 |
| Xilinx Inc. | 2.950% | 6/1/24 | 10,212 | 9,759 |
| Transportation (2.2%) | ||||
| 1 American Airlines 2013-1 Class A Pass Through Trust | 4.000% | 1/15/27 | 3,262 | 3,255 |
| 1 American Airlines 2014-1 Class A Pass Through Trust | 3.700% | 4/1/28 | 5,407 | 5,292 |
| 1 American Airlines 2015-1 Class A Pass Through Trust | 3.375% | 11/1/28 | 11,712 | 11,302 |
| 1 American Airlines 2015-1 Class B Pass Through Trust | 3.700% | 11/1/24 | 1,734 | 1,691 |
| 1 American Airlines 2015-2 Class AA Pass Through Trust | 3.600% | 9/22/27 | 3,101 | 3,035 |
| 1 American Airlines 2016-1 Class AA Pass Through Trust | 3.575% | 1/15/28 | 6,941 | 6,778 |
| 1 American Airlines 2016-2 Class A Pass Through Trust | 3.650% | 6/15/28 | 3,665 | 3,559 |
| 1 American Airlines 2016-2 Class AA Pass Through Trust | 3.200% | 12/15/29 | 6,938 | 6,610 |
| 1 American Airlines 2017-1B Class B Pass Through Trust | 4.950% | 2/15/25 | 1,887 | 1,904 |
| 1 BNSF Funding Trust I | 6.613% | 12/15/55 | 1,890 | 2,108 |
| Burlington Northern Santa Fe LLC | 3.850% | 9/1/23 | 9,536 | 9,720 |
| Burlington Northern Santa Fe LLC | 3.750% | 4/1/24 | 13,610 | 13,804 |
| Burlington Northern Santa Fe LLC | 3.400% | 9/1/24 | 7,792 | 7,756 |
| Burlington Northern Santa Fe LLC | 3.000% | 4/1/25 | 12,162 | 11,762 |
| Burlington Northern Santa Fe LLC | 3.650% | 9/1/25 | 8,450 | 8,514 |
| Burlington Northern Santa Fe LLC | 7.000% | 12/15/25 | 3,001 | 3,637 |
| Burlington Northern Santa Fe LLC | 3.250% | 6/15/27 | 6,795 | 6,639 |
| Canadian National Railway Co. | 2.950% | 11/21/24 | 6,614 | 6,425 |
| Canadian National Railway Co. | 2.750% | 3/1/26 | 6,743 | 6,371 |
| Canadian National Railway Co. | 6.900% | 7/15/28 | 3,971 | 4,966 |
| Canadian Pacific Railway Co. | 2.900% | 2/1/25 | 7,998 | 7,659 |
| Canadian Pacific Railway Co. | 4.000% | 6/1/28 | 7,750 | 7,910 |
| CH Robinson Worldwide Inc. | 4.200% | 4/15/28 | 8,950 | 8,869 |
| 1 Continental Airlines 2012-1 Class A Pass Through Trust | 4.150% | 10/11/25 | 7,795 | 7,885 |
| 1 Continental Airlines 2012-2 Class A Pass Through Trust | 4.000% | 4/29/26 | 5,427 | 5,435 |
| CSX Corp. | 3.700% | 11/1/23 | 2,375 | 2,400 |
| CSX Corp. | 3.400% | 8/1/24 | 10,888 | 10,798 |
| CSX Corp. | 3.350% | 11/1/25 | 7,960 | 7,768 |
| CSX Corp. | 2.600% | 11/1/26 | 11,097 | 10,151 |
| CSX Corp. | 3.250% | 6/1/27 | 12,046 | 11,414 |
| CSX Corp. | 3.800% | 3/1/28 | 11,175 | 11,059 |
| 1 CSX Transportation Inc. | 6.251% | 1/15/23 | 26 | 28 |
| 1 Delta Air Lines 2015-1 Class AA Pass Through Trust | 3.625% | 7/30/27 | 326 | 324 |
| Delta Air Lines Inc. | 4.375% | 4/19/28 | 6,500 | 6,354 |
| FedEx Corp. | 2.700% | 4/15/23 | 1,700 | 1,635 |
| FedEx Corp. | 4.000% | 1/15/24 | 8,518 | 8,755 |
| FedEx Corp. | 3.200% | 2/1/25 | 10,433 | 10,198 |
| FedEx Corp. | 3.250% | 4/1/26 | 9,584 | 9,285 |
| FedEx Corp. | 3.300% | 3/15/27 | 4,420 | 4,237 |
| FedEx Corp. | 3.400% | 2/15/28 | 6,300 | 6,060 |
| Kirby Corp. | 4.200% | 3/1/28 | 11,100 | 10,916 |
| 1 Latam Airlines 2015-1 Pass Through Trust A | 4.200% | 8/15/29 | 5,348 | 5,134 |
| Norfolk Southern Corp. | 3.850% | 1/15/24 | 3,200 | 3,242 |
| Norfolk Southern Corp. | 5.590% | 5/17/25 | 1,770 | 1,931 |
| Norfolk Southern Corp. | 3.650% | 8/1/25 | 50 | 50 |
| Norfolk Southern Corp. | 2.900% | 6/15/26 | 8,775 | 8,301 |
| Norfolk Southern Corp. | 7.800% | 5/15/27 | 3,692 | 4,687 |
| Norfolk Southern Corp. | 3.150% | 6/1/27 | 8,722 | 8,319 |
| Norfolk Southern Corp. | 3.800% | 8/1/28 | 8,100 | 8,089 |
| Southwest Airlines Co. | 3.000% | 11/15/26 | 3,500 | 3,254 |
| Southwest Airlines Co. | 3.450% | 11/16/27 | 4,190 | 4,003 |
| 1 Southwest Airlines Co. 2007-1 Pass Through Trust | 6.150% | 2/1/24 | 931 | 983 |
| 1 Spirit Airlines Class A Pass Through Certificates Series | ||||
| 2015-1 | 4.100% | 10/1/29 | 2,708 | 2,704 |
| Trinity Industries Inc. | 4.550% | 10/1/24 | 3,435 | 3,300 |
62
| Vanguard® Intermediate-Term Corporate Bond Index Fund | ||||
| Schedule of Investments | ||||
| August 31, 2018 | ||||
| Face | Market | |||
| Maturity | Amount | Value | ||
| Coupon | Date | ($000) | ($000) | |
| Union Pacific Corp. | 3.646% | 2/15/24 | 7,829 | 7,863 |
| Union Pacific Corp. | 3.750% | 3/15/24 | 6,505 | 6,564 |
| Union Pacific Corp. | 3.250% | 1/15/25 | 5,307 | 5,147 |
| Union Pacific Corp. | 3.750% | 7/15/25 | 3,250 | 3,277 |
| Union Pacific Corp. | 3.250% | 8/15/25 | 8,212 | 7,985 |
| Union Pacific Corp. | 2.750% | 3/1/26 | 12,727 | 11,898 |
| Union Pacific Corp. | 3.000% | 4/15/27 | 6,722 | 6,384 |
| 1 United Airlines 2013-1 Class A Pass Through Trust | 4.300% | 2/15/27 | 7,122 | 7,248 |
| 1 United Airlines 2014-1 Class A Pass Through Trust | 4.000% | 10/11/27 | 7,775 | 7,815 |
| 1 United Airlines 2014-2 Class A Pass Through Trust | 3.750% | 3/3/28 | 7,686 | 7,627 |
| 1 United Airlines 2015-1 Class AA Pass Through Trust | 3.450% | 12/1/27 | 7,610 | 7,410 |
| 1 United Airlines 2016-1 Class A Pass Through Trust | 3.450% | 1/7/30 | 1,610 | 1,556 |
| 1 United Airlines 2016-1 Class AA Pass Through Trust | 3.100% | 7/7/28 | 8,999 | 8,559 |
| United Parcel Service Inc. | 2.800% | 11/15/24 | 10,483 | 10,089 |
| United Parcel Service Inc. | 2.400% | 11/15/26 | 8,817 | 8,098 |
| United Parcel Service Inc. | 3.050% | 11/15/27 | 12,730 | 12,202 |
| 1 US Airways 2012-1 Class A Pass Through Trust | 5.900% | 4/1/26 | 812 | 868 |
| 1 US Airways 2013-1 Class A Pass Through Trust | 3.950% | 5/15/27 | 2,640 | 2,624 |
| 1 US Airways Inc. 2012-2 Class A Pass Through Trust | 4.625% | 12/3/26 | 1,903 | 1,953 |
| 11,949,601 | ||||
| Utilities (5.3%) | ||||
| Electric (4.7%) | ||||
| 2 AEP Texas Inc. | 3.950% | 6/1/28 | 9,500 | 9,526 |
| AEP Transmission Co. LLC | 3.100% | 12/1/26 | 6,125 | 5,897 |
| Alabama Power Co. | 3.550% | 12/1/23 | 6,321 | 6,307 |
| Ameren Corp. | 3.650% | 2/15/26 | 4,400 | 4,248 |
| Ameren Illinois Co. | 3.250% | 3/1/25 | 4,247 | 4,170 |
| Ameren Illinois Co. | 3.800% | 5/15/28 | 7,000 | 7,087 |
| American Electric Power Co. Inc. | 3.200% | 11/13/27 | 4,100 | 3,848 |
| Appalachian Power Co. | 3.400% | 6/1/25 | 1,275 | 1,247 |
| Appalachian Power Co. | 3.300% | 6/1/27 | 3,500 | 3,374 |
| Arizona Public Service Co. | 3.150% | 5/15/25 | 4,070 | 3,951 |
| Arizona Public Service Co. | 2.950% | 9/15/27 | 4,125 | 3,872 |
| Avangrid Inc. | 3.150% | 12/1/24 | 8,304 | 7,932 |
| Baltimore Gas & Electric Co. | 2.400% | 8/15/26 | 3,200 | 2,913 |
| Berkshire Hathaway Energy Co. | 3.750% | 11/15/23 | 10,555 | 10,681 |
| Berkshire Hathaway Energy Co. | 3.500% | 2/1/25 | 6,298 | 6,239 |
| Berkshire Hathaway Energy Co. | 3.250% | 4/15/28 | 4,900 | 4,648 |
| Black Hills Corp. | 4.250% | 11/30/23 | 3,454 | 3,521 |
| Black Hills Corp. | 3.950% | 1/15/26 | 9,720 | 9,636 |
| Black Hills Corp. | 3.150% | 1/15/27 | 5,350 | 4,941 |
| CenterPoint Energy Houston Electric LLC | 2.400% | 9/1/26 | 940 | 858 |
| CenterPoint Energy Houston Electric LLC | 3.000% | 2/1/27 | 3,351 | 3,188 |
| Cleco Corporate Holdings LLC | 3.743% | 5/1/26 | 7,016 | 6,642 |
| Cleveland Electric Illuminating Co. | 5.500% | 8/15/24 | 2,900 | 3,175 |
| CMS Energy Corp. | 3.000% | 5/15/26 | 4,609 | 4,293 |
| CMS Energy Corp. | 3.450% | 8/15/27 | 4,775 | 4,601 |
| Commonwealth Edison Co. | 2.550% | 6/15/26 | 6,625 | 6,133 |
| Commonwealth Edison Co. | 2.950% | 8/15/27 | 3,539 | 3,337 |
| Commonwealth Edison Co. | 3.700% | 8/15/28 | 5,300 | 5,328 |
| Connecticut Light & Power Co. | 3.200% | 3/15/27 | 4,750 | 4,603 |
| Consolidated Edison Co. of New York Inc. | 3.125% | 11/15/27 | 4,600 | 4,425 |
| Consolidated Edison Co. of New York Inc. | 3.800% | 5/15/28 | 3,450 | 3,496 |
| Delmarva Power & Light Co. | 3.500% | 11/15/23 | 5,709 | 5,731 |
| Dominion Energy Inc. | 3.625% | 12/1/24 | 5,087 | 5,000 |
| Dominion Energy Inc. | 3.900% | 10/1/25 | 9,105 | 9,007 |
| Dominion Energy Inc. | 2.850% | 8/15/26 | 7,026 | 6,415 |
| Dominion Energy Inc. | 4.250% | 6/1/28 | 6,730 | 6,785 |
| 1 Dominion Energy Inc. | 5.750% | 10/1/54 | 4,975 | 5,172 |
| DTE Electric Co. | 3.650% | 3/15/24 | 5,359 | 5,403 |
| DTE Electric Co. | 3.375% | 3/1/25 | 4,361 | 4,313 |
| DTE Energy Co. | 3.850% | 12/1/23 | 4,525 | 4,545 |
| DTE Energy Co. | 3.500% | 6/1/24 | 5,550 | 5,457 |
63
| Vanguard® Intermediate-Term Corporate Bond Index Fund | ||||
| Schedule of Investments | ||||
| August 31, 2018 | ||||
| Face | Market | |||
| Maturity | Amount | Value | ||
| Coupon | Date | ($000) | ($000) | |
| DTE Energy Co. | 2.850% | 10/1/26 | 9,317 | 8,574 |
| DTE Energy Co. | 3.800% | 3/15/27 | 5,750 | 5,641 |
| Duke Energy Carolinas LLC | 2.950% | 12/1/26 | 5,485 | 5,257 |
| Duke Energy Corp. | 3.950% | 10/15/23 | 4,700 | 4,755 |
| Duke Energy Corp. | 3.750% | 4/15/24 | 16,107 | 16,158 |
| Duke Energy Corp. | 2.650% | 9/1/26 | 20,151 | 18,299 |
| Duke Energy Corp. | 3.150% | 8/15/27 | 10,275 | 9,634 |
| Duke Energy Florida LLC | 3.200% | 1/15/27 | 8,621 | 8,382 |
| Duke Energy Florida LLC | 3.800% | 7/15/28 | 8,575 | 8,669 |
| Duke Energy Ohio Inc. | 3.800% | 9/1/23 | 6,711 | 6,816 |
| Duke Energy Progress LLC | 3.375% | 9/1/23 | 1,000 | 1,004 |
| Duke Energy Progress LLC | 3.250% | 8/15/25 | 7,852 | 7,691 |
| Duke Energy Progress LLC | 3.700% | 9/1/28 | 1,500 | 1,507 |
| Edison International | 4.125% | 3/15/28 | 7,500 | 7,499 |
| Emera US Finance LP | 3.550% | 6/15/26 | 13,266 | 12,592 |
| Enel Americas SA | 4.000% | 10/25/26 | 2,892 | 2,757 |
| Enel Chile SA | 4.875% | 6/12/28 | 13,750 | 14,059 |
| Enel Generacion Chile SA | 4.250% | 4/15/24 | 2,400 | 2,380 |
| Entergy Arkansas Inc. | 3.700% | 6/1/24 | 3,475 | 3,506 |
| Entergy Arkansas Inc. | 3.500% | 4/1/26 | 10,934 | 10,829 |
| Entergy Corp. | 2.950% | 9/1/26 | 9,060 | 8,330 |
| Entergy Gulf States Louisiana LLC | 5.590% | 10/1/24 | 4,349 | 4,766 |
| Entergy Louisiana LLC | 4.050% | 9/1/23 | 5,150 | 5,291 |
| Entergy Louisiana LLC | 5.400% | 11/1/24 | 3,995 | 4,364 |
| Entergy Louisiana LLC | 2.400% | 10/1/26 | 12,104 | 11,002 |
| Entergy Louisiana LLC | 3.120% | 9/1/27 | 9,420 | 9,015 |
| Entergy Louisiana LLC | 3.250% | 4/1/28 | 2,888 | 2,783 |
| Entergy Mississippi Inc. | 2.850% | 6/1/28 | 1,538 | 1,426 |
| Eversource Energy | 2.900% | 10/1/24 | 8,550 | 8,141 |
| Eversource Energy | 3.150% | 1/15/25 | 3,429 | 3,316 |
| Eversource Energy | 3.300% | 1/15/28 | 2,400 | 2,287 |
| Exelon Corp. | 3.950% | 6/15/25 | 11,370 | 11,359 |
| Exelon Corp. | 3.400% | 4/15/26 | 13,197 | 12,626 |
| FirstEnergy Corp. | 3.900% | 7/15/27 | 23,379 | 22,803 |
| Florida Power & Light Co. | 3.250% | 6/1/24 | 6,570 | 6,523 |
| Florida Power & Light Co. | 3.125% | 12/1/25 | 8,390 | 8,203 |
| Fortis Inc. | 3.055% | 10/4/26 | 29,660 | 27,554 |
| Georgia Power Co. | 3.250% | 4/1/26 | 5,776 | 5,482 |
| Georgia Power Co. | 3.250% | 3/30/27 | 5,363 | 5,030 |
| Gulf Power Co. | 3.300% | 5/30/27 | 7,085 | 6,841 |
| Indiana Michigan Power Co. | 3.850% | 5/15/28 | 4,250 | 4,282 |
| Interstate Power & Light Co. | 3.250% | 12/1/24 | 7,950 | 7,801 |
| IPALCO Enterprises Inc. | 3.700% | 9/1/24 | 4,889 | 4,718 |
| ITC Holdings Corp. | 3.650% | 6/15/24 | 4,445 | 4,380 |
| ITC Holdings Corp. | 3.250% | 6/30/26 | 6,612 | 6,237 |
| ITC Holdings Corp. | 3.350% | 11/15/27 | 9,525 | 8,999 |
| Kansas City Power & Light Co. | 3.650% | 8/15/25 | 400 | 395 |
| Louisville Gas & Electric Co. | 3.300% | 10/1/25 | 4,075 | 4,000 |
| MidAmerican Energy Co. | 3.500% | 10/15/24 | 6,665 | 6,677 |
| MidAmerican Energy Co. | 3.100% | 5/1/27 | 4,400 | 4,204 |
| Mississippi Power Co. | 3.950% | 3/30/28 | 2,250 | 2,237 |
| National Rural Utilities Cooperative Finance Corp. | 3.400% | 11/15/23 | 5,475 | 5,486 |
| National Rural Utilities Cooperative Finance Corp. | 2.950% | 2/7/24 | 10,705 | 10,324 |
| National Rural Utilities Cooperative Finance Corp. | 2.850% | 1/27/25 | 6,310 | 6,061 |
| National Rural Utilities Cooperative Finance Corp. | 3.250% | 11/1/25 | 6,361 | 6,255 |
| National Rural Utilities Cooperative Finance Corp. | 3.050% | 4/25/27 | 4,000 | 3,823 |
| National Rural Utilities Cooperative Finance Corp. | 3.400% | 2/7/28 | 6,475 | 6,342 |
| 1 National Rural Utilities Cooperative Finance Corp. | 5.250% | 4/20/46 | 3,125 | 3,225 |
| NextEra Energy Capital Holdings Inc. | 3.550% | 5/1/27 | 17,519 | 17,001 |
| 1 NextEra Energy Capital Holdings Inc. | 4.800% | 12/1/77 | 7,350 | 6,909 |
| NSTAR Electric Co. | 3.200% | 5/15/27 | 10,990 | 10,603 |
| Oklahoma Gas & Electric Co. | 3.800% | 8/15/28 | 5,250 | 5,247 |
| Oncor Electric Delivery Co. LLC | 2.950% | 4/1/25 | 4,730 | 4,561 |
| Pacific Gas & Electric Co. | 3.850% | 11/15/23 | 2,613 | 2,607 |
64
| Vanguard® Intermediate-Term Corporate Bond Index Fund | ||||
| Schedule of Investments | ||||
| August 31, 2018 | ||||
| Face | Market | |||
| Maturity | Amount | Value | ||
| Coupon | Date | ($000) | ($000) | |
| Pacific Gas & Electric Co. | 3.750% | 2/15/24 | 8,283 | 8,112 |
| Pacific Gas & Electric Co. | 3.400% | 8/15/24 | 4,711 | 4,515 |
| Pacific Gas & Electric Co. | 3.500% | 6/15/25 | 8,529 | 8,109 |
| Pacific Gas & Electric Co. | 2.950% | 3/1/26 | 7,822 | 7,074 |
| Pacific Gas & Electric Co. | 3.300% | 3/15/27 | 6,535 | 6,013 |
| Pacific Gas & Electric Co. | 3.300% | 12/1/27 | 15,200 | 13,891 |
| 2 Pacific Gas & Electric Co. | 4.650% | 8/1/28 | 3,475 | 3,507 |
| PacifiCorp | 3.600% | 4/1/24 | 5,810 | 5,828 |
| PECO Energy Co. | 3.150% | 10/15/25 | 1,635 | 1,591 |
| Potomac Electric Power Co. | 3.600% | 3/15/24 | 4,231 | 4,259 |
| PPL Capital Funding Inc. | 3.950% | 3/15/24 | 2,363 | 2,367 |
| PPL Capital Funding Inc. | 3.100% | 5/15/26 | 12,433 | 11,646 |
| Public Service Co. of Colorado | 3.700% | 6/15/28 | 3,000 | 3,023 |
| Public Service Co. of New Hampshire | 3.500% | 11/1/23 | 3,650 | 3,656 |
| Public Service Electric & Gas Co. | 3.000% | 5/15/25 | 4,274 | 4,143 |
| Public Service Electric & Gas Co. | 2.250% | 9/15/26 | 7,756 | 7,034 |
| Public Service Electric & Gas Co. | 3.000% | 5/15/27 | 7,200 | 6,877 |
| Public Service Electric & Gas Co. | 3.700% | 5/1/28 | 4,100 | 4,121 |
| Puget Energy Inc. | 3.650% | 5/15/25 | 7,670 | 7,458 |
| San Diego Gas & Electric Co. | 3.600% | 9/1/23 | 3,200 | 3,222 |
| San Diego Gas & Electric Co. | 2.500% | 5/15/26 | 9,954 | 9,188 |
| Scottish Power Ltd. | 5.810% | 3/15/25 | 1,760 | 1,916 |
| Sierra Pacific Power Co. | 2.600% | 5/1/26 | 5,780 | 5,343 |
| South Carolina Electric & Gas Co. | 4.250% | 8/15/28 | 3,950 | 3,954 |
| Southern California Edison Co. | 3.500% | 10/1/23 | 8,359 | 8,383 |
| Southern California Edison Co. | 3.700% | 8/1/25 | 2,875 | 2,886 |
| Southern California Edison Co. | 3.650% | 3/1/28 | 5,600 | 5,522 |
| Southern Co. | 3.250% | 7/1/26 | 23,939 | 22,426 |
| Southern Power Co. | 4.150% | 12/1/25 | 6,976 | 6,926 |
| Southwestern Electric Power Co. | 2.750% | 10/1/26 | 7,840 | 7,197 |
| Southwestern Public Service Co. | 3.300% | 6/15/24 | 4,050 | 3,986 |
| Tucson Electric Power Co. | 3.050% | 3/15/25 | 2,750 | 2,603 |
| Union Electric Co. | 3.500% | 4/15/24 | 5,660 | 5,669 |
| Union Electric Co. | 2.950% | 6/15/27 | 3,800 | 3,597 |
| Virginia Electric & Power Co. | 3.450% | 2/15/24 | 2,485 | 2,472 |
| Virginia Electric & Power Co. | 3.100% | 5/15/25 | 3,234 | 3,119 |
| Virginia Electric & Power Co. | 3.150% | 1/15/26 | 11,024 | 10,674 |
| Virginia Electric & Power Co. | 2.950% | 11/15/26 | 9,693 | 9,172 |
| Virginia Electric & Power Co. | 3.500% | 3/15/27 | 15,864 | 15,673 |
| Virginia Electric & Power Co. | 3.800% | 4/1/28 | 9,925 | 10,016 |
| WEC Energy Group Inc. | 3.550% | 6/15/25 | 5,942 | 5,873 |
| Westar Energy Inc. | 2.550% | 7/1/26 | 5,874 | 5,420 |
| Westar Energy Inc. | 3.100% | 4/1/27 | 3,357 | 3,216 |
| Wisconsin Power & Light Co. | 3.050% | 10/15/27 | 3,600 | 3,421 |
| Xcel Energy Inc. | 3.300% | 6/1/25 | 8,696 | 8,482 |
| Xcel Energy Inc. | 3.350% | 12/1/26 | 6,305 | 6,086 |
| Xcel Energy Inc. | 4.000% | 6/15/28 | 7,835 | 7,907 |
| Natural Gas (0.5%) | ||||
| Atmos Energy Corp. | 3.000% | 6/15/27 | 6,858 | 6,518 |
| CenterPoint Energy Resources Corp. | 4.000% | 4/1/28 | 4,615 | 4,591 |
| NiSource Finance Corp. | 3.490% | 5/15/27 | 13,578 | 13,068 |
| ONE Gas Inc. | 3.610% | 2/1/24 | 2,314 | 2,306 |
| Sempra Energy | 4.050% | 12/1/23 | 9,511 | 9,624 |
| Sempra Energy | 3.550% | 6/15/24 | 7,034 | 6,941 |
| Sempra Energy | 3.750% | 11/15/25 | 5,038 | 4,964 |
| Sempra Energy | 3.250% | 6/15/27 | 13,602 | 12,655 |
| Sempra Energy | 3.400% | 2/1/28 | 14,850 | 13,950 |
| Southern California Gas Co. | 3.150% | 9/15/24 | 4,350 | 4,287 |
| Southern California Gas Co. | 3.200% | 6/15/25 | 1,975 | 1,921 |
| Southern California Gas Co. | 2.600% | 6/15/26 | 9,375 | 8,686 |
| Southern Co. Gas Capital Corp. | 2.450% | 10/1/23 | 6,076 | 5,729 |
| Southern Co. Gas Capital Corp. | 3.250% | 6/15/26 | 3,875 | 3,653 |
| Southwest Gas Corp. | 3.700% | 4/1/28 | 4,000 | 3,954 |
65
| Vanguard® Intermediate-Term Corporate Bond Index Fund | ||||
| Schedule of Investments | ||||
| August 31, 2018 | ||||
| Face | Market | |||
| Maturity | Amount | Value | ||
| Coupon | Date | ($000) | ($000) | |
| Other Utility (0.1%) | ||||
| American Water Capital Corp. | 3.850% | 3/1/24 | 3,366 | 3,431 |
| American Water Capital Corp. | 3.400% | 3/1/25 | 9,680 | 9,597 |
| American Water Capital Corp. | 2.950% | 9/1/27 | 7,740 | 7,312 |
| American Water Capital Corp. | 3.750% | 9/1/28 | 2,500 | 2,499 |
| United Utilities plc | 6.875% | 8/15/28 | 2,090 | 2,463 |
| 1,103,192 | ||||
| Total Corporate Bonds (Cost $21,156,289) | 20,610,656 | |||
| Market | ||||
| Value | ||||
| Coupon | Shares | ($000) | ||
| Temporary Cash Investment (0.4%) | ||||
| Money Market Fund (0.4%) | ||||
| 4 Vanguard Market Liquidity Fund | ||||
| (Cost $83,780) | 2.153% | 837,734 | 83,790 | |
| Total Investments (99.5%) (Cost $21,301,704) | 20,755,990 | |||
| Other Assets and Liabilities—Net (0.5%) | 113,208 | |||
| Net Assets (100%) | 20,869,198 | |||
1 The average or expected maturity is shorter than the final maturity shown because of the possibility of interim principal payments and
prepayments or the possibility of the issue being called.
2 Security exempt from registration under Rule 144A of the Securities Act of 1933. Such securities may be sold in transactions exempt from
registration, normally to qualified institutional buyers. At August 31, 2018, the aggregate value of these securities was $420,027,000,
representing 2.0% of net assets.
3 Securities with a value of $1,154,000 have been segregated as initial margin for recently closed futures contracts.
4 Affiliated money market fund available only to Vanguard funds and certain trusts and accounts managed by Vanguard. Rate shown is the 7-day
yield.
REIT—Real Estate Investment Trust.
66
| Vanguard® Long-Term Corporate Bond Index Fund | |||||
| Schedule of Investments | |||||
| August 31, 2018 | |||||
| Face | Market | ||||
| Maturity | Amount | Value | |||
| Coupon | Date | ($000) | ($000) | ||
| U.S. Government and Agency Obligations (0.4%) | |||||
| U.S. Government Securities (0.4%) | |||||
| United States Treasury Note/Bond | 2.875% | 8/15/28 | 11,880 | 11,889 | |
| United States Treasury Note/Bond | 3.125% | 5/15/48 | 2,700 | 2,754 | |
| Total U.S. Government and Agency Obligations (Cost $14,679) | 14,643 | ||||
| Corporate Bonds (98.2%) | |||||
| Finance (16.7%) | |||||
| Banking (8.9%) | |||||
| American Express Co. | 4.050% | 12/3/42 | 2,111 | 2,081 | |
| Bank of America Corp. | 6.110% | 1/29/37 | 4,285 | 4,953 | |
| 1 | Bank of America Corp. | 4.244% | 4/24/38 | 4,871 | 4,804 |
| Bank of America Corp. | 7.750% | 5/14/38 | 3,763 | 5,124 | |
| Bank of America Corp. | 5.875% | 2/7/42 | 3,999 | 4,769 | |
| Bank of America Corp. | 5.000% | 1/21/44 | 4,300 | 4,642 | |
| Bank of America Corp. | 4.875% | 4/1/44 | 1,307 | 1,383 | |
| Bank of America Corp. | 4.750% | 4/21/45 | 986 | 1,001 | |
| 1 | Bank of America Corp. | 4.443% | 1/20/48 | 2,870 | 2,870 |
| 1 | Bank of America Corp. | 3.946% | 1/23/49 | 2,805 | 2,595 |
| Bank of America NA | 6.000% | 10/15/36 | 2,592 | 3,098 | |
| Bank of New York Mellon Corp. | 3.000% | 10/30/28 | 333 | 308 | |
| Bank of New York Mellon Corp. | 3.300% | 8/23/29 | 2,065 | 1,951 | |
| Bank One Capital III | 8.750% | 9/1/30 | 453 | 622 | |
| Barclays plc | 5.250% | 8/17/45 | 3,030 | 2,989 | |
| Barclays plc | 4.950% | 1/10/47 | 2,845 | 2,674 | |
| Citigroup Inc. | 6.625% | 6/15/32 | 1,603 | 1,909 | |
| Citigroup Inc. | 5.875% | 2/22/33 | 750 | 830 | |
| Citigroup Inc. | 6.000% | 10/31/33 | 1,869 | 2,120 | |
| Citigroup Inc. | 6.125% | 8/25/36 | 1,400 | 1,603 | |
| 1 | Citigroup Inc. | 3.878% | 1/24/39 | 2,130 | 1,972 |
| Citigroup Inc. | 8.125% | 7/15/39 | 4,037 | 5,833 | |
| Citigroup Inc. | 5.875% | 1/30/42 | 2,148 | 2,513 | |
| Citigroup Inc. | 6.675% | 9/13/43 | 2,390 | 2,973 | |
| Citigroup Inc. | 5.300% | 5/6/44 | 1,074 | 1,144 | |
| Citigroup Inc. | 4.650% | 7/30/45 | 2,800 | 2,842 | |
| Citigroup Inc. | 4.750% | 5/18/46 | 4,556 | 4,512 | |
| 1 | Citigroup Inc. | 4.281% | 4/24/48 | 1,975 | 1,902 |
| Citigroup Inc. | 4.650% | 7/23/48 | 5,225 | 5,316 | |
| Cooperatieve Rabobank UA | 5.250% | 5/24/41 | 3,120 | 3,554 | |
| Cooperatieve Rabobank UA | 5.750% | 12/1/43 | 3,225 | 3,678 | |
| Cooperatieve Rabobank UA | 5.250% | 8/4/45 | 2,219 | 2,378 | |
| Credit Suisse Group Funding Guernsey Ltd. | 4.875% | 5/15/45 | 4,202 | 4,310 | |
| Credit Suisse USA Inc. | 7.125% | 7/15/32 | 1,236 | 1,583 | |
| Fifth Third Bancorp | 8.250% | 3/1/38 | 2,257 | 3,110 | |
| First Republic Bank | 4.375% | 8/1/46 | 463 | 441 | |
| First Republic Bank | 4.625% | 2/13/47 | 1,150 | 1,113 | |
| Goldman Sachs Capital I | 6.345% | 2/15/34 | 2,422 | 2,849 | |
| Goldman Sachs Group Inc. | 6.125% | 2/15/33 | 4,201 | 4,854 | |
| Goldman Sachs Group Inc. | 6.450% | 5/1/36 | 1,581 | 1,862 | |
| Goldman Sachs Group Inc. | 6.750% | 10/1/37 | 12,019 | 14,564 | |
| 1 | Goldman Sachs Group Inc. | 4.017% | 10/31/38 | 5,680 | 5,286 |
| 1 | Goldman Sachs Group Inc. | 4.411% | 4/23/39 | 3,850 | 3,755 |
| Goldman Sachs Group Inc. | 6.250% | 2/1/41 | 5,268 | 6,365 | |
| Goldman Sachs Group Inc. | 4.800% | 7/8/44 | 3,926 | 4,017 | |
| Goldman Sachs Group Inc. | 5.150% | 5/22/45 | 4,315 | 4,440 | |
| Goldman Sachs Group Inc. | 4.750% | 10/21/45 | 3,901 | 3,971 | |
| HSBC Bank USA NA | 5.875% | 11/1/34 | 2,420 | 2,771 | |
| HSBC Bank USA NA | 5.625% | 8/15/35 | 1,911 | 2,139 | |
| HSBC Bank USA NA | 7.000% | 1/15/39 | 1,175 | 1,532 | |
| HSBC Holdings plc | 7.625% | 5/17/32 | 958 | 1,230 | |
| HSBC Holdings plc | 6.500% | 5/2/36 | 4,275 | 5,085 | |
| HSBC Holdings plc | 6.500% | 9/15/37 | 5,610 | 6,701 | |
| HSBC Holdings plc | 6.800% | 6/1/38 | 3,028 | 3,735 | |
67
| Vanguard® Long-Term Corporate Bond Index Fund | ||||
| Schedule of Investments | ||||
| August 31, 2018 | ||||
| Face | Market | |||
| Maturity | Amount | Value | ||
| Coupon | Date | ($000) | ($000) | |
| HSBC Holdings plc | 6.100% | 1/14/42 | 1,428 | 1,734 |
| HSBC Holdings plc | 5.250% | 3/14/44 | 3,797 | 3,975 |
| JPMorgan Chase & Co. | 6.400% | 5/15/38 | 4,471 | 5,625 |
| 1 JPMorgan Chase & Co. | 3.882% | 7/24/38 | 6,400 | 6,007 |
| JPMorgan Chase & Co. | 5.500% | 10/15/40 | 3,056 | 3,485 |
| JPMorgan Chase & Co. | 5.600% | 7/15/41 | 4,291 | 4,952 |
| JPMorgan Chase & Co. | 5.400% | 1/6/42 | 2,310 | 2,604 |
| JPMorgan Chase & Co. | 5.625% | 8/16/43 | 2,503 | 2,840 |
| JPMorgan Chase & Co. | 4.850% | 2/1/44 | 2,620 | 2,761 |
| JPMorgan Chase & Co. | 4.950% | 6/1/45 | 2,891 | 3,035 |
| 1 JPMorgan Chase & Co. | 4.260% | 2/22/48 | 4,745 | 4,576 |
| 1 JPMorgan Chase & Co. | 4.032% | 7/24/48 | 2,570 | 2,395 |
| 1 JPMorgan Chase & Co. | 3.964% | 11/15/48 | 5,050 | 4,665 |
| 1 JPMorgan Chase & Co. | 3.897% | 1/23/49 | 4,700 | 4,296 |
| Lloyds Banking Group plc | 5.300% | 12/1/45 | 1,388 | 1,413 |
| Lloyds Banking Group plc | 4.344% | 1/9/48 | 3,575 | 3,144 |
| Mitsubishi UFJ Financial Group Inc. | 4.286% | 7/26/38 | 1,000 | 1,014 |
| Morgan Stanley | 7.250% | 4/1/32 | 2,325 | 2,973 |
| 1 Morgan Stanley | 3.971% | 7/22/38 | 4,442 | 4,176 |
| 1 Morgan Stanley | 4.457% | 4/22/39 | 2,150 | 2,126 |
| Morgan Stanley | 6.375% | 7/24/42 | 4,876 | 6,087 |
| Morgan Stanley | 4.300% | 1/27/45 | 5,927 | 5,734 |
| Morgan Stanley | 4.375% | 1/22/47 | 3,975 | 3,900 |
| Regions Bank | 6.450% | 6/26/37 | 665 | 788 |
| Regions Financial Corp. | 7.375% | 12/10/37 | 981 | 1,275 |
| Wachovia Corp. | 7.500% | 4/15/35 | 870 | 1,117 |
| Wachovia Corp. | 5.500% | 8/1/35 | 1,188 | 1,295 |
| Wachovia Corp. | 6.550% | 10/15/35 | 25 | 30 |
| Wells Fargo & Co. | 5.375% | 2/7/35 | 1,832 | 2,066 |
| Wells Fargo & Co. | 5.375% | 11/2/43 | 4,438 | 4,786 |
| Wells Fargo & Co. | 5.606% | 1/15/44 | 5,117 | 5,692 |
| Wells Fargo & Co. | 4.650% | 11/4/44 | 4,653 | 4,575 |
| Wells Fargo & Co. | 3.900% | 5/1/45 | 4,750 | 4,434 |
| Wells Fargo & Co. | 4.900% | 11/17/45 | 3,921 | 3,961 |
| Wells Fargo & Co. | 4.400% | 6/14/46 | 3,191 | 3,009 |
| Wells Fargo & Co. | 4.750% | 12/7/46 | 4,269 | 4,261 |
| Wells Fargo Bank NA | 5.950% | 8/26/36 | 1,545 | 1,821 |
| Wells Fargo Bank NA | 5.850% | 2/1/37 | 2,738 | 3,200 |
| Wells Fargo Bank NA | 6.600% | 1/15/38 | 3,213 | 4,087 |
| 1 Wells Fargo Capital X | 5.950% | 2/15/36 | 1,650 | 1,782 |
| Brokerage (0.5%) | ||||
| Brookfield Finance Inc. | 4.700% | 9/20/47 | 1,838 | 1,764 |
| CME Group Inc. | 5.300% | 9/15/43 | 1,670 | 1,986 |
| CME Group Inc. | 4.150% | 6/15/48 | 1,200 | 1,216 |
| Intercontinental Exchange Inc. | 3.750% | 9/21/28 | 1,300 | 1,302 |
| Intercontinental Exchange Inc. | 4.250% | 9/21/48 | 2,530 | 2,529 |
| Invesco Finance plc | 5.375% | 11/30/43 | 858 | 964 |
| Jefferies Group LLC | 6.250% | 1/15/36 | 798 | 824 |
| Jefferies Group LLC | 6.500% | 1/20/43 | 1,008 | 1,052 |
| Jefferies Group LLC / Jefferies Group Capital Finance | ||||
| Inc. | 4.150% | 1/23/30 | 2,400 | 2,180 |
| Legg Mason Inc. | 5.625% | 1/15/44 | 1,350 | 1,382 |
| Raymond James Financial Inc. | 4.950% | 7/15/46 | 1,651 | 1,704 |
| Finance Companies (0.7%) | ||||
| GATX Corp. | 4.550% | 11/7/28 | 975 | 983 |
| GATX Corp. | 5.200% | 3/15/44 | 195 | 203 |
| GATX Corp. | 4.500% | 3/30/45 | 195 | 184 |
| GE Capital International Funding Co. Unlimited Co. | 4.418% | 11/15/35 | 24,687 | 23,680 |
| Insurance (5.8%) | ||||
| ACE Capital Trust II | 9.700% | 4/1/30 | 507 | 712 |
| Aetna Inc. | 6.625% | 6/15/36 | 1,280 | 1,591 |
| Aetna Inc. | 6.750% | 12/15/37 | 1,061 | 1,327 |
| Aetna Inc. | 4.500% | 5/15/42 | 1,547 | 1,523 |
68
| Vanguard® Long-Term Corporate Bond Index Fund | ||||
| Schedule of Investments | ||||
| August 31, 2018 | ||||
| Face | Market | |||
| Maturity | Amount | Value | ||
| Coupon | Date | ($000) | ($000) | |
| Aetna Inc. | 4.125% | 11/15/42 | 1,283 | 1,188 |
| Aetna Inc. | 4.750% | 3/15/44 | 890 | 889 |
| Aetna Inc. | 3.875% | 8/15/47 | 2,215 | 1,964 |
| Aflac Inc. | 4.000% | 10/15/46 | 738 | 694 |
| Alleghany Corp. | 4.900% | 9/15/44 | 767 | 785 |
| Allstate Corp. | 5.350% | 6/1/33 | 882 | 994 |
| Allstate Corp. | 5.550% | 5/9/35 | 1,286 | 1,483 |
| Allstate Corp. | 5.950% | 4/1/36 | 985 | 1,190 |
| Allstate Corp. | 4.500% | 6/15/43 | 528 | 544 |
| Allstate Corp. | 4.200% | 12/15/46 | 1,509 | 1,500 |
| 1 Allstate Corp. | 6.500% | 5/15/67 | 1,000 | 1,119 |
| American Financial Group Inc. | 4.500% | 6/15/47 | 1,033 | 976 |
| American International Group Inc. | 3.875% | 1/15/35 | 3,458 | 3,110 |
| American International Group Inc. | 4.700% | 7/10/35 | 1,173 | 1,169 |
| American International Group Inc. | 6.250% | 5/1/36 | 740 | 848 |
| American International Group Inc. | 4.500% | 7/16/44 | 4,214 | 3,995 |
| American International Group Inc. | 4.800% | 7/10/45 | 2,375 | 2,348 |
| American International Group Inc. | 4.750% | 4/1/48 | 2,690 | 2,659 |
| American International Group Inc. | 4.375% | 1/15/55 | 1,719 | 1,505 |
| 1 American International Group Inc. | 8.175% | 5/15/68 | 725 | 912 |
| Anthem Inc. | 5.950% | 12/15/34 | 1 | 1 |
| Anthem Inc. | 5.850% | 1/15/36 | 750 | 854 |
| Anthem Inc. | 6.375% | 6/15/37 | 700 | 839 |
| Anthem Inc. | 4.625% | 5/15/42 | 3,231 | 3,126 |
| Anthem Inc. | 4.650% | 1/15/43 | 2,247 | 2,187 |
| Anthem Inc. | 5.100% | 1/15/44 | 2,035 | 2,100 |
| Anthem Inc. | 4.650% | 8/15/44 | 1,502 | 1,461 |
| Anthem Inc. | 4.375% | 12/1/47 | 2,775 | 2,622 |
| Anthem Inc. | 4.550% | 3/1/48 | 750 | 726 |
| Anthem Inc. | 4.850% | 8/15/54 | 675 | 656 |
| Aon Corp. | 6.250% | 9/30/40 | 670 | 831 |
| Aon plc | 4.600% | 6/14/44 | 1,520 | 1,517 |
| Aon plc | 4.750% | 5/15/45 | 1,174 | 1,187 |
| Arch Capital Finance LLC | 5.031% | 12/15/46 | 1,038 | 1,088 |
| Arch Capital Group Ltd. | 7.350% | 5/1/34 | 375 | 488 |
| Arch Capital Group US Inc. | 5.144% | 11/1/43 | 1,258 | 1,344 |
| Assurant Inc. | 6.750% | 2/15/34 | 784 | 913 |
| 2 AXA Equitable Holdings Inc. | 5.000% | 4/20/48 | 3,870 | 3,634 |
| AXA SA | 8.600% | 12/15/30 | 2,613 | 3,441 |
| Berkshire Hathaway Finance Corp. | 5.750% | 1/15/40 | 1,669 | 2,021 |
| Berkshire Hathaway Finance Corp. | 4.400% | 5/15/42 | 1,779 | 1,843 |
| Berkshire Hathaway Finance Corp. | 4.300% | 5/15/43 | 1,083 | 1,110 |
| Berkshire Hathaway Finance Corp. | 4.200% | 8/15/48 | 5,400 | 5,460 |
| Berkshire Hathaway Inc. | 4.500% | 2/11/43 | 1,881 | 1,980 |
| Brighthouse Financial Inc. | 4.700% | 6/22/47 | 3,100 | 2,597 |
| Chubb Corp. | 6.000% | 5/11/37 | 1,766 | 2,165 |
| Chubb Corp. | 6.500% | 5/15/38 | 1,093 | 1,402 |
| Chubb INA Holdings Inc. | 6.700% | 5/15/36 | 865 | 1,123 |
| Chubb INA Holdings Inc. | 4.150% | 3/13/43 | 887 | 893 |
| Chubb INA Holdings Inc. | 4.350% | 11/3/45 | 3,593 | 3,721 |
| Cigna Corp. | 5.375% | 2/15/42 | 600 | 637 |
| Cigna Corp. | 3.875% | 10/15/47 | 1,575 | 1,340 |
| Cincinnati Financial Corp. | 6.125% | 11/1/34 | 669 | 785 |
| Everest Reinsurance Holdings Inc. | 4.868% | 6/1/44 | 703 | 719 |
| Hartford Financial Services Group Inc. | 5.950% | 10/15/36 | 379 | 441 |
| Hartford Financial Services Group Inc. | 6.100% | 10/1/41 | 1,316 | 1,566 |
| Hartford Financial Services Group Inc. | 4.300% | 4/15/43 | 588 | 562 |
| Hartford Financial Services Group Inc. | 4.400% | 3/15/48 | 925 | 914 |
| Humana Inc. | 4.625% | 12/1/42 | 1,024 | 1,021 |
| Humana Inc. | 4.950% | 10/1/44 | 1,513 | 1,568 |
| Humana Inc. | 4.800% | 3/15/47 | 915 | 943 |
| Lincoln National Corp. | 6.150% | 4/7/36 | 714 | 817 |
| Lincoln National Corp. | 6.300% | 10/9/37 | 1,188 | 1,408 |
| Lincoln National Corp. | 7.000% | 6/15/40 | 668 | 852 |
69
| Vanguard® Long-Term Corporate Bond Index Fund | ||||
| Schedule of Investments | ||||
| August 31, 2018 | ||||
| Face | Market | |||
| Maturity | Amount | Value | ||
| Coupon | Date | ($000) | ($000) | |
| Lincoln National Corp. | 4.350% | 3/1/48 | 950 | 901 |
| Loews Corp. | 6.000% | 2/1/35 | 678 | 788 |
| Loews Corp. | 4.125% | 5/15/43 | 1,336 | 1,274 |
| Manulife Financial Corp. | 5.375% | 3/4/46 | 1,490 | 1,693 |
| Markel Corp. | 5.000% | 4/5/46 | 850 | 885 |
| Markel Corp. | 4.300% | 11/1/47 | 600 | 551 |
| Marsh & McLennan Cos. Inc. | 5.875% | 8/1/33 | 803 | 950 |
| Marsh & McLennan Cos. Inc. | 4.350% | 1/30/47 | 808 | 811 |
| Marsh & McLennan Cos. Inc. | 4.200% | 3/1/48 | 1,600 | 1,585 |
| MetLife Inc. | 6.500% | 12/15/32 | 429 | 533 |
| MetLife Inc. | 6.375% | 6/15/34 | 2,435 | 2,947 |
| MetLife Inc. | 5.700% | 6/15/35 | 2,437 | 2,820 |
| MetLife Inc. | 5.875% | 2/6/41 | 1,289 | 1,532 |
| MetLife Inc. | 4.125% | 8/13/42 | 1,133 | 1,078 |
| MetLife Inc. | 4.875% | 11/13/43 | 1,415 | 1,493 |
| MetLife Inc. | 4.721% | 12/15/44 | 1,447 | 1,503 |
| MetLife Inc. | 4.050% | 3/1/45 | 2,650 | 2,499 |
| MetLife Inc. | 4.600% | 5/13/46 | 1,424 | 1,458 |
| 1 MetLife Inc. | 6.400% | 12/15/66 | 4,077 | 4,367 |
| 1 MetLife Inc. | 10.750% | 8/1/69 | 523 | 806 |
| 1 Nationwide Financial Services Inc. | 6.750% | 5/15/87 | 803 | 869 |
| Principal Financial Group Inc. | 6.050% | 10/15/36 | 350 | 415 |
| Principal Financial Group Inc. | 4.625% | 9/15/42 | 665 | 683 |
| Principal Financial Group Inc. | 4.350% | 5/15/43 | 773 | 747 |
| Principal Financial Group Inc. | 4.300% | 11/15/46 | 1,900 | 1,855 |
| Progressive Corp. | 6.625% | 3/1/29 | 128 | 155 |
| Progressive Corp. | 6.250% | 12/1/32 | 462 | 567 |
| Progressive Corp. | 4.350% | 4/25/44 | 1,075 | 1,092 |
| Progressive Corp. | 3.700% | 1/26/45 | 150 | 139 |
| Progressive Corp. | 4.125% | 4/15/47 | 2,366 | 2,337 |
| Progressive Corp. | 4.200% | 3/15/48 | 1,520 | 1,516 |
| Prudential Financial Inc. | 5.750% | 7/15/33 | 826 | 954 |
| Prudential Financial Inc. | 5.700% | 12/14/36 | 1,084 | 1,257 |
| Prudential Financial Inc. | 6.625% | 12/1/37 | 513 | 651 |
| Prudential Financial Inc. | 6.625% | 6/21/40 | 685 | 875 |
| Prudential Financial Inc. | 6.200% | 11/15/40 | 620 | 746 |
| Prudential Financial Inc. | 5.100% | 8/15/43 | 516 | 558 |
| Prudential Financial Inc. | 4.600% | 5/15/44 | 1,021 | 1,054 |
| Prudential Financial Inc. | 3.905% | 12/7/47 | 2,270 | 2,098 |
| Prudential Financial Inc. | 4.418% | 3/27/48 | 750 | 761 |
| Prudential Financial Inc. | 3.935% | 12/7/49 | 2,281 | 2,104 |
| Sompo International Holdings Ltd. | 7.000% | 7/15/34 | 595 | 710 |
| Transatlantic Holdings Inc. | 8.000% | 11/30/39 | 636 | 876 |
| Travelers Cos. Inc. | 6.750% | 6/20/36 | 1,005 | 1,311 |
| Travelers Cos. Inc. | 6.250% | 6/15/37 | 1,720 | 2,152 |
| Travelers Cos. Inc. | 5.350% | 11/1/40 | 1,463 | 1,684 |
| Travelers Cos. Inc. | 4.600% | 8/1/43 | 1,116 | 1,174 |
| Travelers Cos. Inc. | 4.300% | 8/25/45 | 1,033 | 1,042 |
| Travelers Cos. Inc. | 3.750% | 5/15/46 | 1,238 | 1,150 |
| Travelers Cos. Inc. | 4.000% | 5/30/47 | 831 | 804 |
| Travelers Cos. Inc. | 4.050% | 3/7/48 | 600 | 588 |
| Travelers Property Casualty Corp. | 6.375% | 3/15/33 | 600 | 748 |
| UnitedHealth Group Inc. | 4.625% | 7/15/35 | 3,066 | 3,288 |
| UnitedHealth Group Inc. | 5.800% | 3/15/36 | 2,297 | 2,754 |
| UnitedHealth Group Inc. | 6.500% | 6/15/37 | 1,640 | 2,135 |
| UnitedHealth Group Inc. | 6.625% | 11/15/37 | 975 | 1,276 |
| UnitedHealth Group Inc. | 6.875% | 2/15/38 | 2,596 | 3,518 |
| UnitedHealth Group Inc. | 5.700% | 10/15/40 | 389 | 469 |
| UnitedHealth Group Inc. | 5.950% | 2/15/41 | 193 | 239 |
| UnitedHealth Group Inc. | 4.625% | 11/15/41 | 248 | 266 |
| UnitedHealth Group Inc. | 4.375% | 3/15/42 | 423 | 440 |
| UnitedHealth Group Inc. | 3.950% | 10/15/42 | 2,308 | 2,243 |
| UnitedHealth Group Inc. | 4.250% | 3/15/43 | 1,103 | 1,120 |
| UnitedHealth Group Inc. | 4.750% | 7/15/45 | 4,152 | 4,533 |
70
| Vanguard® Long-Term Corporate Bond Index Fund | ||||
| Schedule of Investments | ||||
| August 31, 2018 | ||||
| Face | Market | |||
| Maturity | Amount | Value | ||
| Coupon | Date | ($000) | ($000) | |
| UnitedHealth Group Inc. | 4.200% | 1/15/47 | 2,910 | 2,940 |
| UnitedHealth Group Inc. | 4.250% | 4/15/47 | 1,540 | 1,548 |
| UnitedHealth Group Inc. | 3.750% | 10/15/47 | 1,925 | 1,803 |
| UnitedHealth Group Inc. | 4.250% | 6/15/48 | 3,215 | 3,229 |
| Unum Group | 5.750% | 8/15/42 | 990 | 1,056 |
| Voya Financial Inc. | 5.700% | 7/15/43 | 766 | 853 |
| Voya Financial Inc. | 4.800% | 6/15/46 | 707 | 707 |
| WR Berkley Corp. | 4.750% | 8/1/44 | 659 | 651 |
| XLIT Ltd. | 5.250% | 12/15/43 | 722 | 779 |
| XLIT Ltd. | 5.500% | 3/31/45 | 940 | 998 |
| Real Estate Investment Trusts (0.8%) | ||||
| Alexandria Real Estate Equities Inc. | 4.500% | 7/30/29 | 539 | 542 |
| Alexandria Real Estate Equities Inc. | 4.700% | 7/1/30 | 1,125 | 1,156 |
| AvalonBay Communities Inc. | 3.900% | 10/15/46 | 1,000 | 942 |
| AvalonBay Communities Inc. | 4.150% | 7/1/47 | 213 | 209 |
| AvalonBay Communities Inc. | 4.350% | 4/15/48 | 910 | 927 |
| ERP Operating LP | 4.500% | 7/1/44 | 1,652 | 1,691 |
| ERP Operating LP | 4.500% | 6/1/45 | 633 | 650 |
| ERP Operating LP | 4.000% | 8/1/47 | 513 | 488 |
| Essex Portfolio LP | 4.500% | 3/15/48 | 735 | 732 |
| Federal Realty Investment Trust | 4.500% | 12/1/44 | 1,413 | 1,446 |
| HCP Inc. | 6.750% | 2/1/41 | 959 | 1,206 |
| Hospitality Properties Trust | 4.375% | 2/15/30 | 825 | 766 |
| Kilroy Realty LP | 4.250% | 8/15/29 | 400 | 393 |
| Kimco Realty Corp. | 4.250% | 4/1/45 | 1,202 | 1,085 |
| Kimco Realty Corp. | 4.125% | 12/1/46 | 538 | 478 |
| Kimco Realty Corp. | 4.450% | 9/1/47 | 720 | 669 |
| Prologis LP | 3.875% | 9/15/28 | 500 | 508 |
| Prologis LP | 4.375% | 9/15/48 | 800 | 830 |
| Realty Income Corp. | 4.650% | 3/15/47 | 1,453 | 1,498 |
| Regency Centers LP | 4.400% | 2/1/47 | 900 | 865 |
| Simon Property Group LP | 6.750% | 2/1/40 | 1,126 | 1,480 |
| Simon Property Group LP | 4.750% | 3/15/42 | 1,150 | 1,221 |
| Simon Property Group LP | 4.250% | 10/1/44 | 788 | 780 |
| Simon Property Group LP | 4.250% | 11/30/46 | 1,386 | 1,375 |
| Ventas Realty LP | 4.400% | 1/15/29 | 1,450 | 1,462 |
| Ventas Realty LP | 5.700% | 9/30/43 | 564 | 630 |
| Ventas Realty LP | 4.375% | 2/1/45 | 808 | 751 |
| Welltower Inc. | 6.500% | 3/15/41 | 629 | 760 |
| Welltower Inc. | 4.950% | 9/1/48 | 950 | 959 |
| 579,723 | ||||
| Industrial (69.3%) | ||||
| Basic Industry (3.9%) | ||||
| Albemarle Corp. | 5.450% | 12/1/44 | 678 | 707 |
| ArcelorMittal | 7.000% | 10/15/39 | 1,000 | 1,161 |
| Barrick Gold Corp. | 5.250% | 4/1/42 | 1,199 | 1,236 |
| Barrick North America Finance LLC | 5.700% | 5/30/41 | 2,616 | 2,839 |
| Barrick North America Finance LLC | 5.750% | 5/1/43 | 1,631 | 1,792 |
| Barrick PD Australia Finance Pty Ltd. | 5.950% | 10/15/39 | 2,212 | 2,431 |
| BHP Billiton Finance USA Ltd. | 4.125% | 2/24/42 | 2,250 | 2,233 |
| BHP Billiton Finance USA Ltd. | 5.000% | 9/30/43 | 5,185 | 5,786 |
| Celulosa Arauco y Constitucion SA | 5.500% | 11/2/47 | 800 | 782 |
| Dow Chemical Co. | 7.375% | 11/1/29 | 1,948 | 2,455 |
| Dow Chemical Co. | 4.250% | 10/1/34 | 2,588 | 2,501 |
| Dow Chemical Co. | 9.400% | 5/15/39 | 1,390 | 2,132 |
| Dow Chemical Co. | 5.250% | 11/15/41 | 2,255 | 2,390 |
| Dow Chemical Co. | 4.375% | 11/15/42 | 2,919 | 2,763 |
| Dow Chemical Co. | 4.625% | 10/1/44 | 395 | 390 |
| Eastman Chemical Co. | 4.800% | 9/1/42 | 975 | 973 |
| Eastman Chemical Co. | 4.650% | 10/15/44 | 2,223 | 2,171 |
| Ecolab Inc. | 5.500% | 12/8/41 | 913 | 1,075 |
| Ecolab Inc. | 3.950% | 12/1/47 | 1,775 | 1,713 |
| EI du Pont de Nemours & Co. | 4.900% | 1/15/41 | 1,001 | 1,037 |
71
| Vanguard® Long-Term Corporate Bond Index Fund | ||||
| Schedule of Investments | ||||
| August 31, 2018 | ||||
| Face | Market | |||
| Maturity | Amount | Value | ||
| Coupon | Date | ($000) | ($000) | |
| EI du Pont de Nemours & Co. | 4.150% | 2/15/43 | 2,395 | 2,252 |
| Georgia-Pacific LLC | 7.250% | 6/1/28 | 366 | 455 |
| Georgia-Pacific LLC | 7.750% | 11/15/29 | 754 | 1,002 |
| Georgia-Pacific LLC | 8.875% | 5/15/31 | 953 | 1,393 |
| Goldcorp Inc. | 5.450% | 6/9/44 | 1,183 | 1,246 |
| International Flavors & Fragrances Inc. | 4.375% | 6/1/47 | 1,025 | 937 |
| International Paper Co. | 5.000% | 9/15/35 | 1,701 | 1,744 |
| International Paper Co. | 7.300% | 11/15/39 | 1,409 | 1,792 |
| International Paper Co. | 6.000% | 11/15/41 | 1,005 | 1,128 |
| International Paper Co. | 4.800% | 6/15/44 | 1,750 | 1,724 |
| International Paper Co. | 5.150% | 5/15/46 | 1,560 | 1,591 |
| International Paper Co. | 4.400% | 8/15/47 | 2,390 | 2,205 |
| International Paper Co. | 4.350% | 8/15/48 | 2,325 | 2,134 |
| Lubrizol Corp. | 6.500% | 10/1/34 | 528 | 681 |
| LYB International Finance BV | 5.250% | 7/15/43 | 1,450 | 1,515 |
| LYB International Finance BV | 4.875% | 3/15/44 | 2,185 | 2,182 |
| LyondellBasell Industries NV | 4.625% | 2/26/55 | 2,094 | 1,948 |
| Meadwestvaco Corp. | 7.950% | 2/15/31 | 718 | 933 |
| Methanex Corp. | 5.650% | 12/1/44 | 639 | 612 |
| Mosaic Co. | 5.450% | 11/15/33 | 1,338 | 1,372 |
| Mosaic Co. | 4.875% | 11/15/41 | 555 | 515 |
| Mosaic Co. | 5.625% | 11/15/43 | 1,241 | 1,266 |
| Newmont Mining Corp. | 5.875% | 4/1/35 | 1,187 | 1,347 |
| Newmont Mining Corp. | 6.250% | 10/1/39 | 1,873 | 2,127 |
| Newmont Mining Corp. | 4.875% | 3/15/42 | 2,320 | 2,285 |
| Nucor Corp. | 6.400% | 12/1/37 | 1,403 | 1,730 |
| Nucor Corp. | 5.200% | 8/1/43 | 995 | 1,097 |
| Nucor Corp. | 4.400% | 5/1/48 | 1,190 | 1,185 |
| Nutrien Ltd. | 4.125% | 3/15/35 | 1,183 | 1,098 |
| Nutrien Ltd. | 7.125% | 5/23/36 | 380 | 463 |
| Nutrien Ltd. | 5.875% | 12/1/36 | 1,086 | 1,213 |
| Nutrien Ltd. | 5.625% | 12/1/40 | 660 | 718 |
| Nutrien Ltd. | 6.125% | 1/15/41 | 1,096 | 1,249 |
| Nutrien Ltd. | 4.900% | 6/1/43 | 1,053 | 1,043 |
| Nutrien Ltd. | 5.250% | 1/15/45 | 936 | 979 |
| Placer Dome Inc. | 6.450% | 10/15/35 | 234 | 272 |
| Praxair Inc. | 3.550% | 11/7/42 | 1,163 | 1,091 |
| Rio Tinto Alcan Inc. | 7.250% | 3/15/31 | 843 | 1,069 |
| Rio Tinto Alcan Inc. | 6.125% | 12/15/33 | 569 | 684 |
| Rio Tinto Alcan Inc. | 5.750% | 6/1/35 | 1,110 | 1,287 |
| Rio Tinto Finance USA Ltd. | 5.200% | 11/2/40 | 2,442 | 2,745 |
| Rio Tinto Finance USA plc | 4.750% | 3/22/42 | 1,191 | 1,265 |
| Rio Tinto Finance USA plc | 4.125% | 8/21/42 | 1,803 | 1,763 |
| Rohm & Haas Co. | 7.850% | 7/15/29 | 1,190 | 1,538 |
| RPM International Inc. | 5.250% | 6/1/45 | 393 | 405 |
| RPM International Inc. | 4.250% | 1/15/48 | 800 | 715 |
| Sherwin-Williams Co. | 4.000% | 12/15/42 | 354 | 318 |
| Sherwin-Williams Co. | 4.550% | 8/1/45 | 713 | 694 |
| Sherwin-Williams Co. | 4.500% | 6/1/47 | 2,890 | 2,783 |
| Southern Copper Corp. | 7.500% | 7/27/35 | 3,086 | 3,800 |
| Southern Copper Corp. | 6.750% | 4/16/40 | 2,565 | 3,031 |
| Southern Copper Corp. | 5.250% | 11/8/42 | 1,990 | 1,994 |
| Southern Copper Corp. | 5.875% | 4/23/45 | 2,845 | 3,085 |
| Vale Canada Ltd. | 7.200% | 9/15/32 | 510 | 556 |
| Vale Overseas Ltd. | 8.250% | 1/17/34 | 1,718 | 2,178 |
| Vale Overseas Ltd. | 6.875% | 11/21/36 | 6,103 | 7,026 |
| Vale Overseas Ltd. | 6.875% | 11/10/39 | 3,127 | 3,635 |
| Vale SA | 5.625% | 9/11/42 | 1,400 | 1,432 |
| Westlake Chemical Corp. | 5.000% | 8/15/46 | 1,676 | 1,694 |
| Westlake Chemical Corp. | 4.375% | 11/15/47 | 1,185 | 1,082 |
| Westrock MWV LLC | 8.200% | 1/15/30 | 1,026 | 1,348 |
| Weyerhaeuser Co. | 7.375% | 3/15/32 | 1,969 | 2,511 |
| Weyerhaeuser Co. | 6.875% | 12/15/33 | 625 | 762 |
72
| Vanguard® Long-Term Corporate Bond Index Fund | ||||
| Schedule of Investments | ||||
| August 31, 2018 | ||||
| Face | Market | |||
| Maturity | Amount | Value | ||
| Coupon | Date | ($000) | ($000) | |
| Capital Goods (5.2%) | ||||
| 3M Co. | 3.875% | 6/15/44 | 590 | 580 |
| 3M Co. | 3.125% | 9/19/46 | 2,023 | 1,740 |
| 3M Co. | 3.625% | 10/15/47 | 1,507 | 1,427 |
| 3 ABB Finance USA Inc. | 4.375% | 5/8/42 | 1,489 | 1,537 |
| Boeing Co. | 6.125% | 2/15/33 | 511 | 639 |
| Boeing Co. | 3.300% | 3/1/35 | 470 | 442 |
| Boeing Co. | 6.625% | 2/15/38 | 923 | 1,241 |
| Boeing Co. | 3.550% | 3/1/38 | 765 | 735 |
| Boeing Co. | 6.875% | 3/15/39 | 1,135 | 1,572 |
| Boeing Co. | 5.875% | 2/15/40 | 971 | 1,224 |
| Boeing Co. | 3.375% | 6/15/46 | 1,003 | 910 |
| Boeing Co. | 3.650% | 3/1/47 | 660 | 624 |
| Boeing Co. | 3.625% | 3/1/48 | 650 | 613 |
| Caterpillar Inc. | 5.300% | 9/15/35 | 648 | 747 |
| Caterpillar Inc. | 6.050% | 8/15/36 | 913 | 1,127 |
| Caterpillar Inc. | 5.200% | 5/27/41 | 916 | 1,058 |
| Caterpillar Inc. | 3.803% | 8/15/42 | 5,144 | 4,944 |
| Caterpillar Inc. | 4.300% | 5/15/44 | 670 | 694 |
| Caterpillar Inc. | 4.750% | 5/15/64 | 894 | 939 |
| Crane Co. | 4.200% | 3/15/48 | 1,000 | 946 |
| Deere & Co. | 5.375% | 10/16/29 | 557 | 637 |
| Deere & Co. | 7.125% | 3/3/31 | 313 | 405 |
| Deere & Co. | 3.900% | 6/9/42 | 3,483 | 3,463 |
| Dover Corp. | 5.375% | 10/15/35 | 600 | 677 |
| Dover Corp. | 6.600% | 3/15/38 | 125 | 159 |
| Dover Corp. | 5.375% | 3/1/41 | 576 | 653 |
| Eaton Corp. | 4.000% | 11/2/32 | 668 | 666 |
| Eaton Corp. | 4.150% | 11/2/42 | 2,025 | 1,949 |
| Eaton Corp. | 3.915% | 9/15/47 | 623 | 574 |
| Emerson Electric Co. | 5.250% | 11/15/39 | 115 | 132 |
| Fortive Corp. | 4.300% | 6/15/46 | 983 | 940 |
| General Dynamics Corp. | 3.600% | 11/15/42 | 1,582 | 1,516 |
| General Electric Co. | 6.750% | 3/15/32 | 6,634 | 8,221 |
| General Electric Co. | 6.150% | 8/7/37 | 3,294 | 3,866 |
| General Electric Co. | 5.875% | 1/14/38 | 6,649 | 7,573 |
| General Electric Co. | 6.875% | 1/10/39 | 3,021 | 3,821 |
| General Electric Co. | 4.125% | 10/9/42 | 4,605 | 4,210 |
| General Electric Co. | 4.500% | 3/11/44 | 4,995 | 4,837 |
| Harris Corp. | 4.854% | 4/27/35 | 1,319 | 1,360 |
| Harris Corp. | 6.150% | 12/15/40 | 548 | 648 |
| Harris Corp. | 5.054% | 4/27/45 | 643 | 687 |
| Honeywell International Inc. | 5.700% | 3/15/36 | 863 | 1,048 |
| Honeywell International Inc. | 5.700% | 3/15/37 | 1,363 | 1,659 |
| Honeywell International Inc. | 5.375% | 3/1/41 | 616 | 726 |
| Honeywell International Inc. | 3.812% | 11/21/47 | 700 | 679 |
| Illinois Tool Works Inc. | 4.875% | 9/15/41 | 1,496 | 1,666 |
| Illinois Tool Works Inc. | 3.900% | 9/1/42 | 2,696 | 2,664 |
| Ingersoll-Rand Global Holding Co. Ltd. | 5.750% | 6/15/43 | 1,127 | 1,303 |
| Ingersoll-Rand Global Holding Co. Ltd. | 4.300% | 2/21/48 | 1,200 | 1,165 |
| Ingersoll-Rand Luxembourg Finance SA | 4.650% | 11/1/44 | 1,178 | 1,204 |
| Johnson Controls International plc | 6.000% | 1/15/36 | 660 | 767 |
| Johnson Controls International plc | 5.700% | 3/1/41 | 400 | 431 |
| Johnson Controls International plc | 4.625% | 7/2/44 | 1,005 | 992 |
| Johnson Controls International plc | 5.125% | 9/14/45 | 962 | 1,016 |
| Johnson Controls International plc | 4.500% | 2/15/47 | 1,777 | 1,723 |
| Johnson Controls International plc | 4.950% | 7/2/64 | 755 | 722 |
| Lafarge SA | 7.125% | 7/15/36 | 1,200 | 1,479 |
| Lockheed Martin Corp. | 3.600% | 3/1/35 | 1,513 | 1,416 |
| Lockheed Martin Corp. | 4.500% | 5/15/36 | 746 | 777 |
| Lockheed Martin Corp. | 6.150% | 9/1/36 | 815 | 995 |
| Lockheed Martin Corp. | 5.720% | 6/1/40 | 779 | 926 |
| Lockheed Martin Corp. | 4.850% | 9/15/41 | 1,130 | 1,216 |
73
| Vanguard® Long-Term Corporate Bond Index Fund | ||||
| Schedule of Investments | ||||
| August 31, 2018 | ||||
| Face | Market | |||
| Maturity | Amount | Value | ||
| Coupon | Date | ($000) | ($000) | |
| Lockheed Martin Corp. | 4.070% | 12/15/42 | 2,668 | 2,565 |
| Lockheed Martin Corp. | 3.800% | 3/1/45 | 2,292 | 2,123 |
| Lockheed Martin Corp. | 4.700% | 5/15/46 | 3,530 | 3,753 |
| Lockheed Martin Corp. | 4.090% | 9/15/52 | 1,717 | 1,630 |
| Martin Marietta Materials Inc. | 4.250% | 12/15/47 | 1,370 | 1,204 |
| Masco Corp. | 7.750% | 8/1/29 | 140 | 169 |
| Masco Corp. | 6.500% | 8/15/32 | 140 | 154 |
| Masco Corp. | 4.500% | 5/15/47 | 553 | 481 |
| Northrop Grumman Corp. | 5.050% | 11/15/40 | 871 | 930 |
| Northrop Grumman Corp. | 4.750% | 6/1/43 | 1,863 | 1,931 |
| Northrop Grumman Corp. | 3.850% | 4/15/45 | 1,714 | 1,566 |
| Northrop Grumman Corp. | 4.030% | 10/15/47 | 3,911 | 3,654 |
| Northrop Grumman Systems Corp. | 7.750% | 2/15/31 | 1,056 | 1,404 |
| Owens Corning | 7.000% | 12/1/36 | 563 | 641 |
| Owens Corning | 4.300% | 7/15/47 | 1,453 | 1,178 |
| Owens Corning | 4.400% | 1/30/48 | 1,000 | 836 |
| Parker-Hannifin Corp. | 4.200% | 11/21/34 | 1,553 | 1,572 |
| Parker-Hannifin Corp. | 6.250% | 5/15/38 | 835 | 1,042 |
| Parker-Hannifin Corp. | 4.450% | 11/21/44 | 507 | 526 |
| Parker-Hannifin Corp. | 4.100% | 3/1/47 | 2,330 | 2,323 |
| Precision Castparts Corp. | 3.900% | 1/15/43 | 692 | 664 |
| Precision Castparts Corp. | 4.375% | 6/15/45 | 938 | 974 |
| Raytheon Co. | 4.875% | 10/15/40 | 1,008 | 1,139 |
| Raytheon Co. | 4.700% | 12/15/41 | 823 | 912 |
| Raytheon Co. | 4.200% | 12/15/44 | 553 | 574 |
| Republic Services Inc. | 6.200% | 3/1/40 | 875 | 1,065 |
| Republic Services Inc. | 5.700% | 5/15/41 | 580 | 679 |
| Rockwell Collins Inc. | 4.800% | 12/15/43 | 738 | 759 |
| Rockwell Collins Inc. | 4.350% | 4/15/47 | 1,780 | 1,725 |
| Snap-on Inc. | 4.100% | 3/1/48 | 800 | 795 |
| Sonoco Products Co. | 5.750% | 11/1/40 | 1,268 | 1,409 |
| Stanley Black & Decker Inc. | 5.200% | 9/1/40 | 790 | 882 |
| Timken Co. | 4.500% | 12/15/28 | 200 | 200 |
| United Technologies Corp. | 4.125% | 11/16/28 | 6,450 | 6,466 |
| United Technologies Corp. | 7.500% | 9/15/29 | 535 | 685 |
| United Technologies Corp. | 5.400% | 5/1/35 | 1,028 | 1,138 |
| United Technologies Corp. | 6.050% | 6/1/36 | 1,178 | 1,373 |
| United Technologies Corp. | 6.125% | 7/15/38 | 1,684 | 1,992 |
| United Technologies Corp. | 4.450% | 11/16/38 | 2,500 | 2,498 |
| United Technologies Corp. | 5.700% | 4/15/40 | 2,039 | 2,330 |
| United Technologies Corp. | 4.500% | 6/1/42 | 7,955 | 7,900 |
| United Technologies Corp. | 4.150% | 5/15/45 | 1,649 | 1,551 |
| United Technologies Corp. | 3.750% | 11/1/46 | 2,175 | 1,920 |
| United Technologies Corp. | 4.050% | 5/4/47 | 1,000 | 922 |
| United Technologies Corp. | 4.625% | 11/16/48 | 4,200 | 4,246 |
| Valmont Industries Inc. | 5.000% | 10/1/44 | 800 | 737 |
| Valmont Industries Inc. | 5.250% | 10/1/54 | 825 | 728 |
| Vulcan Materials Co. | 4.500% | 6/15/47 | 2,148 | 1,955 |
| 2 Vulcan Materials Co. | 4.700% | 3/1/48 | 325 | 305 |
| Waste Management Inc. | 3.900% | 3/1/35 | 1,180 | 1,155 |
| Waste Management Inc. | 6.125% | 11/30/39 | 350 | 427 |
| Waste Management Inc. | 4.100% | 3/1/45 | 1,936 | 1,918 |
| WW Grainger Inc. | 4.600% | 6/15/45 | 2,266 | 2,398 |
| WW Grainger Inc. | 3.750% | 5/15/46 | 588 | 544 |
| WW Grainger Inc. | 4.200% | 5/15/47 | 975 | 974 |
| Xylem Inc. | 4.375% | 11/1/46 | 784 | 769 |
| Communication (13.9%) | ||||
| 21st Century Fox America Inc. | 6.550% | 3/15/33 | 676 | 834 |
| 21st Century Fox America Inc. | 6.200% | 12/15/34 | 2,425 | 2,946 |
| 21st Century Fox America Inc. | 6.400% | 12/15/35 | 2,422 | 3,006 |
| 21st Century Fox America Inc. | 8.150% | 10/17/36 | 631 | 910 |
| 21st Century Fox America Inc. | 6.150% | 3/1/37 | 2,580 | 3,142 |
| 21st Century Fox America Inc. | 6.650% | 11/15/37 | 1,832 | 2,372 |
74
| Vanguard® Long-Term Corporate Bond Index Fund | ||||
| Schedule of Investments | ||||
| August 31, 2018 | ||||
| Face | Market | |||
| Maturity | Amount | Value | ||
| Coupon | Date | ($000) | ($000) | |
| 21st Century Fox America Inc. | 6.900% | 8/15/39 | 2,285 | 3,015 |
| 21st Century Fox America Inc. | 6.150% | 2/15/41 | 3,293 | 4,069 |
| 21st Century Fox America Inc. | 5.400% | 10/1/43 | 2,158 | 2,468 |
| 21st Century Fox America Inc. | 4.750% | 9/15/44 | 2,035 | 2,152 |
| 21st Century Fox America Inc. | 4.950% | 10/15/45 | 800 | 875 |
| 21st Century Fox America Inc. | 7.750% | 12/1/45 | 405 | 592 |
| 21st Century Fox America Inc. | 4.750% | 11/15/46 | 850 | 909 |
| Activision Blizzard Inc. | 4.500% | 6/15/47 | 875 | 852 |
| America Movil SAB de CV | 6.375% | 3/1/35 | 2,264 | 2,677 |
| America Movil SAB de CV | 6.125% | 11/15/37 | 800 | 925 |
| America Movil SAB de CV | 6.125% | 3/30/40 | 4,146 | 4,851 |
| America Movil SAB de CV | 4.375% | 7/16/42 | 2,725 | 2,658 |
| AT&T Corp. | 8.250% | 11/15/31 | 822 | 1,082 |
| 2 AT&T Inc. | 4.300% | 2/15/30 | 7,725 | 7,384 |
| AT&T Inc. | 4.500% | 5/15/35 | 5,610 | 5,212 |
| AT&T Inc. | 5.250% | 3/1/37 | 7,489 | 7,412 |
| 2 AT&T Inc. | 4.900% | 8/15/37 | 6,600 | 6,328 |
| AT&T Inc. | 6.300% | 1/15/38 | 25 | 27 |
| AT&T Inc. | 6.550% | 2/15/39 | 250 | 280 |
| AT&T Inc. | 6.350% | 3/15/40 | 1,113 | 1,226 |
| AT&T Inc. | 6.000% | 8/15/40 | 1,971 | 2,063 |
| AT&T Inc. | 5.350% | 9/1/40 | 5,060 | 4,959 |
| AT&T Inc. | 6.375% | 3/1/41 | 2,210 | 2,407 |
| AT&T Inc. | 5.550% | 8/15/41 | 2,149 | 2,130 |
| AT&T Inc. | 5.150% | 3/15/42 | 2,369 | 2,276 |
| AT&T Inc. | 4.300% | 12/15/42 | 3,759 | 3,222 |
| AT&T Inc. | 4.800% | 6/15/44 | 5,728 | 5,202 |
| AT&T Inc. | 4.350% | 6/15/45 | 7,276 | 6,193 |
| AT&T Inc. | 4.750% | 5/15/46 | 7,549 | 6,810 |
| 2 AT&T Inc. | 5.150% | 11/15/46 | 4,493 | 4,258 |
| AT&T Inc. | 5.450% | 3/1/47 | 4,984 | 4,936 |
| AT&T Inc. | 4.500% | 3/9/48 | 9,533 | 8,214 |
| AT&T Inc. | 4.550% | 3/9/49 | 5,812 | 5,032 |
| 2 AT&T Inc. | 5.150% | 2/15/50 | 4,150 | 3,901 |
| AT&T Inc. | 5.700% | 3/1/57 | 1,961 | 1,965 |
| 2 AT&T Inc. | 5.300% | 8/15/58 | 1,425 | 1,368 |
| Bell Canada Inc. | 4.464% | 4/1/48 | 1,575 | 1,572 |
| British Telecommunications plc | 9.625% | 12/15/30 | 5,785 | 8,233 |
| CBS Corp. | 7.875% | 7/30/30 | 1,056 | 1,324 |
| CBS Corp. | 5.500% | 5/15/33 | 1,191 | 1,239 |
| CBS Corp. | 5.900% | 10/15/40 | 727 | 803 |
| CBS Corp. | 4.850% | 7/1/42 | 1,523 | 1,483 |
| CBS Corp. | 4.900% | 8/15/44 | 1,192 | 1,152 |
| CBS Corp. | 4.600% | 1/15/45 | 1,155 | 1,079 |
| Charter Communications Operating LLC / Charter | ||||
| Communications Operating Capital | 6.384% | 10/23/35 | 4,810 | 5,111 |
| Charter Communications Operating LLC / Charter | ||||
| Communications Operating Capital | 5.375% | 4/1/38 | 1,750 | 1,692 |
| Charter Communications Operating LLC / Charter | ||||
| Communications Operating Capital | 6.484% | 10/23/45 | 7,370 | 7,867 |
| Charter Communications Operating LLC / Charter | ||||
| Communications Operating Capital | 5.375% | 5/1/47 | 5,295 | 4,960 |
| Charter Communications Operating LLC / Charter | ||||
| Communications Operating Capital | 5.750% | 4/1/48 | 3,915 | 3,852 |
| Charter Communications Operating LLC / Charter | ||||
| Communications Operating Capital | 6.834% | 10/23/55 | 890 | 979 |
| Comcast Corp. | 4.250% | 1/15/33 | 3,743 | 3,729 |
| Comcast Corp. | 7.050% | 3/15/33 | 1,892 | 2,399 |
| Comcast Corp. | 4.200% | 8/15/34 | 2,179 | 2,116 |
| Comcast Corp. | 5.650% | 6/15/35 | 1,440 | 1,627 |
| Comcast Corp. | 4.400% | 8/15/35 | 1,683 | 1,667 |
| Comcast Corp. | 6.500% | 11/15/35 | 2,113 | 2,557 |
| Comcast Corp. | 3.200% | 7/15/36 | 1,574 | 1,340 |
| Comcast Corp. | 6.450% | 3/15/37 | 1,815 | 2,189 |
75
| Vanguard® Long-Term Corporate Bond Index Fund | ||||
| Schedule of Investments | ||||
| August 31, 2018 | ||||
| Face | Market | |||
| Maturity | Amount | Value | ||
| Coupon | Date | ($000) | ($000) | |
| Comcast Corp. | 6.950% | 8/15/37 | 1,687 | 2,134 |
| Comcast Corp. | 3.900% | 3/1/38 | 3,350 | 3,101 |
| Comcast Corp. | 6.400% | 5/15/38 | 1,368 | 1,638 |
| Comcast Corp. | 6.550% | 7/1/39 | 175 | 214 |
| Comcast Corp. | 6.400% | 3/1/40 | 911 | 1,078 |
| Comcast Corp. | 4.650% | 7/15/42 | 3,269 | 3,258 |
| Comcast Corp. | 4.500% | 1/15/43 | 1,021 | 987 |
| Comcast Corp. | 4.750% | 3/1/44 | 2,371 | 2,394 |
| Comcast Corp. | 4.600% | 8/15/45 | 3,256 | 3,204 |
| Comcast Corp. | 3.400% | 7/15/46 | 3,186 | 2,639 |
| Comcast Corp. | 4.000% | 8/15/47 | 250 | 227 |
| Comcast Corp. | 3.969% | 11/1/47 | 6,125 | 5,503 |
| Comcast Corp. | 3.999% | 11/1/49 | 6,204 | 5,585 |
| Comcast Corp. | 4.049% | 11/1/52 | 3,130 | 2,768 |
| Crown Castle International Corp. | 4.750% | 5/15/47 | 800 | 768 |
| Deutsche Telekom International Finance BV | 8.750% | 6/15/30 | 8,875 | 11,985 |
| Discovery Communications LLC | 5.000% | 9/20/37 | 2,628 | 2,563 |
| Discovery Communications LLC | 6.350% | 6/1/40 | 1,630 | 1,786 |
| Discovery Communications LLC | 4.950% | 5/15/42 | 1,000 | 940 |
| Discovery Communications LLC | 4.875% | 4/1/43 | 2,054 | 1,899 |
| Discovery Communications LLC | 5.200% | 9/20/47 | 2,855 | 2,762 |
| Grupo Televisa SAB | 8.500% | 3/11/32 | 640 | 812 |
| Grupo Televisa SAB | 6.625% | 1/15/40 | 1,344 | 1,517 |
| Grupo Televisa SAB | 5.000% | 5/13/45 | 2,143 | 1,978 |
| Grupo Televisa SAB | 6.125% | 1/31/46 | 1,925 | 2,072 |
| Koninklijke KPN NV | 8.375% | 10/1/30 | 1,726 | 2,252 |
| Moody's Corp. | 5.250% | 7/15/44 | 1,270 | 1,419 |
| NBCUniversal Media LLC | 6.400% | 4/30/40 | 1,450 | 1,744 |
| NBCUniversal Media LLC | 5.950% | 4/1/41 | 2,475 | 2,864 |
| NBCUniversal Media LLC | 4.450% | 1/15/43 | 2,182 | 2,093 |
| Orange SA | 9.000% | 3/1/31 | 5,155 | 7,228 |
| Orange SA | 5.375% | 1/13/42 | 2,362 | 2,557 |
| Orange SA | 5.500% | 2/6/44 | 1,274 | 1,407 |
| Rogers Communications Inc. | 7.500% | 8/15/38 | 725 | 971 |
| Rogers Communications Inc. | 4.500% | 3/15/43 | 889 | 882 |
| Rogers Communications Inc. | 5.450% | 10/1/43 | 1,438 | 1,590 |
| Rogers Communications Inc. | 5.000% | 3/15/44 | 2,551 | 2,662 |
| Rogers Communications Inc. | 4.300% | 2/15/48 | 1,455 | 1,416 |
| S&P Global Inc. | 6.550% | 11/15/37 | 959 | 1,220 |
| S&P Global Inc. | 4.500% | 5/15/48 | 925 | 948 |
| Telefonica Emisiones SAU | 7.045% | 6/20/36 | 4,363 | 5,270 |
| Telefonica Emisiones SAU | 4.665% | 3/6/38 | 1,700 | 1,614 |
| Telefonica Emisiones SAU | 5.213% | 3/8/47 | 5,466 | 5,385 |
| Telefonica Emisiones SAU | 4.895% | 3/6/48 | 2,700 | 2,563 |
| Telefonica Europe BV | 8.250% | 9/15/30 | 2,362 | 3,071 |
| TELUS Corp. | 4.600% | 11/16/48 | 1,550 | 1,548 |
| Thomson Reuters Corp. | 5.500% | 8/15/35 | 900 | 952 |
| Thomson Reuters Corp. | 5.850% | 4/15/40 | 1,097 | 1,207 |
| Thomson Reuters Corp. | 4.500% | 5/23/43 | 750 | 689 |
| Thomson Reuters Corp. | 5.650% | 11/23/43 | 917 | 988 |
| Time Warner Cable LLC | 6.550% | 5/1/37 | 2,979 | 3,223 |
| Time Warner Cable LLC | 7.300% | 7/1/38 | 3,400 | 3,941 |
| Time Warner Cable LLC | 6.750% | 6/15/39 | 3,031 | 3,324 |
| Time Warner Cable LLC | 5.875% | 11/15/40 | 2,423 | 2,426 |
| Time Warner Cable LLC | 5.500% | 9/1/41 | 3,085 | 2,965 |
| Time Warner Cable LLC | 4.500% | 9/15/42 | 3,065 | 2,580 |
| Time Warner Entertainment Co. LP | 8.375% | 7/15/33 | 1,748 | 2,199 |
| Time Warner Inc. | 3.800% | 2/15/27 | 750 | 725 |
| Time Warner Inc. | 6.200% | 3/15/40 | 900 | 976 |
| Time Warner Inc. | 6.100% | 7/15/40 | 500 | 536 |
| Time Warner Inc. | 5.375% | 10/15/41 | 1,170 | 1,157 |
| Time Warner Inc. | 4.900% | 6/15/42 | 3,198 | 2,999 |
| Time Warner Inc. | 5.350% | 12/15/43 | 1,663 | 1,637 |
| Time Warner Inc. | 4.650% | 6/1/44 | 2,296 | 2,098 |
76
| Vanguard® Long-Term Corporate Bond Index Fund | ||||
| Schedule of Investments | ||||
| August 31, 2018 | ||||
| Face | Market | |||
| Maturity | Amount | Value | ||
| Coupon | Date | ($000) | ($000) | |
| 2 Verizon Communications Inc. | 4.329% | 9/21/28 | 10,100 | 10,174 |
| Verizon Communications Inc. | 4.500% | 8/10/33 | 7,541 | 7,431 |
| Verizon Communications Inc. | 4.400% | 11/1/34 | 5,717 | 5,488 |
| Verizon Communications Inc. | 5.850% | 9/15/35 | 325 | 363 |
| Verizon Communications Inc. | 4.272% | 1/15/36 | 6,447 | 6,065 |
| Verizon Communications Inc. | 5.250% | 3/16/37 | 7,058 | 7,420 |
| Verizon Communications Inc. | 4.812% | 3/15/39 | 4,425 | 4,416 |
| Verizon Communications Inc. | 4.750% | 11/1/41 | 1,980 | 1,924 |
| Verizon Communications Inc. | 3.850% | 11/1/42 | 2,861 | 2,476 |
| Verizon Communications Inc. | 4.125% | 8/15/46 | 4,230 | 3,735 |
| Verizon Communications Inc. | 4.862% | 8/21/46 | 10,179 | 10,002 |
| Verizon Communications Inc. | 5.500% | 3/16/47 | 3,500 | 3,771 |
| Verizon Communications Inc. | 4.522% | 9/15/48 | 9,919 | 9,351 |
| Verizon Communications Inc. | 5.012% | 4/15/49 | 8,594 | 8,626 |
| Verizon Communications Inc. | 5.012% | 8/21/54 | 11,889 | 11,588 |
| Verizon Communications Inc. | 4.672% | 3/15/55 | 11,369 | 10,378 |
| Viacom Inc. | 6.875% | 4/30/36 | 2,343 | 2,634 |
| Viacom Inc. | 4.375% | 3/15/43 | 3,685 | 3,174 |
| Viacom Inc. | 5.850% | 9/1/43 | 2,960 | 3,077 |
| Vodafone Group plc | 7.875% | 2/15/30 | 1,313 | 1,638 |
| Vodafone Group plc | 6.250% | 11/30/32 | 1,214 | 1,365 |
| Vodafone Group plc | 6.150% | 2/27/37 | 3,760 | 4,215 |
| Vodafone Group plc | 5.000% | 5/30/38 | 2,150 | 2,129 |
| Vodafone Group plc | 4.375% | 2/19/43 | 3,108 | 2,812 |
| Vodafone Group plc | 5.250% | 5/30/48 | 6,475 | 6,516 |
| Walt Disney Co. | 7.000% | 3/1/32 | 1,130 | 1,476 |
| Walt Disney Co. | 4.375% | 8/16/41 | 806 | 821 |
| Walt Disney Co. | 4.125% | 12/1/41 | 1,308 | 1,295 |
| Walt Disney Co. | 3.700% | 12/1/42 | 1,135 | 1,048 |
| Walt Disney Co. | 4.125% | 6/1/44 | 2,070 | 2,051 |
| Walt Disney Co. | 3.000% | 7/30/46 | 580 | 480 |
| Warner Media LLC | 7.625% | 4/15/31 | 2,800 | 3,558 |
| Warner Media LLC | 4.850% | 7/15/45 | 20 | 19 |
| WPP Finance 2010 | 5.125% | 9/7/42 | 1,020 | 990 |
| WPP Finance 2010 | 5.625% | 11/15/43 | 804 | 835 |
| Consumer Cyclical (6.1%) | ||||
| Alibaba Group Holding Ltd. | 4.500% | 11/28/34 | 1,486 | 1,485 |
| Alibaba Group Holding Ltd. | 4.000% | 12/6/37 | 2,150 | 2,014 |
| Alibaba Group Holding Ltd. | 4.200% | 12/6/47 | 3,750 | 3,502 |
| Alibaba Group Holding Ltd. | 4.400% | 12/6/57 | 2,180 | 2,040 |
| Amazon.com Inc. | 4.800% | 12/5/34 | 3,067 | 3,359 |
| Amazon.com Inc. | 3.875% | 8/22/37 | 6,035 | 5,914 |
| Amazon.com Inc. | 4.950% | 12/5/44 | 3,224 | 3,635 |
| Amazon.com Inc. | 4.050% | 8/22/47 | 7,320 | 7,164 |
| Amazon.com Inc. | 4.250% | 8/22/57 | 4,775 | 4,741 |
| Aptiv plc | 4.400% | 10/1/46 | 655 | 599 |
| Bed Bath & Beyond Inc. | 4.915% | 8/1/34 | 550 | 449 |
| Bed Bath & Beyond Inc. | 5.165% | 8/1/44 | 1,914 | 1,442 |
| BorgWarner Inc. | 4.375% | 3/15/45 | 915 | 878 |
| Cummins Inc. | 7.125% | 3/1/28 | 325 | 398 |
| Cummins Inc. | 4.875% | 10/1/43 | 738 | 816 |
| Daimler Finance North America LLC | 8.500% | 1/18/31 | 2,636 | 3,713 |
| Darden Restaurants Inc. | 4.550% | 2/15/48 | 600 | 569 |
| eBay Inc. | 4.000% | 7/15/42 | 1,472 | 1,232 |
| Ford Motor Co. | 6.625% | 10/1/28 | 1,053 | 1,121 |
| Ford Motor Co. | 7.450% | 7/16/31 | 4,505 | 5,017 |
| Ford Motor Co. | 4.750% | 1/15/43 | 3,886 | 3,211 |
| Ford Motor Co. | 7.400% | 11/1/46 | 778 | 881 |
| Ford Motor Co. | 5.291% | 12/8/46 | 2,915 | 2,598 |
| General Motors Co. | 5.000% | 4/1/35 | 1,006 | 947 |
| General Motors Co. | 6.600% | 4/1/36 | 2,999 | 3,235 |
| General Motors Co. | 5.150% | 4/1/38 | 2,438 | 2,339 |
| General Motors Co. | 6.250% | 10/2/43 | 3,314 | 3,433 |
77
| Vanguard® Long-Term Corporate Bond Index Fund | ||||
| Schedule of Investments | ||||
| August 31, 2018 | ||||
| Face | Market | |||
| Maturity | Amount | Value | ||
| Coupon | Date | ($000) | ($000) | |
| General Motors Co. | 5.200% | 4/1/45 | 4,318 | 3,967 |
| General Motors Co. | 6.750% | 4/1/46 | 1,730 | 1,897 |
| General Motors Co. | 5.400% | 4/1/48 | 903 | 860 |
| Harley-Davidson Inc. | 4.625% | 7/28/45 | 713 | 675 |
| Home Depot Inc. | 5.875% | 12/16/36 | 6,326 | 7,756 |
| Home Depot Inc. | 5.400% | 9/15/40 | 1,730 | 2,043 |
| Home Depot Inc. | 5.950% | 4/1/41 | 2,225 | 2,769 |
| Home Depot Inc. | 4.200% | 4/1/43 | 3,101 | 3,119 |
| Home Depot Inc. | 4.875% | 2/15/44 | 1,203 | 1,336 |
| Home Depot Inc. | 4.400% | 3/15/45 | 2,419 | 2,490 |
| Home Depot Inc. | 4.250% | 4/1/46 | 2,720 | 2,754 |
| Home Depot Inc. | 3.900% | 6/15/47 | 1,445 | 1,396 |
| Home Depot Inc. | 3.500% | 9/15/56 | 2,113 | 1,842 |
| Hyatt Hotels Corp. | 4.375% | 9/15/28 | 800 | 795 |
| Kohl's Corp. | 5.550% | 7/17/45 | 985 | 945 |
| Lowe's Cos. Inc. | 6.500% | 3/15/29 | 331 | 403 |
| Lowe's Cos. Inc. | 4.650% | 4/15/42 | 1,515 | 1,585 |
| Lowe's Cos. Inc. | 4.250% | 9/15/44 | 818 | 811 |
| Lowe's Cos. Inc. | 4.375% | 9/15/45 | 1,931 | 1,959 |
| Lowe's Cos. Inc. | 3.700% | 4/15/46 | 3,400 | 3,117 |
| Lowe's Cos. Inc. | 4.050% | 5/3/47 | 3,914 | 3,802 |
| Macy's Retail Holdings Inc. | 7.000% | 2/15/28 | 250 | 272 |
| Macy's Retail Holdings Inc. | 6.900% | 4/1/29 | 520 | 559 |
| Macy's Retail Holdings Inc. | 4.500% | 12/15/34 | 960 | 802 |
| Mastercard Inc. | 3.800% | 11/21/46 | 1,160 | 1,135 |
| Mastercard Inc. | 3.950% | 2/26/48 | 1,215 | 1,229 |
| McDonald's Corp. | 4.700% | 12/9/35 | 1,695 | 1,773 |
| McDonald's Corp. | 6.300% | 10/15/37 | 1,600 | 1,942 |
| McDonald's Corp. | 6.300% | 3/1/38 | 2,055 | 2,481 |
| McDonald's Corp. | 5.700% | 2/1/39 | 720 | 823 |
| McDonald's Corp. | 3.700% | 2/15/42 | 1,002 | 898 |
| McDonald's Corp. | 3.625% | 5/1/43 | 1,203 | 1,027 |
| McDonald's Corp. | 4.600% | 5/26/45 | 1,039 | 1,046 |
| McDonald's Corp. | 4.875% | 12/9/45 | 3,873 | 4,039 |
| McDonald's Corp. | 4.450% | 3/1/47 | 2,531 | 2,516 |
| McDonald's Corp. | 4.450% | 9/1/48 | 1,600 | 1,585 |
| NIKE Inc. | 3.625% | 5/1/43 | 808 | 759 |
| NIKE Inc. | 3.875% | 11/1/45 | 2,096 | 2,028 |
| NIKE Inc. | 3.375% | 11/1/46 | 1,395 | 1,243 |
| Nordstrom Inc. | 5.000% | 1/15/44 | 2,049 | 1,885 |
| QVC Inc. | 5.450% | 8/15/34 | 685 | 617 |
| QVC Inc. | 5.950% | 3/15/43 | 105 | 96 |
| Starbucks Corp. | 4.000% | 11/15/28 | 2,000 | 2,002 |
| Starbucks Corp. | 4.300% | 6/15/45 | 640 | 616 |
| Starbucks Corp. | 3.750% | 12/1/47 | 1,000 | 882 |
| Starbucks Corp. | 4.500% | 11/15/48 | 2,050 | 2,021 |
| Target Corp. | 6.350% | 11/1/32 | 744 | 915 |
| Target Corp. | 6.500% | 10/15/37 | 1,067 | 1,377 |
| Target Corp. | 7.000% | 1/15/38 | 1,475 | 1,975 |
| Target Corp. | 4.000% | 7/1/42 | 3,057 | 2,964 |
| Target Corp. | 3.625% | 4/15/46 | 2,185 | 1,986 |
| Target Corp. | 3.900% | 11/15/47 | 1,590 | 1,514 |
| VF Corp. | 6.450% | 11/1/37 | 720 | 919 |
| Visa Inc. | 4.150% | 12/14/35 | 3,991 | 4,178 |
| Visa Inc. | 4.300% | 12/14/45 | 7,232 | 7,580 |
| Visa Inc. | 3.650% | 9/15/47 | 1,305 | 1,235 |
| Walgreen Co. | 4.400% | 9/15/42 | 1,085 | 975 |
| Walgreens Boots Alliance Inc. | 4.500% | 11/18/34 | 1,101 | 1,064 |
| Walgreens Boots Alliance Inc. | 4.800% | 11/18/44 | 3,211 | 3,073 |
| Walgreens Boots Alliance Inc. | 4.650% | 6/1/46 | 1,110 | 1,044 |
| Walmart Inc. | 7.550% | 2/15/30 | 1,043 | 1,410 |
| Walmart Inc. | 5.250% | 9/1/35 | 4,645 | 5,414 |
| Walmart Inc. | 6.200% | 4/15/38 | 2,754 | 3,555 |
| Walmart Inc. | 3.950% | 6/28/38 | 3,660 | 3,671 |
78
| Vanguard® Long-Term Corporate Bond Index Fund | ||||
| Schedule of Investments | ||||
| August 31, 2018 | ||||
| Face | Market | |||
| Maturity | Amount | Value | ||
| Coupon | Date | ($000) | ($000) | |
| Walmart Inc. | 5.625% | 4/1/40 | 1,577 | 1,933 |
| Walmart Inc. | 4.875% | 7/8/40 | 875 | 982 |
| Walmart Inc. | 5.000% | 10/25/40 | 1,033 | 1,178 |
| Walmart Inc. | 5.625% | 4/15/41 | 2,541 | 3,114 |
| Walmart Inc. | 4.000% | 4/11/43 | 2,011 | 2,002 |
| Walmart Inc. | 4.300% | 4/22/44 | 990 | 1,031 |
| Walmart Inc. | 3.625% | 12/15/47 | 2,903 | 2,736 |
| Walmart Inc. | 4.050% | 6/29/48 | 6,625 | 6,685 |
| Western Union Co. | 6.200% | 11/17/36 | 1,023 | 1,023 |
| Consumer Noncyclical (17.8%) | ||||
| Abbott Laboratories | 4.750% | 11/30/36 | 4,783 | 5,079 |
| Abbott Laboratories | 6.150% | 11/30/37 | 289 | 349 |
| Abbott Laboratories | 6.000% | 4/1/39 | 814 | 970 |
| Abbott Laboratories | 5.300% | 5/27/40 | 1,813 | 2,029 |
| Abbott Laboratories | 4.750% | 4/15/43 | 728 | 775 |
| Abbott Laboratories | 4.900% | 11/30/46 | 7,475 | 8,078 |
| AbbVie Inc. | 4.500% | 5/14/35 | 5,485 | 5,354 |
| AbbVie Inc. | 4.300% | 5/14/36 | 2,073 | 1,991 |
| AbbVie Inc. | 4.400% | 11/6/42 | 5,569 | 5,223 |
| AbbVie Inc. | 4.700% | 5/14/45 | 6,205 | 6,050 |
| AbbVie Inc. | 4.450% | 5/14/46 | 4,291 | 4,063 |
| Actavis Inc. | 4.625% | 10/1/42 | 1,275 | 1,207 |
| Advocate Health & Hospitals Corp. | 4.272% | 8/15/48 | 875 | 892 |
| AHS Hospital Corp. | 5.024% | 7/1/45 | 763 | 859 |
| Allergan Funding SCS | 4.550% | 3/15/35 | 5,495 | 5,388 |
| Allergan Funding SCS | 4.850% | 6/15/44 | 3,211 | 3,176 |
| Allergan Funding SCS | 4.750% | 3/15/45 | 1,790 | 1,773 |
| Altria Group Inc. | 4.250% | 8/9/42 | 2,966 | 2,772 |
| Altria Group Inc. | 4.500% | 5/2/43 | 1,910 | 1,852 |
| Altria Group Inc. | 5.375% | 1/31/44 | 3,286 | 3,578 |
| Altria Group Inc. | 3.875% | 9/16/46 | 3,110 | 2,753 |
| AmerisourceBergen Corp. | 4.250% | 3/1/45 | 328 | 294 |
| AmerisourceBergen Corp. | 4.300% | 12/15/47 | 2,170 | 1,951 |
| Amgen Inc. | 6.400% | 2/1/39 | 2,195 | 2,636 |
| Amgen Inc. | 4.950% | 10/1/41 | 1,663 | 1,691 |
| Amgen Inc. | 5.150% | 11/15/41 | 2,625 | 2,763 |
| Amgen Inc. | 4.400% | 5/1/45 | 4,341 | 4,166 |
| Amgen Inc. | 4.563% | 6/15/48 | 4,270 | 4,191 |
| Amgen Inc. | 4.663% | 6/15/51 | 7,982 | 7,949 |
| Anheuser-Busch InBev Finance Inc. | 4.700% | 2/1/36 | 14,542 | 14,736 |
| Anheuser-Busch InBev Finance Inc. | 4.000% | 1/17/43 | 1,490 | 1,340 |
| Anheuser-Busch InBev Finance Inc. | 4.625% | 2/1/44 | 1,525 | 1,495 |
| Anheuser-Busch InBev Finance Inc. | 4.900% | 2/1/46 | 25,458 | 25,948 |
| Anheuser-Busch InBev Worldwide Inc. | 5.875% | 6/15/35 | 850 | 975 |
| Anheuser-Busch InBev Worldwide Inc. | 4.375% | 4/15/38 | 4,825 | 4,693 |
| Anheuser-Busch InBev Worldwide Inc. | 8.200% | 1/15/39 | 1,810 | 2,589 |
| Anheuser-Busch InBev Worldwide Inc. | 8.000% | 11/15/39 | 728 | 1,022 |
| Anheuser-Busch InBev Worldwide Inc. | 4.950% | 1/15/42 | 3,285 | 3,416 |
| Anheuser-Busch InBev Worldwide Inc. | 3.750% | 7/15/42 | 2,074 | 1,832 |
| Anheuser-Busch InBev Worldwide Inc. | 4.600% | 4/15/48 | 6,655 | 6,541 |
| Anheuser-Busch InBev Worldwide Inc. | 4.439% | 10/6/48 | 2,500 | 2,404 |
| Anheuser-Busch InBev Worldwide Inc. | 4.750% | 4/15/58 | 1,240 | 1,212 |
| Archer-Daniels-Midland Co. | 5.935% | 10/1/32 | 880 | 1,024 |
| Archer-Daniels-Midland Co. | 5.375% | 9/15/35 | 1,005 | 1,143 |
| Archer-Daniels-Midland Co. | 4.535% | 3/26/42 | 1,396 | 1,447 |
| Archer-Daniels-Midland Co. | 4.016% | 4/16/43 | 1,622 | 1,577 |
| Archer-Daniels-Midland Co. | 3.750% | 9/15/47 | 1,340 | 1,240 |
| Ascension Health | 3.945% | 11/15/46 | 1,878 | 1,855 |
| 1 Ascension Health | 4.847% | 11/15/53 | 738 | 833 |
| AstraZeneca plc | 4.000% | 1/17/29 | 1,575 | 1,567 |
| AstraZeneca plc | 6.450% | 9/15/37 | 5,553 | 6,924 |
| AstraZeneca plc | 4.000% | 9/18/42 | 2,487 | 2,346 |
| AstraZeneca plc | 4.375% | 11/16/45 | 1,144 | 1,131 |
79
| Vanguard® Long-Term Corporate Bond Index Fund | ||||
| Schedule of Investments | ||||
| August 31, 2018 | ||||
| Face | Market | |||
| Maturity | Amount | Value | ||
| Coupon | Date | ($000) | ($000) | |
| AstraZeneca plc | 4.375% | 8/17/48 | 2,200 | 2,170 |
| 2 BAT Capital Corp. | 4.390% | 8/15/37 | 7,225 | 6,719 |
| 2 BAT Capital Corp. | 4.540% | 8/15/47 | 5,285 | 4,877 |
| Baxalta Inc. | 5.250% | 6/23/45 | 2,538 | 2,763 |
| Baxter International Inc. | 3.500% | 8/15/46 | 1,058 | 908 |
| Baylor Scott & White Holdings | 4.185% | 11/15/45 | 1,036 | 1,049 |
| Baylor Scott & White Holdings | 3.967% | 11/15/46 | 200 | 192 |
| Becton Dickinson & Co. | 4.685% | 12/15/44 | 2,651 | 2,603 |
| Becton Dickinson & Co. | 4.669% | 6/6/47 | 3,124 | 3,081 |
| Becton Dickinson & Co. | 5.000% | 11/12/40 | 257 | 261 |
| Biogen Inc. | 5.200% | 9/15/45 | 3,893 | 4,172 |
| Boston Children's Hospital Corp. Revenue | 4.115% | 1/1/47 | 585 | 589 |
| Boston Scientific Corp. | 7.000% | 11/15/35 | 530 | 673 |
| Boston Scientific Corp. | 7.375% | 1/15/40 | 685 | 919 |
| Bristol-Myers Squibb Co. | 3.250% | 8/1/42 | 1,075 | 946 |
| Bristol-Myers Squibb Co. | 4.500% | 3/1/44 | 1,088 | 1,160 |
| Brown-Forman Corp. | 4.000% | 4/15/38 | 700 | 702 |
| Brown-Forman Corp. | 4.500% | 7/15/45 | 1,001 | 1,070 |
| Campbell Soup Co. | 3.800% | 8/2/42 | 875 | 685 |
| Campbell Soup Co. | 4.800% | 3/15/48 | 2,330 | 2,110 |
| Cardinal Health Inc. | 4.600% | 3/15/43 | 1,027 | 938 |
| Cardinal Health Inc. | 4.500% | 11/15/44 | 1,192 | 1,069 |
| Cardinal Health Inc. | 4.900% | 9/15/45 | 725 | 683 |
| Cardinal Health Inc. | 4.368% | 6/15/47 | 1,519 | 1,328 |
| 1 Catholic Health Initiatives Colorado GO | 4.350% | 11/1/42 | 1,504 | 1,425 |
| Celgene Corp. | 5.250% | 8/15/43 | 1,385 | 1,439 |
| Celgene Corp. | 4.625% | 5/15/44 | 2,429 | 2,279 |
| Celgene Corp. | 5.000% | 8/15/45 | 4,290 | 4,260 |
| Celgene Corp. | 4.350% | 11/15/47 | 2,375 | 2,177 |
| Celgene Corp. | 4.550% | 2/20/48 | 3,225 | 3,061 |
| Children's Hospital Medical Center Ohio GO | 4.268% | 5/15/44 | 625 | 651 |
| Church & Dwight Co. Inc. | 3.950% | 8/1/47 | 763 | 693 |
| City of Hope | 5.623% | 11/15/43 | 575 | 696 |
| City of Hope | 4.378% | 8/15/48 | 800 | 805 |
| Cleveland Clinic Foundation Ohio Revenue | 4.858% | 1/1/14 | 838 | 883 |
| Coca-Cola Femsa SAB de CV | 5.250% | 11/26/43 | 1,200 | 1,326 |
| Colgate-Palmolive Co. | 4.000% | 8/15/45 | 991 | 983 |
| Colgate-Palmolive Co. | 3.700% | 8/1/47 | 1,260 | 1,194 |
| Conagra Brands Inc. | 7.000% | 10/1/28 | 671 | 772 |
| Conagra Brands Inc. | 8.250% | 9/15/30 | 548 | 715 |
| Constellation Brands Inc. | 4.500% | 5/9/47 | 485 | 452 |
| Constellation Brands Inc. | 4.100% | 2/15/48 | 1,936 | 1,707 |
| CVS Health Corp. | 4.875% | 7/20/35 | 2,740 | 2,775 |
| CVS Health Corp. | 4.780% | 3/25/38 | 6,750 | 6,687 |
| CVS Health Corp. | 6.125% | 9/15/39 | 3,000 | 3,469 |
| CVS Health Corp. | 5.300% | 12/5/43 | 2,973 | 3,128 |
| CVS Health Corp. | 5.125% | 7/20/45 | 7,385 | 7,549 |
| CVS Health Corp. | 5.050% | 3/25/48 | 17,470 | 17,781 |
| Danaher Corp. | 4.375% | 9/15/45 | 1,072 | 1,122 |
| Dartmouth-Hitchcock Health | 4.178% | 8/1/48 | 625 | 620 |
| Delhaize America LLC | 9.000% | 4/15/31 | 320 | 434 |
| Diageo Capital plc | 5.875% | 9/30/36 | 1,481 | 1,788 |
| Diageo Capital plc | 3.875% | 4/29/43 | 883 | 868 |
| Diageo Investment Corp. | 7.450% | 4/15/35 | 837 | 1,166 |
| Diageo Investment Corp. | 4.250% | 5/11/42 | 1,166 | 1,177 |
| Dignity Health California GO | 4.500% | 11/1/42 | 950 | 908 |
| Dignity Health California GO | 5.267% | 11/1/64 | 413 | 419 |
| Duke University Health System Inc. | 3.920% | 6/1/47 | 1,168 | 1,154 |
| Eli Lilly & Co. | 5.550% | 3/15/37 | 1,071 | 1,284 |
| Eli Lilly & Co. | 3.700% | 3/1/45 | 1,596 | 1,529 |
| Eli Lilly & Co. | 3.950% | 5/15/47 | 1,600 | 1,592 |
| Estee Lauder Cos. Inc. | 6.000% | 5/15/37 | 645 | 793 |
| Estee Lauder Cos. Inc. | 4.375% | 6/15/45 | 1,078 | 1,123 |
| Estee Lauder Cos. Inc. | 4.150% | 3/15/47 | 1,058 | 1,074 |
80
| Vanguard® Long-Term Corporate Bond Index Fund | ||||
| Schedule of Investments | ||||
| August 31, 2018 | ||||
| Face | Market | |||
| Maturity | Amount | Value | ||
| Coupon | Date | ($000) | ($000) | |
| Express Scripts Holding Co. | 6.125% | 11/15/41 | 928 | 1,030 |
| Express Scripts Holding Co. | 4.800% | 7/15/46 | 4,355 | 4,220 |
| Fomento Economico Mexicano SAB de CV | 4.375% | 5/10/43 | 1,398 | 1,369 |
| Genentech Inc. | 5.250% | 7/15/35 | 488 | 564 |
| General Mills Inc. | 4.550% | 4/17/38 | 1,040 | 1,019 |
| General Mills Inc. | 5.400% | 6/15/40 | 1,398 | 1,493 |
| General Mills Inc. | 4.150% | 2/15/43 | 925 | 832 |
| General Mills Inc. | 4.700% | 4/17/48 | 1,325 | 1,292 |
| Gilead Sciences Inc. | 4.600% | 9/1/35 | 2,374 | 2,457 |
| Gilead Sciences Inc. | 4.000% | 9/1/36 | 2,435 | 2,345 |
| Gilead Sciences Inc. | 5.650% | 12/1/41 | 1,573 | 1,810 |
| Gilead Sciences Inc. | 4.800% | 4/1/44 | 4,359 | 4,544 |
| Gilead Sciences Inc. | 4.500% | 2/1/45 | 5,074 | 5,083 |
| Gilead Sciences Inc. | 4.750% | 3/1/46 | 4,710 | 4,896 |
| Gilead Sciences Inc. | 4.150% | 3/1/47 | 3,252 | 3,102 |
| GlaxoSmithKline Capital Inc. | 5.375% | 4/15/34 | 955 | 1,097 |
| GlaxoSmithKline Capital Inc. | 6.375% | 5/15/38 | 6,420 | 8,203 |
| GlaxoSmithKline Capital Inc. | 4.200% | 3/18/43 | 692 | 698 |
| Hackensack Meridian Health | 4.500% | 7/1/57 | 513 | 543 |
| Hackensack Meridian Health Inc. | 4.211% | 7/1/48 | 725 | 729 |
| Hasbro Inc. | 6.350% | 3/15/40 | 588 | 647 |
| Hasbro Inc. | 5.100% | 5/15/44 | 1,128 | 1,070 |
| Indiana University Health Inc. Obligated Group | 3.970% | 11/1/48 | 700 | 699 |
| JM Smucker Co. | 4.250% | 3/15/35 | 1,250 | 1,189 |
| JM Smucker Co. | 4.375% | 3/15/45 | 1,413 | 1,312 |
| Johns Hopkins Health System Corp. | 3.837% | 5/15/46 | 913 | 871 |
| Johnson & Johnson | 6.950% | 9/1/29 | 1,660 | 2,188 |
| Johnson & Johnson | 4.950% | 5/15/33 | 968 | 1,106 |
| Johnson & Johnson | 4.375% | 12/5/33 | 1,440 | 1,553 |
| Johnson & Johnson | 3.550% | 3/1/36 | 3,389 | 3,278 |
| Johnson & Johnson | 3.625% | 3/3/37 | 1,968 | 1,918 |
| Johnson & Johnson | 5.950% | 8/15/37 | 1,613 | 2,046 |
| Johnson & Johnson | 3.400% | 1/15/38 | 2,770 | 2,613 |
| Johnson & Johnson | 5.850% | 7/15/38 | 726 | 908 |
| Johnson & Johnson | 4.500% | 9/1/40 | 997 | 1,077 |
| Johnson & Johnson | 4.850% | 5/15/41 | 420 | 476 |
| Johnson & Johnson | 4.500% | 12/5/43 | 1,075 | 1,171 |
| Johnson & Johnson | 3.700% | 3/1/46 | 4,515 | 4,343 |
| Johnson & Johnson | 3.750% | 3/3/47 | 2,035 | 1,980 |
| Johnson & Johnson | 3.500% | 1/15/48 | 2,525 | 2,384 |
| Kaiser Foundation Hospitals | 4.875% | 4/1/42 | 1,800 | 2,010 |
| Kaiser Foundation Hospitals | 4.150% | 5/1/47 | 2,240 | 2,275 |
| Kellogg Co. | 7.450% | 4/1/31 | 1,027 | 1,311 |
| Kellogg Co. | 4.500% | 4/1/46 | 1,400 | 1,332 |
| 2 Keurig Dr Pepper Inc. | 4.985% | 5/25/38 | 2,025 | 2,071 |
| Keurig Dr Pepper Inc. | 4.500% | 11/15/45 | 1,003 | 928 |
| Keurig Dr Pepper Inc. | 4.420% | 12/15/46 | 713 | 655 |
| 2 Keurig Dr Pepper Inc. | 5.085% | 5/25/48 | 1,350 | 1,375 |
| Kimberly-Clark Corp. | 6.625% | 8/1/37 | 1,018 | 1,348 |
| Kimberly-Clark Corp. | 5.300% | 3/1/41 | 950 | 1,115 |
| Kimberly-Clark Corp. | 3.700% | 6/1/43 | 644 | 602 |
| Kimberly-Clark Corp. | 3.200% | 7/30/46 | 1,470 | 1,269 |
| Kimberly-Clark Corp. | 3.900% | 5/4/47 | 450 | 441 |
| Koninklijke Ahold Delhaize NV | 5.700% | 10/1/40 | 2,149 | 2,375 |
| Koninklijke Philips NV | 6.875% | 3/11/38 | 1,175 | 1,532 |
| Koninklijke Philips NV | 5.000% | 3/15/42 | 1,608 | 1,780 |
| Kraft Foods Group Inc. | 6.875% | 1/26/39 | 1,490 | 1,754 |
| Kraft Foods Group Inc. | 6.500% | 2/9/40 | 2,513 | 2,835 |
| Kraft Foods Group Inc. | 5.000% | 6/4/42 | 4,266 | 4,101 |
| Kraft Heinz Foods Co. | 4.625% | 1/30/29 | 3,494 | 3,485 |
| Kraft Heinz Foods Co. | 5.000% | 7/15/35 | 2,398 | 2,366 |
| Kraft Heinz Foods Co. | 5.200% | 7/15/45 | 3,436 | 3,345 |
| Kraft Heinz Foods Co. | 4.375% | 6/1/46 | 6,700 | 5,850 |
| Kroger Co. | 7.700% | 6/1/29 | 680 | 838 |
81
| Vanguard® Long-Term Corporate Bond Index Fund | ||||
| Schedule of Investments | ||||
| August 31, 2018 | ||||
| Face | Market | |||
| Maturity | Amount | Value | ||
| Coupon | Date | ($000) | ($000) | |
| Kroger Co. | 8.000% | 9/15/29 | 300 | 374 |
| Kroger Co. | 7.500% | 4/1/31 | 456 | 567 |
| Kroger Co. | 6.900% | 4/15/38 | 483 | 583 |
| Kroger Co. | 5.400% | 7/15/40 | 928 | 965 |
| Kroger Co. | 5.000% | 4/15/42 | 1 | 1 |
| Kroger Co. | 5.150% | 8/1/43 | 1,380 | 1,383 |
| Kroger Co. | 3.875% | 10/15/46 | 725 | 607 |
| Kroger Co. | 4.450% | 2/1/47 | 2,654 | 2,453 |
| Kroger Co. | 4.650% | 1/15/48 | 1,076 | 1,033 |
| Laboratory Corp. of America Holdings | 4.700% | 2/1/45 | 2,071 | 2,029 |
| 1 Mayo Clinic | 3.774% | 11/15/43 | 750 | 727 |
| 1 Mayo Clinic | 4.000% | 11/15/47 | 648 | 640 |
| 1 Mayo Clinic | 4.128% | 11/15/52 | 525 | 533 |
| McCormick & Co. Inc. | 4.200% | 8/15/47 | 575 | 547 |
| McKesson Corp. | 6.000% | 3/1/41 | 575 | 669 |
| Mead Johnson Nutrition Co. | 5.900% | 11/1/39 | 1,145 | 1,370 |
| Mead Johnson Nutrition Co. | 4.600% | 6/1/44 | 948 | 983 |
| Medtronic Inc. | 4.375% | 3/15/35 | 6,257 | 6,517 |
| Medtronic Inc. | 6.500% | 3/15/39 | 905 | 1,165 |
| Medtronic Inc. | 5.550% | 3/15/40 | 879 | 1,031 |
| Medtronic Inc. | 4.500% | 3/15/42 | 1,057 | 1,108 |
| Medtronic Inc. | 4.625% | 3/15/44 | 1,367 | 1,451 |
| Medtronic Inc. | 4.625% | 3/15/45 | 10,193 | 10,886 |
| Memorial Sloan-Kettering Cancer Center New York GO | 5.000% | 7/1/42 | 885 | 1,020 |
| Memorial Sloan-Kettering Cancer Center New York GO | 4.125% | 7/1/52 | 1,195 | 1,201 |
| Memorial Sloan-Kettering Cancer Center New York GO | 4.200% | 7/1/55 | 753 | 766 |
| Merck & Co. Inc. | 3.600% | 9/15/42 | 1,595 | 1,512 |
| Merck & Co. Inc. | 4.150% | 5/18/43 | 3,670 | 3,780 |
| Merck & Co. Inc. | 3.700% | 2/10/45 | 5,265 | 5,086 |
| Molson Coors Brewing Co. | 5.000% | 5/1/42 | 2,522 | 2,540 |
| Molson Coors Brewing Co. | 4.200% | 7/15/46 | 3,842 | 3,421 |
| 1 Montefiore Obligated Group | 5.246% | 11/1/48 | 1,000 | 1,011 |
| 1 Mount Sinai Hospitals Group Inc. | 3.981% | 7/1/48 | 575 | 548 |
| Mylan Inc. | 5.400% | 11/29/43 | 882 | 850 |
| 2 Mylan Inc. | 5.200% | 4/15/48 | 1,915 | 1,790 |
| Mylan NV | 5.250% | 6/15/46 | 2,025 | 1,892 |
| New York & Presbyterian Hospital | 4.024% | 8/1/45 | 1,638 | 1,621 |
| New York & Presbyterian Hospital | 4.063% | 8/1/56 | 713 | 703 |
| Newell Brands Inc. | 5.375% | 4/1/36 | 1,400 | 1,344 |
| Newell Brands Inc. | 5.500% | 4/1/46 | 3,496 | 3,344 |
| Northwell Healthcare Inc. | 3.979% | 11/1/46 | 1,065 | 974 |
| Northwell Healthcare Inc. | 4.260% | 11/1/47 | 1,800 | 1,732 |
| Novartis Capital Corp. | 3.700% | 9/21/42 | 871 | 848 |
| Novartis Capital Corp. | 4.400% | 5/6/44 | 4,620 | 4,940 |
| Novartis Capital Corp. | 4.000% | 11/20/45 | 2,525 | 2,551 |
| NYU Hospitals Center | 4.784% | 7/1/44 | 938 | 1,030 |
| 1 NYU Hospitals Center | 4.368% | 7/1/47 | 748 | 772 |
| Orlando Health Obligated Group | 4.089% | 10/1/48 | 600 | 596 |
| Partners Healthcare System Inc. | 3.765% | 7/1/48 | 650 | 607 |
| Partners Healthcare System Inc. | 4.117% | 7/1/55 | 475 | 463 |
| Pepsi Bottling Group Inc. | 7.000% | 3/1/29 | 2,415 | 3,089 |
| PepsiCo Inc. | 5.500% | 1/15/40 | 1,299 | 1,550 |
| PepsiCo Inc. | 4.875% | 11/1/40 | 1,704 | 1,872 |
| PepsiCo Inc. | 4.000% | 3/5/42 | 1,920 | 1,883 |
| PepsiCo Inc. | 3.600% | 8/13/42 | 600 | 552 |
| PepsiCo Inc. | 4.250% | 10/22/44 | 1,697 | 1,722 |
| PepsiCo Inc. | 4.600% | 7/17/45 | 1,037 | 1,109 |
| PepsiCo Inc. | 4.450% | 4/14/46 | 3,771 | 3,976 |
| PepsiCo Inc. | 3.450% | 10/6/46 | 2,913 | 2,631 |
| PepsiCo Inc. | 4.000% | 5/2/47 | 1,955 | 1,936 |
| Perrigo Finance Unlimited Co. | 4.900% | 12/15/44 | 1,334 | 1,236 |
| Pfizer Inc. | 4.000% | 12/15/36 | 2,246 | 2,273 |
| Pfizer Inc. | 7.200% | 3/15/39 | 5,372 | 7,503 |
| Pfizer Inc. | 5.600% | 9/15/40 | 286 | 343 |
82
| Vanguard® Long-Term Corporate Bond Index Fund | ||||
| Schedule of Investments | ||||
| August 31, 2018 | ||||
| Face | Market | |||
| Maturity | Amount | Value | ||
| Coupon | Date | ($000) | ($000) | |
| Pfizer Inc. | 4.300% | 6/15/43 | 1,420 | 1,469 |
| Pfizer Inc. | 4.400% | 5/15/44 | 2,540 | 2,653 |
| Pfizer Inc. | 4.125% | 12/15/46 | 3,548 | 3,588 |
| Pharmacia LLC | 6.600% | 12/1/28 | 1,680 | 2,041 |
| Philip Morris International Inc. | 6.375% | 5/16/38 | 2,725 | 3,290 |
| Philip Morris International Inc. | 4.375% | 11/15/41 | 1,580 | 1,537 |
| Philip Morris International Inc. | 4.500% | 3/20/42 | 1,859 | 1,850 |
| Philip Morris International Inc. | 3.875% | 8/21/42 | 1,445 | 1,307 |
| Philip Morris International Inc. | 4.125% | 3/4/43 | 1,985 | 1,857 |
| Philip Morris International Inc. | 4.875% | 11/15/43 | 1,165 | 1,206 |
| Philip Morris International Inc. | 4.250% | 11/10/44 | 3,052 | 2,906 |
| Procter & Gamble Co. | 5.550% | 3/5/37 | 1,000 | 1,218 |
| Procter & Gamble Co. | 3.500% | 10/25/47 | 1,950 | 1,825 |
| 1 Providence St. Joseph Health Obligated Group | 3.744% | 10/1/47 | 800 | 747 |
| 1 Providence St. Joseph Health Obligated Group | 3.930% | 10/1/48 | 715 | 684 |
| Quest Diagnostics Inc. | 4.700% | 3/30/45 | 588 | 575 |
| Reynolds American Inc. | 5.700% | 8/15/35 | 2,054 | 2,218 |
| Reynolds American Inc. | 7.250% | 6/15/37 | 1,076 | 1,350 |
| Reynolds American Inc. | 6.150% | 9/15/43 | 518 | 580 |
| Reynolds American Inc. | 5.850% | 8/15/45 | 3,614 | 3,928 |
| RWJ Barnabas Health Inc. | 3.949% | 7/1/46 | 813 | 768 |
| Stanford Health Care | 3.795% | 11/15/48 | 1,000 | 971 |
| Stryker Corp. | 4.100% | 4/1/43 | 852 | 807 |
| Stryker Corp. | 4.375% | 5/15/44 | 735 | 724 |
| Stryker Corp. | 4.625% | 3/15/46 | 2,120 | 2,190 |
| Sutter Health | 4.091% | 8/15/48 | 725 | 699 |
| Sysco Corp. | 5.375% | 9/21/35 | 76 | 85 |
| Sysco Corp. | 4.850% | 10/1/45 | 975 | 1,014 |
| Sysco Corp. | 4.500% | 4/1/46 | 1,109 | 1,099 |
| Sysco Corp. | 4.450% | 3/15/48 | 1,085 | 1,080 |
| 1 Texas Health Resources | 4.330% | 11/15/55 | 552 | 561 |
| Thermo Fisher Scientific Inc. | 5.300% | 2/1/44 | 1,658 | 1,845 |
| Thermo Fisher Scientific Inc. | 4.100% | 8/15/47 | 580 | 556 |
| Trinity Health Corp. | 4.125% | 12/1/45 | 725 | 708 |
| Tyson Foods Inc. | 4.875% | 8/15/34 | 1,504 | 1,535 |
| Tyson Foods Inc. | 5.150% | 8/15/44 | 2,050 | 2,104 |
| Tyson Foods Inc. | 4.550% | 6/2/47 | 455 | 425 |
| Unilever Capital Corp. | 5.900% | 11/15/32 | 1,654 | 2,025 |
| Whirlpool Corp. | 4.500% | 6/1/46 | 1,040 | 935 |
| Wyeth LLC | 6.500% | 2/1/34 | 1,568 | 1,983 |
| Wyeth LLC | 6.000% | 2/15/36 | 737 | 907 |
| Wyeth LLC | 5.950% | 4/1/37 | 4,248 | 5,127 |
| Zimmer Biomet Holdings Inc. | 5.750% | 11/30/39 | 750 | 840 |
| Zimmer Biomet Holdings Inc. | 4.450% | 8/15/45 | 877 | 844 |
| Zoetis Inc. | 4.700% | 2/1/43 | 2,160 | 2,221 |
| Zoetis Inc. | 3.950% | 9/12/47 | 978 | 907 |
| Zoetis Inc. | 4.450% | 8/20/48 | 800 | 796 |
| Energy (11.4%) | ||||
| Anadarko Finance Co. | 7.500% | 5/1/31 | 2,042 | 2,561 |
| Anadarko Petroleum Corp. | 6.450% | 9/15/36 | 4,156 | 4,795 |
| Anadarko Petroleum Corp. | 7.950% | 6/15/39 | 295 | 382 |
| Anadarko Petroleum Corp. | 6.200% | 3/15/40 | 1,828 | 2,054 |
| Anadarko Petroleum Corp. | 4.500% | 7/15/44 | 1,043 | 967 |
| Anadarko Petroleum Corp. | 6.600% | 3/15/46 | 2,605 | 3,139 |
| Andeavor | 4.500% | 4/1/48 | 1,195 | 1,113 |
| Andeavor Logistics LP / Tesoro Logistics Finance Corp. | 5.200% | 12/1/47 | 1,375 | 1,375 |
| Apache Corp. | 4.375% | 10/15/28 | 1,800 | 1,778 |
| Apache Corp. | 7.750% | 12/15/29 | 630 | 779 |
| Apache Corp. | 6.000% | 1/15/37 | 1,973 | 2,192 |
| Apache Corp. | 5.100% | 9/1/40 | 3,446 | 3,431 |
| Apache Corp. | 5.250% | 2/1/42 | 931 | 943 |
| Apache Corp. | 4.750% | 4/15/43 | 2,698 | 2,561 |
| Apache Corp. | 4.250% | 1/15/44 | 1,775 | 1,588 |
83
| Vanguard® Long-Term Corporate Bond Index Fund | ||||
| Schedule of Investments | ||||
| August 31, 2018 | ||||
| Face | Market | |||
| Maturity | Amount | Value | ||
| Coupon | Date | ($000) | ($000) | |
| Baker Hughes a GE Co. LLC | 5.125% | 9/15/40 | 2,300 | 2,436 |
| Baker Hughes a GE Co. LLC / Baker Hughes Co-Obligor | ||||
| Inc. | 4.080% | 12/15/47 | 3,195 | 2,905 |
| BP Capital Markets plc | 3.723% | 11/28/28 | 2,070 | 2,069 |
| Buckeye Partners LP | 5.850% | 11/15/43 | 1,058 | 1,000 |
| Buckeye Partners LP | 5.600% | 10/15/44 | 599 | 548 |
| Burlington Resources Finance Co. | 7.200% | 8/15/31 | 1,257 | 1,612 |
| Burlington Resources Finance Co. | 7.400% | 12/1/31 | 1,419 | 1,862 |
| Canadian Natural Resources Ltd. | 7.200% | 1/15/32 | 818 | 1,003 |
| Canadian Natural Resources Ltd. | 6.450% | 6/30/33 | 886 | 1,046 |
| Canadian Natural Resources Ltd. | 5.850% | 2/1/35 | 400 | 450 |
| Canadian Natural Resources Ltd. | 6.500% | 2/15/37 | 906 | 1,078 |
| Canadian Natural Resources Ltd. | 6.250% | 3/15/38 | 2,629 | 3,081 |
| Canadian Natural Resources Ltd. | 6.750% | 2/1/39 | 840 | 1,034 |
| Canadian Natural Resources Ltd. | 4.950% | 6/1/47 | 1,620 | 1,685 |
| Cenovus Energy Inc. | 5.250% | 6/15/37 | 2,712 | 2,682 |
| Cenovus Energy Inc. | 6.750% | 11/15/39 | 3,050 | 3,496 |
| Cenovus Energy Inc. | 4.450% | 9/15/42 | 1,150 | 1,003 |
| Cenovus Energy Inc. | 5.200% | 9/15/43 | 750 | 721 |
| Cenovus Energy Inc. | 5.400% | 6/15/47 | 1,902 | 1,897 |
| Columbia Pipeline Group Inc. | 5.800% | 6/1/45 | 1,030 | 1,152 |
| Concho Resources Inc. | 4.875% | 10/1/47 | 1,823 | 1,851 |
| Concho Resources Inc. | 4.850% | 8/15/48 | 1,175 | 1,184 |
| Conoco Funding Co. | 7.250% | 10/15/31 | 1,413 | 1,826 |
| ConocoPhillips | 5.900% | 10/15/32 | 1,398 | 1,663 |
| ConocoPhillips | 5.900% | 5/15/38 | 1,681 | 2,025 |
| ConocoPhillips | 6.500% | 2/1/39 | 5,400 | 7,025 |
| ConocoPhillips Canada Funding Co. I | 5.950% | 10/15/36 | 922 | 1,123 |
| ConocoPhillips Co. | 4.150% | 11/15/34 | 100 | 99 |
| ConocoPhillips Co. | 4.300% | 11/15/44 | 1,903 | 1,969 |
| ConocoPhillips Co. | 5.950% | 3/15/46 | 746 | 947 |
| ConocoPhillips Holding Co. | 6.950% | 4/15/29 | 3,407 | 4,270 |
| Continental Resources Inc. | 4.900% | 6/1/44 | 1,300 | 1,290 |
| Devon Energy Corp. | 7.950% | 4/15/32 | 690 | 885 |
| Devon Energy Corp. | 5.600% | 7/15/41 | 2,367 | 2,531 |
| Devon Energy Corp. | 4.750% | 5/15/42 | 1,876 | 1,833 |
| Devon Energy Corp. | 5.000% | 6/15/45 | 1,707 | 1,726 |
| Devon Financing Co. LLC | 7.875% | 9/30/31 | 1,355 | 1,699 |
| Dominion Energy Gas Holdings LLC | 4.800% | 11/1/43 | 866 | 872 |
| Dominion Energy Gas Holdings LLC | 4.600% | 12/15/44 | 1,002 | 1,008 |
| Enable Midstream Partners LP | 5.000% | 5/15/44 | 966 | 876 |
| Enbridge Energy Partners LP | 7.500% | 4/15/38 | 1,043 | 1,321 |
| Enbridge Energy Partners LP | 5.500% | 9/15/40 | 1,533 | 1,630 |
| Enbridge Energy Partners LP | 7.375% | 10/15/45 | 875 | 1,140 |
| Enbridge Inc. | 4.500% | 6/10/44 | 1,050 | 1,012 |
| Enbridge Inc. | 5.500% | 12/1/46 | 1,570 | 1,759 |
| Encana Corp. | 8.125% | 9/15/30 | 650 | 833 |
| Encana Corp. | 7.375% | 11/1/31 | 1,070 | 1,321 |
| Encana Corp. | 6.500% | 8/15/34 | 2,288 | 2,672 |
| Encana Corp. | 6.625% | 8/15/37 | 820 | 975 |
| Encana Corp. | 6.500% | 2/1/38 | 1,076 | 1,273 |
| Encana Corp. | 5.150% | 11/15/41 | 50 | 50 |
| Energy Transfer LP | 8.250% | 11/15/29 | 264 | 320 |
| Energy Transfer LP | 4.900% | 3/15/35 | 1,518 | 1,430 |
| Energy Transfer LP | 6.625% | 10/15/36 | 895 | 998 |
| Energy Transfer LP | 7.500% | 7/1/38 | 1,063 | 1,265 |
| Energy Transfer LP | 6.050% | 6/1/41 | 1,600 | 1,672 |
| Energy Transfer LP | 6.500% | 2/1/42 | 2,170 | 2,377 |
| Energy Transfer LP | 5.150% | 2/1/43 | 545 | 510 |
| Energy Transfer LP | 5.950% | 10/1/43 | 715 | 735 |
| Energy Transfer LP | 5.150% | 3/15/45 | 2,316 | 2,178 |
| Energy Transfer LP | 6.125% | 12/15/45 | 1,624 | 1,720 |
| Energy Transfer LP | 5.300% | 4/15/47 | 2,180 | 2,105 |
| Energy Transfer Partners LP | 5.800% | 6/15/38 | 2,150 | 2,232 |
84
| Vanguard® Long-Term Corporate Bond Index Fund | ||||
| Schedule of Investments | ||||
| August 31, 2018 | ||||
| Face | Market | |||
| Maturity | Amount | Value | ||
| Coupon | Date | ($000) | ($000) | |
| Energy Transfer Partners LP | 6.000% | 6/15/48 | 2,000 | 2,140 |
| Enterprise Products Operating LLC | 6.875% | 3/1/33 | 992 | 1,241 |
| Enterprise Products Operating LLC | 6.650% | 10/15/34 | 303 | 368 |
| Enterprise Products Operating LLC | 7.550% | 4/15/38 | 218 | 292 |
| Enterprise Products Operating LLC | 6.125% | 10/15/39 | 1,306 | 1,525 |
| Enterprise Products Operating LLC | 6.450% | 9/1/40 | 980 | 1,193 |
| Enterprise Products Operating LLC | 5.950% | 2/1/41 | 926 | 1,069 |
| Enterprise Products Operating LLC | 5.700% | 2/15/42 | 1,262 | 1,428 |
| Enterprise Products Operating LLC | 4.850% | 8/15/42 | 2,835 | 2,910 |
| Enterprise Products Operating LLC | 4.450% | 2/15/43 | 2,208 | 2,133 |
| Enterprise Products Operating LLC | 4.850% | 3/15/44 | 3,408 | 3,457 |
| Enterprise Products Operating LLC | 5.100% | 2/15/45 | 2,971 | 3,134 |
| Enterprise Products Operating LLC | 4.900% | 5/15/46 | 2,270 | 2,349 |
| Enterprise Products Operating LLC | 4.250% | 2/15/48 | 2,385 | 2,231 |
| Enterprise Products Operating LLC | 4.950% | 10/15/54 | 1,150 | 1,161 |
| EOG Resources Inc. | 3.900% | 4/1/35 | 930 | 915 |
| EQT Midstream Partners LP | 6.500% | 7/15/48 | 1,480 | 1,562 |
| Exxon Mobil Corp. | 3.567% | 3/6/45 | 1,868 | 1,745 |
| Exxon Mobil Corp. | 4.114% | 3/1/46 | 5,341 | 5,446 |
| Halliburton Co. | 4.850% | 11/15/35 | 3,095 | 3,230 |
| Halliburton Co. | 6.700% | 9/15/38 | 1,599 | 1,984 |
| Halliburton Co. | 7.450% | 9/15/39 | 1,759 | 2,351 |
| Halliburton Co. | 4.500% | 11/15/41 | 1,193 | 1,180 |
| Halliburton Co. | 4.750% | 8/1/43 | 1,613 | 1,635 |
| Halliburton Co. | 5.000% | 11/15/45 | 4,299 | 4,576 |
| Hess Corp. | 7.875% | 10/1/29 | 1,145 | 1,388 |
| Hess Corp. | 7.300% | 8/15/31 | 1,233 | 1,433 |
| Hess Corp. | 7.125% | 3/15/33 | 1,300 | 1,509 |
| Hess Corp. | 6.000% | 1/15/40 | 1,297 | 1,334 |
| Hess Corp. | 5.600% | 2/15/41 | 2,436 | 2,469 |
| Hess Corp. | 5.800% | 4/1/47 | 1,675 | 1,751 |
| Husky Energy Inc. | 6.800% | 9/15/37 | 815 | 1,005 |
| Kerr-McGee Corp. | 7.875% | 9/15/31 | 818 | 1,031 |
| Kinder Morgan Energy Partners LP | 7.400% | 3/15/31 | 251 | 297 |
| Kinder Morgan Energy Partners LP | 7.750% | 3/15/32 | 1,492 | 1,805 |
| Kinder Morgan Energy Partners LP | 7.300% | 8/15/33 | 875 | 1,040 |
| Kinder Morgan Energy Partners LP | 5.800% | 3/15/35 | 1,238 | 1,301 |
| Kinder Morgan Energy Partners LP | 6.500% | 2/1/37 | 1,248 | 1,386 |
| Kinder Morgan Energy Partners LP | 6.950% | 1/15/38 | 2,975 | 3,484 |
| Kinder Morgan Energy Partners LP | 6.500% | 9/1/39 | 606 | 672 |
| Kinder Morgan Energy Partners LP | 6.550% | 9/15/40 | 825 | 921 |
| Kinder Morgan Energy Partners LP | 7.500% | 11/15/40 | 763 | 931 |
| Kinder Morgan Energy Partners LP | 6.375% | 3/1/41 | 938 | 1,043 |
| Kinder Morgan Energy Partners LP | 5.625% | 9/1/41 | 1,003 | 1,032 |
| Kinder Morgan Energy Partners LP | 5.000% | 8/15/42 | 1,082 | 1,045 |
| Kinder Morgan Energy Partners LP | 4.700% | 11/1/42 | 1,142 | 1,058 |
| Kinder Morgan Energy Partners LP | 5.000% | 3/1/43 | 709 | 676 |
| Kinder Morgan Energy Partners LP | 5.500% | 3/1/44 | 1,678 | 1,705 |
| Kinder Morgan Energy Partners LP | 5.400% | 9/1/44 | 1,295 | 1,302 |
| Kinder Morgan Inc. | 7.800% | 8/1/31 | 625 | 775 |
| Kinder Morgan Inc. | 7.750% | 1/15/32 | 2,930 | 3,631 |
| Kinder Morgan Inc. | 5.300% | 12/1/34 | 2,380 | 2,416 |
| Kinder Morgan Inc. | 5.550% | 6/1/45 | 3,800 | 3,922 |
| Kinder Morgan Inc. | 5.050% | 2/15/46 | 1,350 | 1,310 |
| Kinder Morgan Inc. | 5.200% | 3/1/48 | 1,700 | 1,704 |
| Magellan Midstream Partners LP | 5.150% | 10/15/43 | 1,015 | 1,084 |
| Magellan Midstream Partners LP | 4.250% | 9/15/46 | 998 | 946 |
| Magellan Midstream Partners LP | 4.200% | 10/3/47 | 1,440 | 1,331 |
| Marathon Oil Corp. | 6.800% | 3/15/32 | 1,387 | 1,635 |
| Marathon Oil Corp. | 6.600% | 10/1/37 | 1,696 | 1,998 |
| Marathon Oil Corp. | 5.200% | 6/1/45 | 773 | 804 |
| Marathon Petroleum Corp. | 6.500% | 3/1/41 | 2,233 | 2,634 |
| Marathon Petroleum Corp. | 4.750% | 9/15/44 | 1,719 | 1,664 |
| Marathon Petroleum Corp. | 5.850% | 12/15/45 | 240 | 256 |
85
| Vanguard® Long-Term Corporate Bond Index Fund | ||||
| Schedule of Investments | ||||
| August 31, 2018 | ||||
| Face | Market | |||
| Maturity | Amount | Value | ||
| Coupon | Date | ($000) | ($000) | |
| Marathon Petroleum Corp. | 5.000% | 9/15/54 | 1,088 | 1,049 |
| MPLX LP | 4.500% | 4/15/38 | 3,750 | 3,497 |
| MPLX LP | 5.200% | 3/1/47 | 2,060 | 2,059 |
| MPLX LP | 4.700% | 4/15/48 | 3,120 | 2,905 |
| MPLX LP | 4.900% | 4/15/58 | 1,075 | 966 |
| National Fuel Gas Co. | 4.750% | 9/1/28 | 650 | 640 |
| National Oilwell Varco Inc. | 3.950% | 12/1/42 | 2,217 | 1,922 |
| Noble Energy Inc. | 6.000% | 3/1/41 | 2,496 | 2,681 |
| Noble Energy Inc. | 5.250% | 11/15/43 | 1,992 | 1,988 |
| Noble Energy Inc. | 5.050% | 11/15/44 | 995 | 970 |
| Noble Energy Inc. | 4.950% | 8/15/47 | 1,543 | 1,503 |
| Occidental Petroleum Corp. | 4.625% | 6/15/45 | 1,099 | 1,157 |
| Occidental Petroleum Corp. | 4.400% | 4/15/46 | 3,235 | 3,310 |
| Occidental Petroleum Corp. | 4.100% | 2/15/47 | 1,053 | 1,031 |
| Occidental Petroleum Corp. | 4.200% | 3/15/48 | 2,725 | 2,709 |
| ONEOK Inc. | 6.000% | 6/15/35 | 665 | 726 |
| ONEOK Inc. | 4.950% | 7/13/47 | 1,613 | 1,615 |
| ONEOK Inc. | 5.200% | 7/15/48 | 1,475 | 1,522 |
| ONEOK Partners LP | 6.650% | 10/1/36 | 1,155 | 1,366 |
| ONEOK Partners LP | 6.850% | 10/15/37 | 1,900 | 2,268 |
| ONEOK Partners LP | 6.125% | 2/1/41 | 1,061 | 1,194 |
| ONEOK Partners LP | 6.200% | 9/15/43 | 612 | 697 |
| Petro-Canada | 5.350% | 7/15/33 | 573 | 630 |
| Petro-Canada | 5.950% | 5/15/35 | 935 | 1,080 |
| Petro-Canada | 6.800% | 5/15/38 | 1,904 | 2,433 |
| Phillips 66 | 4.650% | 11/15/34 | 2,565 | 2,587 |
| Phillips 66 | 5.875% | 5/1/42 | 3,141 | 3,618 |
| Phillips 66 | 4.875% | 11/15/44 | 3,399 | 3,506 |
| Phillips 66 Partners LP | 4.680% | 2/15/45 | 775 | 734 |
| Phillips 66 Partners LP | 4.900% | 10/1/46 | 1,700 | 1,666 |
| Plains All American Pipeline LP / PAA Finance Corp. | 6.650% | 1/15/37 | 835 | 923 |
| Plains All American Pipeline LP / PAA Finance Corp. | 5.150% | 6/1/42 | 1,075 | 1,005 |
| Plains All American Pipeline LP / PAA Finance Corp. | 4.300% | 1/31/43 | 780 | 664 |
| Plains All American Pipeline LP / PAA Finance Corp. | 4.700% | 6/15/44 | 1,705 | 1,545 |
| Plains All American Pipeline LP / PAA Finance Corp. | 4.900% | 2/15/45 | 1,410 | 1,320 |
| Shell International Finance BV | 4.125% | 5/11/35 | 3,409 | 3,454 |
| Shell International Finance BV | 6.375% | 12/15/38 | 5,730 | 7,439 |
| Shell International Finance BV | 5.500% | 3/25/40 | 2,149 | 2,538 |
| Shell International Finance BV | 3.625% | 8/21/42 | 1,052 | 972 |
| Shell International Finance BV | 4.550% | 8/12/43 | 2,782 | 2,943 |
| Shell International Finance BV | 4.375% | 5/11/45 | 5,803 | 5,942 |
| Shell International Finance BV | 4.000% | 5/10/46 | 4,961 | 4,827 |
| Shell International Finance BV | 3.750% | 9/12/46 | 3,411 | 3,178 |
| Spectra Energy Partners LP | 5.950% | 9/25/43 | 966 | 1,077 |
| Spectra Energy Partners LP | 4.500% | 3/15/45 | 1,390 | 1,319 |
| Suncor Energy Inc. | 7.150% | 2/1/32 | 735 | 924 |
| Suncor Energy Inc. | 5.950% | 12/1/34 | 825 | 962 |
| Suncor Energy Inc. | 6.500% | 6/15/38 | 2,546 | 3,156 |
| Suncor Energy Inc. | 6.850% | 6/1/39 | 2,255 | 2,895 |
| Suncor Energy Inc. | 4.000% | 11/15/47 | 1,450 | 1,366 |
| Sunoco Logistics Partners Operations LP | 6.100% | 2/15/42 | 738 | 769 |
| Sunoco Logistics Partners Operations LP | 4.950% | 1/15/43 | 1,063 | 979 |
| Sunoco Logistics Partners Operations LP | 5.300% | 4/1/44 | 1,828 | 1,755 |
| Sunoco Logistics Partners Operations LP | 5.350% | 5/15/45 | 880 | 846 |
| Sunoco Logistics Partners Operations LP | 5.400% | 10/1/47 | 2,728 | 2,675 |
| Tennessee Gas Pipeline Co. LLC | 7.000% | 10/15/28 | 400 | 466 |
| Tennessee Gas Pipeline Co. LLC | 7.625% | 4/1/37 | 834 | 1,019 |
| Texas Eastern Transmission LP | 7.000% | 7/15/32 | 929 | 1,121 |
| TransCanada PipeLines Ltd. | 4.625% | 3/1/34 | 2,285 | 2,313 |
| TransCanada PipeLines Ltd. | 5.600% | 3/31/34 | 548 | 603 |
| TransCanada PipeLines Ltd. | 5.850% | 3/15/36 | 585 | 661 |
| TransCanada PipeLines Ltd. | 6.200% | 10/15/37 | 1,905 | 2,235 |
| TransCanada PipeLines Ltd. | 4.750% | 5/15/38 | 1,250 | 1,286 |
| TransCanada PipeLines Ltd. | 7.250% | 8/15/38 | 2,042 | 2,625 |
86
| Vanguard® Long-Term Corporate Bond Index Fund | ||||
| Schedule of Investments | ||||
| August 31, 2018 | ||||
| Face | Market | |||
| Maturity | Amount | Value | ||
| Coupon | Date | ($000) | ($000) | |
| TransCanada PipeLines Ltd. | 7.625% | 1/15/39 | 2,670 | 3,561 |
| TransCanada PipeLines Ltd. | 6.100% | 6/1/40 | 2,343 | 2,722 |
| TransCanada PipeLines Ltd. | 5.000% | 10/16/43 | 1,250 | 1,291 |
| TransCanada PipeLines Ltd. | 4.875% | 5/15/48 | 1,800 | 1,851 |
| Transcontinental Gas Pipe Line Co. LLC | 5.400% | 8/15/41 | 635 | 685 |
| Transcontinental Gas Pipe Line Co. LLC | 4.450% | 8/1/42 | 1,385 | 1,337 |
| 2 Transcontinental Gas Pipe Line Co. LLC | 4.600% | 3/15/48 | 850 | 825 |
| Valero Energy Corp. | 7.500% | 4/15/32 | 1,414 | 1,813 |
| Valero Energy Corp. | 6.625% | 6/15/37 | 2,921 | 3,517 |
| Valero Energy Corp. | 4.900% | 3/15/45 | 1,859 | 1,919 |
| Western Gas Partners LP | 5.450% | 4/1/44 | 1,238 | 1,191 |
| Western Gas Partners LP | 5.300% | 3/1/48 | 1,400 | 1,323 |
| Western Gas Partners LP | 5.500% | 8/15/48 | 550 | 533 |
| Williams Cos. Inc. | 7.500% | 1/15/31 | 1,168 | 1,425 |
| Williams Cos. Inc. | 6.300% | 4/15/40 | 3,050 | 3,472 |
| Williams Cos. Inc. | 5.800% | 11/15/43 | 1,171 | 1,262 |
| Williams Cos. Inc. | 5.400% | 3/4/44 | 654 | 673 |
| Williams Cos. Inc. | 5.750% | 6/24/44 | 1,400 | 1,505 |
| Williams Cos. Inc. | 4.900% | 1/15/45 | 1,076 | 1,051 |
| Williams Cos. Inc. | 5.100% | 9/15/45 | 2,969 | 2,972 |
| Williams Cos. Inc. | 4.850% | 3/1/48 | 1,000 | 972 |
| Other Industrial (0.6%) | ||||
| 1 Boston University | 4.061% | 10/1/48 | 525 | 532 |
| California Institute of Technology GO | 4.321% | 8/1/45 | 605 | 634 |
| California Institute of Technology GO | 4.700% | 11/1/11 | 693 | 728 |
| Fluor Corp. | 4.250% | 9/15/28 | 1,275 | 1,263 |
| 1 Johns Hopkins University Maryland GO | 4.083% | 7/1/53 | 685 | 689 |
| 1 Massachusetts Institute of Technology GO | 3.959% | 7/1/38 | 725 | 736 |
| Massachusetts Institute of Technology GO | 5.600% | 7/1/11 | 1,170 | 1,501 |
| Massachusetts Institute of Technology GO | 4.678% | 7/1/14 | 1,600 | 1,739 |
| Massachusetts Institute of Technology GO | 3.885% | 7/1/16 | 950 | 876 |
| 1 Northwestern University Illinois GO | 4.643% | 12/1/44 | 1,225 | 1,373 |
| 1 Northwestern University Illinois GO | 3.662% | 12/1/57 | 413 | 399 |
| President & Fellows of Harvard College Massachusetts | ||||
| GO | 3.619% | 10/1/37 | 436 | 435 |
| President & Fellows of Harvard College Massachusetts | ||||
| Revenue | 3.300% | 7/15/56 | 1,000 | 899 |
| 1 Rice University Texas GO | 3.574% | 5/15/45 | 1,347 | 1,293 |
| Stanford University California GO | 3.647% | 5/1/48 | 1,455 | 1,416 |
| 1 University of Notre Dame du Lac | 3.438% | 2/15/45 | 875 | 820 |
| University of Notre Dame du Lac | 3.394% | 2/15/48 | 800 | 755 |
| University of Pennsylvania GO | 4.674% | 9/1/12 | 600 | 616 |
| 1 University of Southern California GO | 3.028% | 10/1/39 | 1,342 | 1,215 |
| 1 University of Southern California GO | 3.841% | 10/1/47 | 875 | 882 |
| Technology (6.8%) | ||||
| Analog Devices Inc. | 5.300% | 12/15/45 | 653 | 702 |
| Apple Inc. | 4.500% | 2/23/36 | 2,700 | 2,922 |
| Apple Inc. | 3.850% | 5/4/43 | 6,527 | 6,297 |
| Apple Inc. | 4.450% | 5/6/44 | 1,923 | 2,027 |
| Apple Inc. | 3.450% | 2/9/45 | 3,997 | 3,611 |
| Apple Inc. | 4.375% | 5/13/45 | 4,254 | 4,437 |
| Apple Inc. | 4.650% | 2/23/46 | 8,898 | 9,657 |
| Apple Inc. | 3.850% | 8/4/46 | 4,723 | 4,552 |
| Apple Inc. | 4.250% | 2/9/47 | 1,975 | 2,025 |
| Apple Inc. | 3.750% | 9/12/47 | 3,268 | 3,103 |
| Apple Inc. | 3.750% | 11/13/47 | 1,935 | 1,821 |
| Applied Materials Inc. | 5.100% | 10/1/35 | 1,113 | 1,235 |
| Applied Materials Inc. | 5.850% | 6/15/41 | 1,331 | 1,602 |
| Applied Materials Inc. | 4.350% | 4/1/47 | 2,115 | 2,141 |
| Cisco Systems Inc. | 5.900% | 2/15/39 | 4,472 | 5,583 |
| Cisco Systems Inc. | 5.500% | 1/15/40 | 4,114 | 4,943 |
| Corning Inc. | 5.750% | 8/15/40 | 841 | 971 |
| Corning Inc. | 4.750% | 3/15/42 | 406 | 410 |
87
| Vanguard® Long-Term Corporate Bond Index Fund | ||||
| Schedule of Investments | ||||
| August 31, 2018 | ||||
| Face | Market | |||
| Maturity | Amount | Value | ||
| Coupon | Date | ($000) | ($000) | |
| Corning Inc. | 4.375% | 11/15/57 | 1,870 | 1,661 |
| 2 Diamond 1 Finance Corp. / Diamond 2 Finance Corp. | 8.100% | 7/15/36 | 3,555 | 4,192 |
| 2 Diamond 1 Finance Corp. / Diamond 2 Finance Corp. | 8.350% | 7/15/46 | 4,246 | 5,188 |
| Fidelity National Information Services Inc. | 4.500% | 8/15/46 | 1,055 | 1,010 |
| Fidelity National Information Services Inc. | 4.750% | 5/15/48 | 1,250 | 1,254 |
| Hewlett Packard Enterprise Co. | 6.200% | 10/15/35 | 1,642 | 1,700 |
| Hewlett Packard Enterprise Co. | 6.350% | 10/15/45 | 3,407 | 3,511 |
| HP Inc. | 6.000% | 9/15/41 | 2,517 | 2,591 |
| Intel Corp. | 4.000% | 12/15/32 | 1,546 | 1,598 |
| Intel Corp. | 4.800% | 10/1/41 | 2,497 | 2,742 |
| Intel Corp. | 4.250% | 12/15/42 | 1,479 | 1,505 |
| Intel Corp. | 4.100% | 5/19/46 | 3,267 | 3,264 |
| Intel Corp. | 3.734% | 12/8/47 | 6,438 | 6,044 |
| International Business Machines Corp. | 5.875% | 11/29/32 | 1,540 | 1,855 |
| International Business Machines Corp. | 5.600% | 11/30/39 | 1,455 | 1,728 |
| International Business Machines Corp. | 4.000% | 6/20/42 | 2,781 | 2,695 |
| International Business Machines Corp. | 4.700% | 2/19/46 | 1,773 | 1,942 |
| Juniper Networks Inc. | 5.950% | 3/15/41 | 818 | 825 |
| Microsoft Corp. | 3.500% | 2/12/35 | 4,162 | 4,016 |
| Microsoft Corp. | 4.200% | 11/3/35 | 1,093 | 1,144 |
| Microsoft Corp. | 3.450% | 8/8/36 | 4,595 | 4,400 |
| Microsoft Corp. | 4.100% | 2/6/37 | 6,291 | 6,550 |
| Microsoft Corp. | 5.200% | 6/1/39 | 1,283 | 1,507 |
| Microsoft Corp. | 4.500% | 10/1/40 | 1,996 | 2,173 |
| Microsoft Corp. | 5.300% | 2/8/41 | 1,654 | 1,960 |
| Microsoft Corp. | 3.500% | 11/15/42 | 2,409 | 2,253 |
| Microsoft Corp. | 3.750% | 5/1/43 | 1,312 | 1,265 |
| Microsoft Corp. | 4.875% | 12/15/43 | 988 | 1,120 |
| Microsoft Corp. | 3.750% | 2/12/45 | 3,667 | 3,566 |
| Microsoft Corp. | 4.450% | 11/3/45 | 7,125 | 7,718 |
| Microsoft Corp. | 3.700% | 8/8/46 | 9,196 | 8,858 |
| Microsoft Corp. | 4.250% | 2/6/47 | 7,532 | 7,945 |
| Microsoft Corp. | 4.000% | 2/12/55 | 6,834 | 6,759 |
| Microsoft Corp. | 3.950% | 8/8/56 | 4,269 | 4,213 |
| Microsoft Corp. | 4.500% | 2/6/57 | 4,075 | 4,424 |
| Motorola Solutions Inc. | 5.500% | 9/1/44 | 865 | 815 |
| Oracle Corp. | 3.250% | 5/15/30 | 929 | 885 |
| Oracle Corp. | 4.300% | 7/8/34 | 4,017 | 4,130 |
| Oracle Corp. | 3.900% | 5/15/35 | 3,031 | 2,970 |
| Oracle Corp. | 3.850% | 7/15/36 | 2,660 | 2,584 |
| Oracle Corp. | 3.800% | 11/15/37 | 4,775 | 4,569 |
| Oracle Corp. | 6.500% | 4/15/38 | 2,470 | 3,174 |
| Oracle Corp. | 6.125% | 7/8/39 | 2,325 | 2,899 |
| Oracle Corp. | 5.375% | 7/15/40 | 4,853 | 5,582 |
| Oracle Corp. | 4.500% | 7/8/44 | 2,080 | 2,155 |
| Oracle Corp. | 4.125% | 5/15/45 | 4,294 | 4,203 |
| Oracle Corp. | 4.000% | 7/15/46 | 6,390 | 6,143 |
| Oracle Corp. | 4.000% | 11/15/47 | 4,880 | 4,679 |
| Oracle Corp. | 4.375% | 5/15/55 | 2,875 | 2,884 |
| QUALCOMM Inc. | 4.650% | 5/20/35 | 2,143 | 2,158 |
| QUALCOMM Inc. | 4.800% | 5/20/45 | 3,259 | 3,290 |
| QUALCOMM Inc. | 4.300% | 5/20/47 | 3,220 | 3,014 |
| Seagate HDD Cayman | 5.750% | 12/1/34 | 1,025 | 930 |
| Texas Instruments Inc. | 4.150% | 5/15/48 | 3,250 | 3,303 |
| Tyco Electronics Group SA | 7.125% | 10/1/37 | 1,208 | 1,629 |
| Verisk Analytics Inc. | 5.500% | 6/15/45 | 868 | 902 |
| Xerox Corp. | 6.750% | 12/15/39 | 612 | 602 |
| Transportation (3.6%) | ||||
| 1 American Airlines 2016-3 Class A Pass Through Trust | 3.250% | 4/15/30 | 261 | 247 |
| 1 American Airlines 2016-3 Class AA Pass Through Trust | 3.000% | 10/15/28 | 900 | 846 |
| 1 American Airlines 2017-1 Class AA Pass Through Trust | 3.650% | 8/15/30 | 878 | 859 |
| 1 American Airlines 2017-2 Class AA Pass Through Trust | 3.350% | 10/15/29 | 1,100 | 1,056 |
| Burlington Northern Santa Fe LLC | 6.200% | 8/15/36 | 198 | 246 |
88
| Vanguard® Long-Term Corporate Bond Index Fund | ||||
| Schedule of Investments | ||||
| August 31, 2018 | ||||
| Face | Market | |||
| Maturity | Amount | Value | ||
| Coupon | Date | ($000) | ($000) | |
| Burlington Northern Santa Fe LLC | 6.150% | 5/1/37 | 375 | 462 |
| Burlington Northern Santa Fe LLC | 5.750% | 5/1/40 | 1,435 | 1,716 |
| Burlington Northern Santa Fe LLC | 5.050% | 3/1/41 | 1,379 | 1,530 |
| Burlington Northern Santa Fe LLC | 5.400% | 6/1/41 | 1,453 | 1,671 |
| Burlington Northern Santa Fe LLC | 4.950% | 9/15/41 | 313 | 343 |
| Burlington Northern Santa Fe LLC | 4.400% | 3/15/42 | 1,828 | 1,884 |
| Burlington Northern Santa Fe LLC | 4.375% | 9/1/42 | 1,409 | 1,447 |
| Burlington Northern Santa Fe LLC | 4.450% | 3/15/43 | 2,379 | 2,450 |
| Burlington Northern Santa Fe LLC | 5.150% | 9/1/43 | 1,623 | 1,821 |
| Burlington Northern Santa Fe LLC | 4.900% | 4/1/44 | 2,444 | 2,672 |
| Burlington Northern Santa Fe LLC | 4.550% | 9/1/44 | 3,025 | 3,166 |
| Burlington Northern Santa Fe LLC | 4.150% | 4/1/45 | 747 | 739 |
| Burlington Northern Santa Fe LLC | 4.700% | 9/1/45 | 1,303 | 1,401 |
| Burlington Northern Santa Fe LLC | 3.900% | 8/1/46 | 1,670 | 1,595 |
| Burlington Northern Santa Fe LLC | 4.125% | 6/15/47 | 1,755 | 1,741 |
| Burlington Northern Santa Fe LLC | 4.050% | 6/15/48 | 1,702 | 1,657 |
| Burlington Northern Santa Fe LLC | 4.150% | 12/15/48 | 1,600 | 1,588 |
| Canadian National Railway Co. | 6.250% | 8/1/34 | 1,063 | 1,330 |
| Canadian National Railway Co. | 6.200% | 6/1/36 | 680 | 849 |
| Canadian National Railway Co. | 6.375% | 11/15/37 | 610 | 781 |
| Canadian National Railway Co. | 4.500% | 11/7/43 | 200 | 207 |
| Canadian National Railway Co. | 3.200% | 8/2/46 | 1,310 | 1,134 |
| Canadian National Railway Co. | 3.650% | 2/3/48 | 1,460 | 1,373 |
| Canadian Pacific Railway Co. | 7.125% | 10/15/31 | 1,049 | 1,333 |
| Canadian Pacific Railway Co. | 5.750% | 3/15/33 | 170 | 195 |
| Canadian Pacific Railway Co. | 4.800% | 9/15/35 | 418 | 446 |
| Canadian Pacific Railway Co. | 5.950% | 5/15/37 | 935 | 1,127 |
| Canadian Pacific Railway Co. | 4.800% | 8/1/45 | 995 | 1,074 |
| Canadian Pacific Railway Co. | 6.125% | 9/15/15 | 1,955 | 2,335 |
| CSX Corp. | 6.000% | 10/1/36 | 828 | 985 |
| CSX Corp. | 6.150% | 5/1/37 | 1,438 | 1,736 |
| CSX Corp. | 6.220% | 4/30/40 | 1,195 | 1,468 |
| CSX Corp. | 5.500% | 4/15/41 | 1,091 | 1,232 |
| CSX Corp. | 4.750% | 5/30/42 | 1,240 | 1,281 |
| CSX Corp. | 4.400% | 3/1/43 | 500 | 497 |
| CSX Corp. | 4.100% | 3/15/44 | 2,099 | 1,990 |
| CSX Corp. | 3.800% | 11/1/46 | 1,576 | 1,426 |
| CSX Corp. | 4.300% | 3/1/48 | 1,605 | 1,562 |
| CSX Corp. | 3.950% | 5/1/50 | 1,150 | 1,045 |
| CSX Corp. | 4.500% | 8/1/54 | 1,026 | 1,000 |
| CSX Corp. | 4.250% | 11/1/66 | 1,909 | 1,714 |
| CSX Corp. | 4.650% | 3/1/68 | 845 | 808 |
| FedEx Corp. | 4.900% | 1/15/34 | 1,468 | 1,556 |
| FedEx Corp. | 3.900% | 2/1/35 | 857 | 807 |
| FedEx Corp. | 3.875% | 8/1/42 | 849 | 763 |
| FedEx Corp. | 4.100% | 4/15/43 | 813 | 748 |
| FedEx Corp. | 5.100% | 1/15/44 | 2,388 | 2,509 |
| FedEx Corp. | 4.100% | 2/1/45 | 1,227 | 1,117 |
| FedEx Corp. | 4.750% | 11/15/45 | 2,090 | 2,095 |
| FedEx Corp. | 4.550% | 4/1/46 | 2,092 | 2,049 |
| FedEx Corp. | 4.400% | 1/15/47 | 2,021 | 1,923 |
| FedEx Corp. | 4.050% | 2/15/48 | 2,200 | 1,998 |
| Kansas City Southern | 4.300% | 5/15/43 | 920 | 867 |
| Kansas City Southern | 4.950% | 8/15/45 | 1,063 | 1,092 |
| Kansas City Southern | 4.700% | 5/1/48 | 1,175 | 1,174 |
| Norfolk Southern Corp. | 7.050% | 5/1/37 | 255 | 332 |
| Norfolk Southern Corp. | 4.837% | 10/1/41 | 2,095 | 2,225 |
| Norfolk Southern Corp. | 3.950% | 10/1/42 | 1,225 | 1,161 |
| Norfolk Southern Corp. | 4.450% | 6/15/45 | 1,798 | 1,813 |
| Norfolk Southern Corp. | 4.650% | 1/15/46 | 675 | 698 |
| Norfolk Southern Corp. | 3.942% | 11/1/47 | 100 | 94 |
| Norfolk Southern Corp. | 4.150% | 2/28/48 | 1,745 | 1,692 |
| Norfolk Southern Corp. | 4.050% | 8/15/52 | 1,620 | 1,522 |
| Norfolk Southern Corp. | 5.100% | 8/1/18 | 1,325 | 1,318 |
89
| Vanguard® Long-Term Corporate Bond Index Fund | ||||
| Schedule of Investments | ||||
| August 31, 2018 | ||||
| Face | Market | |||
| Maturity | Amount | Value | ||
| Coupon | Date | ($000) | ($000) | |
| Union Pacific Corp. | 3.950% | 9/10/28 | 3,300 | 3,322 |
| Union Pacific Corp. | 3.375% | 2/1/35 | 996 | 906 |
| Union Pacific Corp. | 3.600% | 9/15/37 | 2,212 | 2,030 |
| Union Pacific Corp. | 4.375% | 9/10/38 | 1,300 | 1,329 |
| Union Pacific Corp. | 4.750% | 9/15/41 | 265 | 279 |
| Union Pacific Corp. | 4.300% | 6/15/42 | 925 | 926 |
| Union Pacific Corp. | 4.250% | 4/15/43 | 1,072 | 1,044 |
| Union Pacific Corp. | 4.821% | 2/1/44 | 625 | 668 |
| Union Pacific Corp. | 4.150% | 1/15/45 | 325 | 315 |
| Union Pacific Corp. | 4.050% | 11/15/45 | 1,101 | 1,056 |
| Union Pacific Corp. | 4.050% | 3/1/46 | 700 | 667 |
| Union Pacific Corp. | 3.350% | 8/15/46 | 1,432 | 1,217 |
| Union Pacific Corp. | 4.000% | 4/15/47 | 1,101 | 1,055 |
| Union Pacific Corp. | 4.500% | 9/10/48 | 4,150 | 4,249 |
| Union Pacific Corp. | 3.799% | 10/1/51 | 1,136 | 1,012 |
| Union Pacific Corp. | 3.875% | 2/1/55 | 1,703 | 1,491 |
| Union Pacific Corp. | 4.800% | 9/10/58 | 1,050 | 1,097 |
| Union Pacific Corp. | 4.375% | 11/15/65 | 1,280 | 1,183 |
| Union Pacific Corp. | 4.100% | 9/15/67 | 1,065 | 932 |
| 1 United Airlines 2016-2 Class A Pass Through Trust | 3.100% | 10/7/28 | 462 | 436 |
| 1 United Airlines 2016-2 Class AA Pass Through Trust | 2.875% | 10/7/28 | 828 | 775 |
| 1 United Airlines 2018-1 Class AA Pass Through Trust | 3.500% | 3/1/30 | 1,450 | 1,401 |
| United Parcel Service Inc. | 6.200% | 1/15/38 | 2,358 | 2,963 |
| United Parcel Service Inc. | 4.875% | 11/15/40 | 348 | 388 |
| United Parcel Service Inc. | 3.625% | 10/1/42 | 1,203 | 1,105 |
| United Parcel Service Inc. | 3.400% | 11/15/46 | 409 | 359 |
| United Parcel Service Inc. | 3.750% | 11/15/47 | 4,040 | 3,748 |
| United Parcel Service of America Inc. | 8.375% | 4/1/30 | 325 | 430 |
| 2,413,257 | ||||
| Utilities (12.2%) | ||||
| Electric (11.0%) | ||||
| AEP Texas Inc. | 3.800% | 10/1/47 | 650 | 599 |
| AEP Transmission Co. LLC | 4.000% | 12/1/46 | 800 | 780 |
| AEP Transmission Co. LLC | 3.750% | 12/1/47 | 688 | 635 |
| Alabama Power Co. | 6.125% | 5/15/38 | 790 | 964 |
| Alabama Power Co. | 6.000% | 3/1/39 | 956 | 1,183 |
| Alabama Power Co. | 3.850% | 12/1/42 | 235 | 220 |
| Alabama Power Co. | 4.150% | 8/15/44 | 1,483 | 1,473 |
| Alabama Power Co. | 3.750% | 3/1/45 | 750 | 702 |
| Alabama Power Co. | 4.300% | 1/2/46 | 1,010 | 1,028 |
| Alabama Power Co. | 3.700% | 12/1/47 | 1,040 | 959 |
| Alabama Power Co. | 4.300% | 7/15/48 | 1,100 | 1,108 |
| Ameren Illinois Co. | 4.150% | 3/15/46 | 996 | 1,002 |
| Ameren Illinois Co. | 3.700% | 12/1/47 | 1,575 | 1,482 |
| Appalachian Power Co. | 7.000% | 4/1/38 | 873 | 1,161 |
| Appalachian Power Co. | 4.400% | 5/15/44 | 807 | 809 |
| Appalachian Power Co. | 4.450% | 6/1/45 | 675 | 693 |
| Arizona Public Service Co. | 5.050% | 9/1/41 | 580 | 647 |
| Arizona Public Service Co. | 4.500% | 4/1/42 | 956 | 991 |
| Arizona Public Service Co. | 4.350% | 11/15/45 | 413 | 420 |
| Arizona Public Service Co. | 3.750% | 5/15/46 | 1,075 | 992 |
| Arizona Public Service Co. | 4.200% | 8/15/48 | 1,000 | 996 |
| Avista Corp. | 4.350% | 6/1/48 | 700 | 722 |
| Baltimore Gas & Electric Co. | 6.350% | 10/1/36 | 698 | 879 |
| Baltimore Gas & Electric Co. | 3.500% | 8/15/46 | 1,225 | 1,097 |
| Baltimore Gas & Electric Co. | 3.750% | 8/15/47 | 625 | 583 |
| Berkshire Hathaway Energy Co. | 6.125% | 4/1/36 | 3,476 | 4,193 |
| Berkshire Hathaway Energy Co. | 5.950% | 5/15/37 | 1,721 | 2,060 |
| Berkshire Hathaway Energy Co. | 5.150% | 11/15/43 | 1,963 | 2,169 |
| Berkshire Hathaway Energy Co. | 4.500% | 2/1/45 | 1,499 | 1,500 |
| Berkshire Hathaway Energy Co. | 3.800% | 7/15/48 | 1,150 | 1,053 |
| 2 Berkshire Hathaway Energy Co. | 4.450% | 1/15/49 | 2,100 | 2,112 |
| Black Hills Corp. | 4.350% | 5/1/33 | 850 | 852 |
90
| Vanguard® Long-Term Corporate Bond Index Fund | ||||
| Schedule of Investments | ||||
| August 31, 2018 | ||||
| Face | Market | |||
| Maturity | Amount | Value | ||
| Coupon | Date | ($000) | ($000) | |
| Black Hills Corp. | 4.200% | 9/15/46 | 589 | 559 |
| CenterPoint Energy Houston Electric LLC | 6.950% | 3/15/33 | 450 | 594 |
| CenterPoint Energy Houston Electric LLC | 3.550% | 8/1/42 | 1,045 | 970 |
| CenterPoint Energy Houston Electric LLC | 4.500% | 4/1/44 | 1,984 | 2,118 |
| CenterPoint Energy Houston Electric LLC | 3.950% | 3/1/48 | 750 | 734 |
| Cleco Corporate Holdings LLC | 4.973% | 5/1/46 | 650 | 644 |
| Cleveland Electric Illuminating Co. | 5.950% | 12/15/36 | 1,098 | 1,288 |
| CMS Energy Corp. | 4.875% | 3/1/44 | 589 | 626 |
| Commonwealth Edison Co. | 5.900% | 3/15/36 | 1,457 | 1,758 |
| Commonwealth Edison Co. | 6.450% | 1/15/38 | 996 | 1,286 |
| Commonwealth Edison Co. | 3.800% | 10/1/42 | 224 | 214 |
| Commonwealth Edison Co. | 4.600% | 8/15/43 | 616 | 661 |
| Commonwealth Edison Co. | 4.700% | 1/15/44 | 1,006 | 1,092 |
| Commonwealth Edison Co. | 3.700% | 3/1/45 | 1,395 | 1,309 |
| Commonwealth Edison Co. | 4.350% | 11/15/45 | 1,138 | 1,169 |
| Commonwealth Edison Co. | 3.650% | 6/15/46 | 1,455 | 1,351 |
| Commonwealth Edison Co. | 3.750% | 8/15/47 | 1,250 | 1,178 |
| Commonwealth Edison Co. | 4.000% | 3/1/48 | 1,800 | 1,765 |
| Connecticut Light & Power Co. | 4.300% | 4/15/44 | 978 | 1,015 |
| Connecticut Light & Power Co. | 4.150% | 6/1/45 | 527 | 538 |
| Connecticut Light & Power Co. | 4.000% | 4/1/48 | 1,450 | 1,441 |
| Consolidated Edison Co. of New York Inc. | 5.300% | 3/1/35 | 809 | 909 |
| Consolidated Edison Co. of New York Inc. | 5.850% | 3/15/36 | 823 | 985 |
| Consolidated Edison Co. of New York Inc. | 6.200% | 6/15/36 | 490 | 606 |
| Consolidated Edison Co. of New York Inc. | 6.300% | 8/15/37 | 1,540 | 1,947 |
| Consolidated Edison Co. of New York Inc. | 6.750% | 4/1/38 | 1,032 | 1,372 |
| Consolidated Edison Co. of New York Inc. | 5.500% | 12/1/39 | 1,815 | 2,110 |
| Consolidated Edison Co. of New York Inc. | 5.700% | 6/15/40 | 940 | 1,129 |
| Consolidated Edison Co. of New York Inc. | 4.200% | 3/15/42 | 649 | 634 |
| Consolidated Edison Co. of New York Inc. | 3.950% | 3/1/43 | 377 | 361 |
| Consolidated Edison Co. of New York Inc. | 4.450% | 3/15/44 | 1,976 | 2,039 |
| Consolidated Edison Co. of New York Inc. | 4.500% | 12/1/45 | 1,593 | 1,653 |
| Consolidated Edison Co. of New York Inc. | 3.850% | 6/15/46 | 1,338 | 1,267 |
| Consolidated Edison Co. of New York Inc. | 3.875% | 6/15/47 | 1,121 | 1,065 |
| Consolidated Edison Co. of New York Inc. | 4.625% | 12/1/54 | 1,860 | 1,907 |
| Consolidated Edison Co. of New York Inc. | 4.300% | 12/1/56 | 768 | 747 |
| Consolidated Edison Co. of New York Inc. | 4.000% | 11/15/57 | 1,050 | 967 |
| Consolidated Edison Co. of New York Inc. | 4.500% | 5/15/58 | 1,700 | 1,708 |
| Consumers Energy Co. | 3.950% | 5/15/43 | 845 | 836 |
| Consumers Energy Co. | 3.250% | 8/15/46 | 894 | 780 |
| Consumers Energy Co. | 3.950% | 7/15/47 | 608 | 600 |
| Consumers Energy Co. | 4.050% | 5/15/48 | 1,300 | 1,299 |
| Delmarva Power & Light Co. | 4.150% | 5/15/45 | 738 | 739 |
| Dominion Energy Inc. | 6.300% | 3/15/33 | 632 | 750 |
| Dominion Energy Inc. | 5.250% | 8/1/33 | 672 | 716 |
| Dominion Energy Inc. | 5.950% | 6/15/35 | 1,955 | 2,206 |
| Dominion Energy Inc. | 7.000% | 6/15/38 | 206 | 263 |
| Dominion Energy Inc. | 4.900% | 8/1/41 | 1,185 | 1,236 |
| Dominion Energy Inc. | 4.050% | 9/15/42 | 930 | 866 |
| Dominion Energy Inc. | 4.700% | 12/1/44 | 929 | 946 |
| DTE Electric Co. | 4.000% | 4/1/43 | 975 | 963 |
| DTE Electric Co. | 4.300% | 7/1/44 | 201 | 208 |
| DTE Electric Co. | 3.700% | 3/15/45 | 1,053 | 974 |
| DTE Electric Co. | 3.700% | 6/1/46 | 1,103 | 1,033 |
| DTE Electric Co. | 3.750% | 8/15/47 | 913 | 866 |
| DTE Electric Co. | 4.050% | 5/15/48 | 1,275 | 1,272 |
| DTE Energy Co. | 6.375% | 4/15/33 | 745 | 889 |
| Duke Energy Carolinas LLC | 6.000% | 12/1/28 | 435 | 511 |
| Duke Energy Carolinas LLC | 6.450% | 10/15/32 | 508 | 634 |
| Duke Energy Carolinas LLC | 6.100% | 6/1/37 | 1,065 | 1,313 |
| Duke Energy Carolinas LLC | 6.000% | 1/15/38 | 980 | 1,207 |
| Duke Energy Carolinas LLC | 6.050% | 4/15/38 | 1,316 | 1,643 |
| Duke Energy Carolinas LLC | 5.300% | 2/15/40 | 1,630 | 1,879 |
| Duke Energy Carolinas LLC | 4.250% | 12/15/41 | 1,553 | 1,592 |
91
| Vanguard® Long-Term Corporate Bond Index Fund | ||||
| Schedule of Investments | ||||
| August 31, 2018 | ||||
| Face | Market | |||
| Maturity | Amount | Value | ||
| Coupon | Date | ($000) | ($000) | |
| Duke Energy Carolinas LLC | 4.000% | 9/30/42 | 1,625 | 1,587 |
| Duke Energy Carolinas LLC | 3.750% | 6/1/45 | 1,630 | 1,535 |
| Duke Energy Carolinas LLC | 3.875% | 3/15/46 | 625 | 594 |
| Duke Energy Carolinas LLC | 3.700% | 12/1/47 | 1,000 | 923 |
| Duke Energy Carolinas LLC | 3.950% | 3/15/48 | 700 | 679 |
| Duke Energy Corp. | 4.800% | 12/15/45 | 1,550 | 1,632 |
| Duke Energy Corp. | 3.750% | 9/1/46 | 4,015 | 3,590 |
| Duke Energy Florida LLC | 6.350% | 9/15/37 | 1,785 | 2,286 |
| Duke Energy Florida LLC | 6.400% | 6/15/38 | 1,551 | 2,003 |
| Duke Energy Florida LLC | 5.650% | 4/1/40 | 775 | 924 |
| Duke Energy Florida LLC | 3.850% | 11/15/42 | 75 | 72 |
| Duke Energy Florida LLC | 3.400% | 10/1/46 | 1,473 | 1,288 |
| Duke Energy Florida LLC | 4.200% | 7/15/48 | 1,150 | 1,163 |
| 1 Duke Energy Florida Project Finance LLC | 2.538% | 9/1/29 | 1,200 | 1,109 |
| 1 Duke Energy Florida Project Finance LLC | 2.858% | 3/1/33 | 300 | 269 |
| 1 Duke Energy Florida Project Finance LLC | 3.112% | 9/1/36 | 225 | 207 |
| Duke Energy Indiana LLC | 6.120% | 10/15/35 | 683 | 825 |
| Duke Energy Indiana LLC | 6.350% | 8/15/38 | 1,011 | 1,299 |
| Duke Energy Indiana LLC | 6.450% | 4/1/39 | 768 | 995 |
| Duke Energy Indiana LLC | 4.900% | 7/15/43 | 895 | 988 |
| Duke Energy Indiana LLC | 3.750% | 5/15/46 | 1,400 | 1,301 |
| Duke Energy Ohio Inc. | 3.700% | 6/15/46 | 645 | 595 |
| Duke Energy Progress LLC | 3.700% | 9/1/28 | 2,000 | 2,009 |
| Duke Energy Progress LLC | 6.300% | 4/1/38 | 863 | 1,100 |
| Duke Energy Progress LLC | 4.100% | 5/15/42 | 573 | 567 |
| Duke Energy Progress LLC | 4.100% | 3/15/43 | 1,235 | 1,227 |
| Duke Energy Progress LLC | 4.375% | 3/30/44 | 795 | 815 |
| Duke Energy Progress LLC | 4.150% | 12/1/44 | 1,005 | 1,005 |
| Duke Energy Progress LLC | 4.200% | 8/15/45 | 766 | 767 |
| Duke Energy Progress LLC | 3.700% | 10/15/46 | 2,115 | 1,967 |
| Duke Energy Progress LLC | 3.600% | 9/15/47 | 1,000 | 903 |
| El Paso Electric Co. | 6.000% | 5/15/35 | 684 | 781 |
| El Paso Electric Co. | 5.000% | 12/1/44 | 663 | 678 |
| Emera US Finance LP | 4.750% | 6/15/46 | 2,966 | 2,959 |
| Entergy Louisiana LLC | 3.050% | 6/1/31 | 1,113 | 1,028 |
| Entergy Louisiana LLC | 4.000% | 3/15/33 | 1,850 | 1,867 |
| Entergy Louisiana LLC | 4.950% | 1/15/45 | 228 | 233 |
| Entergy Louisiana LLC | 4.200% | 9/1/48 | 1,600 | 1,612 |
| Exelon Corp. | 4.950% | 6/15/35 | 2,050 | 2,150 |
| Exelon Corp. | 5.625% | 6/15/35 | 1,321 | 1,481 |
| Exelon Corp. | 5.100% | 6/15/45 | 1,980 | 2,101 |
| Exelon Corp. | 4.450% | 4/15/46 | 691 | 678 |
| Exelon Generation Co. LLC | 6.250% | 10/1/39 | 1,872 | 2,016 |
| Exelon Generation Co. LLC | 5.750% | 10/1/41 | 635 | 640 |
| Exelon Generation Co. LLC | 5.600% | 6/15/42 | 1,742 | 1,771 |
| FirstEnergy Corp. | 7.375% | 11/15/31 | 4,265 | 5,517 |
| FirstEnergy Corp. | 4.850% | 7/15/47 | 1,846 | 1,892 |
| Florida Power & Light Co. | 5.625% | 4/1/34 | 550 | 643 |
| Florida Power & Light Co. | 4.950% | 6/1/35 | 135 | 149 |
| Florida Power & Light Co. | 5.650% | 2/1/37 | 537 | 648 |
| Florida Power & Light Co. | 5.950% | 2/1/38 | 1,555 | 1,937 |
| Florida Power & Light Co. | 5.960% | 4/1/39 | 1,655 | 2,095 |
| Florida Power & Light Co. | 5.690% | 3/1/40 | 946 | 1,150 |
| Florida Power & Light Co. | 5.250% | 2/1/41 | 674 | 783 |
| Florida Power & Light Co. | 4.125% | 2/1/42 | 1,685 | 1,721 |
| Florida Power & Light Co. | 4.050% | 6/1/42 | 1,305 | 1,316 |
| Florida Power & Light Co. | 3.800% | 12/15/42 | 1,660 | 1,613 |
| Florida Power & Light Co. | 4.050% | 10/1/44 | 597 | 601 |
| Florida Power & Light Co. | 3.700% | 12/1/47 | 1,650 | 1,558 |
| Florida Power & Light Co. | 3.950% | 3/1/48 | 1,925 | 1,904 |
| Florida Power & Light Co. | 4.125% | 6/1/48 | 1,120 | 1,145 |
| Georgia Power Co. | 4.750% | 9/1/40 | 2,556 | 2,594 |
| Georgia Power Co. | 4.300% | 3/15/42 | 2,208 | 2,134 |
| Georgia Power Co. | 4.300% | 3/15/43 | 965 | 931 |
92
| Vanguard® Long-Term Corporate Bond Index Fund | ||||
| Schedule of Investments | ||||
| August 31, 2018 | ||||
| Face | Market | |||
| Maturity | Amount | Value | ||
| Coupon | Date | ($000) | ($000) | |
| Iberdrola International BV | 6.750% | 7/15/36 | 579 | 709 |
| Indiana Michigan Power Co. | 6.050% | 3/15/37 | 968 | 1,170 |
| Indiana Michigan Power Co. | 4.550% | 3/15/46 | 893 | 927 |
| Indiana Michigan Power Co. | 3.750% | 7/1/47 | 838 | 771 |
| Indiana Michigan Power Co. | 4.250% | 8/15/48 | 1,500 | 1,511 |
| Interstate Power & Light Co. | 6.250% | 7/15/39 | 740 | 945 |
| Interstate Power & Light Co. | 3.700% | 9/15/46 | 428 | 397 |
| ITC Holdings Corp. | 5.300% | 7/1/43 | 616 | 688 |
| 1 John Sevier Combined Cycle Generation LLC | 4.626% | 1/15/42 | 860 | 910 |
| Kansas City Power & Light Co. | 6.050% | 11/15/35 | 250 | 304 |
| Kansas City Power & Light Co. | 5.300% | 10/1/41 | 745 | 841 |
| Kansas City Power & Light Co. | 4.200% | 6/15/47 | 440 | 433 |
| Kansas City Power & Light Co. | 4.200% | 3/15/48 | 575 | 560 |
| Kentucky Utilities Co. | 5.125% | 11/1/40 | 1,622 | 1,838 |
| MidAmerican Energy Co. | 6.750% | 12/30/31 | 1,055 | 1,360 |
| MidAmerican Energy Co. | 5.750% | 11/1/35 | 623 | 745 |
| MidAmerican Energy Co. | 5.800% | 10/15/36 | 685 | 828 |
| MidAmerican Energy Co. | 4.800% | 9/15/43 | 761 | 838 |
| MidAmerican Energy Co. | 4.400% | 10/15/44 | 700 | 731 |
| MidAmerican Energy Co. | 4.250% | 5/1/46 | 1,926 | 1,973 |
| MidAmerican Energy Co. | 3.950% | 8/1/47 | 375 | 367 |
| MidAmerican Energy Co. | 3.650% | 8/1/48 | 1,330 | 1,224 |
| Mississippi Power Co. | 4.250% | 3/15/42 | 931 | 880 |
| National Rural Utilities Cooperative Finance Corp. | 8.000% | 3/1/32 | 798 | 1,108 |
| National Rural Utilities Cooperative Finance Corp. | 4.023% | 11/1/32 | 1,217 | 1,232 |
| Nevada Power Co. | 6.650% | 4/1/36 | 913 | 1,177 |
| Nevada Power Co. | 6.750% | 7/1/37 | 636 | 833 |
| Northern States Power Co. | 6.250% | 6/1/36 | 585 | 736 |
| Northern States Power Co. | 6.200% | 7/1/37 | 971 | 1,217 |
| Northern States Power Co. | 5.350% | 11/1/39 | 870 | 1,022 |
| Northern States Power Co. | 3.400% | 8/15/42 | 905 | 824 |
| Northern States Power Co. | 4.125% | 5/15/44 | 588 | 595 |
| Northern States Power Co. | 4.000% | 8/15/45 | 450 | 448 |
| Northern States Power Co. | 3.600% | 5/15/46 | 870 | 810 |
| Northern States Power Co. | 3.600% | 9/15/47 | 1,113 | 1,028 |
| NorthWestern Corp. | 4.176% | 11/15/44 | 939 | 945 |
| NSTAR Electric Co. | 5.500% | 3/15/40 | 873 | 1,026 |
| NSTAR Electric Co. | 4.400% | 3/1/44 | 265 | 274 |
| Oglethorpe Power Corp. | 5.950% | 11/1/39 | 200 | 241 |
| Oglethorpe Power Corp. | 5.375% | 11/1/40 | 1,476 | 1,659 |
| Oglethorpe Power Corp. | 5.250% | 9/1/50 | 548 | 594 |
| Ohio Edison Co. | 6.875% | 7/15/36 | 653 | 859 |
| Ohio Power Co. | 4.150% | 4/1/48 | 750 | 751 |
| Oklahoma Gas & Electric Co. | 4.150% | 4/1/47 | 600 | 589 |
| Oklahoma Gas & Electric Co. | 3.850% | 8/15/47 | 600 | 568 |
| 2 Oncor Electric Delivery Co. LLC | 3.700% | 11/15/28 | 700 | 705 |
| Oncor Electric Delivery Co. LLC | 7.000% | 5/1/32 | 1,089 | 1,428 |
| Oncor Electric Delivery Co. LLC | 7.250% | 1/15/33 | 638 | 863 |
| Oncor Electric Delivery Co. LLC | 7.500% | 9/1/38 | 600 | 853 |
| Oncor Electric Delivery Co. LLC | 5.250% | 9/30/40 | 1,330 | 1,542 |
| Oncor Electric Delivery Co. LLC | 4.550% | 12/1/41 | 865 | 923 |
| Oncor Electric Delivery Co. LLC | 5.300% | 6/1/42 | 431 | 504 |
| Oncor Electric Delivery Co. LLC | 3.750% | 4/1/45 | 1,085 | 1,037 |
| Oncor Electric Delivery Co. LLC | 3.800% | 9/30/47 | 1,120 | 1,086 |
| 2 Oncor Electric Delivery Co. LLC | 4.100% | 11/15/48 | 1,200 | 1,207 |
| Pacific Gas & Electric Co. | 6.050% | 3/1/34 | 6,194 | 6,927 |
| Pacific Gas & Electric Co. | 5.800% | 3/1/37 | 2,341 | 2,585 |
| Pacific Gas & Electric Co. | 6.350% | 2/15/38 | 678 | 778 |
| Pacific Gas & Electric Co. | 6.250% | 3/1/39 | 1,229 | 1,393 |
| Pacific Gas & Electric Co. | 5.400% | 1/15/40 | 1,710 | 1,817 |
| Pacific Gas & Electric Co. | 4.450% | 4/15/42 | 1,210 | 1,139 |
| Pacific Gas & Electric Co. | 4.600% | 6/15/43 | 1,999 | 1,910 |
| Pacific Gas & Electric Co. | 5.125% | 11/15/43 | 946 | 977 |
| Pacific Gas & Electric Co. | 4.750% | 2/15/44 | 1,647 | 1,618 |
93
| Vanguard® Long-Term Corporate Bond Index Fund | ||||
| Schedule of Investments | ||||
| August 31, 2018 | ||||
| Face | Market | |||
| Maturity | Amount | Value | ||
| Coupon | Date | ($000) | ($000) | |
| Pacific Gas & Electric Co. | 4.300% | 3/15/45 | 1,334 | 1,238 |
| Pacific Gas & Electric Co. | 4.250% | 3/15/46 | 833 | 767 |
| Pacific Gas & Electric Co. | 4.000% | 12/1/46 | 1,623 | 1,432 |
| Pacific Gas & Electric Co. | 3.950% | 12/1/47 | 850 | 746 |
| PacifiCorp | 7.700% | 11/15/31 | 600 | 820 |
| PacifiCorp | 5.250% | 6/15/35 | 585 | 663 |
| PacifiCorp | 6.100% | 8/1/36 | 1,190 | 1,484 |
| PacifiCorp | 5.750% | 4/1/37 | 1,479 | 1,791 |
| PacifiCorp | 6.250% | 10/15/37 | 1,315 | 1,672 |
| PacifiCorp | 6.350% | 7/15/38 | 375 | 483 |
| PacifiCorp | 6.000% | 1/15/39 | 742 | 924 |
| PacifiCorp | 4.100% | 2/1/42 | 840 | 837 |
| PacifiCorp | 4.125% | 1/15/49 | 1,675 | 1,664 |
| PECO Energy Co. | 5.950% | 10/1/36 | 533 | 651 |
| PECO Energy Co. | 4.150% | 10/1/44 | 445 | 450 |
| PECO Energy Co. | 3.700% | 9/15/47 | 450 | 419 |
| PECO Energy Co. | 3.900% | 3/1/48 | 625 | 611 |
| Potomac Electric Power Co. | 6.500% | 11/15/37 | 1,108 | 1,420 |
| Potomac Electric Power Co. | 4.150% | 3/15/43 | 1,540 | 1,546 |
| PPL Capital Funding Inc. | 4.700% | 6/1/43 | 1,336 | 1,357 |
| PPL Capital Funding Inc. | 5.000% | 3/15/44 | 1,000 | 1,062 |
| PPL Capital Funding Inc. | 4.000% | 9/15/47 | 775 | 709 |
| PPL Electric Utilities Corp. | 6.250% | 5/15/39 | 895 | 1,144 |
| PPL Electric Utilities Corp. | 4.125% | 6/15/44 | 760 | 763 |
| PPL Electric Utilities Corp. | 4.150% | 10/1/45 | 350 | 353 |
| PPL Electric Utilities Corp. | 3.950% | 6/1/47 | 1,241 | 1,207 |
| PPL Electric Utilities Corp. | 4.150% | 6/15/48 | 1,075 | 1,080 |
| Progress Energy Inc. | 7.750% | 3/1/31 | 1,158 | 1,541 |
| Progress Energy Inc. | 7.000% | 10/30/31 | 858 | 1,087 |
| Progress Energy Inc. | 6.000% | 12/1/39 | 1,190 | 1,450 |
| PSEG Power LLC | 8.625% | 4/15/31 | 1,365 | 1,788 |
| Public Service Co. of Colorado | 6.250% | 9/1/37 | 585 | 749 |
| Public Service Co. of Colorado | 6.500% | 8/1/38 | 230 | 302 |
| Public Service Co. of Colorado | 3.600% | 9/15/42 | 1,220 | 1,145 |
| Public Service Co. of Colorado | 4.300% | 3/15/44 | 468 | 483 |
| Public Service Co. of Colorado | 3.800% | 6/15/47 | 588 | 563 |
| Public Service Co. of Colorado | 4.100% | 6/15/48 | 1,250 | 1,266 |
| Public Service Electric & Gas Co. | 5.800% | 5/1/37 | 803 | 985 |
| Public Service Electric & Gas Co. | 5.500% | 3/1/40 | 325 | 390 |
| Public Service Electric & Gas Co. | 3.950% | 5/1/42 | 655 | 650 |
| Public Service Electric & Gas Co. | 3.650% | 9/1/42 | 1,655 | 1,566 |
| Public Service Electric & Gas Co. | 3.800% | 1/1/43 | 685 | 662 |
| Public Service Electric & Gas Co. | 3.800% | 3/1/46 | 1,101 | 1,060 |
| Public Service Electric & Gas Co. | 3.600% | 12/1/47 | 1,285 | 1,198 |
| Puget Sound Energy Inc. | 6.274% | 3/15/37 | 701 | 886 |
| Puget Sound Energy Inc. | 5.757% | 10/1/39 | 960 | 1,169 |
| Puget Sound Energy Inc. | 5.795% | 3/15/40 | 477 | 586 |
| Puget Sound Energy Inc. | 5.638% | 4/15/41 | 428 | 514 |
| Puget Sound Energy Inc. | 4.300% | 5/20/45 | 966 | 998 |
| Puget Sound Energy Inc. | 4.223% | 6/15/48 | 1,400 | 1,431 |
| San Diego Gas & Electric Co. | 6.000% | 6/1/39 | 629 | 774 |
| San Diego Gas & Electric Co. | 4.500% | 8/15/40 | 981 | 1,023 |
| San Diego Gas & Electric Co. | 3.750% | 6/1/47 | 690 | 639 |
| San Diego Gas & Electric Co. | 4.150% | 5/15/48 | 750 | 746 |
| South Carolina Electric & Gas Co. | 6.625% | 2/1/32 | 950 | 1,133 |
| South Carolina Electric & Gas Co. | 5.300% | 5/15/33 | 555 | 599 |
| South Carolina Electric & Gas Co. | 6.050% | 1/15/38 | 990 | 1,130 |
| South Carolina Electric & Gas Co. | 5.450% | 2/1/41 | 686 | 744 |
| South Carolina Electric & Gas Co. | 4.350% | 2/1/42 | 1,011 | 986 |
| South Carolina Electric & Gas Co. | 4.600% | 6/15/43 | 1,146 | 1,159 |
| South Carolina Electric & Gas Co. | 4.100% | 6/15/46 | 848 | 789 |
| South Carolina Electric & Gas Co. | 4.500% | 6/1/64 | 724 | 670 |
| South Carolina Electric & Gas Co. | 5.100% | 6/1/65 | 810 | 830 |
| Southern California Edison Co. | 6.650% | 4/1/29 | 563 | 672 |
94
| Vanguard® Long-Term Corporate Bond Index Fund | ||||
| Schedule of Investments | ||||
| August 31, 2018 | ||||
| Face | Market | |||
| Maturity | Amount | Value | ||
| Coupon | Date | ($000) | ($000) | |
| Southern California Edison Co. | 6.000% | 1/15/34 | 598 | 702 |
| Southern California Edison Co. | 5.750% | 4/1/35 | 277 | 319 |
| Southern California Edison Co. | 5.350% | 7/15/35 | 681 | 754 |
| Southern California Edison Co. | 5.550% | 1/15/36 | 220 | 244 |
| Southern California Edison Co. | 5.625% | 2/1/36 | 1,690 | 1,911 |
| Southern California Edison Co. | 5.550% | 1/15/37 | 1,280 | 1,450 |
| Southern California Edison Co. | 5.950% | 2/1/38 | 1,082 | 1,288 |
| Southern California Edison Co. | 6.050% | 3/15/39 | 1,035 | 1,253 |
| Southern California Edison Co. | 5.500% | 3/15/40 | 1,045 | 1,188 |
| Southern California Edison Co. | 4.500% | 9/1/40 | 731 | 747 |
| Southern California Edison Co. | 4.050% | 3/15/42 | 2,620 | 2,523 |
| Southern California Edison Co. | 3.900% | 3/15/43 | 395 | 368 |
| Southern California Edison Co. | 4.650% | 10/1/43 | 1,176 | 1,222 |
| Southern California Edison Co. | 3.600% | 2/1/45 | 209 | 187 |
| Southern California Edison Co. | 4.000% | 4/1/47 | 2,165 | 2,061 |
| Southern California Edison Co. | 4.125% | 3/1/48 | 2,750 | 2,663 |
| Southern Co. | 4.250% | 7/1/36 | 1,037 | 993 |
| Southern Co. | 4.400% | 7/1/46 | 4,000 | 3,842 |
| Southern Power Co. | 5.150% | 9/15/41 | 1,148 | 1,168 |
| Southern Power Co. | 5.250% | 7/15/43 | 770 | 800 |
| Southern Power Co. | 4.950% | 12/15/46 | 775 | 772 |
| Southwestern Electric Power Co. | 6.200% | 3/15/40 | 773 | 939 |
| Southwestern Electric Power Co. | 3.900% | 4/1/45 | 978 | 922 |
| Southwestern Electric Power Co. | 3.850% | 2/1/48 | 975 | 894 |
| Southwestern Public Service Co. | 4.500% | 8/15/41 | 795 | 836 |
| Southwestern Public Service Co. | 3.400% | 8/15/46 | 800 | 712 |
| Southwestern Public Service Co. | 3.700% | 8/15/47 | 1,238 | 1,156 |
| Tampa Electric Co. | 4.100% | 6/15/42 | 890 | 880 |
| Tampa Electric Co. | 4.350% | 5/15/44 | 665 | 661 |
| Tampa Electric Co. | 4.300% | 6/15/48 | 1,075 | 1,071 |
| Toledo Edison Co. | 6.150% | 5/15/37 | 573 | 696 |
| TransAlta Corp. | 6.500% | 3/15/40 | 685 | 670 |
| Union Electric Co. | 5.300% | 8/1/37 | 343 | 386 |
| Union Electric Co. | 8.450% | 3/15/39 | 560 | 853 |
| Union Electric Co. | 3.900% | 9/15/42 | 827 | 807 |
| Union Electric Co. | 3.650% | 4/15/45 | 965 | 892 |
| Union Electric Co. | 4.000% | 4/1/48 | 800 | 780 |
| Virginia Electric & Power Co. | 6.000% | 1/15/36 | 1,510 | 1,817 |
| Virginia Electric & Power Co. | 6.000% | 5/15/37 | 1,483 | 1,808 |
| Virginia Electric & Power Co. | 6.350% | 11/30/37 | 302 | 381 |
| Virginia Electric & Power Co. | 8.875% | 11/15/38 | 958 | 1,487 |
| Virginia Electric & Power Co. | 4.000% | 1/15/43 | 1,246 | 1,195 |
| Virginia Electric & Power Co. | 4.650% | 8/15/43 | 1,158 | 1,230 |
| Virginia Electric & Power Co. | 4.450% | 2/15/44 | 1,842 | 1,889 |
| Virginia Electric & Power Co. | 4.200% | 5/15/45 | 1,403 | 1,385 |
| Virginia Electric & Power Co. | 4.000% | 11/15/46 | 693 | 663 |
| Virginia Electric & Power Co. | 3.800% | 9/15/47 | 1,350 | 1,257 |
| Westar Energy Inc. | 4.125% | 3/1/42 | 1,273 | 1,273 |
| Westar Energy Inc. | 4.100% | 4/1/43 | 1,051 | 1,049 |
| Westar Energy Inc. | 4.250% | 12/1/45 | 317 | 325 |
| Wisconsin Electric Power Co. | 5.625% | 5/15/33 | 335 | 388 |
| Wisconsin Electric Power Co. | 5.700% | 12/1/36 | 250 | 302 |
| Wisconsin Power & Light Co. | 6.375% | 8/15/37 | 649 | 824 |
| Wisconsin Public Service Corp. | 3.671% | 12/1/42 | 420 | 386 |
| Wisconsin Public Service Corp. | 4.752% | 11/1/44 | 913 | 1,004 |
| Xcel Energy Inc. | 6.500% | 7/1/36 | 889 | 1,143 |
| Natural Gas (0.9%) | ||||
| Atmos Energy Corp. | 5.500% | 6/15/41 | 1,000 | 1,171 |
| Atmos Energy Corp. | 4.150% | 1/15/43 | 572 | 567 |
| Atmos Energy Corp. | 4.125% | 10/15/44 | 1,758 | 1,734 |
| CenterPoint Energy Resources Corp. | 5.850% | 1/15/41 | 589 | 696 |
| CenterPoint Energy Resources Corp. | 4.100% | 9/1/47 | 633 | 597 |
| KeySpan Corp. | 5.803% | 4/1/35 | 630 | 731 |
95
| Vanguard® Long-Term Corporate Bond Index Fund | ||||
| Schedule of Investments | ||||
| August 31, 2018 | ||||
| Face | Market | |||
| Maturity | Amount | Value | ||
| Coupon | Date | ($000) | ($000) | |
| NiSource Finance Corp. | 5.950% | 6/15/41 | 916 | 1,077 |
| Nisource Finance Corp. | 5.250% | 2/15/43 | 1,340 | 1,479 |
| NiSource Finance Corp. | 4.800% | 2/15/44 | 1,131 | 1,173 |
| NiSource Finance Corp. | 5.650% | 2/1/45 | 1,425 | 1,645 |
| NiSource Finance Corp. | 4.375% | 5/15/47 | 2,285 | 2,245 |
| NiSource Finance Corp. | 3.950% | 3/30/48 | 1,235 | 1,133 |
| ONE Gas Inc. | 4.658% | 2/1/44 | 1,271 | 1,351 |
| Piedmont Natural Gas Co. Inc. | 4.650% | 8/1/43 | 325 | 347 |
| Piedmont Natural Gas Co. Inc. | 3.640% | 11/1/46 | 925 | 847 |
| Sempra Energy | 3.800% | 2/1/38 | 3,790 | 3,484 |
| Sempra Energy | 6.000% | 10/15/39 | 1,752 | 2,039 |
| Sempra Energy | 4.000% | 2/1/48 | 1,875 | 1,690 |
| Southern California Gas Co. | 5.125% | 11/15/40 | 115 | 130 |
| Southern California Gas Co. | 3.750% | 9/15/42 | 675 | 636 |
| Southern California Gas Co. | 4.125% | 6/1/48 | 750 | 754 |
| Southern Co. Gas Capital Corp. | 5.875% | 3/15/41 | 980 | 1,130 |
| Southern Co. Gas Capital Corp. | 4.400% | 6/1/43 | 2,035 | 1,969 |
| Southern Co. Gas Capital Corp. | 3.950% | 10/1/46 | 1,750 | 1,584 |
| Southern Co. Gas Capital Corp. | 4.400% | 5/30/47 | 1,045 | 1,019 |
| Southwest Gas Corp. | 3.800% | 9/29/46 | 540 | 491 |
| Washington Gas Light Co. | 3.796% | 9/15/46 | 863 | 801 |
| Other Utility (0.3%) | ||||
| American Water Capital Corp. | 3.750% | 9/1/28 | 1,500 | 1,499 |
| American Water Capital Corp. | 6.593% | 10/15/37 | 1,123 | 1,481 |
| American Water Capital Corp. | 4.300% | 12/1/42 | 865 | 860 |
| American Water Capital Corp. | 4.300% | 9/1/45 | 1,115 | 1,133 |
| American Water Capital Corp. | 4.000% | 12/1/46 | 425 | 413 |
| American Water Capital Corp. | 3.750% | 9/1/47 | 1,458 | 1,349 |
| American Water Capital Corp. | 4.200% | 9/1/48 | 1,500 | 1,494 |
| Veolia Environnement SA | 6.750% | 6/1/38 | 577 | 694 |
| 423,844 | ||||
| Total Corporate Bonds (Cost $3,516,059) | 3,416,824 | |||
| Taxable Municipal Bonds (0.2%) | ||||
| George Washington University District of Columbia GO | 4.300% | 9/15/44 | 965 | 1,009 |
| George Washington University District of Columbia GO | 4.868% | 9/15/45 | 40 | 45 |
| George Washington University Revenue | 4.126% | 9/15/48 | 1,994 | 2,004 |
| Missouri Health & Educational Facilities Authority | ||||
| Revenue (Washington University) | 3.652% | 8/15/57 | 95 | 89 |
| New York University Hospitals Center Revenue | 5.750% | 7/1/43 | 745 | 922 |
| President & Fellows of Harvard College Massachusetts | ||||
| GO | 4.875% | 10/15/40 | 443 | 516 |
| President & Fellows of Harvard College Massachusetts | ||||
| GO | 3.150% | 7/15/46 | 1,065 | 950 |
| Princeton University New Jersey GO | 5.700% | 3/1/39 | 1,210 | 1,536 |
| University of Southern California GO | 5.250% | 10/1/11 | 770 | 923 |
| Total Taxable Municipal Bonds (Cost $8,079) | 7,994 | |||
| Shares | ||||
| Temporary Cash Investment (0.6%) | ||||
| Money Market Fund (0.6%) | ||||
| 4 Vanguard Market Liquidity Fund (Cost $19,766) | 2.153% | 197,644 | 19,769 | |
| Total Investments (99.4%) (Cost $3,558,583) | 3,459,230 | |||
| Other Assets and Liabilities—Net (0.6%) | 21,568 | |||
| Net Assets (100%) | 3,480,798 | |||
| 1 The average or expected maturity is shorter than the final maturity shown because of the possibility of interim principal payments and | ||||
| prepayments or the possibility of the issue being called. | ||||
96
Vanguard® Long-Term Corporate Bond Index Fund
Schedule of Investments
August 31, 2018
2 Security exempt from registration under Rule 144A of the Securities Act of 1933. Such securities may be sold in transactions exempt from
registration, normally to qualified institutional buyers. At August 31, 2018, the aggregate value of these securities was $68,413,000,
representing 2.0% of net assets.
3 Securities with a value of $681,000 have been segregated as initial margin for open futures contracts.
4 Affiliated money market fund available only to Vanguard funds and certain trusts and accounts managed by Vanguard. Rate shown is the 7-day
yield.
GO—General Obligation Bond.
97
This page intentionally left blank.
This page intentionally left blank.
© 2018 The Vanguard Group, Inc.
All rights reserved.
Vanguard Marketing Corporation, Distributor.
SNA16420 102018
Report of Independent Registered Public Accounting Firm
To the Board of Trustees of Vanguard Scottsdale Funds and Shareholders of Vanguard Russell 1000 Index Fund, Vanguard Russell 1000 Value Index Fund and Vanguard Russell 1000 Growth Index Fund
Opinions on the Financial Statements
We have audited the accompanying statements of net assets—investments summary of Vanguard Russell 1000 Index Fund, Vanguard Russell 1000 Value Index Fund and Vanguard Russell 1000 Growth Index Fund (three of the funds constituting Vanguard Scottsdale Funds, hereafter collectively referred to as the
"Funds”) as of August 31, 2018, the related statements of operations for the year ended August 31, 2018, the statements of changes in net assets for each of the two years in the period ended August 31, 2018, including the related notes, and the financial highlights for each of the five years in the period ended August 31, 2018 (included in Item 1 of this Form N-CSR) and the schedules of investments (included in Item 6 of this Form N-CSR) as of August 31, 2018 (collectively referred to as the “financial statements”). In our opinion, the financial statements present fairly, in all material respects, the financial position of each of the Funds as of August 31, 2018, the results of each of their operations for the year then ended, the changes in each of their net assets for each of the two years in the period ended August 31, 2018 and each of the financial highlights for each of the five years in the period ended August 31, 2018 in conformity with accounting principles generally accepted in the United States of America.
Basis for Opinions
These financial statements are the responsibility of the Funds’ management. Our responsibility is to express an opinion on the Funds’ financial statements based on our audits. We are a public accounting firm registered with the Public Company Accounting Oversight Board (United States) (“PCAOB”) and are required to be independent with respect to the Funds in accordance with the U.S. federal securities laws and the applicable rules and regulations of the Securities and Exchange Commission and the PCAOB.
We conducted our audits of these financial statements in accordance with the standards of the PCAOB. Those standards require that we plan and perform the audit to obtain reasonable assurance about whether the financial statements are free of material misstatement, whether due to error or fraud.
Our audits included performing procedures to assess the risks of material misstatement of the financial statements, whether due to error or fraud, and performing procedures that respond to those risks. Such procedures included examining, on a test basis, evidence regarding the amounts and disclosures in the financial statements. Our audits also included evaluating the accounting principles used and significant estimates made by management, as well as evaluating the overall presentation of the financial statements. Our procedures included confirmation of securities owned as of August 31, 2018 by correspondence with the custodian and brokers and by agreement to the underlying ownership records of the transfer agent; when replies were not received from brokers, we performed other auditing procedures. We believe that our audits provide a reasonable basis for our opinions.

October 18, 2018
We have served as the auditor of one or more investment companies in The Vanguard Group of Funds since 1975.
PricewaterhouseCoopers LLP, Two Commerce Square, Suite 1800, 2001 Market Street,
Philadelphia, PA 19103-7042 T: (267) 330-3000, F: (267) 330-3300, www.pwc.com/us
Report of Independent Registered Public Accounting Firm
To the Board of Trustees of Vanguard Scottsdale Funds and Shareholders of Vanguard Russell 2000 Index Fund, Vanguard Russell 2000 Value Index Fund and Vanguard Russell 2000 Growth Index Fund
Opinions on the Financial Statements
We have audited the accompanying statements of net assets—investments summary of Vanguard Russell 2000 Index Fund, Vanguard Russell 2000 Value Index Fund and Vanguard Russell 2000 Growth Index Fund (three of the funds constituting Vanguard Scottsdale Funds, hereafter collectively referred to as the
"Funds”) as of August 31, 2018, the related statements of operations for the year ended August 31, 2018, the statements of changes in net assets for each of the two years in the period ended August 31, 2018, including the related notes, and the financial highlights for each of the five years in the period ended August 31, 2018 (included in Item 1 of this Form N-CSR) and the schedules of investments (included in Item 6 of this Form N-CSR) as of August 31, 2018 (collectively referred to as the “financial statements”). In our opinion, the financial statements present fairly, in all material respects, the financial position of each of the Funds as of August 31, 2018, the results of each of their operations for the year then ended, the changes in each of their net assets for each of the two years in the period ended August 31, 2018 and each of the financial highlights for each of the five years in the period ended August 31, 2018 in conformity with accounting principles generally accepted in the United States of America.
Basis for Opinions
These financial statements are the responsibility of the Funds’ management. Our responsibility is to express an opinion on the Funds’ financial statements based on our audits. We are a public accounting firm registered with the Public Company Accounting Oversight Board (United States) (“PCAOB”) and are required to be independent with respect to the Funds in accordance with the U.S. federal securities laws and the applicable rules and regulations of the Securities and Exchange Commission and the PCAOB.
We conducted our audits of these financial statements in accordance with the standards of the PCAOB. Those standards require that we plan and perform the audit to obtain reasonable assurance about whether the financial statements are free of material misstatement, whether due to error or fraud.
Our audits included performing procedures to assess the risks of material misstatement of the financial statements, whether due to error or fraud, and performing procedures that respond to those risks. Such procedures included examining, on a test basis, evidence regarding the amounts and disclosures in the financial statements. Our audits also included evaluating the accounting principles used and significant estimates made by management, as well as evaluating the overall presentation of the financial statements. Our procedures included confirmation of securities owned as of August 31, 2018 by correspondence with the custodian and brokers and by agreement to the underlying ownership records of the transfer agent; when replies were not received from brokers, we performed other auditing procedures. We believe that our audits provide a reasonable basis for our opinions.

October 18, 2018
We have served as the auditor of one or more investment companies in The Vanguard Group of Funds since 1975.
PricewaterhouseCoopers LLP, Two Commerce Square, Suite 1800, 2001 Market Street,
Philadelphia, PA 19103-7042 T: (267) 330-3000, F: (267) 330-3300, www.pwc.com/us
Report of Independent Registered Public Accounting Firm
To the Board of Trustees of Vanguard Scottsdale Funds and Shareholders of Vanguard Russell 3000 Index Fund
Opinion on the Financial Statements
We have audited the accompanying statement of net assets—investments summary of Vanguard Russell 3000 Index Fund (one of the funds constituting Vanguard Scottsdale Funds, referred to hereafter as the
"Fund”) as of August 31, 2018, the related statement of operations for the year ended August 31, 2018, the statement of changes in net assets for each of the two years in the period ended August 31, 2018, including the related notes, and the financial highlights for each of the five years in the period ended August 31, 2018 (included in Item 1 of this Form N-CSR) and the schedule of investments (included in Item 6 of this Form N-CSR) as of August 31, 2018 (collectively referred to as the “financial statements”). In our opinion, the financial statements present fairly, in all material respects, the financial position of the Fund as of August 31, 2018, the results of its operations for the year then ended, the changes in its net assets for each of the two years in the period ended August 31, 2018 and the financial highlights for each of the five years in the period ended August 31, 2018 in conformity with accounting principles generally accepted in the United States of America.
Basis for Opinion
These financial statements are the responsibility of the Fund’s management. Our responsibility is to express an opinion on the Fund’s financial statements based on our audits. We are a public accounting firm registered with the Public Company Accounting Oversight Board (United States) (“PCAOB”) and are required to be independent with respect to the Fund in accordance with the U.S. federal securities laws and the applicable rules and regulations of the Securities and Exchange Commission and the PCAOB.
We conducted our audits of these financial statements in accordance with the standards of the PCAOB. Those standards require that we plan and perform the audit to obtain reasonable assurance about whether the financial statements are free of material misstatement, whether due to error or fraud.
Our audits included performing procedures to assess the risks of material misstatement of the financial statements, whether due to error or fraud, and performing procedures that respond to those risks. Such procedures included examining, on a test basis, evidence regarding the amounts and disclosures in the financial statements. Our audits also included evaluating the accounting principles used and significant estimates made by management, as well as evaluating the overall presentation of the financial statements. Our procedures included confirmation of securities owned as of August 31, 2018 by correspondence with the custodians and brokers and by agreement to the underlying ownership records of the transfer agent; when replies were not received from brokers, we performed other auditing procedures. We believe that our audits provide a reasonable basis for our opinion.

We have served as the auditor of one or more investment companies in The Vanguard Group of Funds since 1975.
PricewaterhouseCoopers LLP, Two Commerce Square, Suite 1800, 2001 Market Street, Philadelphia, PA 19103-7042 T: (267) 330-3000, F: (267) 330-3300, www.pwc.com/us
Report of Independent Registered Public Accounting Firm
To the Board of Trustees of Vanguard Scottsdale Funds and Shareholders of Vanguard Short-Term Treasury Index Fund (formerly known as Vanguard Short-Term Government Bond Index Fund), Vanguard Intermediate-Term Treasury Index Fund (formerly known as Vanguard Intermediate-Term Government Bond Index Fund), Vanguard Long-Term Treasury Index Fund (formerly known as Vanguard Long-Term Government Bond Index Fund), Vanguard Short-Term Corporate Bond Index Fund, Vanguard Intermediate-Term Corporate Bond Index Fund, Vanguard Long-Term Corporate Bond Index Fund and Vanguard Mortgage-Backed Securities Index Fund
Opinions on the Financial Statements
We have audited the accompanying statements of assets and liabilities of Vanguard Short-Term Treasury Index Fund and Vanguard Mortgage-Backed Securities Index Fund, statements of net assets-investments summary of Vanguard Short-Term Corporate Bond Index Fund, Vanguard Intermediate-Term Corporate Bond Index Fund and Vanguard Long-Term Corporate Bond Index Fund, statements of net assets of Vanguard Short-Term Treasury Index Fund, Vanguard Intermediate-Term Treasury Index Fund, Vanguard Long-Term Treasury Index Fund and Vanguard Mortgage-Backed Securities Index Fund (seven of the funds constituting Vanguard Scottsdale Funds, hereafter collectively referred to as the "Funds”) as of August 31, 2018, the related statements of operations for the year ended August 31, 2018, the statements of changes in net assets for each of the two years in the period ended August 31, 2018, including the related notes, and the financial highlights for each of the periods indicated therein (included in Item 1 of this Form N-CSR) and the schedules of investments (included in Item 6 of this Form N-CSR) as of August 31, 2018 (collectively referred to as the “financial statements”). In our opinion, the financial statements present fairly, in all material respects, the financial position of each of the Funds as of August 31, 2018, the results of each of their operations for the year then ended, the changes in each of their net assets for each of the two years in the period ended August 31, 2018 and each of the financial highlights for each of the periods indicated therein in conformity with accounting principles generally accepted in the United States of America.
Basis for Opinions
These financial statements are the responsibility of the Funds’ management. Our responsibility is to express an opinion on the Funds’ financial statements based on our audits. We are a public accounting firm registered with the Public Company Accounting Oversight Board (United States) (“PCAOB”) and are required to be independent with respect to the Funds in accordance with the U.S. federal securities laws and the applicable rules and regulations of the Securities and Exchange Commission and the PCAOB.
We conducted our audits of these financial statements in accordance with the standards of the PCAOB. Those standards require that we plan and perform the audit to obtain reasonable assurance about whether the financial statements are free of material misstatement, whether due to error or fraud.
Our audits included performing procedures to assess the risks of material misstatement of the financial statements, whether due to error or fraud, and performing procedures that respond to those risks. Such procedures included examining, on a test basis, evidence regarding the amounts and disclosures in the financial statements. Our audits also included evaluating the accounting principles used and significant estimates made by management, as well as evaluating the overall presentation of the financial statements.
PricewaterhouseCoopers LLP, Two Commerce Square, Suite 1800, 2001 Market Street,
Philadelphia, PA 19103-7042 T: (267) 330-3000, F: (267) 330-3300, www.pwc.com/us

Our procedures included confirmation of securities owned as of August 31, 2018 by correspondence with the custodian and brokers and by agreement to the underlying ownership records of the transfer agent; when replies were not received from brokers, we performed other auditing procedures. We believe that our audits provide a reasonable basis for our opinions.

October 18, 2018
We have served as the auditor of one or more investment companies in The Vanguard Group of Funds since 1975.
2
Item 7: Disclosure of Proxy Voting Policies and Procedures for Closed-End Management Investment Companies.
Not Applicable.
Item 8: Portfolio Managers of Closed-End Management Investment Companies.
Not Applicable.
Item 9: Purchase of Equity Securities by Closed-End Management Investment Company and Affiliated Purchasers.
Not Applicable.
Item 10: Submission of Matters to a Vote of Security Holders.
Not Applicable.
Item 11: Controls and Procedures.
(a) Disclosure Controls and Procedures. The Principal Executive and Financial Officers concluded that the Registrant’s Disclosure Controls and Procedures are effective based on their evaluation of the Disclosure Controls and Procedures as of a date within 90 days of the filing date of this report.
(b) Internal Control Over Financial Reporting. There were no significant changes in Registrant’s Internal Control Over Financial Reporting or in other factors that could significantly affect this control subsequent to the date of the evaluation, including any corrective actions with regard to significant deficiencies and material weaknesses.
Item 12: Disclosure of Securities Lending Activities for Closed-End Management Investment Companies.
Not Applicable.
Item 13: Exhibits.
(a) Code of Ethics.
(b) Certifications.
Pursuant to the requirements of the Securities Exchange Act of 1934 and the Investment Company Act of 1940, the registrant has duly caused this report to be signed on its behalf by the undersigned, thereunto duly authorized.
| VANGUARD SCOTTSDALE FUNDS | |
| BY: | /s/ MORTIMER J. BUCKLEY* |
| MORTIMER J. BUCKLEY | |
| CHIEF EXECUTIVE OFFICER | |
| Date: October 19, 2018 | |
Pursuant to the requirements of the Securities Exchange Act of 1934 and the Investment Company Act of 1940, this report has been signed below by the following persons on behalf of the registrant and in the capacities and on the dates indicated.
| VANGUARD SCOTTSDALE FUNDS | |
| BY: | /s/ MORTIMER J. BUCKLEY * |
| MORTIMER J. BUCKLEY | |
| CHIEF EXECUTIVE OFFICER | |
| Date: October 19, 2018 | |
|
|
VANGUARD SCOTTSDALE FUNDS |
|
BY: |
/s/ THOMAS J. HIGGINS* |
| THOMAS J. HIGGINS | |
| CHIEF FINANCIAL OFFICER | |
| Date: October 19, 2018 | |
* By: /s/ Anne E. Robinson
Anne E. Robinson, pursuant to a Power of Attorney filed on January 18, 2018 see file
Number 33-32216, Incorporated by Reference.