UNITED STATES
SECURITIES AND EXCHANGE COMMISSION
Washington, D.C. 20549
FORM N-CSR
CERTIFIED SHAREHOLDER REPORT OF
REGISTERED MANAGEMENT INVESTMENT COMPANIES
Investment Company Act file number: 811-07803
Name of Registrant: Vanguard Scottsdale Funds
Address of Registrant:
P.O. Box 2600
Valley Forge, PA 19482
Name and address of agent for service:
Anne E. Robinson, Esquire
P.O. Box 876
Valley Forge, PA 19482
Registrant’s telephone number, including area code: (610) 669-1000
Date of fiscal year end: August 31
Date of reporting period: September 1, 2015 – August 31, 2016
Item 1: Reports to Shareholders
Annual Report | August 31, 2016
Vanguard Explorer Value™ Fund
A new format, unwavering commitment
As you begin reading this report, you’ll notice that we’ve made some improvements to the opening sections—based on feedback from you, our clients.
Page 1 starts with a new ”Your Fund’s Performance at a Glance,” a concise, handy summary of how your fund performed during the period.
In the renamed ”Chairman’s Perspective,” Bill McNabb will focus on enduring principles and investment insights.
We’ve modified some tables, and eliminated some redundancy, but we haven’t removed any information.
At Vanguard, we’re always looking for better ways to communicate and to help you make sound investment decisions. Thank you for entrusting your assets to us.
| Contents | |
| Your Fund’s Performance at a Glance. | 1 |
| Chairman’s Perspective. | 3 |
| Advisors’ Report. | 6 |
| Fund Profile. | 10 |
| Performance Summary. | 11 |
| Financial Statements. | 13 |
| Your Fund’s After-Tax Returns. | 25 |
| About Your Fund’s Expenses. | 26 |
| Glossary. | 28 |
Please note: The opinions expressed in this report are just that—informed opinions. They should not be considered promises or advice. Also, please keep in mind that the information and opinions cover the period through the date on the front of this report. Of course, the risks of investing in your fund are spelled out in the prospectus.
See the Glossary for definitions of investment terms used in this report.
About the cover: No matter what language you speak, Vanguard has one consistent message and set of principles. Our primary focus is on you, our clients. We conduct our business with integrity as a faithful steward of your assets. This message is shown translated into seven languages, reflecting our expanding global presence.
Your Fund’s Performance at a Glance
• Vanguard Explorer Value Fund returned more than 11% for the 12 months ended August 31, 2016, trailing the nearly 13% result for the benchmark Russell 2500 Value Index but exceeding the nearly 10% average return of its peer small-capitalization value funds.
• Value stocks outperformed their growth brethren for the period, and large-cap stocks topped mid- and small-caps. Seven of Explorer Value’s industry sectors recorded gains, six of them in double digits. Health care and consumer discretionary were the only sectors to decline.
• The fund advisors’ information technology and energy stocks performed especially well versus their benchmark counterparts. Although financial stocks added the most to Explorer Value’s absolute return, they lagged those in the benchmark. The fund’s consumer staples stocks returned more than 40%, but its light exposure to the sector limited the positive effect.
| Total Returns: Fiscal Year Ended August 31, 2016 | |
| Total | |
| Returns | |
| Vanguard Explorer Value Fund | 11.41% |
| Russell 2500 Value Index | 12.79 |
| Small-Cap Value Funds Average | 9.80 |
| Small-Cap Value Funds Average: Derived from data provided by Lipper, a Thomson Reuters Company. | |
| Total Returns: Inception Through August 31, 2016 | |
| Average | |
| Annual Return | |
| Explorer Value Fund (Returns since inception: 3/30/2010) | 12.35% |
| Russell 2500 Value Index | 11.42 |
| Small-Cap Value Funds Average | 10.10 |
| Small-Cap Value Funds Average: Derived from data provided by Lipper, a Thomson Reuters Company. | |
The figures shown represent past performance, which is not a guarantee of future results. (Current performance may be lower or higher than the performance data cited. For performance data current to the most recent month-end, visit our website at vanguard.com/performance.) Note, too, that both investment returns and principal value can fluctuate widely, so an investor’s shares, when sold, could be worth more or less than their original cost.
1
| Expense Ratios | ||
| Your Fund Compared With Its Peer Group | ||
| Peer Group | ||
| Fund | Average | |
| Explorer Value Fund | 0.65% | 1.33% |
The fund expense ratio shown is from the prospectus dated December 22, 2015, and represents estimated costs for the current fiscal year. For the fiscal year ended August 31, 2016, the fund’s expense ratio was 0.57%. The peer-group expense ratio is derived from data provided by Lipper, a Thomson Reuters Company, and captures information through year-end 2015.
Peer group: Small-Cap Value Funds.
2
Chairman’s Perspective

Bill McNabb
Chairman and Chief Executive Officer
Dear Shareholder,
Even as the global economy continued to expand at a slow but sustained pace over the 12 months ended August 31, 2016, a series of disquieting developments highlighted the importance for investors of remaining disciplined.
Chief among them was “Brexit”—the British public’s vote to exit the European Union—but plenty of others moved the markets as well. We saw sharp ups and downs in the prices of oil and other commodities, choppy U.S. job numbers, shifting expectations about when the Federal Reserve might raise interest rates again, and decreases in already negative yields for European and Japanese government bonds.
Beyond being the end of the fiscal period, August marked a milestone: 40 years since Vanguard introduced the first index mutual fund. In ways that are perhaps still not fully appreciated, indexing has vastly improved investing for individuals, advisors, and institutions all over the world. Later in this letter, I’ll discuss the revolution wrought by what was initially a little-heralded new fund from a fledgling outfit in Valley Forge, Pennsylvania.
Brexit added another layer of uncertainty for investors
I think it’s fair to say that the momentous June 23 Brexit vote caught even the British off guard. Although we saw some market jitters in the run-up to the referendum, the unexpected outcome triggered a spike in
3
volatility worldwide. Stocks around the world lost 5%–10% in U.S. dollar terms in the first two trading sessions following the vote, with U.K. and European markets among the hardest hit; global bonds, though, headed in the other direction. It was a textbook illustration of the value of having a diversified portfolio.
That kind of volatility can push investors to “do something.” But some of the worst days in the stock markets are sometimes followed by some of the best—as happened at the end of June. Investors who scrambled to protect their portfolios by shedding stocks amid headlines warning of a global market meltdown may well have ended up locking in post-Brexit losses, then missing out on the strong rebound that took place just days later. Those headlines were noise that investors would have been better off tuning out. I’m pleased to say that Vanguard investors on the whole did just that—we continued to see cash flows into our funds in the days after the vote.
For the 12 months, stocks generally finished higher, with U.S. stocks up more than 11% and international stocks about 3% for U.S.-based investors.
In a surprise, bonds turned in a solid performance that few would have predicted a year ago. It seemed as if rates had fallen so far that they couldn’t go any lower, but many did. Central banks in a number of European countries and Japan set key monetary policy rates below zero.
| Market Barometer | |||
| Average Annual Total Returns | |||
| Periods Ended August 31, 2016 | |||
| One | Three | Five | |
| Year | Years | Years | |
| Stocks | |||
| Russell 1000 Index (Large-caps) | 11.69% | 12.02% | 14.60% |
| Russell 2000 Index (Small-caps) | 8.59 | 8.53 | 12.85 |
| Russell 3000 Index (Broad U.S. market) | 11.44 | 11.74 | 14.46 |
| FTSE All-World ex US Index (International) | 3.37 | 2.59 | 3.72 |
| Bonds | |||
| Barclays U.S. Aggregate Bond Index (Broad taxable market) | 5.97% | 4.37% | 3.24% |
| Barclays Municipal Bond Index (Broad tax-exempt market) | 6.88 | 6.47 | 4.80 |
| Citigroup Three-Month U.S. Treasury Bill Index | 0.18 | 0.05 | 0.06 |
| CPI | |||
| Consumer Price Index | 1.06% | 0.98% | 1.23% |
4
These policies held down short-term rates, while more muted expectations for global growth and inflation weighed on longer-term rates.
Yields in the United States weren’t quite as low as in many developed countries. The Fed raised the federal funds target rate only once, in December, to a slim 0.25%–0.5%. Further out on the maturity spectrum, the bellwether 10-year U.S. Treasury yield dropped in early July to a record low 1.36%, before moving back up a little to end the period at 1.58%. Over the 12 months, U.S. bonds returned about 6%, and international bonds returned even more—about 11%—for U.S.-based investors, again underscoring the markets’ unpredictability and the merits of diversification.
Over the years, many investors have embraced the pluses of indexing
Market upsets like Brexit aren’t rare occurrences. Fortunately, indexing has proved to be a durable behavioral tool to help keep investors from making bad financial decisions when upsets happen. In fact, this is one of indexing’s less appreciated benefits: Holding index funds as part of a broadly diversified portfolio can counterbalance that tendency to react to news headlines. When times are volatile, you’ll know you might have some exposure to a part of the market that has dropped, but also to other parts that may be holding up better.
Vanguard’s launch of the First Index Investment Trust, now Vanguard 500 Index Fund, initially met with a frosty reception. Its mandate to track the performance of a broadly diversified benchmark at a low cost seemed underwhelming to an investing public accustomed to funds that offered the chance to outperform. Investors have since come around, as experience has demonstrated the benefits of low costs and broad diversification.
Indexing accounted for about 30% of U.S. mutual fund and exchange-traded fund (ETF) assets at the end of 2015, according to the Investment Company Institute. Some now even proclaim the “triumph of indexing,” implying that it’s the only way to invest.
In our view, the rise of indexing has served to underscore an investment principle that long predates 1976: A long-term, low-cost, diversified approach gives investors the best chance for success. That’s true whether the investments you choose are indexed or actively managed—or both.
As always, thank you for investing with Vanguard.
Sincerely,

F. William McNabb III
Chairman and Chief Executive Officer
September 9, 2016
5
Advisors’ Report
For the fiscal year ended August 31, 2016, Vanguard Explorer Value Fund returned 11.41%, behind the return of its benchmark, the Russell 2500 Value Index, but ahead of the average return of its small-capitalization value peers. Your fund is managed by two independent advisors, a strategy that enhances the fund’s diversification by providing exposure to distinct yet complementary investment approaches. It is not uncommon for different advisors to have different views about individual securities or the broader investment environment.
Please note that as of June, Sterling Capital Management LLC is no longer an advisor to the Explorer Value Fund. The assets formerly managed by Sterling have been allocated between Frontier Capital Management Co., LLC, and Cardinal Capital Management, L.L.C.
The advisors, the amount and percentage of fund assets each manages, and brief descriptions of their investment strategies are presented in the table below. The advisors have also prepared a discussion of the investment environment that existed during the 12 months and of how their portfolio positioning reflects this assessment. (Please note that the Frontier discussion refers to industry sectors as defined by Russell classifications, rather than by the Global Industry Classification Standard used elsewhere in this report.) These comments were prepared on September 20, 2016.
| Vanguard Explorer Value Fund Investment Advisors | |||
| Fund Assets Managed | |||
| Investment Advisor | % | $ Million | Investment Strategy |
| Frontier Capital Management Co., | 49 | 184 | The advisor selects stocks by identifying companies it |
| LLC | believes are underpriced relative to their long-term | ||
| value. These companies are generally inexpensive and | |||
| have low price-to-book and price-to-earnings ratios. | |||
| Cardinal Capital Management, | 47 | 176 | The advisor seeks stocks that are able to generate |
| L.L.C. | excess cash flow and reinvest the cash to increase | ||
| shareholder value. | |||
| Cash Investments | 4 | 17 | These short-term reserves are invested by Vanguard in |
| equity index products to simulate investment in stocks. | |||
| Each advisor may also maintain a modest cash | |||
| position. | |||
6
Frontier Capital Management Co., LLC
Portfolio Managers: Thomas W. Duncan, Jr., Senior Vice President William A. Teichner, CFA, Senior Vice President
Our performance was primarily helped by strong stock selection and positive sector selection and driven by holdings in financial services, consumer discretionary, and technology.
The portfolio’s ten best contributors added, on average, about 90 basis points each to absolute performance. They comprised four financial stocks, two companies each from consumer discretionary and producer durables, one from materials and processing, and one from technology. The financial stocks consisted of two banks, an insurance firm, and a real estate investment trust.
The top contributor was Central Garden & Pet, a producer and distributor of products to the lawn and garden and pet supplies industries. The stock added about 140 basis points to performance. The company has met or exceeded consensus revenue and earnings estimates in recent quarters and has steadily increased its earnings outlook. It has benefited from organic revenue growth, acquisitions, improved operating profitability, its exit from a money-losing business, and lower interest expense.
Central Garden & Pet has been transformed since 2013, when John Ranelli became CEO and began focusing the company on product innovation, operational efficiency, increased shelf space in stores, and lowered expenses. Board member George Roeth was appointed CEO upon Mr. Ranelli’s retirement in June 2016.
We expect Mr. Roeth, who has many years of experience at consumer-related product companies, to continue on the firm’s path of solid execution.
The portfolio’s ten largest detractors trimmed, on average, about 50 basis points each from performance. They comprised two holdings each from producer durables, consumer discretionary, technology, and energy, along with one from health care and one from materials and processing.
The largest detractor was Celadon Group, a provider of truckload freight transportation, which hindered performance by about 80 basis points. Sluggish industry freight volumes and some pricing pressure have dampened the company’s earnings. Investors have also been concerned about the volatility and distraction of a noncore business that primarily sells used trucks. As a result, Celadon has refocused on improving profitability and transforming its ancillary business into one with a more consistent income stream less reliant on equipment sales.
In addition, new federal regulations that take effect late next year should benefit the company by tightening industry capacity. For safety reasons, these rules require commercial vehicles to install electronic
7
logging devices to help make sure that drivers do not exceed allowable hours of service. Less capable drivers and firms that do not comply would be forced to exit the industry.
We believe that Celadon stock, at $8 per share, is attractive. It sells at less than 70% of tangible book value and five times our estimate of potential earnings over the next several years. Historically, Celadon has traded at median multiples of nearly two times tangible book and 15 times earnings.
During the fiscal year, we bought 21 new stocks and sold 20 holdings. Our purchases were spread across six sectors, and our sales were across eight. The net effect was an increase in consumer discretionary, energy, materials and processing, and producer durables, and a reduction in health care, technology, and utilities. As is usual for the portfolio, the changes were for company-specific reasons, rather than sector positioning.
Cardinal Capital Management, L.L.C.
Portfolio Managers:
Eugene Fox III,
Managing Partner
Robert B. Kirkpatrick, CFA,
Managing Partner
Rachel D. Matthews, Partner
U.S. economic data were mixed during the fiscal year, although better than for most other developed economies.
Returns for small- and mid-capitalization stocks were volatile despite ending with double-digit gains.
In December, the Federal Reserve finally took its first step to normalize interest rates, raising the federal funds rate by 0.25 percentage point. Although the move was well-telegraphed, equity markets corrected early in 2016; they then recovered and rose until U.K. voters, in the June “Brexit” referendum, chose to leave the European Union. Although Brexit surprised the markets and increased economic and political uncertainty, U.S. equities quickly recovered and continued to perform well despite concerns that Europe’s economic environment is likely to deteriorate and that growth rates in China are still slowing.
The primary relative detractors were stock selection in financials, information technology, and materials and a lack of holdings in utilities. Shares of Affiliated Managers Group, a global asset management holding company with investments in boutique asset managers, traded down on disappointing fund flows and issues at one of its firms. The stock price of ACI Worldwide, a developer of electronic payments-related software and services for financial institutions and retailers, declined after it missed earnings estimates as it migrates to more subscription sales. The share price of packaging company Silgan Holdings declined after it was outbid for the assets that had to be divested for competitor Ball to finish acquiring Rexam.
8
We have not found attractive utilities investments for many years because of a disparity between our high return objective and the returns permitted by regulators in a low interest rate world. Although the equity market highly values stable and growing dividends, utility stocks are now very levered to small rate movements with the attendant risks and rewards.
Our stock selection in and an underweighting of energy contributed to relative performance. Specifically, the stock price of fuel logistics provider World Fuel Services rose sharply on continued solid financial performance and its announcement that it was acquiring ExxonMobil’s international airport fuel operations.
For the balance of 2016, we expect U.S. growth to remain modest and inflation benign. Short-term U.S. interest rates are likely to edge up despite the uncertainty created by Brexit, as economic data—particularly U.S. employment figures—have been better than expected. Oil prices are likely to remain range-bound as supply continues to exceed demand despite slipping U.S. production. Although economic uncertainty rose after the Brexit vote, the impact has been less than feared; economic data have been better than expected, and equity markets around the world recovered their short-term losses quickly. Despite low oil prices and weak global economies, U.S. corporate earnings should grow modestly as energy prices and, to a lesser degree, the U.S. dollar shift from headwinds to tailwinds.
9
| Explorer Value Fund | |||
| Fund Profile | |||
| As of August 31, 2016 | |||
| Portfolio Characteristics | |||
| Russell | DJ | ||
| 2500 | U.S. Total | ||
| Value | Market | ||
| Fund | Index | FA Index | |
| Number of Stocks | 123 | 1,703 | 3,817 |
| Median Market Cap | $2.7B | $3.5B | $51.2B |
| Price/Earnings Ratio | 24.6x | 26.6x | 23.5x |
| Price/Book Ratio | 1.9x | 1.6x | 2.8x |
| Return on Equity | 10.7% | 8.5% | 16.6% |
| Earnings Growth | |||
| Rate | 11.5% | 7.7% | 7.5% |
| Dividend Yield | 1.7% | 2.1% | 2.0% |
| Foreign Holdings | 1.5% | 0.0% | 0.0% |
| Turnover Rate | 63% | — | — |
| Ticker Symbol | VEVFX | — | — |
| Expense Ratio1 | 0.65% | — | — |
| 30-Day SEC Yield | 1.14% | — | — |
| Short-Term Reserves | 4.1% | — | — |
| Sector Diversification (% of equity exposure) | |||
| DJ | |||
| U.S. | |||
| Russell | Total | ||
| 2500 | Market | ||
| Value | FA | ||
| Fund | Index | Index | |
| Consumer Discretionary | 10.2% | 9.4% | 12.9% |
| Consumer Staples | 1.5 | 2.6 | 8.9 |
| Energy | 5.3 | 7.5 | 6.4 |
| Financials | 35.6 | 40.7 | 18.0 |
| Health Care | 4.3 | 4.6 | 14.1 |
| Industrials | 18.6 | 12.4 | 10.4 |
| Information Technology | 12.5 | 9.4 | 20.3 |
| Materials | 8.6 | 5.3 | 3.3 |
| Telecommunication | |||
| Services | 0.1 | 0.7 | 2.4 |
| Utilities | 3.3 | 7.4 | 3.3 |
| Volatility Measures | ||
| Russell | DJ | |
| 2500 | U.S. Total | |
| Value | Market | |
| Index | FA Index | |
| R-Squared | 0.95 | 0.82 |
| Beta | 1.04 | 1.08 |
| These measures show the degree and timing of the fund’s fluctuations compared with the indexes over 36 months. | ||
| Ten Largest Holdings (% of total net assets) | ||
| PacWest Bancorp | Regional Banks | 2.1% |
| Howard Hughes Corp. | Real Estate | |
| Development | 2.0 | |
| KAR Auction Services | Diversified Support | |
| Inc. | Services | 2.0 |
| BWX Technologies Inc. | Aerospace & | |
| Defense | 1.7 | |
| Starwood Property Trust | ||
| Inc. | Mortgage REITs | 1.5 |
| IAC/InterActiveCorp | Internet Software & | |
| Services | 1.5 | |
| MB Financial Inc. | Regional Banks | 1.5 |
| Medical Properties Trust | ||
| Inc. | Health Care REITs | 1.5 |
| Popular Inc. | Regional Banks | 1.5 |
| Ligand Pharmaceuticals | ||
| Inc. | Biotechnology | 1.4 |
| Top Ten | 16.7% | |
| The holdings listed exclude any temporary cash investments and equity index products. | ||

1 The expense ratio shown is from the prospectus dated December 22, 2015, and represents estimated costs for the current fiscal year. For the fiscal year ended August 31, 2016, the expense ratio was 0.57%.
10
Explorer Value Fund
Performance Summary
All of the returns in this report represent past performance, which is not a guarantee of future results that may be achieved by the fund. (Current performance may be lower or higher than the performance data cited. For performance data current to the most recent month-end, visit our website at vanguard.com/performance.) Note, too, that both investment returns and principal value can fluctuate widely, so an investor’s shares, when sold, could be worth more or less than their original cost. The returns shown do not reflect taxes that a shareholder would pay on fund distributions or on the sale of fund shares.
Cumulative Performance: March 30, 2010, Through August 31, 2016
Initial Investment of $10,000
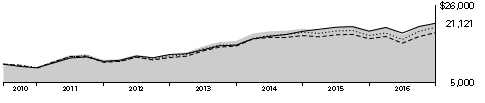
| Average Annual Total Returns | |||||
| Periods Ended August 31, 2016 | |||||
| Since | Final Value | ||||
| One | Five | Inception | of a $10,000 | ||
| Year | Years | (3/30/2010) | Investment | ||
| Explorer Value Fund | 11.41% | 13.67% | 12.35% | $21,121 | |
| •••••••• | Russell 2500 Value Index | 12.79 | 13.53 | 11.42 | 20,034 |
| – – – – | Small-Cap Value Funds Average | 9.80 | 12.02 | 10.10 | 18,556 |
| Dow Jones U.S. Total Stock Market | |||||
| Float Adjusted Index | 11.34 | 14.40 | 12.34 | 21,113 | |
| Small-Cap Value Funds Average: Derived from data provided by Lipper, a Thomson Reuters Company. | |||||
| "Since Inception" performance is calculated from the inception date for both the fund and its comparative standards. | |||||
See Financial Highlights for dividend and capital gains information.
11
Explorer Value Fund
Fiscal-Year Total Returns (%): March 30, 2010, Through August 31, 2016


Average Annual Total Returns: Periods Ended June 30, 2016
This table presents returns through the latest calendar quarter—rather than through the end of the fiscal period.
Securities and Exchange Commission rules require that we provide this information.
| Inception | One | Five | Since | |
| Date | Year | Years | Inception | |
| Explorer Value Fund | 3/30/2010 | -2.39% | 9.94% | 11.63% |
12
Explorer Value Fund
Financial Statements
Statement of Net Assets
As of August 31, 2016
The fund reports a complete list of its holdings in regulatory filings four times in each fiscal year, at the quarter-ends. For the second and fourth fiscal quarters, the lists appear in the fund’s semiannual and annual reports to shareholders. For the first and third fiscal quarters, the fund files the lists with the Securities and Exchange Commission on Form N-Q. Shareholders can look up the fund’s Forms N-Q on the SEC’s website at sec.gov. Forms N-Q may also be reviewed and copied at the SEC’s Public Reference Room (see the back cover of this report for further information).
| Market | |||
| Value• | |||
| Shares | ($000) | ||
| Common Stocks (91.4%)1 | |||
| Consumer Discretionary (9.2%) | |||
| Six Flags Entertainment | |||
| Corp. | 76,720 | 3,742 | |
| Wendy’s Co. | 307,687 | 3,135 | |
| Lithia Motors Inc. Class A | 37,580 | 3,111 | |
| American Eagle Outfitters | |||
| Inc. | 167,151 | 3,099 | |
| * | Modine Manufacturing Co. | 275,816 | 2,954 |
| MDC Partners Inc. Class A | 230,985 | 2,850 | |
| * | LGI Homes Inc. | 61,709 | 2,371 |
| Chico’s FAS Inc. | 165,423 | 2,098 | |
| * | Deckers Outdoor Corp. | 25,131 | 1,642 |
| * | Career Education Corp. | 222,736 | 1,457 |
| * | Crocs Inc. | 165,194 | 1,427 |
| * | Boot Barn Holdings Inc. | 109,463 | 1,355 |
| * | Global Eagle Entertainment | ||
| Inc. | 156,073 | 1,299 | |
| * | Del Taco Restaurants Inc. | 104,187 | 1,170 |
| * | Ascena Retail Group Inc. | 133,715 | 1,088 |
| DSW Inc. Class A | 43,029 | 1,031 | |
| Libbey Inc. | 46,770 | 829 | |
| 34,658 | |||
| Consumer Staples (1.3%) | |||
| Pinnacle Foods Inc. | 67,160 | 3,401 | |
| * | Central Garden & Pet Co. | ||
| Class A | 61,267 | 1,486 | |
| 4,887 | |||
| Energy (4.9%) | |||
| * | Parsley Energy Inc. Class A | 131,680 | 4,457 |
| * | Concho Resources Inc. | 32,540 | 4,204 |
| * | Carrizo Oil & Gas Inc. | 88,495 | 3,389 |
| World Fuel Services Corp. | 58,280 | 2,598 | |
| SM Energy Co. | 37,139 | 1,407 | |
| * | PDC Energy Inc. | 19,322 | 1,283 |
| QEP Resources Inc. | 58,014 | 1,108 | |
| 18,446 | |||
| Market | |||
| Value• | |||
| Shares | ($000) | ||
| Financials (33.1%) | |||
| PacWest Bancorp | 186,845 | 8,092 | |
| * | Howard Hughes Corp. | 63,190 | 7,470 |
| Starwood Property Trust | |||
| Inc. | 253,860 | 5,813 | |
| MB Financial Inc. | 140,510 | 5,505 | |
| Medical Properties Trust | |||
| Inc. | 359,890 | 5,496 | |
| Popular Inc. | 139,679 | 5,491 | |
| Columbia Banking System | |||
| Inc. | 159,880 | 5,282 | |
| BGC Partners Inc. Class A | 599,500 | 5,258 | |
| Argo Group International | |||
| Holdings Ltd. | 88,448 | 5,019 | |
| First Horizon National Corp. | 287,233 | 4,418 | |
| Gaming and Leisure | |||
| Properties Inc. | 125,150 | 4,281 | |
| Aspen Insurance Holdings | |||
| Ltd. | 92,314 | 4,243 | |
| Renasant Corp. | 116,885 | 4,144 | |
| Forest City Realty Trust Inc. | |||
| Class A | 169,630 | 4,013 | |
| Endurance Specialty | |||
| Holdings Ltd. | 56,882 | 3,746 | |
| WSFS Financial Corp. | 95,863 | 3,729 | |
| Flushing Financial Corp. | 159,796 | 3,706 | |
| Colony Starwood Homes | 109,430 | 3,392 | |
| Navigators Group Inc. | 35,149 | 3,303 | |
| * | Affiliated Managers Group | ||
| Inc. | 23,150 | 3,288 | |
| Washington Federal Inc. | 118,326 | 3,136 | |
| Selective Insurance Group | |||
| Inc. | 75,606 | 3,017 | |
| Mack-Cali Realty Corp. | 105,636 | 2,932 | |
| National Retail Properties | |||
| Inc. | 56,489 | 2,830 | |
| Parkway Properties Inc. | 156,508 | 2,817 | |
13
| Explorer Value Fund | |||
| Market | |||
| Value• | |||
| Shares | ($000) | ||
| * | Texas Capital Bancshares | ||
| Inc. | 48,560 | 2,550 | |
| James River Group Holdings | |||
| Ltd. | 67,816 | 2,478 | |
| First Midwest Bancorp Inc. | 107,695 | 2,108 | |
| Hersha Hospitality Trust | |||
| Class A | 104,575 | 2,043 | |
| Investment Technology | |||
| Group Inc. | 120,341 | 1,851 | |
| EPR Properties | 23,400 | 1,833 | |
| Cash America International | |||
| Inc. | 33,000 | 1,436 | |
| 124,720 | |||
| Health Care (3.5%) | |||
| * | Ligand Pharmaceuticals Inc. | 52,100 | 5,382 |
| * | Air Methods Corp. | 73,210 | 2,576 |
| * | Akorn Inc. | 86,630 | 2,332 |
| * | Myriad Genetics Inc. | 81,170 | 1,653 |
| * | Merit Medical Systems Inc. | 60,495 | 1,466 |
| 13,409 | |||
| Industrials (17.2%) | |||
| KAR Auction Services Inc. | 175,040 | 7,401 | |
| BWX Technologies Inc. | 163,680 | 6,352 | |
| * | Genesee & Wyoming Inc. | ||
| Class A | 70,110 | 4,767 | |
| * | Teledyne Technologies Inc. | 39,242 | 4,204 |
| * | Beacon Roofing Supply Inc. | 74,339 | 3,418 |
| HNI Corp. | 58,853 | 3,286 | |
| Kaman Corp. | 62,500 | 2,806 | |
| * | FTI Consulting Inc. | 62,874 | 2,785 |
| CEB Inc. | 41,180 | 2,479 | |
| * | Babcock & Wilcox | ||
| Enterprises Inc. | 142,610 | 2,332 | |
| * | Wesco Aircraft Holdings Inc. | 165,939 | 2,280 |
| Altra Industrial Motion Corp. | 75,729 | 2,136 | |
| * | BMC Stock Holdings Inc. | 99,864 | 1,991 |
| Encore Wire Corp. | 46,979 | 1,819 | |
| * | Saia Inc. | 50,178 | 1,527 |
| * | MRC Global Inc. | 99,597 | 1,461 |
| * | KLX Inc. | 38,006 | 1,419 |
| Actuant Corp. Class A | 57,212 | 1,363 | |
| * | WESCO International Inc. | 21,862 | 1,359 |
| Brady Corp. Class A | 40,415 | 1,353 | |
| Primoris Services Corp. | 69,789 | 1,341 | |
| EnerSys | 18,856 | 1,327 | |
| * | DXP Enterprises Inc. | 46,811 | 1,315 |
| * | Team Inc. | 39,743 | 1,263 |
| Briggs & Stratton Corp. | 63,178 | 1,201 | |
| Interface Inc. Class A | 58,386 | 1,032 | |
| Celadon Group Inc. | 123,369 | 964 | |
| 64,981 | |||
| Market | |||
| Value• | |||
| Shares | ($000) | ||
| Information Technology (11.2%) | |||
| IAC/InterActiveCorp | 97,570 | 5,728 | |
| * | ACI Worldwide Inc. | 187,310 | 3,578 |
| j2 Global Inc. | 51,760 | 3,528 | |
| InterDigital Inc. | 48,830 | 3,487 | |
| * | ON Semiconductor Corp. | 309,941 | 3,347 |
| Jabil Circuit Inc. | 138,173 | 2,928 | |
| Silicon Motion Technology | |||
| Corp. ADR | 55,000 | 2,776 | |
| * | Itron Inc. | 54,567 | 2,599 |
| * | Semtech Corp. | 83,128 | 2,211 |
| * | Lattice Semiconductor | ||
| Corp. | 357,672 | 2,200 | |
| * | FormFactor Inc. | 167,113 | 1,730 |
| * | Insight Enterprises Inc. | 52,886 | 1,618 |
| Convergys Corp. | 46,040 | 1,373 | |
| Littelfuse Inc. | 10,422 | 1,322 | |
| * | Ultratech Inc. | 43,688 | 1,093 |
| * | Integrated Device | ||
| Technology Inc. | 54,247 | 1,090 | |
| * | Infinera Corp. | 101,457 | 870 |
| Ingram Micro Inc. | 23,071 | 807 | |
| 42,285 | |||
| Materials (8.0%) | |||
| Ashland Inc. | 43,160 | 5,053 | |
| Silgan Holdings Inc. | 95,610 | 4,601 | |
| * | Kraton Performance | ||
| Polymers Inc. | 112,503 | 4,057 | |
| FMC Corp. | 72,140 | 3,386 | |
| * | Boise Cascade Co. | 109,788 | 2,881 |
| Eagle Materials Inc. | 31,750 | 2,552 | |
| PH Glatfelter Co. | 113,755 | 2,522 | |
| Compass Minerals | |||
| International Inc. | 25,040 | 1,866 | |
| Innophos Holdings Inc. | 31,571 | 1,333 | |
| Albemarle Corp. | 13,150 | 1,052 | |
| * | LSB Industries Inc. | 76,867 | 922 |
| 30,225 | |||
| Utilities (3.0%) | |||
| Portland General Electric Co. | 99,465 | 4,188 | |
| MDU Resources Group Inc. | 103,373 | 2,437 | |
| Unitil Corp. | 60,931 | 2,409 | |
| Southwest Gas Corp. | 33,783 | 2,359 | |
| 11,393 | |||
| Total Common Stocks | |||
| (Cost $291,941) | 345,004 | ||
14
| Explorer Value Fund | |||
| Market | |||
| Value• | |||
| Shares | ($000) | ||
| Temporary Cash Investments (8.6%)1 | |||
| Money Market Fund (7.7%) | |||
| 2 | Vanguard Market | ||
| Liquidity Fund, | |||
| 0.612% | 290,336 | 29,037 | |
| Face | |||
| Amount | |||
| ($000) | |||
| U.S. Government and Agency Obligations (0.9%) | |||
| 3,4 | Federal Home Loan | ||
| Bank Discount Notes, | |||
| 0.371%, 9/13/16 | 500 | 500 | |
| 3,4 | Federal Home Loan | ||
| Bank Discount Notes, | |||
| 0.465%, 10/28/16 | 300 | 300 | |
| 3 | Federal Home Loan | ||
| Bank Discount Notes, | |||
| 0.381%, 12/21/16 | 500 | 499 | |
| 3 | Federal Home Loan | ||
| Bank Discount Notes, | |||
| 0.401%, 12/23/16 | 2,100 | 2,097 | |
| 3,396 | |||
| Total Temporary Cash Investments | |||
| (Cost $32,427) | 32,433 | ||
| Total Investments (100.0%) | |||
| (Cost $324,368) | 377,437 | ||
| Amount | |
| ($000) | |
| Other Assets and Liabilities (0.0%) | |
| Other Assets | |
| Investment in Vanguard | 34 |
| Receivables for Investment | |
| Securities Sold | 670 |
| Receivables for Accrued Income | 379 |
| Receivables for Capital Shares Issued | 569 |
| Other Assets | 30 |
| Total Other Assets | 1,682 |
| Liabilities | |
| Payables for Investment Securities | |
| Purchased | (957) |
| Payables to Investment Advisor | (257) |
| Payables for Capital Shares Redeemed | (134) |
| Payables to Vanguard | (380) |
| Other Liabilities | (89) |
| Total Liabilities | (1,817) |
| Net Assets (100%) | |
| Applicable to 11,959,495 outstanding | |
| $.001 par value shares of beneficial | |
| interest (unlimited authorization) | 377,302 |
| Net Asset Value Per Share | $31.55 |
| At August 31, 2016, net assets consisted of: | |
| Amount | |
| ($000) | |
| Paid-in Capital | 317,359 |
| Undistributed Net Investment Income | 1,258 |
| Accumulated Net Realized Gains | 4,559 |
| Unrealized Appreciation (Depreciation) | |
| Investment Securities | 53,069 |
| Futures Contracts | 1,057 |
| Net Assets | 377,302 |
• See Note A in Notes to Financial Statements. * Non-income-producing security.
1 The fund invests a portion of its cash reserves in equity markets through the use of index futures contracts. After giving effect to futures investments, the fund’s effective common stock and temporary cash investment positions represent 95.9% and 4.1%, respectively, of net assets.
2 Affiliated money market fund available only to Vanguard funds and certain trusts and accounts managed by Vanguard. Rate shown is the 7-day yield.
3 The issuer operates under a congressional charter; its securities are generally neither guaranteed by the U.S. Treasury nor backed by the full faith and credit of the U.S. government.
4 Securities with a value of $800,000 have been segregated as initial margin for open futures contracts. ADR—American Depositary Receipt.
See accompanying Notes, which are an integral part of the Financial Statements.
15
| Explorer Value Fund | |
| Statement of Operations | |
| Year Ended | |
| August 31, 2016 | |
| ($000) | |
| Investment Income | |
| Income | |
| Dividends | 4,701 |
| Interest1 | 90 |
| Securities Lending—Net | 55 |
| Total Income | 4,846 |
| Expenses | |
| Investment Advisory Fees—Note B | |
| Basic Fee | 1,050 |
| Performance Adjustment | (20) |
| The Vanguard Group—Note C | |
| Management and Administrative | 579 |
| Marketing and Distribution | 47 |
| Custodian Fees | 17 |
| Auditing Fees | 46 |
| Shareholders’ Reports | 6 |
| Trustees’ Fees and Expenses | 1 |
| Total Expenses | 1,726 |
| Net Investment Income | 3,120 |
| Realized Net Gain (Loss) | |
| Investment Securities Sold1 | 5,919 |
| Futures Contracts | (380) |
| Realized Net Gain (Loss) | 5,539 |
| Change in Unrealized Appreciation (Depreciation) | |
| Investment Securities | 24,554 |
| Futures Contracts | 1,795 |
| Change in Unrealized Appreciation (Depreciation) | 26,349 |
| Net Increase (Decrease) in Net Assets Resulting from Operations | 35,008 |
1 Interest income and realized net gain (loss) from an affiliated company of the fund were $88,000 and ($3,000), respectively.
See accompanying Notes, which are an integral part of the Financial Statements.
16
| Explorer Value Fund | ||
| Statement of Changes in Net Assets | ||
| Year Ended August 31, | ||
| 2016 | 2015 | |
| ($000) | ($000) | |
| Increase (Decrease) in Net Assets | ||
| Operations | ||
| Net Investment Income | 3,120 | 2,419 |
| Realized Net Gain (Loss) | 5,539 | 17,919 |
| Change in Unrealized Appreciation (Depreciation) | 26,349 | (30,227) |
| Net Increase (Decrease) in Net Assets Resulting from Operations | 35,008 | (9,889) |
| Distributions | ||
| Net Investment Income | (2,298) | (2,556) |
| Realized Capital Gain1 | (15,125) | (14,878) |
| Total Distributions | (17,423) | (17,434) |
| Capital Share Transactions | ||
| Issued | 108,001 | 53,864 |
| Issued in Lieu of Cash Distributions | 16,350 | 16,524 |
| Redeemed | (55,907) | (74,410) |
| Net Increase (Decrease) from Capital Share Transactions | 68,444 | (4,022) |
| Total Increase (Decrease) | 86,029 | (31,345) |
| Net Assets | ||
| Beginning of Period | 291,273 | 322,618 |
| End of Period2 | 377,302 | 291,273 |
1 Includes fiscal 2016 and 2015 short-term gain distributions totaling $252,000 and $4,803,000, respectively. Short-term gain distributions are treated as ordinary income dividends for tax purposes.
2 Net Assets—End of Period includes undistributed (overdistributed) net investment income of $1,258,000 and $679,000.
See accompanying Notes, which are an integral part of the Financial Statements.
17
| Explorer Value Fund | |||||
| Financial Highlights | |||||
| For a Share Outstanding | Year Ended August 31, | ||||
| Throughout Each Period | 2016 | 2015 | 2014 | 2013 | 2012 |
| Net Asset Value, Beginning of Period | $30.09 | $32.97 | $29.39 | $23.44 | $21.94 |
| Investment Operations | |||||
| Net Investment Income | .293 | .259 | .251 | .255 | .232 |
| Net Realized and Unrealized Gain (Loss) | |||||
| on Investments | 2.964 | (1.284) | 5.539 | 6.429 | 2.476 |
| Total from Investment Operations | 3.257 | (1.025) | 5.790 | 6.684 | 2.708 |
| Distributions | |||||
| Dividends from Net Investment Income | (.237) | (.272) | (.168) | (.290) | (.189) |
| Distributions from Realized Capital Gains | (1.560) | (1.583) | (2.042) | (.444) | (1.019) |
| Total Distributions | (1.797) | (1.855) | (2.210) | (.734) | (1.208) |
| Net Asset Value, End of Period | $31.55 | $30.09 | $32.97 | $29.39 | $23.44 |
| Total Return1 | 11.41% | -3.12% | 20.34% | 29.19% | 13.10% |
| Ratios/Supplemental Data | |||||
| Net Assets, End of Period (Millions) | $377 | $291 | $323 | $222 | $123 |
| Ratio of Total Expenses to Average Net Assets2 | 0.57% | 0.56% | 0.57% | 0.60% | 0.59% |
| Ratio of Net Investment Income to | |||||
| Average Net Assets | 1.03% | 0.78% | 0.83% | 0.88% | 1.00% |
| Portfolio Turnover Rate | 61% | 35% | 36% | 46% | 38% |
1 Total returns do not include account service fees that may have applied in the periods shown. Fund prospectuses provide information about any applicable account service fees.
2 Includes performance-based investment advisory fee increases (decreases) of (0.01%), (0.02%), (0.02%), 0.04%, and 0.03%.
See accompanying Notes, which are an integral part of the Financial Statements.
18
Explorer Value Fund
Notes to Financial Statements
Vanguard Explorer Value Fund is registered under the Investment Company Act of 1940 as an open-end investment company, or mutual fund.
A. The following significant accounting policies conform to generally accepted accounting principles for U.S. investment companies. The fund consistently follows such policies in preparing its financial statements.
1. Security Valuation: Securities are valued as of the close of trading on the New York Stock Exchange (generally 4 p.m., Eastern time) on the valuation date. Equity securities are valued at the latest quoted sales prices or official closing prices taken from the primary market in which each security trades; such securities not traded on the valuation date are valued at the mean of the latest quoted bid and asked prices. Securities for which market quotations are not readily available, or whose values have been materially affected by events occurring before the fund’s pricing time but after the close of the securities’ primary markets, are valued by methods deemed by the board of trustees to represent fair value. Investments in Vanguard Market Liquidity Fund are valued at that fund’s net asset value. Temporary cash investments acquired over 60 days to maturity are valued using the latest bid prices or using valuations based on a matrix system (which considers such factors as security prices, yields, maturities, and ratings), both as furnished by independent pricing services. Other temporary cash investments are valued at amortized cost, which approximates market value.
2. Futures Contracts: The fund uses index futures contracts to a limited extent, with the objective of maintaining full exposure to the stock market while maintaining liquidity. The fund may purchase or sell futures contracts to achieve a desired level of investment, whether to accommodate portfolio turnover or cash flows from capital share transactions. The primary risks associated with the use of futures contracts are imperfect correlation between changes in market values of stocks held by the fund and the prices of futures contracts, and the possibility of an illiquid market. Counterparty risk involving futures is mitigated because a regulated clearinghouse is the counterparty instead of the clearing broker. To further mitigate counterparty risk, the fund trades futures contracts on an exchange, monitors the financial strength of its clearing brokers and clearinghouse, and has entered into clearing agreements with its clearing brokers. The clearinghouse imposes initial margin requirements to secure the fund’s performance and requires daily settlement of variation margin representing changes in the market value of each contract.
Futures contracts are valued at their quoted daily settlement prices. The aggregate settlement values of the contracts are not recorded in the Statement of Net Assets. Fluctuations in the value of the contracts are recorded in the Statement of Net Assets as an asset (liability) and in the Statement of Operations as unrealized appreciation (depreciation) until the contracts are closed, when they are recorded as realized futures gains (losses).
During the year ended August 31, 2016, the fund’s average investments in long and short futures contracts represented 3% and 0% of net assets, respectively, based on the average of aggregate settlement values at each quarter-end during the period.
3. Federal Income Taxes: The fund intends to continue to qualify as a regulated investment company and distribute all of its taxable income. Management has analyzed the fund’s tax positions taken for all open federal income tax years (August 31, 2013–2016), and has concluded that no provision for federal income tax is required in the fund’s financial statements.
4. Distributions: Distributions to shareholders are recorded on the ex-dividend date.
19
Explorer Value Fund
5. Securities Lending: To earn additional income, the fund lends its securities to qualified institutional borrowers. Security loans are subject to termination by the fund at any time, and are required to be secured at all times by collateral in an amount at least equal to the market value of securities loaned. Daily market fluctuations could cause the value of loaned securities to be more or less than the value of the collateral received. When this occurs, the collateral is adjusted and settled on the next business day. The fund further mitigates its counterparty risk by entering into securities lending transactions only with a diverse group of prequalified counterparties, monitoring their financial strength, and entering into master securities lending agreements with its counterparties. The master securities lending agreements provide that, in the event of a counterparty’s default (including bankruptcy), the fund may terminate any loans with that borrower, determine the net amount owed, and sell or retain the collateral up to the net amount owed to the fund; however, such actions may be subject to legal proceedings. While collateral mitigates counterparty risk, in the absence of a default the fund may experience delays and costs in recovering the securities loaned. The fund invests cash collateral received in Vanguard Market Liquidity Fund, and records a liability in the Statement of Net Assets for the return of the collateral, during the period the securities are on loan. Securities lending income represents fees charged to borrowers plus income earned on invested cash collateral, less expenses associated with the loan. During the term of the loan, the fund is entitled to all distributions made on or in respect of the loaned securities.
6. Credit Facility: The fund and certain other funds managed by The Vanguard Group (“Vanguard”) participate in a $3.1 billion committed credit facility provided by a syndicate of lenders pursuant to a credit agreement that may be renewed annually; each fund is individually liable for its borrowings, if any, under the credit facility. Borrowings may be utilized for temporary and emergency purposes, and are subject to the fund’s regulatory and contractual borrowing restrictions. The participating funds are charged administrative fees and an annual commitment fee of 0.10% of the undrawn amount of the facility; these fees are allocated to the funds based on a method approved by the fund’s board of trustees and included in Management and Administrative expenses on the fund’s Statement of Operations. Any borrowings under this facility bear interest at a rate based upon the higher of the one-month London Interbank Offered Rate, federal funds effective rate, or overnight bank funding rate plus an agreed-upon spread.
The fund had no borrowings outstanding at August 31, 2016, or at any time during the period then ended.
7. Other: Dividend income is recorded on the ex-dividend date. Interest income includes income distributions received from Vanguard Market Liquidity Fund and is accrued daily. Premiums and discounts on debt securities purchased are amortized and accreted, respectively, to interest income over the lives of the respective securities. Security transactions are accounted for on the date securities are bought or sold. Costs used to determine realized gains (losses) on the sale of investment securities are those of the specific securities sold.
B. The investment advisory firms Frontier Capital Management Co., LLC, and Cardinal Capital Management, L.L.C., each provide investment advisory services to a portion of the fund for a fee calculated at an annual percentage rate of average net assets managed by the advisor. The basic fee of Frontier Capital Management Co., LLC, is subject to quarterly adjustments based on performance relative to the Russell 2000 Value Index for the preceding three years. The basic fee of Cardinal Capital Management, L.L.C., is subject to quarterly adjustments based on performance relative to the Russell Mid-Cap Value Custom Cap-Range Index for periods prior to March 1, 2015, and the new benchmark,
20
Explorer Value Fund
Russell 3000 Value Custom Index, beginning March 1, 2015, for the preceding three years. The new benchmark will be fully phased in by February 2018. Until the end of May 2016, a portion of the fund was managed by Sterling Capital Management LLC . The basic fee paid to Sterling Capital Management LLC was subject to quarterly adjustments based on performance relative to the Russell 2500 Value Index for the preceding three years.
Vanguard manages the cash reserves of the fund as described below.
For the year ended August 31, 2016, the aggregate investment advisory fee represented an effective annual basic rate of 0.35% of the fund’s average net assets, before a decrease of $20,000 (0.01%) based on performance.
C. In accordance with the terms of a Funds’ Service Agreement (the “FSA”) between Vanguard and the fund, Vanguard furnishes to the fund corporate management, administrative, marketing, distribution, and cash management services at Vanguard’s cost of operations (as defined by the FSA). These costs of operations are allocated to the fund based on methods and guidelines approved by the board of trustees. Vanguard does not require reimbursement in the current period for certain costs of operations (such as deferred compensation/benefits and risk/insurance costs); the fund’s liability for these costs of operations is included in Payables to Vanguard on the Statement of Net Assets.
Upon the request of Vanguard, the fund may invest up to 0.40% of its net assets as capital in Vanguard. At August 31, 2016, the fund had contributed to Vanguard capital in the amount of $34,000, representing 0.01% of the fund’s net assets and 0.01% of Vanguard’s capitalization. The fund’s trustees and officers are also directors and employees, respectively, of Vanguard.
D. Various inputs may be used to determine the value of the fund’s investments. These inputs are summarized in three broad levels for financial statement purposes. The inputs or methodologies used to value securities are not necessarily an indication of the risk associated with investing in those securities.
Level 1—Quoted prices in active markets for identical securities.
Level 2—Other significant observable inputs (including quoted prices for similar securities, interest rates, prepayment speeds, credit risk, etc.).
Level 3—Significant unobservable inputs (including the fund’s own assumptions used to determine the fair value of investments).
The following table summarizes the market value of the fund’s investments as of August 31, 2016, based on the inputs used to value them:
| Level 1 | Level 2 | Level 3 | |
| Investments | ($000) | ($000) | ($000) |
| Common Stocks | 345,004 | — | — |
| Temporary Cash Investments | 29,037 | 3,396 | — |
| Futures Contracts—Liabilities1 | (89) | — | — |
| Total | 373,952 | 3,396 | — |
| 1 Represents variation margin on the last day of the reporting period. |
21
Explorer Value Fund
E. At August 31, 2016, the aggregate settlement value of open futures contracts and the related unrealized appreciation (depreciation) were:
| ($000) | ||||
| Aggregate | ||||
| Number of | Settlement | Unrealized | ||
| Long (Short) | Value | Appreciation | ||
| Futures Contracts | Expiration | Contracts | Long (Short) | (Depreciation) |
| E-mini Russell 2000 Index | September 2016 | 120 | 14,866 | 1,054 |
| E-mini S&P 500 Index | September 2016 | 18 | 1,953 | 3 |
| 1,057 |
Unrealized appreciation (depreciation) on open futures contracts is required to be treated as realized gain (loss) for tax purposes.
F. Distributions are determined on a tax basis and may differ from net investment income and realized capital gains for financial reporting purposes. Differences may be permanent or temporary. Permanent differences are reclassified among capital accounts in the financial statements to reflect their tax character. Temporary differences arise when certain items of income, expense, gain, or loss are recognized in different periods for financial statement and tax purposes. These differences will reverse at some time in the future. Differences in classification may also result from the treatment of short-term gains as ordinary income for tax purposes.
The fund used a tax accounting practice to treat a portion of the price of capital shares redeemed during the year as distributions from net investment income and realized capital gains. Accordingly, the fund has reclassified $243,000 from undistributed net investment income, and $574,000 from accumulated net realized gains, to paid-in capital.
For tax purposes, at August 31, 2016, the fund had $1,593,000 of ordinary income and $5,690,000 of long-term capital gains available for distribution.
At August 31, 2016, the cost of investment securities for tax purposes was $324,444,000. Net unrealized appreciation of investment securities for tax purposes was $52,993,000, consisting of unrealized gains of $60,996,000 on securities that had risen in value since their purchase and $8,003,000 in unrealized losses on securities that had fallen in value since their purchase.
G. During the year ended August 31, 2016, the fund purchased $217,107,000 of investment securities and sold $175,041,000 of investment securities, other than temporary cash investments.
22
Explorer Value Fund
| H. Capital shares issued and redeemed were: | ||
| Year Ended August 31, | ||
| 2016 | 2015 | |
| Shares | Shares | |
| (000) | (000) | |
| Issued | 3,629 | 1,703 |
| Issued in Lieu of Cash Distributions | 569 | 548 |
| Redeemed | (1,919) | (2,356) |
| Net Increase (Decrease) in Shares Outstanding | 2,279 | (105) |
I. Management has determined that no material events or transactions occurred subsequent to August 31, 2016, that would require recognition or disclosure in these financial statements.
23
Report of Independent Registered Public Accounting Firm
To the Board of Trustees of Vanguard Scottsdale Funds and the Shareholders of Vanguard Explorer Value Fund:
In our opinion, the accompanying statement of net assets and the related statements of operations and of changes in net assets and the financial highlights present fairly, in all material respects, the financial position of Vanguard Explorer Value Fund (constituting a separate portfolio of Vanguard Scottsdale Funds, hereafter referred to as the “Fund”) at August 31, 2016, the results of its operations for the year then ended, the changes in its net assets for each of the two years in the period then ended, and the financial highlights for each of the five years in the period then ended, in conformity with accounting principles generally accepted in the United States of America. These financial statements and financial highlights (hereafter referred to as “financial statements”) are the responsibility of the Fund’s management. Our responsibility is to express an opinion on these financial statements based on our audits. We conducted our audits of these financial statements in accordance with the standards of the Public Company Accounting Oversight Board (United States). Those standards require that we plan and perform the audit to obtain reasonable assurance about whether the financial statements are free of material misstatement. An audit includes examining, on a test basis, evidence supporting the amounts and disclosures in the financial statements, assessing the accounting principles used and significant estimates made by management, and evaluating the overall financial statement presentation. We believe that our audits, which included confirmation of securities at August 31, 2016 by correspondence with the custodian and brokers and by agreement to the underlying ownership records of the transfer agent, provide a reasonable basis for our opinion.
/s/PricewaterhouseCoopers LLP
Philadelphia, Pennsylvania
October 12, 2016
Special 2016 tax information (unaudited) for Vanguard Explorer Value Fund
This information for the fiscal year ended August 31, 2016, is included pursuant to provisions of the Internal Revenue Code.
The fund distributed $15,447,000 as capital gain dividends (20% rate gain distributions) to shareholders during the fiscal year.
For nonresident alien shareholders, 100% of short-term capital gain dividends distributed by the fund are qualified short-term capital gains.
The fund distributed $2,550,000 of qualified dividend income to shareholders during the fiscal year.
For corporate shareholders, 98.0% of investment income (dividend income plus short-term gains, if any) qualifies for the dividends-received deduction.
24
Your Fund’s After-Tax Returns
This table presents returns for your fund both before and after taxes. The after-tax returns are shown in two ways: (1) assuming that an investor owned the fund during the entire period and paid taxes on the fund’s distributions, and (2) assuming that an investor paid taxes on the fund’s distributions and sold all shares at the end of each period.
Calculations are based on the highest individual federal income tax and capital gains tax rates in effect at the times of the distributions and the hypothetical sales. State and local taxes were not considered. After-tax returns reflect any qualified dividend income, using actual prior-year figures and estimates for 2016. (In the example, returns after the sale of fund shares may be higher than those assuming no sale. This occurs when the sale would have produced a capital loss. The calculation assumes that the investor received a tax deduction for the loss.)
Please note that your actual after-tax returns will depend on your tax situation and may differ from those shown. Also note that if you own the fund in a tax-deferred account, such as an individual retirement account or a 401(k) plan, this information does not apply to you. Such accounts are not subject to current taxes.
Finally, keep in mind that a fund’s performance—whether before or after taxes—does not guarantee future results.
| Average Annual Total Returns: Explorer Value Fund | |||
| Periods Ended August 31, 2016 | |||
| Since | |||
| One | Five | Inception | |
| Year | Years | (3/30/2010) | |
| Returns Before Taxes | 11.41% | 13.67% | 12.35% |
| Returns After Taxes on Distributions | 9.85 | 12.04 | 11.03 |
| Returns After Taxes on Distributions and Sale of Fund Shares | 7.55 | 10.53 | 9.65 |
25
About Your Fund’s Expenses
As a shareholder of the fund, you incur ongoing costs, which include costs for portfolio management, administrative services, and shareholder reports (like this one), among others. Operating expenses, which are deducted from a fund’s gross income, directly reduce the investment return of the fund.
A fund’s expenses are expressed as a percentage of its average net assets. This figure is known as the expense ratio. The following examples are intended to help you understand the ongoing costs (in dollars) of investing in your fund and to compare these costs with those of other mutual funds. The examples are based on an investment of $1,000 made at the beginning of the period shown and held for the entire period.
The accompanying table illustrates your fund’s costs in two ways:
• Based on actual fund return. This section helps you to estimate the actual expenses that you paid over the period. The ”Ending Account Value“ shown is derived from the fund‘s actual return, and the third column shows the dollar amount that would have been paid by an investor who started with $1,000 in the fund. You may use the information here, together with the amount you invested, to estimate the expenses that you paid over the period.
To do so, simply divide your account value by $1,000 (for example, an $8,600 account value divided by $1,000 = 8.6), then multiply the result by the number given for your fund under the heading ”Expenses Paid During Period.“
• Based on hypothetical 5% yearly return. This section is intended to help you compare your fund‘s costs with those of other mutual funds. It assumes that the fund had a yearly return of 5% before expenses, but that the expense ratio is unchanged. In this case—because the return used is not the fund’s actual return—the results do not apply to your investment. The example is useful in making comparisons because the Securities and Exchange Commission requires all mutual funds to calculate expenses based on a 5% return. You can assess your fund’s costs by comparing this hypothetical example with the hypothetical examples that appear in shareholder reports of other funds.
Note that the expenses shown in the table are meant to highlight and help you compare ongoing costs only and do not reflect transaction costs incurred by the fund for buying and selling securities. Further, the expenses do not include any purchase, redemption, or account service fees described in the fund prospectus. If such fees were applied to your account, your costs would be higher. Your fund does not carry a “sales load.”
The calculations assume no shares were bought or sold during the period. Your actual costs may have been higher or lower, depending on the amount of your investment and the timing of any purchases or redemptions.
You can find more information about the fund’s expenses, including annual expense ratios, in the Financial Statements section of this report. For additional information on operating expenses and other shareholder costs, please refer to your fund’s current prospectus.
26
| Six Months Ended August 31, 2016 | |||
| Beginning | Ending | Expenses | |
| Account Value | Account Value | Paid During | |
| Explorer Value Fund | 2/29/2016 | 8/31/2016 | Period |
| Based on Actual Fund Return | $1,000.00 | $1,177.68 | $3.07 |
| Based on Hypothetical 5% Yearly Return | 1,000.00 | 1,022.32 | 2.85 |
The calculations are based on expenses incurred in the most recent six-month period. The fund’s annualized six-month expense ratio for that period is 0.56%. The dollar amounts shown as “Expenses Paid” are equal to the annualized expense ratio multiplied by the average account value over the period, multiplied by the number of days in the most recent six-month period, then divided by the number of days in the most recent 12-month period (184/366).
27
Glossary
30-Day SEC Yield. A fund’s 30-day SEC yield is derived using a formula specified by the U.S. Securities and Exchange Commission. Under the formula, data related to the fund’s security holdings in the previous 30 days are used to calculate the fund’s hypothetical net income for that period, which is then annualized and divided by the fund’s estimated average net assets over the calculation period. For the purposes of this calculation, a security’s income is based on its current market yield to maturity (for bonds), its actual income (for asset-backed securities), or its projected dividend yield (for stocks). Because the SEC yield represents hypothetical annualized income, it will differ—at times significantly—from the fund’s actual experience. As a result, the fund’s income distributions may be higher or lower than implied by the SEC yield.
Beta. A measure of the magnitude of a fund’s past share-price fluctuations in relation to the ups and downs of a given market index. The index is assigned a beta of 1.00. Compared with a given index, a fund with a beta of 1.20 typically would have seen its share price rise or fall by 12% when the index rose or fell by 10%. For this report, beta is based on returns over the past 36 months for both the fund and the index. Note that a fund’s beta should be reviewed in conjunction with its R-squared (see definition). The lower the R-squared, the less correlation there is between the fund and the index, and the less reliable beta is as an indicator of volatility.
Dividend Yield. Dividend income earned by stocks, expressed as a percentage of the aggregate market value (or of net asset value, for a fund). The yield is determined by dividing the amount of the annual dividends by the aggregate value (or net asset value) at the end of the period. For a fund, the dividend yield is based solely on stock holdings and does not include any income produced by other investments.
Earnings Growth Rate. The average annual rate of growth in earnings over the past five years for the stocks now in a fund.
Equity Exposure. A measure that reflects a fund’s investments in stocks and stock futures. Any holdings in short-term reserves are excluded.
Expense Ratio. A fund’s total annual operating expenses expressed as a percentage of the fund’s average net assets. The expense ratio includes management and administrative expenses, but does not include the transaction costs of buying and selling portfolio securities.
Foreign Holdings. The percentage of a fund represented by securities or depositary receipts of companies based outside the United States.
Inception Date. The date on which the assets of a fund (or one of its share classes) are first invested in accordance with the fund’s investment objective. For funds with a subscription period, the inception date is the day after that period ends. Investment performance is measured from the inception date.
Median Market Cap. An indicator of the size of companies in which a fund invests; the midpoint of market capitalization (market price x shares outstanding) of a fund’s stocks, weighted by the proportion of the fund’s assets invested in each stock. Stocks representing half of the fund’s assets have market capitalizations above the median, and the rest are below it.
Price/Book Ratio. The share price of a stock divided by its net worth, or book value, per share. For a fund, the weighted average price/book ratio of the stocks it holds.
28
Price/Earnings Ratio. The ratio of a stock’s current price to its per-share earnings over the past year. For a fund, the weighted average P/E of the stocks it holds. P/E is an indicator of market expectations about corporate prospects; the higher the P/E, the greater the expectations for a company’s future growth.
R-Squared. A measure of how much of a fund’s past returns can be explained by the returns from the market in general, as measured by a given index. If a fund’s total returns were precisely synchronized with an index’s returns, its R-squared would be 1.00. If the fund’s returns bore no relationship to the index’s returns, its R-squared would be 0. For this report, R-squared is based on returns over the past 36 months for both the fund and the index.
Return on Equity. The annual average rate of return generated by a company during the past five years for each dollar of shareholder’s equity (net income divided by shareholder’s equity). For a fund, the weighted average return on equity for the companies whose stocks it holds.
Short-Term Reserves. The percentage of a fund invested in highly liquid, short-term securities that can be readily converted to cash.
Turnover Rate. An indication of the fund’s trading activity. Funds with high turnover rates incur higher transaction costs and may be more likely to distribute capital gains (which may be taxable to investors). The turnover rate excludes in-kind transactions, which have minimal impact on costs.
29
This page intentionally left blank.
This page intentionally left blank.
The People Who Govern Your Fund
The trustees of your mutual fund are there to see that the fund is operated and managed in your best interests since, as a shareholder, you are a part owner of the fund. Your fund’s trustees also serve on the board of directors of The Vanguard Group, Inc., which is owned by the Vanguard funds and provides services to them on an at-cost basis.
A majority of Vanguard’s board members are independent, meaning that they have no affiliation with Vanguard or the funds they oversee, apart from the sizable personal investments they have made as private individuals. The independent board members have distinguished backgrounds in business, academia, and public service. Each of the trustees and executive officers oversees 198 Vanguard funds.
The following table provides information for each trustee and executive officer of the fund. The mailing address of the trustees and officers is P.O. Box 876, Valley Forge, PA 19482. More information about the trustees is in the Statement of Additional Information, which can be obtained, without charge, by contacting Vanguard at 800-662-7447, or online at vanguard.com.
InterestedTrustee1
F. William McNabb III
Born 1957. Trustee Since July 2009. Chairman of the Board. Principal Occupation(s) During the Past Five Years and Other Experience: Chairman of the Board of The Vanguard Group, Inc., and of each of the investment companies served by The Vanguard Group, since January 2010; Director of The Vanguard Group since 2008; Chief Executive Officer and President of The Vanguard Group, and of each of the investment companies served by The Vanguard Group, since 2008; Director of Vanguard Marketing Corporation; Managing Director of The Vanguard Group (1995–2008).
IndependentTrustees
Emerson U. Fullwood
Born 1948. Trustee Since January 2008. Principal Occupation(s) During the Past Five Years and Other Experience: Executive Chief Staff and Marketing Officer for North America and Corporate Vice President (retired 2008) of Xerox Corporation (document management products and services); Executive in Residence and 2009–2010 Distinguished Minett Professor at the Rochester Institute of Technology; Lead Director of SPX FLOW, Inc. (multi-industry manufacturing); Director of the United Way of Rochester, the University of Rochester Medical Center, Monroe Community College Foundation, North Carolina A&T University, and Roberts Wesleyan College.
Rajiv L. Gupta
Born 1945. Trustee Since December 2001.2 Principal Occupation(s) During the Past Five Years and Other Experience: Chairman and Chief Executive Officer (retired 2009) and President (2006–2008) of Rohm and Haas Co. (chemicals); Director of Tyco International plc (diversified manufacturing and services), HP Inc. (printer and personal computer manufacturing), and Delphi Automotive plc (automotive components); Senior Advisor at New Mountain Capital.
Amy Gutmann
Born 1949. Trustee Since June 2006. Principal Occupation(s) During the Past Five Years and Other Experience: President of the University of Pennsylvania; Christopher H. Browne Distinguished Professor of Political Science, School of Arts and Sciences, and Professor of Communication, Annenberg School for Communication, with secondary faculty appointments in the Department of Philosophy, School of Arts and Sciences, and at the Graduate School of Education, University of Pennsylvania; Trustee of the National Constitution Center; Chair of the Presidential Commission for the Study of Bioethical Issues.
JoAnn Heffernan Heisen
Born 1950. Trustee Since July 1998. Principal Occupation(s) During the Past Five Years and Other Experience: Corporate Vice President and Chief Global Diversity Officer (retired 2008) and Member of the Executive Committee (1997–2008) of Johnson & Johnson (pharmaceuticals/medical devices/consumer products); Director of Skytop Lodge Corporation (hotels) and the Robert Wood Johnson Foundation; Member of the Advisory Board of the Institute for Women’s Leadership at Rutgers University.
F. Joseph Loughrey
Born 1949. Trustee Since October 2009. Principal Occupation(s) During the Past Five Years and Other Experience: President and Chief Operating Officer (retired 2009) of Cummins Inc. (industrial machinery); Chairman of the Board of Hillenbrand, Inc. (specialized consumer services), and of Oxfam America; Director of SKF AB (industrial machinery), Hyster-Yale Materials Handling, Inc. (forklift trucks), the Lumina Foundation for Education, and the V Foundation for Cancer Research; Member of the Advisory Council for the College of Arts and Letters and of the Advisory Board to the Kellogg Institute for International Studies, both at the University of Notre Dame.
Mark Loughridge
Born 1953. Trustee Since March 2012. Principal Occupation(s) During the Past Five Years and Other Experience: Senior Vice President and Chief Financial Officer (retired 2013) at IBM (information technology services); Fiduciary Member of IBM’s Retirement Plan Committee (2004–2013); Director of the Dow Chemical Company; Member of the Council on Chicago Booth.
Scott C. Malpass
Born 1962. Trustee Since March 2012. Principal Occupation(s) During the Past Five Years and Other Experience: Chief Investment Officer and Vice President at the University of Notre Dame; Assistant Professor of Finance at the Mendoza College of Business at Notre Dame; Member of the Notre Dame 403(b) Investment Committee, the Board of Advisors for Spruceview Capital Partners, and the Investment Advisory Committee of Major League Baseball; Board Member of TIFF Advisory Services, Inc., and Catholic Investment Services, Inc. (investment advisors).
André F. Perold
Born 1952. Trustee Since December 2004. Principal Occupation(s) During the Past Five Years and Other Experience: George Gund Professor of Finance and Banking, Emeritus at the Harvard Business School (retired 2011); Chief Investment Officer and Managing Partner of HighVista Strategies LLC (private investment firm); Director of Rand Merchant Bank; Overseer of the Museum of Fine Arts Boston.
Peter F. Volanakis
Born 1955. Trustee Since July 2009. Principal Occupation(s) During the Past Five Years and Other Experience: President and Chief Operating Officer (retired 2010) of Corning Incorporated (communications equipment); Chairman of the Board of Trustees of Colby-Sawyer College; Member of the Advisory Board of the Norris Cotton Cancer Center.
Executive Officers
Glenn Booraem
Born 1967. Treasurer Since May 2015. Principal Occupation(s) During the Past Five Years and Other Experience: Principal of The Vanguard Group, Inc.; Treasurer of each of the investment companies served by The Vanguard Group; Controller of each of the investment companies served by The Vanguard Group (2010–2015); Assistant Controller of each of the investment companies served by The Vanguard Group (2001–2010).
Thomas J. Higgins
Born 1957. Chief Financial Officer Since September 2008. Principal Occupation(s) During the Past Five Years and Other Experience: Principal of The Vanguard Group, Inc.; Chief Financial Officer of each of the investment companies served by The Vanguard Group; Treasurer of each of the investment companies served by The Vanguard Group (1998–2008).
Peter Mahoney
Born 1974. Controller Since May 2015. Principal Occupation(s) During the Past Five Years and Other Experience: Head of Global Fund Accounting at The Vanguard Group, Inc.; Controller of each of the investment companies served by The Vanguard Group; Head of International Fund Services at The Vanguard Group (2008–2014).
Heidi Stam
Born 1956. Secretary Since July 2005. Principal Occupation(s) During the Past Five Years and Other Experience: Managing Director of The Vanguard Group, Inc.; General Counsel of The Vanguard Group; Secretary of The Vanguard Group and of each of the investment companies served by The Vanguard Group; Director and Senior Vice President of Vanguard Marketing Corporation.
Vanguard Senior Management Team
|
Mortimer J. Buckley Kathleen C. Gubanich Martha G. King John T. Marcante Chris D. McIsaac |
James M. Norris Thomas M. Rampulla Glenn W. Reed Karin A. Risi Michael Rollings |
Chairman Emeritus and Senior Advisor
John J. Brennan
Chairman, 1996–2009
Chief Executive Officer and President, 1996–2008
Founder John C. Bogle
Chairman and Chief Executive Officer, 1974–1996
1 Mr. McNabb is considered an “interested person,” as defined in the Investment Company Act of 1940, because he is an officer of the Vanguard funds.
2 December 2002 for Vanguard Equity Income Fund, the Vanguard Municipal Bond Funds, and the Vanguard State Tax-Exempt Funds.
 |
| P.O. Box 2600 |
| Valley Forge, PA 19482-2600 |
Connect with Vanguard® > vanguard.com
| Fund Information > 800-662-7447 | CFA® is a registered trademark owned by CFA Institute. |
| Direct Investor Account Services > 800-662-2739 | |
| Institutional Investor Services > 800-523-1036 | |
| Text Telephone for People | |
| Who Are Deaf or Hard of Hearing> 800-749-7273 | |
| This material may be used in conjunction | |
| with the offering of shares of any Vanguard | |
| fund only if preceded or accompanied by | |
| the fund’s current prospectus. | |
| All comparative mutual fund data are from Lipper, a | |
| Thomson Reuters Company, or Morningstar, Inc., unless | |
| otherwise noted. | |
| You can obtain a free copy of Vanguard’s proxy voting | |
| guidelines by visiting vanguard.com/proxyreporting or by | |
| calling Vanguard at 800-662-2739. The guidelines are | |
| also available from the SEC’s website, sec.gov. In | |
| addition, you may obtain a free report on how your fund | |
| voted the proxies for securities it owned during the 12 | |
| months ended June 30. To get the report, visit either | |
| vanguard.com/proxyreporting or sec.gov. | |
| You can review and copy information about your fund at | |
| the SEC’s Public Reference Room in Washington, D.C. To | |
| find out more about this public service, call the SEC at | |
| 202-551-8090. Information about your fund is also | |
| available on the SEC’s website, and you can receive | |
| copies of this information, for a fee, by sending a | |
| request in either of two ways: via email addressed to | |
| publicinfo@sec.gov or via regular mail addressed to the | |
| Public Reference Section, Securities and Exchange | |
| Commission, Washington, DC 20549-1520. | |
| © 2016 The Vanguard Group, Inc. | |
| All rights reserved. | |
| Vanguard Marketing Corporation, Distributor. | |
| Q16900 102016 | |
Annual Report | August 31, 2016
Vanguard Russell 1000 Index Funds
Vanguard Russell 1000 Index Fund
Vanguard Russell 1000 Value Index Fund
Vanguard Russell 1000 Growth Index Fund
A new format, unwavering commitment
As you begin reading this report, you’ll notice that we’ve made some improvements to the opening sections—based on feedback from you, our clients.
Page 1 starts with a new ”Your Fund’s Performance at a Glance,” a concise, handy summary of how your fund performed during the period.
In the renamed ”Chairman’s Perspective,” Bill McNabb will focus on enduring principles and investment insights.
We’ve modified some tables, and eliminated some redundancy, but we haven’t removed any information.
At Vanguard, we’re always looking for better ways to communicate and to help you make sound investment decisions. Thank you for entrusting your assets to us.
| Contents | |
| Your Fund’s Performance at a Glance. | 1 |
| Chairman’s Perspective. | 4 |
| Russell 1000 Index Fund. | 8 |
| Russell 1000 Value Index Fund. | 24 |
| Russell 1000 Growth Index Fund. | 39 |
| Your Fund’s After-Tax Returns. | 56 |
| About Your Fund’s Expenses. | 57 |
| Trustees Approve Advisory Arrangements. | 59 |
| Glossary. | 61 |
Please note: The opinions expressed in this report are just that—informed opinions. They should not be considered promises or advice. Also, please keep in mind that the information and opinions cover the period through the date on the front of this report. Of course, the risks of investing in your fund are spelled out in the prospectus.
See the Glossary for definitions of investment terms used in this report.
About the cover: No matter what language you speak, Vanguard has one consistent message and set of principles. Our primary focus is on you, our clients. We conduct our business with integrity as a faithful steward of your assets. This message is shown translated into seven languages, reflecting our expanding global presence.
Your Fund’s Performance at a Glance
• Value stocks generally outperformed their growth-oriented counterparts for the 12 months ended August 31, 2016. This broad market trend was mirrored in the performance of the Vanguard Russell 1000 Index Funds.
• Results ranged from about 13% for the Value Index Fund to about 10% for the Growth Index Fund. The Russell 1000 Index Fund, which includes both growth and value stocks, returned about 11%.
• All three funds closely tracked their target indexes and exceeded the average returns of their large-cap fund peers.
• Technology was the top contributing sector for all three funds. Producer durables, consumer staples, and financial services also added to performance.
• Health care and energy posted negative results for the Growth Index Fund.
| Total Returns: Fiscal Year Ended August 31, 2016 | |
| Total | |
| Returns | |
| Vanguard Russell 1000 Index Fund | |
| ETF Shares | |
| Market Price | 11.35% |
| Net Asset Value | 11.41 |
| Institutional Shares | 11.47 |
| Russell 1000 Index | 11.69 |
| Large-Cap Core Funds Average | 9.22 |
| Large-Cap Core Funds Average: Derived from data provided by Lipper, a Thomson Reuters Company. | |
| Vanguard Russell 1000 Value Index Fund | |
| ETF Shares | |
| Market Price | 12.63% |
| Net Asset Value | 12.65 |
| Institutional Shares | 12.72 |
| Russell 1000 Value Index | 12.92 |
| Large-Cap Value Funds Average | 8.66 |
| Large-Cap Value Funds Average: Derived from data provided by Lipper, a Thomson Reuters Company. | |
1
| Total | |
| Returns | |
| Vanguard Russell 1000 Growth Index Fund | |
| ETF Shares | |
| Market Price | 10.43% |
| Net Asset Value | 10.44 |
| Institutional Shares | 10.48 |
| Russell 1000 Growth Index | 10.54 |
| Large-Cap Growth Funds Average | 6.69 |
| Large-Cap Growth Funds Average: Derived from data provided by Lipper, a Thomson Reuters Company. |
Institutional Shares are available to certain institutional investors who meet specific administrative, service, and account-size criteria. The Vanguard ETF® Shares shown are traded on the Nasdaq exchange and are available only through brokers. The table provides ETF returns based on both the Nasdaq market price and the net asset value for a share. U.S. Pat. Nos. 6,879,964; 7,337,138; 7,720,749; 7,925,573; 8,090,646; and 8,417,623.
For the ETF Shares, the market price is determined by the midpoint of the bid-offer spread as of the closing time of the New York Stock Exchange (generally 4 p.m., Eastern time). The net asset value is also determined as of the NYSE closing time. For more information about how the ETF Shares' market prices have compared with their net asset value, visit vanguard.com, select your ETF, and then select the Price and Performance tab. The ETF premium/discount analysis there shows the percentages of days on which the ETF Shares' market price was above or below the NAV.
| Total Returns: Inception Through August 31, 2016 | |
| Average | |
| Annual Return | |
| Russell 1000 Index Fund ETF Shares Net Asset Value (Returns since inception: 9/20/2010) | 13.64% |
| Russell 1000 Index | 13.80 |
| Large-Cap Core Funds Average | 11.85 |
| Large-Cap Core Funds Average: Derived from data provided by Lipper, a Thomson Reuters Company. | |
| Russell 1000 Value Index Fund ETF Shares Net Asset Value (Returns since inception: 9/20/2010) | 12.80% |
| Russell 1000 Value Index | 12.97 |
| Large-Cap Value Funds Average | 11.14 |
| Large-Cap Value Funds Average: Derived from data provided by Lipper, a Thomson Reuters Company. | |
| Russell 1000 Growth Index Fund ETF Shares Net Asset Value (Returns since inception: 9/20/2010) | 14.41% |
| Russell 1000 Growth Index | 14.58 |
| Large-Cap Growth Funds Average | 12.46 |
| Large-Cap Growth Funds Average: Derived from data provided by Lipper, a Thomson Reuters Company. | |
The figures shown represent past performance, which is not a guarantee of future results. (Current performance may be lower or higher than the performance data cited. For performance data current to the most recent month-end, visit our website at vanguard.com/performance.) Note, too, that both investment returns and principal value can fluctuate widely, so an investor’s shares, when sold, could be worth more or less than their original cost.
2
| Expense Ratios | |||
| Your Fund Compared With Its Peer Group | |||
| ETF | Institutional | Peer Group | |
| Shares | Shares | Average | |
| Russell 1000 Index Fund | 0.12% | 0.08% | 1.11% |
| Russell 1000 Value Index Fund | 0.12 | 0.08 | 1.10 |
| Russell 1000 Growth Index Fund | 0.12 | 0.08 | 1.17 |
The fund expense ratios shown are from the prospectus dated December 22, 2015, and represent estimated costs for the current fiscal year. For the fiscal year ended August 31, 2016, the funds’ expense ratios were: for the Russell 1000 Index Fund, 0.12% for ETF Shares and 0.08% for Institutional Shares; for the Russell 1000 Value Index Fund, 0.12% for ETF Shares and 0.08% for Institutional Shares; and for the Russell 1000 Growth Index Fund, 0.12% for ETF Shares and 0.08% for Institutional Shares. Peer-group expense ratios are derived from data provided by Lipper, a Thomson Reuters Company, and capture information through year-end 2015.
Peer groups: For the Russell 1000 Index Fund, Large-Cap Core Funds; for the Russell 1000 Value Index Fund, Large-Cap Value Funds; and for the Russell 1000 Growth Index Fund, Large-Cap Growth Funds.
3
Chairman’s Perspective

Bill McNabb
Chairman and Chief Executive Officer
Dear Shareholder,
Even as the global economy continued to expand at a slow but sustained pace over the 12 months ended August 31, 2016, a series of disquieting developments highlighted the importance for investors of remaining disciplined.
Chief among them was “Brexit”—the British public’s vote to exit the European Union—but plenty of others moved the markets as well. We saw sharp ups and downs in the prices of oil and other commodities, choppy U.S. job numbers, shifting expectations about when the Federal Reserve might raise interest rates again, and decreases in already negative yields for European and Japanese government bonds.
Beyond being the end of the fiscal period, August marked a milestone: 40 years since Vanguard introduced the first index mutual fund. In ways that are perhaps still not fully appreciated, indexing has vastly improved investing for individuals, advisors, and institutions all over the world. Later in this letter, I’ll discuss the revolution wrought by what was initially a little-heralded new fund from a fledgling outfit in Valley Forge, Pennsylvania.
Brexit added another layer of uncertainty for investors
I think it’s fair to say that the momentous June 23 Brexit vote caught even the British off guard. Although we saw some market jitters in the run-up to the referendum, the unexpected outcome triggered a spike in
4
volatility worldwide. Stocks around the world lost 5%–10% in U.S. dollar terms in the first two trading sessions following the vote, with U.K. and European markets among the hardest hit; global bonds, though, headed in the other direction. It was a textbook illustration of the value of having a diversified portfolio.
That kind of volatility can push investors to “do something.” But some of the worst days in the stock markets are sometimes followed by some of the best—as happened at the end of June. Investors who scrambled to protect their portfolios by shedding stocks amid headlines warning of a global market meltdown may well have ended up locking in post-Brexit losses, then missing out on the strong rebound that took place just days later. Those headlines were noise that investors would have been better off tuning out. I’m pleased to say that Vanguard investors on the whole did just that—we continued to see cash flows into our funds in the days after the vote.
For the 12 months, stocks generally finished higher, with U.S. stocks up more than 11% and international stocks about 3% for U.S.-based investors.
In a surprise, bonds turned in a solid performance that few would have predicted a year ago. It seemed as if rates had fallen so far that they couldn’t go any lower, but many did. Central banks in a number of European countries and Japan set key monetary policy rates below zero.
| Market Barometer | |||
| Average Annual Total Returns | |||
| Periods Ended August 31, 2016 | |||
| One | Three | Five | |
| Year | Years | Years | |
| Stocks | |||
| Russell 1000 Index (Large-caps) | 11.69% | 12.02% | 14.60% |
| Russell 2000 Index (Small-caps) | 8.59 | 8.53 | 12.85 |
| Russell 3000 Index (Broad U.S. market) | 11.44 | 11.74 | 14.46 |
| FTSE All-World ex US Index (International) | 3.37 | 2.59 | 3.72 |
| Bonds | |||
| Barclays U.S. Aggregate Bond Index (Broad taxable market) | 5.97% | 4.37% | 3.24% |
| Barclays Municipal Bond Index (Broad tax-exempt market) | 6.88 | 6.47 | 4.80 |
| Citigroup Three-Month U.S. Treasury Bill Index | 0.18 | 0.05 | 0.06 |
| CPI | |||
| Consumer Price Index | 1.06% | 0.98% | 1.23% |
5
| When being ‘average’ is a lot better than average |
| Not only did Vanguard founder John C. Bogle launch the first index mutual fund in 1976, but |
| he also was among the first to clearly explain to the investing public the benefits of what was |
| then a novel, unproven strategy. |
| Back in 1977, in the first annual report for what was later renamed Vanguard 500 Index Fund, |
| Mr. Bogle wrote that an index fund “represents a tough and demanding ‘par.’. And if there |
| are some professionals who can ‘beat par’ more often than not—in investing or in golf—they |
| do not seem to be in the majority.” |
| Mr. Bogle’s analogy has been borne out by historical returns. As you can see in the chart |
| below, out of 1,238 actively managed large-capitalization funds, a clear majority—65%— |
| trailed the Standard & Poor’s 500 Index in average annual return over the decade ended |
| December 31, 2015. And 518 funds, or about 42% of the total number, trailed by more than |
| 1 percentage point. |
| The track record looks even more discouraging when you consider that of the 35% of funds |
| that outperformed the index, only119—or about10%in all—did so by morethan 1 percentage |
| point. The 315 others also took on risk to try to outperform the index (and likely experienced |
| greatervolatility)butcameoutaheadbylessthan1percentagepointinaverageannualreturn. |
| Over a decade, a majority of active large-cap funds lagged the S&P 500 Index |
| Based on average annual returns, 2006–2015 |
| Notes: Data based on average annual returns ofall 1,238existing actively managed large-cap funds overthe decade endedDecember 31, |
| 2015. Note thatindexfunds seekto track theperformance ofabenchmarkindexbuttypically won't“match”thebenchmark'sreturns because |
| of the costs of passive indexing. |
| Sources: Vanguard calculations, using data from Standard & Poor’s. |
| Pastperformanceisnotaguarantee offutureresults.Theperformanceofanindexis notanexactrepresentationofanyparticularinvestment, |
| asyoucannotinvestdirectlyinanindex. |
6
These policies held down short-term rates, while more muted expectations for global growth and inflation weighed on longer-term rates.
Yields in the United States weren’t quite as low as in many developed countries. The Fed raised the federal funds target rate only once, in December, to a slim 0.25%–0.5%. Further out on the maturity spectrum, the bellwether 10-year U.S. Treasury yield dropped in early July to a record low 1.36%, before moving back up a little to end the period at 1.58%. Over the 12 months, U.S. bonds returned about 6%, and international bonds returned even more—about 11%—for U.S.-based investors, again underscoring the markets’ unpredictability and the merits of diversification.
Over the years, many investors have embraced the pluses of indexing
Market upsets like Brexit aren’t rare occurrences. Fortunately, indexing has proved to be a durable behavioral tool to help keep investors from making bad financial decisions when upsets happen. In fact, this is one of indexing’s less appreciated benefits: Holding index funds as part of a broadly diversified portfolio can counterbalance that tendency to react to news headlines. When times are volatile, you’ll know you might have some exposure to a part of the market that has dropped, but also to other parts that may be holding up better.
Vanguard’s launch of the First Index Investment Trust, now Vanguard 500 Index Fund, initially met with a frosty reception. Its mandate to track the performance of a broadly diversified benchmark at a low cost seemed underwhelming to an investing public accustomed to funds that offered the chance to outperform. Investors have since come around, as experience has demonstrated the benefits of low costs and broad diversification.
Indexing accounted for about 30% of U.S. mutual fund and exchange-traded fund (ETF) assets at the end of 2015, according to the Investment Company Institute. Some now even proclaim the “triumph of indexing,” implying that it’s the only way to invest.
In our view, the rise of indexing has served to underscore an investment principle that long predates 1976: A long-term, low-cost, diversified approach gives investors the best chance for success. That’s true whether the investments you choose are indexed or actively managed—or both.
As always, thank you for investing with Vanguard.
Sincerely,
F. William McNabb III
Chairman and Chief Executive Officer
September 9, 2016
7
Russell 1000 Index Fund
Fund Profile
As of August 31, 2016
| Share-Class Characteristics | |||
| ETF | Institutional | ||
| Shares | Shares | ||
| Ticker Symbol | VONE | VRNIX | |
| Expense Ratio1 | 0.12% | 0.08% | |
| 30-Day SEC Yield | 1.92% | 1.96% | |
| Portfolio Characteristics | |||
| DJ | |||
| U.S. | |||
| Total | |||
| Russell | Market | ||
| 1000 | FA | ||
| Fund | Index | Index | |
| Number of Stocks | 1,002 | 1,000 | 3,817 |
| Median Market Cap | $66.4B | $66.4B | $51.2B |
| Price/Earnings Ratio | 22.9x | 22.9x | 23.5x |
| Price/Book Ratio | 2.8x | 2.8x | 2.8x |
| Return on Equity | 17.2% | 17.0% | 16.6% |
| Earnings Growth | |||
| Rate | 7.5% | 7.5% | 7.5% |
| Dividend Yield | 2.0% | 2.0% | 2.0% |
| Foreign Holdings | 0.0% | 0.0% | 0.0% |
| Turnover Rate | 9% | — | — |
| Short-Term Reserves | -0.2% | — | — |
| Sector Diversification (% of equity exposure) | |||
| DJ | |||
| U.S. | |||
| Total | |||
| Russell Market | |||
| 1000 | FA | ||
| Fund | Index | Index | |
| Consumer Discretionary | 14.1% | 14.1% | 14.2% |
| Consumer Staples | 8.4 | 8.4 | 8.0 |
| Energy | 6.8 | 6.8 | 6.5 |
| Financial Services | 19.5 | 19.5 | 20.0 |
| Health Care | 14.1 | 14.1 | 14.0 |
| Materials & Processing | 3.6 | 3.6 | 3.9 |
| Producer Durables | 10.3 | 10.3 | 10.5 |
| Technology | 17.4 | 17.4 | 17.3 |
| Utilities | 5.8 | 5.8 | 5.6 |
| Volatility Measures | ||
| DJ | ||
| Russell | U.S. Total | |
| 1000 | Market | |
| Index | FA Index | |
| R-Squared | 1.00 | 1.00 |
| Beta | 1.00 | 0.99 |
| These measures show the degree and timing of the fund’s | ||
| fluctuations compared with the indexes over 36 months. | ||
| Ten Largest Holdings (% of total net assets) | ||
| Apple Inc. | Computer | |
| Technology | 2.8% | |
| Alphabet Inc. | Computer Services | |
| Software & Systems | 2.2 | |
| Microsoft Corp. | Computer Services | |
| Software & Systems | 2.1 | |
| Exxon Mobil Corp. | Oil: Integrated | 1.7 |
| Johnson & Johnson | Pharmaceuticals | 1.6 |
| Amazon.com Inc. | Diversified Retail | 1.4 |
| General Electric Co. | Diversified | |
| Manufacturing | ||
| Operations | 1.4 | |
| Berkshire Hathaway Inc. Insurance: Multi-Line | 1.3 | |
| Facebook Inc. | Computer Services | |
| Software & Systems | 1.3 | |
| AT&T Inc. | Utilities: | |
| Telecommunications | 1.2 | |
| Top Ten | 17.0% | |
| The holdings listed exclude any temporary cash investments and | ||
| equity index products. | ||

1 The expense ratios shown are from the prospectus dated December 22, 2015, and represent estimated costs for the current fiscal year. For the fiscal year ended August 31, 2016, the expense ratios were 0.12% for ETF Shares and 0.08% for Institutional Shares.
8
Russell 1000 Index Fund
Performance Summary
All of the returns in this report represent past performance, which is not a guarantee of future results that may be achieved by the fund. (Current performance may be lower or higher than the performance data cited. For performance data current to the most recent month-end, visit our website at vanguard.com/performance.) Note, too, that both investment returns and principal value can fluctuate widely, so an investor’s shares, when sold, could be worth more or less than their original cost. The returns shown do not reflect taxes that a shareholder would pay on fund distributions or on the sale of fund shares.
Cumulative Performance: September 20, 2010, Through August 31, 2016
Initial Investment of $10,000
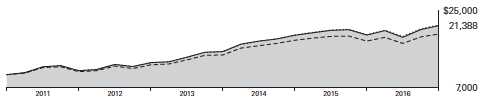
| Average Annual Total Returns | |||||
| Periods Ended August 31, 2016 | |||||
| Since | Final Value | ||||
| One | Five | Inception | of a $10,000 | ||
| Year | Years | (9/20/2010) | Investment | ||
| Russell 1000 Index Fund*ETF Shares | |||||
| Net Asset Value | 11.41% | 14.43% | 13.64% | $21,388 | |
| Russell 1000 Index Fund*ETF Shares | |||||
| Market Price | 11.35 | 14.42 | 13.64 | 21,385 | |
| •••••••• | Russell 1000 Index | 11.69 | 14.60 | 13.80 | 21,571 |
| – – – – | Large-Cap Core Funds Average | 9.22 | 12.72 | 11.85 | 19,462 |
| Dow Jones U.S. Total Stock Market | |||||
| Float Adjusted Index | 11.34 | 14.40 | 13.66 | 21,415 | |
| Large-Cap Core Funds Average: Derived from data provided by Lipper, a Thomson Reuters Company. | |||||
| "Since Inception" performance is calculated from the ETF Shares’ inception date for both the fund and its comparative standards. | |||||
| Since | Final Value | |||
| One | Five | Inception | of a $5,000,000 | |
| Year | Years | (10/15/2010) | Investment | |
| Russell 1000 Index Fund Institutional Shares | 11.47% | 14.48% | 13.25% | $10,388,136 |
| Russell 1000 Index | 11.69 | 14.60 | 13.36 | 10,449,981 |
| Dow Jones U.S. Total Stock Market Float | ||||
| Adjusted Index | 11.34 | 14.40 | 13.19 | 10,358,678 |
"Since Inception" performance is calculated from the Institutional Shares’ inception date for both the fund and its comparative standards.
See Financial Highlights for dividend and capital gains information.
9
Russell 1000 Index Fund
| Cumulative Returns of ETF Shares: September 20, 2010, Through August 31, 2016 | |||
| Since | |||
| One | Five | Inception | |
| Year | Years | (9/20/2010) | |
| Russell 1000 Index Fund ETF Shares Market Price | 11.35% | 96.15% | 113.85% |
| Russell 1000 Index Fund ETF Shares Net Asset | |||
| Value | 11.41 | 96.19 | 113.88 |
| Russell 1000 Index | 11.69 | 97.65 | 115.71 |
"Since Inception" performance is calculated from the ETF Shares’ inception date for both the fund and its comparative standards.
Fiscal-Year Total Returns (%): September 20, 2010, Through August 31, 2016
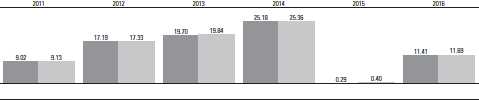
Russell 1000 Index Fund ETF Shares Net Asset Value
Russell 1000 Index
Average Annual Total Returns: Periods Ended June 30, 2016
This table presents returns through the latest calendar quarter—rather than through the end of the fiscal period.
Securities and Exchange Commission rules require that we provide this information.
| Inception | One | Five | Since | |
| Date | Year | Years | Inception | |
| ETF Shares | 9/20/2010 | |||
| Market Price | 2.60% | 11.71% | 13.30% | |
| Net Asset Value | 2.68 | 11.72 | 13.31 | |
| Institutional Shares | 10/15/2010 | 2.72 | 11.76 | 12.90 |
10
Russell 1000 Index Fund
Financial Statements
Statement of Net Assets—Investments Summary
As of August 31, 2016
This Statement summarizes the fund’s holdings by asset type. Details are reported for each of the fund’s 50 largest individual holdings and for investments that, in total for any issuer, represent more than 1% of the fund’s net assets. The total value of smaller holdings is reported as a single amount within each category.
The fund reports a complete list of its holdings in regulatory filings four times in each fiscal year, at the quarter-ends. For the second and fourth fiscal quarters, the complete listing of the fund’s holdings is available electronically on vanguard.com and on the Securities and Exchange Commission’s website (sec.gov), or you can have it mailed to you without charge by calling 800-662-7447. For the first and third fiscal quarters, the fund files the lists with the SEC on Form N-Q. Shareholders can look up the fund’s Forms N-Q on the SEC’s website. Forms N-Q may also be reviewed and copied at the SEC’s Public Reference Room (see the back cover of this report for further information).
| Market | Percentage | ||
| Value• | of Net | ||
| Shares | ($000) | Assets | |
| Common Stocks | |||
| Consumer Discretionary | |||
| * Amazon.com Inc. | 41,085 | 31,601 | 1.4% |
| Home Depot Inc. | 131,443 | 17,629 | 0.8% |
| Comcast Corp. Class A | 254,588 | 16,614 | 0.8% |
| Walt Disney Co. | 171,406 | 16,191 | 0.7% |
| Wal-Mart Stores Inc. | 159,807 | 11,417 | 0.5% |
| McDonald’s Corp. | 92,823 | 10,736 | 0.5% |
| Consumer Discretionary—Other † | 209,144 | 9.4% | |
| 313,332 | 14.1% | ||
| Consumer Staples | |||
| Procter & Gamble Co. | 281,492 | 24,577 | 1.1% |
| Coca-Cola Co. | 411,536 | 17,873 | 0.8% |
| Philip Morris International Inc. | 163,736 | 16,362 | 0.7% |
| PepsiCo Inc. | 152,566 | 16,286 | 0.7% |
| Altria Group Inc. | 206,607 | 13,655 | 0.6% |
| CVS Health Corp. | 113,356 | 10,587 | 0.5% |
| Consumer Staples—Other † | 87,959 | 4.0% | |
| 187,299 | 8.4% | ||
| Energy | |||
| Exxon Mobil Corp. | 438,012 | 38,168 | 1.7% |
| Chevron Corp. | 198,638 | 19,979 | 0.9% |
| Schlumberger Ltd. | 146,888 | 11,604 | 0.5% |
| Energy—Other † | 81,044 | 3.7% | |
| 150,795 | 6.8% | ||
| Financial Services | |||
| * Berkshire Hathaway Inc. Class B | 199,741 | 30,059 | 1.4% |
| JPMorgan Chase & Co. | 384,524 | 25,955 | 1.2% |
| Wells Fargo & Co. | 482,701 | 24,521 | 1.1% |
11
| Russell 1000 Index Fund | |||
| Market | Percentage | ||
| Value• | of Net | ||
| Shares | ($000) | Assets | |
| Bank of America Corp. | 1,085,620 | 17,522 | 0.8% |
| Visa Inc. Class A | 201,270 | 16,283 | 0.7% |
| Citigroup Inc. | 310,121 | 14,805 | 0.7% |
| MasterCard Inc. Class A | 101,745 | 9,832 | 0.4% |
| Financial Services—Other † | 294,187 | 13.2% | |
| 433,164 | 19.5% | ||
| Health Care | |||
| Johnson & Johnson | 290,273 | 34,641 | 1.6% |
| Pfizer Inc. | 634,818 | 22,092 | 1.0% |
| Merck & Co. Inc. | 292,677 | 18,377 | 0.8% |
| Amgen Inc. | 79,380 | 13,499 | 0.6% |
| UnitedHealth Group Inc. | 99,051 | 13,476 | 0.6% |
| Medtronic plc | 148,179 | 12,896 | 0.6% |
| Gilead Sciences Inc. | 139,962 | 10,970 | 0.5% |
| AbbVie Inc. | 170,938 | 10,957 | 0.5% |
| Bristol-Myers Squibb Co. | 176,401 | 10,124 | 0.4% |
| * Allergan plc | 41,773 | 9,797 | 0.4% |
| * Celgene Corp. | 81,180 | 8,665 | 0.4% |
| Health Care—Other † | 146,922 | 6.6% | |
| 312,416 | 14.0% | ||
| Materials & Processing † | 80,202 | 3.6% | |
| Producer Durables | |||
| General Electric Co. | 972,045 | 30,367 | 1.3% |
| 3M Co. | 62,094 | 11,130 | 0.5% |
| Honeywell International Inc. | 80,379 | 9,381 | 0.4% |
| United Technologies Corp. | 81,984 | 8,726 | 0.4% |
| Union Pacific Corp. | 89,023 | 8,504 | 0.4% |
| Producer Durables—Other † | 159,928 | 7.2% | |
| 228,036 | 10.2% | ||
| Technology | |||
| Apple Inc. | 578,995 | 61,431 | 2.8% |
| Microsoft Corp. | 800,109 | 45,974 | 2.1% |
| * Facebook Inc. Class A | 237,040 | 29,896 | 1.3% |
| * Alphabet Inc. Class A | 31,114 | 24,575 | 1.1% |
| * Alphabet Inc. Class C | 31,240 | 23,963 | 1.1% |
| Intel Corp. | 499,388 | 17,923 | 0.8% |
| Cisco Systems Inc. | 531,729 | 16,718 | 0.7% |
| International Business Machines Corp. | 92,855 | 14,753 | 0.7% |
| Oracle Corp. | 312,366 | 12,876 | 0.6% |
| QUALCOMM Inc. | 155,179 | 9,787 | 0.4% |
| Technology—Other † | 129,154 | 5.8% | |
| 387,050 | 17.4% | ||
| Utilities | |||
| AT&T Inc. | 650,727 | 26,602 | 1.2% |
| Verizon Communications Inc. | 430,977 | 22,553 | 1.0% |
| Utilities—Other † | 78,768 | 3.5% | |
| 127,923 | 5.7% | ||
| Total Common Stocks (Cost $1,899,451) | 2,220,217 | 99.7%1 | |
12
| Russell 1000 Index Fund | ||||
| Market | Percentage | |||
| Value• | of Net | |||
| Coupon | Shares | ($000) | Assets | |
| Temporary Cash Investments | ||||
| Money Market Fund | ||||
| 2,3 Vanguard Market Liquidity Fund | 0.612% | 66,306 | 6,631 | 0.3% |
| 4U.S. Government and Agency Obligations † | 500 | 0.0% | ||
| Total Temporary Cash Investments (Cost $7,131) | 7,131 | 0.3%1 | ||
| 5Total Investments (Cost $1,906,582) | 2,227,348 | 100.0% | ||
| Amount | ||||
| ($000) | ||||
| Other Assets and Liabilities | ||||
| Other Assets | ||||
| Investment in Vanguard | 171 | |||
| Receivables for Investment Securities Sold | 1,012 | |||
| Receivables for Accrued Income | 4,645 | |||
| Receivables for Capital Shares Issued | 40 | |||
| Other Assets | 12 | |||
| Total Other Assets | 5,880 | 0.2% | ||
| Liabilities | ||||
| Payables for Investment Securities Purchased | (992) | |||
| Collateral for Securities on Loan | (3,619) | |||
| Payables for Capital Shares Redeemed | (65) | |||
| Payables to Vanguard | (530) | |||
| Other Liabilities | (20) | |||
| Total Liabilities | (5,226) | (0.2%) | ||
| Net Assets | 2,228,002 | 100.0% | ||
13
| Russell 1000 Index Fund | |
| At August 31, 2016, net assets consisted of: | |
| Amount | |
| ($000) | |
| Paid-in Capital | 1,942,738 |
| Undistributed Net Investment Income | 9,020 |
| Accumulated Net Realized Losses | (44,829) |
| Unrealized Appreciation (Depreciation) | |
| Investment Securities | 320,766 |
| Futures Contracts | 307 |
| Net Assets | 2,228,002 |
| ETF Shares—Net Assets | |
| Applicable to 6,800,000 outstanding $.001 par value shares of | |
| beneficial interest (unlimited authorization) | 678,721 |
| Net Asset Value Per Share—ETF Shares | $99.81 |
| Institutional Shares—Net Assets | |
| Applicable to 8,012,485 outstanding $.001 par value shares of | |
| beneficial interest (unlimited authorization) | 1,549,281 |
| Net Asset Value Per Share—Institutional Shares | $193.36 |
• See Note A in Notes to Financial Statements.
* Non-income-producing security.
† Represents the aggregate value, by category, of securities that are not among the 50 largest holdings and, in total for any issuer, represent 1% or less of net assets.
1 The fund invests a portion of its cash reserves in equity markets through the use of index futures contracts. After giving effect to futures investments, the fund’s effective common stock and temporary cash investment positions represent 100.0% and 0.0%, respectively, of net assets.
2 Affiliated money market fund available only to Vanguard funds and certain trusts and accounts managed by Vanguard. Rate shown is the 7-day yield.
3 Includes $3,619,000 of collateral received for securities on loan.
4 Securities with a value of $300,000 have been segregated as initial margin for open futures contracts.
5 The total value of securities on loan is $3,422,000.
See accompanying Notes, which are an integral part of the Financial Statements.
14
| Russell 1000 Index Fund | |
| Statement of Operations | |
| Year Ended | |
| August 31, 2016 | |
| ($000) | |
| Investment Income | |
| Income | |
| Dividends | 42,375 |
| Interest1 | 34 |
| Securities Lending—Net | 187 |
| Total Income | 42,596 |
| Expenses | |
| The Vanguard Group—Note B | |
| Investment Advisory Services | 340 |
| Management and Administrative—ETF Shares | 480 |
| Management and Administrative—Institutional Shares | 651 |
| Marketing and Distribution—ETF Shares | 49 |
| Marketing and Distribution—Institutional Shares | 36 |
| Custodian Fees | 204 |
| Auditing Fees | 32 |
| Shareholders’ Reports—ETF Shares | 14 |
| Shareholders’ Reports—Institutional Shares | 2 |
| Trustees’ Fees and Expenses | 1 |
| Total Expenses | 1,809 |
| Net Investment Income | 40,787 |
| Realized Net Gain (Loss) | |
| Investment Securities Sold1 | 11,832 |
| Futures Contracts | (402) |
| Realized Net Gain (Loss) | 11,430 |
| Change in Unrealized Appreciation (Depreciation) | |
| Investment Securities | 163,442 |
| Futures Contracts | 700 |
| Change in Unrealized Appreciation (Depreciation) | 164,142 |
| Net Increase (Decrease) in Net Assets Resulting from Operations | 216,359 |
1 Interest income and realized net gain (loss) from an affiliated company of the fund were $33,000 and $0, respectively.
See accompanying Notes, which are an integral part of the Financial Statements.
15
| Russell 1000 Index Fund | ||
| Statement of Changes in Net Assets | ||
| Year Ended August 31, | ||
| 2016 | 2015 | |
| ($000) | ($000) | |
| Increase (Decrease) in Net Assets | ||
| Operations | ||
| Net Investment Income | 40,787 | 31,173 |
| Realized Net Gain (Loss) | 11,430 | 126,340 |
| Change in Unrealized Appreciation (Depreciation) | 164,142 | (161,151) |
| Net Increase (Decrease) in Net Assets Resulting from Operations | 216,359 | (3,638) |
| Distributions | ||
| Net Investment Income | ||
| ETF Shares | (11,541) | (8,056) |
| Institutional Shares | (26,919) | (21,001) |
| Realized Capital Gain | ||
| ETF Shares | — | — |
| Institutional Shares | — | — |
| Total Distributions | (38,460) | (29,057) |
| Capital Share Transactions | ||
| ETF Shares | 110,695 | 142,037 |
| Institutional Shares | 174,442 | 331,383 |
| Net Increase (Decrease) from Capital Share Transactions | 285,137 | 473,420 |
| Total Increase (Decrease) | 463,036 | 440,725 |
| Net Assets | ||
| Beginning of Period | 1,764,966 | 1,324,241 |
| End of Period1 | 2,228,002 | 1,764,966 |
1 Net Assets—End of Period includes undistributed (overdistributed) net investment income of $9,020,000 and $6,693,000.
See accompanying Notes, which are an integral part of the Financial Statements.
16
| Russell 1000 Index Fund | |||||
| Financial Highlights | |||||
| ETF Shares | |||||
| For a Share Outstanding | Year Ended August 31, | ||||
| Throughout Each Period | 2016 | 2015 | 2014 | 2013 | 2012 |
| Net Asset Value, Beginning of Period | $91.37 | $92.70 | $75.40 | $64.29 | $55.94 |
| Investment Operations | |||||
| Net Investment Income | 1.892 | 1.679 | 1.553 | 1.444 | 1.176 |
| Net Realized and Unrealized Gain (Loss) | |||||
| on Investments | 8.383 | (1.355) | 17.272 | 11.068 | 8.307 |
| Total from Investment Operations | 10.275 | .324 | 18.825 | 12.512 | 9.483 |
| Distributions | |||||
| Dividends from Net Investment Income | (1.835) | (1.654) | (1.525) | (1.402) | (1.133) |
| Distributions from Realized Capital Gains | — | — | — | — | — |
| Total Distributions | (1.835) | (1.654) | (1.525) | (1.402) | (1.133) |
| Net Asset Value, End of Period | $99.81 | $91.37 | $92.70 | $75.40 | $64.29 |
| Total Return | 11.41% | 0.29% | 25.18% | 19.70% | 17.19% |
| Ratios/Supplemental Data | |||||
| Net Assets, End of Period (Millions) | $679 | $514 | $380 | $219 | $148 |
| Ratio of Total Expenses to | |||||
| Average Net Assets | 0.12% | 0.12% | 0.12% | 0.12% | 0.12% |
| Ratio of Net Investment Income to | |||||
| Average Net Assets | 2.05% | 1.84% | 1.85% | 2.09% | 2.06% |
| Portfolio Turnover Rate1 | 9% | 4% | 7% | 11% | 36% |
1 Excludes the value of portfolio securities received or delivered as a result of in-kind purchases or redemptions of the fund’s capital shares, including ETF Creation Units.
See accompanying Notes, which are an integral part of the Financial Statements.
17
| Russell 1000 Index Fund | |||||
| Financial Highlights | |||||
| Institutional Shares | |||||
| For a Share Outstanding | Year Ended August 31, | ||||
| Throughout Each Period | 2016 | 2015 | 2014 | 2013 | 2012 |
| Net Asset Value, Beginning of Period | $176.99 | $179.58 | $146.04 | $124.53 | $108.35 |
| Investment Operations | |||||
| Net Investment Income | 3.732 | 3.329 | 3.060 | 2.850 | 2.314 |
| Net Realized and Unrealized Gain (Loss) | |||||
| on Investments | 16.259 | (2.641) | 33.485 | 21.424 | 16.100 |
| Total from Investment Operations | 19.991 | .688 | 36.545 | 24.274 | 18.414 |
| Distributions | |||||
| Dividends from Net Investment Income | (3.621) | (3.278) | (3.005) | (2.764) | (2.234) |
| Distributions from Realized Capital Gains | — | — | — | — | — |
| Total Distributions | (3.621) | (3.278) | (3.005) | (2.764) | (2.234) |
| Net Asset Value, End of Period | $193.36 | $176.99 | $179.58 | $146.04 | $124.53 |
| Total Return | 11.47% | 0.33% | 25.24% | 19.73% | 17.25% |
| Ratios/Supplemental Data | |||||
| Net Assets, End of Period (Millions) | $1,549 | $1,251 | $944 | $677 | $334 |
| Ratio of Total Expenses to | |||||
| Average Net Assets | 0.08% | 0.08% | 0.08% | 0.08% | 0.08% |
| Ratio of Net Investment Income to | |||||
| Average Net Assets | 2.09% | 1.88% | 1.89% | 2.13% | 2.10% |
| Portfolio Turnover Rate1 | 9% | 4% | 7% | 11% | 36% |
1 Excludes the value of portfolio securities received or delivered as a result of in-kind purchases or redemptions of the fund’s capital shares, including ETF Creation Units.
See accompanying Notes, which are an integral part of the Financial Statements.
18
Russell 1000 Index Fund
Notes to Financial Statements
Vanguard Russell 1000 Index Fund is registered under the Investment Company Act of 1940 as an open-end investment company, or mutual fund. The fund offers two classes of shares: ETF Shares and Institutional Shares. ETF Shares are listed for trading on Nasdaq; they can be purchased and sold through a broker. Institutional Shares are designed for investors who meet certain administrative, service, and account-size criteria.
A. The following significant accounting policies conform to generally accepted accounting principles for U.S. investment companies. The fund consistently follows such policies in preparing its financial statements.
1. Security Valuation: Securities are valued as of the close of trading on the New York Stock Exchange (generally 4 p.m., Eastern time) on the valuation date. Equity securities are valued at the latest quoted sales prices or official closing prices taken from the primary market in which each security trades; such securities not traded on the valuation date are valued at the mean of the latest quoted bid and asked prices. Securities for which market quotations are not readily available, or whose values have been materially affected by events occurring before the fund’s pricing time but after the close of the securities’ primary markets, are valued by methods deemed by the board of trustees to represent fair value. Investments in Vanguard Market Liquidity Fund are valued at that fund’s net asset value. Temporary cash investments acquired over 60 days to maturity are valued using the latest bid prices or using valuations based on a matrix system (which considers such factors as security prices, yields, maturities, and ratings), both as furnished by independent pricing services. Other temporary cash investments are valued at amortized cost, which approximates market value.
2. Futures Contracts: The fund uses index futures contracts to a limited extent, with the objectives of maintaining full exposure to the stock market, enhancing returns, maintaining liquidity, and minimizing transaction costs. The fund may purchase futures contracts to immediately invest incoming cash in the market, or sell futures in response to cash outflows, thereby simulating a fully invested position in the underlying index while maintaining a cash balance for liquidity. The fund may seek to enhance returns by using futures contracts instead of the underlying securities when futures are believed to be priced more attractively than the underlying securities. The primary risks associated with the use of futures contracts are imperfect correlation between changes in market values of stocks held by the fund and the prices of futures contracts, and the possibility of an illiquid market. Counterparty risk involving futures is mitigated because a regulated clearinghouse is the counterparty instead of the clearing broker. To further mitigate counterparty risk, the fund trades futures contracts on an exchange, monitors the financial strength of its clearing brokers and clearinghouse, and has entered into clearing agreements with its clearing brokers. The clearinghouse imposes initial margin requirements to secure the fund’s performance and requires daily settlement of variation margin representing changes in the market value of each contract.
Futures contracts are valued at their quoted daily settlement prices. The aggregate settlement values of the contracts are not recorded in the Statement of Net Assets. Fluctuations in the value of the contracts are recorded in the Statement of Net Assets as an asset (liability) and in the Statement of Operations as unrealized appreciation (depreciation) until the contracts are closed, when they are recorded as realized futures gains (losses).
During the year ended August 31, 2016, the fund’s average investments in long and short futures contracts represented less than 1% and 0% of net assets, respectively, based on the average of aggregate settlement values at each quarter-end during the period.
19
Russell 1000 Index Fund
3. Federal Income Taxes: The fund intends to continue to qualify as a regulated investment company and distribute all of its taxable income. Management has analyzed the fund’s tax positions taken for all open federal income tax years (August 31, 2013–2016), and has concluded that no provision for federal income tax is required in the fund’s financial statements.
4. Distributions: Distributions to shareholders are recorded on the ex-dividend date.
5. Securities Lending: To earn additional income, the fund lends its securities to qualified institutional borrowers. Security loans are subject to termination by the fund at any time, and are required to be secured at all times by collateral in an amount at least equal to the market value of securities loaned. Daily market fluctuations could cause the value of loaned securities to be more or less than the value of the collateral received. When this occurs, the collateral is adjusted and settled on the next business day. The fund further mitigates its counterparty risk by entering into securities lending transactions only with a diverse group of prequalified counterparties, monitoring their financial strength, and entering into master securities lending agreements with its counterparties. The master securities lending agreements provide that, in the event of a counterparty’s default (including bankruptcy), the fund may terminate any loans with that borrower, determine the net amount owed, and sell or retain the collateral up to the net amount owed to the fund; however, such actions may be subject to legal proceedings. While collateral mitigates counterparty risk, in the absence of a default the fund may experience delays and costs in recovering the securities loaned. The fund invests cash collateral received in Vanguard Market Liquidity Fund, and records a liability in the Statement of Net Assets for the return of the collateral, during the period the securities are on loan. Securities lending income represents fees charged to borrowers plus income earned on invested cash collateral, less expenses associated with the loan. During the term of the loan, the fund is entitled to all distributions made on or in respect of the loaned securities.
6. Credit Facility: The fund and certain other funds managed by The Vanguard Group (“Vanguard”) participate in a $3.1 billion committed credit facility provided by a syndicate of lenders pursuant to a credit agreement that may be renewed annually; each fund is individually liable for its borrowings, if any, under the credit facility. Borrowings may be utilized for temporary and emergency purposes, and are subject to the fund’s regulatory and contractual borrowing restrictions. The participating funds are charged administrative fees and an annual commitment fee of 0.10% of the undrawn amount of the facility; these fees are allocated to the funds based on a method approved by the fund’s board of trustees and included in Management and Administrative expenses on the fund’s Statement of Operations. Any borrowings under this facility bear interest at a rate based upon the higher of the one-month London Interbank Offered Rate, federal funds effective rate, or overnight bank funding rate plus an agreed-upon spread.
The fund had no borrowings outstanding at August 31, 2016, or at any time during the period then ended.
7. Other: Dividend income is recorded on the ex-dividend date. Interest income includes income distributions received from Vanguard Market Liquidity Fund and is accrued daily. Premiums and discounts on debt securities purchased are amortized and accreted, respectively, to interest income over the lives of the respective securities. Security transactions are accounted for on the date securities are bought or sold. Costs used to determine realized gains (losses) on the sale of investment securities are those of the specific securities sold.
20
Russell 1000 Index Fund
Each class of shares has equal rights as to assets and earnings, except that each class separately bears certain class-specific expenses related to maintenance of shareholder accounts (included in Management and Administrative expenses) and shareholder reporting. Marketing and distribution expenses are allocated to each class of shares based on a method approved by the board of trustees. Income, other non-class-specific expenses, and gains and losses on investments are allocated to each class of shares based on its relative net assets.
B. In accordance with the terms of a Funds’ Service Agreement (the “FSA”) between Vanguard and the fund, Vanguard furnishes to the fund investment advisory, corporate management, administrative, marketing, and distribution services at Vanguard’s cost of operations (as defined by the FSA). These costs of operations are allocated to the fund based on methods and guidelines approved by the board of trustees. Vanguard does not require reimbursement in the current period for certain costs of operations (such as deferred compensation/benefits and risk/insurance costs); the fund’s liability for these costs of operations is included in Payables to Vanguard on the Statement of Net Assets.
Upon the request of Vanguard, the fund may invest up to 0.40% of its net assets as capital in Vanguard. At August 31, 2016, the fund had contributed to Vanguard capital in the amount of $171,000, representing 0.01% of the fund’s net assets and 0.07% of Vanguard’s capitalization. The fund’s trustees and officers are also directors and employees, respectively, of Vanguard.
C. Various inputs may be used to determine the value of the fund’s investments. These inputs are summarized in three broad levels for financial statement purposes. The inputs or methodologies used to value securities are not necessarily an indication of the risk associated with investing in those securities.
Level 1—Quoted prices in active markets for identical securities.
Level 2—Other significant observable inputs (including quoted prices for similar securities, interest rates, prepayment speeds, credit risk, etc.).
Level 3—Significant unobservable inputs (including the fund’s own assumptions used to determine the fair value of investments).
The following table summarizes the market value of the fund’s investments as of August 31, 2016, based on the inputs used to value them:
| Level 1 | Level 2 | Level 3 | |
| Investments | ($000) | ($000) | ($000) |
| Common Stocks | 2,220,217 | — | — |
| Temporary Cash Investments | 6,631 | 500 | — |
| Futures Contracts—Liabilities1 | (20) | — | — |
| Total | 2,226,828 | 500 | — |
| 1 Represents variation margin on the last day of the reporting period. |
21
Russell 1000 Index Fund
D. At August 31, 2016, the aggregate settlement value of open futures contracts and the related unrealized appreciation (depreciation) were:
| ($000) | ||||
| Aggregate | ||||
| Number of | Settlement | Unrealized | ||
| Long (Short) | Value | Appreciation | ||
| Futures Contracts | Expiration | Contracts | Long (Short) | (Depreciation) |
| E-mini S&P 500 Index | September 2016 | 69 | 7,485 | 307 |
Unrealized appreciation (depreciation) on open futures contracts is required to be treated as realized gain (loss) for tax purposes.
E. Distributions are determined on a tax basis and may differ from net investment income and realized capital gains for financial reporting purposes. Differences may be permanent or temporary. Permanent differences are reclassified among capital accounts in the financial statements to reflect their tax character. Temporary differences arise when certain items of income, expense, gain, or loss are recognized in different periods for financial statement and tax purposes. These differences will reverse at some time in the future. Differences in classification may also result from the treatment of short-term gains as ordinary income for tax purposes.
During the year ended August 31, 2016, the fund realized $55,674,000 of net capital gains resulting from in-kind redemptions—in which shareholders exchanged fund shares for securities held by the fund rather than for cash. Because such gains are not taxable to the fund, and are not distributed to shareholders, they have been reclassified from accumulated net realized losses to paid-in capital.
For tax purposes, at August 31, 2016, the fund had $9,440,000 of ordinary income available for distribution. The fund had available capital losses totaling $44,523,000 that may be carried forward indefinitely to offset future net capital gains.
At August 31, 2016, the cost of investment securities for tax purposes was $1,906,582,000.
Net unrealized appreciation of investment securities for tax purposes was $320,766,000, consisting of unrealized gains of $362,279,000 on securities that had risen in value since their purchase and $41,513,000 in unrealized losses on securities that had fallen in value since their purchase.
F. During the year ended August 31, 2016, the fund purchased $606,394,000 of investment securities and sold $317,406,000 of investment securities, other than temporary cash investments. Purchases and sales include $196,509,000 and $149,227,000, respectively, in connection with in-kind purchases and redemptions of the fund’s capital shares.
22
Russell 1000 Index Fund
| G. Capital share transactions for each class of shares were: | ||||
| Year Ended August 31, | ||||
| 2016 | 2015 | |||
| Amount | Shares | Amount | Shares | |
| ($000) | (000) | ($000) | (000) | |
| ETF Shares | ||||
| Issued | 277,860 | 2,950 | 495,727 | 5,225 |
| Issued in Lieu of Cash Distributions | — | — | — | — |
| Redeemed | (167,165) | (1,775) | (353,690) | (3,700) |
| Net Increase (Decrease)—ETF Shares | 110,695 | 1,175 | 142,037 | 1,525 |
| Institutional Shares | ||||
| Issued | 267,141 | 1,450 | 546,260 | 2,966 |
| Issued in Lieu of Cash Distributions | 24,538 | 137 | 19,253 | 105 |
| Redeemed | (117,237) | (643) | (234,130) | (1,260) |
| Net Increase (Decrease) —Institutional Shares | 174,442 | 944 | 331,383 | 1,811 |
H. Management has determined that no material events or transactions occurred subsequent to August 31, 2016, that would require recognition or disclosure in these financial statements.
23
Russell 1000 Value Index Fund
Fund Profile
As of August 31, 2016
| Share-Class Characteristics | |||
| ETF | Institutional | ||
| Shares | Shares | ||
| Ticker Symbol | VONV | VRVIX | |
| Expense Ratio1 | 0.12% | 0.08% | |
| 30-Day SEC Yield | 2.44% | 2.48% | |
| Portfolio Characteristics | |||
| DJ | |||
| U.S. | |||
| Russell | Total | ||
| 1000 | Market | ||
| Value | FA | ||
| Fund | Index | Index | |
| Number of Stocks | 690 | 691 | 3,817 |
| Median Market Cap | $58.7B | $58.7B | $51.2B |
| Price/Earnings Ratio | 21.3x | 21.3x | 23.5x |
| Price/Book Ratio | 1.9x | 1.9x | 2.8x |
| Return on Equity | 12.7% | 12.7% | 16.6% |
| Earnings Growth | |||
| Rate | 2.9% | 2.9% | 7.5% |
| Dividend Yield | 2.6% | 2.6% | 2.0% |
| Foreign Holdings | 0.0% | 0.0% | 0.0% |
| Turnover Rate | 18% | — | — |
| Short-Term Reserves | -0.3% | — | — |
Sector Diversification (% of equity exposure)
| DJ | |||
| U.S. | |||
| Russell | Total | ||
| 1000 | Market | ||
| Value | FA | ||
| Fund | Index | Index | |
| Consumer Discretionary | 5.9% | 5.9% | 14.2% |
| Consumer Staples | 7.8 | 7.8 | 8.0 |
| Energy | 13.0 | 13.0 | 6.5 |
| Financial Services | 29.2 | 29.2 | 20.0 |
| Health Care | 11.5 | 11.5 | 14.0 |
| Materials & Processing | 3.1 | 3.1 | 3.9 |
| Producer Durables | 9.5 | 9.5 | 10.5 |
| Technology | 9.7 | 9.7 | 17.3 |
| Utilities | 10.3 | 10.3 | 5.6 |
| Volatility Measures | ||
| Russell | DJ | |
| 1000 | U.S. Total | |
| Value | Market | |
| Index | FA Index | |
| R-Squared | 1.00 | 0.96 |
| Beta | 1.00 | 0.95 |
These measures show the degree and timing of the fund’s fluctuations compared with the indexes over 36 months.
Ten Largest Holdings (% of total net assets)
| Exxon Mobil Corp. | Oil: Integrated | 3.4% |
| Berkshire Hathaway Inc. Insurance: Multi-Line | 2.7 | |
| Johnson & Johnson | Pharmaceuticals | 2.6 |
| AT&T Inc. | Utilities: | |
| Telecommunications | 2.4 | |
| JPMorgan Chase & Co. | Diversified Financial | |
| Services | 2.3 | |
| Procter & Gamble Co. | Personal Care | 2.2 |
| Wells Fargo & Co. | Banks: Diversified | 2.2 |
| General Electric Co. | Diversified | |
| Manufacturing | ||
| Operations | 2.2 | |
| Pfizer Inc. | Pharmaceuticals | 1.8 |
| Chevron Corp. | Oil: Integrated | 1.8 |
| Top Ten | 23.6% | |
The holdings listed exclude any temporary cash investments and equity index products.
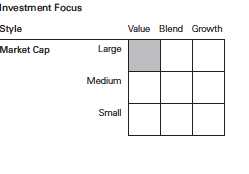
1 The expense ratios shown are from the prospectus dated December 22, 2015, and represent estimated costs for the current fiscal year. For the fiscal year ended August 31, 2016, the expense ratios were 0.12% for ETF Shares and 0.08% for Institutional Shares.
24
Russell 1000 Value Index Fund
Performance Summary
All of the returns in this report represent past performance, which is not a guarantee of future results that may be achieved by the fund. (Current performance may be lower or higher than the performance data cited. For performance data current to the most recent month-end, visit our website at vanguard.com/performance.) Note, too, that both investment returns and principal value can fluctuate widely, so an investor’s shares, when sold, could be worth more or less than their original cost. The returns shown do not reflect taxes that a shareholder would pay on fund distributions or on the sale of fund shares.
Cumulative Performance: September 20, 2010, Through August 31, 2016
Initial Investment of $10,000
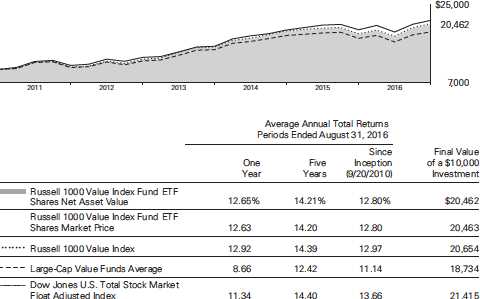
Large-Cap Value Funds Average: Derived from data provided by Lipper, a Thomson Reuters Company.
"Since Inception" performance is calculated from the ETF Shares’ inception date for both the fund and its comparative standards.
| Since | Final Value | |||
| One | Five | Inception | of a $5,000,000 | |
| Year | Years | (12/10/2010) | Investment | |
| Russell 1000 Value Index Fund Institutional | ||||
| Shares | 12.72% | 14.28% | 11.96% | $9,543,839 |
| Russell 1000 Value Index | 12.92 | 14.39 | 12.07 | 9,597,567 |
| Dow Jones U.S. Total Stock Market Float | ||||
| Adjusted Index | 11.34 | 14.40 | 12.31 | 9,718,938 |
"Since Inception" performance is calculated from the Institutional Shares’ inception date for both the fund and its comparative standards.
See Financial Highlights for dividend and capital gains information.
25
Russell 1000 Value Index Fund
| Cumulative Returns of ETF Shares: September 20, 2010, Through August 31, 2016 | |||
| Since | |||
| One | Five | Inception | |
| Year | Years | (9/20/2010) | |
| Russell 1000 Value Index Fund ETF Shares Market | |||
| Price | 12.63% | 94.23% | 104.63% |
| Russell 1000 Value Index Fund ETF Shares Net | |||
| Asset Value | 12.65 | 94.36 | 104.62 |
| Russell 1000 Value Index | 12.92 | 95.83 | 106.54 |
"Since Inception" performance is calculated from the ETF Shares’ inception date for both the fund and its comparative standards.
Fiscal-Year Total Returns (%): September 20, 2010, Through August 31, 2016
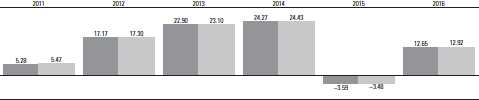
Russell 1000 Value Index Fund ETF Shares Net Asset Value
Russell 1000 Value Index
Average Annual Total Returns: Periods Ended June 30, 2016
This table presents returns through the latest calendar quarter—rather than through the end of the fiscal period.
Securities and Exchange Commission rules require that we provide this information.
| Inception | One | Five | Since | |
| Date | Year | Years | Inception | |
| ETF Shares | 9/20/2010 | |||
| Market Price | 2.58% | 11.18% | 12.49% | |
| Net Asset Value | 2.63 | 11.18 | 12.49 | |
| Institutional Shares | 12/10/2010 | 2.68 | 11.24 | 11.61 |
26
Russell 1000 Value Index Fund
Financial Statements
Statement of Net Assets—Investments Summary
As of August 31, 2016
This Statement summarizes the fund’s holdings by asset type. Details are reported for each of the fund’s 50 largest individual holdings and for investments that, in total for any issuer, represent more than 1% of the fund’s net assets. The total value of smaller holdings is reported as a single amount within each category.
The fund reports a complete list of its holdings in regulatory filings four times in each fiscal year, at the quarter-ends. For the second and fourth fiscal quarters, the complete listing of the fund’s holdings is available electronically on vanguard.com and on the Securities and Exchange Commission’s website (sec.gov), or you can have it mailed to you without charge by calling 800-662-7447. For the first and third fiscal quarters, the fund files the lists with the SEC on Form N-Q. Shareholders can look up the fund’s Forms N-Q on the SEC’s website. Forms N-Q may also be reviewed and copied at the SEC’s Public Reference Room (see the back cover of this report for further information).
| Market | Percentage | ||
| Value• | of Net | ||
| Shares | ($000) | Assets | |
| Common Stocks | |||
| Consumer Discretionary | |||
| Wal-Mart Stores Inc. | 308,761 | 22,058 | 1.0% |
| Ford Motor Co. | 793,233 | 9,995 | 0.5% |
| General Motors Co. | 286,325 | 9,140 | 0.4% |
| Consumer Discretionary—Other † | 85,362 | 4.0% | |
| 126,555 | 5.9% | ||
| Consumer Staples | |||
| Procter & Gamble Co. | 544,172 | 47,512 | 2.2% |
| Philip Morris International Inc. | 282,380 | 28,218 | 1.3% |
| Mondelez International Inc. Class A | 305,369 | 13,748 | 0.7% |
| Walgreens Boots Alliance Inc. | 139,200 | 11,235 | 0.5% |
| Colgate-Palmolive Co. | 145,622 | 10,826 | 0.5% |
| Kraft Heinz Co. | 105,946 | 9,481 | 0.5% |
| Consumer Staples—Other † | 45,938 | 2.1% | |
| 166,958 | 7.8% | ||
| Energy | |||
| Exxon Mobil Corp. | 846,476 | 73,762 | 3.4% |
| Chevron Corp. | 383,743 | 38,597 | 1.8% |
| Schlumberger Ltd. | 284,352 | 22,464 | 1.0% |
| Occidental Petroleum Corp. | 155,864 | 11,978 | 0.6% |
| ConocoPhillips | 253,491 | 10,406 | 0.5% |
| Energy—Other † | 121,946 | 5.7% | |
| 279,153 | 13.0% | ||
| Financial Services | |||
| Berkshire Hathaway Inc. Class B | 386,066 | 58,099 | 2.7% |
| JPMorgan Chase & Co. | 743,072 | 50,157 | 2.3% |
| Wells Fargo & Co. | 932,868 | 47,390 | 2.2% |
| Bank of America Corp. | 2,098,277 | 33,866 | 1.6% |
| Citigroup Inc. | 599,378 | 28,614 | 1.3% |
27
| Russell 1000 Value Index Fund | |||
| Market | Percentage | ||
| Value• | of Net | ||
| Shares | ($000) | Assets | |
| US Bancorp | 331,368 | 14,630 | 0.7% |
| American International Group Inc. | 226,160 | 13,531 | 0.6% |
| Goldman Sachs Group Inc. | 78,653 | 13,329 | 0.6% |
| Chubb Ltd. | 94,377 | 11,979 | 0.6% |
| American Express Co. | 165,087 | 10,826 | 0.5% |
| BlackRock Inc. | 25,506 | 9,509 | 0.5% |
| Morgan Stanley | 291,608 | 9,349 | 0.4% |
| PNC Financial Services Group Inc. | 101,866 | 9,178 | 0.4% |
| Bank of New York Mellon Corp. | 214,035 | 8,919 | 0.4% |
| Financial Services—Other † | 307,412 | 14.3% | |
| 626,788 | 29.1% | ||
| Health Care | |||
| Johnson & Johnson | 464,192 | 55,397 | 2.6% |
| Pfizer Inc. | 1,141,902 | 39,738 | 1.8% |
| Merck & Co. Inc. | 565,676 | 35,519 | 1.6% |
| Medtronic plc | 286,153 | 24,904 | 1.2% |
| Abbott Laboratories | 300,095 | 12,610 | 0.6% |
| Health Care—Other † | 78,253 | 3.6% | |
| 246,421 | 11.4% | ||
| Materials & Processing | |||
| Dow Chemical Co. | 229,071 | 12,287 | 0.6% |
| Materials & Processing—Other † | 54,595 | 2.5% | |
| 66,882 | 3.1% | ||
| Producer Durables | |||
| General Electric Co. | 1,514,146 | 47,302 | 2.2% |
| United Technologies Corp. | 158,482 | 16,867 | 0.8% |
| Union Pacific Corp. | 145,346 | 13,885 | 0.6% |
| Caterpillar Inc. | 113,819 | 9,327 | 0.4% |
| Producer Durables—Other † | 115,821 | 5.4% | |
| 203,202 | 9.4% | ||
| Technology | |||
| Cisco Systems Inc. | 1,027,511 | 32,305 | 1.5% |
| Intel Corp. | 878,919 | 31,544 | 1.5% |
| Oracle Corp. | 545,240 | 22,475 | 1.0% |
| QUALCOMM Inc. | 237,555 | 14,983 | 0.7% |
| EMC Corp. | 355,394 | 10,303 | 0.5% |
| Apple Inc. | 94,035 | 9,977 | 0.5% |
| International Business Machines Corp. | 56,149 | 8,921 | 0.4% |
| Technology—Other † | 77,937 | 3.6% | |
| 208,445 | 9.7% | ||
| Utilities | |||
| AT&T Inc. | 1,257,343 | 51,400 | 2.4% |
| Verizon Communications Inc. | 416,795 | 21,811 | 1.0% |
| NextEra Energy Inc. | 94,003 | 11,369 | 0.5% |
| Duke Energy Corp. | 140,668 | 11,206 | 0.5% |
| Southern Co. | 191,656 | 9,838 | 0.5% |
| Utilities—Other † | 115,919 | 5.4% | |
| 221,543 | 10.3% | ||
| Total Common Stocks (Cost $1,994,886) | 2,145,947 | 99.7%1 | |
28
| Russell 1000 Value Index Fund | ||||
| Market | Percentage | |||
| Value• | of Net | |||
| Coupon | Shares | ($000) | Assets | |
| Temporary Cash Investments | ||||
| Money Market Fund | ||||
| 2,3 Vanguard Market Liquidity Fund | 0.612% | 18,749 | 1,875 | 0.1% |
| 4U.S. Government and Agency Obligations † | 300 | 0.0% | ||
| Total Temporary Cash Investments (Cost $2,175) | 2,175 | 0.1%1 | ||
| 5Total Investments (Cost $1,997,061) | 2,148,122 | 99.8% | ||
| Amount | ||||
| ($000) | ||||
| Other Assets and Liabilities | ||||
| Other Assets | ||||
| Investment in Vanguard | 166 | |||
| Receivables for Investment Securities Sold | 1,875 | |||
| Receivables for Accrued Income | 5,930 | |||
| Receivables for Capital Shares Issued | 697 | |||
| Other Assets4 | 417 | |||
| Total Other Assets | 9,085 | 0.4% | ||
| Liabilities | ||||
| Payables for Investment Securities Purchased | (1,472) | |||
| Collateral for Securities on Loan | (1,838) | |||
| Payables for Capital Shares Redeemed | (460) | |||
| Payables to Vanguard | (535) | |||
| Other Liabilities | (16) | |||
| Total Liabilities | (4,321) | (0.2%) | ||
| Net Assets | 2,152,886 | 100.0% | ||
29
| Russell 1000 Value Index Fund | |
| At August 31, 2016, net assets consisted of: | |
| Amount | |
| ($000) | |
| Paid-in Capital | 2,025,377 |
| Undistributed Net Investment Income | 11,389 |
| Accumulated Net Realized Losses | (35,274) |
| Unrealized Appreciation (Depreciation) | |
| Investment Securities | 151,061 |
| Futures Contracts | 333 |
| Net Assets | 2,152,886 |
| ETF Shares—Net Assets | |
| Applicable to 7,175,000 outstanding $.001 par value shares of | |
| beneficial interest (unlimited authorization) | 668,276 |
| Net Asset Value Per Share—ETF Shares | $93.14 |
| Institutional Shares—Net Assets | |
| Applicable to 8,163,644 outstanding $.001 par value shares of | |
| beneficial interest (unlimited authorization) | 1,484,610 |
| Net Asset Value Per Share—Institutional Shares | $181.86 |
• See Note A in Notes to Financial Statements.
† Represents the aggregate value, by category, of securities that are not among the 50 largest holdings and, in total for any issuer, represent 1% or less of net assets.
1 The fund invests a portion of its cash reserves in equity markets through the use of index futures contracts. After giving effect to futures investments, the fund’s effective common stock and temporary cash investment positions represent 100.0% and -0.2%, respectively, of net assets.
2 Affiliated money market fund available only to Vanguard funds and certain trusts and accounts managed by Vanguard. Rate shown is the 7-day yield.
3 Includes $1,838,000 of collateral received for securities on loan.
4 Securities with a value of $200,000 and cash of $34,000 have been segregated as initial margin for open futures contracts. 5 The total value of securities on loan is $1,705,000.
See accompanying Notes, which are an integral part of the Financial Statements.
30
| Russell 1000 Value Index Fund | |
| Statement of Operations | |
| Year Ended | |
| August 31, 2016 | |
| ($000) | |
| Investment Income | |
| Income | |
| Dividends | 49,669 |
| Interest1 | 25 |
| Securities Lending—Net | 158 |
| Total Income | 49,852 |
| Expenses | |
| The Vanguard Group—Note B | |
| Investment Advisory Services | 321 |
| Management and Administrative—ETF Shares | 411 |
| Management and Administrative—Institutional Shares | 671 |
| Marketing and Distribution—ETF Shares | 40 |
| Marketing and Distribution—Institutional Shares | 38 |
| Custodian Fees | 152 |
| Auditing Fees | 32 |
| Shareholders’ Reports—ETF Shares | 9 |
| Shareholders’ Reports—Institutional Shares | 3 |
| Trustees’ Fees and Expenses | 1 |
| Total Expenses | 1,678 |
| Net Investment Income | 48,174 |
| Realized Net Gain (Loss) | |
| Investment Securities Sold1 | 65,352 |
| Futures Contracts | 142 |
| Realized Net Gain (Loss) | 65,494 |
| Change in Unrealized Appreciation (Depreciation) | |
| Investment Securities | 112,610 |
| Futures Contracts | 659 |
| Change in Unrealized Appreciation (Depreciation) | 113,269 |
| Net Increase (Decrease) in Net Assets Resulting from Operations | 226,937 |
1 Interest income and realized net gain (loss) from an affiliated company of the fund were $23,000 and $0, respectively.
See accompanying Notes, which are an integral part of the Financial Statements.
31
| Russell 1000 Value Index Fund | ||
| Statement of Changes in Net Assets | ||
| Year Ended August 31, | ||
| 2016 | 2015 | |
| ($000) | ($000) | |
| Increase (Decrease) in Net Assets | ||
| Operations | ||
| Net Investment Income | 48,174 | 36,985 |
| Realized Net Gain (Loss) | 65,494 | 142,446 |
| Change in Unrealized Appreciation (Depreciation) | 113,269 | (247,952) |
| Net Increase (Decrease) in Net Assets Resulting from Operations | 226,937 | (68,521) |
| Distributions | ||
| Net Investment Income | ||
| ETF Shares | (11,809) | (7,743) |
| Institutional Shares | (33,672) | (27,223) |
| Realized Capital Gain | ||
| ETF Shares | — | — |
| Institutional Shares | — | — |
| Total Distributions | (45,481) | (34,966) |
| Capital Share Transactions | ||
| ETF Shares | 210,387 | 151,113 |
| Institutional Shares | 71,161 | 137,171 |
| Net Increase (Decrease) from Capital Share Transactions | 281,548 | 288,284 |
| Total Increase (Decrease) | 463,004 | 184,797 |
| Net Assets | ||
| Beginning of Period | 1,689,882 | 1,505,085 |
| End of Period1 | 2,152,886 | 1,689,882 |
1 Net Assets—End of Period includes undistributed (overdistributed) net investment income of $11,389,000 and $8,695,000.
See accompanying Notes, which are an integral part of the Financial Statements.
32
| Russell 1000 Value Index Fund | |||||
| Financial Highlights | |||||
| ETF Shares | |||||
| For a Share Outstanding | Year Ended August 31, | ||||
| Throughout Each Period | 2016 | 2015 | 2014 | 2013 | 2012 |
| Net Asset Value, Beginning of Period | $84.77 | $89.83 | $73.82 | $61.49 | $53.57 |
| Investment Operations | |||||
| Net Investment Income | 2.205 | 1.990 | 1.774 | 1.610 | 1.228 |
| Net Realized and Unrealized Gain (Loss) | |||||
| on Investments | 8.312 | (5.097) | 15.967 | 12.290 | 7.833 |
| Total from Investment Operations | 10.517 | (3.107) | 17.741 | 13.900 | 9.061 |
| Distributions | |||||
| Dividends from Net Investment Income | (2.147) | (1.953) | (1.731) | (1.570) | (1.141) |
| Distributions from Realized Capital Gains | — | — | — | — | — |
| Total Distributions | (2.147) | (1.953) | (1.731) | (1.570) | (1.141) |
| Net Asset Value, End of Period | $93.14 | $84.77 | $89.83 | $73.82 | $61.49 |
| Total Return | 12.65% | -3.59% | 24.27% | 22.90% | 17.17% |
| Ratios/Supplemental Data | |||||
| Net Assets, End of Period (Millions) | $668 | $407 | $283 | $137 | $46 |
| Ratio of Total Expenses to | |||||
| Average Net Assets | 0.12% | 0.12% | 0.12% | 0.15% | 0.15% |
| Ratio of Net Investment Income to | |||||
| Average Net Assets | 2.58% | 2.26% | 2.22% | 2.39% | 2.48% |
| Portfolio Turnover Rate1 | 18% | 18% | 16% | 26% | 29% |
1 Excludes the value of portfolio securities received or delivered as a result of in-kind purchases or redemptions of the fund’s capital shares, including ETF Creation Units.
See accompanying Notes, which are an integral part of the Financial Statements.
33
| Russell 1000 Value Index Fund | |||||
| Financial Highlights | |||||
| Institutional Shares | |||||
| For a Share Outstanding | Year Ended August 31, | ||||
| Throughout Each Period | 2016 | 2015 | 2014 | 2013 | 2012 |
| Net Asset Value, Beginning of Period | $165.50 | $175.38 | $144.13 | $120.04 | $104.59 |
| Investment Operations | |||||
| Net Investment Income | 4.359 | 3.946 | 3.528 | 3.228 | 2.474 |
| Net Realized and Unrealized Gain (Loss) | |||||
| on Investments | 16.249 | (9.955) | 31.182 | 24.017 | 15.262 |
| Total from Investment Operations | 20.608 | (6.009) | 34.710 | 27.245 | 17.736 |
| Distributions | |||||
| Dividends from Net Investment Income | (4.248) | (3.871) | (3.460) | (3.155) | (2.286) |
| Distributions from Realized Capital Gains | — | — | — | — | — |
| Total Distributions | (4.248) | (3.871) | (3.460) | (3.155) | (2.286) |
| Net Asset Value, End of Period | $181.86 | $165.50 | $175.38 | $144.13 | $120.04 |
| Total Return | 12.72% | -3.55% | 24.33% | 23.00% | 17.23% |
| Ratios/Supplemental Data | |||||
| Net Assets, End of Period (Millions) | $1,485 | $1,283 | $1,222 | $797 | $541 |
| Ratio of Total Expenses to | |||||
| Average Net Assets | 0.08% | 0.08% | 0.08% | 0.08% | 0.08% |
| Ratio of Net Investment Income to | |||||
| Average Net Assets | 2.62% | 2.30% | 2.26% | 2.46% | 2.55% |
| Portfolio Turnover Rate1 | 18% | 18% | 16% | 26% | 29% |
1 Excludes the value of portfolio securities received or delivered as a result of in-kind purchases or redemptions of the fund’s capital shares, including ETF Creation Units.
See accompanying Notes, which are an integral part of the Financial Statements.
34
Russell 1000 Value Index Fund
Notes to Financial Statements
Vanguard Russell 1000 Value Index Fund is registered under the Investment Company Act of 1940 as an open-end investment company, or mutual fund. The fund offers two classes of shares: ETF Shares and Institutional Shares. ETF Shares are listed for trading on Nasdaq; they can be purchased and sold through a broker. Institutional Shares are designed for investors who meet certain administrative, service, and account-size criteria.
A. The following significant accounting policies conform to generally accepted accounting principles for U.S. investment companies. The fund consistently follows such policies in preparing its financial statements.
1. Security Valuation: Securities are valued as of the close of trading on the New York Stock Exchange (generally 4 p.m., Eastern time) on the valuation date. Equity securities are valued at the latest quoted sales prices or official closing prices taken from the primary market in which each security trades; such securities not traded on the valuation date are valued at the mean of the latest quoted bid and asked prices. Securities for which market quotations are not readily available, or whose values have been materially affected by events occurring before the fund’s pricing time but after the close of the securities’ primary markets, are valued by methods deemed by the board of trustees to represent fair value. Investments in Vanguard Market Liquidity Fund are valued at that fund’s net asset value. Temporary cash investments acquired over 60 days to maturity are valued using the latest bid prices or using valuations based on a matrix system (which considers such factors as security prices, yields, maturities, and ratings), both as furnished by independent pricing services. Other temporary cash investments are valued at amortized cost, which approximates market value.
2. Futures Contracts: The fund uses index futures contracts to a limited extent, with the objectives of maintaining full exposure to the stock market, enhancing returns, maintaining liquidity, and minimizing transaction costs. The fund may purchase futures contracts to immediately invest incoming cash in the market, or sell futures in response to cash outflows, thereby simulating a fully invested position in the underlying index while maintaining a cash balance for liquidity. The fund may seek to enhance returns by using futures contracts instead of the underlying securities when futures are believed to be priced more attractively than the underlying securities. The primary risks associated with the use of futures contracts are imperfect correlation between changes in market values of stocks held by the fund and the prices of futures contracts, and the possibility of an illiquid market. Counterparty risk involving futures is mitigated because a regulated clearinghouse is the counterparty instead of the clearing broker. To further mitigate counterparty risk, the fund trades futures contracts on an exchange, monitors the financial strength of its clearing brokers and clearinghouse, and has entered into clearing agreements with its clearing brokers. The clearinghouse imposes initial margin requirements to secure the fund’s performance and requires daily settlement of variation margin representing changes in the market value of each contract.
Futures contracts are valued at their quoted daily settlement prices. The aggregate settlement values of the contracts are not recorded in the Statement of Net Assets. Fluctuations in the value of the contracts are recorded in the Statement of Net Assets as an asset (liability) and in the Statement of Operations as unrealized appreciation (depreciation) until the contracts are closed, when they are recorded as realized futures gains (losses).
During the year ended August 31, 2016, the fund’s average investments in long and short futures contracts represented less than 1% and 0% of net assets, respectively, based on the average of aggregate settlement values at each quarter-end during the period.
35
Russell 1000 Value Index Fund
3. Federal Income Taxes: The fund intends to continue to qualify as a regulated investment company and distribute all of its taxable income. Management has analyzed the fund’s tax positions taken for all open federal income tax years (August 31, 2013–2016), and has concluded that no provision for federal income tax is required in the fund’s financial statements.
4. Distributions: Distributions to shareholders are recorded on the ex-dividend date.
5. Securities Lending: To earn additional income, the fund lends its securities to qualified institutional borrowers. Security loans are subject to termination by the fund at any time, and are required to be secured at all times by collateral in an amount at least equal to the market value of securities loaned. Daily market fluctuations could cause the value of loaned securities to be more or less than the value of the collateral received. When this occurs, the collateral is adjusted and settled on the next business day. The fund further mitigates its counterparty risk by entering into securities lending transactions only with a diverse group of prequalified counterparties, monitoring their financial strength, and entering into master securities lending agreements with its counterparties. The master securities lending agreements provide that, in the event of a counterparty’s default (including bankruptcy), the fund may terminate any loans with that borrower, determine the net amount owed, and sell or retain the collateral up to the net amount owed to the fund; however, such actions may be subject to legal proceedings. While collateral mitigates counterparty risk, in the absence of a default the fund may experience delays and costs in recovering the securities loaned. The fund invests cash collateral received in Vanguard Market Liquidity Fund, and records a liability in the Statement of Net Assets for the return of the collateral, during the period the securities are on loan. Securities lending income represents fees charged to borrowers plus income earned on invested cash collateral, less expenses associated with the loan. During the term of the loan, the fund is entitled to all distributions made on or in respect of the loaned securities.
6. Credit Facility: The fund and certain other funds managed by The Vanguard Group (“Vanguard”) participate in a $3.1 billion committed credit facility provided by a syndicate of lenders pursuant to a credit agreement that may be renewed annually; each fund is individually liable for its borrowings, if any, under the credit facility. Borrowings may be utilized for temporary and emergency purposes, and are subject to the fund’s regulatory and contractual borrowing restrictions. The participating funds are charged administrative fees and an annual commitment fee of 0.10% of the undrawn amount of the facility; these fees are allocated to the funds based on a method approved by the fund’s board of trustees and included in Management and Administrative expenses on the fund’s Statement of Operations. Any borrowings under this facility bear interest at a rate based upon the higher of the one-month London Interbank Offered Rate, federal funds effective rate, or overnight bank funding rate plus an agreed-upon spread.
The fund had no borrowings outstanding at August 31, 2016, or at any time during the period then ended.
7. Other: Dividend income is recorded on the ex-dividend date. Interest income includes income distributions received from Vanguard Market Liquidity Fund and is accrued daily. Premiums and discounts on debt securities purchased are amortized and accreted, respectively, to interest income over the lives of the respective securities. Security transactions are accounted for on the date securities are bought or sold. Costs used to determine realized gains (losses) on the sale of investment securities are those of the specific securities sold.
Each class of shares has equal rights as to assets and earnings, except that each class separately bears certain class-specific expenses related to maintenance of shareholder accounts (included in Management and Administrative expenses) and shareholder reporting. Marketing and distribution
36
Russell 1000 Value Index Fund
expenses are allocated to each class of shares based on a method approved by the board of trustees. Income, other non-class-specific expenses, and gains and losses on investments are allocated to each class of shares based on its relative net assets.
B. In accordance with the terms of a Funds’ Service Agreement (the “FSA”) between Vanguard and the fund, Vanguard furnishes to the fund investment advisory, corporate management, administrative, marketing, and distribution services at Vanguard’s cost of operations (as defined by the FSA). These costs of operations are allocated to the fund based on methods and guidelines approved by the board of trustees. Vanguard does not require reimbursement in the current period for certain costs of operations (such as deferred compensation/benefits and risk/insurance costs); the fund’s liability for these costs of operations is included in Payables to Vanguard on the Statement of Net Assets.
Upon the request of Vanguard, the fund may invest up to 0.40% of its net assets as capital in Vanguard. At August 31, 2016, the fund had contributed to Vanguard capital in the amount of $166,000, representing 0.01% of the fund’s net assets and 0.07% of Vanguard’s capitalization. The fund’s trustees and officers are also directors and employees, respectively, of Vanguard.
C. Various inputs may be used to determine the value of the fund’s investments. These inputs are summarized in three broad levels for financial statement purposes. The inputs or methodologies used to value securities are not necessarily an indication of the risk associated with investing in those securities.
Level 1—Quoted prices in active markets for identical securities.
Level 2—Other significant observable inputs (including quoted prices for similar securities, interest rates, prepayment speeds, credit risk, etc.).
Level 3—Significant unobservable inputs (including the fund’s own assumptions used to determine the fair value of investments).
The following table summarizes the market value of the fund’s investments as of August 31, 2016, based on the inputs used to value them:
| Level 1 | Level 2 | Level 3 | |
| Investments | ($000) | ($000) | ($000) |
| Common Stocks | 2,145,947 | — | — |
| Temporary Cash Investments | 1,875 | 300 | — |
| Futures Contracts—Liabilities1 | (16) | — | — |
| Total | 2,147,806 | 300 | — |
| 1 Represents variation margin on the last day of the reporting period. |
D. At August 31, 2016, the aggregate settlement value of open futures contracts and the related unrealized appreciation (depreciation) were:
| ($000) | ||||
| Aggregate | ||||
| Number of | Settlement | Unrealized | ||
| Long (Short) | Value | Appreciation | ||
| Futures Contracts | Expiration | Contracts | Long (Short) | (Depreciation) |
| E-mini S&P 500 Index | September 2016 | 55 | 5,966 | 333 |
Unrealized appreciation (depreciation) on open futures contracts is required to be treated as realized gain (loss) for tax purposes.
37
Russell 1000 Value Index Fund
E. Distributions are determined on a tax basis and may differ from net investment income and realized capital gains for financial reporting purposes. Differences may be permanent or temporary. Permanent differences are reclassified among capital accounts in the financial statements to reflect their tax character. Temporary differences arise when certain items of income, expense, gain, or loss are recognized in different periods for financial statement and tax purposes. These differences will reverse at some time in the future. Differences in classification may also result from the treatment of short-term gains as ordinary income for tax purposes.
During the year ended August 31, 2016, the fund realized $92,938,000 of net capital gains resulting from in-kind redemptions—in which shareholders exchanged fund shares for securities held by the fund rather than for cash. Because such gains are not taxable to the fund, and are not distributed to shareholders, they have been reclassified from accumulated net realized losses to paid-in capital.
For tax purposes, at August 31, 2016, the fund had $11,822,000 of ordinary income available for distribution. The fund had available capital losses totaling $34,941,000 to offset future net capital gains.
At August 31, 2016, the cost of investment securities for tax purposes was $1,997,068,000.
Net unrealized appreciation of investment securities for tax purposes was $151,054,000, consisting of unrealized gains of $219,123,000 on securities that had risen in value since their purchase and $68,069,000 in unrealized losses on securities that had fallen in value since their purchase.
F. During the year ended August 31, 2016, the fund purchased $1,000,616,000 of investment securities and sold $707,706,000 of investment securities, other than temporary cash investments. Purchases and sales include $369,337,000 and $374,527,000, respectively, in connection with in-kind purchases and redemptions of the fund’s capital shares.
| G. Capital share transactions for each class of shares were: | ||||
| Year Ended August 31, | ||||
| 2016 | 2015 | |||
| Amount | Shares | Amount | Shares | |
| ($000) | (000) | ($000) | (000) | |
| ETF Shares | ||||
| Issued | 553,382 | 6,375 | 589,698 | 6,475 |
| Issued in Lieu of Cash Distributions | — | — | — | — |
| Redeemed | (342,995) | (4,000) | (438,585) | (4,825) |
| Net Increase (Decrease)—ETF Shares | 210,387 | 2,375 | 151,113 | 1,650 |
| Institutional Shares | ||||
| Issued | 352,730 | 2,075 | 406,222 | 2,305 |
| Issued in Lieu of Cash Distributions | 32,049 | 192 | 25,336 | 144 |
| Redeemed | (313,618) | (1,855) | (294,387) | (1,665) |
| Net Increase (Decrease) —Institutional Shares | 71,161 | 412 | 137,171 | 784 |
H. Management has determined that no material events or transactions occurred subsequent to August 31, 2016, that would require recognition or disclosure in these financial statements.
38
Russell 1000 Growth Index Fund
| Fund Profile | |||
| As of August 31, 2016 | |||
| Share-Class Characteristics | |||
| ETF | Institutional | ||
| Shares | Shares | ||
| Ticker Symbol | VONG | VRGWX | |
| Expense Ratio1 | 0.12% | 0.08% | |
| 30-Day SEC Yield | 1.41% | 1.45% | |
| Portfolio Characteristics | |||
| DJ | |||
| U.S. | |||
| Russell | Total | ||
| 1000 | Market | ||
| Growth | FA | ||
| Fund | Index | Index | |
| Number of Stocks | 605 | 604 | 3,817 |
| Median Market Cap | $70.3B | $70.3B | $51.2B |
| Price/Earnings Ratio | 24.8x | 24.8x | 23.5x |
| Price/Book Ratio | 5.7x | 5.7x | 2.8x |
| Return on Equity | 22.4% | 22.0% | 16.6% |
| Earnings Growth | |||
| Rate | 11.9% | 11.9% | 7.5% |
| Dividend Yield | 1.5% | 1.5% | 2.0% |
| Foreign Holdings | 0.0% | 0.0% | 0.0% |
| Turnover Rate | 15% | — | — |
| Short-Term Reserves | -0.1% | — | — |
Sector Diversification (% of equity exposure)
| DJ | |||
| U.S. | |||
| Russell | Total | ||
| 1000 | Market | ||
| Growth | FA | ||
| Fund | Index | Index | |
| Consumer Discretionary 22.3% | 22.3% | 14.2% | |
| Consumer Staples | 9.1 | 9.1 | 8.0 |
| Energy | 0.6 | 0.6 | 6.5 |
| Financial Services | 9.8 | 9.8 | 20.0 |
| Health Care | 16.7 | 16.7 | 14.0 |
| Materials & Processing | 4.1 | 4.1 | 3.9 |
| Producer Durables | 11.1 | 11.1 | 10.5 |
| Technology | 25.1 | 25.1 | 17.3 |
| Utilities | 1.2 | 1.2 | 5.6 |
| Volatility Measures | ||
| DJ | ||
| U.S. Total | ||
| Russell 1000 | Market | |
| Growth Index | FA Index | |
| R-Squared | 1.00 | 0.96 |
| Beta | 1.00 | 1.02 |
These measures show the degree and timing of the fund’s fluctuations compared with the indexes over 36 months.
Ten Largest Holdings (% of total net assets)
| Apple Inc. | Computer | |
| Technology | 5.1% | |
| Alphabet Inc. | Computer Services | |
| Software & Systems | 4.4 | |
| Microsoft Corp. | Computer Services | |
| Software & Systems | 4.1 | |
| Amazon.com Inc. | Diversified Retail | 2.8 |
| Facebook Inc. | Computer Services | |
| Software & Systems | 2.7 | |
| Home Depot Inc. | Specialty Retail | 1.6 |
| Visa Inc. | Financial Data & | |
| Systems | 1.5 | |
| Walt Disney Co. | Entertainment | 1.5 |
| Comcast Corp. | Cable Television | |
| Services | 1.4 | |
| PepsiCo Inc. | Beverage: Soft | |
| Drinks | 1.3 | |
| Top Ten | 26.4% |
The holdings listed exclude any temporary cash investments and equity index products.

1 The expense ratios shown are from the prospectus dated December 22, 2015, and represent estimated costs for the current fiscal year. For the fiscal year ended August 31, 2016, the expense ratios were 0.12% for ETF Shares and 0.08% for Institutional Shares.
39
Russell 1000 Growth Index Fund
Performance Summary
All of the returns in this report represent past performance, which is not a guarantee of future results that may be achieved by the fund. (Current performance may be lower or higher than the performance data cited. For performance data current to the most recent month-end, visit our website at vanguard.com/performance.) Note, too, that both investment returns and principal value can fluctuate widely, so an investor’s shares, when sold, could be worth more or less than their original cost. The returns shown do not reflect taxes that a shareholder would pay on fund distributions or on the sale of fund shares.
Cumulative Performance: September 20, 2010, Through August 31, 2016
Initial Investment of $10,000
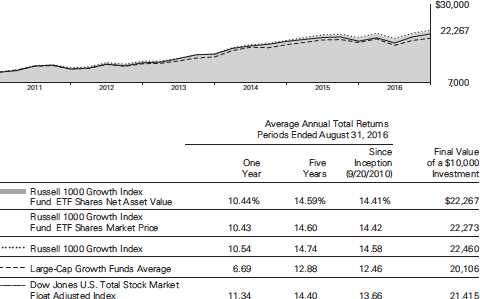
Large-Cap Growth Funds Average: Derived from data provided by Lipper, a Thomson Reuters Company.
"Since Inception" performance is calculated from the ETF Shares’ inception date for both the fund and its comparative standards.
| Since | Final Value | |||
| One | Five | Inception | of a $5,000,000 | |
| Year | Years | (12/6/2010) | Investment | |
| Russell 1000 Growth Index Fund Institutional | ||||
| Shares | 10.48% | 14.65% | 13.04% | $10,097,085 |
| Russell 1000 Growth Index | 10.54 | 14.74 | 13.14 | 10,147,619 |
| Dow Jones U.S. Total Stock Market Float | ||||
| Adjusted Index | 11.34 | 14.40 | 12.56 | 9,856,563 |
"Since Inception" performance is calculated from the Institutional Shares’ inception date for both the fund and its comparative standards.
See Financial Highlights for dividend and capital gains information.
40
| Russell 1000 Growth Index Fund | |||
| Cumulative Returns of ETF Shares: September 20, 2010, Through August 31, 2016 | |||
| Since | |||
| One | Five | Inception | |
| Year | Years | (9/20/2010) | |
| Russell 1000 Growth Index Fund ETF Shares | |||
| Market Price | 10.43% | 97.68% | 122.73% |
| Russell 1000 Growth Index Fund ETF Shares Net | |||
| Asset Value | 10.44 | 97.61 | 122.67 |
| Russell 1000 Growth Index | 10.54 | 98.88 | 124.60 |
"Since Inception" performance is calculated from the ETF Shares’ inception date for both the fund and its comparative standards.
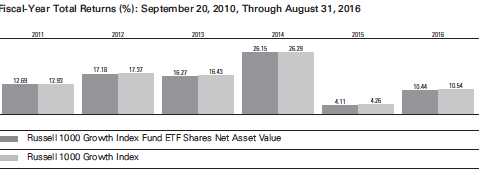
Average Annual Total Returns: Periods Ended June 30, 2016
This table presents returns through the latest calendar quarter—rather than through the end of the fiscal period.
Securities and Exchange Commission rules require that we provide this information.
| Inception | One | Five | Since | |
| Date | Year | Years | Inception | |
| ETF Shares | 9/20/2010 | |||
| Market Price | 2.83% | 12.21% | 14.05% | |
| Net Asset Value | 2.90 | 12.18 | 14.05 | |
| Institutional Shares | 12/6/2010 | 2.94 | 12.25 | 12.63 |
41
Russell 1000 Growth Index Fund
Financial Statements
Statement of Net Assets—Investments Summary
As of August 31, 2016
This Statement summarizes the fund’s holdings by asset type. Details are reported for each of the fund’s 50 largest individual holdings and for investments that, in total for any issuer, represent more than 1% of the fund’s net assets. The total value of smaller holdings is reported as a single amount within each category.
The fund reports a complete list of its holdings in regulatory filings four times in each fiscal year, at the quarter-ends. For the second and fourth fiscal quarters, the complete listing of the fund’s holdings is available electronically on vanguard.com and on the Securities and Exchange Commission’s website (sec.gov), or you can have it mailed to you without charge by calling 800-662-7447. For the first and third fiscal quarters, the fund files the lists with the SEC on Form N-Q. Shareholders can look up the fund’s Forms N-Q on the SEC’s website. Forms N-Q may also be reviewed and copied at the SEC’s Public Reference Room (see the back cover of this report for further information).
| Market | Percentage | ||
| Value• | of Net | ||
| Shares | ($000) | Assets | |
| Common Stocks | |||
| Consumer Discretionary | |||
| * Amazon.com Inc. | 100,593 | 77,372 | 2.8% |
| Home Depot Inc. | 321,958 | 43,181 | 1.6% |
| Walt Disney Co. | 419,203 | 39,598 | 1.4% |
| Comcast Corp. Class A | 576,675 | 37,634 | 1.4% |
| McDonald’s Corp. | 227,450 | 26,307 | 1.0% |
| Starbucks Corp. | 368,864 | 20,741 | 0.8% |
| NIKE Inc. Class B | 342,690 | 19,753 | 0.7% |
| Costco Wholesale Corp. | 112,608 | 18,253 | 0.7% |
| * Priceline Group Inc. | 12,795 | 18,127 | 0.7% |
| Lowe’s Cos. Inc. | 231,134 | 17,696 | 0.6% |
| * Charter Communications Inc. Class A | 51,816 | 13,328 | 0.5% |
| TJX Cos. Inc. | 170,804 | 13,227 | 0.5% |
| Consumer Discretionary—Other † | 262,204 | 9.6% | |
| 607,421 | 22.3% | ||
| Consumer Staples | |||
| PepsiCo Inc. | 325,150 | 34,710 | 1.3% |
| Altria Group Inc. | 505,580 | 33,414 | 1.2% |
| Coca-Cola Co. | 753,973 | 32,745 | 1.2% |
| CVS Health Corp. | 261,601 | 24,433 | 0.9% |
| Consumer Staples—Other † | 121,964 | 4.4% | |
| 247,266 | 9.0% | ||
| Energy † | 15,766 | 0.6% | |
| Financial Services | |||
| Visa Inc. Class A | 492,796 | 39,867 | 1.5% |
| MasterCard Inc. Class A | 249,059 | 24,067 | 0.9% |
| Simon Property Group Inc. | 72,446 | 15,610 | 0.6% |
| American Tower Corporation | 109,456 | 12,410 | 0.4% |
42
| Russell 1000 Growth Index Fund | |||
| Market | Percentage | ||
| Value• | of Net | ||
| Shares | ($000) | Assets | |
| * PayPal Holdings Inc. | 292,720 | 10,875 | 0.4% |
| Financial Services—Other † | 164,098 | 6.0% | |
| 266,927 | 9.8% | ||
| Health Care | |||
| Amgen Inc. | 194,327 | 33,047 | 1.2% |
| UnitedHealth Group Inc. | 242,476 | 32,989 | 1.2% |
| Gilead Sciences Inc. | 342,677 | 26,859 | 1.0% |
| AbbVie Inc. | 418,630 | 26,834 | 1.0% |
| Bristol-Myers Squibb Co. | 431,930 | 24,788 | 0.9% |
| * Celgene Corp. | 198,568 | 21,195 | 0.8% |
| Eli Lilly & Co. | 252,043 | 19,596 | 0.7% |
| * Biogen Inc. | 56,564 | 17,288 | 0.6% |
| Johnson & Johnson | 123,034 | 14,683 | 0.6% |
| * Allergan plc | 60,558 | 14,203 | 0.5% |
| Health Care—Other † | 221,491 | 8.1% | |
| 452,973 | 16.6% | ||
| Materials & Processing | |||
| EI du Pont de Nemours & Co. | 225,960 | 15,727 | 0.6% |
| Materials & Processing—Other † | 96,256 | 3.5% | |
| 111,983 | 4.1% | ||
| 1Other † | — | 0.0% | |
| Producer Durables | |||
| 3M Co. | 152,224 | 27,285 | 1.0% |
| Honeywell International Inc. | 196,499 | 22,933 | 0.8% |
| Boeing Co. | 154,436 | 19,992 | 0.7% |
| United Parcel Service Inc. Class B | 178,929 | 19,543 | 0.7% |
| Accenture plc Class A | 161,244 | 18,543 | 0.7% |
| Lockheed Martin Corp. | 65,701 | 15,963 | 0.6% |
| General Electric Co. | 462,194 | 14,439 | 0.5% |
| Producer Durables—Other † | 162,190 | 6.0% | |
| 300,888 | 11.0% | ||
| Technology | |||
| Apple Inc. | 1,298,752 | 137,798 | 5.0% |
| Microsoft Corp. | 1,958,693 | 112,546 | 4.1% |
| * Facebook Inc. Class A | 580,302 | 73,188 | 2.7% |
| * Alphabet Inc. Class A | 75,584 | 59,700 | 2.2% |
| * Alphabet Inc. Class C | 77,109 | 59,146 | 2.2% |
| International Business Machines Corp. | 156,249 | 24,825 | 0.9% |
| Texas Instruments Inc. | 259,961 | 18,078 | 0.7% |
| Broadcom Ltd. | 97,512 | 17,203 | 0.6% |
| * salesforce.com Inc. | 165,620 | 13,153 | 0.5% |
| * Adobe Systems Inc. | 126,130 | 12,904 | 0.5% |
| Technology—Other † | 155,330 | 5.7% | |
| 683,871 | 25.1% | ||
| Utilities | |||
| Verizon Communications Inc. | 528,281 | 27,645 | 1.0% |
| Utilities—Other † | 5,081 | 0.2% | |
| 32,726 | 1.2% | ||
| Total Common Stocks (Cost $2,273,438) | 2,719,821 | 99.7%2 | |
43
| Russell 1000 Growth Index Fund | ||||
| Market | Percentage | |||
| Value• | of Net | |||
| Coupon | Shares | ($000) | Assets | |
| Temporary Cash Investments | ||||
| Money Market Fund | ||||
| 3,4 Vanguard Market Liquidity Fund | 0.612% | 90,817 | 9,082 | 0.4% |
| 5U.S. Government and Agency Obligations † | 700 | 0.0% | ||
| Total Temporary Cash Investments (Cost $9,782) | 9,782 | 0.4%2 | ||
| 6Total Investments (Cost $2,283,220) | 2,729,603 | 100.1% | ||
| Amount | ||||
| ($000) | ||||
| Other Assets and Liabilities | ||||
| Other Assets | ||||
| Investment in Vanguard | 216 | |||
| Receivables for Investment Securities Sold | 1,582 | |||
| Receivables for Accrued Income | 4,072 | |||
| Receivables for Capital Shares Issued | 24,815 | |||
| Other Assets | 3 | |||
| Total Other Assets | 30,688 | 1.1% | ||
| Liabilities | ||||
| Payables for Investment Securities Purchased | (1,515) | |||
| Collateral for Securities on Loan | (6,043) | |||
| Payables for Capital Shares Redeemed | (25,155) | |||
| Payables to Vanguard | (628) | |||
| Other Liabilities | (19) | |||
| Total Liabilities | (33,360) | (1.2%) | ||
| Net Assets | 2,726,931 | 100.0% | ||
| At August 31, 2016, net assets consisted of: | ||||
| Amount | ||||
| ($000) | ||||
| Paid-in Capital | 2,356,977 | |||
| Undistributed Net Investment Income | 9,101 | |||
| Accumulated Net Realized Losses | (85,872) | |||
| Unrealized Appreciation (Depreciation) | ||||
| Investment Securities | 446,383 | |||
| Futures Contracts | 342 | |||
| Net Assets | 2,726,931 | |||
| ETF Shares—Net Assets | ||||
| Applicable to 6,901,711 outstanding $.001 par value shares of | ||||
| beneficial interest (unlimited authorization) | 737,759 | |||
| Net Asset Value Per Share—ETF Shares | $106.90 | |||
44
| Russell 1000 Growth Index Fund | |
| Amount | |
| ($000) | |
| Institutional Shares—Net Assets | |
| Applicable to 9,678,442 outstanding $.001 par value shares of | |
| beneficial interest (unlimited authorization) | 1,989,172 |
| Net Asset Value Per Share—Institutional Shares | $205.53 |
• See Note A in Notes to Financial Statements. * Non-income-producing security.
† Represents the aggregate value, by category, of securities that are not among the 50 largest holdings and, in total for any issuer, represent 1% or less of net assets.
1 “Other” represents securities that are not classified by the fund’s benchmark index.
2 The fund invests a portion of its cash reserves in equity markets through the use of index futures contracts. After giving effect to futures investments, the fund’s effective common stock and temporary cash investment positions represent 100.0% and 0.1%, respectively, of net assets.
3 Affiliated money market fund available only to Vanguard funds and certain trusts and accounts managed by Vanguard. Rate shown is the 7-day yield.
4 Includes $6,043,000 of collateral received for securities on loan.
5 Securities with a value of $300,000 have been segregated as initial margin for open futures contracts. 6 The total value of securities on loan is $5,792,000.
See accompanying Notes, which are an integral part of the Financial Statements.
45
| Russell 1000 Growth Index Fund | |
| Statement of Operations | |
| Year Ended | |
| August 31, 2016 | |
| ($000) | |
| Investment Income | |
| Income | |
| Dividends | 39,471 |
| Interest1 | 43 |
| Securities Lending—Net | 298 |
| Total Income | 39,812 |
| Expenses | |
| The Vanguard Group—Note B | |
| Investment Advisory Services | 402 |
| Management and Administrative—ETF Shares | 487 |
| Management and Administrative—Institutional Shares | 930 |
| Marketing and Distribution—ETF Shares | 45 |
| Marketing and Distribution—Institutional Shares | 48 |
| Custodian Fees | 113 |
| Auditing Fees | 32 |
| Shareholders’ Reports—ETF Shares | 11 |
| Shareholders’ Reports—Institutional Shares | 2 |
| Trustees’ Fees and Expenses | 1 |
| Total Expenses | 2,071 |
| Net Investment Income | 37,741 |
| Realized Net Gain (Loss) | |
| Investment Securities Sold1 | 61,660 |
| Futures Contracts | 870 |
| Realized Net Gain (Loss) | 62,530 |
| Change in Unrealized Appreciation (Depreciation) | |
| Investment Securities | 135,854 |
| Futures Contracts | 538 |
| Change in Unrealized Appreciation (Depreciation) | 136,392 |
| Net Increase (Decrease) in Net Assets Resulting from Operations | 236,663 |
1 Interest income and realized net gain (loss) from an affiliated company of the fund were $40,000 and $1,000, respectively.
See accompanying Notes, which are an integral part of the Financial Statements.
46
| Russell 1000 Growth Index Fund | ||
| Statement of Changes in Net Assets | ||
| Year Ended August 31, | ||
| 2016 | 2015 | |
| ($000) | ($000) | |
| Increase (Decrease) in Net Assets | ||
| Operations | ||
| Net Investment Income | 37,741 | 28,226 |
| Realized Net Gain (Loss) | 62,530 | 139,295 |
| Change in Unrealized Appreciation (Depreciation) | 136,392 | (107,235) |
| Net Increase (Decrease) in Net Assets Resulting from Operations | 236,663 | 60,286 |
| Distributions | ||
| Net Investment Income | ||
| ETF Shares | (8,068) | (5,242) |
| Institutional Shares | (25,753) | (22,086) |
| Realized Capital Gain | ||
| ETF Shares | — | — |
| Institutional Shares | — | — |
| Total Distributions | (33,821) | (27,328) |
| Capital Share Transactions | ||
| ETF Shares | 237,351 | 156,308 |
| Institutional Shares | 274,768 | 67,889 |
| Net Increase (Decrease) from Capital Share Transactions | 512,119 | 224,197 |
| Total Increase (Decrease) | 714,961 | 257,155 |
| Net Assets | ||
| Beginning of Period | 2,011,970 | 1,754,815 |
| End of Period1 | 2,726,931 | 2,011,970 |
1 Net Assets—End of Period includes undistributed (overdistributed) net investment income of $9,101,000 and $5,181,000.
See accompanying Notes, which are an integral part of the Financial Statements.
47
| Russell 1000 Growth Index Fund | |||||
| Financial Highlights | |||||
| ETF Shares | |||||
| For a Share Outstanding | Year Ended August 31, | ||||
| Throughout Each Period | 2016 | 2015 | 2014 | 2013 | 2012 |
| Net Asset Value, Beginning of Period | $98.24 | $95.74 | $77.02 | $67.41 | $58.31 |
| Investment Operations | |||||
| Net Investment Income | 1.602 | 1.466 | 1.293 | 1.226 | .900 |
| Net Realized and Unrealized Gain (Loss) | |||||
| on Investments | 8.556 | 2.481 | 18.713 | 9.611 | 9.023 |
| Total from Investment Operations | 10.158 | 3.947 | 20.006 | 10.837 | 9.923 |
| Distributions | |||||
| Dividends from Net Investment Income | (1.498) | (1.447) | (1.286) | (1.227) | (.823) |
| Distributions from Realized Capital Gains | — | — | — | — | — |
| Total Distributions | (1.498) | (1.447) | (1.286) | (1.227) | (.823) |
| Net Asset Value, End of Period | $106.90 | $98.24 | $95.74 | $77.02 | $67.41 |
| Total Return | 10.44% | 4.11% | 26.15% | 16.27% | 17.18% |
| Ratios/Supplemental Data | |||||
| Net Assets, End of Period (Millions) | $738 | $452 | $295 | $148 | $76 |
| Ratio of Total Expenses to | |||||
| Average Net Assets | 0.12% | 0.12% | 0.12% | 0.15% | 0.15% |
| Ratio of Net Investment Income to | |||||
| Average Net Assets | 1.60% | 1.47% | 1.51% | 1.73% | 1.59% |
| Portfolio Turnover Rate1 | 15% | 20% | 18% | 29% | 25% |
1 Excludes the value of portfolio securities received or delivered as a result of in-kind purchases or redemptions of the fund’s capital shares, including ETF Creation Units.
See accompanying Notes, which are an integral part of the Financial Statements.
48
| Russell 1000 Growth Index Fund | |||||
| Financial Highlights | |||||
| Institutional Shares | |||||
| For a Share Outstanding | Year Ended August 31, | ||||
| Throughout Each Period | 2016 | 2015 | 2014 | 2013 | 2012 |
| Net Asset Value, Beginning of Period | $188.88 | $184.06 | $148.07 | $129.59 | $112.09 |
| Investment Operations | |||||
| Net Investment Income | 3.147 | 2.882 | 2.544 | 2.446 | 1.812 |
| Net Realized and Unrealized Gain (Loss) | |||||
| on Investments | 16.449 | 4.782 | 35.986 | 18.488 | 17.342 |
| Total from Investment Operations | 19.596 | 7.664 | 38.530 | 20.934 | 19.154 |
| Distributions | |||||
| Dividends from Net Investment Income | (2.946) | (2.844) | (2.540) | (2.454) | (1.654) |
| Distributions from Realized Capital Gains | — | — | — | — | — |
| Total Distributions | (2.946) | (2.844) | (2.540) | (2.454) | (1.654) |
| Net Asset Value, End of Period | $205.53 | $188.88 | $184.06 | $148.07 | $129.59 |
| Total Return | 10.48% | 4.15% | 26.20% | 16.35% | 17.26% |
| Ratios/Supplemental Data | |||||
| Net Assets, End of Period (Millions) | $1,989 | $1,560 | $1,460 | $992 | $576 |
| Ratio of Total Expenses to | |||||
| Average Net Assets | 0.08% | 0.08% | 0.08% | 0.08% | 0.08% |
| Ratio of Net Investment Income to | |||||
| Average Net Assets | 1.64% | 1.51% | 1.55% | 1.80% | 1.66% |
| Portfolio Turnover Rate1 | 15% | 20% | 18% | 29% | 25% |
1 Excludes the value of portfolio securities received or delivered as a result of in-kind purchases or redemptions of the fund’s capital shares, including ETF Creation Units.
See accompanying Notes, which are an integral part of the Financial Statements.
49
Russell 1000 Growth Index Fund
Notes to Financial Statements
Vanguard Russell 1000 Growth Index Fund is registered under the Investment Company Act of 1940 as an open-end investment company, or mutual fund. The fund offers two classes of shares: ETF Shares and Institutional Shares. ETF Shares are listed for trading on Nasdaq; they can be purchased and sold through a broker. Institutional Shares are designed for investors who meet certain administrative, service, and account-size criteria.
A. The following significant accounting policies conform to generally accepted accounting principles for U.S. investment companies. The fund consistently follows such policies in preparing its financial statements.
1. Security Valuation: Securities are valued as of the close of trading on the New York Stock Exchange (generally 4 p.m., Eastern time) on the valuation date. Equity securities are valued at the latest quoted sales prices or official closing prices taken from the primary market in which each security trades; such securities not traded on the valuation date are valued at the mean of the latest quoted bid and asked prices. Securities for which market quotations are not readily available, or whose values have been materially affected by events occurring before the fund’s pricing time but after the close of the securities’ primary markets, are valued by methods deemed by the board of trustees to represent fair value. Investments in Vanguard Market Liquidity Fund are valued at that fund’s net asset value. Temporary cash investments acquired over 60 days to maturity are valued using the latest bid prices or using valuations based on a matrix system (which considers such factors as security prices, yields, maturities, and ratings), both as furnished by independent pricing services. Other temporary cash investments are valued at amortized cost, which approximates market value.
2. Futures Contracts: The fund uses index futures contracts to a limited extent, with the objectives of maintaining full exposure to the stock market, enhancing returns, maintaining liquidity, and minimizing transaction costs. The fund may purchase futures contracts to immediately invest incoming cash in the market, or sell futures in response to cash outflows, thereby simulating a fully invested position in the underlying index while maintaining a cash balance for liquidity. The fund may seek to enhance returns by using futures contracts instead of the underlying securities when futures are believed to be priced more attractively than the underlying securities. The primary risks associated with the use of futures contracts are imperfect correlation between changes in market values of stocks held by the fund and the prices of futures contracts, and the possibility of an illiquid market. Counterparty risk involving futures is mitigated because a regulated clearinghouse is the counterparty instead of the clearing broker. To further mitigate counterparty risk, the fund trades futures contracts on an exchange, monitors the financial strength of its clearing brokers and clearinghouse, and has entered into clearing agreements with its clearing brokers. The clearinghouse imposes initial margin requirements to secure the fund’s performance and requires daily settlement of variation margin representing changes in the market value of each contract.
Futures contracts are valued at their quoted daily settlement prices. The aggregate settlement values of the contracts are not recorded in the Statement of Net Assets. Fluctuations in the value of the contracts are recorded in the Statement of Net Assets as an asset (liability) and in the Statement of Operations as unrealized appreciation (depreciation) until the contracts are closed, when they are recorded as realized futures gains (losses).
During the year ended August 31, 2016, the fund’s average investments in long and short futures contracts represented less than 1% and 0% of net assets, respectively, based on the average of aggregate settlement values at each quarter-end during the period.
50
Russell 1000 Growth Index Fund
3. Federal Income Taxes: The fund intends to continue to qualify as a regulated investment company and distribute all of its taxable income. Management has analyzed the fund’s tax positions taken for all open federal income tax years (August 31, 2013–2016), and has concluded that no provision for federal income tax is required in the fund’s financial statements.
4. Distributions: Distributions to shareholders are recorded on the ex-dividend date.
5. Securities Lending: To earn additional income, the fund lends its securities to qualified institutional borrowers. Security loans are subject to termination by the fund at any time, and are required to be secured at all times by collateral in an amount at least equal to the market value of securities loaned. Daily market fluctuations could cause the value of loaned securities to be more or less than the value of the collateral received. When this occurs, the collateral is adjusted and settled on the next business day. The fund further mitigates its counterparty risk by entering into securities lending transactions only with a diverse group of prequalified counterparties, monitoring their financial strength, and entering into master securities lending agreements with its counterparties. The master securities lending agreements provide that, in the event of a counterparty’s default (including bankruptcy), the fund may terminate any loans with that borrower, determine the net amount owed, and sell or retain the collateral up to the net amount owed to the fund; however, such actions may be subject to legal proceedings. While collateral mitigates counterparty risk, in the absence of a default the fund may experience delays and costs in recovering the securities loaned. The fund invests cash collateral received in Vanguard Market Liquidity Fund, and records a liability in the Statement of Net Assets for the return of the collateral, during the period the securities are on loan. Securities lending income represents fees charged to borrowers plus income earned on invested cash collateral, less expenses associated with the loan. During the term of the loan, the fund is entitled to all distributions made on or in respect of the loaned securities.
6. Credit Facility: The fund and certain other funds managed by The Vanguard Group (“Vanguard”) participate in a $3.1 billion committed credit facility provided by a syndicate of lenders pursuant to a credit agreement that may be renewed annually; each fund is individually liable for its borrowings, if any, under the credit facility. Borrowings may be utilized for temporary and emergency purposes, and are subject to the fund’s regulatory and contractual borrowing restrictions. The participating funds are charged administrative fees and an annual commitment fee of 0.10% of the undrawn amount of the facility; these fees are allocated to the funds based on a method approved by the fund’s board of trustees and included in Management and Administrative expenses on the fund’s Statement of Operations. Any borrowings under this facility bear interest at a rate based upon the higher of the one-month London Interbank Offered Rate, federal funds effective rate, or overnight bank funding rate plus an agreed-upon spread.
The fund had no borrowings outstanding at August 31, 2016, or at any time during the period then ended.
7. Other: Dividend income is recorded on the ex-dividend date. Interest income includes income distributions received from Vanguard Market Liquidity Fund and is accrued daily. Premiums and discounts on debt securities purchased are amortized and accreted, respectively, to interest income over the lives of the respective securities. Security transactions are accounted for on the date securities are bought or sold. Costs used to determine realized gains (losses) on the sale of investment securities are those of the specific securities sold.
Each class of shares has equal rights as to assets and earnings, except that each class separately bears certain class-specific expenses related to maintenance of shareholder accounts (included in Management and Administrative expenses) and shareholder reporting. Marketing and distribution
51
Russell 1000 Growth Index Fund
expenses are allocated to each class of shares based on a method approved by the board of trustees. Income, other non-class-specific expenses, and gains and losses on investments are allocated to each class of shares based on its relative net assets.
B. In accordance with the terms of a Funds’ Service Agreement (the “FSA”) between Vanguard and the fund, Vanguard furnishes to the fund investment advisory, corporate management, administrative, marketing, and distribution services at Vanguard’s cost of operations (as defined by the FSA). These costs of operations are allocated to the fund based on methods and guidelines approved by the board of trustees. Vanguard does not require reimbursement in the current period for certain costs of operations (such as deferred compensation/benefits and risk/insurance costs); the fund’s liability for these costs of operations is included in Payables to Vanguard on the Statement of Net Assets.
Upon the request of Vanguard, the fund may invest up to 0.40% of its net assets as capital in Vanguard. At August 31, 2016, the fund had contributed to Vanguard capital in the amount of $216,000, representing 0.01% of the fund’s net assets and 0.09% of Vanguard’s capitalization. The fund’s trustees and officers are also directors and employees, respectively, of Vanguard.
C. Various inputs may be used to determine the value of the fund’s investments. These inputs are summarized in three broad levels for financial statement purposes. The inputs or methodologies used to value securities are not necessarily an indication of the risk associated with investing in those securities.
Level 1—Quoted prices in active markets for identical securities.
Level 2—Other significant observable inputs (including quoted prices for similar securities, interest rates, prepayment speeds, credit risk, etc.).
Level 3—Significant unobservable inputs (including the fund’s own assumptions used to determine the fair value of investments).
The following table summarizes the market value of the fund’s investments as of August 31, 2016, based on the inputs used to value them:
| Level 1 | Level 2 | Level 3 | |
| Investments | ($000) | ($000) | ($000) |
| Common Stocks | 2,719,821 | — | — |
| Temporary Cash Investments | 9,082 | 700 | — |
| Futures Contracts—Liabilities1 | (20) | — | — |
| Total | 2,728,883 | 700 | — |
| 1 Represents variation margin on the last day of the reporting period. |
D. At August 31, 2016, the aggregate settlement value of open futures contracts and the related unrealized appreciation (depreciation) were:
| ($000) | ||||
| Aggregate | ||||
| Number of | Settlement | Unrealized | ||
| Long (Short) | Value | Appreciation | ||
| Futures Contracts | Expiration | Contracts | Long (Short) | (Depreciation) |
| E-mini S&P 500 Index | September 2016 | 70 | 7,593 | 342 |
Unrealized appreciation (depreciation) on open futures contracts is required to be treated as realized gain (loss) for tax purposes.
52
Russell 1000 Growth Index Fund
E. Distributions are determined on a tax basis and may differ from net investment income and realized capital gains for financial reporting purposes. Differences may be permanent or temporary. Permanent differences are reclassified among capital accounts in the financial statements to reflect their tax character. Temporary differences arise when certain items of income, expense, gain, or loss are recognized in different periods for financial statement and tax purposes. These differences will reverse at some time in the future. Differences in classification may also result from the treatment of short-term gains as ordinary income for tax purposes.
During the year ended August 31, 2016, the fund realized $106,319,000 of net capital gains resulting from in-kind redemptions—in which shareholders exchanged fund shares for securities held by the fund rather than for cash. Because such gains are not taxable to the fund, and are not distributed to shareholders, they have been reclassified from accumulated net realized losses to paid-in capital.
For tax purposes, at August 31, 2016, the fund had $9,591,000 of ordinary income available for distribution. The fund had available capital losses totaling $85,531,000 that may be carried forward indefinitely to offset future net capital gains.
At August 31, 2016, the cost of investment securities for tax purposes was $2,283,220,000. Net unrealized appreciation of investment securities for tax purposes was $446,383,000, consisting of unrealized gains of $485,329,000 on securities that had risen in value since their purchase and $38,946,000 in unrealized losses on securities that had fallen in value since their purchase.
F. During the year ended August 31, 2016, the fund purchased $1,137,908,000 of investment securities and sold $621,917,000 of investment securities, other than temporary cash investments. Purchases and sales include $278,376,000 and $275,452,000, respectively, in connection with in-kind purchases and redemptions of the fund’s capital shares.
| G. Capital share transactions for each class of shares were: | ||||
| Year Ended August 31, | ||||
| 2016 | 2015 | |||
| Amount | Shares | Amount | Shares | |
| ($000) | (000) | ($000) | (000) | |
| ETF Shares | ||||
| Issued | 471,904 | 4,600 | 591,973 | 5,900 |
| Issued in Lieu of Cash Distributions | — | — | — | — |
| Redeemed | (234,553) | (2,300) | (435,665) | (4,375) |
| Net Increase (Decrease) —ETF Shares | 237,351 | 2,300 | 156,308 | 1,525 |
| Institutional Shares | ||||
| Issued | 620,161 | 3,160 | 431,791 | 2,235 |
| Issued in Lieu of Cash Distributions | 24,379 | 126 | 20,780 | 109 |
| Redeemed | (369,772) | (1,866) | (384,682) | (2,019) |
| Net Increase (Decrease) —Institutional Shares | 274,768 | 1,420 | 67,889 | 325 |
H. Management has determined that no material events or transactions occurred subsequent to August 31, 2016, that would require recognition or disclosure in these financial statements.
53
Report of Independent Registered Public Accounting Firm
To the Board of Trustees of Vanguard Scottsdale Funds and the Shareholders of Vanguard Russell 1000 Index Fund, Vanguard Russell 1000 Value Index Fund and Vanguard Russell 1000 Growth Index Fund:
In our opinion, the accompanying statements of net assets—investments summary and the related statements of operations and of changes in net assets and the financial highlights present fairly, in all material respects, the financial position of Vanguard Russell 1000 Index Fund, Vanguard Russell 1000 Value Index Fund and Vanguard Russell 1000 Growth Index Fund (constituting separate portfolios of Vanguard Scottsdale Funds, hereafter referred to as the “Funds”) at August 31, 2016, the results of each of their operations for the year then ended, the changes in each of their net assets for each of the two years in the period then ended, and the financial highlights for each of the five years in the period then ended, in conformity with accounting principles generally accepted in the United States of America. These financial statements and financial highlights (hereafter referred to as “financial statements”) are the responsibility of the Funds’ management. Our responsibility is to express an opinion on these financial statements based on our audits. We conducted our audits of these financial statements in accordance with the standards of the Public Company Accounting Oversight Board (United States). Those standards require that we plan and perform the audit to obtain reasonable assurance about whether the financial statements are free of material misstatement. An audit includes examining, on a test basis, evidence supporting the amounts and disclosures in the financial statements, assessing the accounting principles used and significant estimates made by management, and evaluating the overall financial statement presentation. We believe that our audits, which included confirmation of securities at August 31, 2016 by correspondence with the custodian and brokers and by agreement to the underlying ownership records of the transfer agent, provide a reasonable basis for our opinion.
/s/PricewaterhouseCoopers LLP
Philadelphia, Pennsylvania
October 12, 2016
54
Special 2016 tax information (unaudited) for Vanguard Russell 1000 Index Funds
This information for the fiscal year ended August 31, 2016, is included pursuant to provisions of the Internal Revenue Code.
The funds distributed qualified dividend income to shareholders during the fiscal year as follows:
| Fund | ($000) |
| Russell 1000 Index Fund | 38,460 |
| Russell 1000 Value Index Fund | 45,481 |
| Russell 1000 Growth Index Fund | 33,821 |
For corporate shareholders, the percentage of investment income (dividend income plus short-term gains, if any) that qualifies for the dividends-received deduction is as follows:
| Fund | Percentage |
| Russell 1000 Index Fund | 93.2% |
| Russell 1000 Value Index Fund | 90.2 |
| Russell 1000 Growth Index Fund | 94.4 |
55
Your Fund’s After-Tax Returns
This table presents returns for your fund both before and after taxes. The after-tax returns are shown in two ways: (1) assuming that an investor owned the fund during the entire period and paid taxes on the fund’s distributions, and (2) assuming that an investor paid taxes on the fund’s distributions and sold all shares at the end of each period.
Calculations are based on the highest individual federal income tax and capital gains tax rates in effect at the times of the distributions and the hypothetical sales. State and local taxes were not considered. After-tax returns reflect any qualified dividend income, using actual prior-year figures and estimates for 2016. (In the example, returns after the sale of fund shares may be higher than those assuming no sale. This occurs when the sale would have produced a capital loss. The calculation assumes that the investor received a tax deduction for the loss.)
Please note that your actual after-tax returns will depend on your tax situation and may differ from those shown. Also note that if you own the fund in a tax-deferred account, such as an individual retirement account or a 401(k) plan, this information does not apply to you. Such accounts are not subject to current taxes.
Finally, keep in mind that a fund’s performance—whether before or after taxes—does not guarantee future results.
| Average Annual Total Returns: Russell 1000 Index Funds | |||
| Periods Ended August 31, 2016 | |||
| Since | |||
| One | Five | Inception | |
| Year | Years | (9/20/2010) | |
| Russell 1000 Index Fund ETF Shares | |||
| Returns Before Taxes | 11.41% | 14.43% | 13.64% |
| Returns After Taxes on Distributions | 10.89 | 13.98 | 13.23 |
| Returns After Taxes on Distributions and Sale of Fund Shares | 6.83 | 11.58 | 11.04 |
| Since | |||
| One | Five | Inception | |
| Year | Years | (9/20/2010) | |
| Russell 1000 Value Index Fund ETF Shares | |||
| Returns Before Taxes | 12.65% | 14.21% | 12.80% |
| Returns After Taxes on Distributions | 11.99 | 13.67 | 12.31 |
| Returns After Taxes on Distributions and Sale of Fund Shares | 7.63 | 11.38 | 10.31 |
| Since | |||
| One | Five | Inception | |
| Year | Years | (9/20/2010) | |
| Russell 1000 Growth Index Fund ETF Shares | |||
| Returns Before Taxes | 10.44% | 14.59% | 14.41% |
| Returns After Taxes on Distributions | 10.05 | 14.23 | 14.09 |
| Returns After Taxes on Distributions and Sale of Fund Shares | 6.20 | 11.72 | 11.70 |
56
About Your Fund’s Expenses
As a shareholder of the fund, you incur ongoing costs, which include costs for portfolio management, administrative services, and shareholder reports (like this one), among others. Operating expenses, which are deducted from a fund’s gross income, directly reduce the investment return of the fund.
A fund’s expenses are expressed as a percentage of its average net assets. This figure is known as the expense ratio. The following examples are intended to help you understand the ongoing costs (in dollars) of investing in your fund and to compare these costs with those of other mutual funds. The examples are based on an investment of $1,000 made at the beginning of the period shown and held for the entire period.
The accompanying table illustrates your fund’s costs in two ways:
• Based on actual fund return. This section helps you to estimate the actual expenses that you paid over the period. The ”Ending Account Value“ shown is derived from the fund‘s actual return, and the third column shows the dollar amount that would have been paid by an investor who started with $1,000 in the fund. You may use the information here, together with the amount you invested, to estimate the expenses that you paid over the period.
To do so, simply divide your account value by $1,000 (for example, an $8,600 account value divided by $1,000 = 8.6), then multiply the result by the number given for your fund under the heading ”Expenses Paid During Period.“
• Based on hypothetical 5% yearly return. This section is intended to help you compare your fund‘s costs with those of other mutual funds. It assumes that the fund had a yearly return of 5% before expenses, but that the expense ratio is unchanged. In this case—because the return used is not the fund’s actual return—the results do not apply to your investment. The example is useful in making comparisons because the Securities and Exchange Commission requires all mutual funds to calculate expenses based on a 5% return. You can assess your fund’s costs by comparing this hypothetical example with the hypothetical examples that appear in shareholder reports of other funds.
Note that the expenses shown in the table are meant to highlight and help you compare ongoing costs only and do not reflect transaction costs incurred by the fund for buying and selling securities. Further, the expenses do not include any purchase, redemption, or account service fees described in the fund prospectus. If such fees were applied to your account, your costs would be higher. Your fund does not carry a “sales load.”
The calculations assume no shares were bought or sold during the period. Your actual costs may have been higher or lower, depending on the amount of your investment and the timing of any purchases or redemptions.
You can find more information about the fund’s expenses, including annual expense ratios, in the Financial Statements section of this report. For additional information on operating expenses and other shareholder costs, please refer to your fund’s current prospectus.
57
| Six Months Ended August 31, 2016 | |||
| Beginning | Ending | Expenses | |
| Account Value | Account Value | Paid During | |
| 2/29/2016 | 8/31/2016 | Period | |
| Based on Actual Fund Return | |||
| Russell 1000 Index Fund | |||
| ETF Shares | $1,000.00 | $1,137.92 | $0.86 |
| Institutional Shares | 1,000.00 | 1,138.30 | 0.65 |
| Russell 1000 Value Index Fund | |||
| ETF Shares | $1,000.00 | $1,160.32 | $0.81 |
| Institutional Shares | 1,000.00 | 1,160.61 | 0.60 |
| Russell 1000 Growth Index Fund | |||
| ETF Shares | $1,000.00 | $1,118.65 | $0.80 |
| Institutional Shares | 1,000.00 | 1,118.85 | 0.59 |
| Based on Hypothetical 5% Yearly Return | |||
| Russell 1000 Index Fund | |||
| ETF Shares | $1,000.00 | $1,024.33 | $0.81 |
| Institutional Shares | 1,000.00 | 1,024.53 | 0.61 |
| Russell 1000 Value Index Fund | |||
| ETF Shares | $1,000.00 | $1,024.38 | $0.76 |
| Institutional Shares | 1,000.00 | 1,024.58 | 0.56 |
| Russell 1000 Growth Index Fund | |||
| ETF Shares | $1,000.00 | $1,024.38 | $0.76 |
| Institutional Shares | 1,000.00 | 1,024.58 | 0.56 |
The calculations are based on expenses incurred in the most recent six-month period. The funds’ annualized six-month expense ratios for that period are: for the Russell 1000 Index Fund, 0.16% for ETF Shares and 0.12% for Institutional Shares; for the Russell 1000 Value Index Fund, 0.15% for ETF Shares and 0.11% for Institutional Shares; and for the Russell 1000 Growth Index Fund, 0.15% for ETF Shares and 0.11% for Institutional Shares. The dollar amounts shown as ”Expenses Paid” are equal to the annualized expense ratio multiplied by the average account value over the period, multiplied by the number of days in the most recent six-month period, then divided by the number of days in the most recent 12-month period (184/366).
58
Trustees Approve Advisory Arrangements
The board of trustees of Vanguard Russell 1000 Index Fund, Russell 1000 Value Index Fund, and Russell 1000 Growth Index Fund has renewed each fund’s investment advisory arrangement with The Vanguard Group, Inc. (Vanguard). Vanguard—through its Equity Index Group—serves as investment advisor for each fund. The board determined that continuing each fund’s internalized management structure was in the best interests of each fund and its shareholders.
The board based its decision upon an evaluation of the advisor’s investment staff, portfolio management process, and performance. This evaluation included information provided to the board by Vanguard’s Portfolio Review Department, which is responsible for fund and advisor oversight and product management. The Portfolio Review Department met regularly with the advisor and made monthly presentations to the board during the fiscal year directing the board’s focus to relevant information and topics.
The board, or an investment committee made up of board members, also received information throughout the year through advisor presentations. For each advisor presentation, the board was provided with letters and reports that included information about, among other things, the advisory firm and the advisor’s assessment of the investment environment, portfolio performance, and portfolio characteristics.
In addition, the board received monthly reports, which included a Market and Economic Report, a Fund Dashboard Monthly Summary, and a Fund Performance Report.
Prior to their meeting, the trustees were provided with a memo and materials that summarized the information they had received over the course of the year. They also considered the factors discussed below, among others. However, no single factor determined whether the board approved the arrangements. Rather, it was the totality of the circumstances that drove the board’s decision.
Nature, extent, and quality of services
The board reviewed the quality of each fund’s investment management services over both the short and long term, and took into account the organizational depth and stability of the advisor. The board considered that Vanguard has been managing investments for more than three decades. The Equity Index Group adheres to a sound, disciplined investment management process; the team has considerable experience, stability, and depth.
The board concluded that Vanguard’s experience, stability, depth, and performance, among other factors, warranted continuation of each advisory arrangement.
Investment performance
The board considered the short- and long-term performance of each fund, including any periods of outperformance or underperformance relative to its target index and peer group. The board concluded that the performance was such that each advisory arrangement should continue. Information about each fund’s most recent performance can be found in the Performance Summary pages of this report.
Cost
The board concluded that each fund’s expense ratio was well below the average expense ratios charged by funds in its respective peer group and that each fund’s advisory expenses were also well below its peer group average. Information about the funds’ expenses appears in the About Your Fund’s Expenses section of this report as well as in the Financial Statements sections.
59
The board does not conduct a profitability analysis of Vanguard because of Vanguard’s unique “at-cost” structure. Unlike most other mutual fund management companies, Vanguard is owned by the funds it oversees and produces “profits” only in the form of reduced expenses for fund shareholders.
The benefit of economies of scale
The board concluded that each fund’s at-cost arrangement with Vanguard ensures that the funds will realize economies of scale as they grow, with the cost to shareholders declining as fund assets increase.
The board will consider whether to renew the advisory arrangements again after a one-year period.
60
Glossary
30-Day SEC Yield. A fund’s 30-day SEC yield is derived using a formula specified by the U.S. Securities and Exchange Commission. Under the formula, data related to the fund’s security holdings in the previous 30 days are used to calculate the fund’s hypothetical net income for that period, which is then annualized and divided by the fund’s estimated average net assets over the calculation period. For the purposes of this calculation, a security’s income is based on its current market yield to maturity (for bonds), its actual income (for asset-backed securities), or its projected dividend yield (for stocks). Because the SEC yield represents hypothetical annualized income, it will differ—at times significantly—from the fund’s actual experience. As a result, the fund’s income distributions may be higher or lower than implied by the SEC yield.
Beta. A measure of the magnitude of a fund’s past share-price fluctuations in relation to the ups and downs of a given market index. The index is assigned a beta of 1.00. Compared with a given index, a fund with a beta of 1.20 typically would have seen its share price rise or fall by 12% when the index rose or fell by 10%. For this report, beta is based on returns over the past 36 months for both the fund and the index. Note that a fund’s beta should be reviewed in conjunction with its R-squared (see definition). The lower the R-squared, the less correlation there is between the fund and the index, and the less reliable beta is as an indicator of volatility.
Dividend Yield. Dividend income earned by stocks, expressed as a percentage of the aggregate market value (or of net asset value, for a fund). The yield is determined by dividing the amount of the annual dividends by the aggregate value (or net asset value) at the end of the period. For a fund, the dividend yield is based solely on stock holdings and does not include any income produced by other investments.
Earnings Growth Rate. The average annual rate of growth in earnings over the past five years for the stocks now in a fund.
Equity Exposure. A measure that reflects a fund’s investments in stocks and stock futures. Any holdings in short-term reserves are excluded.
Expense Ratio. A fund’s total annual operating expenses expressed as a percentage of the fund’s average net assets. The expense ratio includes management and administrative expenses, but does not include the transaction costs of buying and selling portfolio securities.
Foreign Holdings. The percentage of a fund represented by securities or depositary receipts of companies based outside the United States.
Inception Date. The date on which the assets of a fund (or one of its share classes) are first invested in accordance with the fund’s investment objective. For funds with a subscription period, the inception date is the day after that period ends. Investment performance is measured from the inception date.
Median Market Cap. An indicator of the size of companies in which a fund invests; the midpoint of market capitalization (market price x shares outstanding) of a fund’s stocks, weighted by the proportion of the fund’s assets invested in each stock. Stocks representing half of the fund’s assets have market capitalizations above the median, and the rest are below it.
Price/Book Ratio. The share price of a stock divided by its net worth, or book value, per share. For a fund, the weighted average price/book ratio of the stocks it holds.
61
Price/Earnings Ratio. The ratio of a stock’s current price to its per-share earnings over the past year. For a fund, the weighted average P/E of the stocks it holds. P/E is an indicator of market expectations about corporate prospects; the higher the P/E, the greater the expectations for a company’s future growth.
R-Squared. A measure of how much of a fund’s past returns can be explained by the returns from the market in general, as measured by a given index. If a fund’s total returns were precisely synchronized with an index’s returns, its R-squared would be 1.00. If the fund’s returns bore no relationship to the index’s returns, its R-squared would be 0. For this report, R-squared is based on returns over the past 36 months for both the fund and the index.
Return on Equity. The annual average rate of return generated by a company during the past five years for each dollar of shareholder’s equity (net income divided by shareholder’s equity). For a fund, the weighted average return on equity for the companies whose stocks it holds.
Short-Term Reserves. The percentage of a fund invested in highly liquid, short-term securities that can be readily converted to cash.
Turnover Rate. An indication of the fund’s trading activity. Funds with high turnover rates incur higher transaction costs and may be more likely to distribute capital gains (which may be taxable to investors). The turnover rate excludes in-kind transactions, which have minimal impact on costs.
62
This page intentionally left blank.
The People Who Govern Your Fund
The trustees of your mutual fund are there to see that the fund is operated and managed in your best interests since, as a shareholder, you are a part owner of the fund. Your fund’s trustees also serve on the board of directors of The Vanguard Group, Inc., which is owned by the Vanguard funds and provides services to them on an at-cost basis.
A majority of Vanguard’s board members are independent, meaning that they have no affiliation with Vanguard or the funds they oversee, apart from the sizable personal investments they have made as private individuals. The independent board members have distinguished backgrounds in business, academia, and public service. Each of the trustees and executive officers oversees 198 Vanguard funds.
The following table provides information for each trustee and executive officer of the fund. The mailing address of the trustees and officers is P.O. Box 876, Valley Forge, PA 19482. More information about the trustees is in the Statement of Additional Information, which can be obtained, without charge, by contacting Vanguard at 800-662-7447, or online at vanguard.com.
InterestedTrustee1
F. William McNabb III
Born 1957. Trustee Since July 2009. Chairman of the Board. Principal Occupation(s) During the Past Five Years and Other Experience: Chairman of the Board of The Vanguard Group, Inc., and of each of the investment companies served by The Vanguard Group, since January 2010; Director of The Vanguard Group since 2008; Chief Executive Officer and President of The Vanguard Group, and of each of the investment companies served by The Vanguard Group, since 2008; Director of Vanguard Marketing Corporation; Managing Director of The Vanguard Group (1995–2008).
IndependentTrustees
Emerson U. Fullwood
Born 1948. Trustee Since January 2008. Principal Occupation(s) During the Past Five Years and Other Experience: Executive Chief Staff and Marketing Officer for North America and Corporate Vice President (retired 2008) of Xerox Corporation (document management products and services); Executive in Residence and 2009–2010 Distinguished Minett Professor at the Rochester Institute of Technology; Lead Director of SPX FLOW, Inc. (multi-industry manufacturing); Director of the United Way of Rochester, the University of Rochester Medical Center, Monroe Community College Foundation, North Carolina A&T University, and Roberts Wesleyan College.
Rajiv L. Gupta
Born 1945. Trustee Since December 2001.2 Principal Occupation(s) During the Past Five Years and Other Experience: Chairman and Chief Executive Officer (retired 2009) and President (2006–2008) of Rohm and Haas Co. (chemicals); Director of Tyco International plc (diversified manufacturing and services), HP Inc. (printer and personal computer manufacturing), and Delphi Automotive plc (automotive components); Senior Advisor at New Mountain Capital.
Amy Gutmann
Born 1949. Trustee Since June 2006. Principal Occupation(s) During the Past Five Years and Other Experience: President of the University of Pennsylvania; Christopher H. Browne Distinguished Professor of Political Science, School of Arts and Sciences, and Professor of Communication, Annenberg School for Communication, with secondary faculty appointments in the Department of Philosophy, School of Arts and Sciences, and at the Graduate School of Education, University of Pennsylvania; Trustee of the National Constitution Center; Chair of the Presidential Commission for the Study of Bioethical Issues.
JoAnn Heffernan Heisen
Born 1950. Trustee Since July 1998. Principal Occupation(s) During the Past Five Years and Other Experience: Corporate Vice President and Chief Global Diversity Officer (retired 2008) and Member of the Executive Committee (1997–2008) of Johnson & Johnson (pharmaceuticals/medical devices/consumer products); Director of Skytop Lodge Corporation (hotels) and the Robert Wood Johnson Foundation; Member of the Advisory Board of the Institute for Women’s Leadership at Rutgers University.
F. Joseph Loughrey
Born 1949. Trustee Since October 2009. Principal Occupation(s) During the Past Five Years and Other Experience: President and Chief Operating Officer (retired 2009) of Cummins Inc. (industrial machinery); Chairman of the Board of Hillenbrand, Inc. (specialized consumer services), and of Oxfam America; Director of SKF AB (industrial machinery), Hyster-Yale Materials Handling, Inc. (forklift trucks), the Lumina Foundation for Education, and the V Foundation for Cancer Research; Member of the Advisory Council for the College of Arts and Letters and of the Advisory Board to the Kellogg Institute for International Studies, both at the University of Notre Dame.
Mark Loughridge
Born 1953. Trustee Since March 2012. Principal Occupation(s) During the Past Five Years and Other Experience: Senior Vice President and Chief Financial Officer (retired 2013) at IBM (information technology services); Fiduciary Member of IBM’s Retirement Plan Committee (2004–2013); Director of the Dow Chemical Company; Member of the Council on Chicago Booth.
Scott C. Malpass
Born 1962. Trustee Since March 2012. Principal Occupation(s) During the Past Five Years and Other Experience: Chief Investment Officer and Vice President at the University of Notre Dame; Assistant Professor of Finance at the Mendoza College of Business at Notre Dame; Member of the Notre Dame 403(b) Investment Committee, the Board of Advisors for Spruceview Capital Partners, and the Investment Advisory Committee of Major League Baseball; Board Member of TIFF Advisory Services, Inc., and Catholic Investment Services, Inc. (investment advisors).
André F. Perold
Born 1952. Trustee Since December 2004. Principal Occupation(s) During the Past Five Years and Other Experience: George Gund Professor of Finance and Banking, Emeritus at the Harvard Business School (retired 2011); Chief Investment Officer and Managing Partner of HighVista Strategies LLC (private investment firm); Director of Rand Merchant Bank; Overseer of the Museum of Fine Arts Boston.
Peter F. Volanakis
Born 1955. Trustee Since July 2009. Principal Occupation(s) During the Past Five Years and Other Experience: President and Chief Operating Officer (retired 2010) of Corning Incorporated (communications equipment); Chairman of the Board of Trustees of Colby-Sawyer College; Member of the Advisory Board of the Norris Cotton Cancer Center.
Executive Officers
Glenn Booraem
Born 1967. Treasurer Since May 2015. Principal Occupation(s) During the Past Five Years and Other Experience: Principal of The Vanguard Group, Inc.; Treasurer of each of the investment companies served by The Vanguard Group; Controller of each of the investment companies served by The Vanguard Group (2010–2015); Assistant Controller of each of the investment companies served by The Vanguard Group (2001–2010).
Thomas J. Higgins
Born 1957. Chief Financial Officer Since September 2008. Principal Occupation(s) During the Past Five Years and Other Experience: Principal of The Vanguard Group, Inc.; Chief Financial Officer of each of the investment companies served by The Vanguard Group; Treasurer of each of the investment companies served by The Vanguard Group (1998–2008).
Peter Mahoney
Born 1974. Controller Since May 2015. Principal Occupation(s) During the Past Five Years and Other Experience: Head of Global Fund Accounting at The Vanguard Group, Inc.; Controller of each of the investment companies served by The Vanguard Group; Head of International Fund Services at The Vanguard Group (2008–2014).
Heidi Stam
Born 1956. Secretary Since July 2005. Principal Occupation(s) During the Past Five Years and Other Experience: Managing Director of The Vanguard Group, Inc.; General Counsel of The Vanguard Group; Secretary of The Vanguard Group and of each of the investment companies served by The Vanguard Group; Director and Senior Vice President of Vanguard Marketing Corporation.
Vanguard Senior Management Team
|
Mortimer J. Buckley Kathleen C. Gubanich Martha G. King John T. Marcante Chris D. McIsaac |
James M. Norris Thomas M. Rampulla Glenn W. Reed Karin A. Risi Michael Rollings |
Chairman Emeritus and Senior Advisor
John J. Brennan
Chairman, 1996–2009
Chief Executive Officer and President, 1996–2008
Founder John C. Bogle
Chairman and Chief Executive Officer, 1974–1996
1 Mr. McNabb is considered an “interested person,” as defined in the Investment Company Act of 1940, because he is an officer of the Vanguard funds.
2 December 2002 for Vanguard Equity Income Fund, the Vanguard Municipal Bond Funds, and the Vanguard State Tax-Exempt Funds.
 |
| P.O. Box 2600 |
| Valley Forge, PA 19482-2600 |
Connect with Vanguard® > vanguard.com
| Fund Information > 800-662-7447 | The Russell Indexes and Russell® are registered |
| Direct Investor Account Services > 800-662-2739 | trademarks of Russell Investments and have been |
| licensed for use by The Vanguard Group, Inc. The | |
| Institutional Investor Services > 800-523-1036 | products are not sponsored, endorsed, sold, or |
| Text Telephone for People | promoted by Russell Investments and Russell |
| Who Are Deaf or Hard of Hearing> 800-749-7273 | Investments makes no representation regarding the |
| advisability of investing in the products. | |
| This material may be used in conjunction | |
| with the offering of shares of any Vanguard | |
| fund only if preceded or accompanied by | |
| the fund’s current prospectus. | |
| All comparative mutual fund data are from Lipper, a | |
| Thomson Reuters Company, or Morningstar, Inc., unless | |
| otherwise noted. | |
| You can obtain a free copy of Vanguard’s proxy voting | |
| guidelines by visiting vanguard.com/proxyreporting or by | |
| calling Vanguard at 800-662-2739. The guidelines are | |
| also available from the SEC’s website, sec.gov. In | |
| addition, you may obtain a free report on how your fund | |
| voted the proxies for securities it owned during the 12 | |
| months ended June 30. To get the report, visit either | |
| vanguard.com/proxyreporting or sec.gov. | |
| You can review and copy information about your fund at | |
| the SEC’s Public Reference Room in Washington, D.C. To | |
| find out more about this public service, call the SEC at | |
| 202-551-8090. Information about your fund is also | |
| available on the SEC’s website, and you can receive | |
| copies of this information, for a fee, by sending a | |
| request in either of two ways: via email addressed to | |
| publicinfo@sec.gov or via regular mail addressed to the | |
| Public Reference Section, Securities and Exchange | |
| Commission, Washington, DC 20549-1520. | |
| © 2016 The Vanguard Group, Inc. | |
| All rights reserved. | |
| Vanguard Marketing Corporation, Distributor. | |
| Q18480 102016 | |
Annual Report | August 31, 2016
Vanguard Russell 2000 Index Funds
Vanguard Russell 2000 Index Fund
Vanguard Russell 2000 Value Index Fund
Vanguard Russell 2000 Growth Index Fund
A new format, unwavering commitment
As you begin reading this report, you’ll notice that we’ve made some improvements to the opening sections—based on feedback from you, our clients.
Page 1 starts with a new ”Your Fund’s Performance at a Glance,” a concise, handy summary of how your fund performed during the period.
In the renamed ”Chairman’s Perspective,” Bill McNabb will focus on enduring principles and investment insights.
We’ve modified some tables, and eliminated some redundancy, but we haven’t removed any information.
At Vanguard, we’re always looking for better ways to communicate and to help you make sound investment decisions. Thank you for entrusting your assets to us.
| Contents | |
| Your Fund’s Performance at a Glance. | 1 |
| Chairman’s Perspective. | 4 |
| Russell 2000 Index Fund. | 8 |
| Russell 2000 Value Index Fund. | 24 |
| Russell 2000 Growth Index Fund. | 39 |
| Your Fund’s After-Tax Returns. | 56 |
| About Your Fund’s Expenses. | 57 |
| Trustees Approve Advisory Arrangements. | 59 |
| Glossary. | 61 |
Please note: The opinions expressed in this report are just that—informed opinions. They should not be considered promises or advice. Also, please keep in mind that the information and opinions cover the period through the date on the front of this report. Of course, the risks of investing in your fund are spelled out in the prospectus.
See the Glossary for definitions of investment terms used in this report.
About the cover: No matter what language you speak, Vanguard has one consistent message and set of principles. Our primary focus is on you, our clients. We conduct our business with integrity as a faithful steward of your assets. This message is shown translated into seven languages, reflecting our expanding global presence.
Your Fund’s Performance at a Glance
• Value stocks generally outpaced their growth-oriented counterparts and large-capitalization stocks beat small-caps for the 12 months ended August 31, 2016. This broad market trend was reflected in the performance of the three Vanguard Russell 2000 Index Funds.
• Results ranged from more than 3% for Vanguard Russell 2000 Growth Index Fund to nearly 14% for Vanguard Russell 2000 Value Index Fund. Vanguard Russell 2000 Index Fund, which includes both growth and value stocks, returned more than 8%.
• All three funds closely tracked their target indexes and exceeded the average returns of their small-cap peers.
• Financial services and technology were among the top sector contributors for all three funds, with producer durables and materials & processing also adding significantly. Health care, energy, and consumer discretionary were some of the weakest sectors.
| Total Returns: Fiscal Year Ended August 31, 2016 | |
| Total | |
| Returns | |
| Vanguard Russell 2000 Index Fund | |
| ETF Shares | |
| Market Price | 8.58% |
| Net Asset Value | 8.62 |
| Institutional Shares | 8.69 |
| Russell 2000 Index | 8.59 |
| Small-Cap Core Funds Average | 7.64 |
| Small-Cap Core Funds Average: Derived from data provided by Lipper, a Thomson Reuters Company. | |
| Vanguard Russell 2000 Value Index Fund | |
| ETF Shares | |
| Market Price | 13.74% |
| Net Asset Value | 13.62 |
| Institutional Shares | 13.76 |
| Russell 2000 Value Index | 13.80 |
| Small-Cap Value Funds Average | 9.80 |
| Small-Cap Value Funds Average: Derived from data provided by Lipper, a Thomson Reuters Company. | |
1
| Total | |
| Returns | |
| Vanguard Russell 2000 Growth Index Fund | |
| ETF Shares | |
| Market Price | 3.55% |
| Net Asset Value | 3.62 |
| Institutional Shares | 3.74 |
| Russell 2000 Growth Index | 3.55 |
| Small-Cap Growth Funds Average | 2.63 |
| Small-Cap Growth Funds Average: Derived from data provided by Lipper, a Thomson Reuters Company. |
Institutional Shares are available to certain institutional investors who meet specific administrative, service, and account-size criteria. The Vanguard ETF® Shares shown are traded on the Nasdaq exchange and are available only through brokers. The table provides ETF returns based on both the Nasdaq market price and the net asset value for a share. U.S. Pat. Nos. 6,879,964; 7,337,138; 7,720,749; 7,925,573; 8,090,646; and 8,417,623.
For the ETF Shares, the market price is determined by the midpoint of the bid-offer spread as of the closing time of the New York Stock Exchange (generally 4 p.m., Eastern time). The net asset value is also determined as of the NYSE closing time. For more information about how the ETF Shares' market prices have compared with their net asset value, visit vanguard.com, select your ETF, and then select the Price and Performance tab. The ETF premium/discount analysis there shows the percentages of days on which the ETF Shares' market price was above or below the NAV.
| Total Returns: Inception Through August 31, 2016 | |
| Average | |
| Annual Return | |
| Russell 2000 Index Fund ETF Shares Net Asset Value (Returns since inception: 9/20/2010) | 12.41% |
| Russell 2000 Index | 12.44 |
| Small-Cap Core Funds Average | 11.43 |
| Small-Cap Core Funds Average: Derived from data provided by Lipper, a Thomson Reuters Company. | |
| Russell 2000 Value Index Fund ETF Shares Net Asset Value (Returns since inception: 9/20/2010) | 11.44% |
| Russell 2000 Value Index | 11.62 |
| Small-Cap Value Funds Average | 11.28 |
| Small-Cap Value Funds Average: Derived from data provided by Lipper, a Thomson Reuters Company. | |
| Russell 2000 Growth Index Fund ETF Shares Net Asset Value (Returns since inception: 9/20/2010) | 13.16% |
| Russell 2000 Growth Index | 13.20 |
| Small-Cap Growth Funds Average | 11.72 |
| Small-Cap Growth Funds Average: Derived from data provided by Lipper, a Thomson Reuters Company. | |
The figures shown represent past performance, which is not a guarantee of future results. (Current performance may be lower or higher than the performance data cited. For performance data current to the most recent month-end, visit our website at vanguard.com/performance.) Note, too, that both investment returns and principal value can fluctuate widely, so an investor’s shares, when sold, could be worth more or less than their original cost.
2
| Expense Ratios | |||
| Your Fund Compared With Its Peer Group | |||
| ETF | Institutional | Peer Group | |
| Shares | Shares | Average | |
| Russell 2000 Index Fund | 0.15% | 0.08% | 1.25% |
| Russell 2000 Value Index Fund | 0.20 | 0.08 | 1.33 |
| Russell 2000 Growth Index Fund | 0.20 | 0.08 | 1.36 |
The fund expense ratios shown are from the prospectus dated December 22, 2015, and represent estimated costs for the current fiscal year. For the fiscal year ended August 31, 2016, the funds’ expense ratios were: for the Russell 2000 Index Fund, 0.15% for ETF Shares and 0.08% for Institutional Shares; for the Russell 2000 Value Index Fund, 0.20% for ETF Shares and 0.08% for Institutional Shares; and for the Russell 2000 Growth Index Fund, 0.20% for ETF Shares and 0.08% for Institutional Shares. Peer-group expense ratios are derived from data provided by Lipper, a Thomson Reuters Company, and capture information through year-end 2015.
Peer groups: For the Russell 2000 Index Fund, Small-Cap Core Funds; for the Russell 2000 Value Index Fund, Small-Cap Value Funds; and for the Russell 2000 Growth Index Fund, Small-Cap Growth Funds.
3
Chairman’s Perspective

Bill McNabb
Chairman and Chief Executive Officer
Dear Shareholder,
Even as the global economy continued to expand at a slow but sustained pace over the 12 months ended August 31, 2016, a series of disquieting developments highlighted the importance for investors of remaining disciplined.
Chief among them was “Brexit”—the British public’s vote to exit the European Union—but plenty of others moved the markets as well. We saw sharp ups and downs in the prices of oil and other commodities, choppy U.S. job numbers, shifting expectations about when the Federal Reserve might raise interest rates again, and decreases in already negative yields for European and Japanese government bonds.
Beyond being the end of the fiscal period, August marked a milestone: 40 years since Vanguard introduced the first index mutual fund. In ways that are perhaps still not fully appreciated, indexing has vastly improved investing for individuals, advisors, and institutions all over the world. Later in this letter, I’ll discuss the revolution wrought by what was initially a little-heralded new fund from a fledgling outfit in Valley Forge, Pennsylvania.
Brexit added another layer of uncertainty for investors
I think it’s fair to say that the momentous June 23 Brexit vote caught even the British off guard. Although we saw some market jitters in the run-up to the referendum, the unexpected outcome triggered a spike in
4
volatility worldwide. Stocks around the world lost 5%–10% in U.S. dollar terms in the first two trading sessions following the vote, with U.K. and European markets among the hardest hit; global bonds, though, headed in the other direction. It was a textbook illustration of the value of having a diversified portfolio.
That kind of volatility can push investors to “do something.” But some of the worst days in the stock markets are sometimes followed by some of the best—as happened at the end of June. Investors who scrambled to protect their portfolios by shedding stocks amid headlines warning of a global market meltdown may well have ended up locking in post-Brexit losses, then missing out on the strong rebound that took place just days later. Those headlines were noise that investors would have been better off tuning out. I’m pleased to say that Vanguard investors on the whole did just that—we continued to see cash flows into our funds in the days after the vote.
For the 12 months, stocks generally finished higher, with U.S. stocks up more than 11% and international stocks about 3% for U.S.-based investors.
In a surprise, bonds turned in a solid performance that few would have predicted a year ago. It seemed as if rates had fallen so far that they couldn’t go any lower, but many did. Central banks in a number of European countries and Japan set key monetary policy rates below zero.
| Market Barometer | |||
| Average Annual Total Returns | |||
| Periods Ended August 31, 2016 | |||
| One | Three | Five | |
| Year | Years | Years | |
| Stocks | |||
| Russell 1000 Index (Large-caps) | 11.69% | 12.02% | 14.60% |
| Russell 2000 Index (Small-caps) | 8.59 | 8.53 | 12.85 |
| Russell 3000 Index (Broad U.S. market) | 11.44 | 11.74 | 14.46 |
| FTSE All-World ex US Index (International) | 3.37 | 2.59 | 3.72 |
| Bonds | |||
| Barclays U.S. Aggregate Bond Index (Broad taxable market) | 5.97% | 4.37% | 3.24% |
| Barclays Municipal Bond Index (Broad tax-exempt market) | 6.88 | 6.47 | 4.80 |
| Citigroup Three-Month U.S. Treasury Bill Index | 0.18 | 0.05 | 0.06 |
| CPI | |||
| Consumer Price Index | 1.06% | 0.98% | 1.23% |
5
| When being ‘average’ is a lot better than average |
| Not only did Vanguard founder John C. Bogle launch the first index mutual fund in 1976, but |
| he also was among the first to clearly explain to the investing public the benefits of what was |
| then a novel, unproven strategy. |
| Back in 1977, in the first annual report for what was later renamed Vanguard 500 Index Fund, |
| Mr. Bogle wrote that an index fund “represents a tough and demanding ‘par.’. And if there |
| are some professionals who can ‘beat par’ more often than not—in investing or in golf—they |
| do not seem to be in the majority.” |
| Mr. Bogle’s analogy has been borne out by historical returns. As you can see in the chart |
| below, out of 1,238 actively managed large-capitalization funds, a clear majority—65%— |
| trailed the Standard & Poor’s 500 Index in average annual return over the decade ended |
| December 31, 2015. And 518 funds, or about 42% of the total number, trailed by more than |
| 1 percentage point. |
| The track record looks even more discouraging when you consider that of the 35% of funds |
| that outperformed the index, only119—or about10%in all—did so by morethan 1 percentage |
| point. The 315 others also took on risk to try to outperform the index (and likely experienced |
| greatervolatility)butcameoutaheadbylessthan1percentagepointinaverageannualreturn. |
| Over a decade, a majority of active large-cap funds lagged the S&P 500 Index |
| Based on average annual returns, 2006–2015 |
| Notes: Data based on average annual returns ofall 1,238existing actively managed large-cap funds overthe decade endedDecember 31, |
| 2015. Note thatindexfunds seekto track theperformance ofabenchmarkindexbuttypically won't“match”thebenchmark'sreturns because |
| of the costs of passive indexing. |
| Sources: Vanguard calculations, using data from Standard & Poor’s. |
| Pastperformanceisnotaguarantee offutureresults.Theperformanceofanindexis notanexactrepresentationofanyparticularinvestment, |
| asyoucannotinvestdirectlyinanindex. |
6
These policies held down short-term rates, while more muted expectations for global growth and inflation weighed on longer-term rates.
Yields in the United States weren’t quite as low as in many developed countries. The Fed raised the federal funds target rate only once, in December, to a slim 0.25%–0.5%. Further out on the maturity spectrum, the bellwether 10-year U.S. Treasury yield dropped in early July to a record low 1.36%, before moving back up a little to end the period at 1.58%. Over the 12 months, U.S. bonds returned about 6%, and international bonds returned even more—about 11%—for U.S.-based investors, again underscoring the markets’ unpredictability and the merits of diversification.
Over the years, many investors have embraced the pluses of indexing
Market upsets like Brexit aren’t rare occurrences. Fortunately, indexing has proved to be a durable behavioral tool to help keep investors from making bad financial decisions when upsets happen. In fact, this is one of indexing’s less appreciated benefits: Holding index funds as part of a broadly diversified portfolio can counterbalance that tendency to react to news headlines. When times are volatile, you’ll know you might have some exposure to a part of the market that has dropped, but also to other parts that may be holding up better.
Vanguard’s launch of the First Index Investment Trust, now Vanguard 500 Index Fund, initially met with a frosty reception. Its mandate to track the performance of a broadly diversified benchmark at a low cost seemed underwhelming to an investing public accustomed to funds that offered the chance to outperform. Investors have since come around, as experience has demonstrated the benefits of low costs and broad diversification.
Indexing accounted for about 30% of U.S. mutual fund and exchange-traded fund (ETF) assets at the end of 2015, according to the Investment Company Institute. Some now even proclaim the “triumph of indexing,” implying that it’s the only way to invest.
In our view, the rise of indexing has served to underscore an investment principle that long predates 1976: A long-term, low-cost, diversified approach gives investors the best chance for success. That’s true whether the investments you choose are indexed or actively managed—or both.
As always, thank you for investing with Vanguard.
Sincerely,
F. William McNabb III
Chairman and Chief Executive Officer
September 9, 2016
7
Russell 2000 Index Fund
Fund Profile
As of August 31, 2016
| Share-Class Characteristics | |||
| ETF | Institutional | ||
| Shares | Shares | ||
| Ticker Symbol | VTWO | VRTIX | |
| Expense Ratio1 | 0.15% | 0.08% | |
| 30-Day SEC Yield | 1.29% | 1.33% | |
| Portfolio Characteristics | |||
| DJ | |||
| U.S. | |||
| Total | |||
| Russell | Market | ||
| 2000 | FA | ||
| Fund | Index | Index | |
| Number of Stocks | 1,997 | 1,979 | 3,817 |
| Median Market Cap | $1.8B | $1.8B | $51.2B |
| Price/Earnings Ratio | 34.7x | 33.9x | 23.5x |
| Price/Book Ratio | 2.2x | 2.2x | 2.8x |
| Return on Equity | 10.2% | 10.3% | 16.6% |
| Earnings Growth | |||
| Rate | 7.8% | 7.8% | 7.5% |
| Dividend Yield | 1.5% | 1.5% | 2.0% |
| Foreign Holdings | 0.0% | 0.0% | 0.0% |
| Turnover Rate | 19% | — | — |
| Short-Term | |||
| Reserves | 0.3% | — | — |
Sector Diversification (% of equity exposure)
| DJ | |||
| U.S. | |||
| Total | |||
| Russell | Market | ||
| 2000 | FA | ||
| Fund | Index | Index | |
| Consumer Discretionary 13.9% | 14.0% | 14.2% | |
| Consumer Staples | 2.7 | 2.7 | 8.0 |
| Energy | 2.9 | 2.9 | 6.5 |
| Financial Services | 26.8 | 26.8 | 20.0 |
| Health Care | 13.4 | 13.4 | 14.0 |
| Materials & Processing | 7.3 | 7.2 | 3.9 |
| Producer Durables | 13.5 | 13.5 | 10.5 |
| Technology | 14.7 | 14.7 | 17.3 |
| Utilities | 4.8 | 4.8 | 5.6 |
| Volatility Measures | ||
| DJ | ||
| Russell | U.S. Total | |
| 2000 | Market | |
| Index | FA Index | |
| R-Squared | 1.00 | 0.75 |
| Beta | 1.00 | 1.16 |
These measures show the degree and timing of the fund’s fluctuations compared with the indexes over 36 months.
Ten Largest Holdings (% of total net assets)
| Advanced Micro Devices Semiconductors & | ||
| Inc. | Components | 0.3% |
| Microsemi Corp. | Semiconductors & | |
| Components | 0.3 | |
| Gramercy Property Trust Diversified REITs | 0.2 | |
| Fair Isaac Corp. | Financial Data & | |
| Systems | 0.2 | |
| Curtiss-Wright Corp. | Aerospace | 0.2 |
| Healthcare Realty Trust | Real Estate | |
| Inc. | Investment Trusts | |
| (REITs) | 0.2 | |
| IDACORP Inc. | Utilities: Electrical | 0.2 |
| MAXIMUS Inc. | Back Office Support | |
| HR & Consulting | 0.2 | |
| Aspen Technology Inc. | Computer Services | |
| Software & Systems | 0.2 | |
| Prosperity Bancshares | ||
| Inc. | Banks: Diversified | 0.2 |
| Top Ten | 2.2% | |
The holdings listed exclude any temporary cash investments and equity index products.

1 The expense ratios shown are from the prospectus dated December 22, 2015, and represent estimated costs for the current fiscal year. For the fiscal year ended August 31, 2016, the expense ratios were 0.15% for ETF Shares and 0.08% for Institutional Shares.
8
Russell 2000 Index Fund
Performance Summary
All of the returns in this report represent past performance, which is not a guarantee of future results that may be achieved by the fund. (Current performance may be lower or higher than the performance data cited. For performance data current to the most recent month-end, visit our website at vanguard.com/performance.) Note, too, that both investment returns and principal value can fluctuate widely, so an investor’s shares, when sold, could be worth more or less than their original cost. The returns shown do not reflect taxes that a shareholder would pay on fund distributions or on the sale of fund shares.
Cumulative Performance: September 20, 2010, Through August 31, 2016
Initial Investment of $10,000
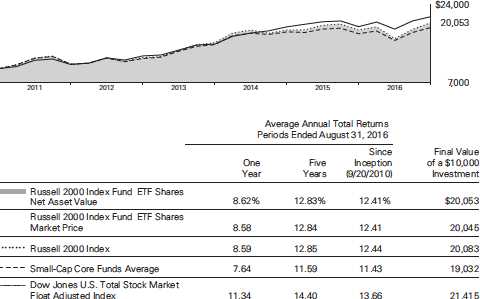
Small-Cap Core Funds Average: Derived from data provided by Lipper, a Thomson Reuters Company.
"Since Inception" performance is calculated from the ETF Shares’ inception date for both the fund and its comparative standards.
| Since | Final Value | |||
| One | Five | Inception | of a $5,000,000 | |
| Year | Years | (12/22/2010) | Investment | |
| Russell 2000 Index Fund Institutional Shares | 8.69% | 12.91% | 9.79% | $8,506,797 |
| Russell 2000 Index | 8.59 | 12.85 | 9.73 | 8,482,999 |
| Dow Jones U.S. Total Stock Market Float | ||||
| Adjusted Index | 11.34 | 14.40 | 12.07 | 9,563,421 |
"Since Inception" performance is calculated from the Institutional Shares’ inception date for both the fund and its comparative standards.
See Financial Highlights for dividend and capital gains information.
9
Russell 2000 Index Fund
| Cumulative Returns of ETF Shares: September 20, 2010, Through August 31, 2016 | |||
| Since | |||
| One | Five | Inception | |
| Year | Years | (9/20/2010) | |
| Russell 2000 Index Fund ETF Shares Market Price | 8.58% | 82.92% | 100.45% |
| Russell 2000 Index Fund ETF Shares Net Asset | |||
| Value | 8.62 | 82.90 | 100.53 |
| Russell 2000 Index | 8.59 | 83.04 | 100.83 |
"Since Inception" performance is calculated from the ETF Shares’ inception date for both the fund and its comparative standards.
Fiscal-Year Total Returns (%): September 20, 2010, Through August 31, 2016

Russell 2000 Index Fund ETF Shares Net Asset Value
Russell 2000 Index
Average Annual Total Returns: Periods Ended June 30, 2016
This table presents returns through the latest calendar quarter—rather than through the end of the fiscal period.
Securities and Exchange Commission rules require that we provide this information.
| Inception | One | Five | Since | |
| Date | Year | Years | Inception | |
| ETF Shares | 9/20/2010 | |||
| Market Price | -6.74% | 8.35% | 11.34% | |
| Net Asset Value | -6.72 | 8.34 | 11.34 | |
| Institutional Shares | 12/22/2010 | -6.64 | 8.41 | 8.61 |
10
Russell 2000 Index Fund
Financial Statements
Statement of Net Assets—Investments Summary
As of August 31, 2016
This Statement summarizes the fund’s holdings by asset type. Details are reported for each of the fund’s 50 largest individual holdings and for investments that, in total for any issuer, represent more than 1% of the fund’s net assets. The total value of smaller holdings is reported as a single amount within each category.
The fund reports a complete list of its holdings in regulatory filings four times in each fiscal year, at the quarter-ends. For the second and fourth fiscal quarters, the complete listing of the fund’s holdings is available electronically on vanguard.com and on the Securities and Exchange Commission’s website (sec.gov), or you can have it mailed to you without charge by calling 800-662-7447. For the first and third fiscal quarters, the fund files the lists with the SEC on Form N-Q. Shareholders can look up the fund’s Forms N-Q on the SEC’s website. Forms N-Q may also be reviewed and copied at the SEC’s Public Reference Room (see the back cover of this report for further information).
| Market | Percentage | ||
| Value• | of Net | ||
| Shares | ($000) | Assets | |
| Common Stocks | |||
| Consumer Discretionary | |||
| Jack in the Box Inc. | 22,131 | 2,201 | 0.2% |
| * Tenneco Inc. | 38,425 | 2,145 | 0.2% |
| Consumer Discretionary—Other † | 159,081 | 13.5% | |
| 163,427 | 13.9% | ||
| Consumer Staples † | 31,905 | 2.7% | |
| Energy † | 33,649 | 2.9% | |
| Financial Services | |||
| Gramercy Property Trust | 285,424 | 2,763 | 0.3% |
| Fair Isaac Corp. | 21,101 | 2,700 | 0.2% |
| Healthcare Realty Trust Inc. | 76,930 | 2,697 | 0.2% |
| Prosperity Bancshares Inc. | 45,788 | 2,540 | 0.2% |
| Investors Bancorp Inc. | 202,492 | 2,481 | 0.2% |
| Umpqua Holdings Corp. | 150,121 | 2,465 | 0.2% |
| PrivateBancorp Inc. | 53,359 | 2,452 | 0.2% |
| Medical Properties Trust Inc. | 160,524 | 2,451 | 0.2% |
| Webster Financial Corp. | 61,965 | 2,394 | 0.2% |
| Bank of the Ozarks Inc. | 60,303 | 2,363 | 0.2% |
| New Residential Investment Corp. | 164,605 | 2,362 | 0.2% |
| Education Realty Trust Inc. | 48,213 | 2,185 | 0.2% |
| First Industrial Realty Trust Inc. | 74,934 | 2,156 | 0.2% |
| DuPont Fabros Technology Inc. | 50,766 | 2,152 | 0.2% |
| Hudson Pacific Properties Inc. | 63,661 | 2,131 | 0.2% |
| Financial Services—Other † | 278,833 | 23.7% | |
| 315,125 | 26.8% | ||
11
| Russell 2000 Index Fund | ||||
| Market | Percentage | |||
| Value• | of Net | |||
| Shares | ($000) | Assets | ||
| Health Care | ||||
| HealthSouth Corp. | 60,394 | 2,459 | 0.2% | |
| * | PAREXEL International Corp. | 35,533 | 2,417 | 0.2% |
| * | NuVasive Inc. | 33,613 | 2,201 | 0.2% |
| Health Care—Other † | 150,765 | 12.8% | ||
| 157,842 | 13.4% | |||
| Materials & Processing | ||||
| Olin Corp. | 112,999 | 2,445 | 0.2% | |
| Sensient Technologies Corp. | 29,844 | 2,185 | 0.2% | |
| Belden Inc. | 28,600 | 2,133 | 0.2% | |
| Materials & Processing—Other † | 78,297 | 6.6% | ||
| 85,060 | 7.2% | |||
| 1Other † | 256 | 0.0% | ||
| Producer Durables | ||||
| Curtiss-Wright Corp. | 30,011 | 2,698 | 0.2% | |
| MAXIMUS Inc. | 43,362 | 2,551 | 0.2% | |
| * | Teledyne Technologies Inc. | 23,229 | 2,489 | 0.2% |
| *,^ | XPO Logistics Inc. | 66,580 | 2,384 | 0.2% |
| EMCOR Group Inc. | 41,216 | 2,360 | 0.2% | |
| Deluxe Corp. | 33,246 | 2,266 | 0.2% | |
| Woodward Inc. | 35,378 | 2,219 | 0.2% | |
| CLARCOR Inc. | 32,445 | 2,124 | 0.2% | |
| Producer Durables—Other † | 138,978 | 11.8% | ||
| 158,069 | 13.4% | |||
| Technology | ||||
| * | Advanced Micro Devices Inc. | 445,130 | 3,294 | 0.3% |
| * | Microsemi Corp. | 77,437 | 3,094 | 0.2% |
| * | Aspen Technology Inc. | 56,008 | 2,546 | 0.2% |
| * | Take-Two Interactive Software Inc. | 56,261 | 2,446 | 0.2% |
| * | Cavium Inc. | 43,488 | 2,421 | 0.2% |
| * | ViaSat Inc. | 30,325 | 2,276 | 0.2% |
| * | EPAM Systems Inc. | 32,792 | 2,237 | 0.2% |
| * | GrubHub Inc. | 54,462 | 2,210 | 0.2% |
| * | Ellie Mae Inc. | 22,333 | 2,186 | 0.2% |
| Blackbaud Inc. | 32,241 | 2,172 | 0.2% | |
| * | Cirrus Logic Inc. | 42,595 | 2,162 | 0.2% |
| * | Proofpoint Inc. | 28,049 | 2,158 | 0.2% |
| SYNNEX Corp. | 19,869 | 2,109 | 0.2% | |
| Technology—Other † | 141,064 | 11.9% | ||
| 172,375 | 14.6% | |||
| Utilities | ||||
| IDACORP Inc. | 34,109 | 2,595 | 0.2% | |
| Portland General Electric Co. | 60,293 | 2,539 | 0.2% | |
| Southwest Gas Corp. | 32,230 | 2,250 | 0.2% | |
| j2 Global Inc. | 32,409 | 2,209 | 0.2% | |
| ONE Gas Inc. | 35,480 | 2,172 | 0.2% | |
| WGL Holdings Inc. | 34,414 | 2,163 | 0.2% | |
| Utilities—Other † | 42,423 | 3.6% | ||
| 56,351 | 4.8% | |||
| Total Common Stocks (Cost $1,176,946) | 1,174,059 | 99.7%2 | ||
12
| Russell 2000 Index Fund | ||||
| Market | Percentage | |||
| Value• | of Net | |||
| Coupon | Shares | ($000) | Assets | |
| Temporary Cash Investments | ||||
| Money Market Fund | ||||
| 3,4 Vanguard Market Liquidity Fund | 0.612% | 318,134 | 31,817 | 2.7% |
| 5U.S. Government and Agency Obligations † | 799 | 0.1% | ||
| Total Temporary Cash Investments (Cost $32,613) | 32,616 | 2.8%2 | ||
| Total Investments (Cost $1,209,559) | 1,206,675 | 102.5% | ||
| Amount | ||||
| ($000) | ||||
| Other Assets and Liabilities | ||||
| Other Assets | ||||
| Investment in Vanguard | 86 | |||
| Receivables for Investment Securities Sold | 6,586 | |||
| Receivables for Accrued Income | 849 | |||
| Receivables for Capital Shares Issued | 42 | |||
| Other Assets | 463 | |||
| Total Other Assets | 8,026 | 0.7% | ||
| Liabilities | ||||
| Payables for Investment Securities Purchased | (12,190) | |||
| Collateral for Securities on Loan | (24,747) | |||
| Payables for Capital Shares Redeemed | (119) | |||
| Payables to Vanguard | (312) | |||
| Other Liabilities | (79) | |||
| Total Liabilities | (37,447) | (3.2%) | ||
| Net Assets | 1,177,254 | 100.0% | ||
| At August 31, 2016, net assets consisted of: | ||||
| Amount | ||||
| ($000) | ||||
| Paid-in Capital | 1,211,648 | |||
| Undistributed Net Investment Income | 3,819 | |||
| Accumulated Net Realized Losses | (35,329) | |||
| Unrealized Appreciation (Depreciation) | ||||
| Investment Securities | (2,884) | |||
| Futures Contracts | — | |||
| Net Assets | 1,177,254 | |||
13
| Russell 2000 Index Fund | |
| Amount | |
| ($000) | |
| ETF Shares—Net Assets | |
| Applicable to 7,050,000 outstanding $.001 par value shares of | |
| beneficial interest (unlimited authorization) | 697,777 |
| Net Asset Value Per Share—ETF Shares | $98.98 |
| Institutional Shares—Net Assets | |
| Applicable to 2,532,798 outstanding $.001 par value shares of | |
| beneficial interest (unlimited authorization) | 479,477 |
| Net Asset Value Per Share—Institutional Shares | $189.31 |
• See Note A in Notes to Financial Statements.
* Non-income-producing security.
^ Includes partial security positions on loan to broker-dealers. The total value of securities on loan is $22,964,000.
† Represents the aggregate value, by category, of securities that are not among the 50 largest holdings and, in total for any issuer, represent 1% or less of net assets.
1 “Other” represents securities that are not classified by the fund’s benchmark index.
2 The fund invests a portion of its cash reserves in equity markets through the use of index futures contracts. After giving effect to futures investments, the fund’s effective common stock and temporary cash investment positions represent 100.1% and 2.4%, respectively, of net assets.
3 Affiliated money market fund available only to Vanguard funds and certain trusts and accounts managed by Vanguard. Rate shown is the 7-day yield.
4 Includes $24,747,000 of collateral received for securities on loan.
5 Securities with a value of $400,000 have been segregated as initial margin for open futures contracts.
See accompanying Notes, which are an integral part of the Financial Statements.
14
| Russell 2000 Index Fund | |
| Statement of Operations | |
| Year Ended | |
| August 31, 2016 | |
| ($000) | |
| Investment Income | |
| Income | |
| Dividends | 15,567 |
| Interest1 | 18 |
| Securities Lending—Net | 1,657 |
| Total Income | 17,242 |
| Expenses | |
| The Vanguard Group—Note B | |
| Investment Advisory Services | 168 |
| Management and Administrative—ETF Shares | 443 |
| Management and Administrative—Institutional Shares | 100 |
| Marketing and Distribution—ETF Shares | 47 |
| Marketing and Distribution—Institutional Shares | 13 |
| Custodian Fees | 393 |
| Auditing Fees | 32 |
| Shareholders’ Reports—ETF Shares | 33 |
| Shareholders’ Reports—Institutional Shares | 1 |
| Total Expenses | 1,230 |
| Net Investment Income | 16,012 |
| Realized Net Gain (Loss) | |
| Investment Securities Sold1 | 43,152 |
| Futures Contracts | 402 |
| Realized Net Gain (Loss) | 43,554 |
| Change in Unrealized Appreciation (Depreciation) | |
| Investment Securities | 28,185 |
| Futures Contracts | 318 |
| Change in Unrealized Appreciation (Depreciation) | 28,503 |
| Net Increase (Decrease) in Net Assets Resulting from Operations | 88,069 |
1 Interest income and realized net gain (loss) from an affiliated company of the fund were $17,000 and $0, respectively.
See accompanying Notes, which are an integral part of the Financial Statements.
15
| Russell 2000 Index Fund | ||
| Statement of Changes in Net Assets | ||
| Year Ended August 31, | ||
| 2016 | 2015 | |
| ($000) | ($000) | |
| Increase (Decrease) in Net Assets | ||
| Operations | ||
| Net Investment Income | 16,012 | 11,162 |
| Realized Net Gain (Loss) | 43,554 | 99,230 |
| Change in Unrealized Appreciation (Depreciation) | 28,503 | (125,717) |
| Net Increase (Decrease) in Net Assets Resulting from Operations | 88,069 | (15,325) |
| Distributions | ||
| Net Investment Income | ||
| ETF Shares | (9,645) | (5,355) |
| Institutional Shares | (9,668) | (3,706) |
| Realized Capital Gain | ||
| ETF Shares | — | — |
| Institutional Shares | — | — |
| Total Distributions | (19,313) | (9,061) |
| Capital Share Transactions | ||
| ETF Shares | 102,679 | 188,644 |
| Institutional Shares | (76,587) | 223,654 |
| Net Increase (Decrease) from Capital Share Transactions | 26,092 | 412,298 |
| Total Increase (Decrease) | 94,848 | 387,912 |
| Net Assets | ||
| Beginning of Period | 1,082,406 | 694,494 |
| End of Period1 | 1,177,254 | 1,082,406 |
1 Net Assets—End of Period includes undistributed (overdistributed) net investment income of $3,819,000 and $7,050,000.
See accompanying Notes, which are an integral part of the Financial Statements.
16
| Russell 2000 Index Fund | |||||
| Financial Highlights | |||||
| ETF Shares | |||||
| For a Share Outstanding | Year Ended August 31, | ||||
| Throughout Each Period | 2016 | 2015 | 2014 | 2013 | 2012 |
| Net Asset Value, Beginning of Period | $92.71 | $93.72 | $80.46 | $64.74 | $57.66 |
| Investment Operations | |||||
| Net Investment Income | 1.302 | 1.2241 | 1.054 | 1.161 | .8691 |
| Net Realized and Unrealized Gain (Loss) | |||||
| on Investments | 6.537 | (1.163) | 13.163 | 15.604 | 6.749 |
| Total from Investment Operations | 7.839 | .061 | 14.217 | 16.765 | 7.618 |
| Distributions | |||||
| Dividends from Net Investment Income | (1.569) | (1.071) | (.957) | (1.045) | (. 538) |
| Distributions from Realized Capital Gains | — | — | — | — | — |
| Total Distributions | (1.569) | (1.071) | (.957) | (1.045) | (. 538) |
| Net Asset Value, End of Period | $98.98 | $92.71 | $93.72 | $80.46 | $64.74 |
| Total Return | 8.62% | 0.03% | 17.69% | 26.23% | 13.30% |
| Ratios/Supplemental Data | |||||
| Net Assets, End of Period (Millions) | $698 | $554 | $375 | $257 | $149 |
| Ratio of Total Expenses to Average Net Assets | 0.15% | 0.15% | 0.15% | 0.15% | 0.15% |
| Ratio of Net Investment Income to | |||||
| Average Net Assets | 1.52% | 1.28% | 1.23% | 1.71% | 1.45% |
| Portfolio Turnover Rate 2 | 19% | 17% | 16% | 32% | 35% |
1 Calculated based on average shares outstanding.
2 Excludes the value of portfolio securities received or delivered as a result of in-kind purchases or redemptions of the fund’s capital shares, including ETF Creation Units.
See accompanying Notes, which are an integral part of the Financial Statements.
17
| Russell 2000 Index Fund | |||||
| Financial Highlights | |||||
| Institutional Shares | |||||
| For a Share Outstanding | Year Ended August 31, | ||||
| Throughout Each Period | 2016 | 2015 | 2014 | 2013 | 2012 |
| Net Asset Value, Beginning of Period | $177.40 | $179.29 | $153.88 | $123.77 | $110.21 |
| Investment Operations | |||||
| Net Investment Income | 2.606 | 2.4531 | 2.110 | 2.306 | 1.7331 |
| Net Realized and Unrealized Gain (Loss) | |||||
| on Investments | 12.503 | (2.212) | 25.206 | 29.858 | 12.899 |
| Total from Investment Operations | 15.109 | .241 | 27.316 | 32.164 | 14.632 |
| Distributions | |||||
| Dividends from Net Investment Income | (3.199) | (2.131) | (1.906) | (2.054) | (1.072) |
| Distributions from Realized Capital Gains | — | — | — | — | — |
| Total Distributions | (3.199) | (2.131) | (1.906) | (2.054) | (1.072) |
| Net Asset Value, End of Period | $189.31 | $177.40 | $179.29 | $153.88 | $123.77 |
| Total Return | 8.69% | 0.11% | 17.78% | 26.33% | 13.37% |
| Ratios/Supplemental Data | |||||
| Net Assets, End of Period (Millions) | $479 | $528 | $320 | $278 | $202 |
| Ratio of Total Expenses to Average Net Assets | 0.08% | 0.08% | 0.08% | 0.08% | 0.08% |
| Ratio of Net Investment Income to | |||||
| Average Net Assets | 1.59% | 1.35% | 1.30% | 1.78% | 1.52% |
| Portfolio Turnover Rate2 | 19% | 17% | 16% | 32% | 35% |
1 Calculated based on average shares outstanding.
2 Excludes the value of portfolio securities received or delivered as a result of in-kind purchases or redemptions of the fund’s capital shares, including ETF Creation Units.
See accompanying Notes, which are an integral part of the Financial Statements.
18
Russell 2000 Index Fund
Notes to Financial Statements
Vanguard Russell 2000 Index Fund is registered under the Investment Company Act of 1940 as an open-end investment company, or mutual fund. The fund offers two classes of shares: ETF Shares and Institutional Shares. ETF Shares are listed for trading on Nasdaq; they can be purchased and sold through a broker. Institutional Shares are designed for investors who meet certain administrative, service, and account-size criteria.
A. The following significant accounting policies conform to generally accepted accounting principles for U.S. investment companies. The fund consistently follows such policies in preparing its financial statements.
1. Security Valuation: Securities are valued as of the close of trading on the New York Stock Exchange (generally 4 p.m., Eastern time) on the valuation date. Equity securities are valued at the latest quoted sales prices or official closing prices taken from the primary market in which each security trades; such securities not traded on the valuation date are valued at the mean of the latest quoted bid and asked prices. Securities for which market quotations are not readily available, or whose values have been materially affected by events occurring before the fund’s pricing time but after the close of the securities’ primary markets, are valued by methods deemed by the board of trustees to represent fair value. Investments in Vanguard Market Liquidity Fund are valued at that fund’s net asset value. Temporary cash investments acquired over 60 days to maturity are valued using the latest bid prices or using valuations based on a matrix system (which considers such factors as security prices, yields, maturities, and ratings), both as furnished by independent pricing services. Other temporary cash investments are valued at amortized cost, which approximates market value.
2. Futures Contracts: The fund uses index futures contracts to a limited extent, with the objectives of maintaining full exposure to the stock market, enhancing returns, maintaining liquidity, and minimizing transaction costs. The fund may purchase futures contracts to immediately invest incoming cash in the market, or sell futures in response to cash outflows, thereby simulating a fully invested position in the underlying index while maintaining a cash balance for liquidity. The fund may seek to enhance returns by using futures contracts instead of the underlying securities when futures are believed to be priced more attractively than the underlying securities. The primary risks associated with the use of futures contracts are imperfect correlation between changes in market values of stocks held by the fund and the prices of futures contracts, and the possibility of an illiquid market. Counterparty risk involving futures is mitigated because a regulated clearinghouse is the counterparty instead of the clearing broker. To further mitigate counterparty risk, the fund trades futures contracts on an exchange, monitors the financial strength of its clearing brokers and clearinghouse, and has entered into clearing agreements with its clearing brokers. The clearinghouse imposes initial margin requirements to secure the fund’s performance and requires daily settlement of variation margin representing changes in the market value of each contract.
Futures contracts are valued at their quoted daily settlement prices. The aggregate settlement values of the contracts are not recorded in the Statement of Net Assets. Fluctuations in the value of the contracts are recorded in the Statement of Net Assets as an asset (liability) and in the Statement of Operations as unrealized appreciation (depreciation) until the contracts are closed, when they are recorded as realized futures gains (losses).
During the year ended August 31, 2016, the fund’s average investments in long and short futures contracts represented less than 1% and 0% of net assets, respectively, based on the average of aggregate settlement values at each quarter-end during the period.
19
Russell 2000 Index Fund
3. Federal Income Taxes: The fund intends to continue to qualify as a regulated investment company and distribute all of its taxable income. Management has analyzed the fund’s tax positions taken for all open federal income tax years (August 31, 2013–2016), and has concluded that no provision for federal income tax is required in the fund’s financial statements.
4. Distributions: Distributions to shareholders are recorded on the ex-dividend date.
5. Securities Lending: To earn additional income, the fund lends its securities to qualified institutional borrowers. Security loans are subject to termination by the fund at any time, and are required to be secured at all times by collateral in an amount at least equal to the market value of securities loaned. Daily market fluctuations could cause the value of loaned securities to be more or less than the value of the collateral received. When this occurs, the collateral is adjusted and settled on the next business day. The fund further mitigates its counterparty risk by entering into securities lending transactions only with a diverse group of prequalified counterparties, monitoring their financial strength, and entering into master securities lending agreements with its counterparties. The master securities lending agreements provide that, in the event of a counterparty’s default (including bankruptcy), the fund may terminate any loans with that borrower, determine the net amount owed, and sell or retain the collateral up to the net amount owed to the fund; however, such actions may be subject to legal proceedings. While collateral mitigates counterparty risk, in the absence of a default the fund may experience delays and costs in recovering the securities loaned. The fund invests cash collateral received in Vanguard Market Liquidity Fund, and records a liability in the Statement of Net Assets for the return of the collateral, during the period the securities are on loan. Securities lending income represents fees charged to borrowers plus income earned on invested cash collateral, less expenses associated with the loan. During the term of the loan, the fund is entitled to all distributions made on or in respect of the loaned securities.
6. Credit Facility: The fund and certain other funds managed by The Vanguard Group (“Vanguard”) participate in a $3.1 billion committed credit facility provided by a syndicate of lenders pursuant to a credit agreement that may be renewed annually; each fund is individually liable for its borrowings, if any, under the credit facility. Borrowings may be utilized for temporary and emergency purposes, and are subject to the fund’s regulatory and contractual borrowing restrictions. The participating funds are charged administrative fees and an annual commitment fee of 0.10% of the undrawn amount of the facility; these fees are allocated to the funds based on a method approved by the fund’s board of trustees and included in Management and Administrative expenses on the fund’s Statement of Operations. Any borrowings under this facility bear interest at a rate based upon the higher of the one-month London Interbank Offered Rate, federal funds effective rate, or overnight bank funding rate plus an agreed-upon spread.
The fund had no borrowings outstanding at August 31, 2016, or at any time during the period then ended.
7. Other: Dividend income is recorded on the ex-dividend date. Interest income includes income distributions received from Vanguard Market Liquidity Fund and is accrued daily. Premiums and discounts on debt securities purchased are amortized and accreted, respectively, to interest income over the lives of the respective securities. Security transactions are accounted for on the date securities are bought or sold. Costs used to determine realized gains (losses) on the sale of investment securities are those of the specific securities sold.
Each class of shares has equal rights as to assets and earnings, except that each class separately bears certain class-specific expenses related to maintenance of shareholder accounts (included in Management and Administrative expenses) and shareholder reporting. Marketing and distribution
20
Russell 2000 Index Fund
expenses are allocated to each class of shares based on a method approved by the board of trustees. Income, other non-class-specific expenses, and gains and losses on investments are allocated to each class of shares based on its relative net assets.
B. In accordance with the terms of a Funds’ Service Agreement (the “FSA”) between Vanguard and the fund, Vanguard furnishes to the fund investment advisory, corporate management, administrative, marketing, and distribution services at Vanguard’s cost of operations (as defined by the FSA). These costs of operations are allocated to the fund based on methods and guidelines approved by the board of trustees. Vanguard does not require reimbursement in the current period for certain costs of operations (such as deferred compensation/benefits and risk/insurance costs); the fund’s liability for these costs of operations is included in Payables to Vanguard on the Statement of Net Assets.
Upon the request of Vanguard, the fund may invest up to 0.40% of its net assets as capital in Vanguard. At August 31, 2016, the fund had contributed to Vanguard capital in the amount of $86,000, representing 0.01% of the fund’s net assets and 0.03% of Vanguard’s capitalization. The fund’s trustees and officers are also directors and employees, respectively, of Vanguard.
C. Various inputs may be used to determine the value of the fund’s investments. These inputs are summarized in three broad levels for financial statement purposes. The inputs or methodologies used to value securities are not necessarily an indication of the risk associated with investing in those securities.
Level 1—Quoted prices in active markets for identical securities.
Level 2—Other significant observable inputs (including quoted prices for similar securities, interest rates, prepayment speeds, credit risk, etc.).
Level 3—Significant unobservable inputs (including the fund’s own assumptions used to determine the fair value of investments).
The following table summarizes the market value of the fund’s investments as of August 31, 2016, based on the inputs used to value them:
| Level 1 | Level 2 | Level 3 | |
| Investments | ($000) | ($000) | ($000) |
| Common Stocks | 1,173,851 | — | 208 |
| Temporary Cash Investments | 31,817 | 799 | — |
| Futures Contracts—Liabilities1 | (79) | — | — |
| Total | 1,205,589 | 799 | 208 |
| 1 Represents variation margin on the last day of the reporting period. |
D. At August 31, 2016, the aggregate settlement value of open futures contracts and the related unrealized appreciation (depreciation) were:
| ($000) | ||||
| Aggregate | ||||
| Number of | Settlement | Unrealized | ||
| Long (Short) | Value | Appreciation | ||
| Futures Contracts | Expiration | Contracts | Long (Short) | (Depreciation) |
| E-mini Russell 2000 Index | September 2016 | 33 | 4,088 | — |
Unrealized appreciation (depreciation) on open futures contracts is required to be treated as realized gain (loss) for tax purposes.
21
Russell 2000 Index Fund
E. Distributions are determined on a tax basis and may differ from net investment income and realized capital gains for financial reporting purposes. Differences may be permanent or temporary. Permanent differences are reclassified among capital accounts in the financial statements to reflect their tax character. Temporary differences arise when certain items of income, expense, gain, or loss are recognized in different periods for financial statement and tax purposes. These differences will reverse at some time in the future. Differences in classification may also result from the treatment of short-term gains as ordinary income for tax purposes.
Certain of the fund’s investments are in securities considered to be passive foreign investment companies, for which any unrealized appreciation and/or realized gains are required to be included in distributable net income for tax purposes. During the year ended August 31, 2016, the fund realized gains on the sale of passive foreign investment companies of $64,000, which have been included in current and prior periods’ taxable income; accordingly, such gains have been reclassified from accumulated net realized losses to undistributed net investment income.
During the year ended August 31, 2016, the fund realized $55,710,000 of net capital gains resulting from in-kind redemptions—in which shareholders exchanged fund shares for securities held by the fund rather than for cash. Because such gains are not taxable to the fund, and are not distributed to shareholders, they have been reclassified from accumulated net realized losses to paid-in capital.
For tax purposes, at August 31, 2016, the fund had $4,106,000 of ordinary income available for distribution. The fund had available capital losses totaling $35,330,000 that may be carried forward indefinitely to offset future net capital gains.
At August 31, 2016, the cost of investment securities for tax purposes was $1,209,619,000. Net unrealized depreciation of investment securities for tax purposes was $2,944,000, consisting of unrealized gains of $127,264,000 on securities that had risen in value since their purchase and $130,208,000 in unrealized losses on securities that had fallen in value since their purchase.
F. During the year ended August 31, 2016, the fund purchased $490,903,000 of investment securities and sold $462,490,000 of investment securities, other than temporary cash investments. Purchases and sales include $171,231,000 and $261,265,000, respectively, in connection with in-kind purchases and redemptions of the fund’s capital shares.
22
Russell 2000 Index Fund
| G. Capital share transactions for each class of shares were: | ||||
| Year Ended August 31, | ||||
| 2016 | 2015 | |||
| Amount | Shares | Amount | Shares | |
| ($000) | (000) | ($000) | (000) | |
| ETF Shares | ||||
| Issued | 369,546 | 4,075 | 647,425 | 6,700 |
| Issued in Lieu of Cash Distributions | — | — | — | — |
| Redeemed | (266,867) | (3,000) | (458,781) | (4,725) |
| Net Increase (Decrease)—ETF Shares | 102,679 | 1,075 | 188,644 | 1,975 |
| Institutional Shares | ||||
| Issued | 172,053 | 993 | 316,346 | 1,709 |
| Issued in Lieu of Cash Distributions | 8,838 | 51 | 3,416 | 19 |
| Redeemed | (257,478) | (1,490) | (96,108) | (532) |
| Net Increase (Decrease) —Institutional Shares | (76,587) | (446) | 223,654 | 1,196 |
H. Management has determined that no material events or transactions occurred subsequent to August 31, 2016, that would require recognition or disclosure in these financial statements.
23
Russell 2000 Value Index Fund
Fund Profile
As of August 31, 2016
| Share-Class Characteristics | |||
| ETF | Institutional | ||
| Shares | Shares | ||
| Ticker Symbol | VTWV | VRTVX | |
| Expense Ratio1 | 0.20% | 0.08% | |
| 30-Day SEC Yield | 1.89% | 2.00% | |
| Portfolio Characteristics | |||
| DJ | |||
| U.S. | |||
| Russell | Total | ||
| 2000 | Market | ||
| Value | FA | ||
| Fund | Index | Index | |
| Number of Stocks | 1,355 | 1,348 | 3,817 |
| Median Market Cap | $1.6B | $1.6B | $51.2B |
| Price/Earnings Ratio | 28.8x | 27.5x | 23.5x |
| Price/Book Ratio | 1.5x | 1.5x | 2.8x |
| Return on Equity | 7.7% | 7.9% | 16.6% |
| Earnings Growth | |||
| Rate | 5.2% | 5.2% | 7.5% |
| Dividend Yield | 2.2% | 2.2% | 2.0% |
| Foreign Holdings | 0.0% | 0.0% | 0.0% |
| Turnover Rate | 31% | — | — |
| Short-Term | |||
| Reserves | 0.3% | — | — |
Sector Diversification (% of equity exposure)
| DJ | |||
| U.S. | |||
| Russell | Total | ||
| 2000 | Market | ||
| Value | FA | ||
| Fund | Index | Index | |
| Consumer Discretionary 11.0% | 11.0% | 14.2% | |
| Consumer Staples | 2.3 | 2.3 | 8.0 |
| Energy | 4.8 | 4.8 | 6.5 |
| Financial Services | 41.9 | 41.8 | 20.0 |
| Health Care | 4.5 | 4.5 | 14.0 |
| Materials & Processing | 5.2 | 5.2 | 3.9 |
| Producer Durables | 12.7 | 12.8 | 10.5 |
| Technology | 10.2 | 10.2 | 17.3 |
| Utilities | 7.4 | 7.4 | 5.6 |
| Volatility Measures | ||
| Russell | DJ | |
| 2000 | U.S. Total | |
| Value | Market | |
| Index | FA Index | |
| R-Squared | 1.00 | 0.72 |
| Beta | 1.00 | 1.07 |
These measures show the degree and timing of the fund’s fluctuations compared with the indexes over 36 months.
Ten Largest Holdings (% of total net assets)
| Healthcare Realty Trust | Real Estate | |
| Inc. | Investment Trusts | |
| (REITs) | 0.5% | |
| IDACORP Inc. | Utilities: Electrical | 0.4 |
| Portland General Electric | ||
| Co. | Utilities: Electrical | 0.4 |
| Prosperity Bancshares | ||
| Inc. | Banks: Diversified | 0.4 |
| Umpqua Holdings Corp. | Banks: Diversified | 0.4 |
| Investors Bancorp Inc. | Banks: Diversified | 0.4 |
| PrivateBancorp Inc. | Banks: Diversified | 0.4 |
| Olin Corp. | Chemicals: | |
| Diversified | 0.4 | |
| Webster Financial Corp. | Banks: Diversified | 0.4 |
| New Residential | ||
| Investment Corp. | Mortgage REITs | 0.4 |
| Top Ten | 4.1% |
The holdings listed exclude any temporary cash investments and equity index products.
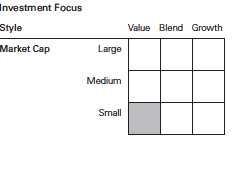
1 The expense ratios shown are from the prospectus dated December 22, 2015, and represent estimated costs for the current fiscal year. For the fiscal year ended August 31, 2016, the expense ratios were 0.20% for ETF Shares and 0.08% for Institutional Shares.
24
Russell 2000 Value Index Fund
Performance Summary
All of the returns in this report represent past performance, which is not a guarantee of future results that may be achieved by the fund. (Current performance may be lower or higher than the performance data cited. For performance data current to the most recent month-end, visit our website at vanguard.com/performance.) Note, too, that both investment returns and principal value can fluctuate widely, so an investor’s shares, when sold, could be worth more or less than their original cost. The returns shown do not reflect taxes that a shareholder would pay on fund distributions or on the sale of fund shares.
Cumulative Performance: September 20, 2010, Through August 31, 2016
Initial Investment of $10,000
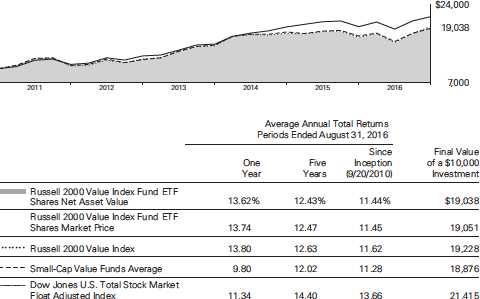
Small-Cap Value Funds Average: Derived from data provided by Lipper, a Thomson Reuters Company.
"Since Inception" performance is calculated from the ETF Shares’ inception date for both the fund and its comparative standards.
| Since | Final Value | ||
| One | Inception | of a $5,000,000 | |
| Year | (7/13/2012) | Investment | |
| Russell 2000 Value Index Fund Institutional | |||
| Shares | 13.76% | 12.19% | $8,045,371 |
| Russell 2000 Value Index | 13.80 | 12.24 | 8,059,055 |
| Dow Jones U.S. Total Stock Market Float | |||
| Adjusted Index | 11.34 | 14.27 | 8,679,230 |
"Since Inception" performance is calculated from the Institutional Shares’ inception date for both the fund and its comparative standards.
See Financial Highlights for dividend and capital gains information.
25
Russell 2000 Value Index Fund
| Cumulative Returns of ETF Shares: September 20, 2010, Through August 31, 2016 | |||
| Since | |||
| One | Five | Inception | |
| Year | Years | (9/20/2010) | |
| Russell 2000 Value Index Fund ETF Shares Market | |||
| Price | 13.74% | 79.98% | 90.51% |
| Russell 2000 Value Index Fund ETF Shares Net | |||
| Asset Value | 13.62 | 79.64 | 90.38 |
| Russell 2000 Value Index | 13.80 | 81.27 | 92.28 |
"Since Inception" performance is calculated from the ETF Shares’ inception date for both the fund and its comparative standards.
Fiscal-Year Total Returns (%): September 20, 2010, Through August 31, 2016
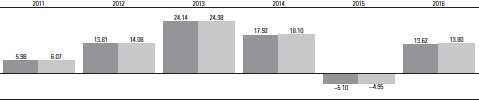
Russell 2000 Value Index Fund ETF Shares Net Asset Value
Russell 2000 Value Index
Average Annual Total Returns: Periods Ended June 30, 2016
This table presents returns through the latest calendar quarter—rather than through the end of the fiscal period.
Securities and Exchange Commission rules require that we provide this information.
| Inception | One | Five | Since | |
| Date | Year | Years | Inception | |
| ETF Shares | 9/20/2010 | |||
| Market Price | -2.73% | 8.00% | 10.32% | |
| Net Asset Value | -2.77 | 7.97 | 10.31 | |
| Institutional Shares | 7/13/2012 | -2.64 | — | 10.58 |
26
Russell 2000 Value Index Fund
Financial Statements
Statement of Net Assets—Investments Summary
As of August 31, 2016
This Statement summarizes the fund’s holdings by asset type. Details are reported for each of the fund’s 50 largest individual holdings and for investments that, in total for any issuer, represent more than 1% of the fund’s net assets. The total value of smaller holdings is reported as a single amount within each category.
The fund reports a complete list of its holdings in regulatory filings four times in each fiscal year, at the quarter-ends. For the second and fourth fiscal quarters, the complete listing of the fund’s holdings is available electronically on vanguard.com and on the Securities and Exchange Commission’s website (sec.gov), or you can have it mailed to you without charge by calling 800-662-7447. For the first and third fiscal quarters, the fund files the lists with the SEC on Form N-Q. Shareholders can look up the fund’s Forms N-Q on the SEC’s website. Forms N-Q may also be reviewed and copied at the SEC’s Public Reference Room (see the back cover of this report for further information).
| Market | Percentage | ||
| Value• | of Net | ||
| Shares | ($000) | Assets | |
| Common Stocks | |||
| Consumer Discretionary † | 27,177 | 10.9% | |
| Consumer Staples | |||
| Snyder’s-Lance Inc. | 23,059 | 815 | 0.3% |
| Consumer Staples—Other † | 4,959 | 2.0% | |
| 5,774 | 2.3% | ||
| Energy | |||
| * RSP Permian Inc. | 22,637 | 884 | 0.4% |
| * PDC Energy Inc. | 13,273 | 881 | 0.3% |
| Energy—Other † | 10,184 | 4.1% | |
| 11,949 | 4.8% | ||
| Financial Services | |||
| Healthcare Realty Trust Inc. | 32,699 | 1,146 | 0.5% |
| Prosperity Bancshares Inc. | 19,238 | 1,067 | 0.4% |
| Umpqua Holdings Corp. | 63,991 | 1,051 | 0.4% |
| Investors Bancorp Inc. | 85,230 | 1,044 | 0.4% |
| PrivateBancorp Inc. | 22,503 | 1,034 | 0.4% |
| Webster Financial Corp. | 26,429 | 1,021 | 0.4% |
| New Residential Investment Corp. | 70,231 | 1,008 | 0.4% |
| Gramercy Property Trust | 102,972 | 997 | 0.4% |
| Hudson Pacific Properties Inc. | 26,771 | 896 | 0.4% |
| Sunstone Hotel Investors Inc. | 62,578 | 869 | 0.4% |
| LaSalle Hotel Properties | 30,732 | 862 | 0.4% |
| Radian Group Inc. | 61,398 | 842 | 0.4% |
| RLJ Lodging Trust | 35,617 | 831 | 0.3% |
| CNO Financial Group Inc. | 51,027 | 829 | 0.3% |
| Education Realty Trust Inc. | 18,150 | 822 | 0.3% |
| Wintrust Financial Corp. | 14,770 | 821 | 0.3% |
| IBERIABANK Corp. | 11,827 | 813 | 0.3% |
| * MGIC Investment Corp. | 98,161 | 794 | 0.3% |
| MB Financial Inc. | 20,096 | 787 | 0.3% |
27
| Russell 2000 Value Index Fund | ||||
| Market | Percentage | |||
| Value• | of Net | |||
| Shares | ($000) | Assets | ||
| UMB Financial Corp. | 12,834 | 780 | 0.3% | |
| FNB Corp. | 60,043 | 750 | 0.3% | |
| * | Stifel Financial Corp. | 18,953 | 746 | 0.3% |
| First Industrial Realty Trust Inc. | 25,898 | 745 | 0.3% | |
| United Bankshares Inc. | 18,783 | 740 | 0.3% | |
| Hancock Holding Co. | 22,385 | 730 | 0.3% | |
| Financial Services—Other † | 82,093 | 33.0% | ||
| 104,118 | 41.8% | |||
| Health Care | ||||
| * | Wright Medical Group NV | 29,729 | 736 | 0.3% |
| Health Care—Other † | 10,476 | 4.2% | ||
| 11,212 | 4.5% | |||
| Materials & Processing | ||||
| Olin Corp. | 47,512 | 1,028 | 0.4% | |
| Materials & Processing—Other † | 11,865 | 4.8% | ||
| 12,893 | 5.2% | |||
| 1Other † | 24 | 0.0% | ||
| Producer Durables | ||||
| *,^ | XPO Logistics Inc. | 28,058 | 1,005 | 0.4% |
| EMCOR Group Inc. | 14,401 | 825 | 0.3% | |
| Joy Global Inc. | 28,345 | 773 | 0.3% | |
| * | Teledyne Technologies Inc. | 7,194 | 771 | 0.3% |
| Producer Durables—Other † | 28,280 | 11.4% | ||
| 31,654 | 12.7% | |||
| Technology | ||||
| SYNNEX Corp. | 8,526 | 905 | 0.4% | |
| * | NetScout Systems Inc. | 26,135 | 773 | 0.3% |
| Intersil Corp. Class A | 38,595 | 762 | 0.3% | |
| * | Tech Data Corp. | 10,048 | 746 | 0.3% |
| Mentor Graphics Corp. | 30,554 | 734 | 0.3% | |
| Technology—Other † | 21,283 | 8.5% | ||
| 25,203 | 10.1% | |||
| Utilities | ||||
| IDACORP Inc. | 14,524 | 1,105 | 0.4% | |
| Portland General Electric Co. | 25,592 | 1,078 | 0.4% | |
| ONE Gas Inc. | 14,965 | 916 | 0.4% | |
| Black Hills Corp. | 14,927 | 873 | 0.4% | |
| WGL Holdings Inc. | 13,684 | 860 | 0.4% | |
| Southwest Gas Corp. | 12,139 | 847 | 0.3% | |
| ALLETE Inc. | 14,173 | 840 | 0.3% | |
| Spire Inc. | 12,782 | 827 | 0.3% | |
| NorthWestern Corp. | 13,899 | 804 | 0.3% | |
| New Jersey Resources Corp. | 22,775 | 766 | 0.3% | |
| Avista Corp. | 18,120 | 736 | 0.3% | |
| Utilities—Other † | 8,682 | 3.5% | ||
| 18,334 | 7.3% | |||
| Total Common Stocks (Cost $240,984) | 248,338 | 99.6%2 | ||
28
| Russell 2000 Value Index Fund | ||||
| Market | Percentage | |||
| Value• | of Net | |||
| Coupon | Shares | ($000) | Assets | |
| Temporary Cash Investments | ||||
| Money Market Fund | ||||
| 3,4 Vanguard Market Liquidity Fund | 0.612% | 52,690 | 5,270 | 2.1% |
| 5U.S. Government and Agency Obligations † | 399 | 0.2% | ||
| Total Temporary Cash Investments (Cost $5,668) | 5,669 | 2.3%2 | ||
| Total Investments (Cost $246,652) | 254,007 | 101.9% | ||
| Amount | ||||
| ($000) | ||||
| Other Assets and Liabilities | ||||
| Other Assets | ||||
| Investment in Vanguard | 18 | |||
| Receivables for Investment Securities Sold | 481 | |||
| Receivables for Accrued Income | 234 | |||
| Receivables for Capital Shares Issued | 183 | |||
| Other Assets | 6 | |||
| Total Other Assets | 922 | 0.4% | ||
| Liabilities | ||||
| Payables for Investment Securities Purchased | (1,447) | |||
| Collateral for Securities on Loan | (4,215) | |||
| Payables for Capital Shares Redeemed | (5) | |||
| Payables to Vanguard | (54) | |||
| Other Liabilities | (21) | |||
| Total Liabilities | (5,742) | (2.3%) | ||
| Net Assets | 249,187 | 100.0% | ||
| At August 31, 2016, net assets consisted of: | ||||
| Amount | ||||
| ($000) | ||||
| Paid-in Capital | 252,847 | |||
| Undistributed Net Investment Income | 1,127 | |||
| Accumulated Net Realized Losses | (12,138) | |||
| Unrealized Appreciation (Depreciation) | ||||
| Investment Securities | 7,355 | |||
| Futures Contracts | (4) | |||
| Net Assets | 249,187 | |||
29
| Russell 2000 Value Index Fund | |
| Amount | |
| ($000) | |
| ETF Shares—Net Assets | |
| Applicable to 1,325,000 outstanding $.001 par value shares of | |
| beneficial interest (unlimited authorization) | 120,102 |
| Net Asset Value Per Share—ETF Shares | $90.64 |
| Institutional Shares—Net Assets | |
| Applicable to 722,102 outstanding $.001 par value shares of | |
| beneficial interest (unlimited authorization) | 129,085 |
| Net Asset Value Per Share—Institutional Shares | $178.76 |
• See Note A in Notes to Financial Statements. * Non-income-producing security.
^ Includes partial security positions on loan to broker-dealers. The total value of securities on loan is $3,864,000.
† Represents the aggregate value, by category, of securities that are not among the 50 largest holdings and, in total for any issuer, represent 1% or less of net assets.
1 “Other” represents securities that are not classified by the fund’s benchmark index.
2 The fund invests a portion of its cash reserves in equity markets through the use of index futures contracts. After giving effect to futures investments, the fund’s effective common stock and temporary cash investment positions represent 99.9% and 2.0%, respectively, of net assets.
3 Affiliated money market fund available only to Vanguard funds and certain trusts and accounts managed by Vanguard. Rate shown is the 7-day yield.
4 Includes $4,215,000 of collateral received for securities on loan.
5 Securities with a value of $100,000 have been segregated as initial margin for open futures contracts.
See accompanying Notes, which are an integral part of the Financial Statements.
30
| Russell 2000 Value Index Fund | |
| Statement of Operations | |
| Year Ended | |
| August 31, 2016 | |
| ($000) | |
| Investment Income | |
| Income | |
| Dividends | 3,827 |
| Interest1 | 6 |
| Securities Lending—Net | 147 |
| Total Income | 3,980 |
| Expenses | |
| The Vanguard Group—Note B | |
| Investment Advisory Services | 32 |
| Management and Administrative—ETF Shares | 103 |
| Management and Administrative—Institutional Shares | 9 |
| Marketing and Distribution—ETF Shares | 7 |
| Marketing and Distribution—Institutional Shares | 2 |
| Custodian Fees | 60 |
| Auditing Fees | 32 |
| Shareholders’ Reports—ETF Shares | 5 |
| Shareholders’ Reports—Institutional Shares | — |
| Total Expenses | 250 |
| Net Investment Income | 3,730 |
| Realized Net Gain (Loss) | |
| Investment Securities Sold1 | 1,235 |
| Futures Contracts | 70 |
| Realized Net Gain (Loss) | 1,305 |
| Change in Unrealized Appreciation (Depreciation) | |
| Investment Securities | 22,997 |
| Futures Contracts | 40 |
| Change in Unrealized Appreciation (Depreciation) | 23,037 |
| Net Increase (Decrease) in Net Assets Resulting from Operations | 28,072 |
1 Interest income and realized net gain (loss) from an affiliated company of the fund were $4,000 and $0, respectively.
See accompanying Notes, which are an integral part of the Financial Statements.
31
| Russell 2000 Value Index Fund | ||
| Statement of Changes in Net Assets | ||
| Year Ended August 31, | ||
| 2016 | 2015 | |
| ($000) | ($000) | |
| Increase (Decrease) in Net Assets | ||
| Operations | ||
| Net Investment Income | 3,730 | 2,926 |
| Realized Net Gain (Loss) | 1,305 | 11,893 |
| Change in Unrealized Appreciation (Depreciation) | 23,037 | (21,977) |
| Net Increase (Decrease) in Net Assets Resulting from Operations | 28,072 | (7,158) |
| Distributions | ||
| Net Investment Income | ||
| ETF Shares | (2,075) | (1,353) |
| Institutional Shares | (2,259) | (1,497) |
| Realized Capital Gain | ||
| ETF Shares | — | — |
| Institutional Shares | — | — |
| Total Distributions | (4,334) | (2,850) |
| Capital Share Transactions | ||
| ETF Shares | 35,395 | 8,868 |
| Institutional Shares | 45,812 | (6,380) |
| Net Increase (Decrease) from Capital Share Transactions | 81,207 | 2,488 |
| Total Increase (Decrease) | 104,945 | (7,520) |
| Net Assets | ||
| Beginning of Period | 144,242 | 151,762 |
| End of Period1 | 249,187 | 144,242 |
1 Net Assets—End of Period includes undistributed (overdistributed) net investment income of $1,127,000 and $1,725,000.
See accompanying Notes, which are an integral part of the Financial Statements.
32
| Russell 2000 Value Index Fund | |||||
| Financial Highlights | |||||
| ETF Shares | |||||
| For a Share Outstanding | Year Ended August 31, | ||||
| Throughout Each Period | 2016 | 2015 | 2014 | 2013 | 2012 |
| Net Asset Value, Beginning of Period | $81.88 | $87.76 | $75.48 | $61.97 | $55.14 |
| Investment Operations | |||||
| Net Investment Income | 1.561 | 1.530 | 1.284 | 1.639 | 1.1261 |
| Net Realized and Unrealized Gain (Loss) | |||||
| on Investments | 9.305 | (5.907) | 12.219 | 13.109 | 6.424 |
| Total from Investment Operations | 10.866 | (4.377) | 13.503 | 14.748 | 7.550 |
| Distributions | |||||
| Dividends from Net Investment Income | (2.106) | (1.503) | (1.223) | (1.238) | (.720) |
| Distributions from Realized Capital Gains | — | — | — | — | — |
| Total Distributions | (2.106) | (1.503) | (1.223) | (1.238) | (.720) |
| Net Asset Value, End of Period | $90.64 | $81.88 | $87.76 | $75.48 | $61.97 |
| Total Return | 13.62% | -5.10% | 17.92% | 24.14% | 13.81% |
| Ratios/Supplemental Data | |||||
| Net Assets, End of Period (Millions) | $120 | $74 | $70 | $45 | $19 |
| Ratio of Total Expenses to Average Net Assets | 0.20% | 0.20% | 0.20% | 0.20% | 0.20% |
| Ratio of Net Investment Income to | |||||
| Average Net Assets | 2.02% | 1.80% | 1.83% | 2.12% | 2.02% |
| Portfolio Turnover Rate 2 | 31% | 28% | 36% | 60% | 40% |
1 Calculated based on average shares outstanding.
2 Excludes the value of portfolio securities received or delivered as a result of in-kind purchases or redemptions of the fund’s capital shares, including ETF Creation Units.
See accompanying Notes, which are an integral part of the Financial Statements.
33
| Russell 2000 Value Index Fund | |||||
| Financial Highlights | |||||
| Institutional Shares | |||||
| July 13, | |||||
| 20121 to | |||||
| Year Ended August 31, | |||||
| For a Share Outstanding | Aug. 31, | ||||
| Throughout Each Period | 2016 | 2015 | 2014 | 2013 | 2012 |
| Net Asset Value, Beginning of Period | $161.59 | $173.15 | $148.87 | $122.12 | $120.40 |
| Investment Operations | |||||
| Net Investment Income | 3.265 | 3.195 | 2.724 | 3.360 | . 276 2 |
| Net Realized and Unrealized Gain (Loss) | |||||
| on Investments | 18.355 | (11.619) | 24.103 | 25.888 | 1.444 |
| Total from Investment Operations | 21.620 | (8.424) | 26.827 | 29.248 | 1.720 |
| Distributions | |||||
| Dividends from Net Investment Income | (4.450) | (3.136) | (2.547) | (2.498) | — |
| Distributions from Realized Capital Gains | — | — | — | — | — |
| Total Distributions | (4.450) | (3.136) | (2.547) | (2.498) | — |
| Net Asset Value, End of Period | $178.76 | $161.59 | $173.15 | $148.87 | $122.12 |
| Total Return | 13.76% | -4.97% | 18.07% | 24.29% | 1.43% |
| Ratios/Supplemental Data | |||||
| Net Assets, End of Period (Millions) | $129 | $71 | $82 | $51 | $6 |
| Ratio of Total Expenses to Average Net Assets | 0.08% | 0.08% | 0.08% | 0.08% | 0.08%3 |
| Ratio of Net Investment Income to | |||||
| Average Net Assets | 2.14% | 1.92% | 1.95% | 2.24% | 2.14%3 |
| Portfolio Turnover Rate 4 | 31% | 28% | 36% | 60% | 40% |
| 1 | Inception. |
| 2 | Calculated based on average shares outstanding. |
| 3 | Annualized. |
| 4 | Excludes the value of portfolio securities received or delivered as a result of in-kind purchases or redemptions of the fund’s capital shares, including ETF Creation Units. |
See accompanying Notes, which are an integral part of the Financial Statements.
34
Russell 2000 Value Index Fund
Notes to Financial Statements
Vanguard Russell 2000 Value Index Fund is registered under the Investment Company Act of 1940 as an open-end investment company, or mutual fund. The fund offers two classes of shares: ETF Shares and Institutional Shares. ETF Shares are listed for trading on Nasdaq; they can be purchased and sold through a broker. Institutional Shares are designed for investors who meet certain administrative, service, and account-size criteria.
A. The following significant accounting policies conform to generally accepted accounting principles for U.S. investment companies. The fund consistently follows such policies in preparing its financial statements.
1. Security Valuation: Securities are valued as of the close of trading on the New York Stock Exchange (generally 4 p.m., Eastern time) on the valuation date. Equity securities are valued at the latest quoted sales prices or official closing prices taken from the primary market in which each security trades; such securities not traded on the valuation date are valued at the mean of the latest quoted bid and asked prices. Securities for which market quotations are not readily available, or whose values have been materially affected by events occurring before the fund’s pricing time but after the close of the securities’ primary markets, are valued by methods deemed by the board of trustees to represent fair value. Investments in Vanguard Market Liquidity Fund are valued at that fund’s net asset value. Temporary cash investments acquired over 60 days to maturity are valued using the latest bid prices or using valuations based on a matrix system (which considers such factors as security prices, yields, maturities, and ratings), both as furnished by independent pricing services. Other temporary cash investments are valued at amortized cost, which approximates market value.
2. Futures Contracts: The fund uses index futures contracts to a limited extent, with the objectives of maintaining full exposure to the stock market, enhancing returns, maintaining liquidity, and minimizing transaction costs. The fund may purchase futures contracts to immediately invest incoming cash in the market, or sell futures in response to cash outflows, thereby simulating a fully invested position in the underlying index while maintaining a cash balance for liquidity. The fund may seek to enhance returns by using futures contracts instead of the underlying securities when futures are believed to be priced more attractively than the underlying securities. The primary risks associated with the use of futures contracts are imperfect correlation between changes in market values of stocks held by the fund and the prices of futures contracts, and the possibility of an illiquid market. Counterparty risk involving futures is mitigated because a regulated clearinghouse is the counterparty instead of the clearing broker. To further mitigate counterparty risk, the fund trades futures contracts on an exchange, monitors the financial strength of its clearing brokers and clearinghouse, and has entered into clearing agreements with its clearing brokers. The clearinghouse imposes initial margin requirements to secure the fund’s performance and requires daily settlement of variation margin representing changes in the market value of each contract.
Futures contracts are valued at their quoted daily settlement prices. The aggregate settlement values of the contracts are not recorded in the Statement of Net Assets. Fluctuations in the value of the contracts are recorded in the Statement of Net Assets as an asset (liability) and in the Statement of Operations as unrealized appreciation (depreciation) until the contracts are closed, when they are recorded as realized futures gains (losses).
During the year ended August 31, 2016, the fund’s average investments in long and short futures contracts represented less than 1% and 0% of net assets, respectively, based on the average of aggregate settlement values at each quarter-end during the period.
35
Russell 2000 Value Index Fund
3. Federal Income Taxes: The fund intends to continue to qualify as a regulated investment company and distribute all of its taxable income. Management has analyzed the fund’s tax positions taken for all open federal income tax years (August 31, 2013–2016), and has concluded that no provision for federal income tax is required in the fund’s financial statements.
4. Distributions: Distributions to shareholders are recorded on the ex-dividend date.
5. Securities Lending: To earn additional income, the fund lends its securities to qualified institutional borrowers. Security loans are subject to termination by the fund at any time, and are required to be secured at all times by collateral in an amount at least equal to the market value of securities loaned. Daily market fluctuations could cause the value of loaned securities to be more or less than the value of the collateral received. When this occurs, the collateral is adjusted and settled on the next business day. The fund further mitigates its counterparty risk by entering into securities lending transactions only with a diverse group of prequalified counterparties, monitoring their financial strength, and entering into master securities lending agreements with its counterparties. The master securities lending agreements provide that, in the event of a counterparty’s default (including bankruptcy), the fund may terminate any loans with that borrower, determine the net amount owed, and sell or retain the collateral up to the net amount owed to the fund; however, such actions may be subject to legal proceedings. While collateral mitigates counterparty risk, in the absence of a default the fund may experience delays and costs in recovering the securities loaned. The fund invests cash collateral received in Vanguard Market Liquidity Fund, and records a liability in the Statement of Net Assets for the return of the collateral, during the period the securities are on loan. Securities lending income represents fees charged to borrowers plus income earned on invested cash collateral, less expenses associated with the loan. During the term of the loan, the fund is entitled to all distributions made on or in respect of the loaned securities.
6. Credit Facility: The fund and certain other funds managed by The Vanguard Group (“Vanguard”) participate in a $3.1 billion committed credit facility provided by a syndicate of lenders pursuant to a credit agreement that may be renewed annually; each fund is individually liable for its borrowings, if any, under the credit facility. Borrowings may be utilized for temporary and emergency purposes, and are subject to the fund’s regulatory and contractual borrowing restrictions. The participating funds are charged administrative fees and an annual commitment fee of 0.10% of the undrawn amount of the facility; these fees are allocated to the funds based on a method approved by the fund’s board of trustees and included in Management and Administrative expenses on the fund’s Statement of Operations. Any borrowings under this facility bear interest at a rate based upon the higher of the one-month London Interbank Offered Rate, federal funds effective rate, or overnight bank funding rate plus an agreed-upon spread.
The fund had no borrowings outstanding at August 31, 2016, or at any time during the period then ended.
7. Other: Dividend income is recorded on the ex-dividend date. Interest income includes income distributions received from Vanguard Market Liquidity Fund and is accrued daily. Premiums and discounts on debt securities purchased are amortized and accreted, respectively, to interest income over the lives of the respective securities. Security transactions are accounted for on the date securities are bought or sold. Costs used to determine realized gains (losses) on the sale of investment securities are those of the specific securities sold.
Each class of shares has equal rights as to assets and earnings, except that each class separately bears certain class-specific expenses related to maintenance of shareholder accounts (included in Management and Administrative expenses) and shareholder reporting. Marketing and distribution
36
Russell 2000 Value Index Fund
expenses are allocated to each class of shares based on a method approved by the board of trustees. Income, other non-class-specific expenses, and gains and losses on investments are allocated to each class of shares based on its relative net assets.
B. In accordance with the terms of a Funds’ Service Agreement (the “FSA”) between Vanguard and the fund, Vanguard furnishes to the fund investment advisory, corporate management, administrative, marketing, and distribution services at Vanguard’s cost of operations (as defined by the FSA). These costs of operations are allocated to the fund based on methods and guidelines approved by the board of trustees. Vanguard does not require reimbursement in the current period for certain costs of operations (such as deferred compensation/benefits and risk/insurance costs); the fund’s liability for these costs of operations is included in Payables to Vanguard on the Statement of Net Assets.
Upon the request of Vanguard, the fund may invest up to 0.40% of its net assets as capital in Vanguard. At August 31, 2016, the fund had contributed to Vanguard capital in the amount of $18,000, representing 0.01% of the fund’s net assets and 0.01% of Vanguard’s capitalization. The fund’s trustees and officers are also directors and employees, respectively, of Vanguard.
C. Various inputs may be used to determine the value of the fund’s investments. These inputs are summarized in three broad levels for financial statement purposes. The inputs or methodologies used to value securities are not necessarily an indication of the risk associated with investing in those securities.
Level 1—Quoted prices in active markets for identical securities.
Level 2—Other significant observable inputs (including quoted prices for similar securities, interest rates, prepayment speeds, credit risk, etc.).
Level 3—Significant unobservable inputs (including the fund’s own assumptions used to determine the fair value of investments).
The following table summarizes the market value of the fund’s investments as of August 31, 2016, based on the inputs used to value them:
| Level 1 | Level 2 | Level 3 | |
| Investments | ($000) | ($000) | ($000) |
| Common Stocks | 248,299 | — | 39 |
| Temporary Cash Investments | 5,270 | 399 | — |
| Futures Contracts—Liabilities1 | (16) | — | — |
| Total | 253,553 | 399 | 39 |
| 1 Represents variation margin on the last day of the reporting period. |
D. At August 31, 2016, the aggregate settlement value of open futures contracts and the related unrealized appreciation (depreciation) were:
| ($000) | ||||
| Aggregate | ||||
| Number of | Settlement | Unrealized | ||
| Long (Short) | Value | Appreciation | ||
| Futures Contracts | Expiration | Contracts | Long (Short) | (Depreciation) |
| E-mini Russell 2000 Index | September 2016 | 6 | 743 | (4) |
Unrealized appreciation (depreciation) on open futures contracts is required to be treated as realized gain (loss) for tax purposes.
37
Russell 2000 Value Index Fund
E. Distributions are determined on a tax basis and may differ from net investment income and realized capital gains for financial reporting purposes. Differences may be permanent or temporary. Permanent differences are reclassified among capital accounts in the financial statements to reflect their tax character. Temporary differences arise when certain items of income, expense, gain, or loss are recognized in different periods for financial statement and tax purposes. These differences will reverse at some time in the future. Differences in classification may also result from the treatment of short-term gains as ordinary income for tax purposes.
During the year ended August 31, 2016, the fund realized $5,286,000 of net capital gains resulting from in-kind redemptions—in which shareholders exchanged fund shares for securities held by the fund rather than for cash. Because such gains are not taxable to the fund, and are not distributed to shareholders, they have been reclassified from accumulated net realized losses to paid-in capital.
For tax purposes, at August 31, 2016, the fund had $1,180,000 of ordinary income available for distribution. The fund had available capital losses totaling $12,141,000 that may be carried forward indefinitely to offset future net capital gains.
At August 31, 2016, the cost of investment securities for tax purposes was $246,669,000. Net unrealized appreciation of investment securities for tax purposes was $7,338,000, consisting of unrealized gains of $24,183,000 on securities that had risen in value since their purchase and $16,845,000 in unrealized losses on securities that had fallen in value since their purchase.
F. During the year ended August 31, 2016, the fund purchased $167,508,000 of investment securities and sold $86,133,000 of investment securities, other than temporary cash investments. Purchases and sales include $49,392,000 and $30,258,000, respectively, in connection with in-kind purchases and redemptions of the fund’s capital shares.
| G. Capital share transactions for each class of shares were: | ||||
| Year Ended August 31, | ||||
| 2016 | 2015 | |||
| Amount | Shares | Amount | Shares | |
| ($000) | (000) | ($000) | (000) | |
| ETF Shares | ||||
| Issued | 67,427 | 825 | 175,714 | 2,000 |
| Issued in Lieu of Cash Distributions | — | — | — | — |
| Redeemed | (32,032) | (400) | (166,846) | (1,900) |
| Net Increase (Decrease)—ETF Shares | 35,395 | 425 | 8,868 | 100 |
| Institutional Shares | ||||
| Issued | 69,100 | 433 | 15,832 | 93 |
| Issued in Lieu of Cash Distributions | 2,218 | 14 | 1,497 | 9 |
| Redeemed | (25,506) | (161) | (23,709) | (136) |
| Net Increase (Decrease) —Institutional Shares | 45,812 | 286 | (6,380) | (34) |
H. Management has determined that no material events or transactions occurred subsequent to August 31, 2016, that would require recognition or disclosure in these financial statements.
38
Russell 2000 Growth Index Fund
| Fund Profile | |||
| As of August 31, 2016 | |||
| Share-Class Characteristics | |||
| ETF | Institutional | ||
| Shares | Shares | ||
| Ticker Symbol | VTWG | VRTGX | |
| Expense Ratio1 | 0.20% | 0.08% | |
| 30-Day SEC Yield | 0.58% | 0.71% | |
| Portfolio Characteristics | |||
| DJ | |||
| U.S. | |||
| Russell | Total | ||
| 2000 | Market | ||
| Growth | FA | ||
| Fund | Index | Index | |
| Number of Stocks | 1,175 | 1,164 | 3,817 |
| Median Market Cap | $1.9B | $1.9B | $51.2B |
| Price/Earnings Ratio | 43.4x | 43.3x | 23.5x |
| Price/Book Ratio | 4.0x | 4.0x | 2.8x |
| Return on Equity | 13.1% | 13.1% | 16.6% |
| Earnings Growth | |||
| Rate | 10.6% | 10.6% | 7.5% |
| Dividend Yield | 0.8% | 0.8% | 2.0% |
| Foreign Holdings | 0.0% | 0.0% | 0.0% |
| Turnover Rate | 33% | — | — |
| Short-Term | |||
| Reserves | -0.2% | — | — |
Sector Diversification (% of equity exposure)
| DJ | |||
| U.S. | |||
| Russell | Total | ||
| 2000 | Market | ||
| Growth | FA | ||
| Fund | Index | Index | |
| Consumer Discretionary 16.9% | 16.9% | 14.2% | |
| Consumer Staples | 3.1 | 3.1 | 8.0 |
| Energy | 0.9 | 1.0 | 6.5 |
| Financial Services | 11.9 | 11.9 | 20.0 |
| Health Care | 22.4 | 22.3 | 14.0 |
| Materials & Processing | 9.3 | 9.3 | 3.9 |
| Producer Durables | 14.1 | 14.1 | 10.5 |
| Technology | 19.2 | 19.2 | 17.3 |
| Utilities | 2.2 | 2.2 | 5.6 |
| Volatility Measures | ||
| DJ | ||
| U.S. Total | ||
| Russell 2000 | Market | |
| Growth Index | FA Index | |
| R-Squared | 1.00 | 0.73 |
| Beta | 1.00 | 1.25 |
These measures show the degree and timing of the fund’s fluctuations compared with the indexes over 36 months.
Ten Largest Holdings (% of total net assets)
| Microsemi Corp. | Semiconductors & | |
| Components | 0.5% | |
| Fair Isaac Corp. | Financial Data & | |
| Systems | 0.5 | |
| MAXIMUS Inc. | Back Office Support | |
| HR & Consulting | 0.4 | |
| Aspen Technology Inc. | Computer Services | |
| Software & Systems | 0.4 | |
| HealthSouth Corp. | Health Care Facilities | 0.4 |
| Take-Two Interactive | Electronic | |
| Software Inc. | Entertainment | 0.4 |
| PAREXEL International | ||
| Corp. | Medical Services | 0.4 |
| Bank of the Ozarks Inc. | Banks | 0.4 |
| Deluxe Corp. | Forms and Bulk | |
| Printing Services | 0.4 | |
| Woodward Inc. | Machinery: Industrial | 0.4 |
| Top Ten | 4.2% |
The holdings listed exclude any temporary cash investments and equity index products.

1 The expense ratios shown are from the prospectus dated December 22, 2015, and represent estimated costs for the current fiscal year. For the fiscal year ended August 31, 2016, the expense ratios were 0.20% for ETF Shares and 0.08% for Institutional Shares.
39
Russell 2000 Growth Index Fund
Performance Summary
All of the returns in this report represent past performance, which is not a guarantee of future results that may be achieved by the fund. (Current performance may be lower or higher than the performance data cited. For performance data current to the most recent month-end, visit our website at vanguard.com/performance.) Note, too, that both investment returns and principal value can fluctuate widely, so an investor’s shares, when sold, could be worth more or less than their original cost. The returns shown do not reflect taxes that a shareholder would pay on fund distributions or on the sale of fund shares.
Cumulative Performance: September 20, 2010, Through August 31, 2016
Initial Investment of $10,000

| Average Annual Total Returns | |||||
| Periods Ended August 31, 2016 | |||||
| Since | Final Value | ||||
| One | Five | Inception | of a $10,000 | ||
| Year | Years | (9/20/2010) | Investment | ||
| Russell 2000 Growth Index | |||||
| Fund*ETF Shares Net Asset Value | 3.62% | 13.01% | 13.16% | $20,861 | |
| Russell 2000 Growth Index | |||||
| Fund*ETF Shares Market Price | 3.55 | 13.01 | 13.15 | 20,843 | |
| •••••••• | Russell 2000 Growth Index | 3.55 | 13.02 | 13.20 | 20,899 |
| – – – – | Small-Cap Growth Funds Average | 2.63 | 11.38 | 11.72 | 19,333 |
| Dow Jones U.S. Total Stock Market | |||||
| Float Adjusted Index | 11.34 | 14.40 | 13.66 | 21,415 | |
Small-Cap Growth Funds Average: Derived from data provided by Lipper, a Thomson Reuters Company.
"Since Inception" performance is calculated from the ETF Shares’ inception date for both the fund and its comparative standards.
| Since | Final Value | |||
| One | Five | Inception | of a $5,000,000 | |
| Year | Years | (5/25/2011) | Investment | |
| Russell 2000 Growth Index Fund Institutional | ||||
| Shares | 3.74% | 13.14% | 9.94% | $8,237,107 |
| Russell 2000 Growth Index | 3.55 | 13.02 | 9.83 | 8,196,325 |
| Dow Jones U.S. Total Stock Market Float | ||||
| Adjusted Index | 11.34 | 14.40 | 11.86 | 9,026,066 |
"Since Inception" performance is calculated from the Institutional Shares’ inception date for both the fund and its comparative standards.
See Financial Highlights for dividend and capital gains information.
40
Russell 2000 Growth Index Fund
| Cumulative Returns of ETF Shares: September 20, 2010, Through August 31, 2016 | |||
| Since | |||
| One | Five | Inception | |
| Year | Years | (9/20/2010) | |
| Russell 2000 Growth Index Fund ETF Shares | |||
| Market Price | 3.55% | 84.35% | 108.43% |
| Russell 2000 Growth Index Fund ETF Shares Net | |||
| Asset Value | 3.62 | 84.31 | 108.61 |
| Russell 2000 Growth Index | 3.55 | 84.41 | 108.99 |
| "Since Inception" performance is calculated from the ETF Shares’ inception date for both the fund and its comparative standards. | |||

Average Annual Total Returns: Periods Ended June 30, 2016
This table presents returns through the latest calendar quarter—rather than through the end of the fiscal period.
Securities and Exchange Commission rules require that we provide this information.
| Inception | One | Five | Since | |
| Date | Year | Years | Inception | |
| ETF Shares | 9/20/2010 | |||
| Market Price | -10.78% | 8.50% | 12.13% | |
| Net Asset Value | -10.69 | 8.49 | 12.13 | |
| Institutional Shares | 5/25/2011 | -10.57 | 8.62 | 8.69 |
41
Russell 2000 Growth Index Fund
Financial Statements
Statement of Net Assets—Investments Summary
As of August 31, 2016
This Statement summarizes the fund’s holdings by asset type. Details are reported for each of the fund’s 50 largest individual holdings and for investments that, in total for any issuer, represent more than 1% of the fund’s net assets. The total value of smaller holdings is reported as a single amount within each category.
The fund reports a complete list of its holdings in regulatory filings four times in each fiscal year, at the quarter-ends. For the second and fourth fiscal quarters, the complete listing of the fund’s holdings is available electronically on vanguard.com and on the Securities and Exchange Commission’s website (sec.gov), or you can have it mailed to you without charge by calling 800-662-7447. For the first and third fiscal quarters, the fund files the lists with the SEC on Form N-Q. Shareholders can look up the fund’s Forms N-Q on the SEC’s website. Forms N-Q may also be reviewed and copied at the SEC’s Public Reference Room (see the back cover of this report for further information).
| Market | Percentage | ||
| Value• | of Net | ||
| Shares | ($000) | Assets | |
| Common Stocks | |||
| Consumer Discretionary | |||
| * Tenneco Inc. | 23,447 | 1,309 | 0.4% |
| * Buffalo Wild Wings Inc. | 7,904 | 1,282 | 0.4% |
| * Bright Horizons Family Solutions Inc. | 18,434 | 1,257 | 0.4% |
| Texas Roadhouse Inc. Class A | 27,616 | 1,223 | 0.3% |
| American Eagle Outfitters Inc. | 62,267 | 1,154 | 0.3% |
| ^ Cracker Barrel Old Country Store Inc. | 7,548 | 1,148 | 0.3% |
| Consumer Discretionary—Other † | 53,877 | 14.8% | |
| 61,250 | 16.9% | ||
| Consumer Staples | |||
| B&G Foods Inc. | 27,429 | 1,302 | 0.3% |
| Consumer Staples—Other † | 10,023 | 2.8% | |
| 11,325 | 3.1% | ||
| Energy † | 3,365 | 0.9% | |
| Financial Services | |||
| Fair Isaac Corp. | 12,899 | 1,650 | 0.5% |
| Bank of the Ozarks Inc. | 36,872 | 1,445 | 0.4% |
| DuPont Fabros Technology Inc. | 31,132 | 1,320 | 0.4% |
| National Health Investors Inc. | 15,642 | 1,256 | 0.3% |
| Home BancShares Inc. | 50,350 | 1,178 | 0.3% |
| ^ Primerica Inc. | 19,591 | 1,115 | 0.3% |
| CoreSite Realty Corp. | 13,968 | 1,090 | 0.3% |
| Urban Edge Properties | 37,491 | 1,074 | 0.3% |
| Financial Services—Other † | 32,826 | 9.0% | |
| 42,954 | 11.8% | ||
| Health Care | |||
| HealthSouth Corp. | 36,947 | 1,504 | 0.4% |
| * PAREXEL International Corp. | 21,888 | 1,489 | 0.4% |
| * NuVasive Inc. | 20,561 | 1,346 | 0.4% |
42
| Russell 2000 Growth Index Fund | |||
| Market | Percentage | ||
| Value• | of Net | ||
| Shares | ($000) | Assets | |
| * Horizon Pharma plc | 67,013 | 1,260 | 0.4% |
| * Medidata Solutions Inc. | 22,735 | 1,230 | 0.3% |
| Cantel Medical Corp. | 14,811 | 1,120 | 0.3% |
| * Integra LifeSciences Holdings Corp. | 12,577 | 1,087 | 0.3% |
| Health Care—Other † | 71,834 | 19.8% | |
| 80,870 | 22.3% | ||
| Materials & Processing | |||
| Sensient Technologies Corp. | 18,642 | 1,365 | 0.4% |
| Belden Inc. | 17,381 | 1,296 | 0.4% |
| PolyOne Corp. | 35,035 | 1,208 | 0.3% |
| * Beacon Roofing Supply Inc. | 24,881 | 1,144 | 0.3% |
| * Louisiana-Pacific Corp. | 55,981 | 1,091 | 0.3% |
| Materials & Processing—Other † | 27,514 | 7.6% | |
| 33,618 | 9.3% | ||
| 1Other † | 125 | 0.0% | |
| Producer Durables | |||
| MAXIMUS Inc. | 26,738 | 1,573 | 0.4% |
| Deluxe Corp. | 20,387 | 1,390 | 0.4% |
| Woodward Inc. | 22,081 | 1,385 | 0.4% |
| CLARCOR Inc. | 19,849 | 1,300 | 0.4% |
| Curtiss-Wright Corp. | 13,479 | 1,212 | 0.3% |
| Healthcare Services Group Inc. | 29,444 | 1,189 | 0.3% |
| Littelfuse Inc. | 9,158 | 1,161 | 0.3% |
| Producer Durables—Other † | 41,894 | 11.6% | |
| 51,104 | 14.1% | ||
| Technology | |||
| * Microsemi Corp. | 47,450 | 1,896 | 0.5% |
| * Aspen Technology Inc. | 34,530 | 1,570 | 0.4% |
| * Take-Two Interactive Software Inc. | 34,515 | 1,500 | 0.4% |
| * EPAM Systems Inc. | 20,081 | 1,370 | 0.4% |
| * GrubHub Inc. | 33,555 | 1,361 | 0.4% |
| * Ellie Mae Inc. | 13,652 | 1,336 | 0.4% |
| * Cirrus Logic Inc. | 26,112 | 1,325 | 0.4% |
| Blackbaud Inc. | 19,574 | 1,319 | 0.4% |
| * Cavium Inc. | 23,380 | 1,302 | 0.4% |
| * Proofpoint Inc. | 16,917 | 1,302 | 0.4% |
| Monolithic Power Systems Inc. | 16,227 | 1,245 | 0.3% |
| * Ciena Corp. | 56,834 | 1,219 | 0.3% |
| * ViaSat Inc. | 16,167 | 1,213 | 0.3% |
| * Integrated Device Technology Inc. | 56,048 | 1,126 | 0.3% |
| Science Applications International Corp. | 17,612 | 1,124 | 0.3% |
| Technology—Other † | 49,382 | 13.6% | |
| 69,590 | 19.2% | ||
| Utilities | |||
| j2 Global Inc. | 19,723 | 1,345 | 0.4% |
| Utilities—Other † | 6,663 | 1.8% | |
| 8,008 | 2.2% | ||
| Total Common Stocks (Cost $350,485) | 362,209 | 99.8%2 | |
43
| Russell 2000 Growth Index Fund | ||||
| Market | Percentage | |||
| Value• | of Net | |||
| Coupon | Shares | ($000) | Assets | |
| Temporary Cash Investments | ||||
| Money Market Fund | ||||
| 3,4 Vanguard Market Liquidity Fund | 0.612% | 85,663 | 8,567 | 2.3% |
| 5U.S. Government and Agency Obligations † | 200 | 0.1% | ||
| Total Temporary Cash Investments (Cost $8,766) | 8,767 | 2.4%2 | ||
| Total Investments (Cost $359,251) | 370,976 | 102.2% | ||
| Amount | ||||
| ($000) | ||||
| Other Assets and Liabilities | ||||
| Other Assets | ||||
| Investment in Vanguard | 29 | |||
| Receivables for Investment Securities Sold | 8,365 | |||
| Receivables for Accrued Income | 189 | |||
| Receivables for Capital Shares Issued | 242 | |||
| Other Assets | 15 | |||
| Total Other Assets | 8,840 | 2.4% | ||
| Liabilities | ||||
| Payables for Investment Securities Purchased | (664) | |||
| Collateral for Securities on Loan | (8,550) | |||
| Payables for Capital Shares Redeemed | (7,478) | |||
| Payables to Vanguard | (111) | |||
| Other Liabilities | (4) | |||
| Total Liabilities | (16,807) | (4.6%) | ||
| Net Assets | 363,009 | 100.0% | ||
| At August 31, 2016, net assets consisted of: | ||||
| Amount | ||||
| ($000) | ||||
| Paid-in Capital | 399,422 | |||
| Undistributed Net Investment Income | 1,208 | |||
| Accumulated Net Realized Losses | (49,389) | |||
| Unrealized Appreciation (Depreciation) | ||||
| Investment Securities | 11,725 | |||
| Futures Contracts | 43 | |||
| Net Assets | 363,009 | |||
44
| Russell 2000 Growth Index Fund | |
| Amount | |
| ($000) | |
| ETF Shares—Net Assets | |
| Applicable to 1,350,000 outstanding $.001 par value shares of | |
| beneficial interest (unlimited authorization) | 144,419 |
| Net Asset Value Per Share—ETF Shares | $106.98 |
| Institutional Shares—Net Assets | |
| Applicable to 1,072,648 outstanding $.001 par value shares of | |
| beneficial interest (unlimited authorization) | 218,590 |
| Net Asset Value Per Share—Institutional Shares | $203.79 |
• See Note A in Notes to Financial Statements.
* Non-income-producing security.
^ Includes partial security positions on loan to broker-dealers. The total value of securities on loan is $8,007,000.
† Represents the aggregate value, by category, of securities that are not among the 50 largest holdings and, in total for any issuer, represent
1% or less of net assets.
1 “Other” represents securities that are not classified by the fund’s benchmark index.
2 The fund invests a portion of its cash reserves in equity markets through the use of index futures contracts. After giving effect to futures investments, the fund’s effective common stock and temporary cash investment positions represent 100.0% and 2.2%, respectively, of net assets.
3 Affiliated money market fund available only to Vanguard funds and certain trusts and accounts managed by Vanguard. Rate shown is the 7-day yield.
4 Includes $8,550,000 of collateral received for securities on loan.
5 Securities with a value of $100,000 have been segregated as initial margin for open futures contracts.
See accompanying Notes, which are an integral part of the Financial Statements.
45
| Russell 2000 Growth Index Fund | |
| Statement of Operations | |
| Year Ended | |
| August 31, 2016 | |
| ($000) | |
| Investment Income | |
| Income | |
| Dividends | 3,520 |
| Interest1 | 8 |
| Securities Lending—Net | 874 |
| Total Income | 4,402 |
| Expenses | |
| The Vanguard Group—Note B | |
| Investment Advisory Services | 63 |
| Management and Administrative—ETF Shares | 199 |
| Management and Administrative—Institutional Shares | 84 |
| Marketing and Distribution—ETF Shares | 11 |
| Marketing and Distribution—Institutional Shares | 7 |
| Custodian Fees | 59 |
| Auditing Fees | 32 |
| Shareholders’ Reports—ETF Shares | 8 |
| Shareholders’ Reports—Institutional Shares | 1 |
| Total Expenses | 464 |
| Net Investment Income | 3,938 |
| Realized Net Gain (Loss) | |
| Investment Securities Sold1 | (1,826) |
| Futures Contracts | 434 |
| Realized Net Gain (Loss) | (1,392) |
| Change in Unrealized Appreciation (Depreciation) | |
| Investment Securities | 6,617 |
| Futures Contracts | (16) |
| Change in Unrealized Appreciation (Depreciation) | 6,601 |
| Net Increase (Decrease) in Net Assets Resulting from Operations | 9,147 |
1 Interest income and realized net gain (loss) from an affiliated company of the fund were $7,000 and $0, respectively.
See accompanying Notes, which are an integral part of the Financial Statements.
46
| Russell 2000 Growth Index Fund | ||
| Statement of Changes in Net Assets | ||
| Year Ended August 31, | ||
| 2016 | 2015 | |
| ($000) | ($000) | |
| Increase (Decrease) in Net Assets | ||
| Operations | ||
| Net Investment Income | 3,938 | 2,326 |
| Realized Net Gain (Loss) | (1,392) | 30,695 |
| Change in Unrealized Appreciation (Depreciation) | 6,601 | (20,057) |
| Net Increase (Decrease) in Net Assets Resulting from Operations | 9,147 | 12,964 |
| Distributions | ||
| Net Investment Income | ||
| ETF Shares | (1,472) | (705) |
| Institutional Shares | (2,744) | (1,350) |
| Realized Capital Gain | ||
| ETF Shares | — | — |
| Institutional Shares | — | — |
| Total Distributions | (4,216) | (2,055) |
| Capital Share Transactions | ||
| ETF Shares | (6,957) | 45,567 |
| Institutional Shares | 29,431 | 7,835 |
| Net Increase (Decrease) from Capital Share Transactions | 22,474 | 53,402 |
| Total Increase (Decrease) | 27,405 | 64,311 |
| Net Assets | ||
| Beginning of Period | 335,604 | 271,293 |
| End of Period1 | 363,009 | 335,604 |
1 Net Assets—End of Period includes undistributed (overdistributed) net investment income of $1,208,000 and $1,486,000.
See accompanying Notes, which are an integral part of the Financial Statements.
47
| Russell 2000 Growth Index Fund | |||||
| Financial Highlights | |||||
| ETF Shares | |||||
| For a Share Outstanding | Year Ended August 31, | ||||
| Throughout Each Period | 2016 | 2015 | 2014 | 2013 | 2012 |
| Net Asset Value, Beginning of Period | $104.34 | $99.83 | $85.58 | $67.37 | $60.02 |
| Investment Operations | |||||
| Net Investment Income | . 989 | . 680 | . 646 | .699 | .4021 |
| Net Realized and Unrealized Gain (Loss) | |||||
| on Investments | 2.721 | 4.471 | 14.153 | 18.073 | 7.133 |
| Total from Investment Operations | 3.710 | 5.151 | 14.799 | 18.772 | 7.535 |
| Distributions | |||||
| Dividends from Net Investment Income | (1.070) | (.641) | (.549) | (. 562) | (.185) |
| Distributions from Realized Capital Gains | — | — | — | — | — |
| Total Distributions | (1.070) | (.641) | (.549) | (. 562) | (.185) |
| Net Asset Value, End of Period | $106.98 | $104.34 | $99.83 | $85.58 | $67.37 |
| Total Return | 3.62% | 5.17% | 17.30% | 28.07% | 12.58% |
| Ratios/Supplemental Data | |||||
| Net Assets, End of Period (Millions) | $144 | $149 | $100 | $68 | $20 |
| Ratio of Total Expenses to Average Net Assets | 0.20% | 0.20% | 0.20% | 0.20% | 0.20% |
| Ratio of Net Investment Income to | |||||
| Average Net Assets | 0.99% | 0.67% | 0.60% | 0.96% | 0.63% |
| Portfolio Turnover Rate2 | 33% | 34% | 35% | 50% | 51% |
1 Calculated based on average shares outstanding.
2 Excludes the value of portfolio securities received or delivered as a result of in-kind purchases or redemptions of the fund’s capital shares, including ETF Creation Units.
See accompanying Notes, which are an integral part of the Financial Statements.
48
| Russell 2000 Growth Index Fund | |||||
| Financial Highlights | |||||
| Institutional Shares | |||||
| For a Share Outstanding | Year Ended August 31, | ||||
| Throughout Each Period | 2016 | 2015 | 2014 | 2013 | 2012 |
| Net Asset Value, Beginning of Period | $198.85 | $190.26 | $162.99 | $128.23 | $114.21 |
| Investment Operations | |||||
| Net Investment Income | 2.121 | 1.478 | 1.412 | 1.412 | .8591 |
| Net Realized and Unrealized Gain (Loss) | |||||
| on Investments | 5.185 | 8.565 | 26.992 | 34.504 | 13.616 |
| Total from Investment Operations | 7.306 | 10.043 | 28.404 | 35.916 | 14.475 |
| Distributions | |||||
| Dividends from Net Investment Income | (2.366) | (1.453) | (1.134) | (1.156) | (.455) |
| Distributions from Realized Capital Gains | — | — | — | — | — |
| Total Distributions | (2.366) | (1.453) | (1.134) | (1.156) | (.455) |
| Net Asset Value, End of Period | $203.79 | $198.85 | $190.26 | $162.99 | $128.23 |
| Total Return | 3.74% | 5.29% | 17.44% | 28.23% | 12.72% |
| Ratios/Supplemental Data | |||||
| Net Assets, End of Period (Millions) | $219 | $187 | $171 | $185 | $87 |
| Ratio of Total Expenses to Average Net Assets | 0.08% | 0.08% | 0.08% | 0.08% | 0.08% |
| Ratio of Net Investment Income to | |||||
| Average Net Assets | 1.11% | 0.79% | 0.72% | 1.08% | 0.75% |
| Portfolio Turnover Rate 2 | 33% | 34% | 35% | 50% | 51% |
1 Calculated based on average shares outstanding.
2 Excludes the value of portfolio securities received or delivered as a result of in-kind purchases or redemptions of the fund’s capital shares, including ETF Creation Units.
See accompanying Notes, which are an integral part of the Financial Statements.
49
Russell 2000 Growth Index Fund
Notes to Financial Statements
Vanguard Russell 2000 Growth Index Fund is registered under the Investment Company Act of 1940 as an open-end investment company, or mutual fund. The fund offers two classes of shares: ETF Shares and Institutional Shares. ETF Shares are listed for trading on Nasdaq; they can be purchased and sold through a broker. Institutional Shares are designed for investors who meet certain administrative, service, and account-size criteria.
A. The following significant accounting policies conform to generally accepted accounting principles for U.S. investment companies. The fund consistently follows such policies in preparing its financial statements.
1. Security Valuation: Securities are valued as of the close of trading on the New York Stock Exchange (generally 4 p.m., Eastern time) on the valuation date. Equity securities are valued at the latest quoted sales prices or official closing prices taken from the primary market in which each security trades; such securities not traded on the valuation date are valued at the mean of the latest quoted bid and asked prices. Securities for which market quotations are not readily available, or whose values have been materially affected by events occurring before the fund’s pricing time but after the close of the securities’ primary markets, are valued by methods deemed by the board of trustees to represent fair value. Investments in Vanguard Market Liquidity Fund are valued at that fund’s net asset value. Temporary cash investments acquired over 60 days to maturity are valued using the latest bid prices or using valuations based on a matrix system (which considers such factors as security prices, yields, maturities, and ratings), both as furnished by independent pricing services. Other temporary cash investments are valued at amortized cost, which approximates market value.
2. Futures Contracts: The fund uses index futures contracts to a limited extent, with the objectives of maintaining full exposure to the stock market, enhancing returns, maintaining liquidity, and minimizing transaction costs. The fund may purchase futures contracts to immediately invest incoming cash in the market, or sell futures in response to cash outflows, thereby simulating a fully invested position in the underlying index while maintaining a cash balance for liquidity. The fund may seek to enhance returns by using futures contracts instead of the underlying securities when futures are believed to be priced more attractively than the underlying securities. The primary risks associated with the use of futures contracts are imperfect correlation between changes in market values of stocks held by the fund and the prices of futures contracts, and the possibility of an illiquid market. Counterparty risk involving futures is mitigated because a regulated clearinghouse is the counterparty instead of the clearing broker. To further mitigate counterparty risk, the fund trades futures contracts on an exchange, monitors the financial strength of its clearing brokers and clearinghouse, and has entered into clearing agreements with its clearing brokers. The clearinghouse imposes initial margin requirements to secure the fund’s performance and requires daily settlement of variation margin representing changes in the market value of each contract.
Futures contracts are valued at their quoted daily settlement prices. The aggregate settlement values of the contracts are not recorded in the Statement of Net Assets. Fluctuations in the value of the contracts are recorded in the Statement of Net Assets as an asset (liability) and in the Statement of Operations as unrealized appreciation (depreciation) until the contracts are closed, when they are recorded as realized futures gains (losses).
During the year ended August 31, 2016, the fund’s average investments in long and short futures contracts represented less than 1% and 0% of net assets, respectively, based on the average of aggregate settlement values at each quarter-end during the period.
50
Russell 2000 Growth Index Fund
3. Federal Income Taxes: The fund intends to continue to qualify as a regulated investment company and distribute all of its taxable income. Management has analyzed the fund’s tax positions taken for all open federal income tax years (August 31, 2013–2016), and has concluded that no provision for federal income tax is required in the fund’s financial statements.
4. Distributions: Distributions to shareholders are recorded on the ex-dividend date.
5. Securities Lending: To earn additional income, the fund lends its securities to qualified institutional borrowers. Security loans are subject to termination by the fund at any time, and are required to be secured at all times by collateral in an amount at least equal to the market value of securities loaned. Daily market fluctuations could cause the value of loaned securities to be more or less than the value of the collateral received. When this occurs, the collateral is adjusted and settled on the next business day. The fund further mitigates its counterparty risk by entering into securities lending transactions only with a diverse group of prequalified counterparties, monitoring their financial strength, and entering into master securities lending agreements with its counterparties. The master securities lending agreements provide that, in the event of a counterparty’s default (including bankruptcy), the fund may terminate any loans with that borrower, determine the net amount owed, and sell or retain the collateral up to the net amount owed to the fund; however, such actions may be subject to legal proceedings. While collateral mitigates counterparty risk, in the absence of a default the fund may experience delays and costs in recovering the securities loaned. The fund invests cash collateral received in Vanguard Market Liquidity Fund, and records a liability in the Statement of Net Assets for the return of the collateral, during the period the securities are on loan. Securities lending income represents fees charged to borrowers plus income earned on invested cash collateral, less expenses associated with the loan. During the term of the loan, the fund is entitled to all distributions made on or in respect of the loaned securities.
6. Credit Facility: The fund and certain other funds managed by The Vanguard Group (“Vanguard”) participate in a $3.1 billion committed credit facility provided by a syndicate of lenders pursuant to a credit agreement that may be renewed annually; each fund is individually liable for its borrowings, if any, under the credit facility. Borrowings may be utilized for temporary and emergency purposes, and are subject to the fund’s regulatory and contractual borrowing restrictions. The participating funds are charged administrative fees and an annual commitment fee of 0.10% of the undrawn amount of the facility; these fees are allocated to the funds based on a method approved by the fund’s board of trustees and included in Management and Administrative expenses on the fund’s Statement of Operations. Any borrowings under this facility bear interest at a rate based upon the higher of the one-month London Interbank Offered Rate, federal funds effective rate, or overnight bank funding rate plus an agreed-upon spread.
The fund had no borrowings outstanding at August 31, 2016, or at any time during the period then ended.
7. Other: Dividend income is recorded on the ex-dividend date. Interest income includes income distributions received from Vanguard Market Liquidity Fund and is accrued daily. Premiums and discounts on debt securities purchased are amortized and accreted, respectively, to interest income over the lives of the respective securities. Security transactions are accounted for on the date securities are bought or sold. Costs used to determine realized gains (losses) on the sale of investment securities are those of the specific securities sold.
Each class of shares has equal rights as to assets and earnings, except that each class separately bears certain class-specific expenses related to maintenance of shareholder accounts (included in Management and Administrative expenses) and shareholder reporting. Marketing and distribution
51
Russell 2000 Growth Index Fund
expenses are allocated to each class of shares based on a method approved by the board of trustees. Income, other non-class-specific expenses, and gains and losses on investments are allocated to each class of shares based on its relative net assets.
B. In accordance with the terms of a Funds’ Service Agreement (the “FSA”) between Vanguard and the fund, Vanguard furnishes to the fund investment advisory, corporate management, administrative, marketing, and distribution services at Vanguard’s cost of operations (as defined by the FSA). These costs of operations are allocated to the fund based on methods and guidelines approved by the board of trustees. Vanguard does not require reimbursement in the current period for certain costs of operations (such as deferred compensation/benefits and risk/insurance costs); the fund’s liability for these costs of operations is included in Payables to Vanguard on the Statement of Net Assets.
Upon the request of Vanguard, the fund may invest up to 0.40% of its net assets as capital in Vanguard. At August 31, 2016, the fund had contributed to Vanguard capital in the amount of $29,000, representing 0.01% of the fund’s net assets and 0.01% of Vanguard’s capitalization. The fund’s trustees and officers are also directors and employees, respectively, of Vanguard.
C. Various inputs may be used to determine the value of the fund’s investments. These inputs are summarized in three broad levels for financial statement purposes. The inputs or methodologies used to value securities are not necessarily an indication of the risk associated with investing in those securities.
Level 1—Quoted prices in active markets for identical securities.
Level 2—Other significant observable inputs (including quoted prices for similar securities, interest rates, prepayment speeds, credit risk, etc.).
Level 3—Significant unobservable inputs (including the fund’s own assumptions used to determine the fair value of investments).
The following table summarizes the market value of the fund’s investments as of August 31, 2016, based on the inputs used to value them:
| Level 1 | Level 2 | Level 3 | |
| Investments | ($000) | ($000) | ($000) |
| Common Stocks | 362,114 | — | 95 |
| Temporary Cash Investments | 8,567 | 200 | — |
| Futures Contracts—Liabilities1 | (4) | — | — |
| Total | 370,677 | 200 | 95 |
| 1 Represents variation margin on the last day of the reporting period. |
D. At August 31, 2016, the aggregate settlement value of open futures contracts and the related unrealized appreciation (depreciation) were:
| ($000) | ||||
| Aggregate | ||||
| Number of | Settlement | Unrealized | ||
| Long (Short) | Value | Appreciation | ||
| Futures Contracts | Expiration | Contracts | Long (Short) | (Depreciation) |
| E-mini Russell 2000 Index | September 2016 | 7 | 867 | 43 |
Unrealized appreciation (depreciation) on open futures contracts is required to be treated as realized gain (loss) for tax purposes.
52
Russell 2000 Growth Index Fund
E. Distributions are determined on a tax basis and may differ from net investment income and realized capital gains for financial reporting purposes. Differences may be permanent or temporary. Permanent differences are reclassified among capital accounts in the financial statements to reflect their tax character. Temporary differences arise when certain items of income, expense, gain, or loss are recognized in different periods for financial statement and tax purposes. These differences will reverse at some time in the future. Differences in classification may also result from the treatment of short-term gains as ordinary income for tax purposes.
During the year ended August 31, 2016, the fund realized $27,477,000 of net capital gains resulting from in-kind redemptions—in which shareholders exchanged fund shares for securities held by the fund rather than for cash. Because such gains are not taxable to the fund, and are not distributed to shareholders, they have been reclassified from accumulated net realized losses to paid-in capital.
For tax purposes, at August 31, 2016, the fund had $1,291,000 of ordinary income available for distribution. The fund had available capital losses totaling $49,347,000 that may be carried forward indefinitely to offset future net capital gains.
At August 31, 2016, the cost of investment securities for tax purposes was $359,251,000. Net unrealized appreciation of investment securities for tax purposes was $11,725,000, consisting of unrealized gains of $42,275,000 on securities that had risen in value since their purchase and $30,550,000 in unrealized losses on securities that had fallen in value since their purchase.
F. During the year ended August 31, 2016, the fund purchased $275,256,000 of investment securities and sold $251,822,000 of investment securities, other than temporary cash investments. Purchases and sales include $42,328,000 and $129,952,000, respectively, in connection with in-kind purchases and redemptions of the fund’s capital shares.
| G. Capital share transactions for each class of shares were: | ||||
| Year Ended August 31, | ||||
| 2016 | 2015 | |||
| Amount | Shares | Amount | Shares | |
| ($000) | (000) | ($000) | (000) | |
| ETF Shares | ||||
| Issued | 125,137 | 1,275 | 224,830 | 2,100 |
| Issued in Lieu of Cash Distributions | — | — | — | — |
| Redeemed | (132,094) | (1,350) | (179,263) | (1,675) |
| Net Increase (Decrease)—ETF Shares | (6,957) | (75) | 45,567 | 425 |
| Institutional Shares | ||||
| Issued | 152,112 | 788 | 61,431 | 310 |
| Issued in Lieu of Cash Distributions | 2,744 | 14 | 1,350 | 7 |
| Redeemed | (125,425) | (669) | (54,946) | (278) |
| Net Increase (Decrease) —Institutional Shares | 29,431 | 133 | 7,835 | 39 |
H. Management has determined that no material events or transactions occurred subsequent to August 31, 2016, that would require recognition or disclosure in these financial statements.
53
Report of Independent Registered Public Accounting Firm
To the Board of Trustees of Vanguard Scottsdale Funds and the Shareholders of Vanguard Russell 2000 Index Fund, Vanguard Russell 2000 Value Index Fund and Vanguard Russell 2000 Growth Index Fund:
In our opinion, the accompanying statements of net assets—investments summary and the related statements of operations and of changes in net assets and the financial highlights present fairly, in all material respects, the financial position of Vanguard Russell 2000 Index Fund, Vanguard Russell 2000 Value Index Fund and Vanguard Russell 2000 Growth Index Fund (constituting separate portfolios of Vanguard Scottsdale Funds, hereafter referred to as the “Funds”) at August 31, 2016, the results of each of their operations for the year then ended, the changes in each of their net assets for each of the two years in the period then ended, and the financial highlights for each of the periods indicated, in conformity with accounting principles generally accepted in the United States of America. These financial statements and financial highlights (hereafter referred to as “financial statements”) are the responsibility of the Funds’ management. Our responsibility is to express an opinion on these financial statements based on our audits. We conducted our audits of these financial statements in accordance with the standards of the Public Company Accounting Oversight Board (United States). Those standards require that we plan and perform the audit to obtain reasonable assurance about whether the financial statements are free of material misstatement. An audit includes examining, on a test basis, evidence supporting the amounts and disclosures in the financial statements, assessing the accounting principles used and significant estimates made by management, and evaluating the overall financial statement presentation. We believe that our audits, which included confirmation of securities at August 31, 2016 by correspondence with the custodian and brokers and by agreement to the underlying ownership records of the transfer agent, provide a reasonable basis for our opinion.
/s/PricewaterhouseCoopers LLP
Philadelphia, Pennsylvania
October 18, 2016
54
Special 2016 tax information (unaudited) for Vanguard Russell 2000 Index Funds
This information for the fiscal year ended August 31, 2016, is included pursuant to provisions of the Internal Revenue Code.
The funds distributed qualified dividend income to shareholders during the fiscal year as follows:
| Fund | ($000) |
| Russell 2000 Index Fund | 12,937 |
| Russell 2000 Value Index Fund | 2,840 |
| Russell 2000 Growth Index Fund | 3,031 |
For corporate shareholders, the percentage of investment income (dividend income plus short-term gains, if any) that qualifies for the dividends-received deduction is as follows:
| Fund | Percentage |
| Russell 2000 Index Fund | 62.2% |
| Russell 2000 Value Index Fund | 60.7 |
| Russell 2000 Growth Index Fund | 61.1 |
55
Your Fund’s After-Tax Returns
This table presents returns for your fund both before and after taxes. The after-tax returns are shown in two ways: (1) assuming that an investor owned the fund during the entire period and paid taxes on the fund’s distributions, and (2) assuming that an investor paid taxes on the fund’s distributions and sold all shares at the end of each period.
Calculations are based on the highest individual federal income tax and capital gains tax rates in effect at the times of the distributions and the hypothetical sales. State and local taxes were not considered. After-tax returns reflect any qualified dividend income, using actual prior-year figures and estimates for 2016. (In the example, returns after the sale of fund shares may be higher than those assuming no sale. This occurs when the sale would have produced a capital loss. The calculation assumes that the investor received a tax deduction for the loss.)
The table shows returns for ETF Shares only; returns for other share classes will differ. Please note that your actual after-tax returns will depend on your tax situation and may differ from those shown. Also note that if you own the fund in a tax-deferred account, such as an individual retirement account or a 401(k) plan, this information does not apply to you. Such accounts are not subject to current taxes.
Finally, keep in mind that a fund’s performance—whether before or after taxes—does not guarantee future results.
Average Annual Total Returns: Russell 2000 Index Funds
Periods Ended August 31, 2016
| Since | |||
| One | Five | Inception | |
| Year | Years | (9/20/2010) | |
| Russell 2000 Index Fund ETF Shares | |||
| Returns Before Taxes | 8.62% | 12.83% | 12.41% |
| Returns After Taxes on Distributions | 8.05 | 12.45 | 12.08 |
| Returns After Taxes on Distributions and Sale of Fund Shares | 5.07 | 10.18 | 9.94 |
| Since | |||
| One | Five | Inception | |
| Year | Years | (9/20/2010) | |
| Russell 2000 Value Index Fund ETF Shares | |||
| Returns Before Taxes | 13.62% | 12.43% | 11.44% |
| Returns After Taxes on Distributions | 12.72 | 11.87 | 10.94 |
| Returns After Taxes on Distributions and Sale of Fund Shares | 7.98 | 9.78 | 9.06 |
| Since | |||
| One | Five | Inception | |
| Year | Years | (9/20/2010) | |
| Russell 2000 Growth Index Fund ETF Shares | |||
| Returns Before Taxes | 3.62% | 13.01% | 13.16% |
| Returns After Taxes on Distributions | 3.30 | 12.83 | 13.00 |
| Returns After Taxes on Distributions and Sale of Fund Shares | 2.18 | 10.40 | 10.65 |
56
About Your Fund’s Expenses
As a shareholder of the fund, you incur ongoing costs, which include costs for portfolio management, administrative services, and shareholder reports (like this one), among others. Operating expenses, which are deducted from a fund’s gross income, directly reduce the investment return of the fund.
A fund’s expenses are expressed as a percentage of its average net assets. This figure is known as the expense ratio. The following examples are intended to help you understand the ongoing costs (in dollars) of investing in your fund and to compare these costs with those of other mutual funds. The examples are based on an investment of $1,000 made at the beginning of the period shown and held for the entire period.
The accompanying table illustrates your fund’s costs in two ways:
• Based on actual fund return. This section helps you to estimate the actual expenses that you paid over the period. The ”Ending Account Value“ shown is derived from the fund‘s actual return, and the third column shows the dollar amount that would have been paid by an investor who started with $1,000 in the fund. You may use the information here, together with the amount you invested, to estimate the expenses that you paid over the period.
To do so, simply divide your account value by $1,000 (for example, an $8,600 account value divided by $1,000 = 8.6), then multiply the result by the number given for your fund under the heading ”Expenses Paid During Period.“
• Based on hypothetical 5% yearly return. This section is intended to help you compare your fund‘s costs with those of other mutual funds. It assumes that the fund had a yearly return of 5% before expenses, but that the expense ratio is unchanged. In this case—because the return used is not the fund’s actual return—the results do not apply to your investment. The example is useful in making comparisons because the Securities and Exchange Commission requires all mutual funds to calculate expenses based on a 5% return. You can assess your fund’s costs by comparing this hypothetical example with the hypothetical examples that appear in shareholder reports of other funds.
Note that the expenses shown in the table are meant to highlight and help you compare ongoing costs only and do not reflect transaction costs incurred by the fund for buying and selling securities. Further, the expenses do not include any purchase, redemption, or account service fees described in the fund prospectus. If such fees were applied to your account, your costs would be higher. Your fund does not carry a “sales load.”
The calculations assume no shares were bought or sold during the period. Your actual costs may have been higher or lower, depending on the amount of your investment and the timing of any purchases or redemptions.
You can find more information about the fund’s expenses, including annual expense ratios, in the Financial Statements section of this report. For additional information on operating expenses and other shareholder costs, please refer to your fund’s current prospectus.
57
| Six Months Ended August 31, 2016 | |||
| Beginning | Ending | Expenses | |
| Account Value | Account Value | Paid During | |
| 2/29/2016 | 8/31/2016 | Period | |
| Based on Actual Fund Return | |||
| Russell 2000 Index Fund | |||
| ETF Shares | $1,000.00 | $1,208.68 | $0.89 |
| Institutional Shares | 1,000.00 | 1,208.98 | 0.56 |
| Russell 2000 Value Index Fund | |||
| ETF Shares | $1,000.00 | $1,218.86 | $1.17 |
| Institutional Shares | 1,000.00 | 1,219.57 | 0.50 |
| Russell 2000 Growth Index Fund | |||
| ETF Shares | $1,000.00 | $1,196.90 | $1.21 |
| Institutional Shares | 1,000.00 | 1,197.67 | 0.50 |
| Based on Hypothetical 5% Yearly Return | |||
| Russell 2000 Index Fund | |||
| ETF Shares | $1,000.00 | $1,024.33 | $0.81 |
| Institutional Shares | 1,000.00 | 1,024.63 | 0.51 |
| Russell 2000 Value Index Fund | |||
| ETF Shares | $1,000.00 | $1,024.08 | $1.07 |
| Institutional Shares | 1,000.00 | 1,024.68 | 0.46 |
| Russell 2000 Growth Index Fund | |||
| ETF Shares | $1,000.00 | $1,024.03 | $1.12 |
| Institutional Shares | 1,000.00 | 1,024.68 | 0.46 |
The calculations are based on expenses incurred in the most recent six-month period. The funds’ annualized six-month expense ratios for that period are: for the Russell 2000 Index Fund, 0.16% for ETF Shares and 0.10% for Institutional Shares; for the Russell 2000 Value Index Fund, 0.21% for ETF Shares and 0.09% for Institutional Shares; and for the Russell 2000 Growth Index Fund, 0.22% for ETF Shares and 0.09% for Institutional Shares. The dollar amounts shown as “Expenses Paid” are equal to the annualized expense ratio multiplied by the average account value over the period, multiplied by the number of days in the most recent six-month period, then divided by the number of days in the most recent 12-month period (184/366).
58
Trustees Approve Advisory Arrangements
The board of trustees of Vanguard Russell 2000 Index Fund, Russell 2000 Value Index Fund, and Russell 2000 Growth Index Fund has renewed each fund’s investment advisory arrangement with The Vanguard Group, Inc. (Vanguard). Vanguard—through its Equity Index Group—serves as investment advisor for each fund. The board determined that continuing each fund’s internalized management structure was in the best interests of each fund and its shareholders.
The board based its decision upon an evaluation of the advisor’s investment staff, portfolio management process, and performance. This evaluation included information provided to the board by Vanguard’s Portfolio Review Department, which is responsible for fund and advisor oversight and product management. The Portfolio Review Department met regularly with the advisor and made monthly presentations to the board during the fiscal year directing the board’s focus to relevant information and topics.
The board, or an investment committee made up of board members, also received information throughout the year through advisor presentations. For each advisor presentation, the board was provided with letters and reports that included information about, among other things, the advisory firm and the advisor’s assessment of the investment environment, portfolio performance, and portfolio characteristics.
In addition, the board received monthly reports, which included a Market and Economic Report, a Fund Dashboard Monthly Summary, and a Fund Performance Report.
Prior to their meeting, the trustees were provided with a memo and materials that summarized the information they had received over the course of the year. They also considered the factors discussed below, among others. However, no single factor determined whether the board approved the arrangements. Rather, it was the totality of the circumstances that drove the board’s decision.
Nature, extent, and quality of services
The board reviewed the quality of each fund’s investment management services over both the short and long term and took into account the organizational depth and stability of the advisor. The board considered that Vanguard has been managing investments for more than three decades. The Equity Index Group adheres to a sound, disciplined investment management process; the team has considerable experience, stability, and depth.
The board concluded that Vanguard’s experience, stability, depth, and performance, among other factors, warranted continuation of each advisory arrangement.
Investment performance
The board considered the short- and long-term performance of each fund, including any periods of outperformance or underperformance relative to its target index and peer group. The board concluded that the performance was such that each advisory arrangement should continue. Information about each fund’s most recent performance can be found in the Performance Summary pages of this report.
Cost
The board concluded that each fund’s expense ratio was well below the average expense ratios charged by funds in its peer group and that each fund’s advisory expenses were also well below its peer group average. Information about the funds’ expenses appears in the About Your Fund’s Expenses section of this report as well as in the Financial Statements sections.
59
The board does not conduct a profitability analysis of Vanguard because of Vanguard’s unique “at-cost” structure. Unlike most other mutual fund management companies, Vanguard is owned by the funds it oversees and produces “profits” only in the form of reduced expenses for fund shareholders.
The benefit of economies of scale
The board concluded that each fund’s at-cost arrangement with Vanguard ensures that the funds will realize economies of scale as they grow, with the cost to shareholders declining as fund assets increase.
The board will consider whether to renew the advisory arrangements again after a one-year period.
60
Glossary
30-Day SEC Yield. A fund’s 30-day SEC yield is derived using a formula specified by the U.S. Securities and Exchange Commission. Under the formula, data related to the fund’s security holdings in the previous 30 days are used to calculate the fund’s hypothetical net income for that period, which is then annualized and divided by the fund’s estimated average net assets over the calculation period. For the purposes of this calculation, a security’s income is based on its current market yield to maturity (for bonds), its actual income (for asset-backed securities), or its projected dividend yield (for stocks). Because the SEC yield represents hypothetical annualized income, it will differ—at times significantly—from the fund’s actual experience. As a result, the fund’s income distributions may be higher or lower than implied by the SEC yield.
Beta. A measure of the magnitude of a fund’s past share-price fluctuations in relation to the ups and downs of a given market index. The index is assigned a beta of 1.00. Compared with a given index, a fund with a beta of 1.20 typically would have seen its share price rise or fall by 12% when the index rose or fell by 10%. For this report, beta is based on returns over the past 36 months for both the fund and the index. Note that a fund’s beta should be reviewed in conjunction with its R-squared (see definition). The lower the R-squared, the less correlation there is between the fund and the index, and the less reliable beta is as an indicator of volatility.
Dividend Yield. Dividend income earned by stocks, expressed as a percentage of the aggregate market value (or of net asset value, for a fund). The yield is determined by dividing the amount of the annual dividends by the aggregate value (or net asset value) at the end of the period. For a fund, the dividend yield is based solely on stock holdings and does not include any income produced by other investments.
Earnings Growth Rate. The average annual rate of growth in earnings over the past five years for the stocks now in a fund.
Equity Exposure. A measure that reflects a fund’s investments in stocks and stock futures. Any holdings in short-term reserves are excluded.
Expense Ratio. A fund’s total annual operating expenses expressed as a percentage of the fund’s average net assets. The expense ratio includes management and administrative expenses, but does not include the transaction costs of buying and selling portfolio securities.
Foreign Holdings. The percentage of a fund represented by securities or depositary receipts of companies based outside the United States.
Inception Date. The date on which the assets of a fund (or one of its share classes) are first invested in accordance with the fund’s investment objective. For funds with a subscription period, the inception date is the day after that period ends. Investment performance is measured from the inception date.
Median Market Cap. An indicator of the size of companies in which a fund invests; the midpoint of market capitalization (market price x shares outstanding) of a fund’s stocks, weighted by the proportion of the fund’s assets invested in each stock. Stocks representing half of the fund’s assets have market capitalizations above the median, and the rest are below it.
Price/Book Ratio. The share price of a stock divided by its net worth, or book value, per share. For a fund, the weighted average price/book ratio of the stocks it holds.
61
Price/Earnings Ratio. The ratio of a stock’s current price to its per-share earnings over the past year. For a fund, the weighted average P/E of the stocks it holds. P/E is an indicator of market expectations about corporate prospects; the higher the P/E, the greater the expectations for a company’s future growth.
R-Squared. A measure of how much of a fund’s past returns can be explained by the returns from the market in general, as measured by a given index. If a fund’s total returns were precisely synchronized with an index’s returns, its R-squared would be 1.00. If the fund’s returns bore no relationship to the index’s returns, its R-squared would be 0. For this report, R-squared is based on returns over the past 36 months for both the fund and the index.
Return on Equity. The annual average rate of return generated by a company during the past five years for each dollar of shareholder’s equity (net income divided by shareholder’s equity). For a fund, the weighted average return on equity for the companies whose stocks it holds.
Short-Term Reserves. The percentage of a fund invested in highly liquid, short-term securities that can be readily converted to cash.
Turnover Rate. An indication of the fund’s trading activity. Funds with high turnover rates incur higher transaction costs and may be more likely to distribute capital gains (which may be taxable to investors). The turnover rate excludes in-kind transactions, which have minimal impact on costs.
62
This page intentionally left blank.
The People Who Govern Your Fund
The trustees of your mutual fund are there to see that the fund is operated and managed in your best interests since, as a shareholder, you are a part owner of the fund. Your fund’s trustees also serve on the board of directors of The Vanguard Group, Inc., which is owned by the Vanguard funds and provides services to them on an at-cost basis.
A majority of Vanguard’s board members are independent, meaning that they have no affiliation with Vanguard or the funds they oversee, apart from the sizable personal investments they have made as private individuals. The independent board members have distinguished backgrounds in business, academia, and public service. Each of the trustees and executive officers oversees 198 Vanguard funds.
The following table provides information for each trustee and executive officer of the fund. The mailing address of the trustees and officers is P.O. Box 876, Valley Forge, PA 19482. More information about the trustees is in the Statement of Additional Information, which can be obtained, without charge, by contacting Vanguard at 800-662-7447, or online at vanguard.com.
InterestedTrustee1
F. William McNabb III
Born 1957. Trustee Since July 2009. Chairman of the Board. Principal Occupation(s) During the Past Five Years and Other Experience: Chairman of the Board of The Vanguard Group, Inc., and of each of the investment companies served by The Vanguard Group, since January 2010; Director of The Vanguard Group since 2008; Chief Executive Officer and President of The Vanguard Group, and of each of the investment companies served by The Vanguard Group, since 2008; Director of Vanguard Marketing Corporation; Managing Director of The Vanguard Group (1995–2008).
IndependentTrustees
Emerson U. Fullwood
Born 1948. Trustee Since January 2008. Principal Occupation(s) During the Past Five Years and Other Experience: Executive Chief Staff and Marketing Officer for North America and Corporate Vice President (retired 2008) of Xerox Corporation (document management products and services); Executive in Residence and 2009–2010 Distinguished Minett Professor at the Rochester Institute of Technology; Lead Director of SPX FLOW, Inc. (multi-industry manufacturing); Director of the United Way of Rochester, the University of Rochester Medical Center, Monroe Community College Foundation, North Carolina A&T University, and Roberts Wesleyan College.
Rajiv L. Gupta
Born 1945. Trustee Since December 2001.2 Principal Occupation(s) During the Past Five Years and Other Experience: Chairman and Chief Executive Officer (retired 2009) and President (2006–2008) of Rohm and Haas Co. (chemicals); Director of Tyco International plc (diversified manufacturing and services), HP Inc. (printer and personal computer manufacturing), and Delphi Automotive plc (automotive components); Senior Advisor at New Mountain Capital.
Amy Gutmann
Born 1949. Trustee Since June 2006. Principal Occupation(s) During the Past Five Years and Other Experience: President of the University of Pennsylvania; Christopher H. Browne Distinguished Professor of Political Science, School of Arts and Sciences, and Professor of Communication, Annenberg School for Communication, with secondary faculty appointments in the Department of Philosophy, School of Arts and Sciences, and at the Graduate School of Education, University of Pennsylvania; Trustee of the National Constitution Center; Chair of the Presidential Commission for the Study of Bioethical Issues.
JoAnn Heffernan Heisen
Born 1950. Trustee Since July 1998. Principal Occupation(s) During the Past Five Years and Other Experience: Corporate Vice President and Chief Global Diversity Officer (retired 2008) and Member of the Executive Committee (1997–2008) of Johnson & Johnson (pharmaceuticals/medical devices/consumer products); Director of Skytop Lodge Corporation (hotels) and the Robert Wood Johnson Foundation; Member of the Advisory Board of the Institute for Women’s Leadership at Rutgers University.
F. Joseph Loughrey
Born 1949. Trustee Since October 2009. Principal Occupation(s) During the Past Five Years and Other Experience: President and Chief Operating Officer (retired 2009) of Cummins Inc. (industrial machinery); Chairman of the Board of Hillenbrand, Inc. (specialized consumer services), and of Oxfam America; Director of SKF AB (industrial machinery), Hyster-Yale Materials Handling, Inc. (forklift trucks), the Lumina Foundation for Education, and the V Foundation for Cancer Research; Member of the Advisory Council for the College of Arts and Letters and of the Advisory Board to the Kellogg Institute for International Studies, both at the University of Notre Dame.
Mark Loughridge
Born 1953. Trustee Since March 2012. Principal Occupation(s) During the Past Five Years and Other Experience: Senior Vice President and Chief Financial Officer (retired 2013) at IBM (information technology services); Fiduciary Member of IBM’s Retirement Plan Committee (2004–2013); Director of the Dow Chemical Company; Member of the Council on Chicago Booth.
Scott C. Malpass
Born 1962. Trustee Since March 2012. Principal Occupation(s) During the Past Five Years and Other Experience: Chief Investment Officer and Vice President at the University of Notre Dame; Assistant Professor of Finance at the Mendoza College of Business at Notre Dame; Member of the Notre Dame 403(b) Investment Committee, the Board of Advisors for Spruceview Capital Partners, and the Investment Advisory Committee of Major League Baseball; Board Member of TIFF Advisory Services, Inc., and Catholic Investment Services, Inc. (investment advisors).
André F. Perold
Born 1952. Trustee Since December 2004. Principal Occupation(s) During the Past Five Years and Other Experience: George Gund Professor of Finance and Banking, Emeritus at the Harvard Business School (retired 2011); Chief Investment Officer and Managing Partner of HighVista Strategies LLC (private investment firm); Director of Rand Merchant Bank; Overseer of the Museum of Fine Arts Boston.
Peter F. Volanakis
Born 1955. Trustee Since July 2009. Principal Occupation(s) During the Past Five Years and Other Experience: President and Chief Operating Officer (retired 2010) of Corning Incorporated (communications equipment); Chairman of the Board of Trustees of Colby-Sawyer College; Member of the Advisory Board of the Norris Cotton Cancer Center.
Executive Officers
Glenn Booraem
Born 1967. Treasurer Since May 2015. Principal Occupation(s) During the Past Five Years and Other Experience: Principal of The Vanguard Group, Inc.; Treasurer of each of the investment companies served by The Vanguard Group; Controller of each of the investment companies served by The Vanguard Group (2010–2015); Assistant Controller of each of the investment companies served by The Vanguard Group (2001–2010).
Thomas J. Higgins
Born 1957. Chief Financial Officer Since September 2008. Principal Occupation(s) During the Past Five Years and Other Experience: Principal of The Vanguard Group, Inc.; Chief Financial Officer of each of the investment companies served by The Vanguard Group; Treasurer of each of the investment companies served by The Vanguard Group (1998–2008).
Peter Mahoney
Born 1974. Controller Since May 2015. Principal Occupation(s) During the Past Five Years and Other Experience: Head of Global Fund Accounting at The Vanguard Group, Inc.; Controller of each of the investment companies served by The Vanguard Group; Head of International Fund Services at The Vanguard Group (2008–2014).
Heidi Stam
Born 1956. Secretary Since July 2005. Principal Occupation(s) During the Past Five Years and Other Experience: Managing Director of The Vanguard Group, Inc.; General Counsel of The Vanguard Group; Secretary of The Vanguard Group and of each of the investment companies served by The Vanguard Group; Director and Senior Vice President of Vanguard Marketing Corporation.
Vanguard Senior Management Team
|
Mortimer J. Buckley Kathleen C. Gubanich Martha G. King John T. Marcante Chris D. McIsaac |
James M. Norris Thomas M. Rampulla Glenn W. Reed Karin A. Risi Michael Rollings |
Chairman Emeritus and Senior Advisor
John J. Brennan
Chairman, 1996–2009
Chief Executive Officer and President, 1996–2008
Founder John C. Bogle
Chairman and Chief Executive Officer, 1974–1996
1 Mr. McNabb is considered an “interested person,” as defined in the Investment Company Act of 1940, because he is an officer of the Vanguard funds.
2 December 2002 for Vanguard Equity Income Fund, the Vanguard Municipal Bond Funds, and the Vanguard State Tax-Exempt Funds.
 |
| P.O. Box 2600 |
| Valley Forge, PA 19482-2600 |
Connect with Vanguard® > vanguard.com
| Fund Information > 800-662-7447 | The Russell Indexes and Russell® are registered |
| Direct Investor Account Services > 800-662-2739 | trademarks of Russell Investments and have been |
| licensed for use by The Vanguard Group, Inc. The | |
| Institutional Investor Services > 800-523-1036 | products are not sponsored, endorsed, sold, or |
| Text Telephone for People | promoted by Russell Investments and Russell |
| Who Are Deaf or Hard of Hearing> 800-749-7273 | Investments makes no representation regarding the |
| advisability of investing in the products. | |
| This material may be used in conjunction | |
| with the offering of shares of any Vanguard | |
| fund only if preceded or accompanied by | |
| the fund’s current prospectus. | |
| All comparative mutual fund data are from Lipper, a | |
| Thomson Reuters Company, or Morningstar, Inc., unless | |
| otherwise noted. | |
| You can obtain a free copy of Vanguard’s proxy voting | |
| guidelines by visiting vanguard.com/proxyreporting or by | |
| calling Vanguard at 800-662-2739. The guidelines are | |
| also available from the SEC’s website, sec.gov. In | |
| addition, you may obtain a free report on how your fund | |
| voted the proxies for securities it owned during the 12 | |
| months ended June 30. To get the report, visit either | |
| vanguard.com/proxyreporting or sec.gov. | |
| You can review and copy information about your fund at | |
| the SEC’s Public Reference Room in Washington, D.C. To | |
| find out more about this public service, call the SEC at | |
| 202-551-8090. Information about your fund is also | |
| available on the SEC’s website, and you can receive | |
| copies of this information, for a fee, by sending a | |
| request in either of two ways: via email addressed to | |
| publicinfo@sec.gov or via regular mail addressed to the | |
| Public Reference Section, Securities and Exchange | |
| Commission, Washington, DC 20549-1520. | |
| © 2016 The Vanguard Group, Inc. | |
| All rights reserved. | |
| Vanguard Marketing Corporation, Distributor. | |
| Q18510 102016 | |
Annual Report | August 31, 2016
Vanguard Russell 3000 Index Fund
A new format, unwavering commitment
As you begin reading this report, you’ll notice that we’ve made some improvements to the opening sections—based on feedback from you, our clients.
Page 1 starts with a new ”Your Fund’s Performance at a Glance,” a concise, handy summary of how your fund performed during the period.
In the renamed ”Chairman’s Perspective,” Bill McNabb will focus on enduring principles and investment insights.
We’ve modified some tables, and eliminated some redundancy, but we haven’t removed any information.
At Vanguard, we’re always looking for better ways to communicate and to help you make sound investment decisions. Thank you for entrusting your assets to us.
| Contents | |
| Your Fund’s Performance at a Glance. | 1 |
| Chairman’s Perspective. | 3 |
| Fund Profile. | 7 |
| Performance Summary. | 8 |
| Financial Statements. | 10 |
| Your Fund’s After-Tax Returns. | 23 |
| About Your Fund’s Expenses. | 24 |
| Trustees Approve Advisory Arrangement. | 26 |
| Glossary. | 28 |
Please note: The opinions expressed in this report are just that—informed opinions. They should not be considered promises or advice. Also, please keep in mind that the information and opinions cover the period through the date on the front of this report. Of course, the risks of investing in your fund are spelled out in the prospectus.
See the Glossary for definitions of investment terms used in this report.
About the cover: No matter what language you speak, Vanguard has one consistent message and set of principles. Our primary focus is on you, our clients. We conduct our business with integrity as a faithful steward of your assets. This message is shown translated into seven languages, reflecting our expanding global presence.
Your Fund’s Performance at a Glance
• Vanguard Russell 3000 Index Fund, which represents the broad U.S. stock market, returned about 11% for the 12 months ended August 31, 2016. The fund’s return was in line with that of its benchmark index and exceeded the average return of its multi-capitalization core peers.
• In general, large-cap stocks outperformed small-cap stocks, and value stocks topped their growth brethren during the period.
• Each of the Russell 3000 Index Fund’s nine industry sectors produced positive results.
Technology stocks, which represented about 17% of the fund, contributed most to the fund’s return. Producer durables and financial services stocks also added significantly to performance.
• Health care and energy stocks posted the weakest results. In health care, biotechnology companies struggled amid regulatory and drug market challenges. In energy, equipment and services providers and alternative energy companies weighed on performance.
| Total Returns: Fiscal Year Ended August 31, 2016 | |
| Total | |
| Returns | |
| Vanguard Russell 3000 Index Fund | |
| ETF Shares | |
| Market Price | 11.11% |
| Net Asset Value | 11.20 |
| Institutional Shares | 11.28 |
| Russell 3000 Index | 11.44 |
| Multi-Cap Core Funds Average | 7.13 |
Multi-Cap Core Funds Average: Derived from data provided by Lipper, a Thomson Reuters Company.
Institutional Shares are available to certain institutional investors who meet specific administrative, service, and account-size criteria. The Vanguard ETF® Shares shown are traded on the Nasdaq exchange and are available only through brokers. The table provides ETF returns based on both the Nasdaq market price and the net asset value for a share. U.S. Pat. Nos. 6,879,964; 7,337,138; 7,720,749; 7,925,573; 8,090,646; and 8,417,623.
For the ETF Shares, the market price is determined by the midpoint of the bid-offer spread as of the closing time of the New York Stock Exchange (generally 4 p.m., Eastern time). The net asset value is also determined as of the NYSE closing time. For more information about how the ETF Shares' market prices have compared with their net asset value, visit vanguard.com, select your ETF, and then select the Price and Performance tab. The ETF premium/discount analysis there shows the percentages of days on which the ETF Shares' market price was above or below the NAV.
1
| Total Returns: Inception Through August 31, 2016 | |
| Average | |
| Annual Return | |
| Russell 3000 Index Fund ETF Shares Net Asset Value (Returns since inception: 9/20/2010) | 13.52% |
| Russell 3000 Index | 13.69 |
| Multi-Cap Core Funds Average | 11.06 |
| Multi-Cap Core Funds Average: Derived from data provided by Lipper, a Thomson Reuters Company. |
The figures shown represent past performance, which is not a guarantee of future results. (Current performance may be lower or higher than the performance data cited. For performance data current to the most recent month-end, visit our website at vanguard.com/performance.) Note, too, that both investment returns and principal value can fluctuate widely, so an investor’s shares, when sold, could be worth more or less than their original cost.
| Expense Ratios | |||
| Your Fund Compared With Its Peer Group | |||
| ETF | Institutional | Peer Group | |
| Shares | Shares | Average | |
| Russell 3000 Index Fund | 0.15% | 0.08% | 1.17% |
The fund expense ratios shown are from the prospectus dated December 22, 2015, and represent estimated costs for the current fiscal year. For the fiscal year ended August 31, 2016, the fund’s expense ratios were 0.15% for ETF Shares and 0.08% for Institutional Shares. The peer-group expense ratio is derived from data provided by Lipper, a Thomson Reuters Company, and captures information through year-end 2015.
Peer group: Multi-Cap Core Funds.
2
Chairman’s Perspective

Bill McNabb
Chairman and Chief Executive Officer
Dear Shareholder,
Even as the global economy continued to expand at a slow but sustained pace over the 12 months ended August 31, 2016, a series of disquieting developments highlighted the importance for investors of remaining disciplined.
Chief among them was “Brexit”—the British public’s vote to exit the European Union—but plenty of others moved the markets as well. We saw sharp ups and downs in the prices of oil and other commodities, choppy U.S. job numbers, shifting expectations about when the Federal Reserve might raise interest rates again, and decreases in already negative yields for European and Japanese government bonds.
Beyond being the end of the fiscal period, August marked a milestone: 40 years since Vanguard introduced the first index mutual fund. In ways that are perhaps still not fully appreciated, indexing has vastly improved investing for individuals, advisors, and institutions all over the world. Later in this letter, I’ll discuss the revolution wrought by what was initially a little-heralded new fund from a fledgling outfit in Valley Forge, Pennsylvania.
Brexit added another layer of uncertainty for investors
I think it’s fair to say that the momentous June 23 Brexit vote caught even the British off guard. Although we saw some market jitters in the run-up to the referendum, the unexpected outcome triggered a spike in
3
volatility worldwide. Stocks around the world lost 5%–10% in U.S. dollar terms in the first two trading sessions following the vote, with U.K. and European markets among the hardest hit; global bonds, though, headed in the other direction. It was a textbook illustration of the value of having a diversified portfolio.
That kind of volatility can push investors to “do something.” But some of the worst days in the stock markets are sometimes followed by some of the best—as happened at the end of June. Investors who scrambled to protect their portfolios by shedding stocks amid headlines warning of a global market meltdown may well have ended up locking in post-Brexit losses, then missing out on the strong rebound that took place just days later. Those headlines were noise that investors would have been better off tuning out. I’m pleased to say that Vanguard investors on the whole did just that—we continued to see cash flows into our funds in the days after the vote.
For the 12 months, stocks generally finished higher, with U.S. stocks up more than 11% and international stocks about 3% for U.S.-based investors.
In a surprise, bonds turned in a solid performance that few would have predicted a year ago. It seemed as if rates had fallen so far that they couldn’t go any lower, but many did. Central banks in a number of European countries and Japan set key monetary policy rates below zero.
| Market Barometer | |||
| Average Annual Total Returns | |||
| Periods Ended August 31, 2016 | |||
| One | Three | Five | |
| Year | Years | Years | |
| Stocks | |||
| Russell 1000 Index (Large-caps) | 11.69% | 12.02% | 14.60% |
| Russell 2000 Index (Small-caps) | 8.59 | 8.53 | 12.85 |
| Russell 3000 Index (Broad U.S. market) | 11.44 | 11.74 | 14.46 |
| FTSE All-World ex US Index (International) | 3.37 | 2.59 | 3.72 |
| Bonds | |||
| Barclays U.S. Aggregate Bond Index (Broad taxable market) | 5.97% | 4.37% | 3.24% |
| Barclays Municipal Bond Index (Broad tax-exempt market) | 6.88 | 6.47 | 4.80 |
| Citigroup Three-Month U.S. Treasury Bill Index | 0.18 | 0.05 | 0.06 |
| CPI | |||
| Consumer Price Index | 1.06% | 0.98% | 1.23% |
4
| When being ‘average’ is a lot better than average |
| Not only did Vanguard founder John C. Bogle launch the first index mutual fund in 1976, but |
| he also was among the first to clearly explain to the investing public the benefits of what was |
| then a novel, unproven strategy. |
| Back in 1977, in the first annual report for what was later renamed Vanguard 500 Index Fund, |
| Mr. Bogle wrote that an index fund “represents a tough and demanding ‘par.’. And if there |
| are some professionals who can ‘beat par’ more often than not—in investing or in golf—they |
| do not seem to be in the majority.” |
| Mr. Bogle’s analogy has been borne out by historical returns. As you can see in the chart |
| below, out of 1,238 actively managed large-capitalization funds, a clear majority—65%— |
| trailed the Standard & Poor’s 500 Index in average annual return over the decade ended |
| December 31, 2015. And 518 funds, or about 42% of the total number, trailed by more than |
| 1 percentage point. |
| The track record looks even more discouraging when you consider that of the 35% of funds |
| that outperformed the index, only119—or about10%in all—did so by morethan 1 percentage |
| point. The 315 others also took on risk to try to outperform the index (and likely experienced |
| greatervolatility)butcameoutaheadbylessthan1percentagepointinaverageannualreturn. |
| Over a decade, a majority of active large-cap funds lagged the S&P 500 Index |
| Based on average annual returns, 2006–2015 |
| Notes: Data based on average annual returns ofall 1,238existing actively managed large-cap funds overthe decade endedDecember 31, |
| 2015. Note thatindexfunds seekto track theperformance ofabenchmarkindexbuttypically won't“match”thebenchmark'sreturns because |
| of the costs of passive indexing. |
| Sources: Vanguard calculations, using data from Standard & Poor’s. |
| Pastperformanceisnotaguarantee offutureresults.Theperformanceofanindexis notanexactrepresentationofanyparticularinvestment, |
| asyoucannotinvestdirectlyinanindex. |
5
These policies held down short-term rates, while more muted expectations for global growth and inflation weighed on longer-term rates.
Yields in the United States weren’t quite as low as in many developed countries. The Fed raised the federal funds target rate only once, in December, to a slim 0.25%–0.5%. Further out on the maturity spectrum, the bellwether 10-year U.S. Treasury yield dropped in early July to a record low 1.36%, before moving back up a little to end the period at 1.58%. Over the 12 months, U.S. bonds returned about 6%, and international bonds returned even more—about 11%—for U.S.-based investors, again underscoring the markets’ unpredictability and the merits of diversification.
Over the years, many investors have embraced the pluses of indexing
Market upsets like Brexit aren’t rare occurrences. Fortunately, indexing has proved to be a durable behavioral tool to help keep investors from making bad financial decisions when upsets happen. In fact, this is one of indexing’s less appreciated benefits: Holding index funds as part of a broadly diversified portfolio can counterbalance that tendency to react to news headlines. When times are volatile, you’ll know you might have some exposure to a part of the market that has dropped, but also to other parts that may be holding up better.
Vanguard’s launch of the First Index Investment Trust, now Vanguard 500 Index Fund, initially met with a frosty reception. Its mandate to track the performance of a broadly diversified benchmark at a low cost seemed underwhelming to an investing public accustomed to funds that offered the chance to outperform. Investors have since come around, as experience has demonstrated the benefits of low costs and broad diversification.
Indexing accounted for about 30% of U.S. mutual fund and exchange-traded fund (ETF) assets at the end of 2015, according to the Investment Company Institute. Some now even proclaim the “triumph of indexing,” implying that it’s the only way to invest.
In our view, the rise of indexing has served to underscore an investment principle that long predates 1976: A long-term, low-cost, diversified approach gives investors the best chance for success. That’s true whether the investments you choose are indexed or actively managed—or both.
As always, thank you for investing with Vanguard.
Sincerely,
F. William McNabb III
Chairman and Chief Executive Officer
September 9, 2016
6
Russell 3000 Index Fund
Fund Profile
As of August 31, 2016
| Share-Class Characteristics | |||
| ETF | Institutional | ||
| Shares | Shares | ||
| Ticker Symbol | VTHR | VRTTX | |
| Expense Ratio1 | 0.15% | 0.08% | |
| 30-Day SEC Yield | 1.84% | 1.90% | |
| Portfolio Characteristics | |||
| DJ | |||
| U.S. | |||
| Total | |||
| Russell | Market | ||
| 3000 | FA | ||
| Fund | Index | Index | |
| Number of Stocks | 2,988 | 2,979 | 3,817 |
| Median Market Cap | $53.8B | $53.8B | $51.2B |
| Price/Earnings Ratio | 23.5x | 23.5x | 23.5x |
| Price/Book Ratio | 2.8x | 2.8x | 2.8x |
| Return on Equity | 16.8% | 16.6% | 16.6% |
| Earnings Growth | |||
| Rate | 7.5% | 7.5% | 7.5% |
| Dividend Yield | 2.0% | 2.0% | 2.0% |
| Foreign Holdings | 0.0% | 0.0% | 0.0% |
| Turnover Rate | 8% | — | — |
| Short-Term | |||
| Reserves | -0.1% | — | — |
Sector Diversification (% of equity exposure)
| DJ | |||
| U.S. | |||
| Total | |||
| Russell | Market | ||
| 3000 | FA | ||
| Fund | Index | Index | |
| Consumer Discretionary 14.1% | 14.1% | 14.2% | |
| Consumer Staples | 8.0 | 8.0 | 8.0 |
| Energy | 6.5 | 6.5 | 6.5 |
| Financial Services | 20.1 | 20.1 | 20.0 |
| Health Care | 14.0 | 14.0 | 14.0 |
| Materials & Processing | 3.9 | 3.9 | 3.9 |
| Producer Durables | 10.5 | 10.5 | 10.5 |
| Technology | 17.2 | 17.2 | 17.3 |
| Utilities | 5.7 | 5.7 | 5.6 |
| Volatility Measures | ||
| DJ | ||
| Russell | U.S. Total | |
| 3000 | Market | |
| Index | FA Index | |
| R-Squared | 1.00 | 1.00 |
| Beta | 1.00 | 1.00 |
| These measures show the degree and timing of the fund’s fluctuations compared with the indexes over 36 months. | ||
| Ten Largest Holdings (% of total net assets) | ||
| Apple Inc. | Computer | |
| Technology | 2.6% | |
| Alphabet Inc. | Computer Services | |
| Software & Systems | 2.0 | |
| Microsoft Corp. | Computer Services | |
| Software & Systems | 1.9 | |
| Exxon Mobil Corp. | Oil: Integrated | 1.6 |
| Johnson & Johnson | Pharmaceuticals | 1.4 |
| Amazon.com Inc. | Diversified Retail | 1.3 |
| General Electric Co. | Diversified | |
| Manufacturing | ||
| Operations | 1.2 | |
| Berkshire Hathaway Inc. Insurance: Multi-Line | 1.2 | |
| Facebook Inc. | Computer Services | |
| Software & Systems | 1.2 | |
| AT&T Inc. | Utilities: | |
| Telecommunications | 1.1 | |
| Top Ten | 15.5% | |
| The holdings listed exclude any temporary cash investments and equity index products. | ||
Investment Focus
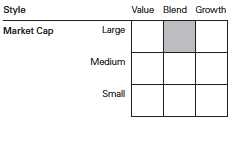
1 The expense ratios shown are from the prospectus dated December 22, 2015, and represent estimated costs for the current fiscal year. For the fiscal year ended August 31, 2016, the expense ratios were 0.15% for ETF Shares and 0.08% for Institutional Shares.
7
Russell 3000 Index Fund
Performance Summary
All of the returns in this report represent past performance, which is not a guarantee of future results that may be achieved by the fund. (Current performance may be lower or higher than the performance data cited. For performance data current to the most recent month-end, visit our website at vanguard.com/performance.) Note, too, that both investment returns and principal value can fluctuate widely, so an investor’s shares, when sold, could be worth more or less than their original cost. The returns shown do not reflect taxes that a shareholder would pay on fund distributions or on the sale of fund shares.
Cumulative Performance: September 20, 2010, Through August 31, 2016
Initial Investment of $10,000

| Average Annual Total Returns | |||||
| Periods Ended August 31, 2016 | |||||
| Since | Final Value | ||||
| One | Five | Inception | of a $10,000 | ||
| Year | Years | (9/20/2010) | Investment | ||
| Russell 3000 Index Fund*ETF Shares | |||||
| Net Asset Value | 11.20% | 14.27% | 13.52% | $21,253 | |
| Russell 3000 Index Fund*ETF Shares | |||||
| Market Price | 11.11 | 14.27 | 13.52 | 21,256 | |
| •••••••• | Russell 3000 Index | 11.44 | 14.46 | 13.69 | 21,445 |
| – – – – | Multi-Cap Core Funds Average | 7.13 | 11.74 | 11.06 | 18,663 |
| Dow Jones U.S. Total Stock Market | |||||
| Float Adjusted Index | 11.34 | 14.40 | 13.66 | 21,415 | |
| Multi-Cap Core Funds Average: Derived from data provided by Lipper, a Thomson Reuters Company. | |||||
| "Since Inception" performance is calculated from the ETF Shares’ inception date for both the fund and its comparative standards. | |||||
| Since | Final Value | |||
| One | Five | Inception | of a $5,000,000 | |
| Year | Years | (11/1/2010) | Investment | |
| Russell 3000 Index Fund Institutional Shares | 11.28% | 14.35% | 13.10% | $10,251,320 |
| Russell 3000 Index | 11.44 | 14.46 | 13.19 | 10,299,249 |
| Dow Jones U.S. Total Stock Market Float | ||||
| Adjusted Index | 11.34 | 14.40 | 13.16 | 10,283,067 |
| "Since Inception" performance is calculated from the Institutional Shares’ inception date for both the fund and its comparative standards. | ||||
See Financial Highlights for dividend and capital gains information.
8
Russell 3000 Index Fund
| Cumulative Returns of ETF Shares: September 20, 2010, Through August 31, 2016 | |||
| Since | |||
| One | Five | Inception | |
| Year | Years | (9/20/2010) | |
| Russell 3000 Index Fund ETF Shares Market Price | 11.11% | 94.79% | 112.56% |
| Russell 3000 Index Fund ETF Shares Net Asset | |||
| Value | 11.20 | 94.81 | 112.53 |
| Russell 3000 Index | 11.44 | 96.42 | 114.45 |
"Since Inception" performance is calculated from the ETF Shares’ inception date for both the fund and its comparative standards.
Fiscal-Year Total Returns (%): September 20, 2010, Through August 31, 2016

Russell 3000 Index Fund ETF Shares Net Asset Value
Russell 3000 Index
Average Annual Total Returns: Periods Ended June 30, 2016
This table presents returns through the latest calendar quarter—rather than through the end of the fiscal period.
Securities and Exchange Commission rules require that we provide this information.
| Inception | One | Five | Since | |
| Date | Year | Years | Inception | |
| ETF Shares | 9/20/2010 | |||
| Market Price | 1.86% | 11.42% | 13.14% | |
| Net Asset Value | 1.90 | 11.42 | 13.13 | |
| Institutional Shares | 11/1/2010 | 1.99 | 11.50 | 12.69 |
9
Russell 3000 Index Fund
Financial Statements
Statement of Net Assets—Investments Summary
As of August 31, 2016
This Statement summarizes the fund’s holdings by asset type. Details are reported for each of the fund’s 50 largest individual holdings and for investments that, in total for any issuer, represent more than 1% of the fund’s net assets. The total value of smaller holdings is reported as a single amount within each category.
The fund reports a complete list of its holdings in regulatory filings four times in each fiscal year, at the quarter-ends. For the second and fourth fiscal quarters, the complete listing of the fund’s holdings is available electronically on vanguard.com and on the Securities and Exchange Commission’s website (sec.gov), or you can have it mailed to you without charge by calling 800-662-7447. For the first and third fiscal quarters, the fund files the lists with the SEC on Form N-Q. Shareholders can look up the fund’s Forms N-Q on the SEC’s website. Forms N-Q may also be reviewed and copied at the SEC’s Public Reference Room (see the back cover of this report for further information).
| Market | Percentage | ||
| Value• | of Net | ||
| Shares | ($000) | Assets | |
| Common Stocks | |||
| Consumer Discretionary | |||
| * Amazon.com Inc. | 19,244 | 14,802 | 1.3% |
| Home Depot Inc. | 61,465 | 8,244 | 0.7% |
| Comcast Corp. Class A | 119,018 | 7,767 | 0.7% |
| Walt Disney Co. | 80,476 | 7,602 | 0.7% |
| Wal-Mart Stores Inc. | 75,037 | 5,361 | 0.5% |
| McDonald’s Corp. | 43,382 | 5,018 | 0.4% |
| Consumer Discretionary—Other † | 109,817 | 9.7% | |
| 158,611 | 14.0% | ||
| Consumer Staples | |||
| Procter & Gamble Co. | 131,989 | 11,524 | 1.0% |
| Coca-Cola Co. | 193,114 | 8,387 | 0.7% |
| Philip Morris International Inc. | 76,303 | 7,625 | 0.7% |
| PepsiCo Inc. | 71,425 | 7,625 | 0.7% |
| Altria Group Inc. | 92,750 | 6,130 | 0.5% |
| CVS Health Corp. | 52,993 | 4,950 | 0.4% |
| Consumer Staples—Other † | 43,523 | 3.9% | |
| 89,764 | 7.9% | ||
| Energy | |||
| Exxon Mobil Corp. | 205,256 | 17,886 | 1.6% |
| Chevron Corp. | 92,951 | 9,349 | 0.8% |
| Schlumberger Ltd. | 68,891 | 5,442 | 0.5% |
| Energy—Other † | 40,524 | 3.6% | |
| 73,201 | 6.5% | ||
| Financial Services | |||
| * Berkshire Hathaway Inc. Class B | 93,480 | 14,068 | 1.2% |
| JPMorgan Chase & Co. | 180,103 | 12,157 | 1.1% |
| Wells Fargo & Co. | 224,081 | 11,383 | 1.0% |
| Bank of America Corp. | 507,349 | 8,189 | 0.7% |
| Visa Inc. Class A | 94,279 | 7,627 | 0.7% |
10
| Russell 3000 Index Fund | |||
| Market | Percentage | ||
| Value• | of Net | ||
| Shares | ($000) | Assets | |
| Citigroup Inc. | 145,474 | 6,945 | 0.6% |
| MasterCard Inc. Class A | 47,706 | 4,610 | 0.4% |
| Financial Services—Other † | 161,109 | 14.3% | |
| 226,088 | 20.0% | ||
| Health Care | |||
| Johnson & Johnson | 136,118 | 16,244 | 1.4% |
| Pfizer Inc. | 297,266 | 10,345 | 0.9% |
| Merck & Co. Inc. | 137,417 | 8,628 | 0.8% |
| Amgen Inc. | 37,551 | 6,386 | 0.6% |
| UnitedHealth Group Inc. | 46,410 | 6,314 | 0.6% |
| Medtronic plc | 69,109 | 6,015 | 0.5% |
| Gilead Sciences Inc. | 66,279 | 5,195 | 0.5% |
| AbbVie Inc. | 79,798 | 5,115 | 0.4% |
| Bristol-Myers Squibb Co. | 82,359 | 4,727 | 0.4% |
| * Allergan plc | 19,543 | 4,584 | 0.4% |
| * Celgene Corp. | 37,943 | 4,050 | 0.4% |
| Health Care—Other † | 80,153 | 7.1% | |
| 157,756 | 14.0% | ||
| Materials & Processing † | 43,721 | 3.9% | |
| Other1 | |||
| * Leap Wireless International Inc. CVR | 1,716 | 4 | 0.0% |
| Other—Other † | 11 | 0.0% | |
| 15 | 0.0% | ||
| Producer Durables | |||
| General Electric Co. | 451,516 | 14,105 | 1.2% |
| 3M Co. | 29,176 | 5,230 | 0.5% |
| Honeywell International Inc. | 37,543 | 4,382 | 0.4% |
| United Technologies Corp. | 38,285 | 4,075 | 0.4% |
| Union Pacific Corp. | 41,831 | 3,996 | 0.3% |
| Producer Durables—Other † | 86,651 | 7.7% | |
| 118,439 | 10.5% | ||
| Technology | |||
| Apple Inc. | 271,436 | 28,799 | 2.6% |
| Microsoft Corp. | 374,160 | 21,499 | 1.9% |
| * Facebook Inc. Class A | 110,923 | 13,990 | 1.2% |
| * Alphabet Inc. Class A | 14,433 | 11,400 | 1.0% |
| * Alphabet Inc. Class C | 14,720 | 11,291 | 1.0% |
| Intel Corp. | 234,292 | 8,409 | 0.8% |
| Cisco Systems Inc. | 247,113 | 7,769 | 0.7% |
| International Business Machines Corp. | 43,690 | 6,941 | 0.6% |
| Oracle Corp. | 146,880 | 6,054 | 0.5% |
| QUALCOMM Inc. | 72,521 | 4,574 | 0.4% |
| Technology—Other † | 73,130 | 6.5% | |
| 193,856 | 17.2% | ||
| Utilities | |||
| AT&T Inc. | 304,766 | 12,459 | 1.1% |
| Verizon Communications Inc. | 202,306 | 10,587 | 1.0% |
| Utilities—Other † | 40,814 | 3.6% | |
| 63,860 | 5.7% | ||
| Total Common Stocks (Cost $1,058,966) | 1,125,311 | 99.7%2 | |
11
| Russell 3000 Index Fund | ||||
| Market | Percentage | |||
| Value• | of Net | |||
| Coupon | Shares | ($000) | Assets | |
| Temporary Cash Investments | ||||
| Money Market Fund | ||||
| 3,4 Vanguard Market Liquidity Fund | 0.612% | 18,212 | 1,822 | 0.2% |
| 5U.S. Government and Agency Obligations † | 1,000 | 0.1% | ||
| Total Temporary Cash Investments (Cost $2,821) | 2,822 | 0.3%2 | ||
| 6Total Investments (Cost $1,061,787) | 1,128,133 | 100.0% | ||
| Amount | ||||
| ($000) | ||||
| Other Assets and Liabilities | ||||
| Other Assets | ||||
| Investment in Vanguard | 86 | |||
| Receivables for Investment Securities Sold | 4,546 | |||
| Receivables for Accrued Income | 2,240 | |||
| Receivables for Capital Shares Issued | 10 | |||
| Total Other Assets | 6,882 | 0.6% | ||
| Liabilities | ||||
| Payables for Investment Securities Purchased | (4,451) | |||
| Collateral for Securities on Loan | (1,642) | |||
| Payables for Capital Shares Redeemed | (10) | |||
| Payables to Vanguard | (261) | |||
| Other Liabilities | (75) | |||
| Total Liabilities | (6,439) | (0.6%) | ||
| Net Assets | 1,128,576 | 100.0% | ||
| At August 31, 2016, net assets consisted of: | ||||
| Amount | ||||
| ($000) | ||||
| Paid-in Capital | 1,080,349 | |||
| Undistributed Net Investment Income | 4,554 | |||
| Accumulated Net Realized Losses | (22,697) | |||
| Unrealized Appreciation (Depreciation) | ||||
| Investment Securities | 66,346 | |||
| Futures Contracts | 24 | |||
| Net Assets | 1,128,576 | |||
12
| Russell 3000 Index Fund | |
| Amount | |
| ($000) | |
| ETF Shares—Net Assets | |
| Applicable to 2,825,000 outstanding $.001 par value shares of | |
| beneficial interest (unlimited authorization) | 281,849 |
| Net Asset Value Per Share—ETF Shares | $99.77 |
| Institutional Shares—Net Assets | |
| Applicable to 4,384,808 outstanding $.001 par value shares of | |
| beneficial interest (unlimited authorization) | 846,727 |
| Net Asset Value Per Share—Institutional Shares | $193.10 |
• See Note A in Notes to Financial Statements.
* Non-income-producing security.
† Represents the aggregate value, by category, of securities that are not among the 50 largest holdings and, in total for any issuer, represent 1% or less of net assets.
1 “Other” represents securities that are not classified by the fund’s benchmark index.
2 The fund invests a portion of its cash reserves in equity markets through the use of index futures contracts. After giving effect to futures investments, the fund’s effective common stock and temporary cash investment positions represent 100.0% and 0.0%, respectively, of net assets.
3 Affiliated money market fund available only to Vanguard funds and certain trusts and accounts managed by Vanguard. Rate shown is the 7-day yield.
4 Includes $1,642,000 of collateral received for securities on loan.
5 Securities with a value of $400,000 have been segregated as initial margin for open futures contracts.
6 The total value of securities on loan is $1,525,000.
CVR—Contingent Value Rights.
See accompanying Notes, which are an integral part of the Financial Statements.
13
| Russell 3000 Index Fund | |
| Statement of Operations | |
| Year Ended | |
| August 31, 2016 | |
| ($000) | |
| Investment Income | |
| Income | |
| Dividends | 21,152 |
| Interest1 | 17 |
| Securities Lending—Net | 141 |
| Total Income | 21,310 |
| Expenses | |
| The Vanguard Group—Note B | |
| Investment Advisory Services | 169 |
| Management and Administrative—ETF Shares | 175 |
| Management and Administrative—Institutional Shares | 151 |
| Marketing and Distribution—ETF Shares | 17 |
| Marketing and Distribution—Institutional Shares | 22 |
| Custodian Fees | 386 |
| Auditing Fees | 32 |
| Shareholders’ Reports—ETF Shares | 7 |
| Shareholders’ Reports—Institutional Shares | — |
| Total Expenses | 959 |
| Net Investment Income | 20,351 |
| Realized Net Gain (Loss) | |
| Investment Securities Sold1 | 37,071 |
| Futures Contracts | 519 |
| Realized Net Gain (Loss) | 37,590 |
| Change in Unrealized Appreciation (Depreciation) | |
| Investment Securities | 58,695 |
| Futures Contracts | (112) |
| Change in Unrealized Appreciation (Depreciation) | 58,583 |
| Net Increase (Decrease) in Net Assets Resulting from Operations | 116,524 |
1 Interest income and realized net gain (loss) from an affiliated company of the fund were $16,000 and $0, respectively.
See accompanying Notes, which are an integral part of the Financial Statements.
14
| Russell 3000 Index Fund | ||
| Statement of Changes in Net Assets | ||
| Year Ended August 31, | ||
| 2016 | 2015 | |
| ($000) | ($000) | |
| Increase (Decrease) in Net Assets | ||
| Operations | ||
| Net Investment Income | 20,351 | 14,582 |
| Realized Net Gain (Loss) | 37,590 | 113,500 |
| Change in Unrealized Appreciation (Depreciation) | 58,583 | (135,902) |
| Net Increase (Decrease) in Net Assets Resulting from Operations | 116,524 | (7,820) |
| Distributions | ||
| Net Investment Income | ||
| ETF Shares | (3,948) | (2,304) |
| Institutional Shares | (15,210) | (11,310) |
| Realized Capital Gain | ||
| ETF Shares | — | — |
| Institutional Shares | — | — |
| Total Distributions | (19,158) | (13,614) |
| Capital Share Transactions | ||
| ETF Shares | 90,853 | 53,219 |
| Institutional Shares | (16,462) | 204,190 |
| Net Increase (Decrease) from Capital Share Transactions | 74,391 | 257,409 |
| Total Increase (Decrease) | 171,757 | 235,975 |
| Net Assets | ||
| Beginning of Period | 956,819 | 720,844 |
| End of Period1 | 1,128,576 | 956,819 |
1 Net Assets—End of Period includes undistributed (overdistributed) net investment income of $4,554,000 and $3,357,000.
See accompanying Notes, which are an integral part of the Financial Statements.
15
| Russell 3000 Index Fund | |||||
| Financial Highlights | |||||
| ETF Shares | |||||
| For a Share Outstanding | Year Ended August 31, | ||||
| Throughout Each Period | 2016 | 2015 | 2014 | 2013 | 2012 |
| Net Asset Value, Beginning of Period | $91.43 | $92.82 | $75.79 | $64.28 | $55.97 |
| Investment Operations | |||||
| Net Investment Income | 1.850 | 1.649 | 1.485 | 1.313 | 1.037 |
| Net Realized and Unrealized Gain (Loss) | |||||
| on Investments | 8.248 | (1.396) | 17.004 | 11.484 | 8.255 |
| Total from Investment Operations | 10.098 | .253 | 18.489 | 12.797 | 9.292 |
| Distributions | |||||
| Dividends from Net Investment Income | (1.758) | (1.643) | (1.459) | (1.287) | (.982) |
| Distributions from Realized Capital Gains | — | — | — | — | — |
| Total Distributions | (1.758) | (1.643) | (1.459) | (1.287) | (.982) |
| Net Asset Value, End of Period | $99.77 | $91.43 | $92.82 | $75.79 | $64.28 |
| Total Return | 11.20% | 0.21% | 24.58% | 20.14% | 16.80% |
| Ratios/Supplemental Data | |||||
| Net Assets, End of Period (Millions) | $282 | $169 | $121 | $76 | $39 |
| Ratio of Total Expenses to | |||||
| Average Net Assets | 0.15% | 0.15% | 0.15% | 0.15% | 0.15% |
| Ratio of Net Investment Income to | |||||
| Average Net Assets | 1.98% | 1.76% | 1.77% | 2.03% | 1.99% |
| Portfolio Turnover Rate1 | 8% | 4% | 8% | 16% | 20% |
1 Excludes the value of portfolio securities received or delivered as a result of in-kind purchases or redemptions of the fund’s capital shares, including ETF Creation Units.
See accompanying Notes, which are an integral part of the Financial Statements.
16
| Russell 3000 Index Fund | |||||
| Financial Highlights | |||||
| Institutional Shares | |||||
| For a Share Outstanding | Year Ended August 31, | ||||
| Throughout Each Period | 2016 | 2015 | 2014 | 2013 | 2012 |
| Net Asset Value, Beginning of Period | $176.98 | $179.64 | $146.68 | $124.40 | $108.32 |
| Investment Operations | |||||
| Net Investment Income | 3.689 | 3.318 | 2.986 | 2.630 | 2.087 |
| Net Realized and Unrealized Gain (Loss) | |||||
| on Investments | 15.965 | (2.689) | 32.903 | 22.226 | 15.972 |
| Total from Investment Operations | 19.654 | .629 | 35.889 | 24.856 | 18.059 |
| Distributions | |||||
| Dividends from Net Investment Income | (3.534) | (3.289) | (2.929) | (2.576) | (1.979) |
| Distributions from Realized Capital Gains | — | — | — | — | — |
| Total Distributions | (3.534) | (3.289) | (2.929) | (2.576) | (1.979) |
| Net Asset Value, End of Period | $193.10 | $176.98 | $179.64 | $146.68 | $124.40 |
| Total Return | 11.28% | 0.30% | 24.66% | 20.21% | 16.89% |
| Ratios/Supplemental Data | |||||
| Net Assets, End of Period (Millions) | $847 | $788 | $600 | $426 | $126 |
| Ratio of Total Expenses to | |||||
| Average Net Assets | 0.08% | 0.08% | 0.08% | 0.08% | 0.08% |
| Ratio of Net Investment Income to | |||||
| Average Net Assets | 2.05% | 1.83% | 1.84% | 2.10% | 2.06% |
| Portfolio Turnover Rate1 | 8% | 4% | 8% | 16% | 20% |
1 Excludes the value of portfolio securities received or delivered as a result of in-kind purchases or redemptions of the fund’s capital shares, including ETF Creation Units.
See accompanying Notes, which are an integral part of the Financial Statements.
17
Russell 3000 Index Fund
Notes to Financial Statements
Vanguard Russell 3000 Index Fund is registered under the Investment Company Act of 1940 as an open-end investment company, or mutual fund. The fund offers two classes of shares: ETF Shares and Institutional Shares. ETF Shares are listed for trading on Nasdaq; they can be purchased and sold through a broker. Institutional Shares are designed for investors who meet certain administrative, service, and account-size criteria.
A. The following significant accounting policies conform to generally accepted accounting principles for U.S. investment companies. The fund consistently follows such policies in preparing its financial statements.
1. Security Valuation: Securities are valued as of the close of trading on the New York Stock Exchange (generally 4 p.m., Eastern time) on the valuation date. Equity securities are valued at the latest quoted sales prices or official closing prices taken from the primary market in which each security trades; such securities not traded on the valuation date are valued at the mean of the latest quoted bid and asked prices. Securities for which market quotations are not readily available, or whose values have been materially affected by events occurring before the fund’s pricing time but after the close of the securities’ primary markets, are valued by methods deemed by the board of trustees to represent fair value. Investments in Vanguard Market Liquidity Fund are valued at that fund’s net asset value. Temporary cash investments acquired over 60 days to maturity are valued using the latest bid prices or using valuations based on a matrix system (which considers such factors as security prices, yields, maturities, and ratings), both as furnished by independent pricing services. Other temporary cash investments are valued at amortized cost, which approximates market value.
2. Futures Contracts: The fund uses index futures contracts to a limited extent, with the objectives of maintaining full exposure to the stock market, enhancing returns, maintaining liquidity, and minimizing transaction costs. The fund may purchase futures contracts to immediately invest incoming cash in the market, or sell futures in response to cash outflows, thereby simulating a fully invested position in the underlying index while maintaining a cash balance for liquidity. The fund may seek to enhance returns by using futures contracts instead of the underlying securities when futures are believed to be priced more attractively than the underlying securities. The primary risks associated with the use of futures contracts are imperfect correlation between changes in market values of stocks held by the fund and the prices of futures contracts, and the possibility of an illiquid market. Counterparty risk involving futures is mitigated because a regulated clearinghouse is the counterparty instead of the clearing broker. To further mitigate counterparty risk, the fund trades futures contracts on an exchange, monitors the financial strength of its clearing brokers and clearinghouse, and has entered into clearing agreements with its clearing brokers. The clearinghouse imposes initial margin requirements to secure the fund’s performance and requires daily settlement of variation margin representing changes in the market value of each contract.
Futures contracts are valued at their quoted daily settlement prices. The aggregate settlement values of the contracts are not recorded in the Statement of Net Assets. Fluctuations in the value of the contracts are recorded in the Statement of Net Assets as an asset (liability) and in the Statement of Operations as unrealized appreciation (depreciation) until the contracts are closed, when they are recorded as realized futures gains (losses).
During the year ended August 31, 2016, the fund’s average investments in long and short futures contracts represented less than 1% and 0% of net assets, respectively, based on the average of aggregate settlement values at each quarter-end during the period.
18
Russell 3000 Index Fund
3. Federal Income Taxes: The fund intends to continue to qualify as a regulated investment company and distribute all of its taxable income. Management has analyzed the fund’s tax positions taken for all open federal income tax years (August 31, 2013–2016), and has concluded that no provision for federal income tax is required in the fund’s financial statements.
4. Distributions: Distributions to shareholders are recorded on the ex-dividend date.
5. Securities Lending: To earn additional income, the fund lends its securities to qualified institutional borrowers. Security loans are subject to termination by the fund at any time, and are required to be secured at all times by collateral in an amount at least equal to the market value of securities loaned. Daily market fluctuations could cause the value of loaned securities to be more or less than the value of the collateral received. When this occurs, the collateral is adjusted and settled on the next business day. The fund further mitigates its counterparty risk by entering into securities lending transactions only with a diverse group of prequalified counterparties, monitoring their financial strength, and entering into master securities lending agreements with its counterparties. The master securities lending agreements provide that, in the event of a counterparty’s default (including bankruptcy), the fund may terminate any loans with that borrower, determine the net amount owed, and sell or retain the collateral up to the net amount owed to the fund; however, such actions may be subject to legal proceedings. While collateral mitigates counterparty risk, in the absence of a default the fund may experience delays and costs in recovering the securities loaned. The fund invests cash collateral received in Vanguard Market Liquidity Fund, and records a liability in the Statement of Net Assets for the return of the collateral, during the period the securities are on loan. Securities lending income represents fees charged to borrowers plus income earned on invested cash collateral, less expenses associated with the loan. During the term of the loan, the fund is entitled to all distributions made on or in respect of the loaned securities.
6. Credit Facility: The fund and certain other funds managed by The Vanguard Group (“Vanguard”) participate in a $3.1 billion committed credit facility provided by a syndicate of lenders pursuant to a credit agreement that may be renewed annually; each fund is individually liable for its borrowings, if any, under the credit facility. Borrowings may be utilized for temporary and emergency purposes, and are subject to the fund’s regulatory and contractual borrowing restrictions. The participating funds are charged administrative fees and an annual commitment fee of 0.10% of the undrawn amount of the facility; these fees are allocated to the funds based on a method approved by the fund’s board of trustees and included in Management and Administrative expenses on the fund’s Statement of Operations. Any borrowings under this facility bear interest at a rate based upon the higher of the one-month London Interbank Offered Rate, federal funds effective rate, or overnight bank funding rate plus an agreed-upon spread.
The fund had no borrowings outstanding at August 31, 2016, or at any time during the period then ended.
7. Other: Dividend income is recorded on the ex-dividend date. Interest income includes income distributions received from Vanguard Market Liquidity Fund and is accrued daily. Premiums and discounts on debt securities purchased are amortized and accreted, respectively, to interest income over the lives of the respective securities. Security transactions are accounted for on the date securities are bought or sold. Costs used to determine realized gains (losses) on the sale of investment securities are those of the specific securities sold.
Each class of shares has equal rights as to assets and earnings, except that each class separately bears certain class-specific expenses related to maintenance of shareholder accounts (included in Management and Administrative expenses) and shareholder reporting. Marketing and distribution
19
Russell 3000 Index Fund
expenses are allocated to each class of shares based on a method approved by the board of trustees. Income, other non-class-specific expenses, and gains and losses on investments are allocated to each class of shares based on its relative net assets.
B. In accordance with the terms of a Funds’ Service Agreement (the “FSA”) between Vanguard and the fund, Vanguard furnishes to the fund investment advisory, corporate management, administrative, marketing, and distribution services at Vanguard’s cost of operations (as defined by the FSA). These costs of operations are allocated to the fund based on methods and guidelines approved by the board of trustees. Vanguard does not require reimbursement in the current period for certain costs of operations (such as deferred compensation/benefits and risk/insurance costs); the fund’s liability for these costs of operations is included in Payables to Vanguard on the Statement of Net Assets.
Upon the request of Vanguard, the fund may invest up to 0.40% of its net assets as capital in Vanguard. At August 31, 2016, the fund had contributed to Vanguard capital in the amount of $86,000, representing 0.01% of the fund’s net assets and 0.03% of Vanguard’s capitalization. The fund’s trustees and officers are also directors and employees, respectively, of Vanguard.
C. Various inputs may be used to determine the value of the fund’s investments. These inputs are summarized in three broad levels for financial statement purposes. The inputs or methodologies used to value securities are not necessarily an indication of the risk associated with investing in those securities.
Level 1—Quoted prices in active markets for identical securities.
Level 2—Other significant observable inputs (including quoted prices for similar securities, interest rates, prepayment speeds, credit risk, etc.).
Level 3—Significant unobservable inputs (including the fund’s own assumptions used to determine the fair value of investments).
The following table summarizes the market value of the fund’s investments as of August 31, 2016, based on the inputs used to value them:
| Level 1 | Level 2 | Level 3 | |
| Investments | ($000) | ($000) | ($000) |
| Common Stocks | 1,125,295 | — | 16 |
| Temporary Cash Investments | 1,822 | 1,000 | — |
| Futures Contracts—Liabilities1 | (7) | — | — |
| Total | 1,127,110 | 1,000 | 16 |
| 1 Represents variation margin on the last day of the reporting period. |
D. At August 31, 2016, the aggregate settlement value of open futures contracts and the related unrealized appreciation (depreciation) were:
| ($000) | ||||
| Aggregate | ||||
| Number of | Settlement | Unrealized | ||
| Long (Short) | Value | Appreciation | ||
| Futures Contracts | Expiration | Contracts | Long (Short) | (Depreciation) |
| E-mini S&P 500 Index | September 2016 | 25 | 2,712 | 24 |
Unrealized appreciation (depreciation) on open futures contracts is required to be treated as realized gain (loss) for tax purposes.
20
Russell 3000 Index Fund
E. Distributions are determined on a tax basis and may differ from net investment income and realized capital gains for financial reporting purposes. Differences may be permanent or temporary. Permanent differences are reclassified among capital accounts in the financial statements to reflect their tax character. Temporary differences arise when certain items of income, expense, gain, or loss are recognized in different periods for financial statement and tax purposes. These differences will reverse at some time in the future. Differences in classification may also result from the treatment of short-term gains as ordinary income for tax purposes.
During the year ended August 31, 2016, the fund realized $58,209,000 of net capital gains resulting from in-kind redemptions—in which shareholders exchanged fund shares for securities held by the fund rather than for cash. Because such gains are not taxable to the fund, and are not distributed to shareholders, they have been reclassified from accumulated net realized losses to paid-in capital.
For tax purposes, at August 31, 2016, the fund had $4,753,000 of ordinary income available for distribution. The fund had available capital losses totaling $22,673,000 that may be carried forward indefinitely to offset future net capital gains.
At August 31, 2016, the cost of investment securities for tax purposes was $1,061,789,000. Net unrealized appreciation of investment securities for tax purposes was $66,344,000, consisting of unrealized gains of $110,677,000 on securities that had risen in value since their purchase and $44,333,000 in unrealized losses on securities that had fallen in value since their purchase.
F. During the year ended August 31, 2016, the fund purchased $392,394,000 of investment securities and sold $311,444,000 of investment securities, other than temporary cash investments. Purchases and sales include $123,777,000 and $235,295,000, respectively, in connection with in-kind purchases and redemptions of the fund’s capital shares.
| G. Capital share transactions for each class of shares were: | ||||
| Year Ended August 31, | ||||
| 2016 | 2015 | |||
| Amount | Shares | Amount | Shares | |
| ($000) | (000) | ($000) | (000) | |
| ETF Shares | ||||
| Issued | 356,389 | 3,775 | 618,159 | 6,450 |
| Issued in Lieu of Cash Distributions | — | — | — | — |
| Redeemed | (265,536) | (2,800) | (564,940) | (5,900) |
| Net Increase (Decrease)—ETF Shares | 90,853 | 975 | 53,219 | 550 |
| Institutional Shares | ||||
| Issued | 203,851 | 1,138 | 325,512 | 1,765 |
| Issued in Lieu of Cash Distributions | 14,875 | 83 | 11,310 | 62 |
| Redeemed | (235,188) | (1,287) | (132,632) | (717) |
| Net Increase (Decrease) —Institutional Shares | (16,462) | (66) | 204,190 | 1,110 |
H. Management has determined that no material events or transactions occurred subsequent to August 31, 2016, that would require recognition or disclosure in these financial statements.
21
Report of Independent Registered Public Accounting Firm
To the Board of Trustees of Vanguard Scottsdale Funds and the Shareholders of Vanguard Russell 3000 Index Fund:
In our opinion, the accompanying statement of net assets—investments summary and the related statements of operations and of changes in net assets and the financial highlights present fairly, in all material respects, the financial position of Vanguard Russell 3000 Index Fund (constituting a separate portfolio of Vanguard Scottsdale Funds, hereafter referred to as the “Fund”) at August 31, 2016, the results of its operations for the year then ended, the changes in its net assets for each of the two years in the period then ended, and the financial highlights for each of the five years in the period then ended, in conformity with accounting principles generally accepted in the United States of America. These financial statements and financial highlights (hereafter referred to as “financial statements”) are the responsibility of the Fund’s management. Our responsibility is to express an opinion on these financial statements based on our audits. We conducted our audits of these financial statements in accordance with the standards of the Public Company Accounting Oversight Board (United States). Those standards require that we plan and perform the audit to obtain reasonable assurance about whether the financial statements are free of material misstatement. An audit includes examining, on a test basis, evidence supporting the amounts and disclosures in the financial statements, assessing the accounting principles used and significant estimates made by management, and evaluating the overall financial statement presentation. We believe that our audits, which included confirmation of securities at August 31, 2016 by correspondence with the custodian and brokers and by agreement to the underlying ownership records of the transfer agent, provide a reasonable basis for our opinion.
/s/PricewaterhouseCoopers LLP
Philadelphia, Pennsylvania
October 18, 2016
Special 2016 tax information (unaudited) for Vanguard Russell 3000 Index Fund
This information for the fiscal year ended August 31, 2016, is included pursuant to provisions of the Internal Revenue Code.
The fund distributed $19,158,000 of qualified dividend income to shareholders during the fiscal year.
For corporate shareholders, 92.0% of investment income (dividend income plus short-term gains, if any) qualifies for the dividends-received deduction.
22
Your Fund’s After-Tax Returns
This table presents returns for your fund both before and after taxes. The after-tax returns are shown in two ways: (1) assuming that an investor owned the fund during the entire period and paid taxes on the fund’s distributions, and (2) assuming that an investor paid taxes on the fund’s distributions and sold all shares at the end of each period.
Calculations are based on the highest individual federal income tax and capital gains tax rates in effect at the times of the distributions and the hypothetical sales. State and local taxes were not considered. After-tax returns reflect any qualified dividend income, using actual prior-year figures and estimates for 2016. (In the example, returns after the sale of fund shares may be higher than those assuming no sale. This occurs when the sale would have produced a capital loss. The calculation assumes that the investor received a tax deduction for the loss.)
The table shows returns for ETF Shares only; returns for other share classes will differ. Please note that your actual after-tax returns will depend on your tax situation and may differ from those shown. Also note that if you own the fund in a tax-deferred account, such as an individual retirement account or a 401(k) plan, this information does not apply to you. Such accounts are not subject to current taxes.
Finally, keep in mind that a fund’s performance—whether before or after taxes—does not guarantee future results.
Average Annual Total Returns: Russell 3000 Index Fund ETF Shares
Periods Ended August 31, 2016
| Since | |||
| One | Five | Inception | |
| Year | Years | (9/20/2010) | |
| Returns Before Taxes | 11.20% | 14.27% | 13.52% |
| Returns After Taxes on Distributions | 10.70 | 13.84 | 13.13 |
| Returns After Taxes on Distributions and Sale of Fund Shares | 6.70 | 11.45 | 10.94 |
23
About Your Fund’s Expenses
As a shareholder of the fund, you incur ongoing costs, which include costs for portfolio management, administrative services, and shareholder reports (like this one), among others. Operating expenses, which are deducted from a fund’s gross income, directly reduce the investment return of the fund.
A fund’s expenses are expressed as a percentage of its average net assets. This figure is known as the expense ratio. The following examples are intended to help you understand the ongoing costs (in dollars) of investing in your fund and to compare these costs with those of other mutual funds. The examples are based on an investment of $1,000 made at the beginning of the period shown and held for the entire period.
The accompanying table illustrates your fund’s costs in two ways:
• Based on actual fund return. This section helps you to estimate the actual expenses that you paid over the period. The ”Ending Account Value“ shown is derived from the fund‘s actual return, and the third column shows the dollar amount that would have been paid by an investor who started with $1,000 in the fund. You may use the information here, together with the amount you invested, to estimate the expenses that you paid over the period.
To do so, simply divide your account value by $1,000 (for example, an $8,600 account value divided by $1,000 = 8.6), then multiply the result by the number given for your fund under the heading ”Expenses Paid During Period.“
• Based on hypothetical 5% yearly return. This section is intended to help you compare your fund‘s costs with those of other mutual funds. It assumes that the fund had a yearly return of 5% before expenses, but that the expense ratio is unchanged. In this case—because the return used is not the fund’s actual return—the results do not apply to your investment. The example is useful in making comparisons because the Securities and Exchange Commission requires all mutual funds to calculate expenses based on a 5% return. You can assess your fund’s costs by comparing this hypothetical example with the hypothetical examples that appear in shareholder reports of other funds.
Note that the expenses shown in the table are meant to highlight and help you compare ongoing costs only and do not reflect transaction costs incurred by the fund for buying and selling securities. Further, the expenses do not include any purchase, redemption, or account service fees described in the fund prospectus. If such fees were applied to your account, your costs would be higher. Your fund does not carry a “sales load.”
The calculations assume no shares were bought or sold during the period. Your actual costs may have been higher or lower, depending on the amount of your investment and the timing of any purchases or redemptions.
You can find more information about the fund’s expenses, including annual expense ratios, in the Financial Statements section of this report. For additional information on operating expenses and other shareholder costs, please refer to your fund’s current prospectus.
24
| Six Months Ended August 31, 2016 | |||
| Beginning | Ending | Expenses | |
| Account Value | Account Value | Paid During | |
| Russell 3000 Index Fund | 2/29/2016 | 8/31/2016 | Period |
| Based on Actual Fund Return | |||
| ETF Shares | $1,000.00 | $1,142.79 | $0.86 |
| Institutional Shares | 1,000.00 | 1,143.21 | 0.49 |
| Based on Hypothetical 5% Yearly Return | |||
| ETF Shares | $1,000.00 | $1,024.33 | $0.81 |
| Institutional Shares | 1,000.00 | 1,024.68 | 0.46 |
The calculations are based on expenses incurred in the most recent six-month period. The fund’s annualized six-month expense ratios for that period are 0.16% for ETF Shares and 0.09% for Institutional Shares. The dollar amounts shown as ”Expenses Paid” are equal to the annualized expense ratio multiplied by the average account value over the period, multiplied by the number of days in the most recent six-month period, then divided by the number of days in the most recent 12-month period (184/366).
25
Trustees Approve Advisory Arrangement
The board of trustees of Vanguard Russell 3000 Index Fund has renewed the fund’s investment advisory arrangement with The Vanguard Group, Inc. (Vanguard). Vanguard—through its Equity Index Group—serves as investment advisor to the fund. The board determined that continuing the fund’s internalized management structure was in the best interests of the fund and its shareholders.
The board based its decision upon an evaluation of the advisor’s investment staff, portfolio management process, and performance. This evaluation included information provided to the board by Vanguard’s Portfolio Review Department, which is responsible for fund and advisor oversight and product management. The Portfolio Review Department met regularly with the advisor and made monthly presentations to the board during the fiscal year directing the board’s focus to relevant information and topics.
The board, or an investment committee made up of board members, also received information throughout the year through advisor presentations. For each advisor presentation, the board was provided with letters and reports that included information about, among other things, the advisory firm and the advisor’s assessment of the investment environment, portfolio performance, and portfolio characteristics.
In addition, the board received monthly reports, which included a Market and Economic Report, a Fund Dashboard Monthly Summary, and a Fund Performance Report.
Prior to their meeting, the trustees were provided with a memo and materials that summarized the information they had received over the course of the year. They also considered the factors discussed below, among others. However, no single factor determined whether the board approved the arrangement. Rather, it was the totality of the circumstances that drove the board’s decision.
Nature, extent, and quality of services
The board reviewed the quality of the fund’s investment management services over both the short and long term, and took into account the organizational depth and stability of the advisor. The board considered that Vanguard has been managing investments for more than three decades. The Equity Index Group adheres to a sound, disciplined investment management process; the team has considerable experience, stability, and depth.
The board concluded that Vanguard’s experience, stability, depth, and performance, among other factors, warranted continuation of the advisory arrangement.
Investment performance
The board considered the short- and long-term performance of the fund, including any periods of outperformance or underperformance relative to its target index and peer group. The board concluded that the performance was such that the advisory arrangement should continue. Information about the fund’s most recent performance can be found in the Performance Summary section of this report.
26
Cost
The board concluded that the fund’s expense ratio was well below the average expense ratio charged by funds in its peer group and that the fund’s advisory expenses were also well below its peer-group average. Information about the fund’s expenses appears in the About Your Fund’s Expenses section of the report as well as in the Financial Statements section.
The board does not conduct a profitability analysis of Vanguard, because of Vanguard’s unique “at-cost” structure. Unlike most other mutual fund management companies, Vanguard is owned by the funds it oversees, and produces “profits” only in the form of reduced expenses for fund shareholders.
The benefit of economies of scale
The board concluded that the fund’s at-cost arrangement with Vanguard ensures that the fund will realize economies of scale as it grows, with the cost to shareholders declining as fund assets increase.
The board will consider whether to renew the advisory arrangement again after a one-year period.
27
Glossary
30-Day SEC Yield. A fund’s 30-day SEC yield is derived using a formula specified by the U.S. Securities and Exchange Commission. Under the formula, data related to the fund’s security holdings in the previous 30 days are used to calculate the fund’s hypothetical net income for that period, which is then annualized and divided by the fund’s estimated average net assets over the calculation period. For the purposes of this calculation, a security’s income is based on its current market yield to maturity (for bonds), its actual income (for asset-backed securities), or its projected dividend yield (for stocks). Because the SEC yield represents hypothetical annualized income, it will differ—at times significantly—from the fund’s actual experience. As a result, the fund’s income distributions may be higher or lower than implied by the SEC yield.
Beta. A measure of the magnitude of a fund’s past share-price fluctuations in relation to the ups and downs of a given market index. The index is assigned a beta of 1.00. Compared with a given index, a fund with a beta of 1.20 typically would have seen its share price rise or fall by 12% when the index rose or fell by 10%. For this report, beta is based on returns over the past 36 months for both the fund and the index. Note that a fund’s beta should be reviewed in conjunction with its R-squared (see definition). The lower the R-squared, the less correlation there is between the fund and the index, and the less reliable beta is as an indicator of volatility.
Dividend Yield. Dividend income earned by stocks, expressed as a percentage of the aggregate market value (or of net asset value, for a fund). The yield is determined by dividing the amount of the annual dividends by the aggregate value (or net asset value) at the end of the period. For a fund, the dividend yield is based solely on stock holdings and does not include any income produced by other investments.
Earnings Growth Rate. The average annual rate of growth in earnings over the past five years for the stocks now in a fund.
Equity Exposure. A measure that reflects a fund’s investments in stocks and stock futures. Any holdings in short-term reserves are excluded.
Expense Ratio. A fund’s total annual operating expenses expressed as a percentage of the fund’s average net assets. The expense ratio includes management and administrative expenses, but does not include the transaction costs of buying and selling portfolio securities.
Foreign Holdings. The percentage of a fund represented by securities or depositary receipts of companies based outside the United States.
Inception Date. The date on which the assets of a fund (or one of its share classes) are first invested in accordance with the fund’s investment objective. For funds with a subscription period, the inception date is the day after that period ends. Investment performance is measured from the inception date.
Median Market Cap. An indicator of the size of companies in which a fund invests; the midpoint of market capitalization (market price x shares outstanding) of a fund’s stocks, weighted by the proportion of the fund’s assets invested in each stock. Stocks representing half of the fund’s assets have market capitalizations above the median, and the rest are below it.
Price/Book Ratio. The share price of a stock divided by its net worth, or book value, per share. For a fund, the weighted average price/book ratio of the stocks it holds.
28
Price/Earnings Ratio. The ratio of a stock’s current price to its per-share earnings over the past year. For a fund, the weighted average P/E of the stocks it holds. P/E is an indicator of market expectations about corporate prospects; the higher the P/E, the greater the expectations for a company’s future growth.
R-Squared. A measure of how much of a fund’s past returns can be explained by the returns from the market in general, as measured by a given index. If a fund’s total returns were precisely synchronized with an index’s returns, its R-squared would be 1.00. If the fund’s returns bore no relationship to the index’s returns, its R-squared would be 0. For this report, R-squared is based on returns over the past 36 months for both the fund and the index.
Return on Equity. The annual average rate of return generated by a company during the past five years for each dollar of shareholder’s equity (net income divided by shareholder’s equity). For a fund, the weighted average return on equity for the companies whose stocks it holds.
Short-Term Reserves. The percentage of a fund invested in highly liquid, short-term securities that can be readily converted to cash.
Turnover Rate. An indication of the fund’s trading activity. Funds with high turnover rates incur higher transaction costs and may be more likely to distribute capital gains (which may be taxable to investors). The turnover rate excludes in-kind transactions, which have minimal impact on costs.
29
This page intentionally left blank.
This page intentionally left blank.
The People Who Govern Your Fund
The trustees of your mutual fund are there to see that the fund is operated and managed in your best interests since, as a shareholder, you are a part owner of the fund. Your fund’s trustees also serve on the board of directors of The Vanguard Group, Inc., which is owned by the Vanguard funds and provides services to them on an at-cost basis.
A majority of Vanguard’s board members are independent, meaning that they have no affiliation with Vanguard or the funds they oversee, apart from the sizable personal investments they have made as private individuals. The independent board members have distinguished backgrounds in business, academia, and public service. Each of the trustees and executive officers oversees 198 Vanguard funds.
The following table provides information for each trustee and executive officer of the fund. The mailing address of the trustees and officers is P.O. Box 876, Valley Forge, PA 19482. More information about the trustees is in the Statement of Additional Information, which can be obtained, without charge, by contacting Vanguard at 800-662-7447, or online at vanguard.com.
InterestedTrustee1
F. William McNabb III
Born 1957. Trustee Since July 2009. Chairman of the Board. Principal Occupation(s) During the Past Five Years and Other Experience: Chairman of the Board of The Vanguard Group, Inc., and of each of the investment companies served by The Vanguard Group, since January 2010; Director of The Vanguard Group since 2008; Chief Executive Officer and President of The Vanguard Group, and of each of the investment companies served by The Vanguard Group, since 2008; Director of Vanguard Marketing Corporation; Managing Director of The Vanguard Group (1995–2008).
IndependentTrustees
Emerson U. Fullwood
Born 1948. Trustee Since January 2008. Principal Occupation(s) During the Past Five Years and Other Experience: Executive Chief Staff and Marketing Officer for North America and Corporate Vice President (retired 2008) of Xerox Corporation (document management products and services); Executive in Residence and 2009–2010 Distinguished Minett Professor at the Rochester Institute of Technology; Lead Director of SPX FLOW, Inc. (multi-industry manufacturing); Director of the United Way of Rochester, the University of Rochester Medical Center, Monroe Community College Foundation, North Carolina A&T University, and Roberts Wesleyan College.
Rajiv L. Gupta
Born 1945. Trustee Since December 2001.2 Principal Occupation(s) During the Past Five Years and Other Experience: Chairman and Chief Executive Officer (retired 2009) and President (2006–2008) of Rohm and Haas Co. (chemicals); Director of Tyco International plc (diversified manufacturing and services), HP Inc. (printer and personal computer manufacturing), and Delphi Automotive plc (automotive components); Senior Advisor at New Mountain Capital.
Amy Gutmann
Born 1949. Trustee Since June 2006. Principal Occupation(s) During the Past Five Years and Other Experience: President of the University of Pennsylvania; Christopher H. Browne Distinguished Professor of Political Science, School of Arts and Sciences, and Professor of Communication, Annenberg School for Communication, with secondary faculty appointments in the Department of Philosophy, School of Arts and Sciences, and at the Graduate School of Education, University of Pennsylvania; Trustee of the National Constitution Center; Chair of the Presidential Commission for the Study of Bioethical Issues.
JoAnn Heffernan Heisen
Born 1950. Trustee Since July 1998. Principal Occupation(s) During the Past Five Years and Other Experience: Corporate Vice President and Chief Global Diversity Officer (retired 2008) and Member of the Executive Committee (1997–2008) of Johnson & Johnson (pharmaceuticals/medical devices/consumer products); Director of Skytop Lodge Corporation (hotels) and the Robert Wood Johnson Foundation; Member of the Advisory Board of the Institute for Women’s Leadership at Rutgers University.
F. Joseph Loughrey
Born 1949. Trustee Since October 2009. Principal Occupation(s) During the Past Five Years and Other Experience: President and Chief Operating Officer (retired 2009) of Cummins Inc. (industrial machinery); Chairman of the Board of Hillenbrand, Inc. (specialized consumer services), and of Oxfam America; Director of SKF AB (industrial machinery), Hyster-Yale Materials Handling, Inc. (forklift trucks), the Lumina Foundation for Education, and the V Foundation for Cancer Research; Member of the Advisory Council for the College of Arts and Letters and of the Advisory Board to the Kellogg Institute for International Studies, both at the University of Notre Dame.
Mark Loughridge
Born 1953. Trustee Since March 2012. Principal Occupation(s) During the Past Five Years and Other Experience: Senior Vice President and Chief Financial Officer (retired 2013) at IBM (information technology services); Fiduciary Member of IBM’s Retirement Plan Committee (2004–2013); Director of the Dow Chemical Company; Member of the Council on Chicago Booth.
Scott C. Malpass
Born 1962. Trustee Since March 2012. Principal Occupation(s) During the Past Five Years and Other Experience: Chief Investment Officer and Vice President at the University of Notre Dame; Assistant Professor of Finance at the Mendoza College of Business at Notre Dame; Member of the Notre Dame 403(b) Investment Committee, the Board of Advisors for Spruceview Capital Partners, and the Investment Advisory Committee of Major League Baseball; Board Member of TIFF Advisory Services, Inc., and Catholic Investment Services, Inc. (investment advisors).
André F. Perold
Born 1952. Trustee Since December 2004. Principal Occupation(s) During the Past Five Years and Other Experience: George Gund Professor of Finance and Banking, Emeritus at the Harvard Business School (retired 2011); Chief Investment Officer and Managing Partner of HighVista Strategies LLC (private investment firm); Director of Rand Merchant Bank; Overseer of the Museum of Fine Arts Boston.
Peter F. Volanakis
Born 1955. Trustee Since July 2009. Principal Occupation(s) During the Past Five Years and Other Experience: President and Chief Operating Officer (retired 2010) of Corning Incorporated (communications equipment); Chairman of the Board of Trustees of Colby-Sawyer College; Member of the Advisory Board of the Norris Cotton Cancer Center.
Executive Officers
Glenn Booraem
Born 1967. Treasurer Since May 2015. Principal Occupation(s) During the Past Five Years and Other Experience: Principal of The Vanguard Group, Inc.; Treasurer of each of the investment companies served by The Vanguard Group; Controller of each of the investment companies served by The Vanguard Group (2010–2015); Assistant Controller of each of the investment companies served by The Vanguard Group (2001–2010).
Thomas J. Higgins
Born 1957. Chief Financial Officer Since September 2008. Principal Occupation(s) During the Past Five Years and Other Experience: Principal of The Vanguard Group, Inc.; Chief Financial Officer of each of the investment companies served by The Vanguard Group; Treasurer of each of the investment companies served by The Vanguard Group (1998–2008).
Peter Mahoney
Born 1974. Controller Since May 2015. Principal Occupation(s) During the Past Five Years and Other Experience: Head of Global Fund Accounting at The Vanguard Group, Inc.; Controller of each of the investment companies served by The Vanguard Group; Head of International Fund Services at The Vanguard Group (2008–2014).
Heidi Stam
Born 1956. Secretary Since July 2005. Principal Occupation(s) During the Past Five Years and Other Experience: Managing Director of The Vanguard Group, Inc.; General Counsel of The Vanguard Group; Secretary of The Vanguard Group and of each of the investment companies served by The Vanguard Group; Director and Senior Vice President of Vanguard Marketing Corporation.
Vanguard Senior Management Team
|
Mortimer J. Buckley Kathleen C. Gubanich Martha G. King John T. Marcante Chris D. McIsaac |
James M. Norris Thomas M. Rampulla Glenn W. Reed Karin A. Risi Michael Rollings |
Chairman Emeritus and Senior Advisor
John J. Brennan
Chairman, 1996–2009
Chief Executive Officer and President, 1996–2008
Founder John C. Bogle
Chairman and Chief Executive Officer, 1974–1996
1 Mr. McNabb is considered an “interested person,” as defined in the Investment Company Act of 1940, because he is an officer of the Vanguard funds.
2 December 2002 for Vanguard Equity Income Fund, the Vanguard Municipal Bond Funds, and the Vanguard State Tax-Exempt Funds.
 |
| P.O. Box 2600 |
| Valley Forge, PA 19482-2600 |
Connect with Vanguard® > vanguard.com
| Fund Information > 800-662-7447 | The Russell Indexes and Russell® are registered |
| Direct Investor Account Services > 800-662-2739 | trademarks of Russell Investments and have been |
| licensed for use by The Vanguard Group, Inc. The | |
| Institutional Investor Services > 800-523-1036 | products are not sponsored, endorsed, sold, or |
| Text Telephone for People | promoted by Russell Investments and Russell |
| Who Are Deaf or Hard of Hearing> 800-749-7273 | Investments makes no representation regarding the |
| advisability of investing in the products. | |
| This material may be used in conjunction | |
| with the offering of shares of any Vanguard | |
| fund only if preceded or accompanied by | |
| the fund’s current prospectus. | |
| All comparative mutual fund data are from Lipper, a | |
| Thomson Reuters Company, or Morningstar, Inc., unless | |
| otherwise noted. | |
| You can obtain a free copy of Vanguard’s proxy voting | |
| guidelines by visiting vanguard.com/proxyreporting or by | |
| calling Vanguard at 800-662-2739. The guidelines are | |
| also available from the SEC’s website, sec.gov. In | |
| addition, you may obtain a free report on how your fund | |
| voted the proxies for securities it owned during the 12 | |
| months ended June 30. To get the report, visit either | |
| vanguard.com/proxyreporting or sec.gov. | |
| You can review and copy information about your fund at | |
| the SEC’s Public Reference Room in Washington, D.C. To | |
| find out more about this public service, call the SEC at | |
| 202-551-8090. Information about your fund is also | |
| available on the SEC’s website, and you can receive | |
| copies of this information, for a fee, by sending a | |
| request in either of two ways: via email addressed to | |
| publicinfo@sec.gov or via regular mail addressed to the | |
| Public Reference Section, Securities and Exchange | |
| Commission, Washington, DC 20549-1520. | |
| © 2016 The Vanguard Group, Inc. | |
| All rights reserved. | |
| Vanguard Marketing Corporation, Distributor. | |
| Q18540 102016 | |
Annual Report | August 31, 2016
Vanguard Sector Bond Index Funds
Vanguard Short-Term Government Bond Index Fund
Vanguard Intermediate-Term Government Bond Index Fund
Vanguard Long-Term Government Bond Index Fund
Vanguard Short-Term Corporate Bond Index Fund
Vanguard Intermediate-Term Corporate Bond Index Fund
Vanguard Long-Term Corporate Bond Index Fund
Vanguard Mortgage-Backed Securities Index Fund
A new format, unwavering commitment
As you begin reading this report, you’ll notice that we’ve made some improvements to the opening sections—based on feedback from you, our clients.
Page 1 starts with a new ”Your Fund’s Performance at a Glance,” a concise, handy summary of how your fund performed during the period.
In the renamed ”Chairman’s Perspective,” Bill McNabb will focus on enduring principles and investment insights.
We’ve modified some tables, and eliminated some redundancy, but we haven’t removed any information.
At Vanguard, we’re always looking for better ways to communicate and to help you make sound investment decisions. Thank you for entrusting your assets to us.
| Contents | |
| Your Fund’s Performance at a Glance. | 1 |
| Chairman’s Perspective. | 6 |
| Short-Term Government Bond Index Fund. | 10 |
| Intermediate-Term Government Bond Index Fund. | 27 |
| Long-Term Government Bond Index Fund. | 44 |
| Short-Term Corporate Bond Index Fund. | 60 |
| Intermediate-Term Corporate Bond Index Fund. | 77 |
| Long-Term Corporate Bond Index Fund. | 95 |
| Mortgage-Backed Securities Index Fund. | 114 |
| About Your Fund’s Expenses. | 135 |
| Trustees Approve Advisory Arrangements. | 138 |
| Glossary. | 140 |
Please note: The opinions expressed in this report are just that—informed opinions. They should not be considered promises or advice. Also, please keep in mind that the information and opinions cover the period through the date on the front of this report. Of course, the risks of investing in your fund are spelled out in the prospectus.
See the Glossary for definitions of investment terms used in this report.
About the cover: No matter what language you speak, Vanguard has one consistent message and set of principles. Our primary focus is on you, our clients. We conduct our business with integrity as a faithful steward of your assets. This message is shown translated into seven languages, reflecting our expanding global presence.
Your Fund’s Performance at a Glance
• Bonds provided a safe harbor from stock market volatility during the 12 months ended August 31, 2016. In June, amid uncertainty surrounding the U.K. Brexit vote, the broad U.S. bond market returned almost 2%, its best month of the fiscal year.
• Several of the funds covered in this report met their investment objective of closely tracking their benchmark indexes, after expenses. Divergences can arise because the funds and their indexes value securities at slightly different times toward the end of the day and use different pricing methods.
• Short-term interest rates rose, but longer-term rates declined—boosting long-term bond prices. (Rates and bond prices move in opposite directions.)
• Returns for ETF Shares (based on net asset value) ranged from about 1% for the Short-Term Government Bond Index Fund to more than 18% for the Long-Term Corporate Bond Index Fund. Both income and capital returns were positive for each fund.
| Total Returns: Fiscal Year Ended August 31, 2016 | ||||
| 30-Day SEC | Income | Capital | Total | |
| Yield | Returns | Returns | Returns | |
| Vanguard Short-Term Government Bond Index Fund | ||||
| ETF Shares | 0.74% | |||
| Market Price | 0.97% | |||
| Net Asset Value | 0.98 | |||
| Admiral™ Shares | 0.74 | 0.79% | 0.19% | 0.98 |
| Institutional Shares | 0.74 | 0.82 | 0.16 | 0.98 |
| Barclays U.S. 1–3 Year Government Float Adjusted Index | 1.06 | |||
| Short U.S. Government Funds Average | 0.68 | |||
| Short U.S. Government Funds Average: Derived from data provided by Lipper, a Thomson Reuters Company. | ||||
| Vanguard Intermediate-Term Government Bond Index Fund | ||||
| ETF Shares | 1.18% | |||
| Market Price | 4.35% | |||
| Net Asset Value | 4.37 | |||
| Admiral Shares | 1.18 | 1.64% | 2.74% | 4.38 |
| Institutional Shares | 1.18 | 1.65 | 2.77 | 4.42 |
| Barclays U.S. 3–10 Year Government Float Adjusted Index | 4.47 | |||
| Intermediate U.S. Government Funds Average | 3.22 | |||
Intermediate U.S. Government Funds Average: Derived from data provided by Lipper, a Thomson Reuters Company.
1
| 30-Day SEC | Income | Capital | Total | |
| Yield | Returns | Returns | Returns | |
| Vanguard Long-Term Government Bond Index Fund | ||||
| ETF Shares | 2.13% | |||
| Market Price | 16.95% | |||
| Net Asset Value | 16.96 | |||
| Admiral Shares | 2.12 | 2.93% | 14.04% | 16.97 |
| Institutional Shares | 2.13 | 2.96 | 14.03 | 16.99 |
| Barclays U.S. Long Government Float Adjusted Index | 16.59 | |||
| General U.S. Government Funds Average | 4.18 | |||
| General U.S. Government Funds Average: Derived from data provided by Lipper, a Thomson Reuters Company. | ||||
| Vanguard Short-Term Corporate Bond Index Fund | ||||
| ETF Shares | 1.73% | |||
| Market Price | 3.93% | |||
| Net Asset Value | 3.71 | |||
| Admiral Shares | 1.71 | 2.14% | 1.56% | 3.70 |
| Institutional Shares | 1.72 | 2.16 | 1.56 | 3.72 |
| Barclays U.S. 1–5 Year Corporate Bond Index | 3.78 | |||
| Short-Intermediate Investment-Grade Debt Funds Average | 2.86 | |||
| Short-Intermediate Investment-Grade Debt Funds Average: Derived from data provided by Lipper, a Thomson Reuters Company. | ||||
| Vanguard Intermediate-Term Corporate Bond Index Fund | ||||
| ETF Shares | 2.75% | |||
| Market Price | 10.04% | |||
| Net Asset Value | 9.58 | |||
| Admiral Shares | 2.74 | 3.54% | 6.03% | 9.57 |
| Institutional Shares | 2.75 | 3.56 | 6.02 | 9.58 |
| Barclays U.S. 5–10 Year Corporate Bond Index | 9.46 | |||
| Core Bond Funds Average | 5.66 | |||
| Core Bond Funds Average: Derived from data provided by Lipper, a Thomson Reuters Company. | ||||
| Vanguard Long-Term Corporate Bond Index Fund | ||||
| ETF Shares | 3.99% | |||
| Market Price | 18.29% | |||
| Net Asset Value | 18.21 | |||
| Admiral Shares | 3.99 | 5.10% | 13.11% | 18.21 |
| Institutional Shares | 4.00 | 5.12 | 13.10 | 18.22 |
| Barclays U.S. 10+ Year Corporate Bond Index | 17.71 | |||
| Corporate Debt Funds BBB-Rated Average | 8.70 | |||
| Corporate Debt Funds BBB-Rated Average: Derived from data provided by Lipper, a Thomson Reuters Company. | ||||
2
| 30-Day SEC | Income | Capital | Total | |
| Yield | Returns | Returns | Returns | |
| Vanguard Mortgage-Backed Securities Index Fund | ||||
| ETF Shares | 1.80% | |||
| Market Price | 3.78% | |||
| Net Asset Value | 3.70 | |||
| Admiral Shares | 1.81 | 1.87% | 1.83% | 3.70 |
| Institutional Shares | 1.80 | 1.90 | 1.82 | 3.72 |
| Barclays U.S. MBS Float Adjusted Index | 3.76 | |||
| U.S. Mortgage Funds Average | 3.51 |
U.S. Mortgage Funds Average: Derived from data provided by Lipper, a Thomson Reuters Company.
Admiral Shares carry lower expenses and are available to investors who meet certain account-balance requirements. Institutional Shares are available to certain institutional investors who meet specific administrative, service, and account-size criteria. The Vanguard ETF® Shares shown are traded on the Nasdaq exchange and are available only through brokers. The table provides ETF returns based on both the Nasdaq market price and the net asset value for a share. U.S. Pat. Nos. 6,879,964; 7,337,138; 7,720,749; 7,925,573; 8,090,646; and 8,417,623.
For the ETF Shares, the market price is determined by the midpoint of the bid-offer spread as of the closing time of the New York Stock Exchange (generally 4 p.m., Eastern time). The net asset value is also determined as of the NYSE closing time. For more information about how the ETF Shares' market prices have compared with their net asset value, visit vanguard.com, select your ETF, and then select the Price and Performance tab. The ETF premium/discount analysis there shows the percentages of days on which the ETF Shares' market price was above or below the NAV.
| Total Returns: Inception Through August 31, 2016 | |
| Average | |
| Annual Return | |
| Short-Term Government Bond Index Fund ETF Shares Net Asset Value (Returns since inception: | |
| 11/19/2009) | 0.87% |
| Barclays U.S. 1–3 Year Government Float Adjusted Index | 0.99 |
| Short U.S. Government Funds Average | 0.87 |
| Short U.S. Government Funds Average: Derived from data provided by Lipper, a Thomson Reuters Company. |
| Intermediate-Term Government Bond Index Fund ETF Shares Net Asset Value (Returns since inception: | |
| 11/19/2009) | 3.62% |
| Barclays U.S. 3–10 Year Government Float Adjusted Index | 3.74 |
| Intermediate U.S. Government Funds Average | 2.70 |
| Intermediate U.S. Government Funds Average: Derived from data provided by Lipper, a Thomson Reuters Company. | |
| Long-Term Government Bond Index Fund ETF Shares Net Asset Value (Returns since inception: | |
| 11/19/2009) | 8.70% |
| Barclays U.S. Long Government Float Adjusted Index | 8.81 |
| General U.S. Government Funds Average | 3.29 |
General U.S. Government Funds Average: Derived from data provided by Lipper, a Thomson Reuters Company.
3
| Average | |
| Annual Return | |
| Short-Term Corporate Bond Index Fund ETF Shares Net Asset Value (Returns since inception: | |
| 11/19/2009) | 3.26% |
| Barclays U.S. 1–5 Year Corporate Bond Index | 3.48 |
| Short-Intermediate Investment-Grade Debt Funds Average | 2.70 |
| Short-Intermediate Investment-Grade Debt Funds Average: Derived from data provided by Lipper, a Thomson Reuters Company. | |
| Intermediate-Term Corporate Bond Index Fund ETF Shares Net Asset Value (Returns since inception: | |
| 11/19/2009) | 6.56% |
| Barclays U.S. 5–10 Year Corporate Bond Index | 6.65 |
| Spliced Core Bond Funds Average | 4.36 |
| For a benchmark description, see the Glossary. | |
| Spliced Core Bond Funds Average: Derived from data provided by Lipper, a Thomson Reuters Company. | |
| Long-Term Corporate Bond Index Fund ETF Shares Net Asset Value (Returns since inception: | |
| 11/19/2009) | 8.87% |
| Barclays U.S. 10+ Year Corporate Bond Index | 8.83 |
| Corporate Debt Funds BBB-Rated Average | 6.17 |
| Corporate Debt Funds BBB-Rated Average: Derived from data provided by Lipper, a Thomson Reuters Company. | |
| Mortgage-Backed Securities Index Fund ETF Shares Net Asset Value (Returns since inception: | |
| 11/19/2009) | 3.24% |
| Barclays U.S. MBS Float Adjusted Index | 3.27 |
| U.S. Mortgage Funds Average | 3.63 |
| U.S. Mortgage Funds Average: Derived from data provided by Lipper, a Thomson Reuters Company. | |
The figures shown represent past performance, which is not a guarantee of future results. (Current performance may be lower or higher than the performance data cited. For performance data current to the most recent month-end, visit our website at vanguard.com/performance.) Note, too, that both investment returns and principal value can fluctuate widely, so an investor’s shares, when sold, could be worth more or less than their original cost.
4
| Expense Ratios | ||||
| Your Fund Compared With Its Peer Group | ||||
| ETF | Admiral | Institutional | Peer Group | |
| Shares | Shares | Shares | Average | |
| Short-Term Government Bond Index | ||||
| Fund | 0.10% | 0.10% | 0.07% | 0.80% |
| Intermediate-Term Government Bond | ||||
| Index Fund | 0.10 | 0.10 | 0.07 | 0.96 |
| Long-Term Government Bond Index | ||||
| Fund | 0.10 | 0.10 | 0.07 | 1.09 |
| Short-Term Corporate Bond Index Fund | 0.10 | 0.10 | 0.07 | 0.81 |
| Intermediate-Term Corporate Bond | ||||
| Index Fund | 0.10 | 0.10 | 0.07 | 0.80 |
| Long-Term Corporate Bond Index Fund | 0.10 | 0.10 | 0.07 | 0.90 |
| Mortgage-Backed Securities Index | ||||
| Fund | 0.10 | 0.10 | 0.07 | 0.90 |
The fund expense ratios shown are from the prospectus dated December 22, 2015, and represent estimated costs for the current fiscal year. For the fiscal year ended August 31, 2016, the funds’ expense ratios were: for the Short-Term Government Bond Index Fund, 0.07% for ETF Shares, 0.07% for Admiral Shares, and 0.05% for Institutional Shares; for the Intermediate-Term Government Bond Index Fund, 0.07% for ETF Shares, 0.07% for Admiral Shares, and 0.05% for Institutional Shares; for the Long-Term Government Bond Index Fund, 0.07% for ETF Shares, 0.07% for Admiral Shares, and 0.05% for Institutional Shares; for the Short-Term Corporate Bond Index Fund, 0.07% for ETF Shares, 0.07% for Admiral Shares, and 0.05% for Institutional Shares; for the Intermediate-Term Corporate Bond Index Fund, 0.07% for ETF Shares, 0.07% for Admiral Shares, 0.05% for Institutional Shares; for the Long-Term Corporate Bond Index Fund, 0.07% for ETF Shares, 0.07% for Admiral Shares, and 0.05% for Institutional Shares; and for the Mortgage-Backed Securities Index Fund, 0.07% for ETF Shares, 0.07% for Admiral Shares, and 0.05% for Institutional Shares. Peer-group expense ratios are derived from data provided by Lipper, a Thomson Reuters Company, and capture information through year-end 2015.
Peer groups: For the Short-Term Government Bond Index Fund, Short U.S. Government Funds; for the Intermediate-Term Government Bond Index Fund, Intermediate U.S. Government Funds; for the Long-Term Government Bond Index Fund, General U.S. Government Funds; for the Short-Term Corporate Bond Index Fund, Short-Intermediate Investment-Grade Debt Funds; for the Intermediate-Term Corporate Bond Index Fund, Core Bond Funds; for the Long-Term Corporate Bond Index Fund, Corporate BBB-Rated Debt Funds; for the Mortgage-Backed Securities Index Fund, U.S. Mortgage Funds.
5
Chairman's Perspective
Bill McNabb
Chairman and Chief Executive Officer
Dear Shareholder,
Even as the global economy continued to expand at a slow but sustained pace over the 12 months ended August 31, 2016, a series of disquieting developments highlighted the importance for investors of remaining disciplined.
Chief among them was "Brexit "- the British public's vote to exit the European Union- but plenty of others moved the markets as well. We saw sharp ups and downs in the prices of oil and other commodities, choppy U.S. job numbers, shifting expectations about when the Federal Reserve might raise interest rates again, and decreases in already negative yields for European and Japanese government bonds.
Beyond being the end of the fiscal period, August marked a milestone: 40 years since Vanguard introduced the first index mutual fund. In ways that are perhaps still not fully appreciated. indexing has vastly improved investing for individuals, advisors, and institutions all over the world. Later in this letter. I'll discuss the revolution wrought by what was initially a little-heralded new fund from a fledgling outfit in Valley Forge, Pennsylvania.
Brexit added another layer of uncertainty for investors
I think it' s fair to say that the momentous June 23 Brexit vote caught even the British off guard. Although we saw some market jitters in the run-up to the referendum, the unexpected outcome triggered a spike in
6
volatility worldwide. Stocks around the world lost 5%-10% in U.S. dollar terms in the first two trading sessions following the vote, with U.K. and European markets among the hardest hit; global bonds, though, headed in the other direction. It was a textbook illustration of the value of having a diversified portfolio.
That kind of volatility can push investors to "do something." But some of the worst days in the stock markets are sometimes followed by some of the best-as happened at the end of June. Investors who scrambled to protect their portfolios by shedding stocks amid head lines warning of a global market meltdown may well have ended up locking in post-Brexit losses, then missing out on the strong rebound that took place
| Market Barometer | |||
| Average Annual Total Returns | |||
| Periods Ended August 31, 2016 | |||
| One | Three | Five | |
| Year | Years | Years | |
| Stocks | |||
| Russell 1000 Index (Large-<:aps) | 11.69% | 12.02% | 14.60% |
| Russell 2000 Index (Small-caps) | 8.59 | 8.53 | 12.85 |
| Russell 3000 Index (Broad U.S. market) | 11.44 | 11.74 | 14.46 |
| FTSE All-Wor ld ex US Index (International) | 3.37 | 2.59 | 3.72 |
| Bonds | |||
| Barclays U.S. Aggregat e Bond Index (Broad taxable market) | 5.97 % | 4.37% | 3.24% |
| Barclays Municipal Bond Index (Broad tax-exempt market) | 6.88 | 647 | 4.80 |
| Citig roup Three-Month U.S. Treasury Bill Index | 0.18 | 0.05 | 0.06 |
| CPI | |||
| Consumer Price Index | 1.06% | 0.98% | 1.23% |
just days later. Those headlines were noise that investors would have been better off tuning out. I'm pleased to say that Vanguard investors on the whole did just that- we continued to see cashflows in to our funds in the days after the vote.
For the 12 months, stocks generally finished higher, with U.S. stocks up more than 11 % and international stocks about 3% for U.S.-based investors.
In a surprise, bonds turned in a solid performance that few would have predicted a year ago. It seemed as if rates had fallen so far that they couldn't go any lower, but many did. Central banks in a number of European countries and Japan set key monetary policy rates below zero.
7
When being 'average' is a lot better than average
Not only did Vanguard founder John C. Bogle launch the first index mutual fund in 1976, but he also was among the first to clearly explain to the investing public the benefits of what was then a novel, unproven strategy.
Back in 1977, in the first annual report for what was later renamed Vanguard 500 Index Fund, Mr. Bogle wrote that an index fund "represents a tough and demanding 'par.'... And if there are some professionals who can 'beat par' more often than not- in investing or in golf- they do not seem to be in the majority."
Mr. Bogle's analogy has been borne out by historical returns. As you can see in the chart below, out of 1,238 actively managed large-capitalization funds, a clear majority-65%-trailed the Standard & Poor's 500 Index in average annual return over the decade ended December 31, 2015. And 518 funds, or about 42% of the total number, trailed by more than 1 percentage point.
The track record looks even more discouraging when you consider that of the 35% of funds that outperformed the index, only 119- or about 10% in all- did so by more than 1 percentage point. The 315 others also took on risk to try to outperform the index (and likely experienced greater volatility) but came out ahead by less than 1 percentage point in average annual return.
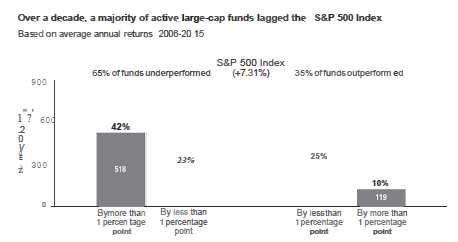
Notes: Databased on average annual returns of all 1,238 existing actively managed large-cap funds over the decade ended December 31, 2015. Note that index funds seek to track the performance of a benchmark index but typically won' t "match" the benchmark's returns because of the costs of passive indexing.
Sources: Vanguard calculations. using data from Standard & Poor·s.
Past performance is not a guarantee of future results. The performance of an index is not an exact representation of any particular investment. as you cannot invest directly in an index.
8
These policies held down short-term rates, while more muted expectations for global growth and inflation weighed on longer-term rates.
Yields in the United States weren't quite as low as in many developed countries. The Fed raised the federal funds target rate only once, in December, to a slim 0.25%-0.5%. Further out on the maturity spectrum, the bellwether 10-year U.S. Treasury yield dropped in early July to a record low 1.36%, before moving back up a little to end the period at 1.58%. Over the 12 months, U.S. bonds returned about 6%, and international bonds returned even more- about 11%-for U.S.-based investors, again underscoring the markets' unpredictability and the merits of diversification.
Over the years, many investors have embraced the pluses of indexing
Market upsets like Brexit aren't rare occurrences. Fortunately, indexing has proved to be a durable behavioral tool to help keep investors from making bad financial decisions when upsets happen. In fact, this is one of indexing's less appreciated benefits: Holding index funds as part of a broadly diversified portfolio can counterbalance that tendency to react to news headlines. When times are volatile, you'll know you might have some exposure to a part of the market that has dropped, but also to other parts that may be holding up better.
Vanguard's launch of the First Index Investment Trust, now Vanguard 500 Index Fund, initially met with a frosty reception. Its mandate to track the performance of a broadly diversified benchmark at a low cost seemed underwhelming to an investing public accustomed to funds that offered the chance to outperform. Investors have since come around, as experience has demonstrated the benefits of low costs and broad diversification.
Indexing accounted for about 30% of U.S. mutual fund and exchange-traded fund (ETF) assets at the end of 2015, according to the Investment Company Institute. Some now even proclaim the "triumph of indexing," implying that it's theonly way to invest.
In our view, the rise of indexing has served to underscore an investment principle that long predates 1976: A long-term, low -cost, diversified approach gives investors thebest chance for success. That's true whether the investments you choose are indexed or actively managed-or both.
As always, thank you for investing with Vanguard.

F. William McNabb Ill
Chairman and Chief Executive Officer
September 9, 2016
9
Short-Term Government Bond Index Fund
| Fund Profile | |||
| As of August 31, 2016 | |||
| Share-Class Characteristics | |||
| ETF | Admiral | Institutional | |
| Shares | Shares | Shares | |
| Ticker Symbol | VGSH | VSBSX | VSBIX |
| Expense Ratio1 | 0.10% | 0.10% | 0.07% |
| 30-Day SEC Yield | 0.74% | 0.74% | 0.74% |
| Financial Attributes | |||
| Barclays | |||
| 1–3 Year | |||
| Gov’t | Barclays | ||
| Float Adj | Aggregate | ||
| Fund | Index | FA Index | |
| Number of Bonds | 143 | 406 | 9,864 |
| Yield to Maturity | |||
| (before expenses) | 0.8% | 0.8% | 1.9% |
| Average Coupon | 1.3% | 1.4% | 3.1% |
| Average Duration | 1.9 years | 1.9 years | 5.8 years |
| Average Effective | |||
| Maturity | 2.0 years | 2.0 years | 8.0 years |
| Short-Term | |||
| Reserves | 1.0% | — | — |
| Sector Diversification (% of portfolio) | |||
| Treasury/Agency | 100.0% | ||
The agency and mortgage-backed securities sectors may include issues from government-sponsored enterprises; such issues are generally not backed by the full faith and credit of the U.S. government.
| Volatility Measures | ||
| Barclays | ||
| 1–3 Year | ||
| Gov’t | Barclays | |
| Float Adj | Aggregate | |
| Index | FA Index | |
| R-Squared | 0.99 | 0.64 |
| Beta | 1.02 | 0.22 |
These measures show the degree and timing of the fund’s fluctuations compared with the indexes over 36 months.
| Distribution by Effective Maturity | |
| (% of portfolio) | |
| Under 1 Year | 1.5% |
| 1 - 3 Years | 98.5 |
| Distribution by Credit Quality (% of portfolio) | |
| U.S. Government | 100.0% |
Credit-quality ratings are obtained from Barclays and are from Moody's, Fitch, and S&P. When ratings from all three agencies are used, the median rating is shown. When ratings from two of the agencies are used, the lower rating for each issue is shown. "Not Rated" is used to classify securities for which a rating is not available. For more information about these ratings, see the Glossary entry for Credit Quality.
Investment Focus
1 The expense ratios shown are from the prospectus dated December 22, 2015, and represent estimated costs for the current fiscal year. For the fiscal year ended August 31, 2016, the expense ratios were 0.07% for ETF Shares, 0.07% for Admiral Shares, and 0.05% for Institutional Shares.
10
Short-Term Government Bond Index Fund
Performance Summary
All of the returns in this report represent past performance, which is not a guarantee of future results that may be achieved by the fund. (Current performance may be lower or higher than the performance data cited. For performance data current to the most recent month-end, visit our website at vanguard.com/performance.) Note, too, that both investment returns and principal value can fluctuate widely, so an investor’s shares, when sold, could be worth more or less than their original cost. The returns shown do not reflect taxes that a shareholder would pay on fund distributions or on the sale of fund shares.
Cumulative Performance: November 19, 2009, Through August 31, 2016
Initial Investment of $10,000
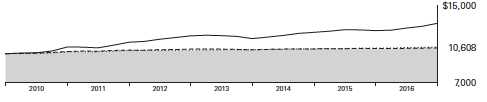
| Average Annual Total Returns | |||||
| Periods Ended August 31, 2016 | |||||
| Since | Final Value | ||||
| One | Five | Inception | of a $10,000 | ||
| Year | Years | (11/19/2009) | Investment | ||
| Short-Term Government Bond Index | |||||
| Fund ETF Shares Net Asset Value | 0.98% | 0.57% | 0.87% | $10,608 | |
| Short-Term Government Bond Index | |||||
| Fund ETF Shares Market Price | 0.97 | 0.57 | 0.88 | 10,612 | |
| Barclays U.S. 1–3 Year Government | |||||
| •••••••• | Float Adjusted Index | 1.06 | 0.67 | 0.99 | 10,691 |
| – – – – | Short U.S. Government Funds | ||||
| Average | 0.68 | 0.45 | 0.87 | 10,603 | |
| Spliced Barclays U.S. Aggregate Float | |||||
| Adjusted Index | 6.15 | 3.28 | 4.11 | 13,145 | |
For a benchmark description, see the Glossary.
Short U.S. Government Funds Average: Derived from data provided by Lipper, a Thomson Reuters Company.
"Since Inception" performance is calculated from the ETF Shares’ inception date for both the fund and its comparative standards.
See Financial Highlights for dividend and capital gains information.
11
| Short-Term Government Bond Index Fund | ||||
| Average Annual Total Returns | ||||
| Periods Ended August 31, 2016 | ||||
| Since | Final Value | |||
| One | Five | Inception | of a $10,000 | |
| Year | Years | (12/28/2009) | Investment | |
| Short-Term Government Bond Index Fund | ||||
| Admiral Shares | 0.98% | 0.57% | 0.96% | $10,656 |
| Barclays U.S. 1–3 Year Government Float | ||||
| Adjusted Index | 1.06 | 0.67 | 1.07 | 10,736 |
| Spliced Barclays U.S. Aggregate Float | ||||
| Adjusted Index | 6.15 | 3.28 | 4.34 | 13,282 |
"Since Inception" performance is calculated from the Admiral Shares’ inception date for both the fund and its comparative standards.
| Since | Final Value | |||
| One | Five | Inception | of a $5,000,000 | |
| Year | Years | (8/23/2010) | Investment | |
| Short-Term Government Bond Index Fund | ||||
| Institutional Shares | 0.98% | 0.60% | 0.74% | $5,226,607 |
| Barclays U.S. 1–3 Year Government Float | ||||
| Adjusted Index | 1.06 | 0.67 | 0.82 | 5,251,737 |
| Barclays U.S. Aggregate Float Adjusted | ||||
| Index | 6.15 | 3.28 | 3.56 | 6,171,550 |
"Since Inception" performance is calculated from the Institutional Shares’ inception date for both the fund and its comparative standards.
| Cumulative Returns of ETF Shares: November 19, 2009, Through August 31, 2016 | |||
| Since | |||
| One | Five | Inception | |
| Year | Years | (11/19/2009) | |
| Short-Term Government Bond Index Fund ETF | |||
| Shares Market Price | 0.97% | 2.86% | 6.12% |
| Short-Term Government Bond Index Fund ETF | |||
| Shares Net Asset Value | 0.98 | 2.89 | 6.08 |
| Barclays U.S. 1–3 Year Government Float Adjusted | |||
| Index | 1.06 | 3.41 | 6.91 |
"Since Inception" performance is calculated from the ETF Shares’ inception date for both the fund and its comparative standards.
12
| Short-Term Government Bond Index Fund | ||
| Fiscal-Year Total Returns (%): November 19, 2009, Through August 31, 2016 | ||
| Barclays | ||
| 1–3 Year | ||
| Gov’t | ||
| Float Adj | ||
| ETF Shares Net Asset Value | Index | |
| Fiscal Year | Total Returns | Total Returns |
| 2010 | 1.69% | 1.83% |
| 2011 | 1.39 | 1.53 |
| 2012 | 0.40 | 0.50 |
| 2013 | 0.04 | 0.16 |
| 2014 | 0.70 | 0.80 |
| 2015 | 0.75 | 0.84 |
| 2016 | 0.98 | 1.06 |
Average Annual Total Returns: Periods Ended June 30, 2016
This table presents returns through the latest calendar quarter—rather than through the end of the fiscal period.
Securities and Exchange Commission rules require that we provide this information.
| Since Inception | ||||||
| Inception Date | One Year | Five Years | Income | Capital | Total | |
| ETF Shares | 11/19/2009 | |||||
| Market Price | 1.24% | 0.73% | 0.94% | |||
| Net Asset Value | 1.24 | 0.74 | 0.93 | |||
| Admiral Shares | 12/28/2009 | 1.24 | 0.74 | 0.52% | 0.50% | 1.02 |
| Institutional Shares | 8/23/2010 | 1.25 | 0.76 | 0.55 | 0.25 | 0.80 |
13
Short-Term Government Bond Index Fund
Financial Statements
Statement of Net Assets
As of August 31, 2016
The fund reports a complete list of its holdings in regulatory filings four times in each fiscal year, at the quarter-ends. For the second and fourth fiscal quarters, the lists appear in the fund’s semiannual and annual reports to shareholders. For the first and third fiscal quarters, the fund files the lists with the Securities and Exchange Commission on Form N-Q. Shareholders can look up the fund’s Forms N-Q on the SEC’s website at sec.gov. Forms N-Q may also be reviewed and copied at the SEC’s Public Reference Room (see the back cover of this report for further information).
| Face | Market | |||
| Maturity | Amount | Value• | ||
| Coupon | Date | ($000) | ($000) | |
| U.S. Government and Agency Obligations (98.8%) | ||||
| U.S. Government Securities (88.8%) | ||||
| United States Treasury Note/Bond | 4.750% | 8/15/17 | 12,465 | 12,942 |
| United States Treasury Note/Bond | 1.875% | 8/31/17 | 7,345 | 7,431 |
| United States Treasury Note/Bond | 1.000% | 9/15/17 | 24,995 | 25,069 |
| United States Treasury Note/Bond | 0.625% | 9/30/17 | 38,630 | 38,600 |
| United States Treasury Note/Bond | 1.875% | 9/30/17 | 6,230 | 6,308 |
| United States Treasury Note/Bond | 0.875% | 10/15/17 | 10,440 | 10,458 |
| United States Treasury Note/Bond | 0.750% | 10/31/17 | 21,380 | 21,387 |
| United States Treasury Note/Bond | 1.875% | 10/31/17 | 14,184 | 14,370 |
| United States Treasury Note/Bond | 0.875% | 11/15/17 | 13,200 | 13,223 |
| United States Treasury Note/Bond | 4.250% | 11/15/17 | 11,440 | 11,919 |
| United States Treasury Note/Bond | 0.625% | 11/30/17 | 6,955 | 6,945 |
| United States Treasury Note/Bond | 0.875% | 11/30/17 | 13,747 | 13,773 |
| United States Treasury Note/Bond | 2.250% | 11/30/17 | 8,150 | 8,300 |
| United States Treasury Note/Bond | 1.000% | 12/15/17 | 16,497 | 16,551 |
| United States Treasury Note/Bond | 0.750% | 12/31/17 | 20,065 | 20,065 |
| United States Treasury Note/Bond | 1.000% | 12/31/17 | 11,798 | 11,837 |
| United States Treasury Note/Bond | 0.875% | 1/15/18 | 15,745 | 15,770 |
| United States Treasury Note/Bond | 0.750% | 1/31/18 | 17,806 | 17,800 |
| United States Treasury Note/Bond | 0.875% | 1/31/18 | 6,690 | 6,700 |
| United States Treasury Note/Bond | 2.625% | 1/31/18 | 20,320 | 20,847 |
| United States Treasury Note/Bond | 1.000% | 2/15/18 | 16,775 | 16,830 |
| United States Treasury Note/Bond | 3.500% | 2/15/18 | 9,850 | 10,236 |
| United States Treasury Note/Bond | 0.750% | 2/28/18 | 21,989 | 21,982 |
| United States Treasury Note/Bond | 2.750% | 2/28/18 | 13,745 | 14,149 |
| United States Treasury Note/Bond | 1.000% | 3/15/18 | 10,275 | 10,309 |
| United States Treasury Note/Bond | 0.750% | 3/31/18 | 15,290 | 15,283 |
| United States Treasury Note/Bond | 0.875% | 3/31/18 | 14,678 | 14,699 |
| United States Treasury Note/Bond | 2.875% | 3/31/18 | 4,118 | 4,251 |
| United States Treasury Note/Bond | 0.750% | 4/15/18 | 22,710 | 22,692 |
| United States Treasury Note/Bond | 0.625% | 4/30/18 | 18,570 | 18,521 |
| United States Treasury Note/Bond | 0.750% | 4/30/18 | 20,004 | 19,992 |
| United States Treasury Note/Bond | 1.000% | 5/15/18 | 2,750 | 2,759 |
| United States Treasury Note/Bond | 0.875% | 5/31/18 | 14,821 | 14,840 |
| United States Treasury Note/Bond | 1.000% | 5/31/18 | 22,467 | 22,541 |
| United States Treasury Note/Bond | 1.125% | 6/15/18 | 11,566 | 11,629 |
| United States Treasury Note/Bond | 0.625% | 6/30/18 | 18,575 | 18,517 |
| United States Treasury Note/Bond | 1.375% | 6/30/18 | 12,130 | 12,253 |
14
| Short-Term Government Bond Index Fund | ||||
| Face | Market | |||
| Maturity | Amount | Value• | ||
| Coupon | Date | ($000) | ($000) | |
| United States Treasury Note/Bond | 2.375% | 6/30/18 | 5,596 | 5,754 |
| United States Treasury Note/Bond | 0.875% | 7/15/18 | 3,500 | 3,504 |
| United States Treasury Note/Bond | 0.750% | 7/31/18 | 25,847 | 25,819 |
| United States Treasury Note/Bond | 1.375% | 7/31/18 | 14,765 | 14,920 |
| United States Treasury Note/Bond | 2.250% | 7/31/18 | 3,000 | 3,082 |
| United States Treasury Note/Bond | 1.000% | 8/15/18 | 12,600 | 12,643 |
| United States Treasury Note/Bond | 0.750% | 8/31/18 | 14,153 | 14,138 |
| United States Treasury Note/Bond | 1.500% | 8/31/18 | 22,955 | 23,256 |
| United States Treasury Note/Bond | 1.000% | 9/15/18 | 26,380 | 26,471 |
| United States Treasury Note/Bond | 1.375% | 9/30/18 | 25,635 | 25,919 |
| United States Treasury Note/Bond | 0.875% | 10/15/18 | 23,185 | 23,199 |
| United States Treasury Note/Bond | 1.250% | 10/31/18 | 20,852 | 21,028 |
| United States Treasury Note/Bond | 1.750% | 10/31/18 | 4,438 | 4,523 |
| United States Treasury Note/Bond | 1.250% | 11/15/18 | 17,443 | 17,590 |
| United States Treasury Note/Bond | 3.750% | 11/15/18 | 11,331 | 12,050 |
| United States Treasury Note/Bond | 1.250% | 11/30/18 | 12,700 | 12,811 |
| United States Treasury Note/Bond | 1.375% | 11/30/18 | 5,000 | 5,058 |
| United States Treasury Note/Bond | 1.250% | 12/15/18 | 15,259 | 15,392 |
| United States Treasury Note/Bond | 1.375% | 12/31/18 | 7,000 | 7,081 |
| United States Treasury Note/Bond | 1.500% | 12/31/18 | 17,490 | 17,744 |
| United States Treasury Note/Bond | 1.125% | 1/15/19 | 24,572 | 24,718 |
| United States Treasury Note/Bond | 1.250% | 1/31/19 | 10,000 | 10,089 |
| United States Treasury Note/Bond | 1.500% | 1/31/19 | 11,950 | 12,127 |
| United States Treasury Note/Bond | 0.750% | 2/15/19 | 21,538 | 21,471 |
| United States Treasury Note/Bond | 2.750% | 2/15/19 | 11,000 | 11,502 |
| United States Treasury Note/Bond | 1.375% | 2/28/19 | 10,000 | 10,122 |
| United States Treasury Note/Bond | 1.500% | 2/28/19 | 13,000 | 13,199 |
| United States Treasury Note/Bond | 1.000% | 3/15/19 | 10,406 | 10,437 |
| United States Treasury Note/Bond | 1.500% | 3/31/19 | 5,500 | 5,586 |
| United States Treasury Note/Bond | 1.625% | 3/31/19 | 18,560 | 18,908 |
| United States Treasury Note/Bond | 0.875% | 4/15/19 | 12,980 | 12,976 |
| United States Treasury Note/Bond | 1.250% | 4/30/19 | 5,000 | 5,047 |
| United States Treasury Note/Bond | 1.625% | 4/30/19 | 16,300 | 16,611 |
| United States Treasury Note/Bond | 0.875% | 5/15/19 | 21,664 | 21,651 |
| United States Treasury Note/Bond | 3.125% | 5/15/19 | 13,500 | 14,297 |
| United States Treasury Note/Bond | 1.125% | 5/31/19 | 5,000 | 5,030 |
| United States Treasury Note/Bond | 1.500% | 5/31/19 | 15,000 | 15,239 |
| United States Treasury Note/Bond | 0.875% | 6/15/19 | 14,000 | 13,982 |
| United States Treasury Note/Bond | 1.625% | 6/30/19 | 22,945 | 23,397 |
| United States Treasury Note/Bond | 0.750% | 7/15/19 | 22,950 | 22,839 |
| United States Treasury Note/Bond | 0.875% | 7/31/19 | 2,500 | 2,496 |
| United States Treasury Note/Bond | 1.625% | 7/31/19 | 17,500 | 17,850 |
| United States Treasury Note/Bond | 0.750% | 8/15/19 | 20,960 | 20,855 |
| United States Treasury Note/Bond | 3.625% | 8/15/19 | 15,000 | 16,167 |
| United States Treasury Note/Bond | 1.000% | 8/31/19 | 5,000 | 5,009 |
| United States Treasury Note/Bond | 1.625% | 8/31/19 | 15,000 | 15,300 |
| 1,210,665 | ||||
| Agency Bonds and Notes (10.0%) | ||||
| 1 AID-Jordan | 1.945% | 6/23/19 | 200 | 205 |
| 1 AID-Ukraine | 1.844% | 5/16/19 | 200 | 205 |
| 2 Federal Farm Credit Banks | 1.125% | 9/22/17 | 750 | 753 |
| 2 Federal Farm Credit Banks | 1.000% | 9/25/17 | 200 | 201 |
| 2 Federal Farm Credit Banks | 1.125% | 12/18/17 | 225 | 226 |
| 2 Federal Farm Credit Banks | 1.110% | 2/20/18 | 200 | 201 |
| 2 Federal Farm Credit Banks | 0.750% | 4/18/18 | 2,000 | 1,996 |
15
| Short-Term Government Bond Index Fund | ||||
| Face | Market | |||
| Maturity | Amount | Value• | ||
| Coupon | Date | ($000) | ($000) | |
| 2 Federal Farm Credit Banks | 1.100% | 6/1/18 | 100 | 100 |
| 2 Federal Home Loan Banks | 0.625% | 10/26/17 | 1,500 | 1,498 |
| 2 Federal Home Loan Banks | 5.000% | 11/17/17 | 2,260 | 2,375 |
| 2 Federal Home Loan Banks | 1.000% | 12/19/17 | 2,000 | 2,004 |
| 2 Federal Home Loan Banks | 1.375% | 3/9/18 | 4,200 | 4,232 |
| 2 Federal Home Loan Banks | 0.875% | 3/19/18 | 3,920 | 3,920 |
| 2 Federal Home Loan Banks | 1.125% | 4/25/18 | 3,795 | 3,810 |
| 2 Federal Home Loan Banks | 0.875% | 6/29/18 | 5,000 | 4,998 |
| 2 Federal Home Loan Banks | 0.625% | 8/7/18 | 3,000 | 2,984 |
| 2 Federal Home Loan Banks | 0.875% | 10/1/18 | 5,000 | 4,995 |
| 2 Federal Home Loan Banks | 1.500% | 3/8/19 | 1,000 | 1,012 |
| 2 Federal Home Loan Banks | 1.875% | 3/8/19 | 1,070 | 1,093 |
| 2 Federal Home Loan Banks | 1.125% | 6/21/19 | 2,045 | 2,051 |
| 2 Federal Home Loan Banks | 0.875% | 8/5/19 | 4,000 | 3,980 |
| 3 Federal Home Loan Mortgage Corp. | 1.000% | 9/29/17 | 400 | 401 |
| 3 Federal Home Loan Mortgage Corp. | 5.125% | 11/17/17 | 2,625 | 2,762 |
| 3 Federal Home Loan Mortgage Corp. | 1.000% | 12/15/17 | 6,700 | 6,715 |
| 3 Federal Home Loan Mortgage Corp. | 0.750% | 1/12/18 | 5,655 | 5,646 |
| 3 Federal Home Loan Mortgage Corp. | 0.875% | 3/7/18 | 7,660 | 7,660 |
| 3 Federal Home Loan Mortgage Corp. | 0.750% | 4/9/18 | 1,200 | 1,197 |
| 3 Federal Home Loan Mortgage Corp. | 4.875% | 6/13/18 | 500 | 535 |
| 3 Federal Home Loan Mortgage Corp. | 3.750% | 3/27/19 | 2,365 | 2,530 |
| 3 Federal Home Loan Mortgage Corp. | 1.125% | 4/15/19 | 4,300 | 4,312 |
| 3 Federal Home Loan Mortgage Corp. | 1.750% | 5/30/19 | 400 | 408 |
| 3 Federal Home Loan Mortgage Corp. | 0.875% | 7/19/19 | 6,500 | 6,467 |
| 3 Federal Home Loan Mortgage Corp. | 1.250% | 8/1/19 | 450 | 453 |
| 3 Federal National Mortgage Assn. | 1.000% | 9/27/17 | 5,735 | 5,752 |
| 3 Federal National Mortgage Assn. | 0.875% | 10/26/17 | 1,205 | 1,206 |
| 3 Federal National Mortgage Assn. | 0.875% | 12/20/17 | 900 | 901 |
| 3 Federal National Mortgage Assn. | 0.875% | 2/8/18 | 8,975 | 8,976 |
| 3 Federal National Mortgage Assn. | 0.875% | 3/28/18 | 1,400 | 1,400 |
| 3 Federal National Mortgage Assn. | 0.875% | 5/21/18 | 6,280 | 6,278 |
| 3 Federal National Mortgage Assn. | 1.125% | 7/20/18 | 2,500 | 2,511 |
| 3 Federal National Mortgage Assn. | 1.875% | 9/18/18 | 3,292 | 3,356 |
| 3 Federal National Mortgage Assn. | 1.125% | 10/19/18 | 1,200 | 1,205 |
| 3 Federal National Mortgage Assn. | 1.625% | 11/27/18 | 2,100 | 2,132 |
| 3 Federal National Mortgage Assn. | 1.125% | 12/14/18 | 4,497 | 4,514 |
| 3 Federal National Mortgage Assn. | 1.375% | 1/28/19 | 1,000 | 1,010 |
| 3 Federal National Mortgage Assn. | 1.875% | 2/19/19 | 1,750 | 1,788 |
| 3 Federal National Mortgage Assn. | 1.000% | 2/26/19 | 1,425 | 1,426 |
| 3 Federal National Mortgage Assn. | 1.750% | 6/20/19 | 800 | 816 |
| 3 Federal National Mortgage Assn. | 0.875% | 8/2/19 | 5,000 | 4,975 |
| 3 Federal National Mortgage Assn. | 1.000% | 8/28/19 | 4,000 | 3,992 |
| 2 Financing Corp. | 10.700% | 10/6/17 | 142 | 157 |
| 2 Financing Corp. | 9.800% | 11/30/17 | 385 | 427 |
| 2 Financing Corp. | 9.800% | 4/6/18 | 200 | 228 |
| 2 Financing Corp. | 10.350% | 8/3/18 | 250 | 294 |
| NCUA Guaranteed Notes | 3.000% | 6/12/19 | 180 | 189 |
| Private Export Funding Corp. | 2.250% | 12/15/17 | 25 | 25 |
| Private Export Funding Corp. | 1.875% | 7/15/18 | 50 | 51 |
| Private Export Funding Corp. | 4.375% | 3/15/19 | 700 | 757 |
| Private Export Funding Corp. | 1.450% | 8/15/19 | 125 | 126 |
| 2 Tennessee Valley Authority | 1.750% | 10/15/18 | 625 | 636 |
| 137,053 | ||||
| Total U.S. Government and Agency Obligations (Cost $1,346,001) | 1,347,718 | |||
16
| Short-Term Government Bond Index Fund | |||
| Market | |||
| Value• | |||
| Coupon | Shares | ($000) | |
| Temporary Cash Investment (1.0%) | |||
| Money Market Fund (1.0%) | |||
| 4 Vanguard Market Liquidity Fund (Cost $13,056) | 0.612% | 130,562 | 13,058 |
| Total Investments (99.8%) (Cost $1,359,057) | 1,360,776 | ||
| Other Assets and Liabilities (0.2%) | |||
| Other Assets | 89,895 | ||
| Liabilities | (87,038) | ||
| 2,857 | |||
| Net Assets (100%) | 1,363,633 | ||
| Amount | |||
| ($000) | |||
| Statement of Assets and Liabilities | |||
| Assets | |||
| Investments in Securities, at Value | |||
| Unaffiliated Issuers | 1,347,718 | ||
| Affiliated Vanguard Funds | 13,058 | ||
| Total Investments in Securities | 1,360,776 | ||
| Investment in Vanguard | 104 | ||
| Receivables for Investment Securities Sold | 82,942 | ||
| Receivables for Accrued Income | 4,900 | ||
| Receivables for Capital Shares Issued | 1,949 | ||
| Total Assets | 1,450,671 | ||
| Liabilities | |||
| Payables for Investment Securities Purchased | 85,444 | ||
| Payables for Capital Shares Redeemed | 85 | ||
| Payables for Distributions | 85 | ||
| Payables to Vanguard | 234 | ||
| Other Liabilities | 1,190 | ||
| Total Liabilities | 87,038 | ||
| Net Assets | 1,363,633 | ||
17
| Short-Term Government Bond Index Fund | |
| At August 31, 2016, net assets consisted of: | |
| Amount | |
| ($000) | |
| Paid-in Capital | 1,361,084 |
| Undistributed Net Investment Income | 716 |
| Accumulated Net Realized Gains | 114 |
| Unrealized Appreciation (Depreciation) | 1,719 |
| Net Assets | 1,363,633 |
| ETF Shares—Net Assets | |
| Applicable to 14,847,442 outstanding $.001 par value shares of | |
| beneficial interest (unlimited authorization) | 907,708 |
| Net Asset Value Per Share—ETF Shares | $61.14 |
| Admiral Shares—Net Assets | |
| Applicable to 17,871,620 outstanding $.001 par value shares of | |
| beneficial interest (unlimited authorization) | 364,206 |
| Net Asset Value Per Share—Admiral Shares | $20.38 |
| Institutional Shares—Net Assets | |
| Applicable to 3,582,256 outstanding $.001 par value shares of | |
| beneficial interest (unlimited authorization) | 91,719 |
| Net Asset Value Per Share—Institutional Shares | $25.60 |
• See Note A in Notes to Financial Statements.
1 U.S. government-guaranteed.
2 The issuer operates under a congressional charter; its securities are generally neither guaranteed by the U.S. Treasury nor backed by the full faith and credit of the U.S. government.
3 The issuer was placed under federal conservatorship in September 2008; since that time, its daily operations have been managed by the Federal Housing Finance Agency and it receives capital from the U.S. Treasury, as needed to maintain a positive net worth, in exchange for senior preferred stock.
4 Affiliated money market fund available only to Vanguard funds and certain trusts and accounts managed by Vanguard. Rate shown is the 7-day yield.
See accompanying Notes, which are an integral part of the Financial Statements.
18
| Short-Term Government Bond Index Fund | |
| Statement of Operations | |
| Year Ended | |
| August 31, 2016 | |
| ($000) | |
| Investment Income | |
| Income | |
| Interest1 | 10,057 |
| Total Income | 10,057 |
| Expenses | |
| The Vanguard Group—Note B | |
| Investment Advisory Services | 31 |
| Management and Administrative—ETF Shares | 356 |
| Management and Administrative—Admiral Shares | 148 |
| Management and Administrative—Institutional Shares | 24 |
| Marketing and Distribution—ETF Shares | 62 |
| Marketing and Distribution—Admiral Shares | 35 |
| Marketing and Distribution—Institutional Shares | 1 |
| Custodian Fees | 8 |
| Auditing Fees | 51 |
| Shareholders’ Reports—ETF Shares | 70 |
| Shareholders’ Reports—Admiral Shares | 16 |
| Shareholders’ Reports—Institutional Shares | 3 |
| Trustees’ Fees and Expenses | 1 |
| Total Expenses | 806 |
| Net Investment Income | 9,251 |
| Realized Net Gain (Loss) on Investment Securities Sold1 | 1,013 |
| Change in Unrealized Appreciation (Depreciation) of Investment Securities | 1,216 |
| Net Increase (Decrease) in Net Assets Resulting from Operations | 11,480 |
1 Interest income and realized net gain (loss) from an affiliated company of the fund were $60,000 and ($1,000), respectively.
See accompanying Notes, which are an integral part of the Financial Statements.
19
| Short-Term Government Bond Index Fund | ||
| Statement of Changes in Net Assets | ||
| Year Ended August 31, | ||
| 2016 | 2015 | |
| ($000) | ($000) | |
| Increase (Decrease) in Net Assets | ||
| Operations | ||
| Net Investment Income | 9,251 | 4,657 |
| Realized Net Gain (Loss) | 1,013 | 1,248 |
| Change in Unrealized Appreciation (Depreciation) | 1,216 | (36) |
| Net Increase (Decrease) in Net Assets Resulting from Operations | 11,480 | 5,869 |
| Distributions | ||
| Net Investment Income | ||
| ETF Shares | (5,809) | (3,087) |
| Admiral Shares | (2,541) | (1,044) |
| Institutional Shares | (547) | (348) |
| Realized Capital Gain1 | ||
| ETF Shares | (269) | (299) |
| Admiral Shares | (106) | (93) |
| Institutional Shares | (24) | (24) |
| Total Distributions | (9,296) | (4,895) |
| Capital Share Transactions | ||
| ETF Shares | 271,434 | 137,215 |
| Admiral Shares | 142,241 | 95,668 |
| Institutional Shares | 24,698 | 18,278 |
| Net Increase (Decrease) from Capital Share Transactions | 438,373 | 251,161 |
| Total Increase (Decrease) | 440,557 | 252,135 |
| Net Assets | ||
| Beginning of Period | 923,076 | 670,941 |
| End of Period2 | 1,363,633 | 923,076 |
1 Includes fiscal 2016 and 2015 short-term gain distributions totaling $200,000 and $149,000, respectively. Short-term gain distributions are treated as ordinary income dividends for tax purposes.
2 Net Assets—End of Period includes undistributed (overdistributed) net investment income of $716,000 and $361,000.
See accompanying Notes, which are an integral part of the Financial Statements.
20
| Short-Term Government Bond Index Fund | |||||
| Financial Highlights | |||||
| ETF Shares | |||||
| For a Share Outstanding | Year Ended August 31, | ||||
| Throughout Each Period | 2016 | 2015 | 2014 | 2013 | 2012 |
| Net Asset Value, Beginning of Period | $61.03 | $60.95 | $60.75 | $60.98 | $61.11 |
| Investment Operations | |||||
| Net Investment Income | . 478 | .351 | .198 | .158 | .270 |
| Net Realized and Unrealized Gain (Loss) | |||||
| on Investments | .118 | .102 | .227 | (.134) | (.028) |
| Total from Investment Operations | .596 | .453 | .425 | . 024 | .242 |
| Distributions | |||||
| Dividends from Net Investment Income | (.462) | (.340) | (.177) | (.158) | (.267) |
| Distributions from Realized Capital Gains | (.024) | (. 033) | (. 048) | (. 096) | (.105) |
| Total Distributions | (.486) | (. 373) | (. 225) | (. 254) | (.372) |
| Net Asset Value, End of Period | $61.14 | $61.03 | $60.95 | $60.75 | $60.98 |
| Total Return | 0.98% | 0.75% | 0.70% | 0.04% | 0.40% |
| Ratios/Supplemental Data | |||||
| Net Assets, End of Period (Millions) | $908 | $635 | $497 | $307 | $183 |
| Ratio of Total Expenses to Average Net Assets | 0.07% | 0.10% | 0.12% | 0.12% | 0.12% |
| Ratio of Net Investment Income to | |||||
| Average Net Assets | 0.80% | 0.59% | 0.34% | 0.26% | 0.44% |
| Portfolio Turnover Rate1 | 73% | 64% | 64% | 73% | 72% |
1 Excludes the value of portfolio securities received or delivered as a result of in-kind purchases or redemptions of the fund’s capital shares, including ETF Creation Units.
See accompanying Notes, which are an integral part of the Financial Statements.
21
| Short-Term Government Bond Index Fund | |||||
| Financial Highlights | |||||
| Admiral Shares | |||||
| For a Share Outstanding | Year Ended August 31, | ||||
| Throughout Each Period | 2016 | 2015 | 2014 | 2013 | 2012 |
| Net Asset Value, Beginning of Period | $20.35 | $20.33 | $20.27 | $20.35 | $20.39 |
| Investment Operations | |||||
| Net Investment Income | .158 | .116 | .068 | .053 | .089 |
| Net Realized and Unrealized Gain (Loss) | |||||
| on Investments | .040 | .031 | .074 | (. 048) | (.007) |
| Total from Investment Operations | .198 | .147 | .142 | .005 | .082 |
| Distributions | |||||
| Dividends from Net Investment Income | (.160) | (.116) | (. 066) | (. 053) | (. 087) |
| Distributions from Realized Capital Gains | (.008) | (. 011) | (. 016) | (. 032) | (. 035) |
| Total Distributions | (.168) | (.127) | (.082) | (. 085) | (.122) |
| Net Asset Value, End of Period | $20.38 | $20.35 | $20.33 | $20.27 | $20.35 |
| Total Return1 | 0.98% | 0.72% | 0.70% | 0.02% | 0.40% |
| Ratios/Supplemental Data | |||||
| Net Assets, End of Period (Millions) | $364 | $221 | $126 | $53 | $37 |
| Ratio of Total Expenses to Average Net Assets | 0.07% | 0.10% | 0.12% | 0.12% | 0.12% |
| Ratio of Net Investment Income to | |||||
| Average Net Assets | 0.80% | 0.59% | 0.34% | 0.26% | 0.44% |
| Portfolio Turnover Rate2 | 73% | 64% | 64% | 73% | 72% |
Signal Shares were renamed Admiral Shares in October 2013. Prior periods’ Financial Highlights are for the Signal class.
1 Total returns do not include transaction or account service fees that may have applied in the periods shown. Fund prospectuses provide information about any applicable transaction and account service fees.
2 Excludes the value of portfolio securities received or delivered as a result of in-kind purchases or redemptions of the fund’s capital shares, including ETF Creation Units.
See accompanying Notes, which are an integral part of the Financial Statements.
22
| Short-Term Government Bond Index Fund | |||||
| Financial Highlights | |||||
| Institutional Shares | |||||
| For a Share Outstanding | Year Ended August 31, | ||||
| Throughout Each Period | 2016 | 2015 | 2014 | 2013 | 2012 |
| Net Asset Value, Beginning of Period | $25.57 | $25.54 | $25.47 | $25.57 | $25.62 |
| Investment Operations | |||||
| Net Investment Income | . 207 | .156 | .095 | .075 | .121 |
| Net Realized and Unrealized Gain (Loss) | |||||
| on Investments | .042 | .043 | .088 | (. 059) | (. 007) |
| Total from Investment Operations | .249 | .199 | .183 | .016 | .114 |
| Distributions | |||||
| Dividends from Net Investment Income | (. 209) | (.155) | (. 093) | (. 075) | (.120) |
| Distributions from Realized Capital Gains | (.010) | (.014) | (. 020) | (. 041) | (.044) |
| Total Distributions | (. 219) | (.169) | (.113) | (.116) | (.164) |
| Net Asset Value, End of Period | $25.60 | $25.57 | $25.54 | $25.47 | $25.57 |
| Total Return1 | 0.98% | 0.78% | 0.72% | 0.06% | 0.45% |
| Ratios/Supplemental Data | |||||
| Net Assets, End of Period (Millions) | $92 | $67 | $49 | $17 | $44 |
| Ratio of Total Expenses to Average Net Assets | 0.05% | 0.07% | 0.09% | 0.09% | 0.09% |
| Ratio of Net Investment Income to | |||||
| Average Net Assets | 0.82% | 0.62% | 0.37% | 0.29% | 0.47% |
| Portfolio Turnover Rate 2 | 73% | 64% | 64% | 73% | 72% |
1 Total returns do not include transaction fees that may have applied in the periods shown. Fund prospectuses provide information about any applicable transaction fees.
2 Excludes the value of portfolio securities received or delivered as a result of in-kind purchases or redemptions of the fund’s capital shares, including ETF Creation Units.
See accompanying Notes, which are an integral part of the Financial Statements.
23
Short-Term Government Bond Index Fund
Notes to Financial Statements
Vanguard Short-Term Government Bond Index Fund is registered under the Investment Company Act of 1940 as an open-end investment company, or mutual fund. The fund offers three classes of shares: ETF Shares, Admiral Shares, and Institutional Shares. ETF Shares are listed for trading on Nasdaq; they can be purchased and sold through a broker. Admiral Shares and Institutional Shares are designed for investors who meet certain administrative, service, and account-size criteria.
A. The following significant accounting policies conform to generally accepted accounting principles for U.S. investment companies. The fund consistently follows such policies in preparing its financial statements.
1. Security Valuation: Securities are valued as of the close of trading on the New York Stock Exchange (generally 4 p.m., Eastern time) on the valuation date. Bonds and temporary cash investments acquired over 60 days to maturity are valued using the latest bid prices or using valuations based on a matrix system (which considers such factors as security prices, yields, maturities, and ratings), both as furnished by independent pricing services. Investments in Vanguard Market Liquidity Fund are valued at that fund’s net asset value. Other temporary cash investments are valued at amortized cost, which approximates market value. Securities for which market quotations are not readily available, or whose values have been affected by events occurring before the fund’s pricing time but after the close of the securities’ primary markets, are valued by methods deemed by the board of trustees to represent fair value.
2. Federal Income Taxes: The fund intends to continue to qualify as a regulated investment company and distribute all of its taxable income. Management has analyzed the fund’s tax positions taken for all open federal income tax years (August 31, 2013–2016), and has concluded that no provision for federal income tax is required in the fund’s financial statements.
3. Distributions: Distributions to shareholders are recorded on the ex-dividend date.
4. Credit Facility: The fund and certain other funds managed by The Vanguard Group (“Vanguard”) participate in a $3.1 billion committed credit facility provided by a syndicate of lenders pursuant to a credit agreement that may be renewed annually; each fund is individually liable for its borrowings, if any, under the credit facility. Borrowings may be utilized for temporary and emergency purposes, and are subject to the fund’s regulatory and contractual borrowing restrictions. The participating funds are charged administrative fees and an annual commitment fee of 0.10% of the undrawn amount of the facility; these fees are allocated to the funds based on a method approved by the fund’s board of trustees and included in Management and Administrative expenses on the fund’s Statement of Operations. Any borrowings under this facility bear interest at a rate based upon the higher of the one-month London Interbank Offered Rate, federal funds effective rate, or overnight bank funding rate plus an agreed-upon spread.
The fund had no borrowings outstanding at August 31, 2016, or at any time during the period then ended.
5. Other: Interest income includes income distributions received from Vanguard Market Liquidity Fund and is accrued daily. Premiums and discounts on debt securities purchased are amortized and accreted, respectively, to interest income over the lives of the respective securities. Security transactions are accounted for on the date securities are bought or sold. Costs used to determine realized gains (losses) on the sale of investment securities are those of the specific securities sold.
24
Short-Term Government Bond Index Fund
Each class of shares has equal rights as to assets and earnings, except that each class separately bears certain class-specific expenses related to maintenance of shareholder accounts (included in Management and Administrative expenses) and shareholder reporting. Marketing and distribution expenses are allocated to each class of shares based on a method approved by the board of trustees. Income, other non-class-specific expenses, and gains and losses on investments are allocated to each class of shares based on its relative net assets.
B. In accordance with the terms of a Funds’ Service Agreement (the “FSA”) between Vanguard and the fund, Vanguard furnishes to the fund investment advisory, corporate management, administrative, marketing, and distribution services at Vanguard’s cost of operations (as defined by the FSA). These costs of operations are allocated to the fund based on methods and guidelines approved by the board of trustees. Vanguard does not require reimbursement in the current period for certain costs of operations (such as deferred compensation/benefits and risk/insurance costs); the fund’s liability for these costs of operations is included in Payables to Vanguard on the Statement of Assets and Liabilities.
Upon the request of Vanguard, the fund may invest up to 0.40% of its net assets as capital in Vanguard. At August 31, 2016, the fund had contributed to Vanguard capital in the amount of $104,000, representing 0.01% of the fund’s net assets and 0.04% of Vanguard’s capitalization. The fund’s trustees and officers are also directors and employees, respectively, of Vanguard.
C. Various inputs may be used to determine the value of the fund’s investments. These inputs are summarized in three broad levels for financial statement purposes. The inputs or methodologies used to value securities are not necessarily an indication of the risk associated with investing in those securities.
Level 1—Quoted prices in active markets for identical securities.
Level 2—Other significant observable inputs (including quoted prices for similar securities, interest rates, prepayment speeds, credit risk, etc.).
Level 3—Significant unobservable inputs (including the fund’s own assumptions used to determine the fair value of investments).
The following table summarizes the market value of the fund’s investments as of August 31, 2016, based on the inputs used to value them:
| Level 1 | Level 2 | Level 3 | |
| Investments | ($000) | ($000) | ($000) |
| U.S. Government and Agency Obligations | — | 1,347,718 | — |
| Temporary Cash Investments | 13,058 | — | — |
| Total | 13,058 | 1,347,718 | — |
D. Distributions are determined on a tax basis and may differ from net investment income and realized capital gains for financial reporting purposes. Differences may be permanent or temporary. Permanent differences are reclassified among capital accounts in the financial statements to reflect their tax character. Temporary differences arise when certain items of income, expense, gain, or loss are recognized in different periods for financial statement and tax purposes. These differences will reverse at some time in the future. Differences in classification may also result from the treatment of short-term gains as ordinary income for tax purposes.
25
Short-Term Government Bond Index Fund
During the year ended August 31, 2016, the fund realized $625,000 of net capital gains resulting from in-kind redemptions—in which shareholders exchanged fund shares for securities held by the fund rather than for cash. Because such gains are not taxable to the fund, and are not distributed to shareholders, they have been reclassified from accumulated net realized gains to paid-in capital.
The fund used a tax accounting practice to treat a portion of the price of capital shares redeemed during the year as distributions from realized capital gains. Accordingly, the fund has reclassified $182,000 from accumulated net realized gains to paid-in capital.
For tax purposes, at August 31, 2016, the fund had $994,000 of ordinary income and $140,000 of long-term capital gains available for distribution.
At August 31, 2016, the cost of investment securities for tax purposes was $1,359,057,000. Net unrealized appreciation of investment securities for tax purposes was $1,719,000, consisting of unrealized gains of $2,388,000 on securities that had risen in value since their purchase and $669,000 in unrealized losses on securities that had fallen in value since their purchase.
E. During the year ended August 31, 2016, the fund purchased $1,440,089,000 of investment securities and sold $999,350,000 of investment securities, other than temporary cash investments. Purchases and sales include $425,306,000 and $165,640,000, respectively, in connection with in-kind purchases and redemptions of the fund’s capital shares.
| F. Capital share transactions for each class of shares were: | ||||
| Year Ended August 31, | ||||
| 2016 | 2015 | |||
| Amount | Shares | Amount | Shares | |
| ($000) | (000) | ($000) | (000) | |
| ETF Shares | ||||
| Issued | 439,524 | 7,197 | 378,274 | 6,200 |
| Issued in Lieu of Cash Distributions | — | — | — | — |
| Redeemed | (168,090) | (2,750) | (241,059) | (3,950) |
| Net Increase (Decrease)—ETF Shares | 271,434 | 4,447 | 137,215 | 2,250 |
| Admiral Shares | ||||
| Issued | 372,695 | 18,300 | 176,583 | 8,677 |
| Issued in Lieu of Cash Distributions | 2,119 | 104 | 963 | 47 |
| Redeemed | (232,573) | (11,408) | (81,878) | (4,023) |
| Net Increase (Decrease) —Admiral Shares | 142,241 | 6,996 | 95,668 | 4,701 |
| Institutional Shares | ||||
| Issued | 37,398 | 1,458 | 29,714 | 1,162 |
| Issued in Lieu of Cash Distributions | 360 | 14 | 235 | 9 |
| Redeemed | (13,060) | (510) | (11,671) | (457) |
| Net Increase (Decrease) —Institutional Shares | 24,698 | 962 | 18,278 | 714 |
G. Management has determined that no material events or transactions occurred subsequent to August 31, 2016, that would require recognition or disclosure in these financial statements.
26
Intermediate-Term Government Bond Index Fund
| Fund Profile | |||
| As of August 31, 2016 | |||
| Share-Class Characteristics | |||
| ETF | Admiral | Institutional | |
| Shares | Shares | Shares | |
| Ticker Symbol | VGIT | VSIGX | VIIGX |
| Expense Ratio1 | 0.10% | 0.10% | 0.07% |
| 30-Day SEC Yield | 1.18% | 1.18% | 1.18% |
| Financial Attributes | |||
| Barclays | |||
| 3–10 Year | |||
| Gov’t | Barclays | ||
| Float Adj | Aggregate | ||
| Fund | Index | FA Index | |
| Number of Bonds | 166 | 300 | 9,864 |
| Yield to Maturity | |||
| (before expenses) | 1.3% | 1.3% | 1.9% |
| Average Coupon | 2.0% | 2.0% | 3.1% |
| Average Duration | 5.3 years | 5.2 years | 5.8 years |
| Average Effective | |||
| Maturity | 5.6 years | 5.6 years | 8.0 years |
| Short-Term | |||
| Reserves | 0.7% | — | — |
| Sector Diversification (% of portfolio) | |||
| Treasury/Agency | 100.0% | ||
The agency and mortgage-backed securities sectors may include issues from government-sponsored enterprises; such issues are generally not backed by the full faith and credit of the U.S. government.
| Volatility Measures | ||
| Barclays | ||
| 3–10 Year | ||
| Gov’t | Barclays | |
| Float Adj | Aggregate | |
| Index | FA Index | |
| R-Squared | 0.99 | 0.84 |
| Beta | 1.03 | 1.14 |
These measures show the degree and timing of the fund’s fluctuations compared with the indexes over 36 months.
| Distribution by Effective Maturity | |
| (% of portfolio) | |
| 1 - 3 Years | 1.5% |
| 3 - 5 Years | 47.1 |
| 5 - 10 Years | 51.4 |
| Distribution by Credit Quality (% of portfolio) | |
| U.S. Government | 100.0% |
Credit-quality ratings are obtained from Barclays and are from Moody's, Fitch, and S&P. When ratings from all three agencies are used, the median rating is shown. When ratings from two of the agencies are used, the lower rating for each issue is shown. "Not Rated" is used to classify securities for which a rating is not available. For more information about these ratings, see the Glossary entry for Credit Quality.
Investment Focus

1 The expense ratios shown are from the prospectus dated December 22, 2015, and represent estimated costs for the current fiscal year. For the fiscal year ended August 31, 2016, the expense ratios were 0.07% for ETF Shares, 0.07% for Admiral Shares, and 0.05% for Institutional Shares.
27
Intermediate-Term Government Bond Index Fund
Performance Summary
All of the returns in this report represent past performance, which is not a guarantee of future results that may be achieved by the fund. (Current performance may be lower or higher than the performance data cited. For performance data current to the most recent month-end, visit our website at vanguard.com/performance.) Note, too, that both investment returns and principal value can fluctuate widely, so an investor’s shares, when sold, could be worth more or less than their original cost. The returns shown do not reflect taxes that a shareholder would pay on fund distributions or on the sale of fund shares.
Cumulative Performance: November 19, 2009, Through August 31, 2016
Initial Investment of $10,000

| Average Annual Total Returns | |||||
| Periods Ended August 31, 2016 | |||||
| Since | Final Value | ||||
| One | Five | Inception | of a $10,000 | ||
| Year | Years | (11/19/2009) | Investment | ||
| Intermediate-Term Government Bond | |||||
| Index Fund ETF Shares Net Asset | |||||
| Value | 4.37% | 2.34% | 3.62% | $12,725 | |
| Intermediate-Term Government Bond | |||||
| Index Fund ETF Shares Market Price | 4.35 | 2.32 | 3.62 | 12,730 | |
| Barclays U.S. 3–10 Year Government | |||||
| •••••••• | Float Adjusted Index | 4.47 | 2.44 | 3.74 | 12,826 |
| – – – – | Intermediate U.S. Government Funds | ||||
| Average | 3.22 | 1.76 | 2.70 | 11,982 | |
| Spliced Barclays U.S. Aggregate Float | |||||
| Adjusted Index | 6.15 | 3.28 | 4.11 | 13,145 | |
For a benchmark description, see the Glossary.
Intermediate U.S. Government Funds Average: Derived from data provided by Lipper, a Thomson Reuters Company.
"Since Inception" performance is calculated from the ETF Shares’ inception date for both the fund and its comparative standards.
See Financial Highlights for dividend and capital gains information.
28
| Intermediate-Term Government Bond Index Fund | ||||
| Average Annual Total Returns | ||||
| Periods Ended August 31, 2016 | ||||
| Since | Final Value | |||
| One | Five | Inception | of a $10,000 | |
| Year | Years | (8/4/2010) | Investment | |
| Intermediate-Term Government Bond Index | ||||
| Fund Admiral Shares | 4.38% | 2.33% | 3.12% | $12,051 |
| Barclays U.S. 3–10 Year Government Float | ||||
| Adjusted Index | 4.47 | 2.44 | 3.24 | 12,136 |
| Barclays U.S. Aggregate Float Adjusted Index | 6.15 | 3.28 | 3.71 | 12,474 |
"Since Inception" performance is calculated from the Admiral Shares’ inception date for both the fund and its comparative standards.
| Since | Final Value | |||
| One | Five | Inception | of a $5,000,000 | |
| Year | Years | (3/19/2010) | Investment | |
| Intermediate-Term Government Bond Index | ||||
| Fund Institutional Shares | 4.42% | 2.37% | 3.84% | $6,377,202 |
| Barclays U.S. 3–10 Year Government Float | ||||
| Adjusted Index | 4.47 | 2.44 | 3.94 | 6,414,859 |
| Barclays U.S. Aggregate Float Adjusted | ||||
| Index | 6.15 | 3.28 | 4.13 | 6,493,950 |
"Since Inception" performance is calculated from the Institutional Shares’ inception date for both the fund and its comparative standards.
| Cumulative Returns of ETF Shares: November 19, 2009, Through August 31, 2016 | |||
| Since | |||
| One | Five | Inception | |
| Year | Years | (11/19/2009) | |
| Intermediate-Term Government Bond Index Fund | |||
| ETF Shares Market Price | 4.35% | 12.14% | 27.30% |
| Intermediate-Term Government Bond Index Fund | |||
| ETF Shares Net Asset Value | 4.37 | 12.25 | 27.25 |
| Barclays U.S. 3–10 Year Government Float Adjusted | |||
| Index | 4.47 | 12.79 | 28.26 |
"Since Inception" performance is calculated from the ETF Shares’ inception date for both the fund and its comparative standards.
29
| Intermediate-Term Government Bond Index Fund | ||
| Fiscal-Year Total Returns (%): November 19, 2009, Through August 31, 2016 | ||
| Barclays | ||
| 3–10 Year | ||
| Gov’t | ||
| Float Adj | ||
| ETF Shares Net Asset Value | Index | |
| Fiscal Year | Total Returns | Total Returns |
| 2010 | 7.65% | 7.76% |
| 2011 | 5.30 | 5.53 |
| 2012 | 4.50 | 4.51 |
| 2013 | -3.18 | -2.99 |
| 2014 | 3.54 | 3.54 |
| 2015 | 2.67 | 2.86 |
| 2016 | 4.37 | 4.47 |
Average Annual Total Returns: Periods Ended June 30, 2016
This table presents returns through the latest calendar quarter—rather than through the end of the fiscal period.
Securities and Exchange Commission rules require that we provide this information.
| Since Inception | ||||||
| Inception Date | One Year | Five Years | Income | Capital | Total | |
| ETF Shares | 11/19/2009 | |||||
| Market Price | 5.95% | 3.43% | 3.82% | |||
| Net Asset Value | 5.92 | 3.44 | 3.81 | |||
| Admiral Shares | 8/4/2010 | 5.91 | 3.43 | 1.68% | 1.64% | 3.32 |
| Institutional Shares | 3/19/2010 | 5.96 | 3.47 | 1.75 | 2.30 | 4.05 |
30
Intermediate-Term Government Bond Index Fund
Financial Statements
Statement of Net Assets
As of August 31, 2016
The fund reports a complete list of its holdings in regulatory filings four times in each fiscal year, at the quarter-ends. For the second and fourth fiscal quarters, the lists appear in the fund’s semiannual and annual reports to shareholders. For the first and third fiscal quarters, the fund files the lists with the Securities and Exchange Commission on Form N-Q. Shareholders can look up the fund’s Forms N-Q on the SEC’s website at sec.gov. Forms N-Q may also be reviewed and copied at the SEC’s Public Reference Room (see the back cover of this report for further information).
| Face | Market | |||
| Maturity | Amount | Value• | ||
| Coupon | Date | ($000) | ($000) | |
| U.S. Government and Agency Obligations (99.5%) | ||||
| U.S. Government Securities (96.0%) | ||||
| United States Treasury Note/Bond | 3.625% | 8/15/19 | 8,997 | 9,697 |
| United States Treasury Note/Bond | 8.125% | 8/15/19 | 2,692 | 3,256 |
| United States Treasury Note/Bond | 1.000% | 8/31/19 | 4,940 | 4,949 |
| United States Treasury Note/Bond | 1.625% | 8/31/19 | 14,133 | 14,416 |
| United States Treasury Note/Bond | 1.000% | 9/30/19 | 31,190 | 31,234 |
| United States Treasury Note/Bond | 1.750% | 9/30/19 | 24,100 | 24,672 |
| United States Treasury Note/Bond | 1.250% | 10/31/19 | 3,576 | 3,607 |
| United States Treasury Note/Bond | 1.500% | 10/31/19 | 17,770 | 18,059 |
| United States Treasury Note/Bond | 3.375% | 11/15/19 | 9,950 | 10,699 |
| United States Treasury Note/Bond | 1.000% | 11/30/19 | 7,855 | 7,857 |
| United States Treasury Note/Bond | 1.500% | 11/30/19 | 8,950 | 9,094 |
| United States Treasury Note/Bond | 1.125% | 12/31/19 | 6,475 | 6,500 |
| United States Treasury Note/Bond | 1.625% | 12/31/19 | 21,558 | 21,989 |
| United States Treasury Note/Bond | 1.250% | 1/31/20 | 10,300 | 10,377 |
| United States Treasury Note/Bond | 1.375% | 1/31/20 | 2,552 | 2,582 |
| United States Treasury Note/Bond | 3.625% | 2/15/20 | 5,780 | 6,287 |
| United States Treasury Note/Bond | 8.500% | 2/15/20 | 360 | 452 |
| United States Treasury Note/Bond | 1.250% | 2/29/20 | 5,560 | 5,600 |
| United States Treasury Note/Bond | 1.375% | 2/29/20 | 9,500 | 9,610 |
| United States Treasury Note/Bond | 1.125% | 3/31/20 | 1,050 | 1,053 |
| United States Treasury Note/Bond | 1.375% | 3/31/20 | 3,789 | 3,832 |
| United States Treasury Note/Bond | 1.125% | 4/30/20 | 2,775 | 2,782 |
| United States Treasury Note/Bond | 1.375% | 4/30/20 | 29,025 | 29,352 |
| United States Treasury Note/Bond | 3.500% | 5/15/20 | 36,689 | 39,899 |
| United States Treasury Note/Bond | 8.750% | 5/15/20 | 1,500 | 1,918 |
| United States Treasury Note/Bond | 1.375% | 5/31/20 | 12,045 | 12,175 |
| United States Treasury Note/Bond | 1.500% | 5/31/20 | 7,243 | 7,354 |
| United States Treasury Note/Bond | 1.625% | 6/30/20 | 8,000 | 8,159 |
| United States Treasury Note/Bond | 1.875% | 6/30/20 | 5,150 | 5,301 |
| United States Treasury Note/Bond | 1.625% | 7/31/20 | 29,480 | 30,065 |
| United States Treasury Note/Bond | 2.000% | 7/31/20 | 8,060 | 8,335 |
| United States Treasury Note/Bond | 2.625% | 8/15/20 | 42,935 | 45,417 |
| United States Treasury Note/Bond | 8.750% | 8/15/20 | 1,950 | 2,529 |
| United States Treasury Note/Bond | 1.375% | 8/31/20 | 27,940 | 28,215 |
| United States Treasury Note/Bond | 2.125% | 8/31/20 | 31,192 | 32,401 |
| United States Treasury Note/Bond | 1.375% | 9/30/20 | 6,978 | 7,044 |
| United States Treasury Note/Bond | 2.000% | 9/30/20 | 5,059 | 5,231 |
31
| Intermediate-Term Government Bond Index Fund | ||||
| Face | Market | |||
| Maturity | Amount | Value• | ||
| Coupon | Date | ($000) | ($000) | |
| United States Treasury Note/Bond | 1.375% | 10/31/20 | 6,789 | 6,852 |
| United States Treasury Note/Bond | 1.750% | 10/31/20 | 9,445 | 9,675 |
| United States Treasury Note/Bond | 2.625% | 11/15/20 | 43,627 | 46,245 |
| United States Treasury Note/Bond | 1.625% | 11/30/20 | 5,750 | 5,862 |
| United States Treasury Note/Bond | 2.000% | 11/30/20 | 8,875 | 9,183 |
| United States Treasury Note/Bond | 1.750% | 12/31/20 | 17,850 | 18,291 |
| United States Treasury Note/Bond | 2.375% | 12/31/20 | 10,580 | 11,119 |
| United States Treasury Note/Bond | 1.375% | 1/31/21 | 20,932 | 21,112 |
| United States Treasury Note/Bond | 2.125% | 1/31/21 | 14,122 | 14,694 |
| United States Treasury Note/Bond | 3.625% | 2/15/21 | 12,857 | 14,213 |
| United States Treasury Note/Bond | 7.875% | 2/15/21 | 1,966 | 2,538 |
| United States Treasury Note/Bond | 1.125% | 2/28/21 | 8,800 | 8,783 |
| United States Treasury Note/Bond | 2.000% | 2/28/21 | 11,590 | 12,003 |
| United States Treasury Note/Bond | 1.250% | 3/31/21 | 22,620 | 22,684 |
| United States Treasury Note/Bond | 2.250% | 3/31/21 | 5,925 | 6,204 |
| United States Treasury Note/Bond | 1.375% | 4/30/21 | 13,790 | 13,900 |
| United States Treasury Note/Bond | 2.250% | 4/30/21 | 4,000 | 4,191 |
| United States Treasury Note/Bond | 3.125% | 5/15/21 | 25,717 | 27,959 |
| United States Treasury Note/Bond | 8.125% | 5/15/21 | 1,340 | 1,765 |
| United States Treasury Note/Bond | 1.375% | 5/31/21 | 25,925 | 26,144 |
| United States Treasury Note/Bond | 2.000% | 5/31/21 | 21,270 | 22,044 |
| United States Treasury Note/Bond | 1.125% | 6/30/21 | 16,150 | 16,094 |
| United States Treasury Note/Bond | 2.125% | 6/30/21 | 15,830 | 16,505 |
| United States Treasury Note/Bond | 1.125% | 7/31/21 | 15,490 | 15,427 |
| United States Treasury Note/Bond | 2.250% | 7/31/21 | 6,200 | 6,502 |
| United States Treasury Note/Bond | 2.125% | 8/15/21 | 7,250 | 7,558 |
| United States Treasury Note/Bond | 8.125% | 8/15/21 | 1,775 | 2,364 |
| United States Treasury Note/Bond | 1.125% | 8/31/21 | 22,000 | 21,924 |
| United States Treasury Note/Bond | 2.000% | 8/31/21 | 7,325 | 7,595 |
| United States Treasury Note/Bond | 2.125% | 9/30/21 | 38,760 | 40,425 |
| United States Treasury Note/Bond | 2.000% | 10/31/21 | 21,005 | 21,780 |
| United States Treasury Note/Bond | 2.000% | 11/15/21 | 5,013 | 5,199 |
| United States Treasury Note/Bond | 8.000% | 11/15/21 | 7,115 | 9,536 |
| United States Treasury Note/Bond | 1.875% | 11/30/21 | 26,220 | 27,031 |
| United States Treasury Note/Bond | 2.125% | 12/31/21 | 12,350 | 12,886 |
| United States Treasury Note/Bond | 1.500% | 1/31/22 | 16,500 | 16,678 |
| United States Treasury Note/Bond | 2.000% | 2/15/22 | 31,394 | 32,571 |
| United States Treasury Note/Bond | 1.750% | 2/28/22 | 13,346 | 13,661 |
| United States Treasury Note/Bond | 1.750% | 3/31/22 | 14,606 | 14,944 |
| United States Treasury Note/Bond | 1.750% | 4/30/22 | 8,500 | 8,694 |
| United States Treasury Note/Bond | 1.750% | 5/15/22 | 5,000 | 5,117 |
| United States Treasury Note/Bond | 1.875% | 5/31/22 | 11,375 | 11,716 |
| United States Treasury Note/Bond | 2.125% | 6/30/22 | 8,900 | 9,289 |
| United States Treasury Note/Bond | 2.000% | 7/31/22 | 5,300 | 5,495 |
| United States Treasury Note/Bond | 1.625% | 8/15/22 | 4,399 | 4,469 |
| United States Treasury Note/Bond | 7.250% | 8/15/22 | 975 | 1,307 |
| United States Treasury Note/Bond | 1.875% | 8/31/22 | 15,626 | 16,085 |
| United States Treasury Note/Bond | 1.750% | 9/30/22 | 8,300 | 8,482 |
| United States Treasury Note/Bond | 1.875% | 10/31/22 | 7,300 | 7,514 |
| United States Treasury Note/Bond | 1.625% | 11/15/22 | 34,115 | 34,606 |
| United States Treasury Note/Bond | 7.625% | 11/15/22 | 1,975 | 2,714 |
| United States Treasury Note/Bond | 2.000% | 11/30/22 | 21,045 | 21,808 |
| United States Treasury Note/Bond | 2.125% | 12/31/22 | 10,902 | 11,377 |
| United States Treasury Note/Bond | 1.750% | 1/31/23 | 14,200 | 14,495 |
| United States Treasury Note/Bond | 2.000% | 2/15/23 | 25,575 | 26,514 |
32
| Intermediate-Term Government Bond Index Fund | ||||
| Face | Market | |||
| Maturity | Amount | Value• | ||
| Coupon | Date | ($000) | ($000) | |
| United States Treasury Note/Bond | 7.125% | 2/15/23 | 2,590 | 3,512 |
| United States Treasury Note/Bond | 1.500% | 2/28/23 | 18,900 | 18,994 |
| United States Treasury Note/Bond | 1.500% | 3/31/23 | 24,915 | 25,024 |
| United States Treasury Note/Bond | 1.625% | 4/30/23 | 12,930 | 13,086 |
| United States Treasury Note/Bond | 1.750% | 5/15/23 | 32,725 | 33,390 |
| United States Treasury Note/Bond | 1.625% | 5/31/23 | 20,950 | 21,202 |
| United States Treasury Note/Bond | 1.375% | 6/30/23 | 18,150 | 18,073 |
| United States Treasury Note/Bond | 1.250% | 7/31/23 | 16,725 | 16,511 |
| United States Treasury Note/Bond | 2.500% | 8/15/23 | 11,495 | 12,303 |
| United States Treasury Note/Bond | 6.250% | 8/15/23 | 1,725 | 2,279 |
| United States Treasury Note/Bond | 1.375% | 8/31/23 | 15,400 | 15,321 |
| United States Treasury Note/Bond | 2.750% | 11/15/23 | 8,995 | 9,795 |
| United States Treasury Note/Bond | 2.750% | 2/15/24 | 35,955 | 39,202 |
| United States Treasury Note/Bond | 2.500% | 5/15/24 | 38,025 | 40,818 |
| United States Treasury Note/Bond | 2.375% | 8/15/24 | 27,785 | 29,574 |
| United States Treasury Note/Bond | 2.250% | 11/15/24 | 24,416 | 25,774 |
| United States Treasury Note/Bond | 7.500% | 11/15/24 | 1,690 | 2,482 |
| United States Treasury Note/Bond | 2.000% | 2/15/25 | 36,608 | 37,924 |
| United States Treasury Note/Bond | 7.625% | 2/15/25 | 300 | 447 |
| United States Treasury Note/Bond | 2.125% | 5/15/25 | 39,915 | 41,761 |
| United States Treasury Note/Bond | 2.000% | 8/15/25 | 27,840 | 28,836 |
| United States Treasury Note/Bond | 6.875% | 8/15/25 | 1,150 | 1,670 |
| United States Treasury Note/Bond | 2.250% | 11/15/25 | 41,250 | 43,609 |
| United States Treasury Note/Bond | 1.625% | 2/15/26 | 28,240 | 28,333 |
| United States Treasury Note/Bond | 1.625% | 5/15/26 | 34,425 | 34,522 |
| United States Treasury Note/Bond | 1.500% | 8/15/26 | 14,000 | 13,897 |
| 1,814,161 | ||||
| Agency Bonds and Notes (3.5%) | ||||
| 1 AID-Israel | 5.500% | 9/18/23 | 125 | 156 |
| 1 AID-Israel | 5.500% | 12/4/23 | 500 | 625 |
| 1 AID-Israel | 5.500% | 4/26/24 | 500 | 629 |
| 1 AID-Jordan | 2.503% | 10/30/20 | 175 | 184 |
| 1 AID-Jordan | 2.578% | 6/30/22 | 500 | 527 |
| 1 AID-Tunisia | 1.416% | 8/5/21 | 510 | 510 |
| 1 AID-Ukraine | 1.847% | 5/29/20 | 300 | 305 |
| 2 Federal Farm Credit Banks | 5.150% | 11/15/19 | 300 | 338 |
| 2 Federal Farm Credit Banks | 3.500% | 12/20/23 | 100 | 112 |
| 2 Federal Home Loan Banks | 1.875% | 3/13/20 | 150 | 154 |
| 2 Federal Home Loan Banks | 4.125% | 3/13/20 | 7,270 | 8,024 |
| 2 Federal Home Loan Banks | 3.375% | 6/12/20 | 125 | 135 |
| 2 Federal Home Loan Banks | 3.125% | 12/11/20 | 1,000 | 1,078 |
| 2 Federal Home Loan Banks | 5.250% | 12/11/20 | 250 | 292 |
| 2 Federal Home Loan Banks | 1.375% | 2/18/21 | 975 | 979 |
| 2 Federal Home Loan Banks | 5.625% | 6/11/21 | 400 | 479 |
| 2 Federal Home Loan Banks | 1.125% | 7/14/21 | 1,500 | 1,485 |
| 2 Federal Home Loan Banks | 2.000% | 9/9/22 | 1,265 | 1,300 |
| 2 Federal Home Loan Banks | 2.125% | 3/10/23 | 475 | 491 |
| 2 Federal Home Loan Banks | 2.875% | 6/14/24 | 200 | 216 |
| 2 Federal Home Loan Banks | 2.875% | 9/13/24 | 1,000 | 1,084 |
| 3 Federal Home Loan Mortgage Corp. | 1.250% | 10/2/19 | 3,229 | 3,246 |
| 3 Federal Home Loan Mortgage Corp. | 1.375% | 5/1/20 | 2,225 | 2,244 |
| 3 Federal Home Loan Mortgage Corp. | 1.125% | 8/12/21 | 1,000 | 989 |
| 3 Federal Home Loan Mortgage Corp. | 2.375% | 1/13/22 | 9,100 | 9,559 |
| 3 Federal National Mortgage Assn. | 1.750% | 9/12/19 | 5,350 | 5,461 |
| 3 Federal National Mortgage Assn. | 0.000% | 10/9/19 | 1,150 | 1,102 |
33
| Intermediate-Term Government Bond Index Fund | |||||
| Face | Market | ||||
| Maturity | Amount | Value• | |||
| Coupon | Date | ($000) | ($000) | ||
| 3 | Federal National Mortgage Assn. | 1.750% | 11/26/19 | 750 | 766 |
| 3 | Federal National Mortgage Assn. | 1.625% | 1/21/20 | 6,635 | 6,748 |
| 3 | Federal National Mortgage Assn. | 1.500% | 6/22/20 | 1,200 | 1,215 |
| 3 | Federal National Mortgage Assn. | 1.500% | 11/30/20 | 1,000 | 1,011 |
| 3 | Federal National Mortgage Assn. | 1.875% | 12/28/20 | 2,000 | 2,051 |
| 3 | Federal National Mortgage Assn. | 1.375% | 2/26/21 | 3,285 | 3,296 |
| 3 | Federal National Mortgage Assn. | 1.250% | 8/17/21 | 1,500 | 1,492 |
| 3 | Federal National Mortgage Assn. | 2.625% | 9/6/24 | 1,495 | 1,597 |
| 3 | Federal National Mortgage Assn. | 2.125% | 4/24/26 | 2,200 | 2,251 |
| 2 | Financing Corp. | 9.700% | 4/5/19 | 50 | 61 |
| Private Export Funding Corp. | 2.250% | 3/15/20 | 150 | 156 | |
| Private Export Funding Corp. | 2.300% | 9/15/20 | 75 | 78 | |
| Private Export Funding Corp. | 2.050% | 11/15/22 | 175 | 178 | |
| Private Export Funding Corp. | 3.550% | 1/15/24 | 75 | 84 | |
| Private Export Funding Corp. | 2.450% | 7/15/24 | 205 | 213 | |
| Private Export Funding Corp. | 3.250% | 6/15/25 | 75 | 83 | |
| 2 | Tennessee Valley Authority | 3.875% | 2/15/21 | 225 | 250 |
| 2 | Tennessee Valley Authority | 1.875% | 8/15/22 | 125 | 127 |
| 2 | Tennessee Valley Authority | 2.875% | 9/15/24 | 400 | 433 |
| 2 | Tennessee Valley Authority | 6.750% | 11/1/25 | 1,225 | 1,704 |
| 65,498 | |||||
| Total U.S. Government and Agency Obligations (Cost $1,847,851) | 1,879,659 | ||||
| Shares | |||||
| Temporary Cash Investment (0.7%) | |||||
| Money Market Fund (0.7%) | |||||
| 4 | Vanguard Market Liquidity Fund (Cost $13,705) | 0.612% | 137,054 | 13,707 | |
| Total Investments (100.2%) (Cost $1,861,556) | 1,893,366 | ||||
| Amount | |||||
| ($000) | |||||
| Other Assets and Liabilities (-0.2%) | |||||
| Other Assets | |||||
| Investment in Vanguard | 142 | ||||
| Receivables for Investment Securities Sold | 38,826 | ||||
| Receivables for Accrued Income | 7,374 | ||||
| Receivables for Capital Shares Issued | 2,871 | ||||
| Total Other Assets | 49,213 | ||||
| Liabilities | |||||
| Payables for Investment Securities Purchased | (51,191) | ||||
| Payables for Capital Shares Redeemed | (572) | ||||
| Payables for Distributions | (145) | ||||
| Payables to Vanguard | (257) | ||||
| Other Liabilities | (91) | ||||
| Total Liabilities | (52,256) | ||||
| Net Assets (100%) | 1,890,323 | ||||
34
| Intermediate-Term Government Bond Index Fund | |
| At August 31, 2016, net assets consisted of: | |
| Amount | |
| ($000) | |
| Paid-in Capital | 1,855,538 |
| Undistributed Net Investment Income | 1,244 |
| Accumulated Net Realized Gains | 1,731 |
| Unrealized Appreciation (Depreciation) | 31,810 |
| Net Assets | 1,890,323 |
| ETF Shares—Net Assets | |
| Applicable to 13,650,877 outstanding $.001 par value shares of | |
| beneficial interest (unlimited authorization) | 908,264 |
| Net Asset Value Per Share—ETF Shares | $66.54 |
| Admiral Shares—Net Assets | |
| Applicable to 31,647,872 outstanding $.001 par value shares of | |
| beneficial interest (unlimited authorization) | 710,442 |
| Net Asset Value Per Share—Admiral Shares | $22.45 |
| Institutional Shares—Net Assets | |
| Applicable to 9,750,828 outstanding $.001 par value shares of | |
| beneficial interest (unlimited authorization) | 271,617 |
| Net Asset Value Per Share—Institutional Shares | $27.86 |
• See Note A in Notes to Financial Statements.
1 U.S. government-guaranteed.
2 The issuer operates under a congressional charter; its securities are generally neither guaranteed by the U.S. Treasury nor backed by the full faith and credit of the U.S. government.
3 The issuer was placed under federal conservatorship in September 2008; since that time, its daily operations have been managed by the Federal Housing Finance Agency and it receives capital from the U.S. Treasury, as needed to maintain a positive net worth, in exchange for senior preferred stock.
4 Affiliated money market fund available only to Vanguard funds and certain trusts and accounts managed by Vanguard. Rate shown is the 7-day yield.
See accompanying Notes, which are an integral part of the Financial Statements.
35
| Intermediate-Term Government Bond Index Fund | |
| Statement of Operations | |
| Year Ended | |
| August 31, 2016 | |
| ($000) | |
| Investment Income | |
| Income | |
| Interest1 | 22,703 |
| Total Income | 22,703 |
| Expenses | |
| The Vanguard Group—Note B | |
| Investment Advisory Services | 36 |
| Management and Administrative—ETF Shares | 314 |
| Management and Administrative—Admiral Shares | 265 |
| Management and Administrative—Institutional Shares | 87 |
| Marketing and Distribution—ETF Shares | 45 |
| Marketing and Distribution—Admiral Shares | 57 |
| Marketing and Distribution—Institutional Shares | 7 |
| Custodian Fees | 11 |
| Auditing Fees | 51 |
| Shareholders’ Reports—ETF Shares | 17 |
| Shareholders’ Reports—Admiral Shares | 7 |
| Shareholders’ Reports—Institutional Shares | — |
| Trustees’ Fees and Expenses | 1 |
| Total Expenses | 898 |
| Net Investment Income | 21,805 |
| Realized Net Gain (Loss) on Investment Securities Sold1 | 4,551 |
| Change in Unrealized Appreciation (Depreciation) of Investment Securities | 27,039 |
| Net Increase (Decrease) in Net Assets Resulting from Operations | 53,395 |
1 Interest income and realized net gain (loss) from an affiliated company of the fund were $38,000 and ($1,000), respectively.
See accompanying Notes, which are an integral part of the Financial Statements.
36
| Intermediate-Term Government Bond Index Fund | ||
| Statement of Changes in Net Assets | ||
| Year Ended August 31, | ||
| 2016 | 2015 | |
| ($000) | ($000) | |
| Increase (Decrease) in Net Assets | ||
| Operations | ||
| Net Investment Income | 21,805 | 11,158 |
| Realized Net Gain (Loss) | 4,551 | 757 |
| Change in Unrealized Appreciation (Depreciation) | 27,039 | 2,636 |
| Net Increase (Decrease) in Net Assets Resulting from Operations | 53,395 | 14,551 |
| Distributions | ||
| Net Investment Income | ||
| ETF Shares | (8,980) | (4,277) |
| Admiral Shares | (8,458) | (4,736) |
| Institutional Shares | (3,688) | (1,815) |
| Realized Capital Gain1 | ||
| ETF Shares | (180) | — |
| Admiral Shares | (178) | — |
| Institutional Shares | (92) | — |
| Total Distributions | (21,576) | (10,828) |
| Capital Share Transactions | ||
| ETF Shares | 534,498 | 195,097 |
| Admiral Shares | 339,752 | 123,954 |
| Institutional Shares | 58,786 | 153,733 |
| Net Increase (Decrease) from Capital Share Transactions | 933,036 | 472,784 |
| Total Increase (Decrease) | 964,855 | 476,507 |
| Net Assets | ||
| Beginning of Period | 925,468 | 448,961 |
| End of Period2 | 1,890,323 | 925,468 |
1 Includes fiscal 2016 and 2015 short-term gain distributions totaling $200,000 and $78,000, respectively. Short-term gain distributions are treated as ordinary income dividends for tax purposes.
2 Net Assets—End of Period includes undistributed (overdistributed) net investment income of $1,244,000 and $565,000.
See accompanying Notes, which are an integral part of the Financial Statements.
37
| Intermediate-Term Government Bond Index Fund | |||||
| Financial Highlights | |||||
| ETF Shares | |||||
| For a Share Outstanding | Year Ended August 31, | ||||
| Throughout Each Period | 2016 | 2015 | 2014 | 2013 | 2012 |
| Net Asset Value, Beginning of Period | $64.80 | $64.14 | $62.96 | $66.58 | $64.91 |
| Investment Operations | |||||
| Net Investment Income | 1.035 | 1.054 | .920 | .861 | 1.097 |
| Net Realized and Unrealized Gain (Loss) | |||||
| on Investments | 1.770 | .649 | 1.292 | (2.940) | 1.791 |
| Total from Investment Operations | 2.805 | 1.703 | 2.212 | (2.079) | 2.888 |
| Distributions | |||||
| Dividends from Net Investment Income | (1.038) | (1.043) | (. 843) | (. 861) | (1.094) |
| Distributions from Realized Capital Gains | (.027) | — | (.189) | (.680) | (.124) |
| Total Distributions | (1.065) | (1.043) | (1.032) | (1.541) | (1.218) |
| Net Asset Value, End of Period | $66.54 | $64.80 | $64.14 | $62.96 | $66.58 |
| Total Return | 4.37% | 2.67% | 3.54% | -3.18% | 4.50% |
| Ratios/Supplemental Data | |||||
| Net Assets, End of Period (Millions) | $908 | $360 | $164 | $123 | $133 |
| Ratio of Total Expenses to Average Net Assets | 0.07% | 0.10% | 0.12% | 0.12% | 0.12% |
| Ratio of Net Investment Income to | |||||
| Average Net Assets | 1.61% | 1.67% | 1.50% | 1.32% | 1.67% |
| Portfolio Turnover Rate1 | 37% | 35% | 43% | 54% | 51% |
1 Excludes the value of portfolio securities received or delivered as a result of in-kind purchases or redemptions of the fund’s capital shares, including ETF Creation Units.
See accompanying Notes, which are an integral part of the Financial Statements.
38
| Intermediate-Term Government Bond Index Fund | |||||
| Financial Highlights | |||||
| Admiral Shares | |||||
| For a Share Outstanding | Year Ended August 31, | ||||
| Throughout Each Period | 2016 | 2015 | 2014 | 2013 | 2012 |
| Net Asset Value, Beginning of Period | $21.86 | $21.64 | $21.27 | $22.50 | $21.94 |
| Investment Operations | |||||
| Net Investment Income | . 349 | .355 | .317 | .292 | .369 |
| Net Realized and Unrealized Gain (Loss) | |||||
| on Investments | .601 | .220 | .432 | (1.000) | .602 |
| Total from Investment Operations | .950 | .575 | .749 | (.708) | .971 |
| Distributions | |||||
| Dividends from Net Investment Income | (. 351) | (. 355) | (. 315) | (. 292) | (. 369) |
| Distributions from Realized Capital Gains | (.009) | — | (.064) | (. 230) | (. 042) |
| Total Distributions | (. 360) | (. 355) | (. 379) | (. 522) | (. 411) |
| Net Asset Value, End of Period | $22.45 | $21.86 | $21.64 | $21.27 | $22.50 |
| Total Return1 | 4.38% | 2.67% | 3.55% | -3.21% | 4.47% |
| Ratios/Supplemental Data | |||||
| Net Assets, End of Period (Millions) | $710 | $358 | $232 | $95 | $35 |
| Ratio of Total Expenses to Average Net Assets | 0.07% | 0.10% | 0.12% | 0.12% | 0.12% |
| Ratio of Net Investment Income to | |||||
| Average Net Assets | 1.61% | 1.67% | 1.50% | 1.32% | 1.67% |
| Portfolio Turnover Rate2 | 37% | 35% | 43% | 54% | 51% |
Signal Shares were renamed Admiral Shares in October 2013. Prior periods’ Financial Highlights are for the Signal class.
1 Total returns do not include transaction or account service fees that may have applied in the periods shown. Fund prospectuses provide information about any applicable transaction and account service fees.
2 Excludes the value of portfolio securities received or delivered as a result of in-kind purchases or redemptions of the fund’s capital shares, including ETF Creation Units.
See accompanying Notes, which are an integral part of the Financial Statements.
39
| Intermediate-Term Government Bond Index Fund | |||||
| Financial Highlights | |||||
| Institutional Shares | |||||
| For a Share Outstanding | Year Ended August 31, | ||||
| Throughout Each Period | 2016 | 2015 | 2014 | 2013 | 2012 |
| Net Asset Value, Beginning of Period | $27.12 | $26.85 | $26.39 | $27.91 | $27.21 |
| Investment Operations | |||||
| Net Investment Income | . 437 | .447 | .400 | .368 | .466 |
| Net Realized and Unrealized Gain (Loss) | |||||
| on Investments | .752 | . 271 | .536 | (1.235) | .752 |
| Total from Investment Operations | 1.189 | .718 | .936 | (.867) | 1.218 |
| Distributions | |||||
| Dividends from Net Investment Income | (.438) | (.448) | (.397) | (.368) | (.465) |
| Distributions from Realized Capital Gains | (.011) | — | (.079) | (. 285) | (.053) |
| Total Distributions | (.449) | (.448) | (.476) | (. 653) | (. 518) |
| Net Asset Value, End of Period | $27.86 | $27.12 | $26.85 | $26.39 | $27.91 |
| Total Return1 | 4.42% | 2.69% | 3.58% | -3.17% | 4.52% |
| Ratios/Supplemental Data | |||||
| Net Assets, End of Period (Millions) | $272 | $208 | $54 | $59 | $117 |
| Ratio of Total Expenses to Average Net Assets | 0.05% | 0.07% | 0.09% | 0.09% | 0.09% |
| Ratio of Net Investment Income to | |||||
| Average Net Assets | 1.63% | 1.70% | 1.53% | 1.35% | 1.70% |
| Portfolio Turnover Rate2 | 37% | 35% | 43% | 54% | 51% |
1 Total returns do not include transaction fees that may have applied in the periods shown. Fund prospectuses provide information about any applicable transaction fees.
2 Excludes the value of portfolio securities received or delivered as a result of in-kind purchases or redemptions of the fund’s capital shares, including ETF Creation Units.
See accompanying Notes, which are an integral part of the Financial Statements.
40
Intermediate-Term Government Bond Index Fund
Notes to Financial Statements
Vanguard Intermediate-Term Government Bond Index Fund is registered under the Investment Company Act of 1940 as an open-end investment company, or mutual fund. The fund offers three classes of shares: ETF Shares, Admiral Shares, and Institutional Shares. ETF Shares are listed for trading on Nasdaq; they can be purchased and sold through a broker. Admiral Shares and Institutional Shares are designed for investors who meet certain administrative, service, and account-size criteria.
A. The following significant accounting policies conform to generally accepted accounting principles for U.S. investment companies. The fund consistently follows such policies in preparing its financial statements.
1. Security Valuation: Securities are valued as of the close of trading on the New York Stock Exchange (generally 4 p.m., Eastern time) on the valuation date. Bonds and temporary cash investments acquired over 60 days to maturity are valued using the latest bid prices or using valuations based on a matrix system (which considers such factors as security prices, yields, maturities, and ratings), both as furnished by independent pricing services. Investments in Vanguard Market Liquidity Fund are valued at that fund’s net asset value. Other temporary cash investments are valued at amortized cost, which approximates market value. Securities for which market quotations are not readily available, or whose values have been affected by events occurring before the fund’s pricing time but after the close of the securities’ primary markets, are valued by methods deemed by the board of trustees to represent fair value.
2. Federal Income Taxes: The fund intends to continue to qualify as a regulated investment company and distribute all of its taxable income. Management has analyzed the fund’s tax positions taken for all open federal income tax years (August 31, 2013–2016), and has concluded that no provision for federal income tax is required in the fund’s financial statements.
3. Distributions: Distributions to shareholders are recorded on the ex-dividend date.
4. Credit Facility: The fund and certain other funds managed by The Vanguard Group (“Vanguard”) participate in a $3.1 billion committed credit facility provided by a syndicate of lenders pursuant to a credit agreement that may be renewed annually; each fund is individually liable for its borrowings, if any, under the credit facility. Borrowings may be utilized for temporary and emergency purposes, and are subject to the fund’s regulatory and contractual borrowing restrictions. The participating funds are charged administrative fees and an annual commitment fee of 0.10% of the undrawn amount of the facility; these fees are allocated to the funds based on a method approved by the fund’s board of trustees and included in Management and Administrative expenses on the fund’s Statement of Operations. Any borrowings under this facility bear interest at a rate based upon the higher of the one-month London Interbank Offered Rate, federal funds effective rate, or overnight bank funding rate plus an agreed-upon spread.
The fund had no borrowings outstanding at August 31, 2016, or at any time during the period then ended.
5. Other: Interest income includes income distributions received from Vanguard Market Liquidity Fund and is accrued daily. Premiums and discounts on debt securities purchased are amortized and accreted, respectively, to interest income over the lives of the respective securities. Security transactions are accounted for on the date securities are bought or sold. Costs used to determine realized gains (losses) on the sale of investment securities are those of the specific securities sold.
41
Intermediate-Term Government Bond Index Fund
Each class of shares has equal rights as to assets and earnings, except that each class separately bears certain class-specific expenses related to maintenance of shareholder accounts (included in Management and Administrative expenses) and shareholder reporting. Marketing and distribution expenses are allocated to each class of shares based on a method approved by the board of trustees. Income, other non-class-specific expenses, and gains and losses on investments are allocated to each class of shares based on its relative net assets.
B. In accordance with the terms of a Funds’ Service Agreement (the “FSA”) between Vanguard and the fund, Vanguard furnishes to the fund investment advisory, corporate management, administrative, marketing, and distribution services at Vanguard’s cost of operations (as defined by the FSA). These costs of operations are allocated to the fund based on methods and guidelines approved by the board of trustees. Vanguard does not require reimbursement in the current period for certain costs of operations (such as deferred compensation/benefits and risk/insurance costs); the fund’s liability for these costs of operations is included in Payables to Vanguard on the Statement of Net Assets.
Upon the request of Vanguard, the fund may invest up to 0.40% of its net assets as capital in Vanguard. At August 31, 2016, the fund had contributed to Vanguard capital in the amount of $142,000, representing 0.01% of the fund’s net assets and 0.06% of Vanguard’s capitalization. The fund’s trustees and officers are also directors and employees, respectively, of Vanguard.
C. Various inputs may be used to determine the value of the fund’s investments. These inputs are summarized in three broad levels for financial statement purposes. The inputs or methodologies used to value securities are not necessarily an indication of the risk associated with investing in those securities.
Level 1—Quoted prices in active markets for identical securities.
Level 2—Other significant observable inputs (including quoted prices for similar securities, interest rates, prepayment speeds, credit risk, etc.).
Level 3—Significant unobservable inputs (including the fund’s own assumptions used to determine the fair value of investments).
The following table summarizes the market value of the fund’s investments as of August 31, 2016, based on the inputs used to value them:
| Level 1 | Level 2 | Level 3 | |
| Investments | ($000) | ($000) | ($000) |
| U.S. Government and Agency Obligations | — | 1,879,659 | — |
| Temporary Cash Investments | 13,707 | — | — |
| Total | 13,707 | 1,879,659 | — |
D. Distributions are determined on a tax basis and may differ from net investment income and realized capital gains for financial reporting purposes. Differences may be permanent or temporary. Permanent differences are reclassified among capital accounts in the financial statements to reflect their tax character. Temporary differences arise when certain items of income, expense, gain, or loss are recognized in different periods for financial statement and tax purposes. These differences will reverse at some time in the future. Differences in classification may also result from the treatment of short-term gains as ordinary income for tax purposes.
42
Intermediate-Term Government Bond Index Fund
During the year ended August 31, 2016, the fund realized $2,036,000 of net capital gains resulting from in-kind redemptions—in which shareholders exchanged fund shares for securities held by the fund rather than for cash. Because such gains are not taxable to the fund, and are not distributed to shareholders, they have been reclassified from accumulated net realized gains to paid-in capital.
The fund used a tax accounting practice to treat a portion of the price of capital shares redeemed during the year as distributions from realized capital gains. Accordingly, the fund has reclassified $374,000 from accumulated net realized gains to paid-in capital.
For tax purposes, at August 31, 2016, the fund had $1,967,000 of ordinary income and $1,379,000 of long-term capital gains available for distribution.
At August 31, 2016, the cost of investment securities for tax purposes was $1,861,556,000. Net unrealized appreciation of investment securities for tax purposes was $31,810,000, consisting of unrealized gains of $32,407,000 on securities that had risen in value since their purchase and $597,000 in unrealized losses on securities that had fallen in value since their purchase.
E. During the year ended August 31, 2016, the fund purchased $1,506,621,000 of investment securities and sold $569,645,000 of investment securities, other than temporary cash investments. Purchases and sales include $602,721,000 and $74,508,000, respectively, in connection with in-kind purchases and redemptions of the fund’s capital shares.
| F. Capital share transactions for each class of shares were: | ||||
| Year Ended August 31, | ||||
| 2016 | 2015 | |||
| Amount | Shares | Amount | Shares | |
| ($000) | (000) | ($000) | (000) | |
| ETF Shares | ||||
| Issued | 609,814 | 9,250 | 217,599 | 3,351 |
| Issued in Lieu of Cash Distributions | — | — | — | — |
| Redeemed | (75,316) | (1,150) | (22,502) | (350) |
| Net Increase (Decrease) —ETF Shares | 534,498 | 8,100 | 195,097 | 3,001 |
| Admiral Shares | ||||
| Issued | 520,311 | 23,394 | 202,742 | 9,279 |
| Issued in Lieu of Cash Distributions | 7,829 | 352 | 4,523 | 207 |
| Redeemed | (188,388) | (8,485) | (83,311) | (3,815) |
| Net Increase (Decrease) —Admiral Shares | 339,752 | 15,261 | 123,954 | 5,671 |
| Institutional Shares | ||||
| Issued | 225,833 | 8,188 | 155,729 | 5,732 |
| Issued in Lieu of Cash Distributions | 3,524 | 128 | 1,703 | 63 |
| Redeemed | (170,571) | (6,217) | (3,699) | (136) |
| Net Increase (Decrease) —Institutional Shares | 58,786 | 2,099 | 153,733 | 5,659 |
G. Management has determined that no material events or transactions occurred subsequent to August 31, 2016, that would require recognition or disclosure in these financial statements.
43
Long-Term Government Bond Index Fund
| Fund Profile | |||
| As of August 31, 2016 | |||
| Share-Class Characteristics | |||
| ETF | Admiral | Institutional | |
| Shares | Shares | Shares | |
| Ticker Symbol | VGLT | VLGSX | VLGIX |
| Expense Ratio1 | 0.10% | 0.10% | 0.07% |
| 30-Day SEC Yield | 2.13% | 2.12% | 2.13% |
| Financial Attributes | |||
| Barclays | |||
| Long Gov | Barclays | ||
| Float Adj | Aggregate | ||
| Fund | Index | FA Index | |
| Number of Bonds | 71 | 83 | 9,864 |
| Yield to Maturity | |||
| (before expenses) | 2.1% | 2.1% | 1.9% |
| Average Coupon | 3.6% | 3.6% | 3.1% |
| Average Duration | 18.0 years | 18.0 years | 5.8 years |
| Average Effective | |||
| Maturity | 25.0 years | 25.0 years | 8.0 years |
| Short-Term | |||
| Reserves | 1.1% | — | — |
| Sector Diversification (% of portfolio) | |||
| Treasury/Agency | 100.0% | ||
The agency and mortgage-backed securities sectors may include issues from government-sponsored enterprises; such issues are generally not backed by the full faith and credit of the U.S. government.
| Volatility Measures | ||
| Barclays | ||
| Long Gov | Barclays | |
| Float Adj | Aggregate | |
| Index | FA Index | |
| R-Squared | 0.99 | 0.83 |
| Beta | 1.06 | 3.52 |
These measures show the degree and timing of the fund’s fluctuations compared with the indexes over 36 months.
| Distribution by Effective Maturity | |
| (% of portfolio) | |
| 5 - 10 Years | 0.7% |
| 10 - 20 Years | 11.9 |
| 20 - 30 Years | 87.1 |
| Over 30 Years | 0.3 |
| Distribution by Credit Quality (% of portfolio) | |
| U.S. Government | 100.0% |
Credit-quality ratings are obtained from Barclays and are from Moody's, Fitch, and S&P. When ratings from all three agencies are used, the median rating is shown. When ratings from two of the agencies are used, the lower rating for each issue is shown. "Not Rated" is used to classify securities for which a rating is not available. For more information about these ratings, see the Glossary entry for Credit Quality.
Investment Focus

1 The expense ratios shown are from the prospectus dated December 22, 2015, and represent estimated costs for the current fiscal year. For the fiscal year ended August 31, 2016, the expense ratios were 0.07% for ETF Shares, 0.07% for Admiral Shares, and 0.05% for Institutional Shares.
44
Long-Term Government Bond Index Fund
Performance Summary
All of the returns in this report represent past performance, which is not a guarantee of future results that may be achieved by the fund. (Current performance may be lower or higher than the performance data cited. For performance data current to the most recent month-end, visit our website at vanguard.com/performance.) Note, too, that both investment returns and principal value can fluctuate widely, so an investor’s shares, when sold, could be worth more or less than their original cost. The returns shown do not reflect taxes that a shareholder would pay on fund distributions or on the sale of fund shares.
Cumulative Performance: November 19, 2009, Through August 31, 2016
Initial Investment of $10,000
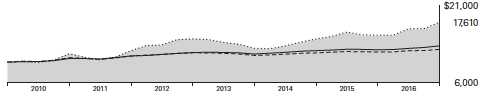
| Average Annual Total Returns | |||||
| Periods Ended August 31, 2016 | |||||
| Since | Final Value | ||||
| One | Five | Inception | of a $10,000 | ||
| Year | Years | (11/19/2009) | Investment | ||
| Long-Term Government Bond Index | |||||
| Fund ETF Shares Net Asset Value | 16.96% | 7.69% | 8.70% | $17,610 | |
| Long-Term Government Bond Index | |||||
| Fund ETF Shares Market Price | 16.95 | 7.70 | 8.71 | 17,624 | |
| Barclays U.S. Long Government Float | |||||
| •••••••• | Adjusted Index | 16.59 | 7.75 | 8.81 | 17,726 |
| – – – – | General U.S. Government Funds | ||||
| Average | 4.18 | 2.18 | 3.29 | 12,453 | |
| Spliced Barclays U.S. Aggregate Float | |||||
| Adjusted Index | 6.15 | 3.28 | 4.11 | 13,145 | |
For a benchmark description, see the Glossary.
General U.S. Government Funds Average: Derived from data provided by Lipper, a Thomson Reuters Company.
"Since Inception" performance is calculated from the ETF Shares’ inception date for both the fund and its comparative standards.
See Financial Highlights for dividend and capital gains information.
45
| Long-Term Government Bond Index Fund | ||||
| Average Annual Total Returns | ||||
| Periods Ended August 31, 2016 | ||||
| Since | Final Value | |||
| One | Five | Inception | of a $10,000 | |
| Year | Years | (3/1/2010) | Investment | |
| Long-Term Government Bond Index Fund | ||||
| Admiral Shares | 16.97% | 7.68% | 9.31% | $17,843 |
| Barclays U.S. Long Government Float | ||||
| Adjusted Index | 16.59 | 7.75 | 9.42 | 17,960 |
| Barclays U.S. Aggregate Float Adjusted Index | 6.15 | 3.28 | 4.14 | 13,021 |
"Since Inception" performance is calculated from the Admiral Shares’ inception date for both the fund and its comparative standards.
| Since | Final Value | |||
| One | Five | Inception | of a $5,000,000 | |
| Year | Years | (7/30/2010) | Investment | |
| Long-Term Government Bond Index Fund | ||||
| Institutional Shares | 16.99% | 7.73% | 8.28% | $8,116,660 |
| Barclays U.S. Long Government Float | ||||
| Adjusted Index | 16.59 | 7.75 | 8.33 | 8,138,767 |
| Barclays U.S. Aggregate Float Adjusted | ||||
| Index | 6.15 | 3.28 | 3.68 | 6,231,853 |
"Since Inception" performance is calculated from the Institutional Shares’ inception date for both the fund and its comparative standards.
| Cumulative Returns of ETF Shares: November 19, 2009, Through August 31, 2016 | |||
| Since | |||
| One | Five | Inception | |
| Year | Years | (11/19/2009) | |
| Long-Term Government Bond Index Fund ETF | |||
| Shares Market Price | 16.95% | 44.89% | 76.24% |
| Long-Term Government Bond Index Fund ETF | |||
| Shares Net Asset Value | 16.96 | 44.83 | 76.10 |
| Barclays U.S. Long Government Float Adjusted | |||
| Index | 16.59 | 45.23 | 77.26 |
"Since Inception" performance is calculated from the ETF Shares’ inception date for both the fund and its comparative standards.
46
| Long-Term Government Bond Index Fund | ||
| Fiscal-Year Total Returns (%): November 19, 2009, Through August 31, 2016 | ||
| Barclays | ||
| Long Gov | ||
| Float Adj | ||
| ETF Shares Net Asset Value | Index | |
| Fiscal Year | Total Returns | Total Returns |
| 2010 | 16.21% | 16.12% |
| 2011 | 4.63 | 5.11 |
| 2012 | 19.06 | 18.68 |
| 2013 | -13.13 | -12.46 |
| 2014 | 14.65 | 14.15 |
| 2015 | 4.44 | 5.05 |
| 2016 | 16.96 | 16.59 |
Average Annual Total Returns: Periods Ended June 30, 2016
This table presents returns through the latest calendar quarter—rather than through the end of the fiscal period.
Securities and Exchange Commission rules require that we provide this information.
| Since Inception | ||||||
| Inception Date | One Year | Five Years | Income | Capital | Total | |
| ETF Shares | 11/19/2009 | |||||
| Market Price | 19.75% | 10.14% | 8.78% | |||
| Net Asset Value | 19.70 | 10.13 | 8.77 | |||
| Admiral Shares | 3/1/2010 | 19.70 | 10.12 | 3.27% | 6.13% | 9.40 |
| Institutional Shares | 7/30/2010 | 19.77 | 10.17 | 3.23 | 5.12 | 8.35 |
47
Long-Term Government Bond Index Fund
Financial Statements
Statement of Net Assets
As of August 31, 2016
The fund reports a complete list of its holdings in regulatory filings four times in each fiscal year, at the quarter-ends. For the second and fourth fiscal quarters, the lists appear in the fund’s semiannual and annual reports to shareholders. For the first and third fiscal quarters, the fund files the lists with the Securities and Exchange Commission on Form N-Q. Shareholders can look up the fund’s Forms N-Q on the SEC’s website at sec.gov. Forms N-Q may also be reviewed and copied at the SEC’s Public Reference Room (see the back cover of this report for further information).
| Face | Market | |||
| Maturity | Amount | Value• | ||
| Coupon | Date | ($000) | ($000) | |
| U.S. Government and Agency Obligations (99.5%) | ||||
| U.S. Government Securities (95.3%) | ||||
| United States Treasury Note/Bond | 6.750% | 8/15/26 | 5,040 | 7,469 |
| United States Treasury Note/Bond | 6.500% | 11/15/26 | 3,574 | 5,237 |
| United States Treasury Note/Bond | 6.625% | 2/15/27 | 1,373 | 2,040 |
| United States Treasury Note/Bond | 6.375% | 8/15/27 | 3,108 | 4,591 |
| United States Treasury Note/Bond | 6.125% | 11/15/27 | 5,648 | 8,240 |
| United States Treasury Note/Bond | 5.500% | 8/15/28 | 10,303 | 14,571 |
| United States Treasury Note/Bond | 5.250% | 11/15/28 | 6,969 | 9,709 |
| United States Treasury Note/Bond | 5.250% | 2/15/29 | 4,335 | 6,064 |
| United States Treasury Note/Bond | 6.125% | 8/15/29 | 2,625 | 3,972 |
| United States Treasury Note/Bond | 6.250% | 5/15/30 | 4,887 | 7,597 |
| United States Treasury Note/Bond | 5.375% | 2/15/31 | 13,283 | 19,513 |
| United States Treasury Note/Bond | 4.500% | 2/15/36 | 8,550 | 12,214 |
| United States Treasury Note/Bond | 4.750% | 2/15/37 | 3,510 | 5,179 |
| United States Treasury Note/Bond | 5.000% | 5/15/37 | 1,106 | 1,685 |
| United States Treasury Note/Bond | 4.375% | 2/15/38 | 8,069 | 11,448 |
| United States Treasury Note/Bond | 4.500% | 5/15/38 | 5,716 | 8,253 |
| United States Treasury Note/Bond | 3.500% | 2/15/39 | 16,891 | 21,296 |
| United States Treasury Note/Bond | 4.250% | 5/15/39 | 10,331 | 14,412 |
| United States Treasury Note/Bond | 4.500% | 8/15/39 | 11,545 | 16,657 |
| United States Treasury Note/Bond | 4.375% | 11/15/39 | 19,447 | 27,621 |
| United States Treasury Note/Bond | 4.625% | 2/15/40 | 19,952 | 29,311 |
| United States Treasury Note/Bond | 4.375% | 5/15/40 | 16,898 | 24,043 |
| United States Treasury Note/Bond | 3.875% | 8/15/40 | 14,323 | 19,045 |
| United States Treasury Note/Bond | 4.250% | 11/15/40 | 14,893 | 20,887 |
| United States Treasury Note/Bond | 4.750% | 2/15/41 | 16,463 | 24,736 |
| United States Treasury Note/Bond | 4.375% | 5/15/41 | 13,594 | 19,452 |
| United States Treasury Note/Bond | 3.750% | 8/15/41 | 15,695 | 20,560 |
| United States Treasury Note/Bond | 3.125% | 11/15/41 | 4,396 | 5,220 |
| United States Treasury Note/Bond | 3.125% | 2/15/42 | 7,151 | 8,499 |
| United States Treasury Note/Bond | 3.000% | 5/15/42 | 8,770 | 10,201 |
| United States Treasury Note/Bond | 2.750% | 8/15/42 | 28,015 | 31,153 |
| United States Treasury Note/Bond | 2.750% | 11/15/42 | 31,724 | 35,238 |
| United States Treasury Note/Bond | 3.125% | 2/15/43 | 33,010 | 39,246 |
| United States Treasury Note/Bond | 2.875% | 5/15/43 | 34,320 | 39,002 |
| United States Treasury Note/Bond | 3.625% | 8/15/43 | 28,075 | 36,471 |
| United States Treasury Note/Bond | 3.750% | 11/15/43 | 24,977 | 33,165 |
| United States Treasury Note/Bond | 3.625% | 2/15/44 | 43,185 | 56,100 |
48
| Long-Term Government Bond Index Fund | ||||
| Face | Market | |||
| Maturity | Amount | Value• | ||
| Coupon | Date | ($000) | ($000) | |
| United States Treasury Note/Bond | 3.375% | 5/15/44 | 35,075 | 43,674 |
| United States Treasury Note/Bond | 3.125% | 8/15/44 | 44,920 | 53,511 |
| United States Treasury Note/Bond | 3.000% | 11/15/44 | 33,030 | 38,444 |
| United States Treasury Note/Bond | 2.500% | 2/15/45 | 28,075 | 29,645 |
| United States Treasury Note/Bond | 3.000% | 5/15/45 | 31,305 | 36,436 |
| United States Treasury Note/Bond | 2.875% | 8/15/45 | 34,685 | 39,449 |
| United States Treasury Note/Bond | 3.000% | 11/15/45 | 34,134 | 39,766 |
| United States Treasury Note/Bond | 2.500% | 2/15/46 | 46,200 | 48,813 |
| United States Treasury Note/Bond | 2.500% | 5/15/46 | 34,520 | 36,526 |
| United States Treasury Note/Bond | 2.250% | 8/15/46 | 12,500 | 12,547 |
| 1,038,908 | ||||
| Agency Bonds and Notes (4.2%) | ||||
| 1 AID-Israel | 5.500% | 9/18/33 | 150 | 212 |
| 2 Federal Home Loan Banks | 5.500% | 7/15/36 | 1,710 | 2,508 |
| 3 Federal Home Loan Mortgage Corp. | 6.750% | 9/15/29 | 913 | 1,382 |
| 3 Federal Home Loan Mortgage Corp. | 6.750% | 3/15/31 | 2,990 | 4,636 |
| 3 Federal Home Loan Mortgage Corp. | 6.250% | 7/15/32 | 3,669 | 5,591 |
| 3 Federal National Mortgage Assn. | 6.250% | 5/15/29 | 700 | 1,014 |
| 3 Federal National Mortgage Assn. | 7.125% | 1/15/30 | 1,730 | 2,710 |
| 3 Federal National Mortgage Assn. | 7.250% | 5/15/30 | 3,895 | 6,187 |
| 3 Federal National Mortgage Assn. | 6.625% | 11/15/30 | 3,985 | 6,095 |
| 3 Federal National Mortgage Assn. | 5.625% | 7/15/37 | 675 | 1,009 |
| 3 Federal National Mortgage Assn. | 6.210% | 8/6/38 | 300 | 476 |
| 2 Tennessee Valley Authority | 7.125% | 5/1/30 | 650 | 1,004 |
| 2 Tennessee Valley Authority | 4.700% | 7/15/33 | 100 | 129 |
| 2 Tennessee Valley Authority | 4.650% | 6/15/35 | 575 | 746 |
| 2 Tennessee Valley Authority | 5.880% | 4/1/36 | 2,330 | 3,450 |
| 2 Tennessee Valley Authority | 6.150% | 1/15/38 | 165 | 253 |
| 2 Tennessee Valley Authority | 5.500% | 6/15/38 | 150 | 216 |
| 2 Tennessee Valley Authority | 5.250% | 9/15/39 | 2,712 | 3,799 |
| 2 Tennessee Valley Authority | 3.500% | 12/15/42 | 250 | 278 |
| 2 Tennessee Valley Authority | 4.875% | 1/15/48 | 245 | 326 |
| 2 Tennessee Valley Authority | 5.375% | 4/1/56 | 815 | 1,172 |
| 2 Tennessee Valley Authority | 4.625% | 9/15/60 | 850 | 1,093 |
| 2 Tennessee Valley Authority | 4.250% | 9/15/65 | 600 | 719 |
| 45,005 | ||||
| Total U.S. Government and Agency Obligations (Cost $1,000,166) | 1,083,913 | |||
| Shares | ||||
| Temporary Cash Investment (1.1%) | ||||
| Money Market Fund (1.1%) | ||||
| 4 Vanguard Market Liquidity Fund (Cost $12,213) | 0.612% | 122,118 | 12,213 | |
| Total Investments (100.6%) (Cost $1,012,379) | 1,096,126 | |||
49
| Long-Term Government Bond Index Fund | |
| Amount | |
| ($000) | |
| Other Assets and Liabilities (-0.6%) | |
| Other Assets | |
| Investment in Vanguard | 92 |
| Receivables for Investment Securities Sold | 4,690 |
| Receivables for Accrued Income | 5,349 |
| Receivables for Capital Shares Issued | 1,437 |
| Total Other Assets | 11,568 |
| Liabilities | |
| Payables for Investment Securities Purchased | (13,289) |
| Payables for Capital Shares Redeemed | (249) |
| Payables for Distributions | (59) |
| Payables to Vanguard | (171) |
| Other Liabilities | (3,808) |
| Total Liabilities | (17,576) |
| Net Assets (100%) | 1,090,118 |
| At August 31, 2016, net assets consisted of: | |
| Amount | |
| ($000) | |
| Paid-in Capital | 1,015,667 |
| Undistributed Net Investment Income | 1,196 |
| Accumulated Net Realized Losses | (10,492) |
| Unrealized Appreciation (Depreciation) | 83,747 |
| Net Assets | 1,090,118 |
| ETF Shares—Net Assets | |
| Applicable to 6,754,811 outstanding $.001 par value shares of | |
| beneficial interest (unlimited authorization) | 578,450 |
| Net Asset Value Per Share—ETF Shares | $85.64 |
| Admiral Shares—Net Assets | |
| Applicable to 13,012,726 outstanding $.001 par value shares of | |
| beneficial interest (unlimited authorization) | 374,135 |
| Net Asset Value Per Share—Admiral Shares | $28.75 |
| Institutional Shares—Net Assets | |
| Applicable to 3,768,968 outstanding $.001 par value shares of | |
| beneficial interest (unlimited authorization) | 137,533 |
| Net Asset Value Per Share—Institutional Shares | $36.49 |
• See Note A in Notes to Financial Statements.
1 U.S. government-guaranteed.
2 The issuer operates under a congressional charter; its securities are generally neither guaranteed by the U.S. Treasury nor backed by the full faith and credit of the U.S. government.
3 The issuer was placed under federal conservatorship in September 2008; since that time, its daily operations have been managed by the Federal Housing Finance Agency and it receives capital from the U.S. Treasury, as needed to maintain a positive net worth, in exchange for senior preferred stock.
4 Affiliated money market fund available only to Vanguard funds and certain trusts and accounts managed by Vanguard. Rate shown is the 7-day yield.
See accompanying Notes, which are an integral part of the Financial Statements.
50
| Long-Term Government Bond Index Fund | |
| Statement of Operations | |
| Year Ended | |
| August 31, 2016 | |
| ($000) | |
| Investment Income | |
| Income | |
| Interest1 | 21,277 |
| Total Income | 21,277 |
| Expenses | |
| The Vanguard Group—Note B | |
| Investment Advisory Services | 22 |
| Management and Administrative—ETF Shares | 227 |
| Management and Administrative—Admiral Shares | 99 |
| Management and Administrative—Institutional Shares | 51 |
| Marketing and Distribution—ETF Shares | 36 |
| Marketing and Distribution—Admiral Shares | 24 |
| Marketing and Distribution—Institutional Shares | 3 |
| Custodian Fees | 7 |
| Auditing Fees | 51 |
| Shareholders’ Reports—ETF Shares | 8 |
| Shareholders’ Reports—Admiral Shares | 5 |
| Shareholders’ Reports—Institutional Shares | — |
| Total Expenses | 533 |
| Net Investment Income | 20,744 |
| Realized Net Gain (Loss) | |
| Investment Securities Sold1 | 25,042 |
| Futures Contracts | 1 |
| Realized Net Gain (Loss) | 25,043 |
| Change in Unrealized Appreciation (Depreciation) of Investment Securities | 81,087 |
| Net Increase (Decrease) in Net Assets Resulting from Operations | 126,874 |
1 Interest income and realized net gain (loss) from an affiliated company of the fund were $12,000 and $0, respectively.
See accompanying Notes, which are an integral part of the Financial Statements.
51
| Long-Term Government Bond Index Fund | ||
| Statement of Changes in Net Assets | ||
| Year Ended August 31, | ||
| 2016 | 2015 | |
| ($000) | ($000) | |
| Increase (Decrease) in Net Assets | ||
| Operations | ||
| Net Investment Income | 20,744 | 11,946 |
| Realized Net Gain (Loss) | 25,043 | 1,980 |
| Change in Unrealized Appreciation (Depreciation) | 81,087 | (8,505) |
| Net Increase (Decrease) in Net Assets Resulting from Operations | 126,874 | 5,421 |
| Distributions | ||
| Net Investment Income | ||
| ETF Shares | (11,086) | (5,289) |
| Admiral Shares | (5,615) | (2,856) |
| Institutional Shares | (3,463) | (3,453) |
| Realized Capital Gain | ||
| ETF Shares | — | — |
| Admiral Shares | — | — |
| Institutional Shares | — | — |
| Total Distributions | (20,164) | (11,598) |
| Capital Share Transactions | ||
| ETF Shares | 266,095 | 148,580 |
| Admiral Shares | 215,021 | 89,912 |
| Institutional Shares | (33,186) | 57,366 |
| Net Increase (Decrease) from Capital Share Transactions | 447,930 | 295,858 |
| Total Increase (Decrease) | 554,640 | 289,681 |
| Net Assets | ||
| Beginning of Period | 535,478 | 245,797 |
| End of Period1 | 1,090,118 | 535,478 |
1 Net Assets—End of Period includes undistributed (overdistributed) net investment income of $1,196,000 and $616,000.
See accompanying Notes, which are an integral part of the Financial Statements.
52
| Long-Term Government Bond Index Fund | |||||
| Financial Highlights | |||||
| ETF Shares | |||||
| For a Share Outstanding | Year Ended August 31, | ||||
| Throughout Each Period | 2016 | 2015 | 2014 | 2013 | 2012 |
| Net Asset Value, Beginning of Period | $75.13 | $73.93 | $66.33 | $78.69 | $68.07 |
| Investment Operations | |||||
| Net Investment Income | 2.021 | 2.073 | 2.100 | 2.055 | 2.213 |
| Net Realized and Unrealized Gain (Loss) | |||||
| on Investments | 10.511 | 1.206 | 7.429 | (12.216) | 10.611 |
| Total from Investment Operations | 12.532 | 3.279 | 9.529 | (10.161) | 12.824 |
| Distributions | |||||
| Dividends from Net Investment Income | (2.022) | (2.079) | (1.929) | (2.056) | (2.204) |
| Distributions from Realized Capital Gains | — | — | — | (.143) | — |
| Total Distributions | (2.022) | (2.079) | (1.929) | (2.199) | (2.204) |
| Net Asset Value, End of Period | $85.64 | $75.13 | $73.93 | $66.33 | $78.69 |
| Total Return | 16.96% | 4.44% | 14.65% | -13.13% | 19.06% |
| Ratios/Supplemental Data | |||||
| Net Assets, End of Period (Millions) | $578 | $252 | $107 | $63 | $75 |
| Ratio of Total Expenses to Average Net Assets | 0.07% | 0.10% | 0.12% | 0.12% | 0.12% |
| Ratio of Net Investment Income to | |||||
| Average Net Assets | 2.58% | 2.76% | 3.17% | 2.80% | 2.99% |
| Portfolio Turnover Rate1 | 18% | 24% | 23% | 54% | 46% |
1 Excludes the value of portfolio securities received or delivered as a result of in-kind purchases or redemptions of the fund’s capital shares, including ETF Creation Units.
See accompanying Notes, which are an integral part of the Financial Statements.
53
| Long-Term Government Bond Index Fund | |||||
| Financial Highlights | |||||
| Admiral Shares | |||||
| For a Share Outstanding | Year Ended August 31, | ||||
| Throughout Each Period | 2016 | 2015 | 2014 | 2013 | 2012 |
| Net Asset Value, Beginning of Period | $25.21 | $24.81 | $22.32 | $26.48 | $22.91 |
| Investment Operations | |||||
| Net Investment Income | . 679 | .698 | .711 | .693 | .746 |
| Net Realized and Unrealized Gain (Loss) | |||||
| on Investments | 3.540 | .399 | 2.491 | (4.112) | 3.567 |
| Total from Investment Operations | 4.219 | 1.097 | 3.202 | (3.419) | 4.313 |
| Distributions | |||||
| Dividends from Net Investment Income | (.679) | (.697) | (.712) | (. 693) | (.743) |
| Distributions from Realized Capital Gains | — | — | — | (.048) | — |
| Total Distributions | (.679) | (.697) | (.712) | (.741) | (.743) |
| Net Asset Value, End of Period | $28.75 | $25.21 | $24.81 | $22.32 | $26.48 |
| Total Return1 | 16.97% | 4.40% | 14.63% | -13.13% | 19.05% |
| Ratios/Supplemental Data | |||||
| Net Assets, End of Period (Millions) | $374 | $130 | $44 | $6 | $5 |
| Ratio of Total Expenses to Average Net Assets | 0.07% | 0.10% | 0.12% | 0.12% | 0.12% |
| Ratio of Net Investment Income to | |||||
| Average Net Assets | 2.58% | 2.76% | 3.17% | 2.80% | 2.99% |
| Portfolio Turnover Rate2 | 18% | 24% | 23% | 54% | 46% |
Signal Shares were renamed Admiral Shares in October 2013. Prior periods’ Financial Highlights are for the Signal class.
1 Total returns do not include transaction or account service fees that may have applied in the periods shown. Fund prospectuses provide information about any applicable transaction and account service fees.
2 Excludes the value of portfolio securities received or delivered as a result of in-kind purchases or redemptions of the fund’s capital shares, including ETF Creation Units.
See accompanying Notes, which are an integral part of the Financial Statements.
54
| Long-Term Government Bond Index Fund | |||||
| Financial Highlights | |||||
| Institutional Shares | |||||
| For a Share Outstanding | Year Ended August 31, | ||||
| Throughout Each Period | 2016 | 2015 | 2014 | 2013 | 2012 |
| Net Asset Value, Beginning of Period | $32.00 | $31.48 | $28.32 | $33.60 | $29.06 |
| Investment Operations | |||||
| Net Investment Income | . 868 | .896 | .910 | .890 | .956 |
| Net Realized and Unrealized Gain (Loss) | |||||
| on Investments | 4.492 | .517 | 3.161 | (5.219) | 4.537 |
| Total from Investment Operations | 5.360 | 1.413 | 4.071 | (4.329) | 5.493 |
| Distributions | |||||
| Dividends from Net Investment Income | (.870) | (. 893) | (. 911) | (. 890) | (.953) |
| Distributions from Realized Capital Gains | — | — | — | (.061) | — |
| Total Distributions | (.870) | (. 893) | (. 911) | (. 951) | (. 953) |
| Net Asset Value, End of Period | $36.49 | $32.00 | $31.48 | $28.32 | $33.60 |
| Total Return1 | 16.99% | 4.47% | 14.66% | -13.10% | 19.13% |
| Ratios/Supplemental Data | |||||
| Net Assets, End of Period (Millions) | $138 | $154 | $95 | $37 | $84 |
| Ratio of Total Expenses to Average Net Assets | 0.05% | 0.07% | 0.09% | 0.09% | 0.09% |
| Ratio of Net Investment Income to | |||||
| Average Net Assets | 2.60% | 2.79% | 3.20% | 2.83% | 3.02% |
| Portfolio Turnover Rate2 | 18% | 24% | 23% | 54% | 46% |
1 Total returns do not include transaction fees that may have applied in the periods shown. Fund prospectuses provide information about any applicable transaction fees.
2 Excludes the value of portfolio securities received or delivered as a result of in-kind purchases or redemptions of the fund’s capital shares, including ETF Creation Units.
See accompanying Notes, which are an integral part of the Financial Statements.
55
Long-Term Government Bond Index Fund
Notes to Financial Statements
Vanguard Long-Term Government Bond Index Fund is registered under the Investment Company Act of 1940 as an open-end investment company, or mutual fund. The fund offers three classes of shares: ETF Shares, Admiral Shares, and Institutional Shares. ETF Shares are listed for trading on Nasdaq; they can be purchased and sold through a broker. Admiral Shares and Institutional Shares are designed for investors who meet certain administrative, service, and account-size criteria.
A. The following significant accounting policies conform to generally accepted accounting principles for U.S. investment companies. The fund consistently follows such policies in preparing its financial statements.
1. Security Valuation: Securities are valued as of the close of trading on the New York Stock Exchange (generally 4 p.m., Eastern time) on the valuation date. Bonds and temporary cash investments acquired over 60 days to maturity are valued using the latest bid prices or using valuations based on a matrix system (which considers such factors as security prices, yields, maturities, and ratings), both as furnished by independent pricing services. Investments in Vanguard Market Liquidity Fund are valued at that fund’s net asset value. Other temporary cash investments are valued at amortized cost, which approximates market value. Securities for which market quotations are not readily available, or whose values have been affected by events occurring before the fund’s pricing time but after the close of the securities’ primary markets, are valued by methods deemed by the board of trustees to represent fair value.
2. Futures Contracts: The fund uses futures contracts to invest in fixed income asset classes with greater efficiency and lower cost than is possible through direct investment, to add value when these instruments are attractively priced, or to adjust sensitivity to changes in interest rates. The primary risks associated with the use of futures contracts are imperfect correlation between changes in market values of bonds held by the fund and the prices of futures contracts, and the possibility of an illiquid market. Counterparty risk involving futures is mitigated because a regulated clearinghouse is the counterparty instead of the clearing broker. To further mitigate counterparty risk, the fund trades futures contracts on an exchange, monitors the financial strength of its clearing brokers and clearing-house, and has entered into clearing agreements with its clearing brokers. The clearinghouse imposes initial margin requirements to secure the fund’s performance and requires daily settlement of variation margin representing changes in the market value of each contract.
Futures contracts are valued at their quoted daily settlement prices. The aggregate settlement values of the contracts are not recorded in the Statement of Net Assets. Fluctuations in the value of the contracts are recorded in the Statement of Net Assets as an asset (liability) and in the Statement of Operations as unrealized appreciation (depreciation) until the contracts are closed, when they are recorded as realized futures gains (losses).
During the year ended August 31, 2016, the fund’s average investments in long and short futures contracts represented less than 1% and 0% of net assets, respectively, based on the average of aggregate settlement values at each quarter-end during the period. The fund had no open futures contracts at August 31, 2016.
3. Federal Income Taxes: The fund intends to continue to qualify as a regulated investment company and distribute all of its taxable income. Management has analyzed the fund’s tax positions taken for all open federal income tax years (August 31, 2013–2016), and has concluded that no provision for federal income tax is required in the fund’s financial statements.
56
Long-Term Government Bond Index Fund
4. Distributions: Distributions to shareholders are recorded on the ex-dividend date.
5. Credit Facility: The fund and certain other funds managed by The Vanguard Group (“Vanguard”) participate in a $3.1 billion committed credit facility provided by a syndicate of lenders pursuant to a credit agreement that may be renewed annually; each fund is individually liable for its borrowings, if any, under the credit facility. Borrowings may be utilized for temporary and emergency purposes, and are subject to the fund’s regulatory and contractual borrowing restrictions. The participating funds are charged administrative fees and an annual commitment fee of 0.10% of the undrawn amount of the facility; these fees are allocated to the funds based on a method approved by the fund’s board of trustees and included in Management and Administrative expenses on the fund’s Statement of Operations. Any borrowings under this facility bear interest at a rate based upon the higher of the one-month London Interbank Offered Rate, federal funds effective rate, or overnight bank funding rate plus an agreed-upon spread.
The fund had no borrowings outstanding at August 31, 2016, or at any time during the period then ended.
6. Other: Interest income includes income distributions received from Vanguard Market Liquidity Fund and is accrued daily. Premiums and discounts on debt securities purchased are amortized and accreted, respectively, to interest income over the lives of the respective securities. Security transactions are accounted for on the date securities are bought or sold. Costs used to determine realized gains (losses) on the sale of investment securities are those of the specific securities sold.
Each class of shares has equal rights as to assets and earnings, except that each class separately bears certain class-specific expenses related to maintenance of shareholder accounts (included in Management and Administrative expenses) and shareholder reporting. Marketing and distribution expenses are allocated to each class of shares based on a method approved by the board of trustees. Income, other non-class-specific expenses, and gains and losses on investments are allocated to each class of shares based on its relative net assets.
B. In accordance with the terms of a Funds’ Service Agreement (the “FSA”) between Vanguard and the fund, Vanguard furnishes to the fund investment advisory, corporate management, administrative, marketing, and distribution services at Vanguard’s cost of operations (as defined by the FSA). These costs of operations are allocated to the fund based on methods and guidelines approved by the board of trustees. Vanguard does not require reimbursement in the current period for certain costs of operations (such as deferred compensation/benefits and risk/insurance costs); the fund’s liability for these costs of operations is included in Payables to Vanguard on the Statement of Net Assets.
Upon the request of Vanguard, the fund may invest up to 0.40% of its net assets as capital in Vanguard. At August 31, 2016, the fund had contributed to Vanguard capital in the amount of $92,000, representing 0.01% of the fund’s net assets and 0.04% of Vanguard’s capitalization. The fund’s trustees and officers are also directors and employees, respectively, of Vanguard.
C. Various inputs may be used to determine the value of the fund’s investments. These inputs are summarized in three broad levels for financial statement purposes. The inputs or methodologies used to value securities are not necessarily an indication of the risk associated with investing in those securities.
57
Long-Term Government Bond Index Fund
Level 1—Quoted prices in active markets for identical securities.
Level 2—Other significant observable inputs (including quoted prices for similar securities, interest rates, prepayment speeds, credit risk, etc.).
Level 3—Significant unobservable inputs (including the fund’s own assumptions used to determine the fair value of investments).
The following table summarizes the market value of the fund’s investments as of August 31, 2016, based on the inputs used to value them:
| Level 1 | Level 2 | Level 3 | |
| Investments | ($000) | ($000) | ($000) |
| U.S. Government and Agency Obligations | — | 1,083,913 | — |
| Temporary Cash Investments | 12,213 | — | — |
| Total | 12,213 | 1,083,913 | — |
D. Distributions are determined on a tax basis and may differ from net investment income and realized capital gains for financial reporting purposes. Differences may be permanent or temporary. Permanent differences are reclassified among capital accounts in the financial statements to reflect their tax character. Temporary differences arise when certain items of income, expense, gain, or loss are recognized in different periods for financial statement and tax purposes. These differences will reverse at some time in the future. Differences in classification may also result from the treatment of short-term gains as ordinary income for tax purposes.
During the year ended August 31, 2016, the fund realized $25,959,000 of net capital gains resulting from in-kind redemptions—in which shareholders exchanged fund shares for securities held by the fund rather than for cash. Because such gains are not taxable to the fund, and are not distributed to shareholders, they have been reclassified from accumulated net realized losses to paid-in capital.
For tax purposes, at August 31, 2016, the fund had $1,412,000 of ordinary income available for distribution. The fund had available capital losses totaling $10,492,000 that may be carried forward indefinitely to offset future net capital gains.
At August 31, 2016, the cost of investment securities for tax purposes was $1,012,379,000. Net unrealized appreciation of investment securities for tax purposes was $83,747,000, consisting entirely of unrealized gains on securities that had risen in value since their purchase.
E. During the year ended August 31, 2016, the fund purchased $796,663,000 of investment securities and sold $345,792,000 of investment securities, other than temporary cash investments. Purchases and sales include $458,164,000 and $203,072,000, respectively, in connection with in-kind purchases and redemptions of the fund’s capital shares.
58
Long-Term Government Bond Index Fund
| F. Capital share transactions for each class of shares were: | ||||
| Year Ended August 31, | ||||
| 2016 | 2015 | |||
| Amount | Shares | Amount | Shares | |
| ($000) | (000) | ($000) | (000) | |
| ETF Shares | ||||
| Issued | 471,835 | 5,903 | 178,492 | 2,302 |
| Issued in Lieu of Cash Distributions | — | — | — | — |
| Redeemed | (205,740) | (2,500) | (29,912) | (400) |
| Net Increase (Decrease)—ETF Shares | 266,095 | 3,403 | 148,580 | 1,902 |
| Admiral Shares | ||||
| Issued | 306,304 | 11,244 | 169,663 | 6,504 |
| Issued in Lieu of Cash Distributions | 5,157 | 190 | 2,686 | 104 |
| Redeemed | (96,440) | (3,572) | (82,437) | (3,228) |
| Net Increase (Decrease) —Admiral Shares | 215,021 | 7,862 | 89,912 | 3,380 |
| Institutional Shares | ||||
| Issued | 29,337 | 869 | 99,644 | 3,032 |
| Issued in Lieu of Cash Distributions | 3,462 | 102 | 3,404 | 104 |
| Redeemed | (65,985) | (2,007) | (45,682) | (1,338) |
| Net Increase (Decrease) —Institutional Shares | (33,186) | (1,036) | 57,366 | 1,798 |
G. Management has determined that no material events or transactions occurred subsequent to August 31, 2016, that would require recognition or disclosure in these financial statements.
59
Short-Term Corporate Bond Index Fund
| Fund Profile | |||
| As of August 31, 2016 | |||
| Share-Class Characteristics | |||
| ETF | Admiral | Institutional | |
| Shares | Shares | Shares | |
| Ticker Symbol | VCSH | VSCSX | VSTBX |
| Expense Ratio1 | 0.10% | 0.10% | 0.07% |
| 30-Day SEC Yield | 1.73% | 1.71% | 1.72% |
| Financial Attributes | |||
| Barclays | |||
| 1–5 Year | Barclays | ||
| Corporate | Aggregate | ||
| Fund | Index | FA Index | |
| Number of Bonds | 2,092 | 2,172 | 9,864 |
| Yield to Maturity | |||
| (before expenses) | 1.8% | 1.8% | 1.9% |
| Average Coupon | 3.5% | 3.6% | 3.1% |
| Average Duration | 2.8 years | 2.8 years | 5.8 years |
| Average Effective | |||
| Maturity | 3.0 years | 2.9 years | 8.0 years |
| Short-Term | |||
| Reserves | 0.3% | — | — |
| Sector Diversification (% of portfolio) | |||
| Finance | 41.7% | ||
| Industrial | 53.3 | ||
| Utilities | 5.0 | ||
The agency and mortgage-backed securities sectors may include issues from government-sponsored enterprises; such issues are generally not backed by the full faith and credit of the U.S. government.
| Volatility Measures | ||
| Barclays | ||
| 1–5 Year | Barclays | |
| Corporate | Aggregate | |
| Index | FA Index | |
| R-Squared | 0.98 | 0.71 |
| Beta | 0.98 | 0.46 |
| These measures show the degree and timing of the fund’s | |
| fluctuations compared with the indexes over 36 months. | |
| Distribution by Effective Maturity | |
| (% of portfolio) | |
| 1 - 3 Years | 53.6% |
| 3 - 5 Years | 46.3 |
| 5 - 10 Years | 0.1 |
| Distribution by Credit Quality (% of portfolio) | |
| Aaa | 0.8% |
| Aa | 14.6 |
| A | 42.1 |
| Baa | 42.5 |
Credit-quality ratings are obtained from Barclays and are from Moody's, Fitch, and S&P. When ratings from all three agencies are used, the median rating is shown. When ratings from two of the agencies are used, the lower rating for each issue is shown. "Not Rated" is used to classify securities for which a rating is not available. For more information about these ratings, see the Glossary entry for Credit Quality.
Investment Focus
1 The expense ratios shown are from the prospectus dated December 22, 2015, and represent estimated costs for the current fiscal year. For the fiscal year ended August 31, 2016, the expense ratios were 0.07% for ETF Shares, 0.07% for Admiral Shares, and 0.05% for Institutional Shares.
60
Short-Term Corporate Bond Index Fund
Performance Summary
All of the returns in this report represent past performance, which is not a guarantee of future results that may be achieved by the fund. (Current performance may be lower or higher than the performance data cited. For performance data current to the most recent month-end, visit our website at vanguard.com/performance.) Note, too, that both investment returns and principal value can fluctuate widely, so an investor’s shares, when sold, could be worth more or less than their original cost. The returns shown do not reflect taxes that a shareholder would pay on fund distributions or on the sale of fund shares.
Cumulative Performance: November 19, 2009, Through August 31, 2016
Initial Investment of $10,000

| Average Annual Total Returns | |||||
| Periods Ended August 31, 2016 | |||||
| Since | Final Value | ||||
| One | Five | Inception | of a $10,000 | ||
| Year | Years | (11/19/2009) | Investment | ||
| Short-Term Corporate Bond Index | |||||
| Fund ETF Shares Net Asset Value | 3.71% | 2.76% | 3.26% | $12,427 | |
| Short-Term Corporate Bond Index | |||||
| Fund ETF Shares Market Price | 3.93 | 2.69 | 3.29 | 12,451 | |
| Barclays U.S. 1–5 Year Corporate | |||||
| •••••••• | Bond Index | 3.78 | 2.91 | 3.48 | 12,608 |
| – – – – | Short-Intermediate Investment-Grade | ||||
| Debt Funds Average | 2.86 | 1.94 | 2.70 | 11,977 | |
| Spliced Barclays U.S. Aggregate Float | |||||
| Adjusted Index | 6.15 | 3.28 | 4.11 | 13,145 | |
For a benchmark description, see the Glossary.
Short-Intermediate Investment-Grade Debt Funds Average: Derived from data provided by Lipper, a Thomson Reuters Company.
"Since Inception" performance is calculated from the ETF Shares’ inception date for both the fund and its comparative standards.
See Financial Highlights for dividend and capital gains information.
61
| Short-Term Corporate Bond Index Fund | ||||
| Average Annual Total Returns | ||||
| Periods Ended August 31, 2016 | ||||
| Since | Final Value | |||
| One | Five | Inception | of a $10,000 | |
| Year | Years | (11/18/2010) | Investment | |
| Short-Term Corporate Bond Index Fund | ||||
| Admiral Shares | 3.70% | 2.76% | 2.78% | $11,721 |
| Barclays U.S. 1–5 Year Corporate Bond Index | 3.78 | 2.91 | 2.95 | 11,833 |
| Barclays U.S. Aggregate Float Adjusted Index | 6.15 | 3.28 | 3.71 | 12,348 |
"Since Inception" performance is calculated from the Admiral Shares’ inception date for both the fund and its comparative standards.
| Since | Final Value | |||
| One | Five | Inception | of a $5,000,000 | |
| Year | Years | (11/19/2009) | Investment | |
| Short-Term Corporate Bond Index Fund | ||||
| Institutional Shares | 3.72% | 2.79% | 3.29% | $6,229,096 |
| Barclays U.S. 1–5 Year Corporate Bond Index | 3.78 | 2.91 | 3.48 | 6,303,944 |
| Spliced Barclays U.S. Aggregate Float | ||||
| Adjusted Index | 6.15 | 3.28 | 4.11 | 6,572,522 |
"Since Inception" performance is calculated from the Institutional Shares’ inception date for both the fund and its comparative standards.
| Cumulative Returns of ETF Shares: November 19, 2009, Through August 31, 2016 | |||
| Since | |||
| One | Five | Inception | |
| Year | Years | (11/19/2009) | |
| Short-Term Corporate Bond Index Fund ETF Shares | |||
| Market Price | 3.93% | 14.20% | 24.51% |
| Short-Term Corporate Bond Index Fund ETF Shares | |||
| Net Asset Value | 3.71 | 14.60 | 24.27 |
| Barclays U.S. 1–5 Year Corporate Bond Index | 3.78 | 15.40 | 26.08 |
"Since Inception" performance is calculated from the ETF Shares’ inception date for both the fund and its comparative standards.
62
| Short-Term Corporate Bond Index Fund | ||
| Fiscal-Year Total Returns (%): November 19, 2009, Through August 31, 2016 | ||
| Barclays | ||
| 1–5 Year | ||
| Corporate | ||
| ETF Shares Net Asset Value | Index | |
| Fiscal Year | Total Returns | Total Returns |
| 2010 | 5.34% | 5.61% |
| 2011 | 2.94 | 3.45 |
| 2012 | 4.68 | 4.81 |
| 2013 | 1.03 | 1.29 |
| 2014 | 3.50 | 3.67 |
| 2015 | 0.96 | 1.03 |
| 2016 | 3.71 | 3.78 |
Average Annual Total Returns: Periods Ended June 30, 2016
This table presents returns through the latest calendar quarter—rather than through the end of the fiscal period.
Securities and Exchange Commission rules require that we provide this information.
| Since Inception | ||||||
| Inception Date | One Year | Five Years | Income | Capital | Total | |
| ETF Shares | 11/19/2009 | |||||
| Market Price | 3.82% | 2.78% | 3.35% | |||
| Net Asset Value | 3.35 | 2.78 | 3.29 | |||
| Admiral Shares | 11/18/2010 | 3.35 | 2.78 | 2.09% | 0.71% | 2.80 |
| Institutional Shares | 11/19/2009 | 3.38 | 2.81 | 2.15 | 1.17 | 3.32 |
63
Short-Term Corporate Bond Index Fund
Financial Statements
Statement of Net Assets—Investments Summary
As of August 31, 2016
This Statement summarizes the fund’s holdings by asset type. Details are reported for each of the fund’s 50 largest individual holdings and for investments that, in total for any issuer, represent more than 1% of the fund’s net assets. The total value of smaller holdings is reported as a single amount within each category.
The fund reports a complete list of its holdings in regulatory filings four times in each fiscal year, at the quarter-ends. For the second and fourth fiscal quarters, the complete listing of the fund’s holdings is available electronically on vanguard.com and on the Securities and Exchange Commission’s website (sec.gov), or you can have it mailed to you without charge by calling 800-662-7447. For the first and third fiscal quarters, the fund files the lists with the SEC on Form N-Q. Shareholders can look up the fund’s Forms N-Q on the SEC’s website. Forms N-Q may also be reviewed and copied at the SEC’s Public Reference Room (see the back cover of this report for further information).
| Face | Market | Percentage | |||
| Maturity | Amount | Value• | of Net | ||
| Coupon | Date | ($000) | ($000) | Assets | |
| U.S. Government and Agency Obligations | |||||
| U.S. Government Securities (0.3%) | |||||
| United States Treasury Note/Bond | |||||
| (Cost $59,133) | 0.750% | 7/31/18 | 59,200 | 59,135 | 0.3% |
| Corporate Bonds | |||||
| Finance | |||||
| Banking | |||||
| Bank of America Corp. | 6.875% | 4/25/18 | 53,339 | 57,811 | 0.3% |
| Bank of America Corp. | 2.600% | 1/15/19 | 41,232 | 42,142 | 0.2% |
| Bank of America Corp. | 5.650% | 5/1/18 | 34,284 | 36,476 | 0.2% |
| Bank of America Corp. | 2.000% | 1/11/18 | 34,840 | 35,049 | 0.2% |
| Bank of America Corp. | 5.625% | 7/1/20 | 28,240 | 31,874 | 0.2% |
| Bank of America Corp. | 2.650% | 4/1/19 | 28,486 | 29,068 | 0.2% |
| Bank of America Corp. | 2.250%–7.625% | 9/1/17–5/13/21 | 171,447 | 183,242 | 1.1% |
| Bank of America NA | 1.650%–2.050% | 3/26/18–12/7/18 | 43,091 | 43,416 | 0.3% |
| Bear Stearns Cos. LLC | 7.250% | 2/1/18 | 30,305 | 32,702 | 0.2% |
| Bear Stearns Cos. LLC | 4.650%–6.400% | 10/2/17–7/2/18 | 24,485 | 25,796 | 0.1% |
| Citigroup Inc. | 1.700%–8.500% | 11/21/17–8/2/21 | 276,742 | 281,579 | 1.6% |
| Goldman Sachs Group Inc. | 6.150% | 4/1/18 | 38,959 | 41,722 | 0.2% |
| Goldman Sachs Group Inc. | 5.250% | 7/27/21 | 32,783 | 37,216 | 0.2% |
| Goldman Sachs Group Inc. | 5.950% | 1/18/18 | 31,314 | 33,184 | 0.2% |
| Goldman Sachs Group Inc. | 2.625% | 1/31/19 | 29,522 | 30,222 | 0.2% |
| Goldman Sachs Group Inc. | 7.500% | 2/15/19 | 26,072 | 29,665 | 0.2% |
| Goldman Sachs Group Inc. | 2.000%–6.000% | 1/22/18–4/25/21 | 179,236 | 186,966 | 1.1% |
| HSBC Bank USA NA | 4.875% | 8/24/20 | 11,680 | 12,716 | 0.1% |
| HSBC Holdings plc | 5.100% | 4/5/21 | 25,602 | 28,588 | 0.2% |
| HSBC Holdings plc | 3.400% | 3/8/21 | 27,369 | 28,536 | 0.2% |
| HSBC Holdings plc | 2.950% | 5/25/21 | 20,500 | 21,022 | 0.1% |
| HSBC USA Inc. | 1.625%–5.000% | 1/16/18–9/27/20 | 92,063 | 93,047 | 0.5% |
| JPMorgan Chase & Co. | 6.000% | 1/15/18 | 47,128 | 50,002 | 0.3% |
| JPMorgan Chase & Co. | 2.250% | 1/23/20 | 40,655 | 41,171 | 0.2% |
| JPMorgan Chase & Co. | 4.350% | 8/15/21 | 27,000 | 29,703 | 0.2% |
| JPMorgan Chase & Co. | 2.750% | 6/23/20 | 28,040 | 28,856 | 0.2% |
64
| Short-Term Corporate Bond Index Fund | ||||||
| Face | Market | Percentage | ||||
| Maturity | Amount | Value• | of Net | |||
| Coupon | Date | ($000) | ($000) | Assets | ||
| JPMorgan Chase & Co. | 1.625%–6.300% | 1/25/18–8/15/21 | 257,207 | 267,724 | 1.6% | |
| JPMorgan Chase Bank NA | 6.000% | 10/1/17 | 22,785 | 23,881 | 0.1% | |
| Mitsubishi UFJ Financial | ||||||
| Group Inc. | 2.950% | 3/1/21 | 34,321 | 35,406 | 0.2% | |
| Morgan Stanley | 6.625% | 4/1/18 | 32,275 | 34,769 | 0.2% | |
| Morgan Stanley | 5.625% | 9/23/19 | 29,306 | 32,567 | 0.2% | |
| Morgan Stanley | 2.450% | 2/1/19 | 29,400 | 29,936 | 0.2% | |
| Morgan Stanley | 2.500% | 4/21/21 | 29,301 | 29,607 | 0.2% | |
| Morgan Stanley | 1.875%–7.300% | 12/28/17–7/28/21 | 230,819 | 246,052 | 1.4% | |
| UBS AG | 2.375% | 8/14/19 | 32,082 | 32,717 | 0.2% | |
| UBS AG | 1.800% | 3/26/18 | 28,996 | 29,117 | 0.2% | |
| Wachovia Corp. | 5.750% | 2/1/18 | 29,621 | 31,448 | 0.2% | |
| Wells Fargo & Co. | 2.600% | 7/22/20 | 31,328 | 32,191 | 0.2% | |
| Wells Fargo & Co. | 1.400%–5.625% | 9/8/17–7/26/21 | 200,748 | 206,082 | 1.2% | |
| Wells Fargo Bank NA | 1.650%–6.000% | 11/15/17–5/24/19 | 53,965 | 54,810 | 0.3% | |
| 1 | Banking—Other † | 3,085,060 | 18.0% | |||
| 1 | Brokerage † | 156,646 | 0.9% | |||
| Finance Companies | ||||||
| GE Capital International | ||||||
| Funding Co. | 2.342% | 11/15/20 | 56,924 | 58,582 | 0.3% | |
| HSBC Finance Corp. | 6.676% | 1/15/21 | 25,597 | 29,515 | 0.2% | |
| 1,2 | Finance Companies—Other † | 155,832 | 0.9% | |||
| Insurance | ||||||
| Berkshire Hathaway | ||||||
| Finance Corp. | 1.300%–5.400% | 3/7/18–1/15/21 | 61,546 | 63,644 | 0.4% | |
| Berkshire Hathaway Inc. | 1.150%–3.750% | 2/9/18–8/15/21 | 26,165 | 27,003 | 0.2% | |
| Insurance—Other † | 537,830 | 3.1% | ||||
| Other Finance † | 61 | 0.0% | ||||
| Real Estate Investment Trusts † | 333,212 | 2.0% | ||||
| 7,025,463 | 41.1% | |||||
| Industrial | ||||||
| Basic Industry | ||||||
| Lubrizol Corp. | 8.875% | 2/1/19 | 4,216 | 4,951 | 0.0% | |
| Basic Industry—Other † | 440,976 | 2.6% | ||||
| Capital Goods | ||||||
| General Electric Capital | ||||||
| Corp. | 1.600%–6.000% | 9/15/17–2/11/21 | 131,271 | 144,033 | 0.8% | |
| General Electric Co. | 5.250% | 12/6/17 | 39,989 | 42,107 | 0.3% | |
| Precision Castparts Corp. | 1.250%–2.250% | 1/15/18–6/15/20 | 19,459 | 19,650 | 0.1% | |
| 1 | Capital Goods—Other † | 671,777 | 3.9% | |||
| Communication | ||||||
| AT&T Inc. | 1.400%–5.875% | 12/1/17–8/15/21 | 208,756 | 222,232 | 1.3% | |
| Verizon Communications Inc. | 4.500% | 9/15/20 | 36,650 | 40,376 | 0.3% | |
| Verizon Communications Inc. | 2.625% | 2/21/20 | 39,123 | 40,312 | 0.2% | |
| Verizon Communications Inc. | 3.650% | 9/14/18 | 29,281 | 30,611 | 0.2% | |
| 1 | Communication—Other † | 770,178 | 4.5% | |||
| Consumer Cyclical | ||||||
| CVS Health Corp. | 2.800% | 7/20/20 | 29,850 | 31,091 | 0.2% | |
| Ford Motor Co. | 6.500% | 8/1/18 | 150 | 163 | 0.0% | |
| Ford Motor Credit Co. LLC | 1.684%–8.125% | 9/8/17–8/2/21 | 216,110 | 225,649 | 1.3% | |
| Visa Inc. | 2.200% | 12/14/20 | 29,974 | 30,826 | 0.2% | |
| Consumer Cyclical—Other † | 1,027,634 | 6.0% | ||||
| Consumer Noncyclical | ||||||
| AbbVie Inc. | 2.500% | 5/14/20 | 38,862 | 39,778 | 0.2% | |
| AbbVie Inc. | 1.750% | 11/6/17 | 32,543 | 32,687 | 0.2% | |
65
| Short-Term Corporate Bond Index Fund | |||||
| Face | Market | Percentage | |||
| Maturity | Amount | Value• | of Net | ||
| Coupon | Date | ($000) | ($000) | Assets | |
| AbbVie Inc. | 1.800% | 5/14/18 | 29,165 | 29,308 | 0.2% |
| Actavis Funding SCS | 3.000% | 3/12/20 | 30,154 | 31,002 | 0.2% |
| Anheuser-Busch Cos. LLC | 5.000%–5.500% | 1/15/18–3/1/19 | 10,378 | 11,075 | 0.1% |
| Anheuser-Busch InBev | |||||
| Finance Inc. | 2.650% | 2/1/21 | 77,540 | 79,865 | 0.5% |
| Anheuser-Busch InBev | |||||
| Finance Inc. | 1.900% | 2/1/19 | 36,075 | 36,430 | 0.2% |
| Anheuser-Busch InBev | |||||
| Finance Inc. | 1.250%–2.150% | 1/17/18–2/1/19 | 21,970 | 22,172 | 0.1% |
| Anheuser-Busch InBev | |||||
| Worldwide Inc. | 4.375%–7.750% | 1/15/19–2/15/21 | 53,907 | 61,183 | 0.3% |
| Pfizer Inc. | 6.200% | 3/15/19 | 30,317 | 33,897 | 0.2% |
| 1 Consumer Noncyclical—Other † | 1,981,290 | 11.6% | |||
| Energy | |||||
| Shell International Finance BV | 1.875% | 5/10/21 | 28,550 | 28,650 | 0.2% |
| Energy—Other † | 1,327,140 | 7.7% | |||
| Other Industrial † | 5,908 | 0.0% | |||
| Technology | |||||
| Apple Inc. | 1.000% | 5/3/18 | 40,398 | 40,388 | 0.2% |
| Apple Inc. | 2.250% | 2/23/21 | 36,760 | 37,744 | 0.2% |
| 1 Diamond 1 Finance Corp. / | |||||
| Diamond 2 Finance Corp. | 4.420% | 6/15/21 | 43,535 | 45,454 | 0.3% |
| 1 Diamond 1 Finance Corp. / | |||||
| Diamond 2 Finance Corp. | 3.480% | 6/1/19 | 37,150 | 38,204 | 0.2% |
| 1 Hewlett Packard Enterprise Co. | 3.600% | 10/15/20 | 31,876 | 33,356 | 0.2% |
| Intel Corp. | 1.350% | 12/15/17 | 31,537 | 31,674 | 0.2% |
| 1 Technology—Other † | 1,089,763 | 6.4% | |||
| Transportation | |||||
| Burlington Northern | |||||
| Santa Fe LLC | 3.600%–5.750% | 3/15/18–6/1/21 | 17,074 | 18,503 | 0.1% |
| Transportation—Other † | 176,639 | 1.1% | |||
| 8,974,676 | 52.5% | ||||
| Utilities | |||||
| Electric | |||||
| Berkshire Hathaway | |||||
| Energy Co. | 2.000%–5.750% | 4/1/18–2/1/20 | 16,168 | 16,876 | 0.1% |
| MidAmerican Energy Co. | 2.400%–5.300% | 3/15/18–3/15/19 | 2,083 | 2,168 | 0.0% |
| Nevada Power Co. | 6.500%–7.125% | 5/15/18–3/15/19 | 16,418 | 18,343 | 0.1% |
| PacifiCorp | 3.850%–5.650% | 7/15/18–6/15/21 | 12,621 | 13,717 | 0.1% |
| 1 Electric—Other † | 730,520 | 4.3% | |||
| Natural Gas † | 56,699 | 0.3% | |||
| Other Utility † | 6,376 | 0.0% | |||
| 844,699 | 4.9% | ||||
| Total Corporate Bonds (Cost $16,632,284) | 16,844,838 | 98.5% | |||
| Taxable Municipal Bonds (Cost $12,253) † | 12,346 | 0.1% | |||
| Shares | |||||
| Temporary Cash Investment | |||||
| Money Market Fund | |||||
| 3 Vanguard Market Liquidity Fund | |||||
| (Cost $56,448) | 0.612% | 564,462 | 56,452 | 0.4% | |
| Total Investments (Cost $16,760,118) | 16,972,771 | 99.3% | |||
66
| Short-Term Corporate Bond Index Fund | ||
| Percentage | ||
| Amount | of Net | |
| ($000) | Assets | |
| Other Assets and Liabilities | ||
| Other Assets | ||
| Investment in Vanguard | 1,257 | |
| Receivables for Investment Securities Sold | 62,719 | |
| Receivables for Accrued Income | 147,971 | |
| Receivables for Capital Shares Issued | 13,527 | |
| Other Assets | 1 | |
| Total Other Assets | 225,475 | 1.3% |
| Liabilities | ||
| Payables for Investment Securities Purchased | (90,108) | |
| Payables for Capital Shares Redeemed | (1,364) | |
| Payables for Distributions | (1,039) | |
| Payables to Vanguard | (3,254) | |
| Other Liabilities | (2,925) | |
| Total Liabilities | (98,690) | (0.6%) |
| Net Assets | 17,099,556 | 100.0% |
| At August 31, 2016, net assets consisted of: | ||
| Amount | ||
| ($000) | ||
| Paid-in Capital | 16,888,362 | |
| Undistributed Net Investment Income | 24,195 | |
| Accumulated Net Realized Losses | (25,654) | |
| Unrealized Appreciation (Depreciation) | 212,653 | |
| Net Assets | 17,099,556 | |
| ETF Shares—Net Assets | ||
| Applicable to 175,378,695 outstanding $.001 par value shares of | ||
| beneficial interest (unlimited authorization) | 14,120,679 | |
| Net Asset Value Per Share—ETF Shares | $80.52 | |
| Admiral Shares—Net Assets | ||
| Applicable to 89,490,410 outstanding $.001 par value shares of | ||
| beneficial interest (unlimited authorization) | 1,959,095 | |
| Net Asset Value Per Share—Admiral Shares | $21.89 | |
| Institutional Shares—Net Assets | ||
| Applicable to 38,056,333 outstanding $.001 par value shares of | ||
| beneficial interest (unlimited authorization) | 1,019,782 | |
| Net Asset Value Per Share—Institutional Shares | $26.80 | |
• See Note A in Notes to Financial Statements.
† Represents the aggregate value, by category, of securities that are not among the 50 largest holdings and, in total for any issuer, represent 1% or less of net assets.
1 Certain of the fund’s securities are exempt from registration under Rule 144A of the Securities Act of 1933. Such securities may be sold in transactions exempt from registration, normally to qualified institutional buyers. At August 31, 2016, the aggregate value of these securities was $277,288,000, representing 1.6% of net assets.
2 Securities with a value of $2,617,000 have been segregated as initial margin for recently closed futures contracts.
3 Affiliated money market fund available only to Vanguard funds and certain trusts and accounts managed by Vanguard. Rate shown is the 7-day yield.
See accompanying Notes, which are an integral part of the Financial Statements.
67
| Short-Term Corporate Bond Index Fund | |
| Statement of Operations | |
| Year Ended | |
| August 31, 2016 | |
| ($000) | |
| Investment Income | |
| Income | |
| Interest1 | 306,720 |
| Total Income | 306,720 |
| Expenses | |
| The Vanguard Group—Note B | |
| Investment Advisory Services | 374 |
| Management and Administrative—ETF Shares | 6,735 |
| Management and Administrative—Admiral Shares | 840 |
| Management and Administrative—Institutional Shares | 373 |
| Marketing and Distribution—ETF Shares | 716 |
| Marketing and Distribution—Admiral Shares | 171 |
| Marketing and Distribution—Institutional Shares | 24 |
| Custodian Fees | 117 |
| Auditing Fees | 48 |
| Shareholders’ Reports—ETF Shares | 212 |
| Shareholders’ Reports—Admiral Shares | 20 |
| Shareholders’ Reports—Institutional Shares | 1 |
| Trustees’ Fees and Expenses | 7 |
| Total Expenses | 9,638 |
| Net Investment Income | 297,082 |
| Realized Net Gain (Loss) | |
| Investment Securities Sold1 | (13,232) |
| Futures Contracts | (5,558) |
| Realized Net Gain (Loss) | (18,790) |
| Change in Unrealized Appreciation (Depreciation) of Investment Securities | 239,761 |
| Net Increase (Decrease) in Net Assets Resulting from Operations | 518,053 |
1 Interest income and realized net gain (loss) from an affiliated company of the fund were $245,000 and ($2,000), respectively.
See accompanying Notes, which are an integral part of the Financial Statements.
68
| Short-Term Corporate Bond Index Fund | ||
| Statement of Changes in Net Assets | ||
| Year Ended August 31, | ||
| 2016 | 2015 | |
| ($000) | ($000) | |
| Increase (Decrease) in Net Assets | ||
| Operations | ||
| Net Investment Income | 297,082 | 215,742 |
| Realized Net Gain (Loss) | (18,790) | 12,958 |
| Change in Unrealized Appreciation (Depreciation) | 239,761 | (123,579) |
| Net Increase (Decrease) in Net Assets Resulting from Operations | 518,053 | 105,121 |
| Distributions | ||
| Net Investment Income | ||
| ETF Shares | (238,185) | (178,240) |
| Admiral Shares | (32,914) | (19,430) |
| Institutional Shares | (18,203) | (13,670) |
| Realized Capital Gain1 | ||
| ETF Shares | (8,713) | (17,076) |
| Admiral Shares | (1,082) | (1,706) |
| Institutional Shares | (649) | (1,287) |
| Total Distributions | (299,746) | (231,409) |
| Capital Share Transactions | ||
| ETF Shares | 3,563,464 | 2,052,107 |
| Admiral Shares | 711,799 | 414,035 |
| Institutional Shares | 261,911 | 119,665 |
| Net Increase (Decrease) from Capital Share Transactions | 4,537,174 | 2,585,807 |
| Total Increase (Decrease) | 4,755,481 | 2,459,519 |
| Net Assets | ||
| Beginning of Period | 12,344,075 | 9,884,556 |
| End of Period2 | 17,099,556 | 12,344,075 |
1 Includes fiscal 2016 and 2015 short-term gain distributions totaling $614,000 and $4,014,000, respectively. Short-term gain distributions are treated as ordinary income dividends for tax purposes.
2 Net Assets—End of Period includes undistributed (overdistributed) net investment income of $24,195,000 and $16,415,000.
See accompanying Notes, which are an integral part of the Financial Statements.
69
| Short-Term Corporate Bond Index Fund | |||||
| Financial Highlights | |||||
| ETF Shares | |||||
| For a Share Outstanding | Year Ended August 31, | ||||
| Throughout Each Period | 2016 | 2015 | 2014 | 2013 | 2012 |
| Net Asset Value, Beginning of Period | $79.33 | $80.21 | $78.97 | $79.78 | $78.06 |
| Investment Operations | |||||
| Net Investment Income | 1.661 | 1.504 | 1.436 | 1.523 | 1.793 |
| Net Realized and Unrealized Gain (Loss) | |||||
| on Investments | 1.240 | (.743) | 1.305 | (.699) | 1.808 |
| Total from Investment Operations | 2.901 | .761 | 2.741 | .824 | 3.601 |
| Distributions | |||||
| Dividends from Net Investment Income | (1.648) | (1.492) | (1.321) | (1.517) | (1.789) |
| Distributions from Realized Capital Gains | (.063) | (.149) | (.180) | (.117) | (.092) |
| Total Distributions | (1.711) | (1.641) | (1.501) | (1.634) | (1.881) |
| Net Asset Value, End of Period | $80.52 | $79.33 | $80.21 | $78.97 | $79.78 |
| Total Return | 3.71% | 0.96% | 3.50% | 1.03% | 4.68% |
| Ratios/Supplemental Data | |||||
| Net Assets, End of Period (Millions) | $14,121 | $10,377 | $8,430 | $6,705 | $3,686 |
| Ratio of Total Expenses to Average Net Assets | 0.07% | 0.10% | 0.12% | 0.12% | 0.12% |
| Ratio of Net Investment Income to | |||||
| Average Net Assets | 2.11% | 1.90% | 1.82% | 1.92% | 2.33% |
| Portfolio Turnover Rate1 | 57% | 62% | 56% | 61% | 65% |
1 Excludes the value of portfolio securities received or delivered as a result of in-kind purchases or redemptions of the fund’s capital shares, including ETF Creation Units.
See accompanying Notes, which are an integral part of the Financial Statements.
70
| Short-Term Corporate Bond Index Fund | |||||
| Financial Highlights | |||||
| Admiral Shares | |||||
| For a Share Outstanding | Year Ended August 31, | ||||
| Throughout Each Period | 2016 | 2015 | 2014 | 2013 | 2012 |
| Net Asset Value, Beginning of Period | $21.57 | $21.81 | $21.51 | $21.73 | $21.26 |
| Investment Operations | |||||
| Net Investment Income | . 451 | .409 | .395 | .414 | .488 |
| Net Realized and Unrealized Gain (Loss) | |||||
| on Investments | .337 | (.199) | . 347 | (.189) | .494 |
| Total from Investment Operations | .788 | .210 | .742 | .225 | .982 |
| Distributions | |||||
| Dividends from Net Investment Income | (.451) | (.410) | (. 393) | (. 413) | (.487) |
| Distributions from Realized Capital Gains | (.017) | (.040) | (.049) | (. 032) | (. 025) |
| Total Distributions | (.468) | (.450) | (.442) | (. 445) | (. 512) |
| Net Asset Value, End of Period | $21.89 | $21.57 | $21.81 | $21.51 | $21.73 |
| Total Return1 | 3.70% | 0.97% | 3.47% | 1.03% | 4.69% |
| Ratios/Supplemental Data | |||||
| Net Assets, End of Period (Millions) | $1,959 | $1,222 | $821 | $76 | $25 |
| Ratio of Total Expenses to Average Net Assets | 0.07% | 0.10% | 0.12% | 0.12% | 0.12% |
| Ratio of Net Investment Income to | |||||
| Average Net Assets | 2.11% | 1.90% | 1.82% | 1.92% | 2.33% |
| Portfolio Turnover Rate2 | 57% | 62% | 56% | 61% | 65% |
Signal Shares were renamed Admiral Shares in October 2013. Prior periods’ Financial Highlights are for the Signal Class.
1 Total returns do not include transaction or account service fees that may have applied in the periods shown. Fund prospectuses provide information about any applicable transaction and account service fees.
2 Excludes the value of portfolio securities received or delivered as a result of in-kind purchases or redemptions of the fund’s capital shares, including ETF Creation Units.
See accompanying Notes, which are an integral part of the Financial Statements.
71
| Short-Term Corporate Bond Index Fund | |||||
| Financial Highlights | |||||
| Institutional Shares | |||||
| For a Share Outstanding | Year Ended August 31, | ||||
| Throughout Each Period | 2016 | 2015 | 2014 | 2013 | 2012 |
| Net Asset Value, Beginning of Period | $26.41 | $26.71 | $26.33 | $26.60 | $26.03 |
| Investment Operations | |||||
| Net Investment Income | . 558 | .509 | . 491 | . 516 | . 605 |
| Net Realized and Unrealized Gain (Loss) | |||||
| on Investments | .413 | (.249) | .437 | (. 233) | . 599 |
| Total from Investment Operations | .971 | .260 | .928 | .283 | 1.204 |
| Distributions | |||||
| Dividends from Net Investment Income | (. 560) | (. 510) | (. 488) | (.514) | (.603) |
| Distributions from Realized Capital Gains | (. 021) | (. 050) | (. 060) | (. 039) | (. 031) |
| Total Distributions | (.581) | (. 560) | (. 548) | (. 553) | (. 634) |
| Net Asset Value, End of Period | $26.80 | $26.41 | $26.71 | $26.33 | $26.60 |
| Total Return1 | 3.72% | 0.98% | 3.55% | 1.06% | 4.70% |
| Ratios/Supplemental Data | |||||
| Net Assets, End of Period (Millions) | $1,020 | $745 | $634 | $262 | $161 |
| Ratio of Total Expenses to Average Net Assets | 0.05% | 0.07% | 0.09% | 0.09% | 0.09% |
| Ratio of Net Investment Income to | |||||
| Average Net Assets | 2.13% | 1.93% | 1.85% | 1.95% | 2.36% |
| Portfolio Turnover Rate2 | 57% | 62% | 56% | 61% | 65% |
1 Total returns do not include transaction fees that may have applied in the periods shown. Fund prospectuses provide information about any applicable transaction fees.
2 Excludes the value of portfolio securities received or delivered as a result of in-kind purchases or redemptions of the fund’s capital shares, including ETF Creation Units.
See accompanying Notes, which are an integral part of the Financial Statements.
72
Short-Term Corporate Bond Index Fund
Notes to Financial Statements
Vanguard Short-Term Corporate Bond Index Fund is registered under the Investment Company Act of 1940 as an open-end investment company, or mutual fund. Certain of the fund’s investments are in corporate debt instruments; the issuers’ abilities to meet their obligations may be affected by economic developments in their respective industries. The fund offers three classes of shares: ETF Shares, Admiral Shares, and Institutional Shares. ETF Shares are listed for trading on Nasdaq; they can be purchased and sold through a broker. Admiral Shares and Institutional Shares are designed for investors who meet certain administrative, service, and account-size criteria.
A. The following significant accounting policies conform to generally accepted accounting principles for U.S. investment companies. The fund consistently follows such policies in preparing its financial statements.
1. Security Valuation: Securities are valued as of the close of trading on the New York Stock Exchange (generally 4 p.m., Eastern time) on the valuation date. Bonds and temporary cash investments acquired over 60 days to maturity are valued using the latest bid prices or using valuations based on a matrix system (which considers such factors as security prices, yields, maturities, and ratings), both as furnished by independent pricing services. Investments in Vanguard Market Liquidity Fund are valued at that fund’s net asset value. Other temporary cash investments are valued at amortized cost, which approximates market value. Securities for which market quotations are not readily available, or whose values have been affected by events occurring before the fund’s pricing time but after the close of the securities’ primary markets, are valued by methods deemed by the board of trustees to represent fair value.
2. Futures Contracts: The fund uses futures contracts to invest in fixed income asset classes with greater efficiency and lower cost than is possible through direct investment, to add value when these instruments are attractively priced, or to adjust sensitivity to changes in interest rates. The primary risks associated with the use of futures contracts are imperfect correlation between changes in market values of bonds held by the fund and the prices of futures contracts, and the possibility of an illiquid market. Counterparty risk involving futures is mitigated because a regulated clearinghouse is the counterparty instead of the clearing broker. To further mitigate counterparty risk, the fund trades futures contracts on an exchange, monitors the financial strength of its clearing brokers and clearinghouse, and has entered into clearing agreements with its clearing brokers. The clearinghouse imposes initial margin requirements to secure the fund’s performance and requires daily settlement of variation margin representing changes in the market value of each contract.
Futures contracts are valued at their quoted daily settlement prices. The aggregate settlement values of the contracts are not recorded in the Statement of Net Assets. Fluctuations in the value of the contracts are recorded in the Statement of Net Assets as an asset (liability) and in the Statement of Operations as unrealized appreciation (depreciation) until the contracts are closed, when they are recorded as realized futures gains (losses).
During the year ended August 31, 2016, the fund’s average investments in long and short futures contracts each represented less than 1% of net assets, based on the average of aggregate settlement values at each quarter-end during the period. The fund had no open futures contracts at August 31, 2016.
73
Short-Term Corporate Bond Index Fund
3. Federal Income Taxes: The fund intends to continue to qualify as a regulated investment company and distribute all of its taxable income. Management has analyzed the fund’s tax positions taken for all open federal income tax years (August 31, 2013–2016), and has concluded that no provision for federal income tax is required in the fund’s financial statements.
4. Distributions: Distributions to shareholders are recorded on the ex-dividend date.
5. Credit Facility: The fund and certain other funds managed by The Vanguard Group (“Vanguard”) participate in a $3.1 billion committed credit facility provided by a syndicate of lenders pursuant to a credit agreement that may be renewed annually; each fund is individually liable for its borrowings, if any, under the credit facility. Borrowings may be utilized for temporary and emergency purposes, and are subject to the fund’s regulatory and contractual borrowing restrictions. The participating funds are charged administrative fees and an annual commitment fee of 0.10% of the undrawn amount of the facility; these fees are allocated to the funds based on a method approved by the fund’s board of trustees and included in Management and Administrative expenses on the fund’s Statement of Operations. Any borrowings under this facility bear interest at a rate based upon the higher of the one-month London Interbank Offered Rate, federal funds effective rate, or overnight bank funding rate plus an agreed-upon spread.
The fund had no borrowings outstanding at August 31, 2016, or at any time during the period then ended.
6. Other: Interest income includes income distributions received from Vanguard Market Liquidity Fund and is accrued daily. Premiums and discounts on debt securities purchased are amortized and accreted, respectively, to interest income over the lives of the respective securities. Security transactions are accounted for on the date securities are bought or sold. Costs used to determine realized gains (losses) on the sale of investment securities are those of the specific securities sold.
Each class of shares has equal rights as to assets and earnings, except that each class separately bears certain class-specific expenses related to maintenance of shareholder accounts (included in Management and Administrative expenses) and shareholder reporting. Marketing and distribution expenses are allocated to each class of shares based on a method approved by the board of trustees. Income, other non-class-specific expenses, and gains and losses on investments are allocated to each class of shares based on its relative net assets.
B. In accordance with the terms of a Funds’ Service Agreement (the “FSA”) between Vanguard and the fund, Vanguard furnishes to the fund investment advisory, corporate management, administrative, marketing, and distribution services at Vanguard’s cost of operations (as defined by the FSA). These costs of operations are allocated to the fund based on methods and guidelines approved by the board of trustees. Vanguard does not require reimbursement in the current period for certain costs of operations (such as deferred compensation/benefits and risk/insurance costs); the fund’s liability for these costs of operations is included in Payables to Vanguard on the Statement of Net Assets.
Upon the request of Vanguard, the fund may invest up to 0.40% of its net assets as capital in Vanguard. At August 31, 2016, the fund had contributed to Vanguard capital in the amount of $1,257,000, representing 0.01% of the fund’s net assets and 0.50% of Vanguard’s capitalization. The fund’s trustees and officers are also directors and employees, respectively, of Vanguard.
74
Short-Term Corporate Bond Index Fund
C. Various inputs may be used to determine the value of the fund’s investments. These inputs are summarized in three broad levels for financial statement purposes. The inputs or methodologies used to value securities are not necessarily an indication of the risk associated with investing in those securities.
Level 1—Quoted prices in active markets for identical securities.
Level 2—Other significant observable inputs (including quoted prices for similar securities, interest rates, prepayment speeds, credit risk, etc.).
Level 3—Significant unobservable inputs (including the fund’s own assumptions used to determine the fair value of investments).
The following table summarizes the market value of the fund’s investments as of August 31, 2016, based on the inputs used to value them:
| Level 1 | Level 2 | Level 3 | |
| Investments | ($000) | ($000) | ($000) |
| U.S. Government and Agency Obligations | — | 59,135 | — |
| Corporate Bonds | — | 16,844,838 | — |
| Taxable Municipal Bonds | — | 12,346 | — |
| Temporary Cash Investments | 56,452 | — | — |
| Futures Contracts—Liabilities1 | (49) | — | |
| Total | 56,403 | 16,916,319 | — |
| 1 Represents variation margin on the last day of the reporting period for recently closed futures contracts. | |||
D. Distributions are determined on a tax basis and may differ from net investment income and realized capital gains for financial reporting purposes. Differences may be permanent or temporary. Permanent differences are reclassified among capital accounts in the financial statements to reflect their tax character. Temporary differences arise when certain items of income, expense, gain, or loss are recognized in different periods for financial statement and tax purposes. These differences will reverse at some time in the future. Differences in classification may also result from the treatment of short-term gains as ordinary income for tax purposes.
During the year ended August 31, 2016, the fund realized $259,000 of net capital gains resulting from in-kind redemptions—in which shareholders exchanged fund shares for securities held by the fund rather than for cash. Because such gains are not taxable to the fund, and are not distributed to shareholders, they have been reclassified from accumulated net realized losses to paid-in capital.
For tax purposes, at August 31, 2016, the fund had $28,324,000 of ordinary income available for distribution. The fund had available capital losses totaling $22,947,000 that may be carried forward indefinitely to offset future net capital gains.
At August 31, 2016, the cost of investment securities for tax purposes was $16,762,780,000. Net unrealized appreciation of investment securities for tax purposes was $209,991,000, consisting of unrealized gains of $214,504,000 on securities that had risen in value since their purchase and $4,513,000 in unrealized losses on securities that had fallen in value since their purchase.
75
Short-Term Corporate Bond Index Fund
E. During the year ended August 31, 2016, the fund purchased $8,800,507,000 of investment securities and sold $4,227,279,000 of investment securities, other than U.S. government securities and temporary cash investments. Purchases and sales of U.S. government securities were $3,963,063,000 and $3,906,680,000, respectively. Total purchases and sales include $3,481,484,000 and $140,693,000, respectively, in connection with in-kind purchases and redemptions of the fund’s capital shares.
The fund purchased securities from and sold securities to other Vanguard funds or accounts managed by Vanguard or its affiliates, in accordance with procedures adopted by the board of trustees in compliance with Rule 17a-7 of the Investment Company Act of 1940. For the year ended August 31, 2016, such purchases and sales were $2,123,245,000 and $394,338,000, respectively; these amounts are included in the purchases and sales of investment securities noted above.
| F. Capital share transactions for each class of shares were: | ||||
| Year Ended August 31, | ||||
| 2016 | 2015 | |||
| Amount | Shares | Amount | Shares | |
| ($000) | (000) | ($000) | (000) | |
| ETF Shares | ||||
| Issued | 3,706,576 | 46,374 | 2,442,985 | 30,603 |
| Issued in Lieu of Cash Distributions | — | — | — | — |
| Redeemed | (143,112) | (1,800) | (390,878) | (4,900) |
| Net Increase (Decrease)—ETF Shares | 3,563,464 | 44,574 | 2,052,107 | 25,703 |
| Admiral Shares | ||||
| Issued | 1,294,752 | 59,705 | 875,488 | 40,286 |
| Issued in Lieu of Cash Distributions | 28,222 | 1,301 | 18,577 | 856 |
| Redeemed | (611,175) | (28,178) | (480,030) | (22,095) |
| Net Increase (Decrease)—Admiral Shares | 711,799 | 32,828 | 414,035 | 19,047 |
| Institutional Shares | ||||
| Issued | 395,051 | 14,846 | 203,197 | 7,633 |
| Issued in Lieu of Cash Distributions | 15,170 | 571 | 12,940 | 487 |
| Redeemed | (148,310) | (5,567) | (96,472) | (3,637) |
| Net Increase (Decrease)—Institutional Shares | 261,911 | 9,850 | 119,665 | 4,483 |
G. Management has determined that no material events or transactions occurred subsequent to August 31, 2016, that would require recognition or disclosure in these financial statements.
76
Intermediate-Term Corporate Bond Index Fund
| Fund Profile | |||
| As of August 31, 2016 | |||
| Share-Class Characteristics | |||
| ETF | Admiral | Institutional | |
| Shares | Shares | Shares | |
| Ticker Symbol | VCIT | VICSX | VICBX |
| Expense Ratio1 | 0.10% | 0.10% | 0.07% |
| 30-Day SEC Yield | 2.75% | 2.74% | 2.75% |
| Financial Attributes | |||
| Barclays | |||
| 5–10 Year | Barclays | ||
| Corporate | Aggregate | ||
| Fund | Index | FA Index | |
| Number of Bonds | 1,773 | 1,811 | 9,864 |
| Yield to Maturity | |||
| (before expenses) | 2.8% | 2.8% | 1.9% |
| Average Coupon | 3.7% | 3.7% | 3.1% |
| Average Duration | 6.5 years | 6.5 years | 5.8 years |
| Average Effective | |||
| Maturity | 7.5 years | 7.4 years | 8.0 years |
| Short-Term | |||
| Reserves | 0.7% | — | — |
| Sector Diversification (% of portfolio) | |||
| Finance | 31.5% | ||
| Industrial | 63.1 | ||
| Utilities | 5.4 | ||
The agency and mortgage-backed securities sectors may include issues from government-sponsored enterprises; such issues are generally not backed by the full faith and credit of the U.S. government.
| Volatility Measures | ||
| Barclays | ||
| 5–10 Year | Barclays | |
| Corporate | Aggregate | |
| Index | FA Index | |
| R-Squared | 0.99 | 0.86 |
| Beta | 1.02 | 1.30 |
| These measures show the degree and timing of the fund’s | |
| fluctuations compared with the indexes over 36 months. | |
| Distribution by Effective Maturity | |
| (% of portfolio) | |
| 1 - 3 Years | 0.1% |
| 3 - 5 Years | 2.1 |
| 5 - 10 Years | 97.5 |
| 10 - 20 Years | 0.3 |
| Distribution by Credit Quality (% of portfolio) | |
| Aaa | 1.3% |
| Aa | 7.9 |
| A | 36.5 |
| Baa | 54.3 |
Credit-quality ratings are obtained from Barclays and are from Moody's, Fitch, and S&P. When ratings from all three agencies are used, the median rating is shown. When ratings from two of the agencies are used, the lower rating for each issue is shown. "Not Rated" is used to classify securities for which a rating is not available. For more information about these ratings, see the Glossary entry for Credit Quality.
Investment Focus

1 The expense ratios shown are from the prospectus dated December 22, 2015, and represent estimated costs for the current fiscal year. For the fiscal year ended August 31, 2016, the expense ratios were 0.07% for ETF Shares, 0.07% for Admiral Shares, and 0.05% for Institutional Shares.
77
Intermediate-Term Corporate Bond Index Fund
Performance Summary
All of the returns in this report represent past performance, which is not a guarantee of future results that may be achieved by the fund. (Current performance may be lower or higher than the performance data cited. For performance data current to the most recent month-end, visit our website at vanguard.com/performance.) Note, too, that both investment returns and principal value can fluctuate widely, so an investor’s shares, when sold, could be worth more or less than their original cost. The returns shown do not reflect taxes that a shareholder would pay on fund distributions or on the sale of fund shares.
Cumulative Performance: November 19, 2009, Through August 31, 2016
Initial Investment of $10,000

| Average Annual Total Returns | |||||
| Periods Ended August 31, 2016 | |||||
| Since | Final Value | ||||
| One | Five | Inception | of a $10,000 | ||
| Year | Years | (11/19/2009) | Investment | ||
| Intermediate-Term Corporate Bond | |||||
| Index Fund ETF Shares Net Asset | |||||
| Value | 9.58% | 5.53% | 6.56% | $15,388 | |
| Intermediate-Term Corporate Bond | |||||
| Index Fund ETF Shares Market Price | 10.04 | 5.34 | 6.58 | 15,406 | |
| Barclays U.S. 5–10 Year Corporate | |||||
| •••••••• | Bond Index | 9.46 | 5.51 | 6.65 | 15,472 |
| – – – – | Spliced Core Bond Funds Average | 5.66 | 3.43 | 4.36 | 13,355 |
| Spliced Barclays U.S. Aggregate Float | |||||
| Adjusted Index | 6.15 | 3.28 | 4.11 | 13,145 | |
For a benchmark description, see the Glossary.
Spliced Core Bond Funds Average: Derived from data provided by Lipper, a Thomson Reuters Company.
"Since Inception" performance is calculated from the ETF Shares’ inception date for both the fund and its comparative standards.
Vanguard fund returns are adjusted to reflect the 0.25% fee on purchases of fund shares. The fee does not apply to the ETF Shares. The Fiscal-Year Total Returns table is not adjusted for fees.
See Financial Highlights for dividend and capital gains information.
78
| Intermediate-Term Corporate Bond Index Fund | ||||
| Average Annual Total Returns | ||||
| Periods Ended August 31, 2016 | ||||
| Since | Final Value | |||
| One | Five | Inception | of a $10,000 | |
| Year | Years | (3/2/2010) | Investment | |
| Intermediate-Term Corporate Bond Index | ||||
| Fund Admiral Shares | 9.30% | 5.48% | 6.46% | $15,019 |
| Barclays U.S. 5–10 Year Corporate Bond | ||||
| Index | 9.46 | 5.51 | 6.54 | 15,091 |
| Barclays U.S. Aggregate Float Adjusted Index | 6.15 | 3.28 | 4.13 | 13,011 |
"Since Inception" performance is calculated from the Admiral Shares’ inception date for both the fund and its comparative standards.
| Since | Final Value | |||
| One | Five | Inception | of a $5,000,000 | |
| Year | Years | (11/19/2009) | Investment | |
| Intermediate-Term Corporate Bond Index | ||||
| Fund Institutional Shares | 9.30% | 5.50% | 6.56% | $7,693,971 |
| Barclays U.S. 5–10 Year Corporate Bond | ||||
| Index | 9.46 | 5.51 | 6.65 | 7,735,966 |
| Spliced Barclays U.S. Aggregate Float | ||||
| Adjusted Index | 6.15 | 3.28 | 4.11 | 6,572,522 |
"Since Inception" performance is calculated from the Institutional Shares’ inception date for both the fund and its comparative standards.
| Cumulative Returns of ETF Shares: November 19, 2009, Through August 31, 2016 | |||
| Since | |||
| One | Five | Inception | |
| Year | Years | (11/19/2009) | |
| Intermediate-Term Corporate Bond Index Fund ETF | |||
| Shares Market Price | 10.04% | 29.69% | 54.06% |
| Intermediate-Term Corporate Bond Index Fund ETF | |||
| Shares Net Asset Value | 9.58 | 30.86 | 53.88 |
| Barclays U.S. 5–10 Year Corporate Bond Index | 9.46 | 30.78 | 54.72 |
"Since Inception" performance is calculated from the ETF Shares’ inception date for both the fund and its comparative standards.
Vanguard fund returns are adjusted to reflect the 0.25% fee on purchases of fund shares. The fee does not apply to the ETF Shares. The Fiscal-Year Total Returns table is not adjusted for fees.
79
| Intermediate-Term Corporate Bond Index Fund | ||
| Fiscal-Year Total Returns (%): November 19, 2009, Through August 31, 2016 | ||
| Barclays | ||
| 5–10 Year | ||
| Corporate | ||
| ETF Shares Net Asset Value | Index | |
| Fiscal Year | Total Returns | Total Returns |
| 2010 | 11.30% | 11.41% |
| 2011 | 5.65 | 6.19 |
| 2012 | 10.43 | 10.07 |
| 2013 | -1.64 | -1.27 |
| 2014 | 9.60 | 9.51 |
| 2015 | 0.32 | 0.39 |
| 2016 | 9.58 | 9.46 |
Average Annual Total Returns: Periods Ended June 30, 2016
This table presents returns through the latest calendar quarter—rather than through the end of the fiscal period.
Securities and Exchange Commission rules require that we provide this information.
| Since Inception | ||||||
| Inception Date | One Year | Five Years | Income | Capital | Total | |
| ETF Shares | 11/19/2009 | |||||
| Market Price | 8.37% | 5.87% | 6.63% | |||
| Net Asset Value | 8.03 | 5.87 | 6.54 | |||
| Admiral Shares | 3/2/2010 | 8.02 | 5.88 | 3.66% | 2.82% | 6.48 |
| Fee-Adjusted Returns | 7.75 | 5.82 | 6.43 | |||
| Institutional Shares | 11/19/2009 | 8.07 | 5.90 | 3.72 | 2.87 | 6.59 |
| Fee-Adjusted Returns | 7.80 | 5.85 | 6.55 | |||
Vanguard fund returns are adjusted to reflect the 0.25% fee on purchases of fund shares. The fee does not apply to the ETF Shares. The Fiscal-Year Total Returns table is not adjusted for fees.
80
Intermediate-Term Corporate Bond Index Fund
Financial Statements
Statement of Net Assets—Investments Summary
As of August 31, 2016
This Statement summarizes the fund’s holdings by asset type. Details are reported for each of the fund’s 50 largest individual holdings and for investments that, in total for any issuer, represent more than 1% of the fund’s net assets. The total value of smaller holdings is reported as a single amount within each category.
The fund reports a complete list of its holdings in regulatory filings four times in each fiscal year, at the quarter-ends. For the second and fourth fiscal quarters, the complete listing of the fund’s holdings is available electronically on vanguard.com and on the Securities and Exchange Commission’s website (sec.gov), or you can have it mailed to you without charge by calling 800-662-7447. For the first and third fiscal quarters, the fund files the lists with the SEC on Form N-Q. Shareholders can look up the fund’s Forms N-Q on the SEC’s website. Forms N-Q may also be reviewed and copied at the SEC’s Public Reference Room (see the back cover of this report for further information).
| Face | Market | Percentage | |||
| Maturity | Amount | Value• | of Net | ||
| Coupon | Date | ($000) | ($000) | Assets | |
| Corporate Bonds | |||||
| Finance | |||||
| Banking | |||||
| Bank of America Corp. | 3.875% | 8/1/25 | 25,729 | 27,476 | 0.3% |
| Bank of America Corp. | 3.300% | 1/11/23 | 26,398 | 27,410 | 0.2% |
| Bank of America Corp. | 4.000% | 4/1/24 | 23,835 | 25,723 | 0.2% |
| Bank of America Corp. | 4.000% | 1/22/25 | 20,203 | 21,050 | 0.2% |
| Bank of America Corp. | 3.500%–5.700% | 5/13/21–4/19/26 | 117,582 | 126,662 | 1.1% |
| Citigroup Inc. | 4.400% | 6/10/25 | 20,700 | 21,854 | 0.2% |
| Citigroup Inc. | 3.300%–5.500% | 1/14/22–11/20/26 | 122,642 | 130,395 | 1.2% |
| Credit Suisse AG | 3.625% | 9/9/24 | 23,900 | 25,043 | 0.2% |
| Goldman Sachs Group Inc. | 5.750% | 1/24/22 | 30,958 | 35,893 | 0.3% |
| Goldman Sachs Group Inc. | 4.000% | 3/3/24 | 23,236 | 25,027 | 0.2% |
| Goldman Sachs Group Inc. | 3.850% | 7/8/24 | 21,141 | 22,433 | 0.2% |
| Goldman Sachs Group Inc. | 3.500%–4.250% | 1/22/23–2/25/26 | 72,516 | 76,298 | 0.7% |
| HSBC Bank plc | 7.650% | 5/1/25 | 650 | 807 | 0.0% |
| HSBC Holdings plc | 4.300% | 3/8/26 | 22,995 | 24,722 | 0.2% |
| HSBC Holdings plc | 3.600%–5.100% | 4/5/21–5/25/26 | 80,018 | 84,032 | 0.8% |
| HSBC USA Inc. | 3.500% | 6/23/24 | 3,600 | 3,747 | 0.0% |
| JPMorgan Chase & Co. | 3.250% | 9/23/22 | 26,649 | 27,978 | 0.3% |
| JPMorgan Chase & Co. | 4.500% | 1/24/22 | 22,949 | 25,368 | 0.2% |
| JPMorgan Chase & Co. | 3.200% | 1/25/23 | 23,727 | 24,687 | 0.2% |
| JPMorgan Chase & Co. | 3.900% | 7/15/25 | 21,520 | 23,277 | 0.2% |
| JPMorgan Chase & Co. | 2.700%–3.875% | 5/1/23–10/1/26 | 118,410 | 123,548 | 1.1% |
| Mitsubishi UFJ Financial | |||||
| Group Inc. | 3.850% | 3/1/26 | 22,575 | 24,656 | 0.2% |
| Morgan Stanley | 4.000% | 7/23/25 | 26,280 | 28,379 | 0.3% |
| Morgan Stanley | 3.875% | 1/27/26 | 26,174 | 27,947 | 0.3% |
| Morgan Stanley | 3.700% | 10/23/24 | 24,318 | 25,772 | 0.2% |
| Morgan Stanley | 3.875% | 4/29/24 | 20,779 | 22,322 | 0.2% |
| Morgan Stanley | 3.125%–6.250% | 11/1/22–8/9/26 | 80,847 | 87,478 | 0.8% |
| Wachovia Corp. | 6.605%–7.574% | 10/1/25–8/1/26 | 2,250 | 2,938 | 0.0% |
| Wells Fargo & Co. | 3.000% | 4/22/26 | 21,825 | 22,377 | 0.2% |
81
| Intermediate-Term Corporate Bond Index Fund | ||||||
| Face | Market | Percentage | ||||
| Maturity | Amount | Value• | of Net | |||
| Coupon | Date | ($000) | ($000) | Assets | ||
| Wells Fargo & Co. | 3.000% | 2/19/25 | 20,663 | 21,207 | 0.2% | |
| Wells Fargo & Co. | 3.300%–4.480% | 3/8/22–6/3/26 | 104,815 | 111,956 | 1.0% | |
| 1 | Banking—Other † | 907,475 | 8.2% | |||
| Brokerage † | 147,124 | 1.3% | ||||
| Finance Companies † | 68,372 | 0.6% | ||||
| Insurance | ||||||
| Aetna Inc. | 3.200% | 6/15/26 | 22,620 | 23,038 | 0.2% | |
| Berkshire Hathaway | ||||||
| Finance Corp. | 3.000% | 5/15/22 | 7,161 | 7,580 | 0.1% | |
| Berkshire Hathaway Inc. | 2.750%–3.400% | 1/31/22–3/15/26 | 42,834 | 45,133 | 0.4% | |
| Insurance—Other † | 469,884 | 4.2% | ||||
| Other Finance † | 990 | 0.0% | ||||
| 1 | Real Estate Investment Trusts † | 516,050 | 4.7% | |||
| 3,464,108 | 31.1% | |||||
| Industrial | ||||||
| 1 | Basic Industry † | 433,066 | 3.9% | |||
| Capital Goods | ||||||
| General Electric Co. | 2.700% | 10/9/22 | 20,972 | 21,864 | 0.2% | |
| Precision Castparts Corp. | 2.500%–3.250% | 1/15/23–6/15/25 | 15,472 | 16,263 | 0.1% | |
| 1 | Capital Goods—Other † | 485,469 | 4.4% | |||
| Communication | ||||||
| AT&T Inc. | 3.950% | 1/15/25 | 28,825 | 30,923 | 0.3% | |
| AT&T Inc. | 3.400% | 5/15/25 | 26,734 | 27,608 | 0.3% | |
| AT&T Inc. | 3.600% | 2/17/23 | 23,638 | 24,961 | 0.2% | |
| AT&T Inc. | 3.000% | 6/30/22 | 22,415 | 23,096 | 0.2% | |
| AT&T Inc. | 2.625%–4.450% | 2/15/22–2/17/26 | 59,421 | 62,874 | 0.6% | |
| 1 | Charter Communications | |||||
| Operating LLC / Charter | ||||||
| Communications | ||||||
| Operating Capital | 4.908% | 7/23/25 | 35,031 | 38,626 | 0.4% | |
| Pacific Bell Telephone Co. | 7.125% | 3/15/26 | 1,202 | 1,568 | 0.0% | |
| Verizon Communications Inc. | 5.150% | 9/15/23 | 61,552 | 72,001 | 0.6% | |
| Verizon Communications | ||||||
| Inc. | 2.450%–4.150% | 11/1/21–8/15/26 | 78,642 | 82,517 | 0.7% | |
| 1 | Communication—Other † | 560,374 | 5.0% | |||
| Consumer Cyclical | ||||||
| CVS Health Corp. | 3.875% | 7/20/25 | 19,645 | 21,634 | 0.2% | |
| Visa Inc. | 3.150% | 12/14/25 | 31,230 | 33,273 | 0.3% | |
| 1 | Consumer Cyclical—Other † | 793,337 | 7.1% | |||
| Consumer Noncyclical | ||||||
| AbbVie Inc. | 3.600% | 5/14/25 | 26,280 | 27,787 | 0.2% | |
| AbbVie Inc. | 2.900% | 11/6/22 | 22,590 | 23,291 | 0.2% | |
| Actavis Funding SCS | 3.800% | 3/15/25 | 31,356 | 33,042 | 0.3% | |
| Actavis Funding SCS | 3.450% | 3/15/22 | 22,088 | 23,130 | 0.2% | |
| Anheuser-Busch InBev | ||||||
| Finance Inc. | 3.650% | 2/1/26 | 80,489 | 85,903 | 0.8% | |
| Anheuser-Busch InBev | ||||||
| Finance Inc. | 3.300% | 2/1/23 | 40,454 | 42,382 | 0.4% | |
| Anheuser-Busch InBev | ||||||
| Finance Inc. | 2.625%–3.700% | 1/17/23–2/1/24 | 18,391 | 19,329 | 0.2% | |
| Anheuser-Busch InBev | ||||||
| Worldwide Inc. | 2.500% | 7/15/22 | 25,850 | 26,307 | 0.2% | |
| Medtronic Inc. | 3.500% | 3/15/25 | 27,379 | 29,622 | 0.3% | |
| Medtronic Inc. | 3.150% | 3/15/22 | 21,917 | 23,305 | 0.2% | |
| 1 | Consumer Noncyclical—Other † | 1,498,382 | 13.5% | |||
82
| Intermediate-Term Corporate Bond Index Fund | |||||
| Face | Market | Percentage | |||
| Maturity | Amount | Value• | of Net | ||
| Coupon | Date | ($000) | ($000) | Assets | |
| 1 Energy † | 1,074,371 | 9.6% | |||
| Other Industrial † | 28,333 | 0.2% | |||
| Technology | |||||
| Apple Inc. | 2.400% | 5/3/23 | 39,112 | 39,984 | 0.4% |
| Apple Inc. | 3.250% | 2/23/26 | 22,978 | 24,562 | 0.2% |
| Apple Inc. | 3.450% | 5/6/24 | 21,504 | 23,312 | 0.2% |
| Apple Inc. | 2.150%–3.200% | 2/9/22–8/4/26 | 67,549 | 70,073 | 0.6% |
| 1 Diamond 1 Finance Corp. / | |||||
| Diamond 2 Finance Corp. | 6.020% | 6/15/26 | 36,100 | 38,570 | 0.4% |
| 1 Diamond 1 Finance Corp. / | |||||
| Diamond 2 Finance Corp. | 5.450% | 6/15/23 | 33,169 | 35,336 | 0.3% |
| Intel Corp. | 3.700% | 7/29/25 | 19,516 | 21,670 | 0.2% |
| Microsoft Corp. | 2.400% | 8/8/26 | 30,000 | 30,079 | 0.3% |
| Microsoft Corp. | 3.125% | 11/3/25 | 20,488 | 21,824 | 0.2% |
| Microsoft Corp. | 2.000%–3.625% | 2/12/22–2/12/25 | 67,127 | 69,530 | 0.6% |
| Oracle Corp. | 1.900% | 9/15/21 | 30,475 | 30,494 | 0.3% |
| Oracle Corp. | 2.500% | 5/15/22 | 22,416 | 22,947 | 0.2% |
| Oracle Corp. | 2.400%–3.625% | 10/15/22–7/15/26 | 90,681 | 93,733 | 0.8% |
| 1 Technology—Other † | 519,612 | 4.7% | |||
| Transportation | |||||
| 2 BNSF Funding Trust I | 6.613% | 12/15/55 | 1,890 | 2,178 | 0.0% |
| Burlington Northern | |||||
| Santa Fe LLC | 3.000%–7.000% | 9/15/21–12/15/25 | 43,143 | 47,299 | 0.4% |
| Transportation—Other † | 185,249 | 1.7% | |||
| 6,941,090 | 62.3% | ||||
| Utilities | |||||
| Electric | |||||
| Berkshire Hathaway | |||||
| Energy Co. | 3.500%–3.750% | 11/15/23–2/1/25 | 7,000 | 7,597 | 0.1% |
| MidAmerican Energy Co. | 3.500% | 10/15/24 | 4,948 | 5,400 | 0.1% |
| PacifiCorp | 2.950%–3.600% | 2/1/22–7/1/25 | 11,362 | 12,176 | 0.1% |
| 1 Sierra Pacific Power Co. | 2.600%–3.375% | 8/15/23–5/1/26 | 5,150 | 5,266 | 0.0% |
| 1 Electric—Other † | 523,463 | 4.7% | |||
| Natural Gas † | 40,208 | 0.4% | |||
| Other Utility † | 4,822 | 0.0% | |||
| 598,932 | 5.4% | ||||
| Total Corporate Bonds (Cost $10,556,599) | 11,004,130 | 98.8% | |||
| Taxable Municipal Bonds (Cost $1,489) † | 1,554 | 0.0% | |||
| Shares | |||||
| Temporary Cash Investment | |||||
| Money Market Fund | |||||
| 3 Vanguard Market Liquidity Fund | |||||
| (Cost $72,919) | 0.612% | 729,135 | 72,921 | 0.7% | |
| Total Investments (Cost $10,631,007) | 11,078,605 | 99.5% | |||
83
| Intermediate-Term Corporate Bond Index Fund | ||
| Percentage | ||
| Amount | of Net | |
| ($000) | Assets | |
| Other Assets and Liabilities | ||
| Other Assets | ||
| Investment in Vanguard | 837 | |
| Receivables for Investment Securities Sold | 103,384 | |
| Receivables for Accrued Income | 103,147 | |
| Receivables for Capital Shares Issued | 955 | |
| Other Assets4 | 10,024 | |
| Total Other Assets | 218,347 | 2.0% |
| Liabilities | ||
| Payables for Investment Securities Purchased | (157,667) | |
| Payables for Capital Shares Redeemed | (514) | |
| Payables for Distributions | (708) | |
| Payables to Vanguard | (1,824) | |
| Other Liabilities | (974) | |
| Total Liabilities | (161,687) | (1.5%) |
| Net Assets | 11,135,265 | 100.0% |
84
| Intermediate-Term Corporate Bond Index Fund | |
| At August 31, 2016, net assets consisted of: | |
| Amount | |
| ($000) | |
| Paid-in Capital | 10,694,753 |
| Undistributed Net Investment Income | 26,560 |
| Accumulated Net Realized Losses | (33,668) |
| Unrealized Appreciation (Depreciation) | |
| Investment Securities | 447,598 |
| Futures Contracts | 22 |
| Net Assets | 11,135,265 |
| ETF Shares—Net Assets | |
| Applicable to 112,309,890 outstanding $.001 par value shares of | |
| beneficial interest (unlimited authorization) | 10,048,297 |
| Net Asset Value Per Share—ETF Shares | $89.47 |
| Admiral Shares—Net Assets | |
| Applicable to 29,070,277 outstanding $.001 par value shares of | |
| beneficial interest (unlimited authorization) | 699,979 |
| Net Asset Value Per Share—Admiral Shares | $24.08 |
| Institutional Shares—Net Assets | |
| Applicable to 13,006,006 outstanding $.001 par value shares of | |
| beneficial interest (unlimited authorization) | 386,989 |
| Net Asset Value Per Share—Institutional Shares | $29.75 |
• See Note A in Notes to Financial Statements.
† Represents the aggregate value, by category, of securities that are not among the 50 largest holdings and, in total for any issuer, represent 1% or less of net assets.
1 Certain of the fund’s securities are exempt from registration under Rule 144A of the Securities Act of 1933. Such securities may be sold in transactions exempt from registration, normally to qualified institutional buyers. At August 31, 2016, the aggregate value of these securities was $299,784,000, representing 2.7% of net assets.
2 The average or expected maturity is shorter than the final maturity shown because of the possibility of interim principal payments and prepayments or the possibility of the issue being called.
3 Affiliated money market fund available only to Vanguard funds and certain trusts and accounts managed by Vanguard. Rate shown is the 7-day yield.
4 Cash of $700,000 has been segregated as initial margin for open futures contracts.
See accompanying Notes, which are an integral part of the Financial Statements.
85
| Intermediate-Term Corporate Bond Index Fund | |
| Statement of Operations | |
| Year Ended | |
| August 31, 2016 | |
| ($000) | |
| Investment Income | |
| Income | |
| Interest1 | 284,014 |
| Total Income | 284,014 |
| Expenses | |
| The Vanguard Group—Note B | |
| Investment Advisory Services | 223 |
| Management and Administrative—ETF Shares | 4,075 |
| Management and Administrative—Admiral Shares | 281 |
| Management and Administrative—Institutional Shares | 155 |
| Marketing and Distribution—ETF Shares | 565 |
| Marketing and Distribution—Admiral Shares | 58 |
| Marketing and Distribution—Institutional Shares | 10 |
| Custodian Fees | 82 |
| Auditing Fees | 48 |
| Shareholders’ Reports—ETF Shares | 165 |
| Shareholders’ Reports—Admiral Shares | 8 |
| Shareholders’ Reports—Institutional Shares | — |
| Trustees’ Fees and Expenses | 4 |
| Total Expenses | 5,674 |
| Net Investment Income | 278,340 |
| Realized Net Gain (Loss) | |
| Investment Securities Sold1 | (10,841) |
| Futures Contracts | (2,949) |
| Realized Net Gain (Loss) | (13,790) |
| Change in Unrealized Appreciation (Depreciation) | |
| Investment Securities | 535,188 |
| Futures Contracts | 23 |
| Change in Unrealized Appreciation (Depreciation) | 535,211 |
| Net Increase (Decrease) in Net Assets Resulting from Operations | 799,761 |
1 Interest income and realized net gain (loss) from an affiliated company of the fund were $179,000 and $0, respectively.
See accompanying Notes, which are an integral part of the Financial Statements.
86
| Intermediate-Term Corporate Bond Index Fund | ||
| Statement of Changes in Net Assets | ||
| Year Ended August 31, | ||
| 2016 | 2015 | |
| ($000) | ($000) | |
| Increase (Decrease) in Net Assets | ||
| Operations | ||
| Net Investment Income | 278,340 | 179,856 |
| Realized Net Gain (Loss) | (13,790) | 10,536 |
| Change in Unrealized Appreciation (Depreciation) | 535,211 | (187,849) |
| Net Increase (Decrease) in Net Assets Resulting from Operations | 799,761 | 2,543 |
| Distributions | ||
| Net Investment Income | ||
| ETF Shares | (237,627) | (153,363) |
| Admiral Shares | (17,675) | (11,087) |
| Institutional Shares | (11,793) | (10,537) |
| Realized Capital Gain1 | ||
| ETF Shares | — | (6,812) |
| Admiral Shares | — | (446) |
| Institutional Shares | — | (461) |
| Total Distributions | (267,095) | (182,706) |
| Capital Share Transactions | ||
| ETF Shares | 4,175,449 | 1,541,965 |
| Admiral Shares | 245,617 | 195,685 |
| Institutional Shares | 27,275 | 41,479 |
| Net Increase (Decrease) from Capital Share Transactions | 4,448,341 | 1,779,129 |
| Total Increase (Decrease) | 4,981,007 | 1,598,966 |
| Net Assets | ||
| Beginning of Period | 6,154,258 | 4,555,292 |
| End of Period2 | 11,135,265 | 6,154,258 |
1 Includes fiscal 2016 and 2015 short-term gain distributions totaling $0 and $0, respectively. Short-term gain distributions are treated as ordinary income dividends for tax purposes.
2 Net Assets—End of Period includes undistributed (overdistributed) net investment income of $26,560,000 and $15,315,000.
See accompanying Notes, which are an integral part of the Financial Statements.
87
| Intermediate-Term Corporate Bond Index Fund | |||||
| Financial Highlights | |||||
| ETF Shares | |||||
| For a Share Outstanding | Year Ended August 31, | ||||
| Throughout Each Period | 2016 | 2015 | 2014 | 2013 | 2012 |
| Net Asset Value, Beginning of Period | $84.39 | $86.98 | $82.31 | $86.78 | $81.49 |
| Investment Operations | |||||
| Net Investment Income | 2.831 | 2.767 | 2.724 | 2.715 | 2.966 |
| Net Realized and Unrealized Gain (Loss) | |||||
| on Investments1 | 5.083 | (2.473) | 5.024 | (4.042) | 5.350 |
| Total from Investment Operations | 7.914 | .294 | 7.748 | (1.327) | 8.316 |
| Distributions | |||||
| Dividends from Net Investment Income | (2.834) | (2.754) | (2.496) | (2.713) | (2.963) |
| Distributions from Realized Capital Gains | — | (.130) | (.582) | (. 430) | (.063) |
| Total Distributions | (2.834) | (2.884) | (3.078) | (3.143) | (3.026) |
| Net Asset Value, End of Period | $89.47 | $84.39 | $86.98 | $82.31 | $86.78 |
| Total Return | 9.58% | 0.32% | 9.60% | -1.64% | 10.43% |
| Ratios/Supplemental Data | |||||
| Net Assets, End of Period (Millions) | $10,048 | $5,393 | $4,010 | $3,161 | $2,751 |
| Ratio of Total Expenses to Average Net Assets | 0.07% | 0.10% | 0.12% | 0.12% | 0.12% |
| Ratio of Net Investment Income to | |||||
| Average Net Assets | 3.34% | 3.25% | 3.25% | 3.16% | 3.62% |
| Portfolio Turnover Rate 2 | 71% | 56% | 65% | 73% | 69% |
1 Includes increases from purchase fees of $.01, $.02, $.02, $.00, and $.03.
2 Excludes the value of portfolio securities received or delivered as a result of in-kind purchases or redemptions of the fund’s capital shares, including ETF Creation Units.
See accompanying Notes, which are an integral part of the Financial Statements.
88
| Intermediate-Term Corporate Bond Index Fund | |||||
| Financial Highlights | |||||
| Admiral Shares | |||||
| For a Share Outstanding | Year Ended August 31, | ||||
| Throughout Each Period | 2016 | 2015 | 2014 | 2013 | 2012 |
| Net Asset Value, Beginning of Period | $22.71 | $23.40 | $22.20 | $23.40 | $21.98 |
| Investment Operations | |||||
| Net Investment Income | .764 | .745 | .736 | .732 | . 800 |
| Net Realized and Unrealized Gain (Loss) | |||||
| on Investments1 | 1.371 | (.654) | 1.355 | (1.085) | 1.437 |
| Total from Investment Operations | 2.135 | .091 | 2.091 | (.353) | 2.237 |
| Distributions | |||||
| Dividends from Net Investment Income | (.765) | (.746) | (.734) | (.731) | (.800) |
| Distributions from Realized Capital Gains | — | (.035) | (.157) | (.116) | (. 017) |
| Total Distributions | (.765) | (.781) | (.891) | (. 847) | (.817) |
| Net Asset Value, End of Period | $24.08 | $22.71 | $23.40 | $22.20 | $23.40 |
| Total Return2 | 9.57% | 0.37% | 9.60% | -1.62% | 10.41% |
| Ratios/Supplemental Data | |||||
| Net Assets, End of Period (Millions) | $700 | $423 | $239 | $55 | $51 |
| Ratio of Total Expenses to Average Net Assets | 0.07% | 0.10% | 0.12% | 0.12% | 0.12% |
| Ratio of Net Investment Income to | |||||
| Average Net Assets | 3.34% | 3.25% | 3.25% | 3.16% | 3.62% |
| Portfolio Turnover Rate 3 | 71% | 56% | 65% | 73% | 69% |
Signal Shares were renamed Admiral Shares in October 2013. Prior periods’ Financial Highlights are for the Signal Class.
1 Includes increases from purchase fees of $.00, $.00, $.01, $.00, and $.01.
2 Total returns do not include transaction or account service fees that may have applied in the periods shown. Fund prospectuses provide information about any applicable transaction and account service fees.
3 Excludes the value of portfolio securities received or delivered as a result of in-kind purchases or redemptions of the fund’s capital shares, including ETF Creation Units.
See accompanying Notes, which are an integral part of the Financial Statements.
89
| Intermediate-Term Corporate Bond Index Fund | |||||
| Financial Highlights | |||||
| Institutional Shares | |||||
| For a Share Outstanding | Year Ended August 31, | ||||
| Throughout Each Period | 2016 | 2015 | 2014 | 2013 | 2012 |
| Net Asset Value, Beginning of Period | $28.06 | $28.92 | $27.44 | $28.93 | $27.17 |
| Investment Operations | |||||
| Net Investment Income | . 949 | .931 | .919 | .913 | .999 |
| Net Realized and Unrealized Gain (Loss) | |||||
| on Investments1 | 1.690 | (.816) | 1.671 | (1.347) | 1.780 |
| Total from Investment Operations | 2.639 | .115 | 2.590 | (.434) | 2.779 |
| Distributions | |||||
| Dividends from Net Investment Income | (.949) | (. 932) | (. 916) | (. 913) | (. 998) |
| Distributions from Realized Capital Gains | — | (.043) | (.194) | (.143) | (.021) |
| Total Distributions | (.949) | (. 975) | (1.110) | (1.056) | (1.019) |
| Net Asset Value, End of Period | $29.75 | $28.06 | $28.92 | $27.44 | $28.93 |
| Total Return2 | 9.58% | 0.37% | 9.62% | -1.61% | 10.46% |
| Ratios/Supplemental Data | |||||
| Net Assets, End of Period (Millions) | $387 | $338 | $307 | $164 | $185 |
| Ratio of Total Expenses to Average Net Assets | 0.05% | 0.07% | 0.09% | 0.09% | 0.09% |
| Ratio of Net Investment Income to | |||||
| Average Net Assets | 3.36% | 3.28% | 3.28% | 3.19% | 3.65% |
| Portfolio Turnover Rate 3 | 71% | 56% | 65% | 73% | 69% |
1 Includes increases from purchase fees of $.00, $.01, $.01, $.00, and $.01.
2 Total returns do not include transaction fees that may have applied in the periods shown. Fund prospectuses provide information about any applicable transaction fees.
3 Excludes the value of portfolio securities received or delivered as a result of in-kind purchases or redemptions of the fund’s capital shares, including ETF Creation Units.
See accompanying Notes, which are an integral part of the Financial Statements.
90
Intermediate-Term Corporate Bond Index Fund
Notes to Financial Statements
Vanguard Intermediate-Term Corporate Bond Index Fund is registered under the Investment Company Act of 1940 as an open-end investment company, or mutual fund. Certain of the fund’s investments are in corporate debt instruments; the issuers’ abilities to meet their obligations may be affected by economic developments in their respective industries. The fund offers three classes of shares: ETF Shares, Admiral Shares, and Institutional Shares. ETF Shares are listed for trading on Nasdaq; they can be purchased and sold through a broker. Admiral Shares and Institutional Shares are designed for investors who meet certain administrative, service, and account-size criteria.
A. The following significant accounting policies conform to generally accepted accounting principles for U.S. investment companies. The fund consistently follows such policies in preparing its financial statements.
1. Security Valuation: Securities are valued as of the close of trading on the New York Stock Exchange (generally 4 p.m., Eastern time) on the valuation date. Bonds and temporary cash investments acquired over 60 days to maturity are valued using the latest bid prices or using valuations based on a matrix system (which considers such factors as security prices, yields, maturities, and ratings), both as furnished by independent pricing services. Investments in Vanguard Market Liquidity Fund are valued at that fund’s net asset value. Other temporary cash investments are valued at amortized cost, which approximates market value. Securities for which market quotations are not readily available, or whose values have been affected by events occurring before the fund’s pricing time but after the close of the securities’ primary markets, are valued by methods deemed by the board of trustees to represent fair value.
2. Futures Contracts: The fund uses futures contracts to invest in fixed income asset classes with greater efficiency and lower cost than is possible through direct investment, to add value when these instruments are attractively priced, or to adjust sensitivity to changes in interest rates. The primary risks associated with the use of futures contracts are imperfect correlation between changes in market values of bonds held by the fund and the prices of futures contracts, and the possibility of an illiquid market. Counterparty risk involving futures is mitigated because a regulated clearinghouse is the counterparty instead of the clearing broker. To further mitigate counterparty risk, the fund trades futures contracts on an exchange, monitors the financial strength of its clearing brokers and clearinghouse, and has entered into clearing agreements with its clearing brokers. The clearinghouse imposes initial margin requirements to secure the fund’s performance and requires daily settlement of variation margin representing changes in the market value of each contract.
Futures contracts are valued at their quoted daily settlement prices. The aggregate settlement values of the contracts are not recorded in the Statement of Net Assets. Fluctuations in the value of the contracts are recorded in the Statement of Net Assets as an asset (liability) and in the Statement of Operations as unrealized appreciation (depreciation) until the contracts are closed, when they are recorded as realized futures gains (losses).
During the year ended August 31, 2016, the fund’s average investments in long and short futures contracts each represented less than 1% of net assets, based on the average of aggregate settlement values at each quarter-end during the period.
3. Federal Income Taxes: The fund intends to continue to qualify as a regulated investment company and distribute all of its taxable income. Management has analyzed the fund’s tax positions taken for all open federal income tax years (August 31, 2013–2016), and has concluded that no provision for federal income tax is required in the fund’s financial statements.
91
Intermediate-Term Corporate Bond Index Fund
4. Distributions: Distributions to shareholders are recorded on the ex-dividend date.
5. Credit Facility: The fund and certain other funds managed by The Vanguard Group (“Vanguard”) participate in a $3.1 billion committed credit facility provided by a syndicate of lenders pursuant to a credit agreement that may be renewed annually; each fund is individually liable for its borrowings, if any, under the credit facility. Borrowings may be utilized for temporary and emergency purposes, and are subject to the fund’s regulatory and contractual borrowing restrictions. The participating funds are charged administrative fees and an annual commitment fee of 0.10% of the undrawn amount of the facility; these fees are allocated to the funds based on a method approved by the fund’s board of trustees and included in Management and Administrative expenses on the fund’s Statement of Operations. Any borrowings under this facility bear interest at a rate based upon the higher of the one-month London Interbank Offered Rate, federal funds effective rate, or overnight bank funding rate plus an agreed-upon spread.
The fund had no borrowings outstanding at August 31, 2016, or at any time during the period then ended.
6. Other: Interest income includes income distributions received from Vanguard Market Liquidity Fund and is accrued daily. Premiums and discounts on debt securities purchased are amortized and accreted, respectively, to interest income over the lives of the respective securities. Security transactions are accounted for on the date securities are bought or sold. Costs used to determine realized gains (losses) on the sale of investment securities are those of the specific securities sold. Fees assessed on capital share transactions are credited to paid-in capital.
Each class of shares has equal rights as to assets and earnings, except that each class separately bears certain class-specific expenses related to maintenance of shareholder accounts (included in Management and Administrative expenses) and shareholder reporting. Marketing and distribution expenses are allocated to each class of shares based on a method approved by the board of trustees. Income, other non-class-specific expenses, and gains and losses on investments are allocated to each class of shares based on its relative net assets.
B. In accordance with the terms of a Funds’ Service Agreement (the “FSA”) between Vanguard and the fund, Vanguard furnishes to the fund investment advisory, corporate management, administrative, marketing, and distribution services at Vanguard’s cost of operations (as defined by the FSA). These costs of operations are allocated to the fund based on methods and guidelines approved by the board of trustees. Vanguard does not require reimbursement in the current period for certain costs of operations (such as deferred compensation/benefits and risk/insurance costs); the fund’s liability for these costs of operations is included in Payables to Vanguard on the Statement of Net Assets.
Upon the request of Vanguard, the fund may invest up to 0.40% of its net assets as capital in Vanguard. At August 31, 2016, the fund had contributed to Vanguard capital in the amount of $837,000, representing 0.01% of the fund’s net assets and 0.33% of Vanguard’s capitalization. The fund’s trustees and officers are also directors and employees, respectively, of Vanguard.
C. Various inputs may be used to determine the value of the fund’s investments. These inputs are summarized in three broad levels for financial statement purposes. The inputs or methodologies used to value securities are not necessarily an indication of the risk associated with investing in those securities.
92
Intermediate-Term Corporate Bond Index Fund
Level 1—Quoted prices in active markets for identical securities.
Level 2—Other significant observable inputs (including quoted prices for similar securities, interest rates, prepayment speeds, credit risk, etc.).
Level 3—Significant unobservable inputs (including the fund’s own assumptions used to determine the fair value of investments).
The following table summarizes the market value of the fund’s investments as of August 31, 2016, based on the inputs used to value them:
| Level 1 | Level 2 | Level 3 | |
| Investments | ($000) | ($000) | ($000) |
| Corporate Bonds | — | 11,004,130 | — |
| Taxable Municipal Bonds | — | 1,554 | — |
| Temporary Cash Investments | 72,921 | — | — |
| Futures Contracts—Assets1 | 35 | — | — |
| Futures Contracts—Liabilities1 | (15) | — | — |
| Total | 72,941 | 11,005,684 | — |
| 1 Represents variation margin on the last day of the reporting period. |
D. At August 31, 2016, the aggregate settlement value of open futures contracts and the related unrealized appreciation (depreciation) were:
| ($000) | ||||
| Aggregate | ||||
| Number of | Settlement | Unrealized | ||
| Long (Short) | Value | Appreciation | ||
| Futures Contracts | Expiration | Contracts | Long (Short) | (Depreciation) |
| Ultra 10-Year U.S. Treasury Note | December 2016 | 198 | 28,586 | 3 |
| 10-Year U.S. Treasury Note | December 2016 | (147) | (19,245) | 19 |
| 22 |
Unrealized appreciation (depreciation) on open futures contracts is required to be treated as realized gain (loss) for tax purposes.
E. Distributions are determined on a tax basis and may differ from net investment income and realized capital gains for financial reporting purposes. Differences may be permanent or temporary. Permanent differences are reclassified among capital accounts in the financial statements to reflect their tax character. Temporary differences arise when certain items of income, expense, gain, or loss are recognized in different periods for financial statement and tax purposes. These differences will reverse at some time in the future. Differences in classification may also result from the treatment of short-term gains as ordinary income for tax purposes.
During the year ended August 31, 2016, the fund realized $11,247,000 of net capital gains resulting from in-kind redemptions—in which shareholders exchanged fund shares for securities held by the fund rather than for cash. Because such gains are not taxable to the fund, and are not distributed to shareholders, they have been reclassified from accumulated net realized losses to paid-in capital.
93
Intermediate-Term Corporate Bond Index Fund
For tax purposes, at August 31, 2016, the fund had $28,921,000 of ordinary income available for distribution. The fund had available capital losses totaling $28,978,000 that may be carried forward indefinitely to offset future net capital gains.
At August 31, 2016, the cost of investment securities for tax purposes was $10,635,629,000. Net unrealized appreciation of investment securities for tax purposes was $442,976,000, consisting of unrealized gains of $446,861,000 on securities that had risen in value since their purchase and $3,885,000 in unrealized losses on securities that had fallen in value since their purchase.
F. During the year ended August 31, 2016, the fund purchased $7,597,009,000 of investment securities and sold $3,187,466,000 of investment securities, other than U.S. government securities and temporary cash investments. Purchases and sales of U.S. government securities were $2,977,864,000 and $2,978,670,000, respectively. Total purchases and sales include $3,816,147,000 and $297,600,000, respectively, in connection with in-kind purchases and redemptions of the fund’s capital shares.
The fund purchased securities from and sold securities to other Vanguard funds or accounts managed by Vanguard or its affiliates, in accordance with procedures adopted by the board of trustees in compliance with Rule 17a-7 of the Investment Company Act of 1940. For the year ended August 31, 2016, such purchases and sales were $976,198,000 and $2,154,789,000 respectively; these amounts are included in the purchases and sales of investment securities noted above.
| G. Capital share transactions for each class of shares were: | ||||
| Year Ended August 31, | ||||
| 2016 | 2015 | |||
| Amount | Shares | Amount | Shares | |
| ($000) | (000) | ($000) | (000) | |
| ETF Shares | ||||
| Issued1 | 4,483,789 | 52,004 | 2,179,326 | 25,206 |
| Issued in Lieu of Cash Distributions | — | — | — | — |
| Redeemed | (308,340) | (3,600) | (637,361) | (7,400) |
| Net Increase (Decrease)—ETF Shares | 4,175,449 | 48,404 | 1,541,965 | 17,806 |
| Admiral Shares | ||||
| Issued1 | 366,221 | 15,690 | 301,432 | 12,952 |
| Issued in Lieu of Cash Distributions | 15,255 | 654 | 10,270 | 442 |
| Redeemed | (135,859) | (5,881) | (116,017) | (4,991) |
| Net Increase (Decrease)—Admiral Shares | 245,617 | 10,463 | 195,685 | 8,403 |
| Institutional Shares | ||||
| Issued1 | 30,428 | 1,053 | 185,789 | 6,461 |
| Issued in Lieu of Cash Distributions | 6,542 | 227 | 8,213 | 286 |
| Redeemed | (9,695) | (336) | (152,523) | (5,289) |
| Net Increase (Decrease)—Institutional Shares | 27,275 | 944 | 41,479 | 1,458 |
1 Includes purchase fees for fiscal 2016 and 2015 of $1,011,000 and $1,119,000, respectively (fund totals).
H. Management has determined that no material events or transactions occurred subsequent to August 31, 2016, that would require recognition or disclosure in these financial statements.
94
Long-Term Corporate Bond Index Fund
| Fund Profile | |||
| As of August 31, 2016 | |||
| Share-Class Characteristics | |||
| ETF | Admiral | Institutional | |
| Shares | Shares | Shares | |
| Ticker Symbol | VCLT | VLTCX | VLCIX |
| Expense Ratio1 | 0.10% | 0.10% | 0.07% |
| 30-Day SEC Yield | 3.99% | 3.99% | 4.00% |
| Financial Attributes | |||
| Barclays | |||
| 10+ Year | |||
| Corporate | Barclays | ||
| Bond | Aggregate | ||
| Fund | Index | FA Index | |
| Number of Bonds | 1,732 | 1,815 | 9,864 |
| Yield to Maturity | |||
| (before expenses) | 4.0% | 4.0% | 1.9% |
| Average Coupon | 5.3% | 5.3% | 3.1% |
| Average Duration | 14.3 years | 14.3 years | 5.8 years |
| Average Effective | |||
| Maturity | 23.9 years | 23.7 years | 8.0 years |
| Short-Term | |||
| Reserves | 0.5% | — | — |
| Sector Diversification (% of portfolio) | |||
| Finance | 17.6% | ||
| Industrial | 69.1 | ||
| Treasury/Agency | 0.1 | ||
| Utilities | 13.2 | ||
The agency and mortgage-backed securities sectors may include issues from government-sponsored enterprises; such issues are generally not backed by the full faith and credit of the U.S. government.
| Volatility Measures | ||
| Barclays | ||
| 10+ Year | Barclays | |
| Corporate | Aggregate | |
| Bond Index | FA Index | |
| R-Squared | 0.98 | 0.75 |
| Beta | 1.03 | 2.48 |
| These measures show the degree and timing of the fund’s fluctuations compared with the indexes over 36 months. | |
| Distribution by Effective Maturity | |
| (% of portfolio) | |
| 5 - 10 Years | 1.0% |
| 10 - 20 Years | 26.0 |
| 20 - 30 Years | 69.5 |
| Over 30 Years | 3.5 |
| Distribution by Credit Quality (% of portfolio) | |
| Aaa | 2.7 |
| Aa | 9.3 |
| A | 40.0 |
| Baa | 48.0 |
Credit-quality ratings are obtained from Barclays and are from Moody's, Fitch, and S&P. When ratings from all three agencies are used, the median rating is shown. When ratings from two of the agencies are used, the lower rating for each issue is shown. "Not Rated" is used to classify securities for which a rating is not available. For more information about these ratings, see the Glossary entry for Credit Quality.
Investment Focus
1 The expense ratios shown are from the prospectus dated December 22, 2015, and represent estimated costs for the current fiscal year. For the fiscal year ended August 31, 2016, the expense ratios were 0.07% for ETF Shares, 0.07% for Admiral Shares, and 0.05% for Institutional Shares.
95
Long-Term Corporate Bond Index Fund
Performance Summary
All of the returns in this report represent past performance, which is not a guarantee of future results that may be achieved by the fund. (Current performance may be lower or higher than the performance data cited. For performance data current to the most recent month-end, visit our website at vanguard.com/performance.) Note, too, that both investment returns and principal value can fluctuate widely, so an investor’s shares, when sold, could be worth more or less than their original cost. The returns shown do not reflect taxes that a shareholder would pay on fund distributions or on the sale of fund shares.
Cumulative Performance: November 19, 2009, Through August 31, 2016
Initial Investment of $10,000
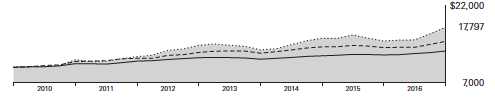
For a benchmark description, see the Glossary.
Corporate Debt Funds BBB-Rated Average: Derived from data provided by Lipper, a Thomson Reuters Company.
"Since Inception" performance is calculated from the ETF Shares’ inception date for both the fund and its comparative standards.
Vanguard fund returns are adjusted to reflect the 1.00% fee on purchases of fund shares. The fee does not apply to the ETF Shares. The Fiscal-Year Total Returns table is not adjusted for fees.
See Financial Highlights for dividend and capital gains information.
96
| Average Annual Total Returns | |||||
| Periods Ended August 31, 2016 | |||||
| Since | Final Value | ||||
| One | Five | Inception | of a $10,000 | ||
| Year | Years | (11/19/2009) | Investment | ||
| Long-Term Corporate Bond Index | |||||
| Fund ETF Shares Net Asset Value | 18.21% | 8.32% | 8.87% | $17,797 | |
| Long-Term Corporate Bond Index | |||||
| Fund ETF Shares Market Price | 18.29 | 8.05 | 8.86 | 17,779 | |
| Barclays U.S. 10+ Year Corporate | |||||
| •••••••• | Bond Index | 17.71 | 8.08 | 8.83 | 17,753 |
| – – – – | Corporate Debt Funds BBB-Rated | ||||
| Average | 8.70 | 5.06 | 6.17 | 15,007 | |
| Spliced Barclays U.S. Aggregate Float | |||||
| Adjusted Index | 6.15 | 3.28 | 4.11 | 13,145 | |
| Long-Term Corporate Bond Index Fund | ||||
| Average Annual Total Returns | ||||
| Periods Ended August 31, 2016 | ||||
| Since | Final Value | |||
| One | Five | Inception | of a $10,000 | |
| Year | Years | (1/19/2010) | Investment | |
| Long-Term Corporate Bond Index Fund | ||||
| Admiral Shares | 17.03% | 8.11% | 8.78% | $17,446 |
| Barclays U.S. 10+ Year Corporate Bond Index | 17.71 | 8.08 | 8.92 | 17,600 |
| Barclays U.S. Aggregate Float Adjusted Index | 6.15 | 3.28 | 4.19 | 13,122 |
"Since Inception" performance is calculated from the Admiral Shares’ inception date for both the fund and its comparative standards.
| Since | Final Value | |||
| One | Five | Inception | of a $5,000,000 | |
| Year | Years | (11/19/2009) | Investment | |
| Long-Term Corporate Bond Index Fund | ||||
| Institutional Shares | 17.04% | 8.14% | 8.75% | $8,833,518 |
| Barclays U.S. 10+ Year Corporate Bond | ||||
| Index | 17.71 | 8.08 | 8.83 | 8,876,547 |
| Spliced Barclays U.S. Aggregate Float | ||||
| Adjusted Index | 6.15 | 3.28 | 4.11 | 6,572,522 |
"Since Inception" performance is calculated from the Institutional Shares’ inception date for both the fund and its comparative standards.
| Cumulative Returns of ETF Shares: November 19, 2009, Through August 31, 2016 | |||
| Since | |||
| One | Five | Inception | |
| Year | Years | (11/19/2009) | |
| Long-Term Corporate Bond Index Fund ETF Shares | |||
| Market Price | 18.29% | 47.30% | 77.79% |
| Long-Term Corporate Bond Index Fund ETF Shares | |||
| Net Asset Value | 18.21 | 49.14 | 77.97 |
| Barclays U.S. 10+ Year Corporate Bond Index | 17.71 | 47.47 | 77.53 |
"Since Inception" performance is calculated from the ETF Shares’ inception date for both the fund and its comparative standards.
Vanguard fund returns are adjusted to reflect the 1.00% fee on purchases of fund shares. The fee does not apply to the ETF Shares. The Fiscal-Year Total Returns table is not adjusted for fees.
97
| Long-Term Corporate Bond Index Fund | ||
| Fiscal-Year Total Returns (%): November 19, 2009, Through August 31, 2016 | ||
| Barclays | ||
| 10+ Year | ||
| Corporate | ||
| ETF Shares Net Asset Value | Bond Index | |
| Fiscal Year | Total Returns | Total Returns |
| 2010 | 14.54% | 14.46% |
| 2011 | 4.19 | 5.18 |
| 2012 | 19.40 | 18.33 |
| 2013 | -6.55 | -6.09 |
| 2014 | 17.35 | 16.80 |
| 2015 | -3.64 | -3.48 |
| 2016 | 18.21 | 17.71 |
Average Annual Total Returns: Periods Ended June 30, 2016
This table presents returns through the latest calendar quarter—rather than through the end of the fiscal period.
Securities and Exchange Commission rules require that we provide this information.
| Since Inception | ||||||
| Inception Date | One Year | Five Years | Income | Capital | Total | |
| ETF Shares | 11/19/2009 | |||||
| Market Price | 15.94% | 8.63% | 8.67% | |||
| Net Asset Value | 14.16 | 8.68 | 8.54 | |||
| Admiral Shares | 1/19/2010 | 14.17 | 8.69 | 5.03% | 3.57% | 8.60 |
| Fee-Adjusted Returns | 13.03 | 8.47 | 8.43 | |||
| Institutional Shares | 11/19/2009 | 14.20 | 8.72 | 5.06 | 3.53 | 8.59 |
| Fee-Adjusted Returns | 13.06 | 8.50 | 8.42 | |||
Vanguard fund returns are adjusted to reflect the 1.00% fee on purchases of fund shares. The fee does not apply to the ETF Shares. The Fiscal-Year Total Returns table is not adjusted for fees.
98
Long-Term Corporate Bond Index Fund
Financial Statements
Statement of Net Assets—Investments Summary
As of August 31, 2016
This Statement summarizes the fund’s holdings by asset type. Details are reported for each of the fund’s 50 largest individual holdings and for investments that, in total for any issuer, represent more than 1% of the fund’s net assets. The total value of smaller holdings is reported as a single amount within each category.
The fund reports a complete list of its holdings in regulatory filings four times in each fiscal year, at the quarter-ends. For the second and fourth fiscal quarters, the complete listing of the fund’s holdings is available electronically on vanguard.com and on the Securities and Exchange Commission’s website (sec.gov), or you can have it mailed to you without charge by calling 800-662-7447. For the first and third fiscal quarters, the fund files the lists with the SEC on Form N-Q. Shareholders can look up the fund’s Forms N-Q on the SEC’s website. Forms N-Q may also be reviewed and copied at the SEC’s Public Reference Room (see the back cover of this report for further information).
| Face | Market | Percentage | ||||
| Maturity | Amount | Value• | of Net | |||
| Coupon | Date | ($000) | ($000) | Assets | ||
| U.S. Government and Agency Obligations | ||||||
| 1U.S. Government Securities (Cost $969) † | 968 | 0.0% | ||||
| Corporate Bonds | ||||||
| Finance | ||||||
| Banking | ||||||
| Bank of America Corp. | 5.000% | 1/21/44 | 3,230 | 3,873 | 0.2% | |
| Bank of America Corp. | 4.250%–7.750% | 9/15/26–4/21/45 | 12,536 | 15,375 | 0.8% | |
| Bank of America NA | 6.000% | 10/15/36 | 975 | 1,266 | 0.1% | |
| Bank One Capital III | 8.750% | 9/1/30 | 845 | 1,217 | 0.1% | |
| Bank One Corp. | 7.625%–8.000% | 10/15/26–4/29/27 | 1,045 | 1,405 | 0.1% | |
| Citigroup Inc. | 4.450% | 9/29/27 | 3,900 | 4,110 | 0.2% | |
| Citigroup Inc. | 4.125%–8.125% | 6/10/25–5/18/46 | 15,949 | 19,558 | 1.0% | |
| Goldman Sachs Capital I | 6.345% | 2/15/34 | 1,530 | 1,865 | 0.1% | |
| Goldman Sachs Group Inc. | 6.750% | 10/1/37 | 5,892 | 7,560 | 0.4% | |
| Goldman Sachs Group Inc. | 6.250% | 2/1/41 | 3,805 | 5,023 | 0.2% | |
| Goldman Sachs Group Inc. | 6.125% | 2/15/33 | 3,469 | 4,384 | 0.2% | |
| Goldman Sachs Group Inc. | 4.750%–6.450% | 1/15/27–10/21/45 | 10,590 | 12,143 | 0.6% | |
| HSBC Holdings plc | 6.500% | 9/15/37 | 3,490 | 4,515 | 0.2% | |
| JPMorgan Chase & Co. | 6.400% | 5/15/38 | 2,920 | 4,077 | 0.2% | |
| JPMorgan Chase & Co. | 2.950%–5.625% | 10/1/26–6/1/45 | 17,943 | 20,997 | 1.0% | |
| Morgan Stanley | 6.375% | 7/24/42 | 2,911 | 3,995 | 0.2% | |
| Wachovia Bank NA | 5.850% | 2/1/37 | 1,095 | 1,399 | 0.1% | |
| Wachovia Corp. | 5.500%–7.500% | 4/15/35–10/15/35 | 1,079 | 1,381 | 0.1% | |
| Wells Fargo & Co. | 5.606% | 1/15/44 | 3,067 | 3,827 | 0.2% | |
| Wells Fargo & Co. | 3.900%–5.375% | 7/22/27–6/14/46 | 16,772 | 18,634 | 0.9% | |
| Wells Fargo Bank NA | 5.950%–6.600% | 8/26/36–1/15/38 | 2,700 | 3,635 | 0.2% | |
| 2 | Wells Fargo Capital X | 5.950% | 12/1/86 | 1,150 | 1,265 | 0.1% |
| 3 | Banking—Other † | 44,783 | 2.3% | |||
| Brokerage † | 5,901 | 0.3% | ||||
| Finance Companies | ||||||
| GE Capital International Funding Co. 4.418% | 11/15/35 | 13,857 | 15,861 | 0.8% | ||
| Finance Companies—Other † | 620 | 0.0% | ||||
99
| Long-Term Corporate Bond Index Fund | |||||
| Face | Market | Percentage | |||
| Maturity | Amount | Value• | of Net | ||
| Coupon | Date | ($000) | ($000) | Assets | |
| Insurance | |||||
| Berkshire Hathaway Finance | |||||
| Corp. | 4.300%–5.750% | 1/15/40–5/15/43 | 2,679 | 3,325 | 0.1% |
| Berkshire Hathaway Inc. | 4.500% | 2/11/43 | 1,330 | 1,574 | 0.1% |
| Insurance—Other † | 113,988 | 5.8% | |||
| 3 Real Estate Investment Trusts † | 13,645 | 0.7% | |||
| 341,201 | 17.3% | ||||
| Industrial | |||||
| Basic Industry | |||||
| Lubrizol Corp. | 6.500% | 10/1/34 | 315 | 429 | 0.0% |
| 3 Basic Industry—Other † | 88,778 | 4.5% | |||
| Capital Goods | |||||
| General Electric Capital | |||||
| Corp. | 5.875% | 1/14/38 | 3,934 | 5,362 | 0.3% |
| General Electric Capital | |||||
| Corp. | 6.750% | 3/15/32 | 3,286 | 4,701 | 0.2% |
| General Electric Capital | |||||
| Corp. | 6.150%–6.875% | 8/7/37–1/10/39 | 3,995 | 5,877 | 0.3% |
| General Electric Co. | 4.125%–4.500% | 10/9/42–3/11/44 | 5,455 | 6,316 | 0.3% |
| Precision Castparts Corp. | 3.900%–4.375% | 6/15/35–6/15/45 | 1,400 | 1,619 | 0.1% |
| United Technologies Corp. | 4.500% | 6/1/42 | 4,030 | 4,777 | 0.3% |
| 3 Capital Goods—Other † | 71,173 | 3.6% | |||
| Communication | |||||
| Ameritech Capital Funding Corp. | 6.550% | 1/15/28 | 385 | 446 | 0.0% |
| AT&T Corp. | 8.250% | 11/15/31 | 880 | 1,291 | 0.1% |
| AT&T Inc. | 4.750% | 5/15/46 | 4,731 | 5,052 | 0.3% |
| AT&T Inc. | 5.350% | 9/1/40 | 4,014 | 4,594 | 0.2% |
| AT&T Inc. | 4.500% | 5/15/35 | 3,955 | 4,186 | 0.2% |
| AT&T Inc. | 4.350% | 6/15/45 | 3,926 | 3,925 | 0.2% |
| AT&T Inc. | 4.300%–6.550% | 9/15/34–6/15/44 | 19,660 | 23,335 | 1.2% |
| AT&T Mobility LLC | 7.125% | 12/15/31 | 422 | 570 | 0.0% |
| Bellsouth Capital Funding | |||||
| Corp. | 7.120%–7.875% | 2/15/30–7/15/97 | 798 | 1,095 | 0.1% |
| BellSouth LLC | 6.000%–6.875% | 10/15/31–11/15/34 | 1,268 | 1,501 | 0.1% |
| BellSouth | |||||
| Telecommunications LLC | 6.375% | 6/1/28 | 422 | 509 | 0.0% |
| British Telecommunications plc | 9.375% | 12/15/30 | 3,052 | 4,983 | 0.3% |
| 3 Charter Communications | |||||
| Operating LLC / Charter | |||||
| Communications Operating | |||||
| Capital | 6.484% | 10/23/45 | 4,675 | 5,749 | 0.3% |
| 3 Charter Communications | |||||
| Operating LLC / Charter | |||||
| Communications Operating | |||||
| Capital | 6.384%–6.834% | 10/23/35–10/23/55 | 2,625 | 3,171 | 0.1% |
| Comcast Corp. | 3.200%–7.050% | 1/15/33–7/15/46 | 25,378 | 31,226 | 1.6% |
| Deutsche Telekom | |||||
| International Finance BV | 8.750% | 6/15/30 | 3,764 | 5,880 | 0.3% |
| GTE Corp. | 6.940% | 4/15/28 | 810 | 1,060 | 0.1% |
| Historic TW Inc. | 6.625% | 5/15/29 | 1,110 | 1,462 | 0.1% |
| NBCUniversal Media LLC | 4.450%–6.400% | 4/30/40–1/15/43 | 4,070 | 5,422 | 0.3% |
| New Cingular Wireless | |||||
| Services Inc. | 8.750% | 3/1/31 | 970 | 1,497 | 0.1% |
| Orange SA | 9.000% | 3/1/31 | 3,070 | 4,923 | 0.2% |
100
| Long-Term Corporate Bond Index Fund | ||||||
| Face | Market | Percentage | ||||
| Maturity | Amount | Value• | of Net | |||
| Coupon | Date | ($000) | ($000) | Assets | ||
| TCI Communications Inc. | 7.125% | 2/15/28 | 545 | 771 | 0.0% | |
| Time Warner Cable Inc. | 4.500%–7.300% | 5/1/37–9/15/42 | 10,106 | 11,725 | 0.6% | |
| Time Warner Cos. Inc. | 6.950% | 1/15/28 | 688 | 903 | 0.0% | |
| Time Warner Entertainment | ||||||
| Co. LP | 8.375% | 7/15/33 | 1,150 | 1,564 | 0.1% | |
| Time Warner Inc. | 4.650%–7.700% | 4/15/31–7/15/45 | 13,609 | 17,632 | 0.9% | |
| Verizon Communications Inc. | 5.012% | 8/21/54 | 6,324 | 6,996 | 0.4% | |
| Verizon Communications Inc. | 4.862% | 8/21/46 | 6,198 | 6,858 | 0.3% | |
| Verizon Communications Inc. | 6.550% | 9/15/43 | 4,820 | 6,532 | 0.3% | |
| Verizon Communications Inc. | 4.672% | 3/15/55 | 6,119 | 6,402 | 0.3% | |
| Verizon Communications Inc. | 4.522% | 9/15/48 | 4,570 | 4,818 | 0.2% | |
| Verizon Communications Inc. | 4.400% | 11/1/34 | 3,720 | 3,940 | 0.2% | |
| Verizon Communications | ||||||
| Inc. | 3.850%–7.750% | 12/1/30–8/15/46 | 21,132 | 24,810 | 1.3% | |
| Communication—Other † | 74,490 | 3.8% | ||||
| Consumer Cyclical | ||||||
| CVS Health Corp. | 5.125% | 7/20/45 | 5,650 | 7,046 | 0.4% | |
| Home Depot Inc. | 5.875% | 12/16/36 | 3,455 | 4,762 | 0.3% | |
| Visa Inc. | 4.300% | 12/14/45 | 3,825 | 4,542 | 0.2% | |
| Wal-Mart Stores Inc. | 6.500% | 8/15/37 | 4,025 | 5,968 | 0.3% | |
| Wal-Mart Stores Inc. | 4.000%–7.550% | 4/5/27–4/22/44 | 17,714 | 23,759 | 1.2% | |
| Consumer Cyclical—Other † | 86,993 | 4.4% | ||||
| Consumer Noncyclical | ||||||
| 3 Amgen Inc. | 4.663% | 6/15/51 | 4,101 | 4,406 | 0.2% | |
| Amgen Inc. | 5.150% | 11/15/41 | 3,650 | 4,241 | 0.2% | |
| Anheuser-Busch Cos. LLC | 5.750%–6.800% | 8/20/32–5/1/42 | 1,815 | 2,466 | 0.1% | |
| Anheuser-Busch InBev | ||||||
| Finance Inc. | 4.900% | 2/1/46 | 14,392 | 17,350 | 0.9% | |
| Anheuser-Busch InBev | ||||||
| Finance Inc. | 4.700% | 2/1/36 | 7,169 | 8,295 | 0.4% | |
| Anheuser-Busch InBev | ||||||
| Finance Inc. | 4.000%–4.625% | 1/17/43–2/1/44 | 2,490 | 2,769 | 0.2% | |
| Anheuser-Busch InBev | ||||||
| Worldwide Inc. | 3.750%–8.200% | 1/15/39–7/15/42 | 4,134 | 5,919 | 0.3% | |
| AstraZeneca plc | 6.450% | 9/15/37 | 2,837 | 3,988 | 0.2% | |
| GlaxoSmithKline Capital Inc. | 6.375% | 5/15/38 | 3,060 | 4,469 | 0.2% | |
| Medtronic Inc. | 4.625% | 3/15/45 | 5,555 | 6,630 | 0.4% | |
| Medtronic Inc. | 4.375% | 3/15/35 | 3,340 | 3,824 | 0.2% | |
| Teva Pharmaceutical Finance | ||||||
| Netherlands III BV | 3.150% | 10/1/26 | 4,000 | 4,034 | 0.2% | |
| 3 Consumer Noncyclical—Other † | 265,394 | 13.5% | ||||
| Energy | ||||||
| ConocoPhillips | 6.500% | 2/1/39 | 3,330 | 4,376 | 0.2% | |
| El Paso Natural Gas Co. LLC | 8.375% | 6/15/32 | 297 | 365 | 0.0% | |
| Exxon Mobil Corp. | 4.114% | 3/1/46 | 3,750 | 4,299 | 0.2% | |
| Kinder Morgan Energy | ||||||
| Partners LP | 4.700%–7.750% | 3/15/31–9/1/44 | 10,921 | 11,521 | 0.6% | |
| Kinder Morgan Inc. | 5.300%–7.750% | 1/15/32–6/1/45 | 5,090 | 5,383 | 0.3% | |
| Shell International Finance BV | 4.375% | 5/11/45 | 3,587 | 3,957 | 0.2% | |
| Shell International Finance BV | 6.375% | 12/15/38 | 2,803 | 3,833 | 0.2% | |
| Southern Natural Gas Co. LLC | 8.000% | 3/1/32 | 320 | 409 | 0.0% | |
| Tennessee Gas Pipeline | ||||||
| Co. LLC | 7.000%–7.625% | 3/15/27–4/1/37 | 2,010 | 2,396 | 0.1% | |
| Energy—Other † | 162,415 | 8.3% | ||||
101
| Long-Term Corporate Bond Index Fund | |||||
| Face | Market | Percentage | |||
| Maturity | Amount | Value• | of Net | ||
| Coupon | Date | ($000) | ($000) | Assets | |
| Other Industrial † | 10,651 | 0.5% | |||
| Technology | |||||
| Apple Inc. | 4.650% | 2/23/46 | 5,500 | 6,449 | 0.3% |
| Apple Inc. | 3.850% | 5/4/43 | 4,500 | 4,667 | 0.3% |
| Apple Inc. | 3.450%–4.500% | 2/23/36–8/4/46 | 9,007 | 9,837 | 0.5% |
| Cisco Systems Inc. | 5.500% | 1/15/40 | 3,075 | 4,056 | 0.2% |
| Microsoft Corp. | 3.700% | 8/8/46 | 5,450 | 5,660 | 0.3% |
| Microsoft Corp. | 3.450%–5.300% | 2/12/35–8/8/56 | 24,144 | 26,249 | 1.3% |
| Oracle Corp. | 5.375% | 7/15/40 | 3,301 | 4,129 | 0.2% |
| Oracle Corp. | 3.250%–6.500% | 5/15/30–5/15/55 | 16,876 | 19,204 | 1.0% |
| 3 Technology—Other † | 41,458 | 2.1% | |||
| Transportation | |||||
| Burlington Northern | |||||
| Santa Fe LLC | 3.900%–7.950% | 8/15/30–8/1/46 | 12,856 | 15,733 | 0.8% |
| 3 Transportation—Other † | 57,172 | 2.9% | |||
| 1,339,424 | 68.1% | ||||
| Utilities | |||||
| Electric | |||||
| Berkshire Hathaway | |||||
| Energy Co. | 4.500%–8.480% | 9/15/28–2/1/45 | 6,134 | 8,069 | 0.4% |
| Duke Energy Carolinas LLC | 3.750%–6.450% | 12/1/28–3/15/46 | 6,321 | 7,817 | 0.4% |
| Duke Energy Corp. | 2.650%–4.800% | 9/1/26–9/1/46 | 3,975 | 4,105 | 0.2% |
| 2 Duke Energy Florida LLC | 2.538%–6.400% | 9/1/29–11/15/42 | 3,566 | 4,464 | 0.2% |
| Duke Energy Indiana LLC | 3.750%–6.450% | 10/15/35–5/15/46 | 2,883 | 3,680 | 0.2% |
| Duke Energy Ohio Inc. | 3.700% | 6/15/46 | 530 | 559 | 0.0% |
| Duke Energy Progress LLC | 4.100%–6.300% | 4/1/38–8/15/45 | 3,963 | 4,553 | 0.2% |
| MidAmerican Energy Co. | 4.250%–6.750% | 12/30/31–5/1/46 | 2,910 | 3,735 | 0.2% |
| MidAmerican Funding LLC | 6.927% | 3/1/29 | 200 | 282 | 0.0% |
| Nevada Power Co. | 5.375%–6.750% | 4/1/36–5/15/41 | 1,846 | 2,528 | 0.1% |
| Pacific Gas & Electric Co. | 6.050% | 3/1/34 | 3,475 | 4,697 | 0.3% |
| PacifiCorp | 4.100%–7.700% | 11/15/31–2/1/42 | 4,315 | 5,927 | 0.3% |
| Progress Energy Inc. | 6.000%–7.750% | 3/1/31–12/1/39 | 2,012 | 2,736 | 0.2% |
| Sierra Pacific Power Co. | 6.750% | 7/1/37 | 355 | 512 | 0.0% |
| 3 Electric—Other † | 182,577 | 9.3% | |||
| Natural Gas † | 15,328 | 0.8% | |||
| Other Utility † | 3,600 | 0.2% | |||
| 255,169 | 13.0% | ||||
| Total Corporate Bonds (Cost $1,794,510) | 1,935,794 | 98.4% | |||
| Taxable Municipal Bonds (Cost $3,648) † | 4,166 | 0.2% | |||
| Shares | |||||
| Temporary Cash Investment | |||||
| Money Market Fund | |||||
| 4 Vanguard Market Liquidity Fund | |||||
| (Cost $9,174) | 0.612% | 91,734 | 9,174 | 0.5% | |
| Total Investments (Cost $1,808,301) | 1,950,102 | 99.1% | |||
102
| Long-Term Corporate Bond Index Fund | ||
| Percentage | ||
| Amount | of Net | |
| ($000) | Assets | |
| Other Assets and Liabilities | ||
| Other Assets | ||
| Investment in Vanguard | 150 | |
| Receivables for Investment Securities Sold | 7,058 | |
| Receivables for Accrued Income | 23,834 | |
| Receivables for Capital Shares Issued | 189 | |
| Other Assets1 | 219 | |
| Total Other Assets | 31,450 | 1.6% |
| Liabilities | ||
| Payables for Investment Securities Purchased | (12,726) | |
| Payables for Capital Shares Redeemed | (26) | |
| Payables for Distributions | (80) | |
| Payables to Vanguard | (468) | |
| Other Liabilities | (255) | |
| Total Liabilities | (13,555) | (0.7%) |
| Net Assets | 1,967,997 | 100.0% |
103
| Long-Term Corporate Bond Index Fund | |
| At August 31, 2016, net assets consisted of: | |
| Amount | |
| ($000) | |
| Paid-in Capital | 1,853,325 |
| Undistributed Net Investment Income | 5,018 |
| Accumulated Net Realized Losses | (32,152) |
| Unrealized Appreciation (Depreciation) | |
| Investment Securities | 141,801 |
| Futures Contracts | 5 |
| Net Assets | 1,967,997 |
| ETF Shares—Net Assets | |
| Applicable to 15,501,675 outstanding $.001 par value shares of | |
| beneficial interest (unlimited authorization) | 1,493,922 |
| Net Asset Value Per Share—ETF Shares | $96.37 |
| Admiral Shares—Net Assets | |
| Applicable to 3,490,252 outstanding $.001 par value shares of | |
| beneficial interest (unlimited authorization) | 90,030 |
| Net Asset Value Per Share—Admiral Shares | $25.79 |
| Institutional Shares—Net Assets | |
| Applicable to 11,994,674 outstanding $.001 par value shares of | |
| beneficial interest (unlimited authorization) | 384,045 |
| Net Asset Value Per Share—Institutional Shares | $32.02 |
• See Note A in Notes to Financial Statements.
† Represents the aggregate value, by category, of securities that are not among the 50 largest holdings and, in total for any issuer, represent 1% or less of net assets.
1 Securities with a value of $99,000 and cash of $179,000 have been segregated as initial margin for open futures contracts.
2 The average or expected maturity is shorter than the final maturity shown because of the possibility of interim principal payments and prepayments or the possibility of the issue being called.
3 Certain of the fund’s securities are exempt from registration under Rule 144A of the Securities Act of 1933. Such securities may be sold in transactions exempt from registration, normally to qualified institutional buyers. At August 31, 2016, the aggregate value of these securities was $32,271,000, representing 1.6% of net assets.
4 Affiliated money market fund available only to Vanguard funds and certain trusts and accounts managed by Vanguard. Rate shown is the 7-day yield.
See accompanying Notes, which are an integral part of the Financial Statements.
104
| Long-Term Corporate Bond Index Fund | |
| Statement of Operations | |
| Year Ended | |
| August 31, 2016 | |
| ($000) | |
| Investment Income | |
| Income | |
| Interest1 | 70,118 |
| Total Income | 70,118 |
| Expenses | |
| The Vanguard Group—Note B | |
| Investment Advisory Services | 41 |
| Management and Administrative—ETF Shares | 604 |
| Management and Administrative—Admiral Shares | 42 |
| Management and Administrative—Institutional Shares | 130 |
| Marketing and Distribution—ETF Shares | 94 |
| Marketing and Distribution—Admiral Shares | 8 |
| Marketing and Distribution—Institutional Shares | 8 |
| Custodian Fees | 31 |
| Auditing Fees | 48 |
| Shareholders’ Reports—ETF Shares | 8 |
| Shareholders’ Reports—Admiral Shares | 1 |
| Shareholders’ Reports—Institutional Shares | — |
| Trustees’ Fees and Expenses | 1 |
| Total Expenses | 1,016 |
| Net Investment Income | 69,102 |
| Realized Net Gain (Loss) | |
| Investment Securities Sold1 | (17,646) |
| Futures Contracts | (824) |
| Realized Net Gain (Loss) | (18,470) |
| Change in Unrealized Appreciation (Depreciation) | |
| Investment Securities | 215,448 |
| Futures Contracts | 5 |
| Change in Unrealized Appreciation (Depreciation) | 215,453 |
| Net Increase (Decrease) in Net Assets Resulting from Operations | 266,085 |
1 Interest income and realized net gain (loss) from an affiliated company of the fund were $29,000 and $0, respectively.
See accompanying Notes, which are an integral part of the Financial Statements.
105
| Long-Term Corporate Bond Index Fund | ||
| Statement of Changes in Net Assets | ||
| Year Ended August 31, | ||
| 2016 | 2015 | |
| ($000) | ($000) | |
| Increase (Decrease) in Net Assets | ||
| Operations | ||
| Net Investment Income | 69,102 | 61,873 |
| Realized Net Gain (Loss) | (18,470) | 373 |
| Change in Unrealized Appreciation (Depreciation) | 215,453 | (126,994) |
| Net Increase (Decrease) in Net Assets Resulting from Operations | 266,085 | (64,748) |
| Distributions | ||
| Net Investment Income | ||
| ETF Shares | (50,023) | (45,939) |
| Admiral Shares | (3,526) | (2,507) |
| Institutional Shares | (14,304) | (12,835) |
| Realized Capital Gain | ||
| ETF Shares | — | — |
| Admiral Shares | — | — |
| Institutional Shares | — | — |
| Total Distributions | (67,853) | (61,281) |
| Capital Share Transactions | ||
| ETF Shares | 375,872 | 190,279 |
| Admiral Shares | 12,353 | 28,156 |
| Institutional Shares | 46,986 | 70,617 |
| Net Increase (Decrease) from Capital Share Transactions | 435,211 | 289,052 |
| Total Increase (Decrease) | 633,443 | 163,023 |
| Net Assets | ||
| Beginning of Period | 1,334,554 | 1,171,531 |
| End of Period1 | 1,967,997 | 1,334,554 |
1 Net Assets—End of Period includes undistributed (overdistributed) net investment income of $5,018,000 and $3,769,000.
See accompanying Notes, which are an integral part of the Financial Statements.
106
| Long-Term Corporate Bond Index Fund | |||||
| Financial Highlights | |||||
| ETF Shares | |||||
| For a Share Outstanding | Year Ended August 31, | ||||
| Throughout Each Period | 2016 | 2015 | 2014 | 2013 | 2012 |
| Net Asset Value, Beginning of Period | $85.25 | $92.38 | $82.11 | $92.15 | $80.80 |
| Investment Operations | |||||
| Net Investment Income | 3.905 | 3.910 | 3.964 | 4.018 | 3.980 |
| Net Realized and Unrealized Gain (Loss) | |||||
| on Investments1 | 11.127 | (7.127) | 9.937 | (9.816) | 11.351 |
| Total from Investment Operations | 15.032 | (3.217) | 13.901 | (5.798) | 15.331 |
| Distributions | |||||
| Dividends from Net Investment Income | (3.912) | (3.913) | (3.631) | (4.018) | (3.981) |
| Distributions from Realized Capital Gains | — | — | — | (.224) | — |
| Total Distributions | (3.912) | (3.913) | (3.631) | (4.242) | (3.981) |
| Net Asset Value, End of Period | $96.37 | $85.25 | $92.38 | $82.11 | $92.15 |
| Total Return | 18.21% | -3.64% | 17.35% | -6.55% | 19.40% |
| Ratios/Supplemental Data | |||||
| Net Assets, End of Period (Millions) | $1,494 | $972 | $878 | $624 | $1,032 |
| Ratio of Total Expenses to Average Net Assets | 0.07% | 0.10% | 0.12% | 0.12% | 0.12% |
| Ratio of Net Investment Income to | |||||
| Average Net Assets | 4.46% | 4.37% | 4.63% | 4.47% | 4.73% |
| Portfolio Turnover Rate2 | 59% | 64% | 54% | 57% | 71% |
1 Includes increases from purchase fees of $.03, $.11, $.05, $.07, and $.02.
2 Excludes the value of portfolio securities received or delivered as a result of in-kind purchases or redemptions of the fund’s capital shares, including ETF Creation Units.
See accompanying Notes, which are an integral part of the Financial Statements.
107
| Long-Term Corporate Bond Index Fund | |||||
| Financial Highlights | |||||
| Admiral Shares | |||||
| For a Share Outstanding | Year Ended August 31, | ||||
| Throughout Each Period | 2016 | 2015 | 2014 | 2013 | 2012 |
| Net Asset Value, Beginning of Period | $22.80 | $24.71 | $22.04 | $24.74 | $21.69 |
| Investment Operations | |||||
| Net Investment Income | 1.047 | 1.048 | 1.066 | 1.078 | 1.068 |
| Net Realized and Unrealized Gain (Loss) | |||||
| on Investments1 | 2.991 | (1.911) | 2.669 | (2.640) | 3.051 |
| Total from Investment Operations | 4.038 | (. 863) | 3.735 | (1.562) | 4.119 |
| Distributions | |||||
| Dividends from Net Investment Income | (1.048) | (1.047) | (1.065) | (1.078) | (1.069) |
| Distributions from Realized Capital Gains | — | — | — | (.060) | — |
| Total Distributions | (1.048) | (1.047) | (1.065) | (1.138) | (1.069) |
| Net Asset Value, End of Period | $25.79 | $22.80 | $24.71 | $22.04 | $24.74 |
| Total Return2 | 18.21% | -3.66% | 17.37% | -6.57% | 19.43% |
| Ratios/Supplemental Data | |||||
| Net Assets, End of Period (Millions) | $90 | $67 | $44 | $18 | $15 |
| Ratio of Total Expenses to Average Net Assets | 0.07% | 0.10% | 0.12% | 0.12% | 0.12% |
| Ratio of Net Investment Income to | |||||
| Average Net Assets | 4.46% | 4.37% | 4.63% | 4.47% | 4.73% |
| Portfolio Turnover Rate 3 | 59% | 64% | 54% | 57% | 71% |
Signal Shares were renamed Admiral Shares in October 2013. Prior periods’ Financial Highlights are for the Signal class.
1 Includes increases from purchase fees of $.01, $.02, $.01, $.01, and $.01.
2 Total returns do not include transaction or account service fees that may have applied in the periods shown. Fund prospectuses provide information about any applicable transaction and account service fees.
3 Excludes the value of portfolio securities received or delivered as a result of in-kind purchases or redemptions of the fund’s capital shares, including ETF Creation Units.
See accompanying Notes, which are an integral part of the Financial Statements.
108
| Long-Term Corporate Bond Index Fund | |||||
| Financial Highlights | |||||
| Institutional Shares | |||||
| For a Share Outstanding | Year Ended August 31, | ||||
| Throughout Each Period | 2016 | 2015 | 2014 | 2013 | 2012 |
| Net Asset Value, Beginning of Period | $28.31 | $30.68 | $27.37 | $30.71 | $26.93 |
| Investment Operations | |||||
| Net Investment Income | 1.306 | 1.310 | 1.331 | 1.347 | 1.337 |
| Net Realized and Unrealized Gain (Loss) | |||||
| on Investments1 | 3.710 | (2.370) | 3.308 | (3.265) | 3.780 |
| Total from Investment Operations | 5.016 | (1.060) | 4.639 | (1.918) | 5.117 |
| Distributions | |||||
| Dividends from Net Investment Income | (1.306) | (1.310) | (1.329) | (1.347) | (1.337) |
| Distributions from Realized Capital Gains | — | — | — | (.075) | — |
| Total Distributions | (1.306) | (1.310) | (1.329) | (1.422) | (1.337) |
| Net Asset Value, End of Period | $32.02 | $28.31 | $30.68 | $27.37 | $30.71 |
| Total Return2 | 18.22% | -3.62% | 17.38% | -6.50% | 19.44% |
| Ratios/Supplemental Data | |||||
| Net Assets, End of Period (Millions) | $384 | $296 | $250 | $206 | $164 |
| Ratio of Total Expenses to Average Net Assets | 0.05% | 0.07% | 0.09% | 0.09% | 0.09% |
| Ratio of Net Investment Income to | |||||
| Average Net Assets | 4.48% | 4.40% | 4.66% | 4.50% | 4.76% |
| Portfolio Turnover Rate 3 | 59% | 64% | 54% | 57% | 71% |
1 Includes increases from purchase fees of $.01, $.03, $.02, $.01, and $.00.
2 Total returns do not include transaction fees that may have applied in the periods shown. Fund prospectuses provide information about any applicable transaction fees.
3 Excludes the value of portfolio securities received or delivered as a result of in-kind purchases or redemptions of the fund’s capital shares, including ETF Creation Units.
See accompanying Notes, which are an integral part of the Financial Statements.
109
Long-Term Corporate Bond Index Fund
Notes to Financial Statements
Vanguard Long-Term Corporate Bond Index Fund is registered under the Investment Company Act of 1940 as an open-end investment company, or mutual fund. Certain of the fund’s investments are in corporate debt instruments; the issuers’ abilities to meet their obligations may be affected by economic developments in their respective industries. The fund offers three classes of shares: ETF Shares, Admiral Shares, and Institutional Shares. ETF Shares are listed for trading on Nasdaq; they can be purchased and sold through a broker. Admiral Shares and Institutional Shares are designed for investors who meet certain administrative, service, and account-size criteria.
A. The following significant accounting policies conform to generally accepted accounting principles for U.S. investment companies. The fund consistently follows such policies in preparing its financial statements.
1. Security Valuation: Securities are valued as of the close of trading on the New York Stock Exchange (generally 4 p.m., Eastern time) on the valuation date. Bonds and temporary cash investments acquired over 60 days to maturity are valued using the latest bid prices or using valuations based on a matrix system (which considers such factors as security prices, yields, maturities, and ratings), both as furnished by independent pricing services. Investments in Vanguard Market Liquidity Fund are valued at that fund’s net asset value. Other temporary cash investments are valued at amortized cost, which approximates market value. Securities for which market quotations are not readily available, or whose values have been affected by events occurring before the fund’s pricing time but after the close of the securities’ primary markets, are valued by methods deemed by the board of trustees to represent fair value.
2. Futures Contracts: The fund uses futures contracts to invest in fixed income asset classes with greater efficiency and lower cost than is possible through direct investment, to add value when these instruments are attractively priced, or to adjust sensitivity to changes in interest rates. The primary risks associated with the use of futures contracts are imperfect correlation between changes in market values of bonds held by the fund and the prices of futures contracts, and the possibility of an illiquid market. Counterparty risk involving futures is mitigated because a regulated clearinghouse is the counterparty instead of the clearing broker. To further mitigate counterparty risk, the fund trades futures contracts on an exchange, monitors the financial strength of its clearing brokers and clearinghouse, and has entered into clearing agreements with its clearing brokers. The clearinghouse imposes initial margin requirements to secure the fund’s performance and requires daily settlement of variation margin representing changes in the market value of each contract.
Futures contracts are valued at their quoted daily settlement prices. The aggregate settlement values of the contracts are not recorded in the Statement of Net Assets. Fluctuations in the value of the contracts are recorded in the Statement of Net Assets as an asset (liability) and in the Statement of Operations as unrealized appreciation (depreciation) until the contracts are closed, when they are recorded as realized futures gains (losses).
During the year ended August 31, 2016, the fund’s average investments in long and short futures contracts each represented less than 1% of net assets, based on the average of aggregate settlement values at each quarter-end during the period.
3. Federal Income Taxes: The fund intends to continue to qualify as a regulated investment company and distribute all of its taxable income. Management has analyzed the fund’s tax positions taken for all open federal income tax years (August 31, 2013–2016), and has concluded that no provision for federal income tax is required in the fund’s financial statements.
110
Long-Term Corporate Bond Index Fund
4. Distributions: Distributions to shareholders are recorded on the ex-dividend date.
5. Credit Facility: The fund and certain other funds managed by The Vanguard Group (“Vanguard”) participate in a $3.1 billion committed credit facility provided by a syndicate of lenders pursuant to a credit agreement that may be renewed annually; each fund is individually liable for its borrowings, if any, under the credit facility. Borrowings may be utilized for temporary and emergency purposes, and are subject to the fund’s regulatory and contractual borrowing restrictions. The participating funds are charged administrative fees and an annual commitment fee of 0.10% of the undrawn amount of the facility; these fees are allocated to the funds based on a method approved by the fund’s board of trustees and included in Management and Administrative expenses on the fund’s Statement of Operations. Any borrowings under this facility bear interest at a rate based upon the higher of the one-month London Interbank Offered Rate, federal funds effective rate, or overnight bank funding rate plus an agreed-upon spread.
The fund had no borrowings outstanding at August 31, 2016, or at any time during the period then ended.
6. Other: Interest income includes income distributions received from Vanguard Market Liquidity Fund and is accrued daily. Premiums and discounts on debt securities purchased are amortized and accreted, respectively, to interest income over the lives of the respective securities. Security transactions are accounted for on the date securities are bought or sold. Costs used to determine realized gains (losses) on the sale of investment securities are those of the specific securities sold. Fees assessed on capital share transactions are credited to paid-in capital.
Each class of shares has equal rights as to assets and earnings, except that each class separately bears certain class-specific expenses related to maintenance of shareholder accounts (included in Management and Administrative expenses) and shareholder reporting. Marketing and distribution expenses are allocated to each class of shares based on a method approved by the board of trustees. Income, other non-class-specific expenses, and gains and losses on investments are allocated to each class of shares based on its relative net assets.
B. In accordance with the terms of a Funds’ Service Agreement (the “FSA”) between Vanguard and the fund, Vanguard furnishes to the fund investment advisory, corporate management, administrative, marketing, and distribution services at Vanguard’s cost of operations (as defined by the FSA). These costs of operations are allocated to the fund based on methods and guidelines approved by the board of trustees. Vanguard does not require reimbursement in the current period for certain costs of operations (such as deferred compensation/benefits and risk/insurance costs); the fund’s liability for these costs of operations is included in Payables to Vanguard on the Statement of Net Assets.
Upon the request of Vanguard, the fund may invest up to 0.40% of its net assets as capital in Vanguard. At August 31, 2016, the fund had contributed to Vanguard capital in the amount of $150,000, representing 0.01% of the fund’s net assets and 0.06% of Vanguard’s capitalization. The fund’s trustees and officers are also directors and employees, respectively, of Vanguard.
C. Various inputs may be used to determine the value of the fund’s investments. These inputs are summarized in three broad levels for financial statement purposes. The inputs or methodologies used to value securities are not necessarily an indication of the risk associated with investing in those securities.
111
Long-Term Corporate Bond Index Fund
Level 1—Quoted prices in active markets for identical securities.
Level 2—Other significant observable inputs (including quoted prices for similar securities, interest rates, prepayment speeds, credit risk, etc.).
Level 3—Significant unobservable inputs (including the fund’s own assumptions used to determine the fair value of investments).
The following table summarizes the market value of the fund’s investments as of August 31, 2016, based on the inputs used to value them:
| Level 1 | Level 2 | Level 3 | |
| Investments | ($000) | ($000) | ($000) |
| U.S. Government and Agency Obligations | — | 968 | — |
| Corporate Bonds | — | 1,935,544 | 250 |
| Taxable Municipal Bonds | — | 4,166 | — |
| Temporary Cash Investments | 9,174 | — | — |
| Futures Contracts—Assets1 | 39 | — | — |
| Futures Contracts—Liabilities1 | (58) | — | — |
| Total | 9,155 | 1,940,678 | 250 |
| 1 Represents variation margin on the last day of the reporting period. |
D. At August 31, 2016, the aggregate settlement value of open futures contracts and the related unrealized appreciation (depreciation) were:
| ($000) | ||||
| Aggregate | ||||
| Number of | Settlement | Unrealized | ||
| Long (Short) | Value | Appreciation | ||
| Futures Contracts | Expiration | Contracts | Long (Short) | (Depreciation) |
| Ultra 10-Year U.S. Treasury Note | December 2016 | 40 | 5,775 | — |
| Ultra Long U. S. Treasury Bond | December 2016 | (13) | (2,437) | 5 |
| 5 |
Unrealized appreciation (depreciation) on open futures contracts is required to be treated as realized gain (loss) for tax purposes.
E. Distributions are determined on a tax basis and may differ from net investment income and realized capital gains for financial reporting purposes. Differences may be permanent or temporary. Permanent differences are reclassified among capital accounts in the financial statements to reflect their tax character. Temporary differences arise when certain items of income, expense, gain, or loss are recognized in different periods for financial statement and tax purposes. These differences will reverse at some time in the future. Differences in classification may also result from the treatment of short-term gains as ordinary income for tax purposes.
During the year ended August 31, 2016, the fund realized $5,979,000 of net capital losses resulting from in-kind redemptions—in which shareholders exchanged fund shares for securities held by the fund rather than for cash. Because such losses are not taxable to the fund, and are not distributed to shareholders, they have been reclassified from accumulated net realized losses to paid-in capital.
112
Long-Term Corporate Bond Index Fund
For tax purposes, at August 31, 2016, the fund had $5,536,000 of ordinary income available for distribution. The fund had available capital losses totaling $30,958,000 that may be carried forward indefinitely to offset future net capital gains.
At August 31, 2016, the cost of investment securities for tax purposes was $1,809,490,000. Net unrealized appreciation of investment securities for tax purposes was $140,612,000, consisting of unrealized gains of $144,452,000 on securities that had risen in value since their purchase and $3,840,000 in unrealized losses on securities that had fallen in value since their purchase.
F. During the year ended August 31, 2016, the fund purchased $1,174,348,000 of investment securities and sold $743,882,000 of investment securities, other than U.S. government securities and temporary cash investments. Purchases and sales of U.S. government securities were $366,068,000 and $367,281,000, respectively. Total purchases and sales include $552,228,000 and $207,834,000, respectively, in connection with in-kind purchases and redemptions of the fund’s capital shares.
The fund purchased securities from and sold securities to other Vanguard funds or accounts managed by Vanguard or its affiliates, in accordance with procedures adopted by the board of trustees in compliance with Rule 17a-7 of the Investment Company Act of 1940. For the year ended August 31, 2016, such purchases and sales were $206,500,000 and $394,190,000, respectively; these amounts are included in the purchases and sales of investment securities noted above.
| G. Capital share transactions for each class of shares were: | ||||
| Year Ended August 31, | ||||
| 2016 | 2015 | |||
| Amount | Shares | Amount | Shares | |
| ($000) | (000) | ($000) | (000) | |
| ETF Shares | ||||
| Issued1 | 587,866 | 6,602 | 754,420 | 8,200 |
| Issued in Lieu of Cash Distributions | — | — | — | — |
| Redeemed | (211,994) | (2,500) | (564,141) | (6,300) |
| Net Increase (Decrease)—ETF Shares | 375,872 | 4,102 | 190,279 | 1,900 |
| Admiral Shares | ||||
| Issued1 | 49,620 | 2,062 | 46,136 | 1,883 |
| Issued in Lieu of Cash Distributions | 2,788 | 117 | 2,027 | 84 |
| Redeemed | (40,055) | (1,605) | (20,007) | (830) |
| Net Increase (Decrease)—Admiral Shares | 12,353 | 574 | 28,156 | 1,137 |
| Institutional Shares | ||||
| Issued1 | 43,967 | 1,424 | 117,548 | 3,887 |
| Issued in Lieu of Cash Distributions | 14,304 | 485 | 12,835 | 427 |
| Redeemed | (11,285) | (380) | (59,766) | (1,996) |
| Net Increase (Decrease)—Institutional Shares | 46,986 | 1,529 | 70,617 | 2,318 |
| 1 Includes purchase fees for fiscal 2016 and 2015 of $724,000 and $1,672,000, respectively (fund totals). | ||||
H. Management has determined that no material events or transactions occurred subsequent to August 31, 2016, that would require recognition or disclosure in these financial statements.
113
Mortgage-Backed Securities Index Fund
| Fund Profile | |||
| As of August 31, 2016 | |||
| Share-Class Characteristics | |||
| ETF | Admiral | Institutional | |
| Shares | Shares | Shares | |
| Ticker Symbol | VMBS | VMBSX | VMBIX |
| Expense Ratio1 | 0.10% | 0.10% | 0.07% |
| 30-Day SEC Yield | 1.80% | 1.81% | 1.80% |
| Financial Attributes | |||
| Barclays | |||
| MBS | Barclays | ||
| Float Adj | Aggregate | ||
| Fund | Index | FA Index | |
| Number of Bonds | 5382 | 341 | 9,864 |
| Yield to Maturity | |||
| (before expenses) | 2.4% | 2.0% | 1.9% |
| Average Coupon | 3.7% | 3.7% | 3.1% |
| Average Duration | 2.9 years | 2.4 years | 5.8 years |
| Average Effective | |||
| Maturity | 5.8 years | 4.7 years | 8.0 years |
| Short-Term | |||
| Reserves | 17.8% | — | — |
| Sector Diversification (% of portfolio) | |||
| Government Mortgage-Backed | 100.0% | ||
The agency and mortgage-backed securities sectors may include issues from government-sponsored enterprises; such issues are generally not backed by the full faith and credit of the U.S. government.
| Volatility Measures | ||
| Barclays | ||
| MBS | Barclays | |
| Float Adj | Aggregate | |
| Index | FA Index | |
| R-Squared | 0.99 | 0.68 |
| Beta | 1.08 | 0.59 |
These measures show the degree and timing of the fund’s fluctuations compared with the indexes over 36 months.
| Distribution by Effective Maturity | |
| (% of portfolio) | |
| 1 - 3 Years | 1.8% |
| 3 - 5 Years | 71.1 |
| 5 - 10 Years | 27.1 |
| Distribution by Credit Quality (% of portfolio) | |
| U.S. Government | 100.0% |
Credit-quality ratings are obtained from Barclays and are from Moody's, Fitch, and S&P. When ratings from all three agencies are used, the median rating is shown. When ratings from two of the agencies are used, the lower rating for each issue is shown. "Not Rated" is used to classify securities for which a rating is not available. For more information about these ratings, see the Glossary entry for Credit Quality.
| Distribution by Coupon (% of portfolio) | |
| 0 - 5.0 | 95.3% |
| More Than 5.0 - 5.5 | 2.6 |
| More Than 5.5 - 6.0 | 1.7 |
| More Than 6.0 - 6.5 | 0.4 |
1 The expense ratios shown are from the prospectus dated December 22, 2015, and represent estimated costs for the current fiscal year. For the fiscal year ended August 31, 2016, the expense ratios were 0.07% for ETF Shares, 0.07% for Admiral Shares, and 0.05% for Institutional Shares.
2 Issues are mortgage pools grouped by coupon.
114
Mortgage-Backed Securities Index Fund
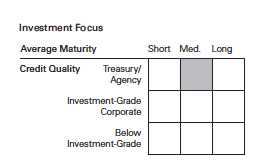
115
Mortgage-Backed Securities Index Fund
Performance Summary
All of the returns in this report represent past performance, which is not a guarantee of future results that may be achieved by the fund. (Current performance may be lower or higher than the performance data cited. For performance data current to the most recent month-end, visit our website at vanguard.com/performance.) Note, too, that both investment returns and principal value can fluctuate widely, so an investor’s shares, when sold, could be worth more or less than their original cost. The returns shown do not reflect taxes that a shareholder would pay on fund distributions or on the sale of fund shares.
Cumulative Performance: November 19, 2009, Through August 31, 2016
Initial Investment of $10,000

| Average Annual Total Returns | |||||
| Periods Ended August 31, 2016 | |||||
| Since | Final Value | ||||
| One | Five | Inception | of a $10,000 | ||
| Year | Years | (11/19/2009) | Investment | ||
| Mortgage-Backed Securities Index | |||||
| Fund ETF Shares Net Asset Value | 3.70% | 2.50% | 3.24% | $12,415 | |
| Mortgage-Backed Securities Index | |||||
| Fund ETF Shares Market Price | 3.78 | 2.50 | 3.25 | 12,426 | |
| Barclays U.S. MBS Float Adjusted | |||||
| •••••••• | Index | 3.76 | 2.57 | 3.27 | 12,439 |
| – – – – | U.S. Mortgage Funds Average | 3.51 | 2.74 | 3.63 | 12,738 |
| Spliced Barclays U.S. Aggregate Float | |||||
| Adjusted Index | 6.15 | 3.28 | 4.11 | 13,145 | |
For a benchmark description, see the Glossary.
U.S. Mortgage Funds Average: Derived from data provided by Lipper, a Thomson Reuters Company.
"Since Inception" performance is calculated from the ETF Shares’ inception date for both the fund and its comparative standards.
See Financial Highlights for dividend and capital gains information.
116
| Mortgage-Backed Securities Index Fund | ||||
| Average Annual Total Returns | ||||
| Periods Ended August 31, 2016 | ||||
| Since | Final Value | |||
| One | Five | Inception | of a $10,000 | |
| Year | Years | (12/3/2009) | Investment | |
| Mortgage-Backed Securities Index Fund | ||||
| Admiral Shares | 3.70% | 2.50% | 3.23% | $12,387 |
| Barclays U.S. MBS Float Adjusted Index | 3.76 | 2.57 | 3.28 | 12,427 |
| Spliced Barclays U.S. Aggregate Float | ||||
| Adjusted Index | 6.15 | 3.28 | 4.12 | 13,129 |
"Since Inception" performance is calculated from the Admiral Shares’ inception date for both the fund and its comparative standards.
| Since | Final Value | ||
| One | Inception | of a $5,000,000 | |
| Year | (10/31/2013) | Investment | |
| Mortgage-Backed Securities Index Fund | |||
| Institutional Shares | 3.72% | 3.33% | $5,485,959 |
| Barclays U.S. MBS Float Adjusted Index | 3.76 | 3.33 | 5,487,105 |
| Barclays U.S. Aggregate Float Adjusted | |||
| Index | 6.15 | 4.02 | 5,590,862 |
"Since Inception" performance is calculated from the Institutional Shares’ inception date for both the fund and its comparative standards.
| Cumulative Returns of ETF Shares: November 19, 2009, Through August 31, 2016 | |||
| Since | |||
| One | Five | Inception | |
| Year | Years | (11/19/2009) | |
| Mortgage-Backed Securities Index Fund ETF Shares | |||
| Market Price | 3.78% | 13.12% | 24.26% |
| Mortgage-Backed Securities Index Fund ETF Shares | |||
| Net Asset Value | 3.70 | 13.12 | 24.15 |
| Barclays U.S. MBS Float Adjusted Index | 3.76 | 13.54 | 24.39 |
"Since Inception" performance is calculated from the ETF Shares’ inception date for both the fund and its comparative standards.
117
| Mortgage-Backed Securities Index Fund | ||
| Fiscal-Year Total Returns (%): November 19, 2009, Through August 31, 2016 | ||
| Barclays | ||
| MBS | ||
| Float Adj | ||
| ETF Shares Net Asset Value | Index | |
| Fiscal Year | Total Returns | Total Returns |
| 2010 | 4.39% | 4.23% |
| 2011 | 5.14 | 5.11 |
| 2012 | 3.62 | 3.62 |
| 2013 | -2.36 | -2.03 |
| 2014 | 5.21 | 5.15 |
| 2015 | 2.49 | 2.51 |
| 2016 | 3.70 | 3.76 |
Average Annual Total Returns: Periods Ended June 30, 2016
This table presents returns through the latest calendar quarter—rather than through the end of the fiscal period.
Securities and Exchange Commission rules require that we provide this information.
| Since Inception | ||||||
| Inception Date | One Year | Five Years | Income | Capital | Total | |
| ETF Shares | 11/19/2009 | |||||
| Market Price | 4.23% | 2.84% | 3.30% | |||
| Net Asset Value | 4.05 | 2.87 | 3.28 | |||
| Admiral Shares | 12/3/2009 | 4.05 | 2.87 | 1.67% | 1.59% | 3.26 |
| Institutional Shares | 10/31/2013 | 4.03 | — | 1.71 | 1.72 | 3.43 |
118
Mortgage-Backed Securities Index Fund
Financial Statements
Statement of Net Assets
As of August 31, 2016
The fund reports a complete list of its holdings in regulatory filings four times in each fiscal year, at the quarter-ends. For the second and fourth fiscal quarters, the lists appear in the fund’s semiannual and annual reports to shareholders. For the first and third fiscal quarters, the fund files the lists with the Securities and Exchange Commission on Form N-Q. Shareholders can look up the fund’s Forms N-Q on the SEC’s website at sec.gov. Forms N-Q may also be reviewed and copied at the SEC’s Public Reference Room (see the back cover of this report for further information).
| Face | Market | ||||
| Maturity | Amount | Value• | |||
| Coupon | Date | ($000) | ($000) | ||
| U.S. Government and Agency Obligations (99.3%) | |||||
| Conventional Mortgage-Backed Securities (98.6%) | |||||
| 1,2 | Fannie Mae Pool | 2.000% | 11/1/27–8/1/31 | 4,718 | 4,792 |
| 1,2,3 Fannie Mae Pool | 2.500% | 11/1/26–1/1/43 | 98,299 | 101,753 | |
| 1,2,3 Fannie Mae Pool | 3.000% | 11/1/25–10/1/46 | 321,131 | 334,998 | |
| 1,2,3 Fannie Mae Pool | 3.500% | 8/1/21–9/1/46 | 388,942 | 411,319 | |
| 1,2,3 Fannie Mae Pool | 4.000% | 7/1/18–9/1/46 | 249,697 | 268,452 | |
| 1,2,3 Fannie Mae Pool | 4.500% | 2/1/18–9/1/46 | 122,000 | 133,565 | |
| 1,2,3 Fannie Mae Pool | 5.000% | 1/1/17–9/1/46 | 63,247 | 70,170 | |
| 1,2,4 Fannie Mae Pool | 5.500% | 12/1/16–2/1/42 | 46,874 | 52,905 | |
| 1,2 | Fannie Mae Pool | 6.000% | 3/1/18–5/1/41 | 32,764 | 37,693 |
| 1,2 | Fannie Mae Pool | 6.500% | 10/1/21–10/1/39 | 10,457 | 12,102 |
| 1,2 | Fannie Mae Pool | 7.000% | 12/1/22–10/1/37 | 971 | 1,138 |
| 1,2 | Fannie Mae Pool | 7.500% | 11/1/22 | 8 | 9 |
| 1,2 | Freddie Mac Gold Pool | 2.000% | 1/1/28–1/1/29 | 4,072 | 4,147 |
| 1,2,3 Freddie Mac Gold Pool | 2.500% | 4/1/27–2/1/43 | 72,198 | 74,846 | |
| 1,2,3 Freddie Mac Gold Pool | 3.000% | 1/1/26–9/1/46 | 211,979 | 221,147 | |
| 1,2,3 Freddie Mac Gold Pool | 3.500% | 9/1/25–9/1/46 | 242,623 | 256,193 | |
| 1,2,3 Freddie Mac Gold Pool | 4.000% | 7/1/18–9/1/46 | 150,663 | 161,808 | |
| 1,2,3 Freddie Mac Gold Pool | 4.500% | 1/1/18–9/1/46 | 69,542 | 76,048 | |
| 1,2 | Freddie Mac Gold Pool | 5.000% | 10/1/17–10/1/41 | 37,639 | 41,610 |
| 1,2 | Freddie Mac Gold Pool | 5.500% | 4/1/21–6/1/41 | 30,941 | 34,780 |
| 1,2 | Freddie Mac Gold Pool | 6.000% | 6/1/17–5/1/40 | 19,444 | 22,221 |
| 1,2 | Freddie Mac Gold Pool | 6.500% | 10/1/28–9/1/39 | 4,757 | 5,458 |
| 1,2 | Freddie Mac Gold Pool | 7.000% | 7/1/28–12/1/38 | 396 | 460 |
| 1,2 | Freddie Mac Gold Pool | 8.000% | 11/1/22 | 1 | 1 |
| 1 | Ginnie Mae I Pool | 3.000% | 1/15/26–9/1/46 | 21,464 | 22,540 |
| 1,3 | Ginnie Mae I Pool | 3.500% | 2/15/26–9/1/46 | 22,528 | 23,989 |
| 1,3 | Ginnie Mae I Pool | 4.000% | 7/15/24–9/1/46 | 34,254 | 36,815 |
| 1,3 | Ginnie Mae I Pool | 4.500% | 9/15/18–9/1/46 | 36,667 | 40,557 |
| 1,3 | Ginnie Mae I Pool | 5.000% | 1/15/18–9/1/46 | 21,895 | 24,481 |
| 1 | Ginnie Mae I Pool | 5.500% | 10/15/32–2/15/40 | 10,230 | 11,587 |
| 1 | Ginnie Mae I Pool | 6.000% | 4/15/28–5/15/41 | 4,482 | 5,145 |
| 1 | Ginnie Mae I Pool | 6.500% | 5/15/24–1/15/39 | 232 | 269 |
| 1 | Ginnie Mae I Pool | 7.000% | 10/15/27 | 7 | 8 |
| 1 | Ginnie Mae II Pool | 2.500% | 6/20/27–4/20/46 | 7,940 | 8,258 |
| 1,3 | Ginnie Mae II Pool | 3.000% | 10/20/26–10/1/46 | 194,407 | 203,980 |
| 1,3 | Ginnie Mae II Pool | 3.500% | 12/20/25–10/1/46 | 343,137 | 364,696 |
| 1,3 | Ginnie Mae II Pool | 4.000% | 9/20/25–9/1/46 | 163,688 | 175,547 |
119
| Mortgage-Backed Securities Index Fund | |||||
| Face | Market | ||||
| Maturity | Amount | Value• | |||
| Coupon | Date | ($000) | ($000) | ||
| 1,3 | Ginnie Mae II Pool | 4.500% | 4/20/18–10/1/46 | 77,044 | 83,411 |
| 1 | Ginnie Mae II Pool | 5.000% | 6/20/33–11/20/44 | 36,167 | 39,838 |
| 1 | Ginnie Mae II Pool | 5.500% | 12/20/33–5/20/45 | 12,403 | 13,732 |
| 1 | Ginnie Mae II Pool | 6.000% | 3/20/31–9/20/41 | 6,574 | 7,449 |
| 1 | Ginnie Mae II Pool | 6.500% | 10/20/28–9/20/40 | 658 | 761 |
| 1 | Ginnie Mae II Pool | 7.000% | 4/20/38–11/20/38 | 122 | 147 |
| 3,390,825 | |||||
| Nonconventional Mortgage-Backed Securities (0.7%) | |||||
| 1,2 | Fannie Mae Pool | 2.100% | 3/1/43 | 673 | 685 |
| 1,2,5 Fannie Mae Pool | 2.113% | 9/1/37 | 32 | 35 | |
| 1,2,5 Fannie Mae Pool | 2.181% | 12/1/41 | 197 | 203 | |
| 1,2 | Fannie Mae Pool | 2.186% | 6/1/42–6/1/43 | 2,376 | 2,459 |
| 1,2 | Fannie Mae Pool | 2.194% | 10/1/42 | 302 | 309 |
| 1,2 | Fannie Mae Pool | 2.209% | 9/1/42 | 877 | 910 |
| 1,2 | Fannie Mae Pool | 2.268% | 7/1/43 | 1,111 | 1,139 |
| 1,2 | Fannie Mae Pool | 2.389% | 7/1/42 | 2,846 | 2,922 |
| 1,2 | Fannie Mae Pool | 2.410% | 5/1/42 | 204 | 212 |
| 1,2 | Fannie Mae Pool | 2.427% | 5/1/43 | 1,246 | 1,286 |
| 1,2 | Fannie Mae Pool | 2.454% | 10/1/42 | 564 | 578 |
| 1,2,5 Fannie Mae Pool | 2.550% | 10/1/39 | 29 | 31 | |
| 1,2,5 Fannie Mae Pool | 2.575% | 11/1/39 | 33 | 35 | |
| 1,2,5 Fannie Mae Pool | 2.581% | 12/1/40 | 330 | 348 | |
| 1,2,5 Fannie Mae Pool | 2.594% | 10/1/40 | 113 | 119 | |
| 1,2,5 Fannie Mae Pool | 2.617% | 12/1/41 | 206 | 219 | |
| 1,2,5 Fannie Mae Pool | 2.619% | 11/1/41 | 56 | 59 | |
| 1,2,5 Fannie Mae Pool | 2.674% | 10/1/40 | 16 | 17 | |
| 1,2,5 Fannie Mae Pool | 2.685% | 12/1/40 | 11 | 11 | |
| 1,2,5 Fannie Mae Pool | 2.690% | 11/1/40–12/1/40 | 25 | 27 | |
| 1,2,5 Fannie Mae Pool | 2.710% | 1/1/40 | 4 | 4 | |
| 1,2 | Fannie Mae Pool | 2.730% | 1/1/42 | 339 | 357 |
| 1,2 | Fannie Mae Pool | 2.734% | 12/1/43 | 954 | 982 |
| 1,2,5 Fannie Mae Pool | 2.754% | 2/1/41 | 7 | 7 | |
| 1,2 | Fannie Mae Pool | 2.775% | 11/1/41 | 142 | 152 |
| 1,2 | Fannie Mae Pool | 2.783% | 3/1/42 | 387 | 403 |
| 1,2,5 Fannie Mae Pool | 2.808% | 5/1/42 | 61 | 63 | |
| 1,2,5 Fannie Mae Pool | 2.833% | 3/1/41 | 271 | 285 | |
| 1,2 | Fannie Mae Pool | 2.871% | 12/1/40 | 80 | 84 |
| 1,2,5 Fannie Mae Pool | 2.929% | 3/1/42 | 149 | 160 | |
| 1,2 | Fannie Mae Pool | 2.935% | 9/1/43 | 610 | 636 |
| 1,2,5 Fannie Mae Pool | 2.939% | 3/1/41 | 322 | 343 | |
| 1,2,5 Fannie Mae Pool | 2.965% | 2/1/42 | 207 | 221 | |
| 1,2,5 Fannie Mae Pool | 2.992% | 5/1/41 | 74 | 78 | |
| 1,2,5 Fannie Mae Pool | 3.041% | 5/1/40 | 4 | 4 | |
| 1,2 | Fannie Mae Pool | 3.121% | 2/1/41 | 70 | 74 |
| 1,2,5 Fannie Mae Pool | 3.195% | 8/1/39 | 25 | 27 | |
| 1,2 | Fannie Mae Pool | 3.360% | 8/1/42 | 186 | 192 |
| 1,2 | Fannie Mae Pool | 3.586% | 7/1/41 | 263 | 279 |
| 1,2 | Fannie Mae Pool | 3.587% | 4/1/41 | 87 | 91 |
| 1,2,5 Fannie Mae Pool | 3.749% | 11/1/39–6/1/41 | 184 | 195 | |
| 1,2,5 Fannie Mae Pool | 3.815% | 8/1/39 | 78 | 81 | |
| 1,2 | Fannie Mae Pool | 3.833% | 9/1/40 | 298 | 317 |
| 1,2,5 Fannie Mae Pool | 4.183% | 12/1/39 | 314 | 329 | |
| 1,2 | Fannie Mae Pool | 4.847% | 3/1/38 | 11 | 11 |
| 1,2 | Fannie Mae Pool | 5.519% | 4/1/37 | 16 | 17 |
| 1,2,5 Fannie Mae Pool | 5.834% | 10/1/37 | 135 | 142 | |
120
| Mortgage-Backed Securities Index Fund | |||||
| Face | Market | ||||
| Maturity | Amount | Value• | |||
| Coupon | Date | ($000) | ($000) | ||
| 1,2,5 Freddie Mac Non Gold Pool | 2.530% | 10/1/37 | 16 | 17 | |
| 1,2 | Freddie Mac Non Gold Pool | 2.550% | 11/1/43 | 526 | 541 |
| 1,2 | Freddie Mac Non Gold Pool | 2.595% | 2/1/42 | 95 | 99 |
| 1,2,5 Freddie Mac Non Gold Pool | 2.620% | 12/1/40 | 44 | 45 | |
| 1,2,5 Freddie Mac Non Gold Pool | 2.652% | 2/1/37 | 21 | 22 | |
| 1,2 | Freddie Mac Non Gold Pool | 2.774% | 1/1/41 | 187 | 195 |
| 1,2,5 Freddie Mac Non Gold Pool | 3.023% | 2/1/41 | 182 | 194 | |
| 1,2,5 Freddie Mac Non Gold Pool | 3.035% | 2/1/41 | 13 | 13 | |
| 1,2 | Freddie Mac Non Gold Pool | 3.068% | 1/1/41 | 112 | 118 |
| 1,2,5 Freddie Mac Non Gold Pool | 3.075% | 5/1/40 | 2 | 2 | |
| 1,2,5 Freddie Mac Non Gold Pool | 3.130% | 6/1/41 | 133 | 139 | |
| 1,2,5 Freddie Mac Non Gold Pool | 3.131% | 6/1/40 | 47 | 51 | |
| 1,2,5 Freddie Mac Non Gold Pool | 3.231% | 6/1/37 | 427 | 454 | |
| 1,2 | Freddie Mac Non Gold Pool | 3.433% | 3/1/42 | 765 | 807 |
| 1,2 | Freddie Mac Non Gold Pool | 3.583% | 6/1/40 | 117 | 123 |
| 1,2 | Freddie Mac Non Gold Pool | 3.682% | 9/1/40 | 111 | 117 |
| 1,2 | Freddie Mac Non Gold Pool | 3.859% | 12/1/39 | 28 | 30 |
| 1,2 | Freddie Mac Non Gold Pool | 5.258% | 3/1/38 | 128 | 138 |
| 1,5 | Ginnie Mae II Pool | 2.000% | 11/20/40–12/20/42 | 933 | 961 |
| 1,5 | Ginnie Mae II Pool | 2.125% | 4/20/41 | 10 | 10 |
| 1 | Ginnie Mae II Pool | 2.500% | 1/20/42 | 1,247 | 1,269 |
| 1,5 | Ginnie Mae II Pool | 2.625% | 5/20/41 | 12 | 13 |
| 1 | Ginnie Mae II Pool | 3.000% | 11/20/40–11/20/41 | 486 | 502 |
| 1,5 | Ginnie Mae II Pool | 3.500% | 7/20/41–8/20/41 | 179 | 184 |
| 23,182 | |||||
| Total U.S. Government and Agency Obligations (Cost $3,385,182) | 3,414,007 | ||||
| Shares | |||||
| Temporary Cash Investment (21.5%) | |||||
| Money Market Fund (21.5%) | |||||
| 6 | Vanguard Market Liquidity Fund (Cost $740,065) | 0.612% | 7,400,619 | 740,136 | |
| Total Investments (120.8%) (Cost $4,125,247) | 4,154,143 | ||||
| Amount | |||||
| ($000) | |||||
| Other Assets and Liabilities (-20.8%) | |||||
| Other Assets | |||||
| Investment in Vanguard | 255 | ||||
| Receivables for Investment Securities Sold | 108,569 | ||||
| Receivables for Accrued Income | 9,631 | ||||
| Receivables for Capital Shares Issued | 19,603 | ||||
| Total Other Assets | 138,058 | ||||
| Liabilities | |||||
| Payables for Investment Securities Purchased | (851,770) | ||||
| Payables for Capital Shares Redeemed | (404) | ||||
| Payables for Distributions | (400) | ||||
| Payables to Vanguard | (440) | ||||
| Other Liabilities | (1,525) | ||||
| Total Liabilities | (854,539) | ||||
| Net Assets (100%) | 3,437,662 | ||||
121
| Mortgage-Backed Securities Index Fund | |
| At August 31, 2016, net assets consisted of: | |
| Amount | |
| ($000) | |
| Paid-in Capital | 3,393,905 |
| Undistributed Net Investment Income | 4,188 |
| Accumulated Net Realized Gains | 10,673 |
| Unrealized Appreciation (Depreciation) | 28,896 |
| Net Assets | 3,437,662 |
| ETF Shares—Net Assets | |
| Applicable to 52,751,190 outstanding $.001 par value shares of | |
| beneficial interest (unlimited authorization) | 2,837,414 |
| Net Asset Value Per Share—ETF Shares | $53.79 |
| Admiral Shares—Net Assets | |
| Applicable to 25,760,983 outstanding $.001 par value shares of | |
| beneficial interest (unlimited authorization) | 553,658 |
| Net Asset Value Per Share—Admiral Shares | $21.49 |
| Institutional Shares—Net Assets | |
| Applicable to 1,599,843 outstanding $.001 par value shares of | |
| beneficial interest (unlimited authorization) | 46,590 |
| Net Asset Value Per Share—Institutional Shares | $29.12 |
• See Note A in Notes to Financial Statements.
1 The average or expected maturity is shorter than the final maturity shown because of the possibility of interim principal payments and prepayments or the possibility of the issue being called.
2 The issuer was placed under federal conservatorship in September 2008; since that time, its daily operations have been managed by the Federal Housing Finance Agency and it receives capital from the U.S. Treasury, as needed to maintain a positive net worth, in exchange for senior preferred stock.
3 Includes securities purchased on a when-issued or delayed-delivery basis for which the fund has not taken delivery as of August 31, 2016. 4 Securities with a value of $7,223,000 have been segregated as collateral for certain open To Be Announced (TBA) transactions.
5 Adjustable-rate security.
6 Affiliated money market fund available only to Vanguard funds and certain trusts and accounts managed by Vanguard. Rate shown is the 7-day yield.
See accompanying Notes, which are an integral part of the Financial Statements.
122
| Mortgage-Backed Securities Index Fund | |
| Statement of Operations | |
| Year Ended | |
| August 31, 2016 | |
| ($000) | |
| Investment Income | |
| Income | |
| Interest1 | 50,146 |
| Total Income | 50,146 |
| Expenses | |
| The Vanguard Group—Note B | |
| Investment Advisory Services | 70 |
| Management and Administrative—ETF Shares | 1,046 |
| Management and Administrative—Admiral Shares | 235 |
| Management and Administrative—Institutional Shares | 18 |
| Marketing and Distribution—ETF Shares | 157 |
| Marketing and Distribution—Admiral Shares | 53 |
| Marketing and Distribution—Institutional Shares | 1 |
| Custodian Fees | 109 |
| Auditing Fees | 43 |
| Shareholders’ Reports—ETF Shares | 57 |
| Shareholders’ Reports—Admiral Shares | 13 |
| Shareholders’ Reports—Institutional Shares | — |
| Trustees’ Fees and Expenses | 1 |
| Total Expenses | 1,803 |
| Net Investment Income | 48,343 |
| Realized Net Gain (Loss) on Investment Securities Sold1 | 16,405 |
| Change in Unrealized Appreciation (Depreciation) of Investment Securities | 28,093 |
| Net Increase (Decrease) in Net Assets Resulting from Operations | 92,841 |
1 Interest income and realized net gain (loss) from an affiliated company of the fund were $2,194,000 and $0, respectively.
See accompanying Notes, which are an integral part of the Financial Statements.
123
| Mortgage-Backed Securities Index Fund | ||
| Statement of Changes in Net Assets | ||
| Year Ended August 31, | ||
| 2016 | 2015 | |
| ($000) | ($000) | |
| Increase (Decrease) in Net Assets | ||
| Operations | ||
| Net Investment Income | 48,343 | 20,790 |
| Realized Net Gain (Loss) | 16,405 | 9,480 |
| Change in Unrealized Appreciation (Depreciation) | 28,093 | (3,777) |
| Net Increase (Decrease) in Net Assets Resulting from Operations | 92,841 | 26,493 |
| Distributions | ||
| Net Investment Income | ||
| ETF Shares | (36,243) | (13,405) |
| Admiral Shares | (8,968) | (5,589) |
| Institutional Shares | (814) | (564) |
| Realized Capital Gain1 | ||
| ETF Shares | (8,196) | (2,480) |
| Admiral Shares | (2,007) | (1,200) |
| Institutional Shares | (197) | (113) |
| Total Distributions | (56,425) | (23,351) |
| Capital Share Transactions | ||
| ETF Shares | 1,357,217 | 907,275 |
| Admiral Shares | 122,904 | 116,880 |
| Institutional Shares | 2,429 | (65,707) |
| Net Increase (Decrease) from Capital Share Transactions | 1,482,550 | 958,448 |
| Total Increase (Decrease) | 1,518,966 | 961,590 |
| Net Assets | ||
| Beginning of Period | 1,918,696 | 957,106 |
| End of Period2 | 3,437,662 | 1,918,696 |
1 Includes fiscal 2016 and 2015 short-term gain distributions totaling $10,400,000, and $3,749,000, respectively. Short-term gain distributions are treated as ordinary income dividends for tax purposes.
2 Net Assets—End of Period includes undistributed (overdistributed) net investment income of $4,188,000 and $1,870,000.
See accompanying Notes, which are an integral part of the Financial Statements.
124
| Mortgage-Backed Securities Index Fund | |||||
| Financial Highlights | |||||
| ETF Shares | |||||
| For a Share Outstanding | Year Ended August 31, | ||||
| Throughout Each Period | 2016 | 2015 | 2014 | 2013 | 2012 |
| Net Asset Value, Beginning of Period | $53.05 | $52.65 | $50.85 | $52.63 | $51.90 |
| Investment Operations | |||||
| Net Investment Income | . 967 | .748 | .887 | .292 | .875 |
| Net Realized and Unrealized Gain (Loss) | |||||
| on Investments1 | .968 | .554 | 1.741 | (1.524) | .976 |
| Total from Investment Operations | 1.935 | 1.302 | 2.628 | (1.232) | 1.851 |
| Distributions | |||||
| Dividends from Net Investment Income | (.955) | (.741) | (.828) | (.294) | (.868) |
| Distributions from Realized Capital Gains | (.240) | (.161) | — | (. 254) | (.253) |
| Total Distributions | (1.195) | (.902) | (.828) | (.548) | (1.121) |
| Net Asset Value, End of Period | $53.79 | $53.05 | $52.65 | $50.85 | $52.63 |
| Total Return | 3.70% | 2.49% | 5.21% | -2.36% | 3.62% |
| Ratios/Supplemental Data | |||||
| Net Assets, End of Period (Millions) | $2,837 | $1,451 | $542 | $417 | $247 |
| Ratio of Total Expenses to Average Net Assets | 0.07% | 0.10% | 0.12% | 0.12% | 0.12% |
| Ratio of Net Investment Income to | |||||
| Average Net Assets | 1.85% | 1.43% | 1.72% | 0.57% | 1.57% |
| Portfolio Turnover Rate 2 | 380% | 713% | 514% | 840% | 529% |
| 1 Includes increases from purchase fees of $.01, $.01, $.01, $.01, and $.02. | |||||
| 2 Includes 175%, 331%, 294%, 371%, and 231% attributable to mortgage-dollar-roll activity. | |||||
See accompanying Notes, which are an integral part of the Financial Statements.
125
| Mortgage-Backed Securities Index Fund | |||||
| Financial Highlights | |||||
| Admiral Shares | |||||
| For a Share Outstanding | Year Ended August 31, | ||||
| Throughout Each Period | 2016 | 2015 | 2014 | 2013 | 2012 |
| Net Asset Value, Beginning of Period | $21.20 | $21.05 | $20.35 | $21.06 | $20.76 |
| Investment Operations | |||||
| Net Investment Income | . 388 | .298 | .356 | .118 | .344 |
| Net Realized and Unrealized Gain (Loss) | |||||
| on Investments | . 387 | .214 | .699 | (.608) | .399 |
| Total from Investment Operations | .775 | .512 | 1.055 | (.490) | .743 |
| Distributions | |||||
| Dividends from Net Investment Income | (.389) | (. 297) | (. 355) | (.118) | (.342) |
| Distributions from Realized Capital Gains | (. 096) | (. 065) | — | (.102) | (.101) |
| Total Distributions | (.485) | (. 362) | (. 355) | (. 220) | (. 443) |
| Net Asset Value, End of Period | $21.49 | $21.20 | $21.05 | $20.35 | $21.06 |
| Total Return1 | 3.70% | 2.44% | 5.22% | -2.35% | 3.63% |
| Ratios/Supplemental Data | |||||
| Net Assets, End of Period (Millions) | $554 | $424 | $305 | $295 | $211 |
| Ratio of Total Expenses to Average Net Assets | 0.07% | 0.10% | 0.12% | 0.12% | 0.12% |
| Ratio of Net Investment Income to | |||||
| Average Net Assets | 1.85% | 1.43% | 1.72% | 0.57% | 1.57% |
| Portfolio Turnover Rate2 | 380% | 713% | 514% | 840% | 529% |
Signal Shares were renamed Admiral Shares in October 2013. Prior periods’ Financial Highlights are for the Signal class.
1 Total returns do not include transaction or account service fees that may have applied in the periods shown. Fund prospectuses provide information about any applicable transaction and account service fees.
2 Includes 175%, 331%, 294%, 371%, and 231% attributable to mortgage-dollar-roll activity.
See accompanying Notes, which are an integral part of the Financial Statements.
126
| Mortgage-Backed Securities Index Fund | |||||
| Financial Highlights | |||||
| Institutional Shares | |||||
| Oct. 31, | Sept. 1, | May 9, | |||
| Year Ended | 20133 to | 2012, to | 20121 to | ||
| August 31, | |||||
| For a Share Outstanding | Aug. 31, | Jan. 22, | Aug. 31, | ||
| Throughout Each Period | 2016 | 2015 | 2014 | 20132 | 2012 |
| Net Asset Value, Beginning of Period | $28.73 | $28.52 | $28.04 | $28.34 | $28.10 |
| Investment Operations | |||||
| Net Investment Income | . 532 | . 412 | .390 | .042 | .137 |
| Net Realized and Unrealized Gain (Loss) | |||||
| on Investments | .522 | . 295 | .504 | (.146) | . 218 |
| Total from Investment Operations | 1.054 | .707 | .894 | (.104) | .355 |
| Distributions | |||||
| Dividends from Net Investment Income | (.534) | (.410) | (.414) | (.049) | (.115) |
| Distributions from Realized Capital Gains | (.130) | (.087) | — | (.137) | — |
| Total Distributions | (.664) | (.497) | (.414) | (.186) | (.115) |
| Net Asset Value, End of Period | $29.12 | $28.73 | $28.52 | $28.052 | $28.34 |
| Total Return4 | 3.72% | 2.49% | 3.22% | -0.37% | 1.27% |
| Ratios/Supplemental Data | |||||
| Net Assets, End of Period (Millions) | $47 | $44 | $109 | $0 | $15 |
| Ratio of Total Expenses to Average Net Assets | 0.05% | 0.07% | 0.09%5 | 0.09%5 | 0.09%5 |
| Ratio of Net Investment Income to | |||||
| Average Net Assets | 1.87% | 1.46% | 1.75%5 | 0.35%5 | 1.60%5 |
| Portfolio Turnover Rate 6 | 380% | 713% | 514% | 840% | 529% |
1 Commencement of operations.
2 Net asset value as of January 22, 2013, at which date all shares were redeemed.
3 Recommencement of operations.
4 Total returns do not include transaction fees that may have applied in the periods shown. Fund prospectuses provide information about any applicable transaction fees.
5 Annualized.
6 Includes 175%, 331%, 294%, 371%, and 231% attributable to mortgage-dollar-roll activity.
See accompanying Notes, which are an integral part of the Financial Statements.
127
Mortgage-Backed Securities Index Fund
Notes to Financial Statements
Vanguard Mortgage-Backed Securities Index Fund is registered under the Investment Company Act of 1940 as an open-end investment company, or mutual fund. The fund offers three classes of shares: ETF Shares, Admiral Shares, and Institutional Shares. ETF Shares are listed for trading on Nasdaq; they can be purchased and sold through a broker. Admiral Shares and Institutional Shares are designed for investors who meet certain administrative, service, and account-size criteria.
A. The following significant accounting policies conform to generally accepted accounting principles for U.S. investment companies. The fund consistently follows such policies in preparing its financial statements.
1. Security Valuation: Securities are valued as of the close of trading on the New York Stock Exchange (generally 4 p.m., Eastern time) on the valuation date. Bonds and temporary cash investments acquired over 60 days to maturity are valued using the latest bid prices or using valuations based on a matrix system (which considers such factors as security prices, yields, maturities, and ratings), both as furnished by independent pricing services. Structured debt securities, including mortgages and asset-backed securities, are valued using the latest bid prices or using valuations based on a matrix system that considers such factors as issuer, tranche, nominal or option-adjusted spreads, weighted average coupon, weighted average maturity, credit enhancements, and collateral. Investments in Vanguard Market Liquidity Fund are valued at that fund’s net asset value. Other temporary cash investments are valued at amortized cost, which approximates market value. Securities for which market quotations are not readily available, or whose values have been affected by events occurring before the fund’s pricing time but after the close of the securities’ primary markets, are valued by methods deemed by the board of trustees to represent fair value.
2. To Be Announced (TBA) Transactions: A TBA transaction is an agreement to buy or sell mortgage-backed securities with agreed-upon characteristics (face amount, coupon, maturity) for settlement at a future date. The fund may be a seller of TBA transactions to reduce its exposure to the mortgage-backed securities market or in order to sell mortgage-backed securities it owns under delayed-delivery arrangements. When the fund is a buyer of TBA transactions, it maintains cash or short-term investments in an amount sufficient to meet the purchase price at the settlement date of the TBA transaction. The primary risk associated with TBA transactions is that a counterparty may default on its obligations. The fund mitigates its counterparty risk by, among other things, performing a credit analysis of counterparties, allocating transactions among numerous counterparties, and monitoring its exposure to each counterparty. The fund may also enter into a Master Securities Forward Transaction Agreement (MSFTA) with certain counterparties and require them to transfer collateral as security for their performance. In the absence of a default, the collateral pledged or received by the fund cannot be repledged, resold or rehypothecated. Under an MSFTA, upon a counterparty default (including bankruptcy), the fund may terminate any TBA transactions with that counterparty, determine the net amount owed by either party in accordance with its master netting arrangements, and sell or retain any collateral held up to the net amount owed to the fund under the master netting arrangements.
At August 31, 2016, counterparties had deposited in segregated accounts cash with a value of $235,000 in connection with TBA transactions.
3. Mortgage Dollar Rolls: The fund enters into mortgage-dollar-roll transactions, in which the fund sells mortgage-backed securities to a dealer and simultaneously agrees to purchase similar securities in the future at a predetermined price. The proceeds of the securities sold in mortgage-dollar-roll transactions are typically invested in high-quality short-term fixed income securities. The fund forgoes principal and interest paid on the securities sold, and is compensated by interest earned on the
128
Mortgage-Backed Securities Index Fund
proceeds of the sale and by a lower price on the securities to be repurchased. The fund has also entered into mortgage-dollar-roll transactions in which the fund buys mortgage-backed securities from a dealer pursuant to a TBA transaction and simultaneously agrees to sell similar securities in the future at a predetermined price. The securities bought in mortgage-dollar-roll transactions are used to cover an open TBA sell position. The fund continues to earn interest on mortgage-backed security pools already held and receives a lower price on the securities to be sold in the future. The fund accounts for mortgage-dollar-roll transactions as purchases and sales; as such, these transactions may increase the fund’s portfolio turnover rate. Amounts to be received or paid in connection with open mortgage dollar rolls are included in Receivables for Investment Securities Sold or Payables for Investment Securities Purchased in the Statement of Net Assets.
4. Federal Income Taxes: The fund intends to continue to qualify as a regulated investment company and distribute all of its taxable income. Management has analyzed the fund’s tax positions taken for all open federal income tax years (August 31, 2013–2016), and has concluded that no provision for federal income tax is required in the fund’s financial statements.
5. Distributions: Distributions to shareholders are recorded on the ex-dividend date.
6. Credit Facility: The fund and certain other funds managed by The Vanguard Group (“Vanguard”) participate in a $3.1 billion committed credit facility provided by a syndicate of lenders pursuant to a credit agreement that may be renewed annually; each fund is individually liable for its borrowings, if any, under the credit facility. Borrowings may be utilized for temporary and emergency purposes, and are subject to the fund’s regulatory and contractual borrowing restrictions. The participating funds are charged administrative fees and an annual commitment fee of 0.10% of the undrawn amount of the facility; these fees are allocated to the funds based on a method approved by the fund’s board of trustees and included in Management and Administrative expenses on the fund’s Statement of Operations. Any borrowings under this facility bear interest at a rate based upon the higher of the one-month London Interbank Offered Rate, federal funds effective rate, or overnight bank funding rate plus an agreed-upon spread.
The fund had no borrowings outstanding at August 31, 2016, or at any time during the period then ended.
7. Other: Interest income includes income distributions received from Vanguard Market Liquidity Fund and is accrued daily. Premiums and discounts on debt securities purchased are amortized and accreted, respectively, to interest income over the lives of the respective securities. Security transactions are accounted for on the date securities are bought or sold. Costs used to determine realized gains (losses) on the sale of investment securities are those of the specific securities sold. Fees, if any, assessed on capital share transactions are credited to paid-in capital.
Each class of shares has equal rights as to assets and earnings, except that each class separately bears certain class-specific expenses related to maintenance of shareholder accounts (included in Management and Administrative expenses) and shareholder reporting. Marketing and distribution expenses are allocated to each class of shares based on a method approved by the board of trustees. Income, other non-class-specific expenses, and gains and losses on investments are allocated to each class of shares based on its relative net assets.
B. In accordance with the terms of a Funds’ Service Agreement (the “FSA”) between Vanguard and the fund, Vanguard furnishes to the fund investment advisory, corporate management, administrative, marketing, and distribution services at Vanguard’s cost of operations (as defined by the FSA). These costs of operations are allocated to the fund based on methods and guidelines approved by the board
129
Mortgage-Backed Securities Index Fund
of trustees. Vanguard does not require reimbursement in the current period for certain costs of operations (such as deferred compensation/benefits and risk/insurance costs); the fund’s liability for these costs of operations is included in Payables to Vanguard on the Statement of Net Assets.
Upon the request of Vanguard, the fund may invest up to 0.40% of its net assets as capital in Vanguard. At August 31, 2016, the fund had contributed to Vanguard capital in the amount of $255,000, representing 0.01% of the fund’s net assets and 0.10% of Vanguard’s capitalization. The fund’s trustees and officers are also directors and employees, respectively, of Vanguard.
C. Various inputs may be used to determine the value of the fund’s investments. These inputs are summarized in three broad levels for financial statement purposes. The inputs or methodologies used to value securities are not necessarily an indication of the risk associated with investing in those securities.
Level 1—Quoted prices in active markets for identical securities.
Level 2—Other significant observable inputs (including quoted prices for similar securities, interest rates, prepayment speeds, credit risk, etc.).
Level 3—Significant unobservable inputs (including the fund’s own assumptions used to determine the fair value of investments).
The following table summarizes the market value of the fund’s investments as of August 31, 2016, based on the inputs used to value them:
| Level 1 | Level 2 | Level 3 | |
| Investments | ($000) | ($000) | ($000) |
| U.S. Government and Agency Obligations | — | 3,414,007 | — |
| Temporary Cash Investments | 740,136 | — | — |
| Total | 740,136 | 3,414,007 | — |
D. Distributions are determined on a tax basis and may differ from net investment income and realized capital gains for financial reporting purposes. Differences may be permanent or temporary. Permanent differences are reclassified among capital accounts in the financial statements to reflect their tax character. Temporary differences arise when certain items of income, expense, gain, or loss are recognized in different periods for financial statement and tax purposes. These differences will reverse at some time in the future. Differences in classification may also result from the treatment of short-term gains as ordinary income for tax purposes.
The fund used a tax accounting practice to treat a portion of the price of capital shares redeemed during the year as distributions from realized capital gains. Accordingly, the fund has reclassified $773,000 from accumulated net realized gains to paid-in capital.
For tax purposes, at August 31, 2016, the fund had $15,604,000 of ordinary income and $102,000 of long-term capital gains available for distribution.
At August 31, 2016, the cost of investment securities for tax purposes was $4,125,286,000. Net unrealized appreciation of investment securities for tax purposes was $28,857,000, consisting of unrealized gains of $31,286,000 on securities that had risen in value since their purchase and $2,429,000 in unrealized losses on securities that had fallen in value since their purchase.
E. During the year ended August 31, 2016, the fund purchased $11,361,745,000 of investment securities and sold $9,879,163,000 of investment securities, other than temporary cash investments.
130
Mortgage-Backed Securities Index Fund
The fund purchased securities from and sold securities to other Vanguard funds or accounts managed by Vanguard or its affiliates, in accordance with procedures adopted by the board of trustees in compliance with Rule 17a-7 of the Investment Company Act of 1940. For the year ended August 31, 2016, such purchases and sales were $493,093,000 and $136,749,000 respectively; these amounts are included in the purchases and sales of investment securities noted above.
| F. Capital share transactions for each class of shares were: | ||||
| Year Ended August 31, | ||||
| 2016 | 2015 | |||
| Amount | Shares | Amount | Shares | |
| ($000) | (000) | ($000) | (000) | |
| ETF Shares | ||||
| Issued1 | 1,515,415 | 28,375 | 1,164,548 | 21,900 |
| Issued in Lieu of Cash Distributions | — | — | — | — |
| Redeemed | (158,198) | (2,975) | (257,273) | (4,850) |
| Net Increase (Decrease)—ETF Shares | 1,357,217 | 25,400 | 907,275 | 17,050 |
| Admiral Shares | ||||
| Issued1 | 257,546 | 12,060 | 224,100 | 10,552 |
| Issued in Lieu of Cash Distributions | 5,214 | 245 | 2,844 | 134 |
| Redeemed | (139,856) | (6,556) | (110,064) | (5,184) |
| Net Increase (Decrease)—Admiral Shares | 122,904 | 5,749 | 116,880 | 5,502 |
| Institutional Shares | ||||
| Issued1 | 6,235 | 216 | 7,488 | 259 |
| Issued in Lieu of Cash Distributions | 1,011 | 35 | 677 | 24 |
| Redeemed | (4,817) | (167) | (73,872) | (2,603) |
| Net Increase (Decrease)—Institutional Shares | 2,429 | 84 | (65,707) | (2,320) |
| 1 Includes purchase fees for fiscal 2016 and 2015 of $727,000 and $579,000, respectively (fund totals). | ||||
At August 31, 2016, one shareholder was the record or beneficial owner of 27% of the fund’s net assets. If the shareholder were to redeem its investment in the fund, the redemption might result in an increase in the fund’s expense ratio.
G. Management has determined that no material events or transactions occurred subsequent to August 31, 2016, that would require recognition or disclosure in these financial statements.
131
Report of Independent Registered Public Accounting Firm
To the Board of Trustees of Vanguard Scottsdale Funds and the Shareholders of Vanguard Short-Term Government Bond Index Fund, Vanguard Intermediate-Term Government Bond Index Fund, Vanguard Long-Term Government Bond Index Fund, Vanguard Short-Term Corporate Bond Index Fund, Vanguard Intermediate-Term Corporate Bond Index Fund, Vanguard Long-Term Corporate Bond Index Fund and Vanguard Mortgage-Backed Securities Index Fund:
In our opinion, the accompanying statements of net assets, the statements of net assets—investments summary, the statements of assets and liabilities and the related statements of operations and of changes in net assets and the financial highlights present fairly, in all material respects, the financial position of Vanguard Short-Term Government Bond Index Fund, Vanguard Intermediate-Term Government Bond Index Fund, Vanguard Long-Term Government Bond Index Fund, Vanguard Short-Term Corporate Bond Index Fund, Vanguard Intermediate-Term Corporate Bond Index Fund, Vanguard Long-Term Corporate Bond Index Fund and Vanguard Mortgage-Backed Securities Index Fund (constituting separate portfolios of Vanguard Scottsdale Funds, hereafter referred to as the “Funds”) at August 31, 2016, the results of each of their operations for the year then ended, the changes in each of their net assets for each of the two years in the period then ended, and the financial highlights for each of the periods indicated, in conformity with accounting principles generally accepted in the United States of America. These financial statements and financial highlights (hereafter referred to as “financial statements”) are the responsibility of the Funds’ management. Our responsibility is to express an opinion on these financial statements based on our audits. We conducted our audits of these financial statements in accordance with the standards of the Public Company Accounting Oversight Board (United States). Those standards require that we plan and perform the audit to obtain reasonable assurance about whether the financial statements are free of material misstatement. An audit includes examining, on a test basis, evidence supporting the amounts and disclosures in the financial statements, assessing the accounting principles used and significant estimates made by management, and evaluating the overall financial statement presentation. We believe that our audits, which included confirmation of securities at August 31, 2016 by correspondence with the custodian and brokers and by agreement to the underlying ownership records of the transfer agent, provide a reasonable basis for our opinion.
/s/PricewaterhouseCoopers LLP
Philadelphia, Pennsylvania
October 18, 2016
Special 2016 tax information (unaudited) for Vanguard Short-Term Government Bond Index Fund
This information for the fiscal year ended August 31, 2016, is included pursuant to provisions of the Internal Revenue Code.
The fund distributed $360,000 as capital gain dividends (20% rate gain distributions) to shareholders during the fiscal year.
For nonresident alien shareholders, 100% of short-term capital gain dividends distributed by the fund are qualified short-term capital gains.
For nonresident alien shareholders, 99.8% of income dividends are interest-related dividends.
132
Special 2016 tax information (unaudited) for Vanguard Intermediate-Term Government Bond Index Fund
This information for the fiscal year ended August 31, 2016, is included pursuant to provisions of the Internal Revenue Code.
The fund distributed $532,000 as capital gain dividends (20% rate gain distributions) to shareholders during the fiscal year.
For nonresident alien shareholders, 100% of short-term capital gain dividends distributed by the fund are qualified short-term capital gains.
For nonresident alien shareholders, 99.9% of income dividends are interest-related dividends.
Special 2016 tax information (unaudited) for Vanguard Long-Term Government Bond Index Fund
This information for the fiscal year ended August 31, 2016, is included pursuant to provisions of the Internal Revenue Code.
For nonresident alien shareholders, 100% of income dividends are interest-related dividends.
Special 2016 tax information (unaudited) for Vanguard Short-Term Corporate Bond Index Fund
This information for the fiscal year ended August 31, 2016, is included pursuant to provisions of the Internal Revenue Code.
The fund distributed $9,831,000 as capital gain dividends (20% rate gain distributions) to shareholders during the fiscal year.
For nonresident alien shareholders, 100% of short-term capital gain dividends distributed by the fund are qualified short-term capital gains.
For nonresident alien shareholders, 79.5% of income dividends are interest-related dividends.
133
Special 2016 tax information (unaudited) for Vanguard Intermediate-Term Corporate Bond Index Fund
This information for the fiscal year ended August 31, 2016, is included pursuant to provisions of the Internal Revenue Code.
For nonresident alien shareholders, 85.5% of income dividends are interest-related dividends.
Special 2016 tax information (unaudited) for Vanguard Long-Term Corporate Bond Index Fund
This information for the fiscal year ended August 31, 2016, is included pursuant to provisions of the Internal Revenue Code.
For nonresident alien shareholders, 87.3% of income dividends are interest-related dividends.
Special 2016 tax information (unaudited) for Vanguard Mortgage-Backed Securities Index Fund
This information for the fiscal year ended August 31, 2016, is included pursuant to provisions of the Internal Revenue Code.
The fund distributed $42,000 as capital gain dividends (20% rate gain distributions) to shareholders during the fiscal year.
For nonresident alien shareholders, 100% of short-term capital gain dividends distributed by the fund are qualified short-term capital gains.
For nonresident alien shareholders, 98.3% of income dividends are interest-related dividends.
134
About Your Fund’s Expenses
As a shareholder of the fund, you incur ongoing costs, which include costs for portfolio management, administrative services, and shareholder reports (like this one), among others. Operating expenses, which are deducted from a fund’s gross income, directly reduce the investment return of the fund.
A fund’s expenses are expressed as a percentage of its average net assets. This figure is known as the expense ratio. The following examples are intended to help you understand the ongoing costs (in dollars) of investing in your fund and to compare these costs with those of other mutual funds. The examples are based on an investment of $1,000 made at the beginning of the period shown and held for the entire period.
The accompanying table illustrates your fund’s costs in two ways:
• Based on actual fund return. This section helps you to estimate the actual expenses that you paid over the period. The ”Ending Account Value“ shown is derived from the fund‘s actual return, and the third column shows the dollar amount that would have been paid by an investor who started with $1,000 in the fund. You may use the information here, together with the amount you invested, to estimate the expenses that you paid over the period.
To do so, simply divide your account value by $1,000 (for example, an $8,600 account value divided by $1,000 = 8.6), then multiply the result by the number given for your fund under the heading ”Expenses Paid During Period.“
• Based on hypothetical 5% yearly return. This section is intended to help you compare your fund‘s costs with those of other mutual funds. It assumes that the fund had a yearly return of 5% before expenses, but that the expense ratio is unchanged. In this case—because the return used is not the fund’s actual return—the results do not apply to your investment. The example is useful in making comparisons because the Securities and Exchange Commission requires all mutual funds to calculate expenses based on a 5% return. You can assess your fund’s costs by comparing this hypothetical example with the hypothetical examples that appear in shareholder reports of other funds.
Note that the expenses shown in the table are meant to highlight and help you compare ongoing costs only and do not reflect transaction costs incurred by the fund for buying and selling securities. Further, the expenses do not include any purchase, redemption, or account service fees described in the fund prospectus. If such fees were applied to your account, your costs would be higher. Your fund does not carry a “sales load.”
The calculations assume no shares were bought or sold during the period. Your actual costs may have been higher or lower, depending on the amount of your investment and the timing of any purchases or redemptions.
You can find more information about the fund’s expenses, including annual expense ratios, in the Financial Statements section of this report. For additional information on operating expenses and other shareholder costs, please refer to your fund’s current prospectus.
135
| Six Months Ended August 31, 2016 | |||
| Beginning | Ending | Expenses | |
| Account Value | Account Value | Paid During | |
| 2/29/2016 | 8/31/2016 | Period | |
| Based on Actual Fund Return | |||
| Short-Term Government Bond Index Fund | |||
| ETF Shares | $1,000.00 | $1,004.34 | $0.30 |
| Admiral Shares | 1,000.00 | 1,004.12 | 0.30 |
| Institutional Shares | 1,000.00 | 1,004.26 | 0.20 |
| Intermediate-Term Government Bond Index Fund | |||
| ETF Shares | $1,000.00 | $1,012.50 | $0.30 |
| Admiral Shares | 1,000.00 | 1,012.52 | 0.30 |
| Institutional Shares | 1,000.00 | 1,012.69 | 0.20 |
| Long-Term Government Bond Index Fund | |||
| ETF Shares | $1,000.00 | $1,076.62 | $0.31 |
| Admiral Shares | 1,000.00 | 1,076.52 | 0.31 |
| Institutional Shares | 1,000.00 | 1,076.54 | 0.21 |
| Short-Term Corporate Bond Index Fund | |||
| ETF Shares | $1,000.00 | $1,029.66 | $0.31 |
| Admiral Shares | 1,000.00 | 1,029.39 | 0.31 |
| Institutional Shares | 1,000.00 | 1,029.97 | 0.20 |
| Intermediate-Term Corporate Bond Index Fund | |||
| ETF Shares | $1,000.00 | $1,071.77 | $0.31 |
| Admiral Shares | 1,000.00 | 1,071.74 | 0.31 |
| Institutional Shares | 1,000.00 | 1,071.63 | 0.21 |
| Long-Term Corporate Bond Index Fund | |||
| ETF Shares | $1,000.00 | $1,163.36 | $0.33 |
| Admiral Shares | 1,000.00 | 1,163.01 | 0.33 |
| Institutional Shares | 1,000.00 | 1,163.52 | 0.22 |
| Mortgage-Backed Securities Index Fund | |||
| ETF Shares | $1,000.00 | $1,016.30 | $0.25 |
| Admiral Shares | 1,000.00 | 1,016.18 | 0.25 |
| Institutional Shares | 1,000.00 | 1,016.50 | 0.20 |
136
| Six Months Ended August 31, 2016 | |||
| Beginning | Ending | Expenses | |
| Account Value | Account Value | Paid During | |
| 2/29/2016 | 8/31/2016 | Period | |
| Based on Hypothetical 5% Yearly Return | |||
| Short-Term Government Bond Index Fund | |||
| ETF Shares | $1,000.00 | $1,024.83 | $0.31 |
| Admiral Shares | 1,000.00 | 1,024.83 | 0.31 |
| Institutional Shares | 1,000.00 | 1,024.94 | 0.20 |
| Intermediate-Term Government Bond Index Fund | |||
| ETF Shares | $1,000.00 | $1,024.83 | $0.31 |
| Admiral Shares | 1,000.00 | 1,024.83 | 0.31 |
| Institutional Shares | 1,000.00 | 1,024.94 | 0.20 |
| Long-Term Government Bond Index Fund | |||
| ETF Shares | $1,000.00 | $1,024.83 | $0.31 |
| Admiral Shares | 1,000.00 | 1,024.83 | 0.31 |
| Institutional Shares | 1,000.00 | 1,024.94 | 0.20 |
| Short-Term Corporate Bond Index Fund | |||
| ETF Shares | $1,000.00 | $1,024.83 | $0.31 |
| Admiral Shares | 1,000.00 | 1,024.83 | 0.31 |
| Institutional Shares | 1,000.00 | 1,024.94 | 0.20 |
| Intermediate-Term Corporate Bond Index Fund | |||
| ETF Shares | $1,000.00 | $1,024.83 | $0.31 |
| Admiral Shares | 1,000.00 | 1,024.83 | 0.31 |
| Institutional Shares | 1,000.00 | 1,024.94 | 0.20 |
| Long-Term Corporate Bond Index Fund | |||
| ETF Shares | $1,000.00 | $1,024.83 | $0.31 |
| Admiral Shares | 1,000.00 | 1,024.83 | 0.31 |
| Institutional Shares | 1,000.00 | 1,024.94 | 0.20 |
| Mortgage-Backed Securities Index Fund | |||
| ETF Shares | $1,000.00 | $1,024.89 | $0.25 |
| Admiral Shares | 1,000.00 | 1,024.89 | 0.25 |
| Institutional Shares | 1,000.00 | 1,024.94 | 0.20 |
The calculations are based on expenses incurred in the most recent six-month period. The funds’ annualized six-month expense ratios for that period are: for the Short-Term Government Bond Index Fund, 0.06% for ETF Shares, 0.06% for Admiral Shares, and 0.04% for Institutional Shares; for the Intermediate-Term Government Bond Index Fund, 0.06% for ETF Shares, 0.06% for Admiral Shares, and 0.04% for Institutional Shares; for the Long-Term Government Bond Index Fund, 0.06% for ETF Shares, 0.06% for Admiral Shares, and 0.04% for Institutional Shares; for the Short-Term Corporate Bond Index Fund, 0.06% for ETF Shares, 0.06% for Admiral Shares, and 0.04% for Institutional Shares; for the Intermediate-Term Corporate Bond Index Fund, 0.06% for ETF Shares, 0.06% for Admiral Shares, and 0.04% for Institutional Shares; for the Long-Term Corporate Bond Index Fund, 0.06% for ETF Shares, 0.06% for Admiral Shares, and 0.04% for Institutional Shares; for the Mortgage-Backed Securities Index Fund, 0.05% for ETF Shares, 0.05% for Admiral Shares, and 0.04% for Institutional Shares. The dollar amounts shown as ”Expenses Paid” are equal to the annualized expense ratio multiplied by the average account value over the period, multiplied by the number of days in the most recent six-month period, then divided by the number of days in the most recent 12-month period (184/366).
137
Trustees Approve Advisory Arrangements
The board of trustees of Vanguard Short-Term Government Bond Index Fund, Intermediate-Term Government Bond Index Fund, Long-Term Government Bond Index Fund, Short-Term Corporate Bond Index Fund, Intermediate-Term Corporate Bond Index Fund, Long-Term Corporate Bond Index Fund, and Mortgage-Backed Securities Index Fund has renewed each fund’s investment advisory arrangement with The Vanguard Group, Inc. (Vanguard). Vanguard—through its Fixed Income Group—serves as the investment advisor for each fund. The board determined that continuing each fund’s internalized management structure was in the best interests of each fund and its shareholders.
The board based its decision upon an evaluation of the advisor’s investment staff, portfolio management process, and performance. This evaluation included information provided to the board by Vanguard’s Portfolio Review Department, which is responsible for fund and advisor oversight and product management. The Portfolio Review Department met regularly with the advisor and made monthly presentations to the board during the fiscal year directing the board’s focus to relevant information and topics.
The board, or an investment committee made up of board members, also received information throughout the year through advisor presentations. For each advisor presentation, the board was provided with letters and reports that included information about, among other things, the advisory firm and the advisor’s assessment of the investment environment, portfolio performance, and portfolio characteristics.
In addition, the board received monthly reports, which included a Market and Economic Report, a Fund Dashboard Monthly Summary, and a Fund Performance Report.
Prior to their meeting, the trustees were provided with a memo and materials that summarized the information they had received over the course of the year. They also considered the factors discussed below, among others. However, no single factor determined whether the board approved the arrangements. Rather, it was the totality of the circumstances that drove the board’s decision.
Nature, extent, and quality of services
The board reviewed the quality of each fund’s investment management services over both the short and long term, and took into account the organizational depth and stability of the advisor. The board considered that Vanguard has been managing investments for more than three decades. The Fixed Income Group adheres to a sound, disciplined investment management process; the team has considerable experience, stability, and depth.
The board concluded that Vanguard’s experience, stability, depth, and performance, among other factors, warranted continuation of each advisory arrangement.
Investment performance
The board considered the short- and long-term performance of each fund, including any periods of outperformance or underperformance relative to its target index and peer group. The board concluded that the performance was such that each advisory arrangement should continue. Information about each fund’s most recent performance can be found in the Performance Summary pages of this report.
138
Cost
The board concluded that each fund’s expense ratio was well below the average expense ratio charged by funds in its respective peer group and that each fund’s advisory expenses were also well below its peer-group average. Information about the funds’ expenses appears in the About Your Fund’s Expenses section of this report as well as in the Financial Statements sections.
The board does not conduct a profitability analysis of Vanguard, because of Vanguard’s unique “at-cost” structure. Unlike most other mutual fund management companies, Vanguard is owned by the funds it oversees, and produces “profits” only in the form of reduced expenses for fund shareholders.
The benefit of economies of scale
The board concluded that each fund’s at-cost arrangement with Vanguard ensures that the funds will realize economies of scale as they grow, with the cost to shareholders declining as fund assets increase.
The board will consider whether to renew the advisory arrangements again after a one-year period.
139
Glossary
30-Day SEC Yield. A fund’s 30-day SEC yield is derived using a formula specified by the U.S. Securities and Exchange Commission. Under the formula, data related to the fund’s security holdings in the previous 30 days are used to calculate the fund’s hypothetical net income for that period, which is then annualized and divided by the fund’s estimated average net assets over the calculation period. For the purposes of this calculation, a security’s income is based on its current market yield to maturity (for bonds), its actual income (for asset-backed securities), or its projected dividend yield (for stocks). Because the SEC yield represents hypothetical annualized income, it will differ—at times significantly—from the fund’s actual experience. As a result, the fund’s income distributions may be higher or lower than implied by the SEC yield.
Average Coupon. The average interest rate paid on the fixed income securities held by a fund. It is expressed as a percentage of face value.
Average Duration. An estimate of how much the value of the bonds held by a fund will fluctuate in response to a change in interest rates. To see how the value could change, multiply the average duration by the change in rates. If interest rates rise by 1 percentage point, the value of the bonds in a fund with an average duration of five years would decline by about 5%. If rates decrease by a percentage point, the value would rise by 5%.
Average Effective Maturity. The average length of time until fixed income securities held by a fund reach maturity and are repaid, taking into consideration the possibility that the issuer may call the bond before its maturity date. The figure reflects the proportion of fund assets represented by each security; it also reflects any futures contracts held. In general, the longer the average effective maturity, the more a fund’s share price will fluctuate in response to changes in market interest rates.
Beta. A measure of the magnitude of a fund’s past share-price fluctuations in relation to the ups and downs of a given market index. The index is assigned a beta of 1.00. Compared with a given index, a fund with a beta of 1.20 typically would have seen its share price rise or fall by 12% when the index rose or fell by 10%. For this report, beta is based on returns over the past 36 months for both the fund and the index. Note that a fund’s beta should be reviewed in conjunction with its R-squared (see definition). The lower the R-squared, the less correlation there is between the fund and the index, and the less reliable beta is as an indicator of volatility.
Credit Quality. Credit-quality ratings are measured on a scale that generally ranges from AAA (highest) to D (lowest). U.S. Treasury, U.S. Agency, and U.S. Agency mortgage-backed securities appear under “U.S. Government.” Credit-quality ratings are obtained from Barclays and are from Moody’s, Fitch, and S&P. When ratings from all three agencies are used, the median rating is shown. When ratings from two of the agencies are used, the lower rating for each issue is shown. “Not Rated” is used to classify securities for which a rating is not available.
Expense Ratio. A fund’s total annual operating expenses expressed as a percentage of the fund’s average net assets. The expense ratio includes management and administrative expenses, but does not include the transaction costs of buying and selling portfolio securities.
Inception Date. The date on which the assets of a fund (or one of its share classes) are first invested in accordance with the fund’s investment objective. For funds with a subscription period, the inception date is the day after that period ends. Investment performance is measured from the inception date.
140
R-Squared. A measure of how much of a fund’s past returns can be explained by the returns from the market in general, as measured by a given index. If a fund’s total returns were precisely synchronized with an index’s returns, its R-squared would be 1.00. If the fund’s returns bore no relationship to the index’s returns, its R-squared would be 0. For this report, R-squared is based on returns over the past 36 months for both the fund and the index.
Short-Term Reserves. The percentage of a fund invested in highly liquid, short-term securities that can be readily converted to cash.
Yield to Maturity. The rate of return an investor would receive if the fixed income securities held by a fund were held to their maturity dates.
Benchmark Information
Spliced Barclays U.S. Aggregate Float Adjusted Index: Barclays U.S. Aggregate Bond Index through December 31, 2009; Barclays U.S. Aggregate Float Adjusted Index thereafter.
Spliced Core Bond Funds Average: Intermediate Investment-Grade Debt Funds Average through August 31, 2013; Core Bond Funds Average thereafter.
141
The Vanguard funds are not sponsored, endorsed, issued, sold, or promoted by Barclays Capital Inc. or any of its affiliates (“Barclays”). Barclays makes no representation or warranty, express or implied, to the owners or purchasers of the funds or any member of the public regarding the advisability of investing in securities generally or in the funds particularly or the ability of the Barclays indexes to track general bond market performance. Barclays has not passed on the legality or suitability of the funds with respect to any person or entity. Barclays’ only relationship to Vanguard and the funds is the licensing of the Barclays indexes, which are determined, composed, and calculated by Barclays without regard to Vanguard or the funds or any owners or purchasers of the funds. Barclays has no obligation to take the needs of Vanguard, the funds, or the owners of the funds into consideration in determining, composing, or calculating the Barclays indexes. Barclays is not responsible for and has not participated in the determination of the timing of, prices at, or quantities of the funds to be issued. Barclays has no obligation or liability in connection with the administration, marketing, or trading of the funds.
Barclays shall have no liability to third parties for the quality, accuracy, and/or completeness of the indexes or any data included therein or for interruptions in the delivery of the indexes. Barclays makes no warranty, express or implied, as to results to be obtained by owners of the funds or any other person or entity from the use of the indexes or any data included therein in connection with the rights licensed hereunder or for any other use. Barclays reserves the right to change the methods of calculation or publication, or to cease the calculation or publication of the Barclays U.S. 1–3 Year Government Float Adjusted Index, Barclays U.S. 3–10 Year Government Float Adjusted Index, Barclays U.S. Long Government Float Adjusted Index, Barclays U.S. 1–5 Year Corporate Bond Index, Barclays U.S. 5–10 Year Corporate Bond Index, Barclays U.S. 10+ Year Corporate Bond Index, or Barclays U.S. MBS Float Adjusted Index, and Barclays shall not be liable for any miscalculation of or any incorrect, delayed, or interrupted publication with respect to any of the Barclays indexes. Barclays makes no express or implied warranties, and hereby expressly disclaims all warranties of merchantability or fitness for a particular purpose or use with respect to the indexes or any data included therein. Barclays shall not be liable for any damages, including, without limitation, any indirect or consequential damages resulting from the use of the indexes or any data included therein.
142
This page intentionally left blank.
The People Who Govern Your Fund
The trustees of your mutual fund are there to see that the fund is operated and managed in your best interests since, as a shareholder, you are a part owner of the fund. Your fund’s trustees also serve on the board of directors of The Vanguard Group, Inc., which is owned by the Vanguard funds and provides services to them on an at-cost basis.
A majority of Vanguard’s board members are independent, meaning that they have no affiliation with Vanguard or the funds they oversee, apart from the sizable personal investments they have made as private individuals. The independent board members have distinguished backgrounds in business, academia, and public service. Each of the trustees and executive officers oversees 198 Vanguard funds.
The following table provides information for each trustee and executive officer of the fund. The mailing address of the trustees and officers is P.O. Box 876, Valley Forge, PA 19482. More information about the trustees is in the Statement of Additional Information, which can be obtained, without charge, by contacting Vanguard at 800-662-7447, or online at vanguard.com.
InterestedTrustee1
F. William McNabb III
Born 1957. Trustee Since July 2009. Chairman of the Board. Principal Occupation(s) During the Past Five Years and Other Experience: Chairman of the Board of The Vanguard Group, Inc., and of each of the investment companies served by The Vanguard Group, since January 2010; Director of The Vanguard Group since 2008; Chief Executive Officer and President of The Vanguard Group, and of each of the investment companies served by The Vanguard Group, since 2008; Director of Vanguard Marketing Corporation; Managing Director of The Vanguard Group (1995–2008).
IndependentTrustees
Emerson U. Fullwood
Born 1948. Trustee Since January 2008. Principal Occupation(s) During the Past Five Years and Other Experience: Executive Chief Staff and Marketing Officer for North America and Corporate Vice President (retired 2008) of Xerox Corporation (document management products and services); Executive in Residence and 2009–2010 Distinguished Minett Professor at the Rochester Institute of Technology; Lead Director of SPX FLOW, Inc. (multi-industry manufacturing); Director of the United Way of Rochester, the University of Rochester Medical Center, Monroe Community College Foundation, North Carolina A&T University, and Roberts Wesleyan College.
Rajiv L. Gupta
Born 1945. Trustee Since December 2001.2 Principal Occupation(s) During the Past Five Years and Other Experience: Chairman and Chief Executive Officer (retired 2009) and President (2006–2008) of Rohm and Haas Co. (chemicals); Director of Tyco International plc (diversified manufacturing and services), HP Inc. (printer and personal computer manufacturing), and Delphi Automotive plc (automotive components); Senior Advisor at New Mountain Capital.
Amy Gutmann
Born 1949. Trustee Since June 2006. Principal Occupation(s) During the Past Five Years and Other Experience: President of the University of Pennsylvania; Christopher H. Browne Distinguished Professor of Political Science, School of Arts and Sciences, and Professor of Communication, Annenberg School for Communication, with secondary faculty appointments in the Department of Philosophy, School of Arts and Sciences, and at the Graduate School of Education, University of Pennsylvania; Trustee of the National Constitution Center; Chair of the Presidential Commission for the Study of Bioethical Issues.
JoAnn Heffernan Heisen
Born 1950. Trustee Since July 1998. Principal Occupation(s) During the Past Five Years and Other Experience: Corporate Vice President and Chief Global Diversity Officer (retired 2008) and Member of the Executive Committee (1997–2008) of Johnson & Johnson (pharmaceuticals/medical devices/consumer products); Director of Skytop Lodge Corporation (hotels) and the Robert Wood Johnson Foundation; Member of the Advisory Board of the Institute for Women’s Leadership at Rutgers University.
F. Joseph Loughrey
Born 1949. Trustee Since October 2009. Principal Occupation(s) During the Past Five Years and Other Experience: President and Chief Operating Officer (retired 2009) of Cummins Inc. (industrial machinery); Chairman of the Board of Hillenbrand, Inc. (specialized consumer services), and of Oxfam America; Director of SKF AB (industrial machinery), Hyster-Yale Materials Handling, Inc. (forklift trucks), the Lumina Foundation for Education, and the V Foundation for Cancer Research; Member of the Advisory Council for the College of Arts and Letters and of the Advisory Board to the Kellogg Institute for International Studies, both at the University of Notre Dame.
Mark Loughridge
Born 1953. Trustee Since March 2012. Principal Occupation(s) During the Past Five Years and Other Experience: Senior Vice President and Chief Financial Officer (retired 2013) at IBM (information technology services); Fiduciary Member of IBM’s Retirement Plan Committee (2004–2013); Director of the Dow Chemical Company; Member of the Council on Chicago Booth.
Scott C. Malpass
Born 1962. Trustee Since March 2012. Principal Occupation(s) During the Past Five Years and Other Experience: Chief Investment Officer and Vice President at the University of Notre Dame; Assistant Professor of Finance at the Mendoza College of Business at Notre Dame; Member of the Notre Dame 403(b) Investment Committee, the Board of Advisors for Spruceview Capital Partners, and the Investment Advisory Committee of Major League Baseball; Board Member of TIFF Advisory Services, Inc., and Catholic Investment Services, Inc. (investment advisors).
André F. Perold
Born 1952. Trustee Since December 2004. Principal Occupation(s) During the Past Five Years and Other Experience: George Gund Professor of Finance and Banking, Emeritus at the Harvard Business School (retired 2011); Chief Investment Officer and Managing Partner of HighVista Strategies LLC (private investment firm); Director of Rand Merchant Bank; Overseer of the Museum of Fine Arts Boston.
Peter F. Volanakis
Born 1955. Trustee Since July 2009. Principal Occupation(s) During the Past Five Years and Other Experience: President and Chief Operating Officer (retired 2010) of Corning Incorporated (communications equipment); Chairman of the Board of Trustees of Colby-Sawyer College; Member of the Advisory Board of the Norris Cotton Cancer Center.
Executive Officers
Glenn Booraem
Born 1967. Treasurer Since May 2015. Principal Occupation(s) During the Past Five Years and Other Experience: Principal of The Vanguard Group, Inc.; Treasurer of each of the investment companies served by The Vanguard Group; Controller of each of the investment companies served by The Vanguard Group (2010–2015); Assistant Controller of each of the investment companies served by The Vanguard Group (2001–2010).
Thomas J. Higgins
Born 1957. Chief Financial Officer Since September 2008. Principal Occupation(s) During the Past Five Years and Other Experience: Principal of The Vanguard Group, Inc.; Chief Financial Officer of each of the investment companies served by The Vanguard Group; Treasurer of each of the investment companies served by The Vanguard Group (1998–2008).
Peter Mahoney
Born 1974. Controller Since May 2015. Principal Occupation(s) During the Past Five Years and Other Experience: Head of Global Fund Accounting at The Vanguard Group, Inc.; Controller of each of the investment companies served by The Vanguard Group; Head of International Fund Services at The Vanguard Group (2008–2014).
Heidi Stam
Born 1956. Secretary Since July 2005. Principal Occupation(s) During the Past Five Years and Other Experience: Managing Director of The Vanguard Group, Inc.; General Counsel of The Vanguard Group; Secretary of The Vanguard Group and of each of the investment companies served by The Vanguard Group; Director and Senior Vice President of Vanguard Marketing Corporation.
Vanguard Senior Management Team
|
Mortimer J. Buckley Kathleen C. Gubanich Martha G. King John T. Marcante Chris D. McIsaac |
James M. Norris Thomas M. Rampulla Glenn W. Reed Karin A. Risi Michael Rollings |
Chairman Emeritus and Senior Advisor
John J. Brennan
Chairman, 1996–2009
Chief Executive Officer and President, 1996–2008
Founder John C. Bogle
Chairman and Chief Executive Officer, 1974–1996
1 Mr. McNabb is considered an “interested person,” as defined in the Investment Company Act of 1940, because he is an officer of the Vanguard funds.
2 December 2002 for Vanguard Equity Income Fund, the Vanguard Municipal Bond Funds, and the Vanguard State Tax-Exempt Funds.
 |
| P.O. Box 2600 |
| Valley Forge, PA 19482-2600 |
Connect with Vanguard® > vanguard.com
| Fund Information > 800-662-7447 | |
| Direct Investor Account Services > 800-662-2739 | |
| Institutional Investor Services > 800-523-1036 | |
| Text Telephone for People | |
| Who Are Deaf or Hard of Hearing> 800-749-7273 | |
| This material may be used in conjunction | |
| with the offering of shares of any Vanguard | |
| fund only if preceded or accompanied by | |
| the fund’s current prospectus. | |
| All comparative mutual fund data are from Lipper, a | |
| Thomson Reuters Company, or Morningstar, Inc., unless | |
| otherwise noted. | |
| You can obtain a free copy of Vanguard’s proxy voting | |
| guidelines by visiting vanguard.com/proxyreporting or by | |
| calling Vanguard at 800-662-2739. The guidelines are | |
| also available from the SEC’s website, sec.gov. In | |
| addition, you may obtain a free report on how your fund | |
| voted the proxies for securities it owned during the 12 | |
| months ended June 30. To get the report, visit either | |
| vanguard.com/proxyreporting or sec.gov. | |
| You can review and copy information about your fund at | |
| the SEC’s Public Reference Room in Washington, D.C. To | |
| find out more about this public service, call the SEC at | |
| 202-551-8090. Information about your fund is also | |
| available on the SEC’s website, and you can receive | |
| copies of this information, for a fee, by sending a | |
| request in either of two ways: via email addressed to | |
| publicinfo@sec.gov or via regular mail addressed to the | |
| Public Reference Section, Securities and Exchange | |
| Commission, Washington, DC 20549-1520. | |
| © 2016 The Vanguard Group, Inc. | |
| All rights reserved. | |
| Vanguard Marketing Corporation, Distributor. | |
| Q16420 102016 | |
Item 2: Code of Ethics. The Registrant has adopted a code of ethics that applies to the Registrant’s principal executive officer, principal financial officer, principal accounting officer or controller or persons performing similar functions. The Code of Ethics was amended during the reporting period covered by this report to make certain technical, non-material changes.
Item 3: Audit Committee Financial Expert. All members of the Audit Committee have been determined by the Registrant’s Board of Trustees to be Audit Committee Financial Experts and to be independent: Rajiv L. Gupta, JoAnn Heffernan Heisen, F. Joseph Loughrey, Mark Loughridge, and Peter F. Volanakis.
Item 4: Principal Accountant Fees and Services.
(a) Audit Fees.
Audit Fees of the Registrant
Fiscal Year Ended August 31, 2016: $610,000
Fiscal Year Ended August 31, 2015: $579,000
Aggregate Audit Fees of Registered Investment Companies in the Vanguard Group.
Fiscal Year Ended August 31, 2016: $9,629,849
Fiscal Year Ended August 31, 2015: $7,000,200
Includes fees billed in connection with audits of the Registrant, other registered investment companies in the Vanguard complex, The Vanguard Group, Inc. and Vanguard Marketing Corporation.
(b) Audit-Related Fees.
Fiscal Year Ended August 31, 2016: $2,717,627
Fiscal Year Ended August 31, 2015: $2,899,096
Includes fees billed in connection with assurance and related services provided to the Registrant, other registered investment companies in the Vanguard complex, The Vanguard Group, Inc., and Vanguard Marketing Corporation.
(c) Tax Fees.
Fiscal Year Ended August 31, 2016: $254,050
Fiscal Year Ended August 31, 2015: $353,389
Includes fees billed in connection with tax compliance, planning, and advice services provided to the Registrant, other registered investment companies in the Vanguard complex, The Vanguard Group, Inc., and Vanguard Marketing Corporation.
(d) All Other Fees.
Fiscal Year Ended August 31, 2016: $214,225
Fiscal Year Ended August 31, 2015: $202,313
Includes fees billed for services related to tax reported information provided to the Registrant, other registered investment companies in the Vanguard complex, The Vanguard Group, Inc., and Vanguard Marketing Corporation.
(e) (1) Pre-Approval Policies. The policy of the Registrant’s Audit Committee is to consider and, if appropriate, approve before the principal accountant is engaged for such services, all specific audit and non-audit services provided to: the Registrant, other registered investment companies in the Vanguard complex, The Vanguard Group, Inc., and entities controlled by The Vanguard Group, Inc. that provide ongoing services to the Registrant. In making a determination, the Audit Committee considers whether the services are consistent with maintaining the principal accountant’s independence.
In the event of a contingency situation in which the principal accountant is needed to provide services in between scheduled Audit Committee meetings, the Chairman of the Audit Committee would be called on to consider and, if appropriate, pre-approve audit or permitted non-audit services in an amount sufficient to complete services through the next Audit Committee meeting, and to determine if such services would be consistent with maintaining the accountant’s independence. At the next scheduled Audit Committee meeting, services and fees would be presented to the Audit Committee for formal consideration, and, if appropriate, approval by the entire Audit Committee. The Audit Committee would again consider whether such services and fees are consistent with maintaining the principal accountant’s independence.
The Registrant’s Audit Committee is informed at least annually of all audit and non-audit services provided by the principal accountant to the Vanguard complex, whether such services are provided to: the Registrant, other registered investment companies in the Vanguard complex, The Vanguard Group, Inc., or other entities controlled by The Vanguard Group, Inc. that provide ongoing services to the Registrant.
(2) No percentage of the principal accountant’s fees or services were approved pursuant to the waiver provision of paragraph (c)(7)(i)(C) of Rule 2-01 of Regulation S-X.
(f) For the most recent fiscal year, over 50% of the hours worked under the principal accountant’s engagement were not performed by persons other than full-time, permanent employees of the principal accountant.
(g) Aggregate Non-Audit Fees.
Fiscal Year Ended August 31, 2016: $468,275
Fiscal Year Ended August 31, 2015: $555,702
Includes fees billed for non-audit services provided to the Registrant, other registered investment companies in the Vanguard complex, The Vanguard Group, Inc., and Vanguard Marketing Corporation.
(h) For the most recent fiscal year, the Audit Committee has determined that the provision of all non-audit services was consistent with maintaining the principal accountant’s independence.
Item 5: Audit Committee of Listed Registrants.
The Registrant is a listed issuer as defined in rule 10A-3 under the Securities Exchange Act of 1934 (“Exchange Act”). The Registrant has a separately-designated standing audit committee established in accordance with Section 3(a)(58)(A) of the Exchange Act. The Registrant’s audit committee members are: Emerson U. Fullwood, Rajiv L. Gupta, Amy Gutmann, JoAnn Heffernan Heisen, F. Joseph Loughrey, Mark Loughridge, Scott C. Malpass, André F. Perold, and Peter F. Volanakis.
Item 6: Investments.
| Vanguard® Russell 1000 Index Fund | ||
| Schedule of Investments | ||
| August 31, 2016 | ||
| Market | ||
| Value | ||
| Shares | ($000) | |
| Common Stocks (99.7%)1 | ||
| Consumer Discretionary (14.1%) | ||
| * Amazon.com Inc. | 41,085 | 31,601 |
| Home Depot Inc. | 131,443 | 17,629 |
| Comcast Corp. Class A | 254,588 | 16,614 |
| Walt Disney Co. | 171,406 | 16,191 |
| Wal-Mart Stores Inc. | 159,807 | 11,417 |
| McDonald's Corp. | 92,823 | 10,736 |
| Starbucks Corp. | 150,638 | 8,470 |
| NIKE Inc. Class B | 139,678 | 8,051 |
| Costco Wholesale Corp. | 46,012 | 7,458 |
| * Priceline Group Inc. | 5,224 | 7,401 |
| Lowe's Cos. Inc. | 94,458 | 7,232 |
| Time Warner Inc. | 83,073 | 6,514 |
| * Charter Communications Inc. Class A | 21,183 | 5,448 |
| TJX Cos. Inc. | 69,791 | 5,405 |
| Ford Motor Co. | 409,986 | 5,166 |
| General Motors Co. | 147,936 | 4,722 |
| Target Corp. | 62,315 | 4,374 |
| * Netflix Inc. | 43,039 | 4,194 |
| Yum! Brands Inc. | 40,738 | 3,695 |
| * eBay Inc. | 112,679 | 3,624 |
| Johnson Controls Inc. | 68,452 | 3,004 |
| * O'Reilly Automotive Inc. | 9,993 | 2,798 |
| Twenty-First Century Fox Inc. Class A | 112,935 | 2,771 |
| Newell Brands Inc. | 49,841 | 2,646 |
| * Tesla Motors Inc. | 12,343 | 2,617 |
| Ross Stores Inc. | 41,557 | 2,586 |
| * AutoZone Inc. | 3,109 | 2,306 |
| VF Corp. | 36,006 | 2,234 |
| Dollar General Corp. | 29,962 | 2,199 |
| CBS Corp. Class B | 42,781 | 2,183 |
| Omnicom Group Inc. | 24,939 | 2,148 |
| Carnival Corp. | 42,799 | 2,046 |
| Nielsen Holdings plc | 38,141 | 2,032 |
| Delphi Automotive plc | 28,743 | 2,031 |
| Estee Lauder Cos. Inc. Class A | 22,705 | 2,026 |
| * Dollar Tree Inc. | 23,902 | 1,977 |
| L Brands Inc. | 25,455 | 1,940 |
| Las Vegas Sands Corp. | 38,503 | 1,933 |
| Genuine Parts Co. | 15,275 | 1,571 |
| * Ulta Salon Cosmetics & Fragrance Inc. | 6,180 | 1,528 |
| Viacom Inc. Class B | 35,341 | 1,426 |
| ^ Marriott International Inc.Class A | 19,734 | 1,408 |
| Whirlpool Corp. | 7,852 | 1,403 |
| Starwood Hotels & Resorts Worldwide Inc. | 17,942 | 1,390 |
| * Mohawk Industries Inc. | 6,486 | 1,380 |
| Expedia Inc. | 12,588 | 1,374 |
| Twenty-First Century Fox Inc. | 53,373 | 1,326 |
| Hilton Worldwide Holdings Inc. | 54,949 | 1,312 |
| Royal Caribbean Cruises Ltd. | 17,592 | 1,251 |
| * Chipotle Mexican Grill Inc. Class A | 2,958 | 1,224 |
| * CarMax Inc. | 20,205 | 1,191 |
| Mattel Inc. | 35,785 | 1,186 |
| Tractor Supply Co. | 14,094 | 1,183 |
| * MGM Resorts International | 49,417 | 1,181 |
| Macy's Inc. | 32,616 | 1,180 |
| Advance Auto Parts Inc. | 7,445 | 1,172 |
| * DISH Network Corp. Class A | 23,102 | 1,160 |
| * LKQ Corp. | 32,136 | 1,160 |
| DR Horton Inc. | 35,668 | 1,143 |
| Coach Inc. | 29,496 | 1,126 |
| Best Buy Co. Inc. | 29,150 | 1,122 |
1
| Vanguard® Russell 1000 Index Fund | |||
| Schedule of Investments | |||
| August 31, 2016 | |||
| Market | |||
| Value | |||
| Shares | ($000) | ||
| Hanesbrands Inc. | 39,997 | 1,061 | |
| Fortune Brands Home & Security Inc. | 16,083 | 1,022 | |
| * | Discovery Communications Inc. Class A | 39,445 | 1,006 |
| Harley-Davidson Inc. | 18,874 | 995 | |
| * | Liberty Interactive Corp. QVC Group Class A | 47,067 | 994 |
| Hasbro Inc. | 11,918 | 974 | |
| Interpublic Group of Cos. Inc. | 41,961 | 971 | |
| Aramark | 25,542 | 969 | |
| Foot Locker Inc. | 14,216 | 933 | |
| PVH Corp. | 8,447 | 910 | |
| Lear Corp. | 7,711 | 897 | |
| Lennar Corp. Class A | 18,517 | 876 | |
| Kohl's Corp. | 19,212 | 853 | |
| * | Michael Kors Holdings Ltd. | 17,243 | 844 |
| Goodyear Tire & Rubber Co. | 28,369 | 833 | |
| Tiffany & Co. | 11,620 | 829 | |
| Wyndham Worldwide Corp. | 11,454 | 811 | |
| BorgWarner Inc. | 23,055 | 793 | |
| * | lululemon athletica Inc. | 10,322 | 790 |
| Domino's Pizza Inc. | 5,249 | 785 | |
| PulteGroup Inc. | 36,284 | 775 | |
| * | Sirius XM Holdings Inc. | 185,563 | 768 |
| *,^ | Under Armour Inc. Class A | 19,265 | 763 |
| Darden Restaurants Inc. | 12,105 | 746 | |
| Wynn Resorts Ltd. | 8,341 | 745 | |
| * | TripAdvisor Inc. | 12,157 | 742 |
| * | Liberty Broadband Corp. | 10,800 | 740 |
| Leggett & Platt Inc. | 13,734 | 721 | |
| Bed Bath & Beyond Inc. | 15,402 | 714 | |
| News Corp. Class A | 49,959 | 702 | |
| * | Under Armour Inc. | 19,421 | 692 |
| Signet Jewelers Ltd. | 8,197 | 672 | |
| ^ | Nordstrom Inc. | 13,085 | 660 |
| * | Liberty SiriusXM Group | 19,862 | 660 |
| Ralph Lauren Corp. Class A | 6,078 | 630 | |
| Harman International Industries Inc. | 7,417 | 628 | |
| * | NVR Inc. | 362 | 611 |
| Vail Resorts Inc. | 3,848 | 610 | |
| KAR Auction Services Inc. | 14,416 | 609 | |
| * | Burlington Stores Inc. | 7,411 | 602 |
| * | Norwegian Cruise Line Holdings Ltd. | 16,706 | 600 |
| * | WABCO Holdings Inc. | 5,599 | 598 |
| Staples Inc. | 68,695 | 588 | |
| Gap Inc. | 23,058 | 573 | |
| Garmin Ltd. | 11,661 | 572 | |
| ^ | Polaris Industries Inc. | 6,436 | 558 |
| Scripps Networks Interactive Inc. Class A | 8,623 | 546 | |
| Dick's Sporting Goods Inc. | 9,166 | 537 | |
| Lamar Advertising Co. Class A | 8,599 | 536 | |
| * | ServiceMaster Global Holdings Inc. | 14,352 | 535 |
| Gentex Corp. | 30,082 | 535 | |
| * | Liberty Ventures Class A | 13,883 | 535 |
| Service Corp. International | 19,899 | 526 | |
| * | Panera Bread Co. Class A | 2,365 | 514 |
| Carter's Inc. | 5,361 | 511 | |
| H&R Block Inc. | 23,560 | 510 | |
| * | Toll Brothers Inc. | 15,916 | 495 |
| Williams-Sonoma Inc. | 9,186 | 484 | |
| TEGNA Inc. | 23,336 | 473 | |
| Dunkin' Brands Group Inc. | 9,456 | 463 | |
| * | Tempur Sealy International Inc. | 5,675 | 445 |
| Brunswick Corp. | 9,640 | 443 | |
| Pool Corp. | 4,303 | 434 | |
| Cinemark Holdings Inc. | 10,965 | 424 | |
2
| Vanguard® Russell 1000 Index Fund | ||
| Schedule of Investments | ||
| August 31, 2016 | ||
| Market | ||
| Value | ||
| Shares | ($000) | |
| * Sally Beauty Holdings Inc. | 15,047 | 410 |
| Thor Industries Inc. | 4,918 | 399 |
| * Hertz Global Holdings Inc. | 7,725 | 380 |
| CST Brands Inc. | 7,856 | 376 |
| * Madison Square Garden Co. Class A | 2,019 | 365 |
| Six Flags Entertainment Corp. | 7,383 | 360 |
| * Live Nation Entertainment Inc. | 13,363 | 357 |
| Tupperware Brands Corp. | 5,350 | 351 |
| * Skechers U.S.A. Inc. Class A | 14,289 | 347 |
| * Urban Outfitters Inc. | 9,648 | 346 |
| * AMC Networks Inc. Class A | 6,244 | 339 |
| * Pandora Media Inc. | 23,908 | 335 |
| * Avis Budget Group Inc. | 8,962 | 324 |
| Outfront Media Inc. | 14,301 | 319 |
| * AutoNation Inc. | 6,579 | 311 |
| Tribune Media Co. Class A | 8,007 | 305 |
| Brinker International Inc. | 5,674 | 305 |
| * JC Penney Co. Inc. | 32,209 | 304 |
| ^ GameStop Corp. Class A | 10,528 | 299 |
| * Liberty SiriusXM Group Class A | 8,871 | 297 |
| John Wiley & Sons Inc. Class A | 4,775 | 278 |
| * Starz | 8,882 | 277 |
| CalAtlantic Group Inc. | 7,567 | 276 |
| * Murphy USA Inc. | 3,771 | 276 |
| Visteon Corp. | 3,676 | 260 |
| Cable One Inc. | 476 | 258 |
| * Vista Outdoor Inc. | 6,299 | 251 |
| * Cabela's Inc. | 5,071 | 248 |
| * Kate Spade & Co. | 13,029 | 243 |
| * Michaels Cos. Inc. | 9,505 | 228 |
| Wendy's Co. | 22,192 | 226 |
| International Game Technology plc | 9,716 | 222 |
| Graham Holdings Co. Class B | 446 | 219 |
| AMERCO | 614 | 211 |
| * Fitbit Inc. Class A | 12,790 | 198 |
| Lions Gate Entertainment Corp. | 9,349 | 196 |
| ^ Regal Entertainment Group Class A | 8,508 | 182 |
| Choice Hotels International Inc. | 3,684 | 179 |
| Penske Automotive Group Inc. | 3,808 | 172 |
| * Liberty Broadband Corp. Class A | 2,511 | 169 |
| * Hyatt Hotels Corp. Class A | 2,607 | 139 |
| Dillard's Inc. Class A | 2,143 | 129 |
| ^ Coty Inc. Class A | 4,494 | 121 |
| Extended Stay America Inc. | 7,992 | 113 |
| Viacom Inc. Class A | 1,890 | 85 |
| Lennar Corp. Class B | 2,105 | 80 |
| News Corp. Class B | 3,764 | 54 |
| Clear Channel Outdoor Holdings Inc. Class A | 3,456 | 23 |
| * Discovery Communications Inc. | 112 | 3 |
| * Liberty Braves Group | 2 | — |
| 313,332 | ||
| Consumer Staples (8.4%) | ||
| Procter & Gamble Co. | 281,492 | 24,577 |
| Coca-Cola Co. | 411,536 | 17,873 |
| Philip Morris International Inc. | 163,736 | 16,362 |
| PepsiCo Inc. | 152,566 | 16,286 |
| Altria Group Inc. | 206,607 | 13,655 |
| CVS Health Corp. | 113,356 | 10,587 |
| Walgreens Boots Alliance Inc. | 90,818 | 7,330 |
| Mondelez International Inc. Class A | 157,731 | 7,101 |
| Colgate-Palmolive Co. | 91,658 | 6,814 |
| Kraft Heinz Co. | 62,936 | 5,632 |
| Kimberly-Clark Corp. | 37,945 | 4,859 |
| General Mills Inc. | 62,763 | 4,445 |
3
| Vanguard® Russell 1000 Index Fund | |||
| Schedule of Investments | |||
| August 31, 2016 | |||
| Market | |||
| Value | |||
| Shares | ($000) | ||
| Reynolds American Inc. | 87,202 | 4,323 | |
| Kroger Co. | 100,387 | 3,211 | |
| Sysco Corp. | 55,466 | 2,876 | |
| Constellation Brands Inc. Class A | 17,495 | 2,870 | |
| Archer-Daniels-Midland Co. | 60,827 | 2,662 | |
| Tyson Foods Inc. Class A | 30,733 | 2,323 | |
| * | Monster Beverage Corp. | 14,714 | 2,264 |
| ConAgra Foods Inc. | 46,177 | 2,152 | |
| Kellogg Co. | 26,056 | 2,142 | |
| Molson Coors Brewing Co. Class B | 18,130 | 1,855 | |
| Dr Pepper Snapple Group Inc. | 19,413 | 1,819 | |
| Clorox Co. | 13,594 | 1,781 | |
| JM Smucker Co. | 12,278 | 1,741 | |
| Mead Johnson Nutrition Co. | 19,602 | 1,668 | |
| Hershey Co. | 14,830 | 1,481 | |
| Church & Dwight Co. Inc. | 13,479 | 1,340 | |
| McCormick & Co. Inc. | 12,169 | 1,241 | |
| Campbell Soup Co. | 19,641 | 1,193 | |
| Hormel Foods Corp. | 28,639 | 1,096 | |
| Ingredion Inc. | 7,608 | 1,042 | |
| * | WhiteWave Foods Co. Class A | 18,303 | 1,015 |
| Brown-Forman Corp. Class B | 20,870 | 1,013 | |
| Whole Foods Market Inc. | 33,181 | 1,008 | |
| Bunge Ltd. | 14,590 | 932 | |
| * | Rite Aid Corp. | 107,181 | 807 |
| Pinnacle Foods Inc. | 11,920 | 604 | |
| * | Post Holdings Inc. | 6,743 | 572 |
| * | TreeHouse Foods Inc. | 5,852 | 554 |
| Casey's General Stores Inc. | 4,172 | 548 | |
| * | Edgewell Personal Care Co. | 6,085 | 487 |
| *,^ | Herbalife Ltd. | 7,613 | 463 |
| * | Hain Celestial Group Inc. | 10,458 | 384 |
| Spectrum Brands Holdings Inc. | 2,587 | 347 | |
| * | Sprouts Farmers Market Inc. | 15,062 | 339 |
| Nu Skin Enterprises Inc. Class A | 5,568 | 322 | |
| Energizer Holdings Inc. | 6,385 | 316 | |
| Brown-Forman Corp. Class A | 5,840 | 302 | |
| Flowers Foods Inc. | 18,348 | 274 | |
| * | Blue Buffalo Pet Products Inc. | 6,127 | 158 |
| Pilgrim's Pride Corp. | 6,202 | 143 | |
| * | US Foods Holding Corp. | 4,524 | 110 |
| 187,299 | |||
| Energy (6.8%) | |||
| Exxon Mobil Corp. | 438,012 | 38,168 | |
| Chevron Corp. | 198,638 | 19,979 | |
| Schlumberger Ltd. | 146,888 | 11,604 | |
| Occidental Petroleum Corp. | 80,602 | 6,194 | |
| ConocoPhillips | 130,997 | 5,377 | |
| EOG Resources Inc. | 58,094 | 5,141 | |
| Kinder Morgan Inc. | 203,148 | 4,439 | |
| Halliburton Co. | 90,511 | 3,893 | |
| Phillips 66 | 47,622 | 3,736 | |
| Pioneer Natural Resources Co. | 17,195 | 3,079 | |
| Anadarko Petroleum Corp. | 53,931 | 2,884 | |
| Valero Energy Corp. | 49,649 | 2,748 | |
| Spectra Energy Corp. | 71,014 | 2,529 | |
| Devon Energy Corp. | 54,954 | 2,381 | |
| Marathon Petroleum Corp. | 55,707 | 2,368 | |
| Baker Hughes Inc. | 46,115 | 2,266 | |
| Williams Cos. Inc. | 72,638 | 2,029 | |
| Apache Corp. | 39,875 | 1,982 | |
| * | Concho Resources Inc. | 15,098 | 1,951 |
| Hess Corp. | 29,816 | 1,619 | |
| Noble Energy Inc. | 44,791 | 1,544 | |
4
| Vanguard® Russell 1000 Index Fund | |||
| Schedule of Investments | |||
| August 31, 2016 | |||
| Market | |||
| Value | |||
| Shares | ($000) | ||
| Marathon Oil Corp. | 89,435 | 1,343 | |
| National Oilwell Varco Inc. | 39,847 | 1,336 | |
| Cimarex Energy Co. | 9,821 | 1,298 | |
| EQT Corp. | 18,093 | 1,294 | |
| Cabot Oil & Gas Corp. | 48,644 | 1,198 | |
| ONEOK Inc. | 22,037 | 1,033 | |
| Tesoro Corp. | 12,690 | 957 | |
| * | Cheniere Energy Inc. | 21,221 | 910 |
| * | Newfield Exploration Co. | 20,696 | 897 |
| * | Diamondback Energy Inc. | 8,262 | 787 |
| * | Southwestern Energy Co. | 51,377 | 715 |
| Targa Resources Corp. | 16,269 | 709 | |
| Range Resources Corp. | 17,662 | 681 | |
| * | FMC Technologies Inc. | 23,516 | 663 |
| Helmerich & Payne Inc. | 10,151 | 614 | |
| Energen Corp. | 10,313 | 593 | |
| * | Parsley Energy Inc. Class A | 17,387 | 589 |
| * | Weatherford International plc | 95,549 | 523 |
| * | Antero Resources Corp. | 19,183 | 490 |
| QEP Resources Inc. | 25,404 | 485 | |
| Murphy Oil Corp. | 17,282 | 462 | |
| * | Continental Resources Inc. | 9,320 | 447 |
| HollyFrontier Corp. | 17,256 | 447 | |
| CONSOL Energy Inc. | 23,612 | 431 | |
| * | WPX Energy Inc. | 35,389 | 425 |
| * | Chesapeake Energy Corp. | 62,549 | 397 |
| * | Gulfport Energy Corp. | 12,884 | 368 |
| * | Transocean Ltd. | 37,196 | 361 |
| SM Energy Co. | 9,308 | 353 | |
| World Fuel Services Corp. | 7,258 | 324 | |
| * | Rice Energy Inc. | 12,150 | 320 |
| Nabors Industries Ltd. | 29,752 | 296 | |
| * | First Solar Inc. | 7,781 | 294 |
| Patterson-UTI Energy Inc. | 14,641 | 285 | |
| Oceaneering International Inc. | 10,366 | 275 | |
| Superior Energy Services Inc. | 15,811 | 266 | |
| Ensco plc Class A | 31,771 | 241 | |
| PBF Energy Inc. Class A | 10,756 | 236 | |
| * | Dril-Quip Inc. | 4,013 | 223 |
| *,^ | Laredo Petroleum Inc. | 15,729 | 193 |
| Rowan Cos. plc Class A | 13,359 | 166 | |
| * | Memorial Resource Development Corp. | 10,256 | 148 |
| * | Whiting Petroleum Corp. | 19,843 | 145 |
| * | SolarCity Corp. | 6,670 | 138 |
| Noble Corp. plc | 23,714 | 137 | |
| Diamond Offshore Drilling Inc. | 6,294 | 116 | |
| * | Kosmos Energy Ltd. | 15,588 | 97 |
| *,^ | RPC Inc. | 5,641 | 86 |
| *,^ | SunPower Corp. Class A | 5,374 | 54 |
| ^ | Frank's International NV | 3,328 | 38 |
| 150,795 | |||
| Financial Services (19.5%) | |||
| * | Berkshire Hathaway Inc. Class B | 199,741 | 30,059 |
| JPMorgan Chase & Co. | 384,524 | 25,955 | |
| Wells Fargo & Co. | 482,701 | 24,521 | |
| Bank of America Corp. | 1,085,620 | 17,522 | |
| Visa Inc. Class A | 201,270 | 16,283 | |
| Citigroup Inc. | 310,121 | 14,805 | |
| MasterCard Inc. Class A | 101,745 | 9,832 | |
| US Bancorp | 171,492 | 7,571 | |
| American International Group Inc. | 117,160 | 7,010 | |
| Simon Property Group Inc. | 32,507 | 7,004 | |
| Goldman Sachs Group Inc. | 40,734 | 6,903 | |
| Chubb Ltd. | 48,796 | 6,194 | |
5
| Vanguard® Russell 1000 Index Fund | ||
| Schedule of Investments | ||
| August 31, 2016 | ||
| Market | ||
| Value | ||
| Shares | ($000) | |
| American Express Co. | 84,467 | 5,539 |
| American Tower Corporation | 44,509 | 5,046 |
| BlackRock Inc. | 13,195 | 4,919 |
| Morgan Stanley | 150,694 | 4,831 |
| PNC Financial Services Group Inc. | 52,716 | 4,750 |
| Bank of New York Mellon Corp. | 110,530 | 4,606 |
| * PayPal Holdings Inc. | 119,449 | 4,438 |
| MetLife Inc. | 98,152 | 4,260 |
| Charles Schwab Corp. | 123,022 | 3,870 |
| CME Group Inc. | 35,659 | 3,864 |
| Capital One Financial Corp. | 53,848 | 3,856 |
| Marsh & McLennan Cos. Inc. | 55,098 | 3,726 |
| Prudential Financial Inc. | 46,611 | 3,700 |
| Travelers Cos. Inc. | 30,891 | 3,667 |
| Intercontinental Exchange Inc. | 12,418 | 3,502 |
| Public Storage | 15,573 | 3,487 |
| S&P Global Inc. | 27,813 | 3,436 |
| Crown Castle International Corp. | 35,470 | 3,362 |
| BB&T Corp. | 85,932 | 3,308 |
| Aflac Inc. | 42,380 | 3,144 |
| Aon plc | 27,751 | 3,090 |
| Prologis Inc. | 55,173 | 2,930 |
| State Street Corp. | 41,675 | 2,927 |
| Welltower Inc. | 37,802 | 2,901 |
| Allstate Corp. | 39,449 | 2,720 |
| Fidelity National Information Services Inc. | 34,254 | 2,717 |
| Equinix Inc. | 7,321 | 2,699 |
| Discover Financial Services | 43,385 | 2,603 |
| Ventas Inc. | 35,521 | 2,581 |
| AvalonBay Communities Inc. | 14,502 | 2,538 |
| Weyerhaeuser Co. | 78,203 | 2,491 |
| Synchrony Financial | 88,363 | 2,459 |
| Equity Residential | 37,741 | 2,448 |
| * Fiserv Inc. | 23,408 | 2,412 |
| SunTrust Banks Inc. | 52,928 | 2,333 |
| Boston Properties Inc. | 16,167 | 2,265 |
| Progressive Corp. | 61,468 | 2,001 |
| Moody's Corp. | 17,880 | 1,943 |
| HCP Inc. | 49,099 | 1,931 |
| Vornado Realty Trust | 18,038 | 1,864 |
| M&T Bank Corp. | 15,683 | 1,856 |
| Realty Income Corp. | 27,247 | 1,791 |
| General Growth Properties Inc. | 60,992 | 1,777 |
| T. Rowe Price Group Inc. | 25,461 | 1,771 |
| Hartford Financial Services Group Inc. | 41,030 | 1,685 |
| Ameriprise Financial Inc. | 16,516 | 1,669 |
| Equifax Inc. | 12,502 | 1,649 |
| Fifth Third Bancorp | 80,577 | 1,624 |
| * FleetCor Technologies Inc. | 9,557 | 1,569 |
| Essex Property Trust Inc. | 6,869 | 1,560 |
| Northern Trust Corp. | 21,725 | 1,534 |
| Digital Realty Trust Inc. | 15,395 | 1,526 |
| KeyCorp | 113,814 | 1,430 |
| Franklin Resources Inc. | 37,931 | 1,384 |
| Host Hotels & Resorts Inc. | 77,523 | 1,381 |
| Principal Financial Group Inc. | 28,130 | 1,380 |
| Citizens Financial Group Inc. | 55,692 | 1,380 |
| Invesco Ltd. | 43,447 | 1,355 |
| * Markel Corp. | 1,440 | 1,341 |
| Regions Financial Corp. | 134,113 | 1,337 |
| Thomson Reuters Corp. | 31,517 | 1,308 |
| Kimco Realty Corp. | 42,366 | 1,273 |
| * Alliance Data Systems Corp. | 6,102 | 1,248 |
| Macerich Co. | 15,029 | 1,231 |
6
| Vanguard® Russell 1000 Index Fund | ||
| Schedule of Investments | ||
| August 31, 2016 | ||
| Market | ||
| Value | ||
| Shares | ($000) | |
| Loews Corp. | 29,374 | 1,230 |
| Global Payments Inc. | 16,138 | 1,226 |
| Cincinnati Financial Corp. | 15,759 | 1,215 |
| SL Green Realty Corp. | 10,279 | 1,210 |
| Lincoln National Corp. | 25,185 | 1,210 |
| First Republic Bank | 15,453 | 1,189 |
| Federal Realty Investment Trust | 7,444 | 1,184 |
| Annaly Capital Management Inc. | 107,005 | 1,146 |
| Huntington Bancshares Inc. | 112,434 | 1,125 |
| Western Union Co. | 51,378 | 1,106 |
| Iron Mountain Inc. | 27,613 | 1,061 |
| VEREIT Inc. | 101,316 | 1,059 |
| FNF Group | 27,793 | 1,048 |
| Duke Realty Corp. | 36,743 | 1,033 |
| Extra Space Storage Inc. | 12,772 | 1,029 |
| UDR Inc. | 28,142 | 1,018 |
| * XL Group Ltd. | 29,385 | 1,006 |
| * Arch Capital Group Ltd. | 12,157 | 984 |
| * CBRE Group Inc. Class A | 31,765 | 949 |
| Ally Financial Inc. | 46,237 | 927 |
| Arthur J Gallagher & Co. | 18,274 | 903 |
| Alexandria Real Estate Equities Inc. | 8,073 | 889 |
| * Vantiv Inc. Class A | 16,488 | 886 |
| Unum Group | 24,786 | 883 |
| Regency Centers Corp. | 10,809 | 871 |
| Comerica Inc. | 18,209 | 861 |
| MSCI Inc. Class A | 9,544 | 860 |
| Everest Re Group Ltd. | 4,405 | 852 |
| Broadridge Financial Solutions Inc. | 12,284 | 851 |
| TD Ameritrade Holding Corp. | 25,881 | 851 |
| Total System Services Inc. | 17,234 | 849 |
| Nasdaq Inc. | 11,733 | 836 |
| * E*TRADE Financial Corp. | 31,669 | 835 |
| * Alleghany Corp. | 1,545 | 828 |
| * Affiliated Managers Group Inc. | 5,703 | 810 |
| Torchmark Corp. | 12,281 | 794 |
| Camden Property Trust | 8,898 | 781 |
| CIT Group Inc. | 20,993 | 774 |
| Raymond James Financial Inc. | 13,106 | 762 |
| Mid-America Apartment Communities Inc. | 8,059 | 757 |
| FactSet Research Systems Inc. | 4,222 | 752 |
| Apartment Investment & Management Co. | 16,598 | 750 |
| National Retail Properties Inc. | 14,939 | 748 |
| New York Community Bancorp Inc. | 49,458 | 747 |
| WP Carey Inc. | 11,026 | 735 |
| Omega Healthcare Investors Inc. | 19,714 | 714 |
| Reinsurance Group of America Inc. Class A | 6,648 | 713 |
| Jack Henry & Associates Inc. | 8,145 | 711 |
| Kilroy Realty Corp. | 9,662 | 702 |
| * Signature Bank | 5,625 | 686 |
| American Campus Communities Inc. | 13,608 | 682 |
| American Capital Agency Corp. | 35,245 | 681 |
| Leucadia National Corp. | 34,749 | 665 |
| Spirit Realty Capital Inc. | 50,114 | 664 |
| MarketAxess Holdings Inc. | 3,814 | 643 |
| Zions Bancorporation | 20,698 | 633 |
| Voya Financial Inc. | 21,598 | 632 |
| Liberty Property Trust | 15,226 | 628 |
| Equity LifeStyle Properties Inc. | 7,974 | 618 |
| SEI Investments Co. | 13,278 | 612 |
| DDR Corp. | 32,118 | 607 |
| * SVB Financial Group | 5,427 | 603 |
| WR Berkley Corp. | 9,996 | 593 |
| CBOE Holdings Inc. | 8,606 | 591 |
7
| Vanguard® Russell 1000 Index Fund | |||
| Schedule of Investments | |||
| August 31, 2016 | |||
| Market | |||
| Value | |||
| Shares | ($000) | ||
| Assurant Inc. | 6,479 | 580 | |
| Brixmor Property Group Inc. | 20,290 | 580 | |
| Forest City Realty Trust Inc. Class A | 23,843 | 564 | |
| Senior Housing Properties Trust | 25,020 | 559 | |
| Starwood Property Trust Inc. | 24,391 | 559 | |
| Axis Capital Holdings Ltd. | 9,705 | 552 | |
| PacWest Bancorp | 12,741 | 552 | |
| American Financial Group Inc. | 7,325 | 550 | |
| Gaming and Leisure Properties Inc. | 16,003 | 547 | |
| Highwoods Properties Inc. | 10,313 | 547 | |
| East West Bancorp Inc. | 14,691 | 546 | |
| Jones Lang LaSalle Inc. | 4,663 | 544 | |
| Douglas Emmett Inc. | 14,433 | 542 | |
| Hospitality Properties Trust | 17,372 | 530 | |
| RenaissanceRe Holdings Ltd. | 4,421 | 529 | |
| People's United Financial Inc. | 32,223 | 524 | |
| EPR Properties | 6,652 | 521 | |
| Dun & Bradstreet Corp. | 3,764 | 518 | |
| Sun Communities Inc. | 6,740 | 516 | |
| CubeSmart | 18,646 | 513 | |
| Navient Corp. | 35,226 | 507 | |
| Lazard Ltd. Class A | 13,669 | 506 | |
| Weingarten Realty Investors | 12,187 | 503 | |
| Old Republic International Corp. | 25,643 | 493 | |
| First American Financial Corp. | 11,321 | 488 | |
| Healthcare Trust of America Inc. Class A | 14,373 | 485 | |
| DCT Industrial Trust Inc. | 9,764 | 476 | |
| STORE Capital Corp. | 15,982 | 474 | |
| Eaton Vance Corp. | 11,802 | 472 | |
| Taubman Centers Inc. | 6,060 | 471 | |
| * | First Data Corp. Class A | 33,673 | 469 |
| Brown & Brown Inc. | 12,029 | 451 | |
| Endurance Specialty Holdings Ltd. | 6,775 | 446 | |
| Synovus Financial Corp. | 13,342 | 441 | |
| * | Howard Hughes Corp. | 3,719 | 440 |
| * | Life Storage Inc. | 4,853 | 437 |
| Commerce Bancshares Inc. | 8,594 | 436 | |
| Popular Inc. | 11,067 | 435 | |
| Retail Properties of America Inc. | 24,534 | 417 | |
| * | Euronet Worldwide Inc. | 5,339 | 414 |
| Cullen/Frost Bankers Inc. | 5,668 | 413 | |
| Tanger Factory Outlet Centers Inc. | 10,103 | 411 | |
| White Mountains Insurance Group Ltd. | 498 | 410 | |
| * | WEX Inc. | 4,128 | 410 |
| Validus Holdings Ltd. | 7,976 | 405 | |
| Realogy Holdings Corp. | 15,050 | 404 | |
| * | Equity Commonwealth | 12,847 | 402 |
| Communications Sales & Leasing Inc. | 12,535 | 391 | |
| American Homes 4 Rent Class A | 17,825 | 390 | |
| Legg Mason Inc. | 11,264 | 390 | |
| * | CoreLogic Inc. | 9,455 | 388 |
| Assured Guaranty Ltd. | 13,857 | 385 | |
| CyrusOne Inc. | 7,561 | 384 | |
| Allied World Assurance Co. Holdings AG | 9,382 | 381 | |
| Post Properties Inc. | 5,664 | 375 | |
| First Horizon National Corp. | 24,318 | 374 | |
| * | Western Alliance Bancorp | 9,453 | 361 |
| *,^ | Zillow Group Inc. | 10,456 | 354 |
| Rayonier Inc. | 12,794 | 352 | |
| Hanover Insurance Group Inc. | 4,434 | 347 | |
| Piedmont Office Realty Trust Inc. Class A | 15,866 | 343 | |
| Paramount Group Inc. | 18,848 | 339 | |
| Apple Hospitality REIT Inc. | 17,192 | 337 | |
| Chimera Investment Corp. | 20,019 | 330 | |
8
| Vanguard® Russell 1000 Index Fund | |||
| Schedule of Investments | |||
| August 31, 2016 | |||
| Market | |||
| Value | |||
| Shares | ($000) | ||
| BankUnited Inc. | 10,210 | 328 | |
| Two Harbors Investment Corp. | 36,516 | 325 | |
| * | SLM Corp. | 42,701 | 317 |
| Bank of Hawaii Corp. | 4,358 | 314 | |
| MFA Financial Inc. | 40,491 | 313 | |
| Associated Banc-Corp | 15,620 | 310 | |
| Equity One Inc. | 9,923 | 308 | |
| Federated Investors Inc. Class B | 9,456 | 305 | |
| ProAssurance Corp. | 5,506 | 303 | |
| Columbia Property Trust Inc. | 12,693 | 299 | |
| Brandywine Realty Trust | 18,016 | 291 | |
| Corporate Office Properties Trust | 10,009 | 285 | |
| Aspen Insurance Holdings Ltd. | 6,101 | 280 | |
| LPL Financial Holdings Inc. | 9,340 | 278 | |
| Erie Indemnity Co. Class A | 2,677 | 273 | |
| Empire State Realty Trust Inc. | 12,155 | 261 | |
| NorthStar Realty Finance Corp. | 19,424 | 259 | |
| Care Capital Properties Inc. | 8,580 | 257 | |
| AmTrust Financial Services Inc. | 9,641 | 255 | |
| TCF Financial Corp. | 16,574 | 243 | |
| Interactive Brokers Group Inc. | 6,551 | 235 | |
| NorthStar Asset Management Group Inc. | 18,858 | 234 | |
| Corrections Corp. of America | 12,311 | 196 | |
| *,^ | Zillow Group Inc. Class A | 5,653 | 191 |
| BOK Financial Corp. | 2,679 | 185 | |
| * | OneMain Holdings Inc. Class A | 5,840 | 181 |
| * | TransUnion | 5,450 | 180 |
| * | Credit Acceptance Corp. | 892 | 178 |
| Morningstar Inc. | 1,850 | 154 | |
| Mercury General Corp. | 2,617 | 142 | |
| * | Santander Consumer USA Holdings Inc. | 10,656 | 134 |
| TFS Financial Corp. | 6,635 | 120 | |
| American National Insurance Co. | 837 | 98 | |
| Artisan Partners Asset Management Inc. Class A | 3,461 | 91 | |
| CNA Financial Corp. | 2,572 | 86 | |
| * | Square Inc. | 5,328 | 65 |
| 433,164 | |||
| Health Care (14.0%) | |||
| Johnson & Johnson | 290,273 | 34,641 | |
| Pfizer Inc. | 634,818 | 22,092 | |
| Merck & Co. Inc. | 292,677 | 18,377 | |
| Amgen Inc. | 79,380 | 13,499 | |
| UnitedHealth Group Inc. | 99,051 | 13,476 | |
| Medtronic plc | 148,179 | 12,896 | |
| Gilead Sciences Inc. | 139,962 | 10,970 | |
| AbbVie Inc. | 170,938 | 10,957 | |
| Bristol-Myers Squibb Co. | 176,401 | 10,124 | |
| * | Allergan plc | 41,773 | 9,797 |
| * | Celgene Corp. | 81,180 | 8,665 |
| Eli Lilly & Co. | 103,014 | 8,009 | |
| * | Biogen Inc. | 23,112 | 7,064 |
| Abbott Laboratories | 155,048 | 6,515 | |
| Thermo Fisher Scientific Inc. | 41,436 | 6,306 | |
| Danaher Corp. | 63,912 | 5,203 | |
| * | Express Scripts Holding Co. | 66,815 | 4,857 |
| McKesson Corp. | 23,734 | 4,382 | |
| Aetna Inc. | 35,888 | 4,203 | |
| Stryker Corp. | 35,543 | 4,111 | |
| Becton Dickinson and Co. | 22,096 | 3,916 | |
| Anthem Inc. | 27,812 | 3,479 | |
| Cigna Corp. | 26,822 | 3,440 | |
| * | Boston Scientific Corp. | 142,370 | 3,391 |
| * | Regeneron Pharmaceuticals Inc. | 8,196 | 3,217 |
| * | Alexion Pharmaceuticals Inc. | 22,934 | 2,887 |
9
| Vanguard® Russell 1000 Index Fund | ||
| Schedule of Investments | ||
| August 31, 2016 | ||
| Market | ||
| Value | ||
| Shares | ($000) | |
| Humana Inc. | 15,693 | 2,805 |
| Cardinal Health Inc. | 34,508 | 2,749 |
| * Intuitive Surgical Inc. | 3,965 | 2,722 |
| * Illumina Inc. | 15,437 | 2,599 |
| * Edwards Lifesciences Corp. | 22,269 | 2,565 |
| Zimmer Biomet Holdings Inc. | 19,520 | 2,530 |
| Zoetis Inc. | 48,170 | 2,462 |
| Baxter International Inc. | 52,619 | 2,459 |
| * Vertex Pharmaceuticals Inc. | 26,001 | 2,457 |
| * HCA Holdings Inc. | 32,231 | 2,435 |
| St. Jude Medical Inc. | 29,178 | 2,274 |
| * Mylan NV | 48,387 | 2,050 |
| * Cerner Corp. | 30,892 | 1,994 |
| CR Bard Inc. | 7,784 | 1,719 |
| * BioMarin Pharmaceutical Inc. | 18,012 | 1,691 |
| AmerisourceBergen Corp. Class A | 18,758 | 1,631 |
| Agilent Technologies Inc. | 34,319 | 1,612 |
| Dentsply Sirona Inc. | 24,330 | 1,495 |
| * Laboratory Corp. of America Holdings | 10,817 | 1,481 |
| * Henry Schein Inc. | 8,648 | 1,416 |
| * Incyte Corp. | 17,068 | 1,384 |
| * Medivation Inc. | 16,855 | 1,358 |
| Perrigo Co. plc | 14,432 | 1,313 |
| Quest Diagnostics Inc. | 14,997 | 1,242 |
| * Centene Corp. | 17,607 | 1,202 |
| * DaVita HealthCare Partners Inc. | 17,592 | 1,137 |
| * Hologic Inc. | 29,517 | 1,134 |
| Universal Health Services Inc. Class B | 9,049 | 1,091 |
| * IDEXX Laboratories Inc. | 9,361 | 1,055 |
| ResMed Inc. | 14,684 | 979 |
| * Varian Medical Systems Inc. | 9,891 | 951 |
| Cooper Cos. Inc. | 4,954 | 921 |
| * Mallinckrodt plc | 11,500 | 857 |
| Teleflex Inc. | 4,665 | 854 |
| * DexCom Inc. | 8,643 | 787 |
| * Align Technology Inc. | 7,497 | 697 |
| * Alkermes plc | 15,821 | 693 |
| * Quintiles Transnational Holdings Inc. | 8,504 | 657 |
| * MEDNAX Inc. | 9,739 | 641 |
| * QIAGEN NV | 23,731 | 629 |
| West Pharmaceutical Services Inc. | 7,574 | 620 |
| PerkinElmer Inc. | 11,373 | 606 |
| * VCA Inc. | 8,028 | 568 |
| * United Therapeutics Corp. | 4,562 | 558 |
| * Alnylam Pharmaceuticals Inc. | 7,746 | 541 |
| * WellCare Health Plans Inc. | 4,687 | 528 |
| * athenahealth Inc. | 4,139 | 507 |
| * ABIOMED Inc. | 4,208 | 496 |
| * Endo International plc | 21,854 | 452 |
| * Neurocrine Biosciences Inc. | 9,150 | 443 |
| * Seattle Genetics Inc. | 9,872 | 440 |
| * Veeva Systems Inc. Class A | 10,332 | 423 |
| * Charles River Laboratories International Inc. | 4,933 | 411 |
| * Envision Healthcare Holdings Inc. | 19,111 | 410 |
| Patterson Cos. Inc. | 8,855 | 407 |
| Bio-Techne Corp. | 3,820 | 402 |
| Hill-Rom Holdings Inc. | 6,726 | 399 |
| * Acadia Healthcare Co. Inc. | 7,444 | 381 |
| * Amsurg Corp. | 5,747 | 373 |
| * Ionis Pharmaceuticals Inc. | 12,573 | 373 |
| * Alere Inc. | 8,946 | 350 |
| * Brookdale Senior Living Inc. | 19,261 | 332 |
| * ACADIA Pharmaceuticals Inc. | 10,258 | 330 |
| * Bio-Rad Laboratories Inc. Class A | 2,155 | 321 |
10
| Vanguard® Russell 1000 Index Fund | |||
| Schedule of Investments | |||
| August 31, 2016 | |||
| Market | |||
| Value | |||
| Shares | ($000) | ||
| *,^ | OPKO Health Inc. | 32,707 | 298 |
| * | Allscripts Healthcare Solutions Inc. | 20,112 | 260 |
| * | Intercept Pharmaceuticals Inc. | 1,729 | 256 |
| Bruker Corp. | 11,081 | 248 | |
| * | LifePoint Health Inc. | 4,149 | 235 |
| * | Akorn Inc. | 8,462 | 228 |
| * | VWR Corp. | 7,934 | 221 |
| * | Tenet Healthcare Corp. | 8,095 | 193 |
| * | Juno Therapeutics Inc. | 6,383 | 189 |
| * | Premier Inc. Class A | 4,846 | 153 |
| * | Intrexon Corp. | 5,866 | 148 |
| * | Agios Pharmaceuticals Inc. | 3,088 | 114 |
| * | Quorum Health Corp. | 35 | — |
| 312,416 | |||
| Materials & Processing (3.6%) | |||
| EI du Pont de Nemours & Co. | 92,329 | 6,426 | |
| Dow Chemical Co. | 118,574 | 6,360 | |
| Monsanto Co. | 46,058 | 4,905 | |
| Praxair Inc. | 30,050 | 3,667 | |
| Ecolab Inc. | 27,442 | 3,377 | |
| Air Products & Chemicals Inc. | 20,676 | 3,218 | |
| PPG Industries Inc. | 27,989 | 2,963 | |
| LyondellBasell Industries NV Class A | 36,604 | 2,888 | |
| Sherwin-Williams Co. | 8,485 | 2,407 | |
| Newmont Mining Corp. | 56,190 | 2,149 | |
| International Paper Co. | 43,314 | 2,100 | |
| Ingersoll-Rand plc | 27,291 | 1,855 | |
| Nucor Corp. | 33,327 | 1,617 | |
| Vulcan Materials Co. | 13,961 | 1,590 | |
| Freeport-McMoRan Inc. | 140,914 | 1,450 | |
| Ball Corp. | 17,966 | 1,423 | |
| Alcoa Inc. | 138,820 | 1,399 | |
| Fastenal Co. | 30,245 | 1,304 | |
| WestRock Co. | 26,474 | 1,268 | |
| Acuity Brands Inc. | 4,566 | 1,256 | |
| Masco Corp. | 34,892 | 1,238 | |
| Martin Marietta Materials Inc. | 6,659 | 1,219 | |
| International Flavors & Fragrances Inc. | 8,357 | 1,158 | |
| Mosaic Co. | 36,760 | 1,105 | |
| Eastman Chemical Co. | 15,417 | 1,047 | |
| Celanese Corp. Class A | 15,511 | 999 | |
| Sealed Air Corp. | 20,675 | 974 | |
| Albemarle Corp. | 11,664 | 933 | |
| Valspar Corp. | 8,267 | 871 | |
| Ashland Inc. | 6,627 | 776 | |
| Packaging Corp. of America | 9,842 | 774 | |
| * | Crown Holdings Inc. | 14,229 | 772 |
| RPM International Inc. | 13,717 | 748 | |
| Owens Corning | 12,138 | 667 | |
| FMC Corp. | 14,192 | 666 | |
| Lennox International Inc. | 4,124 | 664 | |
| CF Industries Holdings Inc. | 24,785 | 644 | |
| Steel Dynamics Inc. | 24,558 | 605 | |
| WR Grace & Co. | 7,473 | 584 | |
| * | Berry Plastics Group Inc. | 12,846 | 583 |
| Reliance Steel & Aluminum Co. | 7,361 | 531 | |
| Sonoco Products Co. | 10,294 | 530 | |
| Bemis Co. Inc. | 9,942 | 523 | |
| Royal Gold Inc. | 6,917 | 507 | |
| * | Axalta Coating Systems Ltd. | 17,532 | 502 |
| AptarGroup Inc. | 6,415 | 500 | |
| Graphic Packaging Holding Co. | 33,846 | 485 | |
| Hexcel Corp. | 9,451 | 424 | |
| Tahoe Resources Inc. | 31,957 | 417 | |
11
| Vanguard® Russell 1000 Index Fund | ||
| Schedule of Investments | ||
| August 31, 2016 | ||
| Market | ||
| Value | ||
| Shares | ($000) | |
| Watsco Inc. | 2,750 | 407 |
| Eagle Materials Inc. | 5,038 | 405 |
| Scotts Miracle-Gro Co. Class A | 4,729 | 392 |
| Huntsman Corp. | 21,283 | 368 |
| NewMarket Corp. | 794 | 345 |
| United States Steel Corp. | 16,547 | 322 |
| Cabot Corp. | 6,402 | 319 |
| * Owens-Illinois Inc. | 16,836 | 302 |
| Valmont Industries Inc. | 2,267 | 296 |
| Compass Minerals International Inc. | 3,678 | 274 |
| * USG Corp. | 8,977 | 246 |
| Domtar Corp. | 6,431 | 240 |
| Timken Co. | 6,992 | 237 |
| Southern Copper Corp. | 8,451 | 218 |
| Silgan Holdings Inc. | 4,351 | 209 |
| * Armstrong World Industries Inc. | 4,708 | 205 |
| Westlake Chemical Corp. | 3,905 | 202 |
| * Platform Specialty Products Corp. | 16,262 | 147 |
| 80,202 | ||
| Producer Durables (10.2%) | ||
| General Electric Co. | 972,045 | 30,367 |
| 3M Co. | 62,094 | 11,130 |
| Honeywell International Inc. | 80,379 | 9,381 |
| United Technologies Corp. | 81,984 | 8,726 |
| Union Pacific Corp. | 89,023 | 8,504 |
| Boeing Co. | 62,995 | 8,155 |
| United Parcel Service Inc. Class B | 72,889 | 7,961 |
| Accenture plc Class A | 65,823 | 7,570 |
| Lockheed Martin Corp. | 26,843 | 6,522 |
| Caterpillar Inc. | 58,812 | 4,820 |
| Raytheon Co. | 31,359 | 4,394 |
| FedEx Corp. | 26,294 | 4,337 |
| Automatic Data Processing Inc. | 48,089 | 4,319 |
| General Dynamics Corp. | 25,764 | 3,922 |
| Northrop Grumman Corp. | 17,574 | 3,727 |
| Illinois Tool Works Inc. | 30,959 | 3,680 |
| Emerson Electric Co. | 67,624 | 3,562 |
| Eaton Corp. plc | 48,271 | 3,212 |
| Delta Air Lines Inc. | 81,510 | 2,996 |
| Waste Management Inc. | 46,788 | 2,992 |
| Norfolk Southern Corp. | 31,133 | 2,923 |
| CSX Corp. | 100,834 | 2,852 |
| Deere & Co. | 33,186 | 2,806 |
| Southwest Airlines Co. | 67,292 | 2,482 |
| PACCAR Inc. | 35,966 | 2,152 |
| Cummins Inc. | 16,561 | 2,080 |
| Paychex Inc. | 33,979 | 2,062 |
| American Airlines Group Inc. | 55,968 | 2,032 |
| Stanley Black & Decker Inc. | 15,657 | 1,938 |
| Roper Technologies Inc. | 10,487 | 1,862 |
| Tyco International plc | 42,128 | 1,840 |
| * United Continental Holdings Inc. | 35,202 | 1,775 |
| Parker-Hannifin Corp. | 14,008 | 1,716 |
| Fortive Corp. | 32,548 | 1,714 |
| Rockwell Automation Inc. | 13,692 | 1,587 |
| * TransDigm Group Inc. | 5,236 | 1,493 |
| WW Grainger Inc. | 5,831 | 1,345 |
| * Verisk Analytics Inc. Class A | 16,019 | 1,330 |
| * Waters Corp. | 8,012 | 1,260 |
| Republic Services Inc. Class A | 24,762 | 1,251 |
| L-3 Communications Holdings Inc. | 8,107 | 1,207 |
| AMETEK Inc. | 24,272 | 1,183 |
| Dover Corp. | 16,172 | 1,172 |
| Textron Inc. | 28,612 | 1,169 |
12
| Vanguard® Russell 1000 Index Fund | ||
| Schedule of Investments | ||
| August 31, 2016 | ||
| Market | ||
| Value | ||
| Shares | ($000) | |
| Rockwell Collins Inc. | 13,724 | 1,149 |
| Pentair plc | 17,603 | 1,128 |
| * Mettler-Toledo International Inc. | 2,789 | 1,124 |
| Cintas Corp. | 9,395 | 1,104 |
| Kansas City Southern | 11,306 | 1,094 |
| CH Robinson Worldwide Inc. | 15,141 | 1,051 |
| Xerox Corp. | 104,885 | 1,033 |
| Expeditors International of Washington Inc. | 19,231 | 974 |
| Xylem Inc. | 18,881 | 960 |
| Snap-on Inc. | 6,139 | 941 |
| Alaska Air Group Inc. | 12,784 | 863 |
| Huntington Ingalls Industries Inc. | 4,945 | 817 |
| * United Rentals Inc. | 9,372 | 771 |
| Fluor Corp. | 14,797 | 768 |
| * HD Supply Holdings Inc. | 21,193 | 765 |
| * Middleby Corp. | 5,898 | 756 |
| * Stericycle Inc. | 8,748 | 752 |
| IDEX Corp. | 8,038 | 751 |
| JB Hunt Transport Services Inc. | 9,314 | 739 |
| AO Smith Corp. | 7,654 | 738 |
| Allegion plc | 10,252 | 730 |
| * Trimble Navigation Ltd. | 26,513 | 726 |
| Avery Dennison Corp. | 9,316 | 721 |
| * CoStar Group Inc. | 3,406 | 706 |
| Carlisle Cos. Inc. | 6,668 | 699 |
| Wabtec Corp. | 9,009 | 690 |
| Flowserve Corp. | 13,734 | 664 |
| * Jacobs Engineering Group Inc. | 12,483 | 658 |
| Macquarie Infrastructure Corp. | 7,886 | 630 |
| * Spirit AeroSystems Holdings Inc. Class A | 13,666 | 626 |
| Hubbell Inc. Class B | 5,691 | 616 |
| Nordson Corp. | 5,939 | 586 |
| * Keysight Technologies Inc. | 18,284 | 556 |
| Toro Co. | 5,695 | 553 |
| B/E Aerospace Inc. | 10,938 | 553 |
| ManpowerGroup Inc. | 7,600 | 543 |
| * JetBlue Airways Corp. | 33,752 | 538 |
| * Copart Inc. | 10,265 | 524 |
| * Old Dominion Freight Line Inc. | 7,295 | 519 |
| Robert Half International Inc. | 13,483 | 517 |
| Donaldson Co. Inc. | 13,516 | 508 |
| * AECOM | 15,780 | 487 |
| Orbital ATK Inc. | 6,001 | 453 |
| FLIR Systems Inc. | 14,501 | 447 |
| Graco Inc. | 5,727 | 422 |
| Lincoln Electric Holdings Inc. | 6,522 | 415 |
| Oshkosh Corp. | 7,624 | 411 |
| * Genesee & Wyoming Inc. Class A | 5,913 | 402 |
| Allison Transmission Holdings Inc. | 14,374 | 399 |
| Trinity Industries Inc. | 16,034 | 392 |
| BWX Technologies Inc. | 10,031 | 389 |
| * Quanta Services Inc. | 15,098 | 388 |
| * Zebra Technologies Corp. | 5,475 | 383 |
| Crane Co. | 5,903 | 380 |
| Pitney Bowes Inc. | 20,019 | 376 |
| RR Donnelley & Sons Co. | 21,927 | 375 |
| Ryder System Inc. | 5,697 | 373 |
| * Genpact Ltd. | 15,753 | 373 |
| Booz Allen Hamilton Holding Corp. Class A | 12,254 | 372 |
| AGCO Corp. | 7,430 | 361 |
| ^ MSC Industrial Direct Co. Inc. Class A | 4,911 | 359 |
| ITT Inc. | 9,419 | 341 |
| Chicago Bridge & Iron Co. NV | 10,987 | 327 |
| * Colfax Corp. | 10,589 | 314 |
13
| Vanguard® Russell 1000 Index Fund | ||
| Schedule of Investments | ||
| August 31, 2016 | ||
| Market | ||
| Value | ||
| Shares | ($000) | |
| * Spirit Airlines Inc. | 7,788 | 311 |
| National Instruments Corp. | 11,041 | 309 |
| Landstar System Inc. | 4,434 | 307 |
| Air Lease Corp. Class A | 10,289 | 302 |
| * Kirby Corp. | 5,719 | 298 |
| Regal Beloit Corp. | 4,811 | 295 |
| Rollins Inc. | 10,317 | 294 |
| * WESCO International Inc. | 4,526 | 281 |
| Terex Corp. | 11,356 | 276 |
| * Clean Harbors Inc. | 5,566 | 266 |
| ^ Copa Holdings SA Class A | 3,275 | 250 |
| Lexmark International Inc. Class A | 6,238 | 223 |
| * Manitowoc Foodservice Inc. | 13,835 | 223 |
| HEICO Corp. Class A | 3,872 | 220 |
| KBR Inc. | 14,561 | 214 |
| Covanta Holding Corp. | 11,671 | 174 |
| HEICO Corp. | 1,869 | 127 |
| * Herc Holdings Inc. | 2,314 | 78 |
| 228,036 | ||
| Technology (17.4%) | ||
| Apple Inc. | 578,995 | 61,431 |
| Microsoft Corp. | 800,109 | 45,974 |
| * Facebook Inc. Class A | 237,040 | 29,896 |
| * Alphabet Inc. Class A | 31,114 | 24,575 |
| * Alphabet Inc. Class C | 31,240 | 23,963 |
| Intel Corp. | 499,388 | 17,923 |
| Cisco Systems Inc. | 531,729 | 16,718 |
| International Business Machines Corp. | 92,855 | 14,753 |
| Oracle Corp. | 312,366 | 12,876 |
| QUALCOMM Inc. | 155,179 | 9,787 |
| Texas Instruments Inc. | 106,210 | 7,386 |
| Broadcom Ltd. | 39,822 | 7,025 |
| EMC Corp. | 206,048 | 5,973 |
| * salesforce.com Inc. | 67,549 | 5,365 |
| * Adobe Systems Inc. | 51,482 | 5,267 |
| * Yahoo! Inc. | 91,637 | 3,917 |
| Hewlett Packard Enterprise Co. | 182,245 | 3,915 |
| * Cognizant Technology Solutions Corp. Class A | 63,705 | 3,659 |
| Applied Materials Inc. | 114,745 | 3,424 |
| NVIDIA Corp. | 53,726 | 3,296 |
| Intuit Inc. | 25,768 | 2,872 |
| HP Inc. | 183,000 | 2,630 |
| Corning Inc. | 113,489 | 2,575 |
| * Electronic Arts Inc. | 30,666 | 2,491 |
| Activision Blizzard Inc. | 59,059 | 2,443 |
| * LinkedIn Corp. Class A | 12,399 | 2,390 |
| Analog Devices Inc. | 32,196 | 2,014 |
| Amphenol Corp. Class A | 31,720 | 1,976 |
| * Micron Technology Inc. | 108,783 | 1,794 |
| Lam Research Corp. | 16,780 | 1,566 |
| Symantec Corp. | 64,430 | 1,555 |
| * SBA Communications Corp. Class A | 13,163 | 1,503 |
| Skyworks Solutions Inc. | 20,026 | 1,499 |
| * Autodesk Inc. | 22,180 | 1,495 |
| Linear Technology Corp. | 25,194 | 1,467 |
| Xilinx Inc. | 26,695 | 1,447 |
| * Citrix Systems Inc. | 16,355 | 1,426 |
| Motorola Solutions Inc. | 18,465 | 1,422 |
| * Red Hat Inc. | 19,038 | 1,389 |
| Western Digital Corp. | 29,627 | 1,383 |
| Microchip Technology Inc. | 22,072 | 1,366 |
| * Twitter Inc. | 66,984 | 1,287 |
| Harris Corp. | 13,207 | 1,228 |
| Maxim Integrated Products Inc. | 29,940 | 1,219 |
14
| Vanguard® Russell 1000 Index Fund | |||
| Schedule of Investments | |||
| August 31, 2016 | |||
| Market | |||
| Value | |||
| Shares | ($000) | ||
| * | ServiceNow Inc. | 16,733 | 1,216 |
| * | Palo Alto Networks Inc. | 9,088 | 1,210 |
| KLA-Tencor Corp. | 16,424 | 1,138 | |
| NetApp Inc. | 30,699 | 1,062 | |
| CA Inc. | 30,427 | 1,032 | |
| * | Workday Inc. Class A | 12,133 | 1,029 |
| * | Akamai Technologies Inc. | 18,179 | 998 |
| CDK Global Inc. | 16,341 | 947 | |
| Amdocs Ltd. | 15,633 | 940 | |
| * | Synopsys Inc. | 15,785 | 936 |
| Juniper Networks Inc. | 39,288 | 907 | |
| * | ANSYS Inc. | 9,410 | 895 |
| * | F5 Networks Inc. | 7,049 | 865 |
| * | Splunk Inc. | 13,886 | 809 |
| * | Cadence Design Systems Inc. | 31,446 | 800 |
| * | Gartner Inc. | 8,443 | 768 |
| * | Qorvo Inc. | 13,266 | 762 |
| CDW Corp. | 17,007 | 759 | |
| * | VeriSign Inc. | 10,010 | 745 |
| Computer Sciences Corp. | 14,649 | 689 | |
| *,^ | VMware Inc. Class A | 8,465 | 621 |
| * | Arrow Electronics Inc. | 9,378 | 617 |
| Sabre Corp. | 21,779 | 613 | |
| * | Ultimate Software Group Inc. | 2,911 | 608 |
| SS&C Technologies Holdings Inc. | 17,417 | 574 | |
| * | Tyler Technologies Inc. | 3,472 | 569 |
| Avnet Inc. | 13,580 | 566 | |
| ^ | Leidos Holdings Inc. | 13,870 | 562 |
| * | ARRIS International plc | 19,769 | 555 |
| * | Fortinet Inc. | 15,345 | 555 |
| Marvell Technology Group Ltd. | 43,147 | 535 | |
| Ingram Micro Inc. | 15,157 | 530 | |
| * | PTC Inc. | 12,004 | 512 |
| * | IMS Health Holdings Inc. | 16,381 | 488 |
| * | ON Semiconductor Corp. | 44,078 | 476 |
| * | Guidewire Software Inc. | 7,662 | 471 |
| * | NetSuite Inc. | 4,268 | 465 |
| FEI Co. | 4,352 | 463 | |
| * | Manhattan Associates Inc. | 7,628 | 462 |
| Brocade Communications Systems Inc. | 49,515 | 445 | |
| IAC/InterActiveCorp | 7,570 | 444 | |
| Teradyne Inc. | 21,047 | 443 | |
| CSRA Inc. | 17,398 | 442 | |
| * | NCR Corp. | 13,008 | 440 |
| * | Teradata Corp. | 13,776 | 437 |
| Cognex Corp. | 8,492 | 423 | |
| DST Systems Inc. | 3,373 | 410 | |
| Jabil Circuit Inc. | 19,264 | 408 | |
| * | CommScope Holding Co. Inc. | 13,766 | 407 |
| Cypress Semiconductor Corp. | 32,931 | 393 | |
| * | Rackspace Hosting Inc. | 11,351 | 357 |
| * | Nuance Communications Inc. | 23,675 | 345 |
| * | Tableau Software Inc. Class A | 5,855 | 340 |
| * | IPG Photonics Corp. | 3,778 | 329 |
| * | Arista Networks Inc. | 3,995 | 318 |
| * | Yelp Inc. Class A | 7,090 | 273 |
| Dolby Laboratories Inc. Class A | 5,525 | 270 | |
| * | Cree Inc. | 10,003 | 240 |
| * | VeriFone Systems Inc. | 11,466 | 228 |
| * | FireEye Inc. | 15,164 | 218 |
| * | Zynga Inc. Class A | 78,402 | 214 |
| * | Groupon Inc. Class A | 37,034 | 197 |
| * | EchoStar Corp. Class A | 4,627 | 179 |
| * | GoDaddy Inc. Class A | 4,793 | 155 |
15
| Vanguard® Russell 1000 Index Fund | |||
| Schedule of Investments | |||
| August 31, 2016 | |||
| Market | |||
| Value | |||
| Shares | ($000) | ||
| * | Black Knight Financial Services Inc. Class A | 2,578 | 101 |
| * | Inovalon Holdings Inc. Class A | 6,037 | 95 |
| * | Atlassian Corp. plc Class A | 2,456 | 72 |
| * | Match Group Inc. | 3,460 | 56 |
| * | CommerceHub Inc. | 2,775 | 41 |
| * | CommerceHub Inc. Class A | 1,389 | 21 |
| 387,050 | |||
| Utilities (5.7%) | |||
| AT&T Inc. | 650,727 | 26,602 | |
| Verizon Communications Inc. | 430,977 | 22,553 | |
| NextEra Energy Inc. | 48,627 | 5,881 | |
| Duke Energy Corp. | 72,920 | 5,809 | |
| Southern Co. | 99,192 | 5,092 | |
| Dominion Resources Inc. | 65,044 | 4,824 | |
| American Electric Power Co. Inc. | 51,960 | 3,355 | |
| PG&E Corp. | 52,407 | 3,246 | |
| Exelon Corp. | 93,708 | 3,186 | |
| Sempra Energy | 26,400 | 2,762 | |
| PPL Corp. | 71,548 | 2,488 | |
| Edison International | 33,366 | 2,426 | |
| Consolidated Edison Inc. | 32,206 | 2,424 | |
| Public Service Enterprise Group Inc. | 53,034 | 2,268 | |
| Xcel Energy Inc. | 53,667 | 2,220 | |
| WEC Energy Group Inc. | 33,423 | 2,001 | |
| Eversource Energy | 33,247 | 1,794 | |
| DTE Energy Co. | 18,937 | 1,759 | |
| CenturyLink Inc. | 56,505 | 1,571 | |
| * | Level 3 Communications Inc. | 30,725 | 1,525 |
| Entergy Corp. | 18,818 | 1,472 | |
| FirstEnergy Corp. | 44,898 | 1,470 | |
| * | T-Mobile US Inc. | 30,008 | 1,391 |
| American Water Works Co. Inc. | 18,787 | 1,390 | |
| Ameren Corp. | 25,614 | 1,266 | |
| CMS Energy Corp. | 29,316 | 1,230 | |
| CenterPoint Energy Inc. | 45,745 | 1,028 | |
| SCANA Corp. | 13,770 | 973 | |
| Alliant Energy Corp. | 24,164 | 917 | |
| Pinnacle West Capital Corp. | 11,596 | 870 | |
| AES Corp. | 70,396 | 850 | |
| UGI Corp. | 18,053 | 821 | |
| Westar Energy Inc. Class A | 14,831 | 815 | |
| NiSource Inc. | 33,453 | 801 | |
| Atmos Energy Corp. | 10,611 | 782 | |
| ITC Holdings Corp. | 15,881 | 718 | |
| OGE Energy Corp. | 20,874 | 650 | |
| Frontier Communications Corp. | 123,511 | 568 | |
| Aqua America Inc. | 18,529 | 563 | |
| Piedmont Natural Gas Co. Inc. | 8,488 | 510 | |
| * | Zayo Group Holdings Inc. | 17,554 | 509 |
| *,^ | Sprint Corp. | 80,605 | 498 |
| MDU Resources Group Inc. | 20,280 | 478 | |
| Questar Corp. | 18,952 | 474 | |
| * | Calpine Corp. | 36,536 | 456 |
| National Fuel Gas Co. | 7,768 | 443 | |
| Great Plains Energy Inc. | 16,015 | 435 | |
| Vectren Corp. | 8,668 | 424 | |
| NRG Energy Inc. | 33,843 | 410 | |
| Hawaiian Electric Industries Inc. | 11,259 | 338 | |
| Telephone & Data Systems Inc. | 10,365 | 289 | |
| Avangrid Inc. | 6,115 | 254 | |
| * | United States Cellular Corp. | 1,195 | 44 |
| 127,923 | |||
| Total Common Stocks (Cost $1,899,451) | 2,220,217 | ||
16
| Vanguard® Russell 1000 Index Fund | |||||
| Schedule of Investments | |||||
| August 31, 2016 | |||||
| Market | |||||
| Value | |||||
| Coupon | Shares | ($000) | |||
| Temporary Cash Investments (0.3%)1 | |||||
| Money Market Fund (0.3%) | |||||
| 2,3 | Vanguard Market Liquidity Fund | 0.612% | 66,306 | 6,631 | |
| Face | |||||
| Maturity | Amount | ||||
| Date | ($000) | ||||
| U.S. Government and Agency Obligations (0.0%) | |||||
| 4,5 | Federal Home Loan Bank Discount Notes | 0.501% | 10/19/16 | 300 | 300 |
| 4 | Federal Home Loan Bank Discount Notes | 0.401% | 12/23/16 | 100 | 100 |
| 6 | Freddie Mac Discount Notes | 0.300% | 11/8/16 | 100 | 100 |
| 500 | |||||
| Total Temporary Cash Investments (Cost $7,131) | 7,131 | ||||
| Total Investments (100.0%) (Cost $1,906,582) | 2,227,348 | ||||
| Other Assets and Liabilities—Net (0.0%)3 | 654 | ||||
| Net Assets (100%) | 2,228,002 | ||||
| * | Non-income-producing security. |
| ^ | Includes partial security positions on loan to broker-dealers. The total value of securities on loan is $3,422,000. |
| 1 | The fund invests a portion of its cash reserves in equity markets through the use of index futures contracts. After giving effect to futures investments, the fund's effective common stock and temporary cash investment positions represent 100.0% and 0.0%, respectively, of net assets. |
| 2 | Affiliated money market fund available only to Vanguard funds and certain trusts and accounts managed by Vanguard. Rate shown is the 7-day yield. |
| 3 | Includes $3,619,000 of collateral received for securities on loan. |
| 4 | The issuer operates under a congressional charter; its securities are generally neither guaranteed by the U.S. Treasury nor backed by the full faith and credit of the U.S. government. |
| 5 | Securities with a value of $300,000 have been segregated as initial margin for open futures contracts. |
| 6 | The issuer was placed under federal conservatorship in September 2008; since that time, its daily operations have been managed by the Federal Housing Finance Agency and it receives capital from the U.S. Treasury, as needed to maintain a positive net worth, in exchange for senior preferred stock. |
| REIT—Real Estate Investment Trust. |
17
| Vanguard® Russell 1000 Value Index Fund | ||
| Schedule of Investments | ||
| August 31, 2016 | ||
| Market | ||
| Value | ||
| Shares | ($000) | |
| Common Stocks (99.7%)1 | ||
| Consumer Discretionary (5.9%) | ||
| Wal-Mart Stores Inc. | 308,761 | 22,058 |
| Ford Motor Co. | 793,233 | 9,995 |
| General Motors Co. | 286,325 | 9,140 |
| Target Corp. | 107,413 | 7,539 |
| Time Warner Inc. | 54,850 | 4,301 |
| Johnson Controls Inc. | 92,530 | 4,060 |
| Carnival Corp. | 82,936 | 3,964 |
| L Brands Inc. | 40,238 | 3,067 |
| Royal Caribbean Cruises Ltd. | 34,289 | 2,438 |
| Whirlpool Corp. | 13,604 | 2,430 |
| Comcast Corp. Class A | 36,743 | 2,398 |
| Macy's Inc. | 62,688 | 2,268 |
| Best Buy Co. Inc. | 56,769 | 2,184 |
| * MGM Resorts International | 87,256 | 2,085 |
| PVH Corp. | 16,375 | 1,765 |
| Coach Inc. | 45,706 | 1,745 |
| Kohl's Corp. | 37,527 | 1,665 |
| Tiffany & Co. | 22,297 | 1,591 |
| Goodyear Tire & Rubber Co. | 54,091 | 1,588 |
| * Liberty Broadband Corp. | 20,586 | 1,411 |
| News Corp. Class A | 97,787 | 1,375 |
| BorgWarner Inc. | 38,851 | 1,336 |
| Bed Bath & Beyond Inc. | 27,132 | 1,258 |
| * Liberty SiriusXM Group | 37,322 | 1,240 |
| Twenty-First Century Fox Inc. Class A | 48,695 | 1,195 |
| Staples Inc. | 131,563 | 1,126 |
| Ralph Lauren Corp. Class A | 10,809 | 1,120 |
| Garmin Ltd. | 22,707 | 1,114 |
| Starwood Hotels & Resorts Worldwide Inc. | 14,116 | 1,093 |
| Aramark | 28,096 | 1,066 |
| Gap Inc. | 42,532 | 1,058 |
| PulteGroup Inc. | 49,376 | 1,055 |
| * Norwegian Cruise Line Holdings Ltd. | 29,384 | 1,055 |
| DR Horton Inc. | 31,308 | 1,004 |
| H&R Block Inc. | 45,798 | 992 |
| TEGNA Inc. | 44,371 | 899 |
| * Liberty Ventures Class A | 22,285 | 859 |
| Nielsen Holdings plc | 16,033 | 854 |
| * Liberty Interactive Corp. QVC Group Class A | 39,579 | 836 |
| Lennar Corp. Class A | 17,086 | 808 |
| CST Brands Inc. | 15,076 | 721 |
| Harman International Industries Inc. | 7,635 | 647 |
| * Madison Square Garden Co. Class A | 3,526 | 637 |
| * Liberty SiriusXM Group Class A | 18,887 | 633 |
| * JC Penney Co. Inc. | 63,692 | 601 |
| ^ GameStop Corp. Class A | 20,858 | 592 |
| Twenty-First Century Fox Inc. | 23,792 | 591 |
| * Hertz Global Holdings Inc. | 11,799 | 581 |
| * Mohawk Industries Inc. | 2,643 | 562 |
| Tribune Media Co. Class A | 14,367 | 547 |
| John Wiley & Sons Inc. Class A | 9,121 | 530 |
| Outfront Media Inc. | 23,337 | 521 |
| * Toll Brothers Inc. | 16,706 | 519 |
| * DISH Network Corp. Class A | 10,159 | 510 |
| * Burlington Stores Inc. | 6,165 | 501 |
| CalAtlantic Group Inc. | 13,333 | 487 |
| International Game Technology plc | 19,793 | 452 |
| * Cabela's Inc. | 8,974 | 440 |
| Graham Holdings Co. Class B | 893 | 438 |
| * Vista Outdoor Inc. | 10,075 | 401 |
| * Liberty Broadband Corp. Class A | 5,765 | 389 |
18
| Vanguard® Russell 1000 Value Index Fund | ||
| Schedule of Investments | ||
| August 31, 2016 | ||
| Market | ||
| Value | ||
| Shares | ($000) | |
| * AutoNation Inc. | 8,060 | 382 |
| Gentex Corp. | 20,834 | 371 |
| Penske Automotive Group Inc. | 8,012 | 363 |
| Marriott International Inc. Class A | 4,917 | 351 |
| Viacom Inc. Class B | 8,420 | 340 |
| * Live Nation Entertainment Inc. | 11,765 | 314 |
| Hilton Worldwide Holdings Inc. | 13,150 | 314 |
| Lear Corp. | 2,477 | 288 |
| * Hyatt Hotels Corp. Class A | 4,726 | 253 |
| ^ Regal Entertainment Group Class A | 11,299 | 242 |
| Dillard's Inc. Class A | 3,989 | 240 |
| Dick's Sporting Goods Inc. | 4,047 | 237 |
| * Murphy USA Inc. | 3,014 | 220 |
| Foot Locker Inc. | 2,925 | 192 |
| Genuine Parts Co. | 1,844 | 190 |
| Wendy's Co. | 17,407 | 177 |
| Extended Stay America Inc. | 12,350 | 175 |
| AMERCO | 455 | 156 |
| Brunswick Corp. | 3,203 | 147 |
| * Urban Outfitters Inc. | 3,830 | 137 |
| Lions Gate Entertainment Corp. | 6,487 | 136 |
| Wynn Resorts Ltd. | 1,324 | 118 |
| Signet Jewelers Ltd. | 1,332 | 109 |
| ^ Coty Inc. Class A | 3,885 | 105 |
| * Discovery Communications Inc. | 4,179 | 104 |
| * Michaels Cos. Inc. | 4,184 | 100 |
| Choice Hotels International Inc. | 2,008 | 97 |
| * Pandora Media Inc. | 6,000 | 84 |
| News Corp. Class B | 5,454 | 79 |
| * Fitbit Inc. Class A | 4,579 | 71 |
| * Discovery Communications Inc. Class A | 2,406 | 61 |
| Lennar Corp. Class B | 1,010 | 38 |
| Clear Channel Outdoor Holdings Inc. Class A | 4,340 | 29 |
| 126,555 | ||
| Consumer Staples (7.8%) | ||
| Procter & Gamble Co. | 544,172 | 47,512 |
| Philip Morris International Inc. | 282,380 | 28,218 |
| Mondelez International Inc. Class A | 305,369 | 13,748 |
| Walgreens Boots Alliance Inc. | 139,200 | 11,235 |
| Colgate-Palmolive Co. | 145,622 | 10,826 |
| Kraft Heinz Co. | 105,946 | 9,481 |
| Coca-Cola Co. | 200,092 | 8,690 |
| Archer-Daniels-Midland Co. | 117,524 | 5,143 |
| PepsiCo Inc. | 38,341 | 4,093 |
| Molson Coors Brewing Co. Class B | 34,939 | 3,575 |
| JM Smucker Co. | 23,554 | 3,340 |
| Reynolds American Inc. | 64,450 | 3,195 |
| Tyson Foods Inc. Class A | 31,552 | 2,384 |
| Mead Johnson Nutrition Co. | 24,359 | 2,072 |
| Bunge Ltd. | 28,266 | 1,806 |
| Whole Foods Market Inc. | 53,743 | 1,633 |
| Kimberly-Clark Corp. | 10,833 | 1,387 |
| Pinnacle Foods Inc. | 23,525 | 1,192 |
| CVS Health Corp. | 12,645 | 1,181 |
| * Edgewell Personal Care Co. | 12,128 | 970 |
| ConAgra Foods Inc. | 18,427 | 859 |
| * TreeHouse Foods Inc. | 7,721 | 731 |
| Ingredion Inc. | 4,226 | 579 |
| Clorox Co. | 3,922 | 514 |
| * Post Holdings Inc. | 5,511 | 467 |
| Nu Skin Enterprises Inc. Class A | 8,030 | 465 |
| Energizer Holdings Inc. | 8,529 | 421 |
| Kellogg Co. | 4,041 | 332 |
| Hormel Foods Corp. | 7,214 | 276 |
19
| Vanguard® Russell 1000 Value Index Fund | ||
| Schedule of Investments | ||
| August 31, 2016 | ||
| Market | ||
| Value | ||
| Shares | ($000) | |
| Pilgrim's Pride Corp. | 10,779 | 249 |
| * Hain Celestial Group Inc. | 5,039 | 185 |
| Brown-Forman Corp. Class B | 2,432 | 118 |
| Flowers Foods Inc. | 3,262 | 49 |
| Brown-Forman Corp. Class A | 628 | 32 |
| 166,958 | ||
| Energy (13.0%) | ||
| Exxon Mobil Corp. | 846,476 | 73,762 |
| Chevron Corp. | 383,743 | 38,597 |
| Schlumberger Ltd. | 284,352 | 22,464 |
| Occidental Petroleum Corp. | 155,864 | 11,978 |
| ConocoPhillips | 253,491 | 10,406 |
| EOG Resources Inc. | 99,623 | 8,816 |
| Kinder Morgan Inc. | 393,135 | 8,590 |
| Halliburton Co. | 174,533 | 7,507 |
| Phillips 66 | 92,129 | 7,227 |
| Pioneer Natural Resources Co. | 33,227 | 5,949 |
| Anadarko Petroleum Corp. | 104,402 | 5,582 |
| Valero Energy Corp. | 96,028 | 5,315 |
| Marathon Petroleum Corp. | 107,537 | 4,571 |
| Baker Hughes Inc. | 89,528 | 4,398 |
| Devon Energy Corp. | 97,297 | 4,216 |
| Spectra Energy Corp. | 115,346 | 4,109 |
| * Concho Resources Inc. | 28,802 | 3,721 |
| Williams Cos. Inc. | 116,591 | 3,258 |
| Hess Corp. | 57,383 | 3,116 |
| Noble Energy Inc. | 86,537 | 2,984 |
| Marathon Oil Corp. | 172,517 | 2,591 |
| National Oilwell Varco Inc. | 76,768 | 2,575 |
| EQT Corp. | 35,038 | 2,505 |
| Cimarex Energy Co. | 16,084 | 2,126 |
| Tesoro Corp. | 24,447 | 1,844 |
| * Cheniere Energy Inc. | 40,883 | 1,754 |
| Targa Resources Corp. | 31,719 | 1,382 |
| Range Resources Corp. | 33,880 | 1,307 |
| * Newfield Exploration Co. | 30,056 | 1,303 |
| * FMC Technologies Inc. | 45,736 | 1,290 |
| Helmerich & Payne Inc. | 19,854 | 1,200 |
| Apache Corp. | 23,954 | 1,190 |
| * Diamondback Energy Inc. | 11,977 | 1,141 |
| Energen Corp. | 19,764 | 1,136 |
| * Parsley Energy Inc. Class A | 30,338 | 1,027 |
| * Weatherford International plc | 182,232 | 997 |
| * Antero Resources Corp. | 36,740 | 939 |
| QEP Resources Inc. | 49,053 | 937 |
| Murphy Oil Corp. | 33,412 | 893 |
| CONSOL Energy Inc. | 46,904 | 855 |
| HollyFrontier Corp. | 32,681 | 846 |
| * WPX Energy Inc. | 68,656 | 824 |
| * Gulfport Energy Corp. | 25,546 | 731 |
| * Chesapeake Energy Corp. | 113,162 | 719 |
| Cabot Oil & Gas Corp. | 28,085 | 692 |
| * Transocean Ltd. | 70,879 | 687 |
| SM Energy Co. | 17,541 | 664 |
| * Rice Energy Inc. | 24,266 | 638 |
| World Fuel Services Corp. | 13,906 | 620 |
| * First Solar Inc. | 15,266 | 577 |
| Patterson-UTI Energy Inc. | 29,362 | 572 |
| Nabors Industries Ltd. | 55,703 | 554 |
| Oceaneering International Inc. | 19,840 | 526 |
| Superior Energy Services Inc. | 30,339 | 511 |
| * Continental Resources Inc. | 9,805 | 470 |
| Ensco plc Class A | 61,906 | 470 |
| PBF Energy Inc. Class A | 19,488 | 427 |
20
| Vanguard® Russell 1000 Value Index Fund | |||
| Schedule of Investments | |||
| August 31, 2016 | |||
| Market | |||
| Value | |||
| Shares | ($000) | ||
| * | Dril-Quip Inc. | 7,645 | 425 |
| * | Laredo Petroleum Inc. | 29,885 | 367 |
| Rowan Cos. plc Class A | 25,821 | 322 | |
| * | Whiting Petroleum Corp. | 40,109 | 292 |
| Noble Corp. plc | 49,132 | 283 | |
| * | SolarCity Corp. | 13,677 | 283 |
| * | Memorial Resource Development Corp. | 17,233 | 248 |
| Diamond Offshore Drilling Inc. | 12,726 | 235 | |
| * | Kosmos Energy Ltd. | 34,225 | 213 |
| *,^ | RPC Inc. | 12,266 | 188 |
| *,^ | SunPower Corp. Class A | 11,449 | 114 |
| ^ | Frank's International NV | 8,408 | 97 |
| 279,153 | |||
| Financial Services (29.1%) | |||
| * | Berkshire Hathaway Inc. Class B | 386,066 | 58,099 |
| JPMorgan Chase & Co. | 743,072 | 50,157 | |
| Wells Fargo & Co. | 932,868 | 47,390 | |
| Bank of America Corp. | 2,098,277 | 33,866 | |
| Citigroup Inc. | 599,378 | 28,614 | |
| US Bancorp | 331,368 | 14,630 | |
| American International Group Inc. | 226,160 | 13,531 | |
| Goldman Sachs Group Inc. | 78,653 | 13,329 | |
| Chubb Ltd. | 94,377 | 11,979 | |
| American Express Co. | 165,087 | 10,826 | |
| BlackRock Inc. | 25,506 | 9,509 | |
| Morgan Stanley | 291,608 | 9,349 | |
| PNC Financial Services Group Inc. | 101,866 | 9,178 | |
| Bank of New York Mellon Corp. | 214,035 | 8,919 | |
| MetLife Inc. | 189,534 | 8,226 | |
| Capital One Financial Corp. | 105,390 | 7,546 | |
| CME Group Inc. | 69,046 | 7,481 | |
| Prudential Financial Inc. | 90,349 | 7,172 | |
| Travelers Cos. Inc. | 59,579 | 7,073 | |
| BB&T Corp. | 166,163 | 6,397 | |
| Aflac Inc. | 82,098 | 6,090 | |
| State Street Corp. | 80,693 | 5,668 | |
| Prologis Inc. | 106,700 | 5,667 | |
| Welltower Inc. | 72,934 | 5,598 | |
| Allstate Corp. | 76,419 | 5,270 | |
| AvalonBay Communities Inc. | 28,019 | 4,904 | |
| Weyerhaeuser Co. | 151,486 | 4,825 | |
| Synchrony Financial | 171,984 | 4,786 | |
| Equity Residential | 72,740 | 4,719 | |
| SunTrust Banks Inc. | 102,068 | 4,498 | |
| HCP Inc. | 95,061 | 3,739 | |
| Boston Properties Inc. | 25,950 | 3,636 | |
| M&T Bank Corp. | 30,442 | 3,602 | |
| Vornado Realty Trust | 34,808 | 3,596 | |
| Intercontinental Exchange Inc. | 12,447 | 3,510 | |
| Progressive Corp. | 106,843 | 3,479 | |
| Realty Income Corp. | 52,658 | 3,461 | |
| Discover Financial Services | 57,627 | 3,458 | |
| Ventas Inc. | 47,507 | 3,452 | |
| General Growth Properties Inc. | 116,982 | 3,409 | |
| Hartford Financial Services Group Inc. | 79,569 | 3,268 | |
| Fifth Third Bancorp | 156,670 | 3,158 | |
| Northern Trust Corp. | 42,089 | 2,971 | |
| KeyCorp | 219,224 | 2,753 | |
| Franklin Resources Inc. | 73,588 | 2,686 | |
| Principal Financial Group Inc. | 54,455 | 2,672 | |
| Host Hotels & Resorts Inc. | 149,787 | 2,669 | |
| * | Markel Corp. | 2,779 | 2,588 |
| Regions Financial Corp. | 257,115 | 2,563 | |
| Thomson Reuters Corp. | 61,216 | 2,540 | |
21
| Vanguard® Russell 1000 Value Index Fund | ||
| Schedule of Investments | ||
| August 31, 2016 | ||
| Market | ||
| Value | ||
| Shares | ($000) | |
| Kimco Realty Corp. | 82,084 | 2,467 |
| Loews Corp. | 57,127 | 2,391 |
| Macerich Co. | 29,120 | 2,385 |
| Cincinnati Financial Corp. | 30,464 | 2,349 |
| SL Green Realty Corp. | 19,902 | 2,343 |
| Fidelity National Information Services Inc. | 28,603 | 2,269 |
| Ameriprise Financial Inc. | 22,156 | 2,240 |
| Annaly Capital Management Inc. | 207,803 | 2,226 |
| Huntington Bancshares Inc. | 218,747 | 2,190 |
| Invesco Ltd. | 70,043 | 2,185 |
| VEREIT Inc. | 196,282 | 2,051 |
| FNF Group | 53,716 | 2,025 |
| Duke Realty Corp. | 70,358 | 1,978 |
| UDR Inc. | 53,955 | 1,952 |
| * Arch Capital Group Ltd. | 23,282 | 1,884 |
| Ally Financial Inc. | 91,568 | 1,835 |
| Lincoln National Corp. | 37,392 | 1,796 |
| Essex Property Trust Inc. | 7,668 | 1,741 |
| Unum Group | 48,859 | 1,740 |
| Comerica Inc. | 35,536 | 1,680 |
| Nasdaq Inc. | 23,011 | 1,639 |
| Everest Re Group Ltd. | 8,469 | 1,638 |
| * Alleghany Corp. | 3,030 | 1,625 |
| Citizens Financial Group Inc. | 63,844 | 1,581 |
| Torchmark Corp. | 24,279 | 1,570 |
| Alexandria Real Estate Equities Inc. | 14,094 | 1,552 |
| Charles Schwab Corp. | 48,835 | 1,536 |
| Camden Property Trust | 17,330 | 1,521 |
| * E*TRADE Financial Corp. | 56,852 | 1,500 |
| Raymond James Financial Inc. | 25,727 | 1,497 |
| CIT Group Inc. | 40,395 | 1,490 |
| New York Community Bancorp Inc. | 96,729 | 1,462 |
| National Retail Properties Inc. | 28,931 | 1,449 |
| Mid-America Apartment Communities Inc. | 15,220 | 1,431 |
| Apartment Investment & Management Co. | 31,600 | 1,428 |
| Reinsurance Group of America Inc. Class A | 13,027 | 1,398 |
| Regency Centers Corp. | 17,347 | 1,397 |
| WP Carey Inc. | 20,864 | 1,391 |
| Kilroy Realty Corp. | 18,619 | 1,352 |
| American Campus Communities Inc. | 26,526 | 1,329 |
| American Capital Agency Corp. | 67,038 | 1,295 |
| Spirit Realty Capital Inc. | 97,186 | 1,288 |
| * XL Group Ltd. | 37,578 | 1,286 |
| Leucadia National Corp. | 67,007 | 1,283 |
| Simon Property Group Inc. | 5,930 | 1,278 |
| Zions Bancorporation | 41,126 | 1,258 |
| Voya Financial Inc. | 42,011 | 1,228 |
| Liberty Property Trust | 29,749 | 1,227 |
| DDR Corp. | 62,718 | 1,186 |
| WR Berkley Corp. | 19,598 | 1,164 |
| Assurant Inc. | 12,666 | 1,134 |
| Brixmor Property Group Inc. | 38,867 | 1,110 |
| Forest City Realty Trust Inc. Class A | 46,620 | 1,103 |
| East West Bancorp Inc. | 29,364 | 1,091 |
| Starwood Property Trust Inc. | 47,239 | 1,082 |
| Jones Lang LaSalle Inc. | 9,237 | 1,078 |
| Douglas Emmett Inc. | 28,485 | 1,070 |
| Axis Capital Holdings Ltd. | 18,661 | 1,061 |
| American Financial Group Inc. | 13,957 | 1,049 |
| PacWest Bancorp | 24,100 | 1,044 |
| Highwoods Properties Inc. | 19,475 | 1,033 |
| People's United Financial Inc. | 62,993 | 1,024 |
| RenaissanceRe Holdings Ltd. | 8,523 | 1,020 |
| EPR Properties | 12,838 | 1,005 |
22
| Vanguard® Russell 1000 Value Index Fund | ||
| Schedule of Investments | ||
| August 31, 2016 | ||
| Market | ||
| Value | ||
| Shares | ($000) | |
| Navient Corp. | 68,943 | 991 |
| Hospitality Properties Trust | 32,439 | 989 |
| Weingarten Realty Investors | 23,772 | 981 |
| Sun Communities Inc. | 12,761 | 976 |
| Old Republic International Corp. | 49,279 | 948 |
| Senior Housing Properties Trust | 42,389 | 947 |
| First American Financial Corp. | 21,826 | 940 |
| STORE Capital Corp. | 30,842 | 914 |
| DCT Industrial Trust Inc. | 18,315 | 892 |
| Digital Realty Trust Inc. | 8,982 | 890 |
| * Howard Hughes Corp. | 7,433 | 879 |
| Commerce Bancshares Inc. | 17,111 | 867 |
| Endurance Specialty Holdings Ltd. | 13,151 | 866 |
| Omega Healthcare Investors Inc. | 23,651 | 856 |
| Synovus Financial Corp. | 25,614 | 847 |
| Brown & Brown Inc. | 22,467 | 842 |
| Lazard Ltd. Class A | 22,669 | 839 |
| Retail Properties of America Inc. | 49,166 | 836 |
| Popular Inc. | 21,147 | 831 |
| T. Rowe Price Group Inc. | 11,789 | 820 |
| White Mountains Insurance Group Ltd. | 973 | 802 |
| Realogy Holdings Corp. | 29,748 | 798 |
| * Equity Commonwealth | 25,375 | 794 |
| Cullen/Frost Bankers Inc. | 10,834 | 790 |
| Communications Sales & Leasing Inc. | 24,734 | 772 |
| Validus Holdings Ltd. | 15,056 | 765 |
| Assured Guaranty Ltd. | 27,482 | 763 |
| Allied World Assurance Co. Holdings AG | 18,136 | 736 |
| Legg Mason Inc. | 21,232 | 734 |
| American Homes 4 Rent Class A | 33,299 | 728 |
| Crown Castle International Corp. | 7,656 | 726 |
| First Horizon National Corp. | 46,805 | 720 |
| Post Properties Inc. | 10,659 | 706 |
| Rayonier Inc. | 25,327 | 697 |
| Hanover Insurance Group Inc. | 8,708 | 681 |
| Paramount Group Inc. | 37,578 | 676 |
| Apple Hospitality REIT Inc. | 33,039 | 648 |
| Piedmont Office Realty Trust Inc. Class A | 29,968 | 648 |
| BankUnited Inc. | 19,967 | 642 |
| Bank of Hawaii Corp. | 8,722 | 628 |
| Two Harbors Investment Corp. | 70,373 | 626 |
| Chimera Investment Corp. | 37,979 | 626 |
| Associated Banc-Corp | 30,753 | 610 |
| Columbia Property Trust Inc. | 25,721 | 607 |
| Dun & Bradstreet Corp. | 4,368 | 601 |
| ProAssurance Corp. | 10,575 | 582 |
| MFA Financial Inc. | 74,825 | 578 |
| Equity One Inc. | 18,580 | 577 |
| Brandywine Realty Trust | 35,710 | 576 |
| Aspen Insurance Holdings Ltd. | 12,398 | 570 |
| * Signature Bank | 4,499 | 549 |
| Arthur J Gallagher & Co. | 11,095 | 548 |
| Corporate Office Properties Trust | 18,970 | 541 |
| NorthStar Realty Finance Corp. | 37,156 | 496 |
| TCF Financial Corp. | 33,500 | 491 |
| Care Capital Properties Inc. | 15,453 | 463 |
| Taubman Centers Inc. | 5,955 | 463 |
| LPL Financial Holdings Inc. | 15,216 | 452 |
| First Republic Bank | 5,818 | 448 |
| AmTrust Financial Services Inc. | 16,604 | 440 |
| Interactive Brokers Group Inc. | 11,215 | 402 |
| Moody's Corp. | 3,702 | 402 |
| Corrections Corp. of America | 23,473 | 374 |
| BOK Financial Corp. | 5,169 | 357 |
23
| Vanguard® Russell 1000 Value Index Fund | |||
| Schedule of Investments | |||
| August 31, 2016 | |||
| Market | |||
| Value | |||
| Shares | ($000) | ||
| * | OneMain Holdings Inc. Class A | 11,257 | 349 |
| * | SVB Financial Group | 2,799 | 311 |
| * | Western Alliance Bancorp | 8,132 | 311 |
| * | CoreLogic Inc. | 7,566 | 310 |
| CubeSmart | 11,042 | 304 | |
| Mercury General Corp. | 5,530 | 300 | |
| * | Life Storage Inc. | 3,251 | 293 |
| * | Santander Consumer USA Holdings Inc. | 22,991 | 289 |
| TFS Financial Corp. | 12,961 | 235 | |
| Healthcare Trust of America Inc. Class A | 6,922 | 234 | |
| Empire State Realty Trust Inc. | 9,656 | 207 | |
| *,^ | Zillow Group Inc. | 6,122 | 207 |
| CNA Financial Corp. | 6,065 | 202 | |
| TD Ameritrade Holding Corp. | 5,944 | 195 | |
| * | Affiliated Managers Group Inc. | 1,366 | 194 |
| American National Insurance Co. | 1,470 | 172 | |
| Erie Indemnity Co. Class A | 1,465 | 149 | |
| * | Zillow Group Inc. Class A | 3,347 | 113 |
| CyrusOne Inc. | 1,682 | 86 | |
| Tanger Factory Outlet Centers Inc. | 1,743 | 71 | |
| * | SLM Corp. | 7,588 | 56 |
| 626,788 | |||
| Health Care (11.4%) | |||
| Johnson & Johnson | 464,192 | 55,397 | |
| Pfizer Inc. | 1,141,902 | 39,738 | |
| Merck & Co. Inc. | 565,676 | 35,519 | |
| Medtronic plc | 286,153 | 24,904 | |
| Abbott Laboratories | 300,095 | 12,610 | |
| * | Allergan plc | 32,927 | 7,723 |
| Danaher Corp. | 90,777 | 7,390 | |
| Thermo Fisher Scientific Inc. | 43,617 | 6,638 | |
| Aetna Inc. | 45,993 | 5,387 | |
| Anthem Inc. | 39,125 | 4,894 | |
| Cigna Corp. | 34,545 | 4,431 | |
| Baxter International Inc. | 90,596 | 4,234 | |
| Dentsply Sirona Inc. | 46,712 | 2,871 | |
| * | Mylan NV | 63,468 | 2,688 |
| Perrigo Co. plc | 28,015 | 2,549 | |
| Quest Diagnostics Inc. | 28,804 | 2,386 | |
| Agilent Technologies Inc. | 48,939 | 2,299 | |
| Zimmer Biomet Holdings Inc. | 17,678 | 2,291 | |
| * | Mallinckrodt plc | 22,185 | 1,654 |
| Universal Health Services Inc. Class B | 13,062 | 1,574 | |
| * | Laboratory Corp. of America Holdings | 11,446 | 1,567 |
| * | HCA Holdings Inc. | 20,114 | 1,520 |
| St. Jude Medical Inc. | 17,268 | 1,346 | |
| * | DaVita HealthCare Partners Inc. | 20,569 | 1,329 |
| Teleflex Inc. | 7,230 | 1,324 | |
| * | QIAGEN NV | 46,223 | 1,225 |
| * | Express Scripts Holding Co. | 15,084 | 1,097 |
| PerkinElmer Inc. | 17,536 | 934 | |
| * | Endo International plc | 41,307 | 855 |
| * | United Therapeutics Corp. | 6,383 | 781 |
| * | Brookdale Senior Living Inc. | 37,240 | 641 |
| * | Bio-Rad Laboratories Inc. Class A | 4,254 | 633 |
| * | Centene Corp. | 8,923 | 609 |
| * | Alere Inc. | 14,240 | 557 |
| * | Acadia Healthcare Co. Inc. | 9,670 | 495 |
| * | Allscripts Healthcare Solutions Inc. | 38,064 | 491 |
| * | LifePoint Health Inc. | 8,237 | 466 |
| * | Quintiles Transnational Holdings Inc. | 5,924 | 458 |
| * | VWR Corp. | 15,080 | 421 |
| Cooper Cos. Inc. | 2,190 | 407 | |
| Cardinal Health Inc. | 4,884 | 389 | |
24
| Vanguard® Russell 1000 Value Index Fund | |||
| Schedule of Investments | |||
| August 31, 2016 | |||
| Market | |||
| Value | |||
| Shares | ($000) | ||
| * | MEDNAX Inc. | 5,484 | 361 |
| Humana Inc. | 1,765 | 315 | |
| * | Amsurg Corp. | 4,844 | 314 |
| * | Premier Inc. Class A | 6,863 | 217 |
| * | Alnylam Pharmaceuticals Inc. | 2,158 | 151 |
| * | Envision Healthcare Holdings Inc. | 5,982 | 128 |
| * | WellCare Health Plans Inc. | 688 | 78 |
| Hill-Rom Holdings Inc. | 881 | 52 | |
| *,^ | OPKO Health Inc. | 5,323 | 48 |
| * | Juno Therapeutics Inc. | 1,187 | 35 |
| 246,421 | |||
| Materials & Processing (3.1%) | |||
| Dow Chemical Co. | 229,071 | 12,287 | |
| Newmont Mining Corp. | 108,605 | 4,153 | |
| International Paper Co. | 83,507 | 4,049 | |
| Monsanto Co. | 31,098 | 3,312 | |
| Nucor Corp. | 65,049 | 3,156 | |
| LyondellBasell Industries NV Class A | 39,320 | 3,102 | |
| Alcoa Inc. | 267,775 | 2,699 | |
| WestRock Co. | 51,114 | 2,448 | |
| Freeport-McMoRan Inc. | 211,821 | 2,180 | |
| Mosaic Co. | 71,615 | 2,153 | |
| Eastman Chemical Co. | 30,171 | 2,048 | |
| Albemarle Corp. | 22,737 | 1,818 | |
| Ingersoll-Rand plc | 26,193 | 1,781 | |
| Celanese Corp. Class A | 27,353 | 1,762 | |
| Ashland Inc. | 12,583 | 1,473 | |
| Owens Corning | 23,338 | 1,282 | |
| CF Industries Holdings Inc. | 47,635 | 1,238 | |
| Sonoco Products Co. | 20,219 | 1,042 | |
| Reliance Steel & Aluminum Co. | 14,270 | 1,029 | |
| Steel Dynamics Inc. | 40,671 | 1,001 | |
| Royal Gold Inc. | 12,299 | 902 | |
| Praxair Inc. | 7,104 | 867 | |
| Bemis Co. Inc. | 16,403 | 863 | |
| Masco Corp. | 23,347 | 828 | |
| Air Products & Chemicals Inc. | 5,196 | 809 | |
| Tahoe Resources Inc. | 60,333 | 787 | |
| AptarGroup Inc. | 9,540 | 744 | |
| Huntsman Corp. | 40,146 | 694 | |
| Cabot Corp. | 12,393 | 618 | |
| United States Steel Corp. | 31,403 | 610 | |
| Compass Minerals International Inc. | 6,828 | 509 | |
| WR Grace & Co. | 6,398 | 500 | |
| * | USG Corp. | 17,727 | 486 |
| Timken Co. | 14,306 | 485 | |
| Domtar Corp. | 12,653 | 472 | |
| * | Armstrong World Industries Inc. | 9,597 | 417 |
| Westlake Chemical Corp. | 7,870 | 408 | |
| * | Platform Specialty Products Corp. | 34,552 | 313 |
| Graphic Packaging Holding Co. | 19,959 | 286 | |
| Southern Copper Corp. | 10,059 | 260 | |
| FMC Corp. | 5,402 | 254 | |
| Martin Marietta Materials Inc. | 1,209 | 221 | |
| Vulcan Materials Co. | 1,864 | 212 | |
| Valmont Industries Inc. | 939 | 123 | |
| Lennox International Inc. | 575 | 93 | |
| Scotts Miracle-Gro Co. Class A | 801 | 66 | |
| NewMarket Corp. | 96 | 42 | |
| 66,882 | |||
| Producer Durables (9.4%) | |||
| General Electric Co. | 1,514,146 | 47,302 | |
| United Technologies Corp. | 158,482 | 16,867 | |
| Union Pacific Corp. | 145,346 | 13,885 | |
25
| Vanguard® Russell 1000 Value Index Fund | ||
| Schedule of Investments | ||
| August 31, 2016 | ||
| Market | ||
| Value | ||
| Shares | ($000) | |
| Caterpillar Inc. | 113,819 | 9,327 |
| Eaton Corp. plc | 93,387 | 6,214 |
| Emerson Electric Co. | 109,464 | 5,767 |
| Norfolk Southern Corp. | 60,360 | 5,668 |
| CSX Corp. | 195,161 | 5,519 |
| Raytheon Co. | 37,430 | 5,245 |
| General Dynamics Corp. | 29,170 | 4,440 |
| Deere & Co. | 48,380 | 4,090 |
| Cummins Inc. | 32,055 | 4,026 |
| American Airlines Group Inc. | 108,084 | 3,923 |
| PACCAR Inc. | 63,378 | 3,793 |
| * United Continental Holdings Inc. | 68,393 | 3,448 |
| Parker-Hannifin Corp. | 27,157 | 3,328 |
| Stanley Black & Decker Inc. | 26,664 | 3,300 |
| Tyco International plc | 73,413 | 3,207 |
| Republic Services Inc. Class A | 47,838 | 2,417 |
| Fortive Corp. | 45,570 | 2,400 |
| L-3 Communications Holdings Inc. | 15,651 | 2,329 |
| Dover Corp. | 31,266 | 2,267 |
| Pentair plc | 33,973 | 2,176 |
| Kansas City Southern | 22,001 | 2,128 |
| Xerox Corp. | 206,489 | 2,034 |
| AMETEK Inc. | 38,090 | 1,857 |
| Roper Technologies Inc. | 9,966 | 1,769 |
| Textron Inc. | 37,611 | 1,536 |
| Fluor Corp. | 28,357 | 1,472 |
| * Jacobs Engineering Group Inc. | 24,293 | 1,280 |
| Delta Air Lines Inc. | 34,789 | 1,278 |
| Macquarie Infrastructure Corp. | 15,184 | 1,214 |
| * Keysight Technologies Inc. | 35,189 | 1,071 |
| ManpowerGroup Inc. | 14,590 | 1,043 |
| Waste Management Inc. | 15,661 | 1,001 |
| * JetBlue Airways Corp. | 60,762 | 969 |
| * AECOM | 31,047 | 957 |
| Carlisle Cos. Inc. | 8,961 | 940 |
| Orbital ATK Inc. | 11,960 | 902 |
| Xylem Inc. | 17,534 | 892 |
| FLIR Systems Inc. | 28,171 | 868 |
| Oshkosh Corp. | 15,014 | 810 |
| Allison Transmission Holdings Inc. | 29,072 | 806 |
| * Genesee & Wyoming Inc. Class A | 11,422 | 777 |
| Trinity Industries Inc. | 30,161 | 737 |
| Ryder System Inc. | 11,019 | 722 |
| AGCO Corp. | 14,380 | 698 |
| ITT Inc. | 18,368 | 665 |
| Crane Co. | 10,056 | 647 |
| Chicago Bridge & Iron Co. NV | 21,202 | 631 |
| Rockwell Automation Inc. | 5,443 | 631 |
| * Spirit AeroSystems Holdings Inc. Class A | 12,993 | 595 |
| * Colfax Corp. | 19,936 | 592 |
| * Spirit Airlines Inc. | 14,376 | 575 |
| Regal Beloit Corp. | 9,178 | 563 |
| * Kirby Corp. | 10,610 | 553 |
| Expeditors International of Washington Inc. | 10,913 | 553 |
| * Quanta Services Inc. | 21,290 | 548 |
| * WESCO International Inc. | 8,546 | 531 |
| Terex Corp. | 21,673 | 526 |
| Flowserve Corp. | 10,339 | 500 |
| Snap-on Inc. | 3,136 | 481 |
| ^ Copa Holdings SA Class A | 6,188 | 473 |
| * Clean Harbors Inc. | 9,798 | 468 |
| Lexmark International Inc. Class A | 12,610 | 452 |
| KBR Inc. | 29,829 | 438 |
| Hubbell Inc. Class B | 3,964 | 429 |
26
| Vanguard® Russell 1000 Value Index Fund | ||
| Schedule of Investments | ||
| August 31, 2016 | ||
| Market | ||
| Value | ||
| Shares | ($000) | |
| ^ MSC Industrial Direct Co. Inc. Class A | 5,576 | 407 |
| * Old Dominion Freight Line Inc. | 5,307 | 377 |
| Alaska Air Group Inc. | 4,504 | 304 |
| Lincoln Electric Holdings Inc. | 4,769 | 303 |
| * Trimble Navigation Ltd. | 11,057 | 303 |
| Air Lease Corp. Class A | 10,195 | 299 |
| Huntington Ingalls Industries Inc. | 1,496 | 247 |
| * Manitowoc Foodservice Inc. | 15,065 | 243 |
| RR Donnelley & Sons Co. | 13,033 | 223 |
| * United Rentals Inc. | 2,514 | 207 |
| * Herc Holdings Inc. | 3,869 | 131 |
| * Zebra Technologies Corp. | 1,844 | 129 |
| National Instruments Corp. | 4,261 | 119 |
| IDEX Corp. | 969 | 91 |
| Donaldson Co. Inc. | 2,194 | 82 |
| * Stericycle Inc. | 884 | 76 |
| Avery Dennison Corp. | 905 | 70 |
| Booz Allen Hamilton Holding Corp. Class A | 1,359 | 41 |
| 203,202 | ||
| Technology (9.7%) | ||
| Cisco Systems Inc. | 1,027,511 | 32,305 |
| Intel Corp. | 878,919 | 31,544 |
| Oracle Corp. | 545,240 | 22,475 |
| QUALCOMM Inc. | 237,555 | 14,983 |
| EMC Corp. | 355,394 | 10,303 |
| Apple Inc. | 94,035 | 9,977 |
| International Business Machines Corp. | 56,149 | 8,921 |
| * Yahoo! Inc. | 177,304 | 7,580 |
| Hewlett Packard Enterprise Co. | 352,792 | 7,578 |
| HP Inc. | 353,738 | 5,083 |
| Corning Inc. | 219,898 | 4,989 |
| Analog Devices Inc. | 62,431 | 3,906 |
| * Micron Technology Inc. | 210,644 | 3,473 |
| Western Digital Corp. | 57,478 | 2,682 |
| Symantec Corp. | 107,159 | 2,586 |
| Motorola Solutions Inc. | 31,510 | 2,426 |
| Harris Corp. | 25,426 | 2,364 |
| NetApp Inc. | 58,990 | 2,040 |
| CA Inc. | 59,372 | 2,013 |
| Xilinx Inc. | 35,521 | 1,926 |
| Applied Materials Inc. | 63,787 | 1,903 |
| Amdocs Ltd. | 30,143 | 1,812 |
| Juniper Networks Inc. | 76,561 | 1,767 |
| * Synopsys Inc. | 27,708 | 1,643 |
| Linear Technology Corp. | 25,614 | 1,492 |
| * Qorvo Inc. | 23,395 | 1,344 |
| Computer Sciences Corp. | 28,189 | 1,326 |
| * ANSYS Inc. | 13,272 | 1,262 |
| * Arrow Electronics Inc. | 18,542 | 1,221 |
| Avnet Inc. | 26,215 | 1,093 |
| * SBA Communications Corp. Class A | 9,186 | 1,049 |
| Ingram Micro Inc. | 29,485 | 1,031 |
| Marvell Technology Group Ltd. | 82,384 | 1,022 |
| Teradyne Inc. | 41,639 | 877 |
| Brocade Communications Systems Inc. | 95,646 | 859 |
| * ARRIS International plc | 29,341 | 824 |
| * VMware Inc. Class A | 11,195 | 821 |
| * ON Semiconductor Corp. | 74,575 | 805 |
| Jabil Circuit Inc. | 37,741 | 800 |
| Cypress Semiconductor Corp. | 62,617 | 747 |
| Lam Research Corp. | 6,459 | 603 |
| * PTC Inc. | 12,877 | 549 |
| ^ Leidos Holdings Inc. | 13,163 | 533 |
| * Autodesk Inc. | 7,808 | 526 |
27
| Vanguard® Russell 1000 Value Index Fund | |||
| Schedule of Investments | |||
| August 31, 2016 | |||
| Market | |||
| Value | |||
| Shares | ($000) | ||
| Dolby Laboratories Inc. Class A | 10,443 | 511 | |
| * | Zynga Inc. Class A | 151,125 | 413 |
| * | EchoStar Corp. Class A | 9,284 | 360 |
| * | FireEye Inc. | 23,848 | 342 |
| * | Cree Inc. | 13,076 | 314 |
| * | Twitter Inc. | 15,518 | 298 |
| Skyworks Solutions Inc. | 3,018 | 226 | |
| * | Akamai Technologies Inc. | 3,718 | 204 |
| IAC/InterActiveCorp | 2,947 | 173 | |
| * | Nuance Communications Inc. | 10,513 | 153 |
| * | Yelp Inc. Class A | 3,010 | 116 |
| * | IPG Photonics Corp. | 1,087 | 94 |
| SS&C Technologies Holdings Inc. | 2,489 | 82 | |
| * | CommerceHub Inc. | 4,330 | 64 |
| * | CommerceHub Inc. Class A | 2,161 | 32 |
| 208,445 | |||
| Utilities (10.3%) | |||
| AT&T Inc. | 1,257,343 | 51,400 | |
| Verizon Communications Inc. | 416,795 | 21,811 | |
| NextEra Energy Inc. | 94,003 | 11,369 | |
| Duke Energy Corp. | 140,668 | 11,206 | |
| Southern Co. | 191,656 | 9,838 | |
| Dominion Resources Inc. | 117,645 | 8,724 | |
| American Electric Power Co. Inc. | 100,508 | 6,490 | |
| PG&E Corp. | 101,368 | 6,279 | |
| Exelon Corp. | 181,071 | 6,156 | |
| Sempra Energy | 51,079 | 5,344 | |
| PPL Corp. | 138,676 | 4,823 | |
| Edison International | 64,660 | 4,702 | |
| Consolidated Edison Inc. | 62,296 | 4,688 | |
| Public Service Enterprise Group Inc. | 103,405 | 4,422 | |
| Xcel Energy Inc. | 103,888 | 4,297 | |
| WEC Energy Group Inc. | 64,516 | 3,863 | |
| Eversource Energy | 64,529 | 3,483 | |
| DTE Energy Co. | 36,641 | 3,404 | |
| CenturyLink Inc. | 109,284 | 3,038 | |
| * | Level 3 Communications Inc. | 59,464 | 2,951 |
| Entergy Corp. | 36,399 | 2,846 | |
| FirstEnergy Corp. | 86,764 | 2,840 | |
| American Water Works Co. Inc. | 36,181 | 2,677 | |
| Ameren Corp. | 49,375 | 2,440 | |
| CMS Energy Corp. | 56,578 | 2,375 | |
| CenterPoint Energy Inc. | 87,713 | 1,971 | |
| SCANA Corp. | 26,610 | 1,880 | |
| Alliant Energy Corp. | 46,207 | 1,754 | |
| Pinnacle West Capital Corp. | 22,575 | 1,694 | |
| AES Corp. | 135,333 | 1,633 | |
| UGI Corp. | 34,864 | 1,586 | |
| Westar Energy Inc. Class A | 28,646 | 1,574 | |
| NiSource Inc. | 65,153 | 1,560 | |
| Atmos Energy Corp. | 20,694 | 1,525 | |
| OGE Energy Corp. | 40,636 | 1,265 | |
| Aqua America Inc. | 36,120 | 1,098 | |
| Frontier Communications Corp. | 238,037 | 1,095 | |
| * | T-Mobile US Inc. | 22,171 | 1,027 |
| *,^ | Sprint Corp. | 155,075 | 958 |
| MDU Resources Group Inc. | 39,780 | 938 | |
| Piedmont Natural Gas Co. Inc. | 15,139 | 910 | |
| * | Calpine Corp. | 72,791 | 908 |
| Questar Corp. | 35,854 | 897 | |
| National Fuel Gas Co. | 15,110 | 862 | |
| Great Plains Energy Inc. | 31,391 | 853 | |
| Vectren Corp. | 16,975 | 830 | |
| NRG Energy Inc. | 63,619 | 770 | |
28
| Vanguard® Russell 1000 Value Index Fund | ||||
| Schedule of Investments | ||||
| August 31, 2016 | ||||
| Market | ||||
| Value | ||||
| Shares | ($000) | |||
| ITC Holdings Corp. | 15,638 | 707 | ||
| Hawaiian Electric Industries Inc. | 21,662 | 650 | ||
| Telephone & Data Systems Inc. | 19,127 | 533 | ||
| Avangrid Inc. | 11,843 | 493 | ||
| * United States Cellular Corp. | 2,842 | 106 | ||
| 221,543 | ||||
| Total Common Stocks (Cost $1,994,886) | 2,145,947 | |||
| Coupon | ||||
| Temporary Cash Investments (0.1%)1 | ||||
| Money Market Fund (0.1%) | ||||
| 2,3 Vanguard Market Liquidity Fund | 0.612% | 18,749 | 1,875 | |
| Face | ||||
| Maturity | Amount | |||
| Date | ($000) | |||
| U.S. Government and Agency Obligations (0.0%) | ||||
| 4,5 Federal Home Loan Bank Discount Notes | 0.501% | 10/19/16 | 200 | 200 |
| United States Treasury Bill | 0.318% | 12/1/16 | 100 | 100 |
| 300 | ||||
| Total Temporary Cash Investments (Cost $2,175) | 2,175 | |||
| Total Investments (99.8%) (Cost $1,997,061) | 2,148,122 | |||
| Other Assets and Liabilities—Net (0.2%)3,5 | 4,764 | |||
| Net Assets (100%) | 2,152,886 | |||
| * | Non-income-producing security. |
| ^ | Includes partial security positions on loan to broker-dealers. The total value of securities on loan is $1,705,000. |
| 1 | The fund invests a portion of its cash reserves in equity markets through the use of index futures contracts. After giving effect to futures investments, the fund's effective common stock and temporary cash investment positions represent 100.0% and -0.2%, respectively, of net assets. |
| 2 | Affiliated money market fund available only to Vanguard funds and certain trusts and accounts managed by Vanguard. Rate shown is the 7-day yield. |
| 3 | Includes $1,838,000 of collateral received for securities on loan. |
| 4 | The issuer operates under a congressional charter; its securities are generally neither guaranteed by the U.S. Treasury nor backed by the full faith and credit of the U.S. government. |
| 5 | Securities with a value of $200,000 and cash of $34,000 have been segregated as initial margin for open futures contracts. REIT—Real Estate Investment Trust. |
29
| Vanguard® Russell 1000 Growth Index Fund | |||
| Schedule of Investments | |||
| August 31, 2016 | |||
| Market | |||
| Value | |||
| Shares | ($000) | ||
| Common Stocks (99.7%)1 | |||
| Consumer Discretionary (22.3%) | |||
| * | Amazon.com Inc. | 100,593 | 77,372 |
| Home Depot Inc. | 321,958 | 43,181 | |
| Walt Disney Co. | 419,203 | 39,598 | |
| Comcast Corp. Class A | 576,675 | 37,634 | |
| McDonald's Corp. | 227,450 | 26,307 | |
| Starbucks Corp. | 368,864 | 20,741 | |
| NIKE Inc. Class B | 342,690 | 19,753 | |
| Costco Wholesale Corp. | 112,608 | 18,253 | |
| * | Priceline Group Inc. | 12,795 | 18,127 |
| Lowe's Cos. Inc. | 231,134 | 17,696 | |
| * | Charter Communications Inc. Class A | 51,816 | 13,328 |
| TJX Cos. Inc. | 170,804 | 13,227 | |
| Time Warner Inc. | 133,687 | 10,482 | |
| * | Netflix Inc. | 105,544 | 10,285 |
| Yum! Brands Inc. | 99,913 | 9,063 | |
| * | eBay Inc. | 276,089 | 8,879 |
| * | O'Reilly Automotive Inc. | 24,424 | 6,838 |
| Newell Brands Inc. | 121,010 | 6,423 | |
| * | Tesla Motors Inc. | 30,126 | 6,387 |
| Ross Stores Inc. | 101,639 | 6,326 | |
| * | AutoZone Inc. | 7,565 | 5,612 |
| Twenty-First Century Fox Inc. Class A | 220,472 | 5,410 | |
| Dollar General Corp. | 73,652 | 5,407 | |
| VF Corp. | 86,686 | 5,379 | |
| CBS Corp. Class B | 104,396 | 5,327 | |
| Omnicom Group Inc. | 61,075 | 5,260 | |
| Estee Lauder Cos. Inc. Class A | 55,895 | 4,988 | |
| Delphi Automotive plc | 70,502 | 4,982 | |
| * | Dollar Tree Inc. | 58,575 | 4,844 |
| Las Vegas Sands Corp. | 93,823 | 4,711 | |
| Nielsen Holdings plc | 72,711 | 3,874 | |
| * | Ulta Salon Cosmetics & Fragrance Inc. | 15,105 | 3,734 |
| Genuine Parts Co. | 35,676 | 3,668 | |
| Expedia Inc. | 30,867 | 3,368 | |
| Viacom Inc. Class B | 76,410 | 3,082 | |
| ^ | Marriott International Inc. Class A | 42,317 | 3,018 |
| * | Chipotle Mexican Grill Inc. Class A | 7,294 | 3,018 |
| * | CarMax Inc. | 49,991 | 2,947 |
| Mattel Inc. | 88,165 | 2,921 | |
| Tractor Supply Co. | 34,394 | 2,887 | |
| Advance Auto Parts Inc. | 18,272 | 2,876 | |
| * | LKQ Corp. | 78,861 | 2,846 |
| Hilton Worldwide Holdings Inc. | 118,759 | 2,835 | |
| * | Mohawk Industries Inc. | 12,593 | 2,680 |
| Hanesbrands Inc. | 97,556 | 2,589 | |
| Fortune Brands Home & Security Inc. | 39,702 | 2,523 | |
| Harley-Davidson Inc. | 46,861 | 2,470 | |
| Interpublic Group of Cos. Inc. | 103,330 | 2,391 | |
| Hasbro Inc. | 29,020 | 2,372 | |
| Twenty-First Century Fox Inc. | 94,030 | 2,337 | |
| Johnson Controls Inc. | 50,485 | 2,215 | |
| * | DISH Network Corp. Class A | 43,716 | 2,196 |
| Foot Locker Inc. | 31,301 | 2,055 | |
| * | Michael Kors Holdings Ltd. | 41,340 | 2,024 |
| Wyndham Worldwide Corp. | 28,457 | 2,014 | |
| Starwood Hotels & Resorts Worldwide Inc. | 25,755 | 1,995 | |
| Domino's Pizza Inc. | 12,981 | 1,942 | |
| * | lululemon athletica Inc. | 25,057 | 1,917 |
| * | Sirius XM Holdings Inc. | 462,724 | 1,916 |
| *,^ | Under Armour Inc. Class A | 47,182 | 1,870 |
| Darden Restaurants Inc. | 30,013 | 1,850 | |
30
| Vanguard® Russell 1000 Growth Index Fund | ||
| Schedule of Investments | ||
| August 31, 2016 | ||
| Market | ||
| Value | ||
| Shares | ($000) | |
| Lear Corp. | 15,727 | 1,829 |
| Leggett & Platt Inc. | 34,365 | 1,803 |
| * TripAdvisor Inc. | 29,380 | 1,792 |
| * Under Armour Inc. | 47,932 | 1,709 |
| Wynn Resorts Ltd. | 18,830 | 1,682 |
| ^ Nordstrom Inc. | 32,041 | 1,617 |
| DR Horton Inc. | 47,819 | 1,533 |
| * NVR Inc. | 902 | 1,522 |
| Signet Jewelers Ltd. | 18,468 | 1,514 |
| KAR Auction Services Inc. | 35,634 | 1,507 |
| Vail Resorts Inc. | 9,324 | 1,477 |
| * WABCO Holdings Inc. | 13,610 | 1,453 |
| * Liberty Interactive Corp. QVC Group Class A | 64,347 | 1,360 |
| Scripps Networks Interactive Inc. Class A | 21,330 | 1,352 |
| Lamar Advertising Co. Class A | 21,648 | 1,349 |
| ^ Polaris Industries Inc. | 15,546 | 1,347 |
| * Discovery Communications Inc. | 53,989 | 1,340 |
| * ServiceMaster Global Holdings Inc. | 35,032 | 1,307 |
| Service Corp. International | 47,932 | 1,267 |
| * Panera Bread Co. Class A | 5,785 | 1,256 |
| Carter's Inc. | 12,943 | 1,233 |
| Williams-Sonoma Inc. | 22,844 | 1,203 |
| Lennar Corp. Class A | 24,986 | 1,182 |
| Dunkin' Brands Group Inc. | 23,885 | 1,169 |
| Target Corp. | 16,503 | 1,158 |
| * Tempur Sealy International Inc. | 13,789 | 1,081 |
| Cinemark Holdings Inc. | 27,355 | 1,057 |
| Pool Corp. | 10,380 | 1,047 |
| * Sally Beauty Holdings Inc. | 38,018 | 1,035 |
| Dick's Sporting Goods Inc. | 17,601 | 1,031 |
| Aramark | 26,791 | 1,016 |
| Thor Industries Inc. | 12,330 | 1,001 |
| * Discovery Communications Inc. Class A | 37,095 | 946 |
| Six Flags Entertainment Corp. | 18,676 | 911 |
| Brunswick Corp. | 19,001 | 874 |
| L Brands Inc. | 11,444 | 872 |
| Tupperware Brands Corp. | 13,056 | 856 |
| * Burlington Stores Inc. | 10,505 | 853 |
| * AMC Networks Inc. Class A | 15,439 | 839 |
| Gentex Corp. | 47,010 | 836 |
| * Skechers U.S.A. Inc. Class A | 33,657 | 818 |
| * Avis Budget Group Inc. | 21,762 | 786 |
| Brinker International Inc. | 14,474 | 777 |
| Harman International Industries Inc. | 8,481 | 718 |
| * Starz | 21,814 | 680 |
| Cable One Inc. | 1,236 | 669 |
| * Pandora Media Inc. | 47,754 | 669 |
| * Urban Outfitters Inc. | 17,828 | 639 |
| Visteon Corp. | 8,910 | 630 |
| * Kate Spade & Co. | 32,890 | 614 |
| * Toll Brothers Inc. | 18,450 | 574 |
| PulteGroup Inc. | 25,876 | 553 |
| Coach Inc. | 13,492 | 515 |
| * Live Nation Entertainment Inc. | 19,150 | 512 |
| * Michaels Cos. Inc. | 18,348 | 440 |
| * Murphy USA Inc. | 5,896 | 431 |
| * Fitbit Inc. Class A | 27,003 | 418 |
| Lions Gate Entertainment Corp. | 15,926 | 334 |
| AMERCO | 959 | 330 |
| Whirlpool Corp. | 1,837 | 328 |
| Wendy's Co. | 31,813 | 324 |
| * AutoNation Inc. | 6,587 | 312 |
| Choice Hotels International Inc. | 6,029 | 292 |
| * Liberty Ventures Class A | 6,611 | 255 |
31
| Vanguard® Russell 1000 Growth Index Fund | |||
| Schedule of Investments | |||
| August 31, 2016 | |||
| Market | |||
| Value | |||
| Shares | ($000) | ||
| * | MGM Resorts International | 10,426 | 249 |
| BorgWarner Inc. | 7,166 | 246 | |
| Bed Bath & Beyond Inc. | 4,251 | 197 | |
| ^ | Coty Inc. Class A | 7,027 | 189 |
| Viacom Inc. Class A | 4,110 | 186 | |
| * | Hertz Global Holdings Inc. | 3,454 | 170 |
| ^ | Regal Entertainment Group Class A | 6,715 | 144 |
| Outfront Media Inc. | 6,283 | 140 | |
| * | Norwegian Cruise Line Holdings Ltd. | 3,496 | 125 |
| * | Vista Outdoor Inc. | 2,734 | 109 |
| Ralph Lauren Corp. Class A | 1,037 | 107 | |
| Gap Inc. | 3,427 | 85 | |
| CalAtlantic Group Inc. | 2,222 | 81 | |
| * | Madison Square Garden Co. Class A | 447 | 81 |
| * | Cabela's Inc. | 1,536 | 75 |
| Tribune Media Co. Class A | 1,469 | 56 | |
| Extended Stay America Inc. | 2,399 | 34 | |
| * | Hyatt Hotels Corp. Class A | 600 | 32 |
| Clear Channel Outdoor Holdings Inc. Class A | 4,597 | 31 | |
| 607,421 | |||
| Consumer Staples (9.0%) | |||
| PepsiCo Inc. | 325,150 | 34,710 | |
| Altria Group Inc. | 505,580 | 33,414 | |
| Coca-Cola Co. | 753,973 | 32,745 | |
| CVS Health Corp. | 261,601 | 24,433 | |
| General Mills Inc. | 153,438 | 10,866 | |
| Kimberly-Clark Corp. | 79,227 | 10,146 | |
| Kroger Co. | 246,091 | 7,872 | |
| Sysco Corp. | 135,886 | 7,047 | |
| Constellation Brands Inc. Class A | 42,838 | 7,028 | |
| Reynolds American Inc. | 131,430 | 6,515 | |
| * | Monster Beverage Corp. | 35,790 | 5,508 |
| Kellogg Co. | 59,289 | 4,874 | |
| Dr Pepper Snapple Group Inc. | 47,893 | 4,488 | |
| Philip Morris International Inc. | 42,899 | 4,287 | |
| ConAgra Foods Inc. | 89,191 | 4,157 | |
| Clorox Co. | 28,512 | 3,736 | |
| Walgreens Boots Alliance Inc. | 45,774 | 3,694 | |
| Hershey Co. | 36,332 | 3,629 | |
| Church & Dwight Co. Inc. | 33,070 | 3,288 | |
| McCormick & Co. Inc. | 29,831 | 3,042 | |
| Colgate-Palmolive Co. | 40,139 | 2,984 | |
| Campbell Soup Co. | 48,173 | 2,925 | |
| Tyson Foods Inc. Class A | 35,193 | 2,660 | |
| * | WhiteWave Foods Co. Class A | 44,873 | 2,487 |
| Brown-Forman Corp. Class B | 48,621 | 2,361 | |
| Hormel Foods Corp. | 60,890 | 2,330 | |
| * | Rite Aid Corp. | 266,146 | 2,004 |
| Ingredion Inc. | 13,045 | 1,787 | |
| Kraft Heinz Co. | 19,662 | 1,760 | |
| Mead Johnson Nutrition Co. | 17,418 | 1,482 | |
| Casey's General Stores Inc. | 10,008 | 1,314 | |
| *,^ | Herbalife Ltd. | 19,054 | 1,157 |
| Spectrum Brands Holdings Inc. | 6,405 | 860 | |
| * | Post Holdings Inc. | 9,594 | 813 |
| * | Sprouts Farmers Market Inc. | 35,949 | 810 |
| * | Hain Celestial Group Inc. | 19,586 | 720 |
| Brown-Forman Corp. Class A | 13,246 | 685 | |
| Flowers Foods Inc. | 40,869 | 609 | |
| * | TreeHouse Foods Inc. | 4,450 | 422 |
| Whole Foods Market Inc. | 13,597 | 413 | |
| * | Blue Buffalo Pet Products Inc. | 15,567 | 401 |
| * | US Foods Holding Corp. | 12,071 | 293 |
| Nu Skin Enterprises Inc. Class A | 3,980 | 230 | |
32
| Vanguard® Russell 1000 Growth Index Fund | ||
| Schedule of Investments | ||
| August 31, 2016 | ||
| Market | ||
| Value | ||
| Shares | ($000) | |
| Energizer Holdings Inc. | 4,641 | 229 |
| ^ Pilgrim's Pride Corp. | 2,207 | 51 |
| 247,266 | ||
| Energy (0.6%) | ||
| Apache Corp. | 67,605 | 3,360 |
| ONEOK Inc. | 54,138 | 2,539 |
| Cabot Oil & Gas Corp. | 83,880 | 2,066 |
| * Southwestern Energy Co. | 126,801 | 1,764 |
| EOG Resources Inc. | 16,150 | 1,429 |
| Spectra Energy Corp. | 26,120 | 930 |
| Williams Cos. Inc. | 29,787 | 832 |
| * Newfield Exploration Co. | 13,122 | 569 |
| Devon Energy Corp. | 11,813 | 512 |
| Cimarex Energy Co. | 3,849 | 509 |
| * Diamondback Energy Inc. | 5,104 | 486 |
| * Continental Resources Inc. | 10,013 | 480 |
| * Parsley Energy Inc. Class A | 4,178 | 141 |
| * Chesapeake Energy Corp. | 12,372 | 79 |
| * Memorial Resource Development Corp. | 4,839 | 70 |
| 15,766 | ||
| Financial Services (9.8%) | ||
| Visa Inc. Class A | 492,796 | 39,867 |
| MasterCard Inc. Class A | 249,059 | 24,067 |
| Simon Property Group Inc. | 72,446 | 15,610 |
| American Tower Corporation | 109,456 | 12,410 |
| * PayPal Holdings Inc. | 292,720 | 10,875 |
| Marsh & McLennan Cos. Inc. | 134,693 | 9,109 |
| Public Storage | 38,193 | 8,553 |
| S&P Global Inc. | 68,055 | 8,408 |
| Aon plc | 68,033 | 7,575 |
| Charles Schwab Corp. | 239,537 | 7,536 |
| Crown Castle International Corp. | 77,329 | 7,328 |
| Equinix Inc. | 17,947 | 6,616 |
| * Fiserv Inc. | 57,431 | 5,918 |
| Moody's Corp. | 39,072 | 4,247 |
| Intercontinental Exchange Inc. | 14,600 | 4,117 |
| Equifax Inc. | 30,452 | 4,017 |
| * FleetCor Technologies Inc. | 23,689 | 3,890 |
| Fidelity National Information Services Inc. | 47,847 | 3,796 |
| T. Rowe Price Group Inc. | 47,616 | 3,311 |
| * Alliance Data Systems Corp. | 14,951 | 3,059 |
| Global Payments Inc. | 39,623 | 3,009 |
| Federal Realty Investment Trust | 18,727 | 2,978 |
| Western Union Co. | 127,126 | 2,736 |
| Digital Realty Trust Inc. | 26,842 | 2,660 |
| Iron Mountain Inc. | 67,253 | 2,583 |
| Extra Space Storage Inc. | 31,421 | 2,531 |
| * CBRE Group Inc. Class A | 77,459 | 2,315 |
| First Republic Bank | 30,078 | 2,315 |
| * Vantiv Inc. Class A | 40,104 | 2,155 |
| Total System Services Inc. | 43,005 | 2,118 |
| Broadridge Financial Solutions Inc. | 30,517 | 2,115 |
| MSCI Inc. Class A | 23,387 | 2,108 |
| Discover Financial Services | 35,041 | 2,102 |
| Ventas Inc. | 27,737 | 2,016 |
| TD Ameritrade Holding Corp. | 56,997 | 1,873 |
| FactSet Research Systems Inc. | 10,393 | 1,850 |
| Jack Henry & Associates Inc. | 20,335 | 1,775 |
| * Affiliated Managers Group Inc. | 12,171 | 1,729 |
| Essex Property Trust Inc. | 7,141 | 1,622 |
| MarketAxess Holdings Inc. | 9,390 | 1,583 |
| Equity LifeStyle Properties Inc. | 20,210 | 1,567 |
| SEI Investments Co. | 32,999 | 1,521 |
| Arthur J Gallagher & Co. | 29,527 | 1,459 |
33
| Vanguard® Russell 1000 Growth Index Fund | |||
| Schedule of Investments | |||
| August 31, 2016 | |||
| Market | |||
| Value | |||
| Shares | ($000) | ||
| CBOE Holdings Inc. | 20,585 | 1,414 | |
| Citizens Financial Group Inc. | 56,298 | 1,395 | |
| Ameriprise Financial Inc. | 12,178 | 1,231 | |
| Eaton Vance Corp. | 28,529 | 1,142 | |
| * | First Data Corp. Class A | 80,708 | 1,123 |
| * | SVB Financial Group | 9,867 | 1,096 |
| * | Euronet Worldwide Inc. | 12,861 | 998 |
| Boston Properties Inc. | 7,082 | 992 | |
| * | WEX Inc. | 9,916 | 985 |
| * | Signature Bank | 7,967 | 972 |
| Tanger Factory Outlet Centers Inc. | 22,917 | 931 | |
| Healthcare Trust of America Inc. Class A | 27,085 | 914 | |
| CubeSmart | 32,126 | 884 | |
| CyrusOne Inc. | 16,321 | 830 | |
| * | XL Group Ltd. | 24,077 | 824 |
| Federated Investors Inc. Class B | 23,390 | 755 | |
| * | Life Storage Inc. | 7,980 | 718 |
| Lincoln National Corp. | 14,033 | 674 | |
| Omega Healthcare Investors Inc. | 18,415 | 667 | |
| Taubman Centers Inc. | 7,962 | 618 | |
| *,^ | Zillow Group Inc. | 17,802 | 603 |
| NorthStar Asset Management Group Inc. | 47,813 | 594 | |
| Invesco Ltd. | 18,371 | 573 | |
| Gaming and Leisure Properties Inc. | 16,681 | 571 | |
| * | CoreLogic Inc. | 13,454 | 552 |
| Dun & Bradstreet Corp. | 3,802 | 523 | |
| * | Western Alliance Bancorp | 13,456 | 514 |
| Progressive Corp. | 15,532 | 506 | |
| Erie Indemnity Co. Class A | 4,653 | 475 | |
| * | TransUnion | 13,676 | 451 |
| Regency Centers Corp. | 5,490 | 442 | |
| *,^ | Credit Acceptance Corp. | 2,154 | 430 |
| Empire State Realty Trust Inc. | 19,093 | 410 | |
| Morningstar Inc. | 4,696 | 390 | |
| *,^ | Zillow Group Inc. Class A | 9,550 | 323 |
| Alexandria Real Estate Equities Inc. | 2,333 | 257 | |
| Artisan Partners Asset Management Inc. Class A | 9,643 | 252 | |
| Senior Housing Properties Trust | 8,781 | 196 | |
| Lazard Ltd. Class A | 4,765 | 176 | |
| * | Square Inc. | 12,541 | 153 |
| Care Capital Properties Inc. | 2,988 | 90 | |
| LPL Financial Holdings Inc. | 2,726 | 81 | |
| Interactive Brokers Group Inc. | 1,976 | 71 | |
| AmTrust Financial Services Inc. | 1,963 | 52 | |
| Brown & Brown Inc. | 1,338 | 50 | |
| 266,927 | |||
| Health Care (16.6%) | |||
| Amgen Inc. | 194,327 | 33,047 | |
| UnitedHealth Group Inc. | 242,476 | 32,989 | |
| Gilead Sciences Inc. | 342,677 | 26,859 | |
| AbbVie Inc. | 418,630 | 26,834 | |
| Bristol-Myers Squibb Co. | 431,930 | 24,788 | |
| * | Celgene Corp. | 198,568 | 21,195 |
| Eli Lilly & Co. | 252,043 | 19,596 | |
| * | Biogen Inc. | 56,564 | 17,288 |
| Johnson & Johnson | 123,034 | 14,683 | |
| * | Allergan plc | 60,558 | 14,203 |
| McKesson Corp. | 58,165 | 10,738 | |
| * | Express Scripts Holding Co. | 144,432 | 10,500 |
| Stryker Corp. | 86,408 | 9,994 | |
| Becton Dickinson and Co. | 54,166 | 9,599 | |
| * | Boston Scientific Corp. | 348,849 | 8,310 |
| * | Regeneron Pharmaceuticals Inc. | 20,077 | 7,881 |
| * | Alexion Pharmaceuticals Inc. | 56,209 | 7,074 |
34
| Vanguard® Russell 1000 Growth Index Fund | |||
| Schedule of Investments | |||
| August 31, 2016 | |||
| Market | |||
| Value | |||
| Shares | ($000) | ||
| Thermo Fisher Scientific Inc. | 46,167 | 7,026 | |
| * | Intuitive Surgical Inc. | 9,752 | 6,694 |
| Humana Inc. | 36,253 | 6,479 | |
| * | Illumina Inc. | 37,795 | 6,362 |
| * | Edwards Lifesciences Corp. | 54,542 | 6,281 |
| Cardinal Health Inc. | 77,961 | 6,211 | |
| * | Vertex Pharmaceuticals Inc. | 63,652 | 6,016 |
| Zoetis Inc. | 117,683 | 6,014 | |
| * | Cerner Corp. | 75,962 | 4,903 |
| CR Bard Inc. | 19,004 | 4,197 | |
| * | BioMarin Pharmaceutical Inc. | 43,841 | 4,116 |
| * | HCA Holdings Inc. | 53,700 | 4,057 |
| AmerisourceBergen Corp. Class A | 45,982 | 3,999 | |
| St. Jude Medical Inc. | 49,991 | 3,895 | |
| Pfizer Inc. | 108,865 | 3,789 | |
| Aetna Inc. | 29,588 | 3,465 | |
| * | Henry Schein Inc. | 21,094 | 3,455 |
| * | Incyte Corp. | 42,065 | 3,411 |
| Danaher Corp. | 41,265 | 3,359 | |
| * | Medivation Inc. | 41,115 | 3,312 |
| Zimmer Biomet Holdings Inc. | 25,408 | 3,293 | |
| Cigna Corp. | 21,906 | 2,810 | |
| * | Hologic Inc. | 72,217 | 2,775 |
| * | IDEXX Laboratories Inc. | 22,988 | 2,590 |
| ResMed Inc. | 35,919 | 2,395 | |
| * | Varian Medical Systems Inc. | 24,493 | 2,355 |
| Anthem Inc. | 18,521 | 2,317 | |
| * | Centene Corp. | 31,680 | 2,163 |
| * | DexCom Inc. | 21,208 | 1,932 |
| Cooper Cos. Inc. | 9,513 | 1,769 | |
| * | Align Technology Inc. | 18,529 | 1,721 |
| * | Alkermes plc | 38,767 | 1,697 |
| * | Laboratory Corp. of America Holdings | 11,871 | 1,625 |
| * | Mylan NV | 37,471 | 1,587 |
| West Pharmaceutical Services Inc. | 18,390 | 1,505 | |
| * | VCA Inc. | 20,063 | 1,421 |
| * | athenahealth Inc. | 10,028 | 1,228 |
| * | ABIOMED Inc. | 10,264 | 1,211 |
| * | WellCare Health Plans Inc. | 10,485 | 1,182 |
| * | Alnylam Pharmaceuticals Inc. | 16,703 | 1,167 |
| * | DaVita HealthCare Partners Inc. | 17,062 | 1,103 |
| * | Seattle Genetics Inc. | 24,713 | 1,101 |
| * | Quintiles Transnational Holdings Inc. | 14,110 | 1,091 |
| * | MEDNAX Inc. | 16,532 | 1,087 |
| * | Neurocrine Biosciences Inc. | 22,070 | 1,070 |
| * | Veeva Systems Inc. Class A | 25,092 | 1,027 |
| Agilent Technologies Inc. | 21,827 | 1,025 | |
| * | Charles River Laboratories International Inc. | 12,038 | 1,002 |
| Bio-Techne Corp. | 9,468 | 997 | |
| Patterson Cos. Inc. | 21,657 | 996 | |
| Hill-Rom Holdings Inc. | 15,853 | 940 | |
| * | Ionis Pharmaceuticals Inc. | 31,052 | 921 |
| * | Envision Healthcare Holdings Inc. | 40,072 | 860 |
| * | ACADIA Pharmaceuticals Inc. | 24,517 | 788 |
| *,^ | OPKO Health Inc. | 75,710 | 689 |
| Baxter International Inc. | 14,435 | 675 | |
| Universal Health Services Inc. Class B | 5,447 | 657 | |
| *,^ | Intercept Pharmaceuticals Inc. | 4,304 | 638 |
| Bruker Corp. | 27,155 | 607 | |
| * | Akorn Inc. | 21,969 | 591 |
| * | Tenet Healthcare Corp. | 21,006 | 502 |
| * | Amsurg Corp. | 7,646 | 496 |
| * | Juno Therapeutics Inc. | 14,695 | 435 |
| * | United Therapeutics Corp. | 3,089 | 378 |
35
| Vanguard® Russell 1000 Growth Index Fund | |||
| Schedule of Investments | |||
| August 31, 2016 | |||
| Market | |||
| Value | |||
| Shares | ($000) | ||
| Teleflex Inc. | 2,045 | 374 | |
| *,^ | Intrexon Corp. | 14,606 | 369 |
| * | Acadia Healthcare Co. Inc. | 6,369 | 326 |
| PerkinElmer Inc. | 5,591 | 298 | |
| * | Agios Pharmaceuticals Inc. | 7,583 | 279 |
| * | Alere Inc. | 3,859 | 151 |
| * | Premier Inc. Class A | 3,421 | 108 |
| * | VWR Corp. | 1,072 | 30 |
| 452,973 | |||
| Materials & Processing (4.1%) | |||
| EI du Pont de Nemours & Co. | 225,960 | 15,727 | |
| Ecolab Inc. | 67,450 | 8,300 | |
| Praxair Inc. | 64,926 | 7,924 | |
| Monsanto Co. | 73,238 | 7,800 | |
| PPG Industries Inc. | 68,617 | 7,265 | |
| Air Products & Chemicals Inc. | 44,084 | 6,860 | |
| Sherwin-Williams Co. | 20,826 | 5,909 | |
| Vulcan Materials Co. | 31,847 | 3,626 | |
| Ball Corp. | 44,046 | 3,488 | |
| Fastenal Co. | 74,317 | 3,204 | |
| LyondellBasell Industries NV Class A | 39,627 | 3,126 | |
| Acuity Brands Inc. | 11,219 | 3,087 | |
| International Flavors & Fragrances Inc. | 20,624 | 2,858 | |
| Martin Marietta Materials Inc. | 14,855 | 2,719 | |
| Sealed Air Corp. | 50,850 | 2,397 | |
| Ingersoll-Rand plc | 33,317 | 2,265 | |
| Valspar Corp. | 20,329 | 2,143 | |
| Masco Corp. | 55,947 | 1,985 | |
| Packaging Corp. of America | 24,192 | 1,902 | |
| * | Crown Holdings Inc. | 34,748 | 1,884 |
| RPM International Inc. | 33,685 | 1,837 | |
| Lennox International Inc. | 9,405 | 1,515 | |
| * | Berry Plastics Group Inc. | 31,361 | 1,423 |
| FMC Corp. | 27,745 | 1,302 | |
| * | Axalta Coating Systems Ltd. | 42,487 | 1,216 |
| Hexcel Corp. | 24,020 | 1,077 | |
| Watsco Inc. | 6,650 | 983 | |
| Eagle Materials Inc. | 12,061 | 969 | |
| Scotts Miracle-Gro Co. Class A | 10,865 | 900 | |
| Graphic Packaging Holding Co. | 58,341 | 837 | |
| WR Grace & Co. | 10,214 | 798 | |
| NewMarket Corp. | 1,755 | 762 | |
| Freeport-McMoRan Inc. | 73,815 | 760 | |
| * | Owens-Illinois Inc. | 42,003 | 753 |
| Valmont Industries Inc. | 4,510 | 588 | |
| Silgan Holdings Inc. | 10,309 | 496 | |
| AptarGroup Inc. | 4,172 | 325 | |
| Southern Copper Corp. | 9,669 | 250 | |
| Celanese Corp. Class A | 3,654 | 235 | |
| Steel Dynamics Inc. | 9,368 | 231 | |
| Bemis Co. Inc. | 3,382 | 178 | |
| Royal Gold Inc. | 1,081 | 79 | |
| 111,983 | |||
| Other (0.0%)2 | |||
| Shire plc ADR | 2 | — | |
| Producer Durables (11.0%) | |||
| 3M Co. | 152,224 | 27,285 | |
| Honeywell International Inc. | 196,499 | 22,933 | |
| Boeing Co. | 154,436 | 19,992 | |
| United Parcel Service Inc. Class B | 178,929 | 19,543 | |
| Accenture plc Class A | 161,244 | 18,543 | |
| Lockheed Martin Corp. | 65,701 | 15,963 | |
| General Electric Co. | 462,194 | 14,439 | |
36
| Vanguard® Russell 1000 Growth Index Fund | ||
| Schedule of Investments | ||
| August 31, 2016 | ||
| Market | ||
| Value | ||
| Shares | ($000) | |
| FedEx Corp. | 64,606 | 10,655 |
| Automatic Data Processing Inc. | 117,860 | 10,585 |
| Northrop Grumman Corp. | 43,034 | 9,126 |
| Illinois Tool Works Inc. | 76,242 | 9,061 |
| Southwest Airlines Co. | 165,333 | 6,097 |
| Waste Management Inc. | 94,683 | 6,054 |
| Delta Air Lines Inc. | 155,149 | 5,702 |
| Paychex Inc. | 83,184 | 5,047 |
| Raytheon Co. | 29,315 | 4,108 |
| General Dynamics Corp. | 26,188 | 3,986 |
| * TransDigm Group Inc. | 12,999 | 3,707 |
| WW Grainger Inc. | 14,313 | 3,301 |
| Union Pacific Corp. | 34,348 | 3,281 |
| * Verisk Analytics Inc. Class A | 39,492 | 3,280 |
| * Waters Corp. | 19,814 | 3,117 |
| Rockwell Automation Inc. | 26,520 | 3,074 |
| Rockwell Collins Inc. | 33,643 | 2,816 |
| * Mettler-Toledo International Inc. | 6,769 | 2,728 |
| Cintas Corp. | 22,838 | 2,684 |
| CH Robinson Worldwide Inc. | 36,817 | 2,556 |
| Roper Technologies Inc. | 13,163 | 2,337 |
| * HD Supply Holdings Inc. | 51,921 | 1,875 |
| * Middleby Corp. | 14,597 | 1,871 |
| JB Hunt Transport Services Inc. | 22,963 | 1,823 |
| AO Smith Corp. | 18,759 | 1,810 |
| Allegion plc | 24,874 | 1,772 |
| * Stericycle Inc. | 20,085 | 1,727 |
| Alaska Air Group Inc. | 25,393 | 1,715 |
| Wabtec Corp. | 22,273 | 1,706 |
| Deere & Co. | 20,168 | 1,705 |
| IDEX Corp. | 18,244 | 1,705 |
| * CoStar Group Inc. | 8,225 | 1,705 |
| Avery Dennison Corp. | 21,650 | 1,677 |
| Snap-on Inc. | 10,896 | 1,670 |
| Expeditors International of Washington Inc. | 32,857 | 1,664 |
| Huntington Ingalls Industries Inc. | 10,017 | 1,654 |
| * United Rentals Inc. | 19,438 | 1,600 |
| Nordson Corp. | 14,655 | 1,447 |
| Emerson Electric Co. | 26,795 | 1,412 |
| * Trimble Navigation Ltd. | 51,218 | 1,403 |
| Toro Co. | 13,767 | 1,337 |
| B/E Aerospace Inc. | 26,440 | 1,337 |
| * Copart Inc. | 25,024 | 1,277 |
| Robert Half International Inc. | 32,548 | 1,248 |
| Xylem Inc. | 24,001 | 1,221 |
| Donaldson Co. Inc. | 30,449 | 1,143 |
| Graco Inc. | 14,220 | 1,048 |
| Fortive Corp. | 19,117 | 1,007 |
| Hubbell Inc. Class B | 9,038 | 979 |
| Flowserve Corp. | 20,168 | 976 |
| BWX Technologies Inc. | 23,695 | 920 |
| * Genpact Ltd. | 38,466 | 910 |
| Pitney Bowes Inc. | 48,457 | 909 |
| Textron Inc. | 21,668 | 885 |
| Booz Allen Hamilton Holding Corp. Class A | 27,697 | 841 |
| * Spirit AeroSystems Holdings Inc. Class A | 17,628 | 808 |
| * Zebra Technologies Corp. | 11,138 | 779 |
| * Old Dominion Freight Line Inc. | 10,785 | 767 |
| Landstar System Inc. | 10,706 | 741 |
| Rollins Inc. | 25,212 | 719 |
| RR Donnelley & Sons Co. | 37,573 | 642 |
| Lincoln Electric Holdings Inc. | 9,928 | 631 |
| National Instruments Corp. | 20,726 | 579 |
| Stanley Black & Decker Inc. | 4,664 | 577 |
37
| Vanguard® Russell 1000 Growth Index Fund | ||
| Schedule of Investments | ||
| August 31, 2016 | ||
| Market | ||
| Value | ||
| Shares | ($000) | |
| HEICO Corp. Class A | 9,745 | 554 |
| AMETEK Inc. | 11,290 | 550 |
| Carlisle Cos. Inc. | 4,843 | 508 |
| PACCAR Inc. | 7,682 | 460 |
| Covanta Holding Corp. | 30,813 | 459 |
| Tyco International plc | 9,504 | 415 |
| ^ MSC Industrial Direct Co. Inc. Class A | 5,237 | 383 |
| Air Lease Corp. Class A | 12,378 | 364 |
| HEICO Corp. | 4,653 | 316 |
| * Quanta Services Inc. | 10,165 | 262 |
| * Manitowoc Foodservice Inc. | 13,420 | 216 |
| * JetBlue Airways Corp. | 5,845 | 93 |
| * Clean Harbors Inc. | 930 | 44 |
| * Herc Holdings Inc. | 1,250 | 42 |
| 300,888 | ||
| Technology (25.1%) | ||
| Apple Inc. | 1,298,752 | 137,798 |
| Microsoft Corp. | 1,958,693 | 112,546 |
| * Facebook Inc. Class A | 580,302 | 73,188 |
| * Alphabet Inc. Class A | 75,584 | 59,700 |
| * Alphabet Inc. Class C | 77,109 | 59,146 |
| International Business Machines Corp. | 156,249 | 24,825 |
| Texas Instruments Inc. | 259,961 | 18,078 |
| Broadcom Ltd. | 97,512 | 17,203 |
| * salesforce.com Inc. | 165,620 | 13,153 |
| * Adobe Systems Inc. | 126,130 | 12,904 |
| * Cognizant Technology Solutions Corp. Class A | 156,102 | 8,966 |
| NVIDIA Corp. | 131,526 | 8,068 |
| Intuit Inc. | 63,015 | 7,023 |
| * Electronic Arts Inc. | 75,171 | 6,106 |
| Applied Materials Inc. | 201,063 | 6,000 |
| Activision Blizzard Inc. | 144,775 | 5,989 |
| * LinkedIn Corp. Class A | 30,368 | 5,853 |
| QUALCOMM Inc. | 78,718 | 4,965 |
| Amphenol Corp. Class A | 77,542 | 4,832 |
| Intel Corp. | 110,074 | 3,950 |
| * Citrix Systems Inc. | 40,095 | 3,496 |
| * Red Hat Inc. | 46,770 | 3,413 |
| Microchip Technology Inc. | 54,563 | 3,378 |
| Skyworks Solutions Inc. | 44,950 | 3,365 |
| Oracle Corp. | 75,127 | 3,097 |
| Lam Research Corp. | 32,997 | 3,079 |
| * Autodesk Inc. | 44,649 | 3,009 |
| * Palo Alto Networks Inc. | 22,487 | 2,995 |
| Maxim Integrated Products Inc. | 73,113 | 2,977 |
| * ServiceNow Inc. | 40,749 | 2,961 |
| KLA-Tencor Corp. | 40,386 | 2,797 |
| * Twitter Inc. | 144,656 | 2,779 |
| * Workday Inc. Class A | 30,107 | 2,553 |
| * SBA Communications Corp. Class A | 20,528 | 2,343 |
| CDK Global Inc. | 40,233 | 2,333 |
| * Akamai Technologies Inc. | 39,465 | 2,167 |
| * F5 Networks Inc. | 17,304 | 2,124 |
| * Cadence Design Systems Inc. | 77,302 | 1,967 |
| * Splunk Inc. | 33,741 | 1,965 |
| * Gartner Inc. | 20,671 | 1,881 |
| CDW Corp. | 42,068 | 1,878 |
| * VeriSign Inc. | 24,627 | 1,833 |
| Linear Technology Corp. | 28,751 | 1,674 |
| EMC Corp. | 53,769 | 1,559 |
| Sabre Corp. | 53,806 | 1,515 |
| * Ultimate Software Group Inc. | 7,083 | 1,480 |
| * Tyler Technologies Inc. | 8,535 | 1,399 |
| * Fortinet Inc. | 37,346 | 1,350 |
38
| Vanguard® Russell 1000 Growth Index Fund | |||
| Schedule of Investments | |||
| August 31, 2016 | |||
| Market | |||
| Value | |||
| Shares | ($000) | ||
| SS&C Technologies Holdings Inc. | 40,086 | 1,321 | |
| * | IMS Health Holdings Inc. | 39,259 | 1,171 |
| * | Guidewire Software Inc. | 18,558 | 1,142 |
| Xilinx Inc. | 20,869 | 1,131 | |
| FEI Co. | 10,519 | 1,120 | |
| * | NetSuite Inc. | 10,283 | 1,120 |
| * | Manhattan Associates Inc. | 18,385 | 1,113 |
| * | NCR Corp. | 31,836 | 1,078 |
| CSRA Inc. | 42,209 | 1,072 | |
| * | Teradata Corp. | 33,444 | 1,061 |
| Cognex Corp. | 21,209 | 1,055 | |
| DST Systems Inc. | 8,445 | 1,026 | |
| * | CommScope Holding Co. Inc. | 33,199 | 982 |
| * | Rackspace Hosting Inc. | 27,740 | 872 |
| IAC/InterActiveCorp | 14,189 | 833 | |
| * | Tableau Software Inc. Class A | 14,154 | 821 |
| * | Arista Networks Inc. | 10,040 | 800 |
| Leidos Holdings Inc. | 16,982 | 688 | |
| * | IPG Photonics Corp. | 7,574 | 659 |
| * | Nuance Communications Inc. | 44,357 | 647 |
| * | ANSYS Inc. | 5,918 | 563 |
| * | VeriFone Systems Inc. | 28,292 | 562 |
| * | PTC Inc. | 13,031 | 556 |
| Symantec Corp. | 22,183 | 535 | |
| * | Yelp Inc. Class A | 13,608 | 524 |
| * | Groupon Inc. Class A | 94,556 | 504 |
| *,^ | VMware Inc. Class A | 6,404 | 470 |
| * | GoDaddy Inc. Class A | 12,228 | 396 |
| Motorola Solutions Inc. | 5,129 | 395 | |
| * | ARRIS International plc | 11,471 | 322 |
| *,^ | Inovalon Holdings Inc. Class A | 15,870 | 249 |
| * | Synopsys Inc. | 3,935 | 233 |
| * | Black Knight Financial Services Inc. Class A | 5,663 | 221 |
| * | Cree Inc. | 8,777 | 211 |
| * | Atlassian Corp. plc Class A | 6,575 | 194 |
| * | Qorvo Inc. | 3,239 | 186 |
| * | FireEye Inc. | 8,477 | 122 |
| * | Match Group Inc. | 7,402 | 120 |
| * | ON Semiconductor Corp. | 9,912 | 107 |
| * | CommerceHub Inc. | 1,322 | 19 |
| * | CommerceHub Inc. Class A | 663 | 10 |
| 683,871 | |||
| Utilities (1.2%) | |||
| Verizon Communications Inc. | 528,281 | 27,645 | |
| * | T-Mobile US Inc. | 45,524 | 2,110 |
| * | Zayo Group Holdings Inc. | 42,626 | 1,236 |
| ITC Holdings Corp. | 19,223 | 869 | |
| Dominion Resources Inc. | 10,149 | 753 | |
| Piedmont Natural Gas Co. Inc. | 1,883 | 113 | |
| AT&T Inc. | 2 | — | |
| 32,726 | |||
| Total Common Stocks (Cost $2,273,438) | 2,719,821 | ||
39
| Vanguard® Russell 1000 Growth Index Fund | |||||
| Schedule of Investments | |||||
| August 31, 2016 | |||||
| Market | |||||
| Value | |||||
| Coupon | Shares | ($000) | |||
| Temporary Cash Investments (0.4%)1 | |||||
| Money Market Fund (0.4%) | |||||
| 3,4 | Vanguard Market Liquidity Fund | 0.612% | 90,817 | 9,082 | |
| Face | |||||
| Maturity | Amount | ||||
| Date | ($000) | ||||
| U.S. Government and Agency Obligations (0.0%) | |||||
| 5,6 | Federal Home Loan Bank Discount Notes | 0.400% | 9/16/16 | 500 | 500 |
| 5 | Federal Home Loan Bank Discount Notes | 0.415% | 9/23/16 | 200 | 200 |
| 700 | |||||
| Total Temporary Cash Investments (Cost $9,782) | 9,782 | ||||
| Total Investments (100.1%) (Cost $2,283,220) | 2,729,603 | ||||
| Other Assets and Liabilities—Net (-0.1%) | (2,672) | ||||
| Net Assets (100%) | 2,726,931 | ||||
| * | Non-income-producing security. |
| ^ | Includes partial security positions on loan to broker-dealers. The total value of securities on loan is $5,792,000. |
| 1 | The fund invests a portion of its cash reserves in equity markets through the use of index futures contracts. After giving effect to futures investments, the fund's effective common stock and temporary cash investment positions represent 100.0% and 0.1%, respectively, of net assets. |
| 2 | “Other” represents securities that are not classified by the fund’s benchmark index. |
| 3 | Affiliated money market fund available only to Vanguard funds and certain trusts and accounts managed by Vanguard. Rate shown is the 7-day yield. |
| 4 | Includes $6,043,000 of collateral received for securities on loan. |
| 5 | The issuer operates under a congressional charter; its securities are generally neither guaranteed by the U.S. Treasury nor backed by the full faith and credit of the U.S. government. |
| 6 | Securities with a value of $300,000 have been segregated as initial margin for open futures contracts. ADR—American Depositary Receipt. |
40
This page intentionally left blank.
© 2016 The Vanguard Group, Inc. All rights reserved.
Vanguard Marketing Corporation, Distributor.
SNA18480 102016
Report of Independent Registered Public Accounting Firm
To the Board of Trustees of Vanguard Scottsdale Funds and the Shareholders of Vanguard Russell 1000 Index Fund, Vanguard Russell 1000 Value Index Fund and Vanguard Russell 1000 Growth Index Fund:
In our opinion, the accompanying statements of net assets – investments summary and the related statements of operations and of changes in net assets and the financial highlights (included in Item 1 of this Form N-CSR) and the schedules of investments (included in Item 6 of this Form N-CSR) present fairly, in all material respects, the financial position of Vanguard Russell 1000 Index Fund, Vanguard Russell 1000 Value Index Fund and Vanguard Russell 1000 Growth Index Fund (constituting separate portfolios of Vanguard Scottsdale Funds, hereafter referred to as the “Funds”) at August 31, 2016, the results of each of their operations for the year then ended, the changes in each of their net assets for each of the two years in the period then ended, and the financial highlights for each of the five years in the period then ended, in conformity with accounting principles generally accepted in the United States of America. These financial statements, financial highlights and schedules of investments (hereafter referred to as "financial statements") are the responsibility of the Funds’ management. Our responsibility is to express an opinion on these financial statements based on our audits. We conducted our audits of these financial statements in accordance with the standards of the Public Company Accounting Oversight Board (United States). Those standards require that we plan and perform the audit to obtain reasonable assurance about whether the financial statements are free of material misstatement. An audit includes examining, on a test basis, evidence supporting the amounts and disclosures in the financial statements, assessing the accounting principles used and significant estimates made by management, and evaluating the overall financial statement presentation. We believe that our audits, which included confirmation of securities at August 31, 2016 by correspondence with the custodian and brokers and by agreement to the underlying ownership records of the transfer agent, provide a reasonable basis for our opinion.
October 12, 2016
PricewaterhouseCoopers LLP, Two Commerce Square, Suite 1800, 2001 Market Street, Philadelphia, PA 19103
T: (267) 330-3000, F: (267) 330-3300, www.pwc.com/us
| Vanguard® Russell 2000 Index Fund | |||
| Schedule of Investments | |||
| August 31, 2016 | |||
| Market | |||
| Value | |||
| Shares | ($000) | ||
| Common Stocks (99.7%)1 | |||
| Consumer Discretionary (13.9%) | |||
| Jack in the Box Inc. | 22,131 | 2,201 | |
| * | Tenneco Inc. | 38,425 | 2,145 |
| American Eagle Outfitters Inc. | 113,282 | 2,100 | |
| * | Buffalo Wild Wings Inc. | 12,858 | 2,086 |
| * | Bright Horizons Family Solutions Inc. | 29,947 | 2,041 |
| Texas Roadhouse Inc. Class A | 45,276 | 2,004 | |
| Cracker Barrel Old Country Store Inc. | 13,000 | 1,977 | |
| Avon Products Inc. | 301,026 | 1,716 | |
| * | Helen of Troy Ltd. | 18,857 | 1,704 |
| * | Cimpress NV | 17,110 | 1,699 |
| Drew Industries Inc. | 16,169 | 1,647 | |
| * | Five Below Inc. | 36,626 | 1,632 |
| Wolverine World Wide Inc. | 66,803 | 1,597 | |
| Cheesecake Factory Inc. | 30,450 | 1,565 | |
| Bloomin' Brands Inc. | 78,000 | 1,524 | |
| Big Lots Inc. | 30,452 | 1,502 | |
| * | Steven Madden Ltd. | 42,436 | 1,489 |
| Dana Inc. | 99,947 | 1,441 | |
| * | TRI Pointe Group Inc. | 104,722 | 1,420 |
| * | Deckers Outdoor Corp. | 21,710 | 1,419 |
| Churchill Downs Inc. | 9,229 | 1,379 | |
| Papa John's International Inc. | 18,235 | 1,365 | |
| Meredith Corp. | 25,721 | 1,364 | |
| Office Depot Inc. | 370,673 | 1,364 | |
| Sotheby's | 33,805 | 1,340 | |
| * | Houghton Mifflin Harcourt Co. | 83,063 | 1,325 |
| Interval Leisure Group Inc. | 75,757 | 1,318 | |
| Lithia Motors Inc. Class A | 15,919 | 1,318 | |
| Matthews International Corp. Class A | 21,412 | 1,317 | |
| * | Media General Inc. | 74,368 | 1,314 |
| Cooper Tire & Rubber Co. | 38,029 | 1,293 | |
| * | Grand Canyon Education Inc. | 30,851 | 1,281 |
| Sinclair Broadcast Group Inc. Class A | 44,257 | 1,260 | |
| Monro Muffler Brake Inc. | 21,625 | 1,220 | |
| * | IMAX Corp. | 39,386 | 1,201 |
| * | Dave & Buster's Entertainment Inc. | 25,380 | 1,179 |
| * | Shutterfly Inc. | 23,232 | 1,167 |
| Marriott Vacations Worldwide Corp. | 15,039 | 1,160 | |
| PriceSmart Inc. | 13,748 | 1,148 | |
| * | Dorman Products Inc. | 18,127 | 1,143 |
| Chico's FAS Inc. | 87,495 | 1,109 | |
| * | Boyd Gaming Corp. | 56,747 | 1,107 |
| ^ | Nexstar Broadcasting Group Inc. Class A | 20,662 | 1,089 |
| DSW Inc. Class A | 45,166 | 1,082 | |
| New York Times Co. Class A | 83,595 | 1,082 | |
| Aaron's Inc. | 44,227 | 1,077 | |
| Travelport Worldwide Ltd. | 77,624 | 1,066 | |
| *,^ | Stamps.com Inc. | 10,914 | 1,056 |
| * | Smith & Wesson Holding Corp. | 36,779 | 1,035 |
| Children's Place Inc. | 12,610 | 1,026 | |
| * | Genesco Inc. | 14,125 | 1,026 |
| Columbia Sportswear Co. | 18,147 | 1,019 | |
| *,^ | GoPro Inc. Class A | 69,554 | 1,019 |
| * | Cooper-Standard Holding Inc. | 10,244 | 1,015 |
| * | Liberty TripAdvisor Holdings Inc. Class A | 48,751 | 1,015 |
| DeVry Education Group Inc. | 43,269 | 997 | |
| * | Ascena Retail Group Inc. | 120,969 | 985 |
| * | Etsy Inc. | 72,505 | 976 |
| Time Inc. | 68,899 | 972 | |
| * | Meritage Homes Corp. | 26,520 | 952 |
| * | LifeLock Inc. | 56,939 | 947 |
1
| Vanguard® Russell 2000 Index Fund | |||
| Schedule of Investments | |||
| August 31, 2016 | |||
| Market | |||
| Value | |||
| Shares | ($000) | ||
| Gannett Co. Inc. | 79,010 | 943 | |
| Sonic Corp. | 32,415 | 930 | |
| DineEquity Inc. | 11,797 | 920 | |
| KB Home | 58,429 | 917 | |
| * | G-III Apparel Group Ltd. | 28,847 | 911 |
| * | Restoration Hardware Holdings Inc. | 26,917 | 908 |
| * | 2U Inc. | 25,349 | 896 |
| La-Z-Boy Inc. | 33,049 | 881 | |
| * | American Axle & Manufacturing Holdings Inc. | 50,971 | 874 |
| HSN Inc. | 20,904 | 873 | |
| Group 1 Automotive Inc. | 14,618 | 867 | |
| * | Fossil Group Inc. | 29,444 | 841 |
| *,^ | Wayfair Inc. | 21,825 | 841 |
| * | Select Comfort Corp. | 31,263 | 821 |
| * | Popeyes Louisiana Kitchen Inc. | 14,990 | 817 |
| * | Gentherm Inc. | 24,599 | 811 |
| Abercrombie & Fitch Co. | 45,604 | 809 | |
| * | American Woodmark Corp. | 9,213 | 802 |
| Caleres Inc. | 30,012 | 779 | |
| Sturm Ruger & Co. Inc. | 12,400 | 760 | |
| Scholastic Corp. | 18,873 | 760 | |
| *,^ | Diamond Resorts International Inc. | 24,683 | 746 |
| * | Shutterstock Inc. | 12,639 | 733 |
| * | Mattress Firm Holding Corp. | 11,417 | 730 |
| Callaway Golf Co. | 62,769 | 717 | |
| * | Asbury Automotive Group Inc. | 13,281 | 713 |
| MDC Holdings Inc. | 27,237 | 711 | |
| Finish Line Inc. Class A | 29,501 | 710 | |
| * | Universal Electronics Inc. | 9,536 | 706 |
| * | Penn National Gaming Inc. | 49,588 | 703 |
| * | MSG Networks Inc. | 40,006 | 699 |
| Guess? Inc. | 41,155 | 684 | |
| * | EW Scripps Co. Class A | 40,052 | 681 |
| Oxford Industries Inc. | 10,767 | 672 | |
| * | TiVo Inc. | 62,491 | 663 |
| * | La Quinta Holdings Inc. | 57,043 | 659 |
| * | Liberty Media Group LLC | 30,953 | 658 |
| Standard Motor Products Inc. | 14,271 | 640 | |
| * | Belmond Ltd. Class A | 56,256 | 628 |
| ClubCorp Holdings Inc. | 43,286 | 621 | |
| * | Meritor Inc. | 55,449 | 618 |
| Cato Corp. Class A | 18,033 | 618 | |
| * | BJ's Restaurants Inc. | 15,534 | 617 |
| National CineMedia Inc. | 41,269 | 617 | |
| * | Cavco Industries Inc. | 5,700 | 596 |
| * | Hibbett Sports Inc. | 15,420 | 592 |
| SeaWorld Entertainment Inc. | 45,036 | 586 | |
| * | Express Inc. | 49,450 | 585 |
| International Speedway Corp. Class A | 17,568 | 585 | |
| ^ | Outerwall Inc. | 11,243 | 584 |
| Ethan Allen Interiors Inc. | 17,373 | 581 | |
| Nutrisystem Inc. | 19,746 | 569 | |
| * | Central Garden & Pet Co. Class A | 23,312 | 565 |
| *,^ | Quotient Technology Inc. | 42,815 | 555 |
| Bob Evans Farms Inc. | 13,453 | 552 | |
| * | Denny's Corp. | 50,531 | 528 |
| * | Carmike Cinemas Inc. | 16,000 | 513 |
| * | Apollo Education Group Inc. | 57,675 | 512 |
| ^ | World Wrestling Entertainment Inc. Class A | 24,285 | 504 |
| ^ | Buckle Inc. | 19,334 | 498 |
| Superior Industries International Inc. | 16,769 | 488 | |
| Barnes & Noble Inc. | 42,535 | 487 | |
| Viad Corp. | 13,528 | 484 | |
| * | Gray Television Inc. | 43,030 | 483 |
2
| Vanguard® Russell 2000 Index Fund | |||
| Schedule of Investments | |||
| August 31, 2016 | |||
| Market | |||
| Value | |||
| Shares | ($000) | ||
| * | Nautilus Inc. | 20,202 | 471 |
| * | Pinnacle Entertainment Inc. | 38,934 | 469 |
| * | HealthStream Inc. | 17,456 | 464 |
| Red Rock Resorts Inc. Class A | 20,310 | 458 | |
| * | Red Robin Gourmet Burgers Inc. | 9,081 | 456 |
| Capella Education Co. | 7,612 | 449 | |
| * | Fiesta Restaurant Group Inc. | 17,599 | 445 |
| * | Vitamin Shoppe Inc. | 15,991 | 443 |
| Winnebago Industries Inc. | 18,231 | 439 | |
| Tailored Brands Inc. | 33,143 | 437 | |
| AMC Entertainment Holdings Inc. | 14,240 | 433 | |
| Rent-A-Center Inc. | 35,261 | 431 | |
| * | Crocs Inc. | 49,766 | 430 |
| MDC Partners Inc. Class A | 34,383 | 424 | |
| New Media Investment Group Inc. | 26,258 | 420 | |
| Inter Parfums Inc. | 11,956 | 409 | |
| *,^ | LGI Homes Inc. | 10,470 | 402 |
| * | Caesars Acquisition Co. Class A | 31,332 | 381 |
| *,^ | Shake Shack Inc. Class A | 10,664 | 376 |
| * | M/I Homes Inc. | 16,057 | 372 |
| * | Francesca's Holdings Corp. | 26,876 | 367 |
| Sonic Automotive Inc. Class A | 21,250 | 362 | |
| * | Taylor Morrison Home Corp. Class A | 20,228 | 357 |
| * | Liberty Media Group LLC Class A | 16,592 | 355 |
| * | Chegg Inc. | 52,759 | 355 |
| * | Liberty Braves Group | 21,231 | 349 |
| * | Strayer Education Inc. | 7,152 | 348 |
| * | Zoe's Kitchen Inc. | 12,718 | 346 |
| * | Motorcar Parts of America Inc. | 12,035 | 342 |
| * | Ollie's Bargain Outlet Holdings Inc. | 13,259 | 337 |
| * | Tile Shop Holdings Inc. | 21,608 | 336 |
| * | MarineMax Inc. | 16,828 | 334 |
| * | Chuy's Holdings Inc. | 10,910 | 330 |
| Tower International Inc. | 13,585 | 330 | |
| Ruth's Hospitality Group Inc. | 21,868 | 327 | |
| *,^ | Eros International plc | 19,457 | 325 |
| Entravision Communications Corp. Class A | 42,778 | 322 | |
| * | Carrols Restaurant Group Inc. | 23,680 | 319 |
| * | XO Group Inc. | 16,794 | 313 |
| Wingstop Inc. | 10,307 | 312 | |
| * | Biglari Holdings Inc. | 704 | 310 |
| * | Stoneridge Inc. | 17,858 | 310 |
| * | Party City Holdco Inc. | 17,650 | 307 |
| * | Regis Corp. | 24,354 | 306 |
| * | Fox Factory Holding Corp. | 14,672 | 305 |
| Marcus Corp. | 12,765 | 301 | |
| * | tronc Inc. | 17,544 | 297 |
| * | Barnes & Noble Education Inc. | 26,263 | 294 |
| * | SiteOne Landscape Supply Inc. | 7,618 | 291 |
| * | Career Education Corp. | 44,425 | 291 |
| National Presto Industries Inc. | 3,293 | 287 | |
| * | Isle of Capri Casinos Inc. | 16,383 | 284 |
| Shoe Carnival Inc. | 9,530 | 283 | |
| * | Scientific Games Corp. Class A | 34,044 | 281 |
| * | Revlon Inc. Class A | 7,725 | 280 |
| * | FTD Cos. Inc. | 11,654 | 274 |
| *,^ | Lumber Liquidators Holdings Inc. | 17,289 | 272 |
| * | William Lyon Homes Class A | 15,675 | 270 |
| Fred's Inc. Class A | 23,893 | 270 | |
| * | WCI Communities Inc. | 14,202 | 267 |
| * | K12 Inc. | 22,207 | 265 |
| * | Angie's List Inc. | 26,046 | 265 |
| * | Eldorado Resorts Inc. | 18,918 | 264 |
| Libbey Inc. | 14,882 | 264 | |
3
| Vanguard® Russell 2000 Index Fund | |||
| Schedule of Investments | |||
| August 31, 2016 | |||
| Market | |||
| Value | |||
| Shares | ($000) | ||
| Haverty Furniture Cos. Inc. | 13,021 | 260 | |
| Blue Nile Inc. | 7,425 | 256 | |
| Pier 1 Imports Inc. | 53,858 | 248 | |
| Entercom Communications Corp. Class A | 17,586 | 241 | |
| * | Del Frisco's Restaurant Group Inc. | 15,887 | 239 |
| * | Iconix Brand Group Inc. | 28,082 | 236 |
| *,^ | Caesars Entertainment Corp. | 37,104 | 235 |
| Movado Group Inc. | 10,325 | 234 | |
| * | Beazer Homes USA Inc. | 20,822 | 234 |
| Carriage Services Inc. Class A | 9,881 | 232 | |
| * | Planet Fitness Inc. Class A | 10,511 | 228 |
| * | Horizon Global Corp. | 12,393 | 221 |
| * | Elizabeth Arden Inc. | 15,661 | 219 |
| * | American Public Education Inc. | 10,420 | 215 |
| * | America's Car-Mart Inc. | 5,323 | 208 |
| * | Potbelly Corp. | 15,621 | 202 |
| Flexsteel Industries Inc. | 4,248 | 202 | |
| * | Vera Bradley Inc. | 13,412 | 201 |
| * | Tuesday Morning Corp. | 29,901 | 199 |
| * | Zumiez Inc. | 11,827 | 198 |
| * | Century Communities Inc. | 9,956 | 196 |
| Citi Trends Inc. | 10,020 | 196 | |
| *,^ | Weight Watchers International Inc. | 18,609 | 196 |
| *,^ | Duluth Holdings Inc. | 6,298 | 191 |
| *,^ | Lands' End Inc. | 10,744 | 189 |
| *,^ | Sequential Brands Group Inc. | 25,730 | 188 |
| * | Federal-Mogul Holdings Corp. | 20,443 | 187 |
| * | El Pollo Loco Holdings Inc. | 13,297 | 181 |
| * | Central Garden & Pet Co. | 7,027 | 180 |
| * | Eastman Kodak Co. | 11,518 | 178 |
| * | Monarch Casino & Resort Inc. | 7,376 | 175 |
| Hooker Furniture Corp. | 7,459 | 174 | |
| * | Sportsman's Warehouse Holdings Inc. | 16,923 | 173 |
| * | Malibu Boats Inc. Class A | 12,632 | 173 |
| * | Daily Journal Corp. | 741 | 172 |
| Bassett Furniture Industries Inc. | 6,894 | 171 | |
| * | Del Taco Restaurants Inc. | 15,166 | 170 |
| Stein Mart Inc. | 20,581 | 165 | |
| * | Instructure Inc. | 6,888 | 165 |
| * | Intrawest Resorts Holdings Inc. | 10,768 | 161 |
| Winmark Corp. | 1,541 | 160 | |
| * | 1-800-Flowers.com Inc. Class A | 17,120 | 158 |
| * | Perry Ellis International Inc. | 8,451 | 158 |
| Metaldyne Performance Group Inc. | 9,846 | 156 | |
| * | Reading International Inc. Class A | 10,887 | 147 |
| Big 5 Sporting Goods Corp. | 11,704 | 146 | |
| CSS Industries Inc. | 5,709 | 145 | |
| * | Hovnanian Enterprises Inc. Class A | 78,230 | 142 |
| Speedway Motorsports Inc. | 7,887 | 141 | |
| * | ZAGG Inc. | 18,977 | 138 |
| * | Habit Restaurants Inc. Class A | 8,822 | 135 |
| * | Overstock.com Inc. | 8,693 | 134 |
| * | TubeMogul Inc. | 14,420 | 131 |
| * | Kirkland's Inc. | 10,065 | 126 |
| Arctic Cat Inc. | 8,722 | 124 | |
| * | Ruby Tuesday Inc. | 39,848 | 121 |
| Johnson Outdoors Inc. Class A | 3,440 | 116 | |
| * | West Marine Inc. | 12,522 | 116 |
| *,^ | Central European Media Enterprises Ltd. Class A | 48,556 | 115 |
| Weyco Group Inc. | 4,439 | 113 | |
| * | Rosetta Stone Inc. | 12,641 | 112 |
| * | Care.com Inc. | 10,608 | 111 |
| * | Destination XL Group Inc. | 23,663 | 110 |
| * | Boot Barn Holdings Inc. | 8,765 | 109 |
4
| Vanguard® Russell 2000 Index Fund | |||
| Schedule of Investments | |||
| August 31, 2016 | |||
| Market | |||
| Value | |||
| Shares | ($000) | ||
| * | Franklin Covey Co. | 6,572 | 107 |
| * | Build-A-Bear Workshop Inc. | 9,069 | 105 |
| * | Bojangles' Inc. | 6,429 | 104 |
| Collectors Universe Inc. | 5,402 | 103 | |
| *,^ | Sears Holdings Corp. | 7,379 | 102 |
| * | Liberty Braves Group Class A | 6,001 | 101 |
| Lifetime Brands Inc. | 7,483 | 100 | |
| Saga Communications Inc. Class A | 2,422 | 99 | |
| Strattec Security Corp. | 2,346 | 98 | |
| * | Nathan's Famous Inc. | 1,986 | 98 |
| * | JAKKS Pacific Inc. | 10,530 | 97 |
| * | Vince Holding Corp. | 13,637 | 96 |
| * | Jamba Inc. | 8,547 | 93 |
| * | J Alexander's Holdings Inc. | 9,165 | 91 |
| Stage Stores Inc. | 16,944 | 91 | |
| * | Lindblad Expeditions Holdings Inc. | 9,650 | 91 |
| * | New Home Co. Inc. | 8,349 | 91 |
| * | Conn's Inc. | 13,308 | 90 |
| * | Century Casinos Inc. | 13,972 | 89 |
| Escalade Inc. | 7,353 | 89 | |
| * | Bridgepoint Education Inc. | 12,028 | 87 |
| Superior Uniform Group Inc. | 5,087 | 86 | |
| Golden Entertainment Inc. | 6,763 | 85 | |
| * | Delta Apparel Inc. | 4,662 | 82 |
| * | QuinStreet Inc. | 24,731 | 76 |
| * | Kona Grill Inc. | 5,518 | 73 |
| * | Tilly's Inc. Class A | 8,231 | 72 |
| * | Performance Sports Group Ltd. | 23,525 | 64 |
| * | Marchex Inc. Class B | 22,964 | 63 |
| MCBC Holdings Inc. | 5,158 | 62 | |
| Liberty Tax Inc. | 4,483 | 61 | |
| * | Red Lion Hotels Corp. | 9,296 | 61 |
| Marine Products Corp. | 6,565 | 59 | |
| Systemax Inc. | 7,190 | 58 | |
| * | Luby's Inc. | 12,756 | 57 |
| * | Hemisphere Media Group Inc. Class A | 4,286 | 57 |
| * | Radio One Inc. | 16,179 | 56 |
| * | Townsquare Media Inc. Class A | 5,674 | 55 |
| Unique Fabricating Inc. | 4,314 | 54 | |
| * | Container Store Group Inc. | 9,644 | 51 |
| * | Sears Hometown and Outlet Stores Inc. | 7,376 | 49 |
| *,^ | IDI Inc. | 9,958 | 48 |
| * | Noodles & Co. Class A | 7,163 | 47 |
| Salem Media Group Inc. Class A | 7,254 | 46 | |
| *,^ | Empire Resorts Inc. | 2,440 | 41 |
| * | Cambium Learning Group Inc. | 8,031 | 39 |
| * | Fogo De Chao Inc. | 3,010 | 37 |
| * | Gaia Inc. Class A | 3,927 | 31 |
| 163,427 | |||
| Consumer Staples (2.7%) | |||
| B&G Foods Inc. | 44,224 | 2,100 | |
| Snyder's-Lance Inc. | 54,570 | 1,929 | |
| Lancaster Colony Corp. | 12,734 | 1,713 | |
| * | United Natural Foods Inc. | 33,233 | 1,515 |
| Vector Group Ltd. | 60,572 | 1,351 | |
| Sanderson Farms Inc. | 13,726 | 1,321 | |
| Fresh Del Monte Produce Inc. | 22,058 | 1,283 | |
| J&J Snack Foods Corp. | 10,328 | 1,260 | |
| Core-Mark Holding Co. Inc. | 30,560 | 1,166 | |
| WD-40 Co. | 9,417 | 1,115 | |
| * | Boston Beer Co. Inc. Class A | 5,958 | 1,088 |
| Dean Foods Co. | 61,548 | 1,059 | |
| * | SUPERVALU Inc. | 187,156 | 1,026 |
| GNC Holdings Inc. Class A | 45,902 | 965 | |
5
| Vanguard® Russell 2000 Index Fund | |||
| Schedule of Investments | |||
| August 31, 2016 | |||
| Market | |||
| Value | |||
| Shares | ($000) | ||
| * | Diplomat Pharmacy Inc. | 30,652 | 959 |
| ^ | Cal-Maine Foods Inc. | 20,809 | 956 |
| Universal Corp. | 15,221 | 916 | |
| SpartanNash Co. | 24,551 | 786 | |
| Andersons Inc. | 17,899 | 661 | |
| * | Performance Food Group Co. | 24,913 | 640 |
| Calavo Growers Inc. | 10,297 | 607 | |
| * | Seaboard Corp. | 182 | 589 |
| Coca-Cola Bottling Co. Consolidated | 3,208 | 482 | |
| * | USANA Health Sciences Inc. | 3,501 | 479 |
| ^ | Tootsie Roll Industries Inc. | 11,674 | 445 |
| * | National Beverage Corp. | 7,883 | 392 |
| * | Omega Protein Corp. | 14,383 | 363 |
| Ingles Markets Inc. Class A | 9,568 | 362 | |
| MGP Ingredients Inc. | 8,627 | 345 | |
| Weis Markets Inc. | 6,445 | 328 | |
| * | Amplify Snack Brands Inc. | 19,155 | 324 |
| John B Sanfilippo & Son Inc. | 5,600 | 288 | |
| PetMed Express Inc. | 13,296 | 268 | |
| Medifast Inc. | 6,981 | 257 | |
| * | Smart & Final Stores Inc. | 15,765 | 202 |
| * | Farmer Brothers Co. | 5,375 | 172 |
| Orchids Paper Products Co. | 6,099 | 171 | |
| * | Craft Brew Alliance Inc. | 8,314 | 165 |
| ^ | Natural Health Trends Corp. | 5,000 | 161 |
| * | Primo Water Corp. | 13,841 | 160 |
| Village Super Market Inc. Class A | 4,851 | 155 | |
| *,^ | Freshpet Inc. | 14,696 | 154 |
| * | Chefs' Warehouse Inc. | 12,810 | 141 |
| * | Nutraceutical International Corp. | 5,525 | 140 |
| Limoneira Co. | 7,816 | 130 | |
| * | Seneca Foods Corp. Class A | 4,286 | 126 |
| * | Inventure Foods Inc. | 12,214 | 118 |
| * | Alliance One International Inc. | 5,469 | 116 |
| * | Lifevantage Corp. | 8,998 | 110 |
| Nature's Sunshine Products Inc. | 5,897 | 80 | |
| * | Natural Grocers by Vitamin Cottage Inc. | 5,911 | 73 |
| Alico Inc. | 1,952 | 55 | |
| * | Synutra International Inc. | 13,643 | 54 |
| * | Turning Point Brands Inc. | 3,894 | 50 |
| * | Lifeway Foods Inc. | 2,698 | 34 |
| 31,905 | |||
| Energy (2.9%) | |||
| * | RSP Permian Inc. | 53,757 | 2,099 |
| * | PDC Energy Inc. | 31,470 | 2,090 |
| * | NOW Inc. | 73,701 | 1,521 |
| * | Carrizo Oil & Gas Inc. | 37,418 | 1,433 |
| Western Refining Inc. | 55,532 | 1,397 | |
| * | Matador Resources Co. | 55,836 | 1,281 |
| Golar LNG Ltd. | 59,858 | 1,247 | |
| * | Callon Petroleum Co. | 84,082 | 1,223 |
| * | Oasis Petroleum Inc. | 119,338 | 1,131 |
| * | Oil States International Inc. | 35,799 | 1,111 |
| SemGroup Corp. Class A | 35,495 | 1,104 | |
| * | Synergy Resources Corp. | 129,826 | 850 |
| * | McDermott International Inc. | 160,578 | 840 |
| Delek US Holdings Inc. | 42,704 | 749 | |
| TerraForm Power Inc. Class A | 58,193 | 747 | |
| * | Denbury Resources Inc. | 233,733 | 720 |
| * | Forum Energy Technologies Inc. | 40,484 | 711 |
| * | SEACOR Holdings Inc. | 10,736 | 631 |
| *,^ | Seadrill Ltd. | 251,149 | 605 |
| * | Flotek Industries Inc. | 38,174 | 592 |
| Green Plains Inc. | 24,304 | 590 | |
6
| Vanguard® Russell 2000 Index Fund | |||
| Schedule of Investments | |||
| August 31, 2016 | |||
| Market | |||
| Value | |||
| Shares | ($000) | ||
| * | Unit Corp. | 33,433 | 571 |
| Archrock Inc. | 49,970 | 551 | |
| * | Helix Energy Solutions Group Inc. | 68,003 | 510 |
| *,^ | Fairmount Santrol Holdings Inc. | 54,442 | 405 |
| * | Newpark Resources Inc. | 56,524 | 399 |
| * | TETRA Technologies Inc. | 61,094 | 370 |
| * | Cobalt International Energy Inc. | 277,656 | 333 |
| * | Matrix Service Co. | 17,990 | 333 |
| ^ | Atwood Oceanics Inc. | 41,317 | 326 |
| * | REX American Resources Corp. | 4,013 | 323 |
| *,^ | Sanchez Energy Corp. | 37,351 | 321 |
| * | Exterran Corp. | 20,822 | 294 |
| SunCoke Energy Inc. | 43,725 | 285 | |
| *,^ | Clayton Williams Energy Inc. | 4,007 | 253 |
| *,^ | Sunrun Inc. | 41,455 | 252 |
| * | Clean Energy Fuels Corp. | 57,442 | 251 |
| * | Ring Energy Inc. | 23,439 | 233 |
| * | Renewable Energy Group Inc. | 24,357 | 219 |
| TerraForm Global Inc. Class A | 59,887 | 217 | |
| Tesco Corp. | 31,824 | 217 | |
| * | Bill Barrett Corp. | 32,221 | 214 |
| * | California Resources Corp. | 20,780 | 206 |
| * | Natural Gas Services Group Inc. | 8,262 | 195 |
| Panhandle Oil and Gas Inc. Class A | 10,347 | 179 | |
| * | Parker Drilling Co. | 78,791 | 169 |
| * | Contango Oil & Gas Co. | 17,095 | 165 |
| Alon USA Energy Inc. | 20,102 | 164 | |
| ^ | CARBO Ceramics Inc. | 12,570 | 158 |
| * | Geospace Technologies Corp. | 8,746 | 155 |
| ^ | CVR Energy Inc. | 10,361 | 151 |
| * | Trecora Resources | 13,427 | 147 |
| * | Pioneer Energy Services Corp. | 42,543 | 142 |
| * | TerraVia Holdings Inc. | 49,816 | 132 |
| * | Eclipse Resources Corp. | 38,573 | 132 |
| * | Green Brick Partners Inc. | 15,270 | 121 |
| * | Pacific Ethanol Inc. | 18,743 | 121 |
| * | Hornbeck Offshore Services Inc. | 21,842 | 120 |
| * | Abraxas Petroleum Corp. | 82,128 | 115 |
| * | RigNet Inc. | 8,404 | 106 |
| *,^ | EP Energy Corp. Class A | 25,371 | 105 |
| *,^ | FuelCell Energy Inc. | 19,610 | 101 |
| *,^ | EXCO Resources Inc. | 98,272 | 100 |
| * | Era Group Inc. | 13,677 | 100 |
| *,^ | Northern Oil and Gas Inc. | 30,630 | 99 |
| * | Independence Contract Drilling Inc. | 19,638 | 99 |
| * | EnerNOC Inc. | 17,030 | 97 |
| Evolution Petroleum Corp. | 16,917 | 96 | |
| * | Dawson Geophysical Co. | 13,228 | 95 |
| * | Westmoreland Coal Co. | 11,986 | 92 |
| * | Ameresco Inc. Class A | 14,494 | 69 |
| * | Jones Energy Inc. Class A | 20,812 | 58 |
| * | Willbros Group Inc. | 28,339 | 55 |
| Adams Resources & Energy Inc. | 1,462 | 54 | |
| *,^ | Vivint Solar Inc. | 15,869 | 51 |
| * | Par Pacific Holdings Inc. | 4,031 | 49 |
| *,^ | W&T Offshore Inc. | 21,731 | 37 |
| * | Isramco Inc. | 401 | 31 |
| *,^ | Erin Energy Corp. | 8,816 | 20 |
| * | Earthstone Energy Inc. | 1,350 | 13 |
| * | Par Pacific Holdings Inc. Rights Exp. 09/14/2016 | 18,331 | 1 |
| * | Global Geophysical Services Inc. | 127 | — |
| 33,649 | |||
| Financial Services (26.8%) | |||
| Gramercy Property Trust | 285,424 | 2,763 | |
7
| Vanguard® Russell 2000 Index Fund | ||
| Schedule of Investments | ||
| August 31, 2016 | ||
| Market | ||
| Value | ||
| Shares | ($000) | |
| Fair Isaac Corp. | 21,101 | 2,700 |
| Healthcare Realty Trust Inc. | 76,930 | 2,697 |
| Prosperity Bancshares Inc. | 45,788 | 2,540 |
| Investors Bancorp Inc. | 202,492 | 2,481 |
| Umpqua Holdings Corp. | 150,121 | 2,465 |
| PrivateBancorp Inc. | 53,359 | 2,452 |
| Medical Properties Trust Inc. | 160,524 | 2,451 |
| Webster Financial Corp. | 61,965 | 2,394 |
| Bank of the Ozarks Inc. | 60,303 | 2,363 |
| New Residential Investment Corp. | 164,605 | 2,362 |
| Education Realty Trust Inc. | 48,213 | 2,185 |
| First Industrial Realty Trust Inc. | 74,934 | 2,156 |
| DuPont Fabros Technology Inc. | 50,766 | 2,152 |
| Hudson Pacific Properties Inc. | 63,661 | 2,131 |
| Sunstone Hotel Investors Inc. | 148,469 | 2,062 |
| LaSalle Hotel Properties | 73,278 | 2,056 |
| National Health Investors Inc. | 25,302 | 2,031 |
| Radian Group Inc. | 147,667 | 2,025 |
| CNO Financial Group Inc. | 122,037 | 1,983 |
| RLJ Lodging Trust | 83,828 | 1,957 |
| Wintrust Financial Corp. | 35,033 | 1,947 |
| Physicians Realty Trust | 90,848 | 1,945 |
| Home BancShares Inc. | 82,769 | 1,937 |
| Acadia Realty Trust | 51,549 | 1,904 |
| IBERIABANK Corp. | 27,599 | 1,898 |
| * MGIC Investment Corp. | 233,321 | 1,888 |
| MB Financial Inc. | 47,657 | 1,867 |
| UMB Financial Corp. | 30,511 | 1,855 |
| RLI Corp. | 25,740 | 1,827 |
| ^ Primerica Inc. | 31,970 | 1,820 |
| FNB Corp. | 143,198 | 1,789 |
| CoreSite Realty Corp. | 22,511 | 1,756 |
| Urban Edge Properties | 61,277 | 1,756 |
| * Washington Prime Group Inc. | 127,327 | 1,749 |
| * Stifel Financial Corp. | 44,345 | 1,745 |
| Hancock Holding Co. | 53,001 | 1,729 |
| United Bankshares Inc. | 43,753 | 1,724 |
| QTS Realty Trust Inc. Class A | 31,748 | 1,720 |
| Lexington Realty Trust | 156,628 | 1,690 |
| Mack-Cali Realty Corp. | 60,873 | 1,690 |
| Fulton Financial Corp. | 116,571 | 1,686 |
| * Texas Capital Bancshares Inc. | 31,648 | 1,662 |
| Washington Federal Inc. | 61,956 | 1,642 |
| Retail Opportunity Investments Corp. | 73,499 | 1,640 |
| Pinnacle Financial Partners Inc. | 28,909 | 1,639 |
| Valley National Bancorp | 168,795 | 1,629 |
| CBL & Associates Properties Inc. | 113,366 | 1,618 |
| * Genworth Financial Inc. Class A | 340,540 | 1,611 |
| Kite Realty Group Trust | 55,600 | 1,606 |
| Washington REIT | 49,386 | 1,605 |
| Ryman Hospitality Properties Inc. | 29,656 | 1,600 |
| First Financial Bankshares Inc. | 43,616 | 1,597 |
| Cathay General Bancorp | 50,621 | 1,590 |
| EastGroup Properties Inc. | 21,655 | 1,589 |
| Cousins Properties Inc. | 141,776 | 1,562 |
| Glacier Bancorp Inc. | 52,127 | 1,561 |
| Selective Insurance Group Inc. | 38,818 | 1,549 |
| Sterling Bancorp | 86,568 | 1,545 |
| * Hope Bancorp Inc. | 86,180 | 1,482 |
| DiamondRock Hospitality Co. | 138,959 | 1,472 |
| PS Business Parks Inc. | 13,242 | 1,467 |
| Janus Capital Group Inc. | 98,539 | 1,465 |
| First Citizens BancShares Inc. Class A | 5,127 | 1,461 |
| BancorpSouth Inc. | 58,098 | 1,447 |
8
| Vanguard® Russell 2000 Index Fund | |||
| Schedule of Investments | |||
| August 31, 2016 | |||
| Market | |||
| Value | |||
| Shares | ($000) | ||
| Pebblebrook Hotel Trust | 48,008 | 1,442 | |
| Colony Capital Inc. Class A | 77,739 | 1,436 | |
| Community Bank System Inc. | 29,385 | 1,394 | |
| * | Cardtronics plc Class A | 30,922 | 1,389 |
| Great Western Bancorp Inc. | 40,375 | 1,382 | |
| Colony Starwood Homes | 44,313 | 1,374 | |
| Evercore Partners Inc. Class A | 26,424 | 1,354 | |
| LTC Properties Inc. | 25,674 | 1,333 | |
| * | Essent Group Ltd. | 50,119 | 1,332 |
| EverBank Financial Corp. | 69,099 | 1,326 | |
| BGC Partners Inc. Class A | 149,437 | 1,311 | |
| Columbia Banking System Inc. | 39,026 | 1,289 | |
| * | HRG Group Inc. | 79,609 | 1,287 |
| Old National Bancorp | 90,702 | 1,284 | |
| Trustmark Corp. | 45,227 | 1,283 | |
| Alexander & Baldwin Inc. | 31,846 | 1,278 | |
| Kennedy-Wilson Holdings Inc. | 57,916 | 1,278 | |
| * | Enstar Group Ltd. | 7,627 | 1,271 |
| * | Blackhawk Network Holdings Inc. | 36,839 | 1,262 |
| Capitol Federal Financial Inc. | 86,264 | 1,240 | |
| South State Corp. | 16,284 | 1,237 | |
| CVB Financial Corp. | 69,030 | 1,228 | |
| Chemical Financial Corp. | 26,246 | 1,213 | |
| Invesco Mortgage Capital Inc. | 76,697 | 1,207 | |
| Xenia Hotels & Resorts Inc. | 71,443 | 1,203 | |
| *,^ | LendingClub Corp. | 221,138 | 1,196 |
| Monogram Residential Trust Inc. | 112,652 | 1,185 | |
| Pennsylvania REIT | 46,806 | 1,174 | |
| Financial Engines Inc. | 36,263 | 1,159 | |
| American Assets Trust Inc. | 26,169 | 1,159 | |
| Select Income REIT | 42,360 | 1,156 | |
| STAG Industrial Inc. | 46,083 | 1,144 | |
| * | Hilltop Holdings Inc. | 50,035 | 1,133 |
| International Bancshares Corp. | 37,929 | 1,125 | |
| Sabra Health Care REIT Inc. | 43,296 | 1,103 | |
| Government Properties Income Trust | 47,247 | 1,101 | |
| Argo Group International Holdings Ltd. | 19,392 | 1,100 | |
| Potlatch Corp. | 28,333 | 1,073 | |
| New York REIT Inc. | 111,009 | 1,072 | |
| First Midwest Bancorp Inc. | 54,432 | 1,065 | |
| Chesapeake Lodging Trust | 41,792 | 1,065 | |
| * | Eagle Bancorp Inc. | 20,551 | 1,064 |
| American Equity Investment Life Holding Co. | 59,204 | 1,043 | |
| Ramco-Gershenson Properties Trust | 53,129 | 1,032 | |
| * | PRA Group Inc. | 32,219 | 1,030 |
| Waddell & Reed Financial Inc. Class A | 55,386 | 1,030 | |
| Kemper Corp. | 27,214 | 1,019 | |
| Northwest Bancshares Inc. | 64,654 | 1,003 | |
| GEO Group Inc. | 49,770 | 997 | |
| Horace Mann Educators Corp. | 27,213 | 995 | |
| United Community Banks Inc. | 47,343 | 993 | |
| Simmons First National Corp. Class A | 19,757 | 992 | |
| Rexford Industrial Realty Inc. | 44,346 | 990 | |
| Renasant Corp. | 27,592 | 978 | |
| Parkway Properties Inc. | 54,088 | 974 | |
| First Cash Financial Services Inc. | 18,458 | 955 | |
| Global Net Lease Inc. | 114,819 | 953 | |
| Astoria Financial Corp. | 62,022 | 949 | |
| NBT Bancorp Inc. | 29,251 | 945 | |
| LegacyTexas Financial Group Inc. | 31,061 | 942 | |
| Talmer Bancorp Inc. Class A | 40,370 | 939 | |
| Franklin Street Properties Corp. | 73,504 | 923 | |
| Independent Bank Corp. | 17,375 | 921 | |
| Provident Financial Services Inc. | 42,159 | 909 | |
9
| Vanguard® Russell 2000 Index Fund | |||
| Schedule of Investments | |||
| August 31, 2016 | |||
| Market | |||
| Value | |||
| Shares | ($000) | ||
| CYS Investments Inc. | 102,232 | 901 | |
| Towne Bank | 37,687 | 897 | |
| Banner Corp. | 20,232 | 896 | |
| First Financial Bancorp | 40,906 | 892 | |
| Park National Corp. | 9,234 | 883 | |
| Yadkin Financial Corp. | 33,704 | 880 | |
| *,^ | BofI Holding Inc. | 40,443 | 870 |
| ^ | Westamerica Bancorporation | 17,045 | 867 |
| Kearny Financial Corp. | 62,259 | 852 | |
| Four Corners Property Trust Inc. | 40,794 | 845 | |
| ServisFirst Bancshares Inc. | 16,018 | 839 | |
| Union Bankshares Corp. | 30,133 | 839 | |
| Summit Hotel Properties Inc. | 58,047 | 830 | |
| Terreno Realty Corp. | 30,700 | 822 | |
| WesBanco Inc. | 24,638 | 806 | |
| ^ | WisdomTree Investments Inc. | 76,411 | 802 |
| Ameris Bancorp | 22,652 | 789 | |
| National General Holdings Corp. | 33,728 | 769 | |
| Redwood Trust Inc. | 51,610 | 764 | |
| * | FCB Financial Holdings Inc. Class A | 19,926 | 763 |
| AMERISAFE Inc. | 12,664 | 760 | |
| WSFS Financial Corp. | 19,085 | 742 | |
| First Merchants Corp. | 27,302 | 741 | |
| Banc of California Inc. | 32,892 | 734 | |
| Agree Realty Corp. | 15,204 | 730 | |
| EVERTEC Inc. | 42,291 | 721 | |
| Tompkins Financial Corp. | 9,648 | 713 | |
| * | MBIA Inc. | 87,675 | 707 |
| Beneficial Bancorp Inc. | 46,724 | 705 | |
| Seritage Growth Properties Class A | 15,829 | 704 | |
| Cash America International Inc. | 16,129 | 702 | |
| Navigators Group Inc. | 7,471 | 702 | |
| Boston Private Financial Holdings Inc. | 54,367 | 700 | |
| Stewart Information Services Corp. | 15,232 | 697 | |
| PennyMac Mortgage Investment Trust | 45,231 | 689 | |
| BNC Bancorp | 27,302 | 671 | |
| S&T Bancorp Inc. | 23,243 | 668 | |
| * | Green Dot Corp. Class A | 28,657 | 665 |
| First Commonwealth Financial Corp. | 65,064 | 664 | |
| Safety Insurance Group Inc. | 9,918 | 659 | |
| Hannon Armstrong Sustainable Infrastructure Capital Inc. | 27,444 | 658 | |
| FelCor Lodging Trust Inc. | 92,170 | 655 | |
| Employers Holdings Inc. | 21,494 | 655 | |
| Apollo Commercial Real Estate Finance Inc. | 39,557 | 645 | |
| HFF Inc. Class A | 23,890 | 640 | |
| * | St. Joe Co. | 33,814 | 639 |
| New Senior Investment Group Inc. | 51,533 | 638 | |
| Capstead Mortgage Corp. | 64,315 | 638 | |
| Alexander's Inc. | 1,458 | 627 | |
| United Fire Group Inc. | 14,465 | 625 | |
| Infinity Property & Casualty Corp. | 7,166 | 604 | |
| Monmouth Real Estate Investment Corp. | 42,574 | 596 | |
| Cohen & Steers Inc. | 13,999 | 590 | |
| Banco Latinoamericano de Comercio Exterior SA | 20,407 | 590 | |
| * | Third Point Reinsurance Ltd. | 44,516 | 580 |
| Lakeland Financial Corp. | 16,037 | 575 | |
| Berkshire Hills Bancorp Inc. | 20,576 | 574 | |
| Cardinal Financial Corp. | 21,319 | 572 | |
| CareTrust REIT Inc. | 38,303 | 569 | |
| * | FNFV Group | 43,913 | 566 |
| CenterState Banks Inc. | 31,198 | 561 | |
| Hanmi Financial Corp. | 21,165 | 555 | |
| ARMOUR Residential REIT Inc. | 24,866 | 553 | |
| * | Ambac Financial Group Inc. | 30,433 | 552 |
10
| Vanguard® Russell 2000 Index Fund | |||
| Schedule of Investments | |||
| August 31, 2016 | |||
| Market | |||
| Value | |||
| Shares | ($000) | ||
| Hersha Hospitality Trust Class A | 28,244 | 552 | |
| Universal Insurance Holdings Inc. | 22,202 | 550 | |
| Brookline Bancorp Inc. | 46,072 | 550 | |
| State Bank Financial Corp. | 23,825 | 549 | |
| Maiden Holdings Ltd. | 39,753 | 549 | |
| Southside Bancshares Inc. | 16,570 | 544 | |
| Investors Real Estate Trust | 80,638 | 535 | |
| Heartland Financial USA Inc. | 14,688 | 533 | |
| * | iStar Inc. | 48,631 | 526 |
| Central Pacific Financial Corp. | 20,445 | 523 | |
| American Capital Mortgage Investment Corp. | 30,482 | 520 | |
| Chatham Lodging Trust | 24,948 | 517 | |
| Tier REIT Inc. | 32,008 | 513 | |
| * | KCG Holdings Inc. Class A | 35,378 | 511 |
| InfraREIT Inc. | 26,903 | 508 | |
| Universal Health Realty Income Trust | 8,246 | 508 | |
| Meridian Bancorp Inc. | 32,112 | 502 | |
| RE/MAX Holdings Inc. Class A | 11,931 | 497 | |
| Sandy Spring Bancorp Inc. | 15,750 | 497 | |
| City Holding Co. | 9,797 | 496 | |
| * | Walker & Dunlop Inc. | 18,641 | 494 |
| First Busey Corp. | 21,130 | 493 | |
| * | Pacific Premier Bancorp Inc. | 18,042 | 487 |
| Nelnet Inc. Class A | 13,662 | 484 | |
| United Financial Bancorp Inc. | 34,451 | 482 | |
| National Storage Affiliates Trust | 23,664 | 481 | |
| Urstadt Biddle Properties Inc. Class A | 20,229 | 459 | |
| Stock Yards Bancorp Inc. | 14,293 | 456 | |
| * | Piper Jaffray Cos. | 10,244 | 455 |
| Northfield Bancorp Inc. | 28,592 | 454 | |
| New York Mortgage Trust Inc. | 74,666 | 451 | |
| FBL Financial Group Inc. Class A | 6,647 | 439 | |
| * | Customers Bancorp Inc. | 16,364 | 438 |
| TrustCo Bank Corp. NY | 61,157 | 437 | |
| Flushing Financial Corp. | 18,797 | 436 | |
| Greenhill & Co. Inc. | 18,825 | 432 | |
| Silver Bay Realty Trust Corp. | 22,589 | 430 | |
| Washington Trust Bancorp Inc. | 10,189 | 429 | |
| Cass Information Systems Inc. | 7,491 | 429 | |
| * | Greenlight Capital Re Ltd. Class A | 19,963 | 428 |
| Altisource Residential Corp. | 38,892 | 427 | |
| Easterly Government Properties Inc. | 21,877 | 426 | |
| Cedar Realty Trust Inc. | 56,252 | 426 | |
| Saul Centers Inc. | 6,420 | 426 | |
| Capital Bank Financial Corp. | 13,489 | 422 | |
| Getty Realty Corp. | 17,929 | 422 | |
| Oritani Financial Corp. | 26,193 | 421 | |
| NorthStar Realty Europe Corp. | 40,692 | 417 | |
| * | HomeStreet Inc. | 15,793 | 412 |
| Opus Bank | 11,736 | 410 | |
| *,^ | LendingTree Inc. | 4,180 | 405 |
| First Interstate BancSystem Inc. Class A | 13,036 | 401 | |
| Enterprise Financial Services Corp. | 12,861 | 396 | |
| Diamond Hill Investment Group Inc. | 2,089 | 396 | |
| Univest Corp. of Pennsylvania | 16,921 | 395 | |
| First Potomac Realty Trust | 38,626 | 389 | |
| * | INTL. FCStone Inc. | 10,743 | 387 |
| * | Flagstar Bancorp Inc. | 13,768 | 387 |
| National Bank Holdings Corp. Class A | 16,066 | 385 | |
| OM Asset Management plc | 28,400 | 383 | |
| * | First BanCorp | 78,222 | 383 |
| James River Group Holdings Ltd. | 10,347 | 378 | |
| MainSource Financial Group Inc. | 15,520 | 374 | |
| TriCo Bancshares | 13,763 | 372 | |
11
| Vanguard® Russell 2000 Index Fund | |||
| Schedule of Investments | |||
| August 31, 2016 | |||
| Market | |||
| Value | |||
| Shares | ($000) | ||
| Community Trust Bancorp Inc. | 10,088 | 372 | |
| 1st Source Corp. | 10,444 | 370 | |
| Meta Financial Group Inc. | 6,004 | 370 | |
| Ashford Hospitality Trust Inc. | 52,534 | 366 | |
| BancFirst Corp. | 5,330 | 366 | |
| Dime Community Bancshares Inc. | 20,657 | 365 | |
| Lakeland Bancorp Inc. | 26,709 | 365 | |
| Heritage Financial Corp. | 19,481 | 360 | |
| *,^ | Nationstar Mortgage Holdings Inc. | 22,388 | 356 |
| Independent Bank Group Inc. | 8,090 | 355 | |
| German American Bancorp Inc. | 9,613 | 354 | |
| Bryn Mawr Bank Corp. | 11,013 | 354 | |
| * | Encore Capital Group Inc. | 16,213 | 350 |
| Virtus Investment Partners Inc. | 3,825 | 349 | |
| Ladder Capital Corp. | 26,208 | 348 | |
| * | EZCORP Inc. Class A | 33,428 | 346 |
| ConnectOne Bancorp Inc. | 19,220 | 342 | |
| Bridge Bancorp Inc. | 11,467 | 342 | |
| *,^ | Citizens Inc. Class A | 31,391 | 342 |
| Investment Technology Group Inc. | 21,888 | 337 | |
| * | Seacoast Banking Corp. of Florida | 20,311 | 334 |
| * | WMIH Corp. | 133,075 | 331 |
| Moelis & Co. Class A | 12,172 | 328 | |
| Armada Hoffler Properties Inc. | 23,679 | 326 | |
| CoBiz Financial Inc. | 24,699 | 324 | |
| Camden National Corp. | 6,963 | 322 | |
| CatchMark Timber Trust Inc. Class A | 26,645 | 312 | |
| Anworth Mortgage Asset Corp. | 63,692 | 311 | |
| OFG Bancorp | 28,520 | 311 | |
| First of Long Island Corp. | 9,363 | 307 | |
| AG Mortgage Investment Trust Inc. | 19,299 | 305 | |
| Great Southern Bancorp Inc. | 7,049 | 297 | |
| Mercantile Bank Corp. | 11,011 | 295 | |
| Apollo Residential Mortgage Inc. | 21,384 | 292 | |
| Waterstone Financial Inc. | 17,154 | 290 | |
| Park Sterling Corp. | 33,901 | 287 | |
| National Western Life Group Inc. Class A | 1,479 | 287 | |
| PJT Partners Inc. | 11,615 | 287 | |
| Western Asset Mortgage Capital Corp. | 26,898 | 285 | |
| * | Forestar Group Inc. | 22,472 | 282 |
| Preferred Bank | 8,010 | 281 | |
| First Financial Corp. | 6,812 | 278 | |
| Resource Capital Corp. | 20,432 | 271 | |
| First Defiance Financial Corp. | 5,904 | 269 | |
| Virtu Financial Inc. Class A | 16,449 | 268 | |
| Suffolk Bancorp | 7,580 | 268 | |
| OceanFirst Financial Corp. | 13,508 | 268 | |
| Gladstone Commercial Corp. | 14,852 | 267 | |
| Ashford Hospitality Prime Inc. | 17,172 | 266 | |
| First Bancorp | 13,219 | 265 | |
| NexPoint Residential Trust Inc. | 12,527 | 262 | |
| Westwood Holdings Group Inc. | 5,225 | 261 | |
| * | CU Bancorp | 10,757 | 260 |
| * | NMI Holdings Inc. Class A | 32,243 | 256 |
| Whitestone REIT | 17,663 | 256 | |
| * | Cowen Group Inc. Class A | 67,023 | 251 |
| First Community Bancshares Inc. | 10,480 | 251 | |
| Peoples Bancorp Inc. | 10,535 | 250 | |
| Independence Realty Trust Inc. | 26,437 | 250 | |
| QCR Holdings Inc. | 7,954 | 248 | |
| * | Marcus & Millichap Inc. | 9,526 | 248 |
| * | Altisource Portfolio Solutions SA | 7,560 | 246 |
| Financial Institutions Inc. | 9,133 | 245 | |
| Stonegate Bank | 7,529 | 245 | |
12
| Vanguard® Russell 2000 Index Fund | ||
| Schedule of Investments | ||
| August 31, 2016 | ||
| Market | ||
| Value | ||
| Shares | ($000) | |
| Fidelity Southern Corp. | 13,587 | 244 |
| Horizon Bancorp | 8,650 | 242 |
| * Ocwen Financial Corp. | 67,658 | 241 |
| Heritage Insurance Holdings Inc. | 17,487 | 240 |
| Arrow Financial Corp. | 7,395 | 240 |
| Blue Hills Bancorp Inc. | 16,157 | 238 |
| State Auto Financial Corp. | 10,367 | 238 |
| CorEnergy Infrastructure Trust Inc. | 7,890 | 232 |
| Southwest Bancorp Inc. | 11,833 | 232 |
| Federal Agricultural Mortgage Corp. | 5,624 | 230 |
| Independent Bank Corp. | 14,072 | 229 |
| * Tejon Ranch Co. | 9,342 | 222 |
| Pacific Continental Corp. | 13,422 | 221 |
| Ares Commercial Real Estate Corp. | 17,577 | 221 |
| Arlington Asset Investment Corp. Class A | 14,691 | 219 |
| * First Foundation Inc. | 8,656 | 217 |
| Preferred Apartment Communities Inc. Class A | 15,660 | 217 |
| * TriState Capital Holdings Inc. | 14,465 | 216 |
| Dynex Capital Inc. | 29,411 | 216 |
| State National Cos. Inc. | 21,201 | 216 |
| * Franklin Financial Network Inc. | 6,136 | 213 |
| Clifton Bancorp Inc. | 14,350 | 213 |
| One Liberty Properties Inc. | 8,664 | 210 |
| Bank Mutual Corp. | 26,754 | 209 |
| West Bancorporation Inc. | 10,618 | 208 |
| United Community Financial Corp. | 31,949 | 208 |
| Republic Bancorp Inc. Class A | 6,497 | 208 |
| * HomeTrust Bancshares Inc. | 10,836 | 207 |
| Peapack Gladstone Financial Corp. | 10,309 | 206 |
| Houlihan Lokey Inc. | 8,136 | 201 |
| * On Deck Capital Inc. | 31,448 | 199 |
| * Triumph Bancorp Inc. | 10,325 | 197 |
| Heritage Commerce Corp. | 17,155 | 197 |
| * Regional Management Corp. | 9,091 | 197 |
| City Office REIT Inc. | 14,805 | 192 |
| Bank of Marin Bancorp | 3,932 | 192 |
| * World Acceptance Corp. | 3,972 | 191 |
| UMH Properties Inc. | 16,045 | 190 |
| Community Healthcare Trust Inc. | 8,266 | 190 |
| * Safeguard Scientifics Inc. | 13,457 | 190 |
| * Allegiance Bancshares Inc. | 7,206 | 189 |
| RAIT Financial Trust | 59,396 | 186 |
| * Nicolet Bankshares Inc. | 4,982 | 186 |
| ^ Fidelity & Guaranty Life | 7,835 | 186 |
| OneBeacon Insurance Group Ltd. Class A | 13,066 | 185 |
| HCI Group Inc. | 5,797 | 184 |
| ^ Peoples Financial Services Corp. | 4,755 | 183 |
| Guaranty Bancorp | 9,883 | 183 |
| CNB Financial Corp. | 9,056 | 182 |
| Live Oak Bancshares Inc. | 12,826 | 182 |
| United Insurance Holdings Corp. | 11,444 | 180 |
| Enterprise Bancorp Inc. | 7,220 | 179 |
| RMR Group Inc. Class A | 4,645 | 179 |
| * NewStar Financial Inc. | 15,858 | 179 |
| Citizens & Northern Corp. | 8,119 | 176 |
| * Atlantic Capital Bancshares Inc. | 11,359 | 175 |
| * Enova International Inc. | 17,866 | 171 |
| * Global Indemnity plc | 5,912 | 171 |
| Bluerock Residential Growth REIT Inc. Class A | 12,663 | 170 |
| People's Utah Bancorp | 8,504 | 167 |
| National Bankshares Inc. | 4,548 | 163 |
| Farmers National Banc Corp. | 16,283 | 162 |
| MidWestOne Financial Group Inc. | 5,435 | 162 |
| First Connecticut Bancorp Inc. | 9,163 | 161 |
13
| Vanguard® Russell 2000 Index Fund | |||
| Schedule of Investments | |||
| August 31, 2016 | |||
| Market | |||
| Value | |||
| Shares | ($000) | ||
| National Interstate Corp. | 4,935 | 161 | |
| Sun Bancorp Inc. | 7,027 | 160 | |
| * | PICO Holdings Inc. | 14,447 | 159 |
| Old Second Bancorp Inc. | 19,440 | 159 | |
| Ames National Corp. | 5,801 | 158 | |
| GAIN Capital Holdings Inc. | 24,442 | 157 | |
| EMC Insurance Group Inc. | 5,633 | 157 | |
| American National Bankshares Inc. | 5,714 | 153 | |
| * | PennyMac Financial Services Inc. Class A | 9,165 | 152 |
| First Bancorp Inc. | 6,731 | 152 | |
| Baldwin & Lyons Inc. | 5,970 | 151 | |
| Federated National Holding Co. | 8,243 | 151 | |
| * | National Commerce Corp. | 5,544 | 149 |
| * | Ladenburg Thalmann Financial Services Inc. | 65,168 | 149 |
| Farmers Capital Bank Corp. | 4,885 | 146 | |
| * | FRP Holdings Inc. | 4,313 | 145 |
| Consolidated-Tomoka Land Co. | 2,741 | 145 | |
| Carolina Financial Corp. | 6,719 | 144 | |
| Territorial Bancorp Inc. | 5,019 | 143 | |
| Orchid Island Capital Inc. | 13,656 | 143 | |
| Great Ajax Corp. | 10,441 | 143 | |
| Bar Harbor Bankshares | 3,889 | 143 | |
| * | Bancorp Inc. | 23,055 | 143 |
| * | MoneyGram International Inc. | 19,569 | 142 |
| Sierra Bancorp | 7,797 | 142 | |
| *,^ | Trupanion Inc. | 9,423 | 142 |
| Penns Woods Bancorp Inc. | 3,163 | 140 | |
| * | Green Bancorp Inc. | 13,547 | 138 |
| * | eHealth Inc. | 12,080 | 136 |
| * | Cascade Bancorp | 22,440 | 135 |
| Macatawa Bank Corp. | 17,325 | 135 | |
| * | First NBC Bank Holding Co. | 10,303 | 135 |
| * | BSB Bancorp Inc. | 5,499 | 133 |
| WashingtonFirst Bankshares Inc. | 5,290 | 132 | |
| Heritage Oaks Bancorp | 15,964 | 129 | |
| Your Community Bankshares Inc. | 3,223 | 126 | |
| Merchants Bancshares Inc. | 3,768 | 125 | |
| First Business Financial Services Inc. | 5,426 | 124 | |
| * | Atlas Financial Holdings Inc. | 7,024 | 123 |
| BankFinancial Corp. | 9,960 | 123 | |
| Access National Corp. | 5,378 | 120 | |
| * | AV Homes Inc. | 7,897 | 120 |
| Hingham Institution for Savings | 920 | 120 | |
| * | Real Industry Inc. | 17,239 | 118 |
| * | Xenith Bankshares Inc. | 49,873 | 117 |
| Charter Financial Corp. | 8,853 | 116 | |
| * | CommunityOne Bancorp | 8,633 | 116 |
| Northrim BanCorp Inc. | 4,420 | 114 | |
| Capital City Bank Group Inc. | 8,080 | 113 | |
| Owens Realty Mortgage Inc. | 6,569 | 112 | |
| Bear State Financial Inc. | 11,757 | 110 | |
| Home Bancorp Inc. | 3,767 | 109 | |
| *,^ | Trinity Place Holdings Inc. | 12,686 | 108 |
| * | Southern First Bancshares Inc. | 3,753 | 106 |
| Summit Financial Group Inc. | 5,464 | 106 | |
| Old Line Bancshares Inc. | 5,487 | 106 | |
| Oppenheimer Holdings Inc. Class A | 6,597 | 106 | |
| ACNB Corp. | 3,895 | 106 | |
| Calamos Asset Management Inc. Class A | 15,095 | 105 | |
| Codorus Valley Bancorp Inc. | 5,060 | 105 | |
| LCNB Corp. | 5,762 | 101 | |
| * | Planet Payment Inc. | 27,748 | 100 |
| MutualFirst Financial Inc. | 3,574 | 99 | |
| MBT Financial Corp. | 11,655 | 99 | |
14
| Vanguard® Russell 2000 Index Fund | |||
| Schedule of Investments | |||
| August 31, 2016 | |||
| Market | |||
| Value | |||
| Shares | ($000) | ||
| Orrstown Financial Services Inc. | 4,840 | 99 | |
| SI Financial Group Inc. | 7,299 | 98 | |
| Associated Capital Group Inc. Class A | 2,936 | 97 | |
| * | First Northwest Bancorp | 7,276 | 96 |
| * | Hallmark Financial Services Inc. | 9,056 | 96 |
| Shore Bancshares Inc. | 8,224 | 96 | |
| First Mid-Illinois Bancshares Inc. | 3,760 | 94 | |
| Southern Missouri Bancorp Inc. | 3,825 | 94 | |
| Premier Financial Bancorp Inc. | 5,572 | 93 | |
| * | Veritex Holdings Inc. | 5,420 | 93 |
| Lake Sunapee Bank Group | 5,133 | 92 | |
| Investors Title Co. | 937 | 92 | |
| Southern National Bancorp of Virginia Inc. | 7,343 | 91 | |
| * | Republic First Bancorp Inc. | 22,046 | 90 |
| C&F Financial Corp. | 2,122 | 90 | |
| Crawford & Co. Class B | 7,848 | 89 | |
| *,^ | Impac Mortgage Holdings Inc. | 5,341 | 89 |
| Farmland Partners Inc. | 7,623 | 89 | |
| Central Valley Community Bancorp | 5,727 | 88 | |
| Donegal Group Inc. Class A | 5,466 | 88 | |
| Middleburg Financial Corp. | 3,084 | 88 | |
| ^ | Union Bankshares Inc. | 2,556 | 87 |
| Tiptree Financial Inc. Class A | 15,820 | 86 | |
| Century Bancorp Inc. Class A | 1,943 | 85 | |
| Bankwell Financial Group Inc. | 3,747 | 84 | |
| Provident Financial Holdings Inc. | 4,316 | 82 | |
| GAMCO Investors Inc. Class A | 2,669 | 82 | |
| First Internet Bancorp | 3,395 | 81 | |
| * | Equity Bancshares Inc. Class A | 3,303 | 80 |
| Independence Holding Co. | 4,535 | 80 | |
| *,^ | First Community Financial Partners Inc. | 8,901 | 80 |
| Westfield Financial Inc. | 10,437 | 79 | |
| First Financial Northwest Inc. | 5,959 | 78 | |
| * | Stratus Properties Inc. | 4,084 | 78 |
| * | Pacific Mercantile Bancorp | 10,046 | 77 |
| ^ | CPI Card Group Inc. | 13,811 | 76 |
| Manning & Napier Inc. | 9,790 | 75 | |
| Pzena Investment Management Inc. Class A | 9,620 | 75 | |
| Resource America Inc. Class A | 7,623 | 74 | |
| ESSA Bancorp Inc. | 5,362 | 74 | |
| Blue Capital Reinsurance Holdings Ltd. | 3,862 | 67 | |
| County Bancorp Inc. | 3,157 | 66 | |
| Hennessy Advisors Inc. | 1,889 | 64 | |
| Chemung Financial Corp. | 2,048 | 60 | |
| Midland States Bancorp Inc. | 2,408 | 59 | |
| FBR & Co. | 4,106 | 58 | |
| B. Riley Financial Inc. | 6,086 | 58 | |
| Silvercrest Asset Management Group Inc. Class A | 4,611 | 57 | |
| ^ | United Development Funding IV | 17,276 | 55 |
| * | Walter Investment Management Corp. | 12,221 | 46 |
| * | Provident Bancorp Inc. | 2,886 | 46 |
| *,^ | UCP Inc. | 5,291 | 45 |
| * | BBX Capital Corp. | 2,101 | 42 |
| Greene County Bancorp Inc. | 1,973 | 33 | |
| Medley Management Inc. Class A | 4,185 | 30 | |
| Fifth Street Asset Management Inc. | 4,016 | 25 | |
| * | Wins Finance Holdings Inc. | 924 | 23 |
| California First National Bancorp | 1,533 | 23 | |
| Griffin Industrial Realty Inc. | 465 | 15 | |
| Value Line Inc. | 776 | 14 | |
| * | American Independence Corp. | 395 | 10 |
| 315,125 | |||
| Health Care (13.4%) | |||
| HealthSouth Corp. | 60,394 | 2,459 | |
15
| Vanguard® Russell 2000 Index Fund | |||
| Schedule of Investments | |||
| August 31, 2016 | |||
| Market | |||
| Value | |||
| Shares | ($000) | ||
| * | PAREXEL International Corp. | 35,533 | 2,417 |
| * | NuVasive Inc. | 33,613 | 2,201 |
| * | Horizon Pharma plc | 109,902 | 2,066 |
| * | Medidata Solutions Inc. | 37,868 | 2,049 |
| Cantel Medical Corp. | 24,404 | 1,845 | |
| * | Medicines Co. | 46,232 | 1,811 |
| * | Integra LifeSciences Holdings Corp. | 20,298 | 1,754 |
| * | Wright Medical Group NV | 70,845 | 1,754 |
| * | Exelixis Inc. | 155,686 | 1,736 |
| * | Prestige Brands Holdings Inc. | 36,034 | 1,734 |
| * | Catalent Inc. | 68,597 | 1,731 |
| * | Cepheid | 49,990 | 1,716 |
| * | Insulet Corp. | 39,660 | 1,679 |
| * | Masimo Corp. | 27,933 | 1,652 |
| * | Ultragenyx Pharmaceutical Inc. | 25,027 | 1,650 |
| * | Nektar Therapeutics | 89,436 | 1,596 |
| * | Molina Healthcare Inc. | 29,619 | 1,594 |
| * | TESARO Inc. | 18,503 | 1,567 |
| *,^ | Kite Pharma Inc. | 27,127 | 1,563 |
| * | Nevro Corp. | 16,488 | 1,557 |
| * | Team Health Holdings Inc. | 45,465 | 1,514 |
| Chemed Corp. | 11,102 | 1,498 | |
| * | Neogen Corp. | 25,205 | 1,489 |
| Owens & Minor Inc. | 42,732 | 1,469 | |
| * | Ligand Pharmaceuticals Inc. | 13,100 | 1,353 |
| * | Exact Sciences Corp. | 72,271 | 1,335 |
| * | Haemonetics Corp. | 35,798 | 1,330 |
| * | WebMD Health Corp. | 25,623 | 1,321 |
| * | ARIAD Pharmaceuticals Inc. | 123,106 | 1,273 |
| * | ICU Medical Inc. | 10,130 | 1,264 |
| *,^ | Novavax Inc. | 180,705 | 1,236 |
| * | HMS Holdings Corp. | 56,595 | 1,234 |
| * | Bluebird Bio Inc. | 24,803 | 1,224 |
| * | INC Research Holdings Inc. Class A | 27,703 | 1,209 |
| * | Penumbra Inc. | 17,049 | 1,203 |
| * | Impax Laboratories Inc. | 49,044 | 1,186 |
| * | Prothena Corp. plc | 23,297 | 1,164 |
| * | Radius Health Inc. | 21,231 | 1,164 |
| * | Ironwood Pharmaceuticals Inc. Class A | 86,670 | 1,156 |
| * | AMN Healthcare Services Inc. | 31,667 | 1,147 |
| * | Halyard Health Inc. | 31,375 | 1,144 |
| * | Globus Medical Inc. | 48,242 | 1,121 |
| * | Ophthotech Corp. | 20,469 | 1,081 |
| * | Alder Biopharmaceuticals Inc. | 31,572 | 1,041 |
| * | Puma Biotechnology Inc. | 16,582 | 981 |
| * | NxStage Medical Inc. | 42,883 | 980 |
| * | Pacira Pharmaceuticals Inc. | 24,469 | 970 |
| * | Magellan Health Inc. | 16,694 | 954 |
| * | HealthEquity Inc. | 29,110 | 948 |
| * | Zeltiq Aesthetics Inc. | 24,579 | 937 |
| * | Omnicell Inc. | 24,927 | 937 |
| * | Intra-Cellular Therapies Inc. Class A | 23,150 | 934 |
| * | Amedisys Inc. | 19,391 | 933 |
| * | Myriad Genetics Inc. | 45,218 | 921 |
| * | Cambrex Corp. | 21,372 | 915 |
| * | Select Medical Holdings Corp. | 75,311 | 895 |
| * | Air Methods Corp. | 24,887 | 876 |
| * | Cynosure Inc. Class A | 16,641 | 867 |
| * | Natus Medical Inc. | 21,902 | 852 |
| * | Depomed Inc. | 40,551 | 823 |
| * | Five Prime Therapeutics Inc. | 18,704 | 823 |
| * | PRA Health Sciences Inc. | 16,094 | 814 |
| * | Relypsa Inc. | 25,426 | 813 |
| * | Community Health Systems Inc. | 74,356 | 794 |
16
| Vanguard® Russell 2000 Index Fund | |||
| Schedule of Investments | |||
| August 31, 2016 | |||
| Market | |||
| Value | |||
| Shares | ($000) | ||
| CONMED Corp. | 18,535 | 756 | |
| * | Sarepta Therapeutics Inc. | 28,834 | 752 |
| Analogic Corp. | 8,395 | 747 | |
| * | Surgical Care Affiliates Inc. | 18,096 | 746 |
| * | Merit Medical Systems Inc. | 30,659 | 743 |
| Abaxis Inc. | 14,810 | 743 | |
| * | Spark Therapeutics Inc. | 12,786 | 723 |
| * | Halozyme Therapeutics Inc. | 72,560 | 711 |
| * | Spectranetics Corp. | 28,717 | 707 |
| * | Repligen Corp. | 22,499 | 697 |
| * | Acorda Therapeutics Inc. | 28,879 | 695 |
| * | Theravance Biopharma Inc. | 24,365 | 691 |
| *,^ | Cempra Inc. | 31,326 | 687 |
| *,^ | TherapeuticsMD Inc. | 99,569 | 685 |
| * | Portola Pharmaceuticals Inc. | 33,185 | 676 |
| * | Amicus Therapeutics Inc. | 100,549 | 673 |
| * | Supernus Pharmaceuticals Inc. | 31,226 | 668 |
| * | Sage Therapeutics Inc. | 17,767 | 660 |
| * | Endologix Inc. | 53,855 | 655 |
| * | Achillion Pharmaceuticals Inc. | 78,869 | 651 |
| * | MacroGenics Inc. | 21,459 | 640 |
| * | Inogen Inc. | 10,888 | 632 |
| * | Lannett Co. Inc. | 18,652 | 632 |
| Kindred Healthcare Inc. | 56,077 | 619 | |
| * | FibroGen Inc. | 35,116 | 608 |
| *,^ | Innoviva Inc. | 53,862 | 597 |
| Ensign Group Inc. | 31,774 | 597 | |
| * | Press Ganey Holdings Inc. | 14,800 | 596 |
| * | Insmed Inc. | 45,932 | 595 |
| * | Coherus Biosciences Inc. | 19,932 | 593 |
| * | Synergy Pharmaceuticals Inc. | 122,496 | 579 |
| * | Emergent BioSolutions Inc. | 21,625 | 576 |
| * | Luminex Corp. | 26,722 | 563 |
| * | AMAG Pharmaceuticals Inc. | 23,525 | 561 |
| *,^ | Clovis Oncology Inc. | 22,428 | 556 |
| * | Acceleron Pharma Inc. | 18,260 | 548 |
| Meridian Bioscience Inc. | 28,120 | 547 | |
| * | Vascular Solutions Inc. | 11,257 | 542 |
| * | Momenta Pharmaceuticals Inc. | 43,888 | 528 |
| * | Orthofix International NV | 11,677 | 527 |
| * | Healthways Inc. | 21,048 | 526 |
| * | Cardiovascular Systems Inc. | 20,994 | 514 |
| * | Dermira Inc. | 16,463 | 511 |
| US Physical Therapy Inc. | 8,037 | 507 | |
| * | MiMedx Group Inc. | 68,999 | 500 |
| * | PharMerica Corp. | 19,569 | 494 |
| * | Integer Holdings Corp. | 20,358 | 493 |
| National HealthCare Corp. | 7,537 | 490 | |
| * | Pacific Biosciences of California Inc. | 56,037 | 467 |
| * | Xencor Inc. | 21,783 | 460 |
| * | Amphastar Pharmaceuticals Inc. | 24,218 | 460 |
| * | Raptor Pharmaceutical Corp. | 59,749 | 445 |
| * | Anika Therapeutics Inc. | 9,358 | 442 |
| * | Retrophin Inc. | 27,428 | 439 |
| *,^ | Cerus Corp. | 67,293 | 426 |
| * | Providence Service Corp. | 8,809 | 415 |
| *,^ | Inovio Pharmaceuticals Inc. | 45,087 | 413 |
| * | Dynavax Technologies Corp. | 26,371 | 413 |
| Atrion Corp. | 913 | 413 | |
| *,^ | ZIOPHARM Oncology Inc. | 81,042 | 411 |
| Quality Systems Inc. | 34,281 | 403 | |
| *,^ | Heron Therapeutics Inc. | 21,424 | 398 |
| *,^ | Lexicon Pharmaceuticals Inc. | 28,601 | 397 |
| * | Adeptus Health Inc. Class A | 9,254 | 394 |
17
| Vanguard® Russell 2000 Index Fund | |||
| Schedule of Investments | |||
| August 31, 2016 | |||
| Market | |||
| Value | |||
| Shares | ($000) | ||
| * | Genomic Health Inc. | 14,533 | 385 |
| * | Quidel Corp. | 17,667 | 385 |
| * | Merrimack Pharmaceuticals Inc. | 82,681 | 382 |
| * | Vanda Pharmaceuticals Inc. | 24,016 | 369 |
| * | Blueprint Medicines Corp. | 13,106 | 365 |
| * | LHC Group Inc. | 10,116 | 360 |
| *,^ | Eagle Pharmaceuticals Inc. | 5,831 | 348 |
| * | Triple-S Management Corp. Class B | 15,872 | 347 |
| *,^ | Aduro Biotech Inc. | 24,235 | 341 |
| * | Glaukos Corp. | 11,363 | 339 |
| * | SciClone Pharmaceuticals Inc. | 33,133 | 334 |
| * | BioTelemetry Inc. | 18,035 | 333 |
| * | Capital Senior Living Corp. | 19,169 | 330 |
| CryoLife Inc. | 20,658 | 329 | |
| *,^ | Accelerate Diagnostics Inc. | 15,044 | 329 |
| * | Array BioPharma Inc. | 94,992 | 326 |
| *,^ | Omeros Corp. | 29,606 | 318 |
| * | Spectrum Pharmaceuticals Inc. | 59,734 | 317 |
| * | AtriCure Inc. | 20,606 | 317 |
| PDL BioPharma Inc. | 108,646 | 316 | |
| * | ANI Pharmaceuticals Inc. | 5,269 | 315 |
| * | OraSure Technologies Inc. | 36,382 | 312 |
| * | Aerie Pharmaceuticals Inc. | 15,780 | 306 |
| * | Agenus Inc. | 49,152 | 304 |
| * | Atara Biotherapeutics Inc. | 15,324 | 299 |
| Landauer Inc. | 6,291 | 299 | |
| Phibro Animal Health Corp. Class A | 12,291 | 298 | |
| * | Progenics Pharmaceuticals Inc. | 47,198 | 296 |
| *,^ | Advaxis Inc. | 25,385 | 293 |
| * | AngioDynamics Inc. | 17,679 | 292 |
| * | Lion Biotechnologies Inc. | 35,897 | 286 |
| * | NeoGenomics Inc. | 35,187 | 283 |
| * | Accuray Inc. | 52,417 | 279 |
| *,^ | Arrowhead Pharmaceuticals Inc. | 40,281 | 279 |
| * | Cotiviti Holdings Inc. | 8,292 | 276 |
| * | Cytokinetics Inc. | 22,640 | 273 |
| Universal American Corp. | 37,953 | 272 | |
| * | Geron Corp. | 100,878 | 271 |
| * | K2M Group Holdings Inc. | 16,860 | 268 |
| *,^ | Novocure Ltd. | 34,496 | 265 |
| * | Intersect ENT Inc. | 16,714 | 263 |
| *,^ | Axovant Sciences Ltd. | 16,023 | 263 |
| * | Flexion Therapeutics Inc. | 15,665 | 261 |
| * | Cross Country Healthcare Inc. | 21,459 | 261 |
| * | Corcept Therapeutics Inc. | 48,954 | 261 |
| * | CorVel Corp. | 6,783 | 261 |
| * | Otonomy Inc. | 15,748 | 259 |
| * | Aimmune Therapeutics Inc. | 17,219 | 254 |
| *,^ | Albany Molecular Research Inc. | 17,093 | 253 |
| Invacare Corp. | 21,253 | 252 | |
| * | Arena Pharmaceuticals Inc. | 161,228 | 250 |
| * | Ardelyx Inc. | 24,644 | 246 |
| * | Surmodics Inc. | 8,580 | 244 |
| *,^ | Teladoc Inc. | 13,591 | 242 |
| * | Loxo Oncology Inc. | 8,742 | 241 |
| * | STAAR Surgical Co. | 27,010 | 237 |
| *,^ | Bellicum Pharmaceuticals Inc. | 13,742 | 237 |
| * | Surgery Partners Inc. | 12,190 | 235 |
| *,^ | Rockwell Medical Inc. | 31,887 | 232 |
| * | GenMark Diagnostics Inc. | 27,105 | 231 |
| *,^ | Organovo Holdings Inc. | 58,181 | 225 |
| * | Enanta Pharmaceuticals Inc. | 10,191 | 224 |
| *,^ | Insys Therapeutics Inc. | 15,681 | 224 |
| * | Versartis Inc. | 17,912 | 222 |
18
| Vanguard® Russell 2000 Index Fund | |||
| Schedule of Investments | |||
| August 31, 2016 | |||
| Market | |||
| Value | |||
| Shares | ($000) | ||
| * | Heska Corp. | 4,057 | 221 |
| *,^ | Keryx Biopharmaceuticals Inc. | 53,740 | 220 |
| * | Celldex Therapeutics Inc. | 64,309 | 214 |
| * | Rigel Pharmaceuticals Inc. | 61,940 | 209 |
| * | Teligent Inc. | 27,398 | 203 |
| * | Imprivata Inc. | 10,498 | 202 |
| * | Sangamo BioSciences Inc. | 46,354 | 199 |
| * | Trevena Inc. | 29,311 | 199 |
| * | Epizyme Inc. | 26,816 | 196 |
| * | Almost Family Inc. | 5,305 | 195 |
| *,^ | BioScrip Inc. | 75,709 | 195 |
| * | BioCryst Pharmaceuticals Inc. | 47,476 | 195 |
| * | Exactech Inc. | 7,007 | 195 |
| * | Aratana Therapeutics Inc. | 21,852 | 194 |
| Computer Programs & Systems Inc. | 7,506 | 194 | |
| * | Akebia Therapeutics Inc. | 23,549 | 191 |
| * | Global Blood Therapeutics Inc. | 11,182 | 190 |
| * | Revance Therapeutics Inc. | 13,399 | 188 |
| * | ConforMIS Inc. | 23,439 | 188 |
| *,^ | Foundation Medicine Inc. | 8,818 | 181 |
| * | Civitas Solutions Inc. | 9,886 | 180 |
| * | Fluidigm Corp. | 19,447 | 177 |
| * | PTC Therapeutics Inc. | 21,309 | 175 |
| * | OncoMed Pharmaceuticals Inc. | 17,172 | 172 |
| *,^ | MannKind Corp. | 212,519 | 170 |
| * | Natera Inc. | 17,093 | 170 |
| * | Sucampo Pharmaceuticals Inc. Class A | 15,399 | 169 |
| * | Paratek Pharmaceuticals Inc. | 12,455 | 168 |
| * | RadNet Inc. | 24,429 | 165 |
| LeMaitre Vascular Inc. | 8,848 | 163 | |
| * | MyoKardia Inc. | 7,377 | 161 |
| * | NanoString Technologies Inc. | 9,742 | 157 |
| * | Minerva Neurosciences Inc. | 12,870 | 157 |
| *,^ | Immunomedics Inc. | 56,708 | 157 |
| *,^ | CytomX Therapeutics Inc. | 13,387 | 157 |
| * | ImmunoGen Inc. | 55,497 | 156 |
| * | REGENXBIO Inc. | 13,282 | 156 |
| *,^ | InVivo Therapeutics Holdings Corp. | 21,878 | 154 |
| Utah Medical Products Inc. | 2,422 | 153 | |
| * | TG Therapeutics Inc. | 23,933 | 152 |
| * | La Jolla Pharmaceutical Co. | 9,293 | 152 |
| *,^ | Oxford Immunotec Global plc | 14,623 | 151 |
| * | Karyopharm Therapeutics Inc. | 15,124 | 150 |
| * | Adamas Pharmaceuticals Inc. | 10,951 | 150 |
| *,^ | XBiotech Inc. | 11,465 | 149 |
| * | NewLink Genetics Corp. | 14,233 | 145 |
| * | Enzo Biochem Inc. | 26,002 | 145 |
| * | Zogenix Inc. | 16,360 | 143 |
| * | AxoGen Inc. | 15,807 | 142 |
| * | Chimerix Inc. | 29,109 | 140 |
| *,^ | BioTime Inc. | 47,479 | 140 |
| * | Durect Corp. | 81,089 | 135 |
| * | Aclaris Therapeutics Inc. | 6,614 | 133 |
| * | BioSpecifics Technologies Corp. | 3,549 | 130 |
| * | Curis Inc. | 72,434 | 127 |
| *,^ | Nobilis Health Corp. | 36,365 | 127 |
| *,^ | AAC Holdings Inc. | 6,497 | 127 |
| *,^ | Seres Therapeutics Inc. | 12,076 | 126 |
| * | OvaScience Inc. | 20,565 | 125 |
| *,^ | Sorrento Therapeutics Inc. | 18,677 | 124 |
| * | American Renal Associates Holdings Inc. | 5,712 | 121 |
| * | WaVe Life Sciences Ltd. | 4,839 | 121 |
| * | Quorum Health Corp. | 19,440 | 120 |
| * | Vitae Pharmaceuticals Inc. | 17,225 | 119 |
19
| Vanguard® Russell 2000 Index Fund | |||
| Schedule of Investments | |||
| August 31, 2016 | |||
| Market | |||
| Value | |||
| Shares | ($000) | ||
| * | RTI Surgical Inc. | 37,012 | 119 |
| * | Invitae Corp. | 14,905 | 117 |
| * | Addus HomeCare Corp. | 4,857 | 116 |
| *,^ | Idera Pharmaceuticals Inc. | 60,506 | 116 |
| * | MediciNova Inc. | 19,459 | 115 |
| * | Avexis Inc. | 3,206 | 113 |
| *,^ | Cellular Biomedicine Group Inc. | 7,964 | 111 |
| * | Castlight Health Inc. Class B | 26,436 | 111 |
| * | Concert Pharmaceuticals Inc. | 11,097 | 108 |
| * | Ignyta Inc. | 19,388 | 107 |
| * | Applied Genetic Technologies Corp. | 8,320 | 106 |
| * | PharmAthene Inc. | 40,830 | 106 |
| * | Medgenics Inc. | 18,721 | 105 |
| * | Esperion Therapeutics Inc. | 9,507 | 102 |
| * | Egalet Corp. | 14,510 | 100 |
| * | Bio-Path Holdings Inc. | 63,271 | 97 |
| * | Athersys Inc. | 49,898 | 95 |
| * | Tetraphase Pharmaceuticals Inc. | 24,984 | 95 |
| * | Edge Therapeutics Inc. | 10,647 | 95 |
| *,^ | Trovagene Inc. | 19,192 | 94 |
| * | Voyager Therapeutics Inc. | 7,701 | 94 |
| * | Cutera Inc. | 8,594 | 94 |
| * | Entellus Medical Inc. | 4,922 | 93 |
| * | Codexis Inc. | 21,931 | 91 |
| National Research Corp. Class A | 5,771 | 91 | |
| * | Intellia Therapeutics Inc. | 4,579 | 89 |
| * | Vital Therapies Inc. | 15,527 | 89 |
| *,^ | NantKwest Inc. | 10,931 | 88 |
| * | Stemline Therapeutics Inc. | 10,681 | 87 |
| * | Tandem Diabetes Care Inc. | 12,175 | 87 |
| * | Pfenex Inc. | 11,976 | 87 |
| *,^ | Synthetic Biologics Inc. | 49,596 | 81 |
| * | Cidara Therapeutics Inc. | 7,025 | 81 |
| * | Inotek Pharmaceuticals Corp. | 11,445 | 81 |
| * | Regulus Therapeutics Inc. | 25,423 | 81 |
| *,^ | Editas Medicine Inc. | 4,699 | 79 |
| * | Cara Therapeutics Inc. | 14,393 | 78 |
| * | Flex Pharma Inc. | 6,976 | 77 |
| * | Endocyte Inc. | 25,458 | 76 |
| *,^ | Ocular Therapeutix Inc. | 11,764 | 75 |
| * | IRIDEX Corp. | 4,950 | 74 |
| * | Collegium Pharmaceutical Inc. | 8,870 | 74 |
| *,^ | AcelRx Pharmaceuticals Inc. | 23,191 | 73 |
| * | Senseonics Holdings Inc. | 18,217 | 73 |
| * | Anthera Pharmaceuticals Inc. | 24,948 | 72 |
| *,^ | Reata Pharmaceuticals Inc. Class A | 3,726 | 71 |
| * | ChemoCentryx Inc. | 13,976 | 70 |
| *,^ | Titan Pharmaceuticals Inc. | 12,337 | 69 |
| *,^ | Anavex Life Sciences Corp. | 21,391 | 65 |
| * | Avinger Inc. | 15,652 | 64 |
| *,^ | T2 Biosystems Inc. | 9,583 | 64 |
| *,^ | TransEnterix Inc. | 45,765 | 63 |
| * | Agile Therapeutics Inc. | 8,626 | 62 |
| * | Galena Biopharma Inc. | 152,225 | 62 |
| * | Fortress Biotech Inc. | 22,331 | 61 |
| ^ | Osiris Therapeutics Inc. | 12,025 | 60 |
| *,^ | Proteostasis Therapeutics Inc. | 4,152 | 59 |
| * | Neos Therapeutics Inc. | 8,998 | 59 |
| * | GlycoMimetics Inc. | 7,661 | 57 |
| * | Genesis Healthcare Inc. | 23,006 | 55 |
| * | Adverum Biotechnologies Inc. | 15,134 | 54 |
| * | Axsome Therapeutics Inc. | 7,292 | 53 |
| * | Immune Design Corp. | 7,209 | 51 |
| * | iRadimed Corp. | 2,659 | 50 |
20
| Vanguard® Russell 2000 Index Fund | |||
| Schedule of Investments | |||
| August 31, 2016 | |||
| Market | |||
| Value | |||
| Shares | ($000) | ||
| * | Infinity Pharmaceuticals Inc. | 31,528 | 48 |
| *,^ | Dimension Therapeutics Inc. | 8,004 | 48 |
| * | Veracyte Inc. | 8,281 | 47 |
| * | Zafgen Inc. | 14,972 | 45 |
| * | Syndax Pharmaceuticals Inc. | 3,098 | 44 |
| *,^ | Corindus Vascular Robotics Inc. | 36,021 | 42 |
| * | Asterias Biotherapeutics Inc. | 14,862 | 41 |
| * | Mirati Therapeutics Inc. | 7,916 | 40 |
| * | Lipocine Inc. | 10,845 | 37 |
| *,^ | Argos Therapeutics Inc. | 6,986 | 35 |
| *,^ | USMD Holdings Inc. | 1,532 | 34 |
| * | Eiger BioPharmaceuticals Inc. | 2,272 | 34 |
| *,^ | Second Sight Medical Products Inc. | 9,569 | 32 |
| * | vTv Therapeutics Inc. Class A | 5,481 | 31 |
| * | Corvus Pharmaceuticals Inc. | 2,185 | 30 |
| * | Aptevo Therapeutics Inc. | 10,812 | 29 |
| * | Tobira Therapeutics Inc. | 5,814 | 29 |
| *,^ | CytRx Corp. | 43,574 | 24 |
| *,^ | Ampio Pharmaceuticals Inc. | 28,788 | 24 |
| *,^ | ViewRay Inc. | 4,341 | 18 |
| * | Tokai Pharmaceuticals Inc. | 5,930 | 7 |
| * | Asterias Biotherapeutics Inc. Warrants Exp. 09/30/2016 | 1,281 | — |
| 157,842 | |||
| Materials & Processing (7.2%) | |||
| Olin Corp. | 112,999 | 2,445 | |
| Sensient Technologies Corp. | 29,844 | 2,185 | |
| Belden Inc. | 28,600 | 2,133 | |
| PolyOne Corp. | 57,185 | 1,971 | |
| * | Louisiana-Pacific Corp. | 98,194 | 1,913 |
| * | Beacon Roofing Supply Inc. | 40,734 | 1,873 |
| US Silica Holdings Inc. | 43,757 | 1,717 | |
| Minerals Technologies Inc. | 23,731 | 1,675 | |
| Chemours Co. | 123,258 | 1,626 | |
| HB Fuller Co. | 33,565 | 1,594 | |
| Universal Forest Products Inc. | 13,570 | 1,481 | |
| Balchem Corp. | 21,125 | 1,479 | |
| Hecla Mining Co. | 261,690 | 1,460 | |
| * | Coeur Mining Inc. | 111,038 | 1,415 |
| * | GCP Applied Technologies Inc. | 47,527 | 1,391 |
| * | Masonite International Corp. | 20,788 | 1,387 |
| Worthington Industries Inc. | 30,804 | 1,321 | |
| Mueller Industries Inc. | 37,974 | 1,312 | |
| Mueller Water Products Inc. Class A | 107,024 | 1,294 | |
| * | Chemtura Corp. | 42,645 | 1,279 |
| * | Ingevity Corp. | 28,593 | 1,269 |
| ^ | Allegheny Technologies Inc. | 72,732 | 1,241 |
| * | Rexnord Corp. | 55,664 | 1,231 |
| * | Trex Co. Inc. | 19,760 | 1,224 |
| Simpson Manufacturing Co. Inc. | 27,789 | 1,219 | |
| * | RBC Bearings Inc. | 15,256 | 1,207 |
| Commercial Metals Co. | 77,175 | 1,198 | |
| Trinseo SA | 19,676 | 1,138 | |
| Carpenter Technology Corp. | 30,889 | 1,121 | |
| KapStone Paper and Packaging Corp. | 59,966 | 1,050 | |
| Kaiser Aluminum Corp. | 12,217 | 1,041 | |
| * | Stillwater Mining Co. | 82,052 | 1,038 |
| * | Summit Materials Inc. Class A | 50,999 | 1,007 |
| * | MRC Global Inc. | 65,092 | 955 |
| Stepan Co. | 13,548 | 952 | |
| Innospec Inc. | 15,799 | 937 | |
| Apogee Enterprises Inc. | 19,290 | 934 | |
| Neenah Paper Inc. | 11,180 | 899 | |
| Quaker Chemical Corp. | 8,874 | 887 | |
| * | Headwaters Inc. | 48,474 | 879 |
21
| Vanguard® Russell 2000 Index Fund | |||
| Schedule of Investments | |||
| August 31, 2016 | |||
| Market | |||
| Value | |||
| Shares | ($000) | ||
| *,^ | Cliffs Natural Resources Inc. | 150,822 | 860 |
| Schweitzer-Mauduit International Inc. | 21,129 | 830 | |
| * | Gibraltar Industries Inc. | 20,985 | 801 |
| AAON Inc. | 28,139 | 796 | |
| Cabot Microelectronics Corp. | 15,668 | 779 | |
| Interface Inc. Class A | 43,462 | 768 | |
| * | Builders FirstSource Inc. | 55,808 | 767 |
| * | Ferro Corp. | 55,279 | 737 |
| * | Clearwater Paper Corp. | 11,871 | 737 |
| * | BMC Stock Holdings Inc. | 36,669 | 731 |
| Greif Inc. Class A | 17,043 | 727 | |
| * | Kraton Performance Polymers Inc. | 19,999 | 721 |
| * | AK Steel Holding Corp. | 158,804 | 708 |
| Comfort Systems USA Inc. | 24,801 | 704 | |
| * | Boise Cascade Co. | 26,197 | 687 |
| PH Glatfelter Co. | 29,202 | 647 | |
| * | Caesarstone Ltd. | 16,025 | 630 |
| * | Patrick Industries Inc. | 9,776 | 626 |
| * | Nortek Inc. | 7,041 | 605 |
| * | Univar Inc. | 28,983 | 600 |
| Innophos Holdings Inc. | 13,055 | 551 | |
| Advanced Drainage Systems Inc. | 23,125 | 535 | |
| * | Continental Building Products Inc. | 23,692 | 526 |
| * | US Concrete Inc. | 9,589 | 508 |
| Deltic Timber Corp. | 7,071 | 502 | |
| Calgon Carbon Corp. | 34,114 | 495 | |
| A Schulman Inc. | 19,372 | 494 | |
| * | Installed Building Products Inc. | 13,591 | 454 |
| Quanex Building Products Corp. | 22,920 | 443 | |
| * | Koppers Holdings Inc. | 13,472 | 440 |
| Materion Corp. | 14,555 | 427 | |
| Global Brass & Copper Holdings Inc. | 14,347 | 403 | |
| Insteel Industries Inc. | 11,889 | 396 | |
| Tronox Ltd. Class A | 43,300 | 395 | |
| Aceto Corp. | 19,224 | 388 | |
| * | PGT Inc. | 31,433 | 374 |
| Rayonier Advanced Materials Inc. | 29,213 | 359 | |
| Ferroglobe plc | 43,076 | 355 | |
| Griffon Corp. | 20,318 | 348 | |
| Schnitzer Steel Industries Inc. | 17,473 | 328 | |
| * | Armstrong Flooring Inc. | 15,330 | 316 |
| Tredegar Corp. | 16,719 | 315 | |
| American Vanguard Corp. | 18,614 | 314 | |
| NN Inc. | 17,194 | 305 | |
| Haynes International Inc. | 8,234 | 304 | |
| Chase Corp. | 4,700 | 303 | |
| AEP Industries Inc. | 2,663 | 295 | |
| * | Veritiv Corp. | 5,559 | 285 |
| * | OMNOVA Solutions Inc. | 27,837 | 278 |
| Hawkins Inc. | 6,308 | 276 | |
| * | NCI Building Systems Inc. | 18,157 | 275 |
| * | Unifi Inc. | 10,259 | 267 |
| * | TimkenSteel Corp. | 26,845 | 264 |
| * | Landec Corp. | 17,833 | 231 |
| Culp Inc. | 7,090 | 225 | |
| ^ | Greif Inc. Class B | 3,848 | 215 |
| * | Century Aluminum Co. | 33,086 | 208 |
| Myers Industries Inc. | 14,226 | 204 | |
| * | Ply Gem Holdings Inc. | 14,468 | 202 |
| * | Multi Packaging Solutions International Ltd. | 13,892 | 195 |
| FutureFuel Corp. | 16,167 | 189 | |
| KMG Chemicals Inc. | 6,287 | 176 | |
| Gold Resource Corp. | 32,772 | 171 | |
| * | LSB Industries Inc. | 13,627 | 164 |
22
| Vanguard® Russell 2000 Index Fund | |||
| Schedule of Investments | |||
| August 31, 2016 | |||
| Market | |||
| Value | |||
| Shares | ($000) | ||
| LSI Industries Inc. | 15,592 | 158 | |
| ^ | Kronos Worldwide Inc. | 14,729 | 131 |
| Oil-Dri Corp. of America | 3,263 | 123 | |
| Olympic Steel Inc. | 5,964 | 115 | |
| * | GMS Inc. | 4,660 | 114 |
| * | UFP Technologies Inc. | 4,198 | 104 |
| * | Ryerson Holding Corp. | 8,508 | 103 |
| Dynamic Materials Corp. | 9,191 | 101 | |
| * | AgroFresh Solutions Inc. | 14,422 | 88 |
| United States Lime & Minerals Inc. | 1,257 | 81 | |
| Omega Flex Inc. | 1,881 | 72 | |
| * | Lawson Products Inc. | 4,004 | 68 |
| *,^ | ChromaDex Corp. | 18,766 | 62 |
| Ampco-Pittsburgh Corp. | 5,608 | 61 | |
| Valhi Inc. | 17,367 | 44 | |
| * | Handy & Harman Ltd. | 1,922 | 43 |
| * | NL Industries Inc. | 7,087 | 42 |
| CompX International Inc. | 1,040 | 13 | |
| 85,060 | |||
| Other (0.0%)2 | |||
| * | Dyax Corp CVR Exp. 12/31/2019 | 83,094 | 92 |
| * | Leap Wireless International Inc. CVR | 22,127 | 56 |
| * | First Hawaiian Inc. | 1,078 | 29 |
| *,^ | Twilio Inc. | 492 | 26 |
| * | Selecta Biosciences Inc. | 1,920 | 23 |
| * | Impinj Inc. | 500 | 11 |
| * | Kinsale Capital Group Inc. | 331 | 7 |
| * | At Home Group Inc. | 434 | 7 |
| * | Chelsea Therapeutics International Ltd. CVR Exp. 12/31/2016 | 31,094 | 3 |
| * | Omthera Pharmaceuticals Inc. CVR | 2,012 | 1 |
| * | Durata Therapeutics Inc CVR Exp. 12/31/2018 | 680 | 1 |
| * | Clinical Data Contingent Value Rights | 913 | — |
| * | Gerber Scientific Inc. CVR | 2,358 | — |
| * | Cubist Pharmaceuticals, Inc. CVR | 13,664 | — |
| 256 | |||
| Producer Durables (13.4%) | |||
| Curtiss-Wright Corp. | 30,011 | 2,698 | |
| MAXIMUS Inc. | 43,362 | 2,551 | |
| * | Teledyne Technologies Inc. | 23,229 | 2,489 |
| *,^ | XPO Logistics Inc. | 66,580 | 2,384 |
| EMCOR Group Inc. | 41,216 | 2,360 | |
| Deluxe Corp. | 33,246 | 2,266 | |
| Woodward Inc. | 35,378 | 2,219 | |
| CLARCOR Inc. | 32,445 | 2,124 | |
| EnerSys | 29,631 | 2,085 | |
| Littelfuse Inc. | 15,135 | 1,919 | |
| Healthcare Services Group Inc. | 47,279 | 1,909 | |
| Joy Global Inc. | 67,334 | 1,837 | |
| Convergys Corp. | 60,250 | 1,797 | |
| HNI Corp. | 31,285 | 1,747 | |
| * | Dycom Industries Inc. | 20,774 | 1,685 |
| * | Hawaiian Holdings Inc. | 35,394 | 1,663 |
| * | Generac Holdings Inc. | 44,146 | 1,647 |
| * | Darling Ingredients Inc. | 111,971 | 1,577 |
| * | Esterline Technologies Corp. | 20,365 | 1,567 |
| * | WageWorks Inc. | 24,954 | 1,542 |
| Kennametal Inc. | 54,469 | 1,523 | |
| * | Electronics For Imaging Inc. | 32,111 | 1,512 |
| Herman Miller Inc. | 41,015 | 1,479 | |
| ABM Industries Inc. | 37,985 | 1,460 | |
| Barnes Group Inc. | 34,246 | 1,416 | |
| Tetra Tech Inc. | 39,538 | 1,396 | |
| John Bean Technologies Corp. | 19,965 | 1,371 | |
| * | KLX Inc. | 36,652 | 1,369 |
23
| Vanguard® Russell 2000 Index Fund | ||
| Schedule of Investments | ||
| August 31, 2016 | ||
| Market | ||
| Value | ||
| Shares | ($000) | |
| UniFirst Corp. | 10,393 | 1,334 |
| * MasTec Inc. | 45,270 | 1,333 |
| Granite Construction Inc. | 27,142 | 1,303 |
| CEB Inc. | 21,574 | 1,299 |
| Hillenbrand Inc. | 40,365 | 1,298 |
| * Moog Inc. Class A | 21,942 | 1,294 |
| * On Assignment Inc. | 34,148 | 1,288 |
| Knight Transportation Inc. | 45,794 | 1,287 |
| G&K Services Inc. Class A | 13,213 | 1,286 |
| * FTI Consulting Inc. | 28,562 | 1,265 |
| Allegiant Travel Co. Class A | 9,114 | 1,260 |
| GATX Corp. | 28,560 | 1,252 |
| Watts Water Technologies Inc. Class A | 18,918 | 1,218 |
| MSA Safety Inc. | 20,859 | 1,215 |
| Franklin Electric Co. Inc. | 31,686 | 1,212 |
| * Advanced Energy Industries Inc. | 27,160 | 1,194 |
| Applied Industrial Technologies Inc. | 24,921 | 1,184 |
| * Advisory Board Co. | 27,526 | 1,160 |
| AZZ Inc. | 17,357 | 1,153 |
| * ExlService Holdings Inc. | 22,343 | 1,144 |
| Brink's Co. | 30,993 | 1,131 |
| Matson Inc. | 28,949 | 1,117 |
| * Itron Inc. | 22,552 | 1,074 |
| Triumph Group Inc. | 33,026 | 1,052 |
| Brady Corp. Class A | 30,623 | 1,026 |
| Korn/Ferry International | 40,346 | 962 |
| * Swift Transportation Co. | 51,394 | 956 |
| SkyWest Inc. | 33,766 | 953 |
| * TASER International Inc. | 35,039 | 949 |
| * Huron Consulting Group Inc. | 15,024 | 944 |
| Actuant Corp. Class A | 39,415 | 939 |
| Forward Air Corp. | 20,037 | 923 |
| * Hub Group Inc. Class A | 22,468 | 916 |
| * Proto Labs Inc. | 16,542 | 905 |
| Steelcase Inc. Class A | 59,666 | 891 |
| Knoll Inc. | 33,659 | 891 |
| Mobile Mini Inc. | 29,731 | 889 |
| * TopBuild Corp. | 25,839 | 882 |
| Exponent Inc. | 17,214 | 868 |
| Albany International Corp. | 19,829 | 839 |
| Cubic Corp. | 17,480 | 818 |
| Kaman Corp. | 18,179 | 816 |
| Astec Industries Inc. | 13,455 | 791 |
| Tennant Co. | 12,168 | 788 |
| * OSI Systems Inc. | 11,661 | 782 |
| ESCO Technologies Inc. | 17,200 | 776 |
| EnPro Industries Inc. | 14,384 | 775 |
| * Sykes Enterprises Inc. | 25,777 | 754 |
| Standex International Corp. | 8,515 | 717 |
| * Virgin America Inc. | 12,852 | 716 |
| * ACCO Brands Corp. | 71,507 | 715 |
| * Aerojet Rocketdyne Holdings Inc. | 39,599 | 712 |
| * SPX FLOW Inc. | 23,639 | 695 |
| Werner Enterprises Inc. | 29,981 | 692 |
| Aircastle Ltd. | 31,812 | 689 |
| Insperity Inc. | 10,439 | 684 |
| US Ecology Inc. | 14,534 | 652 |
| CIRCOR International Inc. | 11,027 | 651 |
| * Navigant Consulting Inc. | 33,005 | 648 |
| * Paylocity Holding Corp. | 14,367 | 647 |
| * Chart Industries Inc. | 21,441 | 646 |
| * Astronics Corp. | 14,269 | 639 |
| * TrueBlue Inc. | 28,401 | 621 |
| Greenbrier Cos. Inc. | 18,270 | 619 |
24
| Vanguard® Russell 2000 Index Fund | ||
| Schedule of Investments | ||
| August 31, 2016 | ||
| Market | ||
| Value | ||
| Shares | ($000) | |
| * Atlas Air Worldwide Holdings Inc. | 16,592 | 616 |
| Badger Meter Inc. | 9,323 | 615 |
| * Team Inc. | 19,201 | 610 |
| ^ Ship Finance International Ltd. | 40,316 | 608 |
| Multi-Color Corp. | 9,101 | 608 |
| * Wabash National Corp. | 43,385 | 605 |
| ^ Nordic American Tankers Ltd. | 58,623 | 602 |
| Raven Industries Inc. | 24,474 | 601 |
| * TriNet Group Inc. | 28,316 | 595 |
| * Tutor Perini Corp. | 25,245 | 585 |
| Heartland Express Inc. | 30,720 | 585 |
| * TriMas Corp. | 30,018 | 576 |
| MTS Systems Corp. | 11,295 | 562 |
| AAR Corp. | 22,269 | 548 |
| * PHH Corp. | 35,721 | 547 |
| Essendant Inc. | 28,177 | 546 |
| Scorpio Tankers Inc. | 110,648 | 541 |
| Briggs & Stratton Corp. | 28,303 | 538 |
| * Lydall Inc. | 11,162 | 536 |
| * SPX Corp. | 28,244 | 535 |
| Quad/Graphics Inc. | 19,666 | 533 |
| McGrath RentCorp | 16,612 | 531 |
| Encore Wire Corp. | 13,664 | 529 |
| Harsco Corp. | 53,160 | 529 |
| Federal Signal Corp. | 40,228 | 527 |
| Primoris Services Corp. | 27,184 | 523 |
| General Cable Corp. | 32,083 | 518 |
| * ICF International Inc. | 12,238 | 512 |
| * Wesco Aircraft Holdings Inc. | 37,074 | 509 |
| ^ Lindsay Corp. | 7,048 | 507 |
| * Babcock & Wilcox Enterprises Inc. | 30,969 | 506 |
| * Saia Inc. | 16,585 | 505 |
| Douglas Dynamics Inc. | 15,706 | 504 |
| * Echo Global Logistics Inc. | 19,078 | 492 |
| Sun Hydraulics Corp. | 15,649 | 482 |
| Altra Industrial Motion Corp. | 16,820 | 474 |
| * Air Transport Services Group Inc. | 32,705 | 474 |
| * Rush Enterprises Inc. Class A | 19,819 | 471 |
| * Navistar International Corp. | 33,562 | 471 |
| * Thermon Group Holdings Inc. | 23,231 | 437 |
| * Aegion Corp. Class A | 23,592 | 437 |
| Argan Inc. | 9,067 | 434 |
| Manitowoc Co. Inc. | 85,956 | 421 |
| Alamo Group Inc. | 6,306 | 409 |
| * Triton International Ltd. | 26,702 | 406 |
| Kadant Inc. | 7,331 | 393 |
| Kelly Services Inc. Class A | 19,880 | 380 |
| * CBIZ Inc. | 32,869 | 372 |
| ^ GasLog Ltd. | 27,291 | 371 |
| Resources Connection Inc. | 24,169 | 365 |
| * FARO Technologies Inc. | 11,187 | 365 |
| * Engility Holdings Inc. | 12,012 | 360 |
| * RPX Corp. | 33,199 | 348 |
| Kimball International Inc. Class B | 27,796 | 346 |
| * Aerovironment Inc. | 13,917 | 344 |
| * Modine Manufacturing Co. | 32,062 | 343 |
| * CSW Industrials Inc. | 10,542 | 340 |
| H&E Equipment Services Inc. | 20,765 | 331 |
| Marten Transport Ltd. | 15,227 | 328 |
| ^ Frontline Ltd. | 42,579 | 326 |
| Hyster-Yale Materials Handling Inc. | 6,280 | 325 |
| Gorman-Rupp Co. | 11,548 | 314 |
| Kforce Inc. | 16,078 | 311 |
| TeleTech Holdings Inc. | 10,794 | 306 |
25
| Vanguard® Russell 2000 Index Fund | |||
| Schedule of Investments | |||
| August 31, 2016 | |||
| Market | |||
| Value | |||
| Shares | ($000) | ||
| ArcBest Corp. | 16,524 | 303 | |
| * | Overseas Shipholding Group Inc. Class A | 27,690 | 300 |
| * | MYR Group Inc. | 9,939 | 288 |
| * | SP Plus Corp. | 11,356 | 284 |
| Ennis Inc. | 16,912 | 280 | |
| Forrester Research Inc. | 6,769 | 277 | |
| * | Energy Recovery Inc. | 22,572 | 273 |
| Titan International Inc. | 29,597 | 272 | |
| * | Mistras Group Inc. | 11,273 | 265 |
| DHT Holdings Inc. | 61,127 | 263 | |
| * | DHI Group Inc. | 32,876 | 254 |
| Bristow Group Inc. | 22,174 | 253 | |
| Hackett Group Inc. | 15,364 | 251 | |
| * | DXP Enterprises Inc. | 8,826 | 248 |
| * | YRC Worldwide Inc. | 21,180 | 246 |
| * | Vectrus Inc. | 7,208 | 243 |
| * | Casella Waste Systems Inc. Class A | 26,107 | 237 |
| Powell Industries Inc. | 5,865 | 233 | |
| Heidrick & Struggles International Inc. | 12,373 | 231 | |
| Columbus McKinnon Corp. | 13,106 | 230 | |
| * | InnerWorkings Inc. | 25,760 | 229 |
| Mesa Laboratories Inc. | 1,968 | 221 | |
| * | Kratos Defense & Security Solutions Inc. | 30,826 | 215 |
| Spartan Motors Inc. | 21,792 | 215 | |
| CECO Environmental Corp. | 19,525 | 215 | |
| Barrett Business Services Inc. | 4,597 | 215 | |
| * | Monster Worldwide Inc. | 58,560 | 214 |
| American Railcar Industries Inc. | 5,081 | 211 | |
| Teekay Corp. | 28,795 | 208 | |
| Park-Ohio Holdings Corp. | 5,625 | 207 | |
| * | ServiceSource International Inc. | 40,124 | 203 |
| * | GP Strategies Corp. | 8,404 | 201 |
| Teekay Tankers Ltd. Class A | 76,359 | 199 | |
| VSE Corp. | 5,660 | 186 | |
| *,^ | Plug Power Inc. | 118,776 | 184 |
| *,^ | Energous Corp. | 9,714 | 175 |
| NACCO Industries Inc. Class A | 2,616 | 174 | |
| * | Roadrunner Transportation Systems Inc. | 20,113 | 168 |
| * | Ducommun Inc. | 7,063 | 168 |
| * | Milacron Holdings Corp. | 9,615 | 166 |
| * | Liquidity Services Inc. | 16,455 | 165 |
| * | CRA International Inc. | 5,981 | 162 |
| Miller Industries Inc. | 7,180 | 159 | |
| * | Ascent Capital Group Inc. Class A | 6,679 | 155 |
| * | Covenant Transportation Group Inc. Class A | 7,993 | 154 |
| ^ | Costamare Inc. | 17,350 | 153 |
| * | PHI Inc. | 8,150 | 152 |
| * | Great Lakes Dredge & Dock Corp. | 39,100 | 151 |
| * | NV5 Global Inc. | 4,799 | 147 |
| Supreme Industries Inc. Class A | 8,493 | 146 | |
| * | Control4 Corp. | 13,048 | 144 |
| Celadon Group Inc. | 17,739 | 139 | |
| ^ | Textainer Group Holdings Ltd. | 15,178 | 135 |
| Ardmore Shipping Corp. | 18,284 | 132 | |
| * | Scorpio Bulkers Inc. | 37,776 | 130 |
| * | Gener8 Maritime Inc. | 25,734 | 129 |
| * | Titan Machinery Inc. | 11,948 | 128 |
| * | Vicor Corp. | 11,556 | 126 |
| * | Rush Enterprises Inc. Class B | 5,177 | 124 |
| * | Vishay Precision Group Inc. | 7,947 | 121 |
| Graham Corp. | 6,293 | 120 | |
| * | Heritage-Crystal Clean Inc. | 8,653 | 120 |
| Hurco Cos. Inc. | 4,277 | 116 | |
| FreightCar America Inc. | 7,623 | 110 | |
26
| Vanguard® Russell 2000 Index Fund | |||
| Schedule of Investments | |||
| August 31, 2016 | |||
| Market | |||
| Value | |||
| Shares | ($000) | ||
| * | Orion Group Holdings Inc. | 18,340 | 109 |
| * | Layne Christensen Co. | 11,875 | 107 |
| * | HC2 Holdings Inc. | 21,876 | 105 |
| * | Maxwell Technologies Inc. | 20,649 | 105 |
| Marlin Business Services Corp. | 5,523 | 104 | |
| * | ExOne Co. | 7,531 | 101 |
| ^ | Tidewater Inc. | 30,365 | 99 |
| * | Hill International Inc. | 22,547 | 99 |
| * | TRC Cos. Inc. | 12,242 | 93 |
| * | PFSweb Inc. | 9,662 | 93 |
| Allied Motion Technologies Inc. | 3,873 | 87 | |
| * | Dorian LPG Ltd. | 16,106 | 86 |
| * | IES Holdings Inc. | 5,130 | 85 |
| * | CAI International Inc. | 10,286 | 82 |
| Hardinge Inc. | 7,670 | 81 | |
| * | Information Services Group Inc. | 20,360 | 77 |
| Universal Logistics Holdings Inc. | 5,624 | 76 | |
| Preformed Line Products Co. | 1,713 | 75 | |
| Navios Maritime Acquisition Corp. | 51,673 | 75 | |
| * | Radiant Logistics Inc. | 25,275 | 74 |
| * | Willis Lease Finance Corp. | 2,794 | 72 |
| * | USA Truck Inc. | 6,408 | 71 |
| * | Neff Corp. Class A | 7,043 | 66 |
| *,^ | Aqua Metals Inc. | 7,039 | 65 |
| *,^ | Patriot National Inc. | 7,118 | 63 |
| * | Workhorse Group Inc. | 7,494 | 61 |
| * | Gencor Industries Inc. | 5,074 | 58 |
| * | Blue Bird Corp. | 3,925 | 57 |
| * | ALJ Regional Holdings Inc. | 12,126 | 55 |
| * | American Superconductor Corp. | 7,698 | 55 |
| * | Global Sources Ltd. | 5,387 | 45 |
| * | Power Solutions International Inc. | 3,345 | 39 |
| * | PAM Transportation Services Inc. | 1,875 | 37 |
| 158,069 | |||
| Technology (14.6%) | |||
| * | Advanced Micro Devices Inc. | 445,130 | 3,294 |
| * | Microsemi Corp. | 77,437 | 3,094 |
| * | Aspen Technology Inc. | 56,008 | 2,546 |
| * | Take-Two Interactive Software Inc. | 56,261 | 2,446 |
| * | Cavium Inc. | 43,488 | 2,421 |
| * | ViaSat Inc. | 30,325 | 2,276 |
| * | EPAM Systems Inc. | 32,792 | 2,237 |
| * | GrubHub Inc. | 54,462 | 2,210 |
| * | Ellie Mae Inc. | 22,333 | 2,186 |
| Blackbaud Inc. | 32,241 | 2,172 | |
| * | Cirrus Logic Inc. | 42,595 | 2,162 |
| * | Proofpoint Inc. | 28,049 | 2,158 |
| SYNNEX Corp. | 19,869 | 2,109 | |
| Monolithic Power Systems Inc. | 26,364 | 2,023 | |
| * | Ciena Corp. | 94,165 | 2,020 |
| * | Integrated Device Technology Inc. | 92,258 | 1,853 |
| Science Applications International Corp. | 28,889 | 1,843 | |
| * | NetScout Systems Inc. | 61,342 | 1,814 |
| Intersil Corp. Class A | 91,753 | 1,811 | |
| * | Tech Data Corp. | 23,888 | 1,773 |
| Mentor Graphics Corp. | 73,200 | 1,758 | |
| MKS Instruments Inc. | 35,813 | 1,746 | |
| * | Coherent Inc. | 16,405 | 1,725 |
| * | Zendesk Inc. | 55,609 | 1,698 |
| InterDigital Inc. | 23,619 | 1,687 | |
| * | Entegris Inc. | 96,562 | 1,645 |
| * | Silicon Laboratories Inc. | 28,420 | 1,628 |
| * | CACI International Inc. Class A | 16,289 | 1,618 |
| * | Universal Display Corp. | 27,788 | 1,600 |
27
| Vanguard® Russell 2000 Index Fund | |||
| Schedule of Investments | |||
| August 31, 2016 | |||
| Market | |||
| Value | |||
| Shares | ($000) | ||
| * | Fleetmatics Group plc | 26,346 | 1,577 |
| *,^ | Ambarella Inc. | 21,875 | 1,576 |
| * | Finisar Corp. | 73,931 | 1,566 |
| * | Fairchild Semiconductor International Inc. Class A | 78,036 | 1,553 |
| * | Paycom Software Inc. | 29,506 | 1,515 |
| * | Cornerstone OnDemand Inc. | 33,803 | 1,485 |
| * | ACI Worldwide Inc. | 77,416 | 1,479 |
| * | Verint Systems Inc. | 42,887 | 1,463 |
| LogMeIn Inc. | 17,376 | 1,451 | |
| * | Synaptics Inc. | 24,862 | 1,416 |
| * | Acxiom Corp. | 52,064 | 1,353 |
| * | CommVault Systems Inc. | 25,910 | 1,335 |
| Vishay Intertechnology Inc. | 93,477 | 1,324 | |
| * | Sanmina Corp. | 50,201 | 1,319 |
| * | Anixter International Inc. | 20,098 | 1,285 |
| Diebold Inc. | 45,785 | 1,285 | |
| * | Viavi Solutions Inc. | 161,113 | 1,253 |
| * | NETGEAR Inc. | 21,639 | 1,233 |
| * | Lumentum Holdings Inc. | 33,929 | 1,192 |
| * | Synchronoss Technologies Inc. | 27,774 | 1,160 |
| * | Inphi Corp. | 26,922 | 1,160 |
| Plantronics Inc. | 22,827 | 1,156 | |
| * | Semtech Corp. | 43,353 | 1,153 |
| * | DigitalGlobe Inc. | 42,485 | 1,151 |
| Tessera Technologies Inc. | 34,022 | 1,141 | |
| * | Rovi Corp. | 55,635 | 1,139 |
| * | Polycom Inc. | 90,961 | 1,132 |
| * | Envestnet Inc. | 27,847 | 1,100 |
| * | HubSpot Inc. | 19,448 | 1,084 |
| Power Integrations Inc. | 18,481 | 1,079 | |
| * | MicroStrategy Inc. Class A | 6,376 | 1,063 |
| * | Plexus Corp. | 23,027 | 1,063 |
| *,^ | 3D Systems Corp. | 72,170 | 1,046 |
| * | Rambus Inc. | 73,232 | 1,012 |
| NIC Inc. | 43,689 | 1,004 | |
| * | Syntel Inc. | 21,590 | 997 |
| * | comScore Inc. | 32,159 | 992 |
| * | Progress Software Corp. | 33,573 | 974 |
| * | Gigamon Inc. | 21,910 | 968 |
| CSG Systems International Inc. | 22,086 | 966 | |
| ^ | Ebix Inc. | 16,886 | 963 |
| * | RealPage Inc. | 36,485 | 939 |
| Methode Electronics Inc. | 25,214 | 924 | |
| * | NeuStar Inc. Class A | 36,259 | 921 |
| * | Fabrinet | 23,498 | 912 |
| * | BroadSoft Inc. | 19,826 | 906 |
| * | Imperva Inc. | 20,030 | 902 |
| * | RingCentral Inc. Class A | 40,707 | 894 |
| *,^ | Ubiquiti Networks Inc. | 17,277 | 888 |
| * | II-VI Inc. | 41,146 | 872 |
| * | Infoblox Inc. | 39,671 | 851 |
| * | Knowles Corp. | 58,624 | 815 |
| * | Infinera Corp. | 94,231 | 809 |
| * | Benchmark Electronics Inc. | 33,045 | 797 |
| * | Callidus Software Inc. | 39,056 | 755 |
| * | Insight Enterprises Inc. | 24,525 | 750 |
| * | SPS Commerce Inc. | 11,188 | 730 |
| * | Interactive Intelligence Group Inc. | 12,069 | 722 |
| * | iRobot Corp. | 18,090 | 721 |
| * | MaxLinear Inc. | 37,163 | 712 |
| * | Stratasys Ltd. | 32,778 | 699 |
| * | AVG Technologies NV | 28,000 | 696 |
| * | Rogers Corp. | 11,998 | 671 |
| *,^ | Globant SA | 17,095 | 668 |
28
| Vanguard® Russell 2000 Index Fund | |||
| Schedule of Investments | |||
| August 31, 2016 | |||
| Market | |||
| Value | |||
| Shares | ($000) | ||
| ManTech International Corp. Class A | 16,464 | 659 | |
| * | Cvent Inc. | 20,050 | 655 |
| * | MACOM Technology Solutions Holdings Inc. | 15,423 | 635 |
| * | Amkor Technology Inc. | 69,645 | 634 |
| * | Qualys Inc. | 18,335 | 631 |
| * | Bottomline Technologies de Inc. | 27,063 | 625 |
| * | Cray Inc. | 27,130 | 621 |
| Pegasystems Inc. | 24,016 | 618 | |
| ADTRAN Inc. | 32,710 | 601 | |
| * | Mercury Systems Inc. | 26,350 | 598 |
| * | Rofin-Sinar Technologies Inc. | 18,114 | 580 |
| Brooks Automation Inc. | 45,877 | 579 | |
| * | ScanSource Inc. | 16,737 | 573 |
| Monotype Imaging Holdings Inc. | 27,011 | 570 | |
| * | Super Micro Computer Inc. | 25,747 | 557 |
| * | Oclaro Inc. | 69,301 | 546 |
| * | New Relic Inc. | 14,790 | 543 |
| *,^ | Pure Storage Inc. Class A | 45,716 | 535 |
| * | Diodes Inc. | 25,849 | 532 |
| * | TTM Technologies Inc. | 49,205 | 528 |
| * | Veeco Instruments Inc. | 26,472 | 521 |
| * | Ixia | 43,358 | 500 |
| * | Lattice Semiconductor Corp. | 81,030 | 498 |
| * | Web.com Group Inc. | 28,203 | 492 |
| * | Q2 Holdings Inc. | 17,251 | 489 |
| * | Virtusa Corp. | 18,623 | 488 |
| * | FormFactor Inc. | 45,788 | 474 |
| * | Perficient Inc. | 23,577 | 471 |
| * | Box Inc. | 34,085 | 468 |
| EarthLink Holdings Corp. | 71,277 | 454 | |
| AVX Corp. | 30,604 | 421 | |
| * | Photronics Inc. | 43,326 | 414 |
| * | CEVA Inc. | 13,089 | 412 |
| * | InvenSense Inc. | 54,890 | 408 |
| CTS Corp. | 20,863 | 402 | |
| * | ePlus Inc. | 4,264 | 386 |
| DTS Inc. | 11,512 | 385 | |
| *,^ | Acacia Communications Inc. | 3,422 | 382 |
| * | GTT Communications Inc. | 17,980 | 382 |
| * | VASCO Data Security International Inc. | 20,670 | 377 |
| * | Ultratech Inc. | 14,773 | 369 |
| * | Novanta Inc. | 21,633 | 365 |
| * | Loral Space & Communications Inc. | 9,988 | 364 |
| * | Applied Micro Circuits Corp. | 51,856 | 362 |
| * | Rudolph Technologies Inc. | 20,370 | 357 |
| * | ShoreTel Inc. | 44,241 | 355 |
| * | Benefitfocus Inc. | 8,732 | 353 |
| * | CalAmp Corp. | 23,678 | 345 |
| * | Unisys Corp. | 34,162 | 345 |
| * | TrueCar Inc. | 35,616 | 344 |
| * | Nimble Storage Inc. | 41,259 | 339 |
| * | Silver Spring Networks Inc. | 24,839 | 339 |
| * | Barracuda Networks Inc. | 14,419 | 335 |
| * | PROS Holdings Inc. | 16,572 | 326 |
| * | Five9 Inc. | 21,652 | 325 |
| * | Endurance International Group Holdings Inc. | 40,058 | 318 |
| * | Nanometrics Inc. | 15,618 | 318 |
| * | Actua Corp. | 29,772 | 303 |
| * | NeoPhotonics Corp. | 20,276 | 303 |
| * | PDF Solutions Inc. | 17,712 | 297 |
| * | RetailMeNot Inc. | 25,278 | 286 |
| * | A10 Networks Inc. | 28,879 | 284 |
| * | LivePerson Inc. | 36,354 | 283 |
| * | Sonus Networks Inc. | 31,731 | 274 |
29
| Vanguard® Russell 2000 Index Fund | |||
| Schedule of Investments | |||
| August 31, 2016 | |||
| Market | |||
| Value | |||
| Shares | ($000) | ||
| * | Blucora Inc. | 25,817 | 267 |
| * | Extreme Networks Inc. | 67,961 | 267 |
| * | Brightcove Inc. | 20,553 | 265 |
| * | Intralinks Holdings Inc. | 27,641 | 264 |
| * | Vocera Communications Inc. | 16,154 | 263 |
| * | Global Eagle Entertainment Inc. | 31,509 | 262 |
| * | Alpha & Omega Semiconductor Ltd. | 12,213 | 257 |
| * | Workiva Inc. | 14,395 | 257 |
| Epiq Systems Inc. | 15,305 | 251 | |
| * | Digimarc Corp. | 6,934 | 250 |
| * | Evolent Health Inc. Class A | 9,982 | 248 |
| * | Bankrate Inc. | 31,074 | 244 |
| * | Exar Corp. | 26,762 | 244 |
| * | KEYW Holding Corp. | 23,525 | 235 |
| * | Rapid7 Inc. | 13,036 | 234 |
| * | Kimball Electronics Inc. | 19,218 | 233 |
| Daktronics Inc. | 24,364 | 232 | |
| * | Axcelis Technologies Inc. | 19,683 | 231 |
| Sapiens International Corp. NV | 16,615 | 223 | |
| * | Harmonic Inc. | 51,206 | 222 |
| * | Rubicon Project Inc. | 25,500 | 217 |
| Park Electrochemical Corp. | 13,100 | 217 | |
| * | Bazaarvoice Inc. | 53,810 | 215 |
| * | Hortonworks Inc. | 26,430 | 211 |
| * | Xactly Corp. | 14,956 | 208 |
| * | Varonis Systems Inc. | 7,008 | 207 |
| * | Calix Inc. | 27,808 | 207 |
| * | Xcerra Corp. | 35,282 | 207 |
| IXYS Corp. | 17,478 | 203 | |
| Acacia Research Corp. | 33,703 | 202 | |
| Comtech Telecommunications Corp. | 15,234 | 196 | |
| * | Digi International Inc. | 17,048 | 196 |
| PC Connection Inc. | 7,463 | 195 | |
| Cohu Inc. | 17,837 | 194 | |
| * | Silicon Graphics International Corp. | 24,725 | 191 |
| * | ChannelAdvisor Corp. | 15,212 | 189 |
| American Software Inc. Class A | 18,045 | 188 | |
| *,^ | Alarm.com Holdings Inc. | 6,770 | 186 |
| * | Avid Technology Inc. | 20,643 | 186 |
| NVE Corp. | 3,173 | 184 | |
| *,^ | Applied Optoelectronics Inc. | 10,916 | 184 |
| * | Lionbridge Technologies Inc. | 37,386 | 182 |
| American Science & Engineering Inc. | 4,885 | 180 | |
| * | Sigma Designs Inc. | 23,855 | 179 |
| * | DSP Group Inc. | 14,630 | 169 |
| * | Tangoe Inc. | 18,111 | 168 |
| *,^ | pdvWireless Inc. | 6,404 | 164 |
| * | MINDBODY Inc. Class A | 9,431 | 164 |
| * | Carbonite Inc. | 11,585 | 162 |
| * | Jive Software Inc. | 37,835 | 160 |
| * | Glu Mobile Inc. | 67,445 | 158 |
| QAD Inc. Class A | 6,805 | 158 | |
| * | Model N Inc. | 14,551 | 156 |
| * | MeetMe Inc. | 27,043 | 156 |
| * | Apigee Corp. | 10,097 | 155 |
| * | Ultra Clean Holdings Inc. | 20,838 | 151 |
| * | Silicom Ltd. | 3,684 | 151 |
| * | Mitek Systems Inc. | 19,300 | 150 |
| Bel Fuse Inc. Class B | 6,366 | 146 | |
| * | Exa Corp. | 9,097 | 144 |
| * | Sparton Corp. | 6,282 | 144 |
| * | Everyday Health Inc. | 18,559 | 142 |
| * | Immersion Corp. | 19,604 | 142 |
| * | Zix Corp. | 36,916 | 141 |
30
| Vanguard® Russell 2000 Index Fund | |||
| Schedule of Investments | |||
| August 31, 2016 | |||
| Market | |||
| Value | |||
| Shares | ($000) | ||
| Black Box Corp. | 10,012 | 140 | |
| * | Clearfield Inc. | 7,697 | 139 |
| * | Datalink Corp. | 13,097 | 128 |
| * | Telenav Inc. | 21,816 | 127 |
| * | Amber Road Inc. | 11,716 | 123 |
| * | Agilysys Inc. | 10,918 | 121 |
| * | USA Technologies Inc. | 23,498 | 117 |
| Reis Inc. | 5,885 | 115 | |
| * | Radisys Corp. | 23,338 | 115 |
| * | Aerohive Networks Inc. | 16,493 | 109 |
| * | Electro Scientific Industries Inc. | 18,023 | 100 |
| * | TechTarget Inc. | 12,300 | 99 |
| * | Autobytel Inc. | 5,704 | 94 |
| * | MobileIron Inc. | 30,574 | 92 |
| * | Appfolio Inc. | 4,987 | 92 |
| * | ARC Document Solutions Inc. | 27,072 | 92 |
| * | KVH Industries Inc. | 10,617 | 91 |
| * | Guidance Software Inc. | 14,816 | 88 |
| EMCORE Corp. | 17,128 | 85 | |
| * | Kopin Corp. | 38,706 | 84 |
| * | Limelight Networks Inc. | 46,667 | 83 |
| *,^ | Park City Group Inc. | 8,491 | 82 |
| *,^ | VirnetX Holding Corp. | 30,909 | 82 |
| * | RealNetworks Inc. | 16,733 | 80 |
| * | GigPeak Inc. | 39,975 | 75 |
| * | Rightside Group Ltd. | 7,611 | 72 |
| * | Numerex Corp. Class A | 9,072 | 68 |
| * | SecureWorks Corp. Class A | 3,984 | 57 |
| NCI Inc. Class A | 3,968 | 48 | |
| * | Majesco | 3,838 | 20 |
| 172,375 | |||
| Utilities (4.8%) | |||
| IDACORP Inc. | 34,109 | 2,595 | |
| Portland General Electric Co. | 60,293 | 2,539 | |
| Southwest Gas Corp. | 32,230 | 2,250 | |
| j2 Global Inc. | 32,409 | 2,209 | |
| ONE Gas Inc. | 35,480 | 2,172 | |
| WGL Holdings Inc. | 34,414 | 2,163 | |
| Black Hills Corp. | 35,061 | 2,051 | |
| ALLETE Inc. | 33,759 | 2,002 | |
| New Jersey Resources Corp. | 58,504 | 1,968 | |
| Spire Inc. | 30,198 | 1,954 | |
| NorthWestern Corp. | 33,234 | 1,922 | |
| Avista Corp. | 42,743 | 1,736 | |
| PNM Resources Inc. | 54,054 | 1,718 | |
| South Jersey Industries Inc. | 54,274 | 1,611 | |
| MGE Energy Inc. | 23,848 | 1,310 | |
| El Paso Electric Co. | 27,735 | 1,267 | |
| Ormat Technologies Inc. | 26,026 | 1,260 | |
| Pattern Energy Group Inc. Class A | 46,033 | 1,096 | |
| Northwest Natural Gas Co. | 18,232 | 1,089 | |
| California Water Service Group | 32,994 | 1,006 | |
| Empire District Electric Co. | 29,640 | 1,002 | |
| * | Dynegy Inc. | 78,424 | 994 |
| Cogent Communications Holdings Inc. | 27,799 | 988 | |
| American States Water Co. | 24,485 | 954 | |
| Otter Tail Corp. | 25,595 | 876 | |
| Shenandoah Telecommunications Co. | 32,212 | 829 | |
| * | 8x8 Inc. | 61,327 | 814 |
| Consolidated Communications Holdings Inc. | 33,391 | 803 | |
| * | Talen Energy Corp. | 55,990 | 773 |
| * | Vonage Holdings Corp. | 132,906 | 772 |
| NRG Yield Inc. | 44,538 | 750 | |
| ^ | Atlantica Yield plc | 39,094 | 739 |
31
| Vanguard® Russell 2000 Index Fund | |||||
| Schedule of Investments | |||||
| August 31, 2016 | |||||
| Market | |||||
| Value | |||||
| Shares | ($000) | ||||
| West Corp. | 29,115 | 682 | |||
| Chesapeake Utilities Corp. | 9,968 | 634 | |||
| * | Cincinnati Bell Inc. | 141,861 | 593 | ||
| ^ | Windstream Holdings Inc. | 64,765 | 551 | ||
| * | inContact Inc. | 39,551 | 549 | ||
| SJW Corp. | 10,999 | 470 | |||
| *,^ | Iridium Communications Inc. | 55,041 | 458 | ||
| ATN International Inc. | 7,014 | 458 | |||
| *,^ | Gogo Inc. | 37,420 | 458 | ||
| * | ORBCOMM Inc. | 43,773 | 436 | ||
| *,^ | Globalstar Inc. | 244,497 | 381 | ||
| NRG Yield Inc. Class A | 22,989 | 370 | |||
| Inteliquent Inc. | 22,037 | 367 | |||
| Unitil Corp. | 9,076 | 359 | |||
| Middlesex Water Co. | 10,556 | 352 | |||
| Connecticut Water Service Inc. | 7,261 | 337 | |||
| * | General Communication Inc. Class A | 19,667 | 273 | ||
| York Water Co. | 8,520 | 241 | |||
| Spok Holdings Inc. | 13,462 | 223 | |||
| Atlantic Power Corp. | 84,502 | 218 | |||
| * | Boingo Wireless Inc. | 23,572 | 200 | ||
| * | FairPoint Communications Inc. | 13,958 | 195 | ||
| IDT Corp. Class B | 11,556 | 172 | |||
| * | Lumos Networks Corp. | 12,403 | 171 | ||
| *,^ | Straight Path Communications Inc. Class B | 6,370 | 151 | ||
| Artesian Resources Corp. Class A | 5,205 | 143 | |||
| Consolidated Water Co. Ltd. | 10,327 | 131 | |||
| * | NII Holdings Inc. | 35,087 | 117 | ||
| Delta Natural Gas Co. Inc. | 4,485 | 112 | |||
| Spark Energy Inc. Class A | 3,206 | 93 | |||
| * | Hawaiian Telcom Holdco Inc. | 3,956 | 89 | ||
| Genie Energy Ltd. Class B | 9,058 | 58 | |||
| * | Intelsat SA | 19,967 | 54 | ||
| ^ | Global Water Resources Inc. | 5,402 | 43 | ||
| 56,351 | |||||
| Total Common Stocks (Cost $1,176,946) | 1,174,059 | ||||
| Coupon | |||||
| Temporary Cash Investments (2.8%)1 | |||||
| Money Market Fund (2.7%) | |||||
| 3,4 | Vanguard Market Liquidity Fund | 0.612% | 318,134 | 31,817 | |
| Face | |||||
| Maturity | Amount | ||||
| Date | ($000) | ||||
| U.S. Government and Agency Obligations (0.1%) | |||||
| 5,6 | Federal Home Loan Bank Discount Notes | 0.431% | 1/25/17 | 500 | 499 |
| 6 | United States Treasury Bill | 0.318% | 10/20/16 | 300 | 300 |
| 799 | |||||
| Total Temporary Cash Investments (Cost $32,613) | 32,616 | ||||
| Total Investments (102.5%) (Cost $1,209,559) | 1,206,675 | ||||
| Other Assets and Liabilities—Net (-2.5%)4 | (29,421) | ||||
| Net Assets (100%) | 1,177,254 | ||||
| * | Non-income-producing security. |
| ^ | Includes partial security positions on loan to broker-dealers. The total value of securities on loan is $22,964,000. |
32
Vanguard® Russell 2000 Index Fund
Schedule of Investments
August 31, 2016
| 1 | The fund invests a portion of its cash reserves in equity markets through the use of index futures contracts. After giving effect to futures investments, the fund's effective common stock and temporary cash investment positions represent 100.1% and 2.4%, respectively, of net assets. |
| 2 | “Other” represents securities that are not classified by the fund’s benchmark index. |
| 3 | Affiliated money market fund available only to Vanguard funds and certain trusts and accounts managed by Vanguard. Rate shown is the 7-day yield. |
| 4 | Includes $24,747,000 of collateral received for securities on loan. |
| 5 | The issuer operates under a congressional charter; its securities are generally neither guaranteed by the U.S. Treasury nor backed by the full faith and credit of the U.S. government. |
| 6 | Securities with a value of $400,000 have been segregated as initial margin for open futures contracts. CVR—Contingent Value Rights. |
| REIT—Real Estate Investment Trust. |
33
| Vanguard® Russell 2000 Value Index Fund | |||
| Schedule of Investments | |||
| August 31, 2016 | |||
| Market | |||
| Value | |||
| Shares | ($000) | ||
| Common Stocks (99.6%)1 | |||
| Consumer Discretionary (10.9%) | |||
| Dana Inc. | 44,151 | 637 | |
| * | Deckers Outdoor Corp. | 8,899 | 582 |
| Office Depot Inc. | 157,901 | 581 | |
| Wolverine World Wide Inc. | 24,087 | 576 | |
| Meredith Corp. | 10,760 | 571 | |
| Avon Products Inc. | 98,827 | 563 | |
| * | Media General Inc. | 31,292 | 553 |
| * | TRI Pointe Group Inc. | 39,989 | 542 |
| Cooper Tire & Rubber Co. | 15,782 | 536 | |
| Interval Leisure Group Inc. | 29,084 | 506 | |
| Marriott Vacations Worldwide Corp. | 6,009 | 463 | |
| DSW Inc. Class A | 19,234 | 461 | |
| New York Times Co. Class A | 35,418 | 458 | |
| Aaron's Inc. | 18,796 | 458 | |
| *,^ | GoPro Inc. Class A | 28,958 | 424 |
| Time Inc. | 29,218 | 412 | |
| DeVry Education Group Inc. | 17,821 | 411 | |
| Gannett Co. Inc. | 33,477 | 399 | |
| * | Meritage Homes Corp. | 10,795 | 388 |
| * | Genesco Inc. | 5,201 | 378 |
| * | Restoration Hardware Holdings Inc. | 11,101 | 374 |
| Abercrombie & Fitch Co. | 19,465 | 345 | |
| * | Fossil Group Inc. | 12,009 | 343 |
| Caleres Inc. | 12,274 | 318 | |
| Scholastic Corp. | 7,720 | 311 | |
| Guess? Inc. | 17,858 | 297 | |
| KB Home | 18,693 | 293 | |
| * | EW Scripps Co. Class A | 16,889 | 287 |
| * | Meritor Inc. | 24,929 | 278 |
| * | Ascena Retail Group Inc. | 33,601 | 274 |
| * | Belmond Ltd. Class A | 24,331 | 272 |
| National CineMedia Inc. | 17,957 | 268 | |
| Group 1 Automotive Inc. | 4,516 | 268 | |
| International Speedway Corp. Class A | 7,639 | 254 | |
| * | Express Inc. | 21,149 | 250 |
| Sotheby's | 6,226 | 247 | |
| * | Liberty Media Group LLC | 10,950 | 233 |
| * | La Quinta Holdings Inc. | 19,013 | 220 |
| La-Z-Boy Inc. | 8,233 | 220 | |
| Cato Corp. Class A | 6,348 | 218 | |
| * | Apollo Education Group Inc. | 24,335 | 216 |
| Jack in the Box Inc. | 2,117 | 211 | |
| Superior Industries International Inc. | 7,215 | 210 | |
| Barnes & Noble Inc. | 17,883 | 205 | |
| * | Central Garden & Pet Co. Class A | 8,374 | 203 |
| Finish Line Inc. Class A | 8,393 | 202 | |
| * | MSG Networks Inc. | 11,424 | 200 |
| Callaway Golf Co. | 17,039 | 195 | |
| * | Houghton Mifflin Harcourt Co. | 11,870 | 189 |
| * | Pinnacle Entertainment Inc. | 15,396 | 185 |
| MDC Holdings Inc. | 7,064 | 184 | |
| Rent-A-Center Inc. | 14,994 | 183 | |
| * | Vitamin Shoppe Inc. | 6,408 | 178 |
| AMC Entertainment Holdings Inc. | 5,786 | 176 | |
| * | Caesars Acquisition Co. Class A | 13,805 | 168 |
| DineEquity Inc. | 2,083 | 162 | |
| * | Red Robin Gourmet Burgers Inc. | 3,093 | 155 |
| New Media Investment Group Inc. | 9,373 | 150 | |
| ^ | Buckle Inc. | 5,519 | 142 |
| Tower International Inc. | 5,833 | 142 | |
| *,^ | Eros International plc | 8,364 | 140 |
34
| Vanguard® Russell 2000 Value Index Fund | |||
| Schedule of Investments | |||
| August 31, 2016 | |||
| Market | |||
| Value | |||
| Shares | ($000) | ||
| * | Liberty Braves Group | 8,292 | 137 |
| Sonic Automotive Inc. Class A | 7,914 | 135 | |
| * | Regis Corp. | 10,578 | 133 |
| * | Barnes & Noble Education Inc. | 11,434 | 128 |
| Tailored Brands Inc. | 9,648 | 127 | |
| ^ | MDC Partners Inc. Class A | 10,160 | 125 |
| Marcus Corp. | 5,300 | 125 | |
| * | M/I Homes Inc. | 5,394 | 125 |
| * | Career Education Corp. | 18,972 | 124 |
| Shoe Carnival Inc. | 4,012 | 119 | |
| *,^ | Lumber Liquidators Holdings Inc. | 7,414 | 117 |
| * | FTD Cos. Inc. | 4,970 | 117 |
| Travelport Worldwide Ltd. | 8,452 | 116 | |
| * | William Lyon Homes Class A | 6,722 | 116 |
| * | K12 Inc. | 9,678 | 116 |
| * | Biglari Holdings Inc. | 262 | 115 |
| * | Liberty Media Group LLC Class A | 5,378 | 115 |
| * | WCI Communities Inc. | 6,104 | 115 |
| Standard Motor Products Inc. | 2,462 | 110 | |
| National Presto Industries Inc. | 1,239 | 108 | |
| Fred's Inc. Class A | 9,426 | 107 | |
| Haverty Furniture Cos. Inc. | 5,259 | 105 | |
| * | Iconix Brand Group Inc. | 12,195 | 102 |
| *,^ | Caesars Entertainment Corp. | 16,060 | 102 |
| Libbey Inc. | 5,703 | 101 | |
| * | Beazer Homes USA Inc. | 8,901 | 100 |
| Entercom Communications Corp. Class A | 7,275 | 100 | |
| Movado Group Inc. | 4,295 | 98 | |
| * | Del Frisco's Restaurant Group Inc. | 6,252 | 94 |
| Inter Parfums Inc. | 2,701 | 92 | |
| * | American Public Education Inc. | 4,434 | 92 |
| * | Chegg Inc. | 13,241 | 89 |
| Viad Corp. | 2,486 | 89 | |
| Pier 1 Imports Inc. | 19,146 | 88 | |
| * | America's Car-Mart Inc. | 2,214 | 87 |
| * | Revlon Inc. Class A | 2,387 | 86 |
| * | Zumiez Inc. | 5,138 | 86 |
| American Eagle Outfitters Inc. | 4,609 | 85 | |
| Flexsteel Industries Inc. | 1,800 | 85 | |
| * | Tuesday Morning Corp. | 12,752 | 85 |
| *,^ | Sequential Brands Group Inc. | 11,108 | 81 |
| * | Federal-Mogul Holdings Corp. | 8,679 | 79 |
| * | Strayer Education Inc. | 1,620 | 79 |
| Citi Trends Inc. | 4,031 | 79 | |
| * | Century Communities Inc. | 3,980 | 78 |
| * | El Pollo Loco Holdings Inc. | 5,665 | 77 |
| * | G-III Apparel Group Ltd. | 2,443 | 77 |
| * | Gray Television Inc. | 6,652 | 75 |
| * | Party City Holdco Inc. | 4,214 | 73 |
| * | Carmike Cinemas Inc. | 2,287 | 73 |
| *,^ | Lands' End Inc. | 4,168 | 73 |
| * | Del Taco Restaurants Inc. | 6,494 | 73 |
| * | Monarch Casino & Resort Inc. | 2,967 | 71 |
| Hooker Furniture Corp. | 2,983 | 69 | |
| * | Intrawest Resorts Holdings Inc. | 4,617 | 69 |
| * | Perry Ellis International Inc. | 3,578 | 67 |
| * | Central Garden & Pet Co. | 2,492 | 64 |
| CSS Industries Inc. | 2,467 | 63 | |
| Big 5 Sporting Goods Corp. | 5,021 | 63 | |
| * | Hovnanian Enterprises Inc. Class A | 33,677 | 61 |
| * | MarineMax Inc. | 3,060 | 61 |
| * | Denny's Corp. | 5,722 | 60 |
| Speedway Motorsports Inc. | 3,292 | 59 | |
| * | tronc Inc. | 3,096 | 52 |
35
| Vanguard® Russell 2000 Value Index Fund | |||
| Schedule of Investments | |||
| August 31, 2016 | |||
| Market | |||
| Value | |||
| Shares | ($000) | ||
| * | Hibbett Sports Inc. | 1,340 | 51 |
| * | Ruby Tuesday Inc. | 16,848 | 51 |
| * | ZAGG Inc. | 7,013 | 51 |
| * | Reading International Inc. Class A | 3,649 | 49 |
| * | West Marine Inc. | 5,274 | 49 |
| * | 1-800-Flowers.com Inc. Class A | 5,238 | 48 |
| * | Boot Barn Holdings Inc. | 3,868 | 48 |
| Chico's FAS Inc. | 3,773 | 48 | |
| Johnson Outdoors Inc. Class A | 1,342 | 45 | |
| Cracker Barrel Old Country Store Inc. | 293 | 45 | |
| Weyco Group Inc. | 1,741 | 44 | |
| * | Build-A-Bear Workshop Inc. | 3,638 | 42 |
| Saga Communications Inc. Class A | 1,036 | 42 | |
| Lifetime Brands Inc. | 3,137 | 42 | |
| * | Penn National Gaming Inc. | 2,957 | 42 |
| Strattec Security Corp. | 994 | 42 | |
| * | Liberty Braves Group Class A | 2,451 | 41 |
| * | JAKKS Pacific Inc. | 4,448 | 41 |
| * | Vince Holding Corp. | 5,654 | 40 |
| Stage Stores Inc. | 7,373 | 40 | |
| * | Conn's Inc. | 5,766 | 39 |
| * | J Alexander's Holdings Inc. | 3,790 | 38 |
| Escalade Inc. | 3,072 | 37 | |
| *,^ | Sears Holdings Corp. | 2,611 | 36 |
| * | Delta Apparel Inc. | 2,028 | 36 |
| * | Bridgepoint Education Inc. | 4,875 | 35 |
| * | Fiesta Restaurant Group Inc. | 1,384 | 35 |
| Bassett Furniture Industries Inc. | 1,357 | 34 | |
| Golden Entertainment Inc. | 2,588 | 32 | |
| Arctic Cat Inc. | 2,188 | 31 | |
| * | Performance Sports Group Ltd. | 11,416 | 31 |
| * | QuinStreet Inc. | 10,025 | 31 |
| * | Tilly's Inc. Class A | 3,456 | 30 |
| * | New Home Co. Inc. | 2,752 | 30 |
| * | Kirkland's Inc. | 2,326 | 29 |
| * | Cooper-Standard Holding Inc. | 286 | 28 |
| Systemax Inc. | 3,321 | 27 | |
| * | Red Lion Hotels Corp. | 4,104 | 27 |
| * | Marchex Inc. Class B | 9,331 | 26 |
| Metaldyne Performance Group Inc. | 1,552 | 25 | |
| * | Daily Journal Corp. | 106 | 25 |
| * | Vera Bradley Inc. | 1,625 | 24 |
| * | Luby's Inc. | 5,216 | 23 |
| * | Townsquare Media Inc. Class A | 2,235 | 22 |
| * | Century Casinos Inc. | 3,360 | 21 |
| * | Carrols Restaurant Group Inc. | 1,490 | 20 |
| * | Sears Hometown and Outlet Stores Inc. | 3,016 | 20 |
| *,^ | IDI Inc. | 4,071 | 20 |
| Salem Media Group Inc. Class A | 2,965 | 19 | |
| * | Cambium Learning Group Inc. | 3,839 | 18 |
| * | Fogo De Chao Inc. | 1,334 | 16 |
| * | Container Store Group Inc. | 2,993 | 16 |
| * | Empire Resorts Inc. | 821 | 14 |
| * | Kona Grill Inc. | 1,039 | 14 |
| * | Destination XL Group Inc. | 2,790 | 13 |
| Capella Education Co. | 218 | 13 | |
| * | Eastman Kodak Co. | 722 | 11 |
| * | Rosetta Stone Inc. | 1,179 | 10 |
| * | Motorcar Parts of America Inc. | 346 | 10 |
| * | Eldorado Resorts Inc. | 699 | 10 |
| * | LGI Homes Inc. | 243 | 9 |
| * | Franklin Covey Co. | 544 | 9 |
| * | Elizabeth Arden Inc. | 538 | 8 |
| Carriage Services Inc. Class A | 289 | 7 | |
36
| Vanguard® Russell 2000 Value Index Fund | |||
| Schedule of Investments | |||
| August 31, 2016 | |||
| Market | |||
| Value | |||
| Shares | ($000) | ||
| * | Noodles & Co. Class A | 1,018 | 7 |
| * | Weight Watchers International Inc. | 521 | 5 |
| Liberty Tax Inc. | 359 | 5 | |
| * | Gaia Inc. Class A | 519 | 4 |
| * | Sportsman's Warehouse Holdings Inc. | 345 | 4 |
| * | Hemisphere Media Group Inc. Class A | 227 | 3 |
| * | Radio One Inc. | 583 | 2 |
| 27,177 | |||
| Consumer Staples (2.3%) | |||
| Snyder's-Lance Inc. | 23,059 | 815 | |
| * | United Natural Foods Inc. | 14,258 | 650 |
| Sanderson Farms Inc. | 5,729 | 551 | |
| Fresh Del Monte Produce Inc. | 8,669 | 504 | |
| * | SUPERVALU Inc. | 76,035 | 417 |
| Universal Corp. | 6,343 | 382 | |
| SpartanNash Co. | 10,606 | 340 | |
| Vector Group Ltd. | 14,316 | 319 | |
| Andersons Inc. | 7,681 | 284 | |
| * | Seaboard Corp. | 76 | 246 |
| Dean Foods Co. | 12,941 | 223 | |
| * | Omega Protein Corp. | 5,914 | 149 |
| Ingles Markets Inc. Class A | 3,935 | 149 | |
| Weis Markets Inc. | 2,778 | 141 | |
| ^ | Cal-Maine Foods Inc. | 1,984 | 91 |
| John B Sanfilippo & Son Inc. | 1,728 | 89 | |
| Village Super Market Inc. Class A | 2,083 | 67 | |
| * | Nutraceutical International Corp. | 2,461 | 62 |
| * | Seneca Foods Corp. Class A | 1,830 | 54 |
| * | Alliance One International Inc. | 2,400 | 51 |
| * | Craft Brew Alliance Inc. | 2,286 | 45 |
| Nature's Sunshine Products Inc. | 2,483 | 34 | |
| * | Natural Grocers by Vitamin Cottage Inc. | 2,631 | 32 |
| * | Smart & Final Stores Inc. | 1,829 | 23 |
| Alico Inc. | 777 | 22 | |
| * | Synutra International Inc. | 4,083 | 16 |
| * | Turning Point Brands Inc. | 739 | 10 |
| * | Chefs' Warehouse Inc. | 435 | 5 |
| Limoneira Co. | 208 | 3 | |
| 5,774 | |||
| Energy (4.8%) | |||
| * | RSP Permian Inc. | 22,637 | 884 |
| * | PDC Energy Inc. | 13,273 | 881 |
| * | NOW Inc. | 31,312 | 646 |
| Western Refining Inc. | 23,413 | 589 | |
| Golar LNG Ltd. | 25,428 | 530 | |
| * | Oasis Petroleum Inc. | 50,784 | 481 |
| SemGroup Corp. Class A | 15,079 | 469 | |
| * | Oil States International Inc. | 15,105 | 469 |
| * | McDermott International Inc. | 69,234 | 362 |
| TerraForm Power Inc. Class A | 24,872 | 319 | |
| Delek US Holdings Inc. | 18,114 | 318 | |
| * | Forum Energy Technologies Inc. | 18,028 | 317 |
| * | Denbury Resources Inc. | 100,760 | 310 |
| * | Synergy Resources Corp. | 46,665 | 306 |
| * | SEACOR Holdings Inc. | 4,499 | 264 |
| *,^ | Seadrill Ltd. | 108,185 | 261 |
| Green Plains Inc. | 10,411 | 253 | |
| * | Unit Corp. | 14,393 | 246 |
| Archrock Inc. | 19,737 | 218 | |
| * | Helix Energy Solutions Group Inc. | 28,928 | 217 |
| *,^ | Fairmount Santrol Holdings Inc. | 22,890 | 170 |
| * | Newpark Resources Inc. | 23,467 | 166 |
| * | Cobalt International Energy Inc. | 117,686 | 141 |
| * | Matrix Service Co. | 7,469 | 138 |
37
| Vanguard® Russell 2000 Value Index Fund | |||
| Schedule of Investments | |||
| August 31, 2016 | |||
| Market | |||
| Value | |||
| Shares | ($000) | ||
| ^ | Atwood Oceanics Inc. | 17,217 | 136 |
| * | REX American Resources Corp. | 1,598 | 129 |
| * | Exterran Corp. | 8,923 | 126 |
| SunCoke Energy Inc. | 18,134 | 118 | |
| *,^ | Clayton Williams Energy Inc. | 1,745 | 110 |
| * | Clean Energy Fuels Corp. | 24,977 | 109 |
| *,^ | Sunrun Inc. | 17,830 | 108 |
| * | Ring Energy Inc. | 10,026 | 99 |
| TerraForm Global Inc. Class A | 26,124 | 95 | |
| * | Renewable Energy Group Inc. | 10,349 | 93 |
| Tesco Corp. | 13,533 | 92 | |
| *,^ | Sanchez Energy Corp. | 10,708 | 92 |
| * | Bill Barrett Corp. | 13,769 | 91 |
| * | California Resources Corp. | 9,056 | 90 |
| * | Natural Gas Services Group Inc. | 3,518 | 83 |
| Alon USA Energy Inc. | 8,998 | 74 | |
| * | Parker Drilling Co. | 34,001 | 73 |
| ^ | CARBO Ceramics Inc. | 5,486 | 69 |
| * | Contango Oil & Gas Co. | 6,968 | 67 |
| * | Geospace Technologies Corp. | 3,733 | 66 |
| ^ | CVR Energy Inc. | 4,272 | 62 |
| * | Pioneer Energy Services Corp. | 17,962 | 60 |
| * | TerraVia Holdings Inc. | 22,193 | 59 |
| * | Eclipse Resources Corp. | 16,449 | 56 |
| * | TETRA Technologies Inc. | 9,130 | 55 |
| * | Pacific Ethanol Inc. | 8,391 | 54 |
| * | Green Brick Partners Inc. | 6,641 | 53 |
| * | Hornbeck Offshore Services Inc. | 9,216 | 50 |
| *,^ | EP Energy Corp. Class A | 10,812 | 45 |
| *,^ | FuelCell Energy Inc. | 8,386 | 43 |
| * | Independence Contract Drilling Inc. | 8,463 | 43 |
| *,^ | Northern Oil and Gas Inc. | 13,060 | 42 |
| *,^ | EXCO Resources Inc. | 41,067 | 42 |
| * | RigNet Inc. | 3,315 | 42 |
| * | Dawson Geophysical Co. | 5,756 | 41 |
| * | Era Group Inc. | 5,510 | 40 |
| * | Westmoreland Coal Co. | 5,179 | 40 |
| Panhandle Oil and Gas Inc. Class A | 2,176 | 38 | |
| * | Ameresco Inc. Class A | 6,067 | 29 |
| * | Abraxas Petroleum Corp. | 18,373 | 26 |
| * | Willbros Group Inc. | 12,443 | 24 |
| * | Jones Energy Inc. Class A | 8,417 | 23 |
| Adams Resources & Energy Inc. | 615 | 23 | |
| *,^ | Vivint Solar Inc. | 6,094 | 19 |
| *,^ | W&T Offshore Inc. | 10,281 | 18 |
| * | Par Pacific Holdings Inc. | 1,008 | 12 |
| * | Trecora Resources | 1,058 | 12 |
| *,^ | Erin Energy Corp. | 4,587 | 10 |
| * | Earthstone Energy Inc. | 670 | 7 |
| * | EnerNOC Inc. | 1,004 | 6 |
| * | Par Pacific Holdings Inc. Rights Exp. 09/14/2016 | 5,008 | — |
| * | Global Geophysical Services Inc. | 223 | — |
| 11,949 | |||
| Financial Services (41.8%) | |||
| Healthcare Realty Trust Inc. | 32,699 | 1,146 | |
| Prosperity Bancshares Inc. | 19,238 | 1,067 | |
| Umpqua Holdings Corp. | 63,991 | 1,051 | |
| Investors Bancorp Inc. | 85,230 | 1,044 | |
| PrivateBancorp Inc. | 22,503 | 1,034 | |
| Webster Financial Corp. | 26,429 | 1,021 | |
| New Residential Investment Corp. | 70,231 | 1,008 | |
| Gramercy Property Trust | 102,972 | 997 | |
| Hudson Pacific Properties Inc. | 26,771 | 896 | |
| Sunstone Hotel Investors Inc. | 62,578 | 869 | |
38
| Vanguard® Russell 2000 Value Index Fund | ||
| Schedule of Investments | ||
| August 31, 2016 | ||
| Market | ||
| Value | ||
| Shares | ($000) | |
| LaSalle Hotel Properties | 30,732 | 862 |
| Radian Group Inc. | 61,398 | 842 |
| RLJ Lodging Trust | 35,617 | 831 |
| CNO Financial Group Inc. | 51,027 | 829 |
| Education Realty Trust Inc. | 18,150 | 822 |
| Wintrust Financial Corp. | 14,770 | 821 |
| IBERIABANK Corp. | 11,827 | 813 |
| * MGIC Investment Corp. | 98,161 | 794 |
| MB Financial Inc. | 20,096 | 787 |
| UMB Financial Corp. | 12,834 | 780 |
| FNB Corp. | 60,043 | 750 |
| * Stifel Financial Corp. | 18,953 | 746 |
| First Industrial Realty Trust Inc. | 25,898 | 745 |
| United Bankshares Inc. | 18,783 | 740 |
| Hancock Holding Co. | 22,385 | 730 |
| Fulton Financial Corp. | 49,201 | 711 |
| Mack-Cali Realty Corp. | 25,621 | 711 |
| Lexington Realty Trust | 65,679 | 709 |
| CBL & Associates Properties Inc. | 49,195 | 702 |
| Washington Federal Inc. | 26,114 | 692 |
| Cathay General Bancorp | 21,896 | 688 |
| Medical Properties Trust Inc. | 44,917 | 686 |
| Valley National Bancorp | 70,811 | 683 |
| Kite Realty Group Trust | 23,613 | 682 |
| * Genworth Financial Inc. Class A | 143,726 | 680 |
| Acadia Realty Trust | 17,888 | 661 |
| Selective Insurance Group Inc. | 16,497 | 658 |
| Cousins Properties Inc. | 59,671 | 658 |
| Glacier Bancorp Inc. | 21,947 | 657 |
| * Texas Capital Bancshares Inc. | 12,321 | 647 |
| Sterling Bancorp | 36,069 | 644 |
| * Hope Bancorp Inc. | 37,289 | 641 |
| First Citizens BancShares Inc. Class A | 2,236 | 637 |
| DiamondRock Hospitality Co. | 58,806 | 623 |
| Janus Capital Group Inc. | 41,343 | 615 |
| BancorpSouth Inc. | 24,667 | 614 |
| Pinnacle Financial Partners Inc. | 10,828 | 614 |
| Pebblebrook Hotel Trust | 20,424 | 614 |
| Colony Capital Inc. Class A | 32,462 | 600 |
| Great Western Bancorp Inc. | 17,118 | 586 |
| Community Bank System Inc. | 12,316 | 584 |
| Colony Starwood Homes | 18,695 | 580 |
| * Washington Prime Group Inc. | 41,546 | 571 |
| EverBank Financial Corp. | 29,678 | 570 |
| Trustmark Corp. | 19,578 | 555 |
| * Enstar Group Ltd. | 3,304 | 550 |
| Columbia Banking System Inc. | 16,538 | 546 |
| Old National Bancorp | 37,980 | 538 |
| Capitol Federal Financial Inc. | 36,281 | 522 |
| CVB Financial Corp. | 29,257 | 520 |
| South State Corp. | 6,755 | 513 |
| Chemical Financial Corp. | 11,066 | 512 |
| Monogram Residential Trust Inc. | 48,502 | 510 |
| Invesco Mortgage Capital Inc. | 32,179 | 507 |
| Xenia Hotels & Resorts Inc. | 29,906 | 504 |
| Select Income REIT | 18,246 | 498 |
| * Hilltop Holdings Inc. | 21,412 | 485 |
| International Bancshares Corp. | 16,306 | 483 |
| Government Properties Income Trust | 20,131 | 469 |
| Argo Group International Holdings Ltd. | 8,212 | 466 |
| New York REIT Inc. | 47,103 | 455 |
| First Midwest Bancorp Inc. | 22,870 | 448 |
| Washington REIT | 13,715 | 446 |
| American Equity Investment Life Holding Co. | 25,266 | 445 |
39
| Vanguard® Russell 2000 Value Index Fund | ||
| Schedule of Investments | ||
| August 31, 2016 | ||
| Market | ||
| Value | ||
| Shares | ($000) | |
| Ramco-Gershenson Properties Trust | 22,466 | 437 |
| Horace Mann Educators Corp. | 11,808 | 432 |
| Northwest Bancshares Inc. | 27,434 | 426 |
| Simmons First National Corp. Class A | 8,446 | 424 |
| Kemper Corp. | 11,265 | 422 |
| * PRA Group Inc. | 13,180 | 422 |
| United Community Banks Inc. | 20,046 | 421 |
| Renasant Corp. | 11,693 | 415 |
| Parkway Properties Inc. | 22,868 | 412 |
| Global Net Lease Inc. | 48,703 | 404 |
| Astoria Financial Corp. | 26,307 | 403 |
| Physicians Realty Trust | 18,745 | 401 |
| NBT Bancorp Inc. | 12,338 | 398 |
| Independent Bank Corp. | 7,485 | 397 |
| Sabra Health Care REIT Inc. | 15,428 | 393 |
| Franklin Street Properties Corp. | 30,970 | 389 |
| LegacyTexas Financial Group Inc. | 12,684 | 385 |
| First Financial Bancorp | 17,552 | 383 |
| CYS Investments Inc. | 43,342 | 382 |
| Towne Bank | 16,034 | 381 |
| Waddell & Reed Financial Inc. Class A | 20,380 | 379 |
| Banner Corp. | 8,548 | 379 |
| Provident Financial Services Inc. | 17,493 | 377 |
| Yadkin Financial Corp. | 14,239 | 372 |
| Park National Corp. | 3,846 | 368 |
| Kearny Financial Corp. | 26,478 | 363 |
| ^ Westamerica Bancorporation | 7,048 | 358 |
| Summit Hotel Properties Inc. | 24,772 | 354 |
| Pennsylvania REIT | 13,884 | 348 |
| Union Bankshares Corp. | 12,420 | 346 |
| Redwood Trust Inc. | 22,491 | 333 |
| GEO Group Inc. | 16,561 | 332 |
| * FCB Financial Holdings Inc. Class A | 8,644 | 331 |
| WesBanco Inc. | 10,077 | 330 |
| American Assets Trust Inc. | 7,373 | 327 |
| WSFS Financial Corp. | 8,281 | 322 |
| First Merchants Corp. | 11,685 | 317 |
| Chesapeake Lodging Trust | 12,429 | 317 |
| Boston Private Financial Holdings Inc. | 24,586 | 317 |
| Agree Realty Corp. | 6,509 | 312 |
| Tompkins Financial Corp. | 4,192 | 310 |
| Navigators Group Inc. | 3,263 | 307 |
| Beneficial Bancorp Inc. | 20,209 | 305 |
| * MBIA Inc. | 37,321 | 301 |
| Stewart Information Services Corp. | 6,549 | 300 |
| Seritage Growth Properties Class A | 6,700 | 298 |
| Cash America International Inc. | 6,839 | 298 |
| PennyMac Mortgage Investment Trust | 19,392 | 296 |
| S&T Bancorp Inc. | 10,247 | 295 |
| New Senior Investment Group Inc. | 22,860 | 283 |
| * LendingClub Corp. | 51,851 | 281 |
| Hannon Armstrong Sustainable Infrastructure Capital Inc. | 11,686 | 280 |
| Employers Holdings Inc. | 9,153 | 279 |
| Apollo Commercial Real Estate Finance Inc. | 17,078 | 278 |
| Safety Insurance Group Inc. | 4,159 | 276 |
| Capstead Mortgage Corp. | 27,644 | 274 |
| * St. Joe Co. | 14,352 | 271 |
| United Fire Group Inc. | 6,196 | 268 |
| Infinity Property & Casualty Corp. | 3,148 | 265 |
| Kennedy-Wilson Holdings Inc. | 11,855 | 262 |
| First Commonwealth Financial Corp. | 25,587 | 261 |
| BNC Bancorp | 10,509 | 258 |
| Terreno Realty Corp. | 9,642 | 258 |
| Rexford Industrial Realty Inc. | 11,436 | 255 |
40
| Vanguard® Russell 2000 Value Index Fund | ||
| Schedule of Investments | ||
| August 31, 2016 | ||
| Market | ||
| Value | ||
| Shares | ($000) | |
| Banco Latinoamericano de Comercio Exterior SA | 8,651 | 250 |
| First Financial Bankshares Inc. | 6,781 | 248 |
| Alexander & Baldwin Inc. | 6,181 | 248 |
| Lakeland Financial Corp. | 6,817 | 244 |
| Berkshire Hills Bancorp Inc. | 8,691 | 242 |
| * FNFV Group | 18,601 | 240 |
| Southside Bancshares Inc. | 7,230 | 238 |
| CenterState Banks Inc. | 13,117 | 236 |
| Brookline Bancorp Inc. | 19,569 | 234 |
| Hanmi Financial Corp. | 8,872 | 233 |
| * Green Dot Corp. Class A | 9,971 | 231 |
| ARMOUR Residential REIT Inc. | 10,394 | 231 |
| * Ambac Financial Group Inc. | 12,743 | 231 |
| American Capital Mortgage Investment Corp. | 13,413 | 229 |
| State Bank Financial Corp. | 9,894 | 228 |
| Investors Real Estate Trust | 34,223 | 227 |
| Heartland Financial USA Inc. | 6,207 | 225 |
| * Third Point Reinsurance Ltd. | 17,313 | 225 |
| Cardinal Financial Corp. | 8,291 | 223 |
| Chatham Lodging Trust | 10,598 | 220 |
| Central Pacific Financial Corp. | 8,566 | 219 |
| Tier REIT Inc. | 13,507 | 216 |
| Hersha Hospitality Trust Class A | 11,008 | 215 |
| * KCG Holdings Inc. Class A | 14,846 | 215 |
| InfraREIT Inc. | 11,275 | 213 |
| City Holding Co. | 4,176 | 211 |
| Sandy Spring Bancorp Inc. | 6,661 | 210 |
| RE/MAX Holdings Inc. Class A | 5,022 | 209 |
| * Walker & Dunlop Inc. | 7,890 | 209 |
| First Busey Corp. | 8,949 | 209 |
| Monmouth Real Estate Investment Corp. | 14,914 | 209 |
| Nelnet Inc. Class A | 5,826 | 206 |
| Maiden Holdings Ltd. | 14,868 | 205 |
| Retail Opportunity Investments Corp. | 9,163 | 204 |
| United Financial Bancorp Inc. | 14,609 | 204 |
| TrustCo Bank Corp. NY | 28,008 | 200 |
| Stock Yards Bancorp Inc. | 6,235 | 199 |
| FBL Financial Group Inc. Class A | 2,848 | 188 |
| New York Mortgage Trust Inc. | 31,144 | 188 |
| * Piper Jaffray Cos. | 4,181 | 186 |
| Meridian Bancorp Inc. | 11,734 | 183 |
| National Storage Affiliates Trust | 8,983 | 182 |
| * Greenlight Capital Re Ltd. Class A | 8,505 | 182 |
| Flushing Financial Corp. | 7,860 | 182 |
| Easterly Government Properties Inc. | 9,292 | 181 |
| Silver Bay Realty Trust Corp. | 9,467 | 180 |
| * HomeStreet Inc. | 6,902 | 180 |
| Oritani Financial Corp. | 11,176 | 180 |
| Washington Trust Bancorp Inc. | 4,259 | 180 |
| Getty Realty Corp. | 7,619 | 179 |
| NorthStar Realty Europe Corp. | 17,357 | 178 |
| Cedar Realty Trust Inc. | 23,332 | 177 |
| Northfield Bancorp Inc. | 10,960 | 174 |
| First Interstate BancSystem Inc. Class A | 5,604 | 172 |
| Enterprise Financial Services Corp. | 5,561 | 171 |
| * Flagstar Bancorp Inc. | 6,044 | 170 |
| First Potomac Realty Trust | 16,800 | 169 |
| * First BanCorp | 34,523 | 169 |
| Community Trust Bancorp Inc. | 4,466 | 165 |
| Altisource Residential Corp. | 14,916 | 164 |
| Univest Corp. of Pennsylvania | 6,976 | 163 |
| Ashford Hospitality Trust Inc. | 23,267 | 162 |
| 1st Source Corp. | 4,572 | 162 |
| Virtus Investment Partners Inc. | 1,748 | 159 |
41
| Vanguard® Russell 2000 Value Index Fund | |||
| Schedule of Investments | |||
| August 31, 2016 | |||
| Market | |||
| Value | |||
| Shares | ($000) | ||
| TriCo Bancshares | 5,851 | 158 | |
| MainSource Financial Group Inc. | 6,544 | 158 | |
| BancFirst Corp. | 2,287 | 157 | |
| Heritage Financial Corp. | 8,349 | 154 | |
| Dime Community Bancshares Inc. | 8,733 | 154 | |
| German American Bancorp Inc. | 4,165 | 154 | |
| * | INTL. FCStone Inc. | 4,229 | 152 |
| Bryn Mawr Bank Corp. | 4,670 | 150 | |
| Lakeland Bancorp Inc. | 10,934 | 149 | |
| * | EZCORP Inc. Class A | 14,404 | 149 |
| Meta Financial Group Inc. | 2,403 | 148 | |
| * | Encore Capital Group Inc. | 6,852 | 148 |
| James River Group Holdings Ltd. | 4,016 | 147 | |
| Bridge Bancorp Inc. | 4,872 | 145 | |
| ConnectOne Bancorp Inc. | 8,134 | 145 | |
| Ladder Capital Corp. | 10,803 | 143 | |
| * | Seacoast Banking Corp. of Florida | 8,672 | 143 |
| *,^ | Citizens Inc. Class A | 13,088 | 142 |
| * | Pacific Premier Bancorp Inc. | 5,271 | 142 |
| Independent Bank Group Inc. | 3,204 | 141 | |
| First of Long Island Corp. | 4,187 | 137 | |
| Camden National Corp. | 2,953 | 137 | |
| Anworth Mortgage Asset Corp. | 27,439 | 134 | |
| CatchMark Timber Trust Inc. Class A | 11,448 | 134 | |
| OFG Bancorp | 12,246 | 134 | |
| RLI Corp. | 1,882 | 134 | |
| National General Holdings Corp. | 5,735 | 131 | |
| AG Mortgage Investment Trust Inc. | 8,247 | 130 | |
| Preferred Bank | 3,702 | 130 | |
| Great Southern Bancorp Inc. | 2,999 | 126 | |
| PJT Partners Inc. | 5,053 | 125 | |
| Investment Technology Group Inc. | 7,991 | 123 | |
| CoBiz Financial Inc. | 9,328 | 122 | |
| National Western Life Group Inc. Class A | 631 | 122 | |
| Apollo Residential Mortgage Inc. | 8,973 | 122 | |
| Western Asset Mortgage Capital Corp. | 11,502 | 122 | |
| Waterstone Financial Inc. | 7,151 | 121 | |
| Mercantile Bank Corp. | 4,468 | 120 | |
| Four Corners Property Trust Inc. | 5,719 | 118 | |
| Gladstone Commercial Corp. | 6,550 | 118 | |
| Resource Capital Corp. | 8,696 | 115 | |
| First Financial Corp. | 2,800 | 114 | |
| Suffolk Bancorp | 3,238 | 114 | |
| OceanFirst Financial Corp. | 5,725 | 113 | |
| First Defiance Financial Corp. | 2,483 | 113 | |
| First Bancorp | 5,564 | 112 | |
| * | NMI Holdings Inc. Class A | 13,904 | 110 |
| * | Forestar Group Inc. | 8,744 | 110 |
| * | Customers Bancorp Inc. | 4,062 | 109 |
| Independence Realty Trust Inc. | 11,465 | 108 | |
| Peoples Bancorp Inc. | 4,535 | 108 | |
| Stonegate Bank | 3,309 | 108 | |
| Whitestone REIT | 7,394 | 107 | |
| NexPoint Residential Trust Inc. | 5,102 | 107 | |
| Fidelity Southern Corp. | 5,882 | 106 | |
| Financial Institutions Inc. | 3,895 | 105 | |
| First Community Bancshares Inc. | 4,366 | 105 | |
| QCR Holdings Inc. | 3,344 | 104 | |
| Horizon Bancorp | 3,705 | 104 | |
| Heritage Insurance Holdings Inc. | 7,538 | 103 | |
| Ashford Hospitality Prime Inc. | 6,629 | 103 | |
| * | Cowen Group Inc. Class A | 27,361 | 103 |
| * | Ocwen Financial Corp. | 28,205 | 100 |
| Federal Agricultural Mortgage Corp. | 2,445 | 100 | |
42
| Vanguard® Russell 2000 Value Index Fund | |||
| Schedule of Investments | |||
| August 31, 2016 | |||
| Market | |||
| Value | |||
| Shares | ($000) | ||
| Arrow Financial Corp. | 3,086 | 100 | |
| State Auto Financial Corp. | 4,341 | 100 | |
| CorEnergy Infrastructure Trust Inc. | 3,378 | 99 | |
| Southwest Bancorp Inc. | 5,045 | 99 | |
| Ares Commercial Real Estate Corp. | 7,706 | 97 | |
| * | CU Bancorp | 4,002 | 97 |
| * | Eagle Bancorp Inc. | 1,858 | 96 |
| Independent Bank Corp. | 5,790 | 94 | |
| Arlington Asset Investment Corp. Class A | 6,327 | 94 | |
| Dynex Capital Inc. | 12,765 | 94 | |
| Blue Hills Bancorp Inc. | 6,331 | 93 | |
| * | Tejon Ranch Co. | 3,911 | 93 |
| * | TriState Capital Holdings Inc. | 6,177 | 92 |
| Clifton Bancorp Inc. | 6,207 | 92 | |
| Bank Mutual Corp. | 11,594 | 90 | |
| One Liberty Properties Inc. | 3,713 | 90 | |
| * | HomeTrust Bancshares Inc. | 4,704 | 90 |
| Peapack Gladstone Financial Corp. | 4,487 | 90 | |
| West Bancorporation Inc. | 4,545 | 89 | |
| Pacific Continental Corp. | 5,392 | 89 | |
| Banc of California Inc. | 3,956 | 88 | |
| Preferred Apartment Communities Inc. Class A | 6,369 | 88 | |
| Capital Bank Financial Corp. | 2,815 | 88 | |
| Talmer Bancorp Inc. Class A | 3,726 | 87 | |
| Republic Bancorp Inc. Class A | 2,703 | 87 | |
| Ameris Bancorp | 2,482 | 86 | |
| Bank of Marin Bancorp | 1,768 | 86 | |
| United Community Financial Corp. | 13,203 | 86 | |
| * | On Deck Capital Inc. | 13,403 | 85 |
| * | Triumph Bancorp Inc. | 4,376 | 84 |
| Community Healthcare Trust Inc. | 3,622 | 83 | |
| * | Nicolet Bankshares Inc. | 2,206 | 83 |
| Park Sterling Corp. | 9,677 | 82 | |
| AMERISAFE Inc. | 1,367 | 82 | |
| RAIT Financial Trust | 26,064 | 82 | |
| * | World Acceptance Corp. | 1,690 | 81 |
| State National Cos. Inc. | 7,975 | 81 | |
| OneBeacon Insurance Group Ltd. Class A | 5,727 | 81 | |
| LTC Properties Inc. | 1,554 | 81 | |
| ^ | Fidelity & Guaranty Life | 3,363 | 80 |
| *,^ | Nationstar Mortgage Holdings Inc. | 5,030 | 80 |
| CNB Financial Corp. | 3,943 | 79 | |
| * | NewStar Financial Inc. | 7,042 | 79 |
| * | Safeguard Scientifics Inc. | 5,603 | 79 |
| Guaranty Bancorp | 4,256 | 79 | |
| ^ | Peoples Financial Services Corp. | 2,005 | 77 |
| HCI Group Inc. | 2,411 | 77 | |
| Heritage Commerce Corp. | 6,581 | 76 | |
| * | Allegiance Bancshares Inc. | 2,783 | 73 |
| Citizens & Northern Corp. | 3,309 | 72 | |
| * | Enova International Inc. | 7,456 | 72 |
| People's Utah Bancorp | 3,632 | 71 | |
| Farmers National Banc Corp. | 7,147 | 71 | |
| Old Second Bancorp Inc. | 8,695 | 71 | |
| Bluerock Residential Growth REIT Inc. Class A | 5,253 | 70 | |
| MidWestOne Financial Group Inc. | 2,342 | 70 | |
| Enterprise Bancorp Inc. | 2,793 | 69 | |
| Cass Information Systems Inc. | 1,201 | 69 | |
| ^ | National Bankshares Inc. | 1,912 | 69 |
| Sun Bancorp Inc. | 2,999 | 69 | |
| Baldwin & Lyons Inc. | 2,686 | 68 | |
| * | Global Indemnity plc | 2,349 | 68 |
| * | Franklin Financial Network Inc. | 1,943 | 68 |
| Ames National Corp. | 2,460 | 67 | |
43
| Vanguard® Russell 2000 Value Index Fund | ||
| Schedule of Investments | ||
| August 31, 2016 | ||
| Market | ||
| Value | ||
| Shares | ($000) | |
| EMC Insurance Group Inc. | 2,374 | 66 |
| First Bancorp Inc. | 2,875 | 65 |
| Federated National Holding Co. | 3,512 | 64 |
| * National Commerce Corp. | 2,377 | 64 |
| * PennyMac Financial Services Inc. Class A | 3,834 | 63 |
| Farmers Capital Bank Corp. | 2,109 | 63 |
| * First Foundation Inc. | 2,510 | 63 |
| Carolina Financial Corp. | 2,885 | 62 |
| Universal Insurance Holdings Inc. | 2,497 | 62 |
| American National Bankshares Inc. | 2,309 | 62 |
| Bar Harbor Bankshares | 1,678 | 62 |
| * Bancorp Inc. | 9,968 | 62 |
| Great Ajax Corp. | 4,490 | 62 |
| * PICO Holdings Inc. | 5,578 | 61 |
| * Atlantic Capital Bancshares Inc. | 3,976 | 61 |
| * BSB Bancorp Inc. | 2,520 | 61 |
| Territorial Bancorp Inc. | 2,126 | 61 |
| Sierra Bancorp | 3,312 | 60 |
| * MoneyGram International Inc. | 8,266 | 60 |
| Opus Bank | 1,707 | 60 |
| * Green Bancorp Inc. | 5,841 | 60 |
| * FRP Holdings Inc. | 1,760 | 59 |
| * Ladenburg Thalmann Financial Services Inc. | 25,621 | 59 |
| * Regional Management Corp. | 2,698 | 58 |
| UMH Properties Inc. | 4,910 | 58 |
| Macatawa Bank Corp. | 7,461 | 58 |
| * First NBC Bank Holding Co. | 4,425 | 58 |
| * Cascade Bancorp | 9,560 | 58 |
| Penns Woods Bancorp Inc. | 1,296 | 57 |
| WashingtonFirst Bankshares Inc. | 2,295 | 57 |
| GAIN Capital Holdings Inc. | 8,752 | 56 |
| EVERTEC Inc. | 3,264 | 56 |
| First Connecticut Bancorp Inc. | 3,100 | 54 |
| Heritage Oaks Bancorp | 6,728 | 54 |
| Your Community Bankshares Inc. | 1,388 | 54 |
| National Interstate Corp. | 1,660 | 54 |
| Merchants Bancshares Inc. | 1,626 | 54 |
| First Business Financial Services Inc. | 2,325 | 53 |
| BankFinancial Corp. | 4,278 | 53 |
| * CommunityOne Bancorp | 3,865 | 52 |
| Access National Corp. | 2,329 | 52 |
| Charter Financial Corp. | 3,843 | 51 |
| Owens Realty Mortgage Inc. | 2,943 | 50 |
| Northrim BanCorp Inc. | 1,906 | 49 |
| OM Asset Management plc | 3,606 | 49 |
| Orchid Island Capital Inc. | 4,621 | 48 |
| Bear State Financial Inc. | 5,081 | 48 |
| Greenhill & Co. Inc. | 2,060 | 47 |
| * Southern First Bancshares Inc. | 1,643 | 47 |
| Summit Financial Group Inc. | 2,389 | 46 |
| ACNB Corp. | 1,702 | 46 |
| Old Line Bancshares Inc. | 2,388 | 46 |
| Codorus Valley Bancorp Inc. | 2,195 | 46 |
| Oppenheimer Holdings Inc. Class A | 2,760 | 44 |
| LCNB Corp. | 2,519 | 44 |
| Capital City Bank Group Inc. | 3,133 | 44 |
| MBT Financial Corp. | 5,124 | 43 |
| Orrstown Financial Services Inc. | 2,123 | 43 |
| MutualFirst Financial Inc. | 1,560 | 43 |
| SI Financial Group Inc. | 3,172 | 43 |
| Associated Capital Group Inc. Class A | 1,291 | 42 |
| * Trinity Place Holdings Inc. | 4,949 | 42 |
| Shore Bancshares Inc. | 3,593 | 42 |
| * First Northwest Bancorp | 3,172 | 42 |
44
| Vanguard® Russell 2000 Value Index Fund | |||
| Schedule of Investments | |||
| August 31, 2016 | |||
| Market | |||
| Value | |||
| Shares | ($000) | ||
| * | Xenith Bankshares Inc. | 17,799 | 42 |
| Home Bancorp Inc. | 1,435 | 41 | |
| Southern Missouri Bancorp Inc. | 1,675 | 41 | |
| First Mid-Illinois Bancshares Inc. | 1,642 | 41 | |
| Premier Financial Bancorp Inc. | 2,434 | 41 | |
| * | Hallmark Financial Services Inc. | 3,831 | 41 |
| * | AV Homes Inc. | 2,669 | 41 |
| Investors Title Co. | 412 | 40 | |
| Lake Sunapee Bank Group | 2,238 | 40 | |
| Southern National Bancorp of Virginia Inc. | 3,215 | 40 | |
| * | Republic First Bancorp Inc. | 9,636 | 40 |
| C&F Financial Corp. | 924 | 39 | |
| Independence Holding Co. | 2,225 | 39 | |
| Central Valley Community Bancorp | 2,541 | 39 | |
| Farmland Partners Inc. | 3,350 | 39 | |
| Middleburg Financial Corp. | 1,355 | 39 | |
| Donegal Group Inc. Class A | 2,384 | 38 | |
| *,^ | Impac Mortgage Holdings Inc. | 2,285 | 38 |
| Century Bancorp Inc. Class A | 859 | 38 | |
| Provident Financial Holdings Inc. | 1,910 | 36 | |
| Tiptree Financial Inc. Class A | 6,659 | 36 | |
| First Internet Bancorp | 1,500 | 36 | |
| * | Equity Bancshares Inc. Class A | 1,468 | 36 |
| *,^ | First Community Financial Partners Inc. | 3,923 | 35 |
| First Financial Northwest Inc. | 2,630 | 34 | |
| * | Pacific Mercantile Bancorp | 4,465 | 34 |
| * | Stratus Properties Inc. | 1,805 | 34 |
| Calamos Asset Management Inc. Class A | 4,877 | 34 | |
| FelCor Lodging Trust Inc. | 4,696 | 33 | |
| Manning & Napier Inc. | 4,267 | 33 | |
| ESSA Bancorp Inc. | 2,377 | 33 | |
| Resource America Inc. Class A | 3,326 | 32 | |
| Westfield Financial Inc. | 4,212 | 32 | |
| GAMCO Investors Inc. Class A | 1,023 | 31 | |
| Bankwell Financial Group Inc. | 1,391 | 31 | |
| Blue Capital Reinsurance Holdings Ltd. | 1,723 | 30 | |
| * | Veritex Holdings Inc. | 1,635 | 28 |
| Chemung Financial Corp. | 942 | 28 | |
| * | Atlas Financial Holdings Inc. | 1,563 | 27 |
| B. Riley Financial Inc. | 2,691 | 26 | |
| Hingham Institution for Savings | 194 | 25 | |
| Midland States Bancorp Inc. | 988 | 24 | |
| FBR & Co. | 1,678 | 24 | |
| Saul Centers Inc. | 334 | 22 | |
| City Office REIT Inc. | 1,634 | 21 | |
| * | BofI Holding Inc. | 949 | 20 |
| ^ | United Development Funding IV | 6,222 | 20 |
| ^ | CPI Card Group Inc. | 3,485 | 19 |
| United Insurance Holdings Corp. | 1,206 | 19 | |
| * | Walter Investment Management Corp. | 5,003 | 19 |
| * | UCP Inc. | 2,024 | 17 |
| * | Provident Bancorp Inc. | 1,076 | 17 |
| * | BBX Capital Corp. | 826 | 16 |
| Alexander's Inc. | 34 | 15 | |
| Armada Hoffler Properties Inc. | 1,017 | 14 | |
| Greene County Bancorp Inc. | 736 | 12 | |
| * | Wins Finance Holdings Inc. | 387 | 10 |
| California First National Bancorp | 630 | 9 | |
| County Bancorp Inc. | 433 | 9 | |
| Pzena Investment Management Inc. Class A | 1,000 | 8 | |
| Virtu Financial Inc. Class A | 432 | 7 | |
| Consolidated-Tomoka Land Co. | 116 | 6 | |
| Medley Management Inc. Class A | 840 | 6 | |
| Griffin Industrial Realty Inc. | 191 | 6 | |
45
| Vanguard® Russell 2000 Value Index Fund | |||
| Schedule of Investments | |||
| August 31, 2016 | |||
| Market | |||
| Value | |||
| Shares | ($000) | ||
| Union Bankshares Inc. | 105 | 4 | |
| * | American Independence Corp. | 95 | 2 |
| Value Line Inc. | 29 | 1 | |
| Fifth Street Asset Management Inc. | 2 | — | |
| 104,118 | |||
| Health Care (4.5%) | |||
| * | Wright Medical Group NV | 29,729 | 736 |
| * | Haemonetics Corp. | 14,596 | 542 |
| Owens & Minor Inc. | 15,698 | 539 | |
| * | Halyard Health Inc. | 13,570 | 495 |
| * | Community Health Systems Inc. | 31,553 | 337 |
| * | Select Medical Holdings Corp. | 28,307 | 336 |
| * | Bluebird Bio Inc. | 6,627 | 327 |
| CONMED Corp. | 7,960 | 325 | |
| Analogic Corp. | 3,282 | 292 | |
| * | Exelixis Inc. | 24,514 | 273 |
| * | Lannett Co. Inc. | 7,939 | 269 |
| Kindred Healthcare Inc. | 23,956 | 264 | |
| * | Five Prime Therapeutics Inc. | 5,941 | 261 |
| * | Acorda Therapeutics Inc. | 10,516 | 253 |
| * | Healthways Inc. | 9,012 | 225 |
| * | Molina Healthcare Inc. | 4,100 | 221 |
| * | PharMerica Corp. | 8,354 | 211 |
| * | Integer Holdings Corp. | 8,626 | 209 |
| National HealthCare Corp. | 3,166 | 206 | |
| * | Merit Medical Systems Inc. | 7,469 | 181 |
| * | Momenta Pharmaceuticals Inc. | 14,200 | 171 |
| * | Retrophin Inc. | 10,314 | 165 |
| * | AMAG Pharmaceuticals Inc. | 6,851 | 163 |
| * | ICU Medical Inc. | 1,302 | 162 |
| * | Triple-S Management Corp. Class B | 6,710 | 147 |
| * | LHC Group Inc. | 4,009 | 143 |
| PDL BioPharma Inc. | 48,349 | 141 | |
| * | Luminex Corp. | 6,556 | 138 |
| * | Array BioPharma Inc. | 37,671 | 129 |
| * | AngioDynamics Inc. | 7,601 | 126 |
| * | Atara Biotherapeutics Inc. | 6,211 | 121 |
| * | Magellan Health Inc. | 2,035 | 116 |
| * | Otonomy Inc. | 6,759 | 111 |
| Invacare Corp. | 9,089 | 108 | |
| Universal American Corp. | 14,788 | 106 | |
| * | Enanta Pharmaceuticals Inc. | 4,405 | 97 |
| * | Spectrum Pharmaceuticals Inc. | 18,235 | 97 |
| * | Celldex Therapeutics Inc. | 26,743 | 89 |
| * | Versartis Inc. | 7,098 | 88 |
| * | Ardelyx Inc. | 8,648 | 86 |
| * | Exactech Inc. | 2,947 | 82 |
| * | K2M Group Holdings Inc. | 5,001 | 80 |
| * | PTC Therapeutics Inc. | 9,293 | 76 |
| *,^ | BioScrip Inc. | 28,296 | 73 |
| * | REGENXBIO Inc. | 5,709 | 67 |
| * | Medicines Co. | 1,628 | 64 |
| * | Almost Family Inc. | 1,702 | 63 |
| * | Zogenix Inc. | 6,963 | 61 |
| * | Merrimack Pharmaceuticals Inc. | 12,875 | 59 |
| * | Chimerix Inc. | 12,115 | 58 |
| * | Akebia Therapeutics Inc. | 7,088 | 58 |
| *,^ | Albany Molecular Research Inc. | 3,879 | 57 |
| * | Karyopharm Therapeutics Inc. | 5,311 | 53 |
| *,^ | Nobilis Health Corp. | 14,876 | 52 |
| * | RTI Surgical Inc. | 16,090 | 52 |
| CryoLife Inc. | 3,089 | 49 | |
| * | OvaScience Inc. | 7,778 | 47 |
| * | Addus HomeCare Corp. | 1,906 | 46 |
46
| Vanguard® Russell 2000 Value Index Fund | |||
| Schedule of Investments | |||
| August 31, 2016 | |||
| Market | |||
| Value | |||
| Shares | ($000) | ||
| * | Esperion Therapeutics Inc. | 3,998 | 43 |
| * | Surgery Partners Inc. | 2,219 | 43 |
| *,^ | Omeros Corp. | 3,898 | 42 |
| * | Tetraphase Pharmaceuticals Inc. | 10,368 | 39 |
| * | ARIAD Pharmaceuticals Inc. | 3,494 | 36 |
| * | Anika Therapeutics Inc. | 763 | 36 |
| *,^ | NantKwest Inc. | 4,292 | 35 |
| Meridian Bioscience Inc. | 1,752 | 34 | |
| * | Cidara Therapeutics Inc. | 2,932 | 34 |
| * | Adamas Pharmaceuticals Inc. | 2,405 | 33 |
| * | Egalet Corp. | 4,765 | 33 |
| * | Stemline Therapeutics Inc. | 3,989 | 33 |
| *,^ | Bellicum Pharmaceuticals Inc. | 1,871 | 32 |
| * | Endocyte Inc. | 10,270 | 31 |
| * | AtriCure Inc. | 1,867 | 29 |
| * | Concert Pharmaceuticals Inc. | 2,842 | 28 |
| * | Cotiviti Holdings Inc. | 818 | 27 |
| * | Innoviva Inc. | 2,404 | 27 |
| * | Agenus Inc. | 4,273 | 26 |
| * | Cara Therapeutics Inc. | 4,861 | 26 |
| * | Epizyme Inc. | 3,351 | 24 |
| *,^ | TransEnterix Inc. | 17,873 | 24 |
| * | Edge Therapeutics Inc. | 2,679 | 24 |
| *,^ | Cerus Corp. | 3,725 | 24 |
| * | Portola Pharmaceuticals Inc. | 1,110 | 23 |
| * | Adverum Biotechnologies Inc. | 6,168 | 22 |
| * | Voyager Therapeutics Inc. | 1,810 | 22 |
| * | Zafgen Inc. | 6,554 | 20 |
| * | TherapeuticsMD Inc. | 2,576 | 18 |
| * | Rigel Pharmaceuticals Inc. | 5,052 | 17 |
| * | BioCryst Pharmaceuticals Inc. | 3,807 | 16 |
| * | Ignyta Inc. | 2,829 | 16 |
| * | NewLink Genetics Corp. | 1,374 | 14 |
| * | Cellular Biomedicine Group Inc. | 995 | 14 |
| *,^ | USMD Holdings Inc. | 586 | 13 |
| * | Dimension Therapeutics Inc. | 2,049 | 12 |
| * | Genesis Healthcare Inc. | 4,288 | 10 |
| * | Corvus Pharmaceuticals Inc. | 753 | 10 |
| * | Rockwell Medical Inc. | 1,396 | 10 |
| * | Syndax Pharmaceuticals Inc. | 663 | 9 |
| * | WaVe Life Sciences Ltd. | 376 | 9 |
| * | Quidel Corp. | 417 | 9 |
| * | Accelerate Diagnostics Inc. | 396 | 9 |
| Phibro Animal Health Corp. Class A | 327 | 8 | |
| * | Arrowhead Pharmaceuticals Inc. | 1,087 | 7 |
| * | American Renal Associates Holdings Inc. | 292 | 6 |
| * | Immunomedics Inc. | 2,045 | 6 |
| * | Aratana Therapeutics Inc. | 574 | 5 |
| * | Flex Pharma Inc. | 422 | 5 |
| National Research Corp. Class A | 282 | 4 | |
| *,^ | Idera Pharmaceuticals Inc. | 1,911 | 4 |
| * | Enzo Biochem Inc. | 638 | 4 |
| * | Inotek Pharmaceuticals Corp. | 465 | 3 |
| * | Trovagene Inc. | 620 | 3 |
| * | PharmAthene Inc. | 987 | 3 |
| * | Neos Therapeutics Inc. | 383 | 2 |
| * | Athersys Inc. | 1,225 | 2 |
| * | Codexis Inc. | 530 | 2 |
| * | Pfenex Inc. | 298 | 2 |
| Osiris Therapeutics Inc. | 384 | 2 | |
| * | Titan Pharmaceuticals Inc. | 293 | 2 |
| * | Infinity Pharmaceuticals Inc. | 1,041 | 2 |
| * | Immune Design Corp. | 175 | 1 |
47
| Vanguard® Russell 2000 Value Index Fund | |||
| Schedule of Investments | |||
| August 31, 2016 | |||
| Market | |||
| Value | |||
| Shares | ($000) | ||
| * | CytRx Corp. | 22 | — |
| 11,212 | |||
| Materials & Processing (5.2%) | |||
| Olin Corp. | 47,512 | 1,028 | |
| Hecla Mining Co. | 108,692 | 607 | |
| ^ | Allegheny Technologies Inc. | 30,949 | 528 |
| Commercial Metals Co. | 32,728 | 508 | |
| Carpenter Technology Corp. | 13,314 | 483 | |
| * | Stillwater Mining Co. | 34,899 | 441 |
| KapStone Paper and Packaging Corp. | 23,126 | 405 | |
| Innospec Inc. | 6,750 | 400 | |
| * | MRC Global Inc. | 26,682 | 391 |
| *,^ | Cliffs Natural Resources Inc. | 63,882 | 364 |
| Stepan Co. | 5,092 | 358 | |
| Minerals Technologies Inc. | 4,621 | 326 | |
| Greif Inc. Class A | 7,322 | 312 | |
| * | Kraton Performance Polymers Inc. | 8,460 | 305 |
| * | AK Steel Holding Corp. | 67,730 | 302 |
| Cabot Microelectronics Corp. | 5,867 | 292 | |
| PH Glatfelter Co. | 12,577 | 279 | |
| Kaiser Aluminum Corp. | 3,265 | 278 | |
| Schweitzer-Mauduit International Inc. | 6,909 | 271 | |
| * | Chemtura Corp. | 8,802 | 264 |
| Calgon Carbon Corp. | 14,473 | 210 | |
| A Schulman Inc. | 8,135 | 207 | |
| Mueller Industries Inc. | 5,342 | 185 | |
| Quanex Building Products Corp. | 8,821 | 171 | |
| Materion Corp. | 5,660 | 166 | |
| Tronox Ltd. Class A | 18,173 | 166 | |
| * | Coeur Mining Inc. | 12,220 | 156 |
| Ferroglobe plc | 18,566 | 153 | |
| Schnitzer Steel Industries Inc. | 7,791 | 146 | |
| Tredegar Corp. | 7,214 | 136 | |
| Haynes International Inc. | 3,668 | 135 | |
| American Vanguard Corp. | 7,996 | 135 | |
| NN Inc. | 7,435 | 132 | |
| * | Armstrong Flooring Inc. | 6,180 | 127 |
| * | Gibraltar Industries Inc. | 3,151 | 120 |
| * | Rexnord Corp. | 5,382 | 119 |
| * | Unifi Inc. | 4,487 | 117 |
| Chemours Co. | 8,615 | 114 | |
| * | Veritiv Corp. | 2,184 | 112 |
| * | TimkenSteel Corp. | 11,218 | 110 |
| * | Ingevity Corp. | 2,423 | 108 |
| Hawkins Inc. | 2,184 | 95 | |
| Quaker Chemical Corp. | 926 | 93 | |
| * | GCP Applied Technologies Inc. | 3,164 | 93 |
| ^ | Greif Inc. Class B | 1,628 | 91 |
| * | Century Aluminum Co. | 13,184 | 83 |
| FutureFuel Corp. | 7,068 | 83 | |
| Universal Forest Products Inc. | 710 | 77 | |
| * | Landec Corp. | 5,768 | 75 |
| * | LSB Industries Inc. | 5,764 | 69 |
| Rayonier Advanced Materials Inc. | 4,738 | 58 | |
| LSI Industries Inc. | 5,697 | 58 | |
| Oil-Dri Corp. of America | 1,436 | 54 | |
| * | Louisiana-Pacific Corp. | 2,779 | 54 |
| ^ | Kronos Worldwide Inc. | 6,009 | 53 |
| Olympic Steel Inc. | 2,561 | 50 | |
| * | BMC Stock Holdings Inc. | 2,376 | 47 |
| * | UFP Technologies Inc. | 1,838 | 46 |
| * | OMNOVA Solutions Inc. | 4,529 | 45 |
| * | Ryerson Holding Corp. | 3,653 | 44 |
| Dynamic Materials Corp. | 4,007 | 44 | |
48
| Vanguard® Russell 2000 Value Index Fund | |||
| Schedule of Investments | |||
| August 31, 2016 | |||
| Market | |||
| Value | |||
| Shares | ($000) | ||
| * | Boise Cascade Co. | 1,671 | 44 |
| KMG Chemicals Inc. | 1,423 | 40 | |
| *,^ | AgroFresh Solutions Inc. | 6,391 | 39 |
| * | Koppers Holdings Inc. | 1,180 | 39 |
| Interface Inc. Class A | 2,138 | 38 | |
| United States Lime & Minerals Inc. | 505 | 32 | |
| Ampco-Pittsburgh Corp. | 2,295 | 25 | |
| Innophos Holdings Inc. | 581 | 25 | |
| Griffon Corp. | 1,321 | 23 | |
| Aceto Corp. | 947 | 19 | |
| * | Handy & Harman Ltd. | 801 | 18 |
| Global Brass & Copper Holdings Inc. | 594 | 17 | |
| Valhi Inc. | 6,287 | 16 | |
| Gold Resource Corp. | 2,762 | 14 | |
| * | NL Industries Inc. | 2,075 | 12 |
| * | Lawson Products Inc. | 464 | 8 |
| CompX International Inc. | 428 | 5 | |
| 12,893 | |||
| Other (0.0%)2 | |||
| * | Leap Wireless International Inc. CVR | 7,564 | 19 |
| * | First Hawaiian Inc. | 125 | 3 |
| * | Impinj Inc. | 60 | 2 |
| * | Gerber Scientific Inc. CVR | 519 | — |
| 24 | |||
| Producer Durables (12.7%) | |||
| *,^ | XPO Logistics Inc. | 28,058 | 1,005 |
| EMCOR Group Inc. | 14,401 | 825 | |
| Joy Global Inc. | 28,345 | 773 | |
| * | Teledyne Technologies Inc. | 7,194 | 771 |
| * | Esterline Technologies Corp. | 8,721 | 671 |
| Kennametal Inc. | 22,731 | 636 | |
| ABM Industries Inc. | 16,189 | 622 | |
| EnerSys | 8,744 | 615 | |
| Barnes Group Inc. | 14,442 | 597 | |
| * | KLX Inc. | 15,066 | 563 |
| GATX Corp. | 11,708 | 513 | |
| UniFirst Corp. | 3,950 | 507 | |
| Tetra Tech Inc. | 13,813 | 488 | |
| * | Moog Inc. Class A | 8,232 | 486 |
| * | Darling Ingredients Inc. | 34,046 | 479 |
| * | FTI Consulting Inc. | 10,753 | 476 |
| Triumph Group Inc. | 14,077 | 449 | |
| SkyWest Inc. | 14,336 | 405 | |
| Convergys Corp. | 12,580 | 375 | |
| * | Huron Consulting Group Inc. | 5,385 | 339 |
| * | OSI Systems Inc. | 5,038 | 338 |
| Cubic Corp. | 7,205 | 337 | |
| ESCO Technologies Inc. | 7,263 | 328 | |
| * | Sykes Enterprises Inc. | 11,100 | 324 |
| * | TopBuild Corp. | 9,482 | 324 |
| Curtiss-Wright Corp. | 3,535 | 318 | |
| Kaman Corp. | 6,998 | 314 | |
| * | ACCO Brands Corp. | 30,547 | 305 |
| Albany International Corp. | 7,073 | 299 | |
| * | SPX FLOW Inc. | 10,060 | 296 |
| Werner Enterprises Inc. | 12,693 | 293 | |
| Aircastle Ltd. | 13,465 | 292 | |
| Applied Industrial Technologies Inc. | 5,912 | 281 | |
| CIRCOR International Inc. | 4,652 | 275 | |
| * | Navigant Consulting Inc. | 13,746 | 270 |
| Matson Inc. | 6,772 | 261 | |
| * | Chart Industries Inc. | 8,651 | 261 |
| * | Atlas Air Worldwide Holdings Inc. | 7,014 | 261 |
| Greenbrier Cos. Inc. | 7,667 | 260 | |
49
| Vanguard® Russell 2000 Value Index Fund | ||
| Schedule of Investments | ||
| August 31, 2016 | ||
| Market | ||
| Value | ||
| Shares | ($000) | |
| ^ Nordic American Tankers Ltd. | 24,934 | 256 |
| ^ Ship Finance International Ltd. | 16,913 | 255 |
| * TriMas Corp. | 12,730 | 244 |
| * TrueBlue Inc. | 11,160 | 244 |
| Harsco Corp. | 23,215 | 231 |
| AAR Corp. | 9,346 | 230 |
| Briggs & Stratton Corp. | 12,090 | 230 |
| * PHH Corp. | 14,987 | 229 |
| * SPX Corp. | 12,010 | 227 |
| Scorpio Tankers Inc. | 46,232 | 226 |
| Federal Signal Corp. | 16,959 | 222 |
| Encore Wire Corp. | 5,718 | 221 |
| * Saia Inc. | 7,140 | 217 |
| * Babcock & Wilcox Enterprises Inc. | 13,172 | 215 |
| * ICF International Inc. | 5,106 | 214 |
| McGrath RentCorp | 6,640 | 212 |
| * Tutor Perini Corp. | 9,024 | 209 |
| Actuant Corp. Class A | 8,651 | 206 |
| Essendant Inc. | 10,594 | 205 |
| * Rush Enterprises Inc. Class A | 8,365 | 199 |
| * Wabash National Corp. | 13,577 | 189 |
| * Navistar International Corp. | 13,473 | 189 |
| * Aegion Corp. Class A | 10,162 | 188 |
| Manitowoc Co. Inc. | 36,004 | 176 |
| * Air Transport Services Group Inc. | 12,118 | 175 |
| Astec Industries Inc. | 2,967 | 174 |
| * Thermon Group Holdings Inc. | 9,233 | 174 |
| * Wesco Aircraft Holdings Inc. | 12,595 | 173 |
| MSA Safety Inc. | 2,861 | 167 |
| Korn/Ferry International | 6,863 | 164 |
| Kelly Services Inc. Class A | 8,402 | 161 |
| ^ GasLog Ltd. | 11,625 | 158 |
| Resources Connection Inc. | 10,456 | 158 |
| * CBIZ Inc. | 13,886 | 157 |
| * Engility Holdings Inc. | 5,139 | 154 |
| * RPX Corp. | 14,469 | 152 |
| * Aerojet Rocketdyne Holdings Inc. | 8,422 | 151 |
| Marten Transport Ltd. | 6,720 | 145 |
| * Modine Manufacturing Co. | 13,355 | 143 |
| * Triton International Ltd. | 9,283 | 141 |
| ^ Frontline Ltd. | 18,447 | 141 |
| Alamo Group Inc. | 2,140 | 139 |
| * CSW Industrials Inc. | 4,228 | 137 |
| Kadant Inc. | 2,509 | 135 |
| * MYR Group Inc. | 4,566 | 132 |
| G&K Services Inc. Class A | 1,333 | 130 |
| Granite Construction Inc. | 2,688 | 129 |
| ArcBest Corp. | 6,904 | 126 |
| * Overseas Shipholding Group Inc. Class A | 11,630 | 126 |
| * Aerovironment Inc. | 5,093 | 126 |
| Ennis Inc. | 7,548 | 125 |
| * FARO Technologies Inc. | 3,581 | 117 |
| Titan International Inc. | 12,633 | 116 |
| DHT Holdings Inc. | 25,639 | 111 |
| Bristow Group Inc. | 9,546 | 109 |
| Quad/Graphics Inc. | 3,877 | 105 |
| Brady Corp. Class A | 3,098 | 104 |
| * DXP Enterprises Inc. | 3,635 | 102 |
| * Casella Waste Systems Inc. Class A | 11,016 | 100 |
| Mobile Mini Inc. | 3,247 | 97 |
| Powell Industries Inc. | 2,438 | 97 |
| Columbus McKinnon Corp. | 5,485 | 96 |
| Heidrick & Struggles International Inc. | 5,150 | 96 |
| Hyster-Yale Materials Handling Inc. | 1,823 | 94 |
50
| Vanguard® Russell 2000 Value Index Fund | |||
| Schedule of Investments | |||
| August 31, 2016 | |||
| Market | |||
| Value | |||
| Shares | ($000) | ||
| Raven Industries Inc. | 3,802 | 93 | |
| Spartan Motors Inc. | 9,352 | 92 | |
| American Railcar Industries Inc. | 2,205 | 91 | |
| * | Kratos Defense & Security Solutions Inc. | 12,962 | 91 |
| * | Monster Worldwide Inc. | 24,664 | 90 |
| Teekay Corp. | 12,442 | 90 | |
| CECO Environmental Corp. | 8,175 | 90 | |
| Park-Ohio Holdings Corp. | 2,377 | 88 | |
| Teekay Tankers Ltd. Class A | 32,779 | 86 | |
| * | YRC Worldwide Inc. | 7,155 | 83 |
| * | Vectrus Inc. | 2,416 | 82 |
| VSE Corp. | 2,426 | 80 | |
| NACCO Industries Inc. Class A | 1,108 | 74 | |
| * | Roadrunner Transportation Systems Inc. | 8,746 | 73 |
| * | Ducommun Inc. | 3,008 | 71 |
| * | Liquidity Services Inc. | 7,133 | 71 |
| Standex International Corp. | 824 | 69 | |
| * | Ascent Capital Group Inc. Class A | 2,907 | 67 |
| * | CRA International Inc. | 2,454 | 67 |
| ^ | Costamare Inc. | 7,392 | 65 |
| * | Covenant Transportation Group Inc. Class A | 3,320 | 64 |
| * | Control4 Corp. | 5,751 | 64 |
| Miller Industries Inc. | 2,815 | 62 | |
| Ardmore Shipping Corp. | 8,178 | 59 | |
| Celadon Group Inc. | 7,559 | 59 | |
| * | PHI Inc. | 3,144 | 59 |
| * | Great Lakes Dredge & Dock Corp. | 14,905 | 58 |
| ^ | Textainer Group Holdings Ltd. | 6,443 | 57 |
| * | Scorpio Bulkers Inc. | 16,124 | 56 |
| * | Gener8 Maritime Inc. | 10,965 | 55 |
| Graham Corp. | 2,776 | 53 | |
| * | Titan Machinery Inc. | 4,911 | 53 |
| * | Rush Enterprises Inc. Class B | 2,188 | 52 |
| * | Vishay Precision Group Inc. | 3,387 | 52 |
| FreightCar America Inc. | 3,430 | 49 | |
| Hurco Cos. Inc. | 1,771 | 48 | |
| * | Layne Christensen Co. | 5,218 | 47 |
| * | HC2 Holdings Inc. | 9,536 | 46 |
| * | Maxwell Technologies Inc. | 8,941 | 45 |
| Marlin Business Services Corp. | 2,359 | 44 | |
| * | Orion Group Holdings Inc. | 7,401 | 44 |
| ^ | Tidewater Inc. | 13,458 | 44 |
| * | TRC Cos. Inc. | 5,078 | 39 |
| Knight Transportation Inc. | 1,355 | 38 | |
| * | ExOne Co. | 2,810 | 38 |
| Watts Water Technologies Inc. Class A | 579 | 37 | |
| * | Dorian LPG Ltd. | 6,834 | 36 |
| Hardinge Inc. | 3,384 | 36 | |
| * | CAI International Inc. | 4,438 | 35 |
| Altra Industrial Motion Corp. | 1,253 | 35 | |
| * | ServiceSource International Inc. | 6,777 | 34 |
| Navios Maritime Acquisition Corp. | 23,490 | 34 | |
| * | Willis Lease Finance Corp. | 1,243 | 32 |
| * | Hub Group Inc. Class A | 766 | 31 |
| Preformed Line Products Co. | 709 | 31 | |
| Lindsay Corp. | 429 | 31 | |
| Franklin Electric Co. Inc. | 764 | 29 | |
| *,^ | Plug Power Inc. | 18,159 | 28 |
| * | Advanced Energy Industries Inc. | 639 | 28 |
| * | USA Truck Inc. | 2,523 | 28 |
| Douglas Dynamics Inc. | 864 | 28 | |
| Supreme Industries Inc. Class A | 1,581 | 27 | |
| * | Gencor Industries Inc. | 2,275 | 26 |
| * | Echo Global Logistics Inc. | 955 | 25 |
51
| Vanguard® Russell 2000 Value Index Fund | |||
| Schedule of Investments | |||
| August 31, 2016 | |||
| Market | |||
| Value | |||
| Shares | ($000) | ||
| * | American Superconductor Corp. | 3,347 | 24 |
| MTS Systems Corp. | 467 | 23 | |
| Tennant Co. | 353 | 23 | |
| * | Heritage-Crystal Clean Inc. | 1,586 | 22 |
| * | Hill International Inc. | 4,991 | 22 |
| * | Global Sources Ltd. | 2,400 | 20 |
| Sun Hydraulics Corp. | 648 | 20 | |
| Kimball International Inc. Class B | 1,515 | 19 | |
| * | Blue Bird Corp. | 1,282 | 19 |
| General Cable Corp. | 1,081 | 17 | |
| Gorman-Rupp Co. | 618 | 17 | |
| * | Team Inc. | 519 | 17 |
| * | Neff Corp. Class A | 1,752 | 16 |
| * | NV5 Global Inc. | 529 | 16 |
| * | Virgin America Inc. | 285 | 16 |
| * | PAM Transportation Services Inc. | 632 | 13 |
| * | Radiant Logistics Inc. | 4,120 | 12 |
| Universal Logistics Holdings Inc. | 772 | 10 | |
| * | Milacron Holdings Corp. | 510 | 9 |
| * | InnerWorkings Inc. | 700 | 6 |
| * | SP Plus Corp. | 237 | 6 |
| * | Vicor Corp. | 402 | 4 |
| * | IES Holdings Inc. | 210 | 4 |
| * | Power Solutions International Inc. | 287 | 3 |
| * | Workhorse Group Inc. | 227 | 2 |
| * | PFSweb Inc. | 170 | 2 |
| 31,654 | |||
| Technology (10.1%) | |||
| SYNNEX Corp. | 8,526 | 905 | |
| * | NetScout Systems Inc. | 26,135 | 773 |
| Intersil Corp. Class A | 38,595 | 762 | |
| * | Tech Data Corp. | 10,048 | 746 |
| Mentor Graphics Corp. | 30,554 | 734 | |
| * | Advanced Micro Devices Inc. | 98,611 | 730 |
| MKS Instruments Inc. | 14,486 | 706 | |
| * | CACI International Inc. Class A | 7,001 | 696 |
| * | Finisar Corp. | 31,057 | 658 |
| * | Verint Systems Inc. | 18,277 | 624 |
| Vishay Intertechnology Inc. | 40,392 | 572 | |
| * | Sanmina Corp. | 21,073 | 554 |
| * | Anixter International Inc. | 8,261 | 528 |
| * | Viavi Solutions Inc. | 67,415 | 524 |
| * | DigitalGlobe Inc. | 18,067 | 489 |
| * | Polycom Inc. | 39,206 | 488 |
| * | Rovi Corp. | 23,065 | 472 |
| * | Plexus Corp. | 9,484 | 438 |
| * | Fairchild Semiconductor International Inc. Class A | 20,739 | 413 |
| *,^ | Ambarella Inc. | 5,491 | 396 |
| Diebold Inc. | 12,900 | 362 | |
| * | Progress Software Corp. | 12,234 | 355 |
| * | Knowles Corp. | 25,251 | 351 |
| * | Benchmark Electronics Inc. | 14,347 | 346 |
| * | Rambus Inc. | 23,278 | 322 |
| * | Insight Enterprises Inc. | 10,445 | 320 |
| * | Acxiom Corp. | 11,467 | 298 |
| ManTech International Corp. Class A | 7,173 | 287 | |
| * | NeuStar Inc. Class A | 10,334 | 263 |
| * | II-VI Inc. | 12,392 | 263 |
| * | Entegris Inc. | 14,918 | 254 |
| * | ScanSource Inc. | 7,285 | 249 |
| * | Rofin-Sinar Technologies Inc. | 7,731 | 247 |
| * | Amkor Technology Inc. | 26,801 | 244 |
| Brooks Automation Inc. | 19,207 | 242 | |
| * | Mercury Systems Inc. | 10,240 | 232 |
52
| Vanguard® Russell 2000 Value Index Fund | |||
| Schedule of Investments | |||
| August 31, 2016 | |||
| Market | |||
| Value | |||
| Shares | ($000) | ||
| * | TTM Technologies Inc. | 21,126 | 227 |
| * | Veeco Instruments Inc. | 11,308 | 222 |
| * | Diodes Inc. | 10,778 | 222 |
| * | MicroStrategy Inc. Class A | 1,261 | 210 |
| * | Ixia | 18,185 | 210 |
| * | Rogers Corp. | 3,345 | 187 |
| * | Super Micro Computer Inc. | 8,600 | 186 |
| AVX Corp. | 13,198 | 181 | |
| * | Photronics Inc. | 18,834 | 180 |
| * | NETGEAR Inc. | 3,156 | 180 |
| CTS Corp. | 8,942 | 172 | |
| * | InvenSense Inc. | 23,139 | 172 |
| Tessera Technologies Inc. | 4,946 | 166 | |
| * | Stratasys Ltd. | 7,337 | 157 |
| * | Rudolph Technologies Inc. | 8,466 | 149 |
| * | Ultratech Inc. | 5,756 | 144 |
| * | Cavium Inc. | 2,353 | 131 |
| * | RetailMeNot Inc. | 10,993 | 124 |
| * | ViaSat Inc. | 1,600 | 120 |
| * | ShoreTel Inc. | 14,663 | 118 |
| * | Novanta Inc. | 6,577 | 111 |
| * | Evolent Health Inc. Class A | 4,419 | 110 |
| * | Alpha & Omega Semiconductor Ltd. | 5,193 | 109 |
| * | NeoPhotonics Corp. | 7,298 | 109 |
| * | Intralinks Holdings Inc. | 11,111 | 106 |
| * | Bankrate Inc. | 13,357 | 105 |
| * | Actua Corp. | 10,189 | 104 |
| * | Global Eagle Entertainment Inc. | 12,404 | 103 |
| * | Sonus Networks Inc. | 11,785 | 102 |
| * | Infinera Corp. | 11,815 | 101 |
| * | KEYW Holding Corp. | 10,141 | 101 |
| Daktronics Inc. | 10,245 | 98 | |
| * | Kimball Electronics Inc. | 8,011 | 97 |
| * | Axcelis Technologies Inc. | 8,192 | 96 |
| * | Bazaarvoice Inc. | 23,342 | 93 |
| * | Harmonic Inc. | 21,388 | 93 |
| * | Blucora Inc. | 8,831 | 91 |
| ADTRAN Inc. | 4,925 | 91 | |
| Park Electrochemical Corp. | 5,459 | 90 | |
| * | Calix Inc. | 11,852 | 88 |
| * | Xcerra Corp. | 15,016 | 88 |
| * | FormFactor Inc. | 8,388 | 87 |
| * | Exar Corp. | 9,491 | 86 |
| Comtech Telecommunications Corp. | 6,575 | 85 | |
| * | Digi International Inc. | 7,315 | 84 |
| Acacia Research Corp. | 13,978 | 84 | |
| PC Connection Inc. | 3,206 | 84 | |
| IXYS Corp. | 7,169 | 83 | |
| Cohu Inc. | 7,433 | 81 | |
| *,^ | Applied Optoelectronics Inc. | 4,678 | 79 |
| American Science & Engineering Inc. | 2,079 | 77 | |
| * | Sigma Designs Inc. | 10,013 | 75 |
| * | Tangoe Inc. | 7,741 | 72 |
| * | DSP Group Inc. | 6,190 | 71 |
| * | pdvWireless Inc. | 2,734 | 70 |
| * | Glu Mobile Inc. | 28,744 | 68 |
| * | Ultra Clean Holdings Inc. | 9,096 | 66 |
| Epiq Systems Inc. | 3,855 | 63 | |
| Bel Fuse Inc. Class B | 2,733 | 63 | |
| QAD Inc. Class A | 2,656 | 62 | |
| Black Box Corp. | 4,244 | 59 | |
| * | Sparton Corp. | 2,468 | 57 |
| * | Perficient Inc. | 2,824 | 56 |
| * | Telenav Inc. | 9,394 | 55 |
53
| Vanguard® Russell 2000 Value Index Fund | ||
| Schedule of Investments | ||
| August 31, 2016 | ||
| Market | ||
| Value | ||
| Shares | ($000) | |
| * Rubicon Project Inc. | 6,417 | 55 |
| * Datalink Corp. | 5,225 | 51 |
| * Unisys Corp. | 4,946 | 50 |
| * Silicom Ltd. | 1,198 | 49 |
| * ePlus Inc. | 512 | 46 |
| * Agilysys Inc. | 4,069 | 45 |
| * Electro Scientific Industries Inc. | 7,795 | 43 |
| NVE Corp. | 721 | 42 |
| * Everyday Health Inc. | 5,393 | 41 |
| * Immersion Corp. | 5,525 | 40 |
| * ARC Document Solutions Inc. | 11,644 | 39 |
| * Vocera Communications Inc. | 2,405 | 39 |
| * Kopin Corp. | 17,870 | 39 |
| * KVH Industries Inc. | 4,363 | 38 |
| EMCORE Corp. | 7,427 | 37 |
| * Limelight Networks Inc. | 20,474 | 36 |
| * Bottomline Technologies de Inc. | 1,536 | 35 |
| * Autobytel Inc. | 1,979 | 32 |
| * Rightside Group Ltd. | 3,358 | 32 |
| * RealNetworks Inc. | 6,470 | 31 |
| * Oclaro Inc. | 3,883 | 31 |
| Methode Electronics Inc. | 832 | 30 |
| * TechTarget Inc. | 3,775 | 30 |
| * GigPeak Inc. | 15,682 | 29 |
| * Avid Technology Inc. | 3,148 | 28 |
| * Nanometrics Inc. | 1,337 | 27 |
| * Numerex Corp. Class A | 3,372 | 25 |
| NCI Inc. Class A | 1,820 | 22 |
| Reis Inc. | 834 | 16 |
| * SecureWorks Corp. Class A | 1,108 | 16 |
| * VASCO Data Security International Inc. | 777 | 14 |
| * Silicon Graphics International Corp. | 1,652 | 13 |
| * PDF Solutions Inc. | 590 | 10 |
| * MeetMe Inc. | 1,506 | 9 |
| * Digimarc Corp. | 205 | 7 |
| * Silver Spring Networks Inc. | 497 | 7 |
| * USA Technologies Inc. | 1,162 | 6 |
| * ChannelAdvisor Corp. | 417 | 5 |
| * Radisys Corp. | 707 | 3 |
| * Park City Group Inc. | 152 | 1 |
| 25,203 | ||
| Utilities (7.3%) | ||
| IDACORP Inc. | 14,524 | 1,105 |
| Portland General Electric Co. | 25,592 | 1,078 |
| ONE Gas Inc. | 14,965 | 916 |
| Black Hills Corp. | 14,927 | 873 |
| WGL Holdings Inc. | 13,684 | 860 |
| Southwest Gas Corp. | 12,139 | 847 |
| ALLETE Inc. | 14,173 | 840 |
| Spire Inc. | 12,782 | 827 |
| NorthWestern Corp. | 13,899 | 804 |
| New Jersey Resources Corp. | 22,775 | 766 |
| Avista Corp. | 18,120 | 736 |
| PNM Resources Inc. | 22,809 | 725 |
| South Jersey Industries Inc. | 23,076 | 685 |
| El Paso Electric Co. | 11,573 | 529 |
| Northwest Natural Gas Co. | 7,745 | 463 |
| Empire District Electric Co. | 12,645 | 428 |
| * Dynegy Inc. | 33,387 | 423 |
| Otter Tail Corp. | 11,085 | 380 |
| * Talen Energy Corp. | 24,134 | 333 |
| ^ Atlantica Yield plc | 16,880 | 319 |
| MGE Energy Inc. | 5,422 | 298 |
| Ormat Technologies Inc. | 6,102 | 295 |
54
| Vanguard® Russell 2000 Value Index Fund | |||||
| Schedule of Investments | |||||
| August 31, 2016 | |||||
| Market | |||||
| Value | |||||
| Shares | ($000) | ||||
| NRG Yield Inc. | 17,319 | 292 | |||
| * | Vonage Holdings Corp. | 48,214 | 280 | ||
| * | Cincinnati Bell Inc. | 60,535 | 253 | ||
| West Corp. | 10,451 | 245 | |||
| Chesapeake Utilities Corp. | 3,653 | 232 | |||
| ^ | Windstream Holdings Inc. | 24,124 | 205 | ||
| SJW Corp. | 4,662 | 199 | |||
| ATN International Inc. | 2,978 | 195 | |||
| *,^ | Iridium Communications Inc. | 23,328 | 194 | ||
| NRG Yield Inc. Class A | 11,161 | 180 | |||
| California Water Service Group | 5,677 | 173 | |||
| Unitil Corp. | 3,981 | 157 | |||
| American States Water Co. | 3,550 | 138 | |||
| Connecticut Water Service Inc. | 2,449 | 114 | |||
| Consolidated Communications Holdings Inc. | 4,293 | 103 | |||
| Pattern Energy Group Inc. Class A | 4,207 | 100 | |||
| Spok Holdings Inc. | 5,823 | 96 | |||
| Atlantic Power Corp. | 34,060 | 88 | |||
| * | Lumos Networks Corp. | 4,841 | 67 | ||
| Artesian Resources Corp. Class A | 2,278 | 63 | |||
| *,^ | Globalstar Inc. | 39,660 | 62 | ||
| Consolidated Water Co. Ltd. | 4,074 | 52 | |||
| * | NII Holdings Inc. | 15,189 | 51 | ||
| Delta Natural Gas Co. Inc. | 1,937 | 48 | |||
| * | Hawaiian Telcom Holdco Inc. | 1,737 | 39 | ||
| * | Boingo Wireless Inc. | 4,414 | 37 | ||
| IDT Corp. Class B | 1,951 | 29 | |||
| Middlesex Water Co. | 722 | 24 | |||
| Genie Energy Ltd. Class B | 3,758 | 24 | |||
| * | Intelsat SA | 7,814 | 21 | ||
| * | FairPoint Communications Inc. | 1,202 | 17 | ||
| * | ORBCOMM Inc. | 1,472 | 15 | ||
| York Water Co. | 396 | 11 | |||
| 18,334 | |||||
| Total Common Stocks (Cost $240,984) | 248,338 | ||||
| Coupon | |||||
| Temporary Cash Investments (2.3%)1 | |||||
| Money Market Fund (2.1%) | |||||
| 3,4 | Vanguard Market Liquidity Fund | 0.612% | 52,690 | 5,270 | |
| Face | |||||
| Maturity | Amount | ||||
| Date | ($000) | ||||
| U.S. Government and Agency Obligations (0.2%) | |||||
| 5 | Federal Home Loan Bank Discount Notes | 0.431% | 1/25/17 | 300 | 299 |
| 6 | United States Treasury Bill | 0.318% | 10/20/16 | 100 | 100 |
| 399 | |||||
| Total Temporary Cash Investments (Cost $5,668) | 5,669 | ||||
| Total Investments (101.9%) (Cost $246,652) | 254,007 | ||||
| Other Assets and Liabilities—Net (-1.9%)4 | (4,820) | ||||
| Net Assets (100%) | 249,187 | ||||
| * | Non-income-producing security. |
| ^ | Includes partial security positions on loan to broker-dealers. The total value of securities on loan is $3,864,000. |
| 1 | The fund invests a portion of its cash reserves in equity markets through the use of index futures contracts. After giving effect to futures investments, the fund's effective common stock and temporary cash investment positions represent 99.9% and 2.0%, respectively, of net assets. |
55
Vanguard® Russell 2000 Value Index Fund
Schedule of Investments
August 31, 2016
| 2 | “Other” represents securities that are not classified by the fund’s benchmark index. |
| 3 | Affiliated money market fund available only to Vanguard funds and certain trusts and accounts managed by Vanguard. Rate shown is the 7-day yield. |
| 4 | Includes $4,215,000 of collateral received for securities on loan. |
| 5 | The issuer operates under a congressional charter; its securities are generally neither guaranteed by the U.S. Treasury nor backed by the full faith and credit of the U.S. government. |
| 6 | Securities with a value of $100,000 have been segregated as initial margin for open futures contracts. CVR—Contingent Value Rights. |
| REIT—Real Estate Investment Trust. |
56
| Vanguard® Russell 2000 Growth Index Fund | |||
| Schedule of Investments | |||
| August 31, 2016 | |||
| Market | |||
| Value | |||
| Shares | ($000) | ||
| Common Stocks (99.8%)1 | |||
| Consumer Discretionary (16.9%) | |||
| * | Tenneco Inc. | 23,447 | 1,309 |
| * | Buffalo Wild Wings Inc. | 7,904 | 1,282 |
| * | Bright Horizons Family Solutions Inc. | 18,434 | 1,257 |
| Texas Roadhouse Inc. Class A | 27,616 | 1,223 | |
| American Eagle Outfitters Inc. | 62,267 | 1,154 | |
| ^ | Cracker Barrel Old Country Store Inc. | 7,548 | 1,148 |
| * | Helen of Troy Ltd. | 11,656 | 1,053 |
| Jack in the Box Inc. | 10,559 | 1,050 | |
| * | Cimpress NV | 10,405 | 1,033 |
| Drew Industries Inc. | 9,950 | 1,013 | |
| * | Five Below Inc. | 22,155 | 987 |
| Cheesecake Factory Inc. | 18,925 | 973 | |
| Bloomin' Brands Inc. | 47,125 | 921 | |
| Big Lots Inc. | 18,440 | 909 | |
| * | Steven Madden Ltd. | 25,470 | 894 |
| Churchill Downs Inc. | 5,685 | 849 | |
| Papa John's International Inc. | 11,293 | 845 | |
| Lithia Motors Inc. Class A | 9,832 | 814 | |
| Matthews International Corp. Class A | 13,187 | 811 | |
| Sinclair Broadcast Group Inc. Class A | 27,414 | 781 | |
| * | Grand Canyon Education Inc. | 18,630 | 774 |
| * | IMAX Corp. | 24,480 | 746 |
| * | Dave & Buster's Entertainment Inc. | 15,757 | 732 |
| Monro Muffler Brake Inc. | 12,946 | 730 | |
| * | Shutterfly Inc. | 14,362 | 721 |
| * | Dorman Products Inc. | 11,001 | 694 |
| PriceSmart Inc. | 8,276 | 691 | |
| * | Boyd Gaming Corp. | 34,146 | 666 |
| *,^ | Stamps.com Inc. | 6,835 | 661 |
| ^ | Nexstar Broadcasting Group Inc. Class A | 12,285 | 648 |
| Children's Place Inc. | 7,921 | 645 | |
| * | Smith & Wesson Holding Corp. | 22,671 | 638 |
| Columbia Sportswear Co. | 11,074 | 622 | |
| * | Liberty TripAdvisor Holdings Inc. Class A | 29,862 | 621 |
| Chico's FAS Inc. | 47,803 | 606 | |
| * | Etsy Inc. | 43,428 | 585 |
| * | LifeLock Inc. | 34,862 | 580 |
| * | Cooper-Standard Holding Inc. | 5,793 | 574 |
| Sonic Corp. | 19,308 | 554 | |
| * | Houghton Mifflin Harcourt Co. | 34,172 | 545 |
| * | American Axle & Manufacturing Holdings Inc. | 31,580 | 541 |
| HSN Inc. | 12,891 | 539 | |
| * | 2U Inc. | 15,038 | 531 |
| * | American Woodmark Corp. | 5,847 | 509 |
| *,^ | Wayfair Inc. | 12,976 | 500 |
| * | Select Comfort Corp. | 18,952 | 498 |
| * | Gentherm Inc. | 14,951 | 493 |
| Travelport Worldwide Ltd. | 35,387 | 486 | |
| * | Popeyes Louisiana Kitchen Inc. | 8,852 | 483 |
| *,^ | Diamond Resorts International Inc. | 15,837 | 478 |
| Sotheby's | 11,842 | 470 | |
| Sturm Ruger & Co. Inc. | 7,645 | 469 | |
| * | Shutterstock Inc. | 7,809 | 453 |
| * | G-III Apparel Group Ltd. | 14,046 | 443 |
| * | Mattress Firm Holding Corp. | 6,888 | 441 |
| * | Asbury Automotive Group Inc. | 8,129 | 437 |
| * | Universal Electronics Inc. | 5,763 | 427 |
| * | TiVo Inc. | 39,984 | 424 |
| Oxford Industries Inc. | 6,197 | 387 | |
| ^ | Outerwall Inc. | 7,283 | 378 |
| ClubCorp Holdings Inc. | 26,190 | 376 | |
57
| Vanguard® Russell 2000 Growth Index Fund | |||
| Schedule of Investments | |||
| August 31, 2016 | |||
| Market | |||
| Value | |||
| Shares | ($000) | ||
| * | BJ's Restaurants Inc. | 9,438 | 375 |
| * | Cavco Industries Inc. | 3,566 | 373 |
| SeaWorld Entertainment Inc. | 28,475 | 370 | |
| * | Penn National Gaming Inc. | 25,908 | 367 |
| Nutrisystem Inc. | 12,459 | 359 | |
| *,^ | Quotient Technology Inc. | 27,301 | 354 |
| Ethan Allen Interiors Inc. | 10,497 | 351 | |
| Bob Evans Farms Inc. | 8,456 | 347 | |
| DineEquity Inc. | 4,260 | 332 | |
| ^ | World Wrestling Entertainment Inc. Class A | 15,415 | 320 |
| * | Nautilus Inc. | 13,105 | 305 |
| * | Hibbett Sports Inc. | 7,728 | 297 |
| Red Rock Resorts Inc. Class A | 12,754 | 288 | |
| Winnebago Industries Inc. | 11,485 | 276 | |
| * | HealthStream Inc. | 10,231 | 272 |
| * | Crocs Inc. | 31,428 | 272 |
| Capella Education Co. | 4,220 | 249 | |
| * | Denny's Corp. | 23,596 | 247 |
| Standard Motor Products Inc. | 5,491 | 246 | |
| * | LGI Homes Inc. | 6,241 | 240 |
| * | Fiesta Restaurant Group Inc. | 9,430 | 238 |
| *,^ | Shake Shack Inc. Class A | 6,710 | 237 |
| * | Francesca's Holdings Corp. | 17,352 | 237 |
| La-Z-Boy Inc. | 8,806 | 235 | |
| Avon Products Inc. | 40,065 | 228 | |
| * | Taylor Morrison Home Corp. Class A | 12,847 | 227 |
| * | Zoe's Kitchen Inc. | 8,142 | 222 |
| * | Ollie's Bargain Outlet Holdings Inc. | 8,623 | 219 |
| * | Carmike Cinemas Inc. | 6,802 | 218 |
| * | Tile Shop Holdings Inc. | 13,912 | 216 |
| * | Chuy's Holdings Inc. | 6,972 | 211 |
| Entravision Communications Corp. Class A | 27,884 | 210 | |
| * | Motorcar Parts of America Inc. | 7,333 | 209 |
| Ruth's Hospitality Group Inc. | 13,614 | 204 | |
| Wingstop Inc. | 6,659 | 202 | |
| * | Ascena Retail Group Inc. | 24,700 | 201 |
| * | XO Group Inc. | 10,740 | 200 |
| * | Stoneridge Inc. | 11,363 | 197 |
| * | Fox Factory Holding Corp. | 9,485 | 197 |
| * | Gray Television Inc. | 16,970 | 191 |
| * | SiteOne Landscape Supply Inc. | 4,923 | 188 |
| * | Scientific Games Corp. Class A | 22,321 | 184 |
| * | Isle of Capri Casinos Inc. | 10,567 | 183 |
| Viad Corp. | 4,891 | 175 | |
| * | Angie's List Inc. | 17,026 | 173 |
| * | Carrols Restaurant Group Inc. | 12,717 | 171 |
| Callaway Golf Co. | 14,904 | 170 | |
| MDC Holdings Inc. | 6,399 | 167 | |
| Blue Nile Inc. | 4,712 | 162 | |
| Wolverine World Wide Inc. | 6,498 | 155 | |
| * | Eldorado Resorts Inc. | 11,043 | 154 |
| * | MSG Networks Inc. | 8,553 | 150 |
| * | Planet Fitness Inc. Class A | 6,710 | 145 |
| * | Horizon Global Corp. | 7,837 | 140 |
| Carriage Services Inc. Class A | 5,842 | 137 | |
| Finish Line Inc. Class A | 5,500 | 132 | |
| * | Potbelly Corp. | 10,173 | 132 |
| * | Elizabeth Arden Inc. | 9,359 | 131 |
| *,^ | Duluth Holdings Inc. | 4,066 | 123 |
| Group 1 Automotive Inc. | 2,065 | 123 | |
| KB Home | 7,795 | 122 | |
| *,^ | Weight Watchers International Inc. | 11,035 | 116 |
| * | MarineMax Inc. | 5,825 | 116 |
| * | tronc Inc. | 6,771 | 115 |
58
| Vanguard® Russell 2000 Growth Index Fund | |||
| Schedule of Investments | |||
| August 31, 2016 | |||
| Market | |||
| Value | |||
| Shares | ($000) | ||
| Inter Parfums Inc. | 3,328 | 114 | |
| * | Instructure Inc. | 4,585 | 110 |
| Stein Mart Inc. | 13,469 | 108 | |
| * | Sportsman's Warehouse Holdings Inc. | 10,532 | 108 |
| ^ | Buckle Inc. | 4,163 | 107 |
| * | Malibu Boats Inc. Class A | 7,596 | 104 |
| Winmark Corp. | 984 | 102 | |
| * | Chegg Inc. | 14,739 | 99 |
| * | Strayer Education Inc. | 1,977 | 96 |
| * | Eastman Kodak Co. | 6,126 | 95 |
| * | Vera Bradley Inc. | 6,175 | 92 |
| * | Party City Holdco Inc. | 5,120 | 89 |
| * | Habit Restaurants Inc. Class A | 5,765 | 88 |
| * | La Quinta Holdings Inc. | 7,521 | 87 |
| * | Overstock.com Inc. | 5,561 | 86 |
| * | TubeMogul Inc. | 9,395 | 85 |
| Tailored Brands Inc. | 6,421 | 85 | |
| MDC Partners Inc. Class A | 6,635 | 82 | |
| Interval Leisure Group Inc. | 4,690 | 82 | |
| *,^ | Central European Media Enterprises Ltd. Class A | 33,200 | 78 |
| * | Genesco Inc. | 1,002 | 73 |
| * | Daily Journal Corp. | 312 | 72 |
| * | Liberty Media Group LLC | 3,404 | 72 |
| Cato Corp. Class A | 2,082 | 71 | |
| * | Bojangles' Inc. | 4,253 | 69 |
| * | Nathan's Famous Inc. | 1,357 | 67 |
| Metaldyne Performance Group Inc. | 4,064 | 65 | |
| * | Lindblad Expeditions Holdings Inc. | 6,482 | 61 |
| * | Deckers Outdoor Corp. | 925 | 60 |
| * | Jamba Inc. | 5,524 | 60 |
| Collectors Universe Inc. | 3,139 | 60 | |
| Superior Uniform Group Inc. | 3,468 | 59 | |
| * | Franklin Covey Co. | 3,582 | 58 |
| Bassett Furniture Industries Inc. | 2,317 | 57 | |
| * | Care.com Inc. | 5,210 | 55 |
| * | Rosetta Stone Inc. | 6,159 | 54 |
| * | Revlon Inc. Class A | 1,500 | 54 |
| * | Red Robin Gourmet Burgers Inc. | 1,072 | 54 |
| * | TRI Pointe Group Inc. | 3,697 | 50 |
| * | Destination XL Group Inc. | 10,688 | 50 |
| * | M/I Homes Inc. | 1,993 | 46 |
| Marriott Vacations Worldwide Corp. | 583 | 45 | |
| Marine Products Corp. | 4,842 | 43 | |
| * | Meritage Homes Corp. | 1,192 | 43 |
| New Media Investment Group Inc. | 2,633 | 42 | |
| * | Central Garden & Pet Co. Class A | 1,727 | 42 |
| MCBC Holdings Inc. | 3,184 | 38 | |
| * | Kirkland's Inc. | 2,767 | 35 |
| Unique Fabricating Inc. | 2,726 | 34 | |
| * | Liberty Media Group LLC Class A | 1,589 | 34 |
| Liberty Tax Inc. | 2,438 | 33 | |
| * | Radio One Inc. | 9,303 | 32 |
| Arctic Cat Inc. | 2,257 | 32 | |
| * | 1-800-Flowers.com Inc. Class A | 3,151 | 29 |
| * | Century Casinos Inc. | 4,099 | 26 |
| Pier 1 Imports Inc. | 5,287 | 24 | |
| * | Kona Grill Inc. | 1,819 | 24 |
| * | Pinnacle Entertainment Inc. | 1,994 | 24 |
| * | Reading International Inc. Class A | 1,646 | 22 |
| *,^ | Noodles & Co. Class A | 3,317 | 22 |
| AMC Entertainment Holdings Inc. | 713 | 22 | |
| * | Hemisphere Media Group Inc. Class A | 1,557 | 21 |
| National Presto Industries Inc. | 210 | 18 | |
| * | Vitamin Shoppe Inc. | 651 | 18 |
59
| Vanguard® Russell 2000 Growth Index Fund | |||
| Schedule of Investments | |||
| August 31, 2016 | |||
| Market | |||
| Value | |||
| Shares | ($000) | ||
| * | Biglari Holdings Inc. | 39 | 17 |
| * | Liberty Braves Group | 883 | 15 |
| * | Central Garden & Pet Co. | 523 | 13 |
| Libbey Inc. | 743 | 13 | |
| * | New Home Co. Inc. | 1,181 | 13 |
| * | Sears Holdings Corp. | 917 | 13 |
| Golden Entertainment Inc. | 884 | 11 | |
| * | Del Frisco's Restaurant Group Inc. | 726 | 11 |
| * | Container Store Group Inc. | 1,965 | 10 |
| * | Century Communities Inc. | 524 | 10 |
| * | ZAGG Inc. | 1,333 | 10 |
| Fred's Inc. Class A | 804 | 9 | |
| Hooker Furniture Corp. | 383 | 9 | |
| * | Vince Holding Corp. | 908 | 6 |
| * | Build-A-Bear Workshop Inc. | 533 | 6 |
| * | Liberty Braves Group Class A | 258 | 4 |
| * | Gaia Inc. Class A | 512 | 4 |
| * | Empire Resorts Inc. | 112 | 2 |
| * | Townsquare Media Inc. Class A | 186 | 2 |
| 61,250 | |||
| Consumer Staples (3.1%) | |||
| B&G Foods Inc. | 27,429 | 1,302 | |
| Lancaster Colony Corp. | 7,837 | 1,054 | |
| J&J Snack Foods Corp. | 6,321 | 771 | |
| Core-Mark Holding Co. Inc. | 18,931 | 722 | |
| WD-40 Co. | 5,929 | 702 | |
| * | Boston Beer Co. Inc. Class A | 3,615 | 660 |
| GNC Holdings Inc. Class A | 28,194 | 593 | |
| * | Diplomat Pharmacy Inc. | 18,948 | 593 |
| ^ | Cal-Maine Foods Inc. | 9,803 | 450 |
| * | Performance Food Group Co. | 15,163 | 390 |
| Calavo Growers Inc. | 6,552 | 386 | |
| Vector Group Ltd. | 15,590 | 348 | |
| Dean Foods Co. | 19,580 | 337 | |
| * | USANA Health Sciences Inc. | 2,187 | 299 |
| Coca-Cola Bottling Co. Consolidated | 1,985 | 298 | |
| ^ | Tootsie Roll Industries Inc. | 7,347 | 280 |
| * | National Beverage Corp. | 5,028 | 250 |
| MGP Ingredients Inc. | 5,389 | 215 | |
| * | Amplify Snack Brands Inc. | 12,365 | 209 |
| PetMed Express Inc. | 8,411 | 170 | |
| Medifast Inc. | 4,446 | 163 | |
| * | Farmer Brothers Co. | 3,423 | 110 |
| Orchids Paper Products Co. | 3,848 | 108 | |
| * | Primo Water Corp. | 9,027 | 105 |
| ^ | Natural Health Trends Corp. | 3,141 | 101 |
| *,^ | Freshpet Inc. | 9,568 | 101 |
| * | Smart & Final Stores Inc. | 7,036 | 90 |
| * | Chefs' Warehouse Inc. | 7,524 | 83 |
| * | Inventure Foods Inc. | 8,235 | 80 |
| ^ | Limoneira Co. | 4,727 | 79 |
| * | Lifevantage Corp. | 5,780 | 71 |
| John B Sanfilippo & Son Inc. | 1,027 | 53 | |
| Fresh Del Monte Produce Inc. | 776 | 45 | |
| * | Craft Brew Alliance Inc. | 1,953 | 39 |
| * | Lifeway Foods Inc. | 2,137 | 26 |
| * | Turning Point Brands Inc. | 1,323 | 17 |
| * | Omega Protein Corp. | 489 | 12 |
| * | Synutra International Inc. | 2,422 | 9 |
| Alico Inc. | 139 | 4 | |
| 11,325 | |||
| Energy (0.9%) | |||
| * | Carrizo Oil & Gas Inc. | 23,096 | 884 |
| * | Matador Resources Co. | 34,354 | 788 |
60
| Vanguard® Russell 2000 Growth Index Fund | |||
| Schedule of Investments | |||
| August 31, 2016 | |||
| Market | |||
| Value | |||
| Shares | ($000) | ||
| * | Callon Petroleum Co. | 50,312 | 732 |
| * | Flotek Industries Inc. | 22,966 | 356 |
| * | TETRA Technologies Inc. | 25,282 | 153 |
| * | Trecora Resources | 6,867 | 75 |
| *,^ | Sanchez Energy Corp. | 7,975 | 69 |
| * | Synergy Resources Corp. | 9,094 | 60 |
| Panhandle Oil and Gas Inc. Class A | 3,393 | 59 | |
| Evolution Petroleum Corp. | 10,299 | 58 | |
| * | EnerNOC Inc. | 9,511 | 54 |
| * | Abraxas Petroleum Corp. | 22,708 | 32 |
| * | Isramco Inc. | 303 | 24 |
| * | Renewable Energy Group Inc. | 1,128 | 10 |
| * | RigNet Inc. | 433 | 6 |
| CVR Energy Inc. | 366 | 5 | |
| * | Par Pacific Holdings Inc. | 29 | — |
| * | Par Pacific Holdings Inc. Rights Exp. 09/14/2016 | 4,529 | — |
| 3,365 | |||
| Financial Services (11.8%) | |||
| Fair Isaac Corp. | 12,899 | 1,650 | |
| Bank of the Ozarks Inc. | 36,872 | 1,445 | |
| DuPont Fabros Technology Inc. | 31,132 | 1,320 | |
| National Health Investors Inc. | 15,642 | 1,256 | |
| Home BancShares Inc. | 50,350 | 1,178 | |
| ^ | Primerica Inc. | 19,591 | 1,115 |
| CoreSite Realty Corp. | 13,968 | 1,090 | |
| Urban Edge Properties | 37,491 | 1,074 | |
| QTS Realty Trust Inc. Class A | 19,312 | 1,046 | |
| Ryman Hospitality Properties Inc. | 17,993 | 971 | |
| EastGroup Properties Inc. | 13,151 | 965 | |
| PS Business Parks Inc. | 8,414 | 932 | |
| RLI Corp. | 13,025 | 924 | |
| * | Cardtronics plc Class A | 18,775 | 843 |
| Evercore Partners Inc. Class A | 16,237 | 832 | |
| * | Essent Group Ltd. | 30,945 | 822 |
| * | HRG Group Inc. | 49,271 | 797 |
| BGC Partners Inc. Class A | 90,656 | 795 | |
| * | Blackhawk Network Holdings Inc. | 22,722 | 778 |
| Retail Opportunity Investments Corp. | 31,779 | 709 | |
| Financial Engines Inc. | 22,077 | 706 | |
| STAG Industrial Inc. | 28,242 | 701 | |
| LTC Properties Inc. | 13,406 | 696 | |
| Potlatch Corp. | 17,007 | 644 | |
| Physicians Realty Trust | 28,803 | 617 | |
| First Financial Bankshares Inc. | 16,565 | 607 | |
| First Cash Financial Services Inc. | 11,304 | 585 | |
| * | Eagle Bancorp Inc. | 9,841 | 509 |
| Medical Properties Trust Inc. | 33,054 | 505 | |
| *,^ | BofI Holding Inc. | 23,255 | 500 |
| ^ | WisdomTree Investments Inc. | 47,088 | 494 |
| ServisFirst Bancshares Inc. | 9,423 | 494 | |
| Talmer Bancorp Inc. Class A | 18,439 | 429 | |
| Alexander & Baldwin Inc. | 10,024 | 402 | |
| HFF Inc. Class A | 14,607 | 392 | |
| Kennedy-Wilson Holdings Inc. | 17,495 | 386 | |
| EVERTEC Inc. | 22,180 | 378 | |
| Cohen & Steers Inc. | 8,880 | 374 | |
| Alexander's Inc. | 845 | 363 | |
| FelCor Lodging Trust Inc. | 50,909 | 362 | |
| Four Corners Property Trust Inc. | 17,246 | 357 | |
| Ameris Bancorp | 10,114 | 352 | |
| Washington REIT | 10,797 | 351 | |
| AMERISAFE Inc. | 5,759 | 346 | |
| CareTrust REIT Inc. | 23,234 | 345 | |
| * | LendingClub Corp. | 62,493 | 338 |
61
| Vanguard® Russell 2000 Growth Index Fund | |||
| Schedule of Investments | |||
| August 31, 2016 | |||
| Market | |||
| Value | |||
| Shares | ($000) | ||
| Banc of California Inc. | 14,923 | 333 | |
| First Industrial Realty Trust Inc. | 10,831 | 312 | |
| * | iStar Inc. | 28,209 | 305 |
| Universal Health Realty Income Trust | 4,831 | 298 | |
| Urstadt Biddle Properties Inc. Class A | 12,502 | 284 | |
| National General Holdings Corp. | 12,103 | 276 | |
| Acadia Realty Trust | 7,252 | 268 | |
| Gramercy Property Trust | 26,903 | 260 | |
| *,^ | LendingTree Inc. | 2,676 | 260 |
| American Assets Trust Inc. | 5,845 | 259 | |
| Universal Insurance Holdings Inc. | 10,107 | 250 | |
| Rexford Industrial Realty Inc. | 10,915 | 244 | |
| National Bank Holdings Corp. Class A | 10,157 | 243 | |
| Diamond Hill Investment Group Inc. | 1,278 | 242 | |
| * | Washington Prime Group Inc. | 17,181 | 236 |
| Saul Centers Inc. | 3,305 | 219 | |
| * | WMIH Corp. | 85,784 | 214 |
| Moelis & Co. Class A | 7,861 | 212 | |
| Pennsylvania REIT | 8,352 | 210 | |
| Greenhill & Co. Inc. | 8,770 | 201 | |
| Education Realty Trust Inc. | 3,950 | 179 | |
| Armada Hoffler Properties Inc. | 12,645 | 174 | |
| Chesapeake Lodging Trust | 6,809 | 173 | |
| Westwood Holdings Group Inc. | 3,378 | 169 | |
| Cass Information Systems Inc. | 2,870 | 164 | |
| Opus Bank | 4,696 | 164 | |
| Virtu Financial Inc. Class A | 9,974 | 163 | |
| * | Marcus & Millichap Inc. | 6,176 | 161 |
| * | Altisource Portfolio Solutions SA | 4,927 | 160 |
| OM Asset Management plc | 11,520 | 155 | |
| Capital Bank Financial Corp. | 4,425 | 139 | |
| GEO Group Inc. | 6,886 | 138 | |
| Terreno Realty Corp. | 5,105 | 137 | |
| Pinnacle Financial Partners Inc. | 2,396 | 136 | |
| Houlihan Lokey Inc. | 5,196 | 129 | |
| Live Oak Bancshares Inc. | 8,382 | 119 | |
| RMR Group Inc. Class A | 2,962 | 114 | |
| Sabra Health Care REIT Inc. | 4,426 | 113 | |
| * | Customers Bancorp Inc. | 4,206 | 112 |
| * | Pacific Premier Bancorp Inc. | 3,801 | 103 |
| *,^ | Nationstar Mortgage Holdings Inc. | 6,059 | 96 |
| City Office REIT Inc. | 7,223 | 94 | |
| *,^ | Trupanion Inc. | 6,058 | 91 |
| * | eHealth Inc. | 7,750 | 87 |
| United Insurance Holdings Corp. | 5,435 | 86 | |
| Consolidated-Tomoka Land Co. | 1,608 | 85 | |
| * | Texas Capital Bancshares Inc. | 1,527 | 80 |
| * | Real Industry Inc. | 11,331 | 78 |
| * | Green Dot Corp. Class A | 3,250 | 75 |
| * | Planet Payment Inc. | 18,295 | 66 |
| Waddell & Reed Financial Inc. Class A | 3,382 | 63 | |
| Monmouth Real Estate Investment Corp. | 4,430 | 62 | |
| Park Sterling Corp. | 7,023 | 60 | |
| Crawford & Co. Class B | 4,947 | 56 | |
| Meridian Bancorp Inc. | 3,332 | 52 | |
| ^ | Union Bankshares Inc. | 1,445 | 49 |
| Maiden Holdings Ltd. | 3,236 | 45 | |
| * | First Foundation Inc. | 1,773 | 44 |
| Hennessy Advisors Inc. | 1,193 | 41 | |
| BNC Bancorp | 1,600 | 39 | |
| * | Atlas Financial Holdings Inc. | 2,181 | 38 |
| Silvercrest Asset Management Group Inc. Class A | 2,907 | 36 | |
| National Storage Affiliates Trust | 1,729 | 35 | |
| Pzena Investment Management Inc. Class A | 4,501 | 35 | |
62
| Vanguard® Russell 2000 Growth Index Fund | |||
| Schedule of Investments | |||
| August 31, 2016 | |||
| Market | |||
| Value | |||
| Shares | ($000) | ||
| * | Franklin Financial Network Inc. | 1,000 | 35 |
| UMH Properties Inc. | 2,863 | 34 | |
| Hingham Institution for Savings | 255 | 33 | |
| Investment Technology Group Inc. | 2,034 | 31 | |
| Northfield Bancorp Inc. | 1,775 | 28 | |
| County Bancorp Inc. | 1,320 | 28 | |
| National Interstate Corp. | 826 | 27 | |
| * | Third Point Reinsurance Ltd. | 2,020 | 26 |
| * | AV Homes Inc. | 1,558 | 24 |
| Cardinal Financial Corp. | 830 | 22 | |
| CoBiz Financial Inc. | 1,645 | 22 | |
| First Connecticut Bancorp Inc. | 1,231 | 22 | |
| * | CU Bancorp | 879 | 21 |
| * | Atlantic Capital Bancshares Inc. | 1,310 | 20 |
| Hersha Hospitality Trust Class A | 976 | 19 | |
| ^ | CPI Card Group Inc. | 3,305 | 18 |
| * | Veritex Holdings Inc. | 1,048 | 18 |
| Orchid Island Capital Inc. | 1,707 | 18 | |
| GAIN Capital Holdings Inc. | 2,620 | 17 | |
| * | Forestar Group Inc. | 1,286 | 16 |
| Blue Hills Bancorp Inc. | 892 | 13 | |
| Fifth Street Asset Management Inc. | 2,084 | 13 | |
| Heritage Commerce Corp. | 1,046 | 12 | |
| State National Cos. Inc. | 1,165 | 12 | |
| * | Xenith Bankshares Inc. | 5,028 | 12 |
| * | Allegiance Bancshares Inc. | 423 | 11 |
| * | Ladenburg Thalmann Financial Services Inc. | 4,830 | 11 |
| GAMCO Investors Inc. Class A | 353 | 11 | |
| * | Regional Management Corp. | 458 | 10 |
| * | Cowen Group Inc. Class A | 2,621 | 10 |
| * | PICO Holdings Inc. | 850 | 9 |
| Home Bancorp Inc. | 309 | 9 | |
| Bankwell Financial Group Inc. | 397 | 9 | |
| * | Trinity Place Holdings Inc. | 929 | 8 |
| Value Line Inc. | 439 | 8 | |
| Medley Management Inc. Class A | 1,059 | 8 | |
| Westfield Financial Inc. | 592 | 4 | |
| * | Provident Bancorp Inc. | 164 | 3 |
| * | American Independence Corp. | 102 | 2 |
| * | UCP Inc. | 224 | 2 |
| Greene County Bancorp Inc. | 114 | 2 | |
| 42,954 | |||
| Health Care (22.3%) | |||
| HealthSouth Corp. | 36,947 | 1,504 | |
| * | PAREXEL International Corp. | 21,888 | 1,489 |
| * | NuVasive Inc. | 20,561 | 1,346 |
| * | Horizon Pharma plc | 67,013 | 1,260 |
| * | Medidata Solutions Inc. | 22,735 | 1,230 |
| Cantel Medical Corp. | 14,811 | 1,120 | |
| * | Integra LifeSciences Holdings Corp. | 12,577 | 1,087 |
| * | Prestige Brands Holdings Inc. | 22,068 | 1,062 |
| * | Catalent Inc. | 41,235 | 1,040 |
| * | Cepheid | 30,040 | 1,031 |
| * | Insulet Corp. | 23,880 | 1,011 |
| * | Masimo Corp. | 17,000 | 1,005 |
| * | Medicines Co. | 25,445 | 997 |
| * | Ultragenyx Pharmaceutical Inc. | 14,864 | 980 |
| * | Nektar Therapeutics | 53,461 | 954 |
| * | Nevro Corp. | 9,954 | 940 |
| * | TESARO Inc. | 11,096 | 940 |
| * | Team Health Holdings Inc. | 28,146 | 937 |
| *,^ | Kite Pharma Inc. | 16,191 | 933 |
| Chemed Corp. | 6,737 | 909 | |
| * | Neogen Corp. | 15,035 | 888 |
63
| Vanguard® Russell 2000 Growth Index Fund | |||
| Schedule of Investments | |||
| August 31, 2016 | |||
| Market | |||
| Value | |||
| Shares | ($000) | ||
| * | Ligand Pharmaceuticals Inc. | 7,926 | 819 |
| * | Exact Sciences Corp. | 43,554 | 804 |
| * | WebMD Health Corp. | 15,544 | 802 |
| * | HMS Holdings Corp. | 34,979 | 763 |
| *,^ | Novavax Inc. | 111,053 | 760 |
| * | INC Research Holdings Inc. Class A | 17,131 | 747 |
| * | Penumbra Inc. | 10,560 | 745 |
| * | Impax Laboratories Inc. | 30,226 | 731 |
| * | Radius Health Inc. | 13,082 | 717 |
| * | AMN Healthcare Services Inc. | 19,625 | 711 |
| * | Prothena Corp. plc | 14,219 | 711 |
| * | ARIAD Pharmaceuticals Inc. | 68,330 | 707 |
| * | Ironwood Pharmaceuticals Inc. Class A | 52,895 | 706 |
| * | Globus Medical Inc. | 29,292 | 680 |
| * | Ophthotech Corp. | 12,537 | 662 |
| * | Exelixis Inc. | 58,070 | 647 |
| * | Molina Healthcare Inc. | 11,836 | 637 |
| * | Alder Biopharmaceuticals Inc. | 19,118 | 630 |
| * | Puma Biotechnology Inc. | 10,194 | 603 |
| * | NxStage Medical Inc. | 26,249 | 600 |
| * | Pacira Pharmaceuticals Inc. | 15,039 | 596 |
| * | HealthEquity Inc. | 17,762 | 578 |
| * | Intra-Cellular Therapies Inc. Class A | 14,145 | 571 |
| * | Myriad Genetics Inc. | 27,716 | 564 |
| * | Cambrex Corp. | 13,129 | 562 |
| * | Zeltiq Aesthetics Inc. | 14,624 | 557 |
| * | Amedisys Inc. | 11,493 | 553 |
| * | Omnicell Inc. | 14,581 | 548 |
| * | ICU Medical Inc. | 4,227 | 527 |
| * | Natus Medical Inc. | 13,290 | 517 |
| * | Relypsa Inc. | 16,086 | 515 |
| * | Air Methods Corp. | 14,577 | 513 |
| * | Depomed Inc. | 25,096 | 509 |
| * | Cynosure Inc. Class A | 9,704 | 505 |
| * | PRA Health Sciences Inc. | 9,907 | 501 |
| * | Spark Therapeutics Inc. | 8,113 | 459 |
| *,^ | Sarepta Therapeutics Inc. | 17,587 | 458 |
| * | Surgical Care Affiliates Inc. | 10,917 | 450 |
| Abaxis Inc. | 8,925 | 447 | |
| * | Halozyme Therapeutics Inc. | 43,995 | 431 |
| * | Spectranetics Corp. | 17,433 | 429 |
| * | Repligen Corp. | 13,810 | 428 |
| * | Supernus Pharmaceuticals Inc. | 19,944 | 426 |
| * | Endologix Inc. | 34,520 | 420 |
| * | Theravance Biopharma Inc. | 14,789 | 419 |
| * | Sage Therapeutics Inc. | 11,248 | 418 |
| * | TherapeuticsMD Inc. | 59,726 | 411 |
| * | Magellan Health Inc. | 7,118 | 407 |
| *,^ | Cempra Inc. | 18,519 | 406 |
| * | Amicus Therapeutics Inc. | 58,901 | 394 |
| * | Achillion Pharmaceuticals Inc. | 47,418 | 392 |
| * | Inogen Inc. | 6,688 | 388 |
| * | MacroGenics Inc. | 12,897 | 384 |
| Ensign Group Inc. | 20,296 | 381 | |
| * | Press Ganey Holdings Inc. | 9,426 | 380 |
| * | Coherus Biosciences Inc. | 12,542 | 373 |
| * | Portola Pharmaceuticals Inc. | 18,290 | 372 |
| * | Emergent BioSolutions Inc. | 13,828 | 369 |
| * | Synergy Pharmaceuticals Inc. | 77,263 | 365 |
| * | FibroGen Inc. | 21,100 | 365 |
| * | Acceleron Pharma Inc. | 11,635 | 349 |
| * | Vascular Solutions Inc. | 7,195 | 347 |
| *,^ | Innoviva Inc. | 30,748 | 341 |
| * | Orthofix International NV | 7,470 | 337 |
64
| Vanguard® Russell 2000 Growth Index Fund | |||
| Schedule of Investments | |||
| August 31, 2016 | |||
| Market | |||
| Value | |||
| Shares | ($000) | ||
| *,^ | Clovis Oncology Inc. | 13,457 | 333 |
| * | Dermira Inc. | 10,513 | 326 |
| * | Insmed Inc. | 24,563 | 318 |
| * | MiMedx Group Inc. | 43,630 | 316 |
| * | Cardiovascular Systems Inc. | 12,897 | 316 |
| US Physical Therapy Inc. | 4,896 | 309 | |
| * | Bluebird Bio Inc. | 5,948 | 293 |
| * | Xencor Inc. | 13,736 | 290 |
| * | Amphastar Pharmaceuticals Inc. | 15,181 | 288 |
| * | Pacific Biosciences of California Inc. | 33,774 | 281 |
| Meridian Bioscience Inc. | 14,312 | 278 | |
| * | Raptor Pharmaceutical Corp. | 36,322 | 271 |
| *,^ | ZIOPHARM Oncology Inc. | 51,989 | 264 |
| * | Providence Service Corp. | 5,551 | 262 |
| *,^ | Inovio Pharmaceuticals Inc. | 28,431 | 261 |
| Atrion Corp. | 574 | 259 | |
| * | Dynavax Technologies Corp. | 16,490 | 258 |
| Quality Systems Inc. | 21,808 | 257 | |
| *,^ | Heron Therapeutics Inc. | 13,575 | 252 |
| * | Adeptus Health Inc. Class A | 5,910 | 252 |
| * | Lexicon Pharmaceuticals Inc. | 17,990 | 250 |
| *,^ | Cerus Corp. | 37,646 | 238 |
| * | Quidel Corp. | 10,886 | 237 |
| * | Blueprint Medicines Corp. | 8,489 | 237 |
| * | Anika Therapeutics Inc. | 4,912 | 232 |
| * | Vanda Pharmaceuticals Inc. | 14,524 | 223 |
| *,^ | Eagle Pharmaceuticals Inc. | 3,727 | 223 |
| * | SciClone Pharmaceuticals Inc. | 21,392 | 215 |
| * | BioTelemetry Inc. | 11,606 | 214 |
| * | Glaukos Corp. | 7,151 | 213 |
| * | Genomic Health Inc. | 8,057 | 213 |
| *,^ | Aduro Biotech Inc. | 15,032 | 212 |
| * | Capital Senior Living Corp. | 12,065 | 207 |
| *,^ | Accelerate Diagnostics Inc. | 9,192 | 201 |
| * | ANI Pharmaceuticals Inc. | 3,345 | 200 |
| * | Aerie Pharmaceuticals Inc. | 10,180 | 197 |
| * | OraSure Technologies Inc. | 22,995 | 197 |
| Landauer Inc. | 4,049 | 192 | |
| * | Progenics Pharmaceuticals Inc. | 29,707 | 187 |
| * | Lion Biotechnologies Inc. | 22,781 | 181 |
| Phibro Animal Health Corp. Class A | 7,460 | 181 | |
| * | NeoGenomics Inc. | 22,416 | 180 |
| * | Accuray Inc. | 33,734 | 180 |
| * | Geron Corp. | 65,301 | 176 |
| * | Cytokinetics Inc. | 14,425 | 174 |
| * | Merit Medical Systems Inc. | 7,077 | 172 |
| * | Intersect ENT Inc. | 10,860 | 171 |
| *,^ | Axovant Sciences Ltd. | 10,421 | 171 |
| * | Corcept Therapeutics Inc. | 31,619 | 169 |
| * | Novocure Ltd. | 21,817 | 168 |
| * | Arrowhead Pharmaceuticals Inc. | 24,088 | 167 |
| * | Aimmune Therapeutics Inc. | 11,229 | 166 |
| * | Advaxis Inc. | 14,359 | 166 |
| * | Flexion Therapeutics Inc. | 9,886 | 165 |
| * | Cross Country Healthcare Inc. | 13,544 | 165 |
| * | AtriCure Inc. | 10,476 | 161 |
| * | CorVel Corp. | 4,182 | 161 |
| * | Arena Pharmaceuticals Inc. | 103,659 | 161 |
| * | Agenus Inc. | 25,935 | 161 |
| *,^ | Teladoc Inc. | 8,850 | 158 |
| * | Surmodics Inc. | 5,527 | 157 |
| * | Loxo Oncology Inc. | 5,685 | 157 |
| * | STAAR Surgical Co. | 17,170 | 151 |
| * | Luminex Corp. | 7,068 | 149 |
65
| Vanguard® Russell 2000 Growth Index Fund | |||
| Schedule of Investments | |||
| August 31, 2016 | |||
| Market | |||
| Value | |||
| Shares | ($000) | ||
| * | Merrimack Pharmaceuticals Inc. | 31,940 | 148 |
| * | GenMark Diagnostics Inc. | 17,071 | 145 |
| * | Heska Corp. | 2,648 | 145 |
| *,^ | Insys Therapeutics Inc. | 10,033 | 143 |
| *,^ | Organovo Holdings Inc. | 36,765 | 142 |
| CryoLife Inc. | 8,896 | 142 | |
| * | Cotiviti Holdings Inc. | 4,117 | 137 |
| *,^ | Keryx Biopharmaceuticals Inc. | 33,266 | 136 |
| *,^ | Rockwell Medical Inc. | 18,572 | 135 |
| * | Imprivata Inc. | 6,914 | 133 |
| * | Teligent Inc. | 17,852 | 132 |
| * | Trevena Inc. | 19,086 | 129 |
| * | Sangamo BioSciences Inc. | 29,410 | 126 |
| * | ConforMIS Inc. | 15,276 | 123 |
| Computer Programs & Systems Inc. | 4,737 | 122 | |
| * | Revance Therapeutics Inc. | 8,606 | 121 |
| * | Global Blood Therapeutics Inc. | 7,097 | 121 |
| * | Five Prime Therapeutics Inc. | 2,697 | 119 |
| * | Civitas Solutions Inc. | 6,443 | 117 |
| *,^ | Omeros Corp. | 10,870 | 117 |
| *,^ | Foundation Medicine Inc. | 5,666 | 116 |
| * | Aratana Therapeutics Inc. | 12,916 | 115 |
| * | Fluidigm Corp. | 12,414 | 113 |
| * | Natera Inc. | 11,116 | 111 |
| * | AMAG Pharmaceuticals Inc. | 4,622 | 110 |
| *,^ | MannKind Corp. | 137,389 | 110 |
| * | Sucampo Pharmaceuticals Inc. Class A | 9,980 | 109 |
| * | RadNet Inc. | 16,009 | 108 |
| Owens & Minor Inc. | 3,146 | 108 | |
| * | Paratek Pharmaceuticals Inc. | 7,933 | 107 |
| * | BioCryst Pharmaceuticals Inc. | 25,943 | 107 |
| * | Rigel Pharmaceuticals Inc. | 31,594 | 106 |
| LeMaitre Vascular Inc. | 5,782 | 106 | |
| * | MyoKardia Inc. | 4,851 | 106 |
| *,^ | Bellicum Pharmaceuticals Inc. | 5,976 | 103 |
| * | NanoString Technologies Inc. | 6,363 | 103 |
| *,^ | CytomX Therapeutics Inc. | 8,742 | 103 |
| * | ImmunoGen Inc. | 36,109 | 101 |
| * | TG Therapeutics Inc. | 15,919 | 101 |
| * | Minerva Neurosciences Inc. | 8,090 | 99 |
| * | La Jolla Pharmaceutical Co. | 5,963 | 97 |
| *,^ | Immunomedics Inc. | 35,008 | 97 |
| * | Oxford Immunotec Global plc | 9,342 | 97 |
| *,^ | XBiotech Inc. | 7,437 | 97 |
| *,^ | InVivo Therapeutics Holdings Corp. | 13,671 | 96 |
| * | AxoGen Inc. | 10,419 | 94 |
| Utah Medical Products Inc. | 1,460 | 92 | |
| * | Durect Corp. | 54,356 | 91 |
| * | Surgery Partners Inc. | 4,686 | 90 |
| * | Epizyme Inc. | 12,253 | 90 |
| * | Enzo Biochem Inc. | 16,016 | 89 |
| *,^ | BioTime Inc. | 30,170 | 89 |
| * | Curis Inc. | 48,445 | 85 |
| * | BioSpecifics Technologies Corp. | 2,321 | 85 |
| *,^ | AAC Holdings Inc. | 4,298 | 84 |
| * | Aclaris Therapeutics Inc. | 4,121 | 83 |
| * | OncoMed Pharmaceuticals Inc. | 8,291 | 83 |
| * | Momenta Pharmaceuticals Inc. | 6,843 | 82 |
| *,^ | Albany Molecular Research Inc. | 5,347 | 79 |
| *,^ | Seres Therapeutics Inc. | 7,504 | 79 |
| * | Invitae Corp. | 9,903 | 78 |
| * | Quorum Health Corp. | 12,633 | 78 |
| * | Vitae Pharmaceuticals Inc. | 11,228 | 78 |
| * | MediciNova Inc. | 12,771 | 75 |
66
| Vanguard® Russell 2000 Growth Index Fund | |||
| Schedule of Investments | |||
| August 31, 2016 | |||
| Market | |||
| Value | |||
| Shares | ($000) | ||
| * | NewLink Genetics Corp. | 7,222 | 74 |
| * | Avexis Inc. | 2,036 | 72 |
| * | American Renal Associates Holdings Inc. | 3,368 | 72 |
| * | Castlight Health Inc. Class B | 16,981 | 71 |
| * | Applied Genetic Technologies Corp. | 5,545 | 71 |
| *,^ | Idera Pharmaceuticals Inc. | 35,982 | 69 |
| * | PharmAthene Inc. | 25,728 | 67 |
| * | Medgenics Inc. | 11,856 | 66 |
| * | Entellus Medical Inc. | 3,298 | 62 |
| * | WaVe Life Sciences Ltd. | 2,479 | 62 |
| * | Acorda Therapeutics Inc. | 2,505 | 60 |
| *,^ | Sorrento Therapeutics Inc. | 8,960 | 60 |
| * | Athersys Inc. | 31,175 | 60 |
| * | Intellia Therapeutics Inc. | 2,986 | 58 |
| * | Bio-Path Holdings Inc. | 37,782 | 58 |
| *,^ | Vital Therapies Inc. | 9,969 | 57 |
| * | Tandem Diabetes Care Inc. | 7,694 | 55 |
| * | Codexis Inc. | 13,017 | 54 |
| * | K2M Group Holdings Inc. | 3,327 | 53 |
| * | Cutera Inc. | 4,848 | 53 |
| *,^ | Trovagene Inc. | 10,686 | 52 |
| * | Spectrum Pharmaceuticals Inc. | 9,829 | 52 |
| *,^ | Synthetic Biologics Inc. | 31,274 | 51 |
| * | Pfenex Inc. | 7,089 | 51 |
| * | Regulus Therapeutics Inc. | 16,030 | 51 |
| * | IRIDEX Corp. | 3,317 | 50 |
| * | Anthera Pharmaceuticals Inc. | 17,116 | 49 |
| National Research Corp. Class A | 3,113 | 49 | |
| * | Collegium Pharmaceutical Inc. | 5,897 | 49 |
| *,^ | Cellular Biomedicine Group Inc. | 3,492 | 49 |
| *,^ | Editas Medicine Inc. | 2,893 | 49 |
| *,^ | Reata Pharmaceuticals Inc. Class A | 2,551 | 49 |
| *,^ | Ocular Therapeutix Inc. | 7,534 | 48 |
| * | Adamas Pharmaceuticals Inc. | 3,444 | 47 |
| * | Inotek Pharmaceuticals Corp. | 6,500 | 46 |
| *,^ | AcelRx Pharmaceuticals Inc. | 14,625 | 46 |
| * | Senseonics Holdings Inc. | 11,491 | 46 |
| Analogic Corp. | 505 | 45 | |
| * | ChemoCentryx Inc. | 8,815 | 44 |
| * | Ignyta Inc. | 7,892 | 43 |
| * | Anavex Life Sciences Corp. | 13,992 | 43 |
| * | Flex Pharma Inc. | 3,748 | 41 |
| *,^ | Titan Pharmaceuticals Inc. | 7,324 | 41 |
| * | Agile Therapeutics Inc. | 5,684 | 41 |
| *,^ | T2 Biosystems Inc. | 6,037 | 40 |
| ^ | Osiris Therapeutics Inc. | 7,897 | 40 |
| * | Select Medical Holdings Corp. | 3,308 | 39 |
| * | GlycoMimetics Inc. | 5,223 | 39 |
| * | Fortress Biotech Inc. | 14,085 | 38 |
| *,^ | Proteostasis Therapeutics Inc. | 2,618 | 37 |
| * | Galena Biopharma Inc. | 90,575 | 37 |
| * | Akebia Therapeutics Inc. | 4,438 | 36 |
| * | Veracyte Inc. | 6,223 | 35 |
| * | Neos Therapeutics Inc. | 5,311 | 35 |
| * | Axsome Therapeutics Inc. | 4,595 | 33 |
| *,^ | Argos Therapeutics Inc. | 6,506 | 32 |
| * | iRadimed Corp. | 1,673 | 31 |
| * | Almost Family Inc. | 834 | 31 |
| * | Immune Design Corp. | 4,354 | 31 |
| * | Eiger BioPharmaceuticals Inc. | 2,030 | 30 |
| * | Avinger Inc. | 7,116 | 29 |
| * | Voyager Therapeutics Inc. | 2,385 | 29 |
| * | Infinity Pharmaceuticals Inc. | 18,172 | 28 |
| * | Concert Pharmaceuticals Inc. | 2,772 | 27 |
67
| Vanguard® Russell 2000 Growth Index Fund | |||
| Schedule of Investments | |||
| August 31, 2016 | |||
| Market | |||
| Value | |||
| Shares | ($000) | ||
| *,^ | Corindus Vascular Robotics Inc. | 22,712 | 27 |
| * | Mirati Therapeutics Inc. | 5,256 | 27 |
| * | Asterias Biotherapeutics Inc. | 9,375 | 26 |
| * | Ardelyx Inc. | 2,541 | 25 |
| *,^ | CytRx Corp. | 43,064 | 24 |
| * | Lipocine Inc. | 6,842 | 23 |
| * | Edge Therapeutics Inc. | 2,584 | 23 |
| * | Genesis Healthcare Inc. | 9,339 | 23 |
| * | Karyopharm Therapeutics Inc. | 2,089 | 21 |
| *,^ | Second Sight Medical Products Inc. | 6,106 | 20 |
| * | Array BioPharma Inc. | 5,730 | 20 |
| * | Aptevo Therapeutics Inc. | 6,835 | 19 |
| * | vTv Therapeutics Inc. Class A | 3,232 | 18 |
| * | Tobira Therapeutics Inc. | 3,662 | 18 |
| *,^ | BioScrip Inc. | 6,126 | 16 |
| * | LHC Group Inc. | 438 | 16 |
| * | Egalet Corp. | 2,270 | 16 |
| *,^ | Ampio Pharmaceuticals Inc. | 18,154 | 15 |
| * | Syndax Pharmaceuticals Inc. | 926 | 13 |
| *,^ | Dimension Therapeutics Inc. | 2,058 | 12 |
| *,^ | ViewRay Inc. | 2,744 | 12 |
| * | Versartis Inc. | 896 | 11 |
| * | Atara Biotherapeutics Inc. | 556 | 11 |
| * | OvaScience Inc. | 1,751 | 11 |
| * | Stemline Therapeutics Inc. | 1,165 | 10 |
| * | Cara Therapeutics Inc. | 1,189 | 6 |
| *,^ | TransEnterix Inc. | 4,572 | 6 |
| * | NantKwest Inc. | 736 | 6 |
| *,^ | Nobilis Health Corp. | 1,694 | 6 |
| * | Tokai Pharmaceuticals Inc. | 4,097 | 5 |
| * | Endocyte Inc. | 1,131 | 3 |
| * | Cidara Therapeutics Inc. | 283 | 3 |
| * | Corvus Pharmaceuticals Inc. | 213 | 3 |
| * | USMD Holdings Inc. | 69 | 2 |
| * | Asterias Biotherapeutics Inc. Warrants Exp. 09/30/2016 | 1,039 | — |
| 80,870 | |||
| Materials & Processing (9.3%) | |||
| Sensient Technologies Corp. | 18,642 | 1,365 | |
| Belden Inc. | 17,381 | 1,296 | |
| PolyOne Corp. | 35,035 | 1,208 | |
| * | Beacon Roofing Supply Inc. | 24,881 | 1,144 |
| * | Louisiana-Pacific Corp. | 55,981 | 1,091 |
| US Silica Holdings Inc. | 26,452 | 1,038 | |
| HB Fuller Co. | 21,001 | 997 | |
| Balchem Corp. | 13,086 | 916 | |
| Chemours Co. | 63,528 | 838 | |
| * | Masonite International Corp. | 12,532 | 836 |
| Worthington Industries Inc. | 18,665 | 801 | |
| Mueller Water Products Inc. Class A | 64,322 | 778 | |
| Universal Forest Products Inc. | 7,109 | 776 | |
| * | Trex Co. Inc. | 12,255 | 759 |
| Simpson Manufacturing Co. Inc. | 17,172 | 754 | |
| * | RBC Bearings Inc. | 9,493 | 751 |
| * | GCP Applied Technologies Inc. | 24,861 | 727 |
| Trinseo SA | 11,927 | 690 | |
| * | Coeur Mining Inc. | 49,460 | 630 |
| * | Ingevity Corp. | 14,100 | 626 |
| * | Summit Materials Inc. Class A | 31,558 | 623 |
| Mueller Industries Inc. | 17,008 | 588 | |
| * | Rexnord Corp. | 26,141 | 578 |
| Apogee Enterprises Inc. | 11,653 | 564 | |
| Neenah Paper Inc. | 6,786 | 546 | |
| * | Headwaters Inc. | 30,025 | 544 |
| Minerals Technologies Inc. | 7,671 | 541 | |
68
| Vanguard® Russell 2000 Growth Index Fund | |||
| Schedule of Investments | |||
| August 31, 2016 | |||
| Market | |||
| Value | |||
| Shares | ($000) | ||
| * | Builders FirstSource Inc. | 34,295 | 471 |
| AAON Inc. | 16,504 | 467 | |
| * | Ferro Corp. | 34,134 | 455 |
| * | Clearwater Paper Corp. | 6,968 | 433 |
| Comfort Systems USA Inc. | 15,125 | 429 | |
| Interface Inc. Class A | 23,432 | 414 | |
| * | Caesarstone Ltd. | 10,125 | 398 |
| Quaker Chemical Corp. | 3,975 | 398 | |
| * | Chemtura Corp. | 13,206 | 396 |
| * | Patrick Industries Inc. | 6,137 | 393 |
| * | Univar Inc. | 18,300 | 379 |
| * | BMC Stock Holdings Inc. | 18,898 | 377 |
| * | Boise Cascade Co. | 13,633 | 358 |
| * | Nortek Inc. | 4,141 | 356 |
| * | Continental Building Products Inc. | 15,060 | 335 |
| * | Gibraltar Industries Inc. | 8,679 | 331 |
| Advanced Drainage Systems Inc. | 14,019 | 324 | |
| Deltic Timber Corp. | 4,471 | 317 | |
| Innophos Holdings Inc. | 7,330 | 310 | |
| * | US Concrete Inc. | 5,744 | 305 |
| * | Installed Building Products Inc. | 8,569 | 286 |
| Insteel Industries Inc. | 7,420 | 247 | |
| * | PGT Inc. | 20,457 | 244 |
| Kaiser Aluminum Corp. | 2,729 | 233 | |
| Global Brass & Copper Holdings Inc. | 8,208 | 230 | |
| * | Koppers Holdings Inc. | 6,961 | 227 |
| Aceto Corp. | 11,099 | 224 | |
| Chase Corp. | 2,987 | 192 | |
| AEP Industries Inc. | 1,719 | 190 | |
| Griffon Corp. | 10,712 | 183 | |
| * | NCI Building Systems Inc. | 11,505 | 174 |
| Culp Inc. | 4,567 | 145 | |
| Rayonier Advanced Materials Inc. | 11,104 | 137 | |
| Myers Industries Inc. | 9,267 | 133 | |
| * | Ply Gem Holdings Inc. | 9,381 | 131 |
| * | Multi Packaging Solutions International Ltd. | 9,060 | 127 |
| * | OMNOVA Solutions Inc. | 11,629 | 116 |
| Schweitzer-Mauduit International Inc. | 2,523 | 99 | |
| Gold Resource Corp. | 17,108 | 89 | |
| * | GMS Inc. | 3,138 | 77 |
| Cabot Microelectronics Corp. | 1,392 | 69 | |
| Stepan Co. | 795 | 56 | |
| Omega Flex Inc. | 1,293 | 50 | |
| KMG Chemicals Inc. | 1,687 | 47 | |
| KapStone Paper and Packaging Corp. | 2,355 | 41 | |
| *,^ | ChromaDex Corp. | 11,827 | 39 |
| * | Landec Corp. | 2,736 | 35 |
| * | Lawson Products Inc. | 2,083 | 35 |
| Hawkins Inc. | 776 | 34 | |
| Quanex Building Products Corp. | 1,347 | 26 | |
| LSI Industries Inc. | 1,356 | 14 | |
| * | Armstrong Flooring Inc. | 581 | 12 |
| * | Century Aluminum Co. | 1,624 | 10 |
| * | Veritiv Corp. | 184 | 9 |
| United States Lime & Minerals Inc. | 57 | 4 | |
| Valhi Inc. | 684 | 2 | |
| 33,618 | |||
| Other (0.0%)2 | |||
| * | Dyax Corp CVR Exp. 12/31/2019 | 73,258 | 81 |
| * | First Hawaiian Inc. | 594 | 16 |
| * | Leap Wireless International Inc. CVR | 4,106 | 10 |
| * | Impinj Inc. | 260 | 6 |
| * | Kinsale Capital Group Inc. | 181 | 4 |
| * | At Home Group Inc. | 234 | 4 |
69
| Vanguard® Russell 2000 Growth Index Fund | ||
| Schedule of Investments | ||
| August 31, 2016 | ||
| Market | ||
| Value | ||
| Shares | ($000) | |
| * Chelsea Therapeutics International Ltd. CVR Exp. 12/31/2016 | 27,975 | 3 |
| * Omthera Pharmaceuticals Inc. CVR | 2,001 | 1 |
| * Durata Therapeutics Inc CVR Exp. 12/31/2018 | 534 | — |
| * Clinical Data Contingent Value Rights | 367 | — |
| * Cubist Pharmaceuticals, Inc. CVR | 13,027 | — |
| 125 | ||
| Producer Durables (14.1%) | ||
| MAXIMUS Inc. | 26,738 | 1,573 |
| Deluxe Corp. | 20,387 | 1,390 |
| Woodward Inc. | 22,081 | 1,385 |
| CLARCOR Inc. | 19,849 | 1,300 |
| Curtiss-Wright Corp. | 13,479 | 1,212 |
| Healthcare Services Group Inc. | 29,444 | 1,189 |
| Littelfuse Inc. | 9,158 | 1,161 |
| HNI Corp. | 18,684 | 1,043 |
| * Hawaiian Holdings Inc. | 22,017 | 1,034 |
| * Dycom Industries Inc. | 12,721 | 1,032 |
| * Generac Holdings Inc. | 27,194 | 1,014 |
| * WageWorks Inc. | 15,167 | 937 |
| * Electronics For Imaging Inc. | 19,695 | 927 |
| Herman Miller Inc. | 24,826 | 895 |
| John Bean Technologies Corp. | 12,108 | 832 |
| * MasTec Inc. | 27,523 | 811 |
| CEB Inc. | 13,452 | 810 |
| * On Assignment Inc. | 21,015 | 792 |
| Hillenbrand Inc. | 24,537 | 789 |
| Allegiant Travel Co. Class A | 5,562 | 769 |
| Knight Transportation Inc. | 25,814 | 725 |
| * Advisory Board Co. | 16,944 | 714 |
| AZZ Inc. | 10,734 | 713 |
| * ExlService Holdings Inc. | 13,723 | 702 |
| Watts Water Technologies Inc. Class A | 10,693 | 689 |
| * Advanced Energy Industries Inc. | 15,483 | 680 |
| Franklin Electric Co. Inc. | 17,788 | 680 |
| Brink's Co. | 18,567 | 678 |
| * Itron Inc. | 13,893 | 662 |
| G&K Services Inc. Class A | 6,161 | 600 |
| Granite Construction Inc. | 12,394 | 595 |
| * TASER International Inc. | 21,579 | 584 |
| * Swift Transportation Co. | 30,748 | 572 |
| Forward Air Corp. | 12,335 | 568 |
| * Proto Labs Inc. | 10,121 | 554 |
| Convergys Corp. | 18,451 | 550 |
| Exponent Inc. | 10,495 | 529 |
| Steelcase Inc. Class A | 35,338 | 528 |
| Knoll Inc. | 19,631 | 519 |
| * Hub Group Inc. Class A | 12,670 | 516 |
| MSA Safety Inc. | 8,605 | 501 |
| Brady Corp. Class A | 14,258 | 478 |
| EnPro Industries Inc. | 8,806 | 475 |
| Tennant Co. | 6,775 | 439 |
| * Teledyne Technologies Inc. | 4,063 | 435 |
| * Virgin America Inc. | 7,730 | 430 |
| Insperity Inc. | 6,406 | 420 |
| * Paylocity Holding Corp. | 9,189 | 414 |
| US Ecology Inc. | 8,897 | 399 |
| Mobile Mini Inc. | 13,282 | 397 |
| Badger Meter Inc. | 5,930 | 391 |
| Multi-Color Corp. | 5,744 | 384 |
| EnerSys | 5,427 | 382 |
| * TriNet Group Inc. | 17,897 | 376 |
| Heartland Express Inc. | 19,593 | 373 |
| * Astronics Corp. | 8,176 | 366 |
| * Team Inc. | 11,449 | 364 |
70
| Vanguard® Russell 2000 Growth Index Fund | |||
| Schedule of Investments | |||
| August 31, 2016 | |||
| Market | |||
| Value | |||
| Shares | ($000) | ||
| Standex International Corp. | 4,107 | 346 | |
| Primoris Services Corp. | 17,146 | 330 | |
| Korn/Ferry International | 13,642 | 325 | |
| MTS Systems Corp. | 6,462 | 321 | |
| * | Lydall Inc. | 6,692 | 321 |
| Matson Inc. | 8,218 | 317 | |
| General Cable Corp. | 19,126 | 309 | |
| Applied Industrial Technologies Inc. | 6,343 | 301 | |
| Actuant Corp. Class A | 12,074 | 288 | |
| Lindsay Corp. | 3,893 | 280 | |
| * | Echo Global Logistics Inc. | 10,696 | 276 |
| Argan Inc. | 5,729 | 274 | |
| Sun Hydraulics Corp. | 8,874 | 273 | |
| * | Darling Ingredients Inc. | 19,110 | 269 |
| Douglas Dynamics Inc. | 8,070 | 259 | |
| Altra Industrial Motion Corp. | 8,881 | 250 | |
| EMCOR Group Inc. | 4,268 | 244 | |
| * | Aerojet Rocketdyne Holdings Inc. | 13,041 | 234 |
| Raven Industries Inc. | 9,547 | 234 | |
| Astec Industries Inc. | 3,834 | 225 | |
| H&E Equipment Services Inc. | 13,488 | 215 | |
| Kforce Inc. | 10,530 | 204 | |
| TeleTech Holdings Inc. | 6,942 | 197 | |
| * | Energy Recovery Inc. | 14,709 | 178 |
| Quad/Graphics Inc. | 6,538 | 177 | |
| Gorman-Rupp Co. | 6,475 | 176 | |
| * | SP Plus Corp. | 6,936 | 173 |
| Forrester Research Inc. | 4,218 | 173 | |
| * | Mistras Group Inc. | 7,263 | 170 |
| * | DHI Group Inc. | 21,384 | 166 |
| Kimball International Inc. Class B | 13,291 | 165 | |
| Hackett Group Inc. | 9,580 | 157 | |
| Mesa Laboratories Inc. | 1,287 | 145 | |
| Tetra Tech Inc. | 3,993 | 141 | |
| Barrett Business Services Inc. | 3,019 | 141 | |
| * | InnerWorkings Inc. | 15,314 | 136 |
| * | GP Strategies Corp. | 5,461 | 131 |
| *,^ | Energous Corp. | 6,426 | 116 |
| * | Wabash National Corp. | 7,472 | 104 |
| * | Milacron Holdings Corp. | 5,421 | 94 |
| * | ServiceSource International Inc. | 16,134 | 82 |
| * | TopBuild Corp. | 2,251 | 77 |
| Albany International Corp. | 1,805 | 76 | |
| UniFirst Corp. | 594 | 76 | |
| *,^ | Plug Power Inc. | 48,503 | 75 |
| * | Moog Inc. Class A | 1,268 | 75 |
| * | Huron Consulting Group Inc. | 1,188 | 75 |
| * | Wesco Aircraft Holdings Inc. | 5,404 | 74 |
| * | NV5 Global Inc. | 2,316 | 71 |
| * | Vicor Corp. | 6,303 | 69 |
| * | FTI Consulting Inc. | 1,514 | 67 |
| Hyster-Yale Materials Handling Inc. | 1,249 | 65 | |
| Allied Motion Technologies Inc. | 2,568 | 58 | |
| Alamo Group Inc. | 879 | 57 | |
| * | FARO Technologies Inc. | 1,740 | 57 |
| * | PFSweb Inc. | 5,818 | 56 |
| * | Tutor Perini Corp. | 2,420 | 56 |
| Supreme Industries Inc. Class A | 3,076 | 53 | |
| * | Information Services Group Inc. | 12,838 | 49 |
| * | IES Holdings Inc. | 2,912 | 48 |
| * | Triton International Ltd. | 3,156 | 48 |
| Kaman Corp. | 1,001 | 45 | |
| * | Air Transport Services Group Inc. | 3,064 | 44 |
| Kadant Inc. | 815 | 44 | |
71
| Vanguard® Russell 2000 Growth Index Fund | |||
| Schedule of Investments | |||
| August 31, 2016 | |||
| Market | |||
| Value | |||
| Shares | ($000) | ||
| *,^ | Aqua Metals Inc. | 4,441 | 41 |
| *,^ | Patriot National Inc. | 4,495 | 40 |
| * | Heritage-Crystal Clean Inc. | 2,828 | 39 |
| * | Workhorse Group Inc. | 4,380 | 36 |
| * | YRC Worldwide Inc. | 3,095 | 36 |
| * | ALJ Regional Holdings Inc. | 7,650 | 35 |
| * | Aerovironment Inc. | 1,371 | 34 |
| Universal Logistics Holdings Inc. | 2,363 | 32 | |
| * | Vectrus Inc. | 843 | 28 |
| * | Radiant Logistics Inc. | 9,253 | 27 |
| * | Hill International Inc. | 5,660 | 25 |
| * | TrueBlue Inc. | 1,096 | 24 |
| * | Navistar International Corp. | 1,427 | 20 |
| * | Power Solutions International Inc. | 1,538 | 18 |
| * | Neff Corp. Class A | 1,782 | 17 |
| Miller Industries Inc. | 386 | 9 | |
| * | Great Lakes Dredge & Dock Corp. | 2,120 | 8 |
| * | ExOne Co. | 574 | 8 |
| * | PHI Inc. | 415 | 8 |
| * | Orion Group Holdings Inc. | 1,035 | 6 |
| * | Blue Bird Corp. | 259 | 4 |
| 51,104 | |||
| Technology (19.2%) | |||
| * | Microsemi Corp. | 47,450 | 1,896 |
| * | Aspen Technology Inc. | 34,530 | 1,570 |
| * | Take-Two Interactive Software Inc. | 34,515 | 1,500 |
| * | EPAM Systems Inc. | 20,081 | 1,370 |
| * | GrubHub Inc. | 33,555 | 1,361 |
| * | Ellie Mae Inc. | 13,652 | 1,336 |
| * | Cirrus Logic Inc. | 26,112 | 1,325 |
| Blackbaud Inc. | 19,574 | 1,319 | |
| * | Cavium Inc. | 23,380 | 1,302 |
| * | Proofpoint Inc. | 16,917 | 1,302 |
| Monolithic Power Systems Inc. | 16,227 | 1,245 | |
| * | Ciena Corp. | 56,834 | 1,219 |
| * | ViaSat Inc. | 16,167 | 1,213 |
| * | Integrated Device Technology Inc. | 56,048 | 1,126 |
| Science Applications International Corp. | 17,612 | 1,124 | |
| * | Coherent Inc. | 10,131 | 1,066 |
| * | Zendesk Inc. | 34,077 | 1,041 |
| InterDigital Inc. | 14,432 | 1,031 | |
| * | Universal Display Corp. | 17,261 | 994 |
| * | Silicon Laboratories Inc. | 17,081 | 979 |
| * | Fleetmatics Group plc | 16,341 | 978 |
| * | Advanced Micro Devices Inc. | 130,635 | 967 |
| * | Paycom Software Inc. | 18,326 | 941 |
| * | Cornerstone OnDemand Inc. | 20,796 | 913 |
| * | ACI Worldwide Inc. | 47,494 | 907 |
| * | Synaptics Inc. | 15,359 | 875 |
| LogMeIn Inc. | 10,439 | 872 | |
| * | CommVault Systems Inc. | 16,096 | 830 |
| * | Lumentum Holdings Inc. | 20,970 | 736 |
| * | Inphi Corp. | 16,610 | 715 |
| * | Synchronoss Technologies Inc. | 17,083 | 713 |
| * | Semtech Corp. | 26,713 | 711 |
| Plantronics Inc. | 13,672 | 692 | |
| * | Envestnet Inc. | 17,039 | 673 |
| Power Integrations Inc. | 11,379 | 665 | |
| * | HubSpot Inc. | 11,886 | 662 |
| * | 3D Systems Corp. | 44,368 | 643 |
| * | Entegris Inc. | 36,703 | 625 |
| * | Syntel Inc. | 13,393 | 618 |
| * | comScore Inc. | 19,694 | 608 |
| NIC Inc. | 26,028 | 598 | |
72
| Vanguard® Russell 2000 Growth Index Fund | |||
| Schedule of Investments | |||
| August 31, 2016 | |||
| Market | |||
| Value | |||
| Shares | ($000) | ||
| * | Gigamon Inc. | 13,497 | 597 |
| ^ | Ebix Inc. | 10,445 | 595 |
| CSG Systems International Inc. | 13,199 | 577 | |
| * | RealPage Inc. | 22,279 | 573 |
| * | Fabrinet | 14,376 | 558 |
| * | BroadSoft Inc. | 12,177 | 557 |
| *,^ | Ubiquiti Networks Inc. | 10,649 | 547 |
| * | Imperva Inc. | 11,776 | 530 |
| * | RingCentral Inc. Class A | 24,097 | 529 |
| * | NETGEAR Inc. | 8,849 | 504 |
| Methode Electronics Inc. | 13,751 | 504 | |
| * | Infoblox Inc. | 23,019 | 494 |
| * | AVG Technologies NV | 17,955 | 446 |
| Tessera Technologies Inc. | 13,181 | 442 | |
| * | Callidus Software Inc. | 22,811 | 441 |
| * | iRobot Corp. | 11,001 | 438 |
| * | MaxLinear Inc. | 22,811 | 437 |
| * | SPS Commerce Inc. | 6,687 | 437 |
| * | Interactive Intelligence Group Inc. | 7,286 | 436 |
| *,^ | Globant SA | 10,929 | 427 |
| * | MACOM Technology Solutions Holdings Inc. | 9,890 | 407 |
| * | Cvent Inc. | 12,290 | 402 |
| * | Acxiom Corp. | 15,419 | 401 |
| * | Qualys Inc. | 11,549 | 397 |
| Pegasystems Inc. | 15,384 | 396 | |
| *,^ | Ambarella Inc. | 5,233 | 377 |
| * | Cray Inc. | 16,347 | 374 |
| * | Fairchild Semiconductor International Inc. Class A | 17,945 | 357 |
| * | MicroStrategy Inc. Class A | 2,124 | 354 |
| Monotype Imaging Holdings Inc. | 16,306 | 344 | |
| * | Bottomline Technologies de Inc. | 14,882 | 344 |
| * | New Relic Inc. | 9,343 | 343 |
| * | Infinera Corp. | 39,777 | 341 |
| *,^ | Pure Storage Inc. Class A | 28,951 | 339 |
| * | Web.com Group Inc. | 18,093 | 316 |
| * | Lattice Semiconductor Corp. | 51,048 | 314 |
| * | Virtusa Corp. | 11,745 | 308 |
| * | Q2 Holdings Inc. | 10,861 | 308 |
| * | Box Inc. | 20,865 | 287 |
| * | Oclaro Inc. | 36,296 | 286 |
| EarthLink Holdings Corp. | 44,833 | 286 | |
| Diebold Inc. | 9,767 | 274 | |
| * | CEVA Inc. | 8,397 | 264 |
| DTS Inc. | 7,470 | 250 | |
| ADTRAN Inc. | 13,587 | 250 | |
| *,^ | Acacia Communications Inc. | 2,200 | 246 |
| * | GTT Communications Inc. | 11,304 | 240 |
| * | Applied Micro Circuits Corp. | 32,526 | 227 |
| * | TrueCar Inc. | 23,394 | 226 |
| * | CalAmp Corp. | 15,378 | 224 |
| * | Benefitfocus Inc. | 5,534 | 223 |
| * | Nimble Storage Inc. | 26,960 | 222 |
| * | Barracuda Networks Inc. | 9,370 | 217 |
| * | Perficient Inc. | 10,783 | 215 |
| * | VASCO Data Security International Inc. | 11,717 | 214 |
| * | Stratasys Ltd. | 9,961 | 213 |
| * | PROS Holdings Inc. | 10,759 | 212 |
| * | Silver Spring Networks Inc. | 15,423 | 210 |
| * | Five9 Inc. | 13,998 | 210 |
| * | Endurance International Group Holdings Inc. | 25,766 | 205 |
| * | Loral Space & Communications Inc. | 5,436 | 198 |
| * | NeuStar Inc. Class A | 7,393 | 188 |
| * | A10 Networks Inc. | 18,815 | 185 |
| * | PDF Solutions Inc. | 10,755 | 180 |
73
| Vanguard® Russell 2000 Growth Index Fund | |||
| Schedule of Investments | |||
| August 31, 2016 | |||
| Market | |||
| Value | |||
| Shares | ($000) | ||
| * | LivePerson Inc. | 22,680 | 177 |
| * | FormFactor Inc. | 16,881 | 175 |
| * | ePlus Inc. | 1,921 | 174 |
| * | Extreme Networks Inc. | 43,969 | 173 |
| * | Workiva Inc. | 9,378 | 167 |
| * | Brightcove Inc. | 12,781 | 165 |
| * | Nanometrics Inc. | 8,072 | 164 |
| * | Rambus Inc. | 11,765 | 163 |
| * | Rapid7 Inc. | 8,522 | 153 |
| * | II-VI Inc. | 7,134 | 151 |
| * | Rogers Corp. | 2,611 | 146 |
| * | Unisys Corp. | 14,361 | 145 |
| Sapiens International Corp. NV | 10,386 | 140 | |
| * | Hortonworks Inc. | 17,059 | 136 |
| * | Xactly Corp. | 9,735 | 136 |
| *,^ | Digimarc Corp. | 3,738 | 135 |
| * | Varonis Systems Inc. | 4,520 | 134 |
| * | Lionbridge Technologies Inc. | 24,690 | 120 |
| * | Vocera Communications Inc. | 7,357 | 120 |
| *,^ | Alarm.com Holdings Inc. | 4,364 | 120 |
| * | ChannelAdvisor Corp. | 9,239 | 115 |
| American Software Inc. Class A | 10,958 | 114 | |
| * | MINDBODY Inc. Class A | 6,154 | 107 |
| * | Carbonite Inc. | 7,636 | 107 |
| * | Jive Software Inc. | 24,753 | 104 |
| * | Model N Inc. | 9,546 | 102 |
| * | Apigee Corp. | 6,665 | 102 |
| * | Silicon Graphics International Corp. | 12,927 | 100 |
| * | Mitek Systems Inc. | 12,666 | 98 |
| * | Exa Corp. | 5,932 | 94 |
| * | Clearfield Inc. | 4,881 | 88 |
| * | MeetMe Inc. | 15,337 | 88 |
| * | Zix Corp. | 22,999 | 88 |
| * | Progress Software Corp. | 2,999 | 87 |
| * | Avid Technology Inc. | 9,314 | 84 |
| * | Amber Road Inc. | 7,456 | 78 |
| * | Super Micro Computer Inc. | 3,502 | 76 |
| * | Radisys Corp. | 14,332 | 70 |
| Epiq Systems Inc. | 4,177 | 69 | |
| * | USA Technologies Inc. | 13,721 | 68 |
| * | Aerohive Networks Inc. | 9,958 | 66 |
| NVE Corp. | 1,065 | 62 | |
| *,^ | Appfolio Inc. | 3,342 | 62 |
| * | MobileIron Inc. | 19,567 | 59 |
| * | Novanta Inc. | 3,425 | 58 |
| MKS Instruments Inc. | 1,167 | 57 | |
| * | Guidance Software Inc. | 9,516 | 57 |
| * | ShoreTel Inc. | 6,808 | 55 |
| *,^ | VirnetX Holding Corp. | 20,453 | 54 |
| * | Rubicon Project Inc. | 6,059 | 51 |
| Reis Inc. | 2,568 | 50 | |
| *,^ | Park City Group Inc. | 5,131 | 50 |
| * | Blucora Inc. | 3,355 | 35 |
| * | NeoPhotonics Corp. | 2,090 | 31 |
| * | Everyday Health Inc. | 3,895 | 30 |
| * | Immersion Corp. | 3,958 | 29 |
| * | Exar Corp. | 3,141 | 29 |
| * | Mercury Systems Inc. | 1,257 | 28 |
| * | Silicom Ltd. | 611 | 25 |
| * | Sonus Networks Inc. | 2,603 | 22 |
| * | Amkor Technology Inc. | 2,318 | 21 |
| * | TechTarget Inc. | 2,534 | 20 |
| * | Ultratech Inc. | 715 | 18 |
| * | Majesco | 2,425 | 13 |
74
| Vanguard® Russell 2000 Growth Index Fund | |||||
| Schedule of Investments | |||||
| August 31, 2016 | |||||
| Market | |||||
| Value | |||||
| Shares | ($000) | ||||
| * | Global Eagle Entertainment Inc. | 1,392 | 12 | ||
| * | Autobytel Inc. | 706 | 12 | ||
| * | SecureWorks Corp. Class A | 800 | 11 | ||
| * | Intralinks Holdings Inc. | 974 | 9 | ||
| * | Numerex Corp. Class A | 983 | 7 | ||
| * | Sparton Corp. | 263 | 6 | ||
| * | Agilysys Inc. | 532 | 6 | ||
| * | Datalink Corp. | 477 | 5 | ||
| * | GigPeak Inc. | 1,856 | 3 | ||
| 69,590 | |||||
| Utilities (2.2%) | |||||
| j2 Global Inc. | 19,723 | 1,345 | |||
| Cogent Communications Holdings Inc. | 17,099 | 608 | |||
| Pattern Energy Group Inc. Class A | 22,348 | 532 | |||
| Shenandoah Telecommunications Co. | 18,876 | 485 | |||
| * | 8x8 Inc. | 36,143 | 480 | ||
| American States Water Co. | 9,782 | 381 | |||
| Ormat Technologies Inc. | 7,516 | 364 | |||
| MGE Energy Inc. | 6,509 | 358 | |||
| California Water Service Group | 11,477 | 350 | |||
| * | inContact Inc. | 24,913 | 346 | ||
| Consolidated Communications Holdings Inc. | 13,973 | 336 | |||
| *,^ | Gogo Inc. | 24,054 | 294 | ||
| * | ORBCOMM Inc. | 25,299 | 252 | ||
| Inteliquent Inc. | 13,927 | 232 | |||
| Middlesex Water Co. | 5,737 | 191 | |||
| * | General Communication Inc. Class A | 12,229 | 170 | ||
| *,^ | Globalstar Inc. | 99,406 | 155 | ||
| Southwest Gas Corp. | 2,090 | 146 | |||
| York Water Co. | 4,832 | 137 | |||
| New Jersey Resources Corp. | 3,010 | 101 | |||
| * | FairPoint Communications Inc. | 7,122 | 99 | ||
| *,^ | Straight Path Communications Inc. Class B | 4,057 | 96 | ||
| * | Boingo Wireless Inc. | 8,837 | 75 | ||
| IDT Corp. Class B | 4,519 | 67 | |||
| WGL Holdings Inc. | 1,052 | 66 | |||
| West Corp. | 2,604 | 61 | |||
| Spark Energy Inc. Class A | 2,021 | 59 | |||
| * | Vonage Holdings Corp. | 9,309 | 54 | ||
| Connecticut Water Service Inc. | 1,003 | 46 | |||
| Chesapeake Utilities Corp. | 715 | 45 | |||
| Windstream Holdings Inc. | 4,681 | 40 | |||
| ^ | Global Water Resources Inc. | 3,402 | 27 | ||
| * | Lumos Networks Corp. | 695 | 10 | ||
| 8,008 | |||||
| Total Common Stocks (Cost $350,485) | 362,209 | ||||
| Coupon | |||||
| Temporary Cash Investments (2.4%)1 | |||||
| Money Market Fund (2.3%) | |||||
| 3,4 | Vanguard Market Liquidity Fund | 0.612% | 85,663 | 8,567 | |
| Face | |||||
| Maturity | Amount | ||||
| Date | ($000) | ||||
| U.S. Government and Agency Obligations (0.1%) | |||||
| 5,6 | Federal Home Loan Bank Discount Notes | 0.365% | 10/5/16 | 200 | 200 |
| Total Temporary Cash Investments (Cost $8,766) | 8,767 | ||||
75
| Vanguard® Russell 2000 Growth Index Fund | |
| Schedule of Investments | |
| August 31, 2016 | |
| Total Investments (102.2%) (Cost $359,251) | 370,976 |
| Other Assets and Liabilities—Net (-2.2%)4 | (7,967) |
| Net Assets (100%) | 363,009 |
| * | Non-income-producing security. |
| ^ | Includes partial security positions on loan to broker-dealers. The total value of securities on loan is $8,007,000. |
| 1 | The fund invests a portion of its cash reserves in equity markets through the use of index futures contracts. After giving effect to futures investments, the fund's effective common stock and temporary cash investment positions represent 100.0% and 2.2%, respectively, of net assets. |
| 2 | “Other” represents securities that are not classified by the fund’s benchmark index. |
| 3 | Affiliated money market fund available only to Vanguard funds and certain trusts and accounts managed by Vanguard. Rate shown is the 7-day yield. |
| 4 | Includes $8,550,000 of collateral received for securities on loan. |
| 5 | The issuer operates under a congressional charter; its securities are generally neither guaranteed by the U.S. Treasury nor backed by the full faith and credit of the U.S. government. |
| 6 | Securities with a value of $100,000 have been segregated as initial margin for open futures contracts. CVR—Contingent Value Rights. |
| REIT—Real Estate Investment Trust. |
76
This page intentionally left blank.
© 2016 The Vanguard Group, Inc. All rights reserved.
Vanguard Marketing Corporation, Distributor.
SNA18510 102016
Report of Independent Registered Public Accounting Firm
To the Board of Trustees of Vanguard Scottsdale Funds and the Shareholders of Vanguard Russell 2000 Index Fund, Vanguard Russell 2000 Value Index Fund and Vanguard Russell 2000 Growth Index Fund:
In our opinion, the accompanying statements of net assets – investments summary and the related statements of operations and of changes in net assets and the financial highlights (included in Item 1 of this Form N-CSR) and the schedules of investments (included in Item 6 of this Form N-CSR) present fairly, in all material respects, the financial position of Vanguard Russell 2000 Index Fund, Vanguard Russell 2000 Value Index Fund and Vanguard Russell 2000 Growth Index Fund (constituting separate portfolios of Vanguard Scottsdale Funds, hereafter referred to as the “Funds”) at August 31, 2016, the results of each of their operations for the year then ended, the changes in each of their net assets for each of the two years in the period then ended, and the financial highlights for each of the periods indicated, in conformity with accounting principles generally accepted in the United States of America. These financial statements, financial highlights and schedules of investments (hereafter referred to as "financial statements") are the responsibility of the Funds’ management. Our responsibility is to express an opinion on these financial statements based on our audits. We conducted our audits of these financial statements in accordance with the standards of the Public Company Accounting Oversight Board (United States). Those standards require that we plan and perform the audit to obtain reasonable assurance about whether the financial statements are free of material misstatement. An audit includes examining, on a test basis, evidence supporting the amounts and disclosures in the financial statements, assessing the accounting principles used and significant estimates made by management, and evaluating the overall financial statement presentation. We believe that our audits, which included confirmation of securities at August 31, 2016 by correspondence with the custodian and brokers and by agreement to the underlying ownership records of the transfer agent, provide a reasonable basis for our opinion.

October 18, 2016
PricewaterhouseCoopers LLP, Two Commerce Square, 2001 Market Street, Suite 1800, Philadelphia, PA 19103-7042
T: (267) 330-3000, F: (267) 330-3300, www.pwc.com/us
| Vanguard® Russell 3000 Index Fund | ||
| Schedule of Investments | ||
| August 31, 2016 | ||
| Market | ||
| Value | ||
| Shares | ($000) | |
| Common Stocks (99.7%)1 | ||
| Consumer Discretionary (14.0%) | ||
| * Amazon.com Inc. | 19,244 | 14,802 |
| Home Depot Inc. | 61,465 | 8,244 |
| Comcast Corp. Class A | 119,018 | 7,767 |
| Walt Disney Co. | 80,476 | 7,602 |
| Wal-Mart Stores Inc. | 75,037 | 5,361 |
| McDonald's Corp. | 43,382 | 5,018 |
| Starbucks Corp. | 70,678 | 3,974 |
| NIKE Inc. Class B | 65,385 | 3,769 |
| Costco Wholesale Corp. | 21,568 | 3,496 |
| * Priceline Group Inc. | 2,435 | 3,450 |
| Lowe's Cos. Inc. | 44,275 | 3,390 |
| Time Warner Inc. | 38,903 | 3,050 |
| * Charter Communications Inc. Class A | 9,948 | 2,559 |
| TJX Cos. Inc. | 32,762 | 2,537 |
| Ford Motor Co. | 192,883 | 2,430 |
| General Motors Co. | 69,634 | 2,223 |
| Target Corp. | 29,455 | 2,067 |
| * Netflix Inc. | 20,319 | 1,980 |
| Yum! Brands Inc. | 19,233 | 1,745 |
| * eBay Inc. | 53,621 | 1,724 |
| Johnson Controls Inc. | 32,242 | 1,415 |
| Twenty-First Century Fox Inc. Class A | 55,244 | 1,356 |
| * O'Reilly Automotive Inc. | 4,609 | 1,290 |
| Newell Brands Inc. | 23,431 | 1,244 |
| * Tesla Motors Inc. | 5,705 | 1,210 |
| Ross Stores Inc. | 19,187 | 1,194 |
| * AutoZone Inc. | 1,529 | 1,134 |
| VF Corp. | 16,862 | 1,046 |
| Dollar General Corp. | 14,190 | 1,042 |
| Omnicom Group Inc. | 11,825 | 1,018 |
| CBS Corp. Class B | 19,781 | 1,009 |
| Nielsen Holdings plc | 18,087 | 964 |
| Carnival Corp. | 20,080 | 960 |
| Estee Lauder Cos. Inc. Class A | 10,639 | 949 |
| Delphi Automotive plc | 13,358 | 944 |
| * Dollar Tree Inc. | 11,337 | 938 |
| L Brands Inc. | 11,852 | 903 |
| Las Vegas Sands Corp. | 17,843 | 896 |
| Genuine Parts Co. | 7,100 | 730 |
| * Ulta Salon Cosmetics & Fragrance Inc. | 2,815 | 696 |
| * Mohawk Industries Inc. | 3,114 | 663 |
| Viacom Inc. Class B | 16,188 | 653 |
| Marriott International Inc. Class A | 9,153 | 653 |
| Starwood Hotels & Resorts Worldwide Inc. | 8,368 | 648 |
| Expedia Inc. | 5,924 | 646 |
| Whirlpool Corp. | 3,608 | 645 |
| * MGM Resorts International | 25,960 | 620 |
| Hilton Worldwide Holdings Inc. | 25,912 | 619 |
| * CarMax Inc. | 10,382 | 612 |
| Macy's Inc. | 16,331 | 591 |
| Twenty-First Century Fox Inc. | 23,355 | 580 |
| Royal Caribbean Cruises Ltd. | 8,117 | 577 |
| * Chipotle Mexican Grill Inc. Class A | 1,362 | 564 |
| Mattel Inc. | 16,782 | 556 |
| Advance Auto Parts Inc. | 3,475 | 547 |
| * DISH Network Corp. Class A | 10,823 | 544 |
| Tractor Supply Co. | 6,457 | 542 |
| * LKQ Corp. | 14,906 | 538 |
| Best Buy Co. Inc. | 13,642 | 525 |
| DR Horton Inc. | 16,369 | 525 |
| Coach Inc. | 13,639 | 521 |
1
| Vanguard® Russell 3000 Index Fund | |||
| Schedule of Investments | |||
| August 31, 2016 | |||
| Market | |||
| Value | |||
| Shares | ($000) | ||
| Hanesbrands Inc. | 18,484 | 491 | |
| Harley-Davidson Inc. | 8,986 | 474 | |
| Fortune Brands Home & Security Inc. | 7,441 | 473 | |
| * | Liberty Interactive Corp. QVC Group Class A | 21,663 | 458 |
| Interpublic Group of Cos. Inc. | 19,439 | 450 | |
| Hasbro Inc. | 5,401 | 441 | |
| Aramark | 11,549 | 438 | |
| Foot Locker Inc. | 6,541 | 429 | |
| Lear Corp. | 3,676 | 427 | |
| Lennar Corp. Class A | 8,914 | 422 | |
| PVH Corp. | 3,900 | 420 | |
| * | Michael Kors Holdings Ltd. | 8,191 | 401 |
| Kohl's Corp. | 8,933 | 396 | |
| Tiffany & Co. | 5,359 | 382 | |
| Wyndham Worldwide Corp. | 5,344 | 378 | |
| Domino's Pizza Inc. | 2,474 | 370 | |
| Goodyear Tire & Rubber Co. | 12,600 | 370 | |
| BorgWarner Inc. | 10,708 | 368 | |
| PulteGroup Inc. | 17,000 | 363 | |
| * | Under Armour Inc. | 10,105 | 360 |
| * | lululemon athletica Inc. | 4,636 | 355 |
| * | Sirius XM Holdings Inc. | 84,930 | 352 |
| Leggett & Platt Inc. | 6,555 | 344 | |
| * | TripAdvisor Inc. | 5,636 | 344 |
| Darden Restaurants Inc. | 5,560 | 343 | |
| Wynn Resorts Ltd. | 3,835 | 343 | |
| * | Liberty Broadband Corp. | 4,922 | 337 |
| *,^ | Under Armour Inc. Class A | 8,348 | 331 |
| Bed Bath & Beyond Inc. | 7,087 | 329 | |
| Signet Jewelers Ltd. | 3,761 | 308 | |
| * | NVR Inc. | 182 | 307 |
| ^ | Nordstrom Inc. | 5,976 | 302 |
| * | Discovery Communications Inc. | 11,806 | 293 |
| * | Liberty SiriusXM Group Class C | 8,741 | 290 |
| Ralph Lauren Corp. Class A | 2,787 | 289 | |
| Harman International Industries Inc. | 3,384 | 287 | |
| News Corp. Class A | 19,712 | 277 | |
| KAR Auction Services Inc. | 6,554 | 277 | |
| Lamar Advertising Co. Class A | 4,421 | 276 | |
| Garmin Ltd. | 5,577 | 274 | |
| * | Norwegian Cruise Line Holdings Ltd. | 7,582 | 272 |
| Vail Resorts Inc. | 1,714 | 272 | |
| Staples Inc. | 31,548 | 270 | |
| * | Burlington Stores Inc. | 3,311 | 269 |
| Scripps Networks Interactive Inc. Class A | 4,179 | 265 | |
| Gap Inc. | 10,612 | 264 | |
| * | WABCO Holdings Inc. | 2,460 | 263 |
| Dick's Sporting Goods Inc. | 4,464 | 262 | |
| Gentex Corp. | 14,023 | 249 | |
| Polaris Industries Inc. | 2,875 | 249 | |
| * | Liberty Ventures Class A | 6,462 | 249 |
| * | Toll Brothers Inc. | 7,945 | 247 |
| Service Corp. International | 9,291 | 246 | |
| * | ServiceMaster Global Holdings Inc. | 6,466 | 241 |
| * | Panera Bread Co. Class A | 1,098 | 238 |
| Carter's Inc. | 2,452 | 234 | |
| H&R Block Inc. | 10,640 | 230 | |
| Dunkin' Brands Group Inc. | 4,594 | 225 | |
| Williams-Sonoma Inc. | 4,157 | 219 | |
| TEGNA Inc. | 10,418 | 211 | |
| Thor Industries Inc. | 2,581 | 209 | |
| Brunswick Corp. | 4,418 | 203 | |
| Cinemark Holdings Inc. | 5,138 | 199 | |
| Pool Corp. | 1,923 | 194 | |
2
| Vanguard® Russell 3000 Index Fund | ||
| Schedule of Investments | ||
| August 31, 2016 | ||
| Market | ||
| Value | ||
| Shares | ($000) | |
| * Discovery Communications Inc. Class A | 7,501 | 191 |
| Outfront Media Inc. | 8,504 | 190 |
| * Sally Beauty Holdings Inc. | 6,919 | 188 |
| * Tempur Sealy International Inc. | 2,401 | 188 |
| Six Flags Entertainment Corp. | 3,655 | 178 |
| * Hertz Global Holdings Inc. | 3,508 | 173 |
| Jack in the Box Inc. | 1,733 | 172 |
| * Live Nation Entertainment Inc. | 6,290 | 168 |
| * AMC Networks Inc. Class A | 2,982 | 162 |
| American Eagle Outfitters Inc. | 8,702 | 161 |
| * Madison Square Garden Co. Class A | 893 | 161 |
| * Skechers U.S.A. Inc. Class A | 6,568 | 160 |
| CST Brands Inc. | 3,330 | 159 |
| Cracker Barrel Old Country Store Inc. | 1,046 | 159 |
| * Tenneco Inc. | 2,837 | 158 |
| * Avis Budget Group Inc. | 4,328 | 156 |
| * Pandora Media Inc. | 10,988 | 154 |
| * AutoNation Inc. | 3,225 | 153 |
| Wendy's Co. | 14,950 | 152 |
| * Urban Outfitters Inc. | 4,215 | 151 |
| * Liberty SiriusXM Group Class A | 4,502 | 151 |
| Tupperware Brands Corp. | 2,279 | 149 |
| Brinker International Inc. | 2,759 | 148 |
| * Murphy USA Inc. | 2,009 | 147 |
| * JC Penney Co. Inc. | 15,511 | 146 |
| * Bright Horizons Family Solutions Inc. | 2,082 | 142 |
| Texas Roadhouse Inc. Class A | 3,065 | 136 |
| Tribune Media Co. Class A | 3,540 | 135 |
| * Buffalo Wild Wings Inc. | 831 | 135 |
| GameStop Corp. Class A | 4,665 | 132 |
| John Wiley & Sons Inc. Class A | 2,238 | 130 |
| Avon Products Inc. | 22,206 | 127 |
| CalAtlantic Group Inc. | 3,463 | 126 |
| Visteon Corp. | 1,778 | 126 |
| Cable One Inc. | 229 | 124 |
| * Kate Spade & Co. | 6,590 | 123 |
| Drew Industries Inc. | 1,203 | 123 |
| * Five Below Inc. | 2,679 | 119 |
| * Cimpress NV | 1,190 | 118 |
| * Starz | 3,785 | 118 |
| Big Lots Inc. | 2,383 | 118 |
| * Cabela's Inc. | 2,397 | 117 |
| * Vista Outdoor Inc. | 2,895 | 115 |
| * Deckers Outdoor Corp. | 1,725 | 113 |
| * Helen of Troy Ltd. | 1,242 | 112 |
| Papa John's International Inc. | 1,492 | 112 |
| International Game Technology plc | 4,882 | 111 |
| Cheesecake Factory Inc. | 2,126 | 109 |
| Wolverine World Wide Inc. | 4,534 | 108 |
| Bloomin' Brands Inc. | 5,478 | 107 |
| * TRI Pointe Group Inc. | 7,833 | 106 |
| * Michaels Cos. Inc. | 4,429 | 106 |
| Matthews International Corp. Class A | 1,703 | 105 |
| Dana Inc. | 7,115 | 103 |
| AMERCO | 295 | 101 |
| Meredith Corp. | 1,886 | 100 |
| Marriott Vacations Worldwide Corp. | 1,287 | 99 |
| Graham Holdings Co. Class B | 202 | 99 |
| * Houghton Mifflin Harcourt Co. | 6,191 | 99 |
| * Steven Madden Ltd. | 2,813 | 99 |
| Penske Automotive Group Inc. | 2,164 | 98 |
| * Grand Canyon Education Inc. | 2,322 | 96 |
| Cooper Tire & Rubber Co. | 2,823 | 96 |
| Sotheby's | 2,407 | 95 |
3
| Vanguard® Russell 3000 Index Fund | |||
| Schedule of Investments | |||
| August 31, 2016 | |||
| Market | |||
| Value | |||
| Shares | ($000) | ||
| * | Fitbit Inc. Class A | 6,012 | 93 |
| Sinclair Broadcast Group Inc. Class A | 3,263 | 93 | |
| Chico's FAS Inc. | 7,191 | 91 | |
| New York Times Co. Class A | 7,000 | 91 | |
| ^ | Regal Entertainment Group Class A | 4,224 | 90 |
| * | Media General Inc. | 5,100 | 90 |
| Nexstar Broadcasting Group Inc. Class A | 1,704 | 90 | |
| Lithia Motors Inc. Class A | 1,082 | 90 | |
| * | IMAX Corp. | 2,935 | 89 |
| Office Depot Inc. | 24,002 | 88 | |
| Monro Muffler Brake Inc. | 1,562 | 88 | |
| Interval Leisure Group Inc. | 5,050 | 88 | |
| Lions Gate Entertainment Corp. | 4,116 | 86 | |
| DSW Inc. Class A | 3,598 | 86 | |
| Choice Hotels International Inc. | 1,772 | 86 | |
| * | Dave & Buster's Entertainment Inc. | 1,835 | 85 |
| PriceSmart Inc. | 1,011 | 84 | |
| Children's Place Inc. | 1,030 | 84 | |
| Churchill Downs Inc. | 556 | 83 | |
| Columbia Sportswear Co. | 1,478 | 83 | |
| Aaron's Inc. | 3,336 | 81 | |
| * | Cooper-Standard Holding Inc. | 818 | 81 |
| * | Smith & Wesson Holding Corp. | 2,836 | 80 |
| * | Liberty Broadband Corp. Class A | 1,181 | 80 |
| Travelport Worldwide Ltd. | 5,787 | 79 | |
| Time Inc. | 5,511 | 78 | |
| * | Meritage Homes Corp. | 2,149 | 77 |
| * | Dorman Products Inc. | 1,215 | 77 |
| * | Boyd Gaming Corp. | 3,918 | 76 |
| Group 1 Automotive Inc. | 1,285 | 76 | |
| News Corp. Class B | 5,213 | 75 | |
| * | Shutterfly Inc. | 1,491 | 75 |
| * | American Axle & Manufacturing Holdings Inc. | 4,323 | 74 |
| * | Liberty TripAdvisor Holdings Inc. Class A | 3,556 | 74 |
| La-Z-Boy Inc. | 2,767 | 74 | |
| KB Home | 4,601 | 72 | |
| * | Genesco Inc. | 966 | 70 |
| Gannett Co. Inc. | 5,868 | 70 | |
| * | Popeyes Louisiana Kitchen Inc. | 1,277 | 70 |
| HSN Inc. | 1,662 | 69 | |
| * | Stamps.com Inc. | 716 | 69 |
| DineEquity Inc. | 883 | 69 | |
| * | American Woodmark Corp. | 790 | 69 |
| Finish Line Inc. Class A | 2,786 | 67 | |
| * | Etsy Inc. | 4,966 | 67 |
| * | LifeLock Inc. | 3,999 | 67 |
| * | 2U Inc. | 1,823 | 64 |
| DeVry Education Group Inc. | 2,767 | 64 | |
| * | Gentherm Inc. | 1,908 | 63 |
| * | Penn National Gaming Inc. | 4,384 | 62 |
| * | Hyatt Hotels Corp. Class A | 1,142 | 61 |
| Sonic Corp. | 2,119 | 61 | |
| * | Ascena Retail Group Inc. | 7,454 | 61 |
| Caleres Inc. | 2,332 | 60 | |
| Abercrombie & Fitch Co. | 3,385 | 60 | |
| MDC Holdings Inc. | 2,266 | 59 | |
| Sturm Ruger & Co. Inc. | 965 | 59 | |
| Scholastic Corp. | 1,461 | 59 | |
| ^ | Coty Inc. Class A | 2,155 | 58 |
| Dillard's Inc. Class A | 947 | 57 | |
| *,^ | GoPro Inc. Class A | 3,887 | 57 |
| * | EW Scripps Co. Class A | 3,285 | 56 |
| * | Asbury Automotive Group Inc. | 1,036 | 56 |
| * | Cavco Industries Inc. | 531 | 56 |
4
| Vanguard® Russell 3000 Index Fund | ||
| Schedule of Investments | ||
| August 31, 2016 | ||
| Market | ||
| Value | ||
| Shares | ($000) | |
| * G-III Apparel Group Ltd. | 1,758 | 56 |
| National CineMedia Inc. | 3,591 | 54 |
| * Select Comfort Corp. | 2,000 | 53 |
| * Apollo Education Group Inc. | 5,902 | 52 |
| * Fossil Group Inc. | 1,831 | 52 |
| International Speedway Corp. Class A | 1,568 | 52 |
| Guess? Inc. | 3,138 | 52 |
| Cato Corp. Class A | 1,496 | 51 |
| * Nautilus Inc. | 2,201 | 51 |
| * Carmike Cinemas Inc. | 1,579 | 51 |
| Oxford Industries Inc. | 806 | 50 |
| Viad Corp. | 1,399 | 50 |
| Capella Education Co. | 840 | 49 |
| Extended Stay America Inc. | 3,477 | 49 |
| * Restoration Hardware Holdings Inc. | 1,453 | 49 |
| * Wayfair Inc. | 1,250 | 48 |
| * Liberty Media Group LLC | 2,211 | 47 |
| * LGI Homes Inc. | 1,222 | 47 |
| * La Quinta Holdings Inc. | 4,051 | 47 |
| * MSG Networks Inc. | 2,647 | 46 |
| Viacom Inc. Class A | 1,017 | 46 |
| Winnebago Industries Inc. | 1,896 | 46 |
| * TiVo Inc. | 4,294 | 46 |
| SeaWorld Entertainment Inc. | 3,493 | 45 |
| New Media Investment Group Inc. | 2,841 | 45 |
| World Wrestling Entertainment Inc. Class A | 2,176 | 45 |
| * Express Inc. | 3,772 | 45 |
| * Central Garden & Pet Co. Class A | 1,832 | 44 |
| * Universal Electronics Inc. | 597 | 44 |
| * M/I Homes Inc. | 1,898 | 44 |
| ClubCorp Holdings Inc. | 3,035 | 44 |
| * Crocs Inc. | 4,976 | 43 |
| Inter Parfums Inc. | 1,257 | 43 |
| Buckle Inc. | 1,643 | 42 |
| * Mattress Firm Holding Corp. | 657 | 42 |
| * Fiesta Restaurant Group Inc. | 1,660 | 42 |
| * Red Robin Gourmet Burgers Inc. | 830 | 42 |
| * Meritor Inc. | 3,681 | 41 |
| Tailored Brands Inc. | 3,058 | 40 |
| Barnes & Noble Inc. | 3,497 | 40 |
| Sonic Automotive Inc. Class A | 2,288 | 39 |
| Outerwall Inc. | 739 | 38 |
| * Hibbett Sports Inc. | 984 | 38 |
| * Diamond Resorts International Inc. | 1,247 | 38 |
| * Shutterstock Inc. | 648 | 38 |
| * Chuy's Holdings Inc. | 1,240 | 38 |
| Callaway Golf Co. | 3,256 | 37 |
| Entravision Communications Corp. Class A | 4,900 | 37 |
| Bob Evans Farms Inc. | 885 | 36 |
| * Pinnacle Entertainment Inc. | 2,986 | 36 |
| * Francesca's Holdings Corp. | 2,630 | 36 |
| * Denny's Corp. | 3,431 | 36 |
| Standard Motor Products Inc. | 797 | 36 |
| Nutrisystem Inc. | 1,224 | 35 |
| Ruth's Hospitality Group Inc. | 2,342 | 35 |
| * BJ's Restaurants Inc. | 868 | 34 |
| * Zoe's Kitchen Inc. | 1,244 | 34 |
| Ethan Allen Interiors Inc. | 1,008 | 34 |
| Haverty Furniture Cos. Inc. | 1,672 | 33 |
| * Biglari Holdings Inc. | 75 | 33 |
| * Quotient Technology Inc. | 2,452 | 32 |
| * Vitamin Shoppe Inc. | 1,121 | 31 |
| * Belmond Ltd. Class A | 2,761 | 31 |
| MDC Partners Inc. Class A | 2,452 | 30 |
5
| Vanguard® Russell 3000 Index Fund | |||
| Schedule of Investments | |||
| August 31, 2016 | |||
| Market | |||
| Value | |||
| Shares | ($000) | ||
| * | Ollie's Bargain Outlet Holdings Inc. | 1,164 | 30 |
| * | HealthStream Inc. | 1,094 | 29 |
| Superior Industries International Inc. | 986 | 29 | |
| Movado Group Inc. | 1,219 | 28 | |
| AMC Entertainment Holdings Inc. | 902 | 27 | |
| Rent-A-Center Inc. | 2,116 | 26 | |
| * | Planet Fitness Inc. Class A | 1,193 | 26 |
| * | Liberty Braves Group | 1,513 | 25 |
| * | Caesars Acquisition Co. Class A | 2,036 | 25 |
| * | Shake Shack Inc. Class A | 693 | 24 |
| * | Taylor Morrison Home Corp. Class A | 1,369 | 24 |
| * | Liberty Media Group LLC Class A | 1,110 | 24 |
| * | Strayer Education Inc. | 472 | 23 |
| * | Angie's List Inc. | 2,131 | 22 |
| Tower International Inc. | 877 | 21 | |
| * | Chegg Inc. | 3,144 | 21 |
| Hooker Furniture Corp. | 908 | 21 | |
| * | SiteOne Landscape Supply Inc. | 548 | 21 |
| * | MarineMax Inc. | 1,052 | 21 |
| * | Stoneridge Inc. | 1,183 | 21 |
| * | Motorcar Parts of America Inc. | 717 | 20 |
| * | tronc Inc. | 1,194 | 20 |
| * | Regis Corp. | 1,530 | 19 |
| * | FTD Cos. Inc. | 794 | 19 |
| * | Eldorado Resorts Inc. | 1,320 | 18 |
| * | Party City Holdco Inc. | 1,045 | 18 |
| * | Tile Shop Holdings Inc. | 1,158 | 18 |
| * | XO Group Inc. | 958 | 18 |
| * | Carrols Restaurant Group Inc. | 1,319 | 18 |
| Marcus Corp. | 741 | 17 | |
| Blue Nile Inc. | 501 | 17 | |
| Fred's Inc. Class A | 1,520 | 17 | |
| *,^ | Eros International plc | 1,023 | 17 |
| * | Weight Watchers International Inc. | 1,603 | 17 |
| * | Scientific Games Corp. Class A | 2,038 | 17 |
| Pier 1 Imports Inc. | 3,612 | 17 | |
| Shoe Carnival Inc. | 560 | 17 | |
| Lennar Corp. Class B | 434 | 16 | |
| * | Lumber Liquidators Holdings Inc. | 1,043 | 16 |
| * | Elizabeth Arden Inc. | 1,145 | 16 |
| * | Vera Bradley Inc. | 1,033 | 15 |
| * | Gray Television Inc. | 1,372 | 15 |
| * | Career Education Corp. | 2,353 | 15 |
| Libbey Inc. | 865 | 15 | |
| * | Revlon Inc. Class A | 419 | 15 |
| * | K12 Inc. | 1,254 | 15 |
| *,^ | Caesars Entertainment Corp. | 2,368 | 15 |
| * | Zumiez Inc. | 877 | 15 |
| * | Isle of Capri Casinos Inc. | 844 | 15 |
| * | Iconix Brand Group Inc. | 1,735 | 15 |
| Entercom Communications Corp. Class A | 1,059 | 15 | |
| National Presto Industries Inc. | 165 | 14 | |
| Carriage Services Inc. Class A | 605 | 14 | |
| * | Daily Journal Corp. | 59 | 14 |
| * | Beazer Homes USA Inc. | 1,201 | 14 |
| * | Barnes & Noble Education Inc. | 1,197 | 13 |
| * | William Lyon Homes Class A | 745 | 13 |
| * | Del Frisco's Restaurant Group Inc. | 846 | 13 |
| Winmark Corp. | 122 | 13 | |
| * | Fox Factory Holding Corp. | 608 | 13 |
| * | Tuesday Morning Corp. | 1,868 | 12 |
| * | WCI Communities Inc. | 657 | 12 |
| * | Del Taco Restaurants Inc. | 1,101 | 12 |
| Bassett Furniture Industries Inc. | 497 | 12 | |
6
| Vanguard® Russell 3000 Index Fund | |||
| Schedule of Investments | |||
| August 31, 2016 | |||
| Market | |||
| Value | |||
| Shares | ($000) | ||
| * | Intrawest Resorts Holdings Inc. | 820 | 12 |
| * | Potbelly Corp. | 926 | 12 |
| * | American Public Education Inc. | 580 | 12 |
| * | America's Car-Mart Inc. | 306 | 12 |
| * | Eastman Kodak Co. | 773 | 12 |
| * | Sears Holdings Corp. | 855 | 12 |
| Citi Trends Inc. | 600 | 12 | |
| *,^ | Lands' End Inc. | 666 | 12 |
| * | Monarch Casino & Resort Inc. | 486 | 12 |
| * | Reading International Inc. Class A | 835 | 11 |
| * | Care.com Inc. | 1,070 | 11 |
| Flexsteel Industries Inc. | 236 | 11 | |
| *,^ | Sequential Brands Group Inc. | 1,510 | 11 |
| * | Federal-Mogul Holdings Corp. | 1,193 | 11 |
| * | 1-800-Flowers.com Inc. Class A | 1,174 | 11 |
| * | Century Communities Inc. | 536 | 11 |
| Clear Channel Outdoor Holdings Inc. Class A | 1,548 | 10 | |
| * | Perry Ellis International Inc. | 548 | 10 |
| * | Horizon Global Corp. | 564 | 10 |
| Big 5 Sporting Goods Corp. | 801 | 10 | |
| CSS Industries Inc. | 391 | 10 | |
| Speedway Motorsports Inc. | 556 | 10 | |
| Stein Mart Inc. | 1,221 | 10 | |
| * | Duluth Holdings Inc. | 319 | 10 |
| * | West Marine Inc. | 995 | 9 |
| * | Malibu Boats Inc. Class A | 645 | 9 |
| * | Franklin Covey Co. | 540 | 9 |
| Weyco Group Inc. | 338 | 9 | |
| * | Overstock.com Inc. | 546 | 8 |
| Wingstop Inc. | 275 | 8 | |
| * | Hovnanian Enterprises Inc. Class A | 4,576 | 8 |
| * | Rosetta Stone Inc. | 913 | 8 |
| Strattec Security Corp. | 188 | 8 | |
| * | Liberty Braves Group Class A | 453 | 8 |
| Stage Stores Inc. | 1,407 | 8 | |
| * | Build-A-Bear Workshop Inc. | 646 | 7 |
| * | El Pollo Loco Holdings Inc. | 530 | 7 |
| * | JAKKS Pacific Inc. | 781 | 7 |
| Arctic Cat Inc. | 502 | 7 | |
| * | Bridgepoint Education Inc. | 968 | 7 |
| * | Nathan's Famous Inc. | 141 | 7 |
| * | Sportsman's Warehouse Holdings Inc. | 678 | 7 |
| * | Kirkland's Inc. | 552 | 7 |
| * | Ruby Tuesday Inc. | 2,256 | 7 |
| * | ZAGG Inc. | 914 | 7 |
| * | Conn's Inc. | 977 | 7 |
| * | Lindblad Expeditions Holdings Inc. | 702 | 7 |
| * | Habit Restaurants Inc. Class A | 429 | 7 |
| * | Century Casinos Inc. | 1,006 | 6 |
| Golden Entertainment Inc. | 487 | 6 | |
| * | Delta Apparel Inc. | 340 | 6 |
| * | J Alexander's Holdings Inc. | 584 | 6 |
| Metaldyne Performance Group Inc. | 354 | 6 | |
| Saga Communications Inc. Class A | 138 | 6 | |
| * | Boot Barn Holdings Inc. | 448 | 6 |
| Red Rock Resorts Inc. Class A | 233 | 5 | |
| * | Vince Holding Corp. | 740 | 5 |
| * | Gaia Inc. Class A | 633 | 5 |
| * | Instructure Inc. | 205 | 5 |
| * | Bojangles' Inc. | 296 | 5 |
| * | Destination XL Group Inc. | 1,020 | 5 |
| Lifetime Brands Inc. | 350 | 5 | |
| * | Jamba Inc. | 426 | 5 |
| * | Performance Sports Group Ltd. | 1,704 | 5 |
7
| Vanguard® Russell 3000 Index Fund | ||
| Schedule of Investments | ||
| August 31, 2016 | ||
| Market | ||
| Value | ||
| Shares | ($000) | |
| * Red Lion Hotels Corp. | 677 | 4 |
| * TubeMogul Inc. | 484 | 4 |
| Liberty Tax Inc. | 321 | 4 |
| * Luby's Inc. | 920 | 4 |
| * Radio One Inc. | 1,172 | 4 |
| Unique Fabricating Inc. | 316 | 4 |
| Superior Uniform Group Inc. | 219 | 4 |
| * IDI Inc. | 723 | 4 |
| * Sears Hometown and Outlet Stores Inc. | 531 | 4 |
| * Kona Grill Inc. | 256 | 3 |
| Salem Media Group Inc. Class A | 522 | 3 |
| Johnson Outdoors Inc. Class A | 94 | 3 |
| * Marchex Inc. Class B | 1,071 | 3 |
| * QuinStreet Inc. | 940 | 3 |
| Escalade Inc. | 232 | 3 |
| Collectors Universe Inc. | 147 | 3 |
| * Hemisphere Media Group Inc. Class A | 201 | 3 |
| * Container Store Group Inc. | 489 | 3 |
| * Fogo De Chao Inc. | 189 | 2 |
| Marine Products Corp. | 254 | 2 |
| * Townsquare Media Inc. Class A | 232 | 2 |
| * Noodles & Co. Class A | 334 | 2 |
| Systemax Inc. | 261 | 2 |
| * Tilly's Inc. Class A | 237 | 2 |
| * Cambium Learning Group Inc. | 417 | 2 |
| * Empire Resorts Inc. | 73 | 1 |
| * Central Garden & Pet Co. | 9 | — |
| * Central European Media Enterprises Ltd. Class A | 72 | — |
| MCBC Holdings Inc. | 9 | — |
| * New Home Co. Inc. | 9 | — |
| 158,611 | ||
| Consumer Staples (7.9%) | ||
| Procter & Gamble Co. | 131,989 | 11,524 |
| Coca-Cola Co. | 193,114 | 8,387 |
| Philip Morris International Inc. | 76,303 | 7,625 |
| PepsiCo Inc. | 71,425 | 7,625 |
| Altria Group Inc. | 92,750 | 6,130 |
| CVS Health Corp. | 52,993 | 4,950 |
| Walgreens Boots Alliance Inc. | 42,431 | 3,425 |
| Mondelez International Inc. Class A | 73,907 | 3,327 |
| Colgate-Palmolive Co. | 42,940 | 3,192 |
| Kraft Heinz Co. | 29,797 | 2,667 |
| Kimberly-Clark Corp. | 17,865 | 2,288 |
| General Mills Inc. | 29,211 | 2,069 |
| Reynolds American Inc. | 40,898 | 2,027 |
| Kroger Co. | 47,431 | 1,517 |
| Sysco Corp. | 25,981 | 1,347 |
| Constellation Brands Inc. Class A | 8,110 | 1,330 |
| Archer-Daniels-Midland Co. | 28,209 | 1,234 |
| * Monster Beverage Corp. | 6,984 | 1,075 |
| Tyson Foods Inc. Class A | 14,165 | 1,070 |
| ConAgra Foods Inc. | 21,418 | 998 |
| Kellogg Co. | 12,083 | 993 |
| Dr Pepper Snapple Group Inc. | 9,374 | 878 |
| Molson Coors Brewing Co. Class B | 8,480 | 868 |
| JM Smucker Co. | 5,819 | 825 |
| Clorox Co. | 6,269 | 822 |
| Mead Johnson Nutrition Co. | 9,160 | 779 |
| Hershey Co. | 6,796 | 679 |
| Church & Dwight Co. Inc. | 6,181 | 615 |
| Campbell Soup Co. | 9,591 | 582 |
| McCormick & Co. Inc. | 5,521 | 563 |
| Hormel Foods Corp. | 13,133 | 502 |
| * WhiteWave Foods Co. Class A | 8,837 | 490 |
8
| Vanguard® Russell 3000 Index Fund | ||
| Schedule of Investments | ||
| August 31, 2016 | ||
| Market | ||
| Value | ||
| Shares | ($000) | |
| Ingredion Inc. | 3,542 | 485 |
| Whole Foods Market Inc. | 15,685 | 477 |
| Brown-Forman Corp. Class B | 9,494 | 461 |
| Bunge Ltd. | 6,698 | 428 |
| * Rite Aid Corp. | 52,704 | 397 |
| Pinnacle Foods Inc. | 5,428 | 275 |
| * Post Holdings Inc. | 3,025 | 256 |
| * TreeHouse Foods Inc. | 2,637 | 250 |
| Casey's General Stores Inc. | 1,825 | 240 |
| * Edgewell Personal Care Co. | 2,908 | 233 |
| * Herbalife Ltd. | 3,446 | 209 |
| Energizer Holdings Inc. | 4,109 | 203 |
| * Hain Celestial Group Inc. | 4,776 | 176 |
| Nu Skin Enterprises Inc. Class A | 2,823 | 163 |
| Spectrum Brands Holdings Inc. | 1,212 | 163 |
| Brown-Forman Corp. Class A | 2,944 | 152 |
| * Sprouts Farmers Market Inc. | 6,702 | 151 |
| B&G Foods Inc. | 2,887 | 137 |
| Snyder's-Lance Inc. | 3,815 | 135 |
| Lancaster Colony Corp. | 930 | 125 |
| Flowers Foods Inc. | 8,339 | 124 |
| Sanderson Farms Inc. | 1,094 | 105 |
| Fresh Del Monte Produce Inc. | 1,704 | 99 |
| * United Natural Foods Inc. | 2,169 | 99 |
| Vector Group Ltd. | 4,281 | 96 |
| J&J Snack Foods Corp. | 766 | 93 |
| Core-Mark Holding Co. Inc. | 2,285 | 87 |
| Dean Foods Co. | 4,964 | 85 |
| * Boston Beer Co. Inc. Class A | 465 | 85 |
| WD-40 Co. | 713 | 84 |
| Universal Corp. | 1,267 | 76 |
| ^ Cal-Maine Foods Inc. | 1,648 | 76 |
| * SUPERVALU Inc. | 13,787 | 76 |
| * Blue Buffalo Pet Products Inc. | 2,847 | 73 |
| ^ Pilgrim's Pride Corp. | 3,162 | 73 |
| * Diplomat Pharmacy Inc. | 2,126 | 67 |
| SpartanNash Co. | 2,051 | 66 |
| GNC Holdings Inc. Class A | 3,109 | 65 |
| Andersons Inc. | 1,721 | 64 |
| Calavo Growers Inc. | 885 | 52 |
| Tootsie Roll Industries Inc. | 1,306 | 50 |
| Coca-Cola Bottling Co. Consolidated | 329 | 49 |
| * Performance Food Group Co. | 1,772 | 46 |
| Weis Markets Inc. | 843 | 43 |
| * Seaboard Corp. | 11 | 36 |
| John B Sanfilippo & Son Inc. | 596 | 31 |
| * USANA Health Sciences Inc. | 220 | 30 |
| * Amplify Snack Brands Inc. | 1,605 | 27 |
| * National Beverage Corp. | 531 | 26 |
| * Omega Protein Corp. | 914 | 23 |
| Ingles Markets Inc. Class A | 566 | 21 |
| Medifast Inc. | 521 | 19 |
| * Chefs' Warehouse Inc. | 1,648 | 18 |
| PetMed Express Inc. | 826 | 17 |
| MGP Ingredients Inc. | 335 | 13 |
| * Farmer Brothers Co. | 383 | 12 |
| * Primo Water Corp. | 997 | 12 |
| * Seneca Foods Corp. Class A | 391 | 12 |
| * Nutraceutical International Corp. | 440 | 11 |
| * Smart & Final Stores Inc. | 864 | 11 |
| Village Super Market Inc. Class A | 320 | 10 |
| Orchids Paper Products Co. | 332 | 9 |
| * Inventure Foods Inc. | 899 | 9 |
| Limoneira Co. | 518 | 9 |
9
| Vanguard® Russell 3000 Index Fund | ||
| Schedule of Investments | ||
| August 31, 2016 | ||
| Market | ||
| Value | ||
| Shares | ($000) | |
| * Alliance One International Inc. | 396 | 8 |
| * Freshpet Inc. | 766 | 8 |
| * Lifevantage Corp. | 646 | 8 |
| Alico Inc. | 213 | 6 |
| * Natural Grocers by Vitamin Cottage Inc. | 465 | 6 |
| * Craft Brew Alliance Inc. | 249 | 5 |
| * US Foods Holding Corp. | 175 | 4 |
| * Turning Point Brands Inc. | 286 | 4 |
| Nature's Sunshine Products Inc. | 259 | 4 |
| * Synutra International Inc. | 400 | 2 |
| * Lifeway Foods Inc. | 92 | 1 |
| Natural Health Trends Corp. | 9 | — |
| 89,764 | ||
| Energy (6.5%) | ||
| Exxon Mobil Corp. | 205,256 | 17,886 |
| Chevron Corp. | 92,951 | 9,349 |
| Schlumberger Ltd. | 68,891 | 5,442 |
| Occidental Petroleum Corp. | 38,333 | 2,946 |
| ConocoPhillips | 62,723 | 2,575 |
| EOG Resources Inc. | 27,776 | 2,458 |
| Kinder Morgan Inc. | 97,352 | 2,127 |
| Halliburton Co. | 43,771 | 1,883 |
| Phillips 66 | 22,223 | 1,743 |
| Pioneer Natural Resources Co. | 7,972 | 1,427 |
| Anadarko Petroleum Corp. | 25,097 | 1,342 |
| Valero Energy Corp. | 22,871 | 1,266 |
| Spectra Energy Corp. | 33,418 | 1,190 |
| Devon Energy Corp. | 25,749 | 1,116 |
| Marathon Petroleum Corp. | 26,107 | 1,110 |
| Baker Hughes Inc. | 21,524 | 1,057 |
| * Concho Resources Inc. | 7,322 | 946 |
| Williams Cos. Inc. | 33,774 | 944 |
| Apache Corp. | 18,703 | 930 |
| Hess Corp. | 13,953 | 758 |
| Noble Energy Inc. | 21,033 | 725 |
| National Oilwell Varco Inc. | 20,101 | 674 |
| Marathon Oil Corp. | 41,757 | 627 |
| Cimarex Energy Co. | 4,613 | 610 |
| EQT Corp. | 8,377 | 599 |
| Cabot Oil & Gas Corp. | 22,634 | 557 |
| ONEOK Inc. | 10,309 | 483 |
| Tesoro Corp. | 5,871 | 443 |
| * Newfield Exploration Co. | 9,857 | 427 |
| * Cheniere Energy Inc. | 9,518 | 408 |
| * Diamondback Energy Inc. | 4,127 | 393 |
| Helmerich & Payne Inc. | 5,737 | 347 |
| Targa Resources Corp. | 7,490 | 326 |
| * Southwestern Energy Co. | 23,137 | 322 |
| * FMC Technologies Inc. | 11,072 | 312 |
| Range Resources Corp. | 8,011 | 309 |
| * Parsley Energy Inc. Class A | 8,498 | 288 |
| QEP Resources Inc. | 14,423 | 275 |
| Energen Corp. | 4,500 | 259 |
| * WPX Energy Inc. | 20,477 | 246 |
| * Weatherford International plc | 44,367 | 243 |
| * Antero Resources Corp. | 8,551 | 219 |
| Murphy Oil Corp. | 7,956 | 213 |
| HollyFrontier Corp. | 8,157 | 211 |
| CONSOL Energy Inc. | 10,689 | 195 |
| * Continental Resources Inc. | 3,999 | 192 |
| * Chesapeake Energy Corp. | 30,157 | 192 |
| SM Energy Co. | 4,825 | 183 |
| * Gulfport Energy Corp. | 5,854 | 167 |
| * Transocean Ltd. | 16,462 | 160 |
10
| Vanguard® Russell 3000 Index Fund | |||
| Schedule of Investments | |||
| August 31, 2016 | |||
| Market | |||
| Value | |||
| Shares | ($000) | ||
| * | PDC Energy Inc. | 2,387 | 159 |
| * | Rice Energy Inc. | 5,676 | 149 |
| World Fuel Services Corp. | 3,288 | 147 | |
| * | RSP Permian Inc. | 3,730 | 146 |
| * | First Solar Inc. | 3,737 | 141 |
| Patterson-UTI Energy Inc. | 7,020 | 137 | |
| Nabors Industries Ltd. | 13,325 | 132 | |
| Superior Energy Services Inc. | 7,827 | 132 | |
| Western Refining Inc. | 5,135 | 129 | |
| Oceaneering International Inc. | 4,616 | 122 | |
| Ensco plc Class A | 15,511 | 118 | |
| * | NOW Inc. | 5,336 | 110 |
| * | Dril-Quip Inc. | 1,847 | 103 |
| * | Carrizo Oil & Gas Inc. | 2,516 | 96 |
| PBF Energy Inc. Class A | 4,321 | 95 | |
| * | Laredo Petroleum Inc. | 7,272 | 89 |
| * | Oasis Petroleum Inc. | 9,166 | 87 |
| * | Oil States International Inc. | 2,701 | 84 |
| Golar LNG Ltd. | 3,905 | 81 | |
| * | Matador Resources Co. | 3,441 | 79 |
| SemGroup Corp. Class A | 2,538 | 79 | |
| * | Memorial Resource Development Corp. | 5,172 | 74 |
| * | SolarCity Corp. | 3,506 | 72 |
| * | Callon Petroleum Co. | 4,943 | 72 |
| Rowan Cos. plc Class A | 5,421 | 68 | |
| * | Forum Energy Technologies Inc. | 3,733 | 66 |
| * | Whiting Petroleum Corp. | 8,858 | 65 |
| Noble Corp. plc | 10,974 | 63 | |
| * | Synergy Resources Corp. | 9,435 | 62 |
| *,^ | RPC Inc. | 3,664 | 56 |
| * | McDermott International Inc. | 10,357 | 54 |
| Diamond Offshore Drilling Inc. | 2,787 | 51 | |
| TerraForm Power Inc. Class A | 3,798 | 49 | |
| * | Denbury Resources Inc. | 15,485 | 48 |
| * | SEACOR Holdings Inc. | 746 | 44 |
| Delek US Holdings Inc. | 2,498 | 44 | |
| * | Kosmos Energy Ltd. | 6,842 | 42 |
| * | Unit Corp. | 2,355 | 40 |
| *,^ | Seadrill Ltd. | 15,407 | 37 |
| *,^ | SunPower Corp. Class A | 3,094 | 31 |
| * | Flotek Industries Inc. | 1,975 | 31 |
| Archrock Inc. | 2,750 | 30 | |
| Green Plains Inc. | 1,074 | 26 | |
| * | Newpark Resources Inc. | 3,228 | 23 |
| * | REX American Resources Corp. | 268 | 22 |
| * | Matrix Service Co. | 1,148 | 21 |
| * | Helix Energy Solutions Group Inc. | 2,830 | 21 |
| *,^ | Fairmount Santrol Holdings Inc. | 2,847 | 21 |
| Atwood Oceanics Inc. | 2,594 | 21 | |
| * | TETRA Technologies Inc. | 3,318 | 20 |
| * | Cobalt International Energy Inc. | 15,962 | 19 |
| * | Par Pacific Holdings Inc. | 1,537 | 19 |
| * | Exterran Corp. | 1,331 | 19 |
| * | Sanchez Energy Corp. | 2,116 | 18 |
| ^ | Frank's International NV | 1,470 | 17 |
| SunCoke Energy Inc. | 2,391 | 16 | |
| * | California Resources Corp. | 1,555 | 15 |
| * | Clayton Williams Energy Inc. | 239 | 15 |
| * | Bill Barrett Corp. | 2,167 | 14 |
| * | Renewable Energy Group Inc. | 1,583 | 14 |
| * | Clean Energy Fuels Corp. | 3,180 | 14 |
| * | Natural Gas Services Group Inc. | 575 | 14 |
| * | Parker Drilling Co. | 5,695 | 12 |
| * | Sunrun Inc. | 1,981 | 12 |
11
| Vanguard® Russell 3000 Index Fund | ||
| Schedule of Investments | ||
| August 31, 2016 | ||
| Market | ||
| Value | ||
| Shares | ($000) | |
| Tesco Corp. | 1,548 | 11 |
| Panhandle Oil and Gas Inc. Class A | 595 | 10 |
| * TerraVia Holdings Inc. | 3,819 | 10 |
| * Ring Energy Inc. | 965 | 10 |
| * Trecora Resources | 867 | 9 |
| CVR Energy Inc. | 626 | 9 |
| CARBO Ceramics Inc. | 725 | 9 |
| Evolution Petroleum Corp. | 1,359 | 8 |
| * Northern Oil and Gas Inc. | 2,178 | 7 |
| * EnerNOC Inc. | 1,223 | 7 |
| * Hornbeck Offshore Services Inc. | 1,272 | 7 |
| * Dawson Geophysical Co. | 953 | 7 |
| * Eclipse Resources Corp. | 1,988 | 7 |
| TerraForm Global Inc. Class A | 1,816 | 7 |
| * Geospace Technologies Corp. | 368 | 7 |
| * Pacific Ethanol Inc. | 954 | 6 |
| * Pioneer Energy Services Corp. | 1,846 | 6 |
| * RigNet Inc. | 445 | 6 |
| * Westmoreland Coal Co. | 721 | 6 |
| * Era Group Inc. | 757 | 6 |
| * Independence Contract Drilling Inc. | 1,032 | 5 |
| * EP Energy Corp. Class A | 1,225 | 5 |
| * Abraxas Petroleum Corp. | 3,067 | 4 |
| Alon USA Energy Inc. | 517 | 4 |
| * EXCO Resources Inc. | 4,019 | 4 |
| * Willbros Group Inc. | 2,051 | 4 |
| * Jones Energy Inc. Class A | 1,055 | 3 |
| * Vivint Solar Inc. | 733 | 2 |
| Adams Resources & Energy Inc. | 60 | 2 |
| * Ameresco Inc. Class A | 463 | 2 |
| * Isramco Inc. | 28 | 2 |
| * W&T Offshore Inc. | 799 | 1 |
| * Erin Energy Corp. | 457 | 1 |
| * Earthstone Energy Inc. | 47 | — |
| * Green Brick Partners Inc. | 27 | — |
| * Contango Oil & Gas Co. | 18 | — |
| * FuelCell Energy Inc. | 27 | — |
| * Par Pacific Holdings Inc. Rights Exp. 09/14/2016 | 1,534 | — |
| 73,201 | ||
| Financial Services (20.0%) | ||
| * Berkshire Hathaway Inc. Class B | 93,480 | 14,068 |
| JPMorgan Chase & Co. | 180,103 | 12,157 |
| Wells Fargo & Co. | 224,081 | 11,383 |
| Bank of America Corp. | 507,349 | 8,189 |
| Visa Inc. Class A | 94,279 | 7,627 |
| Citigroup Inc. | 145,474 | 6,945 |
| MasterCard Inc. Class A | 47,706 | 4,610 |
| US Bancorp | 80,756 | 3,565 |
| Simon Property Group Inc. | 15,332 | 3,304 |
| American International Group Inc. | 54,743 | 3,275 |
| Goldman Sachs Group Inc. | 19,041 | 3,227 |
| Chubb Ltd. | 22,767 | 2,890 |
| American Express Co. | 39,526 | 2,592 |
| American Tower Corporation | 20,943 | 2,375 |
| BlackRock Inc. | 6,207 | 2,314 |
| Morgan Stanley | 70,625 | 2,264 |
| PNC Financial Services Group Inc. | 24,628 | 2,219 |
| Bank of New York Mellon Corp. | 52,346 | 2,181 |
| * PayPal Holdings Inc. | 55,718 | 2,070 |
| MetLife Inc. | 45,619 | 1,980 |
| Capital One Financial Corp. | 26,029 | 1,864 |
| Charles Schwab Corp. | 57,293 | 1,802 |
| CME Group Inc. | 16,614 | 1,800 |
| Marsh & McLennan Cos. Inc. | 25,596 | 1,731 |
12
| Vanguard® Russell 3000 Index Fund | ||
| Schedule of Investments | ||
| August 31, 2016 | ||
| Market | ||
| Value | ||
| Shares | ($000) | |
| Prudential Financial Inc. | 21,642 | 1,718 |
| Travelers Cos. Inc. | 14,278 | 1,695 |
| Public Storage | 7,428 | 1,663 |
| Intercontinental Exchange Inc. | 5,829 | 1,644 |
| S&P Global Inc. | 12,903 | 1,594 |
| Crown Castle International Corp. | 16,713 | 1,584 |
| BB&T Corp. | 40,061 | 1,542 |
| Aflac Inc. | 19,880 | 1,475 |
| Aon plc | 13,028 | 1,451 |
| Welltower Inc. | 17,955 | 1,378 |
| State Street Corp. | 19,540 | 1,372 |
| Prologis Inc. | 25,728 | 1,366 |
| Allstate Corp. | 18,452 | 1,272 |
| Fidelity National Information Services Inc. | 15,900 | 1,261 |
| Equinix Inc. | 3,410 | 1,257 |
| Ventas Inc. | 16,535 | 1,202 |
| Discover Financial Services | 19,995 | 1,200 |
| AvalonBay Communities Inc. | 6,746 | 1,181 |
| Equity Residential | 17,991 | 1,167 |
| Weyerhaeuser Co. | 36,507 | 1,163 |
| Synchrony Financial | 40,730 | 1,134 |
| * Fiserv Inc. | 10,809 | 1,114 |
| SunTrust Banks Inc. | 24,696 | 1,088 |
| Boston Properties Inc. | 7,570 | 1,061 |
| Progressive Corp. | 28,801 | 938 |
| HCP Inc. | 23,123 | 909 |
| Moody's Corp. | 8,282 | 900 |
| Vornado Realty Trust | 8,595 | 888 |
| M&T Bank Corp. | 7,438 | 880 |
| Realty Income Corp. | 12,602 | 828 |
| T. Rowe Price Group Inc. | 11,886 | 827 |
| General Growth Properties Inc. | 28,349 | 826 |
| Hartford Financial Services Group Inc. | 19,891 | 817 |
| Ameriprise Financial Inc. | 8,076 | 816 |
| Fifth Third Bancorp | 38,280 | 772 |
| Equifax Inc. | 5,831 | 769 |
| * FleetCor Technologies Inc. | 4,588 | 753 |
| Essex Property Trust Inc. | 3,179 | 722 |
| Digital Realty Trust Inc. | 7,249 | 718 |
| Northern Trust Corp. | 10,000 | 706 |
| Principal Financial Group Inc. | 13,989 | 686 |
| KeyCorp | 53,152 | 668 |
| Citizens Financial Group Inc. | 26,892 | 666 |
| Regions Financial Corp. | 64,133 | 639 |
| Franklin Resources Inc. | 17,505 | 639 |
| Host Hotels & Resorts Inc. | 35,552 | 634 |
| Thomson Reuters Corp. | 15,152 | 629 |
| * Alliance Data Systems Corp. | 3,070 | 628 |
| Invesco Ltd. | 20,130 | 628 |
| * Markel Corp. | 656 | 611 |
| Lincoln National Corp. | 12,531 | 602 |
| Kimco Realty Corp. | 19,964 | 600 |
| Loews Corp. | 14,210 | 595 |
| Cincinnati Financial Corp. | 7,612 | 587 |
| SL Green Realty Corp. | 4,954 | 583 |
| Macerich Co. | 7,075 | 579 |
| Federal Realty Investment Trust | 3,533 | 562 |
| Global Payments Inc. | 7,349 | 558 |
| Annaly Capital Management Inc. | 50,186 | 537 |
| First Republic Bank | 6,957 | 535 |
| Western Union Co. | 24,089 | 518 |
| Huntington Bancshares Inc. | 50,902 | 510 |
| VEREIT Inc. | 48,475 | 507 |
| Extra Space Storage Inc. | 6,268 | 505 |
13
| Vanguard® Russell 3000 Index Fund | ||
| Schedule of Investments | ||
| August 31, 2016 | ||
| Market | ||
| Value | ||
| Shares | ($000) | |
| Iron Mountain Inc. | 13,045 | 501 |
| * XL Group Ltd. | 14,431 | 494 |
| FNF Group | 13,080 | 493 |
| Duke Realty Corp. | 17,354 | 488 |
| * Arch Capital Group Ltd. | 5,973 | 483 |
| UDR Inc. | 13,104 | 474 |
| * Affiliated Managers Group Inc. | 3,162 | 449 |
| * CBRE Group Inc. Class A | 14,310 | 428 |
| Ally Financial Inc. | 21,176 | 424 |
| * E*TRADE Financial Corp. | 15,876 | 419 |
| Alexandria Real Estate Equities Inc. | 3,779 | 416 |
| Unum Group | 11,640 | 414 |
| Arthur J Gallagher & Co. | 8,368 | 413 |
| MSCI Inc. Class A | 4,572 | 412 |
| TD Ameritrade Holding Corp. | 12,481 | 410 |
| Total System Services Inc. | 8,218 | 405 |
| Regency Centers Corp. | 5,004 | 403 |
| Everest Re Group Ltd. | 2,078 | 402 |
| * Vantiv Inc. Class A | 7,390 | 397 |
| * Alleghany Corp. | 737 | 395 |
| Comerica Inc. | 8,309 | 393 |
| Nasdaq Inc. | 5,487 | 391 |
| Broadridge Financial Solutions Inc. | 5,636 | 391 |
| Torchmark Corp. | 5,925 | 383 |
| Mid-America Apartment Communities Inc. | 3,955 | 372 |
| FactSet Research Systems Inc. | 2,082 | 371 |
| Reinsurance Group of America Inc. Class A | 3,381 | 363 |
| Camden Property Trust | 4,124 | 362 |
| Raymond James Financial Inc. | 6,113 | 356 |
| CIT Group Inc. | 9,499 | 350 |
| National Retail Properties Inc. | 6,983 | 350 |
| Apartment Investment & Management Co. | 7,661 | 346 |
| New York Community Bancorp Inc. | 22,878 | 346 |
| Jack Henry & Associates Inc. | 3,908 | 341 |
| WP Carey Inc. | 4,974 | 332 |
| Kilroy Realty Corp. | 4,544 | 330 |
| Omega Healthcare Investors Inc. | 9,077 | 329 |
| Spirit Realty Capital Inc. | 23,804 | 315 |
| American Campus Communities Inc. | 6,252 | 313 |
| * Signature Bank | 2,522 | 308 |
| PacWest Bancorp | 7,090 | 307 |
| American Capital Agency Corp. | 15,742 | 304 |
| * SVB Financial Group | 2,677 | 297 |
| MarketAxess Holdings Inc. | 1,764 | 297 |
| DDR Corp. | 15,547 | 294 |
| Leucadia National Corp. | 15,346 | 294 |
| Liberty Property Trust | 6,990 | 288 |
| Zions Bancorporation | 9,336 | 286 |
| Voya Financial Inc. | 9,663 | 283 |
| Equity LifeStyle Properties Inc. | 3,638 | 282 |
| Hospitality Properties Trust | 9,208 | 281 |
| SEI Investments Co. | 6,089 | 281 |
| Forest City Realty Trust Inc. Class A | 11,517 | 272 |
| Lazard Ltd. Class A | 7,308 | 271 |
| Jones Lang LaSalle Inc. | 2,317 | 271 |
| CBOE Holdings Inc. | 3,905 | 268 |
| CubeSmart | 9,721 | 268 |
| WR Berkley Corp. | 4,490 | 267 |
| Axis Capital Holdings Ltd. | 4,639 | 264 |
| Assurant Inc. | 2,914 | 261 |
| Brixmor Property Group Inc. | 9,122 | 261 |
| Douglas Emmett Inc. | 6,817 | 256 |
| * WEX Inc. | 2,573 | 256 |
| Starwood Property Trust Inc. | 11,136 | 255 |
14
| Vanguard® Russell 3000 Index Fund | |||
| Schedule of Investments | |||
| August 31, 2016 | |||
| Market | |||
| Value | |||
| Shares | ($000) | ||
| Dun & Bradstreet Corp. | 1,815 | 250 | |
| Senior Housing Properties Trust | 11,138 | 249 | |
| East West Bancorp Inc. | 6,680 | 248 | |
| American Financial Group Inc. | 3,270 | 246 | |
| Webster Financial Corp. | 6,303 | 243 | |
| Cullen/Frost Bankers Inc. | 3,335 | 243 | |
| Weingarten Realty Investors | 5,837 | 241 | |
| Navient Corp. | 16,657 | 240 | |
| Highwoods Properties Inc. | 4,492 | 238 | |
| RenaissanceRe Holdings Ltd. | 1,975 | 236 | |
| People's United Financial Inc. | 14,546 | 236 | |
| EPR Properties | 3,008 | 236 | |
| Old Republic International Corp. | 12,193 | 234 | |
| Taubman Centers Inc. | 2,970 | 231 | |
| Sun Communities Inc. | 2,982 | 228 | |
| Gaming and Leisure Properties Inc. | 6,625 | 227 | |
| * | Howard Hughes Corp. | 1,882 | 222 |
| First American Financial Corp. | 5,120 | 221 | |
| DCT Industrial Trust Inc. | 4,509 | 220 | |
| Healthcare Trust of America Inc. Class A | 6,361 | 215 | |
| STORE Capital Corp. | 7,187 | 213 | |
| Commerce Bancshares Inc. | 4,181 | 212 | |
| Brown & Brown Inc. | 5,613 | 210 | |
| * | First Data Corp. Class A | 14,918 | 208 |
| Eaton Vance Corp. | 5,170 | 207 | |
| Retail Properties of America Inc. | 11,828 | 201 | |
| Endurance Specialty Holdings Ltd. | 3,048 | 201 | |
| White Mountains Insurance Group Ltd. | 242 | 199 | |
| Umpqua Holdings Corp. | 11,860 | 195 | |
| Fair Isaac Corp. | 1,521 | 195 | |
| New Residential Investment Corp. | 13,505 | 194 | |
| Gramercy Property Trust | 19,998 | 194 | |
| Paramount Group Inc. | 10,732 | 193 | |
| * | Life Storage Inc. | 2,126 | 191 |
| Radian Group Inc. | 13,943 | 191 | |
| Healthcare Realty Trust Inc. | 5,413 | 190 | |
| Synovus Financial Corp. | 5,735 | 190 | |
| Hudson Pacific Properties Inc. | 5,530 | 185 | |
| Popular Inc. | 4,648 | 183 | |
| Investors Bancorp Inc. | 14,868 | 182 | |
| Validus Holdings Ltd. | 3,580 | 182 | |
| Realogy Holdings Corp. | 6,726 | 181 | |
| Assured Guaranty Ltd. | 6,492 | 180 | |
| CyrusOne Inc. | 3,529 | 179 | |
| * | Equity Commonwealth | 5,680 | 178 |
| Education Realty Trust Inc. | 3,893 | 176 | |
| Bank of the Ozarks Inc. | 4,491 | 176 | |
| Communications Sales & Leasing Inc. | 5,633 | 176 | |
| * | Euronet Worldwide Inc. | 2,264 | 176 |
| Tanger Factory Outlet Centers Inc. | 4,307 | 175 | |
| Federated Investors Inc. Class B | 5,378 | 174 | |
| American Homes 4 Rent Class A | 7,932 | 173 | |
| Legg Mason Inc. | 5,010 | 173 | |
| Prosperity Bancshares Inc. | 3,097 | 172 | |
| Medical Properties Trust Inc. | 11,187 | 171 | |
| LPL Financial Holdings Inc. | 5,740 | 171 | |
| Bank of Hawaii Corp. | 2,361 | 170 | |
| * | Western Alliance Bancorp | 4,447 | 170 |
| Allied World Assurance Co. Holdings AG | 4,136 | 168 | |
| *,^ | Zillow Group Inc. | 4,886 | 165 |
| MFA Financial Inc. | 21,269 | 164 | |
| PrivateBancorp Inc. | 3,570 | 164 | |
| Acadia Realty Trust | 4,424 | 163 | |
| * | CoreLogic Inc. | 3,947 | 162 |
15
| Vanguard® Russell 3000 Index Fund | ||
| Schedule of Investments | ||
| August 31, 2016 | ||
| Market | ||
| Value | ||
| Shares | ($000) | |
| Post Properties Inc. | 2,434 | 161 |
| Empire State Realty Trust Inc. | 7,501 | 161 |
| Apple Hospitality REIT Inc. | 8,108 | 159 |
| First Horizon National Corp. | 10,311 | 159 |
| Rayonier Inc. | 5,731 | 158 |
| Chimera Investment Corp. | 9,381 | 155 |
| Wintrust Financial Corp. | 2,737 | 152 |
| Hanover Insurance Group Inc. | 1,927 | 151 |
| First Industrial Realty Trust Inc. | 5,228 | 150 |
| Kite Realty Group Trust | 5,200 | 150 |
| DuPont Fabros Technology Inc. | 3,532 | 150 |
| BankUnited Inc. | 4,490 | 144 |
| Piedmont Office Realty Trust Inc. Class A | 6,656 | 144 |
| Two Harbors Investment Corp. | 16,084 | 143 |
| National Health Investors Inc. | 1,780 | 143 |
| RLI Corp. | 1,994 | 142 |
| Primerica Inc. | 2,452 | 140 |
| LaSalle Hotel Properties | 4,966 | 139 |
| CNO Financial Group Inc. | 8,564 | 139 |
| Brandywine Realty Trust | 8,548 | 138 |
| * SLM Corp. | 18,576 | 138 |
| Sunstone Hotel Investors Inc. | 9,805 | 136 |
| Equity One Inc. | 4,363 | 135 |
| RLJ Lodging Trust | 5,797 | 135 |
| Columbia Property Trust Inc. | 5,697 | 134 |
| ProAssurance Corp. | 2,373 | 131 |
| Physicians Realty Trust | 6,095 | 130 |
| Associated Banc-Corp | 6,572 | 130 |
| Corporate Office Properties Trust | 4,552 | 130 |
| MB Financial Inc. | 3,286 | 129 |
| Home BancShares Inc. | 5,465 | 128 |
| Aspen Insurance Holdings Ltd. | 2,769 | 127 |
| IBERIABANK Corp. | 1,837 | 126 |
| Hancock Holding Co. | 3,861 | 126 |
| CoreSite Realty Corp. | 1,592 | 124 |
| Urban Edge Properties | 4,325 | 124 |
| Mack-Cali Realty Corp. | 4,423 | 123 |
| Community Bank System Inc. | 2,559 | 121 |
| Fulton Financial Corp. | 8,363 | 121 |
| EastGroup Properties Inc. | 1,647 | 121 |
| FNB Corp. | 9,653 | 121 |
| QTS Realty Trust Inc. Class A | 2,216 | 120 |
| Washington Federal Inc. | 4,530 | 120 |
| United Bankshares Inc. | 3,021 | 119 |
| * MGIC Investment Corp. | 14,620 | 118 |
| UMB Financial Corp. | 1,934 | 118 |
| Care Capital Properties Inc. | 3,899 | 117 |
| Erie Indemnity Co. Class A | 1,145 | 117 |
| Cousins Properties Inc. | 10,558 | 116 |
| * Stifel Financial Corp. | 2,943 | 116 |
| First Financial Bankshares Inc. | 3,146 | 115 |
| BancorpSouth Inc. | 4,571 | 114 |
| Lexington Realty Trust | 10,516 | 113 |
| Selective Insurance Group Inc. | 2,833 | 113 |
| Pinnacle Financial Partners Inc. | 1,969 | 112 |
| Washington REIT | 3,434 | 112 |
| Ryman Hospitality Properties Inc. | 2,061 | 111 |
| * Washington Prime Group Inc. | 8,041 | 110 |
| Glacier Bancorp Inc. | 3,686 | 110 |
| Cathay General Bancorp | 3,492 | 110 |
| Retail Opportunity Investments Corp. | 4,888 | 109 |
| Sterling Bancorp | 6,021 | 107 |
| TCF Financial Corp. | 7,323 | 107 |
| Valley National Bancorp | 11,053 | 107 |
16
| Vanguard® Russell 3000 Index Fund | ||
| Schedule of Investments | ||
| August 31, 2016 | ||
| Market | ||
| Value | ||
| Shares | ($000) | |
| First Citizens BancShares Inc. Class A | 373 | 106 |
| * Cardtronics plc Class A | 2,353 | 106 |
| NorthStar Realty Finance Corp. | 7,920 | 106 |
| Janus Capital Group Inc. | 7,100 | 106 |
| * Texas Capital Bancshares Inc. | 1,996 | 105 |
| NorthStar Asset Management Group Inc. | 8,402 | 104 |
| CBL & Associates Properties Inc. | 7,247 | 103 |
| DiamondRock Hospitality Co. | 9,758 | 103 |
| Capitol Federal Financial Inc. | 7,116 | 102 |
| * Genworth Financial Inc. Class A | 21,600 | 102 |
| Trustmark Corp. | 3,570 | 101 |
| BOK Financial Corp. | 1,460 | 101 |
| Alexander & Baldwin Inc. | 2,499 | 100 |
| EverBank Financial Corp. | 5,214 | 100 |
| Pebblebrook Hotel Trust | 3,286 | 99 |
| Colony Capital Inc. Class A | 5,324 | 98 |
| Interactive Brokers Group Inc. | 2,730 | 98 |
| Old National Bancorp | 6,888 | 98 |
| Kennedy-Wilson Holdings Inc. | 4,418 | 97 |
| Columbia Banking System Inc. | 2,949 | 97 |
| LTC Properties Inc. | 1,869 | 97 |
| PS Business Parks Inc. | 870 | 96 |
| AmTrust Financial Services Inc. | 3,624 | 96 |
| Great Western Bancorp Inc. | 2,792 | 96 |
| CVB Financial Corp. | 5,369 | 96 |
| Colony Starwood Homes | 3,078 | 95 |
| South State Corp. | 1,248 | 95 |
| Xenia Hotels & Resorts Inc. | 5,618 | 95 |
| Pennsylvania REIT | 3,747 | 94 |
| * Hilltop Holdings Inc. | 4,095 | 93 |
| * Hope Bancorp Inc. | 5,353 | 92 |
| Monogram Residential Trust Inc. | 8,691 | 91 |
| Corrections Corp. of America | 5,657 | 90 |
| American Assets Trust Inc. | 2,021 | 90 |
| * Enstar Group Ltd. | 537 | 89 |
| Kemper Corp. | 2,375 | 89 |
| Evercore Partners Inc. Class A | 1,734 | 89 |
| International Bancshares Corp. | 2,988 | 89 |
| * Credit Acceptance Corp. | 440 | 88 |
| Select Income REIT | 3,200 | 87 |
| * Blackhawk Network Holdings Inc. | 2,532 | 87 |
| Government Properties Income Trust | 3,708 | 86 |
| Financial Engines Inc. | 2,694 | 86 |
| Argo Group International Holdings Ltd. | 1,515 | 86 |
| * Essent Group Ltd. | 3,219 | 86 |
| STAG Industrial Inc. | 3,431 | 85 |
| Parkway Properties Inc. | 4,730 | 85 |
| * LendingClub Corp. | 15,574 | 84 |
| Horace Mann Educators Corp. | 2,304 | 84 |
| * Zillow Group Inc. Class A | 2,488 | 84 |
| BGC Partners Inc. Class A | 9,545 | 84 |
| First Midwest Bancorp Inc. | 4,275 | 84 |
| * TransUnion | 2,529 | 83 |
| Morningstar Inc. | 1,004 | 83 |
| Chemical Financial Corp. | 1,800 | 83 |
| Potlatch Corp. | 2,134 | 81 |
| Ramco-Gershenson Properties Trust | 4,135 | 80 |
| Invesco Mortgage Capital Inc. | 5,101 | 80 |
| Chesapeake Lodging Trust | 3,146 | 80 |
| Sabra Health Care REIT Inc. | 3,129 | 80 |
| Northwest Bancshares Inc. | 5,123 | 80 |
| Mercury General Corp. | 1,452 | 79 |
| First Cash Financial Services Inc. | 1,517 | 78 |
| * Eagle Bancorp Inc. | 1,515 | 78 |
17
| Vanguard® Russell 3000 Index Fund | |||
| Schedule of Investments | |||
| August 31, 2016 | |||
| Market | |||
| Value | |||
| Shares | ($000) | ||
| New York REIT Inc. | 7,920 | 77 | |
| * | HRG Group Inc. | 4,665 | 75 |
| NBT Bancorp Inc. | 2,295 | 74 | |
| CYS Investments Inc. | 8,336 | 73 | |
| Provident Financial Services Inc. | 3,373 | 73 | |
| Renasant Corp. | 2,051 | 73 | |
| Union Bankshares Corp. | 2,611 | 73 | |
| Independent Bank Corp. | 1,358 | 72 | |
| Summit Hotel Properties Inc. | 5,027 | 72 | |
| First Financial Bancorp | 3,294 | 72 | |
| *,^ | BofI Holding Inc. | 3,326 | 72 |
| ServisFirst Bancshares Inc. | 1,364 | 71 | |
| Rexford Industrial Realty Inc. | 3,174 | 71 | |
| * | OneMain Holdings Inc. Class A | 2,265 | 70 |
| GEO Group Inc. | 3,470 | 70 | |
| Park National Corp. | 720 | 69 | |
| Ameris Bancorp | 1,964 | 68 | |
| Kearny Financial Corp. | 4,978 | 68 | |
| Simmons First National Corp. Class A | 1,356 | 68 | |
| Waddell & Reed Financial Inc. Class A | 3,656 | 68 | |
| Westamerica Bancorporation | 1,335 | 68 | |
| WesBanco Inc. | 2,059 | 67 | |
| Redwood Trust Inc. | 4,547 | 67 | |
| Global Net Lease Inc. | 8,076 | 67 | |
| * | PRA Group Inc. | 2,095 | 67 |
| Stewart Information Services Corp. | 1,460 | 67 | |
| Beneficial Bancorp Inc. | 4,410 | 66 | |
| AMERISAFE Inc. | 1,103 | 66 | |
| Franklin Street Properties Corp. | 5,222 | 66 | |
| LegacyTexas Financial Group Inc. | 2,153 | 65 | |
| Yadkin Financial Corp. | 2,501 | 65 | |
| Tompkins Financial Corp. | 878 | 65 | |
| United Community Banks Inc. | 3,088 | 65 | |
| Terreno Realty Corp. | 2,415 | 65 | |
| Towne Bank | 2,711 | 64 | |
| * | FCB Financial Holdings Inc. Class A | 1,665 | 64 |
| American Equity Investment Life Holding Co. | 3,537 | 62 | |
| Navigators Group Inc. | 659 | 62 | |
| Astoria Financial Corp. | 4,032 | 62 | |
| Boston Private Financial Holdings Inc. | 4,754 | 61 | |
| PennyMac Mortgage Investment Trust | 3,965 | 60 | |
| * | Green Dot Corp. Class A | 2,601 | 60 |
| Agree Realty Corp. | 1,249 | 60 | |
| HFF Inc. Class A | 2,235 | 60 | |
| ^ | WisdomTree Investments Inc. | 5,645 | 59 |
| FelCor Lodging Trust Inc. | 8,296 | 59 | |
| Infinity Property & Casualty Corp. | 700 | 59 | |
| Safety Insurance Group Inc. | 886 | 59 | |
| * | Third Point Reinsurance Ltd. | 4,484 | 58 |
| Capstead Mortgage Corp. | 5,742 | 57 | |
| Banco Latinoamericano de Comercio Exterior SA | 1,940 | 56 | |
| Monmouth Real Estate Investment Corp. | 4,000 | 56 | |
| Banner Corp. | 1,252 | 55 | |
| Meridian Bancorp Inc. | 3,541 | 55 | |
| Banc of California Inc. | 2,469 | 55 | |
| Hannon Armstrong Sustainable Infrastructure Capital Inc. | 2,298 | 55 | |
| Cohen & Steers Inc. | 1,297 | 55 | |
| S&T Bancorp Inc. | 1,896 | 55 | |
| Apollo Commercial Real Estate Finance Inc. | 3,335 | 54 | |
| Four Corners Property Trust Inc. | 2,598 | 54 | |
| CenterState Banks Inc. | 2,982 | 54 | |
| CNA Financial Corp. | 1,599 | 53 | |
| State Bank Financial Corp. | 2,280 | 53 | |
| American National Insurance Co. | 447 | 52 | |
18
| Vanguard® Russell 3000 Index Fund | ||
| Schedule of Investments | ||
| August 31, 2016 | ||
| Market | ||
| Value | ||
| Shares | ($000) | |
| Seritage Growth Properties Class A | 1,164 | 52 |
| * Ambac Financial Group Inc. | 2,843 | 52 |
| National General Holdings Corp. | 2,251 | 51 |
| Berkshire Hills Bancorp Inc. | 1,824 | 51 |
| New Senior Investment Group Inc. | 4,093 | 51 |
| Silver Bay Realty Trust Corp. | 2,633 | 50 |
| WSFS Financial Corp. | 1,285 | 50 |
| * Santander Consumer USA Holdings Inc. | 3,883 | 49 |
| BNC Bancorp | 1,984 | 49 |
| Chatham Lodging Trust | 2,350 | 49 |
| EVERTEC Inc. | 2,854 | 49 |
| * Customers Bancorp Inc. | 1,817 | 49 |
| Heartland Financial USA Inc. | 1,335 | 48 |
| Talmer Bancorp Inc. Class A | 2,083 | 48 |
| TFS Financial Corp. | 2,668 | 48 |
| Investors Real Estate Trust | 7,282 | 48 |
| Northfield Bancorp Inc. | 3,029 | 48 |
| Nelnet Inc. Class A | 1,358 | 48 |
| Stock Yards Bancorp Inc. | 1,494 | 48 |
| * Walker & Dunlop Inc. | 1,799 | 48 |
| * HomeStreet Inc. | 1,825 | 48 |
| * St. Joe Co. | 2,496 | 47 |
| Univest Corp. of Pennsylvania | 2,020 | 47 |
| * MBIA Inc. | 5,821 | 47 |
| First Merchants Corp. | 1,712 | 46 |
| Central Pacific Financial Corp. | 1,796 | 46 |
| * Pacific Premier Bancorp Inc. | 1,695 | 46 |
| Lakeland Bancorp Inc. | 3,333 | 45 |
| * INTL. FCStone Inc. | 1,263 | 45 |
| Flushing Financial Corp. | 1,960 | 45 |
| Getty Realty Corp. | 1,927 | 45 |
| Capital Bank Financial Corp. | 1,441 | 45 |
| Enterprise Financial Services Corp. | 1,464 | 45 |
| Greenhill & Co. Inc. | 1,964 | 45 |
| Cash America International Inc. | 1,033 | 45 |
| FBL Financial Group Inc. Class A | 675 | 45 |
| 1st Source Corp. | 1,209 | 43 |
| * Greenlight Capital Re Ltd. Class A | 1,973 | 42 |
| First Busey Corp. | 1,811 | 42 |
| Altisource Residential Corp. | 3,817 | 42 |
| * FNFV Group | 3,241 | 42 |
| MainSource Financial Group Inc. | 1,726 | 42 |
| Artisan Partners Asset Management Inc. Class A | 1,583 | 41 |
| * LendingTree Inc. | 424 | 41 |
| ConnectOne Bancorp Inc. | 2,300 | 41 |
| CareTrust REIT Inc. | 2,715 | 40 |
| Dime Community Bancshares Inc. | 2,278 | 40 |
| Community Trust Bancorp Inc. | 1,087 | 40 |
| Heritage Financial Corp. | 2,162 | 40 |
| InfraREIT Inc. | 2,111 | 40 |
| Employers Holdings Inc. | 1,290 | 39 |
| AG Mortgage Investment Trust Inc. | 2,477 | 39 |
| Alexander's Inc. | 90 | 39 |
| United Fire Group Inc. | 864 | 37 |
| First Commonwealth Financial Corp. | 3,655 | 37 |
| * Encore Capital Group Inc. | 1,728 | 37 |
| * iStar Inc. | 3,388 | 37 |
| Hersha Hospitality Trust Class A | 1,868 | 36 |
| Cardinal Financial Corp. | 1,357 | 36 |
| Tier REIT Inc. | 2,259 | 36 |
| Apollo Residential Mortgage Inc. | 2,640 | 36 |
| National Storage Affiliates Trust | 1,770 | 36 |
| ARMOUR Residential REIT Inc. | 1,592 | 35 |
| Lakeland Financial Corp. | 976 | 35 |
19
| Vanguard® Russell 3000 Index Fund | ||
| Schedule of Investments | ||
| August 31, 2016 | ||
| Market | ||
| Value | ||
| Shares | ($000) | |
| James River Group Holdings Ltd. | 952 | 35 |
| Gladstone Commercial Corp. | 1,929 | 35 |
| * Forestar Group Inc. | 2,707 | 34 |
| Southside Bancshares Inc. | 1,034 | 34 |
| National Western Life Group Inc. Class A | 175 | 34 |
| National Bank Holdings Corp. Class A | 1,413 | 34 |
| Bridge Bancorp Inc. | 1,132 | 34 |
| Hanmi Financial Corp. | 1,278 | 34 |
| Brookline Bancorp Inc. | 2,800 | 33 |
| Investment Technology Group Inc. | 2,170 | 33 |
| American Capital Mortgage Investment Corp. | 1,945 | 33 |
| * Seacoast Banking Corp. of Florida | 2,008 | 33 |
| Universal Health Realty Income Trust | 534 | 33 |
| Universal Insurance Holdings Inc. | 1,303 | 32 |
| Sandy Spring Bancorp Inc. | 1,017 | 32 |
| Easterly Government Properties Inc. | 1,592 | 31 |
| City Holding Co. | 596 | 30 |
| Oritani Financial Corp. | 1,849 | 30 |
| Westwood Holdings Group Inc. | 593 | 30 |
| United Financial Bancorp Inc. | 2,109 | 30 |
| * KCG Holdings Inc. Class A | 2,036 | 29 |
| * Piper Jaffray Cos. | 651 | 29 |
| Maiden Holdings Ltd. | 2,043 | 28 |
| TrustCo Bank Corp. NY | 3,927 | 28 |
| Cass Information Systems Inc. | 476 | 27 |
| Saul Centers Inc. | 411 | 27 |
| Washington Trust Bancorp Inc. | 621 | 26 |
| New York Mortgage Trust Inc. | 4,324 | 26 |
| Cedar Realty Trust Inc. | 3,450 | 26 |
| Urstadt Biddle Properties Inc. Class A | 1,145 | 26 |
| First Interstate BancSystem Inc. Class A | 839 | 26 |
| NorthStar Realty Europe Corp. | 2,436 | 25 |
| * Nationstar Mortgage Holdings Inc. | 1,560 | 25 |
| Virtus Investment Partners Inc. | 267 | 24 |
| First Potomac Realty Trust | 2,404 | 24 |
| * First BanCorp | 4,894 | 24 |
| * WMIH Corp. | 9,610 | 24 |
| Diamond Hill Investment Group Inc. | 126 | 24 |
| TriCo Bancshares | 882 | 24 |
| German American Bancorp Inc. | 627 | 23 |
| Ashford Hospitality Trust Inc. | 3,291 | 23 |
| Ladder Capital Corp. | 1,726 | 23 |
| * EZCORP Inc. Class A | 2,205 | 23 |
| * Flagstar Bancorp Inc. | 802 | 23 |
| Waterstone Financial Inc. | 1,317 | 22 |
| Anworth Mortgage Asset Corp. | 4,522 | 22 |
| Bryn Mawr Bank Corp. | 659 | 21 |
| PJT Partners Inc. | 840 | 21 |
| * Altisource Portfolio Solutions SA | 618 | 20 |
| Moelis & Co. Class A | 744 | 20 |
| * Citizens Inc. Class A | 1,829 | 20 |
| * Square Inc. | 1,632 | 20 |
| Mercantile Bank Corp. | 728 | 20 |
| OFG Bancorp | 1,752 | 19 |
| Federal Agricultural Mortgage Corp. | 458 | 19 |
| Ashford Hospitality Prime Inc. | 1,199 | 19 |
| Resource Capital Corp. | 1,389 | 18 |
| Western Asset Mortgage Capital Corp. | 1,740 | 18 |
| First Financial Corp. | 450 | 18 |
| OceanFirst Financial Corp. | 927 | 18 |
| Suffolk Bancorp | 514 | 18 |
| First Defiance Financial Corp. | 392 | 18 |
| BancFirst Corp. | 259 | 18 |
| CoBiz Financial Inc. | 1,336 | 18 |
20
| Vanguard® Russell 3000 Index Fund | ||
| Schedule of Investments | ||
| August 31, 2016 | ||
| Market | ||
| Value | ||
| Shares | ($000) | |
| Park Sterling Corp. | 2,049 | 17 |
| Armada Hoffler Properties Inc. | 1,258 | 17 |
| * Cowen Group Inc. Class A | 4,600 | 17 |
| Blue Hills Bancorp Inc. | 1,167 | 17 |
| First Community Bancshares Inc. | 718 | 17 |
| Preferred Bank | 491 | 17 |
| First of Long Island Corp. | 519 | 17 |
| CatchMark Timber Trust Inc. Class A | 1,449 | 17 |
| Great Southern Bancorp Inc. | 401 | 17 |
| NexPoint Residential Trust Inc. | 797 | 17 |
| Peoples Bancorp Inc. | 700 | 17 |
| Meta Financial Group Inc. | 270 | 17 |
| First Bancorp | 825 | 17 |
| CorEnergy Infrastructure Trust Inc. | 555 | 16 |
| Independent Bank Corp. | 1,000 | 16 |
| * HomeTrust Bancshares Inc. | 848 | 16 |
| Arrow Financial Corp. | 494 | 16 |
| Independent Bank Group Inc. | 359 | 16 |
| * NMI Holdings Inc. Class A | 1,962 | 16 |
| * First Foundation Inc. | 620 | 16 |
| Southwest Bancorp Inc. | 790 | 15 |
| Clifton Bancorp Inc. | 1,038 | 15 |
| Financial Institutions Inc. | 566 | 15 |
| Camden National Corp. | 329 | 15 |
| United Community Financial Corp. | 2,314 | 15 |
| * TriState Capital Holdings Inc. | 1,005 | 15 |
| Republic Bancorp Inc. Class A | 465 | 15 |
| QCR Holdings Inc. | 471 | 15 |
| Bank Mutual Corp. | 1,877 | 15 |
| * CU Bancorp | 601 | 15 |
| Dynex Capital Inc. | 1,963 | 14 |
| Arlington Asset Investment Corp. Class A | 966 | 14 |
| Stonegate Bank | 440 | 14 |
| Pacific Continental Corp. | 867 | 14 |
| * Ocwen Financial Corp. | 3,935 | 14 |
| * Trupanion Inc. | 927 | 14 |
| Virtu Financial Inc. Class A | 850 | 14 |
| Opus Bank | 395 | 14 |
| * Tejon Ranch Co. | 580 | 14 |
| * Marcus & Millichap Inc. | 527 | 14 |
| OneBeacon Insurance Group Ltd. Class A | 964 | 14 |
| First Connecticut Bancorp Inc. | 778 | 14 |
| Community Healthcare Trust Inc. | 593 | 14 |
| One Liberty Properties Inc. | 560 | 14 |
| Heritage Insurance Holdings Inc. | 985 | 14 |
| Whitestone REIT | 929 | 13 |
| OM Asset Management plc | 978 | 13 |
| State Auto Financial Corp. | 567 | 13 |
| Citizens & Northern Corp. | 600 | 13 |
| Fidelity & Guaranty Life | 545 | 13 |
| * NewStar Financial Inc. | 1,145 | 13 |
| Guaranty Bancorp | 694 | 13 |
| * World Acceptance Corp. | 266 | 13 |
| CNB Financial Corp. | 633 | 13 |
| Houlihan Lokey Inc. | 513 | 13 |
| * Atlantic Capital Bancshares Inc. | 822 | 13 |
| State National Cos. Inc. | 1,237 | 13 |
| National Bankshares Inc. | 348 | 12 |
| Ames National Corp. | 457 | 12 |
| Horizon Bancorp | 443 | 12 |
| Heritage Commerce Corp. | 1,066 | 12 |
| Fidelity Southern Corp. | 682 | 12 |
| Preferred Apartment Communities Inc. Class A | 874 | 12 |
| Peoples Financial Services Corp. | 314 | 12 |
21
| Vanguard® Russell 3000 Index Fund | ||
| Schedule of Investments | ||
| August 31, 2016 | ||
| Market | ||
| Value | ||
| Shares | ($000) | |
| First Bancorp Inc. | 536 | 12 |
| West Bancorporation Inc. | 611 | 12 |
| * Nicolet Bankshares Inc. | 320 | 12 |
| Baldwin & Lyons Inc. | 471 | 12 |
| * Triumph Bancorp Inc. | 620 | 12 |
| UMH Properties Inc. | 994 | 12 |
| United Insurance Holdings Corp. | 747 | 12 |
| Farmers National Banc Corp. | 1,180 | 12 |
| National Interstate Corp. | 361 | 12 |
| * Global Indemnity plc | 407 | 12 |
| Bank of Marin Bancorp | 241 | 12 |
| HCI Group Inc. | 368 | 12 |
| Ares Commercial Real Estate Corp. | 928 | 12 |
| American National Bankshares Inc. | 434 | 12 |
| City Office REIT Inc. | 890 | 12 |
| * Safeguard Scientifics Inc. | 816 | 12 |
| RAIT Financial Trust | 3,593 | 11 |
| Sun Bancorp Inc. | 492 | 11 |
| * FRP Holdings Inc. | 329 | 11 |
| RE/MAX Holdings Inc. Class A | 263 | 11 |
| RMR Group Inc. Class A | 284 | 11 |
| Peapack Gladstone Financial Corp. | 541 | 11 |
| * PennyMac Financial Services Inc. Class A | 653 | 11 |
| EMC Insurance Group Inc. | 376 | 10 |
| Carolina Financial Corp. | 484 | 10 |
| * Regional Management Corp. | 473 | 10 |
| * Enova International Inc. | 1,051 | 10 |
| Penns Woods Bancorp Inc. | 228 | 10 |
| Heritage Oaks Bancorp | 1,243 | 10 |
| First Business Financial Services Inc. | 435 | 10 |
| MidWestOne Financial Group Inc. | 328 | 10 |
| * PICO Holdings Inc. | 886 | 10 |
| Macatawa Bank Corp. | 1,254 | 10 |
| * AV Homes Inc. | 640 | 10 |
| * eHealth Inc. | 859 | 10 |
| * Ladenburg Thalmann Financial Services Inc. | 4,179 | 10 |
| WashingtonFirst Bankshares Inc. | 384 | 10 |
| Resource America Inc. Class A | 961 | 9 |
| Your Community Bankshares Inc. | 238 | 9 |
| Independence Realty Trust Inc. | 960 | 9 |
| Consolidated-Tomoka Land Co. | 167 | 9 |
| Federated National Holding Co. | 472 | 9 |
| * Bancorp Inc. | 1,386 | 9 |
| Northrim BanCorp Inc. | 322 | 8 |
| Owens Realty Mortgage Inc. | 474 | 8 |
| Home Bancorp Inc. | 277 | 8 |
| * Southern First Bancshares Inc. | 276 | 8 |
| * Trinity Place Holdings Inc. | 916 | 8 |
| ACNB Corp. | 286 | 8 |
| Bluerock Residential Growth REIT Inc. Class A | 580 | 8 |
| Summit Financial Group Inc. | 396 | 8 |
| Old Line Bancshares Inc. | 397 | 8 |
| Codorus Valley Bancorp Inc. | 368 | 8 |
| Oppenheimer Holdings Inc. Class A | 466 | 7 |
| Old Second Bancorp Inc. | 912 | 7 |
| LCNB Corp. | 418 | 7 |
| MutualFirst Financial Inc. | 263 | 7 |
| * Planet Payment Inc. | 2,009 | 7 |
| Orrstown Financial Services Inc. | 353 | 7 |
| MBT Financial Corp. | 843 | 7 |
| Charter Financial Corp. | 543 | 7 |
| SI Financial Group Inc. | 525 | 7 |
| First Mid-Illinois Bancshares Inc. | 276 | 7 |
| Southern Missouri Bancorp Inc. | 281 | 7 |
22
| Vanguard® Russell 3000 Index Fund | ||
| Schedule of Investments | ||
| August 31, 2016 | ||
| Market | ||
| Value | ||
| Shares | ($000) | |
| * First Northwest Bancorp | 523 | 7 |
| Shore Bancshares Inc. | 590 | 7 |
| Premier Financial Bancorp Inc. | 404 | 7 |
| * Veritex Holdings Inc. | 392 | 7 |
| Lake Sunapee Bank Group | 373 | 7 |
| * First NBC Bank Holding Co. | 510 | 7 |
| Farmers Capital Bank Corp. | 221 | 7 |
| GAIN Capital Holdings Inc. | 1,021 | 7 |
| Southern National Bancorp of Virginia Inc. | 528 | 7 |
| * Republic First Bancorp Inc. | 1,596 | 7 |
| Middleburg Financial Corp. | 228 | 6 |
| Investors Title Co. | 66 | 6 |
| Farmland Partners Inc. | 549 | 6 |
| Central Valley Community Bancorp | 415 | 6 |
| C&F Financial Corp. | 149 | 6 |
| Associated Capital Group Inc. Class A | 192 | 6 |
| Hingham Institution for Savings | 48 | 6 |
| Bankwell Financial Group Inc. | 275 | 6 |
| Bar Harbor Bankshares | 167 | 6 |
| Union Bankshares Inc. | 180 | 6 |
| * MoneyGram International Inc. | 832 | 6 |
| Provident Financial Holdings Inc. | 316 | 6 |
| First Internet Bancorp | 251 | 6 |
| Tiptree Financial Inc. Class A | 1,080 | 6 |
| GAMCO Investors Inc. Class A | 192 | 6 |
| * BSB Bancorp Inc. | 242 | 6 |
| Westfield Financial Inc. | 757 | 6 |
| * First Community Financial Partners Inc. | 639 | 6 |
| * Stratus Properties Inc. | 299 | 6 |
| First Financial Northwest Inc. | 431 | 6 |
| * Pacific Mercantile Bancorp | 729 | 6 |
| Manning & Napier Inc. | 712 | 5 |
| ESSA Bancorp Inc. | 388 | 5 |
| * Franklin Financial Network Inc. | 148 | 5 |
| * Walter Investment Management Corp. | 1,343 | 5 |
| * Real Industry Inc. | 734 | 5 |
| Blue Capital Reinsurance Holdings Ltd. | 284 | 5 |
| County Bancorp Inc. | 233 | 5 |
| * Atlas Financial Holdings Inc. | 275 | 5 |
| * Green Bancorp Inc. | 472 | 5 |
| Access National Corp. | 213 | 5 |
| * National Commerce Corp. | 170 | 5 |
| Hennessy Advisors Inc. | 134 | 5 |
| Kansas City Life Insurance Co. | 111 | 4 |
| Capital City Bank Group Inc. | 313 | 4 |
| * Impac Mortgage Holdings Inc. | 262 | 4 |
| Century Bancorp Inc. Class A | 98 | 4 |
| United Development Funding IV | 1,342 | 4 |
| Chemung Financial Corp. | 145 | 4 |
| FBR & Co. | 300 | 4 |
| B. Riley Financial Inc. | 440 | 4 |
| Silvercrest Asset Management Group Inc. Class A | 336 | 4 |
| Midland States Bancorp Inc. | 170 | 4 |
| Bear State Financial Inc. | 441 | 4 |
| ^ CPI Card Group Inc. | 720 | 4 |
| Merchants Bancshares Inc. | 113 | 4 |
| * Allegiance Bancshares Inc. | 142 | 4 |
| * Hallmark Financial Services Inc. | 336 | 4 |
| Calamos Asset Management Inc. Class A | 471 | 3 |
| * UCP Inc. | 385 | 3 |
| * Provident Bancorp Inc. | 204 | 3 |
| Independence Holding Co. | 178 | 3 |
| People's Utah Bancorp | 144 | 3 |
| Live Oak Bancshares Inc. | 189 | 3 |
23
| Vanguard® Russell 3000 Index Fund | ||
| Schedule of Investments | ||
| August 31, 2016 | ||
| Market | ||
| Value | ||
| Shares | ($000) | |
| Donegal Group Inc. Class A | 165 | 3 |
| * Equity Bancshares Inc. Class A | 109 | 3 |
| * On Deck Capital Inc. | 390 | 2 |
| Greene County Bancorp Inc. | 140 | 2 |
| Great Ajax Corp. | 166 | 2 |
| Pzena Investment Management Inc. Class A | 286 | 2 |
| * Wins Finance Holdings Inc. | 66 | 2 |
| California First National Bancorp | 109 | 2 |
| * Xenith Bankshares Inc. | 619 | 1 |
| * BBX Capital Corp. | 59 | 1 |
| Griffin Industrial Realty Inc. | 33 | 1 |
| Medley Management Inc. Class A | 141 | 1 |
| Value Line Inc. | 55 | 1 |
| Fifth Street Asset Management Inc. | 139 | 1 |
| * American Independence Corp. | 28 | 1 |
| Territorial Bancorp Inc. | 9 | — |
| Enterprise Bancorp Inc. | 9 | — |
| BankFinancial Corp. | 18 | — |
| Orchid Island Capital Inc. | 18 | — |
| Sierra Bancorp | 9 | — |
| * Cascade Bancorp | 27 | — |
| * CommunityOne Bancorp | 9 | — |
| Crawford & Co. Class B | 9 | — |
| 226,088 | ||
| Health Care (14.0%) | ||
| Johnson & Johnson | 136,118 | 16,244 |
| Pfizer Inc. | 297,266 | 10,345 |
| Merck & Co. Inc. | 137,417 | 8,628 |
| Amgen Inc. | 37,551 | 6,386 |
| UnitedHealth Group Inc. | 46,410 | 6,314 |
| Medtronic plc | 69,109 | 6,015 |
| Gilead Sciences Inc. | 66,279 | 5,195 |
| AbbVie Inc. | 79,798 | 5,115 |
| Bristol-Myers Squibb Co. | 82,359 | 4,727 |
| * Allergan plc | 19,543 | 4,584 |
| * Celgene Corp. | 37,943 | 4,050 |
| Eli Lilly & Co. | 48,746 | 3,790 |
| * Biogen Inc. | 11,028 | 3,370 |
| Abbott Laboratories | 72,375 | 3,041 |
| Thermo Fisher Scientific Inc. | 19,334 | 2,942 |
| Danaher Corp. | 29,926 | 2,436 |
| * Express Scripts Holding Co. | 31,415 | 2,284 |
| McKesson Corp. | 11,085 | 2,047 |
| Aetna Inc. | 16,790 | 1,966 |
| Stryker Corp. | 16,768 | 1,939 |
| Becton Dickinson and Co. | 10,363 | 1,836 |
| Anthem Inc. | 13,027 | 1,629 |
| * Boston Scientific Corp. | 67,991 | 1,620 |
| Cigna Corp. | 12,481 | 1,601 |
| * Regeneron Pharmaceuticals Inc. | 3,857 | 1,514 |
| * Alexion Pharmaceuticals Inc. | 10,677 | 1,344 |
| Cardinal Health Inc. | 16,442 | 1,310 |
| Humana Inc. | 7,314 | 1,307 |
| * Intuitive Surgical Inc. | 1,872 | 1,285 |
| * Illumina Inc. | 7,180 | 1,209 |
| * Edwards Lifesciences Corp. | 10,341 | 1,191 |
| Zoetis Inc. | 23,125 | 1,182 |
| Zimmer Biomet Holdings Inc. | 9,009 | 1,168 |
| * Vertex Pharmaceuticals Inc. | 12,159 | 1,149 |
| Baxter International Inc. | 24,525 | 1,146 |
| * HCA Holdings Inc. | 15,065 | 1,138 |
| St. Jude Medical Inc. | 13,624 | 1,062 |
| * Mylan NV | 22,559 | 956 |
| * Cerner Corp. | 14,487 | 935 |
24
| Vanguard® Russell 3000 Index Fund | |||
| Schedule of Investments | |||
| August 31, 2016 | |||
| Market | |||
| Value | |||
| Shares | ($000) | ||
| * | BioMarin Pharmaceutical Inc. | 9,107 | 855 |
| CR Bard Inc. | 3,625 | 801 | |
| AmerisourceBergen Corp. Class A | 8,785 | 764 | |
| Agilent Technologies Inc. | 16,045 | 754 | |
| Dentsply Sirona Inc. | 11,224 | 690 | |
| * | Laboratory Corp. of America Holdings | 5,005 | 685 |
| * | Henry Schein Inc. | 4,061 | 665 |
| * | Incyte Corp. | 8,067 | 654 |
| * | Medivation Inc. | 7,849 | 632 |
| Perrigo Co. plc | 6,768 | 616 | |
| * | Hologic Inc. | 15,308 | 588 |
| Universal Health Services Inc. Class B | 4,750 | 573 | |
| Quest Diagnostics Inc. | 6,811 | 564 | |
| * | Centene Corp. | 8,193 | 559 |
| * | DaVita HealthCare Partners Inc. | 8,226 | 532 |
| * | IDEXX Laboratories Inc. | 4,369 | 492 |
| ResMed Inc. | 7,058 | 471 | |
| * | Varian Medical Systems Inc. | 4,652 | 447 |
| Cooper Cos. Inc. | 2,271 | 422 | |
| * | Mallinckrodt plc | 5,229 | 390 |
| Teleflex Inc. | 2,085 | 382 | |
| * | DexCom Inc. | 4,091 | 373 |
| * | QIAGEN NV | 12,869 | 341 |
| * | United Therapeutics Corp. | 2,743 | 335 |
| * | Quintiles Transnational Holdings Inc. | 4,147 | 321 |
| * | Align Technology Inc. | 3,443 | 320 |
| * | Alkermes plc | 7,134 | 312 |
| * | MEDNAX Inc. | 4,402 | 290 |
| PerkinElmer Inc. | 5,196 | 277 | |
| West Pharmaceutical Services Inc. | 3,338 | 273 | |
| * | VCA Inc. | 3,846 | 272 |
| * | Alnylam Pharmaceuticals Inc. | 3,498 | 244 |
| * | WellCare Health Plans Inc. | 2,066 | 233 |
| * | athenahealth Inc. | 1,814 | 222 |
| * | ABIOMED Inc. | 1,821 | 215 |
| * | Endo International plc | 10,111 | 209 |
| * | Seattle Genetics Inc. | 4,589 | 204 |
| * | Charles River Laboratories International Inc. | 2,445 | 203 |
| * | Medidata Solutions Inc. | 3,717 | 201 |
| * | Neurocrine Biosciences Inc. | 4,092 | 198 |
| * | Envision Healthcare Holdings Inc. | 9,198 | 197 |
| Bio-Techne Corp. | 1,802 | 190 | |
| Patterson Cos. Inc. | 4,124 | 190 | |
| * | Veeva Systems Inc. Class A | 4,574 | 187 |
| Hill-Rom Holdings Inc. | 3,119 | 185 | |
| * | Ionis Pharmaceuticals Inc. | 6,209 | 184 |
| HealthSouth Corp. | 4,425 | 180 | |
| * | Acadia Healthcare Co. Inc. | 3,474 | 178 |
| * | Alere Inc. | 4,316 | 169 |
| * | Amsurg Corp. | 2,584 | 168 |
| * | Wright Medical Group NV | 6,592 | 163 |
| * | PAREXEL International Corp. | 2,382 | 162 |
| * | TESARO Inc. | 1,821 | 154 |
| * | NuVasive Inc. | 2,273 | 149 |
| * | Brookdale Senior Living Inc. | 8,600 | 148 |
| *,^ | OPKO Health Inc. | 16,237 | 148 |
| * | Ophthotech Corp. | 2,781 | 147 |
| * | Horizon Pharma plc | 7,632 | 143 |
| * | Bio-Rad Laboratories Inc. Class A | 947 | 141 |
| * | ACADIA Pharmaceuticals Inc. | 4,312 | 139 |
| * | Intercept Pharmaceuticals Inc. | 895 | 133 |
| * | Masimo Corp. | 2,222 | 131 |
| * | Exelixis Inc. | 11,241 | 125 |
| * | Catalent Inc. | 4,959 | 125 |
25
| Vanguard® Russell 3000 Index Fund | |||
| Schedule of Investments | |||
| August 31, 2016 | |||
| Market | |||
| Value | |||
| Shares | ($000) | ||
| Cantel Medical Corp. | 1,636 | 124 | |
| * | Insulet Corp. | 2,876 | 122 |
| * | Medicines Co. | 3,106 | 122 |
| * | Nektar Therapeutics | 6,802 | 121 |
| * | Ultragenyx Pharmaceutical Inc. | 1,804 | 119 |
| Bruker Corp. | 5,205 | 116 | |
| * | Prestige Brands Holdings Inc. | 2,409 | 116 |
| * | Akorn Inc. | 4,284 | 115 |
| * | Integra LifeSciences Holdings Corp. | 1,331 | 115 |
| * | Kite Pharma Inc. | 1,990 | 115 |
| * | Nevro Corp. | 1,175 | 111 |
| * | Neogen Corp. | 1,851 | 109 |
| * | Allscripts Healthcare Solutions Inc. | 8,431 | 109 |
| * | LifePoint Health Inc. | 1,918 | 109 |
| * | Cepheid | 3,118 | 107 |
| Chemed Corp. | 791 | 107 | |
| * | Molina Healthcare Inc. | 1,943 | 105 |
| * | VWR Corp. | 3,718 | 104 |
| * | Team Health Holdings Inc. | 3,109 | 104 |
| Owens & Minor Inc. | 3,002 | 103 | |
| * | Haemonetics Corp. | 2,625 | 98 |
| * | WebMD Health Corp. | 1,847 | 95 |
| * | ARIAD Pharmaceuticals Inc. | 8,980 | 93 |
| * | Halyard Health Inc. | 2,545 | 93 |
| * | AMN Healthcare Services Inc. | 2,543 | 92 |
| * | Tenet Healthcare Corp. | 3,824 | 91 |
| * | Ligand Pharmaceuticals Inc. | 858 | 89 |
| * | Juno Therapeutics Inc. | 2,996 | 89 |
| * | Prothena Corp. plc | 1,722 | 86 |
| * | INC Research Holdings Inc. Class A | 1,955 | 85 |
| * | Penumbra Inc. | 1,208 | 85 |
| * | Ironwood Pharmaceuticals Inc. Class A | 6,366 | 85 |
| * | Globus Medical Inc. | 3,620 | 84 |
| *,^ | Novavax Inc. | 12,004 | 82 |
| * | HMS Holdings Corp. | 3,761 | 82 |
| * | Exact Sciences Corp. | 4,319 | 80 |
| * | Bluebird Bio Inc. | 1,603 | 79 |
| * | ICU Medical Inc. | 631 | 79 |
| * | Radius Health Inc. | 1,427 | 78 |
| * | Impax Laboratories Inc. | 3,187 | 77 |
| * | Zeltiq Aesthetics Inc. | 2,008 | 77 |
| * | Omnicell Inc. | 2,014 | 76 |
| * | Air Methods Corp. | 2,123 | 75 |
| * | NxStage Medical Inc. | 3,252 | 74 |
| * | Depomed Inc. | 3,635 | 74 |
| * | Amedisys Inc. | 1,523 | 73 |
| * | Cambrex Corp. | 1,707 | 73 |
| * | Alder Biopharmaceuticals Inc. | 2,217 | 73 |
| * | HealthEquity Inc. | 2,215 | 72 |
| * | Select Medical Holdings Corp. | 6,006 | 71 |
| * | Intra-Cellular Therapies Inc. Class A | 1,754 | 71 |
| * | Cynosure Inc. Class A | 1,348 | 70 |
| * | Relypsa Inc. | 2,133 | 68 |
| * | Merit Medical Systems Inc. | 2,719 | 66 |
| Analogic Corp. | 725 | 65 | |
| * | Puma Biotechnology Inc. | 1,088 | 64 |
| CONMED Corp. | 1,570 | 64 | |
| * | Natus Medical Inc. | 1,635 | 64 |
| * | Five Prime Therapeutics Inc. | 1,437 | 63 |
| * | Pacira Pharmaceuticals Inc. | 1,582 | 63 |
| * | Myriad Genetics Inc. | 3,049 | 62 |
| * | Premier Inc. Class A | 1,954 | 62 |
| * | Magellan Health Inc. | 1,077 | 62 |
| * | Halozyme Therapeutics Inc. | 6,276 | 62 |
26
| Vanguard® Russell 3000 Index Fund | |||
| Schedule of Investments | |||
| August 31, 2016 | |||
| Market | |||
| Value | |||
| Shares | ($000) | ||
| * | Repligen Corp. | 1,978 | 61 |
| * | Intrexon Corp. | 2,423 | 61 |
| Abaxis Inc. | 1,197 | 60 | |
| * | Agios Pharmaceuticals Inc. | 1,623 | 60 |
| * | Achillion Pharmaceuticals Inc. | 7,154 | 59 |
| * | Inogen Inc. | 1,015 | 59 |
| * | Acorda Therapeutics Inc. | 2,431 | 59 |
| * | PRA Health Sciences Inc. | 1,125 | 57 |
| * | Luminex Corp. | 2,580 | 54 |
| * | Surgical Care Affiliates Inc. | 1,301 | 54 |
| * | MacroGenics Inc. | 1,783 | 53 |
| * | Supernus Pharmaceuticals Inc. | 2,458 | 53 |
| * | Momenta Pharmaceuticals Inc. | 4,356 | 52 |
| * | PharMerica Corp. | 2,072 | 52 |
| * | Cempra Inc. | 2,375 | 52 |
| Ensign Group Inc. | 2,773 | 52 | |
| * | Community Health Systems Inc. | 4,807 | 51 |
| * | Sarepta Therapeutics Inc. | 1,944 | 51 |
| Meridian Bioscience Inc. | 2,599 | 51 | |
| * | Synergy Pharmaceuticals Inc. | 10,291 | 49 |
| * | Anika Therapeutics Inc. | 971 | 46 |
| * | Spark Therapeutics Inc. | 810 | 46 |
| * | Portola Pharmaceuticals Inc. | 2,230 | 45 |
| * | MiMedx Group Inc. | 6,268 | 45 |
| * | Acceleron Pharma Inc. | 1,509 | 45 |
| * | TherapeuticsMD Inc. | 6,523 | 45 |
| * | Emergent BioSolutions Inc. | 1,682 | 45 |
| * | Press Ganey Holdings Inc. | 1,111 | 45 |
| National HealthCare Corp. | 687 | 45 | |
| * | Providence Service Corp. | 916 | 43 |
| * | FibroGen Inc. | 2,444 | 42 |
| * | Sage Therapeutics Inc. | 1,123 | 42 |
| *,^ | Innoviva Inc. | 3,693 | 41 |
| * | Spectranetics Corp. | 1,638 | 40 |
| Kindred Healthcare Inc. | 3,622 | 40 | |
| * | OraSure Technologies Inc. | 4,578 | 39 |
| * | Endologix Inc. | 3,128 | 38 |
| * | LHC Group Inc. | 1,022 | 36 |
| * | Orthofix International NV | 805 | 36 |
| * | Lannett Co. Inc. | 1,056 | 36 |
| * | AMAG Pharmaceuticals Inc. | 1,461 | 35 |
| * | Triple-S Management Corp. Class B | 1,581 | 35 |
| * | Theravance Biopharma Inc. | 1,203 | 34 |
| US Physical Therapy Inc. | 540 | 34 | |
| * | Amicus Therapeutics Inc. | 5,047 | 34 |
| * | Healthways Inc. | 1,340 | 34 |
| * | Dermira Inc. | 1,068 | 33 |
| *,^ | Aduro Biotech Inc. | 2,282 | 32 |
| * | Insmed Inc. | 2,474 | 32 |
| *,^ | Albany Molecular Research Inc. | 2,158 | 32 |
| * | Atara Biotherapeutics Inc. | 1,569 | 31 |
| * | Otonomy Inc. | 1,847 | 30 |
| * | Clovis Oncology Inc. | 1,206 | 30 |
| * | Merrimack Pharmaceuticals Inc. | 6,460 | 30 |
| * | CorVel Corp. | 768 | 30 |
| * | Pacific Biosciences of California Inc. | 3,442 | 29 |
| * | Cardiovascular Systems Inc. | 1,171 | 29 |
| * | Heron Therapeutics Inc. | 1,539 | 29 |
| * | Dynavax Technologies Corp. | 1,802 | 28 |
| Atrion Corp. | 62 | 28 | |
| *,^ | Omeros Corp. | 2,594 | 28 |
| * | Coherus Biosciences Inc. | 934 | 28 |
| * | Integer Holdings Corp. | 1,142 | 28 |
| * | Enanta Pharmaceuticals Inc. | 1,243 | 27 |
27
| Vanguard® Russell 3000 Index Fund | |||
| Schedule of Investments | |||
| August 31, 2016 | |||
| Market | |||
| Value | |||
| Shares | ($000) | ||
| * | Intersect ENT Inc. | 1,687 | 27 |
| * | Adeptus Health Inc. Class A | 609 | 26 |
| * | Amphastar Pharmaceuticals Inc. | 1,349 | 26 |
| * | Quidel Corp. | 1,171 | 25 |
| * | Akebia Therapeutics Inc. | 3,127 | 25 |
| *,^ | Inovio Pharmaceuticals Inc. | 2,764 | 25 |
| * | Vanda Pharmaceuticals Inc. | 1,633 | 25 |
| * | Retrophin Inc. | 1,505 | 24 |
| Quality Systems Inc. | 2,041 | 24 | |
| *,^ | Cerus Corp. | 3,744 | 24 |
| *,^ | ZIOPHARM Oncology Inc. | 4,653 | 24 |
| * | Glaukos Corp. | 789 | 24 |
| * | BioTelemetry Inc. | 1,255 | 23 |
| * | La Jolla Pharmaceutical Co. | 1,362 | 22 |
| * | Vascular Solutions Inc. | 462 | 22 |
| * | Xencor Inc. | 1,036 | 22 |
| * | Accelerate Diagnostics Inc. | 1,000 | 22 |
| * | Raptor Pharmaceutical Corp. | 2,930 | 22 |
| * | Aimmune Therapeutics Inc. | 1,467 | 22 |
| * | TG Therapeutics Inc. | 3,284 | 21 |
| * | Genomic Health Inc. | 786 | 21 |
| * | Capital Senior Living Corp. | 1,181 | 20 |
| * | Epizyme Inc. | 2,754 | 20 |
| * | Eagle Pharmaceuticals Inc. | 334 | 20 |
| * | ANI Pharmaceuticals Inc. | 334 | 20 |
| * | Cytokinetics Inc. | 1,627 | 20 |
| * | SciClone Pharmaceuticals Inc. | 1,941 | 20 |
| * | Keryx Biopharmaceuticals Inc. | 4,750 | 19 |
| * | Trevena Inc. | 2,745 | 19 |
| CryoLife Inc. | 1,161 | 19 | |
| Landauer Inc. | 389 | 18 | |
| *,^ | Novocure Ltd. | 2,392 | 18 |
| * | Agenus Inc. | 2,967 | 18 |
| PDL BioPharma Inc. | 6,265 | 18 | |
| * | Accuray Inc. | 3,406 | 18 |
| * | AtriCure Inc. | 1,177 | 18 |
| * | Geron Corp. | 6,732 | 18 |
| * | Teladoc Inc. | 1,005 | 18 |
| * | Cross Country Healthcare Inc. | 1,452 | 18 |
| * | Array BioPharma Inc. | 5,142 | 18 |
| * | NeoGenomics Inc. | 2,189 | 18 |
| * | Surmodics Inc. | 593 | 17 |
| * | Arrowhead Pharmaceuticals Inc. | 2,427 | 17 |
| * | XBiotech Inc. | 1,267 | 16 |
| Invacare Corp. | 1,379 | 16 | |
| * | Lion Biotechnologies Inc. | 1,997 | 16 |
| * | Progenics Pharmaceuticals Inc. | 2,528 | 16 |
| Phibro Animal Health Corp. Class A | 652 | 16 | |
| * | Revance Therapeutics Inc. | 1,101 | 15 |
| Universal American Corp. | 2,149 | 15 | |
| * | AngioDynamics Inc. | 923 | 15 |
| * | Aerie Pharmaceuticals Inc. | 766 | 15 |
| *,^ | MannKind Corp. | 18,396 | 15 |
| * | Advaxis Inc. | 1,267 | 15 |
| * | Rigel Pharmaceuticals Inc. | 4,307 | 15 |
| * | Lexicon Pharmaceuticals Inc. | 1,018 | 14 |
| * | Exactech Inc. | 505 | 14 |
| * | Rockwell Medical Inc. | 1,910 | 14 |
| * | Arena Pharmaceuticals Inc. | 8,795 | 14 |
| * | STAAR Surgical Co. | 1,520 | 13 |
| * | Spectrum Pharmaceuticals Inc. | 2,472 | 13 |
| * | Surgery Partners Inc. | 660 | 13 |
| * | Celldex Therapeutics Inc. | 3,793 | 13 |
| Computer Programs & Systems Inc. | 475 | 12 | |
28
| Vanguard® Russell 3000 Index Fund | |||
| Schedule of Investments | |||
| August 31, 2016 | |||
| Market | |||
| Value | |||
| Shares | ($000) | ||
| * | Almost Family Inc. | 331 | 12 |
| * | Insys Therapeutics Inc. | 853 | 12 |
| Utah Medical Products Inc. | 193 | 12 | |
| * | Corcept Therapeutics Inc. | 2,242 | 12 |
| *,^ | Immunomedics Inc. | 4,231 | 12 |
| * | Teligent Inc. | 1,549 | 11 |
| * | Aratana Therapeutics Inc. | 1,295 | 11 |
| * | RadNet Inc. | 1,683 | 11 |
| * | Loxo Oncology Inc. | 413 | 11 |
| * | GenMark Diagnostics Inc. | 1,330 | 11 |
| * | Sangamo BioSciences Inc. | 2,641 | 11 |
| * | Global Blood Therapeutics Inc. | 665 | 11 |
| *,^ | Organovo Holdings Inc. | 2,890 | 11 |
| * | Sucampo Pharmaceuticals Inc. Class A | 1,014 | 11 |
| * | Civitas Solutions Inc. | 611 | 11 |
| * | PTC Therapeutics Inc. | 1,316 | 11 |
| * | BioCryst Pharmaceuticals Inc. | 2,624 | 11 |
| * | Versartis Inc. | 848 | 11 |
| * | Enzo Biochem Inc. | 1,875 | 10 |
| * | AxoGen Inc. | 1,156 | 10 |
| * | NanoString Technologies Inc. | 637 | 10 |
| * | K2M Group Holdings Inc. | 646 | 10 |
| * | Imprivata Inc. | 534 | 10 |
| * | Blueprint Medicines Corp. | 352 | 10 |
| * | Axovant Sciences Ltd. | 598 | 10 |
| * | Foundation Medicine Inc. | 474 | 10 |
| * | ImmunoGen Inc. | 3,459 | 10 |
| * | Chimerix Inc. | 1,994 | 10 |
| * | Oxford Immunotec Global plc | 918 | 10 |
| * | Minerva Neurosciences Inc. | 760 | 9 |
| * | Flexion Therapeutics Inc. | 549 | 9 |
| * | Curis Inc. | 5,070 | 9 |
| * | WaVe Life Sciences Ltd. | 353 | 9 |
| * | Karyopharm Therapeutics Inc. | 873 | 9 |
| * | Heska Corp. | 157 | 9 |
| * | InVivo Therapeutics Holdings Corp. | 1,194 | 8 |
| * | ConforMIS Inc. | 1,040 | 8 |
| * | MediciNova Inc. | 1,403 | 8 |
| *,^ | Sorrento Therapeutics Inc. | 1,225 | 8 |
| * | Avexis Inc. | 229 | 8 |
| * | NewLink Genetics Corp. | 792 | 8 |
| * | Addus HomeCare Corp. | 324 | 8 |
| * | Zogenix Inc. | 881 | 8 |
| * | PharmAthene Inc. | 2,952 | 8 |
| * | Quorum Health Corp. | 1,200 | 7 |
| * | RTI Surgical Inc. | 2,239 | 7 |
| * | Egalet Corp. | 1,044 | 7 |
| * | ChemoCentryx Inc. | 1,391 | 7 |
| LeMaitre Vascular Inc. | 378 | 7 | |
| *,^ | TransEnterix Inc. | 5,056 | 7 |
| * | Athersys Inc. | 3,601 | 7 |
| * | Seres Therapeutics Inc. | 640 | 7 |
| * | Codexis Inc. | 1,589 | 7 |
| * | Tandem Diabetes Care Inc. | 924 | 7 |
| * | BioTime Inc. | 2,212 | 7 |
| * | Intellia Therapeutics Inc. | 334 | 6 |
| * | Stemline Therapeutics Inc. | 771 | 6 |
| * | BioSpecifics Technologies Corp. | 171 | 6 |
| * | OncoMed Pharmaceuticals Inc. | 604 | 6 |
| * | Bio-Path Holdings Inc. | 3,940 | 6 |
| * | Inotek Pharmaceuticals Corp. | 828 | 6 |
| * | Synthetic Biologics Inc. | 3,580 | 6 |
| * | Durect Corp. | 3,484 | 6 |
| * | MyoKardia Inc. | 257 | 6 |
29
| Vanguard® Russell 3000 Index Fund | |||
| Schedule of Investments | |||
| August 31, 2016 | |||
| Market | |||
| Value | |||
| Shares | ($000) | ||
| *,^ | BioScrip Inc. | 2,145 | 6 |
| * | AAC Holdings Inc. | 281 | 5 |
| * | Entellus Medical Inc. | 289 | 5 |
| * | Esperion Therapeutics Inc. | 506 | 5 |
| * | Tetraphase Pharmaceuticals Inc. | 1,423 | 5 |
| * | Paratek Pharmaceuticals Inc. | 400 | 5 |
| * | Adamas Pharmaceuticals Inc. | 394 | 5 |
| * | IRIDEX Corp. | 359 | 5 |
| * | Applied Genetic Technologies Corp. | 414 | 5 |
| * | AcelRx Pharmaceuticals Inc. | 1,677 | 5 |
| * | Senseonics Holdings Inc. | 1,316 | 5 |
| * | OvaScience Inc. | 849 | 5 |
| * | Castlight Health Inc. Class B | 1,208 | 5 |
| * | Titan Pharmaceuticals Inc. | 890 | 5 |
| * | Cutera Inc. | 440 | 5 |
| * | Editas Medicine Inc. | 285 | 5 |
| * | Aclaris Therapeutics Inc. | 236 | 5 |
| * | Anavex Life Sciences Corp. | 1,551 | 5 |
| *,^ | Idera Pharmaceuticals Inc. | 2,463 | 5 |
| * | Vitae Pharmaceuticals Inc. | 662 | 5 |
| * | Concert Pharmaceuticals Inc. | 456 | 4 |
| * | Fortress Biotech Inc. | 1,617 | 4 |
| * | Natera Inc. | 439 | 4 |
| * | Proteostasis Therapeutics Inc. | 304 | 4 |
| * | Bellicum Pharmaceuticals Inc. | 251 | 4 |
| * | Cellular Biomedicine Group Inc. | 302 | 4 |
| * | Veracyte Inc. | 718 | 4 |
| * | CytomX Therapeutics Inc. | 330 | 4 |
| * | Axsome Therapeutics Inc. | 524 | 4 |
| * | REGENXBIO Inc. | 312 | 4 |
| * | Nobilis Health Corp. | 1,026 | 4 |
| * | GlycoMimetics Inc. | 484 | 4 |
| * | Pfenex Inc. | 490 | 4 |
| * | Vital Therapies Inc. | 610 | 3 |
| Osiris Therapeutics Inc. | 697 | 3 | |
| * | T2 Biosystems Inc. | 508 | 3 |
| * | Cotiviti Holdings Inc. | 101 | 3 |
| National Research Corp. Class A | 209 | 3 | |
| * | Regulus Therapeutics Inc. | 1,041 | 3 |
| * | Syndax Pharmaceuticals Inc. | 229 | 3 |
| * | Cara Therapeutics Inc. | 597 | 3 |
| * | Edge Therapeutics Inc. | 363 | 3 |
| * | Collegium Pharmaceutical Inc. | 387 | 3 |
| * | Genesis Healthcare Inc. | 1,329 | 3 |
| * | Infinity Pharmaceuticals Inc. | 2,097 | 3 |
| * | Ignyta Inc. | 578 | 3 |
| * | Anthera Pharmaceuticals Inc. | 1,092 | 3 |
| * | Ocular Therapeutix Inc. | 471 | 3 |
| * | Immune Design Corp. | 424 | 3 |
| * | Endocyte Inc. | 995 | 3 |
| * | Medgenics Inc. | 519 | 3 |
| * | Voyager Therapeutics Inc. | 236 | 3 |
| * | Lipocine Inc. | 786 | 3 |
| * | Invitae Corp. | 331 | 3 |
| * | Galena Biopharma Inc. | 6,357 | 3 |
| * | Adverum Biotechnologies Inc. | 715 | 3 |
| * | USMD Holdings Inc. | 109 | 2 |
| * | Eiger BioPharmaceuticals Inc. | 160 | 2 |
| * | Agile Therapeutics Inc. | 325 | 2 |
| * | Aptevo Therapeutics Inc. | 841 | 2 |
| * | NantKwest Inc. | 273 | 2 |
| *,^ | Reata Pharmaceuticals Inc. Class A | 111 | 2 |
| * | Avinger Inc. | 516 | 2 |
| * | Corvus Pharmaceuticals Inc. | 154 | 2 |
30
| Vanguard® Russell 3000 Index Fund | ||
| Schedule of Investments | ||
| August 31, 2016 | ||
| Market | ||
| Value | ||
| Shares | ($000) | |
| * Zafgen Inc. | 664 | 2 |
| * iRadimed Corp. | 101 | 2 |
| * Mirati Therapeutics Inc. | 369 | 2 |
| * Second Sight Medical Products Inc. | 541 | 2 |
| * Ampio Pharmaceuticals Inc. | 2,082 | 2 |
| * Neos Therapeutics Inc. | 256 | 2 |
| * CytRx Corp. | 2,786 | 2 |
| * American Renal Associates Holdings Inc. | 71 | 2 |
| * Cidara Therapeutics Inc. | 126 | 1 |
| * Dimension Therapeutics Inc. | 229 | 1 |
| * ViewRay Inc. | 318 | 1 |
| * Asterias Biotherapeutics Inc. | 338 | 1 |
| * Corindus Vascular Robotics Inc. | 755 | 1 |
| * vTv Therapeutics Inc. Class A | 156 | 1 |
| * Tokai Pharmaceuticals Inc. | 578 | 1 |
| * Madrigal Pharmaceuticals Inc. | 46 | 1 |
| * Flex Pharma Inc. | 29 | — |
| * Fluidigm Corp. | 27 | — |
| * Ardelyx Inc. | 18 | — |
| * Trovagene Inc. | 27 | — |
| * Tobira Therapeutics Inc. | 21 | — |
| * Argos Therapeutics Inc. | 11 | — |
| * Asterias Biotherapeutics Inc. Warrants Exp. 09/30/2016 | 70 | — |
| 157,756 | ||
| Materials & Processing (3.9%) | ||
| Dow Chemical Co. | 55,834 | 2,995 |
| EI du Pont de Nemours & Co. | 42,947 | 2,989 |
| Monsanto Co. | 21,509 | 2,291 |
| Praxair Inc. | 14,141 | 1,726 |
| Ecolab Inc. | 12,921 | 1,590 |
| Air Products & Chemicals Inc. | 9,782 | 1,522 |
| PPG Industries Inc. | 13,220 | 1,400 |
| LyondellBasell Industries NV Class A | 16,976 | 1,339 |
| Sherwin-Williams Co. | 4,026 | 1,142 |
| Newmont Mining Corp. | 26,138 | 999 |
| International Paper Co. | 20,199 | 979 |
| Ingersoll-Rand plc | 12,879 | 876 |
| Nucor Corp. | 15,405 | 747 |
| Vulcan Materials Co. | 6,391 | 728 |
| Freeport-McMoRan Inc. | 69,070 | 711 |
| Ball Corp. | 8,358 | 662 |
| Alcoa Inc. | 64,622 | 651 |
| Fastenal Co. | 13,875 | 598 |
| WestRock Co. | 12,417 | 595 |
| Acuity Brands Inc. | 2,133 | 587 |
| Masco Corp. | 16,260 | 577 |
| Martin Marietta Materials Inc. | 3,082 | 564 |
| International Flavors & Fragrances Inc. | 4,044 | 560 |
| Mosaic Co. | 17,270 | 519 |
| Eastman Chemical Co. | 7,146 | 485 |
| Sealed Air Corp. | 10,113 | 477 |
| Celanese Corp. Class A | 7,147 | 460 |
| Albemarle Corp. | 5,311 | 425 |
| Valspar Corp. | 3,797 | 400 |
| RPM International Inc. | 6,656 | 363 |
| FMC Corp. | 7,599 | 357 |
| * Crown Holdings Inc. | 6,558 | 356 |
| Packaging Corp. of America | 4,443 | 349 |
| Ashland Inc. | 2,975 | 348 |
| Lennox International Inc. | 1,866 | 301 |
| Owens Corning | 5,427 | 298 |
| CF Industries Holdings Inc. | 11,035 | 287 |
| Steel Dynamics Inc. | 11,338 | 279 |
| WR Grace & Co. | 3,457 | 270 |
31
| Vanguard® Russell 3000 Index Fund | |||
| Schedule of Investments | |||
| August 31, 2016 | |||
| Market | |||
| Value | |||
| Shares | ($000) | ||
| Sonoco Products Co. | 5,150 | 265 | |
| * | Berry Plastics Group Inc. | 5,642 | 256 |
| Reliance Steel & Aluminum Co. | 3,521 | 254 | |
| Hexcel Corp. | 5,504 | 247 | |
| Royal Gold Inc. | 3,186 | 234 | |
| Bemis Co. Inc. | 4,319 | 227 | |
| Graphic Packaging Holding Co. | 15,832 | 227 | |
| AptarGroup Inc. | 2,907 | 227 | |
| * | Axalta Coating Systems Ltd. | 7,851 | 225 |
| Watsco Inc. | 1,390 | 206 | |
| Scotts Miracle-Gro Co. Class A | 2,408 | 199 | |
| Eagle Materials Inc. | 2,431 | 195 | |
| Tahoe Resources Inc. | 14,335 | 187 | |
| Olin Corp. | 8,071 | 175 | |
| Huntsman Corp. | 9,565 | 165 | |
| NewMarket Corp. | 371 | 161 | |
| Sensient Technologies Corp. | 2,119 | 155 | |
| Compass Minerals International Inc. | 2,035 | 152 | |
| Cabot Corp. | 2,951 | 147 | |
| Belden Inc. | 1,926 | 144 | |
| Valmont Industries Inc. | 1,082 | 141 | |
| PolyOne Corp. | 4,033 | 139 | |
| * | Owens-Illinois Inc. | 7,549 | 135 |
| United States Steel Corp. | 6,889 | 134 | |
| US Silica Holdings Inc. | 3,354 | 132 | |
| * | Louisiana-Pacific Corp. | 6,721 | 131 |
| * | Beacon Roofing Supply Inc. | 2,701 | 124 |
| Timken Co. | 3,631 | 123 | |
| Minerals Technologies Inc. | 1,705 | 120 | |
| * | USG Corp. | 4,371 | 120 |
| HB Fuller Co. | 2,484 | 118 | |
| Balchem Corp. | 1,589 | 111 | |
| Universal Forest Products Inc. | 1,007 | 110 | |
| Domtar Corp. | 2,933 | 109 | |
| * | Trex Co. Inc. | 1,676 | 104 |
| Chemours Co. | 7,863 | 104 | |
| Southern Copper Corp. | 3,990 | 103 | |
| * | Chemtura Corp. | 3,434 | 103 |
| Worthington Industries Inc. | 2,375 | 102 | |
| Mueller Industries Inc. | 2,941 | 102 | |
| * | Masonite International Corp. | 1,508 | 101 |
| Westlake Chemical Corp. | 1,934 | 100 | |
| Mueller Water Products Inc. Class A | 8,079 | 98 | |
| * | RBC Bearings Inc. | 1,194 | 94 |
| * | GCP Applied Technologies Inc. | 3,193 | 93 |
| Hecla Mining Co. | 16,587 | 93 | |
| Silgan Holdings Inc. | 1,919 | 92 | |
| Commercial Metals Co. | 5,801 | 90 | |
| * | Rexnord Corp. | 3,924 | 87 |
| * | Armstrong World Industries Inc. | 1,961 | 85 |
| * | Coeur Mining Inc. | 6,689 | 85 |
| * | Ingevity Corp. | 1,876 | 83 |
| Simpson Manufacturing Co. Inc. | 1,891 | 83 | |
| ^ | Allegheny Technologies Inc. | 4,742 | 81 |
| *,^ | Cliffs Natural Resources Inc. | 14,149 | 81 |
| * | Stillwater Mining Co. | 6,279 | 79 |
| Trinseo SA | 1,360 | 79 | |
| Kaiser Aluminum Corp. | 901 | 77 | |
| * | Platform Specialty Products Corp. | 8,473 | 77 |
| Stepan Co. | 1,068 | 75 | |
| Quaker Chemical Corp. | 741 | 74 | |
| Apogee Enterprises Inc. | 1,523 | 74 | |
| Carpenter Technology Corp. | 2,007 | 73 | |
| Innospec Inc. | 1,225 | 73 | |
32
| Vanguard® Russell 3000 Index Fund | ||
| Schedule of Investments | ||
| August 31, 2016 | ||
| Market | ||
| Value | ||
| Shares | ($000) | |
| Neenah Paper Inc. | 899 | 72 |
| Schweitzer-Mauduit International Inc. | 1,831 | 72 |
| * Gibraltar Industries Inc. | 1,830 | 70 |
| Interface Inc. Class A | 3,767 | 67 |
| Cabot Microelectronics Corp. | 1,331 | 66 |
| * Boise Cascade Co. | 2,509 | 66 |
| * MRC Global Inc. | 4,458 | 65 |
| AAON Inc. | 2,308 | 65 |
| KapStone Paper and Packaging Corp. | 3,694 | 65 |
| * Summit Materials Inc. Class A | 3,265 | 64 |
| * Headwaters Inc. | 3,364 | 61 |
| Comfort Systems USA Inc. | 2,142 | 61 |
| * Patrick Industries Inc. | 908 | 58 |
| * Ferro Corp. | 4,334 | 58 |
| PH Glatfelter Co. | 2,583 | 57 |
| Greif Inc. Class A | 1,333 | 57 |
| * Builders FirstSource Inc. | 3,969 | 55 |
| * Kraton Performance Polymers Inc. | 1,463 | 53 |
| Advanced Drainage Systems Inc. | 2,158 | 50 |
| Calgon Carbon Corp. | 3,303 | 48 |
| * BMC Stock Holdings Inc. | 2,370 | 47 |
| * AK Steel Holding Corp. | 10,540 | 47 |
| A Schulman Inc. | 1,835 | 47 |
| Quanex Building Products Corp. | 2,350 | 45 |
| * Caesarstone Ltd. | 1,133 | 45 |
| * US Concrete Inc. | 813 | 43 |
| Tredegar Corp. | 2,120 | 40 |
| Ferroglobe plc | 4,455 | 37 |
| Innophos Holdings Inc. | 865 | 37 |
| Haynes International Inc. | 983 | 36 |
| * Univar Inc. | 1,690 | 35 |
| Deltic Timber Corp. | 454 | 32 |
| * Clearwater Paper Corp. | 506 | 31 |
| * Nortek Inc. | 353 | 30 |
| * Installed Building Products Inc. | 860 | 29 |
| * Continental Building Products Inc. | 1,268 | 28 |
| NN Inc. | 1,447 | 26 |
| Materion Corp. | 841 | 25 |
| * Koppers Holdings Inc. | 755 | 25 |
| Global Brass & Copper Holdings Inc. | 870 | 24 |
| Aceto Corp. | 1,193 | 24 |
| Insteel Industries Inc. | 713 | 24 |
| Griffon Corp. | 1,346 | 23 |
| * PGT Inc. | 1,843 | 22 |
| Schnitzer Steel Industries Inc. | 1,151 | 22 |
| Tronox Ltd. Class A | 2,358 | 22 |
| American Vanguard Corp. | 1,254 | 21 |
| Rayonier Advanced Materials Inc. | 1,596 | 20 |
| AEP Industries Inc. | 177 | 20 |
| * OMNOVA Solutions Inc. | 1,879 | 19 |
| Chase Corp. | 285 | 18 |
| * Veritiv Corp. | 351 | 18 |
| * NCI Building Systems Inc. | 1,168 | 18 |
| * Armstrong Flooring Inc. | 855 | 18 |
| * TimkenSteel Corp. | 1,564 | 15 |
| Greif Inc. Class B | 275 | 15 |
| * Ply Gem Holdings Inc. | 1,058 | 15 |
| Myers Industries Inc. | 973 | 14 |
| * Century Aluminum Co. | 2,111 | 13 |
| * Landec Corp. | 1,011 | 13 |
| * Unifi Inc. | 496 | 13 |
| Gold Resource Corp. | 2,363 | 12 |
| Culp Inc. | 381 | 12 |
| LSI Industries Inc. | 1,184 | 12 |
33
| Vanguard® Russell 3000 Index Fund | ||
| Schedule of Investments | ||
| August 31, 2016 | ||
| Market | ||
| Value | ||
| Shares | ($000) | |
| FutureFuel Corp. | 959 | 11 |
| * Multi Packaging Solutions International Ltd. | 797 | 11 |
| KMG Chemicals Inc. | 386 | 11 |
| ^ Kronos Worldwide Inc. | 1,068 | 9 |
| * LSB Industries Inc. | 749 | 9 |
| * GMS Inc. | 340 | 8 |
| Olympic Steel Inc. | 426 | 8 |
| * UFP Technologies Inc. | 307 | 8 |
| Dynamic Materials Corp. | 669 | 7 |
| * AgroFresh Solutions Inc. | 1,038 | 6 |
| * ChromaDex Corp. | 1,354 | 4 |
| Ampco-Pittsburgh Corp. | 406 | 4 |
| * Ryerson Holding Corp. | 296 | 4 |
| United States Lime & Minerals Inc. | 55 | 4 |
| * Handy & Harman Ltd. | 155 | 3 |
| Omega Flex Inc. | 90 | 3 |
| * Lawson Products Inc. | 160 | 3 |
| Valhi Inc. | 600 | 2 |
| CompX International Inc. | 74 | 1 |
| * NL Industries Inc. | 144 | 1 |
| Oil-Dri Corp. of America | 9 | — |
| 43,721 | ||
| Other (0.0%)2 | ||
| * Dyax Corp CVR Exp. 12/31/2019 | 6,727 | 8 |
| * Leap Wireless International Inc. CVR | 1,716 | 4 |
| * First Hawaiian Inc. | 78 | 2 |
| * Impinj Inc. | 40 | 1 |
| * Chelsea Therapeutics International Ltd. CVR Exp. 12/31/2016 | 2,322 | — |
| * Omthera Pharmaceuticals Inc. CVR | 152 | — |
| * Durata Therapeutics Inc CVR Exp.12/31/2018 | 12 | — |
| * Clinical Data Contingent Value Rights | 32 | — |
| * Gerber Scientific Inc. CVR | 223 | — |
| * Cubist Pharmaceuticals, Inc. CVR | 1,151 | — |
| 15 | ||
| Producer Durables (10.5%) | ||
| General Electric Co. | 451,516 | 14,105 |
| 3M Co. | 29,176 | 5,230 |
| Honeywell International Inc. | 37,543 | 4,382 |
| United Technologies Corp. | 38,285 | 4,075 |
| Union Pacific Corp. | 41,831 | 3,996 |
| Boeing Co. | 29,601 | 3,832 |
| United Parcel Service Inc. Class B | 34,187 | 3,734 |
| Accenture plc Class A | 30,738 | 3,535 |
| Lockheed Martin Corp. | 12,522 | 3,042 |
| Caterpillar Inc. | 27,359 | 2,242 |
| Raytheon Co. | 14,593 | 2,045 |
| FedEx Corp. | 12,341 | 2,035 |
| Automatic Data Processing Inc. | 22,473 | 2,018 |
| General Dynamics Corp. | 12,103 | 1,842 |
| Northrop Grumman Corp. | 8,169 | 1,732 |
| Illinois Tool Works Inc. | 14,452 | 1,718 |
| Emerson Electric Co. | 31,922 | 1,682 |
| Eaton Corp. plc | 22,355 | 1,488 |
| Delta Air Lines Inc. | 38,275 | 1,407 |
| Waste Management Inc. | 21,761 | 1,391 |
| Norfolk Southern Corp. | 14,523 | 1,364 |
| Deere & Co. | 15,833 | 1,339 |
| CSX Corp. | 47,334 | 1,339 |
| Southwest Airlines Co. | 31,703 | 1,169 |
| PACCAR Inc. | 17,960 | 1,075 |
| Cummins Inc. | 8,161 | 1,025 |
| American Airlines Group Inc. | 26,919 | 977 |
| Paychex Inc. | 16,019 | 972 |
| Stanley Black & Decker Inc. | 7,459 | 923 |
34
| Vanguard® Russell 3000 Index Fund | ||
| Schedule of Investments | ||
| August 31, 2016 | ||
| Market | ||
| Value | ||
| Shares | ($000) | |
| Roper Technologies Inc. | 5,035 | 894 |
| Tyco International plc | 20,097 | 878 |
| * United Continental Holdings Inc. | 16,392 | 826 |
| Parker-Hannifin Corp. | 6,476 | 794 |
| Fortive Corp. | 14,798 | 779 |
| Rockwell Automation Inc. | 6,276 | 728 |
| * TransDigm Group Inc. | 2,485 | 709 |
| WW Grainger Inc. | 2,822 | 651 |
| * Verisk Analytics Inc. Class A | 7,725 | 642 |
| L-3 Communications Holdings Inc. | 3,961 | 589 |
| * Waters Corp. | 3,742 | 589 |
| Republic Services Inc. Class A | 11,319 | 572 |
| AMETEK Inc. | 11,726 | 572 |
| Rockwell Collins Inc. | 6,679 | 559 |
| Dover Corp. | 7,484 | 543 |
| Xerox Corp. | 55,072 | 542 |
| Cintas Corp. | 4,533 | 533 |
| Textron Inc. | 12,954 | 529 |
| Pentair plc | 7,928 | 508 |
| * Mettler-Toledo International Inc. | 1,253 | 505 |
| Kansas City Southern | 5,163 | 499 |
| CH Robinson Worldwide Inc. | 6,814 | 473 |
| Expeditors International of Washington Inc. | 8,925 | 452 |
| Snap-on Inc. | 2,939 | 451 |
| Xylem Inc. | 8,565 | 436 |
| Fluor Corp. | 8,071 | 419 |
| Alaska Air Group Inc. | 6,042 | 408 |
| * CoStar Group Inc. | 1,788 | 371 |
| IDEX Corp. | 3,927 | 367 |
| Huntington Ingalls Industries Inc. | 2,212 | 365 |
| * United Rentals Inc. | 4,332 | 357 |
| * Middleby Corp. | 2,744 | 352 |
| * HD Supply Holdings Inc. | 9,591 | 346 |
| JB Hunt Transport Services Inc. | 4,304 | 342 |
| * Stericycle Inc. | 3,969 | 341 |
| Avery Dennison Corp. | 4,398 | 341 |
| Allegion plc | 4,725 | 337 |
| AO Smith Corp. | 3,466 | 334 |
| * Trimble Navigation Ltd. | 12,105 | 332 |
| Wabtec Corp. | 4,326 | 331 |
| Carlisle Cos. Inc. | 3,103 | 325 |
| * Jacobs Engineering Group Inc. | 5,860 | 309 |
| Flowserve Corp. | 6,092 | 295 |
| * Spirit AeroSystems Holdings Inc. Class A | 6,299 | 289 |
| Hubbell Inc. Class B | 2,650 | 287 |
| Macquarie Infrastructure Corp. | 3,558 | 284 |
| Nordson Corp. | 2,625 | 259 |
| * Old Dominion Freight Line Inc. | 3,573 | 254 |
| Toro Co. | 2,611 | 254 |
| ManpowerGroup Inc. | 3,525 | 252 |
| B/E Aerospace Inc. | 4,949 | 250 |
| Donaldson Co. Inc. | 6,576 | 247 |
| * JetBlue Airways Corp. | 15,255 | 243 |
| * Keysight Technologies Inc. | 7,894 | 240 |
| * Copart Inc. | 4,665 | 238 |
| Robert Half International Inc. | 6,095 | 234 |
| * AECOM | 7,238 | 223 |
| Trinity Industries Inc. | 9,012 | 220 |
| Ryder System Inc. | 3,349 | 219 |
| * Teledyne Technologies Inc. | 2,045 | 219 |
| Orbital ATK Inc. | 2,889 | 218 |
| FLIR Systems Inc. | 6,636 | 205 |
| Deluxe Corp. | 2,965 | 202 |
| Curtiss-Wright Corp. | 2,136 | 192 |
35
| Vanguard® Russell 3000 Index Fund | |||
| Schedule of Investments | |||
| August 31, 2016 | |||
| Market | |||
| Value | |||
| Shares | ($000) | ||
| Oshkosh Corp. | 3,526 | 190 | |
| * | Quanta Services Inc. | 7,361 | 189 |
| Allison Transmission Holdings Inc. | 6,741 | 187 | |
| Graco Inc. | 2,516 | 185 | |
| Lincoln Electric Holdings Inc. | 2,916 | 185 | |
| * | Zebra Technologies Corp. | 2,635 | 184 |
| * | Genpact Ltd. | 7,647 | 181 |
| BWX Technologies Inc. | 4,655 | 181 | |
| * | Genesee & Wyoming Inc. Class A | 2,626 | 179 |
| MAXIMUS Inc. | 2,905 | 171 | |
| *,^ | XPO Logistics Inc. | 4,641 | 166 |
| Booz Allen Hamilton Holding Corp. Class A | 5,411 | 164 | |
| EMCOR Group Inc. | 2,838 | 163 | |
| Pitney Bowes Inc. | 8,660 | 162 | |
| AGCO Corp. | 3,313 | 161 | |
| RR Donnelley & Sons Co. | 9,307 | 159 | |
| Rollins Inc. | 5,532 | 158 | |
| Woodward Inc. | 2,509 | 157 | |
| MSC Industrial Direct Co. Inc. Class A | 2,142 | 156 | |
| Chicago Bridge & Iron Co. NV | 4,967 | 148 | |
| CLARCOR Inc. | 2,206 | 144 | |
| ITT Inc. | 3,983 | 144 | |
| Crane Co. | 2,233 | 144 | |
| * | Spirit Airlines Inc. | 3,558 | 142 |
| National Instruments Corp. | 5,020 | 140 | |
| * | Kirby Corp. | 2,686 | 140 |
| * | Colfax Corp. | 4,703 | 140 |
| Landstar System Inc. | 1,992 | 138 | |
| Convergys Corp. | 4,606 | 137 | |
| Littelfuse Inc. | 1,082 | 137 | |
| EnerSys | 1,938 | 136 | |
| Healthcare Services Group Inc. | 3,315 | 134 | |
| Air Lease Corp. Class A | 4,510 | 133 | |
| * | WESCO International Inc. | 2,097 | 130 |
| HNI Corp. | 2,253 | 126 | |
| * | Dycom Industries Inc. | 1,550 | 126 |
| * | Generac Holdings Inc. | 3,315 | 124 |
| Terex Corp. | 5,068 | 123 | |
| * | Clean Harbors Inc. | 2,548 | 122 |
| Regal Beloit Corp. | 1,928 | 118 | |
| Joy Global Inc. | 4,232 | 115 | |
| HEICO Corp. Class A | 2,019 | 115 | |
| * | WageWorks Inc. | 1,846 | 114 |
| * | Darling Ingredients Inc. | 8,064 | 114 |
| Barnes Group Inc. | 2,698 | 112 | |
| Herman Miller Inc. | 3,043 | 110 | |
| ABM Industries Inc. | 2,845 | 109 | |
| * | Hawaiian Holdings Inc. | 2,325 | 109 |
| ^ | Copa Holdings SA Class A | 1,422 | 109 |
| Lexmark International Inc. Class A | 2,996 | 107 | |
| * | Electronics For Imaging Inc. | 2,276 | 107 |
| * | Moog Inc. Class A | 1,808 | 107 |
| * | Esterline Technologies Corp. | 1,383 | 106 |
| Tetra Tech Inc. | 3,009 | 106 | |
| * | Manitowoc Foodservice Inc. | 6,557 | 106 |
| Hillenbrand Inc. | 3,165 | 102 | |
| * | MasTec Inc. | 3,454 | 102 |
| John Bean Technologies Corp. | 1,477 | 101 | |
| G&K Services Inc. Class A | 1,036 | 101 | |
| * | FTI Consulting Inc. | 2,260 | 100 |
| Applied Industrial Technologies Inc. | 2,102 | 100 | |
| * | KLX Inc. | 2,648 | 99 |
| Kennametal Inc. | 3,453 | 97 | |
| UniFirst Corp. | 751 | 96 | |
36
| Vanguard® Russell 3000 Index Fund | ||
| Schedule of Investments | ||
| August 31, 2016 | ||
| Market | ||
| Value | ||
| Shares | ($000) | |
| GATX Corp. | 2,163 | 95 |
| * Advanced Energy Industries Inc. | 2,151 | 95 |
| * Itron Inc. | 1,982 | 94 |
| * On Assignment Inc. | 2,473 | 93 |
| Granite Construction Inc. | 1,921 | 92 |
| KBR Inc. | 6,269 | 92 |
| Knight Transportation Inc. | 3,235 | 91 |
| MSA Safety Inc. | 1,527 | 89 |
| Franklin Electric Co. Inc. | 2,323 | 89 |
| Brink's Co. | 2,412 | 88 |
| AZZ Inc. | 1,312 | 87 |
| CEB Inc. | 1,435 | 86 |
| * TASER International Inc. | 3,172 | 86 |
| Matson Inc. | 2,212 | 85 |
| Covanta Holding Corp. | 5,617 | 84 |
| Brady Corp. Class A | 2,496 | 84 |
| * ExlService Holdings Inc. | 1,627 | 83 |
| Allegiant Travel Co. Class A | 595 | 82 |
| Watts Water Technologies Inc. Class A | 1,259 | 81 |
| Forward Air Corp. | 1,701 | 78 |
| * Advisory Board Co. | 1,835 | 77 |
| * Hub Group Inc. Class A | 1,889 | 77 |
| Actuant Corp. Class A | 3,113 | 74 |
| Knoll Inc. | 2,796 | 74 |
| Mobile Mini Inc. | 2,453 | 73 |
| * TopBuild Corp. | 2,117 | 72 |
| Tennant Co. | 1,088 | 70 |
| HEICO Corp. | 1,029 | 70 |
| Steelcase Inc. Class A | 4,673 | 70 |
| Triumph Group Inc. | 2,135 | 68 |
| * Proto Labs Inc. | 1,233 | 67 |
| Exponent Inc. | 1,323 | 67 |
| Albany International Corp. | 1,567 | 66 |
| ESCO Technologies Inc. | 1,453 | 66 |
| Korn/Ferry International | 2,744 | 65 |
| * ACCO Brands Corp. | 6,458 | 65 |
| EnPro Industries Inc. | 1,193 | 64 |
| Kaman Corp. | 1,421 | 64 |
| * Sykes Enterprises Inc. | 2,151 | 63 |
| Standex International Corp. | 746 | 63 |
| * Chart Industries Inc. | 2,065 | 62 |
| CIRCOR International Inc. | 1,051 | 62 |
| Cubic Corp. | 1,303 | 61 |
| * Huron Consulting Group Inc. | 966 | 61 |
| * OSI Systems Inc. | 897 | 60 |
| SkyWest Inc. | 2,100 | 59 |
| * Team Inc. | 1,810 | 58 |
| US Ecology Inc. | 1,281 | 57 |
| Greenbrier Cos. Inc. | 1,695 | 57 |
| * Virgin America Inc. | 1,026 | 57 |
| General Cable Corp. | 3,537 | 57 |
| ^ Ship Finance International Ltd. | 3,775 | 57 |
| * Wabash National Corp. | 4,068 | 57 |
| * Lydall Inc. | 1,176 | 56 |
| Werner Enterprises Inc. | 2,424 | 56 |
| Heartland Express Inc. | 2,912 | 55 |
| Badger Meter Inc. | 830 | 55 |
| AAR Corp. | 2,192 | 54 |
| * TriMas Corp. | 2,800 | 54 |
| * Astronics Corp. | 1,192 | 53 |
| * TrueBlue Inc. | 2,432 | 53 |
| * Atlas Air Worldwide Holdings Inc. | 1,411 | 52 |
| * SPX FLOW Inc. | 1,776 | 52 |
| * Swift Transportation Co. | 2,764 | 51 |
37
| Vanguard® Russell 3000 Index Fund | ||
| Schedule of Investments | ||
| August 31, 2016 | ||
| Market | ||
| Value | ||
| Shares | ($000) | |
| ^ Nordic American Tankers Ltd. | 5,012 | 51 |
| Federal Signal Corp. | 3,816 | 50 |
| * Wesco Aircraft Holdings Inc. | 3,617 | 50 |
| Briggs & Stratton Corp. | 2,608 | 50 |
| Encore Wire Corp. | 1,276 | 49 |
| Insperity Inc. | 746 | 49 |
| Aircastle Ltd. | 2,257 | 49 |
| * Babcock & Wilcox Enterprises Inc. | 2,961 | 48 |
| * Echo Global Logistics Inc. | 1,835 | 47 |
| * Air Transport Services Group Inc. | 3,230 | 47 |
| Astec Industries Inc. | 786 | 46 |
| Alamo Group Inc. | 706 | 46 |
| * Aerojet Rocketdyne Holdings Inc. | 2,498 | 45 |
| Sun Hydraulics Corp. | 1,448 | 45 |
| MTS Systems Corp. | 866 | 43 |
| Primoris Services Corp. | 2,233 | 43 |
| * Thermon Group Holdings Inc. | 2,259 | 43 |
| * Herc Holdings Inc. | 1,245 | 42 |
| * FARO Technologies Inc. | 1,261 | 41 |
| * Aegion Corp. Class A | 2,218 | 41 |
| * Tutor Perini Corp. | 1,757 | 41 |
| * TriNet Group Inc. | 1,933 | 41 |
| Kelly Services Inc. Class A | 2,106 | 40 |
| Raven Industries Inc. | 1,639 | 40 |
| Resources Connection Inc. | 2,643 | 40 |
| * Navigant Consulting Inc. | 2,014 | 40 |
| Essendant Inc. | 2,024 | 39 |
| * RPX Corp. | 3,724 | 39 |
| * Modine Manufacturing Co. | 3,582 | 38 |
| Gorman-Rupp Co. | 1,411 | 38 |
| Scorpio Tankers Inc. | 7,747 | 38 |
| H&E Equipment Services Inc. | 2,221 | 35 |
| Lindsay Corp. | 490 | 35 |
| Kimball International Inc. Class B | 2,781 | 35 |
| * ICF International Inc. | 816 | 34 |
| Hyster-Yale Materials Handling Inc. | 652 | 34 |
| Multi-Color Corp. | 502 | 34 |
| * Rush Enterprises Inc. Class A | 1,392 | 33 |
| ArcBest Corp. | 1,807 | 33 |
| Quad/Graphics Inc. | 1,197 | 32 |
| * Paylocity Holding Corp. | 699 | 31 |
| * SPX Corp. | 1,606 | 30 |
| McGrath RentCorp | 947 | 30 |
| * Saia Inc. | 975 | 30 |
| DHT Holdings Inc. | 6,739 | 29 |
| Altra Industrial Motion Corp. | 1,026 | 29 |
| * PHH Corp. | 1,890 | 29 |
| * Navistar International Corp. | 2,036 | 29 |
| Manitowoc Co. Inc. | 5,376 | 26 |
| Harsco Corp. | 2,547 | 25 |
| Argan Inc. | 504 | 24 |
| * CBIZ Inc. | 2,102 | 24 |
| * Engility Holdings Inc. | 778 | 23 |
| * CSW Industrials Inc. | 688 | 22 |
| * Milacron Holdings Corp. | 1,269 | 22 |
| ^ GasLog Ltd. | 1,592 | 22 |
| * Aerovironment Inc. | 849 | 21 |
| TeleTech Holdings Inc. | 697 | 20 |
| * Energy Recovery Inc. | 1,633 | 20 |
| * Triton International Ltd. | 1,257 | 19 |
| * Overseas Shipholding Group Inc. Class A | 1,713 | 19 |
| Forrester Research Inc. | 447 | 18 |
| * Vectrus Inc. | 526 | 18 |
| * Casella Waste Systems Inc. Class A | 1,951 | 18 |
38
| Vanguard® Russell 3000 Index Fund | |||
| Schedule of Investments | |||
| August 31, 2016 | |||
| Market | |||
| Value | |||
| Shares | ($000) | ||
| American Railcar Industries Inc. | 425 | 18 | |
| Titan International Inc. | 1,914 | 18 | |
| Kforce Inc. | 893 | 17 | |
| Hackett Group Inc. | 1,044 | 17 | |
| * | YRC Worldwide Inc. | 1,472 | 17 |
| Ennis Inc. | 981 | 16 | |
| Mesa Laboratories Inc. | 143 | 16 | |
| Powell Industries Inc. | 401 | 16 | |
| Douglas Dynamics Inc. | 495 | 16 | |
| Bristow Group Inc. | 1,372 | 16 | |
| * | Mistras Group Inc. | 664 | 16 |
| Spartan Motors Inc. | 1,579 | 16 | |
| ^ | Frontline Ltd. | 2,021 | 15 |
| VSE Corp. | 464 | 15 | |
| * | DXP Enterprises Inc. | 539 | 15 |
| * | SP Plus Corp. | 600 | 15 |
| Barrett Business Services Inc. | 308 | 14 | |
| * | Kratos Defense & Security Solutions Inc. | 2,010 | 14 |
| * | Ascent Capital Group Inc. Class A | 594 | 14 |
| Teekay Corp. | 1,837 | 13 | |
| * | GP Strategies Corp. | 548 | 13 |
| Miller Industries Inc. | 584 | 13 | |
| * | DHI Group Inc. | 1,646 | 13 |
| * | Energous Corp. | 706 | 13 |
| CECO Environmental Corp. | 1,137 | 12 | |
| Heidrick & Struggles International Inc. | 661 | 12 | |
| * | Monster Worldwide Inc. | 3,330 | 12 |
| Columbus McKinnon Corp. | 693 | 12 | |
| * | Control4 Corp. | 1,088 | 12 |
| * | Ducommun Inc. | 499 | 12 |
| Park-Ohio Holdings Corp. | 303 | 11 | |
| *,^ | Plug Power Inc. | 7,208 | 11 |
| ^ | Costamare Inc. | 1,254 | 11 |
| Supreme Industries Inc. Class A | 610 | 11 | |
| Graham Corp. | 537 | 10 | |
| * | Roadrunner Transportation Systems Inc. | 1,172 | 10 |
| * | ServiceSource International Inc. | 1,905 | 10 |
| * | PHI Inc. | 506 | 9 |
| * | Great Lakes Dredge & Dock Corp. | 2,437 | 9 |
| Teekay Tankers Ltd. Class A | 3,360 | 9 | |
| * | Titan Machinery Inc. | 818 | 9 |
| * | Heritage-Crystal Clean Inc. | 628 | 9 |
| * | Orion Group Holdings Inc. | 1,426 | 8 |
| FreightCar America Inc. | 583 | 8 | |
| Hurco Cos. Inc. | 306 | 8 | |
| Textainer Group Holdings Ltd. | 916 | 8 | |
| Kadant Inc. | 147 | 8 | |
| Celadon Group Inc. | 990 | 8 | |
| * | Layne Christensen Co. | 858 | 8 |
| * | Maxwell Technologies Inc. | 1,487 | 8 |
| * | Rush Enterprises Inc. Class B | 315 | 8 |
| * | Hill International Inc. | 1,657 | 7 |
| Ardmore Shipping Corp. | 931 | 7 | |
| * | CRA International Inc. | 243 | 7 |
| * | Liquidity Services Inc. | 642 | 6 |
| * | IES Holdings Inc. | 373 | 6 |
| * | Dorian LPG Ltd. | 1,112 | 6 |
| Hardinge Inc. | 551 | 6 | |
| * | CAI International Inc. | 718 | 6 |
| Tidewater Inc. | 1,711 | 6 | |
| * | Information Services Group Inc. | 1,467 | 6 |
| * | Scorpio Bulkers Inc. | 1,502 | 5 |
| Navios Maritime Acquisition Corp. | 3,523 | 5 | |
| Universal Logistics Holdings Inc. | 375 | 5 | |
39
| Vanguard® Russell 3000 Index Fund | |||
| Schedule of Investments | |||
| August 31, 2016 | |||
| Market | |||
| Value | |||
| Shares | ($000) | ||
| * | Willis Lease Finance Corp. | 197 | 5 |
| * | USA Truck Inc. | 429 | 5 |
| * | Aqua Metals Inc. | 507 | 5 |
| * | Vicor Corp. | 409 | 4 |
| * | Workhorse Group Inc. | 539 | 4 |
| * | Gencor Industries Inc. | 370 | 4 |
| * | ExOne Co. | 310 | 4 |
| * | NV5 Global Inc. | 136 | 4 |
| * | ALJ Regional Holdings Inc. | 876 | 4 |
| Allied Motion Technologies Inc. | 177 | 4 | |
| * | TRC Cos. Inc. | 517 | 4 |
| * | American Superconductor Corp. | 553 | 4 |
| * | PFSweb Inc. | 395 | 4 |
| * | Gener8 Maritime Inc. | 712 | 4 |
| Marlin Business Services Corp. | 187 | 4 | |
| * | MYR Group Inc. | 121 | 4 |
| * | Global Sources Ltd. | 390 | 3 |
| Preformed Line Products Co. | 74 | 3 | |
| * | HC2 Holdings Inc. | 636 | 3 |
| * | Neff Corp. Class A | 283 | 3 |
| * | Radiant Logistics Inc. | 837 | 2 |
| *,^ | Patriot National Inc. | 239 | 2 |
| * | Blue Bird Corp. | 135 | 2 |
| * | Power Solutions International Inc. | 168 | 2 |
| * | PAM Transportation Services Inc. | 92 | 2 |
| * | Covenant Transportation Group Inc. Class A | 9 | — |
| * | Vishay Precision Group Inc. | 9 | — |
| 118,439 | |||
| Technology (17.2%) | |||
| Apple Inc. | 271,436 | 28,799 | |
| Microsoft Corp. | 374,160 | 21,499 | |
| * | Facebook Inc. Class A | 110,923 | 13,990 |
| * | Alphabet Inc. Class A | 14,433 | 11,400 |
| * | Alphabet Inc. Class C | 14,720 | 11,291 |
| Intel Corp. | 234,292 | 8,409 | |
| Cisco Systems Inc. | 247,113 | 7,769 | |
| International Business Machines Corp. | 43,690 | 6,941 | |
| Oracle Corp. | 146,880 | 6,054 | |
| QUALCOMM Inc. | 72,521 | 4,574 | |
| Texas Instruments Inc. | 49,780 | 3,462 | |
| Broadcom Ltd. | 18,738 | 3,306 | |
| EMC Corp. | 96,426 | 2,795 | |
| * | salesforce.com Inc. | 31,529 | 2,504 |
| * | Adobe Systems Inc. | 24,309 | 2,487 |
| * | Yahoo! Inc. | 42,632 | 1,823 |
| Hewlett Packard Enterprise Co. | 84,706 | 1,819 | |
| * | Cognizant Technology Solutions Corp. Class A | 30,234 | 1,737 |
| Applied Materials Inc. | 54,379 | 1,623 | |
| NVIDIA Corp. | 25,197 | 1,546 | |
| Intuit Inc. | 11,943 | 1,331 | |
| HP Inc. | 84,556 | 1,215 | |
| Corning Inc. | 52,989 | 1,202 | |
| * | Electronic Arts Inc. | 14,188 | 1,152 |
| * | LinkedIn Corp. Class A | 5,911 | 1,139 |
| Activision Blizzard Inc. | 27,436 | 1,135 | |
| Analog Devices Inc. | 15,185 | 950 | |
| Amphenol Corp. Class A | 15,048 | 938 | |
| * | Micron Technology Inc. | 51,006 | 841 |
| * | Autodesk Inc. | 11,208 | 755 |
| Symantec Corp. | 30,318 | 732 | |
| Lam Research Corp. | 7,791 | 727 | |
| Skyworks Solutions Inc. | 9,329 | 698 | |
| Xilinx Inc. | 12,764 | 692 | |
| * | SBA Communications Corp. Class A | 6,045 | 690 |
40
| Vanguard® Russell 3000 Index Fund | |||
| Schedule of Investments | |||
| August 31, 2016 | |||
| Market | |||
| Value | |||
| Shares | ($000) | ||
| Linear Technology Corp. | 11,712 | 682 | |
| * | Red Hat Inc. | 8,963 | 654 |
| * | Citrix Systems Inc. | 7,480 | 652 |
| Western Digital Corp. | 13,878 | 648 | |
| Motorola Solutions Inc. | 8,397 | 646 | |
| Microchip Technology Inc. | 10,220 | 633 | |
| * | Twitter Inc. | 31,769 | 610 |
| Maxim Integrated Products Inc. | 14,297 | 582 | |
| Harris Corp. | 6,077 | 565 | |
| * | Palo Alto Networks Inc. | 4,160 | 554 |
| * | ServiceNow Inc. | 7,618 | 554 |
| NetApp Inc. | 15,961 | 552 | |
| * | Workday Inc. Class A | 6,262 | 531 |
| KLA-Tencor Corp. | 7,576 | 525 | |
| CA Inc. | 13,972 | 474 | |
| * | Akamai Technologies Inc. | 8,333 | 457 |
| CDK Global Inc. | 7,481 | 434 | |
| Amdocs Ltd. | 7,213 | 434 | |
| * | Synopsys Inc. | 7,241 | 429 |
| Juniper Networks Inc. | 18,415 | 425 | |
| * | ANSYS Inc. | 4,197 | 399 |
| * | F5 Networks Inc. | 3,203 | 393 |
| * | Splunk Inc. | 6,545 | 381 |
| * | Cadence Design Systems Inc. | 14,738 | 375 |
| * | Gartner Inc. | 3,878 | 353 |
| Computer Sciences Corp. | 7,380 | 347 | |
| CDW Corp. | 7,760 | 346 | |
| * | Qorvo Inc. | 6,032 | 346 |
| * | VeriSign Inc. | 4,562 | 340 |
| SS&C Technologies Holdings Inc. | 9,713 | 320 | |
| * | Fortinet Inc. | 8,729 | 315 |
| * | PTC Inc. | 7,249 | 309 |
| *,^ | VMware Inc. Class A | 4,004 | 294 |
| * | Arrow Electronics Inc. | 4,383 | 289 |
| * | Ultimate Software Group Inc. | 1,334 | 279 |
| Sabre Corp. | 9,882 | 278 | |
| * | NetSuite Inc. | 2,444 | 266 |
| * | Tyler Technologies Inc. | 1,578 | 259 |
| Avnet Inc. | 6,148 | 256 | |
| ^ | Leidos Holdings Inc. | 6,304 | 255 |
| * | ARRIS International plc | 9,051 | 254 |
| * | Advanced Micro Devices Inc. | 32,609 | 241 |
| Marvell Technology Group Ltd. | 19,195 | 238 | |
| Ingram Micro Inc. | 6,694 | 234 | |
| * | IMS Health Holdings Inc. | 7,540 | 225 |
| * | NCR Corp. | 6,284 | 213 |
| * | Manhattan Associates Inc. | 3,484 | 211 |
| * | Guidewire Software Inc. | 3,370 | 207 |
| Blackbaud Inc. | 3,042 | 205 | |
| * | Take-Two Interactive Software Inc. | 4,713 | 205 |
| * | Microsemi Corp. | 5,110 | 204 |
| IAC/InterActiveCorp | 3,475 | 204 | |
| * | ON Semiconductor Corp. | 18,851 | 204 |
| FEI Co. | 1,879 | 200 | |
| Jabil Circuit Inc. | 9,378 | 199 | |
| DST Systems Inc. | 1,630 | 198 | |
| CSRA Inc. | 7,797 | 198 | |
| * | Teradata Corp. | 6,205 | 197 |
| Brocade Communications Systems Inc. | 21,677 | 195 | |
| Teradyne Inc. | 9,176 | 193 | |
| Cognex Corp. | 3,870 | 193 | |
| * | CommScope Holding Co. Inc. | 6,105 | 181 |
| Cypress Semiconductor Corp. | 14,820 | 177 | |
| * | Ellie Mae Inc. | 1,796 | 176 |
41
| Vanguard® Russell 3000 Index Fund | ||
| Schedule of Investments | ||
| August 31, 2016 | ||
| Market | ||
| Value | ||
| Shares | ($000) | |
| * Rackspace Hosting Inc. | 5,494 | 173 |
| * Aspen Technology Inc. | 3,756 | 171 |
| Mentor Graphics Corp. | 7,105 | 171 |
| * IPG Photonics Corp. | 1,914 | 166 |
| * Cavium Inc. | 2,884 | 161 |
| * ViaSat Inc. | 2,107 | 158 |
| * Cirrus Logic Inc. | 3,047 | 155 |
| * GrubHub Inc. | 3,788 | 154 |
| * Nuance Communications Inc. | 10,498 | 153 |
| * Tableau Software Inc. Class A | 2,620 | 152 |
| * Ciena Corp. | 6,916 | 148 |
| * Arista Networks Inc. | 1,845 | 147 |
| * EPAM Systems Inc. | 2,145 | 146 |
| Monolithic Power Systems Inc. | 1,886 | 145 |
| SYNNEX Corp. | 1,351 | 143 |
| Science Applications International Corp. | 2,223 | 142 |
| * Proofpoint Inc. | 1,815 | 140 |
| * Yelp Inc. Class A | 3,518 | 135 |
| Intersil Corp. Class A | 6,813 | 134 |
| MKS Instruments Inc. | 2,647 | 129 |
| * Tech Data Corp. | 1,730 | 128 |
| * Integrated Device Technology Inc. | 6,373 | 128 |
| InterDigital Inc. | 1,781 | 127 |
| * Coherent Inc. | 1,165 | 123 |
| Dolby Laboratories Inc. Class A | 2,483 | 122 |
| * Fleetmatics Group plc | 2,028 | 121 |
| * Entegris Inc. | 7,024 | 120 |
| * Cornerstone OnDemand Inc. | 2,714 | 119 |
| * NetScout Systems Inc. | 3,994 | 118 |
| * Zendesk Inc. | 3,846 | 117 |
| * Silicon Laboratories Inc. | 2,024 | 116 |
| * Cree Inc. | 4,753 | 114 |
| * Envestnet Inc. | 2,888 | 114 |
| * Universal Display Corp. | 1,977 | 114 |
| * CACI International Inc. Class A | 1,145 | 114 |
| * FireEye Inc. | 7,908 | 114 |
| LogMeIn Inc. | 1,359 | 113 |
| * Paycom Software Inc. | 2,208 | 113 |
| * Fairchild Semiconductor International Inc. Class A | 5,634 | 112 |
| * Finisar Corp. | 5,206 | 110 |
| * Zynga Inc. Class A | 39,184 | 107 |
| * Groupon Inc. Class A | 19,402 | 103 |
| * NETGEAR Inc. | 1,802 | 103 |
| * Ambarella Inc. | 1,398 | 101 |
| * CommVault Systems Inc. | 1,953 | 101 |
| * VeriFone Systems Inc. | 5,062 | 101 |
| Vishay Intertechnology Inc. | 7,076 | 100 |
| * ACI Worldwide Inc. | 5,118 | 98 |
| * Anixter International Inc. | 1,525 | 97 |
| * Verint Systems Inc. | 2,799 | 95 |
| * Viavi Solutions Inc. | 11,965 | 93 |
| * Synaptics Inc. | 1,607 | 92 |
| * Synchronoss Technologies Inc. | 2,192 | 92 |
| Diebold Inc. | 3,242 | 91 |
| * Acxiom Corp. | 3,487 | 91 |
| * Polycom Inc. | 7,280 | 91 |
| Tessera Technologies Inc. | 2,691 | 90 |
| * Lumentum Holdings Inc. | 2,555 | 90 |
| * Semtech Corp. | 3,342 | 89 |
| * Inphi Corp. | 2,051 | 88 |
| * Sanmina Corp. | 3,330 | 88 |
| Power Integrations Inc. | 1,470 | 86 |
| ^ Ebix Inc. | 1,506 | 86 |
| * Rovi Corp. | 4,186 | 86 |
42
| Vanguard® Russell 3000 Index Fund | |||
| Schedule of Investments | |||
| August 31, 2016 | |||
| Market | |||
| Value | |||
| Shares | ($000) | ||
| * | Rambus Inc. | 6,135 | 85 |
| * | EchoStar Corp. Class A | 2,165 | 84 |
| * | 3D Systems Corp. | 5,732 | 83 |
| * | MicroStrategy Inc. Class A | 485 | 81 |
| * | Plexus Corp. | 1,751 | 81 |
| * | Fabrinet | 2,076 | 81 |
| * | Progress Software Corp. | 2,754 | 80 |
| NIC Inc. | 3,375 | 78 | |
| Plantronics Inc. | 1,496 | 76 | |
| * | DigitalGlobe Inc. | 2,793 | 76 |
| * | NeuStar Inc. Class A | 2,950 | 75 |
| * | Infoblox Inc. | 3,492 | 75 |
| * | BroadSoft Inc. | 1,630 | 74 |
| Methode Electronics Inc. | 2,015 | 74 | |
| * | comScore Inc. | 2,379 | 73 |
| CSG Systems International Inc. | 1,671 | 73 | |
| * | Gigamon Inc. | 1,649 | 73 |
| * | RealPage Inc. | 2,808 | 72 |
| * | GoDaddy Inc. Class A | 2,219 | 72 |
| * | Interactive Intelligence Group Inc. | 1,200 | 72 |
| * | RingCentral Inc. Class A | 3,231 | 71 |
| * | Benchmark Electronics Inc. | 2,939 | 71 |
| * | Syntel Inc. | 1,444 | 67 |
| * | iRobot Corp. | 1,662 | 66 |
| * | Imperva Inc. | 1,456 | 66 |
| * | Insight Enterprises Inc. | 2,137 | 65 |
| * | HubSpot Inc. | 1,140 | 64 |
| * | Ubiquiti Networks Inc. | 1,230 | 63 |
| * | AVG Technologies NV | 2,505 | 62 |
| * | II-VI Inc. | 2,876 | 61 |
| * | Qualys Inc. | 1,661 | 57 |
| Brooks Automation Inc. | 4,491 | 57 | |
| * | Rogers Corp. | 1,009 | 56 |
| * | MACOM Technology Solutions Holdings Inc. | 1,364 | 56 |
| Pegasystems Inc. | 2,143 | 55 | |
| * | Rofin-Sinar Technologies Inc. | 1,712 | 55 |
| * | Infinera Corp. | 6,257 | 54 |
| * | ScanSource Inc. | 1,547 | 53 |
| * | Knowles Corp. | 3,795 | 53 |
| * | Bottomline Technologies de Inc. | 2,228 | 51 |
| * | FormFactor Inc. | 4,946 | 51 |
| Monotype Imaging Holdings Inc. | 2,419 | 51 | |
| * | Mercury Systems Inc. | 2,233 | 51 |
| * | Veeco Instruments Inc. | 2,518 | 50 |
| * | Diodes Inc. | 2,349 | 48 |
| *,^ | Globant SA | 1,219 | 48 |
| * | Cray Inc. | 2,077 | 48 |
| * | Stratasys Ltd. | 2,205 | 47 |
| * | SPS Commerce Inc. | 719 | 47 |
| * | Ixia | 4,062 | 47 |
| CTS Corp. | 2,407 | 46 | |
| EarthLink Holdings Corp. | 7,167 | 46 | |
| * | Web.com Group Inc. | 2,593 | 45 |
| * | Inovalon Holdings Inc. Class A | 2,808 | 44 |
| * | Novanta Inc. | 2,553 | 43 |
| * | Callidus Software Inc. | 2,209 | 43 |
| * | MaxLinear Inc. | 2,225 | 43 |
| * | Super Micro Computer Inc. | 1,971 | 43 |
| * | ShoreTel Inc. | 4,937 | 40 |
| * | InvenSense Inc. | 5,241 | 39 |
| ADTRAN Inc. | 2,105 | 39 | |
| * | Oclaro Inc. | 4,897 | 39 |
| *,^ | Pure Storage Inc. Class A | 3,249 | 38 |
| * | New Relic Inc. | 1,036 | 38 |
43
| Vanguard® Russell 3000 Index Fund | ||
| Schedule of Investments | ||
| August 31, 2016 | ||
| Market | ||
| Value | ||
| Shares | ($000) | |
| * ePlus Inc. | 420 | 38 |
| ManTech International Corp. Class A | 948 | 38 |
| * Silver Spring Networks Inc. | 2,681 | 37 |
| * Sonus Networks Inc. | 4,208 | 36 |
| * Cvent Inc. | 1,100 | 36 |
| * NeoPhotonics Corp. | 2,391 | 36 |
| * Black Knight Financial Services Inc. Class A | 860 | 34 |
| * Endurance International Group Holdings Inc. | 4,092 | 33 |
| * Atlassian Corp. plc Class A | 1,082 | 32 |
| * Box Inc. | 2,308 | 32 |
| * Virtusa Corp. | 1,203 | 32 |
| * Ultratech Inc. | 1,212 | 30 |
| * Perficient Inc. | 1,491 | 30 |
| * TTM Technologies Inc. | 2,611 | 28 |
| * Lattice Semiconductor Corp. | 4,553 | 28 |
| * Rapid7 Inc. | 1,518 | 27 |
| AVX Corp. | 1,981 | 27 |
| * CEVA Inc. | 863 | 27 |
| * Amkor Technology Inc. | 2,973 | 27 |
| * Photronics Inc. | 2,822 | 27 |
| * Alarm.com Holdings Inc. | 977 | 27 |
| DTS Inc. | 724 | 24 |
| * Match Group Inc. | 1,479 | 24 |
| * Applied Micro Circuits Corp. | 3,308 | 23 |
| * Alpha & Omega Semiconductor Ltd. | 1,064 | 22 |
| * Rudolph Technologies Inc. | 1,257 | 22 |
| * CalAmp Corp. | 1,427 | 21 |
| * Q2 Holdings Inc. | 723 | 20 |
| * VASCO Data Security International Inc. | 1,105 | 20 |
| * TrueCar Inc. | 2,079 | 20 |
| * Five9 Inc. | 1,338 | 20 |
| * Bankrate Inc. | 2,495 | 20 |
| * CommerceHub Inc. | 1,292 | 19 |
| * Hortonworks Inc. | 2,332 | 19 |
| * GTT Communications Inc. | 871 | 18 |
| * Unisys Corp. | 1,830 | 18 |
| * LivePerson Inc. | 2,367 | 18 |
| * Brightcove Inc. | 1,425 | 18 |
| Epiq Systems Inc. | 1,110 | 18 |
| * Loral Space & Communications Inc. | 496 | 18 |
| * Blucora Inc. | 1,740 | 18 |
| * Extreme Networks Inc. | 4,570 | 18 |
| * Vocera Communications Inc. | 1,100 | 18 |
| Comtech Telecommunications Corp. | 1,383 | 18 |
| * Nanometrics Inc. | 870 | 18 |
| * Actua Corp. | 1,685 | 17 |
| * Barracuda Networks Inc. | 711 | 16 |
| * RetailMeNot Inc. | 1,402 | 16 |
| * Nimble Storage Inc. | 1,888 | 16 |
| * PROS Holdings Inc. | 766 | 15 |
| * Kimball Electronics Inc. | 1,243 | 15 |
| * Tangoe Inc. | 1,610 | 15 |
| * pdvWireless Inc. | 578 | 15 |
| * Intralinks Holdings Inc. | 1,537 | 15 |
| * Evolent Health Inc. Class A | 577 | 14 |
| * Silicon Graphics International Corp. | 1,849 | 14 |
| * KEYW Holding Corp. | 1,419 | 14 |
| * A10 Networks Inc. | 1,426 | 14 |
| * Global Eagle Entertainment Inc. | 1,683 | 14 |
| Sapiens International Corp. NV | 1,037 | 14 |
| * Harmonic Inc. | 3,210 | 14 |
| * Digi International Inc. | 1,191 | 14 |
| Acacia Research Corp. | 2,241 | 13 |
| * Exar Corp. | 1,466 | 13 |
44
| Vanguard® Russell 3000 Index Fund | |||
| Schedule of Investments | |||
| August 31, 2016 | |||
| Market | |||
| Value | |||
| Shares | ($000) | ||
| * | Avid Technology Inc. | 1,471 | 13 |
| * | ChannelAdvisor Corp. | 1,058 | 13 |
| * | Calix Inc. | 1,743 | 13 |
| * | DSP Group Inc. | 1,117 | 13 |
| * | Axcelis Technologies Inc. | 1,096 | 13 |
| Park Electrochemical Corp. | 777 | 13 | |
| Daktronics Inc. | 1,322 | 13 | |
| * | Carbonite Inc. | 900 | 13 |
| PC Connection Inc. | 468 | 12 | |
| American Software Inc. Class A | 1,171 | 12 | |
| * | Sigma Designs Inc. | 1,602 | 12 |
| American Science & Engineering Inc. | 325 | 12 | |
| * | Benefitfocus Inc. | 286 | 12 |
| * | Lionbridge Technologies Inc. | 2,370 | 12 |
| Bel Fuse Inc. Class B | 501 | 11 | |
| * | Applied Optoelectronics Inc. | 681 | 11 |
| * | Varonis Systems Inc. | 381 | 11 |
| * | Ultra Clean Holdings Inc. | 1,547 | 11 |
| * | MeetMe Inc. | 1,949 | 11 |
| Cohu Inc. | 1,027 | 11 | |
| * | Silicom Ltd. | 271 | 11 |
| IXYS Corp. | 949 | 11 | |
| * | Sparton Corp. | 473 | 11 |
| * | Mitek Systems Inc. | 1,392 | 11 |
| * | Exa Corp. | 662 | 11 |
| * | Digimarc Corp. | 286 | 10 |
| * | Glu Mobile Inc. | 4,345 | 10 |
| * | Zix Corp. | 2,658 | 10 |
| * | Rubicon Project Inc. | 1,172 | 10 |
| NVE Corp. | 167 | 10 | |
| * | Jive Software Inc. | 2,276 | 10 |
| * | CommerceHub Inc. Class A | 642 | 9 |
| Black Box Corp. | 665 | 9 | |
| * | Bazaarvoice Inc. | 2,239 | 9 |
| QAD Inc. Class A | 377 | 9 | |
| Reis Inc. | 444 | 9 | |
| * | USA Technologies Inc. | 1,698 | 8 |
| * | Clearfield Inc. | 465 | 8 |
| * | Radisys Corp. | 1,688 | 8 |
| * | Immersion Corp. | 1,130 | 8 |
| * | Model N Inc. | 690 | 7 |
| * | Electro Scientific Industries Inc. | 1,302 | 7 |
| * | Kopin Corp. | 3,357 | 7 |
| * | Telenav Inc. | 1,192 | 7 |
| * | KVH Industries Inc. | 798 | 7 |
| * | Autobytel Inc. | 414 | 7 |
| * | Aerohive Networks Inc. | 940 | 6 |
| * | Everyday Health Inc. | 811 | 6 |
| * | TechTarget Inc. | 739 | 6 |
| *,^ | VirnetX Holding Corp. | 1,963 | 5 |
| * | Rightside Group Ltd. | 548 | 5 |
| * | MINDBODY Inc. Class A | 295 | 5 |
| * | ARC Document Solutions Inc. | 1,504 | 5 |
| * | Acacia Communications Inc. | 44 | 5 |
| * | Numerex Corp. Class A | 651 | 5 |
| * | Limelight Networks Inc. | 2,595 | 5 |
| * | Appfolio Inc. | 248 | 5 |
| * | Xactly Corp. | 323 | 4 |
| * | MobileIron Inc. | 1,432 | 4 |
| * | GigPeak Inc. | 2,207 | 4 |
| * | SecureWorks Corp. Class A | 291 | 4 |
| EMCORE Corp. | 805 | 4 | |
| * | Workiva Inc. | 210 | 4 |
| NCI Inc. Class A | 290 | 3 | |
45
| Vanguard® Russell 3000 Index Fund | |||
| Schedule of Investments | |||
| August 31, 2016 | |||
| Market | |||
| Value | |||
| Shares | ($000) | ||
| * | Amber Road Inc. | 324 | 3 |
| * | RealNetworks Inc. | 553 | 3 |
| * | Park City Group Inc. | 218 | 2 |
| * | Majesco | 282 | 1 |
| * | Guidance Software Inc. | 189 | 1 |
| * | Apigee Corp. | 66 | 1 |
| * | Agilysys Inc. | 18 | — |
| * | Datalink Corp. | 18 | — |
| 193,856 | |||
| Utilities (5.7%) | |||
| AT&T Inc. | 304,766 | 12,459 | |
| Verizon Communications Inc. | 202,306 | 10,587 | |
| NextEra Energy Inc. | 22,784 | 2,756 | |
| Duke Energy Corp. | 34,078 | 2,715 | |
| Southern Co. | 46,878 | 2,406 | |
| Dominion Resources Inc. | 30,545 | 2,265 | |
| American Electric Power Co. Inc. | 24,131 | 1,558 | |
| PG&E Corp. | 24,642 | 1,526 | |
| Exelon Corp. | 43,487 | 1,479 | |
| Sempra Energy | 12,328 | 1,290 | |
| PPL Corp. | 33,499 | 1,165 | |
| Edison International | 15,549 | 1,131 | |
| Consolidated Edison Inc. | 14,856 | 1,118 | |
| Public Service Enterprise Group Inc. | 24,955 | 1,067 | |
| Xcel Energy Inc. | 24,785 | 1,025 | |
| WEC Energy Group Inc. | 15,666 | 938 | |
| Eversource Energy | 15,733 | 849 | |
| DTE Energy Co. | 8,779 | 816 | |
| CenturyLink Inc. | 26,302 | 731 | |
| * | Level 3 Communications Inc. | 14,205 | 705 |
| Entergy Corp. | 9,004 | 704 | |
| FirstEnergy Corp. | 21,217 | 694 | |
| * | T-Mobile US Inc. | 14,245 | 660 |
| Ameren Corp. | 11,933 | 590 | |
| CMS Energy Corp. | 13,436 | 564 | |
| American Water Works Co. Inc. | 7,488 | 554 | |
| CenterPoint Energy Inc. | 20,620 | 463 | |
| SCANA Corp. | 6,213 | 439 | |
| Alliant Energy Corp. | 11,239 | 427 | |
| Westar Energy Inc. Class A | 7,215 | 396 | |
| AES Corp. | 31,978 | 386 | |
| NiSource Inc. | 15,970 | 382 | |
| Pinnacle West Capital Corp. | 5,026 | 377 | |
| UGI Corp. | 8,222 | 374 | |
| Atmos Energy Corp. | 4,781 | 352 | |
| ITC Holdings Corp. | 7,637 | 345 | |
| OGE Energy Corp. | 9,475 | 295 | |
| Frontier Communications Corp. | 61,940 | 285 | |
| Aqua America Inc. | 9,169 | 279 | |
| MDU Resources Group Inc. | 10,684 | 252 | |
| * | Zayo Group Holdings Inc. | 7,787 | 226 |
| Piedmont Natural Gas Co. Inc. | 3,756 | 226 | |
| *,^ | Sprint Corp. | 34,804 | 215 |
| Questar Corp. | 8,520 | 213 | |
| * | Calpine Corp. | 16,970 | 212 |
| National Fuel Gas Co. | 3,512 | 200 | |
| Vectren Corp. | 4,087 | 200 | |
| Great Plains Energy Inc. | 7,341 | 199 | |
| NRG Energy Inc. | 16,294 | 197 | |
| Hawaiian Electric Industries Inc. | 6,367 | 191 | |
| New Jersey Resources Corp. | 5,349 | 180 | |
| Portland General Electric Co. | 4,138 | 174 | |
| IDACORP Inc. | 2,270 | 173 | |
| Southwest Gas Corp. | 2,374 | 166 | |
46
| Vanguard® Russell 3000 Index Fund | ||
| Schedule of Investments | ||
| August 31, 2016 | ||
| Market | ||
| Value | ||
| Shares | ($000) | |
| WGL Holdings Inc. | 2,546 | 160 |
| Black Hills Corp. | 2,654 | 155 |
| ONE Gas Inc. | 2,451 | 150 |
| j2 Global Inc. | 2,145 | 146 |
| South Jersey Industries Inc. | 4,788 | 142 |
| Avangrid Inc. | 3,405 | 142 |
| ALLETE Inc. | 2,305 | 137 |
| Spire Inc. | 2,018 | 131 |
| Telephone & Data Systems Inc. | 4,630 | 129 |
| NorthWestern Corp. | 2,202 | 127 |
| Avista Corp. | 2,968 | 121 |
| PNM Resources Inc. | 3,768 | 120 |
| El Paso Electric Co. | 2,103 | 96 |
| Ormat Technologies Inc. | 1,891 | 92 |
| Northwest Natural Gas Co. | 1,432 | 86 |
| MGE Energy Inc. | 1,549 | 85 |
| Cogent Communications Holdings Inc. | 2,386 | 85 |
| California Water Service Group | 2,556 | 78 |
| American States Water Co. | 1,953 | 76 |
| Empire District Electric Co. | 2,199 | 74 |
| Otter Tail Corp. | 2,135 | 73 |
| Shenandoah Telecommunications Co. | 2,585 | 67 |
| * Dynegy Inc. | 5,232 | 66 |
| Pattern Energy Group Inc. Class A | 2,737 | 65 |
| Consolidated Communications Holdings Inc. | 2,697 | 65 |
| * Vonage Holdings Corp. | 10,158 | 59 |
| Chesapeake Utilities Corp. | 891 | 57 |
| * Cincinnati Bell Inc. | 13,533 | 57 |
| * Globalstar Inc. | 31,266 | 49 |
| * 8x8 Inc. | 3,563 | 47 |
| * Talen Energy Corp. | 3,373 | 47 |
| SJW Corp. | 1,087 | 46 |
| NRG Yield Inc. Class A | 2,702 | 43 |
| ^ Atlantica Yield plc | 2,137 | 40 |
| Unitil Corp. | 1,018 | 40 |
| * inContact Inc. | 2,562 | 36 |
| * United States Cellular Corp. | 952 | 35 |
| Windstream Holdings Inc. | 3,925 | 33 |
| * General Communication Inc. Class A | 2,322 | 32 |
| NRG Yield Inc. | 1,906 | 32 |
| West Corp. | 1,366 | 32 |
| * Gogo Inc. | 2,437 | 30 |
| * Iridium Communications Inc. | 3,451 | 29 |
| * ORBCOMM Inc. | 2,735 | 27 |
| ATN International Inc. | 409 | 27 |
| Inteliquent Inc. | 1,393 | 23 |
| * Straight Path Communications Inc. Class B | 924 | 22 |
| Middlesex Water Co. | 622 | 21 |
| Connecticut Water Service Inc. | 432 | 20 |
| York Water Co. | 601 | 17 |
| * Boingo Wireless Inc. | 1,723 | 15 |
| Spok Holdings Inc. | 864 | 14 |
| Atlantic Power Corp. | 5,183 | 13 |
| * FairPoint Communications Inc. | 798 | 11 |
| * Hawaiian Telcom Holdco Inc. | 483 | 11 |
| IDT Corp. Class B | 698 | 10 |
| * NII Holdings Inc. | 2,537 | 8 |
| Delta Natural Gas Co. Inc. | 327 | 8 |
| Artesian Resources Corp. Class A | 284 | 8 |
| Consolidated Water Co. Ltd. | 433 | 6 |
| Global Water Resources Inc. | 391 | 3 |
| Spark Energy Inc. Class A | 107 | 3 |
| Genie Energy Ltd. Class B | 401 | 3 |
| * Intelsat SA | 799 | 2 |
47
| Vanguard® Russell 3000 Index Fund | ||||
| Schedule of Investments | ||||
| August 31, 2016 | ||||
| Market | ||||
| Value | ||||
| Shares | ($000) | |||
| * Lumos Networks Corp. | 18 | — | ||
| 63,860 | ||||
| Total Common Stocks (Cost $1,058,966) | 1,125,311 | |||
| Coupon | ||||
| Temporary Cash Investments (0.3%)1 | ||||
| Money Market Fund (0.2%) | ||||
| 3,4 Vanguard Market Liquidity Fund | 0.612% | 18,212 | 1,822 | |
| Face | ||||
| Maturity | Amount | |||
| Date | ($000) | |||
| U.S. Government and Agency Obligations (0.1%) | ||||
| 5,6 Federal Home Loan Bank Discount Notes | 0.371% | 9/13/16 | 1,000 | 1,000 |
| Total Temporary Cash Investments (Cost $2,821) | 2,822 | |||
| Total Investments (100.0%) (Cost $1,061,787) | 1,128,133 | |||
| Other Assets and Liabilities—Net (0.0%)4 | 443 | |||
| Net Assets (100%) | 1,128,576 | |||
| * | Non-income-producing security. |
| ^ | Includes partial security positions on loan to broker-dealers. The total value of securities on loan is $1,525,000. |
| 1 | The fund invests a portion of its cash reserves in equity markets through the use of index futures contracts. After giving effect to futures investments, the fund's effective common stock and temporary cash investment positions represent 100.0% and 0.0%, respectively, of net assets. |
| 2 | “Other” represents securities that are not classified by the fund’s benchmark index. |
| 3 | Affiliated money market fund available only to Vanguard funds and certain trusts and accounts managed by Vanguard. Rate shown is the 7-day yield. |
| 4 | Includes $1,642,000 of collateral received for securities on loan. |
| 5 | The issuer operates under a congressional charter; its securities are generally neither guaranteed by the U.S. Treasury nor backed by the full faith and credit of the U.S. government. |
| 6 | Securities with a value of $400,000 have been segregated as initial margin for open futures contracts. CVR—Contingent Value Rights. |
| REIT—Real Estate Investment Trust. |
48
This page intentionally left blank.
© 2016 The Vanguard Group, Inc. All rights reserved.
Vanguard Marketing Corporation, Distributor.
SNA18540 102016
Report of Independent Registered Public Accounting Firm
To the Board of Trustees of Vanguard Scottsdale Funds and the Shareholders of Vanguard Russell 3000 Index Fund:
In our opinion, the accompanying statement of net assets – investments summary and the related statements of operations and of changes in net assets and the financial highlights (included in Item 1 of this Form N-CSR) and the schedule of investments (included in Item 6 of this Form N-CSR) present fairly, in all material respects, the financial position of Vanguard Russell 3000 Index Fund (constituting a separate portfolio of Vanguard Scottsdale Funds, hereafter referred to as the “Fund”) at August 31, 2016, the results of its operations for the year then ended, the changes in its net assets for each of the two years in the period then ended, and the financial highlights for each of the five years in the period then ended, in conformity with accounting principles generally accepted in the United States of America. These financial statements, financial highlights and schedule of investments (hereafter referred to as "financial statements") are the responsibility of the Fund's management. Our responsibility is to express an opinion on these financial statements based on our audits. We conducted our audits of these financial statements in accordance with the standards of the Public Company Accounting Oversight Board (United States). Those standards require that we plan and perform the audit to obtain reasonable assurance about whether the financial statements are free of material misstatement. An audit includes examining, on a test basis, evidence supporting the amounts and disclosures in the financial statements, assessing the accounting principles used and significant estimates made by management, and evaluating the overall financial statement presentation. We believe that our audits, which included confirmation of securities at August 31, 2016 by correspondence with the custodian and brokers and by agreement to the underlying ownership records of the transfer agent, provide a reasonable basis for our opinion.

October 18, 2016
PricewaterhouseCoopers LLP, Two Commerce Square, 2001 Market Street, Suite 1800, Philadelphia, PA 19103-7042
T: (267) 330-3000, F: (267) 330-3300, www.pwc.com/us
Vanguard® Short-Term Corporate Bond Index Fund
Schedule of Investments
August 31, 2016
| Face | Market | |||
| Maturity | Amount | Value | ||
| Coupon | Date | ($000) | ($000) | |
| U.S. Government and Agency Obligations (0.3%) | ||||
| U.S. Government Securities (0.3%) | ||||
| United States Treasury Note/Bond | ||||
| (Costs $59,133) | 0.750% | 7/31/18 | 59,200 | 59,135 |
| Corporate Bonds (98.5%) | ||||
| Finance (41.1%) | ||||
| Banking (33.1%) | ||||
| American Express Bank FSB | 6.000% | 9/13/17 | 8,380 | 8,788 |
| American Express Centurion Bank | 6.000% | 9/13/17 | 4,754 | 4,986 |
| American Express Co. | 7.000% | 3/19/18 | 22,854 | 24,778 |
| American Express Co. | 1.550% | 5/22/18 | 11,789 | 11,817 |
| American Express Co. | 8.125% | 5/20/19 | 1,600 | 1,862 |
| American Express Credit Corp. | 1.550% | 9/22/17 | 5,600 | 5,619 |
| American Express Credit Corp. | 2.125% | 7/27/18 | 8,113 | 8,259 |
| American Express Credit Corp. | 1.800% | 7/31/18 | 7,305 | 7,365 |
| American Express Credit Corp. | 1.875% | 11/5/18 | 5,500 | 5,553 |
| American Express Credit Corp. | 2.125% | 3/18/19 | 15,152 | 15,439 |
| American Express Credit Corp. | 2.250% | 8/15/19 | 12,164 | 12,418 |
| American Express Credit Corp. | 2.375% | 5/26/20 | 17,475 | 17,873 |
| American Express Credit Corp. | 2.600% | 9/14/20 | 12,706 | 13,088 |
| American Express Credit Corp. | 2.250% | 5/5/21 | 18,481 | 18,776 |
| Australia & New Zealand Banking Group Ltd. | 1.875% | 10/6/17 | 6,625 | 6,658 |
| Australia & New Zealand Banking Group Ltd. | 1.500% | 1/16/18 | 4,975 | 4,991 |
| Australia & New Zealand Banking Group Ltd. | 1.450% | 5/15/18 | 10,325 | 10,324 |
| Australia & New Zealand Banking Group Ltd. | 2.000% | 11/16/18 | 8,500 | 8,585 |
| Australia & New Zealand Banking Group Ltd. | 2.250% | 6/13/19 | 9,830 | 9,988 |
| Australia & New Zealand Banking Group Ltd. | 1.600% | 7/15/19 | 9,725 | 9,711 |
| Australia & New Zealand Banking Group Ltd. | 2.700% | 11/16/20 | 8,500 | 8,767 |
| Australia & New Zealand Banking Group Ltd. | 2.300% | 6/1/21 | 11,125 | 11,302 |
| Banco Bilbao Vizcaya Argentaria SA | 3.000% | 10/20/20 | 9,725 | 9,954 |
| Bancolombia SA | 5.950% | 6/3/21 | 8,000 | 8,799 |
| Bank of America Corp. | 6.000% | 9/1/17 | 15,629 | 16,301 |
| Bank of America Corp. | 5.750% | 12/1/17 | 24,955 | 26,243 |
| Bank of America Corp. | 2.000% | 1/11/18 | 34,840 | 35,049 |
| Bank of America Corp. | 6.875% | 4/25/18 | 53,339 | 57,811 |
| Bank of America Corp. | 5.650% | 5/1/18 | 34,284 | 36,476 |
| Bank of America Corp. | 6.500% | 7/15/18 | 4,004 | 4,346 |
| Bank of America Corp. | 6.875% | 11/15/18 | 6,520 | 7,234 |
| Bank of America Corp. | 2.600% | 1/15/19 | 41,232 | 42,142 |
| Bank of America Corp. | 5.490% | 3/15/19 | 3,450 | 3,724 |
| Bank of America Corp. | 2.650% | 4/1/19 | 28,486 | 29,068 |
| Bank of America Corp. | 7.625% | 6/1/19 | 24,824 | 28,521 |
| Bank of America Corp. | 2.250% | 4/21/20 | 25,850 | 26,047 |
| Bank of America Corp. | 5.625% | 7/1/20 | 28,240 | 31,874 |
| Bank of America Corp. | 2.625% | 10/19/20 | 25,675 | 26,234 |
| Bank of America Corp. | 5.875% | 1/5/21 | 13,755 | 15,825 |
| Bank of America Corp. | 2.625% | 4/19/21 | 12,550 | 12,794 |
| Bank of America Corp. | 5.000% | 5/13/21 | 14,235 | 15,973 |
| Bank of America NA | 1.650% | 3/26/18 | 14,416 | 14,481 |
| Bank of America NA | 1.750% | 6/5/18 | 18,225 | 18,348 |
| Bank of America NA | 2.050% | 12/7/18 | 10,450 | 10,587 |
| Bank of Montreal | 1.400% | 9/11/17 | 5,049 | 5,083 |
| Bank of Montreal | 1.450% | 4/9/18 | 10,044 | 10,070 |
| Bank of Montreal | 1.400% | 4/10/18 | 10,475 | 10,491 |
| Bank of Montreal | 1.800% | 7/31/18 | 6,450 | 6,505 |
| Bank of Montreal | 1.350% | 8/28/18 | 5,000 | 5,000 |
| Bank of Montreal | 2.375% | 1/25/19 | 11,600 | 11,842 |
| Bank of Montreal | 1.500% | 7/18/19 | 12,500 | 12,503 |
| Bank of Montreal | 1.900% | 8/27/21 | 19,000 | 18,923 |
| Bank of New York Mellon Corp. | 1.350% | 3/6/18 | 8,434 | 8,452 |
| Bank of New York Mellon Corp. | 1.600% | 5/22/18 | 500 | 504 |
| Bank of New York Mellon Corp. | 2.100% | 8/1/18 | 3,106 | 3,153 |
| Bank of New York Mellon Corp. | 2.100% | 1/15/19 | 10,491 | 10,665 |
1
| Vanguard® Short-Term Corporate Bond Index Fund | ||||
| Schedule of Investments | ||||
| August 31, 2016 | ||||
| Face | Market | |||
| Maturity | Amount | Value | ||
| Coupon | Date | ($000) | ($000) | |
| Bank of New York Mellon Corp. | 2.200% | 3/4/19 | 6,950 | 7,077 |
| Bank of New York Mellon Corp. | 2.200% | 5/15/19 | 9,225 | 9,416 |
| Bank of New York Mellon Corp. | 5.450% | 5/15/19 | 3,300 | 3,644 |
| Bank of New York Mellon Corp. | 2.300% | 9/11/19 | 9,803 | 10,033 |
| Bank of New York Mellon Corp. | 4.600% | 1/15/20 | 1,225 | 1,340 |
| Bank of New York Mellon Corp. | 2.150% | 2/24/20 | 13,440 | 13,661 |
| Bank of New York Mellon Corp. | 2.600% | 8/17/20 | 9,845 | 10,098 |
| Bank of New York Mellon Corp. | 2.450% | 11/27/20 | 15,572 | 16,014 |
| Bank of New York Mellon Corp. | 4.150% | 2/1/21 | 2,000 | 2,188 |
| Bank of New York Mellon Corp. | 2.500% | 4/15/21 | 7,511 | 7,712 |
| Bank of New York Mellon Corp. | 2.050% | 5/3/21 | 13,000 | 13,133 |
| Bank of Nova Scotia | 1.375% | 12/18/17 | 4,894 | 4,901 |
| Bank of Nova Scotia | 1.450% | 4/25/18 | 11,660 | 11,670 |
| Bank of Nova Scotia | 1.700% | 6/11/18 | 8,650 | 8,702 |
| Bank of Nova Scotia | 2.050% | 10/30/18 | 15,666 | 15,886 |
| Bank of Nova Scotia | 1.950% | 1/15/19 | 1,900 | 1,923 |
| Bank of Nova Scotia | 2.050% | 6/5/19 | 16,000 | 16,205 |
| Bank of Nova Scotia | 1.650% | 6/14/19 | 13,725 | 13,769 |
| Bank of Nova Scotia | 2.350% | 10/21/20 | 10,600 | 10,837 |
| Bank of Nova Scotia | 4.375% | 1/13/21 | 5,100 | 5,650 |
| Bank of Nova Scotia | 2.450% | 3/22/21 | 12,380 | 12,704 |
| Bank of Nova Scotia | 2.800% | 7/21/21 | 8,614 | 8,979 |
| Barclays Bank plc | 5.125% | 1/8/20 | 5,890 | 6,383 |
| Barclays Bank plc | 5.140% | 10/14/20 | 9,600 | 10,366 |
| Barclays plc | 2.000% | 3/16/18 | 8,775 | 8,776 |
| Barclays plc | 2.750% | 11/8/19 | 15,035 | 15,139 |
| Barclays plc | 2.875% | 6/8/20 | 9,625 | 9,703 |
| Barclays plc | 3.250% | 1/12/21 | 20,343 | 20,727 |
| Barclays plc | 3.200% | 8/10/21 | 10,000 | 10,052 |
| BB&T Corp. | 1.450% | 1/12/18 | 6,125 | 6,137 |
| BB&T Corp. | 2.050% | 6/19/18 | 11,364 | 11,496 |
| BB&T Corp. | 2.250% | 2/1/19 | 7,400 | 7,537 |
| BB&T Corp. | 6.850% | 4/30/19 | 3,150 | 3,575 |
| BB&T Corp. | 5.250% | 11/1/19 | 4,722 | 5,208 |
| BB&T Corp. | 2.450% | 1/15/20 | 13,775 | 14,111 |
| BB&T Corp. | 2.625% | 6/29/20 | 2,000 | 2,058 |
| BB&T Corp. | 2.050% | 5/10/21 | 14,500 | 14,609 |
| Bear Stearns Cos. LLC | 6.400% | 10/2/17 | 21,470 | 22,613 |
| Bear Stearns Cos. LLC | 7.250% | 2/1/18 | 30,305 | 32,702 |
| Bear Stearns Cos. LLC | 4.650% | 7/2/18 | 3,015 | 3,183 |
| BNP Paribas SA | 2.375% | 9/14/17 | 20,573 | 20,779 |
| BNP Paribas SA | 2.700% | 8/20/18 | 11,060 | 11,296 |
| BNP Paribas SA | 2.400% | 12/12/18 | 19,120 | 19,422 |
| BNP Paribas SA | 2.450% | 3/17/19 | 3,540 | 3,605 |
| BNP Paribas SA | 2.375% | 5/21/20 | 13,618 | 13,836 |
| BNP Paribas SA | 5.000% | 1/15/21 | 21,006 | 23,580 |
| BPCE SA | 2.500% | 12/10/18 | 10,950 | 11,169 |
| BPCE SA | 2.500% | 7/15/19 | 8,875 | 9,074 |
| BPCE SA | 2.250% | 1/27/20 | 9,625 | 9,768 |
| BPCE SA | 2.650% | 2/3/21 | 6,220 | 6,420 |
| Branch Banking & Trust Co. | 2.300% | 10/15/18 | 7,633 | 7,785 |
| Branch Banking & Trust Co. | 1.450% | 5/10/19 | 13,325 | 13,328 |
| Branch Banking & Trust Co. | 2.850% | 4/1/21 | 5,391 | 5,621 |
| Canadian Imperial Bank of Commerce | 1.550% | 1/23/18 | 9,525 | 9,553 |
| Canadian Imperial Bank of Commerce | 1.600% | 9/6/19 | 5,300 | 5,301 |
| Capital One Bank USA NA | 2.150% | 11/21/18 | 3,900 | 3,935 |
| Capital One Bank USA NA | 2.250% | 2/13/19 | 15,550 | 15,734 |
| Capital One Bank USA NA | 2.300% | 6/5/19 | 5,750 | 5,820 |
| Capital One Bank USA NA | 8.800% | 7/15/19 | 2,127 | 2,497 |
| Capital One Financial Corp. | 6.750% | 9/15/17 | 5,325 | 5,609 |
| Capital One Financial Corp. | 2.450% | 4/24/19 | 11,400 | 11,630 |
| Capital One Financial Corp. | 4.750% | 7/15/21 | 11,381 | 12,683 |
| Capital One NA | 1.500% | 9/5/17 | 1,800 | 1,802 |
| Capital One NA | 1.650% | 2/5/18 | 15,400 | 15,420 |
2
| Vanguard® Short-Term Corporate Bond Index Fund | ||||
| Schedule of Investments | ||||
| August 31, 2016 | ||||
| Face | Market | |||
| Maturity | Amount | Value | ||
| Coupon | Date | ($000) | ($000) | |
| Capital One NA | 1.500% | 3/22/18 | 4,806 | 4,800 |
| Capital One NA | 2.350% | 8/17/18 | 7,223 | 7,316 |
| Capital One NA | 2.400% | 9/5/19 | 7,650 | 7,785 |
| Capital One NA | 2.950% | 7/23/21 | 9,400 | 9,724 |
| Citigroup Inc. | 6.125% | 11/21/17 | 11,413 | 12,033 |
| Citigroup Inc. | 1.850% | 11/24/17 | 15,969 | 16,034 |
| Citigroup Inc. | 1.800% | 2/5/18 | 25,310 | 25,402 |
| Citigroup Inc. | 1.700% | 4/27/18 | 28,393 | 28,421 |
| Citigroup Inc. | 1.750% | 5/1/18 | 19,056 | 19,084 |
| Citigroup Inc. | 6.125% | 5/15/18 | 8,089 | 8,682 |
| Citigroup Inc. | 2.150% | 7/30/18 | 8,195 | 8,272 |
| Citigroup Inc. | 2.500% | 9/26/18 | 15,400 | 15,658 |
| Citigroup Inc. | 2.050% | 12/7/18 | 15,090 | 15,200 |
| Citigroup Inc. | 2.550% | 4/8/19 | 23,194 | 23,654 |
| Citigroup Inc. | 8.500% | 5/22/19 | 2,000 | 2,349 |
| Citigroup Inc. | 2.050% | 6/7/19 | 5,050 | 5,086 |
| Citigroup Inc. | 2.500% | 7/29/19 | 17,429 | 17,741 |
| Citigroup Inc. | 2.400% | 2/18/20 | 17,730 | 17,965 |
| Citigroup Inc. | 5.375% | 8/9/20 | 4,574 | 5,132 |
| Citigroup Inc. | 2.650% | 10/26/20 | 20,100 | 20,584 |
| Citigroup Inc. | 2.700% | 3/30/21 | 25,750 | 26,250 |
| Citigroup Inc. | 2.350% | 8/2/21 | 14,000 | 14,032 |
| Citizens Bank NA | 1.600% | 12/4/17 | 3,600 | 3,589 |
| Citizens Bank NA | 2.300% | 12/3/18 | 5,000 | 5,049 |
| Citizens Bank NA | 2.500% | 3/14/19 | 2,700 | 2,743 |
| Citizens Bank NA | 2.450% | 12/4/19 | 4,050 | 4,103 |
| Citizens Bank NA | 2.550% | 5/13/21 | 13,000 | 13,236 |
| Citizens Financial Group Inc. | 2.375% | 7/28/21 | 2,000 | 2,006 |
| City National Corp. | 5.250% | 9/15/20 | 2,050 | 2,307 |
| Comerica Inc. | 2.125% | 5/23/19 | 6,700 | 6,738 |
| Commonwealth Bank of Australia | 1.400% | 9/8/17 | 7,425 | 7,437 |
| Commonwealth Bank of Australia | 1.900% | 9/18/17 | 13,085 | 13,163 |
| Commonwealth Bank of Australia | 1.625% | 3/12/18 | 18,475 | 18,544 |
| Commonwealth Bank of Australia | 2.500% | 9/20/18 | 15,887 | 16,206 |
| Commonwealth Bank of Australia | 1.750% | 11/2/18 | 7,425 | 7,463 |
| Commonwealth Bank of Australia | 2.250% | 3/13/19 | 15,200 | 15,442 |
| Commonwealth Bank of Australia | 2.050% | 3/15/19 | 4,150 | 4,196 |
| Commonwealth Bank of Australia | 2.300% | 9/6/19 | 9,850 | 10,019 |
| Commonwealth Bank of Australia | 2.300% | 3/12/20 | 500 | 509 |
| Commonwealth Bank of Australia | 2.400% | 11/2/20 | 7,325 | 7,489 |
| Commonwealth Bank of Australia | 2.550% | 3/15/21 | 8,350 | 8,567 |
| Compass Bank | 1.850% | 9/29/17 | 2,300 | 2,294 |
| Compass Bank | 6.400% | 10/1/17 | 1,730 | 1,804 |
| Compass Bank | 2.750% | 9/29/19 | 2,885 | 2,872 |
| Cooperatieve Rabobank UA | 1.700% | 3/19/18 | 17,650 | 17,718 |
| Cooperatieve Rabobank UA | 2.250% | 1/14/19 | 16,356 | 16,630 |
| Cooperatieve Rabobank UA | 1.375% | 8/9/19 | 1,000 | 994 |
| Cooperatieve Rabobank UA | 2.250% | 1/14/20 | 10,000 | 10,147 |
| Cooperatieve Rabobank UA | 4.500% | 1/11/21 | 7,011 | 7,775 |
| Cooperatieve Rabobank UA | 2.500% | 1/19/21 | 20,650 | 21,214 |
| Credit Suisse AG | 1.750% | 1/29/18 | 18,955 | 18,976 |
| Credit Suisse AG | 6.000% | 2/15/18 | 12,459 | 13,131 |
| Credit Suisse AG | 1.700% | 4/27/18 | 18,625 | 18,635 |
| Credit Suisse AG | 2.300% | 5/28/19 | 24,356 | 24,697 |
| Credit Suisse AG | 5.300% | 8/13/19 | 10,328 | 11,369 |
| Credit Suisse AG | 5.400% | 1/14/20 | 14,051 | 15,373 |
| Credit Suisse AG | 4.375% | 8/5/20 | 1,761 | 1,894 |
| Credit Suisse Group Funding Guernsey Ltd. | 2.750% | 3/26/20 | 16,800 | 16,819 |
| Credit Suisse Group Funding Guernsey Ltd. | 3.125% | 12/10/20 | 17,590 | 17,820 |
| 1 Credit Suisse Group Funding Guernsey Ltd. | 3.450% | 4/16/21 | 18,650 | 19,044 |
| Deutsche Bank AG | 6.000% | 9/1/17 | 22,565 | 23,441 |
| Deutsche Bank AG | 1.875% | 2/13/18 | 16,625 | 16,522 |
| Deutsche Bank AG | 2.500% | 2/13/19 | 19,811 | 19,833 |
| Deutsche Bank AG | 2.850% | 5/10/19 | 16,375 | 16,391 |
3
| Vanguard® Short-Term Corporate Bond Index Fund | ||||
| Schedule of Investments | ||||
| August 31, 2016 | ||||
| Face | Market | |||
| Maturity | Amount | Value | ||
| Coupon | Date | ($000) | ($000) | |
| Deutsche Bank AG | 2.950% | 8/20/20 | 1,825 | 1,818 |
| Deutsche Bank AG | 3.125% | 1/13/21 | 11,125 | 11,093 |
| Deutsche Bank AG | 3.375% | 5/12/21 | 16,800 | 16,784 |
| Discover Bank | 2.000% | 2/21/18 | 6,665 | 6,683 |
| Discover Bank | 2.600% | 11/13/18 | 7,250 | 7,349 |
| Discover Bank | 7.000% | 4/15/20 | 3,900 | 4,427 |
| Discover Bank | 3.100% | 6/4/20 | 12,050 | 12,372 |
| Discover Bank | 3.200% | 8/9/21 | 4,500 | 4,607 |
| Fifth Third Bancorp | 4.500% | 6/1/18 | 1,875 | 1,963 |
| Fifth Third Bancorp | 2.300% | 3/1/19 | 6,300 | 6,416 |
| Fifth Third Bancorp | 2.875% | 7/27/20 | 14,329 | 14,834 |
| Fifth Third Bank | 1.450% | 2/28/18 | 4,800 | 4,808 |
| Fifth Third Bank | 2.150% | 8/20/18 | 6,225 | 6,304 |
| Fifth Third Bank | 2.300% | 3/15/19 | 7,750 | 7,887 |
| Fifth Third Bank | 2.375% | 4/25/19 | 7,850 | 8,004 |
| Fifth Third Bank | 2.250% | 6/14/21 | 8,800 | 8,928 |
| First Horizon National Corp. | 3.500% | 12/15/20 | 6,750 | 6,876 |
| First Niagara Financial Group Inc. | 6.750% | 3/19/20 | 3,100 | 3,487 |
| First Republic Bank | 2.375% | 6/17/19 | 4,220 | 4,246 |
| Goldman Sachs Group Inc. | 5.950% | 1/18/18 | 31,314 | 33,184 |
| Goldman Sachs Group Inc. | 2.375% | 1/22/18 | 22,522 | 22,799 |
| Goldman Sachs Group Inc. | 6.150% | 4/1/18 | 38,959 | 41,722 |
| Goldman Sachs Group Inc. | 2.900% | 7/19/18 | 23,122 | 23,709 |
| Goldman Sachs Group Inc. | 2.625% | 1/31/19 | 29,522 | 30,222 |
| Goldman Sachs Group Inc. | 7.500% | 2/15/19 | 26,072 | 29,665 |
| Goldman Sachs Group Inc. | 2.000% | 4/25/19 | 1,000 | 1,011 |
| Goldman Sachs Group Inc. | 2.550% | 10/23/19 | 23,066 | 23,582 |
| Goldman Sachs Group Inc. | 5.375% | 3/15/20 | 22,827 | 25,346 |
| Goldman Sachs Group Inc. | 2.600% | 4/23/20 | 22,675 | 23,109 |
| Goldman Sachs Group Inc. | 6.000% | 6/15/20 | 16,149 | 18,397 |
| Goldman Sachs Group Inc. | 2.750% | 9/15/20 | 20,775 | 21,326 |
| Goldman Sachs Group Inc. | 2.875% | 2/25/21 | 9,850 | 10,131 |
| Goldman Sachs Group Inc. | 2.625% | 4/25/21 | 17,250 | 17,556 |
| Goldman Sachs Group Inc. | 5.250% | 7/27/21 | 32,783 | 37,216 |
| HSBC Bank USA NA | 4.875% | 8/24/20 | 11,680 | 12,716 |
| HSBC Holdings plc | 3.400% | 3/8/21 | 27,369 | 28,536 |
| HSBC Holdings plc | 5.100% | 4/5/21 | 25,602 | 28,588 |
| HSBC Holdings plc | 2.950% | 5/25/21 | 20,500 | 21,022 |
| HSBC USA Inc. | 1.625% | 1/16/18 | 19,075 | 19,079 |
| HSBC USA Inc. | 1.700% | 3/5/18 | 10,250 | 10,253 |
| HSBC USA Inc. | 2.000% | 8/7/18 | 5,350 | 5,378 |
| HSBC USA Inc. | 2.625% | 9/24/18 | 5,734 | 5,814 |
| HSBC USA Inc. | 2.250% | 6/23/19 | 6,900 | 6,952 |
| HSBC USA Inc. | 2.375% | 11/13/19 | 11,925 | 12,006 |
| HSBC USA Inc. | 2.350% | 3/5/20 | 18,250 | 18,354 |
| HSBC USA Inc. | 2.750% | 8/7/20 | 9,079 | 9,265 |
| HSBC USA Inc. | 5.000% | 9/27/20 | 5,500 | 5,946 |
| Huntington Bancshares Inc. | 2.600% | 8/2/18 | 3,625 | 3,685 |
| Huntington Bancshares Inc. | 7.000% | 12/15/20 | 3,325 | 3,874 |
| Huntington Bancshares Inc. | 3.150% | 3/14/21 | 5,017 | 5,212 |
| Huntington National Bank | 1.700% | 2/26/18 | 1,285 | 1,288 |
| Huntington National Bank | 2.000% | 6/30/18 | 8,000 | 8,064 |
| Huntington National Bank | 2.200% | 11/6/18 | 6,700 | 6,774 |
| Huntington National Bank | 2.200% | 4/1/19 | 6,050 | 6,109 |
| Huntington National Bank | 2.400% | 4/1/20 | 10,325 | 10,452 |
| Huntington National Bank | 2.875% | 8/20/20 | 3,000 | 3,085 |
| Intesa Sanpaolo SPA | 3.875% | 1/16/18 | 9,000 | 9,045 |
| Intesa Sanpaolo SPA | 3.875% | 1/15/19 | 15,057 | 15,468 |
| Itau Corpbanca | 3.125% | 1/15/18 | 7,100 | 7,189 |
| 1 Itau Corpbanca | 3.875% | 9/22/19 | 2,000 | 2,093 |
| JPMorgan Chase & Co. | 6.000% | 1/15/18 | 47,128 | 50,002 |
| JPMorgan Chase & Co. | 1.800% | 1/25/18 | 14,806 | 14,904 |
| JPMorgan Chase & Co. | 1.700% | 3/1/18 | 20,438 | 20,529 |
| JPMorgan Chase & Co. | 1.625% | 5/15/18 | 22,281 | 22,380 |
4
| Vanguard® Short-Term Corporate Bond Index Fund | ||||
| Schedule of Investments | ||||
| August 31, 2016 | ||||
| Face | Market | |||
| Maturity | Amount | Value | ||
| Coupon | Date | ($000) | ($000) | |
| JPMorgan Chase & Co. | 2.350% | 1/28/19 | 10,350 | 10,563 |
| JPMorgan Chase & Co. | 1.850% | 3/22/19 | 7,880 | 7,932 |
| JPMorgan Chase & Co. | 6.300% | 4/23/19 | 16,991 | 18,997 |
| JPMorgan Chase & Co. | 2.200% | 10/22/19 | 13,503 | 13,732 |
| JPMorgan Chase & Co. | 2.250% | 1/23/20 | 40,655 | 41,171 |
| JPMorgan Chase & Co. | 4.950% | 3/25/20 | 7,904 | 8,720 |
| JPMorgan Chase & Co. | 2.750% | 6/23/20 | 28,040 | 28,856 |
| JPMorgan Chase & Co. | 4.400% | 7/22/20 | 20,625 | 22,462 |
| JPMorgan Chase & Co. | 4.250% | 10/15/20 | 24,341 | 26,470 |
| JPMorgan Chase & Co. | 2.550% | 10/29/20 | 25,834 | 26,417 |
| JPMorgan Chase & Co. | 2.550% | 3/1/21 | 19,254 | 19,639 |
| JPMorgan Chase & Co. | 4.625% | 5/10/21 | 15,700 | 17,361 |
| JPMorgan Chase & Co. | 2.400% | 6/7/21 | 12,000 | 12,183 |
| JPMorgan Chase & Co. | 2.295% | 8/15/21 | 25,300 | 25,435 |
| JPMorgan Chase & Co. | 4.350% | 8/15/21 | 27,000 | 29,703 |
| JPMorgan Chase Bank NA | 6.000% | 10/1/17 | 22,785 | 23,881 |
| KeyBank NA | 1.650% | 2/1/18 | 12,650 | 12,701 |
| KeyBank NA | 1.700% | 6/1/18 | 7,800 | 7,840 |
| KeyBank NA | 2.350% | 3/8/19 | 3,150 | 3,211 |
| KeyBank NA | 1.600% | 8/22/19 | 7,000 | 7,004 |
| KeyBank NA | 2.500% | 12/15/19 | 4,450 | 4,564 |
| KeyBank NA | 2.250% | 3/16/20 | 7,363 | 7,453 |
| KeyCorp | 2.300% | 12/13/18 | 8,235 | 8,365 |
| KeyCorp | 2.900% | 9/15/20 | 6,000 | 6,220 |
| KeyCorp | 5.100% | 3/24/21 | 8,250 | 9,276 |
| Lloyds Bank plc | 1.750% | 3/16/18 | 9,975 | 9,964 |
| Lloyds Bank plc | 1.750% | 5/14/18 | 6,275 | 6,267 |
| Lloyds Bank plc | 2.300% | 11/27/18 | 7,600 | 7,686 |
| Lloyds Bank plc | 2.350% | 9/5/19 | 13,733 | 13,903 |
| Lloyds Bank plc | 2.400% | 3/17/20 | 10,640 | 10,746 |
| Lloyds Bank plc | 2.700% | 8/17/20 | 12,400 | 12,663 |
| Lloyds Bank plc | 6.375% | 1/21/21 | 13,190 | 15,465 |
| Lloyds Banking Group plc | 3.100% | 7/6/21 | 6,780 | 6,903 |
| Manufacturers & Traders Trust Co. | 6.625% | 12/4/17 | 4,165 | 4,407 |
| Manufacturers & Traders Trust Co. | 1.450% | 3/7/18 | 2,150 | 2,153 |
| Manufacturers & Traders Trust Co. | 2.300% | 1/30/19 | 10,775 | 10,967 |
| Manufacturers & Traders Trust Co. | 2.250% | 7/25/19 | 7,400 | 7,510 |
| Manufacturers & Traders Trust Co. | 2.100% | 2/6/20 | 5,375 | 5,430 |
| Mitsubishi UFJ Financial Group Inc. | 2.950% | 3/1/21 | 34,321 | 35,406 |
| Morgan Stanley | 5.950% | 12/28/17 | 17,425 | 18,435 |
| Morgan Stanley | 1.875% | 1/5/18 | 14,683 | 14,758 |
| Morgan Stanley | 6.625% | 4/1/18 | 32,275 | 34,769 |
| Morgan Stanley | 2.125% | 4/25/18 | 19,422 | 19,612 |
| Morgan Stanley | 2.200% | 12/7/18 | 2,008 | 2,031 |
| Morgan Stanley | 2.500% | 1/24/19 | 14,580 | 14,861 |
| Morgan Stanley | 2.450% | 2/1/19 | 29,400 | 29,936 |
| Morgan Stanley | 7.300% | 5/13/19 | 23,072 | 26,337 |
| Morgan Stanley | 2.375% | 7/23/19 | 26,700 | 27,142 |
| Morgan Stanley | 5.625% | 9/23/19 | 29,306 | 32,567 |
| Morgan Stanley | 5.500% | 1/26/20 | 14,425 | 16,021 |
| Morgan Stanley | 2.650% | 1/27/20 | 24,699 | 25,271 |
| Morgan Stanley | 2.800% | 6/16/20 | 21,537 | 22,121 |
| Morgan Stanley | 5.500% | 7/24/20 | 18,836 | 21,167 |
| Morgan Stanley | 5.750% | 1/25/21 | 12,172 | 13,947 |
| Morgan Stanley | 2.500% | 4/21/21 | 29,301 | 29,607 |
| Morgan Stanley | 5.500% | 7/28/21 | 21,260 | 24,349 |
| MUFG Americas Holdings Corp. | 1.625% | 2/9/18 | 3,375 | 3,373 |
| MUFG Americas Holdings Corp. | 2.250% | 2/10/20 | 10,425 | 10,518 |
| MUFG Union Bank NA | 2.625% | 9/26/18 | 14,050 | 14,303 |
| MUFG Union Bank NA | 2.250% | 5/6/19 | 2,700 | 2,730 |
| National Australia Bank Ltd. | 1.875% | 7/23/18 | 1,600 | 1,610 |
| National Australia Bank Ltd. | 2.300% | 7/25/18 | 6,175 | 6,253 |
| National Australia Bank Ltd. | 2.000% | 1/14/19 | 3,300 | 3,333 |
| National Australia Bank Ltd. | 1.375% | 7/12/19 | 8,250 | 8,205 |
5
| Vanguard® Short-Term Corporate Bond Index Fund | ||||
| Schedule of Investments | ||||
| August 31, 2016 | ||||
| Face | Market | |||
| Maturity | Amount | Value | ||
| Coupon | Date | ($000) | ($000) | |
| National Australia Bank Ltd. | 2.625% | 7/23/20 | 13,925 | 14,324 |
| National Australia Bank Ltd. | 2.625% | 1/14/21 | 13,530 | 13,866 |
| National Australia Bank Ltd. | 1.875% | 7/12/21 | 8,250 | 8,215 |
| National Bank of Canada | 1.450% | 11/7/17 | 8,250 | 8,267 |
| National Bank of Canada | 2.100% | 12/14/18 | 5,800 | 5,878 |
| National City Corp. | 6.875% | 5/15/19 | 9,600 | 10,828 |
| Northern Trust Co. | 6.500% | 8/15/18 | 500 | 548 |
| Northern Trust Corp. | 3.450% | 11/4/20 | 5,675 | 6,046 |
| Northern Trust Corp. | 3.375% | 8/23/21 | 3,500 | 3,750 |
| PNC Bank NA | 4.875% | 9/21/17 | 2,225 | 2,299 |
| PNC Bank NA | 1.500% | 10/18/17 | 6,875 | 6,902 |
| PNC Bank NA | 6.000% | 12/7/17 | 3,690 | 3,887 |
| PNC Bank NA | 1.500% | 2/23/18 | 16,960 | 17,014 |
| PNC Bank NA | 6.875% | 4/1/18 | 1,365 | 1,475 |
| PNC Bank NA | 1.600% | 6/1/18 | 9,225 | 9,268 |
| PNC Bank NA | 1.850% | 7/20/18 | 4,300 | 4,337 |
| PNC Bank NA | 1.800% | 11/5/18 | 4,550 | 4,596 |
| PNC Bank NA | 2.200% | 1/28/19 | 8,192 | 8,340 |
| PNC Bank NA | 1.950% | 3/4/19 | 9,700 | 9,820 |
| PNC Bank NA | 2.250% | 7/2/19 | 6,575 | 6,703 |
| PNC Bank NA | 1.450% | 7/29/19 | 11,000 | 10,987 |
| PNC Bank NA | 2.400% | 10/18/19 | 18,200 | 18,645 |
| PNC Bank NA | 2.300% | 6/1/20 | 3,370 | 3,445 |
| PNC Bank NA | 2.600% | 7/21/20 | 2,230 | 2,299 |
| PNC Bank NA | 2.450% | 11/5/20 | 9,500 | 9,746 |
| PNC Bank NA | 2.150% | 4/29/21 | 8,000 | 8,092 |
| PNC Funding Corp. | 6.700% | 6/10/19 | 4,605 | 5,249 |
| PNC Funding Corp. | 5.125% | 2/8/20 | 13,899 | 15,431 |
| PNC Funding Corp. | 4.375% | 8/11/20 | 4,196 | 4,594 |
| Regions Bank | 7.500% | 5/15/18 | 4,130 | 4,509 |
| Regions Bank | 2.250% | 9/14/18 | 5,000 | 5,018 |
| Regions Financial Corp. | 3.200% | 2/8/21 | 7,500 | 7,776 |
| Royal Bank of Canada | 1.400% | 10/13/17 | 11,909 | 11,937 |
| Royal Bank of Canada | 1.500% | 1/16/18 | 13,110 | 13,150 |
| Royal Bank of Canada | 2.200% | 7/27/18 | 17,484 | 17,759 |
| Royal Bank of Canada | 1.800% | 7/30/18 | 12,198 | 12,322 |
| Royal Bank of Canada | 2.000% | 12/10/18 | 10,290 | 10,439 |
| Royal Bank of Canada | 2.150% | 3/15/19 | 8,008 | 8,146 |
| Royal Bank of Canada | 1.625% | 4/15/19 | 6,853 | 6,883 |
| Royal Bank of Canada | 1.500% | 7/29/19 | 11,000 | 10,984 |
| Royal Bank of Canada | 2.150% | 3/6/20 | 6,500 | 6,600 |
| Royal Bank of Canada | 2.350% | 10/30/20 | 17,223 | 17,603 |
| Royal Bank of Canada | 2.500% | 1/19/21 | 18,925 | 19,522 |
| Royal Bank of Scotland Group plc | 6.400% | 10/21/19 | 8,436 | 9,319 |
| Santander Bank NA | 2.000% | 1/12/18 | 5,472 | 5,473 |
| Santander Bank NA | 8.750% | 5/30/18 | 2,539 | 2,798 |
| Santander Holdings USA Inc. | 3.450% | 8/27/18 | 7,803 | 7,999 |
| Santander Holdings USA Inc. | 2.700% | 5/24/19 | 10,575 | 10,679 |
| Santander Holdings USA Inc. | 2.650% | 4/17/20 | 6,025 | 6,055 |
| Santander UK Group Holdings plc | 2.875% | 10/16/20 | 8,850 | 8,904 |
| Santander UK Group Holdings plc | 3.125% | 1/8/21 | 11,380 | 11,536 |
| Santander UK Group Holdings plc | 2.875% | 8/5/21 | 12,850 | 12,826 |
| Santander UK plc | 1.650% | 9/29/17 | 1,250 | 1,252 |
| Santander UK plc | 3.050% | 8/23/18 | 7,971 | 8,162 |
| Santander UK plc | 2.000% | 8/24/18 | 11,332 | 11,361 |
| Santander UK plc | 2.500% | 3/14/19 | 21,675 | 21,971 |
| Santander UK plc | 2.350% | 9/10/19 | 11,025 | 11,146 |
| Skandinaviska Enskilda Banken AB | 2.625% | 3/15/21 | 12,139 | 12,516 |
| Societe Generale SA | 2.750% | 10/12/17 | 11,750 | 11,897 |
| Societe Generale SA | 2.625% | 10/1/18 | 3,950 | 4,024 |
| State Street Bank & Trust Co. | 5.250% | 10/15/18 | 225 | 240 |
| State Street Corp. | 4.956% | 3/15/18 | 5,024 | 5,258 |
| State Street Corp. | 1.350% | 5/15/18 | 5,965 | 5,985 |
| State Street Corp. | 2.550% | 8/18/20 | 14,505 | 14,996 |
6
| Vanguard® Short-Term Corporate Bond Index Fund | ||||
| Schedule of Investments | ||||
| August 31, 2016 | ||||
| Face | Market | |||
| Maturity | Amount | Value | ||
| Coupon | Date | ($000) | ($000) | |
| State Street Corp. | 4.375% | 3/7/21 | 4,911 | 5,431 |
| State Street Corp. | 1.950% | 5/19/21 | 4,757 | 4,800 |
| Sumitomo Mitsui Banking Corp. | 1.750% | 1/16/18 | 100 | 100 |
| Sumitomo Mitsui Banking Corp. | 1.500% | 1/18/18 | 4,650 | 4,645 |
| Sumitomo Mitsui Banking Corp. | 2.500% | 7/19/18 | 2,725 | 2,766 |
| Sumitomo Mitsui Banking Corp. | 1.950% | 7/23/18 | 13,225 | 13,309 |
| Sumitomo Mitsui Banking Corp. | 2.450% | 1/10/19 | 9,150 | 9,296 |
| Sumitomo Mitsui Banking Corp. | 2.050% | 1/18/19 | 1,000 | 1,007 |
| Sumitomo Mitsui Banking Corp. | 2.250% | 7/11/19 | 13,641 | 13,791 |
| Sumitomo Mitsui Banking Corp. | 2.450% | 1/16/20 | 21,191 | 21,562 |
| Sumitomo Mitsui Banking Corp. | 2.650% | 7/23/20 | 7,340 | 7,521 |
| Sumitomo Mitsui Banking Corp. | 2.450% | 10/20/20 | 3,775 | 3,841 |
| Sumitomo Mitsui Financial Group Inc. | 2.934% | 3/9/21 | 16,676 | 17,216 |
| Sumitomo Mitsui Financial Group Inc. | 2.058% | 7/14/21 | 11,350 | 11,273 |
| SunTrust Bank | 7.250% | 3/15/18 | 4,175 | 4,517 |
| SunTrust Banks Inc. | 6.000% | 9/11/17 | 2,100 | 2,194 |
| SunTrust Banks Inc. | 2.350% | 11/1/18 | 8,169 | 8,323 |
| SunTrust Banks Inc. | 2.500% | 5/1/19 | 5,400 | 5,516 |
| SunTrust Banks Inc. | 2.900% | 3/3/21 | 5,100 | 5,289 |
| Svenska Handelsbanken AB | 1.625% | 3/21/18 | 8,418 | 8,446 |
| Svenska Handelsbanken AB | 2.500% | 1/25/19 | 8,375 | 8,562 |
| Svenska Handelsbanken AB | 2.250% | 6/17/19 | 6,275 | 6,390 |
| Svenska Handelsbanken AB | 1.500% | 9/6/19 | 11,000 | 10,967 |
| Svenska Handelsbanken AB | 2.400% | 10/1/20 | 10,050 | 10,295 |
| Svenska Handelsbanken AB | 2.450% | 3/30/21 | 17,126 | 17,532 |
| Synchrony Financial | 3.000% | 8/15/19 | 13,711 | 14,017 |
| Synchrony Financial | 2.700% | 2/3/20 | 6,650 | 6,684 |
| Synchrony Financial | 3.750% | 8/15/21 | 6,850 | 7,184 |
| Toronto-Dominion Bank | 1.625% | 3/13/18 | 4,428 | 4,456 |
| Toronto-Dominion Bank | 1.400% | 4/30/18 | 19,933 | 19,977 |
| Toronto-Dominion Bank | 1.750% | 7/23/18 | 9,559 | 9,629 |
| Toronto-Dominion Bank | 2.625% | 9/10/18 | 16,861 | 17,308 |
| Toronto-Dominion Bank | 2.125% | 7/2/19 | 20,750 | 21,129 |
| Toronto-Dominion Bank | 1.450% | 8/13/19 | 8,200 | 8,195 |
| Toronto-Dominion Bank | 2.250% | 11/5/19 | 13,050 | 13,338 |
| Toronto-Dominion Bank | 2.500% | 12/14/20 | 14,400 | 14,845 |
| Toronto-Dominion Bank | 2.125% | 4/7/21 | 17,400 | 17,612 |
| Toronto-Dominion Bank | 1.800% | 7/13/21 | 8,700 | 8,657 |
| UBS AG | 5.875% | 12/20/17 | 1,775 | 1,877 |
| UBS AG | 1.800% | 3/26/18 | 28,996 | 29,117 |
| UBS AG | 5.750% | 4/25/18 | 2,294 | 2,447 |
| UBS AG | 2.375% | 8/14/19 | 32,082 | 32,717 |
| UBS AG | 2.350% | 3/26/20 | 4,900 | 5,009 |
| UBS AG | 4.875% | 8/4/20 | 7,027 | 7,834 |
| US Bancorp | 1.950% | 11/15/18 | 7,866 | 7,985 |
| US Bancorp | 2.200% | 4/25/19 | 8,678 | 8,861 |
| US Bancorp | 2.350% | 1/29/21 | 7,750 | 7,943 |
| US Bancorp | 4.125% | 5/24/21 | 10,000 | 11,061 |
| US Bank NA | 1.375% | 9/11/17 | 8,475 | 8,493 |
| US Bank NA | 1.350% | 1/26/18 | 10,200 | 10,228 |
| US Bank NA | 1.450% | 1/29/18 | 11,350 | 11,397 |
| US Bank NA | 1.400% | 4/26/19 | 9,775 | 9,785 |
| US Bank NA | 2.125% | 10/28/19 | 15,623 | 15,940 |
| Wachovia Corp. | 5.750% | 2/1/18 | 29,621 | 31,448 |
| Wells Fargo & Co. | 1.400% | 9/8/17 | 15,119 | 15,130 |
| Wells Fargo & Co. | 5.625% | 12/11/17 | 21,841 | 23,019 |
| Wells Fargo & Co. | 1.500% | 1/16/18 | 22,916 | 22,991 |
| Wells Fargo & Co. | 2.150% | 1/15/19 | 18,480 | 18,782 |
| Wells Fargo & Co. | 2.125% | 4/22/19 | 12,550 | 12,760 |
| Wells Fargo & Co. | 2.150% | 1/30/20 | 16,595 | 16,851 |
| Wells Fargo & Co. | 2.600% | 7/22/20 | 31,328 | 32,191 |
| Wells Fargo & Co. | 2.550% | 12/7/20 | 20,464 | 21,004 |
| Wells Fargo & Co. | 3.000% | 1/22/21 | 11,126 | 11,604 |
| Wells Fargo & Co. | 2.500% | 3/4/21 | 19,513 | 19,955 |
7
| Vanguard® Short-Term Corporate Bond Index Fund | ||||
| Schedule of Investments | ||||
| August 31, 2016 | ||||
| Face | Market | |||
| Maturity | Amount | Value | ||
| Coupon | Date | ($000) | ($000) | |
| Wells Fargo & Co. | 4.600% | 4/1/21 | 15,969 | 17,751 |
| Wells Fargo & Co. | 2.100% | 7/26/21 | 26,175 | 26,235 |
| Wells Fargo Bank NA | 6.000% | 11/15/17 | 9,790 | 10,335 |
| Wells Fargo Bank NA | 1.650% | 1/22/18 | 17,225 | 17,326 |
| Wells Fargo Bank NA | 1.750% | 5/24/19 | 26,950 | 27,149 |
| Westpac Banking Corp. | 1.500% | 12/1/17 | 7,975 | 7,995 |
| Westpac Banking Corp. | 1.600% | 1/12/18 | 10,610 | 10,637 |
| Westpac Banking Corp. | 1.550% | 5/25/18 | 2,500 | 2,507 |
| Westpac Banking Corp. | 2.250% | 7/30/18 | 13,450 | 13,637 |
| Westpac Banking Corp. | 1.950% | 11/23/18 | 9,400 | 9,499 |
| Westpac Banking Corp. | 2.250% | 1/17/19 | 15,775 | 16,029 |
| Westpac Banking Corp. | 1.650% | 5/13/19 | 5,300 | 5,318 |
| Westpac Banking Corp. | 1.600% | 8/19/19 | 12,775 | 12,752 |
| Westpac Banking Corp. | 4.875% | 11/19/19 | 21,794 | 23,883 |
| Westpac Banking Corp. | 2.300% | 5/26/20 | 12,400 | 12,615 |
| Westpac Banking Corp. | 2.600% | 11/23/20 | 15,360 | 15,796 |
| Westpac Banking Corp. | 2.100% | 5/13/21 | 10,900 | 10,984 |
| Westpac Banking Corp. | 2.000% | 8/19/21 | 13,000 | 12,984 |
| Brokerage (0.9%) | ||||
| Ameriprise Financial Inc. | 7.300% | 6/28/19 | 2,625 | 3,024 |
| Ameriprise Financial Inc. | 5.300% | 3/15/20 | 6,625 | 7,373 |
| BGC Partners Inc. | 5.375% | 12/9/19 | 2,050 | 2,173 |
| 1 BGC Partners Inc. | 5.125% | 5/27/21 | 2,000 | 2,009 |
| BlackRock Inc. | 6.250% | 9/15/17 | 5,604 | 5,892 |
| BlackRock Inc. | 5.000% | 12/10/19 | 10,600 | 11,800 |
| BlackRock Inc. | 4.250% | 5/24/21 | 6,400 | 7,103 |
| Charles Schwab Corp. | 1.500% | 3/10/18 | 7,625 | 7,656 |
| Charles Schwab Corp. | 2.200% | 7/25/18 | 2,175 | 2,208 |
| Charles Schwab Corp. | 4.450% | 7/22/20 | 5,248 | 5,791 |
| Eaton Vance Corp. | 6.500% | 10/2/17 | 409 | 428 |
| Franklin Resources Inc. | 1.375% | 9/15/17 | 4,135 | 4,148 |
| Franklin Resources Inc. | 4.625% | 5/20/20 | 2,450 | 2,691 |
| Intercontinental Exchange Inc. | 2.500% | 10/15/18 | 4,525 | 4,634 |
| Intercontinental Exchange Inc. | 2.750% | 12/1/20 | 10,375 | 10,801 |
| Jefferies Group LLC | 5.125% | 4/13/18 | 5,742 | 5,987 |
| Jefferies Group LLC | 8.500% | 7/15/19 | 5,805 | 6,669 |
| Jefferies Group LLC | 6.875% | 4/15/21 | 6,930 | 7,917 |
| Lazard Group LLC | 4.250% | 11/14/20 | 3,850 | 4,115 |
| Legg Mason Inc. | 2.700% | 7/15/19 | 3,495 | 3,546 |
| Nasdaq Inc. | 5.250% | 1/16/18 | 1,050 | 1,101 |
| Nasdaq Inc. | 5.550% | 1/15/20 | 6,927 | 7,624 |
| Nomura Holdings Inc. | 2.750% | 3/19/19 | 8,650 | 8,839 |
| Nomura Holdings Inc. | 6.700% | 3/4/20 | 12,800 | 14,722 |
| NYSE Euronext | 2.000% | 10/5/17 | 8,650 | 8,720 |
| Raymond James Financial Inc. | 8.600% | 8/15/19 | 2,450 | 2,882 |
| Stifel Financial Corp. | 3.500% | 12/1/20 | 2,450 | 2,481 |
| TD Ameritrade Holding Corp. | 5.600% | 12/1/19 | 3,875 | 4,312 |
| Finance Companies (1.4%) | ||||
| AerCap Ireland Capital Ltd. / AerCap Global Aviation | ||||
| Trust | 3.750% | 5/15/19 | 8,741 | 8,970 |
| AerCap Ireland Capital Ltd. / AerCap Global Aviation | ||||
| Trust | 4.250% | 7/1/20 | 4,820 | 5,049 |
| AerCap Ireland Capital Ltd. / AerCap Global Aviation | ||||
| Trust | 4.625% | 10/30/20 | 10,457 | 11,045 |
| AerCap Ireland Capital Ltd. / AerCap Global Aviation | ||||
| Trust | 4.500% | 5/15/21 | 9,920 | 10,441 |
| Air Lease Corp. | 2.125% | 1/15/18 | 4,253 | 4,258 |
| Air Lease Corp. | 2.625% | 9/4/18 | 4,625 | 4,677 |
| Air Lease Corp. | 3.375% | 1/15/19 | 7,478 | 7,684 |
| Air Lease Corp. | 4.750% | 3/1/20 | 3,119 | 3,368 |
| Air Lease Corp. | 3.875% | 4/1/21 | 3,925 | 4,136 |
| Air Lease Corp. | 3.375% | 6/1/21 | 6,400 | 6,640 |
| Ares Capital Corp. | 4.875% | 11/30/18 | 5,730 | 5,972 |
8
| Vanguard® Short-Term Corporate Bond Index Fund | ||||
| Schedule of Investments | ||||
| August 31, 2016 | ||||
| Face | Market | |||
| Maturity | Amount | Value | ||
| Coupon | Date | ($000) | ($000) | |
| Ares Capital Corp. | 3.875% | 1/15/20 | 4,575 | 4,733 |
| FS Investment Corp. | 4.000% | 7/15/19 | 4,000 | 4,058 |
| FS Investment Corp. | 4.250% | 1/15/20 | 1,325 | 1,345 |
| GATX Corp. | 2.375% | 7/30/18 | 1,975 | 1,994 |
| GATX Corp. | 2.500% | 7/30/19 | 3,875 | 3,905 |
| GATX Corp. | 2.600% | 3/30/20 | 4,175 | 4,201 |
| GATX Corp. | 4.850% | 6/1/21 | 2,150 | 2,331 |
| GE Capital International Funding Co. | 2.342% | 11/15/20 | 56,924 | 58,582 |
| HSBC Finance Corp. | 6.676% | 1/15/21 | 25,597 | 29,515 |
| International Lease Finance Corp. | 3.875% | 4/15/18 | 10,245 | 10,475 |
| 1 International Lease Finance Corp. | 7.125% | 9/1/18 | 11,155 | 12,257 |
| International Lease Finance Corp. | 5.875% | 4/1/19 | 6,415 | 6,912 |
| International Lease Finance Corp. | 6.250% | 5/15/19 | 11,296 | 12,256 |
| International Lease Finance Corp. | 8.250% | 12/15/20 | 10,247 | 12,220 |
| International Lease Finance Corp. | 4.625% | 4/15/21 | 4,400 | 4,664 |
| Prospect Capital Corp. | 5.000% | 7/15/19 | 2,225 | 2,241 |
| Insurance (3.7%) | ||||
| AEGON Funding Co. LLC | 5.750% | 12/15/20 | 3,026 | 3,470 |
| Aetna Inc. | 1.500% | 11/15/17 | 5,436 | 5,448 |
| Aetna Inc. | 1.700% | 6/7/18 | 6,835 | 6,877 |
| Aetna Inc. | 2.200% | 3/15/19 | 5,330 | 5,410 |
| Aetna Inc. | 1.900% | 6/7/19 | 18,000 | 18,163 |
| Aetna Inc. | 3.950% | 9/1/20 | 3,260 | 3,495 |
| Aetna Inc. | 4.125% | 6/1/21 | 2,699 | 2,902 |
| Aetna Inc. | 2.400% | 6/15/21 | 18,825 | 19,088 |
| Aflac Inc. | 2.400% | 3/16/20 | 5,400 | 5,540 |
| Alleghany Corp. | 5.625% | 9/15/20 | 1,400 | 1,549 |
| Allied World Assurance Co. Ltd. | 5.500% | 11/15/20 | 1,875 | 2,067 |
| Allstate Corp. | 7.450% | 5/16/19 | 100 | 115 |
| Alterra Finance LLC | 6.250% | 9/30/20 | 2,420 | 2,758 |
| American Financial Group Inc. | 9.875% | 6/15/19 | 2,665 | 3,227 |
| American International Group Inc. | 5.850% | 1/16/18 | 10,397 | 10,998 |
| American International Group Inc. | 2.300% | 7/16/19 | 11,027 | 11,229 |
| American International Group Inc. | 3.375% | 8/15/20 | 6,400 | 6,687 |
| American International Group Inc. | 6.400% | 12/15/20 | 5,525 | 6,471 |
| American International Group Inc. | 3.300% | 3/1/21 | 10,850 | 11,381 |
| Anthem Inc. | 1.875% | 1/15/18 | 8,325 | 8,366 |
| Anthem Inc. | 2.300% | 7/15/18 | 4,698 | 4,764 |
| Anthem Inc. | 7.000% | 2/15/19 | 625 | 702 |
| Anthem Inc. | 2.250% | 8/15/19 | 8,365 | 8,496 |
| Anthem Inc. | 4.350% | 8/15/20 | 5,305 | 5,758 |
| Anthem Inc. | 3.700% | 8/15/21 | 4,360 | 4,665 |
| Aon Corp. | 5.000% | 9/30/20 | 4,606 | 5,094 |
| Aon plc | 2.800% | 3/15/21 | 1,368 | 1,397 |
| Aspen Insurance Holdings Ltd. | 6.000% | 12/15/20 | 1,725 | 1,920 |
| Assurant Inc. | 2.500% | 3/15/18 | 2,450 | 2,478 |
| Axis Specialty Finance LLC | 5.875% | 6/1/20 | 6,842 | 7,645 |
| AXIS Specialty Finance plc | 2.650% | 4/1/19 | 4,220 | 4,271 |
| Berkshire Hathaway Finance Corp. | 1.450% | 3/7/18 | 6,500 | 6,538 |
| Berkshire Hathaway Finance Corp. | 1.300% | 5/15/18 | 8,149 | 8,175 |
| Berkshire Hathaway Finance Corp. | 5.400% | 5/15/18 | 12,713 | 13,640 |
| Berkshire Hathaway Finance Corp. | 2.000% | 8/15/18 | 7,034 | 7,149 |
| Berkshire Hathaway Finance Corp. | 1.700% | 3/15/19 | 11,175 | 11,316 |
| Berkshire Hathaway Finance Corp. | 1.300% | 8/15/19 | 8,000 | 7,997 |
| Berkshire Hathaway Finance Corp. | 4.250% | 1/15/21 | 7,975 | 8,829 |
| Berkshire Hathaway Inc. | 1.550% | 2/9/18 | 1,250 | 1,260 |
| Berkshire Hathaway Inc. | 1.150% | 8/15/18 | 4,400 | 4,404 |
| Berkshire Hathaway Inc. | 2.100% | 8/14/19 | 6,750 | 6,901 |
| Berkshire Hathaway Inc. | 2.200% | 3/15/21 | 9,350 | 9,598 |
| Berkshire Hathaway Inc. | 3.750% | 8/15/21 | 4,415 | 4,840 |
| Chubb Corp. | 5.750% | 5/15/18 | 4,610 | 4,955 |
| Chubb INA Holdings Inc. | 5.800% | 3/15/18 | 8,000 | 8,548 |
| Chubb INA Holdings Inc. | 5.900% | 6/15/19 | 3,625 | 4,028 |
9
| Vanguard® Short-Term Corporate Bond Index Fund | ||||
| Schedule of Investments | ||||
| August 31, 2016 | ||||
| Face | Market | |||
| Maturity | Amount | Value | ||
| Coupon | Date | ($000) | ($000) | |
| Chubb INA Holdings Inc. | 2.300% | 11/3/20 | 10,756 | 11,062 |
| Cigna Corp. | 5.125% | 6/15/20 | 2,680 | 2,961 |
| Cigna Corp. | 4.375% | 12/15/20 | 1,750 | 1,901 |
| Cigna Corp. | 4.500% | 3/15/21 | 2,924 | 3,178 |
| CNA Financial Corp. | 7.350% | 11/15/19 | 2,375 | 2,717 |
| CNA Financial Corp. | 5.875% | 8/15/20 | 5,702 | 6,384 |
| CNA Financial Corp. | 5.750% | 8/15/21 | 3,400 | 3,909 |
| Coventry Health Care Inc. | 5.450% | 6/15/21 | 7,279 | 8,244 |
| Hartford Financial Services Group Inc. | 6.300% | 3/15/18 | 3,840 | 4,098 |
| Hartford Financial Services Group Inc. | 6.000% | 1/15/19 | 3,020 | 3,299 |
| Hartford Financial Services Group Inc. | 5.500% | 3/30/20 | 6,280 | 7,012 |
| Humana Inc. | 7.200% | 6/15/18 | 3,303 | 3,627 |
| Humana Inc. | 6.300% | 8/1/18 | 2,435 | 2,634 |
| Humana Inc. | 2.625% | 10/1/19 | 4,205 | 4,293 |
| Lincoln National Corp. | 8.750% | 7/1/19 | 3,500 | 4,088 |
| Lincoln National Corp. | 6.250% | 2/15/20 | 3,425 | 3,858 |
| Lincoln National Corp. | 4.850% | 6/24/21 | 2,325 | 2,566 |
| Manulife Financial Corp. | 4.900% | 9/17/20 | 4,750 | 5,249 |
| Markel Corp. | 5.350% | 6/1/21 | 555 | 617 |
| Marsh & McLennan Cos. Inc. | 2.550% | 10/15/18 | 2,150 | 2,176 |
| Marsh & McLennan Cos. Inc. | 2.350% | 9/10/19 | 2,960 | 3,008 |
| Marsh & McLennan Cos. Inc. | 2.350% | 3/6/20 | 5,636 | 5,716 |
| Marsh & McLennan Cos. Inc. | 4.800% | 7/15/21 | 5,475 | 6,037 |
| MetLife Inc. | 1.756% | 12/15/17 | 3,518 | 3,535 |
| MetLife Inc. | 1.903% | 12/15/17 | 6,650 | 6,700 |
| MetLife Inc. | 6.817% | 8/15/18 | 8,342 | 9,201 |
| MetLife Inc. | 7.717% | 2/15/19 | 8,320 | 9,564 |
| MetLife Inc. | 4.750% | 2/8/21 | 10,550 | 11,848 |
| PartnerRe Finance B LLC | 5.500% | 6/1/20 | 4,945 | 5,469 |
| Principal Financial Group Inc. | 1.850% | 11/15/17 | 2,535 | 2,550 |
| Principal Financial Group Inc. | 8.875% | 5/15/19 | 3,075 | 3,638 |
| 2 Principal Financial Group Inc. | 4.700% | 5/15/55 | 3,800 | 3,779 |
| Progressive Corp. | 3.750% | 8/23/21 | 3,598 | 3,914 |
| Protective Life Corp. | 7.375% | 10/15/19 | 1,650 | 1,901 |
| Prudential Financial Inc. | 6.000% | 12/1/17 | 2,804 | 2,962 |
| Prudential Financial Inc. | 2.300% | 8/15/18 | 3,325 | 3,373 |
| Prudential Financial Inc. | 7.375% | 6/15/19 | 6,875 | 7,923 |
| Prudential Financial Inc. | 2.350% | 8/15/19 | 6,000 | 6,122 |
| Prudential Financial Inc. | 5.375% | 6/21/20 | 9,089 | 10,235 |
| Prudential Financial Inc. | 4.500% | 11/15/20 | 5,900 | 6,487 |
| 2 Prudential Financial Inc. | 8.875% | 6/15/68 | 4,405 | 4,901 |
| Reinsurance Group of America Inc. | 6.450% | 11/15/19 | 3,435 | 3,869 |
| Reinsurance Group of America Inc. | 5.000% | 6/1/21 | 3,025 | 3,305 |
| 2 StanCorp Financial Group Inc. | 6.900% | 6/1/67 | 1,495 | 1,211 |
| Torchmark Corp. | 9.250% | 6/15/19 | 2,500 | 2,963 |
| Travelers Cos. Inc. | 5.750% | 12/15/17 | 2,200 | 2,322 |
| Travelers Cos. Inc. | 5.800% | 5/15/18 | 3,653 | 3,925 |
| Travelers Cos. Inc. | 5.900% | 6/2/19 | 5,515 | 6,146 |
| Travelers Cos. Inc. | 3.900% | 11/1/20 | 3,425 | 3,734 |
| UnitedHealth Group Inc. | 1.400% | 10/15/17 | 7,138 | 7,163 |
| UnitedHealth Group Inc. | 1.400% | 12/15/17 | 6,579 | 6,607 |
| UnitedHealth Group Inc. | 6.000% | 2/15/18 | 9,592 | 10,238 |
| UnitedHealth Group Inc. | 1.900% | 7/16/18 | 13,800 | 13,950 |
| UnitedHealth Group Inc. | 1.700% | 2/15/19 | 1,456 | 1,468 |
| UnitedHealth Group Inc. | 1.625% | 3/15/19 | 4,525 | 4,556 |
| UnitedHealth Group Inc. | 2.300% | 12/15/19 | 7,075 | 7,243 |
| UnitedHealth Group Inc. | 2.700% | 7/15/20 | 14,076 | 14,653 |
| UnitedHealth Group Inc. | 3.875% | 10/15/20 | 2,129 | 2,302 |
| UnitedHealth Group Inc. | 4.700% | 2/15/21 | 3,650 | 4,067 |
| UnitedHealth Group Inc. | 2.125% | 3/15/21 | 8,422 | 8,577 |
| Unum Group | 5.625% | 9/15/20 | 1,893 | 2,118 |
| Unum Group | 3.000% | 5/15/21 | 4,500 | 4,593 |
| Voya Financial Inc. | 2.900% | 2/15/18 | 7,421 | 7,558 |
| Willis Towers Watson plc | 5.750% | 3/15/21 | 3,915 | 4,331 |
10
| Vanguard® Short-Term Corporate Bond Index Fund | ||||
| Schedule of Investments | ||||
| August 31, 2016 | ||||
| Face | Market | |||
| Maturity | Amount | Value | ||
| Coupon | Date | ($000) | ($000) | |
| WR Berkley Corp. | 7.375% | 9/15/19 | 1,282 | 1,469 |
| WR Berkley Corp. | 5.375% | 9/15/20 | 3,175 | 3,479 |
| XLIT Ltd. | 2.300% | 12/15/18 | 3,250 | 3,285 |
| Other Finance (0.0%) | ||||
| ORIX Corp. | 3.750% | 3/9/17 | 60 | 61 |
| Real Estate Investment Trusts (2.0%) | ||||
| Alexandria Real Estate Equities Inc. | 2.750% | 1/15/20 | 3,000 | 3,034 |
| American Campus Communities Operating Partnership | ||||
| LP | 3.350% | 10/1/20 | 4,720 | 4,892 |
| AvalonBay Communities Inc. | 6.100% | 3/15/20 | 750 | 856 |
| AvalonBay Communities Inc. | 3.625% | 10/1/20 | 6,175 | 6,564 |
| AvalonBay Communities Inc. | 3.950% | 1/15/21 | 1,000 | 1,078 |
| Boston Properties LP | 3.700% | 11/15/18 | 8,412 | 8,782 |
| Boston Properties LP | 5.875% | 10/15/19 | 8,859 | 9,871 |
| Boston Properties LP | 5.625% | 11/15/20 | 5,275 | 6,011 |
| Boston Properties LP | 4.125% | 5/15/21 | 6,250 | 6,828 |
| Brandywine Operating Partnership LP | 4.950% | 4/15/18 | 4,835 | 5,041 |
| Camden Property Trust | 4.625% | 6/15/21 | 1,100 | 1,205 |
| Corporate Office Properties LP | 3.700% | 6/15/21 | 2,555 | 2,637 |
| DDR Corp. | 7.500% | 4/1/17 | 1 | 1 |
| DDR Corp. | 4.750% | 4/15/18 | 150 | 156 |
| DDR Corp. | 7.875% | 9/1/20 | 3,375 | 4,057 |
| DDR Corp. | 3.500% | 1/15/21 | 2,423 | 2,491 |
| Digital Realty Trust LP | 5.875% | 2/1/20 | 3,550 | 3,950 |
| Digital Realty Trust LP | 3.400% | 10/1/20 | 3,600 | 3,744 |
| Digital Realty Trust LP | 5.250% | 3/15/21 | 4,110 | 4,603 |
| Duke Realty LP | 6.500% | 1/15/18 | 750 | 799 |
| Duke Realty LP | 6.750% | 3/15/20 | 1,025 | 1,185 |
| Duke Realty LP | 3.875% | 2/15/21 | 2,300 | 2,446 |
| EPR Properties | 7.750% | 7/15/20 | 1,000 | 1,160 |
| Equity CommonWealth | 6.650% | 1/15/18 | 1,000 | 1,037 |
| Equity Commonwealth | 5.875% | 9/15/20 | 1,900 | 2,101 |
| ERP Operating LP | 2.375% | 7/1/19 | 5,069 | 5,210 |
| ERP Operating LP | 4.750% | 7/15/20 | 3,725 | 4,101 |
| Essex Portfolio LP | 5.200% | 3/15/21 | 2,400 | 2,688 |
| 3 Federal Realty Investment Trust | 2.550% | 1/15/21 | 4,100 | 4,208 |
| Government Properties Income Trust | 3.750% | 8/15/19 | 2,745 | 2,812 |
| HCP Inc. | 6.700% | 1/30/18 | 6,329 | 6,767 |
| HCP Inc. | 3.750% | 2/1/19 | 2,000 | 2,076 |
| HCP Inc. | 2.625% | 2/1/20 | 9,125 | 9,274 |
| HCP Inc. | 5.375% | 2/1/21 | 7,867 | 8,823 |
| Healthcare Realty Trust Inc. | 5.750% | 1/15/21 | 1,330 | 1,504 |
| Healthcare Trust of America Holdings LP | 3.375% | 7/15/21 | 2,550 | 2,615 |
| Highwoods Realty LP | 3.200% | 6/15/21 | 2,425 | 2,442 |
| Hospitality Properties Trust | 6.700% | 1/15/18 | 3,925 | 4,092 |
| Hospitality Properties Trust | 4.250% | 2/15/21 | 3,175 | 3,360 |
| Kilroy Realty LP | 4.800% | 7/15/18 | 3,269 | 3,417 |
| Kimco Realty Corp. | 4.300% | 2/1/18 | 4,575 | 4,716 |
| Kimco Realty Corp. | 6.875% | 10/1/19 | 1,975 | 2,268 |
| Kimco Realty Corp. | 3.200% | 5/1/21 | 2,175 | 2,262 |
| Liberty Property LP | 6.625% | 10/1/17 | 1,962 | 2,062 |
| Liberty Property LP | 4.750% | 10/1/20 | 5,235 | 5,674 |
| Mack-Cali Realty LP | 2.500% | 12/15/17 | 1,000 | 1,004 |
| Mack-Cali Realty LP | 7.750% | 8/15/19 | 2,950 | 3,298 |
| National Retail Properties Inc. | 6.875% | 10/15/17 | 2,000 | 2,105 |
| ProLogis LP | 2.750% | 2/15/19 | 3,050 | 3,126 |
| ProLogis LP | 3.350% | 2/1/21 | 4,100 | 4,335 |
| Realty Income Corp. | 2.000% | 1/31/18 | 3,225 | 3,245 |
| Realty Income Corp. | 6.750% | 8/15/19 | 4,265 | 4,855 |
| Realty Income Corp. | 5.750% | 1/15/21 | 1,750 | 1,999 |
| Regency Centers LP | 4.800% | 4/15/21 | 2,825 | 3,114 |
| Select Income REIT | 2.850% | 2/1/18 | 5,375 | 5,410 |
11
| Vanguard® Short-Term Corporate Bond Index Fund | ||||
| Schedule of Investments | ||||
| August 31, 2016 | ||||
| Face | Market | |||
| Maturity | Amount | Value | ||
| Coupon | Date | ($000) | ($000) | |
| Select Income REIT | 3.600% | 2/1/20 | 150 | 153 |
| Senior Housing Properties Trust | 3.250% | 5/1/19 | 4,550 | 4,590 |
| Simon Property Group LP | 2.150% | 9/15/17 | 5,644 | 5,684 |
| Simon Property Group LP | 2.200% | 2/1/19 | 10,097 | 10,294 |
| Simon Property Group LP | 10.350% | 4/1/19 | 5,186 | 6,239 |
| Simon Property Group LP | 5.650% | 2/1/20 | 8,759 | 9,843 |
| Simon Property Group LP | 2.500% | 9/1/20 | 4,748 | 4,902 |
| Simon Property Group LP | 4.375% | 3/1/21 | 7,200 | 7,951 |
| Simon Property Group LP | 2.500% | 7/15/21 | 3,700 | 3,807 |
| SL Green Realty Corp. | 5.000% | 8/15/18 | 250 | 262 |
| SL Green Realty Corp. | 7.750% | 3/15/20 | 2,500 | 2,906 |
| Tanger Properties LP | 6.125% | 6/1/20 | 2,500 | 2,827 |
| UDR Inc. | 4.250% | 6/1/18 | 5,800 | 6,052 |
| UDR Inc. | 3.700% | 10/1/20 | 6,925 | 7,323 |
| Ventas Realty LP / Ventas Capital Corp. | 2.000% | 2/15/18 | 8,396 | 8,451 |
| Ventas Realty LP / Ventas Capital Corp. | 4.000% | 4/30/19 | 3,960 | 4,166 |
| Ventas Realty LP / Ventas Capital Corp. | 2.700% | 4/1/20 | 6,225 | 6,364 |
| Ventas Realty LP / Ventas Capital Corp. | 4.750% | 6/1/21 | 6,200 | 6,897 |
| Vornado Realty LP | 2.500% | 6/30/19 | 3,425 | 3,475 |
| Washington Prime Group LP | 3.850% | 4/1/20 | 2,200 | 2,260 |
| Washington REIT | 4.950% | 10/1/20 | 1,875 | 2,012 |
| Welltower Inc. | 4.700% | 9/15/17 | 7,159 | 7,406 |
| Welltower Inc. | 2.250% | 3/15/18 | 6,494 | 6,553 |
| Welltower Inc. | 4.125% | 4/1/19 | 5,050 | 5,316 |
| Welltower Inc. | 6.125% | 4/15/20 | 3,275 | 3,718 |
| Welltower Inc. | 4.950% | 1/15/21 | 5,785 | 6,370 |
| 7,025,463 | ||||
| Industrial (52.5%) | ||||
| Basic Industry (2.6%) | ||||
| Agrium Inc. | 6.750% | 1/15/19 | 4,599 | 5,096 |
| Air Products & Chemicals Inc. | 1.200% | 10/15/17 | 2,825 | 2,833 |
| Air Products & Chemicals Inc. | 4.375% | 8/21/19 | 1,465 | 1,590 |
| Airgas Inc. | 1.650% | 2/15/18 | 1,850 | 1,857 |
| Airgas Inc. | 2.375% | 2/15/20 | 1,450 | 1,474 |
| Airgas Inc. | 3.050% | 8/1/20 | 5,350 | 5,520 |
| Albemarle Corp. | 3.000% | 12/1/19 | 2,175 | 2,228 |
| Albemarle Corp. | 4.500% | 12/15/20 | 2,050 | 2,208 |
| Barrick North America Finance LLC | 4.400% | 5/30/21 | 16,272 | 17,799 |
| BHP Billiton Finance USA Ltd. | 2.050% | 9/30/18 | 8,806 | 8,922 |
| BHP Billiton Finance USA Ltd. | 6.500% | 4/1/19 | 11,450 | 12,872 |
| Cabot Corp. | 2.550% | 1/15/18 | 1,125 | 1,136 |
| Celanese US Holdings LLC | 5.875% | 6/15/21 | 500 | 570 |
| Celulosa Arauco y Constitucion SA | 7.250% | 7/29/19 | 4,115 | 4,688 |
| Celulosa Arauco y Constitucion SA | 5.000% | 1/21/21 | 3,725 | 4,023 |
| CF Industries Inc. | 6.875% | 5/1/18 | 11,580 | 12,492 |
| CF Industries Inc. | 7.125% | 5/1/20 | 7,947 | 9,109 |
| Dow Chemical Co. | 5.700% | 5/15/18 | 2,200 | 2,354 |
| Dow Chemical Co. | 8.550% | 5/15/19 | 17,800 | 21,029 |
| Dow Chemical Co. | 4.250% | 11/15/20 | 20,055 | 21,796 |
| Eastman Chemical Co. | 2.400% | 6/1/17 | 5,562 | 5,605 |
| Eastman Chemical Co. | 2.700% | 1/15/20 | 8,325 | 8,561 |
| Eastman Chemical Co. | 4.500% | 1/15/21 | 750 | 814 |
| Ecolab Inc. | 1.450% | 12/8/17 | 3,763 | 3,770 |
| Ecolab Inc. | 1.550% | 1/12/18 | 4,375 | 4,393 |
| Ecolab Inc. | 2.000% | 1/14/19 | 2,300 | 2,321 |
| Ecolab Inc. | 2.250% | 1/12/20 | 2,775 | 2,828 |
| EI du Pont de Nemours & Co. | 6.000% | 7/15/18 | 15,666 | 16,984 |
| EI du Pont de Nemours & Co. | 4.625% | 1/15/20 | 9,162 | 10,050 |
| EI du Pont de Nemours & Co. | 3.625% | 1/15/21 | 5,775 | 6,188 |
| EI du Pont de Nemours & Co. | 4.250% | 4/1/21 | 4,800 | 5,288 |
| Goldcorp Inc. | 2.125% | 3/15/18 | 5,945 | 5,958 |
| Goldcorp Inc. | 3.625% | 6/9/21 | 6,775 | 7,119 |
| International Paper Co. | 7.950% | 6/15/18 | 9,400 | 10,462 |
12
| Vanguard® Short-Term Corporate Bond Index Fund | ||||
| Schedule of Investments | ||||
| August 31, 2016 | ||||
| Face | Market | |||
| Maturity | Amount | Value | ||
| Coupon | Date | ($000) | ($000) | |
| International Paper Co. | 9.375% | 5/15/19 | 118 | 139 |
| International Paper Co. | 7.500% | 8/15/21 | 5,940 | 7,258 |
| Lubrizol Corp. | 8.875% | 2/1/19 | 4,216 | 4,951 |
| LyondellBasell Industries NV | 5.000% | 4/15/19 | 20,770 | 22,339 |
| MeadWestvaco Corp. | 7.375% | 9/1/19 | 750 | 860 |
| Methanex Corp. | 3.250% | 12/15/19 | 3,075 | 3,051 |
| Monsanto Co. | 5.125% | 4/15/18 | 3,127 | 3,305 |
| Monsanto Co. | 1.850% | 11/15/18 | 2,035 | 2,044 |
| Monsanto Co. | 2.125% | 7/15/19 | 8,950 | 9,098 |
| Monsanto Co. | 2.750% | 7/15/21 | 3,000 | 3,064 |
| Newmont Mining Corp. | 5.125% | 10/1/19 | 5,806 | 6,318 |
| Nucor Corp. | 5.750% | 12/1/17 | 5,900 | 6,171 |
| Nucor Corp. | 5.850% | 6/1/18 | 5,068 | 5,413 |
| Plum Creek Timberlands LP | 4.700% | 3/15/21 | 4,000 | 4,330 |
| Potash Corp. of Saskatchewan Inc. | 3.250% | 12/1/17 | 5,888 | 5,997 |
| Potash Corp. of Saskatchewan Inc. | 6.500% | 5/15/19 | 3,135 | 3,512 |
| Potash Corp. of Saskatchewan Inc. | 4.875% | 3/30/20 | 3,925 | 4,273 |
| PPG Industries Inc. | 2.300% | 11/15/19 | 5,000 | 5,080 |
| PPG Industries Inc. | 3.600% | 11/15/20 | 2,825 | 2,970 |
| Praxair Inc. | 1.050% | 11/7/17 | 1,925 | 1,925 |
| Praxair Inc. | 1.250% | 11/7/18 | 5,300 | 5,310 |
| Praxair Inc. | 4.500% | 8/15/19 | 6,075 | 6,617 |
| Praxair Inc. | 2.250% | 9/24/20 | 2,100 | 2,159 |
| Praxair Inc. | 4.050% | 3/15/21 | 5,125 | 5,653 |
| Rio Tinto Finance USA Ltd. | 9.000% | 5/1/19 | 21,560 | 25,611 |
| Rio Tinto Finance USA Ltd. | 3.500% | 11/2/20 | 1,753 | 1,858 |
| Rio Tinto Finance USA Ltd. | 4.125% | 5/20/21 | 4,729 | 5,159 |
| Rio Tinto Finance USA plc | 2.250% | 12/14/18 | 1,350 | 1,370 |
| Rohm & Haas Co. | 6.000% | 9/15/17 | 1,756 | 1,837 |
| RPM International Inc. | 6.500% | 2/15/18 | 2,700 | 2,876 |
| RPM International Inc. | 6.125% | 10/15/19 | 3,000 | 3,333 |
| Sherwin-Williams Co. | 1.350% | 12/15/17 | 6,400 | 6,408 |
| Southern Copper Corp. | 5.375% | 4/16/20 | 3,000 | 3,296 |
| Vale Overseas Ltd. | 5.625% | 9/15/19 | 9,975 | 10,461 |
| Vale Overseas Ltd. | 4.625% | 9/15/20 | 7,125 | 7,196 |
| Vale Overseas Ltd. | 5.875% | 6/10/21 | 10,750 | 11,140 |
| Valspar Corp. | 7.250% | 6/15/19 | 1,025 | 1,164 |
| WestRock RKT Co. | 4.450% | 3/1/19 | 5,000 | 5,280 |
| WestRock RKT Co. | 3.500% | 3/1/20 | 2,500 | 2,601 |
| Weyerhaeuser Co. | 7.375% | 10/1/19 | 4,000 | 4,563 |
| Capital Goods (5.1%) | ||||
| 3M Co. | 1.375% | 8/7/18 | 3,875 | 3,897 |
| 3M Co. | 1.625% | 6/15/19 | 4,475 | 4,531 |
| 3M Co. | 2.000% | 8/7/20 | 3,875 | 3,968 |
| Acuity Brands Lighting Inc. | 6.000% | 12/15/19 | 4,175 | 4,627 |
| Bemis Co. Inc. | 6.800% | 8/1/19 | 3,150 | 3,557 |
| Boeing Capital Corp. | 2.900% | 8/15/18 | 1,950 | 2,014 |
| Boeing Capital Corp. | 4.700% | 10/27/19 | 3,909 | 4,314 |
| Boeing Co. | 0.950% | 5/15/18 | 3,866 | 3,859 |
| Boeing Co. | 6.000% | 3/15/19 | 2,710 | 3,026 |
| Boeing Co. | 4.875% | 2/15/20 | 11,725 | 13,133 |
| Boeing Co. | 1.650% | 10/30/20 | 3,200 | 3,222 |
| Boeing Co. | 8.750% | 8/15/21 | 1,800 | 2,365 |
| Caterpillar Financial Services Corp. | 1.250% | 11/6/17 | 9,207 | 9,222 |
| Caterpillar Financial Services Corp. | 1.500% | 2/23/18 | 5,350 | 5,376 |
| Caterpillar Financial Services Corp. | 1.300% | 3/1/18 | 3,356 | 3,359 |
| Caterpillar Financial Services Corp. | 5.450% | 4/15/18 | 3,749 | 3,998 |
| Caterpillar Financial Services Corp. | 1.700% | 6/16/18 | 325 | 328 |
| Caterpillar Financial Services Corp. | 2.450% | 9/6/18 | 7,700 | 7,887 |
| Caterpillar Financial Services Corp. | 7.050% | 10/1/18 | 5,008 | 5,606 |
| Caterpillar Financial Services Corp. | 1.800% | 11/13/18 | 6,500 | 6,583 |
| Caterpillar Financial Services Corp. | 7.150% | 2/15/19 | 12,689 | 14,437 |
| Caterpillar Financial Services Corp. | 1.350% | 5/18/19 | 5,700 | 5,697 |
13
| Vanguard® Short-Term Corporate Bond Index Fund | ||||
| Schedule of Investments | ||||
| August 31, 2016 | ||||
| Face | Market | |||
| Maturity | Amount | Value | ||
| Coupon | Date | ($000) | ($000) | |
| Caterpillar Financial Services Corp. | 2.100% | 6/9/19 | 9,920 | 10,120 |
| Caterpillar Financial Services Corp. | 2.250% | 12/1/19 | 1,152 | 1,181 |
| Caterpillar Financial Services Corp. | 2.000% | 3/5/20 | 3,325 | 3,373 |
| Caterpillar Financial Services Corp. | 2.500% | 11/13/20 | 4,500 | 4,637 |
| Caterpillar Financial Services Corp. | 1.700% | 8/9/21 | 10,000 | 9,925 |
| Caterpillar Financial Services Corp. | 2.750% | 8/20/21 | 2,000 | 2,095 |
| Caterpillar Inc. | 7.900% | 12/15/18 | 9,156 | 10,480 |
| Caterpillar Inc. | 3.900% | 5/27/21 | 7,398 | 8,132 |
| Crane Co. | 2.750% | 12/15/18 | 4,050 | 4,121 |
| CRH America Inc. | 8.125% | 7/15/18 | 2,350 | 2,603 |
| CRH America Inc. | 5.750% | 1/15/21 | 3,159 | 3,565 |
| Deere & Co. | 4.375% | 10/16/19 | 5,664 | 6,191 |
| Dover Corp. | 5.450% | 3/15/18 | 2,260 | 2,403 |
| Dover Corp. | 4.300% | 3/1/21 | 4,300 | 4,719 |
| Eaton Corp. | 1.500% | 11/2/17 | 9,610 | 9,647 |
| Eaton Corp. | 5.600% | 5/15/18 | 5,075 | 5,421 |
| Eaton Corp. | 6.950% | 3/20/19 | 75 | 84 |
| Eaton Electric Holdings LLC | 3.875% | 12/15/20 | 1,875 | 2,006 |
| Emerson Electric Co. | 5.375% | 10/15/17 | 5,010 | 5,241 |
| Emerson Electric Co. | 5.250% | 10/15/18 | 2,950 | 3,197 |
| Emerson Electric Co. | 4.875% | 10/15/19 | 2,310 | 2,555 |
| Emerson Electric Co. | 4.250% | 11/15/20 | 1,650 | 1,826 |
| FLIR Systems Inc. | 3.125% | 6/15/21 | 3,450 | 3,555 |
| 1 Fortive Corp. | 1.800% | 6/15/19 | 2,150 | 2,165 |
| 1 Fortive Corp. | 2.350% | 6/15/21 | 8,000 | 8,110 |
| Fortune Brands Home & Security Inc. | 3.000% | 6/15/20 | 2,490 | 2,553 |
| General Dynamics Corp. | 1.000% | 11/15/17 | 8,403 | 8,398 |
| General Dynamics Corp. | 3.875% | 7/15/21 | 2,543 | 2,795 |
| General Electric Capital Corp. | 5.625% | 9/15/17 | 15,600 | 16,338 |
| General Electric Capital Corp. | 1.600% | 11/20/17 | 1,000 | 1,008 |
| General Electric Capital Corp. | 1.625% | 4/2/18 | 200 | 202 |
| General Electric Capital Corp. | 5.625% | 5/1/18 | 26,285 | 28,246 |
| General Electric Capital Corp. | 2.300% | 1/14/19 | 500 | 514 |
| General Electric Capital Corp. | 6.000% | 8/7/19 | 16,459 | 18,713 |
| General Electric Capital Corp. | 2.100% | 12/11/19 | 2,600 | 2,673 |
| General Electric Capital Corp. | 5.500% | 1/8/20 | 10,724 | 12,168 |
| General Electric Capital Corp. | 2.200% | 1/9/20 | 12,463 | 12,804 |
| General Electric Capital Corp. | 5.550% | 5/4/20 | 9,389 | 10,717 |
| General Electric Capital Corp. | 4.375% | 9/16/20 | 13,446 | 14,901 |
| General Electric Capital Corp. | 4.625% | 1/7/21 | 11,545 | 13,017 |
| General Electric Capital Corp. | 5.300% | 2/11/21 | 11,060 | 12,732 |
| General Electric Co. | 5.250% | 12/6/17 | 39,989 | 42,107 |
| Harris Corp. | 1.999% | 4/27/18 | 7,300 | 7,350 |
| Harris Corp. | 2.700% | 4/27/20 | 3,950 | 4,016 |
| Harris Corp. | 4.400% | 12/15/20 | 3,275 | 3,554 |
| Honeywell International Inc. | 5.300% | 3/1/18 | 11,350 | 12,058 |
| Honeywell International Inc. | 5.000% | 2/15/19 | 6,725 | 7,327 |
| Honeywell International Inc. | 4.250% | 3/1/21 | 6,250 | 6,977 |
| Illinois Tool Works Inc. | 1.950% | 3/1/19 | 6,175 | 6,286 |
| Illinois Tool Works Inc. | 6.250% | 4/1/19 | 6,475 | 7,249 |
| Ingersoll-Rand Global Holding Co. Ltd. | 6.875% | 8/15/18 | 7,073 | 7,816 |
| Ingersoll-Rand Global Holding Co. Ltd. | 2.875% | 1/15/19 | 3,025 | 3,117 |
| Ingersoll-Rand Luxembourg Finance SA | 2.625% | 5/1/20 | 2,050 | 2,083 |
| John Deere Capital Corp. | 2.800% | 9/18/17 | 4,550 | 4,633 |
| John Deere Capital Corp. | 1.200% | 10/10/17 | 3,879 | 3,888 |
| John Deere Capital Corp. | 1.550% | 12/15/17 | 2,582 | 2,601 |
| John Deere Capital Corp. | 1.350% | 1/16/18 | 9,775 | 9,821 |
| John Deere Capital Corp. | 1.300% | 3/12/18 | 8,780 | 8,805 |
| John Deere Capital Corp. | 5.350% | 4/3/18 | 3,164 | 3,375 |
| John Deere Capital Corp. | 1.600% | 7/13/18 | 2,604 | 2,624 |
| John Deere Capital Corp. | 1.750% | 8/10/18 | 4,500 | 4,551 |
| John Deere Capital Corp. | 5.750% | 9/10/18 | 4,769 | 5,193 |
| John Deere Capital Corp. | 1.950% | 12/13/18 | 7,141 | 7,264 |
| John Deere Capital Corp. | 1.950% | 1/8/19 | 4,450 | 4,524 |
14
| Vanguard® Short-Term Corporate Bond Index Fund | ||||
| Schedule of Investments | ||||
| August 31, 2016 | ||||
| Face | Market | |||
| Maturity | Amount | Value | ||
| Coupon | Date | ($000) | ($000) | |
| John Deere Capital Corp. | 1.950% | 3/4/19 | 6,300 | 6,389 |
| John Deere Capital Corp. | 2.250% | 4/17/19 | 8,293 | 8,490 |
| John Deere Capital Corp. | 2.300% | 9/16/19 | 2,925 | 2,990 |
| John Deere Capital Corp. | 1.700% | 1/15/20 | 5,146 | 5,186 |
| John Deere Capital Corp. | 2.050% | 3/10/20 | 6,250 | 6,348 |
| John Deere Capital Corp. | 2.375% | 7/14/20 | 4,165 | 4,285 |
| John Deere Capital Corp. | 2.450% | 9/11/20 | 3,500 | 3,597 |
| John Deere Capital Corp. | 2.550% | 1/8/21 | 4,000 | 4,133 |
| John Deere Capital Corp. | 2.800% | 3/4/21 | 2,900 | 3,020 |
| John Deere Capital Corp. | 3.900% | 7/12/21 | 675 | 740 |
| Kennametal Inc. | 2.650% | 11/1/19 | 3,374 | 3,392 |
| L-3 Communications Corp. | 5.200% | 10/15/19 | 2,950 | 3,241 |
| L-3 Communications Corp. | 4.750% | 7/15/20 | 7,634 | 8,334 |
| L-3 Communications Corp. | 4.950% | 2/15/21 | 8,900 | 9,825 |
| Lockheed Martin Corp. | 1.850% | 11/23/18 | 8,627 | 8,741 |
| Lockheed Martin Corp. | 4.250% | 11/15/19 | 8,100 | 8,807 |
| Lockheed Martin Corp. | 2.500% | 11/23/20 | 11,600 | 11,997 |
| Martin Marietta Materials Inc. | 6.600% | 4/15/18 | 3,050 | 3,228 |
| Northrop Grumman Corp. | 1.750% | 6/1/18 | 9,855 | 9,938 |
| Northrop Grumman Corp. | 5.050% | 8/1/19 | 1,675 | 1,834 |
| Northrop Grumman Corp. | 3.500% | 3/15/21 | 4,450 | 4,760 |
| Owens Corning | 6.500% | 12/1/16 | 197 | 200 |
| Owens Corning | 9.000% | 6/15/19 | 62 | 71 |
| Parker-Hannifin Corp. | 5.500% | 5/15/18 | 4,618 | 4,954 |
| Pentair Finance SA | 1.875% | 9/15/17 | 2,770 | 2,773 |
| Pentair Finance SA | 2.900% | 9/15/18 | 1,025 | 1,032 |
| Pentair Finance SA | 2.650% | 12/1/19 | 500 | 498 |
| Pentair Finance SA | 3.625% | 9/15/20 | 8,000 | 8,174 |
| Pentair Finance SA | 5.000% | 5/15/21 | 3,520 | 3,796 |
| Precision Castparts Corp. | 1.250% | 1/15/18 | 13,384 | 13,421 |
| Precision Castparts Corp. | 2.250% | 6/15/20 | 6,075 | 6,229 |
| Raytheon Co. | 6.750% | 3/15/18 | 900 | 976 |
| Raytheon Co. | 6.400% | 12/15/18 | 3,266 | 3,649 |
| Raytheon Co. | 4.400% | 2/15/20 | 4,850 | 5,329 |
| Raytheon Co. | 3.125% | 10/15/20 | 11,020 | 11,733 |
| Republic Services Inc. | 3.800% | 5/15/18 | 5,726 | 5,959 |
| Republic Services Inc. | 5.500% | 9/15/19 | 5,770 | 6,379 |
| Republic Services Inc. | 5.000% | 3/1/20 | 7,317 | 8,046 |
| Rockwell Automation Inc. | 5.650% | 12/1/17 | 500 | 528 |
| Rockwell Automation Inc. | 2.050% | 3/1/20 | 5,725 | 5,788 |
| Rockwell Collins Inc. | 5.250% | 7/15/19 | 1,750 | 1,936 |
| Roper Technologies Inc. | 1.850% | 11/15/17 | 3,075 | 3,091 |
| Roper Technologies Inc. | 2.050% | 10/1/18 | 9,235 | 9,337 |
| Roper Technologies Inc. | 6.250% | 9/1/19 | 2,868 | 3,204 |
| Roper Technologies Inc. | 3.000% | 12/15/20 | 6,525 | 6,781 |
| Stanley Black & Decker Inc. | 2.451% | 11/17/18 | 5,002 | 5,117 |
| 2 Stanley Black & Decker Inc. | 5.750% | 12/15/53 | 2,800 | 3,003 |
| Textron Inc. | 5.600% | 12/1/17 | 2,775 | 2,906 |
| Textron Inc. | 7.250% | 10/1/19 | 1,550 | 1,782 |
| Textron Inc. | 3.650% | 3/1/21 | 6,500 | 6,836 |
| United Technologies Corp. | 5.375% | 12/15/17 | 8,964 | 9,451 |
| United Technologies Corp. | 1.778% | 5/4/18 | 1,750 | 1,762 |
| United Technologies Corp. | 6.125% | 2/1/19 | 15,400 | 17,147 |
| United Technologies Corp. | 4.500% | 4/15/20 | 10,437 | 11,616 |
| Valmont Industries Inc. | 6.625% | 4/20/20 | 668 | 761 |
| Vulcan Materials Co. | 7.000% | 6/15/18 | 1,000 | 1,094 |
| Vulcan Materials Co. | 7.500% | 6/15/21 | 5,846 | 7,111 |
| Waste Management Inc. | 6.100% | 3/15/18 | 8,052 | 8,661 |
| Waste Management Inc. | 4.750% | 6/30/20 | 5,700 | 6,332 |
| Waste Management Inc. | 4.600% | 3/1/21 | 3,127 | 3,473 |
| Communication (6.5%) | ||||
| 21st Century Fox America Inc. | 7.250% | 5/18/18 | 950 | 1,041 |
| 21st Century Fox America Inc. | 8.250% | 8/10/18 | 3,280 | 3,696 |
15
| Vanguard® Short-Term Corporate Bond Index Fund | ||||
| Schedule of Investments | ||||
| August 31, 2016 | ||||
| Face | Market | |||
| Maturity | Amount | Value | ||
| Coupon | Date | ($000) | ($000) | |
| 21st Century Fox America Inc. | 6.900% | 3/1/19 | 5,675 | 6,390 |
| 21st Century Fox America Inc. | 5.650% | 8/15/20 | 5,150 | 5,872 |
| 21st Century Fox America Inc. | 4.500% | 2/15/21 | 8,078 | 8,981 |
| America Movil SAB de CV | 5.625% | 11/15/17 | 3,529 | 3,693 |
| America Movil SAB de CV | 5.000% | 10/16/19 | 8,225 | 8,983 |
| America Movil SAB de CV | 5.000% | 3/30/20 | 17,205 | 19,070 |
| American Tower Corp. | 4.500% | 1/15/18 | 7,897 | 8,222 |
| American Tower Corp. | 3.400% | 2/15/19 | 8,760 | 9,121 |
| American Tower Corp. | 2.800% | 6/1/20 | 10,000 | 10,248 |
| American Tower Corp. | 5.050% | 9/1/20 | 7,831 | 8,676 |
| American Tower Corp. | 3.300% | 2/15/21 | 13,225 | 13,811 |
| AT&T Inc. | 1.400% | 12/1/17 | 8,751 | 8,760 |
| AT&T Inc. | 1.750% | 1/15/18 | 5,055 | 5,083 |
| AT&T Inc. | 5.500% | 2/1/18 | 24,013 | 25,384 |
| AT&T Inc. | 5.600% | 5/15/18 | 8,213 | 8,795 |
| AT&T Inc. | 2.375% | 11/27/18 | 16,642 | 16,983 |
| AT&T Inc. | 5.800% | 2/15/19 | 19,134 | 21,064 |
| AT&T Inc. | 2.300% | 3/11/19 | 18,749 | 19,121 |
| AT&T Inc. | 5.875% | 10/1/19 | 8,343 | 9,377 |
| AT&T Inc. | 5.200% | 3/15/20 | 12,490 | 13,900 |
| AT&T Inc. | 2.450% | 6/30/20 | 25,205 | 25,754 |
| AT&T Inc. | 4.600% | 2/15/21 | 9,350 | 10,279 |
| AT&T Inc. | 2.800% | 2/17/21 | 8,551 | 8,813 |
| AT&T Inc. | 5.000% | 3/1/21 | 18,345 | 20,640 |
| AT&T Inc. | 4.450% | 5/15/21 | 15,915 | 17,468 |
| AT&T Inc. | 3.875% | 8/15/21 | 10,000 | 10,811 |
| British Telecommunications plc | 5.950% | 1/15/18 | 10,307 | 10,921 |
| British Telecommunications plc | 2.350% | 2/14/19 | 8,115 | 8,281 |
| CBS Corp. | 4.625% | 5/15/18 | 1,025 | 1,076 |
| CBS Corp. | 2.300% | 8/15/19 | 4,500 | 4,556 |
| CBS Corp. | 5.750% | 4/15/20 | 3,910 | 4,423 |
| CBS Corp. | 4.300% | 2/15/21 | 3,125 | 3,410 |
| CC Holdings GS V LLC / Crown Castle GS III Corp. | 2.381% | 12/15/17 | 8,187 | 8,266 |
| 1 Charter Communications Operating LLC/Charter | ||||
| Communications Operating Capital | 3.579% | 7/23/20 | 20,225 | 21,144 |
| Comcast Corp. | 6.300% | 11/15/17 | 5,298 | 5,623 |
| Comcast Corp. | 5.875% | 2/15/18 | 9,899 | 10,574 |
| Comcast Corp. | 5.700% | 5/15/18 | 14,630 | 15,746 |
| Comcast Corp. | 5.700% | 7/1/19 | 4,077 | 4,568 |
| Comcast Corp. | 5.150% | 3/1/20 | 14,440 | 16,226 |
| Crown Castle International Corp. | 3.400% | 2/15/21 | 8,900 | 9,312 |
| Crown Castle International Corp. | 2.250% | 9/1/21 | 2,300 | 2,297 |
| Deutsche Telekom International Finance BV | 6.750% | 8/20/18 | 13,256 | 14,631 |
| Deutsche Telekom International Finance BV | 6.000% | 7/8/19 | 4,925 | 5,527 |
| Discovery Communications LLC | 5.625% | 8/15/19 | 3,035 | 3,327 |
| Discovery Communications LLC | 5.050% | 6/1/20 | 7,850 | 8,628 |
| Discovery Communications LLC | 4.375% | 6/15/21 | 5,800 | 6,277 |
| Electronic Arts Inc. | 3.700% | 3/1/21 | 5,300 | 5,602 |
| Grupo Televisa SAB | 6.000% | 5/15/18 | 3,215 | 3,444 |
| GTE Corp. | 6.840% | 4/15/18 | 2 | 2 |
| Historic TW Inc. | 6.875% | 6/15/18 | 7,019 | 7,683 |
| Interpublic Group of Cos. Inc. | 2.250% | 11/15/17 | 2,250 | 2,263 |
| Moody's Corp. | 2.750% | 7/15/19 | 4,325 | 4,442 |
| Moody's Corp. | 5.500% | 9/1/20 | 2,900 | 3,261 |
| NBCUniversal Media LLC | 5.150% | 4/30/20 | 19,413 | 21,886 |
| NBCUniversal Media LLC | 4.375% | 4/1/21 | 14,810 | 16,561 |
| Omnicom Group Inc. | 6.250% | 7/15/19 | 3,900 | 4,402 |
| Omnicom Group Inc. | 4.450% | 8/15/20 | 10,825 | 11,818 |
| Orange SA | 2.750% | 2/6/19 | 13,220 | 13,591 |
| Orange SA | 5.375% | 7/8/19 | 11,385 | 12,561 |
| RELX Capital Inc. | 8.625% | 1/15/19 | 875 | 1,010 |
| Rogers Communications Inc. | 6.800% | 8/15/18 | 12,075 | 13,282 |
| S&P Global Inc. | 5.900% | 11/15/17 | 2,477 | 2,608 |
| S&P Global Inc. | 2.500% | 8/15/18 | 3,500 | 3,576 |
16
| Vanguard® Short-Term Corporate Bond Index Fund | ||||
| Schedule of Investments | ||||
| August 31, 2016 | ||||
| Face | Market | |||
| Maturity | Amount | Value | ||
| Coupon | Date | ($000) | ($000) | |
| S&P Global Inc. | 3.300% | 8/14/20 | 4,950 | 5,240 |
| Scripps Networks Interactive Inc. | 2.750% | 11/15/19 | 3,000 | 3,059 |
| Scripps Networks Interactive Inc. | 2.800% | 6/15/20 | 6,450 | 6,583 |
| Telefonica Emisiones SAU | 3.192% | 4/27/18 | 14,390 | 14,744 |
| Telefonica Emisiones SAU | 5.877% | 7/15/19 | 4,761 | 5,293 |
| Telefonica Emisiones SAU | 5.134% | 4/27/20 | 15,275 | 16,944 |
| Telefonica Emisiones SAU | 5.462% | 2/16/21 | 11,457 | 13,059 |
| Telefonos de Mexico SAB de CV | 5.500% | 11/15/19 | 1,750 | 1,949 |
| Thomson Reuters Corp. | 1.650% | 9/29/17 | 3,690 | 3,702 |
| Thomson Reuters Corp. | 6.500% | 7/15/18 | 7,505 | 8,172 |
| Thomson Reuters Corp. | 4.700% | 10/15/19 | 4,575 | 4,934 |
| Time Warner Cable Inc. | 6.750% | 7/1/18 | 19,547 | 21,313 |
| Time Warner Cable Inc. | 8.750% | 2/14/19 | 15,375 | 17,852 |
| Time Warner Cable Inc. | 8.250% | 4/1/19 | 11,982 | 13,825 |
| Time Warner Cable Inc. | 5.000% | 2/1/20 | 11,076 | 12,062 |
| Time Warner Cable Inc. | 4.125% | 2/15/21 | 4,900 | 5,210 |
| Time Warner Cos. Inc. | 7.250% | 10/15/17 | 989 | 1,053 |
| Time Warner Inc. | 2.100% | 6/1/19 | 4,600 | 4,671 |
| Time Warner Inc. | 4.875% | 3/15/20 | 11,199 | 12,388 |
| Time Warner Inc. | 4.700% | 1/15/21 | 8,075 | 9,007 |
| Time Warner Inc. | 4.750% | 3/29/21 | 6,792 | 7,620 |
| Verizon Communications Inc. | 1.100% | 11/1/17 | 2,000 | 1,998 |
| Verizon Communications Inc. | 5.500% | 2/15/18 | 5,873 | 6,230 |
| Verizon Communications Inc. | 6.100% | 4/15/18 | 5,087 | 5,476 |
| Verizon Communications Inc. | 3.650% | 9/14/18 | 29,281 | 30,611 |
| Verizon Communications Inc. | 2.550% | 6/17/19 | 5,675 | 5,852 |
| Verizon Communications Inc. | 1.375% | 8/15/19 | 6,500 | 6,487 |
| Verizon Communications Inc. | 2.625% | 2/21/20 | 39,123 | 40,312 |
| Verizon Communications Inc. | 4.500% | 9/15/20 | 36,650 | 40,376 |
| Verizon Communications Inc. | 3.450% | 3/15/21 | 9,489 | 10,130 |
| Verizon Communications Inc. | 4.600% | 4/1/21 | 4,075 | 4,559 |
| Verizon Communications Inc. | 1.750% | 8/15/21 | 9,000 | 8,926 |
| Viacom Inc. | 6.125% | 10/5/17 | 4,800 | 5,035 |
| Viacom Inc. | 2.500% | 9/1/18 | 5,155 | 5,224 |
| Viacom Inc. | 2.200% | 4/1/19 | 4,100 | 4,113 |
| Viacom Inc. | 5.625% | 9/15/19 | 2,500 | 2,752 |
| Viacom Inc. | 2.750% | 12/15/19 | 3,100 | 3,169 |
| Viacom Inc. | 3.875% | 12/15/21 | 4,125 | 4,398 |
| Vodafone Group plc | 1.250% | 9/26/17 | 9,315 | 9,315 |
| Vodafone Group plc | 1.500% | 2/19/18 | 7,850 | 7,860 |
| Vodafone Group plc | 4.625% | 7/15/18 | 9,675 | 10,220 |
| Vodafone Group plc | 5.450% | 6/10/19 | 9,445 | 10,396 |
| Vodafone Group plc | 4.375% | 3/16/21 | 3,649 | 4,013 |
| Walt Disney Co. | 1.100% | 12/1/17 | 11,365 | 11,385 |
| Walt Disney Co. | 5.875% | 12/15/17 | 3,700 | 3,926 |
| Walt Disney Co. | 1.500% | 9/17/18 | 11,103 | 11,202 |
| Walt Disney Co. | 1.650% | 1/8/19 | 5,150 | 5,213 |
| Walt Disney Co. | 5.500% | 3/15/19 | 1,650 | 1,823 |
| Walt Disney Co. | 1.850% | 5/30/19 | 7,573 | 7,702 |
| Walt Disney Co. | 0.875% | 7/12/19 | 450 | 446 |
| Walt Disney Co. | 2.150% | 9/17/20 | 6,950 | 7,149 |
| Walt Disney Co. | 2.300% | 2/12/21 | 5,975 | 6,170 |
| Walt Disney Co. | 3.750% | 6/1/21 | 2,075 | 2,277 |
| Walt Disney Co. | 2.750% | 8/16/21 | 7,061 | 7,443 |
| Consumer Cyclical (7.7%) | ||||
| Advance Auto Parts Inc. | 5.750% | 5/1/20 | 2,175 | 2,413 |
| Alibaba Group Holding Ltd. | 1.625% | 11/28/17 | 7,000 | 7,016 |
| Alibaba Group Holding Ltd. | 2.500% | 11/28/19 | 17,650 | 17,962 |
| Amazon.com Inc. | 1.200% | 11/29/17 | 4,550 | 4,556 |
| Amazon.com Inc. | 2.600% | 12/5/19 | 13,800 | 14,354 |
| American Honda Finance Corp. | 1.550% | 12/11/17 | 9,966 | 10,024 |
| American Honda Finance Corp. | 1.500% | 3/13/18 | 7,127 | 7,165 |
| American Honda Finance Corp. | 1.600% | 7/13/18 | 10,678 | 10,758 |
17
| Vanguard® Short-Term Corporate Bond Index Fund | ||||
| Schedule of Investments | ||||
| August 31, 2016 | ||||
| Face | Market | |||
| Maturity | Amount | Value | ||
| Coupon | Date | ($000) | ($000) | |
| American Honda Finance Corp. | 2.125% | 10/10/18 | 10,461 | 10,665 |
| American Honda Finance Corp. | 1.700% | 2/22/19 | 925 | 934 |
| American Honda Finance Corp. | 1.200% | 7/12/19 | 6,575 | 6,554 |
| American Honda Finance Corp. | 2.250% | 8/15/19 | 12,105 | 12,421 |
| American Honda Finance Corp. | 2.450% | 9/24/20 | 12,495 | 12,895 |
| American Honda Finance Corp. | 1.650% | 7/12/21 | 6,500 | 6,464 |
| Automatic Data Processing Inc. | 2.250% | 9/15/20 | 8,930 | 9,231 |
| AutoNation Inc. | 6.750% | 4/15/18 | 2,500 | 2,667 |
| AutoNation Inc. | 5.500% | 2/1/20 | 2,680 | 2,936 |
| AutoNation Inc. | 3.350% | 1/15/21 | 4,400 | 4,512 |
| AutoZone Inc. | 7.125% | 8/1/18 | 1,325 | 1,458 |
| AutoZone Inc. | 1.625% | 4/21/19 | 4,900 | 4,910 |
| AutoZone Inc. | 4.000% | 11/15/20 | 2,484 | 2,651 |
| AutoZone Inc. | 2.500% | 4/15/21 | 1,375 | 1,399 |
| Best Buy Co. Inc. | 5.000% | 8/1/18 | 226 | 239 |
| Best Buy Co. Inc. | 5.500% | 3/15/21 | 6,325 | 6,989 |
| Block Financial LLC | 4.125% | 10/1/20 | 9,300 | 9,738 |
| BorgWarner Inc. | 4.625% | 9/15/20 | 575 | 624 |
| Brinker International Inc. | 2.600% | 5/15/18 | 2,366 | 2,378 |
| Carnival Corp. | 1.875% | 12/15/17 | 7,054 | 7,097 |
| Carnival Corp. | 3.950% | 10/15/20 | 6,225 | 6,700 |
| Costco Wholesale Corp. | 1.125% | 12/15/17 | 10,812 | 10,834 |
| Costco Wholesale Corp. | 1.700% | 12/15/19 | 8,245 | 8,366 |
| Costco Wholesale Corp. | 1.750% | 2/15/20 | 4,085 | 4,144 |
| CVS Health Corp. | 1.900% | 7/20/18 | 23,009 | 23,283 |
| CVS Health Corp. | 2.250% | 12/5/18 | 15,144 | 15,466 |
| CVS Health Corp. | 2.250% | 8/12/19 | 8,800 | 9,011 |
| CVS Health Corp. | 2.800% | 7/20/20 | 29,850 | 31,091 |
| CVS Health Corp. | 2.125% | 6/1/21 | 13,000 | 13,140 |
| Delphi Automotive plc | 3.150% | 11/19/20 | 4,050 | 4,193 |
| Dollar General Corp. | 1.875% | 4/15/18 | 2,150 | 2,164 |
| eBay Inc. | 2.500% | 3/9/18 | 4,200 | 4,269 |
| eBay Inc. | 2.200% | 8/1/19 | 12,995 | 13,159 |
| eBay Inc. | 3.250% | 10/15/20 | 5,935 | 6,213 |
| eBay Inc. | 2.875% | 8/1/21 | 4,704 | 4,838 |
| Expedia Inc. | 7.456% | 8/15/18 | 4,280 | 4,701 |
| Expedia Inc. | 5.950% | 8/15/20 | 7,600 | 8,522 |
| Ford Motor Co. | 6.500% | 8/1/18 | 150 | 163 |
| Ford Motor Credit Co. LLC | 1.684% | 9/8/17 | 6,000 | 6,008 |
| Ford Motor Credit Co. LLC | 1.724% | 12/6/17 | 9,252 | 9,260 |
| Ford Motor Credit Co. LLC | 2.145% | 1/9/18 | 10,275 | 10,329 |
| Ford Motor Credit Co. LLC | 2.375% | 1/16/18 | 16,187 | 16,334 |
| Ford Motor Credit Co. LLC | 5.000% | 5/15/18 | 21,805 | 22,981 |
| Ford Motor Credit Co. LLC | 2.240% | 6/15/18 | 2,300 | 2,320 |
| Ford Motor Credit Co. LLC | 2.875% | 10/1/18 | 12,783 | 13,051 |
| Ford Motor Credit Co. LLC | 2.551% | 10/5/18 | 8,025 | 8,146 |
| Ford Motor Credit Co. LLC | 2.943% | 1/8/19 | 1,000 | 1,025 |
| Ford Motor Credit Co. LLC | 2.375% | 3/12/19 | 19,197 | 19,452 |
| Ford Motor Credit Co. LLC | 2.021% | 5/3/19 | 5,300 | 5,329 |
| Ford Motor Credit Co. LLC | 1.897% | 8/12/19 | 6,000 | 5,994 |
| Ford Motor Credit Co. LLC | 2.597% | 11/4/19 | 12,427 | 12,645 |
| Ford Motor Credit Co. LLC | 8.125% | 1/15/20 | 11,625 | 13,772 |
| Ford Motor Credit Co. LLC | 2.459% | 3/27/20 | 5,490 | 5,529 |
| Ford Motor Credit Co. LLC | 3.157% | 8/4/20 | 12,732 | 13,142 |
| Ford Motor Credit Co. LLC | 3.200% | 1/15/21 | 14,525 | 14,948 |
| Ford Motor Credit Co. LLC | 5.750% | 2/1/21 | 11,310 | 12,783 |
| Ford Motor Credit Co. LLC | 3.336% | 3/18/21 | 15,150 | 15,689 |
| Ford Motor Credit Co. LLC | 5.875% | 8/2/21 | 14,727 | 16,912 |
| General Motors Co. | 3.500% | 10/2/18 | 14,798 | 15,186 |
| General Motors Financial Co. Inc. | 3.000% | 9/25/17 | 10,376 | 10,519 |
| General Motors Financial Co. Inc. | 2.400% | 4/10/18 | 2,400 | 2,418 |
| General Motors Financial Co. Inc. | 3.250% | 5/15/18 | 7,002 | 7,107 |
| General Motors Financial Co. Inc. | 6.750% | 6/1/18 | 11,100 | 11,988 |
| General Motors Financial Co. Inc. | 3.100% | 1/15/19 | 12,450 | 12,668 |
18
| Vanguard® Short-Term Corporate Bond Index Fund | ||||
| Schedule of Investments | ||||
| August 31, 2016 | ||||
| Face | Market | |||
| Maturity | Amount | Value | ||
| Coupon | Date | ($000) | ($000) | |
| General Motors Financial Co. Inc. | 2.400% | 5/9/19 | 9,000 | 9,045 |
| General Motors Financial Co. Inc. | 3.500% | 7/10/19 | 14,597 | 15,035 |
| General Motors Financial Co. Inc. | 3.150% | 1/15/20 | 6,865 | 7,011 |
| General Motors Financial Co. Inc. | 3.200% | 7/13/20 | 16,750 | 17,106 |
| General Motors Financial Co. Inc. | 3.700% | 11/24/20 | 13,364 | 13,915 |
| General Motors Financial Co. Inc. | 4.200% | 3/1/21 | 9,183 | 9,700 |
| General Motors Financial Co. Inc. | 3.200% | 7/6/21 | 13,825 | 13,998 |
| Home Depot Inc. | 2.250% | 9/10/18 | 7,340 | 7,508 |
| Home Depot Inc. | 2.000% | 6/15/19 | 14,655 | 14,973 |
| Home Depot Inc. | 3.950% | 9/15/20 | 1,600 | 1,749 |
| Home Depot Inc. | 2.000% | 4/1/21 | 12,201 | 12,450 |
| Home Depot Inc. | 4.400% | 4/1/21 | 11,577 | 12,975 |
| Hyatt Hotels Corp. | 5.375% | 8/15/21 | 2,125 | 2,391 |
| Johnson Controls Inc. | 1.400% | 11/2/17 | 1,400 | 1,401 |
| Johnson Controls Inc. | 5.000% | 3/30/20 | 2,950 | 3,193 |
| Johnson Controls Inc. | 4.250% | 3/1/21 | 4,214 | 4,502 |
| Lowe's Cos. Inc. | 1.150% | 4/15/19 | 1,000 | 999 |
| Lowe's Cos. Inc. | 4.625% | 4/15/20 | 4,325 | 4,720 |
| Lowe's Cos. Inc. | 3.750% | 4/15/21 | 3,443 | 3,768 |
| Macy's Retail Holdings Inc. | 3.450% | 1/15/21 | 3,500 | 3,647 |
| Marriott International Inc. | 3.000% | 3/1/19 | 4,188 | 4,310 |
| Marriott International Inc. | 3.375% | 10/15/20 | 4,975 | 5,194 |
| Marriott International Inc. | 2.875% | 3/1/21 | 2,900 | 2,987 |
| MasterCard Inc. | 2.000% | 4/1/19 | 4,625 | 4,713 |
| McDonald's Corp. | 5.800% | 10/15/17 | 3,776 | 3,969 |
| McDonald's Corp. | 5.350% | 3/1/18 | 12,115 | 12,847 |
| McDonald's Corp. | 2.100% | 12/7/18 | 4,910 | 4,994 |
| McDonald's Corp. | 5.000% | 2/1/19 | 6,935 | 7,529 |
| McDonald's Corp. | 1.875% | 5/29/19 | 5,534 | 5,593 |
| McDonald's Corp. | 2.200% | 5/26/20 | 795 | 813 |
| McDonald's Corp. | 3.500% | 7/15/20 | 3,850 | 4,096 |
| McDonald's Corp. | 2.750% | 12/9/20 | 11,150 | 11,603 |
| McDonald's Corp. | 3.625% | 5/20/21 | 3,646 | 3,932 |
| Nordstrom Inc. | 6.250% | 1/15/18 | 5,677 | 6,050 |
| Nordstrom Inc. | 4.750% | 5/1/20 | 3,275 | 3,574 |
| O'Reilly Automotive Inc. | 4.875% | 1/14/21 | 3,837 | 4,243 |
| PACCAR Financial Corp. | 1.400% | 11/17/17 | 2,400 | 2,412 |
| PACCAR Financial Corp. | 1.450% | 3/9/18 | 3,463 | 3,481 |
| PACCAR Financial Corp. | 1.400% | 5/18/18 | 3,000 | 3,016 |
| PACCAR Financial Corp. | 1.750% | 8/14/18 | 2,250 | 2,274 |
| PACCAR Financial Corp. | 1.300% | 5/10/19 | 6,200 | 6,198 |
| PACCAR Financial Corp. | 1.200% | 8/12/19 | 2,390 | 2,382 |
| PACCAR Financial Corp. | 2.200% | 9/15/19 | 1,850 | 1,885 |
| PACCAR Financial Corp. | 2.500% | 8/14/20 | 2,500 | 2,558 |
| PACCAR Financial Corp. | 2.250% | 2/25/21 | 2,500 | 2,547 |
| QVC Inc. | 3.125% | 4/1/19 | 2,250 | 2,302 |
| Ralph Lauren Corp. | 2.125% | 9/26/18 | 1,725 | 1,751 |
| Ralph Lauren Corp. | 2.625% | 8/18/20 | 2,200 | 2,279 |
| Staples Inc. | 2.750% | 1/12/18 | 2,925 | 2,961 |
| Starbucks Corp. | 2.000% | 12/5/18 | 2,625 | 2,673 |
| Starbucks Corp. | 2.100% | 2/4/21 | 6,314 | 6,479 |
| Starwood Hotels & Resorts Worldwide Inc. | 6.750% | 5/15/18 | 1,810 | 1,963 |
| Target Corp. | 6.000% | 1/15/18 | 9,910 | 10,562 |
| Target Corp. | 2.300% | 6/26/19 | 9,425 | 9,704 |
| Target Corp. | 3.875% | 7/15/20 | 10,375 | 11,346 |
| TJX Cos. Inc. | 6.950% | 4/15/19 | 4,775 | 5,448 |
| TJX Cos. Inc. | 2.750% | 6/15/21 | 7,000 | 7,337 |
| Toyota Motor Credit Corp. | 1.250% | 10/5/17 | 9,917 | 9,926 |
| Toyota Motor Credit Corp. | 1.375% | 1/10/18 | 6,553 | 6,574 |
| Toyota Motor Credit Corp. | 1.450% | 1/12/18 | 14,911 | 14,967 |
| Toyota Motor Credit Corp. | 1.200% | 4/6/18 | 11,500 | 11,511 |
| Toyota Motor Credit Corp. | 1.550% | 7/13/18 | 11,454 | 11,515 |
| Toyota Motor Credit Corp. | 2.000% | 10/24/18 | 10,995 | 11,157 |
| Toyota Motor Credit Corp. | 2.100% | 1/17/19 | 14,749 | 15,005 |
19
| Vanguard® Short-Term Corporate Bond Index Fund | ||||
| Schedule of Investments | ||||
| August 31, 2016 | ||||
| Face | Market | |||
| Maturity | Amount | Value | ||
| Coupon | Date | ($000) | ($000) | |
| Toyota Motor Credit Corp. | 1.700% | 2/19/19 | 6,000 | 6,056 |
| Toyota Motor Credit Corp. | 1.400% | 5/20/19 | 10,750 | 10,764 |
| Toyota Motor Credit Corp. | 2.125% | 7/18/19 | 9,710 | 9,912 |
| Toyota Motor Credit Corp. | 2.150% | 3/12/20 | 15,559 | 15,883 |
| Toyota Motor Credit Corp. | 4.500% | 6/17/20 | 1,750 | 1,932 |
| Toyota Motor Credit Corp. | 4.250% | 1/11/21 | 4,875 | 5,374 |
| Toyota Motor Credit Corp. | 1.900% | 4/8/21 | 9,500 | 9,600 |
| Toyota Motor Credit Corp. | 2.750% | 5/17/21 | 5,859 | 6,149 |
| Visa Inc. | 1.200% | 12/14/17 | 12,750 | 12,776 |
| Visa Inc. | 2.200% | 12/14/20 | 29,974 | 30,826 |
| Wal-Mart Stores Inc. | 5.800% | 2/15/18 | 16,067 | 17,179 |
| Wal-Mart Stores Inc. | 1.125% | 4/11/18 | 17,982 | 18,033 |
| Wal-Mart Stores Inc. | 1.950% | 12/15/18 | 15,245 | 15,547 |
| Wal-Mart Stores Inc. | 4.125% | 2/1/19 | 2,600 | 2,785 |
| Wal-Mart Stores Inc. | 3.625% | 7/8/20 | 13,653 | 14,829 |
| Wal-Mart Stores Inc. | 3.250% | 10/25/20 | 12,677 | 13,655 |
| Wal-Mart Stores Inc. | 4.250% | 4/15/21 | 2,550 | 2,865 |
| Walgreen Co. | 5.250% | 1/15/19 | 1,352 | 1,462 |
| Walgreens Boots Alliance Inc. | 1.750% | 11/17/17 | 7,550 | 7,594 |
| Walgreens Boots Alliance Inc. | 1.750% | 5/30/18 | 9,800 | 9,853 |
| Walgreens Boots Alliance Inc. | 2.700% | 11/18/19 | 15,096 | 15,577 |
| Walgreens Boots Alliance Inc. | 2.600% | 6/1/21 | 18,770 | 19,203 |
| Western Union Co. | 2.875% | 12/10/17 | 1,977 | 2,006 |
| Western Union Co. | 3.650% | 8/22/18 | 4,115 | 4,243 |
| Western Union Co. | 5.253% | 4/1/20 | 2,575 | 2,834 |
| Wyndham Worldwide Corp. | 2.500% | 3/1/18 | 2,851 | 2,878 |
| Consumer Noncyclical (13.8%) | ||||
| Abbott Laboratories | 5.125% | 4/1/19 | 3,690 | 4,036 |
| Abbott Laboratories | 2.000% | 3/15/20 | 8,600 | 8,701 |
| Abbott Laboratories | 4.125% | 5/27/20 | 4,065 | 4,426 |
| AbbVie Inc. | 1.750% | 11/6/17 | 32,543 | 32,687 |
| AbbVie Inc. | 1.800% | 5/14/18 | 29,165 | 29,308 |
| AbbVie Inc. | 2.000% | 11/6/18 | 9,013 | 9,104 |
| AbbVie Inc. | 2.500% | 5/14/20 | 38,862 | 39,778 |
| AbbVie Inc. | 2.300% | 5/14/21 | 10,300 | 10,407 |
| Actavis Funding SCS | 2.350% | 3/12/18 | 26,758 | 27,055 |
| Actavis Funding SCS | 2.450% | 6/15/19 | 8,062 | 8,201 |
| Actavis Funding SCS | 3.000% | 3/12/20 | 30,154 | 31,002 |
| Actavis Inc. | 1.875% | 10/1/17 | 10,529 | 10,578 |
| Actavis Inc. | 6.125% | 8/15/19 | 750 | 841 |
| Agilent Technologies Inc. | 5.000% | 7/15/20 | 4,225 | 4,662 |
| Allergan Inc. | 1.350% | 3/15/18 | 4,025 | 4,010 |
| Allergan Inc. | 3.375% | 9/15/20 | 10,393 | 10,883 |
| Altria Group Inc. | 9.700% | 11/10/18 | 2,275 | 2,674 |
| Altria Group Inc. | 9.250% | 8/6/19 | 7,522 | 9,186 |
| Altria Group Inc. | 2.625% | 1/14/20 | 15,400 | 15,992 |
| Altria Group Inc. | 4.750% | 5/5/21 | 15,608 | 17,721 |
| AmerisourceBergen Corp. | 4.875% | 11/15/19 | 2,650 | 2,895 |
| Amgen Inc. | 6.150% | 6/1/18 | 6,310 | 6,827 |
| Amgen Inc. | 5.700% | 2/1/19 | 3,626 | 3,990 |
| Amgen Inc. | 2.200% | 5/22/19 | 17,185 | 17,539 |
| Amgen Inc. | 4.500% | 3/15/20 | 1,900 | 2,081 |
| Amgen Inc. | 2.125% | 5/1/20 | 8,688 | 8,819 |
| Amgen Inc. | 3.450% | 10/1/20 | 7,417 | 7,908 |
| Amgen Inc. | 4.100% | 6/15/21 | 5,725 | 6,265 |
| Amgen Inc. | 1.850% | 8/19/21 | 6,775 | 6,757 |
| Anheuser-Busch Cos. LLC | 5.500% | 1/15/18 | 6,322 | 6,682 |
| Anheuser-Busch Cos. LLC | 5.000% | 3/1/19 | 4,056 | 4,393 |
| Anheuser-Busch InBev Finance Inc. | 1.250% | 1/17/18 | 10,800 | 10,805 |
| Anheuser-Busch InBev Finance Inc. | 1.900% | 2/1/19 | 36,075 | 36,430 |
| Anheuser-Busch InBev Finance Inc. | 2.150% | 2/1/19 | 11,170 | 11,367 |
| Anheuser-Busch InBev Finance Inc. | 2.650% | 2/1/21 | 77,540 | 79,865 |
| Anheuser-Busch InBev Worldwide Inc. | 7.750% | 1/15/19 | 19,435 | 22,174 |
20
| Vanguard® Short-Term Corporate Bond Index Fund | ||||
| Schedule of Investments | ||||
| August 31, 2016 | ||||
| Face | Market | |||
| Maturity | Amount | Value | ||
| Coupon | Date | ($000) | ($000) | |
| Anheuser-Busch InBev Worldwide Inc. | 6.875% | 11/15/19 | 11,972 | 13,924 |
| Anheuser-Busch InBev Worldwide Inc. | 5.375% | 1/15/20 | 13,350 | 14,937 |
| Anheuser-Busch InBev Worldwide Inc. | 5.000% | 4/15/20 | 7,300 | 8,105 |
| Anheuser-Busch InBev Worldwide Inc. | 4.375% | 2/15/21 | 1,850 | 2,043 |
| Archer-Daniels-Midland Co. | 5.450% | 3/15/18 | 4,987 | 5,310 |
| Archer-Daniels-Midland Co. | 4.479% | 3/1/21 | 4,000 | 4,494 |
| AstraZeneca plc | 5.900% | 9/15/17 | 12,898 | 13,509 |
| AstraZeneca plc | 1.750% | 11/16/18 | 12,784 | 12,905 |
| AstraZeneca plc | 1.950% | 9/18/19 | 7,092 | 7,201 |
| AstraZeneca plc | 2.375% | 11/16/20 | 14,125 | 14,494 |
| Baptist Health South Florida Obligated Group Revenue | 4.590% | 8/15/21 | 1,250 | 1,394 |
| Baxalta Inc. | 2.000% | 6/22/18 | 2,700 | 2,707 |
| Baxalta Inc. | 2.875% | 6/23/20 | 7,300 | 7,423 |
| Baxter International Inc. | 5.900% | 9/1/16 | 1 | 1 |
| Baxter International Inc. | 1.700% | 8/15/21 | 4,300 | 4,272 |
| Beam Suntory Inc. | 1.750% | 6/15/18 | 2,725 | 2,731 |
| Becton Dickinson & Co. | 1.800% | 12/15/17 | 10,698 | 10,758 |
| Becton Dickinson & Co. | 5.000% | 5/15/19 | 4,700 | 5,122 |
| Becton Dickinson & Co. | 6.375% | 8/1/19 | 5,150 | 5,841 |
| Becton Dickinson & Co. | 2.675% | 12/15/19 | 11,551 | 11,956 |
| Becton Dickinson & Co. | 3.250% | 11/12/20 | 7,300 | 7,647 |
| Bio-Rad Laboratories Inc. | 4.875% | 12/15/20 | 2,775 | 3,039 |
| Biogen Inc. | 6.875% | 3/1/18 | 7,273 | 7,857 |
| Biogen Inc. | 2.900% | 9/15/20 | 13,500 | 14,055 |
| Boston Scientific Corp. | 2.650% | 10/1/18 | 7,160 | 7,363 |
| Boston Scientific Corp. | 6.000% | 1/15/20 | 6,675 | 7,562 |
| Boston Scientific Corp. | 2.850% | 5/15/20 | 3,725 | 3,832 |
| Bottling Group LLC | 5.125% | 1/15/19 | 12,590 | 13,719 |
| Bristol-Myers Squibb Co. | 1.750% | 3/1/19 | 3,650 | 3,703 |
| Brown-Forman Corp. | 1.000% | 1/15/18 | 2,150 | 2,144 |
| Bunge Ltd. Finance Corp. | 8.500% | 6/15/19 | 5,100 | 5,960 |
| Bunge Ltd. Finance Corp. | 3.500% | 11/24/20 | 4,100 | 4,248 |
| Campbell Soup Co. | 4.500% | 2/15/19 | 1,410 | 1,513 |
| Campbell Soup Co. | 4.250% | 4/15/21 | 2,160 | 2,375 |
| Cardinal Health Inc. | 1.700% | 3/15/18 | 7,660 | 7,695 |
| Cardinal Health Inc. | 1.950% | 6/15/18 | 3,825 | 3,862 |
| Cardinal Health Inc. | 4.625% | 12/15/20 | 6,550 | 7,292 |
| Catholic Health Initiatives Colorado GO | 1.600% | 11/1/17 | 1,700 | 1,701 |
| Celgene Corp. | 2.125% | 8/15/18 | 6,467 | 6,543 |
| Celgene Corp. | 2.300% | 8/15/18 | 5,175 | 5,252 |
| Celgene Corp. | 2.250% | 5/15/19 | 5,850 | 5,937 |
| Celgene Corp. | 2.875% | 8/15/20 | 10,480 | 10,896 |
| Celgene Corp. | 3.950% | 10/15/20 | 8,400 | 9,055 |
| Church & Dwight Co. Inc. | 2.450% | 12/15/19 | 2,825 | 2,875 |
| Clorox Co. | 5.950% | 10/15/17 | 3,406 | 3,589 |
| Coca-Cola Co. | 0.875% | 10/27/17 | 1,000 | 999 |
| Coca-Cola Co. | 1.650% | 3/14/18 | 5,751 | 5,808 |
| Coca-Cola Co. | 1.150% | 4/1/18 | 19,622 | 19,651 |
| Coca-Cola Co. | 1.650% | 11/1/18 | 12,312 | 12,459 |
| Coca-Cola Co. | 1.375% | 5/30/19 | 7,100 | 7,150 |
| Coca-Cola Co. | 1.875% | 10/27/20 | 6,900 | 7,035 |
| Coca-Cola Co. | 2.450% | 11/1/20 | 12,750 | 13,233 |
| Coca-Cola Co. | 3.150% | 11/15/20 | 7,127 | 7,616 |
| Coca-Cola Co. | 1.550% | 9/1/21 | 1,400 | 1,398 |
| Coca-Cola Enterprises Inc. | 3.500% | 9/15/20 | 4,375 | 4,613 |
| Coca-Cola Enterprises Inc. | 3.250% | 8/19/21 | 425 | 445 |
| Coca-Cola Enterprises Inc. | 4.500% | 9/1/21 | 1,700 | 1,884 |
| Coca-Cola Femsa SAB de CV | 2.375% | 11/26/18 | 10,825 | 11,018 |
| Coca-Cola Femsa SAB de CV | 4.625% | 2/15/20 | 2,175 | 2,368 |
| Colgate-Palmolive Co. | 0.900% | 5/1/18 | 3,200 | 3,196 |
| Colgate-Palmolive Co. | 1.500% | 11/1/18 | 2,925 | 2,953 |
| Colgate-Palmolive Co. | 1.750% | 3/15/19 | 7,794 | 7,925 |
| ConAgra Foods Inc. | 1.900% | 1/25/18 | 14,325 | 14,420 |
| ConAgra Foods Inc. | 7.000% | 4/15/19 | 347 | 390 |
21
| Vanguard® Short-Term Corporate Bond Index Fund | ||||
| Schedule of Investments | ||||
| August 31, 2016 | ||||
| Face | Market | |||
| Maturity | Amount | Value | ||
| Coupon | Date | ($000) | ($000) | |
| Covidien International Finance SA | 6.000% | 10/15/17 | 11,884 | 12,534 |
| Covidien International Finance SA | 4.200% | 6/15/20 | 8,425 | 9,193 |
| CR Bard Inc. | 1.375% | 1/15/18 | 4,230 | 4,237 |
| CR Bard Inc. | 4.400% | 1/15/21 | 3,918 | 4,294 |
| Danaher Corp. | 1.650% | 9/15/18 | 9,046 | 9,163 |
| Danaher Corp. | 2.400% | 9/15/20 | 4,119 | 4,251 |
| DENTSPLY Sirona Inc. | 4.125% | 8/15/21 | 1,625 | 1,704 |
| Diageo Capital plc | 5.750% | 10/23/17 | 11,903 | 12,509 |
| Diageo Capital plc | 1.125% | 4/29/18 | 7,436 | 7,415 |
| Diageo Capital plc | 4.828% | 7/15/20 | 4,210 | 4,709 |
| Dignity Health California GO | 2.637% | 11/1/19 | 2,450 | 2,509 |
| Dr Pepper Snapple Group Inc. | 6.820% | 5/1/18 | 6,675 | 7,274 |
| Dr Pepper Snapple Group Inc. | 2.600% | 1/15/19 | 2,250 | 2,295 |
| Dr Pepper Snapple Group Inc. | 2.000% | 1/15/20 | 1,900 | 1,906 |
| Edwards Lifesciences Corp. | 2.875% | 10/15/18 | 4,685 | 4,783 |
| Eli Lilly & Co. | 1.250% | 3/1/18 | 6,368 | 6,388 |
| Eli Lilly & Co. | 1.950% | 3/15/19 | 7,375 | 7,503 |
| Estee Lauder Cos. Inc. | 1.700% | 5/10/21 | 6,800 | 6,826 |
| Express Scripts Holding Co. | 2.250% | 6/15/19 | 10,335 | 10,505 |
| Express Scripts Holding Co. | 3.300% | 2/25/21 | 3,800 | 3,999 |
| Express Scripts Holding Co. | 4.750% | 11/15/21 | 7,000 | 7,872 |
| Express Scripts Inc. | 7.250% | 6/15/19 | 250 | 287 |
| General Mills Inc. | 1.400% | 10/20/17 | 2,781 | 2,791 |
| General Mills Inc. | 5.650% | 2/15/19 | 10,490 | 11,564 |
| General Mills Inc. | 2.200% | 10/21/19 | 5,993 | 6,117 |
| Gilead Sciences Inc. | 1.850% | 9/4/18 | 9,716 | 9,843 |
| Gilead Sciences Inc. | 2.050% | 4/1/19 | 7,038 | 7,174 |
| Gilead Sciences Inc. | 2.350% | 2/1/20 | 6,154 | 6,334 |
| Gilead Sciences Inc. | 2.550% | 9/1/20 | 18,929 | 19,638 |
| Gilead Sciences Inc. | 4.500% | 4/1/21 | 9,981 | 11,146 |
| GlaxoSmithKline Capital Inc. | 5.650% | 5/15/18 | 21,115 | 22,662 |
| Hasbro Inc. | 6.300% | 9/15/17 | 1,975 | 2,071 |
| Hasbro Inc. | 3.150% | 5/15/21 | 5,850 | 6,018 |
| Hershey Co. | 1.600% | 8/21/18 | 2,500 | 2,521 |
| Hershey Co. | 4.125% | 12/1/20 | 3,625 | 3,988 |
| Hillshire Brands Co. | 4.100% | 9/15/20 | 2,492 | 2,614 |
| Hormel Foods Corp. | 4.125% | 4/15/21 | 1,100 | 1,213 |
| Ingredion Inc. | 4.625% | 11/1/20 | 2,425 | 2,656 |
| JM Smucker Co. | 1.750% | 3/15/18 | 2,541 | 2,556 |
| JM Smucker Co. | 2.500% | 3/15/20 | 7,436 | 7,599 |
| Johnson & Johnson | 5.150% | 7/15/18 | 5,107 | 5,505 |
| Johnson & Johnson | 1.650% | 12/5/18 | 6,914 | 7,002 |
| Johnson & Johnson | 1.125% | 3/1/19 | 6,318 | 6,323 |
| Johnson & Johnson | 1.875% | 12/5/19 | 11,180 | 11,448 |
| Johnson & Johnson | 2.950% | 9/1/20 | 6,050 | 6,418 |
| Johnson & Johnson | 1.650% | 3/1/21 | 6,632 | 6,722 |
| Johnson & Johnson | 3.550% | 5/15/21 | 3,250 | 3,565 |
| Kellogg Co. | 3.250% | 5/21/18 | 450 | 464 |
| Kellogg Co. | 4.150% | 11/15/19 | 6,975 | 7,523 |
| Kellogg Co. | 4.000% | 12/15/20 | 7,380 | 8,094 |
| Kimberly-Clark Corp. | 6.250% | 7/15/18 | 1,663 | 1,820 |
| Kimberly-Clark Corp. | 7.500% | 11/1/18 | 4,697 | 5,318 |
| Kimberly-Clark Corp. | 1.400% | 2/15/19 | 3,200 | 3,229 |
| Kimberly-Clark Corp. | 1.900% | 5/22/19 | 2,000 | 2,031 |
| Kimberly-Clark Corp. | 1.850% | 3/1/20 | 2,025 | 2,060 |
| Kimberly-Clark Corp. | 3.625% | 8/1/20 | 1,558 | 1,689 |
| Kimberly-Clark Corp. | 2.150% | 8/15/20 | 1,825 | 1,877 |
| Kimberly-Clark Corp. | 3.875% | 3/1/21 | 2,195 | 2,402 |
| Koninklijke Philips NV | 5.750% | 3/11/18 | 10,363 | 11,022 |
| Kraft Foods Group Inc. | 6.125% | 8/23/18 | 8,236 | 8,971 |
| Kraft Foods Group Inc. | 5.375% | 2/10/20 | 7,154 | 8,017 |
| Kraft Heinz Foods Co. | 2.000% | 7/2/18 | 14,841 | 15,023 |
| Kraft Heinz Foods Co. | 2.800% | 7/2/20 | 16,007 | 16,652 |
| Laboratory Corp. of America Holdings | 2.200% | 8/23/17 | 8,307 | 8,384 |
22
| Vanguard® Short-Term Corporate Bond Index Fund | ||||
| Schedule of Investments | ||||
| August 31, 2016 | ||||
| Face | Market | |||
| Maturity | Amount | Value | ||
| Coupon | Date | ($000) | ($000) | |
| Laboratory Corp. of America Holdings | 2.500% | 11/1/18 | 850 | 861 |
| Laboratory Corp. of America Holdings | 2.625% | 2/1/20 | 5,017 | 5,114 |
| Laboratory Corp. of America Holdings | 4.625% | 11/15/20 | 3,250 | 3,541 |
| Life Technologies Corp. | 6.000% | 3/1/20 | 4,375 | 4,892 |
| Life Technologies Corp. | 5.000% | 1/15/21 | 4,668 | 5,121 |
| Mattel Inc. | 2.350% | 5/6/19 | 4,475 | 4,541 |
| Mattel Inc. | 4.350% | 10/1/20 | 75 | 81 |
| Mattel Inc. | 2.350% | 8/15/21 | 2,500 | 2,500 |
| McCormick & Co. Inc. | 5.750% | 12/15/17 | 765 | 810 |
| McCormick & Co. Inc. | 3.900% | 7/15/21 | 2,625 | 2,860 |
| McKesson Corp. | 1.400% | 3/15/18 | 3,078 | 3,081 |
| McKesson Corp. | 7.500% | 2/15/19 | 4,800 | 5,473 |
| McKesson Corp. | 2.284% | 3/15/19 | 8,750 | 8,921 |
| McKesson Corp. | 4.750% | 3/1/21 | 7,050 | 7,809 |
| Mead Johnson Nutrition Co. | 4.900% | 11/1/19 | 4,475 | 4,912 |
| Mead Johnson Nutrition Co. | 3.000% | 11/15/20 | 11,664 | 12,190 |
| Medco Health Solutions Inc. | 4.125% | 9/15/20 | 4,950 | 5,334 |
| Medtronic Inc. | 1.500% | 3/15/18 | 6,100 | 6,134 |
| Medtronic Inc. | 1.375% | 4/1/18 | 17,015 | 17,073 |
| Medtronic Inc. | 5.600% | 3/15/19 | 3,727 | 4,117 |
| Medtronic Inc. | 2.500% | 3/15/20 | 25,751 | 26,662 |
| Medtronic Inc. | 4.125% | 3/15/21 | 2,353 | 2,586 |
| Merck & Co. Inc. | 1.100% | 1/31/18 | 11,487 | 11,505 |
| Merck & Co. Inc. | 1.300% | 5/18/18 | 10,097 | 10,152 |
| Merck & Co. Inc. | 1.850% | 2/10/20 | 9,450 | 9,651 |
| Merck & Co. Inc. | 3.875% | 1/15/21 | 8,786 | 9,622 |
| Merck Sharp & Dohme Corp. | 5.000% | 6/30/19 | 9,725 | 10,731 |
| Molson Coors Brewing Co. | 1.450% | 7/15/19 | 7,125 | 7,115 |
| Molson Coors Brewing Co. | 2.100% | 7/15/21 | 7,935 | 7,969 |
| Mondelez International Inc. | 6.125% | 2/1/18 | 9,078 | 9,654 |
| Mondelez International Inc. | 6.125% | 8/23/18 | 500 | 544 |
| Mondelez International Inc. | 2.250% | 2/1/19 | 9,560 | 9,730 |
| Mondelez International Inc. | 5.375% | 2/10/20 | 4,451 | 4,989 |
| Mylan Inc. | 2.600% | 6/24/18 | 3,742 | 3,795 |
| Mylan Inc. | 2.550% | 3/28/19 | 10,179 | 10,305 |
| 1 Mylan NV | 3.000% | 12/15/18 | 500 | 512 |
| 1 Mylan NV | 2.500% | 6/7/19 | 5,020 | 5,085 |
| 1 Mylan NV | 3.750% | 12/15/20 | 9,550 | 9,957 |
| 1 Mylan NV | 3.150% | 6/15/21 | 16,170 | 16,474 |
| Newell Brands Inc. | 2.050% | 12/1/17 | 4,750 | 4,790 |
| Newell Brands Inc. | 2.150% | 10/15/18 | 2,200 | 2,230 |
| Newell Brands Inc. | 2.600% | 3/29/19 | 9,150 | 9,360 |
| Newell Brands Inc. | 2.875% | 12/1/19 | 5,200 | 5,350 |
| Newell Brands Inc. | 3.150% | 4/1/21 | 16,649 | 17,358 |
| Novant Health Inc. | 5.850% | 11/1/19 | 1,300 | 1,473 |
| Novartis Capital Corp. | 4.400% | 4/24/20 | 6,125 | 6,767 |
| Novartis Securities Investment Ltd. | 5.125% | 2/10/19 | 25,688 | 28,079 |
| Pall Corp. | 5.000% | 6/15/20 | 1,250 | 1,408 |
| PepsiCo Inc. | 1.000% | 10/13/17 | 3,350 | 3,350 |
| PepsiCo Inc. | 1.250% | 4/30/18 | 1,903 | 1,910 |
| PepsiCo Inc. | 5.000% | 6/1/18 | 15,609 | 16,654 |
| PepsiCo Inc. | 7.900% | 11/1/18 | 11,623 | 13,261 |
| PepsiCo Inc. | 2.250% | 1/7/19 | 7,193 | 7,368 |
| PepsiCo Inc. | 1.500% | 2/22/19 | 250 | 252 |
| PepsiCo Inc. | 4.500% | 1/15/20 | 7,725 | 8,506 |
| PepsiCo Inc. | 1.850% | 4/30/20 | 10,125 | 10,284 |
| PepsiCo Inc. | 2.150% | 10/14/20 | 15,680 | 16,093 |
| PepsiCo Inc. | 3.125% | 11/1/20 | 4,145 | 4,435 |
| PepsiCo Inc. | 3.000% | 8/25/21 | 6,700 | 7,131 |
| Perrigo Co. plc | 2.300% | 11/8/18 | 5,125 | 5,142 |
| Perrigo Finance Unlimited Co. | 3.500% | 3/15/21 | 4,000 | 4,115 |
| Pfizer Inc. | 4.650% | 3/1/18 | 1,000 | 1,052 |
| Pfizer Inc. | 1.200% | 6/1/18 | 8,550 | 8,562 |
| Pfizer Inc. | 1.500% | 6/15/18 | 12,694 | 12,800 |
23
| Vanguard® Short-Term Corporate Bond Index Fund | ||||
| Schedule of Investments | ||||
| August 31, 2016 | ||||
| Face | Market | |||
| Maturity | Amount | Value | ||
| Coupon | Date | ($000) | ($000) | |
| Pfizer Inc. | 6.200% | 3/15/19 | 30,317 | 33,897 |
| Pfizer Inc. | 2.100% | 5/15/19 | 11,916 | 12,186 |
| Pfizer Inc. | 1.450% | 6/3/19 | 10,550 | 10,629 |
| Pfizer Inc. | 1.950% | 6/3/21 | 12,777 | 12,936 |
| Pharmacia LLC | 6.500% | 12/1/18 | 1,340 | 1,492 |
| Philip Morris International Inc. | 1.250% | 11/9/17 | 3,534 | 3,541 |
| Philip Morris International Inc. | 5.650% | 5/16/18 | 18,569 | 19,962 |
| Philip Morris International Inc. | 1.875% | 1/15/19 | 13,515 | 13,716 |
| Philip Morris International Inc. | 1.375% | 2/25/19 | 1,500 | 1,506 |
| Philip Morris International Inc. | 4.500% | 3/26/20 | 9,050 | 9,961 |
| Philip Morris International Inc. | 1.875% | 2/25/21 | 6,934 | 7,002 |
| Philip Morris International Inc. | 4.125% | 5/17/21 | 2,500 | 2,771 |
| 2 Procter & Gamble - Esop | 9.360% | 1/1/21 | 963 | 1,137 |
| Procter & Gamble Co. | 1.600% | 11/15/18 | 4,557 | 4,613 |
| Procter & Gamble Co. | 4.700% | 2/15/19 | 14,249 | 15,488 |
| Procter & Gamble Co. | 1.900% | 11/1/19 | 5,295 | 5,412 |
| Procter & Gamble Co. | 1.850% | 2/2/21 | 6,225 | 6,332 |
| Quest Diagnostics Inc. | 2.700% | 4/1/19 | 2,200 | 2,246 |
| Quest Diagnostics Inc. | 4.750% | 1/30/20 | 3,375 | 3,682 |
| Quest Diagnostics Inc. | 2.500% | 3/30/20 | 3,600 | 3,660 |
| Quest Diagnostics Inc. | 4.700% | 4/1/21 | 3,525 | 3,860 |
| Reynolds American Inc. | 2.300% | 6/12/18 | 10,384 | 10,545 |
| Reynolds American Inc. | 8.125% | 6/23/19 | 4,842 | 5,689 |
| Reynolds American Inc. | 6.875% | 5/1/20 | 4,900 | 5,746 |
| Reynolds American Inc. | 3.250% | 6/12/20 | 10,430 | 10,972 |
| Sanofi | 1.250% | 4/10/18 | 13,464 | 13,493 |
| Sanofi | 4.000% | 3/29/21 | 15,665 | 17,382 |
| St. Jude Medical Inc. | 2.000% | 9/15/18 | 3,745 | 3,792 |
| St. Jude Medical Inc. | 2.800% | 9/15/20 | 3,745 | 3,873 |
| Stryker Corp. | 1.300% | 4/1/18 | 5,600 | 5,600 |
| Stryker Corp. | 2.000% | 3/8/19 | 5,143 | 5,208 |
| Stryker Corp. | 4.375% | 1/15/20 | 4,200 | 4,567 |
| Stryker Corp. | 2.625% | 3/15/21 | 15,550 | 16,053 |
| Sysco Corp. | 5.250% | 2/12/18 | 4,473 | 4,710 |
| Sysco Corp. | 5.375% | 3/17/19 | 150 | 164 |
| Sysco Corp. | 1.900% | 4/1/19 | 5,575 | 5,626 |
| Sysco Corp. | 2.600% | 10/1/20 | 4,150 | 4,282 |
| Sysco Corp. | 2.500% | 7/15/21 | 3,950 | 4,049 |
| Teva Pharmaceutical Finance IV LLC | 2.250% | 3/18/20 | 6,100 | 6,170 |
| Teva Pharmaceutical Finance Netherlands III BV | 1.400% | 7/20/18 | 15,535 | 15,504 |
| Teva Pharmaceutical Finance Netherlands III BV | 1.700% | 7/19/19 | 20,452 | 20,491 |
| Teva Pharmaceutical Finance Netherlands III BV | 2.200% | 7/21/21 | 26,500 | 26,499 |
| The Kroger Co. | 6.800% | 12/15/18 | 860 | 961 |
| The Kroger Co. | 2.000% | 1/15/19 | 4,800 | 4,866 |
| The Kroger Co. | 2.300% | 1/15/19 | 7,381 | 7,524 |
| The Kroger Co. | 6.150% | 1/15/20 | 3,875 | 4,422 |
| The Kroger Co. | 3.300% | 1/15/21 | 7,356 | 7,805 |
| The Kroger Co. | 2.600% | 2/1/21 | 4,250 | 4,379 |
| Thermo Fisher Scientific Inc. | 1.850% | 1/15/18 | 4,043 | 4,070 |
| Thermo Fisher Scientific Inc. | 2.150% | 12/14/18 | 4,000 | 4,049 |
| Thermo Fisher Scientific Inc. | 2.400% | 2/1/19 | 10,207 | 10,415 |
| Thermo Fisher Scientific Inc. | 4.700% | 5/1/20 | 275 | 300 |
| Thermo Fisher Scientific Inc. | 4.500% | 3/1/21 | 10,400 | 11,489 |
| Thermo Fisher Scientific Inc. | 3.600% | 8/15/21 | 9,995 | 10,649 |
| Tupperware Brands Corp. | 4.750% | 6/1/21 | 4,425 | 4,781 |
| Tyson Foods Inc. | 2.650% | 8/15/19 | 13,400 | 13,743 |
| Unilever Capital Corp. | 4.800% | 2/15/19 | 5,625 | 6,100 |
| Unilever Capital Corp. | 2.200% | 3/6/19 | 5,220 | 5,347 |
| Unilever Capital Corp. | 2.100% | 7/30/20 | 7,080 | 7,246 |
| Unilever Capital Corp. | 4.250% | 2/10/21 | 8,163 | 9,094 |
| Unilever Capital Corp. | 1.375% | 7/28/21 | 5,000 | 4,964 |
| Whirlpool Corp. | 1.650% | 11/1/17 | 600 | 602 |
| Whirlpool Corp. | 2.400% | 3/1/19 | 5,095 | 5,189 |
| Whirlpool Corp. | 4.850% | 6/15/21 | 2,425 | 2,716 |
24
| Vanguard® Short-Term Corporate Bond Index Fund | ||||
| Schedule of Investments | ||||
| August 31, 2016 | ||||
| Face | Market | |||
| Maturity | Amount | Value | ||
| Coupon | Date | ($000) | ($000) | |
| Zimmer Biomet Holdings Inc. | 2.000% | 4/1/18 | 10,083 | 10,148 |
| Zimmer Biomet Holdings Inc. | 4.625% | 11/30/19 | 3,925 | 4,241 |
| Zimmer Biomet Holdings Inc. | 2.700% | 4/1/20 | 15,013 | 15,349 |
| Zoetis Inc. | 1.875% | 2/1/18 | 3,510 | 3,518 |
| Zoetis Inc. | 3.450% | 11/13/20 | 6,191 | 6,472 |
| Energy (7.9%) | ||||
| Anadarko Petroleum Corp. | 6.375% | 9/15/17 | 9,834 | 10,288 |
| Anadarko Petroleum Corp. | 8.700% | 3/15/19 | 4,770 | 5,449 |
| Anadarko Petroleum Corp. | 6.950% | 6/15/19 | 750 | 831 |
| Anadarko Petroleum Corp. | 4.850% | 3/15/21 | 11,474 | 12,228 |
| Apache Corp. | 6.900% | 9/15/18 | 1,775 | 1,941 |
| Apache Corp. | 3.625% | 2/1/21 | 6,150 | 6,435 |
| Baker Hughes Inc. | 7.500% | 11/15/18 | 3,621 | 4,060 |
| Baker Hughes Inc. | 3.200% | 8/15/21 | 4,723 | 4,921 |
| Boardwalk Pipelines LP | 5.750% | 9/15/19 | 3,105 | 3,324 |
| BP Capital Markets plc | 1.375% | 11/6/17 | 10,140 | 10,152 |
| BP Capital Markets plc | 1.674% | 2/13/18 | 8,100 | 8,148 |
| BP Capital Markets plc | 1.375% | 5/10/18 | 15,568 | 15,580 |
| BP Capital Markets plc | 2.241% | 9/26/18 | 9,850 | 10,020 |
| BP Capital Markets plc | 4.750% | 3/10/19 | 8,140 | 8,791 |
| BP Capital Markets plc | 1.676% | 5/3/19 | 6,500 | 6,546 |
| BP Capital Markets plc | 2.237% | 5/10/19 | 11,175 | 11,407 |
| BP Capital Markets plc | 2.521% | 1/15/20 | 9,696 | 9,980 |
| BP Capital Markets plc | 2.315% | 2/13/20 | 8,700 | 8,881 |
| BP Capital Markets plc | 4.500% | 10/1/20 | 10,940 | 12,067 |
| BP Capital Markets plc | 4.742% | 3/11/21 | 9,880 | 11,159 |
| Buckeye Partners LP | 6.050% | 1/15/18 | 2,800 | 2,946 |
| Buckeye Partners LP | 2.650% | 11/15/18 | 3,478 | 3,516 |
| Buckeye Partners LP | 4.875% | 2/1/21 | 7,733 | 8,275 |
| Canadian Natural Resources Ltd. | 1.750% | 1/15/18 | 6,675 | 6,640 |
| Canadian Natural Resources Ltd. | 5.900% | 2/1/18 | 2,055 | 2,157 |
| Chevron Corp. | 1.344% | 11/9/17 | 8,750 | 8,779 |
| Chevron Corp. | 1.345% | 11/15/17 | 10,266 | 10,297 |
| Chevron Corp. | 1.104% | 12/5/17 | 11,436 | 11,441 |
| Chevron Corp. | 1.365% | 3/2/18 | 15,798 | 15,844 |
| Chevron Corp. | 1.718% | 6/24/18 | 19,336 | 19,540 |
| Chevron Corp. | 1.790% | 11/16/18 | 11,459 | 11,604 |
| Chevron Corp. | 4.950% | 3/3/19 | 16,721 | 18,203 |
| Chevron Corp. | 1.561% | 5/16/19 | 4,750 | 4,779 |
| Chevron Corp. | 2.193% | 11/15/19 | 5,975 | 6,114 |
| Chevron Corp. | 1.961% | 3/3/20 | 17,900 | 18,201 |
| Chevron Corp. | 2.427% | 6/24/20 | 8,025 | 8,288 |
| Chevron Corp. | 2.419% | 11/17/20 | 9,017 | 9,306 |
| Chevron Corp. | 2.100% | 5/16/21 | 20,600 | 20,964 |
| Columbia Pipeline Group Inc. | 2.450% | 6/1/18 | 4,700 | 4,728 |
| Columbia Pipeline Group Inc. | 3.300% | 6/1/20 | 4,800 | 4,963 |
| ConocoPhillips | 5.200% | 5/15/18 | 3,093 | 3,283 |
| ConocoPhillips | 6.650% | 7/15/18 | 2,689 | 2,933 |
| ConocoPhillips | 5.750% | 2/1/19 | 15,588 | 17,048 |
| ConocoPhillips | 6.000% | 1/15/20 | 10,466 | 11,835 |
| ConocoPhillips Co. | 1.050% | 12/15/17 | 10,502 | 10,446 |
| ConocoPhillips Co. | 1.500% | 5/15/18 | 6,891 | 6,890 |
| ConocoPhillips Co. | 2.200% | 5/15/20 | 7,860 | 7,914 |
| ConocoPhillips Co. | 4.200% | 3/15/21 | 10,350 | 11,169 |
| Copano Energy LLC / Copano Energy Finance Corp. | 7.125% | 4/1/21 | 4,098 | 4,231 |
| Devon Energy Corp. | 4.000% | 7/15/21 | 5,345 | 5,572 |
| Dominion Gas Holdings LLC | 2.500% | 12/15/19 | 7,300 | 7,473 |
| Dominion Gas Holdings LLC | 2.800% | 11/15/20 | 5,350 | 5,526 |
| Enable Midstream Partners LP | 2.400% | 5/15/19 | 4,475 | 4,374 |
| Enbridge Energy Partners LP | 6.500% | 4/15/18 | 2,551 | 2,701 |
| Enbridge Energy Partners LP | 9.875% | 3/1/19 | 3,875 | 4,522 |
| Enbridge Energy Partners LP | 5.200% | 3/15/20 | 6,250 | 6,669 |
| Enbridge Energy Partners LP | 4.375% | 10/15/20 | 4,625 | 4,822 |
25
| Vanguard® Short-Term Corporate Bond Index Fund | ||||
| Schedule of Investments | ||||
| August 31, 2016 | ||||
| Face | Market | |||
| Maturity | Amount | Value | ||
| Coupon | Date | ($000) | ($000) | |
| Encana Corp. | 6.500% | 5/15/19 | 3,600 | 3,853 |
| Energy Transfer Partners LP | 2.500% | 6/15/18 | 4,002 | 4,024 |
| Energy Transfer Partners LP | 6.700% | 7/1/18 | 10,221 | 10,926 |
| Energy Transfer Partners LP | 9.700% | 3/15/19 | 2,500 | 2,877 |
| Energy Transfer Partners LP | 9.000% | 4/15/19 | 1,925 | 2,191 |
| Energy Transfer Partners LP | 4.150% | 10/1/20 | 5,900 | 6,173 |
| Energy Transfer Partners LP | 4.650% | 6/1/21 | 9,876 | 10,515 |
| EnLink Midstream Partners LP | 2.700% | 4/1/19 | 3,050 | 3,004 |
| Enterprise Products Operating LLC | 6.300% | 9/15/17 | 5,627 | 5,902 |
| Enterprise Products Operating LLC | 6.650% | 4/15/18 | 2,469 | 2,663 |
| Enterprise Products Operating LLC | 1.650% | 5/7/18 | 4,064 | 4,072 |
| Enterprise Products Operating LLC | 6.500% | 1/31/19 | 7,200 | 8,010 |
| Enterprise Products Operating LLC | 2.550% | 10/15/19 | 9,825 | 10,067 |
| Enterprise Products Operating LLC | 5.250% | 1/31/20 | 6,475 | 7,150 |
| Enterprise Products Operating LLC | 5.200% | 9/1/20 | 9,125 | 10,259 |
| Enterprise Products Operating LLC | 2.850% | 4/15/21 | 2,902 | 2,996 |
| 2 Enterprise Products Operating LLC | 7.034% | 1/15/68 | 6,601 | 7,022 |
| EOG Resources Inc. | 5.875% | 9/15/17 | 3,005 | 3,149 |
| EOG Resources Inc. | 6.875% | 10/1/18 | 2,575 | 2,846 |
| EOG Resources Inc. | 5.625% | 6/1/19 | 9,655 | 10,576 |
| EOG Resources Inc. | 2.450% | 4/1/20 | 4,050 | 4,105 |
| EOG Resources Inc. | 4.400% | 6/1/20 | 7,150 | 7,733 |
| EOG Resources Inc. | 4.100% | 2/1/21 | 5,175 | 5,593 |
| EQT Corp. | 6.500% | 4/1/18 | 3,546 | 3,723 |
| EQT Corp. | 8.125% | 6/1/19 | 5,275 | 6,048 |
| Exxon Mobil Corp. | 1.439% | 3/1/18 | 11,475 | 11,543 |
| Exxon Mobil Corp. | 1.305% | 3/6/18 | 13,011 | 13,051 |
| Exxon Mobil Corp. | 1.708% | 3/1/19 | 1,475 | 1,492 |
| Exxon Mobil Corp. | 1.819% | 3/15/19 | 16,750 | 16,956 |
| Exxon Mobil Corp. | 1.912% | 3/6/20 | 15,425 | 15,696 |
| Exxon Mobil Corp. | 2.222% | 3/1/21 | 22,900 | 23,488 |
| FMC Technologies Inc. | 2.000% | 10/1/17 | 2,240 | 2,228 |
| Halliburton Co. | 2.000% | 8/1/18 | 3,650 | 3,672 |
| Halliburton Co. | 5.900% | 9/15/18 | 5,175 | 5,600 |
| Halliburton Co. | 6.150% | 9/15/19 | 7,200 | 8,090 |
| Hess Corp. | 8.125% | 2/15/19 | 7,738 | 8,739 |
| Husky Energy Inc. | 6.150% | 6/15/19 | 1,435 | 1,561 |
| Husky Energy Inc. | 7.250% | 12/15/19 | 7,370 | 8,413 |
| Kinder Morgan Energy Partners LP | 5.950% | 2/15/18 | 14,909 | 15,734 |
| Kinder Morgan Energy Partners LP | 2.650% | 2/1/19 | 8,250 | 8,349 |
| Kinder Morgan Energy Partners LP | 9.000% | 2/1/19 | 3,775 | 4,356 |
| Kinder Morgan Energy Partners LP | 6.850% | 2/15/20 | 5,850 | 6,594 |
| Kinder Morgan Energy Partners LP | 6.500% | 4/1/20 | 5,675 | 6,353 |
| Kinder Morgan Energy Partners LP | 5.300% | 9/15/20 | 2,750 | 2,999 |
| Kinder Morgan Energy Partners LP | 3.500% | 3/1/21 | 6,525 | 6,737 |
| Kinder Morgan Energy Partners LP | 5.800% | 3/1/21 | 3,250 | 3,615 |
| Kinder Morgan Inc. | 2.000% | 12/1/17 | 3,254 | 3,266 |
| Kinder Morgan Inc. | 7.250% | 6/1/18 | 1,500 | 1,627 |
| Kinder Morgan Inc. | 3.050% | 12/1/19 | 12,826 | 13,176 |
| Kinder Morgan Inc. | 6.500% | 9/15/20 | 3,278 | 3,710 |
| Magellan Midstream Partners LP | 6.550% | 7/15/19 | 4,196 | 4,725 |
| Magellan Midstream Partners LP | 4.250% | 2/1/21 | 3,900 | 4,199 |
| Marathon Oil Corp. | 6.000% | 10/1/17 | 3,242 | 3,358 |
| Marathon Oil Corp. | 5.900% | 3/15/18 | 7,742 | 8,090 |
| Marathon Oil Corp. | 2.700% | 6/1/20 | 6,750 | 6,556 |
| Marathon Petroleum Corp. | 2.700% | 12/14/18 | 5,630 | 5,757 |
| Marathon Petroleum Corp. | 3.400% | 12/15/20 | 9,050 | 9,421 |
| Marathon Petroleum Corp. | 5.125% | 3/1/21 | 8,300 | 9,243 |
| Nabors Industries Inc. | 6.150% | 2/15/18 | 7,200 | 7,452 |
| Nabors Industries Inc. | 9.250% | 1/15/19 | 1,550 | 1,690 |
| Nabors Industries Inc. | 5.000% | 9/15/20 | 4,450 | 4,406 |
| National Fuel Gas Co. | 8.750% | 5/1/19 | 2,300 | 2,601 |
| National Oilwell Varco Inc. | 1.350% | 12/1/17 | 4,063 | 4,035 |
| Noble Energy Inc. | 8.250% | 3/1/19 | 9,650 | 11,037 |
26
| Vanguard® Short-Term Corporate Bond Index Fund | ||||
| Schedule of Investments | ||||
| August 31, 2016 | ||||
| Face | Market | |||
| Maturity | Amount | Value | ||
| Coupon | Date | ($000) | ($000) | |
| Noble Energy Inc. | 5.625% | 5/1/21 | 1,752 | 1,829 |
| Occidental Petroleum Corp. | 1.500% | 2/15/18 | 5,660 | 5,684 |
| Occidental Petroleum Corp. | 4.100% | 2/1/21 | 9,550 | 10,414 |
| ONEOK Partners LP | 2.000% | 10/1/17 | 3,775 | 3,778 |
| ONEOK Partners LP | 3.200% | 9/15/18 | 2,800 | 2,845 |
| ONEOK Partners LP | 8.625% | 3/1/19 | 6,575 | 7,485 |
| Panhandle Eastern Pipe Line Co. LP | 6.200% | 11/1/17 | 1,561 | 1,613 |
| Panhandle Eastern Pipe Line Co. LP | 7.000% | 6/15/18 | 5,847 | 6,282 |
| Petro-Canada | 6.050% | 5/15/18 | 3,286 | 3,519 |
| Phillips 66 Partners LP | 2.646% | 2/15/20 | 4,075 | 4,102 |
| Pioneer Natural Resources Co. | 6.875% | 5/1/18 | 2,975 | 3,213 |
| Pioneer Natural Resources Co. | 7.500% | 1/15/20 | 5,200 | 6,022 |
| Pioneer Natural Resources Co. | 3.450% | 1/15/21 | 5,300 | 5,485 |
| Plains All American Pipeline LP / PAA Finance Corp. | 6.500% | 5/1/18 | 6,350 | 6,777 |
| Plains All American Pipeline LP / PAA Finance Corp. | 8.750% | 5/1/19 | 6,140 | 7,072 |
| Plains All American Pipeline LP / PAA Finance Corp. | 5.750% | 1/15/20 | 5,640 | 6,149 |
| Plains All American Pipeline LP / PAA Finance Corp. | 5.000% | 2/1/21 | 3,389 | 3,634 |
| Questar Pipeline Co. | 5.830% | 2/1/18 | 1,300 | 1,375 |
| Regency Energy Partners LP / Regency Energy Finance | ||||
| Corp. | 5.750% | 9/1/20 | 5,925 | 6,458 |
| Regency Energy Partners LP / Regency Energy Finance | ||||
| Corp. | 6.500% | 7/15/21 | 3,668 | 3,778 |
| Repsol Oil & Gas Canada Inc. | 3.750% | 2/1/21 | 5,045 | 4,887 |
| Shell International Finance BV | 1.250% | 11/10/17 | 7,500 | 7,507 |
| Shell International Finance BV | 1.900% | 8/10/18 | 10,116 | 10,238 |
| Shell International Finance BV | 1.625% | 11/10/18 | 9,450 | 9,470 |
| Shell International Finance BV | 2.000% | 11/15/18 | 17,088 | 17,336 |
| Shell International Finance BV | 1.375% | 5/10/19 | 3,500 | 3,498 |
| Shell International Finance BV | 4.300% | 9/22/19 | 17,925 | 19,429 |
| Shell International Finance BV | 4.375% | 3/25/20 | 7,890 | 8,619 |
| Shell International Finance BV | 2.125% | 5/11/20 | 17,544 | 17,830 |
| Shell International Finance BV | 2.250% | 11/10/20 | 11,600 | 11,858 |
| Shell International Finance BV | 1.875% | 5/10/21 | 28,550 | 28,650 |
| Southern Natural Gas Co. LLC / Southern Natural | ||||
| Issuing Corp. | 4.400% | 6/15/21 | 1,550 | 1,665 |
| Spectra Energy Capital LLC | 6.200% | 4/15/18 | 6,813 | 7,241 |
| Spectra Energy Capital LLC | 8.000% | 10/1/19 | 5,280 | 6,087 |
| Spectra Energy Capital LLC | 5.650% | 3/1/20 | 600 | 649 |
| Spectra Energy Partners LP | 2.950% | 9/25/18 | 9,498 | 9,670 |
| Spectra Energy Partners LP | 4.600% | 6/15/21 | 1,150 | 1,245 |
| Suncor Energy Inc. | 6.100% | 6/1/18 | 11,027 | 11,809 |
| Sunoco Logistics Partners Operations LP | 5.500% | 2/15/20 | 1,400 | 1,533 |
| Sunoco Logistics Partners Operations LP | 4.400% | 4/1/21 | 8,375 | 8,933 |
| TC Pipelines LP | 4.650% | 6/15/21 | 2,228 | 2,327 |
| Total Capital Canada Ltd. | 1.450% | 1/15/18 | 13,245 | 13,301 |
| Total Capital International SA | 2.125% | 1/10/19 | 8,870 | 9,032 |
| Total Capital International SA | 2.100% | 6/19/19 | 8,650 | 8,817 |
| Total Capital International SA | 2.750% | 6/19/21 | 6,175 | 6,447 |
| Total Capital SA | 2.125% | 8/10/18 | 8,065 | 8,214 |
| Total Capital SA | 4.450% | 6/24/20 | 12,270 | 13,532 |
| Total Capital SA | 4.125% | 1/28/21 | 3,355 | 3,679 |
| TransCanada PipeLines Ltd. | 1.625% | 11/9/17 | 12,100 | 12,139 |
| TransCanada PipeLines Ltd. | 1.875% | 1/12/18 | 7,375 | 7,416 |
| TransCanada PipeLines Ltd. | 6.500% | 8/15/18 | 9,317 | 10,168 |
| TransCanada PipeLines Ltd. | 3.125% | 1/15/19 | 4,750 | 4,901 |
| TransCanada PipeLines Ltd. | 7.125% | 1/15/19 | 2,392 | 2,669 |
| TransCanada PipeLines Ltd. | 3.800% | 10/1/20 | 5,800 | 6,198 |
| Transcontinental Gas Pipe Line Co. LLC | 6.050% | 6/15/18 | 1,375 | 1,447 |
| Valero Energy Corp. | 9.375% | 3/15/19 | 7,348 | 8,681 |
| Valero Energy Corp. | 6.125% | 2/1/20 | 6,655 | 7,540 |
| Western Gas Partners LP | 2.600% | 8/15/18 | 3,550 | 3,552 |
| Western Gas Partners LP | 5.375% | 6/1/21 | 3,357 | 3,648 |
| Williams Partners LP | 5.250% | 3/15/20 | 18,159 | 19,521 |
| Williams Partners LP | 4.125% | 11/15/20 | 2,907 | 3,019 |
27
| Vanguard® Short-Term Corporate Bond Index Fund | ||||
| Schedule of Investments | ||||
| August 31, 2016 | ||||
| Face | Market | |||
| Maturity | Amount | Value | ||
| Coupon | Date | ($000) | ($000) | |
| XTO Energy Inc. | 5.500% | 6/15/18 | 8,350 | 8,973 |
| XTO Energy Inc. | 6.500% | 12/15/18 | 3,235 | 3,608 |
| Other Industrial (0.0%) | ||||
| Cintas Corp. No 2 | 6.125% | 12/1/17 | 2,125 | 2,254 |
| Cintas Corp. No 2 | 4.300% | 6/1/21 | 2,015 | 2,220 |
| Yale University Connecticut GO | 2.086% | 4/15/19 | 1,400 | 1,434 |
| Technology (7.7%) | ||||
| Adobe Systems Inc. | 4.750% | 2/1/20 | 9,475 | 10,451 |
| Alphabet Inc. | 3.625% | 5/19/21 | 6,775 | 7,434 |
| Altera Corp. | 2.500% | 11/15/18 | 7,255 | 7,465 |
| Amphenol Corp. | 1.550% | 9/15/17 | 2,075 | 2,080 |
| Amphenol Corp. | 2.550% | 1/30/19 | 10,328 | 10,570 |
| Apple Inc. | 1.300% | 2/23/18 | 1,750 | 1,759 |
| Apple Inc. | 1.000% | 5/3/18 | 40,398 | 40,388 |
| Apple Inc. | 1.700% | 2/22/19 | 3,185 | 3,228 |
| Apple Inc. | 2.100% | 5/6/19 | 22,296 | 22,808 |
| Apple Inc. | 1.100% | 8/2/19 | 8,775 | 8,750 |
| Apple Inc. | 1.550% | 2/7/20 | 9,725 | 9,781 |
| Apple Inc. | 2.000% | 5/6/20 | 16,325 | 16,670 |
| Apple Inc. | 2.250% | 2/23/21 | 36,760 | 37,744 |
| Apple Inc. | 2.850% | 5/6/21 | 19,884 | 20,955 |
| Apple Inc. | 1.550% | 8/4/21 | 8,175 | 8,134 |
| Applied Materials Inc. | 2.625% | 10/1/20 | 4,000 | 4,118 |
| Applied Materials Inc. | 4.300% | 6/15/21 | 7,299 | 8,082 |
| Arrow Electronics Inc. | 3.000% | 3/1/18 | 3,953 | 4,017 |
| Arrow Electronics Inc. | 6.000% | 4/1/20 | 1,428 | 1,574 |
| Arrow Electronics Inc. | 5.125% | 3/1/21 | 1,300 | 1,402 |
| Autodesk Inc. | 1.950% | 12/15/17 | 3,025 | 3,038 |
| Autodesk Inc. | 3.125% | 6/15/20 | 4,500 | 4,600 |
| Avnet Inc. | 5.875% | 6/15/20 | 1,639 | 1,817 |
| Baidu Inc. | 2.250% | 11/28/17 | 6,200 | 6,245 |
| Baidu Inc. | 3.250% | 8/6/18 | 7,475 | 7,676 |
| Baidu Inc. | 2.750% | 6/9/19 | 7,516 | 7,652 |
| Baidu Inc. | 3.000% | 6/30/20 | 5,500 | 5,631 |
| Broadridge Financial Solutions Inc. | 3.950% | 9/1/20 | 300 | 317 |
| CA Inc. | 2.875% | 8/15/18 | 1,850 | 1,885 |
| CA Inc. | 5.375% | 12/1/19 | 6,425 | 7,081 |
| CA Inc. | 3.600% | 8/1/20 | 4,250 | 4,446 |
| CDK Global Inc. | 3.300% | 10/15/19 | 1,800 | 1,817 |
| Cisco Systems Inc. | 1.400% | 2/28/18 | 14,375 | 14,445 |
| Cisco Systems Inc. | 1.650% | 6/15/18 | 6,234 | 6,300 |
| Cisco Systems Inc. | 4.950% | 2/15/19 | 19,131 | 20,832 |
| Cisco Systems Inc. | 1.600% | 2/28/19 | 9,080 | 9,179 |
| Cisco Systems Inc. | 2.125% | 3/1/19 | 18,809 | 19,238 |
| Cisco Systems Inc. | 4.450% | 1/15/20 | 24,060 | 26,454 |
| Cisco Systems Inc. | 2.450% | 6/15/20 | 14,699 | 15,245 |
| Cisco Systems Inc. | 2.200% | 2/28/21 | 20,281 | 20,817 |
| Cisco Systems Inc. | 2.900% | 3/4/21 | 5,350 | 5,644 |
| Corning Inc. | 1.450% | 11/15/17 | 850 | 850 |
| Corning Inc. | 1.500% | 5/8/18 | 2,750 | 2,746 |
| Corning Inc. | 6.625% | 5/15/19 | 3,155 | 3,533 |
| Corning Inc. | 4.250% | 8/15/20 | 2,000 | 2,160 |
| 1 Diamond 1 Finance Corp. / Diamond 2 Finance Corp. | 3.480% | 6/1/19 | 37,150 | 38,204 |
| 1 Diamond 1 Finance Corp. / Diamond 2 Finance Corp. | 4.420% | 6/15/21 | 43,535 | 45,454 |
| Dun & Bradstreet Corp. | 3.250% | 12/1/17 | 2,100 | 2,114 |
| Dun & Bradstreet Corp. | 4.000% | 6/15/20 | 500 | 521 |
| EMC Corp. | 1.875% | 6/1/18 | 17,853 | 17,771 |
| EMC Corp. | 2.650% | 6/1/20 | 19,880 | 19,728 |
| Equifax Inc. | 2.300% | 6/1/21 | 4,475 | 4,500 |
| Fidelity National Information Services Inc. | 2.000% | 4/15/18 | 475 | 478 |
| Fidelity National Information Services Inc. | 2.850% | 10/15/18 | 5,013 | 5,152 |
| Fidelity National Information Services Inc. | 3.625% | 10/15/20 | 17,219 | 18,271 |
| Fidelity National Information Services Inc. | 2.250% | 8/15/21 | 17,000 | 17,090 |
28
| Vanguard® Short-Term Corporate Bond Index Fund | ||||
| Schedule of Investments | ||||
| August 31, 2016 | ||||
| Face | Market | |||
| Maturity | Amount | Value | ||
| Coupon | Date | ($000) | ($000) | |
| Fiserv Inc. | 2.700% | 6/1/20 | 6,700 | 6,908 |
| Fiserv Inc. | 4.625% | 10/1/20 | 5,454 | 5,976 |
| Flextronics International Ltd. | 4.625% | 2/15/20 | 350 | 372 |
| 1 Hewlett Packard Enterprise Co. | 2.450% | 10/5/17 | 18,208 | 18,364 |
| 1 Hewlett Packard Enterprise Co. | 2.850% | 10/5/18 | 21,825 | 22,239 |
| 1 Hewlett Packard Enterprise Co. | 3.600% | 10/15/20 | 31,876 | 33,356 |
| HP Inc. | 3.750% | 12/1/20 | 457 | 483 |
| HP Inc. | 4.300% | 6/1/21 | 15,895 | 17,160 |
| HP Inc. | 4.650% | 12/9/21 | 5,000 | 5,460 |
| Intel Corp. | 1.350% | 12/15/17 | 31,537 | 31,674 |
| Intel Corp. | 2.450% | 7/29/20 | 12,185 | 12,637 |
| Intel Corp. | 1.700% | 5/19/21 | 4,475 | 4,496 |
| International Business Machines Corp. | 5.700% | 9/14/17 | 24,241 | 25,400 |
| International Business Machines Corp. | 1.125% | 2/6/18 | 20,401 | 20,438 |
| International Business Machines Corp. | 1.250% | 2/8/18 | 13,625 | 13,676 |
| International Business Machines Corp. | 7.625% | 10/15/18 | 12,435 | 14,089 |
| International Business Machines Corp. | 1.950% | 2/12/19 | 4,950 | 5,040 |
| International Business Machines Corp. | 1.875% | 5/15/19 | 3,775 | 3,840 |
| International Business Machines Corp. | 1.800% | 5/17/19 | 8,200 | 8,332 |
| International Business Machines Corp. | 8.375% | 11/1/19 | 3,389 | 4,114 |
| International Business Machines Corp. | 1.625% | 5/15/20 | 13,013 | 13,120 |
| International Business Machines Corp. | 2.250% | 2/19/21 | 7,200 | 7,408 |
| Jabil Circuit Inc. | 8.250% | 3/15/18 | 1,550 | 1,686 |
| Jabil Circuit Inc. | 5.625% | 12/15/20 | 3,500 | 3,762 |
| Juniper Networks Inc. | 3.125% | 2/26/19 | 2,800 | 2,865 |
| Juniper Networks Inc. | 3.300% | 6/15/20 | 2,200 | 2,280 |
| Juniper Networks Inc. | 4.600% | 3/15/21 | 1,655 | 1,778 |
| Keysight Technologies Inc. | 3.300% | 10/30/19 | 3,800 | 3,867 |
| KLA-Tencor Corp. | 3.375% | 11/1/19 | 1,200 | 1,234 |
| Lam Research Corp. | 2.750% | 3/15/20 | 5,230 | 5,362 |
| Lam Research Corp. | 2.800% | 6/15/21 | 8,000 | 8,207 |
| Lexmark International Inc. | 6.650% | 6/1/18 | 1,600 | 1,696 |
| Lexmark International Inc. | 5.125% | 3/15/20 | 3,850 | 4,050 |
| Maxim Integrated Products Inc. | 2.500% | 11/15/18 | 3,788 | 3,837 |
| Microsoft Corp. | 0.875% | 11/15/17 | 3,911 | 3,912 |
| Microsoft Corp. | 1.000% | 5/1/18 | 2,848 | 2,851 |
| Microsoft Corp. | 1.300% | 11/3/18 | 22,573 | 22,666 |
| Microsoft Corp. | 1.625% | 12/6/18 | 2,272 | 2,299 |
| Microsoft Corp. | 4.200% | 6/1/19 | 10,170 | 10,982 |
| Microsoft Corp. | 1.100% | 8/8/19 | 7,000 | 6,980 |
| Microsoft Corp. | 1.850% | 2/12/20 | 9,117 | 9,255 |
| Microsoft Corp. | 3.000% | 10/1/20 | 12,805 | 13,625 |
| Microsoft Corp. | 2.000% | 11/3/20 | 26,725 | 27,255 |
| Microsoft Corp. | 1.550% | 8/8/21 | 25,000 | 24,957 |
| NetApp Inc. | 2.000% | 12/15/17 | 4,510 | 4,532 |
| NetApp Inc. | 3.375% | 6/15/21 | 5,575 | 5,802 |
| Oracle Corp. | 5.750% | 4/15/18 | 24,148 | 25,935 |
| Oracle Corp. | 2.375% | 1/15/19 | 16,250 | 16,692 |
| Oracle Corp. | 5.000% | 7/8/19 | 19,933 | 21,951 |
| Oracle Corp. | 2.250% | 10/8/19 | 22,146 | 22,834 |
| Oracle Corp. | 3.875% | 7/15/20 | 4,225 | 4,602 |
| Oracle Corp. | 2.800% | 7/8/21 | 12,296 | 12,877 |
| Oracle Corp. | 1.900% | 9/15/21 | 16,175 | 16,185 |
| Pitney Bowes Inc. | 5.750% | 9/15/17 | 3,080 | 3,207 |
| Pitney Bowes Inc. | 5.600% | 3/15/18 | 725 | 764 |
| Pitney Bowes Inc. | 4.750% | 5/15/18 | 3,049 | 3,194 |
| Pitney Bowes Inc. | 6.250% | 3/15/19 | 500 | 548 |
| QUALCOMM Inc. | 1.400% | 5/18/18 | 7,500 | 7,540 |
| QUALCOMM Inc. | 2.250% | 5/20/20 | 19,425 | 19,965 |
| Seagate HDD Cayman | 3.750% | 11/15/18 | 5,825 | 5,956 |
| 1 Semiconductor Manufacturing International Corp. | 4.125% | 10/7/19 | 3,500 | 3,644 |
| Symantec Corp. | 4.200% | 9/15/20 | 5,925 | 6,214 |
| Tech Data Corp. | 3.750% | 9/21/17 | 1,700 | 1,740 |
| Texas Instruments Inc. | 1.000% | 5/1/18 | 8,430 | 8,421 |
29
| Vanguard® Short-Term Corporate Bond Index Fund | ||||
| Schedule of Investments | ||||
| August 31, 2016 | ||||
| Face | Market | |||
| Maturity | Amount | Value | ||
| Coupon | Date | ($000) | ($000) | |
| Texas Instruments Inc. | 1.650% | 8/3/19 | 5,721 | 5,791 |
| Texas Instruments Inc. | 1.750% | 5/1/20 | 2,151 | 2,177 |
| Texas Instruments Inc. | 2.750% | 3/12/21 | 250 | 263 |
| Total System Services Inc. | 2.375% | 6/1/18 | 4,375 | 4,407 |
| Total System Services Inc. | 3.800% | 4/1/21 | 9,437 | 10,005 |
| Tyco Electronics Group SA | 6.550% | 10/1/17 | 10,401 | 10,981 |
| Tyco Electronics Group SA | 2.375% | 12/17/18 | 1,778 | 1,810 |
| Tyco Electronics Group SA | 2.350% | 8/1/19 | 4,117 | 4,177 |
| Verisk Analytics Inc. | 5.800% | 5/1/21 | 3,075 | 3,508 |
| Xerox Corp. | 6.350% | 5/15/18 | 6,130 | 6,525 |
| Xerox Corp. | 2.750% | 3/15/19 | 6,186 | 6,178 |
| Xerox Corp. | 5.625% | 12/15/19 | 4,300 | 4,655 |
| Xerox Corp. | 2.800% | 5/15/20 | 1,650 | 1,632 |
| Xerox Corp. | 3.500% | 8/20/20 | 300 | 304 |
| Xerox Corp. | 2.750% | 9/1/20 | 6,225 | 6,122 |
| Xerox Corp. | 4.500% | 5/15/21 | 10,819 | 11,294 |
| Xilinx Inc. | 2.125% | 3/15/19 | 3,290 | 3,326 |
| Xilinx Inc. | 3.000% | 3/15/21 | 4,341 | 4,496 |
| Transportation (1.2%) | ||||
| Burlington Northern Santa Fe LLC | 5.750% | 3/15/18 | 7,950 | 8,501 |
| Burlington Northern Santa Fe LLC | 4.700% | 10/1/19 | 6,032 | 6,633 |
| Burlington Northern Santa Fe LLC | 3.600% | 9/1/20 | 1,675 | 1,800 |
| Burlington Northern Santa Fe LLC | 4.100% | 6/1/21 | 1,417 | 1,569 |
| Canadian National Railway Co. | 5.850% | 11/15/17 | 1,550 | 1,636 |
| Canadian National Railway Co. | 5.550% | 5/15/18 | 1,900 | 2,038 |
| Canadian National Railway Co. | 5.550% | 3/1/19 | 3,950 | 4,363 |
| Canadian Pacific Railway Co. | 6.500% | 5/15/18 | 1,639 | 1,753 |
| Canadian Pacific Railway Co. | 7.250% | 5/15/19 | 3,980 | 4,557 |
| Canadian Pacific Railway Co. | 9.450% | 8/1/21 | 2,250 | 2,890 |
| 2 Continental Airlines 2009-2 Class A Pass Through Trust | 7.250% | 5/10/21 | 2,621 | 2,997 |
| 2 Continental Airlines 2010-1 Class A Pass Through Trust | 4.750% | 7/12/22 | 2,061 | 2,221 |
| CSX Corp. | 6.250% | 3/15/18 | 6,930 | 7,430 |
| CSX Corp. | 7.375% | 2/1/19 | 6,450 | 7,329 |
| CSX Corp. | 3.700% | 10/30/20 | 2,549 | 2,723 |
| CSX Corp. | 4.250% | 6/1/21 | 2,575 | 2,835 |
| 2 Delta Air Lines 2009-1 Class A Pass Through Trust | 7.750% | 6/17/21 | 2,101 | 2,385 |
| 2 Delta Air Lines 2010-1 Class A Pass Through Trust | 6.200% | 1/2/20 | 985 | 1,052 |
| 2 Delta Air Lines 2010-2 Class A Pass Through Trust | 4.950% | 11/23/20 | 1,813 | 1,913 |
| 2 Delta Air Lines 2012-1 Class A Pass Through Trust | 4.750% | 11/7/21 | 1,757 | 1,878 |
| FedEx Corp. | 8.000% | 1/15/19 | 4,850 | 5,576 |
| FedEx Corp. | 2.300% | 2/1/20 | 2,900 | 2,970 |
| JB Hunt Transport Services Inc. | 2.400% | 3/15/19 | 2,150 | 2,178 |
| Kansas City Southern | 2.350% | 5/15/20 | 2,150 | 2,160 |
| Norfolk Southern Corp. | 5.750% | 4/1/18 | 5,891 | 6,300 |
| Norfolk Southern Corp. | 5.900% | 6/15/19 | 4,765 | 5,306 |
| 2 Northwest Airlines 2007-1 Class A Pass Through Trust | 7.027% | 5/1/21 | 1,601 | 1,813 |
| Ryder System Inc. | 2.500% | 3/1/18 | 2,470 | 2,502 |
| Ryder System Inc. | 2.450% | 11/15/18 | 2,675 | 2,715 |
| Ryder System Inc. | 2.350% | 2/26/19 | 2,025 | 2,053 |
| Ryder System Inc. | 2.550% | 6/1/19 | 2,650 | 2,689 |
| Ryder System Inc. | 2.450% | 9/3/19 | 3,050 | 3,098 |
| Ryder System Inc. | 2.650% | 3/2/20 | 5,000 | 5,106 |
| Ryder System Inc. | 2.500% | 5/11/20 | 3,100 | 3,122 |
| Ryder System Inc. | 2.875% | 9/1/20 | 3,050 | 3,098 |
| Southern Railway Co. | 9.750% | 6/15/20 | 1,286 | 1,634 |
| Southwest Airlines Co. | 2.750% | 11/6/19 | 3,000 | 3,097 |
| Southwest Airlines Co. | 2.650% | 11/5/20 | 4,325 | 4,446 |
| Union Pacific Corp. | 5.750% | 11/15/17 | 2,625 | 2,771 |
| Union Pacific Corp. | 5.700% | 8/15/18 | 3,125 | 3,387 |
| Union Pacific Corp. | 2.250% | 2/15/19 | 3,700 | 3,776 |
| Union Pacific Corp. | 1.800% | 2/1/20 | 2,950 | 2,985 |
| Union Pacific Corp. | 2.250% | 6/19/20 | 4,900 | 5,015 |
| Union Pacific Corp. | 4.000% | 2/1/21 | 6,625 | 7,229 |
30
| Vanguard® Short-Term Corporate Bond Index Fund | ||||
| Schedule of Investments | ||||
| August 31, 2016 | ||||
| Face | Market | |||
| Maturity | Amount | Value | ||
| Coupon | Date | ($000) | ($000) | |
| United Parcel Service Inc. | 1.125% | 10/1/17 | 8,625 | 8,644 |
| United Parcel Service Inc. | 5.500% | 1/15/18 | 9,016 | 9,571 |
| United Parcel Service Inc. | 5.125% | 4/1/19 | 9,460 | 10,384 |
| United Parcel Service Inc. | 3.125% | 1/15/21 | 10,050 | 10,729 |
| United Parcel Service of America Inc. | 8.375% | 4/1/20 | 1,850 | 2,285 |
| 8,974,676 | ||||
| Utilities (4.9%) | ||||
| Electric (4.6%) | ||||
| Alabama Power Co. | 5.500% | 10/15/17 | 1,925 | 2,016 |
| Alabama Power Co. | 3.375% | 10/1/20 | 745 | 793 |
| Ameren Corp. | 2.700% | 11/15/20 | 4,375 | 4,521 |
| Ameren Illinois Co. | 6.125% | 11/15/17 | 1,275 | 1,349 |
| American Electric Power Co. Inc. | 1.650% | 12/15/17 | 6,864 | 6,892 |
| Appalachian Power Co. | 4.600% | 3/30/21 | 3,700 | 4,062 |
| Arizona Public Service Co. | 8.750% | 3/1/19 | 6,227 | 7,296 |
| Arizona Public Service Co. | 2.200% | 1/15/20 | 1,750 | 1,778 |
| Atlantic City Electric Co. | 7.750% | 11/15/18 | 750 | 851 |
| Avista Corp. | 5.950% | 6/1/18 | 1,460 | 1,559 |
| Berkshire Hathaway Energy Co. | 5.750% | 4/1/18 | 8,100 | 8,660 |
| Berkshire Hathaway Energy Co. | 2.000% | 11/15/18 | 3,568 | 3,609 |
| Berkshire Hathaway Energy Co. | 2.400% | 2/1/20 | 4,500 | 4,607 |
| Black Hills Corp. | 2.500% | 1/11/19 | 1,975 | 2,005 |
| CenterPoint Energy Houston Electric LLC | 1.850% | 6/1/21 | 2,400 | 2,395 |
| CenterPoint Energy Inc. | 6.500% | 5/1/18 | 2,999 | 3,213 |
| Cleco Power LLC | 6.650% | 6/15/18 | 817 | 880 |
| Cleveland Electric Illuminating Co. | 7.880% | 11/1/17 | 2,128 | 2,277 |
| Cleveland Electric Illuminating Co. | 8.875% | 11/15/18 | 1,000 | 1,153 |
| CMS Energy Corp. | 5.050% | 2/15/18 | 1,000 | 1,050 |
| CMS Energy Corp. | 8.750% | 6/15/19 | 9,150 | 10,888 |
| CMS Energy Corp. | 6.250% | 2/1/20 | 1,825 | 2,083 |
| Commonwealth Edison Co. | 5.800% | 3/15/18 | 5,554 | 5,937 |
| Commonwealth Edison Co. | 2.150% | 1/15/19 | 7,375 | 7,503 |
| Commonwealth Edison Co. | 4.000% | 8/1/20 | 2,625 | 2,858 |
| Connecticut Light & Power Co. | 5.500% | 2/1/19 | 2,125 | 2,329 |
| Consolidated Edison Co. of New York Inc. | 5.850% | 4/1/18 | 7,508 | 8,041 |
| Consolidated Edison Co. of New York Inc. | 7.125% | 12/1/18 | 4,682 | 5,302 |
| Consolidated Edison Co. of New York Inc. | 6.650% | 4/1/19 | 3,675 | 4,148 |
| Consolidated Edison Co. of New York Inc. | 4.450% | 6/15/20 | 1,550 | 1,706 |
| Consolidated Edison Inc. | 2.000% | 5/15/21 | 6,800 | 6,877 |
| Constellation Energy Group Inc. | 5.150% | 12/1/20 | 5,450 | 6,046 |
| Consumers Energy Co. | 5.650% | 9/15/18 | 2,000 | 2,169 |
| Consumers Energy Co. | 6.125% | 3/15/19 | 5,515 | 6,171 |
| Consumers Energy Co. | 6.700% | 9/15/19 | 175 | 202 |
| Consumers Energy Co. | 5.650% | 4/15/20 | 2,875 | 3,266 |
| Dominion Resources Inc. | 1.400% | 9/15/17 | 1,000 | 1,000 |
| Dominion Resources Inc. | 1.900% | 6/15/18 | 1,109 | 1,117 |
| Dominion Resources Inc. | 6.400% | 6/15/18 | 3,873 | 4,202 |
| Dominion Resources Inc. | 2.962% | 7/1/19 | 6,025 | 6,188 |
| Dominion Resources Inc. | 5.200% | 8/15/19 | 2,850 | 3,129 |
| Dominion Resources Inc. | 2.500% | 12/1/19 | 12,055 | 12,307 |
| Dominion Resources Inc. | 4.450% | 3/15/21 | 6,908 | 7,622 |
| Dominion Resources Inc. | 4.104% | 4/1/21 | 850 | 908 |
| DTE Electric Co. | 5.600% | 6/15/18 | 850 | 915 |
| DTE Electric Co. | 3.450% | 10/1/20 | 3,675 | 3,929 |
| DTE Electric Co. | 3.900% | 6/1/21 | 2,350 | 2,579 |
| DTE Energy Co. | 2.400% | 12/1/19 | 5,900 | 6,035 |
| Duke Energy Carolinas LLC | 5.100% | 4/15/18 | 5,932 | 6,309 |
| Duke Energy Carolinas LLC | 7.000% | 11/15/18 | 2,530 | 2,838 |
| Duke Energy Carolinas LLC | 4.300% | 6/15/20 | 2,775 | 3,066 |
| Duke Energy Carolinas LLC | 3.900% | 6/15/21 | 5,125 | 5,624 |
| Duke Energy Corp. | 2.100% | 6/15/18 | 7,695 | 7,783 |
| Duke Energy Corp. | 6.250% | 6/15/18 | 2,250 | 2,437 |
| Duke Energy Corp. | 5.050% | 9/15/19 | 7,420 | 8,168 |
31
| Vanguard® Short-Term Corporate Bond Index Fund | ||||
| Schedule of Investments | ||||
| August 31, 2016 | ||||
| Face | Market | |||
| Maturity | Amount | Value | ||
| Coupon | Date | ($000) | ($000) | |
| Duke Energy Florida LLC | 5.800% | 9/15/17 | 265 | 278 |
| Duke Energy Florida LLC | 5.650% | 6/15/18 | 6,900 | 7,433 |
| Duke Energy Florida LLC | 3.100% | 8/15/21 | 2,125 | 2,249 |
| Duke Energy Indiana LLC | 3.750% | 7/15/20 | 2,950 | 3,184 |
| Duke Energy Ohio Inc. | 5.450% | 4/1/19 | 10,754 | 11,860 |
| Duke Energy Progress LLC | 5.300% | 1/15/19 | 10,083 | 11,001 |
| Edison International | 3.750% | 9/15/17 | 5,565 | 5,712 |
| 1 Emera US Finance LP | 2.150% | 6/15/19 | 5,799 | 5,858 |
| 1 Emera US Finance LP | 2.700% | 6/15/21 | 11,075 | 11,319 |
| Entergy Arkansas Inc. | 3.750% | 2/15/21 | 3,742 | 4,030 |
| Entergy Corp. | 5.125% | 9/15/20 | 875 | 972 |
| Entergy Gulf States Louisiana LLC | 6.000% | 5/1/18 | 3,225 | 3,461 |
| Entergy Gulf States Louisiana LLC | 3.950% | 10/1/20 | 3,810 | 4,081 |
| Entergy Louisiana LLC | 6.500% | 9/1/18 | 1,875 | 2,054 |
| Entergy Texas Inc. | 7.125% | 2/1/19 | 5,655 | 6,365 |
| Eversource Energy | 1.450% | 5/1/18 | 3,650 | 3,653 |
| Eversource Energy | 4.500% | 11/15/19 | 1,532 | 1,666 |
| Eversource Energy | 2.500% | 3/15/21 | 3,125 | 3,197 |
| Exelon Corp. | 2.850% | 6/15/20 | 3,400 | 3,518 |
| Exelon Corp. | 2.450% | 4/15/21 | 1,400 | 1,424 |
| Exelon Generation Co. LLC | 6.200% | 10/1/17 | 5,524 | 5,789 |
| Exelon Generation Co. LLC | 5.200% | 10/1/19 | 6,050 | 6,638 |
| Exelon Generation Co. LLC | 2.950% | 1/15/20 | 11,600 | 11,927 |
| Exelon Generation Co. LLC | 4.000% | 10/1/20 | 5,575 | 5,944 |
| Florida Power & Light Co. | 5.550% | 11/1/17 | 2,727 | 2,864 |
| Georgia Power Co. | 5.400% | 6/1/18 | 2,500 | 2,678 |
| Georgia Power Co. | 1.950% | 12/1/18 | 7,512 | 7,620 |
| Georgia Power Co. | 4.250% | 12/1/19 | 3,655 | 3,960 |
| Georgia Power Co. | 2.400% | 4/1/21 | 3,050 | 3,133 |
| Great Plains Energy Inc. | 4.850% | 6/1/21 | 2,300 | 2,513 |
| Indiana Michigan Power Co. | 7.000% | 3/15/19 | 3,917 | 4,404 |
| Integrys Holding Inc. | 4.170% | 11/1/20 | 570 | 618 |
| Interstate Power & Light Co. | 7.250% | 10/1/18 | 1,000 | 1,114 |
| Kansas City Power & Light Co. | 6.375% | 3/1/18 | 3,346 | 3,576 |
| Kansas City Power & Light Co. | 7.150% | 4/1/19 | 4,300 | 4,890 |
| Kentucky Utilities Co. | 3.250% | 11/1/20 | 3,925 | 4,143 |
| LG&E & KU Energy LLC | 3.750% | 11/15/20 | 3,000 | 3,213 |
| Metropolitan Edison Co. | 7.700% | 1/15/19 | 2,017 | 2,272 |
| MidAmerican Energy Co. | 5.300% | 3/15/18 | 900 | 954 |
| MidAmerican Energy Co. | 2.400% | 3/15/19 | 1,183 | 1,214 |
| National Rural Utilities Cooperative Finance Corp. | 5.450% | 2/1/18 | 3,794 | 4,027 |
| National Rural Utilities Cooperative Finance Corp. | 10.375% | 11/1/18 | 12,917 | 15,379 |
| National Rural Utilities Cooperative Finance Corp. | 2.150% | 2/1/19 | 5,250 | 5,334 |
| National Rural Utilities Cooperative Finance Corp. | 1.650% | 2/8/19 | 1,000 | 1,008 |
| National Rural Utilities Cooperative Finance Corp. | 2.300% | 11/15/19 | 1,800 | 1,845 |
| National Rural Utilities Cooperative Finance Corp. | 2.000% | 1/27/20 | 6,400 | 6,484 |
| National Rural Utilities Cooperative Finance Corp. | 2.350% | 6/15/20 | 2,785 | 2,851 |
| National Rural Utilities Cooperative Finance Corp. | 2.300% | 11/1/20 | 850 | 871 |
| Nevada Power Co. | 6.500% | 5/15/18 | 3,085 | 3,351 |
| Nevada Power Co. | 6.500% | 8/1/18 | 4,598 | 5,035 |
| Nevada Power Co. | 7.125% | 3/15/19 | 8,735 | 9,957 |
| NextEra Energy Capital Holdings Inc. | 6.000% | 3/1/19 | 9,300 | 10,240 |
| NextEra Energy Capital Holdings Inc. | 2.300% | 4/1/19 | 3,150 | 3,198 |
| NextEra Energy Capital Holdings Inc. | 2.400% | 9/15/19 | 4,675 | 4,751 |
| NextEra Energy Capital Holdings Inc. | 2.700% | 9/15/19 | 4,239 | 4,353 |
| NextEra Energy Capital Holdings Inc. | 4.500% | 6/1/21 | 1,480 | 1,627 |
| 2 NextEra Energy Capital Holdings Inc. | 7.300% | 9/1/67 | 1,005 | 999 |
| Northern States Power Co. | 5.250% | 3/1/18 | 2,729 | 2,889 |
| Northern States Power Co. | 2.200% | 8/15/20 | 3,000 | 3,067 |
| NorthWestern Corp. | 6.340% | 4/1/19 | 2,000 | 2,223 |
| NSTAR Electric Co. | 5.625% | 11/15/17 | 2,664 | 2,802 |
| Oglethorpe Power Corp. | 6.100% | 3/15/19 | 725 | 799 |
| Ohio Power Co. | 6.050% | 5/1/18 | 2,775 | 2,970 |
| Oklahoma Gas & Electric Co. | 8.250% | 1/15/19 | 1,225 | 1,412 |
32
| Vanguard® Short-Term Corporate Bond Index Fund | ||||
| Schedule of Investments | ||||
| August 31, 2016 | ||||
| Face | Market | |||
| Maturity | Amount | Value | ||
| Coupon | Date | ($000) | ($000) | |
| Oncor Electric Delivery Co. LLC | 5.000% | 9/30/17 | 1,500 | 1,557 |
| Oncor Electric Delivery Co. LLC | 6.800% | 9/1/18 | 5,201 | 5,731 |
| Oncor Electric Delivery Co. LLC | 2.150% | 6/1/19 | 2,599 | 2,634 |
| Pacific Gas & Electric Co. | 5.625% | 11/30/17 | 9,063 | 9,551 |
| Pacific Gas & Electric Co. | 8.250% | 10/15/18 | 9,797 | 11,148 |
| Pacific Gas & Electric Co. | 3.500% | 10/1/20 | 8,361 | 8,982 |
| Pacific Gas & Electric Co. | 4.250% | 5/15/21 | 3,350 | 3,690 |
| PacifiCorp | 5.650% | 7/15/18 | 6,578 | 7,112 |
| PacifiCorp | 5.500% | 1/15/19 | 3,143 | 3,441 |
| PacifiCorp | 3.850% | 6/15/21 | 2,900 | 3,164 |
| PECO Energy Co. | 5.350% | 3/1/18 | 2,705 | 2,878 |
| Pennsylvania Electric Co. | 6.050% | 9/1/17 | 3,775 | 3,926 |
| Pennsylvania Electric Co. | 5.200% | 4/1/20 | 3,725 | 4,048 |
| PG&E Corp. | 2.400% | 3/1/19 | 2,130 | 2,165 |
| Portland General Electric Co. | 6.100% | 4/15/19 | 2,010 | 2,235 |
| PPL Capital Funding Inc. | 1.900% | 6/1/18 | 5,750 | 5,768 |
| Progress Energy Inc. | 7.050% | 3/15/19 | 200 | 226 |
| Progress Energy Inc. | 4.875% | 12/1/19 | 3,656 | 4,012 |
| Progress Energy Inc. | 4.400% | 1/15/21 | 675 | 739 |
| PSEG Power LLC | 2.450% | 11/15/18 | 3,000 | 3,036 |
| PSEG Power LLC | 5.125% | 4/15/20 | 3,200 | 3,517 |
| PSEG Power LLC | 3.000% | 6/15/21 | 4,200 | 4,314 |
| Public Service Co. of Colorado | 5.800% | 8/1/18 | 100 | 108 |
| Public Service Co. of Colorado | 5.125% | 6/1/19 | 5,000 | 5,502 |
| Public Service Co. of Colorado | 3.200% | 11/15/20 | 3,175 | 3,369 |
| Public Service Co. of New Mexico | 7.950% | 5/15/18 | 765 | 837 |
| Public Service Co. of Oklahoma | 5.150% | 12/1/19 | 1,372 | 1,513 |
| Public Service Co. of Oklahoma | 4.400% | 2/1/21 | 1,900 | 2,067 |
| Public Service Electric & Gas Co. | 5.300% | 5/1/18 | 3,115 | 3,320 |
| Public Service Electric & Gas Co. | 2.300% | 9/15/18 | 2,600 | 2,657 |
| Public Service Electric & Gas Co. | 1.800% | 6/1/19 | 5,450 | 5,498 |
| Public Service Electric & Gas Co. | 2.000% | 8/15/19 | 975 | 993 |
| Public Service Electric & Gas Co. | 3.500% | 8/15/20 | 1,000 | 1,063 |
| Public Service Electric & Gas Co. | 1.900% | 3/15/21 | 7,650 | 7,744 |
| Puget Energy Inc. | 6.500% | 12/15/20 | 3,725 | 4,331 |
| San Diego Gas & Electric Co. | 3.000% | 8/15/21 | 3,077 | 3,265 |
| SCANA Corp. | 6.250% | 4/1/20 | 3,000 | 3,318 |
| SCANA Corp. | 4.750% | 5/15/21 | 3,000 | 3,224 |
| South Carolina Electric & Gas Co. | 5.250% | 11/1/18 | 2,525 | 2,726 |
| South Carolina Electric & Gas Co. | 6.500% | 11/1/18 | 3,325 | 3,687 |
| Southern California Edison Co. | 5.500% | 8/15/18 | 3,700 | 4,010 |
| Southern California Edison Co. | 3.875% | 6/1/21 | 4,000 | 4,382 |
| Southern Co. | 1.550% | 7/1/18 | 4,700 | 4,718 |
| Southern Co. | 2.450% | 9/1/18 | 5,950 | 6,071 |
| Southern Co. | 1.850% | 7/1/19 | 7,900 | 7,954 |
| Southern Co. | 2.150% | 9/1/19 | 5,625 | 5,705 |
| Southern Co. | 2.750% | 6/15/20 | 7,545 | 7,790 |
| Southern Co. | 2.350% | 7/1/21 | 12,575 | 12,738 |
| Southern Power Co. | 1.850% | 12/1/17 | 3,000 | 3,020 |
| Southern Power Co. | 1.500% | 6/1/18 | 2,800 | 2,806 |
| Southern Power Co. | 2.375% | 6/1/20 | 2,400 | 2,446 |
| Southwestern Electric Power Co. | 5.875% | 3/1/18 | 3,450 | 3,655 |
| Southwestern Electric Power Co. | 6.450% | 1/15/19 | 3,770 | 4,166 |
| Southwestern Public Service Co. | 8.750% | 12/1/18 | 155 | 179 |
| Tampa Electric Co. | 6.100% | 5/15/18 | 2,150 | 2,303 |
| Tampa Electric Co. | 5.400% | 5/15/21 | 2,225 | 2,520 |
| TECO Finance Inc. | 6.572% | 11/1/17 | 4,428 | 4,682 |
| TECO Finance Inc. | 5.150% | 3/15/20 | 2,200 | 2,421 |
| TransAlta Corp. | 6.900% | 5/15/18 | 3,930 | 4,123 |
| UIL Holdings Corp. | 4.625% | 10/1/20 | 950 | 1,019 |
| Union Electric Co. | 6.700% | 2/1/19 | 5,275 | 5,930 |
| Virginia Electric & Power Co. | 5.950% | 9/15/17 | 2,000 | 2,099 |
| Virginia Electric & Power Co. | 1.200% | 1/15/18 | 5,425 | 5,422 |
| Virginia Electric & Power Co. | 5.400% | 4/30/18 | 8,128 | 8,664 |
33
| Vanguard® Short-Term Corporate Bond Index Fund | ||||
| Schedule of Investments | ||||
| August 31, 2016 | ||||
| Face | Market | |||
| Maturity | Amount | Value | ||
| Coupon | Date | ($000) | ($000) | |
| WEC Energy Group Inc. | 1.650% | 6/15/18 | 5,217 | 5,253 |
| WEC Energy Group Inc. | 2.450% | 6/15/20 | 3,133 | 3,200 |
| Wisconsin Electric Power Co. | 1.700% | 6/15/18 | 2,250 | 2,270 |
| Wisconsin Electric Power Co. | 4.250% | 12/15/19 | 1,275 | 1,377 |
| Wisconsin Power & Light Co. | 5.000% | 7/15/19 | 2,110 | 2,298 |
| Wisconsin Public Service Corp. | 1.650% | 12/4/18 | 2,150 | 2,169 |
| Xcel Energy Inc. | 4.700% | 5/15/20 | 6,365 | 6,955 |
| Xcel Energy Inc. | 2.400% | 3/15/21 | 7,095 | 7,284 |
| Natural Gas (0.3%) | ||||
| Atmos Energy Corp. | 8.500% | 3/15/19 | 2,787 | 3,251 |
| British Transco Finance Inc. | 6.625% | 6/1/18 | 2,985 | 3,234 |
| CenterPoint Energy Resources Corp. | 6.125% | 11/1/17 | 900 | 945 |
| CenterPoint Energy Resources Corp. | 6.000% | 5/15/18 | 1,000 | 1,066 |
| CenterPoint Energy Resources Corp. | 4.500% | 1/15/21 | 5,052 | 5,457 |
| NiSource Finance Corp. | 6.400% | 3/15/18 | 6,225 | 6,666 |
| NiSource Finance Corp. | 6.800% | 1/15/19 | 3,275 | 3,657 |
| NiSource Finance Corp. | 5.450% | 9/15/20 | 4,855 | 5,466 |
| ONE Gas Inc. | 2.070% | 2/1/19 | 2,600 | 2,635 |
| Sempra Energy | 6.150% | 6/15/18 | 10,965 | 11,849 |
| Sempra Energy | 9.800% | 2/15/19 | 600 | 715 |
| Sempra Energy | 2.400% | 3/15/20 | 4,951 | 5,065 |
| Sempra Energy | 2.850% | 11/15/20 | 3,384 | 3,504 |
| Southern California Gas Co. | 1.550% | 6/15/18 | 100 | 101 |
| Southern Co. Gas Capital Corp. | 5.250% | 8/15/19 | 2,825 | 3,088 |
| Other Utility (0.0%) | ||||
| American Water Capital Corp. | 6.085% | 10/15/17 | 3,002 | 3,156 |
| United Utilities plc | 5.375% | 2/1/19 | 3,000 | 3,220 |
| 844,699 | ||||
| Total Corporate Bonds (Cost $16,632,284) | 16,844,838 | |||
| Taxable Municipal Bonds (0.1%) | ||||
| Cornell University New York GO | 5.450% | 2/1/19 | 1,350 | 1,484 |
| Dartmouth College New Hampshire GO | 4.750% | 6/1/19 | 862 | 948 |
| Emory University Georgia GO | 5.625% | 9/1/19 | 1,980 | 2,229 |
| Princeton University New Jersey GO | 4.950% | 3/1/19 | 4,232 | 4,617 |
| Stanford University California GO | 4.750% | 5/1/19 | 2,800 | 3,068 |
| Total Taxable Municipal Bonds (Cost $12,253) | 12,346 | |||
| Market | ||||
| Value | ||||
| Coupon | Shares | ($000) | ||
| Temporary Cash Investment (0.4%) | ||||
| Money Market Fund (0.4%) | ||||
| 4 Vanguard Market Liquidity Fund (Cost | ||||
| $56,448) | 0.612% | 564,462 | 56,452 | |
| Total Investments (99.3%) (Cost $16,760,118) | 16,972,771 | |||
| Other Assets and Liabilities—Net (0.7%) | 126,785 | |||
| Net Assets (100%) | 17,099,556 | |||
| 1 | Security exempt from registration under Rule 144A of the Securities Act of 1933. Such securities may be sold in transactions exempt from registration, normally to qualified institutional buyers. At August 31, 2016, the aggregate value of these securities was $277,288,000, representing 1.6% of net assets. |
| 2 | The average or expected maturity is shorter than the final maturity shown because of the possibility of interim principal payments and prepayments or the possibility of the issue being called. |
| 3 | Securities with a value of $2,617,000 have been segregated as initial margin for recently closed futures contracts. |
| 4 | Affiliated money market fund available only to Vanguard funds and certain trusts and accounts managed by Vanguard. Rate shown is the 7-day yield. |
| GO—General Obligation Bond. REIT—Real Estate Investment Trust. |
34
| Vanguard® Intermediate-Term Corporate Bond Index Fund | ||||
| Schedule of Investments | ||||
| August 31, 2016 | ||||
| Face | Market | |||
| Maturity | Amount | Value | ||
| Coupon | Date | ($000) | ($000) | |
| Corporate Bonds (98.8%) | ||||
| Finance (31.1%) | ||||
| Banking (19.6%) | ||||
| American Express Co. | 2.650% | 12/2/22 | 8,439 | 8,664 |
| American Express Co. | 3.625% | 12/5/24 | 6,481 | 6,765 |
| Australia & New Zealand Banking Group Ltd. | 3.700% | 11/16/25 | 7,250 | 7,954 |
| Bank of America Corp. | 5.000% | 5/13/21 | 4 | 5 |
| Bank of America Corp. | 5.700% | 1/24/22 | 16,082 | 18,755 |
| Bank of America Corp. | 3.300% | 1/11/23 | 26,398 | 27,410 |
| Bank of America Corp. | 4.100% | 7/24/23 | 14,240 | 15,438 |
| Bank of America Corp. | 4.125% | 1/22/24 | 19,307 | 21,028 |
| Bank of America Corp. | 4.000% | 4/1/24 | 23,835 | 25,723 |
| Bank of America Corp. | 4.200% | 8/26/24 | 18,171 | 19,179 |
| Bank of America Corp. | 4.000% | 1/22/25 | 20,203 | 21,050 |
| Bank of America Corp. | 3.950% | 4/21/25 | 16,103 | 16,699 |
| Bank of America Corp. | 3.875% | 8/1/25 | 25,729 | 27,476 |
| Bank of America Corp. | 4.450% | 3/3/26 | 16,875 | 18,118 |
| Bank of America Corp. | 3.500% | 4/19/26 | 16,800 | 17,440 |
| Bank of Montreal | 2.550% | 11/6/22 | 8,588 | 8,837 |
| Bank of New York Mellon Corp. | 3.550% | 9/23/21 | 7,042 | 7,578 |
| Bank of New York Mellon Corp. | 2.200% | 8/16/23 | 3,000 | 2,987 |
| Bank of New York Mellon Corp. | 3.650% | 2/4/24 | 5,800 | 6,351 |
| Bank of New York Mellon Corp. | 3.400% | 5/15/24 | 6,381 | 6,887 |
| Bank of New York Mellon Corp. | 3.250% | 9/11/24 | 7,150 | 7,601 |
| Bank of New York Mellon Corp. | 3.000% | 2/24/25 | 4,700 | 4,930 |
| Bank of New York Mellon Corp. | 3.950% | 11/18/25 | 1,775 | 1,995 |
| Bank of New York Mellon Corp. | 2.800% | 5/4/26 | 2,075 | 2,135 |
| Bank of New York Mellon Corp. | 2.450% | 8/17/26 | 7,800 | 7,759 |
| Bank of Nova Scotia | 4.500% | 12/16/25 | 10,406 | 11,139 |
| Barclays Bank plc | 3.750% | 5/15/24 | 1,600 | 1,680 |
| Barclays plc | 4.375% | 9/11/24 | 9,800 | 9,936 |
| Barclays plc | 3.650% | 3/16/25 | 14,024 | 13,892 |
| Barclays plc | 4.375% | 1/12/26 | 19,275 | 20,093 |
| Barclays plc | 5.200% | 5/12/26 | 12,950 | 13,448 |
| BB&T Corp. | 3.950% | 3/22/22 | 2,809 | 3,034 |
| BNP Paribas SA | 3.250% | 3/3/23 | 7,860 | 8,230 |
| BNP Paribas SA | 4.250% | 10/15/24 | 5,921 | 6,181 |
| BPCE SA | 4.000% | 4/15/24 | 11,141 | 12,187 |
| Branch Banking & Trust Co. | 3.625% | 9/16/25 | 7,530 | 8,047 |
| Capital One Bank USA NA | 3.375% | 2/15/23 | 12,430 | 12,752 |
| Capital One Financial Corp. | 3.500% | 6/15/23 | 4,825 | 5,041 |
| Capital One Financial Corp. | 3.750% | 4/24/24 | 8,115 | 8,618 |
| Capital One Financial Corp. | 3.200% | 2/5/25 | 6,300 | 6,402 |
| Capital One Financial Corp. | 4.200% | 10/29/25 | 9,775 | 10,205 |
| Capital One Financial Corp. | 3.750% | 7/28/26 | 10,200 | 10,216 |
| Citigroup Inc. | 4.500% | 1/14/22 | 14,291 | 15,752 |
| Citigroup Inc. | 4.050% | 7/30/22 | 7,178 | 7,598 |
| Citigroup Inc. | 3.500% | 5/15/23 | 10,450 | 10,713 |
| Citigroup Inc. | 3.875% | 10/25/23 | 10,873 | 11,690 |
| Citigroup Inc. | 3.750% | 6/16/24 | 10,887 | 11,535 |
| Citigroup Inc. | 4.000% | 8/5/24 | 3,310 | 3,451 |
| Citigroup Inc. | 3.875% | 3/26/25 | 6,640 | 6,852 |
| Citigroup Inc. | 3.300% | 4/27/25 | 9,796 | 10,116 |
| Citigroup Inc. | 4.400% | 6/10/25 | 20,700 | 21,854 |
| Citigroup Inc. | 5.500% | 9/13/25 | 10,983 | 12,415 |
| Citigroup Inc. | 3.700% | 1/12/26 | 18,166 | 19,180 |
| Citigroup Inc. | 4.600% | 3/9/26 | 9,932 | 10,618 |
| Citigroup Inc. | 3.400% | 5/1/26 | 7,411 | 7,626 |
| Citigroup Inc. | 4.300% | 11/20/26 | 2,725 | 2,849 |
| Citizens Financial Group Inc. | 4.300% | 12/3/25 | 5,953 | 6,287 |
| Comerica Bank | 4.000% | 7/27/25 | 1,975 | 2,050 |
| Comerica Inc. | 3.800% | 7/22/26 | 159 | 165 |
| Compass Bank | 3.875% | 4/10/25 | 4,450 | 4,318 |
35
| Vanguard® Intermediate-Term Corporate Bond Index Fund | ||||
| Schedule of Investments | ||||
| August 31, 2016 | ||||
| Face | Market | |||
| Maturity | Amount | Value | ||
| Coupon | Date | ($000) | ($000) | |
| Cooperatieve Rabobank UA | 3.875% | 2/8/22 | 18,135 | 19,800 |
| Cooperatieve Rabobank UA | 3.950% | 11/9/22 | 8,352 | 8,755 |
| Cooperatieve Rabobank UA | 4.625% | 12/1/23 | 14,675 | 15,829 |
| Cooperatieve Rabobank UA | 3.375% | 5/21/25 | 10,600 | 11,322 |
| Cooperatieve Rabobank UA | 4.375% | 8/4/25 | 11,345 | 12,028 |
| Cooperatieve Rabobank UA | 3.750% | 7/21/26 | 10,000 | 10,099 |
| Credit Suisse AG | 3.000% | 10/29/21 | 17,700 | 18,237 |
| Credit Suisse AG | 3.625% | 9/9/24 | 23,900 | 25,043 |
| Credit Suisse Group Funding Guernsey Ltd. | 3.800% | 9/15/22 | 9,550 | 9,797 |
| 1 Credit Suisse Group Funding Guernsey Ltd. | 3.800% | 6/9/23 | 13,500 | 13,725 |
| Credit Suisse Group Funding Guernsey Ltd. | 3.750% | 3/26/25 | 15,921 | 16,002 |
| 1 Credit Suisse Group Funding Guernsey Ltd. | 4.550% | 4/17/26 | 16,500 | 17,434 |
| Deutsche Bank AG | 3.700% | 5/30/24 | 10,819 | 10,725 |
| Deutsche Bank AG | 4.100% | 1/13/26 | 6,250 | 6,342 |
| Discover Bank | 4.200% | 8/8/23 | 6,200 | 6,654 |
| Discover Bank | 4.250% | 3/13/26 | 3,012 | 3,211 |
| Discover Bank/Greenwood DE | 3.450% | 7/27/26 | 5,000 | 5,025 |
| Discover Financial Services | 5.200% | 4/27/22 | 1,325 | 1,449 |
| Discover Financial Services | 3.850% | 11/21/22 | 3,502 | 3,609 |
| Discover Financial Services | 3.950% | 11/6/24 | 4,891 | 5,008 |
| Discover Financial Services | 3.750% | 3/4/25 | 5,770 | 5,858 |
| Fifth Third Bancorp | 3.500% | 3/15/22 | 3,450 | 3,632 |
| Fifth Third Bancorp | 4.300% | 1/16/24 | 5,851 | 6,282 |
| Fifth Third Bank | 2.875% | 10/1/21 | 6,890 | 7,193 |
| Fifth Third Bank/Cincinnati OH | 3.850% | 3/15/26 | 3,525 | 3,748 |
| FirstMerit Corp. | 4.350% | 2/4/23 | 2,950 | 3,047 |
| Goldman Sachs Group Inc. | 5.750% | 1/24/22 | 30,958 | 35,893 |
| Goldman Sachs Group Inc. | 3.625% | 1/22/23 | 17,935 | 19,009 |
| Goldman Sachs Group Inc. | 4.000% | 3/3/24 | 23,236 | 25,027 |
| Goldman Sachs Group Inc. | 3.850% | 7/8/24 | 21,141 | 22,433 |
| Goldman Sachs Group Inc. | 3.500% | 1/23/25 | 20,258 | 21,034 |
| Goldman Sachs Group Inc. | 3.750% | 5/22/25 | 9,813 | 10,373 |
| Goldman Sachs Group Inc. | 4.250% | 10/21/25 | 12,000 | 12,688 |
| Goldman Sachs Group Inc. | 3.750% | 2/25/26 | 12,510 | 13,194 |
| HSBC Bank plc | 7.650% | 5/1/25 | 650 | 807 |
| HSBC Holdings plc | 4.875% | 1/14/22 | 7,170 | 7,982 |
| HSBC Holdings plc | 4.000% | 3/30/22 | 12,079 | 12,907 |
| HSBC Holdings plc | 3.600% | 5/25/23 | 17,500 | 18,113 |
| HSBC Holdings plc | 4.250% | 3/14/24 | 14,846 | 15,438 |
| HSBC Holdings plc | 4.250% | 8/18/25 | 11,881 | 12,329 |
| HSBC Holdings plc | 4.300% | 3/8/26 | 22,995 | 24,722 |
| HSBC Holdings plc | 3.900% | 5/25/26 | 16,542 | 17,263 |
| HSBC USA Inc. | 3.500% | 6/23/24 | 3,600 | 3,747 |
| Huntington Bancshares Inc. | 2.300% | 1/14/22 | 2,000 | 1,992 |
| Intesa Sanpaolo SPA | 5.250% | 1/12/24 | 7,800 | 8,571 |
| JPMorgan Chase & Co. | 4.500% | 1/24/22 | 22,949 | 25,368 |
| JPMorgan Chase & Co. | 3.250% | 9/23/22 | 26,649 | 27,978 |
| JPMorgan Chase & Co. | 3.200% | 1/25/23 | 23,727 | 24,687 |
| JPMorgan Chase & Co. | 3.375% | 5/1/23 | 18,158 | 18,732 |
| JPMorgan Chase & Co. | 2.700% | 5/18/23 | 6,739 | 6,819 |
| JPMorgan Chase & Co. | 3.875% | 2/1/24 | 14,660 | 15,870 |
| JPMorgan Chase & Co. | 3.625% | 5/13/24 | 15,468 | 16,510 |
| JPMorgan Chase & Co. | 3.875% | 9/10/24 | 19,785 | 20,880 |
| JPMorgan Chase & Co. | 3.125% | 1/23/25 | 20,475 | 21,030 |
| JPMorgan Chase & Co. | 3.900% | 7/15/25 | 21,520 | 23,277 |
| JPMorgan Chase & Co. | 3.300% | 4/1/26 | 9,325 | 9,674 |
| JPMorgan Chase & Co. | 3.200% | 6/15/26 | 9,200 | 9,417 |
| JPMorgan Chase & Co. | 2.950% | 10/1/26 | 4,600 | 4,616 |
| KeyBank NA | 3.300% | 6/1/25 | 6,625 | 6,959 |
| KeyBank NA/Cleveland OH | 3.400% | 5/20/26 | 4,000 | 4,096 |
| Lloyds Bank Group plc | 4.650% | 3/24/26 | 7,350 | 7,614 |
| Lloyds Bank plc | 3.500% | 5/14/25 | 10,675 | 11,358 |
36
| Vanguard® Intermediate-Term Corporate Bond Index Fund | ||||
| Schedule of Investments | ||||
| August 31, 2016 | ||||
| Face | Market | |||
| Maturity | Amount | Value | ||
| Coupon | Date | ($000) | ($000) | |
| Lloyds Banking Group plc | 4.500% | 11/4/24 | 4,900 | 5,111 |
| 1 Lloyds Banking Group plc | 4.582% | 12/10/25 | 13,716 | 14,082 |
| Manufacturers & Traders Trust Co. | 2.900% | 2/6/25 | 3,230 | 3,320 |
| Mitsubishi UFJ Financial Group Inc. | 3.850% | 3/1/26 | 22,575 | 24,656 |
| Morgan Stanley | 4.875% | 11/1/22 | 14,182 | 15,732 |
| Morgan Stanley | 3.750% | 2/25/23 | 16,370 | 17,535 |
| Morgan Stanley | 4.100% | 5/22/23 | 18,383 | 19,477 |
| Morgan Stanley | 3.875% | 4/29/24 | 20,779 | 22,322 |
| Morgan Stanley | 3.700% | 10/23/24 | 24,318 | 25,772 |
| Morgan Stanley | 4.000% | 7/23/25 | 26,280 | 28,379 |
| Morgan Stanley | 5.000% | 11/24/25 | 17,772 | 19,796 |
| Morgan Stanley | 3.875% | 1/27/26 | 26,174 | 27,947 |
| Morgan Stanley | 3.125% | 7/27/26 | 11,250 | 11,312 |
| Morgan Stanley | 6.250% | 8/9/26 | 2,890 | 3,626 |
| MUFG Americas Holdings Corp. | 3.500% | 6/18/22 | 4,650 | 4,901 |
| MUFG Americas Holdings Corp. | 3.000% | 2/10/25 | 3,874 | 3,923 |
| National Australia Bank Ltd. | 3.000% | 1/20/23 | 6,625 | 6,898 |
| National Australia Bank Ltd. | 3.375% | 1/14/26 | 2,500 | 2,662 |
| National Australia Bank Ltd. | 2.500% | 7/12/26 | 10,550 | 10,486 |
| Northern Trust Corp. | 2.375% | 8/2/22 | 5,151 | 5,281 |
| Northern Trust Corp. | 3.950% | 10/30/25 | 4,800 | 5,333 |
| People's United Bank NA | 4.000% | 7/15/24 | 1,500 | 1,521 |
| People's United Financial Inc. | 3.650% | 12/6/22 | 2,550 | 2,591 |
| PNC Bank NA | 2.700% | 11/1/22 | 10,936 | 11,116 |
| PNC Bank NA | 2.950% | 1/30/23 | 4,475 | 4,626 |
| PNC Bank NA | 3.800% | 7/25/23 | 4,505 | 4,903 |
| PNC Bank NA | 3.300% | 10/30/24 | 5,625 | 5,972 |
| PNC Bank NA | 2.950% | 2/23/25 | 3,350 | 3,477 |
| PNC Bank NA | 3.250% | 6/1/25 | 5,635 | 5,992 |
| PNC Bank NA | 4.200% | 11/1/25 | 2,125 | 2,380 |
| PNC Financial Services Group Inc. | 2.854% | 11/9/22 | 5,065 | 5,214 |
| PNC Financial Services Group Inc. | 3.900% | 4/29/24 | 4,750 | 5,118 |
| PNC Funding Corp. | 3.300% | 3/8/22 | 9,602 | 10,203 |
| Royal Bank of Canada | 4.650% | 1/27/26 | 12,575 | 13,798 |
| Royal Bank of Scotland Group plc | 4.800% | 4/5/26 | 10,850 | 11,333 |
| Santander Holdings USA Inc. | 4.500% | 7/17/25 | 6,186 | 6,476 |
| Santander Issuances SAU | 5.179% | 11/19/25 | 10,334 | 10,707 |
| Santander UK plc | 4.000% | 3/13/24 | 11,060 | 12,056 |
| State Street Corp. | 3.100% | 5/15/23 | 7,505 | 7,814 |
| State Street Corp. | 3.700% | 11/20/23 | 6,455 | 7,110 |
| State Street Corp. | 3.300% | 12/16/24 | 10,956 | 11,803 |
| State Street Corp. | 3.550% | 8/18/25 | 7,825 | 8,506 |
| State Street Corp. | 2.650% | 5/19/26 | 2,600 | 2,636 |
| Sumitomo Mitsui Banking Corp. | 3.200% | 7/18/22 | 3,842 | 4,019 |
| Sumitomo Mitsui Banking Corp. | 3.000% | 1/18/23 | 1,375 | 1,414 |
| Sumitomo Mitsui Banking Corp. | 3.950% | 7/19/23 | 4,600 | 5,006 |
| Sumitomo Mitsui Banking Corp. | 3.950% | 1/10/24 | 3,180 | 3,474 |
| Sumitomo Mitsui Banking Corp. | 3.400% | 7/11/24 | 3,900 | 4,129 |
| Sumitomo Mitsui Banking Corp. | 3.650% | 7/23/25 | 2,500 | 2,732 |
| Sumitomo Mitsui Financial Group Inc. | 3.784% | 3/9/26 | 10,000 | 10,886 |
| Sumitomo Mitsui Financial Group Inc. | 2.632% | 7/14/26 | 20,500 | 20,292 |
| SunTrust Bank | 2.750% | 5/1/23 | 3,175 | 3,233 |
| SunTrust Bank/Atlanta GA | 3.300% | 5/15/26 | 4,050 | 4,162 |
| SVB Financial Group | 3.500% | 1/29/25 | 3,125 | 3,180 |
| Svenska Handelsbanken AB | 1.875% | 9/7/21 | 7,250 | 7,215 |
| Synchrony Financial | 4.250% | 8/15/24 | 10,904 | 11,420 |
| Synchrony Financial | 4.500% | 7/23/25 | 10,702 | 11,295 |
| Synchrony Financial | 3.700% | 8/4/26 | 3,500 | 3,454 |
| US Bancorp | 3.000% | 3/15/22 | 6,846 | 7,228 |
| US Bancorp | 2.950% | 7/15/22 | 9,256 | 9,630 |
| US Bancorp | 3.700% | 1/30/24 | 7,643 | 8,394 |
| US Bancorp | 3.600% | 9/11/24 | 6,448 | 6,931 |
| US Bancorp | 3.100% | 4/27/26 | 4,505 | 4,638 |
| US Bancorp | 2.375% | 7/22/26 | 10,900 | 10,781 |
37
| Vanguard® Intermediate-Term Corporate Bond Index Fund | ||||
| Schedule of Investments | ||||
| August 31, 2016 | ||||
| Face | Market | |||
| Maturity | Amount | Value | ||
| Coupon | Date | ($000) | ($000) | |
| US Bank NA | 2.800% | 1/27/25 | 5,900 | 6,097 |
| Wachovia Corp. | 6.605% | 10/1/25 | 475 | 589 |
| Wachovia Corp. | 7.574% | 8/1/26 | 1,775 | 2,349 |
| Wells Fargo & Co. | 3.500% | 3/8/22 | 17,957 | 19,161 |
| Wells Fargo & Co. | 3.450% | 2/13/23 | 17,642 | 18,461 |
| Wells Fargo & Co. | 4.125% | 8/15/23 | 12,653 | 13,745 |
| Wells Fargo & Co. | 4.480% | 1/16/24 | 4,892 | 5,381 |
| Wells Fargo & Co. | 3.300% | 9/9/24 | 15,319 | 16,158 |
| Wells Fargo & Co. | 3.000% | 2/19/25 | 20,663 | 21,207 |
| Wells Fargo & Co. | 3.550% | 9/29/25 | 19,634 | 20,951 |
| Wells Fargo & Co. | 3.000% | 4/22/26 | 21,825 | 22,377 |
| Wells Fargo & Co. | 4.100% | 6/3/26 | 16,718 | 18,099 |
| Westpac Banking Corp. | 2.850% | 5/13/26 | 13,450 | 13,701 |
| Westpac Banking Corp. | 2.700% | 8/19/26 | 7,050 | 7,050 |
| Brokerage (1.3%) | ||||
| Affiliated Managers Group Inc. | 4.250% | 2/15/24 | 4,900 | 5,165 |
| Affiliated Managers Group Inc. | 3.500% | 8/1/25 | 1,301 | 1,291 |
| Ameriprise Financial Inc. | 4.000% | 10/15/23 | 4,427 | 4,848 |
| Ameriprise Financial Inc. | 3.700% | 10/15/24 | 3,875 | 4,200 |
| Apollo Investment Corp. | 5.250% | 3/3/25 | 1,900 | 1,881 |
| BlackRock Inc. | 3.375% | 6/1/22 | 5,605 | 5,986 |
| BlackRock Inc. | 3.500% | 3/18/24 | 8,510 | 9,380 |
| Brookfield Asset Management Inc. | 4.000% | 1/15/25 | 2,975 | 3,071 |
| Brookfield Finance Inc. | 4.250% | 6/2/26 | 3,935 | 4,084 |
| Charles Schwab Corp. | 3.225% | 9/1/22 | 1,350 | 1,411 |
| Charles Schwab Corp. | 3.000% | 3/10/25 | 1,025 | 1,067 |
| Charles Schwab Corp. | 3.450% | 2/13/26 | 2,635 | 2,849 |
| CME Group Inc. | 3.000% | 9/15/22 | 6,310 | 6,681 |
| CME Group Inc. | 3.000% | 3/15/25 | 4,192 | 4,415 |
| E*TRADE Financial Corp. | 5.375% | 11/15/22 | 2,925 | 3,148 |
| E*TRADE Financial Corp. | 4.625% | 9/15/23 | 4,525 | 4,712 |
| Eaton Vance Corp. | 3.625% | 6/15/23 | 2,100 | 2,246 |
| Franklin Resources Inc. | 2.800% | 9/15/22 | 1,400 | 1,451 |
| Franklin Resources Inc. | 2.850% | 3/30/25 | 3,425 | 3,522 |
| Intercontinental Exchange Inc. | 4.000% | 10/15/23 | 4,421 | 4,881 |
| Intercontinental Exchange Inc. | 3.750% | 12/1/25 | 9,425 | 10,318 |
| Invesco Finance plc | 3.125% | 11/30/22 | 4,532 | 4,692 |
| Invesco Finance plc | 4.000% | 1/30/24 | 3,875 | 4,249 |
| Invesco Finance plc | 3.750% | 1/15/26 | 4,830 | 5,197 |
| Janus Capital Group Inc. | 4.875% | 8/1/25 | 2,050 | 2,205 |
| Jefferies Group LLC | 5.125% | 1/20/23 | 2,900 | 3,119 |
| Lazard Group LLC | 3.750% | 2/13/25 | 2,350 | 2,357 |
| Legg Mason Inc. | 3.950% | 7/15/24 | 1,265 | 1,292 |
| Legg Mason Inc. | 4.750% | 3/15/26 | 3,500 | 3,819 |
| Leucadia National Corp. | 5.500% | 10/18/23 | 5,050 | 5,298 |
| Nasdaq Inc. | 4.250% | 6/1/24 | 1,658 | 1,789 |
| Nasdaq Inc. | 3.850% | 6/30/26 | 3,600 | 3,783 |
| OM Asset Management plc | 4.800% | 7/27/26 | 1,800 | 1,860 |
| Raymond James Financial Inc. | 3.625% | 9/15/26 | 3,500 | 3,581 |
| Stifel Financial Corp. | 4.250% | 7/18/24 | 3,650 | 3,699 |
| TD Ameritrade Holding Corp. | 2.950% | 4/1/22 | 8,389 | 8,721 |
| TD Ameritrade Holding Corp. | 3.625% | 4/1/25 | 4,500 | 4,856 |
| Finance Companies (0.6%) | ||||
| AerCap Ireland Capital Ltd. / AerCap Global Aviation | ||||
| Trust | 5.000% | 10/1/21 | 5,580 | 6,019 |
| AerCap Ireland Capital Ltd. / AerCap Global Aviation | ||||
| Trust | 3.950% | 2/1/22 | 6,615 | 6,847 |
| AerCap Ireland Capital Ltd. / AerCap Global Aviation | ||||
| Trust | 4.625% | 7/1/22 | 4,250 | 4,510 |
| Air Lease Corp. | 3.750% | 2/1/22 | 2,900 | 3,031 |
| Air Lease Corp. | 3.000% | 9/15/23 | 6,600 | 6,542 |
| Air Lease Corp. | 4.250% | 9/15/24 | 2,425 | 2,549 |
| FS Investment Corp. | 4.750% | 5/15/22 | 1,899 | 1,916 |
38
| Vanguard® Intermediate-Term Corporate Bond Index Fund | ||||
| Schedule of Investments | ||||
| August 31, 2016 | ||||
| Face | Market | |||
| Maturity | Amount | Value | ||
| Coupon | Date | ($000) | ($000) | |
| GATX Corp. | 4.750% | 6/15/22 | 1,775 | 1,879 |
| GATX Corp. | 3.900% | 3/30/23 | 1,225 | 1,241 |
| GATX Corp. | 3.250% | 3/30/25 | 3,400 | 3,418 |
| GE Capital International Funding Co. | 3.373% | 11/15/25 | 14,925 | 16,296 |
| International Lease Finance Corp. | 8.625% | 1/15/22 | 4,787 | 5,948 |
| International Lease Finance Corp. | 5.875% | 8/15/22 | 5,985 | 6,763 |
| Prospect Capital Corp. | 5.875% | 3/15/23 | 1,425 | 1,413 |
| Insurance (4.9%) | ||||
| Aetna Inc. | 2.750% | 11/15/22 | 6,071 | 6,136 |
| Aetna Inc. | 2.800% | 6/15/23 | 8,675 | 8,866 |
| Aetna Inc. | 3.500% | 11/15/24 | 7,000 | 7,441 |
| Aetna Inc. | 3.200% | 6/15/26 | 22,620 | 23,038 |
| Aflac Inc. | 4.000% | 2/15/22 | 825 | 899 |
| Aflac Inc. | 3.625% | 6/15/23 | 5,975 | 6,438 |
| Aflac Inc. | 3.625% | 11/15/24 | 6,251 | 6,754 |
| Aflac Inc. | 3.250% | 3/17/25 | 3,025 | 3,167 |
| Alleghany Corp. | 4.950% | 6/27/22 | 2,586 | 2,840 |
| Allied World Assurance Co. Holdings Ltd. | 4.350% | 10/29/25 | 7,875 | 8,157 |
| Allstate Corp. | 3.150% | 6/15/23 | 2,925 | 3,112 |
| 2 Allstate Corp. | 5.750% | 8/15/53 | 4,925 | 5,307 |
| American Financial Group Inc. | 3.500% | 8/15/26 | 2,175 | 2,184 |
| American International Group Inc. | 4.875% | 6/1/22 | 10,100 | 11,305 |
| American International Group Inc. | 4.125% | 2/15/24 | 7,636 | 8,231 |
| American International Group Inc. | 3.750% | 7/10/25 | 9,884 | 10,354 |
| American International Group Inc. | 3.900% | 4/1/26 | 10,160 | 10,682 |
| Anthem Inc. | 3.125% | 5/15/22 | 6,813 | 7,074 |
| Anthem Inc. | 3.300% | 1/15/23 | 4,769 | 4,989 |
| Anthem Inc. | 3.500% | 8/15/24 | 5,943 | 6,263 |
| Aon plc | 4.000% | 11/27/23 | 1,875 | 2,031 |
| Aon plc | 3.500% | 6/14/24 | 4,189 | 4,377 |
| Aon plc | 3.875% | 12/15/25 | 4,855 | 5,209 |
| Aspen Insurance Holdings Ltd. | 4.650% | 11/15/23 | 1,650 | 1,745 |
| Assurant Inc. | 4.000% | 3/15/23 | 2,800 | 2,860 |
| Assured Guaranty US Holdings Inc. | 5.000% | 7/1/24 | 2,683 | 3,025 |
| Berkshire Hathaway Finance Corp. | 3.000% | 5/15/22 | 7,161 | 7,580 |
| Berkshire Hathaway Inc. | 3.400% | 1/31/22 | 1,944 | 2,094 |
| Berkshire Hathaway Inc. | 3.000% | 2/11/23 | 5,014 | 5,321 |
| Berkshire Hathaway Inc. | 2.750% | 3/15/23 | 16,833 | 17,523 |
| Berkshire Hathaway Inc. | 3.125% | 3/15/26 | 19,043 | 20,195 |
| Brown & Brown Inc. | 4.200% | 9/15/24 | 3,125 | 3,200 |
| Chubb INA Holdings Inc. | 2.875% | 11/3/22 | 11,675 | 12,202 |
| Chubb INA Holdings Inc. | 2.700% | 3/13/23 | 2,522 | 2,589 |
| Chubb INA Holdings Inc. | 3.350% | 5/15/24 | 5,116 | 5,470 |
| Chubb INA Holdings Inc. | 3.150% | 3/15/25 | 6,290 | 6,637 |
| Chubb INA Holdings Inc. | 3.350% | 5/3/26 | 7,600 | 8,144 |
| Cigna Corp. | 4.000% | 2/15/22 | 4,790 | 5,163 |
| Cigna Corp. | 3.250% | 4/15/25 | 5,700 | 5,895 |
| CNA Financial Corp. | 3.950% | 5/15/24 | 3,295 | 3,467 |
| CNA Financial Corp. | 4.500% | 3/1/26 | 3,575 | 3,852 |
| Fidelity National Financial Inc. | 5.500% | 9/1/22 | 2,075 | 2,263 |
| First American Financial Corp. | 4.300% | 2/1/23 | 2,475 | 2,548 |
| First American Financial Corp. | 4.600% | 11/15/24 | 2,850 | 2,952 |
| Hanover Insurance Group Inc. | 4.500% | 4/15/26 | 2,400 | 2,495 |
| Hartford Financial Services Group Inc. | 5.125% | 4/15/22 | 5,806 | 6,576 |
| Horace Mann Educators Corp. | 4.500% | 12/1/25 | 1,325 | 1,378 |
| Humana Inc. | 3.150% | 12/1/22 | 3,069 | 3,178 |
| Humana Inc. | 3.850% | 10/1/24 | 5,325 | 5,722 |
| Infinity Property & Casualty Corp. | 5.000% | 9/19/22 | 1,475 | 1,549 |
| Kemper Corp. | 4.350% | 2/15/25 | 3,000 | 3,077 |
| Lincoln National Corp. | 4.200% | 3/15/22 | 2,872 | 3,095 |
| Lincoln National Corp. | 4.000% | 9/1/23 | 1,825 | 1,935 |
| Lincoln National Corp. | 3.350% | 3/9/25 | 2,010 | 2,043 |
| Loews Corp. | 2.625% | 5/15/23 | 6,162 | 6,217 |
39
| Vanguard® Intermediate-Term Corporate Bond Index Fund | ||||
| Schedule of Investments | ||||
| August 31, 2016 | ||||
| Face | Market | |||
| Maturity | Amount | Value | ||
| Coupon | Date | ($000) | ($000) | |
| Loews Corp. | 3.750% | 4/1/26 | 2,757 | 2,923 |
| Manulife Financial Corp. | 4.150% | 3/4/26 | 6,750 | 7,352 |
| Markel Corp. | 4.900% | 7/1/22 | 3,175 | 3,493 |
| Markel Corp. | 3.625% | 3/30/23 | 2,225 | 2,299 |
| Marsh & McLennan Cos. Inc. | 3.300% | 3/14/23 | 1,800 | 1,886 |
| Marsh & McLennan Cos. Inc. | 4.050% | 10/15/23 | 825 | 895 |
| Marsh & McLennan Cos. Inc. | 3.500% | 6/3/24 | 4,475 | 4,676 |
| Marsh & McLennan Cos. Inc. | 3.500% | 3/10/25 | 3,565 | 3,723 |
| Marsh & McLennan Cos. Inc. | 3.750% | 3/14/26 | 5,180 | 5,580 |
| MetLife Inc. | 3.048% | 12/15/22 | 3,384 | 3,527 |
| MetLife Inc. | 4.368% | 9/15/23 | 8,112 | 8,986 |
| MetLife Inc. | 3.600% | 4/10/24 | 8,375 | 8,872 |
| MetLife Inc. | 3.000% | 3/1/25 | 4,483 | 4,547 |
| MetLife Inc. | 3.600% | 11/13/25 | 4,975 | 5,266 |
| Montpelier Re Holdings Ltd. | 4.700% | 10/15/22 | 675 | 702 |
| Navigators Group Inc. | 5.750% | 10/15/23 | 1,500 | 1,665 |
| Old Republic International Corp. | 4.875% | 10/1/24 | 2,850 | 3,071 |
| Old Republic International Corp. | 3.875% | 8/26/26 | 4,625 | 4,650 |
| OneBeacon US Holdings Inc. | 4.600% | 11/9/22 | 1,625 | 1,639 |
| Primerica Inc. | 4.750% | 7/15/22 | 2,627 | 2,863 |
| Principal Financial Group Inc. | 3.300% | 9/15/22 | 1,675 | 1,720 |
| Principal Financial Group Inc. | 3.125% | 5/15/23 | 3,133 | 3,189 |
| Principal Financial Group Inc. | 3.400% | 5/15/25 | 2,024 | 2,068 |
| ProAssurance Corp. | 5.300% | 11/15/23 | 1,250 | 1,338 |
| Prudential Financial Inc. | 4.500% | 11/16/21 | 3,655 | 4,063 |
| Prudential Financial Inc. | 3.500% | 5/15/24 | 7,260 | 7,609 |
| 2 Prudential Financial Inc. | 5.875% | 9/15/42 | 5,800 | 6,409 |
| 2 Prudential Financial Inc. | 5.625% | 6/15/43 | 9,500 | 10,189 |
| 2 Prudential Financial Inc. | 5.200% | 3/15/44 | 2,675 | 2,769 |
| 2 Prudential Financial Inc. | 5.375% | 5/15/45 | 7,600 | 7,989 |
| Reinsurance Group of America Inc. | 4.700% | 9/15/23 | 2,450 | 2,646 |
| Reinsurance Group of America Inc. | 3.950% | 9/15/26 | 300 | 310 |
| StanCorp Financial Group Inc. | 5.000% | 8/15/22 | 2,000 | 2,130 |
| Swiss Re Solutions Holding Corp. | 7.000% | 2/15/26 | 2,540 | 3,287 |
| Symetra Financial Corp. | 4.250% | 7/15/24 | 1,350 | 1,397 |
| Torchmark Corp. | 3.800% | 9/15/22 | 900 | 918 |
| Trinity Acquisition plc | 3.500% | 9/15/21 | 3,400 | 3,520 |
| Trinity Acquisition plc | 4.625% | 8/15/23 | 1,575 | 1,691 |
| Trinity Acquisition plc | 4.400% | 3/15/26 | 5,550 | 5,846 |
| UnitedHealth Group Inc. | 3.375% | 11/15/21 | 3,000 | 3,221 |
| UnitedHealth Group Inc. | 2.875% | 12/15/21 | 4,100 | 4,310 |
| UnitedHealth Group Inc. | 2.875% | 3/15/22 | 6,777 | 7,089 |
| UnitedHealth Group Inc. | 3.350% | 7/15/22 | 7,019 | 7,536 |
| UnitedHealth Group Inc. | 2.750% | 2/15/23 | 3,850 | 3,988 |
| UnitedHealth Group Inc. | 2.875% | 3/15/23 | 6,027 | 6,292 |
| UnitedHealth Group Inc. | 3.750% | 7/15/25 | 17,765 | 19,683 |
| UnitedHealth Group Inc. | 3.100% | 3/15/26 | 6,750 | 7,115 |
| Unum Group | 4.000% | 3/15/24 | 3,175 | 3,275 |
| Voya Financial Inc. | 5.500% | 7/15/22 | 2,636 | 2,963 |
| Voya Financial Inc. | 3.650% | 6/15/26 | 1,750 | 1,766 |
| WR Berkley Corp. | 4.625% | 3/15/22 | 2,600 | 2,827 |
| XLIT Ltd. | 5.750% | 10/1/21 | 2,365 | 2,706 |
| XLIT Ltd. | 6.375% | 11/15/24 | 1,796 | 2,104 |
| XLIT Ltd. | 4.450% | 3/31/25 | 6,100 | 6,213 |
| Other Finance (0.0%) | ||||
| Jones Lang LaSalle Inc. | 4.400% | 11/15/22 | 925 | 990 |
| Real Estate Investment Trusts (4.7%) | ||||
| Alexandria Real Estate Equities Inc. | 4.600% | 4/1/22 | 4,346 | 4,722 |
| Alexandria Real Estate Equities Inc. | 3.900% | 6/15/23 | 3,050 | 3,171 |
| Alexandria Real Estate Equities Inc. | 4.300% | 1/15/26 | 2,656 | 2,857 |
| American Campus Communities Operating Partnership | ||||
| LP | 3.750% | 4/15/23 | 5,050 | 5,294 |
40
| Vanguard® Intermediate-Term Corporate Bond Index Fund | ||||
| Schedule of Investments | ||||
| August 31, 2016 | ||||
| Face | Market | |||
| Maturity | Amount | Value | ||
| Coupon | Date | ($000) | ($000) | |
| American Campus Communities Operating Partnership | ||||
| LP | 4.125% | 7/1/24 | 2,900 | 3,117 |
| AvalonBay Communities Inc. | 2.950% | 9/15/22 | 500 | 516 |
| AvalonBay Communities Inc. | 2.850% | 3/15/23 | 1,200 | 1,221 |
| AvalonBay Communities Inc. | 4.200% | 12/15/23 | 2,300 | 2,531 |
| AvalonBay Communities Inc. | 3.500% | 11/15/24 | 3,600 | 3,799 |
| AvalonBay Communities Inc. | 3.450% | 6/1/25 | 4,725 | 4,969 |
| AvalonBay Communities Inc. | 3.500% | 11/15/25 | 2,950 | 3,106 |
| AvalonBay Communities Inc. | 2.950% | 5/11/26 | 3,190 | 3,219 |
| Boston Properties LP | 3.850% | 2/1/23 | 5,828 | 6,276 |
| Boston Properties LP | 3.125% | 9/1/23 | 3,125 | 3,241 |
| Boston Properties LP | 3.800% | 2/1/24 | 7,111 | 7,652 |
| Boston Properties LP | 3.650% | 2/1/26 | 7,205 | 7,683 |
| Brandywine Operating Partnership LP | 3.950% | 2/15/23 | 3,572 | 3,652 |
| Brandywine Operating Partnership LP | 4.100% | 10/1/24 | 1,885 | 1,935 |
| Brixmor Operating Partnership LP | 3.875% | 8/15/22 | 3,353 | 3,499 |
| Brixmor Operating Partnership LP | 3.250% | 9/15/23 | 2,700 | 2,705 |
| Brixmor Operating Partnership LP | 3.850% | 2/1/25 | 8,245 | 8,411 |
| Brixmor Operating Partnership LP | 4.125% | 6/15/26 | 3,270 | 3,399 |
| Camden Property Trust | 2.950% | 12/15/22 | 2,925 | 2,946 |
| Camden Property Trust | 4.875% | 6/15/23 | 2,400 | 2,685 |
| Camden Property Trust | 4.250% | 1/15/24 | 3,450 | 3,728 |
| Camden Property Trust | 3.500% | 9/15/24 | 150 | 155 |
| 1 Care Capital Properties LP | 5.125% | 8/15/26 | 3,575 | 3,606 |
| CBL & Associates LP | 5.250% | 12/1/23 | 3,125 | 3,145 |
| CBL & Associates LP | 4.600% | 10/15/24 | 1,800 | 1,729 |
| Columbia Property Trust Operating Partnership LP | 4.150% | 4/1/25 | 2,200 | 2,282 |
| Columbia Property Trust Operating Partnership LP | 3.650% | 8/15/26 | 2,700 | 2,711 |
| Corporate Office Properties LP | 3.600% | 5/15/23 | 3,625 | 3,608 |
| Corporate Office Properties LP | 5.250% | 2/15/24 | 2,500 | 2,704 |
| CubeSmart LP | 4.800% | 7/15/22 | 825 | 913 |
| CubeSmart LP | 4.375% | 12/15/23 | 3,150 | 3,438 |
| CubeSmart LP | 4.000% | 11/15/25 | 2,325 | 2,489 |
| CubeSmart LP | 3.125% | 9/1/26 | 1,000 | 999 |
| DCT Industrial Operating Partnership LP | 4.500% | 10/15/23 | 1,200 | 1,269 |
| DDR Corp. | 4.625% | 7/15/22 | 3,949 | 4,292 |
| DDR Corp. | 3.375% | 5/15/23 | 3,250 | 3,264 |
| DDR Corp. | 3.625% | 2/1/25 | 3,830 | 3,876 |
| DDR Corp. | 4.250% | 2/1/26 | 1,950 | 2,053 |
| Digital Realty Trust LP | 3.950% | 7/1/22 | 4,900 | 5,175 |
| Digital Realty Trust LP | 3.625% | 10/1/22 | 2,025 | 2,110 |
| Digital Realty Trust LP | 4.750% | 10/1/25 | 3,115 | 3,382 |
| Duke Realty LP | 4.375% | 6/15/22 | 100 | 109 |
| Duke Realty LP | 3.875% | 10/15/22 | 2,788 | 2,974 |
| Duke Realty LP | 3.625% | 4/15/23 | 3,450 | 3,638 |
| Duke Realty LP | 3.750% | 12/1/24 | 2,800 | 2,961 |
| Duke Realty LP | 3.250% | 6/30/26 | 1,200 | 1,230 |
| Education Realty Operating Partnership LP | 4.600% | 12/1/24 | 1,300 | 1,363 |
| EPR Properties | 5.750% | 8/15/22 | 2,095 | 2,299 |
| EPR Properties | 5.250% | 7/15/23 | 1,225 | 1,313 |
| EPR Properties | 4.500% | 4/1/25 | 2,850 | 2,897 |
| Equity One Inc. | 3.750% | 11/15/22 | 1,130 | 1,153 |
| ERP Operating LP | 4.625% | 12/15/21 | 6,856 | 7,688 |
| ERP Operating LP | 3.000% | 4/15/23 | 3,975 | 4,088 |
| ERP Operating LP | 3.375% | 6/1/25 | 2,950 | 3,097 |
| Essex Portfolio LP | 3.625% | 8/15/22 | 1,300 | 1,368 |
| Essex Portfolio LP | 3.375% | 1/15/23 | 1,996 | 2,065 |
| Essex Portfolio LP | 3.250% | 5/1/23 | 2,790 | 2,859 |
| Essex Portfolio LP | 3.875% | 5/1/24 | 3,300 | 3,517 |
| Essex Portfolio LP | 3.500% | 4/1/25 | 4,815 | 4,988 |
| Essex Portfolio LP | 3.375% | 4/15/26 | 2,000 | 2,066 |
| Federal Realty Investment Trust | 3.000% | 8/1/22 | 875 | 907 |
| Federal Realty Investment Trust | 2.750% | 6/1/23 | 5,025 | 5,112 |
| HCP Inc. | 3.150% | 8/1/22 | 2,950 | 2,979 |
41
| Vanguard® Intermediate-Term Corporate Bond Index Fund | ||||
| Schedule of Investments | ||||
| August 31, 2016 | ||||
| Face | Market | |||
| Maturity | Amount | Value | ||
| Coupon | Date | ($000) | ($000) | |
| HCP Inc. | 4.000% | 12/1/22 | 4,400 | 4,637 |
| HCP Inc. | 4.250% | 11/15/23 | 5,759 | 6,084 |
| HCP Inc. | 4.200% | 3/1/24 | 3,075 | 3,197 |
| HCP Inc. | 3.875% | 8/15/24 | 5,725 | 5,841 |
| HCP Inc. | 3.400% | 2/1/25 | 3,488 | 3,445 |
| HCP Inc. | 4.000% | 6/1/25 | 4,571 | 4,693 |
| Healthcare Realty Trust Inc. | 3.750% | 4/15/23 | 1,150 | 1,172 |
| Healthcare Realty Trust Inc. | 3.875% | 5/1/25 | 1,531 | 1,562 |
| Healthcare Trust of America Holdings LP | 3.700% | 4/15/23 | 1,875 | 1,924 |
| Healthcare Trust of America Holdings LP | 3.500% | 8/1/26 | 2,800 | 2,821 |
| Highwoods Realty LP | 3.625% | 1/15/23 | 800 | 814 |
| Hospitality Properties Trust | 5.000% | 8/15/22 | 4,586 | 4,979 |
| Hospitality Properties Trust | 4.500% | 6/15/23 | 1,875 | 1,928 |
| Hospitality Properties Trust | 4.650% | 3/15/24 | 2,640 | 2,707 |
| Hospitality Properties Trust | 4.500% | 3/15/25 | 3,100 | 3,157 |
| Hospitality Properties Trust | 5.250% | 2/15/26 | 1,000 | 1,060 |
| Host Hotels & Resorts LP | 6.000% | 10/1/21 | 2,600 | 2,948 |
| Host Hotels & Resorts LP | 5.250% | 3/15/22 | 2,347 | 2,578 |
| Host Hotels & Resorts LP | 4.750% | 3/1/23 | 3,491 | 3,757 |
| Host Hotels & Resorts LP | 3.750% | 10/15/23 | 3,940 | 4,009 |
| Host Hotels & Resorts LP | 4.000% | 6/15/25 | 3,500 | 3,586 |
| Kilroy Realty LP | 3.800% | 1/15/23 | 3,200 | 3,351 |
| Kilroy Realty LP | 4.375% | 10/1/25 | 2,075 | 2,244 |
| Kimco Realty Corp. | 3.400% | 11/1/22 | 3,400 | 3,570 |
| Kimco Realty Corp. | 3.125% | 6/1/23 | 3,088 | 3,161 |
| Lexington Realty Trust | 4.250% | 6/15/23 | 1,325 | 1,355 |
| Lexington Realty Trust | 4.400% | 6/15/24 | 2,155 | 2,200 |
| Liberty Property LP | 4.125% | 6/15/22 | 3,568 | 3,778 |
| Liberty Property LP | 3.375% | 6/15/23 | 3,225 | 3,293 |
| Liberty Property LP | 4.400% | 2/15/24 | 3,025 | 3,270 |
| Liberty Property LP | 3.750% | 4/1/25 | 1,975 | 2,054 |
| Mack-Cali Realty LP | 4.500% | 4/18/22 | 2,290 | 2,334 |
| Mack-Cali Realty LP | 3.150% | 5/15/23 | 810 | 758 |
| Mid-America Apartments LP | 4.300% | 10/15/23 | 2,375 | 2,578 |
| Mid-America Apartments LP | 3.750% | 6/15/24 | 1,650 | 1,734 |
| Mid-America Apartments LP | 4.000% | 11/15/25 | 4,050 | 4,336 |
| National Retail Properties Inc. | 3.800% | 10/15/22 | 2,233 | 2,359 |
| National Retail Properties Inc. | 3.300% | 4/15/23 | 1,800 | 1,840 |
| National Retail Properties Inc. | 3.900% | 6/15/24 | 2,875 | 3,031 |
| National Retail Properties Inc. | 4.000% | 11/15/25 | 2,400 | 2,579 |
| Omega Healthcare Investors Inc. | 4.375% | 8/1/23 | 5,865 | 5,968 |
| Omega Healthcare Investors Inc. | 5.875% | 3/15/24 | 2,200 | 2,299 |
| Omega Healthcare Investors Inc. | 4.950% | 4/1/24 | 2,955 | 3,088 |
| Omega Healthcare Investors Inc. | 4.500% | 1/15/25 | 2,285 | 2,319 |
| Omega Healthcare Investors Inc. | 5.250% | 1/15/26 | 3,725 | 3,958 |
| Piedmont Operating Partnership LP | 3.400% | 6/1/23 | 1,000 | 985 |
| Piedmont Operating Partnership LP | 4.450% | 3/15/24 | 4,025 | 4,235 |
| Post Apartment Homes LP | 3.375% | 12/1/22 | 1,001 | 1,020 |
| ProLogis LP | 4.250% | 8/15/23 | 4,875 | 5,409 |
| Prologis LP | 3.750% | 11/1/25 | 3,350 | 3,628 |
| Realty Income Corp. | 3.250% | 10/15/22 | 4,220 | 4,360 |
| Realty Income Corp. | 4.650% | 8/1/23 | 5,505 | 6,096 |
| Realty Income Corp. | 3.875% | 7/15/24 | 2,200 | 2,328 |
| Regency Centers LP | 3.750% | 6/15/24 | 2,825 | 2,975 |
| Regency Centers LP | 3.900% | 11/1/25 | 1,000 | 1,062 |
| Retail Opportunity Investments Partnership LP | 5.000% | 12/15/23 | 1,250 | 1,337 |
| Retail Properties of America Inc. | 4.000% | 3/15/25 | 1,750 | 1,734 |
| Select Income REIT | 4.150% | 2/1/22 | 1,275 | 1,278 |
| Select Income REIT | 4.500% | 2/1/25 | 3,775 | 3,741 |
| Senior Housing Properties Trust | 4.750% | 5/1/24 | 2,575 | 2,705 |
| Simon Property Group LP | 4.125% | 12/1/21 | 3,025 | 3,347 |
| Simon Property Group LP | 3.375% | 3/15/22 | 3,264 | 3,475 |
| Simon Property Group LP | 2.750% | 2/1/23 | 4,677 | 4,824 |
| Simon Property Group LP | 3.750% | 2/1/24 | 4,960 | 5,422 |
42
| Vanguard® Intermediate-Term Corporate Bond Index Fund | ||||
| Schedule of Investments | ||||
| August 31, 2016 | ||||
| Face | Market | |||
| Maturity | Amount | Value | ||
| Coupon | Date | ($000) | ($000) | |
| Simon Property Group LP | 3.375% | 10/1/24 | 5,417 | 5,806 |
| Simon Property Group LP | 3.500% | 9/1/25 | 4,773 | 5,163 |
| Simon Property Group LP | 3.300% | 1/15/26 | 7,250 | 7,744 |
| Sovran Acquisition LP | 3.500% | 7/1/26 | 6,250 | 6,386 |
| 1 Spirit Realty LP | 4.450% | 9/15/26 | 1,800 | 1,791 |
| Tanger Properties LP | 3.875% | 12/1/23 | 1,750 | 1,841 |
| Tanger Properties LP | 3.750% | 12/1/24 | 1,100 | 1,152 |
| Tanger Properties LP | 3.125% | 9/1/26 | 1,750 | 1,746 |
| UDR Inc. | 4.625% | 1/10/22 | 4,300 | 4,748 |
| UDR Inc. | 3.750% | 7/1/24 | 2,230 | 2,378 |
| UDR Inc. | 4.000% | 10/1/25 | 1,200 | 1,305 |
| UDR Inc. | 2.950% | 9/1/26 | 1,200 | 1,202 |
| Ventas Realty LP | 3.125% | 6/15/23 | 2,500 | 2,542 |
| Ventas Realty LP | 3.750% | 5/1/24 | 2,555 | 2,674 |
| Ventas Realty LP | 3.500% | 2/1/25 | 3,820 | 3,955 |
| Ventas Realty LP | 4.125% | 1/15/26 | 4,549 | 4,917 |
| Ventas Realty LP / Ventas Capital Corp. | 4.250% | 3/1/22 | 4,251 | 4,595 |
| Ventas Realty LP / Ventas Capital Corp. | 3.250% | 8/15/22 | 3,450 | 3,552 |
| Vornado Realty LP | 5.000% | 1/15/22 | 1,400 | 1,527 |
| Washington REIT | 3.950% | 10/15/22 | 1,550 | 1,574 |
| Weingarten Realty Investors | 3.375% | 10/15/22 | 2,550 | 2,606 |
| Weingarten Realty Investors | 3.500% | 4/15/23 | 2,975 | 3,038 |
| Weingarten Realty Investors | 4.450% | 1/15/24 | 725 | 780 |
| Weingarten Realty Investors | 3.850% | 6/1/25 | 600 | 627 |
| Weingarten Realty Investors | 3.250% | 8/15/26 | 2,600 | 2,593 |
| Welltower Inc. | 5.250% | 1/15/22 | 4,431 | 5,020 |
| Welltower Inc. | 3.750% | 3/15/23 | 4,625 | 4,868 |
| Welltower Inc. | 4.500% | 1/15/24 | 3,154 | 3,451 |
| Welltower Inc. | 4.000% | 6/1/25 | 9,226 | 9,886 |
| Welltower Inc. | 4.250% | 4/1/26 | 4,850 | 5,292 |
| WP Carey Inc. | 4.600% | 4/1/24 | 4,058 | 4,237 |
| WP Carey Inc. | 4.000% | 2/1/25 | 2,550 | 2,532 |
| 3,464,108 | ||||
| Industrial (62.3%) | ||||
| Basic Industry (3.9%) | ||||
| Agrium Inc. | 3.150% | 10/1/22 | 7,043 | 7,257 |
| Agrium Inc. | 3.500% | 6/1/23 | 5,299 | 5,562 |
| Agrium Inc. | 3.375% | 3/15/25 | 3,940 | 4,053 |
| Air Products & Chemicals Inc. | 3.000% | 11/3/21 | 4,500 | 4,805 |
| Air Products & Chemicals Inc. | 2.750% | 2/3/23 | 1,800 | 1,868 |
| Air Products & Chemicals Inc. | 3.350% | 7/31/24 | 2,995 | 3,248 |
| Airgas Inc. | 2.900% | 11/15/22 | 1,550 | 1,562 |
| Airgas Inc. | 3.650% | 7/15/24 | 1,750 | 1,863 |
| Albemarle Corp. | 4.150% | 12/1/24 | 3,075 | 3,336 |
| Barrick Gold Corp. | 4.100% | 5/1/23 | 8,588 | 9,202 |
| BHP Billiton Finance USA Ltd. | 3.250% | 11/21/21 | 8,545 | 9,085 |
| BHP Billiton Finance USA Ltd. | 2.875% | 2/24/22 | 7,505 | 7,821 |
| BHP Billiton Finance USA Ltd. | 3.850% | 9/30/23 | 13,495 | 14,702 |
| Braskem Finance Ltd. | 6.450% | 2/3/24 | 5,000 | 5,400 |
| Cabot Corp. | 3.700% | 7/15/22 | 2,950 | 3,054 |
| Celulosa Arauco y Constitucion SA | 4.750% | 1/11/22 | 4,200 | 4,468 |
| Celulosa Arauco y Constitucion SA | 4.500% | 8/1/24 | 2,900 | 3,056 |
| CF Industries Inc. | 3.450% | 6/1/23 | 6,850 | 6,813 |
| Cytec Industries Inc. | 3.500% | 4/1/23 | 3,631 | 3,610 |
| Cytec Industries Inc. | 3.950% | 5/1/25 | 200 | 203 |
| Domtar Corp. | 4.400% | 4/1/22 | 1,446 | 1,546 |
| Dow Chemical Co. | 4.125% | 11/15/21 | 9,591 | 10,489 |
| Dow Chemical Co. | 3.000% | 11/15/22 | 8,142 | 8,428 |
| Dow Chemical Co. | 3.500% | 10/1/24 | 5,850 | 6,200 |
| Eastman Chemical Co. | 3.600% | 8/15/22 | 8,183 | 8,596 |
| Eastman Chemical Co. | 3.800% | 3/15/25 | 5,000 | 5,287 |
| Ecolab Inc. | 4.350% | 12/8/21 | 9,642 | 10,810 |
| Ecolab Inc. | 3.250% | 1/14/23 | 2,100 | 2,196 |
43
| Vanguard® Intermediate-Term Corporate Bond Index Fund | ||||
| Schedule of Investments | ||||
| August 31, 2016 | ||||
| Face | Market | |||
| Maturity | Amount | Value | ||
| Coupon | Date | ($000) | ($000) | |
| EI du Pont de Nemours & Co. | 2.800% | 2/15/23 | 8,855 | 9,065 |
| Fibria Overseas Finance Ltd. | 5.250% | 5/12/24 | 3,310 | 3,422 |
| FMC Corp. | 3.950% | 2/1/22 | 1,775 | 1,848 |
| FMC Corp. | 4.100% | 2/1/24 | 4,500 | 4,750 |
| Georgia-Pacific LLC | 8.000% | 1/15/24 | 2,541 | 3,382 |
| Georgia-Pacific LLC | 7.375% | 12/1/25 | 2,427 | 3,218 |
| Goldcorp Inc. | 3.700% | 3/15/23 | 8,500 | 8,850 |
| International Flavors & Fragrances Inc. | 3.200% | 5/1/23 | 1,475 | 1,520 |
| International Paper Co. | 4.750% | 2/15/22 | 10,052 | 11,128 |
| International Paper Co. | 3.650% | 6/15/24 | 4,324 | 4,560 |
| International Paper Co. | 3.800% | 1/15/26 | 3,925 | 4,156 |
| LYB International Finance BV | 4.000% | 7/15/23 | 5,294 | 5,757 |
| LyondellBasell Industries NV | 6.000% | 11/15/21 | 7,400 | 8,621 |
| LyondellBasell Industries NV | 5.750% | 4/15/24 | 7,225 | 8,643 |
| Methanex Corp. | 4.250% | 12/1/24 | 3,340 | 3,194 |
| Monsanto Co. | 2.200% | 7/15/22 | 750 | 745 |
| Monsanto Co. | 3.375% | 7/15/24 | 6,785 | 7,112 |
| Monsanto Co. | 2.850% | 4/15/25 | 4,250 | 4,273 |
| Monsanto Co. | 5.500% | 8/15/25 | 575 | 673 |
| Mosaic Co. | 3.750% | 11/15/21 | 3,475 | 3,667 |
| Mosaic Co. | 4.250% | 11/15/23 | 8,275 | 8,812 |
| NewMarket Corp. | 4.100% | 12/15/22 | 1,050 | 1,087 |
| Newmont Mining Corp. | 3.500% | 3/15/22 | 12,629 | 13,134 |
| Nucor Corp. | 4.125% | 9/15/22 | 3,641 | 3,979 |
| Nucor Corp. | 4.000% | 8/1/23 | 5,289 | 5,719 |
| Packaging Corp. of America | 3.900% | 6/15/22 | 3,897 | 4,133 |
| Packaging Corp. of America | 4.500% | 11/1/23 | 5,245 | 5,812 |
| Packaging Corp. of America | 3.650% | 9/15/24 | 4,400 | 4,564 |
| Plum Creek Timberlands LP | 3.250% | 3/15/23 | 500 | 499 |
| Potash Corp. of Saskatchewan Inc. | 3.625% | 3/15/24 | 4,040 | 4,251 |
| Potash Corp. of Saskatchewan Inc. | 3.000% | 4/1/25 | 4,300 | 4,336 |
| Praxair Inc. | 3.000% | 9/1/21 | 3,720 | 3,933 |
| Praxair Inc. | 2.450% | 2/15/22 | 5,650 | 5,805 |
| Praxair Inc. | 2.200% | 8/15/22 | 4,743 | 4,821 |
| Praxair Inc. | 2.650% | 2/5/25 | 1,340 | 1,384 |
| Praxair Inc. | 3.200% | 1/30/26 | 7,625 | 8,202 |
| Rayonier Inc. | 3.750% | 4/1/22 | 2,225 | 2,263 |
| Reliance Steel & Aluminum Co. | 4.500% | 4/15/23 | 2,275 | 2,317 |
| Rio Tinto Finance USA Ltd. | 3.750% | 9/20/21 | 3,000 | 3,227 |
| Rio Tinto Finance USA Ltd. | 3.750% | 6/15/25 | 9,950 | 10,530 |
| Rio Tinto Finance USA plc | 3.500% | 3/22/22 | 7,357 | 7,812 |
| Rio Tinto Finance USA plc | 2.875% | 8/21/22 | 6,651 | 6,819 |
| RPM International Inc. | 3.450% | 11/15/22 | 2,275 | 2,308 |
| Sherwin-Williams Co. | 3.450% | 8/1/25 | 2,100 | 2,162 |
| Southern Copper Corp. | 3.500% | 11/8/22 | 1,200 | 1,207 |
| Southern Copper Corp. | 3.875% | 4/23/25 | 4,450 | 4,500 |
| Syngenta Finance NV | 3.125% | 3/28/22 | 3,502 | 3,581 |
| Vale Overseas Ltd. | 4.375% | 1/11/22 | 16,390 | 15,960 |
| Vale Overseas Ltd. | 6.250% | 8/10/26 | 7,000 | 7,227 |
| Valspar Corp. | 4.200% | 1/15/22 | 2,400 | 2,555 |
| Valspar Corp. | 3.950% | 1/15/26 | 2,900 | 3,077 |
| Westlake Chemical Corp. | 3.600% | 7/15/22 | 1,725 | 1,772 |
| 1 Westlake Chemical Corp. | 3.600% | 8/15/26 | 5,400 | 5,413 |
| WestRock RKT Co. | 4.900% | 3/1/22 | 2,000 | 2,206 |
| WestRock RKT Co. | 4.000% | 3/1/23 | 3,120 | 3,299 |
| Weyerhaeuser Co. | 4.625% | 9/15/23 | 4,750 | 5,293 |
| Weyerhaeuser Co. | 8.500% | 1/15/25 | 1,375 | 1,818 |
| Worthington Industries Inc. | 4.550% | 4/15/26 | 1,225 | 1,264 |
| Yamana Gold Inc. | 4.950% | 7/15/24 | 2,835 | 2,881 |
| Capital Goods (4.7%) | ||||
| 3M Co. | 2.000% | 6/26/22 | 3,435 | 3,491 |
| 3M Co. | 3.000% | 8/7/25 | 2,324 | 2,509 |
| ABB Finance USA Inc. | 2.875% | 5/8/22 | 6,071 | 6,328 |
44
| Vanguard® Intermediate-Term Corporate Bond Index Fund | ||||
| Schedule of Investments | ||||
| August 31, 2016 | ||||
| Face | Market | |||
| Maturity | Amount | Value | ||
| Coupon | Date | ($000) | ($000) | |
| Avery Dennison Corp. | 3.350% | 4/15/23 | 1,150 | 1,182 |
| Bemis Co. Inc. | 4.500% | 10/15/21 | 2,025 | 2,210 |
| Boeing Co. | 2.350% | 10/30/21 | 2,600 | 2,683 |
| Boeing Co. | 2.200% | 10/30/22 | 870 | 886 |
| Boeing Co. | 1.875% | 6/15/23 | 3,400 | 3,373 |
| Boeing Co. | 7.950% | 8/15/24 | 4,915 | 6,898 |
| Boeing Co. | 2.850% | 10/30/24 | 3,408 | 3,593 |
| Boeing Co. | 2.500% | 3/1/25 | 1,250 | 1,280 |
| Boeing Co. | 2.600% | 10/30/25 | 1,500 | 1,553 |
| Boeing Co. | 2.250% | 6/15/26 | 1,075 | 1,076 |
| Carlisle Cos. Inc. | 3.750% | 11/15/22 | 2,475 | 2,543 |
| Caterpillar Financial Services Corp. | 2.850% | 6/1/22 | 2,839 | 2,967 |
| Caterpillar Financial Services Corp. | 2.625% | 3/1/23 | 2,600 | 2,654 |
| Caterpillar Financial Services Corp. | 3.750% | 11/24/23 | 4,100 | 4,519 |
| Caterpillar Financial Services Corp. | 3.300% | 6/9/24 | 2,000 | 2,144 |
| Caterpillar Financial Services Corp. | 3.250% | 12/1/24 | 2,350 | 2,524 |
| Caterpillar Financial Services Corp. | 2.400% | 8/9/26 | 2,000 | 1,982 |
| Caterpillar Inc. | 2.600% | 6/26/22 | 3,150 | 3,266 |
| Caterpillar Inc. | 3.400% | 5/15/24 | 9,240 | 9,980 |
| Crane Co. | 4.450% | 12/15/23 | 2,200 | 2,358 |
| Deere & Co. | 2.600% | 6/8/22 | 7,350 | 7,606 |
| Dover Corp. | 3.150% | 11/15/25 | 2,700 | 2,859 |
| Eaton Corp. | 2.750% | 11/2/22 | 11,013 | 11,349 |
| Embraer Netherlands Finance BV | 5.050% | 6/15/25 | 10,450 | 10,515 |
| 1 Embraer Overseas Ltd. | 5.696% | 9/16/23 | 2,725 | 2,913 |
| Embraer SA | 5.150% | 6/15/22 | 700 | 741 |
| Emerson Electric Co. | 2.625% | 12/1/21 | 2,750 | 2,875 |
| Emerson Electric Co. | 2.625% | 2/15/23 | 2,500 | 2,588 |
| Emerson Electric Co. | 3.150% | 6/1/25 | 2,550 | 2,704 |
| Exelis Inc. | 5.550% | 10/1/21 | 5,675 | 6,489 |
| Flowserve Corp. | 3.500% | 9/15/22 | 6,625 | 6,808 |
| Flowserve Corp. | 4.000% | 11/15/23 | 2,925 | 3,074 |
| 1 Fortive Corp. | 3.150% | 6/15/26 | 6,400 | 6,657 |
| Fortune Brands Home & Security Inc. | 4.000% | 6/15/25 | 3,600 | 3,859 |
| General Dynamics Corp. | 2.250% | 11/15/22 | 8,115 | 8,311 |
| General Dynamics Corp. | 1.875% | 8/15/23 | 2,000 | 1,981 |
| General Dynamics Corp. | 2.125% | 8/15/26 | 3,000 | 2,951 |
| General Electric Capital Corp. | 4.650% | 10/17/21 | 13,963 | 15,942 |
| General Electric Capital Corp. | 3.150% | 9/7/22 | 10,292 | 10,988 |
| General Electric Capital Corp. | 3.100% | 1/9/23 | 9,632 | 10,313 |
| General Electric Capital Corp. | 3.450% | 5/15/24 | 6,928 | 7,481 |
| General Electric Co. | 2.700% | 10/9/22 | 20,972 | 21,864 |
| General Electric Co. | 3.375% | 3/11/24 | 4,183 | 4,570 |
| Harris Corp. | 3.832% | 4/27/25 | 3,400 | 3,598 |
| Hexcel Corp. | 4.700% | 8/15/25 | 500 | 533 |
| Honeywell International Inc. | 3.350% | 12/1/23 | 2,775 | 3,018 |
| Hubbell Inc. | 3.350% | 3/1/26 | 3,575 | 3,768 |
| IDEX Corp. | 4.200% | 12/15/21 | 2,775 | 2,961 |
| Illinois Tool Works Inc. | 3.375% | 9/15/21 | 2,077 | 2,233 |
| Illinois Tool Works Inc. | 3.500% | 3/1/24 | 9,686 | 10,607 |
| Ingersoll-Rand Global Holding Co. Ltd. | 4.250% | 6/15/23 | 6,460 | 7,135 |
| Ingersoll-Rand Luxembourg Finance SA | 3.550% | 11/1/24 | 2,168 | 2,289 |
| John Deere Capital Corp. | 3.150% | 10/15/21 | 3,500 | 3,714 |
| John Deere Capital Corp. | 2.750% | 3/15/22 | 2,650 | 2,752 |
| John Deere Capital Corp. | 2.800% | 1/27/23 | 3,075 | 3,194 |
| John Deere Capital Corp. | 2.800% | 3/6/23 | 8,000 | 8,363 |
| John Deere Capital Corp. | 3.350% | 6/12/24 | 3,600 | 3,875 |
| John Deere Capital Corp. | 3.400% | 9/11/25 | 4,175 | 4,526 |
| John Deere Capital Corp. | 2.650% | 6/10/26 | 3,700 | 3,777 |
| Kennametal Inc. | 3.875% | 2/15/22 | 1,600 | 1,625 |
| L-3 Communications Corp. | 3.950% | 5/28/24 | 2,695 | 2,890 |
| Leggett & Platt Inc. | 3.800% | 11/15/24 | 2,700 | 2,830 |
| Legrand France SA | 8.500% | 2/15/25 | 2,785 | 3,832 |
| Lockheed Martin Corp. | 3.350% | 9/15/21 | 6,749 | 7,227 |
45
| Vanguard® Intermediate-Term Corporate Bond Index Fund | ||||
| Schedule of Investments | ||||
| August 31, 2016 | ||||
| Face | Market | |||
| Maturity | Amount | Value | ||
| Coupon | Date | ($000) | ($000) | |
| Lockheed Martin Corp. | 3.100% | 1/15/23 | 3,015 | 3,182 |
| Lockheed Martin Corp. | 2.900% | 3/1/25 | 7,405 | 7,693 |
| Lockheed Martin Corp. | 3.550% | 1/15/26 | 14,700 | 15,917 |
| Martin Marietta Materials Inc. | 4.250% | 7/2/24 | 2,400 | 2,544 |
| Mohawk Industries Inc. | 3.850% | 2/1/23 | 4,565 | 4,787 |
| Northrop Grumman Corp. | 3.250% | 8/1/23 | 10,865 | 11,628 |
| Northrop Grumman Systems Corp. | 7.875% | 3/1/26 | 1,300 | 1,808 |
| Owens Corning | 4.200% | 12/15/22 | 5,125 | 5,463 |
| Owens Corning | 4.200% | 12/1/24 | 1,850 | 1,960 |
| Owens Corning | 3.400% | 8/15/26 | 2,400 | 2,402 |
| Parker-Hannifin Corp. | 3.500% | 9/15/22 | 2,895 | 3,139 |
| Parker-Hannifin Corp. | 3.300% | 11/21/24 | 4,297 | 4,607 |
| Pentair Finance SA | 3.150% | 9/15/22 | 3,000 | 2,963 |
| Pentair Finance SA | 4.650% | 9/15/25 | 2,500 | 2,609 |
| Precision Castparts Corp. | 2.500% | 1/15/23 | 9,398 | 9,728 |
| Precision Castparts Corp. | 3.250% | 6/15/25 | 6,074 | 6,535 |
| Raytheon Co. | 2.500% | 12/15/22 | 9,300 | 9,664 |
| Raytheon Co. | 3.150% | 12/15/24 | 2,375 | 2,552 |
| Republic Services Inc. | 5.250% | 11/15/21 | 5,353 | 6,171 |
| Republic Services Inc. | 3.550% | 6/1/22 | 5,683 | 6,121 |
| Republic Services Inc. | 4.750% | 5/15/23 | 3,056 | 3,471 |
| Republic Services Inc. | 3.200% | 3/15/25 | 3,900 | 4,075 |
| Republic Services Inc. | 2.900% | 7/1/26 | 5,925 | 6,032 |
| Rockwell Automation Inc. | 2.875% | 3/1/25 | 1,500 | 1,554 |
| Rockwell Collins Inc. | 3.100% | 11/15/21 | 559 | 579 |
| Rockwell Collins Inc. | 3.700% | 12/15/23 | 3,015 | 3,286 |
| Roper Technologies Inc. | 3.125% | 11/15/22 | 3,247 | 3,320 |
| Roper Technologies Inc. | 3.850% | 12/15/25 | 3,850 | 4,110 |
| Snap-on Inc. | 6.125% | 9/1/21 | 1,410 | 1,689 |
| Sonoco Products Co. | 4.375% | 11/1/21 | 775 | 828 |
| Spirit AeroSystems Inc. | 5.250% | 3/15/22 | 1,900 | 2,004 |
| Spirit AeroSystems Inc. | 3.850% | 6/15/26 | 1,910 | 1,977 |
| Stanley Black & Decker Inc. | 3.400% | 12/1/21 | 3,825 | 4,097 |
| Stanley Black & Decker Inc. | 2.900% | 11/1/22 | 2,639 | 2,767 |
| Textron Inc. | 5.950% | 9/21/21 | 1,250 | 1,441 |
| Textron Inc. | 4.300% | 3/1/24 | 2,740 | 2,945 |
| Textron Inc. | 3.875% | 3/1/25 | 2,700 | 2,839 |
| Textron Inc. | 4.000% | 3/15/26 | 3,000 | 3,165 |
| Timken CO | 3.875% | 9/1/24 | 2,185 | 2,177 |
| Tyco International Finance SA | 3.900% | 2/14/26 | 5,460 | 5,950 |
| United Technologies Corp. | 3.100% | 6/1/22 | 16,560 | 17,713 |
| Vulcan Materials Co. | 4.500% | 4/1/25 | 3,500 | 3,803 |
| Waste Management Inc. | 2.900% | 9/15/22 | 3,460 | 3,619 |
| Waste Management Inc. | 2.400% | 5/15/23 | 3,823 | 3,868 |
| Waste Management Inc. | 3.500% | 5/15/24 | 2,955 | 3,195 |
| Waste Management Inc. | 3.125% | 3/1/25 | 5,045 | 5,324 |
| Waste Management Inc. | 7.100% | 8/1/26 | 1,000 | 1,352 |
| Xylem Inc. | 4.875% | 10/1/21 | 2,550 | 2,759 |
| Communication (8.3%) | ||||
| 21st Century Fox America Inc. | 3.000% | 9/15/22 | 10,085 | 10,511 |
| 21st Century Fox America Inc. | 8.875% | 4/26/23 | 1,000 | 1,353 |
| 21st Century Fox America Inc. | 4.000% | 10/1/23 | 2,350 | 2,585 |
| 21st Century Fox America Inc. | 3.700% | 9/15/24 | 2,900 | 3,143 |
| 21st Century Fox America Inc. | 3.700% | 10/15/25 | 3,100 | 3,380 |
| 21st Century Fox America Inc. | 7.700% | 10/30/25 | 3,785 | 5,184 |
| America Movil SAB de CV | 3.125% | 7/16/22 | 12,747 | 13,259 |
| American Tower Corp. | 3.450% | 9/15/21 | 4,800 | 5,043 |
| American Tower Corp. | 5.900% | 11/1/21 | 7,074 | 8,239 |
| American Tower Corp. | 4.700% | 3/15/22 | 3,605 | 3,995 |
| American Tower Corp. | 3.500% | 1/31/23 | 7,794 | 8,148 |
| American Tower Corp. | 5.000% | 2/15/24 | 4,878 | 5,566 |
| American Tower Corp. | 4.000% | 6/1/25 | 8,300 | 8,947 |
| American Tower Corp. | 4.400% | 2/15/26 | 2,575 | 2,856 |
46
| Vanguard® Intermediate-Term Corporate Bond Index Fund | ||||
| Schedule of Investments | ||||
| August 31, 2016 | ||||
| Face | Market | |||
| Maturity | Amount | Value | ||
| Coupon | Date | ($000) | ($000) | |
| American Tower Corp. | 3.375% | 10/15/26 | 2,000 | 2,044 |
| AT&T Inc. | 3.000% | 2/15/22 | 13,930 | 14,378 |
| AT&T Inc. | 3.800% | 3/15/22 | 10,803 | 11,601 |
| AT&T Inc. | 3.000% | 6/30/22 | 22,415 | 23,096 |
| AT&T Inc. | 2.625% | 12/1/22 | 11,125 | 11,265 |
| AT&T Inc. | 3.600% | 2/17/23 | 23,638 | 24,961 |
| AT&T Inc. | 3.900% | 3/11/24 | 5,475 | 5,869 |
| AT&T Inc. | 4.450% | 4/1/24 | 7,602 | 8,392 |
| AT&T Inc. | 3.950% | 1/15/25 | 28,825 | 30,923 |
| AT&T Inc. | 3.400% | 5/15/25 | 26,734 | 27,608 |
| AT&T Inc. | 4.125% | 2/17/26 | 10,486 | 11,369 |
| CBS Corp. | 3.375% | 3/1/22 | 2,296 | 2,404 |
| CBS Corp. | 3.700% | 8/15/24 | 7,133 | 7,514 |
| CBS Corp. | 3.500% | 1/15/25 | 3,650 | 3,789 |
| CBS Corp. | 4.000% | 1/15/26 | 5,825 | 6,233 |
| CC Holdings GS V LLC / Crown Castle GS III Corp. | 3.849% | 4/15/23 | 7,582 | 8,111 |
| 1 Charter Communications Operating LLC / Charter | ||||
| Communications Operating Capital | 4.464% | 7/23/22 | 18,025 | 19,532 |
| 1 Charter Communications Operating LLC / Charter | ||||
| Communications Operating Capital | 4.908% | 7/23/25 | 35,031 | 38,626 |
| Comcast Cable Communications Holdings Inc. | 9.455% | 11/15/22 | 7,404 | 10,426 |
| Comcast Corp. | 1.625% | 1/15/22 | 250 | 248 |
| Comcast Corp. | 3.125% | 7/15/22 | 11,725 | 12,500 |
| Comcast Corp. | 2.850% | 1/15/23 | 5,549 | 5,809 |
| Comcast Corp. | 2.750% | 3/1/23 | 2,705 | 2,819 |
| Comcast Corp. | 3.600% | 3/1/24 | 10,182 | 11,175 |
| Comcast Corp. | 3.375% | 2/15/25 | 8,575 | 9,217 |
| Comcast Corp. | 3.375% | 8/15/25 | 11,212 | 12,087 |
| Comcast Corp. | 3.150% | 3/1/26 | 17,372 | 18,335 |
| Crown Castle International Corp. | 2.250% | 9/1/21 | 3,000 | 2,996 |
| Crown Castle International Corp. | 4.875% | 4/15/22 | 7,700 | 8,586 |
| Crown Castle International Corp. | 5.250% | 1/15/23 | 11,710 | 13,349 |
| Crown Castle International Corp. | 4.450% | 2/15/26 | 8,470 | 9,381 |
| Crown Castle International Corp. | 3.700% | 6/15/26 | 5,325 | 5,579 |
| Discovery Communications LLC | 3.300% | 5/15/22 | 1,853 | 1,888 |
| Discovery Communications LLC | 3.250% | 4/1/23 | 1,900 | 1,899 |
| Discovery Communications LLC | 3.450% | 3/15/25 | 2,350 | 2,299 |
| Discovery Communications LLC | 4.900% | 3/11/26 | 5,000 | 5,419 |
| Electronic Arts Inc. | 4.800% | 3/1/26 | 2,500 | 2,735 |
| Grupo Televisa SAB | 6.625% | 3/18/25 | 8,410 | 10,510 |
| Grupo Televisa SAB | 4.625% | 1/30/26 | 1,300 | 1,440 |
| Historic TW Inc. | 9.150% | 2/1/23 | 2,745 | 3,729 |
| Interpublic Group of Cos. Inc. | 3.750% | 2/15/23 | 1,800 | 1,884 |
| Interpublic Group of Cos. Inc. | 4.200% | 4/15/24 | 4,375 | 4,727 |
| Moody's Corp. | 4.500% | 9/1/22 | 3,021 | 3,363 |
| Moody's Corp. | 4.875% | 2/15/24 | 6,959 | 7,933 |
| NBCUniversal Media LLC | 2.875% | 1/15/23 | 12,298 | 12,885 |
| Omnicom Group Inc. | 3.625% | 5/1/22 | 9,523 | 10,180 |
| Omnicom Group Inc. | 3.650% | 11/1/24 | 6,233 | 6,631 |
| Omnicom Group Inc. | 3.600% | 4/15/26 | 9,995 | 10,647 |
| Orange SA | 4.125% | 9/14/21 | 6,481 | 7,114 |
| Pacific Bell Telephone Co. | 7.125% | 3/15/26 | 1,202 | 1,568 |
| Qwest Corp. | 6.750% | 12/1/21 | 6,260 | 7,001 |
| Qwest Corp. | 7.250% | 9/15/25 | 4,804 | 5,190 |
| RELX Capital Inc. | 3.125% | 10/15/22 | 4,219 | 4,282 |
| Rogers Communications Inc. | 3.000% | 3/15/23 | 2,250 | 2,351 |
| Rogers Communications Inc. | 4.100% | 10/1/23 | 722 | 804 |
| Rogers Communications Inc. | 3.625% | 12/15/25 | 6,375 | 6,960 |
| S&P Global Inc. | 4.000% | 6/15/25 | 2,975 | 3,256 |
| S&P Global Inc. | 4.400% | 2/15/26 | 4,720 | 5,343 |
| Scripps Networks Interactive Inc. | 3.500% | 6/15/22 | 5,200 | 5,419 |
| Scripps Networks Interactive Inc. | 3.900% | 11/15/24 | 2,400 | 2,533 |
| TCI Communications Inc. | 7.875% | 2/15/26 | 1,457 | 2,074 |
| Telefonica Emisiones SAU | 4.570% | 4/27/23 | 6,375 | 7,153 |
47
| Vanguard® Intermediate-Term Corporate Bond Index Fund | ||||
| Schedule of Investments | ||||
| August 31, 2016 | ||||
| Face | Market | |||
| Maturity | Amount | Value | ||
| Coupon | Date | ($000) | ($000) | |
| Thomson Reuters Corp. | 3.950% | 9/30/21 | 3,377 | 3,594 |
| Thomson Reuters Corp. | 4.300% | 11/23/23 | 2,000 | 2,199 |
| Thomson Reuters Corp. | 3.850% | 9/29/24 | 3,950 | 4,221 |
| Thomson Reuters Corp. | 3.350% | 5/15/26 | 7,000 | 7,228 |
| Time Warner Cable Inc. | 4.000% | 9/1/21 | 7,191 | 7,664 |
| Time Warner Cos. Inc. | 7.570% | 2/1/24 | 4,220 | 5,482 |
| Time Warner Entertainment Co. LP | 8.375% | 3/15/23 | 5,135 | 6,689 |
| Time Warner Inc. | 4.000% | 1/15/22 | 3,225 | 3,524 |
| Time Warner Inc. | 3.400% | 6/15/22 | 2,401 | 2,550 |
| Time Warner Inc. | 4.050% | 12/15/23 | 3,846 | 4,238 |
| Time Warner Inc. | 3.550% | 6/1/24 | 7,353 | 7,834 |
| Time Warner Inc. | 3.600% | 7/15/25 | 14,053 | 14,998 |
| Time Warner Inc. | 2.950% | 7/15/26 | 700 | 713 |
| Verizon Communications Inc. | 3.000% | 11/1/21 | 6,570 | 6,891 |
| Verizon Communications Inc. | 3.500% | 11/1/21 | 10,568 | 11,364 |
| Verizon Communications Inc. | 2.450% | 11/1/22 | 17,145 | 17,394 |
| Verizon Communications Inc. | 5.150% | 9/15/23 | 61,552 | 72,001 |
| Verizon Communications Inc. | 4.150% | 3/15/24 | 12,614 | 13,997 |
| Verizon Communications Inc. | 3.500% | 11/1/24 | 17,670 | 18,952 |
| Verizon Communications Inc. | 2.625% | 8/15/26 | 14,075 | 13,919 |
| Viacom Inc. | 3.875% | 12/15/21 | 6,479 | 6,908 |
| Viacom Inc. | 3.125% | 6/15/22 | 3,000 | 2,983 |
| Viacom Inc. | 4.250% | 9/1/23 | 12,316 | 13,064 |
| Viacom Inc. | 3.875% | 4/1/24 | 4,325 | 4,467 |
| Vodafone Group plc | 2.500% | 9/26/22 | 7,192 | 7,295 |
| Vodafone Group plc | 2.950% | 2/19/23 | 11,441 | 11,864 |
| Walt Disney Co. | 2.550% | 2/15/22 | 5,982 | 6,221 |
| Walt Disney Co. | 2.350% | 12/1/22 | 4,378 | 4,549 |
| Walt Disney Co. | 3.150% | 9/17/25 | 4,925 | 5,353 |
| Walt Disney Co. | 3.000% | 2/13/26 | 8,800 | 9,335 |
| Walt Disney Co. | 1.850% | 7/30/26 | 1,575 | 1,514 |
| WPP Finance 2010 | 4.750% | 11/21/21 | 3,409 | 3,802 |
| WPP Finance 2010 | 3.625% | 9/7/22 | 4,975 | 5,282 |
| WPP Finance 2010 | 3.750% | 9/19/24 | 4,531 | 4,811 |
| Consumer Cyclical (7.6%) | ||||
| Advance Auto Parts Inc. | 4.500% | 1/15/22 | 2,300 | 2,483 |
| Advance Auto Parts Inc. | 4.500% | 12/1/23 | 2,975 | 3,213 |
| Alibaba Group Holding Ltd. | 3.125% | 11/28/21 | 9,800 | 10,139 |
| Alibaba Group Holding Ltd. | 3.600% | 11/28/24 | 16,575 | 17,295 |
| Amazon.com Inc. | 3.300% | 12/5/21 | 9,234 | 9,931 |
| Amazon.com Inc. | 2.500% | 11/29/22 | 7,180 | 7,408 |
| Amazon.com Inc. | 3.800% | 12/5/24 | 8,268 | 9,228 |
| Automatic Data Processing Inc. | 3.375% | 9/15/25 | 7,341 | 8,000 |
| AutoNation Inc. | 4.500% | 10/1/25 | 4,500 | 4,772 |
| AutoZone Inc. | 3.700% | 4/15/22 | 5,447 | 5,821 |
| AutoZone Inc. | 2.875% | 1/15/23 | 2,500 | 2,549 |
| AutoZone Inc. | 3.125% | 7/15/23 | 1,500 | 1,552 |
| AutoZone Inc. | 3.250% | 4/15/25 | 3,825 | 3,980 |
| AutoZone Inc. | 3.125% | 4/21/26 | 3,000 | 3,092 |
| Bed Bath & Beyond Inc. | 3.749% | 8/1/24 | 1,475 | 1,529 |
| Block Financial LLC | 5.500% | 11/1/22 | 3,875 | 4,191 |
| Block Financial LLC | 5.250% | 10/1/25 | 5,950 | 6,464 |
| BorgWarner Inc. | 3.375% | 3/15/25 | 2,575 | 2,643 |
| Brinker International Inc. | 3.875% | 5/15/23 | 1,450 | 1,445 |
| Coach Inc. | 4.250% | 4/1/25 | 3,725 | 3,908 |
| Costco Wholesale Corp. | 2.250% | 2/15/22 | 3,200 | 3,283 |
| Cummins Inc. | 3.650% | 10/1/23 | 4,683 | 5,081 |
| CVS Health Corp. | 3.500% | 7/20/22 | 12,495 | 13,409 |
| CVS Health Corp. | 2.750% | 12/1/22 | 13,335 | 13,779 |
| CVS Health Corp. | 4.750% | 12/1/22 | 1,324 | 1,500 |
| CVS Health Corp. | 4.000% | 12/5/23 | 9,364 | 10,335 |
| CVS Health Corp. | 3.375% | 8/12/24 | 6,090 | 6,471 |
| CVS Health Corp. | 5.000% | 12/1/24 | 1,000 | 1,162 |
48
| Vanguard® Intermediate-Term Corporate Bond Index Fund | ||||
| Schedule of Investments | ||||
| August 31, 2016 | ||||
| Face | Market | |||
| Maturity | Amount | Value | ||
| Coupon | Date | ($000) | ($000) | |
| CVS Health Corp. | 3.875% | 7/20/25 | 19,645 | 21,634 |
| CVS Health Corp. | 2.875% | 6/1/26 | 8,525 | 8,725 |
| Delphi Automotive plc | 4.250% | 1/15/26 | 6,250 | 6,766 |
| Delphi Corp. | 5.000% | 2/15/23 | 3,357 | 3,567 |
| Delphi Corp. | 4.150% | 3/15/24 | 3,827 | 4,095 |
| Dollar General Corp. | 3.250% | 4/15/23 | 5,100 | 5,272 |
| Dollar General Corp. | 4.150% | 11/1/25 | 4,800 | 5,227 |
| eBay Inc. | 3.800% | 3/9/22 | 5,250 | 5,609 |
| eBay Inc. | 2.600% | 7/15/22 | 6,500 | 6,565 |
| eBay Inc. | 3.450% | 8/1/24 | 4,615 | 4,763 |
| Expedia Inc. | 4.500% | 8/15/24 | 3,835 | 4,015 |
| 1 Expedia Inc. | 5.000% | 2/15/26 | 3,937 | 4,161 |
| Ford Motor Credit Co. LLC | 3.219% | 1/9/22 | 9,650 | 9,936 |
| Ford Motor Credit Co. LLC | 4.250% | 9/20/22 | 6,875 | 7,445 |
| Ford Motor Credit Co. LLC | 3.096% | 5/4/23 | 1,341 | 1,351 |
| Ford Motor Credit Co. LLC | 4.375% | 8/6/23 | 6,925 | 7,502 |
| Ford Motor Credit Co. LLC | 3.664% | 9/8/24 | 6,100 | 6,299 |
| Ford Motor Credit Co. LLC | 4.134% | 8/4/25 | 15,550 | 16,482 |
| Ford Motor Credit Co. LLC | 4.389% | 1/8/26 | 7,300 | 7,885 |
| General Motors Co. | 4.875% | 10/2/23 | 13,299 | 14,463 |
| General Motors Co. | 4.000% | 4/1/25 | 3,340 | 3,411 |
| General Motors Financial Co. Inc. | 4.375% | 9/25/21 | 10,170 | 10,831 |
| General Motors Financial Co. Inc. | 3.450% | 4/10/22 | 12,802 | 13,042 |
| General Motors Financial Co. Inc. | 3.700% | 5/9/23 | 8,750 | 8,914 |
| General Motors Financial Co. Inc. | 4.250% | 5/15/23 | 5,283 | 5,521 |
| General Motors Financial Co. Inc. | 4.000% | 1/15/25 | 9,038 | 9,174 |
| General Motors Financial Co. Inc. | 4.300% | 7/13/25 | 4,665 | 4,840 |
| General Motors Financial Co. Inc. | 5.250% | 3/1/26 | 6,100 | 6,741 |
| Harley-Davidson Inc. | 3.500% | 7/28/25 | 3,850 | 4,064 |
| Harman International Industries Inc. | 4.150% | 5/15/25 | 4,050 | 4,181 |
| Home Depot Inc. | 2.625% | 6/1/22 | 12,471 | 12,969 |
| Home Depot Inc. | 2.700% | 4/1/23 | 8,953 | 9,331 |
| Home Depot Inc. | 3.750% | 2/15/24 | 10,033 | 11,168 |
| Home Depot Inc. | 3.350% | 9/15/25 | 6,500 | 7,103 |
| Home Depot Inc. | 3.000% | 4/1/26 | 3,875 | 4,127 |
| Hyatt Hotels Corp. | 3.375% | 7/15/23 | 2,725 | 2,815 |
| Hyatt Hotels Corp. | 4.850% | 3/15/26 | 1,900 | 2,113 |
| JD.com Inc. | 3.875% | 4/29/26 | 2,250 | 2,217 |
| Johnson Controls Inc. | 3.750% | 12/1/21 | 2,821 | 2,972 |
| Johnson Controls Inc. | 3.625% | 7/2/24 | 1,800 | 1,919 |
| Kohl's Corp. | 4.000% | 11/1/21 | 3,270 | 3,466 |
| Kohl's Corp. | 3.250% | 2/1/23 | 2,825 | 2,841 |
| Kohl's Corp. | 4.750% | 12/15/23 | 1,263 | 1,366 |
| Kohl's Corp. | 4.250% | 7/17/25 | 4,350 | 4,516 |
| Lowe's Cos. Inc. | 3.800% | 11/15/21 | 5,753 | 6,316 |
| Lowe's Cos. Inc. | 3.120% | 4/15/22 | 2,474 | 2,628 |
| Lowe's Cos. Inc. | 3.875% | 9/15/23 | 5,316 | 5,922 |
| Lowe's Cos. Inc. | 3.125% | 9/15/24 | 2,479 | 2,637 |
| Lowe's Cos. Inc. | 3.375% | 9/15/25 | 8,725 | 9,441 |
| Lowe's Cos. Inc. | 2.500% | 4/15/26 | 7,275 | 7,375 |
| Macy's Retail Holdings Inc. | 3.875% | 1/15/22 | 4,025 | 4,199 |
| Macy's Retail Holdings Inc. | 2.875% | 2/15/23 | 7,130 | 7,004 |
| Macy's Retail Holdings Inc. | 4.375% | 9/1/23 | 2,775 | 2,931 |
| Macy's Retail Holdings Inc. | 3.625% | 6/1/24 | 3,603 | 3,655 |
| Macy's Retail Holdings Inc. | 6.650% | 7/15/24 | 50 | 59 |
| Magna International Inc. | 3.625% | 6/15/24 | 3,313 | 3,465 |
| Magna International Inc. | 4.150% | 10/1/25 | 2,850 | 3,132 |
| Marriott International Inc. | 2.300% | 1/15/22 | 4,250 | 4,274 |
| Marriott International Inc. | 3.125% | 10/15/21 | 2,500 | 2,580 |
| Marriott International Inc. | 3.125% | 6/15/26 | 6,370 | 6,480 |
| Marriott International Inc. | 3.250% | 9/15/22 | 2,300 | 2,398 |
| Marriott International Inc. | 3.750% | 10/1/25 | 1,485 | 1,581 |
| MasterCard Inc. | 3.375% | 4/1/24 | 6,308 | 6,864 |
| McDonald's Corp. | 2.625% | 1/15/22 | 3,941 | 4,058 |
49
| Vanguard® Intermediate-Term Corporate Bond Index Fund | ||||
| Schedule of Investments | ||||
| August 31, 2016 | ||||
| Face | Market | |||
| Maturity | Amount | Value | ||
| Coupon | Date | ($000) | ($000) | |
| McDonald's Corp. | 3.250% | 6/10/24 | 1,500 | 1,618 |
| McDonald's Corp. | 3.375% | 5/26/25 | 9,520 | 10,092 |
| McDonald's Corp. | 3.700% | 1/30/26 | 13,225 | 14,236 |
| NIKE Inc. | 2.250% | 5/1/23 | 1,574 | 1,618 |
| Nordstrom Inc. | 4.000% | 10/15/21 | 5,000 | 5,358 |
| NVR Inc. | 3.950% | 9/15/22 | 3,152 | 3,326 |
| O'Reilly Automotive Inc. | 4.625% | 9/15/21 | 1,596 | 1,759 |
| O'Reilly Automotive Inc. | 3.800% | 9/1/22 | 2,250 | 2,385 |
| O'Reilly Automotive Inc. | 3.850% | 6/15/23 | 3,625 | 3,891 |
| O'Reilly Automotive Inc. | 3.550% | 3/15/26 | 2,145 | 2,284 |
| Priceline Group Inc. | 3.650% | 3/15/25 | 4,850 | 5,104 |
| Priceline Group Inc. | 3.600% | 6/1/26 | 6,040 | 6,318 |
| QVC Inc. | 5.125% | 7/2/22 | 4,335 | 4,612 |
| QVC Inc. | 4.375% | 3/15/23 | 2,525 | 2,550 |
| QVC Inc. | 4.850% | 4/1/24 | 7,533 | 7,769 |
| QVC Inc. | 4.450% | 2/15/25 | 3,000 | 2,987 |
| Ross Stores Inc. | 3.375% | 9/15/24 | 1,125 | 1,197 |
| Signet UK Finance plc | 4.700% | 6/15/24 | 2,175 | 2,126 |
| Staples Inc. | 4.375% | 1/12/23 | 2,675 | 2,763 |
| Starbucks Corp. | 2.700% | 6/15/22 | 2,250 | 2,360 |
| Starbucks Corp. | 3.850% | 10/1/23 | 4,789 | 5,377 |
| Starbucks Corp. | 2.450% | 6/15/26 | 3,800 | 3,873 |
| Starwood Hotels & Resorts Worldwide Inc. | 3.125% | 2/15/23 | 1,625 | 1,654 |
| Starwood Hotels & Resorts Worldwide Inc. | 3.750% | 3/15/25 | 3,300 | 3,460 |
| Target Corp. | 2.900% | 1/15/22 | 5,795 | 6,117 |
| Target Corp. | 3.500% | 7/1/24 | 8,325 | 9,174 |
| Target Corp. | 2.500% | 4/15/26 | 8,650 | 8,851 |
| TJX Cos. Inc. | 2.500% | 5/15/23 | 4,525 | 4,675 |
| Toyota Motor Credit Corp. | 3.400% | 9/15/21 | 6,500 | 6,968 |
| Toyota Motor Credit Corp. | 3.300% | 1/12/22 | 8,717 | 9,316 |
| Toyota Motor Credit Corp. | 2.800% | 7/13/22 | 2,300 | 2,401 |
| Toyota Motor Credit Corp. | 2.625% | 1/10/23 | 5,184 | 5,382 |
| Under Armour Inc. | 3.250% | 6/15/26 | 4,065 | 4,113 |
| VF Corp. | 3.500% | 9/1/21 | 3,165 | 3,399 |
| Visa Inc. | 2.800% | 12/14/22 | 15,450 | 16,212 |
| Visa Inc. | 3.150% | 12/14/25 | 31,230 | 33,273 |
| Wal-Mart Stores Inc. | 2.550% | 4/11/23 | 14,584 | 15,188 |
| Wal-Mart Stores Inc. | 3.300% | 4/22/24 | 12,161 | 13,301 |
| Walgreen Co. | 3.100% | 9/15/22 | 5,127 | 5,325 |
| Walgreens Boots Alliance Inc. | 3.300% | 11/18/21 | 11,014 | 11,630 |
| Walgreens Boots Alliance Inc. | 3.100% | 6/1/23 | 6,865 | 7,059 |
| Walgreens Boots Alliance Inc. | 3.800% | 11/18/24 | 12,768 | 13,688 |
| Walgreens Boots Alliance Inc. | 3.450% | 6/1/26 | 17,977 | 18,732 |
| Wyndham Worldwide Corp. | 4.250% | 3/1/22 | 4,150 | 4,381 |
| Wyndham Worldwide Corp. | 3.900% | 3/1/23 | 2,850 | 2,926 |
| Wyndham Worldwide Corp. | 5.100% | 10/1/25 | 3,950 | 4,350 |
| Consumer Noncyclical (16.5%) | ||||
| Abbott Laboratories | 2.550% | 3/15/22 | 3,858 | 3,947 |
| Abbott Laboratories | 2.950% | 3/15/25 | 6,250 | 6,445 |
| AbbVie Inc. | 2.900% | 11/6/22 | 22,590 | 23,291 |
| AbbVie Inc. | 3.200% | 11/6/22 | 8,052 | 8,393 |
| AbbVie Inc. | 2.850% | 5/14/23 | 7,000 | 7,107 |
| AbbVie Inc. | 3.600% | 5/14/25 | 26,280 | 27,787 |
| AbbVie Inc. | 3.200% | 5/14/26 | 14,000 | 14,328 |
| Actavis Funding SCS | 3.450% | 3/15/22 | 22,088 | 23,130 |
| Actavis Funding SCS | 3.850% | 6/15/24 | 10,270 | 10,900 |
| Actavis Funding SCS | 3.800% | 3/15/25 | 31,356 | 33,042 |
| Actavis Inc. | 3.250% | 10/1/22 | 12,250 | 12,697 |
| Agilent Technologies Inc. | 3.200% | 10/1/22 | 5,200 | 5,360 |
| Agilent Technologies Inc. | 3.875% | 7/15/23 | 3,950 | 4,180 |
| Allergan Inc. | 2.800% | 3/15/23 | 3,350 | 3,346 |
| Altria Group Inc. | 2.850% | 8/9/22 | 14,686 | 15,383 |
| Altria Group Inc. | 2.950% | 5/2/23 | 2,222 | 2,339 |
50
| Vanguard® Intermediate-Term Corporate Bond Index Fund | ||||
| Schedule of Investments | ||||
| August 31, 2016 | ||||
| Face | Market | |||
| Maturity | Amount | Value | ||
| Coupon | Date | ($000) | ($000) | |
| Altria Group Inc. | 4.000% | 1/31/24 | 10,093 | 11,319 |
| AmerisourceBergen Corp. | 3.500% | 11/15/21 | 5,125 | 5,480 |
| AmerisourceBergen Corp. | 3.400% | 5/15/24 | 3,685 | 3,900 |
| AmerisourceBergen Corp. | 3.250% | 3/1/25 | 2,175 | 2,297 |
| Amgen Inc. | 3.875% | 11/15/21 | 10,920 | 11,876 |
| Amgen Inc. | 2.700% | 5/1/22 | 6,472 | 6,655 |
| Amgen Inc. | 3.625% | 5/15/22 | 9,813 | 10,548 |
| Amgen Inc. | 2.250% | 8/19/23 | 2,000 | 1,986 |
| Amgen Inc. | 3.625% | 5/22/24 | 10,081 | 10,872 |
| Amgen Inc. | 3.125% | 5/1/25 | 5,067 | 5,316 |
| Amgen Inc. | 2.600% | 8/19/26 | 9,000 | 8,937 |
| Anheuser-Busch InBev Finance Inc. | 2.625% | 1/17/23 | 9,244 | 9,432 |
| Anheuser-Busch InBev Finance Inc. | 3.300% | 2/1/23 | 40,454 | 42,382 |
| Anheuser-Busch InBev Finance Inc. | 3.700% | 2/1/24 | 9,147 | 9,897 |
| Anheuser-Busch InBev Finance Inc. | 3.650% | 2/1/26 | 80,489 | 85,903 |
| Anheuser-Busch InBev Worldwide Inc. | 2.500% | 7/15/22 | 25,850 | 26,307 |
| Archer-Daniels-Midland Co. | 2.500% | 8/11/26 | 9,000 | 9,032 |
| AstraZeneca plc | 3.375% | 11/16/25 | 14,875 | 15,925 |
| Baxalta Inc. | 3.600% | 6/23/22 | 4,304 | 4,458 |
| Baxalta Inc. | 4.000% | 6/23/25 | 11,457 | 12,245 |
| Baxter International Inc. | 2.600% | 8/15/26 | 3,000 | 2,966 |
| Beam Suntory Inc. | 3.250% | 5/15/22 | 1,375 | 1,408 |
| Beam Suntory Inc. | 3.250% | 6/15/23 | 1,050 | 1,078 |
| Becton Dickinson & Co. | 3.125% | 11/8/21 | 6,570 | 6,923 |
| Becton Dickinson & Co. | 3.300% | 3/1/23 | 2,150 | 2,259 |
| Becton Dickinson & Co. | 3.875% | 5/15/24 | 2,795 | 3,028 |
| Becton Dickinson and Co. | 3.734% | 12/15/24 | 13,243 | 14,385 |
| Biogen Inc. | 3.625% | 9/15/22 | 7,303 | 7,812 |
| Biogen Inc. | 4.050% | 9/15/25 | 12,475 | 13,607 |
| Boston Scientific Corp. | 3.375% | 5/15/22 | 4,175 | 4,384 |
| Boston Scientific Corp. | 4.125% | 10/1/23 | 2,710 | 2,930 |
| Boston Scientific Corp. | 3.850% | 5/15/25 | 5,000 | 5,362 |
| Bristol-Myers Squibb Co. | 2.000% | 8/1/22 | 7,453 | 7,538 |
| Bristol-Myers Squibb Co. | 7.150% | 6/15/23 | 900 | 1,183 |
| Bristol-Myers Squibb Co. | 3.250% | 11/1/23 | 3,075 | 3,360 |
| Brown-Forman Corp. | 2.250% | 1/15/23 | 1,675 | 1,689 |
| Bunge Ltd. Finance Corp. | 3.250% | 8/15/26 | 5,100 | 5,130 |
| Campbell Soup Co. | 2.500% | 8/2/22 | 2,075 | 2,120 |
| Campbell Soup Co. | 3.300% | 3/19/25 | 1,100 | 1,161 |
| Cardinal Health Inc. | 3.200% | 6/15/22 | 2,550 | 2,675 |
| Cardinal Health Inc. | 3.200% | 3/15/23 | 5,357 | 5,628 |
| Cardinal Health Inc. | 3.500% | 11/15/24 | 1,500 | 1,602 |
| Cardinal Health Inc. | 3.750% | 9/15/25 | 4,800 | 5,193 |
| Catholic Health Initiatives Colorado GO | 2.950% | 11/1/22 | 2,250 | 2,261 |
| Celgene Corp. | 3.250% | 8/15/22 | 7,315 | 7,630 |
| Celgene Corp. | 3.550% | 8/15/22 | 7,164 | 7,631 |
| Celgene Corp. | 4.000% | 8/15/23 | 5,935 | 6,467 |
| Celgene Corp. | 3.625% | 5/15/24 | 6,309 | 6,685 |
| Celgene Corp. | 3.875% | 8/15/25 | 19,381 | 20,907 |
| Church & Dwight Co. Inc. | 2.875% | 10/1/22 | 900 | 928 |
| Clorox Co. | 3.800% | 11/15/21 | 3,288 | 3,576 |
| Clorox Co. | 3.050% | 9/15/22 | 2,100 | 2,199 |
| Clorox Co. | 3.500% | 12/15/24 | 3,033 | 3,254 |
| Coca-Cola Bottling Co. Consolidated | 3.800% | 11/25/25 | 3,750 | 4,031 |
| Coca-Cola Co. | 1.550% | 9/1/21 | 6,300 | 6,289 |
| Coca-Cola Co. | 3.300% | 9/1/21 | 9,987 | 10,770 |
| Coca-Cola Co. | 2.500% | 4/1/23 | 5,403 | 5,602 |
| Coca-Cola Co. | 3.200% | 11/1/23 | 10,300 | 11,191 |
| Coca-Cola Co. | 2.875% | 10/27/25 | 12,187 | 12,854 |
| Coca-Cola Co. | 2.550% | 6/1/26 | 3,475 | 3,563 |
| Coca-Cola Co. | 2.250% | 9/1/26 | 5,400 | 5,395 |
| Coca-Cola Enterprises Inc. | 4.500% | 9/1/21 | 2,150 | 2,383 |
| Coca-Cola Femsa SAB de CV | 3.875% | 11/26/23 | 5,610 | 6,051 |
| Coca-Cola Refreshments USA Inc. | 8.500% | 2/1/22 | 975 | 1,299 |
51
| Vanguard® Intermediate-Term Corporate Bond Index Fund | ||||
| Schedule of Investments | ||||
| August 31, 2016 | ||||
| Face | Market | |||
| Maturity | Amount | Value | ||
| Coupon | Date | ($000) | ($000) | |
| Colgate-Palmolive Co. | 2.450% | 11/15/21 | 2,875 | 3,004 |
| Colgate-Palmolive Co. | 2.300% | 5/3/22 | 3,414 | 3,536 |
| Colgate-Palmolive Co. | 1.950% | 2/1/23 | 6,075 | 6,148 |
| Colgate-Palmolive Co. | 2.100% | 5/1/23 | 650 | 664 |
| Colgate-Palmolive Co. | 3.250% | 3/15/24 | 3,853 | 4,247 |
| ConAgra Foods Inc. | 3.250% | 9/15/22 | 3,675 | 3,804 |
| ConAgra Foods Inc. | 3.200% | 1/25/23 | 5,763 | 6,007 |
| Covidien International Finance SA | 3.200% | 6/15/22 | 7,080 | 7,482 |
| Covidien International Finance SA | 2.950% | 6/15/23 | 5,000 | 5,240 |
| CR Bard Inc. | 3.000% | 5/15/26 | 3,200 | 3,257 |
| Danaher Corp. | 3.350% | 9/15/25 | 3,760 | 4,138 |
| Diageo Capital plc | 2.625% | 4/29/23 | 12,520 | 12,908 |
| Diageo Investment Corp. | 2.875% | 5/11/22 | 5,987 | 6,262 |
| Dignity Health California GO | 3.125% | 11/1/22 | 800 | 817 |
| Dignity Health California GO | 3.812% | 11/1/24 | 2,600 | 2,794 |
| Dr Pepper Snapple Group Inc. | 3.200% | 11/15/21 | 2,175 | 2,289 |
| Dr Pepper Snapple Group Inc. | 2.700% | 11/15/22 | 1,125 | 1,147 |
| Dr Pepper Snapple Group Inc. | 3.400% | 11/15/25 | 3,400 | 3,612 |
| Eli Lilly & Co. | 2.750% | 6/1/25 | 6,740 | 7,177 |
| Estee Lauder Cos. Inc. | 2.350% | 8/15/22 | 1,500 | 1,523 |
| Express Scripts Holding Co. | 4.750% | 11/15/21 | 11,537 | 12,975 |
| Express Scripts Holding Co. | 3.900% | 2/15/22 | 8,454 | 9,112 |
| Express Scripts Holding Co. | 3.000% | 7/15/23 | 7,420 | 7,506 |
| Express Scripts Holding Co. | 3.500% | 6/15/24 | 5,496 | 5,708 |
| Express Scripts Holding Co. | 4.500% | 2/25/26 | 13,000 | 14,360 |
| Flowers Foods Inc. | 4.375% | 4/1/22 | 2,725 | 2,940 |
| Fomento Economico Mexicano SAB de CV | 2.875% | 5/10/23 | 1,800 | 1,813 |
| General Mills Inc. | 3.150% | 12/15/21 | 6,250 | 6,645 |
| General Mills Inc. | 3.650% | 2/15/24 | 2,911 | 3,185 |
| Gilead Sciences Inc. | 4.400% | 12/1/21 | 11,627 | 13,053 |
| Gilead Sciences Inc. | 3.250% | 9/1/22 | 6,607 | 7,030 |
| Gilead Sciences Inc. | 3.700% | 4/1/24 | 14,493 | 15,727 |
| Gilead Sciences Inc. | 3.500% | 2/1/25 | 13,709 | 14,624 |
| Gilead Sciences Inc. | 3.650% | 3/1/26 | 19,123 | 20,684 |
| GlaxoSmithKline Capital Inc. | 2.800% | 3/18/23 | 6,473 | 6,785 |
| GlaxoSmithKline Capital plc | 2.850% | 5/8/22 | 13,268 | 13,971 |
| Hershey Co. | 2.625% | 5/1/23 | 1,750 | 1,802 |
| Hershey Co. | 3.200% | 8/21/25 | 2,100 | 2,247 |
| Hershey Co. | 2.300% | 8/15/26 | 3,500 | 3,485 |
| JM Smucker Co. | 3.500% | 10/15/21 | 5,655 | 6,038 |
| JM Smucker Co. | 3.000% | 3/15/22 | 3,225 | 3,378 |
| JM Smucker Co. | 3.500% | 3/15/25 | 6,466 | 6,970 |
| Johnson & Johnson | 2.450% | 12/5/21 | 7,450 | 7,834 |
| Johnson & Johnson | 2.050% | 3/1/23 | 4,219 | 4,299 |
| Johnson & Johnson | 6.730% | 11/15/23 | 50 | 67 |
| Johnson & Johnson | 3.375% | 12/5/23 | 6,600 | 7,332 |
| Johnson & Johnson | 2.450% | 3/1/26 | 10,750 | 11,100 |
| Kaiser Foundation Hospitals | 3.500% | 4/1/22 | 2,675 | 2,858 |
| Kellogg Co. | 3.125% | 5/17/22 | 825 | 865 |
| Kellogg Co. | 3.250% | 4/1/26 | 6,091 | 6,325 |
| Kimberly-Clark Corp. | 2.400% | 3/1/22 | 2,200 | 2,271 |
| Kimberly-Clark Corp. | 2.400% | 6/1/23 | 2,985 | 3,087 |
| Kimberly-Clark Corp. | 2.650% | 3/1/25 | 3,900 | 4,069 |
| Kimberly-Clark Corp. | 3.050% | 8/15/25 | 3,000 | 3,219 |
| Kimberly-Clark Corp. | 2.750% | 2/15/26 | 2,000 | 2,085 |
| Koninklijke Philips NV | 3.750% | 3/15/22 | 6,462 | 6,957 |
| Kraft Foods Group Inc. | 3.500% | 6/6/22 | 15,704 | 16,778 |
| Kraft Heinz Foods Co. | 3.500% | 7/15/22 | 8,520 | 9,098 |
| Kraft Heinz Foods Co. | 3.950% | 7/15/25 | 10,875 | 11,823 |
| Kraft Heinz Foods Co. | 3.000% | 6/1/26 | 17,500 | 17,721 |
| Laboratory Corp. of America Holdings | 3.200% | 2/1/22 | 3,730 | 3,873 |
| Laboratory Corp. of America Holdings | 3.750% | 8/23/22 | 2,277 | 2,408 |
| Laboratory Corp. of America Holdings | 4.000% | 11/1/23 | 1,950 | 2,090 |
| Laboratory Corp. of America Holdings | 3.600% | 2/1/25 | 6,665 | 6,985 |
52
| Vanguard® Intermediate-Term Corporate Bond Index Fund | ||||
| Schedule of Investments | ||||
| August 31, 2016 | ||||
| Face | Market | |||
| Maturity | Amount | Value | ||
| Coupon | Date | ($000) | ($000) | |
| Mattel Inc. | 3.150% | 3/15/23 | 850 | 855 |
| McCormick & Co. Inc. | 3.500% | 9/1/23 | 1,550 | 1,662 |
| McCormick & Co. Inc. | 3.250% | 11/15/25 | 3,150 | 3,351 |
| McKesson Corp. | 2.700% | 12/15/22 | 4,345 | 4,411 |
| McKesson Corp. | 2.850% | 3/15/23 | 3,350 | 3,432 |
| McKesson Corp. | 3.796% | 3/15/24 | 7,395 | 8,017 |
| Mead Johnson Nutrition Co. | 4.125% | 11/15/25 | 6,650 | 7,275 |
| Medtronic Inc. | 3.125% | 3/15/22 | 4,373 | 4,628 |
| Medtronic Inc. | 3.150% | 3/15/22 | 21,917 | 23,305 |
| Medtronic Inc. | 3.625% | 3/15/24 | 7,491 | 8,189 |
| Medtronic Inc. | 3.500% | 3/15/25 | 27,379 | 29,622 |
| Merck & Co. Inc. | 2.350% | 2/10/22 | 9,833 | 10,134 |
| Merck & Co. Inc. | 2.400% | 9/15/22 | 9,629 | 9,921 |
| Merck & Co. Inc. | 2.800% | 5/18/23 | 10,049 | 10,583 |
| Merck & Co. Inc. | 2.750% | 2/10/25 | 17,473 | 18,236 |
| Molson Coors Brewing Co. | 3.500% | 5/1/22 | 3,625 | 3,863 |
| Molson Coors Brewing Co. | 3.000% | 7/15/26 | 14,650 | 14,825 |
| Mondelez International Inc. | 4.000% | 2/1/24 | 11,225 | 12,356 |
| Mylan Inc. | 4.200% | 11/29/23 | 4,500 | 4,785 |
| 1 Mylan NV | 3.950% | 6/15/26 | 9,875 | 10,190 |
| Newell Brands Inc. | 4.000% | 6/15/22 | 375 | 399 |
| Newell Brands Inc. | 3.850% | 4/1/23 | 15,405 | 16,446 |
| Newell Brands Inc. | 4.000% | 12/1/24 | 4,447 | 4,719 |
| Newell Brands Inc. | 3.900% | 11/1/25 | 1,850 | 1,955 |
| Newell Brands Inc. | 4.200% | 4/1/26 | 18,905 | 20,697 |
| Novartis Capital Corp. | 2.400% | 9/21/22 | 12,552 | 13,010 |
| Novartis Capital Corp. | 3.400% | 5/6/24 | 11,118 | 12,178 |
| Novartis Capital Corp. | 3.000% | 11/20/25 | 9,320 | 9,930 |
| Owens & Minor Inc. | 4.375% | 12/15/24 | 2,600 | 2,639 |
| PepsiCo Inc. | 2.750% | 3/5/22 | 11,417 | 12,003 |
| PepsiCo Inc. | 3.100% | 7/17/22 | 5,965 | 6,372 |
| PepsiCo Inc. | 2.750% | 3/1/23 | 6,251 | 6,574 |
| PepsiCo Inc. | 3.600% | 3/1/24 | 7,850 | 8,599 |
| PepsiCo Inc. | 2.750% | 4/30/25 | 7,924 | 8,265 |
| PepsiCo Inc. | 3.500% | 7/17/25 | 4,660 | 5,149 |
| PepsiCo Inc. | 2.850% | 2/24/26 | 4,250 | 4,481 |
| PerkinElmer Inc. | 5.000% | 11/15/21 | 3,400 | 3,746 |
| Perrigo Co. plc | 4.000% | 11/15/23 | 7,175 | 7,354 |
| Perrigo Finance Unlimited Co. | 3.500% | 12/15/21 | 4,628 | 4,782 |
| Perrigo Finance Unlimited Co. | 3.900% | 12/15/24 | 5,350 | 5,410 |
| Perrigo Finance Unlimited Co. | 4.375% | 3/15/26 | 3,500 | 3,631 |
| Pfizer Inc. | 3.000% | 6/15/23 | 6,858 | 7,335 |
| Pfizer Inc. | 3.400% | 5/15/24 | 4,861 | 5,308 |
| Pfizer Inc. | 2.750% | 6/3/26 | 9,240 | 9,601 |
| Philip Morris International Inc. | 2.900% | 11/15/21 | 5,069 | 5,330 |
| Philip Morris International Inc. | 2.500% | 8/22/22 | 3,616 | 3,716 |
| Philip Morris International Inc. | 2.625% | 3/6/23 | 2,750 | 2,832 |
| Philip Morris International Inc. | 2.125% | 5/10/23 | 2,175 | 2,175 |
| Philip Morris International Inc. | 3.600% | 11/15/23 | 5,794 | 6,367 |
| Philip Morris International Inc. | 3.250% | 11/10/24 | 6,850 | 7,338 |
| Philip Morris International Inc. | 3.375% | 8/11/25 | 5,800 | 6,267 |
| Philip Morris International Inc. | 2.750% | 2/25/26 | 5,250 | 5,409 |
| Procter & Gamble Co. | 2.300% | 2/6/22 | 6,824 | 7,051 |
| Procter & Gamble Co. | 3.100% | 8/15/23 | 6,670 | 7,220 |
| Procter & Gamble Co. | 6.450% | 1/15/26 | 1,450 | 1,950 |
| Procter & Gamble Co. | 2.700% | 2/2/26 | 5,850 | 6,148 |
| Quest Diagnostics Inc. | 4.250% | 4/1/24 | 900 | 979 |
| Quest Diagnostics Inc. | 3.500% | 3/30/25 | 2,600 | 2,720 |
| Quest Diagnostics Inc. | 3.450% | 6/1/26 | 6,100 | 6,309 |
| Reynolds American Inc. | 4.000% | 6/12/22 | 8,040 | 8,808 |
| Reynolds American Inc. | 4.850% | 9/15/23 | 4,120 | 4,729 |
| Reynolds American Inc. | 4.450% | 6/12/25 | 16,710 | 18,743 |
| St. Jude Medical Inc. | 3.250% | 4/15/23 | 7,400 | 7,631 |
| St. Jude Medical Inc. | 3.875% | 9/15/25 | 1,400 | 1,497 |
53
| Vanguard® Intermediate-Term Corporate Bond Index Fund | ||||
| Schedule of Investments | ||||
| August 31, 2016 | ||||
| Face | Market | |||
| Maturity | Amount | Value | ||
| Coupon | Date | ($000) | ($000) | |
| Stryker Corp. | 3.375% | 5/15/24 | 2,475 | 2,613 |
| Stryker Corp. | 3.375% | 11/1/25 | 8,550 | 9,029 |
| Stryker Corp. | 3.500% | 3/15/26 | 9,370 | 9,955 |
| Sysco Corp. | 2.600% | 6/12/22 | 1,350 | 1,371 |
| Sysco Corp. | 3.750% | 10/1/25 | 6,691 | 7,242 |
| Sysco Corp. | 3.300% | 7/15/26 | 3,715 | 3,890 |
| Teva Pharmaceutical Finance Co. BV | 3.650% | 11/10/21 | 3,751 | 3,983 |
| Teva Pharmaceutical Finance Co. BV | 2.950% | 12/18/22 | 4,236 | 4,334 |
| Teva Pharmaceutical Finance IV BV | 3.650% | 11/10/21 | 2,449 | 2,604 |
| Teva Pharmaceutical Finance Netherlands III BV | 2.800% | 7/21/23 | 15,800 | 15,873 |
| Teva Pharmaceutical Finance Netherlands III BV | 3.150% | 10/1/26 | 12,000 | 12,102 |
| The Kroger Co. | 2.950% | 11/1/21 | 7,686 | 8,028 |
| The Kroger Co. | 3.400% | 4/15/22 | 2,118 | 2,246 |
| The Kroger Co. | 3.850% | 8/1/23 | 5,448 | 5,955 |
| The Kroger Co. | 4.000% | 2/1/24 | 4,525 | 4,994 |
| The Kroger Co. | 3.500% | 2/1/26 | 875 | 942 |
| Thermo Fisher Scientific Inc. | 3.300% | 2/15/22 | 6,210 | 6,524 |
| Thermo Fisher Scientific Inc. | 3.150% | 1/15/23 | 3,671 | 3,767 |
| Thermo Fisher Scientific Inc. | 3.000% | 4/15/23 | 9,150 | 9,388 |
| Thermo Fisher Scientific Inc. | 4.150% | 2/1/24 | 6,015 | 6,592 |
| Thermo Fisher Scientific Inc. | 3.650% | 12/15/25 | 2,800 | 2,963 |
| Tyson Foods Inc. | 4.500% | 6/15/22 | 8,970 | 9,931 |
| Tyson Foods Inc. | 3.950% | 8/15/24 | 10,626 | 11,514 |
| Unilever Capital Corp. | 3.100% | 7/30/25 | 2,225 | 2,394 |
| Unilever Capital Corp. | 2.000% | 7/28/26 | 6,200 | 6,074 |
| Whirlpool Corp. | 4.700% | 6/1/22 | 1,898 | 2,118 |
| Whirlpool Corp. | 3.700% | 3/1/23 | 3,475 | 3,674 |
| Whirlpool Corp. | 3.700% | 5/1/25 | 1,600 | 1,686 |
| 1 Whole Foods Market Inc. | 5.200% | 12/3/25 | 7,175 | 7,800 |
| Wyeth LLC | 6.450% | 2/1/24 | 7,644 | 9,726 |
| Zeneca Wilmington Inc. | 7.000% | 11/15/23 | 1,600 | 2,057 |
| Zimmer Biomet Holdings Inc. | 3.375% | 11/30/21 | 1,650 | 1,726 |
| Zimmer Biomet Holdings Inc. | 3.150% | 4/1/22 | 6,200 | 6,406 |
| Zimmer Biomet Holdings Inc. | 3.550% | 4/1/25 | 13,383 | 13,946 |
| Zoetis Inc. | 3.250% | 2/1/23 | 8,850 | 9,119 |
| Zoetis Inc. | 4.500% | 11/13/25 | 5,725 | 6,405 |
| Energy (9.6%) | ||||
| Anadarko Petroleum Corp. | 3.450% | 7/15/24 | 5,258 | 5,120 |
| Anadarko Petroleum Corp. | 5.550% | 3/15/26 | 8,780 | 9,703 |
| Apache Corp. | 3.250% | 4/15/22 | 8,942 | 9,151 |
| Apache Corp. | 2.625% | 1/15/23 | 1,075 | 1,056 |
| Boardwalk Pipelines LP | 3.375% | 2/1/23 | 3,275 | 3,096 |
| Boardwalk Pipelines LP | 4.950% | 12/15/24 | 4,225 | 4,370 |
| Boardwalk Pipelines LP | 5.950% | 6/1/26 | 4,300 | 4,688 |
| BP Capital Markets plc | 3.561% | 11/1/21 | 7,111 | 7,666 |
| BP Capital Markets plc | 3.062% | 3/17/22 | 6,664 | 6,993 |
| BP Capital Markets plc | 3.245% | 5/6/22 | 12,976 | 13,723 |
| BP Capital Markets plc | 2.500% | 11/6/22 | 9,650 | 9,783 |
| BP Capital Markets plc | 2.750% | 5/10/23 | 13,574 | 13,882 |
| BP Capital Markets plc | 3.994% | 9/26/23 | 5,275 | 5,775 |
| BP Capital Markets plc | 3.814% | 2/10/24 | 8,919 | 9,690 |
| BP Capital Markets plc | 3.535% | 11/4/24 | 5,725 | 6,125 |
| BP Capital Markets plc | 3.506% | 3/17/25 | 6,510 | 6,953 |
| BP Capital Markets plc | 3.119% | 5/4/26 | 5,000 | 5,160 |
| Buckeye Partners LP | 4.150% | 7/1/23 | 5,846 | 5,912 |
| Canadian Natural Resources Ltd. | 3.450% | 11/15/21 | 1,275 | 1,298 |
| Canadian Natural Resources Ltd. | 3.800% | 4/15/24 | 7,929 | 7,929 |
| Canadian Natural Resources Ltd. | 3.900% | 2/1/25 | 2,025 | 2,032 |
| Chevron Corp. | 2.411% | 3/3/22 | 8,025 | 8,231 |
| Chevron Corp. | 2.355% | 12/5/22 | 12,789 | 13,080 |
| Chevron Corp. | 2.566% | 5/16/23 | 1,000 | 1,022 |
| Chevron Corp. | 3.191% | 6/24/23 | 17,097 | 18,273 |
| Chevron Corp. | 3.326% | 11/17/25 | 5,000 | 5,389 |
54
| Vanguard® Intermediate-Term Corporate Bond Index Fund | ||||
| Schedule of Investments | ||||
| August 31, 2016 | ||||
| Face | Market | |||
| Maturity | Amount | Value | ||
| Coupon | Date | ($000) | ($000) | |
| Chevron Corp. | 2.954% | 5/16/26 | 18,800 | 19,580 |
| Cimarex Energy Co. | 5.875% | 5/1/22 | 3,227 | 3,371 |
| Cimarex Energy Co. | 4.375% | 6/1/24 | 7,350 | 7,691 |
| Columbia Pipeline Group Inc. | 4.500% | 6/1/25 | 6,775 | 7,329 |
| ConocoPhillips Co. | 2.875% | 11/15/21 | 5,250 | 5,377 |
| ConocoPhillips Co. | 2.400% | 12/15/22 | 7,560 | 7,522 |
| ConocoPhillips Co. | 3.350% | 11/15/24 | 5,467 | 5,625 |
| ConocoPhillips Co. | 4.950% | 3/15/26 | 13,518 | 15,328 |
| Devon Energy Corp. | 3.250% | 5/15/22 | 8,212 | 8,146 |
| Devon Energy Corp. | 5.850% | 12/15/25 | 7,400 | 8,305 |
| Dominion Gas Holdings LLC | 3.550% | 11/1/23 | 1,725 | 1,820 |
| Dominion Gas Holdings LLC | 3.600% | 12/15/24 | 5,725 | 6,078 |
| El Paso Natural Gas Co. LLC | 8.625% | 1/15/22 | 1,291 | 1,596 |
| Enable Midstream Partners LP | 3.900% | 5/15/24 | 4,000 | 3,760 |
| Enbridge Energy Partners LP | 4.200% | 9/15/21 | 4,469 | 4,615 |
| Enbridge Energy Partners LP | 5.875% | 10/15/25 | 3,550 | 3,951 |
| Enbridge Inc. | 4.000% | 10/1/23 | 3,944 | 3,954 |
| Enbridge Inc. | 3.500% | 6/10/24 | 4,706 | 4,562 |
| Encana Corp. | 3.900% | 11/15/21 | 4,114 | 4,061 |
| Energy Transfer Partners LP | 5.200% | 2/1/22 | 9,482 | 10,247 |
| Energy Transfer Partners LP | 3.600% | 2/1/23 | 6,445 | 6,369 |
| Energy Transfer Partners LP | 7.600% | 2/1/24 | 1,430 | 1,622 |
| Energy Transfer Partners LP | 4.050% | 3/15/25 | 9,045 | 9,032 |
| Energy Transfer Partners LP | 4.750% | 1/15/26 | 6,360 | 6,668 |
| EnLink Midstream Partners LP | 4.400% | 4/1/24 | 7,725 | 7,513 |
| EnLink Midstream Partners LP | 4.150% | 6/1/25 | 1,300 | 1,235 |
| EnLink Midstream Partners LP | 4.850% | 7/15/26 | 3,850 | 3,831 |
| Enterprise Products Operating LLC | 4.050% | 2/15/22 | 4,793 | 5,170 |
| Enterprise Products Operating LLC | 3.350% | 3/15/23 | 11,280 | 11,641 |
| Enterprise Products Operating LLC | 3.900% | 2/15/24 | 4,854 | 5,143 |
| Enterprise Products Operating LLC | 3.750% | 2/15/25 | 10,126 | 10,573 |
| Enterprise Products Operating LLC | 3.700% | 2/15/26 | 4,950 | 5,138 |
| EOG Resources Inc. | 2.625% | 3/15/23 | 9,543 | 9,540 |
| EOG Resources Inc. | 3.150% | 4/1/25 | 4,001 | 4,079 |
| EOG Resources Inc. | 4.150% | 1/15/26 | 4,625 | 5,104 |
| EQT Corp. | 4.875% | 11/15/21 | 4,125 | 4,495 |
| EQT Midstream Partners LP | 4.000% | 8/1/24 | 2,775 | 2,714 |
| Exxon Mobil Corp. | 2.397% | 3/6/22 | 13,800 | 14,203 |
| Exxon Mobil Corp. | 2.726% | 3/1/23 | 5,420 | 5,651 |
| Exxon Mobil Corp. | 3.176% | 3/15/24 | 2,965 | 3,169 |
| Exxon Mobil Corp. | 2.709% | 3/6/25 | 13,820 | 14,417 |
| Exxon Mobil Corp. | 3.043% | 3/1/26 | 18,800 | 19,951 |
| FMC Technologies Inc. | 3.450% | 10/1/22 | 2,575 | 2,485 |
| Gulf South Pipeline Co. LP | 4.000% | 6/15/22 | 750 | 726 |
| Halliburton Co. | 3.250% | 11/15/21 | 4,856 | 5,050 |
| Halliburton Co. | 3.500% | 8/1/23 | 7,745 | 8,019 |
| Halliburton Co. | 3.800% | 11/15/25 | 13,383 | 13,823 |
| Helmerich & Payne International Drilling Co. | 4.650% | 3/15/25 | 2,050 | 2,176 |
| Hess Corp. | 3.500% | 7/15/24 | 2,000 | 1,942 |
| HollyFrontier Corp. | 5.875% | 4/1/26 | 1,000 | 1,095 |
| Husky Energy Inc. | 3.950% | 4/15/22 | 3,519 | 3,715 |
| Husky Energy Inc. | 4.000% | 4/15/24 | 6,268 | 6,425 |
| Kerr-McGee Corp. | 6.950% | 7/1/24 | 4,148 | 4,847 |
| Kinder Morgan Energy Partners LP | 5.000% | 10/1/21 | 5,150 | 5,597 |
| Kinder Morgan Energy Partners LP | 4.150% | 3/1/22 | 2,350 | 2,443 |
| Kinder Morgan Energy Partners LP | 3.950% | 9/1/22 | 6,280 | 6,515 |
| Kinder Morgan Energy Partners LP | 3.450% | 2/15/23 | 5,150 | 5,100 |
| Kinder Morgan Energy Partners LP | 3.500% | 9/1/23 | 5,400 | 5,347 |
| Kinder Morgan Energy Partners LP | 4.150% | 2/1/24 | 6,583 | 6,717 |
| Kinder Morgan Energy Partners LP | 4.300% | 5/1/24 | 4,218 | 4,348 |
| Kinder Morgan Energy Partners LP | 4.250% | 9/1/24 | 5,243 | 5,397 |
| Kinder Morgan Inc. | 4.300% | 6/1/25 | 7,350 | 7,626 |
| Magellan Midstream Partners LP | 3.200% | 3/15/25 | 2,275 | 2,290 |
| Magellan Midstream Partners LP | 5.000% | 3/1/26 | 2,850 | 3,254 |
55
| Vanguard® Intermediate-Term Corporate Bond Index Fund | ||||
| Schedule of Investments | ||||
| August 31, 2016 | ||||
| Face | Market | |||
| Maturity | Amount | Value | ||
| Coupon | Date | ($000) | ($000) | |
| Marathon Oil Corp. | 2.800% | 11/1/22 | 3,839 | 3,513 |
| Marathon Oil Corp. | 3.850% | 6/1/25 | 9,312 | 8,730 |
| Marathon Petroleum Corp. | 3.625% | 9/15/24 | 6,399 | 6,481 |
| 1 MPLX LP | 4.500% | 7/15/23 | 10,766 | 10,860 |
| 1 MPLX LP | 4.875% | 12/1/24 | 9,698 | 9,904 |
| MPLX LP | 4.000% | 2/15/25 | 2,054 | 2,010 |
| 1 MPLX LP | 4.875% | 6/1/25 | 10,225 | 10,442 |
| Nabors Industries Inc. | 4.625% | 9/15/21 | 4,725 | 4,477 |
| Nabors Industries Inc. | 5.100% | 9/15/23 | 2,225 | 2,003 |
| National Fuel Gas Co. | 4.900% | 12/1/21 | 1,725 | 1,863 |
| National Fuel Gas Co. | 3.750% | 3/1/23 | 6,075 | 6,155 |
| National Fuel Gas Co. | 5.200% | 7/15/25 | 2,250 | 2,465 |
| National Oilwell Varco Inc. | 2.600% | 12/1/22 | 9,899 | 9,283 |
| Noble Energy Inc. | 4.150% | 12/15/21 | 7,086 | 7,521 |
| Noble Energy Inc. | 3.900% | 11/15/24 | 4,677 | 4,772 |
| Occidental Petroleum Corp. | 3.125% | 2/15/22 | 4,925 | 5,179 |
| Occidental Petroleum Corp. | 2.600% | 4/15/22 | 4,125 | 4,221 |
| Occidental Petroleum Corp. | 2.700% | 2/15/23 | 6,320 | 6,436 |
| Occidental Petroleum Corp. | 3.500% | 6/15/25 | 4,890 | 5,225 |
| Occidental Petroleum Corp. | 3.400% | 4/15/26 | 10,900 | 11,523 |
| Oceaneering International Inc. | 4.650% | 11/15/24 | 2,850 | 2,854 |
| ONEOK Partners LP | 3.375% | 10/1/22 | 6,513 | 6,562 |
| ONEOK Partners LP | 5.000% | 9/15/23 | 1,450 | 1,569 |
| ONEOK Partners LP | 4.900% | 3/15/25 | 5,250 | 5,687 |
| Petro-Canada | 9.250% | 10/15/21 | 2,575 | 3,275 |
| Petro-Canada | 7.875% | 6/15/26 | 1,695 | 2,168 |
| Phillips 66 | 4.300% | 4/1/22 | 16,550 | 18,229 |
| Phillips 66 Partners LP | 3.605% | 2/15/25 | 2,743 | 2,738 |
| Pioneer Natural Resources Co. | 3.950% | 7/15/22 | 3,615 | 3,807 |
| Pioneer Natural Resources Co. | 4.450% | 1/15/26 | 4,350 | 4,746 |
| Plains All American Pipeline LP / PAA Finance Corp. | 3.650% | 6/1/22 | 4,800 | 4,848 |
| Plains All American Pipeline LP / PAA Finance Corp. | 2.850% | 1/31/23 | 4,300 | 4,069 |
| Plains All American Pipeline LP / PAA Finance Corp. | 3.850% | 10/15/23 | 7,978 | 7,939 |
| Plains All American Pipeline LP / PAA Finance Corp. | 3.600% | 11/1/24 | 3,774 | 3,659 |
| Plains All American Pipeline LP / PAA Finance Corp. | 4.650% | 10/15/25 | 5,050 | 5,240 |
| Regency Energy Partners LP / Regency Energy Finance | ||||
| Corp. | 5.875% | 3/1/22 | 5,955 | 6,543 |
| Regency Energy Partners LP / Regency Energy Finance | ||||
| Corp. | 5.000% | 10/1/22 | 7,400 | 7,881 |
| Regency Energy Partners LP / Regency Energy Finance | ||||
| Corp. | 5.500% | 4/15/23 | 3,800 | 3,923 |
| Regency Energy Partners LP / Regency Energy Finance | ||||
| Corp. | 4.500% | 11/1/23 | 5,160 | 5,212 |
| Sasol Financing International plc | 4.500% | 11/14/22 | 3,100 | 3,111 |
| Schlumberger Investment SA | 3.650% | 12/1/23 | 12,952 | 14,084 |
| Shell International Finance BV | 2.375% | 8/21/22 | 4,714 | 4,810 |
| Shell International Finance BV | 2.250% | 1/6/23 | 8,356 | 8,390 |
| Shell International Finance BV | 3.400% | 8/12/23 | 7,019 | 7,520 |
| Shell International Finance BV | 3.250% | 5/11/25 | 18,082 | 19,091 |
| Shell International Finance BV | 2.875% | 5/10/26 | 15,550 | 15,927 |
| Spectra Energy Capital LLC | 3.300% | 3/15/23 | 7,325 | 7,249 |
| Spectra Energy Partners LP | 4.750% | 3/15/24 | 7,250 | 8,058 |
| Spectra Energy Partners LP | 3.500% | 3/15/25 | 5,550 | 5,686 |
| Suncor Energy Inc. | 3.600% | 12/1/24 | 5,120 | 5,408 |
| Sunoco Logistics Partners Operations LP | 4.650% | 2/15/22 | 1,650 | 1,777 |
| Sunoco Logistics Partners Operations LP | 3.450% | 1/15/23 | 1,020 | 1,017 |
| Sunoco Logistics Partners Operations LP | 4.250% | 4/1/24 | 8,700 | 9,037 |
| Sunoco Logistics Partners Operations LP | 5.950% | 12/1/25 | 5,450 | 6,286 |
| Sunoco Logistics Partners Operations LP | 3.900% | 7/15/26 | 1,000 | 1,010 |
| TC PipeLines LP | 4.375% | 3/13/25 | 100 | 101 |
| Total Capital Canada Ltd. | 2.750% | 7/15/23 | 7,187 | 7,414 |
| Total Capital International SA | 2.875% | 2/17/22 | 7,138 | 7,458 |
| Total Capital International SA | 2.700% | 1/25/23 | 7,784 | 8,029 |
| Total Capital International SA | 3.700% | 1/15/24 | 7,702 | 8,422 |
56
| Vanguard® Intermediate-Term Corporate Bond Index Fund | ||||
| Schedule of Investments | ||||
| August 31, 2016 | ||||
| Face | Market | |||
| Maturity | Amount | Value | ||
| Coupon | Date | ($000) | ($000) | |
| Total Capital International SA | 3.750% | 4/10/24 | 6,879 | 7,556 |
| Total Capital SA | 4.250% | 12/15/21 | 5,450 | 6,076 |
| TransCanada PipeLines Ltd. | 2.500% | 8/1/22 | 9,080 | 9,107 |
| TransCanada PipeLines Ltd. | 3.750% | 10/16/23 | 5,449 | 5,839 |
| TransCanada PipeLines Ltd. | 4.875% | 1/15/26 | 5,225 | 6,042 |
| Valero Energy Corp. | 3.650% | 3/15/25 | 4,025 | 4,135 |
| Western Gas Partners LP | 4.000% | 7/1/22 | 3,406 | 3,469 |
| Western Gas Partners LP | 3.950% | 6/1/25 | 5,779 | 5,682 |
| Western Gas Partners LP | 4.650% | 7/1/26 | 1,000 | 1,039 |
| Williams Partners LP | 4.000% | 11/15/21 | 5,136 | 5,275 |
| Williams Partners LP | 3.600% | 3/15/22 | 9,975 | 9,947 |
| Williams Partners LP | 3.350% | 8/15/22 | 4,275 | 4,192 |
| Williams Partners LP | 4.500% | 11/15/23 | 2,900 | 3,009 |
| Williams Partners LP | 4.300% | 3/4/24 | 9,222 | 9,430 |
| Williams Partners LP | 3.900% | 1/15/25 | 10,510 | 10,450 |
| Williams Partners LP | 4.000% | 9/15/25 | 8,695 | 8,695 |
| Williams Partners LP / ACMP Finance Corp. | 6.125% | 7/15/22 | 2,792 | 2,893 |
| Williams Partners LP / ACMP Finance Corp. | 4.875% | 5/15/23 | 9,748 | 9,845 |
| Williams Partners LP / ACMP Finance Corp. | 4.875% | 3/15/24 | 6,515 | 6,580 |
| Other Industrial (0.2%) | ||||
| CBRE Services Inc. | 5.000% | 3/15/23 | 3,587 | 3,793 |
| CBRE Services Inc. | 5.250% | 3/15/25 | 4,400 | 4,774 |
| CBRE Services Inc. | 4.875% | 3/1/26 | 4,275 | 4,542 |
| Cintas Corp. No 2 | 3.250% | 6/1/22 | 1,300 | 1,383 |
| Fluor Corp. | 3.375% | 9/15/21 | 3,680 | 3,903 |
| Fluor Corp. | 3.500% | 12/15/24 | 975 | 1,042 |
| Howard Hughes Medical Institute Revenue | 3.500% | 9/1/23 | 8,117 | 8,896 |
| Technology (9.4%) | ||||
| Adobe Systems Inc. | 3.250% | 2/1/25 | 7,765 | 8,168 |
| Alphabet Inc. | 3.375% | 2/25/24 | 7,048 | 7,722 |
| Alphabet Inc. | 1.998% | 8/15/26 | 9,500 | 9,338 |
| Altera Corp. | 4.100% | 11/15/23 | 2,600 | 2,949 |
| Amphenol Corp. | 3.125% | 9/15/21 | 1,500 | 1,545 |
| Amphenol Corp. | 4.000% | 2/1/22 | 2,400 | 2,546 |
| Analog Devices Inc. | 2.875% | 6/1/23 | 2,550 | 2,576 |
| Analog Devices Inc. | 3.900% | 12/15/25 | 6,100 | 6,521 |
| Apple Inc. | 2.150% | 2/9/22 | 5,087 | 5,177 |
| Apple Inc. | 2.700% | 5/13/22 | 14,146 | 14,795 |
| Apple Inc. | 2.850% | 2/23/23 | 11,800 | 12,391 |
| Apple Inc. | 2.400% | 5/3/23 | 39,112 | 39,984 |
| Apple Inc. | 3.450% | 5/6/24 | 21,504 | 23,312 |
| Apple Inc. | 2.500% | 2/9/25 | 15,897 | 16,127 |
| Apple Inc. | 3.200% | 5/13/25 | 14,719 | 15,673 |
| Apple Inc. | 3.250% | 2/23/26 | 22,978 | 24,562 |
| Apple Inc. | 2.450% | 8/4/26 | 5,900 | 5,910 |
| Applied Materials Inc. | 3.900% | 10/1/25 | 9,750 | 10,801 |
| Arrow Electronics Inc. | 3.500% | 4/1/22 | 2,300 | 2,317 |
| Arrow Electronics Inc. | 4.500% | 3/1/23 | 2,170 | 2,307 |
| Arrow Electronics Inc. | 4.000% | 4/1/25 | 2,400 | 2,428 |
| Autodesk Inc. | 3.600% | 12/15/22 | 2,243 | 2,306 |
| Autodesk Inc. | 4.375% | 6/15/25 | 1,800 | 1,904 |
| Avnet Inc. | 4.875% | 12/1/22 | 2,825 | 3,083 |
| Avnet Inc. | 4.625% | 4/15/26 | 3,800 | 3,951 |
| Baidu Inc. | 3.500% | 11/28/22 | 5,499 | 5,758 |
| Baidu Inc. | 4.125% | 6/30/25 | 2,450 | 2,646 |
| Broadcom Corp. | 2.500% | 8/15/22 | 500 | 440 |
| Broadridge Financial Solutions Inc. | 3.400% | 6/27/26 | 3,425 | 3,511 |
| CA Inc. | 4.500% | 8/15/23 | 1,200 | 1,307 |
| Cadence Design Systems Inc. | 4.375% | 10/15/24 | 1,575 | 1,629 |
| CDK Global Inc. | 4.500% | 10/15/24 | 3,300 | 3,302 |
| Cisco Systems Inc. | 3.000% | 6/15/22 | 1,600 | 1,706 |
| Cisco Systems Inc. | 2.600% | 2/28/23 | 7,000 | 7,276 |
| Cisco Systems Inc. | 3.625% | 3/4/24 | 7,676 | 8,534 |
57
| Vanguard® Intermediate-Term Corporate Bond Index Fund | ||||
| Schedule of Investments | ||||
| August 31, 2016 | ||||
| Face | Market | |||
| Maturity | Amount | Value | ||
| Coupon | Date | ($000) | ($000) | |
| Cisco Systems Inc. | 2.950% | 2/28/26 | 8,583 | 9,161 |
| Computer Sciences Corp. | 4.450% | 9/15/22 | 1,500 | 1,593 |
| Corning Inc. | 2.900% | 5/15/22 | 2,000 | 2,049 |
| Corning Inc. | 3.700% | 11/15/23 | 1,300 | 1,383 |
| 1 Diamond 1 Finance Corp. / Diamond 2 Finance Corp. | 5.450% | 6/15/23 | 33,169 | 35,336 |
| 1 Diamond 1 Finance Corp. / Diamond 2 Finance Corp. | 6.020% | 6/15/26 | 36,100 | 38,570 |
| Dun & Bradstreet Corp. | 4.375% | 12/1/22 | 1,800 | 1,864 |
| EMC Corp. | 3.375% | 6/1/23 | 240 | 235 |
| Equifax Inc. | 3.300% | 12/15/22 | 1,750 | 1,831 |
| Equifax Inc. | 3.250% | 6/1/26 | 1,400 | 1,450 |
| Fidelity National Information Services Inc. | 5.000% | 3/15/22 | 4,269 | 4,418 |
| Fidelity National Information Services Inc. | 4.500% | 10/15/22 | 3,400 | 3,782 |
| Fidelity National Information Services Inc. | 3.500% | 4/15/23 | 6,325 | 6,633 |
| Fidelity National Information Services Inc. | 3.875% | 6/5/24 | 4,783 | 5,118 |
| Fidelity National Information Services Inc. | 5.000% | 10/15/25 | 15,215 | 17,441 |
| Fidelity National Information Services Inc. | 3.000% | 8/15/26 | 11,700 | 11,630 |
| Fiserv Inc. | 3.500% | 10/1/22 | 6,366 | 6,753 |
| Fiserv Inc. | 3.850% | 6/1/25 | 7,350 | 7,944 |
| Flextronics International Ltd. | 4.750% | 6/15/25 | 5,875 | 6,242 |
| 1 Hewlett Packard Enterprise Co. | 4.400% | 10/15/22 | 12,351 | 13,043 |
| 1 Hewlett Packard Enterprise Co. | 4.900% | 10/15/25 | 19,375 | 20,694 |
| HP Inc. | 4.375% | 9/15/21 | 8,825 | 9,513 |
| HP Inc. | 4.650% | 12/9/21 | 8,699 | 9,500 |
| HP Inc. | 4.050% | 9/15/22 | 2,900 | 3,069 |
| Ingram Micro Inc. | 5.000% | 8/10/22 | 450 | 470 |
| Ingram Micro Inc. | 4.950% | 12/15/24 | 5,208 | 5,303 |
| Intel Corp. | 3.300% | 10/1/21 | 13,720 | 14,791 |
| Intel Corp. | 3.100% | 7/29/22 | 10,657 | 11,370 |
| Intel Corp. | 2.700% | 12/15/22 | 11,893 | 12,434 |
| Intel Corp. | 3.700% | 7/29/25 | 19,516 | 21,670 |
| Intel Corp. | 2.600% | 5/19/26 | 3,088 | 3,152 |
| International Business Machines Corp. | 2.900% | 11/1/21 | 5,675 | 5,996 |
| International Business Machines Corp. | 1.875% | 8/1/22 | 4,850 | 4,839 |
| International Business Machines Corp. | 2.875% | 11/9/22 | 7,850 | 8,244 |
| International Business Machines Corp. | 3.375% | 8/1/23 | 8,900 | 9,602 |
| International Business Machines Corp. | 3.625% | 2/12/24 | 17,874 | 19,509 |
| International Business Machines Corp. | 7.000% | 10/30/25 | 4,850 | 6,592 |
| International Business Machines Corp. | 3.450% | 2/19/26 | 5,775 | 6,295 |
| Jabil Circuit Inc. | 4.700% | 9/15/22 | 2,825 | 2,952 |
| Juniper Networks Inc. | 4.500% | 3/15/24 | 2,525 | 2,682 |
| Juniper Networks Inc. | 4.350% | 6/15/25 | 1,450 | 1,510 |
| Keysight Technologies Inc. | 4.550% | 10/30/24 | 3,900 | 4,042 |
| KLA-Tencor Corp. | 4.125% | 11/1/21 | 600 | 644 |
| KLA-Tencor Corp. | 4.650% | 11/1/24 | 9,631 | 10,590 |
| Lam Research Corp. | 3.450% | 6/15/23 | 6,450 | 6,611 |
| Lam Research Corp. | 3.800% | 3/15/25 | 3,525 | 3,709 |
| Lam Research Corp. | 3.900% | 6/15/26 | 7,265 | 7,583 |
| Lender Processing Services Inc / Black Knight Lending | ||||
| Solutions Inc | 5.750% | 4/15/23 | 1,540 | 1,636 |
| Maxim Integrated Products Inc. | 3.375% | 3/15/23 | 3,350 | 3,442 |
| Microsoft Corp. | 2.375% | 2/12/22 | 15,814 | 16,311 |
| Microsoft Corp. | 2.650% | 11/3/22 | 7,025 | 7,327 |
| Microsoft Corp. | 2.125% | 11/15/22 | 4,750 | 4,805 |
| Microsoft Corp. | 2.375% | 5/1/23 | 5,277 | 5,416 |
| Microsoft Corp. | 2.000% | 8/8/23 | 9,000 | 8,958 |
| Microsoft Corp. | 3.625% | 12/15/23 | 8,495 | 9,371 |
| Microsoft Corp. | 2.700% | 2/12/25 | 16,766 | 17,342 |
| Microsoft Corp. | 3.125% | 11/3/25 | 20,488 | 21,824 |
| Microsoft Corp. | 2.400% | 8/8/26 | 30,000 | 30,079 |
| Motorola Solutions Inc. | 3.500% | 9/1/21 | 675 | 693 |
| Motorola Solutions Inc. | 3.750% | 5/15/22 | 7,878 | 8,082 |
| Motorola Solutions Inc. | 3.500% | 3/1/23 | 5,515 | 5,512 |
| Motorola Solutions Inc. | 4.000% | 9/1/24 | 5,891 | 5,891 |
58
| Vanguard® Intermediate-Term Corporate Bond Index Fund | ||||
| Schedule of Investments | ||||
| August 31, 2016 | ||||
| Face | Market | |||
| Maturity | Amount | Value | ||
| Coupon | Date | ($000) | ($000) | |
| Motorola Solutions Inc. | 7.500% | 5/15/25 | 1,471 | 1,728 |
| NetApp Inc. | 3.250% | 12/15/22 | 450 | 456 |
| Oracle Corp. | 1.900% | 9/15/21 | 30,475 | 30,494 |
| Oracle Corp. | 2.500% | 5/15/22 | 22,416 | 22,947 |
| Oracle Corp. | 2.500% | 10/15/22 | 20,506 | 21,038 |
| Oracle Corp. | 3.625% | 7/15/23 | 10,421 | 11,355 |
| Oracle Corp. | 2.400% | 9/15/23 | 18,350 | 18,500 |
| Oracle Corp. | 3.400% | 7/8/24 | 11,619 | 12,462 |
| Oracle Corp. | 2.950% | 5/15/25 | 14,235 | 14,721 |
| Oracle Corp. | 2.650% | 7/15/26 | 15,550 | 15,657 |
| Pitney Bowes Inc. | 4.625% | 3/15/24 | 2,625 | 2,755 |
| QUALCOMM Inc. | 3.000% | 5/20/22 | 15,071 | 15,858 |
| QUALCOMM Inc. | 3.450% | 5/20/25 | 12,766 | 13,771 |
| Seagate HDD Cayman | 4.750% | 6/1/23 | 6,182 | 5,997 |
| Seagate HDD Cayman | 4.750% | 1/1/25 | 6,225 | 5,727 |
| Symantec Corp. | 3.950% | 6/15/22 | 2,705 | 2,742 |
| Telefonaktiebolaget LM Ericsson | 4.125% | 5/15/22 | 5,575 | 5,996 |
| Texas Instruments Inc. | 1.850% | 5/15/22 | 500 | 498 |
| Texas Instruments Inc. | 2.250% | 5/1/23 | 2,685 | 2,708 |
| Total System Services Inc. | 3.750% | 6/1/23 | 2,200 | 2,270 |
| Total System Services Inc. | 4.800% | 4/1/26 | 7,050 | 7,772 |
| Trimble Navigation Ltd. | 4.750% | 12/1/24 | 1,975 | 2,077 |
| Tyco Electronics Group SA | 3.500% | 2/3/22 | 3,468 | 3,625 |
| Tyco Electronics Group SA | 3.450% | 8/1/24 | 2,200 | 2,299 |
| Tyco Electronics Group SA | 3.700% | 2/15/26 | 3,900 | 4,113 |
| Verisk Analytics Inc. | 4.125% | 9/12/22 | 3,090 | 3,297 |
| Verisk Analytics Inc. | 4.000% | 6/15/25 | 9,150 | 9,706 |
| Xerox Corp. | 3.800% | 5/15/24 | 125 | 124 |
| Transportation (2.1%) | ||||
| 2 American Airlines 2013-1 Class A Pass Through Trust | 4.000% | 1/15/27 | 2,849 | 3,038 |
| 2 American Airlines 2013-2 Class A Pass Through Trust | 4.950% | 7/15/24 | 7,252 | 7,941 |
| 2 American Airlines 2015-1 Class B Pass Through Trust | 3.700% | 11/1/24 | 1,680 | 1,638 |
| 2 BNSF Funding Trust I | 6.613% | 12/15/55 | 1,890 | 2,178 |
| Burlington Northern Santa Fe LLC | 3.450% | 9/15/21 | 2,719 | 2,937 |
| Burlington Northern Santa Fe LLC | 3.050% | 3/15/22 | 2,995 | 3,182 |
| Burlington Northern Santa Fe LLC | 3.050% | 9/1/22 | 6,375 | 6,767 |
| Burlington Northern Santa Fe LLC | 3.000% | 3/15/23 | 4,383 | 4,625 |
| Burlington Northern Santa Fe LLC | 3.850% | 9/1/23 | 4,135 | 4,577 |
| Burlington Northern Santa Fe LLC | 3.750% | 4/1/24 | 3,925 | 4,347 |
| Burlington Northern Santa Fe LLC | 3.400% | 9/1/24 | 9,256 | 10,030 |
| Burlington Northern Santa Fe LLC | 3.000% | 4/1/25 | 3,375 | 3,561 |
| Burlington Northern Santa Fe LLC | 3.650% | 9/1/25 | 3,265 | 3,593 |
| Burlington Northern Santa Fe LLC | 7.000% | 12/15/25 | 2,715 | 3,680 |
| Canadian National Railway Co. | 2.850% | 12/15/21 | 2,210 | 2,328 |
| Canadian National Railway Co. | 2.250% | 11/15/22 | 1,525 | 1,534 |
| Canadian National Railway Co. | 2.950% | 11/21/24 | 2,925 | 3,118 |
| Canadian National Railway Co. | 2.750% | 3/1/26 | 2,725 | 2,841 |
| Canadian Pacific Railway Co. | 4.450% | 3/15/23 | 3,711 | 4,128 |
| Canadian Pacific Railway Co. | 2.900% | 2/1/25 | 5,100 | 5,226 |
| Canadian Pacific Railway Co. | 3.700% | 2/1/26 | 2,935 | 3,157 |
| Canadian Pacific Railway Ltd. | 4.500% | 1/15/22 | 1,475 | 1,625 |
| 2 Continental Airlines 2007-1 Class A Pass Through Trust | 5.983% | 10/19/23 | 3,263 | 3,692 |
| 2 Continental Airlines 2012-1 Class A Pass Through Trust | 4.150% | 10/11/25 | 4,125 | 4,435 |
| 2 Continental Airlines 2012-2 Class A Pass Through Trust | 4.000% | 4/29/26 | 3,641 | 3,896 |
| CSX Corp. | 3.700% | 11/1/23 | 6,075 | 6,599 |
| CSX Corp. | 3.400% | 8/1/24 | 3,708 | 3,954 |
| CSX Corp. | 3.350% | 11/1/25 | 2,975 | 3,188 |
| 2 CSX Transportation Inc. | 6.251% | 1/15/23 | 31 | 36 |
| 2 Delta Air Lines 2007-1 Class A Pass Through Trust | 6.821% | 2/10/24 | 4,805 | 5,627 |
| FedEx Corp. | 2.625% | 8/1/22 | 3,330 | 3,424 |
| FedEx Corp. | 2.700% | 4/15/23 | 1,700 | 1,739 |
| FedEx Corp. | 4.000% | 1/15/24 | 4,825 | 5,350 |
| FedEx Corp. | 3.200% | 2/1/25 | 4,891 | 5,138 |
59
| Vanguard® Intermediate-Term Corporate Bond Index Fund | ||||
| Schedule of Investments | ||||
| August 31, 2016 | ||||
| Face | Market | |||
| Maturity | Amount | Value | ||
| Coupon | Date | ($000) | ($000) | |
| FedEx Corp. | 3.250% | 4/1/26 | 6,150 | 6,481 |
| 2 Hawaiian Airlines 2013-1 Class A Pass Through | ||||
| Certificates | 3.900% | 1/15/26 | 2,277 | 2,288 |
| JB Hunt Transport Services Inc. | 3.300% | 8/15/22 | 2,400 | 2,458 |
| JB Hunt Transport Services Inc. | 3.850% | 3/15/24 | 2,325 | 2,452 |
| Kansas City Southern | 3.000% | 5/15/23 | 4,125 | 4,190 |
| Kansas City Southern | 3.125% | 6/1/26 | 2,200 | 2,234 |
| Norfolk Southern Corp. | 3.250% | 12/1/21 | 4,021 | 4,256 |
| Norfolk Southern Corp. | 3.000% | 4/1/22 | 6,942 | 7,263 |
| Norfolk Southern Corp. | 2.903% | 2/15/23 | 3,986 | 4,124 |
| Norfolk Southern Corp. | 3.850% | 1/15/24 | 2,635 | 2,882 |
| Norfolk Southern Corp. | 5.590% | 5/17/25 | 3,270 | 3,956 |
| 2 Southwest Airlines Co. 2007-1 Pass Through Trust | 6.150% | 2/1/24 | 1,213 | 1,376 |
| Trinity Industries Inc. | 4.550% | 10/1/24 | 2,490 | 2,467 |
| Union Pacific Corp. | 4.163% | 7/15/22 | 7,099 | 7,970 |
| Union Pacific Corp. | 2.950% | 1/15/23 | 2,925 | 3,058 |
| Union Pacific Corp. | 2.750% | 4/15/23 | 1,550 | 1,612 |
| Union Pacific Corp. | 3.646% | 2/15/24 | 3,550 | 3,895 |
| Union Pacific Corp. | 3.750% | 3/15/24 | 3,375 | 3,714 |
| Union Pacific Corp. | 3.250% | 1/15/25 | 3,350 | 3,596 |
| Union Pacific Corp. | 3.250% | 8/15/25 | 4,479 | 4,825 |
| Union Pacific Corp. | 2.750% | 3/1/26 | 2,298 | 2,378 |
| 2 United Airlines 2013-1 Class A Pass Through Trust | 4.300% | 2/15/27 | 3,789 | 4,140 |
| 2 United Airlines 2014-1 Class A Pass Through Trust | 4.000% | 10/11/27 | 3,818 | 4,085 |
| United Parcel Service Inc. | 2.450% | 10/1/22 | 9,097 | 9,496 |
| 2 US Airways 2012-1 Class A Pass Through Trust | 5.900% | 4/1/26 | 939 | 1,089 |
| 2 US Airways 2013-1 Class A Pass Through Trust | 3.950% | 5/15/27 | 3,050 | 3,241 |
| 2 US Airways Inc. 2012-2 Class A Pass Through Trust | 4.625% | 12/3/26 | 1,891 | 2,071 |
| 6,941,090 | ||||
| Utilities (5.4%) | ||||
| Electric (5.0%) | ||||
| Alabama Power Co. | 3.550% | 12/1/23 | 2,400 | 2,619 |
| Alabama Power Co. | 2.800% | 4/1/25 | 5,150 | 5,337 |
| Ameren Corp. | 3.650% | 2/15/26 | 1,060 | 1,136 |
| Ameren Illinois Co. | 2.700% | 9/1/22 | 2,670 | 2,771 |
| Ameren Illinois Co. | 3.250% | 3/1/25 | 5,400 | 5,772 |
| American Electric Power Co. Inc. | 2.950% | 12/15/22 | 2,379 | 2,482 |
| Appalachian Power Co. | 3.400% | 6/1/25 | 1,200 | 1,271 |
| Arizona Public Service Co. | 3.350% | 6/15/24 | 900 | 968 |
| Arizona Public Service Co. | 3.150% | 5/15/25 | 2,000 | 2,120 |
| Baltimore Gas & Electric Co. | 3.500% | 11/15/21 | 3,922 | 4,207 |
| Baltimore Gas & Electric Co. | 3.350% | 7/1/23 | 1,125 | 1,205 |
| Baltimore Gas & Electric Co. | 2.400% | 8/15/26 | 3,575 | 3,562 |
| Berkshire Hathaway Energy Co. | 3.750% | 11/15/23 | 3,525 | 3,855 |
| Berkshire Hathaway Energy Co. | 3.500% | 2/1/25 | 3,475 | 3,742 |
| Black Hills Corp. | 4.250% | 11/30/23 | 1,000 | 1,087 |
| Black Hills Corp. | 3.950% | 1/15/26 | 3,470 | 3,702 |
| CenterPoint Energy Houston Electric LLC | 2.250% | 8/1/22 | 1,875 | 1,888 |
| CenterPoint Energy Houston Electric LLC | 2.400% | 9/1/26 | 1,650 | 1,659 |
| 1 Cleco Corporate Holdings LLC | 3.743% | 5/1/26 | 5,000 | 5,275 |
| Cleveland Electric Illuminating Co. | 5.500% | 8/15/24 | 2,300 | 2,748 |
| CMS Energy Corp. | 5.050% | 3/15/22 | 1,775 | 2,016 |
| CMS Energy Corp. | 3.875% | 3/1/24 | 2,825 | 3,095 |
| CMS Energy Corp. | 3.600% | 11/15/25 | 1,750 | 1,877 |
| CMS Energy Corp. | 3.000% | 5/15/26 | 1,775 | 1,814 |
| Commonwealth Edison Co. | 3.400% | 9/1/21 | 3,100 | 3,336 |
| Commonwealth Edison Co. | 3.100% | 11/1/24 | 2,325 | 2,473 |
| Commonwealth Edison Co. | 2.550% | 6/15/26 | 5,600 | 5,702 |
| Connecticut Light & Power Co. | 2.500% | 1/15/23 | 4,475 | 4,570 |
| Consolidated Edison Co. of New York Inc. | 3.300% | 12/1/24 | 1,325 | 1,430 |
| Consumers Energy Co. | 2.850% | 5/15/22 | 2,684 | 2,810 |
| Consumers Energy Co. | 3.375% | 8/15/23 | 4,060 | 4,406 |
| Consumers Energy Co. | 3.125% | 8/31/24 | 1,600 | 1,694 |
60
| Vanguard® Intermediate-Term Corporate Bond Index Fund | ||||
| Schedule of Investments | ||||
| August 31, 2016 | ||||
| Face | Market | |||
| Maturity | Amount | Value | ||
| Coupon | Date | ($000) | ($000) | |
| Delmarva Power & Light Co. | 3.500% | 11/15/23 | 4,249 | 4,603 |
| Dominion Resources Inc. | 2.750% | 9/15/22 | 1,500 | 1,530 |
| Dominion Resources Inc. | 3.625% | 12/1/24 | 4,050 | 4,316 |
| Dominion Resources Inc. | 3.900% | 10/1/25 | 6,400 | 6,966 |
| Dominion Resources Inc. | 2.850% | 8/15/26 | 2,800 | 2,798 |
| 2 Dominion Resources Inc. | 5.750% | 10/1/54 | 4,225 | 4,408 |
| DTE Electric Co. | 2.650% | 6/15/22 | 3,482 | 3,606 |
| DTE Electric Co. | 3.650% | 3/15/24 | 3,350 | 3,683 |
| DTE Electric Co. | 3.375% | 3/1/25 | 1,700 | 1,841 |
| DTE Energy Co. | 3.300% | 6/15/22 | 2,625 | 2,792 |
| DTE Energy Co. | 3.500% | 6/1/24 | 4,100 | 4,387 |
| Duke Energy Corp. | 1.800% | 9/1/21 | 2,000 | 1,994 |
| Duke Energy Corp. | 3.550% | 9/15/21 | 2,600 | 2,787 |
| Duke Energy Corp. | 3.050% | 8/15/22 | 4,288 | 4,488 |
| Duke Energy Corp. | 3.950% | 10/15/23 | 3,700 | 4,070 |
| Duke Energy Corp. | 3.750% | 4/15/24 | 7,175 | 7,798 |
| Duke Energy Ohio Inc. | 3.800% | 9/1/23 | 4,476 | 4,940 |
| Duke Energy Progress LLC | 3.000% | 9/15/21 | 4,856 | 5,148 |
| Duke Energy Progress LLC | 2.800% | 5/15/22 | 2,922 | 3,067 |
| Duke Energy Progress LLC | 3.250% | 8/15/25 | 5,750 | 6,189 |
| Edison International | 2.950% | 3/15/23 | 1,850 | 1,908 |
| 1 Emera US Finance LP | 3.550% | 6/15/26 | 5,000 | 5,266 |
| Empresa Nacional de Electricidad SA | 4.250% | 4/15/24 | 2,200 | 2,364 |
| Entergy Arkansas Inc. | 3.050% | 6/1/23 | 200 | 210 |
| Entergy Arkansas Inc. | 3.700% | 6/1/24 | 1,100 | 1,204 |
| Entergy Arkansas Inc. | 3.500% | 4/1/26 | 3,020 | 3,284 |
| Entergy Corp. | 4.000% | 7/15/22 | 2,874 | 3,094 |
| Entergy Corp. | 2.950% | 9/1/26 | 2,300 | 2,316 |
| Entergy Gulf States Louisiana LLC | 5.590% | 10/1/24 | 2,785 | 3,343 |
| Entergy Louisiana LLC | 4.050% | 9/1/23 | 5,050 | 5,593 |
| Entergy Louisiana LLC | 5.400% | 11/1/24 | 3,515 | 4,254 |
| Entergy Louisiana LLC | 4.440% | 1/15/26 | 210 | 241 |
| Entergy Mississippi Inc. | 3.100% | 7/1/23 | 2,225 | 2,300 |
| Eversource Energy | 2.800% | 5/1/23 | 1,985 | 2,019 |
| Eversource Energy | 3.150% | 1/15/25 | 3,300 | 3,461 |
| Eversource Energy | 3.350% | 3/15/26 | 3,875 | 4,099 |
| Exelon Corp. | 3.950% | 6/15/25 | 8,800 | 9,632 |
| Exelon Corp. | 3.400% | 4/15/26 | 1,400 | 1,473 |
| Exelon Generation Co. LLC | 4.250% | 6/15/22 | 6,011 | 6,437 |
| FirstEnergy Solutions Corp. | 6.050% | 8/15/21 | 2,175 | 1,895 |
| Florida Power & Light Co. | 2.750% | 6/1/23 | 2,150 | 2,235 |
| Florida Power & Light Co. | 3.250% | 6/1/24 | 2,675 | 2,868 |
| Florida Power & Light Co. | 3.125% | 12/1/25 | 4,800 | 5,128 |
| Georgia Power Co. | 2.850% | 5/15/22 | 1,900 | 1,989 |
| Georgia Power Co. | 3.250% | 4/1/26 | 1,300 | 1,382 |
| Indiana Michigan Power Co. | 3.200% | 3/15/23 | 2,125 | 2,214 |
| Interstate Power & Light Co. | 3.250% | 12/1/24 | 1,275 | 1,348 |
| Interstate Power & Light Co. | 3.400% | 8/15/25 | 1,725 | 1,847 |
| ITC Holdings Corp. | 4.050% | 7/1/23 | 1,925 | 2,071 |
| ITC Holdings Corp. | 3.650% | 6/15/24 | 2,575 | 2,721 |
| ITC Holdings Corp. | 3.250% | 6/30/26 | 2,575 | 2,640 |
| Kansas City Power & Light Co. | 3.150% | 3/15/23 | 3,525 | 3,626 |
| Kansas City Power & Light Co. | 3.650% | 8/15/25 | 100 | 106 |
| Kentucky Utilities Co. | 3.300% | 10/1/25 | 5,200 | 5,632 |
| LG&E & KU Energy LLC | 4.375% | 10/1/21 | 1,840 | 2,027 |
| Louisville Gas & Electric Co. | 3.300% | 10/1/25 | 1,600 | 1,715 |
| MidAmerican Energy Co. | 3.500% | 10/15/24 | 4,948 | 5,400 |
| National Rural Utilities Cooperative Finance Corp. | 3.050% | 2/15/22 | 3,148 | 3,291 |
| National Rural Utilities Cooperative Finance Corp. | 2.700% | 2/15/23 | 3,800 | 3,926 |
| National Rural Utilities Cooperative Finance Corp. | 3.400% | 11/15/23 | 875 | 937 |
| National Rural Utilities Cooperative Finance Corp. | 2.850% | 1/27/25 | 4,062 | 4,203 |
| National Rural Utilities Cooperative Finance Corp. | 3.250% | 11/1/25 | 4,950 | 5,302 |
| 2 National Rural Utilities Cooperative Finance Corp. | 4.750% | 4/30/43 | 1,850 | 1,859 |
| 2 National Rural Utilities Cooperative Finance Corp. | 5.250% | 4/20/46 | 3,125 | 3,279 |
61
| Vanguard® Intermediate-Term Corporate Bond Index Fund | ||||
| Schedule of Investments | ||||
| August 31, 2016 | ||||
| Face | Market | |||
| Maturity | Amount | Value | ||
| Coupon | Date | ($000) | ($000) | |
| NextEra Energy Capital Holdings Inc. | 3.625% | 6/15/23 | 1,625 | 1,722 |
| Northern States Power Co. | 2.150% | 8/15/22 | 1,575 | 1,597 |
| Northern States Power Co. | 2.600% | 5/15/23 | 2,685 | 2,777 |
| NSTAR Electric Co. | 2.375% | 10/15/22 | 1,800 | 1,828 |
| NSTAR Electric Co. | 3.250% | 11/15/25 | 775 | 826 |
| NSTAR Electric Co. | 2.700% | 6/1/26 | 1,775 | 1,822 |
| Ohio Power Co. | 5.375% | 10/1/21 | 2,275 | 2,610 |
| Oncor Electric Delivery Co. LLC | 4.100% | 6/1/22 | 2,750 | 3,042 |
| Oncor Electric Delivery Co. LLC | 7.000% | 9/1/22 | 5,169 | 6,555 |
| Oncor Electric Delivery Co. LLC | 2.950% | 4/1/25 | 2,350 | 2,457 |
| Pacific Gas & Electric Co. | 3.250% | 9/15/21 | 1,000 | 1,061 |
| Pacific Gas & Electric Co. | 2.450% | 8/15/22 | 3,881 | 3,940 |
| Pacific Gas & Electric Co. | 3.250% | 6/15/23 | 4,225 | 4,505 |
| Pacific Gas & Electric Co. | 3.850% | 11/15/23 | 3,313 | 3,654 |
| Pacific Gas & Electric Co. | 3.750% | 2/15/24 | 4,506 | 4,967 |
| Pacific Gas & Electric Co. | 3.400% | 8/15/24 | 2,475 | 2,664 |
| Pacific Gas & Electric Co. | 3.500% | 6/15/25 | 2,775 | 3,020 |
| Pacific Gas & Electric Co. | 2.950% | 3/1/26 | 6,500 | 6,779 |
| PacifiCorp | 2.950% | 2/1/22 | 4,462 | 4,688 |
| PacifiCorp | 3.600% | 4/1/24 | 2,650 | 2,894 |
| PacifiCorp | 3.350% | 7/1/25 | 4,250 | 4,594 |
| PECO Energy Co. | 2.375% | 9/15/22 | 1,829 | 1,865 |
| PECO Energy Co. | 3.150% | 10/15/25 | 1,100 | 1,172 |
| Potomac Electric Power Co. | 3.600% | 3/15/24 | 1,700 | 1,845 |
| PPL Capital Funding Inc. | 4.200% | 6/15/22 | 4,360 | 4,755 |
| PPL Capital Funding Inc. | 3.500% | 12/1/22 | 2,180 | 2,319 |
| PPL Capital Funding Inc. | 3.400% | 6/1/23 | 3,119 | 3,286 |
| PPL Capital Funding Inc. | 3.950% | 3/15/24 | 2,138 | 2,311 |
| PPL Capital Funding Inc. | 3.100% | 5/15/26 | 5,650 | 5,750 |
| PPL Electric Utilities Corp. | 3.000% | 9/15/21 | 2,650 | 2,804 |
| Progress Energy Inc. | 3.150% | 4/1/22 | 1,150 | 1,207 |
| PSEG Power LLC | 4.150% | 9/15/21 | 1,161 | 1,241 |
| PSEG Power LLC | 4.300% | 11/15/23 | 1,325 | 1,432 |
| Public Service Co. of Colorado | 2.250% | 9/15/22 | 3,085 | 3,145 |
| Public Service Co. of Colorado | 2.500% | 3/15/23 | 800 | 821 |
| Public Service Co. of Colorado | 2.900% | 5/15/25 | 2,565 | 2,698 |
| Public Service Co. of New Hampshire | 3.500% | 11/1/23 | 2,550 | 2,747 |
| Public Service Co. of New Mexico | 3.850% | 8/1/25 | 1,475 | 1,576 |
| Public Service Electric & Gas Co. | 2.375% | 5/15/23 | 3,677 | 3,749 |
| Public Service Electric & Gas Co. | 3.150% | 8/15/24 | 2,250 | 2,393 |
| Public Service Electric & Gas Co. | 3.050% | 11/15/24 | 5,200 | 5,502 |
| Public Service Electric & Gas Co. | 3.000% | 5/15/25 | 1,656 | 1,753 |
| Puget Energy Inc. | 6.000% | 9/1/21 | 3,439 | 3,988 |
| Puget Energy Inc. | 5.625% | 7/15/22 | 3,950 | 4,538 |
| Puget Energy Inc. | 3.650% | 5/15/25 | 4,350 | 4,538 |
| San Diego Gas & Electric Co. | 3.600% | 9/1/23 | 2,250 | 2,473 |
| San Diego Gas & Electric Co. | 2.500% | 5/15/26 | 4,475 | 4,525 |
| San Diego Gas & Electric Co. | 6.000% | 6/1/26 | 870 | 1,132 |
| SCANA Corp. | 4.125% | 2/1/22 | 3,825 | 3,984 |
| Scottish Power Ltd. | 5.810% | 3/15/25 | 1,760 | 2,052 |
| Sierra Pacific Power Co. | 3.375% | 8/15/23 | 750 | 802 |
| 1 Sierra Pacific Power Co. | 2.600% | 5/1/26 | 4,400 | 4,464 |
| 2 Southern California Edison Co. | 1.845% | 2/1/22 | 2,180 | 2,183 |
| Southern California Edison Co. | 2.400% | 2/1/22 | 850 | 875 |
| Southern California Edison Co. | 3.500% | 10/1/23 | 4,556 | 4,967 |
| Southern Co. | 2.950% | 7/1/23 | 10,325 | 10,663 |
| Southern Co. | 3.250% | 7/1/26 | 12,000 | 12,502 |
| Southern Power Co. | 4.150% | 12/1/25 | 3,475 | 3,763 |
| Southwestern Electric Power Co. | 3.550% | 2/15/22 | 2,925 | 3,110 |
| Southwestern Public Service Co. | 3.300% | 6/15/24 | 1,850 | 1,971 |
| System Energy Resources Inc. | 4.100% | 4/1/23 | 4,350 | 4,591 |
| Tampa Electric Co. | 2.600% | 9/15/22 | 2,586 | 2,649 |
| TransAlta Corp. | 4.500% | 11/15/22 | 2,169 | 2,116 |
| Tri-State Generation & Transmission Assn. Inc. | 3.700% | 11/1/24 | 1,100 | 1,170 |
62
| Vanguard® Intermediate-Term Corporate Bond Index Fund | ||||
| Schedule of Investments | ||||
| August 31, 2016 | ||||
| Face | Market | |||
| Maturity | Amount | Value | ||
| Coupon | Date | ($000) | ($000) | |
| Tucson Electric Power Co. | 5.150% | 11/15/21 | 675 | 755 |
| Tucson Electric Power Co. | 3.050% | 3/15/25 | 1,650 | 1,665 |
| Union Electric Co. | 3.500% | 4/15/24 | 3,550 | 3,833 |
| Virginia Electric & Power Co. | 2.950% | 1/15/22 | 3,725 | 3,916 |
| Virginia Electric & Power Co. | 3.450% | 9/1/22 | 1,965 | 2,105 |
| Virginia Electric & Power Co. | 2.750% | 3/15/23 | 7,100 | 7,367 |
| Virginia Electric & Power Co. | 3.450% | 2/15/24 | 1,515 | 1,646 |
| Virginia Electric & Power Co. | 3.100% | 5/15/25 | 1,950 | 2,060 |
| Virginia Electric & Power Co. | 3.150% | 1/15/26 | 3,185 | 3,376 |
| WEC Energy Group Inc. | 3.550% | 6/15/25 | 2,480 | 2,672 |
| Westar Energy Inc. | 3.250% | 12/1/25 | 1,950 | 2,073 |
| Westar Energy Inc. | 2.550% | 7/1/26 | 2,725 | 2,734 |
| Wisconsin Electric Power Co. | 2.950% | 9/15/21 | 2,345 | 2,473 |
| Wisconsin Electric Power Co. | 3.100% | 6/1/25 | 700 | 740 |
| Wisconsin Power & Light Co. | 2.250% | 11/15/22 | 875 | 887 |
| Xcel Energy Inc. | 3.300% | 6/1/25 | 3,775 | 3,992 |
| Natural Gas (0.4%) | ||||
| NiSource Finance Corp. | 6.125% | 3/1/22 | 5,310 | 6,319 |
| NiSource Finance Corp. | 3.850% | 2/15/23 | 1,000 | 1,076 |
| ONE Gas Inc. | 3.610% | 2/1/24 | 1,500 | 1,615 |
| Sempra Energy | 2.875% | 10/1/22 | 3,100 | 3,203 |
| Sempra Energy | 4.050% | 12/1/23 | 5,400 | 5,955 |
| Sempra Energy | 3.550% | 6/15/24 | 2,699 | 2,863 |
| Sempra Energy | 3.750% | 11/15/25 | 2,325 | 2,511 |
| Southern California Gas Co. | 3.150% | 9/15/24 | 2,025 | 2,180 |
| Southern California Gas Co. | 3.200% | 6/15/25 | 1,000 | 1,069 |
| Southern California Gas Co. | 2.600% | 6/15/26 | 6,400 | 6,533 |
| Southern Co. Gas Capital Corp. | 3.500% | 9/15/21 | 3,200 | 3,372 |
| Southern Co. Gas Capital Corp. | 3.875% | 11/15/25 | 975 | 1,051 |
| Southern Co. Gas Capital Corp. | 3.250% | 6/15/26 | 1,875 | 1,932 |
| Southwest Gas Corp. | 3.875% | 4/1/22 | 500 | 529 |
| Other Utility (0.0%) | ||||
| American Water Capital Corp. | 3.850% | 3/1/24 | 2,275 | 2,509 |
| American Water Capital Corp. | 3.400% | 3/1/25 | 2,147 | 2,313 |
| 598,932 | ||||
| Total Corporate Bonds (Cost $10,556,599) | 11,004,130 | |||
| Taxable Municipal Bonds (0.0%) | ||||
| George Washington University District of Columbia GO | 3.485% | 9/15/22 | 1,450 | 1,554 |
| Total Taxable Municipal Bonds (Cost $1,489) | 1,554 | |||
| Shares | ||||
| Temporary Cash Investment (0.7%) | ||||
| Money Market Fund (0.7%) | ||||
| 3 Vanguard Market Liquidity Fund | ||||
| (Cost $72,919) | 0.612% | 729,135 | 72,921 | |
| Total Investments (99.5%) (Cost $10,631,007) | 11,078,605 | |||
| Other Assets and Liabilities—Net (0.5%)4 | 56,660 | |||
| Net Assets (100%) | 11,135,265 | |||
| 1 | Security exempt from registration under Rule 144A of the Securities Act of 1933. Such securities may be sold in transactions exempt from registration, normally to qualified institutional buyers. At August 31, 2016, the aggregate value of these securities was $299,784,000, representing 2.7% of net assets. |
| 2 | The average or expected maturity is shorter than the final maturity shown because of the possibility of interim principal payments and prepayments or the possibility of the issue being called. |
| 3 | Affiliated money market fund available only to Vanguard funds and certain trusts and accounts managed by Vanguard. Rate shown is the 7-day yield. |
| 4 | Cash of $700,000 has been segregated as initial margin for open futures contracts. |
63
Vanguard® Intermediate-Term Corporate Bond Index Fund Schedule of Investments August 31, 2016 GO—General Obligation Bond.
REIT—Real Estate Investment Trust.
64
| Vanguard® Long-Term Corporate Bond Index Fund | ||||
| Schedule of Investments | ||||
| August 31, 2016 | ||||
| Face | Market | |||
| Maturity | Amount | Value | ||
| Coupon | Date | ($000) | ($000) | |
| U.S. Government and Agency Obligations (0.0%) | ||||
| U.S. Government Securities (0.0%) | ||||
| 1 United States Treasury Note/Bond (Cost 969) | 1.500% | 8/15/26 | 975 | 968 |
| Corporate Bonds (98.4%) | ||||
| Finance (17.3%) | ||||
| Banking (9.5%) | ||||
| American Express Co. | 4.050% | 12/3/42 | 1,227 | 1,312 |
| Bank of America Corp. | 6.220% | 9/15/26 | 400 | 474 |
| Bank of America Corp. | 4.250% | 10/22/26 | 2,886 | 3,049 |
| Bank of America Corp. | 6.750% | 6/1/28 | 575 | 729 |
| Bank of America Corp. | 6.110% | 1/29/37 | 2,635 | 3,257 |
| Bank of America Corp. | 7.750% | 5/14/38 | 2,253 | 3,325 |
| Bank of America Corp. | 5.875% | 2/7/42 | 1,150 | 1,507 |
| Bank of America Corp. | 5.000% | 1/21/44 | 3,230 | 3,873 |
| Bank of America Corp. | 4.875% | 4/1/44 | 1,937 | 2,268 |
| Bank of America Corp. | 4.750% | 4/21/45 | 700 | 766 |
| Bank of America NA | 6.000% | 10/15/36 | 975 | 1,266 |
| Bank One Capital III | 8.750% | 9/1/30 | 845 | 1,217 |
| Bank One Corp. | 7.625% | 10/15/26 | 545 | 730 |
| Bank One Corp. | 8.000% | 4/29/27 | 500 | 675 |
| Barclays plc | 5.250% | 8/17/45 | 1,560 | 1,800 |
| Branch Banking & Trust Co. | 3.800% | 10/30/26 | 748 | 815 |
| Citigroup Inc. | 4.400% | 6/10/25 | 750 | 792 |
| Citigroup Inc. | 4.600% | 3/9/26 | 50 | 54 |
| Citigroup Inc. | 4.300% | 11/20/26 | 1,098 | 1,148 |
| Citigroup Inc. | 4.450% | 9/29/27 | 3,900 | 4,110 |
| Citigroup Inc. | 6.625% | 1/15/28 | 200 | 252 |
| Citigroup Inc. | 4.125% | 7/25/28 | 1,000 | 1,016 |
| Citigroup Inc. | 6.625% | 6/15/32 | 1,320 | 1,646 |
| Citigroup Inc. | 6.000% | 10/31/33 | 1,410 | 1,679 |
| Citigroup Inc. | 6.125% | 8/25/36 | 798 | 976 |
| Citigroup Inc. | 8.125% | 7/15/39 | 2,227 | 3,512 |
| Citigroup Inc. | 5.875% | 1/30/42 | 1,475 | 1,899 |
| Citigroup Inc. | 6.675% | 9/13/43 | 1,160 | 1,545 |
| Citigroup Inc. | 4.950% | 11/7/43 | 661 | 770 |
| Citigroup Inc. | 5.300% | 5/6/44 | 1,900 | 2,162 |
| Citigroup Inc. | 4.650% | 7/30/45 | 1,300 | 1,475 |
| Citigroup Inc. | 4.750% | 5/18/46 | 600 | 632 |
| Cooperatieve Rabobank UA | 5.250% | 5/24/41 | 2,405 | 3,110 |
| Cooperatieve Rabobank UA | 5.750% | 12/1/43 | 1,600 | 1,984 |
| Cooperatieve Rabobank UA | 5.250% | 8/4/45 | 844 | 983 |
| Credit Suisse Group Funding Guernsey Ltd. | 4.875% | 5/15/45 | 2,520 | 2,730 |
| Credit Suisse USA Inc. | 7.125% | 7/15/32 | 775 | 1,058 |
| Fifth Third Bancorp | 8.250% | 3/1/38 | 1,207 | 1,815 |
| First Republic Bank | 4.375% | 8/1/46 | 200 | 200 |
| FirstMerit Bank NA | 4.270% | 11/25/26 | 450 | 469 |
| Goldman Sachs Capital I | 6.345% | 2/15/34 | 1,530 | 1,865 |
| Goldman Sachs Group Inc. | 5.950% | 1/15/27 | 1,015 | 1,203 |
| Goldman Sachs Group Inc. | 6.125% | 2/15/33 | 3,469 | 4,384 |
| Goldman Sachs Group Inc. | 6.450% | 5/1/36 | 1,695 | 2,100 |
| Goldman Sachs Group Inc. | 6.750% | 10/1/37 | 5,892 | 7,560 |
| Goldman Sachs Group Inc. | 6.250% | 2/1/41 | 3,805 | 5,023 |
| Goldman Sachs Group Inc. | 4.800% | 7/8/44 | 2,117 | 2,415 |
| Goldman Sachs Group Inc. | 5.150% | 5/22/45 | 3,190 | 3,489 |
| Goldman Sachs Group Inc. | 4.750% | 10/21/45 | 2,573 | 2,936 |
| HSBC Bank USA NA | 5.875% | 11/1/34 | 950 | 1,175 |
| HSBC Bank USA NA | 5.625% | 8/15/35 | 560 | 669 |
| HSBC Bank USA NA | 7.000% | 1/15/39 | 1,175 | 1,600 |
| HSBC Holdings plc | 7.625% | 5/17/32 | 595 | 791 |
| HSBC Holdings plc | 6.500% | 5/2/36 | 2,750 | 3,525 |
| HSBC Holdings plc | 6.500% | 9/15/37 | 3,490 | 4,515 |
| HSBC Holdings plc | 6.800% | 6/1/38 | 1,580 | 2,112 |
65
| Vanguard® Long-Term Corporate Bond Index Fund | ||||
| Schedule of Investments | ||||
| August 31, 2016 | ||||
| Face | Market | |||
| Maturity | Amount | Value | ||
| Coupon | Date | ($000) | ($000) | |
| HSBC Holdings plc | 6.100% | 1/14/42 | 990 | 1,348 |
| HSBC Holdings plc | 5.250% | 3/14/44 | 2,210 | 2,515 |
| JPMorgan Chase & Co. | 2.950% | 10/1/26 | 2,100 | 2,107 |
| JPMorgan Chase & Co. | 4.125% | 12/15/26 | 1,752 | 1,874 |
| JPMorgan Chase & Co. | 4.250% | 10/1/27 | 2,740 | 2,972 |
| JPMorgan Chase & Co. | 6.400% | 5/15/38 | 2,920 | 4,077 |
| JPMorgan Chase & Co. | 5.500% | 10/15/40 | 2,315 | 2,962 |
| JPMorgan Chase & Co. | 5.600% | 7/15/41 | 1,685 | 2,170 |
| JPMorgan Chase & Co. | 5.400% | 1/6/42 | 2,105 | 2,657 |
| JPMorgan Chase & Co. | 5.625% | 8/16/43 | 1,475 | 1,834 |
| JPMorgan Chase & Co. | 4.850% | 2/1/44 | 1,290 | 1,577 |
| JPMorgan Chase & Co. | 4.950% | 6/1/45 | 2,481 | 2,844 |
| KeyBank NA | 6.950% | 2/1/28 | 361 | 470 |
| 2 Lloyds Banking Group plc | 5.300% | 12/1/45 | 950 | 1,035 |
| Morgan Stanley | 4.350% | 9/8/26 | 2,906 | 3,103 |
| Morgan Stanley | 3.950% | 4/23/27 | 2,845 | 2,940 |
| Morgan Stanley | 7.250% | 4/1/32 | 1,234 | 1,718 |
| Morgan Stanley | 6.375% | 7/24/42 | 2,911 | 3,995 |
| Morgan Stanley | 4.300% | 1/27/45 | 3,200 | 3,458 |
| Regions Bank | 6.450% | 6/26/37 | 597 | 732 |
| Regions Financial Corp. | 7.375% | 12/10/37 | 250 | 325 |
| Santander UK plc | 7.950% | 10/26/29 | 790 | 991 |
| Wachovia Bank NA | 5.850% | 2/1/37 | 1,095 | 1,399 |
| Wachovia Corp. | 7.500% | 4/15/35 | 445 | 624 |
| Wachovia Corp. | 5.500% | 8/1/35 | 609 | 725 |
| Wachovia Corp. | 6.550% | 10/15/35 | 25 | 32 |
| Wells Fargo & Co. | 4.300% | 7/22/27 | 3,265 | 3,590 |
| Wells Fargo & Co. | 5.375% | 2/7/35 | 860 | 1,065 |
| Wells Fargo & Co. | 5.375% | 11/2/43 | 2,354 | 2,816 |
| Wells Fargo & Co. | 5.606% | 1/15/44 | 3,067 | 3,827 |
| Wells Fargo & Co. | 4.650% | 11/4/44 | 2,056 | 2,243 |
| Wells Fargo & Co. | 3.900% | 5/1/45 | 2,750 | 2,886 |
| Wells Fargo & Co. | 4.900% | 11/17/45 | 2,637 | 3,013 |
| Wells Fargo & Co. | 4.400% | 6/14/46 | 2,850 | 3,021 |
| Wells Fargo Bank NA | 5.950% | 8/26/36 | 1,175 | 1,509 |
| Wells Fargo Bank NA | 6.600% | 1/15/38 | 1,525 | 2,126 |
| 3 Wells Fargo Capital X | 5.950% | 12/1/86 | 1,150 | 1,265 |
| Brokerage (0.3%) | ||||
| Brookfield Asset Management Inc. | 7.375% | 3/1/33 | 235 | 287 |
| CME Group Inc. | 5.300% | 9/15/43 | 945 | 1,244 |
| Invesco Finance plc | 5.375% | 11/30/43 | 740 | 892 |
| Jefferies Group LLC | 6.450% | 6/8/27 | 599 | 661 |
| Jefferies Group LLC | 6.250% | 1/15/36 | 535 | 569 |
| Jefferies Group LLC | 6.500% | 1/20/43 | 425 | 441 |
| Legg Mason Inc. | 5.625% | 1/15/44 | 695 | 728 |
| Leucadia National Corp. | 6.625% | 10/23/43 | 285 | 285 |
| Raymond James Financial Inc. | 3.625% | 9/15/26 | 500 | 512 |
| Raymond James Financial Inc. | 4.950% | 7/15/46 | 275 | 282 |
| Finance Companies (0.8%) | ||||
| GATX Corp. | 5.200% | 3/15/44 | 190 | 204 |
| GATX Corp. | 4.500% | 3/30/45 | 435 | 416 |
| GE Capital International Funding Co. | 4.418% | 11/15/35 | 13,857 | 15,861 |
| Insurance (6.0%) | ||||
| ACE Capital Trust II | 9.700% | 4/1/30 | 340 | 516 |
| Aetna Inc. | 4.250% | 6/15/36 | 1,975 | 2,059 |
| Aetna Inc. | 6.625% | 6/15/36 | 830 | 1,135 |
| Aetna Inc. | 6.750% | 12/15/37 | 940 | 1,312 |
| Aetna Inc. | 4.500% | 5/15/42 | 689 | 763 |
| Aetna Inc. | 4.125% | 11/15/42 | 550 | 576 |
| Aetna Inc. | 4.750% | 3/15/44 | 425 | 487 |
| Aetna Inc. | 4.375% | 6/15/46 | 2,975 | 3,101 |
| Aflac Inc. | 6.900% | 12/17/39 | 495 | 706 |
| Aflac Inc. | 6.450% | 8/15/40 | 500 | 684 |
66
| Vanguard® Long-Term Corporate Bond Index Fund | ||||
| Schedule of Investments | ||||
| August 31, 2016 | ||||
| Face | Market | |||
| Maturity | Amount | Value | ||
| Coupon | Date | ($000) | ($000) | |
| Alleghany Corp. | 4.900% | 9/15/44 | 304 | 320 |
| Allstate Corp. | 5.350% | 6/1/33 | 315 | 396 |
| Allstate Corp. | 5.550% | 5/9/35 | 590 | 766 |
| Allstate Corp. | 5.950% | 4/1/36 | 510 | 696 |
| Allstate Corp. | 4.500% | 6/15/43 | 555 | 658 |
| 3 Allstate Corp. | 6.500% | 5/15/67 | 650 | 746 |
| American International Group Inc. | 3.875% | 1/15/35 | 1,480 | 1,468 |
| American International Group Inc. | 4.700% | 7/10/35 | 661 | 710 |
| American International Group Inc. | 6.250% | 5/1/36 | 1,138 | 1,415 |
| American International Group Inc. | 4.500% | 7/16/44 | 2,289 | 2,368 |
| American International Group Inc. | 4.800% | 7/10/45 | 765 | 823 |
| American International Group Inc. | 4.375% | 1/15/55 | 1,475 | 1,445 |
| 3 American International Group Inc. | 8.175% | 5/15/68 | 475 | 621 |
| Anthem Inc. | 5.950% | 12/15/34 | 466 | 570 |
| Anthem Inc. | 5.850% | 1/15/36 | 895 | 1,120 |
| Anthem Inc. | 6.375% | 6/15/37 | 740 | 982 |
| Anthem Inc. | 4.625% | 5/15/42 | 1,190 | 1,317 |
| Anthem Inc. | 4.650% | 1/15/43 | 1,150 | 1,284 |
| Anthem Inc. | 5.100% | 1/15/44 | 625 | 737 |
| Anthem Inc. | 4.650% | 8/15/44 | 900 | 1,003 |
| Anthem Inc. | 4.850% | 8/15/54 | 375 | 414 |
| Aon Corp. | 8.205% | 1/1/27 | 725 | 960 |
| Aon Corp. | 6.250% | 9/30/40 | 285 | 368 |
| Aon plc | 4.450% | 5/24/43 | 350 | 356 |
| Aon plc | 4.600% | 6/14/44 | 650 | 692 |
| Aon plc | 4.750% | 5/15/45 | 850 | 938 |
| Arch Capital Group Ltd. | 7.350% | 5/1/34 | 375 | 512 |
| Arch Capital Group US Inc. | 5.144% | 11/1/43 | 545 | 605 |
| Assurant Inc. | 6.750% | 2/15/34 | 500 | 634 |
| AXA SA | 8.600% | 12/15/30 | 1,610 | 2,251 |
| AXIS Specialty Finance plc | 5.150% | 4/1/45 | 525 | 572 |
| Berkshire Hathaway Finance Corp. | 5.750% | 1/15/40 | 1,169 | 1,585 |
| Berkshire Hathaway Finance Corp. | 4.400% | 5/15/42 | 840 | 973 |
| Berkshire Hathaway Finance Corp. | 4.300% | 5/15/43 | 670 | 767 |
| Berkshire Hathaway Inc. | 4.500% | 2/11/43 | 1,330 | 1,574 |
| Chubb Corp. | 6.000% | 5/11/37 | 775 | 1,066 |
| Chubb Corp. | 6.500% | 5/15/38 | 805 | 1,180 |
| Chubb INA Holdings Inc. | 6.700% | 5/15/36 | 550 | 801 |
| Chubb INA Holdings Inc. | 4.150% | 3/13/43 | 968 | 1,097 |
| Chubb INA Holdings Inc. | 4.350% | 11/3/45 | 1,775 | 2,094 |
| Cigna Corp. | 7.875% | 5/15/27 | 415 | 581 |
| Cigna Corp. | 6.150% | 11/15/36 | 530 | 679 |
| Cigna Corp. | 5.875% | 3/15/41 | 300 | 380 |
| Cigna Corp. | 5.375% | 2/15/42 | 875 | 1,073 |
| Cincinnati Financial Corp. | 6.920% | 5/15/28 | 425 | 553 |
| Cincinnati Financial Corp. | 6.125% | 11/1/34 | 394 | 485 |
| Endurance Specialty Holdings Ltd. | 7.000% | 7/15/34 | 320 | 385 |
| Everest Reinsurance Holdings Inc. | 4.868% | 6/1/44 | 415 | 437 |
| Hartford Financial Services Group Inc. | 5.950% | 10/15/36 | 865 | 1,040 |
| Hartford Financial Services Group Inc. | 6.625% | 3/30/40 | 450 | 584 |
| Hartford Financial Services Group Inc. | 6.100% | 10/1/41 | 505 | 622 |
| Humana Inc. | 8.150% | 6/15/38 | 280 | 413 |
| Humana Inc. | 4.625% | 12/1/42 | 455 | 488 |
| Humana Inc. | 4.950% | 10/1/44 | 880 | 993 |
| Lincoln National Corp. | 6.150% | 4/7/36 | 575 | 685 |
| Lincoln National Corp. | 6.300% | 10/9/37 | 150 | 182 |
| Lincoln National Corp. | 7.000% | 6/15/40 | 835 | 1,087 |
| Loews Corp. | 6.000% | 2/1/35 | 465 | 593 |
| Loews Corp. | 4.125% | 5/15/43 | 485 | 512 |
| Manulife Financial Corp. | 5.375% | 3/4/46 | 1,350 | 1,650 |
| Markel Corp. | 5.000% | 3/30/43 | 250 | 271 |
| Markel Corp. | 5.000% | 4/5/46 | 650 | 716 |
| Marsh & McLennan Cos. Inc. | 5.875% | 8/1/33 | 290 | 369 |
| MetLife Inc. | 6.500% | 12/15/32 | 600 | 786 |
67
| Vanguard® Long-Term Corporate Bond Index Fund | ||||
| Schedule of Investments | ||||
| August 31, 2016 | ||||
| Face | Market | |||
| Maturity | Amount | Value | ||
| Coupon | Date | ($000) | ($000) | |
| MetLife Inc. | 6.375% | 6/15/34 | 1,140 | 1,484 |
| MetLife Inc. | 5.700% | 6/15/35 | 1,415 | 1,735 |
| MetLife Inc. | 5.875% | 2/6/41 | 1,241 | 1,566 |
| MetLife Inc. | 4.125% | 8/13/42 | 860 | 871 |
| MetLife Inc. | 4.875% | 11/13/43 | 1,080 | 1,215 |
| MetLife Inc. | 4.721% | 12/15/44 | 480 | 525 |
| MetLife Inc. | 4.050% | 3/1/45 | 995 | 992 |
| MetLife Inc. | 4.600% | 5/13/46 | 1,170 | 1,273 |
| 3 MetLife Inc. | 6.400% | 12/15/66 | 1,640 | 1,843 |
| 3 MetLife Inc. | 10.750% | 8/1/69 | 510 | 819 |
| Munich Re America Corp. | 7.450% | 12/15/26 | 350 | 466 |
| 3 Nationwide Financial Services Inc. | 6.750% | 5/15/87 | 415 | 436 |
| Principal Financial Group Inc. | 6.050% | 10/15/36 | 740 | 930 |
| Principal Financial Group Inc. | 4.625% | 9/15/42 | 300 | 324 |
| Principal Financial Group Inc. | 4.350% | 5/15/43 | 320 | 331 |
| Progressive Corp. | 2.450% | 1/15/27 | 1,100 | 1,093 |
| Progressive Corp. | 6.625% | 3/1/29 | 338 | 444 |
| Progressive Corp. | 6.250% | 12/1/32 | 590 | 794 |
| Progressive Corp. | 4.350% | 4/25/44 | 700 | 822 |
| Protective Life Corp. | 8.450% | 10/15/39 | 310 | 443 |
| Prudential Financial Inc. | 5.750% | 7/15/33 | 525 | 629 |
| Prudential Financial Inc. | 5.400% | 6/13/35 | 320 | 368 |
| Prudential Financial Inc. | 5.900% | 3/17/36 | 370 | 457 |
| Prudential Financial Inc. | 5.700% | 12/14/36 | 1,050 | 1,282 |
| Prudential Financial Inc. | 6.625% | 12/1/37 | 928 | 1,216 |
| Prudential Financial Inc. | 6.625% | 6/21/40 | 545 | 719 |
| Prudential Financial Inc. | 6.200% | 11/15/40 | 900 | 1,134 |
| Prudential Financial Inc. | 5.625% | 5/12/41 | 768 | 930 |
| Prudential Financial Inc. | 5.100% | 8/15/43 | 380 | 430 |
| Prudential Financial Inc. | 4.600% | 5/15/44 | 975 | 1,064 |
| Reinsurance Group of America Inc. | 3.950% | 9/15/26 | 525 | 543 |
| Transatlantic Holdings Inc. | 8.000% | 11/30/39 | 671 | 937 |
| Travelers Cos. Inc. | 6.750% | 6/20/36 | 555 | 808 |
| Travelers Cos. Inc. | 6.250% | 6/15/37 | 860 | 1,201 |
| Travelers Cos. Inc. | 5.350% | 11/1/40 | 863 | 1,132 |
| Travelers Cos. Inc. | 4.600% | 8/1/43 | 528 | 641 |
| Travelers Cos. Inc. | 4.300% | 8/25/45 | 475 | 555 |
| Travelers Cos. Inc. | 3.750% | 5/15/46 | 625 | 673 |
| Travelers Property Casualty Corp. | 6.375% | 3/15/33 | 500 | 688 |
| Trinity Acquisition plc | 6.125% | 8/15/43 | 310 | 352 |
| UnitedHealth Group Inc. | 4.625% | 7/15/35 | 1,100 | 1,306 |
| UnitedHealth Group Inc. | 5.800% | 3/15/36 | 1,035 | 1,390 |
| UnitedHealth Group Inc. | 6.500% | 6/15/37 | 690 | 986 |
| UnitedHealth Group Inc. | 6.625% | 11/15/37 | 1,175 | 1,702 |
| UnitedHealth Group Inc. | 6.875% | 2/15/38 | 1,410 | 2,094 |
| UnitedHealth Group Inc. | 5.700% | 10/15/40 | 160 | 213 |
| UnitedHealth Group Inc. | 5.950% | 2/15/41 | 635 | 879 |
| UnitedHealth Group Inc. | 4.625% | 11/15/41 | 663 | 784 |
| UnitedHealth Group Inc. | 4.375% | 3/15/42 | 573 | 659 |
| UnitedHealth Group Inc. | 3.950% | 10/15/42 | 625 | 680 |
| UnitedHealth Group Inc. | 4.250% | 3/15/43 | 775 | 877 |
| UnitedHealth Group Inc. | 4.750% | 7/15/45 | 2,400 | 2,974 |
| Unum Group | 5.750% | 8/15/42 | 525 | 600 |
| Validus Holdings Ltd. | 8.875% | 1/26/40 | 235 | 333 |
| Voya Financial Inc. | 5.700% | 7/15/43 | 403 | 460 |
| Voya Financial Inc. | 4.800% | 6/15/46 | 500 | 507 |
| WR Berkley Corp. | 6.250% | 2/15/37 | 100 | 125 |
| WR Berkley Corp. | 4.750% | 8/1/44 | 950 | 1,024 |
| XLIT Ltd. | 6.250% | 5/15/27 | 205 | 246 |
| XLIT Ltd. | 5.250% | 12/15/43 | 400 | 431 |
| XLIT Ltd. | 5.500% | 3/31/45 | 665 | 665 |
| Real Estate Investment Trusts (0.7%) | ||||
| Alexandria Real Estate Equities Inc. | 3.950% | 1/15/27 | 400 | 421 |
68
| Vanguard® Long-Term Corporate Bond Index Fund | ||||
| Schedule of Investments | ||||
| August 31, 2016 | ||||
| Face | Market | |||
| Maturity | Amount | Value | ||
| Coupon | Date | ($000) | ($000) | |
| Alexandria Real Estate Equities Inc. | 4.500% | 7/30/29 | 290 | 310 |
| Boston Properties LP | 2.750% | 10/1/26 | 1,000 | 990 |
| Brandywine Operating Partnership LP | 4.550% | 10/1/29 | 500 | 519 |
| ERP Operating LP | 4.500% | 7/1/44 | 925 | 1,042 |
| ERP Operating LP | 4.500% | 6/1/45 | 725 | 820 |
| Federal Realty Investment Trust | 4.500% | 12/1/44 | 700 | 810 |
| Federal Realty Investment Trust | 3.625% | 8/1/46 | 150 | 150 |
| HCP Inc. | 6.750% | 2/1/41 | 319 | 403 |
| Kilroy Realty LP | 4.250% | 8/15/29 | 375 | 398 |
| Kimco Realty Corp. | 2.800% | 10/1/26 | 500 | 498 |
| Kimco Realty Corp. | 4.250% | 4/1/45 | 450 | 480 |
| Omega Healthcare Investors Inc. | 4.500% | 4/1/27 | 855 | 857 |
| Realty Income Corp. | 4.125% | 10/15/26 | 275 | 298 |
| Realty Income Corp. | 5.875% | 3/15/35 | 285 | 356 |
| Simon Property Group LP | 6.750% | 2/1/40 | 770 | 1,153 |
| Simon Property Group LP | 4.750% | 3/15/42 | 710 | 863 |
| Simon Property Group LP | 4.250% | 10/1/44 | 400 | 456 |
| 2 Spirit Realty LP | 4.450% | 9/15/26 | 300 | 299 |
| Tanger Properties LP | 3.125% | 9/1/26 | 275 | 274 |
| UDR Inc. | 2.950% | 9/1/26 | 300 | 301 |
| Ventas Realty LP | 5.700% | 9/30/43 | 382 | 472 |
| Ventas Realty LP | 4.375% | 2/1/45 | 388 | 402 |
| Welltower Inc. | 6.500% | 3/15/41 | 479 | 629 |
| Welltower Inc. | 5.125% | 3/15/43 | 395 | 444 |
| 341,201 | ||||
| Industrial (68.1%) | ||||
| Basic Industry (4.5%) | ||||
| Agrium Inc. | 4.125% | 3/15/35 | 500 | 493 |
| Agrium Inc. | 7.125% | 5/23/36 | 380 | 500 |
| Agrium Inc. | 6.125% | 1/15/41 | 733 | 886 |
| Agrium Inc. | 4.900% | 6/1/43 | 915 | 965 |
| Agrium Inc. | 5.250% | 1/15/45 | 1,100 | 1,227 |
| Albemarle Corp. | 5.450% | 12/1/44 | 400 | 473 |
| Barrick Gold Corp. | 5.250% | 4/1/42 | 1,135 | 1,239 |
| Barrick North America Finance LLC | 7.500% | 9/15/38 | 290 | 360 |
| Barrick North America Finance LLC | 5.700% | 5/30/41 | 1,050 | 1,216 |
| Barrick North America Finance LLC | 5.750% | 5/1/43 | 950 | 1,118 |
| Barrick PD Australia Finance Pty Ltd. | 5.950% | 10/15/39 | 1,145 | 1,328 |
| BHP Billiton Finance USA Ltd. | 4.125% | 2/24/42 | 980 | 1,030 |
| BHP Billiton Finance USA Ltd. | 5.000% | 9/30/43 | 2,905 | 3,451 |
| CF Industries Inc. | 5.150% | 3/15/34 | 1,741 | 1,717 |
| CF Industries Inc. | 4.950% | 6/1/43 | 800 | 741 |
| CF Industries Inc. | 5.375% | 3/15/44 | 910 | 890 |
| Domtar Corp. | 6.250% | 9/1/42 | 425 | 459 |
| Domtar Corp. | 6.750% | 2/15/44 | 175 | 197 |
| Dow Chemical Co. | 7.375% | 11/1/29 | 1,435 | 1,960 |
| Dow Chemical Co. | 4.250% | 10/1/34 | 721 | 750 |
| Dow Chemical Co. | 9.400% | 5/15/39 | 820 | 1,341 |
| Dow Chemical Co. | 5.250% | 11/15/41 | 1,430 | 1,637 |
| Dow Chemical Co. | 4.375% | 11/15/42 | 1,625 | 1,683 |
| Dow Chemical Co. | 4.625% | 10/1/44 | 650 | 698 |
| Eastman Chemical Co. | 4.800% | 9/1/42 | 500 | 513 |
| Eastman Chemical Co. | 4.650% | 10/15/44 | 1,065 | 1,092 |
| Ecolab Inc. | 5.500% | 12/8/41 | 839 | 1,061 |
| EI du Pont de Nemours & Co. | 6.500% | 1/15/28 | 150 | 192 |
| EI du Pont de Nemours & Co. | 4.900% | 1/15/41 | 1,560 | 1,795 |
| EI du Pont de Nemours & Co. | 4.150% | 2/15/43 | 470 | 494 |
| Georgia-Pacific LLC | 7.250% | 6/1/28 | 446 | 610 |
| Georgia-Pacific LLC | 7.750% | 11/15/29 | 300 | 435 |
| Georgia-Pacific LLC | 8.875% | 5/15/31 | 665 | 1,058 |
| Glencore Canada Corp. | 6.200% | 6/15/35 | 300 | 306 |
| Goldcorp Inc. | 5.450% | 6/9/44 | 570 | 618 |
| International Paper Co. | 3.000% | 2/15/27 | 500 | 497 |
69
| Vanguard® Long-Term Corporate Bond Index Fund | ||||
| Schedule of Investments | ||||
| August 31, 2016 | ||||
| Face | Market | |||
| Maturity | Amount | Value | ||
| Coupon | Date | ($000) | ($000) | |
| International Paper Co. | 5.000% | 9/15/35 | 1,063 | 1,187 |
| International Paper Co. | 8.700% | 6/15/38 | 250 | 375 |
| International Paper Co. | 7.300% | 11/15/39 | 1,118 | 1,512 |
| International Paper Co. | 6.000% | 11/15/41 | 425 | 506 |
| International Paper Co. | 4.800% | 6/15/44 | 785 | 834 |
| International Paper Co. | 5.150% | 5/15/46 | 850 | 950 |
| International Paper Co. | 4.400% | 8/15/47 | 1,700 | 1,723 |
| Lubrizol Corp. | 6.500% | 10/1/34 | 315 | 429 |
| LYB International Finance BV | 5.250% | 7/15/43 | 875 | 981 |
| LYB International Finance BV | 4.875% | 3/15/44 | 1,150 | 1,256 |
| LyondellBasell Industries NV | 4.625% | 2/26/55 | 1,487 | 1,488 |
| Meadwestvaco Corp. | 7.950% | 2/15/31 | 350 | 471 |
| Methanex Corp. | 5.650% | 12/1/44 | 300 | 263 |
| Monsanto Co. | 4.200% | 7/15/34 | 830 | 864 |
| Monsanto Co. | 5.875% | 4/15/38 | 305 | 366 |
| Monsanto Co. | 3.600% | 7/15/42 | 665 | 603 |
| Monsanto Co. | 4.400% | 7/15/44 | 920 | 958 |
| Monsanto Co. | 3.950% | 4/15/45 | 425 | 412 |
| Monsanto Co. | 4.700% | 7/15/64 | 1,120 | 1,078 |
| Mosaic Co. | 5.450% | 11/15/33 | 500 | 548 |
| Mosaic Co. | 4.875% | 11/15/41 | 345 | 342 |
| Mosaic Co. | 5.625% | 11/15/43 | 725 | 794 |
| Newmont Mining Corp. | 5.875% | 4/1/35 | 761 | 863 |
| Newmont Mining Corp. | 6.250% | 10/1/39 | 853 | 1,000 |
| Newmont Mining Corp. | 4.875% | 3/15/42 | 1,753 | 1,868 |
| Nucor Corp. | 6.400% | 12/1/37 | 705 | 894 |
| Nucor Corp. | 5.200% | 8/1/43 | 795 | 918 |
| Placer Dome Inc. | 6.450% | 10/15/35 | 334 | 382 |
| Potash Corp. of Saskatchewan Inc. | 5.875% | 12/1/36 | 860 | 1,039 |
| Potash Corp. of Saskatchewan Inc. | 5.625% | 12/1/40 | 235 | 286 |
| PPG Industries Inc. | 5.500% | 11/15/40 | 545 | 684 |
| Praxair Inc. | 3.550% | 11/7/42 | 525 | 559 |
| Reliance Steel & Aluminum Co. | 6.850% | 11/15/36 | 285 | 313 |
| Rio Tinto Alcan Inc. | 7.250% | 3/15/31 | 855 | 1,063 |
| Rio Tinto Alcan Inc. | 6.125% | 12/15/33 | 794 | 933 |
| Rio Tinto Alcan Inc. | 5.750% | 6/1/35 | 535 | 604 |
| Rio Tinto Finance USA Ltd. | 7.125% | 7/15/28 | 665 | 868 |
| Rio Tinto Finance USA Ltd. | 5.200% | 11/2/40 | 1,370 | 1,599 |
| Rio Tinto Finance USA plc | 4.750% | 3/22/42 | 640 | 708 |
| Rio Tinto Finance USA plc | 4.125% | 8/21/42 | 475 | 490 |
| Rohm & Haas Co. | 7.850% | 7/15/29 | 760 | 1,060 |
| RPM International Inc. | 5.250% | 6/1/45 | 450 | 480 |
| Sherwin-Williams Co. | 4.000% | 12/15/42 | 216 | 217 |
| Sherwin-Williams Co. | 4.550% | 8/1/45 | 550 | 604 |
| Southern Copper Corp. | 7.500% | 7/27/35 | 1,545 | 1,837 |
| Southern Copper Corp. | 6.750% | 4/16/40 | 1,240 | 1,375 |
| Southern Copper Corp. | 5.250% | 11/8/42 | 350 | 336 |
| Southern Copper Corp. | 5.875% | 4/23/45 | 2,625 | 2,674 |
| Syngenta Finance NV | 4.375% | 3/28/42 | 225 | 226 |
| Vale Canada Ltd. | 7.200% | 9/15/32 | 560 | 546 |
| Vale Overseas Ltd. | 8.250% | 1/17/34 | 295 | 327 |
| Vale Overseas Ltd. | 6.875% | 11/21/36 | 2,985 | 2,951 |
| Vale Overseas Ltd. | 6.875% | 11/10/39 | 2,050 | 2,029 |
| Vale SA | 5.625% | 9/11/42 | 2,460 | 2,109 |
| 2 Westlake Chemical Corp. | 5.000% | 8/15/46 | 850 | 873 |
| Westrock MWV LLC | 8.200% | 1/15/30 | 500 | 688 |
| Weyerhaeuser Co. | 6.950% | 10/1/27 | 405 | 509 |
| Weyerhaeuser Co. | 7.375% | 3/15/32 | 1,270 | 1,726 |
| Weyerhaeuser Co. | 6.875% | 12/15/33 | 475 | 599 |
| Capital Goods (5.1%) | ||||
| 3M Co. | 6.375% | 2/15/28 | 305 | 421 |
| 3M Co. | 5.700% | 3/15/37 | 905 | 1,250 |
| 3M Co. | 3.875% | 6/15/44 | 152 | 174 |
70
| Vanguard® Long-Term Corporate Bond Index Fund | ||||
| Schedule of Investments | ||||
| August 31, 2016 | ||||
| Face | Market | |||
| Maturity | Amount | Value | ||
| Coupon | Date | ($000) | ($000) | |
| ABB Finance USA Inc. | 4.375% | 5/8/42 | 750 | 869 |
| Boeing Co. | 6.125% | 2/15/33 | 875 | 1,197 |
| Boeing Co. | 3.300% | 3/1/35 | 670 | 695 |
| Boeing Co. | 6.875% | 3/15/39 | 395 | 601 |
| Boeing Co. | 5.875% | 2/15/40 | 500 | 695 |
| Boeing Co. | 3.500% | 3/1/45 | 100 | 105 |
| Boeing Co. | 3.375% | 6/15/46 | 825 | 841 |
| Caterpillar Inc. | 5.300% | 9/15/35 | 350 | 432 |
| Caterpillar Inc. | 6.050% | 8/15/36 | 990 | 1,323 |
| Caterpillar Inc. | 5.200% | 5/27/41 | 550 | 689 |
| Caterpillar Inc. | 3.803% | 8/15/42 | 2,255 | 2,359 |
| Caterpillar Inc. | 4.300% | 5/15/44 | 500 | 564 |
| Caterpillar Inc. | 4.750% | 5/15/64 | 850 | 988 |
| Deere & Co. | 5.375% | 10/16/29 | 1,071 | 1,372 |
| Deere & Co. | 8.100% | 5/15/30 | 604 | 920 |
| Deere & Co. | 7.125% | 3/3/31 | 300 | 429 |
| Deere & Co. | 3.900% | 6/9/42 | 870 | 968 |
| Dover Corp. | 6.600% | 3/15/38 | 425 | 620 |
| Dover Corp. | 5.375% | 3/1/41 | 600 | 776 |
| Eaton Corp. | 4.000% | 11/2/32 | 1,250 | 1,349 |
| Eaton Corp. | 4.150% | 11/2/42 | 700 | 772 |
| Emerson Electric Co. | 6.000% | 8/15/32 | 160 | 211 |
| Emerson Electric Co. | 6.125% | 4/15/39 | 420 | 596 |
| Emerson Electric Co. | 5.250% | 11/15/39 | 345 | 441 |
| 2 Fortive Corp. | 4.300% | 6/15/46 | 650 | 722 |
| General Dynamics Corp. | 3.600% | 11/15/42 | 411 | 443 |
| General Electric Capital Corp. | 6.750% | 3/15/32 | 3,286 | 4,701 |
| General Electric Capital Corp. | 6.150% | 8/7/37 | 1,785 | 2,493 |
| General Electric Capital Corp. | 5.875% | 1/14/38 | 3,934 | 5,362 |
| General Electric Capital Corp. | 6.875% | 1/10/39 | 2,210 | 3,384 |
| General Electric Co. | 4.125% | 10/9/42 | 2,525 | 2,849 |
| General Electric Co. | 4.500% | 3/11/44 | 2,930 | 3,467 |
| Harris Corp. | 4.854% | 4/27/35 | 675 | 757 |
| Harris Corp. | 6.150% | 12/15/40 | 325 | 417 |
| Harris Corp. | 5.054% | 4/27/45 | 385 | 450 |
| Honeywell International Inc. | 5.700% | 3/15/36 | 700 | 933 |
| Honeywell International Inc. | 5.700% | 3/15/37 | 580 | 784 |
| Honeywell International Inc. | 5.375% | 3/1/41 | 780 | 1,049 |
| Illinois Tool Works Inc. | 4.875% | 9/15/41 | 714 | 900 |
| Illinois Tool Works Inc. | 3.900% | 9/1/42 | 1,632 | 1,823 |
| Ingersoll-Rand Global Holding Co. Ltd. | 5.750% | 6/15/43 | 635 | 795 |
| Ingersoll-Rand Luxembourg Finance SA | 4.650% | 11/1/44 | 365 | 405 |
| Lafarge SA | 7.125% | 7/15/36 | 650 | 817 |
| Lockheed Martin Corp. | 3.600% | 3/1/35 | 500 | 518 |
| Lockheed Martin Corp. | 4.500% | 5/15/36 | 700 | 816 |
| Lockheed Martin Corp. | 6.150% | 9/1/36 | 565 | 771 |
| Lockheed Martin Corp. | 5.500% | 11/15/39 | 275 | 350 |
| Lockheed Martin Corp. | 5.720% | 6/1/40 | 579 | 757 |
| Lockheed Martin Corp. | 4.850% | 9/15/41 | 1,230 | 1,468 |
| Lockheed Martin Corp. | 4.070% | 12/15/42 | 1,965 | 2,131 |
| Lockheed Martin Corp. | 3.800% | 3/1/45 | 1,130 | 1,174 |
| Lockheed Martin Corp. | 4.700% | 5/15/46 | 2,300 | 2,754 |
| Northrop Grumman Corp. | 5.050% | 11/15/40 | 690 | 843 |
| Northrop Grumman Corp. | 4.750% | 6/1/43 | 880 | 1,070 |
| Northrop Grumman Corp. | 3.850% | 4/15/45 | 650 | 694 |
| Northrop Grumman Systems Corp. | 7.750% | 2/15/31 | 510 | 762 |
| Owens Corning | 7.000% | 12/1/36 | 1,120 | 1,435 |
| Parker-Hannifin Corp. | 4.200% | 11/21/34 | 669 | 759 |
| Parker-Hannifin Corp. | 6.250% | 5/15/38 | 490 | 705 |
| Parker-Hannifin Corp. | 4.450% | 11/21/44 | 485 | 584 |
| Precision Castparts Corp. | 4.200% | 6/15/35 | 775 | 888 |
| Precision Castparts Corp. | 3.900% | 1/15/43 | 225 | 251 |
| Precision Castparts Corp. | 4.375% | 6/15/45 | 400 | 480 |
| Raytheon Co. | 7.200% | 8/15/27 | 455 | 643 |
71
| Vanguard® Long-Term Corporate Bond Index Fund | ||||
| Schedule of Investments | ||||
| August 31, 2016 | ||||
| Face | Market | |||
| Maturity | Amount | Value | ||
| Coupon | Date | ($000) | ($000) | |
| Raytheon Co. | 4.875% | 10/15/40 | 600 | 745 |
| Raytheon Co. | 4.700% | 12/15/41 | 580 | 714 |
| Raytheon Co. | 4.200% | 12/15/44 | 545 | 638 |
| Republic Services Inc. | 6.200% | 3/1/40 | 500 | 686 |
| Republic Services Inc. | 5.700% | 5/15/41 | 420 | 549 |
| Rockwell Automation Inc. | 6.700% | 1/15/28 | 285 | 385 |
| Rockwell Automation Inc. | 6.250% | 12/1/37 | 419 | 584 |
| Rockwell Collins Inc. | 4.800% | 12/15/43 | 400 | 486 |
| Sonoco Products Co. | 5.750% | 11/1/40 | 695 | 846 |
| Stanley Black & Decker Inc. | 5.200% | 9/1/40 | 440 | 539 |
| Tyco International Finance SA | 5.125% | 9/14/45 | 900 | 1,072 |
| United Technologies Corp. | 6.700% | 8/1/28 | 400 | 542 |
| United Technologies Corp. | 7.500% | 9/15/29 | 705 | 1,042 |
| United Technologies Corp. | 5.400% | 5/1/35 | 1,353 | 1,698 |
| United Technologies Corp. | 6.050% | 6/1/36 | 600 | 820 |
| United Technologies Corp. | 6.125% | 7/15/38 | 940 | 1,304 |
| United Technologies Corp. | 5.700% | 4/15/40 | 1,579 | 2,146 |
| United Technologies Corp. | 4.500% | 6/1/42 | 4,030 | 4,777 |
| United Technologies Corp. | 4.150% | 5/15/45 | 769 | 874 |
| Valmont Industries Inc. | 5.000% | 10/1/44 | 180 | 177 |
| Valmont Industries Inc. | 5.250% | 10/1/54 | 365 | 345 |
| Waste Management Inc. | 7.000% | 7/15/28 | 557 | 765 |
| Waste Management Inc. | 3.900% | 3/1/35 | 775 | 840 |
| Waste Management Inc. | 6.125% | 11/30/39 | 350 | 490 |
| Waste Management Inc. | 4.100% | 3/1/45 | 695 | 790 |
| WW Grainger Inc. | 4.600% | 6/15/45 | 1,140 | 1,361 |
| WW Grainger Inc. | 3.750% | 5/15/46 | 525 | 549 |
| Communication (14.2%) | ||||
| 21st Century Fox America Inc. | 6.550% | 3/15/33 | 485 | 631 |
| 21st Century Fox America Inc. | 6.200% | 12/15/34 | 685 | 873 |
| 21st Century Fox America Inc. | 6.400% | 12/15/35 | 1,965 | 2,566 |
| 21st Century Fox America Inc. | 8.150% | 10/17/36 | 428 | 630 |
| 21st Century Fox America Inc. | 6.150% | 3/1/37 | 550 | 704 |
| 21st Century Fox America Inc. | 6.650% | 11/15/37 | 1,665 | 2,236 |
| 21st Century Fox America Inc. | 7.850% | 3/1/39 | 250 | 369 |
| 21st Century Fox America Inc. | 6.900% | 8/15/39 | 1,035 | 1,417 |
| 21st Century Fox America Inc. | 6.150% | 2/15/41 | 2,163 | 2,803 |
| 21st Century Fox America Inc. | 5.400% | 10/1/43 | 1,380 | 1,676 |
| 21st Century Fox America Inc. | 4.750% | 9/15/44 | 575 | 648 |
| 21st Century Fox America Inc. | 4.950% | 10/15/45 | 200 | 235 |
| 21st Century Fox America Inc. | 7.750% | 12/1/45 | 905 | 1,368 |
| America Movil SAB de CV | 6.375% | 3/1/35 | 930 | 1,195 |
| America Movil SAB de CV | 6.125% | 11/15/37 | 1,250 | 1,562 |
| America Movil SAB de CV | 6.125% | 3/30/40 | 2,535 | 3,206 |
| America Movil SAB de CV | 4.375% | 7/16/42 | 1,100 | 1,160 |
| American Tower Corp. | 3.375% | 10/15/26 | 1,100 | 1,124 |
| Ameritech Capital Funding Corp. | 6.550% | 1/15/28 | 385 | 446 |
| AT&T Corp. | 8.250% | 11/15/31 | 880 | 1,291 |
| AT&T Inc. | 6.150% | 9/15/34 | 1,342 | 1,657 |
| AT&T Inc. | 4.500% | 5/15/35 | 3,955 | 4,186 |
| AT&T Inc. | 6.500% | 9/1/37 | 1,187 | 1,547 |
| AT&T Inc. | 6.300% | 1/15/38 | 2,835 | 3,607 |
| AT&T Inc. | 6.400% | 5/15/38 | 660 | 852 |
| AT&T Inc. | 6.550% | 2/15/39 | 1,375 | 1,798 |
| AT&T Inc. | 6.350% | 3/15/40 | 500 | 638 |
| AT&T Inc. | 6.000% | 8/15/40 | 843 | 1,027 |
| AT&T Inc. | 5.350% | 9/1/40 | 4,014 | 4,594 |
| AT&T Inc. | 6.375% | 3/1/41 | 1,900 | 2,392 |
| AT&T Inc. | 5.550% | 8/15/41 | 2,456 | 2,905 |
| AT&T Inc. | 5.150% | 3/15/42 | 1,734 | 1,940 |
| AT&T Inc. | 4.300% | 12/15/42 | 2,663 | 2,666 |
| AT&T Inc. | 4.800% | 6/15/44 | 2,165 | 2,306 |
| AT&T Inc. | 4.350% | 6/15/45 | 3,926 | 3,925 |
72
| Vanguard® Long-Term Corporate Bond Index Fund | ||||
| Schedule of Investments | ||||
| August 31, 2016 | ||||
| Face | Market | |||
| Maturity | Amount | Value | ||
| Coupon | Date | ($000) | ($000) | |
| AT&T Inc. | 4.750% | 5/15/46 | 4,731 | 5,052 |
| AT&T Mobility LLC | 7.125% | 12/15/31 | 422 | 570 |
| Bellsouth Capital Funding Corp. | 7.875% | 2/15/30 | 598 | 829 |
| Bellsouth Capital Funding Corp. | 7.120% | 7/15/97 | 200 | 266 |
| BellSouth LLC | 6.875% | 10/15/31 | 223 | 283 |
| BellSouth LLC | 6.550% | 6/15/34 | 520 | 621 |
| BellSouth LLC | 6.000% | 11/15/34 | 525 | 597 |
| BellSouth Telecommunications LLC | 6.375% | 6/1/28 | 422 | 509 |
| British Telecommunications plc | 9.375% | 12/15/30 | 3,052 | 4,983 |
| CBS Corp. | 2.900% | 1/15/27 | 950 | 924 |
| CBS Corp. | 7.875% | 7/30/30 | 446 | 635 |
| CBS Corp. | 5.500% | 5/15/33 | 715 | 803 |
| CBS Corp. | 5.900% | 10/15/40 | 425 | 518 |
| CBS Corp. | 4.850% | 7/1/42 | 695 | 743 |
| CBS Corp. | 4.900% | 8/15/44 | 750 | 816 |
| 2 Charter Communications Operating LLC / Charter | ||||
| Communications Operating Capital | 6.384% | 10/23/35 | 2,125 | 2,546 |
| 2 Charter Communications Operating LLC / Charter | ||||
| Communications Operating Capital | 6.484% | 10/23/45 | 4,675 | 5,749 |
| 2 Charter Communications Operating LLC / Charter | ||||
| Communications Operating Capital | 6.834% | 10/23/55 | 500 | 625 |
| Comcast Corp. | 4.250% | 1/15/33 | 1,910 | 2,143 |
| Comcast Corp. | 7.050% | 3/15/33 | 1,235 | 1,770 |
| Comcast Corp. | 4.200% | 8/15/34 | 1,850 | 2,066 |
| Comcast Corp. | 5.650% | 6/15/35 | 1,535 | 1,996 |
| Comcast Corp. | 4.400% | 8/15/35 | 865 | 991 |
| Comcast Corp. | 6.500% | 11/15/35 | 560 | 787 |
| Comcast Corp. | 3.200% | 7/15/36 | 1,000 | 997 |
| Comcast Corp. | 6.450% | 3/15/37 | 1,805 | 2,530 |
| Comcast Corp. | 6.950% | 8/15/37 | 2,025 | 2,993 |
| Comcast Corp. | 6.400% | 5/15/38 | 955 | 1,341 |
| Comcast Corp. | 6.550% | 7/1/39 | 250 | 358 |
| Comcast Corp. | 6.400% | 3/1/40 | 1,618 | 2,306 |
| Comcast Corp. | 4.650% | 7/15/42 | 1,990 | 2,324 |
| Comcast Corp. | 4.500% | 1/15/43 | 1,125 | 1,294 |
| Comcast Corp. | 4.750% | 3/1/44 | 1,830 | 2,184 |
| Comcast Corp. | 4.600% | 8/15/45 | 2,125 | 2,492 |
| Comcast Corp. | 3.400% | 7/15/46 | 2,700 | 2,654 |
| Deutsche Telekom International Finance BV | 8.750% | 6/15/30 | 3,764 | 5,880 |
| Deutsche Telekom International Finance BV | 9.250% | 6/1/32 | 838 | 1,387 |
| Discovery Communications LLC | 6.350% | 6/1/40 | 1,210 | 1,279 |
| Discovery Communications LLC | 4.950% | 5/15/42 | 525 | 494 |
| Discovery Communications LLC | 4.875% | 4/1/43 | 625 | 589 |
| Grupo Televisa SAB | 8.500% | 3/11/32 | 390 | 526 |
| Grupo Televisa SAB | 6.625% | 1/15/40 | 550 | 674 |
| Grupo Televisa SAB | 5.000% | 5/13/45 | 1,150 | 1,196 |
| Grupo Televisa SAB | 6.125% | 1/31/46 | 1,175 | 1,412 |
| GTE Corp. | 6.940% | 4/15/28 | 810 | 1,060 |
| Historic TW Inc. | 6.625% | 5/15/29 | 1,110 | 1,462 |
| Koninklijke KPN NV | 8.375% | 10/1/30 | 1,015 | 1,412 |
| Moody's Corp. | 5.250% | 7/15/44 | 800 | 996 |
| NBCUniversal Media LLC | 6.400% | 4/30/40 | 1,275 | 1,819 |
| NBCUniversal Media LLC | 5.950% | 4/1/41 | 1,870 | 2,552 |
| NBCUniversal Media LLC | 4.450% | 1/15/43 | 925 | 1,051 |
| New Cingular Wireless Services Inc. | 8.750% | 3/1/31 | 970 | 1,497 |
| Orange SA | 9.000% | 3/1/31 | 3,070 | 4,923 |
| Orange SA | 5.375% | 1/13/42 | 1,605 | 1,986 |
| Orange SA | 5.500% | 2/6/44 | 235 | 301 |
| Qwest Corp. | 6.875% | 9/15/33 | 1,915 | 1,925 |
| Qwest Corp. | 7.125% | 11/15/43 | 500 | 510 |
| Rogers Communications Inc. | 7.500% | 8/15/38 | 325 | 464 |
| Rogers Communications Inc. | 4.500% | 3/15/43 | 900 | 995 |
| Rogers Communications Inc. | 5.450% | 10/1/43 | 775 | 958 |
| Rogers Communications Inc. | 5.000% | 3/15/44 | 1,151 | 1,376 |
73
| Vanguard® Long-Term Corporate Bond Index Fund | ||||
| Schedule of Investments | ||||
| August 31, 2016 | ||||
| Face | Market | |||
| Maturity | Amount | Value | ||
| Coupon | Date | ($000) | ($000) | |
| S&P Global Inc. | 6.550% | 11/15/37 | 788 | 1,007 |
| TCI Communications Inc. | 7.125% | 2/15/28 | 545 | 771 |
| Telefonica Emisiones SAU | 7.045% | 6/20/36 | 2,705 | 3,625 |
| Telefonica Europe BV | 8.250% | 9/15/30 | 1,412 | 2,068 |
| Thomson Reuters Corp. | 5.500% | 8/15/35 | 300 | 343 |
| Thomson Reuters Corp. | 5.850% | 4/15/40 | 505 | 612 |
| Thomson Reuters Corp. | 4.500% | 5/23/43 | 350 | 374 |
| Thomson Reuters Corp. | 5.650% | 11/23/43 | 525 | 640 |
| Time Warner Cable Inc. | 6.550% | 5/1/37 | 2,195 | 2,645 |
| Time Warner Cable Inc. | 7.300% | 7/1/38 | 1,785 | 2,303 |
| Time Warner Cable Inc. | 6.750% | 6/15/39 | 1,720 | 2,118 |
| Time Warner Cable Inc. | 5.875% | 11/15/40 | 1,508 | 1,685 |
| Time Warner Cable Inc. | 5.500% | 9/1/41 | 1,423 | 1,545 |
| Time Warner Cable Inc. | 4.500% | 9/15/42 | 1,475 | 1,429 |
| Time Warner Cos. Inc. | 6.950% | 1/15/28 | 688 | 903 |
| Time Warner Entertainment Co. LP | 8.375% | 7/15/33 | 1,150 | 1,564 |
| Time Warner Inc. | 7.625% | 4/15/31 | 1,896 | 2,677 |
| Time Warner Inc. | 7.700% | 5/1/32 | 2,405 | 3,439 |
| Time Warner Inc. | 6.500% | 11/15/36 | 1,515 | 1,973 |
| Time Warner Inc. | 6.200% | 3/15/40 | 761 | 983 |
| Time Warner Inc. | 6.100% | 7/15/40 | 1,360 | 1,749 |
| Time Warner Inc. | 6.250% | 3/29/41 | 1,530 | 2,010 |
| Time Warner Inc. | 5.375% | 10/15/41 | 220 | 265 |
| Time Warner Inc. | 4.900% | 6/15/42 | 1,145 | 1,294 |
| Time Warner Inc. | 5.350% | 12/15/43 | 1,050 | 1,270 |
| Time Warner Inc. | 4.650% | 6/1/44 | 327 | 362 |
| Time Warner Inc. | 4.850% | 7/15/45 | 1,400 | 1,610 |
| Verizon Communications Inc. | 7.750% | 12/1/30 | 1,300 | 1,866 |
| Verizon Communications Inc. | 6.400% | 9/15/33 | 1,907 | 2,493 |
| Verizon Communications Inc. | 5.050% | 3/15/34 | 2,095 | 2,390 |
| Verizon Communications Inc. | 4.400% | 11/1/34 | 3,720 | 3,940 |
| Verizon Communications Inc. | 5.850% | 9/15/35 | 2,300 | 2,848 |
| Verizon Communications Inc. | 4.272% | 1/15/36 | 3,371 | 3,530 |
| Verizon Communications Inc. | 6.250% | 4/1/37 | 945 | 1,216 |
| Verizon Communications Inc. | 6.400% | 2/15/38 | 1,320 | 1,727 |
| Verizon Communications Inc. | 6.900% | 4/15/38 | 590 | 799 |
| Verizon Communications Inc. | 7.350% | 4/1/39 | 750 | 1,075 |
| Verizon Communications Inc. | 6.000% | 4/1/41 | 889 | 1,121 |
| Verizon Communications Inc. | 4.750% | 11/1/41 | 1,795 | 1,944 |
| Verizon Communications Inc. | 3.850% | 11/1/42 | 2,245 | 2,169 |
| Verizon Communications Inc. | 6.550% | 9/15/43 | 4,820 | 6,532 |
| Verizon Communications Inc. | 4.125% | 8/15/46 | 1,625 | 1,632 |
| Verizon Communications Inc. | 4.862% | 8/21/46 | 6,198 | 6,858 |
| Verizon Communications Inc. | 4.522% | 9/15/48 | 4,570 | 4,818 |
| Verizon Communications Inc. | 5.012% | 8/21/54 | 6,324 | 6,996 |
| Verizon Communications Inc. | 4.672% | 3/15/55 | 6,119 | 6,402 |
| Viacom Inc. | 4.850% | 12/15/34 | 650 | 655 |
| Viacom Inc. | 6.875% | 4/30/36 | 1,135 | 1,322 |
| Viacom Inc. | 4.500% | 2/27/42 | 250 | 230 |
| Viacom Inc. | 4.375% | 3/15/43 | 2,450 | 2,233 |
| Viacom Inc. | 4.875% | 6/15/43 | 450 | 420 |
| Viacom Inc. | 5.850% | 9/1/43 | 1,285 | 1,435 |
| Viacom Inc. | 5.250% | 4/1/44 | 721 | 738 |
| Vodafone Group plc | 7.875% | 2/15/30 | 975 | 1,338 |
| Vodafone Group plc | 6.250% | 11/30/32 | 815 | 1,005 |
| Vodafone Group plc | 6.150% | 2/27/37 | 1,310 | 1,635 |
| Vodafone Group plc | 4.375% | 2/19/43 | 2,210 | 2,267 |
| Walt Disney Co. | 7.000% | 3/1/32 | 595 | 861 |
| Walt Disney Co. | 4.375% | 8/16/41 | 745 | 887 |
| Walt Disney Co. | 4.125% | 12/1/41 | 685 | 786 |
| Walt Disney Co. | 3.700% | 12/1/42 | 815 | 872 |
| Walt Disney Co. | 4.125% | 6/1/44 | 875 | 1,003 |
| WPP Finance 2010 | 5.125% | 9/7/42 | 725 | 812 |
74
| Vanguard® Long-Term Corporate Bond Index Fund | ||||
| Schedule of Investments | ||||
| August 31, 2016 | ||||
| Face | Market | |||
| Maturity | Amount | Value | ||
| Coupon | Date | ($000) | ($000) | |
| Consumer Cyclical (6.8%) | ||||
| Alibaba Group Holding Ltd. | 4.500% | 11/28/34 | 700 | 774 |
| Amazon.com Inc. | 4.800% | 12/5/34 | 1,570 | 1,881 |
| Amazon.com Inc. | 4.950% | 12/5/44 | 1,893 | 2,371 |
| Bed Bath & Beyond Inc. | 4.915% | 8/1/34 | 570 | 582 |
| Bed Bath & Beyond Inc. | 5.165% | 8/1/44 | 925 | 908 |
| BorgWarner Inc. | 4.375% | 3/15/45 | 615 | 662 |
| Cummins Inc. | 7.125% | 3/1/28 | 525 | 726 |
| Cummins Inc. | 4.875% | 10/1/43 | 550 | 666 |
| CVS Health Corp. | 5.300% | 12/5/43 | 1,058 | 1,326 |
| CVS Health Corp. | 5.125% | 7/20/45 | 5,650 | 7,046 |
| Daimler Finance North America LLC | 8.500% | 1/18/31 | 1,705 | 2,829 |
| Darden Restaurants Inc. | 6.800% | 10/15/37 | 100 | 120 |
| eBay Inc. | 4.000% | 7/15/42 | 825 | 775 |
| Ford Holdings LLC | 9.300% | 3/1/30 | 650 | 940 |
| Ford Motor Co. | 6.625% | 10/1/28 | 825 | 1,047 |
| Ford Motor Co. | 6.375% | 2/1/29 | 546 | 676 |
| Ford Motor Co. | 7.450% | 7/16/31 | 1,707 | 2,318 |
| Ford Motor Co. | 4.750% | 1/15/43 | 2,850 | 3,064 |
| Ford Motor Co. | 7.400% | 11/1/46 | 435 | 645 |
| General Motors Co. | 5.000% | 4/1/35 | 1,017 | 1,072 |
| General Motors Co. | 6.600% | 4/1/36 | 1,900 | 2,346 |
| General Motors Co. | 6.250% | 10/2/43 | 2,368 | 2,842 |
| General Motors Co. | 5.200% | 4/1/45 | 1,200 | 1,275 |
| General Motors Co. | 6.750% | 4/1/46 | 595 | 764 |
| Harley-Davidson Inc. | 4.625% | 7/28/45 | 335 | 368 |
| Home Depot Inc. | 5.875% | 12/16/36 | 3,455 | 4,762 |
| Home Depot Inc. | 5.400% | 9/15/40 | 655 | 857 |
| Home Depot Inc. | 5.950% | 4/1/41 | 915 | 1,267 |
| Home Depot Inc. | 4.200% | 4/1/43 | 1,100 | 1,251 |
| Home Depot Inc. | 4.875% | 2/15/44 | 1,658 | 2,064 |
| Home Depot Inc. | 4.400% | 3/15/45 | 1,680 | 1,992 |
| Home Depot Inc. | 4.250% | 4/1/46 | 1,845 | 2,139 |
| Johnson Controls Inc. | 6.000% | 1/15/36 | 510 | 619 |
| Johnson Controls Inc. | 5.700% | 3/1/41 | 405 | 481 |
| Johnson Controls Inc. | 5.250% | 12/1/41 | 280 | 321 |
| Johnson Controls Inc. | 4.625% | 7/2/44 | 400 | 442 |
| Johnson Controls Inc. | 4.950% | 7/2/64 | 305 | 325 |
| Kohl's Corp. | 5.550% | 7/17/45 | 650 | 644 |
| Lowe's Cos. Inc. | 6.875% | 2/15/28 | 410 | 559 |
| Lowe's Cos. Inc. | 6.500% | 3/15/29 | 690 | 931 |
| Lowe's Cos. Inc. | 5.500% | 10/15/35 | 420 | 540 |
| Lowe's Cos. Inc. | 5.800% | 10/15/36 | 775 | 1,017 |
| Lowe's Cos. Inc. | 6.650% | 9/15/37 | 130 | 188 |
| Lowe's Cos. Inc. | 5.800% | 4/15/40 | 385 | 520 |
| Lowe's Cos. Inc. | 5.125% | 11/15/41 | 611 | 767 |
| Lowe's Cos. Inc. | 4.650% | 4/15/42 | 260 | 308 |
| Lowe's Cos. Inc. | 5.000% | 9/15/43 | 980 | 1,212 |
| Lowe's Cos. Inc. | 4.250% | 9/15/44 | 375 | 423 |
| Lowe's Cos. Inc. | 4.375% | 9/15/45 | 1,400 | 1,622 |
| Lowe's Cos. Inc. | 3.700% | 4/15/46 | 1,650 | 1,723 |
| Macy's Retail Holdings Inc. | 7.000% | 2/15/28 | 450 | 527 |
| Macy's Retail Holdings Inc. | 6.900% | 4/1/29 | 365 | 414 |
| Macy's Retail Holdings Inc. | 6.900% | 1/15/32 | 225 | 256 |
| Macy's Retail Holdings Inc. | 6.700% | 7/15/34 | 190 | 210 |
| Macy's Retail Holdings Inc. | 4.500% | 12/15/34 | 750 | 709 |
| Macy's Retail Holdings Inc. | 6.375% | 3/15/37 | 710 | 778 |
| Macy's Retail Holdings Inc. | 5.125% | 1/15/42 | 635 | 604 |
| Macy's Retail Holdings Inc. | 4.300% | 2/15/43 | 225 | 191 |
| McDonald's Corp. | 4.700% | 12/9/35 | 1,100 | 1,263 |
| McDonald's Corp. | 6.300% | 10/15/37 | 910 | 1,220 |
| McDonald's Corp. | 6.300% | 3/1/38 | 1,073 | 1,436 |
| McDonald's Corp. | 5.700% | 2/1/39 | 350 | 445 |
75
| Vanguard® Long-Term Corporate Bond Index Fund | ||||
| Schedule of Investments | ||||
| August 31, 2016 | ||||
| Face | Market | |||
| Maturity | Amount | Value | ||
| Coupon | Date | ($000) | ($000) | |
| McDonald's Corp. | 3.700% | 2/15/42 | 585 | 585 |
| McDonald's Corp. | 3.625% | 5/1/43 | 1,050 | 1,036 |
| McDonald's Corp. | 4.600% | 5/26/45 | 695 | 788 |
| McDonald's Corp. | 4.875% | 12/9/45 | 2,407 | 2,847 |
| Metropolitan Museum of Art New York Revenue | 3.400% | 7/1/45 | 300 | 319 |
| NIKE Inc. | 3.625% | 5/1/43 | 1,025 | 1,104 |
| NIKE Inc. | 3.875% | 11/1/45 | 800 | 895 |
| Nordstrom Inc. | 6.950% | 3/15/28 | 305 | 386 |
| Nordstrom Inc. | 5.000% | 1/15/44 | 924 | 968 |
| QVC Inc. | 5.450% | 8/15/34 | 250 | 238 |
| QVC Inc. | 5.950% | 3/15/43 | 350 | 339 |
| Starbucks Corp. | 4.300% | 6/15/45 | 425 | 512 |
| Starwood Hotels & Resorts Worldwide Inc. | 4.500% | 10/1/34 | 350 | 364 |
| Target Corp. | 6.350% | 11/1/32 | 549 | 754 |
| Target Corp. | 6.500% | 10/15/37 | 827 | 1,201 |
| Target Corp. | 7.000% | 1/15/38 | 550 | 829 |
| Target Corp. | 4.000% | 7/1/42 | 1,357 | 1,501 |
| Target Corp. | 3.625% | 4/15/46 | 1,650 | 1,722 |
| Tiffany & Co. | 4.900% | 10/1/44 | 325 | 338 |
| VF Corp. | 6.450% | 11/1/37 | 555 | 770 |
| Visa Inc. | 4.150% | 12/14/35 | 2,255 | 2,584 |
| Visa Inc. | 4.300% | 12/14/45 | 3,825 | 4,542 |
| Wal-Mart Stores Inc. | 5.875% | 4/5/27 | 1,505 | 1,980 |
| Wal-Mart Stores Inc. | 7.550% | 2/15/30 | 1,745 | 2,673 |
| Wal-Mart Stores Inc. | 5.250% | 9/1/35 | 2,827 | 3,766 |
| Wal-Mart Stores Inc. | 6.500% | 8/15/37 | 4,025 | 5,968 |
| Wal-Mart Stores Inc. | 6.200% | 4/15/38 | 2,135 | 3,081 |
| Wal-Mart Stores Inc. | 5.625% | 4/1/40 | 1,997 | 2,725 |
| Wal-Mart Stores Inc. | 4.875% | 7/8/40 | 1,225 | 1,544 |
| Wal-Mart Stores Inc. | 5.000% | 10/25/40 | 1,730 | 2,209 |
| Wal-Mart Stores Inc. | 5.625% | 4/15/41 | 2,175 | 2,972 |
| Wal-Mart Stores Inc. | 4.000% | 4/11/43 | 1,275 | 1,451 |
| Wal-Mart Stores Inc. | 4.750% | 10/2/43 | 750 | 940 |
| Wal-Mart Stores Inc. | 4.300% | 4/22/44 | 350 | 418 |
| Walgreen Co. | 4.400% | 9/15/42 | 610 | 651 |
| Walgreens Boots Alliance Inc. | 4.500% | 11/18/34 | 625 | 683 |
| Walgreens Boots Alliance Inc. | 4.800% | 11/18/44 | 2,000 | 2,243 |
| Walgreens Boots Alliance Inc. | 4.650% | 6/1/46 | 700 | 773 |
| Western Union Co. | 6.200% | 11/17/36 | 950 | 1,033 |
| Western Union Co. | 6.200% | 6/21/40 | 270 | 288 |
| Consumer Noncyclical (17.0%) | ||||
| Abbott Laboratories | 6.150% | 11/30/37 | 1,275 | 1,693 |
| Abbott Laboratories | 6.000% | 4/1/39 | 470 | 611 |
| Abbott Laboratories | 5.300% | 5/27/40 | 200 | 241 |
| AbbVie Inc. | 4.500% | 5/14/35 | 3,298 | 3,576 |
| AbbVie Inc. | 4.300% | 5/14/36 | 1,297 | 1,377 |
| AbbVie Inc. | 4.400% | 11/6/42 | 2,915 | 3,117 |
| AbbVie Inc. | 4.700% | 5/14/45 | 3,392 | 3,763 |
| AbbVie Inc. | 4.450% | 5/14/46 | 2,526 | 2,708 |
| Actavis Funding SCS | 4.550% | 3/15/35 | 3,127 | 3,341 |
| Actavis Funding SCS | 4.850% | 6/15/44 | 2,252 | 2,511 |
| Actavis Funding SCS | 4.750% | 3/15/45 | 3,200 | 3,564 |
| Actavis Inc. | 4.625% | 10/1/42 | 1,001 | 1,086 |
| Ahold Finance USA LLC | 6.875% | 5/1/29 | 630 | 816 |
| 3 Allina Health System | 4.805% | 11/15/45 | 225 | 275 |
| Altria Group Inc. | 9.950% | 11/10/38 | 1,143 | 2,077 |
| Altria Group Inc. | 10.200% | 2/6/39 | 791 | 1,481 |
| Altria Group Inc. | 4.250% | 8/9/42 | 1,170 | 1,308 |
| Altria Group Inc. | 4.500% | 5/2/43 | 1,055 | 1,217 |
| Altria Group Inc. | 5.375% | 1/31/44 | 1,975 | 2,561 |
| AmerisourceBergen Corp. | 4.250% | 3/1/45 | 637 | 705 |
| Amgen Inc. | 4.950% | 10/1/41 | 1,555 | 1,774 |
| Amgen Inc. | 5.150% | 11/15/41 | 3,650 | 4,241 |
76
| Vanguard® Long-Term Corporate Bond Index Fund | ||||
| Schedule of Investments | ||||
| August 31, 2016 | ||||
| Face | Market | |||
| Maturity | Amount | Value | ||
| Coupon | Date | ($000) | ($000) | |
| Amgen Inc. | 4.400% | 5/1/45 | 1,325 | 1,424 |
| 2 Amgen Inc. | 4.563% | 6/15/48 | 2,976 | 3,219 |
| 2 Amgen Inc. | 4.663% | 6/15/51 | 4,101 | 4,406 |
| Anheuser-Busch Cos. LLC | 6.800% | 8/20/32 | 365 | 498 |
| Anheuser-Busch Cos. LLC | 5.950% | 1/15/33 | 20 | 26 |
| Anheuser-Busch Cos. LLC | 5.750% | 4/1/36 | 325 | 418 |
| Anheuser-Busch Cos. LLC | 6.450% | 9/1/37 | 830 | 1,137 |
| Anheuser-Busch Cos. LLC | 6.500% | 5/1/42 | 275 | 387 |
| Anheuser-Busch InBev Finance Inc. | 4.700% | 2/1/36 | 7,169 | 8,295 |
| Anheuser-Busch InBev Finance Inc. | 4.000% | 1/17/43 | 1,340 | 1,433 |
| Anheuser-Busch InBev Finance Inc. | 4.625% | 2/1/44 | 1,150 | 1,336 |
| Anheuser-Busch InBev Finance Inc. | 4.900% | 2/1/46 | 14,392 | 17,350 |
| Anheuser-Busch InBev Worldwide Inc. | 8.200% | 1/15/39 | 1,590 | 2,600 |
| Anheuser-Busch InBev Worldwide Inc. | 8.000% | 11/15/39 | 715 | 1,158 |
| Anheuser-Busch InBev Worldwide Inc. | 6.375% | 1/15/40 | 860 | 1,174 |
| Anheuser-Busch InBev Worldwide Inc. | 3.750% | 7/15/42 | 969 | 987 |
| Archer-Daniels-Midland Co. | 5.935% | 10/1/32 | 405 | 526 |
| Archer-Daniels-Midland Co. | 5.375% | 9/15/35 | 810 | 1,014 |
| Archer-Daniels-Midland Co. | 4.535% | 3/26/42 | 1,133 | 1,332 |
| Archer-Daniels-Midland Co. | 4.016% | 4/16/43 | 125 | 137 |
| Ascension Health | 3.945% | 11/15/46 | 900 | 1,010 |
| 3 Ascension Health | 4.847% | 11/15/53 | 475 | 607 |
| AstraZeneca plc | 6.450% | 9/15/37 | 2,837 | 3,988 |
| AstraZeneca plc | 4.000% | 9/18/42 | 1,572 | 1,680 |
| AstraZeneca plc | 4.375% | 11/16/45 | 1,425 | 1,614 |
| Baxalta Inc. | 5.250% | 6/23/45 | 1,050 | 1,241 |
| Baxter International Inc. | 3.500% | 8/15/46 | 1,150 | 1,123 |
| Baylor Scott & White Holdings Texas Revenue | 4.185% | 11/15/45 | 540 | 605 |
| Becton Dickinson & Co. | 6.000% | 5/15/39 | 325 | 420 |
| Becton Dickinson & Co. | 5.000% | 11/12/40 | 490 | 570 |
| Becton Dickinson & Co. | 4.875% | 5/15/44 | 210 | 249 |
| Becton Dickinson & Co. | 4.685% | 12/15/44 | 1,427 | 1,661 |
| Biogen Inc. | 5.200% | 9/15/45 | 2,220 | 2,679 |
| Boston Scientific Corp. | 7.000% | 11/15/35 | 425 | 575 |
| Boston Scientific Corp. | 7.375% | 1/15/40 | 340 | 470 |
| Bristol-Myers Squibb Co. | 5.875% | 11/15/36 | 999 | 1,368 |
| Bristol-Myers Squibb Co. | 6.125% | 5/1/38 | 270 | 385 |
| Bristol-Myers Squibb Co. | 3.250% | 8/1/42 | 650 | 667 |
| Bristol-Myers Squibb Co. | 4.500% | 3/1/44 | 475 | 598 |
| Brown-Forman Corp. | 3.750% | 1/15/43 | 275 | 290 |
| Brown-Forman Corp. | 4.500% | 7/15/45 | 525 | 614 |
| Campbell Soup Co. | 3.800% | 8/2/42 | 200 | 205 |
| Cardinal Health Inc. | 4.600% | 3/15/43 | 432 | 481 |
| Cardinal Health Inc. | 4.500% | 11/15/44 | 300 | 331 |
| Cardinal Health Inc. | 4.900% | 9/15/45 | 550 | 658 |
| 3 Catholic Health Initiatives Colorado GO | 4.350% | 11/1/42 | 780 | 774 |
| Celgene Corp. | 5.700% | 10/15/40 | 510 | 628 |
| Celgene Corp. | 5.250% | 8/15/43 | 1,500 | 1,736 |
| Celgene Corp. | 4.625% | 5/15/44 | 400 | 434 |
| Celgene Corp. | 5.000% | 8/15/45 | 1,987 | 2,295 |
| Children's Hospital Medical Center Ohio GO | 4.268% | 5/15/44 | 425 | 489 |
| Cleveland Clinic Foundation Ohio Revenue | 4.858% | 1/1/14 | 450 | 523 |
| Coca-Cola Co. | 2.250% | 9/1/26 | 900 | 899 |
| Coca-Cola Femsa SAB de CV | 5.250% | 11/26/43 | 700 | 864 |
| Colgate-Palmolive Co. | 4.000% | 8/15/45 | 700 | 827 |
| ConAgra Foods Inc. | 7.125% | 10/1/26 | 893 | 1,160 |
| ConAgra Foods Inc. | 7.000% | 10/1/28 | 475 | 609 |
| ConAgra Foods Inc. | 8.250% | 9/15/30 | 345 | 487 |
| Danaher Corp. | 4.375% | 9/15/45 | 600 | 723 |
| Delhaize America LLC | 9.000% | 4/15/31 | 320 | 448 |
| Diageo Capital plc | 5.875% | 9/30/36 | 275 | 373 |
| Diageo Capital plc | 3.875% | 4/29/43 | 675 | 724 |
| Diageo Investment Corp. | 7.450% | 4/15/35 | 793 | 1,207 |
| Diageo Investment Corp. | 4.250% | 5/11/42 | 754 | 856 |
77
| Vanguard® Long-Term Corporate Bond Index Fund | ||||
| Schedule of Investments | ||||
| August 31, 2016 | ||||
| Face | Market | |||
| Maturity | Amount | Value | ||
| Coupon | Date | ($000) | ($000) | |
| Dignity Health California GO | 4.500% | 11/1/42 | 375 | 408 |
| Dignity Health California GO | 5.267% | 11/1/64 | 400 | 478 |
| Dr Pepper Snapple Group Inc. | 7.450% | 5/1/38 | 415 | 619 |
| Dr Pepper Snapple Group Inc. | 4.500% | 11/15/45 | 270 | 310 |
| Eli Lilly & Co. | 5.500% | 3/15/27 | 500 | 644 |
| Eli Lilly & Co. | 5.550% | 3/15/37 | 920 | 1,228 |
| Eli Lilly & Co. | 3.700% | 3/1/45 | 1,189 | 1,290 |
| Estee Lauder Cos. Inc. | 6.000% | 5/15/37 | 365 | 493 |
| Estee Lauder Cos. Inc. | 3.700% | 8/15/42 | 550 | 575 |
| Estee Lauder Cos. Inc. | 4.375% | 6/15/45 | 500 | 587 |
| Express Scripts Holding Co. | 3.400% | 3/1/27 | 2,425 | 2,446 |
| Express Scripts Holding Co. | 6.125% | 11/15/41 | 332 | 419 |
| Express Scripts Holding Co. | 4.800% | 7/15/46 | 2,500 | 2,691 |
| Fomento Economico Mexicano SAB de CV | 4.375% | 5/10/43 | 735 | 790 |
| Genentech Inc. | 5.250% | 7/15/35 | 500 | 652 |
| General Mills Inc. | 5.400% | 6/15/40 | 573 | 734 |
| General Mills Inc. | 4.150% | 2/15/43 | 425 | 468 |
| Gilead Sciences Inc. | 4.600% | 9/1/35 | 1,275 | 1,443 |
| Gilead Sciences Inc. | 5.650% | 12/1/41 | 1,444 | 1,831 |
| Gilead Sciences Inc. | 4.800% | 4/1/44 | 2,875 | 3,314 |
| Gilead Sciences Inc. | 4.500% | 2/1/45 | 2,259 | 2,523 |
| Gilead Sciences Inc. | 4.750% | 3/1/46 | 2,575 | 2,996 |
| GlaxoSmithKline Capital Inc. | 5.375% | 4/15/34 | 1,055 | 1,340 |
| GlaxoSmithKline Capital Inc. | 6.375% | 5/15/38 | 3,060 | 4,469 |
| Hasbro Inc. | 6.350% | 3/15/40 | 535 | 666 |
| Hasbro Inc. | 5.100% | 5/15/44 | 405 | 439 |
| Hershey Co. | 7.200% | 8/15/27 | 42 | 58 |
| Ingredion Inc. | 6.625% | 4/15/37 | 275 | 357 |
| JM Smucker Co. | 4.250% | 3/15/35 | 646 | 716 |
| JM Smucker Co. | 4.375% | 3/15/45 | 1,225 | 1,384 |
| Johnson & Johnson | 6.950% | 9/1/29 | 410 | 607 |
| Johnson & Johnson | 4.950% | 5/15/33 | 700 | 907 |
| Johnson & Johnson | 4.375% | 12/5/33 | 1,200 | 1,470 |
| Johnson & Johnson | 3.550% | 3/1/36 | 1,140 | 1,284 |
| Johnson & Johnson | 5.950% | 8/15/37 | 1,265 | 1,885 |
| Johnson & Johnson | 5.850% | 7/15/38 | 765 | 1,131 |
| Johnson & Johnson | 4.500% | 9/1/40 | 584 | 747 |
| Johnson & Johnson | 4.850% | 5/15/41 | 370 | 493 |
| Johnson & Johnson | 4.500% | 12/5/43 | 407 | 526 |
| Johnson & Johnson | 3.700% | 3/1/46 | 2,400 | 2,778 |
| Kaiser Foundation Hospitals | 4.875% | 4/1/42 | 970 | 1,207 |
| Kellogg Co. | 7.450% | 4/1/31 | 275 | 388 |
| Kellogg Co. | 4.500% | 4/1/46 | 1,300 | 1,438 |
| Kimberly-Clark Corp. | 6.625% | 8/1/37 | 860 | 1,304 |
| Kimberly-Clark Corp. | 5.300% | 3/1/41 | 235 | 316 |
| Kimberly-Clark Corp. | 3.700% | 6/1/43 | 625 | 675 |
| Kimberly-Clark Corp. | 3.200% | 7/30/46 | 675 | 674 |
| Koninkijke Ahold Dlhaize | 5.700% | 10/1/40 | 932 | 1,147 |
| Koninklijke Philips NV | 6.875% | 3/11/38 | 1,440 | 1,905 |
| Koninklijke Philips NV | 5.000% | 3/15/42 | 665 | 755 |
| Kraft Foods Group Inc. | 6.875% | 1/26/39 | 1,895 | 2,678 |
| Kraft Foods Group Inc. | 6.500% | 2/9/40 | 635 | 876 |
| Kraft Foods Group Inc. | 5.000% | 6/4/42 | 2,366 | 2,718 |
| Kraft Heinz Foods Co. | 5.000% | 7/15/35 | 1,210 | 1,429 |
| Kraft Heinz Foods Co. | 5.200% | 7/15/45 | 2,420 | 2,900 |
| Kraft Heinz Foods Co. | 4.375% | 6/1/46 | 3,300 | 3,567 |
| Laboratory Corp. of America Holdings | 4.700% | 2/1/45 | 1,100 | 1,208 |
| 3 Mayo Clinic | 3.774% | 11/15/43 | 450 | 478 |
| 3 Mayo Clinic | 4.000% | 11/15/47 | 385 | 427 |
| 3 Mayo Clinic | 4.128% | 11/15/52 | 225 | 261 |
| McKesson Corp. | 6.000% | 3/1/41 | 730 | 956 |
| McKesson Corp. | 4.883% | 3/15/44 | 980 | 1,171 |
| Mead Johnson Nutrition Co. | 5.900% | 11/1/39 | 645 | 815 |
| Mead Johnson Nutrition Co. | 4.600% | 6/1/44 | 614 | 672 |
78
| Vanguard® Long-Term Corporate Bond Index Fund | ||||
| Schedule of Investments | ||||
| August 31, 2016 | ||||
| Face | Market | |||
| Maturity | Amount | Value | ||
| Coupon | Date | ($000) | ($000) | |
| Medtronic Inc. | 4.375% | 3/15/35 | 3,340 | 3,824 |
| Medtronic Inc. | 6.500% | 3/15/39 | 155 | 220 |
| Medtronic Inc. | 5.550% | 3/15/40 | 643 | 835 |
| Medtronic Inc. | 4.500% | 3/15/42 | 1,237 | 1,454 |
| Medtronic Inc. | 4.625% | 3/15/44 | 806 | 956 |
| Medtronic Inc. | 4.625% | 3/15/45 | 5,555 | 6,630 |
| Memorial Sloan-Kettering Cancer Center | 4.200% | 7/1/55 | 600 | 684 |
| Memorial Sloan-Kettering Cancer Center New York GO | 5.000% | 7/1/42 | 585 | 752 |
| Memorial Sloan-Kettering Cancer Center New York GO | 4.125% | 7/1/52 | 475 | 534 |
| Merck & Co. Inc. | 6.500% | 12/1/33 | 1,385 | 1,973 |
| Merck & Co. Inc. | 6.550% | 9/15/37 | 980 | 1,404 |
| Merck & Co. Inc. | 3.600% | 9/15/42 | 590 | 626 |
| Merck & Co. Inc. | 4.150% | 5/18/43 | 1,870 | 2,143 |
| Merck & Co. Inc. | 3.700% | 2/10/45 | 2,430 | 2,594 |
| Merck Sharp & Dohme Corp. | 5.950% | 12/1/28 | 355 | 471 |
| Merck Sharp & Dohme Corp. | 5.850% | 6/30/39 | 150 | 205 |
| Molson Coors Brewing Co. | 5.000% | 5/1/42 | 1,175 | 1,377 |
| Molson Coors Brewing Co. | 4.200% | 7/15/46 | 2,375 | 2,491 |
| Mondelez International Inc. | 6.500% | 11/1/31 | 565 | 746 |
| Mondelez International Inc. | 6.500% | 2/9/40 | 684 | 936 |
| Mylan Inc. | 5.400% | 11/29/43 | 160 | 179 |
| 2 Mylan NV | 5.250% | 6/15/46 | 1,200 | 1,309 |
| New York & Presbyterian Hospital | 3.563% | 8/1/36 | 250 | 265 |
| New York & Presbyterian Hospital | 4.024% | 8/1/45 | 1,000 | 1,118 |
| New York & Presbyterian Hospital | 4.063% | 8/1/56 | 200 | 220 |
| New York & Presbyterian Hospital | 4.763% | 8/1/16 | 300 | 329 |
| Newell Brands Inc. | 5.375% | 4/1/36 | 875 | 1,042 |
| Newell Brands Inc. | 5.500% | 4/1/46 | 2,400 | 2,972 |
| Novant Health Inc. | 4.371% | 11/1/43 | 300 | 347 |
| Novartis Capital Corp. | 3.700% | 9/21/42 | 1,023 | 1,097 |
| Novartis Capital Corp. | 4.400% | 5/6/44 | 1,640 | 1,960 |
| Novartis Capital Corp. | 4.000% | 11/20/45 | 1,850 | 2,112 |
| NYU Hospitals Center | 4.784% | 7/1/44 | 425 | 494 |
| Ochsner Clinic Foundation | 5.897% | 5/15/45 | 275 | 358 |
| Partners Healthcare System Inc. | 4.117% | 7/1/55 | 275 | 312 |
| PepsiCo Inc. | 5.500% | 1/15/40 | 584 | 778 |
| PepsiCo Inc. | 4.875% | 11/1/40 | 1,165 | 1,453 |
| PepsiCo Inc. | 4.000% | 3/5/42 | 1,450 | 1,618 |
| PepsiCo Inc. | 4.250% | 10/22/44 | 1,078 | 1,251 |
| PepsiCo Inc. | 4.600% | 7/17/45 | 737 | 900 |
| PepsiCo Inc. | 4.450% | 4/14/46 | 1,440 | 1,742 |
| Perrigo Co. plc | 5.300% | 11/15/43 | 950 | 987 |
| Pfizer Inc. | 7.200% | 3/15/39 | 2,255 | 3,463 |
| Pfizer Inc. | 4.300% | 6/15/43 | 1,130 | 1,290 |
| Pfizer Inc. | 4.400% | 5/15/44 | 910 | 1,065 |
| Pharmacia LLC | 6.600% | 12/1/28 | 1,555 | 2,146 |
| Philip Morris International Inc. | 6.375% | 5/16/38 | 1,540 | 2,168 |
| Philip Morris International Inc. | 4.375% | 11/15/41 | 1,080 | 1,233 |
| Philip Morris International Inc. | 4.500% | 3/20/42 | 910 | 1,046 |
| Philip Morris International Inc. | 3.875% | 8/21/42 | 660 | 697 |
| Philip Morris International Inc. | 4.125% | 3/4/43 | 915 | 1,003 |
| Philip Morris International Inc. | 4.875% | 11/15/43 | 1,435 | 1,747 |
| Philip Morris International Inc. | 4.250% | 11/10/44 | 990 | 1,111 |
| Premier Health Partners | 2.911% | 11/15/26 | 250 | 250 |
| Procter & Gamble Co. | 5.500% | 2/1/34 | 575 | 795 |
| Procter & Gamble Co. | 5.800% | 8/15/34 | 635 | 907 |
| Procter & Gamble Co. | 5.550% | 3/5/37 | 1,863 | 2,647 |
| Quest Diagnostics Inc. | 5.750% | 1/30/40 | 13 | 15 |
| Quest Diagnostics Inc. | 4.700% | 3/30/45 | 325 | 356 |
| Reynolds American Inc. | 5.700% | 8/15/35 | 1,165 | 1,451 |
| Reynolds American Inc. | 7.250% | 6/15/37 | 676 | 935 |
| Reynolds American Inc. | 6.150% | 9/15/43 | 575 | 769 |
| Reynolds American Inc. | 5.850% | 8/15/45 | 2,489 | 3,238 |
| Southern Baptist Hospital of Florida Inc. | 4.857% | 7/15/45 | 175 | 218 |
79
| Vanguard® Long-Term Corporate Bond Index Fund | ||||
| Schedule of Investments | ||||
| August 31, 2016 | ||||
| Face | Market | |||
| Maturity | Amount | Value | ||
| Coupon | Date | ($000) | ($000) | |
| St. Jude Medical Inc. | 4.750% | 4/15/43 | 750 | 822 |
| Stryker Corp. | 4.100% | 4/1/43 | 407 | 429 |
| Stryker Corp. | 4.375% | 5/15/44 | 2,150 | 2,356 |
| Stryker Corp. | 4.625% | 3/15/46 | 850 | 977 |
| Sysco Corp. | 5.375% | 9/21/35 | 854 | 1,038 |
| Sysco Corp. | 4.850% | 10/1/45 | 350 | 412 |
| Sysco Corp. | 4.500% | 4/1/46 | 1,025 | 1,142 |
| Teva Pharmaceutical Finance Co. LLC | 6.150% | 2/1/36 | 1,134 | 1,458 |
| Teva Pharmaceutical Finance Netherlands III BV | 3.150% | 10/1/26 | 4,000 | 4,034 |
| Teva Pharmaceutical Finance Netherlands III BV | 4.100% | 10/1/46 | 3,000 | 3,059 |
| 3 Texas Health Resources | 4.330% | 11/15/55 | 300 | 344 |
| The Kroger Co. | 7.700% | 6/1/29 | 530 | 741 |
| The Kroger Co. | 8.000% | 9/15/29 | 200 | 287 |
| The Kroger Co. | 7.500% | 4/1/31 | 230 | 327 |
| The Kroger Co. | 6.900% | 4/15/38 | 1,094 | 1,556 |
| The Kroger Co. | 5.400% | 7/15/40 | 550 | 679 |
| The Kroger Co. | 5.150% | 8/1/43 | 310 | 385 |
| The Pepsi Bottling Group Inc. | 7.000% | 3/1/29 | 1,610 | 2,314 |
| Thermo Fisher Scientific Inc. | 5.300% | 2/1/44 | 633 | 768 |
| Trinity Health Corp. | 4.125% | 12/1/45 | 400 | 447 |
| Tyson Foods Inc. | 4.875% | 8/15/34 | 850 | 966 |
| Tyson Foods Inc. | 5.150% | 8/15/44 | 1,300 | 1,580 |
| Unilever Capital Corp. | 5.900% | 11/15/32 | 1,620 | 2,277 |
| Whirlpool Corp. | 5.150% | 3/1/43 | 334 | 394 |
| Whirlpool Corp. | 4.500% | 6/1/46 | 575 | 631 |
| Wyeth LLC | 6.500% | 2/1/34 | 1,465 | 2,015 |
| Wyeth LLC | 6.000% | 2/15/36 | 584 | 788 |
| Wyeth LLC | 5.950% | 4/1/37 | 2,684 | 3,618 |
| Zimmer Biomet Holdings Inc. | 4.250% | 8/15/35 | 545 | 563 |
| Zimmer Biomet Holdings Inc. | 5.750% | 11/30/39 | 640 | 784 |
| Zimmer Biomet Holdings Inc. | 4.450% | 8/15/45 | 1,505 | 1,599 |
| Zoetis Inc. | 4.700% | 2/1/43 | 1,435 | 1,541 |
| Energy (10.1%) | ||||
| Alberta Energy Co. Ltd. | 7.375% | 11/1/31 | 575 | 598 |
| Anadarko Finance Co. | 7.500% | 5/1/31 | 1,277 | 1,547 |
| Anadarko Petroleum Corp. | 6.450% | 9/15/36 | 2,345 | 2,697 |
| Anadarko Petroleum Corp. | 7.950% | 6/15/39 | 195 | 242 |
| Anadarko Petroleum Corp. | 6.200% | 3/15/40 | 865 | 966 |
| Anadarko Petroleum Corp. | 4.500% | 7/15/44 | 1,000 | 912 |
| Anadarko Petroleum Corp. | 6.600% | 3/15/46 | 1,250 | 1,485 |
| Apache Corp. | 6.000% | 1/15/37 | 1,186 | 1,363 |
| Apache Corp. | 5.100% | 9/1/40 | 2,235 | 2,333 |
| Apache Corp. | 5.250% | 2/1/42 | 1,005 | 1,071 |
| Apache Corp. | 4.750% | 4/15/43 | 1,145 | 1,182 |
| Apache Corp. | 4.250% | 1/15/44 | 100 | 98 |
| Apache Finance Canada Corp. | 7.750% | 12/15/29 | 950 | 1,253 |
| Baker Hughes Inc. | 5.125% | 9/15/40 | 1,655 | 1,899 |
| Buckeye Partners LP | 5.850% | 11/15/43 | 475 | 494 |
| Buckeye Partners LP | 5.600% | 10/15/44 | 350 | 353 |
| Burlington Resources Finance Co. | 7.200% | 8/15/31 | 644 | 854 |
| Burlington Resources Finance Co. | 7.400% | 12/1/31 | 1,082 | 1,400 |
| Canadian Natural Resources Ltd. | 7.200% | 1/15/32 | 678 | 782 |
| Canadian Natural Resources Ltd. | 6.450% | 6/30/33 | 650 | 712 |
| Canadian Natural Resources Ltd. | 5.850% | 2/1/35 | 400 | 416 |
| Canadian Natural Resources Ltd. | 6.500% | 2/15/37 | 655 | 711 |
| Canadian Natural Resources Ltd. | 6.250% | 3/15/38 | 1,177 | 1,297 |
| Canadian Natural Resources Ltd. | 6.750% | 2/1/39 | 159 | 180 |
| Columbia Pipeline Group Inc. | 5.800% | 6/1/45 | 550 | 660 |
| Conoco Funding Co. | 7.250% | 10/15/31 | 515 | 674 |
| ConocoPhillips | 5.900% | 10/15/32 | 665 | 785 |
| ConocoPhillips | 5.900% | 5/15/38 | 1,071 | 1,306 |
| ConocoPhillips | 6.500% | 2/1/39 | 3,330 | 4,376 |
| ConocoPhillips Canada Funding Co. I | 5.950% | 10/15/36 | 1,075 | 1,301 |
80
| Vanguard® Long-Term Corporate Bond Index Fund | ||||
| Schedule of Investments | ||||
| August 31, 2016 | ||||
| Face | Market | |||
| Maturity | Amount | Value | ||
| Coupon | Date | ($000) | ($000) | |
| ConocoPhillips Co. | 4.150% | 11/15/34 | 575 | 583 |
| ConocoPhillips Co. | 4.300% | 11/15/44 | 553 | 568 |
| ConocoPhillips Co. | 5.950% | 3/15/46 | 750 | 959 |
| ConocoPhillips Holding Co. | 6.950% | 4/15/29 | 935 | 1,194 |
| Devon Energy Corp. | 7.950% | 4/15/32 | 1,245 | 1,523 |
| Devon Energy Corp. | 5.600% | 7/15/41 | 1,160 | 1,158 |
| Devon Energy Corp. | 4.750% | 5/15/42 | 1,065 | 990 |
| Devon Energy Corp. | 5.000% | 6/15/45 | 839 | 807 |
| Devon Financing Co. LLC | 7.875% | 9/30/31 | 1,795 | 2,201 |
| Dominion Gas Holdings LLC | 4.800% | 11/1/43 | 625 | 697 |
| Dominion Gas Holdings LLC | 4.600% | 12/15/44 | 540 | 588 |
| El Paso Natural Gas Co. LLC | 8.375% | 6/15/32 | 297 | 365 |
| Enable Midstream Partners LP | 5.000% | 5/15/44 | 625 | 530 |
| Enbridge Energy Partners LP | 7.500% | 4/15/38 | 1,195 | 1,402 |
| Enbridge Energy Partners LP | 5.500% | 9/15/40 | 875 | 874 |
| Enbridge Inc. | 4.500% | 6/10/44 | 600 | 525 |
| Encana Corp. | 6.500% | 8/15/34 | 515 | 519 |
| Encana Corp. | 6.625% | 8/15/37 | 1,750 | 1,772 |
| Encana Corp. | 6.500% | 2/1/38 | 524 | 523 |
| Encana Corp. | 5.150% | 11/15/41 | 50 | 44 |
| Energy Transfer Partners LP | 8.250% | 11/15/29 | 264 | 326 |
| Energy Transfer Partners LP | 4.900% | 3/15/35 | 765 | 732 |
| Energy Transfer Partners LP | 6.625% | 10/15/36 | 645 | 697 |
| Energy Transfer Partners LP | 7.500% | 7/1/38 | 862 | 1,014 |
| Energy Transfer Partners LP | 6.050% | 6/1/41 | 819 | 845 |
| Energy Transfer Partners LP | 6.500% | 2/1/42 | 1,730 | 1,868 |
| Energy Transfer Partners LP | 5.150% | 2/1/43 | 525 | 490 |
| Energy Transfer Partners LP | 5.950% | 10/1/43 | 524 | 543 |
| Energy Transfer Partners LP | 5.150% | 3/15/45 | 1,100 | 1,055 |
| Energy Transfer Partners LP | 6.125% | 12/15/45 | 1,273 | 1,372 |
| Eni USA Inc. | 7.300% | 11/15/27 | 395 | 478 |
| EnLink Midstream Partners LP | 5.600% | 4/1/44 | 383 | 349 |
| EnLink Midstream Partners LP | 5.050% | 4/1/45 | 600 | 513 |
| Enterprise Products Operating LLC | 6.875% | 3/1/33 | 540 | 676 |
| Enterprise Products Operating LLC | 6.650% | 10/15/34 | 360 | 443 |
| Enterprise Products Operating LLC | 5.750% | 3/1/35 | 300 | 339 |
| Enterprise Products Operating LLC | 7.550% | 4/15/38 | 390 | 520 |
| Enterprise Products Operating LLC | 6.125% | 10/15/39 | 1,030 | 1,222 |
| Enterprise Products Operating LLC | 6.450% | 9/1/40 | 710 | 873 |
| Enterprise Products Operating LLC | 5.950% | 2/1/41 | 975 | 1,151 |
| Enterprise Products Operating LLC | 5.700% | 2/15/42 | 804 | 933 |
| Enterprise Products Operating LLC | 4.850% | 8/15/42 | 715 | 757 |
| Enterprise Products Operating LLC | 4.450% | 2/15/43 | 1,575 | 1,584 |
| Enterprise Products Operating LLC | 4.850% | 3/15/44 | 1,530 | 1,626 |
| Enterprise Products Operating LLC | 5.100% | 2/15/45 | 1,414 | 1,551 |
| Enterprise Products Operating LLC | 4.900% | 5/15/46 | 1,450 | 1,557 |
| Enterprise Products Operating LLC | 4.950% | 10/15/54 | 650 | 675 |
| EOG Resources Inc. | 3.900% | 4/1/35 | 610 | 618 |
| EOG Resources Inc. | 5.100% | 1/15/36 | 279 | 323 |
| Exxon Mobil Corp. | 3.567% | 3/6/45 | 750 | 791 |
| Exxon Mobil Corp. | 4.114% | 3/1/46 | 3,750 | 4,299 |
| Halliburton Co. | 4.850% | 11/15/35 | 1,815 | 1,944 |
| Halliburton Co. | 6.700% | 9/15/38 | 916 | 1,183 |
| Halliburton Co. | 7.450% | 9/15/39 | 870 | 1,218 |
| Halliburton Co. | 4.500% | 11/15/41 | 650 | 667 |
| Halliburton Co. | 4.750% | 8/1/43 | 870 | 919 |
| Halliburton Co. | 5.000% | 11/15/45 | 2,645 | 2,908 |
| Hess Corp. | 7.875% | 10/1/29 | 1,045 | 1,265 |
| Hess Corp. | 7.300% | 8/15/31 | 370 | 431 |
| Hess Corp. | 7.125% | 3/15/33 | 950 | 1,085 |
| Hess Corp. | 6.000% | 1/15/40 | 1,132 | 1,192 |
| Hess Corp. | 5.600% | 2/15/41 | 1,500 | 1,524 |
| Husky Energy Inc. | 6.800% | 9/15/37 | 490 | 582 |
| Kerr-McGee Corp. | 7.875% | 9/15/31 | 465 | 562 |
81
| Vanguard® Long-Term Corporate Bond Index Fund | ||||
| Schedule of Investments | ||||
| August 31, 2016 | ||||
| Face | Market | |||
| Maturity | Amount | Value | ||
| Coupon | Date | ($000) | ($000) | |
| Kinder Morgan Energy Partners LP | 7.400% | 3/15/31 | 238 | 268 |
| Kinder Morgan Energy Partners LP | 7.750% | 3/15/32 | 442 | 523 |
| Kinder Morgan Energy Partners LP | 7.300% | 8/15/33 | 575 | 671 |
| Kinder Morgan Energy Partners LP | 5.800% | 3/15/35 | 375 | 389 |
| Kinder Morgan Energy Partners LP | 6.500% | 2/1/37 | 985 | 1,052 |
| Kinder Morgan Energy Partners LP | 6.950% | 1/15/38 | 1,420 | 1,626 |
| Kinder Morgan Energy Partners LP | 6.500% | 9/1/39 | 655 | 711 |
| Kinder Morgan Energy Partners LP | 6.550% | 9/15/40 | 625 | 700 |
| Kinder Morgan Energy Partners LP | 7.500% | 11/15/40 | 400 | 474 |
| Kinder Morgan Energy Partners LP | 6.375% | 3/1/41 | 725 | 779 |
| Kinder Morgan Energy Partners LP | 5.625% | 9/1/41 | 540 | 531 |
| Kinder Morgan Energy Partners LP | 5.000% | 8/15/42 | 612 | 592 |
| Kinder Morgan Energy Partners LP | 4.700% | 11/1/42 | 1,379 | 1,273 |
| Kinder Morgan Energy Partners LP | 5.000% | 3/1/43 | 600 | 573 |
| Kinder Morgan Energy Partners LP | 5.500% | 3/1/44 | 650 | 661 |
| Kinder Morgan Energy Partners LP | 5.400% | 9/1/44 | 700 | 698 |
| Kinder Morgan Inc. | 7.750% | 1/15/32 | 1,050 | 1,270 |
| Kinder Morgan Inc. | 5.300% | 12/1/34 | 1,865 | 1,869 |
| Kinder Morgan Inc. | 5.550% | 6/1/45 | 2,175 | 2,244 |
| Magellan Midstream Partners LP | 6.400% | 5/1/37 | 265 | 328 |
| Magellan Midstream Partners LP | 4.200% | 12/1/42 | 250 | 245 |
| Magellan Midstream Partners LP | 5.150% | 10/15/43 | 350 | 387 |
| Magellan Midstream Partners LP | 4.200% | 3/15/45 | 675 | 658 |
| Marathon Oil Corp. | 6.800% | 3/15/32 | 561 | 591 |
| Marathon Oil Corp. | 6.600% | 10/1/37 | 555 | 569 |
| Marathon Oil Corp. | 5.200% | 6/1/45 | 1,050 | 940 |
| Marathon Petroleum Corp. | 6.500% | 3/1/41 | 1,395 | 1,563 |
| Marathon Petroleum Corp. | 4.750% | 9/15/44 | 1,475 | 1,343 |
| Marathon Petroleum Corp. | 5.850% | 12/15/45 | 275 | 288 |
| Marathon Petroleum Corp. | 5.000% | 9/15/54 | 650 | 587 |
| National Oilwell Varco Inc. | 3.950% | 12/1/42 | 1,210 | 968 |
| Noble Energy Inc. | 8.000% | 4/1/27 | 245 | 300 |
| Noble Energy Inc. | 6.000% | 3/1/41 | 836 | 911 |
| Noble Energy Inc. | 5.250% | 11/15/43 | 1,150 | 1,161 |
| Noble Energy Inc. | 5.050% | 11/15/44 | 1,530 | 1,527 |
| Occidental Petroleum Corp. | 4.625% | 6/15/45 | 800 | 919 |
| Occidental Petroleum Corp. | 4.400% | 4/15/46 | 1,580 | 1,756 |
| ONEOK Partners LP | 6.650% | 10/1/36 | 589 | 643 |
| ONEOK Partners LP | 6.850% | 10/15/37 | 560 | 647 |
| ONEOK Partners LP | 6.125% | 2/1/41 | 371 | 406 |
| ONEOK Partners LP | 6.200% | 9/15/43 | 1,209 | 1,338 |
| Petro-Canada | 7.000% | 11/15/28 | 145 | 191 |
| Petro-Canada | 5.350% | 7/15/33 | 545 | 592 |
| Petro-Canada | 5.950% | 5/15/35 | 920 | 1,113 |
| Petro-Canada | 6.800% | 5/15/38 | 1,010 | 1,349 |
| Phillips 66 | 4.650% | 11/15/34 | 1,475 | 1,612 |
| Phillips 66 | 5.875% | 5/1/42 | 2,126 | 2,677 |
| Phillips 66 | 4.875% | 11/15/44 | 1,994 | 2,240 |
| Phillips 66 Partners LP | 4.680% | 2/15/45 | 275 | 264 |
| Pioneer Natural Resources Co. | 7.200% | 1/15/28 | 325 | 403 |
| Plains All American Pipeline LP / PAA Finance Corp. | 6.700% | 5/15/36 | 415 | 462 |
| Plains All American Pipeline LP / PAA Finance Corp. | 6.650% | 1/15/37 | 485 | 541 |
| Plains All American Pipeline LP / PAA Finance Corp. | 5.150% | 6/1/42 | 745 | 690 |
| Plains All American Pipeline LP / PAA Finance Corp. | 4.300% | 1/31/43 | 425 | 353 |
| Plains All American Pipeline LP / PAA Finance Corp. | 4.700% | 6/15/44 | 1,155 | 1,024 |
| Plains All American Pipeline LP / PAA Finance Corp. | 4.900% | 2/15/45 | 225 | 207 |
| Shell International Finance BV | 4.125% | 5/11/35 | 1,604 | 1,749 |
| Shell International Finance BV | 6.375% | 12/15/38 | 2,803 | 3,833 |
| Shell International Finance BV | 5.500% | 3/25/40 | 1,329 | 1,654 |
| Shell International Finance BV | 3.625% | 8/21/42 | 1,152 | 1,137 |
| Shell International Finance BV | 4.550% | 8/12/43 | 2,325 | 2,608 |
| Shell International Finance BV | 4.375% | 5/11/45 | 3,587 | 3,957 |
| Shell International Finance BV | 4.000% | 5/10/46 | 2,800 | 2,933 |
| Southern Natural Gas Co. LLC | 8.000% | 3/1/32 | 320 | 409 |
82
| Vanguard® Long-Term Corporate Bond Index Fund | ||||
| Schedule of Investments | ||||
| August 31, 2016 | ||||
| Face | Market | |||
| Maturity | Amount | Value | ||
| Coupon | Date | ($000) | ($000) | |
| Spectra Energy Capital LLC | 7.500% | 9/15/38 | 440 | 537 |
| Spectra Energy Partners LP | 5.950% | 9/25/43 | 350 | 424 |
| Spectra Energy Partners LP | 4.500% | 3/15/45 | 275 | 283 |
| Suncor Energy Inc. | 7.150% | 2/1/32 | 715 | 912 |
| Suncor Energy Inc. | 5.950% | 12/1/34 | 825 | 994 |
| Suncor Energy Inc. | 6.500% | 6/15/38 | 1,190 | 1,561 |
| Suncor Energy Inc. | 6.850% | 6/1/39 | 800 | 1,096 |
| Sunoco Logistics Partners Operations LP | 6.100% | 2/15/42 | 675 | 737 |
| Sunoco Logistics Partners Operations LP | 4.950% | 1/15/43 | 650 | 637 |
| Sunoco Logistics Partners Operations LP | 5.300% | 4/1/44 | 600 | 613 |
| Sunoco Logistics Partners Operations LP | 5.350% | 5/15/45 | 1,200 | 1,239 |
| Tennessee Gas Pipeline Co. LLC | 7.000% | 3/15/27 | 560 | 661 |
| Tennessee Gas Pipeline Co. LLC | 7.000% | 10/15/28 | 965 | 1,155 |
| Tennessee Gas Pipeline Co. LLC | 7.625% | 4/1/37 | 485 | 580 |
| Texas Eastern Transmission LP | 7.000% | 7/15/32 | 990 | 1,246 |
| Tosco Corp. | 7.800% | 1/1/27 | 747 | 979 |
| Tosco Corp. | 8.125% | 2/15/30 | 520 | 713 |
| TransCanada PipeLines Ltd. | 4.625% | 3/1/34 | 800 | 872 |
| TransCanada PipeLines Ltd. | 5.600% | 3/31/34 | 460 | 541 |
| TransCanada PipeLines Ltd. | 5.850% | 3/15/36 | 1,010 | 1,241 |
| TransCanada PipeLines Ltd. | 6.200% | 10/15/37 | 2,765 | 3,528 |
| TransCanada PipeLines Ltd. | 7.250% | 8/15/38 | 830 | 1,178 |
| TransCanada PipeLines Ltd. | 6.100% | 6/1/40 | 995 | 1,273 |
| TransCanada PipeLines Ltd. | 5.000% | 10/16/43 | 850 | 985 |
| Transcontinental Gas Pipe Line Co. LLC | 5.400% | 8/15/41 | 400 | 433 |
| Transcontinental Gas Pipe Line Co. LLC | 4.450% | 8/1/42 | 335 | 323 |
| Valero Energy Corp. | 7.500% | 4/15/32 | 1,509 | 1,890 |
| Valero Energy Corp. | 6.625% | 6/15/37 | 727 | 851 |
| Valero Energy Corp. | 10.500% | 3/15/39 | 365 | 558 |
| Valero Energy Corp. | 4.900% | 3/15/45 | 995 | 983 |
| Western Gas Partners LP | 5.450% | 4/1/44 | 425 | 418 |
| Williams Partners LP | 6.300% | 4/15/40 | 1,135 | 1,241 |
| Williams Partners LP | 5.800% | 11/15/43 | 931 | 984 |
| Williams Partners LP | 5.400% | 3/4/44 | 450 | 453 |
| Williams Partners LP | 4.900% | 1/15/45 | 525 | 501 |
| Williams Partners LP | 5.100% | 9/15/45 | 1,765 | 1,731 |
| XTO Energy Inc. | 6.750% | 8/1/37 | 105 | 157 |
| Other Industrial (0.5%) | ||||
| California Institute of Technology GO | 4.321% | 8/1/45 | 275 | 332 |
| California Institute of Technology GO | 4.700% | 11/1/11 | 568 | 643 |
| Cintas Corp. No 2 | 6.150% | 8/15/36 | 127 | 167 |
| George Washington University | 3.545% | 9/15/46 | 275 | 278 |
| 3 Johns Hopkins University Maryland GO | 4.083% | 7/1/53 | 435 | 501 |
| Massachusetts Institute of Technology | 3.885% | 7/1/16 | 400 | 413 |
| 3 Massachusetts Institute of Technology GO | 3.959% | 7/1/38 | 650 | 752 |
| Massachusetts Institute of Technology GO | 5.600% | 7/1/11 | 1,070 | 1,539 |
| Massachusetts Institute of Technology GO | 4.678% | 7/1/14 | 650 | 780 |
| 3 Northwestern University Illinois GO | 3.688% | 12/1/38 | 600 | 668 |
| 3 Northwestern University Illinois GO | 4.643% | 12/1/44 | 675 | 868 |
| President & Fellows of Harvard College Massachusetts | ||||
| GO | 3.619% | 10/1/37 | 400 | 447 |
| 3 Rice University Texas GO | 3.574% | 5/15/45 | 850 | 949 |
| Trustees of Dartmouth College | 3.474% | 6/1/46 | 300 | 323 |
| 3 University of Notre Dame DU LAC Indiana GO | 3.438% | 2/15/45 | 475 | 509 |
| University of Pennsylvania GO | 4.674% | 9/1/12 | 375 | 449 |
| 3 University of Southern California | 3.028% | 10/1/39 | 750 | 761 |
| Wesleyan University Connecticut GO | 4.781% | 7/1/16 | 250 | 272 |
| Technology (6.2%) | ||||
| Analog Devices Inc. | 5.300% | 12/15/45 | 400 | 450 |
| Apple Inc. | 4.500% | 2/23/36 | 2,250 | 2,600 |
| Apple Inc. | 3.850% | 5/4/43 | 4,500 | 4,667 |
| Apple Inc. | 4.450% | 5/6/44 | 855 | 967 |
| Apple Inc. | 3.450% | 2/9/45 | 1,502 | 1,477 |
83
| Vanguard® Long-Term Corporate Bond Index Fund | ||||
| Schedule of Investments | ||||
| August 31, 2016 | ||||
| Face | Market | |||
| Maturity | Amount | Value | ||
| Coupon | Date | ($000) | ($000) | |
| Apple Inc. | 4.375% | 5/13/45 | 2,500 | 2,825 |
| Apple Inc. | 4.650% | 2/23/46 | 5,500 | 6,449 |
| Apple Inc. | 3.850% | 8/4/46 | 1,900 | 1,968 |
| Applied Materials Inc. | 5.100% | 10/1/35 | 650 | 769 |
| Applied Materials Inc. | 5.850% | 6/15/41 | 715 | 903 |
| Cisco Systems Inc. | 5.900% | 2/15/39 | 1,895 | 2,597 |
| Cisco Systems Inc. | 5.500% | 1/15/40 | 3,075 | 4,056 |
| Corning Inc. | 7.250% | 8/15/36 | 260 | 319 |
| Corning Inc. | 4.700% | 3/15/37 | 250 | 265 |
| Corning Inc. | 5.750% | 8/15/40 | 720 | 863 |
| Corning Inc. | 4.750% | 3/15/42 | 255 | 273 |
| 2 Diamond 1 Finance Corp. / Diamond 2 Finance Corp. | 8.100% | 7/15/36 | 1,575 | 1,827 |
| 2 Diamond 1 Finance Corp. / Diamond 2 Finance Corp. | 8.350% | 7/15/46 | 3,000 | 3,488 |
| Equifax Inc. | 7.000% | 7/1/37 | 200 | 264 |
| Fidelity National Information Services Inc. | 4.500% | 8/15/46 | 700 | 716 |
| 2 Hewlett Packard Enterprise Co. | 6.200% | 10/15/35 | 1,325 | 1,390 |
| 2 Hewlett Packard Enterprise Co. | 6.350% | 10/15/45 | 1,675 | 1,729 |
| HP Enterprise Services LLC | 7.450% | 10/15/29 | 260 | 314 |
| HP Inc. | 6.000% | 9/15/41 | 1,360 | 1,392 |
| Intel Corp. | 4.000% | 12/15/32 | 648 | 724 |
| Intel Corp. | 4.800% | 10/1/41 | 2,334 | 2,772 |
| Intel Corp. | 4.250% | 12/15/42 | 1,575 | 1,748 |
| Intel Corp. | 4.900% | 7/29/45 | 2,454 | 2,993 |
| Intel Corp. | 4.100% | 5/19/46 | 1,000 | 1,092 |
| International Business Machines Corp. | 6.220% | 8/1/27 | 222 | 295 |
| International Business Machines Corp. | 6.500% | 1/15/28 | 350 | 477 |
| International Business Machines Corp. | 5.875% | 11/29/32 | 1,430 | 1,939 |
| International Business Machines Corp. | 5.600% | 11/30/39 | 840 | 1,093 |
| International Business Machines Corp. | 4.000% | 6/20/42 | 2,434 | 2,604 |
| Juniper Networks Inc. | 5.950% | 3/15/41 | 270 | 284 |
| KLA-Tencor Corp. | 5.650% | 11/1/34 | 255 | 286 |
| Microsoft Corp. | 3.500% | 2/12/35 | 2,875 | 2,978 |
| Microsoft Corp. | 4.200% | 11/3/35 | 300 | 338 |
| Microsoft Corp. | 3.450% | 8/8/36 | 2,750 | 2,830 |
| Microsoft Corp. | 5.200% | 6/1/39 | 355 | 447 |
| Microsoft Corp. | 4.500% | 10/1/40 | 1,300 | 1,515 |
| Microsoft Corp. | 5.300% | 2/8/41 | 900 | 1,152 |
| Microsoft Corp. | 3.500% | 11/15/42 | 1,705 | 1,716 |
| Microsoft Corp. | 3.750% | 5/1/43 | 1,225 | 1,280 |
| Microsoft Corp. | 4.875% | 12/15/43 | 900 | 1,098 |
| Microsoft Corp. | 3.750% | 2/12/45 | 2,975 | 3,102 |
| Microsoft Corp. | 4.450% | 11/3/45 | 2,130 | 2,476 |
| Microsoft Corp. | 3.700% | 8/8/46 | 5,450 | 5,660 |
| Microsoft Corp. | 4.000% | 2/12/55 | 2,614 | 2,751 |
| Microsoft Corp. | 4.750% | 11/3/55 | 1,615 | 1,926 |
| Microsoft Corp. | 3.950% | 8/8/56 | 2,500 | 2,640 |
| Motorola Solutions Inc. | 5.500% | 9/1/44 | 590 | 571 |
| Oracle Corp. | 3.250% | 5/15/30 | 200 | 210 |
| Oracle Corp. | 4.300% | 7/8/34 | 1,888 | 2,095 |
| Oracle Corp. | 3.900% | 5/15/35 | 1,775 | 1,866 |
| Oracle Corp. | 3.850% | 7/15/36 | 1,850 | 1,950 |
| Oracle Corp. | 6.500% | 4/15/38 | 1,795 | 2,528 |
| Oracle Corp. | 6.125% | 7/8/39 | 1,640 | 2,240 |
| Oracle Corp. | 5.375% | 7/15/40 | 3,301 | 4,129 |
| Oracle Corp. | 4.500% | 7/8/44 | 1,145 | 1,290 |
| Oracle Corp. | 4.125% | 5/15/45 | 1,883 | 2,009 |
| Oracle Corp. | 4.000% | 7/15/46 | 3,000 | 3,167 |
| Oracle Corp. | 4.375% | 5/15/55 | 1,700 | 1,849 |
| QUALCOMM Inc. | 4.650% | 5/20/35 | 1,275 | 1,412 |
| QUALCOMM Inc. | 4.800% | 5/20/45 | 1,687 | 1,916 |
| Seagate HDD Cayman | 4.875% | 6/1/27 | 725 | 631 |
| Seagate HDD Cayman | 5.750% | 12/1/34 | 525 | 434 |
| Tyco Electronics Group SA | 7.125% | 10/1/37 | 870 | 1,245 |
| Verisk Analytics Inc. | 5.500% | 6/15/45 | 1,075 | 1,168 |
84
| Vanguard® Long-Term Corporate Bond Index Fund | |||||
| Schedule of Investments | |||||
| August 31, 2016 | |||||
| Face | Market | ||||
| Maturity | Amount | Value | |||
| Coupon | Date | ($000) | ($000) | ||
| Xerox Corp. | 6.750% | 12/15/39 | 210 | 215 | |
| Transportation (3.7%) | |||||
| 3 | American Airlines 2014-1 Class A Pass Through Trust | 3.700% | 4/1/28 | 731 | 769 |
| 3 | American Airlines 2015-1 Class A Pass Through Trust | 3.375% | 11/1/28 | 988 | 1,019 |
| 3 | American Airlines 2015-2 Class AA Pass Through Trust | 3.600% | 9/22/27 | 625 | 670 |
| 3 | American Airlines 2016-1 Class A Pass Through Trust | 4.100% | 1/15/28 | 299 | 323 |
| 3 | American Airlines 2016-1 Class AA Pass Through Trust | 3.575% | 1/15/28 | 673 | 722 |
| 3 | American Airlines 2016-2 Class A Pass Through Trust | 3.650% | 6/15/28 | 300 | 316 |
| 3 | American Airlines 2016-2 Class AA Pass Through Trust | 3.200% | 6/15/28 | 650 | 679 |
| Burlington Northern Santa Fe LLC | 7.950% | 8/15/30 | 295 | 446 | |
| Burlington Northern Santa Fe LLC | 6.200% | 8/15/36 | 670 | 913 | |
| Burlington Northern Santa Fe LLC | 5.750% | 5/1/40 | 824 | 1,104 | |
| Burlington Northern Santa Fe LLC | 5.050% | 3/1/41 | 626 | 777 | |
| Burlington Northern Santa Fe LLC | 5.400% | 6/1/41 | 1,050 | 1,362 | |
| Burlington Northern Santa Fe LLC | 4.950% | 9/15/41 | 300 | 370 | |
| Burlington Northern Santa Fe LLC | 4.400% | 3/15/42 | 1,056 | 1,211 | |
| Burlington Northern Santa Fe LLC | 4.375% | 9/1/42 | 1,240 | 1,422 | |
| Burlington Northern Santa Fe LLC | 4.450% | 3/15/43 | 865 | 1,009 | |
| Burlington Northern Santa Fe LLC | 5.150% | 9/1/43 | 725 | 922 | |
| Burlington Northern Santa Fe LLC | 4.900% | 4/1/44 | 1,715 | 2,116 | |
| Burlington Northern Santa Fe LLC | 4.550% | 9/1/44 | 815 | 962 | |
| Burlington Northern Santa Fe LLC | 4.150% | 4/1/45 | 575 | 644 | |
| Burlington Northern Santa Fe LLC | 4.700% | 9/1/45 | 1,600 | 1,931 | |
| Burlington Northern Santa Fe LLC | 3.900% | 8/1/46 | 500 | 544 | |
| Canadian National Railway Co. | 6.900% | 7/15/28 | 621 | 894 | |
| Canadian National Railway Co. | 6.250% | 8/1/34 | 625 | 866 | |
| Canadian National Railway Co. | 6.200% | 6/1/36 | 460 | 640 | |
| Canadian National Railway Co. | 6.375% | 11/15/37 | 240 | 346 | |
| Canadian National Railway Co. | 3.500% | 11/15/42 | 585 | 610 | |
| Canadian National Railway Co. | 4.500% | 11/7/43 | 200 | 240 | |
| Canadian National Railway Co. | 3.200% | 8/2/46 | 1,225 | 1,213 | |
| Canadian Pacific Railway Co. | 7.125% | 10/15/31 | 560 | 773 | |
| Canadian Pacific Railway Co. | 5.750% | 3/15/33 | 170 | 206 | |
| Canadian Pacific Railway Co. | 4.800% | 9/15/35 | 550 | 639 | |
| Canadian Pacific Railway Co. | 5.950% | 5/15/37 | 720 | 930 | |
| Canadian Pacific Railway Co. | 4.800% | 8/1/45 | 350 | 416 | |
| Canadian Pacific Railway Co. | 6.125% | 9/15/15 | 980 | 1,222 | |
| Canadian Pacific Railway Ltd. | 5.750% | 1/15/42 | 300 | 389 | |
| CSX Corp. | 6.000% | 10/1/36 | 666 | 857 | |
| CSX Corp. | 6.150% | 5/1/37 | 588 | 782 | |
| CSX Corp. | 6.220% | 4/30/40 | 785 | 1,069 | |
| CSX Corp. | 5.500% | 4/15/41 | 596 | 750 | |
| CSX Corp. | 4.750% | 5/30/42 | 865 | 999 | |
| CSX Corp. | 4.400% | 3/1/43 | 350 | 390 | |
| CSX Corp. | 4.100% | 3/15/44 | 1,225 | 1,331 | |
| CSX Corp. | 3.950% | 5/1/50 | 650 | 668 | |
| CSX Corp. | 4.500% | 8/1/54 | 685 | 754 | |
| 3 | Delta Air Lines 2015-1 Class AA Pass Through Trust | 3.625% | 7/30/27 | 359 | 389 |
| FedEx Corp. | 4.900% | 1/15/34 | 630 | 730 | |
| FedEx Corp. | 3.900% | 2/1/35 | 770 | 803 | |
| FedEx Corp. | 3.875% | 8/1/42 | 581 | 590 | |
| FedEx Corp. | 4.100% | 4/15/43 | 661 | 689 | |
| FedEx Corp. | 5.100% | 1/15/44 | 861 | 1,025 | |
| FedEx Corp. | 4.100% | 2/1/45 | 530 | 552 | |
| FedEx Corp. | 4.750% | 11/15/45 | 1,555 | 1,784 | |
| FedEx Corp. | 4.550% | 4/1/46 | 1,375 | 1,531 | |
| FedEx Corp. | 4.500% | 2/1/65 | 265 | 277 | |
| Kansas City Southern | 4.300% | 5/15/43 | 1,025 | 1,082 | |
| Kansas City Southern | 4.950% | 8/15/45 | 670 | 780 | |
| 2,3 | Latam Airlines 2015-1 Pass Through Trust A | 4.200% | 11/15/27 | 895 | 866 |
| Norfolk Southern Corp. | 7.800% | 5/15/27 | 450 | 640 | |
| Norfolk Southern Corp. | 7.250% | 2/15/31 | 530 | 749 | |
| Norfolk Southern Corp. | 7.050% | 5/1/37 | 255 | 360 | |
85
| Vanguard® Long-Term Corporate Bond Index Fund | ||||
| Schedule of Investments | ||||
| August 31, 2016 | ||||
| Face | Market | |||
| Maturity | Amount | Value | ||
| Coupon | Date | ($000) | ($000) | |
| Norfolk Southern Corp. | 4.837% | 10/1/41 | 856 | 1,014 |
| Norfolk Southern Corp. | 3.950% | 10/1/42 | 585 | 619 |
| Norfolk Southern Corp. | 4.800% | 8/15/43 | 861 | 1,021 |
| Norfolk Southern Corp. | 4.450% | 6/15/45 | 529 | 602 |
| Norfolk Southern Corp. | 4.650% | 1/15/46 | 845 | 993 |
| Norfolk Southern Corp. | 7.900% | 5/15/97 | 200 | 307 |
| Norfolk Southern Corp. | 6.000% | 3/15/05 | 713 | 876 |
| Norfolk Southern Corp. | 6.000% | 5/23/11 | 520 | 647 |
| 3 Spirit Airlines Class A Pass Through Certificates Series | ||||
| 2015-1 | 4.100% | 10/1/29 | 485 | 494 |
| Union Pacific Corp. | 6.625% | 2/1/29 | 330 | 456 |
| Union Pacific Corp. | 3.375% | 2/1/35 | 355 | 368 |
| Union Pacific Corp. | 4.750% | 9/15/41 | 555 | 668 |
| Union Pacific Corp. | 4.300% | 6/15/42 | 485 | 552 |
| Union Pacific Corp. | 4.250% | 4/15/43 | 350 | 396 |
| Union Pacific Corp. | 4.750% | 12/15/43 | 855 | 1,031 |
| Union Pacific Corp. | 4.821% | 2/1/44 | 1,202 | 1,473 |
| Union Pacific Corp. | 4.850% | 6/15/44 | 391 | 483 |
| Union Pacific Corp. | 4.150% | 1/15/45 | 325 | 368 |
| Union Pacific Corp. | 4.050% | 11/15/45 | 550 | 614 |
| Union Pacific Corp. | 4.050% | 3/1/46 | 900 | 1,010 |
| Union Pacific Corp. | 3.350% | 8/15/46 | 300 | 299 |
| Union Pacific Corp. | 3.875% | 2/1/55 | 790 | 828 |
| Union Pacific Corp. | 4.375% | 11/15/65 | 280 | 312 |
| 3 United Airlines 2014-2 Class A Pass Through Trust | 3.750% | 3/3/28 | 840 | 888 |
| 3 United Airlines 2015-1 Class AA Pass Through Trust | 3.450% | 12/1/27 | 450 | 477 |
| 3 United Airlines 2016-1 Class A Pass Through Trust | 3.450% | 7/7/28 | 450 | 469 |
| 3 United Airlines 2016-1 Class AA Pass Through Trust | 3.100% | 7/7/28 | 950 | 986 |
| United Parcel Service Inc. | 6.200% | 1/15/38 | 1,678 | 2,449 |
| United Parcel Service Inc. | 4.875% | 11/15/40 | 775 | 994 |
| United Parcel Service Inc. | 3.625% | 10/1/42 | 615 | 673 |
| United Parcel Service of America Inc. | 8.375% | 4/1/30 | 325 | 476 |
| 1,339,424 | ||||
| Utilities (13.0%) | ||||
| Electric (12.0%) | ||||
| AEP Texas Central Co. | 6.650% | 2/15/33 | 885 | 1,155 |
| Alabama Power Co. | 6.125% | 5/15/38 | 490 | 664 |
| Alabama Power Co. | 6.000% | 3/1/39 | 655 | 875 |
| Alabama Power Co. | 5.500% | 3/15/41 | 320 | 415 |
| Alabama Power Co. | 5.200% | 6/1/41 | 706 | 895 |
| Alabama Power Co. | 4.100% | 1/15/42 | 260 | 287 |
| Alabama Power Co. | 3.850% | 12/1/42 | 425 | 453 |
| Alabama Power Co. | 4.150% | 8/15/44 | 400 | 447 |
| Alabama Power Co. | 3.750% | 3/1/45 | 800 | 846 |
| Alabama Power Co. | 4.300% | 1/2/46 | 350 | 403 |
| Ameren Illinois Co. | 4.800% | 12/15/43 | 500 | 618 |
| Ameren Illinois Co. | 4.300% | 7/1/44 | 220 | 256 |
| Ameren Illinois Co. | 4.150% | 3/15/46 | 155 | 180 |
| Appalachian Power Co | 4.400% | 5/15/44 | 285 | 310 |
| Appalachian Power Co. | 5.800% | 10/1/35 | 370 | 453 |
| Appalachian Power Co. | 6.375% | 4/1/36 | 355 | 457 |
| Appalachian Power Co. | 6.700% | 8/15/37 | 260 | 349 |
| Appalachian Power Co. | 7.000% | 4/1/38 | 440 | 610 |
| Appalachian Power Co. | 4.450% | 6/1/45 | 375 | 413 |
| Arizona Public Service Co. | 5.500% | 9/1/35 | 382 | 489 |
| Arizona Public Service Co. | 5.050% | 9/1/41 | 330 | 413 |
| Arizona Public Service Co. | 4.500% | 4/1/42 | 498 | 587 |
| Arizona Public Service Co. | 4.700% | 1/15/44 | 395 | 479 |
| Arizona Public Service Co. | 4.350% | 11/15/45 | 150 | 174 |
| Arizona Public Service Co. | 3.750% | 5/15/46 | 355 | 380 |
| Baltimore Gas & Electric Co. | 6.350% | 10/1/36 | 448 | 623 |
| Baltimore Gas & Electric Co. | 3.500% | 8/15/46 | 650 | 664 |
| Berkshire Hathaway Energy Co. | 8.480% | 9/15/28 | 328 | 507 |
86
| Vanguard® Long-Term Corporate Bond Index Fund | ||||
| Schedule of Investments | ||||
| August 31, 2016 | ||||
| Face | Market | |||
| Maturity | Amount | Value | ||
| Coupon | Date | ($000) | ($000) | |
| Berkshire Hathaway Energy Co. | 6.125% | 4/1/36 | 1,830 | 2,456 |
| Berkshire Hathaway Energy Co. | 5.950% | 5/15/37 | 546 | 719 |
| Berkshire Hathaway Energy Co. | 6.500% | 9/15/37 | 1,485 | 2,064 |
| Berkshire Hathaway Energy Co. | 5.150% | 11/15/43 | 1,095 | 1,350 |
| Berkshire Hathaway Energy Co. | 4.500% | 2/1/45 | 850 | 973 |
| Black Hills Corp. | 3.150% | 1/15/27 | 450 | 454 |
| Black Hills Corp. | 4.200% | 9/15/46 | 400 | 414 |
| CenterPoint Energy Houston Electric LLC | 2.400% | 9/1/26 | 300 | 302 |
| CenterPoint Energy Houston Electric LLC | 6.950% | 3/15/33 | 450 | 648 |
| CenterPoint Energy Houston Electric LLC | 3.550% | 8/1/42 | 625 | 650 |
| CenterPoint Energy Houston Electric LLC | 4.500% | 4/1/44 | 390 | 467 |
| 2 Cleco Corporate Holdings LLC | 4.973% | 5/1/46 | 425 | 476 |
| Cleco Power LLC | 6.500% | 12/1/35 | 255 | 335 |
| Cleco Power LLC | 6.000% | 12/1/40 | 392 | 503 |
| Cleveland Electric Illuminating Co. | 5.950% | 12/15/36 | 280 | 325 |
| CMS Energy Corp. | 4.700% | 3/31/43 | 290 | 334 |
| CMS Energy Corp. | 4.875% | 3/1/44 | 384 | 458 |
| Commonwealth Edison Co. | 5.875% | 2/1/33 | 435 | 565 |
| Commonwealth Edison Co. | 5.900% | 3/15/36 | 945 | 1,257 |
| Commonwealth Edison Co. | 6.450% | 1/15/38 | 546 | 779 |
| Commonwealth Edison Co. | 3.800% | 10/1/42 | 370 | 396 |
| Commonwealth Edison Co. | 4.600% | 8/15/43 | 900 | 1,082 |
| Commonwealth Edison Co. | 4.700% | 1/15/44 | 1,075 | 1,307 |
| Commonwealth Edison Co. | 3.700% | 3/1/45 | 415 | 439 |
| Commonwealth Edison Co. | 4.350% | 11/15/45 | 475 | 553 |
| Commonwealth Edison Co. | 3.650% | 6/15/46 | 825 | 871 |
| Connecticut Light & Power Co. | 6.350% | 6/1/36 | 351 | 489 |
| Connecticut Light & Power Co. | 4.300% | 4/15/44 | 260 | 301 |
| Consolidated Edison Co. of New York Inc. | 5.300% | 3/1/35 | 745 | 913 |
| Consolidated Edison Co. of New York Inc. | 5.850% | 3/15/36 | 550 | 720 |
| Consolidated Edison Co. of New York Inc. | 6.200% | 6/15/36 | 276 | 373 |
| Consolidated Edison Co. of New York Inc. | 5.700% | 12/1/36 | 483 | 625 |
| Consolidated Edison Co. of New York Inc. | 6.300% | 8/15/37 | 1,055 | 1,456 |
| Consolidated Edison Co. of New York Inc. | 6.750% | 4/1/38 | 575 | 845 |
| Consolidated Edison Co. of New York Inc. | 5.500% | 12/1/39 | 425 | 552 |
| Consolidated Edison Co. of New York Inc. | 5.700% | 6/15/40 | 535 | 705 |
| Consolidated Edison Co. of New York Inc. | 4.200% | 3/15/42 | 375 | 420 |
| Consolidated Edison Co. of New York Inc. | 3.950% | 3/1/43 | 1,157 | 1,252 |
| Consolidated Edison Co. of New York Inc. | 4.450% | 3/15/44 | 1,325 | 1,556 |
| Consolidated Edison Co. of New York Inc. | 4.500% | 12/1/45 | 710 | 835 |
| Consolidated Edison Co. of New York Inc. | 3.850% | 6/15/46 | 650 | 702 |
| Consolidated Edison Co. of New York Inc. | 4.625% | 12/1/54 | 585 | 695 |
| Consumers Energy Co. | 3.950% | 5/15/43 | 420 | 470 |
| Consumers Energy Co. | 4.100% | 11/15/45 | 290 | 333 |
| Consumers Energy Co. | 3.250% | 8/15/46 | 775 | 781 |
| Consumers Energy Co. | 4.350% | 8/31/64 | 180 | 210 |
| Delmarva Power & Light Co. | 4.000% | 6/1/42 | 445 | 489 |
| Dominion Resources Inc. | 6.300% | 3/15/33 | 420 | 528 |
| Dominion Resources Inc. | 5.250% | 8/1/33 | 588 | 670 |
| Dominion Resources Inc. | 5.950% | 6/15/35 | 505 | 627 |
| Dominion Resources Inc. | 7.000% | 6/15/38 | 150 | 206 |
| Dominion Resources Inc. | 4.900% | 8/1/41 | 475 | 536 |
| Dominion Resources Inc. | 4.050% | 9/15/42 | 405 | 413 |
| Dominion Resources Inc. | 4.700% | 12/1/44 | 971 | 1,105 |
| DTE Electric Co. | 6.625% | 6/1/36 | 654 | 941 |
| DTE Electric Co. | 5.700% | 10/1/37 | 200 | 267 |
| DTE Electric Co. | 3.950% | 6/15/42 | 680 | 758 |
| DTE Electric Co. | 4.000% | 4/1/43 | 375 | 418 |
| DTE Electric Co. | 4.300% | 7/1/44 | 355 | 414 |
| DTE Electric Co. | 3.700% | 3/15/45 | 450 | 485 |
| DTE Electric Co. | 3.700% | 6/1/46 | 425 | 459 |
| DTE Energy Co. | 6.375% | 4/15/33 | 420 | 554 |
| Duke Energy Carolinas LLC | 6.000% | 12/1/28 | 335 | 440 |
| Duke Energy Carolinas LLC | 6.450% | 10/15/32 | 463 | 635 |
87
| Vanguard® Long-Term Corporate Bond Index Fund | ||||
| Schedule of Investments | ||||
| August 31, 2016 | ||||
| Face | Market | |||
| Maturity | Amount | Value | ||
| Coupon | Date | ($000) | ($000) | |
| Duke Energy Carolinas LLC | 6.100% | 6/1/37 | 670 | 899 |
| Duke Energy Carolinas LLC | 6.000% | 1/15/38 | 560 | 768 |
| Duke Energy Carolinas LLC | 6.050% | 4/15/38 | 670 | 925 |
| Duke Energy Carolinas LLC | 5.300% | 2/15/40 | 820 | 1,058 |
| Duke Energy Carolinas LLC | 4.250% | 12/15/41 | 813 | 926 |
| Duke Energy Carolinas LLC | 4.000% | 9/30/42 | 785 | 862 |
| Duke Energy Carolinas LLC | 3.750% | 6/1/45 | 605 | 649 |
| Duke Energy Carolinas LLC | 3.875% | 3/15/46 | 600 | 655 |
| Duke Energy Corp. | 2.650% | 9/1/26 | 1,500 | 1,496 |
| Duke Energy Corp. | 4.800% | 12/15/45 | 650 | 768 |
| Duke Energy Corp. | 3.750% | 9/1/46 | 1,825 | 1,841 |
| 3 Duke Energy Florida LLC | 2.538% | 9/1/29 | 500 | 502 |
| 3 Duke Energy Florida LLC | 2.858% | 3/1/33 | 300 | 304 |
| 3 Duke Energy Florida LLC | 3.112% | 9/1/36 | 325 | 332 |
| Duke Energy Florida LLC | 6.350% | 9/15/37 | 600 | 856 |
| Duke Energy Florida LLC | 6.400% | 6/15/38 | 1,151 | 1,659 |
| Duke Energy Florida LLC | 5.650% | 4/1/40 | 275 | 366 |
| Duke Energy Florida LLC | 3.850% | 11/15/42 | 415 | 445 |
| Duke Energy Indiana LLC | 6.120% | 10/15/35 | 523 | 700 |
| Duke Energy Indiana LLC | 6.350% | 8/15/38 | 590 | 840 |
| Duke Energy Indiana LLC | 6.450% | 4/1/39 | 500 | 717 |
| Duke Energy Indiana LLC | 4.200% | 3/15/42 | 280 | 314 |
| Duke Energy Indiana LLC | 4.900% | 7/15/43 | 365 | 448 |
| Duke Energy Indiana LLC | 3.750% | 5/15/46 | 625 | 661 |
| Duke Energy Ohio Inc. | 3.700% | 6/15/46 | 530 | 559 |
| Duke Energy Progress LLC | 6.300% | 4/1/38 | 340 | 480 |
| Duke Energy Progress LLC | 4.100% | 5/15/42 | 613 | 680 |
| Duke Energy Progress LLC | 4.100% | 3/15/43 | 810 | 898 |
| Duke Energy Progress LLC | 4.375% | 3/30/44 | 470 | 543 |
| Duke Energy Progress LLC | 4.150% | 12/1/44 | 805 | 901 |
| Duke Energy Progress LLC | 4.200% | 8/15/45 | 925 | 1,051 |
| El Paso Electric Co. | 6.000% | 5/15/35 | 480 | 597 |
| El Paso Electric Co. | 5.000% | 12/1/44 | 350 | 407 |
| 2 Emera US Finance LP | 4.750% | 6/15/46 | 1,550 | 1,712 |
| Entergy Corp. | 2.950% | 9/1/26 | 525 | 529 |
| Entergy Louisiana LLC | 3.250% | 4/1/28 | 1,300 | 1,384 |
| Entergy Louisiana LLC | 3.050% | 6/1/31 | 375 | 385 |
| Entergy Louisiana LLC | 4.950% | 1/15/45 | 750 | 798 |
| Entergy Mississippi Inc. | 2.850% | 6/1/28 | 600 | 613 |
| Entergy Texas Inc. | 5.150% | 6/1/45 | 430 | 465 |
| Exelon Corp. | 4.950% | 6/15/35 | 425 | 492 |
| Exelon Corp. | 5.625% | 6/15/35 | 700 | 853 |
| Exelon Corp. | 5.100% | 6/15/45 | 835 | 982 |
| Exelon Corp. | 4.450% | 4/15/46 | 925 | 1,028 |
| Exelon Generation Co. LLC | 6.250% | 10/1/39 | 1,145 | 1,319 |
| Exelon Generation Co. LLC | 5.750% | 10/1/41 | 410 | 446 |
| Exelon Generation Co. LLC | 5.600% | 6/15/42 | 953 | 1,019 |
| Florida Power & Light Co. | 5.625% | 4/1/34 | 275 | 363 |
| Florida Power & Light Co. | 4.950% | 6/1/35 | 285 | 354 |
| Florida Power & Light Co. | 5.650% | 2/1/37 | 406 | 542 |
| Florida Power & Light Co. | 5.950% | 2/1/38 | 710 | 982 |
| Florida Power & Light Co. | 5.960% | 4/1/39 | 850 | 1,187 |
| Florida Power & Light Co. | 5.690% | 3/1/40 | 675 | 929 |
| Florida Power & Light Co. | 5.250% | 2/1/41 | 260 | 340 |
| Florida Power & Light Co. | 5.125% | 6/1/41 | 275 | 357 |
| Florida Power & Light Co. | 4.125% | 2/1/42 | 830 | 949 |
| Florida Power & Light Co. | 4.050% | 6/1/42 | 705 | 801 |
| Florida Power & Light Co. | 3.800% | 12/15/42 | 435 | 476 |
| Florida Power & Light Co. | 4.050% | 10/1/44 | 1,400 | 1,602 |
| Georgia Power Co. | 5.650% | 3/1/37 | 635 | 809 |
| Georgia Power Co. | 5.950% | 2/1/39 | 685 | 909 |
| Georgia Power Co. | 5.400% | 6/1/40 | 700 | 879 |
| Georgia Power Co. | 4.750% | 9/1/40 | 381 | 444 |
| Georgia Power Co. | 4.300% | 3/15/42 | 1,420 | 1,572 |
88
| Vanguard® Long-Term Corporate Bond Index Fund | ||||
| Schedule of Investments | ||||
| August 31, 2016 | ||||
| Face | Market | |||
| Maturity | Amount | Value | ||
| Coupon | Date | ($000) | ($000) | |
| Georgia Power Co. | 4.300% | 3/15/43 | 330 | 366 |
| Iberdrola International BV | 6.750% | 7/15/36 | 590 | 823 |
| Indiana Michigan Power Co. | 6.050% | 3/15/37 | 565 | 719 |
| Indiana Michigan Power Co. | 4.550% | 3/15/46 | 450 | 516 |
| Interstate Power & Light Co. | 6.250% | 7/15/39 | 440 | 614 |
| ITC Holdings Corp. | 5.300% | 7/1/43 | 310 | 373 |
| Jersey Central Power & Light Co. | 6.150% | 6/1/37 | 345 | 415 |
| 3 John Sevier Combined Cycle Generation LLC | 4.626% | 1/15/42 | 881 | 1,034 |
| Kansas City Power & Light Co. | 6.050% | 11/15/35 | 250 | 320 |
| Kansas City Power & Light Co. | 5.300% | 10/1/41 | 470 | 569 |
| Kentucky Utilities Co. | 5.125% | 11/1/40 | 720 | 905 |
| Kentucky Utilities Co. | 4.650% | 11/15/43 | 410 | 495 |
| Kentucky Utilities Co. | 4.375% | 10/1/45 | 100 | 116 |
| Louisville Gas & Electric Co. | 5.125% | 11/15/40 | 495 | 630 |
| Louisville Gas & Electric Co. | 4.650% | 11/15/43 | 225 | 271 |
| Louisville Gas & Electric Co. | 4.375% | 10/1/45 | 525 | 611 |
| MidAmerican Energy Co. | 6.750% | 12/30/31 | 690 | 971 |
| MidAmerican Energy Co. | 5.750% | 11/1/35 | 610 | 803 |
| MidAmerican Energy Co. | 5.800% | 10/15/36 | 210 | 282 |
| MidAmerican Energy Co. | 4.800% | 9/15/43 | 550 | 683 |
| MidAmerican Energy Co. | 4.400% | 10/15/44 | 350 | 414 |
| MidAmerican Energy Co. | 4.250% | 5/1/46 | 500 | 582 |
| MidAmerican Funding LLC | 6.927% | 3/1/29 | 200 | 282 |
| Mississippi Power Co. | 4.250% | 3/15/42 | 405 | 379 |
| National Rural Utilities Cooperative Finance Corp. | 8.000% | 3/1/32 | 700 | 1,059 |
| National Rural Utilities Cooperative Finance Corp. | 4.023% | 11/1/32 | 886 | 973 |
| Nevada Power Co. | 6.650% | 4/1/36 | 850 | 1,188 |
| Nevada Power Co. | 6.750% | 7/1/37 | 470 | 667 |
| Nevada Power Co. | 5.375% | 9/15/40 | 235 | 297 |
| Nevada Power Co. | 5.450% | 5/15/41 | 291 | 376 |
| Northern States Power Co. | 5.250% | 7/15/35 | 240 | 308 |
| Northern States Power Co. | 6.250% | 6/1/36 | 340 | 477 |
| Northern States Power Co. | 6.200% | 7/1/37 | 486 | 687 |
| Northern States Power Co. | 5.350% | 11/1/39 | 375 | 493 |
| Northern States Power Co. | 4.850% | 8/15/40 | 445 | 551 |
| Northern States Power Co. | 3.400% | 8/15/42 | 605 | 621 |
| Northern States Power Co. | 4.125% | 5/15/44 | 400 | 457 |
| Northern States Power Co. | 4.000% | 8/15/45 | 450 | 508 |
| Northern States Power Co. | 3.600% | 5/15/46 | 1,000 | 1,058 |
| NorthWestern Corp. | 4.176% | 11/15/44 | 470 | 524 |
| NSTAR Electric Co. | 5.500% | 3/15/40 | 810 | 1,063 |
| NSTAR Electric Co. | 4.400% | 3/1/44 | 265 | 310 |
| Oglethorpe Power Corp. | 5.950% | 11/1/39 | 365 | 467 |
| Oglethorpe Power Corp. | 5.375% | 11/1/40 | 495 | 606 |
| Oglethorpe Power Corp. | 4.200% | 12/1/42 | 365 | 389 |
| Oglethorpe Power Corp. | 4.550% | 6/1/44 | 430 | 477 |
| Oglethorpe Power Corp. | 4.250% | 4/1/46 | 525 | 567 |
| Oglethorpe Power Corp. | 5.250% | 9/1/50 | 235 | 283 |
| Ohio Edison Co. | 6.875% | 7/15/36 | 670 | 885 |
| Ohio Edison Co. | 8.250% | 10/15/38 | 275 | 422 |
| Ohio Power Co. | 6.600% | 2/15/33 | 450 | 589 |
| Ohio Power Co. | 5.850% | 10/1/35 | 321 | 401 |
| Oklahoma Gas & Electric Co. | 5.850% | 6/1/40 | 210 | 281 |
| Oklahoma Gas & Electric Co. | 5.250% | 5/15/41 | 325 | 410 |
| Oklahoma Gas & Electric Co. | 3.900% | 5/1/43 | 350 | 373 |
| Oklahoma Gas & Electric Co. | 4.550% | 3/15/44 | 245 | 289 |
| Oklahoma Gas & Electric Co. | 4.000% | 12/15/44 | 400 | 438 |
| Oncor Electric Delivery Co. LLC | 7.000% | 5/1/32 | 599 | 849 |
| Oncor Electric Delivery Co. LLC | 7.250% | 1/15/33 | 380 | 557 |
| Oncor Electric Delivery Co. LLC | 7.500% | 9/1/38 | 375 | 597 |
| Oncor Electric Delivery Co. LLC | 5.250% | 9/30/40 | 455 | 589 |
| Oncor Electric Delivery Co. LLC | 4.550% | 12/1/41 | 405 | 485 |
| Oncor Electric Delivery Co. LLC | 5.300% | 6/1/42 | 740 | 972 |
| Oncor Electric Delivery Co. LLC | 3.750% | 4/1/45 | 455 | 492 |
89
| Vanguard® Long-Term Corporate Bond Index Fund | ||||
| Schedule of Investments | ||||
| August 31, 2016 | ||||
| Face | Market | |||
| Maturity | Amount | Value | ||
| Coupon | Date | ($000) | ($000) | |
| Pacific Gas & Electric Co. | 6.050% | 3/1/34 | 3,475 | 4,697 |
| Pacific Gas & Electric Co. | 5.800% | 3/1/37 | 1,000 | 1,323 |
| Pacific Gas & Electric Co. | 6.350% | 2/15/38 | 519 | 725 |
| Pacific Gas & Electric Co. | 6.250% | 3/1/39 | 620 | 862 |
| Pacific Gas & Electric Co. | 5.400% | 1/15/40 | 785 | 1,008 |
| Pacific Gas & Electric Co. | 4.500% | 12/15/41 | 245 | 284 |
| Pacific Gas & Electric Co. | 4.450% | 4/15/42 | 450 | 517 |
| Pacific Gas & Electric Co. | 4.600% | 6/15/43 | 949 | 1,118 |
| Pacific Gas & Electric Co. | 5.125% | 11/15/43 | 1,095 | 1,381 |
| Pacific Gas & Electric Co. | 4.750% | 2/15/44 | 1,040 | 1,255 |
| Pacific Gas & Electric Co. | 4.300% | 3/15/45 | 610 | 699 |
| Pacific Gas & Electric Co. | 4.250% | 3/15/46 | 550 | 626 |
| PacifiCorp | 7.700% | 11/15/31 | 550 | 847 |
| PacifiCorp | 5.250% | 6/15/35 | 585 | 728 |
| PacifiCorp | 6.100% | 8/1/36 | 365 | 496 |
| PacifiCorp | 5.750% | 4/1/37 | 730 | 967 |
| PacifiCorp | 6.250% | 10/15/37 | 715 | 1,003 |
| PacifiCorp | 6.350% | 7/15/38 | 610 | 870 |
| PacifiCorp | 6.000% | 1/15/39 | 640 | 882 |
| PacifiCorp | 4.100% | 2/1/42 | 120 | 134 |
| PECO Energy Co. | 5.950% | 10/1/36 | 170 | 228 |
| PECO Energy Co. | 4.150% | 10/1/44 | 240 | 272 |
| Pennsylvania Electric Co. | 6.150% | 10/1/38 | 185 | 217 |
| Potomac Electric Power Co. | 6.500% | 11/15/37 | 275 | 395 |
| Potomac Electric Power Co. | 7.900% | 12/15/38 | 270 | 434 |
| Potomac Electric Power Co. | 4.150% | 3/15/43 | 815 | 904 |
| PPL Capital Funding Inc. | 4.700% | 6/1/43 | 385 | 438 |
| PPL Capital Funding Inc. | 5.000% | 3/15/44 | 475 | 547 |
| PPL Electric Utilities Corp. | 6.250% | 5/15/39 | 555 | 789 |
| PPL Electric Utilities Corp. | 5.200% | 7/15/41 | 509 | 647 |
| PPL Electric Utilities Corp. | 4.750% | 7/15/43 | 250 | 303 |
| PPL Electric Utilities Corp. | 4.125% | 6/15/44 | 480 | 541 |
| Progress Energy Inc. | 7.750% | 3/1/31 | 780 | 1,101 |
| Progress Energy Inc. | 7.000% | 10/30/31 | 542 | 735 |
| Progress Energy Inc. | 6.000% | 12/1/39 | 690 | 900 |
| PSEG Power LLC | 8.625% | 4/15/31 | 690 | 908 |
| Public Service Co. of Colorado | 6.500% | 8/1/38 | 230 | 337 |
| Public Service Co. of Colorado | 4.750% | 8/15/41 | 345 | 422 |
| Public Service Co. of Colorado | 3.600% | 9/15/42 | 360 | 378 |
| Public Service Co. of Colorado | 3.950% | 3/15/43 | 170 | 189 |
| Public Service Co. of Colorado | 4.300% | 3/15/44 | 1,125 | 1,314 |
| Public Service Co. of Oklahoma | 6.625% | 11/15/37 | 225 | 297 |
| Public Service Electric & Gas Co. | 5.700% | 12/1/36 | 744 | 998 |
| Public Service Electric & Gas Co. | 5.800% | 5/1/37 | 440 | 597 |
| Public Service Electric & Gas Co. | 5.375% | 11/1/39 | 302 | 393 |
| Public Service Electric & Gas Co. | 5.500% | 3/1/40 | 105 | 140 |
| Public Service Electric & Gas Co. | 3.950% | 5/1/42 | 355 | 397 |
| Public Service Electric & Gas Co. | 3.650% | 9/1/42 | 1,080 | 1,159 |
| Public Service Electric & Gas Co. | 4.000% | 6/1/44 | 306 | 345 |
| Public Service Electric & Gas Co. | 4.050% | 5/1/45 | 330 | 377 |
| Public Service Electric & Gas Co. | 4.150% | 11/1/45 | 475 | 551 |
| Public Service Electric & Gas Co. | 3.800% | 3/1/46 | 725 | 801 |
| Puget Sound Energy Inc. | 7.020% | 12/1/27 | 645 | 889 |
| Puget Sound Energy Inc. | 5.483% | 6/1/35 | 290 | 368 |
| Puget Sound Energy Inc. | 6.724% | 6/15/36 | 228 | 328 |
| Puget Sound Energy Inc. | 6.274% | 3/15/37 | 426 | 590 |
| Puget Sound Energy Inc. | 5.757% | 10/1/39 | 470 | 630 |
| Puget Sound Energy Inc. | 5.795% | 3/15/40 | 420 | 571 |
| Puget Sound Energy Inc. | 5.764% | 7/15/40 | 295 | 398 |
| Puget Sound Energy Inc. | 5.638% | 4/15/41 | 200 | 266 |
| Puget Sound Energy Inc. | 4.434% | 11/15/41 | 395 | 461 |
| Puget Sound Energy Inc. | 4.300% | 5/20/45 | 365 | 427 |
| San Diego Gas & Electric Co. | 5.350% | 5/15/35 | 265 | 336 |
| San Diego Gas & Electric Co. | 6.125% | 9/15/37 | 310 | 433 |
90
| Vanguard® Long-Term Corporate Bond Index Fund | ||||
| Schedule of Investments | ||||
| August 31, 2016 | ||||
| Face | Market | |||
| Maturity | Amount | Value | ||
| Coupon | Date | ($000) | ($000) | |
| San Diego Gas & Electric Co. | 6.000% | 6/1/39 | 245 | 343 |
| San Diego Gas & Electric Co. | 5.350% | 5/15/40 | 410 | 535 |
| San Diego Gas & Electric Co. | 4.500% | 8/15/40 | 536 | 640 |
| San Diego Gas & Electric Co. | 3.950% | 11/15/41 | 300 | 335 |
| San Diego Gas & Electric Co. | 4.300% | 4/1/42 | 310 | 361 |
| Sierra Pacific Power Co. | 6.750% | 7/1/37 | 355 | 512 |
| South Carolina Electric & Gas Co. | 6.625% | 2/1/32 | 490 | 663 |
| South Carolina Electric & Gas Co. | 5.300% | 5/15/33 | 405 | 490 |
| South Carolina Electric & Gas Co. | 6.050% | 1/15/38 | 490 | 657 |
| South Carolina Electric & Gas Co. | 5.450% | 2/1/41 | 395 | 505 |
| South Carolina Electric & Gas Co. | 4.350% | 2/1/42 | 566 | 633 |
| South Carolina Electric & Gas Co. | 4.600% | 6/15/43 | 405 | 470 |
| South Carolina Electric & Gas Co. | 4.100% | 6/15/46 | 605 | 659 |
| South Carolina Electric & Gas Co. | 4.500% | 6/1/64 | 783 | 836 |
| South Carolina Electric & Gas Co. | 5.100% | 6/1/65 | 490 | 586 |
| Southern California Edison Co. | 6.650% | 4/1/29 | 450 | 602 |
| Southern California Edison Co. | 6.000% | 1/15/34 | 480 | 646 |
| Southern California Edison Co. | 5.750% | 4/1/35 | 401 | 531 |
| Southern California Edison Co. | 5.350% | 7/15/35 | 280 | 355 |
| Southern California Edison Co. | 5.550% | 1/15/36 | 220 | 284 |
| Southern California Edison Co. | 5.625% | 2/1/36 | 640 | 834 |
| Southern California Edison Co. | 5.550% | 1/15/37 | 330 | 433 |
| Southern California Edison Co. | 5.950% | 2/1/38 | 665 | 917 |
| Southern California Edison Co. | 6.050% | 3/15/39 | 600 | 839 |
| Southern California Edison Co. | 5.500% | 3/15/40 | 570 | 753 |
| Southern California Edison Co. | 4.500% | 9/1/40 | 1,015 | 1,201 |
| Southern California Edison Co. | 3.900% | 12/1/41 | 560 | 610 |
| Southern California Edison Co. | 4.050% | 3/15/42 | 620 | 694 |
| Southern California Edison Co. | 3.900% | 3/15/43 | 225 | 248 |
| Southern California Edison Co. | 4.650% | 10/1/43 | 756 | 931 |
| Southern California Edison Co. | 3.600% | 2/1/45 | 535 | 567 |
| Southern Co. | 4.250% | 7/1/36 | 1,496 | 1,606 |
| Southern Co. | 4.400% | 7/1/46 | 2,200 | 2,434 |
| Southern Power Co. | 5.150% | 9/15/41 | 520 | 574 |
| Southern Power Co. | 5.250% | 7/15/43 | 620 | 692 |
| Southwestern Electric Power Co. | 6.200% | 3/15/40 | 375 | 481 |
| Southwestern Electric Power Co. | 3.900% | 4/1/45 | 500 | 508 |
| Southwestern Public Service Co. | 4.500% | 8/15/41 | 520 | 610 |
| Southwestern Public Service Co. | 3.400% | 8/15/46 | 500 | 507 |
| Tampa Electric Co. | 6.550% | 5/15/36 | 350 | 487 |
| Tampa Electric Co. | 6.150% | 5/15/37 | 265 | 360 |
| Tampa Electric Co. | 4.100% | 6/15/42 | 580 | 627 |
| Tampa Electric Co. | 4.350% | 5/15/44 | 340 | 383 |
| Tampa Electric Co. | 4.200% | 5/15/45 | 120 | 132 |
| Toledo Edison Co. | 6.150% | 5/15/37 | 310 | 388 |
| TransAlta Corp. | 6.500% | 3/15/40 | 351 | 321 |
| Tri-State Generation & Transmission Assn. Inc. | 4.700% | 11/1/44 | 270 | 306 |
| Tri-State Generation & Transmission Assn. Inc. | 4.250% | 6/1/46 | 275 | 298 |
| Union Electric Co. | 5.300% | 8/1/37 | 385 | 485 |
| Union Electric Co. | 8.450% | 3/15/39 | 560 | 954 |
| Union Electric Co. | 3.900% | 9/15/42 | 280 | 306 |
| Union Electric Co. | 3.650% | 4/15/45 | 615 | 651 |
| Virginia Electric & Power Co. | 6.000% | 1/15/36 | 760 | 1,020 |
| Virginia Electric & Power Co. | 6.000% | 5/15/37 | 1,053 | 1,425 |
| Virginia Electric & Power Co. | 6.350% | 11/30/37 | 727 | 1,018 |
| Virginia Electric & Power Co. | 8.875% | 11/15/38 | 655 | 1,127 |
| Virginia Electric & Power Co. | 4.000% | 1/15/43 | 635 | 696 |
| Virginia Electric & Power Co. | 4.650% | 8/15/43 | 615 | 739 |
| Virginia Electric & Power Co. | 4.450% | 2/15/44 | 870 | 1,018 |
| Virginia Electric & Power Co. | 4.200% | 5/15/45 | 290 | 332 |
| Westar Energy Inc. | 4.125% | 3/1/42 | 635 | 706 |
| Westar Energy Inc. | 4.100% | 4/1/43 | 513 | 570 |
| Westar Energy Inc. | 4.625% | 9/1/43 | 540 | 642 |
| Westar Energy Inc. | 4.250% | 12/1/45 | 125 | 142 |
91
| Vanguard® Long-Term Corporate Bond Index Fund | ||||
| Schedule of Investments | ||||
| August 31, 2016 | ||||
| Face | Market | |||
| Maturity | Amount | Value | ||
| Coupon | Date | ($000) | ($000) | |
| Wisconsin Electric Power Co. | 5.625% | 5/15/33 | 335 | 430 |
| Wisconsin Electric Power Co. | 5.700% | 12/1/36 | 390 | 515 |
| Wisconsin Electric Power Co. | 3.650% | 12/15/42 | 200 | 213 |
| Wisconsin Electric Power Co. | 4.250% | 6/1/44 | 270 | 312 |
| Wisconsin Electric Power Co. | 4.300% | 12/15/45 | 575 | 668 |
| Wisconsin Power & Light Co. | 6.375% | 8/15/37 | 484 | 687 |
| Wisconsin Power & Light Co. | 4.100% | 10/15/44 | 500 | 561 |
| Wisconsin Public Service Corp. | 3.671% | 12/1/42 | 295 | 312 |
| Wisconsin Public Service Corp. | 4.752% | 11/1/44 | 470 | 582 |
| Xcel Energy Inc. | 6.500% | 7/1/36 | 480 | 663 |
| Xcel Energy Inc. | 4.800% | 9/15/41 | 265 | 318 |
| Natural Gas (0.8%) | ||||
| Atmos Energy Corp. | 5.500% | 6/15/41 | 650 | 836 |
| Atmos Energy Corp. | 4.150% | 1/15/43 | 455 | 500 |
| Atmos Energy Corp. | 4.125% | 10/15/44 | 775 | 861 |
| CenterPoint Energy Resources Corp. | 6.625% | 11/1/37 | 355 | 441 |
| CenterPoint Energy Resources Corp. | 5.850% | 1/15/41 | 389 | 473 |
| KeySpan Corp. | 8.000% | 11/15/30 | 230 | 326 |
| KeySpan Corp. | 5.803% | 4/1/35 | 406 | 502 |
| NiSource Finance Corp. | 6.250% | 12/15/40 | 755 | 994 |
| NiSource Finance Corp. | 5.950% | 6/15/41 | 800 | 1,033 |
| NiSource Finance Corp. | 5.800% | 2/1/42 | 415 | 535 |
| NiSource Finance Corp. | 5.250% | 2/15/43 | 620 | 757 |
| NiSource Finance Corp. | 4.800% | 2/15/44 | 590 | 682 |
| ONE Gas Inc. | 4.658% | 2/1/44 | 728 | 853 |
| Piedmont Natural Gas Co. Inc. | 4.100% | 9/18/34 | 370 | 395 |
| Piedmont Natural Gas Co. Inc. | 4.650% | 8/1/43 | 325 | 378 |
| Piedmont Natural Gas Co. Inc. | 3.640% | 11/1/46 | 275 | 278 |
| Sempra Energy | 6.000% | 10/15/39 | 800 | 1,041 |
| Southern California Gas Co. | 5.750% | 11/15/35 | 400 | 534 |
| Southern California Gas Co. | 5.125% | 11/15/40 | 625 | 802 |
| Southern California Gas Co. | 3.750% | 9/15/42 | 325 | 351 |
| Southern Co. Gas Capital Corp. | 6.000% | 10/1/34 | 215 | 267 |
| Southern Co. Gas Capital Corp. | 5.875% | 3/15/41 | 784 | 992 |
| Southern Co. Gas Capital Corp. | 4.400% | 6/1/43 | 685 | 734 |
| Southwest Gas Corp. | 4.875% | 10/1/43 | 300 | 354 |
| Spire Inc. | 4.700% | 8/15/44 | 375 | 409 |
| Other Utility (0.2%) | ||||
| American Water Capital Corp. | 6.593% | 10/15/37 | 905 | 1,324 |
| American Water Capital Corp. | 4.300% | 12/1/42 | 475 | 550 |
| American Water Capital Corp. | 4.300% | 9/1/45 | 375 | 439 |
| United Utilities plc | 6.875% | 8/15/28 | 645 | 754 |
| Veolia Environnement SA | 6.750% | 6/1/38 | 400 | 533 |
| 255,169 | ||||
| Total Corporate Bonds (Cost $1,794,510) | 1,935,794 | |||
| Taxable Municipal Bonds (0.2%) | ||||
| George Washington University District of Columbia GO | 4.300% | 9/15/44 | 750 | 845 |
| George Washington University District of Columbia GO | 4.868% | 9/15/45 | 40 | 48 |
| New York University Hospitals Center GO | 4.428% | 7/1/42 | 350 | 383 |
| New York University Hospitals Center Revenue | 5.750% | 7/1/43 | 345 | 459 |
| President & Fellows of Harvard College Massachusetts | ||||
| GO | 4.875% | 10/15/40 | 268 | 354 |
| Princeton University New Jersey GO | 5.700% | 3/1/39 | 560 | 821 |
| Stanford University California GO | 3.460% | 5/1/47 | 315 | 360 |
| Tufts University Massachusetts GO | 5.017% | 4/15/12 | 325 | 401 |
| University of Southern California GO | 5.250% | 10/1/11 | 365 | 495 |
| Total Taxable Municipal Bonds (Cost $3,648) | 4,166 | |||
92
| Vanguard® Long-Term Corporate Bond Index Fund | |||
| Schedule of Investments | |||
| August 31, 2016 | |||
| Market | |||
| Value | |||
| Coupon | Shares | ($000) | |
| Temporary Cash Investment (0.5%) | |||
| Money Market Fund (0.5%) | |||
| 4 Vanguard Market Liquidity Fund (Cost | |||
| $9,174) | 0.612% | 91,734 | 9,174 |
| Total Investments (99.1%) (Cost $1,808,301) | 1,950,102 | ||
| Other Assets and Liabilities—Net (0.9%) | 17,895 | ||
| Net Assets (100%) | 1,967,997 | ||
| 1 | Securities with a value of $99,000 and cash of $179,000 have been segregated as initial margin for open futures contracts. |
| 2 | Security exempt from registration under Rule 144A of the Securities Act of 1933. Such securities may be sold in transactions exempt from registration, normally to qualified institutional buyers. At August 31, 2016, the aggregate value of these securities was $32,271,000, representing 1.6% of net assets. |
| 3 | The average or expected maturity is shorter than the final maturity shown because of the possibility of interim principal payments and prepayments or the possibility of the issue being called. |
| 4 | Affiliated money market fund available only to Vanguard funds and certain trusts and accounts managed by Vanguard. Rate shown is the 7-day yield. |
| GO—General Obligation Bond. |
93
© 2016 The Vanguard Group, Inc. All rights reserved.
Vanguard Marketing Corporation, Distributor.
SNA16420_102016
Report of Independent Registered Public Accounting Firm
To the Board of Trustees of Vanguard Scottsdale Funds and the Shareholders of Vanguard Short-Term Corporate Bond Index Fund, Vanguard Intermediate-Term Corporate Bond Index Fund and Vanguard Long-Term Corporate Bond Index Fund:
In our opinion, the accompanying statements of net assets – investments summary and the related statements of operations and of changes in net assets and the financial highlights (included in Item 1 of this Form N-CSR) and the schedules of investments (included in Item 6 of this Form N-CSR) present fairly, in all material respects, the financial position of Vanguard Short-Term Corporate Bond Index Fund, Vanguard Intermediate-Term Corporate Bond Index Fund and Vanguard Long-Term Corporate Bond Index Fund (constituting separate portfolios of Vanguard Scottsdale Funds, hereafter referred to as the
“Funds”) at August 31, 2016, the results of each of their operations for the year then ended, the changes in each of their net assets for each of the two years in the period then ended, and the financial highlights for each of the five years in the period then ended, in conformity with accounting principles generally accepted in the United States of America. These financial statements, financial highlights and schedules of investments (hereafter referred to as "financial statements") are the responsibility of the Funds’ management. Our responsibility is to express an opinion on these financial statements based on our audits. We conducted our audits of these financial statements in accordance with the standards of the Public Company Accounting Oversight Board (United States). Those standards require that we plan and perform the audit to obtain reasonable assurance about whether the financial statements are free of material misstatement. An audit includes examining, on a test basis, evidence supporting the amounts and disclosures in the financial statements, assessing the accounting principles used and significant estimates made by management, and evaluating the overall financial statement presentation. We believe that our audits, which included confirmation of securities at August 31, 2016 by correspondence with the custodian and brokers and by agreement to the underlying ownership records of the transfer agent, provide a reasonable basis for our opinion.

October 18, 2016
PricewaterhouseCoopers LLP, Two Commerce Square, 2001 Market Street, Suite 1800, Philadelphia, PA 19103-7042
T: (267) 330-3000, F: (267) 330-3300, www.pwc.com/us
Item 7: Disclosure of Proxy Voting Policies and Procedures for Closed-End Management Investment Companies.
Not Applicable.
Item 8: Portfolio Managers of Closed-End Management Investment Companies.
Not Applicable.
Item 9: Purchase of Equity Securities by Closed-End Management Investment Company and Affiliated Purchasers.
Not Applicable.
Item 10: Submission of Matters to a Vote of Security Holders.
Not Applicable.
Item 11: Controls and Procedures.
(a) Disclosure Controls and Procedures. The Principal Executive and Financial Officers concluded that the Registrant’s Disclosure Controls and Procedures are effective based on their evaluation of the Disclosure Controls and Procedures as of a date within 90 days of the filing date of this report.
(b) Internal Control Over Financial Reporting. There were no significant changes in Registrant’s Internal Control Over Financial Reporting or in other factors that could significantly affect this control subsequent to the date of the evaluation, including any corrective actions with regard to significant deficiencies and material weaknesses.
Item 12: Exhibits.
(a) Code of Ethics.
(b) Certifications.
Pursuant to the requirements of the Securities Exchange Act of 1934 and the Investment Company Act of 1940, the registrant has duly caused this report to be signed on its behalf by the undersigned, thereunto duly authorized.
| VANGUARD SCOTTSDALE FUNDS | |
| By: | /s/ F. WILLIAM MCNABB III* |
| F. WILLIAM MCNABB III | |
| CHIEF EXECUTIVE OFFICER | |
| Date: October 17, 2016 | |
Pursuant to the requirements of the Securities Exchange Act of 1934 and the Investment Company Act of 1940, this report has been signed below by the following persons on behalf of the registrant and in the capacities and on the dates indicated.
| VANGUARD SCOTTSDALE FUNDS | |
| By: | /s/ F. WILLIAM MCNABB III* |
| F. WILLIAM MCNABB III | |
| CHIEF EXECUTIVE OFFICER | |
| Date: October 17, 2016 | |
| VANGUARD SCOTTSDALE FUNDS | |
| By: | /s/ THOMAS J. HIGGINS* |
| THOMAS J. HIGGINS | |
| CHIEF FINANCIAL OFFICER | |
| Date: October 17, 2016 | |
* By: /s/ Anne E. Robinson
Anne E. Robinson, pursuant to a Power of Attorney filed on October 4, 2016 see file Number 33-32548, Incorporated by Reference.