UNITED STATES
SECURITIES AND EXCHANGE COMMISSION
Washington, D.C. 20549
FORM N-CSR
CERTIFIED SHAREHOLDER REPORT
OF
REGISTERED MANAGEMENT INVESTMENT COMPANIES
Investment Company Act file number: 811-7803
Name of Registrant: Vanguard Scottsdale Funds
Address of Registrant:
P.O. Box 2600
Valley Forge, PA 19482
Name and address of agent for service:
Heidi Stam, Esquire
P.O. Box 876
Valley Forge, PA 19482
Registrant’s telephone number, including area code: (610) 669-1000
Date of fiscal year end: August 31
Date of reporting period: September 1, 2010 – August 31, 2011
Item 1: Reports to Shareholders
| Annual Report | August 31, 2011 |
| Vanguard Sector Bond Index Funds |
| Vanguard Short-Term Government Bond Index Fund |
| Vanguard Intermediate-Term Government Bond Index Fund |
| Vanguard Long-Term Government Bond Index Fund |
| Vanguard Short-Term Corporate Bond Index Fund |
| Vanguard Intermediate-Term Corporate Bond Index Fund |
| Vanguard Long-Term Corporate Bond Index Fund |
| Vanguard Mortgage-Backed Securities Index Fund |
> For the 12 months ended August 31, 2011, Vanguard’s Sector Bond Index Funds produced solid returns in a period marked by pronounced ups and downs.
> Vanguard Intermediate-Term Corporate Bond Index Fund delivered the highest return of the group; Vanguard Short-Term Government Bond Index Fund delivered the lowest.
> In general, bond yields finished the period below their yields at the start.
| Contents | |
| Your Fund’s Total Returns. | 1 |
| Chairman’s Letter. | 4 |
| Short-Term Government Bond Index Fund. | 10 |
| Intermediate-Term Government Bond Index Fund. | 26 |
| Long-Term Government Bond Index Fund. | 42 |
| Short-Term Corporate Bond Index Fund. | 57 |
| Intermediate-Term Corporate Bond Index Fund. | 87 |
| Long-Term Corporate Bond Index Fund. | 116 |
| Mortgage-Backed Securities Index Fund. | 141 |
| About Your Fund’s Expenses. | 159 |
| Trustees Approve Advisory Arrangement. | 162 |
| Glossary. | 163 |
Please note: The opinions expressed in this report are just that—informed opinions. They should not be considered promises or advice.
Also, please keep in mind that the information and opinions cover the period through the date on the front of this report. Of course, the risks of investing in your fund are spelled out in the prospectus.
See the Glossary for definitions of investment terms used in this report.
About the cover: Vanguard was named for the HMS Vanguard, flagship of British Admiral Horatio Nelson. A ship—whose performance and safety depend on the work of all hands—has served as a fitting metaphor for the Vanguard crew as we strive to help clients reach their financial goals.
Your Fund’s Total Returns
| Fiscal Year Ended August 31, 2011 | ||||
| 30-Day SEC | Income | Capital | Total | |
| Yields | Returns | Returns | Returns | |
| Vanguard Short-Term Government Bond Index Fund | ||||
| Signal® Shares | 0.18% | 0.67% | 0.73% | 1.40% |
| Institutional Shares | 0.18 | 0.72 | 0.71 | 1.43 |
| ETF Shares | 0.17 | |||
| Market Price | 1.35 | |||
| Net Asset Value | 1.39 | |||
| Barclays Capital U.S. 1–3 Year Government Float | ||||
| Adjusted Index | 1.53 | |||
| Short U.S. Government Funds Average | 1.35 | |||
| Short U.S. Government Funds Average: Derived from data provided by Lipper Inc. | ||||
| Vanguard Intermediate-Term Government Bond Index Fund | ||||
| Signal® Shares | 1.11% | 2.18% | 3.13% | 5.31% |
| Institutional Shares | 1.12 | 2.22 | 3.14 | 5.36 |
| ETF Shares | 1.11 | |||
| Market Price | 5.41 | |||
| Net Asset Value | 5.30 | |||
| Barclays Capital U.S. 3–10 Year Government Float | ||||
| Adjusted Index | 5.53 | |||
| Intermediate U.S. Government Funds Average | 3.53 | |||
| Intermediate U.S. Government Funds Average: Derived from data provided by Lipper Inc. | ||||
| Vanguard Long-Term Government Bond Index Fund | ||||
| Signal® Shares | 3.24% | 3.85% | 0.81% | 4.66% |
| Institutional Shares | 3.24 | 3.90 | 0.77 | 4.67 |
| ETF Shares | 3.26 | |||
| Market Price | 4.61 | |||
| Net Asset Value | 4.63 | |||
| Barclays Capital U.S. Long Government Float | ||||
| Adjusted Index | 5.11 | |||
| General U.S. Government Funds Average | 3.06 | |||
| General U.S. Government Funds Average: Derived from data provided by Lipper Inc. | ||||
Signal Shares and Institutional Shares are available to certain institutional investors who meet specific administrative, service, and account-size criteria. The Vanguard ETF® Shares shown are traded on the Nasdaq exchange and are available only through brokers. The table provides ETF returns based on both the Nasdaq market price and the net asset value for a share. U.S. Pat. No. 6,879,964 B2; 7,337,138; 7,720,749; 7,925,573.
1
Your Fund’s Total Returns
| Fiscal Year Ended August 31, 2011 | ||||
| 30-Day SEC | Income | Capital | Total | |
| Yields | Returns | Returns | Returns | |
| Vanguard Short-Term Corporate Bond Index Fund | ||||
| Signal® Shares (Inception: 11/18/2010) | 1.92% | 1.96% | 0.32% | 2.28% |
| Institutional Shares | 1.95 | 2.42 | 0.59 | 3.01 |
| ETF Shares | 1.93 | |||
| Market Price | 3.31 | |||
| Net Asset Value | 2.94 | |||
| Barclays Capital U.S. 1–5 Year Corporate Bond | ||||
| Index | 3.45 | |||
| Short-Intermediate Investment-Grade Debt Funds | ||||
| Average | 2.99 | |||
| Short-Intermediate Investment-Grade Debt Funds Average: Derived from data provided by Lipper Inc. | ||||
| Vanguard Intermediate-Term Corporate Bond Index Fund | ||||
| Signal® Shares | 3.66% | 4.19% | 1.46% | 5.65% |
| Institutional Shares | 3.68 | 4.25 | 1.45 | 5.70 |
| ETF Shares | 3.67 | |||
| Market Price | 6.25 | |||
| Net Asset Value | 5.65 | |||
| Barclays Capital U.S. 5–10 Year Corporate Bond | ||||
| Index | 6.19 | |||
| Intermediate Investment-Grade Debt Funds | ||||
| Average | 4.19 | |||
| Intermediate Investment-Grade Debt Funds Average: Derived from data provided by Lipper Inc. | ||||
Signal Shares and Institutional Shares are available to certain institutional investors who meet specific administrative, service, and account-size criteria. The Vanguard ETF® Shares shown are traded on the Nasdaq exchange and are available only through brokers. The table provides ETF returns based on both the Nasdaq market price and the net asset value for a share. U.S. Pat. No. 6,879,964 B2; 7,337,138; 7,720,749; 7,925,573.
2
Your Fund’s Total Returns
| Fiscal Year Ended August 31, 2011 | ||||
| 30-Day SEC | Income | Capital | Total | |
| Yields | Returns | Returns | Returns | |
| Vanguard Long-Term Corporate Bond Index Fund | ||||
| Signal® Shares | 5.25% | 5.31% | -1.10% | 4.21% |
| Institutional Shares | 5.26 | 5.37 | -1.12 | 4.25 |
| ETF Shares | 5.23 | |||
| Market Price | 4.42 | |||
| Net Asset Value | 4.19 | |||
| Barclays Capital U.S. 10+ Year Corporate Bond | ||||
| Index | 5.18 | |||
| Corporate A-Rated Debt Funds Average | 4.27 | |||
| Corporate A-Rated Debt Funds Average: Derived from data provided by Lipper Inc. | ||||
| Vanguard Mortgage-Backed Securities Index Fund | ||||
| Signal® Shares | 2.81% | 2.33% | 2.83% | 5.16% |
| ETF Shares | 2.81 | |||
| Market Price | 5.02 | |||
| Net Asset Value | 5.14 | |||
| Barclays Capital U.S. MBS Float Adjusted Index | 5.11 | |||
| U.S. Mortgage Funds Average | 5.05 | |||
| U.S. Mortgage Funds Average: Derived from data provided by Lipper Inc. | ||||
Signal Shares and Institutional Shares are available to certain institutional investors who meet specific administrative, service, and account-size criteria. The Vanguard ETF® Shares shown are traded on the Nasdaq exchange and are available only through brokers. The table provides ETF returns based on both the Nasdaq market price and the net asset value for a share. U.S. Pat. No. 6,879,964 B2; 7,337,138; 7,720,749; 7,925,573.
For the ETF Shares, the market price is determined by the midpoint of the bid-offer spread as of the closing time of the New York Stock Exchange (generally 4 p.m., Eastern time). The net asset value is also determined as of the NYSE closing time. For more information about how the ETF Shares' market prices have compared with their net asset value, visit vanguard.com, select your ETF, and then select the Price and Performance tab. The ETF premium/discount analysis there shows the percentages of days on which the ETF Shares' market price was above or below the NAV.
3

Chairman’s Letter
Dear Shareholder,
The Vanguard Sector Bond Index Funds captured the returns of their respective market segments during a period marked by swift and dramatic changes in investor sentiment and prevailing interest rates. For the full 12 months, returns ranged from 1.39% for Vanguard Short-Term Government Bond Index Fund’s ETF Shares (as calculated by changes in net asset value, adjusted for distributions) to 5.70% for the Institutional Shares of Vanguard Intermediate-Term Corporate Bond Index Fund.
The 30-day SEC yields of the short- and intermediate-term funds declined over the period; the yields of the mortgage-backed securities fund and the two long-term funds were unchanged or slightly higher.
The Vanguard Short- and Long-Term Corporate Bond Index Funds finished the period a step behind the average returns of their peer groups; the rest of the sector bond index funds outperformed their peer-group averages.
As expected, there were differences between fund and index returns that can be attributed to the real impact of operating and transaction costs and to the funds’ sampling strategy. (It’s impractical to own every single security in the indexes; instead, we use a sophisticated sampling method-ology to capture the indexes’ investment characteristics.) We expect these gaps to moderate, though not necessarily disappear, as the funds’ asset bases increase. The gaps also reflect differences in the bond-pricing models used by the
4
index provider and Vanguard. These gaps generally disappear in the normal course of bond market trading.
Solid 12-month returns in a tale of two markets
Even as yields hovered near generational lows, the U.S. bond market produced solid returns in a fiscal year marked by distinct periods of weakness and strength.
In the first half of the year, yields rose (and prices declined) as the prospect of improved economic growth and inflationary pressures set the market’s tone. In the second half, risk aversion was on the rise. Investors bid up Treasuries, trimming the yield of the 10-year Treasury note to barely 2%.
The rush into investment-grade bonds (Treasuries, in particular) boosted near-term returns, even as declining yields implied more modest results on subsequent bond purchases. For the full year, the taxable investment-grade U.S. bond market returned 4.62%; the broad municipal bond market returned 2.66%.
The yields of money market instruments remained near zero, consistent with the Federal Reserve’s target for short-term interest rates. Toward the end of the period, the Fed indicated that it expected to maintain this exceptionally low target at least through mid-2013.
| Market Barometer | |||
| Average Annual Total Returns | |||
| Periods Ended August 31, 2011 | |||
| One | Three | Five | |
| Year | Years | Years | |
| Bonds | |||
| Barclays Capital U.S. Aggregate Bond Index (Broad | |||
| taxable market) | 4.62% | 7.23% | 6.56% |
| Barclays Capital Municipal Bond Index (Broad tax-exempt | |||
| market) | 2.66 | 6.00 | 4.94 |
| Citigroup Three-Month U.S. Treasury Bill Index | 0.12 | 0.24 | 1.69 |
| Stocks | |||
| Russell 1000 Index (Large-caps) | 19.06% | 0.84% | 1.11% |
| Russell 2000 Index (Small-caps) | 22.19 | 0.83 | 1.53 |
| Dow Jones U.S. Total Stock Market Index | 19.16 | 1.18 | 1.52 |
| MSCI All Country World Index ex USA (International) | 10.34 | -0.97 | 0.79 |
| CPI | |||
| Consumer Price Index | 3.77% | 1.12% | 2.13% |
5
A stock market rally followed by a partial retreat
The bond market’s midyear pivot was mirrored in the stock market. During the first six months, stock prices surged, with the broad U.S. stock market returning about 29%. As the slow, grinding economic recovery seemed to gather momentum, energy and industrial stocks, which are keenly sensitive to the rhythms of the business cycle, produced the best returns.
In the second six months, growth decelerated and stock market volatility spiked, amplified by Europe’s sovereign-debt drama, political wrangling over the U.S. debt ceiling, and Standard & Poor’s decision to downgrade the U.S. credit rating. (Vanguard’s confidence in the “full faith and credit” of the U.S. government remains unshaken.) Stock prices retreated, and those sectors that led the market in the first half lost ground in the second, displaced by defensive sectors such as utilities and consumer staples.
Same dynamics, different degrees of response
The performance of both investment- grade corporate and government bonds responded to similar dynamics in the 12 months ended August 31. In part because
Expense Ratios
Your Fund Compared With Its Peer Group
| Signal | Institutional | ETF | Peer Group | |
| Shares | Shares | Shares | Average | |
| Short-Term Government Bond Index Fund | 0.15% | 0.09% | 0.15% | 0.86% |
| Intermediate-Term Government Bond Index | ||||
| Fund | 0.15 | 0.09 | 0.15 | 0.93 |
| Long-Term Government Bond Index Fund | 0.15 | 0.09 | 0.15 | 1.14 |
| Short-Term Corporate Bond Index Fund | 0.15 | 0.09 | 0.15 | 0.87 |
| Intermediate-Term Corporate Bond Index | ||||
| Fund | 0.15 | 0.09 | 0.15 | 0.91 |
| Long-Term Corporate Bond Index Fund | 0.15 | 0.09 | 0.15 | 1.05 |
| Mortgage-Backed Securities Index Fund | 0.15 | — | 0.15 | 0.92 |
The fund expense ratios shown are from the prospectus dated December 28, 2010, and represent estimated costs for the current fiscal year. For the fiscal year ended August 31, 2011, the funds’ expense ratios were: for the Short-Term Government Bond Index Fund, 0.14% for Signal Shares, 0.09% for Institutional Shares, and 0.14% for ETF Shares; for the Intermediate-Term Government Bond Index Fund, 0.13% for Signal Shares, 0.09% for Institutional Shares, and 0.14% for ETF Shares; for the Long-Term Government Bond Index Fund, 0.14% for Signal Shares, 0.09% for Institutional Shares, and 0.14% for ETF Shares; for the Short-Term Corporate Bond Index Fund, 0.09% for Institutional Shares, and 0.14% for ETF Shares; for the Intermediate-Term Corporate Bond Index Fund, 0.14% for Signal Shares, 0.09% for Institutional Shares, and 0.14% for ETF Shares; for the Long-Term Corporate Bond Index Fund, 0.14% for Signal Shares, 0.09% for Institutional Shares, and 0.14% for ETF Shares; and for the Mortgage-Backed Securities Index Fund, 0.15% for Signal Shares and 0.15% for ETF Shares. For the Short-Term Corporate Bond Index Fund Signal Shares, the annualized expense ratio from inception on November 18, 2010, through August 31, 2011, was 0.14%. Peer-group expense ratios are derived from data provided by Lipper Inc. and capture information through year-end 2010.
Peer groups: For the Short-Term Government Bond Index Fund, Short U.S. Government Funds; for the Intermediate-Term Government Bond Index Fund, Intermediate U.S. Government Funds; for the Long-Term Government Bond Index Fund, General U.S. Government Funds; for the Short-Term Corporate Bond Index Fund, Short-Intermediate Investment-Grade Debt Funds; for the Intermediate-Term Corporate Bond Index Fund, Intermediate Investment-Grade Debt Funds; for the Long-Term Corporate Bond Index Fund, Corporate A-Rated Debt Funds; for the Mortgage-Backed Securities Index Fund, U.S. Mortgage Funds.
6
of their greater liquidity, which makes them a better barometer of fast-changing investor sentiment, government bonds responded to these dynamics in a more dramatic fashion.
In the first half of the fiscal year, as economic reports and the surprising strength of corporate earnings encouraged investors to seek opportunities beyond the relatively scant yields on longer-term investment-grade bonds, Vanguard Long-Term Corporate Bond Index Fund returned about –3%; the long-term government fund returned about –10%. Vanguard Intermediate-Term Government Bond Index Fund, also produced a negative return. The other intermediate- and short-term funds held up better as interest income offset negative price returns.
In the second half of the year, gathering economic gloom cast a shadow on the stock market and other riskier assets. Investors sought safety in investment-grade bonds. Vanguard Long-Term Government Bond Index Fund returned more than 16% for the six-month period; its corporate counterpart returned almost 8%. The shorter-maturity funds also registered strong returns as investors bid up prices.
Over the full 12 months, the funds’ weak start and strong finish added up to modestly positive returns at the short end of the yield curve, respectable 5%-plus returns for the intermediate-term government and corporate bond funds, and 4%-plus returns at the long end. Vanguard Mortgage-Backed Securities Index Fund
| Yields of U.S. Treasury Securities | ||
| August 31, | August 31, | |
| Maturity | 2010 | 2011 |
| 2 years | 0.48% | 0.19% |
| 3 years | 0.70 | 0.32 |
| 5 years | 1.34 | 0.95 |
| 10 years | 2.48 | 2.22 |
| 30 years | 3.53 | 3.59 |
| Source: Vanguard. | ||
7
kept pace with Vanguard Intermediate-Term Government Bond Index Fund, a surprising result in a period of declining rates.
When mortgage rates tumble, as they did over the fiscal year, the returns of mortgage-backed securities can be restrained as homeowners refinance into lower-cost, and thus lower-returning, mortgages. As the economy and the housing market struggled and mortgage lending standards tightened, however, homeowners have been less able to take advantage of lower mortgage rates, reducing the securities’ prepayment risk.
A balanced response to unnerving shocks
Since their introduction almost two years ago, the Vanguard Sector Bond Index Funds have provided exposure to narrow segments of the investment-grade U.S. bond market, allowing investors to round out incomplete portfolios or execute strategies tailored to a unique goal. Like Vanguard’s more broadly diversified index funds, the Sector Bond Index Funds benefit from the Fixed Income Group’s pioneering work in index fund management and from the funds’ low costs.
Over the past year, these timeless benefits have been eclipsed by disappointing economic reports, policymaking strife, and investors’ swift reactions in the stock and bond markets. As always, the most effective preparation for these shocks is to maintain a diversified portfolio balanced between riskier assets such as stock funds and risk-reducing assets such as bond and money market funds. An investment mix consistent with your goals and risk tolerance can help reinforce your resolve to stick with a sensible plan through good times and bad.
Thank you for entrusting your assets to Vanguard.
Sincerely,

F. William McNabb III
Chairman and Chief Executive Officer
September 14, 2011
8
Your Fund’s Performance at a Glance
August 31, 2010 , Through August 31, 2011
| Distributions Per Share | ||||
| Starting | Ending | Income | Capital | |
| Share Price | Share Price | Dividends | Gains | |
| Vanguard Short-Term Government Bond Index | ||||
| Fund | ||||
| Signal Shares | $20.25 | $20.39 | $0.135 | $0.008 |
| Institutional Shares | 25.45 | 25.62 | 0.183 | 0.010 |
| ETF Shares | 60.70 | 61.11 | 0.405 | 0.024 |
| Vanguard Intermediate-Term Government | ||||
| Bond Index Fund | ||||
| Signal Shares | $21.49 | $21.94 | $0.441 | $0.208 |
| Institutional Shares | 26.65 | 27.21 | 0.558 | 0.258 |
| ETF Shares | 63.58 | 64.91 | 1.304 | 0.616 |
| Vanguard Long-Term Government Bond Index | ||||
| Fund | ||||
| Signal Shares | $22.75 | $22.91 | $0.781 | $0.021 |
| Institutional Shares | 28.87 | 29.06 | 1.004 | 0.027 |
| ETF Shares | 67.61 | 68.07 | 2.324 | 0.063 |
| Vanguard Short-Term Corporate Bond Index | ||||
| Fund | ||||
| Signal Shares (Inception: 11/18/2010) | $21.21 | $21.26 | $0.410 | $0.018 |
| Institutional Shares | 25.90 | 26.03 | 0.618 | 0.022 |
| ETF Shares | 77.68 | 78.06 | 1.813 | 0.065 |
| Vanguard Intermediate-Term Corporate Bond | ||||
| Index Fund | ||||
| Signal Shares | $21.76 | $21.98 | $0.875 | $0.093 |
| Institutional Shares | 26.90 | 27.17 | 1.097 | 0.114 |
| ETF Shares | 80.67 | 81.49 | 3.248 | 0.343 |
| Vanguard Long-Term Corporate Bond Index | ||||
| Fund | ||||
| Signal Shares | $22.00 | $21.69 | $1.100 | $0.064 |
| Institutional Shares | 27.32 | 26.93 | 1.379 | 0.080 |
| ETF Shares | 81.96 | 80.80 | 4.095 | 0.239 |
| Vanguard Mortgage-Backed Securities Index | ||||
| Fund | ||||
| Signal Shares | $20.52 | $20.76 | $0.456 | $0.329 |
| ETF Shares | 51.31 | 51.90 | 1.142 | 0.822 |
9
Short-Term Government Bond Index Fund
Fund Profile
As of August 31, 2011
| Share-Class Characteristics | |||
| Signal | Institutional | ETF | |
| Shares | Shares | Shares | |
| Ticker Symbol | VSBSX | VSBIX | VGSH |
| Expense Ratio1 | 0.15% | 0.09% | 0.15% |
| 30-Day SEC Yield | 0.18% | 0.18% | 0.17% |
| Financial Attributes | |||
| Barclays | |||
| 1–3 Year | |||
| Gov’t | Barclays | ||
| Float Adj | Aggregate | ||
| Fund | Index | FA Index | |
| Number of Bonds | 127 | 420 | 7,873 |
| Yield to Maturity | |||
| (before expenses) | 0.2% | 0.3% | 2.3% |
| Average Coupon | 1.7% | 1.8% | 4.1% |
| Average Duration | 1.8 years | 1.8 years | 5.1 years |
| Average Effective | |||
| Maturity | 1.9 years | 1.9 years | 7.3 years |
| Short-Term | |||
| Reserves | 0.8% | — | — |
| Sector Diversification (% of portfolio) | |||
| Treasury/Agency | 100.0% | ||
The agency and mortgage-backed securities sectors may include issues from government-sponsored enterprises; such issues are not backed by the full faith and credit of the U.S. government.
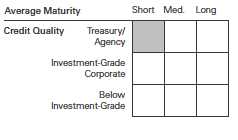
| Distribution by Maturity (% of portfolio) | |
| Under 1 Year | 3.9% |
| 1 - 3 Years | 95.9 |
| 3 - 5 Years | 0.2 |
| Distribution by Credit Quality (% of portfolio) | |
| U.S. Government | 100.0% |
| For information about these ratings, see the Glossary entry for Credit Quality. | |
Investment Focus
1 The expense ratios shown are from the prospectus dated December 28, 2010, and represent estimated costs for the current fiscal year. For the fiscal year ended August 31, 2011, the expense ratios were 0.14% for Signal Shares, 0.09% for Institutional Shares, and 0.14% for ETF Shares.
10
Short-Term Government Bond Index Fund
Performance Summary
All of the returns in this report represent past performance, which is not a guarantee of future results that may be achieved by the fund. (Current performance may be lower or higher than the performance data cited. For performance data current to the most recent month-end, visit our website at vanguard.com/performance.) Note, too, that both investment returns and principal value can fluctuate widely, so an investor’s shares, when sold, could be worth more or less than their original cost. The returns shown do not reflect taxes that a shareholder would pay on fund distributions or on the sale of fund shares.
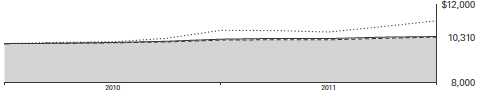
Cumulative Performance: November 19, 2009, Through August 31, 2011
Initial Investment of $10,000
| Average Annual Total Returns | |||
| Periods Ended August 31, 2011 | |||
| Since | Final Value | ||
| One | Inception | of a $10,000 | |
| Year | (11/19/2009) | Investment | |
| Short-Term Government Bond Index | |||
| Fund ETF Shares Net Asset Value | 1.39% | 1.73% | $10,310 |
| Short-Term Government Bond Index | |||
| Fund ETF Shares Market Price | 1.35 | 1.77 | 10,317 |
| Spliced Barclays Capital U.S. | |||
| Aggregate Float Adjusted Index | 4.62 | 6.49 | 11,184 |
| Barclays Capital U.S. 1–3 Year | |||
| Government Float Adjusted Index | 1.53 | 1.88 | 10,338 |
| Short U.S. Government Funds Average | 1.35 | 2.05 | 10,369 |
"Since Inception" performance is calculated from the ETF Shares’ inception date for both the fund and its comparative standards.
Spliced Barclays Capital U.S. Aggregate Float Adjusted Index: Barclays Capital U.S. Aggregate Bond Index through December 31, 2009; Barclays Capital U.S. Aggregate Float Adjusted Index thereafter.
Short U.S. Government Funds Average: Derived from data provided by Lipper Inc.
See Financial Highlights for dividend and capital gains information.
11
Short-Term Government Bond Index Fund
| Average Annual Total Returns | |||
| Periods Ended August 31, 2011 | |||
| Since | Final Value | ||
| One | Inception | of a $10,000 | |
| Year | (12/28/2009) | Investment | |
| Short-Term Government Bond | |||
| Index Fund Signal Shares | 1.40% | 2.13% | $10,360 |
| Spliced Barclays Capital U.S. | |||
| Aggregate Float Adjusted Index | 4.62 | 7.58 | 11,300 |
| Barclays Capital U.S. 1–3 Year | |||
| Government Float Adjusted Index | 1.53 | 2.27 | 10,382 |
| "Since Inception" performance is calculated from the Signal Shares’ inception date for both the fund and its comparative standards. | |||
| Since | Final Value | ||
| One | Inception | of a $5,000,000 | |
| Year | (8/23/2010) | Investment | |
| Short-Term Government Bond Index | |||
| Fund Institutional Shares | 1.43% | 1.43% | $5,073,306 |
| Barclays Capital U.S. Aggregate | |||
| Float Adjusted Index | 4.62 | 4.91 | 5,250,873 |
| Barclays Capital U.S. 1–3 Year | |||
| Government Float Adjusted Index | 1.53 | 1.54 | 5,078,561 |
| "Since Inception" performance is calculated from the Institutional Shares’ inception date for both the fund and its comparative standards. | |||
| Cumulative Returns of ETF Shares: November 19, 2009, Through August 31, 2011 | ||
| Since | ||
| One | Inception | |
| Year | (11/19/2009) | |
| Short-Term Government Bond Index Fund | ||
| ETF Shares Market Price | 1.35% | 3.17% |
| Short-Term Government Bond Index Fund | ||
| ETF Shares Net Asset Value | 1.39 | 3.10 |
| Barclays Capital U.S. 1–3 Year Government Float | ||
| Adjusted Index | 1.53 | 3.38 |
| "Since Inception" performance is calculated from the ETF Shares’ inception date for both the fund and its comparative standards. | ||
12
Short-Term Government Bond Index Fund
| Fiscal-Year Total Returns (%): November 19, 2009, Through August 31, 2011 | ||
| Barclays | ||
| 1–3 Year | ||
| Gov’t | ||
| Float Adj | ||
| ETF Shares Net Asset Value | Index | |
| Fiscal Year | Total Returns | Total Returns |
| 2010 | 1.69% | 1.83% |
| 2011 | 1.39 | 1.53 |
Average Annual Total Returns: Periods Ended June 30, 2011
This table presents returns through the latest calendar quarter—rather than through the end of the fiscal period.
Securities and Exchange Commission rules require that we provide this information.
| Since Inception | |||||
| Inception Date | One Year | Income | Capital | Total | |
| Signal Shares | 12/28/2009 | 1.18% | 0.71% | 1.26% | 1.97% |
| Institutional Shares | 8/23/2010 | — | 0.68 | 0.20 | 0.88 |
| ETF Shares | 11/19/2009 | ||||
| Market Price | 1.19 | 1.60 | |||
| Net Asset Value | 1.22 | 1.55 |
13
Short-Term Government Bond Index Fund
Financial Statements
Statement of Net Assets
As of August 31, 2011
The fund reports a complete list of its holdings in regulatory filings four times in each fiscal year, at the quarter-ends. For the second and fourth fiscal quarters, the lists appear in the fund’s semiannual and annual reports to shareholders. For the first and third fiscal quarters, the fund files the lists with the Securities and Exchange Commission on Form N-Q. Shareholders can look up the fund’s Forms N-Q on the SEC’s website at sec.gov. Forms N-Q may also be reviewed and copied at the SEC’s Public Reference Room (see the back cover of this report for further information).
| Face | Market | |||
| Maturity | Amount | Value | ||
| Coupon | Date | ($000) | ($000) | |
| U.S. Government and Agency Obligations (98.6%) | ||||
| U.S. Government Securities (79.4%) | ||||
| United States Treasury Note/Bond | 1.750% | 8/15/12 | 2,201 | 2,235 |
| United States Treasury Note/Bond | 4.375% | 8/15/12 | 1,305 | 1,358 |
| United States Treasury Note/Bond | 0.375% | 8/31/12 | 841 | 843 |
| United States Treasury Note/Bond | 4.125% | 8/31/12 | 1,144 | 1,189 |
| United States Treasury Note/Bond | 1.375% | 9/15/12 | 2,560 | 2,592 |
| United States Treasury Note/Bond | 0.375% | 9/30/12 | 2,014 | 2,019 |
| United States Treasury Note/Bond | 4.250% | 9/30/12 | 902 | 942 |
| United States Treasury Note/Bond | 1.375% | 10/15/12 | 2,890 | 2,929 |
| United States Treasury Note/Bond | 0.375% | 10/31/12 | 1,311 | 1,314 |
| United States Treasury Note/Bond | 3.875% | 10/31/12 | 3,533 | 3,685 |
| United States Treasury Note/Bond | 1.375% | 11/15/12 | 2,381 | 2,416 |
| United States Treasury Note/Bond | 4.000% | 11/15/12 | 767 | 802 |
| United States Treasury Note/Bond | 0.500% | 11/30/12 | 2,296 | 2,306 |
| United States Treasury Note/Bond | 3.375% | 11/30/12 | 855 | 889 |
| United States Treasury Note/Bond | 1.125% | 12/15/12 | 3,352 | 3,393 |
| United States Treasury Note/Bond | 0.625% | 12/31/12 | 1,753 | 1,763 |
| United States Treasury Note/Bond | 3.625% | 12/31/12 | 2,900 | 3,033 |
| United States Treasury Note/Bond | 1.375% | 1/15/13 | 2,275 | 2,312 |
| United States Treasury Note/Bond | 0.625% | 1/31/13 | 2,285 | 2,299 |
| United States Treasury Note/Bond | 2.875% | 1/31/13 | 1,440 | 1,495 |
| United States Treasury Note/Bond | 1.375% | 2/15/13 | 2,584 | 2,628 |
| United States Treasury Note/Bond | 3.875% | 2/15/13 | 1,644 | 1,732 |
| United States Treasury Note/Bond | 0.625% | 2/28/13 | 2,475 | 2,491 |
| United States Treasury Note/Bond | 2.750% | 2/28/13 | 1,325 | 1,376 |
| United States Treasury Note/Bond | 1.375% | 3/15/13 | 2,656 | 2,704 |
| United States Treasury Note/Bond | 0.750% | 3/31/13 | 2,564 | 2,586 |
| United States Treasury Note/Bond | 2.500% | 3/31/13 | 2,579 | 2,672 |
| United States Treasury Note/Bond | 1.750% | 4/15/13 | 1,241 | 1,272 |
| United States Treasury Note/Bond | 0.625% | 4/30/13 | 2,414 | 2,431 |
| United States Treasury Note/Bond | 3.125% | 4/30/13 | 1,517 | 1,591 |
| United States Treasury Note/Bond | 1.375% | 5/15/13 | 3,707 | 3,781 |
| United States Treasury Note/Bond | 3.625% | 5/15/13 | 1,405 | 1,487 |
| United States Treasury Note/Bond | 0.500% | 5/31/13 | 3,375 | 3,393 |
| United States Treasury Note/Bond | 3.500% | 5/31/13 | 1,355 | 1,433 |
| United States Treasury Note/Bond | 1.125% | 6/15/13 | 2,133 | 2,168 |
| United States Treasury Note/Bond | 0.375% | 6/30/13 | 4,750 | 4,766 |
| United States Treasury Note/Bond | 3.375% | 6/30/13 | 2,387 | 2,525 |
14
| Short-Term Government Bond Index Fund | ||||
| Face | Market | |||
| Maturity | Amount | Value | ||
| Coupon | Date | ($000) | ($000) | |
| United States Treasury Note/Bond | 1.000% | 7/15/13 | 2,809 | 2,851 |
| United States Treasury Note/Bond | 0.375% | 7/31/13 | 3,100 | 3,110 |
| United States Treasury Note/Bond | 3.375% | 7/31/13 | 2,312 | 2,452 |
| United States Treasury Note/Bond | 0.750% | 8/15/13 | 3,440 | 3,477 |
| United States Treasury Note/Bond | 4.250% | 8/15/13 | 2,938 | 3,169 |
| United States Treasury Note/Bond | 0.125% | 8/31/13 | 2,200 | 2,197 |
| United States Treasury Note/Bond | 3.125% | 8/31/13 | 1,335 | 1,412 |
| United States Treasury Note/Bond | 0.750% | 9/15/13 | 1,498 | 1,514 |
| United States Treasury Note/Bond | 3.125% | 9/30/13 | 1,631 | 1,730 |
| United States Treasury Note/Bond | 0.500% | 10/15/13 | 981 | 987 |
| United States Treasury Note/Bond | 2.750% | 10/31/13 | 1,807 | 1,905 |
| United States Treasury Note/Bond | 0.500% | 11/15/13 | 2,094 | 2,106 |
| United States Treasury Note/Bond | 4.250% | 11/15/13 | 1,923 | 2,093 |
| United States Treasury Note/Bond | 2.000% | 11/30/13 | 627 | 652 |
| United States Treasury Note/Bond | 0.750% | 12/15/13 | 1,979 | 2,003 |
| United States Treasury Note/Bond | 1.500% | 12/31/13 | 1,581 | 1,627 |
| United States Treasury Note/Bond | 1.000% | 1/15/14 | 1,776 | 1,808 |
| United States Treasury Note/Bond | 1.750% | 1/31/14 | 834 | 864 |
| United States Treasury Note/Bond | 1.250% | 2/15/14 | 2,311 | 2,368 |
| United States Treasury Note/Bond | 4.000% | 2/15/14 | 2,254 | 2,460 |
| United States Treasury Note/Bond | 1.875% | 2/28/14 | 1,616 | 1,681 |
| United States Treasury Note/Bond | 1.250% | 3/15/14 | 1,183 | 1,213 |
| United States Treasury Note/Bond | 1.750% | 3/31/14 | 2,004 | 2,080 |
| United States Treasury Note/Bond | 1.250% | 4/15/14 | 2,131 | 2,186 |
| United States Treasury Note/Bond | 1.875% | 4/30/14 | 2,275 | 2,371 |
| United States Treasury Note/Bond | 1.000% | 5/15/14 | 2,420 | 2,468 |
| United States Treasury Note/Bond | 4.750% | 5/15/14 | 1,859 | 2,083 |
| United States Treasury Note/Bond | 2.250% | 5/31/14 | 3,802 | 4,005 |
| United States Treasury Note/Bond | 0.750% | 6/15/14 | 2,300 | 2,329 |
| United States Treasury Note/Bond | 0.625% | 7/15/14 | 4,770 | 4,813 |
| United States Treasury Note/Bond | 0.500% | 8/15/14 | 7,000 | 7,036 |
| 153,900 | ||||
| Agency Bonds and Notes (19.2%) | ||||
| 1 Ally Financial Inc. | 1.750% | 10/30/12 | 550 | 559 |
| 1 Citibank NA | 1.750% | 12/28/12 | 450 | 458 |
| 1 Citigroup Funding Inc. | 1.875% | 10/22/12 | 675 | 686 |
| 2 Federal Agricultural Mortgage Corp. | 1.250% | 12/6/13 | 45 | 46 |
| 2 Federal Farm Credit Bank | 1.750% | 2/21/13 | 200 | 204 |
| 2 Federal Farm Credit Bank | 1.375% | 6/25/13 | 60 | 61 |
| 2 Federal Farm Credit Bank | 1.125% | 2/27/14 | 100 | 102 |
| 2 Federal Farm Credit Bank | 2.625% | 4/17/14 | 550 | 581 |
| 2 Federal Home Loan Banks | 1.625% | 9/26/12 | 690 | 700 |
| 2 Federal Home Loan Banks | 4.625% | 10/10/12 | 600 | 629 |
| 2 Federal Home Loan Banks | 1.625% | 11/21/12 | 410 | 417 |
| 2 Federal Home Loan Banks | 1.750% | 12/14/12 | 50 | 51 |
| 2 Federal Home Loan Banks | 1.500% | 1/16/13 | 25 | 25 |
| 2 Federal Home Loan Banks | 1.625% | 3/20/13 | 25 | 26 |
| 2 Federal Home Loan Banks | 1.000% | 3/27/13 | 900 | 910 |
| 2 Federal Home Loan Banks | 3.875% | 6/14/13 | 50 | 53 |
| 2 Federal Home Loan Banks | 1.875% | 6/21/13 | 1,700 | 1,747 |
| 2 Federal Home Loan Banks | 0.500% | 8/28/13 | 1,300 | 1,304 |
| 2 Federal Home Loan Banks | 4.000% | 9/6/13 | 250 | 268 |
| 2 Federal Home Loan Banks | 0.875% | 12/27/13 | 1,910 | 1,929 |
| 2 Federal Home Loan Banks | 2.500% | 6/13/14 | 100 | 105 |
| 2 Federal Home Loan Banks | 5.500% | 8/13/14 | 700 | 803 |
15
| Short-Term Government Bond Index Fund | |||||
| Face | Market | ||||
| Maturity | Amount | Value | |||
| Coupon | Date | ($000) | ($000) | ||
| 2 | Federal Home Loan Mortgage Corp. | 2.125% | 9/21/12 | 650 | 663 |
| 2 | Federal Home Loan Mortgage Corp. | 0.375% | 11/30/12 | 250 | 250 |
| 2 | Federal Home Loan Mortgage Corp. | 0.625% | 12/28/12 | 1,310 | 1,315 |
| 2 | Federal Home Loan Mortgage Corp. | 0.750% | 12/28/12 | 150 | 151 |
| 2 | Federal Home Loan Mortgage Corp. | 0.750% | 3/28/13 | 1,675 | 1,687 |
| 2 | Federal Home Loan Mortgage Corp. | 1.625% | 4/15/13 | 2,780 | 2,840 |
| 2 | Federal Home Loan Mortgage Corp. | 4.500% | 7/15/13 | 375 | 404 |
| 2 | Federal Home Loan Mortgage Corp. | 0.875% | 10/28/13 | 745 | 753 |
| 2 | Federal Home Loan Mortgage Corp. | 2.500% | 1/7/14 | 265 | 278 |
| 2 | Federal Home Loan Mortgage Corp. | 4.500% | 1/15/14 | 200 | 219 |
| 2 | Federal Home Loan Mortgage Corp. | 1.375% | 2/25/14 | 1,065 | 1,089 |
| 2 | Federal Home Loan Mortgage Corp. | 2.500% | 4/23/14 | 190 | 200 |
| 2 | Federal Home Loan Mortgage Corp. | 3.000% | 7/28/14 | 285 | 306 |
| 2 | Federal Home Loan Mortgage Corp. | 1.000% | 7/30/14 | 325 | 330 |
| 2 | Federal Home Loan Mortgage Corp. | 1.000% | 8/27/14 | 800 | 811 |
| 2 | Federal Home Loan Mortgage Corp. | 0.500% | 9/19/14 | 475 | 474 |
| 2 | Federal National Mortgage Assn. | 4.375% | 9/15/12 | 945 | 985 |
| 2 | Federal National Mortgage Assn. | 0.625% | 9/24/12 | 200 | 201 |
| 2 | Federal National Mortgage Assn. | 0.500% | 10/30/12 | 500 | 501 |
| 2 | Federal National Mortgage Assn. | 0.375% | 12/28/12 | 1,155 | 1,156 |
| 2 | Federal National Mortgage Assn. | 0.750% | 2/26/13 | 1,200 | 1,208 |
| 2 | Federal National Mortgage Assn. | 4.375% | 3/15/13 | 1,570 | 1,668 |
| 2 | Federal National Mortgage Assn. | 1.750% | 5/7/13 | 25 | 26 |
| 2 | Federal National Mortgage Assn. | 1.500% | 6/26/13 | 475 | 485 |
| 2 | Federal National Mortgage Assn. | 3.875% | 7/12/13 | 280 | 298 |
| 2 | Federal National Mortgage Assn. | 0.500% | 8/9/13 | 1,125 | 1,128 |
| 2 | Federal National Mortgage Assn. | 1.250% | 8/20/13 | 550 | 560 |
| 2 | Federal National Mortgage Assn. | 2.875% | 12/11/13 | 80 | 84 |
| 2 | Federal National Mortgage Assn. | 0.750% | 12/18/13 | 2,065 | 2,080 |
| 2 | Federal National Mortgage Assn. | 2.750% | 2/5/14 | 370 | 391 |
| 2 | Federal National Mortgage Assn. | 1.250% | 2/27/14 | 600 | 612 |
| 2 | Federal National Mortgage Assn. | 2.750% | 3/13/14 | 225 | 238 |
| 2 | Federal National Mortgage Assn. | 1.125% | 6/27/14 | 475 | 484 |
| 2 | Federal National Mortgage Assn. | 0.875% | 8/28/14 | 1,250 | 1,263 |
| 1 | General Electric Capital Corp. | 2.000% | 9/28/12 | 115 | 117 |
| 1 | General Electric Capital Corp. | 2.125% | 12/21/12 | 255 | 261 |
| 37,180 | |||||
| Total U.S. Government and Agency Obligations (Cost $189,485) | 191,080 | ||||
| Shares | |||||
| Temporary Cash Investment (0.8%) | |||||
| Money Market Fund (0.8%) | |||||
| 3 | Vanguard Market Liquidity Fund (Cost $1,465) | 0.132% | 1,464,608 | 1,465 | |
| Total Investments (99.4%) (Cost $190,950) | 192,545 | ||||
| Other Assets and Liabilities (0.6%) | |||||
| Other Assets | 13,577 | ||||
| Liabilities | (12,398) | ||||
| 1,179 | |||||
| Net Assets (100%) | 193,724 | ||||
16
| Short-Term Government Bond Index Fund | |
| Market | |
| Value | |
| ($000) | |
| Statement of Assets and Liabilities | |
| Assets | |
| Investments in Securities, at Value | 192,545 |
| Receivables for Investment Securities Sold | 12,568 |
| Other Assets | 1,009 |
| Total Assets | 206,122 |
| Liabilities | |
| Payables for Investment Securities Purchased | 12,057 |
| Other Liabilities | 341 |
| Total Liabilities | 12,398 |
| Net Assets | 193,724 |
| At August 31, 2011, net assets consisted of: | |
| Amount | |
| ($000) | |
| Paid-in Capital | 191,857 |
| Overdistributed Net Investment Income | (9) |
| Accumulated Net Realized Gains | 281 |
| Unrealized Appreciation (Depreciation) | 1,595 |
| Net Assets | 193,724 |
| Signal Shares—Net Assets | |
| Applicable to 521,107 outstanding $.001 par value shares of | |
| beneficial interest (unlimited authorization) | 10,624 |
| Net Asset Value Per Share—Signal Shares | $20.39 |
| Institutional Shares—Net Assets | |
| Applicable to 1,302,610 outstanding $.001 par value shares of | |
| beneficial interest (unlimited authorization) | 33,375 |
| Net Asset Value Per Share—Institutional Shares | $25.62 |
| ETF Shares—Net Assets | |
| Applicable to 2,450,000 outstanding $.001 par value shares of | |
| beneficial interest (unlimited authorization) | 149,725 |
| Net Asset Value Per Share—ETF Shares | $61.11 |
See Note A in Notes to Financial Statements.
1 Guaranteed by the Federal Deposit Insurance Corporation (FDIC) as part of the Temporary Liquidity Guarantee Program.
2 The issuer operates under a congressional charter; its securities are not backed by the full faith and credit of the U.S. government.
3 Affiliated money market fund available only to Vanguard funds and certain trusts and accounts managed by Vanguard. Rate shown is the 7-day yield.
See accompanying Notes, which are an integral part of the Financial Statements.
17
Short-Term Government Bond Index Fund
Statement of Operations
| Year Ended | |
| August 31, 2011 | |
| ($000) | |
| Investment Income | |
| Income | |
| Interest1 | 1,110 |
| Total Income | 1,110 |
| Expenses | |
| The Vanguard Group—Note B | |
| Investment Advisory Services | 8 |
| Management and Administrative—Signal Shares | 8 |
| Management and Administrative—Institutional Shares | 10 |
| Management and Administrative—ETF Shares | 74 |
| Marketing and Distribution—Signal Shares | 3 |
| Marketing and Distribution—Institutional Shares | — |
| Marketing and Distribution—ETF Shares | 30 |
| Custodian Fees | 2 |
| Auditing Fees | 41 |
| Shareholders’ Reports—Signal Shares | — |
| Shareholders’ Reports—Institutional Shares | — |
| Shareholders’ Reports—ETF Shares | 7 |
| Total Expenses | 183 |
| Net Investment Income | 927 |
| Realized Net Gain (Loss) on Investment Securities Sold | 360 |
| Change in Unrealized Appreciation (Depreciation) of Investment Securities | 887 |
| Net Increase (Decrease) in Net Assets Resulting from Operations | 2,174 |
| 1 Interest income from an affiliated company of the fund was $3,000. | |
See accompanying Notes, which are an integral part of the Financial Statements.
18
Short-Term Government Bond Index Fund
Statement of Changes in Net Assets
| November 19, | ||
| Year Ended | 20091 to | |
| August 31, | August 31, | |
| 2011 | 2010 | |
| ($000) | ($000) | |
| Increase (Decrease) in Net Assets | ||
| Operations | ||
| Net Investment Income | 927 | 283 |
| Realized Net Gain (Loss) | 360 | 44 |
| Change in Unrealized Appreciation (Depreciation) | 887 | 708 |
| Net Increase (Decrease) in Net Assets Resulting from Operations | 2,174 | 1,035 |
| Distributions | ||
| Net Investment Income | ||
| Signal Shares | (72) | (25) |
| Institutional Shares | (127) | (6) |
| ETF Shares | (737) | (252) |
| Realized Capital Gain2 | ||
| Signal Shares | (5) | — |
| Institutional Shares | (4) | — |
| ETF Shares | (41) | — |
| Total Distributions | (986) | (283) |
| Capital Share Transactions | ||
| Signal Shares | 4,982 | 5,526 |
| Institutional Shares | 25,172 | 8,005 |
| ETF Shares | 69,867 | 78,232 |
| Net Increase (Decrease) from Capital Share Transactions | 100,021 | 91,763 |
| Total Increase (Decrease) | 101,209 | 92,515 |
| Net Assets | ||
| Beginning of Period | 92,515 | — |
| End of Period3 | 193,724 | 92,515 |
1 Inception.
2 Includes fiscal 2011 short-term gain distributions totaling $50,000. Short-term gain distributions are treated as ordinary income dividends for tax purposes.
3 Net Assets—End of Period includes undistributed (overdistributed) net investment income of ($9,000) and $0.
See accompanying Notes, which are an integral part of the Financial Statements.
19
Short-Term Government Bond Index Fund
Financial Highlights
| Signal Shares | ||
| Year | Dec. 28, | |
| Ended | 20091 to | |
| August 31, | Aug. 31, | |
| For a Share Outstanding Throughout Each Period | 2011 | 2010 |
| Net Asset Value, Beginning of Period | $20.25 | $19.92 |
| Investment Operations | ||
| Net Investment Income | .134 | .101 |
| Net Realized and Unrealized Gain (Loss) on Investments | .149 | .329 |
| Total from Investment Operations | .283 | .430 |
| Distributions | ||
| Dividends from Net Investment Income | (.135) | (.100) |
| Distributions from Realized Capital Gains | (.008) | — |
| Total Distributions | (.143) | (.100) |
| Net Asset Value, End of Period | $20.39 | $20.25 |
| Total Return | 1.40% | 2.16% |
| Ratios/Supplemental Data | ||
| Net Assets, End of Period (Millions) | $11 | $6 |
| Ratio of Total Expenses to Average Net Assets | 0.14% | 0.15%2 |
| Ratio of Net Investment Income to Average Net Assets | 0.66% | 0.84%2 |
| Portfolio Turnover Rate3 | 69% | 69% |
1 Inception.
2 Annualized.
3 Excludes the value of portfolio securities received or delivered as a result of in-kind purchases or redemptions of the fund’s capital shares, including ETF Creation Units.
See accompanying Notes, which are an integral part of the Financial Statements.
20
Short-Term Government Bond Index Fund
Financial Highlights
| Institutional Shares | ||
| Year | Aug. 23, | |
| Ended | 20101 to | |
| August 31, | Aug. 31, | |
| For a Share Outstanding Throughout Each Period | 2011 | 2010 |
| Net Asset Value, Beginning of Period | $25.45 | $25.46 |
| Investment Operations | ||
| Net Investment Income | .183 | .005 |
| Net Realized and Unrealized Gain (Loss) on Investments | .180 | .003 |
| Total from Investment Operations | .363 | .008 |
| Distributions | ||
| Dividends from Net Investment Income | (.183) | (.018) |
| Distributions from Realized Capital Gains | (.010) | — |
| Total Distributions | (.193) | (.018) |
| Net Asset Value, End of Period | $25.62 | $25.45 |
| Total Return | 1.43% | 0.03% |
| Ratios/Supplemental Data | ||
| Net Assets, End of Period (Millions) | $33 | $8 |
| Ratio of Total Expenses to Average Net Assets | 0.09% | 0.09%2 |
| Ratio of Net Investment Income to Average Net Assets | 0.71% | 0.90%2 |
| Portfolio Turnover Rate3 | 69% | 69% |
1 Inception.
2 Annualized.
3 Excludes the value of portfolio securities received or delivered as a result of in-kind purchases or redemptions of the fund’s capital shares, including ETF Creation Units.
See accompanying Notes, which are an integral part of the Financial Statements.
21
Short-Term Government Bond Index Fund
Financial Highlights
| ETF Shares | ||
| Year | Nov. 19, | |
| Ended | 20091 to | |
| August 31, | Aug. 31, | |
| For a Share Outstanding Throughout Each Period | 2011 | 2010 |
| Net Asset Value, Beginning of Period | $60.70 | $60.04 |
| Investment Operations | ||
| Net Investment Income | .405 | .349 |
| Net Realized and Unrealized Gain (Loss) on Investments | .434 | .660 |
| Total from Investment Operations | .839 | 1.009 |
| Distributions | ||
| Dividends from Net Investment Income | (.405) | (.349) |
| Distributions from Realized Capital Gains | (.024) | — |
| Total Distributions | (.429) | (.349) |
| Net Asset Value, End of Period | $61.11 | $60.70 |
| Total Return | 1.39% | 1.69% |
| Ratios/Supplemental Data | ||
| Net Assets, End of Period (Millions) | $150 | $79 |
| Ratio of Total Expenses to Average Net Assets | 0.14% | 0.15%2 |
| Ratio of Net Investment Income to Average Net Assets | 0.66% | 0.84%2 |
| Portfolio Turnover Rate3 | 69% | 69% |
1 Inception.
2 Annualized.
3 Excludes the value of portfolio securities received or delivered as a result of in-kind purchases or redemptions of the fund’s capital shares, including ETF Creation Units.
See accompanying Notes, which are an integral part of the Financial Statements.
22
Short-Term Government Bond Index Fund
Notes to Financial Statements
Vanguard Short-Term Government Bond Index Fund is registered under the Investment Company Act of 1940 as an open-end investment company, or mutual fund. The fund offers three classes of shares: Signal Shares, Institutional Shares, and ETF Shares. Signal Shares and Institutional Shares are designed for investors who meet certain administrative, service, and account-size criteria. ETF Shares are listed for trading on Nasdaq; they can be purchased and sold through a broker.
A. The following significant accounting policies conform to generally accepted accounting principles for U.S. mutual funds. The fund consistently follows such policies in preparing its financial statements.
1. Security Valuation: Bonds, and temporary cash investments acquired over 60 days to maturity, are valued using the latest bid prices or using valuations based on a matrix system (which considers such factors as security prices, yields, maturities, and ratings), both as furnished by independent pricing services. Investments in Vanguard Market Liquidity Fund are valued at that fund’s net asset value. Other temporary cash investments are valued at amortized cost, which approximates market value. Securities for which market quotations are not readily available, or whose values have been affected by events occurring before the fund’s pricing time but after the close of the securities’ primary markets, are valued by methods deemed by the board of trustees to represent fair value.
2. Federal Income Taxes: The fund intends to continue to qualify as a regulated investment company and distribute all of its taxable income. Management has analyzed the fund’s tax positions taken for all open federal income tax years (August 31, 2010–2011), and has concluded that no provision for federal income tax is required in the fund’s financial statements.
3. Distributions: Distributions to shareholders are recorded on the ex-dividend date.
4. Other: Interest income includes income distributions received from Vanguard Market Liquidity Fund and is accrued daily. Premiums and discounts on debt securities purchased are amortized and accreted, respectively, to interest income over the lives of the respective securities. Security transactions are accounted for on the date securities are bought or sold. Costs used to determine realized gains (losses) on the sale of investment securities are those of the specific securities sold. Fees, if any, assessed on purchases of capital shares are credited to paid-in capital.
Each class of shares has equal rights as to assets and earnings, except that each class separately bears certain class-specific expenses related to maintenance of shareholder accounts (included in Management and Administrative expenses) and shareholder reporting. Marketing and distribution expenses are allocated to each class of shares based on a method approved by the board of trustees. Income, other non-class-specific expenses, and gains and losses on investments are allocated to each class of shares based on its relative net assets.
B. The Vanguard Group furnishes at cost investment advisory, corporate management, administrative, marketing, and distribution services. The costs of such services are allocated to the fund under methods approved by the board of trustees. The fund has committed to provide up to 0.40% of its net assets in capital contributions to Vanguard. At August 31, 2011, the fund had contributed capital of $29,000 to Vanguard (included in Other Assets), representing 0.01% of the fund’s net assets and 0.01% of Vanguard’s capitalization. The fund’s trustees and officers are also directors and officers of Vanguard.
23
Short-Term Government Bond Index Fund
C. Various inputs may be used to determine the value of the fund’s investments. These inputs are summarized in three broad levels for financial statement purposes. The inputs or methodologies used to value securities are not necessarily an indication of the risk associated with investing in those securities.
Level 1—Quoted prices in active markets for identical securities.
Level 2—Other significant observable inputs (including quoted prices for similar securities, interest rates, prepayment speeds, credit risk, etc.).
Level 3—Significant unobservable inputs (including the fund’s own assumptions used to determine the fair value of investments).
The following table summarizes the fund’s investments as of August 31, 2011, based on the inputs used to value them:
| Level 1 | Level 2 | Level 3 | |
| Investments | ($000) | ($000) | ($000) |
| U.S. Government and Agency Obligations | — | 191,080 | — |
| Temporary Cash Investments | 1,465 | — | — |
| Total | 1,465 | 191,080 | — |
D. Distributions are determined on a tax basis and may differ from net investment income and realized capital gains for financial reporting purposes. Differences may be permanent or temporary. Permanent differences are reclassified among capital accounts in the financial statements to reflect their tax character. Temporary differences arise when certain items of income, expense, gain, or loss are recognized in different periods for financial statement and tax purposes; these differences will reverse at some time in the future. Differences in classification may also result from the treatment of short-term gains as ordinary income for tax purposes.
During the year ended August 31, 2011, the fund realized $64,000 of net capital gains resulting from in-kind redemptions—in which shareholders exchanged fund shares for securities held by the fund rather than for cash. Because such gains are not taxable to the fund, and are not distributed to shareholders, they have been reclassified from accumulated net realized gains to paid-in capital.
The fund used a tax accounting practice to treat a portion of the price of capital shares redeemed during the year as distributions from realized capital gains. Accordingly, the fund has reclassified $9,000 from accumulated net realized gains to paid-in capital.
For tax purposes, at August 31, 2011, the fund had short-term and long-term capital gains of $156,000 and $125,000, respectively, available for distribution. Short-term gain distributions are treated as ordinary income dividends for tax purposes.
At August 31, 2011, the cost of investment securities for tax purposes was $190,950,000. Net unrealized appreciation of investment securities for tax purposes was $1,595,000, consisting of unrealized gains of $1,598,000 on securities that had risen in value since their purchase and $3,000 in unrealized losses on securities that had fallen in value since their purchase.
24
Short-Term Government Bond Index Fund
E. During the year ended August 31, 2011, the fund purchased $205,391,000 of investment securities and sold $102,350,000 of investment securities, other than temporary cash investments.
F. Capital share transactions for each class of shares were:
| Year Ended | Inception1 to | |||
| August 31, 2011 | August 31, 2010 | |||
| Amount | Shares | Amount | Shares | |
| ($000) | (000) | ($000) | (000) | |
| Signal Shares | ||||
| Issued | 11,614 | 574 | 5,501 | 275 |
| Issued in Lieu of Cash Distributions | 77 | 4 | 25 | 1 |
| Redeemed | (6,709) | (333) | — | — |
| Net Increase (Decrease)—Signal Shares | 4,982 | 245 | 5,526 | 276 |
| Institutional Shares | ||||
| Issued | 25,041 | 983 | 7,999 | 314 |
| Issued in Lieu of Cash Distributions | 131 | 5 | 6 | — |
| Redeemed | — | — | — | — |
| Net Increase (Decrease)—Institutional Shares | 25,172 | 988 | 8,005 | 314 |
| ETF Shares | ||||
| Issued | 78,970 | 1,300 | 78,232 | 1,300 |
| Issued in Lieu of Cash Distributions | — | — | — | — |
| Redeemed | (9,103) | (150) | — | — |
| Net Increase (Decrease)—ETF Shares | 69,867 | 1,150 | 78,232 | 1,300 |
1 Inception was November 19, 2009, for ETF Shares, December 28, 2009, for Signal Shares, and August 23, 2010, for Institutional Shares.
G. In preparing the financial statements as of August 31, 2011, management considered the impact of subsequent events for potential recognition or disclosure in these financial statements.
25
Intermediate-Term Government Bond Index Fund
Fund Profile
As of August 31, 2011
| Share-Class Characteristics | |||
| Signal | Institutional | ETF | |
| Shares | Shares | Shares | |
| Ticker Symbol | VSIGX | VIIGX | VGIT |
| Expense Ratio1 | 0.15% | 0.09% | 0.15% |
| 30-Day SEC Yield | 1.11% | 1.12% | 1.11% |
| Financial Attributes | |||
| Barclays | |||
| 3–10 Year | |||
| Gov’t | Barclays | ||
| Float Adj | Aggregate | ||
| Fund | Index | FA Index | |
| Number of Bonds | 142 | 416 | 7,873 |
| Yield to Maturity | |||
| (before expenses) | 1.2% | 1.2% | 2.3% |
| Average Coupon | 3.0% | 3.0% | 4.1% |
| Average Duration | 5.3 years | 5.3 years | 5.1 years |
| Average Effective | |||
| Maturity | 5.7 years | 5.8 years | 7.3 years |
| Short-Term | |||
| Reserves | 2.2% | — | — |
| Sector Diversification (% of portfolio) | |||
| Treasury/Agency | 100.0% | ||
The agency and mortgage-backed securities sectors may include issues from government-sponsored enterprises; such issues are not backed by the full faith and credit of the U.S. government.
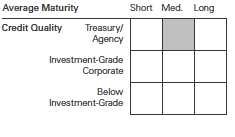
| Distribution by Maturity (% of portfolio) | |
| Under 1 Year | 1.4% |
| 1 - 3 Years | 0.7 |
| 3 - 5 Years | 44.1 |
| 5 - 10 Years | 53.8 |
| Distribution by Credit Quality (% of portfolio) | |
| U.S. Government | 100.0% |
| For information about these ratings, see the Glossary entry for Credit Quality. | |
Investment Focus
1 The expense ratios shown are from the prospectus dated December 28, 2010, and represent estimated costs for the current fiscal year. For the fiscal year ended August 31, 2011, the expense ratios were 0.13% for Signal Shares, 0.09% for Institutional Shares, and 0.14% for ETF Shares.
26
Intermediate-Term Government Bond Index Fund
Performance Summary
All of the returns in this report represent past performance, which is not a guarantee of future results that may be achieved by the fund. (Current performance may be lower or higher than the performance data cited. For performance data current to the most recent month-end, visit our website at vanguard.com/performance.) Note, too, that both investment returns and principal value can fluctuate widely, so an investor’s shares, when sold, could be worth more or less than their original cost. The returns shown do not reflect taxes that a shareholder would pay on fund distributions or on the sale of fund shares.
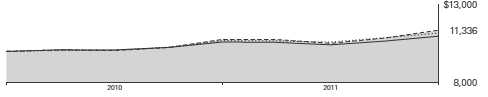
Cumulative Performance: November 19, 2009, Through August 31, 2011
Initial Investment of $10,000
| Average Annual Total Returns | |||
| Periods Ended August 31, 2011 | |||
| Since | Final Value | ||
| One | Inception | of a $10,000 | |
| Year | (11/19/2009) | Investment | |
| Intermediate-Term Government Bond | |||
| Index Fund ETF Shares Net Asset | |||
| Value | 5.30% | 7.30% | $11,336 |
| Intermediate-Term Government Bond | |||
| Index Fund ETF Shares Market Price | 5.41 | 7.38 | 11,352 |
| Spliced Barclays Capital U.S. | |||
| Aggregate Float Adjusted Index | 4.62 | 6.49 | 11,184 |
| Barclays Capital U.S. 3–10 Year | |||
| Government Float Adjusted Index | 5.53 | 7.48 | 11,372 |
| Intermediate U.S. Government Funds | |||
| Average | 3.53 | 5.40 | 10,982 |
"Since Inception" performance is calculated from the ETF Shares’ inception date for both the fund and its comparative standards.
Spliced Barclays Capital U.S. Aggregate Float Adjusted Index: Barclays Capital U.S. Aggregate Bond Index through December 31, 2009; Barclays Capital U.S. Aggregate Float Adjusted Index thereafter.
Intermediate U.S. Government Funds Average: Derived from data provided by Lipper Inc.
See Financial Highlights for dividend and capital gains information.
27
Intermediate-Term Government Bond Index Fund
| Average Annual Total Returns | |||
| Periods Ended August 31, 2011 | |||
| Since | Final Value | ||
| One | Inception | of a $10,000 | |
| Year | (8/4/2010) | Investment | |
| Intermediate-Term Government | |||
| Bond Index Fund Signal Shares | 5.31% | 6.87% | $10,740 |
| Barclays Capital U.S. | |||
| Aggregate Float Adjusted Index | 4.62 | 5.70 | 10,613 |
| Barclays Capital U.S. 3–10 Year | |||
| Government Float Adjusted Index | 5.53 | 7.05 | 10,759 |
| "Since Inception" performance is calculated from the Signal Shares’ inception date for both the fund and its comparative standards. | |||
| Since | Final Value | ||
| One | Inception | of a $5,000,000 | |
| Year | (3/19/2010) | Investment | |
| Intermediate-Term Government Bond | |||
| Index Fund Institutional Shares | 5.36% | 9.09% | $5,673,488 |
| Barclays Capital U.S. Aggregate | |||
| Float Adjusted Index | 4.62 | 7.12 | 5,525,177 |
| Barclays Capital U.S. 3–10 Year | |||
| Government Float Adjusted Index | 5.53 | 9.27 | 5,687,245 |
| "Since Inception" performance is calculated from the Institutional Shares’ inception date for both the fund and its comparative standards. | |||
| Cumulative Returns of ETF Shares: November 19, 2009, Through August 31, 2011 | ||
| Since | ||
| One | Inception | |
| Year | (11/19/2009) | |
| Intermediate-Term Government Bond Index Fund | ||
| ETF Shares Market Price | 5.41% | 13.52% |
| Intermediate-Term Government Bond Index Fund | ||
| ETF Shares Net Asset Value | 5.30 | 13.36 |
| Barclays Capital U.S. 3–10 Year Government Float | ||
| Adjusted Index | 5.53 | 13.72 |
| "Since Inception" performance is calculated from the ETF Shares’ inception date for both the fund and its comparative standards. | ||
28
Intermediate-Term Government Bond Index Fund
| Fiscal-Year Total Returns (%): November 19, 2009, Through August 31, 2011 | ||
| Barclays | ||
| 3–10 Year | ||
| Gov’t | ||
| Float Adj | ||
| ETF Shares Net Asset Value | Index | |
| Fiscal Year | Total Returns | Total Returns |
| 2010 | 7.65% | 7.76% |
| 2011 | 5.30 | 5.53 |
Average Annual Total Returns: Periods Ended June 30, 2011
This table presents returns through the latest calendar quarter—rather than through the end of the fiscal period.
Securities and Exchange Commission rules require that we provide this information.
| Since Inception | |||||
| Inception Date | One Year | Income | Capital | Total | |
| Signal Shares | 8/4/2010 | — | 1.96% | 0.49% | 2.45% |
| Institutional Shares | 3/19/2010 | 3.47% | 2.35 | 4.04 | 6.39 |
| ETF Shares | 11/19/2009 | ||||
| Market Price | 3.40 | 5.04 | |||
| Net Asset Value | 3.39 | 4.99 |
29
Intermediate-Term Government Bond Index Fund
Financial Statements
Statement of Net Assets
As of August 31, 2011
The fund reports a complete list of its holdings in regulatory filings four times in each fiscal year, at the quarter-ends. For the second and fourth fiscal quarters, the lists appear in the fund’s semiannual and annual reports to shareholders. For the first and third fiscal quarters, the fund files the lists with the Securities and Exchange Commission on Form N-Q. Shareholders can look up the fund’s Forms N-Q on the SEC’s website at sec.gov. Forms N-Q may also be reviewed and copied at the SEC’s Public Reference Room (see the back cover of this report for further information).
| Face | Market | |||
| Maturity | Amount | Value | ||
| Coupon | Date | ($000) | ($000) | |
| U.S. Government and Agency Obligations (98.1%) | ||||
| U.S. Government Securities (90.0%) | ||||
| United States Treasury Note/Bond | 2.625% | 6/30/14 | 16 | 17 |
| United States Treasury Note/Bond | 2.625% | 7/31/14 | 656 | 700 |
| United States Treasury Note/Bond | 2.375% | 8/31/14 | 481 | 510 |
| United States Treasury Note/Bond | 2.375% | 9/30/14 | 2,034 | 2,159 |
| United States Treasury Note/Bond | 2.375% | 10/31/14 | 2,704 | 2,873 |
| United States Treasury Note/Bond | 2.125% | 11/30/14 | 2,695 | 2,844 |
| United States Treasury Note/Bond | 2.625% | 12/31/14 | 2,560 | 2,746 |
| United States Treasury Note/Bond | 2.250% | 1/31/15 | 2,254 | 2,391 |
| United States Treasury Note/Bond | 4.000% | 2/15/15 | 1,027 | 1,151 |
| United States Treasury Note/Bond | 11.250% | 2/15/15 | 461 | 631 |
| United States Treasury Note/Bond | 2.375% | 2/28/15 | 3,584 | 3,821 |
| United States Treasury Note/Bond | 2.500% | 3/31/15 | 2,180 | 2,335 |
| United States Treasury Note/Bond | 2.500% | 4/30/15 | 1,877 | 2,011 |
| United States Treasury Note/Bond | 4.125% | 5/15/15 | 1,710 | 1,934 |
| United States Treasury Note/Bond | 2.125% | 5/31/15 | 2,246 | 2,377 |
| United States Treasury Note/Bond | 1.875% | 6/30/15 | 2,010 | 2,109 |
| United States Treasury Note/Bond | 1.750% | 7/31/15 | 2,080 | 2,172 |
| United States Treasury Note/Bond | 4.250% | 8/15/15 | 633 | 723 |
| United States Treasury Note/Bond | 10.625% | 8/15/15 | 613 | 853 |
| United States Treasury Note/Bond | 1.250% | 8/31/15 | 1,696 | 1,738 |
| United States Treasury Note/Bond | 1.250% | 9/30/15 | 1,724 | 1,765 |
| United States Treasury Note/Bond | 1.250% | 10/31/15 | 1,767 | 1,808 |
| United States Treasury Note/Bond | 4.500% | 11/15/15 | 1,113 | 1,288 |
| United States Treasury Note/Bond | 9.875% | 11/15/15 | 158 | 218 |
| United States Treasury Note/Bond | 1.375% | 11/30/15 | 2,234 | 2,296 |
| United States Treasury Note/Bond | 2.125% | 12/31/15 | 794 | 841 |
| United States Treasury Note/Bond | 2.000% | 1/31/16 | 1,633 | 1,720 |
| United States Treasury Note/Bond | 4.500% | 2/15/16 | 1,085 | 1,262 |
| United States Treasury Note/Bond | 9.250% | 2/15/16 | 266 | 365 |
| United States Treasury Note/Bond | 2.125% | 2/29/16 | 800 | 848 |
| United States Treasury Note/Bond | 2.625% | 2/29/16 | 736 | 796 |
| United States Treasury Note/Bond | 2.250% | 3/31/16 | 1,913 | 2,037 |
| United States Treasury Note/Bond | 2.375% | 3/31/16 | 1,182 | 1,265 |
| United States Treasury Note/Bond | 2.000% | 4/30/16 | 1,870 | 1,969 |
| United States Treasury Note/Bond | 2.625% | 4/30/16 | 2,337 | 2,526 |
| United States Treasury Note/Bond | 5.125% | 5/15/16 | 746 | 893 |
| United States Treasury Note/Bond | 7.250% | 5/15/16 | 123 | 159 |
30
| Intermediate-Term Government Bond Index Fund | ||||
| Face | Market | |||
| Maturity | Amount | Value | ||
| Coupon | Date | ($000) | ($000) | |
| United States Treasury Note/Bond | 1.750% | 5/31/16 | 2,686 | 2,795 |
| United States Treasury Note/Bond | 3.250% | 5/31/16 | 387 | 430 |
| United States Treasury Note/Bond | 1.500% | 6/30/16 | 2,150 | 2,210 |
| United States Treasury Note/Bond | 3.250% | 6/30/16 | 1,660 | 1,845 |
| United States Treasury Note/Bond | 1.500% | 7/31/16 | 1,890 | 1,941 |
| United States Treasury Note/Bond | 3.250% | 7/31/16 | 1,177 | 1,308 |
| United States Treasury Note/Bond | 4.875% | 8/15/16 | 172 | 205 |
| United States Treasury Note/Bond | 1.000% | 8/31/16 | 2,200 | 2,203 |
| United States Treasury Note/Bond | 3.000% | 8/31/16 | 772 | 849 |
| United States Treasury Note/Bond | 3.000% | 9/30/16 | 950 | 1,044 |
| United States Treasury Note/Bond | 3.125% | 10/31/16 | 707 | 782 |
| United States Treasury Note/Bond | 4.625% | 11/15/16 | 555 | 656 |
| United States Treasury Note/Bond | 7.500% | 11/15/16 | 315 | 419 |
| United States Treasury Note/Bond | 2.750% | 11/30/16 | 3,005 | 3,265 |
| United States Treasury Note/Bond | 3.250% | 12/31/16 | 223 | 248 |
| United States Treasury Note/Bond | 3.125% | 1/31/17 | 2,670 | 2,954 |
| United States Treasury Note/Bond | 4.625% | 2/15/17 | 705 | 836 |
| United States Treasury Note/Bond | 3.000% | 2/28/17 | 927 | 1,020 |
| United States Treasury Note/Bond | 3.250% | 3/31/17 | 2,359 | 2,626 |
| United States Treasury Note/Bond | 3.125% | 4/30/17 | 863 | 955 |
| United States Treasury Note/Bond | 4.500% | 5/15/17 | 669 | 792 |
| United States Treasury Note/Bond | 8.750% | 5/15/17 | 387 | 550 |
| United States Treasury Note/Bond | 2.750% | 5/31/17 | 1,204 | 1,307 |
| United States Treasury Note/Bond | 2.500% | 6/30/17 | 1,646 | 1,762 |
| United States Treasury Note/Bond | 2.375% | 7/31/17 | 1,523 | 1,618 |
| United States Treasury Note/Bond | 4.750% | 8/15/17 | 724 | 870 |
| United States Treasury Note/Bond | 8.875% | 8/15/17 | 1,320 | 1,904 |
| United States Treasury Note/Bond | 1.875% | 8/31/17 | 1,536 | 1,587 |
| United States Treasury Note/Bond | 1.875% | 9/30/17 | 1,658 | 1,711 |
| United States Treasury Note/Bond | 1.875% | 10/31/17 | 1,550 | 1,599 |
| United States Treasury Note/Bond | 4.250% | 11/15/17 | 288 | 339 |
| United States Treasury Note/Bond | 2.250% | 11/30/17 | 2,795 | 2,944 |
| United States Treasury Note/Bond | 2.750% | 12/31/17 | 1,111 | 1,204 |
| United States Treasury Note/Bond | 2.625% | 1/31/18 | 909 | 978 |
| United States Treasury Note/Bond | 3.500% | 2/15/18 | 1,176 | 1,329 |
| United States Treasury Note/Bond | 2.750% | 2/28/18 | 1,006 | 1,090 |
| United States Treasury Note/Bond | 2.875% | 3/31/18 | 1,162 | 1,267 |
| United States Treasury Note/Bond | 2.625% | 4/30/18 | 1,567 | 1,683 |
| United States Treasury Note/Bond | 3.875% | 5/15/18 | 811 | 937 |
| United States Treasury Note/Bond | 9.125% | 5/15/18 | 171 | 256 |
| United States Treasury Note/Bond | 2.375% | 5/31/18 | 1,682 | 1,778 |
| United States Treasury Note/Bond | 2.375% | 6/30/18 | 1,805 | 1,905 |
| United States Treasury Note/Bond | 4.000% | 8/15/18 | 985 | 1,148 |
| United States Treasury Note/Bond | 1.500% | 8/31/18 | 1,300 | 1,294 |
| United States Treasury Note/Bond | 3.750% | 11/15/18 | 2,057 | 2,365 |
| United States Treasury Note/Bond | 9.000% | 11/15/18 | 133 | 201 |
| United States Treasury Note/Bond | 2.750% | 2/15/19 | 1,802 | 1,943 |
| United States Treasury Note/Bond | 8.875% | 2/15/19 | 494 | 749 |
| United States Treasury Note/Bond | 3.125% | 5/15/19 | 2,298 | 2,535 |
| United States Treasury Note/Bond | 3.625% | 8/15/19 | 2,223 | 2,531 |
| United States Treasury Note/Bond | 8.125% | 8/15/19 | 1,184 | 1,750 |
| United States Treasury Note/Bond | 3.375% | 11/15/19 | 2,885 | 3,225 |
| United States Treasury Note/Bond | 3.625% | 2/15/20 | 4,910 | 5,575 |
| United States Treasury Note/Bond | 8.500% | 2/15/20 | 295 | 449 |
| United States Treasury Note/Bond | 3.500% | 5/15/20 | 3,204 | 3,602 |
31
| Intermediate-Term Government Bond Index Fund | ||||
| Face | Market | |||
| Maturity | Amount | Value | ||
| Coupon | Date | ($000) | ($000) | |
| United States Treasury Note/Bond | 8.750% | 5/15/20 | 621 | 962 |
| United States Treasury Note/Bond | 2.625% | 8/15/20 | 3,014 | 3,157 |
| United States Treasury Note/Bond | 8.750% | 8/15/20 | 410 | 638 |
| United States Treasury Note/Bond | 2.625% | 11/15/20 | 3,712 | 3,873 |
| United States Treasury Note/Bond | 3.625% | 2/15/21 | 3,566 | 4,021 |
| United States Treasury Note/Bond | 7.875% | 2/15/21 | 306 | 458 |
| United States Treasury Note/Bond | 3.125% | 5/15/21 | 3,867 | 4,182 |
| United States Treasury Note/Bond | 8.125% | 5/15/21 | 207 | 316 |
| United States Treasury Note/Bond | 2.125% | 8/15/21 | 1,925 | 1,906 |
| 163,032 | ||||
| Agency Bonds and Notes (8.1%) | ||||
| 1 Federal Agricultural Mortgage Corp. | 2.125% | 9/15/15 | 50 | 52 |
| 1 Federal Agricultural Mortgage Corp. | 2.000% | 7/27/16 | 50 | 51 |
| 1 Federal Farm Credit Bank | 1.625% | 11/19/14 | 50 | 52 |
| 1 Federal Farm Credit Bank | 1.500% | 11/16/15 | 50 | 51 |
| 1 Federal Farm Credit Bank | 4.875% | 1/17/17 | 500 | 587 |
| 1 Federal Home Loan Banks | 4.500% | 11/14/14 | 100 | 112 |
| 1 Federal Home Loan Banks | 2.750% | 12/12/14 | 675 | 721 |
| 1 Federal Home Loan Banks | 3.125% | 3/11/16 | 425 | 463 |
| 1 Federal Home Loan Banks | 5.375% | 5/18/16 | 485 | 579 |
| 1 Federal Home Loan Banks | 4.750% | 12/16/16 | 240 | 281 |
| 1 Federal Home Loan Banks | 4.125% | 3/13/20 | 660 | 738 |
| 1 Federal Home Loan Banks | 5.625% | 6/11/21 | 400 | 495 |
| 1 Federal Home Loan Mortgage Corp. | 4.500% | 1/15/15 | 660 | 745 |
| 1 Federal Home Loan Mortgage Corp. | 5.050% | 1/26/15 | 50 | 57 |
| 1 Federal Home Loan Mortgage Corp. | 2.875% | 2/9/15 | 450 | 484 |
| 1 Federal Home Loan Mortgage Corp. | 1.750% | 9/10/15 | 1,150 | 1,189 |
| 1 Federal Home Loan Mortgage Corp. | 2.500% | 5/27/16 | 575 | 610 |
| 1 Federal Home Loan Mortgage Corp. | 5.500% | 7/18/16 | 250 | 301 |
| 1 Federal Home Loan Mortgage Corp. | 2.000% | 8/25/16 | 525 | 544 |
| 1 Federal Home Loan Mortgage Corp. | 5.000% | 2/16/17 | 100 | 118 |
| 1 Federal Home Loan Mortgage Corp. | 5.000% | 4/18/17 | 200 | 237 |
| 1 Federal Home Loan Mortgage Corp. | 5.125% | 11/17/17 | 225 | 270 |
| 1 Federal Home Loan Mortgage Corp. | 3.750% | 3/27/19 | 425 | 477 |
| 1 Federal National Mortgage Assn. | 2.625% | 11/20/14 | 600 | 639 |
| 1 Federal National Mortgage Assn. | 5.000% | 4/15/15 | 460 | 530 |
| 1 Federal National Mortgage Assn. | 2.375% | 7/28/15 | 1,075 | 1,140 |
| 1 Federal National Mortgage Assn. | 4.375% | 10/15/15 | 175 | 199 |
| 1 Federal National Mortgage Assn. | 1.625% | 10/26/15 | 75 | 77 |
| 1 Federal National Mortgage Assn. | 5.000% | 3/15/16 | 25 | 29 |
| 1 Federal National Mortgage Assn. | 2.375% | 4/11/16 | 100 | 105 |
| 1 Federal National Mortgage Assn. | 4.875% | 12/15/16 | 100 | 118 |
| 1 Federal National Mortgage Assn. | 5.000% | 2/13/17 | 380 | 450 |
| 1 Federal National Mortgage Assn. | 5.000% | 5/11/17 | 465 | 552 |
| 1 Federal National Mortgage Assn. | 5.375% | 6/12/17 | 535 | 647 |
| 1 Federal National Mortgage Assn. | 0.000% | 10/9/19 | 450 | 334 |
| 1 Financing Corp. Fico | 10.700% | 10/6/17 | 100 | 150 |
| Private Export Funding Corp. | 3.050% | 10/15/14 | 175 | 187 |
| Private Export Funding Corp. | 2.250% | 12/15/17 | 25 | 26 |
| 1 Tennessee Valley Authority | 5.500% | 7/18/17 | 125 | 151 |
| 1 Tennessee Valley Authority | 3.875% | 2/15/21 | 75 | 83 |
| 14,631 | ||||
| Total U.S. Government and Agency Obligations (Cost $168,171) | 177,663 | |||
32
| Intermediate-Term Government Bond Index Fund | |||
| Market | |||
| Value | |||
| Coupon | Shares | ($000) | |
| Temporary Cash Investment (2.2%) | |||
| Money Market Fund (2.2%) | |||
| 2 Vanguard Market Liquidity Fund (Cost $4,051) | 0.132% | 4,050,914 | 4,051 |
| Total Investments (100.3%) (Cost $172,222) | 181,714 | ||
| Other Assets and Liabilities (-0.3%) | |||
| Other Assets | 4,947 | ||
| Liabilities | (5,449) | ||
| (502) | |||
| Net Assets (100%) | 181,212 | ||
| At August 31, 2011, net assets consisted of: | |||
| Amount | |||
| ($000) | |||
| Paid-in Capital | 171,492 | ||
| Overdistributed Net Investment Income | (6) | ||
| Accumulated Net Realized Gains | 234 | ||
| Unrealized Appreciation (Depreciation) | 9,492 | ||
| Net Assets | 181,212 | ||
| Signal Shares—Net Assets | |||
| Applicable to 380,536 outstanding $.001 par value shares of | |||
| beneficial interest (unlimited authorization) | 8,348 | ||
| Net Asset Value Per Share—Signal Shares | $21.94 | ||
| Institutional Shares—Net Assets | |||
| Applicable to 4,325,977 outstanding $.001 par value shares of | |||
| beneficial interest (unlimited authorization) | 117,694 | ||
| Net Asset Value Per Share—Institutional Shares | $27.21 | ||
| ETF Shares—Net Assets | |||
| Applicable to 850,000 outstanding $.001 par value shares of | |||
| beneficial interest (unlimited authorization) | 55,170 | ||
| Net Asset Value Per Share—ETF Shares | $64.91 | ||
See Note A in Notes to Financial Statements.
1 The issuer operates under a congressional charter; its securities are not backed by the full faith and credit of the U.S. government.
2 Affiliated money market fund available only to Vanguard funds and certain trusts and accounts managed by Vanguard. Rate shown is the 7-day yield.
See accompanying Notes, which are an integral part of the Financial Statements.
33
Intermediate-Term Government Bond Index Fund
Statement of Operations
| Year Ended | |
| August 31, 2011 | |
| ($000) | |
| Investment Income | |
| Income | |
| Interest1 | 2,937 |
| Total Income | 2,937 |
| Expenses | |
| The Vanguard Group—Note B | |
| Investment Advisory Services | 8 |
| Management and Administrative—Signal Shares | 3 |
| Management and Administrative—Institutional Shares | 19 |
| Management and Administrative—ETF Shares | 19 |
| Marketing and Distribution—Signal Shares | — |
| Marketing and Distribution—Institutional Shares | 25 |
| Marketing and Distribution—ETF Shares | 11 |
| Custodian Fees | 3 |
| Auditing Fees | 41 |
| Shareholders’ Reports—Signal Shares | — |
| Shareholders’ Reports—Institutional Shares | 1 |
| Shareholders’ Reports—ETF Shares | 8 |
| Total Expenses | 138 |
| Net Investment Income | 2,799 |
| Realized Net Gain (Loss) on Investment Securities Sold | 994 |
| Change in Unrealized Appreciation (Depreciation) of Investment Securities | 5,068 |
| Net Increase (Decrease) in Net Assets Resulting from Operations | 8,861 |
| 1 Interest income from an affiliated company of the fund was $3,000. | |
See accompanying Notes, which are an integral part of the Financial Statements.
34
Intermediate-Term Government Bond Index Fund
Statement of Changes in Net Assets
| November 19, | ||
| Year Ended | 20091 to | |
| August 31, | August 31, | |
| 2011 | 2010 | |
| ($000) | ($000) | |
| Increase (Decrease) in Net Assets | ||
| Operations | ||
| Net Investment Income | 2,799 | 883 |
| Realized Net Gain (Loss) | 994 | 988 |
| Change in Unrealized Appreciation (Depreciation) | 5,068 | 4,424 |
| Net Increase (Decrease) in Net Assets Resulting from Operations | 8,861 | 6,295 |
| Distributions | ||
| Net Investment Income | ||
| Signal Shares | (73) | (6) |
| Institutional Shares | (1,914) | (537) |
| ETF Shares | (819) | (339) |
| Realized Capital Gain2 | ||
| Signal Shares | (22) | — |
| Institutional Shares | (814) | — |
| ETF Shares | (308) | — |
| Total Distributions | (3,950) | (882) |
| Capital Share Transactions | ||
| Signal Shares | 4,662 | 3,365 |
| Institutional Shares | 41,161 | 69,740 |
| ETF Shares | 15,628 | 36,332 |
| Net Increase (Decrease) from Capital Share Transactions | 61,451 | 109,437 |
| Total Increase (Decrease) | 66,362 | 114,850 |
| Net Assets | ||
| Beginning of Period | 114,850 | — |
| End of Period3 | 181,212 | 114,850 |
1 Inception.
2 Includes fiscal 2011 short-term gain distributions totaling $1,144,000. Short-term gain distributions are treated as ordinary income dividends for tax purposes.
3 Net Assets—End of Period includes undistributed (overdistributed) net investment income of ($6,000) and $1,000.
See accompanying Notes, which are an integral part of the Financial Statements.
35
Intermediate-Term Government Bond Index Fund
Financial Highlights
| Signal Shares | ||
| Year | Aug. 4, | |
| Ended | 20101 to | |
| August 31, | Aug. 31, | |
| For a Share Outstanding Throughout Each Period | 2011 | 2010 |
| Net Asset Value, Beginning of Period | $21.49 | $21.11 |
| Investment Operations | ||
| Net Investment Income | .441 | .033 |
| Net Realized and Unrealized Gain (Loss) on Investments | .658 | .385 |
| Total from Investment Operations | 1.099 | .418 |
| Distributions | ||
| Dividends from Net Investment Income | (.441) | (.038) |
| Distributions from Realized Capital Gains | (.208) | — |
| Total Distributions | (.649) | (.038) |
| Net Asset Value, End of Period | $21.94 | $21.49 |
| Total Return | 5.31% | 1.98% |
| Ratios/Supplemental Data | ||
| Net Assets, End of Period (Millions) | $8 | $3 |
| Ratio of Total Expenses to Average Net Assets | 0.13% | 0.15%2 |
| Ratio of Net Investment Income to Average Net Assets | 2.10% | 2.29%2 |
| Portfolio Turnover Rate3 | 41% | 106% |
1 Inception.
2 Annualized.
3 Excludes the value of portfolio securities received or delivered as a result of in-kind purchases or redemptions of the fund’s capital shares, including ETF Creation Units.
See accompanying Notes, which are an integral part of the Financial Statements.
36
Intermediate-Term Government Bond Index Fund
Financial Highlights
| Institutional Shares | ||
| Year | March 19, | |
| Ended | 20101 to | |
| August 31, | Aug. 31, | |
| For a Share Outstanding Throughout Each Period | 2011 | 2010 |
| Net Asset Value, Beginning of Period | $26.65 | $25.01 |
| Investment Operations | ||
| Net Investment Income | .557 | .239 |
| Net Realized and Unrealized Gain (Loss) on Investments | .819 | 1.674 |
| Total from Investment Operations | 1.376 | 1.913 |
| Distributions | ||
| Dividends from Net Investment Income | (.558) | (.273) |
| Distributions from Realized Capital Gains | (.258) | — |
| Total Distributions | (.816) | (.273) |
| Net Asset Value, End of Period | $27.21 | $26.65 |
| Total Return | 5.36% | 7.69% |
| Ratios/Supplemental Data | ||
| Net Assets, End of Period (Millions) | $118 | $73 |
| Ratio of Total Expenses to Average Net Assets | 0.09% | 0.09%2 |
| Ratio of Net Investment Income to Average Net Assets | 2.14% | 2.35%2 |
| Portfolio Turnover Rate3 | 41% | 106% |
1 Inception.
2 Annualized.
3 Excludes the value of portfolio securities received or delivered as a result of in-kind purchases or redemptions of the fund’s capital shares, including ETF Creation Units.
See accompanying Notes, which are an integral part of the Financial Statements.
37
Intermediate-Term Government Bond Index Fund
Financial Highlights
| ETF Shares | ||
| Year | Nov. 19, | |
| Ended | 20091 to | |
| August 31, | Aug. 31, | |
| For a Share Outstanding Throughout Each Period | 2011 | 2010 |
| Net Asset Value, Beginning of Period | $63.58 | $60.00 |
| Investment Operations | ||
| Net Investment Income | 1.301 | .961 |
| Net Realized and Unrealized Gain (Loss) on Investments | 1.949 | 3.579 |
| Total from Investment Operations | 3.250 | 4.540 |
| Distributions | ||
| Dividends from Net Investment Income | (1.304) | (.960) |
| Distributions from Realized Capital Gains | (.616) | — |
| Total Distributions | (1.920) | (.960) |
| Net Asset Value, End of Period | $64.91 | $63.58 |
| Total Return | 5.30% | 7.65% |
| Ratios/Supplemental Data | ||
| Net Assets, End of Period (Millions) | $55 | $38 |
| Ratio of Total Expenses to Average Net Assets | 0.14% | 0.15%2 |
| Ratio of Net Investment Income to Average Net Assets | 2.09% | 2.29%2 |
| Portfolio Turnover Rate3 | 41% | 106% |
1 Inception.
2 Annualized.
3 Excludes the value of portfolio securities received or delivered as a result of in-kind purchases or redemptions of the fund’s capital shares, including ETF Creation Units.
See accompanying Notes, which are an integral part of the Financial Statements.
38
Intermediate-Term Government Bond Index Fund
Notes to Financial Statements
Vanguard Intermediate-Term Government Bond Index Fund is registered under the Investment Company Act of 1940 as an open-end investment company, or mutual fund. The fund offers three classes of shares: Signal Shares, Institutional Shares, and ETF Shares. Signal Shares and Institutional Shares are designed for investors who meet certain administrative, service, and account-size criteria. ETF Shares are listed for trading on Nasdaq; they can be purchased and sold through a broker.
A. The following significant accounting policies conform to generally accepted accounting principles for U.S. mutual funds. The fund consistently follows such policies in preparing its financial statements.
1. Security Valuation: Bonds, and temporary cash investments acquired over 60 days to maturity, are valued using the latest bid prices or using valuations based on a matrix system (which considers such factors as security prices, yields, maturities, and ratings), both as furnished by independent pricing services. Investments in Vanguard Market Liquidity Fund are valued at that fund’s net asset value. Other temporary cash investments are valued at amortized cost, which approximates market value. Securities for which market quotations are not readily available, or whose values have been affected by events occurring before the fund’s pricing time but after the close of the securities’ primary markets, are valued by methods deemed by the board of trustees to represent fair value.
2. Federal Income Taxes: The fund intends to continue to qualify as a regulated investment company and distribute all of its taxable income. Management has analyzed the fund’s tax positions taken for all open federal income tax years (August 31, 2010–2011), and has concluded that no provision for federal income tax is required in the fund’s financial statements.
3. Distributions: Distributions to shareholders are recorded on the ex-dividend date.
4. Other: Interest income includes income distributions received from Vanguard Market Liquidity Fund and is accrued daily. Premiums and discounts on debt securities purchased are amortized and accreted, respectively, to interest income over the lives of the respective securities. Security transactions are accounted for on the date securities are bought or sold. Costs used to determine realized gains (losses) on the sale of investment securities are those of the specific securities sold. Fees, if any, assessed on purchases of capital shares are credited to paid-in capital.
Each class of shares has equal rights as to assets and earnings, except that each class separately bears certain class-specific expenses related to maintenance of shareholder accounts (included in Management and Administrative expenses) and shareholder reporting. Marketing and distribution expenses are allocated to each class of shares based on a method approved by the board of trustees. Income, other non-class-specific expenses, and gains and losses on investments are allocated to each class of shares based on its relative net assets.
B. The Vanguard Group furnishes at cost investment advisory, corporate management, administrative, marketing, and distribution services. The costs of such services are allocated to the fund under methods approved by the board of trustees. The fund has committed to provide up to 0.40% of its net assets in capital contributions to Vanguard. At August 31, 2011, the fund had contributed capital of $27,000 to Vanguard (included in Other Assets), representing 0.01% of the fund’s net assets and 0.01% of Vanguard’s capitalization. The fund’s trustees and officers are also directors and officers of Vanguard.
39
Intermediate-Term Government Bond Index Fund
C. Various inputs may be used to determine the value of the fund’s investments. These inputs are summarized in three broad levels for financial statement purposes. The inputs or methodologies used to value securities are not necessarily an indication of the risk associated with investing in those securities.
Level 1—Quoted prices in active markets for identical securities.
Level 2—Other significant observable inputs (including quoted prices for similar securities, interest rates, prepayment speeds, credit risk, etc.).
Level 3—Significant unobservable inputs (including the fund’s own assumptions used to determine the fair value of investments).
The following table summarizes the fund’s investments as of August 31, 2011, based on the inputs used to value them:
| Level 1 | Level 2 | Level 3 | |
| Investments | ($000) | ($000) | ($000) |
| U.S. Government and Agency Obligations | — | 177,663 | — |
| Temporary Cash Investments | 4,051 | — | — |
| Total | 4,051 | 177,663 | — |
D. Distributions are determined on a tax basis and may differ from net investment income and realized capital gains for financial reporting purposes. Differences may be permanent or temporary. Permanent differences are reclassified among capital accounts in the financial statements to reflect their tax character. Temporary differences arise when certain items of income, expense, gain, or loss are recognized in different periods for financial statement and tax purposes; these differences will reverse at some time in the future. Differences in classification may also result from the treatment of short-term gains as ordinary income for tax purposes.
During the year ended August 31, 2011, the fund realized $491,000 of net capital gains resulting from in-kind redemptions—in which shareholders exchanged fund shares for securities held by the fund rather than for cash. Because such gains are not taxable to the fund, and are not distributed to shareholders, they have been reclassified from accumulated net realized gains to paid-in capital.
The fund used a tax accounting practice to treat a portion of the price of capital shares redeemed during the year as distributions from realized capital gains. Accordingly, the fund has reclassified $113,000 from accumulated net realized gains to paid-in capital.
For tax purposes, at August 31, 2011, the fund had short-term and long-term capital gains of $108,000 and $126,000, respectively, available for distribution. Short-term gain distributions are treated as ordinary income dividends for tax purposes.
At August 31, 2011, the cost of investment securities for tax purposes was $172,222,000. Net unrealized appreciation of investment securities for tax purposes was $9,492,000, consisting of unrealized gains of $9,507,000 on securities that had risen in value since their purchase and $15,000 in unrealized losses on securities that had fallen in value since their purchase.
40
Intermediate-Term Government Bond Index Fund
E. During the year ended August 31, 2011, the fund purchased $126,039,000 of investment securities and sold $65,948,000 of investment securities, other than temporary cash investments.
F. Capital share transactions for each class of shares were:
| Year Ended | Inception1 to | |||
| August 31, 2011 | August 31, 2010 | |||
| Amount | Shares | Amount | Shares | |
| ($000) | (000) | ($000) | (000) | |
| Signal Shares | ||||
| Issued | 6,111 | 289 | 3,359 | 158 |
| Issued in Lieu of Cash Distributions | 96 | 5 | 6 | — |
| Redeemed | (1,545) | (71) | — | — |
| Net Increase (Decrease)—Signal Shares | 4,662 | 223 | 3,365 | 158 |
| Institutional Shares | ||||
| Issued | 41,367 | 1,583 | 69,387 | 2,737 |
| Issued in Lieu of Cash Distributions | 1,676 | 65 | 353 | 14 |
| Redeemed | (1,882) | (73) | — | — |
| Net Increase (Decrease)—Institutional Shares | 41,161 | 1,575 | 69,740 | 2,751 |
| ETF Shares | ||||
| Issued | 28,247 | 450 | 36,332 | 600 |
| Issued in Lieu of Cash Distributions | — | — | — | — |
| Redeemed | (12,619) | (200) | — | — |
| Net Increase (Decrease)—ETF Shares | 15,628 | 250 | 36,332 | 600 |
1 Inception was November 19, 2009, for ETF Shares, March 19, 2010, for Institutional Shares, and August 4, 2010, for Signal Shares.
G. In preparing the financial statements as of August 31, 2011, management considered the impact of subsequent events for potential recognition or disclosure in these financial statements.
41
Long-Term Government Bond Index Fund
Fund Profile
As of August 31, 2011
| Share-Class Characteristics | |||
| Signal | Institutional | ETF | |
| Shares | Shares | Shares | |
| Ticker Symbol | VLGSX | VLGIX | VGLT |
| Expense Ratio1 | 0.15% | 0.09% | 0.15% |
| 30-Day SEC Yield | 3.24% | 3.24% | 3.26% |
| Financial Attributes | |||
| Barclays | |||
| Long Gov | Barclays | ||
| Float Adj | Aggregate | ||
| Fund | Index | FA Index | |
| Number of Bonds | 57 | 102 | 7,873 |
| Yield to Maturity | |||
| (before expenses) | 3.3% | 3.3% | 2.3% |
| Average Coupon | 5.0% | 5.0% | 4.1% |
| Average Duration | 15.2 years | 15.2 years | 5.1 years |
| Average Effective | |||
| Maturity | 23.4 years | 23.5 years | 7.3 years |
| Short-Term | |||
| Reserves | 2.0% | — | — |
| Sector Diversification (% of portfolio) | |||
| Treasury/Agency | 100.0% | ||
The agency and mortgage-backed securities sectors may include issues from government-sponsored enterprises; such issues are not backed by the full faith and credit of the U.S. government.
| Distribution by Maturity (% of portfolio) | |
| Under 1 Year | 0.9% |
| 10 - 20 Years | 34.6 |
| 20 - 30 Years | 63.9 |
| Over 30 Years | 0.6 |
| Distribution by Credit Quality (% of portfolio) | |
| U.S. Government | 99.1% |
| Aaa | 0.4 |
| Aa | 0.5 |
| For information about these ratings, see the Glossary entry for Credit Quality. | |
Investment Focus
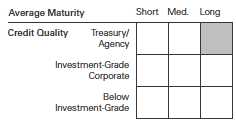
1 The expense ratios shown are from the prospectus dated December 28, 2010, and represent estimated costs for the current fiscal year. For the fiscal year ended August 31, 2011, the expense ratios were 0.14% for Signal Shares, 0.09% for Institutional Shares, and 0.14% for ETF Shares.
42
Long-Term Government Bond Index Fund
Performance Summary
All of the returns in this report represent past performance, which is not a guarantee of future results that may be achieved by the fund. (Current performance may be lower or higher than the performance data cited. For performance data current to the most recent month-end, visit our website at vanguard.com/performance.) Note, too, that both investment returns and principal value can fluctuate widely, so an investor’s shares, when sold, could be worth more or less than their original cost. The returns shown do not reflect taxes that a shareholder would pay on fund distributions or on the sale of fund shares.
Cumulative Performance: November 19, 2009, Through August 31, 2011
Initial Investment of $10,000
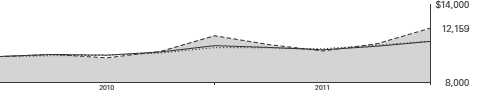
| Average Annual Total Returns | |||
| Periods Ended August 31, 2011 | |||
| Since | Final Value | ||
| One | Inception | of a $10,000 | |
| Year | (11/19/2009) | Investment | |
| Long-Term Government Bond Index | |||
| Fund ETF Shares Net Asset Value | 4.63% | 11.60% | $12,159 |
| Long-Term Government Bond Index | |||
| Fund ETF Shares Market Price | 4.61 | 11.63 | 12,164 |
| Spliced Barclays Capital U.S. | |||
| Aggregate Float Adjusted Index | 4.62 | 6.49 | 11,184 |
| Barclays Capital U.S. Long Government | |||
| Float Adjusted Index | 5.11 | 11.84 | 12,205 |
| General U.S. Government Funds | |||
| Average | 3.06 | 6.45 | 11,178 |
"Since Inception" performance is calculated from the ETF Shares’ inception date for both the fund and its comparative standards.
Spliced Barclays Capital U.S. Aggregate Float Adjusted Index: Barclays Capital U.S. Aggregate Bond Index through December 31, 2009; Barclays Capital U.S. Aggregate Float Adjusted Index thereafter.
General U.S. Government Funds Average: Derived from data provided by Lipper Inc.
See Financial Highlights for dividend and capital gains information.
43
Long-Term Government Bond Index Fund
| Average Annual Total Returns | |||
| Periods Ended August 31, 2011 | |||
| Since | Final Value | ||
| One | Inception | of a $10,000 | |
| Year | (3/1/2010) | Investment | |
| Long-Term Government Bond Index | |||
| Fund Signal Shares | 4.66% | 14.93% | $12,324 |
| Barclays Capital U.S. | |||
| Aggregate Float Adjusted Index | 4.62 | 7.06 | 11,078 |
| Barclays Capital U.S. Long | |||
| Government Float Adjusted Index | 5.11 | 15.20 | 12,367 |
"Since Inception" performance is calculated from the Signal Shares’ inception date for both the fund and its comparative standards.
| Since | Final Value | ||
| One | Inception | of a $5,000,000 | |
| Year | (7/30/2010) | Investment | |
| Long-Term Government Bond Index | |||
| Fund Institutional Shares | 4.67% | 10.89% | $5,594,824 |
| Barclays Capital U.S. Aggregate | |||
| Float Adjusted Index | 4.62 | 5.54 | 5,302,180 |
| Barclays Capital U.S. Long Government | |||
| Float Adjusted Index | 5.11 | 11.06 | 5,604,040 |
"Since Inception" performance is calculated from the Institutional Shares’ inception date for both the fund and its comparative standards.
| Cumulative Returns of ETF Shares: November 19, 2009, Through August 31, 2011 | ||
| Since | ||
| One | Inception | |
| Year | (11/19/2009) | |
| Long-Term Government Bond Index Fund | ||
| ETF Shares Market Price | 4.61% | 21.64% |
| Long-Term Government Bond Index Fund | ||
| ETF Shares Net Asset Value | 4.63 | 21.59 |
| Barclays Capital U.S. Long Government Float | ||
| Adjusted Index | 5.11 | 22.05 |
"Since Inception" performance is calculated from the ETF Shares’ inception date for both the fund and its comparative standards.
| Fiscal-Year Total Returns (%): November 19, 2009, Through August 31, 2011 | ||
| Barclays | ||
| Long Gov | ||
| Float Adj | ||
| ETF Shares Net Asset Value | Index | |
| Fiscal Year | Total Returns | Total Returns |
| 2010 | 16.21% | 16.12% |
| 2011 | 4.63 | 5.11 |
44
Long-Term Government Bond Index Fund
Average Annual Total Returns: Periods Ended June 30, 2011
This table presents returns through the latest calendar quarter—rather than through the end of the fiscal period.
Securities and Exchange Commission rules require that we provide this information.
| Since Inception | |||||
| Inception Date | One Year | Income | Capital | Total | |
| Signal Shares | 3/1/2010 | -0.98% | 3.86% | 2.89% | 6.75% |
| Institutional Shares | 7/30/2010 | — | 3.34 | -4.29 | -0.95 |
| ETF Shares | 11/19/2009 | ||||
| Market Price | -1.02 | 4.67 | |||
| Net Asset Value | -1.01 | 4.67 |
45
Long-Term Government Bond Index Fund
Financial Statements
Statement of Net Assets
As of August 31, 2011
The fund reports a complete list of its holdings in regulatory filings four times in each fiscal year, at the quarter-ends. For the second and fourth fiscal quarters, the lists appear in the fund’s semiannual and annual reports to shareholders. For the first and third fiscal quarters, the fund files the lists with the Securities and Exchange Commission on Form N-Q. Shareholders can look up the fund’s Forms N-Q on the SEC’s website at sec.gov. Forms N-Q may also be reviewed and copied at the SEC’s Public Reference Room (see the back cover of this report for further information).
| Face | Market | |||
| Maturity | Amount | Value | ||
| Coupon | Date | ($000) | ($000) | |
| U.S. Government and Agency Obligations (98.4%) | ||||
| U.S. Government Securities (91.5%) | ||||
| United States Treasury Note/Bond | 8.000% | 11/15/21 | 1,063 | 1,624 |
| United States Treasury Note/Bond | 7.250% | 8/15/22 | 546 | 803 |
| United States Treasury Note/Bond | 7.625% | 11/15/22 | 765 | 1,158 |
| United States Treasury Note/Bond | 7.125% | 2/15/23 | 1,054 | 1,545 |
| United States Treasury Note/Bond | 6.250% | 8/15/23 | 2,161 | 2,983 |
| United States Treasury Note/Bond | 7.500% | 11/15/24 | 1,320 | 2,027 |
| United States Treasury Note/Bond | 7.625% | 2/15/25 | 680 | 1,057 |
| United States Treasury Note/Bond | 6.875% | 8/15/25 | 1,308 | 1,928 |
| United States Treasury Note/Bond | 6.000% | 2/15/26 | 861 | 1,182 |
| United States Treasury Note/Bond | 6.750% | 8/15/26 | 614 | 903 |
| United States Treasury Note/Bond | 6.500% | 11/15/26 | 1,205 | 1,739 |
| United States Treasury Note/Bond | 6.625% | 2/15/27 | 293 | 429 |
| United States Treasury Note/Bond | 6.375% | 8/15/27 | 403 | 579 |
| United States Treasury Note/Bond | 6.125% | 11/15/27 | 1,401 | 1,968 |
| United States Treasury Note/Bond | 5.500% | 8/15/28 | 538 | 712 |
| United States Treasury Note/Bond | 5.250% | 11/15/28 | 1,089 | 1,404 |
| United States Treasury Note/Bond | 5.250% | 2/15/29 | 1,440 | 1,857 |
| United States Treasury Note/Bond | 6.125% | 8/15/29 | 874 | 1,238 |
| United States Treasury Note/Bond | 6.250% | 5/15/30 | 1,262 | 1,818 |
| United States Treasury Note/Bond | 5.375% | 2/15/31 | 1,262 | 1,661 |
| United States Treasury Note/Bond | 4.500% | 2/15/36 | 2,065 | 2,421 |
| United States Treasury Note/Bond | 4.750% | 2/15/37 | 1,875 | 2,275 |
| United States Treasury Note/Bond | 5.000% | 5/15/37 | 2,080 | 2,619 |
| United States Treasury Note/Bond | 4.375% | 2/15/38 | 1,059 | 1,213 |
| United States Treasury Note/Bond | 4.500% | 5/15/38 | 1,876 | 2,191 |
| United States Treasury Note/Bond | 3.500% | 2/15/39 | 3,360 | 3,305 |
| United States Treasury Note/Bond | 4.250% | 5/15/39 | 4,047 | 4,531 |
| United States Treasury Note/Bond | 4.500% | 8/15/39 | 3,260 | 3,797 |
| United States Treasury Note/Bond | 4.375% | 11/15/39 | 3,992 | 4,556 |
| United States Treasury Note/Bond | 4.625% | 2/15/40 | 4,072 | 4,836 |
| United States Treasury Note/Bond | 4.375% | 5/15/40 | 4,338 | 4,949 |
| United States Treasury Note/Bond | 3.875% | 8/15/40 | 4,878 | 5,114 |
| United States Treasury Note/Bond | 4.250% | 11/15/40 | 4,712 | 5,266 |
| United States Treasury Note/Bond | 4.750% | 2/15/41 | 4,908 | 5,951 |
| United States Treasury Note/Bond | 4.375% | 5/15/41 | 4,019 | 4,592 |
| United States Treasury Note/Bond | 3.750% | 8/15/41 | 1,600 | 1,640 |
| 87,871 |
46
| Long-Term Government Bond Index Fund | |||||
| Face | Market | ||||
| Maturity | Amount | Value | |||
| Coupon | Date | ($000) | ($000) | ||
| Agency Bonds and Notes (6.9%) | |||||
| 1 | Federal Home Loan Banks | 5.500% | 7/15/36 | 390 | 474 |
| 1 | Federal Home Loan Mortgage Corp. | 6.750% | 9/15/29 | 235 | 330 |
| 1 | Federal Home Loan Mortgage Corp. | 6.750% | 3/15/31 | 490 | 694 |
| 1 | Federal Home Loan Mortgage Corp. | 6.250% | 7/15/32 | 410 | 559 |
| 1 | Federal National Mortgage Assn. | 6.250% | 5/15/29 | 100 | 134 |
| 1 | Federal National Mortgage Assn. | 7.125% | 1/15/30 | 470 | 685 |
| 1 | Federal National Mortgage Assn. | 7.250% | 5/15/30 | 685 | 1,016 |
| 1 | Federal National Mortgage Assn. | 6.625% | 11/15/30 | 330 | 462 |
| 1 | Federal National Mortgage Assn. | 5.625% | 7/15/37 | 100 | 126 |
| Israel Government AID Bond | 5.500% | 9/18/23 | 350 | 429 | |
| Israel Government AID Bond | 5.500% | 4/26/24 | 200 | 246 | |
| Private Export Funding Corp. | 4.300% | 12/15/21 | 25 | 28 | |
| 1 | Tennessee Valley Authority | 6.750% | 11/1/25 | 180 | 253 |
| 1 | Tennessee Valley Authority | 4.650% | 6/15/35 | 125 | 135 |
| 1 | Tennessee Valley Authority | 5.880% | 4/1/36 | 50 | 63 |
| 1 | Tennessee Valley Authority | 5.500% | 6/15/38 | 150 | 182 |
| 1 | Tennessee Valley Authority | 5.250% | 9/15/39 | 207 | 243 |
| 1 | Tennessee Valley Authority | 4.875% | 1/15/48 | 120 | 136 |
| 1 | Tennessee Valley Authority | 5.375% | 4/1/56 | 205 | 251 |
| 1 | Tennessee Valley Authority | 4.625% | 9/15/60 | 150 | 161 |
| 6,607 | |||||
| Total U.S. Government and Agency Obligations (Cost $86,348) | 94,478 | ||||
| Shares | |||||
| Temporary Cash Investment (2.0%) | |||||
| Money Market Fund (2.0%) | |||||
| 2 | Vanguard Market Liquidity Fund (Cost $1,955) | 0.132% | 1,955,073 | 1,955 | |
| Total Investments (100.4%) (Cost $88,303) | 96,433 | ||||
| Other Assets and Liabilities (-0.4%) | |||||
| Other Assets | 2,665 | ||||
| Liabilities | (3,068) | ||||
| (403) | |||||
| Net Assets (100%) | 96,030 | ||||
47
| Long-Term Government Bond Index Fund | |
| At August 31, 2011, net assets consisted of: | |
| Amount | |
| ($000) | |
| Paid-in Capital | 89,970 |
| Overdistributed Net Investment Income | (1) |
| Accumulated Net Realized Losses | (2,069) |
| Unrealized Appreciation (Depreciation) | 8,130 |
| Net Assets | 96,030 |
| Signal Shares—Net Assets | |
| Applicable to 53,683 outstanding $.001 par value shares of | |
| beneficial interest (unlimited authorization) | 1,230 |
| Net Asset Value Per Share—Signal Shares | $22.91 |
| Institutional Shares—Net Assets | |
| Applicable to 2,090,833 outstanding $.001 par value shares of | |
| beneficial interest (unlimited authorization) | 60,765 |
| Net Asset Value Per Share—Institutional Shares | $29.06 |
| ETF Shares—Net Assets | |
| Applicable to 500,000 outstanding $.001 par value shares of | |
| beneficial interest (unlimited authorization) | 34,035 |
| Net Asset Value Per Share—ETF Shares | $68.07 |
See Note A in Notes to Financial Statements.
1 The issuer operates under a congressional charter; its securities are not backed by the full faith and credit of the U.S. government.
2 Affiliated money market fund available only to Vanguard funds and certain trusts and accounts managed by Vanguard. Rate shown is the 7-day yield.
See accompanying Notes, which are an integral part of the Financial Statements.
48
Long-Term Government Bond Index Fund
Statement of Operations
| Year Ended | |
| August 31, 2011 | |
| ($000) | |
| Investment Income | |
| Income | |
| Interest1 | 3,253 |
| Total Income | 3,253 |
| Expenses | |
| The Vanguard Group—Note B | |
| Investment Advisory Services | 3 |
| Management and Administrative—Signal Shares | 1 |
| Management and Administrative—Institutional Shares | 12 |
| Management and Administrative—ETF Shares | 24 |
| Marketing and Distribution—Signal Shares | — |
| Marketing and Distribution—Institutional Shares | 2 |
| Marketing and Distribution—ETF Shares | 12 |
| Custodian Fees | 3 |
| Auditing Fees | 41 |
| Shareholders’ Reports—Signal Shares | — |
| Shareholders’ Reports—Institutional Shares | — |
| Shareholders’ Reports—ETF Shares | 3 |
| Total Expenses | 101 |
| Net Investment Income | 3,152 |
| Realized Net Gain (Loss) on Investment Securities Sold | (3,894) |
| Change in Unrealized Appreciation (Depreciation) of Investment Securities | 2,760 |
| Net Increase (Decrease) in Net Assets Resulting from Operations | 2,018 |
| 1 Interest income from an affiliated company of the fund was $2,000. | |
See accompanying Notes, which are an integral part of the Financial Statements.
49
Long-Term Government Bond Index Fund
Statement of Changes in Net Assets
| November 19, | ||
| Year Ended | 20091 to | |
| August 31, | August 31, | |
| 2011 | 2010 | |
| ($000) | ($000) | |
| Increase (Decrease) in Net Assets | ||
| Operations | ||
| Net Investment Income | 3,152 | 586 |
| Realized Net Gain (Loss) | (3,894) | 133 |
| Change in Unrealized Appreciation (Depreciation) | 2,760 | 5,370 |
| Net Increase (Decrease) in Net Assets Resulting from Operations | 2,018 | 6,089 |
| Distributions | ||
| Net Investment Income | ||
| Signal Shares | (41) | (19) |
| Institutional Shares | (1,316) | (11) |
| ETF Shares | (1,798) | (554) |
| Realized Capital Gain2 | ||
| Signal Shares | (1) | — |
| Institutional Shares | (22) | — |
| ETF Shares | (76) | — |
| Total Distributions | (3,254) | (584) |
| Capital Share Transactions | ||
| Signal Shares | 22 | 1,037 |
| Institutional Shares | 46,507 | 8,532 |
| ETF Shares | (37,116) | 72,779 |
| Net Increase (Decrease) from Capital Share Transactions | 9,413 | 82,348 |
| Total Increase (Decrease) | 8,177 | 87,853 |
| Net Assets | ||
| Beginning of Period | 87,853 | — |
| End of Period3 | 96,030 | 87,853 |
1 Inception.
2 Includes fiscal 2011 short-term gain distributions totaling $99,000. Short-term gain distributions are treated as ordinary income dividends for tax purposes.
3 Net Assets—End of Period includes undistributed (overdistributed) net investment income of ($1,000) and $2,000.
See accompanying Notes, which are an integral part of the Financial Statements.
50
Long-Term Government Bond Index Fund
Financial Highlights
| Signal Shares | ||
| Year | March 1, | |
| Ended | 20101 to | |
| August 31, | Aug. 31, | |
| For a Share Outstanding Throughout Each Period | 2011 | 2010 |
| Net Asset Value, Beginning of Period | $22.75 | $19.66 |
| Investment Operations | ||
| Net Investment Income | .780 | .364 |
| Net Realized and Unrealized Gain (Loss) on Investments | .182 | 3.084 |
| Total from Investment Operations | .962 | 3.448 |
| Distributions | ||
| Dividends from Net Investment Income | (.781) | (.358) |
| Distributions from Realized Capital Gains | (.021) | — |
| Total Distributions | (.802) | (.358) |
| Net Asset Value, End of Period | $22.91 | $22.75 |
| Total Return | 4.66% | 17.75% |
| Ratios/Supplemental Data | ||
| Net Assets, End of Period (Millions) | $1 | $1 |
| Ratio of Total Expenses to Average Net Assets | 0.14% | 0.15%2 |
| Ratio of Net Investment Income to Average Net Assets | 3.68% | 3.75%2 |
| Portfolio Turnover Rate3 | 40% | 70% |
1 Inception.
2 Annualized.
3 Excludes the value of portfolio securities received or delivered as a result of in-kind purchases or redemptions of the fund’s capital shares, including ETF Creation Units.
See accompanying Notes, which are an integral part of the Financial Statements.
51
Long-Term Government Bond Index Fund
Financial Highlights
| Institutional Shares | ||
| Year | July 30, | |
| Ended | 20101 to | |
| August 31, | Aug. 31, | |
| For a Share Outstanding Throughout Each Period | 2011 | 2010 |
| Net Asset Value, Beginning of Period | $28.87 | $27.07 |
| Investment Operations | ||
| Net Investment Income | 1.003 | .070 |
| Net Realized and Unrealized Gain (Loss) on Investments | .218 | 1.799 |
| Total from Investment Operations | 1.221 | 1.869 |
| Distributions | ||
| Dividends from Net Investment Income | (1.004) | (.069) |
| Distributions from Realized Capital Gains | (.027) | — |
| Total Distributions | (1.031) | (.069) |
| Net Asset Value, End of Period | $29.06 | $28.87 |
| Total Return | 4.67% | 6.91% |
| Ratios/Supplemental Data | ||
| Net Assets, End of Period (Millions) | $61 | $9 |
| Ratio of Total Expenses to Average Net Assets | 0.09% | 0.09%2 |
| Ratio of Net Investment Income to Average Net Assets | 3.73% | 3.81%2 |
| Portfolio Turnover Rate3 | 40% | 70% |
1 Inception.
2 Annualized.
3 Excludes the value of portfolio securities received or delivered as a result of in-kind purchases or redemptions of the fund’s capital shares, including ETF Creation Units.
See accompanying Notes, which are an integral part of the Financial Statements.
52
Long-Term Government Bond Index Fund
Financial Highlights
| ETF Shares | ||
| Year | Nov. 19, | |
| Ended | 20091 to | |
| August 31, | Aug. 31, | |
| For a Share Outstanding Throughout Each Period | 2011 | 2010 |
| Net Asset Value, Beginning of Period | $67.61 | $59.84 |
| Investment Operations | ||
| Net Investment Income | 2.321 | 1.691 |
| Net Realized and Unrealized Gain (Loss) on Investments | .526 | 7.768 |
| Total from Investment Operations | 2.847 | 9.459 |
| Distributions | ||
| Dividends from Net Investment Income | (2.324) | (1.689) |
| Distributions from Realized Capital Gains | (.063) | — |
| Total Distributions | (2.387) | (1.689) |
| Net Asset Value, End of Period | $68.07 | $67.61 |
| Total Return | 4.63% | 16.21% |
| Ratios/Supplemental Data | ||
| Net Assets, End of Period (Millions) | $34 | $78 |
| Ratio of Total Expenses to Average Net Assets | 0.14% | 0.15%2 |
| Ratio of Net Investment Income to Average Net Assets | 3.68% | 3.75%2 |
| Portfolio Turnover Rate3 | 40% | 70% |
1 Inception.
2 Annualized.
3 Excludes the value of portfolio securities received or delivered as a result of in-kind purchases or redemptions of the fund’s capital shares, including ETF Creation Units.
See accompanying Notes, which are an integral part of the Financial Statements.
53
Long-Term Government Bond Index Fund
Notes to Financial Statements
Vanguard Long-Term Government Bond Index Fund is registered under the Investment Company Act of 1940 as an open-end investment company, or mutual fund. The fund offers three classes of shares: Signal Shares, Institutional Shares, and ETF Shares. Signal Shares and Institutional Shares are designed for investors who meet certain administrative, service, and account-size criteria. ETF Shares are listed for trading on Nasdaq; they can be purchased and sold through a broker.
A. The following significant accounting policies conform to generally accepted accounting principles for U.S. mutual funds. The fund consistently follows such policies in preparing its financial statements.
1. Security Valuation: Bonds, and temporary cash investments acquired over 60 days to maturity, are valued using the latest bid prices or using valuations based on a matrix system (which considers such factors as security prices, yields, maturities, and ratings), both as furnished by independent pricing services. Investments in Vanguard Market Liquidity Fund are valued at that fund’s net asset value. Other temporary cash investments are valued at amortized cost, which approximates market value. Securities for which market quotations are not readily available, or whose values have been affected by events occurring before the fund’s pricing time but after the close of the securities’ primary markets, are valued by methods deemed by the board of trustees to represent fair value.
2. Federal Income Taxes: The fund intends to continue to qualify as a regulated investment company and distribute all of its taxable income. Management has analyzed the fund’s tax positions taken for all open federal income tax years (August 31, 2010–2011), and has concluded that no provision for federal income tax is required in the fund’s financial statements.
3. Distributions: Distributions to shareholders are recorded on the ex-dividend date.
4. Other: Interest income includes income distributions received from Vanguard Market Liquidity Fund and is accrued daily. Premiums and discounts on debt securities purchased are amortized and accreted, respectively, to interest income over the lives of the respective securities. Security transactions are accounted for on the date securities are bought or sold. Costs used to determine realized gains (losses) on the sale of investment securities are those of the specific securities sold. Fees, if any, assessed on purchases of capital shares are credited to paid-in capital.
Each class of shares has equal rights as to assets and earnings, except that each class separately bears certain class-specific expenses related to maintenance of shareholder accounts (included in Management and Administrative expenses) and shareholder reporting. Marketing and distribution expenses are allocated to each class of shares based on a method approved by the board of trustees. Income, other non-class-specific expenses, and gains and losses on investments are allocated to each class of shares based on its relative net assets.
B. The Vanguard Group furnishes at cost investment advisory, corporate management, administrative, marketing, and distribution services. The costs of such services are allocated to the fund under methods approved by the board of trustees. The fund has committed to provide up to 0.40% of its net assets in capital contributions to Vanguard. At August 31, 2011, the fund had contributed capital of $14,000 to Vanguard (included in Other Assets), representing 0.01% of the fund’s net assets and 0.01% of Vanguard’s capitalization. The fund’s trustees and officers are also directors and officers of Vanguard.
54
Long-Term Government Bond Index Fund
C. Various inputs may be used to determine the value of the fund’s investments. These inputs are summarized in three broad levels for financial statement purposes. The inputs or methodologies used to value securities are not necessarily an indication of the risk associated with investing in those securities.
Level 1—Quoted prices in active markets for identical securities.
Level 2—Other significant observable inputs (including quoted prices for similar securities, interest rates, prepayment speeds, credit risk, etc.).
Level 3—Significant unobservable inputs (including the fund’s own assumptions used to determine the fair value of investments).
The following table summarizes the fund’s investments as of August 31, 2011, based on the inputs used to value them:
| Level 1 | Level 2 | Level 3 | |
| Investments | ($000) | ($000) | ($000) |
| U.S. Government and Agency Obligations | — | 94,478 | — |
| Temporary Cash Investments | 1,955 | — | — |
| Total | 1,955 | 94,478 | — |
D. Distributions are determined on a tax basis and may differ from net investment income and realized capital gains for financial reporting purposes. Differences may be permanent or temporary. Permanent differences are reclassified among capital accounts in the financial statements to reflect their tax character. Temporary differences arise when certain items of income, expense, gain, or loss are recognized in different periods for financial statement and tax purposes; these differences will reverse at some time in the future. Differences in classification may also result from the treatment of short-term gains as ordinary income for tax purposes.
During the year ended August 31, 2011, the fund realized $1,832,000 of net capital losses resulting from in-kind redemptions—in which shareholders exchanged fund shares for securities held by the fund rather than for cash. Because such losses are not taxable losses to the fund, they have been reclassified from accumulated net realized losses to paid-in capital.
For tax purposes, at August 31, 2011, the fund had available capital loss carryforwards totaling $3,000 to offset future net capital gains through August 31, 2019. In addition, the fund realized losses of $2,065,000 during the period from November 1, 2010, through August 31, 2011, which are deferred and will be treated as realized for tax purposes in fiscal 2012.
At August 31, 2011, the cost of investment securities for tax purposes was $88,303,000. Net unrealized appreciation of investment securities for tax purposes was $8,130,000, consisting of unrealized gains of $8,146,000 on securities that had risen in value since their purchase and $16,000 in unrealized losses on securities that had fallen in value since their purchase.
55
Long-Term Government Bond Index Fund
E. During the year ended August 31, 2011, the fund purchased $106,972,000 of investment securities and sold $97,572,000 of investment securities, other than temporary cash investments.
F. Capital share transactions for each class of shares were:
| Year Ended | Inception1 to | |||
| August 31, 2011 | August 31, 2010 | |||
| Amount | Shares | Amount | Shares | |
| ($000) | (000) | ($000) | (000) | |
| Signal Shares | ||||
| Issued | 159 | 8 | 1,018 | 52 |
| Issued in Lieu of Cash Distributions | 42 | 2 | 19 | 1 |
| Redeemed | (179) | (9) | — | — |
| Net Increase (Decrease)—Signal Shares | 22 | 1 | 1,037 | 53 |
| Institutional Shares | ||||
| Issued | 46,497 | 1,778 | 8,521 | 308 |
| Issued in Lieu of Cash Distributions | 1,338 | 51 | 11 | — |
| Redeemed | (1,328) | (47) | — | — |
| Net Increase (Decrease)—Institutional Shares | 46,507 | 1,782 | 8,532 | 308 |
| ETF Shares | ||||
| Issued | 27,524 | 450 | 78,645 | 1,250 |
| Issued in Lieu of Cash Distributions | — | — | — | — |
| Redeemed | (64,640) | (1,100) | (5,866) | (100) |
| Net Increase (Decrease)—ETF Shares | (37,116) | (650) | 72,779 | 1,150 |
| 1 Inception was November 19, 2009, for ETF Shares, March 1, 2010, for Signal Shares, and July 30, 2010, for Institutional Shares. | ||||
G. In preparing the financial statements as of August 31, 2011, management considered the impact of subsequent events for potential recognition or disclosure in these financial statements.
56
Short-Term Corporate Bond Index Fund
Fund Profile
As of August 31, 2011
| Share-Class Characteristics | |||
| Signal | Institutional | ETF | |
| Shares | Shares | Shares | |
| Ticker Symbol | VSCSX | VSTBX | VCSH |
| Expense Ratio1 | 0.15% | 0.09% | 0.15% |
| 30-Day SEC Yield | 1.92% | 1.95% | 1.93% |
| Financial Attributes | |||
| Barclays | |||
| 1–5 Year | Barclays | ||
| Corporate | Aggregate | ||
| Fund | Index | FA Index | |
| Number of Bonds | 879 | 1,450 | 7,873 |
| Yield to Maturity | |||
| (before expenses) | 2.2% | 2.2% | 2.3% |
| Average Coupon | 4.4% | 4.6% | 4.1% |
| Average Duration | 2.8 years | 2.8 years | 5.1 years |
| Average Effective | |||
| Maturity | 3.0 years | 3.0 years | 7.3 years |
| Short-Term | |||
| Reserves | 0.9% | — | — |
| Sector Diversification (% of portfolio) | |||
| Finance | 44.4% | ||
| Industrial | 47.9 | ||
| Treasury/Agency | 0.4 | ||
| Utilities | 7.2 | ||
| Other | 0.1 | ||
| Distribution by Maturity (% of portfolio) | |
| Under 1 Year | 1.5% |
| 1 - 3 Years | 50.4 |
| 3 - 5 Years | 47.8 |
| 5 - 10 Years | 0.3 |
| Distribution by Credit Quality (% of portfolio) | |
| U.S. Government | 0.4% |
| Aaa | 1.1 |
| Aa | 24.7 |
| A | 45.4 |
| Baa | 28.4 |
| For information about these ratings, see the Glossary entry for Credit Quality. | |
Investment Focus
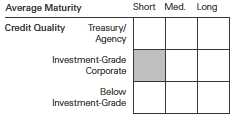
1 The expense ratios shown are from the prospectus dated December 28, 2010, and represent estimated costs for the current fiscal year. For the fiscal year ended August 31, 2011, the expense ratios were 0.09% for Institutional Shares, and 0.14% for ETF Shares. For the Signal Shares, the annualized expense ratio from inception on November 18, 2010, through August 31, 2011, was 0.14%.
57
Short-Term Corporate Bond Index Fund
Performance Summary
All of the returns in this report represent past performance, which is not a guarantee of future results that may be achieved by the fund. (Current performance may be lower or higher than the performance data cited. For performance data current to the most recent month-end, visit our website at vanguard.com/performance.) Note, too, that both investment returns and principal value can fluctuate widely, so an investor’s shares, when sold, could be worth more or less than their original cost. The returns shown do not reflect taxes that a shareholder would pay on fund distributions or on the sale of fund shares.
Cumulative Performance: November 19, 2009, Through August 31, 2011
Initial Investment of $10,000
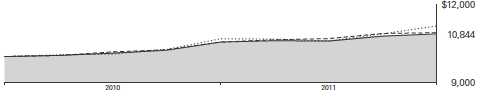
| Average Annual Total Returns | |||
| Periods Ended August 31, 2011 | |||
| Since | Final Value | ||
| One | Inception | of a $10,000 | |
| Year | (11/19/2009) | Investment | |
| Short-Term Corporate Bond Index Fund | |||
| ETF Shares Net Asset Value | 2.94% | 4.65% | $10,844 |
| Short-Term Corporate Bond Index Fund | |||
| ETF Shares Market Price | 3.31 | 4.97 | 10,903 |
| Spliced Barclays Capital U.S. | |||
| Aggregate Float Adjusted Index | 4.62 | 6.49 | 11,184 |
| Barclays Capital U.S. 1–5 Year | |||
| Corporate Bond Index | 3.45 | 5.10 | 10,926 |
| Short-Intermediate Investment-Grade | |||
| Debt Funds Average | 2.99 | 4.84 | 10,879 |
"Since Inception" performance is calculated from the ETF Shares’ inception date for both the fund and its comparative standards.
Spliced Barclays Capital U.S. Aggregate Float Adjusted Index: Barclays Capital U.S. Aggregate Bond Index through December 31, 2009; Barclays Capital U.S. Aggregate Float Adjusted Index thereafter.
Short-Intermediate Investment-Grade Debt Funds Average: Derived from data provided by Lipper Inc.
Vanguard fund returns are adjusted to reflect the 0.25% fee on purchases; the fee does not apply to the ETF Shares. In the final table, non-adjusted returns are shown along with the fee-adjusted returns.
See Financial Highlights for dividend and capital gains information.
58
| Short-Term Corporate Bond Index Fund | ||
| Average Annual Total Returns | ||
| Periods Ended August 31, 2011 | ||
| Since | Final Value | |
| Inception | of a $10,000 | |
| (11/18/2010) | Investment | |
| Short-Term Corporate Bond Index | ||
| Fund Signal Shares | 2.03% | $10,203 |
| Barclays Capital U.S. | ||
| Aggregate Float Adjusted Index | 5.06 | 10,506 |
| Barclays Capital U.S. 1–5 Year | ||
| Corporate Bond Index | 2.54 | 10,254 |
"Since Inception" performance is calculated from the Signal Shares’ inception date for both the fund and its comparative standards.
| Since | Final Value | ||
| One | Inception | of a $5,000,000 | |
| Year | (11/19/2009) | Investment | |
| Short-Term Corporate Bond Index Fund | |||
| Institutional Shares | 2.75% | 4.57% | $5,414,537 |
| Spliced Barclays Capital U.S. Aggregate | |||
| Float Adjusted Index | 4.62 | 6.49 | 5,592,028 |
| Barclays Capital U.S. 1–5 Year Corporate | |||
| Bond Index | 3.45 | 5.10 | 5,462,785 |
"Since Inception" performance is calculated from the Institutional Shares’ inception date for both the fund and its comparative standards.
| Cumulative Returns of ETF Shares: November 19, 2009, Through August 31, 2011 | ||
| Since | ||
| One | Inception | |
| Year | (11/19/2009) | |
| Short-Term Corporate Bond Index Fund | ||
| ETF Shares Market Price | 3.31% | 9.03% |
| Short-Term Corporate Bond Index Fund | ||
| ETF Shares Net Asset Value | 2.94 | 8.44 |
| Barclays Capital U.S. 1–5 Year Corporate Bond | ||
| Index | 3.45 | 9.26 |
"Since Inception" performance is calculated from the ETF Shares’ inception date for both the fund and its comparative standards.
| Fiscal-Year Total Returns (%): November 19, 2009, Through August 31, 2011 | ||
| Barclays | ||
| 1–5 Year | ||
| Corporate | ||
| ETF Shares Net Asset Value | Index | |
| Fiscal Year | Total Returns | Total Returns |
| 2010 | 5.34% | 5.61% |
| 2011 | 2.94 | 3.45 |
Vanguard fund returns are adjusted to reflect the 0.25% fee on purchases; the fee does not apply to the ETF Shares. In the final table, non-adjusted returns are shown along with the fee-adjusted returns.
59
Short-Term Corporate Bond Index Fund
Average Annual Total Returns: Periods Ended June 30, 2011
This table presents returns through the latest calendar quarter—rather than through the end of the fiscal period.
Securities and Exchange Commission rules require that we provide this information.
| Since Inception | |||||
| Inception Date | One Year | Income | Capital | Total | |
| Signal Shares | 11/18/2010 | — | 1.57% | 0.27% | 1.84% |
| Fee-Adjusted Returns | — | 1.58 | |||
| Institutional Shares | 11/19/2009 | 4.73% | 2.44 | 2.49 | 4.93 |
| Fee-Adjusted Returns | 4.47 | 4.76 | |||
| ETF Shares | 11/19/2009 | ||||
| Market Price | 4.74 | 5.14 | |||
| Net Asset Value | 4.68 | 4.87 |
Vanguard fund returns are adjusted to reflect the 0.25% fee on purchases; the fee does not apply to the ETF Shares. In the final table, non-adjusted returns are shown along with the fee-adjusted returns.
60
Short-Term Corporate Bond Index Fund
Financial Statements
Statement of Net Assets
As of August 31, 2011
The fund reports a complete list of its holdings in regulatory filings four times in each fiscal year, at the quarter-ends. For the second and fourth fiscal quarters, the lists appear in the fund’s semiannual and annual reports to shareholders. For the first and third fiscal quarters, the fund files the lists with the Securities and Exchange Commission on Form N-Q. Shareholders can look up the fund’s Forms N-Q on the SEC’s website at sec.gov. Forms N-Q may also be reviewed and copied at the SEC’s Public Reference Room (see the back cover of this report for further information).
| Face | Market | ||||
| Maturity | Amount | Value | |||
| Coupon | Date | ($000) | ($000) | ||
| U.S. Government and Agency Obligations (1.3%) | |||||
| U.S. Government Securities (1.3%) | |||||
| United States Treasury Note/Bond | |||||
| (Cost $25,415) | 1.000% | 8/31/16 | 25,350 | 25,390 | |
| Corporate Bonds (97.7%) | |||||
| Finance (43.6%) | |||||
| Banking (32.2%) | |||||
| AbbeyNational Treasury Services PLC | 2.875% | 4/25/14 | 1,175 | 1,124 | |
| AbbeyNational Treasury Services PLC | 4.000% | 4/27/16 | 875 | 836 | |
| American Express Co. | 7.250% | 5/20/14 | 496 | 565 | |
| American Express Credit Corp. | 5.875% | 5/2/13 | 11,150 | 11,915 | |
| American Express Credit Corp. | 7.300% | 8/20/13 | 4,750 | 5,223 | |
| American Express Credit Corp. | 5.125% | 8/25/14 | 2,750 | 3,011 | |
| American Express Credit Corp. | 2.750% | 9/15/15 | 4,125 | 4,200 | |
| Astoria Financial Corp. | 5.750% | 10/15/12 | 150 | 156 | |
| 1 | BanColombia SA | 4.250% | 1/12/16 | 500 | 510 |
| 1 | BanColombia SA | 5.950% | 6/3/21 | 100 | 101 |
| Bank of America Corp. | 6.250% | 4/15/12 | 2,325 | 2,377 | |
| Bank of America Corp. | 5.375% | 9/11/12 | 500 | 512 | |
| Bank of America Corp. | 4.875% | 1/15/13 | 100 | 102 | |
| Bank of America Corp. | 4.900% | 5/1/13 | 16,650 | 17,049 | |
| Bank of America Corp. | 7.375% | 5/15/14 | 1,325 | 1,449 | |
| Bank of America Corp. | 4.500% | 4/1/15 | 5,950 | 6,015 | |
| Bank of America Corp. | 7.750% | 8/15/15 | 1,000 | 1,070 | |
| Bank of America Corp. | 3.700% | 9/1/15 | 8,550 | 8,384 | |
| Bank of America Corp. | 3.625% | 3/17/16 | 4,450 | 4,343 | |
| Bank of America Corp. | 3.750% | 7/12/16 | 1,325 | 1,307 | |
| Bank of America Corp. | 6.500% | 8/1/16 | 3,850 | 4,154 | |
| Bank of Montreal | 2.125% | 6/28/13 | 1,625 | 1,664 | |
| Bank of Montreal | 1.750% | 4/29/14 | 3,525 | 3,592 | |
| Bank of New York Mellon Corp. | 4.950% | 11/1/12 | 3,375 | 3,540 | |
| Bank of New York Mellon Corp. | 4.500% | 4/1/13 | 75 | 79 | |
| Bank of New York Mellon Corp. | 5.125% | 8/27/13 | 2,317 | 2,501 | |
| Bank of New York Mellon Corp. | 4.300% | 5/15/14 | 2,913 | 3,136 | |
| Bank of New York Mellon Corp. | 4.950% | 3/15/15 | 1,000 | 1,085 | |
| Bank of New York Mellon Corp. | 2.950% | 6/18/15 | 2,050 | 2,141 | |
| Bank of New York Mellon Corp. | 2.500% | 1/15/16 | 1,325 | 1,354 | |
| Bank of New York Mellon Corp. | 2.300% | 7/28/16 | 1,375 | 1,390 | |
| Bank of Nova Scotia | 2.250% | 1/22/13 | 3,300 | 3,370 | |
61
| Short-Term Corporate Bond Index Fund | ||||
| Face | Market | |||
| Maturity | Amount | Value | ||
| Coupon | Date | ($000) | ($000) | |
| Bank of Nova Scotia | 2.375% | 12/17/13 | 2,700 | 2,778 |
| Bank of Nova Scotia | 3.400% | 1/22/15 | 8,750 | 9,300 |
| 1 Bank of Tokyo-Mitsubishi UFJ Ltd. | 2.450% | 9/11/15 | 1,000 | 1,012 |
| Bank One Corp. | 5.250% | 1/30/13 | 50 | 52 |
| Barclays Bank plc | 5.450% | 9/12/12 | 575 | 595 |
| Barclays Bank plc | 2.500% | 1/23/13 | 10,725 | 10,732 |
| Barclays Bank plc | 5.200% | 7/10/14 | 2,000 | 2,098 |
| Barclays Bank plc | 3.900% | 4/7/15 | 3,100 | 3,110 |
| BB&T Corp. | 2.050% | 4/28/14 | 3,725 | 3,760 |
| BB&T Corp. | 5.200% | 12/23/15 | 2,700 | 2,917 |
| BB&T Corp. | 3.200% | 3/15/16 | 1,025 | 1,054 |
| BB&T Corp. | 3.950% | 4/29/16 | 500 | 532 |
| BBVA US Senior SAU | 3.250% | 5/16/14 | 1,475 | 1,452 |
| Bear Stearns Cos. LLC | 5.700% | 11/15/14 | 1,652 | 1,820 |
| Bear Stearns Cos. LLC | 5.300% | 10/30/15 | 2,100 | 2,293 |
| BNPParibas / BNP Paribas US | ||||
| Medium-Term Note Program LLC | 2.125% | 12/21/12 | 5,475 | 5,401 |
| BNPParibas SA | 3.250% | 3/11/15 | 4,400 | 4,352 |
| BNPParibas SA | 3.600% | 2/23/16 | 2,775 | 2,782 |
| Canadian Imperial Bank of Commerce | 1.450% | 9/13/13 | 1,150 | 1,156 |
| Canadian Imperial Bank of Commerce | 2.350% | 12/11/15 | 2,750 | 2,802 |
| Capital One Financial Corp. | 7.375% | 5/23/14 | 5,625 | 6,320 |
| Capital One Financial Corp. | 3.150% | 7/15/16 | 975 | 962 |
| Citigroup Inc. | 5.300% | 10/17/12 | 6,525 | 6,768 |
| Citigroup Inc. | 5.500% | 4/11/13 | 15,950 | 16,620 |
| Citigroup Inc. | 6.500% | 8/19/13 | 1,305 | 1,387 |
| Citigroup Inc. | 6.000% | 12/13/13 | 550 | 583 |
| Citigroup Inc. | 6.375% | 8/12/14 | 1,050 | 1,142 |
| Citigroup Inc. | 5.000% | 9/15/14 | 5,875 | 6,020 |
| Citigroup Inc. | 5.500% | 10/15/14 | 500 | 533 |
| Citigroup Inc. | 6.010% | 1/15/15 | 2,350 | 2,537 |
| Citigroup Inc. | 4.875% | 5/7/15 | 2,000 | 1,989 |
| Citigroup Inc. | 4.750% | 5/19/15 | 10,860 | 11,367 |
| Citigroup Inc. | 4.587% | 12/15/15 | 10,200 | 10,568 |
| Citigroup Inc. | 5.300% | 1/7/16 | 2,450 | 2,596 |
| Comerica Inc. | 3.000% | 9/16/15 | 725 | 743 |
| Cooperatieve Centrale | ||||
| Raiffeisen-Boerenleenbank BA/Netherlands | 1.850% | 1/10/14 | 2,450 | 2,485 |
| Cooperatieve Centrale | ||||
| Raiffeisen-Boerenleenbank BA/Netherlands | 2.125% | 10/13/15 | 3,275 | 3,299 |
| Countrywide Financial Corp. | 6.250% | 5/15/16 | 1,600 | 1,591 |
| Credit Suisse New York | 3.450% | 7/2/12 | 4,200 | 4,287 |
| Credit Suisse New York | 5.000% | 5/15/13 | 9,135 | 9,604 |
| Credit Suisse New York | 2.200% | 1/14/14 | 4,100 | 4,099 |
| Credit Suisse New York | 5.500% | 5/1/14 | 1,525 | 1,647 |
| Credit Suisse New York | 3.500% | 3/23/15 | 4,250 | 4,337 |
| Credit Suisse USA Inc. | 4.875% | 1/15/15 | 750 | 801 |
| Credit Suisse USA Inc. | 5.125% | 8/15/15 | 1,600 | 1,733 |
| Credit Suisse USA Inc. | 5.850% | 8/16/16 | 3,250 | 3,654 |
| Deutsche Bank AG | 5.375% | 10/12/12 | 5,100 | 5,289 |
| Deutsche Bank AG | 4.875% | 5/20/13 | 5,945 | 6,189 |
| Deutsche Bank AG | 3.875% | 8/18/14 | 6,475 | 6,741 |
| Deutsche Bank AG | 3.250% | 1/11/16 | 4,450 | 4,461 |
| Fifth Third Bancorp | 6.250% | 5/1/13 | 4,750 | 5,061 |
| Fifth Third Bancorp | 3.625% | 1/25/16 | 1,875 | 1,904 |
62
| Short-Term Corporate Bond Index Fund | ||||
| Face | Market | |||
| Maturity | Amount | Value | ||
| Coupon | Date | ($000) | ($000) | |
| First Horizon National Corp. | 5.375% | 12/15/15 | 3,375 | 3,484 |
| First Tennessee Bank NA | 5.050% | 1/15/15 | 225 | 232 |
| Goldman Sachs Group Inc. | 3.625% | 8/1/12 | 4,475 | 4,559 |
| Goldman Sachs Group Inc. | 5.450% | 11/1/12 | 1,450 | 1,509 |
| Goldman Sachs Group Inc. | 4.750% | 7/15/13 | 775 | 805 |
| Goldman Sachs Group Inc. | 5.250% | 10/15/13 | 12,825 | 13,356 |
| Goldman Sachs Group Inc. | 5.150% | 1/15/14 | 3,650 | 3,834 |
| Goldman Sachs Group Inc. | 6.000% | 5/1/14 | 4,600 | 4,940 |
| Goldman Sachs Group Inc. | 5.000% | 10/1/14 | 500 | 524 |
| Goldman Sachs Group Inc. | 5.125% | 1/15/15 | 1,875 | 1,970 |
| Goldman Sachs Group Inc. | 3.700% | 8/1/15 | 9,700 | 9,789 |
| Goldman Sachs Group Inc. | 5.350% | 1/15/16 | 1,850 | 1,974 |
| Goldman Sachs Group Inc. | 3.625% | 2/7/16 | 5,600 | 5,588 |
| Goldman Sachs Group Inc. | 5.750% | 10/1/16 | 1,000 | 1,096 |
| HSBC Bank USA NA | 4.625% | 4/1/14 | 400 | 413 |
| HSBC Holdings plc | 5.250% | 12/12/12 | 4,500 | 4,622 |
| 1 ICICI Bank Ltd. | 6.625% | 10/3/12 | 775 | 807 |
| JPMorganChase & Co. | 5.375% | 10/1/12 | 4,125 | 4,319 |
| JPMorganChase & Co. | 5.750% | 1/2/13 | 464 | 489 |
| JPMorganChase & Co. | 4.750% | 5/1/13 | 8,075 | 8,549 |
| JPMorganChase & Co. | 1.650% | 9/30/13 | 815 | 820 |
| JPMorganChase & Co. | 2.050% | 1/24/14 | 3,810 | 3,848 |
| JPMorganChase & Co. | 4.875% | 3/15/14 | 175 | 186 |
| JPMorganChase & Co. | 4.650% | 6/1/14 | 2,964 | 3,191 |
| JPMorganChase & Co. | 5.125% | 9/15/14 | 2,700 | 2,893 |
| JPMorganChase & Co. | 3.700% | 1/20/15 | 18,350 | 19,042 |
| JPMorganChase & Co. | 4.750% | 3/1/15 | 4,175 | 4,417 |
| JPMorganChase & Co. | 5.150% | 10/1/15 | 375 | 397 |
| JPMorganChase & Co. | 2.600% | 1/15/16 | 2,075 | 2,080 |
| JPMorganChase & Co. | 3.450% | 3/1/16 | 3,150 | 3,234 |
| JPMorganChase & Co. | 3.150% | 7/5/16 | 4,600 | 4,686 |
| KeyBank NA | 5.800% | 7/1/14 | 950 | 1,034 |
| KeyCorp | 6.500% | 5/14/13 | 3,440 | 3,698 |
| KeyCorp | 3.750% | 8/13/15 | 3,150 | 3,241 |
| Lloyds TSB Bank plc | 4.875% | 1/21/16 | 4,750 | 4,757 |
| M&IMarshall & Ilsley Bank | 4.850% | 6/16/15 | 550 | 585 |
| MBNA Corp. | 5.000% | 6/15/15 | 2,300 | 2,339 |
| Merrill Lynch & Co. Inc. | 5.450% | 2/5/13 | 5,775 | 5,905 |
| Merrill Lynch & Co. Inc. | 6.150% | 4/25/13 | 1,700 | 1,772 |
| Merrill Lynch & Co. Inc. | 5.000% | 1/15/15 | 2,775 | 2,835 |
| Merrill Lynch & Co. Inc. | 6.050% | 5/16/16 | 3,200 | 3,224 |
| Morgan Stanley | 5.300% | 3/1/13 | 8,285 | 8,572 |
| Morgan Stanley | 2.875% | 1/24/14 | 2,150 | 2,130 |
| Morgan Stanley | 4.750% | 4/1/14 | 4,800 | 4,867 |
| Morgan Stanley | 6.000% | 5/13/14 | 1,375 | 1,450 |
| Morgan Stanley | 4.200% | 11/20/14 | 2,750 | 2,763 |
| Morgan Stanley | 4.100% | 1/26/15 | 7,775 | 7,693 |
| Morgan Stanley | 6.000% | 4/28/15 | 3,400 | 3,568 |
| Morgan Stanley | 4.000% | 7/24/15 | 6,425 | 6,392 |
| Morgan Stanley | 5.375% | 10/15/15 | 1,725 | 1,795 |
| Morgan Stanley | 3.450% | 11/2/15 | 3,000 | 2,887 |
| Morgan Stanley | 3.800% | 4/29/16 | 4,925 | 4,831 |
| National City Bank | 4.625% | 5/1/13 | 175 | 184 |
| 2 National City Preferred Capital Trust I | 12.000% | 12/29/49 | 600 | 645 |
| Northern Trust Corp. | 5.500% | 8/15/13 | 1,000 | 1,085 |
63
| Short-Term Corporate Bond Index Fund | ||||
| Face | Market | |||
| Maturity | Amount | Value | ||
| Coupon | Date | ($000) | ($000) | |
| PNC Funding Corp. | 5.400% | 6/10/14 | 850 | 939 |
| PNC Funding Corp. | 3.625% | 2/8/15 | 7,000 | 7,378 |
| PNC Funding Corp. | 4.250% | 9/21/15 | 600 | 644 |
| Royal Bank of Canada | 2.100% | 7/29/13 | 6,825 | 6,998 |
| Royal Bank of Canada | 2.625% | 12/15/15 | 3,700 | 3,847 |
| Royal Bank of Canada | 2.875% | 4/19/16 | 200 | 209 |
| Royal Bank of Scotland Group plc | 5.000% | 11/12/13 | 800 | 781 |
| Royal Bank of Scotland Group plc | 5.000% | 10/1/14 | 5,015 | 4,808 |
| Royal Bank of Scotland Group plc | 5.050% | 1/8/15 | 600 | 558 |
| Royal Bank of Scotland plc | 3.400% | 8/23/13 | 1,750 | 1,737 |
| Royal Bank of Scotland plc | 4.875% | 3/16/15 | 5,150 | 5,192 |
| Royal Bank of Scotland plc | 3.950% | 9/21/15 | 3,375 | 3,254 |
| Santander Holdings USA Inc. | 4.625% | 4/19/16 | 2,725 | 2,687 |
| State Street Corp. | 4.300% | 5/30/14 | 2,205 | 2,381 |
| State Street Corp. | 2.875% | 3/7/16 | 2,950 | 3,042 |
| SunTrust Banks Inc. | 5.250% | 11/5/12 | 1,900 | 1,978 |
| SunTrust Banks Inc. | 3.600% | 4/15/16 | 2,175 | 2,201 |
| Toronto-Dominion Bank | 1.375% | 7/14/14 | 1,240 | 1,256 |
| Toronto-Dominion Bank | 2.500% | 7/14/16 | 1,860 | 1,911 |
| UBS AG | 2.250% | 8/12/13 | 4,525 | 4,564 |
| UBS AG | 2.250% | 1/28/14 | 150 | 151 |
| UBS AG | 3.875% | 1/15/15 | 8,175 | 8,419 |
| Union Bank NA | 2.125% | 12/16/13 | 450 | 456 |
| Union Bank NA | 5.950% | 5/11/16 | 1,800 | 1,946 |
| Union Bank NA | 3.000% | 6/6/16 | 875 | 884 |
| US Bancorp | 2.000% | 6/14/13 | 7,800 | 7,971 |
| US Bancorp | 1.125% | 10/30/13 | 825 | 825 |
| US Bancorp | 4.200% | 5/15/14 | 225 | 242 |
| US Bancorp | 2.875% | 11/20/14 | 325 | 339 |
| US Bancorp | 2.450% | 7/27/15 | 4,075 | 4,210 |
| US Bancorp | 3.442% | 2/1/16 | 2,250 | 2,325 |
| US Bank NA | 6.300% | 2/4/14 | 150 | 167 |
| US Bank NA | 4.950% | 10/30/14 | 360 | 391 |
| US Bank NA | 4.800% | 4/15/15 | 600 | 658 |
| 2 US Bank NA | 3.778% | 4/29/20 | 1,000 | 1,049 |
| Wachovia Bank NA | 4.800% | 11/1/14 | 950 | 1,009 |
| Wachovia Bank NA | 5.000% | 8/15/15 | 500 | 540 |
| Wachovia Corp. | 5.500% | 5/1/13 | 2,225 | 2,378 |
| Wachovia Corp. | 4.875% | 2/15/14 | 750 | 788 |
| Wells Fargo & Co. | 5.250% | 10/23/12 | 3,075 | 3,222 |
| Wells Fargo & Co. | 4.375% | 1/31/13 | 15,375 | 16,038 |
| Wells Fargo & Co. | 4.950% | 10/16/13 | 3,000 | 3,197 |
| Wells Fargo & Co. | 4.625% | 4/15/14 | 1,000 | 1,050 |
| Wells Fargo & Co. | 3.750% | 10/1/14 | 15,375 | 16,359 |
| Wells Fargo & Co. | 5.000% | 11/15/14 | 150 | 160 |
| Wells Fargo & Co. | 3.625% | 4/15/15 | 1,150 | 1,210 |
| Wells Fargo & Co. | 3.676% | 6/15/16 | 6,000 | 6,356 |
| Wells Fargo Bank NA | 4.750% | 2/9/15 | 500 | 528 |
| 2 Wells Fargo Capital XIII | 7.700% | 12/29/49 | 6,025 | 6,055 |
| 2 Wells Fargo Capital XV | 9.750% | 9/29/49 | 1,450 | 1,508 |
| Westpac Banking Corp. | 2.250% | 11/19/12 | 2,275 | 2,309 |
| Westpac Banking Corp. | 2.100% | 8/2/13 | 5,700 | 5,774 |
| Westpac Banking Corp. | 1.850% | 12/9/13 | 3,750 | 3,783 |
| Westpac Banking Corp. | 4.200% | 2/27/15 | 1,225 | 1,294 |
| Westpac Banking Corp. | 3.000% | 8/4/15 | 4,200 | 4,264 |
64
| Short-Term Corporate Bond Index Fund | ||||
| Face | Market | |||
| Maturity | Amount | Value | ||
| Coupon | Date | ($000) | ($000) | |
| Brokerage (0.6%) | ||||
| Ameriprise Financial Inc. | 5.650% | 11/15/15 | 900 | 1,019 |
| 2 Ameriprise Financial Inc. | 7.518% | 6/1/66 | 1,200 | 1,203 |
| BlackRock Inc. | 2.250% | 12/10/12 | 1,625 | 1,652 |
| BlackRock Inc. | 3.500% | 12/10/14 | 950 | 1,013 |
| Charles Schwab Corp. | 4.950% | 6/1/14 | 775 | 853 |
| Franklin Resources Inc. | 2.000% | 5/20/13 | 175 | 178 |
| Franklin Resources Inc. | 3.125% | 5/20/15 | 150 | 159 |
| Jefferies Group Inc. | 5.875% | 6/8/14 | 100 | 108 |
| Jefferies Group Inc. | 3.875% | 11/9/15 | 100 | 101 |
| Jefferies Group Inc. | 5.500% | 3/15/16 | 600 | 627 |
| Lazard Group LLC | 7.125% | 5/15/15 | 975 | 1,092 |
| MF Global Holdings Ltd. | 6.250% | 8/8/16 | 600 | 586 |
| Nomura Holdings Inc. | 5.000% | 3/4/15 | 1,450 | 1,523 |
| Nomura Holdings Inc. | 4.125% | 1/19/16 | 1,750 | 1,779 |
| Raymond James Financial Inc. | 4.250% | 4/15/16 | 300 | 309 |
| TD Ameritrade Holding Corp. | 4.150% | 12/1/14 | 700 | 746 |
| Finance Companies (4.5%) | ||||
| Block Financial LLC | 7.875% | 1/15/13 | 1,875 | 1,965 |
| Block Financial LLC | 5.125% | 10/30/14 | 250 | 258 |
| General Electric Capital Corp. | 2.800% | 1/8/13 | 300 | 306 |
| General Electric Capital Corp. | 5.450% | 1/15/13 | 21,325 | 22,526 |
| General Electric Capital Corp. | 4.800% | 5/1/13 | 75 | 79 |
| General Electric Capital Corp. | 1.875% | 9/16/13 | 16,450 | 16,638 |
| General Electric Capital Corp. | 2.100% | 1/7/14 | 3,000 | 3,036 |
| General Electric Capital Corp. | 5.900% | 5/13/14 | 1,050 | 1,166 |
| General Electric Capital Corp. | 3.750% | 11/14/14 | 3,925 | 4,116 |
| General Electric Capital Corp. | 3.500% | 6/29/15 | 2,425 | 2,523 |
| General Electric Capital Corp. | 4.375% | 9/21/15 | 2,000 | 2,144 |
| General Electric Capital Corp. | 2.250% | 11/9/15 | 6,125 | 6,153 |
| General Electric Capital Corp. | 2.950% | 5/9/16 | 2,200 | 2,223 |
| 2 HSBC Finance Capital Trust IX | 5.911% | 11/30/35 | 1,700 | 1,505 |
| HSBC Finance Corp. | 6.375% | 11/27/12 | 305 | 320 |
| HSBC Finance Corp. | 4.750% | 7/15/13 | 1,850 | 1,924 |
| HSBC Finance Corp. | 5.250% | 1/15/14 | 525 | 554 |
| HSBC Finance Corp. | 5.000% | 6/30/15 | 6,450 | 6,784 |
| HSBC Finance Corp. | 5.500% | 1/19/16 | 6,000 | 6,423 |
| SLM Corp. | 5.000% | 10/1/13 | 4,275 | 4,290 |
| SLM Corp. | 5.000% | 4/15/15 | 1,875 | 1,833 |
| SLM Corp. | 6.250% | 1/25/16 | 4,100 | 4,160 |
| Insurance (4.6%) | ||||
| ACE INA Holdings Inc. | 5.875% | 6/15/14 | 375 | 419 |
| ACE INA Holdings Inc. | 5.600% | 5/15/15 | 750 | 836 |
| ACE INA Holdings Inc. | 2.600% | 11/23/15 | 1,440 | 1,464 |
| Aegon NV | 4.625% | 12/1/15 | 2,375 | 2,484 |
| Aetna Inc. | 6.000% | 6/15/16 | 1,275 | 1,479 |
| AflacInc. | 3.450% | 8/15/15 | 1,575 | 1,616 |
| Allied World Assurance Co. Ltd. | 7.500% | 8/1/16 | 900 | 1,033 |
| Allstate Corp. | 5.000% | 8/15/14 | 207 | 225 |
| Allstate Life Global Funding Trusts | 5.375% | 4/30/13 | 5,172 | 5,528 |
| American International Group Inc. | 4.250% | 5/15/13 | 950 | 965 |
| American International Group Inc. | 5.050% | 10/1/15 | 3,675 | 3,727 |
| AON Corp. | 3.500% | 9/30/15 | 3,675 | 3,797 |
| Assurant Inc. | 5.625% | 2/15/14 | 350 | 372 |
65
| Short-Term Corporate Bond Index Fund | ||||
| Face | Market | |||
| Maturity | Amount | Value | ||
| Coupon | Date | ($000) | ($000) | |
| Berkshire Hathaway Finance Corp. | 4.600% | 5/15/13 | 996 | 1,058 |
| Berkshire Hathaway Finance Corp. | 5.000% | 8/15/13 | 750 | 807 |
| Berkshire Hathaway Finance Corp. | 4.850% | 1/15/15 | 3,000 | 3,340 |
| Berkshire Hathaway Inc. | 2.125% | 2/11/13 | 3,750 | 3,820 |
| Berkshire Hathaway Inc. | 3.200% | 2/11/15 | 3,475 | 3,652 |
| Chubb Corp. | 5.200% | 4/1/13 | 25 | 26 |
| CNAFinancial Corp. | 5.850% | 12/15/14 | 1,850 | 1,994 |
| Coventry Health Care Inc. | 6.300% | 8/15/14 | 200 | 221 |
| Genworth Financial Inc. | 5.750% | 6/15/14 | 1,635 | 1,590 |
| Genworth Financial Inc. | 4.950% | 10/1/15 | 1,000 | 965 |
| Hartford Financial Services Group Inc. | 4.625% | 7/15/13 | 250 | 257 |
| Hartford Financial Services Group Inc. | 4.000% | 3/30/15 | 750 | 763 |
| Humana Inc. | 6.450% | 6/1/16 | 675 | 773 |
| Jefferson-Pilot Corp. | 4.750% | 1/30/14 | 525 | 556 |
| Lincoln National Corp. | 4.300% | 6/15/15 | 400 | 428 |
| 2 Lincoln National Corp. | 7.000% | 5/17/66 | 1,575 | 1,471 |
| Loews Corp. | 5.250% | 3/15/16 | 575 | 644 |
| Manulife Financial Corp. | 3.400% | 9/17/15 | 2,725 | 2,812 |
| Marsh & McLennan Cos. Inc. | 4.850% | 2/15/13 | 400 | 415 |
| Marsh & McLennan Cos. Inc. | 5.375% | 7/15/14 | 1 | 1 |
| Marsh & McLennan Cos. Inc. | 5.750% | 9/15/15 | 1,432 | 1,581 |
| MetLife Inc. | 2.375% | 2/6/14 | 4,625 | 4,679 |
| MetLife Inc. | 5.000% | 6/15/15 | 1,800 | 1,987 |
| MetLife Inc. | 6.750% | 6/1/16 | 1,000 | 1,170 |
| 1 Metropolitan Life Global Funding I | 5.125% | 6/10/14 | 100 | 109 |
| Principal Financial Group Inc. | 7.875% | 5/15/14 | 850 | 969 |
| 1 Principal Life Global Funding I | 5.125% | 10/15/13 | 175 | 187 |
| Principal Life Income Funding Trusts | 5.300% | 4/24/13 | 3,075 | 3,260 |
| Protective Life Secured Trusts | 5.450% | 9/28/12 | 150 | 157 |
| Prudential Financial Inc. | 2.750% | 1/14/13 | 225 | 229 |
| Prudential Financial Inc. | 5.150% | 1/15/13 | 200 | 209 |
| Prudential Financial Inc. | 5.100% | 9/20/14 | 4,725 | 5,093 |
| Prudential Financial Inc. | 6.200% | 1/15/15 | 400 | 439 |
| Prudential Financial Inc. | 4.750% | 9/17/15 | 5,900 | 6,258 |
| Prudential Financial Inc. | 5.500% | 3/15/16 | 575 | 630 |
| 2 Reinsurance Group of America Inc. | 6.750% | 12/15/65 | 1,400 | 1,302 |
| Torchmark Corp. | 6.375% | 6/15/16 | 500 | 558 |
| Transatlantic Holdings Inc. | 5.750% | 12/14/15 | 725 | 784 |
| Travelers Cos. Inc. | 5.500% | 12/1/15 | 1,350 | 1,520 |
| Travelers Cos. Inc. | 6.250% | 6/20/16 | 700 | 819 |
| UnitedHealth Group Inc. | 4.875% | 2/15/13 | 1,425 | 1,504 |
| UnitedHealth Group Inc. | 4.875% | 4/1/13 | 500 | 529 |
| UnitedHealth Group Inc. | 4.875% | 3/15/15 | 1,250 | 1,388 |
| UnitedHealth Group Inc. | 5.375% | 3/15/16 | 2,600 | 2,983 |
| WellPoint Inc. | 6.800% | 8/1/12 | 2,475 | 2,604 |
| WellPoint Inc. | 6.000% | 2/15/14 | 595 | 660 |
| WellPoint Inc. | 5.250% | 1/15/16 | 500 | 560 |
| Willis Group Holdings plc | 4.125% | 3/15/16 | 700 | 726 |
| Willis North America Inc. | 5.625% | 7/15/15 | 275 | 299 |
| Other Finance (0.3%) | ||||
| CME Group Inc. | 5.750% | 2/15/14 | 787 | 868 |
| NASDAQ OMX Group Inc. | 4.000% | 1/15/15 | 225 | 232 |
| NYSE Euronext | 4.800% | 6/28/13 | 833 | 886 |
| ORIX Corp. | 4.710% | 4/27/15 | 1,250 | 1,315 |
| ORIX Corp. | 5.000% | 1/12/16 | 1,775 | 1,876 |
66
| Short-Term Corporate Bond Index Fund | ||||
| Face | Market | |||
| Maturity | Amount | Value | ||
| Coupon | Date | ($000) | ($000) | |
| Real Estate Investment Trusts (1.4%) | ||||
| Boston Properties LP | 5.625% | 4/15/15 | 1,000 | 1,114 |
| Brandywine Operating Partnership LP | 7.500% | 5/15/15 | 450 | 513 |
| CommonWealth REIT | 6.250% | 8/15/16 | 1,200 | 1,325 |
| Digital Realty Trust LP | 4.500% | 7/15/15 | 2,500 | 2,593 |
| Duke Realty LP | 7.375% | 2/15/15 | 850 | 940 |
| ERP Operating LP | 5.250% | 9/15/14 | 100 | 109 |
| ERP Operating LP | 5.125% | 3/15/16 | 2,425 | 2,639 |
| HCP Inc. | 5.650% | 12/15/13 | 100 | 107 |
| HCP Inc. | 2.700% | 2/1/14 | 2,050 | 2,035 |
| HCP Inc. | 3.750% | 2/1/16 | 2,175 | 2,196 |
| Health Care REIT Inc. | 3.625% | 3/15/16 | 1,225 | 1,228 |
| Health Care REIT Inc. | 6.200% | 6/1/16 | 1,275 | 1,440 |
| Hospitality Properties Trust | 6.750% | 2/15/13 | 500 | 515 |
| Hospitality Properties Trust | 7.875% | 8/15/14 | 150 | 165 |
| Hospitality Properties Trust | 5.125% | 2/15/15 | 150 | 154 |
| Kilroy Realty LP | 5.000% | 11/3/15 | 125 | 131 |
| Kimco Realty Corp. | 5.783% | 3/15/16 | 500 | 554 |
| Liberty Property LP | 5.125% | 3/2/15 | 600 | 648 |
| ProLogis LP | 7.625% | 8/15/14 | 750 | 840 |
| Regency Centers LP | 5.250% | 8/1/15 | 250 | 270 |
| Simon Property Group LP | 6.750% | 5/15/14 | 3,445 | 3,874 |
| Simon Property Group LP | 4.200% | 2/1/15 | 2,550 | 2,706 |
| Simon Property Group LP | 5.100% | 6/15/15 | 175 | 191 |
| Ventas Realty LP / Ventas Capital Corp. | 3.125% | 11/30/15 | 900 | 886 |
| Vornado Realty LP | 4.250% | 4/1/15 | 2,300 | 2,392 |
| 887,042 | ||||
| Industrial (46.9%) | ||||
| Basic Industry (4.1%) | ||||
| Air Products & Chemicals Inc. | 4.150% | 2/1/13 | 100 | 104 |
| Air Products & Chemicals Inc. | 2.000% | 8/2/16 | 925 | 939 |
| Airgas Inc. | 3.250% | 10/1/15 | 950 | 980 |
| Airgas Inc. | 2.950% | 6/15/16 | 500 | 507 |
| Alcoa Inc. | 6.000% | 7/15/13 | 1,960 | 2,110 |
| ArcelorMittal | 5.375% | 6/1/13 | 5,650 | 5,854 |
| ArcelorMittal | 9.000% | 2/15/15 | 1,225 | 1,401 |
| ArcelorMittal | 3.750% | 8/5/15 | 1,425 | 1,403 |
| ArcelorMittal USA Inc. | 6.500% | 4/15/14 | 250 | 268 |
| 1 Barrick Gold Corp. | 1.750% | 5/30/14 | 1,350 | 1,373 |
| 1 Barrick Gold Corp. | 2.900% | 5/30/16 | 1,325 | 1,376 |
| Barrick Gold Financeco LLC | 6.125% | 9/15/13 | 1,330 | 1,468 |
| BHP Billiton Finance USA Ltd. | 5.500% | 4/1/14 | 7,850 | 8,730 |
| Celulosa Arauco y Constitucion SA | 5.625% | 4/20/15 | 450 | 490 |
| Dow Chemical Co. | 7.600% | 5/15/14 | 4,400 | 5,064 |
| Dow Chemical Co. | 5.900% | 2/15/15 | 2,350 | 2,634 |
| Dow Chemical Co. | 2.500% | 2/15/16 | 2,625 | 2,634 |
| Eastman Chemical Co. | 3.000% | 12/15/15 | 250 | 259 |
| EI du Pont de Nemours & Co. | 5.000% | 7/15/13 | 1,475 | 1,586 |
| EI du Pont de Nemours & Co. | 1.750% | 3/25/14 | 700 | 715 |
| EI du Pont de Nemours & Co. | 4.875% | 4/30/14 | 450 | 496 |
| EI du Pont de Nemours & Co. | 3.250% | 1/15/15 | 3,200 | 3,404 |
| EI du Pont de Nemours & Co. | 2.750% | 4/1/16 | 3,725 | 3,899 |
| International Paper Co. | 7.400% | 6/15/14 | 2,800 | 3,177 |
| 1 Kinross Gold Corp. | 3.625% | 9/1/16 | 450 | 450 |
| Monsanto Co. | 2.750% | 4/15/16 | 1,100 | 1,157 |
67
| Short-Term Corporate Bond Index Fund | ||||
| Face | Market | |||
| Maturity | Amount | Value | ||
| Coupon | Date | ($000) | ($000) | |
| Nucor Corp. | 5.000% | 6/1/13 | 925 | 989 |
| Potash Corp. of Saskatchewan Inc. | 5.250% | 5/15/14 | 3,625 | 4,015 |
| PPG Industries Inc. | 5.750% | 3/15/13 | 1,400 | 1,503 |
| Praxair Inc. | 1.750% | 11/15/12 | 1,150 | 1,165 |
| Praxair Inc. | 5.250% | 11/15/14 | 1,950 | 2,196 |
| Rio Tinto Alcan Inc. | 5.000% | 6/1/15 | 700 | 784 |
| Rio Tinto Finance USA Ltd. | 5.875% | 7/15/13 | 3,475 | 3,790 |
| Rio Tinto Finance USA Ltd. | 8.950% | 5/1/14 | 2,625 | 3,145 |
| Rio Tinto Finance USA Ltd. | 1.875% | 11/2/15 | 4,725 | 4,770 |
| Rohm & Haas Co. | 5.600% | 3/15/13 | 275 | 292 |
| Teck Resources Ltd. | 9.750% | 5/15/14 | 403 | 481 |
| Teck Resources Ltd. | 10.250% | 5/15/16 | 1,800 | 2,106 |
| Vale Canada Ltd. | 5.700% | 10/15/15 | 3,200 | 3,573 |
| Xstrata Canada Corp. | 6.000% | 10/15/15 | 1,000 | 1,106 |
| Capital Goods (4.4%) | ||||
| 3M Co. | 4.375% | 8/15/13 | 2,135 | 2,297 |
| Bemis Co. Inc. | 5.650% | 8/1/14 | 800 | 877 |
| Black & Decker Corp. | 8.950% | 4/15/14 | 1,000 | 1,178 |
| Boeing Capital Corp. | 3.250% | 10/27/14 | 3,500 | 3,746 |
| Boeing Capital Corp. | 2.125% | 8/15/16 | 2,150 | 2,179 |
| Boeing Co. | 1.875% | 11/20/12 | 1,740 | 1,767 |
| Caterpillar Financial Services Corp. | 2.000% | 4/5/13 | 2,750 | 2,808 |
| Caterpillar Financial Services Corp. | 6.200% | 9/30/13 | 200 | 221 |
| Caterpillar Financial Services Corp. | 6.125% | 2/17/14 | 8,574 | 9,606 |
| Caterpillar Financial Services Corp. | 1.375% | 5/20/14 | 425 | 429 |
| Caterpillar Financial Services Corp. | 2.050% | 8/1/16 | 2,050 | 2,066 |
| Caterpillar Inc. | 1.375% | 5/27/14 | 2,800 | 2,828 |
| Cooper US Inc. | 5.250% | 11/15/12 | 25 | 26 |
| Cooper US Inc. | 5.450% | 4/1/15 | 950 | 1,082 |
| CRH America Inc. | 5.300% | 10/15/13 | 1,775 | 1,873 |
| Danaher Corp. | 2.300% | 6/23/16 | 1,200 | 1,234 |
| Deere & Co. | 6.950% | 4/25/14 | 125 | 144 |
| Dover Corp. | 4.875% | 10/15/15 | 175 | 199 |
| Eaton Corp. | 4.900% | 5/15/13 | 900 | 959 |
| Emerson Electric Co. | 4.500% | 5/1/13 | 2,000 | 2,123 |
| General Dynamics Corp. | 5.250% | 2/1/14 | 4,275 | 4,723 |
| General Dynamics Corp. | 1.375% | 1/15/15 | 3,600 | 3,638 |
| General Electric Co. | 5.000% | 2/1/13 | 9,500 | 9,993 |
| Harsco Corp. | 2.700% | 10/15/15 | 300 | 308 |
| Honeywell International Inc. | 3.875% | 2/15/14 | 2,600 | 2,796 |
| Honeywell International Inc. | 5.400% | 3/15/16 | 275 | 320 |
| Illinois Tool Works Inc. | 5.150% | 4/1/14 | 150 | 165 |
| Ingersoll-Rand Global Holding Co. Ltd. | 9.500% | 4/15/14 | 2,450 | 2,916 |
| John Deere Capital Corp. | 4.900% | 9/9/13 | 2,600 | 2,808 |
| John Deere Capital Corp. | 1.600% | 3/3/14 | 5,000 | 5,088 |
| John Deere Capital Corp. | 2.950% | 3/9/15 | 2,650 | 2,791 |
| Lockheed Martin Corp. | 4.121% | 3/14/13 | 1,725 | 1,813 |
| Northrop Grumman Corp. | 3.700% | 8/1/14 | 225 | 241 |
| Northrop Grumman Corp. | 1.850% | 11/15/15 | 2,750 | 2,757 |
| Raytheon Co. | 1.625% | 10/15/15 | 200 | 200 |
| Roper Industries Inc. | 6.625% | 8/15/13 | 1,375 | 1,515 |
| TycoInternational Finance SA | 6.000% | 11/15/13 | 950 | 1,050 |
| TycoInternational Finance SA | 4.125% | 10/15/14 | 2,925 | 3,162 |
| TycoInternational Finance SA | 3.375% | 10/15/15 | 200 | 211 |
68
| Short-Term Corporate Bond Index Fund | ||||
| Face | Market | |||
| Maturity | Amount | Value | ||
| Coupon | Date | ($000) | ($000) | |
| United Technologies Corp. | 4.875% | 5/1/15 | 2,700 | 3,057 |
| Waste Management Inc. | 6.375% | 11/15/12 | 325 | 345 |
| Waste Management Inc. | 5.000% | 3/15/14 | 100 | 109 |
| Waste Management Inc. | 6.375% | 3/11/15 | 534 | 616 |
| Waste Management Inc. | 2.600% | 9/1/16 | 1,800 | 1,822 |
| Communication (9.5%) | ||||
| America Movil SAB de CV | 5.500% | 3/1/14 | 2,600 | 2,864 |
| America Movil SAB de CV | 3.625% | 3/30/15 | 700 | 742 |
| America Movil SAB de CV | 2.375% | 9/8/16 | 2,025 | 2,009 |
| American Tower Corp. | 4.625% | 4/1/15 | 1,600 | 1,728 |
| AT&T Inc. | 4.950% | 1/15/13 | 8,200 | 8,595 |
| AT&T Inc. | 6.700% | 11/15/13 | 7,425 | 8,288 |
| AT&T Inc. | 4.850% | 2/15/14 | 1,900 | 2,058 |
| AT&T Inc. | 5.100% | 9/15/14 | 3,250 | 3,582 |
| AT&T Inc. | 2.500% | 8/15/15 | 3,700 | 3,785 |
| AT&T Inc. | 2.950% | 5/15/16 | 1,300 | 1,347 |
| AT&T Inc. | 5.625% | 6/15/16 | 1,300 | 1,489 |
| AT&T Inc. | 2.400% | 8/15/16 | 1,325 | 1,341 |
| BellSouth Corp. | 5.200% | 9/15/14 | 200 | 221 |
| British Telecommunications plc | 5.150% | 1/15/13 | 2,525 | 2,660 |
| CBS Corp. | 8.200% | 5/15/14 | 400 | 465 |
| Cellco Partnership / Verizon Wireless Capital LLC | 5.550% | 2/1/14 | 8,300 | 9,131 |
| CenturyLink Inc. | 5.000% | 2/15/15 | 300 | 307 |
| Comcast Cable Communications Holdings Inc. | 8.375% | 3/15/13 | 5,730 | 6,349 |
| Comcast Corp. | 5.300% | 1/15/14 | 8,075 | 8,848 |
| Comcast Corp. | 6.500% | 1/15/15 | 250 | 286 |
| Comcast Corp. | 5.900% | 3/15/16 | 250 | 289 |
| COX Communications Inc. | 4.625% | 6/1/13 | 3,750 | 3,978 |
| COX Communications Inc. | 5.450% | 12/15/14 | 1,675 | 1,867 |
| Deutsche Telekom International Finance BV | 5.250% | 7/22/13 | 1,700 | 1,815 |
| Deutsche Telekom International Finance BV | 5.875% | 8/20/13 | 146 | 159 |
| Deutsche Telekom International Finance BV | 4.875% | 7/8/14 | 2,475 | 2,676 |
| Deutsche Telekom International Finance BV | 5.750% | 3/23/16 | 1,725 | 1,933 |
| DIRECTV Holdings LLC / DIRECTV | ||||
| Financing Co. Inc. | 4.750% | 10/1/14 | 2,100 | 2,306 |
| DIRECTV Holdings LLC / DIRECTV | ||||
| Financing Co. Inc. | 3.550% | 3/15/15 | 4,050 | 4,283 |
| DIRECTV Holdings LLC / DIRECTV | ||||
| Financing Co. Inc. | 3.500% | 3/1/16 | 2,000 | 2,087 |
| DIRECTV Holdings LLC / DIRECTV | ||||
| Financing Co. Inc. | 7.625% | 5/15/16 | 2,500 | 2,687 |
| Discovery Communications LLC | 3.700% | 6/1/15 | 1,400 | 1,492 |
| Embarq Corp. | 7.082% | 6/1/16 | 4,000 | 4,371 |
| France Telecom SA | 4.375% | 7/8/14 | 4,800 | 5,130 |
| McGraw-Hill Cos. Inc. | 5.375% | 11/15/12 | 200 | 209 |
| NBCUniversal Media LLC | 2.100% | 4/1/14 | 1,100 | 1,121 |
| NBCUniversal Media LLC | 3.650% | 4/30/15 | 375 | 398 |
| NBCUniversal Media LLC | 2.875% | 4/1/16 | 2,100 | 2,157 |
| News America Inc. | 5.300% | 12/15/14 | 3,000 | 3,308 |
| Omnicom Group Inc. | 5.900% | 4/15/16 | 1,500 | 1,699 |
| QwestCorp. | 8.375% | 5/1/16 | 7,525 | 8,558 |
| Reed Elsevier Capital Inc. | 7.750% | 1/15/14 | 1,122 | 1,279 |
| Rogers Communications Inc. | 6.375% | 3/1/14 | 4,075 | 4,577 |
| TCI Communications Inc. | 8.750% | 8/1/15 | 125 | 153 |
69
| Short-Term Corporate Bond Index Fund | ||||
| Face | Market | |||
| Maturity | Amount | Value | ||
| Coupon | Date | ($000) | ($000) | |
| Telecom Italia Capital SA | 5.250% | 11/15/13 | 630 | 631 |
| Telecom Italia Capital SA | 6.175% | 6/18/14 | 7,250 | 7,397 |
| Telecom Italia Capital SA | 4.950% | 9/30/14 | 150 | 149 |
| Telecom Italia Capital SA | 5.250% | 10/1/15 | 1,000 | 983 |
| Telefonica Emisiones SAU | 2.582% | 4/26/13 | 6,850 | 6,766 |
| Telefonica Emisiones SAU | 4.949% | 1/15/15 | 250 | 256 |
| Telefonica Emisiones SAU | 3.729% | 4/27/15 | 550 | 544 |
| Telefonica Emisiones SAU | 3.992% | 2/16/16 | 3,300 | 3,268 |
| Telefonica Emisiones SAU | 6.421% | 6/20/16 | 1,000 | 1,057 |
| Thomson Reuters Corp. | 5.950% | 7/15/13 | 1,350 | 1,451 |
| Thomson Reuters Corp. | 5.250% | 8/15/13 | 145 | 156 |
| Thomson Reuters Corp. | 5.700% | 10/1/14 | 2,550 | 2,840 |
| Time Warner Cable Inc. | 6.200% | 7/1/13 | 2,225 | 2,414 |
| Time Warner Cable Inc. | 8.250% | 2/14/14 | 1,500 | 1,723 |
| Time Warner Cable Inc. | 7.500% | 4/1/14 | 2,900 | 3,315 |
| Time Warner Cable Inc. | 3.500% | 2/1/15 | 425 | 447 |
| Time Warner Entertainment Co. LP | 8.875% | 10/1/12 | 250 | 272 |
| Verizon Communications Inc. | 4.350% | 2/15/13 | 2,175 | 2,282 |
| Verizon Communications Inc. | 5.250% | 4/15/13 | 7,990 | 8,533 |
| Verizon Communications Inc. | 1.950% | 3/28/14 | 3,325 | 3,395 |
| Verizon Communications Inc. | 5.550% | 2/15/16 | 1,600 | 1,819 |
| Verizon Communications Inc. | 3.000% | 4/1/16 | 3,100 | 3,227 |
| Verizon Global Funding Corp. | 7.375% | 9/1/12 | 250 | 266 |
| Vodafone Group plc | 4.150% | 6/10/14 | 8,876 | 9,617 |
| Vodafone Group plc | 3.375% | 11/24/15 | 1,825 | 1,938 |
| Vodafone Group plc | 5.750% | 3/15/16 | 275 | 317 |
| WPP Finance UK | 8.000% | 9/15/14 | 2,700 | 3,145 |
| Consumer Cyclical (4.3%) | ||||
| AutoZone Inc. | 5.750% | 1/15/15 | 100 | 111 |
| AutoZone Inc. | 5.500% | 11/15/15 | 2,200 | 2,481 |
| Best Buy Co. Inc. | 6.750% | 7/15/13 | 1,500 | 1,621 |
| CVS Caremark Corp. | 3.250% | 5/18/15 | 3,475 | 3,669 |
| Daimler Finance North America LLC | 6.500% | 11/15/13 | 2,525 | 2,791 |
| Darden Restaurants Inc. | 5.625% | 10/15/12 | 250 | 262 |
| eBay Inc. | 0.875% | 10/15/13 | 425 | 427 |
| eBay Inc. | 1.625% | 10/15/15 | 2,950 | 2,969 |
| 1 Harley-Davidson Funding Corp. | 5.250% | 12/15/12 | 175 | 183 |
| Home Depot Inc. | 5.250% | 12/16/13 | 1,725 | 1,875 |
| Home Depot Inc. | 5.400% | 3/1/16 | 6,650 | 7,559 |
| HyattHotels Corp. | 3.875% | 8/15/16 | 400 | 402 |
| Johnson Controls Inc. | 5.500% | 1/15/16 | 3,075 | 3,469 |
| Lowe’s Cos. Inc. | 5.600% | 9/15/12 | 1,000 | 1,052 |
| Lowe’s Cos. Inc. | 5.000% | 10/15/15 | 1,800 | 2,036 |
| Macy’s Retail Holdings Inc. | 5.750% | 7/15/14 | 600 | 647 |
| Macy’s Retail Holdings Inc. | 8.125% | 7/15/15 | 1,825 | 2,146 |
| Marriott International Inc. | 5.625% | 2/15/13 | 400 | 417 |
| Marriott International Inc. | 6.200% | 6/15/16 | 1,200 | 1,396 |
| McDonald’s Corp. | 4.300% | 3/1/13 | 2,461 | 2,597 |
| Nordstrom Inc. | 6.750% | 6/1/14 | 50 | 57 |
| PACCAR Financial Corp. | 1.950% | 12/17/12 | 175 | 178 |
| PACCAR Inc. | 6.875% | 2/15/14 | 2,125 | 2,423 |
| Staples Inc. | 7.375% | 10/1/12 | 150 | 160 |
| Staples Inc. | 9.750% | 1/15/14 | 3,725 | 4,368 |
| Target Corp. | 1.125% | 7/18/14 | 2,000 | 2,017 |
70
| Short-Term Corporate Bond Index Fund | ||||
| Face | Market | |||
| Maturity | Amount | Value | ||
| Coupon | Date | ($000) | ($000) | |
| Target Corp. | 5.875% | 7/15/16 | 1,500 | 1,779 |
| Time Warner Inc. | 3.150% | 7/15/15 | 3,475 | 3,618 |
| Toyota Motor Credit Corp. | 1.375% | 8/12/13 | 4,225 | 4,271 |
| Toyota Motor Credit Corp. | 3.200% | 6/17/15 | 750 | 796 |
| Turner Broadcasting System Inc. | 8.375% | 7/1/13 | 1,650 | 1,851 |
| Viacom Inc. | 4.375% | 9/15/14 | 4,450 | 4,817 |
| Wal-Mart Stores Inc. | 4.250% | 4/15/13 | 4,125 | 4,370 |
| Wal-Mart Stores Inc. | 4.550% | 5/1/13 | 4,700 | 5,012 |
| Wal-Mart Stores Inc. | 1.625% | 4/15/14 | 2,950 | 3,022 |
| Wal-Mart Stores Inc. | 3.200% | 5/15/14 | 1,975 | 2,102 |
| Wal-Mart Stores Inc. | 4.500% | 7/1/15 | 1,200 | 1,351 |
| Wal-Mart Stores Inc. | 2.250% | 7/8/15 | 625 | 651 |
| Wal-Mart Stores Inc. | 1.500% | 10/25/15 | 825 | 831 |
| Walgreen Co. | 4.875% | 8/1/13 | 2,125 | 2,293 |
| Walt Disney Co. | 4.500% | 12/15/13 | 3,575 | 3,881 |
| Western Union Co. | 6.500% | 2/26/14 | 475 | 528 |
| Consumer Noncyclical (12.9%) | ||||
| AbbottLaboratories | 5.150% | 11/30/12 | 2,875 | 3,041 |
| AbbottLaboratories | 2.700% | 5/27/15 | 175 | 185 |
| AbbottLaboratories | 5.875% | 5/15/16 | 4,400 | 5,204 |
| Allergan Inc. | 5.750% | 4/1/16 | 1,200 | 1,408 |
| Altria Group Inc. | 8.500% | 11/10/13 | 875 | 1,005 |
| Altria Group Inc. | 4.125% | 9/11/15 | 5,400 | 5,779 |
| AmerisourceBergen Corp. | 5.625% | 9/15/12 | 25 | 26 |
| AmerisourceBergen Corp. | 5.875% | 9/15/15 | 925 | 1,062 |
| Amgen Inc. | 4.850% | 11/18/14 | 3,600 | 4,025 |
| Anheuser-Busch InBev Worldwide Inc. | 3.000% | 10/15/12 | 5,400 | 5,538 |
| Anheuser-Busch InBev Worldwide Inc. | 2.500% | 3/26/13 | 1,375 | 1,408 |
| Anheuser-Busch InBev Worldwide Inc. | 1.500% | 7/14/14 | 400 | 406 |
| Anheuser-Busch InBev Worldwide Inc. | 5.375% | 11/15/14 | 3,100 | 3,496 |
| Anheuser-Busch InBev Worldwide Inc. | 4.125% | 1/15/15 | 2,925 | 3,194 |
| Anheuser-Busch InBev Worldwide Inc. | 2.875% | 2/15/16 | 200 | 211 |
| AstraZeneca plc | 5.400% | 9/15/12 | 3,200 | 3,359 |
| AstraZeneca plc | 5.400% | 6/1/14 | 875 | 987 |
| Avon Products Inc. | 5.625% | 3/1/14 | 450 | 486 |
| Baxter International Inc. | 1.800% | 3/15/13 | 200 | 203 |
| Baxter International Inc. | 4.000% | 3/1/14 | 333 | 358 |
| Baxter International Inc. | 4.625% | 3/15/15 | 400 | 446 |
| Biogen Idec Inc. | 6.000% | 3/1/13 | 25 | 27 |
| Boston Scientific Corp. | 4.500% | 1/15/15 | 1,400 | 1,486 |
| Boston Scientific Corp. | 6.250% | 11/15/15 | 2,800 | 3,111 |
| Bottling Group LLC | 6.950% | 3/15/14 | 475 | 545 |
| Bottling Group LLC | 5.500% | 4/1/16 | 425 | 496 |
| Bristol-Myers Squibb Co. | 5.250% | 8/15/13 | 1,325 | 1,442 |
| Brown-Forman Corp. | 2.500% | 1/15/16 | 575 | 596 |
| Bunge Ltd. Finance Corp. | 5.875% | 5/15/13 | 400 | 425 |
| Bunge Ltd. Finance Corp. | 5.350% | 4/15/14 | 525 | 561 |
| Bunge Ltd. Finance Corp. | 4.100% | 3/15/16 | 1,500 | 1,567 |
| Campbell Soup Co. | 3.375% | 8/15/14 | 2,700 | 2,907 |
| Cardinal Health Inc. | 4.000% | 6/15/15 | 325 | 351 |
| CareFusion Corp. | 5.125% | 8/1/14 | 2,700 | 2,963 |
| Celgene Corp. | 2.450% | 10/15/15 | 375 | 380 |
| Church & Dwight Co. Inc. | 3.350% | 12/15/15 | 250 | 261 |
| Cia de Bebidas das Americas | 8.750% | 9/15/13 | 1,000 | 1,140 |
71
| Short-Term Corporate Bond Index Fund | ||||
| Face | Market | |||
| Maturity | Amount | Value | ||
| Coupon | Date | ($000) | ($000) | |
| Clorox Co. | 5.000% | 3/1/13 | 3,000 | 3,134 |
| Coca-Cola Co. | 3.625% | 3/15/14 | 850 | 913 |
| Coca-Cola Co. | 1.500% | 11/15/15 | 600 | 609 |
| Coca-Cola Enterprises Inc. | 2.125% | 9/15/15 | 1,200 | 1,218 |
| Coca-Cola Enterprises Inc. | 2.000% | 8/19/16 | 500 | 498 |
| Coca-Cola Refreshments USA Inc. | 7.375% | 3/3/14 | 4,450 | 5,143 |
| Coca-Cola Refreshments USA Inc. | 4.250% | 3/1/15 | 1,885 | 2,082 |
| Corn Products International Inc. | 3.200% | 11/1/15 | 125 | 130 |
| Covidien International Finance SA | 1.875% | 6/15/13 | 4,000 | 4,072 |
| Delhaize Group SA | 5.875% | 2/1/14 | 25 | 28 |
| DENTSPLY International Inc. | 2.750% | 8/15/16 | 525 | 525 |
| Diageo Capital plc | 7.375% | 1/15/14 | 3,475 | 3,979 |
| Diageo Finance BV | 5.500% | 4/1/13 | 2,200 | 2,363 |
| Dr Pepper Snapple Group Inc. | 2.350% | 12/21/12 | 600 | 610 |
| Dr Pepper Snapple Group Inc. | 2.900% | 1/15/16 | 3,025 | 3,142 |
| Eli Lilly & Co. | 4.200% | 3/6/14 | 600 | 650 |
| Express Scripts Inc. | 5.250% | 6/15/12 | 775 | 800 |
| Express Scripts Inc. | 6.250% | 6/15/14 | 100 | 111 |
| Express Scripts Inc. | 3.125% | 5/15/16 | 2,850 | 2,920 |
| Fortune Brands Inc. | 3.000% | 6/1/12 | 2,000 | 2,024 |
| Genentech Inc. | 4.750% | 7/15/15 | 475 | 533 |
| General Mills Inc. | 5.650% | 9/10/12 | 150 | 157 |
| General Mills Inc. | 5.250% | 8/15/13 | 3,175 | 3,439 |
| General Mills Inc. | 5.200% | 3/17/15 | 2,150 | 2,436 |
| GlaxoSmithKline Capital Inc. | 4.850% | 5/15/13 | 6,333 | 6,779 |
| GlaxoSmithKline Capital Inc. | 4.375% | 4/15/14 | 1,575 | 1,725 |
| Hasbro Inc. | 6.125% | 5/15/14 | 1,025 | 1,132 |
| Hospira Inc. | 5.900% | 6/15/14 | 25 | 28 |
| Johnson & Johnson | 5.150% | 8/15/12 | 4,950 | 5,163 |
| Kellogg Co. | 5.125% | 12/3/12 | 2,090 | 2,200 |
| Kellogg Co. | 4.450% | 5/30/16 | 3,275 | 3,653 |
| Kimberly-Clark Corp. | 4.875% | 8/15/15 | 2,550 | 2,895 |
| Koninklijke Philips Electronics NV | 4.625% | 3/11/13 | 1,075 | 1,134 |
| Kraft Foods Inc. | 6.000% | 2/11/13 | 130 | 139 |
| Kraft Foods Inc. | 2.625% | 5/8/13 | 2,650 | 2,705 |
| Kraft Foods Inc. | 5.250% | 10/1/13 | 3,635 | 3,922 |
| Kraft Foods Inc. | 6.750% | 2/19/14 | 125 | 141 |
| Kraft Foods Inc. | 4.125% | 2/9/16 | 4,425 | 4,737 |
| Kroger Co. | 5.000% | 4/15/13 | 875 | 928 |
| Kroger Co. | 7.500% | 1/15/14 | 2,375 | 2,724 |
| Kroger Co. | 3.900% | 10/1/15 | 1,750 | 1,872 |
| Laboratory Corp. of America Holdings | 5.625% | 12/15/15 | 1,075 | 1,218 |
| Life Technologies Corp. | 4.400% | 3/1/15 | 4,450 | 4,687 |
| Lorillard Tobacco Co. | 3.500% | 8/4/16 | 800 | 803 |
| McKesson Corp. | 6.500% | 2/15/14 | 575 | 649 |
| McKesson Corp. | 3.250% | 3/1/16 | 2,175 | 2,313 |
| Medco Health Solutions Inc. | 6.125% | 3/15/13 | 900 | 959 |
| Medco Health Solutions Inc. | 7.250% | 8/15/13 | 400 | 439 |
| Medco Health Solutions Inc. | 2.750% | 9/15/15 | 1,525 | 1,555 |
| Medtronic Inc. | 4.500% | 3/15/14 | 100 | 109 |
| Medtronic Inc. | 3.000% | 3/15/15 | 5,050 | 5,344 |
| Medtronic Inc. | 2.625% | 3/15/16 | 1,000 | 1,042 |
| Merck & Co. Inc. | 5.300% | 12/1/13 | 6,125 | 6,731 |
| Merck & Co. Inc. | 4.750% | 3/1/15 | 550 | 619 |
| Merck & Co. Inc. | 4.000% | 6/30/15 | 175 | 193 |
72
| Short-Term Corporate Bond Index Fund | ||||
| Face | Market | |||
| Maturity | Amount | Value | ||
| Coupon | Date | ($000) | ($000) | |
| Merck & Co. Inc. | 2.250% | 1/15/16 | 2,475 | 2,569 |
| Newell Rubbermaid Inc. | 5.500% | 4/15/13 | 1,150 | 1,221 |
| Novartis Capital Corp. | 1.900% | 4/24/13 | 5,550 | 5,676 |
| Novartis Capital Corp. | 4.125% | 2/10/14 | 4,075 | 4,408 |
| Novartis Capital Corp. | 2.900% | 4/24/15 | 1,325 | 1,401 |
| PepsiAmericas Inc. | 4.875% | 1/15/15 | 225 | 253 |
| PepsiCo Inc. | 4.650% | 2/15/13 | 6,529 | 6,906 |
| PepsiCo Inc. | 3.750% | 3/1/14 | 650 | 697 |
| PepsiCo Inc. | 0.800% | 8/25/14 | 1,000 | 1,001 |
| PepsiCo Inc. | 3.100% | 1/15/15 | 3,850 | 4,097 |
| PepsiCo Inc. | 2.500% | 5/10/16 | 2,400 | 2,492 |
| Pfizer Inc. | 5.350% | 3/15/15 | 7,300 | 8,303 |
| Philip Morris International Inc. | 4.875% | 5/16/13 | 3,050 | 3,251 |
| Philip Morris International Inc. | 6.875% | 3/17/14 | 2,800 | 3,189 |
| Procter & Gamble Co. | 0.700% | 8/15/14 | 1,050 | 1,052 |
| Procter & Gamble Co. | 3.150% | 9/1/15 | 3,275 | 3,525 |
| Procter & Gamble Co. | 4.850% | 12/15/15 | 500 | 570 |
| Procter & Gamble Co. | 1.450% | 8/15/16 | 1,550 | 1,551 |
| Quest Diagnostics Inc. | 3.200% | 4/1/16 | 1,000 | 1,046 |
| Reynolds American Inc. | 7.250% | 6/1/13 | 1,575 | 1,724 |
| Reynolds American Inc. | 7.625% | 6/1/16 | 1,000 | 1,201 |
| Safeway Inc. | 6.250% | 3/15/14 | 2,000 | 2,231 |
| Sanofi | 1.625% | 3/28/14 | 1,375 | 1,401 |
| Sanofi | 2.625% | 3/29/16 | 4,550 | 4,729 |
| Sara Lee Corp. | 2.750% | 9/15/15 | 1,575 | 1,585 |
| St. Jude Medical Inc. | 2.200% | 9/15/13 | 450 | 461 |
| St. Jude Medical Inc. | 3.750% | 7/15/14 | 50 | 54 |
| St. Jude Medical Inc. | 2.500% | 1/15/16 | 975 | 1,010 |
| Stryker Corp. | 3.000% | 1/15/15 | 1,375 | 1,450 |
| SyscoCorp. | 4.200% | 2/12/13 | 75 | 79 |
| Teva Pharmaceutical Finance II BV / | ||||
| Teva Pharmaceutical Finance III LLC | 3.000% | 6/15/15 | 400 | 419 |
| Teva Pharmaceutical Finance III LLC | 1.500% | 6/15/12 | 1,825 | 1,838 |
| Thermo Fisher Scientific Inc. | 2.050% | 2/21/14 | 350 | 360 |
| Thermo Fisher Scientific Inc. | 3.250% | 11/20/14 | 150 | 159 |
| Thermo Fisher Scientific Inc. | 3.200% | 5/1/15 | 1,375 | 1,453 |
| Thermo Fisher Scientific Inc. | 3.200% | 3/1/16 | 1,700 | 1,780 |
| Thermo Fisher Scientific Inc. | 2.250% | 8/15/16 | 2,000 | 2,017 |
| Unilever Capital Corp. | 3.650% | 2/15/14 | 300 | 320 |
| Unilever Capital Corp. | 2.750% | 2/10/16 | 1,750 | 1,856 |
| Whirlpool Corp. | 5.500% | 3/1/13 | 4,850 | 5,082 |
| Wyeth | 5.500% | 3/15/13 | 50 | 54 |
| Wyeth | 5.500% | 2/1/14 | 4,305 | 4,768 |
| Wyeth | 5.500% | 2/15/16 | 2,500 | 2,897 |
| Energy (4.9%) | ||||
| Anadarko Petroleum Corp. | 7.625% | 3/15/14 | 2,950 | 3,365 |
| Anadarko Petroleum Corp. | 5.750% | 6/15/14 | 560 | 618 |
| Apache Corp. | 5.250% | 4/15/13 | 1,920 | 2,055 |
| Apache Corp. | 6.000% | 9/15/13 | 1,450 | 1,598 |
| Baker Hughes Inc. | 6.500% | 11/15/13 | 1,200 | 1,350 |
| BPCapital Markets plc | 5.250% | 11/7/13 | 6,900 | 7,457 |
| BPCapital Markets plc | 3.625% | 5/8/14 | 1,150 | 1,216 |
| BPCapital Markets plc | 3.875% | 3/10/15 | 6,825 | 7,296 |
| BPCapital Markets plc | 3.125% | 10/1/15 | 2,050 | 2,145 |
73
| Short-Term Corporate Bond Index Fund | ||||
| Face | Market | |||
| Maturity | Amount | Value | ||
| Coupon | Date | ($000) | ($000) | |
| Canadian Natural Resources Ltd. | 5.150% | 2/1/13 | 2,500 | 2,642 |
| Canadian Natural Resources Ltd. | 4.900% | 12/1/14 | 400 | 445 |
| Cenovus Energy Inc. | 4.500% | 9/15/14 | 2,750 | 2,983 |
| Chevron Corp. | 3.950% | 3/3/14 | 4,325 | 4,669 |
| ConocoPhillips | 4.750% | 2/1/14 | 5,075 | 5,535 |
| ConocoPhillips | 4.600% | 1/15/15 | 3,625 | 3,987 |
| Devon Energy Corp. | 5.625% | 1/15/14 | 1,800 | 1,990 |
| Devon Energy Corp. | 2.400% | 7/15/16 | 1,300 | 1,319 |
| Diamond Offshore Drilling Inc. | 5.150% | 9/1/14 | 750 | 827 |
| EnCana Holdings Finance Corp. | 5.800% | 5/1/14 | 2,450 | 2,713 |
| Ensco plc | 3.250% | 3/15/16 | 1,425 | 1,471 |
| EOG Resources Inc. | 2.950% | 6/1/15 | 1,125 | 1,185 |
| Husky Energy Inc. | 5.900% | 6/15/14 | 1,400 | 1,556 |
| 1 Marathon Petroleum Corp. | 3.500% | 3/1/16 | 2,700 | 2,845 |
| Noble Holding International Ltd. | 3.450% | 8/1/15 | 800 | 846 |
| Noble Holding International Ltd. | 3.050% | 3/1/16 | 1,000 | 1,042 |
| Occidental Petroleum Corp. | 1.450% | 12/13/13 | 1,250 | 1,271 |
| Occidental Petroleum Corp. | 2.500% | 2/1/16 | 800 | 834 |
| Occidental Petroleum Corp. | 4.125% | 6/1/16 | 1,200 | 1,336 |
| Shell International Finance BV | 1.875% | 3/25/13 | 3,450 | 3,518 |
| Shell International Finance BV | 4.000% | 3/21/14 | 9,225 | 9,948 |
| Shell International Finance BV | 3.100% | 6/28/15 | 400 | 425 |
| Shell International Finance BV | 3.250% | 9/22/15 | 775 | 826 |
| Statoil ASA | 3.875% | 4/15/14 | 500 | 540 |
| Statoil ASA | 2.900% | 10/15/14 | 4,375 | 4,636 |
| Total Capital Canada Ltd. | 1.625% | 1/28/14 | 1,000 | 1,020 |
| Total Capital SA | 3.000% | 6/24/15 | 5,575 | 5,911 |
| Total Capital SA | 2.300% | 3/15/16 | 1,900 | 1,965 |
| Transocean Inc. | 5.250% | 3/15/13 | 1,450 | 1,523 |
| Transocean Inc. | 4.950% | 11/15/15 | 1,295 | 1,395 |
| Valero Energy Corp. | 4.750% | 6/15/13 | 775 | 817 |
| Other Industrial (0.0%) | ||||
| Connecticut Health & Educational Facilities | ||||
| Authority Revenue (Yale University) | 2.900% | 10/15/14 | 660 | 704 |
| Technology (5.6%) | ||||
| Adobe Systems Inc. | 3.250% | 2/1/15 | 2,250 | 2,377 |
| Agilent Technologies Inc. | 4.450% | 9/14/12 | 25 | 26 |
| Agilent Technologies Inc. | 5.500% | 9/14/15 | 3,300 | 3,692 |
| Analog Devices Inc. | 3.000% | 4/15/16 | 1,000 | 1,041 |
| Applied Materials Inc. | 2.650% | 6/15/16 | 700 | 714 |
| Arrow Electronics Inc. | 3.375% | 11/1/15 | 500 | 519 |
| 1 Broadcom Corp. | 1.500% | 11/1/13 | 500 | 503 |
| CA Inc. | 6.125% | 12/1/14 | 1,500 | 1,687 |
| Cisco Systems Inc. | 1.625% | 3/14/14 | 2,050 | 2,088 |
| Cisco Systems Inc. | 2.900% | 11/17/14 | 5,500 | 5,833 |
| Cisco Systems Inc. | 5.500% | 2/22/16 | 2,250 | 2,604 |
| Computer Sciences Corp. | 5.500% | 3/15/13 | 1,700 | 1,797 |
| Dell Inc. | 1.400% | 9/10/13 | 475 | 478 |
| Dell Inc. | 2.300% | 9/10/15 | 4,375 | 4,462 |
| Dell Inc. | 3.100% | 4/1/16 | 2,225 | 2,320 |
| Dun & Bradstreet Corp. | 6.000% | 4/1/13 | 50 | 54 |
| Dun & Bradstreet Corp. | 2.875% | 11/15/15 | 625 | 645 |
| Fiserv Inc. | 3.125% | 6/15/16 | 925 | 946 |
74
| Short-Term Corporate Bond Index Fund | ||||
| Face | Market | |||
| Maturity | Amount | Value | ||
| Coupon | Date | ($000) | ($000) | |
| Google Inc. | 2.125% | 5/19/16 | 2,700 | 2,789 |
| Harris Corp. | 5.000% | 10/1/15 | 200 | 224 |
| Hewlett-Packard Co. | 4.500% | 3/1/13 | 6,200 | 6,487 |
| Hewlett-Packard Co. | 1.250% | 9/13/13 | 3,850 | 3,837 |
| Hewlett-Packard Co. | 6.125% | 3/1/14 | 2,768 | 3,056 |
| Hewlett-Packard Co. | 1.550% | 5/30/14 | 1,725 | 1,739 |
| Hewlett-Packard Co. | 2.125% | 9/13/15 | 2,650 | 2,657 |
| Hewlett-Packard Co. | 2.200% | 12/1/15 | 375 | 379 |
| Hewlett-Packard Co. | 2.650% | 6/1/16 | 1,220 | 1,244 |
| HPEnterprise Services LLC | 6.000% | 8/1/13 | 425 | 462 |
| IBM International Group Capital LLC | 5.050% | 10/22/12 | 5,665 | 5,956 |
| International Business Machines Corp. | 4.750% | 11/29/12 | 125 | 132 |
| International Business Machines Corp. | 2.100% | 5/6/13 | 5,725 | 5,863 |
| International Business Machines Corp. | 1.000% | 8/5/13 | 3,700 | 3,727 |
| International Business Machines Corp. | 6.500% | 10/15/13 | 925 | 1,036 |
| International Business Machines Corp. | 1.250% | 5/12/14 | 2,775 | 2,815 |
| International Business Machines Corp. | 2.000% | 1/5/16 | 775 | 790 |
| International Business Machines Corp. | 1.950% | 7/22/16 | 2,425 | 2,464 |
| Juniper Networks Inc. | 3.100% | 3/15/16 | 300 | 312 |
| Lexmark International Inc. | 5.900% | 6/1/13 | 150 | 159 |
| Maxim Integrated Products Inc. | 3.450% | 6/14/13 | 150 | 155 |
| Microsoft Corp. | 0.875% | 9/27/13 | 300 | 302 |
| Microsoft Corp. | 2.950% | 6/1/14 | 5,150 | 5,471 |
| Microsoft Corp. | 1.625% | 9/25/15 | 450 | 457 |
| Microsoft Corp. | 2.500% | 2/8/16 | 2,200 | 2,319 |
| Oracle Corp. | 4.950% | 4/15/13 | 1,175 | 1,255 |
| Oracle Corp. | 3.750% | 7/8/14 | 4,930 | 5,350 |
| Oracle Corp. | 5.250% | 1/15/16 | 2,700 | 3,115 |
| Pitney Bowes Inc. | 4.875% | 8/15/14 | 1,800 | 1,951 |
| Pitney Bowes Inc. | 4.750% | 1/15/16 | 2,750 | 2,974 |
| SymantecCorp. | 2.750% | 9/15/15 | 1,000 | 1,019 |
| Texas Instruments Inc. | 1.375% | 5/15/14 | 1,000 | 1,015 |
| Texas Instruments Inc. | 2.375% | 5/16/16 | 2,925 | 3,013 |
| TycoElectronics Group SA | 6.000% | 10/1/12 | 527 | 556 |
| Xerox Corp. | 5.500% | 5/15/12 | 3,250 | 3,350 |
| Xerox Corp. | 5.650% | 5/15/13 | 125 | 133 |
| Xerox Corp. | 4.250% | 2/15/15 | 3,025 | 3,221 |
| Transportation (1.2%) | ||||
| Burlington Northern Santa Fe LLC | 7.000% | 2/1/14 | 3,100 | 3,524 |
| Canadian National Railway Co. | 4.400% | 3/15/13 | 1,000 | 1,057 |
| Canadian National Railway Co. | 5.800% | 6/1/16 | 700 | 830 |
| 2 Continental Airlines 2009-1 Pass Through Trust | 9.000% | 7/8/16 | 912 | 994 |
| CSX Corp. | 6.250% | 4/1/15 | 4,825 | 5,581 |
| JB Hunt Transport Services Inc. | 3.375% | 9/15/15 | 300 | 306 |
| Norfolk Southern Corp. | 5.750% | 1/15/16 | 1,500 | 1,728 |
| RyderSystem Inc. | 6.000% | 3/1/13 | 150 | 159 |
| RyderSystem Inc. | 5.850% | 3/1/14 | 500 | 549 |
| RyderSystem Inc. | 3.150% | 3/2/15 | 525 | 545 |
| RyderSystem Inc. | 7.200% | 9/1/15 | 325 | 385 |
| RyderSystem Inc. | 3.600% | 3/1/16 | 2,100 | 2,187 |
| Union Pacific Corp. | 5.450% | 1/31/13 | 900 | 958 |
| United Parcel Service Inc. | 4.500% | 1/15/13 | 500 | 526 |
| United Parcel Service Inc. | 3.875% | 4/1/14 | 5,025 | 5,434 |
| 954,232 | ||||
75
| Short-Term Corporate Bond Index Fund | ||||
| Face | Market | |||
| Maturity | Amount | Value | ||
| Coupon | Date | ($000) | ($000) | |
| Utilities (7.2%) | ||||
| Electric (5.1%) | ||||
| Alabama Power Co. | 4.850% | 12/15/12 | 200 | 211 |
| Ameren Corp. | 8.875% | 5/15/14 | 525 | 599 |
| Appalachian Power Co. | 3.400% | 5/24/15 | 600 | 636 |
| Carolina Power & Light Co. | 5.125% | 9/15/13 | 75 | 81 |
| Carolina Power & Light Co. | 5.150% | 4/1/15 | 237 | 267 |
| CenterPoint Energy Houston Electric LLC | 7.000% | 3/1/14 | 3,450 | 3,938 |
| Cleveland Electric Illuminating Co. | 5.650% | 12/15/13 | 75 | 81 |
| Commonwealth Edison Co. | 1.625% | 1/15/14 | 725 | 732 |
| Commonwealth Edison Co. | 4.700% | 4/15/15 | 600 | 665 |
| Consolidated Edison Co. of New York Inc. | 4.875% | 2/1/13 | 3,500 | 3,681 |
| Consolidated Natural Gas Co. | 5.000% | 12/1/14 | 225 | 250 |
| Constellation Energy Group Inc. | 4.550% | 6/15/15 | 525 | 565 |
| Consumers Energy Co. | 5.375% | 4/15/13 | 50 | 54 |
| Consumers Energy Co. | 5.500% | 8/15/16 | 1,300 | 1,494 |
| Dayton Power & Light Co. | 5.125% | 10/1/13 | 710 | 771 |
| Dominion Resources Inc. | 5.700% | 9/17/12 | 1,100 | 1,155 |
| Dominion Resources Inc. | 5.000% | 3/15/13 | 200 | 212 |
| Dominion Resources Inc. | 1.800% | 3/15/14 | 2,000 | 2,021 |
| Dominion Resources Inc. | 5.150% | 7/15/15 | 1,725 | 1,940 |
| 2 Dominion Resources Inc. | 7.500% | 6/30/66 | 1,100 | 1,129 |
| Duke Energy Corp. | 6.300% | 2/1/14 | 3,900 | 4,342 |
| Duke Energy Corp. | 3.950% | 9/15/14 | 1,975 | 2,119 |
| Duke Energy Corp. | 3.350% | 4/1/15 | 3,375 | 3,575 |
| Exelon Corp. | 4.900% | 6/15/15 | 4,450 | 4,880 |
| FirstEnergy Solutions Corp. | 4.800% | 2/15/15 | 2,550 | 2,768 |
| Florida Power Corp. | 5.100% | 12/1/15 | 2,150 | 2,465 |
| Great Plains Energy Inc. | 2.750% | 8/15/13 | 325 | 333 |
| 1 IberdrolaFinance Ireland Ltd. | 3.800% | 9/11/14 | 50 | 50 |
| Kentucky Utilities Co. | 1.625% | 11/1/15 | 350 | 352 |
| LG&E and KU Energy LLC | 2.125% | 11/15/15 | 425 | 421 |
| Louisville Gas & Electric Co. | 1.625% | 11/15/15 | 200 | 202 |
| Midamerican Energy Holdings Co. | 5.875% | 10/1/12 | 3,150 | 3,314 |
| National Rural Utilities Cooperative Finance Corp. | 5.500% | 7/1/13 | 6,325 | 6,842 |
| National Rural Utilities Cooperative Finance Corp. | 3.050% | 3/1/16 | 400 | 420 |
| NextEra Energy Capital Holdings Inc. | 2.550% | 11/15/13 | 375 | 385 |
| NextEra Energy Capital Holdings Inc. | 7.875% | 12/15/15 | 3,600 | 4,327 |
| 1 Niagara Mohawk Power Corp. | 3.553% | 10/1/14 | 50 | 53 |
| Northeast Utilities | 5.650% | 6/1/13 | 25 | 27 |
| Northern States Power Co. | 1.950% | 8/15/15 | 125 | 128 |
| NSTAR Electric Co. | 4.875% | 10/15/12 | 50 | 52 |
| Ohio Power Co. | 6.000% | 6/1/16 | 2,000 | 2,328 |
| Oncor Electric Delivery Co. LLC | 5.950% | 9/1/13 | 525 | 572 |
| Oncor Electric Delivery Co. LLC | 6.375% | 1/15/15 | 2,100 | 2,420 |
| Pacific Gas & Electric Co. | 6.250% | 12/1/13 | 310 | 345 |
| Pacific Gas & Electric Co. | 4.800% | 3/1/14 | 4,725 | 5,152 |
| Peco Energy Co. | 5.000% | 10/1/14 | 25 | 28 |
| Pepco Holdings Inc. | 2.700% | 10/1/15 | 500 | 519 |
| PG&E Corp. | 5.750% | 4/1/14 | 50 | 55 |
| PPL Energy Supply LLC | 6.300% | 7/15/13 | 1,650 | 1,786 |
| PPL Energy Supply LLC | 5.400% | 8/15/14 | 75 | 83 |
| PPL Energy Supply LLC | 6.200% | 5/15/16 | 1,100 | 1,281 |
| Progress Energy Inc. | 6.050% | 3/15/14 | 1,450 | 1,622 |
| PSEG Power LLC | 2.500% | 4/15/13 | 1,750 | 1,779 |
| PSEG Power LLC | 5.000% | 4/1/14 | 100 | 107 |
76
| Short-Term Corporate Bond Index Fund | ||||
| Face | Market | |||
| Maturity | Amount | Value | ||
| Coupon | Date | ($000) | ($000) | |
| PSEG Power LLC | 5.500% | 12/1/15 | 975 | 1,090 |
| Public Service Co. of Colorado | 7.875% | 10/1/12 | 3,715 | 3,995 |
| Public Service Electric & Gas Co. | 5.125% | 9/1/12 | 1,700 | 1,773 |
| Public Service Electric & Gas Co. | 2.700% | 5/1/15 | 150 | 159 |
| San Diego Gas & Electric Co. | 5.300% | 11/15/15 | 300 | 348 |
| Sierra Pacific Power Co. | 6.000% | 5/15/16 | 1,350 | 1,596 |
| Southern California Edison Co. | 5.750% | 3/15/14 | 3,850 | 4,303 |
| Southern California Edison Co. | 4.150% | 9/15/14 | 1,089 | 1,180 |
| Southern California Edison Co. | 4.650% | 4/1/15 | 600 | 665 |
| Southern Co. | 4.150% | 5/15/14 | 1,141 | 1,221 |
| Southern Co. | 2.375% | 9/15/15 | 4,450 | 4,543 |
| Southern Power Co. | 4.875% | 7/15/15 | 1,875 | 2,083 |
| TECO Finance Inc. | 4.000% | 3/15/16 | 725 | 778 |
| TransAlta Corp. | 4.750% | 1/15/15 | 1,600 | 1,732 |
| Virginia Electric and Power Co. | 5.100% | 11/30/12 | 1,300 | 1,368 |
| Wisconsin Electric Power Co. | 6.000% | 4/1/14 | 950 | 1,073 |
| Natural Gas (2.0%) | ||||
| Atmos Energy Corp. | 5.125% | 1/15/13 | 300 | 317 |
| Atmos Energy Corp. | 4.950% | 10/15/14 | 105 | 116 |
| CenterPoint Energy Resources Corp. | 6.150% | 5/1/16 | 1,350 | 1,585 |
| DCP Midstream Operating LP | 3.250% | 10/1/15 | 200 | 205 |
| Enbridge Energy Partners LP | 5.875% | 12/15/16 | 1,000 | 1,177 |
| Enbridge Inc. | 5.800% | 6/15/14 | 325 | 361 |
| Energy Transfer Partners LP | 6.000% | 7/1/13 | 340 | 362 |
| Energy Transfer Partners LP | 5.950% | 2/1/15 | 4,550 | 5,006 |
| Enterprise Products Operating LLC | 6.375% | 2/1/13 | 100 | 107 |
| Enterprise Products Operating LLC | 9.750% | 1/31/14 | 425 | 502 |
| Enterprise Products Operating LLC | 5.600% | 10/15/14 | 3,600 | 3,974 |
| Enterprise Products Operating LLC | 5.000% | 3/1/15 | 206 | 227 |
| Enterprise Products Operating LLC | 3.700% | 6/1/15 | 1,300 | 1,368 |
| Enterprise Products Operating LLC | 3.200% | 2/1/16 | 1,500 | 1,551 |
| Kinder Morgan Energy Partners LP | 5.850% | 9/15/12 | 300 | 315 |
| Kinder Morgan Energy Partners LP | 5.000% | 12/15/13 | 1,550 | 1,673 |
| Kinder Morgan Energy Partners LP | 3.500% | 3/1/16 | 1,150 | 1,191 |
| National Grid plc | 6.300% | 8/1/16 | 1,800 | 2,100 |
| Nisource Finance Corp. | 6.150% | 3/1/13 | 1,675 | 1,795 |
| Nisource Finance Corp. | 5.400% | 7/15/14 | 2,325 | 2,569 |
| Oneok Inc. | 5.200% | 6/15/15 | 225 | 249 |
| ONEOKPartners LP | 3.250% | 2/1/16 | 1,725 | 1,783 |
| Plains All American Pipeline LP / | ||||
| PAA Finance Corp. | 4.250% | 9/1/12 | 1,500 | 1,546 |
| Questar Corp. | 2.750% | 2/1/16 | 275 | 288 |
| Sempra Energy | 2.000% | 3/15/14 | 2,400 | 2,442 |
| Spectra Energy Capital LLC | 6.250% | 2/15/13 | 1,725 | 1,839 |
| Texas Gas Transmission LLC | 4.600% | 6/1/15 | 175 | 189 |
| TransCanada PipeLines Ltd. | 4.000% | 6/15/13 | 425 | 450 |
| TransCanada PipeLines Ltd. | 3.400% | 6/1/15 | 1,500 | 1,607 |
| Williams Partners LP | 3.800% | 2/15/15 | 4,400 | 4,667 |
| Other Utility (0.1%) | ||||
| Veolia Environnement SA | 5.250% | 6/3/13 | 900 | 953 |
| 146,035 | ||||
| Total Corporate Bonds (Cost $1,965,794) | 1,987,309 | |||
77
| Short-Term Corporate Bond Index Fund | |||
| Market | |||
| Value | |||
| Coupon | Shares | ($000) | |
| Temporary Cash Investment (0.9%) | |||
| Money Market Fund (0.9%) | |||
| 3 Vanguard Market Liquidity Fund (Cost $17,586) | 0.132% | 17,585,994 | 17,586 |
| Total Investments (99.9%) (Cost $2,008,795) | 2,030,285 | ||
| Other Assets and Liabilities (0.1%) | |||
| Other Assets | 59,883 | ||
| Liabilities | (56,873) | ||
| 3,010 | |||
| Net Assets (100%) | 2,033,295 | ||
| At August 31, 2011, net assets consisted of: | |||
| Amount | |||
| ($000) | |||
| Paid-in Capital | 2,009,403 | ||
| Overdistributed Net Investment Income | (206) | ||
| Accumulated Net Realized Gains | 2,608 | ||
| Unrealized Appreciation (Depreciation) | 21,490 | ||
| Net Assets | 2,033,295 | ||
| Signal Shares—Net Assets | |||
| Applicable to 163,468 outstanding $.001 par value shares of | |||
| beneficial interest (unlimited authorization) | 3,475 | ||
| Net Asset Value Per Share—Signal Shares | $21.26 | ||
| Institutional Shares—Net Assets | |||
| Applicable to 4,809,033 outstanding $.001 par value shares of | |||
| beneficial interest (unlimited authorization) | 125,162 | ||
| Net Asset Value Per Share—Institutional Shares | $26.03 | ||
| ETF Shares—Net Assets | |||
| Applicable to 24,400,000 outstanding $.001 par value shares of | |||
| beneficial interest (unlimited authorization) | 1,904,658 | ||
| Net Asset Value Per Share—ETF Shares | $78.06 | ||
See Note A in Notes to Financial Statements.
1 Security exempt from registration under Rule 144A of the Securities Act of 1933. Such securities may be sold in transactions exempt from registration, normally to qualified institutional buyers. At August 31, 2011, the aggregate value of these securities was $9,559,000, representing 0.5% of net assets.
2 The average or expected maturity is shorter than the final maturity shown because of the possibility of interim principal payments and prepayments or the possibility of the issue being called.
3 Affiliated money market fund available only to Vanguard funds and certain trusts and accounts managed by Vanguard. Rate shown is the 7-day yield.
REIT—Real Estate Investment Trust.
See accompanying Notes, which are an integral part of the Financial Statements.
78
Short-Term Corporate Bond Index Fund
Statement of Operations
| Year Ended | |
| August 31, 2011 | |
| ($000) | |
| Investment Income | |
| Income | |
| Interest1 | 35,502 |
| Total Income | 35,502 |
| Expenses | |
| The Vanguard Group—Note B | |
| Investment Advisory Services | 80 |
| Management and Administrative—Signal Shares | 1 |
| Management and Administrative—Institutional Shares | 71 |
| Management and Administrative—ETF Shares | 1,249 |
| Marketing and Distribution—Signal Shares | — |
| Marketing and Distribution—Institutional Shares | 45 |
| Marketing and Distribution—ETF Shares | 315 |
| Custodian Fees | 15 |
| Auditing Fees | 41 |
| Shareholders’ Reports—Signal Shares | — |
| Shareholders’ Reports—Institutional Shares | — |
| Shareholders’ Reports—ETF Shares | 59 |
| Trustees’ Fees and Expenses | 1 |
| Total Expenses | 1,877 |
| Net Investment Income | 33,625 |
| Realized Net Gain (Loss) | |
| Investment Securities Sold | 3,847 |
| Futures Contracts | (373) |
| Realized Net Gain (Loss) | 3,474 |
| Change in Unrealized Appreciation (Depreciation) of Investment Securities | 4,900 |
| Net Increase (Decrease) in Net Assets Resulting from Operations | 41,999 |
| 1 Interest income from an affiliated company of the fund was $10,000. | |
See accompanying Notes, which are an integral part of the Financial Statements.
79
Short-Term Corporate Bond Index Fund
Statement of Changes in Net Assets
| November 19, | ||
| Year Ended | 20091 to | |
| August 31, | August 31, | |
| 2011 | 2010 | |
| ($000) | ($000) | |
| Increase (Decrease) in Net Assets | ||
| Operations | ||
| Net Investment Income | 33,625 | 7,757 |
| Realized Net Gain (Loss) | 3,474 | 535 |
| Change in Unrealized Appreciation (Depreciation) | 4,900 | 16,590 |
| Net Increase (Decrease) in Net Assets Resulting from Operations | 41,999 | 24,882 |
| Distributions | ||
| Net Investment Income | ||
| Signal Shares | (25) | — |
| Institutional Shares | (3,490) | (1,442) |
| ETF Shares | (30,249) | (6,382) |
| Realized Capital Gain2 | ||
| Signal Shares | — | — |
| Institutional Shares | (127) | — |
| ETF Shares | (800) | — |
| Total Distributions | (34,691) | (7,824) |
| Capital Share Transactions | ||
| Signal Shares | 3,477 | — |
| Institutional Shares | (9,699) | 130,482 |
| ETF Shares | 1,191,319 | 693,350 |
| Net Increase (Decrease) from Capital Share Transactions | 1,185,097 | 823,832 |
| Total Increase (Decrease) | 1,192,405 | 840,890 |
| Net Assets | ||
| Beginning of Period | 840,890 | — |
| End of Period3 | 2,033,295 | 840,890 |
1 Inception.
2 Includes fiscal 2011 short-term gain distributions totaling $927,000. Short-term gain distributions are treated as ordinary income dividends for tax purposes.
3 Net Assets—End of Period includes undistributed (overdistributed) net investment income of ($206,000) and ($67,000).
See accompanying Notes, which are an integral part of the Financial Statements.
80
Short-Term Corporate Bond Index Fund
Financial Highlights
| Signal Shares | |
| November 18, 20101 to | |
| For a Share Outstanding Throughout the Period | August 31, 2011 |
| Net Asset Value, Beginning of Period | $21.21 |
| Investment Operations | |
| Net Investment Income | .387 |
| Net Realized and Unrealized Gain (Loss) on Investments | .091 |
| Total from Investment Operations | .478 |
| Distributions | |
| Dividends from Net Investment Income | (.410) |
| Distributions from Realized Capital Gains | (.018) |
| Total Distributions | (.428) |
| Net Asset Value, End of Period | $21.26 |
| Total Return2 | 2.28% |
| Ratios/Supplemental Data | |
| Net Assets, End of Period (Millions) | $3 |
| Ratio of Total Expenses to Average Net Assets | 0.14%3 |
| Ratio of Net Investment Income to Average Net Assets | 2.39%3 |
| Portfolio Turnover Rate4 | 63% |
1 Inception.
2 Total returns do not include transaction fees that may have applied in the periods shown. Fund prospectuses provide information about any applicable transaction fees.
3 Annualized.
4 Excludes the value of portfolio securities received or delivered as a result of in-kind purchases or redemptions of the fund’s capital shares, including ETF Creation Units.
See accompanying Notes, which are an integral part of the Financial Statements.
81
Short-Term Corporate Bond Index Fund
Financial Highlights
| Institutional Shares | ||
| Year | Nov. 19, | |
| Ended | 20091 to | |
| August 31, | Aug. 31, | |
| For a Share Outstanding Throughout Each Period | 2011 | 2010 |
| Net Asset Value, Beginning of Period | $25.90 | $25.02 |
| Investment Operations | ||
| Net Investment Income | .619 | .453 |
| Net Realized and Unrealized Gain (Loss) on Investments | .151 | .882 |
| Total from Investment Operations | .770 | 1.335 |
| Distributions | ||
| Dividends from Net Investment Income | (.618) | (.455) |
| Distributions from Realized Capital Gains | (.022) | — |
| Total Distributions | (.640) | (.455) |
| Net Asset Value, End of Period | $26.03 | $25.90 |
| Total Return2 | 3.01% | 5.39% |
| Ratios/Supplemental Data | ||
| Net Assets, End of Period (Millions) | $125 | $134 |
| Ratio of Total Expenses to Average Net Assets | 0.09% | 0.09%3 |
| Ratio of Net Investment Income to Average Net Assets | 2.44% | 2.62%3 |
| Portfolio Turnover Rate4 | 63% | 68% |
1 Inception.
2 Total returns do not include transaction fees that may have applied in the periods shown. Fund prospectuses provide information about any applicable transaction fees.
3 Annualized.
4 Excludes the value of portfolio securities received or delivered as a result of in-kind purchases or redemptions of the fund’s capital shares, including ETF Creation Units.
See accompanying Notes, which are an integral part of the Financial Statements.
82
Short-Term Corporate Bond Index Fund
Financial Highlights
| ETF Shares | ||
| Year | Nov. 19, | |
| Ended | 20091 to | |
| August 31, | Aug. 31, | |
| For a Share Outstanding Throughout Each Period | 2011 | 2010 |
| Net Asset Value, Beginning of Period | $77.68 | $75.05 |
| Investment Operations | ||
| Net Investment Income | 1.815 | 1.334 |
| Net Realized and Unrealized Gain (Loss) on Investments | .443 | 2.636 |
| Total from Investment Operations | 2.258 | 3.970 |
| Distributions | ||
| Dividends from Net Investment Income | (1.813) | (1.340) |
| Distributions from Realized Capital Gains | (.065) | — |
| Total Distributions | (1.878) | (1.340) |
| Net Asset Value, End of Period | $78.06 | $77.68 |
| Total Return | 2.94% | 5.34% |
| Ratios/Supplemental Data | ||
| Net Assets, End of Period (Millions) | $1,905 | $707 |
| Ratio of Total Expenses to Average Net Assets | 0.14% | 0.15%2 |
| Ratio of Net Investment Income to Average Net Assets | 2.39% | 2.56%2 |
| Portfolio Turnover Rate3 | 63% | 68% |
1 Inception.
2 Annualized.
3 Excludes the value of portfolio securities received or delivered as a result of in-kind purchases or redemptions of the fund’s capital shares, including ETF Creation Units.
See accompanying Notes, which are an integral part of the Financial Statements.
83
Short-Term Corporate Bond Index Fund
Notes to Financial Statements
Vanguard Short-Term Corporate Bond Index Fund is registered under the Investment Company Act of 1940 as an open-end investment company, or mutual fund. Certain of the fund’s investments are in corporate debt instruments; the issuers’ abilities to meet their obligations may be affected by economic developments in their respective industries. The fund offers three classes of shares: Signal Shares, Institutional Shares, and ETF Shares. Signal Shares and Institutional Shares are designed for investors who meet certain administrative, service, and account-size criteria. Signal Shares were first issued on November 18, 2010. ETF Shares are listed for trading on Nasdaq; they can be purchased and sold through a broker.
A. The following significant accounting policies conform to generally accepted accounting principles for U.S. mutual funds. The fund consistently follows such policies in preparing its financial statements.
1. Security Valuation: Bonds, and temporary cash investments acquired over 60 days to maturity, are valued using the latest bid prices or using valuations based on a matrix system (which considers such factors as security prices, yields, maturities, and ratings), both as furnished by independent pricing services. Investments in Vanguard Market Liquidity Fund are valued at that fund’s net asset value. Other temporary cash investments are valued at amortized cost, which approximates market value. Securities for which market quotations are not readily available, or whose values have been affected by events occurring before the fund’s pricing time but after the close of the securities’ primary markets, are valued by methods deemed by the board of trustees to represent fair value.
2. Futures Contracts: The fund uses futures contracts to invest in fixed income asset classes with greater efficiency and lower cost than is possible through direct investment, to add value when these instruments are attractively priced, or to adjust sensitivity to changes in interest rates. The primary risks associated with the use of futures contracts are imperfect correlation between changes in market values of bonds held by the fund and the prices of futures contracts, and the possibility of an illiquid market. There were no open futures contracts at August 31, 2011.
Futures contracts are valued based upon their quoted daily settlement prices. The aggregate principal amounts of the contracts are not recorded in the Statement of Net Assets. Fluctuations in the value of the contracts are recorded in the Statement of Net Assets as an asset (liability) and in the Statement of Operations as unrealized appreciation (depreciation) until the contracts are closed, when they are recorded as realized futures gains (losses).
3. Federal Income Taxes: The fund intends to continue to qualify as a regulated investment company and distribute all of its taxable income. Management has analyzed the fund’s tax positions taken for all open federal income tax years (August 31, 2010–2011), and has concluded that no provision for federal income tax is required in the fund’s financial statements.
4. Distributions: Distributions to shareholders are recorded on the ex-dividend date.
5. Other: Interest income includes income distributions received from Vanguard Market Liquidity Fund and is accrued daily. Premiums and discounts on debt securities purchased are amortized and accreted, respectively, to interest income over the lives of the respective securities. Security transactions are accounted for on the date securities are bought or sold. Costs used to determine realized gains (losses) on the sale of investment securities are those of the specific securities sold. Fees assessed on purchases of capital shares are credited to paid-in capital.
Each class of shares has equal rights as to assets and earnings, except that each class separately bears certain class-specific expenses related to maintenance of shareholder accounts (included in Management and Administrative expenses) and shareholder reporting. Marketing and distribution
84
Short-Term Corporate Bond Index Fund
expenses are allocated to each class of shares based on a method approved by the board of trustees. Income, other non-class-specific expenses, and gains and losses on investments are allocated to each class of shares based on its relative net assets.
B. The Vanguard Group furnishes at cost investment advisory, corporate management, administrative, marketing, and distribution services. The costs of such services are allocated to the fund under methods approved by the board of trustees. The fund has committed to provide up to 0.40% of its net assets in capital contributions to Vanguard. At August 31, 2011, the fund had contributed capital of $301,000 to Vanguard (included in Other Assets), representing 0.01% of the fund’s net assets and 0.12% of Vanguard’s capitalization. The fund’s trustees and officers are also directors and officers of Vanguard.
C. Various inputs may be used to determine the value of the fund’s investments. These inputs are summarized in three broad levels for financial statement purposes. The inputs or methodologies used to value securities are not necessarily an indication of the risk associated with investing in those securities.
Level 1—Quoted prices in active markets for identical securities.
Level 2—Other significant observable inputs (including quoted prices for similar securities, interest rates, prepayment speeds, credit risk, etc.).
Level 3—Significant unobservable inputs (including the fund’s own assumptions used to determine the fair value of investments).
The following table summarizes the fund’s investments as of August 31, 2011, based on the inputs used to value them:
| Level 1 | Level 2 | Level 3 | |
| Investments | ($000) | ($000) | ($000) |
| U.S. Government and Agency Obligations | — | 25,390 | — |
| Corporate Bonds | — | 1,987,309 | — |
| Temporary Cash Investments | 17,586 | — | — |
| Total | 17,586 | 2,012,699 | — |
D. Distributions are determined on a tax basis and may differ from net investment income and realized capital gains for financial reporting purposes. Differences may be permanent or temporary. Permanent differences are reclassified among capital accounts in the financial statements to reflect their tax character. Temporary differences arise when certain items of income, expense, gain, or loss are recognized in different periods for financial statement and tax purposes; these differences will reverse at some time in the future. Differences in classification may also result from the treatment of short-term gains as ordinary income for tax purposes.
During the year ended August 31, 2011, the fund realized $362,000 of net capital gains resulting from in-kind redemptions—in which shareholders exchanged fund shares for securities held by the fund rather than for cash. Because such gains are not taxable to the fund, and are not distributed to shareholders, they have been reclassified from accumulated net realized gains to paid-in capital.
The fund used a tax accounting practice to treat a portion of the price of capital shares redeemed during the year as distributions from realized capital gains. Accordingly, the fund has reclassified $108,000 from accumulated net realized gains to paid-in capital.
85
Short-Term Corporate Bond Index Fund
For tax purposes, at August 31, 2011, the fund had short-term and long-term capital gains of $1,506,000 and $1,229,000, respectively, available for distribution. Short-term gain distributions are treated as ordinary income dividends for tax purposes.
At August 31, 2011, the cost of investment securities for tax purposes was $2,008,922,000. Net unrealized appreciation of investment securities for tax purposes was $21,363,000, consisting of unrealized gains of $28,030,000 on securities that had risen in value since their purchase and $6,667,000 in unrealized losses on securities that had fallen in value since their purchase.
E. During the year ended August 31, 2011, the fund purchased $1,652,313,000 of investment securities and sold $488,905,000 of investment securities, other than U.S. government securities and temporary cash investments. Purchases and sales of U.S. government securities were $414,203,000 and $396,145,000, respectively.
F. Capital share transactions for each class of shares were:
| Year Ended | Inception1 to | |||
| August 31, 2011 | August 31, 2010 | |||
| Amount | Shares | Amount | Shares | |
| ($000) | (000) | ($000) | (000) | |
| Signal Shares | ||||
| Issued2 | 4,404 | 207 | — | — |
| Issued in Lieu of Cash Distributions | 24 | 1 | — | — |
| Redeemed | (951) | (45) | — | — |
| Net Increase (Decrease)—Signal Shares | 3,477 | 163 | — | — |
| Institutional Shares | ||||
| Issued2 | 20,397 | 785 | 132,040 | 5,234 |
| Issued in Lieu of Cash Distributions | 3,552 | 137 | 1,442 | 57 |
| Redeemed | (33,648) | (1,287) | (3,000) | (117) |
| Net Increase (Decrease)—Institutional Shares | (9,699) | (365) | 130,482 | 5,174 |
| ETF Shares | ||||
| Issued2 | 1,214,469 | 15,600 | 693,350 | 9,100 |
| Issued in Lieu of Cash Distributions | — | — | — | — |
| Redeemed | (23,150) | (300) | — | — |
| Net Increase (Decrease)—ETF Shares | 1,191,319 | 15,300 | 693,350 | 9,100 |
1 Inception was November 19, 2009, for ETF Shares and Institutional Shares, and November 18, 2010, for Signal Shares.
2 Includes purchase fees for fiscal 2011 and 2010 of $177,000 and $178,000, respectively (fund totals).
G. In preparing the financial statements as of August 31, 2011, management considered the impact of subsequent events for potential recognition or disclosure in these financial statements.
86
Intermediate-Term Corporate Bond Index Fund
Fund Profile
As of August 31, 2011
| Share-Class Characteristics | |||
| Signal | Institutional | ETF | |
| Shares | Shares | Shares | |
| Ticker Symbol | VICSX | VICBX | VCIT |
| Expense Ratio1 | 0.15% | 0.09% | 0.15% |
| 30-Day SEC Yield | 3.66% | 3.68% | 3.67% |
| Financial Attributes | |||
| Barclays | |||
| 5–10 Year | Barclays | ||
| Corporate | Aggregate | ||
| Fund | Index | FA Index | |
| Number of Bonds | 752 | 1,347 | 7,873 |
| Yield to Maturity | |||
| (before expenses) | 3.9% | 3.9% | 2.3% |
| Average Coupon | 5.7% | 5.8% | 4.1% |
| Average Duration | 6.2 years | 6.2 years | 5.1 years |
| Average Effective | |||
| Maturity | 7.4 years | 7.5 years | 7.3 years |
| Short-Term | |||
| Reserves | 1.5% | — | — |
| Sector Diversification (% of portfolio) | |||
| Finance | 35.1% | ||
| Industrial | 53.1 | ||
| Treasury/Agency | 0.2 | ||
| Utilities | 10.4 | ||
| Other | 1.2 | ||
The agency and mortgage-backed securities sectors may include issues from government-sponsored enterprises; such issues are not backed by the full faith and credit of the U.S. government.
| Distribution by Maturity (% of portfolio) | |
| Under 1 Year | 1.5% |
| 1 - 3 Years | 0.1 |
| 3 - 5 Years | 0.5 |
| 5 - 10 Years | 97.6 |
| 10 - 20 Years | 0.3 |
| Distribution by Credit Quality (% of portfolio) | |
| U.S. Government | 0.2% |
| Aaa | 2.2 |
| Aa | 12.8 |
| A | 43.4 |
| Baa | 41.4 |
| For information about these ratings, see the Glossary entry for Credit Quality. | |
Investment Focus
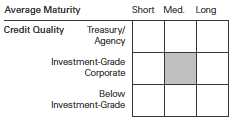
1 The expense ratios shown are from the prospectus dated December 28, 2010, and represent estimated costs for the current fiscal year. For the fiscal year ended August 31, 2011, the expense ratios were 0.14% for Signal Shares, 0.09% for Institutional Shares, and 0.14% for ETF Shares.
87
Intermediate-Term Corporate Bond Index Fund
Performance Summary
All of the returns in this report represent past performance, which is not a guarantee of future results that may be achieved by the fund. (Current performance may be lower or higher than the performance data cited. For performance data current to the most recent month-end, visit our website at vanguard.com/performance.) Note, too, that both investment returns and principal value can fluctuate widely, so an investor’s shares, when sold, could be worth more or less than their original cost. The returns shown do not reflect taxes that a shareholder would pay on fund distributions or on the sale of fund shares.
Cumulative Performance: November 19, 2009, Through August 31, 2011
Initial Investment of $10,000
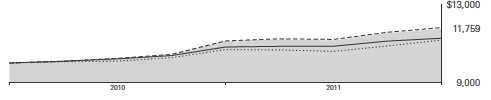
| Average Annual Total Returns | |||
| Periods Ended August 31, 2011 | |||
| Since | Final Value | ||
| One | Inception | of a $10,000 | |
| Year | (11/19/2009) | Investment | |
| Intermediate-Term Corporate Bond | |||
| Index Fund ETF Shares Net Asset | |||
| Value | 5.65% | 9.53% | $11,759 |
| Intermediate-Term Corporate Bond | |||
| Index Fund ETF Shares Market Price | 6.25 | 10.15 | 11,879 |
| Spliced Barclays Capital U.S. | |||
| Aggregate Float Adjusted Index | 4.62 | 6.49 | 11,184 |
| Barclays Capital U.S. 5–10 Year | |||
| Corporate Bond Index | 6.19 | 9.90 | 11,831 |
| Intermediate Investment-Grade Debt | |||
| Funds Average | 4.19 | 7.00 | 11,280 |
"Since Inception" performance is calculated from the ETF Shares’ inception date for both the fund and its comparative standards.
Spliced Barclays Capital U.S. Aggregate Float Adjusted Index: Barclays Capital U.S. Aggregate Bond Index through December 31, 2009; Barclays Capital U.S. Aggregate Float Adjusted Index thereafter.
Intermediate Investment-Grade Debt Funds Average: Derived from data provided by Lipper Inc.
Vanguard fund returns are adjusted to reflect the 0.50% fee on purchases; the fee does not apply to the ETF Shares. In the final table, non-adjusted returns are shown along with the fee-adjusted returns.
See Financial Highlights for dividend and capital gains information.
88
Intermediate-Term Corporate Bond Index Fund
| Average Annual Total Returns | |||
| Periods Ended August 31, 2011 | |||
| Since | Final Value | ||
| One | Inception | of a $10,000 | |
| Year | (3/2/2010) | Investment | |
| Intermediate-Term Corporate Bond | |||
| Index Fund Signal Shares | 5.12% | 9.41% | $11,443 |
| Barclays Capital U.S. | |||
| Aggregate Float Adjusted Index | 4.62 | 7.02 | 11,070 |
| Barclays Capital U.S. 5–10 Year | |||
| Corporate Bond Index | 6.19 | 10.02 | 11,539 |
"Since Inception" performance is calculated from the Signal Shares’ inception date for both the fund and its comparative standards.
| Since | Final Value | ||
| One | Inception | of a $5,000,000 | |
| Year | (11/19/2009) | Investment | |
| Intermediate-Term Corporate Bond Index | |||
| Fund Institutional Shares | 5.17% | 9.29% | $5,857,066 |
| Spliced Barclays Capital U.S. Aggregate | |||
| Float Adjusted Index | 4.62 | 6.49 | 5,592,028 |
| Barclays Capital U.S. 5–10 Year | |||
| Corporate Bond Index | 6.19 | 9.90 | 5,915,294 |
"Since Inception" performance is calculated from the Institutional Shares’ inception date for both the fund and its comparative standards.
| Cumulative Returns of ETF Shares: November 19, 2009, Through August 31, 2011 | ||
| Since | ||
| One | Inception | |
| Year | (11/19/2009) | |
| Intermediate-Term Corporate Bond Index Fund | ||
| ETF Shares Market Price | 6.25% | 18.79% |
| Intermediate-Term Corporate Bond Index Fund | ||
| ETF Shares Net Asset Value | 5.65 | 17.59 |
| Barclays Capital U.S. 5–10 Year Corporate Bond | ||
| Index | 6.19 | 18.31 |
"Since Inception" performance is calculated from the ETF Shares’ inception date for both the fund and its comparative standards.
| Fiscal-Year Total Returns (%): November 19, 2009, Through August 31, 2011 | ||
| Barclays | ||
| 5–10 Year | ||
| Corporate | ||
| ETF Shares Net Asset Value | Index | |
| Fiscal Year | Total Returns | Total Returns |
| 2010 | 11.30% | 11.41% |
| 2011 | 5.65 | 6.19 |
Vanguard fund returns are adjusted to reflect the 0.50% fee on purchases; the fee does not apply to the ETF Shares. In the final table, non-adjusted returns are shown along with the fee-adjusted returns.
89
Intermediate-Term Corporate Bond Index Fund
Average Annual Total Returns: Periods Ended June 30, 2011
This table presents returns through the latest calendar quarter—rather than through the end of the fiscal period.
Securities and Exchange Commission rules require that we provide this information.
| Since Inception | |||||
| Inception Date | One Year | Income | Capital | Total | |
| Signal Shares | 3/2/2010 | 7.41% | 4.47% | 4.30% | 8.77% |
| Fee-Adjusted Returns | 6.87 | 8.36 | |||
| Institutional Shares | 11/19/2009 | 7.47 | 4.49 | 4.26 | 8.75 |
| Fee-Adjusted Returns | 6.93 | 8.41 | |||
| ETF Shares | 11/19/2009 | ||||
| Market Price | 7.35 | 9.02 | |||
| Net Asset Value | 7.43 | 8.68 |
Vanguard fund returns are adjusted to reflect the 0.50% fee on purchases; the fee does not apply to the ETF Shares. In the final table, non-adjusted returns are shown along with the fee-adjusted returns.
90
Intermediate-Term Corporate Bond Index Fund
Financial Statements
Statement of Net Assets
As of August 31, 2011
The fund reports a complete list of its holdings in regulatory filings four times in each fiscal year, at the quarter-ends. For the second and fourth fiscal quarters, the lists appear in the fund’s semiannual and annual reports to shareholders. For the first and third fiscal quarters, the fund files the lists with the Securities and Exchange Commission on Form N-Q. Shareholders can look up the fund’s Forms N-Q on the SEC’s website at sec.gov. Forms N-Q may also be reviewed and copied at the SEC’s Public Reference Room (see the back cover of this report for further information).
| Face | Market | ||||
| Maturity | Amount | Value | |||
| Coupon | Date | ($000) | ($000) | ||
| U.S. Government and Agency Obligations (0.5%) | |||||
| U.S. Government Securities (0.5%) | |||||
| United States Treasury Note/Bond | 4.125% | 8/31/12 | 400 | 416 | |
| United States Treasury Note/Bond | 3.250% | 7/31/16 | 5 | 6 | |
| United States Treasury Note/Bond | 1.000% | 8/31/16 | 185 | 185 | |
| United States Treasury Note/Bond | 2.125% | 8/15/21 | 3,620 | 3,585 | |
| Total U.S. Government and Agency Obligations (Cost $4,206) | 4,192 | ||||
| Corporate Bonds (97.0%) | |||||
| Finance (34.5%) | |||||
| Banking (22.5%) | |||||
| American Express Co. | 6.150% | 8/28/17 | 2,450 | 2,814 | |
| American Express Co. | 7.000% | 3/19/18 | 3,125 | 3,722 | |
| American Express Co. | 8.125% | 5/20/19 | 575 | 738 | |
| 1 | American Express Co. | 6.800% | 9/1/66 | 400 | 399 |
| 2 | BanColombia SA | 5.950% | 6/3/21 | 600 | 605 |
| Bank of America Corp. | 5.625% | 10/14/16 | 1,950 | 1,953 | |
| Bank of America Corp. | 5.420% | 3/15/17 | 500 | 488 | |
| Bank of America Corp. | 6.000% | 9/1/17 | 5,250 | 5,528 | |
| Bank of America Corp. | 5.750% | 12/1/17 | 475 | 493 | |
| Bank of America Corp. | 5.650% | 5/1/18 | 5,525 | 5,662 | |
| Bank of America Corp. | 5.625% | 7/1/20 | 2,825 | 2,860 | |
| Bank of America Corp. | 5.875% | 1/5/21 | 1,200 | 1,231 | |
| Bank of America NA | 5.300% | 3/15/17 | 3,100 | 3,047 | |
| Bank of New York Mellon Corp. | 4.600% | 1/15/20 | 825 | 894 | |
| Bank of New York Mellon Corp. | 4.150% | 2/1/21 | 900 | 951 | |
| Bank of Nova Scotia | 4.375% | 1/13/21 | 275 | 297 | |
| Barclays Bank plc | 5.000% | 9/22/16 | 3,150 | 3,244 | |
| Barclays Bank plc | 6.750% | 5/22/19 | 950 | 1,050 | |
| Barclays Bank plc | 5.140% | 10/14/20 | 1,825 | 1,670 | |
| BB&T Corp. | 6.850% | 4/30/19 | 1,000 | 1,206 | |
| Bear Stearns Cos. LLC | 5.550% | 1/22/17 | 75 | 80 | |
| Bear Stearns Cos. LLC | 6.400% | 10/2/17 | 3,900 | 4,466 | |
| Bear Stearns Cos. LLC | 7.250% | 2/1/18 | 1,300 | 1,531 | |
| BNPParibas SA | 5.000% | 1/15/21 | 2,500 | 2,578 | |
| Capital One Bank USA NA | 8.800% | 7/15/19 | 425 | 522 | |
| Capital One Financial Corp. | 6.150% | 9/1/16 | 2,600 | 2,778 | |
| Capital One Financial Corp. | 6.750% | 9/15/17 | 925 | 1,052 | |
| Capital One Financial Corp. | 4.750% | 7/15/21 | 300 | 301 | |
91
| Intermediate-Term Corporate Bond Index Fund | ||||
| Face | Market | |||
| Maturity | Amount | Value | ||
| Coupon | Date | ($000) | ($000) | |
| Citigroup Inc. | 5.500% | 2/15/17 | 4,150 | 4,211 |
| Citigroup Inc. | 6.000% | 8/15/17 | 425 | 460 |
| Citigroup Inc. | 6.125% | 11/21/17 | 1,425 | 1,560 |
| Citigroup Inc. | 6.125% | 5/15/18 | 3,700 | 4,005 |
| Citigroup Inc. | 8.500% | 5/22/19 | 2,000 | 2,445 |
| Citigroup Inc. | 5.375% | 8/9/20 | 850 | 902 |
| Comerica Bank | 5.200% | 8/22/17 | 650 | 719 |
| Compass Bank | 6.400% | 10/1/17 | 400 | 439 |
| Cooperatieve Centrale Raiffeisen- | ||||
| Boerenleenbank BA | 4.500% | 1/11/21 | 1,525 | 1,648 |
| 1 Credit Suisse AG | 5.860% | 5/29/49 | 976 | 842 |
| Credit Suisse New York | 6.000% | 2/15/18 | 1,700 | 1,790 |
| Credit Suisse New York | 5.300% | 8/13/19 | 1,700 | 1,744 |
| Credit Suisse New York | 4.375% | 8/5/20 | 1,250 | 1,219 |
| Deutsche Bank AG | 6.000% | 9/1/17 | 2,750 | 3,137 |
| DFC Global Corp. Cvt. | 5.400% | 1/14/20 | 2,175 | 2,177 |
| Discover Bank | 8.700% | 11/18/19 | 725 | 857 |
| Fifth Third Bancorp | 5.450% | 1/15/17 | 1,600 | 1,726 |
| 1 Fifth Third Capital Trust IV | 6.500% | 4/15/67 | 525 | 484 |
| First Niagara Financial Group Inc. | 6.750% | 3/19/20 | 100 | 112 |
| Goldman Sachs Group Inc. | 5.750% | 10/1/16 | 2,275 | 2,493 |
| Goldman Sachs Group Inc. | 5.625% | 1/15/17 | 1,975 | 2,040 |
| Goldman Sachs Group Inc. | 5.950% | 1/18/18 | 1,700 | 1,809 |
| Goldman Sachs Group Inc. | 6.150% | 4/1/18 | 6,100 | 6,515 |
| Goldman Sachs Group Inc. | 7.500% | 2/15/19 | 885 | 1,006 |
| Goldman Sachs Group Inc. | 5.375% | 3/15/20 | 1,475 | 1,505 |
| Goldman Sachs Group Inc. | 6.000% | 6/15/20 | 1,850 | 1,953 |
| Goldman Sachs Group Inc. | 5.250% | 7/27/21 | 1,550 | 1,563 |
| HSBC Bank USA NA | 6.000% | 8/9/17 | 625 | 677 |
| HSBC Bank USA NA | 4.875% | 8/24/20 | 1,255 | 1,218 |
| HSBC Holdings plc | 5.100% | 4/5/21 | 2,050 | 2,197 |
| Huntington Bancshares Inc. | 7.000% | 12/15/20 | 1,125 | 1,279 |
| JPMorganChase & Co. | 3.700% | 1/20/15 | 50 | 52 |
| JPMorganChase & Co. | 6.125% | 6/27/17 | 725 | 804 |
| JPMorganChase & Co. | 6.000% | 1/15/18 | 3,515 | 3,943 |
| JPMorganChase & Co. | 6.300% | 4/23/19 | 2,850 | 3,264 |
| JPMorganChase & Co. | 4.400% | 7/22/20 | 1,750 | 1,796 |
| JPMorganChase & Co. | 4.250% | 10/15/20 | 1,250 | 1,274 |
| JPMorganChase & Co. | 4.625% | 5/10/21 | 1,600 | 1,679 |
| JPMorganChase & Co. | 4.350% | 8/15/21 | 1,100 | 1,125 |
| JPMorganChase Bank NA | 6.000% | 10/1/17 | 2,260 | 2,499 |
| KeyCorp | 5.100% | 3/24/21 | 725 | 742 |
| Lloyds TSB Bank plc | 6.375% | 1/21/21 | 2,350 | 2,449 |
| Merrill Lynch & Co. Inc. | 5.700% | 5/2/17 | 900 | 884 |
| Merrill Lynch & Co. Inc. | 6.875% | 4/25/18 | 2,175 | 2,297 |
| Merrill Lynch & Co. Inc. | 6.875% | 11/15/18 | 400 | 411 |
| Morgan Stanley | 5.450% | 1/9/17 | 6,025 | 6,166 |
| Morgan Stanley | 5.550% | 4/27/17 | 900 | 931 |
| Morgan Stanley | 5.950% | 12/28/17 | 175 | 182 |
| Morgan Stanley | 6.625% | 4/1/18 | 2,350 | 2,516 |
| Morgan Stanley | 7.300% | 5/13/19 | 350 | 388 |
| Morgan Stanley | 5.625% | 9/23/19 | 290 | 291 |
| Morgan Stanley | 5.500% | 1/26/20 | 8,275 | 8,179 |
| Morgan Stanley | 5.500% | 7/24/20 | 425 | 423 |
| Morgan Stanley | 5.750% | 1/25/21 | 1,875 | 1,919 |
92
| Intermediate-Term Corporate Bond Index Fund | ||||
| Face | Market | |||
| Maturity | Amount | Value | ||
| Coupon | Date | ($000) | ($000) | |
| National City Corp. | 6.875% | 5/15/19 | 1,750 | 2,058 |
| Northern Trust Corp. | 3.450% | 11/4/20 | 300 | 306 |
| Northern Trust Corp. | 3.375% | 8/23/21 | 575 | 573 |
| PNC Funding Corp. | 5.125% | 2/8/20 | 1,250 | 1,376 |
| PNC Funding Corp. | 4.375% | 8/11/20 | 2,000 | 2,115 |
| Royal Bank of Scotland Group plc | 6.400% | 10/21/19 | 3,525 | 3,528 |
| Royal Bank of Scotland plc | 5.625% | 8/24/20 | 75 | 75 |
| Sovereign Bank | 8.750% | 5/30/18 | 400 | 458 |
| State Street Corp. | 4.956% | 3/15/18 | 475 | 511 |
| State Street Corp. | 4.375% | 3/7/21 | 600 | 642 |
| SunTrust Banks Inc. | 6.000% | 9/11/17 | 575 | 615 |
| UBS AG | 5.875% | 12/20/17 | 3,425 | 3,612 |
| UBS AG | 5.750% | 4/25/18 | 200 | 211 |
| UBS AG | 4.875% | 8/4/20 | 2,375 | 2,390 |
| US Bancorp | 4.125% | 5/24/21 | 1,050 | 1,112 |
| Wachovia Corp. | 5.625% | 10/15/16 | 1,150 | 1,253 |
| Wachovia Corp. | 5.750% | 2/1/18 | 1,575 | 1,791 |
| Wells Fargo & Co. | 5.625% | 12/11/17 | 5,375 | 6,130 |
| Wells Fargo & Co. | 4.600% | 4/1/21 | 1,375 | 1,477 |
| Westpac Banking Corp. | 4.875% | 11/19/19 | 1,525 | 1,614 |
| Brokerage (1.1%) | ||||
| Ameriprise Financial Inc. | 5.300% | 3/15/20 | 600 | 666 |
| BlackRock Inc. | 6.250% | 9/15/17 | 200 | 236 |
| BlackRock Inc. | 5.000% | 12/10/19 | 900 | 980 |
| BlackRock Inc. | 4.250% | 5/24/21 | 1,100 | 1,111 |
| Charles Schwab Corp. | 4.450% | 7/22/20 | 1,150 | 1,204 |
| 2 GFI Group Inc. | 8.375% | 7/19/18 | 150 | 148 |
| Jefferies Group Inc. | 8.500% | 7/15/19 | 1,830 | 2,177 |
| Lazard Group LLC | 6.850% | 6/15/17 | 200 | 224 |
| Nomura Holdings Inc. | 6.700% | 3/4/20 | 975 | 1,103 |
| TD Ameritrade Holding Corp. | 5.600% | 12/1/19 | 1,000 | 1,099 |
| Finance Companies (3.0%) | ||||
| Discover Financial Services | 6.450% | 6/12/17 | 100 | 109 |
| Discover Financial Services | 10.250% | 7/15/19 | 300 | 387 |
| 1 GE Capital Trust I | 6.375% | 11/15/67 | 800 | 786 |
| General Electric Capital Corp. | 5.375% | 10/20/16 | 500 | 548 |
| General Electric Capital Corp. | 5.625% | 9/15/17 | 2,165 | 2,402 |
| General Electric Capital Corp. | 5.625% | 5/1/18 | 1,470 | 1,619 |
| General Electric Capital Corp. | 6.000% | 8/7/19 | 8,400 | 9,419 |
| General Electric Capital Corp. | 5.550% | 5/4/20 | 250 | 270 |
| General Electric Capital Corp. | 4.375% | 9/16/20 | 550 | 560 |
| General Electric Capital Corp. | 4.625% | 1/7/21 | 975 | 1,008 |
| General Electric Capital Corp. | 5.300% | 2/11/21 | 900 | 956 |
| 1 General Electric Capital Corp. | 6.375% | 11/15/67 | 650 | 638 |
| 2 HSBC Finance Corp. | 6.676% | 1/15/21 | 1,968 | 1,927 |
| SLM Corp. | 8.450% | 6/15/18 | 2,550 | 2,696 |
| SLM Corp. | 8.000% | 3/25/20 | 900 | 932 |
| Insurance (5.3%) | ||||
| ACE INA Holdings Inc. | 5.700% | 2/15/17 | 200 | 229 |
| ACE INA Holdings Inc. | 5.900% | 6/15/19 | 1,400 | 1,629 |
| Aetna Inc. | 6.500% | 9/15/18 | 750 | 900 |
| Aetna Inc. | 3.950% | 9/1/20 | 1,300 | 1,329 |
93
| Intermediate-Term Corporate Bond Index Fund | ||||
| Face | Market | |||
| Maturity | Amount | Value | ||
| Coupon | Date | ($000) | ($000) | |
| AflacInc. | 8.500% | 5/15/19 | 800 | 981 |
| Alleghany Corp. | 5.625% | 9/15/20 | 100 | 105 |
| Allstate Corp. | 7.450% | 5/16/19 | 1,425 | 1,723 |
| 1 Allstate Corp. | 6.125% | 5/15/67 | 350 | 319 |
| Alterra Finance LLC | 6.250% | 9/30/20 | 95 | 100 |
| American International Group Inc. | 5.600% | 10/18/16 | 500 | 511 |
| American International Group Inc. | 5.450% | 5/18/17 | 675 | 687 |
| American International Group Inc. | 5.850% | 1/16/18 | 450 | 458 |
| American International Group Inc. | 8.250% | 8/15/18 | 400 | 448 |
| American International Group Inc. | 6.400% | 12/15/20 | 5,100 | 5,360 |
| AON Corp. | 5.000% | 9/30/20 | 950 | 1,015 |
| Aspen Insurance Holdings Ltd. | 6.000% | 12/15/20 | 100 | 109 |
| Axis Specialty Finance LLC | 5.875% | 6/1/20 | 200 | 210 |
| Berkshire Hathaway Finance Corp. | 5.400% | 5/15/18 | 1,275 | 1,456 |
| Berkshire Hathaway Finance Corp. | 4.250% | 1/15/21 | 200 | 212 |
| Chubb Corp. | 5.750% | 5/15/18 | 575 | 671 |
| 1 Chubb Corp. | 6.375% | 3/29/67 | 550 | 547 |
| CIGNA Corp. | 4.375% | 12/15/20 | 425 | 439 |
| CIGNA Corp. | 4.500% | 3/15/21 | 125 | 130 |
| CNAFinancial Corp. | 5.875% | 8/15/20 | 100 | 104 |
| CNAFinancial Corp. | 5.750% | 8/15/21 | 500 | 518 |
| Coventry Health Care Inc. | 5.450% | 6/15/21 | 550 | 592 |
| Genworth Financial Inc. | 8.625% | 12/15/16 | 50 | 50 |
| Genworth Financial Inc. | 7.700% | 6/15/20 | 400 | 359 |
| Genworth Financial Inc. | 7.200% | 2/15/21 | 225 | 196 |
| Genworth Financial Inc. | 7.625% | 9/24/21 | 500 | 443 |
| Hartford Financial Services Group Inc. | 6.300% | 3/15/18 | 100 | 106 |
| Hartford Financial Services Group Inc. | 5.500% | 3/30/20 | 1,875 | 1,877 |
| Humana Inc. | 7.200% | 6/15/18 | 300 | 356 |
| Lincoln National Corp. | 8.750% | 7/1/19 | 825 | 1,021 |
| 1 Lincoln National Corp. | 6.050% | 4/20/67 | 300 | 264 |
| Manulife Financial Corp. | 4.900% | 9/17/20 | 925 | 943 |
| Markel Corp. | 5.350% | 6/1/21 | 380 | 391 |
| Marsh & McLennan Cos. Inc. | 4.800% | 7/15/21 | 625 | 646 |
| MetLife Inc. | 6.817% | 8/15/18 | 1,950 | 2,295 |
| MetLife Inc. | 7.717% | 2/15/19 | 545 | 667 |
| MetLife Inc. | 4.750% | 2/8/21 | 100 | 104 |
| PartnerRe Finance B LLC | 5.500% | 6/1/20 | 400 | 410 |
| Progressive Corp. | 3.750% | 8/23/21 | 400 | 401 |
| 1 Progressive Corp. | 6.700% | 6/15/67 | 525 | 520 |
| Protective Life Corp. | 7.375% | 10/15/19 | 100 | 114 |
| Prudential Financial Inc. | 7.375% | 6/15/19 | 1,625 | 1,930 |
| Prudential Financial Inc. | 5.375% | 6/21/20 | 850 | 901 |
| 1 Prudential Financial Inc. | 8.875% | 6/15/68 | 425 | 458 |
| Travelers Cos. Inc. | 5.800% | 5/15/18 | 600 | 678 |
| Travelers Cos. Inc. | 5.900% | 6/2/19 | 1,200 | 1,369 |
| UnitedHealth Group Inc. | 6.000% | 2/15/18 | 2,050 | 2,418 |
| Unum Group | 5.625% | 9/15/20 | 225 | 242 |
| WellPoint Inc. | 5.250% | 1/15/16 | 100 | 112 |
| WellPoint Inc. | 7.000% | 2/15/19 | 1,600 | 1,972 |
| Willis Group Holdings plc | 5.750% | 3/15/21 | 450 | 467 |
| Willis North America Inc. | 7.000% | 9/29/19 | 150 | 173 |
| WR Berkley Corp. | 5.375% | 9/15/20 | 175 | 184 |
94
| Intermediate-Term Corporate Bond Index Fund | ||||
| Face | Market | |||
| Maturity | Amount | Value | ||
| Coupon | Date | ($000) | ($000) | |
| Other Finance (0.0%) | ||||
| NASDAQ OMX Group Inc. | 5.550% | 1/15/20 | 300 | 305 |
| Real Estate Investment Trusts (2.6%) | ||||
| AvalonBay Communities Inc. | 5.700% | 3/15/17 | 335 | 383 |
| Boston Properties LP | 5.875% | 10/15/19 | 1,350 | 1,506 |
| Boston Properties LP | 5.625% | 11/15/20 | 500 | 546 |
| Brandywine Operating Partnership LP | 5.700% | 5/1/17 | 200 | 209 |
| CommonWealth REIT | 5.875% | 9/15/20 | 400 | 420 |
| Digital Realty Trust LP | 5.875% | 2/1/20 | 600 | 630 |
| Digital Realty Trust LP | 5.250% | 3/15/21 | 785 | 780 |
| Duke Realty LP | 6.750% | 3/15/20 | 850 | 909 |
| ERP Operating LP | 5.750% | 6/15/17 | 1,125 | 1,273 |
| ERP Operating LP | 4.750% | 7/15/20 | 300 | 312 |
| HCP Inc. | 6.000% | 1/30/17 | 300 | 322 |
| HCP Inc. | 6.700% | 1/30/18 | 1,750 | 1,945 |
| HCP Inc. | 5.375% | 2/1/21 | 300 | 306 |
| Health Care REIT Inc. | 4.700% | 9/15/17 | 1,025 | 1,044 |
| Health Care REIT Inc. | 4.950% | 1/15/21 | 900 | 877 |
| Healthcare Realty Trust Inc. | 5.750% | 1/15/21 | 400 | 403 |
| Hospitality Properties Trust | 5.625% | 3/15/17 | 350 | 358 |
| Kilroy Realty LP | 4.800% | 7/15/18 | 950 | 932 |
| Kimco Realty Corp. | 6.875% | 10/1/19 | 450 | 518 |
| Liberty Property LP | 6.625% | 10/1/17 | 250 | 291 |
| Liberty Property LP | 4.750% | 10/1/20 | 365 | 373 |
| ProLogis LP | 4.500% | 8/15/17 | 200 | 192 |
| ProLogis LP | 7.375% | 10/30/19 | 450 | 477 |
| ProLogis LP | 6.875% | 3/15/20 | 900 | 929 |
| Realty Income Corp. | 5.750% | 1/15/21 | 450 | 493 |
| Simon Property Group LP | 5.250% | 12/1/16 | 900 | 992 |
| Simon Property Group LP | 6.125% | 5/30/18 | 325 | 368 |
| Simon Property Group LP | 10.350% | 4/1/19 | 1,250 | 1,721 |
| Simon Property Group LP | 5.650% | 2/1/20 | 1,050 | 1,156 |
| UDR Inc. | 4.250% | 6/1/18 | 125 | 128 |
| Ventas Realty LP / Ventas Capital Corp. | 4.750% | 6/1/21 | 775 | 755 |
| 280,860 | ||||
| Industrial (52.2%) | ||||
| Basic Industry (6.0%) | ||||
| Albemarle Corp. | 4.500% | 12/15/20 | 125 | 133 |
| Alcoa Inc. | 5.550% | 2/1/17 | 2,100 | 2,211 |
| Alcoa Inc. | 6.750% | 7/15/18 | 200 | 215 |
| Alcoa Inc. | 6.150% | 8/15/20 | 775 | 808 |
| Alcoa Inc. | 5.400% | 4/15/21 | 625 | 626 |
| Allegheny Technologies Inc. | 5.950% | 1/15/21 | 265 | 296 |
| AngloGold Ashanti Holdings plc | 5.375% | 4/15/20 | 600 | 604 |
| ArcelorMittal | 6.125% | 6/1/18 | 1,150 | 1,212 |
| ArcelorMittal | 9.850% | 6/1/19 | 175 | 214 |
| ArcelorMittal | 5.250% | 8/5/20 | 2,925 | 2,857 |
| Barrick Gold Corp. | 6.950% | 4/1/19 | 725 | 890 |
| Barrick North America Finance LLC | 6.800% | 9/15/18 | 1,700 | 2,096 |
| 2 Barrick North America Finance LLC | 4.400% | 5/30/21 | 550 | 577 |
| BHP Billiton Finance USA Ltd. | 6.500% | 4/1/19 | 2,075 | 2,566 |
| Carpenter Technology Corp. | 5.200% | 7/15/21 | 200 | 211 |
| Celulosa Arauco y Constitucion SA | 5.000% | 1/21/21 | 350 | 349 |
| Cliffs Natural Resources Inc. | 5.900% | 3/15/20 | 50 | 54 |
95
| Intermediate-Term Corporate Bond Index Fund | ||||
| Face | Market | |||
| Maturity | Amount | Value | ||
| Coupon | Date | ($000) | ($000) | |
| Cliffs Natural Resources Inc. | 4.875% | 4/1/21 | 550 | 555 |
| Commercial Metals Co. | 7.350% | 8/15/18 | 500 | 520 |
| Dow Chemical Co. | 5.700% | 5/15/18 | 1,375 | 1,534 |
| Dow Chemical Co. | 4.250% | 11/15/20 | 3,600 | 3,673 |
| Eastman Chemical Co. | 4.500% | 1/15/21 | 150 | 157 |
| EI du Pont de Nemours & Co. | 6.000% | 7/15/18 | 425 | 513 |
| EI du Pont de Nemours & Co. | 4.625% | 1/15/20 | 2,175 | 2,432 |
| EI du Pont de Nemours & Co. | 3.625% | 1/15/21 | 500 | 517 |
| EI du Pont de Nemours & Co. | 4.250% | 4/1/21 | 500 | 542 |
| Freeport-McMoRan Copper & Gold Inc. | 8.375% | 4/1/17 | 1,530 | 1,649 |
| International Paper Co. | 7.950% | 6/15/18 | 2,325 | 2,781 |
| International Paper Co. | 9.375% | 5/15/19 | 175 | 224 |
| 2 Kinross Gold Corp. | 5.125% | 9/1/21 | 350 | 346 |
| Lubrizol Corp. | 8.875% | 2/1/19 | 600 | 809 |
| Newmont Mining Corp. | 5.125% | 10/1/19 | 150 | 167 |
| Plum Creek Timberlands LP | 4.700% | 3/15/21 | 250 | 255 |
| Potash Corp. of Saskatchewan Inc. | 3.250% | 12/1/17 | 1,450 | 1,503 |
| Potash Corp. of Saskatchewan Inc. | 6.500% | 5/15/19 | 100 | 122 |
| Potash Corp. of Saskatchewan Inc. | 4.875% | 3/30/20 | 200 | 221 |
| PPG Industries Inc. | 6.650% | 3/15/18 | 400 | 490 |
| PPG Industries Inc. | 3.600% | 11/15/20 | 1,270 | 1,307 |
| Praxair Inc. | 4.500% | 8/15/19 | 300 | 333 |
| Praxair Inc. | 3.000% | 9/1/21 | 1,175 | 1,165 |
| Rio Tinto Finance USA Ltd. | 6.500% | 7/15/18 | 1,750 | 2,129 |
| Rio Tinto Finance USA Ltd. | 9.000% | 5/1/19 | 675 | 922 |
| Rio Tinto Finance USA Ltd. | 4.125% | 5/20/21 | 1,600 | 1,677 |
| RPMInternational Inc. | 6.125% | 10/15/19 | 325 | 361 |
| Sigma-Aldrich Corp. | 3.375% | 11/1/20 | 40 | 40 |
| Southern Copper Corp. | 5.375% | 4/16/20 | 200 | 211 |
| Teck Resources Ltd. | 3.150% | 1/15/17 | 1,725 | 1,723 |
| Teck Resources Ltd. | 3.850% | 8/15/17 | 400 | 420 |
| Teck Resources Ltd. | 10.750% | 5/15/19 | 275 | 337 |
| Vale Overseas Ltd. | 5.625% | 9/15/19 | 1,925 | 2,100 |
| Vale Overseas Ltd. | 4.625% | 9/15/20 | 1,050 | 1,077 |
| Capital Goods (5.6%) | ||||
| Acuity Brands Lighting Inc. | 6.000% | 12/15/19 | 200 | 220 |
| Allied Waste North America Inc. | 6.875% | 6/1/17 | 200 | 215 |
| Boeing Capital Corp. | 2.900% | 8/15/18 | 300 | 309 |
| Boeing Co. | 3.750% | 11/20/16 | 700 | 772 |
| Boeing Co. | 6.000% | 3/15/19 | 225 | 273 |
| Boeing Co. | 4.875% | 2/15/20 | 400 | 452 |
| Boeing Co. | 8.750% | 8/15/21 | 300 | 425 |
| Caterpillar Financial Services Corp. | 7.150% | 2/15/19 | 3,050 | 3,892 |
| Caterpillar Inc. | 7.900% | 12/15/18 | 1,100 | 1,461 |
| CRH America Inc. | 6.000% | 9/30/16 | 1,400 | 1,535 |
| CRH America Inc. | 8.125% | 7/15/18 | 200 | 236 |
| CRH America Inc. | 5.750% | 1/15/21 | 400 | 423 |
| Danaher Corp. | 5.400% | 3/1/19 | 475 | 563 |
| Danaher Corp. | 3.900% | 6/23/21 | 475 | 505 |
| Deere & Co. | 4.375% | 10/16/19 | 1,050 | 1,158 |
| Dover Corp. | 4.300% | 3/1/21 | 950 | 1,039 |
| Embraer Overseas Ltd. | 6.375% | 1/24/17 | 200 | 216 |
| Embraer Overseas Ltd. | 6.375% | 1/15/20 | 1,275 | 1,385 |
| Emerson Electric Co. | 4.875% | 10/15/19 | 100 | 114 |
96
| Intermediate-Term Corporate Bond Index Fund | ||||
| Face | Market | |||
| Maturity | Amount | Value | ||
| Coupon | Date | ($000) | ($000) | |
| Emerson Electric Co. | 4.250% | 11/15/20 | 575 | 634 |
| General Dynamics Corp. | 3.875% | 7/15/21 | 300 | 320 |
| General Electric Co. | 5.250% | 12/6/17 | 3,125 | 3,501 |
| Goodrich Corp. | 4.875% | 3/1/20 | 225 | 250 |
| Goodrich Corp. | 3.600% | 2/1/21 | 375 | 378 |
| Harsco Corp. | 5.750% | 5/15/18 | 475 | 540 |
| Honeywell International Inc. | 5.300% | 3/1/18 | 1,850 | 2,174 |
| Illinois Tool Works Inc. | 6.250% | 4/1/19 | 475 | 583 |
| 2 Illinois Tool Works Inc. | 3.375% | 9/15/21 | 250 | 253 |
| Ingersoll-Rand Global Holding Co. Ltd. | 6.875% | 8/15/18 | 1,429 | 1,736 |
| John Deere Capital Corp. | 5.500% | 4/13/17 | 800 | 939 |
| John Deere Capital Corp. | 2.800% | 9/18/17 | 300 | 308 |
| John Deere Capital Corp. | 5.350% | 4/3/18 | 250 | 293 |
| L-3 Communications Corp. | 5.200% | 10/15/19 | 75 | 80 |
| L-3 Communications Corp. | 4.750% | 7/15/20 | 1,725 | 1,781 |
| L-3 Communications Corp. | 4.950% | 2/15/21 | 425 | 444 |
| Lockheed Martin Corp. | 4.250% | 11/15/19 | 1,675 | 1,828 |
| Northrop Grumman Corp. | 5.050% | 8/1/19 | 1,275 | 1,443 |
| OwensCorning | 6.500% | 12/1/16 | 850 | 911 |
| Raytheon Co. | 4.400% | 2/15/20 | 125 | 134 |
| Raytheon Co. | 3.125% | 10/15/20 | 1,625 | 1,598 |
| Republic Services Inc. | 5.500% | 9/15/19 | 1,225 | 1,407 |
| Republic Services Inc. | 5.000% | 3/1/20 | 1,175 | 1,308 |
| Roper Industries Inc. | 6.250% | 9/1/19 | 600 | 711 |
| TycoInternational Finance SA | 3.750% | 1/15/18 | 600 | 631 |
| TycoInternational Finance SA | 8.500% | 1/15/19 | 250 | 329 |
| TycoInternational Ltd. / | ||||
| Tyco International Finance SA | 6.875% | 1/15/21 | 250 | 309 |
| United Technologies Corp. | 6.125% | 2/1/19 | 1,675 | 2,079 |
| United Technologies Corp. | 4.500% | 4/15/20 | 1,100 | 1,226 |
| Waste Management Inc. | 6.100% | 3/15/18 | 650 | 760 |
| Waste Management Inc. | 4.750% | 6/30/20 | 1,250 | 1,357 |
| Waste Management Inc. | 4.600% | 3/1/21 | 450 | 483 |
| Communication (8.7%) | ||||
| America Movil SAB de CV | 2.375% | 9/8/16 | 500 | 496 |
| America Movil SAB de CV | 5.000% | 10/16/19 | 450 | 484 |
| America Movil SAB de CV | 5.000% | 3/30/20 | 2,775 | 3,009 |
| American Tower Corp. | 7.000% | 10/15/17 | 600 | 694 |
| American Tower Corp. | 4.500% | 1/15/18 | 650 | 665 |
| American Tower Corp. | 5.050% | 9/1/20 | 500 | 508 |
| AT&T Inc. | 5.500% | 2/1/18 | 5,200 | 5,963 |
| AT&T Inc. | 4.450% | 5/15/21 | 750 | 803 |
| AT&T Inc. | 3.875% | 8/15/21 | 425 | 438 |
| British Telecommunications plc | 5.950% | 1/15/18 | 1,225 | 1,381 |
| CBS Corp. | 8.875% | 5/15/19 | 1,000 | 1,290 |
| CBS Corp. | 5.750% | 4/15/20 | 440 | 487 |
| CBS Corp. | 4.300% | 2/15/21 | 250 | 254 |
| Cellco Partnership / Verizon Wireless Capital LLC | 8.500% | 11/15/18 | 1,775 | 2,384 |
| CenturyLink Inc. | 5.150% | 6/15/17 | 1,500 | 1,484 |
| CenturyLink Inc. | 6.450% | 6/15/21 | 1,700 | 1,668 |
| Comcast Corp. | 6.500% | 1/15/17 | 1,425 | 1,685 |
| Comcast Corp. | 6.300% | 11/15/17 | 2,200 | 2,609 |
| Comcast Corp. | 5.700% | 5/15/18 | 1,050 | 1,212 |
| Comcast Corp. | 5.150% | 3/1/20 | 200 | 227 |
97
| Intermediate-Term Corporate Bond Index Fund | ||||
| Face | Market | |||
| Maturity | Amount | Value | ||
| Coupon | Date | ($000) | ($000) | |
| Deutsche Telekom International Finance BV | 6.000% | 7/8/19 | 725 | 866 |
| DIRECTV Holdings LLC / | ||||
| DIRECTV Financing Co. Inc. | 5.875% | 10/1/19 | 2,775 | 3,175 |
| DIRECTV Holdings LLC / | ||||
| DIRECTV Financing Co. Inc. | 5.200% | 3/15/20 | 200 | 220 |
| DIRECTV Holdings LLC / | ||||
| DIRECTV Financing Co. Inc. | 4.600% | 2/15/21 | 400 | 418 |
| Discovery Communications LLC | 5.050% | 6/1/20 | 1,775 | 1,934 |
| Discovery Communications LLC | 4.375% | 6/15/21 | 500 | 519 |
| France Telecom SA | 5.375% | 7/8/19 | 925 | 1,034 |
| Grupo Televisa SA | 6.000% | 5/15/18 | 400 | 446 |
| NBCUniversal Media LLC | 5.150% | 4/30/20 | 1,025 | 1,131 |
| NBCUniversal Media LLC | 4.375% | 4/1/21 | 1,515 | 1,574 |
| News America Inc. | 6.900% | 3/1/19 | 2,525 | 2,951 |
| Omnicom Group Inc. | 4.450% | 8/15/20 | 650 | 669 |
| Reed Elsevier Capital Inc. | 8.625% | 1/15/19 | 450 | 584 |
| Rogers Communications Inc. | 6.800% | 8/15/18 | 850 | 1,038 |
| Telecom Italia Capital SA | 6.999% | 6/4/18 | 675 | 692 |
| Telecom Italia Capital SA | 7.175% | 6/18/19 | 700 | 727 |
| Telefonica Emisiones SAU | 6.421% | 6/20/16 | 1,550 | 1,638 |
| Telefonica Emisiones SAU | 5.877% | 7/15/19 | 310 | 311 |
| Telefonica Emisiones SAU | 5.134% | 4/27/20 | 875 | 837 |
| Telefonica Emisiones SAU | 5.462% | 2/16/21 | 225 | 219 |
| Thomson Reuters Corp. | 6.500% | 7/15/18 | 750 | 910 |
| Thomson Reuters Corp. | 4.700% | 10/15/19 | 800 | 889 |
| Time Warner Cable Inc. | 5.850% | 5/1/17 | 3,125 | 3,521 |
| Time Warner Cable Inc. | 6.750% | 7/1/18 | 1,500 | 1,764 |
| Time Warner Cable Inc. | 8.250% | 4/1/19 | 1,325 | 1,678 |
| Time Warner Cable Inc. | 5.000% | 2/1/20 | 750 | 797 |
| Verizon Communications Inc. | 5.500% | 2/15/18 | 5,325 | 6,137 |
| Verizon Communications Inc. | 6.100% | 4/15/18 | 200 | 237 |
| Verizon Communications Inc. | 8.750% | 11/1/18 | 825 | 1,114 |
| Verizon Communications Inc. | 4.600% | 4/1/21 | 1,000 | 1,092 |
| 2 Virgin Media Secured Finance plc | 5.250% | 1/15/21 | 500 | 529 |
| Vodafone Group plc | 5.625% | 2/27/17 | 300 | 348 |
| Vodafone Group plc | 4.625% | 7/15/18 | 250 | 278 |
| Vodafone Group plc | 5.450% | 6/10/19 | 1,975 | 2,287 |
| Vodafone Group plc | 4.375% | 3/16/21 | 500 | 537 |
| Consumer Cyclical (5.0%) | ||||
| AutoZone Inc. | 4.000% | 11/15/20 | 300 | 300 |
| Best Buy Co. Inc. | 5.500% | 3/15/21 | 300 | 284 |
| BorgWarner Inc. | 4.625% | 9/15/20 | 75 | 79 |
| Costco Wholesale Corp. | 5.500% | 3/15/17 | 825 | 980 |
| CVS Caremark Corp. | 5.750% | 6/1/17 | 1,600 | 1,841 |
| CVS Caremark Corp. | 4.750% | 5/18/20 | 1,400 | 1,510 |
| Darden Restaurants Inc. | 6.200% | 10/15/17 | 300 | 351 |
| eBay Inc. | 3.250% | 10/15/20 | 150 | 147 |
| Expedia Inc. | 7.456% | 8/15/18 | 350 | 394 |
| Expedia Inc. | 5.950% | 8/15/20 | 1,175 | 1,188 |
| Family Dollar Stores Inc. | 5.000% | 2/1/21 | 100 | 99 |
| Gap Inc. | 5.950% | 4/12/21 | 1,500 | 1,421 |
| Home Depot Inc. | 3.950% | 9/15/20 | 1,500 | 1,554 |
| HyattHotels Corp. | 5.375% | 8/15/21 | 150 | 152 |
| International Game Technology | 5.500% | 6/15/20 | 50 | 53 |
98
| Intermediate-Term Corporate Bond Index Fund | ||||
| Face | Market | |||
| Maturity | Amount | Value | ||
| Coupon | Date | ($000) | ($000) | |
| Johnson Controls Inc. | 5.000% | 3/30/20 | 725 | 800 |
| Kohl’s Corp. | 6.250% | 12/15/17 | 300 | 358 |
| Lowe’s Cos. Inc. | 4.625% | 4/15/20 | 1,400 | 1,540 |
| Lowe’s Cos. Inc. | 3.750% | 4/15/21 | 500 | 514 |
| Macy’s Retail Holdings Inc. | 5.900% | 12/1/16 | 1,700 | 1,882 |
| McDonald’s Corp. | 5.350% | 3/1/18 | 675 | 790 |
| McDonald’s Corp. | 5.000% | 2/1/19 | 500 | 580 |
| McDonald’s Corp. | 3.500% | 7/15/20 | 1,500 | 1,590 |
| Nordstrom Inc. | 6.250% | 1/15/18 | 400 | 470 |
| O’ReillyAutomotive Inc. | 4.875% | 1/14/21 | 150 | 160 |
| Target Corp. | 6.000% | 1/15/18 | 2,150 | 2,564 |
| Time Warner Inc. | 5.875% | 11/15/16 | 675 | 787 |
| Time Warner Inc. | 4.875% | 3/15/20 | 3,250 | 3,499 |
| TJX Cos. Inc. | 6.950% | 4/15/19 | 150 | 190 |
| Toyota Motor Credit Corp. | 4.500% | 6/17/20 | 650 | 705 |
| Toyota Motor Credit Corp. | 4.250% | 1/11/21 | 125 | 134 |
| VF Corp. | 3.500% | 9/1/21 | 400 | 400 |
| Viacom Inc. | 3.500% | 4/1/17 | 1,175 | 1,212 |
| Viacom Inc. | 6.125% | 10/5/17 | 600 | 695 |
| Wal-Mart Stores Inc. | 5.375% | 4/5/17 | 200 | 237 |
| Wal-Mart Stores Inc. | 5.800% | 2/15/18 | 500 | 600 |
| Wal-Mart Stores Inc. | 3.625% | 7/8/20 | 1,325 | 1,378 |
| Wal-Mart Stores Inc. | 3.250% | 10/25/20 | 1,825 | 1,853 |
| Wal-Mart Stores Inc. | 4.250% | 4/15/21 | 300 | 327 |
| Walgreen Co. | 5.250% | 1/15/19 | 1,325 | 1,547 |
| Walt Disney Co. | 5.625% | 9/15/16 | 550 | 654 |
| Walt Disney Co. | 3.750% | 6/1/21 | 1,500 | 1,603 |
| Walt Disney Co. | 2.750% | 8/16/21 | 500 | 491 |
| Western Union Co. | 5.930% | 10/1/16 | 700 | 794 |
| Western Union Co. | 3.650% | 8/22/18 | 400 | 399 |
| Yum! Brands Inc. | 6.250% | 3/15/18 | 650 | 771 |
| Yum! Brands Inc. | 3.875% | 11/1/20 | 800 | 804 |
| Consumer Noncyclical (13.4%) | ||||
| AbbottLaboratories | 5.600% | 11/30/17 | 2,050 | 2,437 |
| AbbottLaboratories | 5.125% | 4/1/19 | 550 | 643 |
| AbbottLaboratories | 4.125% | 5/27/20 | 1,100 | 1,206 |
| Allergan Inc. | 3.375% | 9/15/20 | 1,125 | 1,151 |
| Altria Group Inc. | 9.700% | 11/10/18 | 2,375 | 3,131 |
| Altria Group Inc. | 9.250% | 8/6/19 | 1,650 | 2,163 |
| Altria Group Inc. | 4.750% | 5/5/21 | 1,950 | 2,021 |
| Amgen Inc. | 5.850% | 6/1/17 | 1,675 | 1,994 |
| Amgen Inc. | 5.700% | 2/1/19 | 150 | 177 |
| Amgen Inc. | 3.450% | 10/1/20 | 1,375 | 1,394 |
| Amgen Inc. | 4.100% | 6/15/21 | 350 | 366 |
| Anheuser-Busch Cos. Inc. | 5.500% | 1/15/18 | 750 | 878 |
| Anheuser-Busch InBev Worldwide Inc. | 7.750% | 1/15/19 | 575 | 755 |
| Anheuser-Busch InBev Worldwide Inc. | 6.875% | 11/15/19 | 600 | 764 |
| Anheuser-Busch InBev Worldwide Inc. | 5.375% | 1/15/20 | 2,825 | 3,296 |
| Anheuser-Busch InBev Worldwide Inc. | 5.000% | 4/15/20 | 175 | 199 |
| Anheuser-Busch InBev Worldwide Inc. | 4.375% | 2/15/21 | 1,350 | 1,480 |
| Archer-Daniels-Midland Co. | 5.450% | 3/15/18 | 500 | 589 |
| Archer-Daniels-Midland Co. | 4.479% | 3/1/21 | 475 | 526 |
| AstraZeneca plc | 5.900% | 9/15/17 | 1,050 | 1,259 |
| Avon Products Inc. | 6.500% | 3/1/19 | 350 | 411 |
99
| Intermediate-Term Corporate Bond Index Fund | |||||
| Face | Market | ||||
| Maturity | Amount | Value | |||
| Coupon | Date | ($000) | ($000) | ||
| Baxter International Inc. | 5.900% | 9/1/16 | 700 | 842 | |
| Becton Dickinson and Co. | 3.250% | 11/12/20 | 450 | 454 | |
| Biogen Idec Inc. | 6.875% | 3/1/18 | 600 | 729 | |
| Boston Scientific Corp. | 6.000% | 1/15/20 | 700 | 777 | |
| Bottling Group LLC | 5.125% | 1/15/19 | 500 | 578 | |
| Bristol-Myers Squibb Co. | 5.450% | 5/1/18 | 855 | 1,007 | |
| Bunge Ltd. Finance Corp. | 8.500% | 6/15/19 | 700 | 875 | |
| Campbell Soup Co. | 3.050% | 7/15/17 | 125 | 131 | |
| Campbell Soup Co. | 4.250% | 4/15/21 | 425 | 461 | |
| Cardinal Health Inc. | 4.625% | 12/15/20 | 200 | 215 | |
| CareFusion Corp. | 6.375% | 8/1/19 | 750 | 889 | |
| Celgene Corp. | 3.950% | 10/15/20 | 65 | 65 | |
| Coca-Cola Co. | 5.350% | 11/15/17 | 1,975 | 2,348 | |
| Coca-Cola Co. | 3.150% | 11/15/20 | 1,000 | 1,009 | |
| Coca-Cola Enterprises Inc. | 3.250% | 8/19/21 | 425 | 418 | |
| Colgate-Palmolive Co. | 2.625% | 5/1/17 | 300 | 314 | |
| ConAgra Foods Inc. | 7.000% | 4/15/19 | 600 | 708 | |
| Corn Products International Inc. | 4.625% | 11/1/20 | 50 | 52 | |
| Covidien International Finance SA | 6.000% | 10/15/17 | 825 | 991 | |
| Covidien International Finance SA | 4.200% | 6/15/20 | 875 | 943 | |
| CR Bard Inc. | 4.400% | 1/15/21 | 1,200 | 1,317 | |
| DENTSPLY International Inc. | 4.125% | 8/15/21 | 300 | 300 | |
| Diageo Capital plc | 5.500% | 9/30/16 | 200 | 235 | |
| Diageo Capital plc | 5.750% | 10/23/17 | 900 | 1,058 | |
| Diageo Capital plc | 4.828% | 7/15/20 | 510 | 569 | |
| Dr Pepper Snapple Group Inc. | 6.820% | 5/1/18 | 770 | 949 | |
| Eli Lilly & Co. | 5.200% | 3/15/17 | 1,300 | 1,512 | |
| 2 | Energizer Holdings Inc. | 4.700% | 5/19/21 | 525 | 547 |
| General Mills Inc. | 5.700% | 2/15/17 | 675 | 794 | |
| General Mills Inc. | 5.650% | 2/15/19 | 1,550 | 1,818 | |
| Gilead Sciences Inc. | 4.500% | 4/1/21 | 450 | 477 | |
| GlaxoSmithKline Capital Inc. | 5.650% | 5/15/18 | 2,275 | 2,724 | |
| Hershey Co. | 4.125% | 12/1/20 | 225 | 245 | |
| Hormel Foods Corp. | 4.125% | 4/15/21 | 100 | 109 | |
| Johnson & Johnson | 5.550% | 8/15/17 | 1,675 | 2,027 | |
| Johnson & Johnson | 5.150% | 7/15/18 | 1,100 | 1,312 | |
| Kellogg Co. | 3.250% | 5/21/18 | 525 | 547 | |
| Kellogg Co. | 4.150% | 11/15/19 | 75 | 81 | |
| Kellogg Co. | 4.000% | 12/15/20 | 600 | 629 | |
| Kimberly-Clark Corp. | 6.125% | 8/1/17 | 829 | 1,004 | |
| Kimberly-Clark Corp. | 7.500% | 11/1/18 | 425 | 553 | |
| Kimberly-Clark Corp. | 3.625% | 8/1/20 | 100 | 105 | |
| Kimberly-Clark Corp. | 3.875% | 3/1/21 | 75 | 81 | |
| Koninklijke Philips Electronics NV | 5.750% | 3/11/18 | 875 | 1,009 | |
| Kraft Foods Inc. | 6.500% | 8/11/17 | 1,075 | 1,293 | |
| Kraft Foods Inc. | 6.125% | 2/1/18 | 3,350 | 3,948 | |
| Kraft Foods Inc. | 6.125% | 8/23/18 | 400 | 473 | |
| Kraft Foods Inc. | 5.375% | 2/10/20 | 1,375 | 1,558 | |
| Kroger Co. | 6.400% | 8/15/17 | 600 | 715 | |
| Kroger Co. | 6.150% | 1/15/20 | 250 | 297 | |
| Laboratory Corp. of America Holdings | 4.625% | 11/15/20 | 900 | 971 | |
| Life Technologies Corp. | 6.000% | 3/1/20 | 500 | 546 | |
| Life Technologies Corp. | 5.000% | 1/15/21 | 400 | 408 | |
| Lorillard Tobacco Co. | 8.125% | 6/23/19 | 650 | 774 | |
| Lorillard Tobacco Co. | 6.875% | 5/1/20 | 900 | 988 | |
| 100 | |||||
| Intermediate-Term Corporate Bond Index Fund | ||||
| Face | Market | |||
| Maturity | Amount | Value | ||
| Coupon | Date | ($000) | ($000) | |
| McCormick & Co. Inc. | 3.900% | 7/15/21 | 275 | 288 |
| McKesson Corp. | 4.750% | 3/1/21 | 1,100 | 1,228 |
| Mead Johnson Nutrition Co. | 4.900% | 11/1/19 | 1,150 | 1,265 |
| Medco Health Solutions Inc. | 7.125% | 3/15/18 | 1,550 | 1,862 |
| Medtronic Inc. | 4.450% | 3/15/20 | 2,075 | 2,311 |
| Merck & Co. Inc. | 5.000% | 6/30/19 | 1,500 | 1,756 |
| Merck & Co. Inc. | 3.875% | 1/15/21 | 300 | 320 |
| Newell Rubbermaid Inc. | 4.700% | 8/15/20 | 100 | 102 |
| Novartis Capital Corp. | 4.400% | 4/24/20 | 300 | 333 |
| Novartis Securities Investment Ltd. | 5.125% | 2/10/19 | 2,450 | 2,841 |
| PepsiCo Inc. | 5.000% | 6/1/18 | 450 | 521 |
| PepsiCo Inc. | 7.900% | 11/1/18 | 2,200 | 2,922 |
| PepsiCo Inc. | 3.125% | 11/1/20 | 895 | 903 |
| PepsiCo Inc. | 3.000% | 8/25/21 | 350 | 349 |
| Pfizer Inc. | 6.200% | 3/15/19 | 2,225 | 2,729 |
| Philip Morris International Inc. | 5.650% | 5/16/18 | 2,200 | 2,597 |
| Philip Morris International Inc. | 4.500% | 3/26/20 | 675 | 736 |
| Procter & Gamble Co. | 4.700% | 2/15/19 | 1,445 | 1,674 |
| Quest Diagnostics Inc. | 4.700% | 4/1/21 | 950 | 1,011 |
| Reynolds American Inc. | 6.750% | 6/15/17 | 700 | 815 |
| Safeway Inc. | 6.350% | 8/15/17 | 575 | 671 |
| Safeway Inc. | 5.000% | 8/15/19 | 125 | 135 |
| Safeway Inc. | 3.950% | 8/15/20 | 350 | 349 |
| Sanofi | 4.000% | 3/29/21 | 3,025 | 3,189 |
| Sara Lee Corp. | 4.100% | 9/15/20 | 100 | 99 |
| St. Jude Medical Inc. | 4.875% | 7/15/19 | 400 | 454 |
| Stryker Corp. | 4.375% | 1/15/20 | 100 | 108 |
| SyscoCorp. | 5.250% | 2/12/18 | 150 | 175 |
| Thermo Fisher Scientific Inc. | 4.500% | 3/1/21 | 475 | 514 |
| Thermo Fisher Scientific Inc. | 3.600% | 8/15/21 | 925 | 940 |
| Unilever Capital Corp. | 4.250% | 2/10/21 | 1,700 | 1,890 |
| Wyeth | 5.450% | 4/1/17 | 900 | 1,059 |
| Zimmer Holdings Inc. | 4.625% | 11/30/19 | 175 | 190 |
| Energy (6.7%) | ||||
| Anadarko Petroleum Corp. | 5.950% | 9/15/16 | 1,875 | 2,107 |
| Anadarko Petroleum Corp. | 6.375% | 9/15/17 | 1,750 | 1,954 |
| Apache Corp. | 5.625% | 1/15/17 | 300 | 357 |
| Apache Corp. | 3.625% | 2/1/21 | 1,500 | 1,555 |
| Baker Hughes Inc. | 7.500% | 11/15/18 | 650 | 851 |
| 2 Baker Hughes Inc. | 3.200% | 8/15/21 | 325 | 324 |
| BPCapital Markets plc | 4.750% | 3/10/19 | 1,200 | 1,316 |
| BPCapital Markets plc | 4.500% | 10/1/20 | 975 | 1,051 |
| BPCapital Markets plc | 4.742% | 3/11/21 | 450 | 490 |
| Cameron International Corp. | 4.500% | 6/1/21 | 350 | 366 |
| Canadian Natural Resources Ltd. | 5.700% | 5/15/17 | 975 | 1,138 |
| Cenovus Energy Inc. | 5.700% | 10/15/19 | 1,450 | 1,692 |
| Chevron Corp. | 4.950% | 3/3/19 | 1,000 | 1,168 |
| ConocoPhillips | 5.750% | 2/1/19 | 450 | 535 |
| ConocoPhillips Canada Funding Co. I | 5.625% | 10/15/16 | 3,600 | 4,233 |
| Devon Energy Corp. | 6.300% | 1/15/19 | 625 | 752 |
| Devon Energy Corp. | 4.000% | 7/15/21 | 425 | 440 |
| Encana Corp. | 5.900% | 12/1/17 | 825 | 961 |
| Ensco plc | 4.700% | 3/15/21 | 950 | 989 |
| EOG Resources Inc. | 5.875% | 9/15/17 | 300 | 356 |
101
| Intermediate-Term Corporate Bond Index Fund | |||||
| Face | Market | ||||
| Maturity | Amount | Value | |||
| Coupon | Date | ($000) | ($000) | ||
| EOG Resources Inc. | 5.625% | 6/1/19 | 150 | 175 | |
| EOG Resources Inc. | 4.100% | 2/1/21 | 1,290 | 1,358 | |
| Halliburton Co. | 6.150% | 9/15/19 | 1,000 | 1,205 | |
| Hess Corp. | 8.125% | 2/15/19 | 1,200 | 1,558 | |
| Husky Energy Inc. | 7.250% | 12/15/19 | 1,200 | 1,464 | |
| Marathon Oil Corp. | 5.900% | 3/15/18 | 2,050 | 2,402 | |
| 2 | Marathon Petroleum Corp. | 5.125% | 3/1/21 | 100 | 105 |
| Nabors Industries Inc. | 6.150% | 2/15/18 | 750 | 837 | |
| Nabors Industries Inc. | 9.250% | 1/15/19 | 1,300 | 1,666 | |
| Noble Energy Inc. | 8.250% | 3/1/19 | 750 | 995 | |
| Noble Holding International Ltd. | 4.625% | 3/1/21 | 325 | 343 | |
| Occidental Petroleum Corp. | 4.100% | 2/1/21 | 650 | 701 | |
| Petro-Canada | 6.050% | 5/15/18 | 600 | 695 | |
| Pride International Inc. | 8.500% | 6/15/19 | 650 | 842 | |
| Rowan Cos. Inc. | 5.000% | 9/1/17 | 1,150 | 1,212 | |
| Shell International Finance BV | 4.300% | 9/22/19 | 1,750 | 1,937 | |
| Shell International Finance BV | 4.375% | 3/25/20 | 1,100 | 1,200 | |
| Statoil ASA | 3.125% | 8/17/17 | 125 | 133 | |
| Statoil ASA | 5.250% | 4/15/19 | 1,750 | 2,028 | |
| Suncor Energy Inc. | 6.100% | 6/1/18 | 1,250 | 1,449 | |
| Talisman Energy Inc. | 7.750% | 6/1/19 | 700 | 881 | |
| Total Capital SA | 4.450% | 6/24/20 | 125 | 137 | |
| Total Capital SA | 4.125% | 1/28/21 | 1,400 | 1,494 | |
| Transocean Inc. | 6.000% | 3/15/18 | 1,150 | 1,267 | |
| Transocean Inc. | 6.500% | 11/15/20 | 115 | 130 | |
| Valero Energy Corp. | 9.375% | 3/15/19 | 1,200 | 1,576 | |
| Valero Energy Corp. | 6.125% | 2/1/20 | 975 | 1,086 | |
| Weatherford International Ltd. | 9.625% | 3/1/19 | 700 | 937 | |
| Weatherford International Ltd. | 5.125% | 9/15/20 | 1,800 | 1,878 | |
| XTO Energy Inc. | 5.500% | 6/15/18 | 300 | 365 | |
| XTO Energy Inc. | 6.500% | 12/15/18 | 200 | 258 | |
| Other Industrial (0.0%) | |||||
| Cornell University New York Revenue | 5.450% | 2/1/19 | 150 | 179 | |
| Technology (4.5%) | |||||
| Adobe Systems Inc. | 4.750% | 2/1/20 | 400 | 423 | |
| Agilent Technologies Inc. | 6.500% | 11/1/17 | 1,500 | 1,767 | |
| Applied Materials Inc. | 4.300% | 6/15/21 | 400 | 415 | |
| Arrow Electronics Inc. | 5.125% | 3/1/21 | 300 | 299 | |
| Avnet Inc. | 5.875% | 6/15/20 | 500 | 533 | |
| CA Inc. | 5.375% | 12/1/19 | 850 | 929 | |
| Cisco Systems Inc. | 3.150% | 3/14/17 | 1,075 | 1,128 | |
| Cisco Systems Inc. | 4.950% | 2/15/19 | 625 | 703 | |
| Cisco Systems Inc. | 4.450% | 1/15/20 | 2,575 | 2,807 | |
| Computer Sciences Corp. | 6.500% | 3/15/18 | 1,200 | 1,307 | |
| Dell Inc. | 5.650% | 4/15/18 | 750 | 857 | |
| Dell Inc. | 5.875% | 6/15/19 | 250 | 288 | |
| Dell Inc. | 4.625% | 4/1/21 | 375 | 393 | |
| Fiserv Inc. | 4.625% | 10/1/20 | 300 | 312 | |
| Fiserv Inc. | 4.750% | 6/15/21 | 450 | 468 | |
| Google Inc. | 3.625% | 5/19/21 | 1,400 | 1,477 | |
| Harris Corp. | 4.400% | 12/15/20 | 425 | 445 | |
| Hewlett-Packard Co. | 5.400% | 3/1/17 | 300 | 341 | |
| Hewlett-Packard Co. | 5.500% | 3/1/18 | 550 | 626 | |
| 102 | |||||
| Intermediate-Term Corporate Bond Index Fund | ||||
| Face | Market | |||
| Maturity | Amount | Value | ||
| Coupon | Date | ($000) | ($000) | |
| Hewlett-Packard Co. | 3.750% | 12/1/20 | 2,025 | 2,016 |
| Hewlett-Packard Co. | 4.300% | 6/1/21 | 575 | 597 |
| International Business Machines Corp. | 5.700% | 9/14/17 | 2,725 | 3,263 |
| International Business Machines Corp. | 7.625% | 10/15/18 | 929 | 1,221 |
| Juniper Networks Inc. | 4.600% | 3/15/21 | 90 | 94 |
| KLA-Tencor Corp. | 6.900% | 5/1/18 | 350 | 406 |
| Microsoft Corp. | 4.200% | 6/1/19 | 1,075 | 1,188 |
| Microsoft Corp. | 3.000% | 10/1/20 | 1,000 | 1,014 |
| Microsoft Corp. | 4.000% | 2/8/21 | 50 | 55 |
| Nokia Oyj | 5.375% | 5/15/19 | 1,725 | 1,719 |
| Oracle Corp. | 5.750% | 4/15/18 | 1,800 | 2,160 |
| Oracle Corp. | 5.000% | 7/8/19 | 1,500 | 1,710 |
| 2 Oracle Corp. | 3.875% | 7/15/20 | 1,025 | 1,087 |
| Pitney Bowes Inc. | 6.250% | 3/15/19 | 829 | 933 |
| 2 SAIC Inc. | 4.450% | 12/1/20 | 150 | 161 |
| SymantecCorp. | 4.200% | 9/15/20 | 125 | 125 |
| TycoElectronics Group SA | 6.550% | 10/1/17 | 800 | 952 |
| Xerox Corp. | 6.350% | 5/15/18 | 1,775 | 2,053 |
| Transportation (2.3%) | ||||
| 1 American Airlines 2011-1 Class A | ||||
| Pass Through Trust | 5.250% | 1/31/21 | 150 | 137 |
| 1 American Airlines Pass Through Trust 2009-1A | 10.375% | 7/2/19 | 680 | 745 |
| Burlington Northern Santa Fe LLC | 5.650% | 5/1/17 | 850 | 986 |
| Burlington Northern Santa Fe LLC | 5.750% | 3/15/18 | 1,500 | 1,753 |
| Canadian National Railway Co. | 5.550% | 3/1/19 | 325 | 389 |
| Canadian Pacific Railway Co. | 7.250% | 5/15/19 | 1,050 | 1,320 |
| Con-way Inc. | 7.250% | 1/15/18 | 200 | 226 |
| 1 Continental Airlines 2009-2 Class A | ||||
| Pass Through Trust | 7.250% | 11/10/19 | 190 | 199 |
| 1 Continental Airlines 2010-1 Class A | ||||
| Pass Through Trust | 4.750% | 1/12/21 | 600 | 564 |
| CSX Corp. | 7.375% | 2/1/19 | 1,675 | 2,112 |
| 1 Delta Air Lines 2009-1 Class A | ||||
| Pass Through Trust | 7.750% | 12/17/19 | 210 | 221 |
| 1 Delta Air Lines 2010-1 Class A | ||||
| Pass Through Trust | 6.200% | 7/2/18 | 472 | 481 |
| 1 Delta Air Lines 2010-2 Class A | ||||
| Pass Through Trust | 4.950% | 5/23/19 | 690 | 669 |
| FedEx Corp. | 8.000% | 1/15/19 | 150 | 194 |
| Norfolk Southern Corp. | 5.750% | 4/1/18 | 200 | 235 |
| Norfolk Southern Corp. | 5.900% | 6/15/19 | 1,700 | 2,026 |
| RyderSystem Inc. | 5.850% | 11/1/16 | 100 | 115 |
| RyderSystem Inc. | 3.500% | 6/1/17 | 1,225 | 1,266 |
| 1 UAL 2009-2A Pass Through Trust | 9.750% | 1/15/17 | 756 | 826 |
| Union Pacific Corp. | 6.125% | 2/15/20 | 150 | 179 |
| Union Pacific Corp. | 4.000% | 2/1/21 | 300 | 312 |
| 2 Union Pacific Corp. | 4.163% | 7/15/22 | 1,137 | 1,199 |
| United Parcel Service Inc. | 5.500% | 1/15/18 | 150 | 178 |
| United Parcel Service Inc. | 5.125% | 4/1/19 | 600 | 713 |
| United Parcel Service Inc. | 3.125% | 1/15/21 | 1,300 | 1,339 |
| 424,914 | ||||
103
| Intermediate-Term Corporate Bond Index Fund | |||||
| Face | Market | ||||
| Maturity | Amount | Value | |||
| Coupon | Date | ($000) | ($000) | ||
| Utilities (10.3%) | |||||
| Electric (6.6%) | |||||
| American Water Capital Corp. | 6.085% | 10/15/17 | 450 | 530 | |
| Appalachian Power Co. | 7.950% | 1/15/20 | 175 | 229 | |
| Appalachian Power Co. | 4.600% | 3/30/21 | 2,100 | 2,236 | |
| Carolina Power & Light Co. | 5.300% | 1/15/19 | 1,425 | 1,667 | |
| Cleveland Electric Illuminating Co. | 5.700% | 4/1/17 | 1,000 | 1,115 | |
| Commonwealth Edison Co. | 4.000% | 8/1/20 | 800 | 840 | |
| Consolidated Edison Co. of New York Inc. | 5.850% | 4/1/18 | 600 | 727 | |
| Consolidated Edison Co. of New York Inc. | 7.125% | 12/1/18 | 1,100 | 1,403 | |
| Consolidated Edison Co. of New York Inc. | 4.450% | 6/15/20 | 500 | 555 | |
| Constellation Energy Group Inc. | 5.150% | 12/1/20 | 400 | 415 | |
| Consumers Energy Co. | 6.700% | 9/15/19 | 125 | 156 | |
| Consumers Energy Co. | 5.650% | 4/15/20 | 175 | 207 | |
| Detroit Edison Co. | 3.900% | 6/1/21 | 475 | 508 | |
| Dominion Resources Inc. | 8.875% | 1/15/19 | 450 | 595 | |
| Dominion Resources Inc. | 5.200% | 8/15/19 | 2,100 | 2,403 | |
| Dominion Resources Inc. | 4.450% | 3/15/21 | 975 | 1,052 | |
| Duke Energy Carolinas LLC | 7.000% | 11/15/18 | 1,300 | 1,636 | |
| Duke Energy Corp. | 5.050% | 9/15/19 | 775 | 868 | |
| Duke Energy Indiana Inc. | 3.750% | 7/15/20 | 700 | 731 | |
| Entergy Arkansas Inc. | 3.750% | 2/15/21 | 425 | 427 | |
| Entergy Gulf States Louisiana LLC | 6.000% | 5/1/18 | 450 | 515 | |
| Entergy Gulf States Louisiana LLC | 3.950% | 10/1/20 | 325 | 330 | |
| Exelon Generation Co. LLC | 6.200% | 10/1/17 | 275 | 316 | |
| Exelon Generation Co. LLC | 4.000% | 10/1/20 | 2,800 | 2,799 | |
| FirstEnergy Solutions Corp. | 6.050% | 8/15/21 | 925 | 1,019 | |
| Florida Power Corp. | 5.650% | 6/15/18 | 225 | 268 | |
| Georgia Power Co. | 5.700% | 6/1/17 | 200 | 236 | |
| Georgia Power Co. | 4.250% | 12/1/19 | 875 | 952 | |
| Great Plains Energy Inc. | 4.850% | 6/1/21 | 675 | 711 | |
| Kentucky Utilities Co. | 3.250% | 11/1/20 | 525 | 543 | |
| LG&E and KU Energy LLC | 3.750% | 11/15/20 | 195 | 195 | |
| Midamerican Energy Holdings Co. | 5.750% | 4/1/18 | 2,075 | 2,411 | |
| National Rural Utilities Cooperative Finance Corp. | 5.450% | 4/10/17 | 300 | 349 | |
| National Rural Utilities Cooperative Finance Corp. | 10.375% | 11/1/18 | 1,475 | 2,108 | |
| Nevada Power Co. | 7.125% | 3/15/19 | 650 | 811 | |
| NextEra Energy Capital Holdings Inc. | 6.000% | 3/1/19 | 350 | 402 | |
| NextEra Energy Capital Holdings Inc. | 4.500% | 6/1/21 | 1,275 | 1,328 | |
| 1 | NextEra Energy Capital Holdings Inc. | 6.350% | 10/1/66 | 400 | 384 |
| 1 | NextEra Energy Capital Holdings Inc. | 6.650% | 6/15/67 | 225 | 219 |
| Northern States Power Co. | 5.250% | 3/1/18 | 1,350 | 1,584 | |
| NSTAR | 4.500% | 11/15/19 | 244 | 268 | |
| Oncor Electric Delivery Co. LLC | 6.800% | 9/1/18 | 475 | 576 | |
| Pacific Gas & Electric Co. | 5.625% | 11/30/17 | 1,400 | 1,640 | |
| Pacific Gas & Electric Co. | 8.250% | 10/15/18 | 650 | 856 | |
| Pennsylvania Electric Co. | 6.050% | 9/1/17 | 400 | 458 | |
| Pennsylvania Electric Co. | 5.200% | 4/1/20 | 350 | 394 | |
| PPL Energy Supply LLC | 6.500% | 5/1/18 | 1,200 | 1,425 | |
| Progress Energy Inc. | 4.400% | 1/15/21 | 1,500 | 1,593 | |
| PSEG Power LLC | 5.125% | 4/15/20 | 1,500 | 1,625 | |
| Public Service Co. of Oklahoma | 4.400% | 2/1/21 | 500 | 532 | |
| Public Service Electric & Gas Co. | 3.500% | 8/15/20 | 375 | 380 | |
| SCANA Corp. | 4.750% | 5/15/21 | 800 | 844 | |
| Southern California Edison Co. | 5.500% | 8/15/18 | 100 | 118 | |
| 104 | |||||
| Intermediate-Term Corporate Bond Index Fund | ||||
| Face | Market | |||
| Maturity | Amount | Value | ||
| Coupon | Date | ($000) | ($000) | |
| Southern California Edison Co. | 3.875% | 6/1/21 | 1,800 | 1,916 |
| Southwestern Electric Power Co. | 5.875% | 3/1/18 | 300 | 342 |
| TransAlta Corp. | 6.650% | 5/15/18 | 550 | 642 |
| UIL Holdings Corp. | 4.625% | 10/1/20 | 150 | 151 |
| Union Electric Co. | 6.400% | 6/15/17 | 1,185 | 1,422 |
| Union Electric Co. | 6.700% | 2/1/19 | 200 | 243 |
| 1 Wisconsin Energy Corp. | 6.250% | 5/15/67 | 1,050 | 1,041 |
| Xcel Energy Inc. | 4.700% | 5/15/20 | 975 | 1,086 |
| Natural Gas (3.7%) | ||||
| Buckeye Partners LP | 4.875% | 2/1/21 | 750 | 778 |
| 2 CenterPoint Energy Resources Corp. | 4.500% | 1/15/21 | 300 | 318 |
| Enbridge Energy Partners LP | 6.500% | 4/15/18 | 400 | 474 |
| Enbridge Energy Partners LP | 9.875% | 3/1/19 | 1,100 | 1,501 |
| Energy Transfer Partners LP | 6.125% | 2/15/17 | 350 | 388 |
| Energy Transfer Partners LP | 6.700% | 7/1/18 | 500 | 562 |
| Energy Transfer Partners LP | 9.700% | 3/15/19 | 1,200 | 1,513 |
| Energy Transfer Partners LP | 9.000% | 4/15/19 | 400 | 492 |
| Enterprise Products Operating LLC | 6.300% | 9/15/17 | 1,575 | 1,851 |
| Enterprise Products Operating LLC | 6.500% | 1/31/19 | 500 | 583 |
| Enterprise Products Operating LLC | 5.200% | 9/1/20 | 300 | 327 |
| EQT Corp. | 8.125% | 6/1/19 | 575 | 721 |
| Kinder Morgan Energy Partners LP | 5.950% | 2/15/18 | 600 | 692 |
| Kinder Morgan Energy Partners LP | 9.000% | 2/1/19 | 275 | 353 |
| Kinder Morgan Energy Partners LP | 6.850% | 2/15/20 | 2,400 | 2,832 |
| Magellan Midstream Partners LP | 4.250% | 2/1/21 | 1,200 | 1,239 |
| Nisource Finance Corp. | 6.400% | 3/15/18 | 1,825 | 2,140 |
| ONEOKPartners LP | 8.625% | 3/1/19 | 1,475 | 1,901 |
| Plains All American Pipeline LP / | ||||
| PAA Finance Corp. | 6.500% | 5/1/18 | 150 | 173 |
| Plains All American Pipeline LP / | ||||
| PAA Finance Corp. | 5.750% | 1/15/20 | 800 | 897 |
| Plains All American Pipeline LP / | ||||
| PAA Finance Corp. | 5.000% | 2/1/21 | 1,450 | 1,540 |
| Sempra Energy | 9.800% | 2/15/19 | 650 | 917 |
| 2 Southern Natural Gas Co. / | ||||
| Southern Natural Issuing Corp. | 4.400% | 6/15/21 | 450 | 474 |
| Spectra Energy Capital LLC | 8.000% | 10/1/19 | 1,000 | 1,285 |
| Tennessee Gas Pipeline Co. | 7.500% | 4/1/17 | 450 | 555 |
| TransCanada PipeLines Ltd. | 6.500% | 8/15/18 | 850 | 1,034 |
| TransCanada PipeLines Ltd. | 3.800% | 10/1/20 | 1,050 | 1,090 |
| 1 TransCanada PipeLines Ltd. | 6.350% | 5/15/67 | 650 | 650 |
| Williams Partners LP | 5.250% | 3/15/20 | 650 | 709 |
| Williams Partners LP / | ||||
| Williams Partners Finance Corp. | 7.250% | 2/1/17 | 2,000 | 2,384 |
| Other Utility (0.0%) | ||||
| Veolia Environnement SA | 6.000% | 6/1/18 | 150 | 171 |
| 83,876 | ||||
| Total Corporate Bonds (Cost $769,381) | 789,650 | |||
105
| Intermediate-Term Corporate Bond Index Fund | ||||
| Face | Market | |||
| Maturity | Amount | Value | ||
| Coupon | Date | ($000) | ($000) | |
| Taxable Municipal Bonds (0.1%) | ||||
| California Educational Facilities Authority | ||||
| Revenue (Stanford University) | 4.750% | 5/1/19 | 150 | 173 |
| Maryland Health & Higher Educational Facilities | ||||
| Authority Revenue (Johns Hopkins University) | 5.250% | 7/1/19 | 290 | 334 |
| New Hampshire Health & Educational Facilities | ||||
| Authority Revenue (Dartmouth College) | 4.750% | 6/1/19 | 200 | 226 |
| Total Taxable Municipal Bonds (Cost $692) | 733 | |||
| Shares | ||||
| Temporary Cash Investment (1.5%) | ||||
| Money Market Fund (1.5%) | ||||
| 3 Vanguard Market Liquidity Fund | ||||
| (Cost $12,472) | 0.132% | 12,472,424 | 12,472 | |
| Total Investments (99.1%) (Cost $786,751) | 807,047 | |||
| Other Assets and Liabilities (0.9%) | ||||
| Other Assets | 26,516 | |||
| Liabilities | (19,085) | |||
| 7,431 | ||||
| Net Assets (100%) | 814,478 | |||
106
Intermediate-Term Corporate Bond Index Fund
| At August 31, 2011, net assets consisted of: | |
| Amount | |
| ($000) | |
| Paid-in Capital | 793,626 |
| Overdistributed Net Investment Income | (65) |
| Accumulated Net Realized Gains | 621 |
| Unrealized Appreciation (Depreciation) | 20,296 |
| Net Assets | 814,478 |
| Signal Shares—Net Assets | |
| Applicable to 314,280 outstanding $.001 par value shares of | |
| beneficial interest (unlimited authorization) | 6,908 |
| Net Asset Value Per Share—Signal Shares | $21.98 |
| Institutional Shares—Net Assets | |
| Applicable to 3,030,897 outstanding $.001 par value shares of | |
| beneficial interest (unlimited authorization) | 82,336 |
| Net Asset Value Per Share—Institutional Shares | $27.17 |
| ETF Shares—Net Assets | |
| Applicable to 8,900,000 outstanding $.001 par value shares of | |
| beneficial interest (unlimited authorization) | 725,234 |
| Net Asset Value Per Share—ETF Shares | $81.49 |
See Note A in Notes to Financial Statements.
1 The average or expected maturity is shorter than the final maturity shown because of the possibility of interim principal payments and prepayments or the possibility of the issue being called.
2 Security exempt from registration under Rule 144A of the Securities Act of 1933. Such securities may be sold in transactions exempt from registration, normally to qualified institutional buyers. At August 31, 2011, the aggregate value of these securities was $8,600,000, representing 1.1% of net assets.
3 Affiliated money market fund available only to Vanguard funds and certain trusts and accounts managed by Vanguard. Rate shown is the 7-day yield.
REIT—Real Estate Investment Trust.
See accompanying Notes, which are an integral part of the Financial Statements.
107
Intermediate-Term Corporate Bond Index Fund
Statement of Operations
| Year Ended | |
| August 31, 2011 | |
| ($000) | |
| Investment Income | |
| Income | |
| Interest1 | 20,443 |
| Total Income | 20,443 |
| Expenses | |
| The Vanguard Group—Note B | |
| Investment Advisory Services | 26 |
| Management and Administrative—Signal Shares | 5 |
| Management and Administrative—Institutional Shares | 24 |
| Management and Administrative—ETF Shares | 387 |
| Marketing and Distribution—Signal Shares | — |
| Marketing and Distribution—Institutional Shares | 8 |
| Marketing and Distribution—ETF Shares | 109 |
| Custodian Fees | 10 |
| Auditing Fees | 41 |
| Shareholders’ Reports—Signal Shares | — |
| Shareholders’ Reports—Institutional Shares | — |
| Shareholders’ Reports—ETF Shares | 28 |
| Total Expenses | 638 |
| Net Investment Income | 19,805 |
| Realized Net Gain (Loss) | |
| Investment Securities Sold | 2,749 |
| Futures Contracts | (16) |
| Realized Net Gain (Loss) | 2,733 |
| Change in Unrealized Appreciation (Depreciation) | |
| Investment Securities | 5,983 |
| Futures Contracts | (1) |
| Change in Unrealized Appreciation (Depreciation) | 5,982 |
| Net Increase (Decrease) in Net Assets Resulting from Operations | 28,520 |
| 1 Interest income from an affiliated company of the fund was $6,000. | |
See accompanying Notes, which are an integral part of the Financial Statements.
108
Intermediate-Term Corporate Bond Index Fund
Statement of Changes in Net Assets
| November 19, | ||
| Year Ended | 20091 to | |
| August 31, | August 31, | |
| 2011 | 2010 | |
| ($000) | ($000) | |
| Increase (Decrease) in Net Assets | ||
| Operations | ||
| Net Investment Income | 19,805 | 5,256 |
| Realized Net Gain (Loss) | 2,733 | 572 |
| Change in Unrealized Appreciation (Depreciation) | 5,982 | 14,314 |
| Net Increase (Decrease) in Net Assets Resulting from Operations | 28,520 | 20,142 |
| Distributions | ||
| Net Investment Income | ||
| Signal Shares | (177) | (54) |
| Institutional Shares | (1,726) | (300) |
| ETF Shares | (17,939) | (4,930) |
| Realized Capital Gain2 | ||
| Signal Shares | (15) | — |
| Institutional Shares | (86) | — |
| ETF Shares | (1,338) | — |
| Total Distributions | (21,281) | (5,284) |
| Capital Share Transactions | ||
| Signal Shares | 4,567 | 2,118 |
| Institutional Shares | 68,419 | 11,439 |
| ETF Shares | 445,610 | 260,228 |
| Net Increase (Decrease) from Capital Share Transactions | 518,596 | 273,785 |
| Total Increase (Decrease) | 525,835 | 288,643 |
| Net Assets | ||
| Beginning of Period | 288,643 | — |
| End of Period3 | 814,478 | 288,643 |
1 Inception.
2 Includes fiscal 2011 short-term gain distributions totaling $1,439,000. Short-term gain distributions are treated as ordinary income dividends for tax purposes.
3 Net Assets—End of Period includes undistributed (overdistributed) net investment income of ($65,000) and ($28,000).
See accompanying Notes, which are an integral part of the Financial Statements.
109
Intermediate-Term Corporate Bond Index Fund
Financial Highlights
| Signal Shares | ||
| Year | March 2, | |
| Ended | 20101 to | |
| August 31, | Aug. 31, | |
| For a Share Outstanding Throughout Each Period | 2011 | 2010 |
| Net Asset Value, Beginning of Period | $21.76 | $20.43 |
| Investment Operations | ||
| Net Investment Income | .876 | .441 |
| Net Realized and Unrealized Gain (Loss) on Investments2 | .312 | 1.345 |
| Total from Investment Operations | 1.188 | 1.786 |
| Distributions | ||
| Dividends from Net Investment Income | (.875) | (.456) |
| Distributions from Realized Capital Gains | (.093) | — |
| Total Distributions | (.968) | (.456) |
| Net Asset Value, End of Period | $21.98 | $21.76 |
| Total Return3 | 5.65% | 8.86% |
| Ratios/Supplemental Data | ||
| Net Assets, End of Period (Millions) | $7 | $2 |
| Ratio of Total Expenses to Average Net Assets | 0.14% | 0.15%4 |
| Ratio of Net Investment Income to Average Net Assets | 4.15% | 4.60%4 |
| Portfolio Turnover Rate5 | 80% | 61% |
1 Inception.
2 Includes increases from purchase fees of $.02 and $.00.
3 Total returns do not include transaction fees that may have applied in the periods shown. Fund prospectuses provide information about any applicable transaction fees.
4 Annualized.
5 Excludes the value of portfolio securities received or delivered as a result of in-kind purchases or redemptions of the fund’s capital shares, including ETF Creation Units.
See accompanying Notes, which are an integral part of the Financial Statements.
110
Intermediate-Term Corporate Bond Index Fund
Financial Highlights
| Institutional Shares | ||
| Year | Nov. 19, | |
| Ended | 20091 to | |
| August 31, | Aug. 31, | |
| For a Share Outstanding Throughout Each Period | 2011 | 2010 |
| Net Asset Value, Beginning of Period | $26.90 | $24.97 |
| Investment Operations | ||
| Net Investment Income | 1.098 | .850 |
| Net Realized and Unrealized Gain (Loss) on Investments2 | .383 | 1.933 |
| Total from Investment Operations | 1.481 | 2.783 |
| Distributions | ||
| Dividends from Net Investment Income | (1.097) | (.853) |
| Distributions from Realized Capital Gains | (.114) | — |
| Total Distributions | (1.211) | (.853) |
| Net Asset Value, End of Period | $27.17 | $26.90 |
| Total Return3 | 5.70% | 11.38% |
| Ratios/Supplemental Data | ||
| Net Assets, End of Period (Millions) | $82 | $12 |
| Ratio of Total Expenses to Average Net Assets | 0.09% | 0.09%4 |
| Ratio of Net Investment Income to Average Net Assets | 4.20% | 4.66%4 |
| Portfolio Turnover Rate5 | 80% | 61% |
1 Inception.
2 Includes increases from purchase fees of $.02 and $.00.
3 Total returns do not include transaction fees that may have applied in the periods shown. Fund prospectuses provide information about any applicable transaction fees.
4 Annualized.
5 Excludes the value of portfolio securities received or delivered as a result of in-kind purchases or redemptions of the fund’s capital shares, including ETF Creation Units.
See accompanying Notes, which are an integral part of the Financial Statements.
111
Intermediate-Term Corporate Bond Index Fund
Financial Highlights
| ETF Shares | ||
| Year | Nov. 19, | |
| Ended | 20091 to | |
| August 31, | Aug. 31, | |
| For a Share Outstanding Throughout Each Period | 2011 | 2010 |
| Net Asset Value, Beginning of Period | $80.67 | $74.90 |
| Investment Operations | ||
| Net Investment Income | 3.249 | 2.519 |
| Net Realized and Unrealized Gain (Loss) on Investments2 | 1.162 | 5.778 |
| Total from Investment Operations | 4.411 | 8.297 |
| Distributions | ||
| Dividends from Net Investment Income | (3.248) | (2.527) |
| Distributions from Realized Capital Gains | (.343) | — |
| Total Distributions | (3.591) | (2.527) |
| Net Asset Value, End of Period | $81.49 | $80.67 |
| Total Return | 5.65% | 11.30% |
| Ratios/Supplemental Data | ||
| Net Assets, End of Period (Millions) | $725 | $274 |
| Ratio of Total Expenses to Average Net Assets | 0.14% | 0.15%3 |
| Ratio of Net Investment Income to Average Net Assets | 4.15% | 4.60%3 |
| Portfolio Turnover Rate4 | 80% | 61% |
1 Inception.
2 Includes increases from purchase fees of $.06 and $.01.
3 Annualized.
4 Excludes the value of portfolio securities received or delivered as a result of in-kind purchases or redemptions of the fund’s capital shares, including ETF Creation Units.
See accompanying Notes, which are an integral part of the Financial Statements.
112
Intermediate-Term Corporate Bond Index Fund
Notes to Financial Statements
Vanguard Intermediate-Term Corporate Bond Index Fund is registered under the Investment Company Act of 1940 as an open-end investment company, or mutual fund. Certain of the fund’s investments are in corporate debt instruments; the issuers’ abilities to meet their obligations may be affected by economic developments in their respective industries. The fund offers three classes of shares: Signal Shares, Institutional Shares, and ETF Shares. Signal Shares and Institutional Shares are designed for investors who meet certain administrative, service, and account-size criteria. ETF Shares are listed for trading on Nasdaq; they can be purchased and sold through a broker.
A. The following significant accounting policies conform to generally accepted accounting principles for U.S. mutual funds. The fund consistently follows such policies in preparing its financial statements.
1. Security Valuation: Bonds, and temporary cash investments acquired over 60 days to maturity, are valued using the latest bid prices or using valuations based on a matrix system (which considers such factors as security prices, yields, maturities, and ratings), both as furnished by independent pricing services. Investments in Vanguard Market Liquidity Fund are valued at that fund’s net asset value. Other temporary cash investments are valued at amortized cost, which approximates market value. Securities for which market quotations are not readily available, or whose values have been affected by events occurring before the fund’s pricing time but after the close of the securities’ primary markets, are valued by methods deemed by the board of trustees to represent fair value.
2. Futures Contracts: The fund uses futures contracts to invest in fixed income asset classes with greater efficiency and lower cost than is possible through direct investment, to add value when these instruments are attractively priced, or to adjust sensitivity to changes in interest rates. The primary risks associated with the use of futures contracts are imperfect correlation between changes in market values of bonds held by the fund and the prices of futures contracts, and the possibility of an illiquid market.
Futures contracts are valued based upon their quoted daily settlement prices. The aggregate principal amounts of the contracts are not recorded in the Statement of Net Assets. Fluctuations in the value of the contracts are recorded in the Statement of Net Assets as an asset (liability) and in the Statement of Operations as unrealized appreciation (depreciation) until the contracts are closed, when they are recorded as realized futures gains (losses). There were no open futures contracts at August 31, 2011.
3. Federal Income Taxes: The fund intends to continue to qualify as a regulated investment company and distribute all of its taxable income. Management has analyzed the fund’s tax positions taken for all open federal income tax years (August 31, 2010–2011), and has concluded that no provision for federal income tax is required in the fund’s financial statements.
4. Distributions: Distributions to shareholders are recorded on the ex-dividend date.
5. Other: Interest income includes income distributions received from Vanguard Market Liquidity Fund and is accrued daily. Premiums and discounts on debt securities purchased are amortized and accreted, respectively, to interest income over the lives of the respective securities. Security transactions are accounted for on the date securities are bought or sold. Costs used to determine realized gains (losses) on the sale of investment securities are those of the specific securities sold. Fees assessed on purchases of capital shares are credited to paid-in capital.
Each class of shares has equal rights as to assets and earnings, except that each class separately bears certain class-specific expenses related to maintenance of shareholder accounts (included in Management and Administrative expenses) and shareholder reporting. Marketing and distribution
113
Intermediate-Term Corporate Bond Index Fund
expenses are allocated to each class of shares based on a method approved by the board of trustees. Income, other non-class-specific expenses, and gains and losses on investments are allocated to each class of shares based on its relative net assets.
B. The Vanguard Group furnishes at cost investment advisory, corporate management, administrative, marketing, and distribution services. The costs of such services are allocated to the fund under methods approved by the board of trustees. The fund has committed to provide up to 0.40% of its net assets in capital contributions to Vanguard. At August 31, 2011, the fund had contributed capital of $115,000 to Vanguard (included in Other Assets), representing 0.01% of the fund’s net assets and 0.05% of Vanguard’s capitalization. The fund’s trustees and officers are also directors and officers of Vanguard.
C. Various inputs may be used to determine the value of the fund’s investments. These inputs are summarized in three broad levels for financial statement purposes. The inputs or methodologies used to value securities are not necessarily an indication of the risk associated with investing in those securities.
Level 1—Quoted prices in active markets for identical securities.
Level 2—Other significant observable inputs (including quoted prices for similar securities, interest rates, prepayment speeds, credit risk, etc.).
Level 3—Significant unobservable inputs (including the fund’s own assumptions used to determine the fair value of investments).
The following table summarizes the fund’s investments as of August 31, 2011, based on the inputs used to value them:
| Level 1 | Level 2 | Level 3 | |
| Investments | ($000) | ($000) | ($000) |
| U.S. Government and Agency Obligations | — | 4,192 | — |
| Corporate Bonds | — | 789,650 | — |
| Taxable Municipal Bonds | — | 733 | — |
| Temporary Cash Investments | 12,472 | — | — |
| Total | 12,472 | 794,575 | — |
D. Distributions are determined on a tax basis and may differ from net investment income and realized capital gains for financial reporting purposes. Differences may be permanent or temporary. Permanent differences are reclassified among capital accounts in the financial statements to reflect their tax character. Temporary differences arise when certain items of income, expense, gain, or loss are recognized in different periods for financial statement and tax purposes; these differences will reverse at some time in the future. Differences in classification may also result from the treatment of short-term gains as ordinary income for tax purposes.
During the year ended August 31, 2011, the fund realized $841,000 of net capital gains resulting from in-kind redemptions—in which shareholders exchanged fund shares for securities held by the fund rather than for cash. Because such gains are not taxable to the fund, and are not distributed to shareholders, they have been reclassified from accumulated net realized gains to paid-in capital.
The fund used a tax accounting practice to treat a portion of the price of capital shares redeemed during the year as distributions from realized capital gains. Accordingly, the fund has reclassified $404,000 from accumulated net realized gains to paid-in capital.
114
Intermediate-Term Corporate Bond Index Fund
For tax purposes, at August 31, 2011, the fund had $642,000 of long-term capital gains available for distribution.
At August 31, 2011, the cost of investment securities for tax purposes was $786,755,000. Net unrealized appreciation of investment securities for tax purposes was $20,292,000, consisting of unrealized gains of $24,121,000 on securities that had risen in value since their purchase and $3,829,000 in unrealized losses on securities that had fallen in value since their purchase.
E. During the year ended August 31, 2011, the fund purchased $709,681,000 of investment securities and sold $210,074,000 of investment securities, other than U.S. government securities and temporary cash investments. Purchases and sales of U.S. government securities were $254,703,000 and $251,666,000, respectively.
F. Capital share transactions for each class of shares were:
| Year Ended | Inception1 to | |||
| August 31, 2011 | August 31, 2010 | |||
| Amount | Shares | Amount | Shares | |
| ($000) | (000) | ($000) | (000) | |
| Signal Shares | ||||
| Issued2 | 5,732 | 263 | 3,064 | 149 |
| Issued in Lieu of Cash Distributions | 191 | 9 | 54 | 3 |
| Redeemed | (1,356) | (62) | (1,000) | (48) |
| Net Increase (Decrease)—Signal Shares | 4,567 | 210 | 2,118 | 104 |
| Institutional Shares | ||||
| Issued2 | 67,412 | 2,543 | 11,139 | 438 |
| Issued in Lieu of Cash Distributions | 1,671 | 63 | 300 | 12 |
| Redeemed | (664) | (25) | — | — |
| Net Increase (Decrease)—Institutional Shares | 68,419 | 2,581 | 11,439 | 450 |
| ETF Shares | ||||
| Issued2 | 532,385 | 6,600 | 260,228 | 3,400 |
| Issued in Lieu of Cash Distributions | — | — | — | — |
| Redeemed | (86,775) | (1,100) | — | — |
| Net Increase (Decrease)—ETF Shares | 445,610 | 5,500 | 260,228 | 3,400 |
1 Inception was November 19, 2009, for ETF Shares and Institutional Shares, and March 2, 2010, for Signal Shares. 2 Includes purchase fees for fiscal 2011 and 2010 of $620,000 and $71,000, respectively (fund totals).
G. In preparing the financial statements as of August 31, 2011, management considered the impact of subsequent events for potential recognition or disclosure in these financial statements.
115
Long-Term Corporate Bond Index Fund
Fund Profile
As of August 31, 2011
| Share-Class Characteristics | |||
| Signal | Institutional | ETF | |
| Shares | Shares | Shares | |
| Ticker Symbol | VLTCX | VLCIX | VCLT |
| Expense Ratio1 | 0.15% | 0.09% | 0.15% |
| 30-Day SEC Yield | 5.25% | 5.26% | 5.23% |
| Financial Attributes | |||
| Barclays | |||
| 10+ Year | Barclays | ||
| Corporate | Aggregate | ||
| Fund | Index | FA Index | |
| Number of Bonds | 537 | 1,075 | 7,873 |
| Yield to Maturity | |||
| (before expenses) | 5.4% | 5.4% | 2.3% |
| Average Coupon | 6.5% | 6.5% | 4.1% |
| Average Duration | 13.0 years | 13.0 years | 5.1 years |
| Average Effective | |||
| Maturity | 24.5 years | 24.6 years | 7.3 years |
| Short-Term | |||
| Reserves | 0.9% | — | — |
| Sector Diversification (% of portfolio) | |||
| Finance | 20.2% | ||
| Industrial | 61.4 | ||
| Treasury/Agency | 1.1 | ||
| Utilities | 16.8 | ||
| Other | 0.5 | ||
The agency and mortgage-backed securities sectors may include issues from government-sponsored enterprises; such issues are not backed by the full faith and credit of the U.S. government.
| Distribution by Maturity (% of portfolio) | |
| Under 1 Year | 0.6% |
| 3 - 5 Years | 0.3 |
| 5 - 10 Years | 1.6 |
| 10 - 20 Years | 14.4 |
| 20 - 30 Years | 82.2 |
| Over 30 Years | 0.9 |
| Distribution by Credit Quality (% of portfolio) | |
| U.S. Government | 1.1% |
| Aaa | 1.5 |
| Aa | 12.6 |
| A | 42.9 |
| Baa | 41.9 |
| For information about these ratings, see the Glossary entry for Credit Quality. | |
Investment Focus
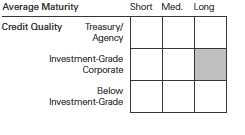
1 The expense ratios shown are from the prospectus dated December 28, 2010, and represent estimated costs for the current fiscal year. For the fiscal year ended August 31, 2011, the expense ratios were 0.14% for Signal Shares, 0.09% for Institutional Shares, and 0.14% for ETF Shares.
116
Long-Term Corporate Bond Index Fund
Performance Summary
All of the returns in this report represent past performance, which is not a guarantee of future results that may be achieved by the fund. (Current performance may be lower or higher than the performance data cited. For performance data current to the most recent month-end, visit our website at vanguard.com/performance.) Note, too, that both investment returns and principal value can fluctuate widely, so an investor’s shares, when sold, could be worth more or less than their original cost. The returns shown do not reflect taxes that a shareholder would pay on fund distributions or on the sale of fund shares.
Cumulative Performance: November 19, 2009, Through August 31, 2011
Initial Investment of $10,000
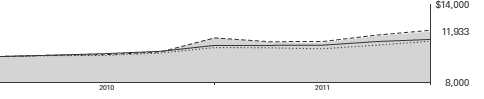
| Average Annual Total Returns | |||
| Periods Ended August 31, 2011 | |||
| Since | Final Value | ||
| One | Inception | of a $10,000 | |
| Year | (11/19/2009) | Investment | |
| Long-Term Corporate Bond Index Fund | |||
| ETF Shares Net Asset Value | 4.19% | 10.43% | $11,933 |
| Long-Term Corporate Bond Index Fund | |||
| ETF Shares Market Price | 4.42 | 11.14 | 12,070 |
| Spliced Barclays Capital U.S. | |||
| Aggregate Float Adjusted Index | 4.62 | 6.49 | 11,184 |
| Barclays Capital U.S. 10+ Year | |||
| Corporate Bond Index | 5.18 | 10.98 | 12,038 |
| Corporate A-Rated Debt Funds | |||
| Average | 4.27 | 7.25 | 11,328 |
"Since Inception" performance is calculated from the ETF Shares’ inception date for both the fund and its comparative standards.
Spliced Barclays Capital U.S. Aggregate Float Adjusted Index: Barclays Capital U.S. Aggregate Bond Index through December 31, 2009; Barclays Capital U.S. Aggregate Float Adjusted Index thereafter.
Corporate A-Rated Debt Funds Average: Derived from data provided by Lipper Inc.
Vanguard fund returns are adjusted to reflect the 1.00% fee on purchases; the fee does not apply to the ETF Shares. In the final table, non-adjusted returns are shown along with the fee-adjusted returns.
See Financial Highlights for dividend and capital gains information.
117
Long-Term Corporate Bond Index Fund
| Average Annual Total Returns | |||
| Periods Ended August 31, 2011 | |||
| Since | Final Value | ||
| One | Inception | of a $10,000 | |
| Year | (1/19/2010) | Investment | |
| Long-Term Corporate Bond Index | |||
| Fund Signal Shares | 3.17% | 10.20% | $11,696 |
| Barclays Capital U.S. | |||
| Aggregate Float Adjusted Index | 4.62 | 7.06 | 11,164 |
| Barclays Capital U.S. 10+ Year | |||
| Corporate Bond Index | 5.18 | 11.58 | 11,934 |
"Since Inception" performance is calculated from the Signal Shares’ inception date for both the fund and its comparative standards.
| Since | Final Value | ||
| One | Inception | of a $5,000,000 | |
| Year | (11/19/2009) | Investment | |
| Long-Term Corporate Bond Index Fund | |||
| Institutional Shares | 3.20% | 9.89% | $5,913,989 |
| Spliced Barclays Capital U.S. Aggregate | |||
| Float Adjusted Index | 4.62 | 6.49 | 5,592,028 |
| Barclays Capital U.S. 10+ Year Corporate | |||
| Bond Index | 5.18 | 10.98 | 6,019,154 |
"Since Inception" performance is calculated from the Institutional Shares’ inception date for both the fund and its comparative standards.
| Cumulative Returns of ETF Shares: November 19, 2009, Through August 31, 2011 | ||
| Since | ||
| One | Inception | |
| Year | (11/19/2009) | |
| Long-Term Corporate Bond Index Fund | ||
| ETF Shares Market Price | 4.42% | 20.70% |
| Long-Term Corporate Bond Index Fund | ||
| ETF Shares Net Asset Value | 4.19 | 19.33 |
| Barclays Capital U.S. 10+ Year Corporate Bond | ||
| Index | 5.18 | 20.38 |
"Since Inception" performance is calculated from the ETF Shares’ inception date for both the fund and its comparative standards.
| Fiscal-Year Total Returns (%): November 19, 2009, Through August 31, 2011 | ||
| Barclays | ||
| 10+ Year | ||
| Corporate | ||
| ETF Shares Net Asset Value | Index | |
| Fiscal Year | Total Returns | Total Returns |
| 2010 | 14.54% | 14.46% |
| 2011 | 4.19 | 5.18 |
Vanguard fund returns are adjusted to reflect the 1.00% fee on purchases; the fee does not apply to the ETF Shares. In the final table, non-adjusted returns are shown along with the fee-adjusted returns.
118
Long-Term Corporate Bond Index Fund
Average Annual Total Returns: Periods Ended June 30, 2011
This table presents returns through the latest calendar quarter—rather than through the end of the fiscal period.
Securities and Exchange Commission rules require that we provide this information.
| Since Inception | |||||
| Inception Date | One Year | Income | Capital | Total | |
| Signal Shares | 1/19/2010 | 5.66% | 5.87% | 2.45% | 8.32% |
| Fee-Adjusted Returns | 4.60 | 7.57 | |||
| Institutional Shares | 11/19/2009 | 5.73 | 5.75 | 2.43 | 8.18 |
| Fee-Adjusted Returns | 4.67 | 7.51 | |||
| ETF Shares | 11/19/2009 | ||||
| Market Price | 6.27 | 8.79 | |||
| Net Asset Value | 5.66 | 8.11 |
Vanguard fund returns are adjusted to reflect the 1.00% fee on purchases; the fee does not apply to the ETF Shares. In the final table, non-adjusted returns are shown along with the fee-adjusted returns.
119
Long-Term Corporate Bond Index Fund
Financial Statements
Statement of Net Assets
As of August 31, 2011
The fund reports a complete list of its holdings in regulatory filings four times in each fiscal year, at the quarter-ends. For the second and fourth fiscal quarters, the lists appear in the fund’s semiannual and annual reports to shareholders. For the first and third fiscal quarters, the fund files the lists with the Securities and Exchange Commission on Form N-Q. Shareholders can look up the fund’s Forms N-Q on the SEC’s website at sec.gov. Forms N-Q may also be reviewed and copied at the SEC’s Public Reference Room (see the back cover of this report for further information).
| Face | Market | ||||
| Maturity | Amount | Value | |||
| Coupon | Date | ($000) | ($000) | ||
| U.S. Government and Agency Obligations (1.1%) | |||||
| U.S. Government Securities (1.1%) | |||||
| United States Treasury Note/Bond | |||||
| (Cost $3,126) | 5.375% | 2/15/31 | 2,465 | 3,245 | |
| Corporate Bonds (97.1%) | |||||
| Finance (20.0%) | |||||
| Banking (10.9%) | |||||
| 1 | AbbeyNational Capital Trust I | 8.963% | 12/29/49 | 100 | 100 |
| American Express Co. | 8.150% | 3/19/38 | 230 | 325 | |
| BAC Capital Trust VI | 5.625% | 3/8/35 | 500 | 384 | |
| Bank of America Corp. | 4.500% | 4/1/15 | 350 | 354 | |
| Bank of America Corp. | 6.500% | 9/15/37 | 400 | 358 | |
| Bank of America NA | 6.000% | 10/15/36 | 1,000 | 921 | |
| Bank One Capital III | 8.750% | 9/1/30 | 225 | 294 | |
| Bank One Corp. | 7.625% | 10/15/26 | 50 | 61 | |
| 1 | BB&T Capital Trust IV | 6.820% | 6/12/77 | 475 | 476 |
| 1 | Capital One Capital III | 7.686% | 8/1/66 | 675 | 663 |
| Capital One Capital IV | 6.745% | 2/17/37 | 150 | 147 | |
| Capital One Capital V | 10.250% | 8/15/39 | 375 | 389 | |
| Citigroup Inc. | 5.875% | 2/22/33 | 150 | 130 | |
| Citigroup Inc. | 6.000% | 10/31/33 | 500 | 459 | |
| Citigroup Inc. | 6.125% | 8/25/36 | 1,100 | 1,039 | |
| Citigroup Inc. | 6.875% | 3/5/38 | 1,675 | 1,765 | |
| Citigroup Inc. | 8.125% | 7/15/39 | 900 | 1,098 | |
| Cooperatieve Centrale Raiffeisen- | |||||
| Boerenleenbank BA | 5.250% | 5/24/41 | 550 | 571 | |
| Credit Suisse USA Inc. | 7.125% | 7/15/32 | 300 | 357 | |
| Fifth Third Bancorp | 8.250% | 3/1/38 | 582 | 669 | |
| FleetBoston Financial Corp. | 6.700% | 7/15/28 | 100 | 98 | |
| Goldman Sachs Group Inc. | 5.375% | 3/15/20 | 1,400 | 1,429 | |
| Goldman Sachs Group Inc. | 5.950% | 1/15/27 | 300 | 289 | |
| Goldman Sachs Group Inc. | 6.125% | 2/15/33 | 300 | 291 | |
| Goldman Sachs Group Inc. | 6.450% | 5/1/36 | 650 | 586 | |
| Goldman Sachs Group Inc. | 6.750% | 10/1/37 | 2,775 | 2,645 | |
| Goldman Sachs Group Inc. | 6.250% | 2/1/41 | 600 | 589 | |
| HSBC Bank USA NA | 5.875% | 11/1/34 | 1,925 | 1,892 | |
| HSBC Bank USA NA | 7.000% | 1/15/39 | 475 | 529 | |
| HSBC Holdings plc | 6.500% | 5/2/36 | 75 | 75 | |
| HSBC Holdings plc | 6.500% | 9/15/37 | 450 | 442 | |
| 120 | |||||
| Long-Term Corporate Bond Index Fund | ||||
| Face | Market | |||
| Maturity | Amount | Value | ||
| Coupon | Date | ($000) | ($000) | |
| HSBC Holdings plc | 6.800% | 6/1/38 | 675 | 670 |
| 1 JPMorgan Chase Capital XX | 6.550% | 9/15/66 | 575 | 572 |
| 1 JPMorgan Chase Capital XXII | 6.450% | 1/15/87 | 375 | 371 |
| JPMorgan Chase Capital XXV | 6.800% | 10/1/37 | 600 | 595 |
| JPMorganChase & Co. | 6.400% | 5/15/38 | 1,630 | 1,841 |
| JPMorganChase & Co. | 5.500% | 10/15/40 | 350 | 349 |
| JPMorganChase & Co. | 5.600% | 7/15/41 | 500 | 515 |
| JPMorganChase Capital XXVII | 7.000% | 11/1/39 | 125 | 124 |
| Merrill Lynch & Co. Inc. | 6.220% | 9/15/26 | 775 | 678 |
| Merrill Lynch & Co. Inc. | 7.750% | 5/14/38 | 1,275 | 1,273 |
| Morgan Stanley | 6.000% | 9/27/25 | 300 | 294 |
| Morgan Stanley | 6.250% | 8/9/26 | 250 | 255 |
| Morgan Stanley | 7.250% | 4/1/32 | 700 | 773 |
| NB Capital Trust II | 7.830% | 12/15/26 | 350 | 342 |
| Santander UK plc | 7.950% | 10/26/29 | 443 | 491 |
| 1 SunTrust Capital VIII | 6.100% | 12/1/66 | 450 | 437 |
| UBS AG | 5.750% | 4/25/18 | 250 | 264 |
| Wachovia Bank NA | 6.600% | 1/15/38 | 1,385 | 1,577 |
| Wachovia Corp. | 5.500% | 8/1/35 | 1,040 | 1,036 |
| Wells Fargo Bank NA | 5.950% | 8/26/36 | 525 | 550 |
| 1 Wells Fargo Capital X | 5.950% | 12/1/86 | 300 | 299 |
| Brokerage (0.1%) | ||||
| Jefferies Group Inc. | 6.250% | 1/15/36 | 225 | 215 |
| Finance Companies (2.6%) | ||||
| General Electric Capital Corp. | 5.550% | 1/5/26 | 475 | 482 |
| General Electric Capital Corp. | 6.750% | 3/15/32 | 3,250 | 3,643 |
| General Electric Capital Corp. | 6.150% | 8/7/37 | 1,675 | 1,721 |
| General Electric Capital Corp. | 5.875% | 1/14/38 | 1,750 | 1,794 |
| SLM Corp. | 5.625% | 8/1/33 | 300 | 243 |
| Insurance (6.1%) | ||||
| ACE INA Holdings Inc. | 6.700% | 5/15/36 | 350 | 423 |
| Aetna Inc. | 6.625% | 6/15/36 | 325 | 390 |
| Aetna Inc. | 6.750% | 12/15/37 | 255 | 312 |
| AflacInc. | 6.900% | 12/17/39 | 100 | 103 |
| AflacInc. | 6.450% | 8/15/40 | 275 | 257 |
| Allstate Corp. | 5.350% | 6/1/33 | 150 | 147 |
| Allstate Corp. | 5.550% | 5/9/35 | 500 | 497 |
| Allstate Corp. | 6.900% | 5/15/38 | 200 | 239 |
| 1 Allstate Corp. | 6.500% | 5/15/57 | 200 | 182 |
| American International Group Inc. | 6.250% | 5/1/36 | 840 | 815 |
| American International Group Inc. | 6.250% | 3/15/37 | 960 | 763 |
| 1 American International Group Inc. | 8.175% | 5/15/68 | 875 | 866 |
| AON Corp. | 6.250% | 9/30/40 | 325 | 356 |
| AXA SA | 8.600% | 12/15/30 | 605 | 668 |
| Berkshire Hathaway Finance Corp. | 5.750% | 1/15/40 | 200 | 213 |
| Chubb Corp. | 6.000% | 5/11/37 | 290 | 321 |
| Chubb Corp. | 6.500% | 5/15/38 | 300 | 347 |
| CIGNA Corp. | 5.875% | 3/15/41 | 250 | 263 |
| Cincinnati Financial Corp. | 6.920% | 5/15/28 | 250 | 272 |
| Endurance Specialty Holdings Ltd. | 7.000% | 7/15/34 | 70 | 68 |
| Genworth Financial Inc. | 7.625% | 9/24/21 | 400 | 354 |
| Hartford Financial Services Group Inc. | 6.625% | 3/30/40 | 400 | 376 |
121
| Long-Term Corporate Bond Index Fund | |||||
| Face | Market | ||||
| Maturity | Amount | Value | |||
| Coupon | Date | ($000) | ($000) | ||
| Hartford Financial Services Group Inc. | 6.100% | 10/1/41 | 150 | 133 | |
| Lincoln National Corp. | 6.150% | 4/7/36 | 200 | 194 | |
| Lincoln National Corp. | 7.000% | 6/15/40 | 125 | 133 | |
| Marsh & McLennan Cos. Inc. | 5.875% | 8/1/33 | 300 | 313 | |
| MetLife Inc. | 6.500% | 12/15/32 | 225 | 250 | |
| MetLife Inc. | 5.700% | 6/15/35 | 375 | 385 | |
| MetLife Inc. | 5.875% | 2/6/41 | 740 | 765 | |
| 1 | MetLife Inc. | 6.400% | 12/15/66 | 660 | 595 |
| Principal Financial Group Inc. | 6.050% | 10/15/36 | 525 | 543 | |
| Progressive Corp. | 6.625% | 3/1/29 | 100 | 119 | |
| Protective Life Corp. | 8.450% | 10/15/39 | 275 | 311 | |
| Prudential Financial Inc. | 5.750% | 7/15/33 | 775 | 762 | |
| Prudential Financial Inc. | 5.700% | 12/14/36 | 250 | 237 | |
| Prudential Financial Inc. | 5.625% | 5/12/41 | 700 | 656 | |
| SwissRe Solutions Holding Corp. | 7.750% | 6/15/30 | 235 | 271 | |
| Transatlantic Holdings Inc. | 8.000% | 11/30/39 | 75 | 86 | |
| Travelers Cos. Inc. | 6.250% | 6/15/37 | 625 | 695 | |
| Travelers Cos. Inc. | 5.350% | 11/1/40 | 430 | 427 | |
| UnitedHealth Group Inc. | 5.800% | 3/15/36 | 575 | 621 | |
| UnitedHealth Group Inc. | 6.875% | 2/15/38 | 810 | 998 | |
| Validus Holdings Ltd. | 8.875% | 1/26/40 | 35 | 40 | |
| WellPoint Inc. | 5.850% | 1/15/36 | 950 | 1,029 | |
| WellPoint Inc. | 5.800% | 8/15/40 | 175 | 191 | |
| XL Group plc | 6.250% | 5/15/27 | 100 | 102 | |
| Real Estate Investment Trusts (0.3%) | |||||
| HCP Inc. | 6.750% | 2/1/41 | 175 | 180 | |
| Health Care REIT Inc. | 5.250% | 1/15/22 | 250 | 248 | |
| Realty Income Corp. | 5.875% | 3/15/35 | 45 | 44 | |
| Simon Property Group LP | 6.750% | 2/1/40 | 325 | 363 | |
| 59,752 | |||||
| Industrial (60.7%) | |||||
| Basic Industry (4.7%) | |||||
| Agrium Inc. | 6.125% | 1/15/41 | 350 | 396 | |
| Alcoa Inc. | 5.870% | 2/23/22 | 275 | 272 | |
| Alcoa Inc. | 5.900% | 2/1/27 | 275 | 271 | |
| Alcoa Inc. | 6.750% | 1/15/28 | 100 | 104 | |
| Alcoa Inc. | 5.950% | 2/1/37 | 225 | 200 | |
| ArcelorMittal | 7.000% | 10/15/39 | 540 | 518 | |
| ArcelorMittal | 6.750% | 3/1/41 | 450 | 428 | |
| Barrick North America Finance LLC | 7.500% | 9/15/38 | 75 | 94 | |
| 2 | Barrick North America Finance LLC | 5.700% | 5/30/41 | 200 | 212 |
| Barrick PD Australia Finance Pty Ltd. | 5.950% | 10/15/39 | 600 | 653 | |
| Cliffs Natural Resources Inc. | 6.250% | 10/1/40 | 500 | 494 | |
| Dow Chemical Co. | 9.400% | 5/15/39 | 775 | 1,181 | |
| EI du Pont de Nemours & Co. | 4.900% | 1/15/41 | 500 | 507 | |
| International Paper Co. | 7.300% | 11/15/39 | 125 | 134 | |
| 2 | Kinross Gold Corp. | 6.875% | 9/1/41 | 100 | 102 |
| Monsanto Co. | 5.875% | 4/15/38 | 175 | 211 | |
| Newmont Mining Corp. | 6.250% | 10/1/39 | 575 | 649 | |
| Nucor Corp. | 4.125% | 9/15/22 | 475 | 496 | |
| Nucor Corp. | 6.400% | 12/1/37 | 250 | 302 | |
| Potash Corp. of Saskatchewan Inc. | 5.625% | 12/1/40 | 375 | 414 | |
| PPG Industries Inc. | 7.700% | 3/15/38 | 100 | 135 | |
| Rio Tinto Finance USA Ltd. | 7.125% | 7/15/28 | 850 | 1,078 | |
| 122 | |||||
| Long-Term Corporate Bond Index Fund | ||||
| Face | Market | |||
| Maturity | Amount | Value | ||
| Coupon | Date | ($000) | ($000) | |
| Rio Tinto Finance USA Ltd. | 5.200% | 11/2/40 | 225 | 227 |
| Southern Copper Corp. | 7.500% | 7/27/35 | 325 | 372 |
| Southern Copper Corp. | 6.750% | 4/16/40 | 725 | 734 |
| Teck Resources Ltd. | 4.750% | 1/15/22 | 800 | 821 |
| Teck Resources Ltd. | 6.125% | 10/1/35 | 150 | 148 |
| Teck Resources Ltd. | 6.000% | 8/15/40 | 200 | 203 |
| Teck Resources Ltd. | 6.250% | 7/15/41 | 425 | 449 |
| Vale Overseas Ltd. | 8.250% | 1/17/34 | 325 | 420 |
| Vale Overseas Ltd. | 6.875% | 11/21/36 | 1,200 | 1,373 |
| Vale Overseas Ltd. | 6.875% | 11/10/39 | 455 | 513 |
| Capital Goods (4.3%) | ||||
| 3M Co. | 6.375% | 2/15/28 | 100 | 126 |
| 3M Co. | 5.700% | 3/15/37 | 350 | 420 |
| Boeing Co. | 6.875% | 3/15/39 | 390 | 504 |
| Boeing Co. | 5.875% | 2/15/40 | 200 | 237 |
| Caterpillar Inc. | 6.050% | 8/15/36 | 800 | 956 |
| Caterpillar Inc. | 5.200% | 5/27/41 | 950 | 1,017 |
| Deere & Co. | 5.375% | 10/16/29 | 525 | 603 |
| Dover Corp. | 6.600% | 3/15/38 | 135 | 175 |
| Dover Corp. | 5.375% | 3/1/41 | 325 | 359 |
| Emerson Electric Co. | 6.000% | 8/15/32 | 125 | 148 |
| Emerson Electric Co. | 5.250% | 11/15/39 | 80 | 90 |
| Honeywell International Inc. | 5.700% | 3/15/36 | 300 | 344 |
| Honeywell International Inc. | 5.700% | 3/15/37 | 25 | 29 |
| Honeywell International Inc. | 5.375% | 3/1/41 | 225 | 247 |
| 2 Illinois Tool Works Inc. | 4.875% | 9/15/41 | 225 | 230 |
| Lockheed Martin Corp. | 6.150% | 9/1/36 | 450 | 516 |
| Lockheed Martin Corp. | 5.500% | 11/15/39 | 200 | 214 |
| Lockheed Martin Corp. | 5.720% | 6/1/40 | 470 | 522 |
| Northrop Grumman Corp. | 5.050% | 11/15/40 | 475 | 476 |
| Northrop Grumman Systems Corp. | 7.750% | 2/15/31 | 25 | 35 |
| OwensCorning | 7.000% | 12/1/36 | 375 | 375 |
| Parker Hannifin Corp. | 3.500% | 9/15/22 | 75 | 77 |
| Raytheon Co. | 4.875% | 10/15/40 | 385 | 379 |
| Republic Services Inc. | 5.250% | 11/15/21 | 900 | 1,003 |
| Republic Services Inc. | 5.700% | 5/15/41 | 100 | 104 |
| Rockwell Automation Inc. | 6.700% | 1/15/28 | 100 | 123 |
| Sonoco Products Co. | 5.750% | 11/1/40 | 25 | 27 |
| Stanley Black & Decker Inc. | 5.200% | 9/1/40 | 305 | 311 |
| TycoInternational Finance SA | 4.625% | 1/15/23 | 50 | 53 |
| United Technologies Corp. | 7.500% | 9/15/29 | 75 | 104 |
| United Technologies Corp. | 6.125% | 7/15/38 | 800 | 967 |
| United Technologies Corp. | 5.700% | 4/15/40 | 775 | 896 |
| Waste Management Inc. | 7.100% | 8/1/26 | 175 | 218 |
| Waste Management Inc. | 7.750% | 5/15/32 | 150 | 193 |
| Waste Management Inc. | 6.125% | 11/30/39 | 550 | 618 |
| Communication (15.7%) | ||||
| Alltel Corp. | 7.875% | 7/1/32 | 525 | 720 |
| America Movil SAB de CV | 6.125% | 3/30/40 | 1,300 | 1,417 |
| AT&T Corp. | 8.000% | 11/15/31 | 1,925 | 2,599 |
| AT&T Inc. | 5.600% | 5/15/18 | 175 | 203 |
| AT&T Inc. | 6.150% | 9/15/34 | 1,025 | 1,088 |
| AT&T Inc. | 6.800% | 5/15/36 | 2,125 | 2,495 |
123
| Long-Term Corporate Bond Index Fund | ||||
| Face | Market | |||
| Maturity | Amount | Value | ||
| Coupon | Date | ($000) | ($000) | |
| AT&T Inc. | 6.500% | 9/1/37 | 1,400 | 1,594 |
| AT&T Inc. | 6.300% | 1/15/38 | 875 | 970 |
| AT&T Inc. | 6.400% | 5/15/38 | 275 | 305 |
| AT&T Inc. | 5.350% | 9/1/40 | 215 | 220 |
| AT&T Inc. | 5.550% | 8/15/41 | 425 | 445 |
| AT&T Mobility LLC | 7.125% | 12/15/31 | 250 | 313 |
| British Telecommunications plc | 9.875% | 12/15/30 | 1,175 | 1,707 |
| CBS Corp. | 7.875% | 7/30/30 | 551 | 682 |
| CenturyLink Inc. | 7.600% | 9/15/39 | 750 | 702 |
| Comcast Corp. | 5.150% | 3/1/20 | 1,250 | 1,417 |
| Comcast Corp. | 5.650% | 6/15/35 | 225 | 230 |
| Comcast Corp. | 6.500% | 11/15/35 | 75 | 84 |
| Comcast Corp. | 6.450% | 3/15/37 | 100 | 110 |
| Comcast Corp. | 6.950% | 8/15/37 | 2,240 | 2,610 |
| Comcast Corp. | 6.400% | 5/15/38 | 150 | 166 |
| Comcast Corp. | 6.400% | 3/1/40 | 250 | 283 |
| Deutsche Telekom International Finance BV | 8.750% | 6/15/30 | 1,335 | 1,800 |
| DIRECTV Holdings LLC / | ||||
| DIRECTV Financing Co. Inc. | 6.000% | 8/15/40 | 350 | 368 |
| DIRECTV Holdings LLC / | ||||
| DIRECTV Financing Co. Inc. | 6.375% | 3/1/41 | 925 | 1,022 |
| Discovery Communications LLC | 6.350% | 6/1/40 | 200 | 225 |
| Embarq Corp. | 7.082% | 6/1/16 | 250 | 273 |
| Embarq Corp. | 7.995% | 6/1/36 | 675 | 643 |
| France Telecom SA | 8.500% | 3/1/31 | 885 | 1,182 |
| Grupo Televisa SA | 6.625% | 3/18/25 | 100 | 113 |
| Grupo Televisa SA | 6.625% | 1/15/40 | 500 | 534 |
| GTE Corp. | 8.750% | 11/1/21 | 125 | 174 |
| GTE Corp. | 6.940% | 4/15/28 | 350 | 411 |
| Koninklijke KPN NV | 8.375% | 10/1/30 | 625 | 806 |
| NBCUniversal Media LLC | 6.400% | 4/30/40 | 425 | 480 |
| NBCUniversal Media LLC | 5.950% | 4/1/41 | 375 | 403 |
| New Cingular Wireless Services Inc. | 8.750% | 3/1/31 | 700 | 995 |
| News America Inc. | 7.700% | 10/30/25 | 50 | 61 |
| News America Inc. | 6.200% | 12/15/34 | 900 | 926 |
| News America Inc. | 6.150% | 3/1/37 | 1,000 | 1,035 |
| News America Inc. | 6.650% | 11/15/37 | 600 | 648 |
| News America Inc. | 6.150% | 2/15/41 | 100 | 105 |
| News America Inc. | 7.750% | 12/1/45 | 300 | 356 |
| QwestCorp. | 7.500% | 6/15/23 | 225 | 221 |
| QwestCorp. | 7.250% | 9/15/25 | 100 | 100 |
| QwestCorp. | 7.125% | 11/15/43 | 75 | 70 |
| Telecom Italia Capital SA | 7.200% | 7/18/36 | 875 | 809 |
| Telecom Italia Capital SA | 7.721% | 6/4/38 | 550 | 534 |
| Telefonica Emisiones SAU | 7.045% | 6/20/36 | 1,425 | 1,434 |
| Thomson Reuters Corp. | 5.500% | 8/15/35 | 100 | 108 |
| Thomson Reuters Corp. | 5.850% | 4/15/40 | 700 | 757 |
| Time Warner Cable Inc. | 6.550% | 5/1/37 | 1,300 | 1,413 |
| Time Warner Cable Inc. | 7.300% | 7/1/38 | 975 | 1,144 |
| Time Warner Cable Inc. | 6.750% | 6/15/39 | 575 | 645 |
| United States Cellular Corp. | 6.700% | 12/15/33 | 100 | 100 |
| Verizon Communications Inc. | 8.750% | 11/1/18 | 100 | 135 |
| Verizon Communications Inc. | 6.250% | 4/1/37 | 1,290 | 1,447 |
| Verizon Communications Inc. | 6.400% | 2/15/38 | 150 | 172 |
| Verizon Communications Inc. | 6.900% | 4/15/38 | 910 | 1,110 |
124
| Long-Term Corporate Bond Index Fund | ||||
| Face | Market | |||
| Maturity | Amount | Value | ||
| Coupon | Date | ($000) | ($000) | |
| Verizon Communications Inc. | 8.950% | 3/1/39 | 1,000 | 1,496 |
| Verizon Communications Inc. | 6.000% | 4/1/41 | 1,000 | 1,130 |
| Verizon Global Funding Corp. | 7.750% | 12/1/30 | 50 | 66 |
| Vodafone Group plc | 7.875% | 2/15/30 | 375 | 518 |
| Vodafone Group plc | 6.150% | 2/27/37 | 600 | 685 |
| Consumer Cyclical (7.8%) | ||||
| CVS Caremark Corp. | 6.250% | 6/1/27 | 675 | 781 |
| CVS Caremark Corp. | 5.750% | 5/15/41 | 595 | 619 |
| Daimler Finance North America LLC | 8.500% | 1/18/31 | 500 | 680 |
| Darden Restaurants Inc. | 6.800% | 10/15/37 | 250 | 294 |
| Historic TW Inc. | 6.625% | 5/15/29 | 1,075 | 1,199 |
| Home Depot Inc. | 5.875% | 12/16/36 | 950 | 1,027 |
| Home Depot Inc. | 5.400% | 9/15/40 | 335 | 335 |
| Home Depot Inc. | 5.950% | 4/1/41 | 625 | 674 |
| Johnson Controls Inc. | 5.700% | 3/1/41 | 425 | 457 |
| Kohl’s Corp. | 6.875% | 12/15/37 | 75 | 91 |
| Lowe’s Cos. Inc. | 5.500% | 10/15/35 | 775 | 811 |
| Macy’s Retail Holdings Inc. | 6.900% | 4/1/29 | 200 | 228 |
| Macy’s Retail Holdings Inc. | 6.375% | 3/15/37 | 950 | 954 |
| McDonald’s Corp. | 6.300% | 10/15/37 | 825 | 1,034 |
| Nordstrom Inc. | 7.000% | 1/15/38 | 395 | 479 |
| Target Corp. | 7.000% | 7/15/31 | 675 | 855 |
| Target Corp. | 6.500% | 10/15/37 | 525 | 636 |
| Target Corp. | 7.000% | 1/15/38 | 400 | 514 |
| Time Warner Inc. | 7.625% | 4/15/31 | 850 | 1,043 |
| Time Warner Inc. | 7.700% | 5/1/32 | 475 | 590 |
| Time Warner Inc. | 6.250% | 3/29/41 | 1,100 | 1,221 |
| VF Corp. | 6.450% | 11/1/37 | 225 | 269 |
| Viacom Inc. | 6.875% | 4/30/36 | 975 | 1,153 |
| Wal-Mart Stores Inc. | 5.875% | 4/5/27 | 250 | 296 |
| Wal-Mart Stores Inc. | 7.550% | 2/15/30 | 625 | 858 |
| Wal-Mart Stores Inc. | 5.250% | 9/1/35 | 450 | 481 |
| Wal-Mart Stores Inc. | 6.500% | 8/15/37 | 2,375 | 2,954 |
| Wal-Mart Stores Inc. | 6.200% | 4/15/38 | 125 | 150 |
| Wal-Mart Stores Inc. | 5.625% | 4/1/40 | 1,450 | 1,640 |
| Wal-Mart Stores Inc. | 5.625% | 4/15/41 | 300 | 339 |
| Walt Disney Co. | 3.750% | 6/1/21 | 250 | 267 |
| Western Union Co. | 6.200% | 11/17/36 | 100 | 102 |
| Yum! Brands Inc. | 6.875% | 11/15/37 | 225 | 270 |
| Consumer Noncyclical (12.3%) | ||||
| AbbottLaboratories | 6.150% | 11/30/37 | 500 | 605 |
| AbbottLaboratories | 5.300% | 5/27/40 | 675 | 735 |
| Altria Group Inc. | 9.950% | 11/10/38 | 350 | 489 |
| Altria Group Inc. | 10.200% | 2/6/39 | 900 | 1,290 |
| Amgen Inc. | 6.375% | 6/1/37 | 700 | 828 |
| Amgen Inc. | 6.400% | 2/1/39 | 500 | 596 |
| Amgen Inc. | 5.650% | 6/15/42 | 500 | 543 |
| Anheuser-Busch InBev Worldwide Inc. | 8.200% | 1/15/39 | 950 | 1,382 |
| Anheuser-Busch InBev Worldwide Inc. | 6.375% | 1/15/40 | 900 | 1,117 |
| Archer-Daniels-Midland Co. | 5.935% | 10/1/32 | 575 | 683 |
| Archer-Daniels-Midland Co. | 5.375% | 9/15/35 | 175 | 192 |
| Archer-Daniels-Midland Co. | 5.765% | 3/1/41 | 225 | 261 |
| AstraZeneca plc | 6.450% | 9/15/37 | 1,465 | 1,832 |
125
| Long-Term Corporate Bond Index Fund | |||||
| Face | Market | ||||
| Maturity | Amount | Value | |||
| Coupon | Date | ($000) | ($000) | ||
| Baxter International Inc. | 6.250% | 12/1/37 | 300 | 372 | |
| Becton Dickinson and Co. | 5.000% | 11/12/40 | 200 | 210 | |
| Boston Scientific Corp. | 7.000% | 11/15/35 | 50 | 56 | |
| Boston Scientific Corp. | 7.375% | 1/15/40 | 100 | 118 | |
| Bristol-Myers Squibb Co. | 5.875% | 11/15/36 | 750 | 880 | |
| Bristol-Myers Squibb Co. | 6.125% | 5/1/38 | 425 | 508 | |
| Celgene Corp. | 5.700% | 10/15/40 | 25 | 26 | |
| Coca-Cola Refreshments USA Inc. | 8.500% | 2/1/22 | 75 | 107 | |
| ConAgra Foods Inc. | 8.250% | 9/15/30 | 125 | 156 | |
| Corn Products International Inc. | 6.625% | 4/15/37 | 25 | 28 | |
| Covidien International Finance SA | 6.550% | 10/15/37 | 250 | 302 | |
| Delhaize Group SA | 5.700% | 10/1/40 | 475 | 472 | |
| Diageo Capital plc | 5.875% | 9/30/36 | 300 | 341 | |
| Eli Lilly & Co. | 5.500% | 3/15/27 | 525 | 598 | |
| Eli Lilly & Co. | 5.550% | 3/15/37 | 300 | 338 | |
| Estee Lauder Cos. Inc. | 6.000% | 5/15/37 | 175 | 200 | |
| Genentech Inc. | 5.250% | 7/15/35 | 125 | 133 | |
| General Mills Inc. | 5.400% | 6/15/40 | 375 | 411 | |
| GlaxoSmithKline Capital Inc. | 6.375% | 5/15/38 | 1,250 | 1,557 | |
| Hasbro Inc. | 6.350% | 3/15/40 | 300 | 321 | |
| HJ Heinz Finance Co. | 6.750% | 3/15/32 | 200 | 237 | |
| Hospira Inc. | 5.600% | 9/15/40 | 50 | 51 | |
| Johnson & Johnson | 4.950% | 5/15/33 | 425 | 461 | |
| Johnson & Johnson | 5.950% | 8/15/37 | 825 | 1,019 | |
| Kellogg Co. | 7.450% | 4/1/31 | 425 | 576 | |
| Kimberly-Clark Corp. | 6.625% | 8/1/37 | 375 | 481 | |
| Kimberly-Clark Corp. | 5.300% | 3/1/41 | 175 | 193 | |
| Koninklijke Philips Electronics NV | 6.875% | 3/11/38 | 200 | 244 | |
| Kraft Foods Inc. | 6.875% | 2/1/38 | 650 | 772 | |
| Kraft Foods Inc. | 6.500% | 2/9/40 | 1,600 | 1,849 | |
| Kroger Co. | 7.500% | 4/1/31 | 300 | 382 | |
| Kroger Co. | 6.900% | 4/15/38 | 500 | 623 | |
| Lorillard Tobacco Co. | 7.000% | 8/4/41 | 150 | 150 | |
| McKesson Corp. | 6.000% | 3/1/41 | 325 | 378 | |
| Mead Johnson Nutrition Co. | 4.900% | 11/1/19 | 350 | 385 | |
| Medtronic Inc. | 6.500% | 3/15/39 | 100 | 130 | |
| Medtronic Inc. | 5.550% | 3/15/40 | 250 | 289 | |
| Merck & Co. Inc. | 6.400% | 3/1/28 | 75 | 94 | |
| Merck & Co. Inc. | 6.500% | 12/1/33 | 1,150 | 1,460 | |
| Merck & Co. Inc. | 6.550% | 9/15/37 | 400 | 515 | |
| Pepsi Bottling Group Inc. | 7.000% | 3/1/29 | 625 | 833 | |
| PepsiAmericas Inc. | 5.500% | 5/15/35 | 75 | 83 | |
| PepsiCo Inc. | 5.500% | 1/15/40 | 250 | 286 | |
| PepsiCo Inc. | 4.875% | 11/1/40 | 325 | 343 | |
| Pfizer Inc. | 7.200% | 3/15/39 | 1,770 | 2,378 | |
| Pharmacia Corp. | 6.600% | 12/1/28 | 250 | 316 | |
| Philip Morris International Inc. | 6.375% | 5/16/38 | 650 | 770 | |
| 3 | Procter & Gamble Co. | 5.550% | 3/5/37 | 1,015 | 1,195 |
| Quest Diagnostics Inc. | 6.950% | 7/1/37 | 315 | 381 | |
| Ralcorp Holdings Inc. | 6.625% | 8/15/39 | 75 | 73 | |
| Safeway Inc. | 7.250% | 2/1/31 | 400 | 478 | |
| SyscoCorp. | 5.375% | 9/21/35 | 300 | 352 | |
| Teva Pharmaceutical Finance Co. LLC | 6.150% | 2/1/36 | 200 | 229 | |
| Unilever Capital Corp. | 5.900% | 11/15/32 | 425 | 516 | |
| 126 | |||||
| Long-Term Corporate Bond Index Fund | ||||
| Face | Market | |||
| Maturity | Amount | Value | ||
| Coupon | Date | ($000) | ($000) | |
| Wyeth | 6.450% | 2/1/24 | 235 | 299 |
| Wyeth | 6.000% | 2/15/36 | 25 | 29 |
| Wyeth | 5.950% | 4/1/37 | 100 | 116 |
| Energy (9.8%) | ||||
| Anadarko Finance Co. | 7.500% | 5/1/31 | 175 | 206 |
| Anadarko Petroleum Corp. | 6.450% | 9/15/36 | 1,000 | 1,046 |
| Anadarko Petroleum Corp. | 6.200% | 3/15/40 | 625 | 643 |
| Apache Corp. | 5.100% | 9/1/40 | 825 | 878 |
| Apache Corp. | 5.250% | 2/1/42 | 300 | 327 |
| Baker Hughes Inc. | 5.125% | 9/15/40 | 650 | 689 |
| Cameron International Corp. | 5.950% | 6/1/41 | 200 | 212 |
| Canadian Natural Resources Ltd. | 6.250% | 3/15/38 | 1,110 | 1,287 |
| Cenovus Energy Inc. | 6.750% | 11/15/39 | 800 | 928 |
| ConocoPhillips | 5.900% | 5/15/38 | 1,150 | 1,337 |
| ConocoPhillips | 6.500% | 2/1/39 | 800 | 1,006 |
| ConocoPhillips Holding Co. | 6.950% | 4/15/29 | 325 | 412 |
| Devon Energy Corp. | 5.600% | 7/15/41 | 695 | 741 |
| Devon Financing Corp. ULC | 7.875% | 9/30/31 | 725 | 977 |
| Encana Corp. | 6.500% | 8/15/34 | 200 | 223 |
| Encana Corp. | 6.625% | 8/15/37 | 250 | 278 |
| Encana Corp. | 6.500% | 2/1/38 | 650 | 731 |
| Halliburton Co. | 6.700% | 9/15/38 | 450 | 552 |
| Halliburton Co. | 7.450% | 9/15/39 | 390 | 517 |
| Hess Corp. | 7.875% | 10/1/29 | 50 | 66 |
| Hess Corp. | 7.300% | 8/15/31 | 520 | 648 |
| Hess Corp. | 6.000% | 1/15/40 | 150 | 163 |
| Hess Corp. | 5.600% | 2/15/41 | 795 | 822 |
| Husky Energy Inc. | 6.800% | 9/15/37 | 200 | 235 |
| Marathon Oil Corp. | 6.800% | 3/15/32 | 550 | 638 |
| 2 Marathon Petroleum Corp. | 6.500% | 3/1/41 | 475 | 508 |
| Nexen Inc. | 6.400% | 5/15/37 | 600 | 615 |
| Nexen Inc. | 7.500% | 7/30/39 | 800 | 927 |
| Noble Energy Inc. | 6.000% | 3/1/41 | 375 | 403 |
| Noble Holding International Ltd. | 6.200% | 8/1/40 | 350 | 397 |
| Petro-Canada | 5.950% | 5/15/35 | 200 | 207 |
| Petro-Canada | 6.800% | 5/15/38 | 675 | 782 |
| Shell International Finance BV | 6.375% | 12/15/38 | 1,300 | 1,659 |
| Statoil ASA | 7.150% | 1/15/29 | 100 | 130 |
| Statoil ASA | 5.100% | 8/17/40 | 915 | 989 |
| Suncor Energy Inc. | 6.500% | 6/15/38 | 975 | 1,112 |
| Talisman Energy Inc. | 6.250% | 2/1/38 | 900 | 988 |
| Tosco Corp. | 7.800% | 1/1/27 | 100 | 132 |
| Tosco Corp. | 8.125% | 2/15/30 | 575 | 795 |
| Transocean Inc. | 6.800% | 3/15/38 | 650 | 704 |
| Valero Energy Corp. | 6.625% | 6/15/37 | 1,175 | 1,253 |
| Weatherford International Ltd. | 6.500% | 8/1/36 | 1,000 | 1,065 |
| Williams Cos. Inc. | 7.875% | 9/1/21 | 450 | 566 |
| Williams Cos. Inc. | 7.500% | 1/15/31 | 350 | 408 |
| XTO Energy Inc. | 6.750% | 8/1/37 | 40 | 57 |
| Other Industrial (0.0%) | ||||
| Massachusetts Development Finance Agency | ||||
| Revenue (Harvard University) | 4.875% | 10/15/40 | 75 | 80 |
127
| Long-Term Corporate Bond Index Fund | ||||
| Face | Market | |||
| Maturity | Amount | Value | ||
| Coupon | Date | ($000) | ($000) | |
| Technology (3.1%) | ||||
| Applied Materials Inc. | 5.850% | 6/15/41 | 300 | 320 |
| Cisco Systems Inc. | 5.900% | 2/15/39 | 1,015 | 1,139 |
| Cisco Systems Inc. | 5.500% | 1/15/40 | 600 | 651 |
| Corning Inc. | 5.750% | 8/15/40 | 175 | 186 |
| Dell Inc. | 5.400% | 9/10/40 | 325 | 324 |
| Hewlett-Packard Co. | 4.300% | 6/1/21 | 325 | 337 |
| International Business Machines Corp. | 5.875% | 11/29/32 | 775 | 918 |
| International Business Machines Corp. | 5.600% | 11/30/39 | 825 | 959 |
| Juniper Networks Inc. | 5.950% | 3/15/41 | 300 | 310 |
| Microsoft Corp. | 4.500% | 10/1/40 | 315 | 318 |
| 3 Microsoft Corp. | 5.300% | 2/8/41 | 310 | 354 |
| Nokia Oyj | 6.625% | 5/15/39 | 400 | 361 |
| Oracle Corp. | 6.500% | 4/15/38 | 925 | 1,145 |
| Oracle Corp. | 6.125% | 7/8/39 | 750 | 906 |
| 2 Oracle Corp. | 5.375% | 7/15/40 | 100 | 110 |
| Pitney Bowes Inc. | 5.250% | 1/15/37 | 100 | 104 |
| Science Applications International Corp. | 5.500% | 7/1/33 | 225 | 234 |
| TycoElectronics Group SA | 7.125% | 10/1/37 | 250 | 317 |
| Xerox Corp. | 6.750% | 12/15/39 | 100 | 114 |
| Transportation (3.0%) | ||||
| 1 BNSFFunding Trust I | 6.613% | 12/15/55 | 150 | 152 |
| Burlington Northern Santa Fe LLC | 6.150% | 5/1/37 | 325 | 367 |
| Burlington Northern Santa Fe LLC | 5.750% | 5/1/40 | 615 | 671 |
| Burlington Northern Santa Fe LLC | 5.050% | 3/1/41 | 100 | 99 |
| Burlington Northern Santa Fe LLC | 5.400% | 6/1/41 | 375 | 392 |
| Burlington Northern Santa Fe LLC | 4.950% | 9/15/41 | 125 | 123 |
| Canadian National Railway Co. | 6.900% | 7/15/28 | 150 | 193 |
| Canadian National Railway Co. | 6.375% | 11/15/37 | 550 | 680 |
| Canadian Pacific Railway Co. | 4.450% | 3/15/23 | 925 | 962 |
| 1 Continental Airlines 2007-1 Class A | ||||
| Pass Through Trust | 5.983% | 4/19/22 | 95 | 95 |
| CSX Corp. | 6.000% | 10/1/36 | 500 | 556 |
| CSX Corp. | 6.150% | 5/1/37 | 275 | 314 |
| CSX Corp. | 5.500% | 4/15/41 | 200 | 211 |
| 1 Delta Air Lines 2007-1 Class A | ||||
| Pass Through Trust | 6.821% | 8/10/22 | 151 | 153 |
| Norfolk Southern Corp. | 5.640% | 5/17/29 | 125 | 142 |
| Norfolk Southern Corp. | 7.250% | 2/15/31 | 640 | 843 |
| Norfolk Southern Corp. | 7.050% | 5/1/37 | 750 | 981 |
| 1 UAL 2009-2A Pass Through Trust | 9.750% | 1/15/17 | 133 | 146 |
| Union Pacific Corp. | 6.625% | 2/1/29 | 525 | 649 |
| Union Pacific Corp. | 4.750% | 9/15/41 | 375 | 368 |
| United Parcel Service Inc. | 6.200% | 1/15/38 | 780 | 974 |
| 181,292 | ||||
| Utilities (16.4%) | ||||
| Electric (12.2%) | ||||
| Alabama Power Co. | 5.200% | 6/1/41 | 350 | 387 |
| Appalachian Power Co. | 6.375% | 4/1/36 | 100 | 112 |
| Appalachian Power Co. | 7.000% | 4/1/38 | 1,075 | 1,325 |
| Cleco Power LLC | 6.000% | 12/1/40 | 50 | 56 |
| Commonwealth Edison Co. | 6.450% | 1/15/38 | 100 | 122 |
| Consolidated Edison Co. of New York Inc. | 5.300% | 3/1/35 | 50 | 54 |
| Consolidated Edison Co. of New York Inc. | 6.200% | 6/15/36 | 100 | 123 |
128
| Long-Term Corporate Bond Index Fund | ||||
| Face | Market | |||
| Maturity | Amount | Value | ||
| Coupon | Date | ($000) | ($000) | |
| Consolidated Edison Co. of New York Inc. | 6.300% | 8/15/37 | 325 | 400 |
| Consolidated Edison Co. of New York Inc. | 6.750% | 4/1/38 | 375 | 488 |
| Consolidated Edison Co. of New York Inc. | 5.700% | 6/15/40 | 750 | 862 |
| Constellation Energy Group Inc. | 7.600% | 4/1/32 | 275 | 331 |
| Detroit Edison Co. | 5.700% | 10/1/37 | 125 | 147 |
| Dominion Resources Inc. | 2.250% | 9/1/15 | 100 | 102 |
| Dominion Resources Inc. | 7.000% | 6/15/38 | 100 | 126 |
| Dominion Resources Inc. | 4.900% | 8/1/41 | 250 | 248 |
| Duke Energy Carolinas LLC | 6.050% | 4/15/38 | 975 | 1,175 |
| Duke Energy Carolinas LLC | 5.300% | 2/15/40 | 800 | 890 |
| Entergy Louisiana LLC | 4.440% | 1/15/26 | 75 | 75 |
| Exelon Generation Co. LLC | 6.250% | 10/1/39 | 1,000 | 1,096 |
| Exelon Generation Co. LLC | 5.750% | 10/1/41 | 450 | 462 |
| FirstEnergy Corp. | 7.375% | 11/15/31 | 1,075 | 1,263 |
| FirstEnergy Solutions Corp. | 6.800% | 8/15/39 | 1,025 | 1,079 |
| Florida Power & Light Co. | 5.950% | 2/1/38 | 800 | 979 |
| Florida Power & Light Co. | 5.960% | 4/1/39 | 600 | 739 |
| Florida Power & Light Co. | 5.690% | 3/1/40 | 325 | 387 |
| Florida Power Corp. | 6.400% | 6/15/38 | 975 | 1,233 |
| Georgia Power Co. | 5.950% | 2/1/39 | 915 | 1,071 |
| Georgia Power Co. | 5.400% | 6/1/40 | 275 | 300 |
| IberdrolaInternational BV | 6.750% | 7/15/36 | 90 | 97 |
| Interstate Power & Light Co. | 6.250% | 7/15/39 | 200 | 241 |
| Kentucky Utilities Co. | 5.125% | 11/1/40 | 140 | 157 |
| Midamerican Energy Holdings Co. | 6.125% | 4/1/36 | 1,905 | 2,182 |
| Midamerican Energy Holdings Co. | 5.950% | 5/15/37 | 250 | 279 |
| Midamerican Energy Holdings Co. | 6.500% | 9/15/37 | 1,085 | 1,299 |
| National Rural Utilities Cooperative Finance Corp. | 8.000% | 3/1/32 | 475 | 656 |
| Nevada Power Co. | 6.650% | 4/1/36 | 225 | 287 |
| Nevada Power Co. | 5.375% | 9/15/40 | 375 | 412 |
| Northern States Power Co. | 6.250% | 6/1/36 | 450 | 568 |
| Northern States Power Co. | 5.350% | 11/1/39 | 300 | 341 |
| Oglethorpe Power Corp. | 5.950% | 11/1/39 | 225 | 256 |
| Oglethorpe Power Corp. | 5.375% | 11/1/40 | 75 | 78 |
| Oncor Electric Delivery Co. LLC | 7.000% | 9/1/22 | 900 | 1,149 |
| Pacific Gas & Electric Co. | 6.050% | 3/1/34 | 1,700 | 1,964 |
| Pacific Gas & Electric Co. | 5.800% | 3/1/37 | 575 | 643 |
| Pacific Gas & Electric Co. | 6.350% | 2/15/38 | 100 | 120 |
| Pacific Gas & Electric Co. | 6.250% | 3/1/39 | 50 | 59 |
| PacifiCorp | 7.700% | 11/15/31 | 80 | 111 |
| PacifiCorp | 6.000% | 1/15/39 | 125 | 148 |
| Potomac Electric Power Co. | 6.500% | 11/15/37 | 225 | 290 |
| PPL Electric Utilities Corp. | 5.200% | 7/15/41 | 550 | 599 |
| Progress Energy Inc. | 7.000% | 10/30/31 | 350 | 428 |
| PSEG Power LLC | 8.625% | 4/15/31 | 575 | 769 |
| Public Service Co. of Colorado | 6.250% | 9/1/37 | 150 | 187 |
| Public Service Co. of Colorado | 4.750% | 8/15/41 | 200 | 207 |
| Public Service Electric & Gas Co. | 5.500% | 3/1/40 | 175 | 199 |
| Puget Sound Energy Inc. | 5.795% | 3/15/40 | 150 | 177 |
| Puget Sound Energy Inc. | 5.638% | 4/15/41 | 775 | 884 |
| San Diego Gas & Electric Co. | 4.500% | 8/15/40 | 675 | 693 |
| South Carolina Electric & Gas Co. | 6.625% | 2/1/32 | 100 | 125 |
| South Carolina Electric & Gas Co. | 6.050% | 1/15/38 | 175 | 211 |
129
| Long-Term Corporate Bond Index Fund | ||||
| Face | Market | |||
| Maturity | Amount | Value | ||
| Coupon | Date | ($000) | ($000) | |
| South Carolina Electric & Gas Co. | 5.450% | 2/1/41 | 100 | 112 |
| Southern California Edison Co. | 6.000% | 1/15/34 | 700 | 848 |
| Southern California Edison Co. | 5.950% | 2/1/38 | 350 | 425 |
| Southern California Edison Co. | 4.500% | 9/1/40 | 800 | 814 |
| Tampa Electric Co. | 6.150% | 5/15/37 | 100 | 118 |
| TransAlta Corp. | 6.500% | 3/15/40 | 75 | 87 |
| Union Electric Co. | 8.450% | 3/15/39 | 200 | 311 |
| United Utilities plc | 6.875% | 8/15/28 | 150 | 167 |
| Virginia Electric and Power Co. | 6.000% | 5/15/37 | 1,050 | 1,237 |
| Virginia Electric and Power Co. | 8.875% | 11/15/38 | 400 | 627 |
| Wisconsin Electric Power Co. | 5.700% | 12/1/36 | 100 | 118 |
| Wisconsin Power & Light Co. | 6.375% | 8/15/37 | 101 | 130 |
| Natural Gas (4.2%) | ||||
| AGL Capital Corp. | 6.000% | 10/1/34 | 150 | 166 |
| AGL Capital Corp. | 5.875% | 3/15/41 | 400 | 461 |
| Atmos Energy Corp. | 5.500% | 6/15/41 | 100 | 112 |
| CenterPoint Energy Resources Corp. | 6.625% | 11/1/37 | 200 | 238 |
| El Paso Natural Gas Co. | 8.625% | 1/15/22 | 150 | 205 |
| El Paso Natural Gas Co. | 8.375% | 6/15/32 | 115 | 150 |
| Enbridge Energy Partners LP | 7.500% | 4/15/38 | 350 | 439 |
| Energy Transfer Partners LP | 7.500% | 7/1/38 | 635 | 720 |
| Enterprise Products Operating LLC | 6.650% | 10/15/34 | 125 | 141 |
| Enterprise Products Operating LLC | 7.550% | 4/15/38 | 300 | 353 |
| Enterprise Products Operating LLC | 6.125% | 10/15/39 | 900 | 942 |
| Kinder Morgan Energy Partners LP | 6.500% | 2/1/37 | 100 | 104 |
| Kinder Morgan Energy Partners LP | 6.950% | 1/15/38 | 1,075 | 1,192 |
| Kinder Morgan Energy Partners LP | 6.375% | 3/1/41 | 900 | 943 |
| Kinder Morgan Energy Partners LP | 5.625% | 9/1/41 | 100 | 94 |
| Nisource Finance Corp. | 6.125% | 3/1/22 | 700 | 812 |
| Oneok Inc. | 6.000% | 6/15/35 | 125 | 132 |
| ONEOKPartners LP | 6.125% | 2/1/41 | 875 | 936 |
| Plains All American Pipeline LP / | ||||
| PAA Finance Corp. | 6.650% | 1/15/37 | 575 | 632 |
| Sempra Energy | 6.000% | 10/15/39 | 500 | 569 |
| Southern Union Co. | 7.600% | 2/1/24 | 150 | 182 |
| Sunoco Logistics Partners Operations LP | 4.650% | 2/15/22 | 175 | 179 |
| Sunoco Logistics Partners Operations LP | 6.850% | 2/15/40 | 150 | 161 |
| Tennessee Gas Pipeline Co. | 7.000% | 3/15/27 | 100 | 120 |
| TransCanada PipeLines Ltd. | 6.200% | 10/15/37 | 275 | 314 |
| TransCanada PipeLines Ltd. | 7.250% | 8/15/38 | 300 | 397 |
| TransCanada PipeLines Ltd. | 7.625% | 1/15/39 | 450 | 595 |
| TransCanada PipeLines Ltd. | 6.100% | 6/1/40 | 600 | 701 |
| Williams Partners LP | 6.300% | 4/15/40 | 450 | 495 |
| Other Utility (0.0%) | ||||
| American Water Capital Corp. | 6.593% | 10/15/37 | 100 | 118 |
| 49,045 | ||||
| Total Corporate Bonds (Cost $285,438) | 290,089 | |||
| Taxable Municipal Bonds (0.0%) | ||||
| University of Southern California (Cost $100) | 5.250% | 10/1/11 | 100 | 99 |
130
| Long-Term Corporate Bond Index Fund | |||
| Market | |||
| Value | |||
| Coupon | Shares | ($000) | |
| Temporary Cash Investment (0.9%) | |||
| Money Market Fund (0.9%) | |||
| 4 Vanguard Market Liquidity Fund (Cost $2,831) | 0.132% | 2,831,002 | 2,831 |
| Total Investments (99.1%) (Cost $291,495) | 296,264 | ||
| Other Assets and Liabilities (0.9%) | |||
| Other Assets | 6,077 | ||
| Liabilities | (3,478) | ||
| 2,599 | |||
| Net Assets (100%) | 298,863 | ||
| At August 31, 2011, net assets consisted of: | |||
| Amount | |||
| ($000) | |||
| Paid-in Capital | 294,704 | ||
| Undistributed Net Investment Income | 1 | ||
| Accumulated Net Realized Losses | (615) | ||
| Unrealized Appreciation (Depreciation) | |||
| Investment Securities | 4,769 | ||
| Futures Contracts | 4 | ||
| Net Assets | 298,863 | ||
| Signal Shares—Net Assets | |||
| Applicable to 432,537 outstanding $.001 par value shares of | |||
| beneficial interest (unlimited authorization) | 9,381 | ||
| Net Asset Value Per Share—Signal Shares | $21.69 | ||
| Institutional Shares—Net Assets | |||
| Applicable to 548,650 outstanding $.001 par value shares of | |||
| beneficial interest (unlimited authorization) | 14,776 | ||
| Net Asset Value Per Share—Institutional Shares | $26.93 | ||
| ETF Shares—Net Assets | |||
| Applicable to 3,400,000 outstanding $.001 par value shares of | |||
| beneficial interest (unlimited authorization) | 274,706 | ||
| Net Asset Value Per Share—ETF Shares | $80.80 | ||
See Note A in Notes to Financial Statements.
1 The average or expected maturity is shorter than the final maturity shown because of the possibility of interim principal payments and prepayments or the possibility of the issue being called.
2 Security exempt from registration under Rule 144A of the Securities Act of 1933. Such securities may be sold in transactions exempt from registration, normally to qualified institutional buyers. At August 31, 2011, the aggregate value of these securities was $1,162,000, representing 0.4% of net assets.
3 Securities with a value of $211,000 have been segregated as initial margin for open futures contracts.
4 Affiliated money market fund available only to Vanguard funds and certain trusts and accounts managed by Vanguard. Rate shown is the 7-day yield.
REIT—Real Estate Investment Trust.
See accompanying Notes, which are an integral part of the Financial Statements.
131
Long-Term Corporate Bond Index Fund
Statement of Operations
| Year Ended | |
| August 31, 2011 | |
| ($000) | |
| Investment Income | |
| Income | |
| Interest1 | 6,338 |
| Total Income | 6,338 |
| Expenses | |
| The Vanguard Group—Note B | |
| Investment Advisory Services | 4 |
| Management and Administrative—Signal Shares | 5 |
| Management and Administrative—Institutional Shares | — |
| Management and Administrative—ETF Shares | 75 |
| Marketing and Distribution—Signal Shares | 1 |
| Marketing and Distribution—Institutional Shares | 3 |
| Marketing and Distribution—ETF Shares | 14 |
| Custodian Fees | 5 |
| Auditing Fees | 41 |
| Shareholders’ Reports—Signal Shares | — |
| Shareholders’ Reports—Institutional Shares | 1 |
| Shareholders’ Reports—ETF Shares | 5 |
| Total Expenses | 154 |
| Net Investment Income | 6,184 |
| Realized Net Gain (Loss) | |
| Investment Securities Sold | 413 |
| Futures Contracts | (107) |
| Realized Net Gain (Loss) | 306 |
| Change in Unrealized Appreciation (Depreciation) | |
| Investment Securities | 203 |
| Futures Contracts | 4 |
| Change in Unrealized Appreciation (Depreciation) | 207 |
| Net Increase (Decrease) in Net Assets Resulting from Operations | 6,697 |
| 1 Interest income from an affiliated company of the fund was $2,000. | |
See accompanying Notes, which are an integral part of the Financial Statements.
132
Long-Term Corporate Bond Index Fund
Statement of Changes in Net Assets
| November 19, | ||
| Year Ended | 20091 to | |
| August 31, | August 31, | |
| 2011 | 2010 | |
| ($000) | ($000) | |
| Increase (Decrease) in Net Assets | ||
| Operations | ||
| Net Investment Income | 6,184 | 2,070 |
| Realized Net Gain (Loss) | 306 | 326 |
| Change in Unrealized Appreciation (Depreciation) | 207 | 4,566 |
| Net Increase (Decrease) in Net Assets Resulting from Operations | 6,697 | 6,962 |
| Distributions | ||
| Net Investment Income | ||
| Signal Shares | (341) | (103) |
| Institutional Shares | (497) | (252) |
| ETF Shares | (5,349) | (1,711) |
| Realized Capital Gain2 | ||
| Signal Shares | (10) | — |
| Institutional Shares | (26) | — |
| ETF Shares | (215) | — |
| Total Distributions | (6,438) | (2,066) |
| Capital Share Transactions | ||
| Signal Shares | 5,659 | 3,202 |
| Institutional Shares | 7,603 | 6,453 |
| ETF Shares | 209,252 | 61,539 |
| Net Increase (Decrease) from Capital Share Transactions | 222,514 | 71,194 |
| Total Increase (Decrease) | 222,773 | 76,090 |
| Net Assets | ||
| Beginning of Period | 76,090 | — |
| End of Period3 | 298,863 | 76,090 |
1 Inception.
2 Includes fiscal 2011 short-term gain distributions totaling $251,000. Short-term gain distributions are treated as ordinary income dividends for tax purposes.
3 Net Assets—End of Period includes undistributed net investment income of $1,000 and $4,000.
See accompanying Notes, which are an integral part of the Financial Statements.
133
Long-Term Corporate Bond Index Fund
Financial Highlights
| Signal Shares | ||
| Year | Jan. 19, | |
| Ended | 20101 to | |
| August 31, | Aug. 31, | |
| For a Share Outstanding Throughout Each Period | 2011 | 2010 |
| Net Asset Value, Beginning of Period | $22.00 | $20.12 |
| Investment Operations | ||
| Net Investment Income | 1.100 | .680 |
| Net Realized and Unrealized Gain (Loss) on Investments2 | (.246) | 1.936 |
| Total from Investment Operations | .854 | 2.616 |
| Distributions | ||
| Dividends from Net Investment Income | (1.100) | (.736) |
| Distributions from Realized Capital Gains | (.064) | — |
| Total Distributions | (1.164) | (.736) |
| Net Asset Value, End of Period | $21.69 | $22.00 |
| Total Return3 | 4.21% | 13.37% |
| Ratios/Supplemental Data | ||
| Net Assets, End of Period (Millions) | $9 | $4 |
| Ratio of Total Expenses to Average Net Assets | 0.14% | 0.15%4 |
| Ratio of Net Investment Income to Average Net Assets | 5.36% | 5.65%4 |
| Portfolio Turnover Rate5 | 110% | 41% |
1 Inception.
2 Includes increases from purchase fees of $.04 and $.03.
3 Total returns do not include transaction fees that may have applied in the periods shown. Fund prospectuses provide information about any applicable transaction fees.
4 Annualized.
5 Excludes the value of portfolio securities received or delivered as a result of in-kind purchases or redemptions of the fund’s capital shares, including ETF Creation Units.
See accompanying Notes, which are an integral part of the Financial Statements.
134
Long-Term Corporate Bond Index Fund
Financial Highlights
| Institutional Shares | ||
| Year | Nov. 19, | |
| Ended | 20091 to | |
| August 31, | Aug. 31, | |
| For a Share Outstanding Throughout Each Period | 2011 | 2010 |
| Net Asset Value, Beginning of Period | $27.32 | $24.89 |
| Investment Operations | ||
| Net Investment Income | 1.377 | 1.090 |
| Net Realized and Unrealized Gain (Loss) on Investments2 | (.308) | 2.428 |
| Total from Investment Operations | 1.069 | 3.518 |
| Distributions | ||
| Dividends from Net Investment Income | (1.379) | (1.088) |
| Distributions from Realized Capital Gains | (.080) | — |
| Total Distributions | (1.459) | (1.088) |
| Net Asset Value, End of Period | $26.93 | $27.32 |
| Total Return3 | 4.25% | 14.61% |
| Ratios/Supplemental Data | ||
| Net Assets, End of Period (Millions) | $15 | $7 |
| Ratio of Total Expenses to Average Net Assets | 0.09% | 0.09%4 |
| Ratio of Net Investment Income to Average Net Assets | 5.41% | 5.71%4 |
| Portfolio Turnover Rate5 | 110% | 41% |
1 Inception.
2 Includes increases from purchase fees of $.04 and $.03.
3 Total returns do not include transaction fees that may have applied in the periods shown. Fund prospectuses provide information about any applicable transaction fees.
4 Annualized.
5 Excludes the value of portfolio securities received or delivered as a result of in-kind purchases or redemptions of the fund’s capital shares, including ETF Creation Units.
See accompanying Notes, which are an integral part of the Financial Statements.
135
Long-Term Corporate Bond Index Fund
Financial Highlights
| ETF Shares | ||
| Year | Nov. 19, | |
| Ended | 20091 to | |
| August 31, | Aug. 31, | |
| For a Share Outstanding Throughout Each Period | 2011 | 2010 |
| Net Asset Value, Beginning of Period | $81.96 | $74.67 |
| Investment Operations | ||
| Net Investment Income | 4.091 | 3.236 |
| Net Realized and Unrealized Gain (Loss) on Investments2 | (.917) | 7.286 |
| Total from Investment Operations | 3.174 | 10.522 |
| Distributions | ||
| Dividends from Net Investment Income | (4.095) | (3.232) |
| Distributions from Realized Capital Gains | (.239) | — |
| Total Distributions | (4.334) | (3.232) |
| Net Asset Value, End of Period | $80.80 | $81.96 |
| Total Return | 4.19% | 14.54% |
| Ratios/Supplemental Data | ||
| Net Assets, End of Period (Millions) | $275 | $66 |
| Ratio of Total Expenses to Average Net Assets | 0.14% | 0.15%3 |
| Ratio of Net Investment Income to Average Net Assets | 5.36% | 5.65%3 |
| Portfolio Turnover Rate4 | 110% | 41% |
1 Inception.
2 Includes increases from purchase fees of $.07 and $.10.
3 Annualized.
4 Excludes the value of portfolio securities received or delivered as a result of in-kind purchases or redemptions of the fund’s capital shares, including ETF Creation Units.
See accompanying Notes, which are an integral part of the Financial Statements.
136
Long-Term Corporate Bond Index Fund
Notes to Financial Statements
Vanguard Long-Term Corporate Bond Index Fund is registered under the Investment Company Act of 1940 as an open-end investment company, or mutual fund. Certain of the fund’s investments are in corporate debt instruments; the issuers’ abilities to meet their obligations may be affected by economic developments in their respective industries. The fund offers three classes of shares: Signal Shares, Institutional Shares, and ETF Shares. Signal Shares and Institutional Shares are designed for investors who meet certain administrative, service, and account-size criteria. ETF Shares are listed for trading on Nasdaq; they can be purchased and sold through a broker.
A. The following significant accounting policies conform to generally accepted accounting principles for U.S. mutual funds. The fund consistently follows such policies in preparing its financial statements.
1. Security Valuation: Bonds, and temporary cash investments acquired over 60 days to maturity, are valued using the latest bid prices or using valuations based on a matrix system (which considers such factors as security prices, yields, maturities, and ratings), both as furnished by independent pricing services. Investments in Vanguard Market Liquidity Fund are valued at that fund’s net asset value. Other temporary cash investments are valued at amortized cost, which approximates market value. Securities for which market quotations are not readily available, or whose values have been affected by events occurring before the fund’s pricing time but after the close of the securities’ primary markets, are valued by methods deemed by the board of trustees to represent fair value.
2. Futures Contracts: The fund uses futures contracts to invest in fixed income asset classes with greater efficiency and lower cost than is possible through direct investment, to add value when these instruments are attractively priced, or to adjust sensitivity to changes in interest rates. The primary risks associated with the use of futures contracts are imperfect correlation between changes in market values of bonds held by the fund and the prices of futures contracts, and the possibility of an illiquid market.
Futures contracts are valued based upon their quoted daily settlement prices. The aggregate principal amounts of the contracts are not recorded in the Statement of Net Assets. Fluctuations in the value of the contracts are recorded in the Statement of Net Assets as an asset (liability) and in the Statement of Operations as unrealized appreciation (depreciation) until the contracts are closed, when they are recorded as realized futures gains (losses).
3. Federal Income Taxes: The fund intends to continue to qualify as a regulated investment company and distribute all of its taxable income. Management has analyzed the fund’s tax positions taken for all open federal income tax years (August 31, 2010–2011), and has concluded that no provision for federal income tax is required in the fund’s financial statements.
4. Distributions: Distributions to shareholders are recorded on the ex-dividend date.
5. Other: Interest income includes income distributions received from Vanguard Market Liquidity Fund and is accrued daily. Premiums and discounts on debt securities purchased are amortized and accreted, respectively, to interest income over the lives of the respective securities. Security transactions are accounted for on the date securities are bought or sold. Costs used to determine realized gains (losses) on the sale of investment securities are those of the specific securities sold. Fees assessed on purchases of capital shares are credited to paid-in capital.
137
Long-Term Corporate Bond Index Fund
Each class of shares has equal rights as to assets and earnings, except that each class separately bears certain class-specific expenses related to maintenance of shareholder accounts (included in Management and Administrative expenses) and shareholder reporting. Marketing and distribution expenses are allocated to each class of shares based on a method approved by the board of trustees. Income, other non-class-specific expenses, and gains and losses on investments are allocated to each class of shares based on its relative net assets.
B. The Vanguard Group furnishes at cost investment advisory, corporate management, administrative, marketing, and distribution services. The costs of such services are allocated to the fund under methods approved by the board of trustees. The fund has committed to provide up to 0.40% of its net assets in capital contributions to Vanguard. At August 31, 2011, the fund had contributed capital of $33,000 to Vanguard (included in Other Assets), representing 0.01% of the fund’s net assets and 0.01% of Vanguard’s capitalization. The fund’s trustees and officers are also directors and officers of Vanguard.
C. Various inputs may be used to determine the value of the fund’s investments. These inputs are summarized in three broad levels for financial statement purposes. The inputs or methodologies used to value securities are not necessarily an indication of the risk associated with investing in those securities.
Level 1—Quoted prices in active markets for identical securities.
Level 2—Other significant observable inputs (including quoted prices for similar securities, interest rates, prepayment speeds, credit risk, etc.).
Level 3—Significant unobservable inputs (including the fund’s own assumptions used to determine the fair value of investments).
The following table summarizes the fund’s investments as of August 31, 2011, based on the inputs used to value them:
| Level 1 | Level 2 | Level 3 | |
| Investments | ($000) | ($000) | ($000) |
| U.S. Government and Agency Obligations | — | 3,245 | — |
| Corporate Bonds | — | 290,089 | — |
| Taxable Municipal Bonds | — | 99 | — |
| Temporary Cash Investments | 2,831 | — | — |
| Futures Contracts—Assets1 | 112 | — | — |
| Futures Contracts—Liabilities1 | (77) | — | — |
| Total | 2,866 | 293,433 | — |
| 1 Represents variation margin on the last day of the reporting period. | |||
138
Long-Term Corporate Bond Index Fund
D. At August 31, 2011, the aggregate settlement value of open futures contracts and the related unrealized appreciation (depreciation) were:
| ($000) | ||||
| Aggregate | ||||
| Number of | Settlement | Unrealized | ||
| Long (Short) | Value | Appreciation | ||
| Futures Contracts | Expiration | Contracts | Long (Short) | (Depreciation) |
| 30-Year U.S. Treasury Bond | December 2011 | 60 | 8,162 | 24 |
| Ultra Long U.S. Treasury Bond | December 2011 | (56) | (8,017) | (20) |
Unrealized appreciation (depreciation) on open futures contracts is required to be treated as realized gain (loss) for tax purposes.
E. Distributions are determined on a tax basis and may differ from net investment income and realized capital gains for financial reporting purposes. Differences may be permanent or temporary. Permanent differences are reclassified among capital accounts in the financial statements to reflect their tax character. Temporary differences arise when certain items of income, expense, gain, or loss are recognized in different periods for financial statement and tax purposes; these differences will reverse at some time in the future. Differences in classification may also result from the treatment of short-term gains as ordinary income for tax purposes.
During the year ended August 31, 2011, the fund realized $880,000 of net capital gains resulting from in-kind redemptions—in which shareholders exchanged fund shares for securities held by the fund rather than for cash. Because such gains are not taxable to the fund, and are not distributed to shareholders, they have been reclassified from accumulated net realized losses to paid-in capital.
For tax purposes, at August 31, 2011, the fund had available capital loss carryforwards totaling $7,000 to offset future net capital gains through August 31, 2019. In addition, the fund realized losses of $546,000 during the period from November 1, 2010, through August 31, 2011, which are deferred and will be treated as realized for tax purposes in fiscal 2012.
At August 31, 2011, the cost of investment securities for tax purposes was $291,529,000. Net unrealized appreciation of investment securities for tax purposes was $4,735,000, consisting of unrealized gains of $8,030,000 on securities that had risen in value since their purchase and $3,295,000 in unrealized losses on securities that had fallen in value since their purchase.
F. During the year ended August 31, 2011, the fund purchased $275,659,000 of investment securities and sold $69,724,000 of investment securities, other than U.S. government securities and temporary cash investments. Purchases and sales of U.S. government securities were $80,870,000 and $78,175,000, respectively.
139
Long-Term Corporate Bond Index Fund
G. Capital share transactions for each class of shares were:
| Year Ended | Inception1 to | |||
| August 31, 2011 | August 31, 2010 | |||
| Amount | Shares | Amount | Shares | |
| ($000) | (000) | ($000) | (000) | |
| Signal Shares | ||||
| Issued2 | 6,808 | 323 | 3,099 | 154 |
| Issued in Lieu of Cash Distributions | 351 | 17 | 103 | 5 |
| Redeemed | (1,500) | (67) | — | — |
| Net Increase (Decrease)—Signal Shares | 5,659 | 273 | 3,202 | 159 |
| Institutional Shares | ||||
| Issued2 | 7,080 | 272 | 6,201 | 247 |
| Issued in Lieu of Cash Distributions | 523 | 20 | 252 | 10 |
| Redeemed | — | — | — | — |
| Net Increase (Decrease)—Institutional Shares | 7,603 | 292 | 6,453 | 257 |
| ETF Shares | ||||
| Issued2 | 233,137 | 2,900 | 76,625 | 1,000 |
| Issued in Lieu of Cash Distributions | — | — | — | — |
| Redeemed | (23,885) | (300) | (15,086) | (200) |
| Net Increase (Decrease)—ETF Shares | 209,252 | 2,600 | 61,539 | 800 |
1 Inception was November 19, 2009, for ETF Shares and Institutional Shares, and January 19, 2010, for Signal Shares.
2 Includes purchase fees for fiscal 2011 and 2010 of $287,000 and $94,000, respectively (fund totals).
H. In preparing the financial statements as of August 31, 2011, management considered the impact of subsequent events for potential recognition or disclosure in these financial statements.
140
Mortgage-Backed Securities Index Fund
Fund Profile
As of August 31, 2011
| Share-Class Characteristics | |||
| Signal | ETF | ||
| Shares | Shares | ||
| Ticker Symbol | VMBSX | VMBS | |
| Expense Ratio1 | 0.15% | 0.15% | |
| 30-Day SEC Yield | 2.81% | 2.81% | |
| Financial Attributes | |||
| Barclays | |||
| MBS | Barclays | ||
| Float Adj | Aggregate | ||
| Fund | Index | FA Index | |
| Number of Bonds | 2602 | 1,090 | 7,873 |
| Yield to Maturity | |||
| (before expenses) | 2.9% | 2.9% | 2.3% |
| Average Coupon | 4.9% | 4.9% | 4.1% |
| Average Duration | 3.5 years | 3.6 years | 5.1 years |
| Average Effective | |||
| Maturity | 5.6 years | 5.7 years | 7.3 years |
| Short-Term | |||
| Reserves | 2.6% | — | — |
| Sector Diversification (% of portfolio) | |||
| Government Mortgage-Backed | 100.0% | ||
The agency and mortgage-backed securities sectors may include issues from government-sponsored enterprises; such issues are not backed by the full faith and credit of the U.S. government.
| Distribution by Credit Quality (% of portfolio) | |
| U.S. Government | 97.4% |
| Aaa | 2.6 |
| For information about these ratings, see the Glossary entry for Credit Quality. | |
| Distribution by Coupon (% of portfolio) | |
| Below 5% | 69.7% |
| 5% - 6% | 26.3 |
| Above 6% | 4.0 |
Investment Focus
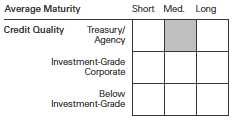
1 The expense ratios shown are from the prospectus dated December 28, 2010, and represent estimated costs for the current fiscal year. For the fiscal year ended August 31, 2011, the expense ratios were 0.15% for Signal Shares and 0.15% for ETF Shares.
2 Issues are mortgage pools grouped by coupon.
141
Mortgage-Backed Securities Index Fund
Performance Summary
All of the returns in this report represent past performance, which is not a guarantee of future results that may be achieved by the fund. (Current performance may be lower or higher than the performance data cited. For performance data current to the most recent month-end, visit our website at vanguard.com/performance.) Note, too, that both investment returns and principal value can fluctuate widely, so an investor’s shares, when sold, could be worth more or less than their original cost. The returns shown do not reflect taxes that a shareholder would pay on fund distributions or on the sale of fund shares.
Cumulative Performance: November 19, 2009, Through August 31, 2011
Initial Investment of $10,000
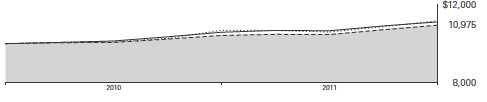
| Average Annual Total Returns | |||
| Periods Ended August 31, 2011 | |||
| Since | Final Value | ||
| One | Inception | of a $10,000 | |
| Year | (11/19/2009) | Investment | |
| Mortgage-Backed Securities Index | |||
| Fund ETF Shares Net Asset Value | 5.14% | 5.36% | $10,975 |
| Mortgage-Backed Securities Index | |||
| Fund ETF Shares Market Price | 5.02 | 5.41 | 10,984 |
| Spliced Barclays Capital U.S. | |||
| Aggregate Float Adjusted Index | 4.62 | 6.49 | 11,184 |
| Barclays Capital U.S. MBS Float | |||
| Adjusted Index | 5.11 | 5.26 | 10,956 |
| U.S. Mortgage Funds Average | 5.05 | 6.17 | 11,125 |
"Since Inception" performance is calculated from the ETF Shares’ inception date for both the fund and its comparative standards.
Spliced Barclays Capital U.S. Aggregate Float Adjusted Index: Barclays Capital U.S. Aggregate Bond Index through December 31, 2009; Barclays Capital U.S. Aggregate Float Adjusted Index thereafter.
U.S. Mortgage Funds Average: Derived from data provided by Lipper Inc.
See Financial Highlights for dividend and capital gains information.
142
Mortgage-Backed Securities Index Fund
| Average Annual Total Returns | |||
| Periods Ended August 31, 2011 | |||
| Since | Final Value | ||
| One | Inception | of a $10,000 | |
| Year | (12/3/2009) | Investment | |
| Mortgage-Backed Securities Index | |||
| Fund Signal Shares | 5.16% | 5.34% | $10,950 |
| Spliced Barclays Capital U.S. | |||
| Aggregate Float Adjusted Index | 4.62 | 6.56 | 11,171 |
| Barclays Capital U.S. MBS Float | |||
| Adjusted Index | 5.11 | 5.32 | 10,946 |
"Since Inception" performance is calculated from the Signal Shares’ inception date for both the fund and its comparative standards.
| Cumulative Returns of ETF Shares: November 19, 2009, Through August 31, 2011 | ||
| Since | ||
| One | Inception | |
| Year | (11/19/2009) | |
| Mortgage-Backed Securities Index Fund | ||
| ETF Shares Market Price | 5.02% | 9.84% |
| Mortgage-Backed Securities Index Fund | ||
| ETF Shares Net Asset Value | 5.14 | 9.75 |
| Barclays Capital U.S. MBS Float Adjusted Index | 5.11 | 9.56 |
"Since Inception" performance is calculated from the ETF Shares’ inception date for both the fund and its comparative standards.
| Fiscal-Year Total Returns (%): November 19, 2009, Through August 31, 2011 | ||
| Barclays | ||
| MBS | ||
| Float Adj | ||
| ETF Shares Net Asset Value | Index | |
| Fiscal Year | Total Returns | Total Returns |
| 2010 | 4.39% | 4.23% |
| 2011 | 5.14 | 5.11 |
Average Annual Total Returns: Periods Ended June 30, 2011
This table presents returns through the latest calendar quarter—rather than through the end of the fiscal period.
Securities and Exchange Commission rules require that we provide this information.
| Since Inception | |||||
| Inception Date | One Year | Income | Capital | Total | |
| Signal Shares | 12/3/2009 | 3.65% | 2.30% | 2.22% | 4.52% |
| ETF Shares | 11/19/2009 | ||||
| Market Price | 3.91 | 4.73 | |||
| Net Asset Value | 3.66 | 4.57 |
143
Mortgage-Backed Securities Index Fund
Financial Statements
Statement of Net Assets
As of August 31, 2011
The fund reports a complete list of its holdings in regulatory filings four times in each fiscal year, at the quarter-ends. For the second and fourth fiscal quarters, the lists appear in the fund’s semiannual and annual reports to shareholders. For the first and third fiscal quarters, the fund files the lists with the Securities and Exchange Commission on Form N-Q. Shareholders can look up the fund’s Forms N-Q on the SEC’s website at sec.gov. Forms N-Q may also be reviewed and copied at the SEC’s Public Reference Room (see the back cover of this report for further information).
| Face | Market | ||||
| Maturity | Amount | Value | |||
| Coupon | Date | ($000) | ($000) | ||
| U.S. Government and Agency Obligations (99.0%) | |||||
| Conventional Mortgage-Backed Securities (95.5%) | |||||
| 1,2,3 Fannie Mae Pool | 3.500% | 7/1/26–9/1/41 | 2,446 | 2,530 | |
| 1,2,3 Fannie Mae Pool | 4.000% | 7/1/18–9/1/41 | 6,541 | 6,834 | |
| 1,2,3 Fannie Mae Pool | 4.500% | 2/1/18–9/1/41 | 6,849 | 7,277 | |
| 1,2,4 Fannie Mae Pool | 5.000% | 3/1/17–9/1/41 | 6,869 | 7,435 | |
| 1,2,3 Fannie Mae Pool | 5.500% | 12/1/16–9/1/41 | 6,390 | 7,019 | |
| 1,2,3 Fannie Mae Pool | 6.000% | 12/1/13–9/1/41 | 4,324 | 4,801 | |
| 1,2,3 Fannie Mae Pool | 6.500% | 4/1/16–9/1/41 | 1,255 | 1,410 | |
| 1,2 | Fannie Mae Pool | 7.000% | 12/1/15–4/1/37 | 267 | 309 |
| 1,2,3 Freddie Mac Gold Pool | 3.500% | 6/1/26–11/1/40 | 1,327 | 1,379 | |
| 1,2,3 Freddie Mac Gold Pool | 4.000% | 7/1/18–9/1/41 | 4,174 | 4,365 | |
| 1,2,3 Freddie Mac Gold Pool | 4.500% | 2/1/18–9/1/41 | 4,987 | 5,283 | |
| 1,2,3 Freddie Mac Gold Pool | 5.000% | 10/1/17–9/1/41 | 4,553 | 4,908 | |
| 1,2,3 Freddie Mac Gold Pool | 5.500% | 4/1/14–9/1/41 | 4,298 | 4,705 | |
| 1,2,3 Freddie Mac Gold Pool | 6.000% | 4/1/14–9/1/41 | 2,855 | 3,168 | |
| 1,2 | Freddie Mac Gold Pool | 6.500% | 1/1/29–9/1/39 | 922 | 1,039 |
| 1,2 | Freddie Mac Gold Pool | 7.000% | 7/1/28–2/1/37 | 339 | 390 |
| 1,2 | Freddie Mac Gold Pool | 8.000% | 11/1/22 | 4 | 5 |
| 1 | Ginnie Mae I Pool | 3.500% | 2/15/26–1/15/41 | 217 | 226 |
| 1,3 | Ginnie Mae I Pool | 4.000% | 10/15/24–9/1/41 | 1,575 | 1,669 |
| 1,3 | Ginnie Mae I Pool | 4.500% | 9/15/18–9/1/41 | 2,791 | 3,028 |
| 1,3 | Ginnie Mae I Pool | 5.000% | 1/15/18–9/1/41 | 2,150 | 2,371 |
| 1,3 | Ginnie Mae I Pool | 5.500% | 10/15/32–9/1/41 | 1,124 | 1,258 |
| 1,3 | Ginnie Mae I Pool | 6.000% | 4/15/28–9/1/41 | 780 | 879 |
| 1,3 | Ginnie Mae I Pool | 6.500% | 5/15/24–9/1/41 | 351 | 399 |
| 1 | Ginnie Mae I Pool | 7.000% | 10/15/27 | 17 | 20 |
| 1,3 | Ginnie Mae II Pool | 4.000% | 12/20/40–9/1/41 | 1,310 | 1,385 |
| 1,3 | Ginnie Mae II Pool | 4.500% | 4/20/18–9/1/41 | 3,788 | 4,101 |
| 1,3 | Ginnie Mae II Pool | 5.000% | 6/20/33–9/1/41 | 2,751 | 3,039 |
| 1,3 | Ginnie Mae II Pool | 5.500% | 12/20/33–9/1/41 | 1,200 | 1,344 |
| 1 | Ginnie Mae II Pool | 6.000% | 1/20/32–7/20/39 | 745 | 839 |
| 1 | Ginnie Mae II Pool | 6.500% | 10/20/28–8/20/37 | 141 | 160 |
| 1 | Ginnie Mae II Pool | 7.000% | 4/20/38–11/20/38 | 89 | 102 |
| 83,677 | |||||
| Nonconventional Mortgage-Backed Securities (3.5%) | |||||
| 1,2 | Fannie Mae Pool | 2.870% | 3/1/41 | 71 | 74 |
| 1,2 | Fannie Mae Pool | 3.108% | 12/1/40 | 79 | 82 |
| 1,2 | Fannie Mae Pool | 3.141% | 2/1/41 | 47 | 49 |
144
| Mortgage-Backed Securities Index Fund | |||||
| Face | Market | ||||
| Maturity | Amount | Value | |||
| Coupon | Date | ($000) | ($000) | ||
| 1,2 | Fannie Mae Pool | 3.154% | 2/1/41 | 98 | 102 |
| 1,2 | Fannie Mae Pool | 3.194% | 12/1/40 | 71 | 74 |
| 1,2 | Fannie Mae Pool | 3.255% | 10/1/40 | 135 | 141 |
| 1,2 | Fannie Mae Pool | 3.259% | 11/1/40 | 86 | 90 |
| 1,2 | Fannie Mae Pool | 3.297% | 1/1/40 | 23 | 24 |
| 1,2 | Fannie Mae Pool | 3.449% | 12/1/39 | 295 | 309 |
| 1,2 | Fannie Mae Pool | 3.509% | 5/1/40 | 52 | 55 |
| 1,2 | Fannie Mae Pool | 3.528% | 3/1/40 | 40 | 42 |
| 1,2 | Fannie Mae Pool | 3.617% | 4/1/41 | 70 | 74 |
| 1,2 | Fannie Mae Pool | 5.069% | 3/1/38 | 145 | 158 |
| 1,2 | Fannie Mae Pool | 5.661% | 3/1/37 | 314 | 327 |
| 1,2 | Fannie Mae Pool | 5.730% | 4/1/37 | 77 | 83 |
| 1,2 | Fannie Mae Pool | 6.259% | 9/1/37 | 51 | 54 |
| 1,2 | Freddie Mac Non Gold Pool | 2.982% | 2/1/41 | 69 | 72 |
| 1,2 | Freddie Mac Non Gold Pool | 3.341% | 4/1/40 | 58 | 61 |
| 1,2 | Freddie Mac Non Gold Pool | 3.356% | 5/1/40 | 17 | 18 |
| 1,2 | Freddie Mac Non Gold Pool | 3.601% | 6/1/40 | 216 | 226 |
| 1,2 | Freddie Mac Non Gold Pool | 3.621% | 1/1/40 | 129 | 135 |
| 1,2 | Freddie Mac Non Gold Pool | 3.674% | 9/1/40 | 87 | 91 |
| 1,2 | Freddie Mac Non Gold Pool | 3.977% | 3/1/40 | 250 | 263 |
| 1,2 | Freddie Mac Non Gold Pool | 5.794% | 10/1/37 | 83 | 88 |
| 1,2 | Freddie Mac Non Gold Pool | 6.398% | 2/1/37 | 135 | 146 |
| 1 | Ginnie Mae II Pool | 2.500% | 1/20/41–2/20/41 | 144 | 145 |
| 1 | Ginnie Mae II Pool | 3.000% | 4/20/41–5/20/41 | 93 | 95 |
| 3,078 | |||||
| Total U.S. Government and Agency Obligations (Cost $84,958) | 86,755 | ||||
| Shares | |||||
| Temporary Cash Investment (13.7%) | |||||
| Money Market Fund (13.7%) | |||||
| 5 | Vanguard Market Liquidity Fund (Cost $12,057) | 0.132% | 12,057,000 | 12,057 | |
| Total Investments (112.7%) (Cost $97,015) | 98,812 | ||||
| Other Assets and Liabilities (-12.7%) | |||||
| Other Assets | 10,189 | ||||
| Liabilities | (21,340) | ||||
| (11,151) | |||||
| Net Assets (100%) | 87,661 | ||||
| Statement of Assets and Liabilities | |||||
| Assets | |||||
| Investments in Securities, at Value | 98,812 | ||||
| Receivables for Investment Securities Sold | 9,468 | ||||
| Other Assets | 721 | ||||
| Total Assets | 109,001 | ||||
| Liabilities | |||||
| Payables for Investment Securities Purchased | 21,086 | ||||
| Other Liabilities | 254 | ||||
| Total Liabilities | 21,340 | ||||
| Net Assets | 87,661 | ||||
145
| Mortgage-Backed Securities Index Fund | |
| At August 31, 2011, net assets consisted of: | |
| Amount | |
| ($000) | |
| Paid-in Capital | 85,245 |
| Overdistributed Net Investment Income | (7) |
| Accumulated Net Realized Gains | 626 |
| Unrealized Appreciation (Depreciation) | 1,797 |
| Net Assets | 87,661 |
| Signal Shares—Net Assets | |
| Applicable to 720,280 outstanding $.001 par value shares of | |
| beneficial interest (unlimited authorization) | 14,951 |
| Net Asset Value Per Share—Signal Shares | $20.76 |
| ETF Shares—Net Assets | |
| Applicable to 1,400,980 outstanding $.001 par value shares of | |
| beneficial interest (unlimited authorization) | 72,710 |
| Net Asset Value Per Share—ETF Shares | $51.90 |
• See Note A in Notes to Financial Statements.
1 The average or expected maturity is shorter than the final maturity shown because of the possibility of interim principal payments and prepayments or the possibility of the issue being called.
2 The issuer operates under a congressional charter; its securities are not backed by the full faith and credit of the U.S. government.
3 Includes securities purchased on a when-issued or delayed-delivery basis for which the fund has not taken delivery as of August 31, 2011.
4 Securities with a value of $33,000 have been segregated as initial margin for open futures contracts.
5 Affiliated money market fund available only to Vanguard funds and certain trusts and accounts managed by Vanguard. Rate shown is the 7-day yield.
See accompanying Notes, which are an integral part of the Financial Statements.
146
Mortgage-Backed Securities Index Fund
Statement of Operations
| Year Ended | |
| August 31, 2011 | |
| ($000) | |
| Investment Income | |
| Income | |
| Interest1 | 1,400 |
| Total Income | 1,400 |
| Expenses | |
| The Vanguard Group—Note B | |
| Management and Administrative—Signal Shares | 4 |
| Management and Administrative—ETF Shares | 14 |
| Marketing and Distribution—Signal Shares | — |
| Marketing and Distribution—ETF Shares | — |
| Custodian Fees | 28 |
| Auditing Fees | 36 |
| Shareholders’ Reports—Signal Shares | — |
| Shareholders’ Reports—ETF Shares | 3 |
| Total Expenses | 85 |
| Net Investment Income | 1,315 |
| Realized Net Gain (Loss) on Investment Securities Sold | 663 |
| Change in Unrealized Appreciation (Depreciation) of Investment Securities | 1,402 |
| Net Increase (Decrease) in Net Assets Resulting from Operations | 3,380 |
| 1 Interest income from an affiliated company of the fund was $24,000. | |
See accompanying Notes, which are an integral part of the Financial Statements.
147
Mortgage-Backed Securities Index Fund
Statement of Changes in Net Assets
| November 19, | ||
| Year Ended | 20091 to | |
| August 31, | August 31, | |
| 2011 | 2010 | |
| ($000) | ($000) | |
| Increase (Decrease) in Net Assets | ||
| Operations | ||
| Net Investment Income | 1,315 | 724 |
| Realized Net Gain (Loss) | 663 | 754 |
| Change in Unrealized Appreciation (Depreciation) | 1,402 | 395 |
| Net Increase (Decrease) in Net Assets Resulting from Operations | 3,380 | 1,873 |
| Distributions | ||
| Net Investment Income | ||
| Signal Shares | (219) | (97) |
| Institutional Shares | — | (41) |
| ETF Shares | (1,097) | (592) |
| Realized Capital Gain2 | ||
| Signal Shares | (100) | — |
| Institutional Shares | — | — |
| ETF Shares | (576) | — |
| Total Distributions | (1,992) | (730) |
| Capital Share Transactions | ||
| Signal Shares | 8,572 | 5,965 |
| Institutional Shares | — | 148 |
| ETF Shares | 40,764 | 29,681 |
| Net Increase (Decrease) from Capital Share Transactions | 49,336 | 35,794 |
| Total Increase (Decrease) | 50,724 | 36,937 |
| Net Assets | ||
| Beginning of Period | 36,937 | — |
| End of Period3 | 87,661 | 36,937 |
1 Inception.
2 Includes fiscal 2011 short-term gain distributions totaling $676,000. Short-term gain distributions are treated as ordinary income dividends for tax purposes.
3 Net Assets—End of Period includes undistributed (overdistributed) net investment income of ($7,000) and ($6,000).
See accompanying Notes, which are an integral part of the Financial Statements.
148
Mortgage-Backed Securities Index Fund
Financial Highlights
| Signal Shares | ||
| Year | Dec. 3, | |
| Ended | 20091 to | |
| August 31, | Aug. 31, | |
| For a Share Outstanding Throughout Each Period | 2011 | 2010 |
| Net Asset Value, Beginning of Period | $20.52 | $20.04 |
| Investment Operations | ||
| Net Investment Income | .456 | .332 |
| Net Realized and Unrealized Gain (Loss) on Investments | .569 | .487 |
| Total from Investment Operations | 1.025 | .819 |
| Distributions | ||
| Dividends from Net Investment Income | (.456) | (.339) |
| Distributions from Realized Capital Gains | (.329) | — |
| Total Distributions | (.785) | (.339) |
| Net Asset Value, End of Period | $20.76 | $20.52 |
| Total Return | 5.16% | 4.13% |
| Ratios/Supplemental Data | ||
| Net Assets, End of Period (Millions) | $15 | $6 |
| Ratio of Total Expenses to Average Net Assets | 0.15% | 0.15%2 |
| Ratio of Net Investment Income to Average Net Assets | 2.30% | 2.12%2 |
| Portfolio Turnover Rate3 | 344% | 402% |
1 Inception.
2 Annualized.
3 Includes 187% and 166% attributable to mortgage-dollar-roll activity.
See accompanying Notes, which are an integral part of the Financial Statements.
149
Mortgage-Backed Securities Index Fund
Financial Highlights
| Institutional Shares | |
| November 19, 20091 to | |
| For a Share Outstanding Throughout the Period | December 29, 20092 |
| Net Asset Value, Beginning of Period | $24.99 |
| Investment Operations | |
| Net Investment Income | .051 |
| Net Realized and Unrealized Gain (Loss) on Investments | (.180) |
| Total from Investment Operations | (.129) |
| Distributions | |
| Dividends from Net Investment Income | (.051) |
| Distributions from Realized Capital Gains | — |
| Total Distributions | (.051) |
| Net Asset Value, End of Period | $24.812 |
| Total Return | -0.52% |
| Ratios/Supplemental Data | |
| Net Assets, End of Period (Millions) | $0 |
| Ratio of Total Expenses to Average Net Assets | 0.09%3 |
| Ratio of Net Investment Income to Average Net Assets | 1.72%3 |
| Portfolio Turnover Rate | 402%4 |
1 Inception.
2 Net asset value as of December 29, 2009, at which date the sole shareholder account converted into ETF Shares.
3 Annualized.
4 Includes 166% attributable to mortgage-dollar-roll activity.
See accompanying Notes, which are an integral part of the Financial Statements.
150
Mortgage-Backed Securities Index Fund
Financial Highlights
| ETF Shares | ||
| Year | Nov. 19, | |
| Ended | 20091 to | |
| August 31, | Aug. 31, | |
| For a Share Outstanding Throughout Each Period | 2011 | 2010 |
| Net Asset Value, Beginning of Period | $51.31 | $49.98 |
| Investment Operations | ||
| Net Investment Income | 1.142 | .836 |
| Net Realized and Unrealized Gain (Loss) on Investments | 1.412 | 1.338 |
| Total from Investment Operations | 2.554 | 2.174 |
| Distributions | ||
| Dividends from Net Investment Income | (1.142) | (.844) |
| Distributions from Realized Capital Gains | (.822) | — |
| Total Distributions | (1.964) | (.844) |
| Net Asset Value, End of Period | $51.90 | $51.31 |
| Total Return | 5.14% | 4.39% |
| Ratios/Supplemental Data | ||
| Net Assets, End of Period (Millions) | $73 | $31 |
| Ratio of Total Expenses to Average Net Assets | 0.15% | 0.15%2 |
| Ratio of Net Investment Income to Average Net Assets | 2.30% | 2.12%2 |
| Portfolio Turnover Rate3 | 344% | 402% |
1 Inception.
2 Annualized.
3 Includes 187% and 166% attributable to mortgage-dollar-roll activity.
See accompanying Notes, which are an integral part of the Financial Statements.
151
Mortgage-Backed Securities Index Fund
Notes to Financial Statements
Vanguard Mortgage-Backed Securities Index Fund is registered under the Investment Company Act of 1940 as an open-end investment company, or mutual fund. The fund offers three classes of shares: Signal Shares, Institutional Shares, and ETF Shares. Signal Shares and Institutional Shares are designed for investors who meet certain administrative, service, and account-size criteria. Institutional Shares were first issued on November 19, 2009. All outstanding Institutional Shares were converted to ETF Shares on December 29, 2009. The fund has not issued any additional Institutional Shares as of August 31, 2011. ETF Shares are listed for trading on Nasdaq; they can be purchased and sold through a broker.
A. The following significant accounting policies conform to generally accepted accounting principles for U.S. mutual funds. The fund consistently follows such policies in preparing its financial statements.
1. Security Valuation: Bonds, and temporary cash investments acquired over 60 days to maturity, are valued using the latest bid prices or using valuations based on a matrix system (which considers such factors as security prices, yields, maturities, and ratings), both as furnished by independent pricing services. Investments in Vanguard Market Liquidity Fund are valued at that fund’s net asset value. Other temporary cash investments are valued at amortized cost, which approximates market value. Securities for which market quotations are not readily available, or whose values have been affected by events occurring before the fund’s pricing time but after the close of the securities’ primary markets, are valued by methods deemed by the board of trustees to represent fair value.
2. Futures Contracts: The fund uses futures contracts to invest in fixed income asset classes with greater efficiency and lower cost than is possible through direct investment, to add value when these instruments are attractively priced, or to adjust sensitivity to changes in interest rates. The primary risks associated with the use of futures contracts are imperfect correlation between changes in market values of bonds held by the fund and the prices of futures contracts, and the possibility of an illiquid market.
Futures contracts are valued based upon their quoted daily settlement prices. The aggregate principal amounts of the contracts are not recorded in the Statement of Net Assets. Fluctuations in the value of the contracts are recorded in the Statement of Net Assets as an asset (liability) and in the Statement of Operations as unrealized appreciation (depreciation) until the contracts are closed, when they are recorded as realized futures gains (losses).
3. To Be Announced (TBA) Transactions: A TBA transaction is an agreement to buy or sell mortgage-backed securities with agreed-upon characteristics (face amount, coupon, maturity) for settlement at a future date. The fund may enter into TBA sells to reduce its exposure to the mortgage-backed securities market or in order to dispose of mortgage-backed securities it owns under delayed-delivery arrangements. For TBA purchases, the fund maintains cash or short-term investments until settlement date in an amount sufficient to meet the purchase price.
4. Mortgage Dollar Rolls: The fund has entered into mortgage-dollar-roll transactions, in which the fund sells mortgage-backed securities to a dealer and simultaneously purchases similar securities for future settlement at a lower price. The proceeds of the securities sold in mortgage-dollar-roll transactions are typically invested in high-quality short-term fixed income securities. Although the fund forgoes principal and interest paid on the securities sold, it is compensated by interest earned on the sale proceeds and by a lower price on the securities to be repurchased. The fund has also entered into mortgage-dollar-roll transactions in which the fund buys securities from a dealer pursuant to a TBA transaction and
152
Mortgage-Backed Securities Index Fund
simultaneously sells similar securities for future settlement. The securities bought in mortgage-dollar-roll transactions are used to cover an open TBA sell position. The fund continues to earn interest on mortgage-backed security pools already held and receives a lower price on the securities to be sold in the future. The fund accounts for mortgage-dollar-roll transactions as purchases and sales; as such, these transactions may increase the fund’s portfolio turnover rate. Amounts to be received or paid in connection with open mortgage dollar rolls are included in Receivables for Investment Securities Sold or Payables for Investment Securities Purchased in the Statement of Assets and Liabilities. The primary risk associated with mortgage dollar rolls is that a counterparty will default on its obligations. This risk is mitigated by entering into mortgage dollar rolls with only highly rated counterparties, allocating transactions among numerous counterparties, and monitoring exposure to each counterparty.
In April 2011, the Financial Accounting Standards Board adopted Accounting Standards Update (ASU) 2011-03, “Transfers and Servicing (Topic 860)—Reconsideration of Effective Control for Repurchase Agreements.” The ASU takes effect for periods beginning after December 15, 2011. Under the ASU, certain mortgage-dollar-roll transactions that previously would have been accounted for as purchases and sales may be accounted for as financing transactions. Treating these transactions as financing would have no impact on total return, but certain transactions that previously resulted in realized gains and losses would instead be reflected in net income and unrealized gains and losses. Management is currently assessing whether the ASU will affect the accounting for the fund’s mortgage-dollar-roll transactions.
5. Federal Income Taxes: The fund intends to continue to qualify as a regulated investment company and distribute all of its taxable income. Management has analyzed the fund’s tax positions taken for all open federal income tax years (August 31, 2010–2011), and has concluded that no provision for federal income tax is required in the fund’s financial statements.
6. Distributions: Distributions to shareholders are recorded on the ex-dividend date.
7. Other: Interest income includes income distributions received from Vanguard Market Liquidity Fund and is accrued daily. Premiums and discounts on debt securities purchased are amortized and accreted, respectively, to interest income over the lives of the respective securities. Security transactions are accounted for on the date securities are bought or sold. Costs used to determine realized gains (losses) on the sale of investment securities are those of the specific securities sold. Fees, if any, assessed on purchases of capital shares are credited to paid-in capital.
Each class of shares has equal rights as to assets and earnings, except that each class separately bears certain class-specific expenses related to maintenance of shareholder accounts (included in Management and Administrative expenses) and shareholder reporting. Marketing and distribution expenses are allocated to each class of shares based on a method approved by the board of trustees. Income, other non-class-specific expenses, and gains and losses on investments are allocated to each class of shares based on its relative net assets.
B. The Vanguard Group furnishes at cost investment advisory, corporate management, administrative, marketing, and distribution services. The costs of such services are allocated to the fund under methods approved by the board of trustees. The fund has committed to provide up to 0.40% of its net assets in capital contributions to Vanguard. At August 31, 2011, the fund had contributed capital of $12,000 to Vanguard (included in Other Assets), representing 0.01% of the fund’s net assets and 0.00% of Vanguard’s capitalization. The fund’s trustees and officers are also directors and officers of Vanguard.
153
Mortgage-Backed Securities Index Fund
C. Various inputs may be used to determine the value of the fund’s investments. These inputs are summarized in three broad levels for financial statement purposes. The inputs or methodologies used to value securities are not necessarily an indication of the risk associated with investing in those securities.
Level 1—Quoted prices in active markets for identical securities.
Level 2—Other significant observable inputs (including quoted prices for similar securities, interest rates, prepayment speeds, credit risk, etc.).
Level 3—Significant unobservable inputs (including the fund’s own assumptions used to determine the fair value of investments).
The following table summarizes the fund’s investments as of August 31, 2011, based on the inputs used to value them:
| Level 1 | Level 2 | Level 3 | |
| Investments | ($000) | ($000) | ($000) |
| U.S. Government and Agency Obligations | — | 86,755 | — |
| Temporary Cash Investments | 12,057 | — | — |
| Futures Contracts—Assets1 | 1 | — | — |
| Total | 12,058 | 86,755 | — |
| 1 Represents variation margin on the last day of the reporting period. | |||
D. At August 31, 2011, the aggregate settlement value of open futures contracts and the related unrealized appreciation (depreciation) were:
| ($000) | ||||
| Aggregate | ||||
| Number of | Settlement | Unrealized | ||
| Long (Short) | Value | Appreciation | ||
| Futures Contracts | Expiration | Contracts | Long (Short) | (Depreciation) |
| 10-Year U.S. Treasury Note | December 2011 | (1) | (129) | — |
| 5-Year U.S. Treasury Note | December 2011 | (1) | (123) | — |
Unrealized appreciation (depreciation) on open futures contracts is required to be treated as realized gain (loss) for tax purposes.
E. Distributions are determined on a tax basis and may differ from net investment income and realized capital gains for financial reporting purposes. Differences may be permanent or temporary. Permanent differences are reclassified among capital accounts in the financial statements to reflect their tax character. Temporary differences arise when certain items of income, expense, gain, or loss are recognized in different periods for financial statement and tax purposes; these differences will reverse at some time in the future. Differences in classification may also result from the treatment of short-term gains as ordinary income for tax purposes.
The fund used a tax accounting practice to treat a portion of the price of capital shares redeemed during the year as distributions from realized capital gains. Accordingly, the fund has reclassified $3,000 from accumulated net realized gains to paid-in capital.
154
Mortgage-Backed Securities Index Fund
For tax purposes, at August 31, 2011, the fund had short-term and long-term capital gains of $607,000 and $21,000, respectively, available for distribution. Short-term gain distributions are treated as ordinary income dividends for tax purposes.
At August 31, 2011, the cost of investment securities for tax purposes was $97,017,000. Net unrealized appreciation of investment securities for tax purposes was $1,795,000, consisting of unrealized gains of $1,827,000 on securities that had risen in value since their purchase and $32,000 in unrealized losses on securities that had fallen in value since their purchase.
F. During the year ended August 31, 2011, the fund purchased $242,523,000 of investment securities and sold $193,974,000 of investment securities, other than temporary cash investments.
G. Capital share transactions for each class of shares were:
| Year Ended | Inception1 to | |||
| August 31, 2011 | August 31, 2010 | |||
| Amount | Shares | Amount | Shares | |
| ($000) | (000) | ($000) | (000) | |
| Signal Shares | ||||
| Issued | 8,577 | 423 | 5,893 | 293 |
| Issued in Lieu of Cash Distributions | 319 | 16 | 97 | 5 |
| Redeemed | (324) | (16) | (25) | (1) |
| Net Increase (Decrease)—Signal Shares | 8,572 | 423 | 5,965 | 297 |
| Institutional Shares | ||||
| Issued | — | — | 20,007 | 800 |
| Issued in Lieu of Cash Distributions | — | — | 41 | 2 |
| Redeemed | — | — | (19,900) | (802) |
| Net Increase (Decrease)—Institutional Shares | — | — | 148 | —2 |
| ETF Shares | ||||
| Issued | 40,764 | 800 | 50,061 | 1,001 |
| Issued in Lieu of Cash Distributions | — | — | — | — |
| Redeemed | — | — | (20,380) | (400) |
| Net Increase (Decrease)—ETF Shares | 40,764 | 800 | 29,681 | 601 |
1 Inception was November 19, 2009, for ETF Shares and Institutional Shares, and December 3, 2009, for Signal Shares.
2 On December 29, 2009, all shares held in Institutional Shares were converted into ETF Shares.
H. In preparing the financial statements as of August 31, 2011, management considered the impact of subsequent events for potential recognition or disclosure in these financial statements.
155
Report of Independent Registered
Public Accounting Firm
To the Trustees of Vanguard Scottsdale Funds and the Shareholders of Vanguard Short-Term Government Bond Index Fund, Vanguard Intermediate-Term Government Bond Index Fund, Vanguard Long-Term Government Bond Index Fund, Vanguard Short-Term Corporate Bond Index Fund, Vanguard Intermediate-Term Corporate Bond Index Fund, Vanguard Long-Term Corporate Bond Index Fund and Vanguard Mortgage-Backed Securities Index Fund:
In our opinion, the accompanying statements of net assets, the statements of assets and liabilities and the related statements of operations and of changes in net assets and the financial highlights present fairly, in all material respects, the financial position of Vanguard Short-Term Government Bond Index Fund, Vanguard Intermediate-Term Government Bond Index Fund, Vanguard Long-Term Government Bond Index Fund, Vanguard Short-Term Corporate Bond Index Fund, Vanguard Intermediate-Term Corporate Bond Index Fund, Vanguard Long-Term Corporate Bond Index Fund and Vanguard Mortgage-Backed Securities Index Fund (constituting separate portfolios of Vanguard Scottsdale Funds, hereafter referred to as the “Funds”) at August 31, 2011, the results of each of their operations for the year then ended, and the changes in each of their net assets and financial highlights for the year then ended and for each of the periods indicated, in conformity with accounting principles generally accepted in the United States of America. These financial statements and financial highlights (hereafter referred to as “financial statements”) are the responsibility of the Funds’ management; our responsibility is to express an opinion on these financial statements based on our audits. We conducted our audits of these financial statements in accordance with the standards of the Public Company Accounting Oversight Board (United States). Those standards require that we plan and perform the audit to obtain reasonable assurance about whether the financial statements are free of material misstatement. An audit includes examining, on a test basis, evidence supporting the amounts and disclosures in the financial statements, assessing the accounting principles used and significant estimates made by management, and evaluating the overall financial statement presentation. We believe that our audits, which included confirmation of securities at August 31, 2011 by correspondence with the custodian and brokers and by agreement to the underlying ownership records of Vanguard Market Liquidity Fund, provide a reasonable basis for our opinion.
PricewaterhouseCoopers LLP
Philadelphia, Pennsylvania
October 13, 2011
| Special 2011 tax information (unaudited) for Vanguard Short-Term Government Bond Index Fund |
This information for the fiscal year ended August 31, 2011, is included pursuant to provisions of the Internal Revenue Code.
The fund distributed $4,000 as capital gain dividends (from net long-term capital gains) to shareholders during the fiscal year.
For nonresident alien shareholders, 100.0% of short-term capital gain dividends distributed by the fund are qualified short-term capital gains.
For nonresident alien shareholders, 100.0% of income dividends are interest-related dividends.
156
| Special 2011 tax information (unaudited) for Vanguard Intermediate-Term Government Bond Index Fund |
This information for the fiscal year ended August 31, 2011, is included pursuant to provisions of the Internal Revenue Code.
The fund distributed $37,000 as capital gain dividends (from net long-term capital gains) to shareholders during the fiscal year.
For nonresident alien shareholders, 100.0% of short-term capital gain dividends distributed by the fund are qualified short-term capital gains.
For nonresident alien shareholders, 100.0% of income dividends are interest-related dividends.
| Special 2011 tax information (unaudited) for Vanguard Long-Term Government Bond Index Fund |
This information for the fiscal year ended August 31, 2011, is included pursuant to provisions of the Internal Revenue Code.
For nonresident alien shareholders, 100.0% of short-term capital gain dividends distributed by the fund are qualified short-term capital gains.
For nonresident alien shareholders, 99.3% of income dividends are interest-related dividends.
| Special 2011 tax information (unaudited) for Vanguard Short-Term Corporate Bond Index Fund |
This information for the fiscal year ended August 31, 2011, is included pursuant to provisions of the Internal Revenue Code.
The fund distributed $43,000 as capital gain dividends (from net long-term capital gains) to shareholders during the fiscal year.
For nonresident alien shareholders, 100% of short-term capital gain dividends distributed by the fund are qualified short-term capital gains.
For nonresident alien shareholders, 78.3% of income dividends are interest-related dividends.
| Special 2011 tax information (unaudited) for Vanguard Intermediate-Term Corporate Bond Index Fund |
This information for the fiscal year ended August 31, 2011, is included pursuant to provisions of the Internal Revenue Code.
The fund distributed $172,000 as capital gain dividends (from net long-term capital gains) to shareholders during the fiscal year.
For nonresident alien shareholders, 100% of short-term capital gain dividends distributed by the fund are qualified short-term capital gains.
For nonresident alien shareholders, 83.0% of income dividends are interest-related dividends.
157
| Special 2011 tax information (unaudited) for Vanguard Long-Term Corporate Bond Index Fund |
This information for the fiscal year ended August 31, 2011, is included pursuant to provisions of the Internal Revenue Code.
For nonresident alien shareholders, 100.0% of short-term capital gain dividends distributed by the fund are qualified short-term capital gains.
For nonresident alien shareholders, 83.9% of income dividends are interest-related dividends.
| Special 2011 tax information (unaudited) for Vanguard Mortgage-Backed Securities Index Fund |
This information for the fiscal year ended August 31, 2011, is included pursuant to provisions of the Internal Revenue Code.
For nonresident alien shareholders, 100% of short-term capital gain dividends distributed by the fund are qualified short-term capital gains.
For nonresident alien shareholders, 99.9% of income dividends are interest-related dividends.
158
About Your Fund’s Expenses
As a shareholder of the fund, you incur ongoing costs, which include costs for portfolio management, administrative services, and shareholder reports (like this one), among others. Operating expenses, which are deducted from a fund’s gross income, directly reduce the investment return of the fund.
A fund’s expenses are expressed as a percentage of its average net assets. This figure is known as the expense ratio. The following examples are intended to help you understand the ongoing costs (in dollars) of investing in your fund and to compare these costs with those of other mutual funds. The examples are based on an investment of $1,000 made at the beginning of the period shown and held for the entire period.
The accompanying table illustrates your fund’s costs in two ways:
• Based on actual fund return. This section helps you to estimate the actual expenses that you paid over the period. The ”Ending Account Value“ shown is derived from the fund‘s actual return, and the third column shows the dollar amount that would have been paid by an investor who started with $1,000 in the fund. You may use the information here, together with the amount you invested, to estimate the expenses that you paid over the period.
To do so, simply divide your account value by $1,000 (for example, an $8,600 account value divided by $1,000 = 8.6), then multiply the result by the number given for your fund under the heading ”Expenses Paid During Period.“
• Based on hypothetical 5% yearly return. This section is intended to help you compare your fund‘s costs with those of other mutual funds. It assumes that the fund had a yearly return of 5% before expenses, but that the expense ratio is unchanged. In this case—because the return used is not the fund’s actual return—the results do not apply to your investment. The example is useful in making comparisons because the Securities and Exchange Commission requires all mutual funds to calculate expenses based on a 5% return. You can assess your fund’s costs by comparing this hypothetical example with the hypothetical examples that appear in shareholder reports of other funds.
Note that the expenses shown in the table are meant to highlight and help you compare ongoing costs only and do not reflect transaction costs incurred by the fund for buying and selling securities. Further, the expenses do not include any purchase, redemption, or account service fees described in the fund prospectus. If such fees were applied to your account, your costs would be higher. Your fund does not carry a “sales load.”
The calculations assume no shares were bought or sold during the period. Your actual costs may have been higher or lower, depending on the amount of your investment and the timing of any purchases or redemptions.
You can find more information about the fund’s expenses, including annual expense ratios, in the Financial Statements section of this report. For additional information on operating expenses and other shareholder costs, please refer to your fund’s current prospectus.
159
| Six Months Ended August 31, 2011 | |||
| Beginning | Ending | Expenses | |
| Account Value | Account Value | Paid During | |
| 2/28/2011 | 8/31/2011 | Period | |
| Based on Actual Fund Return | |||
| Short-Term Government Bond Index Fund | |||
| Signal Shares | $1,000.00 | $1,013.15 | $0.66 |
| Institutional Shares | 1,000.00 | 1,013.27 | 0.46 |
| ETF Shares | 1,000.00 | 1,013.18 | 0.66 |
| Intermediate-Term Government Bond Index Fund | |||
| Signal Shares | $1,000.00 | $1,079.36 | $0.63 |
| Institutional Shares | 1,000.00 | 1,079.73 | 0.47 |
| ETF Shares | 1,000.00 | 1,079.51 | 0.68 |
| Long-Term Government Bond Index Fund | |||
| Signal Shares | $1,000.00 | $1,166.79 | $0.71 |
| Institutional Shares | 1,000.00 | 1,167.12 | 0.49 |
| ETF Shares | 1,000.00 | 1,166.91 | 0.60 |
| Short-Term Corporate Bond Index Fund | |||
| Signal Shares | $1,000.00 | $1,019.89 | $0.66 |
| Institutional Shares | 1,000.00 | 1,020.21 | 0.46 |
| ETF Shares | 1,000.00 | 1,020.01 | 0.66 |
| Intermediate-Term Corporate Bond Index Fund | |||
| Signal Shares | $1,000.00 | $1,053.31 | $0.67 |
| Institutional Shares | 1,000.00 | 1,053.49 | 0.47 |
| ETF Shares | 1,000.00 | 1,053.20 | 0.67 |
| Long-Term Corporate Bond Index Fund | |||
| Signal Shares | $1,000.00 | $1,077.88 | $0.68 |
| Institutional Shares | 1,000.00 | 1,077.92 | 0.47 |
| ETF Shares | 1,000.00 | 1,077.75 | 0.68 |
| Mortgage-Backed Securities Index Fund | |||
| Signal Shares | $1,000.00 | $1,045.35 | $0.77 |
| ETF Shares | 1,000.00 | 1,045.24 | 0.77 |
160
| Six Months Ended August 31, 2011 | |||
| Beginning | Ending | Expenses | |
| Account Value | Account Value | Paid During | |
| 2/28/2011 | 8/31/2011 | Period | |
| Based on Hypothetical 5% Yearly Return | |||
| Short-Term Government Bond Index Fund | |||
| Signal Shares | $1,000.00 | $1,024.55 | $0.66 |
| Institutional Shares | 1,000.00 | 1,024.75 | 0.46 |
| ETF Shares | 1,000.00 | 1,024.55 | 0.66 |
| Intermediate-Term Government Bond Index Fund | |||
| Signal Shares | $1,000.00 | $1,024.60 | $0.61 |
| Institutional Shares | 1,000.00 | 1,024.75 | 0.46 |
| ETF Shares | 1,000.00 | 1,024.55 | 0.66 |
| Long-Term Government Bond Index Fund | |||
| Signal Shares | $1,000.00 | $1,024.55 | $0.66 |
| Institutional Shares | 1,000.00 | 1,024.75 | 0.46 |
| ETF Shares | 1,000.00 | 1,024.65 | 0.56 |
| Short-Term Corporate Bond Index Fund | |||
| Signal Shares | $1,000.00 | $1,024.55 | $0.66 |
| Institutional Shares | 1,000.00 | 1,024.75 | 0.46 |
| ETF Shares | 1,000.00 | 1,024.55 | 0.66 |
| Intermediate-Term Corporate Bond Index Fund | |||
| Signal Shares | $1,000.00 | $1,024.55 | $0.66 |
| Institutional Shares | 1,000.00 | 1,024.75 | 0.46 |
| ETF Shares | 1,000.00 | 1,024.55 | 0.66 |
| Long-Term Corporate Bond Index Fund | |||
| Signal Shares | $1,000.00 | $1,024.55 | $0.66 |
| Institutional Shares | 1,000.00 | 1,024.75 | 0.46 |
| ETF Shares | 1,000.00 | 1,024.55 | 0.66 |
| Mortgage-Backed Securities Index Fund | |||
| Signal Shares | $1,000.00 | $1,024.45 | $0.77 |
| ETF Shares | 1,000.00 | 1,024.45 | 0.77 |
The calculations are based on expenses incurred in the most recent six-month period. The funds’ annualized six-month expense ratios for that period are: for the Short-Term Government Bond Index Fund, 0.13% for Signal Shares, 0.09% for Institutional Shares, and 0.13% for ETF Shares; for the Intermediate-Term Government Bond Index Fund, 0.12% for Signal Shares, 0.09% for Institutional Shares, and 0.13% for ETF Shares; for the Long-Term Government Bond Index Fund, 0.13% for Signal Shares, 0.09% for Institutional Shares, and 0.11% for ETF Shares; for the Short-Term Corporate Bond Index Fund, 0.13% for Signal Shares, 0.09% for Institutional Shares, and 0.13% for ETF Shares; for the Intermediate-Term Corporate Bond Index Fund, 0.13% for Signal Shares, 0.09% for Institutional Shares, and 0.13% for ETF Shares; for the Long-Term Corporate Bond Index Fund, 0.13% for Signal Shares, 0.09% for Institutional Shares, and 0.13% for ETF Shares; for the Mortgage-Backed Securities Index Fund, 0.15% for Signal Shares and 0.15% for ETF Shares. The dollar amounts shown as ”Expenses Paid” are equal to the annualized expense ratio multiplied by the average account value over the period, multiplied by the number of days in the most recent six-month period, then divided by the number of days in the most recent 12-month period.
161
Trustees Approve Advisory Arrangement
The board of trustees of Vanguard Short-Term Government Bond Index Fund, Intermediate-Term Government Bond Index Fund, Long-Term Government Bond Index Fund, Short-Term Corporate Bond Index Fund, Intermediate-Term Corporate Bond Index Fund, Long-Term Corporate Bond Index Fund, and Mortgage-Backed Securities Index Fund has renewed the funds’ investment advisory arrangement with The Vanguard Group, Inc. Vanguard—through its Fixed Income Group—serves as the investment advisor to the funds. The board determined that continuing the funds’ internalized management structure was in the best interests of the funds and their shareholders.
The board based its decision upon an evaluation of the advisor’s investment staff, portfolio management process, and performance. The trustees considered the factors discussed below, among others. However, no single factor determined whether the board approved the arrangement. Rather, it was the totality of the circumstances that drove the board’s decision.
Nature, extent, and quality of services
The board considered the quality of the investment management services provided to the funds since their inception in 2009, and took into account the organizational depth and stability of the advisor. The board noted that Vanguard has been managing investments for more than three decades. The Fixed Income Group adheres to a sound, disciplined investment management process; the team has considerable experience, stability, and depth.
The board concluded that Vanguard’s experience, stability, depth, and performance, among other factors, warranted continuation of the advisory arrangement.
Investment performance
The board considered the funds’ performance since their inception, including any periods of outperformance or underperformance of their target indexes and peer groups. The board concluded that the funds have performed in line with expectations, and that their results have been consistent with their investment strategies. Information about each fund’s most recent performance can be found in the Performance Summary pages of this report.
Cost
The board concluded that each fund’s expense ratio was well below the average expense ratios charged by funds in its respective peer group and that the funds’ advisory fee rates were also well below their peer-group averages. Information about the funds’ expenses appears in the About Your Fund’s Expenses section of this report as well as in the Financial Statements section for each fund.
The board does not conduct a profitability analysis of Vanguard, because of Vanguard’s unique “at-cost” structure. Unlike most other mutual fund management companies, Vanguard is owned by the funds it oversees, and produces “profits” only in the form of reduced expenses for fund shareholders.
The benefit of economies of scale
The board concluded that the funds’ low-cost arrangement with Vanguard ensures that the funds will realize economies of scale as they grow, with the cost to shareholders declining as fund assets increase.
The board will consider whether to renew the advisory arrangement again after a one-year period.
162
Glossary
30-Day SEC Yield. A fund’s 30-day SEC yield is derived using a formula specified by the U.S. Securities and Exchange Commission. Under the formula, data related to the fund’s security holdings in the previous 30 days are used to calculate the fund’s hypothetical net income for that period, which is then annualized and divided by the fund’s estimated average net assets over the calculation period. For the purposes of this calculation, a security’s income is based on its current market yield to maturity (in the case of bonds), its actual income (for asset-backed securities), or its projected dividend yield (for stocks). Because the SEC yield represents hypothetical annualized income, it will differ—at times significantly—from the fund’s actual experience. As a result, the fund’s income distributions may be higher or lower than implied by the SEC yield.
Average Coupon. The average interest rate paid on the fixed income securities held by a fund. It is expressed as a percentage of face value.
Average Duration. An estimate of how much the value of the bonds held by a fund will fluctuate in response to a change in interest rates. To see how the value could change, multiply the average duration by the change in rates. If interest rates rise by 1 percentage point, the value of the bonds in a fund with an average duration of five years would decline by about 5%. If rates decrease by a percentage point, the value would rise by 5%.
Average Effective Maturity. The average length of time until fixed income securities held by a fund reach maturity and are repaid, taking into consideration the possibility that the issuer may call the bond before its maturity date. The figure reflects the proportion of fund assets represented by each security; it also reflects any futures contracts held. In general, the longer the average effective maturity, the more a fund’s share price will fluctuate in response to changes in market interest rates.
Credit Quality. Credit-quality ratings are measured on a scale that generally ranges from AAA (highest) to D (lowest). “Not Rated” is used to classify securities for which a rating is not available. U.S. Treasury, U.S. Agency, and U.S. Agency mortgage-backed securities appear under “U.S. Government.” Credit-quality ratings are obtained from Barclays Capital using ratings generally derived from Moody’s, Fitch, and S&P. When ratings from all three agencies are used, the median rating is shown. When ratings from two of the agencies are used, the lower rating is shown.
Expense Ratio. The percentage of a fund’s average net assets used to pay its annual administrative and advisory expenses. These expenses directly reduce returns to investors.
Inception Date. The date on which the assets of a fund (or one of its share classes) are first invested in accordance with the fund’s investment objective. For funds with a subscription period, the inception date is the day after that period ends. Investment performance is measured from the inception date.
Short-Term Reserves. The percentage of a fund invested in highly liquid, short-term securities that can be readily converted to cash.
Yield to Maturity. The rate of return an investor would receive if the fixed income securities held by a fund were held to their maturity dates.
163
The People Who Govern Your Fund
The trustees of your mutual fund are there to see that the fund is operated and managed in your best interests since, as a shareholder, you are a part owner of the fund. Your fund’s trustees also serve on the board of directors of The Vanguard Group, Inc., which is owned by the Vanguard funds and provides services to them on an at-cost basis.
A majority of Vanguard’s board members are independent, meaning that they have no affiliation with Vanguard or the funds they oversee, apart from the sizable personal investments they have made as private individuals. The independent board members have distinguished backgrounds in business, academia, and public service. Each of the trustees and executive officers oversees 178 Vanguard funds.
The following table provides information for each trustee and executive officer of the fund. More information about the trustees is in the Statement of Additional Information, which can be obtained, without charge, by contacting Vanguard at 800-662-7447, or online at vanguard.com.
| Interested Trustee1 | and President (2006–2008) of Rohm and Haas Co. |
| (chemicals); Director of Tyco International, Ltd. | |
| F. William McNabb III | (diversified manufacturing and services) and Hewlett- |
| Born 1957. Trustee Since July 2009. Chairman of the | Packard Co. (electronic computer manufacturing); |
| Board. Principal Occupation(s) During the Past Five | Senior Advisor at New Mountain Capital; Trustee |
| Years: Chairman of the Board of The Vanguard Group, | of The Conference Board; Member of the Board of |
| Inc., and of each of the investment companies served | Managers of Delphi Automotive LLP (automotive |
| by The Vanguard Group, since January 2010; Director | components). |
| of The Vanguard Group since 2008; Chief Executive | |
| Officer and President of The Vanguard Group and of | Amy Gutmann |
| each of the investment companies served by The | Born 1949. Trustee Since June 2006. Principal |
| Vanguard Group since 2008; Director of Vanguard | Occupation(s) During the Past Five Years: President |
| Marketing Corporation; Managing Director of The | of the University of Pennsylvania; Christopher H. |
| Vanguard Group (1995–2008). | Browne Distinguished Professor of Political Science |
| in the School of Arts and Sciences with secondary | |
| appointments at the Annenberg School for Commu- | |
| Independent Trustees | nication and the Graduate School of Education |
| of the University of Pennsylvania; Director of | |
| Emerson U. Fullwood | Carnegie Corporation of New York, Schuylkill River |
| Born 1948. Trustee Since January 2008. Principal | Development Corporation, and Greater Philadelphia |
| Occupation(s) During the Past Five Years: Executive | Chamber of Commerce; Trustee of the National |
| Chief Staff and Marketing Officer for North America | Constitution Center; Chair of the Presidential |
| and Corporate Vice President (retired 2008) of Xerox | Commission for the Study of Bioethical Issues. |
| Corporation (document management products and | |
| services); Executive in Residence and 2010 | JoAnn Heffernan Heisen |
| Distinguished Minett Professor at the Rochester | Born 1950. Trustee Since July 1998. Principal |
| Institute of Technology; Director of SPX Corporation | Occupation(s) During the Past Five Years: Corporate |
| (multi-industry manufacturing), the United Way of | Vice President and Chief Global Diversity Officer |
| Rochester, Amerigroup Corporation (managed health | (retired 2008) and Member of the Executive |
| care), the University of Rochester Medical Center, | Committee (1997–2008) of Johnson & Johnson |
| Monroe Community College Foundation, and North | (pharmaceuticals/consumer products); Director of |
| Carolina A&T University. | Skytop Lodge Corporation (hotels), the University |
| Medical Center at Princeton, the Robert Wood | |
| Rajiv L. Gupta | Johnson Foundation, and the Center for Work Life |
| Born 1945. Trustee Since December 2001. 2 | Policy; Member of the Advisory Board of the |
| Principal Occupation(s) During the Past Five Years: | Maxwell School of Citizenship and Public Affairs |
| Chairman and Chief Executive Officer (retired 2009) | at Syracuse University. |
This page intentionally left blank.
This page intentionally left blank.
This page intentionally left blank.
This page intentionally left blank.
| F. Joseph Loughrey | Thomas J. Higgins | |
| Born 1949. Trustee Since October 2009. Principal | Born 1957. Chief Financial Officer Since September | |
| Occupation(s) During the Past Five Years: President | 2008. Principal Occupation(s) During the Past Five | |
| and Chief Operating Officer (retired 2009) and Vice | Years: Principal of The Vanguard Group, Inc.; Chief | |
| Chairman of the Board (2008–2009) of Cummins Inc. | Financial Officer of each of the investment companies | |
| (industrial machinery); Director of SKF AB (industrial | served by The Vanguard Group since 2008; Treasurer | |
| machinery), Hillenbrand, Inc. (specialized consumer | of each of the investment companies served by The | |
| services), the Lumina Foundation for Education, and | Vanguard Group (1998–2008). | |
| Oxfam America; Chairman of the Advisory Council | ||
| for the College of Arts and Letters and Member | Kathryn J. Hyatt | |
| of the Advisory Board to the Kellogg Institute for | Born 1955. Treasurer Since November 2008. Principal | |
| International Studies at the University of Notre Dame. | Occupation(s) During the Past Five Years: Principal | |
| of The Vanguard Group, Inc.; Treasurer of each of | ||
| André F. Perold | the investment companies served by The Vanguard | |
| Born 1952. Trustee Since December 2004. Principal | Group since 2008; Assistant Treasurer of each of the | |
| Occupation(s) During the Past Five Years: George | investment companies served by The Vanguard Group | |
| Gund Professor of Finance and Banking at the Harvard | (1988–2008). | |
| Business School (retired July 2011); Chief Investment | ||
| Officer and co-Managing Partner of HighVista | Heidi Stam | |
| Strategies LLC (private investment firm); Director of | Born 1956. Secretary Since July 2005. Principal | |
| Rand Merchant Bank; Overseer of the Museum of | Occupation(s) During the Past Five Years: Managing | |
| Fine Arts Boston. | Director of The Vanguard Group, Inc., since 2006; | |
| General Counsel of The Vanguard Group since 2005; | ||
| Alfred M. Rankin, Jr. | Secretary of The Vanguard Group and of each of the | |
| Born 1941. Trustee Since January 1993. Principal | investment companies served by The Vanguard Group | |
| Occupation(s) During the Past Five Years: Chairman, | since 2005; Director and Senior Vice President of | |
| President, and Chief Executive Officer of NACCO | Vanguard Marketing Corporation since 2005; | |
| Industries, Inc. (forklift trucks/housewares/lignite); | Principal of The Vanguard Group (1997–2006). | |
| Director of Goodrich Corporation (industrial products/ | ||
| aircraft systems and services) and the National | ||
| Association of Manufacturers; Chairman of the | Vanguard Senior Management Team | |
| Federal Reserve Bank of Cleveland; Vice Chairman | ||
| of University Hospitals of Cleveland; President of | R. Gregory Barton | Michael S. Miller |
| the Board of The Cleveland Museum of Art. | Mortimer J. Buckley | James M. Norris |
| Kathleen C. Gubanich | Glenn W. Reed | |
| Peter F. Volanakis | Paul A. Heller | George U. Sauter |
| Born 1955. Trustee Since July 2009. Principal | Martha G. King | |
| Occupation(s) During the Past Five Years: President | ||
| and Chief Operating Officer (retired 2010) of Corning | ||
| Incorporated (communications equipment); Director of | Chairman Emeritus and Senior Advisor | |
| Corning Incorporated (2000–2010) and Dow Corning | ||
| (2001–2010); Overseer of the Amos Tuck School of | John J. Brennan | |
| Business Administration at Dartmouth College. | Chairman, 1996–2009 | |
| Chief Executive Officer and President, 1996–2008 | ||
| Executive Officers | ||
| Founder | ||
| Glenn Booraem | ||
| Born 1967. Controller Since July 2010. Principal | John C. Bogle | |
| Occupation(s) During the Past Five Years: Principal | Chairman and Chief Executive Officer, 1974–1996 | |
| of The Vanguard Group, Inc.; Controller of each of | ||
| the investment companies served by The Vanguard | ||
| Group since 2010; Assistant Controller of each of | ||
| the investment companies served by The Vanguard | ||
| Group (2001–2010). | ||
1 Mr. McNabb is considered an “interested person,” as defined in the Investment Company Act of 1940, because he is an officer of the Vanguard funds.
2 December 2002 for Vanguard Equity Income Fund, Vanguard Growth Equity Fund, the Vanguard Municipal Bond Funds, and the Vanguard State Tax-Exempt Funds.

| |
| P.O. Box 2600 | |
| Valley Forge, PA 19482-2600 |
Connect with Vanguard® > vanguard.com
| Fund Information > 800-662-7447 | Vanguard ETFs are not sponsored, endorsed, sold, or |
| Direct Investor Account Services > 800-662-2739 | promoted by Barclays Capital. Barclays Capital makes |
| Institutional Investor Services > 800-523-1036 | no representation or warranty, express or implied, to |
| Text Telephone for People | the owners of Vanguard ETFs or any member of the |
| With Hearing Impairment > 800-749-7273 | public regarding the advisability of investing in |
| securities generally or in Vanguard ETFs particularly or | |
| the ability of the Barclays Capital Index to track general | |
| This material may be used in conjunction | bond market performance. Barclays Capital hereby |
| with the offering of shares of any Vanguard | expressly disclaims all warranties of merchantability |
| fund only if preceded or accompanied by | and fitness for a particular purpose with respect to the |
| Barclays Capital Index and any data included therein. | |
| the fund’s current prospectus. | Barclays Capital’s only relationship to Vanguard and |
| All comparative mutual fund data are from Lipper Inc. or | Vanguard ETFs is the licensing of the Barclays Capital |
| Morningstar, Inc., unless otherwise noted. | Index which is determined, composed, and calculated |
| by Barclays Capital without regard to Vanguard or the | |
| You can obtain a free copy of Vanguard’s proxy voting | Vanguard ETFs. Barclays Capital is not responsible for, |
| guidelines by visiting vanguard.com/proxyreporting or by | and has not participated in, the determination of the |
| calling Vanguard at 800-662-2739. The guidelines are | timing of, prices of, or quantities of Vanguard ETFs to |
| also available from the SEC’s website, sec.gov. In | be issued. Source of index data: Barclays Capital Global |
| addition, you may obtain a free report on how your fund | Family of Indices. Copyright 2011, Barclays Capital. All |
| voted the proxies for securities it owned during the 12 | rights reserved. |
| months ended June 30. To get the report, visit either | |
| vanguard.com/proxyreporting or sec.gov. | |
| You can review and copy information about your fund at | |
| the SEC’s Public Reference Room in Washington, D.C. To | |
| find out more about this public service, call the SEC at | |
| 202-551-8090. Information about your fund is also | |
| available on the SEC’s website, and you can receive | |
| copies of this information, for a fee, by sending a | |
| request in either of two ways: via e-mail addressed to | |
| publicinfo@sec.gov or via regular mail addressed to the | |
| Public Reference Section, Securities and Exchange | |
| Commission, Washington, DC 20549-1520. | |
| © 2011 The Vanguard Group, Inc. | |
| All rights reserved. | |
| Vanguard Marketing Corporation, Distributor. | |
| Q16420 102011 | |
|
|
| Annual Report | August 31, 2011 |
| Vanguard Explorer ValueTM Fund |
> For the 12 months ended August 31, 2011, Vanguard Explorer Value Fund returned about 23%.
> The fund’s return outpaced the results of its benchmark index as well as the average return of its small-cap value fund peers.
> Health care, information technology, and industrial stocks were among the top performers as strength was notable across the board.
| Contents | |
| Your Fund’s Total Returns. | 1 |
| Chairman’s Letter. | 2 |
| Advisors’ Report. | 7 |
| Fund Profile. | 12 |
| Performance Summary. | 13 |
| Financial Statements. | 15 |
| Your Fund’s After-Tax Returns. | 27 |
| About Your Fund’s Expenses. | 28 |
| Glossary. | 30 |
Please note: The opinions expressed in this report are just that—informed opinions. They should not be considered promises or advice. Also, please keep in mind that the information and opinions cover the period through the date on the front of this report. Of course, the risks of investing in your fund are spelled out in the prospectus.
See the Glossary for definitions of investment terms used in this report.
About the cover: Vanguard was named for the HMS Vanguard, flagship of British Admiral Horatio Nelson. A ship—whose performance and safety depend on the work of all hands—has served as a fitting metaphor for the Vanguard crew as we strive to help clients reach their financial goals.
Your Fund’s Total Returns
| Fiscal Year Ended August 31, 2011 | |
| Total | |
| Returns | |
| Vanguard Explorer Value Fund | 23.04% |
| Russell 2500 Value Index | 17.28 |
| Small-Cap Value Funds Average | 18.35 |
| Small-Cap Value Funds Average: Derived from data provided by Lipper Inc. | |
| Your Fund’s Performance at a Glance | ||||
| August 31, 2010 , Through August 31, 2011 | ||||
| Distributions Per Share | ||||
| Starting | Ending | Income | Capital | |
| Share Price | Share Price | Dividends | Gains | |
| Vanguard Explorer Value Fund | $18.09 | $21.94 | $0.135 | $0.196 |
1

Chairman’s Letter
Dear Shareholder,
Vanguard Explorer Value Fund returned about 23% for the 12 months ended August 31, 2011, as small- and mid-capitalization stocks outperformed their large-cap brethren during the period. The fund’s advisors made the most of the propitious environment for smaller stocks. Strong stock selection helped the fund handily surpass the return of its benchmark index, the Russell 2500 Value Index, along with the average return for small-cap value funds. The advisors’ choices were most notable in the information technology, industrial, and health care sectors.
All ten of the fund’s industry sectors recorded positive returns during the period. Only financial stocks and the lightly represented telecommunication services and consumer staples sectors had returns that failed to exceed 20%.
Please note that in May, we lowered the minimum investment requirement for several Vanguard funds, including Explorer Value, to $3,000. This was part of our ongoing effort to increase the accessibility of our funds. Also, our preliminary estimates suggest that the Fund will distribute capital gains of roughly $0.98 per share in December 2011. If you own the fund in a taxable account, you may wish to review the information about its after-tax returns later in this report.
2
Strong 12-month returns in a tale of two markets
Global stock markets delivered strong returns in a fiscal year marked by distinct periods of strength and weakness.
During the first six months, stock prices surged, with the broad U.S. stock market returning about 29%. As the slow, grinding economic recovery seemed to gather momentum, energy and industrial stocks, which are keenly sensitive to the rhythms of the business cycle, produced the best returns.
In the second six months, growth decelerated and stock market volatility spiked, amplified by Europe’s sovereign-debt drama, political wrangling over the U.S. debt ceiling, and Standard & Poor’s decision to downgrade the U.S. credit rating. (Vanguard’s confidence in the “full faith and credit” of the U.S. government remains unshaken.) Stock prices retreated, and those sectors that led the market in the first half lost ground in the second, displaced by defensive sectors such as utilities and consumer staples.
Treasuries rallied as risk aversion returned
The stock market’s midyear pivot from offense to defense was mirrored in the bond market. In the first half of the year, yields rose (and prices declined) as the prospect of improved economic growth and inflationary pressures set the market’s tone. Corporate bonds outperformed U.S. Treasury securities.
| Market Barometer | |||
| Average Annual Total Returns | |||
| Periods Ended August 31, 2011 | |||
| One | Three | Five | |
| Year | Years | Years | |
| Stocks | |||
| Russell 1000 Index (Large-caps) | 19.06% | 0.84% | 1.11% |
| Russell 2000 Index (Small-caps) | 22.19 | 0.83 | 1.53 |
| Dow Jones U.S. Total Stock Market Index | 19.16 | 1.18 | 1.52 |
| MSCI All Country World Index ex USA (International) | 10.34 | -0.97 | 0.79 |
| Bonds | |||
| Barclays Capital U.S. Aggregate Bond Index (Broad | |||
| taxable market) | 4.62% | 7.23% | 6.56% |
| Barclays Capital Municipal Bond Index (Broad | |||
| tax-exempt market) | 2.66 | 6.00 | 4.94 |
| Citigroup Three-Month U.S. Treasury Bill Index | 0.12 | 0.24 | 1.69 |
| CPI | |||
| Consumer Price Index | 3.77% | 1.12% | 2.13% |
3
In the second half, risk aversion set the tone. Investors bid up Treasuries, trimming the yield of the 10-year Treasury note to barely 2%, and government bonds were among the market’s best performers. For the full year, the taxable investment-grade U.S. bond market returned 4.62%; the broad municipal bond market returned 2.66%.
The yields of money market instruments hovered near zero, consistent with the Federal Reserve’s target for short-term interest rates. Toward the end of the period, the Fed indicated that it expected to maintain this exceptionally low target at least through mid-2013.
Fund’s tech and industrial holdings drove strong overall returns
Although the economy sputtered and the stock market retreated as the fiscal year continued, the Explorer Value Fund’s strength over the period’s first six months more than offset the second-half weakness. The fund climbed 37% in the first half before the stock market’s pullback, which affected small- and mid-cap stocks more than large-caps as investors retreated from risks they had embraced earlier.
Even as the investment environment deteriorated, the fund’s three advisors––Frontier Capital, Cardinal Capital, and Sterling Capital—distinguished themselves.
| Expense Ratios | ||
| Your Fund Compared With Its Peer Group | ||
| Peer Group | ||
| Fund | Average | |
| Explorer Value Fund | 0.57% | 1.53% |
The fund expense ratio shown is from the prospectus dated December 28, 2010, and represents estimated costs for the current fiscal year. For the fiscal year ended August 31, 2011, the fund’s expense ratio was 0.57%. The peer-group expense ratio is derived from data provided by Lipper Inc. and captures information through year-end 2010.
Peer group: Small-Cap Value Funds.
4
Using three distinct but complementary methods, the advisors seek companies that are undervalued or unrecognized by the market.
The advisors’ stock selection was most notable in the information technology sector. The fund’s technology holdings rose nearly 34% behind strong performances from a range of industries: communications equipment, the internet, software, semiconductors, electronic equipment, and computers. Corporate expenditures and spending by consumers, particularly on mobile technology, had a positive effect, as did mergers and acquisitions.
Industrial stocks, representing the fund’s second-largest weighting, returned about 28%. Both the advisors’ stock selection and sizeable exposure to the sector helped performance. Before the economy wavered, strong demand for manufacturing and services lifted companies involved in industry groups such as machinery, trading and distributing, electrical equipment, commercial services and supplies, and aerospace and defense.
Although the fund didn’t have heavy exposure to health care stocks, its holdings returned 48%––more than any other sector, and superior to the return of the benchmark’s health care stocks. Acquisitions in the pharmaceutical industry were a catalyst. Pharmaceutical companies and health care equipment firms are benefiting from new opportunities in emerging markets. Health care providers also performed well.
Amid the fund’s—and the market’sdouble-digit returns, financial stocks, the fund’s largest allocation, were notable laggards, returning about 9%. However, the advisors’ decision to keep the fund’s exposure to the sector lower than in the benchmark aided performance, as did investments in consumer finance stocks, which received a boost from improving credit trends. The advisors’ selections came up short in consumer staples, the fund’s smallest weighting. Errors of omission were the culprit as the advisors missed several opportunities in the food products industry.
Short-term volatility may accompany long-term results
The Explorer Value Fund has traced an upward, but jagged, path since its launch on March 30, 2010, with a cumulative return of 11.29% for the 17 months through August 31. Its benchmark, the Russell 2500 Value Index, returned 6.20% during the same period. At Vanguard, we recognize that 17 months isn’t an adequate amount of time to assess an investment. The Explorer Value Fund was developed to serve long-term investors, and a 17-month window can provide only limited perspective on its success in meeting long-term expectations. Even
5
so, the window does reveal that volatility is likely to be a constant companion on the fund’s longer-term journey.
Volatility is a common, indeed intrinsic, part of stock market investing. The best way to approach the market’s inevitable turbulence is to create a diversified and balanced investment plan, featuring a combination of risk control and return potential, that can fortify your resolve to hold fast through the stock market’s occasional rough patches.
With its experienced team of advisors and low costs, Vanguard Explorer Value Fund can be a useful way to gain exposure to small- and mid-cap value stocks as part of such a diversified and balanced portfolio.
Thank you for entrusting your assets to Vanguard.
Sincerely,

F. William McNabb III
Chairman and Chief Executive Officer
September 14, 2011
6
Advisors’ Report
For the fiscal year ended August 31, 2011, Vanguard Explorer Value Fund returned about 23%. Your fund is managed by three independent advisors, a strategy that enhances the fund’s diversification by providing exposure to distinct, yet complementary, investment approaches. It is not uncommon for different advisors to have different views about individual securities or the broader investment environment. The advisors, the amount and percentage of fund assets each manages, and brief descriptions of their
investment strategies are presented in the table below. The advisors have also prepared a discussion of the investment environment that existed during the fiscal year and of how their portfolio positioning reflects this assessment. (Please note that the Frontier and Sterling discussions refer to industry sectors as defined by Russell classifications, rather than by the Global Industry Classification Standard used elsewhere in this report.) These comments were prepared on September 21, 2011.
| Vanguard Explorer Value Fund Investment Advisors | |||
| Fund Assets Managed | |||
| Investment Advisor | % | $ Million | Investment Strategy |
| Frontier Capital Management Co., | 34 | 39 | The advisor selects stocks by identifying companies it |
| LLC | believes are underpriced relative to their long-term | ||
| value. These companies are generally inexpensive and | |||
| have low price-to-book and price-to earnings ratios. | |||
| Cardinal Capital Management, | 33 | 38 | The advisor seeks stocks of companies that are able to |
| L.L.C. | generate excess cash flow and reinvest the cash to | ||
| increase shareholder value. | |||
| Sterling Capital Management LLC | 30 | 35 | The advisor searches for stocks of quality companies |
| selling at large discounts compared with their | |||
| underlying value. It defines quality companies as those | |||
| that generate considerable cash flow, reinvest in | |||
| opportunities with attractive returns, and have a | |||
| competitive advantage within their business sector. | |||
| Cash Investments | 3 | 4 | These short-term reserves are invested by Vanguard in |
| equity index products to simulate investment in stocks. | |||
| Each advisor may also maintain a modest cash | |||
| position. | |||
7
Frontier Capital Management Co., LLC
Portfolio Managers:
Thomas W. Duncan, Jr., Senior Vice President
William A. Teichner, CFA, Senior Vice President
Our portion of the fund benefited from both positive stock and sector selection, with our performance driven by strong stock selection in the technology, producer durables, and health care sectors.
During the period, the portfolio’s ten best-contributing stocks were spread over six sectors and included three technology companies, two stocks each in energy and producer durables, and three holdings in other sectors.
The portfolio’s best-contributing stock was SM Energy Company, an oil and natural gas producer. The stock added approximately 150 basis points to performance. (One basis point equals one-hundredth of a percentage point.) During the period, the company reported results that exceeded consensus estimates for oil and gas production, earnings, and cash flow. Energy production was boosted by the firm’s wells in the Eagle Ford shale formation in South Texas.
The portfolio’s ten largest detractors were spread over five sectors and included five holdings in financial services, two in materials and processing, and three stocks in other sectors. The financials were spread across two savings banks, one commercial bank, an insurance company, and a securities brokerage firm. The largest single detractor during the period was Eagle Materials Inc., a manufacturer of gypsum wallboard and cement, which hurt performance by approximately 40 basis points. Eagle reported revenues and earnings that fell short of consensus estimates. It had been affected by weak construction markets where it sells its products, a competitive environment, and adverse weather conditions. We maintain a position in the stock because it is inexpensive relative to its longer-term earnings potential. Eagle’s low-cost structure should help it manage its current challenges.
During the period we bought 20 new stocks and sold 17 holdings. The purchases were spread across eight sectors; the sales were across six. The net effect was primarily an increase in the number of producer durables and materials and processing stocks and a reduction in financial services firms. As is typical for Frontier, the changes were made because of company-specific reasons rather than top-down positioning.
Beginning in late July 2011, the stock market weakened and became volatile. This coincided with investor concerns about a weakening U.S. economy, the level of U.S. federal debt, and other issues. Nevertheless, we believe that the longer-term earnings power of most of our holdings has not changed.
8
Cardinal Capital Management, L.L.C.
Portfolio Managers: Amy K. Minella, Partner
Eugene Fox, Partner
Robert B. Kirkpatrick, CFA, Partner
Stock selection in the financial services, consumer discretionary, information technology, industrial, and energy sectors was the largest contributor to relative performance in our portfolio. Stock selection within financials contributed more than 400 basis points of relative performance, led by Cash America, a provider of pawn and payday lending services, whose shares rose sharply after the threat of adverse legislation in Texas ended, and Affiliated Managers Group, an asset management firm with an equity focus, which benefited from the strong equity market.
In information technology, IAC/InterActive Corp, an internet-based services company, benefited from strong results in its internet search and Match.com businesses; in consumer discretionary, Six Flags, a regional theme park operator that emerged from bankruptcy last summer, benefited from strong results and ambitious guidance as well as a positive market reaction to significant insider buying.
The absence of utilities and the drag from holding a residual cash position detracted from performance.
The largest new positions purchased over the last 12 months were IAC/InterActive Corp, InterDigital, Six Flags, Oasis Petroleum, and CapitalSource. IAC InterActive Corp operates more than 35 online brands in a well-positioned portfolio whose largest business segments include search (Ask.com, toolbars, and applications) and personals (Match.com). InterDigital designs and develops advanced digital wireless technologies used in virtually all digital cellular and wireless products and networks.
Six Flags is the largest regional theme park operator in the United States; it provides thrill rides, shows, and animal attractions to 25 million visitors annually at 19 parks. Six Flags filed for bankruptcy in 2009, when it was laden with billions of dollars in debt. The company emerged last year with substantially less debt and significant tax assets and hired new management (which Cardinal had invested with successfully when the managers were at Dade Behring), which we believe will execute on its plans to reduce costs, boost sales, and monetize non-core assets.
Notable positions sold over the last 12 months include Oceaneering International and Tiffany & Company, which reached our price targets; Beckman Coulter, which was acquired by Danaher at a substantial premium; Ralcorp Holdings, which reached our price target after an unsolicited approach by ConAgra; and Hudson City Bancorp, which was sold because of
9
fundamental concerns, including a flattening yield curve and a new requirement that the company restructure its balance sheet, which would have reduced its operating margins.
Our near-term investment outlook is cautiously optimistic, as monetary policy remains accommodative and credit conditions have improved despite the sluggish economy. Equity valuations continue to be attractive despite poor market sentiment as investors remain concerned about economic fallout from the European debt crisis and skeptical that U.S. government spending can be brought under control intelligently. In coming months, we expect investors to focus on employment and growth trends to assess whether the economy will dip into recession in the second half of the year. Mergers and acquisition activity has remained strong and is important to our positive stance on equities.
Sterling Capital Management LLC
Portfolio Managers:
Eduardo A. Brea, CFA, Managing Director
Brian R. Walton, CFA, Managing Director
For the trailing 12 months ended August 31, 2011, U.S. domestic small-and mid-cap equities generated solid returns, benefiting from supportive monetary policies. The portfolio’s strong performance was mostly driven by positive stock selection from several individual holdings.
Both the technology and health care sectors were areas of strength for the portfolio over the last 12 months. Microstrategy, for example, benefited from growing acceptance of its business intelligence software. Consolidation trends within the technology space also provided a catalyst for several portfolio holdings, such as National Semiconductor, which was acquired by Texas Instruments at more than a 70% premium. DST Systems, which remains the portfolio’s largest holding, has received overtures from private equity firms about the possibility of purchasing the company at a substantial premium to its current stock price. Mergers and acquisition activity also benefited the portfolio’s health care holdings as King Pharmaceuticals was acquired by Pfizer at a meaningful premium.
The financials sector has acted as the biggest detractor to performance, primarily because of the portfolio’s banking exposure. Although banks do not represent a huge overweighting (just under 12% of the portfolio versus 9% in the index), as a group they have significantly under-performed. The portfolio’s exposure is made up entirely of mid- to smaller-sized banks that have almost no exposure to the sovereign-credit issues challenging global financial institutions. Nevertheless, there is no shortage of issues for all banks to deal with, including weak loan growth, net interest margin pressure, heightened regulation, and higher capital requirements. Despite these real challenges, we continue to believe that well-capitalized banks such as Comerica, Fifth Third, and First Citizens
10
offer compelling long-term opportunities, as valuations are at historical lows while capital ratios have grown measurably.
There are numerous challenges facing both the domestic and global economies. Certainly, the overhang of excessive leverage in both the private and public sectors will have a long-term dampening influence on economic growth. Our bottom-up discounted cash-flow modeling incorporates slower long-term growth assumptions than evident in past recoveries. Nonetheless, we believe several catalysts could lead to solid equity returns over the next 12 to 18 months––flush corporate balance sheets, strong corporate operating profits, and continued improvement in capital spending. Further, although recent volatility in capital markets could temper short-term activity, mergers and acquisitions should provide a long-term catalyst for small and midsize companies, producing strong levels of free cash flow.
Explorer Value Fund
Fund Profile
As of August 31, 2011
| Portfolio Characteristics | |||
| Russell | DJ | ||
| 2500 | U.S. Total | ||
| Value | Market | ||
| Fund | Index | Index | |
| Number of Stocks | 185 | 1,692 | 3,716 |
| Median Market Cap | $1.8B | $2.2B | $30.4B |
| Price/Earnings Ratio | 16.7x | 16.6x | 14.7x |
| Price/Book Ratio | 1.4x | 1.3x | 2.0x |
| Return on Equity | 11.7% | 8.3% | 19.0% |
| Earnings Growth Rate | 1.4% | -0.5% | 7.0% |
| Dividend Yield | 1.6% | 2.2% | 2.0% |
| Foreign Holdings | 0.0% | 0.0% | 0.0% |
| Turnover Rate | 41% | — | — |
| Ticker Symbol | VEVFX | — | — |
| Expense Ratio1 | 0.57% | — | — |
| 30-Day SEC Yield | 0.94% | — | — |
| Short-Term Reserves | 3.2% | — | — |
| Sector Diversification (% of equity exposure) | |||
| Russell | DJ | ||
| 2500 | U.S. Total | ||
| Value | Market | ||
| Fund | Index | Index | |
| Consumer | |||
| Discretionary | 9.1% | 12.7% | 12.3% |
| Consumer Staples | 1.2 | 3.3 | 10.5 |
| Energy | 6.2 | 5.3 | 10.8 |
| Financials | 25.9 | 32.3 | 14.8 |
| Health Care | 7.7 | 5.6 | 11.4 |
| Industrials | 22.2 | 14.0 | 11.0 |
| Information | |||
| Technology | 19.2 | 9.6 | 18.7 |
| Materials | 3.9 | 5.9 | 4.4 |
| Telecommunication | |||
| Services | 2.0 | 0.8 | 2.6 |
| Utilities | 2.6 | 10.5 | 3.5 |
| Ten Largest Holdings (% of total net assets) | ||
| Teleflex Inc. | Health Care | |
| Equipment | 1.7% | |
| Chico's FAS Inc. | Apparel Retail | 1.3 |
| Silgan Holdings Inc. | Metal & Glass | |
| Containers | 1.3 | |
| DST Systems Inc. | Data Processing & | |
| Outsourced | ||
| Services | 1.3 | |
| Teledyne Technologies | Aerospace & | |
| Inc. | Defense | 1.3 |
| j2 Global | Internet Software & | |
| Communications Inc. | Services | 1.3 |
| Lexmark International | Computer Storage | |
| Inc. Class A | & Peripherals | 1.3 |
| IAC/InterActiveCorp | Internet Software & | |
| Services | 1.2 | |
| Atlas Air Worldwide | Air Freight & | |
| Holdings Inc. | Logistics | 1.2 |
| Affiliated Managers | Asset Management | |
| Group Inc. | & Custody Banks | 1.2 |
| Top Ten | 13.1% | |
The holdings listed exclude any temporary cash investments and equity index products.
Investment Focus
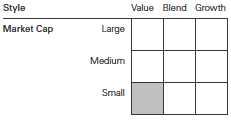
1 The expense ratio shown is from the prospectus dated December 28, 2010, and represents estimated costs for the current fiscal year. For the fiscal year ended August 31, 2011, the expense ratio was 0.57%.
12
Explorer Value Fund
Performance Summary
All of the returns in this report represent past performance, which is not a guarantee of future results that may be achieved by the fund. (Current performance may be lower or higher than the performance data cited. For performance data current to the most recent month-end, visit our website at vanguard.com/performance.) Note, too, that both investment returns and principal value can fluctuate widely, so an investor’s shares, when sold, could be worth more or less than their original cost. The returns shown do not reflect taxes that a shareholder would pay on fund distributions or on the sale of fund shares.
Cumulative Performance: March 30, 2010, Through August 31, 2011
Initial Investment of $10,000
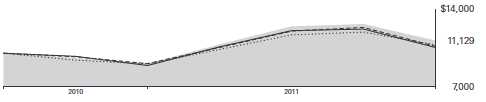
| Average Annual Total Returns | |||
| Periods Ended August 31, 2011 | |||
| Since | Final Value | ||
| One | Inception | of a $10,000 | |
| Year | (3/30/2010) | Investment | |
| Explorer Value Fund | 23.04% | 7.81% | $11,129 |
| Dow Jones U.S. Total Stock Market | |||
| Index | 19.16 | 5.23 | 10,752 |
| Russell 2500 Value Index | 17.28 | 4.32 | 10,620 |
| Small-Cap Value Funds Average | 18.35 | 3.61 | 10,518 |
| Small-Cap Value Funds Average: Derived from data provided by Lipper Inc. | |||
| "Since Inception" performance is calculated from the fund’s inception date for both the fund and its comparative standards. | |||
See Financial Highlights for dividend and capital gains information.
13
Explorer Value Fund
Fiscal-Year Total Returns (%): March 30, 2010, Through August 31, 2011
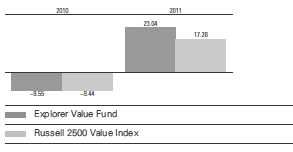
Average Annual Total Returns: Periods Ended June 30, 2011
This table presents returns through the latest calendar quarter—rather than through the end of the fiscal period.
Securities and Exchange Commission rules require that we provide this information.
| Inception | One | Since | |
| Date | Year | Inception | |
| Explorer Value Fund | 3/30/2010 | 36.95% | 18.65% |
14
Explorer Value Fund
Financial Statements
Statement of Net Assets
As of August 31, 2011
The fund reports a complete list of its holdings in regulatory filings four times in each fiscal year, at the quarter-ends. For the second and fourth fiscal quarters, the lists appear in the fund’s semiannual and annual reports to shareholders. For the first and third fiscal quarters, the fund files the lists with the Securities and Exchange Commission on Form N-Q. Shareholders can look up the fund’s Forms N-Q on the SEC’s website at sec.gov. Forms N-Q may also be reviewed and copied at the SEC’s Public Reference Room (see the back cover of this report for further information).
| Market | |||
| Value | |||
| Shares | ($000) | ||
| Common Stocks (94.0%)1 | |||
| Consumer Discretionary (8.4%) | |||
| Chico’s FAS Inc. | 109,757 | 1,528 | |
| Six Flags Entertainment | |||
| Corp. | 29,400 | 986 | |
| Interpublic Group of | |||
| Cos. Inc. | 85,400 | 737 | |
| Virgin Media Inc. | 26,100 | 662 | |
| American Eagle | |||
| Outfitters Inc. | 52,000 | 576 | |
| * | Entercom Communications | ||
| Corp. Class A | 83,550 | 510 | |
| * | Ascena Retail Group Inc. | 17,000 | 483 |
| * | Exide Technologies | 84,400 | 476 |
| Regis Corp. | 30,200 | 446 | |
| Meredith Corp. | 17,121 | 442 | |
| Newell Rubbermaid Inc. | 30,643 | 424 | |
| International Speedway | |||
| Corp. Class A | 16,240 | 409 | |
| * | Kirkland’s Inc. | 43,500 | 403 |
| *,^ | hhgregg Inc. | 34,200 | 376 |
| * | Valassis Communications | ||
| Inc. | 14,600 | 369 | |
| Wendy’s Co. | 51,000 | 248 | |
| Christopher & Banks Corp. | 50,220 | 239 | |
| Thor Industries Inc. | 9,100 | 202 | |
| * | Cambium Learning Group | ||
| Inc. | 58,100 | 174 | |
| 9,690 | |||
| Consumer Staples (1.0%) | |||
| JM Smucker Co. | 8,900 | 641 | |
| Inter Parfums Inc. | 17,863 | 296 | |
| * | Pantry Inc. | 20,165 | 252 |
| 1,189 | |||
| Energy (5.8%) | |||
| * | Oasis Petroleum Inc. | 35,800 | 953 |
| World Fuel Services Corp. | 25,500 | 947 | |
| EXCO Resources Inc. | 55,100 | 737 | |
| SM Energy Co. | 8,663 | 663 | |
| Market | |||
| Value | |||
| Shares | ($000) | ||
| * | Rex Energy Corp. | 52,500 | 645 |
| * | Concho Resources Inc. | 6,400 | 557 |
| * | Resolute Energy Corp. | 36,700 | 495 |
| * | Carrizo Oil & Gas Inc. | 15,988 | 480 |
| * | Comstock Resources Inc. | 21,480 | 437 |
| * | Forest Oil Corp. | 20,400 | 397 |
| * | Plains Exploration | ||
| & Production Co. | 13,100 | 385 | |
| 6,696 | |||
| Financials (24.6%) | |||
| * | Affiliated Managers | ||
| Group Inc. | 16,200 | 1,412 | |
| Willis Group Holdings plc | 34,600 | 1,354 | |
| Aspen Insurance | |||
| Holdings Ltd. | 55,666 | 1,337 | |
| Cash America International | |||
| Inc. | 18,900 | 1,056 | |
| Nelnet Inc. Class A | 53,800 | 1,033 | |
| First Citizens BancShares | |||
| Inc. Class A | 5,600 | 890 | |
| Parkway Properties Inc. | 60,400 | 820 | |
| Endurance Specialty | |||
| Holdings Ltd. | 22,500 | 814 | |
| Fifth Third Bancorp | 74,800 | 794 | |
| CapitalSource Inc. | 123,900 | 787 | |
| Comerica Inc. | 30,100 | 770 | |
| * | Texas Capital Bancshares | ||
| Inc. | 29,170 | 749 | |
| Bank of the Ozarks Inc. | 31,090 | 706 | |
| Raymond James Financial | |||
| Inc. | 25,124 | 706 | |
| HCC Insurance Holdings | |||
| Inc. | 24,023 | 702 | |
| Brookline Bancorp Inc. | 81,000 | 682 | |
| Ares Capital Corp. | 42,800 | 651 | |
| Hatteras Financial Corp. | 22,500 | 621 | |
| Argo Group International | |||
| Holdings Ltd. | 22,202 | 611 | |
| First American Financial | |||
| Corp. | 39,900 | 609 | |
15
Explorer Value Fund
| Market | |||
| Value | |||
| Shares | ($000) | ||
| Northwest Bancshares Inc. | 50,700 | 604 | |
| Assured Guaranty Ltd. | 42,300 | 571 | |
| Assurant Inc. | 16,100 | 566 | |
| BOK Financial Corp. | 10,870 | 535 | |
| Entertainment Properties | |||
| Trust | 12,600 | 531 | |
| Starwood Property | |||
| Trust Inc. | 28,600 | 529 | |
| National Retail Properties | |||
| Inc. | 19,274 | 525 | |
| * | E*Trade Financial Corp. | 40,200 | 497 |
| Government Properties | |||
| Income Trust | 20,600 | 482 | |
| Medical Properties | |||
| Trust Inc. | 44,100 | 471 | |
| * | Beneficial Mutual Bancorp | ||
| Inc. | 58,510 | 459 | |
| Cypress Sharpridge | |||
| Investments Inc. | 34,300 | 458 | |
| Campus Crest Communities | |||
| Inc. | 38,707 | 458 | |
| Renasant Corp. | 31,111 | 431 | |
| Flushing Financial Corp. | 36,840 | 423 | |
| First Community | |||
| Bancshares Inc. | 35,524 | 422 | |
| Washington Federal Inc. | 24,300 | 365 | |
| Hancock Holding Co. | 11,540 | 360 | |
| * | Pinnacle Financial | ||
| Partners Inc. | 28,267 | 358 | |
| GFI Group Inc. | 80,674 | 353 | |
| Home Bancshares Inc. | 14,940 | 351 | |
| WSFS Financial Corp. | 8,836 | 309 | |
| * | Investment Technology | ||
| Group Inc. | 25,900 | 295 | |
| * | Popular Inc. | 141,500 | 294 |
| First Financial Holdings Inc. | 45,370 | 286 | |
| First Horizon National Corp. | 38,784 | 273 | |
| Bank Mutual Corp. | 55,100 | 175 | |
| 28,485 | |||
| Health Care (7.1%) | |||
| Teleflex Inc. | 33,600 | 1,933 | |
| Cooper Cos. Inc. | 13,414 | 1,010 | |
| * | Coventry Health Care Inc. | 28,600 | 940 |
| * | Henry Schein Inc. | 12,000 | 791 |
| Omnicare Inc. | 26,400 | 784 | |
| Chemed Corp. | 13,300 | 772 | |
| * | VCA Antech Inc. | 29,000 | 537 |
| * | CONMED Corp. | 21,202 | 497 |
| West Pharmaceutical | |||
| Services Inc. | 9,400 | 377 | |
| * | Synovis Life | ||
| Technologies Inc. | 18,875 | 322 | |
| * | IRIS International Inc. | 24,490 | 209 |
| 8,172 | |||
| Market | |||
| Value | |||
| Shares | ($000) | ||
| Industrials (21.1%) | |||
| * | Teledyne Technologies Inc. | 27,042 | 1,476 |
| * | Atlas Air Worldwide | ||
| Holdings Inc. | 28,825 | 1,415 | |
| RR Donnelley & Sons Co. | 64,900 | 990 | |
| * | FTI Consulting Inc. | 25,800 | 939 |
| * | DXP Enterprises Inc. | 37,735 | 909 |
| * | SYKES Enterprises Inc. | 56,000 | 876 |
| Mueller Industries Inc. | 17,500 | 825 | |
| * | KAR Auction Services Inc. | 53,200 | 780 |
| Equifax Inc. | 22,500 | 727 | |
| * | WESCO International Inc. | 14,916 | 643 |
| * | BE Aerospace Inc. | 17,963 | 626 |
| Viad Corp. | 30,200 | 621 | |
| * | Altra Holdings Inc. | 39,155 | 608 |
| Brink’s Co. | 23,600 | 606 | |
| Harsco Corp. | 26,000 | 594 | |
| Snap-on Inc. | 10,895 | 576 | |
| * | Kirby Corp. | 10,398 | 572 |
| * | Colfax Corp. | 22,404 | 562 |
| * | On Assignment Inc. | 72,129 | 548 |
| * | RailAmerica Inc. | 39,754 | 543 |
| Kaman Corp. | 14,400 | 492 | |
| Interface Inc. Class A | 31,597 | 476 | |
| * | Celadon Group Inc. | 39,678 | 465 |
| * | Beacon Roofing Supply Inc. | 24,603 | 457 |
| Granite Construction Inc. | 21,800 | 452 | |
| Actuant Corp. Class A | 21,801 | 438 | |
| UTi Worldwide Inc. | 30,700 | 416 | |
| * | GrafTech International Ltd. | 25,800 | 405 |
| Encore Wire Corp. | 17,950 | 402 | |
| * | Saia Inc. | 33,216 | 398 |
| EnergySolutions Inc. | 110,800 | 391 | |
| * | Orbital Sciences Corp. | 24,585 | 384 |
| Carlisle Cos. Inc. | 9,450 | 370 | |
| Alliant Techsystems Inc. | 5,700 | 362 | |
| * | Columbus McKinnon Corp. | 25,075 | 362 |
| JB Hunt Transport | |||
| Services Inc. | 8,900 | 358 | |
| Heidrick & Struggles | |||
| International Inc. | 16,460 | 342 | |
| * | Titan Machinery Inc. | 10,896 | 289 |
| Apogee Enterprises Inc. | 28,500 | 268 | |
| AMETEK Inc. | 6,800 | 266 | |
| * | Furmanite Corp. | 43,135 | 263 |
| * | CRA International Inc. | 11,082 | 261 |
| HNI Corp. | 12,466 | 257 | |
| * | WABCO Holdings Inc. | 4,626 | 216 |
| Mine Safety Appliances Co. | 6,600 | 204 | |
| 24,430 | |||
| Information Technology (18.1%) | |||
| DST Systems Inc. | 31,600 | 1,483 | |
| j2 Global Communications | |||
| Inc. | 45,900 | 1,467 | |
16
Explorer Value Fund
| Market | |||
| Value | |||
| Shares | ($000) | ||
| * | Lexmark International Inc. | ||
| Class A | 45,841 | 1,465 | |
| * | IAC/InterActiveCorp | 35,900 | 1,419 |
| InterDigital Inc. | 15,800 | 1,112 | |
| Broadridge Financial | |||
| Solutions Inc. | 47,450 | 988 | |
| CA Inc. | 44,500 | 934 | |
| * | Convergys Corp. | 82,600 | 880 |
| * | Progress Software Corp. | 42,150 | 878 |
| Earthlink Inc. | 95,900 | 708 | |
| * | Compuware Corp. | 80,900 | 684 |
| * | Axcelis Technologies Inc. | 481,600 | 655 |
| * | Insight Enterprises Inc. | 32,520 | 612 |
| MTS Systems Corp. | 15,417 | 557 | |
| Jabil Circuit Inc. | 32,397 | 546 | |
| Lender Processing | |||
| Services Inc. | 30,200 | 533 | |
| * | Brightpoint Inc. | 52,590 | 501 |
| * | OSI Systems Inc. | 12,106 | 471 |
| * | Pericom Semiconductor | ||
| Corp. | 59,905 | 466 | |
| * | Fairchild Semiconductor | ||
| International Inc. Class A | 34,200 | 453 | |
| * | SAIC Inc. | 28,700 | 430 |
| * | Anaren Inc. | 21,645 | 429 |
| Harris Corp. | 10,500 | 424 | |
| * | Cabot Microelectronics Corp. | 10,400 | 413 |
| * | Atmel Corp. | 38,300 | 349 |
| * | Netscout Systems Inc. | 25,000 | 345 |
| Littelfuse Inc. | 7,418 | 344 | |
| * | Acxiom Corp. | 28,900 | 317 |
| Diebold Inc. | 10,398 | 298 | |
| * | Lionbridge Technologies Inc. | 86,050 | 257 |
| * | Advanced Energy | ||
| Industries Inc. | 21,200 | 212 | |
| * | Virtusa Corp. | 12,150 | 192 |
| * | Avid Technology Inc. | 9,770 | 96 |
| 20,918 | |||
| Materials (3.7%) | |||
| Silgan Holdings Inc. | 39,700 | 1,506 | |
| FMC Corp. | 10,200 | 775 | |
| PH Glatfelter Co. | 35,330 | 507 | |
| Cabot Corp. | 11,062 | 381 | |
| Eagle Materials Inc. | 17,130 | 338 | |
| American Vanguard Corp. | 21,900 | 261 | |
| * | RTI International Metals Inc. | 9,072 | 242 |
| Cytec Industries Inc. | 5,162 | 234 | |
| 4,244 | |||
| Market | |||
| Value | |||
| Shares | ($000) | ||
| Telecommunication Services (1.9%) | |||
| * | NII Holdings Inc. | 29,900 | 1,152 |
| NTELOS Holdings Corp. | 32,500 | 639 | |
| Windstream Corp. | 31,700 | 402 | |
| 2,193 | |||
| Utilities (2.3%) | |||
| Westar Energy Inc. | 29,165 | 777 | |
| Portland General Electric Co. | 27,353 | 660 | |
| Piedmont Natural Gas Co. | |||
| Inc. | 15,046 | 465 | |
| Unitil Corp. | 17,770 | 465 | |
| Southwest Gas Corp. | 9,895 | 366 | |
| 2,733 | |||
| Total Common Stocks | |||
| (Cost $110,449) | 108,750 | ||
| Temporary Cash Investments (6.3%)1 | |||
| Money Market Fund (5.9%) | |||
| 2,3 | Vanguard Market | ||
| Liquidity Fund, 0.132% 6,886,597 | 6,887 | ||
| Face | |||
| Amount | |||
| ($000) | |||
| U.S. Government and Agency Obligations (0.4%) | |||
| 4,5 | Fannie Mae Discount | ||
| Notes, 0.070%, 10/19/11 | 200 | 200 | |
| 4,5 | Federal Home Loan | ||
| Bank Discount Notes, | |||
| 0.050%, 9/23/11 | 250 | 250 | |
| 450 | |||
| Total Temporary Cash Investments | |||
| (Cost $7,337) | 7,337 | ||
| Total Investments (100.3%) | |||
| (Cost $117,786) | 116,087 | ||
| Other Assets and Liabilities (-0.3%) | |||
| Other Assets | 429 | ||
| Liabilities3 | (797) | ||
| (368) | |||
| Net Assets (100%) | |||
| Applicable to 5,274,242 outstanding | |||
| $.001 par value shares of beneficial | |||
| interest (unlimited authorization) | 115,719 | ||
| Net Asset Value Per Share | $21.94 | ||
17
Explorer Value Fund
| At August 31, 2011, net assets consisted of: | |
| Amount | |
| ($000) | |
| Paid-in Capital | 111,808 |
| Undistributed Net Investment Income | 428 |
| Accumulated Net Realized Gains | 5,348 |
| Unrealized Appreciation (Depreciation) | |
| Investment Securities | (1,699) |
| Futures Contracts | (166) |
| Net Assets | 115,719 |
See Note A in Notes to Financial Statements.
* Non-income-producing security.
^ Part of security position is on loan to broker-dealers. The total value of securities on loan is $261,000.
1 The fund invests a portion of its cash reserves in equity markets through the use of index futures contracts. After giving effect to futures investments, the fund’s effective common stock and temporary cash investment positions represent 97.1% and 3.2%, respectively, of net assets.
2 Affiliated money market fund available only to Vanguard funds and certain trusts and accounts managed by Vanguard. Rate shown is the 7-day yield.
3 Includes $286,000 of collateral received for securities on loan.
4 The issuer operates under a congressional charter; its securities are not backed by the full faith and credit of the U.S. government.
5 Securities with a value of $450,000 have been segregated as initial margin for open futures contracts.
See accompanying Notes, which are an integral part of the Financial Statements.
18
Explorer Value Fund
| Statement of Operations | |
| Year Ended | |
| August 31, 2011 | |
| ($000) | |
| Investment Income | |
| Income | |
| Dividends | 1,524 |
| Interest1 | 18 |
| Security Lending | 14 |
| Total Income | 1,556 |
| Expenses | |
| Investment Advisory Fees—Note B | |
| Basic Fee | 391 |
| Performance Adjustment | 16 |
| The Vanguard Group—Note C | |
| Management and Administrative | 158 |
| Marketing and Distribution | 20 |
| Custodian Fees | 11 |
| Auditing Fees | 39 |
| Shareholders’ Reports | 7 |
| Total Expenses | 642 |
| Net Investment Income | 914 |
| Realized Net Gain (Loss) | |
| Investment Securities Sold | 6,524 |
| Futures Contracts | 610 |
| Realized Net Gain (Loss) | 7,134 |
| Change in Unrealized Appreciation (Depreciation) | |
| Investment Securities | 7,068 |
| Futures Contracts | 86 |
| Change in Unrealized Appreciation (Depreciation) | 7,154 |
| Net Increase (Decrease) in Net Assets Resulting from Operations | 15,202 |
| 1 Interest income from an affiliated company of the fund was $18,000. | |
See accompanying Notes, which are an integral part of the Financial Statements.
19
Explorer Value Fund
| Statement of Changes in Net Assets | ||
| March 16, | ||
| Year Ended | 20101 to | |
| August 31, | August 31, | |
| 2011 | 2010 | |
| ($000) | ($000) | |
| Increase (Decrease) in Net Assets | ||
| Operations | ||
| Net Investment Income | 914 | 184 |
| Realized Net Gain (Loss) | 7,134 | 71 |
| Change in Unrealized Appreciation (Depreciation) | 7,154 | (9,019) |
| Net Increase (Decrease) in Net Assets Resulting from Operations | 15,202 | (8,764) |
| Distributions | ||
| Net Investment Income | (576) | — |
| Realized Capital Gain2 | (837) | — |
| Total Distributions | (1,413) | — |
| Capital Share Transactions | ||
| Issued | 64,108 | 96,958 |
| Issued in Lieu of Cash Distributions | 1,289 | — |
| Redeemed | (38,764) | (12,897) |
| Net Increase (Decrease) from Capital Share Transactions | 26,633 | 84,061 |
| Total Increase (Decrease) | 40,422 | 75,297 |
| Net Assets | ||
| Beginning of Period | 75,297 | — |
| End of Period3 | 115,719 | 75,297 |
1 Commencement of subscription period for the fund.
2 Includes fiscal 2011 short-term gain distributions totaling $815,000. Short-term gain distributions are treated as ordinary income dividends for tax purposes.
3 Net Assets—End of Period includes undistributed net investment income of $428,000 and $184,000.
See accompanying Notes, which are an integral part of the Financial Statements.
20
Explorer Value Fund
Financial Highlights
| March 16, | ||
| Year Ended | 20101 to | |
| August 31, | Aug. 31, | |
| For a Share Outstanding Throughout Each Period | 2011 | 2010 |
| Net Asset Value, Beginning of Period | $18.09 | $20.00 |
| Investment Operations | ||
| Net Investment Income | .190 | .044 |
| Net Realized and Unrealized Gain (Loss) on Investments | 3.991 | (1.954) |
| Total from Investment Operations | 4.181 | (1.910) |
| Distributions | ||
| Dividends from Net Investment Income | (.135) | — |
| Distributions from Realized Capital Gains | (.196) | — |
| Total Distributions | (.331) | — |
| Net Asset Value, End of Period | $21.94 | $18.09 |
| Total Return2 | 23.04% | -9.55% |
| Ratios/Supplemental Data | ||
| Net Assets, End of Period (Millions) | $116 | $75 |
| Ratio of Total Expenses to Average Net Assets3 | 0.57% | 0.56%4 |
| Ratio of Net Investment Income to Average Net Assets | 0.82% | 0.55%4 |
| Portfolio Turnover Rate | 41% | 16% |
1 Subscription period for the fund was March 16, 2010, to March 30, 2010, during which time all assets were held in money market instruments. Performance measurement began March 30, 2010, at a net asset value of $20.00.
2 Total returns do not include account service fees that may have applied in the periods shown. Fund prospectuses provide information about any applicable account service fees.
3 Includes performance-based advisory fee increases of 0.01% and 0.00%.
4 Annualized.
See accompanying Notes, which are an integral part of the Financial Statements.
21
Explorer Value Fund
Notes to Financial Statements
Vanguard Explorer Value Fund is registered under the Investment Company Act of 1940 as an open-end investment company, or mutual fund.
A. The following significant accounting policies conform to generally accepted accounting principles for U.S. mutual funds. The fund consistently follows such policies in preparing its financial statements.
1. Security Valuation: Securities are valued as of the close of trading on the New York Stock Exchange (generally 4 p.m., Eastern time) on the valuation date. Equity securities are valued at the latest quoted sales prices or official closing prices taken from the primary market in which each security trades; such securities not traded on the valuation date are valued at the mean of the latest quoted bid and asked prices. Securities for which market quotations are not readily available, or whose values have been materially affected by events occurring before the fund’s pricing time but after the close of the securities’ primary markets, are valued by methods deemed by the board of trustees to represent fair value. Investments in Vanguard Market Liquidity Fund are valued at that fund’s net asset value. Temporary cash investments acquired over 60 days to maturity are valued using the latest bid prices or using valuations based on a matrix system (which considers such factors as security prices, yields, maturities, and ratings), both as furnished by independent pricing services. Other temporary cash investments are valued at amortized cost, which approximates market value.
2. Futures Contracts: The fund uses index futures contracts to a limited extent, with the objective of maintaining full exposure to the stock market while maintaining liquidity. The fund may purchase or sell futures contracts to achieve a desired level of investment, whether to accommodate portfolio turnover or cash flows from capital share transactions. The primary risks associated with the use of futures contracts are imperfect correlation between changes in market values of stocks held by the fund and the prices of futures contracts, and the possibility of an illiquid market.
Futures contracts are valued at their quoted daily settlement prices. The aggregate principal amounts of the contracts are not recorded in the Statement of Net Assets. Fluctuations in the value of the contracts are recorded in the Statement of Net Assets as an asset (liability) and in the Statement of Operations as unrealized appreciation (depreciation) until the contracts are closed, when they are recorded as realized futures gains (losses).
3. Federal Income Taxes: The fund intends to continue to qualify as a regulated investment company and distribute all of its taxable income. Management has analyzed the fund’s tax positions taken for all open federal income tax years (August 31, 2010–2011), and has concluded that no provision for federal income tax is required in the fund’s financial statements.
4. Security Lending: The fund may lend its securities to qualified institutional borrowers to earn additional income. Security loans are required to be secured at all times by collateral at least equal to the market value of securities loaned. The fund invests cash collateral received in Vanguard Market Liquidity Fund, and records a liability for the return of the collateral, during the period the securities are on loan. Security lending income represents fees charged to borrowers plus income earned on investing cash collateral, less expenses associated with the loan.
5. Distributions: Distributions to shareholders are recorded on the ex-dividend date.
6. Other: Dividend income is recorded on the ex-dividend date. Interest income includes income distributions received from Vanguard Market Liquidity Fund and is accrued daily. Security transactions are accounted for on the date securities are bought or sold. Costs used to determine realized gains (losses) on the sale of investment securities are those of the specific securities sold.
22
Explorer Value Fund
B. Frontier Capital Management Co., LLC, Cardinal Capital Management, L.L.C., and Sterling Capital Management LLC each provide investment advisory services to a portion of the fund for a fee calculated at an annual percentage rate of average net assets managed by the advisor. In accordance with the advisory contracts entered into with Frontier Capital Management Co., LLC, Cardinal Capital Management, L.L.C., and Sterling Capital Management LLC in March 2010, the investment advisory fees are subject to quarterly adjustments, beginning March 1, 2011, based on performance since May 31, 2010, relative to the Russell 2000 Value Index, Russell Mid-Cap Value Custom Cap-Range Index, and Russell 2500 Value Index, respectively.
The Vanguard Group manages the cash reserves of the fund on an at-cost basis.
For the year ended August 31, 2011, the aggregate investment advisory fee represented an effective annual basic rate of 0.35% of the fund’s average net assets, before an increase of $16,000 (0.01%) based on performance.
C. The Vanguard Group furnishes at cost corporate management, administrative, marketing, and distribution services. The costs of such services are allocated to the fund under methods approved by the board of trustees. The fund has committed to provide up to 0.40% of its net assets in capital contributions to Vanguard. At August 31, 2011, the fund had contributed capital of $21,000 to Vanguard (included in Other Assets), representing 0.02% of the fund’s net assets and 0.01% of Vanguard’s capitalization. The fund’s trustees and officers are also directors and officers of Vanguard.
D. Various inputs may be used to determine the value of the fund’s investments. These inputs are summarized in three broad levels for financial statement purposes. The inputs or methodologies used to value securities are not necessarily an indication of the risk associated with investing in those securities.
Level 1—Quoted prices in active markets for identical securities.
Level 2—Other significant observable inputs (including quoted prices for similar securities, interest rates, prepayment speeds, credit risk, etc.).
Level 3—Significant unobservable inputs (including the fund’s own assumptions used to determine the fair value of investments).
The following table summarizes the fund’s investments as of August 31, 2011, based on the inputs used to value them:
| Level 1 | Level 2 | Level 3 | |
| Investments | ($000) | ($000) | ($000) |
| Common Stocks | 108,750 | — | — |
| Temporary Cash Investments | 6,887 | 450 | — |
| Futures Contracts—Assets1 | 21 | — | — |
| Total | 115,658 | 450 | — |
| 1 Represents variation margin on the last day of the reporting period. |
23
Explorer Value Fund
E. At August 31, 2011, the aggregate settlement value of open futures contracts and the related unrealized appreciation (depreciation) were:
| ($000) | ||||
| Aggregate | ||||
| Number of | Settlement | Unrealized | ||
| Long (Short) | Value | Appreciation | ||
| Futures Contracts | Expiration | Contracts | Long (Short) | (Depreciation) |
| E-mini Russell 2000 Index | September 2011 | 50 | 3,631 | (166) |
Unrealized appreciation (depreciation) on open futures contracts is required to be treated as realized gain (loss) for tax purposes.
F. Distributions are determined on a tax basis and may differ from net investment income and realized capital gains for financial reporting purposes. Differences may be permanent or temporary. Permanent differences are reclassified among capital accounts in the financial statements to reflect their tax character. Temporary differences arise when certain items of income, expense, gain, or loss are recognized in different periods for financial statement and tax purposes; these differences will reverse at some time in the future. Differences in classification may also result from the treatment of short-term gains as ordinary income for tax purposes.
The fund used a tax accounting practice to treat a portion of the price of capital shares redeemed during the year as distributions from net investment income and realized capital gains. Accordingly, the fund has reclassified $94,000 from undistributed net investment income, and $1,020,000 from accumulated net realized gains, to paid-in capital.
For tax purposes, at August 31, 2011, the fund had $4,617,000 of ordinary income and $1,030,000 of long-term capital gains available for distribution.
At August 31, 2011, the cost of investment securities for tax purposes was $117,786,000. Net unrealized depreciation of investment securities for tax purposes was $1,699,000, consisting of unrealized gains of $8,271,000 on securities that had risen in value since their purchase and $9,970,000 in unrealized losses on securities that had fallen in value since their purchase G. During the year ended August 31, 2011, the fund purchased $67,282,000 of investment securities and sold $42,033,000 of investment securities, other than temporary cash investments.
24
Explorer Value Fund
H. Capital shares issued and redeemed were:
| Year Ended | March 16, 20101 to | |
| August 31, 2011 | August 31, 2010 | |
| Shares | Shares | |
| (000) | (000) | |
| Issued | 2,748 | 4,840 |
| Issued in Lieu of Cash Distributions | 57 | — |
| Redeemed | (1,693) | (677) |
| Net Increase (Decrease) in Shares Outstanding | 1,112 | 4,163 |
| 1 Commencement of subscription period for the fund. |
I. In preparing the financial statements as of August 31, 2011, management considered the impact of subsequent events for potential recognition or disclosure in these financial statements.
25
Report of Independent Registered Public Accounting Firm
To the Trustees of Vanguard Scottsdale Funds and the Shareholders of Vanguard Explorer Value Fund:
In our opinion, the accompanying statement of net assets and the related statements of operations and of changes in net assets and the financial highlights present fairly, in all material respects, the financial position of Vanguard Explorer Value Fund (constituting a separate portfolio of Vanguard Scottsdale Funds, hereafter referred to as the “Fund”) at August 31, 2011, the results of its operations for the year then ended, and the changes in its net assets and the financial highlights for the year then ended and for the period March 16, 2010 (commencement of operations) through August 31, 2010, in conformity with accounting principles generally accepted in the United States of America. These financial statements and financial highlights (hereafter referred to as “financial statements”) are the responsibility of the Fund’s management; our responsibility is to express an opinion on these financial statements based on our audits. We conducted our audits of these financial statements in accordance with the standards of the Public Company Accounting Oversight Board (United States). Those standards require that we plan and perform the audit to obtain reasonable assurance about whether the financial statements are free of material misstatement. An audit includes examining, on a test basis, evidence supporting the amounts and disclosures in the financial statements, assessing the accounting principles used and significant estimates made by management, and evaluating the overall financial statement presentation. We believe that our audits, which included confirmation of securities at August 31, 2011 by correspondence with the custodian and broker and by agreement to the underlying ownership records of Vanguard Market Liquidity Fund, provide a reasonable basis for our opinion.
PricewaterhouseCoopers LLP
Philadelphia, Pennsylvania
October 13, 2011
| Special 2011 tax information (unaudited) for Vanguard Explorer Value Fund |
This information for the fiscal year ended August 31, 2011, is included pursuant to provisions of the Internal Revenue Code.
The fund distributed $489,000 as capital gain dividends (from net long-term capital gains) to shareholders during the fiscal year.
The fund distributed $726,000 of qualified dividend income to shareholders during the fiscal year.
For corporate shareholders, 16.2% of investment income (dividend income plus short-term gains, if any) qualifies for the dividends-received deduction.
26
Your Fund’s After-Tax Returns
This table presents returns for your fund both before and after taxes. The after-tax returns are shown in two ways: (1) assuming that an investor owned the fund during the entire period and paid taxes on the fund’s distributions, and (2) assuming that an investor paid taxes on the fund’s distributions and sold all shares at the end of each period.
Calculations are based on the highest individual federal income tax and capital gains tax rates in effect at the times of the distributions and the hypothetical sales. State and local taxes were not considered. After-tax returns reflect any qualified dividend income , using actual prior-year figures and estimates for 2011. (In the example, returns after the sale of fund shares may be higher than those assuming no sale. This occurs when the sale would have produced a capital loss. The calculation assumes that the investor received a tax deduction for the loss.)
Please note that your actual after-tax returns will depend on your tax situation and may differ from those shown. Also note that if you own the fund in a tax-deferred account, such as an individual retirement account or a 401(k) plan, this information does not apply to you. Such accounts are not subject to current taxes.
Finally, keep in mind that a fund’s performance—whether before or after taxes—does not guarantee future results.
| Average Annual Total Returns: Explorer Value Fund | ||
| Periods Ended August 31, 2011 | ||
| Since | ||
| One | Inception | |
| Year | (3/30/2010) | |
| Returns Before Taxes | 23.04% | 7.81% |
| Returns After Taxes on Distributions | 22.61 | 7.55 |
| Returns After Taxes on Distributions and Sale of Fund Shares | 15.18 | 6.56 |
27
About Your Fund’s Expenses
As a shareholder of the fund, you incur ongoing costs, which include costs for portfolio management, administrative services, and shareholder reports (like this one), among others. Operating expenses, which are deducted from a fund’s gross income, directly reduce the investment return of the fund.
A fund’s expenses are expressed as a percentage of its average net assets. This figure is known as the expense ratio. The following examples are intended to help you understand the ongoing costs (in dollars) of investing in your fund and to compare these costs with those of other mutual funds. The examples are based on an investment of $1,000 made at the beginning of the period shown and held for the entire period.
The accompanying table illustrates your fund’s costs in two ways:
• Based on actual fund return. This section helps you to estimate the actual expenses that you paid over the period. The ”Ending Account Value“ shown is derived from the fund‘s actual return, and the third column shows the dollar amount that would have been paid by an investor who started with $1,000 in the fund. You may use the information here, together with the amount you invested, to estimate the expenses that you paid over the period.
To do so, simply divide your account value by $1,000 (for example, an $8,600 account value divided by $1,000 = 8.6), then multiply the result by the number given for your fund under the heading ”Expenses Paid During Period.“
• Based on hypothetical 5% yearly return. This section is intended to help you compare your fund‘s costs with those of other mutual funds. It assumes that the fund had a yearly return of 5% before expenses, but that the expense ratio is unchanged. In this case—because the return used is not the fund’s actual return—the results do not apply to your investment. The example is useful in making comparisons because the Securities and Exchange Commission requires all mutual funds to calculate expenses based on a 5% return. You can assess your fund’s costs by comparing this hypothetical example with the hypothetical examples that appear in shareholder reports of other funds.
Note that the expenses shown in the table are meant to highlight and help you compare ongoing costs only and do not reflect transaction costs incurred by the fund for buying and selling securities. Further, the expenses do not include any purchase, redemption, or account service fees described in the fund prospectus. If such fees were applied to your account, your costs would be higher. Your fund does not carry a “sales load.”
The calculations assume no shares were bought or sold during the period. Your actual costs may have been higher or lower, depending on the amount of your investment and the timing of any purchases or redemptions.
You can find more information about the fund’s expenses, including annual expense ratios, in the Financial Statements section of this report. For additional information on operating expenses and other shareholder costs, please refer to your fund’s current prospectus.
28
| Six Months Ended August 31, 2011 | |||
| Beginning | Ending | Expenses | |
| Account Value | Account Value | Paid During | |
| Explorer Value Fund | 2/28/2011 | 8/31/2011 | Period |
| Based on Actual Fund Return | $1,000.00 | $896.24 | $2.77 |
| Based on Hypothetical 5% Yearly Return | 1,000.00 | 1,022.28 | 2.96 |
The calculations are based on expenses incurred in the most recent six-month period. The fund’s annualized six-month expense ratio for that period is 0.58%. The dollar amounts shown as “Expenses Paid” are equal to the annualized expense ratio multiplied by the average account value over the period, multiplied by the number of days in the most recent six-month period, then divided by the number of days in the most recent 12-month period.
29
Glossary
30-Day SEC Yield. A fund’s 30-day SEC yield is derived using a formula specified by the U.S. Securities and Exchange Commission. Under the formula, data related to the fund’s security holdings in the previous 30 days are used to calculate the fund’s hypothetical net income for that period, which is then annualized and divided by the fund’s estimated average net assets over the calculation period. For the purposes of this calculation, a security’s income is based on its current market yield to maturity (in the case of bonds), its actual income (for asset-backed securities), or its projected dividend yield (for stocks). Because the SEC yield represents hypothetical annualized income, it will differ—at times significantly—from the fund’s actual experience. As a result, the fund’s income distributions may be higher or lower than implied by the SEC yield.
Dividend Yield. Dividend income earned by stocks, expressed as a percentage of the aggregate market value (or of net asset value, for a fund). The yield is determined by dividing the amount of the annual dividends by the aggregate value (or net asset value) at the end of the period. For a fund, the dividend yield is based solely on stock holdings and does not include any income produced by other investments.
Earnings Growth Rate. The average annual rate of growth in earnings over the past five years for the stocks now in a fund.
Equity Exposure. A measure that reflects a fund’s investments in stocks and stock futures. Any holdings in short-term reserves are excluded.
Expense Ratio. The percentage of a fund’s average net assets used to pay its annual administrative and advisory expenses. These expenses directly reduce returns to investors.
Foreign Holdings. The percentage of a fund represented by securities or depositary receipts of companies based outside the United States.
Inception Date. The date on which the assets of a fund (or one of its share classes) are first invested in accordance with the fund’s investment objective. For funds with a subscription period, the inception date is the day after that period ends. Investment performance is measured from the inception date.
Median Market Cap. An indicator of the size of companies in which a fund invests; the midpoint of market capitalization (market price x shares outstanding) of a fund’s stocks, weighted by the proportion of the fund’s assets invested in each stock. Stocks representing half of the fund’s assets have market capitalizations above the median, and the rest are below it.
Price/Book Ratio. The share price of a stock divided by its net worth, or book value, per share. For a fund, the weighted average price/book ratio of the stocks it holds.
Price/Earnings Ratio. The ratio of a stock’s current price to its per-share earnings over the past year. For a fund, the weighted average P/E of the stocks it holds. P/E is an indicator of market expectations about corporate prospects; the higher the P/E, the greater the expectations for a company’s future growth.
Return on Equity. The annual average rate of return generated by a company during the past five years for each dollar of shareholder’s equity (net income divided by shareholder’s equity). For a fund, the weighted average return on equity for the companies whose stocks it holds.
30
Short-Term Reserves. The percentage of a fund invested in highly liquid, short-term securities that can be readily converted to cash.
Turnover Rate. An indication of the fund’s trading activity. Funds with high turnover rates incur higher transaction costs and may be more likely to distribute capital gains (which may be taxable to investors). The turnover rate excludes in-kind transactions, which have minimal impact on costs.
31
The People Who Govern Your Fund
The trustees of your mutual fund are there to see that the fund is operated and managed in your best interests since, as a shareholder, you are a part owner of the fund. Your fund’s trustees also serve on the board of directors of The Vanguard Group, Inc., which is owned by the Vanguard funds and provides services to them on an at-cost basis.
A majority of Vanguard’s board members are independent, meaning that they have no affiliation with Vanguard or the funds they oversee, apart from the sizable personal investments they have made as private individuals. The independent board members have distinguished backgrounds in business, academia, and public service. Each of the trustees and executive officers oversees 178 Vanguard funds.
The following table provides information for each trustee and executive officer of the fund. More information about the trustees is in the Statement of Additional Information, which can be obtained, without charge, by contacting Vanguard at 800-662-7447, or online at vanguard.com.
| Interested Trustee1 | and President (2006–2008) of Rohm and Haas Co. |
| (chemicals); Director of Tyco International, Ltd. | |
| F. William McNabb III | (diversified manufacturing and services) and Hewlett- |
| Born 1957. Trustee Since July 2009. Chairman of the | Packard Co. (electronic computer manufacturing); |
| Board. Principal Occupation(s) During the Past Five | Senior Advisor at New Mountain Capital; Trustee |
| Years: Chairman of the Board of The Vanguard Group, | of The Conference Board; Member of the Board of |
| Inc., and of each of the investment companies served | Managers of Delphi Automotive LLP (automotive |
| by The Vanguard Group, since January 2010; Director | components). |
| of The Vanguard Group since 2008; Chief Executive | |
| Officer and President of The Vanguard Group and of | Amy Gutmann |
| each of the investment companies served by The | Born 1949. Trustee Since June 2006. Principal |
| Vanguard Group since 2008; Director of Vanguard | Occupation(s) During the Past Five Years: President |
| Marketing Corporation; Managing Director of The | of the University of Pennsylvania; Christopher H. |
| Vanguard Group (1995–2008). | Browne Distinguished Professor of Political Science |
| in the School of Arts and Sciences with secondary | |
| appointments at the Annenberg School for Commu- | |
| Independent Trustees | nication and the Graduate School of Education |
| of the University of Pennsylvania; Director of | |
| Emerson U. Fullwood | Carnegie Corporation of New York, Schuylkill River |
| Born 1948. Trustee Since January 2008. Principal | Development Corporation, and Greater Philadelphia |
| Occupation(s) During the Past Five Years: Executive | Chamber of Commerce; Trustee of the National |
| Chief Staff and Marketing Officer for North America | Constitution Center; Chair of the Presidential |
| and Corporate Vice President (retired 2008) of Xerox | Commission for the Study of Bioethical Issues. |
| Corporation (document management products and | |
| services); Executive in Residence and 2010 | JoAnn Heffernan Heisen |
| Distinguished Minett Professor at the Rochester | Born 1950. Trustee Since July 1998. Principal |
| Institute of Technology; Director of SPX Corporation | Occupation(s) During the Past Five Years: Corporate |
| (multi-industry manufacturing), the United Way of | Vice President and Chief Global Diversity Officer |
| Rochester, Amerigroup Corporation (managed health | (retired 2008) and Member of the Executive |
| care), the University of Rochester Medical Center, | Committee (1997–2008) of Johnson & Johnson |
| Monroe Community College Foundation, and North | (pharmaceuticals/consumer products); Director of |
| Carolina A&T University. | Skytop Lodge Corporation (hotels), the University |
| Medical Center at Princeton, the Robert Wood | |
| Rajiv L. Gupta | Johnson Foundation, and the Center for Work Life |
| Born 1945. Trustee Since December 2001.2 | Policy; Member of the Advisory Board of the |
| Principal Occupation(s) During the Past Five Years: | Maxwell School of Citizenship and Public Affairs |
| Chairman and Chief Executive Officer (retired 2009) | at Syracuse University. |
| F. Joseph Loughrey | Thomas J. Higgins | |
| Born 1949. Trustee Since October 2009. Principal | Born 1957. Chief Financial Officer Since September | |
| Occupation(s) During the Past Five Years: President | 2008. Principal Occupation(s) During the Past Five | |
| and Chief Operating Officer (retired 2009) and Vice | Years: Principal of The Vanguard Group, Inc.; Chief | |
| Chairman of the Board (2008–2009) of Cummins Inc. | Financial Officer of each of the investment companies | |
| (industrial machinery); Director of SKF AB (industrial | served by The Vanguard Group since 2008; Treasurer | |
| machinery), Hillenbrand, Inc. (specialized consumer | of each of the investment companies served by The | |
| services), the Lumina Foundation for Education, and | Vanguard Group (1998–2008). | |
| Oxfam America; Chairman of the Advisory Council | ||
| for the College of Arts and Letters and Member | Kathryn J. Hyatt | |
| of the Advisory Board to the Kellogg Institute for | Born 1955. Treasurer Since November 2008. Principal | |
| International Studies at the University of Notre Dame. | Occupation(s) During the Past Five Years: Principal | |
| of The Vanguard Group, Inc.; Treasurer of each of | ||
| André F. Perold | the investment companies served by The Vanguard | |
| Born 1952. Trustee Since December 2004. Principal | Group since 2008; Assistant Treasurer of each of the | |
| Occupation(s) During the Past Five Years: George | investment companies served by The Vanguard Group | |
| Gund Professor of Finance and Banking at the Harvard | (1988–2008). | |
| Business School (retired July 2011); Chief Investment | ||
| Officer and co-Managing Partner of HighVista | Heidi Stam | |
| Strategies LLC (private investment firm); Director of | Born 1956. Secretary Since July 2005. Principal | |
| Rand Merchant Bank; Overseer of the Museum of | Occupation(s) During the Past Five Years: Managing | |
| Fine Arts Boston. | Director of The Vanguard Group, Inc., since 2006; | |
| General Counsel of The Vanguard Group since 2005; | ||
| Alfred M. Rankin, Jr. | Secretary of The Vanguard Group and of each of the | |
| Born 1941. Trustee Since January 1993. Principal | investment companies served by The Vanguard Group | |
| Occupation(s) During the Past Five Years: Chairman, | since 2005; Director and Senior Vice President of | |
| President, and Chief Executive Officer of NACCO | Vanguard Marketing Corporation since 2005; | |
| Industries, Inc. (forklift trucks/housewares/lignite); | Principal of The Vanguard Group (1997–2006). | |
| Director of Goodrich Corporation (industrial products/ | ||
| aircraft systems and services) and the National | ||
| Association of Manufacturers; Chairman of the | Vanguard Senior Management Team | |
| Federal Reserve Bank of Cleveland; Vice Chairman | ||
| of University Hospitals of Cleveland; President of | R. Gregory Barton | Michael S. Miller |
| the Board of The Cleveland Museum of Art. | Mortimer J. Buckley | James M. Norris |
| Kathleen C. Gubanich | Glenn W. Reed | |
| Peter F. Volanakis | Paul A. Heller | George U. Sauter |
| Born 1955. Trustee Since July 2009. Principal | Martha G. King | |
| Occupation(s) During the Past Five Years: President | ||
| and Chief Operating Officer (retired 2010) of Corning | ||
| Incorporated (communications equipment); Director of | Chairman Emeritus and Senior Advisor | |
| Corning Incorporated (2000–2010) and Dow Corning | ||
| (2001–2010); Overseer of the Amos Tuck School of | John J. Brennan | |
| Business Administration at Dartmouth College. | Chairman, 1996–2009 | |
| Chief Executive Officer and President, 1996–2008 | ||
| Executive Officers | ||
| Founder | ||
| Glenn Booraem | ||
| Born 1967. Controller Since July 2010. Principal | John C. Bogle | |
| Occupation(s) During the Past Five Years: Principal | Chairman and Chief Executive Officer, 1974–1996 | |
| of The Vanguard Group, Inc.; Controller of each of | ||
| the investment companies served by The Vanguard | ||
| Group since 2010; Assistant Controller of each of | ||
| the investment companies served by The Vanguard | ||
| Group (2001–2010). | ||
1 Mr. McNabb is considered an “interested person,” as defined in the Investment Company Act of 1940, because he is an officer of the Vanguard funds.
2 December 2002 for Vanguard Equity Income Fund, Vanguard Growth Equity Fund, the Vanguard Municipal Bond Funds, and the Vanguard State Tax-Exempt Funds.
 | |
| P.O. Box 2600 | |
| Valley Forge, PA 19482-2600 |
Connect with Vanguard® > vanguard.com
| Fund Information > 800-662-7447 | CFA® is a trademark owned by CFA Institute. |
| Direct Investor Account Services > 800-662-2739 | |
| Institutional Investor Services > 800-523-1036 | |
| Text Telephone for People | |
| With Hearing Impairment > 800-749-7273 | |
| This material may be used in conjunction | |
| with the offering of shares of any Vanguard | |
| fund only if preceded or accompanied by | |
| the fund’s current prospectus. | |
| All comparative mutual fund data are from Lipper Inc. or | |
| Morningstar, Inc., unless otherwise noted. | |
| You can obtain a free copy of Vanguard’s proxy voting | |
| guidelines by visiting vanguard.com/proxyreporting or by | |
| calling Vanguard at 800-662-2739. The guidelines are | |
| also available from the SEC’s website, sec.gov. In | |
| addition, you may obtain a free report on how your fund | |
| voted the proxies for securities it owned during the 12 | |
| months ended June 30. To get the report, visit either | |
| vanguard.com/proxyreporting or sec.gov. | |
| You can review and copy information about your fund at | |
| the SEC’s Public Reference Room in Washington, D.C. To | |
| find out more about this public service, call the SEC at | |
| 202-551-8090. Information about your fund is also | |
| available on the SEC’s website, and you can receive | |
| copies of this information, for a fee, by sending a | |
| request in either of two ways: via e-mail addressed to | |
| publicinfo@sec.gov or via regular mail addressed to the | |
| Public Reference Section, Securities and Exchange | |
| Commission, Washington, DC 20549-1520. | |
| © 2011 The Vanguard Group, Inc. | |
| All rights reserved. | |
| Vanguard Marketing Corporation, Distributor. | |
| Q16900 102011 | |
|
|
| Annual Report | August 31, 2011 |
| Vanguard Russell 1000 Index Funds |
| Vanguard Russell 1000 Index Fund |
| Vanguard Russell 1000 Value Index Fund |
| Vanguard Russell 1000 Growth Index Fund |
> The Vanguard Russell 1000 Index Funds closely tracked their target indexes.
> Large-cap growth stocks performed better than their value counterparts.
> The information technology, energy, and consumer-oriented sectors were among the funds’ top contributors.
| Contents | |
| Your Fund’s Total Returns. | 1 |
| Chairman’s Letter. | 2 |
| Russell 1000 Index Fund. | 8 |
| Russell 1000 Value Index Fund. | 21 |
| Russell 1000 Growth Index Fund. | 34 |
| About Your Fund’s Expenses. | 50 |
| Trustees Approve Advisory Arrangement. | 52 |
| Glossary. | 53 |
Please note: The opinions expressed in this report are just that—informed opinions. They should not be considered promises or advice. Also, please keep in mind that the information and opinions cover the period through the date on the front of this report. Of course, the risks of investing in your fund are spelled out in the prospectus.
See the Glossary for definitions of investment terms used in this report.
About the cover: Vanguard was named for the HMS Vanguard, flagship of British Admiral Horatio Nelson. A ship—whose performance and safety depend on the work of all hands—has served as a fitting metaphor for the Vanguard crew as we strive to help clients reach their financial goals.
Your Fund’s Total Returns
| Period Ended August 31, 2011 | |
| Returns | |
| Since Inception | |
| Vanguard Russell 1000 Index Fund | |
| Institutional Shares (Inception: 10/15/2010) | 5.67% |
| ETF Shares (Inception: 9/20/2010) | |
| Market Price | 9.03 |
| Net Asset Value | 9.02 |
| Russell 1000 Index | 9.13 |
| Large-Cap Core Funds Average | 6.95 |
| Large-Cap Core Funds Average: Derived from data provided by Lipper Inc. | |
| Benchmark returns are calculated from the start of the reporting period or from the earliest share-class inception date. | |
| Vanguard Russell 1000 Value Index Fund | |
| Institutional Shares (Inception: 12/10/2010) | -2.06% |
| ETF Shares (Inception: 9/20/2010) | |
| Market Price | 5.36 |
| Net Asset Value | 5.28 |
| Russell 1000 Value Index | 5.47 |
| Large-Cap Value Funds Average | 4.34 |
| Large-Cap Value Funds Average: Derived from data provided by Lipper Inc. | |
| Benchmark returns are calculated from the start of the reporting period or from the earliest share-class inception date. | |
| Vanguard Russell 1000 Growth Index Fund | |
| Institutional Shares (Inception: 12/6/2010) | 1.92% |
| ETF Shares (Inception: 9/20/2010) | |
| Market Price | 12.68 |
| Net Asset Value | 12.69 |
| Russell 1000 Growth Index | 12.93 |
| Large-Cap Growth Funds Average | 9.73 |
| Large-Cap Growth Funds Average: Derived from data provided by Lipper Inc. |
Benchmark returns are calculated from the start of the reporting period or from the earliest share-class inception date.
Institutional Shares are available to certain institutional investors who meet specific administrative, service, and account-size criteria. The Vanguard ETF® Shares shown are traded on the Nasdaq exchange and are available only through brokers. The table provides ETF returns based on both the Nasdaq market price and the net asset value for a share. U.S. Pat. No. 6,879,964 B2; 7,337,138; 7,720,749; 7,925,573.
For the ETF Shares, the market price is determined by the midpoint of the bid-offer spread as of the closing time of the New York Stock Exchange (generally 4 p.m., Eastern time). The net asset value is also determined as of the NYSE closing time. For more information about how the ETF Shares' market prices have compared with their net asset value, visit vanguard.com, select your ETF, and then select the Price and Performance tab. The ETF premium/discount analysis there shows the percentages of days on which the ETF Shares' market price was above or below the NAV.
1

Chairman’s Letter
Dear Shareholder,
From their inception in September 2010 through August 31 of this year, the Vanguard Russell 1000 Index Funds delivered solid returns, despite the volatility in stock markets in recent months.
The returns of the funds’ ETF Shares for this period ranged from about 5% for the Russell 1000 Value Index Fund to more than 12% for the Russell 1000 Growth Index Fund. The Russell 1000 Index Fund, which holds both growth and value stocks, returned about 9%. The funds’ Institutional Shares, which were issued at various (and less favorable) points after the ETF Shares were launched, posted returns ranging from about –2% to more than 5%. All three funds closely tracked their benchmark indexes. From the ETFs’ inception through August 31, the Russell 1000 Index funds outperformed their peers.
This report begins with a look at the investment environment over the entire fiscal year and then reviews the drivers of the funds’ performance during their briefer period of operation.
2
Strong 12-month returns in a tale of two markets
Global stock markets delivered strong returns in a fiscal year marked by distinct periods of strength and weakness.
During the first six months, stock prices surged, with the broad U.S. stock market returning about 29%. As the slow, grinding economic recovery seemed to gather momentum, energy and industrial stocks, which are keenly sensitive to the rhythms of the business cycle, produced the best returns.
In the second six months, growth decelerated and stock market volatility spiked, amplified by Europe’s sovereign-debt drama, political wrangling over the U.S. debt ceiling, and Standard & Poor’s
decision to downgrade the U.S. credit rating. (Vanguard’s confidence in the “full faith and credit” of the U.S. government remains unshaken.) Stock prices retreated, and those sectors that led the market in the first half lost ground in the second, displaced by defensive sectors such as utilities and consumer staples.
Treasuries rallied as risk aversion returned
The stock market’s midyear pivot from offense to defense was mirrored in the bond market. In the first half of the year, yields rose (and prices declined) as the prospect of improved economic growth and inflationary pressures set the market’s tone. Corporate bonds outperformed U.S. Treasury securities.
| Market Barometer | |||
| Average Annual Total Returns | |||
| Periods Ended August 31, 2011 | |||
| One | Three | Five | |
| Year | Years | Years | |
| Stocks | |||
| Russell 1000 Index (Large-caps) | 19.06% | 0.84% | 1.11% |
| Russell 2000 Index (Small-caps) | 22.19 | 0.83 | 1.53 |
| Dow Jones U.S. Total Stock Market Index | 19.16 | 1.18 | 1.52 |
| MSCI All Country World Index ex USA (International) | 10.34 | -0.97 | 0.79 |
| Bonds | |||
| Barclays Capital U.S. Aggregate Bond Index (Broad | |||
| taxable market) | 4.62% | 7.23% | 6.56% |
| Barclays Capital Municipal Bond Index (Broad | |||
| tax-exempt market) | 2.66 | 6.00 | 4.94 |
| Citigroup Three-Month U.S. Treasury Bill Index | 0.12 | 0.24 | 1.69 |
| CPI | |||
| Consumer Price Index | 3.77% | 1.12% | 2.13% |
3
In the second half, risk aversion set the tone. Investors bid up Treasuries, trimming the yield of the 10-year Treasury note to barely 2%, and government bonds were among the market’s best performers.
For the full year, the taxable investment-grade U.S. bond market returned 4.62%; the broad municipal bond market returned 2.66%.
The yields of money market instruments hovered near zero, consistent with the Federal Reserve’s target for short-term interest rates. Toward the end of the period, the Fed indicated that it expected to maintain this exceptionally low target at least through mid-2013.
Growth stocks outpaced their value brethren
The Vanguard Russell 1000 Index Funds debuted during a broad-based rally among large-cap and mid-sized stocks that continued into the first half of the fiscal period, but then abated in the second half. Despite this second-half setback, large-cap and mid-sized stocks of all flavors managed to end the fiscal year with respectable gains.
The Russell 1000 Index Funds mirrored trends within the broad stock market: Large- and mid-cap growth funds did better than their value counterparts; large-cap funds with both growth and value stocks had results somewhere in the middle.
| Expense Ratios | |||
| Your Fund Compared With Its Peer Group | |||
| Institutional | ETF | Peer Group | |
| Shares | Shares | Average | |
| Russell 1000 Index Fund | 0.08% | 0.12% | 1.26% |
| Russell 1000 Value Index Fund | 0.08 | 0.15 | 1.27 |
| Russell 1000 Growth Index Fund | 0.08 | 0.15 | 1.37 |
The fund expense ratios shown are from the prospectus dated September 16, 2010, and represent estimated costs for the current fiscal year. For the periods from inception through August 31, 2011, the funds’ expense ratios were: for the Russell 1000 Index Fund, 0.08% for Institutional Shares and 0.12% for ETF Shares; for the Russell 1000 Value Index Fund, 0.08% for Institutional Shares and 0.15% for ETF Shares; and for the Russell 1000 Growth Index Fund, 0.08% for Institutional Shares and 0.15% for ETF Shares. The ratios are annualized since inception for each share class. Peer-group expense ratios are derived from data provided by Lipper Inc. and capture information through year-end 2010.
4
The group’s top performer was the Russell 1000 Growth Index Fund. The fund’s holdings in the energy and consumer-oriented sectors delivered notably strong returns. Energy stocks soared, particularly in the first half of the fiscal year, as political turmoil in North Africa and the Middle East increased fears of shortages and drove up crude oil prices. Consumer discretionary stocks turned in double-digit results as more consumers dined at fast-food franchises and shopped at specialty retailer stores and online. Food and beverage companies and personal care companies boosted the consumer staples sector.
The growth fund’s large commitment to technology stocks also was a big contributor. Growing demand for smartphones and tablet computers and the components that are needed to make them have been the key drivers behind the sector’s success.
The Russell 1000 Index Fund’s best results came from its holdings in energy, but the fund also got a lift from its sizable holdings in the consumer-oriented and health care sectors. Cable and satellite providers, fast-food franchises, and online retailers were among the key contributors in the consumer-related sectors. In health care, pharmaceutical companies and managed health care providers were top contributors.
The weakest performer of the three funds was the Russell 1000 Value Index Fund. Its quite significant allocation to the still-ailing financial sector dragged down results: Financials, the only sector in the fund to record a negative return for the period, subtracted more than 2 percentage points from the fund’s overall performance. While many financial companies have rebuilt their balance sheets and positioned themselves for growth since the 2008 credit crisis, they continue to be plagued by the sluggish housing market and anxieties tied to the global credit market. Despite disappointment in financials, the fund benefited from its substantial holdings in energy and health care stocks.
Since inception, the funds have tracked their indexes
The three funds have successfully tracked their target indexes for the roughly 11 months ended August 31. Stock market volatility can create challenges for index fund advisors, who must manage purchases and sales in the face of fast-changing prices so as to minimize the gap between fund and index returns. Since their inception, the Russell 1000 Index Funds have met the challenge.
Such performance is a tribute to Vanguard Quantitative Equity Group, the funds’ advisor, whose decades of experience and sophisticated portfolio construction and management techniques have kept returns close to those of the funds’ benchmarks. The advisor has been aided in this task by the funds’ low expense ratios.
5
Balance and diversification are vital in volatile markets
The stark contrast in stock market performance between the beginning of the fiscal year and the end reminds us, once again, of the markets’ unpredictable nature. That said, the recent turmoil is not altogether unusual. Vanguard research finds that declines in global stock markets following the U.S. Treasury downgrade in August were similar to declines related to other recent significant macroeconomic events.
And while this volatility has been unnerving, it has done nothing to shake our confidence in stocks as an attractive opportunity for long-term investment growth. In fact, we consider the recent upheaval to be further evidence that a portfolio balanced between stock funds and less-volatile bond and money market funds can limit some of the short-term damage inflicted by these occasional swoons.
As always, the most effective preparation for these shocks is to maintain a balanced and diversified portfolio that aligns with your long-term goals and risk tolerance. The Russell 1000 Index Funds can play an important role in such a portfolio, with their low costs and broad diversification across the large-cap market, whether you choose to invest in the segment as a whole or in its growth or value segments.
Thank you for entrusting your assets to Vanguard.
Sincerely,

F. William McNabb III
Chairman and Chief Executive Officer
September 16, 2011
6
| Your Fund’s Performance at a Glance | ||||
| Inception Through August 31, 2011 | ||||
| Distributions Per Share | ||||
| Starting | Ending | Income | Capital | |
| Share Price | Share Price | Dividends | Gains | |
| Vanguard Russell 1000 Index Fund | ||||
| Institutional Shares (Inception: 10/15/2010) | $103.49 | $108.35 | $1.057 | $0.000 |
| ETF Shares (Inception: 9/20/2010) | 51.78 | 55.94 | 0.533 | 0.000 |
| Vanguard Russell 1000 Value Index Fund | ||||
| Institutional Shares (Inception: 12/10/2010) | $108.03 | $104.59 | $1.306 | $0.000 |
| ETF Shares (Inception: 9/20/2010) | 51.46 | 53.57 | 0.652 | 0.000 |
| Vanguard Russell 1000 Growth Index Fund | ||||
| Institutional Shares (Inception: 12/6/2010) | $110.81 | $112.09 | $0.877 | $0.000 |
| ETF Shares (Inception: 9/20/2010) | 52.12 | 58.31 | 0.433 | 0.000 |
7
Russell 1000 Index Fund
Fund Profile
As of August 31, 2011
| Share-Class Characteristics | ||
| Institutional | ETF | |
| Shares | Shares | |
| Ticker Symbol | VRNIX | VONE |
| Expense Ratio1 | 0.08% | 0.12% |
| 30-Day SEC Yield | 1.99% | 1.93% |
| Portfolio Characteristics | |||
| DJ | |||
| Russell | U.S. Total | ||
| 1000 | Market | ||
| Fund | Index | Index | |
| Number of Stocks | 983 | 981 | 3,716 |
| Median Market Cap | $35.1B | $35.1B | $30.4B |
| Price/Earnings Ratio | 14.2x | 14.2x | 14.7x |
| Price/Book Ratio | 2.0x | 2.0x | 2.0x |
| Return on Equity | 19.4% | 19.3% | 19.0% |
| Earnings Growth Rate | 7.0% | 7.0% | 7.0% |
| Dividend Yield | 2.1% | 2.1% | 2.0% |
| Foreign Holdings | 0.0% | 0.0% | 0.0% |
| Turnover Rate | 20% | — | — |
| Short-Term Reserves | 0.0% | — | — |
| Sector Diversification (% of equity exposure) | |||
| DJ | |||
| Russell | U.S. Total | ||
| 1000 | Market | ||
| Fund | Index | Index | |
| Consumer | |||
| Discretionary | 11.6% | 11.6% | 12.3% |
| Consumer Staples | 10.2 | 10.2 | 10.5 |
| Energy | 11.7 | 11.7 | 10.8 |
| Financials | 14.8 | 14.8 | 14.8 |
| Health Care | 11.7 | 11.7 | 11.4 |
| Industrials | 10.7 | 10.7 | 11.0 |
| Information | |||
| Technology | 18.2 | 18.2 | 18.7 |
| Materials | 4.3 | 4.3 | 4.4 |
| Telecommunication | |||
| Services | 3.0 | 3.0 | 2.6 |
| Utilities | 3.8 | 3.8 | 3.5 |
| Ten Largest Holdings (% of total net assets) | ||
| Exxon Mobil Corp. | Integrated Oil & | |
| Gas | 2.9% | |
| Apple Inc. | Computer | |
| Hardware | 2.8 | |
| International Business | IT Consulting & | |
| Machines Corp. | Other Services | 1.6 |
| Chevron Corp. | Integrated Oil & | |
| Gas | 1.6 | |
| Microsoft Corp. | Systems Software | 1.6 |
| Johnson & Johnson | Pharmaceuticals | 1.4 |
| Procter & Gamble Co. | Household | |
| Products | 1.4 | |
| General Electric Co. | Industrial | |
| Conglomerates | 1.4 | |
| AT&T Inc. | Integrated | |
| Telecommunication | ||
| Services | 1.3 | |
| Pfizer Inc. | Pharmaceuticals | 1.2 |
| Top Ten | 17.2% | |
The holdings listed exclude any temporary cash investments and equity index products.
Investment Focus
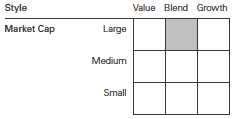
1 The expense ratios shown are from the prospectus dated September 16, 2010, and represent estimated costs for the current fiscal year. For the periods from inception through August 31, 2011, the annualized expense ratios were 0.08% for Institutional Shares and 0.12% for ETF Shares.
8
Russell 1000 Index Fund
Performance Summary
All of the returns in this report represent past performance, which is not a guarantee of future results that may be achieved by the fund. (Current performance may be lower or higher than the performance data cited. For performance data current to the most recent month-end, visit our website at vanguard.com/performance.) Note, too, that both investment returns and principal value can fluctuate widely, so an investor’s shares, when sold, could be worth more or less than their original cost. The returns shown do not reflect taxes that a shareholder would pay on fund distributions or on the sale of fund shares.
Cumulative Performance: September 20, 2010, Through August 31, 2011
Initial Investment of $10,000
| Total Returns | ||
| Periods Ended August 31, 2011 | ||
| Since | Final Value | |
| Inception | of a $10,000 | |
| (9/20/2010) | Investment | |
| Russell 1000 Index Fund ETF Shares | ||
| Net Asset Value | 9.02% | $10,902 |
| Russell 1000 Index Fund ETF Shares | ||
| Market Price | 9.03 | 10,903 |
| Dow Jones U.S. Total Stock Market | ||
| Index | 9.04 | 10,904 |
| Russell 1000 Index | 9.13 | 10,913 |
| Large-Cap Core Funds Average | 6.95 | 10,695 |
| Large-Cap Core Funds Average: Derived from data provided by Lipper Inc. | ||
| "Since Inception" performance is calculated from the ETF Shares’ inception date for both the fund and its comparative standards. | ||
| Since | Final Value | |
| Inception | of a $5,000,000 | |
| (10/15/2010) | Investment | |
| Russell 1000 Index Fund Institutional | ||
| Shares | 5.67% | $5,283,596 |
| Dow Jones U.S. Total Stock Market | ||
| Index | 5.43 | 5,271,373 |
| Russell 1000 Index | 5.74 | 5,286,994 |
| "Since Inception" performance is calculated from the Institutional Shares’ inception date for both the fund and its comparative standards. | ||
See Financial Highlights for dividend and capital gains information.
9
Russell 1000 Index Fund
| Cumulative Returns of ETF Shares: September 20, 2010, Through August 31, 2011 | |
| Since | |
| Inception | |
| (9/20/2010) | |
| Russell 1000 Index Fund | |
| ETF Shares Market Price | 9.03% |
| Russell 1000 Index Fund | |
| ETF Shares Net Asset Value | 9.02 |
| Russell 1000 Index | 9.13 |
| "Since Inception" performance is calculated from the ETF Shares’ inception date for both the fund and its comparative standards. | |
Fiscal-Period Total Returns (%): September 20, 2010, Through August 31, 2011
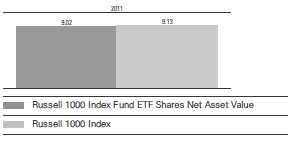
Total Returns: Periods Ended June 30, 2011
This table presents returns through the latest calendar quarter—rather than through the end of the fiscal period. Securities and Exchange Commission rules require that we provide this information.
| Inception | Since | |
| Date | Inception | |
| Institutional Shares | 10/15/2010 | 14.63% |
| ETF Shares | 9/20/2010 | |
| Market Price | 18.22 | |
| Net Asset Value | 18.26 |
10
Russell 1000 Index Fund
Financial Statements
Statement of Net Assets—Investments Summary
As of August 31, 2011
This Statement summarizes the fund’s holdings by asset type. Details are reported for each of the fund’s 50 largest individual holdings and for investments that, in total for any issuer, represent more than 1% of the fund’s net assets. The total value of smaller holdings is reported as a single amount within each category.
The fund reports a complete list of its holdings in regulatory filings four times in each fiscal year, at the quarter-ends. For the second and fourth fiscal quarters, the complete listing of the fund’s holdings is available electronically on vanguard.com and on the Securities and Exchange Commission’s website (sec.gov), or you can have it mailed to you without charge by calling 800-662-7447. For the first and third fiscal quarters, the fund files the lists with the SEC on Form N-Q. Shareholders can look up the fund’s Forms N-Q on the SEC’s website. Forms N-Q may also be reviewed and copied at the SEC’s Public Reference Room (see the back cover of this report for further information).
| Market | Percentage | ||
| Value | of Net | ||
| Shares | ($000) | Assets | |
| Common Stocks | |||
| Consumer Discretionary | |||
| McDonald’s Corp. | 15,681 | 1,419 | 0.7% |
| Amazon.com Inc. | 5,476 | 1,179 | 0.6% |
| Walt Disney Co. | 28,473 | 970 | 0.5% |
| Comcast Corp. Class A | 41,546 | 894 | 0.5% |
| Home Depot Inc. | 24,074 | 804 | 0.4% |
| Consumer Discretionary—Other † | 16,922 | 8.8% | |
| 22,188 | 11.5% | ||
| Consumer Staples | |||
| Procter & Gamble Co. | 42,176 | 2,686 | 1.4% |
| Coca-Cola Co. | 29,858 | 2,104 | 1.1% |
| Philip Morris International Inc. | 26,878 | 1,863 | 1.0% |
| PepsiCo Inc. | 23,889 | 1,539 | 0.8% |
| Wal-Mart Stores Inc. | 26,818 | 1,427 | 0.7% |
| Kraft Foods Inc. | 24,892 | 872 | 0.5% |
| Altria Group Inc. | 31,534 | 857 | 0.4% |
| CVS Caremark Corp. | 20,448 | 734 | 0.4% |
| Consumer Staples—Other † | 7,423 | 3.9% | |
| 19,505 | 10.2% | ||
| Energy | |||
| Exxon Mobil Corp. | 74,435 | 5,511 | 2.9% |
| Chevron Corp. | 30,376 | 3,005 | 1.6% |
| Schlumberger Ltd. | 20,508 | 1,602 | 0.8% |
| ConocoPhillips | 21,363 | 1,454 | 0.8% |
| Occidental Petroleum Corp. | 12,245 | 1,062 | 0.5% |
| Atlas Energy Inc. Escrow | 402 | — | 0.0% |
| Energy—Other † | 9,809 | 5.1% | |
| 22,443 | 11.7% |
11
Russell 1000 Index Fund
| Market | Percentage | ||
| Value | of Net | ||
| Shares | ($000) | Assets | |
| Financials | |||
| JPMorgan Chase & Co. | 60,055 | 2,256 | 1.2% |
| Wells Fargo & Co. | 74,339 | 1,940 | 1.0% |
| Berkshire Hathaway Inc. Class B | 26,547 | 1,938 | 1.0% |
| Citigroup Inc. | 43,919 | 1,364 | 0.7% |
| Bank of America Corp. | 153,140 | 1,251 | 0.6% |
| Goldman Sachs Group Inc. | 7,800 | 907 | 0.5% |
| American Express Co. | 15,828 | 787 | 0.4% |
| Financials—Other † | 17,802 | 9.3% | |
| 28,245 | 14.7% | ||
| Health Care | |||
| Johnson & Johnson | 41,419 | 2,725 | 1.4% |
| Pfizer Inc. | 119,410 | 2,266 | 1.2% |
| Merck & Co. Inc. | 46,648 | 1,545 | 0.8% |
| Abbott Laboratories | 23,414 | 1,230 | 0.7% |
| Amgen Inc. | 14,022 | 777 | 0.4% |
| UnitedHealth Group Inc. | 16,340 | 777 | 0.4% |
| Bristol-Myers Squibb Co. | 25,728 | 765 | 0.4% |
| Health Care—Other † | 12,320 | 6.4% | |
| 22,405 | 11.7% | ||
| Industrials | |||
| General Electric Co. | 160,250 | 2,614 | 1.4% |
| United Technologies Corp. | 13,788 | 1,024 | 0.5% |
| 3M Co. | 10,705 | 888 | 0.5% |
| Caterpillar Inc. | 9,713 | 884 | 0.4% |
| United Parcel Service Inc. Class B | 11,081 | 747 | 0.4% |
| Boeing Co. | 11,134 | 744 | 0.4% |
| Industrials—Other † | 13,531 | 7.0% | |
| 20,432 | 10.6% | ||
| Information Technology | |||
| Apple Inc. | 13,974 | 5,378 | 2.8% |
| International Business Machines Corp. | 18,301 | 3,146 | 1.6% |
| Microsoft Corp. | 112,129 | 2,983 | 1.6% |
| Google Inc. Class A | 3,804 | 2,058 | 1.1% |
| Oracle Corp. | 58,049 | 1,629 | 0.8% |
| Intel Corp. | 80,130 | 1,613 | 0.8% |
| Cisco Systems Inc. | 83,125 | 1,303 | 0.7% |
| QUALCOMM Inc. | 25,232 | 1,298 | 0.7% |
| Hewlett-Packard Co. | 32,598 | 849 | 0.4% |
| EMC Corp. | 31,029 | 701 | 0.4% |
| Information Technology—Other † | 13,837 | 7.2% | |
| 34,795 | 18.1% | ||
| Materials † | 8,317 | 4.3% | |
| Telecommunication Services | |||
| AT&T Inc. | 89,483 | 2,548 | 1.4% |
| Verizon Communications Inc. | 42,756 | 1,547 | 0.8% |
| Telecommunication Services—Other † | 1,579 | 0.8% | |
| 5,674 | 3.0% | ||
| Utilities † | 7,248 | 3.8% | |
| Total Common Stocks (Cost $199,133) | 191,252 | 99.6%1 | |
12
Russell 1000 Index Fund
| Market | Percentage | |||
| Value | of Net | |||
| Coupon | Shares | ($000) | Assets | |
| Temporary Cash Investments | ||||
| Money Market Fund | ||||
| 2 Vanguard Market Liquidity Fund | 0.132% | 673,345 | 673 | 0.3% |
| 3 U.S. Government and Agency Obligations † | 100 | 0.1% | ||
| Total Temporary Cash Investments (Cost $773) | 773 | 0.4%1 | ||
| Total Investments (Cost $199,906) | 192,025 | 100.0% | ||
| Other Assets and Liabilities | ||||
| Other Assets | 1,008 | 0.5% | ||
| Liabilities | (1,001) | (0.5%) | ||
| 7 | 0.0% | |||
| Net Assets | 192,032 | 100.0% | ||
| At August 31, 2011, net assets consisted of: | |
| Amount | |
| ($000) | |
| Paid-in Capital | 201,419 |
| Undistributed Net Investment Income | 712 |
| Accumulated Net Realized Losses | (2,212) |
| Unrealized Appreciation (Depreciation) | |
| Investment Securities | (7,881) |
| Futures Contracts | (6) |
| Net Assets | 192,032 |
| Institutional Shares—Net Assets | |
| Applicable to 1,643,282 outstanding $.001 par value shares of | |
| beneficial interest (unlimited authorization) | 178,048 |
| Net Asset Value Per Share—Institutional Shares | $108.35 |
| ETF Shares—Net Assets | |
| Applicable to 250,000 outstanding $.001 par value shares of | |
| beneficial interest (unlimited authorization) | 13,984 |
| Net Asset Value Per Share—ETF Shares | $55.94 |
See Note A in Notes to Financial Statements.
† Represents the aggregate value, by category, of securities that are not among the 50 largest holdings and, in total for any issuer, represent 1% or less of net assets.
1 The fund invests a portion of its cash reserves in equity markets through the use of index futures contracts. After giving effect to futures investments, the fund’s effective common stock and temporary cash investment positions represent 100.0% and 0.0%, respectively, of net assets.
2 Affiliated money market fund available only to Vanguard funds and certain trusts and accounts managed by Vanguard. Rate shown is the 7-day yield.
3 Securities with a value of $100,000 have been segregated as initial margin for open futures contracts.
See accompanying Notes, which are an integral part of the Financial Statements.
13
Russell 1000 Index Fund
| Statement of Operations | |
| September 20, 20101 to | |
| August 31, 2011 | |
| ($000) | |
| Investment Income | |
| Income | |
| Dividends | 1,638 |
| Interest2 | 1 |
| Total Income | 1,639 |
| Expenses | |
| The Vanguard Group—Note B | |
| Management and Administrative—Institutional Shares | 19 |
| Management and Administrative—ETF Shares | 5 |
| Marketing and Distribution—Institutional Shares | 3 |
| Marketing and Distribution—ETF Shares | — |
| Custodian Fees | 35 |
| Auditing Fees | 7 |
| Shareholders’ Reports—Institutional Shares | — |
| Shareholders’ Reports—ETF Shares | 1 |
| Total Expenses | 70 |
| Net Investment Income | 1,569 |
| Realized Net Gain (Loss) | |
| Investment Securities Sold | (1,444) |
| Futures Contracts | 14 |
| Realized Net Gain (Loss) | (1,430) |
| Change in Unrealized Appreciation (Depreciation) | |
| Investment Securities | (7,881) |
| Futures Contracts | (6) |
| Change in Unrealized Appreciation (Depreciation) | (7,887) |
| Net Increase (Decrease) in Net Assets Resulting from Operations | (7,748) |
| 1 Inception. | |
| 2 Interest income from an affiliated company of the fund was $1,000. | |
See accompanying Notes, which are an integral part of the Financial Statements.
14
Russell 1000 Index Fund
| Statement of Changes in Net Assets | |
| September 20, 20101 to | |
| August 31, 2011 | |
| ($000) | |
| Increase (Decrease) in Net Assets | |
| Operations | |
| Net Investment Income | 1,569 |
| Realized Net Gain (Loss) | (1,430) |
| Change in Unrealized Appreciation (Depreciation) | (7,887) |
| Net Increase (Decrease) in Net Assets Resulting from Operations | (7,748) |
| Distributions | |
| Net Investment Income | |
| Institutional Shares | (760) |
| ETF Shares | (97) |
| Realized Capital Gain | |
| Institutional Shares | — |
| ETF Shares | — |
| Total Distributions | (857) |
| Capital Share Transactions | |
| Institutional Shares | 186,983 |
| ETF Shares | 13,654 |
| Net Increase (Decrease) from Capital Share Transactions | 200,637 |
| Total Increase (Decrease) | 192,032 |
| Net Assets | |
| Beginning of Period | — |
| End of Period2 | 192,032 |
| 1 Inception. | |
| 2 Net Assets—End of Period includes undistributed net investment income of $712,000. | |
See accompanying Notes, which are an integral part of the Financial Statements.
15
Russell 1000 Index Fund
Financial Highlights
| Institutional Shares | |
| October 15, 20101 to | |
| For a Share Outstanding Throughout the Period | August 31, 2011 |
| Net Asset Value, Beginning of Period | $103.49 |
| Investment Operations | |
| Net Investment Income | 1.348 |
| Net Realized and Unrealized Gain (Loss) on Investments | 4.569 |
| Total from Investment Operations | 5.917 |
| Distributions | |
| Dividends from Net Investment Income | (1.057) |
| Distributions from Realized Capital Gains | — |
| Total Distributions | (1.057) |
| Net Asset Value, End of Period | $108.35 |
| Total Return | 5.67% |
| Ratios/Supplemental Data | |
| Net Assets, End of Period (Millions) | $178 |
| Ratio of Total Expenses to Average Net Assets | 0.08%2 |
| Ratio of Net Investment Income to Average Net Assets | 1.90%2 |
| Portfolio Turnover Rate3 | 20% |
1 Inception.
2 Annualized.
3 Excludes the value of portfolio securities received or delivered as a result of in-kind purchases or redemptions of the fund’s capital shares, including ETF Creation Units.
See accompanying Notes, which are an integral part of the Financial Statements.
16
Russell 1000 Index Fund
Financial Highlights
| ETF Shares | |
| September 20, 20101 to | |
| For a Share Outstanding Throughout the Period | August 31, 2011 |
| Net Asset Value, Beginning of Period | $51.78 |
| Investment Operations | |
| Net Investment Income | .736 |
| Net Realized and Unrealized Gain (Loss) on Investments | 3.957 |
| Total from Investment Operations | 4.693 |
| Distributions | |
| Dividends from Net Investment Income | (.533) |
| Distributions from Realized Capital Gains | — |
| Total Distributions | (.533) |
| Net Asset Value, End of Period | $55.94 |
| Total Return | 9.02% |
| Ratios/Supplemental Data | |
| Net Assets, End of Period (Millions) | $14 |
| Ratio of Total Expenses to Average Net Assets | 0.12%2 |
| Ratio of Net Investment Income to Average Net Assets | 1.86%2 |
| Portfolio Turnover Rate3 | 20% |
1 Inception.
2 Annualized.
3 Excludes the value of portfolio securities received or delivered as a result of in-kind purchases or redemptions of the fund’s capital shares, including ETF Creation Units.
See accompanying Notes, which are an integral part of the Financial Statements.
17
Russell 1000 Index Fund
Notes to Financial Statements
Vanguard Russell 1000 Index Fund is registered under the Investment Company Act of 1940 as an open-end investment company, or mutual fund. The fund offers two classes of shares: Institutional Shares and ETF Shares. Institutional Shares are designed for investors who meet certain administrative, service, and account-size criteria. Institutional Shares were first issued on October 15, 2010. ETF Shares were first issued on September 20, 2010, and first offered to the public on September 22, 2010. ETF Shares are listed for trading on Nasdaq; they can be purchased and sold through a broker.
A. The following significant accounting policies conform to generally accepted accounting principles for U.S. mutual funds. The fund consistently follows such policies in preparing its financial statements.
1. Security Valuation: Securities are valued as of the close of trading on the New York Stock Exchange (generally 4 p.m., Eastern time) on the valuation date. Equity securities are valued at the latest quoted sales prices or official closing prices taken from the primary market in which each security trades; such securities not traded on the valuation date are valued at the mean of the latest quoted bid and asked prices. Securities for which market quotations are not readily available, or whose values have been materially affected by events occurring before the fund’s pricing time but after the close of the securities’ primary markets, are valued by methods deemed by the board of trustees to represent fair value. Investments in Vanguard Market Liquidity Fund are valued at that fund’s net asset value. Temporary cash investments acquired over 60 days to maturity are valued using the latest bid prices or using valuations based on a matrix system (which considers such factors as security prices, yields, maturities, and ratings), both as furnished by independent pricing services. Other temporary cash investments are valued at amortized cost, which approximates market value.
2. Futures Contracts: The fund uses index futures contracts to a limited extent, with the objectives of maintaining full exposure to the stock market, enhancing returns, maintaining liquidity, and minimizing transaction costs. The fund may purchase futures contracts to immediately invest incoming cash in the market, or sell futures in response to cash outflows, thereby simulating a fully invested position in the underlying index while maintaining a cash balance for liquidity. The fund may seek to enhance returns by using futures contracts instead of the underlying securities when futures are believed to be priced more attractively than the underlying securities. The primary risks associated with the use of futures contracts are imperfect correlation between changes in market values of stocks held by the fund and the prices of futures contracts, and the possibility of an illiquid market.
Futures contracts are valued at their quoted daily settlement prices. The aggregate principal amounts of the contracts are not recorded in the Statement of Net Assets. Fluctuations in the value of the contracts are recorded in the Statement of Net Assets as an asset (liability) and in the Statement of Operations as unrealized appreciation (depreciation) until the contracts are closed, when they are recorded as realized futures gains (losses).
3. Federal Income Taxes: The fund intends to qualify as a regulated investment company and distribute all of its taxable income. Management has analyzed the fund’s tax positions taken for its open federal income tax period ended August 31, 2011, and has concluded that no provision for federal income tax is required in the fund’s financial statements.
4. Distributions: Distributions to shareholders are recorded on the ex-dividend date.
5. Other: Dividend income is recorded on the ex-dividend date. Interest income includes income distributions received from Vanguard Market Liquidity Fund and is accrued daily. Security transactions are accounted for on the date securities are bought or sold. Costs used to determine realized gains (losses) on the sale of investment securities are those of the specific securities sold.
18
Russell 1000 Index Fund
Each class of shares has equal rights as to assets and earnings, except that each class separately bears certain class-specific expenses related to maintenance of shareholder accounts (included in Management and Administrative expenses) and shareholder reporting. Marketing and distribution expenses are allocated to each class of shares based on a method approved by the board of trustees. Income, other non-class-specific expenses, and gains and losses on investments are allocated to each class of shares based on its relative net assets.
B. The Vanguard Group furnishes at cost investment advisory, corporate management, administrative, marketing, and distribution services. The costs of such services are allocated to the fund under methods approved by the board of trustees. The fund has committed to provide up to 0.40% of its net assets in capital contributions to Vanguard. At August 31, 2011, the fund had contributed capital of $32,000 to Vanguard (included in Other Assets), representing 0.02% of the fund’s net assets and 0.01% of Vanguard’s capitalization. The fund’s trustees and officers are also directors and officers of Vanguard.
C. Various inputs may be used to determine the value of the fund’s investments. These inputs are summarized in three broad levels for financial statement purposes. The inputs or methodologies used to value securities are not necessarily an indication of the risk associated with investing in those securities.
Level 1—Quoted prices in active markets for identical securities.
Level 2—Other significant observable inputs (including quoted prices for similar securities, interest rates, prepayment speeds, credit risk, etc.).
Level 3—Significant unobservable inputs (including the fund’s own assumptions used to determine the fair value of investments).
The following table summarizes the fund’s market value as of August 31, 2011, based on the inputs used to value them:
| Level 1 | Level 2 | Level 3 | |
| Investments | ($000) | ($000) | ($000) |
| Common Stocks | 191,252 | — | — |
| Temporary Cash Investments | 673 | 100 | — |
| Futures Contracts—Assets1 | 8 | — | — |
| Total | 191,933 | 100 | — |
| 1 Represents variation margin on the last day of the reporting period. |
D. At August 31, 2011, the aggregate settlement value of open futures contracts and the related unrealized appreciation (depreciation) were:
| ($000) | ||||
| Aggregate | ||||
| Number of | Settlement | Unrealized | ||
| Long (Short) | Value | Appreciation | ||
| Futures Contracts | Expiration | Contracts | Long (Short) | (Depreciation) |
| E-mini S&P 500 Index | September 2011 | 8 | 487 | 9 |
| S&P 500 Index | September 2011 | 1 | 304 | (15) |
Unrealized appreciation (depreciation) on open futures contracts is required to be treated as realized gain (loss) for tax purposes.
19
Russell 1000 Index Fund
E. Distributions are determined on a tax basis and may differ from net investment income and realized capital gains for financial reporting purposes. Differences may be permanent or temporary. Permanent differences are reclassified among capital accounts in the financial statements to reflect their tax character. Temporary differences arise when certain items of income, expense, gain, or loss are recognized in different periods for financial statement and tax purposes; these differences will reverse at some time in the future. Differences in classification may also result from the treatment of short-term gains as ordinary income for tax purposes.
During the period ended August 31, 2011, the fund realized $782,000 of net capital gains resulting from in-kind redemptions—in which shareholders exchanged fund shares for securities held by the fund rather than for cash. Because such gains are not taxable to the fund, and are not distributed to shareholders, they have been reclassified from accumulated net realized losses to paid-in capital.
For tax purposes, at August 31, 2011, the fund had $713,000 of ordinary income available for distribution. The fund realized losses of $2,104,000 during the period from November 1, 2010, through August 31, 2011, which are deferred and will be treated as realized for tax purposes in fiscal 2012.
At August 31, 2011, the cost of investment securities for tax purposes was $200,021,000. Net unrealized depreciation of investment securities for tax purposes was $7,996,000, consisting of unrealized gains of $4,875,000 on securities that had risen in value since their purchase and $12,871,000 in unrealized losses on securities that had fallen in value since their purchase.
F. During the period ended August 31, 2011, the fund purchased $226,208,000 of investment securities and sold $25,628,000 of investment securities, other than temporary cash investments.
G. Capital share transactions for each class of shares were:
| Inception1 to | ||
| August 31, 2011 | ||
| Amount | Shares | |
| ($000) | (000) | |
| Institutional Shares | ||
| Issued | 190,949 | 1,677 |
| Issued in Lieu of Cash Distributions | 743 | 6 |
| Redeemed | (4,709) | (40) |
| Net Increase (Decrease)—Institutional Shares | 186,983 | 1,643 |
| ETF Shares | ||
| Issued | 21,900 | 400 |
| Issued in Lieu of Cash Distributions | — | — |
| Redeemed | (8,246) | (150) |
| Net Increase (Decrease)—ETF Shares | 13,654 | 250 |
| 1 Inception was September 20, 2010, for ETF Shares and October 15, 2010, for Institutional Shares. | ||
H. In preparing the financial statements as of August 31, 2011, management considered the impact of subsequent events for potential recognition or disclosure in these financial statements.
20
Russell 1000 Value Index Fund
Fund Profile
As of August 31, 2011
| Share-Class Characteristics | ||
| Institutional | ETF | |
| Shares | Shares | |
| Ticker Symbol | VRVIX | VONV |
| Expense Ratio1 | 0.08% | 0.15% |
| 30-Day SEC Yield | 2.54% | 2.47% |
| Portfolio Characteristics | |||
| Russell | DJ | ||
| 1000 | U.S. Total | ||
| Value | Market | ||
| Fund | Index | Index | |
| Number of Stocks | 657 | 654 | 3,716 |
| Median Market Cap $35.1B | $35.1B | $30.4B | |
| Price/Earnings Ratio | 12.6x | 12.6x | 14.7x |
| Price/Book Ratio | 1.4x | 1.4x | 2.0x |
| Return on Equity | 13.6% | 13.6% | 19.0% |
| Earnings Growth Rate | 0.3% | 0.3% | 7.0% |
| Dividend Yield | 2.6% | 2.6% | 2.0% |
| Foreign Holdings | 0.0% | 0.0% | 0.0% |
| Turnover Rate | 39% | — | — |
| Short-Term Reserves | -0.4% | — | — |
| Sector Diversification (% of equity exposure) | |||
| Russell | DJ | ||
| 1000 | U.S. Total | ||
| Value | Market | ||
| Fund | Index | Index | |
| Consumer | |||
| Discretionary | 8.8% | 8.8% | 12.3% |
| Consumer Staples | 7.9 | 7.8 | 10.5 |
| Energy | 12.4 | 12.4 | 10.8 |
| Financials | 25.6 | 25.8 | 14.8 |
| Health Care | 12.7 | 12.7 | 11.4 |
| Industrials | 8.9 | 8.9 | 11.0 |
| Information | |||
| Technology | 8.6 | 8.5 | 18.7 |
| Materials | 2.8 | 2.8 | 4.4 |
| Telecommunication | |||
| Services | 4.8 | 4.8 | 2.6 |
| Utilities | 7.5 | 7.5 | 3.5 |
| Ten Largest Holdings (% of total net assets) | ||
| Chevron Corp. | Integrated Oil & | |
| Gas | 3.0% | |
| General Electric Co. | Industrial | |
| Conglomerates | 2.7 | |
| AT&T Inc. | Integrated | |
| Telecommunication | ||
| Services | 2.7 | |
| Procter & Gamble Co. | Household | |
| Products | 2.6 | |
| Pfizer Inc. | Pharmaceuticals | 2.4 |
| JPMorgan Chase & Co. | Other Diversified | |
| Financial Services | 2.4 | |
| Johnson & Johnson | Pharmaceuticals | 2.3 |
| Berkshire Hathaway Inc. | Property & Casualty | |
| Insurance | 2.0 | |
| Wells Fargo & Co. | Diversified Banks | 1.9 |
| Intel Corp. | Semiconductors | 1.7 |
| Top Ten | 23.7% | |
The holdings listed exclude any temporary cash investments and equity index products.
Investment Focus
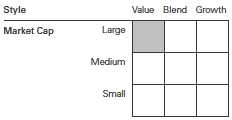
1 The expense ratios shown are from the prospectus dated September 16, 2010, and represent estimated costs for the current fiscal year. For the periods from inception through August 31, 2011, the annualized expense ratios were 0.08% for Institutional Shares and 0.15% for ETF Shares.
21
Russell 1000 Value Index Fund
Performance Summary
All of the returns in this report represent past performance, which is not a guarantee of future results that may be achieved by the fund. (Current performance may be lower or higher than the performance data cited. For performance data current to the most recent month-end, visit our website at vanguard.com/performance.) Note, too, that both investment returns and principal value can fluctuate widely, so an investor’s shares, when sold, could be worth more or less than their original cost. The returns shown do not reflect taxes that a shareholder would pay on fund distributions or on the sale of fund shares.
Cumulative Performance: September 20, 2010, Through August 31, 2011
Initial Investment of $10,000
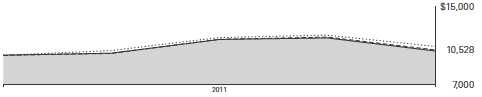
| Total Returns | ||
| Periods Ended August 31, 2011 | ||
| Since | Final Value | |
| Inception | of a $10,000 | |
| (9/20/2010) | Investment | |
| Russell 1000 Value Index Fund ETF | ||
| Shares Net Asset Value | 5.28% | $10,528 |
| Russell 1000 Value Index Fund ETF | ||
| Shares Market Price | 5.36 | 10,536 |
| Dow Jones U.S. Total Stock Market | ||
| Index | 9.04 | 10,904 |
| Russell 1000 Value Index | 5.47 | 10,547 |
| Large-Cap Value Funds Average | 4.34 | 10,434 |
| Large-Cap Value Funds Average: Derived from data provided by Lipper Inc. | ||
| "Since Inception" performance is calculated from the ETF Shares’ inception date for both the fund and its comparative standards. | ||
| Since | Final Value | |
| Inception | of a $5,000,000 | |
| (12/10/2010) | Investment | |
| Russell 1000 Value Index Fund | ||
| Institutional Shares | -2.06% | $4,896,904 |
| Dow Jones U.S. Total Stock Market | ||
| Index | -1.14 | 4,943,168 |
| Russell 1000 Value Index | -1.98 | 4,900,955 |
| "Since Inception" performance is calculated from the Institutional Shares’ inception date for both the fund and its comparative standards. | ||
See Financial Highlights for dividend and capital gains information.
22
Russell 1000 Value Index Fund
| Cumulative Returns of ETF Shares: September 20, 2010, Through August 31, 2011 | |
| Since | |
| Inception | |
| (9/20/2010) | |
| Russell 1000 Value Index Fund | |
| ETF Shares Market Price | 5.36% |
| Russell 1000 Value Index Fund | |
| ETF Shares Net Asset Value | 5.28 |
| Russell 1000 Value Index | 5.47 |
| "Since Inception" performance is calculated from the ETF Shares’ inception date for both the fund and its comparative standards. | |
Fiscal-Period Total Returns (%): September 20, 2010, Through August 31, 2011
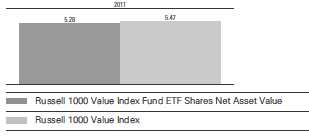
Total Returns: Periods Ended June 30, 2011
This table presents returns through the latest calendar quarter—rather than through the end of the fiscal period.
Securities and Exchange Commission rules require that we provide this information.
| Inception | Since | |
| Date | Inception | |
| Institutional Shares | 12/10/2010 | 8.09% |
| ETF Shares | 9/20/2010 | |
| Market Price | 16.19 | |
| Net Asset Value | 16.21 |
23
Russell 1000 Value Index Fund
Financial Statements
Statement of Net Assets—Investments Summary
As of August 31, 2011
This Statement summarizes the fund’s holdings by asset type. Details are reported for each of the fund’s 50 largest individual holdings and for investments that, in total for any issuer, represent more than 1% of the fund’s net assets. The total value of smaller holdings is reported as a single amount within each category.
The fund reports a complete list of its holdings in regulatory filings four times in each fiscal year, at the quarter-ends. For the second and fourth fiscal quarters, the complete listing of the fund’s holdings is available electronically on vanguard.com and on the Securities and Exchange Commission’s website (sec.gov), or you can have it mailed to you without charge by calling 800-662-7447. For the first and third fiscal quarters, the fund files the lists with the SEC on Form N-Q. Shareholders can look up the fund’s Forms N-Q on the SEC’s website. Forms N-Q may also be reviewed and copied at the SEC’s Public Reference Room (see the back cover of this report for further information).
| Market | Percentage | ||
| Value | of Net | ||
| Shares | ($000) | Assets | |
| Common Stocks | |||
| Consumer Discretionary | |||
| Walt Disney Co. | 57,126 | 1,946 | 1.0% |
| News Corp. Class A | 69,382 | 1,198 | 0.6% |
| Time Warner Inc. | 32,363 | 1,025 | 0.6% |
| Target Corp. | 19,725 | 1,019 | 0.5% |
| Lowe’s Cos. Inc. | 39,353 | 784 | 0.4% |
| Comcast Corp. Class A | 35,811 | 770 | 0.4% |
| Consumer Discretionary—Other † | 10,003 | 5.3% | |
| 16,745 | 8.8% | ||
| Consumer Staples | |||
| Procter & Gamble Co. | 78,710 | 5,012 | 2.6% |
| Kraft Foods Inc. | 49,940 | 1,749 | 0.9% |
| CVS Caremark Corp. | 40,981 | 1,472 | 0.8% |
| Consumer Staples—Other † | 6,673 | 3.5% | |
| 14,906 | 7.8% | ||
| Energy | |||
| Chevron Corp. | 57,293 | 5,667 | 3.0% |
| ConocoPhillips | 42,720 | 2,908 | 1.5% |
| Exxon Mobil Corp. | 39,008 | 2,888 | 1.5% |
| Occidental Petroleum Corp. | 17,492 | 1,517 | 0.8% |
| Anadarko Petroleum Corp. | 12,751 | 940 | 0.5% |
| Devon Energy Corp. | 12,786 | 867 | 0.5% |
| Apache Corp. | 8,253 | 851 | 0.4% |
| National Oilwell Varco Inc. | 12,788 | 846 | 0.4% |
| * Atlas Energy Inc. Escrow | 362 | — | 0.0% |
| Energy—Other † | 7,047 | 3.7% | |
| 23,531 | 12.3% | ||
| Financials | |||
| JPMorgan Chase & Co. | 120,097 | 4,511 | 2.4% |
| * Berkshire Hathaway Inc. Class B | 52,908 | 3,862 | 2.0% |
| Wells Fargo & Co. | 138,255 | 3,608 | 1.9% |
24
Russell 1000 Value Index Fund
| Market | Percentage | ||
| Value | of Net | ||
| Shares | ($000) | Assets | |
| Citigroup Inc. | 87,828 | 2,727 | 1.4% |
| Bank of America Corp. | 306,247 | 2,502 | 1.3% |
| Goldman Sachs Group Inc. | 15,647 | 1,818 | 1.0% |
| US Bancorp | 58,228 | 1,351 | 0.7% |
| Morgan Stanley | 48,003 | 840 | 0.5% |
| MetLife Inc. | 24,824 | 834 | 0.4% |
| PNC Financial Services Group Inc. | 15,907 | 798 | 0.4% |
| Bank of New York Mellon Corp. | 37,530 | 776 | 0.4% |
| Prudential Financial Inc. | 14,691 | 738 | 0.4% |
| Financials—Other † | 24,564 | 12.9% | |
| 48,929 | 25.7% | ||
| Health Care | |||
| Pfizer Inc. | 238,795 | 4,532 | 2.4% |
| Johnson & Johnson | 65,946 | 4,339 | 2.3% |
| Merck & Co. Inc. | 93,286 | 3,090 | 1.6% |
| Amgen Inc. | 28,101 | 1,557 | 0.8% |
| UnitedHealth Group Inc. | 32,745 | 1,556 | 0.8% |
| Bristol-Myers Squibb Co. | 51,561 | 1,534 | 0.8% |
| Eli Lilly & Co. | 20,668 | 775 | 0.4% |
| Health Care—Other † | 6,665 | 3.5% | |
| 24,048 | 12.6% | ||
| Industrials | |||
| General Electric Co. | 320,528 | 5,228 | 2.7% |
| Union Pacific Corp. | 12,409 | 1,144 | 0.6% |
| Industrials—Other † | 10,502 | 5.5% | |
| 16,874 | 8.8% | ||
| Information Technology | |||
| Intel Corp. | 160,242 | 3,226 | 1.7% |
| Cisco Systems Inc. | 166,232 | 2,607 | 1.4% |
| Hewlett-Packard Co. | 65,400 | 1,702 | 0.9% |
| Visa Inc. Class A | 10,700 | 940 | 0.5% |
| Information Technology—Other † | 7,709 | 4.0% | |
| 16,184 | 8.5% | ||
| Materials | |||
| Dow Chemical Co. | 35,530 | 1,011 | 0.5% |
| Newmont Mining Corp. | 14,701 | 921 | 0.5% |
| Materials—Other † | 3,346 | 1.8% | |
| 5,278 | 2.8% | ||
| Telecommunication Services | |||
| AT&T Inc. | 178,981 | 5,097 | 2.7% |
| Verizon Communications Inc. | 66,179 | 2,394 | 1.2% |
| Telecommunication Services—Other † | 1,545 | 0.8% | |
| 9,036 | 4.7% | ||
| Utilities | |||
| Southern Co. | 25,664 | 1,061 | 0.6% |
| Exelon Corp. | 20,021 | 863 | 0.5% |
| Dominion Resources Inc. | 17,402 | 848 | 0.4% |
| Duke Energy Corp. | 40,237 | 761 | 0.4% |
| Utilities—Other † | 10,766 | 5.6% | |
| 14,299 | 7.5% | ||
| Total Common Stocks (Cost $199,281) | 189,830 | 99.5%1 |
25
Russell 1000 Value Index Fund
| Market | Percentage | |||
| Value | of Net | |||
| Coupon | Shares | ($000) | Assets | |
| Temporary Cash Investments | ||||
| Money Market Fund | ||||
| 2 Vanguard Market Liquidity Fund | 0.132% | 300,000 | 300 | 0.1% |
| 3 U.S. Government and Agency Obligations † | 100 | 0.1% | ||
| Total Temporary Cash Investments (Cost $401) | 400 | 0.2%1 | ||
| Total Investments (Cost $199,682) | 190,230 | 99.7% | ||
| Other Assets and Liabilities | ||||
| Other Assets | 1,295 | 0.7% | ||
| Liabilities | (752) | (0.4%) | ||
| 543 | 0.3% | |||
| Net Assets | 190,773 | 100.0% | ||
| At August 31, 2011, net assets consisted of: | |
| Amount | |
| ($000) | |
| Paid-in Capital | 201,610 |
| Undistributed Net Investment Income | 817 |
| Accumulated Net Realized Losses | (2,259) |
| Unrealized Appreciation (Depreciation) | |
| Investment Securities | (9,452) |
| Futures Contracts | 57 |
| Net Assets | 190,773 |
| Institutional Shares—Net Assets | |
| Applicable to 1,567,890 outstanding $.001 par value shares of | |
| beneficial interest (unlimited authorization) | 163,986 |
| Net Asset Value Per Share—Institutional Shares | $104.59 |
| ETF Shares—Net Assets | |
| Applicable to 500,000 outstanding $.001 par value shares of | |
| beneficial interest (unlimited authorization) | 26,787 |
| Net Asset Value Per Share—ETF Shares | $53.57 |
See Note A in Notes to Financial Statements.
† Represents the aggregate value, by category, of securities that are not among the 50 largest holdings and, in total for any issuer, represent 1% or less of net assets.
1 The fund invests a portion of its cash reserves in equity markets through the use of index futures contracts. After giving effect to futures investments, the fund’s effective common stock and temporary cash investment positions represent 100.0% and -0.3%, respectively, of net assets.
2 Affiliated money market fund available only to Vanguard funds and certain trusts and accounts managed by Vanguard. Rate shown is the 7-day yield.
3 Securities with a value of $100,000 have been segregated as initial margin for open futures contracts.
See accompanying Notes, which are an integral part of the Financial Statements.
26
Russell 1000 Value Index Fund
| Statement of Operations | |
| September 20, 20101 to | |
| August 31, 2011 | |
| ($000) | |
| Investment Income | |
| Income | |
| Dividends | 2,478 |
| Interest2 | 2 |
| Total Income | 2,480 |
| Expenses | |
| The Vanguard Group—Note B | |
| Investment Advisory Services | 5 |
| Management and Administrative—Institutional Shares | 18 |
| Management and Administrative—ETF Shares | 16 |
| Marketing and Distribution—Institutional Shares | 17 |
| Marketing and Distribution—ETF Shares | 3 |
| Custodian Fees | 28 |
| Auditing Fees | 7 |
| Shareholders’ Reports—Institutional Shares | — |
| Shareholders’ Reports—ETF Shares | 1 |
| Total Expenses | 95 |
| Net Investment Income | 2,385 |
| Realized Net Gain (Loss) | |
| Investment Securities Sold | (1,608) |
| Futures Contracts | (26) |
| Realized Net Gain (Loss) | (1,634) |
| Change in Unrealized Appreciation (Depreciation) | |
| Investment Securities | (9,452) |
| Futures Contracts | 57 |
| Change in Unrealized Appreciation (Depreciation) | (9,395) |
| Net Increase (Decrease) in Net Assets Resulting from Operations | (8,644) |
| 1 Inception. | |
| 2 Interest income from an affiliated company of the fund was $1,000. | |
See accompanying Notes, which are an integral part of the Financial Statements.
27
Russell 1000 Value Index Fund
| Statement of Changes in Net Assets | |
| September 20, 20101 to | |
| August 31, 2011 | |
| ($000) | |
| Increase (Decrease) in Net Assets | |
| Operations | |
| Net Investment Income | 2,385 |
| Realized Net Gain (Loss) | (1,634) |
| Change in Unrealized Appreciation (Depreciation) | (9,395) |
| Net Increase (Decrease) in Net Assets Resulting from Operations | (8,644) |
| Distributions | |
| Net Investment Income | |
| Institutional Shares | (1,362) |
| ETF Shares | (206) |
| Realized Capital Gain | |
| Institutional Shares | — |
| ETF Shares | — |
| Total Distributions | (1,568) |
| Capital Share Transactions | |
| Institutional Shares | 174,124 |
| ETF Shares | 26,861 |
| Net Increase (Decrease) from Capital Share Transactions | 200,985 |
| Total Increase (Decrease) | 190,773 |
| Net Assets | |
| Beginning of Period | — |
| End of Period2 | 190,773 |
| 1 Inception. | |
| 2 Net Assets—End of Period includes undistributed net investment income of $817,000. | |
See accompanying Notes, which are an integral part of the Financial Statements.28
Russell 1000 Value Index Fund
Financial Highlights
| Institutional Shares | |
| December 10, 20101 to | |
| For a Share Outstanding Throughout the Period | August 31, 2011 |
| Net Asset Value, Beginning of Period | $108.03 |
| Investment Operations | |
| Net Investment Income | 1.239 |
| Net Realized and Unrealized Gain (Loss) on Investments | (3.373) |
| Total from Investment Operations | (2.134) |
| Distributions | |
| Dividends from Net Investment Income | (1.306) |
| Distributions from Realized Capital Gains | — |
| Total Distributions | (1.306) |
| Net Asset Value, End of Period | $104.59 |
| Total Return | -2.06% |
| Ratios/Supplemental Data | |
| Net Assets, End of Period (Millions) | $164 |
| Ratio of Total Expenses to Average Net Assets | 0.08%2 |
| Ratio of Net Investment Income to Average Net Assets | 2.30%2 |
| Portfolio Turnover Rate3 | 39% |
1 Inception.
2 Annualized.
3 Excludes the value of portfolio securities received or delivered as a result of in-kind purchases or redemptions of the fund’s capital shares, including ETF Creation Units.
See accompanying Notes, which are an integral part of the Financial Statements.
29
Russell 1000 Value Index Fund
Financial Highlights
| ETF Shares | |
| September 20, 20101 to | |
| For a Share Outstanding Throughout the Period | August 31, 2011 |
| Net Asset Value, Beginning of Period | $51.46 |
| Investment Operations | |
| Net Investment Income | .876 |
| Net Realized and Unrealized Gain (Loss) on Investments | 1.886 |
| Total from Investment Operations | 2.762 |
| Distributions | |
| Dividends from Net Investment Income | (.652) |
| Distributions from Realized Capital Gains | — |
| Total Distributions | (.652) |
| Net Asset Value, End of Period | $53.57 |
| Total Return | 5.28% |
| Ratios/Supplemental Data | |
| Net Assets, End of Period (Millions) | $27 |
| Ratio of Total Expenses to Average Net Assets | 0.15%2 |
| Ratio of Net Investment Income to Average Net Assets | 2.23%2 |
| Portfolio Turnover Rate3 | 39% |
1 Inception.
2 Annualized.
3 Excludes the value of portfolio securities received or delivered as a result of in-kind purchases or redemptions of the fund’s capital shares, including ETF Creation Units.
See accompanying Notes, which are an integral part of the Financial Statements.
30
Russell 1000 Value Index Fund
Notes to Financial Statements
Vanguard Russell 1000 Value Index Fund is registered under the Investment Company Act of 1940 as an open-end investment company, or mutual fund. The fund offers two classes of shares: Institutional Shares and ETF Shares. Institutional Shares are designed for investors who meet certain administrative, service, and account-size criteria. Institutional Shares were first issued on December 10, 2010. ETF Shares were first issued on September 20, 2010, and first offered to the public on September 22, 2010. ETF Shares are listed for trading on Nasdaq; they can be purchased and sold through a broker.
A. The following significant accounting policies conform to generally accepted accounting principles for U.S. mutual funds. The fund consistently follows such policies in preparing its financial statements.
1. Security Valuation: Securities are valued as of the close of trading on the New York Stock Exchange (generally 4 p.m., Eastern time) on the valuation date. Equity securities are valued at the latest quoted sales prices or official closing prices taken from the primary market in which each security trades; such securities not traded on the valuation date are valued at the mean of the latest quoted bid and asked prices. Securities for which market quotations are not readily available, or whose values have been materially affected by events occurring before the fund’s pricing time but after the close of the securities’ primary markets, are valued by methods deemed by the board of trustees to represent fair value. Investments in Vanguard Market Liquidity Fund are valued at that fund’s net asset value. Temporary cash investments acquired over 60 days to maturity are valued using the latest bid prices or using valuations based on a matrix system (which considers such factors as security prices, yields, maturities, and ratings), both as furnished by independent pricing services. Other temporary cash investments are valued at amortized cost, which approximates market value.
2. Futures Contracts: The fund uses index futures contracts to a limited extent, with the objectives of maintaining full exposure to the stock market, enhancing returns, maintaining liquidity, and minimizing transaction costs. The fund may purchase futures contracts to immediately invest incoming cash in the market, or sell futures in response to cash outflows, thereby simulating a fully invested position in the underlying index while maintaining a cash balance for liquidity. The fund may seek to enhance returns by using futures contracts instead of the underlying securities when futures are believed to be priced more attractively than the underlying securities. The primary risks associated with the use of futures contracts are imperfect correlation between changes in market values of stocks held by the fund and the prices of futures contracts, and the possibility of an illiquid market.
Futures contracts are valued at their quoted daily settlement prices. The aggregate principal amounts of the contracts are not recorded in the Statement of Net Assets. Fluctuations in the value of the contracts are recorded in the Statement of Net Assets as an asset (liability) and in the Statement of Operations as unrealized appreciation (depreciation) until the contracts are closed, when they are recorded as realized futures gains (losses).
3. Federal Income Taxes: The fund intends to qualify as a regulated investment company and distribute all of its taxable income. Management has analyzed the fund’s tax positions taken for its open federal income tax period ended August 31, 2011, and has concluded that no provision for federal income tax is required in the fund’s financial statements.
4. Distributions: Distributions to shareholders are recorded on the ex-dividend date.
5. Other: Dividend income is recorded on the ex-dividend date. Interest income includes income distributions received from Vanguard Market Liquidity Fund and is accrued daily. Security transactions are accounted for on the date securities are bought or sold. Costs used to determine realized gains (losses) on the sale of investment securities are those of the specific securities sold.
31
Russell 1000 Value Index Fund
Each class of shares has equal rights as to assets and earnings, except that each class separately bears certain class-specific expenses related to maintenance of shareholder accounts (included in Management and Administrative expenses) and shareholder reporting. Marketing and distribution expenses are allocated to each class of shares based on a method approved by the board of trustees. Income, other non-class-specific expenses, and gains and losses on investments are allocated to each class of shares based on its relative net assets.
B. The Vanguard Group furnishes at cost investment advisory, corporate management, administrative, marketing, and distribution services. The costs of such services are allocated to the fund under methods approved by the board of trustees. The fund has committed to provide up to 0.40% of its net assets in capital contributions to Vanguard. At August 31, 2011, the fund had contributed capital of $31,000 to Vanguard (included in Other Assets), representing 0.02% of the fund’s net assets and 0.01% of Vanguard’s capitalization. The fund’s trustees and officers are also directors and officers of Vanguard.
C. Various inputs may be used to determine the value of the fund’s investments. These inputs are summarized in three broad levels for financial statement purposes. The inputs or methodologies used to value securities are not necessarily an indication of the risk associated with investing in those securities.
Level 1—Quoted prices in active markets for identical securities.
Level 2—Other significant observable inputs (including quoted prices for similar securities, interest rates, prepayment speeds, credit risk, etc.).
Level 3—Significant unobservable inputs (including the fund’s own assumptions used to determine the fair value of investments).
The following table summarizes the fund’s market value as of August 31, 2011, based on the inputs used to value them:
| Level 1 | Level 2 | Level 3 | |
| Investments | ($000) | ($000) | ($000) |
| Common Stocks | 189,830 | — | — |
| Temporary Cash Investments | 300 | 100 | — |
| Futures Contracts—Assets1 | 11 | — | — |
| Total | 190,141 | 100 | — |
| 1 Represents variation margin on the last day of the reporting period. |
D. At August 31, 2011, the aggregate settlement value of open futures contracts and the related unrealized appreciation (depreciation) were:
| ($000) | ||||
| Aggregate | ||||
| Number of | Settlement | Unrealized | ||
| Long (Short) | Value | Appreciation | ||
| Futures Contracts | Expiration | Contracts | Long (Short) | (Depreciation) |
| E-mini S&P 500 Index | September 2011 | 17 | 1,035 | 57 |
Unrealized appreciation (depreciation) on open futures contracts is required to be treated as realized gain (loss) for tax purposes.
32
Russell 1000 Value Index Fund
E. Distributions are determined on a tax basis and may differ from net investment income and realized capital gains for financial reporting purposes. Differences may be permanent or temporary. Permanent differences are reclassified among capital accounts in the financial statements to reflect their tax character. Temporary differences arise when certain items of income, expense, gain, or loss are recognized in different periods for financial statement and tax purposes; these differences will reverse at some time in the future. Differences in classification may also result from the treatment of short-term gains as ordinary income for tax purposes.
During the period ended August 31, 2011, the fund realized $625,000 of net capital gains resulting from in-kind redemptions—in which shareholders exchanged fund shares for securities held by the fund rather than for cash. Because such gains are not taxable to the fund, and are not distributed to shareholders, they have been reclassified from accumulated net realized losses to paid-in capital.
For tax purposes, at August 31, 2011, the fund had $822,000 of ordinary income available for distribution. The fund realized losses of $1,286,000 during the period from November 1, 2010, through August 31, 2011, which are deferred and will be treated as realized for tax purposes in fiscal 2012.
At August 31, 2011, the cost of investment securities for tax purposes was $200,599,000. Net unrealized depreciation of investment securities for tax purposes was $10,369,000, consisting of unrealized gains of $4,654,000 on securities that had risen in value since their purchase and $15,023,000 in unrealized losses on securities that had fallen in value since their purchase.
F. During the period ended August 31, 2011, the fund purchased $253,332,000 of investment securities and sold $52,438,000 of investment securities, other than temporary cash investments.
G. Capital share transactions for each class of shares were:
| Inception1 to | ||
| August 31, 2011 | ||
| Amount | Shares | |
| ($000) | (000) | |
| Institutional Shares | ||
| Issued | 186,341 | 1,679 |
| Issued in Lieu of Cash Distributions | 1,302 | 12 |
| Redeemed | (13,519) | (123) |
| Net Increase (Decrease)—Institutional Shares | 174,124 | 1,568 |
| ETF Shares | ||
| Issued | 34,817 | 650 |
| Issued in Lieu of Cash Distributions | — | — |
| Redeemed | (7,956) | (150) |
| Net Increase (Decrease)—ETF Shares | 26,861 | 500 |
| 1 Inception was September 20, 2010, for ETF Shares and December 10, 2010, for Institutional Shares. | ||
H. In preparing the financial statements as of August 31, 2011, management considered the impact of subsequent events for potential recognition or disclosure in these financial statements.
33
Russell 1000 Growth Index Fund
Fund Profile
As of August 31, 2011
| Share-Class Characteristics | ||
| Institutional | ETF | |
| Shares | Shares | |
| Ticker Symbol | VRGWX | VONG |
| Expense Ratio1 | 0.08% | 0.15% |
| 30-Day SEC Yield | 1.48% | 1.41% |
| Portfolio Characteristics | |||
| Russell | DJ | ||
| 1000 | U.S. Total | ||
| Growth | Market | ||
| Fund | Index | Index | |
| Number of Stocks | 591 | 589 | 3,716 |
| Median Market Cap | $35.0B | $35.0B | $30.4B |
| Price/Earnings Ratio | 16.3x | 16.3x | 14.7x |
| Price/Book Ratio | 3.7x | 3.7x | 2.0x |
| Return on Equity | 25.7% | 25.4% | 19.0% |
| Earnings Growth Rate | 13.2% | 13.2% | 7.0% |
| Dividend Yield | 1.6% | 1.6% | 2.0% |
| Foreign Holdings | 0.0% | 0.0% | 0.0% |
| Turnover Rate | 30% | — | — |
| Short-Term Reserves | -0.2% | — | — |
| Sector Diversification (% of equity exposure) | |||
| Russell | DJ | ||
| 1000 | U.S. Total | ||
| Growth | Market | ||
| Fund | Index | Index | |
| Consumer | |||
| Discretionary | 14.3% | 14.3% | 12.3% |
| Consumer Staples | 12.5 | 12.5 | 10.5 |
| Energy | 11.1 | 11.1 | 10.8 |
| Financials | 3.9 | 3.9 | 14.8 |
| Health Care | 10.8 | 10.8 | 11.4 |
| Industrials | 12.5 | 12.5 | 11.0 |
| Information | |||
| Technology | 27.7 | 27.7 | 18.7 |
| Materials | 5.9 | 5.9 | 4.4 |
| Telecommunication | |||
| Services | 1.2 | 1.2 | 2.6 |
| Utilities | 0.1 | 0.1 | 3.5 |
| Ten Largest Holdings (% of total net assets) | ||
| Apple Inc. | Computer | |
| Hardware | 5.6% | |
| Exxon Mobil Corp. | Integrated Oil & | |
| Gas | 4.2 | |
| International Business | IT Consulting & | |
| Machines Corp. | Other Services | 3.3 |
| Microsoft Corp. | Systems Software | 3.1 |
| Coca-Cola Co. | Soft Drinks | 2.3 |
| Google Inc. | Internet Software & | |
| Services | 2.1 | |
| Philip Morris | ||
| International Inc. | Tobacco | 1.7 |
| Oracle Corp. | Systems Software | 1.7 |
| Schlumberger Ltd. | Oil & Gas | |
| Equipment & | ||
| Services | 1.7 | |
| PepsiCo Inc. | Soft Drinks | 1.6 |
| Top Ten | 27.3% | |
The holdings listed exclude any temporary cash investments and equity index products.
Investment Focus
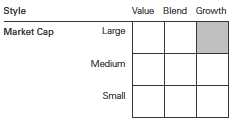
1 The expense ratios shown are from the prospectus dated September 16, 2010, and represent estimated costs for the current fiscal year. For the periods from inception through August 31, 2011, the annualized expense ratios were 0.08% for Institutional Shares and 0.15% for ETF Shares.
34
Russell 1000 Growth Index Fund
Performance Summary
All of the returns in this report represent past performance, which is not a guarantee of future results that may be achieved by the fund. (Current performance may be lower or higher than the performance data cited. For performance data current to the most recent month-end, visit our website at vanguard.com/performance.) Note, too, that both investment returns and principal value can fluctuate widely, so an investor’s shares, when sold, could be worth more or less than their original cost. The returns shown do not reflect taxes that a shareholder would pay on fund distributions or on the sale of fund shares.
Cumulative Performance: September 20, 2010, Through August 31, 2011
Initial Investment of $10,000
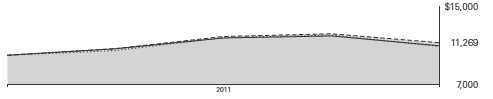
| Total Returns | ||
| Periods Ended August 31, 2011 | ||
| Since | Final Value | |
| Inception | of a $10,000 | |
| (9/20/2010) | Investment | |
| Russell 1000 Growth Index Fund ETF | ||
| Shares Net Asset Value | 12.69% | $11,269 |
| Russell 1000 Growth Index Fund ETF | ||
| Shares Market Price | 12.68 | 11,268 |
| Dow Jones U.S. Total Stock Market | ||
| Index | 9.04 | 10,904 |
| Russell 1000 Growth Index | 12.93 | 11,293 |
| Large-Cap Growth Funds Average | 9.73 | 10,973 |
| Large-Cap Growth Funds Average: Derived from data provided by Lipper Inc. | ||
| "Since Inception" performance is calculated from the ETF Shares’ inception date for both the fund and its comparative standards. | ||
| Since | Final Value | |
| Inception | of a $5,000,000 | |
| (12/6/2010) | Investment | |
| Russell 1000 Growth Index Fund | ||
| Institutional Shares | 1.92% | $5,096,119 |
| Dow Jones U.S. Total Stock Market | ||
| Index | 0.26 | 5,013,098 |
| Russell 1000 Growth Index | 2.05 | 5,102,419 |
| "Since Inception" performance is calculated from the Institutional Shares’ inception date for both the fund and its comparative standards. | ||
See Financial Highlights for dividend and capital gains information.
35
Russell 1000 Growth Index Fund
| Cumulative Returns of ETF Shares: September 20, 2010, Through August 31, 2011 | |
| Since | |
| Inception | |
| (9/20/2010) | |
| Russell 1000 Growth Index Fund | |
| ETF Shares Market Price | 12.68% |
| Russell 1000 Growth Index Fund | |
| ETF Shares Net Asset Value | 12.69 |
| Russell 1000 Growth Index | 12.93 |
| "Since Inception" performance is calculated from the ETF Shares’ inception date for both the fund and its comparative standards. | |
Fiscal-Period Total Returns (%): September 20, 2010, Through August 31, 2011
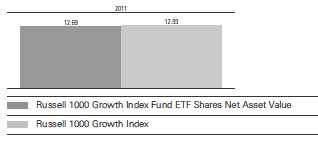
Total Returns: Periods Ended June 30, 2011
This table presents returns through the latest calendar quarter—rather than through the end of the fiscal period. Securities and Exchange Commission rules require that we provide this information.
| Inception | Since | |
| Date | Inception | |
| Institutional Shares | 12/6/2010 | 8.78% |
| ETF Shares | 9/20/2010 | |
| Market Price | 20.14 | |
| Net Asset Value | 20.28 |
36
Russell 1000 Growth Index Fund
Financial Statements
Statement of Net Assets—Investments Summary
As of August 31, 2011
This Statement summarizes the fund’s holdings by asset type. Details are reported for each of the fund’s 50 largest individual holdings and for investments that, in total for any issuer, represent more than 1% of the fund’s net assets. The total value of smaller holdings is reported as a single amount within each category.
The fund reports a complete list of its holdings in regulatory filings four times in each fiscal year, at the quarter-ends. For the second and fourth fiscal quarters, the complete listing of the fund’s holdings is available electronically on vanguard.com and on the Securities and Exchange Commission’s website (sec.gov), or you can have it mailed to you without charge by calling 800-662-7447. For the first and third fiscal quarters, the fund files the lists with the SEC on Form N-Q. Shareholders can look up the fund’s Forms N-Q on the SEC’s website. Forms N-Q may also be reviewed and copied at the SEC’s Public Reference Room (see the back cover of this report for further information).
| Market | Percentage | ||
| Value | of Net | ||
| Shares | ($000) | Assets | |
| Common Stocks | |||
| Consumer Discretionary | |||
| McDonald’s Corp. | 33,577 | 3,037 | 1.5% |
| * Amazon.com Inc. | 11,762 | 2,532 | 1.2% |
| * DIRECTV Class A | 24,847 | 1,093 | 0.5% |
| Home Depot Inc. | 31,184 | 1,041 | 0.5% |
| NIKE Inc. Class B | 11,554 | 1,001 | 0.5% |
| Starbucks Corp. | 24,258 | 937 | 0.5% |
| Viacom Inc. Class B | 18,935 | 913 | 0.4% |
| * priceline.com Inc. | 1,606 | 863 | 0.4% |
| Comcast Corp. Class A | 38,913 | 837 | 0.4% |
| Yum! Brands Inc. | 15,066 | 819 | 0.4% |
| Consumer Discretionary—Other † | 16,424 | 8.0% | |
| 29,497 | 14.3% | ||
| Consumer Staples | |||
| Coca-Cola Co. | 63,934 | 4,504 | 2.2% |
| Philip Morris International Inc. | 52,084 | 3,611 | 1.7% |
| PepsiCo Inc. | 51,153 | 3,296 | 1.6% |
| Wal-Mart Stores Inc. | 43,644 | 2,322 | 1.1% |
| Altria Group Inc. | 50,538 | 1,374 | 0.7% |
| Colgate-Palmolive Co. | 14,271 | 1,284 | 0.6% |
| Costco Wholesale Corp. | 14,137 | 1,110 | 0.5% |
| Walgreen Co. | 27,967 | 985 | 0.5% |
| Consumer Staples—Other † | 7,353 | 3.6% | |
| 25,839 | 12.5% | ||
| Energy | |||
| Exxon Mobil Corp. | 117,649 | 8,711 | 4.2% |
| Schlumberger Ltd. | 43,912 | 3,430 | 1.7% |
| Halliburton Co. | 29,612 | 1,314 | 0.6% |
| Energy—Other † | 9,422 | 4.6% | |
| 22,877 | 11.1% |
37
Russell 1000 Growth Index Fund
| Market | Percentage | ||
| Value | of Net | ||
| Shares | ($000) | Assets | |
| Financials | |||
| American Express Co. | 20,571 | 1,023 | 0.5% |
| Simon Property Group Inc. | 7,756 | 911 | 0.4% |
| Financials—Other † | 6,120 | 3.0% | |
| 8,054 | 3.9% | ||
| Health Care | |||
| Abbott Laboratories | 47,231 | 2,480 | 1.2% |
| Johnson & Johnson | 18,096 | 1,191 | 0.6% |
| Medtronic Inc. | 29,887 | 1,048 | 0.5% |
| * Gilead Sciences Inc. | 25,470 | 1,016 | 0.5% |
| Baxter International Inc. | 16,612 | 930 | 0.5% |
| * Celgene Corp. | 14,977 | 891 | 0.4% |
| Health Care—Other † | 14,665 | 7.1% | |
| 22,221 | 10.8% | ||
| Industrials | |||
| United Technologies Corp. | 28,020 | 2,080 | 1.0% |
| Caterpillar Inc. | 20,863 | 1,899 | 0.9% |
| 3M Co. | 20,305 | 1,685 | 0.8% |
| United Parcel Service Inc. Class B | 23,777 | 1,602 | 0.8% |
| Boeing Co. | 21,192 | 1,417 | 0.7% |
| Honeywell International Inc. | 25,469 | 1,218 | 0.6% |
| Emerson Electric Co. | 24,326 | 1,132 | 0.5% |
| Deere & Co. | 13,582 | 1,098 | 0.5% |
| Industrials—Other † | 13,550 | 6.6% | |
| 25,681 | 12.4% | ||
| Information Technology | |||
| * Apple Inc. | 29,926 | 11,516 | 5.6% |
| International Business Machines Corp. | 39,197 | 6,738 | 3.3% |
| Microsoft Corp. | 240,150 | 6,388 | 3.1% |
| * Google Inc. Class A | 8,145 | 4,406 | 2.1% |
| Oracle Corp. | 124,299 | 3,489 | 1.7% |
| QUALCOMM Inc. | 54,029 | 2,780 | 1.4% |
| * EMC Corp. | 66,586 | 1,504 | 0.7% |
| Mastercard Inc. Class A | 3,471 | 1,144 | 0.6% |
| Accenture plc Class A | 20,894 | 1,120 | 0.5% |
| Information Technology—Other † | 18,043 | 8.7% | |
| 57,128 | 27.7% | ||
| Materials | |||
| EI du Pont de Nemours & Co. | 30,054 | 1,451 | 0.7% |
| Freeport-McMoRan Copper & Gold Inc. | 30,656 | 1,445 | 0.7% |
| Monsanto Co. | 17,345 | 1,196 | 0.6% |
| Praxair Inc. | 9,818 | 967 | 0.5% |
| Materials—Other † | 7,097 | 3.4% | |
| 12,156 | 5.9% | ||
| Telecommunication Services † | 2,486 | 1.2% | |
| Utilities † | 179 | 0.1% | |
| Total Common Stocks (Cost $217,374) | 206,118 | 99.9%1 | |
38
Russell 1000 Growth Index Fund
| Market | Percentage | |||
| Value | of Net | |||
| Coupon | Shares | ($000) | Assets | |
| Temporary Cash Investments | ||||
| Money Market Fund | ||||
| 2 Vanguard Market Liquidity Fund | 0.132% | 11,849,283 | 11,849 | 5.7% |
| 3 U.S. Government and Agency Obligations † | 105 | 0.1% | ||
| Total Temporary Cash Investments (Cost $11,954) | 11,954 | 5.8%1 | ||
| Total Investments (Cost $229,328) | 218,072 | 105.7% | ||
| Other Assets and Liabilities | ||||
| Other Assets | 522 | 0.2% | ||
| Liabilities | (12,238) | (5.9%) | ||
| (11,716) | (5.7%) | |||
| Net Assets | 206,356 | 100.0% | ||
| Market | |
| Value | |
| ($000) | |
| Statement of Assets and Liabilities | |
| Assets | |
| Investments in Securities, at Value | 218,072 |
| Other Assets | 522 |
| Total Assets | 218,594 |
| Liabilities | |
| Payables for Investment Securities Purchased | 12,124 |
| Other Liabilities | 114 |
| Total Liabilities | 12,238 |
| Net Assets | 206,356 |
39
Russell 1000 Growth Index Fund
| At August 31, 2011, net assets consisted of: | |
| Amount | |
| ($000) | |
| Paid-in Capital | 221,095 |
| Undistributed Net Investment Income | 539 |
| Accumulated Net Realized Losses | (4,024) |
| Unrealized Appreciation (Depreciation) | |
| Investment Securities | (11,256) |
| Futures Contracts | 2 |
| Net Assets | 206,356 |
| Institutional Shares—Net Assets | |
| Applicable to 1,372,828 outstanding $.001 par value shares of | |
| beneficial interest (unlimited authorization) | 153,876 |
| Net Asset Value Per Share—Institutional Shares | $112.09 |
| ETF Shares—Net Assets | |
| Applicable to 900,000 outstanding $.001 par value shares of | |
| beneficial interest (unlimited authorization) | 52,480 |
| Net Asset Value Per Share—ETF Shares | $58.31 |
See Note A in Notes to Financial Statements.
* Non-income-producing security.
† Represents the aggregate value, by category, of securities that are not among the 50 largest holdings and, in total for any issuer, represent 1% or less of net assets.
1 The fund invests a portion of its cash reserves in equity markets through the use of index futures contracts. After giving effect to futures investments, the fund’s effective common stock and temporary cash investment positions represent 100.0% and 5.7%, respectively, of net assets.
2 Affiliated money market fund available only to Vanguard funds and certain trusts and accounts managed by Vanguard. Rate shown is the 7-day yield.
3 Securities with a value of $100,000 have been segregated as initial margin for open futures contracts.
See accompanying Notes, which are an integral part of the Financial Statements.
40
Russell 1000 Growth Index Fund
| Statement of Operations | |
| September 20, 20101 to | |
| August 31, 2011 | |
| ($000) | |
| Investment Income | |
| Income | |
| Dividends | 1,409 |
| Interest2 | 2 |
| Total Income | 1,411 |
| Expenses | |
| The Vanguard Group—Note B | |
| Management and Administrative—Institutional Shares | 17 |
| Management and Administrative—ETF Shares | 36 |
| Marketing and Distribution—Institutional Shares | 5 |
| Marketing and Distribution—ETF Shares | 7 |
| Custodian Fees | 21 |
| Auditing Fees | 7 |
| Shareholders’ Reports—Institutional Shares | — |
| Shareholders’ Reports—ETF Shares | 2 |
| Total Expenses | 95 |
| Net Investment Income | 1,316 |
| Realized Net Gain (Loss) | |
| Investment Securities Sold | 1,162 |
| Futures Contracts | 5 |
| Realized Net Gain (Loss) | 1,167 |
| Change in Unrealized Appreciation (Depreciation) | |
| Investment Securities | (11,256) |
| Futures Contracts | 2 |
| Change in Unrealized Appreciation (Depreciation) | (11,254) |
| Net Increase (Decrease) in Net Assets Resulting from Operations | (8,771) |
| 1 Inception. | |
| 2 Interest income from an affiliated company of the fund was $2,000. | |
See accompanying Notes, which are an integral part of the Financial Statements.
41
Russell 1000 Growth Index Fund
| Statement of Changes in Net Assets | |
| September 20, 20101 to | |
| August 31, 2011 | |
| ($000) | |
| Increase (Decrease) in Net Assets | |
| Operations | |
| Net Investment Income | 1,316 |
| Realized Net Gain (Loss) | 1,167 |
| Change in Unrealized Appreciation (Depreciation) | (11,254) |
| Net Increase (Decrease) in Net Assets Resulting from Operations | (8,771) |
| Distributions | |
| Net Investment Income | |
| Institutional Shares | (474) |
| ETF Shares | (303) |
| Realized Capital Gain | |
| Institutional Shares | — |
| ETF Shares | — |
| Total Distributions | (777) |
| Capital Share Transactions | |
| Institutional Shares | 161,203 |
| ETF Shares | 54,701 |
| Net Increase (Decrease) from Capital Share Transactions | 215,904 |
| Total Increase (Decrease) | 206,356 |
| Net Assets | |
| Beginning of Period | — |
| End of Period2 | 206,356 |
| 1 Inception. | |
| 2 Net Assets—End of Period includes undistributed net investment income of $539,000. | |
See accompanying Notes, which are an integral part of the Financial Statements.
42
Russell 1000 Growth Index Fund
Financial Highlights
| Institutional Shares | |
| December 6, 20101 to | |
| For a Share Outstanding Throughout the Period | August 31, 2011 |
| Net Asset Value, Beginning of Period | $110.81 |
| Investment Operations | |
| Net Investment Income | .879 |
| Net Realized and Unrealized Gain (Loss) on Investments | 1.278 |
| Total from Investment Operations | 2.157 |
| Distributions | |
| Dividends from Net Investment Income | (.877) |
| Distributions from Realized Capital Gains | — |
| Total Distributions | (.877) |
| Net Asset Value, End of Period | $112.09 |
| Total Return | 1.92% |
| Ratios/Supplemental Data | |
| Net Assets, End of Period (Millions) | $154 |
| Ratio of Total Expenses to Average Net Assets | 0.08%2 |
| Ratio of Net Investment Income to Average Net Assets | 1.54%2 |
| Portfolio Turnover Rate3 | 30% |
1 Inception.
2 Annualized.
3 Excludes the value of portfolio securities received or delivered as a result of in-kind purchases or redemptions of the fund’s capital shares, including ETF Creation Units.
See accompanying Notes, which are an integral part of the Financial Statements.
43
Russell 1000 Growth Index Fund
Financial Highlights
| ETF Shares | |
| September 20, 20101 to | |
| For a Share Outstanding Throughout the Period | August 31, 2011 |
| Net Asset Value, Beginning of Period | $52.12 |
| Investment Operations | |
| Net Investment Income | .579 |
| Net Realized and Unrealized Gain (Loss) on Investments | 6.044 |
| Total from Investment Operations | 6.623 |
| Distributions | |
| Dividends from Net Investment Income | (.433) |
| Distributions from Realized Capital Gains | — |
| Total Distributions | (.433) |
| Net Asset Value, End of Period | $58.31 |
| Total Return | 12.69% |
| Ratios/Supplemental Data | |
| Net Assets, End of Period (Millions) | $52 |
| Ratio of Total Expenses to Average Net Assets | 0.15%2 |
| Ratio of Net Investment Income to Average Net Assets | 1.47%2 |
| Portfolio Turnover Rate3 | 30% |
1 Inception.
2 Annualized.
3 Excludes the value of portfolio securities received or delivered as a result of in-kind purchases or redemptions of the fund’s capital shares, including ETF Creation Units.
See accompanying Notes, which are an integral part of the Financial Statements.
44
Russell 1000 Growth Index Fund
Notes to Financial Statements
Vanguard Russell 1000 Growth Index Fund is registered under the Investment Company Act of 1940 as an open-end investment company, or mutual fund. The fund offers two classes of shares: Institutional Shares and ETF Shares. Institutional Shares are designed for investors who meet certain administrative, service, and account-size criteria. Institutional Shares were first issued on December 6, 2010. ETF Shares were first issued on September 20, 2010, and first offered to the public on September 22, 2010. ETF Shares are listed for trading on Nasdaq; they can be purchased and sold through a broker.
A. The following significant accounting policies conform to generally accepted accounting principles for U.S. mutual funds. The fund consistently follows such policies in preparing its financial statements.
1. Security Valuation: Securities are valued as of the close of trading on the New York Stock Exchange (generally 4 p.m., Eastern time) on the valuation date. Equity securities are valued at the latest quoted sales prices or official closing prices taken from the primary market in which each security trades; such securities not traded on the valuation date are valued at the mean of the latest quoted bid and asked prices. Securities for which market quotations are not readily available, or whose values have been materially affected by events occurring before the fund’s pricing time but after the close of the securities’ primary markets, are valued by methods deemed by the board of trustees to represent fair value. Investments in Vanguard Market Liquidity Fund are valued at that fund’s net asset value. Temporary cash investments acquired over 60 days to maturity are valued using the latest bid prices or using valuations based on a matrix system (which considers such factors as security prices, yields, maturities, and ratings), both as furnished by independent pricing services. Other temporary cash investments are valued at amortized cost, which approximates market value.
2. Futures Contracts: The fund uses index futures contracts to a limited extent, with the objectives of maintaining full exposure to the stock market, enhancing returns, maintaining liquidity, and minimizing transaction costs. The fund may purchase futures contracts to immediately invest incoming cash in the market, or sell futures in response to cash outflows, thereby simulating a fully invested position in the underlying index while maintaining a cash balance for liquidity. The fund may seek to enhance returns by using futures contracts instead of the underlying securities when futures are believed to be priced more attractively than the underlying securities. The primary risks associated with the use of futures contracts are imperfect correlation between changes in market values of stocks held by the fund and the prices of futures contracts, and the possibility of an illiquid market.
Futures contracts are valued at their quoted daily settlement prices. The aggregate principal amounts of the contracts are not recorded in the Statement of Net Assets. Fluctuations in the value of the contracts are recorded in the Statement of Net Assets as an asset (liability) and in the Statement of Operations as unrealized appreciation (depreciation) until the contracts are closed, when they are recorded as realized futures gains (losses).
3. Federal Income Taxes: The fund intends to qualify as a regulated investment company and distribute all of its taxable income. Management has analyzed the fund’s tax positions taken for its open federal income tax period ended August 31, 2011, and has concluded that no provision for federal income tax is required in the fund’s financial statements.
4. Distributions: Distributions to shareholders are recorded on the ex-dividend date.
5. Other: Dividend income is recorded on the ex-dividend date. Interest income includes income distributions received from Vanguard Market Liquidity Fund and is accrued daily. Security transactions are accounted for on the date securities are bought or sold. Costs used to determine realized gains (losses) on the sale of investment securities are those of the specific securities sold.
45
Russell 1000 Growth Index Fund
Each class of shares has equal rights as to assets and earnings, except that each class separately bears certain class-specific expenses related to maintenance of shareholder accounts (included in Management and Administrative expenses) and shareholder reporting. Marketing and distribution expenses are allocated to each class of shares based on a method approved by the board of trustees. Income, other non-class-specific expenses, and gains and losses on investments are allocated to each class of shares based on its relative net assets.
B. The Vanguard Group furnishes at cost investment advisory, corporate management, administrative, marketing, and distribution services. The costs of such services are allocated to the fund under methods approved by the board of trustees. The fund has committed to provide up to 0.40% of its net assets in capital contributions to Vanguard. At August 31, 2011, the fund had contributed capital of $30,000 to Vanguard (included in Other Assets), representing 0.01% of the fund’s net assets and 0.01% of Vanguard’s capitalization. The fund’s trustees and officers are also directors and officers of Vanguard.
C. Various inputs may be used to determine the value of the fund’s investments. These inputs are summarized in three broad levels for financial statement purposes. The inputs or methodologies used to value securities are not necessarily an indication of the risk associated with investing in those securities.
Level 1—Quoted prices in active markets for identical securities.
Level 2—Other significant observable inputs (including quoted prices for similar securities, interest rates, prepayment speeds, credit risk, etc.).
Level 3—Significant unobservable inputs (including the fund’s own assumptions used to determine the fair value of investments).
The following table summarizes the fund’s market value as of August 31, 2011, based on the inputs used to value them:
| Level 1 | Level 2 | Level 3 | |
| Investments | ($000) | ($000) | ($000 |
| Common Stocks | 206,118 | — | — |
| Temporary Cash Investments | 11,849 | 105 | — |
| Futures Contracts—Assets1 | 8 | — | — |
| Futures Contracts—Liabilities1 | (2) | — | — |
| Total | 217,973 | 105 | — |
| 1 Represents variation margin on the last day of the reporting period. |
D. At August 31, 2011, the aggregate settlement value of open futures contracts and the related unrealized appreciation (depreciation) were:
| ($000) | ||||
| Aggregate | ||||
| Number of | Settlement | Unrealized | ||
| Long (Short) | Value | Appreciation | ||
| Futures Contracts | Expiration | Contracts | Long (Short) | (Depreciation) |
| E-mini S&P 500 Index | September 2011 | 5 | 304 | 2 |
Unrealized appreciation (depreciation) on open futures contracts is required to be treated as realized gain (loss) for tax purposes.
46
Russell 1000 Growth Index Fund
E. Distributions are determined on a tax basis and may differ from net investment income and realized capital gains for financial reporting purposes. Differences may be permanent or temporary. Permanent differences are reclassified among capital accounts in the financial statements to reflect their tax character. Temporary differences arise when certain items of income, expense, gain, or loss are recognized in different periods for financial statement and tax purposes; these differences will reverse at some time in the future. Differences in classification may also result from the treatment of short-term gains as ordinary income for tax purposes.
During the period ended August 31, 2011, the fund realized $5,191,000 of net capital gains resulting from in-kind redemptions—in which shareholders exchanged fund shares for securities held by the fund rather than for cash. Because such gains are not taxable to the fund, and are not distributed to shareholders, they have been reclassified from accumulated net realized losses to paid-in capital.
For tax purposes, at August 31, 2011, the fund had $540,000 of ordinary income available for distribution. The fund realized losses of $3,108,000 during the period from November 1, 2010, through August 31, 2011, which are deferred and will be treated as realized for tax purposes in fiscal 2012.
At August 31, 2011, the cost of investment securities for tax purposes was $230,243,000. Net unrealized depreciation of investment securities for tax purposes was $12,171,000, consisting of unrealized gains of $4,089,000 on securities that had risen in value since their purchase and $16,260,000 in unrealized losses on securities that had fallen in value since their purchase.
F. During the period ended August 31, 2011, the fund purchased $503,632,000 of investment securities and sold $287,417,000 of investment securities, other than temporary cash investments.
G. Capital share transactions for each class of shares were:
| Inception1 to | ||
| August 31, 2011 | ||
| Amount | Shares | |
| ($000) | (000) | |
| Institutional Shares | ||
| Issued | 167,763 | 1,433 |
| Issued in Lieu of Cash Distributions | 474 | 4 |
| Redeemed | (7,034) | (64) |
| Net Increase (Decrease)—Institutional Shares | 161,203 | 1,373 |
| ETF Shares | ||
| Issued | 309,433 | 5,050 |
| Issued in Lieu of Cash Distributions | — | — |
| Redeemed | (254,732) | (4,150) |
| Net Increase (Decrease)—ETF Shares | 54,701 | 900 |
| 1 Inception was September 20, 2010, for ETF Shares and December 6, 2010, for Institutional Shares. | ||
H. In preparing the financial statements as of August 31, 2011, management considered the impact of subsequent events for potential recognition or disclosure in these financial statements.
47
Report of Independent Registered Public Accounting Firm
To the Trustees of Vanguard Scottsdale Funds and the Shareholders of Vanguard Russell 1000 Index Fund, Vanguard Russell 1000 Value Index Fund and Vanguard Russell 1000 Growth Index Fund:
In our opinion, the accompanying statements of net assets-investments summary, the statement of assets and liabilities and the related statements of operations and of changes in net assets and the financial highlights present fairly, in all material respects, the financial position of Vanguard Russell 1000 Index Fund, Vanguard Russell 1000 Value Index Fund and Vanguard Russell 1000 Growth Index Fund (constituting separate portfolios of Vanguard Scottsdale Funds, hereafter referred to as the “Funds”) at August 31, 2011, and the results of each of their operations, the changes in each of their net assets and the financial highlights for the period September 20, 2010 (commencement of operations) through August 31, 2011, in conformity with accounting principles generally accepted in the United States of America. These financial statements and financial highlights (hereafter referred to as “financial statements”) are the responsibility of the Funds’ management; our responsibility is to express an opinion on these financial statements based on our audits. We conducted our audits of these financial statements in accordance with the standards of the Public Company Accounting Oversight Board (United States). Those standards require that we plan and perform the audit to obtain reasonable assurance about whether the financial statements are free of material misstatement. An audit includes examining, on a test basis, evidence supporting the amounts and disclosures in the financial statements, assessing the accounting principles used and significant estimates made by management, and evaluating the overall financial statement presentation. We believe that our audits, which included confirmation of securities at August 31, 2011 by correspondence with the custodian and broker and by agreement to the underlying ownership records of Vanguard Market Liquidity Fund, provide a reasonable basis for our opinion.
PricewaterhouseCoopers LLP
Philadelphia, Pennsylvania
October 13, 2011
Special 2011 tax information (unaudited) for Vanguard Russell 1000 Index Funds
This information for the period ended August 31, 2011, is included pursuant to provisions of the Internal Revenue Code.
The funds distributed qualified dividend income to shareholders during the period as follows:
| Qualified Dividend Income | |
| Index Fund | ($000) |
| Russell 1000 Index | 857 |
| Russell 1000 Value Index | 1,473 |
| Russell 1000 Growth Index | 730 |
For corporate shareholders, the percentage of investment income (dividend income plus short-term gains, if any) that qualifies for the dividends-received deduction is as follows:
| Index Fund | Percentage |
| Russell 1000 Index | 97.0% |
| Russell 1000 Value Index | 93.7 |
| Russell 1000 Growth Index | 96.3 |
49
About Your Fund’s Expenses
As a shareholder of the fund, you incur ongoing costs, which include costs for portfolio management, administrative services, and shareholder reports (like this one), among others. Operating expenses, which are deducted from a fund’s gross income, directly reduce the investment return of the fund.
A fund’s expenses are expressed as a percentage of its average net assets. This figure is known as the expense ratio. The following examples are intended to help you understand the ongoing costs (in dollars) of investing in your fund and to compare these costs with those of other mutual funds. The examples are based on an investment of $1,000 made at the beginning of the period shown and held for the entire period.
The accompanying table illustrates your fund’s costs in two ways:
• Based on actual fund return. This section helps you to estimate the actual expenses that you paid over the period. The ”Ending Account Value“ shown is derived from the fund‘s actual return, and the third column shows the dollar amount that would have been paid by an investor who started with $1,000 in the fund. You may use the information here, together with the amount you invested, to estimate the expenses that you paid over the period.
To do so, simply divide your account value by $1,000 (for example, an $8,600 account value divided by $1,000 = 8.6), then multiply the result by the number given for your fund under the heading ”Expenses Paid During Period.“
• Based on hypothetical 5% yearly return. This section is intended to help you compare your fund‘s costs with those of other mutual funds. It assumes that the fund had a yearly return of 5% before expenses, but that the expense ratio is unchanged. In this case—because the return used is not the fund’s actual return—the results do not apply to your investment. The example is useful in making comparisons because the Securities and Exchange Commission requires all mutual funds to calculate expenses based on a 5% return. You can assess your fund’s costs by comparing this hypothetical example with the hypothetical examples that appear in shareholder reports of other funds.
Note that the expenses shown in the table are meant to highlight and help you compare ongoing costs only and do not reflect transaction costs incurred by the fund for buying and selling securities. Further, the expenses do not include any purchase, redemption, or account service fees described in the fund prospectus. If such fees were applied to your account, your costs would be higher. Your fund does not carry a “sales load.”
The calculations assume no shares were bought or sold during the period. Your actual costs may have been higher or lower, depending on the amount of your investment and the timing of any purchases or redemptions.
You can find more information about the fund’s expenses, including annual expense ratios, in the Financial Statements section of this report. For additional information on operating expenses and other shareholder costs, please refer to your fund’s current prospectus.
50
| Six Months Ended August 31, 2011 | |||
| Beginning | Ending | Expenses | |
| Account Value | Account Value | Paid During | |
| 2/28/2011 | 8/31/2011 | Period | |
| Based on Actual Fund Return | |||
| Russell 1000 Index Fund | |||
| Institutional Shares | $1,000.00 | $925.22 | $0.39 |
| ETF Shares | 1,000.00 | 925.04 | 0.58 |
| Russell 1000 Value Index Fund | |||
| Institutional Shares | $1,000.00 | $904.90 | $0.38 |
| ETF Shares | 1,000.00 | 904.58 | 0.67 |
| Russell 1000 Growth Index Fund | |||
| Institutional Shares | $1,000.00 | $944.94 | $0.39 |
| ETF Shares | 1,000.00 | 944.51 | 0.69 |
| Based on Hypothetical 5% Yearly Return | |||
| Russell 1000 Index Fund | |||
| Institutional Shares | $1,000.00 | $1,024.80 | $0.41 |
| ETF Shares | 1,000.00 | 1,024.60 | 0.61 |
| Russell 1000 Value Index Fund | |||
| Institutional Shares | $1,000.00 | $1,024.80 | $0.41 |
| ETF Shares | 1,000.00 | 1,024.50 | 0.71 |
| Russell 1000 Growth Index Fund | |||
| Institutional Shares | $1,000.00 | $1,024.80 | $0.41 |
| ETF Shares | 1,000.00 | 1,024.50 | 0.71 |
The calculations are based on expenses incurred in the most recent six-month period. The funds’ annualized six-month expense ratios for that period are: for the Russell 1000 Index Fund, 0.08% for Institutional Shares and 0.12% for ETF Shares; for the Russell 1000 Value Index Fund, 0.08% for Institutional Shares and 0.14% for ETF Shares; and for the Russell 1000 Growth Index Fund, 0.08% for Institutional Shares and 0.14% for ETF Shares. The dollar amounts shown as ”Expenses Paid” are equal to the annualized expense ratio multiplied by the average account value over the period, multiplied by the number of days in the most recent six-month period, then divided by the number of days in the most recent 12-month period.
51
Trustees Approve Advisory Arrangement
The board of trustees of Vanguard Russell 1000 Index Fund, Russell 1000 Value Index Fund, and Russell 1000 Growth Index Fund has renewed the funds’ investment advisory arrangement with The Vanguard Group, Inc. Vanguard—through its Quantitative Equity Group—serves as investment advisor to the funds. The board determined that continuing the funds’ internalized management structure was in the best interests of the funds and their shareholders.
The board based its decision upon an evaluation of the advisor’s investment staff, portfolio management process, and performance. The trustees considered the factors discussed below, among others. However, no single factor determined whether the board approved the arrangement. Rather, it was the totality of the circumstances that drove the board’s decision.
Nature, extent, and quality of services
The board considered the quality of the investment management services provided to the funds since their inception in 2010 and took into account the organizational depth and stability of the advisor. The board noted that Vanguard has been managing investments for more than three decades. The Quantitative Equity Group adheres to a sound, disciplined investment management process; the team has considerable experience, stability, and depth.
The board concluded that Vanguard’s experience, stability, depth, and performance, among other factors, warranted approval of the advisory arrangement.
Investment performance
The board considered the funds’ performance since their inception, including any periods of outperformance or underperformance of their target indexes and peer groups. The board concluded that the funds’ have performed in line with expectations and that their results have been consistent with their investment strategies. Information about each fund’s performance can be found in the Performance Summary pages of this report.
Cost
The board concluded that each fund’s expense ratio was well below the average expense ratios charged by funds in its peer group and that the funds’ advisory fee rates were also well below their peer-group averages. Information about the funds’ expenses appears in the About Your Fund’s Expenses section of this report as well as in the Financial Statements sections.
The board does not conduct a profitability analysis of Vanguard, because of Vanguard’s unique “at-cost” structure. Unlike most other mutual fund management companies, Vanguard is owned by the funds it oversees, and produces “profits” only in the form of reduced expenses for fund shareholders.
The benefit of economies of scale
The board concluded that the funds’ low-cost arrangement with Vanguard ensures that the funds will realize economies of scale as they grow, with the cost to shareholders declining as fund
assets increase.
The board will consider whether to renew the advisory arrangement again after a one-year period.
52
Glossary
30-Day SEC Yield. A fund’s 30-day SEC yield is derived using a formula specified by the U.S. Securities and Exchange Commission. Under the formula, data related to the fund’s security holdings in the previous 30 days are used to calculate the fund’s hypothetical net income for that period, which is then annualized and divided by the fund’s estimated average net assets over the calculation period. For the purposes of this calculation, a security’s income is based on its current market yield to maturity (in the case of bonds), its actual income (for asset-backed securities), or its projected dividend yield (for stocks). Because the SEC yield represents hypothetical annualized income, it will differ—at times significantly—from the fund’s actual experience. As a result, the fund’s income distributions may be higher or lower than implied by the SEC yield.
Dividend Yield. Dividend income earned by stocks, expressed as a percentage of the aggregate market value (or of net asset value, for a fund). The yield is determined by dividing the amount of the annual dividends by the aggregate value (or net asset value) at the end of the period. For a fund, the dividend yield is based solely on stock holdings and does not include any income produced by other investments.
Earnings Growth Rate. The average annual rate of growth in earnings over the past five years for the stocks now in a fund.
Equity Exposure. A measure that reflects a fund’s investments in stocks and stock futures. Any holdings in short-term reserves are excluded.
Expense Ratio. The percentage of a fund’s average net assets used to pay its annual administrative and advisory expenses. These expenses directly reduce returns to investors.
Foreign Holdings. The percentage of a fund represented by securities or depositary receipts of companies based outside the United States.
Inception Date. The date on which the assets of a fund (or one of its share classes) are first invested in accordance with the fund’s investment objective. For funds with a subscription period, the inception date is the day after that period ends. Investment performance is measured from the inception date.
Median Market Cap. An indicator of the size of companies in which a fund invests; the midpoint of market capitalization (market price x shares outstanding) of a fund’s stocks, weighted by the proportion of the fund’s assets invested in each stock. Stocks representing half of the fund’s assets have market capitalizations above the median, and the rest are below it.
Price/Book Ratio. The share price of a stock divided by its net worth, or book value, per share. For a fund, the weighted average price/book ratio of the stocks it holds.
Price/Earnings Ratio. The ratio of a stock’s current price to its per-share earnings over the past year. For a fund, the weighted average P/E of the stocks it holds. P/E is an indicator of market expectations about corporate prospects; the higher the P/E, the greater the expectations for a company’s future growth.
Return on Equity. The annual average rate of return generated by a company during the past five years for each dollar of shareholder’s equity (net income divided by shareholder’s equity). For a fund, the weighted average return on equity for the companies whose stocks it holds.
53
Short-Term Reserves. The percentage of a fund invested in highly liquid, short-term securities that can be readily converted to cash.
Turnover Rate. An indication of the fund’s trading activity. Funds with high turnover rates incur higher transaction costs and may be more likely to distribute capital gains (which may be taxable to investors). The turnover rate excludes in-kind transactions, which have minimal impact on costs.
54
This page intentionally left blank.
The People Who Govern Your Fund
The trustees of your mutual fund are there to see that the fund is operated and managed in your best interests since, as a shareholder, you are a part owner of the fund. Your fund’s trustees also serve on the board of directors of The Vanguard Group, Inc., which is owned by the Vanguard funds and provides services to them on an at-cost basis.
A majority of Vanguard’s board members are independent, meaning that they have no affiliation with Vanguard or the funds they oversee, apart from the sizable personal investments they have made as private individuals. The independent board members have distinguished backgrounds in business, academia, and public service. Each of the trustees and executive officers oversees 178 Vanguard funds.
The following table provides information for each trustee and executive officer of the fund. More information about the trustees is in the Statement of Additional Information, which can be obtained, without charge, by contacting Vanguard at 800-662-7447, or online at vanguard.com.
| Interested Trustee1 | and President (2006–2008) of Rohm and Haas Co. |
| (chemicals); Director of Tyco International, Ltd. | |
| F. William McNabb III | (diversified manufacturing and services) and Hewlett- |
| Born 1957. Trustee Since July 2009. Chairman of the | Packard Co. (electronic computer manufacturing); |
| Board. Principal Occupation(s) During the Past Five | Senior Advisor at New Mountain Capital; Trustee |
| Years: Chairman of the Board of The Vanguard Group, | of The Conference Board; Member of the Board of |
| Inc., and of each of the investment companies served | Managers of Delphi Automotive LLP (automotive |
| by The Vanguard Group, since January 2010; Director | components). |
| of The Vanguard Group since 2008; Chief Executive | |
| Officer and President of The Vanguard Group and of | Amy Gutmann |
| each of the investment companies served by The | Born 1949. Trustee Since June 2006. Principal |
| Vanguard Group since 2008; Director of Vanguard | Occupation(s) During the Past Five Years: President |
| Marketing Corporation; Managing Director of The | of the University of Pennsylvania; Christopher H. |
| Vanguard Group (1995–2008). | Browne Distinguished Professor of Political Science |
| in the School of Arts and Sciences with secondary | |
| appointments at the Annenberg School for Commu- | |
| Independent Trustees | nication and the Graduate School of Education |
| of the University of Pennsylvania; Director of | |
| Emerson U. Fullwood | Carnegie Corporation of New York, Schuylkill River |
| Born 1948. Trustee Since January 2008. Principal | Development Corporation, and Greater Philadelphia |
| Occupation(s) During the Past Five Years: Executive | Chamber of Commerce; Trustee of the National |
| Chief Staff and Marketing Officer for North America | Constitution Center; Chair of the Presidential |
| and Corporate Vice President (retired 2008) of Xerox | Commission for the Study of Bioethical Issues. |
| Corporation (document management products and | |
| services); Executive in Residence and 2010 | JoAnn Heffernan Heisen |
| Distinguished Minett Professor at the Rochester | Born 1950. Trustee Since July 1998. Principal |
| Institute of Technology; Director of SPX Corporation | Occupation(s) During the Past Five Years: Corporate |
| (multi-industry manufacturing), the United Way of | Vice President and Chief Global Diversity Officer |
| Rochester, Amerigroup Corporation (managed health | (retired 2008) and Member of the Executive |
| care), the University of Rochester Medical Center, | Committee (1997–2008) of Johnson & Johnson |
| Monroe Community College Foundation, and North | (pharmaceuticals/consumer products); Director of |
| Carolina A&T University. | Skytop Lodge Corporation (hotels), the University |
| Medical Center at Princeton, the Robert Wood | |
| Rajiv L. Gupta | Johnson Foundation, and the Center for Work Life |
| Born 1945. Trustee Since December 2001.2 | Policy; Member of the Advisory Board of the |
| Principal Occupation(s) During the Past Five Years: | Maxwell School of Citizenship and Public Affairs |
| Chairman and Chief Executive Officer (retired 2009) | at Syracuse University. |
| F. Joseph Loughrey | Thomas J. Higgins | |
| Born 1949. Trustee Since October 2009. Principal | Born 1957. Chief Financial Officer Since September | |
| Occupation(s) During the Past Five Years: President | 2008. Principal Occupation(s) During the Past Five | |
| and Chief Operating Officer (retired 2009) and Vice | Years: Principal of The Vanguard Group, Inc.; Chief | |
| Chairman of the Board (2008–2009) of Cummins Inc. | Financial Officer of each of the investment companies | |
| (industrial machinery); Director of SKF AB (industrial | served by The Vanguard Group since 2008; Treasurer | |
| machinery), Hillenbrand, Inc. (specialized consumer | of each of the investment companies served by The | |
| services), the Lumina Foundation for Education, and | Vanguard Group (1998–2008). | |
| Oxfam America; Chairman of the Advisory Council | ||
| for the College of Arts and Letters and Member | Kathryn J. Hyatt | |
| of the Advisory Board to the Kellogg Institute for | Born 1955. Treasurer Since November 2008. Principal | |
| International Studies at the University of Notre Dame. | Occupation(s) During the Past Five Years: Principal | |
| of The Vanguard Group, Inc.; Treasurer of each of | ||
| André F. Perold | the investment companies served by The Vanguard | |
| Born 1952. Trustee Since December 2004. Principal | Group since 2008; Assistant Treasurer of each of the | |
| Occupation(s) During the Past Five Years: George | investment companies served by The Vanguard Group | |
| Gund Professor of Finance and Banking at the Harvard | (1988–2008). | |
| Business School (retired July 2011); Chief Investment | ||
| Officer and co-Managing Partner of HighVista | Heidi Stam | |
| Strategies LLC (private investment firm); Director of | Born 1956. Secretary Since July 2005. Principal | |
| Rand Merchant Bank; Overseer of the Museum of | Occupation(s) During the Past Five Years: Managing | |
| Fine Arts Boston. | Director of The Vanguard Group, Inc., since 2006; | |
| General Counsel of The Vanguard Group since 2005; | ||
| Alfred M. Rankin, Jr. | Secretary of The Vanguard Group and of each of the | |
| Born 1941. Trustee Since January 1993. Principal | investment companies served by The Vanguard Group | |
| Occupation(s) During the Past Five Years: Chairman, | since 2005; Director and Senior Vice President of | |
| President, and Chief Executive Officer of NACCO | Vanguard Marketing Corporation since 2005; | |
| Industries, Inc. (forklift trucks/housewares/lignite); | Principal of The Vanguard Group (1997–2006). | |
| Director of Goodrich Corporation (industrial products/ | ||
| aircraft systems and services) and the National | ||
| Association of Manufacturers; Chairman of the | Vanguard Senior Management Team | |
| Federal Reserve Bank of Cleveland; Vice Chairman | ||
| of University Hospitals of Cleveland; President of | R. Gregory Barton | Michael S. Miller |
| the Board of The Cleveland Museum of Art. | Mortimer J. Buckley | James M. Norris |
| Kathleen C. Gubanich | Glenn W. Reed | |
| Peter F. Volanakis | Paul A. Heller | George U. Sauter |
| Born 1955. Trustee Since July 2009. Principal | Martha G. King | |
| Occupation(s) During the Past Five Years: President | ||
| and Chief Operating Officer (retired 2010) of Corning | ||
| Incorporated (communications equipment); Director of | Chairman Emeritus and Senior Advisor | |
| Corning Incorporated (2000–2010) and Dow Corning | ||
| (2001–2010); Overseer of the Amos Tuck School of | John J. Brennan | |
| Business Administration at Dartmouth College. | Chairman, 1996–2009 | |
| Chief Executive Officer and President, 1996–2008 | ||
| Executive Officers | ||
| Founder | ||
| Glenn Booraem | ||
| Born 1967. Controller Since July 2010. Principal | John C. Bogle | |
| Occupation(s) During the Past Five Years: Principal | Chairman and Chief Executive Officer, 1974–1996 | |
| of The Vanguard Group, Inc.; Controller of each of | ||
| the investment companies served by The Vanguard | ||
| Group since 2010; Assistant Controller of each of | ||
| the investment companies served by The Vanguard | ||
1 Mr. McNabb is considered an “interested person,” as defined in the Investment Company Act of 1940, because he is an officer of the Vanguard funds.
2 December 2002 for Vanguard Equity Income Fund, Vanguard Growth Equity Fund, the Vanguard Municipal Bond Funds, and the Vanguard State Tax-Exempt Funds.

| |
| P.O. Box 2600 | |
| Valley Forge, PA 19482-2600 |
Connect with Vanguard® > vanguard.com
| The Russell Indexes and Russell® are registered | |
| Fund Information > 800-662-7447 | trademarks of Russell Investments and have been |
| Direct Investor Account Services > 800-662-2739 | licensed for use by The Vanguard Group, Inc. The |
| Institutional Investor Services > 800-523-1036 | products are not sponsored, endorsed, sold, or |
| Text Telephone for People | promoted by Russell Investments and Russell |
| With Hearing Impairment > 800-749-7273 | Investments makes no representation regarding the |
| advisability of investing in the products. | |
| This material may be used in conjunction | |
| with the offering of shares of any Vanguard | |
| fund only if preceded or accompanied by | |
| the fund’s current prospectus. | |
| All comparative mutual fund data are from Lipper Inc. or | |
| Morningstar, Inc., unless otherwise noted. | |
| You can obtain a free copy of Vanguard’s proxy voting | |
| guidelines by visiting vanguard.com/proxyreporting or by | |
| calling Vanguard at 800-662-2739. The guidelines are | |
| also available from the SEC’s website, sec.gov. In | |
| addition, you may obtain a free report on how your fund | |
| voted the proxies for securities it owned during the 12 | |
| months ended June 30. To get the report, visit either | |
| vanguard.com/proxyreporting or sec.gov. | |
| You can review and copy information about your fund at | |
| the SEC’s Public Reference Room in Washington, D.C. To | |
| find out more about this public service, call the SEC at | |
| 202-551-8090. Information about your fund is also | |
| available on the SEC’s website, and you can receive | |
| copies of this information, for a fee, by sending a | |
| request in either of two ways: via e-mail addressed to | |
| publicinfo@sec.gov or via regular mail addressed to the | |
| Public Reference Section, Securities and Exchange | |
| Commission, Washington, DC 20549-1520. | |
| © 2011 The Vanguard Group, Inc. | |
| All rights reserved. | |
| Vanguard Marketing Corporation, Distributor. | |
| Q18480 102011 | |
| Vanguard® Russell 1000 Index Fund | ||
| Schedule of Investments | ||
| August 31, 2011 | ||
| Market | ||
| Value | ||
| Shares | ($000) | |
| Common Stocks (99.6%)1 | ||
| Consumer Discretionary (11.5%) | ||
| McDonald's Corp. | 15,681 | 1,419 |
| * Amazon.com Inc. | 5,476 | 1,179 |
| Walt Disney Co. | 28,473 | 970 |
| Comcast Corp. Class A | 41,546 | 894 |
| Home Depot Inc. | 24,074 | 804 |
| * Ford Motor Co. | 56,312 | 626 |
| News Corp. Class A | 34,308 | 593 |
| Target Corp. | 10,416 | 538 |
| Time Warner Inc. | 16,180 | 512 |
| * DIRECTV Class A | 11,601 | 510 |
| NIKE Inc. Class B | 5,395 | 467 |
| Starbucks Corp. | 11,329 | 438 |
| Viacom Inc. Class B | 8,843 | 427 |
| * priceline.com Inc. | 751 | 403 |
| Lowe's Cos. Inc. | 19,679 | 392 |
| Yum! Brands Inc. | 7,037 | 383 |
| Time Warner Cable Inc. | 5,085 | 333 |
| Johnson Controls Inc. | 10,254 | 327 |
| TJX Cos. Inc. | 5,836 | 319 |
| * Las Vegas Sands Corp. | 5,928 | 276 |
| * General Motors Co. | 11,488 | 276 |
| CBS Corp. Class B | 10,108 | 253 |
| Coach Inc. | 4,438 | 250 |
| * Bed Bath & Beyond Inc. | 3,712 | 211 |
| Carnival Corp. | 6,357 | 210 |
| Kohl's Corp. | 4,325 | 200 |
| McGraw-Hill Cos. Inc. | 4,550 | 192 |
| * Netflix Inc. | 787 | 185 |
| Wynn Resorts Ltd. | 1,187 | 184 |
| * Discovery Communications Inc. Class A | 4,175 | 177 |
| Thomson Reuters Corp. | 5,630 | 174 |
| Omnicom Group Inc. | 4,212 | 171 |
| * Liberty Global Inc. Class A | 4,189 | 169 |
| Macy's Inc. | 6,388 | 166 |
| Staples Inc. | 10,704 | 158 |
| VF Corp. | 1,310 | 153 |
| Limited Brands Inc. | 4,006 | 151 |
| * Chipotle Mexican Grill Inc. Class A | 470 | 147 |
| * Liberty Media Corp. - Interactive | 9,072 | 144 |
| Mattel Inc. | 5,249 | 141 |
| Tiffany & Co. | 1,935 | 139 |
| Harley-Davidson Inc. | 3,578 | 138 |
| Ross Stores Inc. | 1,778 | 136 |
| * O'Reilly Automotive Inc. | 2,093 | 136 |
| * Dollar Tree Inc. | 1,868 | 133 |
| Fortune Brands Inc. | 2,333 | 133 |
| Genuine Parts Co. | 2,396 | 132 |
| Starwood Hotels & Resorts Worldwide Inc. | 2,956 | 132 |
| Ralph Lauren Corp. Class A | 960 | 132 |
| Marriott International Inc. Class A | 4,223 | 124 |
| Best Buy Co. Inc. | 4,802 | 123 |
| Virgin Media Inc. | 4,821 | 122 |
| * AutoZone Inc. | 395 | 121 |
| * BorgWarner Inc. | 1,677 | 120 |
| Nordstrom Inc. | 2,432 | 111 |
| * Sirius XM Radio Inc. | 60,889 | 110 |
| Family Dollar Stores Inc. | 1,848 | 99 |
| Darden Restaurants Inc. | 2,045 | 98 |
| Gap Inc. | 5,798 | 96 |
| * CarMax Inc. | 3,336 | 94 |
| Expedia Inc. | 2,969 | 90 |
1
| Vanguard® Russell 1000 Index Fund | ||
| Schedule of Investments | ||
| August 31, 2011 | ||
| Market | ||
| Value | ||
| Shares | ($000) | |
| * Apollo Group Inc. Class A | 1,846 | 86 |
| Abercrombie & Fitch Co. | 1,343 | 85 |
| Wyndham Worldwide Corp. | 2,610 | 85 |
| * Liberty Media Corp. - Capital | 1,095 | 78 |
| Lear Corp. | 1,629 | 78 |
| * Fossil Inc. | 802 | 77 |
| * DISH Network Corp. Class A | 3,090 | 77 |
| Autoliv Inc. | 1,365 | 76 |
| PetSmart Inc. | 1,762 | 74 |
| Whirlpool Corp. | 1,177 | 74 |
| Hasbro Inc. | 1,886 | 73 |
| H&R Block Inc. | 4,799 | 73 |
| International Game Technology | 4,673 | 71 |
| Tractor Supply Co. | 1,131 | 69 |
| JC Penney Co. Inc. | 2,566 | 68 |
| Advance Auto Parts Inc. | 1,114 | 68 |
| Interpublic Group of Cos. Inc. | 7,611 | 66 |
| * TRW Automotive Holdings Corp. | 1,535 | 64 |
| Newell Rubbermaid Inc. | 4,610 | 64 |
| Tupperware Brands Corp. | 943 | 63 |
| Scripps Networks Interactive Inc. Class A | 1,415 | 61 |
| * Tempur-Pedic International Inc. | 1,034 | 60 |
| PVH Corp. | 902 | 60 |
| Cablevision Systems Corp. Class A | 3,273 | 59 |
| * MGM Resorts International | 5,323 | 59 |
| * NVR Inc. | 88 | 56 |
| Gentex Corp. | 2,157 | 56 |
| * LKQ Corp. | 2,155 | 55 |
| * Dollar General Corp. | 1,483 | 54 |
| * Liberty Media Corp. - Starz | 788 | 54 |
| Garmin Ltd. | 1,600 | 54 |
| Royal Caribbean Cruises Ltd. | 2,034 | 53 |
| Polaris Industries Inc. | 479 | 53 |
| Williams-Sonoma Inc. | 1,554 | 51 |
| * Deckers Outdoor Corp. | 577 | 51 |
| * Signet Jewelers Ltd. | 1,312 | 51 |
| * GameStop Corp. Class A | 2,085 | 50 |
| * Panera Bread Co. Class A | 429 | 49 |
| * Dick's Sporting Goods Inc. | 1,399 | 49 |
| Foot Locker Inc. | 2,301 | 48 |
| Leggett & Platt Inc. | 2,130 | 47 |
| * Urban Outfitters Inc. | 1,785 | 47 |
| * Goodyear Tire & Rubber Co. | 3,689 | 46 |
| DeVry Inc. | 1,039 | 46 |
| DR Horton Inc. | 4,190 | 44 |
| * Charter Communications Inc. Class A | 867 | 43 |
| * Hanesbrands Inc. | 1,507 | 43 |
| * Penn National Gaming Inc. | 1,061 | 42 |
| * Mohawk Industries Inc. | 849 | 42 |
| Gannett Co. Inc. | 3,603 | 42 |
| * Ulta Salon Cosmetics & Fragrance Inc. | 687 | 41 |
| * Big Lots Inc. | 1,187 | 40 |
| Jarden Corp. | 1,384 | 40 |
| * Visteon Corp. | 770 | 39 |
| * Under Armour Inc. Class A | 555 | 39 |
| Chico's FAS Inc. | 2,767 | 39 |
| * Toll Brothers Inc. | 2,212 | 38 |
| Harman International Industries Inc. | 1,047 | 38 |
| Lennar Corp. Class A | 2,543 | 37 |
| Service Corp. International | 3,637 | 37 |
| John Wiley & Sons Inc. Class A | 748 | 36 |
| * Sears Holdings Corp. | 605 | 36 |
| Aaron's Inc. | 1,293 | 34 |
| American Eagle Outfitters Inc. | 3,061 | 34 |
2
| Vanguard® Russell 1000 Index Fund | ||
| Schedule of Investments | ||
| August 31, 2011 | ||
| Market | ||
| Value | ||
| Shares | ($000) | |
| Guess? Inc. | 987 | 34 |
| * AMC Networks Inc. Class A | 883 | 33 |
| * ITT Educational Services Inc. | 444 | 32 |
| Brinker International Inc. | 1,368 | 31 |
| Washington Post Co. Class B | 82 | 29 |
| Weight Watchers International Inc. | 477 | 29 |
| * AutoNation Inc. | 683 | 28 |
| * Sally Beauty Holdings Inc. | 1,597 | 27 |
| * Hyatt Hotels Corp. Class A | 757 | 27 |
| Dillard's Inc. Class A | 571 | 26 |
| * DreamWorks Animation SKG Inc. Class A | 1,216 | 26 |
| * Madison Square Garden Co. Class A | 1,033 | 25 |
| Morningstar Inc. | 418 | 25 |
| * Pulte Group Inc. | 5,145 | 25 |
| * Bally Technologies Inc. | 748 | 23 |
| * Tesla Motors Inc. | 900 | 22 |
| Wendy's Co. | 4,520 | 22 |
| RadioShack Corp. | 1,507 | 20 |
| * WMS Industries Inc. | 863 | 19 |
| * Lamar Advertising Co. Class A | 878 | 18 |
| Regal Entertainment Group Class A | 1,224 | 16 |
| * Career Education Corp. | 932 | 16 |
| * DSW Inc. Class A | 325 | 15 |
| Thor Industries Inc. | 668 | 15 |
| Choice Hotels International Inc. | 432 | 13 |
| * Education Management Corp. | 581 | 9 |
| * Clear Channel Outdoor Holdings Inc. Class A | 618 | 7 |
| News Corp. Class B | 387 | 7 |
| * Federal-Mogul Corp. | 295 | 5 |
| * Dunkin' Brands Group Inc. | 50 | 1 |
| 22,188 | ||
| Consumer Staples (10.2%) | ||
| Procter & Gamble Co. | 42,176 | 2,686 |
| Coca-Cola Co. | 29,858 | 2,104 |
| Philip Morris International Inc. | 26,878 | 1,863 |
| PepsiCo Inc. | 23,889 | 1,539 |
| Wal-Mart Stores Inc. | 26,818 | 1,427 |
| Kraft Foods Inc. | 24,892 | 872 |
| Altria Group Inc. | 31,534 | 857 |
| CVS Caremark Corp. | 20,448 | 734 |
| Colgate-Palmolive Co. | 7,373 | 663 |
| Costco Wholesale Corp. | 6,603 | 519 |
| Walgreen Co. | 13,834 | 487 |
| Kimberly-Clark Corp. | 5,938 | 411 |
| General Mills Inc. | 9,545 | 362 |
| Archer-Daniels-Midland Co. | 10,214 | 291 |
| HJ Heinz Co. | 4,864 | 256 |
| Sysco Corp. | 8,819 | 246 |
| Lorillard Inc. | 2,172 | 242 |
| Mead Johnson Nutrition Co. | 3,042 | 217 |
| Kroger Co. | 9,028 | 213 |
| Kellogg Co. | 3,668 | 199 |
| * Green Mountain Coffee Roasters Inc. | 1,839 | 193 |
| Reynolds American Inc. | 5,005 | 188 |
| Estee Lauder Cos. Inc. Class A | 1,693 | 165 |
| Sara Lee Corp. | 8,784 | 158 |
| Whole Foods Market Inc. | 2,332 | 154 |
| ConAgra Foods Inc. | 6,149 | 150 |
| Avon Products Inc. | 6,480 | 146 |
| Bunge Ltd. | 2,221 | 144 |
| Clorox Co. | 2,022 | 141 |
| Coca-Cola Enterprises Inc. | 4,917 | 136 |
| Hershey Co. | 2,313 | 136 |
3
| Vanguard® Russell 1000 Index Fund | ||
| Schedule of Investments | ||
| August 31, 2011 | ||
| Market | ||
| Value | ||
| Shares | ($000) | |
| Dr Pepper Snapple Group Inc. | 3,360 | 129 |
| JM Smucker Co. | 1,770 | 128 |
| Brown-Forman Corp. Class B | 1,527 | 110 |
| Safeway Inc. | 5,509 | 101 |
| Herbalife Ltd. | 1,786 | 100 |
| McCormick & Co. Inc. | 2,000 | 96 |
| Church & Dwight Co. Inc. | 2,167 | 94 |
| * Hansen Natural Corp. | 1,066 | 91 |
| Molson Coors Brewing Co. Class B | 2,042 | 89 |
| Campbell Soup Co. | 2,703 | 86 |
| * Energizer Holdings Inc. | 1,075 | 81 |
| Tyson Foods Inc. Class A | 4,606 | 80 |
| * Ralcorp Holdings Inc. | 860 | 74 |
| Hormel Foods Corp. | 2,074 | 57 |
| * Smithfield Foods Inc. | 2,463 | 54 |
| Corn Products International Inc. | 1,154 | 54 |
| * Constellation Brands Inc. Class A | 2,682 | 53 |
| * BJ's Wholesale Club Inc. | 839 | 43 |
| Flowers Foods Inc. | 1,751 | 33 |
| * Dean Foods Co. | 3,111 | 27 |
| SUPERVALU Inc. | 3,206 | 26 |
| 19,505 | ||
| Energy (11.7%) | ||
| Exxon Mobil Corp. | 74,435 | 5,511 |
| Chevron Corp. | 30,376 | 3,005 |
| Schlumberger Ltd. | 20,508 | 1,602 |
| ConocoPhillips | 21,363 | 1,454 |
| Occidental Petroleum Corp. | 12,245 | 1,062 |
| Halliburton Co. | 13,829 | 614 |
| Apache Corp. | 5,796 | 597 |
| Anadarko Petroleum Corp. | 7,520 | 555 |
| Devon Energy Corp. | 6,393 | 434 |
| National Oilwell Varco Inc. | 6,394 | 423 |
| Baker Hughes Inc. | 6,569 | 401 |
| EOG Resources Inc. | 4,013 | 372 |
| Chesapeake Energy Corp. | 9,940 | 322 |
| Marathon Oil Corp. | 10,762 | 290 |
| Hess Corp. | 4,586 | 272 |
| Spectra Energy Corp. | 9,822 | 255 |
| Williams Cos. Inc. | 8,741 | 236 |
| Noble Energy Inc. | 2,624 | 232 |
| El Paso Corp. | 11,448 | 219 |
| Peabody Energy Corp. | 4,040 | 197 |
| Marathon Petroleum Corp. | 5,315 | 197 |
| * Southwestern Energy Co. | 5,189 | 197 |
| Valero Energy Corp. | 8,528 | 194 |
| * Cameron International Corp. | 3,666 | 191 |
| * FMC Technologies Inc. | 3,613 | 161 |
| Range Resources Corp. | 2,433 | 158 |
| Murphy Oil Corp. | 2,911 | 156 |
| Consol Energy Inc. | 3,408 | 156 |
| Pioneer Natural Resources Co. | 1,764 | 138 |
| * Concho Resources Inc. | 1,564 | 136 |
| EQT Corp. | 2,004 | 120 |
| Cabot Oil & Gas Corp. | 1,559 | 118 |
| * Alpha Natural Resources Inc. | 3,413 | 113 |
| * Newfield Exploration Co. | 2,026 | 103 |
| HollyFrontier Corp. | 1,433 | 103 |
| * Denbury Resources Inc. | 5,932 | 95 |
| QEP Resources Inc. | 2,654 | 93 |
| Cimarex Energy Co. | 1,284 | 91 |
| * Whiting Petroleum Corp. | 1,784 | 84 |
| Helmerich & Payne Inc. | 1,459 | 83 |
| Southern Union Co. | 1,917 | 80 |
4
| Vanguard® Russell 1000 Index Fund | ||
| Schedule of Investments | ||
| August 31, 2011 | ||
| Market | ||
| Value | ||
| Shares | ($000) | |
| * Nabors Industries Ltd. | 4,345 | 80 |
| Core Laboratories NV | 710 | 79 |
| * Ultra Petroleum Corp. | 2,304 | 77 |
| SM Energy Co. | 1,002 | 77 |
| Oceaneering International Inc. | 1,712 | 73 |
| * Rowan Cos. Inc. | 2,011 | 73 |
| Sunoco Inc. | 1,891 | 72 |
| Kinder Morgan Inc. | 2,680 | 69 |
| Diamond Offshore Drilling Inc. | 1,082 | 69 |
| Arch Coal Inc. | 3,342 | 68 |
| * Plains Exploration & Production Co. | 2,214 | 65 |
| Patterson-UTI Energy Inc. | 2,454 | 60 |
| Energen Corp. | 1,089 | 53 |
| * Tesoro Corp. | 2,138 | 51 |
| * Dresser-Rand Group Inc. | 1,205 | 51 |
| * Oil States International Inc. | 774 | 51 |
| * McDermott International Inc. | 3,534 | 51 |
| * Brigham Exploration Co. | 1,741 | 51 |
| CARBO Ceramics Inc. | 289 | 46 |
| * SandRidge Energy Inc. | 6,176 | 45 |
| * Superior Energy Services Inc. | 1,203 | 43 |
| Tidewater Inc. | 791 | 42 |
| * Atwood Oceanics Inc. | 889 | 37 |
| * Continental Resources Inc. | 663 | 37 |
| * Forest Oil Corp. | 1,712 | 33 |
| * Unit Corp. | 677 | 32 |
| EXCO Resources Inc. | 2,355 | 32 |
| SEACOR Holdings Inc. | 352 | 31 |
| * Cobalt International Energy Inc. | 1,788 | 17 |
| Teekay Corp. | 630 | 17 |
| * Quicksilver Resources Inc. | 1,786 | 17 |
| RPC Inc. | 647 | 17 |
| * Kosmos Energy Ltd. | 497 | 7 |
| * Atlas Energy Inc. Escrow | 402 | — |
| 22,443 | ||
| Financials (14.7%) | ||
| JPMorgan Chase & Co. | 60,055 | 2,256 |
| Wells Fargo & Co. | 74,339 | 1,940 |
| * Berkshire Hathaway Inc. Class B | 26,547 | 1,938 |
| Citigroup Inc. | 43,919 | 1,364 |
| Bank of America Corp. | 153,140 | 1,251 |
| Goldman Sachs Group Inc. | 7,800 | 907 |
| American Express Co. | 15,828 | 787 |
| US Bancorp | 29,055 | 674 |
| Simon Property Group Inc. | 4,433 | 521 |
| MetLife Inc. | 12,413 | 417 |
| Morgan Stanley | 23,344 | 409 |
| PNC Financial Services Group Inc. | 7,954 | 399 |
| Bank of New York Mellon Corp. | 18,767 | 388 |
| Prudential Financial Inc. | 7,272 | 365 |
| ACE Ltd. | 5,100 | 329 |
| Capital One Financial Corp. | 6,940 | 320 |
| Travelers Cos. Inc. | 6,331 | 319 |
| Chubb Corp. | 4,422 | 274 |
| Equity Residential | 4,454 | 273 |
| CME Group Inc. | 1,014 | 271 |
| State Street Corp. | 7,618 | 271 |
| Aflac Inc. | 7,069 | 267 |
| Public Storage | 2,123 | 263 |
| Franklin Resources Inc. | 2,190 | 263 |
| Annaly Capital Management Inc. | 14,374 | 261 |
| Marsh & McLennan Cos. Inc. | 8,290 | 246 |
| Vornado Realty Trust | 2,737 | 235 |
| BB&T Corp. | 10,358 | 231 |
5
| Vanguard® Russell 1000 Index Fund | ||
| Schedule of Investments | ||
| August 31, 2011 | ||
| Market | ||
| Value | ||
| Shares | ($000) | |
| AON Corp. | 4,910 | 229 |
| Boston Properties Inc. | 2,165 | 226 |
| HCP Inc. | 6,038 | 225 |
| BlackRock Inc. | 1,293 | 213 |
| T Rowe Price Group Inc. | 3,874 | 207 |
| Allstate Corp. | 7,798 | 205 |
| Discover Financial Services | 8,124 | 204 |
| Ventas Inc. | 3,781 | 202 |
| AvalonBay Communities Inc. | 1,422 | 194 |
| Progressive Corp. | 9,796 | 188 |
| ProLogis Inc. | 6,853 | 187 |
| Charles Schwab Corp. | 15,003 | 185 |
| Loews Corp. | 4,741 | 178 |
| American International Group Inc. | 6,634 | 168 |
| Ameriprise Financial Inc. | 3,637 | 166 |
| SunTrust Banks Inc. | 8,088 | 161 |
| Fifth Third Bancorp | 13,853 | 147 |
| Weyerhaeuser Co. | 8,128 | 147 |
| M&T Bank Corp. | 1,891 | 144 |
| Health Care REIT Inc. | 2,678 | 136 |
| * IntercontinentalExchange Inc. | 1,116 | 132 |
| Hartford Financial Services Group Inc. | 6,708 | 128 |
| Invesco Ltd. | 7,003 | 128 |
| Northern Trust Corp. | 3,288 | 126 |
| Principal Financial Group Inc. | 4,878 | 124 |
| Host Hotels & Resorts Inc. | 10,337 | 122 |
| General Growth Properties Inc. | 8,584 | 117 |
| Unum Group | 4,760 | 112 |
| SLM Corp. | 8,071 | 111 |
| NYSE Euronext | 4,009 | 109 |
| Kimco Realty Corp. | 6,069 | 107 |
| * CIT Group Inc. | 3,090 | 107 |
| Lincoln National Corp. | 4,841 | 100 |
| XL Group plc Class A | 4,667 | 97 |
| Macerich Co. | 1,973 | 97 |
| KeyCorp | 14,033 | 93 |
| Plum Creek Timber Co. Inc. | 2,449 | 93 |
| Moody's Corp. | 2,944 | 91 |
| UDR Inc. | 3,353 | 90 |
| Leucadia National Corp. | 2,999 | 89 |
| SL Green Realty Corp. | 1,222 | 88 |
| Digital Realty Trust Inc. | 1,453 | 87 |
| Federal Realty Investment Trust | 955 | 86 |
| Regions Financial Corp. | 18,959 | 86 |
| New York Community Bancorp Inc. | 6,643 | 85 |
| Comerica Inc. | 3,132 | 80 |
| American Capital Agency Corp. | 2,773 | 79 |
| Rayonier Inc. | 1,884 | 79 |
| Essex Property Trust Inc. | 513 | 74 |
| Camden Property Trust | 1,099 | 73 |
| * Affiliated Managers Group Inc. | 813 | 71 |
| Alexandria Real Estate Equities Inc. | 969 | 71 |
| Realty Income Corp. | 2,006 | 70 |
| People's United Financial Inc. | 5,907 | 69 |
| Huntington Bancshares Inc. | 13,442 | 68 |
| * Arch Capital Group Ltd. | 1,994 | 67 |
| Legg Mason Inc. | 2,347 | 67 |
| * CB Richard Ellis Group Inc. Class A | 4,401 | 67 |
| * MSCI Inc. Class A | 1,815 | 63 |
| Cincinnati Financial Corp. | 2,210 | 62 |
| PartnerRe Ltd. | 1,075 | 61 |
| Torchmark Corp. | 1,588 | 61 |
| Reinsurance Group of America Inc. Class A | 1,116 | 60 |
| Liberty Property Trust | 1,739 | 59 |
6
| Vanguard® Russell 1000 Index Fund | ||
| Schedule of Investments | ||
| August 31, 2011 | ||
| Market | ||
| Value | ||
| Shares | ($000) | |
| * Markel Corp. | 144 | 57 |
| BRE Properties Inc. | 1,127 | 57 |
| Fidelity National Financial Inc. Class A | 3,322 | 56 |
| Senior Housing Properties Trust | 2,367 | 56 |
| Regency Centers Corp. | 1,358 | 56 |
| Everest Re Group Ltd. | 681 | 55 |
| Axis Capital Holdings Ltd. | 1,909 | 55 |
| WR Berkley Corp. | 1,696 | 52 |
| * Genworth Financial Inc. Class A | 7,391 | 51 |
| TD Ameritrade Holding Corp. | 3,307 | 51 |
| Assurant Inc. | 1,442 | 51 |
| RenaissanceRe Holdings Ltd. | 768 | 50 |
| HCC Insurance Holdings Inc. | 1,693 | 50 |
| First Niagara Financial Group Inc. | 4,582 | 49 |
| Lazard Ltd. Class A | 1,676 | 49 |
| Piedmont Office Realty Trust Inc. Class A | 2,569 | 49 |
| Zions Bancorporation | 2,778 | 48 |
| Taubman Centers Inc. | 838 | 48 |
| Apartment Investment & Management Co. | 1,804 | 48 |
| Transatlantic Holdings Inc. | 944 | 48 |
| Arthur J Gallagher & Co. | 1,660 | 47 |
| Ares Capital Corp. | 3,068 | 47 |
| Chimera Investment Corp. | 15,354 | 47 |
| * E*Trade Financial Corp. | 3,743 | 46 |
| * American Capital Ltd. | 5,251 | 46 |
| Duke Realty Corp. | 3,744 | 44 |
| Hudson City Bancorp Inc. | 7,133 | 44 |
| Weingarten Realty Investors | 1,814 | 44 |
| * NASDAQ OMX Group Inc. | 1,865 | 44 |
| Commerce Bancshares Inc. | 1,112 | 44 |
| Hospitality Properties Trust | 1,860 | 44 |
| Jones Lang LaSalle Inc. | 648 | 43 |
| Eaton Vance Corp. | 1,761 | 43 |
| Raymond James Financial Inc. | 1,528 | 43 |
| White Mountains Insurance Group Ltd. | 106 | 42 |
| Mack-Cali Realty Corp. | 1,319 | 41 |
| Cullen/Frost Bankers Inc. | 805 | 41 |
| American Financial Group Inc. | 1,223 | 41 |
| Waddell & Reed Financial Inc. Class A | 1,293 | 40 |
| Developers Diversified Realty Corp. | 3,258 | 40 |
| Old Republic International Corp. | 3,906 | 39 |
| Assured Guaranty Ltd. | 2,776 | 37 |
| SEI Investments Co. | 2,188 | 37 |
| East West Bancorp Inc. | 2,243 | 37 |
| Brown & Brown Inc. | 1,764 | 37 |
| Douglas Emmett Inc. | 1,960 | 35 |
| City National Corp. | 751 | 34 |
| Jefferies Group Inc. | 2,034 | 33 |
| CapitalSource Inc. | 5,254 | 33 |
| Erie Indemnity Co. Class A | 445 | 33 |
| Valley National Bancorp | 2,742 | 33 |
| Validus Holdings Ltd. | 1,250 | 32 |
| * Popular Inc. | 15,419 | 32 |
| Bank of Hawaii Corp. | 770 | 32 |
| Alleghany Corp. | 107 | 32 |
| Allied World Assurance Co. Holdings AG | 614 | 32 |
| Corporate Office Properties Trust | 1,159 | 31 |
| Associated Banc-Corp | 2,805 | 31 |
| * First Republic Bank | 1,198 | 31 |
| Fulton Financial Corp. | 3,275 | 30 |
| * Forest City Enterprises Inc. Class A | 2,247 | 30 |
| Capitol Federal Financial Inc. | 2,732 | 29 |
| Aspen Insurance Holdings Ltd. | 1,168 | 28 |
| Washington Federal Inc. | 1,863 | 28 |
7
| Vanguard® Russell 1000 Index Fund | ||
| Schedule of Investments | ||
| August 31, 2011 | ||
| Market | ||
| Value | ||
| Shares | ($000) | |
| First Horizon National Corp. | 3,968 | 28 |
| Hanover Insurance Group Inc. | 769 | 27 |
| Protective Life Corp. | 1,436 | 27 |
| Federated Investors Inc. Class B | 1,522 | 27 |
| CommonWealth REIT | 1,264 | 26 |
| Endurance Specialty Holdings Ltd. | 694 | 25 |
| TCF Financial Corp. | 2,396 | 25 |
| StanCorp Financial Group Inc. | 785 | 24 |
| Brandywine Realty Trust | 2,356 | 23 |
| Kemper Corp. | 861 | 22 |
| BOK Financial Corp. | 448 | 22 |
| Janus Capital Group Inc. | 2,806 | 20 |
| CBOE Holdings Inc. | 796 | 20 |
| * St. Joe Co. | 983 | 18 |
| * Howard Hughes Corp. | 324 | 18 |
| * MBIA Inc. | 2,234 | 17 |
| Mercury General Corp. | 404 | 16 |
| Greenhill & Co. Inc. | 447 | 16 |
| * LPL Investment Holdings Inc. | 518 | 15 |
| First Citizens BancShares Inc. Class A | 82 | 13 |
| BankUnited Inc. | 505 | 12 |
| * Green Dot Corp. Class A | 334 | 11 |
| * TFS Financial Corp. | 1,207 | 11 |
| CNA Financial Corp. | 402 | 10 |
| Interactive Brokers Group Inc. | 551 | 8 |
| American National Insurance Co. | 103 | 8 |
| Synovus Financial Corp. | 4,120 | 6 |
| 28,245 | ||
| Health Care (11.7%) | ||
| Johnson & Johnson | 41,419 | 2,725 |
| Pfizer Inc. | 119,410 | 2,266 |
| Merck & Co. Inc. | 46,648 | 1,545 |
| Abbott Laboratories | 23,414 | 1,230 |
| Amgen Inc. | 14,022 | 777 |
| UnitedHealth Group Inc. | 16,340 | 777 |
| Bristol-Myers Squibb Co. | 25,728 | 765 |
| Eli Lilly & Co. | 15,449 | 580 |
| Medtronic Inc. | 16,174 | 567 |
| Baxter International Inc. | 8,619 | 483 |
| * Gilead Sciences Inc. | 11,893 | 474 |
| * Celgene Corp. | 6,995 | 416 |
| Covidien plc | 7,493 | 391 |
| Allergan Inc. | 4,561 | 373 |
| WellPoint Inc. | 5,549 | 351 |
| * Express Scripts Inc. | 7,378 | 346 |
| * Biogen Idec Inc. | 3,652 | 344 |
| * Medco Health Solutions Inc. | 6,042 | 327 |
| * Thermo Fisher Scientific Inc. | 5,793 | 318 |
| McKesson Corp. | 3,811 | 305 |
| Becton Dickinson and Co. | 3,307 | 269 |
| Stryker Corp. | 4,661 | 228 |
| Aetna Inc. | 5,644 | 226 |
| * Intuitive Surgical Inc. | 586 | 224 |
| St. Jude Medical Inc. | 4,889 | 223 |
| Cardinal Health Inc. | 5,216 | 222 |
| Humana Inc. | 2,516 | 195 |
| * Agilent Technologies Inc. | 5,205 | 192 |
| CIGNA Corp. | 4,041 | 189 |
| * Zimmer Holdings Inc. | 2,883 | 164 |
| AmerisourceBergen Corp. Class A | 4,112 | 163 |
| * Alexion Pharmaceuticals Inc. | 2,785 | 161 |
| * Boston Scientific Corp. | 22,975 | 156 |
| * Forest Laboratories Inc. | 4,306 | 147 |
| * Cerner Corp. | 2,159 | 142 |
8
| Vanguard® Russell 1000 Index Fund | ||
| Schedule of Investments | ||
| August 31, 2011 | ||
| Market | ||
| Value | ||
| Shares | ($000) | |
| * Vertex Pharmaceuticals Inc. | 3,102 | 140 |
| * Mylan Inc. | 6,652 | 138 |
| * Edwards Lifesciences Corp. | 1,737 | 131 |
| * Watson Pharmaceuticals Inc. | 1,929 | 130 |
| * Laboratory Corp. of America Holdings | 1,519 | 127 |
| CR Bard Inc. | 1,301 | 124 |
| Quest Diagnostics Inc. | 2,397 | 120 |
| * Hospira Inc. | 2,567 | 119 |
| Perrigo Co. | 1,237 | 117 |
| * Life Technologies Corp. | 2,735 | 115 |
| * Waters Corp. | 1,406 | 112 |
| * DaVita Inc. | 1,474 | 108 |
| * Varian Medical Systems Inc. | 1,815 | 103 |
| * Illumina Inc. | 1,856 | 97 |
| * Cephalon Inc. | 1,154 | 93 |
| * Henry Schein Inc. | 1,398 | 92 |
| * CareFusion Corp. | 3,402 | 87 |
| * Mettler-Toledo International Inc. | 497 | 79 |
| DENTSPLY International Inc. | 2,178 | 77 |
| * Pharmasset Inc. | 583 | 77 |
| * Coventry Health Care Inc. | 2,295 | 75 |
| * ResMed Inc. | 2,391 | 74 |
| * IDEXX Laboratories Inc. | 905 | 72 |
| * Hologic Inc. | 4,082 | 68 |
| * Kinetic Concepts Inc. | 965 | 65 |
| * Regeneron Pharmaceuticals Inc. | 1,101 | 65 |
| * Endo Pharmaceuticals Holdings Inc. | 1,858 | 59 |
| Universal Health Services Inc. Class B | 1,365 | 57 |
| * QIAGEN NV | 3,531 | 55 |
| Cooper Cos. Inc. | 683 | 51 |
| Omnicare Inc. | 1,718 | 51 |
| * Allscripts Healthcare Solutions Inc. | 2,815 | 51 |
| * SXC Health Solutions Corp. | 916 | 50 |
| * BioMarin Pharmaceutical Inc. | 1,674 | 50 |
| Pharmaceutical Product Development Inc. | 1,556 | 49 |
| * Mednax Inc. | 720 | 47 |
| Patterson Cos. Inc. | 1,544 | 45 |
| * Covance Inc. | 897 | 44 |
| Warner Chilcott plc Class A | 2,562 | 44 |
| * Gen-Probe Inc. | 720 | 43 |
| Techne Corp. | 559 | 41 |
| * HCA Holdings Inc. | 1,997 | 40 |
| * Sirona Dental Systems Inc. | 844 | 39 |
| * Tenet Healthcare Corp. | 7,389 | 39 |
| PerkinElmer Inc. | 1,702 | 39 |
| Teleflex Inc. | 644 | 37 |
| * Human Genome Sciences Inc. | 2,857 | 37 |
| * Catalyst Health Solutions Inc. | 678 | 36 |
| * United Therapeutics Corp. | 802 | 35 |
| * Health Net Inc. | 1,375 | 34 |
| * AMERIGROUP Corp. | 659 | 33 |
| * Bio-Rad Laboratories Inc. Class A | 321 | 32 |
| * Alere Inc. | 1,289 | 32 |
| * Thoratec Corp. | 933 | 32 |
| * Health Management Associates Inc. Class A | 3,878 | 32 |
| * LifePoint Hospitals Inc. | 861 | 32 |
| * Community Health Systems Inc. | 1,534 | 31 |
| Lincare Holdings Inc. | 1,444 | 31 |
| Hill-Rom Holdings Inc. | 952 | 29 |
| * Charles River Laboratories International Inc. | 852 | 28 |
| * Myriad Genetics Inc. | 1,417 | 28 |
| * Dendreon Corp. | 2,198 | 27 |
| * VCA Antech Inc. | 1,447 | 27 |
| * Brookdale Senior Living Inc. Class A | 1,467 | 24 |
9
| Vanguard® Russell 1000 Index Fund | ||
| Schedule of Investments | ||
| August 31, 2011 | ||
| Market | ||
| Value | ||
| Shares | ($000) | |
| * Amylin Pharmaceuticals Inc. | 1,977 | 22 |
| * Bruker Corp. | 1,280 | 18 |
| * Emdeon Inc. Class A | 441 | 8 |
| 22,405 | ||
| Industrials (10.6%) | ||
| General Electric Co. | 160,250 | 2,614 |
| United Technologies Corp. | 13,788 | 1,024 |
| 3M Co. | 10,705 | 888 |
| Caterpillar Inc. | 9,713 | 884 |
| United Parcel Service Inc. Class B | 11,081 | 747 |
| Boeing Co. | 11,134 | 744 |
| Union Pacific Corp. | 7,398 | 682 |
| Honeywell International Inc. | 11,895 | 569 |
| Emerson Electric Co. | 11,361 | 529 |
| Deere & Co. | 6,342 | 513 |
| Danaher Corp. | 8,218 | 376 |
| FedEx Corp. | 4,771 | 376 |
| CSX Corp. | 16,498 | 362 |
| Norfolk Southern Corp. | 5,287 | 358 |
| Precision Castparts Corp. | 2,167 | 355 |
| General Dynamics Corp. | 5,021 | 322 |
| Lockheed Martin Corp. | 4,327 | 321 |
| Illinois Tool Works Inc. | 6,742 | 314 |
| Tyco International Ltd. | 7,088 | 295 |
| Cummins Inc. | 2,966 | 276 |
| Waste Management Inc. | 7,167 | 237 |
| Raytheon Co. | 5,294 | 229 |
| Northrop Grumman Corp. | 4,120 | 225 |
| Eaton Corp. | 5,082 | 218 |
| PACCAR Inc. | 5,448 | 205 |
| Parker Hannifin Corp. | 2,431 | 178 |
| CH Robinson Worldwide Inc. | 2,480 | 175 |
| Ingersoll-Rand plc | 4,990 | 167 |
| Goodrich Corp. | 1,873 | 167 |
| Dover Corp. | 2,805 | 161 |
| Fluor Corp. | 2,619 | 159 |
| Stanley Black & Decker Inc. | 2,527 | 157 |
| Fastenal Co. | 4,444 | 149 |
| Republic Services Inc. Class A | 4,830 | 147 |
| Expeditors International of Washington Inc. | 3,202 | 146 |
| Rockwell Automation Inc. | 2,182 | 140 |
| WW Grainger Inc. | 868 | 134 |
| Joy Global Inc. | 1,591 | 133 |
| ITT Corp. | 2,789 | 132 |
| Cooper Industries plc | 2,514 | 119 |
| Rockwell Collins Inc. | 2,347 | 118 |
| Roper Industries Inc. | 1,485 | 114 |
| * Stericycle Inc. | 1,267 | 111 |
| L-3 Communications Holdings Inc. | 1,626 | 110 |
| Southwest Airlines Co. | 11,926 | 103 |
| * Delta Air Lines Inc. | 12,742 | 96 |
| AMETEK Inc. | 2,426 | 95 |
| * United Continental Holdings Inc. | 4,920 | 91 |
| * Kansas City Southern | 1,668 | 90 |
| Pall Corp. | 1,759 | 90 |
| Iron Mountain Inc. | 2,736 | 89 |
| Flowserve Corp. | 859 | 81 |
| * Jacobs Engineering Group Inc. | 1,973 | 73 |
| * TransDigm Group Inc. | 786 | 72 |
| Donaldson Co. Inc. | 1,206 | 71 |
| KBR Inc. | 2,359 | 71 |
| Textron Inc. | 4,168 | 70 |
| * Verisk Analytics Inc. Class A | 1,797 | 63 |
| * Quanta Services Inc. | 3,259 | 63 |
10
| Vanguard® Russell 1000 Index Fund | ||
| Schedule of Investments | ||
| August 31, 2011 | ||
| Market | ||
| Value | ||
| Shares | ($000) | |
| Gardner Denver Inc. | 790 | 62 |
| * AGCO Corp. | 1,432 | 61 |
| Equifax Inc. | 1,859 | 60 |
| Cintas Corp. | 1,869 | 60 |
| Waste Connections Inc. | 1,685 | 58 |
| * IHS Inc. Class A | 746 | 58 |
| Pitney Bowes Inc. | 2,766 | 56 |
| JB Hunt Transport Services Inc. | 1,380 | 55 |
| * Owens Corning | 1,886 | 55 |
| Hubbell Inc. Class B | 910 | 54 |
| Robert Half International Inc. | 2,219 | 53 |
| Chicago Bridge & Iron Co. NV | 1,474 | 53 |
| Timken Co. | 1,321 | 52 |
| Pentair Inc. | 1,487 | 51 |
| Towers Watson & Co. Class A | 849 | 50 |
| * BE Aerospace Inc. | 1,436 | 50 |
| Manpower Inc. | 1,239 | 50 |
| Dun & Bradstreet Corp. | 732 | 49 |
| Masco Corp. | 5,395 | 48 |
| * WABCO Holdings Inc. | 1,019 | 47 |
| Avery Dennison Corp. | 1,615 | 47 |
| IDEX Corp. | 1,230 | 46 |
| Snap-on Inc. | 861 | 46 |
| * Navistar International Corp. | 1,091 | 45 |
| Kennametal Inc. | 1,214 | 45 |
| * Kirby Corp. | 809 | 44 |
| Wabtec Corp. | 722 | 44 |
| SPX Corp. | 769 | 44 |
| Lincoln Electric Holdings Inc. | 1,272 | 43 |
| RR Donnelley & Sons Co. | 2,838 | 43 |
| * Hertz Global Holdings Inc. | 3,684 | 41 |
| MSC Industrial Direct Co. Class A | 669 | 41 |
| * URS Corp. | 1,171 | 41 |
| * Babcock & Wilcox Co. | 1,769 | 41 |
| * Aecom Technology Corp. | 1,790 | 41 |
| Nordson Corp. | 906 | 40 |
| * Copart Inc. | 909 | 39 |
| * Corrections Corp. of America | 1,710 | 39 |
| * Nielsen Holdings NV | 1,275 | 38 |
| * Polypore International Inc. | 596 | 37 |
| Ryder System Inc. | 779 | 37 |
| Carlisle Cos. Inc. | 922 | 36 |
| Graco Inc. | 910 | 36 |
| Copa Holdings SA Class A | 519 | 36 |
| * Thomas & Betts Corp. | 797 | 35 |
| Regal-Beloit Corp. | 592 | 35 |
| Alliant Techsystems Inc. | 541 | 34 |
| Valmont Industries Inc. | 367 | 34 |
| Crane Co. | 792 | 33 |
| Trinity Industries Inc. | 1,208 | 33 |
| * GrafTech International Ltd. | 2,092 | 33 |
| Covanta Holding Corp. | 1,961 | 32 |
| * Spirit Aerosystems Holdings Inc. Class A | 1,915 | 32 |
| Landstar System Inc. | 773 | 31 |
| * WESCO International Inc. | 713 | 31 |
| Alexander & Baldwin Inc. | 699 | 30 |
| Toro Co. | 523 | 28 |
| GATX Corp. | 781 | 28 |
| Harsco Corp. | 1,216 | 28 |
| * Oshkosh Corp. | 1,373 | 27 |
| * General Cable Corp. | 887 | 27 |
| * Terex Corp. | 1,652 | 27 |
| * Shaw Group Inc. | 1,088 | 25 |
| Lennox International Inc. | 804 | 25 |
11
| Vanguard® Russell 1000 Index Fund | ||
| Schedule of Investments | ||
| August 31, 2011 | ||
| Market | ||
| Value | ||
| Shares | ($000) | |
| * Huntington Ingalls Industries Inc. | 826 | 25 |
| Con-way Inc. | 957 | 24 |
| Manitowoc Co. Inc. | 1,991 | 22 |
| UTi Worldwide Inc. | 1,545 | 21 |
| * AMR Corp. | 5,023 | 18 |
| * CNH Global NV | 399 | 13 |
| Armstrong World Industries Inc. | 318 | 13 |
| * Air Lease Corp. | 525 | 12 |
| * KAR Auction Services Inc. | 435 | 6 |
| 20,432 | ||
| Information Technology (18.1%) | ||
| * Apple Inc. | 13,974 | 5,378 |
| International Business Machines Corp. | 18,301 | 3,146 |
| Microsoft Corp. | 112,129 | 2,983 |
| * Google Inc. Class A | 3,804 | 2,058 |
| Oracle Corp. | 58,049 | 1,629 |
| Intel Corp. | 80,130 | 1,613 |
| Cisco Systems Inc. | 83,125 | 1,303 |
| QUALCOMM Inc. | 25,232 | 1,298 |
| Hewlett-Packard Co. | 32,598 | 849 |
| * EMC Corp. | 31,029 | 701 |
| Visa Inc. Class A | 7,886 | 693 |
| * eBay Inc. | 17,415 | 538 |
| Mastercard Inc. Class A | 1,622 | 535 |
| Accenture plc Class A | 9,755 | 523 |
| Texas Instruments Inc. | 17,517 | 459 |
| Automatic Data Processing Inc. | 7,553 | 378 |
| * Dell Inc. | 24,503 | 364 |
| Corning Inc. | 23,504 | 353 |
| * Cognizant Technology Solutions Corp. Class A | 4,599 | 292 |
| Broadcom Corp. Class A | 8,103 | 289 |
| * Yahoo! Inc. | 19,692 | 268 |
| * Salesforce.com Inc. | 2,024 | 261 |
| * Intuit Inc. | 4,506 | 222 |
| Applied Materials Inc. | 19,602 | 222 |
| * NetApp Inc. | 5,478 | 206 |
| * Symantec Corp. | 11,284 | 194 |
| * Adobe Systems Inc. | 7,535 | 190 |
| * Motorola Solutions Inc. | 4,493 | 189 |
| Altera Corp. | 4,822 | 175 |
| Xerox Corp. | 21,008 | 174 |
| * Citrix Systems Inc. | 2,822 | 171 |
| * Juniper Networks Inc. | 8,030 | 168 |
| Western Union Co. | 9,491 | 157 |
| Analog Devices Inc. | 4,509 | 149 |
| * Motorola Mobility Holdings Inc. | 3,869 | 146 |
| * Teradata Corp. | 2,556 | 134 |
| * SanDisk Corp. | 3,609 | 132 |
| Paychex Inc. | 4,886 | 132 |
| Amphenol Corp. Class A | 2,674 | 126 |
| Xilinx Inc. | 4,027 | 125 |
| * VMware Inc. Class A | 1,305 | 123 |
| CA Inc. | 5,866 | 123 |
| * Fiserv Inc. | 2,188 | 122 |
| * NVIDIA Corp. | 9,133 | 122 |
| * Red Hat Inc. | 2,966 | 117 |
| Fidelity National Information Services Inc. | 4,049 | 114 |
| * Electronic Arts Inc. | 4,906 | 111 |
| * BMC Software Inc. | 2,699 | 110 |
| * Western Digital Corp. | 3,584 | 106 |
| Maxim Integrated Products Inc. | 4,374 | 101 |
| * Marvell Technology Group Ltd. | 7,599 | 100 |
| * F5 Networks Inc. | 1,222 | 100 |
| Linear Technology Corp. | 3,419 | 98 |
12
| Vanguard® Russell 1000 Index Fund | ||
| Schedule of Investments | ||
| August 31, 2011 | ||
| Market | ||
| Value | ||
| Shares | ($000) | |
| * Autodesk Inc. | 3,462 | 98 |
| Avago Technologies Ltd. | 2,881 | 95 |
| National Semiconductor Corp. | 3,797 | 95 |
| Microchip Technology Inc. | 2,865 | 94 |
| KLA-Tencor Corp. | 2,530 | 93 |
| * First Solar Inc. | 881 | 88 |
| * Rovi Corp. | 1,728 | 84 |
| VeriSign Inc. | 2,587 | 81 |
| Harris Corp. | 1,964 | 79 |
| * Amdocs Ltd. | 2,859 | 79 |
| Activision Blizzard Inc. | 6,584 | 78 |
| * ANSYS Inc. | 1,433 | 77 |
| * Micron Technology Inc. | 13,065 | 77 |
| * Alliance Data Systems Corp. | 798 | 75 |
| * Varian Semiconductor Equipment Associates Inc. | 1,184 | 73 |
| * Lam Research Corp. | 1,929 | 72 |
| Computer Sciences Corp. | 2,337 | 72 |
| * Trimble Navigation Ltd. | 1,929 | 72 |
| * Nuance Communications Inc. | 3,739 | 69 |
| * Informatica Corp. | 1,636 | 68 |
| * SAIC Inc. | 4,538 | 68 |
| * Equinix Inc. | 707 | 66 |
| * Polycom Inc. | 2,777 | 66 |
| FLIR Systems Inc. | 2,515 | 65 |
| Factset Research Systems Inc. | 733 | 64 |
| * Advanced Micro Devices Inc. | 9,289 | 63 |
| * Avnet Inc. | 2,408 | 63 |
| * Atmel Corp. | 6,892 | 63 |
| Solera Holdings Inc. | 1,067 | 63 |
| * Akamai Technologies Inc. | 2,813 | 62 |
| * Skyworks Solutions Inc. | 2,859 | 59 |
| * LSI Corp. | 8,657 | 59 |
| * MICROS Systems Inc. | 1,225 | 58 |
| * Arrow Electronics Inc. | 1,844 | 58 |
| * Riverbed Technology Inc. | 2,313 | 57 |
| * Rackspace Hosting Inc. | 1,557 | 57 |
| * Synopsys Inc. | 2,172 | 56 |
| * TIBCO Software Inc. | 2,507 | 56 |
| Global Payments Inc. | 1,209 | 55 |
| * VeriFone Systems Inc. | 1,541 | 54 |
| * Cree Inc. | 1,650 | 54 |
| * Gartner Inc. | 1,469 | 52 |
| Jabil Circuit Inc. | 2,909 | 49 |
| * ON Semiconductor Corp. | 6,700 | 49 |
| * IAC/InterActiveCorp | 1,215 | 48 |
| Total System Services Inc. | 2,451 | 44 |
| * JDS Uniphase Corp. | 3,414 | 44 |
| Molex Inc. | 2,012 | 44 |
| * Ingram Micro Inc. | 2,448 | 44 |
| * NCR Corp. | 2,400 | 41 |
| * Lexmark International Inc. Class A | 1,244 | 40 |
| Cypress Semiconductor Corp. | 2,492 | 39 |
| * Ariba Inc. | 1,445 | 39 |
| Broadridge Financial Solutions Inc. | 1,868 | 39 |
| * Acme Packet Inc. | 806 | 38 |
| * Cadence Design Systems Inc. | 4,089 | 38 |
| * Tech Data Corp. | 752 | 35 |
| National Instruments Corp. | 1,387 | 35 |
| * Fortinet Inc. | 1,807 | 35 |
| * Teradyne Inc. | 2,840 | 34 |
| * Genpact Ltd. | 2,029 | 34 |
| * Zebra Technologies Corp. | 894 | 32 |
| * WebMD Health Corp. | 891 | 32 |
| Diebold Inc. | 1,081 | 31 |
13
| Vanguard® Russell 1000 Index Fund | ||
| Schedule of Investments | ||
| August 31, 2011 | ||
| Market | ||
| Value | ||
| Shares | ($000) | |
| * Compuware Corp. | 3,590 | 30 |
| * NeuStar Inc. Class A | 1,202 | 30 |
| * Novellus Systems Inc. | 1,052 | 29 |
| * Fairchild Semiconductor International Inc. Class A | 2,129 | 28 |
| DST Systems Inc. | 591 | 28 |
| * Brocade Communications Systems Inc. | 7,117 | 28 |
| * IPG Photonics Corp. | 469 | 27 |
| * Itron Inc. | 682 | 27 |
| * Dolby Laboratories Inc. Class A | 800 | 27 |
| * International Rectifier Corp. | 1,177 | 27 |
| * Silicon Laboratories Inc. | 753 | 26 |
| Tellabs Inc. | 6,245 | 25 |
| * AOL Inc. | 1,611 | 25 |
| * Vishay Intertechnology Inc. | 2,182 | 25 |
| Intersil Corp. Class A | 2,179 | 24 |
| * MEMC Electronic Materials Inc. | 3,471 | 24 |
| Lender Processing Services Inc. | 1,302 | 23 |
| * QLogic Corp. | 1,583 | 22 |
| * PMC - Sierra Inc. | 3,527 | 21 |
| * VistaPrint NV | 647 | 19 |
| * Monster Worldwide Inc. | 1,950 | 18 |
| * Ciena Corp. | 1,433 | 18 |
| * SunPower Corp. Class B | 1,398 | 17 |
| * EchoStar Corp. Class A | 576 | 14 |
| * LinkedIn Corp. Class A | 135 | 11 |
| AVX Corp. | 727 | 10 |
| * Freescale Semiconductor Holdings I Ltd. | 656 | 8 |
| * FleetCor Technologies Inc. | 223 | 6 |
| * Booz Allen Hamilton Holding Corp. | 351 | 6 |
| * SunPower Corp. Class A | 98 | 1 |
| 34,795 | ||
| Materials (4.3%) | ||
| EI du Pont de Nemours & Co. | 14,034 | 677 |
| Freeport-McMoRan Copper & Gold Inc. | 14,315 | 675 |
| Monsanto Co. | 8,101 | 558 |
| Dow Chemical Co. | 17,763 | 505 |
| Newmont Mining Corp. | 7,350 | 460 |
| Praxair Inc. | 4,586 | 452 |
| Mosaic Co. | 4,165 | 296 |
| Air Products & Chemicals Inc. | 3,203 | 262 |
| Alcoa Inc. | 15,876 | 203 |
| CF Industries Holdings Inc. | 1,067 | 195 |
| Ecolab Inc. | 3,470 | 186 |
| PPG Industries Inc. | 2,368 | 181 |
| Cliffs Natural Resources Inc. | 2,188 | 181 |
| International Paper Co. | 6,548 | 178 |
| Nucor Corp. | 4,740 | 171 |
| LyondellBasell Industries NV Class A | 4,712 | 163 |
| Lubrizol Corp. | 981 | 132 |
| Sigma-Aldrich Corp. | 1,862 | 120 |
| Celanese Corp. Class A | 2,412 | 113 |
| Sherwin-Williams Co. | 1,334 | 101 |
| Ball Corp. | 2,542 | 91 |
| Eastman Chemical Co. | 1,069 | 89 |
| Southern Copper Corp. | 2,601 | 88 |
| * Crown Holdings Inc. | 2,382 | 85 |
| FMC Corp. | 1,096 | 83 |
| Allegheny Technologies Inc. | 1,624 | 81 |
| Airgas Inc. | 1,213 | 79 |
| Walter Energy Inc. | 951 | 78 |
| Nalco Holding Co. | 2,096 | 78 |
| International Flavors & Fragrances Inc. | 1,257 | 73 |
| MeadWestvaco Corp. | 2,633 | 73 |
| Albemarle Corp. | 1,414 | 72 |
14
| Vanguard® Russell 1000 Index Fund | ||
| Schedule of Investments | ||
| August 31, 2011 | ||
| Market | ||
| Value | ||
| Shares | ($000) | |
| Vulcan Materials Co. | 2,021 | 71 |
| Ashland Inc. | 1,244 | 66 |
| United States Steel Corp. | 2,166 | 65 |
| Royal Gold Inc. | 815 | 63 |
| Rock-Tenn Co. Class A | 1,046 | 56 |
| * Allied Nevada Gold Corp. | 1,336 | 56 |
| * Rockwood Holdings Inc. | 1,010 | 52 |
| Aptargroup Inc. | 999 | 50 |
| Domtar Corp. | 619 | 50 |
| * Molycorp Inc. | 866 | 49 |
| Bemis Co. Inc. | 1,569 | 49 |
| Martin Marietta Materials Inc. | 676 | 48 |
| Sonoco Products Co. | 1,484 | 47 |
| * Owens-Illinois Inc. | 2,471 | 47 |
| Valspar Corp. | 1,434 | 46 |
| Reliance Steel & Aluminum Co. | 1,117 | 46 |
| Sealed Air Corp. | 2,366 | 44 |
| * WR Grace & Co. | 1,096 | 43 |
| Steel Dynamics Inc. | 3,289 | 42 |
| RPM International Inc. | 1,966 | 41 |
| Packaging Corp. of America | 1,549 | 39 |
| Temple-Inland Inc. | 1,616 | 39 |
| Compass Minerals International Inc. | 500 | 38 |
| Huntsman Corp. | 2,855 | 37 |
| Scotts Miracle-Gro Co. Class A | 733 | 36 |
| Carpenter Technology Corp. | 701 | 35 |
| Cytec Industries Inc. | 774 | 35 |
| Cabot Corp. | 1,000 | 34 |
| Greif Inc. Class A | 614 | 34 |
| * Solutia Inc. | 1,865 | 32 |
| Silgan Holdings Inc. | 804 | 31 |
| * Intrepid Potash Inc. | 872 | 30 |
| Commercial Metals Co. | 2,006 | 24 |
| Titanium Metals Corp. | 1,290 | 21 |
| Schnitzer Steel Industries Inc. | 334 | 15 |
| Westlake Chemical Corp. | 301 | 14 |
| Kronos Worldwide Inc. | 329 | 7 |
| AK Steel Holding Corp. | 697 | 6 |
| 8,317 | ||
| Telecommunication Services (3.0%) | ||
| AT&T Inc. | 89,483 | 2,548 |
| Verizon Communications Inc. | 42,756 | 1,547 |
| CenturyLink Inc. | 9,245 | 334 |
| * American Tower Corp. Class A | 5,995 | 323 |
| * Crown Castle International Corp. | 4,339 | 188 |
| * Sprint Nextel Corp. | 45,067 | 169 |
| Frontier Communications Corp. | 14,684 | 110 |
| * NII Holdings Inc. | 2,557 | 99 |
| Windstream Corp. | 7,686 | 98 |
| * SBA Communications Corp. Class A | 1,799 | 68 |
| * MetroPCS Communications Inc. | 4,184 | 47 |
| * Level 3 Communications Inc. | 25,755 | 46 |
| * tw telecom inc Class A | 2,265 | 44 |
| Telephone & Data Systems Inc. | 1,380 | 35 |
| * United States Cellular Corp. | 218 | 9 |
| * Clearwire Corp. Class A | 2,722 | 9 |
| 5,674 | ||
| Utilities (3.8%) | ||
| Southern Co. | 12,833 | 531 |
| Exelon Corp. | 10,011 | 432 |
| Dominion Resources Inc. | 8,703 | 424 |
| Duke Energy Corp. | 20,121 | 380 |
| NextEra Energy Inc. | 6,311 | 358 |
| American Electric Power Co. Inc. | 7,282 | 281 |
15
| Vanguard® Russell 1000 Index Fund | |||||
| Schedule of Investments | |||||
| August 31, 2011 | |||||
| Market | |||||
| Value | |||||
| Shares | ($000) | ||||
| FirstEnergy Corp. | 6,321 | 280 | |||
| Public Service Enterprise Group Inc. | 7,646 | 261 | |||
| PG&E Corp. | 6,015 | 255 | |||
| PPL Corp. | 8,723 | 252 | |||
| Consolidated Edison Inc. | 4,422 | 249 | |||
| Progress Energy Inc. | 4,383 | 214 | |||
| Sempra Energy | 3,576 | 188 | |||
| Edison International | 4,870 | 181 | |||
| Xcel Energy Inc. | 7,238 | 179 | |||
| Entergy Corp. | 2,665 | 174 | |||
| DTE Energy Co. | 2,585 | 131 | |||
| CenterPoint Energy Inc. | 6,516 | 130 | |||
| Oneok Inc. | 1,594 | 113 | |||
| Wisconsin Energy Corp. | 3,487 | 110 | |||
| * | AES Corp. | 10,125 | 110 | ||
| Ameren Corp. | 3,620 | 110 | |||
| Constellation Energy Group Inc. | 2,794 | 108 | |||
| Northeast Utilities | 2,673 | 93 | |||
| NiSource Inc. | 4,251 | 91 | |||
| * | NRG Energy Inc. | 3,690 | 86 | ||
| American Water Works Co. Inc. | 2,703 | 80 | |||
| * | Calpine Corp. | 5,402 | 80 | ||
| National Fuel Gas Co. | 1,273 | 78 | |||
| CMS Energy Corp. | 3,916 | 77 | |||
| OGE Energy Corp. | 1,519 | 76 | |||
| Pinnacle West Capital Corp. | 1,696 | 75 | |||
| NSTAR | 1,617 | 74 | |||
| SCANA Corp. | 1,811 | 73 | |||
| Alliant Energy Corp. | 1,741 | 71 | |||
| Pepco Holdings Inc. | 3,567 | 69 | |||
| MDU Resources Group Inc. | 2,853 | 61 | |||
| TECO Energy Inc. | 3,248 | 59 | |||
| Integrys Energy Group Inc. | 1,183 | 59 | |||
| ITC Holdings Corp. | 756 | 57 | |||
| NV Energy Inc. | 3,494 | 52 | |||
| DPL Inc. | 1,741 | 52 | |||
| Questar Corp. | 2,668 | 50 | |||
| UGI Corp. | 1,663 | 49 | |||
| AGL Resources Inc. | 1,171 | 48 | |||
| Aqua America Inc. | 2,094 | 46 | |||
| Atmos Energy Corp. | 1,366 | 46 | |||
| Westar Energy Inc. | 1,717 | 46 | |||
| Great Plains Energy Inc. | 2,066 | 40 | |||
| * | GenOn Energy Inc. | 12,204 | 37 | ||
| Hawaiian Electric Industries Inc. | 1,511 | 36 | |||
| Vectren Corp. | 1,300 | 36 | |||
| 7,248 | |||||
| Total Common Stocks (Cost $199,133) | 191,252 | ||||
| Coupon | |||||
| Temporary Cash Investments (0.4%)1 | |||||
| Money Market Fund (0.3%) | |||||
| 2 | Vanguard Market Liquidity Fund | 0.132% | 673,345 | 673 | |
| Face | |||||
| Maturity | Amount | ||||
| Date | ($000) | ||||
| U.S. Government and Agency Obligations (0.1%) | |||||
| 3,4 | Fannie Mae Discount Notes | 0.080% | 12/19/11 | 100 | 100 |
| Total Temporary Cash Investments (Cost $773) | 773 | ||||
16
| Vanguard® Russell 1000 Index Fund | |
| Schedule of Investments | |
| August 31, 2011 | |
| Market | |
| Value | |
| ($000) | |
| Total Investments (100.0%) (Cost $199,906) | 192,025 |
| Other Assets and Liabilities—Net (0.0%) | 7 |
| Net Assets (100%) | 192,032 |
* Non-income-producing security.
1 The fund invests a portion of its cash reserves in equity markets through the use of index futures contracts. After giving effect to futures investments, the fund's effective common stock and temporary cash investment positions represent 100.0% and 0.0%, respectively, of net assets.
2 Affiliated money market fund available only to Vanguard funds and certain trusts and accounts managed by Vanguard. Rate shown is the 7-day yield.
3 The issuer operates under a congressional charter; its securities are not backed by the full faith and credit of the U.S. government.
4 Securities with a value of $100,000 have been segregated as initial margin for open futures contracts.
REIT—Real Estate Investment Trust.
17
| Vanguard® Russell 1000 Value Index Fund | ||
| Schedule of Investments | ||
| August 31, 2011 | ||
| Market | ||
| Value | ||
| Shares | ($000) | |
| Common Stocks (99.5%)1 | ||
| Consumer Discretionary (8.8%) | ||
| Walt Disney Co. | 57,126 | 1,946 |
| News Corp. Class A | 69,382 | 1,198 |
| Time Warner Inc. | 32,363 | 1,025 |
| Target Corp. | 19,725 | 1,019 |
| Lowe's Cos. Inc. | 39,353 | 784 |
| Comcast Corp. Class A | 35,811 | 770 |
| Home Depot Inc. | 19,174 | 640 |
| * General Motors Co. | 22,973 | 552 |
| * Ford Motor Co. | 49,438 | 550 |
| Johnson Controls Inc. | 15,318 | 488 |
| CBS Corp. Class B | 17,081 | 428 |
| Carnival Corp. | 12,888 | 426 |
| Staples Inc. | 21,555 | 318 |
| VF Corp. | 2,629 | 308 |
| Macy's Inc. | 11,274 | 293 |
| * Liberty Media Corp. - Interactive | 18,170 | 287 |
| Fortune Brands Inc. | 4,659 | 266 |
| Best Buy Co. Inc. | 9,564 | 245 |
| Comcast Corp. | 11,200 | 237 |
| Genuine Parts Co. | 3,404 | 187 |
| Gap Inc. | 11,332 | 187 |
| Thomson Reuters Corp. | 5,913 | 183 |
| Wyndham Worldwide Corp. | 5,090 | 165 |
| * CarMax Inc. | 5,668 | 159 |
| * Liberty Media Corp. - Capital | 2,133 | 152 |
| Lear Corp. | 3,156 | 151 |
| Autoliv Inc. | 2,642 | 147 |
| Whirlpool Corp. | 2,291 | 144 |
| JC Penney Co. Inc. | 4,972 | 132 |
| * TRW Automotive Holdings Corp. | 3,018 | 126 |
| Newell Rubbermaid Inc. | 8,798 | 122 |
| * Liberty Media Corp. - Starz | 1,585 | 109 |
| * NVR Inc. | 167 | 106 |
| PVH Corp. | 1,556 | 104 |
| * Signet Jewelers Ltd. | 2,632 | 102 |
| Garmin Ltd. | 3,055 | 102 |
| * GameStop Corp. Class A | 4,261 | 102 |
| Foot Locker Inc. | 4,685 | 98 |
| * MGM Resorts International | 8,336 | 92 |
| DR Horton Inc. | 8,537 | 90 |
| * Mohawk Industries Inc. | 1,733 | 86 |
| Gannett Co. Inc. | 7,344 | 85 |
| * Penn National Gaming Inc. | 2,076 | 83 |
| Jarden Corp. | 2,799 | 81 |
| Interpublic Group of Cos. Inc. | 9,351 | 81 |
| * Toll Brothers Inc. | 4,507 | 77 |
| * Visteon Corp. | 1,485 | 76 |
| Expedia Inc. | 2,476 | 75 |
| Service Corp. International | 7,342 | 75 |
| Mattel Inc. | 2,748 | 74 |
| Lennar Corp. Class A | 4,943 | 73 |
| * Sears Holdings Corp. | 1,195 | 72 |
| McGraw-Hill Cos. Inc. | 1,663 | 70 |
| International Game Technology | 4,511 | 69 |
| American Eagle Outfitters Inc. | 5,889 | 65 |
| Kohl's Corp. | 1,384 | 64 |
| H&R Block Inc. | 3,800 | 57 |
| Washington Post Co. Class B | 151 | 54 |
| * Big Lots Inc. | 1,491 | 51 |
| Williams-Sonoma Inc. | 1,520 | 50 |
| * Pulte Group Inc. | 10,320 | 49 |
18
| Vanguard® Russell 1000 Value Index Fund | ||
| Schedule of Investments | ||
| August 31, 2011 | ||
| Market | ||
| Value | ||
| Shares | ($000) | |
| Dillard's Inc. Class A | 1,027 | 47 |
| Royal Caribbean Cruises Ltd. | 1,804 | 47 |
| * DreamWorks Animation SKG Inc. Class A | 2,158 | 46 |
| * Hyatt Hotels Corp. Class A | 1,267 | 45 |
| * Madison Square Garden Co. Class A | 1,820 | 44 |
| Wendy's Co. | 9,024 | 44 |
| RadioShack Corp. | 3,010 | 39 |
| * WMS Industries Inc. | 1,731 | 38 |
| * DISH Network Corp. Class A | 1,506 | 37 |
| * Career Education Corp. | 1,865 | 32 |
| Thor Industries Inc. | 1,336 | 30 |
| Harman International Industries Inc. | 718 | 26 |
| * Lamar Advertising Co. Class A | 1,232 | 26 |
| * AutoNation Inc. | 627 | 25 |
| Chico's FAS Inc. | 1,778 | 25 |
| Choice Hotels International Inc. | 794 | 25 |
| Leggett & Platt Inc. | 1,075 | 24 |
| Abercrombie & Fitch Co. | 371 | 24 |
| Regal Entertainment Group Class A | 1,682 | 22 |
| Aaron's Inc. | 701 | 19 |
| * Education Management Corp. | 1,163 | 18 |
| DeVry Inc. | 389 | 17 |
| * Clear Channel Outdoor Holdings Inc. Class A | 1,237 | 14 |
| * Federal-Mogul Corp. | 610 | 11 |
| Brinker International Inc. | 199 | 4 |
| * Sally Beauty Holdings Inc. | 212 | 4 |
| * Bally Technologies Inc. | 91 | 3 |
| * DSW Inc. Class A | 46 | 2 |
| 16,745 | ||
| Consumer Staples (7.8%) | ||
| Procter & Gamble Co. | 78,710 | 5,012 |
| Kraft Foods Inc. | 49,940 | 1,749 |
| CVS Caremark Corp. | 40,981 | 1,472 |
| Wal-Mart Stores Inc. | 12,871 | 685 |
| Archer-Daniels-Midland Co. | 20,458 | 583 |
| Lorillard Inc. | 4,344 | 484 |
| Altria Group Inc. | 16,070 | 437 |
| Mead Johnson Nutrition Co. | 5,047 | 360 |
| Philip Morris International Inc. | 5,107 | 354 |
| Clorox Co. | 3,796 | 265 |
| Reynolds American Inc. | 7,041 | 264 |
| ConAgra Foods Inc. | 10,802 | 264 |
| JM Smucker Co. | 3,507 | 253 |
| Bunge Ltd. | 3,306 | 214 |
| HJ Heinz Co. | 4,047 | 213 |
| Safeway Inc. | 10,543 | 193 |
| General Mills Inc. | 4,684 | 178 |
| Molson Coors Brewing Co. Class B | 3,999 | 175 |
| * Energizer Holdings Inc. | 2,094 | 158 |
| Tyson Foods Inc. Class A | 9,015 | 157 |
| * Ralcorp Holdings Inc. | 1,653 | 143 |
| Colgate-Palmolive Co. | 1,444 | 130 |
| * Smithfield Foods Inc. | 5,051 | 111 |
| * Constellation Brands Inc. Class A | 5,523 | 109 |
| Kroger Co. | 4,624 | 109 |
| Kimberly-Clark Corp. | 1,483 | 103 |
| Church & Dwight Co. Inc. | 1,838 | 80 |
| * BJ's Wholesale Club Inc. | 1,504 | 76 |
| Hershey Co. | 1,190 | 70 |
| Coca-Cola Enterprises Inc. | 2,299 | 63 |
| McCormick & Co. Inc. | 1,265 | 60 |
| Walgreen Co. | 1,549 | 54 |
| Sara Lee Corp. | 3,007 | 54 |
| Hormel Foods Corp. | 1,946 | 54 |
19
| Vanguard® Russell 1000 Value Index Fund | ||
| Schedule of Investments | ||
| August 31, 2011 | ||
| Market | ||
| Value | ||
| Shares | ($000) | |
| SUPERVALU Inc. | 6,412 | 51 |
| * Dean Foods Co. | 5,536 | 48 |
| Campbell Soup Co. | 1,303 | 41 |
| Brown-Forman Corp. Class B | 456 | 33 |
| Kellogg Co. | 482 | 26 |
| Corn Products International Inc. | 446 | 21 |
| 14,906 | ||
| Energy (12.3%) | ||
| Chevron Corp. | 57,293 | 5,667 |
| ConocoPhillips | 42,720 | 2,908 |
| Exxon Mobil Corp. | 39,008 | 2,888 |
| Occidental Petroleum Corp. | 17,492 | 1,517 |
| Anadarko Petroleum Corp. | 12,751 | 940 |
| Devon Energy Corp. | 12,786 | 867 |
| Apache Corp. | 8,253 | 851 |
| National Oilwell Varco Inc. | 12,788 | 846 |
| Chesapeake Energy Corp. | 19,878 | 644 |
| Marathon Oil Corp. | 21,521 | 579 |
| Hess Corp. | 9,171 | 544 |
| Spectra Energy Corp. | 19,642 | 510 |
| Baker Hughes Inc. | 7,908 | 483 |
| Williams Cos. Inc. | 17,776 | 480 |
| Marathon Petroleum Corp. | 10,761 | 399 |
| Valero Energy Corp. | 17,236 | 392 |
| Noble Energy Inc. | 4,262 | 377 |
| Murphy Oil Corp. | 4,952 | 265 |
| * Nabors Industries Ltd. | 8,653 | 160 |
| Southern Union Co. | 3,735 | 156 |
| EQT Corp. | 2,456 | 147 |
| Sunoco Inc. | 3,643 | 139 |
| Cimarex Energy Co. | 1,896 | 135 |
| * Plains Exploration & Production Co. | 4,262 | 125 |
| * Rowan Cos. Inc. | 3,236 | 117 |
| Arch Coal Inc. | 5,739 | 117 |
| Energen Corp. | 2,197 | 108 |
| * Tesoro Corp. | 4,369 | 105 |
| Patterson-UTI Energy Inc. | 4,191 | 103 |
| * Cameron International Corp. | 1,952 | 102 |
| * Alpha Natural Resources Inc. | 3,007 | 100 |
| * Newfield Exploration Co. | 1,731 | 88 |
| Tidewater Inc. | 1,487 | 80 |
| Diamond Offshore Drilling Inc. | 1,121 | 72 |
| * Unit Corp. | 1,266 | 60 |
| SEACOR Holdings Inc. | 655 | 58 |
| Pioneer Natural Resources Co. | 667 | 52 |
| * Atwood Oceanics Inc. | 1,222 | 52 |
| Kinder Morgan Inc. | 1,636 | 42 |
| QEP Resources Inc. | 1,148 | 40 |
| Teekay Corp. | 1,260 | 34 |
| * Denbury Resources Inc. | 2,027 | 32 |
| * Quicksilver Resources Inc. | 3,327 | 32 |
| SM Energy Co. | 369 | 28 |
| El Paso Corp. | 1,371 | 26 |
| * Oil States International Inc. | 248 | 16 |
| * Forest Oil Corp. | 739 | 14 |
| * McDermott International Inc. | 885 | 13 |
| Helmerich & Payne Inc. | 210 | 12 |
| EXCO Resources Inc. | 379 | 5 |
| * Cobalt International Energy Inc. | 247 | 2 |
| * Kosmos Energy Ltd. | 159 | 2 |
| * Atlas Energy Inc. Escrow | 362 | — |
| 23,531 | ||
20
| Vanguard® Russell 1000 Value Index Fund | ||
| Schedule of Investments | ||
| August 31, 2011 | ||
| Market | ||
| Value | ||
| Shares | ($000) | |
| Financials (25.7%) | ||
| JPMorgan Chase & Co. | 120,097 | 4,511 |
| * Berkshire Hathaway Inc. Class B | 52,908 | 3,862 |
| Wells Fargo & Co. | 138,255 | 3,608 |
| Citigroup Inc. | 87,828 | 2,727 |
| Bank of America Corp. | 306,247 | 2,502 |
| Goldman Sachs Group Inc. | 15,647 | 1,818 |
| US Bancorp | 58,228 | 1,351 |
| Morgan Stanley | 48,003 | 840 |
| MetLife Inc. | 24,824 | 834 |
| PNC Financial Services Group Inc. | 15,907 | 798 |
| Bank of New York Mellon Corp. | 37,530 | 776 |
| Prudential Financial Inc. | 14,691 | 738 |
| ACE Ltd. | 10,197 | 659 |
| Capital One Financial Corp. | 13,877 | 639 |
| Travelers Cos. Inc. | 12,659 | 639 |
| American Express Co. | 12,543 | 624 |
| Chubb Corp. | 8,842 | 547 |
| CME Group Inc. | 2,026 | 541 |
| State Street Corp. | 15,234 | 541 |
| Aflac Inc. | 14,137 | 533 |
| Annaly Capital Management Inc. | 28,743 | 521 |
| Equity Residential | 8,257 | 505 |
| Marsh & McLennan Cos. Inc. | 16,493 | 490 |
| BB&T Corp. | 21,050 | 469 |
| AON Corp. | 9,991 | 467 |
| HCP Inc. | 12,272 | 458 |
| Vornado Realty Trust | 4,956 | 426 |
| Allstate Corp. | 15,806 | 415 |
| AvalonBay Communities Inc. | 2,849 | 389 |
| Progressive Corp. | 19,819 | 380 |
| ProLogis Inc. | 13,869 | 378 |
| Discover Financial Services | 14,854 | 374 |
| Loews Corp. | 9,577 | 360 |
| American International Group Inc. | 13,359 | 338 |
| Ameriprise Financial Inc. | 7,324 | 335 |
| SunTrust Banks Inc. | 16,227 | 323 |
| Fifth Third Bancorp | 27,725 | 294 |
| M&T Bank Corp. | 3,792 | 288 |
| Health Care REIT Inc. | 5,343 | 272 |
| Hartford Financial Services Group Inc. | 13,458 | 258 |
| Invesco Ltd. | 13,980 | 256 |
| Northern Trust Corp. | 6,562 | 252 |
| Principal Financial Group Inc. | 9,729 | 247 |
| Host Hotels & Resorts Inc. | 20,738 | 245 |
| General Growth Properties Inc. | 17,037 | 232 |
| Unum Group | 9,304 | 219 |
| SLM Corp. | 15,941 | 219 |
| Kimco Realty Corp. | 12,298 | 218 |
| BlackRock Inc. | 1,303 | 215 |
| * CIT Group Inc. | 5,959 | 206 |
| Weyerhaeuser Co. | 11,383 | 205 |
| Lincoln National Corp. | 9,547 | 198 |
| XL Group plc Class A | 9,212 | 192 |
| KeyCorp | 28,344 | 188 |
| Simon Property Group Inc. | 1,596 | 188 |
| Leucadia National Corp. | 5,912 | 175 |
| SL Green Realty Corp. | 2,420 | 175 |
| Regions Financial Corp. | 37,974 | 172 |
| New York Community Bancorp Inc. | 13,081 | 168 |
| UDR Inc. | 6,003 | 160 |
| Ventas Inc. | 2,982 | 159 |
| Comerica Inc. | 6,070 | 155 |
| American Capital Agency Corp. | 5,335 | 152 |
21
| Vanguard® Russell 1000 Value Index Fund | ||
| Schedule of Investments | ||
| August 31, 2011 | ||
| Market | ||
| Value | ||
| Shares | ($000) | |
| NYSE Euronext | 5,419 | 148 |
| Alexandria Real Estate Equities Inc. | 1,861 | 135 |
| * Arch Capital Group Ltd. | 3,973 | 134 |
| Realty Income Corp. | 3,818 | 132 |
| Huntington Bancshares Inc. | 25,999 | 131 |
| Legg Mason Inc. | 4,493 | 128 |
| Macerich Co. | 2,540 | 125 |
| Cincinnati Financial Corp. | 4,419 | 123 |
| Torchmark Corp. | 3,167 | 121 |
| Reinsurance Group of America Inc. Class A | 2,238 | 119 |
| Liberty Property Trust | 3,485 | 118 |
| * Markel Corp. | 296 | 117 |
| PartnerRe Ltd. | 2,044 | 116 |
| Fidelity National Financial Inc. Class A | 6,771 | 115 |
| BRE Properties Inc. | 2,264 | 114 |
| Axis Capital Holdings Ltd. | 3,931 | 113 |
| Regency Centers Corp. | 2,727 | 113 |
| Everest Re Group Ltd. | 1,393 | 112 |
| People's United Financial Inc. | 9,310 | 109 |
| Senior Housing Properties Trust | 4,547 | 108 |
| WR Berkley Corp. | 3,475 | 107 |
| RenaissanceRe Holdings Ltd. | 1,580 | 104 |
| Assurant Inc. | 2,943 | 104 |
| * Genworth Financial Inc. Class A | 14,827 | 102 |
| HCC Insurance Holdings Inc. | 3,472 | 102 |
| First Niagara Financial Group Inc. | 9,265 | 100 |
| Piedmont Office Realty Trust Inc. Class A | 5,266 | 100 |
| Taubman Centers Inc. | 1,707 | 98 |
| Zions Bancorporation | 5,557 | 97 |
| Transatlantic Holdings Inc. | 1,909 | 97 |
| Chimera Investment Corp. | 31,390 | 95 |
| Arthur J Gallagher & Co. | 3,344 | 94 |
| Ares Capital Corp. | 6,201 | 94 |
| * E*Trade Financial Corp. | 7,583 | 94 |
| * American Capital Ltd. | 10,714 | 93 |
| Duke Realty Corp. | 7,649 | 91 |
| Weingarten Realty Investors | 3,671 | 89 |
| Commerce Bancshares Inc. | 2,249 | 89 |
| Raymond James Financial Inc. | 3,109 | 87 |
| Hospitality Properties Trust | 3,712 | 87 |
| White Mountains Insurance Group Ltd. | 209 | 84 |
| Boston Properties Inc. | 795 | 83 |
| Cullen/Frost Bankers Inc. | 1,624 | 83 |
| Mack-Cali Realty Corp. | 2,651 | 83 |
| Developers Diversified Realty Corp. | 6,620 | 82 |
| American Financial Group Inc. | 2,451 | 82 |
| Hudson City Bancorp Inc. | 12,865 | 80 |
| Old Republic International Corp. | 7,940 | 79 |
| * NASDAQ OMX Group Inc. | 3,322 | 79 |
| East West Bancorp Inc. | 4,558 | 76 |
| Assured Guaranty Ltd. | 5,624 | 76 |
| Plum Creek Timber Co. Inc. | 1,975 | 75 |
| Brown & Brown Inc. | 3,569 | 75 |
| Douglas Emmett Inc. | 3,837 | 69 |
| Jefferies Group Inc. | 4,080 | 67 |
| * Popular Inc. | 30,936 | 64 |
| City National Corp. | 1,407 | 63 |
| Essex Property Trust Inc. | 435 | 62 |
| CapitalSource Inc. | 9,767 | 62 |
| Valley National Bancorp | 5,134 | 61 |
| Bank of Hawaii Corp. | 1,442 | 60 |
| Alleghany Corp. | 199 | 59 |
| Allied World Assurance Co. Holdings AG | 1,146 | 59 |
| Associated Banc-Corp | 5,237 | 58 |
22
| Vanguard® Russell 1000 Value Index Fund | ||
| Schedule of Investments | ||
| August 31, 2011 | ||
| Market | ||
| Value | ||
| Shares | ($000) | |
| * First Republic Bank | 2,220 | 57 |
| First Horizon National Corp. | 7,960 | 56 |
| Fulton Financial Corp. | 6,022 | 55 |
| * Forest City Enterprises Inc. Class A | 4,147 | 55 |
| Capitol Federal Financial Inc. | 5,063 | 54 |
| CommonWealth REIT | 2,527 | 52 |
| Validus Holdings Ltd. | 2,010 | 52 |
| Aspen Insurance Holdings Ltd. | 2,139 | 51 |
| Washington Federal Inc. | 3,357 | 50 |
| TCF Financial Corp. | 4,806 | 50 |
| Protective Life Corp. | 2,589 | 49 |
| Hanover Insurance Group Inc. | 1,374 | 49 |
| Endurance Specialty Holdings Ltd. | 1,225 | 44 |
| StanCorp Financial Group Inc. | 1,367 | 42 |
| Federal Realty Investment Trust | 459 | 42 |
| Janus Capital Group Inc. | 5,629 | 41 |
| Brandywine Realty Trust | 4,089 | 41 |
| Camden Property Trust | 592 | 40 |
| Corporate Office Properties Trust | 1,471 | 39 |
| * Affiliated Managers Group Inc. | 450 | 39 |
| Kemper Corp. | 1,511 | 39 |
| BOK Financial Corp. | 773 | 38 |
| * St. Joe Co. | 1,966 | 36 |
| * Howard Hughes Corp. | 649 | 35 |
| * MBIA Inc. | 4,469 | 35 |
| Synovus Financial Corp. | 23,733 | 34 |
| Mercury General Corp. | 809 | 32 |
| Apartment Investment & Management Co. | 1,163 | 31 |
| Public Storage | 247 | 31 |
| First Citizens BancShares Inc. Class A | 164 | 26 |
| BankUnited Inc. | 1,011 | 24 |
| * TFS Financial Corp. | 2,475 | 22 |
| CNA Financial Corp. | 812 | 20 |
| Jones Lang LaSalle Inc. | 292 | 20 |
| Interactive Brokers Group Inc. | 1,171 | 18 |
| American National Insurance Co. | 207 | 16 |
| Federated Investors Inc. Class B | 519 | 9 |
| * LPL Investment Holdings Inc. | 164 | 5 |
| 48,929 | ||
| Health Care (12.6%) | ||
| Pfizer Inc. | 238,795 | 4,532 |
| Johnson & Johnson | 65,946 | 4,339 |
| Merck & Co. Inc. | 93,286 | 3,090 |
| Amgen Inc. | 28,101 | 1,557 |
| UnitedHealth Group Inc. | 32,745 | 1,556 |
| Bristol-Myers Squibb Co. | 51,561 | 1,534 |
| Eli Lilly & Co. | 20,668 | 775 |
| WellPoint Inc. | 11,096 | 702 |
| * Thermo Fisher Scientific Inc. | 11,585 | 636 |
| Aetna Inc. | 11,470 | 459 |
| Humana Inc. | 5,090 | 395 |
| CIGNA Corp. | 8,179 | 382 |
| Covidien plc | 6,982 | 364 |
| * Zimmer Holdings Inc. | 5,802 | 330 |
| * Boston Scientific Corp. | 46,188 | 313 |
| * Forest Laboratories Inc. | 8,649 | 296 |
| Cardinal Health Inc. | 5,298 | 225 |
| * Life Technologies Corp. | 4,933 | 207 |
| * Cephalon Inc. | 2,268 | 183 |
| Medtronic Inc. | 4,386 | 154 |
| Abbott Laboratories | 2,843 | 149 |
| * Coventry Health Care Inc. | 4,449 | 146 |
| * Hologic Inc. | 7,880 | 131 |
| * CareFusion Corp. | 4,645 | 119 |
23
| Vanguard® Russell 1000 Value Index Fund | ||
| Schedule of Investments | ||
| August 31, 2011 | ||
| Market | ||
| Value | ||
| Shares | ($000) | |
| * QIAGEN NV | 7,092 | 110 |
| Omnicare Inc. | 3,528 | 105 |
| Baxter International Inc. | 1,724 | 97 |
| DENTSPLY International Inc. | 2,535 | 89 |
| * Henry Schein Inc. | 1,321 | 87 |
| PerkinElmer Inc. | 3,450 | 79 |
| Cooper Cos. Inc. | 1,036 | 78 |
| * Tenet Healthcare Corp. | 14,176 | 75 |
| Teleflex Inc. | 1,245 | 72 |
| * Health Net Inc. | 2,734 | 68 |
| * Alere Inc. | 2,586 | 65 |
| * Bio-Rad Laboratories Inc. Class A | 599 | 60 |
| * Community Health Systems Inc. | 2,871 | 59 |
| * LifePoint Hospitals Inc. | 1,587 | 58 |
| Patterson Cos. Inc. | 1,878 | 55 |
| * VCA Antech Inc. | 2,611 | 48 |
| * Hospira Inc. | 815 | 38 |
| * Vertex Pharmaceuticals Inc. | 716 | 33 |
| * HCA Holdings Inc. | 1,563 | 31 |
| * Kinetic Concepts Inc. | 414 | 28 |
| * Mylan Inc. | 1,260 | 26 |
| * AMERIGROUP Corp. | 443 | 22 |
| * Allscripts Healthcare Solutions Inc. | 1,127 | 20 |
| Quest Diagnostics Inc. | 386 | 19 |
| * Emdeon Inc. Class A | 911 | 17 |
| * Watson Pharmaceuticals Inc. | 218 | 15 |
| Warner Chilcott plc Class A | 451 | 8 |
| * Brookdale Senior Living Inc. Class A | 383 | 6 |
| Hill-Rom Holdings Inc. | 178 | 6 |
| 24,048 | ||
| Industrials (8.8%) | ||
| General Electric Co. | 320,528 | 5,228 |
| Union Pacific Corp. | 12,409 | 1,144 |
| Norfolk Southern Corp. | 10,675 | 722 |
| FedEx Corp. | 8,987 | 707 |
| General Dynamics Corp. | 10,040 | 643 |
| Tyco International Ltd. | 14,173 | 589 |
| Waste Management Inc. | 14,333 | 474 |
| Raytheon Co. | 10,765 | 465 |
| Northrop Grumman Corp. | 8,377 | 458 |
| Stanley Black & Decker Inc. | 5,081 | 315 |
| Republic Services Inc. Class A | 9,697 | 294 |
| Eaton Corp. | 6,405 | 275 |
| ITT Corp. | 5,566 | 263 |
| L-3 Communications Holdings Inc. | 3,209 | 218 |
| Parker Hannifin Corp. | 2,835 | 208 |
| 3M Co. | 2,468 | 205 |
| Goodrich Corp. | 2,195 | 196 |
| Southwest Airlines Co. | 19,717 | 170 |
| Boeing Co. | 2,505 | 167 |
| * Jacobs Engineering Group Inc. | 3,814 | 142 |
| Textron Inc. | 7,876 | 133 |
| KBR Inc. | 4,286 | 129 |
| * Quanta Services Inc. | 6,526 | 125 |
| * AGCO Corp. | 2,876 | 123 |
| Cintas Corp. | 3,628 | 116 |
| Equifax Inc. | 3,533 | 114 |
| Pitney Bowes Inc. | 5,557 | 113 |
| United Technologies Corp. | 1,501 | 111 |
| * Owens Corning | 3,797 | 110 |
| Hubbell Inc. Class B | 1,836 | 109 |
| Pentair Inc. | 3,003 | 103 |
| Manpower Inc. | 2,485 | 100 |
| Avery Dennison Corp. | 3,030 | 88 |
24
| Vanguard® Russell 1000 Value Index Fund | ||
| Schedule of Investments | ||
| August 31, 2011 | ||
| Market | ||
| Value | ||
| Shares | ($000) | |
| RR Donnelley & Sons Co. | 5,660 | 86 |
| * URS Corp. | 2,400 | 84 |
| Cooper Industries plc | 1,746 | 83 |
| Lockheed Martin Corp. | 1,107 | 82 |
| Towers Watson & Co. Class A | 1,389 | 82 |
| Kennametal Inc. | 2,212 | 82 |
| * Delta Air Lines Inc. | 10,357 | 78 |
| Snap-on Inc. | 1,464 | 77 |
| * Corrections Corp. of America | 3,296 | 75 |
| Ryder System Inc. | 1,584 | 75 |
| Dover Corp. | 1,277 | 73 |
| Ingersoll-Rand plc | 2,072 | 69 |
| Regal-Beloit Corp. | 1,168 | 69 |
| Carlisle Cos. Inc. | 1,698 | 67 |
| Trinity Industries Inc. | 2,414 | 67 |
| SPX Corp. | 1,118 | 64 |
| Crane Co. | 1,472 | 62 |
| Alliant Techsystems Inc. | 947 | 60 |
| * GrafTech International Ltd. | 3,668 | 58 |
| Covanta Holding Corp. | 3,425 | 56 |
| * Oshkosh Corp. | 2,753 | 54 |
| * Terex Corp. | 3,312 | 53 |
| Alexander & Baldwin Inc. | 1,256 | 53 |
| * Thomas & Betts Corp. | 1,200 | 52 |
| Harsco Corp. | 2,224 | 51 |
| * Shaw Group Inc. | 2,181 | 51 |
| GATX Corp. | 1,401 | 51 |
| * Spirit Aerosystems Holdings Inc. Class A | 2,813 | 47 |
| Chicago Bridge & Iron Co. NV | 1,273 | 46 |
| * Aecom Technology Corp. | 1,988 | 45 |
| * Kansas City Southern | 828 | 45 |
| * Huntington Ingalls Industries Inc. | 1,473 | 44 |
| * Navistar International Corp. | 1,002 | 41 |
| Illinois Tool Works Inc. | 888 | 41 |
| Con-way Inc. | 1,517 | 39 |
| Lincoln Electric Holdings Inc. | 983 | 33 |
| * WESCO International Inc. | 687 | 30 |
| * United Continental Holdings Inc. | 1,494 | 28 |
| * CNH Global NV | 801 | 27 |
| * Kirby Corp. | 471 | 26 |
| * Air Lease Corp. | 1,050 | 24 |
| Armstrong World Industries Inc. | 573 | 23 |
| * General Cable Corp. | 757 | 23 |
| * Verisk Analytics Inc. Class A | 590 | 21 |
| * AMR Corp. | 5,313 | 19 |
| Timken Co. | 421 | 17 |
| Waste Connections Inc. | 425 | 15 |
| Copa Holdings SA Class A | 212 | 15 |
| Flowserve Corp. | 152 | 14 |
| * KAR Auction Services Inc. | 698 | 10 |
| * Nielsen Holdings NV | 338 | 10 |
| IDEX Corp. | 259 | 10 |
| * BE Aerospace Inc. | 162 | 6 |
| UTi Worldwide Inc. | 301 | 4 |
| 16,874 | ||
| Information Technology (8.5%) | ||
| Intel Corp. | 160,242 | 3,226 |
| Cisco Systems Inc. | 166,232 | 2,607 |
| Hewlett-Packard Co. | 65,400 | 1,702 |
| Visa Inc. Class A | 10,700 | 940 |
| Corning Inc. | 47,448 | 713 |
| * Yahoo! Inc. | 39,378 | 536 |
| * eBay Inc. | 15,815 | 488 |
| Applied Materials Inc. | 37,332 | 423 |
25
| Vanguard® Russell 1000 Value Index Fund | ||
| Schedule of Investments | ||
| August 31, 2011 | ||
| Market | ||
| Value | ||
| Shares | ($000) | |
| * Motorola Solutions Inc. | 9,093 | 383 |
| Xerox Corp. | 42,167 | 350 |
| Texas Instruments Inc. | 12,810 | 336 |
| * Motorola Mobility Holdings Inc. | 7,882 | 297 |
| * SanDisk Corp. | 7,204 | 264 |
| CA Inc. | 11,594 | 243 |
| Fidelity National Information Services Inc. | 7,930 | 224 |
| * Western Digital Corp. | 6,913 | 204 |
| * Marvell Technology Group Ltd. | 15,070 | 198 |
| * Dell Inc. | 12,856 | 191 |
| * Micron Technology Inc. | 26,212 | 155 |
| * Amdocs Ltd. | 5,583 | 153 |
| Activision Blizzard Inc. | 12,690 | 150 |
| Computer Sciences Corp. | 4,688 | 144 |
| * Avnet Inc. | 4,615 | 121 |
| Harris Corp. | 2,825 | 114 |
| * Synopsys Inc. | 4,152 | 107 |
| * Cree Inc. | 3,156 | 102 |
| * Arrow Electronics Inc. | 3,002 | 94 |
| * IAC/InterActiveCorp | 2,295 | 91 |
| Molex Inc. | 4,114 | 90 |
| Total System Services Inc. | 4,920 | 89 |
| * SAIC Inc. | 5,943 | 89 |
| * Ingram Micro Inc. | 4,900 | 87 |
| * LSI Corp. | 12,066 | 82 |
| * Lexmark International Inc. Class A | 2,428 | 78 |
| * Teradyne Inc. | 5,729 | 69 |
| * Tech Data Corp. | 1,443 | 68 |
| * Novellus Systems Inc. | 2,087 | 58 |
| Diebold Inc. | 1,973 | 57 |
| * Brocade Communications Systems Inc. | 14,279 | 55 |
| * Fairchild Semiconductor International Inc. Class A | 3,857 | 51 |
| * AOL Inc. | 3,231 | 50 |
| * Vishay Intertechnology Inc. | 4,358 | 50 |
| * Itron Inc. | 1,227 | 49 |
| * Fiserv Inc. | 864 | 48 |
| * International Rectifier Corp. | 2,107 | 48 |
| Tellabs Inc. | 10,980 | 45 |
| DST Systems Inc. | 905 | 42 |
| KLA-Tencor Corp. | 1,152 | 42 |
| * PMC - Sierra Inc. | 6,651 | 41 |
| * Monster Worldwide Inc. | 3,909 | 37 |
| * CoreLogic Inc. | 2,931 | 34 |
| * EchoStar Corp. Class A | 1,154 | 28 |
| * SunPower Corp. Class B | 2,325 | 28 |
| Intersil Corp. Class A | 1,905 | 21 |
| Paychex Inc. | 770 | 21 |
| * MEMC Electronic Materials Inc. | 2,797 | 20 |
| AVX Corp. | 1,454 | 19 |
| * NCR Corp. | 1,034 | 18 |
| Jabil Circuit Inc. | 1,030 | 17 |
| * Compuware Corp. | 1,760 | 15 |
| * Genpact Ltd. | 857 | 14 |
| * Akamai Technologies Inc. | 508 | 11 |
| National Semiconductor Corp. | 433 | 11 |
| * SunPower Corp. Class A | 668 | 9 |
| * QLogic Corp. | 583 | 8 |
| * Atmel Corp. | 885 | 8 |
| * Booz Allen Hamilton Holding Corp. | 370 | 6 |
| * Freescale Semiconductor Holdings I Ltd. | 495 | 6 |
| * Silicon Laboratories Inc. | 138 | 5 |
| Broadridge Financial Solutions Inc. | 208 | 4 |
| 16,184 | ||
26
| Vanguard® Russell 1000 Value Index Fund | ||
| Schedule of Investments | ||
| August 31, 2011 | ||
| Market | ||
| Value | ||
| Shares | ($000) | |
| Materials (2.8%) | ||
| Dow Chemical Co. | 35,530 | 1,011 |
| Newmont Mining Corp. | 14,701 | 921 |
| Alcoa Inc. | 32,149 | 412 |
| Nucor Corp. | 9,553 | 345 |
| LyondellBasell Industries NV Class A | 8,822 | 306 |
| International Paper Co. | 10,413 | 283 |
| MeadWestvaco Corp. | 5,102 | 140 |
| Vulcan Materials Co. | 3,882 | 136 |
| United States Steel Corp. | 4,346 | 131 |
| Ashland Inc. | 2,391 | 127 |
| Aptargroup Inc. | 2,049 | 103 |
| Bemis Co. Inc. | 3,217 | 100 |
| Domtar Corp. | 1,242 | 100 |
| Sonoco Products Co. | 3,021 | 95 |
| * Owens-Illinois Inc. | 4,957 | 94 |
| Sealed Air Corp. | 4,858 | 89 |
| RPM International Inc. | 3,982 | 83 |
| Valspar Corp. | 2,554 | 82 |
| Reliance Steel & Aluminum Co. | 1,959 | 81 |
| Cytec Industries Inc. | 1,524 | 69 |
| Cabot Corp. | 1,981 | 68 |
| CF Industries Holdings Inc. | 356 | 65 |
| Greif Inc. Class A | 1,155 | 64 |
| Huntsman Corp. | 4,694 | 62 |
| Temple-Inland Inc. | 2,422 | 59 |
| Martin Marietta Materials Inc. | 732 | 52 |
| Commercial Metals Co. | 3,490 | 41 |
| AK Steel Holding Corp. | 2,662 | 24 |
| Steel Dynamics Inc. | 1,781 | 23 |
| Westlake Chemical Corp. | 476 | 22 |
| Schnitzer Steel Industries Inc. | 476 | 22 |
| Titanium Metals Corp. | 1,195 | 19 |
| Nalco Holding Co. | 511 | 19 |
| Scotts Miracle-Gro Co. Class A | 185 | 9 |
| * WR Grace & Co. | 222 | 9 |
| Packaging Corp. of America | 296 | 7 |
| * Rockwood Holdings Inc. | 106 | 5 |
| 5,278 | ||
| Telecommunication Services (4.7%) | ||
| AT&T Inc. | 178,981 | 5,097 |
| Verizon Communications Inc. | 66,179 | 2,394 |
| CenturyLink Inc. | 18,488 | 668 |
| * Sprint Nextel Corp. | 90,420 | 340 |
| Frontier Communications Corp. | 30,080 | 225 |
| * Level 3 Communications Inc. | 52,193 | 94 |
| Windstream Corp. | 6,901 | 88 |
| Telephone & Data Systems Inc. | 2,789 | 71 |
| * NII Holdings Inc. | 643 | 25 |
| * United States Cellular Corp. | 438 | 19 |
| * tw telecom inc Class A | 660 | 13 |
| * Clearwire Corp. Class A | 741 | 2 |
| 9,036 | ||
| Utilities (7.5%) | ||
| Southern Co. | 25,664 | 1,061 |
| Exelon Corp. | 20,021 | 863 |
| Dominion Resources Inc. | 17,402 | 848 |
| Duke Energy Corp. | 40,237 | 761 |
| NextEra Energy Inc. | 12,753 | 723 |
| American Electric Power Co. Inc. | 14,562 | 563 |
| FirstEnergy Corp. | 12,641 | 559 |
| Public Service Enterprise Group Inc. | 15,290 | 522 |
| PG&E Corp. | 12,027 | 509 |
| PPL Corp. | 17,444 | 504 |
27
| Vanguard® Russell 1000 Value Index Fund | |||||
| Schedule of Investments | |||||
| August 31, 2011 | |||||
| Market | |||||
| Value | |||||
| Shares | ($000) | ||||
| Consolidated Edison Inc. | 8,843 | 497 | |||
| Progress Energy Inc. | 8,901 | 434 | |||
| Sempra Energy | 7,238 | 380 | |||
| Edison International | 9,848 | 366 | |||
| Xcel Energy Inc. | 14,635 | 361 | |||
| Entergy Corp. | 5,379 | 351 | |||
| DTE Energy Co. | 5,119 | 259 | |||
| CenterPoint Energy Inc. | 12,859 | 257 | |||
| Wisconsin Energy Corp. | 7,065 | 224 | |||
| Ameren Corp. | 7,289 | 221 | |||
| Constellation Energy Group Inc. | 5,631 | 217 | |||
| * | AES Corp. | 19,854 | 216 | ||
| Oneok Inc. | 2,941 | 209 | |||
| Northeast Utilities | 5,265 | 183 | |||
| NiSource Inc. | 8,332 | 178 | |||
| * | NRG Energy Inc. | 7,219 | 169 | ||
| American Water Works Co. Inc. | 5,249 | 156 | |||
| * | Calpine Corp. | 10,514 | 155 | ||
| CMS Energy Corp. | 7,556 | 149 | |||
| OGE Energy Corp. | 2,935 | 147 | |||
| Pinnacle West Capital Corp. | 3,270 | 145 | |||
| NSTAR | 3,109 | 142 | |||
| SCANA Corp. | 3,459 | 139 | |||
| Alliant Energy Corp. | 3,336 | 135 | |||
| Pepco Holdings Inc. | 6,793 | 132 | |||
| National Fuel Gas Co. | 2,131 | 131 | |||
| MDU Resources Group Inc. | 5,705 | 122 | |||
| TECO Energy Inc. | 6,497 | 119 | |||
| Integrys Energy Group Inc. | 2,367 | 119 | |||
| NV Energy Inc. | 7,167 | 107 | |||
| DPL Inc. | 3,549 | 106 | |||
| UGI Corp. | 3,405 | 101 | |||
| Questar Corp. | 5,407 | 101 | |||
| AGL Resources Inc. | 2,367 | 98 | |||
| Westar Energy Inc. | 3,444 | 92 | |||
| Atmos Energy Corp. | 2,733 | 92 | |||
| Aqua America Inc. | 3,775 | 83 | |||
| Great Plains Energy Inc. | 4,149 | 81 | |||
| * | GenOn Energy Inc. | 23,786 | 72 | ||
| Hawaiian Electric Industries Inc. | 2,934 | 71 | |||
| Vectren Corp. | 2,521 | 69 | |||
| 14,299 | |||||
| Total Common Stocks (Cost $199,281) | 189,830 | ||||
| Coupon | |||||
| Temporary Cash Investments (0.2%)1 | |||||
| Money Market Fund (0.1%) | |||||
| 2 | Vanguard Market Liquidity Fund | 0.132% | 300,000 | 300 | |
| Face | |||||
| Maturity | Amount | ||||
| Date | ($000) | ||||
| U.S. Government and Agency Obligations (0.1%) | |||||
| 3,4 | Federal Home Loan Bank Discount Notes | 0.070% | 9/16/11 | 100 | 100 |
| Total Temporary Cash Investments (Cost $401) | 400 | ||||
28
| Vanguard® Russell 1000 Value Index Fund | |
| Schedule of Investments | |
| August 31, 2011 | |
| Market | |
| Value | |
| ($000) | |
| Total Investments (99.7%) (Cost $199,682) | 190,230 |
| Other Assets and Liabilities—Net (0.3%) | 543 |
| Net Assets (100%) | 190,773 |
* Non-income-producing security.
1 The fund invests a portion of its cash reserves in equity markets through the use of index futures contracts. After giving effect to futures investments, the fund's effective common stock and temporary cash investment positions represent 100.0% and -0.3%, respectively, of net assets.
2 Affiliated money market fund available only to Vanguard funds and certain trusts and accounts managed by Vanguard. Rate shown is the 7-day yield.
3 The issuer operates under a congressional charter; its securities are not backed by the full faith and credit of the U.S. government.
4 Securities with a value of $100,000 have been segregated as initial margin for open futures contracts.
REIT—Real Estate Investment Trust.
29
| Vanguard® Russell 1000 Growth Index Fund | ||
| Schedule of Investments | ||
| August 31, 2011 | ||
| Market | ||
| Value | ||
| Shares | ($000) | |
| Common Stocks (99.9%)1 | ||
| Consumer Discretionary (14.3%) | ||
| McDonald's Corp. | 33,577 | 3,037 |
| * Amazon.com Inc. | 11,762 | 2,532 |
| * DIRECTV Class A | 24,847 | 1,093 |
| Home Depot Inc. | 31,184 | 1,041 |
| NIKE Inc. Class B | 11,554 | 1,001 |
| Starbucks Corp. | 24,258 | 937 |
| Viacom Inc. Class B | 18,935 | 913 |
| * priceline.com Inc. | 1,606 | 863 |
| Comcast Corp. Class A | 38,913 | 837 |
| Yum! Brands Inc. | 15,066 | 819 |
| * Ford Motor Co. | 67,645 | 752 |
| Time Warner Cable Inc. | 10,887 | 713 |
| TJX Cos. Inc. | 12,495 | 682 |
| * Las Vegas Sands Corp. | 12,692 | 591 |
| Coach Inc. | 9,502 | 534 |
| * Bed Bath & Beyond Inc. | 8,063 | 458 |
| * Netflix Inc. | 1,699 | 399 |
| Wynn Resorts Ltd. | 2,564 | 397 |
| * Discovery Communications Inc. Class A | 9,014 | 381 |
| Omnicom Group Inc. | 9,097 | 369 |
| Kohl's Corp. | 7,951 | 368 |
| * Liberty Global Inc. Class A | 8,972 | 362 |
| McGraw-Hill Cos. Inc. | 8,115 | 342 |
| Limited Brands Inc. | 8,615 | 325 |
| * Chipotle Mexican Grill Inc. Class A | 1,007 | 316 |
| Tiffany & Co. | 4,133 | 297 |
| Harley-Davidson Inc. | 7,646 | 296 |
| Ross Stores Inc. | 3,802 | 291 |
| * O'Reilly Automotive Inc. | 4,461 | 289 |
| * Dollar Tree Inc. | 3,957 | 283 |
| Starwood Hotels & Resorts Worldwide Inc. | 6,313 | 281 |
| Ralph Lauren Corp. Class A | 2,032 | 279 |
| * AutoZone Inc. | 862 | 265 |
| Marriott International Inc. Class A | 9,001 | 264 |
| Virgin Media Inc. | 10,267 | 260 |
| * BorgWarner Inc. | 3,544 | 253 |
| Nordstrom Inc. | 5,277 | 240 |
| * Sirius XM Radio Inc. | 127,707 | 230 |
| Mattel Inc. | 8,356 | 225 |
| Darden Restaurants Inc. | 4,415 | 212 |
| Family Dollar Stores Inc. | 3,958 | 211 |
| * Apollo Group Inc. Class A | 3,904 | 183 |
| Thomson Reuters Corp. | 5,745 | 178 |
| Johnson Controls Inc. | 5,554 | 177 |
| * Fossil Inc. | 1,693 | 164 |
| Abercrombie & Fitch Co. | 2,443 | 155 |
| PetSmart Inc. | 3,670 | 155 |
| Hasbro Inc. | 3,941 | 153 |
| Advance Auto Parts Inc. | 2,386 | 145 |
| Tractor Supply Co. | 2,338 | 144 |
| Tupperware Brands Corp. | 2,020 | 134 |
| Scripps Networks Interactive Inc. Class A | 3,031 | 130 |
| * Tempur-Pedic International Inc. | 2,216 | 129 |
| Cablevision Systems Corp. Class A | 7,029 | 127 |
| * DISH Network Corp. Class A | 4,864 | 121 |
| * LKQ Corp. | 4,721 | 121 |
| Gentex Corp. | 4,619 | 120 |
| * Dollar General Corp. | 3,206 | 117 |
| Polaris Industries Inc. | 1,048 | 115 |
| Expedia Inc. | 3,681 | 112 |
| * Deckers Outdoor Corp. | 1,252 | 111 |
30
| Vanguard® Russell 1000 Growth Index Fund | ||
| Schedule of Investments | ||
| August 31, 2011 | ||
| Market | ||
| Value | ||
| Shares | ($000) | |
| * Panera Bread Co. Class A | 939 | 108 |
| * Dick's Sporting Goods Inc. | 3,048 | 107 |
| * Urban Outfitters Inc. | 3,892 | 102 |
| * Goodyear Tire & Rubber Co. | 7,912 | 99 |
| * Charter Communications Inc. Class A | 1,881 | 94 |
| * Hanesbrands Inc. | 3,148 | 90 |
| H&R Block Inc. | 5,862 | 89 |
| * Ulta Salon Cosmetics & Fragrance Inc. | 1,480 | 87 |
| CBS Corp. Class B | 3,395 | 85 |
| * Under Armour Inc. Class A | 1,191 | 84 |
| DeVry Inc. | 1,833 | 81 |
| Leggett & Platt Inc. | 3,532 | 78 |
| Genuine Parts Co. | 1,411 | 78 |
| International Game Technology | 5,067 | 77 |
| John Wiley & Sons Inc. Class A | 1,537 | 75 |
| Guess? Inc. | 2,142 | 73 |
| * ITT Educational Services Inc. | 931 | 67 |
| * AMC Networks Inc. Class A | 1,810 | 67 |
| Royal Caribbean Cruises Ltd. | 2,520 | 65 |
| Target Corp. | 1,183 | 61 |
| Williams-Sonoma Inc. | 1,831 | 61 |
| Weight Watchers International Inc. | 973 | 59 |
| Brinker International Inc. | 2,531 | 57 |
| Harman International Industries Inc. | 1,423 | 52 |
| Chico's FAS Inc. | 3,636 | 51 |
| Interpublic Group of Cos. Inc. | 5,674 | 49 |
| Aaron's Inc. | 1,801 | 48 |
| * Sally Beauty Holdings Inc. | 2,739 | 46 |
| Morningstar Inc. | 754 | 45 |
| Macy's Inc. | 1,659 | 43 |
| * Tesla Motors Inc. | 1,659 | 41 |
| * Bally Technologies Inc. | 1,260 | 40 |
| * CarMax Inc. | 1,232 | 35 |
| * DSW Inc. Class A | 672 | 31 |
| * Big Lots Inc. | 878 | 30 |
| * MGM Resorts International | 2,646 | 29 |
| * AutoNation Inc. | 698 | 28 |
| PVH Corp. | 256 | 17 |
| * Lamar Advertising Co. Class A | 555 | 12 |
| Regal Entertainment Group Class A | 789 | 10 |
| Garmin Ltd. | 282 | 9 |
| * Visteon Corp. | 60 | 3 |
| * Dunkin' Brands Group Inc. | 70 | 2 |
| * Hyatt Hotels Corp. Class A | 48 | 2 |
| Choice Hotels International Inc. | 32 | 1 |
| 29,497 | ||
| Consumer Staples (12.5%) | ||
| Coca-Cola Co. | 63,934 | 4,504 |
| Philip Morris International Inc. | 52,084 | 3,611 |
| PepsiCo Inc. | 51,153 | 3,296 |
| Wal-Mart Stores Inc. | 43,644 | 2,322 |
| Altria Group Inc. | 50,538 | 1,374 |
| Colgate-Palmolive Co. | 14,271 | 1,284 |
| Costco Wholesale Corp. | 14,137 | 1,110 |
| Walgreen Co. | 27,967 | 985 |
| Kimberly-Clark Corp. | 11,137 | 770 |
| General Mills Inc. | 15,578 | 591 |
| Sysco Corp. | 18,882 | 527 |
| * Green Mountain Coffee Roasters Inc. | 3,976 | 417 |
| Kellogg Co. | 7,444 | 404 |
| Procter & Gamble Co. | 6,052 | 385 |
| Estee Lauder Cos. Inc. Class A | 3,651 | 357 |
| Kroger Co. | 14,700 | 346 |
31
| Vanguard® Russell 1000 Growth Index Fund | ||
| Schedule of Investments | ||
| August 31, 2011 | ||
| Market | ||
| Value | ||
| Shares | ($000) | |
| Whole Foods Market Inc. | 5,004 | 330 |
| HJ Heinz Co. | 6,082 | 320 |
| Avon Products Inc. | 13,924 | 314 |
| Sara Lee Corp. | 15,716 | 284 |
| Dr Pepper Snapple Group Inc. | 7,164 | 276 |
| Coca-Cola Enterprises Inc. | 8,056 | 223 |
| Herbalife Ltd. | 3,858 | 215 |
| Hershey Co. | 3,669 | 215 |
| Brown-Forman Corp. Class B | 2,829 | 203 |
| * Hansen Natural Corp. | 2,265 | 193 |
| McCormick & Co. Inc. | 2,933 | 140 |
| Campbell Soup Co. | 4,346 | 139 |
| Reynolds American Inc. | 3,308 | 124 |
| Church & Dwight Co. Inc. | 2,679 | 117 |
| Corn Products International Inc. | 2,001 | 94 |
| Mead Johnson Nutrition Co. | 1,221 | 87 |
| Bunge Ltd. | 1,241 | 80 |
| Flowers Foods Inc. | 3,697 | 70 |
| Hormel Foods Corp. | 2,421 | 67 |
| ConAgra Foods Inc. | 1,627 | 40 |
| Clorox Co. | 232 | 16 |
| * BJ's Wholesale Club Inc. | 184 | 9 |
| 25,839 | ||
| Energy (11.1%) | ||
| Exxon Mobil Corp. | 117,649 | 8,711 |
| Schlumberger Ltd. | 43,912 | 3,430 |
| Halliburton Co. | 29,612 | 1,314 |
| EOG Resources Inc. | 8,687 | 804 |
| Occidental Petroleum Corp. | 7,576 | 657 |
| El Paso Corp. | 23,417 | 448 |
| Peabody Energy Corp. | 8,762 | 427 |
| * Southwestern Energy Co. | 11,258 | 427 |
| Apache Corp. | 3,574 | 368 |
| Chevron Corp. | 3,708 | 367 |
| * FMC Technologies Inc. | 7,777 | 346 |
| Baker Hughes Inc. | 5,598 | 342 |
| Range Resources Corp. | 5,200 | 337 |
| Consol Energy Inc. | 7,335 | 335 |
| * Cameron International Corp. | 5,844 | 304 |
| * Concho Resources Inc. | 3,346 | 291 |
| Cabot Oil & Gas Corp. | 3,381 | 256 |
| Pioneer Natural Resources Co. | 3,064 | 239 |
| HollyFrontier Corp. | 3,088 | 222 |
| Anadarko Petroleum Corp. | 2,447 | 180 |
| * Whiting Petroleum Corp. | 3,798 | 179 |
| * Denbury Resources Inc. | 10,832 | 173 |
| * Ultra Petroleum Corp. | 4,948 | 166 |
| Core Laboratories NV | 1,476 | 165 |
| Helmerich & Payne Inc. | 2,859 | 163 |
| QEP Resources Inc. | 4,490 | 158 |
| Oceaneering International Inc. | 3,513 | 150 |
| * Alpha Natural Resources Inc. | 4,113 | 136 |
| * Newfield Exploration Co. | 2,511 | 128 |
| SM Energy Co. | 1,663 | 127 |
| * Brigham Exploration Co. | 3,789 | 110 |
| * Dresser-Rand Group Inc. | 2,582 | 110 |
| EQT Corp. | 1,707 | 102 |
| Noble Energy Inc. | 1,149 | 101 |
| CARBO Ceramics Inc. | 622 | 100 |
| Kinder Morgan Inc. | 3,780 | 98 |
| * SandRidge Energy Inc. | 13,297 | 98 |
| * McDermott International Inc. | 6,674 | 96 |
| * Oil States International Inc. | 1,403 | 93 |
| * Superior Energy Services Inc. | 2,596 | 92 |
32
| Vanguard® Russell 1000 Growth Index Fund | ||
| Schedule of Investments | ||
| August 31, 2011 | ||
| Market | ||
| Value | ||
| Shares | ($000) | |
| * Continental Resources Inc. | 1,379 | 77 |
| Diamond Offshore Drilling Inc. | 1,078 | 69 |
| EXCO Resources Inc. | 4,586 | 61 |
| * Forest Oil Corp. | 2,888 | 56 |
| Cimarex Energy Co. | 700 | 50 |
| Murphy Oil Corp. | 913 | 49 |
| RPC Inc. | 1,421 | 37 |
| * Cobalt International Energy Inc. | 3,503 | 34 |
| * Rowan Cos. Inc. | 740 | 27 |
| * Atwood Oceanics Inc. | 525 | 22 |
| Arch Coal Inc. | 743 | 15 |
| * Kosmos Energy Ltd. | 914 | 13 |
| Patterson-UTI Energy Inc. | 513 | 12 |
| Tidewater Inc. | 70 | 4 |
| * Quicksilver Resources Inc. | 126 | 1 |
| * Atlas Energy Inc. Escrow | 467 | — |
| 22,877 | ||
| Financials (3.9%) | ||
| American Express Co. | 20,571 | 1,023 |
| Simon Property Group Inc. | 7,756 | 911 |
| Franklin Resources Inc. | 4,688 | 562 |
| Public Storage | 4,281 | 530 |
| T Rowe Price Group Inc. | 8,406 | 450 |
| Boston Properties Inc. | 3,868 | 403 |
| Charles Schwab Corp. | 32,491 | 401 |
| Wells Fargo & Co. | 11,142 | 291 |
| * IntercontinentalExchange Inc. | 2,379 | 281 |
| Ventas Inc. | 4,980 | 266 |
| BlackRock Inc. | 1,371 | 226 |
| Moody's Corp. | 6,450 | 199 |
| Digital Realty Trust Inc. | 3,079 | 184 |
| Rayonier Inc. | 3,938 | 165 |
| * CB Richard Ellis Group Inc. Class A | 9,453 | 143 |
| Federal Realty Investment Trust | 1,522 | 138 |
| * MSCI Inc. Class A | 3,888 | 134 |
| Plum Creek Timber Co. Inc. | 3,160 | 120 |
| Camden Property Trust | 1,638 | 109 |
| TD Ameritrade Holding Corp. | 7,083 | 109 |
| * Affiliated Managers Group Inc. | 1,203 | 105 |
| Lazard Ltd. Class A | 3,589 | 105 |
| Eaton Vance Corp. | 3,859 | 94 |
| Weyerhaeuser Co. | 5,085 | 92 |
| Waddell & Reed Financial Inc. Class A | 2,817 | 88 |
| Essex Property Trust Inc. | 595 | 85 |
| SEI Investments Co. | 4,773 | 82 |
| Macerich Co. | 1,546 | 76 |
| Jones Lang LaSalle Inc. | 1,100 | 74 |
| NYSE Euronext | 2,665 | 73 |
| Apartment Investment & Management Co. | 2,684 | 71 |
| Erie Indemnity Co. Class A | 918 | 67 |
| Vornado Realty Trust | 627 | 54 |
| CBOE Holdings Inc. | 1,667 | 42 |
| Discover Financial Services | 1,669 | 42 |
| Equity Residential | 678 | 41 |
| Federated Investors Inc. Class B | 2,301 | 41 |
| Greenhill & Co. Inc. | 968 | 34 |
| * LPL Investment Holdings Inc. | 992 | 29 |
| People's United Financial Inc. | 2,430 | 29 |
| * Green Dot Corp. Class A | 716 | 23 |
| Corporate Office Properties Trust | 633 | 17 |
| UDR Inc. | 507 | 13 |
| * NASDAQ OMX Group Inc. | 527 | 12 |
| Validus Holdings Ltd. | 425 | 11 |
33
| Vanguard® Russell 1000 Growth Index Fund | ||
| Schedule of Investments | ||
| August 31, 2011 | ||
| Market | ||
| Value | ||
| Shares | ($000) | |
| Hudson City Bancorp Inc. | 1,384 | 9 |
| 8,054 | ||
| Health Care (10.8%) | ||
| Abbott Laboratories | 47,231 | 2,480 |
| Johnson & Johnson | 18,096 | 1,191 |
| Medtronic Inc. | 29,887 | 1,048 |
| * Gilead Sciences Inc. | 25,470 | 1,016 |
| Baxter International Inc. | 16,612 | 930 |
| * Celgene Corp. | 14,977 | 891 |
| Allergan Inc. | 9,863 | 807 |
| * Express Scripts Inc. | 15,801 | 742 |
| * Biogen Idec Inc. | 7,820 | 737 |
| * Medco Health Solutions Inc. | 12,938 | 700 |
| McKesson Corp. | 8,160 | 652 |
| Becton Dickinson and Co. | 7,079 | 576 |
| Stryker Corp. | 10,146 | 496 |
| * Intuitive Surgical Inc. | 1,272 | 485 |
| St. Jude Medical Inc. | 10,642 | 485 |
| Covidien plc | 8,567 | 447 |
| * Agilent Technologies Inc. | 11,262 | 415 |
| Eli Lilly & Co. | 10,950 | 411 |
| AmerisourceBergen Corp. Class A | 8,865 | 351 |
| * Alexion Pharmaceuticals Inc. | 5,949 | 345 |
| * Cerner Corp. | 4,600 | 303 |
| * Edwards Lifesciences Corp. | 3,711 | 280 |
| * Laboratory Corp. of America Holdings | 3,243 | 271 |
| * Mylan Inc. | 12,864 | 267 |
| * Vertex Pharmaceuticals Inc. | 5,899 | 267 |
| CR Bard Inc. | 2,772 | 264 |
| * Watson Pharmaceuticals Inc. | 3,859 | 259 |
| Perrigo Co. | 2,686 | 254 |
| Cardinal Health Inc. | 5,673 | 241 |
| * Waters Corp. | 2,965 | 237 |
| Quest Diagnostics Inc. | 4,674 | 234 |
| * DaVita Inc. | 3,090 | 227 |
| * Varian Medical Systems Inc. | 3,792 | 216 |
| * Hospira Inc. | 4,555 | 210 |
| * Illumina Inc. | 3,985 | 208 |
| * Mettler-Toledo International Inc. | 1,040 | 166 |
| * Pharmasset Inc. | 1,203 | 158 |
| * ResMed Inc. | 4,949 | 153 |
| * IDEXX Laboratories Inc. | 1,856 | 148 |
| * Regeneron Pharmaceuticals Inc. | 2,359 | 139 |
| Universal Health Services Inc. Class B | 2,924 | 122 |
| * Endo Pharmaceuticals Holdings Inc. | 3,772 | 120 |
| * Kinetic Concepts Inc. | 1,623 | 110 |
| * SXC Health Solutions Corp. | 2,003 | 110 |
| * BioMarin Pharmaceutical Inc. | 3,590 | 106 |
| * Henry Schein Inc. | 1,580 | 104 |
| Pharmaceutical Product Development Inc. | 3,237 | 102 |
| * Mednax Inc. | 1,558 | 102 |
| * Covance Inc. | 1,963 | 97 |
| * Gen-Probe Inc. | 1,559 | 93 |
| * Allscripts Healthcare Solutions Inc. | 4,991 | 90 |
| Techne Corp. | 1,210 | 88 |
| Warner Chilcott plc Class A | 5,046 | 86 |
| * Sirona Dental Systems Inc. | 1,825 | 85 |
| * Human Genome Sciences Inc. | 6,211 | 80 |
| * Catalyst Health Solutions Inc. | 1,401 | 75 |
| * United Therapeutics Corp. | 1,711 | 74 |
| * Health Management Associates Inc. Class A | 8,441 | 69 |
| Lincare Holdings Inc. | 3,145 | 68 |
| DENTSPLY International Inc. | 1,907 | 67 |
| * Thoratec Corp. | 1,913 | 66 |
34
| Vanguard® Russell 1000 Growth Index Fund | ||
| Schedule of Investments | ||
| August 31, 2011 | ||
| Market | ||
| Value | ||
| Shares | ($000) | |
| * Dendreon Corp. | 4,891 | 60 |
| * Charles River Laboratories International Inc. | 1,734 | 57 |
| Hill-Rom Holdings Inc. | 1,853 | 56 |
| * CareFusion Corp. | 2,168 | 55 |
| * Myriad Genetics Inc. | 2,656 | 53 |
| * HCA Holdings Inc. | 2,617 | 52 |
| * Amylin Pharmaceuticals Inc. | 4,119 | 47 |
| * AMERIGROUP Corp. | 905 | 45 |
| * Brookdale Senior Living Inc. Class A | 2,634 | 42 |
| Patterson Cos. Inc. | 1,311 | 38 |
| * Bruker Corp. | 2,686 | 38 |
| Cooper Cos. Inc. | 420 | 32 |
| * Life Technologies Corp. | 504 | 21 |
| * Tenet Healthcare Corp. | 570 | 3 |
| * Emdeon Inc. Class A | 33 | 1 |
| 22,221 | ||
| Industrials (12.4%) | ||
| United Technologies Corp. | 28,020 | 2,080 |
| Caterpillar Inc. | 20,863 | 1,899 |
| 3M Co. | 20,305 | 1,685 |
| United Parcel Service Inc. Class B | 23,777 | 1,602 |
| Boeing Co. | 21,192 | 1,417 |
| Honeywell International Inc. | 25,469 | 1,218 |
| Emerson Electric Co. | 24,326 | 1,132 |
| Deere & Co. | 13,582 | 1,098 |
| Danaher Corp. | 17,773 | 814 |
| CSX Corp. | 35,687 | 783 |
| Precision Castparts Corp. | 4,642 | 761 |
| Illinois Tool Works Inc. | 13,482 | 627 |
| Lockheed Martin Corp. | 8,088 | 600 |
| Cummins Inc. | 6,351 | 590 |
| PACCAR Inc. | 11,828 | 445 |
| CH Robinson Worldwide Inc. | 5,358 | 378 |
| Fluor Corp. | 5,640 | 342 |
| Fastenal Co. | 9,543 | 320 |
| Expeditors International of Washington Inc. | 6,872 | 313 |
| Rockwell Automation Inc. | 4,670 | 299 |
| Ingersoll-Rand plc | 8,500 | 285 |
| WW Grainger Inc. | 1,843 | 284 |
| Joy Global Inc. | 3,391 | 283 |
| Dover Corp. | 4,697 | 270 |
| Rockwell Collins Inc. | 4,986 | 252 |
| * Stericycle Inc. | 2,778 | 244 |
| Roper Industries Inc. | 3,103 | 239 |
| Union Pacific Corp. | 2,587 | 238 |
| AMETEK Inc. | 5,204 | 203 |
| Pall Corp. | 3,757 | 192 |
| Iron Mountain Inc. | 5,832 | 190 |
| Eaton Corp. | 4,184 | 180 |
| * United Continental Holdings Inc. | 9,137 | 170 |
| Cooper Industries plc | 3,492 | 165 |
| Parker Hannifin Corp. | 2,163 | 159 |
| Flowserve Corp. | 1,644 | 155 |
| * TransDigm Group Inc. | 1,617 | 149 |
| Goodrich Corp. | 1,652 | 147 |
| Donaldson Co. Inc. | 2,469 | 146 |
| * Kansas City Southern | 2,664 | 144 |
| Gardner Denver Inc. | 1,692 | 133 |
| * IHS Inc. Class A | 1,599 | 124 |
| * Delta Air Lines Inc. | 16,452 | 124 |
| JB Hunt Transport Services Inc. | 2,958 | 119 |
| Robert Half International Inc. | 4,753 | 114 |
| * Verisk Analytics Inc. Class A | 3,239 | 113 |
| Waste Connections Inc. | 3,221 | 111 |
35
| Vanguard® Russell 1000 Growth Index Fund | ||
| Schedule of Investments | ||
| August 31, 2011 | ||
| Market | ||
| Value | ||
| Shares | ($000) | |
| Dun & Bradstreet Corp. | 1,599 | 107 |
| * BE Aerospace Inc. | 2,971 | 103 |
| Masco Corp. | 11,605 | 103 |
| * WABCO Holdings Inc. | 2,184 | 102 |
| Wabtec Corp. | 1,568 | 95 |
| Timken Co. | 2,401 | 94 |
| IDEX Corp. | 2,418 | 90 |
| * Hertz Global Holdings Inc. | 7,994 | 90 |
| MSC Industrial Direct Co. Class A | 1,444 | 89 |
| * Babcock & Wilcox Co. | 3,834 | 88 |
| Nordson Corp. | 1,981 | 87 |
| * Copart Inc. | 1,949 | 84 |
| * Polypore International Inc. | 1,281 | 79 |
| Graco Inc. | 1,994 | 79 |
| Valmont Industries Inc. | 753 | 70 |
| * Kirby Corp. | 1,261 | 69 |
| Chicago Bridge & Iron Co. NV | 1,923 | 69 |
| * Nielsen Holdings NV | 2,304 | 68 |
| Landstar System Inc. | 1,596 | 65 |
| Lincoln Electric Holdings Inc. | 1,607 | 55 |
| Copa Holdings SA Class A | 788 | 54 |
| Lennox International Inc. | 1,727 | 54 |
| Toro Co. | 968 | 53 |
| * Navistar International Corp. | 1,270 | 53 |
| Manitowoc Co. Inc. | 4,079 | 45 |
| FedEx Corp. | 575 | 45 |
| UTi Worldwide Inc. | 2,921 | 40 |
| * Aecom Technology Corp. | 1,703 | 39 |
| Southwest Airlines Co. | 4,442 | 38 |
| * WESCO International Inc. | 695 | 30 |
| * General Cable Corp. | 936 | 28 |
| SPX Corp. | 488 | 28 |
| Towers Watson & Co. Class A | 418 | 25 |
| * AMR Corp. | 4,523 | 16 |
| Snap-on Inc. | 306 | 16 |
| * Thomas & Betts Corp. | 362 | 16 |
| * Spirit Aerosystems Holdings Inc. Class A | 744 | 12 |
| Kennametal Inc. | 316 | 12 |
| Textron Inc. | 565 | 10 |
| KBR Inc. | 279 | 8 |
| Avery Dennison Corp. | 260 | 8 |
| Carlisle Cos. Inc. | 183 | 7 |
| Harsco Corp. | 263 | 6 |
| Equifax Inc. | 139 | 5 |
| Alliant Techsystems Inc. | 46 | 3 |
| * GrafTech International Ltd. | 144 | 2 |
| Covanta Holding Corp. | 135 | 2 |
| Con-way Inc. | 73 | 2 |
| Armstrong World Industries Inc. | 30 | 1 |
| * KAR Auction Services Inc. | 72 | 1 |
| 25,681 | ||
| Information Technology (27.7%) | ||
| * Apple Inc. | 29,926 | 11,516 |
| International Business Machines Corp. | 39,197 | 6,738 |
| Microsoft Corp. | 240,150 | 6,388 |
| * Google Inc. Class A | 8,145 | 4,406 |
| Oracle Corp. | 124,299 | 3,489 |
| QUALCOMM Inc. | 54,029 | 2,780 |
| * EMC Corp. | 66,586 | 1,504 |
| Mastercard Inc. Class A | 3,471 | 1,144 |
| Accenture plc Class A | 20,894 | 1,120 |
| Automatic Data Processing Inc. | 16,172 | 809 |
| * eBay Inc. | 20,365 | 629 |
| Texas Instruments Inc. | 23,861 | 625 |
36
| Vanguard® Russell 1000 Growth Index Fund | ||
| Schedule of Investments | ||
| August 31, 2011 | ||
| Market | ||
| Value | ||
| Shares | ($000) | |
| * Cognizant Technology Solutions Corp. Class A | 9,846 | 625 |
| Broadcom Corp. Class A | 17,349 | 618 |
| * Dell Inc. | 39,035 | 580 |
| * Salesforce.com Inc. | 4,334 | 558 |
| * Intuit Inc. | 9,792 | 483 |
| Visa Inc. Class A | 5,466 | 480 |
| * NetApp Inc. | 11,904 | 448 |
| * Symantec Corp. | 24,451 | 419 |
| * Adobe Systems Inc. | 16,325 | 412 |
| Altera Corp. | 10,427 | 379 |
| * Citrix Systems Inc. | 6,084 | 368 |
| * Juniper Networks Inc. | 17,251 | 361 |
| Western Union Co. | 20,461 | 338 |
| Analog Devices Inc. | 9,696 | 320 |
| * Teradata Corp. | 5,463 | 286 |
| Amphenol Corp. Class A | 5,701 | 268 |
| Xilinx Inc. | 8,596 | 268 |
| Paychex Inc. | 9,620 | 260 |
| * VMware Inc. Class A | 2,742 | 259 |
| * NVIDIA Corp. | 19,426 | 259 |
| * Red Hat Inc. | 6,246 | 247 |
| * Electronic Arts Inc. | 10,758 | 243 |
| * BMC Software Inc. | 5,724 | 232 |
| Maxim Integrated Products Inc. | 9,558 | 220 |
| * F5 Networks Inc. | 2,625 | 214 |
| Linear Technology Corp. | 7,369 | 211 |
| * Autodesk Inc. | 7,436 | 210 |
| * Fiserv Inc. | 3,722 | 208 |
| Avago Technologies Ltd. | 6,190 | 205 |
| Microchip Technology Inc. | 6,163 | 202 |
| * First Solar Inc. | 1,927 | 193 |
| National Semiconductor Corp. | 7,674 | 191 |
| * Rovi Corp. | 3,654 | 179 |
| VeriSign Inc. | 5,451 | 170 |
| * ANSYS Inc. | 2,972 | 160 |
| * Alliance Data Systems Corp. | 1,651 | 154 |
| KLA-Tencor Corp. | 4,200 | 154 |
| * Lam Research Corp. | 4,029 | 150 |
| * Varian Semiconductor Equipment Associates Inc. | 2,440 | 150 |
| * Trimble Navigation Ltd. | 3,968 | 147 |
| * Nuance Communications Inc. | 7,709 | 143 |
| * Informatica Corp. | 3,422 | 143 |
| * Equinix Inc. | 1,516 | 143 |
| * Polycom Inc. | 5,712 | 136 |
| * Advanced Micro Devices Inc. | 19,892 | 136 |
| Solera Holdings Inc. | 2,286 | 134 |
| FLIR Systems Inc. | 5,168 | 134 |
| Factset Research Systems Inc. | 1,494 | 131 |
| * Skyworks Solutions Inc. | 6,123 | 126 |
| * Atmel Corp. | 13,859 | 126 |
| * MICROS Systems Inc. | 2,625 | 125 |
| * Riverbed Technology Inc. | 4,968 | 123 |
| * Rackspace Hosting Inc. | 3,335 | 122 |
| * Akamai Technologies Inc. | 5,499 | 121 |
| * TIBCO Software Inc. | 5,371 | 120 |
| Global Payments Inc. | 2,591 | 119 |
| * VeriFone Systems Inc. | 3,301 | 116 |
| * Gartner Inc. | 3,148 | 112 |
| * ON Semiconductor Corp. | 14,394 | 105 |
| * JDS Uniphase Corp. | 7,396 | 96 |
| Jabil Circuit Inc. | 5,199 | 88 |
| Cypress Semiconductor Corp. | 5,466 | 87 |
| * Ariba Inc. | 3,161 | 86 |
| * Acme Packet Inc. | 1,751 | 82 |
37
| Vanguard® Russell 1000 Growth Index Fund | ||
| Schedule of Investments | ||
| August 31, 2011 | ||
| Market | ||
| Value | ||
| Shares | ($000) | |
| * Cadence Design Systems Inc. | 8,810 | 81 |
| Broadridge Financial Solutions Inc. | 3,818 | 79 |
| National Instruments Corp. | 2,991 | 76 |
| * Fortinet Inc. | 3,944 | 75 |
| * NCR Corp. | 4,130 | 71 |
| * WebMD Health Corp. | 1,965 | 69 |
| * Zebra Technologies Corp. | 1,822 | 65 |
| * NeuStar Inc. Class A | 2,470 | 62 |
| * Dolby Laboratories Inc. Class A | 1,777 | 60 |
| * Genpact Ltd. | 3,056 | 51 |
| * IPG Photonics Corp. | 860 | 50 |
| Lender Processing Services Inc. | 2,704 | 48 |
| Harris Corp. | 1,081 | 44 |
| * SAIC Inc. | 2,886 | 43 |
| * Silicon Laboratories Inc. | 1,240 | 43 |
| * Compuware Corp. | 5,036 | 43 |
| * VistaPrint NV | 1,406 | 41 |
| * LSI Corp. | 5,808 | 40 |
| * QLogic Corp. | 2,729 | 38 |
| * Ciena Corp. | 3,016 | 37 |
| * MEMC Electronic Materials Inc. | 4,555 | 32 |
| Applied Materials Inc. | 2,783 | 32 |
| * LinkedIn Corp. Class A | 292 | 25 |
| Intersil Corp. Class A | 2,025 | 23 |
| * Arrow Electronics Inc. | 481 | 15 |
| * FleetCor Technologies Inc. | 486 | 14 |
| * Freescale Semiconductor Holdings I Ltd. | 866 | 10 |
| * Synopsys Inc. | 350 | 9 |
| DST Systems Inc. | 168 | 8 |
| * Booz Allen Hamilton Holding Corp. | 474 | 8 |
| * Cree Inc. | 136 | 4 |
| * PMC - Sierra Inc. | 211 | 1 |
| 57,128 | ||
| Materials (5.9%) | ||
| EI du Pont de Nemours & Co. | 30,054 | 1,451 |
| Freeport-McMoRan Copper & Gold Inc. | 30,656 | 1,445 |
| Monsanto Co. | 17,345 | 1,196 |
| Praxair Inc. | 9,818 | 967 |
| Mosaic Co. | 8,917 | 634 |
| Air Products & Chemicals Inc. | 6,857 | 561 |
| Ecolab Inc. | 7,507 | 402 |
| PPG Industries Inc. | 5,118 | 392 |
| Cliffs Natural Resources Inc. | 4,725 | 391 |
| CF Industries Holdings Inc. | 1,932 | 353 |
| Lubrizol Corp. | 2,081 | 280 |
| Sigma-Aldrich Corp. | 3,942 | 254 |
| Celanese Corp. Class A | 5,055 | 238 |
| Sherwin-Williams Co. | 2,904 | 220 |
| Ball Corp. | 5,434 | 195 |
| Eastman Chemical Co. | 2,300 | 190 |
| Southern Copper Corp. | 5,500 | 186 |
| * Crown Holdings Inc. | 5,046 | 179 |
| FMC Corp. | 2,321 | 176 |
| Allegheny Technologies Inc. | 3,434 | 172 |
| Airgas Inc. | 2,540 | 165 |
| Walter Energy Inc. | 2,016 | 165 |
| International Flavors & Fragrances Inc. | 2,601 | 151 |
| Albemarle Corp. | 2,967 | 150 |
| Nalco Holding Co. | 3,982 | 147 |
| Royal Gold Inc. | 1,758 | 135 |
| Rock-Tenn Co. Class A | 2,242 | 120 |
| * Allied Nevada Gold Corp. | 2,888 | 120 |
| * Rockwood Holdings Inc. | 2,101 | 107 |
| * Molycorp Inc. | 1,814 | 103 |
38
| Vanguard® Russell 1000 Growth Index Fund | |||||
| Schedule of Investments | |||||
| August 31, 2011 | |||||
| Market | |||||
| Value | |||||
| Shares | ($000) | ||||
| * | WR Grace & Co. | 2,162 | 85 | ||
| International Paper Co. | 3,037 | 82 | |||
| Compass Minerals International Inc. | 1,076 | 81 | |||
| Packaging Corp. of America | 3,035 | 77 | |||
| Carpenter Technology Corp. | 1,454 | 73 | |||
| * | Solutia Inc. | 4,064 | 71 | ||
| Steel Dynamics Inc. | 5,304 | 68 | |||
| Scotts Miracle-Gro Co. Class A | 1,309 | 64 | |||
| Silgan Holdings Inc. | 1,657 | 63 | |||
| * | Intrepid Potash Inc. | 1,627 | 56 | ||
| Martin Marietta Materials Inc. | 671 | 48 | |||
| LyondellBasell Industries NV Class A | 690 | 24 | |||
| Titanium Metals Corp. | 1,474 | 24 | |||
| Temple-Inland Inc. | 912 | 22 | |||
| Huntsman Corp. | 1,061 | 14 | |||
| Reliance Steel & Aluminum Co. | 330 | 14 | |||
| Kronos Worldwide Inc. | 624 | 14 | |||
| Schnitzer Steel Industries Inc. | 252 | 12 | |||
| Valspar Corp. | 344 | 11 | |||
| AK Steel Holding Corp. | 470 | 4 | |||
| Westlake Chemical Corp. | 89 | 4 | |||
| 12,156 | |||||
| Telecommunication Services (1.2%) | |||||
| Verizon Communications Inc. | 20,691 | 748 | |||
| * | American Tower Corp. Class A | 12,835 | 691 | ||
| * | Crown Castle International Corp. | 9,399 | 408 | ||
| * | NII Holdings Inc. | 4,818 | 186 | ||
| * | SBA Communications Corp. Class A | 3,668 | 139 | ||
| Windstream Corp. | 9,159 | 116 | |||
| * | MetroPCS Communications Inc. | 8,988 | 100 | ||
| * | tw telecom inc Class A | 4,227 | 82 | ||
| * | Clearwire Corp. Class A | 4,998 | 16 | ||
| 2,486 | |||||
| Utilities (0.1%) | |||||
| ITC Holdings Corp. | 1,651 | 125 | |||
| National Fuel Gas Co. | 426 | 26 | |||
| Oneok Inc. | 237 | 17 | |||
| Aqua America Inc. | 506 | 11 | |||
| 179 | |||||
| Total Common Stocks (Cost $217,374) | 206,118 | ||||
| Coupon | |||||
| Temporary Cash Investments (5.8%)1 | |||||
| Money Market Fund (5.7%) | |||||
| 2 | Vanguard Market Liquidity Fund | 0.132% | 11,849,283 | 11,849 | |
| Face | |||||
| Maturity | Amount | ||||
| Date | ($000) | ||||
| U.S. Government and Agency Obligations (0.1%) | |||||
| 3,4 | Freddie Mac Discount Notes | 0.120% | 9/12/11 | 100 | 100 |
| 3 | Freddie Mac Discount Notes | 0.095% | 9/27/11 | 5 | 5 |
| 105 | |||||
| Total Temporary Cash Investments (Cost $11,954) | 11,954 | ||||
39
| Vanguard® Russell 1000 Growth Index Fund | |
| Schedule of Investments | |
| August 31, 2011 | |
| Market | |
| Value | |
| ($000) | |
| Total Investments (105.7%) (Cost $229,328) | 218,072 |
| Other Assets and Liabilities—Net (-5.7%) | (11,716) |
| Net Assets (100%) | 206,356 |
* Non-income-producing security.
1 The fund invests a portion of its cash reserves in equity markets through the use of index futures contracts. After giving effect to futures investments, the fund's effective common stock and temporary cash investment positions represent 100.0% and 5.7%, respectively, of net assets.
2 Affiliated money market fund available only to Vanguard funds and certain trusts and accounts managed by Vanguard. Rate shown is the 7-day yield.
3 The issuer operates under a congressional charter; its securities are not backed by the full faith and credit of the U.S. government.
4 Securities with a value of $100,000 have been segregated as initial margin for open futures contracts.
40
Report of Independent Registered Public Accounting Firm
To the Trustees of Vanguard Scottsdale Funds and the Shareholders of Vanguard Russell 1000 Index Fund, Vanguard Russell 1000 Value Index Fund and Vanguard Russell 1000 Growth Index Fund:
We have audited, in accordance with the standards of the Public Company Accounting Oversight Board (United States), the financial statements (not presented herein) of Vanguard Russell 1000 Index Fund, Vanguard Russell 1000 Value Index Fund and Vanguard Russell 1000 Growth Index Fund (constituting separate portfolios of Vanguard Scottsdale Funds, hereafter referred to as the "Funds") as of August 31, 2011 and for the period then ended and have issued our unqualified report thereon dated October 13, 2011. Our audits included audits of the Funds' schedules of investments as of August 31, 2011. These schedules of investments are the responsibility of the Funds' management. Our responsibility is to express an opinion on these schedules of investments based on our audits.
In our opinion, the accompanying schedules of investments referred to above, when read in conjunction with the financial statements of the Funds referred to above, present fairly, in all material respects, the information set forth therein.
PricewaterhouseCoopers LLP
Philadelphia, Pennsylvania
October 13, 2011
41
| © 2011 The Vanguard Group. Inc. |
| All rights reserved. |
| Vanguard Marketing Corporation, Distributor. |
| SNA 18480 102011 |
|
|
| Annual Report | August 31, 2011 |
| Vanguard Russell 2000 Index Funds |
| Vanguard Russell 2000 Index Fund |
| Vanguard Russell 2000 Value Index Fund |
| Vanguard Russell 2000 Growth Index Fund |
> The three Vanguard Russell 2000 Index Funds succeeded in capturing the returns of their target indexes.
> All ten sectors, in each of the three funds, recorded positive or flat returns as the strong rally in small-capitalization stocks weakened through the spring and summer.
> Small-cap growth stocks were the best performers, small-cap value stocks the worst.
| Contents | |
| Your Fund’s Total Returns | 1 |
| Chairman’s Letter | 2 |
| Russell 2000 Index Fund | 8 |
| Russell 2000 Value Index Fund | 23 |
| Russell 2000 Growth Index Fund | 36 |
| About Your Fund’s Expenses | 51 |
| Trustees Approve Advisory Arrangement | 53 |
| Glossary | 54 |
Please note: The opinions expressed in this report are just that—informed opinions. They should not be considered promises or advice. Also, please keep in mind that the information and opinions cover the period through the date on the front of this report. Of course, the risks of investing in your fund are spelled out in the prospectus.
See the Glossary for definitions of investment terms used in this report.
About the cover: Vanguard was named for the HMS Vanguard, flagship of British Admiral Horatio Nelson. A ship—whose performance and safety depend on the work of all hands—has served as a fitting metaphor for the Vanguard crew as we strive to help clients reach their financial goals.
Your Fund’s Total Returns
| Periods Ended August 31, 2011 | ||
| Total | ||
| Returns | ||
| Ticker | Since | |
| Symbol | Inception | |
| Vanguard Russell 2000 Index Fund | ||
| Institutional Shares (Inception: 12/22/2010) | VRTIX | –7.31% |
| ETF Shares (Inception: 9/20/2010) | VTWO | |
| Market Price | 9.59 | |
| Net Asset Value | 9.64 | |
| Russell 2000 Index | 9.72 | |
| Small-Cap Core Funds Average1 | 10.02 | |
| Vanguard Russell 2000 Value Index Fund | ||
| ETF Shares (Inception: 9/20/2010) | VTWV | |
| Market Price | 5.85% | |
| Net Asset Value | 5.98 | |
| Russell 2000 Value Index | 6.07 | |
| Small-Cap Value Funds Average1 | 6.99 | |
| Vanguard Russell 2000 Growth Index Fund | ||
| Institutional Shares (Inception: 5/25/2011) | VRTGX | –11.15% |
| ETF Shares (Inception: 9/20/2010) | VTWG | |
| Market Price | 13.06 | |
| Net Asset Value | 13.18 | |
| Russell 2000 Growth Index | 13.33 | |
| Small-Cap Growth Funds Average1 | 12.80 | |
Institutional Shares are available to certain institutional investors who meet specific administrative, service, and account-size criteria.
The Vanguard ETF® Shares shown are traded on the Nasdaq exchange and are available only through brokers. The table provides ETF returns based on both the Nasdaq market price and the net asset value for a share. U.S. Pat. No. 6,879,964 B2; 7,337,138.
For the ETF Shares, the market price is determined by the midpoint of the bid-offer spread as of the closing time of the New York Stock Exchange (generally 4 p.m., Eastern time). The net asset value is also determined as of the NYSE closing time. For more information about how the ETF Shares’ market prices have compared with their net asset value, visit vanguard.com, select your ETF, and then select the Price and Performance tab. The ETF premium/discount analysis there shows the percentages of days on which the ETF Shares’ market price was above or below the NAV.
Benchmark performance is shown as of earliest share-class inception date.
1 Derived from data provided by Lipper Inc.
1

Chairman’s Letter
Dear Shareholder,
Vanguard Russell 2000 Index Funds generated strong returns from their September 2010 inception through August 31, 2011. The small-capitalization stocks in the three funds’ Russell benchmarks finished the period a few steps ahead of the broader market. Stocks of all sizes and styles thrived before a spate of disappointing economic news and various geopolitical events at home and abroad cast a shadow on the market.
For the 11-plus months through August 31, 2011, the Russell 2000 Growth Index Fund was the top performer, returning about 13%. The Russell 2000 Value Index Fund was the weakest, returning about 6%. The Russell 2000 Index Fund, a blend of the growth and value components, returned about 9%. Each fund successfully tracked its target index. The Russell 2000 Value Index Fund trailed its peer group, while the Russell 2000 Index Fund and Russell 2000 Growth Index Fund were in range of their peers. Institutional Shares of the Russell 2000 Index Fund and the Russell 2000 Growth Index Fund, issued at later dates, returned –7.31% and –11.15%, respectively.
This report begins with a look at the investment environment that prevailed for the full fiscal year and then examines the dynamics that drove each fund’s performance during its briefer period of operation.
2
Strong 12-month returns in a tale of two markets
Global stock markets delivered strong returns in a fiscal year marked by distinct periods of strength and weakness.
During the first six months, stock prices surged, with the broad U.S. stock market returning about 29%. As the slow, grinding economic recovery seemed to gather momentum, energy and industrial stocks, which are keenly sensitive to the rhythms of the business cycle, produced the best returns.
In the second six months, growth decelerated and stock market volatility spiked, amplified by Europe’s sovereign-debt drama, political wrangling over the U.S. debt ceiling, and Standard & Poor’s
decision to downgrade the U.S. credit rating. (Vanguard’s confidence in the “full faith and credit” of the U.S. government remains unshaken.) Stock prices retreated, and those sectors that led the market in the first half lost ground in the second, displaced by defensive sectors such as utilities and consumer staples.
Treasuries rallied as risk aversion returned
The stock market’s midyear pivot from offense to defense was mirrored in the bond market. In the first half of the year, yields rose (and prices declined) as the prospect of improved economic growth and inflationary pressures set the market’s tone. Corporate bonds outperformed U.S. Treasury securities.
| Market Barometer | |||
| Average Annual Total Returns | |||
| Periods Ended August 31, 2011 | |||
| One Year | Three Years | Five Years | |
| Stocks | |||
| Russell 1000 Index (Large-caps) | 19.06% | 0.84% | 1.11% |
| Russell 2000 Index (Small-caps) | 22.19 | 0.83 | 1.53 |
| Dow Jones U.S. Total Stock Market Index | 19.16 | 1.18 | 1.52 |
| MSCI All Country World Index ex USA (International) | 10.34 | –0.97 | 0.79 |
| Bonds | |||
| Barclays Capital U.S. Aggregate Bond Index | |||
| (Broad taxable market) | 4.62% | 7.23% | 6.56% |
| Barclays Capital Municipal Bond Index | |||
| (Broad tax-exempt market) | 2.66 | 6.00 | 4.94 |
| Citigroup Three-Month U.S. Treasury Bill Index | 0.12 | 0.24 | 1.69 |
| CPI | |||
| Consumer Price Index | 3.77% | 1.12% | 2.13% |
3
In the second half, risk aversion set the tone. Investors bid up Treasuries, trimming the yield of the 10-year Treasury note to barely 2%, and government bonds were among the market’s best performers. For the full year, the taxable investment-grade U.S. bond market returned 4.62%; the broad municipal bond market returned 2.66%.
The yields of money market instruments hovered near zero, consistent with the Federal Reserve’s target for short-term interest rates. Toward the end of the period, the Fed indicated that it expected to maintain this exceptionally low target at least through mid-2013.
Small-caps managed gains despite subpar finish
Small-capitalization stocks, which tend to be more volatile than their large-cap counterparts, strongly rallied through the six months after the Vanguard Russell 2000 Index Funds’ inception. Investors, more receptive to risk, were optimistic that acceleration in the economic recovery would unlock new opportunity for smaller companies. Although the positive environment eroded and the stock market slid over the period’s final months, small-cap stocks finished with solid gains.
With the exception of the flat performance from financial stocks in the Russell 2000 Value Index, every sector of the small-cap market generated gains.
| Expense Ratios | |||
| Your Fund Compared With Its Peer Group | |||
| Institutional | Peer Group | ||
| Shares | ETF Shares | Average | |
| Russell 2000 Index Fund | 0.08% | 0.19% | 1.38% |
| Russell 2000 Value Index Fund | — | 0.27 | 1.53 |
| Russell 2000 Growth Index Fund | 0.08 | 0.20 | 1.61 |
The fund expense ratios shown are from the prospectus dated September 16, 2010, and represent estimated costs for the current fiscal year. For the periods from inception through August 31, 2011, the fund’s annualized expense ratios were: for the Russell 2000 Index Fund, 0.08% for Institutional Shares and 0.15% for ETF Shares; for the Russell 2000 Value Index Fund, 0.20% for ETF Shares; and for the Russell 2000 Growth Index Fund, 0.08% for Institutional Shares and 0.20% for ETF Shares. The peer-group expense ratios are derived from data provided by Lipper Inc. and capture information through year-end 2010.
Peer groups: For the Russell 2000 Index Fund, Small-Cap Core Funds; for the Russell 2000 Value Index Fund, Small-Cap Value Funds; and for the Russell 2000 Growth Index Fund, Small-Cap Growth Funds.
4
Information technology stocks were a bright spot for both the Russell 2000 Growth Index Fund and Russell 2000 Index Fund. Merger and acquisition activity, along with corporate and consumer spending, propelled returns in this sector. Solid performances came from a range of subsectors: software; internet software and services; communications equipment; and electronic equipment, instruments, and components.
Although the funds lacked heavy exposure to energy stocks, which tend to reside in the market’s larger-cap precincts, the strongest returns for all three funds came from that sector. As energy demand grew along with the prospect for higher prices, the Russell 2000 Growth Index Fund’s energy holdings returned about 35%, while those of the Russell 2000 Index Fund returned about 27% and those of the Russell 2000 Value Index Fund returned almost 20%.
The performance of industrial stocks trailed off as disappointing data emerged from the manufacturing front, but the sector held up over the period and made substantial contributions to all three funds. Before the recovery stalled, the nation’s factories were one of its bright spots, as they benefited from demand, both in the United States and overseas, for the basic building blocks of any economy. Farm equipment manufacturers, for example, were helped by higher food prices around the globe.
Weakness was most evident in the Russell 2000 Value Index Fund’s financial stocks, which made up about one-third of the portfolio and returned less than 1%. Returns were slightly better for the Russell 2000 Index Fund. Commercial banks, which were hurt by poor loan and revenue growth, were the culprit for both funds.
With turbulence inevitable, create a long-term plan
Like Vanguard’s other index funds, Vanguard Russell 2000 Index Funds benefit from Vanguard’s pioneering work in index fund management and from its low costs, which minimize the friction between fund and market performance.
Over the past year, these timeless benefits have probably been less striking than the stock market’s volatility, which rippled unevenly through the market’s different sectors. And while the broad stock market has made an impressive comeback since March 2009, investors, especially those who endured the financial crisis of 2008–2009, may have found the recent stretch of volatility unsettling.
However, while such volatility can be alarming, it’s not atypical. Recent Vanguard research has found that stock market volatility in the weeks after Standard & Poor’s downgraded the U.S. credit rating was consistent with the volatility seen during other global shocks such as the
5
Russian default in 1998, the terrorist attacks on September 11, 2001, and the more recent global financial crisis.
Of course, you can’t control how the markets will perform. But you can control how you react to market swings and build a portfolio that is appropriate for your goals and tolerance for risk.
We counsel investors to avoid making investment decisions based on emotion and to create a diversified and balanced investment portfolio with a combination of risk control and return potential that can reinforce your resolve to stick with your plan through the stock market’s occasional, and inevitable, rough patches. The Russell 2000 Index Funds, with their low costs and broad diversification across the entire U.S. small-cap market, can be an important part of such a plan.
Thank you for entrusting your assets to Vanguard.
Sincerely,

| F. William McNabb III |
| Chairman and Chief Executive Officer |
| September 19, 2011 |
| A note on expense ratios |
| The Expense Ratios table in each report’s Chairman’s Letter displays fund expense |
| ratios from the most recent prospectus. These figures include the funds’ actual |
| operating expenses. For some funds, the figures also include “acquired fund fees |
| and expenses,” which result from the funds’ holdings in business development |
| companies (BDCs). |
| Although the Securities and Exchange Commission requires that BDC costs be |
| included in a fund’s expense ratio, these fees are not incurred by the fund. They |
| have no impact on a fund’s total return or on its tracking error relative to an index. |
| A footnote to the Expense Ratios table reports an annualized calculation of the |
| fund’s actual expenses for the period, a more accurate tally of the operating costs |
| incurred by shareholders. |
6
| Your Fund’s Performance at a Glance | ||||
| Inception Through August 31, 2011 | ||||
| Distributions Per Share | ||||
| Starting | Ending | Income | Capital | |
| Share Price | Share Price | Dividends | Gains | |
| Russell 2000 Index Fund | ||||
| Institutional Shares | ||||
| (Inception: 12/22/2010) | $119.33 | $110.21 | $0.432 | $0.000 |
| ETF Shares (Inception: 9/20/2010) | 52.78 | 57.66 | 0.226 | 0.000 |
| Russell 2000 Value Index Fund | ||||
| ETF Shares (Inception: 9/20/2010) | $52.39 | $55.14 | $0.420 | $0.000 |
| Russell 2000 Growth Index Fund | ||||
| Institutional Shares | ||||
| (Inception: 5/25/2011) | $128.54 | $114.21 | $0.000 | $0.000 |
| ETF Shares (Inception: 9/20/2010) | 53.17 | 60.02 | 0.170 | 0.000 |
7
Russell 2000 Index Fund
Fund Profile
As of August 31, 2011
| Portfolio Characteristics | |||
| Target | Broad | ||
| Fund | Index1 | Index2 | |
| Number of Stocks | 1,975 | 1,966 | 3,716 |
| Median Market Cap | $1.1B | $1.1B | $30.4B |
| Price/Earnings Ratio | 22.6x | 22.7x | 14.7x |
| Price/Book Ratio | 1.7x | 1.7x | 2.0x |
| Yield3 | 1.5% | 2.0% | |
| Institutional Shares | 1.4% | — | — |
| ETF Shares | 1.3% | — | — |
| Return on Equity | 9.1% | 9.1% | 19.0% |
| Earnings Growth Rate | 3.9% | 3.8% | 7.0% |
| Foreign Holdings | 0.0% | 0.0% | 0.0% |
| Turnover Rate | 34% | — | — |
| Expense Ratio4 | — | — | |
| Institutional Shares | 0.08% | ||
| ETF Shares | 0.19% | ||
| Short-Term Reserves | –0.1% | — | — |
| Sector Diversification (% of equity exposure) | |||
| Target | Broad | ||
| Fund | Index1 | Index2 | |
| Consumer Discretionary | 13.3% | 13.3% | 12.3% |
| Consumer Staples | 3.6 | 3.6 | 10.5 |
| Energy | 7.0 | 7.0 | 10.8 |
| Financials | 21.8 | 21.6 | 14.8 |
| Health Care | 12.4 | 12.5 | 11.4 |
| Industrials | 15.4 | 15.5 | 11.0 |
| Information Technology | 16.9 | 16.9 | 18.7 |
| Materials | 4.9 | 4.9 | 4.4 |
| Telecommunication | |||
| Services | 1.0 | 1.0 | 2.6 |
| Utilities | 3.7 | 3.7 | 3.5 |
| Ten Largest Holdings5 (% of total net assets) | ||
| InterDigital Inc. | Communications | |
| Equipment | 0.3% | |
| MFA Financial Inc. | Mortgage REITs | 0.2 |
| American Campus | ||
| Communities Inc. | Residential REITs | 0.2 |
| Healthspring Inc. | Managed | |
| Health Care | 0.2 | |
| World Fuel Services Corp. | Oil & Gas Refining | |
| & Marketing | 0.2 | |
| Mid-America Apartment | ||
| Communities Inc. | Residential REITs | 0.2 |
| Home Properties Inc. | Residential REITs | 0.2 |
| Signature Bank | Regional Banks | 0.2 |
| Coeur d’Alene | Precious Metals | |
| Mines Corp. | & Minerals | 0.2 |
| Nicor Inc. | Gas Utilities | 0.2 |
| Top Ten | 2.1% | |
Investment Focus
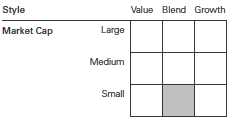
1 Russell 2000 Index.
2 Dow Jones U.S. Total Stock Market Index.
3 30-day SEC yield for the fund; annualized dividend yield for the indexes. See the Glossary.
4 The expense ratios shown are from the prospectus dated September 16, 2010, and represent estimated costs for the current fiscal year. For the periods from inception through August 31, 2011, the annualized expense ratios were 0.08% for Institutional Shares and 0.15% for ETF Shares.
5 The holdings listed exclude any temporary cash investments and equity index products.
8
Russell 2000 Index Fund
Performance Summary
All of the returns in this report represent past performance, which is not a guarantee of future results that may be achieved by the fund. (Current performance may be lower or higher than the performance data cited. For performance data current to the most recent month-end, visit our website at vanguard.com/performance.) Note, too, that both investment returns and principal value can fluctuate widely, so an investor’s shares, when sold, could be worth more or less than their original cost. The returns shown do not reflect taxes that a shareholder would pay on fund distributions or on the sale of fund shares.
Cumulative Performance: September 20, 2010, Through August 31, 2011
Initial Investment of $10,000
| Total Returns | ||
| Period Ended August 31, 2011 | Final Value | |
| Since | of a $10,000 | |
| Inception1 | Investment | |
| Russell 2000 Index Fund ETF Shares Net Asset Value | 9.64% | $10,964 |
| Russell 2000 Index Fund ETF Shares Market Price | 9.59 | 10,959 |
| Dow Jones U.S. Total Stock Market Index | 9.04 | 10,904 |
| Russell 2000 Index | 9.72 | 10,972 |
| Small-Cap Core Funds Average2 | 10.02 | 11,002 |
| Final Value of | ||
| Since | a $5,000,000 | |
| Inception1 | Investment | |
| Russell 2000 Index Fund Institutional Shares | –7.31% | $4,634,680 |
| Dow Jones U.S. Total Stock Market Index | –2.67 | 4,866,378 |
| Russell 2000 Index | –7.31 | 4,634,625 |
1 Performance for the fund and its comparative standards is calculated since the following inception dates: September 20, 2010, for ETF Shares; and December 22, 2010, for Institutional Shares.
2 Derived from data provided by Lipper Inc.
See Financial Highlights for dividend and capital gains information.
9
Russell 2000 Index Fund
| Cumulative Returns of ETF Shares: September 20, 2010, Through August 31, 2011 | |
| Cumulative | |
| Since | |
| Inception | |
| Russell 2000 Index Fund ETF Shares Market Price | 9.59% |
| Russell 2000 Index Fund ETF Shares Net Asset Value | 9.64 |
| Russell 2000 Index | 9.72 |
Fiscal-Period Total Returns (%): September 20, 2010, Through August 31, 2011
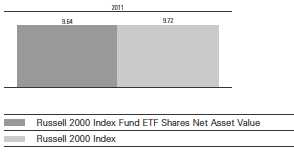
Total Returns: Periods Ended June 30, 2011
This table presents total returns through the latest calendar quarter—rather than through the end of the fiscal period. Securities and Exchange Commission rules require that we provide this information.
| Since | ||
| Inception Date | Inception | |
| Institutional Shares | 12/22/2010 | 5.33% |
| ETF Shares | 9/20/2010 | |
| Market Price | 24.55 | |
| Net Asset Value | 24.59 |
10
Russell 2000 Index Fund
Financial Statements
Statement of Net Assets—Investments Summary
As of August 31, 2011
This Statement summarizes the fund’s holdings by asset type. Details are reported for each of the fund’s 50 largest individual holdings and for investments that, in total for any issuer, represent more than 1% of the fund’s net assets. The total value of smaller holdings is reported as a single amount within each category.
The fund reports a complete list of its holdings in regulatory filings four times in each fiscal year, at the quarter-ends. For the second and fourth fiscal quarters, the complete listing of the fund’s holdings is available electronically on vanguard.com and on the Securities and Exchange Commission’s website (sec.gov), or you can have it mailed to you without charge by calling 800-662-7447. For the first and third fiscal quarters, the fund files the lists with the SEC on Form N-Q. Shareholders can look up the fund’s Forms N-Q on the SEC’s website. Forms N-Q may also be reviewed and copied at the SEC’s Public Reference Room (see the back cover of this report for further information).
| Market | Percentage | ||
| Value• | of Net | ||
| Shares | ($000) | Assets | |
| Common Stocks | |||
| Consumer Discretionary | |||
| Sotheby’s | 6,603 | 246 | 0.2% |
| * Warnaco Group Inc. | 4,302 | 230 | 0.2% |
| * CROCS Inc. | 8,360 | 229 | 0.2% |
| Consumer Discretionary—Other † | 13,452 | 12.6% | |
| 14,157 | 13.2% | ||
| Consumer Staples | |||
| Nu Skin Enterprises Inc. Class A | 5,357 | 227 | 0.2% |
| Consumer Staples—Other † | 3,631 | 3.4% | |
| 3,858 | 3.6% | ||
| Energy | |||
| World Fuel Services Corp. | 6,922 | 257 | 0.3% |
| Berry Petroleum Co. Class A | 5,039 | 247 | 0.2% |
| * CVR Energy Inc. | 8,582 | 244 | 0.2% |
| * Rosetta Resources Inc. | 5,181 | 238 | 0.2% |
| * Complete Production Services Inc. | 7,715 | 224 | 0.2% |
| * Bill Barrett Corp. | 4,614 | 221 | 0.2% |
| * Dril-Quip Inc. | 3,360 | 217 | 0.2% |
| Energy—Other † | 5,830 | 5.5% | |
| 7,478 | 7.0% | ||
| Financials | |||
| MFA Financial Inc. | 34,805 | 261 | 0.3% |
| American Campus Communities Inc. | 6,639 | 259 | 0.3% |
| Mid-America Apartment Communities Inc. | 3,588 | 256 | 0.2% |
| Home Properties Inc. | 3,820 | 255 | 0.2% |
| * Signature Bank | 4,498 | 250 | 0.2% |
| Tanger Factory Outlet Centers | 8,399 | 236 | 0.2% |
| BioMed Realty Trust Inc. | 12,830 | 235 | 0.2% |
| Hancock Holding Co. | 7,460 | 233 | 0.2% |
| Highwoods Properties Inc. | 7,050 | 231 | 0.2% |
| National Retail Properties Inc. | 8,310 | 227 | 0.2% |
11
Russell 2000 Index Fund
| Market | Percentage | ||
| Value• | of Net | ||
| Shares | ($000) | Assets | |
| * ProAssurance Corp. | 2,990 | 217 | 0.2% |
| CBL & Associates Properties Inc. | 14,503 | 213 | 0.2% |
| Equity Lifestyle Properties Inc. | 3,009 | 207 | 0.2% |
| Kilroy Realty Corp. | 5,714 | 204 | 0.2% |
| Post Properties Inc. | 4,872 | 204 | 0.2% |
| Hatteras Financial Corp. | 7,307 | 202 | 0.2% |
| Financials—Other † | 19,575 | 18.3% | |
| 23,265 | 21.7% | ||
| Health Care | |||
| * Healthspring Inc. | 6,624 | 259 | 0.2% |
| Medicis Pharmaceutical Corp. Class A | 6,035 | 235 | 0.2% |
| * Cepheid Inc. | 6,039 | 219 | 0.2% |
| * HMS Holdings Corp. | 8,287 | 217 | 0.2% |
| * Onyx Pharmaceuticals Inc. | 6,193 | 211 | 0.2% |
| * Cubist Pharmaceuticals Inc. | 5,860 | 203 | 0.2% |
| Health Care—Other † | 11,941 | 11.2% | |
| 13,285 | 12.4% | ||
| Industrials | |||
| * Clean Harbors Inc. | 4,581 | 247 | 0.3% |
| CLARCOR Inc. | 4,929 | 229 | 0.2% |
| * Esterline Technologies Corp. | 2,980 | 224 | 0.2% |
| HEICO Corp. | 4,078 | 222 | 0.2% |
| * Hexcel Corp. | 9,574 | 220 | 0.2% |
| * Alaska Air Group Inc. | 3,503 | 202 | 0.2% |
| * Genesee & Wyoming Inc. Class A | 3,874 | 201 | 0.2% |
| Industrials—Other † | 14,910 | 13.9% | |
| 16,455 | 15.4% | ||
| Information Technology | |||
| InterDigital Inc. | 4,434 | 312 | 0.3% |
| Jack Henry & Associates Inc. | 8,439 | 247 | 0.2% |
| * Parametric Technology Corp. | 11,643 | 210 | 0.2% |
| * Netlogic Microsystems Inc. | 6,678 | 200 | 0.2% |
| Information Technology—Other † | 17,039 | 15.9% | |
| 18,008 | 16.8% | ||
| Materials | |||
| * Coeur d’Alene Mines Corp. | 8,751 | 249 | 0.2% |
| * Hecla Mining Co. | 27,292 | 209 | 0.2% |
| Materials—Other † | 4,802 | 4.5% | |
| 5,260 | 4.9% | ||
| Telecommunication Services † | 1,105 | 1.0% | |
| Utilities | |||
| Nicor Inc. | 4,452 | 247 | 0.2% |
| Piedmont Natural Gas Co. Inc. | 7,018 | 217 | 0.2% |
| Cleco Corp. | 5,961 | 212 | 0.2% |
| WGL Holdings Inc. | 5,007 | 207 | 0.2% |
| Utilities—Other † | 3,073 | 2.9% | |
| 3,956 | 3.7% | ||
| Total Common Stocks (Cost $116,178) | 106,827 | 99.7%1 | |
12
Russell 2000 Index Fund
| Market | Percentage | |||
| Value• | of Net | |||
| Coupon | Shares | ($000) | Assets | |
| Temporary Cash Investments | ||||
| Money Market Fund | ||||
| 2 Vanguard Market Liquidity Fund | 0.132% | 6,071,000 | 6,071 | 5.7% |
| 3U.S. Government and Agency Obligations † | 150 | 0.1% | ||
| Total Temporary Cash Investments (Cost $6,221) | 6,221 | 5.8%1 | ||
| Total Investments (Cost $122,399) | 113,048 | 105.5% | ||
| Other Assets and Liabilities | ||||
| Other Assets | 240 | 0.2% | ||
| Liabilities | (6,169) | (5.7%) | ||
| (5,929) | (5.5%) | |||
| Net Assets | 107,119 | 100.0% | ||
| Market | |
| Value• | |
| ($000) | |
| Statement of Assets and Liabilities | |
| Assets | |
| Investments in Securities, at Value | 113,048 |
| Other Assets | 240 |
| Total Assets | 113,288 |
| Liabilities | |
| Payables for Investment Securities Purchased | 6,162 |
| Other Liabilities | 7 |
| Total Liabilities | 6,169 |
| Net Assets | 107,119 |
13
Russell 2000 Index Fund
| At August 31, 2011, net assets consisted of: | |
| Amount | |
| ($000) | |
| Paid-in Capital | 116,761 |
| Undistributed Net Investment Income | 690 |
| Accumulated Net Realized Losses | (998) |
| Unrealized Appreciation (Depreciation) | |
| Investment Securities | (9,351) |
| Futures Contracts | 17 |
| Net Assets | 107,119 |
| Institutional Shares—Net Assets | |
| Applicable to 710,314 outstanding $.001 par value shares of | |
| beneficial interest (unlimited authorization) | 78,287 |
| Net Asset Value Per Share—Institutional Shares | $110.21 |
| ETF Shares—Net Assets | |
| Applicable to 500,000 outstanding $.001 par value shares of | |
| beneficial interest (unlimited authorization) | 28,832 |
| Net Asset Value Per Share—ETF Shares | $57.66 |
• See Note A in Notes to Financial Statements.
* Non-income-producing security.
† Represents the aggregate value, by category, of securities that are not among the 50 largest holdings and, in total for any issuer, represent 1% or less of net assets.
1 The fund invests a portion of its cash reserves in equity markets through the use of index futures contracts. After giving effect to futures investments, the fund’s effective common stock and temporary cash investment positions represent 99.9% and 5.6%, respectively, of net assets.
2 Affiliated money market fund available only to Vanguard funds and certain trusts and accounts managed by Vanguard. Rate shown is the 7-day yield.
3 Securities with a value of $50,000 have been segregated as initial margin for open futures contracts.
See accompanying Notes, which are an integral part of the Financial Statements.
14
Russell 2000 Index Fund
| Statement of Operations | |
| September 20, 20101 to | |
| August 31, 2011 | |
| ($000) | |
| Investment Income | |
| Income | |
| Dividends | 840 |
| Interest2 | 1 |
| Total Income | 841 |
| Expenses | |
| The Vanguard Group—Note B | |
| Management and Administrative—Institutional Shares | — |
| Management and Administrative—ETF Shares | 17 |
| Marketing and Distribution—Institutional Shares | 5 |
| Marketing and Distribution—ETF Shares | 2 |
| Custodian Fees | 34 |
| Auditing Fees | 7 |
| Shareholders’ Reports—Institutional Shares | — |
| Shareholders’ Reports—ETF Shares | 2 |
| Total Expenses | 67 |
| Net Investment Income | 774 |
| Realized Net Gain (Loss) | |
| Investment Securities Sold | 2,390 |
| Futures Contracts | 30 |
| Realized Net Gain (Loss) | 2,420 |
| Change in Unrealized Appreciation (Depreciation) | |
| Investment Securities | (9,351) |
| Futures Contracts | 17 |
| Change in Unrealized Appreciation (Depreciation) | (9,334) |
| Net Increase (Decrease) in Net Assets Resulting from Operations | (6,140) |
| 1 Inception. | |
| 2 Interest income from an affiliated company of the fund was $1,000. | |
See accompanying Notes, which are an integral part of the Financial Statements.
15
Russell 2000 Index Fund
| Statement of Changes in Net Assets | |
| September 20, 20101 to | |
| August 31, 2011 | |
| ($000) | |
| Increase (Decrease) in Net Assets | |
| Operations | |
| Net Investment Income | 774 |
| Realized Net Gain (Loss) | 2,420 |
| Change in Unrealized Appreciation (Depreciation) | (9,334) |
| Net Increase (Decrease) in Net Assets Resulting from Operations | (6,140) |
| Distributions | |
| Net Investment Income | |
| Institutional Shares | (16) |
| ETF Shares | (68) |
| Realized Capital Gain | |
| Institutional Shares | — |
| ETF Shares | — |
| Total Distributions | (84) |
| Capital Share Transactions | |
| Institutional Shares | 83,851 |
| ETF Shares | 29,492 |
| Net Increase (Decrease) from Capital Share Transactions | 113,343 |
| Total Increase (Decrease) | 107,119 |
| Net Assets | |
| Beginning of Period | — |
| End of Period2 | 107,119 |
| 1 Inception. | |
| 2 Net Assets—End of Period includes undistributed net investment income of $690,000. | |
See accompanying Notes, which are an integral part of the Financial Statements.
16
Russell 2000 Index Fund
Financial Highlights
| Institutional Shares | |
| December 22, 20101 to | |
| For a Share Outstanding Throughout the Period | August 31, 2011 |
| Net Asset Value, Beginning of Period | $119.33 |
| Investment Operations | |
| Net Investment Income | .652 |
| Net Realized and Unrealized Gain (Loss) on Investments | (9.340) |
| Total from Investment Operations | (8.688) |
| Distributions | |
| Dividends from Net Investment Income | (.432) |
| Distributions from Realized Capital Gains | — |
| Total Distributions | (.432) |
| Net Asset Value, End of Period | $110.21 |
| Total Return | –7.31% |
| Ratios/Supplemental Data | |
| Net Assets, End of Period (Millions) | $78 |
| Ratio of Total Expenses to Average Net Assets | 0.08%2 |
| Ratio of Net Investment Income to Average Net Assets | 1.21%2 |
| Portfolio Turnover Rate3 | 34% |
1 Inception.
2 Annualized.
3 Excludes the value of portfolio securities received or delivered as a result of in-kind purchases or redemptions of the fund’s capital shares, including ETF Creation Units.
See accompanying Notes, which are an integral part of the Financial Statements.
17
Russell 2000 Index Fund
Financial Highlights
| ETF Shares | |
| September 20, 20101 to | |
| For a Share Outstanding Throughout the Period | August 31, 2011 |
| Net Asset Value, Beginning of Period | $52.78 |
| Investment Operations | |
| Net Investment Income | .575 |
| Net Realized and Unrealized Gain (Loss) on Investments | 4.531 |
| Total from Investment Operations | 5.106 |
| Distributions | |
| Dividends from Net Investment Income | (.226) |
| Distributions from Realized Capital Gains | — |
| Total Distributions | (.226) |
| Net Asset Value, End of Period | $57.66 |
| Total Return | 9.64% |
| Ratios/Supplemental Data | |
| Net Assets, End of Period (Millions) | $29 |
| Ratio of Total Expenses to Average Net Assets | 0.15%2 |
| Ratio of Net Investment Income to Average Net Assets | 1.14%2 |
| Portfolio Turnover Rate3 | 34% |
1 Inception.
2 Annualized.
3 Excludes the value of portfolio securities received or delivered as a result of in-kind purchases or redemptions of the fund’s capital shares, including ETF Creation Units.
See accompanying Notes, which are an integral part of the Financial Statements.
18
Russell 2000 Index Fund
Notes to Financial Statements
Vanguard Russell 2000 Index Fund is registered under the Investment Company Act of 1940 as an open-end investment company, or mutual fund. The fund offers two classes of shares: Institutional Shares and ETF Shares. Institutional Shares are designed for investors who meet certain administrative, service, and account-size criteria. Institutional Shares were first issued on December 22, 2010. ETF Shares were first issued on September 20, 2010, and first offered to the public on September 22, 2010. ETF Shares are listed for trading on Nasdaq; they can be purchased and sold through a broker.
A. The following significant accounting policies conform to generally accepted accounting principles for U.S. mutual funds. The fund consistently follows such policies in preparing its financial statements.
1. Security Valuation: Securities are valued as of the close of trading on the New York Stock Exchange (generally 4 p.m., Eastern time) on the valuation date. Equity securities are valued at the latest quoted sales prices or official closing prices taken from the primary market in which each security trades; such securities not traded on the valuation date are valued at the mean of the latest quoted bid and asked prices. Securities for which market quotations are not readily available, or whose values have been materially affected by events occurring before the fund’s pricing time but after the close of the securities’ primary markets, are valued by methods deemed by the board of trustees to represent fair value. Investments in Vanguard Market Liquidity Fund are valued at that fund’s net asset value. Temporary cash investments acquired over 60 days to maturity are valued using the latest bid prices or using valuations based on a matrix system (which considers such factors as security prices, yields, maturities, and ratings), both as furnished by independent pricing services. Other temporary cash investments are valued at amortized cost, which approximates market value.
2. Futures Contracts: The fund uses index futures contracts to a limited extent, with the objectives of maintaining full exposure to the stock market, enhancing returns, maintaining liquidity, and minimizing transaction costs. The fund may purchase futures contracts to immediately invest incoming cash in the market, or sell futures in response to cash outflows, thereby simulating a fully invested position in the underlying index while maintaining a cash balance for liquidity. The fund may seek to enhance returns by using futures contracts instead of the underlying securities when futures are believed to be priced more attractively than the underlying securities. The primary risks associated with the use of futures contracts are imperfect correlation between changes in market values of stocks held by the fund and the prices of futures contracts, and the possibility of an illiquid market.
Futures contracts are valued at their quoted daily settlement prices. The aggregate principal amounts of the contracts are not recorded in the Statement of Net Assets. Fluctuations in the value of the contracts are recorded in the Statement of Net Assets as an asset (liability) and in the Statement of Operations as unrealized appreciation (depreciation) until the contracts are closed, when they are recorded as realized futures gains (losses).
3. Federal Income Taxes: The fund intends to qualify as a regulated investment company and distribute all of its taxable income. Management has analyzed the fund’s tax positions taken for its open federal income tax period ended August 31, 2011, and has concluded that no provision for federal income tax is required in the financial statements.
4. Distributions: Distributions to shareholders are recorded on the ex-dividend date.
19
Russell 2000 Index Fund
5. Other: Dividend income is recorded on the ex-dividend date. Interest income includes income distributions received from Vanguard Market Liquidity Fund and is accrued daily. Security transactions are accounted for on the date securities are bought or sold. Costs used to determine realized gains (losses) on the sale of investment securities are those of the specific securities sold.
Each class of shares has equal rights as to assets and earnings, except that each class separately bears certain class-specific expenses related to maintenance of shareholder accounts (included in Management and Administrative expenses) and shareholder reporting. Marketing and distribution expenses are allocated to each class of shares based on a method approved by the board of trustees. Income, other non-class-specific expenses, and gains and losses on investments are allocated to each class of shares based on its relative net assets.
B. The Vanguard Group furnishes at cost investment advisory, corporate management, administrative, marketing, and distribution services. The costs of such services are allocated to the fund under methods approved by the board of trustees. The fund has committed to provide up to 0.40% of its net assets in capital contributions to Vanguard. At August 31, 2011, the fund had contributed capital of $18,000 to Vanguard (included in Other Assets), representing 0.02% of the fund’s net assets and 0.01% of Vanguard’s capitalization. The fund’s trustees and officers are also directors and officers of Vanguard.
C. Various inputs may be used to determine the value of the fund’s investments. These inputs are summarized in three broad levels for financial statement purposes. The inputs or methodologies used to value securities are not necessarily an indication of the risk associated with investing in those securities.
Level 1—Quoted prices in active markets for identical securities.
Level 2—Other significant observable inputs (including quoted prices for similar securities, interest rates, prepayment speeds, credit risk, etc.).
Level 3—Significant unobservable inputs (including the fund’s own assumptions used to determine the fair value of investments).
The following table summarizes the fund’s investments as of August 31, 2011, based on the inputs used to value them:
| Level 1 | Level 2 | Level 3 | |
| Investments | ($000) | ($000) | ($000) |
| Common Stocks | 106,826 | — | 1 |
| Temporary Cash Investments | 6,071 | 150 | — |
| Futures Contracts—Assets1 | 4 | — | — |
| Futures Contracts—Liabilities1 | (1) | — | — |
| Total | 112,900 | 150 | 1 |
| 1 Represents variation margin on the last day of the reporting period. |
20
Russell 2000 Index Fund
The following table summarizes changes in investments valued based on Level 3 inputs during the period ended August 31, 2011:
| Investments in | |
| Common Stocks | |
| Amount Valued Based on Level 3 Inputs | ($000) |
| Balance as of September 20, 20101 | — |
| Transfers into Level 3 | 1 |
| Balance as of August 31, 2011 | 1 |
| 1 Inception. |
D. At August 31, 2011, the aggregate settlement value of open futures contracts and the related unrealized appreciation (depreciation) were:
| ($000) | ||||
| Number of | Aggregate | Unrealized | ||
| Long (Short) | Settlement | Appreciation | ||
| Futures Contracts | Expiration | Contracts | Value | (Depreciation) |
| E-mini Russell 2000 Index | September 2011 | 3 | 218 | 17 |
Unrealized appreciation (depreciation) on open futures contracts is required to be treated as realized gain (loss) for tax purposes.
E. Distributions are determined on a tax basis and may differ from net investment income and realized capital gains for financial reporting purposes. Differences may be permanent or temporary. Permanent differences are reclassified among capital accounts in the financial statements to reflect their tax character. Temporary differences arise when certain items of income, expense, gain, or loss are recognized in different periods for financial statement and tax purposes; these differences will reverse at some time in the future. Differences in classification may also result from the treatment of short-term gains as ordinary income for tax purposes.
During the period ended August 31, 2011, the fund realized $3,418,000 of net capital gains resulting from in-kind redemptions—in which shareholders exchanged fund shares for securities held by the fund rather than for cash. Because such gains are not taxable to the fund, and are not distributed to shareholders, they have been reclassified from accumulated net realized losses to paid-in capital.
For tax purposes, at August 31, 2011, the fund had $690,000 of ordinary income available for distribution. The fund realized losses of $974,000 during the period from November 1, 2010, through August 31, 2011, which are deferred and will be treated as realized for tax purposes in fiscal 2012.
At August 31, 2011, the cost of investment securities for tax purposes was $122,406,000. Net unrealized depreciation of investment securities for tax purposes was $9,358,000, consisting of unrealized gains of $4,470,000 on securities that had risen in value since their purchase and $13,828,000 in unrealized losses on securities that had fallen in value since their purchase.
21
Russell 2000 Index Fund
F. During the period ended August 31, 2011, the fund purchased $168,640,000 of investment securities and sold $54,846,000 of investment securities, other than temporary cash investments.
G. Capital share transactions for each class of shares were:
| Inception1 to | ||
| August 31, 2011 | ||
| Amount | Shares | |
| ($000) | (000) | |
| Institutional Shares | ||
| Issued | 90,835 | 767 |
| Issued in Lieu of Cash Distributions | 16 | — |
| Redeemed | (7,000) | (57) |
| Net Increase (Decrease)—Institutional Shares | 83,851 | 710 |
| ETF Shares | ||
| Issued | 59,242 | 1,000 |
| Issued in Lieu of Cash Distributions | — | — |
| Redeemed | (29,750) | (500) |
| Net Increase (Decrease)—ETF Shares | 29,492 | 500 |
| 1 Inception was September 20, 2010, for the ETF Shares and December 22, 2010, for the Institutional Shares. | ||
H. In preparing the financial statements as of August 31, 2011, management considered the impact of subsequent events for potential recognition or disclosure in these financial statements.
22
Russell 2000 Value Index Fund
Fund Profile
As of August 31, 2011
| Portfolio Characteristics | |||
| Target | Broad | ||
| Fund | Index1 | Index2 | |
| Number of Stocks | 1,350 | 1,350 | 3,716 |
| Median Market Cap | $0.9B | $0.9B | $30.4B |
| Price/Earnings Ratio | 19.0x | 19.0x | 14.7x |
| Price/Book Ratio | 1.2x | 1.2x | 2.0x |
| Yield3 | 1.8% | 2.2% | 2.0% |
| Return on Equity | 6.8% | 6.8% | 19.0% |
| Earnings Growth Rate | –0.3% | –0.3% | 7.0% |
| Foreign Holdings | 0.0% | 0.0% | 0.0% |
| Turnover Rate | 101% | — | — |
| Expense Ratio4 | 0.27% | — | — |
| Short-Term Reserves | –0.2% | — | — |
| Sector Diversification (% of equity exposure) | |||
| Target | Broad | ||
| Fund | Index1 | Index2 | |
| Consumer Discretionary | 11.7% | 11.7% | 12.3% |
| Consumer Staples | 3.0 | 2.9 | 10.5 |
| Energy | 5.2 | 5.2 | 10.8 |
| Financials | 35.4 | 35.3 | 14.8 |
| Health Care | 5.3 | 5.3 | 11.4 |
| Industrials | 14.9 | 15.0 | 11.0 |
| Information Technology | 11.0 | 11.0 | 18.7 |
| Materials | 5.4 | 5.4 | 4.4 |
| Telecommunication | |||
| Services | 0.8 | 0.8 | 2.6 |
| Utilities | 7.3 | 7.4 | 3.5 |
| Ten Largest Holdings5 (% of total net assets) | ||
| MFA Financial Inc. | Mortgage REITs | 0.5% |
| Nicor Inc. | Gas Utilities | 0.5 |
| BioMed Realty Trust Inc. | Office REITs | 0.4 |
| Hancock Holding Co. | Regional Banks | 0.4 |
| Coeur d’Alene | Precious Metals | |
| Mines Corp. | & Minerals | 0.4 |
| National Retail | ||
| Properties Inc. | Retail REITs | 0.4 |
| Esterline | Aerospace & | |
| Technologies Corp. | Defense | 0.4 |
| ProAssurance Corp. | Property & | |
| Casualty Insurance | 0.4 | |
| Piedmont Natural | ||
| Gas Co. Inc. | Gas Utilities | 0.4 |
| Cleco Corp. | Electric | 0.4 |
| Top Ten | 4.2% | |
Investment Focus
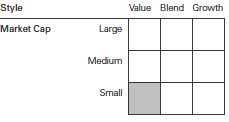
1 Russell 2000 Value Index.
2 Dow Jones U.S. Total Stock Market Index.
3 30-day SEC yield for the fund; annualized dividend yield for the indexes. See the Glossary.
4 The expense ratio shown is from the prospectus dated September 16, 2010, and represents estimated costs for the current fiscal year. For the period from inception through August 31, 2011, the annualized expense ratio was 0.20%.
5 The holdings listed exclude any temporary cash investments and equity index products.
23
Russell 2000 Value Index Fund
Performance Summary
All of the returns in this report represent past performance, which is not a guarantee of future results that may be achieved by the fund. (Current performance may be lower or higher than the performance data cited. For performance data current to the most recent month-end, visit our website at vanguard.com/performance.) Note, too, that both investment returns and principal value can fluctuate widely, so an investor’s shares, when sold, could be worth more or less than their original cost. The returns shown do not reflect taxes that a shareholder would pay on fund distributions or on the sale of fund shares.
Cumulative Performance: September 20, 2010, Through August 31, 2011
Initial Investment of $10,000
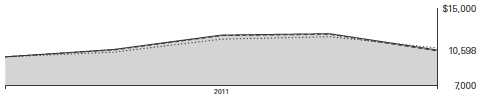
| Total Returns | ||
| Period Ended August 31, 2011 | Final Value | |
| Since | of a $10,000 | |
| Inception1 | Investment | |
| Russell 2000 Value Index Fund ETF Shares | ||
| Net Asset Value | 5.98% | $10,598 |
| Russell 2000 Value Index Fund ETF Shares Market Price | 5.85 | 10,585 |
| Dow Jones U.S. Total Stock Market Index | 9.04 | 10,904 |
| Russell 2000 Value Index | 6.07 | 10,607 |
| Small-Cap Value Funds Average2 | 6.99 | 10,699 |
| Cumulative Returns of ETF Shares: September 20, 2010, Through August 31, 2011 | |
| Cumulative | |
| Since | |
| Inception | |
| Russell 2000 Value Index Fund ETF Shares Market Price | 5.85% |
| Russell 2000 Value Index Fund ETF Shares Net Asset Value | 5.98 |
| Russell 2000 Value Index | 6.07 |
1 Performance for the fund and its comparative standards is calculated since September 20, 2010.
2 Derived from data provided by Lipper Inc.
See Financial Highlights for dividend and capital gains information.
24
Russell 2000 Value Index Fund
Fiscal-Period Total Returns (%): September 20, 2010, Through August 31, 2011
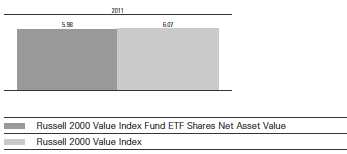
Total Returns: Period Ended June 30, 2011
This table presents total returns through the latest calendar quarter—rather than through the end of the fiscal period. Securities and Exchange Commission rules require that we provide this information.
| Since | ||
| Inception Date | Inception | |
| ETF Shares | 9/20/2010 | |
| Market Price | 20.07% | |
| Net Asset Value | 20.12 |
25
Russell 2000 Value Index Fund
Financial Statements
Statement of Net Assets—Investments Summary
As of August 31, 2011
This Statement summarizes the fund’s holdings by asset type. Details are reported for each of the fund’s 50 largest individual holdings and for investments that, in total for any issuer, represent more than 1% of the fund’s net assets. The total value of smaller holdings is reported as a single amount within each category.
The fund reports a complete list of its holdings in regulatory filings four times in each fiscal year, at the quarter-ends. For the second and fourth fiscal quarters, the complete listing of the fund’s holdings is available electronically on vanguard.com and on the Securities and Exchange Commission’s website (sec.gov), or you can have it mailed to you without charge by calling 800-662-7447. For the first and third fiscal quarters, the fund files the lists with the SEC on Form N-Q. Shareholders can look up the fund’s Forms N-Q on the SEC’s website. Forms N-Q may also be reviewed and copied at the SEC’s Public Reference Room (see the back cover of this report for further information).
| Market | Percentage | ||
| Value• | of Net | ||
| Shares | ($000) | Assets | |
| Common Stocks | |||
| Consumer Discretionary | |||
| Rent-A-Center Inc. | 1,926 | 54 | 0.3% |
| Consumer Discretionary—Other † | 1,863 | 11.3% | |
| 1,917 | 11.6% | ||
| Consumer Staples † | 488 | 3.0% | |
| Energy | |||
| * Bill Barrett Corp. | 1,320 | 63 | 0.4% |
| * Helix Energy Solutions Group Inc. | 3,209 | 54 | 0.3% |
| Bristow Group Inc. | 1,100 | 48 | 0.3% |
| Energy—Other † | 686 | 4.1% | |
| 851 | 5.1% | ||
| Financials | |||
| MFA Financial Inc. | 10,777 | 81 | 0.5% |
| BioMed Realty Trust Inc. | 3,973 | 73 | 0.4% |
| Hancock Holding Co. | 2,310 | 72 | 0.4% |
| National Retail Properties Inc. | 2,573 | 70 | 0.4% |
| * ProAssurance Corp. | 926 | 67 | 0.4% |
| Post Properties Inc. | 1,509 | 63 | 0.4% |
| Hatteras Financial Corp. | 2,263 | 62 | 0.4% |
| Entertainment Properties Trust | 1,412 | 60 | 0.4% |
| Alterra Capital Holdings Ltd. | 2,747 | 56 | 0.3% |
| Apollo Investment Corp. | 5,930 | 54 | 0.3% |
| Prosperity Bancshares Inc. | 1,420 | 54 | 0.3% |
| Colonial Properties Trust | 2,527 | 53 | 0.3% |
| Starwood Property Trust Inc. | 2,822 | 52 | 0.3% |
| Invesco Mortgage Capital Inc. | 2,814 | 50 | 0.3% |
| First American Financial Corp. | 3,184 | 49 | 0.3% |
| LaSalle Hotel Properties | 2,576 | 48 | 0.3% |
| * SVB Financial Group | 1,010 | 47 | 0.3% |
26
Russell 2000 Value Index Fund
| Market | Percentage | ||
| Value• | of Net | ||
| Shares | ($000) | Assets | |
| Washington Real Estate Investment Trust | 1,487 | 46 | 0.3% |
| CBL & Associates Properties Inc. | 3,090 | 45 | 0.3% |
| American Campus Communities Inc. | 1,145 | 45 | 0.3% |
| Financials—Other † | 4,699 | 28.4% | |
| 5,846 | 35.3% | ||
| Health Care | |||
| * Healthsouth Corp. | 2,880 | 62 | 0.4% |
| * Magellan Health Services Inc. | 972 | 48 | 0.3% |
| * Viropharma Inc. | 2,300 | 46 | 0.3% |
| Health Care—Other † | 715 | 4.3% | |
| 871 | 5.3% | ||
| Industrials | |||
| * Esterline Technologies Corp. | 923 | 69 | 0.4% |
| * Alaska Air Group Inc. | 1,024 | 59 | 0.3% |
| Robbins & Myers Inc. | 1,194 | 57 | 0.3% |
| Triumph Group Inc. | 1,007 | 53 | 0.3% |
| * Moog Inc. Class A | 1,242 | 50 | 0.3% |
| Mueller Industries Inc. | 990 | 47 | 0.3% |
| * EMCOR Group Inc. | 2,024 | 46 | 0.3% |
| * FTI Consulting Inc. | 1,273 | 46 | 0.3% |
| AO Smith Corp. | 1,151 | 45 | 0.3% |
| Industrials—Other † | 1,981 | 12.0% | |
| 2,453 | 14.8% | ||
| Information Technology | |||
| * CACI International Inc. Class A | 847 | 47 | 0.3% |
| * RF Micro Devices Inc. | 7,480 | 46 | 0.3% |
| Information Technology—Other † | 1,710 | 10.3% | |
| 1,803 | 10.9% | ||
| Materials | |||
| * Coeur d’Alene Mines Corp. | 2,534 | 72 | 0.5% |
| Sensient Technologies Corp. | 1,516 | 55 | 0.3% |
| Materials—Other † | 762 | 4.6% | |
| 889 | 5.4% | ||
| Telecommunication Services † | 132 | 0.8% | |
| Utilities | |||
| Nicor Inc. | 1,379 | 77 | 0.5% |
| Piedmont Natural Gas Co. Inc. | 2,173 | 67 | 0.4% |
| Cleco Corp. | 1,846 | 66 | 0.4% |
| WGL Holdings Inc. | 1,551 | 64 | 0.4% |
| New Jersey Resources Corp. | 1,253 | 59 | 0.4% |
| IDACORP Inc. | 1,501 | 57 | 0.3% |
| Portland General Electric Co. | 2,280 | 55 | 0.3% |
| UIL Holdings Corp. | 1,530 | 52 | 0.3% |
| Southwest Gas Corp. | 1,388 | 51 | 0.3% |
| Avista Corp. | 1,745 | 44 | 0.3% |
| Utilities—Other † | 619 | 3.7% | |
| 1,211 | 7.3% | ||
| Total Common Stocks (Cost $16,157) | 16,461 | 99.5%1 | |
27
Russell 2000 Value Index Fund
| Market | Percentage | |||
| Value• | of Net | |||
| Coupon | Shares | ($000) | Assets | |
| Temporary Cash Investment | ||||
| Money Market Fund | ||||
| 2 Vanguard Market Liquidity Fund | ||||
| (Cost $3) | 0.132% | 2,777 | 3 | 0.0% |
| Total Investments (Cost $16,160) | 16,464 | 99.5% | ||
| Other Assets and Liabilities | ||||
| Other Assets | 2,990 | 18.1% | ||
| Liabilities | (2,913) | (17.6%) | ||
| 77 | 0.5% | |||
| Net Assets | 16,541 | 100.0% | ||
| Market | ||||
| Value• | ||||
| ($000) | ||||
| Statement of Assets and Liabilities | ||||
| Asset | ||||
| Investments in Securities, at Value | 16,464 | |||
| Receivables for Investment Securities Sold | 2,952 | |||
| Other Assets | 38 | |||
| Total Assets | 19,454 | |||
| Liabilities | ||||
| Payables for Investment Securities Purchased | 2,912 | |||
| Other Liabilities | 1 | |||
| Total Liabilities | 2,913 | |||
| Net Assets | 16,541 | |||
28
Russell 2000 Value Index Fund
| At August 31, 2011, net assets consisted of: | |
| Amount | |
| ($000) | |
| Paid-in Capital | 16,507 |
| Undistributed Net Investment Income | 55 |
| Accumulated Net Realized Losses | (326) |
| Unrealized Appreciation (Depreciation) | |
| Investment Securities | 304 |
| Futures Contracts | 1 |
| Net Assets | 16,541 |
| ETF Shares—Net Assets | |
| Applicable to 300,000 outstanding $.001 par value shares of | |
| beneficial interest (unlimited authorization) | 16,541 |
| Net Asset Value Per Share | $55.14 |
• See Note A in Notes to Financial Statements.
* Non-income-producing security.
† Represents the aggregate value, by category, of securities that are not among the 50 largest holdings and, in total for any issuer, represent 1% or less of net assets.
1 The fund invests a portion of its assets in equity markets through the use of index futures contracts. After giving effect to futures investments, the fund’s effective common stock position represents 100.0% of net assets.
2 Affiliated money market fund available only to Vanguard funds and certain trusts and accounts managed by Vanguard. Rate shown is the 7-day yield.
See accompanying Notes, which are an integral part of the Financial Statements.
29
Russell 2000 Value Index Fund
| Statement of Operations | |
| September 20, 20101 to | |
| August 31, 2011 | |
| ($000) | |
| Investment Income | |
| Income | |
| Dividends | 118 |
| Interest | 1 |
| Total Income | 119 |
| Expenses | |
| The Vanguard Group—Note B | |
| Management and Administrative | 1 |
| Custodian Fees | 3 |
| Auditing Fees | 7 |
| Shareholders’ Reports | 1 |
| Total Expenses | 12 |
| Net Investment Income | 107 |
| Realized Net Gain (Loss) | |
| Investment Securities Sold | 340 |
| Futures Contracts | 5 |
| Realized Net Gain (Loss) | 345 |
| Change in Unrealized Appreciation (Depreciation) | |
| Investment Securities | 304 |
| Futures Contracts | 1 |
| Change in Unrealized Appreciation (Depreciation) | 305 |
| Net Increase (Decrease) in Net Assets Resulting from Operations | 757 |
| 1 Inception. | |
See accompanying Notes, which are an integral part of the Financial Statements.
30
Russell 2000 Value Index Fund
| Statement of Changes in Net Assets | |
| September 20, 20101 to | |
| August 31, 2011 | |
| ($000) | |
| Increase (Decrease) in Net Assets | |
| Operations | |
| Net Investment Income | 107 |
| Realized Net Gain (Loss) | 345 |
| Change in Unrealized Appreciation (Depreciation) | 305 |
| Net Increase (Decrease) in Net Assets Resulting from Operations | 757 |
| Distributions | |
| Net Investment Income | (42) |
| Realized Capital Gain | — |
| Total Distributions | (42) |
| Capital Share Transactions | |
| Issued | 21,329 |
| Issued in Lieu of Cash Distributions | — |
| Redeemed | (5,503) |
| Net Increase (Decrease) from Capital Share Transactions | 15,826 |
| Total Increase (Decrease) | 16,541 |
| Net Assets | |
| Beginning of Period | — |
| End of Period2 | 16,541 |
| 1 Inception. | |
| 2 Net Assets—End of Period includes undistributed net investment income of $55,000. | |
See accompanying Notes, which are an integral part of the Financial Statements.
31
Russell 2000 Value Index Fund
Financial Highlights
| ETF Shares | |
| September 20, 20101 to | |
| For a Share Outstanding Throughout the Period | August 31, 2011 |
| Net Asset Value, Beginning of Period | $52.39 |
| Investment Operations | |
| Net Investment Income | .9212 |
| Net Realized and Unrealized Gain (Loss) on Investments | 2.249 |
| Total from Investment Operations | 3.170 |
| Distributions | |
| Dividends from Net Investment Income | (.420) |
| Distributions from Realized Capital Gains | — |
| Total Distributions | (.420) |
| Net Asset Value, End of Period | $55.14 |
| Total Return | 5.98% |
| Ratios/Supplemental Data | |
| Net Assets, End of Period (Millions) | $17 |
| Ratio of Total Expenses to Average Net Assets | 0.20%3 |
| Ratio of Net Investment Income to Average Net Assets | 1.79%3 |
| Portfolio Turnover Rate4 | 101% |
1 Inception.
2 Calculated based on average shares outstanding.
3 Annualized.
4 Excludes the value of portfolio securities received or delivered as a result of in-kind purchases or redemptions of the fund’s capital shares, including ETF Creation Units.
See accompanying Notes, which are an integral part of the Financial Statements.
32
Russell 2000 Value Index Fund
Notes to Financial Statements
Vanguard Russell 2000 Value Index Fund is registered under the Investment Company Act of 1940 as an open-end investment company, or mutual fund. The fund offers two classes of shares: Institutional Shares and ETF Shares. Institutional Shares are designed for investors who meet certain administrative, service, and account-size criteria. The fund has not issued any Institutional Shares as of August 31, 2011. ETF Shares were first issued on September 20, 2010, and first offered to the public on September 22, 2010. ETF Shares are listed for trading on Nasdaq; they can be purchased and sold through a broker.
A. The following significant accounting policies conform to generally accepted accounting principles for U.S. mutual funds. The fund consistently follows such policies in preparing its financial statements.
1. Security Valuation: Securities are valued as of the close of trading on the New York Stock Exchange (generally 4 p.m., Eastern time) on the valuation date. Equity securities are valued at the latest quoted sales prices or official closing prices taken from the primary market in which each security trades; such securities not traded on the valuation date are valued at the mean of the latest quoted bid and asked prices. Securities for which market quotations are not readily available, or whose values have been materially affected by events occurring before the fund’s pricing time but after the close of the securities’ primary markets, are valued by methods deemed by the board of trustees to represent fair value. Investments in Vanguard Market Liquidity Fund are valued at that fund’s net asset value. Temporary cash investments acquired over 60 days to maturity are valued using the latest bid prices or using valuations based on a matrix system (which considers such factors as security prices, yields, maturities, and ratings), both as furnished by independent pricing services. Other temporary cash investments are valued at amortized cost, which approximates market value.
2. Futures Contracts: The fund uses index futures contracts to a limited extent, with the objectives of maintaining full exposure to the stock market, enhancing returns, maintaining liquidity, and minimizing transaction costs. The fund may purchase futures contracts to immediately invest incoming cash in the market, or sell futures in response to cash outflows, thereby simulating a fully invested position in the underlying index while maintaining a cash balance for liquidity. The fund may seek to enhance returns by using futures contracts instead of the underlying securities when futures are believed to be priced more attractively than the underlying securities. The primary risks associated with the use of futures contracts are imperfect correlation between changes in market values of stocks held by the fund and the prices of futures contracts, and the possibility of an illiquid market.
Futures contracts are valued at their quoted daily settlement prices. The aggregate principal amounts of the contracts are not recorded in the Statement of Net Assets. Fluctuations in the value of the contracts are recorded in the Statement of Net Assets as an asset (liability) and in the Statement of Operations as unrealized appreciation (depreciation) until the contracts are closed, when they are recorded as realized futures gains (losses).
3. Federal Income Taxes: The fund intends to qualify as a regulated investment company and distribute all of its taxable income. Management has analyzed the fund’s tax positions taken for its open federal income tax period ended August 31, 2011, and has concluded that no provision for federal income tax is required in the financial statements.
4. Distributions: Distributions to shareholders are recorded on the ex-dividend date.
33
Russell 2000 Value Index Fund
5. Other: Dividend income is recorded on the ex-dividend date. Interest income includes income distributions received from Vanguard Market Liquidity Fund and is accrued daily. Security transactions are accounted for on the date securities are bought or sold. Costs used to determine realized gains (losses) on the sale of investment securities are those of the specific securities sold.
Each class of shares has equal rights as to assets and earnings, except that each class separately bears certain class-specific expenses related to maintenance of shareholder accounts (included in Management and Administrative expenses) and shareholder reporting. Marketing and distribution expenses are allocated to each class of shares based on a method approved by the board of trustees. Income, other non-class-specific expenses, and gains and losses on investments are allocated to each class of shares based on its relative net assets.
B. The Vanguard Group furnishes at cost investment advisory, corporate management, administrative, marketing, and distribution services. The costs of such services are allocated to the fund under methods approved by the board of trustees. The fund has committed to provide up to 0.40% of its net assets in capital contributions to Vanguard. At August 31, 2011, the fund had contributed capital of $1,000 to Vanguard (included in Other Assets), representing 0.01% of the fund’s net assets and 0.00% of Vanguard’s capitalization. The fund’s trustees and officers are also directors and officers of Vanguard.
C. Various inputs may be used to determine the value of the fund’s investments. These inputs are summarized in three broad levels for financial statement purposes. The inputs or methodologies used to value securities are not necessarily an indication of the risk associated with investing in those securities.
Level 1—Quoted prices in active markets for identical securities.
Level 2—Other significant observable inputs (including quoted prices for similar securities, interest rates, prepayment speeds, credit risk, etc.).
Level 3—Significant unobservable inputs (including the fund’s own assumptions used to determine the fair value of investments).
At August 31, 2011, 100% of the fund’s market value was valued based on Level 1 inputs.
D. At August 31, 2011, the aggregate settlement value of open futures contracts and the related unrealized appreciation (depreciation) were:
| ($000) | ||||
| Number of | Aggregate | Unrealized | ||
| Long (Short) | Settlement | Appreciation | ||
| Futures Contracts | Expiration | Contracts | Value | (Depreciation) |
| E-mini Russell 2000 Index | September 2011 | 1 | 73 | 1 |
Unrealized appreciation (depreciation) on open futures contracts is required to be treated as realized gain (loss) for tax purposes.
34
Russell 2000 Value Index Fund
E. Distributions are determined on a tax basis and may differ from net investment income and realized capital gains for financial reporting purposes. Differences may be permanent or temporary. Permanent differences are reclassified among capital accounts in the financial statements to reflect their tax character. Temporary differences arise when certain items of income, expense, gain, or loss are recognized in different periods for financial statement and tax purposes; these differences will reverse at some time in the future. Differences in classification may also result from the treatment of short-term gains as ordinary income for tax purposes.
During the period ended August 31, 2011, the fund realized $670,000 of net capital gains resulting from in-kind redemptions—in which shareholders exchanged fund shares for securities held by the fund rather than for cash. Because such gains are not taxable to the fund, and are not distributed to shareholders, they have been reclassified from accumulated net realized losses to paid-in capital.
The fund used a tax accounting practice to treat a portion of the price of capital shares redeemed during the year as distributions from net investment income and realized capital gains. Accordingly, the fund has reclassified $10,000 from undistributed net investment income, and $1,000 from accumulated net realized losses, to paid-in capital.
For tax purposes, at August 31, 2011, the fund had $55,000 of ordinary income available for distribution. The fund realized losses of $325,000 during the period from November 1, 2010, through August 31, 2011, which are deferred and will be treated as realized for tax purposes in fiscal 2012.
At August 31, 2011, the cost of investment securities for tax purposes was $16,160,000. Net unrealized appreciation of investment securities for tax purposes was $304,000, consisting of unrealized gains of $411,000 on securities that had risen in value since their purchase and $107,000 in unrealized losses on securities that had fallen in value since their purchase.
F. During the period ended August 31, 2011, the fund purchased $28,310,000 of investment securities and sold $12,486,000 of investment securities, other than temporary cash investments.
G. Capital shares issued and redeemed were:
| September 20, 20101 to | |
| August 31, 2011 | |
| Shares | |
| (000) | |
| ETF Shares | |
| Issued | 400 |
| Issued in Lieu of Cash Distributions | — |
| Redeemed | (100) |
| Net Increase (Decrease) in Shares Outstanding | 300 |
| 1 Inception. |
H. In preparing the financial statements as of August 31, 2011, management considered the impact of subsequent events for potential recognition or disclosure in these financial statements.
35
Russell 2000 Growth Index Fund
Fund Profile
As of August 31, 2011
| Portfolio Characteristics | |||
| Target | Broad | ||
| Fund | Index1 | Index2 | |
| Number of Stocks | 1,156 | 1,146 | 3,716 |
| Median Market Cap | $1.3B | $1.3B | $30.4B |
| Price/Earnings Ratio | 27.8x | 27.8x | 14.7x |
| Price/Book Ratio | 3.1x | 3.1x | 2.0x |
| Yield3 | 0.7% | 2.0% | |
| Institutional Shares | 0.6% | — | — |
| ETF Shares | 0.5% | — | — |
| Return on Equity | 11.8% | 11.8% | 19.0% |
| Earnings Growth Rate | 8.2% | 8.1% | 7.0% |
| Foreign Holdings | 0.0% | 0.0% | 0.0% |
| Turnover Rate | 78% | — | — |
| Expense Ratio4 | — | — | |
| Institutional Shares | 0.08% | ||
| ETF Shares | 0.20% | ||
| Short-Term Reserves | 0.0% | — | — |
| Sector Diversification (% of equity exposure) | |||
| Target | Broad | ||
| Fund | Index1 | Index2 | |
| Consumer Discretionary | 14.9% | 14.8% | 12.3% |
| Consumer Staples | 4.2 | 4.3 | 10.5 |
| Energy | 8.8 | 8.8 | 10.8 |
| Financials | 8.1 | 8.0 | 14.8 |
| Health Care | 19.5 | 19.6 | 11.4 |
| Industrials | 16.0 | 16.1 | 11.0 |
| Information Technology | 22.7 | 22.6 | 18.7 |
| Materials | 4.4 | 4.5 | 4.4 |
| Telecommunication | |||
| Services | 1.3 | 1.2 | 2.6 |
| Utilities | 0.1 | 0.1 | 3.5 |
| Ten Largest Holdings5 (% of total net assets) | ||
| InterDigital Inc. | Communications | |
| Equipment | 0.6% | |
| Mid-America Apartment | ||
| Communities Inc. | Residential REITs | 0.5 |
| Home Properties Inc. | Residential REITs | 0.5 |
| Signature Bank | Regional Banks | 0.5 |
| Berry Petroleum Co. | Oil & Gas | |
| Exploration & | ||
| Production | 0.5 | |
| Jack Henry & | Data Processing | |
| Associates Inc. | & Outsourced | |
| Services | 0.5 | |
| Clean Harbors Inc. | Environmental & | |
| Facilities Services | 0.5 | |
| Sotheby’s | Specialized | |
| Consumer Services | 0.5 | |
| CVR Energy Inc. | Oil & Gas Refining | |
| & Marketing | 0.5 | |
| Rosetta Resources Inc. | Oil & Gas | |
| Exploration & | ||
| Production | 0.4 | |
| Top Ten | 5.0% | |
Investment Focus
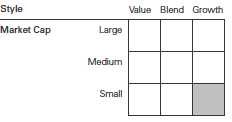
1 Russell 2000 Growth Index.
2 Dow Jones U.S. Total Stock Market Index.
3 30-day SEC yield for the fund; annualized dividend yield for the indexes. See the Glossary.
4 The expense ratios shown are from the prospectus dated September 16, 2010, and represent estimated costs for the current fiscal year. For the periods from inception through August 31, 2011, the annualized expense ratios were 0.08% for Institutional Shares and 0.20% for ETF Shares.
5 The holdings listed exclude any temporary cash investments and equity index products.
36
Russell 2000 Growth Index Fund
Performance Summary
All of the returns in this report represent past performance, which is not a guarantee of future results that may be achieved by the fund. (Current performance may be lower or higher than the performance data cited. For performance data current to the most recent month-end, visit our website at vanguard.com/performance.) Note, too, that both investment returns and principal value can fluctuate widely, so an investor’s shares, when sold, could be worth more or less than their original cost. The returns shown do not reflect taxes that a shareholder would pay on fund distributions or on the sale of fund shares.
Cumulative Performance: September 20, 2010, Through August 31, 2011
Initial Investment of $10,000
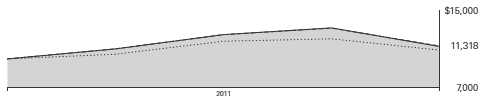
| Total Returns | ||
| Period Ended August 31, 2011 | Final Value | |
| Since | of a $10,000 | |
| Inception1 | Investment | |
| Russell 2000 Growth Index Fund ETF Shares | ||
| Net Asset Value | 13.18% | $11,318 |
| Russell 2000 Growth Index Fund ETF Shares Market Price | 13.06 | 11,306 |
| Dow Jones U.S. Total Stock Market Index | 9.04 | 10,904 |
| Russell 2000 Growth Index | 13.33 | 11,333 |
| Small-Cap Growth Funds Average2 | 12.80 | 11,280 |
| Final Value of | ||
| Since | a $5,000,000 | |
| Inception1 | Investment | |
| Russell 2000 Growth Index Fund Institutional Shares | –11.15% | $4,442,586 |
| Dow Jones U.S. Total Stock Market Index | –7.81 | 4,609,486 |
| Russell 2000 Growth Index | –11.11 | 4,444,701 |
1 Performance for the fund and its comparative standards is calculated since the following inception dates: September 20, 2010, for ETF Shares; and May 25, 2011, for Institutional Shares.
2 Derived from data provided by Lipper Inc.
See Financial Highlights for dividend and capital gains information.
37
Russell 2000 Growth Index Fund
| Cumulative Returns of ETF Shares: September 20, 2010, Through August 31, 2011 | |
| Cumulative | |
| Since | |
| Inception | |
| Russell 2000 Growth Index Fund ETF Shares Market Price | 13.06% |
| Russell 2000 Growth Index Fund ETF Shares Net Asset Value | 13.18 |
| Russell 2000 Growth Index | 13.33 |
Fiscal-Period Total Returns (%): September 20, 2010, Through August 31, 2011
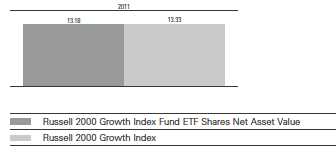
Total Returns: Periods Ended June 30, 2011
This table presents total returns through the latest calendar quarter—rather than through the end of the fiscal period. Securities and Exchange Commission rules require that we provide this information.
| Since | ||
| Inception Date | Inception | |
| Institutional Shares | 5/25/2011 | 1.17% |
| ETF Shares | 9/20/2010 | |
| Market Price | 28.85 | |
| Net Asset Value | 28.91 |
38
Russell 2000 Growth Index Fund
Financial Statements
Statement of Net Assets—Investments Summary
As of August 31, 2011
This Statement summarizes the fund’s holdings by asset type. Details are reported for each of the fund’s 50 largest individual holdings and for investments that, in total for any issuer, represent more than 1% of the fund’s net assets. The total value of smaller holdings is reported as a single amount within each category.
The fund reports a complete list of its holdings in regulatory filings four times in each fiscal year, at the quarter-ends. For the second and fourth fiscal quarters, the complete listing of the fund’s holdings is available electronically on vanguard.com and on the Securities and Exchange Commission’s website (sec.gov), or you can have it mailed to you without charge by calling 800-662-7447. For the first and third fiscal quarters, the fund files the lists with the SEC on Form N-Q. Shareholders can look up the fund’s Forms N-Q on the SEC’s website. Forms N-Q may also be reviewed and copied at the SEC’s Public Reference Room (see the back cover of this report for further information).
| Market | Percentage | ||
| Value• | of Net | ||
| Shares | ($000) | Assets | |
| Common Stocks | |||
| Consumer Discretionary | |||
| Sotheby’s | 4,183 | 156 | 0.5% |
| * CROCS Inc. | 5,296 | 145 | 0.4% |
| * Tenneco Inc. | 3,748 | 123 | 0.4% |
| * Warnaco Group Inc. | 2,297 | 123 | 0.4% |
| Wolverine World Wide Inc. | 3,078 | 112 | 0.3% |
| * Ascena Retail Group Inc. | 3,895 | 111 | 0.3% |
| Consumer Discretionary—Other † | 4,281 | 12.6% | |
| 5,051 | 14.9% | ||
| Consumer Staples | |||
| Nu Skin Enterprises Inc. Class A | 3,395 | 144 | 0.4% |
| * Darling International Inc. | 7,252 | 122 | 0.3% |
| * United Natural Foods Inc. | 2,998 | 122 | 0.4% |
| Consumer Staples—Other † | 1,054 | 3.1% | |
| 1,442 | 4.2% | ||
| Energy | |||
| Berry Petroleum Co. Class A | 3,191 | 156 | 0.5% |
| * CVR Energy Inc. | 5,436 | 155 | 0.5% |
| * Rosetta Resources Inc. | 3,282 | 151 | 0.4% |
| * Complete Production Services Inc. | 4,888 | 142 | 0.4% |
| * Dril-Quip Inc. | 2,130 | 138 | 0.4% |
| * Energy XXI Bermuda Ltd. | 4,518 | 121 | 0.4% |
| Lufkin Industries Inc. | 1,889 | 118 | 0.3% |
| Energy—Other † | 1,999 | 5.9% | |
| 2,980 | 8.8% | ||
| Financials | |||
| Mid-America Apartment Communities Inc | . 2,272 | 162 | 0.5% |
| Home Properties Inc. | 2,420 | 162 | 0.5% |
| * Signature Bank | 2,849 | 158 | 0.5% |
| Tanger Factory Outlet Centers | 5,321 | 150 | 0.4% |
| Highwoods Properties Inc. | 3,386 | 111 | 0.3% |
| Financials—Other † | 1,992 | 5.9% | |
| 2,735 | 8.1% |
39
Russell 2000 Growth Index Fund
| Market | Percentage | |||
| Value• | of Net | |||
| Shares | ($000) | Assets | ||
| Health Care | ||||
| * | Cepheid Inc. | 3,827 | 139 | 0.4% |
| * | HMS Holdings Corp. | 5,250 | 138 | 0.4% |
| * | Onyx Pharmaceuticals Inc. | 3,926 | 134 | 0.4% |
| * | Cubist Pharmaceuticals Inc. | 3,715 | 129 | 0.4% |
| * | athenahealth Inc. | 2,161 | 125 | 0.4% |
| Medicis Pharmaceutical Corp. Class A | 3,153 | 123 | 0.4% | |
| * | WellCare Health Plans Inc. | 2,638 | 121 | 0.4% |
| STERIS Corp. | 3,671 | 118 | 0.3% | |
| Quality Systems Inc. | 1,202 | 111 | 0.3% | |
| Health Care—Other † | 5,497 | 16.2% | ||
| 6,635 | 19.6% | |||
| Industrials | ||||
| * | Clean Harbors Inc. | 2,901 | 156 | 0.5% |
| HEICO Corp. | 2,585 | 141 | 0.4% | |
| CLARCOR Inc. | 2,967 | 138 | 0.4% | |
| * | Genesee & Wyoming Inc. Class A | 2,456 | 128 | 0.4% |
| Acuity Brands Inc. | 2,684 | 124 | 0.4% | |
| Woodward Inc. | 3,811 | 124 | 0.4% | |
| * | Dollar Thrifty Automotive Group Inc. | 1,793 | 119 | 0.3% |
| * | Hexcel Corp. | 5,136 | 118 | 0.3% |
| * | Acacia Research - Acacia Technologies | 2,652 | 116 | 0.3% |
| Industrials—Other † | 4,267 | 12.6% | ||
| 5,431 | 16.0% | |||
| Information Technology | ||||
| InterDigital Inc. | 2,809 | 198 | 0.6% | |
| Jack Henry & Associates Inc. | 5,345 | 156 | 0.5% | |
| * | Parametric Technology Corp. | 7,380 | 133 | 0.4% |
| * | Netlogic Microsystems Inc. | 4,234 | 127 | 0.4% |
| ADTRAN Inc. | 4,008 | 124 | 0.4% | |
| * | SuccessFactors Inc. | 5,159 | 120 | 0.3% |
| * | Universal Display Corp. | 2,384 | 117 | 0.3% |
| * | Concur Technologies Inc. | 2,769 | 116 | 0.3% |
| * | Aruba Networks Inc. | 5,291 | 113 | 0.3% |
| * | QLIK Technologies Inc. | 4,365 | 111 | 0.3% |
| Information Technology—Other † | 6,404 | 18.9% | ||
| 7,719 | 22.7% | |||
| Materials | ||||
| * | Hecla Mining Co. | 17,292 | 133 | 0.4% |
| Materials—Other † | 1,377 | 4.0% | ||
| 1,510 | 4.4% | |||
| Telecommunication Services † | 431 | 1.3% | ||
| Utilities † | 29 | 0.1% | ||
| Total Investments (Cost $36,672) | 33,963 | 100.1% | ||
| Other Assets and Liabilities | ||||
| Other Assets | 4,255 | 12.6% | ||
| Liabilities | (4,303) | (12.7%) | ||
| (48) | (0.1%) | |||
| Net Assets | 33,915 | 100.0% | ||
40
Russell 2000 Growth Index Fund
| Market | |
| Value• | |
| ($000) | |
| Statement of Assets and Liabilities | |
| Asset | |
| Investments in Securities, at Value | 33,963 |
| Receivables for Investment Securities Sold | 4,232 |
| Other Assets | 23 |
| Total Assets | 38,218 |
| Liabilities | |
| Payables for Investment Securities Purchased | 4,239 |
| Other Liabilities | 64 |
| Total Liabilities | 4,303 |
| Net Assets | 33,915 |
| At August 31, 2011, net assets consisted of: | |
| Amount | |
| ($000) | |
| Paid-in Capital | 37,885 |
| Undistributed Net Investment Income | 61 |
| Accumulated Net Realized Losses | (1,322) |
| Unrealized Appreciation (Depreciation) | (2,709) |
| Net Assets | 33,915 |
| Institutional Shares—Net Assets | |
| Applicable to 191,846 outstanding $.001 par value shares of | |
| beneficial interest (unlimited authorization) | 21,911 |
| Net Asset Value Per Share—Institutional Shares | $114.21 |
| ETF Shares—Net Assets | |
| Applicable to 200,000 outstanding $.001 par value shares of | |
| beneficial interest (unlimited authorization) | 12,004 |
| Net Asset Value Per Share—ETF Shares | $60.02 |
• See Note A in Notes to Financial Statements.
* Non-income-producing security.
† Represents the aggregate value, by category, of securities that are not among the 50 largest holdings and, in total for any issuer, represent 1% or less of net assets.
See accompanying Notes, which are an integral part of the Financial Statements.
41
Russell 2000 Growth Index Fund
| Statement of Operations | |
| September 20, 20101 to | |
| August 31, 2011 | |
| ($000) | |
| Investment Income | |
| Income | |
| Dividends | 116 |
| Total Income | 116 |
| Expenses | |
| The Vanguard Group—Note B | |
| Management and Administrative—Institutional Shares | 1 |
| Management and Administrative—ETF Shares | 13 |
| Marketing and Distribution—Institutional Shares | — |
| Marketing and Distribution—ETF Shares | — |
| Custodian Fees | 8 |
| Auditing Fees | 7 |
| Shareholders’ Reports—Institutional Shares | — |
| Shareholders’ Reports—ETF Shares | 1 |
| Total Expenses | 30 |
| Net Investment Income | 86 |
| Realized Net Gain (Loss) | |
| Investment Securities Sold | 107 |
| Futures Contracts | 5 |
| Realized Net Gain (Loss) | 112 |
| Change in Unrealized Appreciation (Depreciation) of Investment Securities | (2,709) |
| Net Increase (Decrease) in Net Assets Resulting from Operations | (2,511) |
| 1 Inception. | |
See accompanying Notes, which are an integral part of the Financial Statements.
42
Russell 2000 Growth Index Fund
| Statement of Changes in Net Assets | |
| September 20, 20101 to | |
| August 31, 2011 | |
| ($000) | |
| Increase (Decrease) in Net Assets | |
| Operations | |
| Net Investment Income | 86 |
| Realized Net Gain (Loss) | 112 |
| Change in Unrealized Appreciation (Depreciation) | (2,709) |
| Net Increase (Decrease) in Net Assets Resulting from Operations | (2,511) |
| Distributions | |
| Net Investment Income | — |
| Institutional Shares | — |
| ETF Shares | (17) |
| Realized Capital Gain | — |
| Institutional Shares | — |
| ETF Shares | — |
| Total Distributions | (17) |
| Capital Share Transactions | |
| Institutional Shares | 23,736 |
| ETF Shares | 12,707 |
| Net Increase (Decrease) from Capital Share Transactions | 36,443 |
| Total Increase (Decrease) | 33,915 |
| Net Assets | |
| Beginning of Period | — |
| End of Period2 | 33,915 |
| 1 Inception. | |
| 2 Net Assets—End of Period includes undistributed net investment income of $61,000. | |
See accompanying Notes, which are an integral part of the Financial Statements.
43
Russell 2000 Growth Index Fund
Financial Highlights
| Institutional Shares | |
| May 25, 20111 to | |
| For a Share Outstanding Throughout the Period | August 31, 2011 |
| Net Asset Value, Beginning of Period | $128.54 |
| Investment Operations | |
| Net Investment Income | .228 |
| Net Realized and Unrealized Gain (Loss) on Investments | (14.558) |
| Total from Investment Operations | (14.330) |
| Distributions | |
| Dividends from Net Investment Income | — |
| Distributions from Realized Capital Gains | — |
| Total Distributions | — |
| Net Asset Value, End of Period | $114.21 |
| Total Return | –11.15% |
| Ratios/Supplemental Data | |
| Net Assets, End of Period (Millions) | $22 |
| Ratio of Total Expenses to Average Net Assets | 0.08%2 |
| Ratio of Net Investment Income to Average Net Assets | 0.57%2 |
| Portfolio Turnover Rate3 | 78% |
1 Inception.
2 Annualized.
3 Excludes the value of portfolio securities received or delivered as a result of in-kind purchases or redemptions of the fund’s capital shares, including ETF Creation Units.
See accompanying Notes, which are an integral part of the Financial Statements.
44
Russell 2000 Growth Index Fund
Financial Highlights
| ETF Shares | |
| September 20, 20101 to | |
| For a Share Outstanding Throughout the Period | August 31, 2011 |
| Net Asset Value, Beginning of Period | $53.17 |
| Investment Operations | |
| Net Investment Income | .258 |
| Net Realized and Unrealized Gain (Loss) on Investments | 6.762 |
| Total from Investment Operations | 7.020 |
| Distributions | |
| Dividends from Net Investment Income | (.170) |
| Distributions from Realized Capital Gains | — |
| Total Distributions | (.170) |
| Net Asset Value, End of Period | $60.02 |
| Total Return | 13.18% |
| Ratios/Supplemental Data | |
| Net Assets, End of Period (Millions) | $12 |
| Ratio of Total Expenses to Average Net Assets | 0.20%2 |
| Ratio of Net Investment Income to Average Net Assets | 0.45%2 |
| Portfolio Turnover Rate3 | 78% |
1 Inception.
2 Annualized.
3 Excludes the value of portfolio securities received or delivered as a result of in-kind purchases or redemptions of the fund’s capital shares, including ETF Creation Units.
See accompanying Notes, which are an integral part of the Financial Statements.
45
Russell 2000 Growth Index Fund
Notes to Financial Statements
Vanguard Russell 2000 Growth Index Fund is registered under the Investment Company Act of 1940 as an open-end investment company, or mutual fund. The fund offers two classes of shares: Institutional Shares and ETF Shares. Institutional Shares are designed for investors who meet certain administrative, service, and account-size criteria. Institutional Shares were first issued on May 25, 2011. ETF Shares were first issued on September 20, 2010, and first offered to the public on September 22, 2010. ETF Shares are listed for trading on Nasdaq; they can be purchased and sold through a broker.
A. The following significant accounting policies conform to generally accepted accounting principles for U.S. mutual funds. The fund consistently follows such policies in preparing its financial statements.
1. Security Valuation: Securities are valued as of the close of trading on the New York Stock Exchange (generally 4 p.m., Eastern time) on the valuation date. Equity securities are valued at the latest quoted sales prices or official closing prices taken from the primary market in which each security trades; such securities not traded on the valuation date are valued at the mean of the latest quoted bid and asked prices. Securities for which market quotations are not readily available, or whose values have been materially affected by events occurring before the fund’s pricing time but after the close of the securities’ primary markets, are valued by methods deemed by the board of trustees to represent fair value.
2. Futures Contracts: The fund uses index futures contracts to a limited extent, with the objectives of maintaining full exposure to the stock market, enhancing returns, maintaining liquidity, and minimizing transaction costs. The fund may purchase futures contracts to immediately invest incoming cash in the market, or sell futures in response to cash outflows, thereby simulating a fully invested position in the underlying index while maintaining a cash balance for liquidity. The fund may seek to enhance returns by using futures contracts instead of the underlying securities when futures are believed to be priced more attractively than the underlying securities. The primary risks associated with the use of futures contracts are imperfect correlation between changes in market values of stocks held by the fund and the prices of futures contracts, and the possibility of an illiquid market.
Futures contracts are valued at their quoted daily settlement prices. The aggregate principal amounts of the contracts are not recorded in the Statement of Net Assets. Fluctuations in the value of the contracts are recorded in the Statement of Net Assets as an asset (liability) and in the Statement of Operations as unrealized appreciation (depreciation) until the contracts are closed, when they are recorded as realized futures gains (losses).
3. Federal Income Taxes: The fund intends to qualify as a regulated investment company and distribute all of its taxable income. Management has analyzed the fund’s tax positions taken for its open federal income tax period ended August 31, 2011, and has concluded that no provision for federal income tax is required in the financial statements.
4. Distributions: Distributions to shareholders are recorded on the ex-dividend date.
5. Other: Dividend income is recorded on the ex-dividend date. Security transactions are accounted for on the date securities are bought or sold. Costs used to determine realized gains (losses) on the sale of investment securities are those of the specific securities sold.
46
Russell 2000 Growth Index Fund
Each class of shares has equal rights as to assets and earnings, except that each class separately bears certain class-specific expenses related to maintenance of shareholder accounts (included in Management and Administrative expenses) and shareholder reporting. Marketing and distribution expenses are allocated to each class of shares based on a method approved by the board of trustees. Income, other non-class-specific expenses, and gains and losses on investments are allocated to each class of shares based on its relative net assets.
B. The Vanguard Group furnishes at cost investment advisory, corporate management, administrative, marketing, and distribution services. The costs of such services are allocated to the fund under methods approved by the board of trustees. The fund has committed to provide up to 0.40% of its net assets in capital contributions to Vanguard. At August 31, 2011, the fund had contributed capital of $6,000 to Vanguard (included in Other Assets), representing 0.02% of the fund’s net assets and 0.00% of Vanguard’s capitalization. The fund’s trustees and officers are also directors and officers of Vanguard.
C. Various inputs may be used to determine the value of the fund’s investments. These inputs are summarized in three broad levels for financial statement purposes. The inputs or methodologies used to value securities are not necessarily an indication of the risk associated with investing in those securities.
Level 1—Quoted prices in active markets for identical securities.
Level 2—Other significant observable inputs (including quoted prices for similar securities, interest rates, prepayment speeds, credit risk, etc.).
Level 3—Significant unobservable inputs (including the fund’s own assumptions used to determine the fair value of investments).
At August 31, 2011, 100% of the fund’s market value was valued based on Level 1 inputs.
D. Distributions are determined on a tax basis and may differ from net investment income and realized capital gains for financial reporting purposes. Differences may be permanent or temporary. Permanent differences are reclassified among capital accounts in the financial statements to reflect their tax character. Temporary differences arise when certain items of income, expense, gain, or loss are recognized in different periods for financial statement and tax purposes; these differences will reverse at some time in the future. Differences in classification may also result from the treatment of short-term gains as ordinary income for tax purposes.
During the period ended August 31, 2011, the fund realized $1,434,000 of net capital gains resulting from in-kind redemptions—in which shareholders exchanged fund shares for securities held by the fund rather than for cash. Because such gains are not taxable to the fund, and are not distributed to shareholders, they have been reclassified from accumulated net realized losses to paid-in capital.
The fund used a tax accounting practice to treat a portion of the price of capital shares redeemed during the year as distributions from net investment income. Accordingly, the fund has reclassified $8,000 from undistributed net investment income to paid-in capital.
For tax purposes, at August 31, 2011, the fund had $61,000 of ordinary income available for distribution. The fund realized losses of $1,318,000 during the period from November 1, 2010, through August 31, 2011, which are deferred and will be treated as realized for tax purposes in fiscal 2012.
47
Russell 2000 Growth Index Fund
At August 31, 2011, the cost of investment securities for tax purposes was $36,676,000. Net unrealized depreciation of investment securities for tax purposes was $2,713,000, consisting of unrealized gains of $772,000 on securities that had risen in value since their purchase and $3,485,000 in unrealized losses on securities that had fallen in value since their purchase.
E. During the period ended August 31, 2011, the fund purchased $64,412,000 of investment securities and sold $27,847,000 of investment securities, other than temporary cash investments.
F. Capital share transactions for each class of shares were:
| Inception1 to | ||
| August 31, 2011 | ||
| Amount | Shares | |
| ($000) | (000) | |
| Institutional Shares | ||
| Issued | 23,736 | 192 |
| Issued in Lieu of Cash Distributions | — | — |
| Redeemed | — | — |
| Net Increase (Decrease)—Institutional Shares | 23,736 | 192 |
| ETF Shares | ||
| Issued | 24,726 | 400 |
| Issued in Lieu of Cash Distributions | — | — |
| Redeemed | (12,019) | (200) |
| Net Increase (Decrease)—ETF Shares | 12,707 | 200 |
| 1 Inception was September 20, 2010, for the ETF Shares and May 25, 2011, for the Institutional Shares. | ||
G. In preparing the financial statements as of August 31, 2011, management considered the impact of subsequent events for potential recognition or disclosure in these financial statements.
48
Report of Independent Registered Public Accounting Firm
To the Trustees of Vanguard Scottsdale Funds and the Shareholders of Vanguard Russell 2000 Index Fund, Vanguard Russell 2000 Value Index Fund and Vanguard Russell 2000 Growth Index Fund: In our opinion, the accompanying statements of net assets-investments summary, statements of assets and liabilities and the related statements of operations and of changes in net assets and the financial highlights present fairly, in all material respects, the financial position of Vanguard Russell 2000 Index Fund, Vanguard Russell 2000 Value Index Fund and Vanguard Russell 2000 Growth Index Fund (constituting separate portfolios of Vanguard Scottsdale Funds, hereafter referred to as the “Funds”) at August 31, 2011, and the results of each of their operations, the changes in each of their net assets and the financial highlights for the period September 20, 2010 (commencement of operations) through August 31, 2011, in conformity with accounting principles generally accepted in the United States of America. These financial statements and financial highlights (hereafter referred to as “financial statements”) are the responsibility of the Funds’ management; our responsibility is to express an opinion on these financial statements based on our audits. We conducted our audits of these financial statements in accordance with the standards of the Public Company Accounting Oversight Board (United States). Those standards require that we plan and perform the audit to obtain reasonable assurance about whether the financial statements are free of material misstatement. An audit includes examining, on a test basis, evidence supporting the amounts and disclosures in the financial statements, assessing the accounting principles used and significant estimates made by management, and evaluating the overall financial statement presentation. We believe that our audits, which included confirmation of securities at August 31, 2011 by correspondence with the custodian and broker and by agreement to the underlying ownership records of Vanguard Market Liquidity Fund, provide a reasonable basis for our opinion.
PricewaterhouseCoopers LLP
Philadelphia, Pennsylvania
October 11, 2011
49
| Special 2011 tax information (unaudited) for Vanguard Russell 2000 Index Funds |
This information for the period ended August 31, 2011, is included pursuant to provisions of the Internal Revenue Code.
The funds distributed qualified dividend income to shareholders during the period as follows:
| Qualified Dividend Income | |
| Index Fund | ($000) |
| Russell 2000 Index | 49 |
| Russell 2000 Value Index | 26 |
| Russell 2000 Growth Index | 17 |
For corporate shareholders, the percentage of investment income (dividend income plus short-term gains, if any) that qualifies for the dividends-received deduction is as follows:
| Index Fund | Percentage |
| Russell 2000 Index | 65.7% |
| Russell 2000 Value Index | 56.7 |
| Russell 2000 Growth Index | 100.0 |
50
About Your Fund’s Expenses
As a shareholder of the fund, you incur ongoing costs, which include costs for portfolio management, administrative services, and shareholder reports (like this one), among others. Operating expenses, which are deducted from a fund’s gross income, directly reduce the investment return of the fund.
A fund’s expenses are expressed as a percentage of its average net assets. This figure is known as the expense ratio. The following examples are intended to help you understand the ongoing costs (in dollars) of investing in your fund and to compare these costs with those of other mutual funds. The examples are based on an investment of $1,000 made at the beginning of the period shown and held for the entire period.
The accompanying table illustrates your fund’s costs in two ways:
• Based on actual fund return. This section helps you to estimate the actual expenses that you paid over the period. The ”Ending Account Value“ shown is derived from the fund‘s actual return, and the third column shows the dollar amount that would have been paid by an investor who started with $1,000 in the fund. You may use the information here, together with the amount you invested, to estimate the expenses that you paid over the period.
To do so, simply divide your account value by $1,000 (for example, an $8,600 account value divided by $1,000 = 8.6), then multiply the result by the number given for your fund under the heading ”Expenses Paid During Period.“
• Based on hypothetical 5% yearly return. This section is intended to help you compare your fund‘s costs with those of other mutual funds. It assumes that the fund had a yearly return of 5% before expenses, but that the expense ratio is unchanged. In this case—because the return used is not the fund’s actual return—the results do not apply to your investment. The example is useful in making comparisons because the Securities and Exchange Commission requires all mutual funds to calculate expenses based on a 5% return. You can assess your fund’s costs by comparing this hypothetical example with the hypothetical examples that appear in shareholder reports of other funds.
Note that the expenses shown in the table are meant to highlight and help you compare ongoing costs only and do not reflect transaction costs incurred by the fund for buying and selling securities. Further, the expenses do not include any purchase, redemption, or account service fees described in the fund prospectus. If such fees were applied to your account, your costs would be higher. Your fund does not carry a “sales load.” The calculations assume no shares were bought or sold during the period. Your actual costs may have been higher or lower, depending on the amount of your investment and the timing of any purchases or redemptions.
You can find more information about the fund’s expenses, including annual expense ratios, in the Financial Statements section of this report. For additional information on operating expenses and other shareholder costs, please refer to your fund’s current prospectus.
51
| Six Months Ended August 31, 20111 | |||
| Beginning | Ending | Expenses | |
| Account Value | Account Value | Paid During | |
| 2/28/2011 | 8/31/2011 | Period2 | |
| Based on Actual Fund Return | |||
| Russell 2000 Index Fund | |||
| Institutional Shares | $1,000.00 | $888.36 | $0.38 |
| ETF Shares | 1,000.00 | 888.03 | 0.71 |
| Russell 2000 Value Index Fund | |||
| ETF Shares | $1,000.00 | $870.13 | $0.94 |
| Russell 2000 Growth Index Fund | |||
| ETF Shares | $1,000.00 | $905.14 | $0.96 |
| Based on Hypothetical 5% Yearly Return | |||
| Russell 2000 Index Fund | |||
| Institutional Shares | $1,000.00 | $1,024.80 | $0.41 |
| ETF Shares | 1,000.00 | 1,024.45 | 0.77 |
| Russell 2000 Value Index Fund | |||
| ETF Shares | $1,000.00 | $1,024.20 | $1.02 |
| Russell 2000 Growth Index Fund | |||
| ETF Shares | $1,000.00 | $1,024.20 | $1.02 |
1 This table does not include data for funds or share classes with fewer than six months of history.
2 The calculations are based on expenses incurred in the most recent six-month period.The funds’ annualized six-month expense ratios for
that period are: for the Russell 2000 Index Fund, 0.08% for Institutional Shares and 0.15% for ETF Shares; for the Russell 2000 Value Index
Fund, 0.20% for ETF Shares; for the Russell 2000 Growth Index Fund, 0.20% for ETF shares. The dollar amounts shown as “Expenses Paid”
are equal to the annualized expense ratio multiplied by the average account value over the period, multiplied by the number of days in the
most recent six-month period, then divided by the number of days in the most recent 12-month period.
52
Trustees Approve Advisory Arrangement
The board of trustees of Vanguard Russell 2000 Index Fund, Russell 2000 Value Index Fund, and Russell 2000 Growth Index Fund has renewed the funds’ investment advisory arrangement with The Vanguard Group, Inc. Vanguard—through its Quantitative Equity Group—serves as investment advisor to the funds. The board determined that continuing the funds’ internalized management structure was in the best interest of the funds and their shareholders.
The board based its decision upon an evaluation of the advisor’s investment staff, portfolio management process, and performance. The trustees considered the factors discussed below, among others. However, no single factor determined whether the board approved the arrangement. Rather, it was the totality of the circumstances that drove the board’s decision.
Nature, extent, and quality of services
The board considered the quality of the investment management services to be provided to the funds since their inception in 2010 and took into account the organizational depth and stability of the advisor. The board noted that Vanguard has been managing investments for more than three decades. The Quantitative Equity Group adheres to a sound, disciplined investment management process; the team has considerable experience, stability, and depth.
The board concluded that Vanguard’s experience, stability, depth, and performance, among other factors, warranted approval of the advisory arrangement.
Investment performance
The board considered the funds’ performance since their inception, including any periods of outperformance or underperformance of their target indexes and peer groups. The board concluded that the funds have performed in line with expectations and that their results have been consistent with their investment strategies. Information about each fund’s performance can be found in the Performance Summary pages of this report.
Cost
The board concluded that each fund’s expense ratio was well below the average expense ratio charged by funds in its peer group and that the funds’ advisory fee rates were also well below their peer group averages. Information about the funds’ expenses appears in the About Your Fund’s Expenses section of this report as well as in the Financial Statements sections.
The board does not conduct a profitability analysis of Vanguard, because of Vanguard’s unique “at-cost” structure. Unlike most other mutual fund management companies, Vanguard is owned by the funds it oversees, and produces “profits” only in the form of reduced expenses for fund shareholders.
The benefit of economies of scale
The board concluded that the funds’ low-cost arrangement with Vanguard ensures that the funds will realize economies of scale as they grow, with the cost to shareholders declining as fund assets
increase.
The board will consider whether to renew the advisory arrangement again after a one-year period.
53
Glossary
30-Day SEC Yield. A fund’s 30-day SEC yield is derived using a formula specified by the U.S. Securities and Exchange Commission. Under the formula, data related to the fund’s security holdings in the previous 30 days are used to calculate the fund’s hypothetical net income for that period, which is then annualized and divided by the fund’s estimated average net assets over the calculation period. For the purposes of this calculation, a security’s income is based on its current market yield to maturity (in the case of bonds) or its projected dividend yield (for stocks). Because the SEC yield represents hypothetical annualized income, it will differ—at times significantly—from the fund’s actual experience. As a result, the fund’s income distributions may be higher or lower than implied by the SEC yield.
Earnings Growth Rate. The average annual rate of growth in earnings over the past five years for the stocks now in a fund.
Equity Exposure. A measure that reflects a fund’s investments in stocks and stock futures. Any holdings in short-term reserves are excluded.
Expense Ratio. The percentage of a fund’s average net assets used to pay its annual administrative and advisory expenses. These expenses directly reduce returns to investors.
Foreign Holdings. The percentage of a fund represented by stocks or depositary receipts of companies based outside the United States.
Inception Date. The date on which the assets of a fund (or one of its share classes) are first invested in accordance with the fund’s investment objective. For funds with a subscription period, the inception date is the day after that period ends. Investment performance is measured from the inception date.
Median Market Cap. An indicator of the size of companies in which a fund invests; the midpoint of market capitalization (market price x shares outstanding) of a fund’s stocks, weighted by the proportion of the fund’s assets invested in each stock. Stocks representing half of the fund’s assets have market capitalizations above the median, and the rest are below it.
Price/Book Ratio. The share price of a stock divided by its net worth, or book value, per share. For a fund, the weighted average price/book ratio of the stocks it holds.
Price/Earnings Ratio. The ratio of a stock’s current price to its per-share earnings over the past year. For a fund, the weighted average P/E of the stocks it holds. P/E is an indicator of market expectations about corporate prospects; the higher the P/E, the greater the expectations for a company’s future growth.
Return on Equity. The annual average rate of return generated by a company during the past five years for each dollar of shareholder’s equity (net income divided by shareholder’s equity). For a fund, the weighted average return on equity for the companies whose stocks it holds.
Short-Term Reserves. The percentage of a fund invested in highly liquid, short-term securities that can be readily converted to cash.
Turnover Rate. An indication of the fund’s trading activity. Funds with high turnover rates incur higher transaction costs and may be more likely to distribute capital gains (which may be taxable to investors). The turnover rate excludes in-kind transactions, which have minimal impact on costs.
54
This page intentionally left blank.
The People Who Govern Your Fund
The trustees of your mutual fund are there to see that the fund is operated and managed in your best interests since, as a shareholder, you are a part owner of the fund. Your fund’s trustees also serve on the board of directors of The Vanguard Group, Inc., which is owned by the Vanguard funds and provides services to them on an at-cost basis.
A majority of Vanguard’s board members are independent, meaning that they have no affiliation with Vanguard or the funds they oversee, apart from the sizable personal investments they have made as private individuals. The independent board members have distinguished backgrounds in business, academia, and public service. Each of the trustees and executive officers oversees 178 Vanguard funds.
The following table provides information for each trustee and executive officer of the fund. More information about the trustees is in the Statement of Additional Information, which can be obtained, without charge, by contacting Vanguard at 800-662-7447, or online at vanguard.com.
| Interested Trustee1 | and President (2006–2008) of Rohm and Haas Co. |
| (chemicals); Director of Tyco International, Ltd. | |
| F. William McNabb III | (diversified manufacturing and services) and Hewlett- |
| Born 1957. Trustee Since July 2009. Chairman of the | Packard Co. (electronic computer manufacturing); |
| Board. Principal Occupation(s) During the Past Five | Senior Advisor at New Mountain Capital; Trustee |
| Years: Chairman of the Board of The Vanguard Group, | of The Conference Board; Member of the Board of |
| Inc., and of each of the investment companies served | Managers of Delphi Automotive LLP (automotive |
| by The Vanguard Group, since January 2010; Director | components). |
| of The Vanguard Group since 2008; Chief Executive | |
| Officer and President of The Vanguard Group and of | Amy Gutmann |
| each of the investment companies served by The | Born 1949. Trustee Since June 2006. Principal |
| Vanguard Group since 2008; Director of Vanguard | Occupation(s) During the Past Five Years: President |
| Marketing Corporation; Managing Director of The | of the University of Pennsylvania; Christopher H. |
| Vanguard Group (1995–2008). | Browne Distinguished Professor of Political Science |
| in the School of Arts and Sciences with secondary | |
| appointments at the Annenberg School for Commu- | |
| Independent Trustees | nication and the Graduate School of Education |
| of the University of Pennsylvania; Director of | |
| Emerson U. Fullwood | Carnegie Corporation of New York, Schuylkill River |
| Born 1948. Trustee Since January 2008. Principal | Development Corporation, and Greater Philadelphia |
| Occupation(s) During the Past Five Years: Executive | Chamber of Commerce; Trustee of the National |
| Chief Staff and Marketing Officer for North America | Constitution Center; Chair of the Presidential |
| and Corporate Vice President (retired 2008) of Xerox | Commission for the Study of Bioethical Issues. |
| Corporation (document management products and | |
| services); Executive in Residence and 2010 | JoAnn Heffernan Heisen |
| Distinguished Minett Professor at the Rochester | Born 1950. Trustee Since July 1998. Principal |
| Institute of Technology; Director of SPX Corporation | Occupation(s) During the Past Five Years: Corporate |
| (multi-industry manufacturing), the United Way of | Vice President and Chief Global Diversity Officer |
| Rochester, Amerigroup Corporation (managed health | (retired 2008) and Member of the Executive |
| care), the University of Rochester Medical Center, | Committee (1997–2008) of Johnson & Johnson |
| Monroe Community College Foundation, and North | (pharmaceuticals/consumer products); Director of |
| Carolina A&T University. | Skytop Lodge Corporation (hotels), the University |
| Medical Center at Princeton, the Robert Wood | |
| Rajiv L. Gupta | Johnson Foundation, and the Center for Work Life |
| Born 1945. Trustee Since December 2001.2 | Policy; Member of the Advisory Board of the |
| Principal Occupation(s) During the Past Five Years: | Maxwell School of Citizenship and Public Affairs |
| Chairman and Chief Executive Officer (retired 2009) | at Syracuse University. |
| F. Joseph Loughrey | Thomas J. Higgins | |
| Born 1949. Trustee Since October 2009. Principal | Born 1957. Chief Financial Officer Since September | |
| Occupation(s) During the Past Five Years: President | 2008. Principal Occupation(s) During the Past Five | |
| and Chief Operating Officer (retired 2009) and Vice | Years: Principal of The Vanguard Group, Inc.; Chief | |
| Chairman of the Board (2008–2009) of Cummins Inc. | Financial Officer of each of the investment companies | |
| (industrial machinery); Director of SKF AB (industrial | served by The Vanguard Group since 2008; Treasurer | |
| machinery), Hillenbrand, Inc. (specialized consumer | of each of the investment companies served by The | |
| services), the Lumina Foundation for Education, and | Vanguard Group (1998–2008). | |
| Oxfam America; Chairman of the Advisory Council | ||
| for the College of Arts and Letters and Member | Kathryn J. Hyatt | |
| of the Advisory Board to the Kellogg Institute for | Born 1955. Treasurer Since November 2008. Principal | |
| International Studies at the University of Notre Dame. | Occupation(s) During the Past Five Years: Principal | |
| of The Vanguard Group, Inc.; Treasurer of each of | ||
| André F. Perold | the investment companies served by The Vanguard | |
| Born 1952. Trustee Since December 2004. Principal | Group since 2008; Assistant Treasurer of each of the | |
| Occupation(s) During the Past Five Years: George | investment companies served by The Vanguard Group | |
| Gund Professor of Finance and Banking at the Harvard | (1988–2008). | |
| Business School (retired July 2011); Chief Investment | ||
| Officer and co-Managing Partner of HighVista | Heidi Stam | |
| Strategies LLC (private investment firm); Director of | Born 1956. Secretary Since July 2005. Principal | |
| Rand Merchant Bank; Overseer of the Museum of | Occupation(s) During the Past Five Years: Managing | |
| Fine Arts Boston. | Director of The Vanguard Group, Inc., since 2006; | |
| General Counsel of The Vanguard Group since 2005; | ||
| Alfred M. Rankin, Jr. | Secretary of The Vanguard Group and of each of the | |
| Born 1941. Trustee Since January 1993. Principal | investment companies served by The Vanguard Group | |
| Occupation(s) During the Past Five Years: Chairman, | since 2005; Director and Senior Vice President of | |
| President, and Chief Executive Officer of NACCO | Vanguard Marketing Corporation since 2005; | |
| Industries, Inc. (forklift trucks/housewares/lignite); | Principal of The Vanguard Group (1997–2006). | |
| Director of Goodrich Corporation (industrial products/ | ||
| aircraft systems and services) and the National | ||
| Association of Manufacturers; Chairman of the | Vanguard Senior Management Team | |
| Federal Reserve Bank of Cleveland; Vice Chairman | ||
| of University Hospitals of Cleveland; President of | R. Gregory Barton | Michael S. Miller |
| the Board of The Cleveland Museum of Art. | Mortimer J. Buckley | James M. Norris |
| Kathleen C. Gubanich | Glenn W. Reed | |
| Peter F. Volanakis | Paul A. Heller | George U. Sauter |
| Born 1955. Trustee Since July 2009. Principal | Martha G. King | |
| Occupation(s) During the Past Five Years: President | ||
| and Chief Operating Officer (retired 2010) of Corning | ||
| Incorporated (communications equipment); Director of | Chairman Emeritus and Senior Advisor | |
| Corning Incorporated (2000–2010) and Dow Corning | ||
| (2001–2010); Overseer of the Amos Tuck School of | John J. Brennan | |
| Business Administration at Dartmouth College. | Chairman, 1996–2009 | |
| Chief Executive Officer and President, 1996–2008 | ||
| Executive Officers | ||
| Founder | ||
| Glenn Booraem | ||
| Born 1967. Controller Since July 2010. Principal | John C. Bogle | |
| Occupation(s) During the Past Five Years: Principal | Chairman and Chief Executive Officer, 1974–1996 | |
| of The Vanguard Group, Inc.; Controller of each of | ||
| the investment companies served by The Vanguard | ||
| Group since 2010; Assistant Controller of each of | ||
| the investment companies served by The Vanguard | ||
| Group (2001–2010). | ||
1 Mr. McNabb is considered an “interested person,” as defined in the Investment Company Act of 1940, because he is an officer of the
Vanguard funds.
2 December 2002 for Vanguard Equity Income Fund, Vanguard Growth Equity Fund, the Vanguard Municipal Bond Funds, and the Vanguard
State Tax-Exempt Funds.

| |
| P.O. Box 2600 | |
| Valley Forge, PA 19482-2600 | |
Connect with Vanguard® > vanguard.com
| Fund Information > 800-662-7447 | |
| The Russell Indexes and Russell® are registered | |
| Direct Investor Account Services > 800-662-2739 | trademarks of Russell Investments and have been |
| licensed for use by The Vanguard Group, Inc. The | |
| Institutional Investor Services > 800-523-1036 | products are not sponsored, endorsed, sold or promoted |
| by Russell Investments and Russell Investments makes | |
| Text Telephone for People | no representation regarding the advisability of investing |
| With Hearing Impairment > 800-749-7273 | in the products. |
| This material may be used in conjunction | |
| with the offering of shares of any Vanguard | |
| fund only if preceded or accompanied by | |
| the fund’s current prospectus. | |
| All comparative mutual fund data are from Lipper Inc. | |
| or Morningstar, Inc., unless otherwise noted. | |
| You can obtain a free copy of Vanguard’s proxy voting | |
| guidelines by visiting vanguard.com/proxyreporting or | |
| by calling Vanguard at 800-662-2739. The guidelines | |
| are also available from the SEC’s website, sec.gov. | |
| In addition, you may obtain a free report on how your | |
| fund voted the proxies for securities it owned during | |
| the 12 months ended June 30. To get the report, visit | |
| either vanguard.com/proxyreporting or sec.gov. | |
| You can review and copy information about your fund | |
| at the SEC’s Public Reference Room in Washington, D.C. | |
| To find out more about this public service, call the SEC | |
| at 202-551-8090. Information about your fund is also | |
| available on the SEC’s website, and you can receive | |
| copies of this information, for a fee, by sending a | |
| request in either of two ways: via e-mail addressed to | |
| publicinfo@sec.gov or via regular mail addressed to the | |
| Public Reference Section, Securities and Exchange | |
| Commission, Washington, DC 20549-1520. | |
| © 2011 The Vanguard Group, Inc. | |
| All rights reserved. | |
| Vanguard Marketing Corporation, Distributor. | |
| Q18510 102011 | |
| Vanguard® Russell 2000 Index Fund | ||
| Schedule of Investments | ||
| August 31, 2011 | ||
| Market | ||
| Value | ||
| Shares | ($000) | |
| Common Stocks (99.7%) 1 | ||
| Consumer Discretionary (13.2%) | ||
| Sotheby's | 6,603 | 246 |
| * Warnaco Group Inc. | 4,302 | 230 |
| * Crocs Inc. | 8,360 | 229 |
| * Tenneco Inc. | 5,911 | 194 |
| Cinemark Holdings Inc. | 9,085 | 190 |
| * Dana Holding Corp. | 14,297 | 182 |
| Wolverine World Wide Inc. | 4,852 | 177 |
| Rent-A-Center Inc. | 6,220 | 175 |
| * Ascena Retail Group Inc. | 6,140 | 174 |
| * Domino's Pizza Inc. | 6,035 | 167 |
| * Timberland Co. Class A | 3,887 | 167 |
| * Life Time Fitness Inc. | 4,135 | 159 |
| * Shutterfly Inc. | 2,913 | 156 |
| * Cheesecake Factory Inc. | 5,646 | 155 |
| * Carter's Inc. | 4,805 | 149 |
| Men's Wearhouse Inc. | 5,033 | 145 |
| Vail Resorts Inc. | 3,520 | 142 |
| * Coinstar Inc. | 3,065 | 140 |
| * Iconix Brand Group Inc. | 7,131 | 140 |
| * JOS A Bank Clothiers Inc. | 2,701 | 138 |
| Brunswick Corp. | 8,704 | 138 |
| Six Flags Entertainment Corp. | 4,076 | 137 |
| * Steven Madden Ltd. | 3,698 | 134 |
| * Live Nation Entertainment Inc. | 13,796 | 128 |
| * HSN Inc. | 3,908 | 126 |
| Hillenbrand Inc. | 6,129 | 125 |
| * Genesco Inc. | 2,316 | 123 |
| Pool Corp. | 4,710 | 122 |
| * Valassis Communications Inc. | 4,803 | 121 |
| * ANN Inc. | 5,089 | 120 |
| Monro Muffler Brake Inc. | 2,981 | 118 |
| Strayer Education Inc. | 1,197 | 113 |
| * Pier 1 Imports Inc. | 10,402 | 111 |
| * Buffalo Wild Wings Inc. | 1,791 | 110 |
| * New York Times Co. Class A | 13,408 | 110 |
| * Childrens Place Retail Stores Inc. | 2,551 | 109 |
| * Saks Inc. | 11,274 | 109 |
| * BJ's Restaurants Inc. | 2,352 | 109 |
| * Vitamin Shoppe Inc. | 2,426 | 107 |
| Buckle Inc. | 2,634 | 104 |
| Express Inc. | 5,402 | 103 |
| Finish Line Inc. Class A | 5,067 | 102 |
| Jones Group Inc. | 8,549 | 100 |
| * Hibbett Sports Inc. | 2,679 | 100 |
| Arbitron Inc. | 2,653 | 100 |
| * Cabela's Inc. | 4,230 | 99 |
| Group 1 Automotive Inc. | 2,349 | 98 |
| Matthews International Corp. Class A | 2,885 | 96 |
| Cracker Barrel Old Country Store Inc. | 2,244 | 95 |
| Bob Evans Farms Inc. | 2,963 | 94 |
| * Jack in the Box Inc. | 4,528 | 94 |
| Meredith Corp. | 3,552 | 92 |
| * Helen of Troy Ltd. | 3,018 | 91 |
| * Aeropostale Inc. | 7,892 | 88 |
| Texas Roadhouse Inc. Class A | 6,152 | 88 |
| * Gaylord Entertainment Co. | 3,485 | 88 |
| * Select Comfort Corp. | 5,434 | 86 |
| * 99 Cents Only Stores | 4,579 | 85 |
| American Greetings Corp. Class A | 3,951 | 84 |
| * Eastman Kodak Co. | 26,299 | 84 |
| Regis Corp. | 5,648 | 83 |
1
| Vanguard® Russell 2000 Index Fund | ||
| Schedule of Investments | ||
| August 31, 2011 | ||
| Market | ||
| Value | ||
| Shares | ($000) | |
| * Pinnacle Entertainment Inc. | 6,053 | 83 |
| * Collective Brands Inc. | 6,018 | 81 |
| Penske Automotive Group Inc. | 4,364 | 80 |
| * True Religion Apparel Inc. | 2,520 | 77 |
| National CineMedia Inc. | 5,391 | 76 |
| Cooper Tire & Rubber Co. | 6,070 | 74 |
| * Orient-Express Hotels Ltd. Class A | 9,316 | 73 |
| * Peet's Coffee & Tea Inc. | 1,253 | 73 |
| International Speedway Corp. Class A | 2,879 | 72 |
| Scholastic Corp. | 2,598 | 72 |
| * American Public Education Inc. | 1,749 | 72 |
| MDC Holdings Inc. | 3,667 | 72 |
| * Office Depot Inc. | 27,133 | 71 |
| Cato Corp. Class A | 2,704 | 69 |
| * K12 Inc. | 2,542 | 68 |
| * Vera Bradley Inc. | 1,936 | 68 |
| * Ascent Capital Group Inc. Class A | 1,408 | 67 |
| PF Chang's China Bistro Inc. | 2,222 | 67 |
| * iRobot Corp. | 2,323 | 65 |
| * DineEquity Inc. | 1,512 | 63 |
| Columbia Sportswear Co. | 1,187 | 63 |
| Sturm Ruger & Co. Inc. | 1,845 | 61 |
| * American Axle & Manufacturing Holdings Inc. | 6,527 | 61 |
| CEC Entertainment Inc. | 1,940 | 60 |
| * Skechers U.S.A. Inc. Class A | 3,660 | 59 |
| Ameristar Casinos Inc. | 3,150 | 59 |
| * Steiner Leisure Ltd. | 1,470 | 59 |
| * Maidenform Brands Inc. | 2,288 | 58 |
| Stage Stores Inc. | 3,530 | 58 |
| * Papa John's International Inc. | 1,929 | 57 |
| * Sonic Corp. | 6,042 | 56 |
| Sonic Automotive Inc. Class A | 3,934 | 55 |
| * GNC Holdings Inc. | 2,233 | 54 |
| Churchill Downs Inc. | 1,229 | 54 |
| * Asbury Automotive Group Inc. | 2,854 | 54 |
| * Quiksilver Inc. | 12,684 | 53 |
| * Ruby Tuesday Inc. | 6,364 | 53 |
| * Modine Manufacturing Co. | 4,549 | 52 |
| * Krispy Kreme Doughnuts Inc. | 5,717 | 52 |
| * Meritage Homes Corp. | 2,732 | 51 |
| PEP Boys-Manny Moe & Jack | 5,147 | 51 |
| Ryland Group Inc. | 4,339 | 51 |
| * Scientific Games Corp. Class A | 5,688 | 50 |
| * OfficeMax Inc. | 7,933 | 50 |
| * Interval Leisure Group Inc. | 3,933 | 50 |
| Belo Corp. Class A | 9,051 | 49 |
| * Capella Education Co. | 1,538 | 49 |
| * Blue Nile Inc. | 1,256 | 49 |
| * Liz Claiborne Inc. | 9,246 | 48 |
| KB Home | 7,102 | 47 |
| * Shuffle Master Inc. | 5,282 | 47 |
| Stewart Enterprises Inc. Class A | 7,702 | 47 |
| * Central European Media Enterprises Ltd. Class A | 3,582 | 46 |
| * G-III Apparel Group Ltd. | 1,615 | 46 |
| * Jakks Pacific Inc. | 2,660 | 45 |
| Oxford Industries Inc. | 1,255 | 45 |
| * La-Z-Boy Inc. | 5,070 | 45 |
| * Wet Seal Inc. Class A | 8,835 | 45 |
| Fred's Inc. Class A | 3,843 | 44 |
| * Grand Canyon Education Inc. | 2,803 | 44 |
| * Exide Technologies | 7,566 | 43 |
| Lithia Motors Inc. Class A | 2,157 | 41 |
| Ethan Allen Interiors Inc. | 2,360 | 41 |
| * Knology Inc. | 2,937 | 40 |
2
| Vanguard® Russell 2000 Index Fund | ||
| Schedule of Investments | ||
| August 31, 2011 | ||
| Market | ||
| Value | ||
| Shares | ($000) | |
| * Core-Mark Holding Co. Inc. | 1,114 | 40 |
| * Red Robin Gourmet Burgers Inc. | 1,268 | 40 |
| Superior Industries International Inc. | 2,288 | 39 |
| * Biglari Holdings Inc. | 119 | 39 |
| MDC Partners Inc. Class A | 2,451 | 39 |
| * Bravo Brio Restaurant Group Inc. | 1,883 | 39 |
| * Bridgepoint Education Inc. | 1,747 | 39 |
| Sinclair Broadcast Group Inc. Class A | 4,931 | 39 |
| * Zumiez Inc. | 2,077 | 38 |
| Barnes & Noble Inc. | 2,839 | 38 |
| Drew Industries Inc. | 1,869 | 37 |
| * Rue21 Inc. | 1,465 | 37 |
| * Denny's Corp. | 9,670 | 37 |
| HOT Topic Inc. | 4,375 | 36 |
| * Charming Shoppes Inc. | 11,363 | 36 |
| Brown Shoe Co. Inc. | 4,335 | 36 |
| Callaway Golf Co. | 6,297 | 35 |
| Harte-Hanks Inc. | 4,327 | 34 |
| * Fuel Systems Solutions Inc. | 1,627 | 34 |
| * Lumber Liquidators Holdings Inc. | 2,262 | 34 |
| * Dorman Products Inc. | 1,058 | 34 |
| Nutrisystem Inc. | 2,636 | 34 |
| * Boyd Gaming Corp. | 5,356 | 33 |
| * Zagg Inc. | 2,165 | 33 |
| * AFC Enterprises Inc. | 2,421 | 31 |
| * Lions Gate Entertainment Corp. | 4,406 | 31 |
| * Universal Technical Institute Inc. | 2,086 | 30 |
| * Perry Ellis International Inc. | 1,268 | 29 |
| * Amerigon Inc. | 2,175 | 29 |
| Blyth Inc. | 509 | 29 |
| * Universal Electronics Inc. | 1,469 | 29 |
| * EW Scripps Co. Class A | 3,330 | 28 |
| * America's Car-Mart Inc. | 898 | 27 |
| * Standard Pacific Corp. | 10,384 | 27 |
| Bebe Stores Inc. | 3,756 | 26 |
| World Wrestling Entertainment Inc. Class A | 2,665 | 26 |
| Standard Motor Products Inc. | 1,923 | 25 |
| * Libbey Inc. | 1,939 | 25 |
| * Cavco Industries Inc. | 667 | 24 |
| Movado Group Inc. | 1,692 | 23 |
| * Fisher Communications Inc. | 863 | 23 |
| * Shoe Carnival Inc. | 896 | 23 |
| * Winnebago Industries Inc. | 2,847 | 22 |
| Haverty Furniture Cos. Inc. | 1,837 | 22 |
| Lincoln Educational Services Corp. | 2,208 | 22 |
| PetMed Express Inc. | 2,116 | 21 |
| * Stoneridge Inc. | 2,586 | 21 |
| * Body Central Corp. | 1,150 | 20 |
| * Global Traffic Network Inc. | 1,398 | 20 |
| Marcus Corp. | 1,993 | 19 |
| * hhgregg Inc. | 1,768 | 19 |
| * Smith & Wesson Holding Corp. | 5,891 | 19 |
| * Caribou Coffee Co. Inc. | 1,263 | 19 |
| Stein Mart Inc. | 2,685 | 19 |
| * Talbots Inc. | 6,451 | 19 |
| * Arctic Cat Inc. | 1,187 | 19 |
| * Ruth's Hospitality Group Inc. | 3,439 | 18 |
| * Casual Male Retail Group Inc. | 4,119 | 17 |
| * Citi Trends Inc. | 1,464 | 17 |
| * Tuesday Morning Corp. | 4,213 | 17 |
| Christopher & Banks Corp. | 3,499 | 17 |
| Mac-Gray Corp. | 1,163 | 16 |
| * Steinway Musical Instruments Inc. | 645 | 16 |
| Big 5 Sporting Goods Corp. | 2,150 | 16 |
3
| Vanguard® Russell 2000 Index Fund | ||
| Schedule of Investments | ||
| August 31, 2011 | ||
| Market | ||
| Value | ||
| Shares | ($000) | |
| Weyco Group Inc. | 701 | 16 |
| * Corinthian Colleges Inc. | 7,190 | 16 |
| * Journal Communications Inc. Class A | 4,223 | 16 |
| * Teavana Holdings Inc. | 600 | 16 |
| Speedway Motorsports Inc. | 1,155 | 15 |
| * MarineMax Inc. | 2,271 | 15 |
| * Unifi Inc. | 1,362 | 15 |
| * Kirkland's Inc. | 1,638 | 15 |
| * M/I Homes Inc. | 1,829 | 15 |
| * Town Sports International Holdings Inc. | 2,004 | 15 |
| Spartan Motors Inc. | 3,260 | 15 |
| * Beazer Homes USA Inc. | 7,031 | 15 |
| * Morgans Hotel Group Co. | 2,157 | 15 |
| Destination Maternity Corp. | 1,049 | 15 |
| * Entercom Communications Corp. Class A | 2,365 | 14 |
| * Cost Plus Inc. | 1,857 | 14 |
| * Valuevision Media Inc. Class A | 3,776 | 14 |
| * Systemax Inc. | 1,056 | 14 |
| * ReachLocal Inc. | 975 | 14 |
| CSS Industries Inc. | 793 | 14 |
| * West Marine Inc. | 1,447 | 14 |
| * Leapfrog Enterprises Inc. | 4,051 | 13 |
| * Rentrak Corp. | 930 | 13 |
| Ambassadors Group Inc. | 1,731 | 13 |
| * Isle of Capri Casinos Inc. | 1,995 | 13 |
| * Multimedia Games Holding Co. Inc. | 2,630 | 13 |
| * K-Swiss Inc. Class A | 2,417 | 13 |
| * Zale Corp. | 3,141 | 13 |
| * Motorcar Parts of America Inc. | 1,180 | 12 |
| * Archipelago Learning Inc. | 1,277 | 12 |
| * Overstock.com Inc. | 1,132 | 12 |
| * interCLICK Inc. | 2,005 | 12 |
| * Delta Apparel Inc. | 693 | 12 |
| Cherokee Inc. | 832 | 12 |
| * Furniture Brands International Inc. | 4,080 | 11 |
| * Carrols Restaurant Group Inc. | 1,231 | 11 |
| * Jamba Inc. | 6,443 | 11 |
| * Audiovox Corp. Class A | 1,765 | 11 |
| * Saga Communications Inc. Class A | 353 | 11 |
| * Benihana Inc. Class A | 1,303 | 11 |
| Winmark Corp. | 221 | 10 |
| * O'Charleys Inc. (Foreign) | 1,803 | 10 |
| * Red Lion Hotels Corp. | 1,435 | 10 |
| * Black Diamond Inc. | 1,294 | 10 |
| * Sealy Corp. | 4,835 | 10 |
| AH Belo Corp. Class A | 1,823 | 10 |
| Outdoor Channel Holdings Inc. | 1,405 | 10 |
| Lifetime Brands Inc. | 908 | 10 |
| * Build-A-Bear Workshop Inc. | 1,626 | 10 |
| * New York & Co. Inc. | 2,662 | 9 |
| * Hovnanian Enterprises Inc. Class A | 5,652 | 9 |
| * Gray Television Inc. | 4,849 | 9 |
| * US Auto Parts Network Inc. | 1,447 | 9 |
| * Summer Infant Inc. | 1,304 | 9 |
| * Global Sources Ltd. | 1,114 | 9 |
| * McClatchy Co. Class A | 5,325 | 9 |
| * LIN TV Corp. Class A | 2,898 | 9 |
| * Monarch Casino & Resort Inc. | 874 | 9 |
| * Martha Stewart Living Omnimedia Class A | 2,660 | 9 |
| RG Barry Corp. | 841 | 9 |
| * Tower International Inc. | 613 | 9 |
| * Geeknet Inc. | 405 | 9 |
| * Luby's Inc. | 1,844 | 8 |
| * HomeAway Inc. | 200 | 8 |
4
| Vanguard® Russell 2000 Index Fund | ||
| Schedule of Investments | ||
| August 31, 2011 | ||
| Market | ||
| Value | ||
| Shares | ($000) | |
| Einstein Noah Restaurant Group Inc. | 557 | 8 |
| * Kenneth Cole Productions Inc. Class A | 707 | 8 |
| * Conn's Inc. | 1,416 | 8 |
| * McCormick & Schmick's Seafood Restaurants Inc. | 1,293 | 8 |
| Bon-Ton Stores Inc. | 1,147 | 8 |
| * Gordmans Stores Inc. | 500 | 7 |
| National American University Holdings Inc. | 827 | 7 |
| * Johnson Outdoors Inc. Class A | 453 | 7 |
| Skyline Corp. | 646 | 7 |
| * Francesca's Holdings Corp. | 300 | 7 |
| * Pacific Sunwear of California Inc. | 4,376 | 7 |
| * Nexstar Broadcasting Group Inc. Class A | 1,009 | 6 |
| * 1-800-Flowers.com Inc. Class A | 2,464 | 6 |
| * Coldwater Creek Inc. | 5,611 | 6 |
| * Cumulus Media Inc. Class A | 2,100 | 6 |
| * Syms Corp. | 616 | 5 |
| * Marine Products Corp. | 964 | 5 |
| * Entravision Communications Corp. Class A | 4,625 | 5 |
| Shiloh Industries Inc. | 515 | 5 |
| * Skullcandy Inc. | 300 | 5 |
| * Orbitz Worldwide Inc. | 1,930 | 5 |
| * Crown Media Holdings Inc. Class A | 3,416 | 4 |
| * Cambium Learning Group Inc. | 1,496 | 4 |
| * Westwood One Inc. | 508 | 3 |
| Value Line Inc. | 127 | 2 |
| 14,157 | ||
| Consumer Staples (3.6%) | ||
| Nu Skin Enterprises Inc. Class A | 5,357 | 227 |
| Ruddick Corp. | 4,803 | 196 |
| * Darling International Inc. | 11,437 | 193 |
| * United Natural Foods Inc. | 4,729 | 192 |
| * TreeHouse Foods Inc. | 3,470 | 190 |
| Diamond Foods Inc. | 2,153 | 170 |
| Casey's General Stores Inc. | 3,711 | 167 |
| Pricesmart Inc. | 1,739 | 114 |
| Lancaster Colony Corp. | 1,830 | 111 |
| * Hain Celestial Group Inc. | 3,501 | 111 |
| * Fresh Market Inc. | 2,749 | 106 |
| Snyders-Lance Inc. | 4,618 | 103 |
| Universal Corp. | 2,265 | 92 |
| Fresh Del Monte Produce Inc. | 3,569 | 86 |
| B&G Foods Inc. Class A | 4,683 | 85 |
| Sanderson Farms Inc. | 2,165 | 85 |
| Vector Group Ltd. | 4,480 | 84 |
| * Elizabeth Arden Inc. | 2,390 | 77 |
| Andersons Inc. | 1,819 | 73 |
| J&J Snack Foods Corp. | 1,398 | 71 |
| WD-40 Co. | 1,654 | 68 |
| * Boston Beer Co. Inc. Class A | 804 | 65 |
| * Rite Aid Corp. | 57,607 | 63 |
| Tootsie Roll Industries Inc. | 2,324 | 59 |
| * Prestige Brands Holdings Inc. | 4,915 | 53 |
| * Heckmann Corp. | 9,032 | 52 |
| * Central European Distribution Corp. | 7,109 | 50 |
| * Chiquita Brands International Inc. | 4,440 | 46 |
| Cal-Maine Foods Inc. | 1,386 | 45 |
| * Spectrum Brands Holdings Inc. | 1,634 | 44 |
| * Winn-Dixie Stores Inc. | 5,457 | 42 |
| Weis Markets Inc. | 1,076 | 42 |
| * Dole Food Co. Inc. | 3,508 | 40 |
| Nash Finch Co. | 1,184 | 38 |
| * Central Garden and Pet Co. Class A | 4,631 | 36 |
| Spartan Stores Inc. | 2,208 | 36 |
| * Smart Balance Inc. | 5,816 | 29 |
5
| Vanguard® Russell 2000 Index Fund | ||
| Schedule of Investments | ||
| August 31, 2011 | ||
| Market | ||
| Value | ||
| Shares | ($000) | |
| * Smart Balance Inc. | 2,069 | 29 |
| * Pantry Inc. | 2,248 | 28 |
| * Alliance One International Inc. | 8,513 | 27 |
| Inter Parfums Inc. | 1,574 | 26 |
| Coca-Cola Bottling Co. Consolidated | 448 | 25 |
| * Star Scientific Inc. | 10,466 | 25 |
| Calavo Growers Inc. | 1,157 | 23 |
| * Omega Protein Corp. | 1,893 | 23 |
| * Medifast Inc. | 1,347 | 22 |
| * Seneca Foods Corp. Class A | 903 | 21 |
| Ingles Markets Inc. Class A | 1,232 | 19 |
| * Nature's Sunshine Products Inc. | 1,092 | 19 |
| National Beverage Corp. | 1,094 | 18 |
| * USANA Health Sciences Inc. | 665 | 17 |
| * Susser Holdings Corp. | 786 | 17 |
| * Pilgrim's Pride Corp. | 4,671 | 16 |
| Village Super Market Inc. Class A | 611 | 15 |
| * Revlon Inc. Class A | 1,062 | 14 |
| Limoneira Co. | 765 | 13 |
| * Nutraceutical International Corp. | 899 | 13 |
| Schiff Nutrition International Inc. | 1,194 | 12 |
| Imperial Sugar Co. | 1,200 | 11 |
| * Synutra International Inc. | 1,662 | 10 |
| * Primo Water Corp. | 1,381 | 10 |
| Oil-Dri Corp. of America | 488 | 9 |
| Arden Group Inc. | 112 | 9 |
| Female Health Co. | 1,806 | 8 |
| Alico Inc. | 334 | 7 |
| MGP Ingredients Inc. | 1,099 | 7 |
| Griffin Land & Nurseries Inc. | 231 | 6 |
| * Craft Brewers Alliance Inc. | 984 | 6 |
| * Lifeway Foods Inc. | 442 | 5 |
| Farmer Bros Co. | 683 | 4 |
| * Harbinger Group Inc. | 806 | 4 |
| 3,859 | ||
| Energy (7.0%) | ||
| World Fuel Services Corp. | 6,922 | 257 |
| Berry Petroleum Co. Class A | 5,039 | 247 |
| * CVR Energy Inc. | 8,582 | 244 |
| * Rosetta Resources Inc. | 5,181 | 238 |
| * Complete Production Services Inc. | 7,715 | 224 |
| * Bill Barrett Corp. | 4,614 | 221 |
| * Dril-Quip Inc. | 3,360 | 217 |
| * Energy XXI Bermuda Ltd. | 7,362 | 197 |
| Lufkin Industries Inc. | 2,978 | 185 |
| * Key Energy Services Inc. | 12,196 | 175 |
| * Helix Energy Solutions Group Inc. | 10,363 | 175 |
| Bristow Group Inc. | 3,550 | 156 |
| * Oasis Petroleum Inc. | 5,819 | 155 |
| * Patriot Coal Corp. | 8,924 | 131 |
| Golar LNG Ltd. | 3,899 | 129 |
| * Swift Energy Co. | 4,147 | 128 |
| * Stone Energy Corp. | 4,790 | 126 |
| * Northern Oil and Gas Inc. | 6,173 | 126 |
| * McMoRan Exploration Co. | 9,602 | 124 |
| * Kodiak Oil & Gas Corp. | 20,458 | 123 |
| * Cloud Peak Energy Inc. | 5,959 | 119 |
| * Gulfport Energy Corp. | 4,082 | 118 |
| * Carrizo Oil & Gas Inc. | 3,806 | 114 |
| * Comstock Resources Inc. | 4,655 | 95 |
| * SemGroup Corp. Class A | 4,058 | 93 |
| * Gulfmark Offshore Inc. | 2,322 | 92 |
| * ION Geophysical Corp. | 12,842 | 91 |
| * Western Refining Inc. | 5,158 | 90 |
6
| Vanguard® Russell 2000 Index Fund | ||
| Schedule of Investments | ||
| August 31, 2011 | ||
| Market | ||
| Value | ||
| Shares | ($000) | |
| Nordic American Tankers Ltd. | 4,617 | 83 |
| * Tetra Technologies Inc. | 7,510 | 77 |
| * Pioneer Drilling Co. | 6,024 | 76 |
| * Exterran Holdings Inc. | 6,248 | 74 |
| * Newpark Resources Inc. | 8,837 | 73 |
| Contango Oil & Gas Co. | 1,194 | 72 |
| W&T Offshore Inc. | 3,407 | 72 |
| Apco Oil and Gas International Inc. | 893 | 71 |
| Ship Finance International Ltd. | 4,401 | 70 |
| * Hyperdynamics Corp. | 15,206 | 68 |
| * Parker Drilling Co. | 11,406 | 65 |
| * Clean Energy Fuels Corp. | 4,845 | 64 |
| * Cheniere Energy Inc. | 8,095 | 63 |
| * Resolute Energy Corp. | 4,512 | 61 |
| * ATP Oil & Gas Corp. | 4,352 | 59 |
| * Petroleum Development Corp. | 2,297 | 55 |
| * Hornbeck Offshore Services Inc. | 2,233 | 54 |
| * Basic Energy Services Inc. | 2,356 | 51 |
| * Tesco Corp. | 2,951 | 49 |
| * Magnum Hunter Resources Corp. | 10,887 | 49 |
| Targa Resources Corp. | 1,606 | 48 |
| * Hercules Offshore Inc. | 11,259 | 47 |
| Crosstex Energy Inc. | 3,969 | 46 |
| * Georesources Inc. | 1,962 | 46 |
| Overseas Shipholding Group Inc. | 2,457 | 44 |
| * Global Industries Ltd. | 9,895 | 44 |
| * Rex Energy Corp. | 3,410 | 42 |
| * Petroquest Energy Inc. | 5,477 | 42 |
| * Approach Resources Inc. | 2,193 | 41 |
| * C&J Energy Services Inc. | 1,556 | 41 |
| * Goodrich Petroleum Corp. | 2,533 | 41 |
| Knightsbridge Tankers Ltd. | 2,149 | 39 |
| * Energy Partners Ltd. | 2,829 | 38 |
| * Harvest Natural Resources Inc. | 3,322 | 38 |
| Frontline Ltd. | 4,757 | 37 |
| * BPZ Resources Inc. | 9,981 | 37 |
| * Endeavour International Corp. | 3,630 | 36 |
| * James River Coal Co. | 3,278 | 35 |
| * Amyris Inc. | 1,725 | 35 |
| Gulf Island Fabrication Inc. | 1,403 | 34 |
| Penn Virginia Corp. | 4,215 | 34 |
| * Venoco Inc. | 2,891 | 33 |
| * Clayton Williams Energy Inc. | 577 | 33 |
| * FX Energy Inc. | 5,115 | 32 |
| * Vaalco Energy Inc. | 5,000 | 32 |
| * OYO Geospace Corp. | 425 | 31 |
| * Abraxas Petroleum Corp. | 8,043 | 30 |
| * PHI Inc. | 1,276 | 29 |
| * Matrix Service Co. | 2,584 | 28 |
| Houston American Energy Corp. | 1,616 | 28 |
| * Dawson Geophysical Co. | 774 | 27 |
| Teekay Tankers Ltd. Class A | 4,144 | 27 |
| * Vantage Drilling Co. | 17,073 | 26 |
| * Cal Dive International Inc. | 8,803 | 26 |
| * Willbros Group Inc. | 3,819 | 25 |
| * Uranium Energy Corp. | 6,970 | 24 |
| * Warren Resources Inc. | 6,982 | 24 |
| * Gastar Exploration Ltd. | 5,675 | 24 |
| * USEC Inc. | 10,709 | 23 |
| * Triangle Petroleum Corp. | 4,198 | 23 |
| * Callon Petroleum Co. | 3,823 | 22 |
| * Rentech Inc. | 21,785 | 22 |
| * Green Plains Renewable Energy Inc. | 2,027 | 21 |
| * Global Geophysical Services Inc. | 1,771 | 21 |
7
| Vanguard® Russell 2000 Index Fund | ||
| Schedule of Investments | ||
| August 31, 2011 | ||
| Market | ||
| Value | ||
| Shares | ($000) | |
| Delek US Holdings Inc. | 1,390 | 21 |
| * Mitcham Industries Inc. | 1,175 | 20 |
| Panhandle Oil and Gas Inc. Class A | 688 | 19 |
| DHT Holdings Inc. | 6,301 | 19 |
| * GMX Resources Inc. | 5,862 | 17 |
| * Scorpio Tankers Inc. | 2,430 | 17 |
| * Natural Gas Services Group Inc. | 1,194 | 15 |
| * Solazyme Inc. | 1,073 | 15 |
| * Uranerz Energy Corp. | 6,311 | 15 |
| * Ur-Energy Inc. | 10,116 | 13 |
| * Voyager Oil & Gas Inc. | 4,592 | 13 |
| * Union Drilling Inc. | 1,481 | 13 |
| * REX American Resources Corp. | 665 | 11 |
| * Uranium Resources Inc. | 9,130 | 11 |
| * Syntroleum Corp. | 8,631 | 10 |
| Alon USA Energy Inc. | 1,109 | 10 |
| * Miller Energy Resources Inc. | 2,866 | 10 |
| * Westmoreland Coal Co. | 968 | 10 |
| * Evolution Petroleum Corp. | 1,571 | 10 |
| * RigNet Inc. | 543 | 8 |
| * L&L Energy Inc. | 2,058 | 7 |
| * Isramco Inc. | 102 | 7 |
| * Zion Oil & Gas Inc. | 2,350 | 7 |
| * Gevo Inc. | 566 | 6 |
| * Crimson Exploration Inc. | 2,101 | 5 |
| * Geokinetics Inc. | 1,057 | 5 |
| * CAMAC Energy Inc. | 5,702 | 5 |
| General Maritime Corp. | 10,707 | 4 |
| Hallador Energy Co. | 410 | 3 |
| * Magnum Hunter Resources Corp. Warrants Exp. 10/14/2013 | 1,086 | — |
| 7,478 | ||
| Financials (21.7%) | ||
| MFA Financial Inc. | 34,805 | 261 |
| American Campus Communities Inc. | 6,639 | 259 |
| Mid-America Apartment Communities Inc. | 3,588 | 256 |
| Home Properties Inc. | 3,820 | 255 |
| * Signature Bank | 4,498 | 250 |
| Tanger Factory Outlet Centers | 8,399 | 236 |
| BioMed Realty Trust Inc. | 12,830 | 235 |
| Hancock Holding Co. | 7,460 | 233 |
| Highwoods Properties Inc. | 7,050 | 231 |
| National Retail Properties Inc. | 8,310 | 227 |
| * ProAssurance Corp. | 2,990 | 217 |
| CBL & Associates Properties Inc. | 14,503 | 213 |
| Equity Lifestyle Properties Inc. | 3,009 | 207 |
| Kilroy Realty Corp. | 5,714 | 204 |
| Post Properties Inc. | 4,872 | 204 |
| Hatteras Financial Corp. | 7,307 | 202 |
| Washington Real Estate Investment Trust | 6,447 | 199 |
| Invesco Mortgage Capital Inc. | 11,265 | 199 |
| Extra Space Storage Inc. | 9,177 | 197 |
| * SVB Financial Group | 4,192 | 193 |
| Entertainment Properties Trust | 4,560 | 192 |
| Alterra Capital Holdings Ltd. | 8,870 | 181 |
| Omega Healthcare Investors Inc. | 9,933 | 180 |
| Apollo Investment Corp. | 19,151 | 174 |
| Prosperity Bancshares Inc. | 4,583 | 173 |
| Colonial Properties Trust | 8,160 | 172 |
| Starwood Property Trust Inc. | 9,112 | 169 |
| Cash America International Inc. | 2,874 | 161 |
| * Stifel Financial Corp. | 5,251 | 158 |
| First American Financial Corp. | 10,281 | 157 |
| LaSalle Hotel Properties | 8,318 | 156 |
| * Ezcorp Inc. Class A | 4,588 | 154 |
8
| Vanguard® Russell 2000 Index Fund | ||
| Schedule of Investments | ||
| August 31, 2011 | ||
| Market | ||
| Value | ||
| Shares | ($000) | |
| * First Cash Financial Services Inc. | 3,061 | 143 |
| * CNO Financial Group Inc. | 21,678 | 139 |
| Iberiabank Corp. | 2,884 | 139 |
| Trustmark Corp. | 6,256 | 135 |
| DuPont Fabros Technology Inc. | 5,750 | 133 |
| FirstMerit Corp. | 10,679 | 133 |
| Healthcare Realty Trust Inc. | 7,598 | 133 |
| Potlatch Corp. | 3,924 | 132 |
| Two Harbors Investment Corp. | 13,742 | 132 |
| Webster Financial Corp. | 7,042 | 127 |
| * Knight Capital Group Inc. Class A | 9,811 | 127 |
| DiamondRock Hospitality Co. | 16,361 | 127 |
| Northwest Bancshares Inc. | 10,372 | 124 |
| * Portfolio Recovery Associates Inc. | 1,673 | 122 |
| UMB Financial Corp. | 3,129 | 121 |
| Westamerica Bancorporation | 2,823 | 120 |
| Medical Properties Trust Inc. | 10,921 | 117 |
| Platinum Underwriters Holdings Ltd. | 3,644 | 115 |
| Delphi Financial Group Inc. | 4,718 | 114 |
| RLI Corp. | 1,783 | 113 |
| FNB Corp. | 12,406 | 111 |
| United Bankshares Inc. | 4,901 | 110 |
| Sovran Self Storage Inc. | 2,707 | 110 |
| Capstead Mortgage Corp. | 8,239 | 110 |
| Umpqua Holdings Corp. | 11,206 | 109 |
| National Health Investors Inc. | 2,384 | 109 |
| DCT Industrial Trust Inc. | 24,014 | 108 |
| Wintrust Financial Corp. | 3,418 | 108 |
| Cypress Sharpridge Investments Inc. | 8,072 | 108 |
| EastGroup Properties Inc. | 2,645 | 107 |
| Montpelier Re Holdings Ltd. | 6,097 | 105 |
| U-Store-It Trust | 9,721 | 104 |
| * PHH Corp. | 5,500 | 104 |
| * Ocwen Financial Corp. | 7,282 | 100 |
| PS Business Parks Inc. | 1,820 | 100 |
| Cathay General Bancorp | 7,687 | 99 |
| Redwood Trust Inc. | 7,678 | 96 |
| * World Acceptance Corp. | 1,472 | 96 |
| Equity One Inc. | 5,246 | 94 |
| * DFC Global Corp. | 4,248 | 94 |
| Prospect Capital Corp. | 10,656 | 94 |
| * Texas Capital Bancshares Inc. | 3,638 | 93 |
| BancorpSouth Inc. | 8,161 | 92 |
| First Financial Bankshares Inc. | 3,074 | 91 |
| First Financial Bancorp | 5,694 | 91 |
| Old National Bancorp | 9,261 | 91 |
| Community Bank System Inc. | 3,597 | 90 |
| Franklin Street Properties Corp. | 6,902 | 90 |
| Glimcher Realty Trust | 10,475 | 89 |
| Anworth Mortgage Asset Corp. | 12,369 | 89 |
| * MF Global Holdings Ltd. | 16,016 | 88 |
| National Penn Bancshares Inc. | 12,094 | 88 |
| Alexander's Inc. | 201 | 87 |
| Astoria Financial Corp. | 8,502 | 87 |
| MB Financial Inc. | 5,321 | 87 |
| Tower Group Inc. | 3,604 | 87 |
| Lexington Realty Trust | 11,704 | 86 |
| Susquehanna Bancshares Inc. | 12,706 | 85 |
| * Financial Engines Inc. | 3,745 | 83 |
| Acadia Realty Trust | 3,942 | 83 |
| MarketAxess Holdings Inc. | 2,805 | 83 |
| Solar Capital Ltd. | 3,566 | 82 |
| * Strategic Hotels & Resorts Inc. | 17,087 | 82 |
| International Bancshares Corp. | 5,182 | 81 |
9
| Vanguard® Russell 2000 Index Fund | ||
| Schedule of Investments | ||
| August 31, 2011 | ||
| Market | ||
| Value | ||
| Shares | ($000) | |
| Government Properties Income Trust | 3,461 | 81 |
| Glacier Bancorp Inc. | 7,030 | 81 |
| Selective Insurance Group Inc. | 5,281 | 80 |
| LTC Properties Inc. | 2,966 | 80 |
| Sun Communities Inc. | 2,077 | 80 |
| Pebblebrook Hotel Trust | 4,975 | 80 |
| * First Industrial Realty Trust Inc. | 8,466 | 80 |
| CVB Financial Corp. | 8,731 | 76 |
| Provident Financial Services Inc. | 5,911 | 74 |
| Argo Group International Holdings Ltd. | 2,683 | 74 |
| Oritani Financial Corp. | 5,494 | 72 |
| Associated Estates Realty Corp. | 4,052 | 72 |
| Symetra Financial Corp. | 6,605 | 71 |
| Fifth Street Finance Corp. | 7,070 | 70 |
| * Sunstone Hotel Investors Inc. | 11,553 | 70 |
| Park National Corp. | 1,262 | 69 |
| * Enstar Group Ltd. | 674 | 69 |
| Primerica Inc. | 3,324 | 69 |
| NBT Bancorp Inc. | 3,367 | 68 |
| Cohen & Steers Inc. | 1,737 | 67 |
| * Investors Bancorp Inc. | 4,525 | 65 |
| * iStar Financial Inc. | 9,040 | 65 |
| Cousins Properties Inc. | 8,915 | 64 |
| First Midwest Bancorp Inc. | 7,286 | 64 |
| Education Realty Trust Inc. | 7,061 | 64 |
| American Assets Trust Inc. | 3,150 | 63 |
| First Potomac Realty Trust | 4,892 | 63 |
| Columbia Banking System Inc. | 3,860 | 63 |
| Walter Investment Management Corp. | 2,523 | 63 |
| BlackRock Kelso Capital Corp. | 7,137 | 63 |
| Bank of the Ozarks Inc. | 2,745 | 62 |
| Infinity Property & Casualty Corp. | 1,213 | 62 |
| * Greenlight Capital Re Ltd. Class A | 2,740 | 61 |
| Inland Real Estate Corp. | 7,538 | 61 |
| Investors Real Estate Trust | 7,847 | 61 |
| American Equity Investment Life Holding Co. | 5,817 | 59 |
| Amtrust Financial Services Inc. | 2,356 | 57 |
| Pennsylvania Real Estate Investment Trust | 5,440 | 56 |
| ARMOUR Residential REIT Inc. | 7,475 | 56 |
| * National Financial Partners Corp. | 4,309 | 55 |
| Compass Diversified Holdings | 3,947 | 54 |
| Evercore Partners Inc. Class A | 2,054 | 54 |
| optionsXpress Holdings Inc. | 4,158 | 52 |
| CreXus Investment Corp. | 5,588 | 52 |
| * Pico Holdings Inc. | 2,219 | 52 |
| PrivateBancorp Inc. Class A | 5,869 | 52 |
| Horace Mann Educators Corp. | 3,899 | 52 |
| KBW Inc. | 3,532 | 52 |
| Home Bancshares Inc. | 2,193 | 51 |
| Hersha Hospitality Trust Class A | 13,760 | 51 |
| S&T Bancorp Inc. | 2,743 | 51 |
| * Navigators Group Inc. | 1,136 | 51 |
| Independent Bank Corp. | 2,096 | 50 |
| Colony Financial Inc. | 3,217 | 50 |
| Oriental Financial Group Inc. | 4,426 | 49 |
| Meadowbrook Insurance Group Inc. | 5,209 | 49 |
| Brookline Bancorp Inc. | 5,775 | 49 |
| BGC Partners Inc. Class A | 7,389 | 49 |
| Nelnet Inc. Class A | 2,522 | 48 |
| Safety Insurance Group Inc. | 1,233 | 48 |
| Getty Realty Corp. | 2,524 | 48 |
| PacWest Bancorp | 2,957 | 47 |
| Boston Private Financial Holdings Inc. | 7,527 | 47 |
| Chemical Financial Corp. | 2,684 | 46 |
10
| Vanguard® Russell 2000 Index Fund | ||
| Schedule of Investments | ||
| August 31, 2011 | ||
| Market | ||
| Value | ||
| Shares | ($000) | |
| PennyMac Mortgage Investment Trust | 2,714 | 46 |
| First Commonwealth Financial Corp. | 10,255 | 46 |
| Employers Holdings Inc. | 3,770 | 46 |
| Retail Opportunity Investments Corp. | 4,114 | 46 |
| * Investment Technology Group Inc. | 4,033 | 46 |
| PennantPark Investment Corp. | 4,456 | 46 |
| Banco Latinoamericano de Comercio Exterior SA | 2,720 | 45 |
| City Holding Co. | 1,491 | 45 |
| * Credit Acceptance Corp. | 654 | 45 |
| Advance America Cash Advance Centers Inc. | 5,386 | 45 |
| * MGIC Investment Corp. | 17,317 | 45 |
| WesBanco Inc. | 2,260 | 44 |
| * State Bank Financial Corp. | 3,090 | 44 |
| Berkshire Hills Bancorp Inc. | 2,027 | 44 |
| * Forestar Group Inc. | 3,463 | 44 |
| Universal Health Realty Income Trust | 1,160 | 43 |
| Newcastle Investment Corp. | 7,750 | 43 |
| Trustco Bank Corp. NY | 9,092 | 42 |
| * Pinnacle Financial Partners Inc. | 3,338 | 42 |
| Maiden Holdings Ltd. | 4,941 | 42 |
| Sabra Healthcare REIT Inc. | 3,600 | 42 |
| * United Community Banks Inc. | 4,059 | 42 |
| Ashford Hospitality Trust Inc. | 5,102 | 41 |
| * Western Alliance Bancorp | 6,778 | 41 |
| ViewPoint Financial Group | 3,406 | 41 |
| Radian Group Inc. | 12,283 | 41 |
| Hercules Technology Growth Capital Inc. | 4,282 | 41 |
| Chesapeake Lodging Trust | 3,144 | 40 |
| * FelCor Lodging Trust Inc. | 11,487 | 39 |
| Simmons First National Corp. Class A | 1,694 | 39 |
| Ramco-Gershenson Properties Trust | 3,766 | 39 |
| Sandy Spring Bancorp Inc. | 2,355 | 39 |
| SCBT Financial Corp. | 1,366 | 38 |
| United Fire & Casualty Co. | 2,105 | 38 |
| Urstadt Biddle Properties Inc. Class A | 2,252 | 38 |
| * Tejon Ranch Co. | 1,392 | 38 |
| Resource Capital Corp. | 6,963 | 38 |
| * Encore Capital Group Inc. | 1,577 | 37 |
| * ICG Group Inc. | 3,625 | 37 |
| Main Street Capital Corp. | 1,967 | 37 |
| * Piper Jaffray Cos. | 1,546 | 37 |
| * Sterling Financial Corp. | 2,622 | 37 |
| Dime Community Bancshares Inc. | 3,043 | 37 |
| First Busey Corp. | 7,534 | 37 |
| FBL Financial Group Inc. Class A | 1,254 | 37 |
| Flagstone Reinsurance Holdings SA | 5,122 | 36 |
| Dynex Capital Inc. | 3,942 | 36 |
| Triangle Capital Corp. | 2,160 | 36 |
| NorthStar Realty Finance Corp. | 9,371 | 36 |
| MCG Capital Corp. | 7,533 | 36 |
| RLJ Lodging Trust | 2,692 | 36 |
| * AMERISAFE Inc. | 1,799 | 35 |
| Campus Crest Communities Inc. | 2,990 | 35 |
| Flushing Financial Corp. | 3,068 | 35 |
| Lakeland Financial Corp. | 1,584 | 35 |
| * FPIC Insurance Group Inc. | 816 | 34 |
| Harleysville Group Inc. | 1,193 | 34 |
| Community Trust Bancorp Inc. | 1,354 | 34 |
| Renasant Corp. | 2,450 | 34 |
| 1st Source Corp. | 1,488 | 34 |
| Duff & Phelps Corp. Class A | 2,969 | 34 |
| First Financial Corp. | 1,089 | 34 |
| * HFF Inc. Class A | 2,839 | 34 |
| * Virtus Investment Partners Inc. | 537 | 33 |
11
| Vanguard® Russell 2000 Index Fund | ||
| Schedule of Investments | ||
| August 31, 2011 | ||
| Market | ||
| Value | ||
| Shares | ($000) | |
| Excel Trust Inc. | 3,027 | 33 |
| National Western Life Insurance Co. Class A | 215 | 32 |
| * Safeguard Scientifics Inc. | 2,022 | 32 |
| GAMCO Investors Inc. | 664 | 32 |
| Southside Bancshares Inc. | 1,607 | 32 |
| Coresite Realty Corp. | 1,942 | 31 |
| Tompkins Financial Corp. | 795 | 31 |
| * Hilltop Holdings Inc. | 3,894 | 30 |
| * Intl. FCStone Inc. | 1,298 | 30 |
| OneBeacon Insurance Group Ltd. Class A | 2,169 | 30 |
| GFI Group Inc. | 6,908 | 30 |
| Apollo Commercial Real Estate Finance Inc. | 2,008 | 30 |
| TICC Capital Corp. | 3,154 | 30 |
| Washington Trust Bancorp Inc. | 1,394 | 30 |
| Hudson Pacific Properties Inc. | 2,156 | 30 |
| Parkway Properties Inc. | 2,147 | 29 |
| Winthrop Realty Trust | 2,804 | 29 |
| Monmouth Real Estate Investment Corp. Class A | 3,462 | 28 |
| TowneBank | 2,380 | 28 |
| * West Coast Bancorp | 1,885 | 28 |
| Artio Global Investors Inc. Class A | 3,059 | 28 |
| Cardinal Financial Corp. | 2,828 | 28 |
| Rockville Financial Inc. | 2,884 | 28 |
| MVC Capital Inc. | 2,345 | 28 |
| * NewStar Financial Inc. | 2,667 | 27 |
| Kennedy-Wilson Holdings Inc. | 2,325 | 27 |
| Hudson Valley Holding Corp. | 1,387 | 27 |
| * eHealth Inc. | 2,091 | 27 |
| CapLease Inc. | 6,653 | 27 |
| StellarOne Corp. | 2,247 | 26 |
| * Nara Bancorp Inc. | 3,715 | 26 |
| Sterling Bancorp | 3,024 | 26 |
| Capital Southwest Corp. | 287 | 26 |
| * Beneficial Mutual Bancorp Inc. | 3,251 | 25 |
| Saul Centers Inc. | 718 | 25 |
| * Citizens Inc. | 3,707 | 25 |
| Banner Corp. | 1,617 | 25 |
| Tower Bancorp Inc. | 1,025 | 25 |
| * Global Indemnity plc | 1,324 | 24 |
| United Financial Bancorp Inc. | 1,575 | 24 |
| Provident New York Bancorp | 3,718 | 24 |
| Territorial Bancorp Inc. | 1,172 | 24 |
| SY Bancorp Inc. | 1,178 | 24 |
| Bancfirst Corp. | 657 | 23 |
| Kite Realty Group Trust | 5,443 | 23 |
| Univest Corp. of Pennsylvania | 1,640 | 23 |
| Enterprise Financial Services Corp. | 1,555 | 23 |
| Arrow Financial Corp. | 963 | 23 |
| * Cowen Group Inc. Class A | 6,537 | 23 |
| Northfield Bancorp Inc. | 1,667 | 22 |
| * Bancorp Inc. | 2,860 | 22 |
| Summit Hotel Properties Inc. | 2,668 | 22 |
| WSFS Financial Corp. | 628 | 22 |
| Calamos Asset Management Inc. Class A | 1,855 | 22 |
| * Phoenix Cos. Inc. | 11,369 | 22 |
| Union First Market Bankshares Corp. | 1,980 | 22 |
| Agree Realty Corp. | 964 | 22 |
| Epoch Holding Corp. | 1,443 | 21 |
| * Ameris Bancorp | 2,323 | 21 |
| Financial Institutions Inc. | 1,349 | 21 |
| Westwood Holdings Group Inc. | 610 | 21 |
| Camden National Corp. | 751 | 21 |
| Westfield Financial Inc. | 2,742 | 21 |
| Presidential Life Corp. | 2,119 | 20 |
12
| Vanguard® Russell 2000 Index Fund | ||
| Schedule of Investments | ||
| August 31, 2011 | ||
| Market | ||
| Value | ||
| Shares | ($000) | |
| * Eagle Bancorp Inc. | 1,638 | 20 |
| * Doral Financial Corp. | 12,444 | 20 |
| Cedar Shopping Centers Inc. | 5,481 | 20 |
| Bryn Mawr Bank Corp. | 1,061 | 20 |
| State Auto Financial Corp. | 1,431 | 20 |
| Oppenheimer Holdings Inc. Class A | 1,009 | 20 |
| FXCM Inc. Class A | 1,694 | 20 |
| Heartland Financial USA Inc. | 1,302 | 20 |
| Citizens & Northern Corp. | 1,192 | 19 |
| German American Bancorp Inc. | 1,231 | 19 |
| * American Safety Insurance Holdings Ltd. | 1,022 | 19 |
| Federal Agricultural Mortgage Corp. | 962 | 19 |
| * Center Financial Corp. | 3,485 | 19 |
| First Merchants Corp. | 2,508 | 19 |
| First Interstate Bancsystem Inc. | 1,542 | 19 |
| Baldwin & Lyons Inc. | 818 | 19 |
| Cogdell Spencer Inc. | 4,357 | 19 |
| Trico Bancshares | 1,375 | 19 |
| Bank of Marin Bancorp | 521 | 19 |
| First Community Bancshares Inc. | 1,554 | 18 |
| Fox Chase Bancorp Inc. | 1,423 | 18 |
| Diamond Hill Investment Group Inc. | 251 | 18 |
| * Central Pacific Financial Corp. | 1,502 | 18 |
| CoBiz Financial Inc. | 3,180 | 18 |
| Crawford & Co. Class B | 2,520 | 18 |
| Lakeland Bancorp Inc. | 2,120 | 18 |
| Heritage Financial Corp. | 1,530 | 18 |
| First of Long Island Corp. | 747 | 18 |
| Gladstone Commercial Corp. | 1,070 | 18 |
| National Bankshares Inc. | 678 | 18 |
| Great Southern Bancorp Inc. | 993 | 18 |
| MainSource Financial Group Inc. | 1,969 | 18 |
| Centerstate Banks Inc. | 2,936 | 18 |
| Abington Bancorp Inc. | 1,978 | 17 |
| Republic Bancorp Inc. Class A | 969 | 17 |
| * Wilshire Bancorp Inc. | 5,554 | 17 |
| OceanFirst Financial Corp. | 1,434 | 17 |
| Stewart Information Services Corp. | 1,778 | 17 |
| One Liberty Properties Inc. | 1,085 | 17 |
| State Bancorp Inc. | 1,447 | 17 |
| STAG Industrial Inc. | 1,552 | 17 |
| Gladstone Capital Corp. | 2,057 | 17 |
| Washington Banking Co. | 1,499 | 17 |
| * OmniAmerican Bancorp Inc. | 1,157 | 17 |
| Home Federal Bancorp Inc. | 1,620 | 16 |
| CNB Financial Corp. | 1,202 | 16 |
| * Netspend Holdings Inc. | 2,744 | 16 |
| Arlington Asset Investment Corp. Class A | 629 | 16 |
| * Ladenburg Thalmann Financial Services Inc. | 10,405 | 16 |
| BankFinancial Corp. | 2,061 | 16 |
| Bancorp Rhode Island Inc. | 364 | 16 |
| * Franklin Financial Corp. | 1,358 | 16 |
| National Interstate Corp. | 674 | 15 |
| NGP Capital Resources Co. | 2,115 | 15 |
| Golub Capital BDC Inc. | 1,002 | 15 |
| Pacific Continental Corp. | 1,802 | 15 |
| ESB Financial Corp. | 1,218 | 15 |
| Gladstone Investment Corp. | 2,158 | 15 |
| First Bancorp | 1,476 | 14 |
| * Hanmi Financial Corp. | 14,786 | 14 |
| Bank Mutual Corp. | 4,496 | 14 |
| * 1st United Bancorp Inc. | 2,662 | 14 |
| Medallion Financial Corp. | 1,438 | 14 |
| Alliance Financial Corp. | 464 | 14 |
13
| Vanguard® Russell 2000 Index Fund | ||
| Schedule of Investments | ||
| August 31, 2011 | ||
| Market | ||
| Value | ||
| Shares | ($000) | |
| * Primus Guaranty Ltd. | 2,463 | 14 |
| Edelman Financial Group Inc. | 1,981 | 14 |
| Terreno Realty Corp. | 909 | 14 |
| RAIT Financial Trust | 3,509 | 14 |
| * Metro Bancorp Inc. | 1,355 | 14 |
| Chatham Lodging Trust | 1,352 | 14 |
| Ames National Corp. | 811 | 14 |
| Mission West Properties Inc. | 1,731 | 14 |
| West Bancorporation Inc. | 1,522 | 13 |
| * Virginia Commerce Bancorp Inc. | 2,289 | 13 |
| * MPG Office Trust Inc. | 4,795 | 13 |
| Penns Woods Bancorp Inc. | 376 | 13 |
| * First Defiance Financial Corp. | 951 | 13 |
| Bridge Bancorp Inc. | 658 | 13 |
| Kansas City Life Insurance Co. | 418 | 13 |
| Merchants Bancshares Inc. | 471 | 13 |
| * Imperial Holdings Inc. | 1,721 | 13 |
| Bank of Kentucky Financial Corp. | 564 | 13 |
| Solar Senior Capital Ltd. | 758 | 13 |
| * FBR & Co. | 4,939 | 13 |
| * Harris & Harris Group Inc. | 3,031 | 13 |
| ESSA Bancorp Inc. | 1,108 | 13 |
| SWS Group Inc. | 2,850 | 12 |
| * BofI Holding Inc. | 865 | 12 |
| Sierra Bancorp | 1,162 | 12 |
| * Walker & Dunlop Inc. | 1,050 | 12 |
| Kohlberg Capital Corp. | 1,869 | 12 |
| SeaBright Holdings Inc. | 1,916 | 12 |
| * Seacoast Banking Corp. of Florida | 7,085 | 12 |
| Kearny Financial Corp. | 1,321 | 12 |
| Consolidated-Tomoka Land Co. | 411 | 12 |
| * Park Sterling Corp. | 2,798 | 12 |
| Medley Capital Corp. | 1,087 | 12 |
| First Bancorp Inc. | 858 | 11 |
| Capital City Bank Group Inc. | 1,117 | 11 |
| Center Bancorp Inc. | 1,182 | 11 |
| Peoples Bancorp Inc. | 1,033 | 11 |
| * Flagstar Bancorp Inc. | 18,041 | 11 |
| * Pacific Capital Bancorp NA | 402 | 11 |
| * Meridian Interstate Bancorp Inc. | 860 | 11 |
| * Sun Bancorp Inc. | 3,676 | 11 |
| First Pactrust Bancorp Inc. | 897 | 11 |
| THL Credit Inc. | 906 | 11 |
| * Nicholas Financial Inc. | 951 | 11 |
| UMH Properties Inc. | 1,126 | 10 |
| First Financial Holdings Inc. | 1,616 | 10 |
| JMP Group Inc. | 1,481 | 10 |
| * Gleacher & Co. Inc. | 7,702 | 10 |
| * Marlin Business Services Corp. | 846 | 10 |
| Orrstown Financial Services Inc. | 683 | 10 |
| Donegal Group Inc. Class A | 757 | 9 |
| * Cape Bancorp Inc. | 1,122 | 9 |
| * Encore Bancshares Inc. | 829 | 9 |
| * Southwest Bancorp Inc. | 1,794 | 9 |
| * Bridge Capital Holdings | 895 | 9 |
| New Mountain Finance Corp. | 712 | 9 |
| Century Bancorp Inc. Class A | 338 | 9 |
| * Avatar Holdings Inc. | 875 | 9 |
| Clifton Savings Bancorp Inc. | 882 | 9 |
| * Heritage Commerce Corp. | 2,040 | 9 |
| Midsouth Bancorp Inc. | 748 | 9 |
| Whitestone REIT Class B | 734 | 8 |
| * Hallmark Financial Services | 1,181 | 8 |
| EMC Insurance Group Inc. | 453 | 8 |
14
| Vanguard® Russell 2000 Index Fund | ||
| Schedule of Investments | ||
| August 31, 2011 | ||
| Market | ||
| Value | ||
| Shares | ($000) | |
| Universal Insurance Holdings Inc. | 1,756 | 8 |
| * First Marblehead Corp. | 5,391 | 8 |
| Enterprise Bancorp Inc. | 539 | 8 |
| Suffolk Bancorp | 897 | 7 |
| * Hampton Roads Bankshares Inc. | 925 | 7 |
| * Taylor Capital Group Inc. | 996 | 6 |
| Roma Financial Corp. | 704 | 6 |
| Charter Financial Corp. | 647 | 6 |
| * Cascade Bancorp | 578 | 6 |
| Independence Holding Co. | 698 | 6 |
| * CIFC Corp. | 1,120 | 6 |
| * Gain Capital Holdings Inc. | 795 | 5 |
| * Capital Bank Corp. | 1,392 | 4 |
| * PMI Group Inc. | 14,057 | 4 |
| Pzena Investment Management Inc. Class A | 785 | 4 |
| California First National Bancorp | 181 | 3 |
| * Fortegra Financial Corp. | 601 | 3 |
| 23,265 | ||
| Health Care (12.4%) | ||
| * Healthspring Inc. | 6,624 | 259 |
| Medicis Pharmaceutical Corp. Class A | 6,035 | 235 |
| * Cepheid Inc. | 6,039 | 219 |
| * HMS Holdings Corp. | 8,287 | 217 |
| * Onyx Pharmaceuticals Inc. | 6,193 | 211 |
| * Cubist Pharmaceuticals Inc. | 5,860 | 203 |
| * Healthsouth Corp. | 9,300 | 199 |
| * athenahealth Inc. | 3,409 | 198 |
| * WellCare Health Plans Inc. | 4,161 | 191 |
| STERIS Corp. | 5,789 | 186 |
| Owens & Minor Inc. | 6,231 | 183 |
| Quality Systems Inc. | 1,895 | 174 |
| * Salix Pharmaceuticals Ltd. | 5,710 | 174 |
| * Seattle Genetics Inc. | 9,431 | 164 |
| * Alkermes Inc. | 9,320 | 162 |
| * Haemonetics Corp. | 2,511 | 157 |
| * Magellan Health Services Inc. | 3,137 | 156 |
| * Questcor Pharmaceuticals Inc. | 5,192 | 156 |
| * Centene Corp. | 4,885 | 156 |
| * Volcano Corp. | 5,098 | 153 |
| * Viropharma Inc. | 7,426 | 147 |
| * Incyte Corp. Ltd. | 8,647 | 139 |
| West Pharmaceutical Services Inc. | 3,274 | 131 |
| * InterMune Inc. | 4,785 | 129 |
| * Theravance Inc. | 6,741 | 128 |
| * PSS World Medical Inc. | 5,423 | 128 |
| * Ariad Pharmaceuticals Inc. | 12,903 | 127 |
| Masimo Corp. | 5,136 | 127 |
| * Impax Laboratories Inc. | 6,382 | 126 |
| Chemed Corp. | 2,080 | 121 |
| * PAREXEL International Corp. | 5,755 | 117 |
| * Align Technology Inc. | 5,994 | 114 |
| * MAKO Surgical Corp. | 3,127 | 112 |
| * Par Pharmaceutical Cos. Inc. | 3,540 | 105 |
| * Accretive Health Inc. | 3,912 | 105 |
| * Acorda Therapeutics Inc. | 3,858 | 101 |
| * Zoll Medical Corp. | 2,142 | 96 |
| * NuVasive Inc. | 3,878 | 94 |
| * Exelixis Inc. | 12,497 | 93 |
| * Jazz Pharmaceuticals Inc. | 2,159 | 93 |
| * MWI Veterinary Supply Inc. | 1,228 | 91 |
| * Arthrocare Corp. | 2,671 | 87 |
| * Luminex Corp. | 3,695 | 85 |
| PDL BioPharma Inc. | 13,654 | 83 |
| * Integra LifeSciences Holdings Corp. | 2,039 | 81 |
15
| Vanguard® Russell 2000 Index Fund | ||
| Schedule of Investments | ||
| August 31, 2011 | ||
| Market | ||
| Value | ||
| Shares | ($000) | |
| * NxStage Medical Inc. | 4,363 | 80 |
| * Immunogen Inc. | 7,343 | 80 |
| * Auxilium Pharmaceuticals Inc. | 4,677 | 80 |
| * DexCom Inc. | 6,557 | 79 |
| * Neogen Corp. | 2,268 | 79 |
| * Insulet Corp. | 4,493 | 79 |
| * Cyberonics Inc. | 2,771 | 78 |
| * Medicines Co. | 5,268 | 77 |
| Computer Programs & Systems Inc. | 1,082 | 77 |
| * Momenta Pharmaceuticals Inc. | 4,509 | 76 |
| Meridian Bioscience Inc. | 4,008 | 74 |
| * HeartWare International Inc. | 1,175 | 74 |
| * Air Methods Corp. | 1,108 | 74 |
| * Isis Pharmaceuticals Inc. | 9,736 | 73 |
| * Vivus Inc. | 8,675 | 72 |
| Invacare Corp. | 2,803 | 70 |
| * Amsurg Corp. Class A | 3,056 | 69 |
| * Kindred Healthcare Inc. | 5,081 | 66 |
| * CONMED Corp. | 2,767 | 65 |
| * Orthofix International NV | 1,766 | 65 |
| * IPC The Hospitalist Co. Inc. | 1,601 | 64 |
| * Nektar Therapeutics | 11,151 | 64 |
| * Ironwood Pharmaceuticals Inc. | 4,932 | 63 |
| * NPS Pharmaceuticals Inc. | 8,407 | 63 |
| * Hanger Orthopedic Group Inc. | 3,275 | 62 |
| Analogic Corp. | 1,227 | 61 |
| * Merit Medical Systems Inc. | 4,096 | 60 |
| * Sequenom Inc. | 9,684 | 59 |
| * Wright Medical Group Inc. | 3,815 | 58 |
| * Abaxis Inc. | 2,202 | 55 |
| * Halozyme Therapeutics Inc. | 8,020 | 55 |
| * MedAssets Inc. | 4,658 | 53 |
| * Rigel Pharmaceuticals Inc. | 6,704 | 53 |
| * Molina Healthcare Inc. | 2,744 | 53 |
| * Emeritus Corp. | 2,987 | 52 |
| * AVEO Pharmaceuticals Inc. | 3,064 | 52 |
| * Pharmacyclics Inc. | 4,489 | 52 |
| * Greatbatch Inc. | 2,279 | 51 |
| * Omnicell Inc. | 3,238 | 51 |
| * Medivation Inc. | 3,064 | 50 |
| * ICU Medical Inc. | 1,188 | 49 |
| * Team Health Holdings Inc. | 2,606 | 49 |
| * Bio-Reference Labs Inc. | 2,401 | 49 |
| Landauer Inc. | 921 | 47 |
| * Amedisys Inc. | 2,720 | 46 |
| * Endologix Inc. | 4,783 | 46 |
| * Optimer Pharmaceuticals Inc. | 4,531 | 45 |
| * Opko Health Inc. | 10,645 | 44 |
| * Akorn Inc. | 5,481 | 44 |
| * Targacept Inc. | 2,693 | 44 |
| * Spectrum Pharmaceuticals Inc. | 5,087 | 43 |
| * Micromet Inc. | 8,948 | 43 |
| * Emergent Biosolutions Inc. | 2,381 | 43 |
| * Quidel Corp. | 2,786 | 43 |
| * PharMerica Corp. | 2,871 | 42 |
| * Healthways Inc. | 3,321 | 42 |
| * Sunrise Senior Living Inc. | 5,611 | 42 |
| * Genomic Health Inc. | 1,662 | 41 |
| * ExamWorks Group Inc. | 2,645 | 40 |
| * Exact Sciences Corp. | 5,105 | 39 |
| * SonoSite Inc. | 1,350 | 39 |
| * Affymetrix Inc. | 6,893 | 39 |
| * ABIOMED Inc. | 3,097 | 39 |
| Ensign Group Inc. | 1,594 | 37 |
16
| Vanguard® Russell 2000 Index Fund | ||
| Schedule of Investments | ||
| August 31, 2011 | ||
| Market | ||
| Value | ||
| Shares | ($000) | |
| * Angiodynamics Inc. | 2,442 | 35 |
| * Caliper Life Sciences Inc. | 4,613 | 35 |
| Universal American Corp. | 3,156 | 35 |
| National Healthcare Corp. | 1,001 | 34 |
| * AVANIR Pharmaceuticals Inc. | 12,131 | 34 |
| * Medidata Solutions Inc. | 2,057 | 34 |
| * Geron Corp. | 12,610 | 34 |
| * OraSure Technologies Inc. | 4,564 | 33 |
| Atrion Corp. | 155 | 33 |
| * Accuray Inc. | 6,685 | 33 |
| * Triple-S Management Corp. Class B | 1,933 | 33 |
| * ZIOPHARM Oncology Inc. | 5,720 | 33 |
| * Depomed Inc. | 5,248 | 33 |
| * Conceptus Inc. | 3,049 | 32 |
| Cantel Medical Corp. | 1,290 | 32 |
| * Select Medical Holdings Corp. | 4,374 | 32 |
| * Enzon Pharmaceuticals Inc. | 3,674 | 31 |
| * Neoprobe Corp. | 9,250 | 31 |
| * Idenix Pharmaceuticals Inc. | 5,358 | 31 |
| * LHC Group Inc. | 1,543 | 31 |
| * Merge Healthcare Inc. | 5,075 | 30 |
| * MAP Pharmaceuticals Inc. | 2,138 | 30 |
| * Natus Medical Inc. | 2,836 | 30 |
| * Symmetry Medical Inc. | 3,556 | 30 |
| * Neurocrine Biosciences Inc. | 4,819 | 30 |
| * Ligand Pharmaceuticals Inc. Class B | 1,920 | 29 |
| * Oncothyreon Inc. | 4,066 | 29 |
| * Achillion Pharmaceuticals Inc. | 4,636 | 29 |
| * Staar Surgical Co. | 3,474 | 28 |
| * Hi-Tech Pharmacal Co. Inc. | 1,013 | 28 |
| * Savient Pharmaceuticals Inc. | 6,556 | 28 |
| * Biosante Pharmaceuticals Inc. | 10,696 | 28 |
| * Sangamo Biosciences Inc. | 5,115 | 28 |
| * Corvel Corp. | 606 | 28 |
| * Medcath Corp. | 1,988 | 28 |
| * Keryx Biopharmaceuticals Inc. | 6,753 | 27 |
| * Dynavax Technologies Corp. | 11,444 | 27 |
| * Ardea Biosciences Inc. | 1,640 | 27 |
| * Unilife Corp. | 5,555 | 26 |
| * Immunomedics Inc. | 6,429 | 26 |
| Assisted Living Concepts Inc. Class A | 1,911 | 26 |
| * MedQuist Holdings Inc. | 3,091 | 26 |
| * Vical Inc. | 7,010 | 25 |
| * XenoPort Inc. | 3,456 | 25 |
| * BioScrip Inc. | 3,979 | 25 |
| * Alnylam Pharmaceuticals Inc. | 3,599 | 25 |
| * eResearchTechnology Inc. | 4,797 | 25 |
| * Cadence Pharmaceuticals Inc. | 3,715 | 24 |
| * Tornier NV | 1,030 | 24 |
| * Curis Inc. | 7,464 | 24 |
| * Pacific Biosciences of California Inc. | 3,316 | 23 |
| US Physical Therapy Inc. | 1,154 | 23 |
| * Kensey Nash Corp. | 834 | 23 |
| * MannKind Corp. | 7,550 | 23 |
| * Arqule Inc. | 5,218 | 23 |
| * Lexicon Pharmaceuticals Inc. | 16,668 | 23 |
| * Chelsea Therapeutics International Ltd. | 5,236 | 22 |
| * Transcend Services Inc. | 861 | 22 |
| * Cell Therapeutics Inc. | 18,830 | 22 |
| * Inhibitex Inc. | 6,214 | 22 |
| * Gentiva Health Services Inc. | 2,821 | 21 |
| * AMN Healthcare Services Inc. | 3,870 | 21 |
| * Antares Pharma Inc. | 8,572 | 21 |
| * Metropolitan Health Networks Inc. | 4,018 | 21 |
17
| Vanguard® Russell 2000 Index Fund | ||
| Schedule of Investments | ||
| August 31, 2011 | ||
| Market | ||
| Value | ||
| Shares | ($000) | |
| * Spectranetics Corp. | 3,260 | 20 |
| * Vascular Solutions Inc. | 1,657 | 20 |
| * Delcath Systems Inc. | 4,698 | 19 |
| * Capital Senior Living Corp. | 2,694 | 19 |
| * Synovis Life Technologies Inc. | 1,120 | 19 |
| * Obagi Medical Products Inc. | 1,812 | 19 |
| * HealthStream Inc. | 1,502 | 19 |
| * Arena Pharmaceuticals Inc. | 14,261 | 19 |
| * Continucare Corp. | 2,898 | 18 |
| * Endocyte Inc. | 1,681 | 18 |
| * SIGA Technologies Inc. | 3,173 | 18 |
| * RTI Biologics Inc. | 5,393 | 18 |
| * Metabolix Inc. | 3,328 | 18 |
| * Progenics Pharmaceuticals Inc. | 2,869 | 18 |
| * Novavax Inc. | 9,392 | 17 |
| * Hansen Medical Inc. | 4,581 | 17 |
| Pain Therapeutics Inc. | 3,606 | 17 |
| * Cardiovascular Systems Inc. | 1,297 | 17 |
| * Vanda Pharmaceuticals Inc. | 2,748 | 17 |
| * American Dental Partners Inc. | 1,509 | 17 |
| * Columbia Laboratories Inc. | 7,171 | 17 |
| * AVI BioPharma Inc. | 13,252 | 16 |
| Maxygen Inc. | 2,952 | 16 |
| * Affymax Inc. | 3,459 | 16 |
| * Raptor Pharmaceutical Corp. | 3,382 | 16 |
| * Santarus Inc. | 5,210 | 16 |
| * Almost Family Inc. | 805 | 16 |
| * SurModics Inc. | 1,491 | 16 |
| * Sciclone Pharmaceuticals Inc. | 3,379 | 16 |
| * Sagent Pharmaceuticals Inc. | 686 | 16 |
| * Cytori Therapeutics Inc. | 4,734 | 16 |
| * Codexis Inc. | 2,399 | 16 |
| * Ampio Pharmaceuticals Inc. | 1,938 | 15 |
| Young Innovations Inc. | 552 | 15 |
| * Nymox Pharmaceutical Corp. | 1,897 | 15 |
| * Palomar Medical Technologies Inc. | 1,859 | 15 |
| * IRIS International Inc. | 1,740 | 15 |
| * Furiex Pharmaceuticals Inc. | 967 | 15 |
| * Dyax Corp. | 9,650 | 14 |
| * ISTA Pharmaceuticals Inc. | 3,131 | 14 |
| * Cambrex Corp. | 2,877 | 14 |
| * Rockwell Medical Technologies Inc. | 1,568 | 14 |
| * AtriCure Inc. | 1,374 | 14 |
| * CryoLife Inc. | 2,730 | 14 |
| * Providence Service Corp. | 1,268 | 13 |
| * Celldex Therapeutics Inc. | 4,314 | 13 |
| * Cross Country Healthcare Inc. | 2,715 | 13 |
| * Alphatec Holdings Inc. | 5,271 | 13 |
| * Five Star Quality Care Inc. | 4,102 | 13 |
| * Allos Therapeutics Inc. | 7,702 | 13 |
| * Aegerion Pharmaceuticals Inc. | 894 | 13 |
| * Infinity Pharmaceuticals Inc. | 1,869 | 13 |
| * Uroplasty Inc. | 2,021 | 13 |
| * Durect Corp. | 7,447 | 12 |
| * Exactech Inc. | 831 | 12 |
| * Array Biopharma Inc. | 5,574 | 12 |
| * Synergetics USA Inc. | 2,175 | 12 |
| * SuperGen Inc. | 5,512 | 12 |
| * Chindex International Inc. | 1,111 | 12 |
| * Zalicus Inc. | 7,269 | 12 |
| * Anthera Pharmaceuticals Inc. | 2,059 | 12 |
| * Corcept Therapeutics Inc. | 4,014 | 11 |
| * OncoGenex Pharmaceutical Inc. | 951 | 11 |
| * Biotime Inc. | 2,415 | 11 |
18
| Vanguard® Russell 2000 Index Fund | ||
| Schedule of Investments | ||
| August 31, 2011 | ||
| Market | ||
| Value | ||
| Shares | ($000) | |
| * Enzo Biochem Inc. | 3,741 | 11 |
| * Insmed Inc. | 2,292 | 11 |
| * Dusa Pharmaceuticals Inc. | 2,389 | 10 |
| Medtox Scientific Inc. | 741 | 10 |
| * Solta Medical Inc. | 5,924 | 10 |
| * Medical Action Industries Inc. | 1,601 | 10 |
| * Sun Healthcare Group Inc. | 2,315 | 10 |
| * Harvard Bioscience Inc. | 2,251 | 10 |
| * Skilled Healthcare Group Inc. | 1,787 | 10 |
| * Cynosure Inc. Class A | 946 | 10 |
| * Cerus Corp. | 4,654 | 10 |
| * Biolase Technology Inc. | 2,808 | 9 |
| * Synta Pharmaceuticals Corp. | 2,211 | 9 |
| * Peregrine Pharmaceuticals Inc. | 6,636 | 9 |
| * BioCryst Pharmaceuticals Inc. | 2,690 | 9 |
| * Complete Genomics Inc. | 972 | 9 |
| * RadNet Inc. | 2,833 | 9 |
| * KV Pharmaceutical Co. Class A | 4,795 | 8 |
| * PharmAthene Inc. | 3,486 | 8 |
| * Osiris Therapeutics Inc. | 1,556 | 8 |
| * Fluidigm Corp. | 596 | 8 |
| * Biospecifics Technologies Corp. | 459 | 8 |
| * Alimera Sciences Inc. | 1,098 | 8 |
| * CardioNet Inc. | 2,382 | 8 |
| * GTx Inc. | 2,060 | 7 |
| * Nabi Biopharmaceuticals | 3,949 | 7 |
| * Albany Molecular Research Inc. | 2,052 | 7 |
| * Cleveland Biolabs Inc. | 2,695 | 7 |
| * Pozen Inc. | 2,442 | 7 |
| * Amicus Therapeutics Inc. | 1,485 | 7 |
| * Epocrates Inc. | 590 | 6 |
| * DynaVox Inc. Class A | 910 | 6 |
| * Cornerstone Therapeutics Inc. | 769 | 6 |
| * Lannett Co. Inc. | 1,539 | 6 |
| * BioMimetic Therapeutics Inc. | 1,772 | 6 |
| National Research Corp. | 172 | 6 |
| * Anacor Pharmaceuticals Inc. | 1,103 | 5 |
| * Stereotaxis Inc. | 4,070 | 5 |
| * BG Medicine Inc. | 744 | 4 |
| * Sunesis Pharmaceuticals Inc. | 2,812 | 4 |
| * Orexigen Therapeutics Inc. | 2,973 | 4 |
| * Bacterin International Holdings Inc. | 2,171 | 4 |
| * Trius Therapeutics Inc. | 626 | 4 |
| * Zogenix Inc. | 1,115 | 4 |
| * Sucampo Pharmaceuticals Inc. Class A | 1,164 | 4 |
| * Pacira Pharmaceuticals Inc. | 480 | 4 |
| * Alliance HealthCare Services Inc. | 2,259 | 4 |
| * Acura Pharmaceuticals Inc. | 1,007 | 3 |
| * Pernix Therapeutics Holdings | 340 | 3 |
| * Neostem Inc. | 4,099 | 3 |
| * Transcept Pharmaceuticals Inc. | 481 | 2 |
| * Clinical Data Inc. Contingent Value Rights Exp. 04/14/2018 | 913 | 1 |
| 13,285 | ||
| Industrials (15.4%) | ||
| * Clean Harbors Inc. | 4,581 | 247 |
| CLARCOR Inc. | 4,929 | 229 |
| * Esterline Technologies Corp. | 2,980 | 224 |
| HEICO Corp. | 4,078 | 222 |
| * Hexcel Corp. | 9,574 | 220 |
| * Alaska Air Group Inc. | 3,503 | 202 |
| * Genesee & Wyoming Inc. Class A | 3,874 | 201 |
| * Teledyne Technologies Inc. | 3,591 | 196 |
| Acuity Brands Inc. | 4,233 | 195 |
| Woodward Inc. | 6,011 | 195 |
19
| Vanguard® Russell 2000 Index Fund | ||
| Schedule of Investments | ||
| August 31, 2011 | ||
| Market | ||
| Value | ||
| Shares | ($000) | |
| Triumph Group Inc. | 3,677 | 193 |
| Robbins & Myers Inc. | 3,855 | 185 |
| * Acacia Research - Acacia Technologies | 4,181 | 183 |
| * Dollar Thrifty Automotive Group Inc. | 2,670 | 177 |
| * Moog Inc. Class A | 4,440 | 177 |
| Mueller Industries Inc. | 3,701 | 174 |
| Watsco Inc. | 2,749 | 164 |
| * EMCOR Group Inc. | 6,535 | 150 |
| * FTI Consulting Inc. | 4,111 | 150 |
| * Old Dominion Freight Line Inc. | 4,638 | 149 |
| * Middleby Corp. | 1,832 | 148 |
| AO Smith Corp. | 3,716 | 146 |
| United Stationers Inc. | 4,498 | 142 |
| Belden Inc. | 4,632 | 141 |
| Curtiss-Wright Corp. | 4,538 | 140 |
| * Geo Group Inc. | 6,342 | 136 |
| * Chart Industries Inc. | 2,872 | 136 |
| * Avis Budget Group Inc. | 10,262 | 135 |
| Actuant Corp. Class A | 6,706 | 135 |
| Rollins Inc. | 6,211 | 130 |
| Brady Corp. Class A | 4,642 | 128 |
| Applied Industrial Technologies Inc. | 4,142 | 127 |
| * CoStar Group Inc. | 2,472 | 127 |
| * Atlas Air Worldwide Holdings Inc. | 2,568 | 126 |
| * MasTec Inc. | 5,536 | 123 |
| Barnes Group Inc. | 5,323 | 123 |
| * Tetra Tech Inc. | 6,095 | 121 |
| Brink's Co. | 4,563 | 117 |
| Simpson Manufacturing Co. Inc. | 4,066 | 116 |
| * HUB Group Inc. Class A | 3,599 | 113 |
| Herman Miller Inc. | 5,600 | 111 |
| Deluxe Corp. | 5,026 | 111 |
| Corporate Executive Board Co. | 3,375 | 111 |
| * EnerSys | 4,910 | 110 |
| Kaydon Corp. | 3,187 | 107 |
| ABM Industries Inc. | 5,183 | 106 |
| * JetBlue Airways Corp. | 24,088 | 105 |
| * United Rentals Inc. | 6,110 | 102 |
| Healthcare Services Group Inc. | 6,488 | 102 |
| * II-VI Inc. | 5,059 | 100 |
| Werner Enterprises Inc. | 4,285 | 100 |
| Franklin Electric Co. Inc. | 2,274 | 98 |
| * Advisory Board Co. | 1,549 | 96 |
| Raven Industries Inc. | 1,768 | 96 |
| AAR Corp. | 3,885 | 92 |
| Knight Transportation Inc. | 5,964 | 90 |
| HNI Corp. | 4,373 | 90 |
| * Orbital Sciences Corp. | 5,711 | 89 |
| * US Airways Group Inc. | 15,835 | 89 |
| Titan International Inc. | 4,113 | 88 |
| Kaman Corp. | 2,568 | 88 |
| * Beacon Roofing Supply Inc. | 4,494 | 83 |
| Watts Water Technologies Inc. Class A | 2,942 | 83 |
| Tennant Co. | 1,872 | 82 |
| Mine Safety Appliances Co. | 2,656 | 82 |
| Forward Air Corp. | 2,872 | 82 |
| ESCO Technologies Inc. | 2,601 | 80 |
| Briggs & Stratton Corp. | 4,930 | 80 |
| * EnPro Industries Inc. | 2,021 | 78 |
| * GeoEye Inc. | 2,168 | 78 |
| Granite Construction Inc. | 3,778 | 78 |
| * DigitalGlobe Inc. | 3,440 | 78 |
| Interface Inc. Class A | 5,150 | 78 |
| Lindsay Corp. | 1,228 | 76 |
20
| Vanguard® Russell 2000 Index Fund | ||
| Schedule of Investments | ||
| August 31, 2011 | ||
| Market | ||
| Value | ||
| Shares | ($000) | |
| * Ceradyne Inc. | 2,434 | 76 |
| Ameron International Corp. | 894 | 76 |
| Heartland Express Inc. | 4,930 | 75 |
| * RBC Bearings Inc. | 2,143 | 75 |
| * Blount International Inc. | 4,755 | 75 |
| * Korn/Ferry International | 4,592 | 75 |
| * 3D Systems Corp. | 4,098 | 74 |
| Knoll Inc. | 4,677 | 74 |
| * Meritor Inc. | 8,715 | 74 |
| Unifirst Corp. | 1,385 | 72 |
| Seaboard Corp. | 31 | 72 |
| * Huron Consulting Group Inc. | 2,171 | 69 |
| * Mobile Mini Inc. | 3,593 | 68 |
| * Allegiant Travel Co. Class A | 1,445 | 68 |
| * Astec Industries Inc. | 1,950 | 68 |
| Aircastle Ltd. | 5,674 | 67 |
| * Swift Transportation Co. | 7,745 | 67 |
| Skywest Inc. | 5,170 | 66 |
| * USG Corp. | 6,981 | 66 |
| Cubic Corp. | 1,545 | 65 |
| Steelcase Inc. Class A | 7,775 | 64 |
| * SYKES Enterprises Inc. | 4,092 | 64 |
| * Insituform Technologies Inc. Class A | 3,860 | 64 |
| * Dycom Industries Inc. | 3,443 | 63 |
| TAL International Group Inc. | 2,146 | 63 |
| * Amerco Inc. | 847 | 62 |
| * TrueBlue Inc. | 4,332 | 61 |
| * Colfax Corp. | 2,403 | 60 |
| American Science & Engineering Inc. | 888 | 60 |
| Albany International Corp. | 2,703 | 59 |
| Universal Forest Products Inc. | 1,909 | 58 |
| * Rush Enterprises Inc. Class A | 3,168 | 58 |
| CIRCOR International Inc. | 1,685 | 58 |
| AZZ Inc. | 1,227 | 58 |
| * Exponent Inc. | 1,370 | 58 |
| Sun Hydraulics Corp. | 1,960 | 58 |
| McGrath Rentcorp | 2,376 | 57 |
| Insperity Inc. | 2,240 | 56 |
| * Layne Christensen Co. | 1,920 | 54 |
| * RSC Holdings Inc. | 6,623 | 53 |
| G&K Services Inc. Class A | 1,829 | 52 |
| Badger Meter Inc. | 1,472 | 52 |
| Arkansas Best Corp. | 2,486 | 51 |
| Quad/Graphics Inc. | 2,468 | 51 |
| * Generac Holdings Inc. | 2,437 | 50 |
| * Sauer-Danfoss Inc. | 1,132 | 49 |
| * Trimas Corp. | 2,498 | 48 |
| * Higher One Holdings Inc. | 2,991 | 48 |
| * Navigant Consulting Inc. | 5,042 | 48 |
| Quanex Building Products Corp. | 3,706 | 48 |
| * Team Inc. | 1,903 | 47 |
| Resources Connection Inc. | 4,531 | 47 |
| * Aerovironment Inc. | 1,653 | 47 |
| * Interline Brands Inc. | 3,261 | 47 |
| National Presto Industries Inc. | 470 | 46 |
| John Bean Technologies Corp. | 2,801 | 44 |
| NACCO Industries Inc. Class A | 570 | 44 |
| * ICF International Inc. | 1,922 | 44 |
| Gorman-Rupp Co. | 1,488 | 43 |
| Tutor Perini Corp. | 3,050 | 43 |
| * A123 Systems Inc. | 8,632 | 41 |
| * MYR Group Inc. | 1,969 | 41 |
| Viad Corp. | 1,992 | 41 |
| * Altra Holdings Inc. | 2,626 | 41 |
21
| Vanguard® Russell 2000 Index Fund | ||
| Schedule of Investments | ||
| August 31, 2011 | ||
| Market | ||
| Value | ||
| Shares | ($000) | |
| * Griffon Corp. | 4,661 | 41 |
| Encore Wire Corp. | 1,814 | 41 |
| Ennis Inc. | 2,546 | 40 |
| * Titan Machinery Inc. | 1,507 | 40 |
| Kelly Services Inc. Class A | 2,606 | 40 |
| Tredegar Corp. | 2,334 | 39 |
| Cascade Corp. | 896 | 38 |
| * Wabash National Corp. | 6,696 | 38 |
| * Global Power Equipment Group Inc. | 1,541 | 38 |
| * Swisher Hygiene Inc. | 8,271 | 37 |
| * ACCO Brands Corp. | 5,392 | 37 |
| Heidrick & Struggles International Inc. | 1,739 | 36 |
| Standex International Corp. | 1,221 | 36 |
| Comfort Systems USA Inc. | 3,707 | 35 |
| Mueller Water Products Inc. Class A | 15,199 | 35 |
| * Kforce Inc. | 3,295 | 34 |
| * Consolidated Graphics Inc. | 879 | 34 |
| * Accuride Corp. | 3,954 | 33 |
| * Pendrell Corp. | 14,778 | 33 |
| Federal Signal Corp. | 6,073 | 33 |
| US Ecology Inc. | 1,790 | 33 |
| * Powell Industries Inc. | 862 | 32 |
| AAON Inc. | 1,837 | 32 |
| Twin Disc Inc. | 827 | 32 |
| * Greenbrier Cos. Inc. | 1,803 | 31 |
| * PMFG Inc. | 1,715 | 31 |
| * Kratos Defense & Security Solutions Inc. | 3,237 | 31 |
| Primoris Services Corp. | 2,610 | 30 |
| * Mistras Group Inc. | 1,439 | 29 |
| Multi-Color Corp. | 1,115 | 29 |
| * Capstone Turbine Corp. | 24,046 | 29 |
| * H&E Equipment Services Inc. | 2,794 | 29 |
| * RailAmerica Inc. | 2,087 | 29 |
| * Force Protection Inc. | 6,942 | 28 |
| * Air Transport Services Group Inc. | 5,263 | 28 |
| * American Superconductor Corp. | 4,122 | 28 |
| Great Lakes Dredge & Dock Corp. | 5,749 | 28 |
| * Kadant Inc. | 1,203 | 28 |
| Marten Transport Ltd. | 1,520 | 28 |
| * Trex Co. Inc. | 1,522 | 28 |
| EnergySolutions Inc. | 7,801 | 28 |
| * On Assignment Inc. | 3,614 | 27 |
| * Astronics Corp. | 920 | 27 |
| * Columbus McKinnon Corp. | 1,882 | 27 |
| * EnerNOC Inc. | 2,146 | 27 |
| Douglas Dynamics Inc. | 1,823 | 26 |
| Textainer Group Holdings Ltd. | 1,114 | 26 |
| * Gibraltar Industries Inc. | 2,972 | 26 |
| * Taser International Inc. | 5,927 | 26 |
| Dynamic Materials Corp. | 1,304 | 26 |
| * CBIZ Inc. | 3,853 | 26 |
| * APAC Customer Services Inc. | 3,080 | 26 |
| Apogee Enterprises Inc. | 2,746 | 26 |
| * GenCorp Inc. | 5,738 | 26 |
| Houston Wire & Cable Co. | 1,737 | 26 |
| * RPX Corp. | 935 | 25 |
| * Standard Parking Corp. | 1,547 | 25 |
| * Dolan Co. | 2,969 | 25 |
| * CRA International Inc. | 1,061 | 25 |
| * Northwest Pipe Co. | 911 | 25 |
| * Cenveo Inc. | 5,383 | 24 |
| * Celadon Group Inc. | 1,962 | 23 |
| LB Foster Co. Class A | 930 | 23 |
| * M&F Worldwide Corp. | 1,036 | 23 |
22
| Vanguard® Russell 2000 Index Fund | ||
| Schedule of Investments | ||
| August 31, 2011 | ||
| Market | ||
| Value | ||
| Shares | ($000) | |
| Miller Industries Inc. | 1,157 | 23 |
| * Furmanite Corp. | 3,612 | 22 |
| Vicor Corp. | 1,916 | 22 |
| * FreightCar America Inc. | 1,169 | 21 |
| * KEYW Holding Corp. | 1,802 | 21 |
| * Zipcar Inc. | 1,002 | 21 |
| * Hawaiian Holdings Inc. | 4,928 | 21 |
| * Sterling Construction Co. Inc. | 1,610 | 21 |
| * Genco Shipping & Trading Ltd. | 2,889 | 21 |
| * DXP Enterprises Inc. | 850 | 21 |
| * Odyssey Marine Exploration Inc. | 7,117 | 20 |
| * Ameresco Inc. Class A | 1,727 | 19 |
| Ducommun Inc. | 1,030 | 19 |
| * InnerWorkings Inc. | 2,521 | 19 |
| * Commercial Vehicle Group Inc. | 2,656 | 19 |
| * NCI Building Systems Inc. | 1,931 | 19 |
| * Saia Inc. | 1,557 | 19 |
| * Michael Baker Corp. | 818 | 18 |
| * Spirit Airlines Inc. | 1,524 | 18 |
| * Lydall Inc. | 1,677 | 18 |
| * GP Strategies Corp. | 1,451 | 18 |
| Insteel Industries Inc. | 1,722 | 18 |
| * CAI International Inc. | 1,183 | 18 |
| * Quality Distribution Inc. | 1,463 | 18 |
| Ampco-Pittsburgh Corp. | 834 | 18 |
| * LMI Aerospace Inc. | 895 | 18 |
| Kimball International Inc. Class B | 3,064 | 17 |
| * American Railcar Industries Inc. | 953 | 17 |
| * Metalico Inc. | 3,923 | 17 |
| * Hurco Cos. Inc. | 630 | 17 |
| * Orion Marine Group Inc. | 2,640 | 17 |
| * Hudson Highland Group Inc. | 3,205 | 17 |
| Graham Corp. | 962 | 16 |
| * Pacer International Inc. | 3,420 | 15 |
| * Xerium Technologies Inc. | 1,077 | 15 |
| * Thermon Group Holdings Inc. | 978 | 15 |
| * Republic Airways Holdings Inc. | 4,711 | 15 |
| Alamo Group Inc. | 653 | 15 |
| * School Specialty Inc. | 1,574 | 15 |
| American Woodmark Corp. | 917 | 15 |
| * Tecumseh Products Co. Class A | 1,807 | 14 |
| SeaCube Container Leasing Ltd. | 1,081 | 14 |
| * FuelCell Energy Inc. | 12,145 | 14 |
| Met-Pro Corp. | 1,434 | 14 |
| * Casella Waste Systems Inc. Class A | 2,475 | 14 |
| LSI Industries Inc. | 1,904 | 14 |
| Schawk Inc. Class A | 1,153 | 14 |
| CDI Corp. | 1,244 | 14 |
| Aceto Corp. | 2,602 | 14 |
| * Roadrunner Transportation Systems Inc. | 889 | 14 |
| Intersections Inc. | 898 | 14 |
| * Patriot Transportation Holding Inc. | 603 | 14 |
| * Pike Electric Corp. | 1,589 | 13 |
| * Hill International Inc. | 2,451 | 13 |
| * American Reprographics Co. | 3,418 | 13 |
| Preformed Line Products Co. | 238 | 13 |
| * Park-Ohio Holdings Corp. | 815 | 13 |
| * NN Inc. | 1,643 | 13 |
| * Franklin Covey Co. | 1,305 | 12 |
| * Active Power Inc. | 7,820 | 12 |
| * Eagle Bulk Shipping Inc. | 6,116 | 12 |
| * Flow International Corp. | 4,627 | 12 |
| * Energy Recovery Inc. | 4,474 | 11 |
| * Satcon Technology Corp. | 8,370 | 11 |
23
| Vanguard® Russell 2000 Index Fund | ||
| Schedule of Investments | ||
| August 31, 2011 | ||
| Market | ||
| Value | ||
| Shares | ($000) | |
| Barrett Business Services Inc. | 744 | 11 |
| * Fuel Tech Inc. | 1,784 | 11 |
| * AT Cross Co. Class A | 936 | 10 |
| VSE Corp. | 405 | 10 |
| * Coleman Cable Inc. | 819 | 10 |
| International Shipholding Corp. | 531 | 10 |
| * TMS International Corp. Class A | 1,261 | 9 |
| * TRC Cos. Inc. | 1,733 | 9 |
| * Builders FirstSource Inc. | 4,474 | 9 |
| * Excel Maritime Carriers Ltd. Class A | 4,219 | 9 |
| * PowerSecure International Inc. | 1,842 | 8 |
| * Valence Technology Inc. | 6,759 | 8 |
| * Argan Inc. | 774 | 8 |
| Baltic Trading Ltd. | 1,530 | 8 |
| * Universal Truckload Services Inc. | 511 | 8 |
| * Heritage-Crystal Clean Inc. | 439 | 7 |
| Courier Corp. | 957 | 7 |
| * Broadwind Energy Inc. | 9,886 | 7 |
| * Ultrapetrol Bahamas Ltd. | 2,087 | 7 |
| * WCA Waste Corp. | 1,563 | 7 |
| * Essex Rental Corp. | 1,595 | 7 |
| Lawson Products Inc. | 355 | 6 |
| * UniTek Global Services Inc. | 1,043 | 5 |
| * Covenant Transportation Group Inc. Class A | 851 | 4 |
| * SFN Group Inc. | 278 | 4 |
| * Omega Flex Inc. | 257 | 3 |
| * Ener1 Inc. | 6,746 | 3 |
| * Astronics Corp. Class B | 85 | 2 |
| Compx International Inc. | 113 | 2 |
| 16,488 | ||
| Information Technology (16.8%) | ||
| InterDigital Inc. | 4,434 | 312 |
| Jack Henry & Associates Inc. | 8,439 | 247 |
| * Parametric Technology Corp. | 11,643 | 210 |
| * Netlogic Microsystems Inc. | 6,678 | 200 |
| ADTRAN Inc. | 6,322 | 196 |
| * SuccessFactors Inc. | 8,145 | 190 |
| * Universal Display Corp. | 3,761 | 185 |
| * Concur Technologies Inc. | 4,364 | 183 |
| * Aruba Networks Inc. | 8,342 | 178 |
| * QLIK Technologies Inc. | 6,881 | 175 |
| * RF Micro Devices Inc. | 26,992 | 168 |
| Anixter International Inc. | 2,834 | 167 |
| * Hittite Microwave Corp. | 3,063 | 166 |
| * CACI International Inc. Class A | 2,944 | 162 |
| * Finisar Corp. | 8,762 | 162 |
| * Wright Express Corp. | 3,776 | 159 |
| * Cavium Inc. | 4,735 | 152 |
| Plantronics Inc. | 4,703 | 151 |
| * GT Advanced Technologies Inc. | 12,307 | 150 |
| * CommVault Systems Inc. | 4,305 | 146 |
| * Veeco Instruments Inc. | 3,983 | 145 |
| * Blackboard Inc. | 3,425 | 145 |
| j2 Global Communications Inc. | 4,495 | 144 |
| * OpenTable Inc. | 2,302 | 140 |
| * Aspen Technology Inc. | 8,271 | 139 |
| * SolarWinds Inc. | 5,570 | 138 |
| * Progress Software Corp. | 6,552 | 136 |
| * Semtech Corp. | 6,378 | 136 |
| * Arris Group Inc. | 12,099 | 132 |
| * Microsemi Corp. | 8,446 | 131 |
| Cognex Corp. | 4,053 | 130 |
| * Ultimate Software Group Inc. | 2,527 | 128 |
| * Viasat Inc. | 3,546 | 126 |
24
| Vanguard® Russell 2000 Index Fund | ||
| Schedule of Investments | ||
| August 31, 2011 | ||
| Market | ||
| Value | ||
| Shares | ($000) | |
| MAXIMUS Inc. | 3,393 | 126 |
| * TiVo Inc. | 11,654 | 124 |
| * TriQuint Semiconductor Inc. | 16,053 | 122 |
| * FEI Co. | 3,783 | 121 |
| * Cymer Inc. | 2,984 | 121 |
| MKS Instruments Inc. | 5,109 | 119 |
| * ValueClick Inc. | 7,691 | 118 |
| Sapient Corp. | 10,679 | 115 |
| * Rambus Inc. | 9,598 | 111 |
| * Ancestry.com Inc. | 3,096 | 111 |
| * Convergys Corp. | 10,284 | 110 |
| * JDA Software Group Inc. | 4,137 | 109 |
| Blackbaud Inc. | 4,351 | 109 |
| * Coherent Inc. | 2,451 | 108 |
| * Mentor Graphics Corp. | 9,412 | 105 |
| * Omnivision Technologies Inc. | 5,668 | 104 |
| * Cardtronics Inc. | 4,211 | 104 |
| * Taleo Corp. Class A | 4,015 | 104 |
| Littelfuse Inc. | 2,222 | 103 |
| * Quest Software Inc. | 5,978 | 103 |
| * Netgear Inc. | 3,579 | 100 |
| Fair Isaac Corp. | 3,895 | 100 |
| * Entegris Inc. | 13,133 | 99 |
| * Cirrus Logic Inc. | 6,473 | 98 |
| * ACI Worldwide Inc. | 3,267 | 98 |
| * MicroStrategy Inc. Class A | 782 | 96 |
| * Take-Two Interactive Software Inc. | 7,186 | 95 |
| * Plexus Corp. | 3,475 | 92 |
| * Cabot Microelectronics Corp. | 2,299 | 91 |
| Power Integrations Inc. | 2,820 | 91 |
| * Acxiom Corp. | 7,932 | 87 |
| * Insight Enterprises Inc. | 4,567 | 86 |
| * NetSuite Inc. | 2,661 | 86 |
| * VirnetX Holding Corp. | 3,980 | 86 |
| Mantech International Corp. Class A | 2,279 | 85 |
| * Integrated Device Technology Inc. | 14,484 | 82 |
| * Synaptics Inc. | 3,349 | 82 |
| * Scansource Inc. | 2,640 | 82 |
| * Euronet Worldwide Inc. | 5,006 | 81 |
| Heartland Payment Systems Inc. | 3,768 | 81 |
| * Benchmark Electronics Inc. | 5,935 | 80 |
| * Websense Inc. | 3,906 | 80 |
| Earthlink Inc. | 10,754 | 79 |
| * RightNow Technologies Inc. | 2,411 | 79 |
| * Tyler Technologies Inc. | 3,133 | 79 |
| * Digital River Inc. | 3,877 | 78 |
| * Rogers Corp. | 1,562 | 78 |
| * Infinera Corp. | 10,220 | 77 |
| * Sourcefire Inc. | 2,780 | 77 |
| * Bottomline Technologies Inc. | 3,327 | 76 |
| * Manhattan Associates Inc. | 2,125 | 76 |
| * DealerTrack Holdings Inc. | 4,020 | 75 |
| * Advent Software Inc. | 3,209 | 74 |
| * Unisys Corp. | 4,207 | 74 |
| * Spansion Inc. Class A | 4,918 | 74 |
| NIC Inc. | 6,254 | 73 |
| Comtech Telecommunications Corp. | 2,609 | 73 |
| * OSI Systems Inc. | 1,862 | 72 |
| * Tessera Technologies Inc. | 4,997 | 70 |
| * Synchronoss Technologies Inc. | 2,583 | 70 |
| * Diodes Inc. | 3,452 | 69 |
| Syntel Inc. | 1,507 | 69 |
| * BroadSoft Inc. | 2,204 | 67 |
| Pegasystems Inc. | 1,626 | 66 |
25
| Vanguard® Russell 2000 Index Fund | ||
| Schedule of Investments | ||
| August 31, 2011 | ||
| Market | ||
| Value | ||
| Shares | ($000) | |
| * Electronics for Imaging Inc. | 4,563 | 65 |
| * Lattice Semiconductor Corp. | 11,515 | 65 |
| * SYNNEX Corp. | 2,459 | 65 |
| * Rofin-Sinar Technologies Inc. | 2,781 | 64 |
| * Brightpoint Inc. | 6,667 | 64 |
| * LogMeIn Inc. | 1,991 | 62 |
| * RealPage Inc. | 2,964 | 62 |
| * Kulicke & Soffa Industries Inc. | 7,039 | 61 |
| * Brooks Automation Inc. | 6,467 | 61 |
| * Sanmina-SCI Corp. | 7,871 | 61 |
| * FARO Technologies Inc. | 1,598 | 61 |
| * LivePerson Inc. | 5,149 | 61 |
| * Loral Space & Communications Inc. | 1,068 | 60 |
| * Ceva Inc. | 2,252 | 60 |
| * Checkpoint Systems Inc. | 3,919 | 60 |
| * Verint Systems Inc. | 2,071 | 59 |
| * Emulex Corp. | 8,578 | 59 |
| * Blue Coat Systems Inc. | 4,014 | 59 |
| * DG FastChannel Inc. | 2,680 | 59 |
| * TTM Technologies Inc. | 5,080 | 57 |
| * RealD Inc. | 4,014 | 56 |
| MTS Systems Corp. | 1,526 | 55 |
| * Constant Contact Inc. | 2,880 | 55 |
| * Calix Inc. | 3,678 | 54 |
| * Kenexa Corp. | 2,582 | 54 |
| * Sonus Networks Inc. | 20,627 | 53 |
| * Harmonic Inc. | 11,222 | 53 |
| * ATMI Inc. | 3,094 | 53 |
| * DTS Inc. | 1,701 | 52 |
| * Netscout Systems Inc. | 3,651 | 50 |
| * Power-One Inc. | 6,655 | 50 |
| * Ultratech Inc. | 2,458 | 50 |
| Park Electrochemical Corp. | 2,027 | 50 |
| Micrel Inc. | 4,929 | 50 |
| * comScore Inc. | 3,117 | 50 |
| * Volterra Semiconductor Corp. | 2,401 | 49 |
| Opnet Technologies Inc. | 1,408 | 49 |
| Forrester Research Inc. | 1,439 | 49 |
| * Silicon Graphics International Corp. | 3,029 | 48 |
| * S1 Corp. | 5,224 | 48 |
| * Stratasys Inc. | 2,066 | 48 |
| * Dice Holdings Inc. | 4,735 | 48 |
| * Newport Corp. | 3,662 | 47 |
| * Maxwell Technologies Inc. | 2,732 | 47 |
| * Standard Microsystems Corp. | 2,249 | 47 |
| United Online Inc. | 8,665 | 47 |
| * Ebix Inc. | 2,813 | 46 |
| * Measurement Specialties Inc. | 1,462 | 46 |
| * CSG Systems International Inc. | 3,383 | 45 |
| * Interactive Intelligence Group | 1,393 | 45 |
| * Amkor Technology Inc. | 10,334 | 45 |
| * Liquidity Services Inc. | 1,837 | 44 |
| * TeleTech Holdings Inc. | 2,479 | 44 |
| Black Box Corp. | 1,757 | 43 |
| * Tekelec | 6,022 | 43 |
| * Quantum Corp. | 22,033 | 43 |
| * Intermec Inc. | 5,806 | 43 |
| * Advanced Energy Industries Inc. | 4,258 | 43 |
| * TNS Inc. | 2,489 | 42 |
| * Silicon Image Inc. | 7,771 | 41 |
| * Mercury Computer Systems Inc. | 2,951 | 41 |
| * ExlService Holdings Inc. | 1,581 | 41 |
| * Monotype Imaging Holdings Inc. | 3,496 | 41 |
| * SS&C Technologies Holdings Inc. | 2,466 | 41 |
26
| Vanguard® Russell 2000 Index Fund | ||
| Schedule of Investments | ||
| August 31, 2011 | ||
| Market | ||
| Value | ||
| Shares | ($000) | |
| * Kemet Corp. | 4,316 | 40 |
| * Formfactor Inc. | 4,951 | 39 |
| EPIQ Systems Inc. | 3,070 | 38 |
| * KIT Digital Inc. | 3,459 | 38 |
| * Photronics Inc. | 5,747 | 37 |
| * Vocus Inc. | 1,722 | 37 |
| * Monolithic Power Systems Inc. | 2,929 | 37 |
| * Super Micro Computer Inc. | 2,626 | 36 |
| * STEC Inc. | 3,792 | 36 |
| * Entropic Communications Inc. | 7,906 | 36 |
| Methode Electronics Inc. | 3,611 | 35 |
| * Applied Micro Circuits Corp. | 6,194 | 35 |
| * Accelrys Inc. | 5,414 | 35 |
| * Infospace Inc. | 3,620 | 35 |
| iGate Corp. | 3,025 | 34 |
| Sycamore Networks Inc. | 1,953 | 34 |
| * Electro Scientific Industries Inc. | 2,208 | 33 |
| * Oplink Communications Inc. | 2,019 | 33 |
| * PROS Holdings Inc. | 2,102 | 33 |
| * Magma Design Automation Inc. | 6,528 | 33 |
| * Fabrinet | 1,995 | 33 |
| Keynote Systems Inc. | 1,363 | 33 |
| Daktronics Inc. | 3,384 | 33 |
| * QuinStreet Inc. | 2,693 | 32 |
| * Ixia | 3,775 | 32 |
| CTS Corp. | 3,356 | 32 |
| * ShoreTel Inc. | 4,611 | 32 |
| * Nanometrics Inc. | 1,969 | 31 |
| * Digi International Inc. | 2,477 | 31 |
| * NVE Corp. | 468 | 31 |
| Cass Information Systems Inc. | 825 | 30 |
| * Anaren Inc. | 1,478 | 29 |
| * Echelon Corp. | 3,433 | 29 |
| * Avid Technology Inc. | 2,897 | 29 |
| * OCZ Technology Group Inc. | 5,024 | 28 |
| * LoopNet Inc. | 1,621 | 28 |
| * IXYS Corp. | 2,361 | 28 |
| * Globecomm Systems Inc. | 2,193 | 28 |
| * Move Inc. | 15,516 | 28 |
| * XO Group Inc. | 3,088 | 28 |
| * IntraLinks Holdings Inc. | 2,949 | 28 |
| * LTX-Credence Corp. | 4,836 | 28 |
| * Powerwave Technologies Inc. | 15,610 | 27 |
| Electro Rent Corp. | 1,836 | 27 |
| * MIPS Technologies Inc. Class A | 4,848 | 27 |
| * Zoran Corp. | 3,334 | 27 |
| * Web.com Group Inc. | 2,841 | 27 |
| * Internap Network Services Corp. | 5,109 | 26 |
| Cohu Inc. | 2,351 | 26 |
| Xyratex Ltd. | 3,025 | 26 |
| * Advanced Analogic Technologies Inc. | 4,201 | 25 |
| * Ness Technologies Inc. | 3,286 | 25 |
| * Sigma Designs Inc. | 3,109 | 25 |
| * Extreme Networks | 9,002 | 25 |
| * AXT Inc. | 3,126 | 24 |
| * GSI Group Inc. | 2,527 | 24 |
| * Kopin Corp. | 6,311 | 24 |
| * Virtusa Corp. | 1,478 | 23 |
| * Symmetricom Inc. | 4,229 | 23 |
| * Actuate Corp. | 3,513 | 22 |
| * Envestnet Inc. | 1,872 | 22 |
| * Rubicon Technology Inc. | 1,714 | 22 |
| * Zix Corp. | 6,490 | 22 |
| * Exar Corp. | 3,578 | 22 |
27
| Vanguard® Russell 2000 Index Fund | ||
| Schedule of Investments | ||
| August 31, 2011 | ||
| Market | ||
| Value | ||
| Shares | ($000) | |
| * Integrated Silicon Solution Inc. | 2,617 | 22 |
| * Supertex Inc. | 1,083 | 21 |
| * Rudolph Technologies Inc. | 3,095 | 21 |
| Marchex Inc. Class B | 2,089 | 21 |
| * MoneyGram International Inc. | 8,177 | 21 |
| * Perficient Inc. | 2,362 | 21 |
| * DemandTec Inc. | 3,157 | 21 |
| * CIBER Inc. | 6,251 | 21 |
| * Digimarc Corp. | 613 | 20 |
| * Imation Corp. | 2,937 | 20 |
| Stamps.com Inc. | 1,036 | 20 |
| * Seachange International Inc. | 2,585 | 20 |
| Renaissance Learning Inc. | 1,291 | 20 |
| * Cray Inc. | 3,537 | 20 |
| * Zygo Corp. | 1,520 | 20 |
| * Oclaro Inc. | 4,656 | 20 |
| * Travelzoo Inc. | 541 | 20 |
| * Immersion Corp. | 2,789 | 20 |
| * Active Network Inc. | 1,202 | 19 |
| * Saba Software Inc. | 2,767 | 19 |
| Richardson Electronics Ltd. | 1,379 | 19 |
| RealNetworks Inc. | 2,062 | 19 |
| * Pericom Semiconductor Corp. | 2,447 | 19 |
| * Mindspeed Technologies Inc. | 3,274 | 19 |
| * Global Cash Access Holdings Inc. | 6,305 | 19 |
| * VASCO Data Security International Inc. | 2,642 | 19 |
| * Wave Systems Corp. Class A | 8,099 | 19 |
| * Intevac Inc. | 2,233 | 18 |
| * SciQuest Inc. | 1,206 | 18 |
| * Vishay Precision Group Inc. | 1,203 | 18 |
| * Lionbridge Technologies Inc. | 6,022 | 18 |
| American Software Inc. Class A | 2,221 | 18 |
| Bel Fuse Inc. Class B | 1,028 | 18 |
| ModusLink Global Solutions Inc. | 4,282 | 18 |
| * ServiceSource International Inc. | 977 | 18 |
| * Cornerstone OnDemand Inc. | 1,116 | 17 |
| * Anadigics Inc. | 6,223 | 17 |
| * TeleCommunication Systems Inc. Class A | 4,535 | 17 |
| * Aeroflex Holding Corp. | 1,940 | 17 |
| * Multi-Fineline Electronix Inc. | 883 | 17 |
| * Computer Task Group Inc. | 1,478 | 17 |
| * Openwave Systems Inc. | 8,331 | 16 |
| * Agilysys Inc. | 1,750 | 16 |
| * Limelight Networks Inc. | 6,262 | 16 |
| * Echo Global Logistics Inc. | 1,102 | 15 |
| * Aviat Networks Inc. | 5,926 | 15 |
| * Inphi Corp. | 1,894 | 15 |
| * SPS Commerce Inc. | 824 | 15 |
| * TeleNav Inc. | 1,610 | 15 |
| * DSP Group Inc. | 2,289 | 15 |
| * LeCroy Corp. | 1,603 | 15 |
| * Rosetta Stone Inc. | 1,073 | 14 |
| * Deltek Inc. | 2,170 | 14 |
| * Radisys Corp. | 1,899 | 14 |
| * Callidus Software Inc. | 2,932 | 14 |
| * Emcore Corp. | 8,635 | 14 |
| * PLX Technology Inc. | 4,352 | 14 |
| Pulse Electronics Corp. | 4,067 | 14 |
| * Responsys Inc. | 927 | 14 |
| * Axcelis Technologies Inc. | 9,790 | 13 |
| * KVH Industries Inc. | 1,454 | 13 |
| * Westell Technologies Inc. Class A | 5,191 | 13 |
| Rimage Corp. | 929 | 13 |
| * MoSys Inc. | 3,190 | 13 |
28
| Vanguard® Russell 2000 Index Fund | ||
| Schedule of Investments | ||
| August 31, 2011 | ||
| Market | ||
| Value | ||
| Shares | ($000) | |
| * Alpha & Omega Semiconductor Ltd. | 1,436 | 13 |
| * Glu Mobile Inc. | 4,098 | 13 |
| * THQ Inc. | 6,279 | 12 |
| * Ultra Clean Holdings | 2,100 | 12 |
| * Procera Networks Inc. | 1,407 | 12 |
| * PDF Solutions Inc. | 2,288 | 12 |
| * Hackett Group Inc. | 2,976 | 11 |
| * PRGX Global Inc. | 1,910 | 11 |
| DDi Corp. | 1,475 | 11 |
| * Zillow Inc. | 300 | 11 |
| * support.com Inc. | 4,474 | 11 |
| * Convio Inc. | 1,183 | 11 |
| * NCI Inc. Class A | 652 | 11 |
| * Novatel Wireless Inc. | 3,134 | 11 |
| * Amtech Systems Inc. | 936 | 10 |
| * GSI Technology Inc. | 1,971 | 10 |
| * FalconStor Software Inc. | 3,005 | 10 |
| * Dot Hill Systems Corp. | 5,523 | 10 |
| * SRS Labs Inc. | 1,179 | 10 |
| * Meru Networks Inc. | 1,053 | 10 |
| * ePlus Inc. | 378 | 10 |
| Communications Systems Inc. | 650 | 9 |
| * X-Rite Inc. | 2,580 | 9 |
| * Microvision Inc. | 10,274 | 9 |
| * TechTarget Inc. | 1,427 | 9 |
| * MaxLinear Inc. | 1,565 | 9 |
| * Dynamics Research Corp. | 875 | 9 |
| * FSI International Inc. | 3,793 | 8 |
| * Guidance Software Inc. | 1,292 | 8 |
| * PC Connection Inc. | 910 | 8 |
| * Motricity Inc. | 3,416 | 8 |
| * ORBCOMM Inc. | 3,217 | 7 |
| QAD Inc. Class A | 614 | 7 |
| * Identive Group Inc. | 3,603 | 7 |
| * Opnext Inc. | 4,185 | 7 |
| * Demand Media Inc. | 730 | 6 |
| * Smith Micro Software Inc. | 3,311 | 6 |
| * BigBand Networks Inc. | 4,354 | 6 |
| * eMagin Corp. | 1,651 | 6 |
| * Numerex Corp. Class A | 903 | 6 |
| * NeoPhotonics Corp. | 850 | 5 |
| * Viasystems Group Inc. | 274 | 5 |
| * Ellie Mae Inc. | 836 | 5 |
| * Dialogic Inc. | 1,497 | 4 |
| * Quepasa Corp. | 707 | 3 |
| * Stream Global Services Inc. | 988 | 3 |
| * FriendFinder Networks Inc. | 600 | 2 |
| * Gerber Scientific Inc. CVR | 2,358 | — |
| 18,008 | ||
| Materials (4.9%) | ||
| * Coeur d'Alene Mines Corp. | 8,751 | 249 |
| * Hecla Mining Co. | 27,292 | 209 |
| Sensient Technologies Corp. | 4,894 | 178 |
| Olin Corp. | 7,790 | 155 |
| * Stillwater Mining Co. | 10,072 | 155 |
| NewMarket Corp. | 881 | 148 |
| * Chemtura Corp. | 9,413 | 125 |
| * Thompson Creek Metals Co. Inc. | 14,931 | 123 |
| Balchem Corp. | 2,821 | 116 |
| PolyOne Corp. | 9,129 | 115 |
| HB Fuller Co. | 4,832 | 107 |
| Buckeye Technologies Inc. | 3,900 | 106 |
| Arch Chemicals Inc. | 2,235 | 105 |
| Minerals Technologies Inc. | 1,787 | 104 |
29
| Vanguard® Russell 2000 Index Fund | ||
| Schedule of Investments | ||
| August 31, 2011 | ||
| Market | ||
| Value | ||
| Shares | ($000) | |
| Globe Specialty Metals Inc. | 6,161 | 103 |
| * OM Group Inc. | 3,031 | 96 |
| Schweitzer-Mauduit International Inc. | 1,572 | 94 |
| Worthington Industries Inc. | 5,619 | 91 |
| Innophos Holdings Inc. | 2,121 | 88 |
| * Calgon Carbon Corp. | 5,521 | 87 |
| * Louisiana-Pacific Corp. | 12,918 | 86 |
| Eagle Materials Inc. | 4,350 | 86 |
| * Clearwater Paper Corp. | 2,252 | 83 |
| Kaiser Aluminum Corp. | 1,592 | 83 |
| Texas Industries Inc. | 2,227 | 79 |
| * RTI International Metals Inc. | 2,952 | 79 |
| * Kraton Performance Polymers Inc. | 3,118 | 75 |
| * LSB Industries Inc. | 1,796 | 72 |
| * Ferro Corp. | 8,462 | 71 |
| * Georgia Gulf Corp. | 3,321 | 70 |
| AMCOL International Corp. | 2,382 | 69 |
| Haynes International Inc. | 1,194 | 69 |
| Koppers Holdings Inc. | 2,014 | 67 |
| * Graphic Packaging Holding Co. | 15,625 | 66 |
| Gold Resource Corp. | 2,777 | 65 |
| PH Glatfelter Co. | 4,501 | 65 |
| * US Gold Corp. | 10,305 | 64 |
| Boise Inc. | 10,193 | 63 |
| * Innospec Inc. | 2,318 | 63 |
| * Golden Star Resources Ltd. | 25,274 | 62 |
| Deltic Timber Corp. | 1,056 | 62 |
| * Century Aluminum Co. | 5,042 | 61 |
| * Graham Packaging Co. Inc. | 2,360 | 60 |
| Stepan Co. | 792 | 60 |
| * KapStone Paper and Packaging Corp. | 3,820 | 57 |
| * Materion Corp. | 1,995 | 57 |
| A Schulman Inc. | 3,017 | 55 |
| * Jaguar Mining Inc. | 8,248 | 51 |
| * Horsehead Holding Corp. | 4,270 | 44 |
| Quaker Chemical Corp. | 1,252 | 42 |
| * TPC Group Inc. | 1,297 | 41 |
| Zep Inc. | 2,145 | 38 |
| * Flotek Industries Inc. | 4,881 | 34 |
| Myers Industries Inc. | 3,098 | 34 |
| * STR Holdings Inc. | 2,954 | 33 |
| Wausau Paper Corp. | 4,807 | 32 |
| Hawkins Inc. | 849 | 31 |
| * Paramount Gold and Silver Corp. | 11,449 | 28 |
| * General Moly Inc. | 6,591 | 26 |
| American Vanguard Corp. | 2,184 | 26 |
| Neenah Paper Inc. | 1,459 | 25 |
| * Noranda Aluminum Holding Corp. | 2,221 | 25 |
| * Zoltek Cos. Inc. | 2,715 | 24 |
| * Vista Gold Corp. | 6,944 | 24 |
| * Universal Stainless & Alloy | 694 | 23 |
| * Midway Gold Corp. | 8,382 | 22 |
| FutureFuel Corp. | 1,825 | 21 |
| * AM Castle & Co. | 1,634 | 20 |
| * Omnova Solutions Inc. | 4,422 | 19 |
| Olympic Steel Inc. | 895 | 19 |
| * Senomyx Inc. | 3,869 | 17 |
| * Golden Minerals Co. | 1,208 | 16 |
| * Landec Corp. | 2,580 | 15 |
| * Metals USA Holdings Corp. | 1,133 | 14 |
| * Spartech Corp. | 3,018 | 13 |
| * AEP Industries Inc. | 470 | 13 |
| * Headwaters Inc. | 5,612 | 12 |
| * Revett Minerals Inc. | 2,450 | 11 |
30
| Vanguard® Russell 2000 Index Fund | ||
| Schedule of Investments | ||
| August 31, 2011 | ||
| Market | ||
| Value | ||
| Shares | ($000) | |
| * United States Lime & Minerals Inc. | 254 | 11 |
| KMG Chemicals Inc. | 702 | 11 |
| NL Industries Inc. | 652 | 10 |
| * Handy & Harman Ltd. | 542 | 8 |
| Chase Corp. | 593 | 8 |
| * US Energy Corp. Wyoming | 2,251 | 6 |
| * SunCoke Energy Inc. | 400 | 6 |
| * Verso Paper Corp. | 1,568 | 4 |
| 5,260 | ||
| Telecommunication Services (1.0%) | ||
| AboveNet Inc. | 2,269 | 139 |
| * Global Crossing Ltd. | 3,000 | 85 |
| * PAETEC Holding Corp. | 12,253 | 69 |
| * Cincinnati Bell Inc. | 19,432 | 66 |
| * Cogent Communications Group Inc. | 4,494 | 64 |
| NTELOS Holdings Corp. | 2,939 | 58 |
| * Leap Wireless International Inc. | 5,970 | 54 |
| * Vonage Holdings Corp. | 13,549 | 49 |
| Consolidated Communications Holdings Inc. | 2,556 | 49 |
| * Premiere Global Services Inc. | 5,107 | 43 |
| * Neutral Tandem Inc. | 3,066 | 36 |
| * General Communication Inc. Class A | 4,051 | 36 |
| Alaska Communications Systems Group Inc. | 4,415 | 34 |
| USA Mobility Inc. | 2,161 | 33 |
| Shenandoah Telecommunications Co. | 2,323 | 32 |
| * Iridium Communications Inc. | 4,260 | 31 |
| Atlantic Tele-Network Inc. | 916 | 30 |
| IDT Corp. Class B | 1,359 | 30 |
| * 8x8 Inc. | 6,072 | 26 |
| * Cbeyond Inc. | 2,731 | 25 |
| SureWest Communications | 1,375 | 16 |
| * Towerstream Corp. | 4,138 | 15 |
| * Fairpoint Communications Inc. | 2,108 | 14 |
| HickoryTech Corp. | 1,306 | 12 |
| * inContact Inc. | 3,000 | 12 |
| * Globalstar Inc. | 9,584 | 8 |
| * Boingo Wireless Inc. | 557 | 5 |
| 1,071 | ||
| Utilities (3.7%) | ||
| Nicor Inc. | 4,452 | 247 |
| Piedmont Natural Gas Co. Inc. | 7,018 | 217 |
| Cleco Corp. | 5,961 | 212 |
| WGL Holdings Inc. | 5,007 | 207 |
| New Jersey Resources Corp. | 4,044 | 190 |
| IDACORP Inc. | 4,845 | 185 |
| Portland General Electric Co. | 7,363 | 178 |
| UIL Holdings Corp. | 4,939 | 168 |
| Southwest Gas Corp. | 4,482 | 166 |
| South Jersey Industries Inc. | 2,929 | 151 |
| Avista Corp. | 5,634 | 143 |
| El Paso Electric Co. | 4,117 | 142 |
| Unisource Energy Corp. | 3,588 | 136 |
| PNM Resources Inc. | 8,473 | 127 |
| Allete Inc. | 3,118 | 122 |
| NorthWestern Corp. | 3,544 | 120 |
| Northwest Natural Gas Co. | 2,608 | 118 |
| Black Hills Corp. | 3,853 | 118 |
| Atlantic Power Corp. | 6,699 | 104 |
| MGE Energy Inc. | 2,260 | 95 |
| Laclede Group Inc. | 2,191 | 87 |
| CH Energy Group Inc. | 1,520 | 85 |
| Empire District Electric Co. | 4,084 | 85 |
| California Water Service Group | 4,081 | 77 |
| Otter Tail Corp. | 3,526 | 72 |
31
| Vanguard® Russell 2000 Index Fund | |||||
| Schedule of Investments | |||||
| August 31, 2011 | |||||
| Market | |||||
| Value | |||||
| Shares | ($000) | ||||
| American States Water Co. | 1,824 | 65 | |||
| Central Vermont Public Service Corp. | 1,310 | 46 | |||
| * | Dynegy Inc. Class A | 10,065 | 44 | ||
| Chesapeake Utilities Corp. | 935 | 38 | |||
| SJW Corp. | 1,379 | 32 | |||
| Ormat Technologies Inc. | 1,754 | 30 | |||
| Unitil Corp. | 1,068 | 28 | |||
| Middlesex Water Co. | 1,525 | 28 | |||
| Connecticut Water Service Inc. | 840 | 22 | |||
| York Water Co. | 1,244 | 22 | |||
| Pennichuck Corp. | 458 | 13 | |||
| * | Cadiz Inc. | 1,179 | 12 | ||
| Consolidated Water Co. Ltd. | 1,424 | 12 | |||
| Artesian Resources Corp. Class A | 636 | 12 | |||
| 3,956 | |||||
| Total Common Stocks (Cost $116,178)1 | 106,827 | ||||
| Coupon | |||||
| Temporary Cash Investments (5.8%) | |||||
| Money Market Fund (5.7%) | |||||
| 2 | Vanguard Market Liquidity Fund | 0.132% | 6,071,000 | 6,071 | |
| Face | |||||
| Maturity | Amount | ||||
| Coupon | Date | ($000) | |||
| U.S. Government and Agency Obligations (0.1%) | |||||
| 3,4 | Fannie Mae Discount Notes | 0.045% | 10/5/11 | 50 | 50 |
| 3,4 | Federal Home Loan Bank Discount Notes | 0.040% | 11/30/11 | 100 | 100 |
| 150 | |||||
| Total Temporary Cash Investments (Cost $6,221) | 6,221 | ||||
| Total Investments (105.5%) (Cost $122,399) | 113,048 | ||||
| Other Assets and Liabilities—Net (-5.5%) | (5,929) | ||||
| Net Assets (100%) | 107,119 | ||||
* Non-income-producing security.
1 The fund invests a portion of its cash reserves in equity markets through the use of index futures contracts. After giving effect to futures investments, the fund’s effective common stock and temporary cash investment positions represent 99.9% and 5.6%, respectively, of net asset.
2 Affiliated money market fund available only to Vanguard funds and certain trusts and accounts managed by Vanguard. Rate shown is the 7-day yield.
3 The issuer operates under a congressional charter; its securities are not backed by the full faith and credit of the U.S. government.
4 Securities with a value of $50,000 have been segregated as initial margin for open futures contracts.
32
| Vanguard® Russell 2000 Value Index Fund | ||
| Schedule of Investments | ||
| August 31, 2011 | ||
| Market | ||
| Value | ||
| Shares | ($000) | |
| Common Stocks (99.5%)1 | ||
| Consumer Discretionary (11.6%) | ||
| Rent-A-Center Inc. | 1,926 | 54 |
| * Iconix Brand Group Inc. | 2,208 | 43 |
| * Live Nation Entertainment Inc. | 4,272 | 40 |
| Men's Wearhouse Inc. | 1,292 | 37 |
| * Genesco Inc. | 645 | 34 |
| * New York Times Co. Class A | 4,152 | 34 |
| * Childrens Place Retail Stores Inc. | 790 | 34 |
| * Saks Inc. | 3,491 | 34 |
| * Domino's Pizza Inc. | 1,157 | 32 |
| Jones Group Inc. | 2,647 | 31 |
| * Cabela's Inc. | 1,310 | 31 |
| Group 1 Automotive Inc. | 728 | 30 |
| * Jack in the Box Inc. | 1,420 | 29 |
| Bob Evans Farms Inc. | 918 | 29 |
| Meredith Corp. | 1,100 | 28 |
| * Helen of Troy Ltd. | 935 | 28 |
| * Gaylord Entertainment Co. | 1,079 | 27 |
| * Eastman Kodak Co. | 8,143 | 26 |
| Regis Corp. | 1,749 | 26 |
| * Collective Brands Inc. | 1,863 | 25 |
| Penske Automotive Group Inc. | 1,352 | 25 |
| American Greetings Corp. Class A | 1,149 | 24 |
| * Pinnacle Entertainment Inc. | 1,762 | 24 |
| * Pier 1 Imports Inc. | 2,203 | 24 |
| * 99 Cents Only Stores | 1,255 | 23 |
| * Orient-Express Hotels Ltd. Class A | 2,885 | 23 |
| International Speedway Corp. Class A | 892 | 22 |
| Scholastic Corp. | 805 | 22 |
| MDC Holdings Inc. | 1,136 | 22 |
| Finish Line Inc. Class A | 1,091 | 22 |
| * Office Depot Inc. | 8,401 | 22 |
| * Ascent Capital Group Inc. Class A | 436 | 21 |
| Matthews International Corp. Class A | 550 | 18 |
| * Skechers U.S.A. Inc. Class A | 1,134 | 18 |
| Stage Stores Inc. | 1,094 | 18 |
| Sonic Automotive Inc. Class A | 1,218 | 17 |
| * Asbury Automotive Group Inc. | 884 | 17 |
| * Quiksilver Inc. | 3,928 | 16 |
| * Ruby Tuesday Inc. | 1,971 | 16 |
| * OfficeMax Inc. | 2,602 | 16 |
| * Modine Manufacturing Co. | 1,409 | 16 |
| * Meritage Homes Corp. | 846 | 16 |
| PEP Boys-Manny Moe & Jack | 1,594 | 16 |
| Ryland Group Inc. | 1,344 | 16 |
| KB Home | 2,330 | 15 |
| * American Axle & Manufacturing Holdings Inc. | 1,589 | 15 |
| Stewart Enterprises Inc. Class A | 2,385 | 14 |
| * Central European Media Enterprises Ltd. Class A | 1,109 | 14 |
| * Liz Claiborne Inc. | 2,717 | 14 |
| * Jakks Pacific Inc. | 824 | 14 |
| * Timberland Co. Class A | 325 | 14 |
| * La-Z-Boy Inc. | 1,570 | 14 |
| * Wet Seal Inc. Class A | 2,735 | 14 |
| Fred's Inc. Class A | 1,190 | 14 |
| Lithia Motors Inc. Class A | 668 | 13 |
| Churchill Downs Inc. | 280 | 12 |
| Superior Industries International Inc. | 709 | 12 |
| Barnes & Noble Inc. | 879 | 12 |
| * Warnaco Group Inc. | 211 | 11 |
| HOT Topic Inc. | 1,355 | 11 |
| * Biglari Holdings Inc. | 34 | 11 |
33
| Vanguard® Russell 2000 Value Index Fund | ||
| Schedule of Investments | ||
| August 31, 2011 | ||
| Market | ||
| Value | ||
| Shares | ($000) | |
| * Charming Shoppes Inc. | 3,519 | 11 |
| Sinclair Broadcast Group Inc. Class A | 1,417 | 11 |
| Brown Shoe Co. Inc. | 1,343 | 11 |
| Callaway Golf Co. | 1,950 | 11 |
| Belo Corp. Class A | 1,976 | 11 |
| Harte-Hanks Inc. | 1,340 | 11 |
| * Fuel Systems Solutions Inc. | 504 | 11 |
| * Core-Mark Holding Co. Inc. | 298 | 11 |
| * Boyd Gaming Corp. | 1,659 | 10 |
| * Exide Technologies | 1,760 | 10 |
| Vail Resorts Inc. | 228 | 9 |
| Blyth Inc. | 158 | 9 |
| * EW Scripps Co. Class A | 1,031 | 9 |
| * Perry Ellis International Inc. | 367 | 8 |
| * Standard Pacific Corp. | 3,215 | 8 |
| Ethan Allen Interiors Inc. | 474 | 8 |
| Bebe Stores Inc. | 1,163 | 8 |
| Standard Motor Products Inc. | 596 | 8 |
| * Cavco Industries Inc. | 207 | 8 |
| * Scientific Games Corp. Class A | 839 | 7 |
| Movado Group Inc. | 524 | 7 |
| Drew Industries Inc. | 358 | 7 |
| * Fisher Communications Inc. | 268 | 7 |
| * Shoe Carnival Inc. | 278 | 7 |
| Haverty Furniture Cos. Inc. | 569 | 7 |
| Lincoln Educational Services Corp. | 684 | 7 |
| * Talbots Inc. | 2,116 | 6 |
| * Carter's Inc. | 201 | 6 |
| Columbia Sportswear Co. | 117 | 6 |
| Marcus Corp. | 618 | 6 |
| Stein Mart Inc. | 832 | 6 |
| * Arctic Cat Inc. | 368 | 6 |
| * hhgregg Inc. | 516 | 6 |
| Cinemark Holdings Inc. | 262 | 5 |
| * Universal Electronics Inc. | 280 | 5 |
| * Casual Male Retail Group Inc. | 1,276 | 5 |
| * Citi Trends Inc. | 454 | 5 |
| * Tuesday Morning Corp. | 1,305 | 5 |
| * Corinthian Colleges Inc. | 2,359 | 5 |
| Christopher & Banks Corp. | 1,084 | 5 |
| Mac-Gray Corp. | 360 | 5 |
| * Steinway Musical Instruments Inc. | 200 | 5 |
| Big 5 Sporting Goods Corp. | 666 | 5 |
| Weyco Group Inc. | 217 | 5 |
| * Beazer Homes USA Inc. | 2,306 | 5 |
| * Journal Communications Inc. Class A | 1,308 | 5 |
| Speedway Motorsports Inc. | 358 | 5 |
| * MarineMax Inc. | 704 | 5 |
| * Unifi Inc. | 422 | 5 |
| * Kirkland's Inc. | 507 | 5 |
| * Ruth's Hospitality Group Inc. | 885 | 5 |
| * M/I Homes Inc. | 567 | 5 |
| * Life Time Fitness Inc. | 121 | 5 |
| Spartan Motors Inc. | 1,010 | 5 |
| * Entercom Communications Corp. Class A | 733 | 4 |
| CSS Industries Inc. | 246 | 4 |
| * K-Swiss Inc. Class A | 793 | 4 |
| * West Marine Inc. | 448 | 4 |
| * Systemax Inc. | 309 | 4 |
| * Leapfrog Enterprises Inc. | 1,255 | 4 |
| * Isle of Capri Casinos Inc. | 618 | 4 |
| * Multimedia Games Holding Co. Inc. | 815 | 4 |
| * America's Car-Mart Inc. | 133 | 4 |
| * Zale Corp. | 973 | 4 |
34
| Vanguard® Russell 2000 Value Index Fund | ||
| Schedule of Investments | ||
| August 31, 2011 | ||
| Market | ||
| Value | ||
| Shares | ($000) | |
| * Smith & Wesson Holding Corp. | 1,206 | 4 |
| * Motorcar Parts of America Inc. | 366 | 4 |
| * Furniture Brands International Inc. | 1,270 | 4 |
| * Audiovox Corp. Class A | 547 | 4 |
| * Saga Communications Inc. Class A | 110 | 3 |
| * Select Comfort Corp. | 216 | 3 |
| * Dana Holding Corp. | 262 | 3 |
| * Benihana Inc. Class A | 404 | 3 |
| * Caribou Coffee Co. Inc. | 213 | 3 |
| * Delta Apparel Inc. | 194 | 3 |
| Ambassadors Group Inc. | 413 | 3 |
| * O'Charleys Inc. (Foreign) | 558 | 3 |
| * Denny's Corp. | 827 | 3 |
| * Red Lion Hotels Corp. | 445 | 3 |
| * Black Diamond Inc. | 401 | 3 |
| * Sealy Corp. | 1,497 | 3 |
| * Hovnanian Enterprises Inc. Class A | 1,854 | 3 |
| AH Belo Corp. Class A | 565 | 3 |
| Outdoor Channel Holdings Inc. | 437 | 3 |
| * McClatchy Co. Class A | 1,747 | 3 |
| * Summer Infant Inc. | 410 | 3 |
| * Build-A-Bear Workshop Inc. | 478 | 3 |
| * New York & Co. Inc. | 770 | 3 |
| * Morgans Hotel Group Co. | 385 | 3 |
| Lifetime Brands Inc. | 242 | 3 |
| * LIN TV Corp. Class A | 825 | 3 |
| * Shuffle Master Inc. | 287 | 3 |
| * Gray Television Inc. | 1,325 | 3 |
| * Martha Stewart Living Omnimedia Class A | 743 | 2 |
| * Town Sports International Holdings Inc. | 321 | 2 |
| Bon-Ton Stores Inc. | 341 | 2 |
| * McCormick & Schmick's Seafood Restaurants Inc. | 383 | 2 |
| * Luby's Inc. | 517 | 2 |
| * Conn's Inc. | 410 | 2 |
| * Monarch Casino & Resort Inc. | 228 | 2 |
| RG Barry Corp. | 224 | 2 |
| Skyline Corp. | 208 | 2 |
| * Johnson Outdoors Inc. Class A | 143 | 2 |
| * Pacific Sunwear of California Inc. | 1,436 | 2 |
| * Kenneth Cole Productions Inc. Class A | 155 | 2 |
| * Coldwater Creek Inc. | 1,580 | 2 |
| * Orbitz Worldwide Inc. | 643 | 2 |
| Texas Roadhouse Inc. Class A | 114 | 2 |
| PF Chang's China Bistro Inc. | 53 | 2 |
| * 1-800-Flowers.com Inc. Class A | 639 | 2 |
| * Cost Plus Inc. | 204 | 2 |
| * Syms Corp. | 176 | 2 |
| * Archipelago Learning Inc. | 167 | 2 |
| Shiloh Industries Inc. | 151 | 2 |
| Cracker Barrel Old Country Store Inc. | 36 | 2 |
| * Nexstar Broadcasting Group Inc. Class A | 248 | 2 |
| * Cambium Learning Group Inc. | 501 | 1 |
| * Cumulus Media Inc. Class A | 543 | 1 |
| * Red Robin Gourmet Burgers Inc. | 45 | 1 |
| * Crown Media Holdings Inc. Class A | 954 | 1 |
| * Knology Inc. | 66 | 1 |
| World Wrestling Entertainment Inc. Class A | 86 | 1 |
| * Marine Products Corp. | 139 | 1 |
| * Westwood One Inc. | 134 | 1 |
| Einstein Noah Restaurant Group Inc. | 45 | 1 |
| * Entravision Communications Corp. Class A | 594 | 1 |
| Cherokee Inc. | 47 | 1 |
| * Valuevision Media Inc. Class A | 164 | 1 |
| * Gordmans Stores Inc. | 35 | 1 |
35
| Vanguard® Russell 2000 Value Index Fund | ||
| Schedule of Investments | ||
| August 31, 2011 | ||
| Market | ||
| Value | ||
| Shares | ($000) | |
| Value Line Inc. | 42 | 1 |
| * Global Sources Ltd. | 16 | — |
| 1,917 | ||
| Consumer Staples (3.0%) | ||
| Snyders-Lance Inc. | 1,430 | 32 |
| Universal Corp. | 701 | 29 |
| Ruddick Corp. | 685 | 28 |
| Fresh Del Monte Produce Inc. | 1,105 | 27 |
| Sanderson Farms Inc. | 671 | 26 |
| * Hain Celestial Group Inc. | 818 | 26 |
| * TreeHouse Foods Inc. | 442 | 24 |
| Andersons Inc. | 563 | 23 |
| * Rite Aid Corp. | 16,482 | 18 |
| * Prestige Brands Holdings Inc. | 1,522 | 16 |
| * Central European Distribution Corp. | 2,202 | 16 |
| * Chiquita Brands International Inc. | 1,375 | 14 |
| Cal-Maine Foods Inc. | 404 | 13 |
| * Winn-Dixie Stores Inc. | 1,690 | 13 |
| Weis Markets Inc. | 333 | 13 |
| Nash Finch Co. | 367 | 12 |
| B&G Foods Inc. Class A | 620 | 11 |
| * Central Garden and Pet Co. Class A | 1,434 | 11 |
| Spartan Stores Inc. | 684 | 11 |
| * Dole Food Co. Inc. | 883 | 10 |
| * Alliance One International Inc. | 2,636 | 8 |
| * Heckmann Corp. | 1,421 | 8 |
| Vector Group Ltd. | 439 | 8 |
| * Smart Balance Inc. | 571 | 8 |
| * Pantry Inc. | 645 | 8 |
| * Seneca Foods Corp. Class A | 280 | 7 |
| * Omega Protein Corp. | 529 | 6 |
| Ingles Markets Inc. Class A | 382 | 6 |
| * Pilgrim's Pride Corp. | 1,532 | 5 |
| * Susser Holdings Corp. | 244 | 5 |
| * Smart Balance Inc. | 949 | 5 |
| Village Super Market Inc. Class A | 190 | 5 |
| * Elizabeth Arden Inc. | 139 | 5 |
| * Revlon Inc. Class A | 329 | 4 |
| * Nutraceutical International Corp. | 279 | 4 |
| Imperial Sugar Co. | 371 | 3 |
| * Spectrum Brands Holdings Inc. | 94 | 3 |
| Oil-Dri Corp. of America | 127 | 2 |
| Schiff Nutrition International Inc. | 233 | 2 |
| MGP Ingredients Inc. | 347 | 2 |
| Griffin Land & Nurseries Inc. | 64 | 2 |
| Alico Inc. | 73 | 2 |
| * Harbinger Group Inc. | 319 | 1 |
| * Craft Brewers Alliance Inc. | 237 | 1 |
| Tootsie Roll Industries Inc. | 45 | 1 |
| Arden Group Inc. | 12 | 1 |
| Farmer Bros Co. | 127 | 1 |
| * Primo Water Corp. | 95 | 1 |
| * Star Scientific Inc. | 244 | 1 |
| 488 | ||
| Energy (5.1%) | ||
| * Bill Barrett Corp. | 1,320 | 63 |
| * Helix Energy Solutions Group Inc. | 3,209 | 54 |
| Bristow Group Inc. | 1,100 | 48 |
| * Swift Energy Co. | 1,284 | 40 |
| World Fuel Services Corp. | 926 | 34 |
| * Comstock Resources Inc. | 1,442 | 29 |
| * Cloud Peak Energy Inc. | 1,465 | 29 |
| * SemGroup Corp. Class A | 1,257 | 29 |
| Nordic American Tankers Ltd. | 1,430 | 26 |
36
| Vanguard® Russell 2000 Value Index Fund | ||
| Schedule of Investments | ||
| August 31, 2011 | ||
| Market | ||
| Value | ||
| Shares | ($000) | |
| * Gulfmark Offshore Inc. | 592 | 23 |
| * Exterran Holdings Inc. | 1,935 | 23 |
| Ship Finance International Ltd. | 1,363 | 22 |
| * Tetra Technologies Inc. | 2,070 | 21 |
| * Newpark Resources Inc. | 2,548 | 21 |
| * Parker Drilling Co. | 3,532 | 20 |
| * Petroleum Development Corp. | 712 | 17 |
| * Hornbeck Offshore Services Inc. | 692 | 17 |
| * Hercules Offshore Inc. | 3,486 | 15 |
| Overseas Shipholding Group Inc. | 806 | 14 |
| * Global Industries Ltd. | 3,064 | 13 |
| Frontline Ltd. | 1,560 | 12 |
| Knightsbridge Tankers Ltd. | 666 | 12 |
| * Energy Partners Ltd. | 876 | 12 |
| * Harvest Natural Resources Inc. | 1,029 | 12 |
| * James River Coal Co. | 1,076 | 12 |
| Penn Virginia Corp. | 1,383 | 11 |
| * Endeavour International Corp. | 1,124 | 11 |
| * Petroquest Energy Inc. | 1,299 | 10 |
| Gulf Island Fabrication Inc. | 371 | 9 |
| * PHI Inc. | 395 | 9 |
| * Vaalco Energy Inc. | 1,364 | 9 |
| * Georesources Inc. | 371 | 9 |
| * BPZ Resources Inc. | 2,343 | 9 |
| Teekay Tankers Ltd. Class A | 1,283 | 8 |
| * Vantage Drilling Co. | 5,287 | 8 |
| * Venoco Inc. | 685 | 8 |
| * USEC Inc. | 3,513 | 8 |
| * Matrix Service Co. | 674 | 7 |
| * Gastar Exploration Ltd. | 1,757 | 7 |
| * Green Plains Renewable Energy Inc. | 628 | 7 |
| Delek US Holdings Inc. | 431 | 6 |
| * Willbros Group Inc. | 958 | 6 |
| * Warren Resources Inc. | 1,814 | 6 |
| * Dawson Geophysical Co. | 174 | 6 |
| DHT Holdings Inc. | 1,951 | 6 |
| * Key Energy Services Inc. | 393 | 6 |
| * Scorpio Tankers Inc. | 753 | 5 |
| * Pioneer Drilling Co. | 398 | 5 |
| * Natural Gas Services Group Inc. | 370 | 5 |
| * Union Drilling Inc. | 459 | 4 |
| * Triangle Petroleum Corp. | 675 | 4 |
| * Approach Resources Inc. | 193 | 4 |
| * GMX Resources Inc. | 1,233 | 4 |
| * REX American Resources Corp. | 208 | 3 |
| * Miller Energy Resources Inc. | 941 | 3 |
| * Cal Dive International Inc. | 1,109 | 3 |
| * Mitcham Industries Inc. | 172 | 3 |
| * Tesco Corp. | 155 | 3 |
| * Patriot Coal Corp. | 172 | 2 |
| * L&L Energy Inc. | 675 | 2 |
| * Westmoreland Coal Co. | 219 | 2 |
| Crosstex Energy Inc. | 146 | 2 |
| * Crimson Exploration Inc. | 661 | 2 |
| * Rex Energy Corp. | 136 | 2 |
| * Western Refining Inc. | 92 | 2 |
| General Maritime Corp. | 3,562 | 1 |
| * CAMAC Energy Inc. | 1,752 | 1 |
| * Solazyme Inc. | 97 | 1 |
| * Voyager Oil & Gas Inc. | 319 | 1 |
| Alon USA Energy Inc. | 84 | 1 |
| * Ur-Energy Inc. | 609 | 1 |
| Hallador Energy Co. | 62 | 1 |
| 851 | ||
37
| Vanguard® Russell 2000 Value Index Fund | ||
| Schedule of Investments | ||
| August 31, 2011 | ||
| Market | ||
| Value | ||
| Shares | ($000) | |
| Financials (35.3%) | ||
| MFA Financial Inc. | 10,777 | 81 |
| BioMed Realty Trust Inc. | 3,973 | 73 |
| Hancock Holding Co. | 2,310 | 72 |
| National Retail Properties Inc. | 2,573 | 70 |
| * ProAssurance Corp. | 926 | 67 |
| Post Properties Inc. | 1,509 | 63 |
| Hatteras Financial Corp. | 2,263 | 62 |
| Entertainment Properties Trust | 1,412 | 60 |
| Alterra Capital Holdings Ltd. | 2,747 | 56 |
| Apollo Investment Corp. | 5,930 | 54 |
| Prosperity Bancshares Inc. | 1,420 | 54 |
| Colonial Properties Trust | 2,527 | 53 |
| Starwood Property Trust Inc. | 2,822 | 52 |
| Invesco Mortgage Capital Inc. | 2,814 | 50 |
| First American Financial Corp. | 3,184 | 49 |
| LaSalle Hotel Properties | 2,576 | 48 |
| * SVB Financial Group | 1,010 | 47 |
| Washington Real Estate Investment Trust | 1,487 | 46 |
| CBL & Associates Properties Inc. | 3,090 | 45 |
| American Campus Communities Inc. | 1,145 | 45 |
| * CNO Financial Group Inc. | 6,712 | 43 |
| Iberiabank Corp. | 893 | 43 |
| Trustmark Corp. | 1,937 | 42 |
| FirstMerit Corp. | 3,307 | 41 |
| Two Harbors Investment Corp. | 4,255 | 41 |
| Webster Financial Corp. | 2,181 | 39 |
| * Knight Capital Group Inc. Class A | 3,038 | 39 |
| DiamondRock Hospitality Co. | 5,066 | 39 |
| Healthcare Realty Trust Inc. | 2,202 | 39 |
| Northwest Bancshares Inc. | 3,212 | 38 |
| UMB Financial Corp. | 969 | 38 |
| Extra Space Storage Inc. | 1,737 | 37 |
| Medical Properties Trust Inc. | 3,382 | 36 |
| Platinum Underwriters Holdings Ltd. | 1,129 | 36 |
| Delphi Financial Group Inc. | 1,461 | 35 |
| RLI Corp. | 552 | 35 |
| FNB Corp. | 3,842 | 34 |
| Sovran Self Storage Inc. | 838 | 34 |
| Capstead Mortgage Corp. | 2,551 | 34 |
| Umpqua Holdings Corp. | 3,470 | 34 |
| DCT Industrial Trust Inc. | 7,436 | 34 |
| Wintrust Financial Corp. | 1,059 | 33 |
| Cypress Sharpridge Investments Inc. | 2,499 | 33 |
| Cash America International Inc. | 592 | 33 |
| Montpelier Re Holdings Ltd. | 1,888 | 32 |
| U-Store-It Trust | 3,010 | 32 |
| * PHH Corp. | 1,703 | 32 |
| Kilroy Realty Corp. | 898 | 32 |
| * Ocwen Financial Corp. | 2,255 | 31 |
| Cathay General Bancorp | 2,380 | 31 |
| Redwood Trust Inc. | 2,378 | 30 |
| United Bankshares Inc. | 1,321 | 30 |
| * Stifel Financial Corp. | 979 | 29 |
| Equity One Inc. | 1,624 | 29 |
| Prospect Capital Corp. | 3,300 | 29 |
| * Texas Capital Bancshares Inc. | 1,127 | 29 |
| BancorpSouth Inc. | 2,527 | 29 |
| First Financial Bancorp | 1,764 | 28 |
| Old National Bancorp | 2,868 | 28 |
| Community Bank System Inc. | 1,114 | 28 |
| Franklin Street Properties Corp. | 2,137 | 28 |
| Anworth Mortgage Asset Corp. | 3,830 | 28 |
| * MF Global Holdings Ltd. | 4,959 | 27 |
38
| Vanguard® Russell 2000 Value Index Fund | ||
| Schedule of Investments | ||
| August 31, 2011 | ||
| Market | ||
| Value | ||
| Shares | ($000) | |
| National Penn Bancshares Inc. | 3,745 | 27 |
| Astoria Financial Corp. | 2,633 | 27 |
| MB Financial Inc. | 1,648 | 27 |
| Tower Group Inc. | 1,116 | 27 |
| Lexington Realty Trust | 3,624 | 27 |
| Susquehanna Bancshares Inc. | 3,934 | 26 |
| Solar Capital Ltd. | 1,105 | 26 |
| DuPont Fabros Technology Inc. | 1,102 | 26 |
| International Bancshares Corp. | 1,605 | 25 |
| Government Properties Income Trust | 1,072 | 25 |
| Glacier Bancorp Inc. | 2,177 | 25 |
| Selective Insurance Group Inc. | 1,635 | 25 |
| Sun Communities Inc. | 643 | 25 |
| Pebblebrook Hotel Trust | 1,541 | 25 |
| * First Industrial Realty Trust Inc. | 2,622 | 25 |
| PS Business Parks Inc. | 452 | 25 |
| CVB Financial Corp. | 2,704 | 24 |
| Provident Financial Services Inc. | 1,830 | 23 |
| Argo Group International Holdings Ltd. | 831 | 23 |
| Oritani Financial Corp. | 1,702 | 22 |
| Symetra Financial Corp. | 2,045 | 22 |
| Fifth Street Finance Corp. | 2,189 | 22 |
| * Sunstone Hotel Investors Inc. | 3,577 | 22 |
| * Enstar Group Ltd. | 209 | 22 |
| Park National Corp. | 391 | 22 |
| Primerica Inc. | 1,030 | 21 |
| NBT Bancorp Inc. | 1,043 | 21 |
| Associated Estates Realty Corp. | 1,190 | 21 |
| Acadia Realty Trust | 970 | 20 |
| LTC Properties Inc. | 753 | 20 |
| Equity Lifestyle Properties Inc. | 294 | 20 |
| Westamerica Bancorporation | 477 | 20 |
| * iStar Financial Inc. | 2,799 | 20 |
| Cousins Properties Inc. | 2,761 | 20 |
| First Midwest Bancorp Inc. | 2,256 | 20 |
| Education Realty Trust Inc. | 2,186 | 20 |
| First Potomac Realty Trust | 1,515 | 20 |
| Columbia Banking System Inc. | 1,195 | 20 |
| Walter Investment Management Corp. | 781 | 19 |
| BlackRock Kelso Capital Corp. | 2,210 | 19 |
| Infinity Property & Casualty Corp. | 376 | 19 |
| Inland Real Estate Corp. | 2,334 | 19 |
| Potlatch Corp. | 563 | 19 |
| * Strategic Hotels & Resorts Inc. | 3,952 | 19 |
| National Health Investors Inc. | 413 | 19 |
| American Equity Investment Life Holding Co. | 1,801 | 18 |
| EastGroup Properties Inc. | 443 | 18 |
| Highwoods Properties Inc. | 531 | 17 |
| Pennsylvania Real Estate Investment Trust | 1,685 | 17 |
| * Investors Bancorp Inc. | 1,207 | 17 |
| ARMOUR Residential REIT Inc. | 2,314 | 17 |
| * National Financial Partners Corp. | 1,335 | 17 |
| Compass Diversified Holdings | 1,222 | 17 |
| Bank of the Ozarks Inc. | 734 | 17 |
| * Pico Holdings Inc. | 688 | 16 |
| CreXus Investment Corp. | 1,730 | 16 |
| PrivateBancorp Inc. Class A | 1,817 | 16 |
| Horace Mann Educators Corp. | 1,208 | 16 |
| KBW Inc. | 1,094 | 16 |
| Home Bancshares Inc. | 679 | 16 |
| Hersha Hospitality Trust Class A | 4,261 | 16 |
| S&T Bancorp Inc. | 850 | 16 |
| * Navigators Group Inc. | 351 | 16 |
| First Financial Bankshares Inc. | 523 | 15 |
39
| Vanguard® Russell 2000 Value Index Fund | ||
| Schedule of Investments | ||
| August 31, 2011 | ||
| Market | ||
| Value | ||
| Shares | ($000) | |
| Independent Bank Corp. | 649 | 15 |
| Amtrust Financial Services Inc. | 637 | 15 |
| Colony Financial Inc. | 997 | 15 |
| Investors Real Estate Trust | 1,966 | 15 |
| Oriental Financial Group Inc. | 1,371 | 15 |
| Meadowbrook Insurance Group Inc. | 1,613 | 15 |
| Brookline Bancorp Inc. | 1,788 | 15 |
| Nelnet Inc. Class A | 781 | 15 |
| Safety Insurance Group Inc. | 382 | 15 |
| * MGIC Investment Corp. | 5,680 | 15 |
| * Greenlight Capital Re Ltd. Class A | 657 | 15 |
| PacWest Bancorp | 916 | 15 |
| Boston Private Financial Holdings Inc. | 2,331 | 15 |
| Chemical Financial Corp. | 831 | 14 |
| PennyMac Mortgage Investment Trust | 841 | 14 |
| First Commonwealth Financial Corp. | 3,176 | 14 |
| Employers Holdings Inc. | 1,168 | 14 |
| Retail Opportunity Investments Corp. | 1,274 | 14 |
| * Investment Technology Group Inc. | 1,249 | 14 |
| PennantPark Investment Corp. | 1,380 | 14 |
| Banco Latinoamericano de Comercio Exterior SA | 843 | 14 |
| City Holding Co. | 462 | 14 |
| WesBanco Inc. | 700 | 14 |
| * State Bank Financial Corp. | 957 | 14 |
| Berkshire Hills Bancorp Inc. | 628 | 14 |
| * Forestar Group Inc. | 1,073 | 14 |
| Radian Group Inc. | 4,029 | 13 |
| * Pinnacle Financial Partners Inc. | 1,034 | 13 |
| Maiden Holdings Ltd. | 1,530 | 13 |
| * United Community Banks Inc. | 1,257 | 13 |
| Ashford Hospitality Trust Inc. | 1,580 | 13 |
| * Western Alliance Bancorp | 2,099 | 13 |
| ViewPoint Financial Group | 1,055 | 13 |
| Hercules Technology Growth Capital Inc. | 1,326 | 13 |
| Chesapeake Lodging Trust | 974 | 13 |
| Trustco Bank Corp. NY | 2,669 | 12 |
| Advance America Cash Advance Centers Inc. | 1,466 | 12 |
| Simmons First National Corp. Class A | 525 | 12 |
| Ramco-Gershenson Properties Trust | 1,166 | 12 |
| Sandy Spring Bancorp Inc. | 730 | 12 |
| SCBT Financial Corp. | 423 | 12 |
| United Fire & Casualty Co. | 652 | 12 |
| Resource Capital Corp. | 2,156 | 12 |
| * Piper Jaffray Cos. | 479 | 11 |
| * Sterling Financial Corp. | 812 | 11 |
| Main Street Capital Corp. | 609 | 11 |
| Dime Community Bancshares Inc. | 943 | 11 |
| First Busey Corp. | 2,333 | 11 |
| FBL Financial Group Inc. Class A | 389 | 11 |
| Dynex Capital Inc. | 1,221 | 11 |
| Triangle Capital Corp. | 669 | 11 |
| NorthStar Realty Finance Corp. | 2,902 | 11 |
| RLJ Lodging Trust | 834 | 11 |
| MCG Capital Corp. | 2,333 | 11 |
| * AMERISAFE Inc. | 557 | 11 |
| Campus Crest Communities Inc. | 926 | 11 |
| Flushing Financial Corp. | 950 | 11 |
| Lakeland Financial Corp. | 491 | 11 |
| * ICG Group Inc. | 1,043 | 11 |
| Flagstone Reinsurance Holdings SA | 1,494 | 11 |
| * FPIC Insurance Group Inc. | 253 | 11 |
| Community Trust Bancorp Inc. | 420 | 11 |
| Harleysville Group Inc. | 369 | 11 |
| Renasant Corp. | 759 | 11 |
40
| Vanguard® Russell 2000 Value Index Fund | ||
| Schedule of Investments | ||
| August 31, 2011 | ||
| Market | ||
| Value | ||
| Shares | ($000) | |
| 1st Source Corp. | 461 | 11 |
| First Financial Corp. | 338 | 10 |
| Urstadt Biddle Properties Inc. Class A | 605 | 10 |
| National Western Life Insurance Co. Class A | 67 | 10 |
| Excel Trust Inc. | 937 | 10 |
| * Safeguard Scientifics Inc. | 626 | 10 |
| Southside Bancshares Inc. | 498 | 10 |
| Coresite Realty Corp. | 602 | 10 |
| Tompkins Financial Corp. | 247 | 10 |
| * Hilltop Holdings Inc. | 1,206 | 9 |
| * Intl. FCStone Inc. | 402 | 9 |
| OneBeacon Insurance Group Ltd. Class A | 672 | 9 |
| Apollo Commercial Real Estate Finance Inc. | 622 | 9 |
| GFI Group Inc. | 2,139 | 9 |
| TICC Capital Corp. | 977 | 9 |
| Washington Trust Bancorp Inc. | 432 | 9 |
| Hudson Pacific Properties Inc. | 668 | 9 |
| Parkway Properties Inc. | 665 | 9 |
| Winthrop Realty Trust | 869 | 9 |
| Monmouth Real Estate Investment Corp. Class A | 1,072 | 9 |
| TowneBank | 737 | 9 |
| * West Coast Bancorp | 584 | 9 |
| Cardinal Financial Corp. | 876 | 9 |
| Rockville Financial Inc. | 894 | 9 |
| MVC Capital Inc. | 727 | 9 |
| * NewStar Financial Inc. | 826 | 8 |
| Kennedy-Wilson Holdings Inc. | 720 | 8 |
| Hudson Valley Holding Corp. | 430 | 8 |
| * eHealth Inc. | 648 | 8 |
| CapLease Inc. | 2,060 | 8 |
| StellarOne Corp. | 696 | 8 |
| * Nara Bancorp Inc. | 1,151 | 8 |
| Sterling Bancorp | 937 | 8 |
| Getty Realty Corp. | 421 | 8 |
| Capital Southwest Corp. | 89 | 8 |
| * Beneficial Mutual Bancorp Inc. | 1,007 | 8 |
| * Citizens Inc. | 1,148 | 8 |
| Banner Corp. | 501 | 8 |
| Tower Bancorp Inc. | 318 | 8 |
| * Global Indemnity plc | 410 | 8 |
| United Financial Bancorp Inc. | 488 | 8 |
| Provident New York Bancorp | 1,152 | 7 |
| Territorial Bancorp Inc. | 363 | 7 |
| Bancfirst Corp. | 204 | 7 |
| Kite Realty Group Trust | 1,686 | 7 |
| Univest Corp. of Pennsylvania | 508 | 7 |
| * Cowen Group Inc. Class A | 2,024 | 7 |
| Northfield Bancorp Inc | 516 | 7 |
| * Bancorp Inc. | 886 | 7 |
| Summit Hotel Properties Inc. | 826 | 7 |
| WSFS Financial Corp. | 195 | 7 |
| Calamos Asset Management Inc. Class A | 575 | 7 |
| * Phoenix Cos. Inc. | 3,520 | 7 |
| Union First Market Bankshares Corp. | 614 | 7 |
| Arrow Financial Corp. | 282 | 7 |
| Agree Realty Corp. | 299 | 7 |
| * Ameris Bancorp | 720 | 7 |
| Financial Institutions Inc. | 418 | 7 |
| Camden National Corp. | 233 | 7 |
| * FelCor Lodging Trust Inc. | 1,884 | 6 |
| Sabra Healthcare REIT Inc. | 551 | 6 |
| Universal Health Realty Income Trust | 170 | 6 |
| Presidential Life Corp. | 657 | 6 |
| * Eagle Bancorp Inc. | 508 | 6 |
41
| Vanguard® Russell 2000 Value Index Fund | ||
| Schedule of Investments | ||
| August 31, 2011 | ||
| Market | ||
| Value | ||
| Shares | ($000) | |
| * Doral Financial Corp. | 3,853 | 6 |
| Cedar Shopping Centers Inc. | 1,697 | 6 |
| Oppenheimer Holdings Inc. Class A | 313 | 6 |
| SY Bancorp Inc. | 310 | 6 |
| Enterprise Financial Services Corp. | 416 | 6 |
| FXCM Inc. Class A | 525 | 6 |
| Heartland Financial USA Inc. | 403 | 6 |
| German American Bancorp Inc. | 382 | 6 |
| Citizens & Northern Corp. | 369 | 6 |
| * American Safety Insurance Holdings Ltd. | 317 | 6 |
| Federal Agricultural Mortgage Corp. | 298 | 6 |
| * Center Financial Corp. | 1,079 | 6 |
| First Merchants Corp. | 777 | 6 |
| First Interstate Bancsystem Inc. | 478 | 6 |
| Baldwin & Lyons Inc. | 254 | 6 |
| Bank of Marin Bancorp | 162 | 6 |
| Trico Bancshares | 426 | 6 |
| First Community Bancshares Inc. | 481 | 6 |
| Fox Chase Bancorp Inc. | 441 | 6 |
| * Central Pacific Financial Corp. | 465 | 6 |
| CoBiz Financial Inc. | 985 | 6 |
| Lakeland Bancorp Inc. | 656 | 6 |
| Heritage Financial Corp. | 474 | 6 |
| First of Long Island Corp. | 232 | 6 |
| State Auto Financial Corp. | 389 | 5 |
| National Bankshares Inc. | 210 | 5 |
| Great Southern Bancorp Inc. | 308 | 5 |
| Centerstate Banks Inc. | 910 | 5 |
| MainSource Financial Group Inc. | 610 | 5 |
| Abington Bancorp Inc. | 613 | 5 |
| Republic Bancorp Inc. Class A | 300 | 5 |
| State Bancorp Inc. | 458 | 5 |
| * Wilshire Bancorp Inc. | 1,720 | 5 |
| OceanFirst Financial Corp. | 444 | 5 |
| Stewart Information Services Corp. | 551 | 5 |
| One Liberty Properties Inc. | 336 | 5 |
| STAG Industrial Inc. | 481 | 5 |
| Washington Banking Co. | 465 | 5 |
| Gladstone Capital Corp. | 637 | 5 |
| * OmniAmerican Bancorp Inc. | 359 | 5 |
| Home Federal Bancorp Inc. | 502 | 5 |
| CNB Financial Corp. | 372 | 5 |
| Arlington Asset Investment Corp. Class A | 195 | 5 |
| BankFinancial Corp. | 638 | 5 |
| Bancorp Rhode Island Inc. | 113 | 5 |
| * Franklin Financial Corp. | 421 | 5 |
| National Interstate Corp. | 209 | 5 |
| Westfield Financial Inc. | 628 | 5 |
| Bryn Mawr Bank Corp. | 245 | 5 |
| NGP Capital Resources Co. | 655 | 5 |
| Golub Capital BDC Inc. | 311 | 5 |
| Pacific Continental Corp. | 558 | 5 |
| ESB Financial Corp. | 378 | 5 |
| Gladstone Investment Corp. | 669 | 5 |
| RAIT Financial Trust | 1,151 | 4 |
| First Bancorp | 458 | 4 |
| * Hanmi Financial Corp. | 4,578 | 4 |
| Bank Mutual Corp. | 1,392 | 4 |
| * 1st United Bancorp Inc. | 825 | 4 |
| Medallion Financial Corp. | 446 | 4 |
| Alliance Financial Corp. | 144 | 4 |
| Edelman Financial Group Inc. | 614 | 4 |
| * Primus Guaranty Ltd. | 763 | 4 |
| Terreno Realty Corp. | 282 | 4 |
42
| Vanguard® Russell 2000 Value Index Fund | ||
| Schedule of Investments | ||
| August 31, 2011 | ||
| Market | ||
| Value | ||
| Shares | ($000) | |
| Cogdell Spencer Inc. | 993 | 4 |
| * Metro Bancorp Inc. | 420 | 4 |
| Chatham Lodging Trust | 419 | 4 |
| Mission West Properties Inc. | 537 | 4 |
| Ames National Corp. | 251 | 4 |
| West Bancorporation Inc. | 471 | 4 |
| * Virginia Commerce Bancorp Inc. | 709 | 4 |
| * MPG Office Trust Inc. | 1,485 | 4 |
| Penns Woods Bancorp Inc. | 117 | 4 |
| * First Defiance Financial Corp. | 295 | 4 |
| Kansas City Life Insurance Co. | 130 | 4 |
| Merchants Bancshares Inc. | 146 | 4 |
| Bank of Kentucky Financial Corp. | 175 | 4 |
| Solar Senior Capital Ltd. | 235 | 4 |
| * FBR & Co. | 1,530 | 4 |
| * Harris & Harris Group Inc. | 939 | 4 |
| ESSA Bancorp Inc. | 344 | 4 |
| SeaBright Holdings Inc. | 606 | 4 |
| SWS Group Inc. | 883 | 4 |
| Sierra Bancorp | 360 | 4 |
| Kohlberg Capital Corp. | 579 | 4 |
| GAMCO Investors Inc. | 77 | 4 |
| * Seacoast Banking Corp. of Florida | 2,194 | 4 |
| * Flagstar Bancorp Inc. | 5,918 | 4 |
| Cohen & Steers Inc. | 93 | 4 |
| * BofI Holding Inc. | 253 | 4 |
| * Park Sterling Corp. | 867 | 4 |
| Medley Capital Corp. | 337 | 4 |
| Consolidated-Tomoka Land Co. | 127 | 4 |
| First Bancorp Inc. | 266 | 4 |
| Glimcher Realty Trust | 416 | 4 |
| Kearny Financial Corp. | 404 | 4 |
| Capital City Bank Group Inc. | 346 | 4 |
| Center Bancorp Inc. | 366 | 4 |
| * Pacific Capital Bancorp NA | 125 | 3 |
| Peoples Bancorp Inc. | 320 | 3 |
| * Meridian Interstate Bancorp Inc. | 266 | 3 |
| * Sun Bancorp Inc. | 1,139 | 3 |
| THL Credit Inc. | 281 | 3 |
| First Pactrust Bancorp Inc. | 278 | 3 |
| * Nicholas Financial Inc. | 295 | 3 |
| Gladstone Commercial Corp. | 195 | 3 |
| UMH Properties Inc. | 349 | 3 |
| First Financial Holdings Inc. | 501 | 3 |
| JMP Group Inc. | 459 | 3 |
| * Marlin Business Services Corp. | 266 | 3 |
| * Gleacher & Co. Inc. | 2,385 | 3 |
| Orrstown Financial Services Inc. | 212 | 3 |
| * Southwest Bancorp Inc. | 589 | 3 |
| Donegal Group Inc. Class A | 240 | 3 |
| * Cape Bancorp Inc. | 356 | 3 |
| * Avatar Holdings Inc. | 271 | 3 |
| Midsouth Bancorp Inc. | 223 | 3 |
| Omega Healthcare Investors Inc. | 141 | 3 |
| Century Bancorp Inc. Class A | 94 | 3 |
| * Encore Bancshares Inc. | 225 | 3 |
| New Mountain Finance Corp. | 196 | 3 |
| Suffolk Bancorp | 294 | 2 |
| * Bridge Capital Holdings | 238 | 2 |
| * Heritage Commerce Corp. | 562 | 2 |
| EMC Insurance Group Inc. | 133 | 2 |
| Universal Insurance Holdings Inc. | 556 | 2 |
| Whitestone REIT Class B | 207 | 2 |
| Enterprise Bancorp Inc. | 169 | 2 |
43
| Vanguard® Russell 2000 Value Index Fund | ||
| Schedule of Investments | ||
| August 31, 2011 | ||
| Market | ||
| Value | ||
| Shares | ($000) | |
| Bridge Bancorp Inc. | 120 | 2 |
| * First Marblehead Corp. | 1,669 | 2 |
| Clifton Savings Bancorp Inc. | 230 | 2 |
| * Cascade Bancorp | 176 | 2 |
| Roma Financial Corp. | 195 | 2 |
| Charter Financial Corp. | 185 | 2 |
| Independence Holding Co. | 196 | 2 |
| * CIFC Corp. | 306 | 2 |
| * Hallmark Financial Services | 215 | 2 |
| * Taylor Capital Group Inc. | 224 | 1 |
| * Capital Bank Corp. | 500 | 1 |
| * Gain Capital Holdings Inc. | 237 | 1 |
| * PMI Group Inc. | 4,840 | 1 |
| American Assets Trust Inc. | 44 | 1 |
| California First National Bancorp | 50 | 1 |
| Newcastle Investment Corp. | 151 | 1 |
| * Virtus Investment Partners Inc. | 13 | 1 |
| Artio Global Investors Inc. Class A | 83 | 1 |
| * Imperial Holdings Inc. | 96 | 1 |
| * Fortegra Financial Corp. | 117 | 1 |
| 5,846 | ||
| Health Care (5.3%) | ||
| * Healthsouth Corp. | 2,880 | 62 |
| * Magellan Health Services Inc. | 972 | 48 |
| * Viropharma Inc. | 2,300 | 46 |
| * Healthspring Inc. | 940 | 37 |
| * Amsurg Corp. Class A | 947 | 21 |
| * InterMune Inc. | 796 | 21 |
| Invacare Corp. | 818 | 21 |
| * Kindred Healthcare Inc. | 1,573 | 20 |
| * CONMED Corp. | 857 | 20 |
| West Pharmaceutical Services Inc. | 459 | 18 |
| * Wright Medical Group Inc. | 1,182 | 18 |
| * Centene Corp. | 568 | 18 |
| * Greatbatch Inc. | 706 | 16 |
| * Amedisys Inc. | 893 | 15 |
| * PharMerica Corp. | 889 | 13 |
| * Healthways Inc. | 1,028 | 13 |
| Medicis Pharmaceutical Corp. Class A | 329 | 13 |
| * Affymetrix Inc. | 2,134 | 12 |
| * ICU Medical Inc. | 279 | 11 |
| * Angiodynamics Inc. | 756 | 11 |
| Universal American Corp. | 978 | 11 |
| National Healthcare Corp. | 310 | 11 |
| Owens & Minor Inc. | 359 | 11 |
| * Medicines Co. | 703 | 10 |
| * Triple-S Management Corp. Class B | 599 | 10 |
| * Enzon Pharmaceuticals Inc. | 1,180 | 10 |
| * Par Pharmaceutical Cos. Inc. | 337 | 10 |
| Cantel Medical Corp. | 400 | 10 |
| * LHC Group Inc. | 454 | 9 |
| * Hanger Orthopedic Group Inc. | 483 | 9 |
| * Medcath Corp. | 616 | 9 |
| * Omnicell Inc. | 521 | 8 |
| * Geron Corp. | 3,038 | 8 |
| Assisted Living Concepts Inc. Class A | 592 | 8 |
| * Select Medical Holdings Corp. | 1,050 | 8 |
| * Nektar Therapeutics | 1,274 | 7 |
| * Gentiva Health Services Inc. | 926 | 7 |
| * Immunogen Inc. | 646 | 7 |
| * Idenix Pharmaceuticals Inc. | 1,200 | 7 |
| * Symmetry Medical Inc. | 825 | 7 |
| * Theravance Inc. | 345 | 7 |
| * Micromet Inc. | 1,358 | 6 |
44
| Vanguard® Russell 2000 Value Index Fund | ||
| Schedule of Investments | ||
| August 31, 2011 | ||
| Market | ||
| Value | ||
| Shares | ($000) | |
| * Molina Healthcare Inc. | 338 | 6 |
| * Hi-Tech Pharmacal Co. Inc. | 217 | 6 |
| * Pacific Biosciences of California Inc. | 801 | 6 |
| * Sequenom Inc. | 915 | 6 |
| * Arena Pharmaceuticals Inc. | 4,081 | 5 |
| * RTI Biologics Inc. | 1,576 | 5 |
| * American Dental Partners Inc. | 467 | 5 |
| Maxygen Inc. | 915 | 5 |
| * SurModics Inc. | 462 | 5 |
| * Almost Family Inc. | 249 | 5 |
| Analogic Corp. | 99 | 5 |
| * Palomar Medical Technologies Inc. | 576 | 5 |
| * Furiex Pharmaceuticals Inc. | 300 | 5 |
| * Lexicon Pharmaceuticals Inc. | 3,371 | 5 |
| PDL BioPharma Inc. | 740 | 4 |
| * Natus Medical Inc. | 423 | 4 |
| * Cambrex Corp. | 891 | 4 |
| * Cross Country Healthcare Inc. | 841 | 4 |
| * Alphatec Holdings Inc. | 1,632 | 4 |
| * Five Star Quality Care Inc. | 1,270 | 4 |
| * Capital Senior Living Corp. | 564 | 4 |
| * CryoLife Inc. | 765 | 4 |
| * Rigel Pharmaceuticals Inc. | 492 | 4 |
| * Exact Sciences Corp. | 494 | 4 |
| * eResearchTechnology Inc. | 719 | 4 |
| * AMN Healthcare Services Inc. | 653 | 4 |
| * Insmed Inc. | 752 | 4 |
| * Celldex Therapeutics Inc. | 1,144 | 4 |
| * Parexel International Corp. | 170 | 3 |
| * SuperGen Inc. | 1,589 | 3 |
| * Impax Laboratories Inc. | 172 | 3 |
| * Providence Service Corp. | 314 | 3 |
| * Sun Healthcare Group Inc. | 775 | 3 |
| * Sunrise Senior Living Inc. | 438 | 3 |
| * Solta Medical Inc. | 1,835 | 3 |
| * Enzo Biochem Inc. | 1,065 | 3 |
| Young Innovations Inc. | 112 | 3 |
| * Harvard Bioscience Inc. | 662 | 3 |
| * Savient Pharmaceuticals Inc. | 622 | 3 |
| * MedAssets Inc. | 229 | 3 |
| * Cynosure Inc. Class A | 255 | 3 |
| * Skilled Healthcare Group Inc. | 478 | 3 |
| * Affymax Inc. | 552 | 3 |
| * Neurocrine Biosciences Inc. | 395 | 2 |
| * Oncothyreon Inc. | 329 | 2 |
| * Albany Molecular Research Inc. | 667 | 2 |
| * Biolase Technology Inc. | 669 | 2 |
| * Array Biopharma Inc. | 998 | 2 |
| * Curis Inc. | 563 | 2 |
| * Novavax Inc. | 949 | 2 |
| * Medical Action Industries Inc. | 280 | 2 |
| * Inhibitex Inc. | 487 | 2 |
| * BioScrip Inc. | 268 | 2 |
| * Chindex International Inc. | 158 | 2 |
| * Cornerstone Therapeutics Inc. | 207 | 2 |
| * Metabolix Inc. | 285 | 2 |
| * Progenics Pharmaceuticals Inc. | 244 | 1 |
| * Continucare Corp. | 237 | 1 |
| * XenoPort Inc. | 206 | 1 |
| * CardioNet Inc. | 457 | 1 |
| * Zalicus Inc. | 893 | 1 |
| * IRIS International Inc. | 165 | 1 |
| * Staar Surgical Co. | 172 | 1 |
| * Cytori Therapeutics Inc. | 411 | 1 |
45
| Vanguard® Russell 2000 Value Index Fund | ||
| Schedule of Investments | ||
| August 31, 2011 | ||
| Market | ||
| Value | ||
| Shares | ($000) | |
| * Lannett Co. Inc. | 344 | 1 |
| * Accuray Inc. | 264 | 1 |
| * Exactech Inc. | 63 | 1 |
| * KV Pharmaceutical Co. Class A | 523 | 1 |
| * Dyax Corp. | 610 | 1 |
| * AVANIR Pharmaceuticals Inc. | 311 | 1 |
| * Columbia Laboratories Inc. | 380 | 1 |
| * Vical Inc. | 229 | 1 |
| * Allos Therapeutics Inc. | 449 | 1 |
| * BioMimetic Therapeutics Inc. | 227 | 1 |
| * Cell Therapeutics Inc. | 634 | 1 |
| * DynaVox Inc. Class A | 104 | 1 |
| * Uroplasty Inc. | 112 | 1 |
| * Nymox Pharmaceutical Corp. | 86 | 1 |
| * Vanda Pharmaceuticals Inc. | 112 | 1 |
| * Durect Corp. | 391 | 1 |
| * Cerus Corp. | 309 | 1 |
| * Neostem Inc. | 785 | 1 |
| * BG Medicine Inc. | 80 | — |
| * ePocrates Inc. | 14 | — |
| * Transcept Pharmaceuticals Inc. | 35 | — |
| * Sunesis Pharmaceuticals Inc. | 56 | — |
| * Anacor Pharmaceuticals Inc. | 16 | — |
| 871 | ||
| Industrials (14.8%) | ||
| * Esterline Technologies Corp. | 923 | 69 |
| * Alaska Air Group Inc. | 1,024 | 59 |
| Robbins & Myers Inc. | 1,194 | 57 |
| Triumph Group Inc. | 1,007 | 53 |
| * Moog Inc. Class A | 1,242 | 50 |
| Mueller Industries Inc. | 990 | 47 |
| * EMCOR Group Inc. | 2,024 | 46 |
| * FTI Consulting Inc. | 1,273 | 46 |
| AO Smith Corp. | 1,151 | 45 |
| * Teledyne Technologies Inc. | 801 | 44 |
| Curtiss-Wright Corp. | 1,405 | 43 |
| * Geo Group Inc. | 1,964 | 42 |
| * Atlas Air Worldwide Holdings Inc. | 795 | 39 |
| Barnes Group Inc. | 1,649 | 38 |
| Brady Corp. Class A | 1,316 | 36 |
| Simpson Manufacturing Co. Inc. | 1,259 | 36 |
| Actuant Corp. Class A | 1,747 | 35 |
| Kaydon Corp. | 987 | 33 |
| * JetBlue Airways Corp. | 7,459 | 32 |
| * Tetra Tech Inc. | 1,504 | 30 |
| * US Airways Group Inc. | 4,904 | 27 |
| Werner Enterprises Inc. | 1,133 | 26 |
| Briggs & Stratton Corp. | 1,527 | 25 |
| Granite Construction Inc. | 1,170 | 24 |
| * EnerSys | 1,075 | 24 |
| ABM Industries Inc. | 1,161 | 24 |
| * Ceradyne Inc. | 754 | 24 |
| Ameron International Corp. | 277 | 23 |
| Watts Water Technologies Inc. Class A | 824 | 23 |
| * GeoEye Inc. | 633 | 23 |
| * United Rentals Inc. | 1,334 | 22 |
| Unifirst Corp. | 429 | 22 |
| * Korn/Ferry International | 1,342 | 22 |
| AAR Corp. | 899 | 21 |
| * Astec Industries Inc. | 604 | 21 |
| Seaboard Corp. | 9 | 21 |
| Skywest Inc. | 1,601 | 20 |
| * Insituform Technologies Inc. Class A | 1,196 | 20 |
| * Amerco Inc. | 263 | 19 |
46
| Vanguard® Russell 2000 Value Index Fund | ||
| Schedule of Investments | ||
| August 31, 2011 | ||
| Market | ||
| Value | ||
| Shares | ($000) | |
| Aircastle Ltd. | 1,580 | 19 |
| ESCO Technologies Inc. | 598 | 18 |
| Universal Forest Products Inc. | 591 | 18 |
| * Rush Enterprises Inc. Class A | 981 | 18 |
| Steelcase Inc. Class A | 2,126 | 18 |
| * SYKES Enterprises Inc. | 1,122 | 18 |
| * Layne Christensen Co. | 595 | 17 |
| * RSC Holdings Inc. | 2,051 | 16 |
| * Dycom Industries Inc. | 888 | 16 |
| * Orbital Sciences Corp. | 1,024 | 16 |
| G&K Services Inc. Class A | 567 | 16 |
| Arkansas Best Corp. | 770 | 16 |
| * Mobile Mini Inc. | 824 | 16 |
| United Stationers Inc. | 492 | 15 |
| Quanex Building Products Corp. | 1,148 | 15 |
| * Navigant Consulting Inc. | 1,561 | 15 |
| Albany International Corp. | 677 | 15 |
| Resources Connection Inc. | 1,403 | 15 |
| * Swift Transportation Co. | 1,701 | 15 |
| Quad/Graphics Inc. | 696 | 14 |
| * EnPro Industries Inc. | 357 | 14 |
| NACCO Industries Inc. Class A | 177 | 14 |
| * Interline Brands Inc. | 920 | 13 |
| Tutor Perini Corp. | 945 | 13 |
| * Griffon Corp. | 1,443 | 13 |
| Encore Wire Corp. | 562 | 13 |
| Ennis Inc. | 789 | 13 |
| Kelly Services Inc. Class A | 807 | 12 |
| Kaman Corp. | 356 | 12 |
| Tredegar Corp. | 723 | 12 |
| * ACCO Brands Corp. | 1,670 | 11 |
| Cascade Corp. | 263 | 11 |
| Cubic Corp. | 268 | 11 |
| Viad Corp. | 535 | 11 |
| Comfort Systems USA Inc. | 1,148 | 11 |
| Mueller Water Products Inc. Class A | 4,706 | 11 |
| * Hexcel Corp. | 457 | 10 |
| * A123 Systems Inc. | 2,195 | 10 |
| Heidrick & Struggles International Inc. | 494 | 10 |
| McGrath Rentcorp | 426 | 10 |
| * Powell Industries Inc. | 267 | 10 |
| * Generac Holdings Inc. | 477 | 10 |
| * Greenbrier Cos. Inc. | 558 | 10 |
| * Kratos Defense & Security Solutions Inc. | 1,003 | 9 |
| Federal Signal Corp. | 1,721 | 9 |
| * American Superconductor Corp. | 1,352 | 9 |
| * Accuride Corp. | 1,101 | 9 |
| Standex International Corp. | 308 | 9 |
| * RailAmerica Inc. | 647 | 9 |
| * Air Transport Services Group Inc. | 1,630 | 9 |
| * ICF International Inc. | 386 | 9 |
| Great Lakes Dredge & Dock Corp. | 1,781 | 9 |
| Multi-Color Corp. | 327 | 8 |
| * Titan Machinery Inc. | 317 | 8 |
| * Gibraltar Industries Inc. | 921 | 8 |
| * CBIZ Inc. | 1,193 | 8 |
| Apogee Enterprises Inc. | 850 | 8 |
| * Dolan Co. | 920 | 8 |
| * Meritor Inc. | 915 | 8 |
| * Northwest Pipe Co. | 282 | 8 |
| * On Assignment Inc. | 1,000 | 8 |
| Marten Transport Ltd. | 398 | 7 |
| LB Foster Co. Class A | 288 | 7 |
| Miller Industries Inc. | 358 | 7 |
47
| Vanguard® Russell 2000 Value Index Fund | ||
| Schedule of Investments | ||
| August 31, 2011 | ||
| Market | ||
| Value | ||
| Shares | ($000) | |
| * M&F Worldwide Corp. | 305 | 7 |
| EnergySolutions Inc. | 1,889 | 7 |
| CIRCOR International Inc. | 193 | 7 |
| * FreightCar America Inc. | 362 | 7 |
| * Keyw Holding Corp. | 558 | 7 |
| * TrueBlue Inc. | 462 | 6 |
| * CRA International Inc. | 271 | 6 |
| * Hawaiian Holdings Inc. | 1,526 | 6 |
| * Sterling Construction Co. Inc. | 499 | 6 |
| * Genco Shipping & Trading Ltd. | 895 | 6 |
| * Kadant Inc. | 272 | 6 |
| Belden Inc. | 204 | 6 |
| * EnerNOC Inc. | 488 | 6 |
| Ducommun Inc. | 319 | 6 |
| * USG Corp. | 629 | 6 |
| * SFN Group Inc. | 419 | 6 |
| * NCI Building Systems Inc. | 598 | 6 |
| * Saia Inc. | 483 | 6 |
| * Global Power Equipment Group Inc. | 237 | 6 |
| * Michael Baker Corp. | 253 | 6 |
| * Spirit Airlines Inc. | 472 | 6 |
| * Lydall Inc. | 520 | 6 |
| Kimball International Inc. Class B | 949 | 5 |
| * American Railcar Industries Inc. | 295 | 5 |
| * Hurco Cos. Inc. | 195 | 5 |
| * Force Protection Inc. | 1,309 | 5 |
| Insteel Industries Inc. | 505 | 5 |
| * Orion Marine Group Inc. | 818 | 5 |
| * Hudson Highland Group Inc. | 993 | 5 |
| Ampco-Pittsburgh Corp. | 234 | 5 |
| Brink's Co. | 190 | 5 |
| * RBC Bearings Inc. | 138 | 5 |
| * H&E Equipment Services Inc. | 467 | 5 |
| * Republic Airways Holdings Inc. | 1,459 | 5 |
| * School Specialty Inc. | 488 | 5 |
| * Odyssey Marine Exploration Inc. | 1,622 | 5 |
| American Woodmark Corp. | 284 | 4 |
| * Tecumseh Products Co. Class A | 560 | 4 |
| SeaCube Container Leasing Ltd. | 335 | 4 |
| LSI Industries Inc. | 590 | 4 |
| Schawk Inc. Class A | 357 | 4 |
| Alamo Group Inc. | 189 | 4 |
| * Pacer International Inc. | 955 | 4 |
| Aceto Corp. | 806 | 4 |
| * Patriot Transportation Holding Inc. | 187 | 4 |
| * Pike Electric Corp. | 492 | 4 |
| * Hill International Inc. | 759 | 4 |
| Met-Pro Corp. | 414 | 4 |
| * Roadrunner Transportation Systems Inc. | 259 | 4 |
| * GP Strategies Corp. | 319 | 4 |
| * Quality Distribution Inc. | 317 | 4 |
| * Franklin Covey Co. | 404 | 4 |
| Douglas Dynamics Inc. | 259 | 4 |
| * American Reprographics Co. | 960 | 4 |
| CDI Corp. | 332 | 4 |
| Preformed Line Products Co. | 67 | 4 |
| * Eagle Bulk Shipping Inc. | 1,894 | 4 |
| CLARCOR Inc. | 77 | 4 |
| * Energy Recovery Inc. | 1,386 | 4 |
| * Cenveo Inc. | 782 | 3 |
| Barrett Business Services Inc. | 231 | 3 |
| International Shipholding Corp. | 165 | 3 |
| * Excel Maritime Carriers Ltd. Class A | 1,384 | 3 |
| * Builders FirstSource Inc. | 1,410 | 3 |
48
| Vanguard® Russell 2000 Value Index Fund | ||
| Schedule of Investments | ||
| August 31, 2011 | ||
| Market | ||
| Value | ||
| Shares | ($000) | |
| VSE Corp. | 108 | 3 |
| * Celadon Group Inc. | 226 | 3 |
| Baltic Trading Ltd. | 494 | 3 |
| * LMI Aerospace Inc. | 128 | 3 |
| Badger Meter Inc. | 72 | 3 |
| * Universal Truckload Services Inc. | 162 | 2 |
| Courier Corp. | 312 | 2 |
| * PowerSecure International Inc. | 484 | 2 |
| * Ultrapetrol Bahamas Ltd. | 647 | 2 |
| * WCA Waste Corp. | 486 | 2 |
| Franklin Electric Co. Inc. | 45 | 2 |
| * Metalico Inc. | 426 | 2 |
| * Essex Rental Corp. | 452 | 2 |
| Lawson Products Inc. | 105 | 2 |
| * GenCorp Inc. | 393 | 2 |
| * UniTek Global Services Inc. | 333 | 2 |
| * TMS International Corp. Class A | 232 | 2 |
| * Broadwind Energy Inc. | 2,400 | 2 |
| * Argan Inc. | 163 | 2 |
| * Columbus McKinnon Corp. | 112 | 2 |
| * Zipcar Inc. | 76 | 2 |
| * Huron Consulting Group Inc. | 46 | 1 |
| Primoris Services Corp. | 126 | 1 |
| * Valence Technology Inc. | 1,197 | 1 |
| * APAC Customer Services Inc. | 171 | 1 |
| * Kforce Inc. | 91 | 1 |
| John Bean Technologies Corp. | 55 | 1 |
| * Covenant Transportation Group Inc. Class A | 167 | 1 |
| * MYR Group Inc. | 38 | 1 |
| US Ecology Inc. | 41 | 1 |
| * Casella Waste Systems Inc. Class A | 128 | 1 |
| * Flow International Corp. | 264 | 1 |
| * CAI International Inc. | 44 | 1 |
| * AT Cross Co. Class A | 59 | 1 |
| * Ener1 Inc. | 1,457 | 1 |
| * Fuel Tech Inc. | 95 | 1 |
| Compx International Inc. | 39 | 1 |
| 2,453 | ||
| Information Technology (10.9%) | ||
| * CACI International Inc. Class A | 847 | 47 |
| * RF Micro Devices Inc. | 7,480 | 46 |
| * Arris Group Inc. | 3,747 | 41 |
| MKS Instruments Inc. | 1,582 | 37 |
| Plantronics Inc. | 1,063 | 34 |
| * Convergys Corp. | 3,185 | 34 |
| * Cymer Inc. | 695 | 28 |
| * JDA Software Group Inc. | 1,043 | 28 |
| * Acxiom Corp. | 2,457 | 27 |
| * Insight Enterprises Inc. | 1,414 | 27 |
| Mantech International Corp. Class A | 706 | 26 |
| * Euronet Worldwide Inc. | 1,550 | 25 |
| Anixter International Inc. | 426 | 25 |
| * Benchmark Electronics Inc. | 1,838 | 25 |
| Earthlink Inc. | 3,330 | 25 |
| * Viasat Inc. | 688 | 24 |
| * Spansion Inc. Class A | 1,523 | 23 |
| Comtech Telecommunications Corp. | 808 | 22 |
| * Infinera Corp. | 2,965 | 22 |
| * Quest Software Inc. | 1,285 | 22 |
| * Cabot Microelectronics Corp. | 549 | 22 |
| * Tessera Technologies Inc. | 1,548 | 22 |
| * Scansource Inc. | 699 | 22 |
| * Digital River Inc. | 1,049 | 21 |
| * Entegris Inc. | 2,745 | 21 |
49
| Vanguard® Russell 2000 Value Index Fund | ||
| Schedule of Investments | ||
| August 31, 2011 | ||
| Market | ||
| Value | ||
| Shares | ($000) | |
| * SYNNEX Corp. | 762 | 20 |
| * Kulicke & Soffa Industries Inc. | 2,180 | 19 |
| * Brooks Automation Inc. | 2,002 | 19 |
| * Sanmina-SCI Corp. | 2,437 | 19 |
| * Electronics for Imaging Inc. | 1,314 | 19 |
| * Checkpoint Systems Inc. | 1,214 | 18 |
| * Emulex Corp. | 2,657 | 18 |
| * Mentor Graphics Corp. | 1,621 | 18 |
| * Loral Space & Communications Inc. | 305 | 17 |
| * Progress Software Corp. | 824 | 17 |
| * Rogers Corp. | 319 | 16 |
| Park Electrochemical Corp. | 628 | 16 |
| * ATMI Inc. | 904 | 15 |
| * Sonus Networks Inc. | 5,895 | 15 |
| * Standard Microsystems Corp. | 697 | 15 |
| United Online Inc. | 2,683 | 15 |
| * Amkor Technology Inc. | 3,200 | 14 |
| * Lattice Semiconductor Corp. | 2,468 | 14 |
| * Veeco Instruments Inc. | 373 | 14 |
| Black Box Corp. | 544 | 13 |
| * Tekelec | 1,865 | 13 |
| * TTM Technologies Inc. | 1,200 | 13 |
| * Unisys Corp. | 761 | 13 |
| * Quantum Corp. | 6,822 | 13 |
| * Intermec Inc. | 1,798 | 13 |
| * Advanced Energy Industries Inc. | 1,319 | 13 |
| * Harmonic Inc. | 2,742 | 13 |
| Fair Isaac Corp. | 503 | 13 |
| * S1 Corp. | 1,395 | 13 |
| * Mercury Computer Systems Inc. | 914 | 13 |
| * SS&C Technologies Holdings Inc. | 764 | 13 |
| * Blue Coat Systems Inc. | 826 | 12 |
| * Formfactor Inc. | 1,533 | 12 |
| * KIT Digital Inc. | 1,071 | 12 |
| * Kemet Corp. | 1,269 | 12 |
| * Photronics Inc. | 1,780 | 12 |
| * Brightpoint Inc. | 1,165 | 11 |
| EPIQ Systems Inc. | 884 | 11 |
| Methode Electronics Inc. | 1,118 | 11 |
| * Accelrys Inc. | 1,677 | 11 |
| * Rofin-Sinar Technologies Inc. | 457 | 11 |
| Sycamore Networks Inc. | 605 | 10 |
| * Newport Corp. | 778 | 10 |
| CTS Corp. | 1,040 | 10 |
| * Nanometrics Inc. | 610 | 10 |
| * Coherent Inc. | 217 | 10 |
| * Electro Scientific Industries Inc. | 621 | 9 |
| * Infospace Inc. | 977 | 9 |
| * Integrated Device Technology Inc. | 1,619 | 9 |
| * QuinStreet Inc. | 735 | 9 |
| * Avid Technology Inc. | 897 | 9 |
| * Zoran Corp. | 1,005 | 8 |
| Daktronics Inc. | 842 | 8 |
| Cohu Inc. | 728 | 8 |
| * Anaren Inc. | 407 | 8 |
| * Digi International Inc. | 641 | 8 |
| Xyratex Ltd. | 937 | 8 |
| * Ness Technologies Inc. | 1,018 | 8 |
| * Sigma Designs Inc. | 963 | 8 |
| * GSI Group Inc. | 783 | 7 |
| Cognex Corp. | 230 | 7 |
| * CSG Systems International Inc. | 545 | 7 |
| * Symmetricom Inc. | 1,310 | 7 |
| * Omnivision Technologies Inc. | 371 | 7 |
50
| Vanguard® Russell 2000 Value Index Fund | ||
| Schedule of Investments | ||
| August 31, 2011 | ||
| Market | ||
| Value | ||
| Shares | ($000) | |
| * Integrated Silicon Solution Inc. | 811 | 7 |
| * Supertex Inc. | 336 | 7 |
| * Rudolph Technologies Inc. | 958 | 6 |
| * Oclaro Inc. | 1,528 | 6 |
| * Ciber Inc. | 1,936 | 6 |
| * Imation Corp. | 910 | 6 |
| * Oplink Communications Inc. | 377 | 6 |
| * Cray Inc. | 1,095 | 6 |
| * Advanced Analogic Technologies Inc. | 1,029 | 6 |
| * Exar Corp. | 985 | 6 |
| Richardson Electronics Ltd. | 427 | 6 |
| RealNetworks Inc. | 638 | 6 |
| * Global Cash Access Holdings Inc. | 1,953 | 6 |
| * Intevac Inc. | 692 | 6 |
| * Anadigics Inc. | 2,041 | 6 |
| * Vishay Precision Group Inc. | 373 | 6 |
| * Extreme Networks | 2,004 | 6 |
| Bel Fuse Inc. Class B | 319 | 6 |
| ModusLink Global Solutions Inc. | 1,326 | 5 |
| * Zygo Corp. | 408 | 5 |
| * Pericom Semiconductor Corp. | 669 | 5 |
| * OSI Systems Inc. | 133 | 5 |
| Electro Rent Corp. | 334 | 5 |
| * Agilysys Inc. | 542 | 5 |
| * Ebix Inc. | 295 | 5 |
| * Aviat Networks Inc. | 1,835 | 5 |
| * DSP Group Inc. | 709 | 5 |
| * Kopin Corp. | 1,200 | 5 |
| * Rosetta Stone Inc. | 332 | 4 |
| * Radisys Corp. | 588 | 4 |
| * Axcelis Technologies Inc. | 3,212 | 4 |
| * AXT Inc. | 558 | 4 |
| * Multi-Fineline Electronix Inc. | 227 | 4 |
| * Emcore Corp. | 2,674 | 4 |
| * PLX Technology Inc. | 1,348 | 4 |
| * DG FastChannel Inc. | 194 | 4 |
| Renaissance Learning Inc. | 265 | 4 |
| * THQ Inc. | 2,060 | 4 |
| * Westell Technologies Inc. Class A | 1,607 | 4 |
| Rimage Corp. | 288 | 4 |
| * LTX-Credence Corp. | 691 | 4 |
| * Alpha & Omega Semiconductor Ltd. | 445 | 4 |
| Littelfuse Inc. | 84 | 4 |
| * XO Group Inc. | 426 | 4 |
| Marchex Inc. Class B | 381 | 4 |
| * KVH Industries Inc. | 427 | 4 |
| * Openwave Systems Inc. | 1,806 | 3 |
| * DealerTrack Holdings Inc. | 171 | 3 |
| * TeleCommunication Systems Inc. Class A | 813 | 3 |
| * GSI Technology Inc. | 611 | 3 |
| Communications Systems Inc. | 205 | 3 |
| * X-Rite Inc. | 799 | 3 |
| * Novatel Wireless Inc. | 872 | 3 |
| * Seachange International Inc. | 357 | 3 |
| * NCI Inc. Class A | 167 | 3 |
| * IXYS Corp. | 224 | 3 |
| * Silicon Image Inc. | 482 | 3 |
| * Plexus Corp. | 96 | 3 |
| * FEI Co. | 79 | 3 |
| * MIPS Technologies Inc. Class A | 447 | 2 |
| * ePlus Inc. | 99 | 2 |
| * Mindspeed Technologies Inc. | 426 | 2 |
| * Monolithic Power Systems Inc. | 193 | 2 |
| * PC Connection Inc. | 273 | 2 |
51
| Vanguard® Russell 2000 Value Index Fund | ||
| Schedule of Investments | ||
| August 31, 2011 | ||
| Market | ||
| Value | ||
| Shares | ($000) | |
| * Globecomm Systems Inc. | 187 | 2 |
| * Dynamics Research Corp. | 238 | 2 |
| * ORBCOMM Inc. | 1,036 | 2 |
| * Dot Hill Systems Corp. | 1,321 | 2 |
| * FSI International Inc. | 1,049 | 2 |
| DDi Corp. | 297 | 2 |
| * Identive Group Inc. | 1,178 | 2 |
| * Smith Micro Software Inc. | 1,086 | 2 |
| * BigBand Networks Inc. | 1,326 | 2 |
| * Opnext Inc. | 1,133 | 2 |
| * Perficient Inc. | 195 | 2 |
| * Applied Micro Circuits Corp. | 298 | 2 |
| * Viasystems Group Inc. | 82 | 2 |
| * Computer Task Group Inc. | 138 | 2 |
| * support.com Inc. | 568 | 1 |
| * Hackett Group Inc. | 369 | 1 |
| * Internap Network Services Corp. | 176 | 1 |
| * Power-One Inc. | 111 | 1 |
| * TechTarget Inc. | 131 | 1 |
| * Limelight Networks Inc. | 307 | 1 |
| * Stream Global Services Inc. | 278 | 1 |
| * MoneyGram International Inc. | 287 | 1 |
| * NeoPhotonics Corp. | 120 | 1 |
| * Actuate Corp. | 112 | 1 |
| * Immersion Corp. | 95 | 1 |
| * TeleNav Inc. | 69 | 1 |
| * Motricity Inc. | 257 | 1 |
| * Amtech Systems Inc. | 52 | 1 |
| * PDF Solutions Inc. | 110 | 1 |
| 1,803 | ||
| Materials (5.4%) | ||
| * Coeur d'Alene Mines Corp. | 2,534 | 72 |
| Sensient Technologies Corp. | 1,516 | 55 |
| * Thompson Creek Metals Co. Inc. | 4,623 | 38 |
| Buckeye Technologies Inc. | 1,208 | 33 |
| Arch Chemicals Inc. | 692 | 32 |
| Minerals Technologies Inc. | 553 | 32 |
| HB Fuller Co. | 1,395 | 31 |
| * OM Group Inc. | 939 | 30 |
| Schweitzer-Mauduit International Inc. | 486 | 29 |
| * Louisiana-Pacific Corp. | 4,000 | 27 |
| * Clearwater Paper Corp. | 698 | 26 |
| Texas Industries Inc. | 690 | 25 |
| * Ferro Corp. | 2,620 | 22 |
| * Georgia Gulf Corp. | 1,029 | 22 |
| * RTI International Metals Inc. | 793 | 21 |
| PH Glatfelter Co. | 1,394 | 20 |
| Boise Inc. | 3,156 | 20 |
| * Golden Star Resources Ltd. | 7,826 | 19 |
| Olin Corp. | 958 | 19 |
| * Century Aluminum Co. | 1,561 | 19 |
| Stepan Co. | 246 | 19 |
| * KapStone Paper and Packaging Corp. | 1,183 | 18 |
| * Graham Packaging Co. Inc. | 676 | 17 |
| * Materion Corp. | 570 | 16 |
| A Schulman Inc. | 886 | 16 |
| * Jaguar Mining Inc. | 2,554 | 16 |
| * Chemtura Corp. | 1,125 | 15 |
| Kaiser Aluminum Corp. | 280 | 14 |
| * Horsehead Holding Corp. | 1,255 | 13 |
| Worthington Industries Inc. | 656 | 11 |
| * STR Holdings Inc. | 915 | 10 |
| Wausau Paper Corp. | 1,489 | 10 |
52
| Vanguard® Russell 2000 Value Index Fund | ||
| Schedule of Investments | ||
| August 31, 2011 | ||
| Market | ||
| Value | ||
| Shares | ($000) | |
| PolyOne Corp. | 778 | 10 |
| Myers Industries Inc. | 889 | 10 |
| * Zoltek Cos. Inc. | 841 | 7 |
| * Universal Stainless & Alloy | 216 | 7 |
| American Vanguard Corp. | 567 | 7 |
| * Vista Gold Corp. | 1,813 | 6 |
| * AM Castle & Co. | 506 | 6 |
| Olympic Steel Inc. | 277 | 6 |
| * Calgon Carbon Corp. | 349 | 5 |
| Eagle Materials Inc. | 256 | 5 |
| Haynes International Inc. | 83 | 5 |
| * Landec Corp. | 799 | 5 |
| * TPC Group Inc. | 143 | 4 |
| * Spartech Corp. | 935 | 4 |
| FutureFuel Corp. | 363 | 4 |
| * Headwaters Inc. | 1,841 | 4 |
| Neenah Paper Inc. | 223 | 4 |
| * Kraton Performance Polymers Inc. | 123 | 3 |
| Quaker Chemical Corp. | 82 | 3 |
| * United States Lime & Minerals Inc. | 60 | 2 |
| Chase Corp. | 188 | 2 |
| * Graphic Packaging Holding Co. | 561 | 2 |
| * US Energy Corp. Wyoming | 739 | 2 |
| * Innospec Inc. | 66 | 2 |
| * Handy & Harman Ltd. | 125 | 2 |
| * Revett Minerals Inc. | 335 | 1 |
| * Verso Paper Corp. | 418 | 1 |
| * Golden Minerals Co. | 60 | 1 |
| KMG Chemicals Inc. | 43 | 1 |
| NL Industries Inc. | 41 | 1 |
| 889 | ||
| Telecommunication Services (0.8%) | ||
| * Cincinnati Bell Inc. | 4,278 | 14 |
| * Leap Wireless International Inc. | 1,464 | 13 |
| * Premiere Global Services Inc. | 1,582 | 13 |
| * Neutral Tandem Inc. | 1,043 | 12 |
| USA Mobility Inc. | 669 | 10 |
| * Global Crossing Ltd. | 345 | 10 |
| * Vonage Holdings Corp. | 2,409 | 9 |
| * Iridium Communications Inc. | 1,164 | 9 |
| Alaska Communications Systems Group Inc. | 1,090 | 8 |
| Atlantic Tele-Network Inc. | 218 | 7 |
| * PAETEC Holding Corp. | 1,108 | 6 |
| SureWest Communications | 400 | 5 |
| * Fairpoint Communications Inc. | 613 | 4 |
| * Pendrell Corp. | 1,671 | 4 |
| Consolidated Communications Holdings Inc. | 142 | 3 |
| * Globalstar Inc. | 3,096 | 2 |
| IDT Corp. Class B | 36 | 1 |
| * Boingo Wireless Inc. | 74 | 1 |
| * inContact Inc. | 156 | 1 |
| 132 | ||
| Utilities (7.3%) | ||
| Nicor Inc. | 1,379 | 77 |
| Piedmont Natural Gas Co. Inc. | 2,173 | 67 |
| Cleco Corp. | 1,846 | 66 |
| WGL Holdings Inc. | 1,551 | 64 |
| New Jersey Resources Corp. | 1,253 | 59 |
| IDACORP Inc. | 1,501 | 57 |
| Portland General Electric Co. | 2,280 | 55 |
| UIL Holdings Corp. | 1,530 | 52 |
| Southwest Gas Corp. | 1,388 | 51 |
| Avista Corp. | 1,745 | 44 |
| El Paso Electric Co. | 1,275 | 44 |
53
| Vanguard® Russell 2000 Value Index Fund | ||||
| Schedule of Investments | ||||
| August 31, 2011 | ||||
| Market | ||||
| Value | ||||
| Shares | ($000) | |||
| Unisource Energy Corp. | 1,111 | 42 | ||
| PNM Resources Inc. | 2,624 | 39 | ||
| South Jersey Industries Inc. | 745 | 38 | ||
| Allete Inc. | 966 | 38 | ||
| NorthWestern Corp. | 1,098 | 37 | ||
| Northwest Natural Gas Co. | 808 | 37 | ||
| Black Hills Corp. | 1,193 | 36 | ||
| Atlantic Power Corp. | 1,917 | 30 | ||
| MGE Energy Inc. | 700 | 29 | ||
| Laclede Group Inc. | 679 | 27 | ||
| CH Energy Group Inc. | 471 | 26 | ||
| Empire District Electric Co. | 1,265 | 26 | ||
| California Water Service Group | 1,264 | 24 | ||
| Otter Tail Corp. | 1,032 | 21 | ||
| American States Water Co. | 565 | 20 | ||
| Central Vermont Public Service Corp. | 406 | 14 | ||
| * | Dynegy Inc. Class A | 3,117 | 14 | |
| Chesapeake Utilities Corp. | 290 | 12 | ||
| SJW Corp. | 427 | 10 | ||
| Ormat Technologies Inc. | 544 | 9 | ||
| Unitil Corp. | 331 | 9 | ||
| Middlesex Water Co. | 472 | 9 | ||
| Connecticut Water Service Inc. | 260 | 7 | ||
| York Water Co. | 385 | 7 | ||
| * | Cadiz Inc. | 365 | 4 | |
| Consolidated Water Co. Ltd. | 441 | 4 | ||
| Artesian Resources Corp. Class A | 197 | 4 | ||
| Pennichuck Corp. | 59 | 2 | ||
| 1,211 | ||||
| Total Common Stocks (Cost $16,157) | 16,461 | |||
| Coupon | ||||
| Temporary Cash Investment (0.0%) | ||||
| Money Market Fund (0.0%) | ||||
| 2 | Vanguard Market Liquidity Fund (Cost $3) | 0.132% | 2,777 | 3 |
| Total Investments (99.5%) (Cost $16,160) | 16,464 | |||
| Other Assets and Liabilities—Net (0.5%) | 77 | |||
| Net Assets (100%) | 16,541 | |||
Securities with a market value of less than $500 are displayed with a dash.
* Non-income-producing security.
1 The fund invests a portion of its assets in equity markets through the use of index futures contracts. After giving effect to futures investments, the fund's effective common stock position represents 99.5% of net assets.
2 Affiliated money market fund available only to Vanguard funds and certain trusts and accounts managed by Vanguard. Rate shown is the 7-day yield.
54
| Vanguard® Russell 2000 Growth Index Fund | ||
| Schedule of Investments | ||
| August 31, 2011 | ||
| Market | ||
| Value | ||
| Shares | ($000) | |
| Common Stocks (100.1%) | ||
| Consumer Discretionary (14.9%) | ||
| Sotheby's | 4,183 | 156 |
| * CROCS Inc. | 5,296 | 145 |
| * Tenneco Inc. | 3,748 | 123 |
| * Warnaco Group Inc. | 2,297 | 123 |
| Wolverine World Wide Inc. | 3,078 | 112 |
| * Ascena Retail Group Inc. | 3,895 | 111 |
| Cinemark Holdings Inc. | 5,226 | 109 |
| * Dana Holding Corp. | 8,535 | 109 |
| * Shutterfly Inc. | 1,850 | 99 |
| * Cheesecake Factory Inc. | 3,582 | 98 |
| * Life Time Fitness Inc. | 2,365 | 91 |
| * Coinstar Inc. | 1,935 | 88 |
| Brunswick Corp. | 5,528 | 88 |
| * JOS A Bank Clothiers Inc. | 1,705 | 87 |
| Six Flags Entertainment Corp. | 2,588 | 87 |
| * Steven Madden Ltd. | 2,349 | 85 |
| * Carter's Inc. | 2,624 | 81 |
| * HSN Inc. | 2,467 | 79 |
| Hillenbrand Inc. | 3,868 | 79 |
| Pool Corp. | 2,973 | 77 |
| * Timberland Co. Class A | 1,791 | 77 |
| * Valassis Communications Inc. | 3,032 | 77 |
| * ANN Inc. | 3,212 | 76 |
| Monro Muffler Brake Inc. | 1,881 | 74 |
| Strayer Education Inc. | 756 | 72 |
| Vail Resorts Inc. | 1,758 | 71 |
| * Buffalo Wild Wings Inc. | 1,131 | 70 |
| * BJ's Restaurants Inc. | 1,484 | 68 |
| * Vitamin Shoppe Inc. | 1,532 | 68 |
| Buckle Inc. | 1,662 | 65 |
| Express Inc. | 3,410 | 65 |
| * Hibbett Sports Inc. | 1,691 | 63 |
| Arbitron Inc. | 1,675 | 63 |
| Cracker Barrel Old Country Store Inc. | 1,338 | 57 |
| * Aeropostale Inc. | 4,981 | 56 |
| Texas Roadhouse Inc. Class A | 3,630 | 52 |
| * True Religion Apparel Inc. | 1,591 | 49 |
| National CineMedia Inc. | 3,403 | 48 |
| * Select Comfort Corp. | 2,992 | 47 |
| Cooper Tire & Rubber Co. | 3,833 | 46 |
| * Peet's Coffee & Tea Inc. | 792 | 46 |
| * American Public Education Inc. | 1,103 | 45 |
| Cato Corp. Class A | 1,707 | 43 |
| * K12 Inc. | 1,604 | 43 |
| * Vera Bradley Inc. | 1,222 | 43 |
| * iRobot Corp. | 1,466 | 41 |
| * Domino's Pizza Inc. | 1,452 | 40 |
| * DineEquity Inc. | 956 | 40 |
| PF Chang's China Bistro Inc. | 1,289 | 39 |
| Sturm Ruger & Co. Inc. | 1,165 | 39 |
| CEC Entertainment Inc. | 1,226 | 38 |
| Ameristar Casinos Inc. | 1,988 | 37 |
| * Steiner Leisure Ltd. | 928 | 37 |
| * Maidenform Brands Inc. | 1,445 | 37 |
| * Papa John's International Inc. | 1,217 | 36 |
| * Sonic Corp. | 3,814 | 35 |
| * GNC Holdings Inc. | 1,410 | 34 |
| * Krispy Kreme Doughnuts Inc. | 3,608 | 33 |
| * Interval Leisure Group Inc. | 2,482 | 31 |
| * Capella Education Co. | 971 | 31 |
| * Blue Nile Inc. | 792 | 31 |
55
| Vanguard® Russell 2000 Growth Index Fund | ||
| Schedule of Investments | ||
| August 31, 2011 | ||
| Market | ||
| Value | ||
| Shares | ($000) | |
| * G-III Apparel Group Ltd. | 1,019 | 29 |
| Oxford Industries Inc. | 793 | 28 |
| * Grand Canyon Education Inc. | 1,769 | 27 |
| Columbia Sportswear Co. | 511 | 27 |
| MDC Partners Inc. Class A | 1,547 | 25 |
| * Bravo Brio Restaurant Group Inc. | 1,189 | 25 |
| * Bridgepoint Education Inc. | 1,103 | 24 |
| * Zumiez Inc. | 1,311 | 24 |
| * Shuffle Master Inc. | 2,698 | 24 |
| * Knology Inc. | 1,728 | 24 |
| Matthews International Corp. Class A | 702 | 23 |
| * Rue21 Inc. | 925 | 23 |
| * Red Robin Gourmet Burgers Inc. | 721 | 22 |
| * Pier 1 Imports Inc. | 2,075 | 22 |
| * Lumber Liquidators Holdings Inc. | 1,428 | 22 |
| * Dorman Products Inc. | 668 | 22 |
| Nutrisystem Inc. | 1,664 | 21 |
| * Zagg Inc. | 1,371 | 21 |
| * AFC Enterprises Inc. | 1,528 | 20 |
| Finish Line Inc. Class A | 976 | 20 |
| * Lions Gate Entertainment Corp. | 2,781 | 19 |
| * Universal Technical Institute Inc. | 1,317 | 19 |
| * Amerigon Inc. | 1,373 | 18 |
| * Denny's Corp. | 4,418 | 17 |
| * Scientific Games Corp. Class A | 1,881 | 17 |
| * Libbey Inc. | 1,224 | 16 |
| Men's Wearhouse Inc. | 544 | 16 |
| World Wrestling Entertainment Inc. Class A | 1,503 | 14 |
| * Winnebago Industries Inc. | 1,797 | 14 |
| PetMed Express Inc. | 1,335 | 13 |
| * Stoneridge Inc. | 1,633 | 13 |
| * Body Central Corp. | 725 | 13 |
| * Global Traffic Network Inc. | 882 | 12 |
| Destination Maternity Corp. | 662 | 9 |
| Belo Corp. Class A | 1,686 | 9 |
| Churchill Downs Inc. | 207 | 9 |
| Ethan Allen Interiors Inc. | 525 | 9 |
| Drew Industries Inc. | 451 | 9 |
| * ReachLocal Inc. | 616 | 9 |
| * America's Car-Mart Inc. | 296 | 9 |
| * Rentrak Corp. | 587 | 8 |
| * HomeAway Inc. | 200 | 8 |
| * American Axle & Manufacturing Holdings Inc. | 885 | 8 |
| * Genesco Inc. | 149 | 8 |
| * Teavana Holdings Inc. | 300 | 8 |
| * Valuevision Media Inc. Class A | 2,018 | 8 |
| * Overstock.com Inc. | 714 | 7 |
| * interCLICK Inc. | 1,270 | 7 |
| * Carrols Restaurant Group Inc. | 780 | 7 |
| * Jamba Inc. | 4,067 | 7 |
| * Universal Electronics Inc. | 359 | 7 |
| * Exide Technologies | 1,190 | 7 |
| Winmark Corp. | 140 | 7 |
| Cherokee Inc. | 459 | 6 |
| * 99 Cents Only Stores | 334 | 6 |
| * Cost Plus Inc. | 756 | 6 |
| * Geeknet Inc. | 278 | 6 |
| * US Auto Parts Network Inc. | 921 | 6 |
| * Caribou Coffee Co. Inc. | 380 | 6 |
| * Tower International Inc. | 412 | 6 |
| * Global Sources Ltd. | 679 | 6 |
| National American University Holdings Inc. | 573 | 5 |
| * Gordmans Stores Inc. | 328 | 5 |
| * Francesca's Holdings Corp. | 200 | 5 |
56
| Vanguard® Russell 2000 Growth Index Fund | ||
| Schedule of Investments | ||
| August 31, 2011 | ||
| Market | ||
| Value | ||
| Shares | ($000) | |
| Einstein Noah Restaurant Group Inc. | 303 | 5 |
| * Archipelago Learning Inc. | 446 | 4 |
| * Smith & Wesson Holding Corp. | 1,216 | 4 |
| * Town Sports International Holdings Inc. | 508 | 4 |
| * Morgans Hotel Group Co. | 519 | 4 |
| * Jack in the Box Inc. | 171 | 4 |
| * Core-Mark Holding Co. Inc. | 95 | 3 |
| * Skullcandy Inc. | 200 | 3 |
| American Greetings Corp. Class A | 151 | 3 |
| * Pinnacle Entertainment Inc. | 231 | 3 |
| * Biglari Holdings Inc. | 7 | 2 |
| Sinclair Broadcast Group Inc. Class A | 234 | 2 |
| * Entravision Communications Corp. Class A | 1,616 | 2 |
| * Ruth's Hospitality Group Inc. | 345 | 2 |
| Ambassadors Group Inc. | 234 | 2 |
| * Marine Products Corp. | 293 | 2 |
| * Kenneth Cole Productions Inc. Class A | 140 | 2 |
| * Liz Claiborne Inc. | 300 | 2 |
| * Perry Ellis International Inc. | 55 | 1 |
| Value Line Inc. | 98 | 1 |
| * Delta Apparel Inc. | 63 | 1 |
| * Nexstar Broadcasting Group Inc. Class A | 170 | 1 |
| * hhgregg Inc. | 91 | 1 |
| * Cumulus Media Inc. Class A | 368 | 1 |
| * Crown Media Holdings Inc. Class A | 689 | 1 |
| RG Barry Corp. | 83 | 1 |
| * Systemax Inc. | 61 | 1 |
| * Conn's Inc. | 117 | 1 |
| * 1-800-Flowers.com Inc. Class A | 218 | 1 |
| * LIN TV Corp. Class A | 135 | — |
| * New York & Co. Inc. | 113 | — |
| 5,051 | ||
| Consumer Staples (4.2%) | ||
| Nu Skin Enterprises Inc. Class A | 3,395 | 144 |
| * Darling International Inc. | 7,252 | 122 |
| * United Natural Foods Inc. | 2,998 | 122 |
| Diamond Foods Inc. | 1,366 | 108 |
| Casey's General Stores Inc. | 2,354 | 106 |
| Pricesmart Inc. | 1,098 | 72 |
| * TreeHouse Foods Inc. | 1,291 | 71 |
| Lancaster Colony Corp. | 1,155 | 70 |
| * Fresh Market Inc. | 1,735 | 67 |
| Ruddick Corp. | 1,638 | 67 |
| J&J Snack Foods Corp. | 882 | 45 |
| WD-40 Co. | 1,044 | 43 |
| * Boston Beer Co. Inc. Class A | 507 | 41 |
| * Elizabeth Arden Inc. | 1,227 | 39 |
| Vector Group Ltd. | 1,935 | 36 |
| Tootsie Roll Industries Inc. | 1,353 | 34 |
| B&G Foods Inc. Class A | 1,694 | 31 |
| * Spectrum Brands Holdings Inc. | 815 | 22 |
| * Hain Celestial Group Inc. | 544 | 17 |
| Inter Parfums Inc. | 994 | 16 |
| * Heckmann Corp. | 2,806 | 16 |
| Coca-Cola Bottling Co. Consolidated | 283 | 16 |
| Calavo Growers Inc. | 730 | 15 |
| * Medifast Inc. | 850 | 14 |
| * Star Scientific Inc. | 5,853 | 14 |
| * Nature's Sunshine Products Inc. | 690 | 12 |
| National Beverage Corp. | 691 | 11 |
| * USANA Health Sciences Inc. | 420 | 11 |
| * Smart Balance Inc. | 1,737 | 9 |
| Limoneira Co. | 482 | 8 |
| * Synutra International Inc. | 1,068 | 7 |
57
| Vanguard® Russell 2000 Growth Index Fund | ||
| Schedule of Investments | ||
| August 31, 2011 | ||
| Market | ||
| Value | ||
| Shares | ($000) | |
| Female Health Co. | 1,176 | 5 |
| * Primo Water Corp. | 642 | 5 |
| * Dole Food Co. Inc. | 392 | 4 |
| Arden Group Inc. | 41 | 3 |
| * Rite Aid Corp. | 2,971 | 3 |
| * Lifeway Foods Inc. | 302 | 3 |
| Schiff Nutrition International Inc. | 225 | 2 |
| * Smart Balance Inc. | 129 | 2 |
| Cal-Maine Foods Inc. | 51 | 2 |
| Alico Inc. | 73 | 2 |
| * Omega Protein Corp. | 125 | 1 |
| * Craft Brewers Alliance Inc. | 226 | 1 |
| * Pantry Inc. | 108 | 1 |
| Oil-Dri Corp. of America | 62 | 1 |
| Farmer Bros Co. | 96 | 1 |
| 1,442 | ||
| Energy (8.8%) | ||
| Berry Petroleum Co. Class A | 3,191 | 156 |
| * CVR Energy Inc. | 5,436 | 155 |
| * Rosetta Resources Inc. | 3,282 | 151 |
| * Complete Production Services Inc. | 4,888 | 142 |
| * Dril-Quip Inc. | 2,130 | 138 |
| * Energy XXI Bermuda Ltd. | 4,518 | 121 |
| Lufkin Industries Inc. | 1,889 | 118 |
| * Key Energy Services Inc. | 6,935 | 100 |
| * Oasis Petroleum Inc. | 3,694 | 98 |
| World Fuel Services Corp. | 2,497 | 93 |
| Golar LNG Ltd. | 2,462 | 81 |
| * Stone Energy Corp. | 3,024 | 80 |
| * Northern Oil and Gas Inc. | 3,895 | 80 |
| * McMoRan Exploration Co. | 6,061 | 78 |
| * Kodiak Oil & Gas Corp. | 12,913 | 77 |
| * Patriot Coal Corp. | 5,256 | 77 |
| * Gulfport Energy Corp. | 2,577 | 74 |
| * Carrizo Oil & Gas Inc. | 2,403 | 72 |
| * ION Geophysical Corp. | 8,107 | 57 |
| * Western Refining Inc. | 3,057 | 53 |
| Contango Oil & Gas Co. | 753 | 46 |
| W&T Offshore Inc. | 2,151 | 45 |
| Apco Oil and Gas International Inc. | 563 | 45 |
| * Hyperdynamics Corp. | 9,598 | 43 |
| * Clean Energy Fuels Corp. | 3,059 | 40 |
| * Cheniere Energy Inc. | 5,110 | 40 |
| * Resolute Energy Corp. | 2,848 | 38 |
| * Pioneer Drilling Co. | 2,992 | 38 |
| * ATP Oil & Gas Corp. | 2,747 | 37 |
| * Basic Energy Services Inc. | 1,487 | 32 |
| * Magnum Hunter Resources Corp. | 6,871 | 31 |
| Targa Resources Corp. | 1,014 | 30 |
| Crosstex Energy Inc. | 2,237 | 26 |
| * Goodrich Petroleum Corp. | 1,599 | 26 |
| * Tesco Corp. | 1,510 | 25 |
| * Rex Energy Corp. | 1,842 | 23 |
| * Amyris Inc. | 1,089 | 22 |
| * Clayton Williams Energy Inc. | 364 | 21 |
| * FX Energy Inc. | 3,229 | 20 |
| * OYO Geospace Corp. | 267 | 20 |
| * Abraxas Petroleum Corp. | 5,077 | 19 |
| * Approach Resources Inc. | 993 | 18 |
| Houston American Energy Corp. | 1,020 | 18 |
| * Cloud Peak Energy Inc. | 775 | 15 |
| * Uranium Energy Corp. | 4,400 | 15 |
| * Callon Petroleum Co. | 2,413 | 14 |
| * Rentech Inc. | 13,751 | 14 |
58
| Vanguard® Russell 2000 Growth Index Fund | ||
| Schedule of Investments | ||
| August 31, 2011 | ||
| Market | ||
| Value | ||
| Shares | ($000) | |
| * Global Geophysical Services Inc. | 1,119 | 14 |
| Panhandle Oil and Gas Inc. Class A | 434 | 12 |
| * Georesources Inc. | 483 | 11 |
| * Bill Barrett Corp. | 222 | 11 |
| * Cal Dive International Inc. | 3,626 | 11 |
| * Gulfmark Offshore Inc. | 260 | 10 |
| * Uranerz Energy Corp. | 3,985 | 9 |
| * C&J Energy Services Inc. | 334 | 9 |
| * Solazyme Inc. | 518 | 7 |
| * Triangle Petroleum Corp. | 1,280 | 7 |
| * Mitcham Industries Inc. | 405 | 7 |
| * Uranium Resources Inc. | 5,783 | 7 |
| * Ur-Energy Inc. | 5,249 | 7 |
| * Syntroleum Corp. | 5,467 | 7 |
| * Evolution Petroleum Corp. | 995 | 6 |
| * Petroquest Energy Inc. | 816 | 6 |
| * Voyager Oil & Gas Inc. | 2,141 | 6 |
| * BPZ Resources Inc. | 1,578 | 6 |
| * RigNet Inc. | 371 | 6 |
| * Tetra Technologies Inc. | 536 | 5 |
| Alon USA Energy Inc. | 557 | 5 |
| * Venoco Inc. | 411 | 5 |
| * Dawson Geophysical Co. | 127 | 4 |
| * Zion Oil & Gas Inc. | 1,490 | 4 |
| * Isramco Inc. | 63 | 4 |
| * Gevo Inc. | 354 | 4 |
| * GMX Resources Inc. | 1,184 | 3 |
| * Geokinetics Inc. | 725 | 3 |
| * Willbros Group Inc. | 502 | 3 |
| * Newpark Resources Inc. | 386 | 3 |
| Gulf Island Fabrication Inc. | 129 | 3 |
| * Matrix Service Co. | 264 | 3 |
| * Vaalco Energy Inc. | 396 | 3 |
| * Warren Resources Inc. | 743 | 3 |
| Hallador Energy Co. | 231 | 2 |
| * Westmoreland Coal Co. | 158 | 2 |
| 2,980 | ||
| Financials (8.1%) | ||
| Mid-America Apartment Communities Inc. | 2,272 | 162 |
| Home Properties Inc. | 2,420 | 162 |
| * Signature Bank | 2,849 | 158 |
| Tanger Factory Outlet Centers | 5,321 | 150 |
| Highwoods Properties Inc. | 3,386 | 111 |
| Omega Healthcare Investors Inc. | 5,968 | 108 |
| * Ezcorp Inc. Class A | 2,913 | 98 |
| * First Cash Financial Services Inc. | 1,944 | 91 |
| Equity Lifestyle Properties Inc. | 1,301 | 90 |
| * Portfolio Recovery Associates Inc. | 1,056 | 77 |
| American Campus Communities Inc. | 1,857 | 72 |
| Kilroy Realty Corp. | 1,779 | 64 |
| * World Acceptance Corp. | 928 | 61 |
| * DFC Global Corp. | 2,682 | 59 |
| Alexander's Inc. | 128 | 55 |
| * Financial Engines Inc. | 2,363 | 53 |
| MarketAxess Holdings Inc. | 1,771 | 52 |
| Glimcher Realty Trust | 5,766 | 49 |
| Extra Space Storage Inc. | 2,253 | 48 |
| Potlatch Corp. | 1,331 | 45 |
| CBL & Associates Properties Inc. | 2,857 | 42 |
| * Stifel Financial Corp. | 1,320 | 40 |
| American Assets Trust Inc. | 1,879 | 38 |
| Cohen & Steers Inc. | 910 | 35 |
| Westamerica Bancorporation | 811 | 34 |
59
| Vanguard® Russell 2000 Growth Index Fund | ||
| Schedule of Investments | ||
| August 31, 2011 | ||
| Market | ||
| Value | ||
| Shares | ($000) | |
| Evercore Partners Inc. Class A | 1,297 | 34 |
| Cash America International Inc. | 608 | 34 |
| optionsXpress Holdings Inc. | 2,625 | 33 |
| Washington Real Estate Investment Trust | 1,038 | 32 |
| DuPont Fabros Technology Inc. | 1,383 | 32 |
| EastGroup Properties Inc. | 766 | 31 |
| BGC Partners Inc. Class A | 4,664 | 31 |
| National Health Investors Inc. | 663 | 30 |
| * Credit Acceptance Corp. | 413 | 29 |
| * SVB Financial Group | 588 | 27 |
| First Financial Bankshares Inc. | 876 | 26 |
| Newcastle Investment Corp. | 4,579 | 25 |
| * Tejon Ranch Co. | 878 | 24 |
| * Encore Capital Group Inc. | 996 | 24 |
| Duff & Phelps Corp. Class A | 1,874 | 21 |
| * HFF Inc. Class A | 1,791 | 21 |
| * Virtus Investment Partners Inc. | 317 | 19 |
| Artio Global Investors Inc. Class A | 1,780 | 16 |
| Saul Centers Inc. | 455 | 16 |
| Universal Health Realty Income Trust | 386 | 15 |
| Getty Realty Corp. | 736 | 14 |
| Epoch Holding Corp. | 911 | 14 |
| Westwood Holdings Group Inc. | 386 | 13 |
| * FelCor Lodging Trust Inc. | 3,841 | 13 |
| * Strategic Hotels & Resorts Inc. | 2,729 | 13 |
| GAMCO Investors Inc. | 264 | 13 |
| PS Business Parks Inc. | 228 | 13 |
| Diamond Hill Investment Group Inc. | 159 | 12 |
| Crawford & Co. Class B | 1,591 | 11 |
| * Netspend Holdings Inc. | 1,835 | 11 |
| Acadia Realty Trust | 513 | 11 |
| * Ladenburg Thalmann Financial Services Inc. | 6,567 | 10 |
| LTC Properties Inc. | 337 | 9 |
| * Greenlight Capital Re Ltd. Class A | 392 | 9 |
| * Walker & Dunlop Inc. | 663 | 8 |
| Investors Real Estate Trust | 949 | 7 |
| Sabra Healthcare REIT Inc. | 627 | 7 |
| * Imperial Holdings Inc. | 926 | 7 |
| * Investors Bancorp Inc. | 402 | 6 |
| Bank of the Ozarks Inc. | 245 | 6 |
| Gladstone Commercial Corp. | 295 | 5 |
| * Hampton Roads Bankshares Inc. | 606 | 5 |
| Amtrust Financial Services Inc. | 180 | 4 |
| Advance America Cash Advance Centers Inc. | 399 | 3 |
| Westfield Financial Inc. | 441 | 3 |
| Bryn Mawr Bank Corp. | 171 | 3 |
| Urstadt Biddle Properties Inc. Class A | 187 | 3 |
| Cogdell Spencer Inc. | 728 | 3 |
| Bridge Bancorp Inc. | 152 | 3 |
| Pzena Investment Management Inc. Class A | 579 | 3 |
| SY Bancorp Inc. | 118 | 2 |
| Associated Estates Realty Corp. | 118 | 2 |
| * Hallmark Financial Services | 274 | 2 |
| Enterprise Financial Services Corp. | 123 | 2 |
| Trustco Bank Corp. NY | 382 | 2 |
| * ICG Group Inc. | 155 | 2 |
| State Auto Financial Corp. | 110 | 2 |
| * Taylor Capital Group Inc. | 220 | 1 |
| Flagstone Reinsurance Holdings SA | 196 | 1 |
| Arrow Financial Corp. | 49 | 1 |
| Clifton Savings Bancorp Inc. | 85 | 1 |
| * BofI Holding Inc. | 58 | 1 |
| 2,735 | ||
60
| Vanguard® Russell 2000 Growth Index Fund | ||
| Schedule of Investments | ||
| August 31, 2011 | ||
| Market | ||
| Value | ||
| Shares | ($000) | |
| Health Care (19.6%) | ||
| * Cepheid Inc. | 3,827 | 139 |
| * HMS Holdings Corp. | 5,250 | 138 |
| * Onyx Pharmaceuticals Inc. | 3,926 | 134 |
| * Cubist Pharmaceuticals Inc. | 3,715 | 129 |
| * athenahealth Inc. | 2,161 | 125 |
| Medicis Pharmaceutical Corp. Class A | 3,153 | 123 |
| * WellCare Health Plans Inc. | 2,638 | 121 |
| STERIS Corp. | 3,671 | 118 |
| Quality Systems Inc. | 1,202 | 111 |
| * Salix Pharmaceuticals Ltd. | 3,622 | 110 |
| * Seattle Genetics Inc. | 5,984 | 104 |
| * Alkermes Inc. | 5,915 | 103 |
| * Haemonetics Corp. | 1,594 | 100 |
| * Questcor Pharmaceuticals Inc. | 3,295 | 99 |
| * Volcano Corp. | 3,234 | 97 |
| Owens & Minor Inc. | 3,219 | 95 |
| * Healthspring Inc. | 2,281 | 89 |
| * Incyte Corp. Ltd. | 5,493 | 88 |
| * PSS World Medical Inc. | 3,423 | 81 |
| * Ariad Pharmaceuticals Inc. | 8,145 | 80 |
| Masimo Corp. | 3,241 | 80 |
| Chemed Corp. | 1,313 | 76 |
| * Impax Laboratories Inc. | 3,678 | 72 |
| * Align Technology Inc. | 3,784 | 72 |
| * MAKO Surgical Corp. | 1,974 | 71 |
| * Theravance Inc. | 3,553 | 68 |
| * Parexel International Corp. | 3,288 | 67 |
| * Accretive Health Inc. | 2,469 | 66 |
| * Acorda Therapeutics Inc. | 2,435 | 63 |
| * Centene Corp. | 1,928 | 61 |
| * Zoll Medical Corp. | 1,352 | 60 |
| * NuVasive Inc. | 2,448 | 59 |
| * Exelixis Inc. | 7,887 | 59 |
| * Jazz Pharmaceuticals Inc. | 1,362 | 58 |
| * MWI Veterinary Supply Inc. | 775 | 57 |
| * Arthrocare Corp. | 1,686 | 55 |
| * Luminex Corp. | 2,332 | 54 |
| * Integra LifeSciences Holdings Corp. | 1,287 | 51 |
| * NxStage Medical Inc. | 2,754 | 51 |
| * Auxilium Pharmaceuticals Inc. | 2,953 | 50 |
| * DexCom Inc. | 4,139 | 50 |
| * Neogen Corp. | 1,431 | 50 |
| * Insulet Corp. | 2,836 | 50 |
| * Cyberonics Inc. | 1,749 | 49 |
| Computer Programs & Systems Inc. | 683 | 48 |
| * Momenta Pharmaceuticals Inc. | 2,846 | 48 |
| Meridian Bioscience Inc. | 2,530 | 47 |
| * HeartWare International Inc. | 742 | 47 |
| * Air Methods Corp. | 699 | 47 |
| * Isis Pharmaceuticals Inc. | 6,145 | 46 |
| * Par Pharmaceutical Cos. Inc. | 1,548 | 46 |
| * Vivus Inc. | 5,495 | 46 |
| West Pharmaceutical Services Inc. | 1,133 | 45 |
| PDL BioPharma Inc. | 7,110 | 43 |
| * Orthofix International NV | 1,114 | 41 |
| * IPC The Hospitalist Co. Inc. | 1,011 | 41 |
| * Ironwood Pharmaceuticals Inc. | 3,112 | 40 |
| * NPS Pharmaceuticals Inc. | 5,307 | 40 |
| * InterMune Inc. | 1,399 | 38 |
| * Merit Medical Systems Inc. | 2,586 | 38 |
| * Immunogen Inc. | 3,319 | 36 |
| * Abaxis Inc. | 1,390 | 35 |
| * Halozyme Therapeutics Inc. | 5,062 | 34 |
61
| Vanguard® Russell 2000 Growth Index Fund | ||
| Schedule of Investments | ||
| August 31, 2011 | ||
| Market | ||
| Value | ||
| Shares | ($000) | |
| * Emeritus Corp. | 1,886 | 33 |
| * AVEO Pharmaceuticals Inc. | 1,934 | 33 |
| * Pharmacyclics Inc. | 2,834 | 33 |
| * Medivation Inc. | 1,935 | 31 |
| * Team Health Holdings Inc. | 1,645 | 31 |
| * Bio-Reference Labs Inc. | 1,516 | 31 |
| Landauer Inc. | 582 | 30 |
| * Endologix Inc. | 3,019 | 29 |
| * Optimer Pharmaceuticals Inc. | 2,860 | 28 |
| Analogic Corp. | 574 | 28 |
| * Opko Health Inc. | 6,720 | 28 |
| * Akorn Inc. | 3,461 | 28 |
| * Targacept Inc. | 1,701 | 28 |
| * Medicines Co. | 1,892 | 28 |
| * MedAssets Inc. | 2,411 | 28 |
| * Spectrum Pharmaceuticals Inc. | 3,212 | 27 |
| * Emergent Biosolutions Inc. | 1,503 | 27 |
| * Quidel Corp. | 1,758 | 27 |
| * Sequenom Inc. | 4,249 | 26 |
| * Genomic Health Inc. | 1,050 | 26 |
| * Rigel Pharmaceuticals Inc. | 3,229 | 25 |
| * Nektar Therapeutics | 4,441 | 25 |
| * ExamWorks Group Inc. | 1,670 | 25 |
| * SonoSite Inc. | 853 | 25 |
| * ABIOMED Inc. | 1,954 | 24 |
| Ensign Group Inc. | 1,006 | 23 |
| * Caliper Life Sciences Inc. | 2,912 | 22 |
| * Medidata Solutions Inc. | 1,298 | 21 |
| * OraSure Technologies Inc. | 2,880 | 21 |
| Atrion Corp. | 98 | 21 |
| * ZIOPHARM Oncology Inc. | 3,611 | 21 |
| * Depomed Inc. | 3,312 | 21 |
| * Conceptus Inc. | 1,925 | 20 |
| * Hanger Orthopedic Group Inc. | 1,084 | 20 |
| * Molina Healthcare Inc. | 1,045 | 20 |
| * Neoprobe Corp. | 5,839 | 20 |
| * Sunrise Senior Living Inc. | 2,649 | 20 |
| * AVANIR Pharmaceuticals Inc. | 6,876 | 20 |
| * Merge Healthcare Inc. | 3,203 | 19 |
| * MAP Pharmaceuticals Inc. | 1,349 | 19 |
| * Ligand Pharmaceuticals Inc. Class B | 1,212 | 18 |
| * Accuray Inc. | 3,714 | 18 |
| * Dynavax Technologies Corp. | 7,632 | 18 |
| * Achillion Pharmaceuticals Inc. | 2,927 | 18 |
| * Biosante Pharmaceuticals Inc. | 6,775 | 18 |
| * Sangamo Biosciences Inc. | 3,229 | 17 |
| * Corvel Corp. | 382 | 17 |
| * Keryx Biopharmaceuticals Inc. | 4,262 | 17 |
| * Exact Sciences Corp. | 2,217 | 17 |
| * Ardea Biosciences Inc. | 1,035 | 17 |
| * Unilife Corp. | 3,506 | 16 |
| * Immunomedics Inc. | 4,057 | 16 |
| * MedQuist Holdings Inc. | 1,951 | 16 |
| * Alnylam Pharmaceuticals Inc. | 2,272 | 16 |
| * Staar Surgical Co. | 1,904 | 16 |
| * Omnicell Inc. | 983 | 15 |
| * Cadence Pharmaceuticals Inc. | 2,346 | 15 |
| * Tornier NV | 652 | 15 |
| * Kensey Nash Corp. | 528 | 15 |
| US Physical Therapy Inc. | 729 | 14 |
| * MannKind Corp. | 4,766 | 14 |
| * Arqule Inc. | 3,294 | 14 |
| * Vical Inc. | 3,943 | 14 |
| * Chelsea Therapeutics International Ltd. | 3,305 | 14 |
62
| Vanguard® Russell 2000 Growth Index Fund | ||
| Schedule of Investments | ||
| August 31, 2011 | ||
| Market | ||
| Value | ||
| Shares | ($000) | |
| * Transcend Services Inc. | 544 | 14 |
| * Micromet Inc. | 2,881 | 14 |
| * Savient Pharmaceuticals Inc. | 3,117 | 13 |
| * Neurocrine Biosciences Inc. | 2,181 | 13 |
| * Antares Pharma Inc. | 5,411 | 13 |
| * Oncothyreon Inc. | 1,833 | 13 |
| * XenoPort Inc. | 1,789 | 13 |
| * Metropolitan Health Networks Inc. | 2,536 | 13 |
| * Spectranetics Corp. | 2,058 | 13 |
| * Vascular Solutions Inc. | 1,046 | 13 |
| * Delcath Systems Inc. | 2,965 | 12 |
| * SIGA Technologies Inc. | 2,122 | 12 |
| * Synovis Life Technologies Inc. | 708 | 12 |
| * BioScrip Inc. | 1,904 | 12 |
| * Obagi Medical Products Inc. | 1,144 | 12 |
| * HealthStream Inc. | 948 | 12 |
| * Endocyte Inc. | 1,065 | 12 |
| * Sagent Pharmaceuticals Inc. | 485 | 11 |
| * Hansen Medical Inc. | 2,891 | 11 |
| Pain Therapeutics Inc. | 2,276 | 11 |
| * Curis Inc. | 3,331 | 11 |
| * Cardiovascular Systems Inc. | 819 | 11 |
| * Cell Therapeutics Inc. | 8,804 | 10 |
| * AVI BioPharma Inc. | 8,365 | 10 |
| * Raptor Pharmaceutical Corp. | 2,135 | 10 |
| * Santarus Inc. | 3,288 | 10 |
| * Inhibitex Inc. | 2,852 | 10 |
| * Sciclone Pharmaceuticals Inc. | 2,133 | 10 |
| * Vanda Pharmaceuticals Inc. | 1,627 | 10 |
| * Codexis Inc. | 1,514 | 10 |
| * Natus Medical Inc. | 929 | 10 |
| * Ampio Pharmaceuticals Inc. | 1,224 | 10 |
| * Continucare Corp. | 1,425 | 9 |
| * Rockwell Medical Technologies Inc. | 989 | 9 |
| * AtriCure Inc. | 867 | 9 |
| * Columbia Laboratories Inc. | 3,657 | 8 |
| * Progenics Pharmaceuticals Inc. | 1,340 | 8 |
| * Aegerion Pharmaceuticals Inc. | 564 | 8 |
| * eResearchTechnology Inc. | 1,563 | 8 |
| * Metabolix Inc. | 1,504 | 8 |
| * Infinity Pharmaceuticals Inc. | 1,180 | 8 |
| * Nymox Pharmaceutical Corp. | 990 | 8 |
| * Durect Corp. | 4,631 | 8 |
| * ICU Medical Inc. | 183 | 8 |
| * Synergetics USA Inc. | 1,378 | 8 |
| * Novavax Inc. | 4,061 | 8 |
| * Dyax Corp. | 4,988 | 7 |
| * Anthera Pharmaceuticals Inc. | 1,304 | 7 |
| * Cytori Therapeutics Inc. | 2,182 | 7 |
| * OncoGenex Pharmaceutical Inc. | 601 | 7 |
| * Corcept Therapeutics Inc. | 2,534 | 7 |
| * Biotime Inc. | 1,524 | 7 |
| * ISTA Pharmaceuticals Inc. | 1,533 | 7 |
| * Uroplasty Inc. | 1,118 | 7 |
| * IRIS International Inc. | 786 | 7 |
| * Allos Therapeutics Inc. | 3,923 | 7 |
| * Dusa Pharmaceuticals Inc. | 1,513 | 7 |
| Medtox Scientific Inc. | 469 | 7 |
| * AMN Healthcare Services Inc. | 1,116 | 6 |
| * Synta Pharmaceuticals Corp. | 1,442 | 6 |
| * BioCryst Pharmaceuticals Inc. | 1,845 | 6 |
| * Peregrine Pharmaceuticals Inc. | 4,189 | 6 |
| * Hi-Tech Pharmacal Co. Inc. | 203 | 6 |
| * Exactech Inc. | 381 | 6 |
63
| Vanguard® Russell 2000 Growth Index Fund | ||
| Schedule of Investments | ||
| August 31, 2011 | ||
| Market | ||
| Value | ||
| Shares | ($000) | |
| * RadNet Inc. | 1,881 | 6 |
| * Complete Genomics Inc. | 619 | 6 |
| * Osiris Therapeutics Inc. | 1,042 | 6 |
| * Idenix Pharmaceuticals Inc. | 958 | 6 |
| * Fluidigm Corp. | 411 | 6 |
| * Biospecifics Technologies Corp. | 316 | 6 |
| * PharmAthene Inc. | 2,217 | 5 |
| * Cerus Corp. | 2,559 | 5 |
| * Affymax Inc. | 1,101 | 5 |
| * Lexicon Pharmaceuticals Inc. | 3,787 | 5 |
| * GTx Inc. | 1,412 | 5 |
| * Alimera Sciences Inc. | 703 | 5 |
| * Nabi Biopharmaceuticals | 2,641 | 5 |
| * Symmetry Medical Inc. | 595 | 5 |
| * Geron Corp. | 1,767 | 5 |
| * Pozen Inc. | 1,633 | 5 |
| * Cleveland Biolabs Inc. | 1,665 | 4 |
| * Select Medical Holdings Corp. | 593 | 4 |
| * Amicus Therapeutics Inc. | 923 | 4 |
| * Zalicus Inc. | 2,631 | 4 |
| * Capital Senior Living Corp. | 531 | 4 |
| * ePocrates Inc. | 358 | 4 |
| * KV Pharmaceutical Co. Class A | 2,086 | 4 |
| National Research Corp. | 109 | 4 |
| * Stereotaxis Inc. | 2,721 | 4 |
| Young Innovations Inc. | 123 | 3 |
| * Pacific Biosciences of California Inc. | 460 | 3 |
| * Array Biopharma Inc. | 1,518 | 3 |
| * Anacor Pharmaceuticals Inc. | 665 | 3 |
| * DynaVox Inc. Class A | 475 | 3 |
| * Chindex International Inc. | 300 | 3 |
| Invacare Corp. | 113 | 3 |
| * Medical Action Industries Inc. | 455 | 3 |
| * Orexigen Therapeutics Inc. | 1,988 | 3 |
| * Trius Therapeutics Inc. | 425 | 3 |
| * Sucampo Pharmaceuticals Inc. Class A | 856 | 3 |
| * Bacterin International Holdings Inc. | 1,419 | 3 |
| * BG Medicine Inc. | 449 | 3 |
| * Alliance HealthCare Services Inc. | 1,511 | 2 |
| * Pacira Pharmaceuticals Inc. | 313 | 2 |
| * Sunesis Pharmaceuticals Inc. | 1,460 | 2 |
| * Zogenix Inc. | 614 | 2 |
| * Neostem Inc. | 2,901 | 2 |
| * Pernix Therapeutics Holdings | 237 | 2 |
| * Acura Pharmaceuticals Inc. | 618 | 2 |
| * Providence Service Corp. | 153 | 2 |
| * BioMimetic Therapeutics Inc. | 480 | 2 |
| * Biolase Technology Inc. | 424 | 1 |
| * Enzon Pharmaceuticals Inc. | 164 | 1 |
| * Celldex Therapeutics Inc. | 434 | 1 |
| * Lannett Co. Inc. | 341 | 1 |
| * CardioNet Inc. | 367 | 1 |
| * LHC Group Inc. | 59 | 1 |
| * CryoLife Inc. | 225 | 1 |
| * Transcept Pharmaceuticals Inc. | 336 | 1 |
| * Arena Pharmaceuticals Inc. | 834 | 1 |
| * SuperGen Inc. | 448 | 1 |
| * Enzo Biochem Inc. | 299 | 1 |
| * Skilled Healthcare Group Inc. | 151 | 1 |
| * RTI Biologics Inc. | 224 | 1 |
| * Harvard Bioscience Inc. | 172 | 1 |
| * Clinical Data Inc. Contingent Value Rights Exp. 04/14/2018 | 367 | — |
| 6,635 | ||
64
| Vanguard® Russell 2000 Growth Index Fund | ||
| Schedule of Investments | ||
| August 31, 2011 | ||
| Market | ||
| Value | ||
| Shares | ($000) | |
| Industrials (16.0%) | ||
| * Clean Harbors Inc. | 2,901 | 156 |
| HEICO Corp. | 2,585 | 141 |
| CLARCOR Inc. | 2,967 | 138 |
| * Genesee & Wyoming Inc. Class A | 2,456 | 128 |
| Acuity Brands Inc. | 2,684 | 124 |
| Woodward Inc. | 3,811 | 124 |
| * Dollar Thrifty Automotive Group Inc. | 1,793 | 119 |
| * Hexcel Corp. | 5,136 | 118 |
| * Acacia Research - Acacia Technologies | 2,652 | 116 |
| Watsco Inc. | 1,745 | 104 |
| * Old Dominion Freight Line Inc. | 2,945 | 95 |
| * Middleby Corp. | 1,164 | 94 |
| * Chart Industries Inc. | 1,813 | 86 |
| * Avis Budget Group Inc. | 6,478 | 85 |
| Rollins Inc. | 3,921 | 82 |
| Applied Industrial Technologies Inc. | 2,615 | 80 |
| * CoStar Group Inc. | 1,560 | 80 |
| * MasTec Inc. | 3,494 | 78 |
| Belden Inc. | 2,509 | 77 |
| * HUB Group Inc. Class A | 2,272 | 72 |
| Herman Miller Inc. | 3,535 | 70 |
| Deluxe Corp. | 3,173 | 70 |
| Corporate Executive Board Co. | 2,130 | 70 |
| Healthcare Services Group Inc. | 4,096 | 64 |
| Brink's Co. | 2,495 | 64 |
| * II-VI Inc. | 3,193 | 63 |
| * Advisory Board Co. | 978 | 61 |
| Raven Industries Inc. | 1,116 | 61 |
| * DigitalGlobe Inc. | 2,569 | 58 |
| United Stationers Inc. | 1,837 | 58 |
| Franklin Electric Co. Inc. | 1,343 | 58 |
| Knight Transportation Inc. | 3,765 | 57 |
| HNI Corp. | 2,761 | 57 |
| Titan International Inc. | 2,597 | 56 |
| * Beacon Roofing Supply Inc. | 2,837 | 53 |
| Tennant Co. | 1,182 | 52 |
| Mine Safety Appliances Co. | 1,676 | 52 |
| Forward Air Corp. | 1,813 | 51 |
| Interface Inc. Class A | 3,251 | 49 |
| Lindsay Corp. | 775 | 48 |
| Heartland Express Inc. | 3,111 | 47 |
| * Blount International Inc. | 3,002 | 47 |
| * 3D Systems Corp. | 2,586 | 47 |
| Knoll Inc. | 2,953 | 47 |
| * Allegiant Travel Co. Class A | 912 | 43 |
| * Huron Consulting Group Inc. | 1,288 | 41 |
| TAL International Group Inc. | 1,360 | 40 |
| * Colfax Corp. | 1,517 | 38 |
| American Science & Engineering Inc. | 561 | 38 |
| * RBC Bearings Inc. | 1,073 | 37 |
| AZZ Inc. | 775 | 37 |
| * Exponent Inc. | 865 | 37 |
| Sun Hydraulics Corp. | 1,237 | 36 |
| Insperity Inc. | 1,414 | 35 |
| * Teledyne Technologies Inc. | 634 | 35 |
| * Meritor Inc. | 3,963 | 33 |
| * Sauer-Danfoss Inc. | 714 | 31 |
| Kaman Corp. | 897 | 31 |
| * Trimas Corp. | 1,577 | 30 |
| * Higher One Holdings Inc. | 1,889 | 30 |
| * Team Inc. | 1,202 | 30 |
| * Aerovironment Inc. | 1,044 | 30 |
| * USG Corp. | 3,124 | 29 |
65
| Vanguard® Russell 2000 Growth Index Fund | ||
| Schedule of Investments | ||
| August 31, 2011 | ||
| Market | ||
| Value | ||
| Shares | ($000) | |
| National Presto Industries Inc. | 296 | 29 |
| Gorman-Rupp Co. | 939 | 27 |
| Badger Meter Inc. | 775 | 27 |
| John Bean Technologies Corp. | 1,641 | 26 |
| * Altra Holdings Inc. | 1,658 | 26 |
| * TrueBlue Inc. | 1,794 | 25 |
| * MYR Group Inc. | 1,167 | 24 |
| * Wabash National Corp. | 4,227 | 24 |
| * Orbital Sciences Corp. | 1,518 | 24 |
| * Swisher Hygiene Inc. | 5,221 | 23 |
| CIRCOR International Inc. | 670 | 23 |
| * Consolidated Graphics Inc. | 555 | 21 |
| * EnPro Industries Inc. | 550 | 21 |
| * EnerSys | 909 | 20 |
| AAON Inc. | 1,160 | 20 |
| Twin Disc Inc. | 522 | 20 |
| * PMFG Inc. | 1,083 | 20 |
| US Ecology Inc. | 1,068 | 19 |
| * Kforce Inc. | 1,848 | 19 |
| * United Rentals Inc. | 1,138 | 19 |
| ABM Industries Inc. | 906 | 18 |
| * Mistras Group Inc. | 909 | 18 |
| * Capstone Turbine Corp. | 15,177 | 18 |
| Cubic Corp. | 431 | 18 |
| * Trex Co. Inc. | 961 | 17 |
| * Astronics Corp. | 577 | 17 |
| * Taser International Inc. | 3,741 | 17 |
| Textainer Group Holdings Ltd. | 702 | 17 |
| Dynamic Materials Corp. | 823 | 17 |
| Primoris Services Corp. | 1,439 | 17 |
| Houston Wire & Cable Co. | 1,096 | 16 |
| * RPX Corp. | 589 | 16 |
| * Standard Parking Corp. | 977 | 16 |
| * Tetra Tech Inc. | 781 | 16 |
| McGrath Rentcorp | 632 | 15 |
| Mueller Industries Inc. | 319 | 15 |
| AAR Corp. | 621 | 15 |
| Triumph Group Inc. | 269 | 14 |
| * Furmanite Corp. | 2,280 | 14 |
| * APAC Customer Services Inc. | 1,628 | 14 |
| Vicor Corp. | 1,209 | 14 |
| * Columbus McKinnon Corp. | 939 | 14 |
| Actuant Corp. Class A | 673 | 13 |
| ESCO Technologies Inc. | 424 | 13 |
| * DXP Enterprises Inc. | 537 | 13 |
| * Commercial Vehicle Group Inc. | 1,776 | 13 |
| * Swift Transportation Co. | 1,423 | 12 |
| * Ameresco Inc. Class A | 1,090 | 12 |
| * InnerWorkings Inc. | 1,592 | 12 |
| * Global Power Equipment Group Inc. | 490 | 12 |
| * GenCorp Inc. | 2,662 | 12 |
| * Generac Holdings Inc. | 568 | 12 |
| * Mobile Mini Inc. | 589 | 11 |
| * Moog Inc. Class A | 273 | 11 |
| * CAI International Inc. | 707 | 11 |
| * Zipcar Inc. | 494 | 10 |
| Graham Corp. | 607 | 10 |
| * ICF International Inc. | 427 | 10 |
| * Xerium Technologies Inc. | 680 | 10 |
| * Thermon Group Holdings Inc. | 617 | 10 |
| Werner Enterprises Inc. | 395 | 9 |
| * Celadon Group Inc. | 778 | 9 |
| Douglas Dynamics Inc. | 623 | 9 |
| * FuelCell Energy Inc. | 7,666 | 9 |
66
| Vanguard® Russell 2000 Growth Index Fund | ||
| Schedule of Investments | ||
| August 31, 2011 | ||
| Market | ||
| Value | ||
| Shares | ($000) | |
| Intersections Inc. | 567 | 9 |
| * H&E Equipment Services Inc. | 814 | 8 |
| * Park-Ohio Holdings Corp. | 515 | 8 |
| * Titan Machinery Inc. | 307 | 8 |
| * Cenveo Inc. | 1,811 | 8 |
| * NN Inc. | 1,037 | 8 |
| * Casella Waste Systems Inc. Class A | 1,361 | 8 |
| * Active Power Inc. | 4,936 | 8 |
| * Satcon Technology Corp. | 5,596 | 7 |
| * Alaska Air Group Inc. | 125 | 7 |
| Albany International Corp. | 329 | 7 |
| * Force Protection Inc. | 1,720 | 7 |
| Brady Corp. Class A | 251 | 7 |
| * Dycom Industries Inc. | 365 | 7 |
| * Flow International Corp. | 2,580 | 7 |
| * Fuel Tech Inc. | 1,070 | 6 |
| * Metalico Inc. | 1,436 | 6 |
| * Coleman Cable Inc. | 518 | 6 |
| * AT Cross Co. Class A | 546 | 6 |
| * LMI Aerospace Inc. | 294 | 6 |
| * EnerNOC Inc. | 443 | 6 |
| * TRC Cos. Inc. | 1,098 | 5 |
| Watts Water Technologies Inc. Class A | 185 | 5 |
| * Heritage-Crystal Clean Inc. | 308 | 5 |
| * Kadant Inc. | 217 | 5 |
| * A123 Systems Inc. | 976 | 5 |
| Steelcase Inc. Class A | 542 | 4 |
| * SYKES Enterprises Inc. | 281 | 4 |
| Aircastle Ltd. | 343 | 4 |
| Standex International Corp. | 137 | 4 |
| EnergySolutions Inc. | 1,034 | 4 |
| * Odyssey Marine Exploration Inc. | 1,244 | 3 |
| Viad Corp. | 165 | 3 |
| * Quality Distribution Inc. | 274 | 3 |
| * GP Strategies Corp. | 263 | 3 |
| Quad/Graphics Inc. | 144 | 3 |
| * GeoEye Inc. | 80 | 3 |
| * CRA International Inc. | 120 | 3 |
| Marten Transport Ltd. | 151 | 3 |
| * Korn/Ferry International | 170 | 3 |
| * Interline Brands Inc. | 188 | 3 |
| * Valence Technology Inc. | 2,176 | 3 |
| * Omega Flex Inc. | 184 | 2 |
| * TMS International Corp. Class A | 288 | 2 |
| * Accuride Corp. | 232 | 2 |
| Heidrick & Struggles International Inc. | 83 | 2 |
| Federal Signal Corp. | 314 | 2 |
| * On Assignment Inc. | 218 | 2 |
| * Astronics Corp. Class B | 58 | 1 |
| Cascade Corp. | 33 | 1 |
| * Broadwind Energy Inc. | 1,849 | 1 |
| * American Reprographics Co. | 333 | 1 |
| CDI Corp. | 113 | 1 |
| Multi-Color Corp. | 48 | 1 |
| Ampco-Pittsburgh Corp. | 56 | 1 |
| * Argan Inc. | 113 | 1 |
| * Pacer International Inc. | 258 | 1 |
| * M&F Worldwide Corp. | 50 | 1 |
| Preformed Line Products Co. | 19 | 1 |
| * SFN Group Inc. | 74 | 1 |
| * PowerSecure International Inc. | 223 | 1 |
| * Essex Rental Corp. | 217 | 1 |
| * Roadrunner Transportation Systems Inc. | 55 | 1 |
| * WCA Waste Corp. | 158 | 1 |
67
| Vanguard® Russell 2000 Growth Index Fund | ||
| Schedule of Investments | ||
| August 31, 2011 | ||
| Market | ||
| Value | ||
| Shares | ($000) | |
| Alamo Group Inc. | 26 | 1 |
| Met-Pro Corp. | 58 | 1 |
| Compx International Inc. | 39 | 1 |
| Insteel Industries Inc. | 53 | 1 |
| 5,431 | ||
| Information Technology (22.7%) | ||
| InterDigital Inc. | 2,809 | 198 |
| Jack Henry & Associates Inc. | 5,345 | 156 |
| * Parametric Technology Corp. | 7,380 | 133 |
| * Netlogic Microsystems Inc. | 4,234 | 127 |
| ADTRAN Inc. | 4,008 | 124 |
| * SuccessFactors Inc. | 5,159 | 120 |
| * Universal Display Corp. | 2,384 | 117 |
| * Concur Technologies Inc. | 2,769 | 116 |
| * Aruba Networks Inc. | 5,291 | 113 |
| * QLIK Technologies Inc. | 4,365 | 111 |
| * Hittite Microwave Corp. | 1,944 | 106 |
| * Finisar Corp. | 5,530 | 102 |
| * Wright Express Corp. | 2,396 | 101 |
| * Cavium Inc. | 2,988 | 96 |
| * GT Advanced Technologies Inc. | 7,812 | 95 |
| * CommVault Systems Inc. | 2,732 | 93 |
| * Blackboard Inc. | 2,174 | 92 |
| j2 Global Communications Inc. | 2,856 | 91 |
| * OpenTable Inc. | 1,462 | 89 |
| * Aspen Technology Inc. | 5,250 | 88 |
| * SolarWinds Inc. | 3,538 | 88 |
| * Semtech Corp. | 4,049 | 86 |
| * Microsemi Corp. | 5,364 | 83 |
| * Ultimate Software Group Inc. | 1,595 | 81 |
| MAXIMUS Inc. | 2,142 | 79 |
| * TiVo Inc. | 7,357 | 78 |
| * TriQuint Semiconductor Inc. | 10,132 | 77 |
| * ValueClick Inc. | 4,855 | 74 |
| Sapient Corp. | 6,741 | 72 |
| * FEI Co. | 2,206 | 71 |
| * Rambus Inc. | 6,059 | 70 |
| * Ancestry.com Inc. | 1,955 | 70 |
| Blackbaud Inc. | 2,746 | 69 |
| Cognex Corp. | 2,090 | 67 |
| * Cardtronics Inc. | 2,658 | 66 |
| * Taleo Corp. Class A | 2,534 | 65 |
| * Veeco Instruments Inc. | 1,755 | 64 |
| * Netgear Inc. | 2,259 | 63 |
| * Cirrus Logic Inc. | 4,085 | 62 |
| * ACI Worldwide Inc. | 2,062 | 62 |
| * MicroStrategy Inc. Class A | 493 | 61 |
| * Take-Two Interactive Software Inc. | 4,536 | 60 |
| Littelfuse Inc. | 1,233 | 57 |
| Power Integrations Inc. | 1,779 | 57 |
| Anixter International Inc. | 922 | 54 |
| * NetSuite Inc. | 1,680 | 54 |
| * VirnetX Holding Corp. | 2,512 | 54 |
| * Plexus Corp. | 1,985 | 53 |
| * Omnivision Technologies Inc. | 2,823 | 52 |
| * Synaptics Inc. | 2,114 | 52 |
| * Progress Software Corp. | 2,457 | 51 |
| Heartland Payment Systems Inc. | 2,379 | 51 |
| * Websense Inc. | 2,465 | 51 |
| * Tyler Technologies Inc. | 1,977 | 50 |
| * RightNow Technologies Inc. | 1,521 | 50 |
| * Coherent Inc. | 1,105 | 49 |
| * Sourcefire Inc. | 1,755 | 48 |
| * Bottomline Technologies Inc. | 2,100 | 48 |
68
| Vanguard® Russell 2000 Growth Index Fund | ||
| Schedule of Investments | ||
| August 31, 2011 | ||
| Market | ||
| Value | ||
| Shares | ($000) | |
| * Manhattan Associates Inc. | 1,342 | 48 |
| * Advent Software Inc. | 2,025 | 47 |
| NIC Inc. | 3,947 | 46 |
| * Synchronoss Technologies Inc. | 1,630 | 44 |
| * Diodes Inc. | 2,180 | 44 |
| Syntel Inc. | 950 | 43 |
| * BroadSoft Inc. | 1,391 | 42 |
| Pegasystems Inc. | 1,026 | 41 |
| * DealerTrack Holdings Inc. | 2,190 | 41 |
| * LogMeIn Inc. | 1,258 | 39 |
| * RealPage Inc. | 1,871 | 39 |
| * FARO Technologies Inc. | 1,008 | 38 |
| * LivePerson Inc. | 3,251 | 38 |
| * Ceva Inc. | 1,422 | 38 |
| * Verint Systems Inc. | 1,307 | 37 |
| Fair Isaac Corp. | 1,434 | 37 |
| * RealD Inc. | 2,534 | 36 |
| * OSI Systems Inc. | 905 | 35 |
| * Constant Contact Inc. | 1,819 | 35 |
| MTS Systems Corp. | 963 | 35 |
| * Calix Inc. | 2,322 | 34 |
| * Kenexa Corp. | 1,630 | 34 |
| * Integrated Device Technology Inc. | 5,843 | 33 |
| * DTS Inc. | 1,074 | 33 |
| * Netscout Systems Inc. | 2,305 | 32 |
| * Ultratech Inc. | 1,552 | 32 |
| Micrel Inc. | 3,111 | 31 |
| * comScore Inc. | 1,967 | 31 |
| * Volterra Semiconductor Corp. | 1,515 | 31 |
| Opnet Technologies Inc. | 888 | 31 |
| Forrester Research Inc. | 909 | 31 |
| * Silicon Graphics International Corp. | 1,912 | 30 |
| * Stratasys Inc. | 1,304 | 30 |
| * Dice Holdings Inc. | 2,988 | 30 |
| * Maxwell Technologies Inc. | 1,725 | 30 |
| * Power-One Inc. | 3,940 | 30 |
| * Viasat Inc. | 838 | 30 |
| * Mentor Graphics Corp. | 2,638 | 30 |
| * Measurement Specialties Inc. | 923 | 29 |
| * Interactive Intelligence Group | 880 | 28 |
| * DG FastChannel Inc. | 1,298 | 28 |
| * Liquidity Services Inc. | 1,159 | 28 |
| * TeleTech Holdings Inc. | 1,565 | 28 |
| * TNS Inc. | 1,571 | 27 |
| * ExlService Holdings Inc. | 998 | 26 |
| * Monotype Imaging Holdings Inc. | 2,207 | 26 |
| Plantronics Inc. | 802 | 26 |
| * STEC Inc. | 2,536 | 24 |
| * Entropic Communications Inc. | 5,287 | 24 |
| * Vocus Inc. | 1,087 | 23 |
| * Fabrinet | 1,400 | 23 |
| * Super Micro Computer Inc. | 1,658 | 23 |
| iGate Corp. | 1,910 | 21 |
| * PROS Holdings Inc. | 1,327 | 21 |
| * Magma Design Automation Inc. | 4,120 | 21 |
| Keynote Systems Inc. | 860 | 21 |
| * Silicon Image Inc. | 3,871 | 21 |
| * Ixia | 2,383 | 20 |
| * ShoreTel Inc. | 2,911 | 20 |
| * Entegris Inc. | 2,695 | 20 |
| * Quest Software Inc. | 1,155 | 20 |
| * Ebix Inc. | 1,212 | 20 |
| * NVE Corp. | 296 | 20 |
| * Unisys Corp. | 1,105 | 19 |
69
| Vanguard® Russell 2000 Growth Index Fund | ||
| Schedule of Investments | ||
| August 31, 2011 | ||
| Market | ||
| Value | ||
| Shares | ($000) | |
| * Rofin-Sinar Technologies Inc. | 826 | 19 |
| * Cymer Inc. | 467 | 19 |
| Cass Information Systems Inc. | 521 | 19 |
| * Applied Micro Circuits Corp. | 3,303 | 19 |
| * Powerwave Technologies Inc. | 10,556 | 19 |
| * IntraLinks Holdings Inc. | 1,972 | 18 |
| * Echelon Corp. | 2,166 | 18 |
| * LoopNet Inc. | 1,024 | 18 |
| * OCZ Technology Group Inc. | 3,171 | 18 |
| * Monolithic Power Systems Inc. | 1,420 | 18 |
| * Move Inc. | 9,793 | 18 |
| * Brightpoint Inc. | 1,835 | 17 |
| * Web.com Group Inc. | 1,794 | 17 |
| * Rogers Corp. | 336 | 17 |
| * Virtusa Corp. | 934 | 15 |
| * Blue Coat Systems Inc. | 1,001 | 15 |
| * Internap Network Services Corp. | 2,777 | 14 |
| * Envestnet Inc. | 1,182 | 14 |
| * Rubicon Technology Inc. | 1,082 | 14 |
| * Zix Corp. | 4,098 | 14 |
| * CSG Systems International Inc. | 1,025 | 14 |
| * Cabot Microelectronics Corp. | 333 | 13 |
| * DemandTec Inc. | 1,994 | 13 |
| * Actuate Corp. | 2,040 | 13 |
| * Digimarc Corp. | 386 | 13 |
| Stamps.com Inc. | 654 | 13 |
| * MIPS Technologies Inc. Class A | 2,293 | 13 |
| * JDA Software Group Inc. | 486 | 13 |
| * Lattice Semiconductor Corp. | 2,238 | 13 |
| * Globecomm Systems Inc. | 980 | 13 |
| * Travelzoo Inc. | 341 | 12 |
| * Active Network Inc. | 759 | 12 |
| * Saba Software Inc. | 1,746 | 12 |
| * MoneyGram International Inc. | 4,712 | 12 |
| * VASCO Data Security International Inc. | 1,668 | 12 |
| * Wave Systems Corp. Class A | 5,112 | 12 |
| * IXYS Corp. | 977 | 12 |
| * SciQuest Inc. | 762 | 11 |
| * Lionbridge Technologies Inc. | 3,801 | 11 |
| American Software Inc. Class A | 1,402 | 11 |
| * Immersion Corp. | 1,611 | 11 |
| * ServiceSource International Inc. | 618 | 11 |
| * RF Micro Devices Inc. | 1,789 | 11 |
| * Cornerstone OnDemand Inc. | 704 | 11 |
| * Aeroflex Holding Corp. | 1,225 | 11 |
| * Inphi Corp. | 1,266 | 10 |
| * XO Group Inc. | 1,082 | 10 |
| * Echo Global Logistics Inc. | 696 | 10 |
| * SPS Commerce Inc. | 521 | 9 |
| * Newport Corp. | 726 | 9 |
| * LTX-Credence Corp. | 1,645 | 9 |
| * Perficient Inc. | 1,053 | 9 |
| * LeCroy Corp. | 1,012 | 9 |
| * Deltek Inc. | 1,370 | 9 |
| * Callidus Software Inc. | 1,850 | 9 |
| * Limelight Networks Inc. | 3,546 | 9 |
| * TeleNav Inc. | 955 | 9 |
| Pulse Electronics Corp. | 2,567 | 9 |
| * Responsys Inc. | 585 | 8 |
| * TTM Technologies Inc. | 760 | 8 |
| * Oplink Communications Inc. | 506 | 8 |
| * MoSys Inc. | 2,013 | 8 |
| * Ultra Clean Holdings | 1,405 | 8 |
| * Glu Mobile Inc. | 2,586 | 8 |
70
| Vanguard® Russell 2000 Growth Index Fund | ||
| Schedule of Investments | ||
| August 31, 2011 | ||
| Market | ||
| Value | ||
| Shares | ($000) | |
| * Scansource Inc. | 244 | 8 |
| * Zillow Inc. | 200 | 7 |
| * CACI International Inc. Class A | 134 | 7 |
| * Procera Networks Inc. | 892 | 7 |
| * Computer Task Group Inc. | 653 | 7 |
| Electro Rent Corp. | 482 | 7 |
| * Harmonic Inc. | 1,495 | 7 |
| * PRGX Global Inc. | 1,205 | 7 |
| * Convio Inc. | 750 | 7 |
| * PDF Solutions Inc. | 1,365 | 7 |
| * Mindspeed Technologies Inc. | 1,127 | 7 |
| * AXT Inc. | 840 | 7 |
| * Seachange International Inc. | 800 | 6 |
| * FalconStor Software Inc. | 1,902 | 6 |
| * Digital River Inc. | 308 | 6 |
| * SRS Labs Inc. | 748 | 6 |
| * Meru Networks Inc. | 665 | 6 |
| * Amtech Systems Inc. | 555 | 6 |
| * Kopin Corp. | 1,557 | 6 |
| * Microvision Inc. | 6,484 | 6 |
| * MaxLinear Inc. | 988 | 6 |
| Marchex Inc. Class B | 559 | 6 |
| * Guidance Software Inc. | 874 | 5 |
| * Motricity Inc. | 2,152 | 5 |
| * Hackett Group Inc. | 1,284 | 5 |
| * TeleCommunication Systems Inc. Class A | 1,261 | 5 |
| QAD Inc. Class A | 409 | 5 |
| * Extreme Networks | 1,675 | 5 |
| * support.com Inc. | 1,856 | 5 |
| * Demand Media Inc. | 488 | 4 |
| Renaissance Learning Inc. | 260 | 4 |
| * S1 Corp. | 434 | 4 |
| Daktronics Inc. | 407 | 4 |
| * TechTarget Inc. | 611 | 4 |
| * eMagin Corp. | 1,034 | 4 |
| * Numerex Corp. Class A | 565 | 3 |
| * Advanced Analogic Technologies Inc. | 545 | 3 |
| * Digi International Inc. | 253 | 3 |
| * Ellie Mae Inc. | 571 | 3 |
| * Loral Space & Communications Inc. | 55 | 3 |
| * Infinera Corp. | 406 | 3 |
| * Electronics for Imaging Inc. | 208 | 3 |
| * Infospace Inc. | 299 | 3 |
| * Sonus Networks Inc. | 1,102 | 3 |
| DDi Corp. | 365 | 3 |
| * Dialogic Inc. | 962 | 3 |
| * Openwave Systems Inc. | 1,405 | 3 |
| * QuinStreet Inc. | 180 | 2 |
| * Zygo Corp. | 150 | 2 |
| * Anaren Inc. | 93 | 2 |
| * Quepasa Corp. | 394 | 2 |
| * ATMI Inc. | 101 | 2 |
| * Electro Scientific Industries Inc. | 114 | 2 |
| EPIQ Systems Inc. | 135 | 2 |
| * Multi-Fineline Electronix Inc. | 88 | 2 |
| * NeoPhotonics Corp. | 254 | 2 |
| * Dot Hill Systems Corp. | 820 | 1 |
| * Exar Corp. | 238 | 1 |
| * Pericom Semiconductor Corp. | 184 | 1 |
| * Kemet Corp. | 148 | 1 |
| * NCI Inc. Class A | 78 | 1 |
| * FriendFinder Networks Inc. | 368 | 1 |
| * Novatel Wireless Inc. | 273 | 1 |
| * KVH Industries Inc. | 92 | 1 |
71
| Vanguard® Russell 2000 Growth Index Fund | ||
| Schedule of Investments | ||
| August 31, 2011 | ||
| Market | ||
| Value | ||
| Shares | ($000) | |
| * Viasystems Group Inc. | 37 | 1 |
| * ePlus Inc. | 23 | 1 |
| * VeriFone Systems Inc. | 2 | — |
| 7,719 | ||
| Materials (4.4%) | ||
| * Hecla Mining Co. | 17,292 | 133 |
| * Stillwater Mining Co. | 6,393 | 98 |
| NewMarket Corp. | 556 | 93 |
| Balchem Corp. | 1,781 | 74 |
| Globe Specialty Metals Inc. | 3,888 | 65 |
| Olin Corp. | 2,965 | 59 |
| Innophos Holdings Inc. | 1,340 | 56 |
| PolyOne Corp. | 4,178 | 53 |
| * Chemtura Corp. | 3,648 | 48 |
| * LSB Industries Inc. | 1,134 | 45 |
| * Calgon Carbon Corp. | 2,773 | 44 |
| Eagle Materials Inc. | 2,224 | 44 |
| AMCOL International Corp. | 1,503 | 44 |
| Koppers Holdings Inc. | 1,272 | 42 |
| Gold Resource Corp. | 1,753 | 41 |
| * Kraton Performance Polymers Inc. | 1,718 | 41 |
| * US Gold Corp. | 6,505 | 40 |
| Deltic Timber Corp. | 667 | 39 |
| * Graphic Packaging Holding Co. | 8,619 | 36 |
| Worthington Industries Inc. | 2,210 | 36 |
| * Innospec Inc. | 1,306 | 35 |
| Haynes International Inc. | 584 | 34 |
| Zep Inc. | 1,355 | 24 |
| Kaiser Aluminum Corp. | 436 | 23 |
| * Flotek Industries Inc. | 3,082 | 21 |
| Quaker Chemical Corp. | 598 | 20 |
| Hawkins Inc. | 537 | 20 |
| * Paramount Gold and Silver Corp. | 7,227 | 18 |
| * TPC Group Inc. | 529 | 17 |
| * General Moly Inc. | 4,160 | 17 |
| * Noranda Aluminum Holding Corp. | 1,402 | 16 |
| * Midway Gold Corp. | 5,291 | 14 |
| * Omnova Solutions Inc. | 2,791 | 12 |
| * Senomyx Inc. | 2,442 | 10 |
| * Coeur d'Alene Mines Corp. | 359 | 10 |
| * Metals USA Holdings Corp. | 715 | 9 |
| * Golden Minerals Co. | 644 | 9 |
| Neenah Paper Inc. | 468 | 8 |
| * AEP Industries Inc. | 296 | 8 |
| * RTI International Metals Inc. | 249 | 7 |
| NL Industries Inc. | 400 | 6 |
| KMG Chemicals Inc. | 392 | 6 |
| FutureFuel Corp. | 436 | 5 |
| HB Fuller Co. | 197 | 4 |
| * SunCoke Energy Inc. | 300 | 4 |
| * Revett Minerals Inc. | 821 | 4 |
| * Graham Packaging Co. Inc. | 114 | 3 |
| * Materion Corp. | 101 | 3 |
| American Vanguard Corp. | 242 | 3 |
| * Vista Gold Corp. | 613 | 2 |
| A Schulman Inc. | 94 | 2 |
| Myers Industries Inc. | 146 | 2 |
| * Horsehead Holding Corp. | 139 | 1 |
| * United States Lime & Minerals Inc. | 32 | 1 |
| * Handy & Harman Ltd. | 71 | 1 |
| 1,510 | ||
| Telecommunication Services (1.3%) | ||
| AboveNet Inc. | 1,433 | 88 |
| * Cogent Communications Group Inc. | 2,837 | 40 |
72
| Vanguard® Russell 2000 Growth Index Fund | |||
| Schedule of Investments | |||
| August 31, 2011 | |||
| Market | |||
| Value | |||
| Shares | ($000) | ||
| NTELOS Holdings Corp. | 1,856 | 36 | |
| * | Global Crossing Ltd. | 1,192 | 34 |
| * | PAETEC Holding Corp. | 5,476 | 31 |
| Consolidated Communications Holdings Inc. | 1,288 | 25 | |
| * | General Communication Inc. Class A | 2,558 | 23 |
| Shenandoah Telecommunications Co. | 1,467 | 20 | |
| IDT Corp. Class B | 788 | 17 | |
| * | 8x8 Inc. | 3,832 | 17 |
| * | Cbeyond Inc. | 1,724 | 16 |
| * | Pendrell Corp. | 5,923 | 13 |
| * | Vonage Holdings Corp. | 3,644 | 13 |
| * | Cincinnati Bell Inc. | 3,545 | 12 |
| * | Towerstream Corp. | 2,612 | 10 |
| HickoryTech Corp. | 825 | 8 | |
| * | Leap Wireless International Inc. | 784 | 7 |
| * | inContact Inc. | 1,741 | 7 |
| Atlantic Tele-Network Inc. | 128 | 4 | |
| Alaska Communications Systems Group Inc. | 540 | 4 | |
| * | Iridium Communications Inc. | 284 | 2 |
| * | Boingo Wireless Inc. | 235 | 2 |
| SureWest Communications | 77 | 1 | |
| * | Fairpoint Communications Inc. | 132 | 1 |
| 431 | |||
| Utilities (0.1%) | |||
| South Jersey Industries Inc. | 331 | 17 | |
| Atlantic Power Corp. | 334 | 5 | |
| Pennichuck Corp. | 141 | 4 | |
| Otter Tail Corp. | 109 | 3 | |
| 29 | |||
| Total Investments (100.1%) (Cost $36,672) | 33,963 | ||
| Other Assets and Liabilities—Net (-0.1%) | (48) | ||
| Net Assets (100%) | 33,915 | ||
| * |
Non-income-producing security. |
73
Report of Independent Registered Public Accounting Firm
To the Trustees of Vanguard Scottsdale Funds and the Shareholders of Vanguard Russell 2000 Index Fund, Vanguard Russell 2000 Value Index Fund and Vanguard Russell 2000 Growth Index Fund:
We have audited, in accordance with the standards of the Public Company Accounting Oversight Board (United States), the financial statements (not presented herein) of Vanguard Russell 2000 Index Fund, Vanguard Russell 2000 Value Index Fund and Vanguard Russell 2000 Growth Index Fund (constituting separate portfolios of Vanguard Scottsdale Funds, hereafter referred to as the "Funds") as of August 31, 2011 and for the period then ended and have issued our unqualified report thereon dated October 11, 2011. Our audits included audits of the Funds' schedules of investments as of August 31, 2011. These schedules of investments are the responsibility of the Funds' management. Our responsibility is to express an opinion on these schedules of investments based on our audits.
In our opinion, the accompanying schedules of investments referred to above, when read in conjunction with the financial statements of the Funds referred to above, present fairly, in all material respects, the information set forth therein.
PricewaterhouseCoopers LLP
Philadelphia, Pennsylvania
October 11, 2011
74
| © 2011 The Vanguard Group. Inc. |
| All rights reserved. |
| Vanguard Marketing Corporation, Distributor. |
| SNA18510_102011 |
|
|
| Annual Report | August 31, 2011 |
| Vanguard Russell 3000 Index Fund |
> Vanguard Russell 3000 Index Fund closely tracked its broad market benchmark, producing a strong return for the roughly 11 months since its inception.
> Stock market returns were especially robust in the first half of the period, but retreated in the second.
> Energy stocks delivered the best returns, financial stocks the worst.
| Contents | |
| Your Fund’s Total Returns. | 1 |
| Chairman’s Letter. | 2 |
| Fund Profile. | 7 |
| Performance Summary. | 8 |
| Financial Statements. | 10 |
| About Your Fund’s Expenses. | 21 |
| Trustees Approve Advisory Arrangement. | 23 |
| Glossary. | 24 |
Please note: The opinions expressed in this report are just that—informed opinions. They should not be considered promises or advice. Also, please keep in mind that the information and opinions cover the period through the date on the front of this report. Of course, the risks of investing in your fund are spelled out in the prospectus.
See the Glossary for definitions of investment terms used in this report.
About the cover: Vanguard was named for the HMS Vanguard, flagship of British Admiral Horatio Nelson. A ship—whose performance and safety depend on the work of all hands—has served as a fitting metaphor for the Vanguard crew as we strive to help clients reach their financial goals.
Your Fund’s Total Returns
| Period Ended August 31, 2011 | |
| Returns | |
| Since Inception | |
| Vanguard Russell 3000 Index Fund | |
| Institutional Shares (Inception: 11/1/2010) | 4.87% |
| ETF Shares (Inception: 9/20/2010) | |
| Market Price | 9.12 |
| Net Asset Value | 9.09 |
| Russell 3000 Index | 9.18 |
| Multi-Cap Core Funds Average | 7.15 |
| Multi-Cap Core Funds Average: Derived from data provided by Lipper Inc. |
Benchmark returns are calculated from the start of the reporting period or from the earliest share-class inception date.
Institutional Shares are available to certain institutional investors who meet specific administrative, service, and account-size criteria. The Vanguard ETF® Shares shown are traded on the Nasdaq exchange and are available only through brokers. The table provides ETF returns based on both the Nasdaq market price and the net asset value for a share. U.S. Pat. No. 6,879,964 B2; 7,337,138; 7,720,749; 7,925,573.
For the ETF Shares, the market price is determined by the midpoint of the bid-offer spread as of the closing time of the New York Stock Exchange (generally 4 p.m., Eastern time). The net asset value is also determined as of the NYSE closing time. For more information about how the ETF Shares' market prices have compared with their net asset value, visit vanguard.com, select your ETF, and then select the Price and Performance tab. The ETF premium/discount analysis there shows the percentages of days on which the ETF Shares' market price was above or below the NAV.
1

Chairman’s Letter
Dear Shareholder,
From its September 20, 2010, inception through August 31, 2011, Vanguard Russell 3000 Index Fund captured the return of its market benchmark, returning more than 9%. The fund’s multi-cap core peers posted an average return of 7.15%. In November, Vanguard Russell 3000 Index Fund issued lower-cost Institutional Shares, which require an initial investment of at least $5 million.
A rally at the start of the period and weak results at the end produced a strong return. Energy stocks generated the best results, reflecting a surge in oil prices early in the period. Financial stocks struggled as banks wrestled with bad mortgages and other legacies of the financial crisis.
This report begins with a look at the investment environment for the full fiscal year and then reviews the drivers of fund performance during its briefer period of operation.
Strong 12-month returns in a tale of two markets
Global stock markets delivered strong returns in a fiscal year marked by distinct periods of strength and weakness.
During the first six months, stock prices surged. The broad U.S. stock market returned about 29% as the slow, grinding economic recovery seemed to gather
2
momentum. In the second six months, growth decelerated and stock market volatility spiked, amplified by Europe’s sovereign-debt drama, political wrangling over the U.S. debt ceiling, and Standard & Poor’s decision to downgrade the U.S. credit rating. (Vanguard’s confidence in the “full faith and credit” of the U.S. government remains unshaken.)
Global stock prices retreated during the fiscal year’s second half, but the returns of most major indexes remained strong for the full 12 months.
Treasuries rallied as risk aversion returned
The stock market’s midyear pivot was mirrored in the bond market. In the first half of the year, yields rose (and prices declined) as the prospect of improved economic growth and inflationary pressures set the market’s tone. Corporate bonds outperformed U.S. Treasury securities.
In the second half, risk aversion set the tone. Investors bid up Treasuries, trimming the yield of the 10-year Treasury note to barely 2%. The rush into government bonds boosted near-term returns, even as declining yields implied more modest results going forward. For the full year, the taxable investment-grade U.S. bond market returned 4.62%; the broad municipal bond market returned 2.66%.
The yields of money market instruments hovered near zero, consistent with the Federal Reserve’s target for short-term
| Market Barometer | |||
| Average Annual Total Returns | |||
| Periods Ended August 31, 2011 | |||
| One | Three | Five | |
| Year | Years | Years | |
| Stocks | |||
| Russell 1000 Index (Large-caps) | 19.06% | 0.84% | 1.11% |
| Russell 2000 Index (Small-caps) | 22.19 | 0.83 | 1.53 |
| Dow Jones U.S. Total Stock Market Index | 19.16 | 1.18 | 1.52 |
| MSCI All Country World Index ex USA (International) | 10.34 | -0.97 | 0.79 |
| Bonds | |||
| Barclays Capital U.S. Aggregate Bond Index (Broad | |||
| taxable market) | 4.62% | 7.23% | 6.56% |
| Barclays Capital Municipal Bond Index (Broad | |||
| tax-exempt market) | 2.66 | 6.00 | 4.94 |
| Citigroup Three-Month U.S. Treasury Bill Index | 0.12 | 0.24 | 1.69 |
| CPI | |||
| Consumer Price Index | 3.77% | 1.12% | 2.13% |
3
interest rates. Toward the end of the period, the Fed indicated that it expected to maintain this exceptionally low target at least through mid-2013.
Global developments reverberated through the U.S. stock market
Since its launch on September 20, 2010, Vanguard Russell 3000 Index Fund has captured the returns of the broad U.S. stock market, as its ups and downs have reflected the big-picture economic and geopolitical themes that have reverberated through the financial markets.
In the fund’s first few months of operation, the prevailing view seemed to be that strength in fast-developing economies such as China and Brazil would help fortify fragile economies in the developed world. Early in calendar 2011, encouraging reports on U.S. employment, exports, and overall economic growth were consistent with that view.
Energy, industrial, and materials stocks were among the best performers, rallying both on expectations of strong demand in emerging markets for the basic building blocks of any economy and on optimism about recovery in the developed world. (Oil stocks also benefited from the threat of supply constraints amid political uprisings in the Middle East and North Africa.) The utilities and consumer staples sectors,
| Expense Ratios | |||
| Your Fund Compared With Its Peer Group | |||
| Institutional | ETF | Peer Group | |
| Shares | Shares | Average | |
| Russell 3000 Index Fund | 0.08% | 0.15% | 1.18% |
The fund expense ratios shown are from the prospectus dated September 16, 2010, and represent estimated costs for the current fiscal year. For the period ended August 31, 2011, the fund’s expense ratios were 0.08% for Institutional Shares and 0.15% for ETF Shares. The ratios are annualized since inception for each share class. The peer-group expense ratio is derived from data provided by Lipper Inc. and captures information through year-end 2010.
Peer group: Multi-Cap Core Funds.
4
which tend to be less sensitive to the rhythms of the business cycle, were weaker performers.
In the last half of the fiscal year, these dynamics were reversed. Optimism about China and Brazil was displaced by anxiety about their rate of inflation and signs of economic deceleration in these markets. U.S. economic reports were discouraging, while Europe’s sovereign-debt issues (and the short-lived but unnerving debate about raising the U.S. debt ceiling) moved center stage. Energy, industrial, and materials stocks were among the weakest performers; utilities and consumer staples stocks took the lead.
By the end of this to-and-fro, Vanguard Russell 3000 Index Fund’s ETF Shares had returned more than 9% for the roughly 11 months since their inception, just a few basis points behind the return of its index, which incurs no operating or transaction costs.
A time-tested response to elevated volatility
Like Vanguard’s other broadly diversified index funds, Vanguard Russell 3000 Index Fund benefits from Vanguard’s pioneering work in index fund management and from its low costs, which minimize the friction between fund and market performance.
Over the past year, these timeless benefits have probably been less striking than the stock market’s volatility, which rippled unevenly through the market’s different sectors. The volatility can be alarming, but it’s not atypical. Recent Vanguard research has found that stock market volatility in the weeks after Standard & Poor’s downgraded the U.S. credit rating was consistent with the volatility seen during other global shocks such as the Russian default in 1998, the terrorist attacks on September 11, 2001, and the more recent global financial crisis.
As always, the most effective preparation for these shocks is to maintain a diversified portfolio that is balanced between riskier assets such as stock funds and risk-reducing assets such as bond and money market funds. A mix consistent with your goals and risk tolerance can reinforce your resolve to stick with a sensible plan through good times and bad. Vanguard Russell 3000 Index Fund can play an important role in such a plan.
Thank you for entrusting your assets to Vanguard.
Sincerely,

F. William McNabb III
Chairman and Chief Executive Officer
September 16, 2011
5
| Your Fund’s Performance at a Glance | ||||
| Inception Through August 31, 2011 | ||||
| Distributions Per Share | ||||
| Starting | Ending | Income | Capital | |
| Share Price | Share Price | Dividends | Gains | |
| Vanguard Russell 3000 Index Fund | ||||
| Institutional Shares | $104.44 | $108.32 | $1.264 | $0.000 |
| ETF Shares (Inception: 9/20/2010) | 51.86 | 55.97 | 0.633 | 0.000 |
6
Russell 3000 Index Fund
Fund Profile
As of August 31, 2011
| Share-Class Characteristics | ||
| Institutional | ETF | |
| Shares | Shares | |
| Ticker Symbol | VRTTX | VTHR |
| Expense Ratio1 | 0.08% | 0.15% |
| 30-Day SEC Yield | 1.92% | 1.85% |
| Portfolio Characteristics | |||
| DJ | |||
| Russell | U.S. Total | ||
| 3000 | Market | ||
| Fund | Index | Index | |
| Number of Stocks | 2,952 | 2,947 | 3,716 |
| Median Market Cap | $29.0B | $29.9B | $30.4B |
| Price/Earnings Ratio | 14.7x | 14.6x | 14.7x |
| Price/Book Ratio | 2.0x | 2.0x | 2.0x |
| Return on Equity | 18.6% | 18.5% | 19.0% |
| Earnings Growth Rate | 6.8% | 6.8% | 7.0% |
| Dividend Yield | 2.0% | 2.0% | 2.0% |
| Foreign Holdings | 0.0% | 0.0% | 0.0% |
| Turnover Rate | 32% | — | — |
| Short-Term Reserves | -0.1% | — | — |
| Sector Diversification (% of equity exposure) | |||
| DJ | |||
| Russell | U.S. Total | ||
| 3000 | Market | ||
| Fund | Index | Index | |
| Consumer | |||
| Discretionary | 11.7% | 11.7% | 12.3% |
| Consumer Staples | 9.7 | 9.7 | 10.5 |
| Energy | 11.4 | 11.3 | 10.8 |
| Financials | 15.3 | 15.3 | 14.8 |
| Health Care | 11.8 | 11.8 | 11.4 |
| Industrials | 11.1 | 11.1 | 11.0 |
| Information | |||
| Technology | 18.1 | 18.1 | 18.7 |
| Materials | 4.4 | 4.4 | 4.4 |
| Telecommunication | |||
| Services | 2.8 | 2.8 | 2.6 |
| Utilities | 3.7 | 3.8 | 3.5 |
| Ten Largest Holdings (% of total net assets) | ||
| Exxon Mobil Corp. | Integrated Oil & | |
| Gas | 2.6% | |
| Apple Inc. | Computer | |
| Hardware | 2.6 | |
| International Business | IT Consulting & | |
| Machines Corp. | Other Services | 1.5 |
| Chevron Corp. | Integrated Oil & | |
| Gas | 1.4 | |
| Microsoft Corp. | Systems Software | 1.4 |
| Johnson & Johnson | Pharmaceuticals | 1.3 |
| Procter & Gamble Co. | Household | |
| Products | 1.3 | |
| General Electric Co. | Industrial | |
| Conglomerates | 1.3 | |
| AT&T Inc. | Integrated | |
| Telecommunication | ||
| Services | 1.2 | |
| Pfizer Inc. | Pharmaceuticals | 1.1 |
| Top Ten | 15.7% | |
The holdings listed exclude any temporary cash investments and equity index products.
Investment Focus
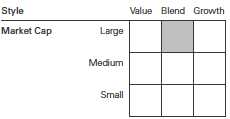
1 The expense ratios shown are from the prospectus dated September 16, 2010, and represent estimated costs for the current fiscal year. For the periods from inception through August 31, 2011, the annualized expense ratios were 0.08% for Institutional Shares and 0.15% for ETF Shares.
7
Russell 3000 Index Fund
Performance Summary
All of the returns in this report represent past performance, which is not a guarantee of future results that may be achieved by the fund. (Current performance may be lower or higher than the performance data cited. For performance data current to the most recent month-end, visit our website at vanguard.com/performance.) Note, too, that both investment returns and principal value can fluctuate widely, so an investor’s shares, when sold, could be worth more or less than their original cost. The returns shown do not reflect taxes that a shareholder would pay on fund distributions or on the sale of fund shares.
Cumulative Performance: September 20, 2010, Through August 31, 2011
Initial Investment of $10,000
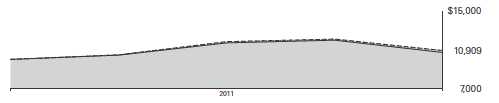
| Total Returns | ||
| Periods Ended August 31, 2011 | ||
| Since | Final Value | |
| Inception | of a $10,000 | |
| (9/20/2010) | Investment | |
| Russell 3000 Index Fund ETF Shares | ||
| Net Asset Value | 9.09% | $10,909 |
| Russell 3000 Index Fund ETF Shares | ||
| Market Price | 9.12 | 10,912 |
| Dow Jones U.S. Total Stock Market | ||
| Index | 9.04 | 10,904 |
| Russell 3000 Index | 9.18 | 10,918 |
| Multi-Cap Core Funds Average | 7.15 | 10,715 |
Multi-Cap Core Funds Average: Derived from data provided by Lipper Inc.
"Since Inception" performance is calculated from the ETF Shares’ inception date for both the fund and its comparative standards.
| Since | Final Value | |
| Inception | of a $5,000,000 | |
| (11/1/2010) | Investment | |
| Russell 3000 Index Fund Institutional | ||
| Shares | 4.87% | $5,243,575 |
| Dow Jones U.S. Total Stock Market | ||
| Index | 4.63 | 5,231,367 |
| Russell 3000 Index | 4.87 | 5,243,449 |
| "Since Inception" performance is calculated from the Institutional Shares’ inception date for both the fund and its comparative standards. | ||
See Financial Highlights for dividend and capital gains information.
8
Russell 3000 Index Fund
| Cumulative Returns of ETF Shares: September 20, 2010, Through August 31, 2011 | |
| Since | |
| Inception | |
| (9/20/2010) | |
| Russell 3000 Index Fund | |
| ETF Shares Market Price | 9.12% |
| Russell 3000 Index Fund | |
| ETF Shares Net Asset Value | 9.09 |
| Russell 3000 Index | 9.18 |
| "Since Inception" performance is calculated from the ETF Shares’ inception date for both the fund and its comparative standards. | |
Fiscal-Period Total Returns (%): September 20, 2010, Through August 31, 2011
Total Returns: Periods Ended June 30, 2011
This table presents returns through the latest calendar quarter—rather than through the end of the fiscal period.
Securities and Exchange Commission rules require that we provide this information.
| Inception | Since | |
| Date | Inception | |
| Institutional Shares | 11/1/2010 | 14.16% |
| ETF Shares | 9/20/2010 | |
| Market Price | 18.80 | |
| Net Asset Value | 18.76 |
9
Russell 3000 Index Fund
Financial Statements
Statement of Net Assets—Investments Summary
As of August 31, 2011
This Statement summarizes the fund’s holdings by asset type. Details are reported for each of the fund’s 50 largest individual holdings and for investments that, in total for any issuer, represent more than 1% of the fund’s net assets. The total value of smaller holdings is reported as a single amount within each category.
The fund reports a complete list of its holdings in regulatory filings four times in each fiscal year, at the quarter-ends. For the second and fourth fiscal quarters, the complete listing of the fund’s holdings is available electronically on vanguard.com and on the Securities and Exchange Commission’s website (sec.gov), or you can have it mailed to you without charge by calling 800-662-7447. For the first and third fiscal quarters, the fund files the lists with the SEC on Form N-Q. Shareholders can look up the fund’s Forms N-Q on the SEC’s website. Forms N-Q may also be reviewed and copied at the SEC’s Public Reference Room (see the back cover of this report for further information).
| Market | Percentage | ||
| Value | of Net | ||
| Shares | ($000) | Assets | |
| Common Stocks | |||
| Consumer Discretionary | |||
| McDonald’s Corp. | 4,269 | 386 | 0.7% |
| * Amazon.com Inc. | 1,495 | 322 | 0.6% |
| Walt Disney Co. | 7,776 | 265 | 0.5% |
| Comcast Corp. Class A | 11,345 | 244 | 0.4% |
| Home Depot Inc. | 6,574 | 219 | 0.4% |
| Consumer Discretionary—Other † | 5,212 | 9.1% | |
| 6,648 | 11.7% | ||
| Consumer Staples | |||
| Procter & Gamble Co. | 11,510 | 733 | 1.3% |
| Coca-Cola Co. | 8,147 | 574 | 1.0% |
| Philip Morris International Inc. | 7,333 | 508 | 0.9% |
| PepsiCo Inc. | 6,503 | 419 | 0.7% |
| Wal-Mart Stores Inc. | 7,300 | 388 | 0.7% |
| Kraft Foods Inc. | 6,797 | 238 | 0.4% |
| Altria Group Inc. | 8,612 | 234 | 0.4% |
| CVS Caremark Corp. | 5,578 | 200 | 0.3% |
| Consumer Staples—Other † | 2,195 | 3.9% | |
| 5,489 | 9.6% | ||
| Energy | |||
| Exxon Mobil Corp. | 20,312 | 1,504 | 2.6% |
| Chevron Corp. | 8,289 | 820 | 1.4% |
| Schlumberger Ltd. | 5,583 | 436 | 0.8% |
| ConocoPhillips | 5,815 | 396 | 0.7% |
| Occidental Petroleum Corp. | 3,344 | 290 | 0.5% |
| Energy—Other † | 2,995 | 5.3% | |
| 6,441 | 11.3% | ||
| Financials | |||
| JPMorgan Chase & Co. | 16,384 | 615 | 1.1% |
| Wells Fargo & Co. | 20,282 | 529 | 0.9% |
| * Berkshire Hathaway Inc. Class B | 7,218 | 527 | 0.9% |
10
Russell 3000 Index Fund
| Market | Percentage | ||
| Value | of Net | ||
| Shares | ($000) | Assets | |
| Citigroup Inc. | 11,954 | 371 | 0.7% |
| Bank of America Corp. | 41,682 | 341 | 0.6% |
| Goldman Sachs Group Inc. | 2,130 | 248 | 0.4% |
| American Express Co. | 4,322 | 215 | 0.4% |
| Financials—Other † | 5,848 | 10.3% | |
| 8,694 | 15.3% | ||
| Health Care | |||
| Johnson & Johnson | 11,303 | 744 | 1.3% |
| Pfizer Inc. | 32,579 | 618 | 1.1% |
| Merck & Co. Inc. | 12,728 | 422 | 0.7% |
| Abbott Laboratories | 6,394 | 336 | 0.6% |
| Amgen Inc. | 3,825 | 212 | 0.4% |
| UnitedHealth Group Inc. | 4,457 | 212 | 0.4% |
| Bristol-Myers Squibb Co. | 7,018 | 209 | 0.4% |
| Health Care—Other † | 3,947 | 6.9% | |
| 6,700 | 11.8% | ||
| Industrials | |||
| General Electric Co. | 43,729 | 713 | 1.2% |
| United Technologies Corp. | 3,765 | 280 | 0.5% |
| 3M Co. | 2,924 | 243 | 0.4% |
| Caterpillar Inc. | 2,653 | 241 | 0.4% |
| United Parcel Service Inc. Class B | 3,023 | 204 | 0.4% |
| Boeing Co. | 3,037 | 203 | 0.4% |
| Industrials—Other † | 4,394 | 7.7% | |
| 6,278 | 11.0% | ||
| Information Technology | |||
| * Apple Inc. | 3,814 | 1,468 | 2.6% |
| International Business Machines Corp. | 4,995 | 859 | 1.5% |
| Microsoft Corp. | 30,598 | 814 | 1.4% |
| * Google Inc. Class A | 1,036 | 560 | 1.0% |
| Oracle Corp. | 15,838 | 445 | 0.8% |
| Intel Corp. | 21,863 | 440 | 0.8% |
| Cisco Systems Inc. | 22,625 | 355 | 0.6% |
| QUALCOMM Inc. | 6,868 | 353 | 0.6% |
| Hewlett-Packard Co. | 8,902 | 232 | 0.4% |
| * EMC Corp. | 8,464 | 191 | 0.3% |
| Information Technology—Other † | 4,550 | 8.0% | |
| 10,267 | 18.0% | ||
| Materials † | 2,479 | 4.4% | |
| Telecommunication Services | |||
| AT&T Inc. | 24,418 | 695 | 1.2% |
| Verizon Communications Inc. | 11,666 | 422 | 0.7% |
| Telecommunication Services—Other † | 482 | 0.9% | |
| 1,599 | 2.8% | ||
| Utilities † | 2,124 | 3.7% | |
| Total Common Stocks (Cost $58,420) | 56,719 | 99.6%1 | |
11
Russell 3000 Index Fund
| Market | Percentage | |||
| Value• | of Net | |||
| Coupon | Shares | ($000) | Assets | |
| Temporary Cash Investment | ||||
| Money Market Fund | ||||
| 2 Vanguard Market Liquidity Fund | ||||
| (Cost $196) | 0.132% | 196,290 | 196 | 0.3%1 |
| Total Investments (Cost $58,616) | 56,915 | 99.9% | ||
| Other Assets and Liabilities | ||||
| Other Assets | 146 | 0.3% | ||
| Liabilities | (84) | (0.2%) | ||
| 62 | 0.1% | |||
| Net Assets | 56,977 | 100.0% |
| At August 31, 2011, net assets consisted of: | |
| Amount | |
| ($000) | |
| Paid-in Capital | 60,002 |
| Undistributed Net Investment Income | 194 |
| Accumulated Net Realized Losses | (1,528) |
| Unrealized Appreciation (Depreciation) | |
| Investment Securities | (1,701) |
| Futures Contracts | 10 |
| Net Assets | 56,977 |
| Institutional Shares—Net Assets | |
| Applicable to 319,334 outstanding $.001 par value shares of | |
| beneficial interest (unlimited authorization) | 34,589 |
| Net Asset Value Per Share—Institutional Shares | $108.32 |
| ETF Shares—Assets | |
| Applicable to 400,000 outstanding $.001 par value shares of | |
| beneficial interest (unlimited authorization) | 22,388 |
| Net Asset Value Per Share—ETF Shares | $55.97 |
• See Note A in Notes to Financial Statements.
* Non-income-producing security.
† Represents the aggregate value, by category, of securities that are not among the 50 largest holdings and, in total for any issuer, represent 1% or less of net assets.
1 The fund invests a portion of its cash reserves in equity markets through the use of index futures contracts. After giving effect to futures investments, the fund’s effective common stock and temporary cash investment positions represent 100% and -0.1%, respectively, of net assets.
2 Affiliated money market fund available only to Vanguard funds and certain trusts and accounts managed by Vanguard. Rate shown is the 7-day yield.
See accompanying Notes, which are an integral part of the Financial Statements.
12
Russell 3000 Index Fund
| Statement of Operations | |
| September 20, 20101 to | |
| August 31, 2011 | |
| ($000) | |
| Investment Income | |
| Income | |
| Dividends | 563 |
| Total Income | 563 |
| Expenses | |
| The Vanguard Group—Note B | |
| Management and Administrative—Institutional Shares | 1 |
| Management and Administrative—ETF Shares | 8 |
| Marketing and Distribution—Institutional Shares | — |
| Marketing and Distribution—ETF Shares | — |
| Custodian Fees | 14 |
| Auditing Fees | 7 |
| Shareholders’ Reports—Institutional Shares | — |
| Shareholders’ Reports—ETF Shares | 4 |
| Total Expenses | 34 |
| Net Investment Income | 529 |
| Realized Net Gain (Loss) | |
| Investment Securities Sold | (209) |
| Futures Contracts | (6) |
| Realized Net Gain (Loss) | (215) |
| Change in Unrealized Appreciation (Depreciation) | |
| Investment Securities | (1,701) |
| Futures Contracts | 10 |
| Change in Unrealized Appreciation (Depreciation) | (1,691) |
| Net Increase (Decrease) in Net Assets Resulting from Operations | (1,377) |
| 1 Inception. | |
See accompanying Notes, which are an integral part of the Financial Statements.
13
Russell 3000 Index Fund
| Statement of Changes in Net Assets | |
| September 20, 20101 to | |
| August 31, 2011 | |
| ($000) | |
| Increase (Decrease) in Net Assets | |
| Operations | |
| Net Investment Income | 529 |
| Realized Net Gain (Loss) | (215) |
| Change in Unrealized Appreciation (Depreciation) | (1,691) |
| Net Increase (Decrease) in Net Assets Resulting from Operations | (1,377) |
| Distributions | |
| Net Investment Income | |
| Institutional Shares | (181) |
| ETF Shares | (154) |
| Realized Capital Gain | |
| Institutional Shares | — |
| ETF Shares | — |
| Total Distributions | (335) |
| Capital Share Transactions | |
| Institutional Shares | 35,657 |
| ETF Shares | 23,032 |
| Net Increase (Decrease) from Capital Share Transactions | 58,689 |
| Total Increase (Decrease) | 56,977 |
| Net Assets | |
| Beginning of Period | — |
| End of Period2 | 56,977 |
| 1 Inception. | |
| 2 Net Assets—End of Period includes undistributed net investment income of $194,000. | |
See accompanying Notes, which are an integral part of the Financial Statements.
14
Russell 3000 Index Fund
Financial Highlights
| Institutional Shares | |
| For a Share Outstanding | November 1, 20101 to |
| Throughout the Period | August 31, 2011 |
| Net Asset Value, Beginning of Period | $104.44 |
| Investment Operations | |
| Net Investment Income | 1.494 |
| Net Realized and Unrealized Gain (Loss) on Investments | 3.650 |
| Total from Investment Operations | 5.144 |
| Distributions | |
| Dividends from Net Investment Income | (1.264) |
| Distributions from Realized Capital Gains | — |
| Total Distributions | (1.264) |
| Net Asset Value, End of Period | $108.32 |
| Total Return | 4.87% |
| Ratios/Supplemental Data | |
| Net Assets, End of Period (Millions) | $35 |
| Ratio of Total Expenses to Average Net Assets | 0.08%2 |
| Ratio of Net Investment Income to Average Net Assets | 1.78%2 |
| Portfolio Turnover Rate3 | 32% |
1 Inception.
2 Annualized.
3 Excludes the value of portfolio securities received or delivered as a result of in-kind purchases or redemptions of the fund’s capital shares, including ETF Creation Units.
See accompanying Notes, which are an integral part of the Financial Statements.
15
Russell 3000 Index Fund
Financial Highlights
| ETF Shares | |
| For a Share Outstanding | September 20, 20101 to |
| Throughout the Period | August 31, 2011 |
| Net Asset Value, Beginning of Period | $51.86 |
| Investment Operations | |
| Net Investment Income | .819 |
| Net Realized and Unrealized Gain (Loss) on Investments | 3.924 |
| Total from Investment Operations | 4.743 |
| Distributions | |
| Dividends from Net Investment Income | (. 633) |
| Distributions from Realized Capital Gains | — |
| Total Distributions | (. 633) |
| Net Asset Value, End of Period | $55.97 |
| Total Return | 9.09% |
| Ratios/Supplemental Data | |
| Net Assets, End of Period (Millions) | $22 |
| Ratio of Total Expenses to Average Net Assets | 0.15%2 |
| Ratio of Net Investment Income to Average Net Assets | 1.71%2 |
| Portfolio Turnover Rate3 | 32% |
1 Inception.
2 Annualized.
3 Excludes the value of portfolio securities received or delivered as a result of in-kind purchases or redemptions of the fund’s capital shares, including ETF Creation Units.
16
Russell 3000 Index Fund
Notes to Financial Statements
Vanguard Russell 3000 Index Fund is registered under the Investment Company Act of 1940 as an open-end investment company, or mutual fund. The fund offers two classes of shares: Institutional Shares and ETF Shares. Institutional Shares are designed for investors who meet certain administrative, service, and account-size criteria. Institutional Shares were first issued on November 1, 2010. ETF Shares were first issued on September 20, 2010, and first offered to the public on September 22, 2010. ETF Shares are listed for trading on Nasdaq; they can be purchased and sold through a broker.
A. The following significant accounting policies conform to generally accepted accounting principles for U.S. mutual funds. The fund consistently follows such policies in preparing its financial statements.
1. Security Valuation: Securities are valued as of the close of trading on the New York Stock Exchange (generally 4 p.m., Eastern time) on the valuation date. Equity securities are valued at the latest quoted sales prices or official closing prices taken from the primary market in which each security trades; such securities not traded on the valuation date are valued at the mean of the latest quoted bid and asked prices. Securities for which market quotations are not readily available, or whose values have been materially affected by events occurring before the fund’s pricing time but after the close of the securities’ primary markets, are valued by methods deemed by the board of trustees to represent fair value. Investments in Vanguard Market Liquidity Fund are valued at that fund’s net asset value.
2. Futures Contracts: The fund uses index futures contracts to a limited extent, with the objectives of maintaining full exposure to the stock market, enhancing returns, maintaining liquidity, and minimizing transaction costs. The fund may purchase futures contracts to immediately invest incoming cash in the market, or sell futures in response to cash outflows, thereby simulating a fully invested position in the underlying index while maintaining a cash balance for liquidity. The fund may seek to enhance returns by using futures contracts instead of the underlying securities when futures are believed to be priced more attractively than the underlying securities. The primary risks associated with the use of futures contracts are imperfect correlation between changes in market values of stocks held by the fund and the prices of futures contracts, and the possibility of an illiquid market.
Futures contracts are valued at their quoted daily settlement prices. The aggregate principal amounts of the contracts are not recorded in the Statement of Net Assets. Fluctuations in the value of the contracts are recorded in the Statement of Net Assets as an asset (liability) and in the Statement of Operations as unrealized appreciation (depreciation) until the contracts are closed, when they are recorded as realized futures gains (losses).
3. Federal Income Taxes: The fund intends to qualify as a regulated investment company and distribute all of its taxable income. Management has analyzed the fund’s tax positions taken for its open federal income tax period ended August 31, 2011, and has concluded that no provision for federal income tax is required in the financial statements.
4. Distributions: Distributions to shareholders are recorded on the ex-dividend date.
5. Other: Dividend income is recorded on the ex-dividend date. Interest income includes income distributions received from Vanguard Market Liquidity Fund and is accrued daily. Security transactions are accounted for on the date securities are bought or sold. Costs used to determine realized gains (losses) on the sale of investment securities are those of the specific securities sold.
17
Russell 3000 Index Fund
Each class of shares has equal rights as to assets and earnings, except that each class separately bears certain class-specific expenses related to maintenance of shareholder accounts (included in Management and Administrative expenses) and shareholder reporting. Marketing and distribution expenses are allocated to each class of shares based on a method approved by the board of trustees. Income, other non-class-specific expenses, and gains and losses on investments are allocated to each class of shares based on its relative net assets.
B. The Vanguard Group furnishes at cost investment advisory, corporate management, administrative, marketing, and distribution services. The costs of such services are allocated to the fund under methods approved by the board of trustees. The fund has committed to provide up to 0.40% of its net assets in capital contributions to Vanguard. At August 31, 2011, the fund had contributed capital of $9,000 to Vanguard (included in Other Assets), representing 0.02% of the fund’s net assets and 0.00% of Vanguard’s capitalization. The fund’s trustees and officers are also directors and officers of Vanguard.
C. Various inputs may be used to determine the value of the fund’s investments. These inputs are summarized in three broad levels for financial statement purposes. The inputs or methodologies used to value securities are not necessarily an indication of the risk associated with investing in those securities.
Level 1—Quoted prices in active markets for identical securities.
Level 2—Other significant observable inputs (including quoted prices for similar securities, interest rates, prepayment speeds, credit risk, etc.).
Level 3—Significant unobservable inputs (including the fund’s own assumptions used to determine the fair value of investments).
At August 31, 2011, 100% of the fund’s market value was valued based on Level 1 inputs.
D. At August 31, 2011, the aggregate settlement value of open futures contracts and the related unrealized appreciation (depreciation) were:
| ($000) | ||||
| Aggregate | ||||
| Number of | Settlement | Unrealized | ||
| Long (Short) | Value | Appreciation | ||
| Futures Contracts | Expiration | Contracts | Long (Short) | (Depreciation) |
| E-mini Russell 2000 Index | September 2011 | 1 | 73 | 8 |
| E-mini S&P 500 Index | September 2011 | 3 | 183 | 2 |
Unrealized appreciation (depreciation) on open futures contracts is required to be treated as realized gain (loss) for tax purposes.
E. Distributions are determined on a tax basis and may differ from net investment income and realized capital gains for financial reporting purposes. Differences may be permanent or temporary. Permanent differences are reclassified among capital accounts in the financial statements to reflect their tax character. Temporary differences arise when certain items of income, expense, gain, or loss are recognized in different periods for financial statement and tax purposes; these differences will reverse at some time in the future. Differences in classification may also result from the treatment of short-term gains as ordinary income for tax purposes.
18
Russell 3000 Index Fund
During the period ended August 31, 2011, the fund realized $1,313,000 of net capital gains resulting from in-kind redemptions—in which shareholders exchanged fund shares for securities held by the fund rather than for cash. Because such gains are not taxable to the fund, and are not distributed to shareholders, they have been reclassified from accumulated net realized losses to paid-in capital.
For tax purposes, at August 31, 2011, the fund had $195,000 of ordinary income available for distribution. The fund realized losses of $1,436,000 during the period from November 1, 2010, through August 31, 2011, which are deferred and will be treated as realized for tax purposes in fiscal 2012.
At August 31, 2011, the cost of investment securities for tax purposes was $58,698,000. Net unrealized depreciation of investment securities for tax purposes was $1,783,000, consisting of unrealized gains of $1,789,000 on securities that had risen in value since their purchase and $3,572,000 in unrealized losses on securities that had fallen in value since their purchase.
F. During the period ended August 31, 2011, the fund purchased $79,759,000 of investment securities and sold $21,131,000 of investment securities, other than temporary cash investments.
G. Capital share transactions for each class of shares were:
| Inception1 to | ||
| August 31, 2011 | ||
| Amount | Shares | |
| ($000) | (000) | |
| Institutional Shares | ||
| Issued | 37,726 | 337 |
| Issued in Lieu of Cash Distributions | 181 | 2 |
| Redeemed | (2,250) | (20) |
| Net Increase (Decrease)—Institutional Shares | 35,657 | 319 |
| ETF Shares | ||
| Issued | 34,354 | 600 |
| Issued in Lieu of Cash Distributions | — | — |
| Redeemed | (11,322) | (200) |
| Net Increase (Decrease)—ETF Shares | 23,032 | 400 |
| 1 Inception was September 20, 2010, for ETF Shares and November 1, 2010, for Institutional Shares. | ||
H. In preparing the financial statements as of August 31, 2011, management considered the impact of subsequent events for potential recognition or disclosure in these financial statements.
19
Report of Independent Registered Public Accounting Firm
To the Trustees of Vanguard Scottsdale Funds and the Shareholders of Vanguard Russell 3000 Index Fund: In our opinion, the accompanying statement of net assets-investments summary and the related statement of operations and of changes in net assets and the financial highlights present fairly, in all material respects, the financial position of Vanguard Russell 3000 Index Fund (constituting a separate portfolio of Vanguard Scottsdale Funds, hereafter referred to as the “Fund”) at August 31, 2011, and the results of its operations, the changes in its net assets and the financial highlights for the period September 20, 2010 (commencement of operations) through August 31, 2011, in conformity with accounting principles generally accepted in the United States of America. These financial statements and financial highlights (hereafter referred to as “financial statements”) are the responsibility of the Fund’s management; our responsibility is to express an opinion on these financial statements based on our audit. We conducted our audit of these financial statements in accordance with the standards of the Public Company Accounting Oversight Board (United States). Those standards require that we plan and perform the audit to obtain reasonable assurance about whether the financial statements are free of material misstatement. An audit includes examining, on a test basis, evidence supporting the amounts and disclosures in the financial statements, assessing the accounting principles used and significant estimates made by management, and evaluating the overall financial statement presentation. We believe that our audit, which included confirmation of securities at August 31, 2011 by correspondence with the custodian and broker, and by agreement to the underlying ownership records of Vanguard Market Liquidity Funds, provides a reasonable basis for our opinion.
PricewaterhouseCoopers LLP
Philadelphia, Pennsylvania
October 13, 2011
| Special 2011 tax information (unaudited) for Vanguard Russell 3000 Index Fund |
This information for the period ended August 31, 2011, is included pursuant to provisions of the Internal Revenue Code.
The fund distributed $327,552 of qualified dividend income to shareholders during the period.
For corporate shareholders, 96.5% of investment income (dividend income plus short-term gains, if any) qualifies for the dividends-received deduction.
20
About Your Fund’s Expenses
As a shareholder of the fund, you incur ongoing costs, which include costs for portfolio management, administrative services, and shareholder reports (like this one), among others. Operating expenses, which are deducted from a fund’s gross income, directly reduce the investment return of the fund.
A fund’s expenses are expressed as a percentage of its average net assets. This figure is known as the expense ratio. The following examples are intended to help you understand the ongoing costs (in dollars) of investing in your fund and to compare these costs with those of other mutual funds. The examples are based on an investment of $1,000 made at the beginning of the period shown and held for the entire period.
The accompanying table illustrates your fund’s costs in two ways:
• Based on actual fund return. This section helps you to estimate the actual expenses that you paid over the period. The ”Ending Account Value“ shown is derived from the fund‘s actual return, and the third column shows the dollar amount that would have been paid by an investor who started with $1,000 in the fund. You may use the information here, together with the amount you invested, to estimate the expenses that you paid over the period.
To do so, simply divide your account value by $1,000 (for example, an $8,600 account value divided by $1,000 = 8.6), then multiply the result by the number given for your fund under the heading ”Expenses Paid During Period.“
• Based on hypothetical 5% yearly return. This section is intended to help you compare your fund‘s costs with those of other mutual funds. It assumes that the fund had a yearly return of 5% before expenses, but that the expense ratio is unchanged. In this case—because the return used is not the fund’s actual return—the results do not apply to your investment. The example is useful in making comparisons because the Securities and Exchange Commission requires all mutual funds to calculate expenses based on a 5% return. You can assess your fund’s costs by comparing this hypothetical example with the hypothetical examples that appear in shareholder reports of other funds.
Note that the expenses shown in the table are meant to highlight and help you compare ongoing costs only and do not reflect transaction costs incurred by the fund for buying and selling securities. Further, the expenses do not include any purchase, redemption, or account service fees described in the fund prospectus. If such fees were applied to your account, your costs would be higher. Your fund does not carry a “sales load.”
The calculations assume no shares were bought or sold during the period. Your actual costs may have been higher or lower, depending on the amount of your investment and the timing of any purchases or redemptions.
You can find more information about the fund’s expenses, including annual expense ratios, in the Financial Statements section of this report. For additional information on operating expenses and other shareholder costs, please refer to your fund’s current prospectus.
21
| Six Months Ended August 31, 2011 | |||
| Beginning | Ending | Expenses | |
| Account Value | Account Value | Paid During | |
| Russell 3000 Index Fund | 2/28/2011 | 8/31/2011 | Period |
| Based on Actual Fund Return | |||
| Institutional Shares | $1,000.00 | $922.52 | $0.48 |
| ETF Shares | 1,000.00 | 922.21 | 0.97 |
| Based on Hypothetical 5% Yearly Return | |||
| Institutional Shares | $1,000.00 | $1,024.70 | $0.51 |
| ETF Shares | 1,000.00 | 1,024.20 | 1.02 |
The calculations are based on expenses incurred in the most recent six-month period. The fund’s annualized six-month expense ratios for that period are 0.10% for Institutional Shares and 0.20% for ETF Shares. The dollar amounts shown as ”Expenses Paid” are equal to the annualized expense ratio multiplied by the average account value over the period, multiplied by the number of days in the most recent six-month period, then divided by the number of days in the most recent 12-month period.
22
Trustees Approve Advisory Arrangement
The board of trustees of Vanguard Russell 3000 Index Fund has renewed the fund’s investment advisory arrangement with The Vanguard Group, Inc. Vanguard—through its Quantitative Equity Group—serves as investment advisor to the fund. The board determined that continuing the fund’s internalized management structure was in the best interests of the fund and its shareholders.
The board based its decision upon an evaluation of the advisor’s investment staff, portfolio management process, and performance. The trustees considered the factors discussed below, among others. However, no single factor determined whether the board approved the arrangement. Rather, it was the totality of the circumstances that drove the board’s decision.
Nature, extent, and quality of services
The board considered the quality of the investment management services to be provided to the fund since its inception in 2010 and took into account the organizational depth and stability of the advisor. The board noted that Vanguard has been managing investments for more than three decades. The Quantitative Equity Group adheres to a sound, disciplined investment management process; the team has considerable experience, stability, and depth.
The board concluded that Vanguard’s experience, stability, depth, and performance, among other factors, warranted approval of the advisory arrangement.
Investment performance
The board considered the fund’s performance since its inception, including any periods of outperformance or underperformance of its target index and peer group. The board concluded that the fund has performed in line with expectations and that its results have been consistent with its investment strategies. Information about the fund’s performance can be found in the Performance Summary section of this report.
Cost
The board concluded that the fund’s expense ratio was well below the average expense ratio charged by funds in its peer group and that the fund’s advisory fee rate was also well below its peer-group average. Information about the fund’s expenses appears in the About Your Fund’s Expenses section of this report as well as in the Financial Statements section.
The board does not conduct a profitability analysis of Vanguard, because of Vanguard’s unique “at-cost” structure. Unlike most other mutual fund management companies, Vanguard is owned by the funds it oversees, and produces “profits” only in the form of reduced expenses for fund shareholders.
The benefit of economies of scale
The board concluded that the fund’s low-cost arrangement with Vanguard ensures that the fund will realize economies of scale as it grows, with the cost to shareholders declining as fund assets increase.
The board will consider whether to renew the advisory arrangement again after a one-year period.
23
Glossary
30-Day SEC Yield. A fund’s 30-day SEC yield is derived using a formula specified by the U.S. Securities and Exchange Commission. Under the formula, data related to the fund’s security holdings in the previous 30 days are used to calculate the fund’s hypothetical net income for that period, which is then annualized and divided by the fund’s estimated average net assets over the calculation period. For the purposes of this calculation, a security’s income is based on its current market yield to maturity (in the case of bonds), its actual income (for asset-backed securities), or its projected dividend yield (for stocks). Because the SEC yield represents hypothetical annualized income, it will differ—at times significantly—from the fund’s actual experience. As a result, the fund’s income distributions may be higher or lower than implied by the SEC yield.
Dividend Yield. Dividend income earned by stocks, expressed as a percentage of the aggregate market value (or of net asset value, for a fund). The yield is determined by dividing the amount of the annual dividends by the aggregate value (or net asset value) at the end of the period. For a fund, the dividend yield is based solely on stock holdings and does not include any income produced by other investments.
Earnings Growth Rate. The average annual rate of growth in earnings over the past five years for the stocks now in a fund.
Equity Exposure. A measure that reflects a fund’s investments in stocks and stock futures. Any holdings in short-term reserves are excluded.
Expense Ratio. The percentage of a fund’s average net assets used to pay its annual administrative and advisory expenses. These expenses directly reduce returns to investors.
Foreign Holdings. The percentage of a fund represented by securities or depositary receipts of companies based outside the United States.
Inception Date. The date on which the assets of a fund (or one of its share classes) are first invested in accordance with the fund’s investment objective. For funds with a subscription period, the inception date is the day after that period ends. Investment performance is measured from the inception date.
Median Market Cap. An indicator of the size of companies in which a fund invests; the midpoint of market capitalization (market price x shares outstanding) of a fund’s stocks, weighted by the proportion of the fund’s assets invested in each stock. Stocks representing half of the fund’s assets have market capitalizations above the median, and the rest are below it.
Price/Book Ratio. The share price of a stock divided by its net worth, or book value, per share. For a fund, the weighted average price/book ratio of the stocks it holds.
Price/Earnings Ratio. The ratio of a stock’s current price to its per-share earnings over the past year. For a fund, the weighted average P/E of the stocks it holds. P/E is an indicator of market expectations about corporate prospects; the higher the P/E, the greater the expectations for a company’s future growth.
Return on Equity. The annual average rate of return generated by a company during the past five years for each dollar of shareholder’s equity (net income divided by shareholder’s equity). For a fund, the weighted average return on equity for the companies whose stocks it holds.
24
Short-Term Reserves. The percentage of a fund invested in highly liquid, short-term securities that can be readily converted to cash.
Turnover Rate. An indication of the fund’s trading activity. Funds with high turnover rates incur higher transaction costs and may be more likely to distribute capital gains (which may be taxable to investors). The turnover rate excludes in-kind transactions, which have minimal impact on costs.
25
This page intentionally left blank.
This page intentionally left blank.
The People Who Govern Your Fund
The trustees of your mutual fund are there to see that the fund is operated and managed in your best interests since, as a shareholder, you are a part owner of the fund. Your fund’s trustees also serve on the board of directors of The Vanguard Group, Inc., which is owned by the Vanguard funds and provides services to them on an at-cost basis.
A majority of Vanguard’s board members are independent, meaning that they have no affiliation with Vanguard or the funds they oversee, apart from the sizable personal investments they have made as private individuals. The independent board members have distinguished backgrounds in business, academia, and public service. Each of the trustees and executive officers oversees 178 Vanguard funds.
The following table provides information for each trustee and executive officer of the fund. More information about the trustees is in the Statement of Additional Information, which can be obtained, without charge, by contacting Vanguard at 800-662-7447, or online at vanguard.com.
| Interested Trustee1 | and President (2006–2008) of Rohm and Haas Co. |
| (chemicals); Director of Tyco International, Ltd. | |
| F. William McNabb III | (diversified manufacturing and services) and Hewlett- |
| Born 1957. Trustee Since July 2009. Chairman of the | Packard Co. (electronic computer manufacturing); |
| Board. Principal Occupation(s) During the Past Five | Senior Advisor at New Mountain Capital; Trustee |
| Years: Chairman of the Board of The Vanguard Group, | of The Conference Board; Member of the Board of |
| Inc., and of each of the investment companies served | Managers of Delphi Automotive LLP (automotive |
| by The Vanguard Group, since January 2010; Director | components). |
| of The Vanguard Group since 2008; Chief Executive | |
| Officer and President of The Vanguard Group and of | Amy Gutmann |
| each of the investment companies served by The | Born 1949. Trustee Since June 2006. Principal |
| Vanguard Group since 2008; Director of Vanguard | Occupation(s) During the Past Five Years: President |
| Marketing Corporation; Managing Director of The | of the University of Pennsylvania; Christopher H. |
| Vanguard Group (1995–2008). | Browne Distinguished Professor of Political Science |
| in the School of Arts and Sciences with secondary | |
| appointments at the Annenberg School for Commu- | |
| Independent Trustees | nication and the Graduate School of Education |
| of the University of Pennsylvania; Director of | |
| Emerson U. Fullwood | Carnegie Corporation of New York, Schuylkill River |
| Born 1948. Trustee Since January 2008. Principal | Development Corporation, and Greater Philadelphia |
| Occupation(s) During the Past Five Years: Executive | Chamber of Commerce; Trustee of the National |
| Chief Staff and Marketing Officer for North America | Constitution Center; Chair of the Presidential |
| and Corporate Vice President (retired 2008) of Xerox | Commission for the Study of Bioethical Issues. |
| Corporation (document management products and | |
| services); Executive in Residence and 2010 | JoAnn Heffernan Heisen |
| Distinguished Minett Professor at the Rochester | Born 1950. Trustee Since July 1998. Principal |
| Institute of Technology; Director of SPX Corporation | Occupation(s) During the Past Five Years: Corporate |
| (multi-industry manufacturing), the United Way of | Vice President and Chief Global Diversity Officer |
| Rochester, Amerigroup Corporation (managed health | (retired 2008) and Member of the Executive |
| care), the University of Rochester Medical Center, | Committee (1997–2008) of Johnson & Johnson |
| Monroe Community College Foundation, and North | (pharmaceuticals/consumer products); Director of |
| Carolina A&T University. | Skytop Lodge Corporation (hotels), the University |
| Medical Center at Princeton, the Robert Wood | |
| Rajiv L. Gupta | Johnson Foundation, and the Center for Work Life |
| Born 1945. Trustee Since December 2001.2 | Policy; Member of the Advisory Board of the |
| Principal Occupation(s) During the Past Five Years: | Maxwell School of Citizenship and Public Affairs |
| Chairman and Chief Executive Officer (retired 2009) | at Syracuse University. |
| F. Joseph Loughrey | Thomas J. Higgins | |
| Born 1949. Trustee Since October 2009. Principal | Born 1957. Chief Financial Officer Since September | |
| Occupation(s) During the Past Five Years: President | 2008. Principal Occupation(s) During the Past Five | |
| and Chief Operating Officer (retired 2009) and Vice | Years: Principal of The Vanguard Group, Inc.; Chief | |
| Chairman of the Board (2008–2009) of Cummins Inc. | Financial Officer of each of the investment companies | |
| (industrial machinery); Director of SKF AB (industrial | served by The Vanguard Group since 2008; Treasurer | |
| machinery), Hillenbrand, Inc. (specialized consumer | of each of the investment companies served by The | |
| services), the Lumina Foundation for Education, and | Vanguard Group (1998–2008). | |
| Oxfam America; Chairman of the Advisory Council | ||
| for the College of Arts and Letters and Member | Kathryn J. Hyatt | |
| of the Advisory Board to the Kellogg Institute for | Born 1955. Treasurer Since November 2008. Principal | |
| International Studies at the University of Notre Dame. | Occupation(s) During the Past Five Years: Principal | |
| of The Vanguard Group, Inc.; Treasurer of each of | ||
| André F. Perold | the investment companies served by The Vanguard | |
| Born 1952. Trustee Since December 2004. Principal | Group since 2008; Assistant Treasurer of each of the | |
| Occupation(s) During the Past Five Years: George | investment companies served by The Vanguard Group | |
| Gund Professor of Finance and Banking at the Harvard | (1988–2008). | |
| Business School (retired July 2011); Chief Investment | ||
| Officer and co-Managing Partner of HighVista | Heidi Stam | |
| Strategies LLC (private investment firm); Director of | Born 1956. Secretary Since July 2005. Principal | |
| Rand Merchant Bank; Overseer of the Museum of | Occupation(s) During the Past Five Years: Managing | |
| Fine Arts Boston. | Director of The Vanguard Group, Inc., since 2006; | |
| General Counsel of The Vanguard Group since 2005; | ||
| Alfred M. Rankin, Jr. | Secretary of The Vanguard Group and of each of the | |
| Born 1941. Trustee Since January 1993. Principal | investment companies served by The Vanguard Group | |
| Occupation(s) During the Past Five Years: Chairman, | since 2005; Director and Senior Vice President of | |
| President, and Chief Executive Officer of NACCO | Vanguard Marketing Corporation since 2005; | |
| Industries, Inc. (forklift trucks/housewares/lignite); | Principal of The Vanguard Group (1997–2006). | |
| Director of Goodrich Corporation (industrial products/ | ||
| aircraft systems and services) and the National | ||
| Association of Manufacturers; Chairman of the | Vanguard Senior Management Team | |
| Federal Reserve Bank of Cleveland; Vice Chairman | ||
| of University Hospitals of Cleveland; President of | R. Gregory Barton | Michael S. Miller |
| the Board of The Cleveland Museum of Art. | Mortimer J. Buckley | James M. Norris |
| Kathleen C. Gubanich | Glenn W. Reed | |
| Peter F. Volanakis | Paul A. Heller | George U. Sauter |
| Born 1955. Trustee Since July 2009. Principal | Martha G. King | |
| Occupation(s) During the Past Five Years: President | ||
| and Chief Operating Officer (retired 2010) of Corning | ||
| Incorporated (communications equipment); Director of | Chairman Emeritus and Senior Advisor | |
| Corning Incorporated (2000–2010) and Dow Corning | ||
| (2001–2010); Overseer of the Amos Tuck School of | John J. Brennan | |
| Business Administration at Dartmouth College. | Chairman, 1996–2009 | |
| Chief Executive Officer and President, 1996–2008 | ||
| Executive Officers | ||
| Founder | ||
| Glenn Booraem | ||
| Born 1967. Controller Since July 2010. Principal | John C. Bogle | |
| Occupation(s) During the Past Five Years: Principal | Chairman and Chief Executive Officer, 1974–1996 | |
| of The Vanguard Group, Inc.; Controller of each of | ||
| the investment companies served by The Vanguard | ||
| Group since 2010; Assistant Controller of each of | ||
| the investment companies served by The Vanguard | ||
| Group (2001–2010). | ||
1 Mr. McNabb is considered an “interested person,” as defined in the Investment Company Act of 1940, because he is an officer of the Vanguard funds.
2 December 2002 for Vanguard Equity Income Fund, Vanguard Growth Equity Fund, the Vanguard Municipal Bond Funds, and the Vanguard State Tax-Exempt Funds.

| |
| P.O. Box 2600 | |
| Valley Forge, PA 19482-2600 |
Connect with Vanguard® > vanguard.com
| The Russell Indexes and Russell® are registered | |
| Fund Information > 800-662-7447 | trademarks of Russell Investments and have been |
| Direct Investor Account Services > 800-662-2739 | licensed for use by The Vanguard Group, Inc. The |
| Institutional Investor Services > 800-523-1036 | products are not sponsored, endorsed, sold, or |
| Text Telephone for People | promoted by Russell Investments and Russell |
| With Hearing Impairment > 800-749-7273 | Investments makes no representation regarding the |
| advisability of investing in the products. | |
| This material may be used in conjunction | |
| with the offering of shares of any Vanguard | |
| fund only if preceded or accompanied by | |
| the fund’s current prospectus. | |
| All comparative mutual fund data are from Lipper Inc. or | |
| Morningstar, Inc., unless otherwise noted. | |
| You can obtain a free copy of Vanguard’s proxy voting | |
| guidelines by visiting vanguard.com/proxyreporting or by | |
| calling Vanguard at 800-662-2739. The guidelines are | |
| also available from the SEC’s website, sec.gov. In | |
| addition, you may obtain a free report on how your fund | |
| voted the proxies for securities it owned during the 12 | |
| months ended June 30. To get the report, visit either | |
| vanguard.com/proxyreporting or sec.gov. | |
| You can review and copy information about your fund at | |
| the SEC’s Public Reference Room in Washington, D.C. To | |
| find out more about this public service, call the SEC at | |
| 202-551-8090. Information about your fund is also | |
| available on the SEC’s website, and you can receive | |
| copies of this information, for a fee, by sending a | |
| request in either of two ways: via e-mail addressed to | |
| publicinfo@sec.gov or via regular mail addressed to the | |
| Public Reference Section, Securities and Exchange | |
| Commission, Washington, DC 20549-1520. | |
| © 2011 The Vanguard Group, Inc. | |
| All rights reserved. | |
| Vanguard Marketing Corporation, Distributor. | |
| Q18540 102011 | |
| Vanguard® Russell 3000 Index Fund | ||
| Schedule of Investments | ||
| August 31, 2011 | ||
| Market | ||
| Value | ||
| Shares | ($000) | |
| Common Stocks (99.6%) 1 | ||
| Consumer Discretionary (11.7%) | ||
| McDonald's Corp. | 4,269 | 386 |
| * Amazon.com Inc. | 1,495 | 322 |
| Walt Disney Co. | 7,776 | 265 |
| Comcast Corp. Class A | 11,345 | 244 |
| Home Depot Inc. | 6,574 | 219 |
| * Ford Motor Co. | 15,327 | 170 |
| News Corp. Class A | 9,443 | 163 |
| Target Corp. | 2,835 | 146 |
| Time Warner Inc. | 4,405 | 139 |
| * DIRECTV Class A | 3,158 | 139 |
| NIKE Inc. Class B | 1,469 | 127 |
| Starbucks Corp. | 3,084 | 119 |
| Viacom Inc. Class B | 2,408 | 116 |
| * priceline.com Inc. | 205 | 110 |
| Lowe's Cos. Inc. | 5,357 | 107 |
| Yum! Brands Inc. | 1,915 | 104 |
| Time Warner Cable Inc. | 1,384 | 91 |
| Johnson Controls Inc. | 2,791 | 89 |
| TJX Cos. Inc. | 1,589 | 87 |
| * General Motors Co. | 3,128 | 75 |
| * Las Vegas Sands Corp. | 1,613 | 75 |
| CBS Corp. Class B | 2,752 | 69 |
| Coach Inc. | 1,208 | 68 |
| * Bed Bath & Beyond Inc. | 1,026 | 58 |
| Carnival Corp. | 1,754 | 58 |
| Kohl's Corp. | 1,195 | 55 |
| McGraw-Hill Cos. Inc. | 1,254 | 53 |
| * Netflix Inc. | 217 | 51 |
| Wynn Resorts Ltd. | 327 | 51 |
| * Discovery Communications Inc. Class A | 1,147 | 48 |
| Thomson Reuters Corp. | 1,548 | 48 |
| Omnicom Group Inc. | 1,157 | 47 |
| * Liberty Global Inc. Class A | 1,143 | 46 |
| Macy's Inc. | 1,752 | 45 |
| Staples Inc. | 2,934 | 43 |
| VF Corp. | 359 | 42 |
| Limited Brands Inc. | 1,096 | 41 |
| * Chipotle Mexican Grill Inc. Class A | 128 | 40 |
| * Liberty Media Corp. - Interactive | 2,473 | 39 |
| Mattel Inc. | 1,431 | 38 |
| Tiffany & Co. | 526 | 38 |
| Harley-Davidson Inc. | 973 | 38 |
| Ross Stores Inc. | 484 | 37 |
| * O'Reilly Automotive Inc. | 568 | 37 |
| Fortune Brands Inc. | 634 | 36 |
| * Dollar Tree Inc. | 503 | 36 |
| Starwood Hotels & Resorts Worldwide Inc. | 803 | 36 |
| Genuine Parts Co. | 648 | 36 |
| Ralph Lauren Corp. Class A | 258 | 35 |
| * AutoZone Inc. | 110 | 34 |
| Marriott International Inc. Class A | 1,145 | 33 |
| Best Buy Co. Inc. | 1,302 | 33 |
| Virgin Media Inc. | 1,309 | 33 |
| * BorgWarner Inc. | 452 | 32 |
| Nordstrom Inc. | 673 | 31 |
| * Sirius XM Radio Inc. | 16,273 | 29 |
| Darden Restaurants Inc. | 563 | 27 |
| Family Dollar Stores Inc. | 505 | 27 |
| * CarMax Inc. | 932 | 26 |
| Gap Inc. | 1,574 | 26 |
| Expedia Inc. | 801 | 24 |
1
| Vanguard® Russell 3000 Index Fund | ||
| Schedule of Investments | ||
| August 31, 2011 | ||
| Market | ||
| Value | ||
| Shares | ($000) | |
| * Apollo Group Inc. Class A | 498 | 23 |
| Abercrombie & Fitch Co. | 363 | 23 |
| Wyndham Worldwide Corp. | 701 | 23 |
| * Liberty Media Corp. - Capital | 294 | 21 |
| * Fossil Inc. | 216 | 21 |
| Lear Corp. | 434 | 21 |
| Autoliv Inc. | 368 | 21 |
| * DISH Network Corp. Class A | 826 | 20 |
| PetSmart Inc. | 468 | 20 |
| Whirlpool Corp. | 314 | 20 |
| International Game Technology | 1,237 | 19 |
| Advance Auto Parts Inc. | 305 | 18 |
| Hasbro Inc. | 477 | 18 |
| H&R Block Inc. | 1,196 | 18 |
| * TRW Automotive Holdings Corp. | 420 | 17 |
| Tractor Supply Co. | 284 | 17 |
| Interpublic Group of Cos. Inc. | 2,011 | 17 |
| JC Penney Co. Inc. | 648 | 17 |
| Tupperware Brands Corp. | 245 | 16 |
| Cablevision Systems Corp. Class A | 894 | 16 |
| * MGM Resorts International | 1,450 | 16 |
| Newell Rubbermaid Inc. | 1,140 | 16 |
| Scripps Networks Interactive Inc. Class A | 367 | 16 |
| PVH Corp. | 235 | 16 |
| * Tempur-Pedic International Inc. | 268 | 16 |
| * LKQ Corp. | 572 | 15 |
| * NVR Inc. | 23 | 15 |
| Gentex Corp. | 559 | 14 |
| Royal Caribbean Cruises Ltd. | 556 | 14 |
| * Dollar General Corp. | 388 | 14 |
| * Liberty Media Corp. - Starz | 205 | 14 |
| Garmin Ltd. | 421 | 14 |
| Polaris Industries Inc. | 127 | 14 |
| Williams-Sonoma Inc. | 411 | 14 |
| * Deckers Outdoor Corp. | 152 | 13 |
| * Signet Jewelers Ltd. | 341 | 13 |
| * GameStop Corp. Class A | 553 | 13 |
| * Panera Bread Co. Class A | 114 | 13 |
| * Dick's Sporting Goods Inc. | 369 | 13 |
| Foot Locker Inc. | 606 | 13 |
| Leggett & Platt Inc. | 560 | 12 |
| * Urban Outfitters Inc. | 471 | 12 |
| DeVry Inc. | 270 | 12 |
| * Goodyear Tire & Rubber Co. | 957 | 12 |
| DR Horton Inc. | 1,095 | 11 |
| Gannett Co. Inc. | 989 | 11 |
| * Charter Communications Inc. Class A | 227 | 11 |
| * Mohawk Industries Inc. | 223 | 11 |
| * Hanesbrands Inc. | 379 | 11 |
| * Penn National Gaming Inc. | 266 | 11 |
| * Ulta Salon Cosmetics & Fragrance Inc. | 179 | 11 |
| Jarden Corp. | 360 | 10 |
| * Visteon Corp. | 201 | 10 |
| * Under Armour Inc. Class A | 144 | 10 |
| * Big Lots Inc. | 295 | 10 |
| Harman International Industries Inc. | 276 | 10 |
| * Toll Brothers Inc. | 579 | 10 |
| Sotheby's | 267 | 10 |
| Chico's FAS Inc. | 693 | 10 |
| Service Corp. International | 939 | 10 |
| * Warnaco Group Inc. | 175 | 9 |
| Lennar Corp. Class A | 635 | 9 |
| * Sears Holdings Corp. | 154 | 9 |
| * CROCS Inc. | 337 | 9 |
2
| Vanguard® Russell 3000 Index Fund | ||
| Schedule of Investments | ||
| August 31, 2011 | ||
| Market | ||
| Value | ||
| Shares | ($000) | |
| John Wiley & Sons Inc. Class A | 184 | 9 |
| Guess? Inc. | 258 | 9 |
| American Eagle Outfitters Inc. | 773 | 9 |
| Aaron's Inc. | 317 | 8 |
| * ITT Educational Services Inc. | 112 | 8 |
| * AMC Networks Inc. Class A | 217 | 8 |
| * Tenneco Inc. | 242 | 8 |
| Cinemark Holdings Inc. | 371 | 8 |
| Brinker International Inc. | 337 | 8 |
| * Dana Holding Corp. | 587 | 7 |
| Washington Post Co. Class B | 21 | 7 |
| Rent-A-Center Inc. | 264 | 7 |
| Wolverine World Wide Inc. | 200 | 7 |
| * Ascena Retail Group Inc. | 252 | 7 |
| Weight Watchers International Inc. | 117 | 7 |
| * Domino's Pizza Inc. | 249 | 7 |
| * Timberland Co. Class A | 160 | 7 |
| * Pulte Group Inc. | 1,405 | 7 |
| * AutoNation Inc. | 165 | 7 |
| * Cheesecake Factory Inc. | 242 | 7 |
| * Life Time Fitness Inc. | 173 | 7 |
| * Shutterfly Inc. | 122 | 7 |
| * Sally Beauty Holdings Inc. | 384 | 6 |
| Wendy's Co. | 1,322 | 6 |
| * Hyatt Hotels Corp. Class A | 181 | 6 |
| Dillard's Inc. Class A | 138 | 6 |
| * DreamWorks Animation SKG Inc. Class A | 302 | 6 |
| * Carter's Inc. | 201 | 6 |
| Men's Wearhouse Inc. | 215 | 6 |
| Vail Resorts Inc. | 150 | 6 |
| * JOS A Bank Clothiers Inc. | 117 | 6 |
| * Coinstar Inc. | 131 | 6 |
| Morningstar Inc. | 100 | 6 |
| * Madison Square Garden Co. Class A | 246 | 6 |
| Brunswick Corp. | 368 | 6 |
| * Iconix Brand Group Inc. | 298 | 6 |
| Six Flags Entertainment Corp. | 171 | 6 |
| RadioShack Corp. | 439 | 6 |
| * Steven Madden Ltd. | 156 | 6 |
| * Bally Technologies Inc. | 177 | 6 |
| * Tesla Motors Inc. | 222 | 5 |
| * Live Nation Entertainment Inc. | 591 | 5 |
| * Genesco Inc. | 103 | 5 |
| * Valassis Communications Inc. | 211 | 5 |
| Hillenbrand Inc. | 261 | 5 |
| * WMS Industries Inc. | 244 | 5 |
| * HSN Inc. | 165 | 5 |
| * Lamar Advertising Co. Class A | 247 | 5 |
| Monro Muffler Brake Inc. | 129 | 5 |
| Pool Corp. | 189 | 5 |
| * New York Times Co. Class A | 599 | 5 |
| * Pier 1 Imports Inc. | 456 | 5 |
| * Buffalo Wild Wings Inc. | 79 | 5 |
| * ANN Inc. | 206 | 5 |
| * Childrens Place Retail Stores Inc. | 113 | 5 |
| * Saks Inc. | 501 | 5 |
| * Vitamin Shoppe Inc. | 108 | 5 |
| * BJ's Restaurants Inc. | 102 | 5 |
| * Career Education Corp. | 273 | 5 |
| Express Inc. | 242 | 5 |
| Regal Entertainment Group Class A | 350 | 5 |
| Buckle Inc. | 116 | 5 |
| Finish Line Inc. Class A | 227 | 5 |
| Strayer Education Inc. | 48 | 5 |
3
| Vanguard® Russell 3000 Index Fund | ||
| Schedule of Investments | ||
| August 31, 2011 | ||
| Market | ||
| Value | ||
| Shares | ($000) | |
| Arbitron Inc. | 120 | 4 |
| * Cabela's Inc. | 184 | 4 |
| Meredith Corp. | 163 | 4 |
| * Hibbett Sports Inc. | 111 | 4 |
| * Jack in the Box Inc. | 200 | 4 |
| Jones Group Inc. | 347 | 4 |
| * Gaylord Entertainment Co. | 159 | 4 |
| Choice Hotels International Inc. | 128 | 4 |
| Matthews International Corp. Class A | 119 | 4 |
| Group 1 Automotive Inc. | 95 | 4 |
| * DSW Inc. Class A | 85 | 4 |
| Cracker Barrel Old Country Store Inc. | 92 | 4 |
| Texas Roadhouse Inc. Class A | 271 | 4 |
| Thor Industries Inc. | 174 | 4 |
| Bob Evans Farms Inc. | 121 | 4 |
| * Helen of Troy Ltd. | 121 | 4 |
| * Aeropostale Inc. | 321 | 4 |
| National CineMedia Inc. | 250 | 4 |
| * Select Comfort Corp. | 222 | 3 |
| * Collective Brands Inc. | 256 | 3 |
| * 99 Cents Only Stores | 185 | 3 |
| * Peet's Coffee & Tea Inc. | 59 | 3 |
| American Greetings Corp. Class A | 161 | 3 |
| * Eastman Kodak Co. | 1,066 | 3 |
| * Pinnacle Entertainment Inc. | 247 | 3 |
| Regis Corp. | 229 | 3 |
| Penske Automotive Group Inc. | 180 | 3 |
| * Orient-Express Hotels Ltd. Class A | 412 | 3 |
| * True Religion Apparel Inc. | 104 | 3 |
| * American Public Education Inc. | 75 | 3 |
| MDC Holdings Inc. | 157 | 3 |
| Cooper Tire & Rubber Co. | 253 | 3 |
| International Speedway Corp. Class A | 121 | 3 |
| * Vera Bradley Inc. | 85 | 3 |
| Scholastic Corp. | 107 | 3 |
| * Office Depot Inc. | 1,140 | 3 |
| Cato Corp. Class A | 114 | 3 |
| * Ascent Capital Group Inc. Class A | 60 | 3 |
| PF Chang's China Bistro Inc. | 95 | 3 |
| * K12 Inc. | 105 | 3 |
| CEC Entertainment Inc. | 86 | 3 |
| Stage Stores Inc. | 161 | 3 |
| * Education Management Corp. | 167 | 3 |
| * iRobot Corp. | 93 | 3 |
| Columbia Sportswear Co. | 49 | 3 |
| * Papa John's International Inc. | 86 | 3 |
| * Asbury Automotive Group Inc. | 136 | 3 |
| * DineEquity Inc. | 61 | 3 |
| Sonic Automotive Inc. Class A | 183 | 3 |
| Ameristar Casinos Inc. | 135 | 2 |
| * Scientific Games Corp. Class A | 285 | 2 |
| * Skechers U.S.A. Inc. Class A | 155 | 2 |
| * American Axle & Manufacturing Holdings Inc. | 265 | 2 |
| * Steiner Leisure Ltd. | 62 | 2 |
| * Krispy Kreme Doughnuts Inc. | 272 | 2 |
| * Maidenform Brands Inc. | 97 | 2 |
| * Wet Seal Inc. Class A | 489 | 2 |
| Sturm Ruger & Co. Inc. | 74 | 2 |
| * GNC Holdings Inc. | 99 | 2 |
| * OfficeMax Inc. | 382 | 2 |
| * Sonic Corp. | 258 | 2 |
| * Quiksilver Inc. | 567 | 2 |
| Churchill Downs Inc. | 54 | 2 |
| * Modine Manufacturing Co. | 203 | 2 |
4
| Vanguard® Russell 3000 Index Fund | ||
| Schedule of Investments | ||
| August 31, 2011 | ||
| Market | ||
| Value | ||
| Shares | ($000) | |
| * Liz Claiborne Inc. | 447 | 2 |
| PEP Boys-Manny Moe & Jack | 236 | 2 |
| KB Home | 351 | 2 |
| Ryland Group Inc. | 198 | 2 |
| * Ruby Tuesday Inc. | 277 | 2 |
| * Biglari Holdings Inc. | 7 | 2 |
| * Interval Leisure Group Inc. | 182 | 2 |
| * Blue Nile Inc. | 58 | 2 |
| * Capella Education Co. | 70 | 2 |
| * Shuffle Master Inc. | 252 | 2 |
| Stewart Enterprises Inc. Class A | 368 | 2 |
| * Jakks Pacific Inc. | 130 | 2 |
| Belo Corp. Class A | 404 | 2 |
| * La-Z-Boy Inc. | 247 | 2 |
| * Central European Media Enterprises Ltd. Class A | 167 | 2 |
| * Clear Channel Outdoor Holdings Inc. Class A | 184 | 2 |
| Fred's Inc. Class A | 181 | 2 |
| * G-III Apparel Group Ltd. | 73 | 2 |
| Ethan Allen Interiors Inc. | 120 | 2 |
| * Meritage Homes Corp. | 110 | 2 |
| * Knology Inc. | 151 | 2 |
| * Exide Technologies | 363 | 2 |
| Oxford Industries Inc. | 56 | 2 |
| * Core-Mark Holding Co. Inc. | 56 | 2 |
| Superior Industries International Inc. | 115 | 2 |
| * Teavana Holdings Inc. | 75 | 2 |
| * Denny's Corp. | 512 | 2 |
| Drew Industries Inc. | 97 | 2 |
| * Charming Shoppes Inc. | 604 | 2 |
| MDC Partners Inc. Class A | 119 | 2 |
| * Federal-Mogul Corp. | 106 | 2 |
| Barnes & Noble Inc. | 141 | 2 |
| Brown Shoe Co. Inc. | 228 | 2 |
| * Bravo Brio Restaurant Group Inc. | 90 | 2 |
| Callaway Golf Co. | 332 | 2 |
| * Grand Canyon Education Inc. | 119 | 2 |
| * Zumiez Inc. | 100 | 2 |
| * Rue21 Inc. | 73 | 2 |
| * Boyd Gaming Corp. | 291 | 2 |
| * Red Robin Gourmet Burgers Inc. | 58 | 2 |
| Sinclair Broadcast Group Inc. Class A | 231 | 2 |
| Lithia Motors Inc. Class A | 95 | 2 |
| Harte-Hanks Inc. | 221 | 2 |
| * AFC Enterprises Inc. | 134 | 2 |
| HOT Topic Inc. | 210 | 2 |
| * Universal Technical Institute Inc. | 117 | 2 |
| * Lumber Liquidators Holdings Inc. | 112 | 2 |
| * Fuel Systems Solutions Inc. | 79 | 2 |
| * Bridgepoint Education Inc. | 74 | 2 |
| * Zagg Inc. | 104 | 2 |
| * Lions Gate Entertainment Corp. | 217 | 1 |
| * Dorman Products Inc. | 45 | 1 |
| Standard Motor Products Inc. | 108 | 1 |
| * Amerigon Inc. | 106 | 1 |
| * Perry Ellis International Inc. | 60 | 1 |
| Blyth Inc. | 24 | 1 |
| Nutrisystem Inc. | 106 | 1 |
| * EW Scripps Co. Class A | 158 | 1 |
| * Caribou Coffee Co. Inc. | 85 | 1 |
| * Universal Electronics Inc. | 66 | 1 |
| Lincoln Educational Services Corp. | 129 | 1 |
| Stein Mart Inc. | 179 | 1 |
| * Libbey Inc. | 96 | 1 |
| * America's Car-Mart Inc. | 41 | 1 |
5
| Vanguard® Russell 3000 Index Fund | ||
| Schedule of Investments | ||
| August 31, 2011 | ||
| Market | ||
| Value | ||
| Shares | ($000) | |
| World Wrestling Entertainment Inc. Class A | 128 | 1 |
| * Stoneridge Inc. | 153 | 1 |
| * Cavco Industries Inc. | 33 | 1 |
| * Fisher Communications Inc. | 45 | 1 |
| * Ruth's Hospitality Group Inc. | 224 | 1 |
| * Global Traffic Network Inc. | 84 | 1 |
| Marcus Corp. | 119 | 1 |
| * Winnebago Industries Inc. | 146 | 1 |
| * Steinway Musical Instruments Inc. | 46 | 1 |
| PetMed Express Inc. | 110 | 1 |
| Bebe Stores Inc. | 162 | 1 |
| * Talbots Inc. | 373 | 1 |
| * M/I Homes Inc. | 133 | 1 |
| * Valuevision Media Inc. Class A | 289 | 1 |
| * Standard Pacific Corp. | 425 | 1 |
| * Shoe Carnival Inc. | 43 | 1 |
| * Tuesday Morning Corp. | 270 | 1 |
| Haverty Furniture Cos. Inc. | 89 | 1 |
| * Smith & Wesson Holding Corp. | 322 | 1 |
| * Beazer Homes USA Inc. | 496 | 1 |
| * Cost Plus Inc. | 132 | 1 |
| * Body Central Corp. | 59 | 1 |
| * Arctic Cat Inc. | 65 | 1 |
| * Town Sports International Holdings Inc. | 135 | 1 |
| Spartan Motors Inc. | 221 | 1 |
| * ReachLocal Inc. | 69 | 1 |
| Big 5 Sporting Goods Corp. | 135 | 1 |
| * Furniture Brands International Inc. | 356 | 1 |
| * Journal Communications Inc. Class A | 270 | 1 |
| * Citi Trends Inc. | 84 | 1 |
| * hhgregg Inc. | 88 | 1 |
| Movado Group Inc. | 70 | 1 |
| * Zale Corp. | 234 | 1 |
| * Rentrak Corp. | 66 | 1 |
| * K-Swiss Inc. Class A | 176 | 1 |
| * Saga Communications Inc. Class A | 30 | 1 |
| * Motorcar Parts of America Inc. | 92 | 1 |
| * interCLICK Inc. | 161 | 1 |
| Christopher & Banks Corp. | 195 | 1 |
| * Kirkland's Inc. | 98 | 1 |
| * Overstock.com Inc. | 86 | 1 |
| * Unifi Inc. | 79 | 1 |
| * Benihana Inc. Class A | 109 | 1 |
| * MarineMax Inc. | 129 | 1 |
| * Geeknet Inc. | 41 | 1 |
| * Hovnanian Enterprises Inc. Class A | 525 | 1 |
| Destination Maternity Corp. | 60 | 1 |
| * Black Diamond Inc. | 109 | 1 |
| * Isle of Capri Casinos Inc. | 125 | 1 |
| * McClatchy Co. Class A | 472 | 1 |
| * Luby's Inc. | 171 | 1 |
| * Corinthian Colleges Inc. | 346 | 1 |
| * Casual Male Retail Group Inc. | 179 | 1 |
| * Multimedia Games Holding Co. Inc. | 145 | 1 |
| Speedway Motorsports Inc. | 53 | 1 |
| Weyco Group Inc. | 31 | 1 |
| * Tower International Inc. | 49 | 1 |
| * Syms Corp. | 77 | 1 |
| Mac-Gray Corp. | 49 | 1 |
| * Systemax Inc. | 50 | 1 |
| * Morgans Hotel Group Co. | 98 | 1 |
| * Orbitz Worldwide Inc. | 260 | 1 |
| Winmark Corp. | 14 | 1 |
| * Carrols Restaurant Group Inc. | 71 | 1 |
6
| Vanguard® Russell 3000 Index Fund | ||
| Schedule of Investments | ||
| August 31, 2011 | ||
| Market | ||
| Value | ||
| Shares | ($000) | |
| Skyline Corp. | 59 | 1 |
| Einstein Noah Restaurant Group Inc. | 43 | 1 |
| Outdoor Channel Holdings Inc. | 93 | 1 |
| * Monarch Casino & Resort Inc. | 63 | 1 |
| * Kenneth Cole Productions Inc. Class A | 54 | 1 |
| * West Marine Inc. | 66 | 1 |
| * Archipelago Learning Inc. | 67 | 1 |
| Lifetime Brands Inc. | 58 | 1 |
| Bon-Ton Stores Inc. | 87 | 1 |
| * Red Lion Hotels Corp. | 87 | 1 |
| * US Auto Parts Network Inc. | 96 | 1 |
| * Entercom Communications Corp. Class A | 99 | 1 |
| CSS Industries Inc. | 34 | 1 |
| * Johnson Outdoors Inc. Class A | 38 | 1 |
| Ambassadors Group Inc. | 79 | 1 |
| * Gordmans Stores Inc. | 40 | 1 |
| * Audiovox Corp. Class A | 92 | 1 |
| * Coldwater Creek Inc. | 556 | 1 |
| Value Line Inc. | 48 | 1 |
| * Build-A-Bear Workshop Inc. | 99 | 1 |
| * Delta Apparel Inc. | 35 | 1 |
| * Cambium Learning Group Inc. | 194 | 1 |
| * 1-800-Flowers.com Inc. Class A | 230 | 1 |
| National American University Holdings Inc. | 65 | 1 |
| * Nexstar Broadcasting Group Inc. Class A | 92 | 1 |
| * Sealy Corp. | 271 | 1 |
| * Cumulus Media Inc. Class A | 205 | 1 |
| RG Barry Corp. | 54 | 1 |
| * Gray Television Inc. | 289 | 1 |
| Shiloh Industries Inc. | 54 | 1 |
| * Jamba Inc. | 310 | 1 |
| * Marine Products Corp. | 97 | 1 |
| * Leapfrog Enterprises Inc. | 163 | 1 |
| * Martha Stewart Living Omnimedia Class A | 158 | 1 |
| Cherokee Inc. | 38 | 1 |
| * Crown Media Holdings Inc. Class A | 394 | 1 |
| * Conn's Inc. | 90 | 1 |
| * Summer Infant Inc. | 73 | 1 |
| * New York & Co. Inc. | 145 | 1 |
| * Westwood One Inc. | 89 | 1 |
| * Entravision Communications Corp. Class A | 445 | 1 |
| * O'Charleys Inc. (Foreign) | 88 | — |
| AH Belo Corp. Class A | 92 | — |
| * McCormick & Schmick's Seafood Restaurants Inc. | 76 | — |
| * LIN TV Corp. Class A | 147 | — |
| * Global Sources Ltd. | 46 | — |
| * Pacific Sunwear of California Inc. | 206 | — |
| 6,648 | ||
| Consumer Staples (9.6%) | ||
| Procter & Gamble Co. | 11,510 | 733 |
| Coca-Cola Co. | 8,147 | 574 |
| Philip Morris International Inc. | 7,333 | 508 |
| PepsiCo Inc. | 6,503 | 419 |
| Wal-Mart Stores Inc. | 7,300 | 388 |
| Kraft Foods Inc. | 6,797 | 238 |
| Altria Group Inc. | 8,612 | 234 |
| CVS Caremark Corp. | 5,578 | 200 |
| Colgate-Palmolive Co. | 2,012 | 181 |
| Costco Wholesale Corp. | 1,797 | 141 |
| Walgreen Co. | 3,766 | 133 |
| Kimberly-Clark Corp. | 1,617 | 112 |
| General Mills Inc. | 2,626 | 100 |
| Archer-Daniels-Midland Co. | 2,787 | 79 |
7
| Vanguard® Russell 3000 Index Fund | ||
| Schedule of Investments | ||
| August 31, 2011 | ||
| Market | ||
| Value | ||
| Shares | ($000) | |
| HJ Heinz Co. | 1,324 | 70 |
| Sysco Corp. | 2,400 | 67 |
| Lorillard Inc. | 592 | 66 |
| Mead Johnson Nutrition Co. | 841 | 60 |
| Kroger Co. | 2,495 | 59 |
| Kellogg Co. | 1,013 | 55 |
| * Green Mountain Coffee Roasters Inc. | 506 | 53 |
| Reynolds American Inc. | 1,380 | 52 |
| Estee Lauder Cos. Inc. Class A | 465 | 45 |
| Sara Lee Corp. | 2,407 | 43 |
| Whole Foods Market Inc. | 636 | 42 |
| ConAgra Foods Inc. | 1,683 | 41 |
| Avon Products Inc. | 1,770 | 40 |
| Bunge Ltd. | 606 | 39 |
| Clorox Co. | 549 | 38 |
| Coca-Cola Enterprises Inc. | 1,338 | 37 |
| Hershey Co. | 626 | 37 |
| Dr Pepper Snapple Group Inc. | 911 | 35 |
| JM Smucker Co. | 478 | 34 |
| Brown-Forman Corp. Class B | 423 | 30 |
| Herbalife Ltd. | 492 | 27 |
| Safeway Inc. | 1,461 | 27 |
| McCormick & Co. Inc. | 547 | 26 |
| Church & Dwight Co. Inc. | 590 | 26 |
| * Hansen Natural Corp. | 290 | 25 |
| Molson Coors Brewing Co. Class B | 554 | 24 |
| Campbell Soup Co. | 732 | 23 |
| * Energizer Holdings Inc. | 288 | 22 |
| Tyson Foods Inc. Class A | 1,241 | 22 |
| * Ralcorp Holdings Inc. | 216 | 19 |
| Hormel Foods Corp. | 538 | 15 |
| * Smithfield Foods Inc. | 650 | 14 |
| * Constellation Brands Inc. Class A | 712 | 14 |
| Corn Products International Inc. | 300 | 14 |
| * BJ's Wholesale Club Inc. | 215 | 11 |
| Nu Skin Enterprises Inc. Class A | 217 | 9 |
| Flowers Foods Inc. | 443 | 8 |
| Ruddick Corp. | 196 | 8 |
| * Darling International Inc. | 468 | 8 |
| * United Natural Foods Inc. | 193 | 8 |
| * TreeHouse Foods Inc. | 143 | 8 |
| Diamond Foods Inc. | 89 | 7 |
| Casey's General Stores Inc. | 155 | 7 |
| SUPERVALU Inc. | 863 | 7 |
| * Dean Foods Co. | 742 | 6 |
| Pricesmart Inc. | 76 | 5 |
| * Fresh Market Inc. | 125 | 5 |
| * Hain Celestial Group Inc. | 152 | 5 |
| Snyders-Lance Inc. | 207 | 5 |
| Lancaster Colony Corp. | 74 | 4 |
| Universal Corp. | 95 | 4 |
| Fresh Del Monte Produce Inc. | 149 | 4 |
| Sanderson Farms Inc. | 89 | 3 |
| B&G Foods Inc. Class A | 190 | 3 |
| Vector Group Ltd. | 180 | 3 |
| * Elizabeth Arden Inc. | 98 | 3 |
| Andersons Inc. | 75 | 3 |
| * Boston Beer Co. Inc. Class A | 37 | 3 |
| J&J Snack Foods Corp. | 58 | 3 |
| WD-40 Co. | 68 | 3 |
| * Rite Aid Corp. | 2,384 | 3 |
| Tootsie Roll Industries Inc. | 103 | 3 |
| * Heckmann Corp. | 405 | 2 |
| Cal-Maine Foods Inc. | 71 | 2 |
8
| Vanguard® Russell 3000 Index Fund | ||
| Schedule of Investments | ||
| August 31, 2011 | ||
| Market | ||
| Value | ||
| Shares | ($000) | |
| * Central European Distribution Corp. | 325 | 2 |
| * Prestige Brands Holdings Inc. | 204 | 2 |
| * Winn-Dixie Stores Inc. | 284 | 2 |
| * Chiquita Brands International Inc. | 211 | 2 |
| * Spectrum Brands Holdings Inc. | 81 | 2 |
| Weis Markets Inc. | 55 | 2 |
| Nash Finch Co. | 63 | 2 |
| * Dole Food Co. Inc. | 177 | 2 |
| * Central Garden and Pet Co. Class A | 245 | 2 |
| * Pantry Inc. | 133 | 2 |
| * Smart Balance Inc. | 303 | 2 |
| Spartan Stores Inc. | 89 | 1 |
| * Omega Protein Corp. | 113 | 1 |
| * Alliance One International Inc. | 402 | 1 |
| Inter Parfums Inc. | 76 | 1 |
| * Smart Balance Inc. | 88 | 1 |
| * Star Scientific Inc. | 513 | 1 |
| * Nature's Sunshine Products Inc. | 69 | 1 |
| Calavo Growers Inc. | 59 | 1 |
| * Seneca Foods Corp. Class A | 50 | 1 |
| Ingles Markets Inc. Class A | 75 | 1 |
| Coca-Cola Bottling Co. Consolidated | 20 | 1 |
| * Medifast Inc. | 68 | 1 |
| Imperial Sugar Co. | 116 | 1 |
| * Pilgrim's Pride Corp. | 284 | 1 |
| * USANA Health Sciences Inc. | 38 | 1 |
| * Susser Holdings Corp. | 42 | 1 |
| Limoneira Co. | 50 | 1 |
| * Primo Water Corp. | 123 | 1 |
| * Revlon Inc. Class A | 65 | 1 |
| National Beverage Corp. | 52 | 1 |
| * Synutra International Inc. | 123 | 1 |
| * Craft Brewers Alliance Inc. | 120 | 1 |
| Village Super Market Inc. Class A | 28 | 1 |
| Schiff Nutrition International Inc. | 68 | 1 |
| * Nutraceutical International Corp. | 45 | 1 |
| Griffin Land & Nurseries Inc. | 23 | 1 |
| Oil-Dri Corp. of America | 31 | 1 |
| MGP Ingredients Inc. | 96 | 1 |
| Farmer Bros Co. | 102 | 1 |
| * Harbinger Group Inc. | 126 | 1 |
| * Lifeway Foods Inc. | 54 | 1 |
| Female Health Co. | 130 | 1 |
| Alico Inc. | 25 | 1 |
| Arden Group Inc. | 6 | — |
| 5,489 | ||
| Energy (11.3%) | ||
| Exxon Mobil Corp. | 20,312 | 1,504 |
| Chevron Corp. | 8,289 | 820 |
| Schlumberger Ltd. | 5,583 | 436 |
| ConocoPhillips | 5,815 | 396 |
| Occidental Petroleum Corp. | 3,344 | 290 |
| Halliburton Co. | 3,765 | 167 |
| Apache Corp. | 1,578 | 163 |
| Anadarko Petroleum Corp. | 2,047 | 151 |
| Devon Energy Corp. | 1,741 | 118 |
| National Oilwell Varco Inc. | 1,741 | 115 |
| Baker Hughes Inc. | 1,788 | 109 |
| EOG Resources Inc. | 1,105 | 102 |
| Chesapeake Energy Corp. | 2,705 | 88 |
| Marathon Oil Corp. | 2,930 | 79 |
| Hess Corp. | 1,248 | 74 |
| Spectra Energy Corp. | 2,673 | 69 |
| Williams Cos. Inc. | 2,420 | 65 |
9
| Vanguard® Russell 3000 Index Fund | ||
| Schedule of Investments | ||
| August 31, 2011 | ||
| Market | ||
| Value | ||
| Shares | ($000) | |
| Noble Energy Inc. | 726 | 64 |
| El Paso Corp. | 3,164 | 61 |
| Peabody Energy Corp. | 1,114 | 54 |
| * Southwestern Energy Co. | 1,431 | 54 |
| Marathon Petroleum Corp. | 1,465 | 54 |
| Valero Energy Corp. | 2,346 | 53 |
| * Cameron International Corp. | 1,008 | 52 |
| * FMC Technologies Inc. | 989 | 44 |
| Range Resources Corp. | 662 | 43 |
| Murphy Oil Corp. | 796 | 43 |
| Consol Energy Inc. | 933 | 43 |
| Pioneer Natural Resources Co. | 480 | 38 |
| * Concho Resources Inc. | 426 | 37 |
| EQT Corp. | 554 | 33 |
| Cabot Oil & Gas Corp. | 431 | 33 |
| * Alpha Natural Resources Inc. | 933 | 31 |
| HollyFrontier Corp. | 394 | 28 |
| * Newfield Exploration Co. | 553 | 28 |
| * Denbury Resources Inc. | 1,653 | 26 |
| QEP Resources Inc. | 729 | 26 |
| Cimarex Energy Co. | 352 | 25 |
| * Whiting Petroleum Corp. | 484 | 23 |
| Helmerich & Payne Inc. | 394 | 22 |
| * Nabors Industries Ltd. | 1,183 | 22 |
| Southern Union Co. | 515 | 22 |
| * Ultra Petroleum Corp. | 630 | 21 |
| Core Laboratories NV | 189 | 21 |
| SM Energy Co. | 263 | 20 |
| Oceaneering International Inc. | 426 | 18 |
| Sunoco Inc. | 475 | 18 |
| * Rowan Cos. Inc. | 499 | 18 |
| Arch Coal Inc. | 871 | 18 |
| Kinder Morgan Inc. | 669 | 17 |
| Diamond Offshore Drilling Inc. | 270 | 17 |
| * Plains Exploration & Production Co. | 553 | 16 |
| Patterson-UTI Energy Inc. | 605 | 15 |
| * McDermott International Inc. | 966 | 14 |
| Energen Corp. | 283 | 14 |
| * Tesoro Corp. | 563 | 14 |
| * Brigham Exploration Co. | 458 | 13 |
| * Dresser-Rand Group Inc. | 313 | 13 |
| * Oil States International Inc. | 201 | 13 |
| CARBO Ceramics Inc. | 76 | 12 |
| * SandRidge Energy Inc. | 1,605 | 12 |
| * Superior Energy Services Inc. | 313 | 11 |
| Tidewater Inc. | 204 | 11 |
| World Fuel Services Corp. | 278 | 10 |
| Berry Petroleum Co. Class A | 203 | 10 |
| * CVR Energy Inc. | 346 | 10 |
| * Rosetta Resources Inc. | 209 | 10 |
| * Atwood Oceanics Inc. | 224 | 9 |
| * Continental Resources Inc. | 166 | 9 |
| * Forest Oil Corp. | 468 | 9 |
| * Complete Production Services Inc. | 313 | 9 |
| * Bill Barrett Corp. | 188 | 9 |
| * Dril-Quip Inc. | 137 | 9 |
| * Energy XXI Bermuda Ltd. | 301 | 8 |
| * Unit Corp. | 168 | 8 |
| EXCO Resources Inc. | 594 | 8 |
| SEACOR Holdings Inc. | 87 | 8 |
| Lufkin Industries Inc. | 122 | 8 |
| * Key Energy Services Inc. | 501 | 7 |
| * Helix Energy Solutions Group Inc. | 426 | 7 |
| Bristow Group Inc. | 148 | 7 |
10
| Vanguard® Russell 3000 Index Fund | ||
| Schedule of Investments | ||
| August 31, 2011 | ||
| Market | ||
| Value | ||
| Shares | ($000) | |
| * Oasis Petroleum Inc. | 243 | 6 |
| * Patriot Coal Corp. | 382 | 6 |
| * Stone Energy Corp. | 208 | 6 |
| Golar LNG Ltd. | 166 | 6 |
| * Swift Energy Co. | 177 | 5 |
| * Northern Oil and Gas Inc. | 266 | 5 |
| * McMoRan Exploration Co. | 408 | 5 |
| * Kodiak Oil & Gas Corp. | 870 | 5 |
| * Cloud Peak Energy Inc. | 258 | 5 |
| * Gulfport Energy Corp. | 176 | 5 |
| * Cobalt International Energy Inc. | 507 | 5 |
| * Carrizo Oil & Gas Inc. | 163 | 5 |
| * Quicksilver Resources Inc. | 505 | 5 |
| Teekay Corp. | 165 | 5 |
| RPC Inc. | 170 | 4 |
| * Comstock Resources Inc. | 208 | 4 |
| * Gulfmark Offshore Inc. | 107 | 4 |
| * ION Geophysical Corp. | 588 | 4 |
| * Western Refining Inc. | 236 | 4 |
| * SemGroup Corp. Class A | 164 | 4 |
| * Pioneer Drilling Co. | 275 | 4 |
| Nordic American Tankers Ltd. | 188 | 3 |
| * Tetra Technologies Inc. | 309 | 3 |
| * Exterran Holdings Inc. | 261 | 3 |
| * Clean Energy Fuels Corp. | 233 | 3 |
| * Newpark Resources Inc. | 367 | 3 |
| W&T Offshore Inc. | 143 | 3 |
| Ship Finance International Ltd. | 188 | 3 |
| Contango Oil & Gas Co. | 49 | 3 |
| * Resolute Energy Corp. | 219 | 3 |
| Apco Oil and Gas International Inc. | 37 | 3 |
| * Cheniere Energy Inc. | 375 | 3 |
| * Hyperdynamics Corp. | 638 | 3 |
| * Parker Drilling Co. | 485 | 3 |
| * ATP Oil & Gas Corp. | 192 | 3 |
| * Hornbeck Offshore Services Inc. | 103 | 3 |
| * Petroleum Development Corp. | 101 | 2 |
| Crosstex Energy Inc. | 205 | 2 |
| * Tesco Corp. | 138 | 2 |
| * Hercules Offshore Inc. | 535 | 2 |
| * Basic Energy Services Inc. | 102 | 2 |
| Targa Resources Corp. | 74 | 2 |
| * Petroquest Energy Inc. | 290 | 2 |
| * Rex Energy Corp. | 173 | 2 |
| Overseas Shipholding Group Inc. | 118 | 2 |
| * Global Industries Ltd. | 474 | 2 |
| * Georesources Inc. | 89 | 2 |
| * Kosmos Energy Ltd. | 148 | 2 |
| * Harvest Natural Resources Inc. | 179 | 2 |
| * Energy Partners Ltd. | 151 | 2 |
| Knightsbridge Tankers Ltd. | 109 | 2 |
| * Goodrich Petroleum Corp. | 122 | 2 |
| * Magnum Hunter Resources Corp. | 433 | 2 |
| Frontline Ltd. | 248 | 2 |
| * Clayton Williams Energy Inc. | 33 | 2 |
| Gulf Island Fabrication Inc. | 76 | 2 |
| * James River Coal Co. | 169 | 2 |
| * Approach Resources Inc. | 97 | 2 |
| Penn Virginia Corp. | 215 | 2 |
| * Amyris Inc. | 86 | 2 |
| * FX Energy Inc. | 272 | 2 |
| * Venoco Inc. | 143 | 2 |
| * Endeavour International Corp. | 167 | 2 |
| Houston American Energy Corp. | 88 | 2 |
11
| Vanguard® Russell 3000 Index Fund | ||
| Schedule of Investments | ||
| August 31, 2011 | ||
| Market | ||
| Value | ||
| Shares | ($000) | |
| * BPZ Resources Inc. | 411 | 2 |
| * OYO Geospace Corp. | 20 | 2 |
| * USEC Inc. | 659 | 1 |
| Teekay Tankers Ltd. Class A | 220 | 1 |
| * PHI Inc. | 63 | 1 |
| * Cal Dive International Inc. | 487 | 1 |
| * Matrix Service Co. | 125 | 1 |
| * Vaalco Energy Inc. | 213 | 1 |
| * Triangle Petroleum Corp. | 246 | 1 |
| Delek US Holdings Inc. | 90 | 1 |
| * Dawson Geophysical Co. | 38 | 1 |
| * Gastar Exploration Ltd. | 310 | 1 |
| * Vantage Drilling Co. | 827 | 1 |
| * Abraxas Petroleum Corp. | 340 | 1 |
| * Rentech Inc. | 1,236 | 1 |
| * GMX Resources Inc. | 426 | 1 |
| * Green Plains Renewable Energy Inc. | 114 | 1 |
| * Willbros Group Inc. | 184 | 1 |
| * Scorpio Tankers Inc. | 172 | 1 |
| * Miller Energy Resources Inc. | 322 | 1 |
| * Warren Resources Inc. | 339 | 1 |
| * Mitcham Industries Inc. | 65 | 1 |
| * Uranium Energy Corp. | 308 | 1 |
| * Global Geophysical Services Inc. | 87 | 1 |
| * Uranerz Energy Corp. | 441 | 1 |
| DHT Holdings Inc. | 346 | 1 |
| Panhandle Oil and Gas Inc. Class A | 36 | 1 |
| * Callon Petroleum Co. | 172 | 1 |
| * Ur-Energy Inc. | 765 | 1 |
| * Voyager Oil & Gas Inc. | 347 | 1 |
| * Syntroleum Corp. | 777 | 1 |
| * Natural Gas Services Group Inc. | 70 | 1 |
| * Union Drilling Inc. | 105 | 1 |
| * C&J Energy Services Inc. | 34 | 1 |
| * Uranium Resources Inc. | 742 | 1 |
| * Westmoreland Coal Co. | 79 | 1 |
| * Geokinetics Inc. | 170 | 1 |
| * Solazyme Inc. | 52 | 1 |
| * Crimson Exploration Inc. | 281 | 1 |
| * RigNet Inc. | 47 | 1 |
| * Zion Oil & Gas Inc. | 253 | 1 |
| * REX American Resources Corp. | 42 | 1 |
| * L&L Energy Inc. | 183 | 1 |
| * Gevo Inc. | 59 | 1 |
| Alon USA Energy Inc. | 66 | 1 |
| General Maritime Corp. | 1,471 | 1 |
| * Isramco Inc. | 9 | 1 |
| * Evolution Petroleum Corp. | 88 | 1 |
| Hallador Energy Co. | 64 | 1 |
| CAMAC Energy Inc. | 625 | 1 |
| * * Atlas Energy Inc. Escrow | 199 | — |
| 6,441 | ||
| Financials (15.3%) | ||
| JPMorgan Chase & Co. | 16,384 | 615 |
| Wells Fargo & Co. | 20,282 | 529 |
| * Berkshire Hathaway Inc. Class B | 7,218 | 527 |
| Citigroup Inc. | 11,954 | 371 |
| Bank of America Corp. | 41,682 | 341 |
| Goldman Sachs Group Inc. | 2,130 | 248 |
| American Express Co. | 4,322 | 215 |
| US Bancorp | 7,926 | 184 |
| Simon Property Group Inc. | 1,208 | 142 |
| MetLife Inc. | 3,379 | 114 |
12
| Vanguard® Russell 3000 Index Fund | ||
| Schedule of Investments | ||
| August 31, 2011 | ||
| Market | ||
| Value | ||
| Shares | ($000) | |
| Morgan Stanley | 6,369 | 111 |
| PNC Financial Services Group Inc. | 2,166 | 109 |
| Bank of New York Mellon Corp. | 5,109 | 106 |
| Prudential Financial Inc. | 2,000 | 100 |
| ACE Ltd. | 1,389 | 90 |
| Capital One Financial Corp. | 1,889 | 87 |
| Travelers Cos. Inc. | 1,723 | 87 |
| Chubb Corp. | 1,204 | 74 |
| Equity Residential | 1,212 | 74 |
| CME Group Inc. | 277 | 74 |
| State Street Corp. | 2,074 | 74 |
| Aflac Inc. | 1,925 | 73 |
| Public Storage | 578 | 71 |
| Franklin Resources Inc. | 596 | 71 |
| Annaly Capital Management Inc. | 3,913 | 71 |
| Marsh & McLennan Cos. Inc. | 2,257 | 67 |
| Vornado Realty Trust | 758 | 65 |
| BB&T Corp. | 2,865 | 64 |
| AON Corp. | 1,360 | 64 |
| Boston Properties Inc. | 600 | 63 |
| HCP Inc. | 1,671 | 62 |
| BlackRock Inc. | 353 | 58 |
| T Rowe Price Group Inc. | 1,069 | 57 |
| Discover Financial Services | 2,244 | 56 |
| Allstate Corp. | 2,152 | 56 |
| Ventas Inc. | 1,043 | 56 |
| AvalonBay Communities Inc. | 388 | 53 |
| Progressive Corp. | 2,698 | 52 |
| ProLogis Inc. | 1,888 | 51 |
| Charles Schwab Corp. | 4,130 | 51 |
| Loews Corp. | 1,304 | 49 |
| American International Group Inc. | 1,818 | 46 |
| Ameriprise Financial Inc. | 997 | 46 |
| SunTrust Banks Inc. | 2,209 | 44 |
| Fifth Third Bancorp | 3,780 | 40 |
| Weyerhaeuser Co. | 2,216 | 40 |
| M&T Bank Corp. | 517 | 39 |
| Health Care REIT Inc. | 728 | 37 |
| * IntercontinentalExchange Inc. | 303 | 36 |
| Hartford Financial Services Group Inc. | 1,832 | 35 |
| Invesco Ltd. | 1,901 | 35 |
| Northern Trust Corp. | 894 | 34 |
| Principal Financial Group Inc. | 1,322 | 33 |
| Host Hotels & Resorts Inc. | 2,823 | 33 |
| General Growth Properties Inc. | 2,325 | 32 |
| Unum Group | 1,270 | 30 |
| SLM Corp. | 2,175 | 30 |
| Kimco Realty Corp. | 1,678 | 30 |
| NYSE Euronext | 1,080 | 29 |
| * CIT Group Inc. | 825 | 28 |
| Lincoln National Corp. | 1,290 | 27 |
| XL Group plc Class A | 1,276 | 27 |
| Macerich Co. | 541 | 27 |
| KeyCorp | 3,912 | 26 |
| Moody's Corp. | 823 | 25 |
| Plum Creek Timber Co. Inc. | 668 | 25 |
| Leucadia National Corp. | 815 | 24 |
| SL Green Realty Corp. | 334 | 24 |
| UDR Inc. | 897 | 24 |
| Digital Realty Trust Inc. | 393 | 23 |
| Regions Financial Corp. | 5,169 | 23 |
| Federal Realty Investment Trust | 257 | 23 |
| New York Community Bancorp Inc. | 1,800 | 23 |
| Comerica Inc. | 827 | 21 |
13
| Vanguard® Russell 3000 Index Fund | ||
| Schedule of Investments | ||
| August 31, 2011 | ||
| Market | ||
| Value | ||
| Shares | ($000) | |
| Rayonier Inc. | 502 | 21 |
| American Capital Agency Corp. | 737 | 21 |
| Camden Property Trust | 275 | 18 |
| Essex Property Trust Inc. | 128 | 18 |
| * CB Richard Ellis Group Inc. Class A | 1,202 | 18 |
| Huntington Bancshares Inc. | 3,553 | 18 |
| * Affiliated Managers Group Inc. | 204 | 18 |
| Alexandria Real Estate Equities Inc. | 242 | 18 |
| * Arch Capital Group Ltd. | 517 | 17 |
| People's United Financial Inc. | 1,475 | 17 |
| Realty Income Corp. | 497 | 17 |
| Torchmark Corp. | 447 | 17 |
| Legg Mason Inc. | 582 | 17 |
| * MSCI Inc. Class A | 471 | 16 |
| Cincinnati Financial Corp. | 573 | 16 |
| PartnerRe Ltd. | 279 | 16 |
| Reinsurance Group of America Inc. Class A | 290 | 15 |
| * Markel Corp. | 39 | 15 |
| Liberty Property Trust | 451 | 15 |
| Fidelity National Financial Inc. Class A | 874 | 15 |
| BRE Properties Inc. | 293 | 15 |
| Axis Capital Holdings Ltd. | 507 | 15 |
| Everest Re Group Ltd. | 180 | 15 |
| Regency Centers Corp. | 352 | 14 |
| Senior Housing Properties Trust | 601 | 14 |
| * Genworth Financial Inc. Class A | 2,018 | 14 |
| WR Berkley Corp. | 447 | 14 |
| Lazard Ltd. Class A | 457 | 13 |
| Assurant Inc. | 379 | 13 |
| RenaissanceRe Holdings Ltd. | 203 | 13 |
| Zions Bancorporation | 756 | 13 |
| TD Ameritrade Holding Corp. | 857 | 13 |
| HCC Insurance Holdings Inc. | 446 | 13 |
| Piedmont Office Realty Trust Inc. Class A | 677 | 13 |
| First Niagara Financial Group Inc. | 1,188 | 13 |
| * E*Trade Financial Corp. | 1,033 | 13 |
| Taubman Centers Inc. | 219 | 13 |
| Apartment Investment & Management Co. | 468 | 12 |
| Transatlantic Holdings Inc. | 245 | 12 |
| Arthur J Gallagher & Co. | 433 | 12 |
| Ares Capital Corp. | 802 | 12 |
| Chimera Investment Corp. | 4,021 | 12 |
| Hudson City Bancorp Inc. | 1,948 | 12 |
| * American Capital Ltd. | 1,380 | 12 |
| Eaton Vance Corp. | 489 | 12 |
| Jones Lang LaSalle Inc. | 178 | 12 |
| Duke Realty Corp. | 989 | 12 |
| Weingarten Realty Investors | 473 | 12 |
| * NASDAQ OMX Group Inc. | 485 | 11 |
| Commerce Bancshares Inc. | 290 | 11 |
| Hospitality Properties Trust | 484 | 11 |
| Raymond James Financial Inc. | 400 | 11 |
| White Mountains Insurance Group Ltd. | 28 | 11 |
| Cullen/Frost Bankers Inc. | 209 | 11 |
| Mack-Cali Realty Corp. | 341 | 11 |
| Waddell & Reed Financial Inc. Class A | 339 | 11 |
| * Signature Bank | 190 | 11 |
| Developers Diversified Realty Corp. | 847 | 10 |
| American Financial Group Inc. | 315 | 10 |
| MFA Financial Inc. | 1,394 | 10 |
| American Campus Communities Inc. | 266 | 10 |
| Mid-America Apartment Communities Inc. | 145 | 10 |
| Home Properties Inc. | 154 | 10 |
| Old Republic International Corp. | 1,016 | 10 |
14
| Vanguard® Russell 3000 Index Fund | ||
| Schedule of Investments | ||
| August 31, 2011 | ||
| Market | ||
| Value | ||
| Shares | ($000) | |
| SEI Investments Co. | 573 | 10 |
| Assured Guaranty Ltd. | 726 | 10 |
| East West Bancorp Inc. | 584 | 10 |
| Brown & Brown Inc. | 458 | 10 |
| Tanger Factory Outlet Centers | 339 | 10 |
| BioMed Realty Trust Inc. | 517 | 9 |
| Hancock Holding Co. | 302 | 9 |
| Highwoods Properties Inc. | 286 | 9 |
| National Retail Properties Inc. | 336 | 9 |
| Jefferies Group Inc. | 556 | 9 |
| * ProAssurance Corp. | 123 | 9 |
| Douglas Emmett Inc. | 491 | 9 |
| * Popular Inc. | 4,210 | 9 |
| CBL & Associates Properties Inc. | 587 | 9 |
| Equity Lifestyle Properties Inc. | 122 | 8 |
| Invesco Mortgage Capital Inc. | 476 | 8 |
| Post Properties Inc. | 199 | 8 |
| City National Corp. | 185 | 8 |
| Kilroy Realty Corp. | 232 | 8 |
| Hatteras Financial Corp. | 298 | 8 |
| Erie Indemnity Co. Class A | 111 | 8 |
| CapitalSource Inc. | 1,283 | 8 |
| Washington Real Estate Investment Trust | 262 | 8 |
| Alleghany Corp. | 27 | 8 |
| Extra Space Storage Inc. | 374 | 8 |
| Valley National Bancorp | 676 | 8 |
| Bank of Hawaii Corp. | 191 | 8 |
| Validus Holdings Ltd. | 307 | 8 |
| * SVB Financial Group | 172 | 8 |
| Allied World Assurance Co. Holdings AG | 152 | 8 |
| Entertainment Properties Trust | 187 | 8 |
| Corporate Office Properties Trust | 285 | 8 |
| First Horizon National Corp. | 1,084 | 8 |
| Associated Banc-Corp | 693 | 8 |
| * First Republic Bank | 293 | 7 |
| Alterra Capital Holdings Ltd. | 363 | 7 |
| Omega Healthcare Investors Inc. | 407 | 7 |
| Fulton Financial Corp. | 800 | 7 |
| * Forest City Enterprises Inc. Class A | 549 | 7 |
| Capitol Federal Financial Inc. | 670 | 7 |
| Apollo Investment Corp. | 787 | 7 |
| Prosperity Bancshares Inc. | 189 | 7 |
| Colonial Properties Trust | 336 | 7 |
| Starwood Property Trust Inc. | 376 | 7 |
| CommonWealth REIT | 337 | 7 |
| Aspen Insurance Holdings Ltd. | 284 | 7 |
| Washington Federal Inc. | 449 | 7 |
| Cash America International Inc. | 120 | 7 |
| TCF Financial Corp. | 642 | 7 |
| Protective Life Corp. | 347 | 7 |
| Hanover Insurance Group Inc. | 185 | 7 |
| * Stifel Financial Corp. | 218 | 7 |
| LaSalle Hotel Properties | 348 | 7 |
| Federated Investors Inc. Class B | 366 | 6 |
| First American Financial Corp. | 425 | 6 |
| * Ezcorp Inc. Class A | 191 | 6 |
| * First Cash Financial Services Inc. | 129 | 6 |
| Endurance Specialty Holdings Ltd. | 166 | 6 |
| * CNO Financial Group Inc. | 915 | 6 |
| Trustmark Corp. | 266 | 6 |
| Janus Capital Group Inc. | 776 | 6 |
| DuPont Fabros Technology Inc. | 243 | 6 |
| FirstMerit Corp. | 448 | 6 |
| Potlatch Corp. | 166 | 6 |
15
| Vanguard® Russell 3000 Index Fund | ||
| Schedule of Investments | ||
| August 31, 2011 | ||
| Market | ||
| Value | ||
| Shares | ($000) | |
| CBOE Holdings Inc. | 220 | 6 |
| Two Harbors Investment Corp. | 577 | 5 |
| Brandywine Realty Trust | 555 | 5 |
| Webster Financial Corp. | 302 | 5 |
| * Knight Capital Group Inc. Class A | 423 | 5 |
| StanCorp Financial Group Inc. | 178 | 5 |
| Iberiabank Corp. | 112 | 5 |
| DiamondRock Hospitality Co. | 692 | 5 |
| Healthcare Realty Trust Inc. | 306 | 5 |
| BOK Financial Corp. | 108 | 5 |
| Westamerica Bancorporation | 125 | 5 |
| * Portfolio Recovery Associates Inc. | 72 | 5 |
| UMB Financial Corp. | 135 | 5 |
| * St. Joe Co. | 278 | 5 |
| Medical Properties Trust Inc. | 475 | 5 |
| RLI Corp. | 80 | 5 |
| Platinum Underwriters Holdings Ltd. | 160 | 5 |
| Delphi Financial Group Inc. | 206 | 5 |
| Northwest Bancshares Inc. | 416 | 5 |
| Kemper Corp. | 193 | 5 |
| National Health Investors Inc. | 107 | 5 |
| Synovus Financial Corp. | 3,365 | 5 |
| Sovran Self Storage Inc. | 120 | 5 |
| * Howard Hughes Corp. | 90 | 5 |
| Umpqua Holdings Corp. | 494 | 5 |
| DCT Industrial Trust Inc. | 1,062 | 5 |
| Wintrust Financial Corp. | 151 | 5 |
| EastGroup Properties Inc. | 118 | 5 |
| FNB Corp. | 529 | 5 |
| U-Store-It Trust | 437 | 5 |
| Cypress Sharpridge Investments Inc. | 351 | 5 |
| Montpelier Re Holdings Ltd. | 271 | 5 |
| Mercury General Corp. | 117 | 5 |
| * PHH Corp. | 242 | 5 |
| * MBIA Inc. | 591 | 5 |
| Greenhill & Co. Inc. | 128 | 5 |
| * Ocwen Financial Corp. | 329 | 5 |
| Capstead Mortgage Corp. | 339 | 4 |
| Cathay General Bancorp | 348 | 4 |
| PS Business Parks Inc. | 81 | 4 |
| * LPL Investment Holdings Inc. | 151 | 4 |
| Redwood Trust Inc. | 345 | 4 |
| Equity One Inc. | 237 | 4 |
| * Texas Capital Bancshares Inc. | 166 | 4 |
| United Bankshares Inc. | 186 | 4 |
| Franklin Street Properties Corp. | 317 | 4 |
| * World Acceptance Corp. | 63 | 4 |
| Prospect Capital Corp. | 464 | 4 |
| Community Bank System Inc. | 161 | 4 |
| MB Financial Inc. | 245 | 4 |
| Glimcher Realty Trust | 459 | 4 |
| Alexander's Inc. | 9 | 4 |
| Lexington Realty Trust | 523 | 4 |
| * DFC Global Corp. | 171 | 4 |
| MarketAxess Holdings Inc. | 128 | 4 |
| BancorpSouth Inc. | 331 | 4 |
| First Financial Bancorp | 230 | 4 |
| First Financial Bankshares Inc. | 124 | 4 |
| Pebblebrook Hotel Trust | 227 | 4 |
| Old National Bancorp | 371 | 4 |
| Government Properties Income Trust | 155 | 4 |
| National Penn Bancshares Inc. | 497 | 4 |
| * First Industrial Realty Trust Inc. | 381 | 4 |
| Sun Communities Inc. | 93 | 4 |
16
| Vanguard® Russell 3000 Index Fund | ||
| Schedule of Investments | ||
| August 31, 2011 | ||
| Market | ||
| Value | ||
| Shares | ($000) | |
| Anworth Mortgage Asset Corp. | 495 | 4 |
| Tower Group Inc. | 148 | 4 |
| * MF Global Holdings Ltd. | 643 | 4 |
| Astoria Financial Corp. | 344 | 3 |
| First Citizens BancShares Inc. Class A | 22 | 3 |
| Susquehanna Bancshares Inc. | 520 | 3 |
| * Financial Engines Inc. | 155 | 3 |
| Acadia Realty Trust | 161 | 3 |
| Solar Capital Ltd. | 146 | 3 |
| Glacier Bancorp Inc. | 290 | 3 |
| International Bancshares Corp. | 213 | 3 |
| * Strategic Hotels & Resorts Inc. | 697 | 3 |
| LTC Properties Inc. | 123 | 3 |
| Fifth Street Finance Corp. | 329 | 3 |
| Selective Insurance Group Inc. | 214 | 3 |
| BankUnited Inc. | 137 | 3 |
| CVB Financial Corp. | 364 | 3 |
| Associated Estates Realty Corp. | 176 | 3 |
| Provident Financial Services Inc. | 244 | 3 |
| Argo Group International Holdings Ltd. | 110 | 3 |
| Oritani Financial Corp. | 229 | 3 |
| * Sunstone Hotel Investors Inc. | 493 | 3 |
| * Green Dot Corp. Class A | 91 | 3 |
| Cohen & Steers Inc. | 76 | 3 |
| Symetra Financial Corp. | 273 | 3 |
| NBT Bancorp Inc. | 142 | 3 |
| * Enstar Group Ltd. | 28 | 3 |
| * TFS Financial Corp. | 325 | 3 |
| Primerica Inc. | 138 | 3 |
| Park National Corp. | 52 | 3 |
| * Investors Bancorp Inc. | 198 | 3 |
| Walter Investment Management Corp. | 114 | 3 |
| * iStar Financial Inc. | 390 | 3 |
| Cousins Properties Inc. | 378 | 3 |
| Education Realty Trust Inc. | 302 | 3 |
| American Assets Trust Inc. | 135 | 3 |
| First Potomac Realty Trust | 209 | 3 |
| Infinity Property & Casualty Corp. | 53 | 3 |
| Columbia Banking System Inc. | 165 | 3 |
| First Midwest Bancorp Inc. | 307 | 3 |
| CNA Financial Corp. | 110 | 3 |
| * Greenlight Capital Re Ltd. Class A | 119 | 3 |
| Inland Real Estate Corp. | 322 | 3 |
| Evercore Partners Inc. Class A | 99 | 3 |
| Investors Real Estate Trust | 330 | 3 |
| Bank of the Ozarks Inc. | 111 | 2 |
| American Equity Investment Life Holding Co. | 248 | 2 |
| * Navigators Group Inc. | 55 | 2 |
| Amtrust Financial Services Inc. | 101 | 2 |
| ARMOUR Residential REIT Inc. | 325 | 2 |
| Pennsylvania Real Estate Investment Trust | 234 | 2 |
| * National Financial Partners Corp. | 188 | 2 |
| Compass Diversified Holdings | 172 | 2 |
| Horace Mann Educators Corp. | 177 | 2 |
| Interactive Brokers Group Inc. | 157 | 2 |
| * Pico Holdings Inc. | 100 | 2 |
| Home Bancshares Inc. | 99 | 2 |
| American National Insurance Co. | 31 | 2 |
| Nelnet Inc. Class A | 121 | 2 |
| optionsXpress Holdings Inc. | 183 | 2 |
| Brookline Bancorp Inc. | 272 | 2 |
| Meadowbrook Insurance Group Inc. | 244 | 2 |
| Radian Group Inc. | 683 | 2 |
| Independent Bank Corp. | 95 | 2 |
17
| Vanguard® Russell 3000 Index Fund | ||
| Schedule of Investments | ||
| August 31, 2011 | ||
| Market | ||
| Value | ||
| Shares | ($000) | |
| Oriental Financial Group Inc. | 204 | 2 |
| S&T Bancorp Inc. | 121 | 2 |
| KBW Inc. | 153 | 2 |
| Employers Holdings Inc. | 183 | 2 |
| Retail Opportunity Investments Corp. | 199 | 2 |
| Colony Financial Inc. | 144 | 2 |
| * Investment Technology Group Inc. | 195 | 2 |
| City Holding Co. | 73 | 2 |
| Boston Private Financial Holdings Inc. | 354 | 2 |
| PennyMac Mortgage Investment Trust | 129 | 2 |
| WesBanco Inc. | 113 | 2 |
| Safety Insurance Group Inc. | 56 | 2 |
| PacWest Bancorp | 136 | 2 |
| Hersha Hospitality Trust Class A | 586 | 2 |
| Banco Latinoamericano de Comercio Exterior SA | 130 | 2 |
| First Commonwealth Financial Corp. | 475 | 2 |
| CreXus Investment Corp. | 228 | 2 |
| * Forestar Group Inc. | 168 | 2 |
| BlackRock Kelso Capital Corp. | 239 | 2 |
| PrivateBancorp Inc. Class A | 236 | 2 |
| Universal Health Realty Income Trust | 56 | 2 |
| * Pinnacle Financial Partners Inc. | 164 | 2 |
| * Credit Acceptance Corp. | 30 | 2 |
| * FelCor Lodging Trust Inc. | 604 | 2 |
| Newcastle Investment Corp. | 374 | 2 |
| Getty Realty Corp. | 108 | 2 |
| Berkshire Hills Bancorp Inc. | 95 | 2 |
| Chemical Financial Corp. | 118 | 2 |
| PennantPark Investment Corp. | 199 | 2 |
| Maiden Holdings Ltd. | 239 | 2 |
| Sandy Spring Bancorp Inc. | 124 | 2 |
| * MGIC Investment Corp. | 773 | 2 |
| BGC Partners Inc. Class A | 303 | 2 |
| * Western Alliance Bancorp | 326 | 2 |
| * State Bank Financial Corp. | 140 | 2 |
| Simmons First National Corp. Class A | 86 | 2 |
| Advance America Cash Advance Centers Inc. | 234 | 2 |
| * ICG Group Inc. | 190 | 2 |
| Ramco-Gershenson Properties Trust | 187 | 2 |
| SCBT Financial Corp. | 69 | 2 |
| Urstadt Biddle Properties Inc. Class A | 115 | 2 |
| Hercules Technology Growth Capital Inc. | 201 | 2 |
| * Piper Jaffray Cos. | 80 | 2 |
| ViewPoint Financial Group | 158 | 2 |
| Flushing Financial Corp. | 165 | 2 |
| Flagstone Reinsurance Holdings SA | 266 | 2 |
| Harleysville Group Inc. | 65 | 2 |
| Trustco Bank Corp. NY | 399 | 2 |
| Main Street Capital Corp. | 99 | 2 |
| * Safeguard Scientifics Inc. | 115 | 2 |
| MCG Capital Corp. | 386 | 2 |
| * Tejon Ranch Co. | 67 | 2 |
| First Busey Corp. | 368 | 2 |
| Ashford Hospitality Trust Inc. | 221 | 2 |
| Excel Trust Inc. | 166 | 2 |
| Dime Community Bancshares Inc. | 147 | 2 |
| * Sterling Financial Corp. | 126 | 2 |
| RLJ Lodging Trust | 133 | 2 |
| Duff & Phelps Corp. Class A | 155 | 2 |
| NorthStar Realty Finance Corp. | 458 | 2 |
| * Hilltop Holdings Inc. | 221 | 2 |
| * FPIC Insurance Group Inc. | 40 | 2 |
| Chesapeake Lodging Trust | 130 | 2 |
| Dynex Capital Inc. | 181 | 2 |
18
| Vanguard® Russell 3000 Index Fund | ||
| Schedule of Investments | ||
| August 31, 2011 | ||
| Market | ||
| Value | ||
| Shares | ($000) | |
| Triangle Capital Corp. | 99 | 2 |
| * HFF Inc. Class A | 140 | 2 |
| Winthrop Realty Trust | 159 | 2 |
| Resource Capital Corp. | 299 | 2 |
| Sabra Healthcare REIT Inc. | 138 | 2 |
| Campus Crest Communities Inc. | 136 | 2 |
| Rockville Financial Inc. | 166 | 2 |
| Monmouth Real Estate Investment Corp. Class A | 194 | 2 |
| CapLease Inc. | 394 | 2 |
| 1st Source Corp. | 68 | 2 |
| Lakeland Financial Corp. | 71 | 2 |
| United Fire & Casualty Co. | 85 | 2 |
| * Encore Capital Group Inc. | 65 | 2 |
| * Virtus Investment Partners Inc. | 25 | 2 |
| * AMERISAFE Inc. | 77 | 1 |
| First Financial Corp. | 49 | 1 |
| GAMCO Investors Inc. | 31 | 1 |
| National Western Life Insurance Co. Class A | 10 | 1 |
| Artio Global Investors Inc. Class A | 164 | 1 |
| FBL Financial Group Inc. Class A | 51 | 1 |
| Washington Trust Bancorp Inc. | 68 | 1 |
| Hudson Pacific Properties Inc. | 105 | 1 |
| Southside Bancshares Inc. | 73 | 1 |
| OneBeacon Insurance Group Ltd. Class A | 101 | 1 |
| * eHealth Inc. | 110 | 1 |
| Tompkins Financial Corp. | 36 | 1 |
| Banner Corp. | 90 | 1 |
| Community Trust Bancorp Inc. | 55 | 1 |
| * NewStar Financial Inc. | 134 | 1 |
| Renasant Corp. | 99 | 1 |
| * Intl. FCStone Inc. | 58 | 1 |
| United Financial Bancorp Inc. | 87 | 1 |
| Agree Realty Corp. | 60 | 1 |
| Territorial Bancorp Inc. | 66 | 1 |
| Capital Southwest Corp. | 15 | 1 |
| Cardinal Financial Corp. | 136 | 1 |
| Kennedy-Wilson Holdings Inc. | 115 | 1 |
| Bancfirst Corp. | 37 | 1 |
| TowneBank | 112 | 1 |
| * West Coast Bancorp | 89 | 1 |
| * Global Indemnity plc | 71 | 1 |
| Northfield Bancorp Inc | 97 | 1 |
| MVC Capital Inc. | 110 | 1 |
| Federal Agricultural Mortgage Corp. | 64 | 1 |
| * Citizens Inc. | 189 | 1 |
| Hudson Valley Holding Corp. | 66 | 1 |
| * Cowen Group Inc. Class A | 366 | 1 |
| Coresite Realty Corp. | 79 | 1 |
| TICC Capital Corp. | 133 | 1 |
| StellarOne Corp. | 108 | 1 |
| Tower Bancorp Inc. | 53 | 1 |
| Apollo Commercial Real Estate Finance Inc. | 84 | 1 |
| * Beneficial Mutual Bancorp Inc. | 161 | 1 |
| * Ameris Bancorp | 135 | 1 |
| GFI Group Inc. | 284 | 1 |
| Saul Centers Inc. | 35 | 1 |
| * Doral Financial Corp. | 758 | 1 |
| Sterling Bancorp | 144 | 1 |
| Westfield Financial Inc. | 162 | 1 |
| Bryn Mawr Bank Corp. | 64 | 1 |
| Kite Realty Group Trust | 283 | 1 |
| FXCM Inc. Class A | 103 | 1 |
| Heartland Financial USA Inc. | 80 | 1 |
| SY Bancorp Inc. | 60 | 1 |
19
| Vanguard® Russell 3000 Index Fund | ||
| Schedule of Investments | ||
| August 31, 2011 | ||
| Market | ||
| Value | ||
| Shares | ($000) | |
| Oppenheimer Holdings Inc. Class A | 60 | 1 |
| * Eagle Bancorp Inc. | 96 | 1 |
| * Nara Bancorp Inc. | 167 | 1 |
| Univest Corp. of Pennsylvania | 84 | 1 |
| Parkway Properties Inc. | 87 | 1 |
| Westwood Holdings Group Inc. | 34 | 1 |
| Diamond Hill Investment Group Inc. | 16 | 1 |
| First Merchants Corp. | 154 | 1 |
| Calamos Asset Management Inc. Class A | 99 | 1 |
| First of Long Island Corp. | 49 | 1 |
| Trico Bancshares | 86 | 1 |
| Camden National Corp. | 41 | 1 |
| German American Bancorp Inc. | 73 | 1 |
| Centerstate Banks Inc. | 193 | 1 |
| Fox Chase Bancorp Inc. | 89 | 1 |
| * Bancorp Inc. | 145 | 1 |
| * Phoenix Cos. Inc. | 589 | 1 |
| Great Southern Bancorp Inc. | 64 | 1 |
| Enterprise Financial Services Corp. | 76 | 1 |
| WSFS Financial Corp. | 32 | 1 |
| * Center Financial Corp. | 202 | 1 |
| Cogdell Spencer Inc. | 261 | 1 |
| Arrow Financial Corp. | 47 | 1 |
| Abington Bancorp Inc. | 127 | 1 |
| STAG Industrial Inc. | 102 | 1 |
| * Central Pacific Financial Corp. | 90 | 1 |
| * Wilshire Bancorp Inc. | 349 | 1 |
| First Interstate Bancsystem Inc. | 88 | 1 |
| Epoch Holding Corp. | 72 | 1 |
| Financial Institutions Inc. | 67 | 1 |
| Cedar Shopping Centers Inc. | 285 | 1 |
| Provident New York Bancorp | 162 | 1 |
| * Franklin Financial Corp. | 89 | 1 |
| CoBiz Financial Inc. | 180 | 1 |
| Union First Market Bankshares Corp. | 93 | 1 |
| Citizens & Northern Corp. | 62 | 1 |
| Presidential Life Corp. | 105 | 1 |
| * American Safety Insurance Holdings Ltd. | 53 | 1 |
| * United Community Banks Inc. | 97 | 1 |
| * Netspend Holdings Inc. | 169 | 1 |
| State Auto Financial Corp. | 71 | 1 |
| Bank of Marin Bancorp | 28 | 1 |
| Baldwin & Lyons Inc. | 43 | 1 |
| Bank of Kentucky Financial Corp. | 43 | 1 |
| First Community Bancshares Inc. | 81 | 1 |
| National Bankshares Inc. | 37 | 1 |
| Gladstone Capital Corp. | 118 | 1 |
| Republic Bancorp Inc. Class A | 53 | 1 |
| Gladstone Commercial Corp. | 57 | 1 |
| * Seacoast Banking Corp. of Florida | 555 | 1 |
| Kohlberg Capital Corp. | 143 | 1 |
| Lakeland Bancorp Inc. | 110 | 1 |
| * First Defiance Financial Corp. | 68 | 1 |
| Heritage Financial Corp. | 79 | 1 |
| One Liberty Properties Inc. | 59 | 1 |
| RAIT Financial Trust | 236 | 1 |
| OceanFirst Financial Corp. | 77 | 1 |
| Summit Hotel Properties Inc. | 110 | 1 |
| * Flagstar Bancorp Inc. | 1,482 | 1 |
| * Pacific Capital Bancorp NA | 33 | 1 |
| SeaBright Holdings Inc. | 143 | 1 |
| * Park Sterling Corp. | 219 | 1 |
| Chatham Lodging Trust | 89 | 1 |
| Center Bancorp Inc. | 93 | 1 |
20
| Vanguard® Russell 3000 Index Fund | ||
| Schedule of Investments | ||
| August 31, 2011 | ||
| Market | ||
| Value | ||
| Shares | ($000) | |
| First Bancorp | 91 | 1 |
| * 1st United Bancorp Inc. | 164 | 1 |
| * Nicholas Financial Inc. | 79 | 1 |
| Washington Banking Co. | 79 | 1 |
| NGP Capital Resources Co. | 123 | 1 |
| Solar Senior Capital Ltd. | 52 | 1 |
| * Sun Bancorp Inc. | 293 | 1 |
| Crawford & Co. Class B | 119 | 1 |
| * Imperial Holdings Inc. | 114 | 1 |
| MainSource Financial Group Inc. | 94 | 1 |
| * Hampton Roads Bankshares Inc. | 106 | 1 |
| First Pactrust Bancorp Inc. | 70 | 1 |
| New Mountain Finance Corp. | 65 | 1 |
| * Walker & Dunlop Inc. | 70 | 1 |
| * Southwest Bancorp Inc. | 159 | 1 |
| * Cascade Bancorp | 81 | 1 |
| Medley Capital Corp. | 76 | 1 |
| * Cape Bancorp Inc. | 98 | 1 |
| * Bridge Capital Holdings | 79 | 1 |
| Enterprise Bancorp Inc. | 57 | 1 |
| Whitestone REIT Class B | 69 | 1 |
| * Heritage Commerce Corp. | 186 | 1 |
| * Ladenburg Thalmann Financial Services Inc. | 505 | 1 |
| Charter Financial Corp. | 83 | 1 |
| West Bancorporation Inc. | 84 | 1 |
| Penns Woods Bancorp Inc. | 21 | 1 |
| Merchants Bancshares Inc. | 27 | 1 |
| National Interstate Corp. | 32 | 1 |
| CNB Financial Corp. | 54 | 1 |
| * OmniAmerican Bancorp Inc. | 50 | 1 |
| Medallion Financial Corp. | 72 | 1 |
| Kansas City Life Insurance Co. | 23 | 1 |
| Stewart Information Services Corp. | 74 | 1 |
| Independence Holding Co. | 85 | 1 |
| Alliance Financial Corp. | 23 | 1 |
| State Bancorp Inc. | 60 | 1 |
| Bancorp Rhode Island Inc. | 16 | 1 |
| ESSA Bancorp Inc. | 61 | 1 |
| * Virginia Commerce Bancorp Inc. | 117 | 1 |
| * PMI Group Inc. | 2,632 | 1 |
| Home Federal Bancorp Inc. | 67 | 1 |
| Arlington Asset Investment Corp. Class A | 26 | 1 |
| * MPG Office Trust Inc. | 241 | 1 |
| Donegal Group Inc. Class A | 55 | 1 |
| * Gain Capital Holdings Inc. | 116 | 1 |
| * Meridian Interstate Bancorp Inc. | 52 | 1 |
| ESB Financial Corp. | 54 | 1 |
| Edelman Financial Group Inc. | 94 | 1 |
| Pacific Continental Corp. | 79 | 1 |
| Capital City Bank Group Inc. | 64 | 1 |
| Gladstone Investment Corp. | 95 | 1 |
| Kearny Financial Corp. | 74 | 1 |
| Consolidated-Tomoka Land Co. | 23 | 1 |
| Midsouth Bancorp Inc. | 56 | 1 |
| First Bancorp Inc. | 48 | 1 |
| * Capital Bank Corp. | 230 | 1 |
| BankFinancial Corp. | 83 | 1 |
| * CIFC Corp. | 129 | 1 |
| Ames National Corp. | 38 | 1 |
| Mission West Properties Inc. | 81 | 1 |
| * Metro Bancorp Inc. | 63 | 1 |
| * Primus Guaranty Ltd. | 113 | 1 |
| Sierra Bancorp | 60 | 1 |
| Clifton Savings Bancorp Inc. | 63 | 1 |
21
| Vanguard® Russell 3000 Index Fund | ||
| Schedule of Investments | ||
| August 31, 2011 | ||
| Market | ||
| Value | ||
| Shares | ($000) | |
| Bridge Bancorp Inc. | 32 | 1 |
| Golub Capital BDC Inc. | 42 | 1 |
| * Hallmark Financial Services | 90 | 1 |
| Universal Insurance Holdings Inc. | 145 | 1 |
| * Encore Bancshares Inc. | 56 | 1 |
| Terreno Realty Corp. | 41 | 1 |
| Peoples Bancorp Inc. | 58 | 1 |
| JMP Group Inc. | 91 | 1 |
| EMC Insurance Group Inc. | 34 | 1 |
| * First Marblehead Corp. | 434 | 1 |
| * Marlin Business Services Corp. | 52 | 1 |
| THL Credit Inc. | 51 | 1 |
| * BofI Holding Inc. | 42 | 1 |
| Bank Mutual Corp. | 186 | 1 |
| Century Bancorp Inc. Class A | 22 | 1 |
| * Taylor Capital Group Inc. | 90 | 1 |
| * Hanmi Financial Corp. | 596 | 1 |
| Roma Financial Corp. | 65 | 1 |
| California First National Bancorp | 33 | 1 |
| * Harris & Harris Group Inc. | 136 | 1 |
| UMH Properties Inc. | 61 | 1 |
| * Fortegra Financial Corp. | 109 | 1 |
| * FBR & Co. | 212 | 1 |
| SWS Group Inc. | 118 | 1 |
| Pzena Investment Management Inc. Class A | 106 | — |
| * Avatar Holdings Inc. | 46 | — |
| First Financial Holdings Inc. | 74 | — |
| Orrstown Financial Services Inc. | 30 | — |
| * Gleacher & Co. Inc. | 327 | — |
| Suffolk Bancorp | 48 | — |
| 8,694 | ||
| Health Care (11.8%) | ||
| Johnson & Johnson | 11,303 | 744 |
| Pfizer Inc. | 32,579 | 618 |
| Merck & Co. Inc. | 12,728 | 422 |
| Abbott Laboratories | 6,394 | 336 |
| Amgen Inc. | 3,825 | 212 |
| UnitedHealth Group Inc. | 4,457 | 212 |
| Bristol-Myers Squibb Co. | 7,018 | 209 |
| Eli Lilly & Co. | 4,205 | 158 |
| Medtronic Inc. | 4,402 | 154 |
| Baxter International Inc. | 2,347 | 131 |
| * Gilead Sciences Inc. | 3,238 | 129 |
| * Celgene Corp. | 1,905 | 113 |
| Covidien plc | 2,039 | 106 |
| Allergan Inc. | 1,254 | 103 |
| WellPoint Inc. | 1,511 | 96 |
| * Express Scripts Inc. | 2,013 | 94 |
| * Biogen Idec Inc. | 995 | 94 |
| * Medco Health Solutions Inc. | 1,645 | 89 |
| * Thermo Fisher Scientific Inc. | 1,577 | 87 |
| McKesson Corp. | 1,037 | 83 |
| Becton Dickinson and Co. | 900 | 73 |
| Stryker Corp. | 1,290 | 63 |
| Aetna Inc. | 1,562 | 62 |
| * Intuitive Surgical Inc. | 162 | 62 |
| St. Jude Medical Inc. | 1,353 | 62 |
| Cardinal Health Inc. | 1,442 | 61 |
| Humana Inc. | 693 | 54 |
| * Agilent Technologies Inc. | 1,432 | 53 |
| CIGNA Corp. | 1,114 | 52 |
| * Zimmer Holdings Inc. | 790 | 45 |
| AmerisourceBergen Corp. Class A | 1,127 | 45 |
| * Alexion Pharmaceuticals Inc. | 757 | 44 |
22
| Vanguard® Russell 3000 Index Fund | ||
| Schedule of Investments | ||
| August 31, 2011 | ||
| Market | ||
| Value | ||
| Shares | ($000) | |
| * Boston Scientific Corp. | 6,287 | 43 |
| * Forest Laboratories Inc. | 1,178 | 40 |
| * Cerner Corp. | 585 | 39 |
| * Vertex Pharmaceuticals Inc. | 848 | 38 |
| * Mylan Inc. | 1,807 | 37 |
| * Edwards Lifesciences Corp. | 472 | 36 |
| * Watson Pharmaceuticals Inc. | 521 | 35 |
| * Laboratory Corp. of America Holdings | 412 | 34 |
| CR Bard Inc. | 354 | 34 |
| Quest Diagnostics Inc. | 648 | 32 |
| Perrigo Co. | 342 | 32 |
| * Hospira Inc. | 693 | 32 |
| * Life Technologies Corp. | 736 | 31 |
| * Waters Corp. | 379 | 30 |
| * DaVita Inc. | 394 | 29 |
| * Varian Medical Systems Inc. | 483 | 27 |
| * Illumina Inc. | 507 | 26 |
| * Cephalon Inc. | 315 | 25 |
| * Henry Schein Inc. | 380 | 25 |
| * CareFusion Corp. | 922 | 24 |
| * Mettler-Toledo International Inc. | 133 | 21 |
| DENTSPLY International Inc. | 581 | 20 |
| * Pharmasset Inc. | 154 | 20 |
| * Coventry Health Care Inc. | 612 | 20 |
| * ResMed Inc. | 599 | 19 |
| * IDEXX Laboratories Inc. | 225 | 18 |
| * Hologic Inc. | 1,025 | 17 |
| * Kinetic Concepts Inc. | 251 | 17 |
| * Regeneron Pharmaceuticals Inc. | 285 | 17 |
| Universal Health Services Inc. Class B | 354 | 15 |
| * Endo Pharmaceuticals Holdings Inc. | 457 | 15 |
| * QIAGEN NV | 915 | 14 |
| Cooper Cos. Inc. | 181 | 14 |
| Omnicare Inc. | 455 | 13 |
| * Allscripts Healthcare Solutions Inc. | 746 | 13 |
| * SXC Health Solutions Corp. | 243 | 13 |
| * BioMarin Pharmaceutical Inc. | 435 | 13 |
| Pharmaceutical Product Development Inc. | 392 | 12 |
| * Mednax Inc. | 188 | 12 |
| Warner Chilcott plc Class A | 698 | 12 |
| Patterson Cos. Inc. | 405 | 12 |
| * Covance Inc. | 238 | 12 |
| * Gen-Probe Inc. | 188 | 11 |
| * HCA Holdings Inc. | 546 | 11 |
| Techne Corp. | 146 | 11 |
| * Healthspring Inc. | 266 | 10 |
| * Sirona Dental Systems Inc. | 219 | 10 |
| * Tenet Healthcare Corp. | 1,917 | 10 |
| PerkinElmer Inc. | 442 | 10 |
| * Human Genome Sciences Inc. | 781 | 10 |
| Medicis Pharmaceutical Corp. Class A | 244 | 9 |
| Teleflex Inc. | 161 | 9 |
| * Catalyst Health Solutions Inc. | 169 | 9 |
| * United Therapeutics Corp. | 206 | 9 |
| * Cepheid Inc. | 245 | 9 |
| * Health Net Inc. | 359 | 9 |
| * Alere Inc. | 352 | 9 |
| * HMS Holdings Corp. | 335 | 9 |
| * AMERIGROUP Corp. | 174 | 9 |
| * Onyx Pharmaceuticals Inc. | 252 | 9 |
| * Cubist Pharmaceuticals Inc. | 240 | 8 |
| * Health Management Associates Inc. Class A | 1,010 | 8 |
| * Healthsouth Corp. | 381 | 8 |
| Lincare Holdings Inc. | 376 | 8 |
23
| Vanguard® Russell 3000 Index Fund | ||
| Schedule of Investments | ||
| August 31, 2011 | ||
| Market | ||
| Value | ||
| Shares | ($000) | |
| * athenahealth Inc. | 139 | 8 |
| * Bio-Rad Laboratories Inc. Class A | 80 | 8 |
| * Community Health Systems Inc. | 391 | 8 |
| * Thoratec Corp. | 229 | 8 |
| * WellCare Health Plans Inc. | 171 | 8 |
| * LifePoint Hospitals Inc. | 211 | 8 |
| Hill-Rom Holdings Inc. | 253 | 8 |
| STERIS Corp. | 238 | 8 |
| Owens & Minor Inc. | 255 | 7 |
| * Dendreon Corp. | 601 | 7 |
| Quality Systems Inc. | 78 | 7 |
| * Salix Pharmaceuticals Ltd. | 235 | 7 |
| * Charles River Laboratories International Inc. | 208 | 7 |
| * Myriad Genetics Inc. | 345 | 7 |
| * Seattle Genetics Inc. | 392 | 7 |
| * Magellan Health Services Inc. | 135 | 7 |
| * Questcor Pharmaceuticals Inc. | 223 | 7 |
| * Alkermes Inc. | 386 | 7 |
| * Haemonetics Corp. | 105 | 7 |
| * VCA Antech Inc. | 350 | 6 |
| * Centene Corp. | 203 | 6 |
| * Brookdale Senior Living Inc. Class A | 397 | 6 |
| * Volcano Corp. | 212 | 6 |
| * Viropharma Inc. | 318 | 6 |
| * Amylin Pharmaceuticals Inc. | 535 | 6 |
| * Incyte Corp. Ltd. | 363 | 6 |
| * PSS World Medical Inc. | 237 | 6 |
| * InterMune Inc. | 206 | 5 |
| West Pharmaceutical Services Inc. | 138 | 5 |
| * Theravance Inc. | 285 | 5 |
| Masimo Corp. | 219 | 5 |
| * Ariad Pharmaceuticals Inc. | 548 | 5 |
| * Impax Laboratories Inc. | 271 | 5 |
| Chemed Corp. | 89 | 5 |
| * Bruker Corp. | 359 | 5 |
| * Parexel International Corp. | 250 | 5 |
| * Align Technology Inc. | 257 | 5 |
| * MAKO Surgical Corp. | 135 | 5 |
| * Accretive Health Inc. | 174 | 5 |
| * Par Pharmaceutical Cos. Inc. | 152 | 4 |
| * Acorda Therapeutics Inc. | 170 | 4 |
| * NuVasive Inc. | 179 | 4 |
| * Zoll Medical Corp. | 96 | 4 |
| * MWI Veterinary Supply Inc. | 57 | 4 |
| * Jazz Pharmaceuticals Inc. | 89 | 4 |
| * Exelixis Inc. | 506 | 4 |
| * Auxilium Pharmaceuticals Inc. | 208 | 3 |
| * Momenta Pharmaceuticals Inc. | 209 | 3 |
| * Luminex Corp. | 153 | 3 |
| * Arthrocare Corp. | 108 | 3 |
| Computer Programs & Systems Inc. | 49 | 3 |
| * Isis Pharmaceuticals Inc. | 454 | 3 |
| PDL BioPharma Inc. | 556 | 3 |
| * Integra LifeSciences Holdings Corp. | 85 | 3 |
| * NxStage Medical Inc. | 178 | 3 |
| * DexCom Inc. | 272 | 3 |
| * Immunogen Inc. | 301 | 3 |
| * Insulet Corp. | 185 | 3 |
| * Cyberonics Inc. | 114 | 3 |
| * Neogen Corp. | 92 | 3 |
| * Medicines Co. | 215 | 3 |
| * HeartWare International Inc. | 49 | 3 |
| Meridian Bioscience Inc. | 166 | 3 |
| * Air Methods Corp. | 46 | 3 |
24
| Vanguard® Russell 3000 Index Fund | ||
| Schedule of Investments | ||
| August 31, 2011 | ||
| Market | ||
| Value | ||
| Shares | ($000) | |
| Invacare Corp. | 118 | 3 |
| * Amsurg Corp. Class A | 127 | 3 |
| * Vivus Inc. | 338 | 3 |
| * CONMED Corp. | 120 | 3 |
| * Merit Medical Systems Inc. | 193 | 3 |
| * Kindred Healthcare Inc. | 211 | 3 |
| * Orthofix International NV | 74 | 3 |
| * Nektar Therapeutics | 472 | 3 |
| * IPC The Hospitalist Co. Inc. | 67 | 3 |
| * NPS Pharmaceuticals Inc. | 359 | 3 |
| Analogic Corp. | 54 | 3 |
| * Ironwood Pharmaceuticals Inc. | 206 | 3 |
| * Sequenom Inc. | 425 | 3 |
| * Molina Healthcare Inc. | 135 | 3 |
| * Hanger Orthopedic Group Inc. | 138 | 3 |
| * Rigel Pharmaceuticals Inc. | 326 | 3 |
| * Emdeon Inc. Class A | 137 | 3 |
| * Wright Medical Group Inc. | 167 | 3 |
| * Emeritus Corp. | 145 | 2 |
| * AVEO Pharmaceuticals Inc. | 149 | 2 |
| * Pharmacyclics Inc. | 215 | 2 |
| * Omnicell Inc. | 154 | 2 |
| * Abaxis Inc. | 96 | 2 |
| * Halozyme Therapeutics Inc. | 350 | 2 |
| * Medivation Inc. | 147 | 2 |
| * Greatbatch Inc. | 103 | 2 |
| * MedAssets Inc. | 200 | 2 |
| Landauer Inc. | 44 | 2 |
| * Bio-Reference Labs Inc. | 111 | 2 |
| * ICU Medical Inc. | 54 | 2 |
| * Spectrum Pharmaceuticals Inc. | 258 | 2 |
| * Team Health Holdings Inc. | 116 | 2 |
| * Micromet Inc. | 450 | 2 |
| * Amedisys Inc. | 127 | 2 |
| * Opko Health Inc. | 503 | 2 |
| * Genomic Health Inc. | 86 | 2 |
| * Sunrise Senior Living Inc. | 278 | 2 |
| * Healthways Inc. | 162 | 2 |
| * Targacept Inc. | 124 | 2 |
| * Quidel Corp. | 131 | 2 |
| * Affymetrix Inc. | 353 | 2 |
| * Optimer Pharmaceuticals Inc. | 197 | 2 |
| * SonoSite Inc. | 67 | 2 |
| * Angiodynamics Inc. | 133 | 2 |
| * Endologix Inc. | 199 | 2 |
| * ABIOMED Inc. | 152 | 2 |
| * ExamWorks Group Inc. | 124 | 2 |
| * ZIOPHARM Oncology Inc. | 322 | 2 |
| * Emergent Biosolutions Inc. | 102 | 2 |
| * PharMerica Corp. | 124 | 2 |
| * Akorn Inc. | 225 | 2 |
| * Triple-S Management Corp. Class B | 106 | 2 |
| Ensign Group Inc. | 76 | 2 |
| * Conceptus Inc. | 167 | 2 |
| * LHC Group Inc. | 87 | 2 |
| * Depomed Inc. | 279 | 2 |
| Atrion Corp. | 8 | 2 |
| * Medidata Solutions Inc. | 103 | 2 |
| National Healthcare Corp. | 49 | 2 |
| * Geron Corp. | 625 | 2 |
| * Staar Surgical Co. | 201 | 2 |
| * Sangamo Biosciences Inc. | 304 | 2 |
| * Exact Sciences Corp. | 210 | 2 |
| * Enzon Pharmaceuticals Inc. | 189 | 2 |
25
| Vanguard® Russell 3000 Index Fund | ||
| Schedule of Investments | ||
| August 31, 2011 | ||
| Market | ||
| Value | ||
| Shares | ($000) | |
| * Natus Medical Inc. | 153 | 2 |
| * Caliper Life Sciences Inc. | 210 | 2 |
| * Accuray Inc. | 318 | 2 |
| * Neoprobe Corp. | 466 | 2 |
| * Savient Pharmaceuticals Inc. | 365 | 2 |
| Cantel Medical Corp. | 62 | 2 |
| * AVANIR Pharmaceuticals Inc. | 543 | 2 |
| * Keryx Biopharmaceuticals Inc. | 373 | 1 |
| * OraSure Technologies Inc. | 207 | 1 |
| * Oncothyreon Inc. | 210 | 1 |
| * Ardea Biosciences Inc. | 92 | 1 |
| * Merge Healthcare Inc. | 252 | 1 |
| * Corvel Corp. | 32 | 1 |
| * Alnylam Pharmaceuticals Inc. | 209 | 1 |
| * MedQuist Holdings Inc. | 172 | 1 |
| Universal American Corp. | 128 | 1 |
| * Medcath Corp. | 100 | 1 |
| * Arqule Inc. | 318 | 1 |
| * Ligand Pharmaceuticals Inc. Class B | 91 | 1 |
| * Select Medical Holdings Corp. | 191 | 1 |
| * Symmetry Medical Inc. | 166 | 1 |
| * Tornier NV | 59 | 1 |
| * Pacific Biosciences of California Inc. | 193 | 1 |
| * Achillion Pharmaceuticals Inc. | 219 | 1 |
| * Antares Pharma Inc. | 546 | 1 |
| * Gentiva Health Services Inc. | 174 | 1 |
| * BioScrip Inc. | 209 | 1 |
| * Kensey Nash Corp. | 48 | 1 |
| * Metropolitan Health Networks Inc. | 251 | 1 |
| Assisted Living Concepts Inc. Class A | 94 | 1 |
| * Hi-Tech Pharmacal Co. Inc. | 45 | 1 |
| * Unilife Corp. | 270 | 1 |
| * XenoPort Inc. | 172 | 1 |
| * Idenix Pharmaceuticals Inc. | 216 | 1 |
| * SIGA Technologies Inc. | 218 | 1 |
| * eResearchTechnology Inc. | 240 | 1 |
| * MAP Pharmaceuticals Inc. | 88 | 1 |
| * Dynavax Technologies Corp. | 505 | 1 |
| * Neurocrine Biosciences Inc. | 194 | 1 |
| * Immunomedics Inc. | 297 | 1 |
| * Dyax Corp. | 797 | 1 |
| * Lexicon Pharmaceuticals Inc. | 866 | 1 |
| * Curis Inc. | 367 | 1 |
| * HealthStream Inc. | 94 | 1 |
| * MannKind Corp. | 383 | 1 |
| * Cell Therapeutics Inc. | 980 | 1 |
| * Vanda Pharmaceuticals Inc. | 190 | 1 |
| * Cadence Pharmaceuticals Inc. | 176 | 1 |
| * Biosante Pharmaceuticals Inc. | 439 | 1 |
| * Cytori Therapeutics Inc. | 341 | 1 |
| * Columbia Laboratories Inc. | 483 | 1 |
| * Transcend Services Inc. | 43 | 1 |
| * Vical Inc. | 304 | 1 |
| * Furiex Pharmaceuticals Inc. | 71 | 1 |
| * Sagent Pharmaceuticals Inc. | 47 | 1 |
| * Inhibitex Inc. | 303 | 1 |
| * Chelsea Therapeutics International Ltd. | 249 | 1 |
| * Alphatec Holdings Inc. | 421 | 1 |
| * Ampio Pharmaceuticals Inc. | 135 | 1 |
| * Cardiovascular Systems Inc. | 82 | 1 |
| * Novavax Inc. | 571 | 1 |
| * Synovis Life Technologies Inc. | 61 | 1 |
| US Physical Therapy Inc. | 52 | 1 |
| Pain Therapeutics Inc. | 217 | 1 |
26
| Vanguard® Russell 3000 Index Fund | ||
| Schedule of Investments | ||
| August 31, 2011 | ||
| Market | ||
| Value | ||
| Shares | ($000) | |
| * Capital Senior Living Corp. | 143 | 1 |
| * Raptor Pharmaceutical Corp. | 216 | 1 |
| * Vascular Solutions Inc. | 84 | 1 |
| * Cross Country Healthcare Inc. | 204 | 1 |
| * SurModics Inc. | 94 | 1 |
| * Spectranetics Corp. | 162 | 1 |
| * AVI BioPharma Inc. | 802 | 1 |
| * Delcath Systems Inc. | 240 | 1 |
| * Almost Family Inc. | 50 | 1 |
| * Metabolix Inc. | 182 | 1 |
| * Durect Corp. | 589 | 1 |
| * Rockwell Medical Technologies Inc. | 109 | 1 |
| * Continucare Corp. | 154 | 1 |
| * Uroplasty Inc. | 154 | 1 |
| * AtriCure Inc. | 93 | 1 |
| * Progenics Pharmaceuticals Inc. | 153 | 1 |
| * Palomar Medical Technologies Inc. | 118 | 1 |
| * Insmed Inc. | 199 | 1 |
| * American Dental Partners Inc. | 86 | 1 |
| * Synergetics USA Inc. | 173 | 1 |
| * Solta Medical Inc. | 550 | 1 |
| * Codexis Inc. | 143 | 1 |
| * Allos Therapeutics Inc. | 548 | 1 |
| * ISTA Pharmaceuticals Inc. | 201 | 1 |
| * KV Pharmaceutical Co. Class A | 519 | 1 |
| * Biolase Technology Inc. | 270 | 1 |
| * RadNet Inc. | 302 | 1 |
| * Arena Pharmaceuticals Inc. | 696 | 1 |
| * OncoGenex Pharmaceutical Inc. | 75 | 1 |
| * Corcept Therapeutics Inc. | 315 | 1 |
| * Endocyte Inc. | 81 | 1 |
| Medtox Scientific Inc. | 63 | 1 |
| * Hansen Medical Inc. | 231 | 1 |
| * Dusa Pharmaceuticals Inc. | 199 | 1 |
| * AMN Healthcare Services Inc. | 157 | 1 |
| * Chindex International Inc. | 81 | 1 |
| * Providence Service Corp. | 80 | 1 |
| * Affymax Inc. | 180 | 1 |
| * PharmAthene Inc. | 344 | 1 |
| * Harvard Bioscience Inc. | 189 | 1 |
| * Skilled Healthcare Group Inc. | 151 | 1 |
| * RTI Biologics Inc. | 242 | 1 |
| * Zalicus Inc. | 502 | 1 |
| * Amicus Therapeutics Inc. | 174 | 1 |
| * Five Star Quality Care Inc. | 245 | 1 |
| * Cambrex Corp. | 160 | 1 |
| * Nabi Biopharmaceuticals | 411 | 1 |
| * Fluidigm Corp. | 57 | 1 |
| * Obagi Medical Products Inc. | 73 | 1 |
| * GTx Inc. | 210 | 1 |
| * BioMimetic Therapeutics Inc. | 227 | 1 |
| * Cleveland Biolabs Inc. | 287 | 1 |
| * Nymox Pharmaceutical Corp. | 92 | 1 |
| * Sunesis Pharmaceuticals Inc. | 465 | 1 |
| Maxygen Inc. | 130 | 1 |
| Young Innovations Inc. | 25 | 1 |
| * Stereotaxis Inc. | 524 | 1 |
| * Biospecifics Technologies Corp. | 38 | 1 |
| * Sciclone Pharmaceuticals Inc. | 142 | 1 |
| * CryoLife Inc. | 130 | 1 |
| * Santarus Inc. | 216 | 1 |
| * DynaVox Inc. Class A | 97 | 1 |
| * Aegerion Pharmaceuticals Inc. | 45 | 1 |
| * Biotime Inc. | 141 | 1 |
27
| Vanguard® Russell 3000 Index Fund | ||
| Schedule of Investments | ||
| August 31, 2011 | ||
| Market | ||
| Value | ||
| Shares | ($000) | |
| * Trius Therapeutics Inc. | 97 | 1 |
| * IRIS International Inc. | 75 | 1 |
| * Transcept Pharmaceuticals Inc. | 193 | 1 |
| * Complete Genomics Inc. | 69 | 1 |
| * Bacterin International Holdings Inc. | 318 | 1 |
| * Anacor Pharmaceuticals Inc. | 126 | 1 |
| National Research Corp. | 18 | 1 |
| * ePocrates Inc. | 57 | 1 |
| * Infinity Pharmaceuticals Inc. | 88 | 1 |
| * Celldex Therapeutics Inc. | 189 | 1 |
| * Array Biopharma Inc. | 272 | 1 |
| * Pernix Therapeutics Holdings | 65 | 1 |
| * Cynosure Inc. Class A | 56 | 1 |
| * Orexigen Therapeutics Inc. | 403 | 1 |
| * Neostem Inc. | 779 | 1 |
| * Pacira Pharmaceuticals Inc. | 74 | 1 |
| * Synta Pharmaceuticals Corp. | 133 | 1 |
| * Lannett Co. Inc. | 146 | 1 |
| * Sucampo Pharmaceuticals Inc. Class A | 169 | 1 |
| * Cornerstone Therapeutics Inc. | 70 | 1 |
| * Zogenix Inc. | 156 | 1 |
| * BioCryst Pharmaceuticals Inc. | 162 | 1 |
| * Exactech Inc. | 36 | 1 |
| * Alimera Sciences Inc. | 74 | 1 |
| * Acura Pharmaceuticals Inc. | 171 | 1 |
| * BG Medicine Inc. | 86 | 1 |
| * Anthera Pharmaceuticals Inc. | 91 | 1 |
| * SuperGen Inc. | 234 | 1 |
| * Osiris Therapeutics Inc. | 94 | 1 |
| * Enzo Biochem Inc. | 169 | — |
| * Cerus Corp. | 240 | — |
| * Medical Action Industries Inc. | 79 | — |
| * Peregrine Pharmaceuticals Inc. | 346 | — |
| * Albany Molecular Research Inc. | 131 | — |
| * Sun Healthcare Group Inc. | 103 | — |
| * Pozen Inc. | 141 | — |
| * CardioNet Inc. | 121 | — |
| * Alliance HealthCare Services Inc. | 162 | — |
| * Clinical Data Inc. Contingent Value Rights Exp. 04/14/2018 | 32 | — |
| 6,700 | ||
| Industrials (11.0%) | ||
| General Electric Co. | 43,729 | 713 |
| United Technologies Corp. | 3,765 | 280 |
| 3M Co. | 2,924 | 243 |
| Caterpillar Inc. | 2,653 | 241 |
| United Parcel Service Inc. Class B | 3,023 | 204 |
| Boeing Co. | 3,037 | 203 |
| Union Pacific Corp. | 2,018 | 186 |
| Honeywell International Inc. | 3,238 | 155 |
| Emerson Electric Co. | 3,092 | 144 |
| Deere & Co. | 1,727 | 140 |
| Danaher Corp. | 2,259 | 103 |
| FedEx Corp. | 1,299 | 102 |
| CSX Corp. | 4,537 | 100 |
| Norfolk Southern Corp. | 1,453 | 98 |
| Precision Castparts Corp. | 591 | 97 |
| General Dynamics Corp. | 1,367 | 88 |
| Lockheed Martin Corp. | 1,178 | 87 |
| Illinois Tool Works Inc. | 1,835 | 85 |
| Tyco International Ltd. | 1,929 | 80 |
| Cummins Inc. | 808 | 75 |
| Waste Management Inc. | 1,951 | 64 |
| Raytheon Co. | 1,466 | 63 |
| Northrop Grumman Corp. | 1,140 | 62 |
28
| Vanguard® Russell 3000 Index Fund | ||
| Schedule of Investments | ||
| August 31, 2011 | ||
| Market | ||
| Value | ||
| Shares | ($000) | |
| Eaton Corp. | 1,404 | 60 |
| PACCAR Inc. | 1,504 | 57 |
| Parker Hannifin Corp. | 668 | 49 |
| CH Robinson Worldwide Inc. | 682 | 48 |
| Goodrich Corp. | 514 | 46 |
| Ingersoll-Rand plc | 1,363 | 46 |
| Dover Corp. | 768 | 44 |
| Fluor Corp. | 717 | 44 |
| Stanley Black & Decker Inc. | 692 | 43 |
| Fastenal Co. | 1,213 | 41 |
| Republic Services Inc. Class A | 1,320 | 40 |
| Expeditors International of Washington Inc. | 875 | 40 |
| Rockwell Automation Inc. | 594 | 38 |
| WW Grainger Inc. | 235 | 36 |
| Joy Global Inc. | 431 | 36 |
| ITT Corp. | 758 | 36 |
| Cooper Industries plc | 679 | 32 |
| Rockwell Collins Inc. | 635 | 32 |
| * Stericycle Inc. | 354 | 31 |
| Roper Industries Inc. | 396 | 30 |
| L-3 Communications Holdings Inc. | 438 | 30 |
| Southwest Airlines Co. | 3,257 | 28 |
| * Delta Air Lines Inc. | 3,480 | 26 |
| AMETEK Inc. | 664 | 26 |
| * United Continental Holdings Inc. | 1,366 | 25 |
| Pall Corp. | 480 | 25 |
| * Kansas City Southern | 453 | 25 |
| Iron Mountain Inc. | 744 | 24 |
| Flowserve Corp. | 230 | 22 |
| * Jacobs Engineering Group Inc. | 522 | 19 |
| Textron Inc. | 1,138 | 19 |
| KBR Inc. | 625 | 19 |
| * TransDigm Group Inc. | 196 | 18 |
| Donaldson Co. Inc. | 299 | 18 |
| * Verisk Analytics Inc. Class A | 467 | 16 |
| * Quanta Services Inc. | 844 | 16 |
| Gardner Denver Inc. | 205 | 16 |
| * AGCO Corp. | 371 | 16 |
| Equifax Inc. | 482 | 16 |
| Waste Connections Inc. | 445 | 15 |
| * IHS Inc. Class A | 194 | 15 |
| Cintas Corp. | 469 | 15 |
| Pitney Bowes Inc. | 717 | 15 |
| JB Hunt Transport Services Inc. | 358 | 14 |
| * Owens Corning | 489 | 14 |
| Timken Co. | 360 | 14 |
| Chicago Bridge & Iron Co. NV | 391 | 14 |
| Hubbell Inc. Class B | 236 | 14 |
| Robert Half International Inc. | 575 | 14 |
| Manpower Inc. | 339 | 14 |
| Towers Watson & Co. Class A | 225 | 13 |
| Pentair Inc. | 386 | 13 |
| * BE Aerospace Inc. | 380 | 13 |
| Masco Corp. | 1,473 | 13 |
| * WABCO Holdings Inc. | 279 | 13 |
| Dun & Bradstreet Corp. | 194 | 13 |
| Avery Dennison Corp. | 440 | 13 |
| RR Donnelley & Sons Co. | 813 | 12 |
| * Navistar International Corp. | 299 | 12 |
| IDEX Corp. | 325 | 12 |
| Snap-on Inc. | 228 | 12 |
| SPX Corp. | 210 | 12 |
| Kennametal Inc. | 321 | 12 |
| * Kirby Corp. | 210 | 12 |
29
| Vanguard® Russell 3000 Index Fund | ||
| Schedule of Investments | ||
| August 31, 2011 | ||
| Market | ||
| Value | ||
| Shares | ($000) | |
| Wabtec Corp. | 189 | 12 |
| * Hertz Global Holdings Inc. | 1,006 | 11 |
| Lincoln Electric Holdings Inc. | 331 | 11 |
| * URS Corp. | 308 | 11 |
| MSC Industrial Direct Co. Class A | 174 | 11 |
| * Babcock & Wilcox Co. | 461 | 11 |
| * Aecom Technology Corp. | 467 | 11 |
| Nordson Corp. | 239 | 11 |
| * Copart Inc. | 235 | 10 |
| * Clean Harbors Inc. | 185 | 10 |
| Ryder System Inc. | 204 | 10 |
| * Corrections Corp. of America | 423 | 10 |
| * Polypore International Inc. | 154 | 10 |
| Carlisle Cos. Inc. | 242 | 9 |
| * Nielsen Holdings NV | 319 | 9 |
| Graco Inc. | 239 | 9 |
| CLARCOR Inc. | 199 | 9 |
| * Esterline Technologies Corp. | 122 | 9 |
| * Thomas & Betts Corp. | 209 | 9 |
| Regal-Beloit Corp. | 154 | 9 |
| HEICO Corp. | 165 | 9 |
| * Hexcel Corp. | 389 | 9 |
| Copa Holdings SA Class A | 129 | 9 |
| Trinity Industries Inc. | 318 | 9 |
| Alliant Techsystems Inc. | 134 | 9 |
| Valmont Industries Inc. | 91 | 8 |
| * Genesee & Wyoming Inc. Class A | 159 | 8 |
| * Alaska Air Group Inc. | 143 | 8 |
| Crane Co. | 194 | 8 |
| * GrafTech International Ltd. | 513 | 8 |
| * Teledyne Technologies Inc. | 147 | 8 |
| Landstar System Inc. | 197 | 8 |
| Woodward Inc. | 246 | 8 |
| Acuity Brands Inc. | 173 | 8 |
| Triumph Group Inc. | 152 | 8 |
| Covanta Holding Corp. | 482 | 8 |
| * Spirit Aerosystems Holdings Inc. Class A | 469 | 8 |
| Robbins & Myers Inc. | 159 | 8 |
| * Dollar Thrifty Automotive Group Inc. | 114 | 8 |
| * Acacia Research - Acacia Technologies | 173 | 8 |
| * WESCO International Inc. | 173 | 7 |
| Harsco Corp. | 324 | 7 |
| * Oshkosh Corp. | 375 | 7 |
| * Moog Inc. Class A | 184 | 7 |
| * Terex Corp. | 451 | 7 |
| Mueller Industries Inc. | 154 | 7 |
| Alexander & Baldwin Inc. | 168 | 7 |
| * Shaw Group Inc. | 298 | 7 |
| Toro Co. | 127 | 7 |
| GATX Corp. | 189 | 7 |
| Watsco Inc. | 114 | 7 |
| Lennox International Inc. | 215 | 7 |
| * General Cable Corp. | 213 | 6 |
| * EMCOR Group Inc. | 273 | 6 |
| * Old Dominion Freight Line Inc. | 194 | 6 |
| * FTI Consulting Inc. | 171 | 6 |
| * Middleby Corp. | 77 | 6 |
| AO Smith Corp. | 156 | 6 |
| * Huntington Ingalls Industries Inc. | 204 | 6 |
| Manitowoc Co. Inc. | 546 | 6 |
| Belden Inc. | 195 | 6 |
| Curtiss-Wright Corp. | 191 | 6 |
| Con-way Inc. | 227 | 6 |
| * Chart Industries Inc. | 122 | 6 |
30
| Vanguard® Russell 3000 Index Fund | ||
| Schedule of Investments | ||
| August 31, 2011 | ||
| Market | ||
| Value | ||
| Shares | ($000) | |
| * Geo Group Inc. | 266 | 6 |
| United Stationers Inc. | 181 | 6 |
| Rollins Inc. | 273 | 6 |
| Actuant Corp. Class A | 284 | 6 |
| UTi Worldwide Inc. | 421 | 6 |
| * Avis Budget Group Inc. | 433 | 6 |
| Brady Corp. Class A | 205 | 6 |
| Applied Industrial Technologies Inc. | 179 | 5 |
| * CoStar Group Inc. | 107 | 5 |
| * Atlas Air Worldwide Holdings Inc. | 111 | 5 |
| * MasTec Inc. | 237 | 5 |
| Barnes Group Inc. | 226 | 5 |
| * Tetra Tech Inc. | 261 | 5 |
| * HUB Group Inc. Class A | 162 | 5 |
| Simpson Manufacturing Co. Inc. | 175 | 5 |
| * AMR Corp. | 1,372 | 5 |
| Deluxe Corp. | 224 | 5 |
| Herman Miller Inc. | 249 | 5 |
| Corporate Executive Board Co. | 149 | 5 |
| * EnerSys | 211 | 5 |
| Brink's Co. | 184 | 5 |
| * United Rentals Inc. | 277 | 5 |
| Healthcare Services Group Inc. | 294 | 5 |
| ABM Industries Inc. | 225 | 5 |
| * JetBlue Airways Corp. | 1,057 | 5 |
| Werner Enterprises Inc. | 192 | 4 |
| Franklin Electric Co. Inc. | 104 | 4 |
| * II-VI Inc. | 223 | 4 |
| * Advisory Board Co. | 70 | 4 |
| Kaydon Corp. | 129 | 4 |
| Raven Industries Inc. | 78 | 4 |
| AAR Corp. | 177 | 4 |
| Knight Transportation Inc. | 271 | 4 |
| Kaman Corp. | 118 | 4 |
| Armstrong World Industries Inc. | 95 | 4 |
| HNI Corp. | 179 | 4 |
| Titan International Inc. | 169 | 4 |
| * Orbital Sciences Corp. | 231 | 4 |
| Granite Construction Inc. | 173 | 4 |
| * US Airways Group Inc. | 638 | 4 |
| * 3D Systems Corp. | 194 | 4 |
| * CNH Global NV | 105 | 3 |
| * Beacon Roofing Supply Inc. | 186 | 3 |
| Tennant Co. | 77 | 3 |
| Watts Water Technologies Inc. Class A | 119 | 3 |
| Mine Safety Appliances Co. | 109 | 3 |
| Forward Air Corp. | 118 | 3 |
| ESCO Technologies Inc. | 108 | 3 |
| Briggs & Stratton Corp. | 204 | 3 |
| * Ceradyne Inc. | 104 | 3 |
| * GeoEye Inc. | 90 | 3 |
| * Meritor Inc. | 382 | 3 |
| * EnPro Industries Inc. | 83 | 3 |
| * DigitalGlobe Inc. | 142 | 3 |
| Ameron International Corp. | 38 | 3 |
| * Air Lease Corp. | 140 | 3 |
| Lindsay Corp. | 51 | 3 |
| Interface Inc. Class A | 209 | 3 |
| Heartland Express Inc. | 205 | 3 |
| * RBC Bearings Inc. | 89 | 3 |
| * Korn/Ferry International | 189 | 3 |
| Knoll Inc. | 194 | 3 |
| * Allegiant Travel Co. Class A | 65 | 3 |
| * Blount International Inc. | 194 | 3 |
31
| Vanguard® Russell 3000 Index Fund | ||
| Schedule of Investments | ||
| August 31, 2011 | ||
| Market | ||
| Value | ||
| Shares | ($000) | |
| Aircastle Ltd. | 259 | 3 |
| Unifirst Corp. | 58 | 3 |
| * Huron Consulting Group Inc. | 91 | 3 |
| * Mobile Mini Inc. | 151 | 3 |
| * Dycom Industries Inc. | 156 | 3 |
| * Astec Industries Inc. | 82 | 3 |
| * Swift Transportation Co. | 326 | 3 |
| * USG Corp. | 296 | 3 |
| Cubic Corp. | 66 | 3 |
| Skywest Inc. | 217 | 3 |
| * Insituform Technologies Inc. Class A | 167 | 3 |
| Steelcase Inc. Class A | 328 | 3 |
| * SYKES Enterprises Inc. | 173 | 3 |
| * Amerco Inc. | 36 | 3 |
| * Colfax Corp. | 105 | 3 |
| Universal Forest Products Inc. | 86 | 3 |
| * TrueBlue Inc. | 186 | 3 |
| AZZ Inc. | 55 | 3 |
| * Exponent Inc. | 61 | 3 |
| American Science & Engineering Inc. | 38 | 3 |
| * Rush Enterprises Inc. Class A | 139 | 3 |
| CIRCOR International Inc. | 74 | 3 |
| Albany International Corp. | 117 | 3 |
| Sun Hydraulics Corp. | 85 | 3 |
| Arkansas Best Corp. | 120 | 2 |
| * Sauer-Danfoss Inc. | 57 | 2 |
| * Layne Christensen Co. | 87 | 2 |
| McGrath Rentcorp | 102 | 2 |
| Insperity Inc. | 95 | 2 |
| * RSC Holdings Inc. | 295 | 2 |
| Badger Meter Inc. | 67 | 2 |
| G&K Services Inc. Class A | 83 | 2 |
| TAL International Group Inc. | 80 | 2 |
| National Presto Industries Inc. | 24 | 2 |
| * Team Inc. | 93 | 2 |
| Seaboard Corp. | 1 | 2 |
| * Generac Holdings Inc. | 110 | 2 |
| Quad/Graphics Inc. | 109 | 2 |
| Quanex Building Products Corp. | 175 | 2 |
| * Aerovironment Inc. | 78 | 2 |
| * Navigant Consulting Inc. | 233 | 2 |
| * Trimas Corp. | 114 | 2 |
| Resources Connection Inc. | 209 | 2 |
| Gorman-Rupp Co. | 74 | 2 |
| * Interline Brands Inc. | 149 | 2 |
| Viad Corp. | 104 | 2 |
| John Bean Technologies Corp. | 134 | 2 |
| * Higher One Holdings Inc. | 132 | 2 |
| Encore Wire Corp. | 94 | 2 |
| * MYR Group Inc. | 100 | 2 |
| Tredegar Corp. | 124 | 2 |
| NACCO Industries Inc. Class A | 27 | 2 |
| Cascade Corp. | 48 | 2 |
| Kelly Services Inc. Class A | 134 | 2 |
| Ennis Inc. | 128 | 2 |
| * ACCO Brands Corp. | 290 | 2 |
| * ICF International Inc. | 87 | 2 |
| * Griffon Corp. | 225 | 2 |
| * A123 Systems Inc. | 411 | 2 |
| * Altra Holdings Inc. | 126 | 2 |
| * KAR Auction Services Inc. | 132 | 2 |
| Heidrick & Struggles International Inc. | 93 | 2 |
| Comfort Systems USA Inc. | 201 | 2 |
| Standex International Corp. | 66 | 2 |
32
| Vanguard® Russell 3000 Index Fund | ||
| Schedule of Investments | ||
| August 31, 2011 | ||
| Market | ||
| Value | ||
| Shares | ($000) | |
| * Titan Machinery Inc. | 72 | 2 |
| Federal Signal Corp. | 341 | 2 |
| * Consolidated Graphics Inc. | 48 | 2 |
| * Swisher Hygiene Inc. | 409 | 2 |
| * Wabash National Corp. | 320 | 2 |
| Tutor Perini Corp. | 129 | 2 |
| AAON Inc. | 103 | 2 |
| * Global Power Equipment Group Inc. | 74 | 2 |
| * Kforce Inc. | 170 | 2 |
| Mueller Water Products Inc. Class A | 758 | 2 |
| * Accuride Corp. | 204 | 2 |
| * H&E Equipment Services Inc. | 164 | 2 |
| Primoris Services Corp. | 143 | 2 |
| * Trex Co. Inc. | 88 | 2 |
| US Ecology Inc. | 84 | 2 |
| * Powell Industries Inc. | 41 | 2 |
| Twin Disc Inc. | 39 | 2 |
| * RailAmerica Inc. | 110 | 2 |
| * EnerNOC Inc. | 119 | 2 |
| * PMFG Inc. | 81 | 1 |
| * Kadant Inc. | 61 | 1 |
| * RPX Corp. | 52 | 1 |
| * Taser International Inc. | 315 | 1 |
| * Greenbrier Cos. Inc. | 80 | 1 |
| Houston Wire & Cable Co. | 94 | 1 |
| Dynamic Materials Corp. | 67 | 1 |
| * American Superconductor Corp. | 196 | 1 |
| * Capstone Turbine Corp. | 1,121 | 1 |
| * CRA International Inc. | 57 | 1 |
| * Astronics Corp. | 45 | 1 |
| * Mistras Group Inc. | 65 | 1 |
| * Columbus McKinnon Corp. | 91 | 1 |
| * Zipcar Inc. | 62 | 1 |
| Multi-Color Corp. | 50 | 1 |
| * On Assignment Inc. | 171 | 1 |
| * Gibraltar Industries Inc. | 146 | 1 |
| * Kratos Defense & Security Solutions Inc. | 137 | 1 |
| Miller Industries Inc. | 66 | 1 |
| * GenCorp Inc. | 287 | 1 |
| * CBIZ Inc. | 187 | 1 |
| * Standard Parking Corp. | 78 | 1 |
| * Celadon Group Inc. | 108 | 1 |
| * Commercial Vehicle Group Inc. | 174 | 1 |
| * Cenveo Inc. | 283 | 1 |
| * Keyw Holding Corp. | 105 | 1 |
| * Furmanite Corp. | 202 | 1 |
| * Northwest Pipe Co. | 45 | 1 |
| * M&F Worldwide Corp. | 56 | 1 |
| Ducommun Inc. | 66 | 1 |
| * LMI Aerospace Inc. | 62 | 1 |
| Marten Transport Ltd. | 66 | 1 |
| Textainer Group Holdings Ltd. | 51 | 1 |
| * Quality Distribution Inc. | 98 | 1 |
| * Force Protection Inc. | 290 | 1 |
| EnergySolutions Inc. | 336 | 1 |
| Great Lakes Dredge & Dock Corp. | 242 | 1 |
| Vicor Corp. | 104 | 1 |
| Ampco-Pittsburgh Corp. | 55 | 1 |
| * FreightCar America Inc. | 63 | 1 |
| * Michael Baker Corp. | 51 | 1 |
| * Spirit Airlines Inc. | 95 | 1 |
| Douglas Dynamics Inc. | 79 | 1 |
| * Air Transport Services Group Inc. | 211 | 1 |
| * Saia Inc. | 95 | 1 |
33
| Vanguard® Russell 3000 Index Fund | ||
| Schedule of Investments | ||
| August 31, 2011 | ||
| Market | ||
| Value | ||
| Shares | ($000) | |
| * NCI Building Systems Inc. | 117 | 1 |
| * Odyssey Marine Exploration Inc. | 401 | 1 |
| * Dolan Co. | 132 | 1 |
| Kimball International Inc. Class B | 193 | 1 |
| * Hurco Cos. Inc. | 40 | 1 |
| * Metalico Inc. | 248 | 1 |
| * Thermon Group Holdings Inc. | 70 | 1 |
| * APAC Customer Services Inc. | 129 | 1 |
| * Hawaiian Holdings Inc. | 258 | 1 |
| * Pacer International Inc. | 238 | 1 |
| Apogee Enterprises Inc. | 114 | 1 |
| Graham Corp. | 63 | 1 |
| * Genco Shipping & Trading Ltd. | 148 | 1 |
| * CAI International Inc. | 69 | 1 |
| * FuelCell Energy Inc. | 879 | 1 |
| * Ameresco Inc. Class A | 93 | 1 |
| * DXP Enterprises Inc. | 43 | 1 |
| * Sterling Construction Co. Inc. | 81 | 1 |
| LB Foster Co. Class A | 42 | 1 |
| Intersections Inc. | 66 | 1 |
| * Orion Marine Group Inc. | 156 | 1 |
| * NN Inc. | 130 | 1 |
| * American Railcar Industries Inc. | 54 | 1 |
| * Active Power Inc. | 639 | 1 |
| * Xerium Technologies Inc. | 69 | 1 |
| CDI Corp. | 86 | 1 |
| Insteel Industries Inc. | 92 | 1 |
| * InnerWorkings Inc. | 127 | 1 |
| Aceto Corp. | 176 | 1 |
| * American Reprographics Co. | 234 | 1 |
| * Republic Airways Holdings Inc. | 284 | 1 |
| * AT Cross Co. Class A | 82 | 1 |
| * Eagle Bulk Shipping Inc. | 443 | 1 |
| Schawk Inc. Class A | 70 | 1 |
| * TMS International Corp. Class A | 115 | 1 |
| * Valence Technology Inc. | 657 | 1 |
| * Hudson Highland Group Inc. | 151 | 1 |
| * Flow International Corp. | 311 | 1 |
| * School Specialty Inc. | 83 | 1 |
| * TRC Cos. Inc. | 156 | 1 |
| * Heritage-Crystal Clean Inc. | 46 | 1 |
| Alamo Group Inc. | 33 | 1 |
| * Covenant Transportation Group Inc. Class A | 154 | 1 |
| * Franklin Covey Co. | 78 | 1 |
| * Lydall Inc. | 68 | 1 |
| * Roadrunner Transportation Systems Inc. | 48 | 1 |
| * GP Strategies Corp. | 59 | 1 |
| * Essex Rental Corp. | 175 | 1 |
| * WCA Waste Corp. | 164 | 1 |
| * UniTek Global Services Inc. | 135 | 1 |
| * Patriot Transportation Holding Inc. | 31 | 1 |
| VSE Corp. | 28 | 1 |
| * Casella Waste Systems Inc. Class A | 120 | 1 |
| Met-Pro Corp. | 69 | 1 |
| * Hill International Inc. | 125 | 1 |
| Baltic Trading Ltd. | 133 | 1 |
| * Satcon Technology Corp. | 503 | 1 |
| * Pike Electric Corp. | 79 | 1 |
| American Woodmark Corp. | 42 | 1 |
| Lawson Products Inc. | 39 | 1 |
| * Coleman Cable Inc. | 53 | 1 |
| LSI Industries Inc. | 88 | 1 |
| Barrett Business Services Inc. | 45 | 1 |
| SeaCube Container Leasing Ltd. | 47 | 1 |
34
| Vanguard® Russell 3000 Index Fund | ||
| Schedule of Investments | ||
| August 31, 2011 | ||
| Market | ||
| Value | ||
| Shares | ($000) | |
| * Ener1 Inc. | 1,592 | 1 |
| * Builders FirstSource Inc. | 311 | 1 |
| * Tecumseh Products Co. Class A | 75 | 1 |
| * Universal Truckload Services Inc. | 39 | 1 |
| * Energy Recovery Inc. | 224 | 1 |
| * Park-Ohio Holdings Corp. | 36 | 1 |
| * Argan Inc. | 55 | 1 |
| International Shipholding Corp. | 31 | 1 |
| Preformed Line Products Co. | 10 | 1 |
| Compx International Inc. | 37 | 1 |
| * Omega Flex Inc. | 40 | 1 |
| * Fuel Tech Inc. | 88 | 1 |
| * Ultrapetrol Bahamas Ltd. | 128 | — |
| * PowerSecure International Inc. | 92 | — |
| Courier Corp. | 57 | — |
| * Excel Maritime Carriers Ltd. Class A | 197 | — |
| * Broadwind Energy Inc. | 439 | — |
| * Astronics Corp. Class B | 2 | — |
| 6,278 | ||
| Information Technology (18.0%) | ||
| * Apple Inc. | 3,814 | 1,468 |
| International Business Machines Corp. | 4,995 | 859 |
| Microsoft Corp. | 30,598 | 814 |
| * Google Inc. Class A | 1,036 | 560 |
| Oracle Corp. | 15,838 | 445 |
| Intel Corp. | 21,863 | 440 |
| Cisco Systems Inc. | 22,625 | 355 |
| QUALCOMM Inc. | 6,868 | 353 |
| Hewlett-Packard Co. | 8,902 | 232 |
| * EMC Corp. | 8,464 | 191 |
| Visa Inc. Class A | 2,151 | 189 |
| * eBay Inc. | 4,742 | 146 |
| Mastercard Inc. Class A | 441 | 145 |
| Accenture plc Class A | 2,656 | 142 |
| Texas Instruments Inc. | 4,777 | 125 |
| Automatic Data Processing Inc. | 2,056 | 103 |
| * Dell Inc. | 6,742 | 100 |
| Corning Inc. | 6,458 | 97 |
| * Cognizant Technology Solutions Corp. Class A | 1,252 | 79 |
| Broadcom Corp. Class A | 2,206 | 79 |
| * Yahoo! Inc. | 5,360 | 73 |
| * Salesforce.com Inc. | 551 | 71 |
| * Intuit Inc. | 1,245 | 61 |
| Applied Materials Inc. | 5,423 | 61 |
| * NetApp Inc. | 1,513 | 57 |
| * Symantec Corp. | 3,108 | 53 |
| * Adobe Systems Inc. | 2,076 | 52 |
| * Motorola Solutions Inc. | 1,238 | 52 |
| Altera Corp. | 1,326 | 48 |
| Xerox Corp. | 5,765 | 48 |
| * Citrix Systems Inc. | 773 | 47 |
| * Juniper Networks Inc. | 2,193 | 46 |
| Western Union Co. | 2,602 | 43 |
| Analog Devices Inc. | 1,233 | 41 |
| * Motorola Mobility Holdings Inc. | 1,073 | 40 |
| * Teradata Corp. | 695 | 36 |
| * SanDisk Corp. | 981 | 36 |
| Paychex Inc. | 1,329 | 36 |
| Amphenol Corp. Class A | 725 | 34 |
| Xilinx Inc. | 1,093 | 34 |
| CA Inc. | 1,582 | 33 |
| * Fiserv Inc. | 592 | 33 |
| * VMware Inc. Class A | 350 | 33 |
| * NVIDIA Corp. | 2,470 | 33 |
35
| Vanguard® Russell 3000 Index Fund | ||
| Schedule of Investments | ||
| August 31, 2011 | ||
| Market | ||
| Value | ||
| Shares | ($000) | |
| * Red Hat Inc. | 796 | 31 |
| * Electronic Arts Inc. | 1,372 | 31 |
| Fidelity National Information Services Inc. | 1,082 | 30 |
| * BMC Software Inc. | 730 | 30 |
| * Western Digital Corp. | 958 | 28 |
| Maxim Integrated Products Inc. | 1,219 | 28 |
| * Marvell Technology Group Ltd. | 2,095 | 28 |
| * F5 Networks Inc. | 334 | 27 |
| Linear Technology Corp. | 939 | 27 |
| * Autodesk Inc. | 945 | 27 |
| Avago Technologies Ltd. | 789 | 26 |
| National Semiconductor Corp. | 1,038 | 26 |
| Microchip Technology Inc. | 785 | 26 |
| KLA-Tencor Corp. | 693 | 25 |
| * First Solar Inc. | 246 | 25 |
| * Rovi Corp. | 466 | 23 |
| VeriSign Inc. | 695 | 22 |
| Harris Corp. | 525 | 21 |
| * Micron Technology Inc. | 3,568 | 21 |
| * Amdocs Ltd. | 766 | 21 |
| Activision Blizzard Inc. | 1,746 | 21 |
| * ANSYS Inc. | 379 | 20 |
| * Alliance Data Systems Corp. | 211 | 20 |
| Computer Sciences Corp. | 639 | 20 |
| * Lam Research Corp. | 514 | 19 |
| * Varian Semiconductor Equipment Associates Inc. | 311 | 19 |
| * Trimble Navigation Ltd. | 480 | 18 |
| * Informatica Corp. | 415 | 17 |
| * Nuance Communications Inc. | 933 | 17 |
| * Equinix Inc. | 184 | 17 |
| * Atmel Corp. | 1,883 | 17 |
| * SAIC Inc. | 1,130 | 17 |
| * Akamai Technologies Inc. | 769 | 17 |
| * Polycom Inc. | 691 | 16 |
| * Advanced Micro Devices Inc. | 2,407 | 16 |
| Solera Holdings Inc. | 277 | 16 |
| FLIR Systems Inc. | 626 | 16 |
| * LSI Corp. | 2,371 | 16 |
| * Skyworks Solutions Inc. | 779 | 16 |
| Factset Research Systems Inc. | 181 | 16 |
| * Avnet Inc. | 599 | 16 |
| * Riverbed Technology Inc. | 632 | 16 |
| * MICROS Systems Inc. | 318 | 15 |
| * Synopsys Inc. | 574 | 15 |
| * Rackspace Hosting Inc. | 404 | 15 |
| * Cree Inc. | 450 | 15 |
| * TIBCO Software Inc. | 650 | 15 |
| Global Payments Inc. | 313 | 14 |
| * Arrow Electronics Inc. | 453 | 14 |
| * VeriFone Systems Inc. | 399 | 14 |
| * Gartner Inc. | 381 | 14 |
| * ON Semiconductor Corp. | 1,830 | 13 |
| Jabil Circuit Inc. | 754 | 13 |
| InterDigital Inc. | 179 | 13 |
| * IAC/InterActiveCorp | 315 | 12 |
| * JDS Uniphase Corp. | 933 | 12 |
| Molex Inc. | 530 | 12 |
| Total System Services Inc. | 635 | 12 |
| * Ingram Micro Inc. | 630 | 11 |
| * NCR Corp. | 621 | 11 |
| Cypress Semiconductor Corp. | 659 | 10 |
| * Ariba Inc. | 380 | 10 |
| Broadridge Financial Solutions Inc. | 484 | 10 |
| * Lexmark International Inc. Class A | 312 | 10 |
36
| Vanguard® Russell 3000 Index Fund | ||
| Schedule of Investments | ||
| August 31, 2011 | ||
| Market | ||
| Value | ||
| Shares | ($000) | |
| Jack Henry & Associates Inc. | 340 | 10 |
| * Acme Packet Inc. | 211 | 10 |
| * Cadence Design Systems Inc. | 1,057 | 10 |
| National Instruments Corp. | 360 | 9 |
| * Fortinet Inc. | 475 | 9 |
| * Teradyne Inc. | 734 | 9 |
| * Tech Data Corp. | 185 | 9 |
| * Parametric Technology Corp. | 472 | 8 |
| * WebMD Health Corp. | 235 | 8 |
| * Genpact Ltd. | 500 | 8 |
| * Netlogic Microsystems Inc. | 273 | 8 |
| ADTRAN Inc. | 259 | 8 |
| * Novellus Systems Inc. | 287 | 8 |
| * Zebra Technologies Corp. | 219 | 8 |
| * Universal Display Corp. | 156 | 8 |
| * Concur Technologies Inc. | 180 | 8 |
| * Brocade Communications Systems Inc. | 1,944 | 8 |
| * Compuware Corp. | 888 | 7 |
| Diebold Inc. | 262 | 7 |
| * SuccessFactors Inc. | 318 | 7 |
| * Aruba Networks Inc. | 346 | 7 |
| * NeuStar Inc. Class A | 295 | 7 |
| * Dolby Laboratories Inc. Class A | 219 | 7 |
| * QLIK Technologies Inc. | 283 | 7 |
| * Vishay Intertechnology Inc. | 612 | 7 |
| Anixter International Inc. | 118 | 7 |
| * RF Micro Devices Inc. | 1,117 | 7 |
| * Hittite Microwave Corp. | 127 | 7 |
| * Finisar Corp. | 370 | 7 |
| * Fairchild Semiconductor International Inc. Class A | 515 | 7 |
| * AOL Inc. | 438 | 7 |
| * CACI International Inc. Class A | 123 | 7 |
| DST Systems Inc. | 142 | 7 |
| * MEMC Electronic Materials Inc. | 948 | 7 |
| * Wright Express Corp. | 157 | 7 |
| * Itron Inc. | 165 | 7 |
| * IPG Photonics Corp. | 113 | 7 |
| * International Rectifier Corp. | 287 | 7 |
| * Silicon Laboratories Inc. | 186 | 6 |
| * Cavium Inc. | 199 | 6 |
| Lender Processing Services Inc. | 356 | 6 |
| Plantronics Inc. | 195 | 6 |
| * GT Advanced Technologies Inc. | 511 | 6 |
| * CommVault Systems Inc. | 179 | 6 |
| * QLogic Corp. | 433 | 6 |
| Tellabs Inc. | 1,482 | 6 |
| * Blackboard Inc. | 143 | 6 |
| * Veeco Instruments Inc. | 166 | 6 |
| j2 Global Communications Inc. | 188 | 6 |
| * OpenTable Inc. | 97 | 6 |
| * Aspen Technology Inc. | 350 | 6 |
| * SolarWinds Inc. | 235 | 6 |
| * PMC - Sierra Inc. | 954 | 6 |
| * Progress Software Corp. | 278 | 6 |
| Intersil Corp. Class A | 515 | 6 |
| * Arris Group Inc. | 527 | 6 |
| * Semtech Corp. | 269 | 6 |
| * Microsemi Corp. | 354 | 5 |
| * VistaPrint NV | 185 | 5 |
| Cognex Corp. | 170 | 5 |
| * TiVo Inc. | 511 | 5 |
| MAXIMUS Inc. | 144 | 5 |
| * Viasat Inc. | 150 | 5 |
| * TriQuint Semiconductor Inc. | 684 | 5 |
37
| Vanguard® Russell 3000 Index Fund | ||
| Schedule of Investments | ||
| August 31, 2011 | ||
| Market | ||
| Value | ||
| Shares | ($000) | |
| * FEI Co. | 162 | 5 |
| * Cymer Inc. | 128 | 5 |
| * Ultimate Software Group Inc. | 101 | 5 |
| MKS Instruments Inc. | 217 | 5 |
| * Monster Worldwide Inc. | 532 | 5 |
| * Ancestry.com Inc. | 139 | 5 |
| * Rambus Inc. | 423 | 5 |
| Blackbaud Inc. | 196 | 5 |
| * Coherent Inc. | 111 | 5 |
| Sapient Corp. | 455 | 5 |
| * Ciena Corp. | 391 | 5 |
| * ValueClick Inc. | 309 | 5 |
| * Convergys Corp. | 442 | 5 |
| * Cardtronics Inc. | 189 | 5 |
| * Mentor Graphics Corp. | 417 | 5 |
| * Taleo Corp. Class A | 177 | 5 |
| * Quest Software Inc. | 265 | 5 |
| Littelfuse Inc. | 96 | 4 |
| * JDA Software Group Inc. | 168 | 4 |
| * SunPower Corp. Class B | 372 | 4 |
| * Entegris Inc. | 586 | 4 |
| * CoreLogic Inc. | 385 | 4 |
| * Netgear Inc. | 156 | 4 |
| * Omnivision Technologies Inc. | 235 | 4 |
| * Take-Two Interactive Software Inc. | 324 | 4 |
| * EchoStar Corp. Class A | 169 | 4 |
| Fair Isaac Corp. | 161 | 4 |
| * Cirrus Logic Inc. | 269 | 4 |
| * MicroStrategy Inc. Class A | 33 | 4 |
| * Plexus Corp. | 149 | 4 |
| Power Integrations Inc. | 123 | 4 |
| * ACI Worldwide Inc. | 132 | 4 |
| * Acxiom Corp. | 354 | 4 |
| Mantech International Corp. Class A | 103 | 4 |
| * VirnetX Holding Corp. | 178 | 4 |
| * Cabot Microelectronics Corp. | 93 | 4 |
| * Tyler Technologies Inc. | 142 | 4 |
| * RightNow Technologies Inc. | 109 | 4 |
| * NetSuite Inc. | 110 | 4 |
| * Insight Enterprises Inc. | 187 | 4 |
| * Infinera Corp. | 457 | 3 |
| * Integrated Device Technology Inc. | 605 | 3 |
| * Benchmark Electronics Inc. | 251 | 3 |
| * Websense Inc. | 163 | 3 |
| * Scansource Inc. | 107 | 3 |
| * OSI Systems Inc. | 85 | 3 |
| * Synaptics Inc. | 135 | 3 |
| Heartland Payment Systems Inc. | 153 | 3 |
| * Synchronoss Technologies Inc. | 121 | 3 |
| NIC Inc. | 282 | 3 |
| * Euronet Worldwide Inc. | 201 | 3 |
| * Manhattan Associates Inc. | 91 | 3 |
| * Digital River Inc. | 160 | 3 |
| Syntel Inc. | 70 | 3 |
| Earthlink Inc. | 433 | 3 |
| * Rogers Corp. | 64 | 3 |
| Comtech Telecommunications Corp. | 113 | 3 |
| * LinkedIn Corp. Class A | 37 | 3 |
| * DealerTrack Holdings Inc. | 166 | 3 |
| * Bottomline Technologies Inc. | 135 | 3 |
| * Sourcefire Inc. | 112 | 3 |
| * SYNNEX Corp. | 117 | 3 |
| * Spansion Inc. Class A | 204 | 3 |
| * Advent Software Inc. | 132 | 3 |
38
| Vanguard® Russell 3000 Index Fund | ||
| Schedule of Investments | ||
| August 31, 2011 | ||
| Market | ||
| Value | ||
| Shares | ($000) | |
| * Unisys Corp. | 174 | 3 |
| * Tessera Technologies Inc. | 207 | 3 |
| * LivePerson Inc. | 247 | 3 |
| * Brightpoint Inc. | 301 | 3 |
| * Diodes Inc. | 142 | 3 |
| * BroadSoft Inc. | 93 | 3 |
| Pegasystems Inc. | 69 | 3 |
| * Electronics for Imaging Inc. | 192 | 3 |
| * Lattice Semiconductor Corp. | 478 | 3 |
| * LogMeIn Inc. | 86 | 3 |
| * Rofin-Sinar Technologies Inc. | 116 | 3 |
| AVX Corp. | 202 | 3 |
| * Blue Coat Systems Inc. | 179 | 3 |
| * RealPage Inc. | 126 | 3 |
| * FARO Technologies Inc. | 69 | 3 |
| * Loral Space & Communications Inc. | 46 | 3 |
| * Sanmina-SCI Corp. | 335 | 3 |
| * Brooks Automation Inc. | 273 | 3 |
| * Netscout Systems Inc. | 186 | 3 |
| * Ceva Inc. | 96 | 3 |
| * Kulicke & Soffa Industries Inc. | 293 | 3 |
| * Verint Systems Inc. | 89 | 3 |
| * Checkpoint Systems Inc. | 166 | 3 |
| * Emulex Corp. | 365 | 2 |
| * TTM Technologies Inc. | 220 | 2 |
| * Sonus Networks Inc. | 948 | 2 |
| * DG FastChannel Inc. | 111 | 2 |
| MTS Systems Corp. | 67 | 2 |
| * Kenexa Corp. | 114 | 2 |
| * Calix Inc. | 162 | 2 |
| * S1 Corp. | 259 | 2 |
| * Power-One Inc. | 314 | 2 |
| * Constant Contact Inc. | 124 | 2 |
| * ATMI Inc. | 137 | 2 |
| * Maxwell Technologies Inc. | 134 | 2 |
| * RealD Inc. | 165 | 2 |
| * Silicon Graphics International Corp. | 145 | 2 |
| * DTS Inc. | 75 | 2 |
| Micrel Inc. | 227 | 2 |
| Forrester Research Inc. | 68 | 2 |
| * Harmonic Inc. | 475 | 2 |
| * Tekelec | 314 | 2 |
| Park Electrochemical Corp. | 91 | 2 |
| * Volterra Semiconductor Corp. | 110 | 2 |
| * comScore Inc. | 139 | 2 |
| United Online Inc. | 407 | 2 |
| * Ebix Inc. | 134 | 2 |
| * Measurement Specialties Inc. | 70 | 2 |
| * Freescale Semiconductor Holdings I Ltd. | 190 | 2 |
| * Ultratech Inc. | 107 | 2 |
| * Standard Microsystems Corp. | 103 | 2 |
| * Dice Holdings Inc. | 214 | 2 |
| * Monotype Imaging Holdings Inc. | 183 | 2 |
| Opnet Technologies Inc. | 62 | 2 |
| * Newport Corp. | 165 | 2 |
| * CSG Systems International Inc. | 158 | 2 |
| * Interactive Intelligence Group | 65 | 2 |
| * Stratasys Inc. | 90 | 2 |
| * Amkor Technology Inc. | 476 | 2 |
| Black Box Corp. | 82 | 2 |
| * FleetCor Technologies Inc. | 71 | 2 |
| EPIQ Systems Inc. | 161 | 2 |
| * Quantum Corp. | 1,025 | 2 |
| * Monolithic Power Systems Inc. | 158 | 2 |
39
| Vanguard® Russell 3000 Index Fund | ||
| Schedule of Investments | ||
| August 31, 2011 | ||
| Market | ||
| Value | ||
| Shares | ($000) | |
| * Silicon Image Inc. | 371 | 2 |
| * Liquidity Services Inc. | 81 | 2 |
| * SS&C Technologies Holdings Inc. | 117 | 2 |
| * Formfactor Inc. | 244 | 2 |
| * Vocus Inc. | 88 | 2 |
| * Kemet Corp. | 205 | 2 |
| * Accelrys Inc. | 289 | 2 |
| * Applied Micro Circuits Corp. | 327 | 2 |
| * TeleTech Holdings Inc. | 104 | 2 |
| * STEC Inc. | 194 | 2 |
| * PROS Holdings Inc. | 116 | 2 |
| * Mercury Computer Systems Inc. | 132 | 2 |
| * Oplink Communications Inc. | 111 | 2 |
| * Super Micro Computer Inc. | 133 | 2 |
| * Intermec Inc. | 242 | 2 |
| * KIT Digital Inc. | 161 | 2 |
| * Booz Allen Hamilton Holding Corp. | 110 | 2 |
| * Nanometrics Inc. | 111 | 2 |
| * Photronics Inc. | 270 | 2 |
| * Advanced Energy Industries Inc. | 175 | 2 |
| * ShoreTel Inc. | 250 | 2 |
| * TNS Inc. | 102 | 2 |
| * ExlService Holdings Inc. | 65 | 2 |
| * Magma Design Automation Inc. | 327 | 2 |
| * QuinStreet Inc. | 138 | 2 |
| * Entropic Communications Inc. | 362 | 2 |
| * Fabrinet | 98 | 2 |
| * Powerwave Technologies Inc. | 917 | 2 |
| Sycamore Networks Inc. | 93 | 2 |
| * IntraLinks Holdings Inc. | 170 | 2 |
| * Electro Scientific Industries Inc. | 105 | 2 |
| * Ixia | 184 | 2 |
| iGate Corp. | 139 | 2 |
| * Internap Network Services Corp. | 299 | 2 |
| * Avid Technology Inc. | 157 | 2 |
| * Infospace Inc. | 159 | 2 |
| * NVE Corp. | 23 | 2 |
| * OCZ Technology Group Inc. | 266 | 1 |
| * LTX-Credence Corp. | 261 | 1 |
| * Web.com Group Inc. | 155 | 1 |
| * Digi International Inc. | 116 | 1 |
| * Zoran Corp. | 179 | 1 |
| Methode Electronics Inc. | 145 | 1 |
| * IXYS Corp. | 118 | 1 |
| * Oclaro Inc. | 328 | 1 |
| * Anaren Inc. | 70 | 1 |
| CTS Corp. | 144 | 1 |
| Cass Information Systems Inc. | 38 | 1 |
| * Advanced Analogic Technologies Inc. | 229 | 1 |
| Keynote Systems Inc. | 57 | 1 |
| * Ness Technologies Inc. | 178 | 1 |
| * Move Inc. | 746 | 1 |
| Daktronics Inc. | 139 | 1 |
| * GSI Group Inc. | 139 | 1 |
| * Echelon Corp. | 157 | 1 |
| * Openwave Systems Inc. | 684 | 1 |
| * XO Group Inc. | 143 | 1 |
| * LoopNet Inc. | 73 | 1 |
| * Kopin Corp. | 339 | 1 |
| * Symmetricom Inc. | 233 | 1 |
| Electro Rent Corp. | 86 | 1 |
| * Envestnet Inc. | 107 | 1 |
| * Global Cash Access Holdings Inc. | 418 | 1 |
| * Zygo Corp. | 95 | 1 |
40
| Vanguard® Russell 3000 Index Fund | ||
| Schedule of Investments | ||
| August 31, 2011 | ||
| Market | ||
| Value | ||
| Shares | ($000) | |
| * Seachange International Inc. | 158 | 1 |
| * Exar Corp. | 201 | 1 |
| * ServiceSource International Inc. | 67 | 1 |
| Cohu Inc. | 108 | 1 |
| * Extreme Networks | 431 | 1 |
| * MIPS Technologies Inc. Class A | 210 | 1 |
| * Virtusa Corp. | 74 | 1 |
| * AXT Inc. | 150 | 1 |
| * Sigma Designs Inc. | 144 | 1 |
| * Lionbridge Technologies Inc. | 386 | 1 |
| * Supertex Inc. | 59 | 1 |
| * Active Network Inc. | 71 | 1 |
| * Integrated Silicon Solution Inc. | 139 | 1 |
| * Globecomm Systems Inc. | 89 | 1 |
| * Vishay Precision Group Inc. | 76 | 1 |
| * Mindspeed Technologies Inc. | 196 | 1 |
| * Ciber Inc. | 345 | 1 |
| * Pericom Semiconductor Corp. | 145 | 1 |
| * SciQuest Inc. | 75 | 1 |
| * Cray Inc. | 198 | 1 |
| * Rubicon Technology Inc. | 87 | 1 |
| * Perficient Inc. | 127 | 1 |
| * Inphi Corp. | 139 | 1 |
| * Cornerstone OnDemand Inc. | 72 | 1 |
| Xyratex Ltd. | 130 | 1 |
| * Zix Corp. | 327 | 1 |
| * Aeroflex Holding Corp. | 126 | 1 |
| * Intevac Inc. | 133 | 1 |
| * Multi-Fineline Electronix Inc. | 57 | 1 |
| ModusLink Global Solutions Inc. | 262 | 1 |
| Bel Fuse Inc. Class B | 62 | 1 |
| RealNetworks Inc. | 116 | 1 |
| * Rudolph Technologies Inc. | 157 | 1 |
| * DSP Group Inc. | 163 | 1 |
| * Imation Corp. | 150 | 1 |
| * LeCroy Corp. | 115 | 1 |
| Stamps.com Inc. | 52 | 1 |
| * Callidus Software Inc. | 206 | 1 |
| * Wave Systems Corp. Class A | 433 | 1 |
| * Anadigics Inc. | 359 | 1 |
| * Actuate Corp. | 156 | 1 |
| * Immersion Corp. | 141 | 1 |
| * TeleCommunication Systems Inc. Class A | 256 | 1 |
| Renaissance Learning Inc. | 62 | 1 |
| * Alpha & Omega Semiconductor Ltd. | 109 | 1 |
| Pulse Electronics Corp. | 286 | 1 |
| * Responsys Inc. | 66 | 1 |
| * Radisys Corp. | 127 | 1 |
| * Emcore Corp. | 597 | 1 |
| * KVH Industries Inc. | 107 | 1 |
| * Glu Mobile Inc. | 312 | 1 |
| * DemandTec Inc. | 143 | 1 |
| * Westell Technologies Inc. Class A | 375 | 1 |
| * MoneyGram International Inc. | 359 | 1 |
| * Ultra Clean Holdings | 162 | 1 |
| * Axcelis Technologies Inc. | 667 | 1 |
| * Computer Task Group Inc. | 81 | 1 |
| * Limelight Networks Inc. | 354 | 1 |
| * TeleNav Inc. | 96 | 1 |
| * Saba Software Inc. | 127 | 1 |
| * Digimarc Corp. | 26 | 1 |
| * Dot Hill Systems Corp. | 493 | 1 |
| * PRGX Global Inc. | 147 | 1 |
| * support.com Inc. | 343 | 1 |
41
| Vanguard® Russell 3000 Index Fund | ||
| Schedule of Investments | ||
| August 31, 2011 | ||
| Market | ||
| Value | ||
| Shares | ($000) | |
| * Motricity Inc. | 366 | 1 |
| * THQ Inc. | 437 | 1 |
| * Amtech Systems Inc. | 78 | 1 |
| Marchex Inc. Class B | 84 | 1 |
| * Novatel Wireless Inc. | 251 | 1 |
| * Aviat Networks Inc. | 320 | 1 |
| Communications Systems Inc. | 57 | 1 |
| * MoSys Inc. | 207 | 1 |
| * Procera Networks Inc. | 100 | 1 |
| * Travelzoo Inc. | 22 | 1 |
| * VASCO Data Security International Inc. | 111 | 1 |
| * ORBCOMM Inc. | 347 | 1 |
| * Agilysys Inc. | 86 | 1 |
| * Ellie Mae Inc. | 139 | 1 |
| Richardson Electronics Ltd. | 55 | 1 |
| * Dynamics Research Corp. | 77 | 1 |
| * Identive Group Inc. | 403 | 1 |
| American Software Inc. Class A | 93 | 1 |
| * eMagin Corp. | 201 | 1 |
| QAD Inc. Class A | 61 | 1 |
| Rimage Corp. | 50 | 1 |
| * Demand Media Inc. | 79 | 1 |
| * Smith Micro Software Inc. | 355 | 1 |
| * NeoPhotonics Corp. | 109 | 1 |
| * Rosetta Stone Inc. | 49 | 1 |
| * Viasystems Group Inc. | 35 | 1 |
| * ePlus Inc. | 26 | 1 |
| * Numerex Corp. Class A | 106 | 1 |
| * Echo Global Logistics Inc. | 46 | 1 |
| * SRS Labs Inc. | 78 | 1 |
| * SPS Commerce Inc. | 35 | 1 |
| * TechTarget Inc. | 98 | 1 |
| * PC Connection Inc. | 70 | 1 |
| * Deltek Inc. | 94 | 1 |
| * Quepasa Corp. | 133 | 1 |
| * Meru Networks Inc. | 67 | 1 |
| * PLX Technology Inc. | 192 | 1 |
| * MaxLinear Inc. | 101 | 1 |
| * X-Rite Inc. | 158 | 1 |
| * FriendFinder Networks Inc. | 191 | 1 |
| * PDF Solutions Inc. | 114 | 1 |
| DDi Corp. | 75 | 1 |
| * Convio Inc. | 61 | 1 |
| * Dialogic Inc. | 201 | 1 |
| * FalconStor Software Inc. | 168 | 1 |
| * SunPower Corp. Class A | 37 | 1 |
| * Stream Global Services Inc. | 190 | 1 |
| * Hackett Group Inc. | 137 | 1 |
| * GSI Technology Inc. | 103 | 1 |
| * Microvision Inc. | 564 | 1 |
| * NCI Inc. Class A | 31 | 1 |
| * Guidance Software Inc. | 79 | — |
| * BigBand Networks Inc. | 300 | — |
| * Opnext Inc. | 265 | — |
| * FSI International Inc. | 180 | — |
| 10,267 | ||
| Materials (4.4%) | ||
| EI du Pont de Nemours & Co. | 3,821 | 184 |
| Freeport-McMoRan Copper & Gold Inc. | 3,897 | 184 |
| Monsanto Co. | 2,205 | 152 |
| Dow Chemical Co. | 4,836 | 138 |
| Newmont Mining Corp. | 2,001 | 125 |
| Praxair Inc. | 1,249 | 123 |
42
| Vanguard® Russell 3000 Index Fund | ||
| Schedule of Investments | ||
| August 31, 2011 | ||
| Market | ||
| Value | ||
| Shares | ($000) | |
| Mosaic Co. | 1,134 | 81 |
| Air Products & Chemicals Inc. | 872 | 71 |
| Alcoa Inc. | 4,376 | 56 |
| CF Industries Holdings Inc. | 295 | 54 |
| Ecolab Inc. | 955 | 51 |
| Cliffs Natural Resources Inc. | 602 | 50 |
| PPG Industries Inc. | 651 | 50 |
| International Paper Co. | 1,799 | 49 |
| Nucor Corp. | 1,300 | 47 |
| LyondellBasell Industries NV Class A | 1,289 | 45 |
| Lubrizol Corp. | 265 | 36 |
| Sigma-Aldrich Corp. | 502 | 32 |
| Celanese Corp. Class A | 644 | 30 |
| Sherwin-Williams Co. | 370 | 28 |
| Ball Corp. | 693 | 25 |
| Eastman Chemical Co. | 294 | 24 |
| Southern Copper Corp. | 701 | 24 |
| * Crown Holdings Inc. | 644 | 23 |
| FMC Corp. | 296 | 22 |
| Allegheny Technologies Inc. | 437 | 22 |
| Nalco Holding Co. | 573 | 21 |
| Airgas Inc. | 324 | 21 |
| Walter Energy Inc. | 257 | 21 |
| MeadWestvaco Corp. | 665 | 18 |
| International Flavors & Fragrances Inc. | 315 | 18 |
| Albemarle Corp. | 360 | 18 |
| United States Steel Corp. | 591 | 18 |
| Vulcan Materials Co. | 505 | 18 |
| Ashland Inc. | 310 | 16 |
| Royal Gold Inc. | 213 | 16 |
| Rock-Tenn Co. Class A | 272 | 15 |
| * Allied Nevada Gold Corp. | 350 | 15 |
| * Rockwood Holdings Inc. | 268 | 14 |
| Aptargroup Inc. | 264 | 13 |
| Domtar Corp. | 161 | 13 |
| Bemis Co. Inc. | 413 | 13 |
| * Owens-Illinois Inc. | 675 | 13 |
| Martin Marietta Materials Inc. | 179 | 13 |
| * Molycorp Inc. | 220 | 12 |
| Sonoco Products Co. | 390 | 12 |
| Reliance Steel & Aluminum Co. | 294 | 12 |
| Valspar Corp. | 376 | 12 |
| Sealed Air Corp. | 659 | 12 |
| Steel Dynamics Inc. | 898 | 11 |
| * WR Grace & Co. | 288 | 11 |
| RPM International Inc. | 511 | 11 |
| Temple-Inland Inc. | 425 | 10 |
| Packaging Corp. of America | 401 | 10 |
| * Coeur d'Alene Mines Corp. | 352 | 10 |
| Huntsman Corp. | 759 | 10 |
| Compass Minerals International Inc. | 130 | 10 |
| Cabot Corp. | 260 | 9 |
| Carpenter Technology Corp. | 176 | 9 |
| Cytec Industries Inc. | 195 | 9 |
| Scotts Miracle-Gro Co. Class A | 181 | 9 |
| Greif Inc. Class A | 152 | 8 |
| * Hecla Mining Co. | 1,106 | 8 |
| * Solutia Inc. | 486 | 8 |
| Silgan Holdings Inc. | 198 | 7 |
| Sensient Technologies Corp. | 202 | 7 |
| * Intrepid Potash Inc. | 212 | 7 |
| Olin Corp. | 324 | 6 |
| * Stillwater Mining Co. | 418 | 6 |
| NewMarket Corp. | 36 | 6 |
43
| Vanguard® Russell 3000 Index Fund | ||
| Schedule of Investments | ||
| August 31, 2011 | ||
| Market | ||
| Value | ||
| Shares | ($000) | |
| Titanium Metals Corp. | 359 | 6 |
| Commercial Metals Co. | 476 | 6 |
| * Chemtura Corp. | 408 | 5 |
| * Thompson Creek Metals Co. Inc. | 621 | 5 |
| PolyOne Corp. | 397 | 5 |
| Balchem Corp. | 121 | 5 |
| HB Fuller Co. | 215 | 5 |
| Buckeye Technologies Inc. | 173 | 5 |
| Arch Chemicals Inc. | 98 | 5 |
| Schnitzer Steel Industries Inc. | 99 | 4 |
| Globe Specialty Metals Inc. | 266 | 4 |
| Schweitzer-Mauduit International Inc. | 71 | 4 |
| Minerals Technologies Inc. | 73 | 4 |
| Worthington Industries Inc. | 255 | 4 |
| Innophos Holdings Inc. | 97 | 4 |
| * Louisiana-Pacific Corp. | 590 | 4 |
| AK Steel Holding Corp. | 433 | 4 |
| * OM Group Inc. | 121 | 4 |
| Kaiser Aluminum Corp. | 72 | 4 |
| Westlake Chemical Corp. | 80 | 4 |
| Texas Industries Inc. | 102 | 4 |
| * Calgon Carbon Corp. | 223 | 4 |
| Eagle Materials Inc. | 176 | 3 |
| * Clearwater Paper Corp. | 92 | 3 |
| * RTI International Metals Inc. | 123 | 3 |
| * Kraton Performance Polymers Inc. | 129 | 3 |
| * Georgia Gulf Corp. | 140 | 3 |
| Haynes International Inc. | 51 | 3 |
| * Ferro Corp. | 353 | 3 |
| * LSB Industries Inc. | 73 | 3 |
| Koppers Holdings Inc. | 86 | 3 |
| AMCOL International Corp. | 98 | 3 |
| * Graphic Packaging Holding Co. | 649 | 3 |
| PH Glatfelter Co. | 190 | 3 |
| Gold Resource Corp. | 115 | 3 |
| * Innospec Inc. | 100 | 3 |
| Deltic Timber Corp. | 46 | 3 |
| * Golden Star Resources Ltd. | 1,083 | 3 |
| * Century Aluminum Co. | 216 | 3 |
| Boise Inc. | 422 | 3 |
| * US Gold Corp. | 419 | 3 |
| Stepan Co. | 34 | 3 |
| * Graham Packaging Co. Inc. | 100 | 3 |
| * KapStone Paper and Packaging Corp. | 169 | 3 |
| A Schulman Inc. | 138 | 3 |
| * Jaguar Mining Inc. | 407 | 3 |
| * Materion Corp. | 86 | 2 |
| Kronos Worldwide Inc. | 98 | 2 |
| * Horsehead Holding Corp. | 209 | 2 |
| Zep Inc. | 114 | 2 |
| Quaker Chemical Corp. | 60 | 2 |
| * TPC Group Inc. | 62 | 2 |
| * Flotek Industries Inc. | 245 | 2 |
| Myers Industries Inc. | 147 | 2 |
| * Paramount Gold and Silver Corp. | 606 | 1 |
| * STR Holdings Inc. | 128 | 1 |
| Hawkins Inc. | 40 | 1 |
| Wausau Paper Corp. | 208 | 1 |
| * Vista Gold Corp. | 398 | 1 |
| American Vanguard Corp. | 113 | 1 |
| Neenah Paper Inc. | 74 | 1 |
| * Midway Gold Corp. | 481 | 1 |
| FutureFuel Corp. | 108 | 1 |
| * General Moly Inc. | 294 | 1 |
44
| Vanguard® Russell 3000 Index Fund | ||
| Schedule of Investments | ||
| August 31, 2011 | ||
| Market | ||
| Value | ||
| Shares | ($000) | |
| * AM Castle & Co. | 96 | 1 |
| * Universal Stainless & Alloy | 34 | 1 |
| * Noranda Aluminum Holding Corp. | 98 | 1 |
| * Zoltek Cos. Inc. | 122 | 1 |
| * Golden Minerals Co. | 81 | 1 |
| * Senomyx Inc. | 245 | 1 |
| Olympic Steel Inc. | 49 | 1 |
| * Omnova Solutions Inc. | 230 | 1 |
| * Spartech Corp. | 218 | 1 |
| * Revett Minerals Inc. | 199 | 1 |
| * Headwaters Inc. | 421 | 1 |
| * Handy & Harman Ltd. | 57 | 1 |
| Chase Corp. | 61 | 1 |
| * United States Lime & Minerals Inc. | 17 | 1 |
| * Landec Corp. | 115 | 1 |
| * AEP Industries Inc. | 24 | 1 |
| * Verso Paper Corp. | 286 | 1 |
| * Metals USA Holdings Corp. | 49 | 1 |
| KMG Chemicals Inc. | 37 | 1 |
| NL Industries Inc. | 37 | 1 |
| * US Energy Corp. Wyoming | 163 | — |
| 2,479 | ||
| Telecommunication Services (2.8%) | ||
| AT&T Inc. | 24,418 | 695 |
| Verizon Communications Inc. | 11,666 | 422 |
| CenturyLink Inc. | 2,517 | 91 |
| * American Tower Corp. Class A | 1,632 | 88 |
| * Crown Castle International Corp. | 1,195 | 52 |
| * Sprint Nextel Corp. | 12,307 | 46 |
| Frontier Communications Corp. | 4,104 | 31 |
| * NII Holdings Inc. | 703 | 27 |
| Windstream Corp. | 2,103 | 27 |
| * SBA Communications Corp. Class A | 444 | 17 |
| * MetroPCS Communications Inc. | 1,087 | 12 |
| * Level 3 Communications Inc. | 6,671 | 12 |
| * tw telecom inc Class A | 591 | 11 |
| Telephone & Data Systems Inc. | 357 | 9 |
| AboveNet Inc. | 96 | 6 |
| * Global Crossing Ltd. | 138 | 4 |
| * PAETEC Holding Corp. | 516 | 3 |
| * Cincinnati Bell Inc. | 837 | 3 |
| * United States Cellular Corp. | 64 | 3 |
| * Cogent Communications Group Inc. | 189 | 3 |
| * Clearwire Corp. Class A | 834 | 3 |
| NTELOS Holdings Corp. | 127 | 2 |
| * Leap Wireless International Inc. | 262 | 2 |
| Consolidated Communications Holdings Inc. | 116 | 2 |
| * Vonage Holdings Corp. | 556 | 2 |
| * Premiere Global Services Inc. | 225 | 2 |
| * Neutral Tandem Inc. | 158 | 2 |
| * General Communication Inc. Class A | 211 | 2 |
| Alaska Communications Systems Group Inc. | 240 | 2 |
| * Pendrell Corp. | 780 | 2 |
| Shenandoah Telecommunications Co. | 127 | 2 |
| * Cbeyond Inc. | 163 | 2 |
| * 8x8 Inc. | 339 | 1 |
| IDT Corp. Class B | 65 | 1 |
| USA Mobility Inc. | 90 | 1 |
| Atlantic Tele-Network Inc. | 41 | 1 |
| * Iridium Communications Inc. | 171 | 1 |
| SureWest Communications | 87 | 1 |
| * Towerstream Corp. | 267 | 1 |
| * Fairpoint Communications Inc. | 153 | 1 |
| * inContact Inc. | 233 | 1 |
45
| Vanguard® Russell 3000 Index Fund | ||
| Schedule of Investments | ||
| August 31, 2011 | ||
| Market | ||
| Value | ||
| Shares | ($000) | |
| HickoryTech Corp. | 96 | 1 |
| Globalstar Inc. | 837 | 1 |
| * * Boingo Wireless Inc. | 78 | 1 |
| 1,599 | ||
| Utilities (3.7%) | ||
| Southern Co. | 3,493 | 144 |
| Exelon Corp. | 2,725 | 117 |
| Dominion Resources Inc. | 2,369 | 115 |
| Duke Energy Corp. | 5,477 | 104 |
| NextEra Energy Inc. | 1,736 | 98 |
| American Electric Power Co. Inc. | 1,982 | 77 |
| FirstEnergy Corp. | 1,721 | 76 |
| Public Service Enterprise Group Inc. | 2,081 | 71 |
| PG&E Corp. | 1,637 | 69 |
| PPL Corp. | 2,375 | 69 |
| Consolidated Edison Inc. | 1,204 | 68 |
| Progress Energy Inc. | 1,212 | 59 |
| Sempra Energy | 986 | 52 |
| Edison International | 1,340 | 50 |
| Xcel Energy Inc. | 1,992 | 49 |
| Entergy Corp. | 733 | 48 |
| DTE Energy Co. | 697 | 35 |
| CenterPoint Energy Inc. | 1,751 | 35 |
| Oneok Inc. | 442 | 31 |
| Wisconsin Energy Corp. | 964 | 30 |
| Ameren Corp. | 995 | 30 |
| Constellation Energy Group Inc. | 768 | 30 |
| * AES Corp. | 2,709 | 29 |
| Northeast Utilities | 729 | 25 |
| NiSource Inc. | 1,153 | 25 |
| * NRG Energy Inc. | 995 | 23 |
| American Water Works Co. Inc. | 724 | 22 |
| * Calpine Corp. | 1,447 | 21 |
| National Fuel Gas Co. | 341 | 21 |
| CMS Energy Corp. | 1,041 | 20 |
| OGE Energy Corp. | 404 | 20 |
| Pinnacle West Capital Corp. | 428 | 19 |
| NSTAR | 406 | 19 |
| SCANA Corp. | 451 | 18 |
| Alliant Energy Corp. | 435 | 18 |
| Pepco Holdings Inc. | 884 | 17 |
| MDU Resources Group Inc. | 739 | 16 |
| TECO Energy Inc. | 842 | 15 |
| Integrys Energy Group Inc. | 307 | 15 |
| ITC Holdings Corp. | 200 | 15 |
| NV Energy Inc. | 924 | 14 |
| DPL Inc. | 458 | 14 |
| UGI Corp. | 438 | 13 |
| Questar Corp. | 695 | 13 |
| AGL Resources Inc. | 307 | 13 |
| Aqua America Inc. | 542 | 12 |
| Westar Energy Inc. | 446 | 12 |
| Atmos Energy Corp. | 354 | 12 |
| Great Plains Energy Inc. | 533 | 10 |
| Nicor Inc. | 179 | 10 |
| * GenOn Energy Inc. | 3,038 | 9 |
| Hawaiian Electric Industries Inc. | 376 | 9 |
| Vectren Corp. | 323 | 9 |
| Piedmont Natural Gas Co. Inc. | 284 | 9 |
| Cleco Corp. | 242 | 9 |
| WGL Holdings Inc. | 204 | 8 |
| New Jersey Resources Corp. | 165 | 8 |
| IDACORP Inc. | 199 | 8 |
| Portland General Electric Co. | 302 | 7 |
46
| Vanguard® Russell 3000 Index Fund | ||||
| Schedule of Investments | ||||
| August 31, 2011 | ||||
| Market | ||||
| Value | ||||
| Shares | ($000) | |||
| UIL Holdings Corp. | 203 | 7 | ||
| Southwest Gas Corp. | 184 | 7 | ||
| South Jersey Industries Inc. | 122 | 6 | ||
| El Paso Electric Co. | 179 | 6 | ||
| Avista Corp. | 236 | 6 | ||
| Unisource Energy Corp. | 151 | 6 | ||
| PNM Resources Inc. | 360 | 5 | ||
| NorthWestern Corp. | 154 | 5 | ||
| Allete Inc. | 133 | 5 | ||
| Northwest Natural Gas Co. | 113 | 5 | ||
| Black Hills Corp. | 166 | 5 | ||
| Atlantic Power Corp. | 298 | 5 | ||
| Empire District Electric Co. | 186 | 4 | ||
| MGE Energy Inc. | 91 | 4 | ||
| California Water Service Group | 189 | 4 | ||
| CH Energy Group Inc. | 63 | 4 | ||
| Laclede Group Inc. | 89 | 4 | ||
| Otter Tail Corp. | 146 | 3 | ||
| American States Water Co. | 77 | 3 | ||
| * | Dynegy Inc. Class A | 472 | 2 | |
| Central Vermont Public Service Corp. | 54 | 2 | ||
| Chesapeake Utilities Corp. | 39 | 2 | ||
| Unitil Corp. | 55 | 1 | ||
| Middlesex Water Co. | 76 | 1 | ||
| SJW Corp. | 59 | 1 | ||
| Ormat Technologies Inc. | 73 | 1 | ||
| Connecticut Water Service Inc. | 41 | 1 | ||
| York Water Co. | 61 | 1 | ||
| Pennichuck Corp. | 34 | 1 | ||
| Artesian Resources Corp. Class A | 36 | 1 | ||
| Consolidated Water Co. Ltd | 76 | 1 | ||
| * | Cadiz Inc. . | 60 | 1 | |
| 2,124 | ||||
| Total Common Stocks (Cost $58,420) | 56,719 | |||
| Coupon | ||||
| Temporary Cash Investment (0.3%)1 | ||||
| Money Market Fund (0.3%) | ||||
| 2 | Vanguard Market Liquidity Fund (Cost $196) | 0.132% | 196,290 | 196 |
| Total Investments (99.9%) (Cost $58,616) | 56,915 | |||
| Other Assets and Liabilities—Net (0.1%) | 62 | |||
| Net Assets (100%) | 56,977 | |||
Securities with a market value of less than $500 are displayed with a dash.
* Non-income-producing security.
1 The fund invests a portion of its cash reserves in equity markets through the use of index futures contracts. After giving effect to futures investments, the fund's effective common stock and temporary cash investment positions represent 100.0% and -0.1%, respectively, of net assets.
2 Affiliated money market fund available only to Vanguard funds and certain trusts and accounts managed by Vanguard. Rate shown is the 7-day yield.
47
Report of Independent Registered Public Accounting Firm
To the Trustees of Vanguard Scottsdale Funds and the Shareholders of Vanguard Russell 3000 Index Fund:
We have audited, in accordance with the standards of the Public Company Accounting Oversight Board (United States), the financial statements (not presented herein) of Vanguard Russell 3000 Index Fund (constituting a separate portfolio of Vanguard Scottsdale Funds, hereafter referred to as the “Fund”) as of August 31, 2011 and for the period then ended and have issued our unqualified report thereon dated October 13, 2011. Our audit included an audit of the Fund’s schedule of investments as of August 31, 2011. This schedule of investments is the responsibility of the Fund’s management. Our responsibility is to express an opinion on this schedule of investments based on our audit.
In our opinion, the accompanying schedule of investments referred to above, when read in conjunction with the financial statements of the Fund referred to above, presents fairly, in all material respects, the information set forth therein.
PricewaterhouseCoopers LLP
Philadelphia, Pennsylvania
October 13, 2011
48
| © 2011 The Vanguard Group. Inc. |
| All rights reserved. |
| Vanguard Marketing Corporation, Distributor. |
| SNA18540_102011 |
Item 2: Code of Ethics. The Registrant has adopted a code of ethics that applies to the Registrant’s principal executive officer, principal financial officer, principal accounting officer or controller or persons performing similar functions. The Code of Ethics was amended during the reporting period covered by this report to make certain technical, non-material changes.
Item 3: Audit Committee Financial Expert. The following members of the Audit Committee have been determined by the Registrant’s Board of Trustees to be Audit Committee Financial Experts serving on its Audit Committee, and to be independent: Charles D. Ellis, Rajiv L. Gupta, JoAnn Heffernan Heisen, André F. Perold, and Alfred M. Rankin, Jr.
Item 4: Principal Accountant Fees and Services.
(a) Audit Fees.
Audit Fees of the Registrant
Fiscal Year Ended August 31, 2011: $370,000
Fiscal Year Ended August 31, 2010: $80,000
Aggregate Audit Fees of Registered Investment Companies in the Vanguard Group.
Fiscal Year Ended August 31, 2011: $3,978,540
Fiscal Year Ended August 31, 2010: $3,607,060
(b) Audit-Related Fees.
Fiscal Year Ended August 31, 2011: $1,341,750
Fiscal Year Ended August 31, 2010: $791,350
Includes fees billed in connection with assurance and related services provided to the Registrant, The Vanguard Group, Inc., Vanguard Marketing Corporation, and other registered investment companies in the Vanguard Group.
(c) Tax Fees.
Fiscal Year Ended August 31, 2011: $373,830
Fiscal Year Ended August 31, 2010: $336,090
Includes fees billed in connection with tax compliance, planning and advice services provided to the Registrant, The Vanguard Group, Inc., Vanguard Marketing Corporation, and other registered investment companies in the Vanguard Group and related to income and excise taxes.
(d) All Other Fees.
Fiscal Year Ended August 31, 2011: $16,000
Fiscal Year Ended August 31, 2010: $16,000
Includes fees billed for services related to risk management and privacy matters. Services were provided to the Registrant, The Vanguard Group, Inc., Vanguard Marketing Corporation, and other registered investment companies in the Vanguard Group.
(e) (1) Pre-Approval Policies. The policy of the Registrant’s Audit Committee is to consider and, if appropriate, approve before the principal accountant is engaged for such services, all specific audit and non-audit services provided to: (1) the Registrant; (2) The Vanguard Group, Inc.; (3) other entities controlled by The Vanguard Group, Inc. that provide ongoing services to the Registrant; and (4) other registered investment companies in the Vanguard Group. In making a determination, the Audit Committee considers whether the services are consistent with maintaining the principal accountant’s independence.
In the event of a contingency situation in which the principal accountant is needed to provide services in between scheduled Audit Committee meetings, the Chairman of the Audit Committee would be called on to consider and, if appropriate, pre-approve audit or permitted non-audit services in an amount sufficient to complete services through the next Audit Committee meeting, and to determine if such services would be consistent with maintaining the accountant’s independence. At the next scheduled Audit Committee meeting, services and fees would be presented to the Audit Committee for formal consideration, and, if appropriate, approval by the entire Audit Committee. The Audit Committee would again consider whether such services and fees are consistent with maintaining the principal accountant’s independence.
The Registrant’s Audit Committee is informed at least annually of all audit and non-audit services provided by the principal accountant to the Vanguard complex, whether such services are provided to: (1) the Registrant; (2) The Vanguard Group, Inc.; (3) other entities controlled by The Vanguard Group, Inc. that provide ongoing services to the Registrant; or (4) other registered investment companies in the Vanguard Group.
(2) No percentage of the principal accountant’s fees or services were approved pursuant to the waiver provision of paragraph (c)(7)(i)(C) of Rule 2-01 of Regulation S-X.
(f) For the most recent fiscal year, over 50% of the hours worked under the principal accountant’s engagement were not performed by persons other than full-time, permanent employees of the principal accountant.
(g) Aggregate Non-Audit Fees.
Fiscal Year Ended August 31, 2011: $389,830
Fiscal Year Ended August 31, 2010: $352,090
Includes fees billed for non-audit services provided to the Registrant, The Vanguard Group, Inc., Vanguard Marketing Corporation, and other registered investment companies in the Vanguard Group.
(h) For the most recent fiscal year, the Audit Committee has determined that the provision of all non-audit services was consistent with maintaining the principal accountant’s independence.
Item 5: Audit Committee of Listed Registrants.
The Registrant is a listed issuer as defined in Rule 10A-3 under the Securities Exchange Act of 1934 (“Exchange Act”). The Registrant has a separately-designated standing audit committee established in accordance with Section 3(a)(58)(A) of the Exchange Act. The Registrant’s audit committee members are: Emerson U. Fullwood, Rajiv L. Gupta, Amy Gutmann, JoAnn Heffernan Heisen, F. Joseph Loughrey, André F. Perold, Alfred M. Rankin, Jr., and Peter F. Volanakis.
Item 6: Investments.
Not Applicable.
Item 7: Disclosure of Proxy Voting Policies and Procedures for Closed-End Management Investment Companies.
Not Applicable.
Item 8: Portfolio Managers of Closed-End Management Investment Companies.
Not Applicable.
Item 9: Purchase of Equity Securities by Closed-End Management Investment Company and Affiliated Purchasers.
Not Applicable.
Item 10: Submission of Matters to a Vote of Security Holders.
Not Applicable.
Item 11: Controls and Procedures.
(a) Disclosure Controls and Procedures. The Principal Executive and Financial Officers concluded that the Registrant's Disclosure Controls and Procedures are effective based on their evaluation of the Disclosure Controls and Procedures as of a date within 90 days of the filing date of this report.
(b) Internal Control Over Financial Reporting. There were no significant changes in Registrant’s Internal Control Over Financial Reporting or in other factors that could significantly affect this control subsequent to the date of the evaluation, including any corrective actions with regard to significant deficiencies and material weaknesses.
Item 12: Exhibits.
(a) Code of Ethics.
(b) Certifications.
Pursuant to the requirements of the Securities Exchange Act of 1934 and the Investment Company Act of 1940, the registrant has duly caused this report to be signed on its behalf by the undersigned, thereunto duly authorized.
| VANGUARD SCOTTSDALE FUNDS | |
| By: | /s/ F. WILLIAM MCNABB III* |
| F. WILLIAM MCNABB III | |
| CHIEF EXECUTIVE OFFICER | |
| Date: October 20, 2011 | |
Pursuant to the requirements of the Securities Exchange Act of 1934 and the Investment Company Act of 1940, this report has been signed below by the following persons on behalf of the registrant and in the capacities and on the dates indicated.
| VANGUARD SCOTTSDALE FUNDS | |
| By: | /s/ F. WILLIAM MCNABB III* |
| F. WILLIAM MCNABB III | |
| CHIEF EXECUTIVE OFFICER | |
| Date: October 20, 2011 | |
| VANGUARD SCOTTSDALE FUNDS | |
| By: | /s/ THOMAS J. HIGGINS* |
| THOMAS J. HIGGINS | |
| CHIEF FINANCIAL OFFICER | |
| Date: October 20, 2011 | |
* By: /s/ Heidi Stam
Heidi Stam, pursuant to a Power of Attorney filed on April 26, 2010, see file Number 33-53683, Incorporated by Reference.